Table of Contents
UNITED STATES
SECURITIES AND EXCHANGE COMMISSION
Washington, D.C. 20549
FORMN-CSR
CERTIFIED SHAREHOLDER REPORT OF REGISTERED MANAGEMENT INVESTMENT COMPANIES
Investment Company Act file number 811-10385
Pacific Funds Series Trust
(Exact name of registrant as specified in charter)
700 Newport Center Drive, P.O. Box 7500
Newport Beach, CA 92660
(Address of principal executive offices) (Zip code)
Robin S. Yonis
Vice President, General Counsel and Assistant Secretary of Pacific Funds Series Trust
700 Newport Center Drive, P.O. Box 9000
Newport Beach, CA 92660
(Name and address of agent for service)
Copies to:
Anthony H. Zacharski, Esq.
Dechert LLP
90 State House Square
Hartford, CT 06103
Registrant’s telephone number, including area code:949-219-6767
Date of fiscal year end: March 31
Date of reporting period:April 1, 2019 -March 31, 2020
FormN-CSR is to be used by management investment companies to file reports with the Commission not later than 10 days after the transmission to stockholders of any report that is required to be transmitted to stockholders under Rule30e-1 under the Investment Company Act of 1940 (17 CFR270.30e-1). The Commission may use the information provided on FormN-CSR in its regulatory, disclosure review, inspection, and policymaking roles.
A registrant is required to disclose the information specified by FormN-CSR, and the Commission will make this information public. A registrant is not required to respond to the collection of information contained in FormN-CSR unless the Form displays a currently valid Office of Management and Budget (“OMB”) control number. Please direct comments concerning the accuracy of the information collection burden estimate and any suggestions for reducing the burden to Secretary, Securities and Exchange Commission, 100 F Street NE, Washington, DC 20549. The OMB has reviewed this collection of information under the clearance requirements of 44 U.S.C. § 3507.
Table of Contents
Item 1. Reports to Stockholders.
The following is a copy of the report transmitted to stockholders pursuant to Rule30e-1 under the Act (17 CFR270.30e-1).
Table of Contents
March 31, 2020
ANNUAL REPORT

Table of Contents
PACIFIC FUNDS
ANNUAL REPORT
AS OF MARCH 31, 2020
| A-1 | ||||
| A-2 | ||||
| B-1 | ||||
Financial Statements: | ||||
| C-1 | ||||
| C-4 | ||||
| C-7 | ||||
| C-13 | ||||
| D-1 | ||||
| E-1 | ||||
| F-1 | ||||
| F-2 | ||||
| F-5 | ||||
| F-8 | ||||
| F-9 | ||||
| F-23 | ||||
| F-24 | ||||
Pacific Funds Series Trust, which is a Delaware statutory trust, may be referred to as “Pacific Funds” or the “Trust”.
Beginning January 2021, as permitted by regulations adopted by the U.S. Securities and Exchange Commission, paper copies of Pacific Funds shareholder reports like this one will no longer be sent by mail, unless you specifically request paper copies of the reports from Pacific Funds or from your financial intermediary (such as a broker-dealer or bank). Instead, the reports will be made available on a website, and you will be notified by mail each time a report is posted and provided with a website link to access the report.
If you already elected to receive shareholder reports electronically, you will not be affected by this change and you need not take any action. You may elect to receive shareholder reports and other communications from Pacific Funds electronically by contacting Pacific Funds using one of the methods listed in the Where To Go For More Information section or by contacting your financial intermediary directly.
You may elect to receive all future reports in paper free of charge. You can inform Pacific Funds or your financial intermediary that you wish to continue receiving paper copies by contacting Pacific Funds using one of the methods listed in the Where To Go For More Information section or by contacting your financial intermediary directly. Your election to receive reports in paper will apply to all communications received for all Funds held with Pacific Funds.
Table of Contents
PACIFIC FUNDS
We are pleased to share with you the Annual Report for the fiscal year ended March 31, 2020 for Pacific Funds Series Trust (“Pacific Funds” or the “Trust”). Pacific Funds is comprised of thirty-three Funds, eighteen of which are included in this report (each individually, a “Fund” and collectively, the “Funds”) and are available for direct investment. Pacific Life Fund Advisors LLC (PLFA) is Adviser to the Funds and also directly manages Pacific FundsSM Portfolio Optimization Conservative, Pacific FundsSM Portfolio Optimization Moderate-Conservative, Pacific FundsSM Portfolio Optimization Moderate, Pacific FundsSM Portfolio Optimization Growth and Pacific FundsSM Portfolio Optimization Aggressive-Growth (together, the “Portfolio Optimization Funds”).
Each of the Portfolio Optimization Funds is an asset allocation “Fund of Funds” that invests in Class P shares of certain other funds of the Trust (the “PF Underlying Funds”). PLFA supervises the management of those PF Underlying Funds which are only available for investment by the Portfolio Optimization Funds and are included in a separate PF Underlying Funds Annual Report. Please see “Where to Go for More Information” for instructions on how to obtain the PF Underlying Funds’ Annual Report. During the period, the Portfolio Optimization Funds invested in Class P shares of Pacific FundsSM Core Income, Pacific FundsSM High Income, Pacific FundsSM Floating Rate Income and Pacific FundsSMSmall-Cap Growth.
The Adviser, Pacific Asset Management LLC, Cadence Capital Management LLC and Rothschild & Co Asset Management US Inc. (together, the “Managers”) and their Funds as of March 31, 2020 are listed below:
| Manager(s) | Fund | Page Number | ||
| Pacific Life Fund Advisors LLC (PLFA) | Pacific FundsSM Portfolio Optimization Conservative | A-4 | ||
| Pacific FundsSM Portfolio Optimization Moderate-Conservative | A-5 | |||
| Pacific FundsSM Portfolio Optimization Moderate | A-7 | |||
| Pacific FundsSM Portfolio Optimization Growth | A-8 | |||
| Pacific FundsSM Portfolio Optimization Aggressive-Growth | A-9 | |||
| Pacific Asset Management LLC (Pacific Asset Management) | Pacific FundsSM Ultra Short Income | A-10 | ||
| Pacific FundsSM Short Duration Income | A-11 | |||
| Pacific FundsSM Core Income | A-12 | |||
| Pacific FundsSM Strategic Income | A-13 | |||
| Pacific FundsSM Floating Rate Income | A-14 | |||
| Pacific FundsSM High Income | A-15 | |||
Cadence Capital Management LLC (Cadence) and Pacific Asset Management | Pacific FundsSM Diversified Income | A-16 | ||
| Rothschild & Co Asset Management US Inc. (Rothschild & Co) | Pacific FundsSMLarge-Cap | A-17 | ||
| Pacific FundsSMLarge-Cap Value | A-18 | |||
| Pacific FundsSMSmall/Mid-Cap | A-19 | |||
| Pacific FundsSMSmall-Cap | A-20 | |||
| Pacific FundsSMSmall-Cap Value | A-22 | |||
| Pacific FundsSMSmall-Cap Growth | A-23 | |||
The Adviser and the Managers have prepared a discussion regarding the performance of the Funds of the Trust that they manage, including commentary discussing positive and negative factors affecting performance for the past twelve months.
We appreciate your confidence in Pacific Funds and look forward to serving your financial needs in the years to come.
Sincerely,
 |  | |
| James T. Morris | Adrian S. Griggs | |
| Chairman of the Board | Chief Executive Officer | |
| Pacific Funds Series Trust | Pacific Funds Series Trust | |
A-1
Table of Contents
PACIFIC FUNDS PERFORMANCE DISCUSSION
This Annual Report is provided for the general information of investors with beneficial interests in the Trust. This report is not authorized for distribution to prospective investors unless preceded or accompanied by a current Trust prospectus, as supplemented, which contains information about the Trust and each of its Funds, including their investment objectives, risks, charges and expenses. You should read the prospectus carefully before investing. There is no assurance that a Fund will achieve its investment objective. Each Fund is subject to market risk. The value of a Fund changes as its asset values go up or down. The value of a Fund’s shares will fluctuate, and when redeemed, may be worth more or less than their original cost. The total return for each Fund of the Trust is net of fees and includes reinvestment of all dividends and capital gain distributions, if any, and does not include deductions of any applicable share class sales charges. Past performance is not predictive of future performance. This report shows you the performance of each of the Funds compared to its benchmark index. Index performance is provided for illustrative and comparative purposes only and does not predict or depict the performance of the Funds. Indices are unmanaged, do not incur transaction costs, do not include fees and expenses, and cannot be purchased directly by investors. Index returns include reinvested dividends.
The composite benchmarks for the Portfolio Optimization Funds are composed of up to four broad-based indices. The percentage amounts of each broad-based index within each composite benchmark are based on each Fund’s target asset class allocations in effect during the reporting period. The percentages attributed to a broad-based index within a composite benchmark will change if a Fund’s target asset class allocations change.
PLFA supervises the management of the Funds contained in this report, subject to the oversight of the Trust’s Board of Trustees (Board). PLFA has written the general market conditions commentary which expresses PLFA’s opinions and views on how the market generally performed for the fiscal year ended March 31, 2020 (the reporting period) as well as separate commentary specific to those Funds that it directly manages that is based on its opinion of how these Funds performed during the year.
All views and opinions expressed in the management discussion of fund performance are subject to change at any time based upon market, economic or other conditions, and the Trust, its Adviser and the Managers disclaim any responsibility to update such views. These views and options may not be relied upon as investment advice or recommendations, or as an offer for any particular security. Any references to “we”, “I”, or “ours” are references to the Managers. Any sectors referenced are provided by the applicable Manager and could be different from the sectors listed in the Schedules of Investments if obtained from another source. The Managers may include statements that constitute “forward-looking statements” under the United States (U.S.) securities laws. Forward-looking statements include information concerning possible or assumed future results of the Trust’s investment operations, asset levels, earnings, expenses, industry or market conditions, regulatory developments and other aspects of the Trust’s operations or general economic conditions. In addition, when used in this report, words such as “believes”, “expects”, “anticipates”, “intends”, “plans”, “estimates”, “projects” and future or conditional verbs such as “will”, “may”, “could”, “should”, and “would”, or any other statement that necessarily depends on future events, are intended to identify forward- looking statements. Forward-looking statements are not guarantees of performance or economic results. They involve risks, uncertainties and assumptions. Although such statements are based on expectations that the Managers believe to be reasonable, actual results may differ materially from expectations. Investors must not rely on any forward-looking statements. Statements of facts and performance data are from sources considered reliable, but no representation or warranty is made as to their completeness or accuracy.
In connection with any forward-looking statements and any investment in the Trust, investors should carefully consider the investment objectives, policies and risks described in the Trust’s current prospectus, as supplemented, and Statement of Additional Information, as supplemented, as filed with the United States (U.S.) Securities and Exchange Commission (SEC), which may be obtained from the SEC’s website atwww.sec.gov.
Market Conditions (for the year ended March 31, 2020)
Executive Summary
While global markets kicked off the new decade with steady gains, risk assets got bombarded in March of 2020 by natural and geopolitical hazards that fueled market volatility. At the start of 2020, economic and business indicators showed that U.S. equities were on track for another positive year. Historically, low employment rates boosted consumer confidence—a key factor behind the rising stock market. This support from American households kept the longest economic expansion in U.S. history going, despite mounting external and operational challenges businesses faced such as rising input costs. However, those stock-market gains over much of the reporting period quickly evaporated with the spread of the coronavirus or “COVID-19”.
Fixed Income
As coronavirus threatened to throw the U.S. economy into a deep recession or worse, the Fed unexpectedly and aggressively lowered the Fed Funds-rate target range from 0% to 0.25% and unleashed multiple credit facilities to maintain ample liquidity in the marketplace. The10-year U.S. Treasury yield slid from nearly 2.5% to 0.70% over the reporting period. The bond market (as defined by the Bloomberg Barclays US Aggregate Bond Index) returned 8.93% for the reporting period. Like equities, spread sectors faced headwinds over the volatile period as the number of coronavirus-related cases and deaths surged, causing elevated risk concerns. Spikes in credit spreads hurt both emerging-market and high-yield bonds, which coincided with the plunge in risk appetite.
Domestic Equity
On the way down, growth stocks continued to outperform value stocks. Value styles and factors tend to have material exposures to financial and energy sectors, both of which performed badly. In the energy sector, a combination of low profit margins, high leverage and tumbling crude prices triggered an outflow of capital. Extremely low interest rates continued to suppress profitability among financial institutions. Amid a flight to quality, investors shifted from small-capitalization stocks to large-capitalization stocks with healthier balance sheets.
A-2
See benchmark definitions on A-24 and A-25
Table of Contents
PACIFIC FUNDS PERFORMANCE DISCUSSION (Continued)
International Equity
Internationally, trade tensions between the U.S. and China improved, although the Trump administration maintained most of its tariffs. Russia and Saudi Arabia had been engaging in acrude-oil price war that caused oil prices to plunge as markets prepared for an oncoming glut of oil. Many experts questioned the validity, rationale and strategic motives for engaging in this conflict as well as the possibility of a potential pact between Saudi Arabia and Russia. While Russian President Vladimir Putin maintained a strong interest in the Middle East region, theoil-for-military bilateral relationship between the Saudis and the U.S. has faded over the last several years, particularly after the Crown Prince Mohammed bin Salman become the second most powerful figure in Saudi Arabia behind his father, King Salman.
International equities continued to lag their U.S. counterparts, as both the MSCI EAFE (Europe, Australasia, and Far East) Index (Net) and the MSCI Emerging Markets (EM) Index (Net) experienced double-digit losses(-14.38% and-17.69%, respectively) over the reporting period. International developed- and emerging-market equities tend to have more exposure than U.S. markets to the financial sector, whose performance was lackluster as major central banks maintained exceptionally loose monetary policies. Additionally, both Asian and European economies were hit by the coronavirus outbreak earlier than the U.S., contributing to the relative underperformance.
Concluding Remarks
These unfolding events have caused many countries to take wartime-like measures to fight the spread of the coronavirus and address its effects on the global economy. The Fed and Trump administration unleashed an extraordinary monetary and$2-trillion fiscal-stimulus package in an attempt to offset the snowballing effects ofCOVID-19 and other geopolitical issues.
The Trump administration has found itself simultaneously battling the unprecedented impacts of coronavirus, a trade war with China, falling crude oil prices and cracks in cyber security. We think the$2-trillion stimulus won’t be enough to fully stabilize the economy, and Congress will be forced to pass another package to further bolster markets. We believe the domestic economy and asset prices may begin recovering in the latter half of 2020 if appropriate measures are taken. In particular, we’ll need to see American businesses and consumers regain some optimism after we come out on the other side of the outbreak.
Globally, the energy sector felt the blow delivered by Putin’s drive to regain market share from U.S. shale. Putin also continues to increase Russia’s global influence, especially in the Middle East where the Trump administration has sent mixed messages about the U.S.’s military commitment in the energy-rich region. Russia has been strategically building its key energy infrastructure projects, though construction of its Nord Stream 2 gas pipeline—designed to run from Russia to Germany—has been halted after the U.S. recently announced it would impose sanctions on vessels that help lay the pipeline in the Baltic Sea.
A minefield of issues threatens the European economy. Once the coronavirus crisis fades, the European Union (EU) will still need to finalize terms of Britain’s exit from the EU; deal with a Eurosceptic and battered Italy; and wrestle with political upheavals in Poland and Hungary. The European Union faces these issues with less support from key allies, most notably the U.S. In addition to the coronavirus and geopolitical issues, regulatory pressures to restrict stockholder payouts could add to the mounting headwinds for European dividend-paying stocks such as those in the banking and energy industries, including value sectors, styles and factors.
The economic outlook for Japan, another key international market, remains cloudy. The latest blow was the postponement of the 2020 Summer Olympics to be held in Tokyo Japan due to the coronavirus. Japan’s economic difficulties (e.g. a declining population, perpetual deflation and monumental debt levels) will likely push the government to reluctantly pass another fiscal stimulus package to address some of the challenges.
China appears to be in the early recovery phase from the coronavirus, and the Trump administration has started to show a willingness to lower trade barriers to help revive economic activity. The Trump administration’s actions indicate that it will consider extraordinary measures in an attempt to revive the U.S. equity market. We anticipate that President Trump will place an emphasis on boosting the stock market ahead of November’s presidential election. Those measures could potentially lift risk assets, specifically U.S. and Chinese equities over the medium term.
Forward-lookingprice-to-earnings multiples appear to be fairly reasonable at current levels; however, we have noticed slow downward revisions to analyst earnings estimates amid heightened levels of uncertainty. While the exceptional amount of stimulus could provide a jolt to equity markets, longer-term management of the U.S. government’s finances will likely become a highly complex issue as it will need to address rapidly surging debt levels from bailout packages on top of the Fed’s diminished ability to further loosen monetary policy.
Though the U.S. and other countries currently face multiple headwinds, diligent and careful asset-allocation decisions should help investors navigate through the maze of investment threats and opportunities.
Performance of the Portfolio Optimization Funds
The performance of the Portfolio Optimization Funds are composites of the performance of each of the PF Underlying Funds in which each invests (which may include domestic and/or international equities and bonds). The Portfolio Optimization Funds are compared to two broad-based indices; however, to further assist in performance comparisons, composite benchmarks were constructed for the Portfolio Optimization Funds. Each composite benchmark is comprised of up to four of the broad-based indices shown below. The composite benchmarks were constructed with allocations to each asset class that correspond to the target allocations for Portfolio Optimization Funds. However, the actual allocations of any Portfolio Optimization Fund will naturally vary from these targets as a result of market performance over time. Theone-year performance for these broad-based indices for the year ended March 31, 2020 is shown in the following table:
Broad-Based Indices | ||||
S&P 500 Index (representing U.S. Stocks) | -6.98% | |||
Morgan Stanley Capital International (MSCI) EAFE Index (Net) (International Stocks) | -14.38% | |||
Bloomberg Barclays US Aggregate Bond Index (Fixed Income) | 8.93% | |||
ICE BofAML U.S.3-MonthT-Bill Index (Cash) | 2.25% | |||
| See benchmark definitions on A-24 and A-25 |
A-3
Table of Contents
PACIFIC FUNDS PERFORMANCE DISCUSSION (Continued)
Pacific Funds Portfolio Optimization Conservative (managed by Pacific Life Fund Advisors LLC)
Q. How did the Fund perform for the year ended March 31, 2020?
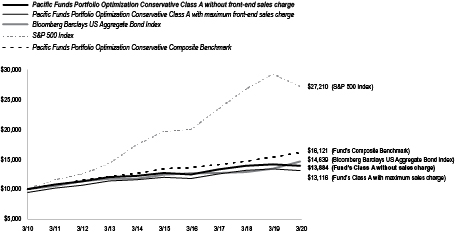
A. For the year ended March 31, 2020, Pacific Funds Portfolio Optimization Conservative’s Class A (without sales charge) returned-1.95%, compared to an 8.93% return for the Bloomberg Barclays US Aggregate Bond Index, a-6.98% return for the S&P 500 Index, and a 4.72% return for the Pacific Funds Portfolio Optimization Conservative Composite Benchmark.
The following graph compares the performance of a hypothetical $10,000 investment in Class A shares of the Fund to its benchmarks for the ten-year period ended March 31, 2020. For comparison purposes, the performance of all classes for the periods ended March 31, 2020 are also shown in the table below. Performance data for Class C and Advisor Class shares will vary due to differences in fees and sales charges. The Fund’s performance reflects reinvestments of all dividends and capital gains distributions, if any.
Performance Comparison
Average Annual Total Returns for the Periods Ended March 31, 2020
| 1 Year | 5 Years | 10 Years | ||||||||||
Fund’s Class A without sales charge | (1.95% | ) | 1.82% | 3.34% | ||||||||
Fund’s Class A with maximum sales charge | (7.38% | ) | 0.68% | 2.75% | ||||||||
Fund’s Class C without sales charge | (2.72% | ) | 1.06% | 2.59% | ||||||||
Fund’s Class C with maximum sales charge | (3.68% | ) | 1.06% | 2.59% | ||||||||
Bloomberg Barclays US Aggregate Bond Index | 8.93% | 3.36% | 3.88% | |||||||||
S&P 500 Index | (6.98% | ) | 6.73% | 10.53% | ||||||||
Pacific Funds Portfolio Optimization Conservative Composite Benchmark | 4.72% | 3.76% | 4.89% | |||||||||
Average Annual Total Returns for the Periods Ended March 31, 2020
| 1 Year | 5 Years | Since Inception (12/31/12) | ||||||||||
Fund’s Advisor Class without sales charge | (1.68% | ) | 2.09% | 2.53% | ||||||||
Bloomberg Barclays US Aggregate Bond Index | 8.93% | 3.36% | 3.06% | |||||||||
S&P 500 Index | (6.98% | ) | 6.73% | 10.81% | ||||||||
Pacific Funds Portfolio Optimization Conservative Composite Benchmark | 4.72% | 3.76% | 4.31% | |||||||||
Performance data shown represents past performance. Investment return and principal value will fluctuate so that shares of the Fund when redeemed may be worth more or less than their original cost. Past performance is not predictive of future performance. The table does not reflect the deduction of taxes that a shareholder would pay on Fund distributions or redemption of Fund shares. |
Q. Discuss both positive and negative factors that materially affected the Fund’s performance during the year, including relevant market conditions, investment strategies and techniques, and particular sectors or securities.
A. For the reporting period, the Fund’s Class A underperformed the Pacific Funds Portfolio Optimization Conservative Composite Benchmark. The Pacific Funds Portfolio Optimization Conservative Composite Benchmark is comprised of the Bloomberg Barclays US Aggregate Bond, S&P 500, ICE BofAML U.S.3-MonthT-Bill, and MSCI EAFE (Net) Indices in a weighting that is fixed and specific to the Fund. The Fund was primarily invested in various fixed income strategies, with a smaller allocation to equity, during the reporting period. Fixed income investments included allocations to intermediate-term bond, short duration bond, inflation-indexed bond, emerging markets bond, and floating rate strategies. The equity segment consisted mainly of allocations to domestic and foreign large-capitalization strategies. The Fund’s alternatives allocation consisted of investments in a currency strategy and an equity long/short strategy.
| See benchmark definitions on A-24 and A-25 |
A-4
Table of Contents
PACIFIC FUNDS PERFORMANCE DISCUSSION (Continued)
Among the fixed income lineup, high yield and emerging market bonds detracted from performance over the reporting period as riskier asset classes fared poorly amid the global coronavirus pandemic and escalating geopolitical issues. Additionally, the PF Managed Bond Fund, which represented the largest weight in the Fund, underperformed the Bloomberg Barclays US Aggregate Bond Index and detracted from performance over the reporting period.
As for domestic equities, exposures to small-capitalization, value-oriented and real estate-focused stocks dragged performance over the reporting period as growth sectors such as information technology continued to surge past value sectors. Nonetheless, the PF Real Estate Fund outperformed its underlying benchmark and contributed positively to performance.
International equities outperformed the MSCI EAFE Index (Net) over the reporting period. An overweight to emerging markets had a positive impact on performance. Additionally, the PF Emerging Markets Fund outpaced its benchmark, the MSCI Emerging Markets Index (Net), which further contributed to performance.
Pacific Funds Portfolio Optimization Moderate-Conservative (managed by Pacific Life Fund Advisors LLC)
Q. How did the Fund perform for the year ended March 31, 2020?
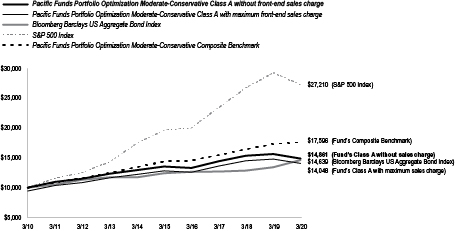
A. For the year ended March 31, 2020, Pacific Funds Portfolio Optimization Moderate-Conservative’s Class A (without sales charge) returned-4.94%, compared to an 8.93% return for the Bloomberg Barclays US Aggregate Bond Index, a-6.98% return for the S&P 500 Index, and a 1.64% return for the Pacific Funds Portfolio Optimization Moderate-Conservative Composite Benchmark.
The following graph compares the performance of a hypothetical $10,000 investment in Class A shares of the Fund to its benchmarks for the ten-year period ended March 31, 2020. For comparison purposes, the performance of all classes for the periods ended March 31, 2020 are also shown in the table below. Performance data for Class C and Advisor Class shares will vary due to differences in fees and sales charges. The Fund’s performance reflects reinvestments of all dividends and capital gains distributions, if any.
Performance Comparison
Average Annual Total Returns for the Periods Ended March 31, 2020
| 1 Year | 5 Years | 10 Years | ||||||||||
Fund’s Class A without sales charge | (4.94% | ) | 1.87% | 4.04% | ||||||||
Fund’s Class A with maximum sales charge | (10.15% | ) | 0.73% | 3.46% | ||||||||
Fund’s Class C without sales charge | (5.63% | ) | 1.12% | 3.29% | ||||||||
Fund’s Class C with maximum sales charge | (6.56% | ) | 1.12% | 3.29% | ||||||||
Bloomberg Barclays US Aggregate Bond Index | 8.93% | 3.36% | 3.88% | |||||||||
S&P 500 Index | (6.98% | ) | 6.73% | 10.53% | ||||||||
Pacific Funds Portfolio Optimization Moderate-Conservative Composite Benchmark | 1.64% | 4.11% | 5.81% | |||||||||
Average Annual Total Returns for the Periods Ended March 31, 2020
| 1 Year | 5 Years | Since Inception (12/31/12) | ||||||||||
Fund’s Advisor Class without sales charge | (4.67% | ) | 2.12% | 3.36% | ||||||||
Bloomberg Barclays US Aggregate Bond Index | 8.93% | 3.36% | 3.06% | |||||||||
S&P 500 Index | (6.98% | ) | 6.73% | 10.81% | ||||||||
Pacific Funds Portfolio Optimization Moderate-Conservative Composite Benchmark | 1.64% | 4.11% | 5.38% | |||||||||
Performance data shown represents past performance. Investment return and principal value will fluctuate so that shares of the Fund when redeemed may be worth more or less than their original cost. Past performance is not predictive of future performance. The table does not reflect the deduction of taxes that a shareholder would pay on Fund distributions or redemption of Fund shares. |
| See benchmark definitions on A-24 and A-25 |
A-5
Table of Contents
PACIFIC FUNDS PERFORMANCE DISCUSSION (Continued)
Q. Discuss both positive and negative factors that materially affected the Fund’s performance during the year, including relevant market conditions, investment strategies and techniques, and particular sectors or securities.
A. For the reporting period, the Fund’s Class A underperformed the Pacific Funds Portfolio Optimization Moderate-Conservative Composite Benchmark. The Pacific Funds Portfolio Optimization Moderate-Conservative Composite Benchmark is comprised of the Bloomberg Barclays US Aggregate Bond, S&P 500, MSCI EAFE (Net), and ICE BofAML U.S.3-MonthT-Bill Indices in a weighting that is fixed and specific to the Fund. The Fund had a diversified allocation mix that was modestly tilted to fixed income during the reporting period. Fixed income investments included intermediate-term bond strategies as well as short duration bond, inflation-indexed bond, high yield bond, emerging markets bond, and floating rate strategies. The Fund’s equity exposure was diversified across style (growth/value), market capitalization and region (including an allocation to foreign small-capitalization and emerging markets strategies). The Fund’s alternatives allocation consisted of investments in a currency strategy and an equity long/short strategy.
Among the fixed income lineup, high yield and emerging market bonds detracted from performance over the reporting period as riskier asset classes fared poorly amid the global coronavirus pandemic and escalating geopolitical issues. Additionally, the PF Managed Bond Fund, which represented the largest weight in the Fund, underperformed the Bloomberg Barclays US Aggregate Bond Index and detracted from performance over the reporting period.
As for domestic equities, exposures to small-capitalization, value-oriented and real estate-focused stocks dragged performance over the reporting period, as growth sectors such as information technology continued to surge past value sectors. Nonetheless, the PF Real Estate Fund outperformed its underlying benchmark and contributed positively to performance.
International equities outperformed the MSCI EAFE Index (Net) over the reporting period. An overweight to emerging markets had a positive impact on performance. Additionally, the PF Emerging Markets Fund outpaced its benchmark, the MSCI Emerging Markets Index (Net), which further contributed to performance.
| See benchmark definitions on A-24 and A-25 |
A-6
Table of Contents
PACIFIC FUNDS PERFORMANCE DISCUSSION (Continued)
Pacific Funds Portfolio Optimization Moderate (managed by Pacific Life Fund Advisors LLC)
Q. How did the Fund perform for the year ended March 31, 2020?
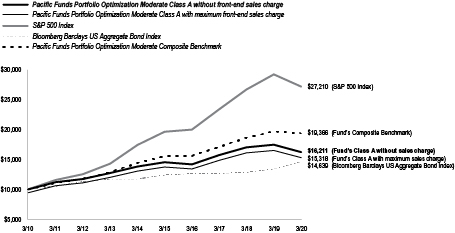
A. For the year ended March 31, 2020, Pacific Funds Portfolio Optimization Moderate’s Class A (without sales charge) returned-7.24%, compared to a-6.98% return for the S&P 500 Index, an 8.93% return for the Bloomberg Barclays US Aggregate Bond Index, and a -1.73% return for the Pacific Funds Portfolio Optimization Moderate Composite Benchmark.
The following graph compares the performance of a hypothetical $10,000 investment in Class A shares of the Fund to its benchmarks for the ten-year period ended March 31, 2020. For comparison purposes, the performance of all classes for the periods ended March 31, 2020 are also shown in the table below. Performance data for Class C and Advisor Class shares will vary due to differences in fees and sales charges. The Fund’s performance reflects reinvestments of all dividends and capital gains distributions, if any.
Performance Comparison
Average Annual Total Returns for the Periods Ended March 31, 2020
| 1 Year | 5 Years | 10 Years | ||||||||||
Fund’s Class A without sales charge | (7.24% | ) | 2.19% | 4.95% | ||||||||
Fund’s Class A with maximum sales charge | (12.35% | ) | 1.03% | 4.36% | ||||||||
Fund’s Class C without sales charge | (7.97% | ) | 1.43% | 4.20% | ||||||||
Fund’s Class C with maximum sales charge | (8.85% | ) | 1.43% | 4.20% | ||||||||
S&P 500 Index | (6.98% | ) | 6.73% | 10.53% | ||||||||
Bloomberg Barclays US Aggregate Bond Index | 8.93% | 3.36% | 3.88% | |||||||||
Pacific Funds Portfolio Optimization Moderate Composite Benchmark | (1.73% | ) | 4.48% | 6.83% | ||||||||
Average Annual Total Returns for the Periods Ended March 31, 2020
| 1 Year | 5 Years | Since Inception (12/31/12) | ||||||||||
Fund’s Advisor Class without sales charge | (7.07% | ) | 2.43% | 4.35% | ||||||||
S&P 500 Index | (6.98% | ) | 6.73% | 10.81% | ||||||||
Bloomberg Barclays US Aggregate Bond Index | 8.93% | 3.36% | 3.06% | |||||||||
Pacific Funds Portfolio Optimization Moderate Composite Benchmark | (1.73% | ) | 4.48% | 6.58% | ||||||||
Performance data shown represents past performance. Investment return and principal value will fluctuate so that shares of the Fund when redeemed may be worth more or less than their original cost. Past performance is not predictive of future performance. The table does not reflect the deduction of taxes that a shareholder would pay on Fund distributions or redemption of Fund shares. |
Q. Discuss both positive and negative factors that materially affected the Fund’s performance during the year, including relevant market conditions, investment strategies and techniques, and particular sectors or securities.
A. For the reporting period, the Fund’s Class A underperformed the Pacific Funds Portfolio Optimization Moderate Composite Benchmark. The Pacific Funds Portfolio Optimization Moderate Composite Benchmark is comprised of the S&P 500, Bloomberg Barclays US Aggregate Bond, MSCI EAFE (Net), and ICE BofAML U.S.3-MonthT-Bill Indices in a weighting that is fixed and specific to the Fund. The Fund allocated to a mix of equity and fixed income strategies during the reporting period, with a larger allocation toward equity investments. The equity exposure was diversified across style (growth/value), market capitalization and region (including allocations to foreign small-capitalization and emerging markets stocks). The Fund also maintained exposure to select market sectors such as publicly-traded real estate investment trusts (REITs). Fixed income investments included intermediate-term bond, short duration bond, inflation-indexed bond, emerging markets bond, and floating rate loan strategies. The Fund’s alternatives allocation consisted of investments in a currency strategy and an equity long/short strategy.
Among domestic equities, exposures to small-capitalization, value-oriented and real estate-focused stocks dragged over the reporting period as growth sectors such as information technology continued to surge past value sectors. Nonetheless, the PF Real Estate Fund outperformed its underlying benchmark and contributed positively to performance.
| See benchmark definitions on A-24 and A-25 |
A-7
Table of Contents
PACIFIC FUNDS PERFORMANCE DISCUSSION (Continued)
International equities outperformed the MSCI EAFE Index (Net) over the reporting period. An overweight to emerging markets had a positive impact on performance. Additionally, the PF Emerging Markets Fund and the PF InternationalLarge-Cap Fund outpaced their respective benchmarks, which further contributed to performance.
Within the fixed income lineup, high yield and emerging market bonds detracted from performance over the reporting period as riskier asset classes fared poorly amid the global coronavirus pandemic and escalating geopolitical issues. Additionally, the PF Managed Bond Fund, which represented among the top three weights in the Fund, underperformed the Bloomberg Barclays US Aggregate Bond Index and detracted from performance over the reporting period.
Pacific Funds Portfolio Optimization Growth (managed by Pacific Life Fund Advisors LLC)
Q. How did the Fund perform for the year ended March 31, 2020?
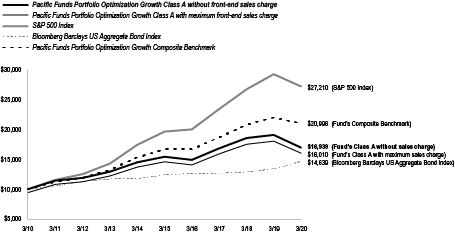
A. For the year ended March 31, 2020, Pacific Funds Portfolio Optimization Growth’s Class A (without sales charge) returned-11.24%, compared to a-6.98% return for the S&P 500 Index, an 8.93% return for the Bloomberg Barclays US Aggregate Bond Index, and a -4.65% return for the Pacific Funds Portfolio Optimization Growth Composite Benchmark.
The following graph compares the performance of a hypothetical $10,000 investment in Class A shares of the Fund to its benchmarks for the ten-year period ended March 31, 2020. For comparison purposes, the performance of all classes for the periods ended March 31, 2020 are also shown in the table below. Performance data for Class C and Advisor Class shares will vary due to differences in fees and sales charges. The Fund’s performance reflects reinvestments of all dividends and capital gains distributions, if any.
Performance Comparison
Average Annual Total Returns for the Periods Ended March 31, 2020
| 1 Year | 5 Years | 10 Years | ||||||||||
Fund’s Class A without sales charge | (11.24% | ) | 1.91% | 5.41% | ||||||||
Fund’s Class A with maximum sales charge | (16.11% | ) | 0.77% | 4.82% | ||||||||
Fund’s Class C without sales charge | (11.81% | ) | 1.17% | 4.68% | ||||||||
Fund’s Class C with maximum sales charge | (12.64% | ) | 1.17% | 4.68% | ||||||||
S&P 500 Index | (6.98% | ) | 6.73% | 10.53% | ||||||||
Bloomberg Barclays US Aggregate Bond Index | 8.93% | 3.36% | 3.88% | |||||||||
Pacific Funds Portfolio Optimization Growth Composite Benchmark | (4.65% | ) | 4.74% | 7.70% | ||||||||
Average Annual Total Returns for the Periods Ended March 31, 2020
| 1 Year | 5 Years | Since Inception (12/31/12) | ||||||||||
Fund’s Advisor Class without sales charge | (10.98% | ) | 2.17% | 4.97% | ||||||||
S&P 500 Index | (6.98% | ) | 6.73% | 10.81% | ||||||||
Bloomberg Barclays US Aggregate Bond Index | 8.93% | 3.36% | 3.06% | |||||||||
Pacific Funds Portfolio Optimization Growth Composite Benchmark | (4.65% | ) | 4.74% | 7.56% | ||||||||
Performance data shown represents past performance. Investment return and principal value will fluctuate so that shares of the Fund when redeemed may be worth more or less than their original cost. Past performance is not predictive of future performance. The table does not reflect the deduction of taxes that a shareholder would pay on Fund distributions or redemption of Fund shares. |
Q. Discuss both positive and negative factors that materially affected the Fund’s performance during the year, including relevant market conditions, investment strategies and techniques, and particular sectors or securities.
A. For the reporting period, the Fund’s Class A underperformed the Pacific Funds Portfolio Optimization Growth Composite Benchmark. The Pacific Funds Portfolio Optimization Growth Composite Benchmark is comprised of the S&P 500, Bloomberg Barclays US Aggregate Bond Index, and MSCI EAFE (Net) Indices in a weighting that is fixed and specific to the Fund. The Fund had a diversified allocation mix during the reporting period that was tilted to equity. The equity exposure was diversified across style (growth/value), market capitalization and region (including
| See benchmark definitions on A-24 and A-25 |
A-8
Table of Contents
PACIFIC FUNDS PERFORMANCE DISCUSSION (Continued)
allocations to foreign small capitalization and emerging markets stocks). The Fund also maintained exposure to select market sectors such as publicly-traded REITs. Fixed income investments included intermediate-term bond strategies as well as specific strategies such as short duration bond, inflation-indexed bond and emerging markets bond strategies. The Fund’s alternatives allocation consisted of investments in a currency strategy and an equity long/short strategy.
Within domestic equities, exposures to small-capitalization, value-oriented and real estate-focused stocks dragged performance over the reporting period as growth sectors such as information technology continued to surge past value sectors. Nonetheless, the PF Real Estate Fund outperformed its underlying benchmark and contributed positively to performance.
International equities outperformed the MSCI EAFE Index (Net) over the reporting period. An overweight to emerging markets had a positive impact on performance. Additionally, the PF Emerging Markets Fund and the PF InternationalLarge-Cap Fund outpaced their respective benchmarks, which further contributed to performance.
Among the fixed income lineup, high yield and emerging market bonds detracted from performance over the reporting period as riskier asset classes fared poorly amid the global coronavirus pandemic and escalating geopolitical issues. Additionally, the PF Managed Bond Fund underperformed the Bloomberg Barclays US Aggregate Bond Index and detracted from performance over the reporting period.
Pacific Funds Portfolio Optimization Aggressive-Growth (managed by Pacific Life Fund Advisors LLC)
Q. How did the Fund perform for the year ended March 31, 2020?
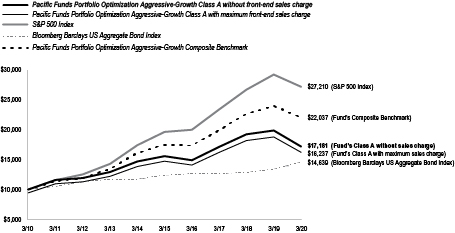
A. For the year ended March 31, 2020, Pacific Funds Portfolio Optimization Aggressive-Growth’s Class A (without sales charge) returned-13.66%, compared to a-6.98% return for the S&P 500 Index, an 8.93% return for the Bloomberg Barclays US Aggregate Bond Index, and a-8.12% return for the Pacific Funds Portfolio Optimization Aggressive-Growth Composite Benchmark.
The following graph compares the performance of a hypothetical $10,000 investment in Class A shares of the Fund to its benchmarks for the ten-year period ended March 31, 2020. For comparison purposes, the performance of all classes for the periods ended March 31, 2020 are also shown in the table below. Performance data for Class C and Advisor Class shares will vary due to differences in fees and sales charges. The Fund’s performance reflects reinvestments of all dividends and capital gains distributions, if any.
Performance Comparison
Average Annual Total Returns for the Periods Ended March 31, 2020
| 1 Year | 5 Years | 10 Years | ||||||||||
Fund’s Class A without sales charge | (13.66% | ) | 1.96% | 5.56% | ||||||||
Fund’s Class A with maximum sales charge | (18.41% | ) | 0.81% | 4.97% | ||||||||
Fund’s Class C without sales charge | (14.25% | ) | 1.19% | 4.88% | ||||||||
Fund’s Class C with maximum sales charge | (15.05% | ) | 1.19% | 4.88% | ||||||||
S&P 500 Index | (6.98% | ) | 6.73% | 10.53% | ||||||||
Bloomberg Barclays US Aggregate Bond Index | 8.93% | 3.36% | 3.88% | |||||||||
Pacific Funds Portfolio Optimization Aggressive-Growth Composite Benchmark | (8.12% | ) | 4.70% | 8.22% | ||||||||
Average Annual Total Returns for the Periods Ended March 31, 2020
| 1 Year | 5 Years | Since Inception (12/31/12) | ||||||||||
Fund’s Advisor Class without sales charge | (13.34% | ) | 2.23% | 5.32% | ||||||||
S&P 500 Index | (6.98% | ) | 6.73% | 10.81% | ||||||||
Bloomberg Barclays US Aggregate Bond Index | 8.93% | 3.36% | 3.06% | |||||||||
Pacific Funds Portfolio Optimization Aggressive-Growth Composite Benchmark | (8.12% | ) | 4.70% | 8.26% | ||||||||
Performance data shown represents past performance. Investment return and principal value will fluctuate so that shares of the Fund when redeemed may be worth more or less than their original cost. Past performance is not predictive of future performance. The table does not reflect the deduction of taxes that a shareholder would pay on Fund distributions or redemption of Fund shares. |
| See benchmark definitions on A-24 and A-25 |
A-9
Table of Contents
PACIFIC FUNDS PERFORMANCE DISCUSSION (Continued)
Q. Discuss both positive and negative factors that materially affected the Fund’s performance during the year, including relevant market conditions, investment strategies and techniques, and particular sectors or securities.
A. For the reporting period, the Fund’s Class A underperformed the Pacific Funds Portfolio Optimization Aggressive-Growth Composite Benchmark. The Pacific Funds Portfolio Optimization Aggressive-Growth Composite Benchmark is comprised of the S&P 500, MSCI EAFE (Net), and Bloomberg Barclays US Aggregate Bond Indices in a weighting that is fixed and specific to the Fund. The Fund primarily allocated to domestic and international equity funds that are diversified across style (growth/value), market capitalization and region (which included allocations to foreign small-capitalization and emerging markets stocks) during the reporting period. The Fund also maintained exposure to select sectors, such as publicly-traded REITs, as well as a small allocation to intermediate-term fixed income securities. The Fund’s alternatives allocation consisted of investments in a currency strategy and an equity long/short strategy.
Within domestic equities, exposures to small-capitalization, value-oriented and real estate-focused stocks dragged performance over the reporting period as growth sectors such as information technology continued to surge past value sectors. Nonetheless, the PF Real Estate Fund outperformed its underlying benchmark and contributed positively to performance.
International equities outperformed the MSCI EAFE Index (Net) over the reporting period. An overweight to emerging markets had a positive impact on performance. Additionally, the PF Emerging Markets Fund and the PF InternationalLarge-Cap Fund outpaced their respective benchmarks, which further contributed to performance.
Among the fixed income lineup, high yield and emerging market bonds detracted from performance over the reporting period as riskier asset classes fared poorly amid the global coronavirus pandemic and escalating geopolitical issues. Additionally, the PF Managed Bond Fund underperformed the Bloomberg Barclays US Aggregate Bond Index and detracted from performance over the reporting period.
Pacific Funds Ultra Short Income (managed by Pacific Asset Management LLC)
Q. How did the Fund perform for the period ended March 31, 2020?
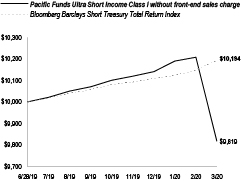
A. Pacific Funds Ultra Short Income commenced operations on June 28, 2019. For the period from inception through March 31, 2020, Pacific Funds Ultra-Short Income’s Class I (without sales charge) returned-1.81%, compared to a 1.94% return for its benchmark, the Bloomberg Barclays Short Treasury Total Return Index
The following graph compares the performance of a hypothetical $10,000 investment in Class I shares of the Fund to its benchmark for the period from inception through March 31, 2020. For comparison purposes, the performance of all classes for the period ended March 31, 2020 are also shown in the table below. Performance data for Advisor Class shares will vary due to differences in fees and sales charges. The Fund’s performance reflects reinvestments of all dividends and capital gains distributions, if any.
Performance Comparison
Total Returns for the Periods Ended March 31, 2020(1)
| Since Inception (6/28/19) | ||||
Fund’s Class I without sales charge | (1.81% | ) | ||
Fund’s Advisor Class without sales charge | (1.81% | ) | ||
Bloomberg Barclays Short Treasury Total Return Index | 1.94% | |||
| (1) | Pacific Asset Management LLC began managing the Fund effective December 31, 2019. Prior to that date, Pacific Life Fund Advisors LLC doing business under the name Pacific Asset Management managed the Fund. |
Performance data shown represents past performance. Investment return and principal value will fluctuate so that shares of the Fund when redeemed may be worth more or less than their original cost. Past performance is not predictive of future performance. The table does not reflect the deduction of taxes that a shareholder would pay on Fund distributions or redemption of Fund shares. |
Q. Discuss both positive and negative factors that materially affected the Fund’s performance during the period, including relevant market conditions, investment strategies and techniques, and particular sectors or securities.
A. For the period from inception through March 31, 2020, the Fund’s Class I underperformed its benchmark. The Fund primarily invests in investment grade short-term fixed and floating rate debt securities Using a fundamental approach with atop-down overlay, Pacific Asset Management’s team of portfolio managers and research analysts look at the relative value of each security and assess the macro environment and marketplace for tailwinds and catalysts in the process of individual investment selection.
| See benchmark definitions on A-24 and A-25 |
A-10
Table of Contents
PACIFIC FUNDS PERFORMANCE DISCUSSION (Continued)
The Fund’s focus on corporate debt versus government securities was the primary detractor from performance. The reporting period saw substantial market volatility in short maturity corporate bonds due to the novel Coronavirus and its impacts on corporate earnings and global economic activity. The Fund’s overweight to corporate bonds, notably BBB rated corporate bonds, detracted from performance. The Fund’s overweight to thenon-investment grade bank loan sector and the high yield bond sector detracted from performance. The Fund’s exposure to treasuries that have longer maturities than the index contributed to performance.
The significant spread widening experienced in March 2020 due to the impact of the novel Coronavirus left valuations at attractive levels for corporate debt. However, we are mindful that the duration of Coronavirus and its impacts on corporate earnings and economic activity remain uncertain. Therefore, we are cautious on those sectors most impacted bystay-at-home orders and forced shutdowns including leisure, travel, retail, and energy. Sector and credit selection remain vital as we focus on issuers that are reducing debt, while staying cautious with sectors experiencing more deterioration in credit metrics.
Pacific Funds Short Duration Income (managed by Pacific Asset Management LLC)
Q. How did the Fund perform for the year ended March 31, 2020?
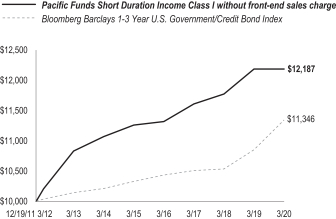
A. For the year ended March 31, 2020, Pacific Funds Short Duration Income’s Class I (without sales charge) returned 0.03%, compared to a 4.53% return for its benchmark, the Bloomberg Barclays1-3 Year U.S. Government/Credit Bond Index.
The following graph compares the performance of a hypothetical $10,000 investment in Class I shares of the Fund to its benchmark for the period from inception through March 31, 2020. For comparison purposes, the performance of all classes for the periods ended March 31, 2020 are also shown in the table below. Performance data for Class A, C and Advisor Class shares will vary due to differences in fees and sales charges. The Fund’s performance reflects reinvestments of all dividends and capital gains distributions, if any.
Performance Comparison
Average Annual Total Returns for the Periods Ended March 31, 2020(1)
| 1 Year | 5 Years | Since Inception (12/19/11) | ||||||||||
Fund’s Class I without sales charge | 0.03% | 1.60% | 2.42% | |||||||||
Bloomberg Barclays1-3 Year US Government/Credit Bond Index | 4.53% | 1.90% | 1.54% | |||||||||
| 1 Year | 5 Years | Since Inception (6/29/12) | ||||||||||
Fund’s Class A without sales charge | (0.13% | ) | 1.33% | 1.92% | ||||||||
Fund’s Class A with maximum sales charge | (3.13% | ) | 0.72% | 1.52% | ||||||||
Fund’s Class C without sales charge | (0.87% | ) | 0.58% | 1.17% | ||||||||
Fund’s Class C with maximum sales charge | (1.85% | ) | 0.58% | 1.17% | ||||||||
Fund’s Advisor Class without sales charge | 0.02% | 1.58% | 2.16% | |||||||||
Bloomberg Barclays1-3 Year US Government/Credit Bond Index | 4.53% | 1.90% | 1.57% | |||||||||
| (1) | Pacific Asset Management LLC began managing the Fund effective December 31, 2019. Prior to that date, Pacific Life Fund Advisors LLC doing business under the name Pacific Asset Management managed the Fund. |
Performance data shown represents past performance. Investment return and principal value will fluctuate so that shares of the Fund when redeemed may be worth more or less than their original cost. Past performance is not predictive of future performance. The table does not reflect the deduction of taxes that a shareholder would pay on Fund distributions or redemption of Fund shares. |
Q. Discuss both positive and negative factors that materially affected the Fund’s performance during the year, including relevant market conditions, investment strategies and techniques, and particular sectors or securities.
A. For the reporting period, the Fund’s Class I underperformed the benchmark. The Fund uses a short maturity corporate debt focused strategy. Using a fundamental approach with atop-down overlay, Pacific Asset Management’s team of portfolio managers and research analysts look at the relative value of each security and assess the macro environment and marketplace for tailwinds and catalysts in the process of individual investment selection.
The Fund’s focus on income producing corporate debt versus government securities was the primary detractor from relative performance. The reporting period saw substantial market volatility in short maturity corporate bonds due to the novel Coronavirus and its impacts on corporate earnings and global economic activity. Relative to the benchmark, the Fund’s overweight to corporate bonds, notably BBB rated corporate bonds, detracted from performance. The Fund’s overweight to thenon-investment grade bank loan sector and the high yield bond sector detracted from performance. The Fund’s duration was below benchmark, which detracted from performance. Sector overweights to food and beverage, auto Asset-Backed Securities (ABS), and environmental contributed to performance while overweights to independent energy and leisure detracted.
The significant spread widening experienced in March 2020 due to the impact of the novel Coronavirus left valuations at attractive levels for corporate debt. However, we are mindful that the duration of Coronavirus and its impacts on corporate earnings and economic activity remain uncertain. Therefore, we are cautious on those sectors most impacted bystay-at-home orders and forced shutdowns including leisure, travel, retail, and energy. Though we selectively favor bank loans given, in our view, better relative value and downside protection than high yield bonds. The Fund is underweight duration relative to its benchmark.
| See benchmark definitions on A-24 and A-25 |
A-11
Table of Contents
PACIFIC FUNDS PERFORMANCE DISCUSSION (Continued)
Pacific Funds Core Income (managed by Pacific Asset Management LLC)
Q. How did the Fund perform for the year ended March 31, 2020?
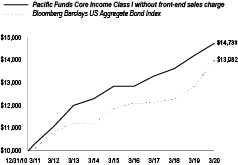
A. For the year ended March 31, 2020, Pacific Funds Core Income’s Class I (without sales charge) returned 3.81%, compared to an 8.93% return for its benchmark, the Bloomberg Barclays US Aggregate Bond Index.
The following graph compares the performance of a hypothetical $10,000 investment in Class I shares of the Fund to its benchmark for the period from inception through March 31, 2020. For comparison purposes, the performance of all classes for the periods ended March 31, 2020 are also shown in the table below. Performance data for Class A, C, P and Advisor Class shares will vary due to differences in fees and sales charges. The Fund’s performance reflects reinvestments of all dividends and capital gains distributions, if any.
Performance Comparison
Average Annual Total Returns for the Periods Ended March 31, 2020(1)
| 1 Year | 5 Years | Since Inception (12/31/10) | ||||||||||
Fund’s Class I without sales charge | 3.81% | 2.80% | 4.28% | |||||||||
Fund’s Class A without sales charge | 3.51% | 2.49% | 4.01% | |||||||||
Fund’s Class A with maximum sales charge | (0.92% | ) | 1.60% | 3.53% | ||||||||
Bloomberg Barclays US Aggregate Bond Index | 8.93% | 3.36% | 3.69% | |||||||||
| 1 Year | 5 Years | Since Inception (6/30/11) | ||||||||||
Fund’s Class C without sales charge | 2.73% | 1.72% | 2.91% | |||||||||
Fund’s Class C with maximum sales charge | 1.73% | 1.72% | 2.91% | |||||||||
Bloomberg Barclays US Aggregate Bond Index | 8.93% | 3.36% | 3.59% | |||||||||
| 1 Year | 5 Years | Since Inception (6/29/12) | ||||||||||
Fund’s Advisor Class without sales charge | 3.81% | 2.77% | 3.45% | |||||||||
Bloomberg Barclays US Aggregate Bond Index | 8.93% | 3.36% | 3.10% | |||||||||
| 1 Year | Since Inception (4/27/15) | |||||||||||
Fund’s Class P without sales charge | 3.80% | 2.64% | ||||||||||
Bloomberg Barclays US Aggregate Bond Index | 8.93% | 3.36% | ||||||||||
| (1) | Pacific Asset Management LLC began managing the Fund effective December 31, 2019. Prior to that date, Pacific Life Fund Advisors LLC doing business under the name Pacific Asset Management managed the Fund. |
Performance data shown represents past performance. Investment return and principal value will fluctuate so that shares of the Fund when redeemed may be worth more or less than their original cost. Past performance is not predictive of future performance. The table does not reflect the deduction of taxes that a shareholder would pay on Fund distributions or redemption of Fund shares. |
Q. Discuss both positive and negative factors that materially affected the Fund’s performance during the year, including relevant market conditions, investment strategies and techniques, and particular sectors or securities.
A. For the reporting period, the Fund’s Class I underperformed the benchmark. The Fund uses an intermediate term corporate debt focused strategy. Using a fundamental approach with atop-down overlay, Pacific Asset Management’s team of portfolio managers and research analysts look at the relative value of each security and assess the macro environment and marketplace for tailwinds and catalysts in the process of individual investment selection.
The Fund’s focus on corporate debt versus government securities was the primary detractor from relative performance. The reporting period saw substantial market volatility due to the novel Coronavirus and its impacts on corporate earnings and global economic activity. The Fund’s overweight (relative to its benchmark) to corporate bonds, notably BBB rated corporate bonds, detracted from performance. The Fund’s overweight to thenon-investment grade bank loan sector and the high yield bond sector detracted from performance. The Fund’s duration was below that of its benchmark, which detracted from performance. At the security level, Sprint Communications, Bank of America, and Citigroup were the top contributors while Diamondback Energy, NEP Group, and Clubcorp were the top detractors. Sector overweights to banking, electric, and auto ABS contributed to performance while overweights to midstream, leisure, and retailers detracted.
The significant spread widening experienced in March 2020 due to impact of the novel Coronavirus left valuations at particularly attractive levels for corporate debt. However, we are mindful that the duration of Coronavirus and its impacts on corporate earnings and economic activity remain uncertain. Therefore, we are cautious on those sectors most impacted bystay-at-home orders and forced shutdowns including leisure, travel, retail, and energy. We expect to maintain exposure to securitized assets and have looked to add to certain deal structures as they became more attractive due to thesell-off in March 2020.Non-investment grade sectors, bank loans and high yield, are both at attractive levels, though we selectively favor bank loans given, in our view, better relative value and downside protection than high yield bonds. The Fund is underweight duration relative to the benchmark.
| See benchmark definitions on A-24 and A-25 |
A-12
Table of Contents
PACIFIC FUNDS PERFORMANCE DISCUSSION (Continued)
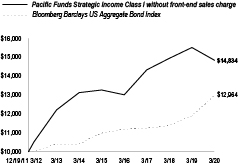
Pacific Funds Strategic Income (managed by Pacific Asset Management LLC)
Q. How did the Fund perform for the year ended March 31, 2020?
A. For the year ended March 31, 2020, Pacific Funds Strategic Income’s Class I (without sales charge) returned-4.32%, compared to an 8.93% return for its benchmark, the Bloomberg Barclays US Aggregate Bond Index.
The following graph compares the performance of a hypothetical $10,000 investment in Class I shares of the Fund to its benchmark for the period from inception through March 31, 2020. For comparison purposes, the performance of all classes for the periods ended March 31, 2020 are also shown in the table below. Performance data for Class A, C and Advisor Class shares will vary due to differences in fees and sales charges. The Fund’s performance reflects reinvestments of all dividends and capital gains distributions, if any.
Performance Comparison
Average Annual Total Returns for the Periods Ended March 31, 2020(1)
| 1 Year | 5 Years | Since Inception (12/19/11) | ||||||||||
Fund’s Class I without sales charge | (4.32% | ) | 2.26% | 4.88% | ||||||||
Bloomberg Barclays US Aggregate Bond Index | 8.93% | 3.36% | 3.19% | |||||||||
| 1 Year | 5 Years | Since Inception (6/29/12) | ||||||||||
Fund’s Class A without sales charge | (4.58% | ) | 1.97% | 3.93% | ||||||||
Fund’s Class A with maximum sales charge | (8.63% | ) | 1.08% | 3.35% | ||||||||
Fund’s Class C without sales charge | (5.35% | ) | 1.23% | 3.17% | ||||||||
Fund’s Class C with maximum sales charge | (6.27% | ) | 1.23% | 3.17% | ||||||||
Fund’s Advisor Class without sales charge | (4.34% | ) | 2.20% | 4.18% | ||||||||
Bloomberg Barclays US Aggregate Bond Index | 8.93% | 3.36% | 3.10% | |||||||||
| (1) | Pacific Asset Management LLC began managing the Fund effective December 31, 2019. Prior to that date, Pacific Life Fund Advisors LLC doing business under the name Pacific Asset Management managed the Fund. |
Performance data shown represents past performance. Investment return and principal value will fluctuate so that shares of the Fund when redeemed may be worth more or less than their original cost. Past performance is not predictive of future performance. The table does not reflect the deduction of taxes that a shareholder would pay on Fund distributions or redemption of Fund shares. |
Q. Discuss both positive and negative factors that materially affected the Fund’s performance during the year, including relevant market conditions, investment strategies and techniques, and particular sectors or securities.
A. For the reporting period, the Fund’s Class I underperformed the benchmark. Based on our view of the market conditions during the reporting period, we positioned the Fund towardsnon-investment grade securities. Using a fundamental approach with atop-down overlay, Pacific Asset Management’s team of portfolio managers and research analysts look at the relative value of each security and assess the macro environment and marketplace for tailwinds and catalysts in the process of individual investment selection.
The Fund’s underperformance relative to the benchmark for the reporting period was primarily driven by asset allocation. The Fund focused during the reporting period on U.S. credit sectors including bank loans, high yield bonds, and corporate debt. The reporting period saw substantial market volatility due to the novel Coronavirus and its impacts on corporate earnings and global economic activity. The Fund’s overweight relative to its benchmark to corporate bonds, notably BBB rated corporate bonds, detracted from performance. The Fund’s overweight to thenon-investment grade bank loan sector and the high yield bond sector detracted from performance. The Fund’s duration was below benchmark, which detracted from performance. At the security level, Sprint Communications, InBev, and Tesla were the top contributors while Ahern Rentals, Golden Nugget, Energy Transfer Operating LP, and Clubcorp were the top detractors.
The significant spread widening experienced in March 2020 due to the impact of the novel Coronavirus left valuations at attractive levels across the credit spectrum. However, we are mindful that the duration of Coronavirus and its impacts on corporate earnings and economic activity remain uncertain. We have maintained a preference for corporate bonds, especiallyBBB-rated corporates. We have not meaningfully increased our bank loan or high yield allocations at the reduction of corporate bonds. The ultimate path for the credit market remains highly contingent on the path of the virus. We continue to underwrite our credits to stressed scenarios and work closely with our research staff to understand the funding needs of our issuers during this period of economic stress. We expect to be quite flexible from an asset allocation perspective as the market reprices quickly in these volatile times. Security and sector selection remain key as does a need to be flexible.
| See benchmark definitions on A-24 and A-25 |
A-13
Table of Contents
PACIFIC FUNDS PERFORMANCE DISCUSSION (Continued)
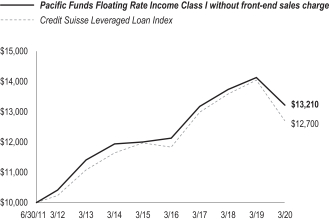
Pacific Funds Floating Rate Income (managed by Pacific Asset Management LLC)
Q. How did the Fund perform for the year ended March 31, 2020?
A. For the year ended March 31, 2020, Pacific Funds Floating Rate Income’s Class I (without sales charge) returned-6.49%, compared to a-9.51% return for its benchmark, the Credit Suisse Leveraged Loan Index.
The following graph compares the performance of a hypothetical $10,000 investment in Class I shares of the Fund to its benchmark for the period from inception through March 31, 2020. For comparison purposes, the performance of all classes for the periods ended March 31, 2020 are also shown in the table below. Performance data for Class A, C, P and Advisor Class shares will vary due to differences in fees and sales charges. The Fund’s performance reflects reinvestments of all dividends and capital gains distributions, if any.
Performance Comparison
Average Annual Total Returns for the Periods Ended March 31, 2020(1)
| 1 Year | 5 Years | Since Inception (6/30/11) | ||||||||||
Fund’s Class I without sales charge | (6.49% | ) | 1.94% | 3.23% | ||||||||
Credit Suisse Leveraged Loan Index | (9.51% | ) | 1.21% | 2.77% | ||||||||
| 1 Year | 5 Years | Since Inception (12/30/11) | ||||||||||
Fund’s Class A without sales charge | (6.69% | ) | 1.63% | 3.12% | ||||||||
Fund’s Class A with maximum sales charge | (9.52% | ) | 1.02% | 2.74% | ||||||||
Fund’s Class C without sales charge | (7.31% | ) | 0.92% | 2.38% | ||||||||
Fund’s Class C with maximum sales charge | (8.20% | ) | 0.92% | 2.38% | ||||||||
Credit Suisse Leveraged Loan Index | (9.51% | ) | 1.21% | 3.15% | ||||||||
| 1 Year | 5 Years | Since Inception (6/29/12) | ||||||||||
Fund’s Advisor Class without sales charge | (6.52% | ) | 1.88% | 2.91% | ||||||||
Credit Suisse Leveraged Loan Index | (9.51% | ) | 1.21% | 2.80% | ||||||||
| 1 Year | 5 Years | Since Inception (12/31/12) | ||||||||||
Fund’s Class P without sales charge | (6.49% | ) | 1.90% | 2.40% | ||||||||
Credit Suisse Leveraged Loan Index | (9.51% | ) | 1.21% | 2.24% | ||||||||
| (1) | Pacific Asset Management LLC began managing the Fund effective December 31, 2019. Prior to that date, Pacific Life Fund Advisors LLC doing business under the name Pacific Asset Management managed the Fund. |
Performance data shown represents past performance. Investment return and principal value will fluctuate so that shares of the Fund when redeemed may be worth more or less than their original cost. Past performance is not predictive of future performance. The table does not reflect the deduction of taxes that a shareholder would pay on Fund distributions or redemption of Fund shares. |
Q. Discuss both positive and negative factors that materially affected the Fund’s performance during the year, including relevant market conditions, investment strategies and techniques, and particular sectors or securities.
A. For the reporting period, the Fund’s Class I outperformed the benchmark. Using a fundamental approach with a top down overlay, Pacific Asset Management’s team of portfolio managers and research analysts look for investment opportunities in floating rate loans and floating rate debt securities.
For the reporting period, the Fund’s outperformance relative to the benchmark was driven by sector allocations and credit selection. The reporting period saw some of the highest levels of market volatility since the Global Financial Crisis of 2008, and an underweight to risk as measured by yield to the benchmark contributed to performance. The Fund’s underweights to energy, retail, and metals/minerals were strong contributors to relative performance. Notable was our near zero exposure to energy related securities during the reporting period. Security selection in the food/drug sector detracted from performance.
As of the end of the reporting period, the Fund was underweight risk as measured to our benchmark by yield. We view valuations, given the steepsell-off in March 2020, as attractive. However, we are mindful that the short term path of the novel Coronavirus, and its impacts on earnings and Gross Domestic Product (GDP), remain uncertain. We remain underweight risk, focused on industries and sectors that are less cyclical, and continue to have limited exposure to the sectors most exposed to Coronavirus. We hold limited to no exposure to airlines, hotels, gym/fitness, or department stores. We do hold select gaming sector exposure where we believe the companies have strong balance sheets and good relative value. We are focused on the performing part of the bank loan market. We are overweight service, forest products/containers, and housing (building materials) and underweights energy, metals/minerals, media/telecom, and information technology.
| See benchmark definitions on A-24 and A-25 |
A-14
Table of Contents
PACIFIC FUNDS PERFORMANCE DISCUSSION (Continued)
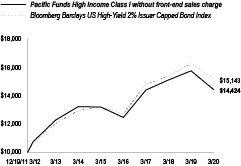
Pacific Funds High Income (managed by Pacific Asset Management LLC)
Q. How did the Fund perform for the year ended March 31, 2020?
A. For the year ended March 31, 2020, Pacific Funds High Income’s Class I (without sales charge) returned-8.36%, compared to a -6.94% return for its benchmark, the Bloomberg Barclays U.S. High-Yield 2% Issuer Capped Bond Index.
The following graph compares the performance of a hypothetical $10,000 investment in Class I shares of the Fund to its benchmark for the period from inception through March 31, 2020. For comparison purposes, the performance of all classes for the periods ended March 31, 2020 are also shown in the table below. Performance data for Class A, C, P and Advisor Class shares will vary due to differences in fees and sales charges. The Fund’s performance reflects reinvestments of all dividends and capital gains distributions, if any.
Performance Comparison
Average Annual Total Returns for the Periods Ended March 31, 2020(1)
| 1 Year | 5 Years | Since Inception (12/19/11) | ||||||||||
Fund’s Class I without sales charge | (8.36% | ) | 1.81% | 4.52% | ||||||||
Bloomberg Barclays US High-Yield 2% Issuer Capped Bond Index | (6.94% | ) | 2.78% | 5.14% | ||||||||
| 1 Year | 5 Years | Since Inception (6/29/12) | ||||||||||
Fund’s Class A without sales charge | (8.61% | ) | 1.53% | 3.44% | ||||||||
Fund’s Class A with maximum sales charge | (12.52% | ) | 0.64% | 2.86% | ||||||||
Fund’s Class C without sales charge | (9.28% | ) | 0.80% | 2.70% | ||||||||
Fund’s Class C with maximum sales charge | (10.15% | ) | 0.80% | 2.70% | ||||||||
Fund’s Advisor Class without sales charge | (8.38% | ) | 1.78% | 3.69% | ||||||||
Bloomberg Barclays US High-Yield 2% Issuer Capped Bond Index | (6.94% | ) | 2.78% | 4.41% | ||||||||
| 1 Year | 5 Years | Since Inception (1/14/15) | ||||||||||
Fund’s Class P without sales charge | (8.46% | ) | 1.77% | 2.26% | ||||||||
Bloomberg Barclays US High-Yield 2% Issuer Capped Bond Index | (6.94% | ) | 2.78% | 3.18% | ||||||||
| (1) | Pacific Asset Management LLC began managing the Fund effective December 31, 2019. Prior to that date, Pacific Life Fund Advisors LLC doing business under the name Pacific Asset Management managed the Fund. |
Performance data shown represents past performance. Investment return and principal value will fluctuate so that shares of the Fund when redeemed may be worth more or less than their original cost. Past performance is not predictive of future performance. The table does not reflect the deduction of taxes that a shareholder would pay on Fund distributions or redemption of Fund shares. |
Q. Discuss both positive and negative factors that materially affected the Fund’s performance during the year, including relevant market conditions, investment strategies and techniques, and particular sectors or securities.
A. For the reporting period, the Fund’s Class I underperformed the benchmark. The Fund seeks a high level of current income by investing innon-investment grade, debt instruments or in instruments with characteristics ofnon-investment grade instruments. Using a fundamental approach with atop-down overlay, Pacific Asset Management’s team of portfolio managers and research analysts look at the relative value of each security and assess the macro environment and marketplace for tailwinds and catalysts.
During the reporting period, the Fund underperformed the benchmark primarily due to sector allocations and an overweight to lower quality securities. Overweights to leisure and midstream and an underweight to technology detracted from performance. Overweights to diversified manufacturing and building materials contributed to performance. At the security level, Golden Nugget, Ahern Rentals and Ascent Resources were the largest detractors. Altice, New Enterprise Stone & Lime, and Howard Hughes Corporation were the top contributors. The Fund’s underweight to BB rated securities and overweight to CCC rated securities also detracted from performance. The Fund held above average cash which benefited performance. The Fund’s duration was shorter than the benchmark, which detracted from relative performance.
As of the end of the reporting period, we believe it is especially important amid current market conditions to continue to maintain our focus on credit selection as the key to our high-yield investment process. The novel Coronavirus, and the duration by which it impacts earnings and GDP, remain uncertain. Current valuations appear attractive, though we remain cautious on many cyclical areas such as retail, energy, and consumer discretionary. The Fund is overweight building materials, leisure, and diversified manufacturing and underweight technology, cable/satellite, and wirelines. The Fund remains underweight exposure to industries in secular decline, which include phone companies in the wirelines sector and hardware companies susceptible to rapid change in the technology sector. The Fund is underweight duration relative to the benchmark.
| See benchmark definitions on A-24 and A-25 |
A-15
Table of Contents
PACIFIC FUNDS PERFORMANCE DISCUSSION (Continued)
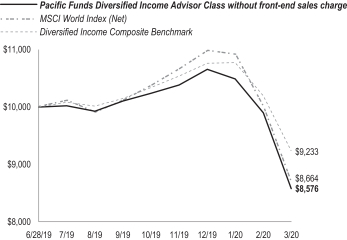
Pacific Funds Diversified Income (co-managed by Cadence Capital Management LLC and Pacific Asset Management LLC)
Q. How did the Fund perform for the period ended March 31, 2020?
A. Pacific Funds Diversified Income commenced operations on June 28, 2019. For the period from inception through March 31, 2020, the Fund’s Advisor Class (without sales charge) returned-14.24%, compared to a-13.36% return for the MSCI World Index (Net) and a-7.67% return for Diversified Income Composite Benchmark.
The following graph compares the performance of a hypothetical $10,000 investment in Advisor Class shares of the Fund to its benchmark for the period from inception through March 31, 2020. The Fund’s performance reflects reinvestments of all dividends and capital gains distributions, if any.
Performance Comparison
Total Returns for the Periods Ended March 31, 2020(1)
| Since Inception (6/28/19) | ||||
Fund’s Advisor Class without sales charge | (14.24% | ) | ||
MSCI World Index (Net) | (13.36% | ) | ||
Diversified Income Composite Benchmark | (7.67% | ) | ||
| (1) | Pacific Asset Management LLC began co-managing the Fund with Cadence effective December 31, 2019. Prior to that date, Pacific Life Fund Advisors LLC doing business under the name Pacific Asset Management co-managed the Fund with Cadence. |
Performance data shown represents past performance. Investment return and principal value will fluctuate so that shares of the Fund when redeemed may be worth more or less than their original cost. Past performance is not predictive of future performance. The table does not reflect the deduction of taxes that a shareholder would pay on Fund distributions or redemption of Fund shares. |
Q. Discuss both positive and negative factors that materially affected the Fund’s performance during the period, including relevant market conditions, investment strategies and techniques, and particular sectors or securities.
A. For the period from inception through March 31, 2020, the Fund’s Advisor Class underperformed the Diversified Income Composite Benchmark, The Fund isco-managed by Pacific Asset Management and Cadence. The following are separate discussions from eachco-manager.
Pacific Asset Management
For our portion of the Fund, we at Pacific Asset Management use anon-investment grade focused multi-sector credit strategy. Our portion of the Fund focuses on U.S. credit sectors including bank loans, high yield bonds, and corporate debt. Using a fundamental approach with atop-down overlay, Pacific Asset Management’s team of portfolio managers and research analysts look at the relative value of each security and assess the macro environment and marketplace for tailwinds and catalysts in the process of individual investment selection.
Underperformance relative the benchmark for our portion of the Fund was primarily driven by asset allocation. The reporting period saw substantial market volatility due to the novel Coronavirus and its impacts on corporate earnings and global economic activity. Our portion of the Fund’s overweight to corporate bonds, notably BBB rated corporate bonds, as well as to thenon-investment grade bank loan sector and the high yield bond sector detracted from performance. Our portion of the Fund’s duration was below benchmark, which detracted from performance. Security selection inT-Mobile and Tesla contributed to performance.
The significant spread widening experienced in March 2020 due to the impact of the novel Coronavirus left valuations at attractive levels across the credit spectrum. However, we are mindful that the duration of Coronavirus and its impacts on corporate earnings and economic activity remain uncertain. We have maintained a preference for corporate bonds, especiallyBBB-rated corporates. We have not meaningfully increased our bank loan or high yield allocations at the reduction of corporate bonds. The more leveraged portions of high yield and bank loans still face an uphill battle to make it to the other side of the economic reopening. The ultimate path for credit market remains highly contingent on the path of the virus. We expect to be quite flexible from an asset allocation perspective as the market reprices quickly in these volatile times. Security and sector selection remain key as does a need to be flexible.
Cadence
For our portion of the Fund, we at Cadence invest in equity investments across the U.S., developed international markets and emerging markets, with an emphasis on premium yielding and high-quality companies, and may invest in other income focused asset classes such as master limited partnerships (MLPs) and real estate investment trusts (REITs) as needed to help achieve the Fund’s investment goal.
| See benchmark definitions on A-24 and A-25 |
A-16
Table of Contents
PACIFIC FUNDS PERFORMANCE DISCUSSION (Continued)
After strong performance in 2019, global equity markets have experienced unprecedentedsell-off in the first quarter of 2020 due to two key factors: the global response and economic weakness due tocoronavirus/COVID-19; and a severe downturn in oil prices and outlook in the energy sector.
Within domestic equities, exposure to energy stocks and specifically the allocation to MLPs, detracted from our portion of the Fund’s performance over the reporting period. A sharpsell-off in oil prices punished MLP and midstream equity prices pushing the allocation to lose over half its value. An underweight to technology domestically also hurt relative performance over the reporting period as technology was one of the best performing sectors.
Internationally, our developed equity allocation outperformed relative to the index, helped by an underweight to the financials sector which, even before the coronavirus-related downturn, had beenhard-hit by low economic growth and the prevalence of negative interest rates in the Europe, the Far East and Australasia (EAFE) region. An overweight to the healthcare sector also contributed to relative performance as the sector has weathered the recent downturn relatively unscathed. Our portion of the Fund’s allocation to emerging markets was a relative detractor to performance as emerging markets have underperformed both domestic and developed international equity markets over the reporting period.
Pacific Funds Large-Cap (managed by Rothschild & Co Asset Management US Inc.)
Q. How did the Fund perform for the year ended March 31, 2020?
A. For the year ended March 31, 2020, Pacific FundsLarge-Cap’s Advisor Class (without sales charge) returned-9.26%, compared to a -6.98% return for its benchmark, the S&P 500 Index.
The following graph compares the performance of a hypothetical $10,000 investment in Advisor Class shares of the Fund to its benchmark for the period from inception through March 31, 2020. For comparison purposes, the performance of all classes for the periods ended March 31, 2020 are also shown in the table below. Performance data for Class A, C, and R6 (formerly Class S) shares will vary due to differences in fees and sales charges. The Fund’s performance reflects reinvestments of all dividends and capital gains distributions, if any.
Performance Comparison
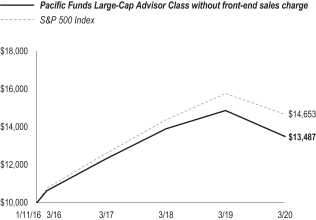
Average Annual Total Returns for the Periods Ended March 31, 2020
| 1 Year | Since Inception (1/11/16) | |||||||||||
Fund’s Advisor Class without sales charge | (9.26% | ) | 7.33% | |||||||||
Fund’s Class A without sales charge | (9.52% | ) | 7.05% | |||||||||
Fund’s Class A with maximum sales charge | (13.34% | ) | 5.96% | |||||||||
Fund’s Class C without sales charge | (10.21% | ) | 6.25% | |||||||||
Fund’s Class C with maximum sales charge | (11.10% | ) | 6.25% | |||||||||
S&P 500 Index | (6.98% | ) | 9.46% | |||||||||
| 1 Year | 5 Years | Since Inception (3/20/15) | ||||||||||
Fund’s Class R6 without sales charge | (9.20% | ) | 4.37% | 4.04% | ||||||||
S&P 500 Index | (6.98% | ) | 6.73% | 6.29% | ||||||||
Performance data shown represents past performance. Investment return and principal value will fluctuate so that shares of the Fund when redeemed may be worth more or less than their original cost. Past performance is not predictive of future performance. The table does not reflect the deduction of taxes that a shareholder would pay on Fund distributions or redemption of Fund shares. |
Q. Discuss both positive and negative factors that materially affected the Fund’s performance during the year, including relevant market conditions, investment strategies and techniques, and particular sectors or securities.
A. For the reporting period, the Fund’s Advisor Class underperformed the benchmark. We at Rothschild & Co implement the Fund’s strategy by investing in common stocks and other equity securities of large capitalization U.S. companies. We analyze a variety of quantitative and fundamental inputs in making stock decisions and seek to build a portfolio that is well diversified at the issuer level and by economic sector. Our focus remains on identifying stocks with attractive relative valuations and the ability to exceed investors’ expectations.
Leading sectors contributing to the Fund’s performance included information technology, health care, and utilities. Conversely, the industrials, consumer discretionary, and energy sectors were the most significant detractors from the Fund’s performance. Sector allocation was neutral for the reporting period, with tailwinds from an overweight to the health care sector and an underweight to the financials sector essentially cancelling out the headwinds from an underweight to the information technology sector and an overweight to the real estate sector. Stock selection was the primary driver of the Fund’s relative under performance, with the effects of contributors in the health care and energy sectors falling short of those of the detractors in the consumer discretionary, industrials, and communication services sectors.
Turning to individual stocks, detractors from the Fund’s performance included EOG Resources, an independent exploration and production company, which underperformed in the final quarter of the reporting period, driven by the rout in oil prices that fell from $60 per barrel at the beginning of the first quarter of 2020 to $20 per barrel. The Fund has subsequently exited the position. Another detractor from the Fund’s performance was U.S. Foods Holding, an American food service distributor, which reported a mixed final quarter of 2019 with revenues softer than expected.
| See benchmark definitions on A-24 and A-25 |
A-17
Table of Contents
PACIFIC FUNDS PERFORMANCE DISCUSSION (Continued)
Operating expenses related to the acquisition of SGA Foods were elevated and organic volume growth was disappointing due to the loss of a client in the healthcare/hospitality segment. A shortened holiday period in December of 2019 also hurt volumes relative to 2018. The pipeline of new clients looks healthy and we believe organic growth will accelerate. Also detracting from the Fund’s performance was Expedia Group, a technology travel company, which was impacted as travel & leisure has been one of the hardest hit industries byCOVID-19. Just after the first quarter of 2020, the Fund exited its position in Expedia Group.
Top individual stock contributors to the Fund’s performance included Vertex Pharmaceuticals, a biotechnology company, as the company saw limited disruptions fromCOVID-19, particularly with regard to its supply chain of Cystic Fibrosis drugs. Merck & Co, a large pharmaceuticals, chemicals, and life sciences company, performed well in the first quarter of 2020 as earnings results came in ahead of expectations, driven by its key oncology drug Keytruda and the positive operating leverage that it brings. Also contributing to the Fund’s performance was Chevron Corp, a large, integrated oil company, which underperformed in the first quarter of 2020, driven by the rout in oil prices that fell from $60 per barrel at the beginning of the first quarter of 2020 to $20 per barrel. However, the Fund sold its position prior to the start of 2020, securing and benefiting from the gains that the stock had experienced through the end of 2019.
Pacific Funds Large-Cap Value (managed by Rothschild & Co Asset Management US Inc.)
Q. How did the Fund perform for the year ended March 31, 2020?
A. For the year ended March 31, 2020, Pacific FundsLarge-Cap Value’s Advisor Class (without sales charge) returned-15.09%, compared to a-17.17% return for its benchmark, the Russell 1000 Value Index.
The following graph compares the performance of a hypothetical $10,000 investment in Advisor Class shares of the Fund to its benchmark for the period from inception through March 31, 2020. For comparison purposes, the performance of all classes for the periods ended March 31, 2020 are also shown in the table below. Performance data for Class A, C, and R6 (formerly Class S) shares will vary due to differences in fees and sales charges. The Fund’s performance reflects reinvestments of all dividends and capital gains distributions, if any.
Performance Comparison
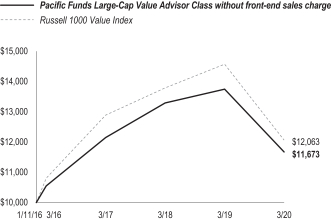
Average Annual Total Returns for the Periods Ended March 31, 2020
| 1 Year | Since Inception (1/11/16) | |||||||
Fund’s Advisor Class without sales charge | (15.09% | ) | 3.73% | |||||
Fund’s Class A without sales charge | (15.34% | ) | 3.44% | |||||
Fund’s Class A with maximum sales charge | (18.91% | ) | 2.38% | |||||
Fund’s Class C without sales charge | (16.01% | ) | 2.66% | |||||
Fund’s Class C with maximum sales charge | (16.77% | ) | 2.66% | |||||
Fund’s Class R6 without sales charge | (15.05% | ) | 3.78% | |||||
Russell 1000 Value Index | (17.17% | ) | 4.54% | |||||
Performance data shown represents past performance. Investment return and principal value will fluctuate so that shares of the Fund when redeemed may be worth more or less than their original cost. Past performance is not predictive of future performance. The table does not reflect the deduction of taxes that a shareholder would pay on Fund distributions or redemption of Fund shares. |
Q. Discuss both positive and negative factors that materially affected the Fund’s performance during the year, including relevant market conditions, investment strategies and techniques, and particular sectors or securities.
A. For the reporting period, the Fund’s Advisor Class outperformed the benchmark. We at Rothschild & Co implement the Fund’s strategy by investing in common stocks and other equity securities of large capitalization U.S. companies. We analyze a variety of quantitative and fundamental inputs in making stock decisions and seek to build a portfolio that is well diversified at the issuer level and by economic sector. Our focus remains on identifying stocks with attractive relative valuations and the ability to exceed investors’ expectations.
Leading sectors contributing to the Fund’s performance included health care, consumer staples, and information technology. Conversely, the financials, energy, and industrials sectors were the most significant detractors from the Fund’s performance. Sector allocation was modestly positive, with tailwinds from an underweight to the consumer discretionary sector and an overweight to the communication services sector exceeding the headwinds from an underweight to the consumer staples sector and an overweight to the health care sector. Stock selection was the primary driver of the Fund’s relative outperformance, with the effects of contributors in the financials, health care, and real estate sectors outpacing those of detractors in the consumer discretionary, information technology, and communication services sectors.
Turning to individual stocks, contributors to the Fund’s performance included Microsoft Corporation, a leading software company, which outperformed significantly as investors sought well-capitalized and structural growth stocks as fears surroundingCOVID-19 took root. Another contributor to the Fund’s performance, Northrop Grumman, a leading defense contractor, was an out performer given relatively limited exposure to the threat of an economic slowdown due to theCOVID-19 outbreak. Similarly, Eli Lily, a pharmaceutical company, outperformed on the back of peer-leading organic growth trends and limited disruptions from theCOVID-19 outbreak.
| See benchmark definitions on A-24 and A-25 |
A-18
Table of Contents
PACIFIC FUNDS PERFORMANCE DISCUSSION (Continued)
Top individual stock detractors from the Fund’s performance included Diamondback Energy and EOG Resources, both independent exploration and production companies which underperformed in the final quarter of the reporting period, driven by the rout in oil prices that fell from $60 per barrel at the beginning of the first quarter of 2020 to $20 per barrel. The Fund has subsequently exited both positions. Another detractor from the Fund’s performance was PVH Corp, a clothing company, whose fall was driven by estimate cuts as theCOVID-19 situation developed, with risks tied to lower global tourism spending as more than half of the company’s revenues originated from outside the U.S. market. Adding to the pressure on estimates was PVH’s exposure to U.S. mall and department store closures.
Pacific Funds Small/Mid-Cap (managed by Rothschild & Co Asset Management US Inc.)
Q. How did the Fund perform for the year ended March 31, 2020?
A. For the year ended March 31, 2020, Pacific FundsSmall/Mid-Cap’s Advisor Class (without sales charge) returned-26.61%, compared to a-22.47% return for its benchmark, the Russell 2500 Index.
The following graph compares the performance of a hypothetical $10,000 investment in Advisor Class shares of the Fund to its benchmark for the period from inception through March 31, 2020. For comparison purposes, the performance of all classes for the periods ended March 31, 2020 are also shown in the table below. Performance data for Class A, C, and R6 (formerly Class S) shares will vary due to differences in fees and sales charges. The Fund’s performance reflects reinvestments of all dividends and capital gains distributions, if any.
Performance Comparison
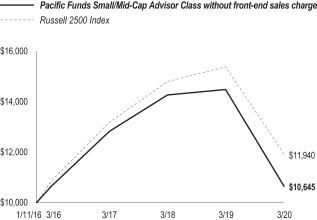
Average Annual Total Returns for the Periods Ended March 31, 2020
| 1 Year | Since Inception (1/11/16) | |||||||||||
Fund’s Advisor Class without sales charge |
| (26.61% | ) | 1.49% | ||||||||
Fund’s Class A without sales charge | (26.71% | ) | 1.28% | |||||||||
Fund’s Class A with maximum sales charge | (29.83% | ) | 0.26% | |||||||||
Fund’s Class C without sales charge | (27.24% | ) | 0.53% | |||||||||
Fund’s Class C with maximum sales charge | (27.97% | ) | 0.53% | |||||||||
Russell 2500 Index | (22.47% | ) | 4.28% | |||||||||
| 1 Year | 5 Years | Since Inception (12/31/14) | ||||||||||
Fund’s Class R6 without sales charge | (26.57% | ) | (1.20% | ) | 0.07% | |||||||
Russell 2500 Index | (22.47% | ) | 0.49% | 1.44% | ||||||||
Performance data shown represents past performance. Investment return and principal value will fluctuate so that shares of the Fund when redeemed may be worth more or less than their original cost. Past performance is not predictive of future performance. The table does not reflect the deduction of taxes that a shareholder would pay on Fund distributions or redemption of Fund shares. |
Q. Discuss both positive and negative factors that materially affected the Fund’s performance during the year, including relevant market conditions, investment strategies and techniques, and particular sectors or securities.
A. For the reporting period, the Fund’s Advisor Class underperformed the benchmark. We at Rothschild & Co implement the Fund’s strategy by investing in common stocks and other equity securities of small and medium capitalization U.S. companies. We analyze a variety of quantitative and fundamental inputs in making stock decisions and seek to build a portfolio that is well diversified at the issuer level and by economic sector. Our focus remains on identifying stocks with attractive relative valuations and the ability to exceed investors’ expectations.
Leading sectors contributing to the Fund’s performance included utilities, consumer staples, and communication services. Conversely, the consumer discretionary, financials, and information technology sectors were the most significant detractors from the Fund’s performance. Sector allocation was positive, with tailwinds from an overweight to the health care sector and the Fund’s small cash position exceeding the headwinds from an underweight to the utilities sector and a small overweight to the consumer discretionary sector. Stock selection was the primary driver of the Fund’s relative underperformance, with the effects of contributors in the real estate, industrials, and utilities sectors falling short of those of the detractors in consumer discretionary, financials, and health care sectors.
Turning to individual stocks, detractors from the Fund’s performance included Invesco Mortgage Capital Inc. (IVR), a hybrid mortgage real estate investment trust (mREIT), which invests in agency andnon-agency residential mortgage backed securities (RMBS) and other securities. Historically the group has provided attractive dividend yields with relatively stable book values. In March of 2020, the overall mortgage market experienced extreme volatility and dislocation. Mortgage REITs use short term repurchase or “repo” agreements to add leverage in order to fund the purchase of mortgage related securities. With the entire system under stress given both credit and liquidity concerns, spreads widened, asset values fell sharply, and the haircuts that repo dealers required increased. This caused widespread liquidity-driven asset sales which further pressured asset values. As a result, many mREITs (including IVR) were unable to meet margin calls and are in discussions with lenders about entering into a forbearance plan. They are also delaying payment of dividends to preserve liquidity. Another detractor from the Fund’s performance was Diamondback Energy, an independent exploration and production company, which underperformed in the final quarter of the reporting period, driven by the rout in oil prices that fell from $60 per barrel at the beginning of the first quarter of 2020 to $20 per barrel. Also
| See benchmark definitions on A-24 and A-25 |
A-19
Table of Contents
PACIFIC FUNDS PERFORMANCE DISCUSSION (Continued)
detracting from the Fund’s performance was Green Dot Corporation, a financial technology provider, which lowered annual guidance following their earnings release at the start of the first quarter of the reporting period. This reflected the company’s decision to proactively spend on marketing for its new product launch in the summer as well as combat increased competitive pressures fromstart-upneo-banks (digital only banking offerings). In addition, the company lowered its annual guidance again, following their results from the first quarter of the reporting period, due to a more conservative-than-expected uptake in its new product, which was partially due to a modestly delayed launch as well as a delay in the start of its new “banking as a service” customers. Green Dot had a very attractive valuation and extremely low expectations along with various potential drivers of the stock’s performance, including receiving a return on its marketing investments, success from its new product launches, and a potentialsale/break-up of the company into legacy and banking as service offerings. Despite these, we exited the position as the company’s CEO and CFO announced their departures, which created an increased level of uncertainty that was too much to bear.
Top individual stock contributors to the Fund’s performance included Generac Holdings, a backup power company, which reported multiple quarters (first, second, and third quarters of the reporting period) of better-than-expected quarterly results and increased full-year guidance throughout the reporting period. In addition, the company’s market opportunity expanded as scheduled brownouts and blackouts in California associated with future wildfire risk increases. Furthermore, the company announced its solar battery backup offering (similar to the Tesla power wall with additional advantages) which further increased investor optimism over future growth prospects. Also contributing to the Fund’s performance was Amedisys, a home health care provider, that was under pressure initially in 2020 as the company reported better-than-expected fourth quarter of 2019 results but issued conservative 2020 guidance. However, in March of 2020,COVID-19 related hospital admissions pushed the need to free up beds and move less severe patients to anout-patient home setting. Also, when appropriate, the Centers for Medicare & Medicaid Services (CMS) will now allow reimbursement for tele-health services, versus priorin-person services and doctor visits, which will have longer lasting benefits given the elimination of logistical challenges for a predominant elderly population and travel costs. Lastly, the Congressional stimulation package rolled back sequestration reimbursement cuts to some home health related services that will help offset volume-related pressures fromshelter-in-place and social distancing policies.
Pacific Funds Small-Cap (managed by Rothschild & Co Asset Management US Inc.)
Q. How did the Fund perform for the year ended March 31, 2020?
A. For the year ended March 31, 2020, Pacific FundsSmall-Cap’s Advisor Class (without sales charge) returned-29.07%, compared to a-23.99% return for its benchmark, the Russell 2000 Index.
The following graph compares the performance of a hypothetical $10,000 investment in Advisor Class shares of the Fund to its benchmark for the period from inception through March 31, 2020. For comparison purposes, the performance of all classes for the periods ended March 31, 2020 are also shown in the table below. Performance data for Class A, C, and R6 (formerly Class S) shares will vary due to differences in fees and sales charges. The Fund’s performance reflects reinvestments of all dividends and capital gains distributions, if any.
Performance Comparison
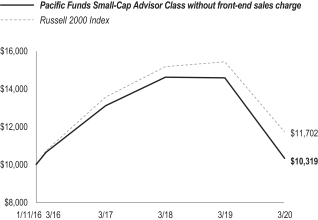
Average Annual Total Returns for the Periods Ended March 31, 2020
| 1 Year | Since Inception (1/11/16) | |||||||||||
Fund’s Advisor Class without sales charge |
| (29.07% | ) | 0.75% | ||||||||
Fund’s Class A without sales charge | (29.27% | ) | 0.49% | |||||||||
Fund’s Class A with maximum sales charge | (32.29% | ) | (0.53% | ) | ||||||||
Fund’s Class C without sales charge | (29.82% | ) | (0.27% | ) | ||||||||
Fund’s Class C with maximum sales charge | (30.52% | ) | (0.27% | ) | ||||||||
Russell 2000 Index | (23.99% | ) | 3.79% | |||||||||
| 1 Year | 5 Years | Since Inception (12/31/14) | ||||||||||
Fund’s Class R6 without sales charge | (29.05% | ) | (2.25% | ) | (1.07% | ) | ||||||
Russell 2000 Index | (23.99% | ) | (0.25% | ) | 0.57% | |||||||
Performance data shown represents past performance. Investment return and principal value will fluctuate so that shares of the Fund when redeemed may be worth more or less than their original cost. Past performance is not predictive of future performance. The table does not reflect the deduction of taxes that a shareholder would pay on Fund distributions or redemption of Fund shares. |
Q. Discuss both positive and negative factors that materially affected the Fund’s performance during the year, including relevant market conditions, investment strategies and techniques, and particular sectors or securities.
A. For the reporting period, the Fund’s Advisor Class underperformed the benchmark. We at Rothschild & Co implement the Fund’s strategy by investing in common stocks and other equity securities of small capitalization U.S. companies. We analyze a variety of quantitative and fundamental inputs in making stock decisions and seek to build a portfolio that is well diversified at the issuer level and by economic sector. Our focus remains on identifying stocks with attractive relative valuations and the ability to exceed investors’ expectations.
| See benchmark definitions on A-24 and A-25 |
A-20
Table of Contents
PACIFIC FUNDS PERFORMANCE DISCUSSION (Continued)
Leading sectors contributing to the Fund’s performance included utilities, consumer staples, and energy. Conversely, the financials, consumer discretionary, and information technology sectors were the most significant detractors from the Fund’s performance. Sector allocation was positive, with tailwinds from an underweight to the energy sector and the Fund’s small cash position exceeding the headwinds from overweights to the consumer discretionary and communication services sectors along with an underweight to the utilities sector. Stock selection was the primary driver of the Fund’s relative under performance, with the effects of contributors in the industrials, real estate, and energy sectors falling short of those of the detractors in the information technology, financials, and health care sectors.
Turning to individual stocks, detractors from the Fund’s performance included Merit Medical Systems, a manufacturer of disposable medical devices, which underperformed due to disappointing results during the third quarter of the reporting period, and lowered 2019 guidance for the second quarter in a row after beating consensus earnings expectations for the preceding 16 straight quarters. The company cited several headwinds: difficult year over year comparisons, weaker seasonal summer trends than normal, geopolitical issues (e.g., Brexit), and new GPO (group purchasing distribution agreement). Their management cited the cyclical low point in their business and expects things to grow from here. Another detractor from the Fund’s performance was Invesco Mortgage Capital, a hybrid mortgage real estate investment trust (mREIT), which invests in agency andnon-agency residential mortgage backed securities (RMBS) and other securities. Historically the group has provided attractive dividend yields with relatively stable book values. In March of 2020, the overall mortgage market experienced extreme volatility and dislocation. Mortgage REITs use short term repurchase or “repo” agreements to add leverage in order to fund the purchase of mortgage related securities. With the entire system under stress given both credit and liquidity concerns, spreads widened, asset values fell sharply, and the haircuts that repo dealers required increased. This caused widespread liquidity-driven asset sales which further pressured asset values. As a result, many mREITs (including IVR) were unable to meet margin calls and are in discussions with lenders about entering into a forbearance plan. They are also delaying payment of dividends to preserve liquidity. Also detracting from the Fund’s performance was Green Dot Corporation, a financial technology provider, which lowered annual guidance following their earnings release at the start of the first quarter of the reporting period. This reflected the company’s decision to proactively spend on marketing for its new product launch in the summer as well as combat increased competitive pressures fromstart-upneo-banks (digital only banking offerings). In addition, the company lowered its annual guidance again, following their results from the first quarter of the reporting period, due to a more conservative-than-expected uptake in its new product, which was partially due to a modestly delayed launch as well as a delay in the start of its new “banking as a service” customers. Green Dot had a very attractive valuation and extremely low expectations along with various potential drivers of the stock’s performance, including receiving a return on its marketing investments, success from its new product launches, and a potentialsale/break-up of the company into legacy and banking as service offerings. Despite this, we exited the position as the company’s CEO and CFO announced their departures, which created an increased level of uncertainty that was too much to bear.
Top individual stock contributors to the Fund’s performance included Quidel, a manufacturer of healthcare equipment, which reported better-than-expected results during the fourth quarter of the reporting period driven by a stronger-than-normal seasonal flu testing, which has continued through March of 2020 with the onset ofCOVID-19. Physicians are ordering rapid flu tests in tandem withCOVID-19 tests. Also, longer term, the company has an opportunity to develop apoint-of-care rapidCOVID-19 test compatible with its Sofia analyzer that controls significant market share in physicians’ offices. A rapid test for the virus could be on the market next year and double flu sales, at significant incremental margins. Also contributing to the Fund’s performance was Amedisys, a home health care provider, that was under pressure initially in 2020 as the company reported better-than-expected fourth quarter of 2019 results but issued conservative 2020 guidance. However, in March of 2020,COVID-19 related hospital admissions pushed the need to free up beds and move less severe patients to anout-patient home setting. Also, when appropriate, the Centers for Medicare & Medicaid Services (CMS) will now allow reimbursement for tele-health services, versus priorin-person services and doctor visits, which will have longer lasting benefits given the elimination of logistical challenges for a predominant elderly population and travel costs. Lastly, the Congressional stimulation package rolled back sequestration reimbursement cuts to some home health related services that will help offset volume-related pressures fromshelter-in-place and social distancing policies.
| See benchmark definitions on A-24 and A-25 |
A-21
Table of Contents
PACIFIC FUNDS PERFORMANCE DISCUSSION (Continued)
Pacific Funds Small-Cap Value (managed by Rothschild & Co Asset Management US Inc.)
Q. How did the Fund perform for the year ended March 31, 2020?
A. For the year ended March 31, 2020, Pacific FundsSmall-Cap Value’s Advisor Class (without sales charge) returned-31.79%, compared to a-29.64% return for its benchmark, the Russell 2000 Value Index.
The following graph compares the performance of a hypothetical $10,000 investment in Advisor Class shares of the Fund to its benchmark for the period from inception through March 31, 2020. For comparison purposes, the performance of all classes for the periods ended March 31, 2020 are also shown in the table below. Performance data for Class A, C, and R6 (formerly Class S) shares will vary due to differences in fees and sales charges. The Fund’s performance reflects reinvestments of all dividends and capital gains distributions, if any.
Performance Comparison
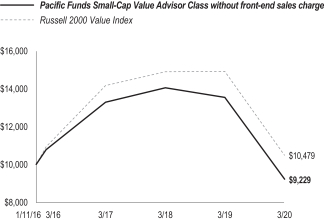
Average Annual Total Returns for the Periods Ended March 31, 2020
| 1 Year | Since Inception (1/11/16) | |||||||||||
Fund’s Advisor Class without sales charge |
| (31.79% | ) | (1.88% | ) | |||||||
Fund’s Class A without sales charge | (31.93% | ) | (2.12% | ) | ||||||||
Fund’s Class A with maximum sales charge | (34.79% | ) | (3.12% | ) | ||||||||
Fund’s Class C without sales charge | (32.44% | ) | (2.85% | ) | ||||||||
Fund’s Class C with maximum sales charge | (33.11% | ) | (2.85% | ) | ||||||||
Russell 2000 Value Index | (29.64% | ) | 1.11% | |||||||||
| 1 Year | 5 Years | Since Inception (12/31/14) | ||||||||||
Fund’s Class R6 without sales charge | (31.67% | ) | (4.35% | ) | (3.45% | ) | ||||||
Russell 2000 Value Index | (29.64% | ) | (2.42% | ) | (1.95% | ) | ||||||
Performance data shown represents past performance. Investment return and principal value will fluctuate so that shares of the Fund when redeemed may be worth more or less than their original cost. Past performance is not predictive of future performance. The table does not reflect the deduction of taxes that a shareholder would pay on Fund distributions or redemption of Fund shares. |
Q. Discuss both positive and negative factors that materially affected the Fund’s performance during the year, including relevant market conditions, investment strategies and techniques, and particular sectors or securities.
A. For the reporting period, the Fund’s Advisor Class underperformed the benchmark. We at Rothschild & Co implement the Fund’s strategy by investing in common stocks and other equity securities of small capitalization U.S. companies. We analyze a variety of quantitative and fundamental inputs in making stock decisions and seek to build a portfolio that is well diversified at the issuer level and by economic sector. Our focus remains on identifying stocks with attractive relative valuations and the ability to exceed investors’ expectations.
Leading sectors contributing to the Fund’s performance included consumer staples, communication services, and utilities. Conversely, the financials, consumer discretionary, and industrials sectors were the most significant detractors from the Fund’s performance. Sector allocation was positive, with tailwinds from an underweight to the energy sector and the Fund’s small cash position exceeding the headwinds from an overweight to the consumer discretionary sector and an underweight to the utilities sector. Stock selection was the primary driver of the Fund’s relative underperformance, with the effects of contributors in the real estate, industrials, and utilities sectors falling short of those of the detractors in the financials, information technology, and health care sectors.
Turning to individual stocks, detractors from the Fund’s performance included MFA Financial and Invesco Mortgage Capital, which are both hybrid mortgage real estate investment trusts (mREIT), which invest in agency andnon-agency residential mortgage backed securities (RMBS) and other securities. Historically the group has provided attractive dividend yields with relatively stable book values. In March of 2020, the overall mortgage market experienced extreme volatility and dislocation. Mortgage REITs use short term repurchase or “repo” agreements to add leverage in order to fund the purchase of mortgage related securities. With the entire system under stress given both credit and liquidity concerns, spreads widened, asset values fell sharply, and the haircuts that repo dealers required increased. This caused widespread liquidity-driven asset sales which further pressured asset values. As a result, many mREITs (including both MFA and Invesco) were unable to meet margin calls and are in discussions with lenders about entering into a forbearance plan. They are also delaying payment of dividends to preserve liquidity. Another detractor from the Fund’s performance was Designer Brands, Inc. which engages in the design, production, and retail of footwear and accessory brands. It operates over 500 DSW stores in the U.S. The company is in the middle of a three-year plan to improve gross margins but hit headwinds from tariff concerns in August of 2019 and more recently, like many retailers, its business was negatively impacted byCOVID-19 related shutdowns. The company has closed its stores, withdrawn its guidance, cut its dividend, and has put 80% of its workforce on temporary leave of absence. Underlying fundamentals were starting to improve but the uncertainty around the duration of the store closures is weighing on the stock.
| See benchmark definitions on A-24 and A-25 |
A-22
Table of Contents
PACIFIC FUNDS PERFORMANCE DISCUSSION (Continued)
Top individual stock contributors to the Fund’s performance included Helen of Troy, a consumer products company whose personal care and household products brands include Braun, Vicks, OXO, and Hydro Flask. In January of 2020, the company reported fiscal third quarter (ended November 2019) earnings that were well-above estimates and increased full-year guidance. It also completed an accretive acquisition. In the current environment, the market expects continuing demand for some of its Health & Home products offsetting likely pressure in its HydroFlask and Beauty appliances businesses. Leverage remains low and the company is taking proactive steps including executive pay cuts and reducing other expenses. The company also drew down on its line of credit to increase liquidity. Also contributing to the Fund’s performance was Southwest Gas Holdings which operates regulated natural gas utilities in Arizona, California, and Nevada, as well as a utility infrastructure services segment for gas and electric utilities throughout North America. The company reported disappointing third quarter 2019 results and lowered full year guidance due to several nonrecurring factors. However, in 2020 the company delivered the expected defensive characteristics in the March 2020sell-off.
Pacific Funds Small-Cap Growth (managed by Rothschild & Co Asset Management US Inc.)
Q. How did the Fund perform for the year ended March 31, 2020?
A. For the year ended March 31, 2020, Pacific FundsSmall-Cap Growth’s Advisor Class (without sales charge) returned-28.89%, compared to a-18.58% return for its benchmark, the Russell 2000 Growth Index.
The following graph compares the performance of a hypothetical $10,000 investment in Advisor Class shares of the Fund to its benchmark for the period from inception through March 31, 2020. For comparison purposes, the performance of all classes for the periods ended March 31, 2020 are also shown in the table below. Performance data for Class A, C, and R6 (formerly Class S) shares will vary due to differences in fees and sales charges. The Fund’s performance reflects reinvestments of all dividends and capital gains distributions, if any.
Performance Comparison
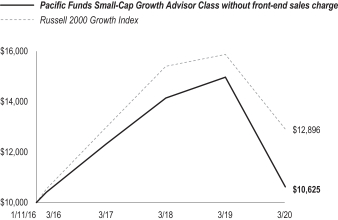
Average Annual Total Returns for the Periods Ended March 31, 2020
| 1 Year | Since Inception (1/11/16) | |||||||
Fund’s Advisor Class without sales charge | (28.89% | ) | 1.44% | |||||
Fund’s Class A without sales charge | (29.01% | ) | 1.19% | |||||
Fund’s Class A with maximum sales charge | (32.03% | ) | 0.16% | |||||
Fund’s Class C without sales charge | (29.61% | ) | 0.42% | |||||
Fund’s Class C with maximum sales charge | (30.32% | ) | 0.42% | |||||
Fund’s Class R6 without sales charge | (28.80% | ) | 1.55% | |||||
Russell 2000 Growth Index | (18.58% | ) | 6.20% | |||||
Performance data shown represents past performance. Investment return and principal value will fluctuate so that shares of the Fund when redeemed may be worth more or less than their original cost. Past performance is not predictive of future performance. The table does not reflect the deduction of taxes that a shareholder would pay on Fund distributions or redemption of Fund shares. |
Q. Discuss both positive and negative factors that materially affected the Fund’s performance during the year, including relevant market conditions, investment strategies and techniques, and particular sectors or securities.
A. For the reporting period, the Fund’s Advisor Class underperformed the benchmark. We at Rothschild & Co implement the Fund’s strategy by investing in common stocks and other equity securities of small capitalization U.S. companies. We analyze a variety of quantitative and fundamental inputs in making stock decisions and seek to build a portfolio that is well diversified at the issuer level and by economic sector. Our focus remains on identifying stocks with attractive relative valuations and the ability to exceed investors’ expectations.
Leading sectors contributing to the Fund’s performance included consumer staples, energy, and real estate. Conversely, the consumer discretionary, information technology, and health care sectors were the most significant detractors from the Fund’s performance. Sector allocation was neutral for the reporting period, with tailwinds from an underweight to the energy sector, an overweight to the information technology sector and the Fund’s small cash position essentially negating the headwinds from an overweight to the consumer discretionary sector and an underweight to the utilities sector. Stock selection was the primary driver of the Fund’s relative underperformance, with the effects of contributors in the industrials and consumer staples sectors falling short of those of the detractors in the information technology, health care, and financials sectors.
Turning to individual stocks, detractors from the Fund’s performance includedG-III Apparel Group, an apparel manufacturer and retailer, which was under pressure fromCOVID-19 related concerns and the impact to its business from department store closures.G-III Apparel was sold from the Fund as it has limiteddirect-to-consumer distribution which would likely help in the current environment. With its significant exposure to department stores we believe it will be difficult to navigate the stores’ closures. This, along with longer-term concerns over this distribution reliance, drove the decision to exit the position. Another detractor from the Fund’s performance was Green Dot Corporation, a financial technology provider, which lowered annual guidance following their earnings release at the start of the first quarter of the reporting
| See benchmark definitions on A-24 and A-25 |
A-23
Table of Contents
PACIFIC FUNDS PERFORMANCE DISCUSSION (Continued)
period. This reflected the company’s decision to proactively spend on marketing for its new product launch in the summer as well as combat increased competitive pressures fromstart-upneo-banks (digital only banking offerings). In addition, the company lowered its annual guidance again, following their results from the first quarter of the reporting period, due to a more conservative-than-expected uptake in its new product, which was partially due to a modestly delayed launch as well as a delay in the start of its new “banking as a service” customers. Green Dot had a very attractive valuation and extremely low expectations along with various potential drivers of the stock’s performance, including receiving a return on its marketing investments, success from its new product launches, and a potentialsale/break-up of the company into legacy and banking as service offerings. Despite this, we exited the position as the company’s CEO and CFO announced their departures, which created an increased level of uncertainty that was too much to bear. Also detracting from the Fund’s performance was Children’s Place, Inc., a specialty retailer, who preannounced their results from the second quarter of the reporting period with same-store sales above expectation andin-line earnings which the market took away as an indication of weaker than expected margins.
Top individual stock contributors to the Fund’s performance included Quidel, a manufacturer of healthcare equipment, which reported better-than-expected results during the fourth quarter of the reporting period driven by a stronger-than-normal seasonal flu testing, which has continued through March of 2020 with the onset ofCOVID-19. Physicians are ordering rapid flu tests in tandem withCOVID-19 tests. Also, longer term, the company has an opportunity to develop apoint-of-care rapidCOVID-19 test compatible with its Sofia analyzer that controls significant market share in physicians’ offices. A rapid test for the virus could be on the market next year and double flu sales, at significant incremental margins. Also contributing to the Fund’s performance was Generac Holdings, a backup power company, which reported multiple quarters (first, second, and third quarters of the reporting period) of better-than-expected quarterly results and increased full-year guidance throughout the reporting period. In addition, the company’s market opportunity expanded as scheduled brownouts and blackouts in California associated with future wildfire risk increases. Furthermore, the company announced its solar battery backup offering (similar to the Tesla power wall with additional advantages) which further increased investor optimism over future growth prospects.
Bloomberg Barclays1-3 Year US Government/Credit Bond Indexmeasures the performance of a subset of the Bloomberg Barclays US Aggregate Bond Index and includes investment grade U.S. dollar-denominated, fixed-rate Treasuries, government-related and corporate securities with maturities of one to three years. Results include the reinvestment of all distributions.
Bloomberg Barclays Short Treasury Total Return Indexmeasures the performance of the US Treasury bills, notes, and bonds under 1 year to maturity. STRIPS are excluded from the index because their inclusion would result in double-counting. Results include the reinvestment of all distributions.
Bloomberg Barclays US Aggregate Bond Indexmeasures the performance of the investment grade, U.S. dollar-denominated, fixed-rate taxable bond market, which includes Treasuries, government-related and corporate securities, mortgage-backed securities, asset-backed securities and commercial mortgage-backed securities. Results include the reinvestment of all distributions.
Bloomberg Barclays US High-Yield 2% Issuer Capped Bond Index is an issuer-constrained version of the Bloomberg Barclays US Corporate High-Yield Bond Index that covers the U.S. dollar-denominated, high yield, fixed-rate corporate bond market and limits issuer exposures to a maximum of 2% and redistributes the excess market value index-wide on apro-rata basis. Results include the reinvestment of all distributions.
Credit Suisse Leveraged Loan Indextracks the investable market of the U.S. dollar-denominated leveraged loan market. It consists of issues rated “5B” or lower, meaning that the highest rated issues included in this index are Moody’s/S&P ratings of Baa1/BB+ or Ba1/BBB+. All loans are funded term loans with a tenure of at least one year and are made by issuers domiciled in developed countries. Results include the reinvestment of all distributions.
Diversified Income Composite Benchmark is 70% MSCI World Index (Net) and 30% Bloomberg Barclays US Aggregate Bond Index.
ICE BofAML U.S.3-Month Treasury Bill(T-Bill) Index(formerly named ICE BofA Merrill Lynch U.S.3-Month Treasury Bill (T-Bill) Index)is an index comprised of a single issue purchased at the beginning of the month and held for a full month. At the end of the month that issue is sold and rolled into a newly selected issue. The issue selected at eachmonth-end rebalancing is the outstanding Treasury Bill that matures closest to, but not beyond, three months from the rebalancing date. To qualify for selection, an issue must have settled on or before themonth-end rebalancing date. Results include the reinvestment of all distributions.
MSCI Emerging Markets Index (Net)is a free float-adjusted market capitalization weighted index that is designed to measure equity market performance of large- andmid-capitalization securities in emerging markets. As of March 31, 2020, the MSCI Emerging Markets Index (Net) consists of the following emerging market country indices: Argentina, Brazil, Chile, China, Colombia, Czech Republic, Egypt, Greece, Hungary, India, Indonesia, Korea, Malaysia, Mexico, Pakistan, Peru, Philippines, Poland, Qatar, Russia, Saudi Arabia, South Africa, Taiwan, Thailand, Turkey, and United Arab Emirates. The word “(Net)” in the index name means the net total return for the index, which includes the reinvestment of dividends after the deduction of withholding tax, applying the tax rate tonon-resident individuals who do not benefit from double taxation treaties.
MSCI EAFE (Europe, Australasia and Far East) Index (Net)is a free float-adjusted market capitalization weighted index that is designed to measure the equity market performance of developed markets, excluding the U.S. & Canada. As of March 31, 2020, the MSCI EAFE Index (Net) consists of the following developed market country indices: Australia, Austria, Belgium, Denmark, Finland, France, Germany, Hong Kong, Ireland, Israel, Italy, Japan, the Netherlands, New Zealand, Norway, Portugal, Singapore, Spain, Sweden, Switzerland, and the United Kingdom (U.K.) The word “(Net)” in the index name means the net total return for the index, which includes the reinvestment of dividends after the deduction of withholding tax, applying the tax rate tonon-resident individuals who do not benefit from double taxation treaties.
MSCI World Index (Net)is a free float-adjusted market capitalization weighted index that is designed to measure the equity market performance of developed markets. As of March 31, 2020, the MSCI World Index (Net) consists of the following developed market country indices: Australia, Austria, Belgium, Canada, Denmark, Finland, France, Germany, Hong Kong, Ireland, Israel, Italy, Japan, Netherlands, New Zealand, Norway, Portugal, Singapore, Spain, Sweden, Switzerland, the U.K., and the U.S. The word “(Net)” in the index name means the net total return for the index, which
A-24
Table of Contents
PACIFIC FUNDS PERFORMANCE DISCUSSION (Continued)
includes the reinvestment of dividends after the deduction of withholding tax, applying the tax rate tonon- resident individuals who do not benefit from double taxation treaties.
Pacific Funds Portfolio Optimization Composite Benchmarks:The composite benchmarks for the Portfolio Optimization Funds show the performance of a combination of three or more broad-based market indices that represent fixed income, domestic equity, international equity and cash asset class categories in weights that are fixed and specific to each Fund. The composition of each Fund’s composite benchmark is shown below. Results include the reinvestment of all distributions. Prior to July 1, 2012, the weighting to each asset category was adjusted annually to reflect the Fund’s target allocations for the year.
Pacific Funds Portfolio Optimization Conservative Composite Benchmarkis 71% Bloomberg Barclays US Aggregate Bond; 17% S&P 500; 7% ICE BofAML U.S.3-Month Treasury Bill; and 5% MSCI EAFE (Net) Indices. Results include the reinvestment of all distributions.
Pacific Funds Portfolio Optimization Moderate-Conservative Composite Benchmarkis 55% Bloomberg Barclays US Aggregate Bond; 30% S&P 500; 10% MSCI EAFE (Net); and 5% ICE BofAML U.S.3-Month Treasury Bill Indices. Results include the reinvestment of all distributions.
Pacific Funds Portfolio Optimization Moderate Composite Benchmarkis 45% S&P 500; 38% Bloomberg Barclays US Aggregate Bond; 15% MSCI EAFE (Net); and 2% ICE BofAML U.S.3-Month Treasury Bill Indices. Results include the reinvestment of all distributions.
Pacific Funds Portfolio Optimization Growth Composite Benchmarkis 58% S&P 500; 23% Bloomberg Barclays US Aggregate Bond; and 19% MSCI EAFE (Net) Indices. Results include the reinvestment of all distributions. Results include the reinvestment of all distributions.
Pacific Funds Portfolio Optimization Aggressive-Growth Composite Benchmarkis 69% S&P 500; 26% MSCI EAFE (Net); and 5% Bloomberg Barclays US Aggregate Bond Indices. Results include the reinvestment of all distributions.
Russell 1000 Indexmeasures the performance of the large-capitalization segment of the U.S. equity universe. It is a subset of the Russell 3000 Index and includes approximately 1,000 of the largest securities based on a combination of their market capitalization and current index membership. The Russell 1000 Index represents approximately 92% of the investable U.S. equity market. It is constructed to provide a comprehensive and unbiased barometer for the large-capitalization and is completely reconstituted annually to ensure new and growing equities are reflected. Results include the reinvestment of all distributions.
Russell 1000 Value Indexmeasures the performance of the large-capitalization segment of the U.S. equity universe. It is a subset of the Russell 3000 Index and includes approximately 1,000 of the largest securities based on a combination of their market capitalization and current index membership. The Russell 1000 Index represents approximately 92% of the investable U.S. equity market. The Russell 1000 Index is constructed to provide a comprehensive and unbiased barometer for thelarge-cap segment and is completely reconstituted annually to ensure new and growing equities are reflected. Results include the reinvestment of all distributions
Russell 2000 Growth Indexmeasures the performance of thesmall-cap growth segment of the U.S. equity universe. It includes those Russell 2000 Index companies with higher growth earning potential as defined by the index provider. The Russell 2000 Growth Index is constructed to provide a comprehensive and unbiased barometer for thesmall-cap growth segment and is completely reconstituted annually to ensure larger stocks do not distort the performance and characteristics of the truesmall-cap opportunity set and that the represented companies continue to reflect growth characteristics. Results include the reinvestment of all distributions.
Russell 2000 Indexmeasures the performance of thesmall-cap segment of the U.S. equity universe. The Russell 2000 Index is a subset of the Russell 3000 Index representing approximately 10% of the total market capitalization of that index. It includes approximately 2,000 of the smallest securities based on a combination of their market cap and current index membership. The Russell 2000 Index is constructed to provide a comprehensive and unbiasedsmall-cap barometer and is completely reconstituted annually to ensure larger stocks do not distort the performance and characteristics of the truesmall-cap opportunity set. Results include the reinvestment of all distributions
Russell 2000 Value Indexmeasures the performance of thesmall-cap value segment of the U.S. equity universe. It includes those Russell 2000 Index companies that are considered more value oriented relative to the overall market as defined by the index provider. The Russell 2000 Value Index is constructed to provide a comprehensive and unbiased barometer for thesmall-cap value segment. The Index is completely reconstituted annually to ensure larger stocks do not distort the performance and characteristics of the truesmall-cap opportunity set and that the represented companies continue to reflect value characteristics. Results include the reinvestment of all distributions
Russell 2500 Indexmeasures the performance of the small tomid-cap segment of the U.S. equity universe, commonly referred to as “smid” cap. The Russell 2500 Index is a subset of the Russell 3000 Index. It includes approximately 2,500 of the smallest securities based on a combination of their market cap and current index membership. The Russell 2500 Index is constructed to provide a comprehensive and unbiased barometer for the small tomid-cap segment. The Index is completely reconstituted annually to ensure larger stocks do not distort the performance and characteristics of the true small tomid-cap opportunity set. Results include the reinvestment of all distributions
Russell 3000 Indexmeasures the performance of the largest 3,000 U.S. companies representing approximately 98% of the investable U.S. equity market. The Russell 3000 Index is constructed to provide a comprehensive, unbiased, and stable barometer of the broad market and is completely reconstituted annually to ensure new and growing equities are reflected. Results include the reinvestment of all distributions
S&P 500 Indexis a capitalization-weighted index of 500 stocks. The index is designed to measure performance of the broad domestic economy through changes in the aggregate market value of 500 stocks representing all major industries. Results include the reinvestment of all distributions.
A-25
Table of Contents
PACIFIC FUNDSSM PORTFOLIO OPTIMIZATION CONSERVATIVE
Schedule of Investments
March 31, 2020
PACIFIC FUNDS
PACIFIC FUNDSSM PORTFOLIO OPTIMIZATION MODERATE-CONSERVATIVE
Schedule of Investments
March 31, 2020
| Value | |||||||
AFFILIATED MUTUAL FUNDS - 100.6% |
| |||||||
Pacific Funds Core Income ‘P’ | 551,703 | $5,870,120 | ||||||
Pacific Funds Floating Rate Income ‘P’ | 246,147 | 2,168,559 | ||||||
Pacific Funds High Income ‘P’ | 2,637,965 | 22,844,778 | ||||||
PF Inflation Managed Fund ‘P’ | 1,247,832 | 11,392,707 | ||||||
PF Managed Bond Fund ‘P’ | 6,550,067 | 72,247,239 | ||||||
PF Short Duration Bond Fund ‘P’ | 3,455,850 | 33,763,657 | ||||||
PF Emerging Markets Debt Fund ‘P’ | 2,030,196 | 14,576,809 | ||||||
PF Developing Growth Fund ‘P’ | 81,633 | 1,158,367 | ||||||
PF Growth Fund ‘P’ | 87,502 | 2,371,306 | ||||||
PF Large-Cap Value Fund ‘P’ | 463,359 | 4,476,046 | ||||||
PF Multi-Asset Fund ‘P’ | 4,334,195 | 35,670,422 | ||||||
PF Small-Cap Value Fund ‘P’ | 223,265 | 1,154,281 | ||||||
PF Emerging Markets Fund ‘P’ | 437,740 | 4,289,848 | ||||||
PF International Small-Cap Fund ‘P’ | 166,614 | 1,162,964 | ||||||
PF Real Estate Fund ‘P’ | 115,963 | 1,194,420 | ||||||
|
| |||||||
Total Affiliated Mutual Funds |
| 214,341,523 | ||||||
|
| |||||||
TOTAL INVESTMENTS - 100.6% |
| 214,341,523 | ||||||
OTHER ASSETS & LIABILITIES, NET - (0.6%) |
| (1,252,545 | ) | |||||
|
| |||||||
NET ASSETS - 100.0% |
| $213,088,978 | ||||||
|
| |||||||
Notes to Schedule of Investments
| (a) | As of March 31, 2020, the Funds’ composition as a percentage of net assets was as follows: |
Pacific Funds Portfolio Optimization Conservative |
| |||
Affiliated Fixed Income Funds | 76.4% | |||
Affiliated Equity Funds | 24.2% | |||
|
| |||
| 100.6% | ||||
Other Assets & Liabilities, Net | (0.6% | ) | ||
|
| |||
| 100.0% | ||||
|
| |||
| Value | |||||||
AFFILIATED MUTUAL FUNDS - 100.1% |
| |||||||
Pacific Funds Core Income ‘P’ | 634,186 | $6,747,736 | ||||||
Pacific Funds Floating Rate Income ‘P’ | 162,400 | 1,430,744 | ||||||
Pacific Funds High Income ‘P’ | 2,978,097 | 25,790,324 | ||||||
PF Inflation Managed Fund ‘P’ | 597,682 | 5,456,837 | ||||||
PF Managed Bond Fund ‘P’ | 7,456,155 | 82,241,385 | ||||||
PF Short Duration Bond Fund ‘P’ | 2,620,479 | 25,602,075 | ||||||
PF Emerging Markets Debt Fund ‘P’ | 2,291,824 | 16,455,295 | ||||||
PF Developing Growth Fund ‘P’ | 107,521 | 1,525,730 | ||||||
PF Growth Fund ‘P’ | 367,651 | 9,963,335 | ||||||
PF Large-Cap Value Fund ‘P’ | 1,983,022 | 19,155,992 | ||||||
PF Multi-Asset Fund ‘P’ | 8,497,349 | 69,933,180 | ||||||
PF Small-Cap Value Fund ‘P’ | 294,030 | 1,520,135 | ||||||
PF Emerging Markets Fund ‘P’ | 1,152,878 | 11,298,209 | ||||||
PF International Large-Cap Fund ‘P’ | 295,246 | 2,671,974 | ||||||
PF International Small-Cap Fund ‘P’ | 219,436 | 1,531,666 | ||||||
PF International Value Fund ‘P’ | 437,256 | 2,247,495 | ||||||
PF Real Estate Fund ‘P’ | 305,494 | 3,146,593 | ||||||
|
| |||||||
Total Affiliated Mutual Funds |
| 286,718,705 | ||||||
|
| |||||||
TOTAL INVESTMENTS - 100.1% |
| 286,718,705 | ||||||
OTHER ASSETS & LIABILITIES, NET - (0.1%) |
| (381,134 | ) | |||||
|
| |||||||
NET ASSETS - 100.0% |
| $286,337,571 | ||||||
|
| |||||||
Pacific Funds Portfolio Optimization Moderate-Conservative |
| |||
Affiliated Fixed Income Funds | 57.2% | |||
Affiliated Equity Funds | 42.9% | |||
|
| |||
| 100.1% | ||||
Other Assets & Liabilities, Net | (0.1% | ) | ||
|
| |||
| 100.0% | ||||
|
| |||
| (b) | Fair Value Measurements |
The following is a summary of the Funds’ investments as categorized under the three-tier hierarchy of inputs used in valuing the Funds’ assets and liabilities as of March 31, 2020:
| Total Value at March 31, 2020 | Level 1 Quoted Price | Level 2 Significant Observable Inputs | Level 3 Significant Unobservable Inputs | |||||||||||||||
Pacific Funds Portfolio Optimization Conservative | ||||||||||||||||||
Assets | Affiliated Mutual Funds | $214,341,523 | $214,341,523 | $— | $— | |||||||||||||
|
|
|
|
|
|
|
| |||||||||||
Pacific Funds Portfolio Optimization Moderate-Conservative | ||||||||||||||||||
Assets | Affiliated Mutual Funds | $286,718,705 | $286,718,705 | $— | $— | |||||||||||||
|
|
|
|
|
|
|
| |||||||||||
| See Notes to Financial Statements | See explanation of symbols and terms, if any, on B-58 |
B-1
Table of Contents
PACIFIC FUNDS
PACIFIC FUNDSSM PORTFOLIO OPTIMIZATION MODERATE
Schedule of Investments
March 31, 2020
PACIFIC FUNDS
PACIFIC FUNDSSM PORTFOLIO OPTIMIZATION GROWTH
Schedule of Investments
March 31, 2020
| Value | |||||||
AFFILIATED MUTUAL FUNDS - 100.1% |
| |||||||
Pacific Funds Core Income ‘P’ | 1,314,637 | $13,987,743 | ||||||
Pacific Funds Floating Rate Income ‘P’ | 488,186 | 4,300,918 | ||||||
Pacific Funds High Income ‘P’ | 5,487,404 | 47,520,915 | ||||||
PF Inflation Managed Fund ‘P’ | 450,520 | 4,113,245 | ||||||
PF Managed Bond Fund ‘P’ | 15,456,022 | 170,479,927 | ||||||
PF Short Duration Bond Fund ‘P’ | 4,990,795 | 48,760,064 | ||||||
PF Emerging Markets Debt Fund ‘P’ | 4,606,736 | 33,076,367 | ||||||
PF Developing Growth Fund ‘P’ | 324,105 | 4,599,050 | ||||||
PF Growth Fund ‘P’ | 2,299,469 | 62,315,604 | ||||||
PF Large-Cap Value Fund ‘P’ | 6,989,993 | 67,523,333 | ||||||
PF Multi-Asset Fund ‘P’ | 40,651,114 | 334,558,667 | ||||||
PF Small-Cap Value Fund ‘P’ | 1,772,672 | 9,164,716 | ||||||
PF Emerging Markets Fund ‘P’ | 3,475,520 | 34,060,098 | ||||||
PF International Large-Cap Fund ‘P’ | 1,335,014 | 12,081,879 | ||||||
PF International Small-Cap Fund ‘P’ | 1,322,935 | 9,234,086 | ||||||
PF International Value Fund ‘P’ | 1,933,043 | 9,935,840 | ||||||
PF Real Estate Fund ‘P’ | 1,381,347 | 14,227,870 | ||||||
|
| |||||||
Total Affiliated Mutual Funds |
| 879,940,322 | ||||||
|
| |||||||
TOTAL INVESTMENTS - 100.1% |
| 879,940,322 | ||||||
OTHER ASSETS & LIABILITIES, NET - (0.1%) |
| (918,359 | ) | |||||
|
| |||||||
NET ASSETS - 100.0% |
| $879,021,963 | ||||||
|
| |||||||
Notes to Schedule of Investments
| (a) | As of March 31, 2020, the Funds’ composition as a percentage of net assets was as follows: |
Pacific Funds Portfolio Optimization Moderate |
| |||
Affiliated Equity Funds | 63.4% | |||
Affiliated Fixed Income Funds | 36.7% | |||
|
| |||
| 100.1% | ||||
Other Assets & Liabilities, Net | (0.1% | ) | ||
|
| |||
| 100.0% | ||||
|
| |||
| Value | |||||||
AFFILIATED MUTUAL FUNDS - 100.1% |
| |||||||
Pacific Funds Core Income ‘P’ | 470,828 | $5,009,609 | ||||||
Pacific Funds High Income ‘P’ | 2,579,489 | 22,338,375 | ||||||
PF Managed Bond Fund ‘P’ | 5,441,796 | 60,023,008 | ||||||
PF Short Duration Bond Fund ‘P’ | 1,228,820 | 12,005,569 | ||||||
PF Emerging Markets Debt Fund ‘P’ | 2,977,473 | 21,378,257 | ||||||
PF Developing Growth Fund ‘P’ | 478,784 | 6,793,941 | ||||||
PF Growth Fund ‘P’ | 1,991,746 | 53,976,306 | ||||||
PF Large-Cap Value Fund ‘P’ | 4,993,382 | 48,236,075 | ||||||
PF Multi-Asset Fund ‘P’ | 39,488,140 | 324,987,393 | ||||||
PF Small-Cap Value Fund ‘P’ | 1,964,092 | 10,154,356 | ||||||
PF Emerging Markets Fund ‘P’ | 3,529,908 | 34,593,100 | ||||||
PF International Large-Cap Fund ‘P’ | 2,008,746 | 18,179,153 | ||||||
PF International Small-Cap Fund ‘P’ | 1,465,807 | 10,231,331 | ||||||
PF International Value Fund ‘P’ | 2,920,495 | 15,011,342 | ||||||
PF Real Estate Fund ‘P’ | 1,700,646 | 17,516,654 | ||||||
|
| |||||||
Total Affiliated Mutual Funds |
| 660,434,469 | ||||||
|
| |||||||
TOTAL INVESTMENTS - 100.1% |
| 660,434,469 | ||||||
OTHER ASSETS & LIABILITIES, NET - (0.1%) |
| (576,389 | ) | |||||
|
| |||||||
NET ASSETS - 100.0% |
| $659,858,080 | ||||||
|
| |||||||
Pacific Funds Portfolio Optimization Growth | ||||
Affiliated Equity Funds | 81.8% | |||
Affiliated Fixed Income Funds | 18.3% | |||
|
| |||
| 100.1% | ||||
Other Assets & Liabilities, Net | (0.1% | ) | ||
|
| |||
| 100.0% | ||||
|
|
| (b) | Fair Value Measurements |
The following is a summary of the Funds’ investments as categorized under the three-tier hierarchy of inputs used in valuing the Funds’ assets and liabilities as of March 31, 2020:
| Total Value at March 31, 2020 | Level 1 Quoted Price | Level 2 Significant Observable Inputs | Level 3 Significant Unobservable Inputs | |||||||||||||||
Pacific Funds Portfolio Optimization Moderate |
| |||||||||||||||||
Assets | Affiliated Mutual Funds | $879,940,322 | $879,940,322 | $— | $— | |||||||||||||
|
|
|
|
|
|
|
| |||||||||||
Pacific Funds Portfolio Optimization Growth |
| |||||||||||||||||
Assets | Affiliated Mutual Funds | $660,434,469 | $660,434,469 | $— | $— | |||||||||||||
|
|
|
|
|
|
|
| |||||||||||
| See Notes to Financial Statements | See explanation of symbols and terms, if any, on B-58 |
B-2
Table of Contents
PACIFIC FUNDS
PACIFIC FUNDSSM PORTFOLIO OPTIMIZATION AGGRESSIVE-GROWTH
Schedule of Investments
March 31, 2020
| Value | |||||||
AFFILIATED MUTUAL FUNDS - 100.1% |
| |||||||
Pacific Funds Core Income ‘P’ | 20,861 | $221,964 | ||||||
Pacific Funds High Income ‘P’ | 261,223 | 2,262,187 | ||||||
PF Managed Bond Fund ‘P’ | 178,973 | 1,974,074 | ||||||
PF Short Duration Bond Fund ‘P’ | 217,802 | 2,127,923 | ||||||
PF Emerging Markets Debt Fund ‘P’ | 301,549 | 2,165,122 | ||||||
PF Developing Growth Fund ‘P’ | 254,510 | 3,611,496 | ||||||
PF Growth Fund ‘P’ | 1,290,497 | 34,972,470 | ||||||
PF Large-Cap Value Fund ‘P’ | 2,166,896 | 20,932,217 | ||||||
PF Multi-Asset Fund ‘P’ | 14,576,879 | 119,967,717 | ||||||
PF Small-Cap Value Fund ‘P’ | 1,160,072 | 5,997,574 | ||||||
PF Emerging Markets Fund ‘P’ | 1,364,831 | 13,375,343 | ||||||
PF International Large-Cap Fund ‘P’ | 983,705 | 8,902,532 | ||||||
PF International Small-Cap Fund ‘P’ | 692,596 | 4,834,320 | ||||||
PF International Value Fund ‘P’ | 1,517,948 | 7,802,250 | ||||||
PF Real Estate Fund ‘P’ | 723,165 | 7,448,597 | ||||||
|
| |||||||
Total Affiliated Mutual Funds |
| 236,595,786 | ||||||
|
| |||||||
TOTAL INVESTMENTS - 100.1% |
| 236,595,786 | ||||||
OTHER ASSETS & LIABILITIES, NET - (0.1%) |
| (146,395 | ) | |||||
|
| |||||||
NET ASSETS - 100.0% |
| $236,449,391 | ||||||
|
| |||||||
Notes to Schedule of Investments
| (a) | As of March 31, 2020, the Fund’s composition as a percentage of net assets was as follows: |
Affiliated Equity Funds | 96.4% | |||
Affiliated Fixed Income Funds | 3.7% | |||
|
| |||
| 100.1% | ||||
Other Assets & Liabilities, Net | (0.1% | ) | ||
|
| |||
| 100.0% | ||||
|
|
| (b) | Fair Value Measurements |
The following is a summary of the Fund’s investments as categorized under the three-tier hierarchy of inputs used in valuing the Fund’s assets and liabilities as of March 31, 2020:
| Total Value at March 31, 2020 | Level 1 Quoted Price | Level 2 Significant Observable Inputs | Level 3 Significant Unobservable Inputs | |||||||||||||||
Assets | Affiliated Mutual Funds | $236,595,786 | $236,595,786 | $— | $— | |||||||||||||
|
|
|
|
|
|
|
| |||||||||||
| See Notes to Financial Statements | See explanation of symbols and terms, if any, on B-58 |
B-3
Table of Contents
PACIFIC FUNDS
PACIFIC FUNDSSM ULTRA SHORT INCOME
Schedule of Investments
March 31, 2020
Principal Amount | Value | |||||||
CORPORATE BONDS & NOTES - 65.1% |
| |||||||
Basic Materials - 1.9% |
| |||||||
Barminco Finance Pty Ltd (Australia) | $75,000 | $72,938 | ||||||
Glencore Funding LLC (Switzerland) | 200,000 | 199,990 | ||||||
Syngenta Finance NV (Switzerland) | 200,000 | 199,618 | ||||||
|
| |||||||
| 472,546 | ||||||||
|
| |||||||
Communications - 7.3% |
| |||||||
AT&T Inc | 400,000 | 393,168 | ||||||
3.875% due 08/15/21 | 100,000 | 102,461 | ||||||
Charter Communications Operating LLC | 250,000 | 249,239 | ||||||
Comcast Corp | 250,000 | 244,545 | ||||||
Sprint Spectrum Co LLC | 459,750 | 459,175 | ||||||
Verizon Communications Inc | 375,000 | 357,027 | ||||||
|
| |||||||
| 1,805,615 | ||||||||
|
| |||||||
Consumer, Cyclical - 7.6% |
| |||||||
British Airways Pass-Through Trust ‘A’ | 100,000 | 95,107 | ||||||
4.625% due 12/20/25 ~ | 87,691 | 87,140 | ||||||
Delta Air Lines Pass-Through Trust ‘A’ | 385,397 | 385,607 | ||||||
General Motors Financial Co Inc | 200,000 | 158,990 | ||||||
Hasbro Inc | 200,000 | 197,574 | ||||||
3.150% due 05/15/21 | 100,000 | 98,144 | ||||||
Hyatt Hotels Corp | 100,000 | 92,335 | ||||||
Marriott International Inc | 250,000 | 213,728 | ||||||
2.300% due 01/15/22 | 100,000 | 93,903 | ||||||
McDonald’s Corp | 150,000 | 147,637 | ||||||
3.300% due 07/01/25 | 100,000 | 103,638 | ||||||
Toyota Motor Credit Corp | 200,000 | 201,399 | ||||||
|
| |||||||
| 1,875,202 | ||||||||
|
| |||||||
Consumer,Non-Cyclical - 7.6% |
| |||||||
AbbVie Inc | 450,000 | 448,521 | ||||||
Cigna Corp | 375,000 | 360,374 | ||||||
CVS Health Corp | 125,000 | 122,447 | ||||||
General Mills Inc | 350,000 | 340,782 | ||||||
Principal Amount | Value | |||||||
Imperial Brands Finance PLC (United Kingdom) | $200,000 | $199,629 | ||||||
Keurig Dr Pepper Inc | 100,000 | 101,699 | ||||||
Tyson Foods Inc | 300,000 | 299,255 | ||||||
|
| |||||||
| 1,872,707 | ||||||||
|
| |||||||
Energy - 5.6% |
| |||||||
Diamondback Energy Inc | 250,000 | 175,190 | ||||||
Exxon Mobil Corp | 250,000 | 229,437 | ||||||
Kinder Morgan Energy Partners LP | 250,000 | 250,000 | ||||||
MPLX LP | 150,000 | 141,778 | ||||||
Occidental Petroleum Corp | 500,000 | 396,289 | ||||||
Sabine Pass Liquefaction LLC | 200,000 | 196,825 | ||||||
|
| |||||||
| 1,389,519 | ||||||||
|
| |||||||
Financial - 23.7% |
| |||||||
American Express Credit Corp | 103,000 | 100,396 | ||||||
AvalonBay Communities Inc REIT | 400,000 | 393,714 | ||||||
Bank of America Corp | 250,000 | 244,267 | ||||||
2.186% (USD LIBOR + 0.380%) | 100,000 | 96,017 | ||||||
Capital One NA | 250,000 | 244,046 | ||||||
Citigroup Inc | 350,000 | 342,779 | ||||||
Host Hotels & Resorts LP REIT | 200,000 | 175,856 | ||||||
HSBC Holdings PLC (United Kingdom) | 200,000 | 191,809 | ||||||
Jackson National Life Global Funding | 250,000 | 239,000 | ||||||
JPMorgan Chase & Co | 500,000 | 487,833 | ||||||
Mitsubishi UFJ Financial Group Inc (Japan) | 250,000 | 225,590 | ||||||
Morgan Stanley | 250,000 | 242,797 | ||||||
New York Life Global Funding | 400,000 | 384,373 | ||||||
Piedmont Operating Partnership LP REIT | 200,000 | 200,856 | ||||||
PNC Bank NA | 250,000 | 235,724 | ||||||
2.252% (USD LIBOR + 0.450%) | 250,000 | 242,459 | ||||||
| See Notes to Financial Statements | See explanation of symbols and terms, if any, on B-58 |
B-4
Table of Contents
PACIFIC FUNDS
PACIFIC FUNDS ULTRA SHORT INCOME
Schedule of Investments (Continued)
March 31, 2020
Principal Amount | Value | |||||||
Reliance Standard Life Global Funding II | $150,000 | $146,632 | ||||||
Royal Bank of Canada (Canada) | 200,000 | 194,385 | ||||||
State Street Corp | 250,000 | 252,452 | ||||||
Sumitomo Mitsui Financial Group Inc (Japan) | 450,000 | 428,467 | ||||||
The Goldman Sachs Group Inc | 250,000 | 239,878 | ||||||
Truist Bank | 250,000 | 227,820 | ||||||
UBS Group AG (Switzerland) | 200,000 | 194,932 | ||||||
Wells Fargo & Co | 100,000 | 102,955 | ||||||
|
| |||||||
| 5,835,037 | ||||||||
|
| |||||||
Industrial - 4.6% |
| |||||||
Carrier Global Corp | 500,000 | 493,231 | ||||||
Otis Worldwide Corp | 200,000 | 190,435 | ||||||
Roper Technologies Inc | 250,000 | 257,465 | ||||||
Ryder System Inc | 200,000 | 199,952 | ||||||
|
| |||||||
| 1,141,083 | ||||||||
|
| |||||||
Technology - 2.8% |
| |||||||
Broadcom Inc | 100,000 | 98,804 | ||||||
3.125% due 10/15/22 ~ | 150,000 | 148,721 | ||||||
Dell International LLC | 200,000 | 202,164 | ||||||
Hewlett Packard Enterprise Co | 250,000 | 241,922 | ||||||
|
| |||||||
| 691,611 | ||||||||
|
| |||||||
Utilities - 4.0% |
| |||||||
DTE Energy Co | 500,000 | 495,537 | ||||||
Edison International | 250,000 | 249,423 | ||||||
Florida Power & Light Co | 250,000 | 235,828 | ||||||
|
| |||||||
| 980,788 | ||||||||
|
| |||||||
Total Corporate Bonds & Notes |
| 16,064,108 | ||||||
|
| |||||||
SENIOR LOAN NOTES - 3.1% |
| |||||||
Consumer, Cyclical - 0.9% |
| |||||||
SeaWorld Parks & Entertainment Inc TermB-5 | 247,449 | 207,857 | ||||||
|
| |||||||
Financial - 0.5% |
| |||||||
Avolon (US) LLC TermB-3 (Ireland) | 138,642 | 125,009 | ||||||
|
| |||||||
Principal Amount | Value | |||||||
Industrial - 1.7% |
| |||||||
GFL Environmental Inc Term B (Canada) | $197,820 | $192,998 | ||||||
Reynolds Group Holdings Inc Term B | 247,440 | 235,996 | ||||||
|
| |||||||
| 428,994 | ||||||||
|
| |||||||
Total Senior Loan Notes |
| 761,860 | ||||||
|
| |||||||
ASSET-BACKED SECURITIES - 21.4% |
| |||||||
AIMCO CLO (Cayman) | 400,000 | 392,687 | ||||||
AmeriCredit Automobile Receivables Trust | 250,000 | 237,228 | ||||||
1.900% due 03/18/22 | 78,005 | 77,738 | ||||||
1.980% due 12/20/21 | 39,710 | 39,666 | ||||||
2.240% due 06/19/23 | 200,000 | 198,640 | ||||||
2.880% due 07/08/21 | 10,339 | 10,336 | ||||||
Benefit Street Partners CLO VI Ltd (Cayman) | 250,000 | 238,838 | ||||||
Dryden 43 Senior Loan CLO Fund (Cayman) | 250,000 | 243,083 | ||||||
Magnetite VIII CLO Ltd (Cayman) | 215,000 | 205,653 | ||||||
Navient Private Education Loan Trust | 12,232 | 12,230 | ||||||
Navient Private Education Refi Loan Trust | 89,449 | 88,025 | ||||||
2.180% due 08/15/68 ~ | 194,382 | 194,330 | ||||||
Navient Student Loan Trust | 184,820 | 183,115 | ||||||
Palmer Square CLO Ltd ‘A1A’ (Cayman) | 250,000 | 238,690 | ||||||
Palmer Square Loan Funding CLO Ltd (Cayman) 2.481% (USD LIBOR + 0.650%) | 143,747 | 140,347 | ||||||
2.483% (USD LIBOR + 0.800%) | 250,000 | 245,682 | ||||||
2.701% (USD LIBOR + 0.900%) | 237,899 | 231,624 | ||||||
2.869% (USD LIBOR + 1.050%) | 238,367 | 234,878 | ||||||
Santander Drive Auto Receivables Trust | 218,798 | 218,415 | ||||||
2.460% due 03/15/22 | 51,066 | 50,910 | ||||||
2.790% due 01/16/24 | 100,000 | 99,134 | ||||||
3.000% due 12/15/22 | 106,064 | 105,944 | ||||||
SLC Student Loan Trust | 59,714 | 59,447 | ||||||
SLM Student Loan Trust | 100,676 | 98,590 | ||||||
SMB Private Education Loan Trust | 64,678 | 64,631 | ||||||
3.050% due 05/15/26 ~ | 220,004 | 221,193 | ||||||
| See Notes to Financial Statements | See explanation of symbols and terms, if any, on B-58 |
B-5
Table of Contents
PACIFIC FUNDS
PACIFIC FUNDS ULTRA SHORT INCOME
Schedule of Investments (Continued)
March 31, 2020
Principal Amount | Value | |||||||
Sofi Consumer Loan Program Trust ‘A’ | $182,138 | $175,188 | ||||||
Sofi Professional Loan Program LLC ‘A1FX’ | 143,573 | 140,118 | ||||||
2.130% due 11/16/48 ~ | 73,787 | 73,720 | ||||||
Toyota Auto Receivables Owner Trust | 72,587 | 72,347 | ||||||
Verizon Owner Trust | 108,560 | 108,229 | ||||||
2.060% due 04/20/22 ~ | 101,955 | 102,081 | ||||||
Voya CLO Ltd (Cayman) | 250,000 | 242,639 | ||||||
2.961% (USD LIBOR + 1.130%) | 250,000 | 240,800 | ||||||
|
| |||||||
Total Asset-Backed Securities |
| 5,286,176 | ||||||
|
| |||||||
U.S. TREASURY OBLIGATIONS - 7.0% | ||||||||
U.S. Treasury Notes - 7.0% | ||||||||
1.375% due 08/31/20 | 250,000 | 251,318 | ||||||
1.500% due 08/31/21 | 450,000 | 458,253 | ||||||
1.125% due 02/28/22 | 1,000,000 | 1,017,148 | ||||||
|
| |||||||
Total U.S. Treasury Obligations | 1,726,719 | |||||||
|
| |||||||
Principal Amount | Value | |||||||
SHORT-TERM INVESTMENT - 2.9% | ||||||||
U.S. Treasury Bill - 2.9% | ||||||||
1.554% due 06/25/20 | $700,000 | $699,871 | ||||||
|
| |||||||
Total Short-Term Investment | 699,871 | |||||||
|
| |||||||
TOTAL INVESTMENTS - 99.5% | 24,538,734 | |||||||
OTHER ASSETS & LIABILITIES, NET - 0.5% | 135,004 | |||||||
|
| |||||||
NET ASSETS - 100.0% | $24,673,738 | |||||||
|
| |||||||
Notes to Schedule of Investments
| (a) | As of March 31, 2020, the Fund’s composition as a percentage of net assets was as follows: |
Corporate Bonds & Notes | 65.1% | |||
Asset-Backed Securities | 21.4% | |||
U.S. Treasury Obligations | 7.0% | |||
Senior Loan Notes | 3.1% | |||
Others (each less than 3.0%) | 2.9% | |||
|
| |||
| 99.5% | ||||
Other Assets & Liabilities, Net | 0.5% | |||
|
| |||
| 100.0% | ||||
|
|
| (b) | Fair Value Measurements |
The following is a summary of the Fund’s investments as categorized under the three-tier hierarchy of inputs used in valuing the Fund’s assets and liabilities as of March 31, 2020:
| Total Value at March 31, 2020 | Level 1 Quoted Price | Level 2 Significant Observable Inputs | Level 3 Significant Unobservable Inputs | |||||||||||||||
Assets | Corporate Bonds & Notes | $16,064,108 | $— | $16,064,108 | $— | |||||||||||||
Senior Loan Notes | 761,860 | — | 761,860 | — | ||||||||||||||
Asset-Backed Securities | 5,286,176 | — | 5,286,176 | — | ||||||||||||||
U.S. Treasury Obligations | 1,726,719 | — | 1,726,719 | — | ||||||||||||||
Short-Term Investment | 699,871 | — | 699,871 | — | ||||||||||||||
|
|
|
|
|
|
|
| |||||||||||
Total | $24,538,734 | — | $24,538,734 | $— | ||||||||||||||
|
|
|
|
|
|
|
| |||||||||||
| See Notes to Financial Statements | See explanation of symbols and terms, if any, on B-58 |
B-6
Table of Contents
PACIFIC FUNDS
PACIFIC FUNDSSM SHORT DURATION INCOME
Schedule of Investments
March 31, 2020
Principal Amount | Value | |||||||
CORPORATE BONDS & NOTES - 54.4% | ||||||||
Basic Materials - 2.0% | ||||||||
Anglo American Capital PLC (South Africa) | ||||||||
3.750% due 04/10/22 ~ | $5,000,000 | $4,875,128 | ||||||
5.375% due 04/01/25 ~ | 3,000,000 | 3,035,270 | ||||||
Barminco Finance Pty Ltd (Australia) | 1,220,000 | 1,186,450 | ||||||
DuPont de Nemours Inc | 6,965,000 | 6,095,503 | ||||||
Glencore Funding LLC (Switzerland) | 3,000,000 | 2,745,522 | ||||||
4.125% due 03/12/24 ~ | 2,500,000 | 2,302,575 | ||||||
|
| |||||||
| 20,240,448 | ||||||||
|
| |||||||
Communications - 2.6% |
| |||||||
AT&T Inc | ||||||||
3.200% due 03/01/22 | 3,000,000 | 3,045,715 | ||||||
3.875% due 08/15/21 | 8,300,000 | 8,504,143 | ||||||
Charter Communications Operating LLC | 4,738,000 | 4,723,562 | ||||||
DISH DBS Corp | 2,000,000 | 1,991,610 | ||||||
Sprint Spectrum Co LLC | 7,256,250 | 7,247,180 | ||||||
The Walt Disney Co | 1,400,000 | 1,410,928 | ||||||
|
| |||||||
| 26,923,138 | ||||||||
|
| |||||||
Consumer, Cyclical - 6.5% |
| |||||||
Alimentation Couche-Tard Inc (Canada) | 3,000,000 | 2,968,864 | ||||||
American Airlines Pass-Through Trust ‘A’ | 901,451 | 906,522 | ||||||
British Airways Pass-Through Trust ‘A’ | ||||||||
3.350% due 12/15/30 ~ | 3,400,000 | 3,233,646 | ||||||
4.625% due 12/20/25 ~ | 2,402,744 | 2,387,641 | ||||||
Daimler Finance North America LLC (Germany) | 4,000,000 | 3,900,120 | ||||||
3.750% due 11/05/21 ~ | 2,100,000 | 2,083,358 | ||||||
Delta Air Lines Inc | 2,050,000 | 1,957,451 | ||||||
Delta Air Lines Pass-Through Trust ‘A’ | 1,330,506 | 1,331,230 | ||||||
Delta Air Lines Pass-Through Trust ‘AA’ | 4,500,000 | 4,398,421 | ||||||
Dr. Horton Inc | 4,500,000 | 4,212,233 | ||||||
Ford Motor Credit Co LLC | 2,000,000 | 1,900,154 | ||||||
5.584% due 03/18/24 | 1,300,000 | 1,212,250 | ||||||
General Motors Financial Co Inc | 2,745,000 | 2,182,139 | ||||||
3.550% due 07/08/22 | 3,000,000 | 2,775,137 | ||||||
Hyatt Hotels Corp | 6,234,000 | 5,756,194 | ||||||
Hyundai Capital America | 2,100,000 | 2,099,290 | ||||||
Las Vegas Sands Corp | 4,650,000 | 4,171,370 | ||||||
Lennar Corp | 5,000,000 | 4,921,475 | ||||||
Marriott International Inc | ||||||||
2.125% due 10/03/22 | 1,350,000 | 1,216,286 | ||||||
2.300% due 01/15/22 | 1,911,000 | 1,794,493 | ||||||
3.600% due 04/15/24 | 2,000,000 | 1,862,994 | ||||||
Principal Amount | Value | |||||||
McDonald’s Corp | ||||||||
1.450% due 09/01/25 | $ | 2,100,000 | $ | 2,002,831 | ||||
3.300% due 07/01/25 | 1,450,000 | 1,502,744 | ||||||
NIKE Inc | 2,500,000 | 2,593,344 | ||||||
Sands China Ltd (Macau) | 1,200,000 | 1,234,188 | ||||||
United Airlines Pass-Through Trust ‘B’ | ||||||||
3.650% due 07/07/27 | 621,528 | 508,160 | ||||||
4.625% due 03/03/24 | 580,877 | 544,084 | ||||||
4.750% due 10/11/23 | 442,323 | 426,383 | ||||||
US Airways Pass-Through Trust ‘A’ | 652,360 | 652,827 | ||||||
|
| |||||||
| 66,735,829 | ||||||||
|
| |||||||
Consumer,Non-Cyclical - 8.0% |
| |||||||
AbbVie Inc | ||||||||
2.300% due 11/21/22 ~ | 2,000,000 | 2,000,958 | ||||||
2.950% due 11/21/26 ~ | 2,500,000 | 2,553,128 | ||||||
Anheuser-Busch InBev Worldwide Inc (Belgium) | ||||||||
3.500% due 01/12/24 | 5,350,000 | 5,587,758 | ||||||
4.150% due 01/23/25 | 2,000,000 | 2,161,078 | ||||||
Anthem Inc | 2,950,000 | 2,916,779 | ||||||
BAT Capital Corp (United Kingdom) | ||||||||
2.294% (USD LIBOR + 0.590%) | 2,400,000 | 2,360,785 | ||||||
2.764% due 08/15/22 | 4,500,000 | 4,437,532 | ||||||
BAT International Finance PLC (United Kingdom) | 2,640,000 | 2,630,013 | ||||||
Baxter International Inc | 2,150,000 | 2,287,920 | ||||||
Cigna Corp | ||||||||
2.721% (USD LIBOR + 0.890%) | 2,300,000 | 2,139,903 | ||||||
3.200% due 09/17/20 | 4,000,000 | 4,006,090 | ||||||
DH Europe Finance II Sarl | 2,650,000 | 2,579,781 | ||||||
General Mills Inc | ||||||||
2.846% (USD LIBOR + 1.010%) | 3,100,000 | 2,998,581 | ||||||
3.700% due 10/17/23 | 1,965,000 | 2,003,573 | ||||||
Global Payments Inc | 6,000,000 | 5,959,453 | ||||||
Keurig Dr Pepper Inc | ||||||||
3.130% due 12/15/23 | 4,500,000 | 4,576,457 | ||||||
3.551% due 05/25/21 | 2,500,000 | 2,531,120 | ||||||
4.057% due 05/25/23 | 3,000,000 | 3,128,343 | ||||||
4.417% due 05/25/25 | 1,000,000 | 1,067,730 | ||||||
Laboratory Corp of America Holdings | 2,550,000 | 2,529,360 | ||||||
Mars Inc | 2,150,000 | 2,214,692 | ||||||
McKesson Corp | 2,350,000 | 2,367,256 | ||||||
Moody’s Corp | 3,000,000 | 3,019,877 | ||||||
PayPal Holdings Inc | 5,000,000 | 4,982,169 | ||||||
Suntory Holdings Ltd (Japan) | 4,200,000 | 4,239,742 | ||||||
Takeda Pharmaceutical Co Ltd (Japan) | 3,500,000 | 3,547,588 | ||||||
Teva Pharmaceutical Finance Netherlands III BV (Israel) | 1,166,000 | 1,120,106 | ||||||
|
| |||||||
| 81,947,772 | ||||||||
|
| |||||||
| See Notes to Financial Statements | See explanation of symbols and terms, if any, on B-58 |
B-7
Table of Contents
PACIFIC FUNDS
PACIFIC FUNDS SHORT DURATION INCOME
Schedule of Investments (Continued)
March 31, 2020
Principal Amount | Value | |||||||
Energy - 3.5% |
| |||||||
Diamondback Energy Inc | $ | 5,250,000 | $ | 3,678,991 | ||||
Energy Transfer Operating LP | ||||||||
3.600% due 02/01/23 | 5,325,000 | 4,740,126 | ||||||
4.250% due 03/15/23 | 1,500,000 | 1,346,138 | ||||||
4.500% due 04/15/24 | 1,800,000 | 1,608,531 | ||||||
Enterprise Products Operating LLC | 4,500,000 | 4,421,046 | ||||||
Harvest Operations Corp (South Korea) | 2,150,000 | 2,318,192 | ||||||
Kinder Morgan Inc | 2,355,000 | 2,464,424 | ||||||
MPLX LP | 6,900,000 | 6,613,389 | ||||||
Newfield Exploration Co | 3,500,000 | 1,883,105 | ||||||
Occidental Petroleum Corp | 2,500,000 | 1,676,099 | ||||||
ONEOK Inc | 4,000,000 | 3,098,257 | ||||||
Sabine Pass Liquefaction LLC | 2,000,000 | 1,968,250 | ||||||
|
| |||||||
| 35,816,548 | ||||||||
|
| |||||||
Financial - 21.7% |
| |||||||
AerCap Ireland Capital DAC (Ireland) | 2,407,000 | 2,374,621 | ||||||
American Express Co | 2,000,000 | 2,037,230 | ||||||
AvalonBay Communities Inc REIT | ||||||||
2.261% (USD LIBOR + 0.430%) | 3,469,000 | 3,414,485 | ||||||
2.850% due 03/15/23 | 1,970,000 | 1,954,192 | ||||||
3.500% due 11/15/24 | 2,000,000 | 2,053,685 | ||||||
Avolon Holdings Funding Ltd (Ireland) | 4,150,000 | 3,683,300 | ||||||
Bank of America Corp | ||||||||
2.328% due 10/01/21 | 2,450,000 | 2,446,897 | ||||||
2.511% (USD LIBOR + 0.770%) due 02/05/26 § | 500,000 | 454,521 | ||||||
2.766% (USD LIBOR + 0.960%) due 07/23/24 § | 5,000,000 | 4,584,349 | ||||||
BOC Aviation Ltd (Singapore) | 3,500,000 | 3,603,742 | ||||||
Boston Properties LP REIT | 2,000,000 | 2,107,047 | ||||||
Canadian Imperial Bank of Commerce (Canada) | 1,400,000 | 1,335,152 | ||||||
Citibank NA | 1,000,000 | 992,209 | ||||||
Citigroup Inc | 5,000,000 | 4,698,936 | ||||||
Citizens Bank NA | ||||||||
2.325% (USD LIBOR + 0.950%) | 2,000,000 | 1,913,705 | ||||||
3.250% due 02/14/22 | 2,500,000 | 2,534,748 | ||||||
Cooperatieve Rabobank UA (Netherlands) | ||||||||
1.791% (USD LIBOR + 0.480%) | 3,000,000 | 2,842,900 | ||||||
2.092% (USD LIBOR + 0.860%) due 09/26/23 § ~ | 1,500,000 | 1,393,309 | ||||||
Credit Suisse Group AG (Switzerland) | 3,000,000 | 2,627,064 | ||||||
Principal Amount | Value | |||||||
Crown Castle International Corp REIT | ||||||||
2.250% due 09/01/21 | $ | 3,000,000 | $ | 2,960,227 | ||||
4.875% due 04/15/22 | 2,000,000 | 2,101,290 | ||||||
Equinix Inc REIT | 2,300,000 | 2,162,103 | ||||||
Fifth Third Bancorp | 4,000,000 | 3,903,691 | ||||||
Healthcare Trust of America Holdings LP REIT | 4,000,000 | 3,874,078 | ||||||
Host Hotels & Resorts LP REIT | 3,800,000 | 3,341,265 | ||||||
Jackson National Life Global Funding | ||||||||
2.650% due 06/21/24 ~ | 5,000,000 | 5,175,522 | ||||||
3.300% due 02/01/22 ~ | 4,350,000 | 4,440,707 | ||||||
JPMorgan Chase & Co | ||||||||
2.536% (USD LIBOR + 0.730%) | 4,000,000 | 3,766,146 | ||||||
2.694% (USD LIBOR + 0.900%) due 04/25/23 § | 3,450,000 | 3,329,077 | ||||||
2.972% due 01/15/23 | 2,000,000 | 2,037,917 | ||||||
Metropolitan Life Global Funding I | ||||||||
2.400% due 06/17/22 ~ | 3,750,000 | 3,774,531 | ||||||
3.375% due 01/11/22 ~ | 1,800,000 | 1,828,860 | ||||||
Mid-America Apartments LP REIT | 2,000,000 | 1,992,216 | ||||||
Mitsubishi UFJ Financial Group Inc (Japan) | ||||||||
2.623% due 07/18/22 | 1,750,000 | 1,749,662 | ||||||
2.654% (USD LIBOR + 0.860%) due 07/26/23 § | 2,000,000 | 1,837,668 | ||||||
2.665% due 07/25/22 | 3,000,000 | 3,008,446 | ||||||
3.218% due 03/07/22 | 2,150,000 | 2,181,429 | ||||||
Morgan Stanley | ||||||||
0.924% (SOFR + 0.830%) | 2,500,000 | 2,386,958 | ||||||
2.625% due 11/17/21 | 2,000,000 | 2,004,307 | ||||||
2.732% (USD LIBOR + 0.930%) due 07/22/22 § | 5,000,000 | 4,867,129 | ||||||
3.201% (USD LIBOR + 1.400%) due 10/24/23 § | 1,500,000 | 1,456,783 | ||||||
5.750% due 01/25/21 | 2,000,000 | 2,053,913 | ||||||
New York Life Global Funding | ||||||||
2.288% (USD LIBOR + 0.440%) | 1,350,000 | 1,297,259 | ||||||
2.950% due 01/28/21 ~ | 3,000,000 | 3,059,888 | ||||||
3.250% due 08/06/21 ~ | 1,500,000 | 1,525,163 | ||||||
Piedmont Operating Partnership LP REIT | 3,800,000 | 3,816,268 | ||||||
PNC Bank NA | ||||||||
2.004% (USD LIBOR + 0.325%) | 6,400,000 | 6,034,537 | ||||||
2.232% due 07/22/22 | 656,000 | 658,155 | ||||||
2.252% (USD LIBOR + 0.450%) due 07/22/22 § | 2,500,000 | 2,424,587 | ||||||
Prudential Financial Inc | 1,750,000 | 1,649,433 | ||||||
Reliance Standard Life Global Funding II | 2,000,000 | 1,955,094 | ||||||
Royal Bank of Canada (Canada) | ||||||||
2.033% (USD LIBOR + 0.660%) | 2,000,000 | 1,982,724 | ||||||
2.250% due 11/01/24 | 5,000,000 | 5,060,021 | ||||||
Springleaf Finance Corp | 5,200,000 | 5,174,416 | ||||||
State Street Corp | 2,000,000 | 2,019,619 | ||||||
Sumitomo Mitsui Financial Group Inc (Japan) | ||||||||
2.348% due 01/15/25 | 2,500,000 | 2,487,832 | ||||||
2.448% due 09/27/24 | 600,000 | 599,424 | ||||||
2.576% (USD LIBOR + 0.740%) due 01/17/23 § | 5,000,000 | 4,488,788 | ||||||
2.784% due 07/12/22 | 3,250,000 | 3,269,128 | ||||||
| See Notes to Financial Statements | See explanation of symbols and terms, if any, on B-58 |
B-8
Table of Contents
PACIFIC FUNDS
PACIFIC FUNDS SHORT DURATION INCOME
Schedule of Investments (Continued)
March 31, 2020
Principal Amount | Value | |||||||
The Bank of New York Mellon Corp | ||||||||
1.950% due 08/23/22 | $ | 2,800,000 | $ | 2,818,759 | ||||
2.100% due 10/24/24 | 2,000,000 | 2,039,251 | ||||||
The Goldman Sachs Group Inc | ||||||||
2.350% due 11/15/21 | 2,000,000 | 1,998,768 | ||||||
2.364% (USD LIBOR + 1.050%) due 06/05/23 § | 3,750,000 | 3,591,107 | ||||||
2.557% (USD LIBOR + 0.780%) due 10/31/22 § | 2,000,000 | 1,927,437 | ||||||
2.862% (USD LIBOR + 1.170%) due 05/15/26 § | 3,200,000 | 2,944,005 | ||||||
3.500% due 04/01/25 | 3,000,000 | 3,047,592 | ||||||
The Huntington National Bank | 3,500,000 | 3,548,962 | ||||||
The PNC Financial Services Group Inc | ||||||||
2.200% due 11/01/24 | 5,000,000 | 5,189,507 | ||||||
3.500% due 01/23/24 | 1,650,000 | 1,714,667 | ||||||
Truist Bank | ||||||||
0.883% (SOFR + 0.730%) | 2,000,000 | 1,822,561 | ||||||
3.525% due 10/26/21 | 4,200,000 | 4,204,818 | ||||||
UBS AG (Switzerland) | 4,200,000 | 4,189,840 | ||||||
US Bancorp | 4,000,000 | 4,007,055 | ||||||
3.375% due 02/05/24 | 2,000,000 | 2,128,118 | ||||||
US Bank NA | 3,300,000 | 3,322,123 | ||||||
Ventas Realty LP REIT | 4,000,000 | 3,848,827 | ||||||
VICI Properties LP REIT | 1,050,000 | 975,844 | ||||||
Wells Fargo & Co | ||||||||
2.625% due 07/22/22 | 4,400,000 | 4,457,349 | ||||||
3.069% due 01/24/23 | 2,000,000 | 2,034,666 | ||||||
Zions Bancorp NA | 3,000,000 | 2,943,893 | ||||||
|
| |||||||
| 223,543,502 | ||||||||
|
| |||||||
Industrial - 3.4% |
| |||||||
Carrier Global Corp | ||||||||
1.923% due 02/15/23 ~ | 2,800,000 | 2,762,093 | ||||||
2.242% due 02/15/25 ~ | 3,000,000 | 2,939,783 | ||||||
John Deere Capital Corp | 6,000,000 | 5,889,274 | ||||||
Masco Corp | 2,811,000 | 2,815,592 | ||||||
Norbord Inc (Canada) | 1,005,000 | 978,614 | ||||||
Otis Worldwide Corp | ||||||||
1.823% (USD LIBOR + 0.450%) | 1,500,000 | 1,428,263 | ||||||
2.056% due 04/05/25 ~ | 2,500,000 | 2,452,470 | ||||||
Penske Truck Leasing Co LP | ||||||||
2.700% due 11/01/24 ~ | 3,250,000 | 3,038,887 | ||||||
3.450% due 07/01/24 ~ | 2,300,000 | 2,304,808 | ||||||
4.125% due 08/01/23 ~ | 2,000,000 | 2,069,224 | ||||||
Raytheon Technologies Corp | 348,000 | 366,578 | ||||||
Reynolds Group Issuer Inc | 2,500,000 | 2,454,375 | ||||||
Roper Technologies Inc | 5,000,000 | 5,149,308 | ||||||
|
| |||||||
| 34,649,269 | ||||||||
|
| |||||||
Technology - 3.5% |
| |||||||
Broadcom Inc | ||||||||
3.125% due 04/15/21 ~ | 4,000,000 | 3,952,164 | ||||||
3.125% due 10/15/22 ~ | 2,500,000 | 2,478,679 | ||||||
3.625% due 10/15/24 ~ | 5,000,000 | 4,917,144 | ||||||
Principal Amount | Value | |||||||
Dell International LLC | $ | 5,100,000 | $ | 5,155,189 | ||||
Fiserv Inc | 5,000,000 | 5,222,224 | ||||||
International Business Machines Corp | ||||||||
2.107% (USD LIBOR + 0.400%) | 6,000,000 | 5,950,835 | ||||||
2.850% due 05/13/22 | 6,000,000 | 6,168,118 | ||||||
Oracle Corp | 2,050,000 | 2,095,199 | ||||||
|
| |||||||
| 35,939,552 | ||||||||
|
| |||||||
Utilities - 3.2% |
| |||||||
Dominion Energy Gas Holdings LLC | 2,550,000 | 2,482,495 | ||||||
DTE Energy Co | ||||||||
2.250% due 11/01/22 | 1,600,000 | 1,585,719 | ||||||
2.600% due 06/15/22 | 2,400,000 | 2,392,334 | ||||||
Duke Energy Corp | ||||||||
1.418% (USD LIBOR + 0.650%) | 1,000,000 | 974,980 | ||||||
2.400% due 08/15/22 | 2,150,000 | 2,148,759 | ||||||
Duke Energy Progress LLC | 1,650,000 | 1,719,629 | ||||||
Edison International | 2,250,000 | 2,244,802 | ||||||
Evergy Inc | 4,350,000 | 4,275,903 | ||||||
FirstEnergy Corp | 3,800,000 | 3,710,428 | ||||||
Florida Power & Light Co | 450,000 | 473,555 | ||||||
NextEra Energy Operating Partners LP | 3,975,000 | 3,900,489 | ||||||
Sempra Energy | 5,000,000 | 4,736,946 | ||||||
Vistra Operations Co LLC | 3,000,000 | 2,829,150 | ||||||
|
| |||||||
| 33,475,189 | ||||||||
|
| |||||||
Total Corporate Bonds & Notes |
| 559,271,247 | ||||||
|
| |||||||
SENIOR LOAN NOTES - 8.3% | ||||||||
Communications - 0.7% |
| |||||||
CSC Holdings LLC TermB-5 | 2,000,000 | 1,936,666 | ||||||
NEP Group Inc Term B | 1,989,924 | 1,253,652 | ||||||
Sprint Communications Inc Term B | 917,579 | 914,138 | ||||||
4.000% (USD LIBOR + 3.000%) | 1,975,000 | 1,959,364 | ||||||
Zayo Group Holdings Inc Term B | 1,500,000 | 1,406,250 | ||||||
|
| |||||||
| 7,470,070 | ||||||||
|
| |||||||
Consumer, Cyclical - 1.9% |
| |||||||
American Builders & Contractors Supply Co Inc | ||||||||
Term B | 2,985,000 | 2,711,374 | ||||||
ClubCorp Holdings Inc Term B | 1,991,283 | 1,279,399 | ||||||
| See Notes to Financial Statements | See explanation of symbols and terms, if any, on B-58 |
B-9
Table of Contents
PACIFIC FUNDS
PACIFIC FUNDS SHORT DURATION INCOME
Schedule of Investments (Continued)
March 31, 2020
Principal Amount | Value | |||||||
Golden Nugget LLC Term B | $ | 3,297,771 | $ | 2,577,758 | ||||
Marriott Ownership Resorts Inc Term B | 2,567,814 | 2,272,516 | ||||||
Restaurant Brands International Inc Term B (Canada) | 4,970,789 | 4,610,407 | ||||||
SeaWorld Parks & Entertainment Inc TermB-5 | 4,428,072 | 3,719,581 | ||||||
SRS Distribution Inc Term B | 3,000,000 | 2,541,000 | ||||||
|
| |||||||
| 19,712,035 | ||||||||
|
| |||||||
Consumer,Non-Cyclical - 1.3% |
| |||||||
Bausch Health Americas Inc Term B | 5,427,919 | 5,201,754 | ||||||
Froneri US Inc Term B (United Kingdom) | 2,880,000 | 2,764,800 | ||||||
H-Food Holdings LLC | ||||||||
4.677% (USD LIBOR + 3.688%) | 657,473 | 562,139 | ||||||
TermB-2 4.989% (USD LIBOR + 4.000%) | 671,599 | 580,934 | ||||||
Sunshine Luxembourg VII Sarl Term B (Luxembourg) | 2,244,375 | 2,053,603 | ||||||
US Foods Inc Term B | 2,430,929 | 2,293,176 | ||||||
|
| |||||||
| 13,456,406 | ||||||||
|
| |||||||
Financial - 1.2% |
| |||||||
AssuredPartners Inc Term B | 5,236,875 | 4,673,911 | ||||||
NFP Corp Term B | 5,000,000 | 4,375,000 | ||||||
USI Inc Term B | 3,431,013 | 3,130,799 | ||||||
|
| |||||||
| 12,179,710 | ||||||||
|
| |||||||
Industrial - 2.4% |
| |||||||
Advanced Disposal Services Inc Term B | 6,893,454 | 6,858,987 | ||||||
Berry Global Inc Term W | 3,131,746 | 3,023,701 | ||||||
Cornerstone Building Brands Inc Term B | 1,994,924 | 1,745,558 | ||||||
Filtration Group Corp Term B | 2,981,556 | 2,634,950 | ||||||
GFL Environmental Inc Term B (Canada) | 2,645,291 | 2,580,812 | ||||||
Reynolds Group Holdings Inc Term B | 4,137,635 | 3,946,269 | ||||||
Principal Amount | Value | |||||||
The Hillman Group Inc Term B | $ | 1,989,873 | $ | 1,578,632 | ||||
TransDigm Inc Term F | 1,989,937 | 1,860,591 | ||||||
|
| |||||||
| 24,229,500 | ||||||||
|
| |||||||
Technology - 0.7% |
| |||||||
Tempo Acquisition LLC Term B | 2,992,308 | 2,688,089 | ||||||
Vertafore Inc Term B | 4,720,530 | 4,260,279 | ||||||
|
| |||||||
| 6,948,368 | ||||||||
|
| |||||||
Utilities - 0.1% |
| |||||||
Vistra Operations Co LLC TermB-3 | 747,946 | 717,093 | ||||||
|
| |||||||
Total Senior Loan Notes |
| 84,713,182 | ||||||
|
| |||||||
ASSET-BACKED SECURITIES - 19.2% |
| |||||||
Ally Auto Receivables Trust | 1,000,000 | 999,149 | ||||||
AmeriCredit Automobile Receivables Trust | ||||||||
0.912% (USD LIBOR + 0.300%) | 1,935,468 | 1,935,508 | ||||||
1.100% due 03/20/23 | 2,500,000 | 2,478,007 | ||||||
1.480% due 01/21/25 | 2,750,000 | 2,609,508 | ||||||
1.900% due 03/18/22 | 748,852 | 746,283 | ||||||
2.020% (USD LIBOR + 0.350%) due 03/20/23 § | 2,000,000 | 1,981,884 | ||||||
2.170% due 01/18/23 | 967,734 | 971,891 | ||||||
2.300% due 02/18/22 | 2,316,835 | 2,306,840 | ||||||
2.360% due 12/19/22 | 2,500,000 | 2,479,228 | ||||||
2.600% due 09/18/23 | 2,000,000 | 1,969,287 | ||||||
2.890% due 01/10/22 | 646,735 | 645,741 | ||||||
2.970% due 11/20/23 | 1,500,000 | 1,511,728 | ||||||
3.130% due 02/18/25 | 1,550,000 | 1,558,999 | ||||||
3.450% due 06/18/24 | 2,000,000 | 2,002,904 | ||||||
3.500% due 01/18/24 | 2,000,000 | 1,964,923 | ||||||
Apidos CLO XV ‘A1RR’ (Cayman) | 1,250,000 | 1,188,750 | ||||||
Apidos CLO XXV ‘A1R’ (Cayman) | 2,000,000 | 1,909,004 | ||||||
Apidos CLO XXX ‘A1A’ (Cayman) | 3,000,000 | 2,858,029 | ||||||
Atrium CLO XIII (Cayman) | 470,000 | 452,408 | ||||||
Benefit Street Partners CLO IV Ltd (Cayman) | 1,000,000 | 972,461 | ||||||
Benefit Street Partners CLO X Ltd (Cayman) | ||||||||
2.971% (USD LIBOR + 1.140%) | 3,050,000 | 2,951,620 | ||||||
3.581% (USD LIBOR + 1.750%) due 01/15/29 § ~ | 500,000 | 459,450 | ||||||
Buttermilk Park CLO Ltd ‘A1’ (Cayman) | 850,000 | 805,547 | ||||||
Capital Auto Receivables Asset Trust | 1,000,000 | 1,001,383 | ||||||
| See Notes to Financial Statements | See explanation of symbols and terms, if any, on B-58 |
B-10
Table of Contents
PACIFIC FUNDS
PACIFIC FUNDS SHORT DURATION INCOME
Schedule of Investments (Continued)
March 31, 2020
Principal Amount | Value | |||||||
Carlyle Global Market Strategies CLO Ltd (Cayman) | $ | 500,000 | $ | 461,467 | ||||
CIFC Funding2015-III CLO Ltd (Cayman) | 1,500,000 | 1,445,887 | ||||||
Dryden 33 Senior Loan Fund (Cayman) | 2,000,000 | 1,876,174 | ||||||
Dryden 43 Senior Loan CLO Fund (Cayman) | 3,750,000 | 3,646,246 | ||||||
Dryden 55 CLO Ltd (Cayman) | 2,500,000 | 2,387,936 | ||||||
Dryden 58 CLO Ltd (Cayman) | 2,000,000 | 1,900,028 | ||||||
Dryden 61 CLO Ltd (Cayman) | 5,000,000 | 4,764,939 | ||||||
Dryden 64 CLO Ltd (Cayman) | 2,000,000 | 1,901,575 | ||||||
Dryden 75 CLO Ltd (Cayman) | 2,400,000 | 2,211,478 | ||||||
Ford Credit Auto Owner Trust | ||||||||
0.945% (USD LIBOR + 0.240%) | 1,082,029 | 1,076,823 | ||||||
2.040% due 08/15/31 ~ | 2,000,000 | 1,869,631 | ||||||
2.130% due 05/15/25 | 5,000,000 | 4,998,899 | ||||||
2.350% due 04/15/23 | 1,000,000 | 1,001,671 | ||||||
2.500% due 05/15/24 | 1,750,000 | 1,753,977 | ||||||
3.380% due 03/15/24 | 1,650,000 | 1,637,492 | ||||||
GM Financial Consumer Automobile Receivables Trust ‘B’ | 1,200,000 | 1,218,242 | ||||||
Hyundai Auto Receivables Trust ‘C’ | 2,000,000 | 1,981,402 | ||||||
Magnetite VIII CLO Ltd (Cayman) | 2,000,000 | 1,913,055 | ||||||
MagnetiteXIV-R CLO Ltd ‘A1’ (Cayman) | 3,000,000 | 2,856,520 | ||||||
Magnetite XVIII CLO Ltd (Cayman) | 3,000,000 | 2,901,116 | ||||||
Magnetite XXI CLO Ltd ‘A’ (Cayman) | 1,000,000 | 966,442 | ||||||
Navient Private Education Loan Trust | 1,400,000 | 1,463,665 | ||||||
Navient Private Education Loan Trust ‘A1’ | 425,441 | 425,039 | ||||||
Navient Private Education Refi Loan Trust ‘A1’ | ||||||||
1.055% (USD LIBOR + 0.350%) | 1,788,972 | 1,760,496 | ||||||
2.103% (USD LIBOR + 0.750%) due 11/15/68 § ~ | 2,000,000 | 1,981,960 | ||||||
2.180% due 08/15/68 ~ | 2,915,733 | 2,914,954 | ||||||
2.820% due 02/15/68 ~ | 1,890,429 | 1,893,650 | ||||||
Navient Private Education Refi Loan Trust ‘A2’ | 2,500,000 | 2,530,584 | ||||||
Navient Private Education Refi Loan Trust ‘A2A’ | 1,000,000 | 1,021,726 | ||||||
Navient Student Loan Trust | 2,000,000 | 2,055,136 | ||||||
Principal Amount | Value | |||||||
Navient Student Loan Trust ‘A1’ | $ | 1,638,121 | $ | 1,627,556 | ||||
Navient Student Loan Trust ‘A2’ | 3,881,222 | 3,845,422 | ||||||
Navient Student Loan Trust ‘A2A’ | 2,000,000 | 2,108,772 | ||||||
OCP CLO Ltd (Cayman) | 1,643,924 | 1,609,099 | ||||||
Octagon Investment Partners 25 Ltd (Cayman) | 3,000,000 | 2,898,750 | ||||||
OneMain Financial Issuance CLO Trust | 979,408 | 963,570 | ||||||
Palmer Square CLO Ltd ‘A1’ (Cayman) | 1,205,468 | 1,174,454 | ||||||
Palmer Square CLO Ltd ‘A1A’ (Cayman) | 2,250,000 | 2,148,208 | ||||||
Palmer Square Loan Funding CLO Ltd (Cayman) | ||||||||
2.481% (USD LIBOR + 0.650%) | 1,581,212 | 1,543,815 | ||||||
2.592% (USD LIBOR + 0.900%) | 1,372,924 | 1,341,127 | ||||||
2.701% (USD LIBOR + 0.900%) | 1,903,193 | 1,852,991 | ||||||
2.869% (USD LIBOR + 1.050%) | 4,111,829 | 4,051,640 | ||||||
3.033% (USD LIBOR + 1.350%) | 2,950,000 | 2,762,111 | ||||||
3.583% (USD LIBOR + 1.900%) | 1,200,000 | 1,144,074 | ||||||
Regatta Funding CLO LP (Cayman) | 3,000,000 | 2,917,450 | ||||||
Regatta X Funding CLO Ltd ‘A’ (Cayman) | 3,000,000 | 2,840,571 | ||||||
Regatta XIV Funding Ltd ‘A’ (Cayman) | 1,100,000 | 969,675 | ||||||
Santander Drive Auto Receivables Trust | ||||||||
2.280% due 09/15/23 | 2,500,000 | 2,447,113 | ||||||
2.630% due 07/15/22 | 959,685 | 959,161 | ||||||
2.790% due 01/16/24 | 5,000,000 | 4,956,719 | ||||||
3.210% due 09/15/23 | 2,000,000 | 1,998,331 | ||||||
3.270% due 01/17/23 | 1,238,876 | 1,240,146 | ||||||
3.290% due 10/17/22 | 594,949 | 594,941 | ||||||
3.420% due 04/15/25 | 1,750,000 | 1,739,068 | ||||||
3.520% due 12/15/22 | 2,222,237 | 2,215,107 | ||||||
SLC Student Loan Trust | ||||||||
0.841% (USD LIBOR + 0.100%) | 1,404,938 | 1,402,251 | ||||||
0.851% (USD LIBOR + 0.110%) due 03/15/27 § | 4,904,753 | 4,830,967 | ||||||
0.861% (USD LIBOR + 0.120%) due 06/15/29 § | 910,329 | 893,298 | ||||||
SLM Student Loan Trust | 1,225,844 | 1,220,183 | ||||||
SMB Private Education Loan Trust | ||||||||
2.340% due 09/15/34 ~ | 3,363,026 | 3,371,601 | ||||||
2.700% due 05/15/31 ~ | 1,427,503 | 1,434,079 | ||||||
3.050% due 05/15/26 ~ | 1,518,031 | 1,526,232 | ||||||
3.440% due 07/15/36 ~ | 1,850,000 | 1,769,165 | ||||||
3.500% due 02/15/36 ~ | 1,000,000 | 1,051,796 | ||||||
3.600% due 01/15/37 ~ | 2,936,061 | 2,928,960 | ||||||
3.630% due 11/15/35 ~ | 2,954,000 | 3,155,612 | ||||||
| See Notes to Financial Statements | See explanation of symbols and terms, if any, on B-58 |
B-11
Table of Contents
PACIFIC FUNDS
PACIFIC FUNDS SHORT DURATION INCOME
Schedule of Investments (Continued)
March 31, 2020
Principal Amount | Value | |||||||
SMB Private Education Loan Trust ‘A1’ | ||||||||
1.055% (USD LIBOR + 0.350%) | $ | 272,616 | $ | 272,328 | ||||
1.055% (USD LIBOR + 0.350%) due 07/15/26 § ~ | 3,604,253 | 3,553,814 | ||||||
Sofi Consumer Loan Program Trust ‘A’ | 1,457,103 | 1,401,501 | ||||||
Sofi Consumer Loan Program Trust ‘A2’ | 1,762,324 | 1,643,396 | ||||||
Sofi Professional Loan Program LLC ‘A1FX’ | ||||||||
2.060% due 05/15/46 ~ | 2,967,170 | 2,895,768 | ||||||
2.130% due 11/16/48 ~ | 1,957,573 | 1,955,799 | ||||||
Verizon Owner Trust | 321,936 | 321,972 | ||||||
Verizon Owner Trust ‘A1A’ | ||||||||
1.850% due 07/22/24 | 3,500,000 | 3,418,665 | ||||||
1.940% due 04/22/24 | 2,000,000 | 1,914,669 | ||||||
Verizon Owner Trust ‘A1B’ | 3,000,000 | 2,958,821 | ||||||
Volvo Financial Equipment LLC | 2,000,000 | 1,918,097 | ||||||
|
| |||||||
Total Asset-Backed Securities |
| 197,367,587 | ||||||
|
| |||||||
U.S. TREASURY OBLIGATIONS - 15.3% |
| |||||||
U.S. Treasury Notes - 15.3% |
| |||||||
0.500% due 03/15/23 | 12,000,000 | 12,076,406 | ||||||
1.125% due 02/28/25 | 3,000,000 | 3,112,500 | ||||||
1.250% due 07/31/23 | 6,000,000 | 6,185,625 | ||||||
1.250% due 08/31/24 | 5,000,000 | 5,198,828 | ||||||
1.375% due 01/31/22 | 5,000,000 | 5,105,762 | ||||||
1.375% due 10/15/22 | 5,000,000 | 5,141,504 | ||||||
1.375% due 02/15/23 | 10,000,000 | 10,318,555 | ||||||
1.375% due 01/31/25 | 5,000,000 | 5,239,453 | ||||||
1.500% due 08/15/22 | 3,000,000 | 3,091,699 | ||||||
1.500% due 09/30/24 | 10,000,000 | 10,510,156 | ||||||
1.750% due 07/31/21 | 3,000,000 | 3,062,754 | ||||||
1.750% due 07/31/24 | 9,500,000 | 10,068,887 | ||||||
2.000% due 01/15/21 | 5,000,000 | 5,075,391 | ||||||
2.000% due 07/31/22 | 3,000,000 | 3,123,750 | ||||||
2.000% due 10/31/22 | 8,000,000 | 8,358,750 | ||||||
Principal Amount | Value | |||||||
2.000% due 08/15/25 | $ | 7,000,000 | $ | 7,577,227 | ||||
2.250% due 03/31/21 | 6,000,000 | 6,126,211 | ||||||
2.500% due 01/15/22 | 8,000,000 | 8,324,844 | ||||||
2.625% due 10/31/20 | 10,000,000 | 10,410,742 | ||||||
2.750% due 11/30/20 | 20,000,000 | 20,347,266 | ||||||
2.875% due 10/31/20 | 8,500,000 | 8,635,303 | ||||||
|
| |||||||
Total U.S. Treasury Obligations |
| 157,091,613 | ||||||
|
| |||||||
Shares | ||||||||
SHORT-TERM INVESTMENT - 2.0% |
| |||||||
Money Market Fund - 2.0% |
| |||||||
BlackRock Liquidity FundsT-Fund Portfolio ‘Institutional’ 0.210% | 20,647,391 | 20,647,391 | ||||||
|
| |||||||
Total Short-Term Investment |
| 20,647,391 | ||||||
|
| |||||||
TOTAL INVESTMENTS - 99.2% |
| 1,019,091,020 | ||||||
OTHER ASSETS & LIABILITIES, NET - 0.8% |
| 8,239,527 | ||||||
|
| |||||||
NET ASSETS - 100.0% |
| $1,027,330,547 | ||||||
|
| |||||||
Notes to Schedule of Investments
| (a) | As of March 31, 2020, the Fund’s composition as a percentage of net assets was as follows: |
Corporate Bonds & Notes | 54.4% | |||
Asset-Backed Securities | 19.2% | |||
U.S. Treasury Obligations | 15.3% | |||
Senior Loan Notes | 8.3% | |||
Others (each less than 3.0%) | 2.0% | |||
|
| |||
| 99.2% | ||||
Other Assets & Liabilities, Net | 0.8% | |||
|
| |||
| 100.0% | ||||
|
|
| (b) | Fair Value Measurements |
The following is a summary of the Fund’s investments as categorized under the three-tier hierarchy of inputs used in valuing the Fund’s assets and liabilities as of March 31, 2020:
| Total Value at March 31, 2020 | Level 1 Quoted Price | Level 2 Significant Observable Inputs | Level 3 Significant Unobservable Inputs | |||||||||||||||
Assets | Corporate Bonds & Notes | $559,271,247 | $— | $559,271,247 | $— | |||||||||||||
Senior Loan Notes | 84,713,182 | — | 78,592,624 | 6,120,558 | ||||||||||||||
Asset-Backed Securities | 197,367,587 | — | 197,367,587 | — | ||||||||||||||
U.S. Treasury Obligations | 157,091,613 | — | 157,091,613 | — | ||||||||||||||
Short-Term Investment | 20,647,391 | 20,647,391 | — | — | ||||||||||||||
|
|
|
|
|
|
|
| |||||||||||
Total | $1,019,091,020 | $20,647,391 | $992,323,071 | $6,120,558 | ||||||||||||||
|
|
|
|
|
|
|
| |||||||||||
| See Notes to Financial Statements | See explanation of symbols and terms, if any, on B-58 |
B-12
Table of Contents
PACIFIC FUNDS
PACIFIC FUNDSSM CORE INCOME
Schedule of Investments
March 31, 2020
Principal Amount | Value | |||||||
CORPORATE BONDS & NOTES - 52.4% |
| |||||||
Basic Materials - 0.6% |
| |||||||
Anglo American Capital PLC (South Africa) | $4,600,000 | $4,678,466 | ||||||
Barminco Finance Pty Ltd (Australia) | 800,000 | 778,000 | ||||||
|
| |||||||
| 5,456,466 | ||||||||
|
| |||||||
Communications - 3.1% |
| |||||||
AT&T Inc | 4,000,000 | 4,672,856 | ||||||
CCO Holdings LLC | 3,000,000 | 3,009,150 | ||||||
Charter Communications Operating LLC | ||||||||
4.800% due 03/01/50 | 1,850,000 | 1,936,830 | ||||||
5.750% due 04/01/48 | 2,000,000 | 2,280,427 | ||||||
Diamond Sports Group LLC | 2,400,000 | 1,963,541 | ||||||
Discovery Communications | 2,500,000 | 2,541,716 | ||||||
Fox Corp | 1,800,000 | 2,163,781 | ||||||
Sprint Communications Inc | 6,000,000 | 6,275,640 | ||||||
Sprint Spectrum Co LLC | 2,245,875 | 2,243,068 | ||||||
The Walt Disney Co | 700,000 | 776,463 | ||||||
Verizon Communications Inc | 2,000,000 | 2,244,261 | ||||||
|
| |||||||
| 30,107,733 | ||||||||
|
| |||||||
Consumer, Cyclical - 7.5% |
| |||||||
Air Canada Pass-Through Trust ‘A’ (Canada) | 4,022,454 | 4,119,261 | ||||||
American Airlines Pass-Through Trust ‘AA’ | 2,512,695 | 2,391,085 | ||||||
American Airlines Pass-Through Trust ‘B’ | 529,794 | 496,572 | ||||||
Beazer Homes USA Inc | 2,150,000 | 1,650,286 | ||||||
British Airways Pass-Through Trust ‘A’ | ||||||||
3.350% due 12/15/30 ~ | 2,879,000 | 2,738,137 | ||||||
4.625% due 12/20/25 ~ | 2,041,456 | 2,028,623 | ||||||
British Airways Pass-Through Trust ‘AA’ (United Kingdom) | 4,347,974 | 4,143,726 | ||||||
Continental Airlines Pass-Through Trust ‘A’ | 2,447,932 | 2,371,387 | ||||||
Delta Air Lines Pass-Through Trust ‘AA’ | 1,389,204 | 1,266,541 | ||||||
Downstream Development Authority of the Quapaw Tribe of Oklahoma | 2,750,000 | 2,224,049 | ||||||
Ford Motor Credit Co LLC | ||||||||
3.087% due 01/09/23 | 1,850,000 | 1,674,250 | ||||||
5.584% due 03/18/24 | 2,350,000 | 2,191,375 | ||||||
General Motors Co | 3,000,000 | 2,635,747 | ||||||
Hasbro Inc | ||||||||
3.000% due 11/19/24 | 5,500,000 | 5,640,599 | ||||||
3.550% due 11/19/26 | 4,285,000 | 4,098,277 | ||||||
Hawaiian Airlines Pass-Through Certificates ‘A’ | 1,692,777 | 1,611,362 | ||||||
Hyatt Hotels Corp | 2,000,000 | 1,831,099 | ||||||
JetBlue Pass-Through Trust ‘AA’ | 1,800,000 | 1,599,240 | ||||||
Principal Amount | Value | |||||||
Lennar Corp | $ | 2,500,000 | $ | 2,515,500 | ||||
McDonald’s Corp | 2,200,000 | 2,308,904 | ||||||
NIKE Inc | 1,500,000 | 1,587,555 | ||||||
Nordstrom Inc | ||||||||
4.375% due 04/01/30 | 3,950,000 | 3,179,655 | ||||||
5.000% due 01/15/44 | 2,500,000 | 1,757,916 | ||||||
Six Flags Entertainment Corp | 2,000,000 | 1,707,510 | ||||||
Spirit Airlines Pass- Through Trust ‘AA’ | 535,609 | 522,691 | ||||||
The Home Depot Inc | 5,350,000 | 5,459,391 | ||||||
United Airlines Pass Through Trust ‘A’ | 1,400,000 | 1,324,334 | ||||||
United Airlines Pass Through Trust ‘AA’ | 1,111,039 | 1,168,826 | ||||||
United Airlines Pass-Through Trust ‘B’ | ||||||||
3.650% due 04/07/27 | 1,491,667 | 1,392,067 | ||||||
4.750% due 10/11/23 | 3,273,187 | 3,155,236 | ||||||
US Airways Pass-Through Trust ‘A’ | 2,212,871 | 2,195,199 | ||||||
|
| |||||||
| 72,986,400 | ||||||||
|
| |||||||
Consumer,Non-Cyclical - 7.5% |
| |||||||
AbbVie Inc | ||||||||
3.200% due 11/21/29 ~ | 5,000,000 | 5,131,876 | ||||||
4.250% due 11/21/49 ~ | 2,500,000 | 2,731,613 | ||||||
Amgen Inc | 2,750,000 | 2,740,586 | ||||||
Anheuser-Busch InBev Worldwide Inc (Belgium) | ||||||||
4.000% due 01/17/43 | 2,000,000 | 1,978,279 | ||||||
4.700% due 02/01/36 | 2,000,000 | 2,096,116 | ||||||
5.450% due 01/23/39 | 5,000,000 | 5,838,459 | ||||||
Baxter International Inc | 2,200,000 | 2,383,670 | ||||||
Cigna Corp | 4,350,000 | 4,690,473 | ||||||
Coca-Cola Femsa SAB de CV (Mexico) | 2,000,000 | 1,969,857 | ||||||
Constellation Brands Inc | 4,000,000 | 3,764,617 | ||||||
CVS Health Corp | 2,200,000 | 2,280,958 | ||||||
General Mills Inc | 850,000 | 851,693 | ||||||
Global Payments Inc | ||||||||
3.200% due 08/15/29 | 4,500,000 | 4,422,701 | ||||||
4.150% due 08/15/49 | 2,450,000 | 2,373,488 | ||||||
Humana Inc | 2,700,000 | 2,561,369 | ||||||
Keurig Dr Pepper Inc | 5,000,000 | 5,338,649 | ||||||
Kimberly-Clark Corp | 1,200,000 | 1,290,226 | ||||||
Kraft Heinz Foods Co | 4,000,000 | 3,896,761 | ||||||
PayPal Holdings Inc | 3,500,000 | 3,437,863 | ||||||
Pfizer Inc | 1,950,000 | 2,048,859 | ||||||
Takeda Pharmaceutical Co Ltd (Japan) | 3,900,000 | 4,112,147 | ||||||
Teva Pharmaceutical Finance Netherlands III BV (Israel) | 260,000 | 249,766 | ||||||
The Procter & Gamble Co | 2,100,000 | 2,334,128 | ||||||
| See Notes to Financial Statements | See explanation of symbols and terms, if any, on B-58 |
B-13
Table of Contents
PACIFIC FUNDS
PACIFIC FUNDS CORE INCOME
Schedule of Investments (Continued)
March 31, 2020
Principal Amount | Value | |||||||
Thermo Fisher Scientific Inc | $ | 1,000,000 | $ | 1,129,464 | ||||
Verisk Analytics Inc | 3,150,000 | 3,332,506 | ||||||
|
| |||||||
| 72,986,124 | ||||||||
|
| |||||||
Energy - 2.8% |
| |||||||
Cheniere Corpus Christi Holdings LLC | 2,075,000 | 1,560,655 | ||||||
Diamondback Energy Inc | ||||||||
3.250% due 12/01/26 | 2,950,000 | 2,090,691 | ||||||
5.375% due 05/31/25 | 3,000,000 | 2,219,241 | ||||||
Energy Transfer Operating LP | 6,000,000 | 5,313,413 | ||||||
EQM Midstream Partners LP | 2,250,000 | 1,245,262 | ||||||
Kinder Morgan Energy Partners LP | ||||||||
4.300% due 05/01/24 | 1,550,000 | �� | 1,552,012 | |||||
5.000% due 08/15/42 | 2,500,000 | 2,320,120 | ||||||
MPLX LP | ||||||||
5.200% due 12/01/47 ~ | 1,200,000 | 1,009,171 | ||||||
5.250% due 01/15/25 ~ | 6,000,000 | 5,290,955 | ||||||
6.875% due 08/15/68 § | 1,000,000 | 610,490 | ||||||
ONEOK Inc | 4,000,000 | 3,098,257 | ||||||
Petroleos Mexicanos (Mexico) | 2,100,000 | 1,334,140 | ||||||
|
| |||||||
| 27,644,407 | ||||||||
|
| |||||||
Financial - 17.4% |
| |||||||
Bank of America Corp | ||||||||
3.194% due 07/23/30 § | 3,000,000 | 3,069,659 | ||||||
4.183% due 11/25/27 | 2,850,000 | 2,952,583 | ||||||
4.200% due 08/26/24 | 3,500,000 | 3,726,948 | ||||||
4.250% due 10/22/26 | 5,500,000 | 5,882,280 | ||||||
Boston Properties LP REIT | ||||||||
2.750% due 10/01/26 | 1,927,000 | 1,848,866 | ||||||
3.400% due 06/21/29 | 1,600,000 | 1,665,018 | ||||||
Citigroup Inc | ||||||||
2.666% due 01/29/31 § | 6,500,000 | 6,331,263 | ||||||
4.125% due 07/25/28 | 3,600,000 | 3,702,244 | ||||||
4.400% due 06/10/25 | 3,000,000 | 3,251,822 | ||||||
4.600% due 03/09/26 | 3,948,000 | 4,253,320 | ||||||
Columbia Property Trust Operating | 3,500,000 | 3,629,738 | ||||||
Crown Castle International Corp REIT | 1,500,000 | 1,487,685 | ||||||
Duke Realty LP REIT | 3,420,000 | 3,533,628 | ||||||
Equinix Inc REIT | 3,650,000 | 3,363,249 | ||||||
GLP Capital LP REIT | 3,450,000 | 3,217,021 | ||||||
Healthpeak Properties Inc REIT | 2,800,000 | 2,745,387 | ||||||
Healthcare Trust of America Holdings LP REIT | 600,000 | 594,710 | ||||||
Host Hotels & Resorts LP REIT | 4,200,000 | 3,550,241 | ||||||
Jackson National Life Global Funding | 4,000,000 | 4,140,418 | ||||||
JPMorgan Chase & Co | ||||||||
2.950% due 10/01/26 | 2,000,000 | 2,071,523 | ||||||
4.125% due 12/15/26 | 4,000,000 | 4,383,064 | ||||||
KeyCorp | 3,500,000 | 3,162,508 | ||||||
Life Storage LP REIT | 2,650,000 | 2,699,555 | ||||||
MassMutual Global Funding II | 3,500,000 | 3,725,586 | ||||||
Principal Amount | Value | |||||||
Mastercard Inc | $ | 750,000 | $ | 835,159 | ||||
Mid-America Apartments LP REIT | ||||||||
2.750% due 03/15/30 | 4,600,000 | 4,270,547 | ||||||
3.600% due 06/01/27 | 1,276,000 | 1,286,866 | ||||||
Morgan Stanley | ||||||||
2.699% due 01/22/31 § | 5,900,000 | 5,795,767 | ||||||
5.000% due 11/24/25 | 6,500,000 | 7,197,522 | ||||||
Nuveen LLC | 2,050,000 | 2,148,741 | ||||||
Piedmont Operating Partnership LP REIT | 3,100,000 | 3,148,392 | ||||||
PNC Bank NA | 2,500,000 | 2,430,785 | ||||||
Prologis LP REIT | 1,750,000 | 1,670,227 | ||||||
Springleaf Finance Corp | ||||||||
5.375% due 11/15/29 | 1,575,000 | 1,450,685 | ||||||
6.125% due 03/15/24 | 5,200,000 | 5,174,416 | ||||||
State Street Corp | 1,450,000 | 1,490,823 | ||||||
Sumitomo Mitsui Financial Group Inc (Japan) | 2,500,000 | 2,487,832 | ||||||
Teachers Insurance & Annuity Association of America | 3,000,000 | 2,895,170 | ||||||
The Goldman Sachs Group Inc | ||||||||
2.600% due 02/07/30 | 6,000,000 | 5,659,132 | ||||||
3.213% (USD LIBOR + 1.600%) due 11/29/23 § | 2,755,000 | 2,693,390 | ||||||
3.272% due 09/29/25 | 2,000,000 | 2,042,945 | ||||||
3.500% due 11/16/26 | 2,000,000 | 2,048,438 | ||||||
The Howard Hughes Corp | 2,500,000 | 2,437,425 | ||||||
The Northwestern Mutual Life Insurance Co | 3,000,000 | 2,648,854 | ||||||
Truist Bank | 1,750,000 | 1,606,683 | ||||||
UDR Inc REIT | ||||||||
2.950% due 09/01/26 | 2,000,000 | 1,947,601 | ||||||
3.000% due 08/15/31 | 3,000,000 | 2,877,199 | ||||||
3.200% due 01/15/30 | 2,100,000 | 2,073,165 | ||||||
US Bancorp | 4,000,000 | 4,007,055 | ||||||
Ventas Realty LP REIT | ||||||||
3.000% due 01/15/30 | 2,050,000 | 1,836,362 | ||||||
3.500% due 02/01/25 | 4,450,000 | 4,379,817 | ||||||
VICI Properties LP REIT | 1,300,000 | 1,208,187 | ||||||
Visa Inc | 2,000,000 | 1,997,100 | ||||||
Wells Fargo & Co | 3,750,000 | 4,240,518 | ||||||
Willis North America Inc | 4,000,000 | 3,825,507 | ||||||
|
| |||||||
| 168,800,626 | ||||||||
|
| |||||||
Industrial - 4.5% |
| |||||||
Allegion US Holding Co Inc | 4,336,000 | 4,308,824 | ||||||
Carrier Global Corp | 5,900,000 | 5,329,889 | ||||||
Jabil Inc | 2,650,000 | 2,371,222 | ||||||
Masco Corp | 2,000,000 | 2,463,763 | ||||||
Norbord Inc (Canada) | ||||||||
5.750% due 07/15/27 ~ | 3,000,000 | 2,764,372 | ||||||
6.250% due 04/15/23 ~ | 2,000,000 | 1,947,490 | ||||||
Otis Worldwide Corp | 1,650,000 | 1,627,051 | ||||||
| See Notes to Financial Statements | See explanation of symbols and terms, if any, on B-58 |
B-14
Table of Contents
PACIFIC FUNDS
PACIFIC FUNDS CORE INCOME
Schedule of Investments (Continued)
March 31, 2020
Principal Amount | Value | |||||||
Owens-Brockway Glass Container Inc | $ | 2,500,000 | $ | 2,538,725 | ||||
Penske Truck Leasing Co LP | ||||||||
2.700% due 11/01/24 ~ | 1,850,000 | 1,729,828 | ||||||
3.450% due 07/01/24 ~ | 1,350,000 | 1,352,822 | ||||||
4.450% due 01/29/26 ~ | 1,200,000 | 1,334,243 | ||||||
Standard Industries Inc | 2,550,000 | 2,338,267 | ||||||
Textron Inc | 4,050,000 | 3,798,628 | ||||||
Union Pacific Corp | 1,200,000 | 1,178,411 | ||||||
United Parcel Service Inc | 1,100,000 | 1,454,796 | ||||||
Waste Connections Inc | ||||||||
3.050% due 04/01/50 | 1,600,000 | 1,447,112 | ||||||
3.500% due 05/01/29 | 2,600,000 | 2,639,316 | ||||||
WRKCo Inc | 2,450,000 | 2,555,435 | ||||||
|
| |||||||
| 43,180,194 | ||||||||
|
| |||||||
Technology - 3.5% |
| |||||||
Broadcom Inc | 5,000,000 | 5,091,339 | ||||||
Citrix Systems Inc | 2,800,000 | 2,620,996 | ||||||
Dell International LLC | 4,000,000 | 3,993,244 | ||||||
Fiserv Inc | ||||||||
3.500% due 07/01/29 | 4,150,000 | 4,416,951 | ||||||
4.400% due 07/01/49 | 3,000,000 | 3,236,574 | ||||||
Micron Technology Inc | 2,100,000 | 2,131,428 | ||||||
NVIDIA Corp | 3,650,000 | 3,996,081 | ||||||
NXP BV (Netherlands) | 3,000,000 | 2,924,214 | ||||||
Oracle Corp | 6,000,000 | 6,003,124 | ||||||
|
| |||||||
| 34,413,951 | ||||||||
|
| |||||||
Utilities - 5.5% |
| |||||||
Avangrid Inc | ||||||||
3.150% due 12/01/24 | 2,160,000 | 2,152,785 | ||||||
3.800% due 06/01/29 | 1,900,000 | 1,949,194 | ||||||
Calpine Corp | 1,250,000 | 1,216,250 | ||||||
Consolidated Edison Co of New York Inc | 2,750,000 | 2,842,366 | ||||||
Dominion Energy Inc | 4,931,000 | 4,938,224 | ||||||
DPL Inc | 1,350,000 | 1,289,085 | ||||||
Electricite de France SA (France) | 2,000,000 | 2,208,725 | ||||||
Exelon Corp | 3,350,000 | 3,513,436 | ||||||
FirstEnergy Corp | ||||||||
2.650% due 03/01/30 | 4,200,000 | 3,984,276 | ||||||
4.850% due 07/15/47 | 2,400,000 | 2,694,350 | ||||||
IPALCO Enterprises Inc | 3,500,000 | 3,638,574 | ||||||
Jersey Central Power & Light Co | 1,700,000 | 1,820,989 | ||||||
Nevada Power Co | 3,000,000 | 3,194,611 | ||||||
NextEra Energy Operating Partners LP | 6,325,000 | 6,206,438 | ||||||
Oklahoma Gas & Electric Co | 2,450,000 | 2,503,121 | ||||||
Principal Amount | Value | |||||||
Southern California Edison Co | $ | 2,750,000 | $ | 2,876,635 | ||||
Talen Energy Supply LLC | ||||||||
6.500% due 06/01/25 | 1,000,000 | 656,045 | ||||||
6.625% due 01/15/28 ~ | 2,500,000 | 2,116,144 | ||||||
Vistra Operations Co LLC | 3,500,000 | 3,300,675 | ||||||
|
| |||||||
| 53,101,923 | ||||||||
|
| |||||||
Total Corporate Bonds & Notes |
| 508,677,824 | ||||||
|
| |||||||
SENIOR LOAN NOTES - 11.3% |
| |||||||
Communications - 1.2% |
| |||||||
CSC Holdings LLC TermB-5 | 4,250,000 | 4,115,415 | ||||||
NEP Group Inc Term B | 2,984,887 | 1,880,479 | ||||||
Sprint Communications Inc Term B | ||||||||
3.500% (USD LIBOR + 2.500%) due 02/03/24 § | 1,862,586 | 1,855,602 | ||||||
4.000% (USD LIBOR + 3.000%) due 02/03/24 § | 2,468,750 | 2,449,205 | ||||||
Zayo Group Holdings Inc Term B | 1,500,000 | 1,406,250 | ||||||
|
| |||||||
| 11,706,951 | ||||||||
|
| |||||||
Consumer, Cyclical - 2.8% |
| |||||||
American Builders & Contractors Supply Co Inc Term B | 4,975,000 | 4,518,957 | ||||||
Bass Pro Group LLC Term B | 1,464,875 | 1,245,144 | ||||||
ClubCorp Holdings Inc Term B | 2,986,925 | 1,919,099 | ||||||
Golden Nugget LLC Term B | 4,151,888 | 3,245,394 | ||||||
Marriott Ownership Resorts Inc Term B | 5,373,508 | 4,755,554 | ||||||
Restaurant Brands International Inc Term B (Canada) | 5,703,862 | 5,290,332 | ||||||
SeaWorld Parks & Entertainment Inc TermB-5 | 4,889,494 | 4,107,175 | ||||||
SRS Distribution Inc Term B | 3,000,000 | 2,541,000 | ||||||
|
| |||||||
| 27,622,655 | ||||||||
|
| |||||||
Consumer,Non-Cyclical - 1.6% |
| |||||||
Bausch Health Americas Inc Term B | 4,529,748 | 4,341,007 | ||||||
Froneri US Inc Term B (United Kingdom) | 3,700,000 | 3,552,000 | ||||||
H-Food Holdings LLC | ||||||||
4.677% (USD LIBOR + 3.688%) due 05/31/25 § | 992,411 | 848,512 | ||||||
TermB-2 4.989% (USD LIBOR + 4.000%) due 05/31/25 § | 994,962 | 860,642 | ||||||
| See Notes to Financial Statements | See explanation of symbols and terms, if any, on B-58 |
B-15
Table of Contents
PACIFIC FUNDS
PACIFIC FUNDS CORE INCOME
Schedule of Investments (Continued)
March 31, 2020
Principal Amount | Value | |||||||
Sunshine Luxembourg VII Sarl Term B (Luxembourg) | $ | 2,244,375 | $ | 2,053,603 | ||||
US Foods Inc Term B | 3,862,340 | 3,643,473 | ||||||
|
| |||||||
| 15,299,237 | ||||||||
|
| |||||||
Financial - 1.6% |
| |||||||
AssuredPartners Inc Term B | 4,239,375 | 3,783,642 | ||||||
Avolon (US) LLC TermB-3 (Ireland) | 689,210 | 621,438 | ||||||
HUB International Ltd Term B | 3,463,623 | 3,273,124 | ||||||
NFP Corp Term B | 5,000,000 | 4,375,000 | ||||||
USI Inc Term B | 3,892,463 | 3,551,873 | ||||||
|
| |||||||
| 15,605,077 | ||||||||
|
| |||||||
Industrial - 3.2% |
| |||||||
Advanced Disposal Services Inc Term B | 6,890,766 | 6,856,312 | ||||||
Cornerstone Building Brands Inc Term B | 2,992,386 | 2,618,338 | ||||||
Filtration Group Corp Term B | 3,973,665 | 3,511,726 | ||||||
GFL Environmental Inc Term B (Canada) | 2,930,622 | 2,859,188 | ||||||
Reynolds Group Holdings Inc Term B | 5,898,556 | 5,625,747 | ||||||
The Hillman Group Inc Term B | 2,984,810 | 2,367,948 | ||||||
TransDigm Inc |
| |||||||
Term E 3.239% (USD LIBOR + 2.250%) due 05/30/25 § | 1,903,874 | 1,780,122 | ||||||
Term F 3.239% (USD LIBOR + 2.250%) due 12/09/25 § | 5,782,996 | 5,407,101 | ||||||
|
| |||||||
| 31,026,482 | ||||||||
|
| |||||||
Technology - 0.9% |
| |||||||
Tempo Acquisition LLC Term B | 2,992,308 | 2,688,089 | ||||||
Vertafore Inc Term B | 6,189,293 | 5,585,837 | ||||||
|
| |||||||
| 8,273,926 | ||||||||
|
| |||||||
Utilities - 0.0% |
| |||||||
Vistra Operations Co LLC TermB-3 | 498,630 | 478,062 | ||||||
|
| |||||||
Total Senior Loan Notes |
| 110,012,390 | ||||||
|
| |||||||
Principal Amount | Value | |||||||
MORTGAGE-BACKED SECURITIES - 0.5% |
| |||||||
Fannie Mae - 0.5% |
| |||||||
2.000% due 04/01/35 | $ | 4,500,000 | $ | 4,621,816 | ||||
|
| |||||||
Total Mortgage-Backed Securities |
| 4,621,816 | ||||||
|
| |||||||
ASSET-BACKED SECURITIES - 12.7% |
| |||||||
AmeriCredit Automobile Receivables Trust | ||||||||
2.240% due 06/19/23 | 1,450,000 | 1,440,142 | ||||||
2.400% due 05/18/22 | 1,850,000 | 1,843,551 | ||||||
2.690% due 06/19/23 | 1,050,000 | 1,042,616 | ||||||
2.710% due 08/18/22 | 1,500,000 | 1,491,795 | ||||||
3.130% due 02/18/25 | 1,250,000 | 1,257,258 | ||||||
3.360% due 02/18/25 | 1,000,000 | 1,010,994 | ||||||
Apidos CLO XXX ‘A2’ (Cayman) | 3,600,000 | 3,238,280 | ||||||
Benefit Street Partners CLO X Ltd (Cayman) | ||||||||
2.971% (USD LIBOR + 1.140%) due 01/15/29 § ~ | 400,000 | 387,098 | ||||||
3.581% (USD LIBOR + 1.750%) due 01/15/29 § ~ | 250,000 | 229,725 | ||||||
Buttermilk Park CLO Ltd ‘A1’ (Cayman) | 1,600,000 | 1,516,324 | ||||||
Capital Auto Receivables Asset Trust | 1,600,000 | 1,589,496 | ||||||
Carlyle Global Market Strategies CLO Ltd (Cayman) | ||||||||
2.844% (USD LIBOR + 1.050%) | 1,000,000 | 922,934 | ||||||
3.344% (USD LIBOR + 1.550%) due 07/27/31 § ~ | 2,000,000 | 1,778,840 | ||||||
CIFC Funding2015-III CLO Ltd (Cayman) | 1,500,000 | 1,445,887 | ||||||
Dryden 33 Senior Loan Fund (Cayman) | 2,000,000 | 1,876,174 | ||||||
Dryden 43 Senior Loan Fund (Cayman) | 3,200,000 | 2,887,784 | ||||||
Dryden 53 CLO Ltd (Cayman) | 1,500,000 | 1,312,965 | ||||||
Dryden 55 CLO Ltd (Cayman) | 1,000,000 | 820,570 | ||||||
Dryden 58 CLO Ltd (Cayman) | ||||||||
3.336% (USD LIBOR + 1.500%) due 07/17/31 § ~ | 2,000,000 | 1,775,219 | ||||||
3.636% (USD LIBOR + 1.800%) due 07/17/31 § ~ | 2,000,000 | 1,656,070 | ||||||
Dryden 61 CLO Ltd (Cayman) | ||||||||
3.486% (USD LIBOR + 1.650%) due 01/17/32 § ~ | 2,250,000 | 2,010,711 | ||||||
3.886% (USD LIBOR + 2.050%) due 01/17/32 § ~ | 2,250,000 | 1,787,552 | ||||||
Dryden 64 CLO Ltd (Cayman) | 1,600,000 | 1,394,534 | ||||||
Dryden 75 CLO Ltd (Cayman) | 900,000 | 829,304 | ||||||
Ford Credit Auto Owner Trust | ||||||||
1.730% due 03/15/22 | 850,000 | 849,202 | ||||||
2.040% due 08/15/31 ~ | 2,000,000 | 1,869,631 | ||||||
| See Notes to Financial Statements | See explanation of symbols and terms, if any, on B-58 |
B-16
Table of Contents
PACIFIC FUNDS
PACIFIC FUNDS CORE INCOME
Schedule of Investments (Continued)
March 31, 2020
Principal Amount | Value | |||||||
2.240% due 06/15/22 | $ | 1,000,000 | $ | 997,403 | ||||
2.350% due 04/15/23 | 2,500,000 | 2,504,178 | ||||||
3.190% due 07/15/31 ~ | 4,000,000 | 4,423,715 | ||||||
Madison Park Funding Ltd (Cayman) | ||||||||
3.431% (USD LIBOR + 1.600%) | 2,600,000 | 2,284,672 | ||||||
3.569% (USD LIBOR + 1.750%) due 10/18/30 § ~ | 2,600,000 | 2,341,806 | ||||||
3.681% (USD LIBOR + 1.850%) due 07/15/30 § ~ | 1,400,000 | 1,142,597 | ||||||
Magnetite VIII CLO Ltd (Cayman) | 3,000,000 | 2,869,582 | ||||||
Navient Private Education Refi Loan Trust | 2,000,000 | 2,055,136 | ||||||
Navient Private Education Refi Loan Trust ‘A2A’ | 1,000,000 | 1,021,726 | ||||||
Navient Student Loan Trust | ||||||||
1.667% (USD LIBOR + 0.720%) | 2,000,000 | 1,905,431 | ||||||
Octagon Investment Partners 25 Ltd (Cayman) | 2,000,000 | 1,858,230 | ||||||
OneMain Financial Issuance CLO Trust | 2,448,519 | 2,408,925 | ||||||
Palmer Square CLO Ltd (Cayman) | 1,205,468 | 1,174,454 | ||||||
2.943% (USD LIBOR + 1.100%) due 07/16/31 § ~ | 2,500,000 | 2,386,898 | ||||||
Palmer Square Loan Funding CLO Ltd (Cayman) | ||||||||
2.592% (USD LIBOR + 0.900%) | 2,615,094 | 2,554,528 | ||||||
2.701% (USD LIBOR + 0.900%) due 10/24/27 § ~ | 2,616,891 | 2,547,862 | ||||||
3.033% (USD LIBOR + 1.350%) due 02/20/28 § ~ | 2,350,000 | 2,200,326 | ||||||
3.401% (USD LIBOR + 1.600%) due 10/24/27 § ~ | 1,750,000 | 1,628,478 | ||||||
3.583% (USD LIBOR + 1.900%) due 02/20/28 § ~ | 1,200,000 | 1,144,074 | ||||||
Regatta XIV Funding Ltd ‘A’ (Cayman) | 1,400,000 | 1,234,131 | ||||||
Santander Drive Auto Receivables Trust | ||||||||
1.035% (USD LIBOR + 0.330%) | 1,448,991 | 1,445,107 | ||||||
2.490% due 10/15/25 | 2,000,000 | 1,937,872 | ||||||
2.630% due 07/15/22 | 331,286 | 331,182 | ||||||
2.960% due 03/15/24 | 1,850,000 | 1,840,628 | ||||||
3.290% due 10/17/22 | 388,010 | 388,005 | ||||||
3.350% due 07/17/23 | 2,000,000 | 1,993,130 | ||||||
3.510% due 08/15/23 | 2,500,000 | 2,493,405 | ||||||
SLM Student Loan Trust | 7,071,972 | 6,633,710 | ||||||
SMB Private Education Loan Trust | ||||||||
2.340% due 09/15/34 ~ | 1,631,270 | 1,635,429 | ||||||
2.700% due 05/15/31 ~ | 1,953,955 | 1,962,955 | ||||||
2.820% due 10/15/35 ~ | 3,557,828 | 3,545,335 | ||||||
2.880% due 09/15/34 ~ | 3,289,538 | 3,360,324 | ||||||
3.440% due 07/15/36 ~ | 1,850,000 | 1,769,165 | ||||||
3.500% due 02/15/36 ~ | 2,300,000 | 2,419,131 | ||||||
3.600% due 01/15/37 ~ | 1,516,965 | 1,513,296 | ||||||
3.630% due 11/15/35 ~ | 2,000,000 | 2,136,501 | ||||||
SoFi Consumer Loan Program Trust ‘A’ | 2,003,517 | 1,927,064 | ||||||
Sofi Professional Loan Program LLC | 2,000,000 | 2,018,141 | ||||||
2.540% due 05/15/46 ~ | 2,150,000 | 2,082,845 | ||||||
Principal Amount | Value | |||||||
TIAA CLO IV Ltd (Cayman) | $ | 2,750,000 | $ | 2,350,394 | ||||
|
| |||||||
Total Asset-Backed Securities |
| 122,732,427 | ||||||
|
| |||||||
U.S. TREASURY OBLIGATIONS - 21.4% |
| |||||||
U.S. Treasury Bonds - 6.0% |
| |||||||
2.000% due 02/15/50 | 10,000,000 | 11,620,117 | ||||||
2.250% due 08/15/46 | 4,050,000 | 4,876,453 | ||||||
2.250% due 08/15/49 | 2,000,000 | 2,433,906 | ||||||
2.500% due 02/15/46 | 3,500,000 | 4,400,430 | ||||||
2.500% due 05/15/46 | 3,000,000 | 3,774,961 | ||||||
2.750% due 11/15/47 | 4,000,000 | 5,295,781 | ||||||
2.875% due 11/15/46 | 3,000,000 | 4,050,938 | ||||||
3.000% due 11/15/44 | 4,000,000 | 5,416,562 | ||||||
3.000% due 02/15/49 | 5,000,000 | 6,974,023 | ||||||
3.375% due 11/15/48 | 6,000,000 | 8,910,000 | ||||||
|
| |||||||
| 57,753,171 | ||||||||
|
| |||||||
U.S. Treasury Notes - 15.4% |
| |||||||
1.125% due 04/30/20 | 3,000,000 | 3,002,521 | ||||||
1.125% due 02/28/27 | 7,000,000 | 7,278,086 | ||||||
1.250% due 07/31/23 | 5,000,000 | 5,154,688 | ||||||
1.375% due 08/31/23 | 4,000,000 | 4,144,533 | ||||||
1.375% due 09/30/23 | 4,500,000 | 4,664,885 | ||||||
1.500% due 02/15/30 | 13,000,000 | 14,016,387 | ||||||
1.625% due 11/15/22 | 5,000,000 | 5,177,637 | ||||||
1.625% due 02/15/26 | 7,000,000 | 7,459,102 | ||||||
1.625% due 05/15/26 | 5,000,000 | 5,337,305 | ||||||
1.625% due 09/30/26 | 10,000,000 | 10,705,469 | ||||||
1.750% due 07/31/21 | 4,000,000 | 4,083,672 | ||||||
1.750% due 11/15/29 | 22,000,000 | 24,187,969 | ||||||
2.000% due 10/31/21 | 1,400,000 | 1,439,266 | ||||||
2.000% due 11/30/22 | 6,000,000 | 6,275,156 | ||||||
2.125% due 12/31/21 | 4,500,000 | 4,649,238 | ||||||
2.250% due 02/15/27 | 2,000,000 | 2,231,953 | ||||||
2.375% due 05/15/29 | 5,000,000 | 5,755,078 | ||||||
2.500% due 02/28/26 | 7,400,000 | 8,268,055 | ||||||
2.625% due 02/15/29 | 7,000,000 | 8,186,719 | ||||||
2.875% due 08/15/28 | 2,250,000 | 2,662,031 | ||||||
3.125% due 11/15/28 | 12,400,000 | 14,977,844 | ||||||
|
| |||||||
| 149,657,594 | ||||||||
|
| |||||||
Total U.S. Treasury Obligations |
| 207,410,765 | ||||||
|
| |||||||
FOREIGN GOVERNMENT BONDS & NOTES - 0.2% |
| |||||||
Mexico Government (Mexico) | 2,300,000 | 2,367,873 | ||||||
|
| |||||||
Total Foreign Government Bonds & Notes |
| 2,367,873 | ||||||
|
| |||||||
| See Notes to Financial Statements | See explanation of symbols and terms, if any, on B-58 |
B-17
Table of Contents
PACIFIC FUNDS
PACIFIC FUNDS CORE INCOME
Schedule of Investments (Continued)
March 31, 2020
Shares | Value | |||||||
SHORT-TERM INVESTMENT - 1.1% |
| |||||||
Money Market Fund - 1.1% |
| |||||||
BlackRock Liquidity FundsT-Fund Portfolio ‘Institutional’ 0.210% | 10,335,104 | $10,335,104 | ||||||
|
| |||||||
Total Short-Term Investment |
| 10,335,104 | ||||||
|
| |||||||
TOTAL INVESTMENTS - 99.6% |
| 966,158,199 | ||||||
OTHER ASSETS & LIABILITIES, NET - 0.4% |
| 4,361,112 | ||||||
|
| |||||||
NET ASSETS - 100.0% |
| $970,519,311 | ||||||
|
| |||||||
Notes to Schedule of Investments
| (a) | As of March 31, 2020, the Fund’s composition as a percentage of net assets was as follows: |
Corporate Bonds & Notes | 52.4% | |||
U.S. Treasury Obligations | 21.4% | |||
Asset-Backed Securities | 12.7% | |||
Senior Loan Notes | 11.3% | |||
Others (each less than 3.0%) | 1.8% | |||
|
| |||
| 99.6% | ||||
Other Assets & Liabilities, Net | 0.4% | |||
|
| |||
| 100.0% | ||||
|
|
| (b) | Fair Value Measurements |
The following is a summary of the Fund’s investments as categorized under the three-tier hierarchy of inputs used in valuing the Fund’s assets and liabilities as of March 31, 2020:
| Total Value at March 31, 2020 | Level 1 Quoted Price | Level 2 Significant Observable Inputs | Level 3 Unobservable Inputs | |||||||||||||||
Assets | Corporate Bonds & Notes | $508,677,824 | $— | $508,677,824 | $— | |||||||||||||
Senior Loan Notes | 110,012,390 | — | 101,773,908 | 8,238,482 | ||||||||||||||
Mortgage-Backed Securities | 4,621,816 | — | 4,621,816 | — | ||||||||||||||
Asset-Backed Securities | 122,732,427 | — | 122,732,427 | — | ||||||||||||||
U.S. Treasury Obligations | 207,410,765 | — | 207,410,765 | — | ||||||||||||||
Foreign Government Bonds & Notes | 2,367,873 | — | 2,367,873 | — | ||||||||||||||
Short-Term Investment | 10,335,104 | 10,335,104 | — | — | ||||||||||||||
|
|
|
|
|
|
|
| |||||||||||
Total | $966,158,199 | $10,335,104 | $947,584,613 | $8,238,482 | ||||||||||||||
|
|
|
|
|
|
|
| |||||||||||
| See Notes to Financial Statements | See explanation of symbols and terms, if any, on B-58 |
B-18
Table of Contents
PACIFIC FUNDS
PACIFIC FUNDSSM STRATEGIC INCOME
Schedule of Investments
March 31, 2020
Shares | Value | |||||||
COMMON STOCKS - 2.3% | ||||||||
Basic Materials - 0.1% | ||||||||
Constellium SE * | 120,738 | $629,045 | ||||||
|
| |||||||
Consumer, Cyclical - 0.3% | ||||||||
Beazer Homes USA Inc * | 100,674 | 648,341 | ||||||
Cedar Fair LP | 21,677 | 397,556 | ||||||
Lennar Corp ‘A’ | 14,409 | 550,424 | ||||||
Six Flags Entertainment Corp | 39,347 | 493,411 | ||||||
|
| |||||||
| 2,089,732 | ||||||||
|
| |||||||
Consumer,Non-Cyclical - 0.2% | ||||||||
HCA Healthcare Inc | 11,238 | 1,009,734 | ||||||
|
| |||||||
Energy - 0.4% | ||||||||
Chevron Corp | 11,146 | 807,639 | ||||||
Diamondback Energy Inc | 19,199 | 503,014 | ||||||
Exxon Mobil Corp | 19,181 | 728,303 | ||||||
Pioneer Natural Resources Co | 8,602 | 603,430 | ||||||
|
| |||||||
| 2,642,386 | ||||||||
|
| |||||||
Financial - 0.8% | ||||||||
Bank of America Corp | 58,223 | 1,236,074 | ||||||
Citigroup Inc | 28,183 | 1,187,068 | ||||||
JPMorgan Chase & Co | 10,387 | 935,142 | ||||||
The Goldman Sachs Group Inc | 7,676 | 1,186,633 | ||||||
Wells Fargo & Co | 26,387 | 757,307 | ||||||
|
| |||||||
| 5,302,224 | ||||||||
|
| |||||||
Industrial - 0.5% | ||||||||
Crown Holdings Inc * | 14,653 | 850,460 | ||||||
Evoqua Water Technologies Corp * | 100,944 | 1,131,582 | ||||||
Xylem Inc | 17,839 | 1,161,854 | ||||||
|
| |||||||
| 3,143,896 | ||||||||
|
| |||||||
Total Common Stocks | 14,817,017 | |||||||
|
| |||||||
Principal Amount | ||||||||
CORPORATE BONDS & NOTES - 63.4% | ||||||||
Basic Materials - 1.5% | ||||||||
Anglo American Capital PLC (South Africa) 5.625% due 04/01/30 ~ | $2,200,000 | 2,237,527 | ||||||
Barminco Finance Pty Ltd (Australia) | 2,025,000 | 1,969,312 | ||||||
Hecla Mining Co | 1,825,000 | 1,620,600 | ||||||
Hexion Inc | 1,375,000 | 1,179,166 | ||||||
JW Aluminum Continuous Cast Co | 2,785,000 | 2,446,741 | ||||||
|
| |||||||
| 9,453,346 | ||||||||
|
| |||||||
Communications - 2.5% | ||||||||
CCO Holdings LLC | 150,000 | 151,434 | ||||||
Charter Communications Operating LLC | 1,500,000 | 1,511,757 | ||||||
4.200% due 03/15/28 | 3,150,000 | 3,240,782 | ||||||
5.050% due 03/30/29 | 1,500,000 | 1,631,812 | ||||||
CSC Holdings LLC | 200,000 | 202,442 | ||||||
6.500% due 02/01/29 ~ | 2,025,000 | 2,195,333 | ||||||
Principal Amount | Value | |||||||
Diamond Sports Group LLC | $5,775,000 | $3,894,082 | ||||||
Front Range BidCo Inc | 350,000 | 334,469 | ||||||
Sprint Capital Corp | 750,000 | 996,037 | ||||||
Sprint Corp | 1,340,000 | 1,492,961 | ||||||
7.625% due 03/01/26 | 275,000 | 312,771 | ||||||
7.875% due 09/15/23 | 25,000 | 27,716 | ||||||
Sprint Spectrum Co LLC | 75,000 | 74,906 | ||||||
Uber Technologies Inc | 250,000 | 248,258 | ||||||
|
| |||||||
| 16,314,760 | ||||||||
|
| |||||||
Consumer, Cyclical - 9.8% | ||||||||
Air Canada Pass-Through Trust ‘B’ (Canada) | 695,716 | 648,301 | ||||||
American Airlines Pass-Through Trust ‘A’ | 1,919,977 | 1,614,173 | ||||||
4.100% due 07/15/29 | 1,249,668 | 1,232,544 | ||||||
American Airlines Pass-Through Trust ‘AA’ | 2,904,580 | 2,655,099 | ||||||
American Airlines Pass-Through Trust ‘B’ | 2,068,631 | 1,608,595 | ||||||
5.250% due 07/15/25 | 994,258 | 1,001,937 | ||||||
Ashton Woods USA LLC | 3,745,000 | 2,986,638 | ||||||
Beazer Homes USA Inc | 2,700,000 | 2,058,953 | ||||||
6.750% due 03/15/25 | 1,000,000 | 813,745 | ||||||
7.250% due 10/15/29 | 1,350,000 | 1,036,226 | ||||||
British Airways Pass-Through Trust ‘AA’ (United Kingdom) | 2,748,719 | 2,619,597 | ||||||
Brookfield Residential Properties Inc (Canada) | 350,000 | 267,208 | ||||||
Caesars Resort Collection LLC | 3,800,000 | 2,772,860 | ||||||
Constellation Merger Sub Inc | 3,250,000 | 1,978,421 | ||||||
Core & Main Holdings LP | 1,575,000 | 1,454,898 | ||||||
Downstream Development Authority of the Quapaw Tribe of Oklahoma | 2,750,000 | 2,224,049 | ||||||
eG Global Finance PLC (United Kingdom) | 2,500,000 | 2,240,638 | ||||||
Gateway Casinos & Entertainment Ltd (Canada) | 1,275,000 | 1,120,400 | ||||||
General Motors Financial Co Inc | 1,550,000 | 1,481,270 | ||||||
4.375% due 09/25/21 | 1,500,000 | 1,381,949 | ||||||
5.100% due 01/17/24 | 1,000,000 | 922,644 | ||||||
5.650% due 01/17/29 | 1,175,000 | 1,054,647 | ||||||
Golden Nugget Inc | 5,375,000 | 3,425,810 | ||||||
8.750% due 10/01/25 ~ | 2,225,000 | 1,165,277 | ||||||
Hasbro Inc | 4,450,000 | 4,256,087 | ||||||
Hyundai Capital America | 3,700,000 | 3,633,236 | ||||||
Las Vegas Sands Corp | 3,450,000 | 3,163,407 | ||||||
Michaels Stores Inc | 2,660,000 | 1,983,163 | ||||||
Norwegian Air Shuttle ASA Pass-Through Trust ‘B’ (Norway) | 293,343 | 265,476 | ||||||
| See Notes to Financial Statements | See explanation of symbols and terms, if any, on B-58 |
B-19
Table of Contents
PACIFIC FUNDS
PACIFIC FUNDS STRATEGIC INCOME
Schedule of Investments (Continued)
March 31, 2020
Principal Amount | Value | |||||||
Panther BF Aggregator 2 LP | $575,000 | $504,821 | ||||||
Scientific Games International Inc | 500,000 | 310,275 | ||||||
7.250% due 11/15/29 ~ | 500,000 | 312,225 | ||||||
8.250% due 03/15/26 ~ | 1,350,000 | 871,738 | ||||||
Tesla Inc | 5,025,000 | 4,754,906 | ||||||
United Airlines Pass Through Trust ‘AA’ | 2,666,493 | 2,805,183 | ||||||
Yum! Brands Inc | 300,000 | 315,750 | ||||||
|
| |||||||
| 62,942,146 | ||||||||
|
| |||||||
Consumer,Non-Cyclical - 8.9% | ||||||||
AbbVie Inc | 1,850,000 | 1,889,314 | ||||||
3.200% due 11/21/29 ~ | 3,000,000 | 3,079,126 | ||||||
Ahern Rentals Inc | 6,600,000 | 3,819,717 | ||||||
Albertsons Cos Inc | 1,400,000 | 1,400,770 | ||||||
5.875% due 02/15/28 ~ | 1,950,000 | 1,995,532 | ||||||
Allied Universal Holdco LLC | 2,950,000 | 2,800,634 | ||||||
Anheuser-Busch InBev Worldwide Inc (Belgium) | 3,825,000 | 4,214,163 | ||||||
Bausch Health Americas Inc | 25,000 | 26,264 | ||||||
9.250% due 04/01/26 ~ | 1,500,000 | 1,574,175 | ||||||
Bausch Health Cos Inc | 800,000 | 763,360 | ||||||
6.125% due 04/15/25 ~ | 600,000 | 594,753 | ||||||
CVS Health Corp | 3,950,000 | 4,124,031 | ||||||
Garda World Security Corp (Canada) | 542,000 | 487,502 | ||||||
HCA Inc | 3,200,000 | 3,323,115 | ||||||
Jaguar Holding Co II | 500,000 | 512,485 | ||||||
JBS Investments II GmbH | 1,000,000 | 976,050 | ||||||
7.000% due 01/15/26 ~ | 950,000 | 951,938 | ||||||
Kraft Heinz Foods Co | 2,475,000 | 2,437,926 | ||||||
5.000% due 07/15/35 | 2,475,000 | 2,477,233 | ||||||
5.200% due 07/15/45 | 3,975,000 | 3,844,305 | ||||||
Reynolds American Inc (United Kingdom) | 1,500,000 | 1,530,221 | ||||||
Select Medical Corp | 3,150,000 | 3,167,341 | ||||||
Sysco Corp | 3,450,000 | 3,761,497 | ||||||
TMS International Holding Corp | 6,417,000 | 5,831,417 | ||||||
Verscend Escrow Corp | 1,675,000 | 1,684,539 | ||||||
|
| |||||||
| 57,267,408 | ||||||||
|
| |||||||
Energy - 8.5% | ||||||||
Antero Resources Corp | 5,125,000 | 3,756,420 | ||||||
Archrock Partners LP | 1,675,000 | 1,168,312 | ||||||
6.875% due 04/01/27 ~ | 1,325,000 | 950,114 | ||||||
Ascent Resources Utica Holdings LLC | 1,450,000 | 429,262 | ||||||
10.000% due 04/01/22 ~ | 1,450,000 | 786,597 | ||||||
Principal Amount | Value | |||||||
Buckeye Partners LP | $175,000 | $148,838 | ||||||
4.500% due 03/01/28 ~ | 175,000 | 144,813 | ||||||
Callon Petroleum Co | 2,350,000 | 396,075 | ||||||
Cheniere Corpus Christi Holdings LLC | 3,125,000 | 2,809,596 | ||||||
Endeavor Energy Resources LP | 3,075,000 | 2,143,821 | ||||||
5.750% due 01/30/28 ~ | 1,275,000 | 874,076 | ||||||
Energy Transfer Operating LP | 2,950,000 | 2,324,463 | ||||||
4.050% due 03/15/25 | 1,200,000 | 1,051,112 | ||||||
4.750% due 01/15/26 | 1,700,000 | 1,505,467 | ||||||
5.800% due 06/15/38 | 3,000,000 | 2,610,950 | ||||||
6.250% due 02/15/69 | 3,650,000 | 1,813,119 | ||||||
Enterprise Products Operating LLC | 3,450,000 | 3,154,622 | ||||||
Global Partners LP | 2,275,000 | 1,725,684 | ||||||
Kinder Morgan Energy Partners LP | 5,315,000 | 5,321,899 | ||||||
5.000% due 08/15/42 | 1,000,000 | 928,048 | ||||||
Moss Creek Resources Holdings Inc | 3,000,000 | 895,628 | ||||||
MPLX LP | 2,650,000 | 2,360,593 | ||||||
4.800% due 02/15/29 | 350,000 | 309,158 | ||||||
5.250% due 01/15/25 ~ | 4,825,000 | 4,254,810 | ||||||
6.875% due 08/15/68 | 450,000 | 274,721 | ||||||
ONEOK Inc | 3,950,000 | 3,006,140 | ||||||
Range Resources Corp | 2,975,000 | 1,801,734 | ||||||
Sabine Pass Liquefaction LLC | 2,725,000 | 2,505,847 | ||||||
SM Energy Co | 3,000,000 | 925,627 | ||||||
Sunoco Logistics Partners Operations LP | 1,200,000 | 951,829 | ||||||
Targa Resources Partners LP | 650,000 | 528,471 | ||||||
5.125% due 02/01/25 | 900,000 | 773,883 | ||||||
5.375% due 02/01/27 | 200,000 | 165,710 | ||||||
5.875% due 04/15/26 | 1,500,000 | 1,257,183 | ||||||
6.500% due 07/15/27 | 500,000 | 430,000 | ||||||
|
| |||||||
| 54,484,622 | ||||||||
|
| |||||||
Financial - 16.4% | ||||||||
AerCap Ireland Capital DAC (Ireland) | 1,850,000 | 1,537,459 | ||||||
3.950% due 02/01/22 | 750,000 | 653,833 | ||||||
4.450% due 10/01/25 | 2,000,000 | 1,764,469 | ||||||
Air Lease Corp | 275,000 | 216,453 | ||||||
3.750% due 06/01/26 | 1,500,000 | 1,297,359 | ||||||
4.250% due 09/15/24 | 1,000,000 | 891,305 | ||||||
4.625% due 10/01/28 | 1,500,000 | 1,218,200 | ||||||
Athene Holding Ltd | 4,925,000 | 4,915,544 | ||||||
Avolon Holdings Funding Ltd (Ireland) | 3,200,000 | 2,522,608 | ||||||
Bank of America Corp | 3,000,000 | 2,931,200 | ||||||
BOC Aviation Ltd (Singapore) | 4,000,000 | 4,056,046 | ||||||
| See Notes to Financial Statements | See explanation of symbols and terms, if any, on B-58 |
B-20
Table of Contents
PACIFIC FUNDS
PACIFIC FUNDS STRATEGIC INCOME
Schedule of Investments (Continued)
March 31, 2020
Principal Amount | Value | |||||||
Citigroup Inc | $3,000,000 | $2,938,108 | ||||||
3.980% due 03/20/30 | 3,000,000 | 3,213,110 | ||||||
4.075% due 04/23/29 | 3,000,000 | 3,188,222 | ||||||
4.400% due 06/10/25 | 2,500,000 | 2,709,852 | ||||||
4.600% due 03/09/26 | 575,000 | 619,468 | ||||||
CNO Financial Group Inc | 3,100,000 | 3,027,050 | ||||||
Crown Castle International Corp REIT | 1,950,000 | 1,928,550 | ||||||
GLP Capital LP REIT | 4,000,000 | 3,448,670 | ||||||
Host Hotels & Resorts LP REIT | 3,300,000 | 2,789,475 | ||||||
Iron Mountain Inc REIT | 3,300,000 | 3,122,947 | ||||||
5.250% due 03/15/28 ~ | 150,000 | 149,002 | ||||||
JPMorgan Chase & Co | 2,000,000 | 2,153,767 | ||||||
4.125% due 12/15/26 | 4,150,000 | 4,547,429 | ||||||
KeyCorp | 2,925,000 | 2,642,953 | ||||||
Morgan Stanley | 2,000,000 | 1,918,742 | ||||||
3.591% due 07/22/28 | 3,950,000 | 4,147,903 | ||||||
3.772% due 01/24/29 | 2,050,000 | 2,167,522 | ||||||
5.000% due 11/24/25 | 3,150,000 | 3,488,030 | ||||||
Service Properties Trust REIT | 4,925,000 | 3,742,139 | ||||||
Springleaf Finance Corp | 2,775,000 | 2,555,969 | ||||||
7.125% due 03/15/26 | 5,725,000 | 5,635,547 | ||||||
The Goldman Sachs Group Inc | 3,000,000 | 2,845,220 | ||||||
3.500% due 11/16/26 | 1,100,000 | 1,126,641 | ||||||
3.750% due 02/25/26 | 2,300,000 | 2,401,182 | ||||||
The Howard Hughes Corp | 3,025,000 | 2,949,284 | ||||||
Ventas Realty LP REIT | 3,200,000 | 3,149,532 | ||||||
VICI Properties LP REIT | 1,050,000 | 995,531 | ||||||
4.625% due 12/01/29 ~ | 1,000,000 | 915,550 | ||||||
Wells Fargo & Co | 4,925,000 | 6,298,052 | ||||||
Weyerhaeuser Co REIT | 2,425,000 | 2,439,761 | ||||||
|
| |||||||
| 105,259,684 | ||||||||
|
| |||||||
Industrial - 10.7% | ||||||||
Allegion US Holding Co Inc | 3,000,000 | 2,854,499 | ||||||
3.550% due 10/01/27 | 650,000 | 645,926 | ||||||
Apex Tool Group LLC | 2,425,000 | 1,597,457 | ||||||
ARD Finance SA (Luxembourg) | 2,800,000 | 2,420,460 | ||||||
Ardagh Packaging Finance PLC (Ireland) | 200,000 | 206,110 | ||||||
Brand Industrial Services Inc | 2,000,000 | 1,585,340 | ||||||
Cargo Aircraft Management Inc | 5,050,000 | 4,721,750 | ||||||
Carrier Global Corp | 2,950,000 | 2,829,483 | ||||||
Flex Acquisition Co Inc | 1,775,000 | 1,647,258 | ||||||
Principal Amount | Value | |||||||
GFL Environmental Inc (Canada) | $175,000 | $171,938 | ||||||
7.000% due 06/01/26 ~ | 1,622,000 | 1,583,814 | ||||||
Husky III Holding Ltd (Canada) | 2,050,000 | 1,521,059 | ||||||
Masco Corp | 1,075,000 | 1,076,756 | ||||||
7.750% due 08/01/29 | 4,110,000 | 5,063,033 | ||||||
Mauser Packaging Solutions Holding Co | 1,375,000 | 1,275,271 | ||||||
7.250% due 04/15/25 ~ | 4,200,000 | 3,213,126 | ||||||
Maxim Crane Works Holdings Capital LLC | 2,800,000 | 2,222,514 | ||||||
New Enterprise Stone & Lime Co Inc | 3,943,000 | 3,966,406 | ||||||
Penske Truck Leasing Co LP | 3,675,000 | 3,697,520 | ||||||
3.450% due 07/01/24 ~ | 2,950,000 | 2,956,167 | ||||||
Standard Industries Inc | 4,443,000 | 4,122,737 | ||||||
5.000% due 02/15/27 ~ | 1,500,000 | 1,375,451 | ||||||
Textron Inc | 3,700,000 | 3,470,351 | ||||||
Titan Acquisition Ltd (Canada) | 4,895,000 | 4,121,431 | ||||||
TransDigm Inc | 675,000 | 609,559 | ||||||
TransDigm UK Holdings PLC | 3,500,000 | 3,284,899 | ||||||
WRKCo Inc | 5,175,000 | 5,324,602 | ||||||
Zekelman Industries Inc | 1,115,000 | 1,083,641 | ||||||
|
| |||||||
| 68,648,558 | ||||||||
|
| |||||||
Technology - 2.6% | ||||||||
Broadcom Inc | 5,175,000 | 5,269,536 | ||||||
Citrix Systems Inc | 1,925,000 | 1,801,935 | ||||||
Dell International LLC | 3,000,000 | 3,032,464 | ||||||
4.900% due 10/01/26 ~ | 1,700,000 | 1,697,128 | ||||||
Oracle Corp | 4,925,000 | 4,980,080 | ||||||
|
| |||||||
| 16,781,143 | ||||||||
|
| |||||||
Utilities - 2.5% | ||||||||
Ameren Corp | 2,950,000 | 2,943,008 | ||||||
Dominion Energy Inc | 4,925,000 | 4,875,504 | ||||||
DPL Inc | 1,325,000 | 1,265,213 | ||||||
Exelon Corp | 1,350,000 | 1,339,746 | ||||||
San Diego Gas & Electric Co | 1,950,000 | 1,975,056 | ||||||
Vistra Operations Co LLC | 3,000,000 | 2,673,494 | ||||||
5.625% due 02/15/27 ~ | 850,000 | 881,280 | ||||||
|
| |||||||
| 15,953,301 | ||||||||
|
| |||||||
Total Corporate Bonds & Notes | 407,104,968 | |||||||
|
| |||||||
| See Notes to Financial Statements | See explanation of symbols and terms, if any, on B-58 |
B-21
Table of Contents
PACIFIC FUNDS
PACIFIC FUNDS STRATEGIC INCOME
Schedule of Investments (Continued)
March 31, 2020
Principal Amount | Value | |||||||
SENIOR LOAN NOTES - 27.2% | ||||||||
Basic Materials - 1.5% | ||||||||
Aleris International Inc | $4,927,386 | $4,508,559 | ||||||
Messer Industries USA Inc Term B | 5,860,201 | 5,266,856 | ||||||
|
| |||||||
| 9,775,415 | ||||||||
|
| |||||||
Communications - 2.9% | ||||||||
Clear Channel Outdoor Holdings Inc Term B | 5,724,991 | 5,188,273 | ||||||
CommScope Inc TermB-2 | 3,482,500 | 3,308,375 | ||||||
CSC Holdings LLC | 638,203 | 619,057 | ||||||
Sprint Communications Inc Term B | 2,429,874 | 2,420,762 | ||||||
4.000% (USD LIBOR + 3.000%) | 1,852,491 | 1,837,824 | ||||||
Uber Technologies Inc Term B | 3,471,067 | 3,276,688 | ||||||
Zayo Group Holdings Inc Term B | 2,250,000 | 2,109,375 | ||||||
|
| |||||||
| 18,760,354 | ||||||||
|
| |||||||
Consumer, Cyclical - 4.5% | ||||||||
Bass Pro Group LLC Term B | 3,454,443 | 2,936,277 | ||||||
Caesars Resort Collection LLC Term B | 6,368,561 | 5,231,320 | ||||||
ClubCorp Holdings Inc Term B | 4,408,142 | 2,832,231 | ||||||
Golden Nugget LLC Term B | 361,366 | 282,468 | ||||||
SeaWorld Parks & Entertainment Inc TermB-5 | 5,754,352 | 4,833,656 | ||||||
Spectacle Gary Holdings LLC | 3,263,513 | 2,790,304 | ||||||
SRS Distribution Inc Term B | 6,948,671 | 5,885,524 | ||||||
Tacala Investment Corp | 3,929,899 | 3,232,342 | ||||||
(2nd Lien) | ||||||||
8.489% (USD LIBOR + 7.500%) due 02/05/28 § ± | 1,500,000 | 1,207,500 | ||||||
|
| |||||||
| 29,231,622 | ||||||||
|
| |||||||
Consumer,Non-Cyclical - 4.0% | ||||||||
Bausch Health Americas Inc Term B | 1,789,474 | 1,705,964 | ||||||
3.612% (USD LIBOR + 3.000%) due 06/01/25 § | 5,169,143 | 4,953,761 | ||||||
Principal Amount | Value | |||||||
Garda World Security Corp Term B (Canada) | $2,404,729 | $2,296,516 | ||||||
Jaguar Holding Co II | 865,909 | 834,881 | ||||||
LifePoint Health Inc Term B | 5,151,861 | 4,834,161 | ||||||
North American Lifting Holdings Inc | 2,454,242 | 1,865,224 | ||||||
(2nd Lien) 10.450% (USD LIBOR + 9.000%) due 11/27/21 § ± | 2,000,000 | 650,000 | ||||||
Ortho-Clinical Diagnostics SA Term B (Luxembourg) | 3,974,093 | 3,401,824 | ||||||
PetVet Care Centers LLC | 2,992,368 | 2,498,627 | ||||||
Sunshine Luxembourg VII Sarl Term B (Luxembourg) | 2,743,125 | 2,509,959 | ||||||
|
| |||||||
| 25,550,917 | ||||||||
|
| |||||||
Energy - 0.3% | ||||||||
Traverse Midstream Partners LLC Term B | 3,484,842 | 2,027,018 | ||||||
|
| |||||||
Financial - 3.6% | ||||||||
AssuredPartners Inc Term B | 5,486,250 | 4,896,478 | ||||||
Deerfield Dakota Holding LLC Term B | 1,500,000 | 1,290,000 | ||||||
HUB International Ltd Term B | 4,916,212 | 4,645,821 | ||||||
NFP Corp Term B | 8,250,000 | 7,218,750 | ||||||
USI Inc Term B | 5,396,164 | 4,923,999 | ||||||
|
| |||||||
| 22,975,048 | ||||||||
|
| |||||||
Industrial - 8.9% | ||||||||
Advanced Disposal Services Inc Term B | 2,752,668 | 2,738,905 | ||||||
Brand Industrial Services Inc | 3,899,749 | 3,184,797 | ||||||
Cornerstone Building Brands Inc Term B | 3,884,578 | 3,399,006 | ||||||
Crosby US Acquisition Corp Term B | 2,977,500 | 2,382,000 | ||||||
Dynasty Acquisition Co Inc | 3,803,322 | 2,997,018 | ||||||
Engineered Machinery Holdings Inc | 3,865,115 | 3,246,696 | ||||||
| See Notes to Financial Statements | See explanation of symbols and terms, if any, on B-58 |
B-22
Table of Contents
PACIFIC FUNDS
PACIFIC FUNDS STRATEGIC INCOME
Schedule of Investments (Continued)
March 31, 2020
Principal Amount | Value | |||||||
EWT Holdings III Corp | $2,451,548 | $2,255,424 | ||||||
Filtration Group Corp Term B | 5,208,793 | 4,603,271 | ||||||
Flex Acquisition Co Inc | 3,765,190 | 3,357,296 | ||||||
Term B 5.159% (USD LIBOR + 3.250%) due 06/29/25 § | 978,518 | 872,512 | ||||||
GFL Environmental Inc Term B (Canada) | 4,048,404 | 3,949,724 | ||||||
Kloeckner Pentaplast of America Inc Term B (Luxembourg) | 3,919,898 | 2,832,126 | ||||||
Mauser Packaging Solutions Holding Co Term B | 3,164,281 | 2,626,353 | ||||||
Reynolds Group Holdings Inc Term B | 8,155,227 | 7,778,048 | ||||||
Standard Aero Ltd | 2,044,797 | 1,611,300 | ||||||
Titan Acquisition Ltd Term B (Canada) | 3,944,824 | 3,362,962 | ||||||
TransDigm Inc | ||||||||
Term E 3.239% (USD LIBOR + 2.250%) due 05/30/25 § | 2,493,750 | 2,331,656 | ||||||
Term F 3.239% (USD LIBOR + 2.250%) due 12/09/25 § | 962,705 | 900,130 | ||||||
TransDigm Inc Term G Term G | 2,803,790 | 2,588,831 | ||||||
|
| |||||||
| 57,018,055 | ||||||||
|
| |||||||
Technology - 1.5% | ||||||||
Tempo Acquisition LLC Term B | 4,961,735 | 4,457,290 | ||||||
Vertafore Inc | ||||||||
(2nd Lien) 8.239% (USD LIBOR + 7.250%) due 07/02/26 § | 1,000,000 | 888,333 | ||||||
Term B 4.239% (USD LIBOR + 3.250%) due 07/02/25 § | 4,463,699 | 4,028,489 | ||||||
|
| |||||||
| 9,374,112 | ||||||||
|
| |||||||
Total Senior Loan Notes | 174,712,541 | |||||||
|
| |||||||
ASSET-BACKED SECURITIES - 3.5% | ||||||||
Apidos CLO XXX ‘A2’ (Cayman) | 2,400,000 | 2,158,853 | ||||||
Buttermilk Park CLO Ltd ‘A1’ (Cayman) | 700,000 | 663,392 | ||||||
Dryden 43 Senior Loan Fund (Cayman) | 1,200,000 | 1,082,919 | ||||||
Principal Amount | Value | |||||||
Dryden 55 CLO Ltd (Cayman) | $250,000 | $205,143 | ||||||
Dryden 58 CLO Ltd (Cayman) | 1,500,000 | 1,331,414 | ||||||
3.636% (USD LIBOR + 1.800%) due 07/17/31 § ~ | 1,500,000 | 1,242,053 | ||||||
Dryden 61 CLO Ltd (Cayman) | 1,500,000 | 1,340,474 | ||||||
3.886% (USD LIBOR + 2.050%) due 01/17/32 § ~ | 1,500,000 | 1,191,701 | ||||||
Dryden 64 CLO Ltd (Cayman) | 2,600,000 | 2,266,117 | ||||||
Madison Park Funding Ltd (Cayman) | 2,000,000 | 1,757,440 | ||||||
3.681% (USD LIBOR + 1.850%) due 07/15/30 § ~ | 1,000,000 | 816,141 | ||||||
3.569% (USD LIBOR + 1.750%) due 10/18/30 § ~ | 2,650,000 | 2,386,841 | ||||||
Palmer Square Loan Funding CLO Ltd (Cayman) | 2,000,000 | 1,872,618 | ||||||
3.583% due 02/20/28 § ~ | 1,000,000 | 953,395 | ||||||
Palmer Square Loan Funding Ltd (Cayman) | 2,250,000 | 1,947,114 | ||||||
Regatta XIII Funding Ltd ‘D’ (Cayman) | 2,500,000 | 1,429,190 | ||||||
|
| |||||||
Total Asset-Backed Securities | 22,644,805 | |||||||
|
| |||||||
FOREIGN GOVERNMENT BONDS & NOTES - 0.5% |
| |||||||
Mexico Government (Mexico) | 2,750,000 | 2,747,965 | ||||||
4.500% due 04/22/29 | 700,000 | 720,657 | ||||||
|
| |||||||
Total Foreign Government Bonds & Notes | 3,468,622 | |||||||
|
| |||||||
Shares | ||||||||
SHORT-TERM INVESTMENT - 2.6% | ||||||||
Money Market Fund - 2.6% | ||||||||
BlackRock Liquidity FundsT-Fund Portfolio ‘Institutional’ 0.210% | 16,591,731 | 16,591,731 | ||||||
|
| |||||||
Total Short-Term Investment | 16,591,731 | |||||||
|
| |||||||
TOTAL INVESTMENTS - 99.5% | 639,339,684 | |||||||
OTHER ASSETS & LIABILITIES, NET - 0.5% | 3,148,074 | |||||||
|
| |||||||
NET ASSETS - 100.0% | $642,487,758 | |||||||
|
| |||||||
| See Notes to Financial Statements | See explanation of symbols and terms, if any, on B-58 |
B-23
Table of Contents
PACIFIC FUNDS
PACIFIC FUNDS STRATEGIC INCOME
Schedule of Investments (Continued)
March 31, 2020
Notes to Schedule of Investments
| (a) | As of March 31, 2020, the Fund’s composition as a percentage of net assets was as follows: |
Corporate Bonds & Notes | 63.4% | |||
Senior Loan Notes | 27.2% | |||
Asset-Backed Securities | 3.5% | |||
Others (each less than 3.0%) | 5.4% | |||
|
| |||
| 99.5% | ||||
Other Assets & Liabilities, Net | 0.5% | |||
|
| |||
| 100.0% | ||||
|
|
| (b) | Pursuant to the terms of the following senior loan agreement, the Fund had an unfunded loan commitment which could be extended at the option of the borrower. |
| Borrower | Unfunded Loan Commitment | Value | Unrealized Appreciation (Depreciation) | |||||||||
Spectacle Gary Holdings LLC ± | $229,648 | $202,196 | ($27,452 | ) | ||||||||
|
|
|
|
|
| |||||||
| (c) | Fair Value Measurements |
The following is a summary of the Fund’s investments as categorized under the three-tier hierarchy of inputs used in valuing the Fund’s assets and liabilities as of March 31, 2020:
| Total Value at March 31, 2020 | Level 1 Quoted Price | Level 2 Significant Observable Inputs | Level 3 Significant Unobservable Inputs | |||||||||||||||
Assets | Common Stocks | $14,817,017 | $14,817,017 | $— | $— | |||||||||||||
Corporate Bonds & Notes | 407,104,968 | — | 407,104,968 | — | ||||||||||||||
Senior Loan Notes | 174,712,541 | — | 147,610,157 | 27,102,384 | ||||||||||||||
Asset-Backed Securities | 22,644,805 | — | 22,644,805 | — | ||||||||||||||
Foreign Government Bonds & Notes | 3,468,622 | — | 3,468,622 | — | ||||||||||||||
Short-Term Investment | 16,591,731 | 16,591,731 | — | — | ||||||||||||||
Unfunded Loan Commitment | 202,196 | — | — | 202,196 | ||||||||||||||
|
|
|
|
|
|
|
| |||||||||||
Total | $639,541,880 | $31,408,748 | $580,828,552 | $27,304,580 | ||||||||||||||
|
|
|
|
|
|
|
| |||||||||||
The following is a reconciliation of investments for significant unobservable inputs (Level 3) used in valuing the Fund’s assets and liabilities for the year ended March 31, 2020:
| Senior Loan Notes and Unfunded Loan Commitment | ||||
Value, Beginning of Year | $— | |||
Purchases | 21,409,064 | |||
Sales (Includes Paydowns) | (17,518 | ) | ||
Accrued Discounts (Premiums) | 4,422 | |||
Net Realized Gains (Losses) | 128 | |||
Change in Net Unrealized Appreciation (Depreciation) | (2,942,022 | ) | ||
Transfers In | 8,850,506 | |||
Transfers Out | — | |||
|
| |||
Value, End of Year | $27,304,580 | |||
|
| |||
Change in Net Unrealized Appreciation (Depreciation) on Level 3 Investments Held at the End of Year, if Applicable | ($2,942,022 | ) | ||
|
| |||
The table below shows transfers within Level 3:
Amount Transferred | Level Transfer | Change in Fair Valuation Measurement Inputs | ||||||||||||
| From | To | From | To | |||||||||||
| $ | 8,850,506 | 2 | 3 | Vendor Price (Observable inputs) | Unobservable Single Broker Quote | |||||||||
All significant unobservable inputs were provided by a single broker quote.
| See Notes to Financial Statements | See explanation of symbols and terms, if any, on B-58 |
B-24
Table of Contents
PACIFIC FUNDS
PACIFIC FUNDSSM FLOATING RATE INCOME
Schedule of Investments
March 31, 2020
| | |||||||
WARRANTS - 0.0% | ||||||||
Communications - 0.0% | ||||||||
iHeartMedia Inc Exercise @ $14.70 | 1,038 | $6,877 | ||||||
|
| |||||||
Total Warrants | 6,877 | |||||||
|
| |||||||
COMMON STOCKS - 0.0% | ||||||||
Communications - 0.0% | ||||||||
iHeartMedia Inc ‘B’ *W | 11 | 80 | ||||||
|
| |||||||
Total Common Stocks | 80 | |||||||
|
| |||||||
EXCHANGE-TRADED FUND - 2.5% | ||||||||
Invesco Senior Loan | 1,492,158 | 30,529,553 | ||||||
|
| |||||||
Total Exchange-Traded Fund | 30,529,553 | |||||||
|
| |||||||
Principal | ||||||||
CORPORATE BONDS & NOTES - 3.2% | ||||||||
Communications - 0.4% | ||||||||
CommScope Inc | $3,770,000 | 3,838,821 | ||||||
Front Range BidCo Inc | 459,000 | 441,788 | ||||||
|
| |||||||
| 4,280,609 | ||||||||
|
| |||||||
Consumer, Cyclical - 1.1% | ||||||||
Beacon Roofing Supply Inc | 4,641,000 | 4,300,118 | ||||||
eG Global Finance PLC (United Kingdom) 6.750% due 02/07/25 ~ | 8,159,000 | 6,741,415 | ||||||
8.500% due 10/30/25 ~ | 2,000,000 | 1,792,510 | ||||||
|
| |||||||
| 12,834,043 | ||||||||
|
| |||||||
Consumer,Non-Cyclical - 0.3% | ||||||||
Ahern Rentals Inc | 6,404,000 | 3,706,283 | ||||||
|
| |||||||
Industrial - 1.4% | ||||||||
GFL Environmental Inc (Canada) | 7,336,000 | 7,462,076 | ||||||
Reynolds Group Issuer Inc | 3,750,000 | 3,681,562 | ||||||
TransDigm Inc | 5,800,000 | 5,803,608 | ||||||
|
| |||||||
| 16,947,246 | ||||||||
|
| |||||||
Total Corporate Bonds & Notes | 37,768,181 | |||||||
|
| |||||||
SENIOR LOAN NOTES - 88.6% | ||||||||
Basic Materials - 2.8% | ||||||||
Aleris International Inc | 10,807,500 | 9,888,862 | ||||||
Principal | | |||||||
ASP Unifrax Holdings Inc Term B | $ | 11,003,781 | $ | 8,821,368 | ||||
Messer Industries USA Inc Term B | 16,759,828 | 15,062,895 | ||||||
|
| |||||||
| 33,773,125 | ||||||||
|
| |||||||
Communications - 7.8% | ||||||||
Clear Channel Outdoor Holdings Inc Term B | 23,261,866 | 21,081,066 | ||||||
CommScope Inc TermB-2 | 14,963,591 | 14,215,411 | ||||||
CSC Holdings LLC | ||||||||
Term B | 4,000,000 | 3,870,000 | ||||||
TermB-5 | 14,518,000 | 14,058,258 | ||||||
NEP Group Inc | ||||||||
(2nd Lien) | 1,700,000 | 850,000 | ||||||
Term B | 506,346 | 318,998 | ||||||
Pug LLC Term B | 11,720,625 | 10,196,944 | ||||||
Sprint Communications Inc Term B | 9,800,684 | 9,723,092 | ||||||
Uber Technologies Inc Term B | 16,118,302 | 15,215,677 | ||||||
Zayo Group Holdings Inc Term B | 4,091,203 | 3,835,503 | ||||||
|
| |||||||
| 93,364,949 | ||||||||
|
| |||||||
Consumer, Cyclical - 15.7% | ||||||||
American Builders & Contractors Supply Co Inc Term B | 7,398,910 | 6,720,674 | ||||||
Bass Pro Group LLC Term B | 11,499,409 | 9,774,498 | ||||||
Beacon Roofing Supply Inc Term B | 6,875,587 | 6,256,784 | ||||||
Belk Inc Term B | 6,955,687 | 3,651,736 | ||||||
BJ’s Wholesale Club Inc Term B | 785,479 | 750,133 | ||||||
Caesars Resort Collection LLC Term B | 17,903,165 | 14,706,179 | ||||||
CityCenter Holdings LLC Term B | 4,922,002 | 4,362,124 | ||||||
Clarios Global LP Term B | 5,124,250 | 4,714,310 | ||||||
| See Notes to Financial Statements | See explanation of symbols and terms, if any, on B-58 |
B-25
Table of Contents
PACIFIC FUNDS
PACIFIC FUNDS FLOATING RATE INCOME
Schedule of Investments (Continued)
March 31, 2020
Principal | | |||||||
ClubCorp Holdings Inc Term B | $ | 7,870,475 | $ | 5,056,780 | ||||
Core & Main LP Term B | 11,825,971 | 10,465,984 | ||||||
Curium Bidco Sarl Term B (Luxembourg) | 6,941,503 | 6,594,428 | ||||||
EG America LLC (2nd Lien) (United Kingdom) | 5,911,121 | 4,743,675 | ||||||
Golden Nugget LLC Term B | 18,320,663 | 14,320,658 | ||||||
K-MAC Holdings Corp (2nd Lien) | 3,831,167 | 3,160,712 | ||||||
Motion Finco LLC Term B | | 1,763,261 231,739 |
| | 1,487,751 188,867 |
| ||
PetSmart Inc TermB-2 | 13,244,867 | 12,764,740 | ||||||
Restaurant Brands International Inc Term B (Canada) | 5,709,460 | 5,295,524 | ||||||
SeaWorld Parks & Entertainment Inc TermB-5 | 21,899,496 | 18,395,577 | ||||||
SMG US Midco 2 Inc | 5,480,184 | 4,137,539 | ||||||
SRS Distribution Inc Term B | 26,488,405 | 22,435,679 | ||||||
5.572% (USD LIBOR + 4.500%) | 5,857,812 | 5,308,643 | ||||||
Stars Group Holdings BV Term B (Canada) | 4,555,393 | 4,367,483 | ||||||
Tacala Investment Corp Term B | 2,238,579 | 1,841,231 | ||||||
Univar Solutions USA Inc | ||||||||
TermB-3 | 3,000,000 | 2,812,500 | ||||||
TermB-5 | 2,493,750 | 2,281,781 | ||||||
Whatabrands LLC Term B | 12,937,575 | 10,988,853 | ||||||
|
| |||||||
| 187,584,843 | ||||||||
|
| |||||||
Consumer,Non-Cyclical - 21.1% |
| |||||||
AlixPartners LLP Term B | 17,196,203 | 16,379,383 | ||||||
Allied Universal Holdco LLC | 10,826,849 | 10,014,835 | ||||||
Arterra Wines Canada Inc TermB-1 (Canada) | 3,814,415 | 3,242,253 | ||||||
AVSC Holding Corp | ||||||||
(2nd Lien) | 6,769,671 | 3,892,561 | ||||||
Principal | | |||||||
Term B | $ | 6,733,125 | $ | 4,208,203 | ||||
Bausch Health Americas Inc Term B | 5,389,240 | 5,137,741 | ||||||
3.612% (USD LIBOR + 3.000%) | 16,099,305 | 15,428,495 | ||||||
Belron Finance US LLC Term B | 3,491,250 | 3,316,687 | ||||||
CHG PPC Parent LLC Term B | 6,903,885 | 6,248,016 | ||||||
Da Vinci Purchaser Corp Term B | 10,551,992 | 9,852,922 | ||||||
Endo International PLC Term B | 11,221,154 | 10,070,986 | ||||||
Envision Healthcare Corp Term B | 6,448,256 | 3,456,265 | ||||||
Garda World Security Corp Term B (Canada) | 5,824,757 | 5,562,643 | ||||||
Guidehouse LLP | 3,711,467 | 3,024,846 | ||||||
Heartland Dental LLC | 9,167,065 | 7,232,814 | ||||||
H-Food Holdings LLC | 991,149 | 847,432 | ||||||
TermB-2 | 5,950,927 | 5,147,552 | ||||||
Jaguar Holding Co II | 17,627,699 | 16,996,046 | ||||||
LifePoint Health Inc Term B | 16,038,568 | 15,049,518 | ||||||
Lineage Logistics LLC Term B | 1,246,819 | 1,206,298 | ||||||
Mister Car Wash Holdings Inc | 6,899,529 | 5,709,361 | ||||||
Ortho-Clinical Diagnostics SA Term B (Luxembourg) | 13,637,056 | 11,673,320 | ||||||
PetVet Care Centers LLC | 6,814,712 | 5,690,284 | ||||||
(2nd Lien) | 7,375,000 | 6,158,125 | ||||||
Term B | 4,750,848 | 3,978,835 | ||||||
PSC Industrial Outsourcing LP (2nd Lien) | 5,000,000 | 4,456,250 | ||||||
Spin Holdco Inc Term B | 19,544,968 | 17,492,746 | ||||||
| See Notes to Financial Statements | See explanation of symbols and terms, if any, on B-58 |
B-26
Table of Contents
PACIFIC FUNDS
PACIFIC FUNDS FLOATING RATE INCOME
Schedule of Investments (Continued)
March 31, 2020
Principal | | |||||||
Sunshine Luxembourg VII Sarl Term B (Luxembourg) | $ | 7,107,187 | $ | 6,503,077 | ||||
VetCor Professional Practices LLC | 16,724,943 | 13,965,327 | ||||||
VVC Holding Corp Term B | 13,465,995 | 12,658,035 | ||||||
Wand NewCo 3 Inc TermB-1 | 19,450,152 | 17,796,889 | ||||||
|
| |||||||
| 252,397,745 | ||||||||
|
| |||||||
Diversified - 0.4% |
| |||||||
First Eagle Holdings Inc Term B | 4,987,500 | 4,233,141 | ||||||
|
| |||||||
Energy - 0.1% |
| |||||||
Prairie ECI Acquiror LP | 1,459,599 | 766,290 | ||||||
|
| |||||||
Financial - 10.3% |
| |||||||
Acrisure LLC Term B | 17,750,000 | 15,087,500 | ||||||
Alliant Holdings Intermediate LLC Term B | 2,408,568 | 2,233,947 | ||||||
3.989% (USD LIBOR + 3.000%) | 13,350,914 | 12,405,229 | ||||||
AssuredPartners Inc Term B | 23,434,363 | 20,915,169 | ||||||
Blackstone Mortgage Trust Inc Term B | 9,147,287 | 8,003,876 | ||||||
BroadStreet Partners Inc Term B | 7,821,000 | 7,024,236 | ||||||
Cushman & Wakefield PLC Term B | 13,506,179 | 12,155,561 | ||||||
Deerfield Dakota Holding LLC Term B | 4,250,000 | 3,655,000 | ||||||
HUB International Ltd Term B | 8,125,215 | 7,678,328 | ||||||
5.692% (USD LIBOR + 4.000%) | 2,443,875 | 2,285,023 | ||||||
NFP Corp Term B | 21,376,859 | 18,704,752 | ||||||
USI Inc Term B | 13,357,556 | 12,188,770 | ||||||
4.989% (USD LIBOR + 4.000%) | 1,039,289 | 950,949 | ||||||
|
| |||||||
| 123,288,340 | ||||||||
|
| |||||||
Industrial - 16.0% |
| |||||||
APi Group DE Inc Term B | 1,496,250 | 1,376,550 | ||||||
Berry Global Inc Term W | 11,524,974 | 11,127,362 | ||||||
Principal | | |||||||
Brand Industrial Services Inc | $ | 14,836,859 | $ | 12,116,773 | ||||
Cornerstone Building Brands Inc Term B | 14,787,276 | 12,938,867 | ||||||
DiversiTech Holdings Inc Term B | 5,537,434 | 4,734,506 | ||||||
Dynasty Acquisition Co Inc | 14,930,814 | 11,765,481 | ||||||
Engineered Machinery Holdings Inc | 8,680,927 | 7,291,979 | ||||||
5.700% (USD LIBOR + 4.250%) | 216,951 | 179,527 | ||||||
EWT Holdings III Corp | 11,636,440 | 10,705,524 | ||||||
Filtration Group Corp Term B | 22,337,251 | 19,740,545 | ||||||
Flex Acquisition Co Inc Term B | 2,176,909 | 1,941,078 | ||||||
Gates Global LLC TermB-2 | 8,742,200 | 7,867,980 | ||||||
GFL Environmental Inc Term B (Canada) | 6,610,360 | 6,449,232 | ||||||
Ingersoll-Rand Services Co Term B | 3,000,000 | 2,820,000 | ||||||
Pro Mach Group Inc Term B | 6,711,556 | 5,335,687 | ||||||
Reynolds Group Holdings Inc Term B | 23,642,236 | 22,548,783 | ||||||
Standard Aero Ltd | 8,027,319 | 6,325,528 | ||||||
Tailwind Smith Cooper Intermediate Corp | 2,200,000 | 1,672,000 | ||||||
The Hillman Group Inc Term B | 15,531,446 | 12,321,609 | ||||||
TransDigm Inc | ||||||||
Term E | 3,852,994 | 3,602,550 | ||||||
Term F | 6,093,181 | 5,697,124 | ||||||
Term G | 11,817,544 | 10,911,529 | ||||||
Vertiv Group Corp Term B | 500,000 | 455,000 | ||||||
WP CPP Holdings LLC Term B | 14,124,915 | 10,770,247 | ||||||
|
| |||||||
| 190,695,461 | ||||||||
|
| |||||||
| See Notes to Financial Statements | See explanation of symbols and terms, if any, on B-58 |
B-27
Table of Contents
PACIFIC FUNDS
PACIFIC FUNDS FLOATING RATE INCOME
Schedule of Investments (Continued)
March 31, 2020
Principal | | |||||||
Technology - 14.4% |
| |||||||
Applied Systems Inc | ||||||||
(2nd Lien) | $ | 16,389,070 | $ | 15,159,890 | ||||
Term B | 13,969,186 | 12,861,625 | ||||||
Epicor Software Corp Term B | 20,582,204 | 19,089,994 | ||||||
Kronos Inc | ||||||||
(2nd Lien) | 6,785,000 | 6,398,255 | ||||||
Term B | 13,122,763 | 12,154,959 | ||||||
Sophia LP Term B | 22,778,600 | 21,791,535 | ||||||
Tempo Acquisition LLC Term B | 25,684,866 | 23,073,563 | ||||||
The Dun & Bradstreet Corp Term B | 27,020,000 | 24,858,400 | ||||||
The Ultimate Software Group Inc | 13,967,281 | 13,199,081 | ||||||
Vertafore Inc | ||||||||
(2nd Lien) | 19,900,000 | 17,677,827 | ||||||
Term B | 6,569,424 | 5,928,905 | ||||||
|
| |||||||
| 172,194,034 | ||||||||
|
| |||||||
Total Senior Loan Notes | 1,058,297,928 | |||||||
|
| |||||||
Shares | | |||||||
SHORT-TERM INVESTMENT - 2.6% |
| |||||||
BlackRock Liquidity FundsT-Fund Portfolio | 31,695,395 | $ | 31,695,395 | |||||
|
| |||||||
Total Short-Term Investment |
| 31,695,395 | ||||||
|
| |||||||
TOTAL INVESTMENTS - 96.9% |
| 1,158,298,014 | ||||||
OTHER ASSETS & LIABILITIES, NET - 3.1% |
| 36,475,824 | ||||||
|
| |||||||
NET ASSETS - 100.0% |
| $1,194,773,838 | ||||||
|
| |||||||
Notes to Schedule of Investments
| (a) | As of March 31, 2020, the Fund’s composition by sector as a percentage of net assets was as follows: |
Consumer,Non-Cyclical | 21.4% | |||
Industrial | 17.4% | |||
Consumer, Cyclical | 16.8% | |||
Technology | 14.4% | |||
Financial | 10.3% | |||
Communications | 8.2% | |||
Others (each less than 3.0%) | 8.4% | |||
|
| |||
| 96.9% | ||||
Other Assets & Liabilities, Net | 3.1% | |||
|
| |||
| 100.0% | ||||
|
|
| (b) | Investments with a total aggregate value of $80 or less than 0.1% of the Fund’s net assets were valued by the Trustee Valuation Committee or determined by a valuation committee established under the Valuation Policy and then subsequently submitted for approval or ratification to either the Trustee Valuation Committee or to the Board of Trustees. |
| (c) | Fair Value Measurements |
The following is a summary of the Fund’s investments as categorized under the three-tier hierarchy of inputs used in valuing the Fund’s assets and liabilities as of March 31, 2020:
| Total Value at March 31, 2020 | Level 1 Quoted Price | Level 2 Significant Observable Inputs | Level 3 Significant Unobservable Inputs | |||||||||||||||
Assets | Warrants | $6,877 | $— | $6,877 | $— | |||||||||||||
Common Stocks | 80 | �� | — | 80 | — | |||||||||||||
Exchange-Traded Fund | 30,529,553 | 30,529,553 | — | — | ||||||||||||||
Corporate Bonds & Notes | 37,768,181 | — | 37,768,181 | — | ||||||||||||||
Senior Loan Notes | 1,058,297,928 | — | 922,248,562 | 136,049,366 | ||||||||||||||
Short-Term Investment | 31,695,395 | 31,695,395 | — | — | ||||||||||||||
|
|
|
|
|
|
|
| |||||||||||
Total Assets | 1,158,298,014 | 62,224,948 | 960,023,700 | 136,049,366 | ||||||||||||||
|
|
|
|
|
|
|
| |||||||||||
Liabilities | Line of Credit | (54,000,000 | ) | — | (54,000,000 | ) | — | |||||||||||
|
|
|
|
|
|
|
| |||||||||||
Total Liabilities | (54,000,000 | ) | — | (54,000,000 | ) | — | ||||||||||||
|
|
|
|
|
|
|
| |||||||||||
Total | $1,104,298,014 | $62,224,948 | $906,023,700 | $136,049,366 | ||||||||||||||
|
|
|
|
|
|
|
| |||||||||||
| See Notes to Financial Statements | See explanation of symbols and terms, if any, on B-58 |
B-28
Table of Contents
PACIFIC FUNDS
PACIFIC FUNDS FLOATING RATE INCOME
Schedule of Investments (Continued)
March 31, 2020
The following is a reconciliation of investments for significant unobservable inputs (Level 3) used in valuing the Fund’s assets and liabilities for the year ended March 31, 2020:
| Senior Loan Notes | ||||
Value, Beginning of Year | $— | |||
Purchases | 92,645,900 | |||
Sales (Includes Paydowns) | (18,800,438 | ) | ||
Accrued Discounts (Premiums) | (529 | ) | ||
Net Realized Gains (Losses) | (965,688 | ) | ||
Change in Net Unrealized Appreciation (Depreciation) | (14,344,656 | ) | ||
Transfers In | 77,514,777 | |||
Transfers Out | — | |||
|
| |||
Value, End of Year | $136,049,366 | |||
|
| |||
Change in Net Unrealized Appreciation (Depreciation) on | ($14,344,656 | ) | ||
|
| |||
The table below shows transfers within Level 3:
Amount Transferred | Level Transfer | Change in Fair Valuation Measurement Inputs | ||||||||||||
| From | To | From | To | |||||||||||
| $ | 77,514,777 | 2 | 3 | Vendor Price (Observable inputs) | Unobservable Single Broker Quote | |||||||||
All significant unobservable inputs were provided by a single broker quote.
| See Notes to Financial Statements | See explanation of symbols and terms, if any, on B-58 |
B-29
Table of Contents
PACIFIC FUNDS
PACIFIC FUNDSSM HIGH INCOME
Schedule of Investments
March 31, 2020
| | |||||||
COMMON STOCKS - 1.2% |
| |||||||
Basic Materials - 0.2% |
| |||||||
Constellium SE * | 19,340 | $100,761 | ||||||
Hexion Holdings Corp ‘B’ * | 11,203 | 106,429 | ||||||
|
| |||||||
| 207,190 | ||||||||
|
| |||||||
Consumer, Cyclical - 0.2% |
| |||||||
Beazer Homes USA Inc * | 9,998 | 64,387 | ||||||
Cedar Fair LP | 3,561 | 65,309 | ||||||
Lennar Corp ‘A’ | 2,857 | 109,137 | ||||||
|
| |||||||
| 238,833 | ||||||||
|
| |||||||
Consumer,Non-Cyclical - 0.1% |
| |||||||
HCA Healthcare Inc | 1,485 | 133,427 | ||||||
|
| |||||||
Energy - 0.1% |
| |||||||
Chevron Corp | 804 | 58,258 | ||||||
Diamondback Energy Inc | 903 | 23,659 | ||||||
Exxon Mobil Corp | 1,235 | 46,893 | ||||||
Pioneer Natural Resources Co | 581 | 40,757 | ||||||
|
| |||||||
| 169,567 | ||||||||
|
| |||||||
Financial - 0.3% |
| |||||||
Citigroup Inc | 4,210 | 177,325 | ||||||
Outfront Media Inc REIT | 4,360 | 58,773 | ||||||
The Goldman Sachs Group Inc | 1,166 | 180,252 | ||||||
|
| |||||||
| 416,350 | ||||||||
|
| |||||||
Industrial - 0.3% |
| |||||||
Crown Holdings Inc * | 2,964 | 172,030 | ||||||
Evoqua Water Technologies Corp * | 14,233 | 159,552 | ||||||
Xylem Inc | 2,037 | 132,670 | ||||||
|
| |||||||
| 464,252 | ||||||||
|
| |||||||
Total Common Stocks |
| 1,629,619 | ||||||
|
| |||||||
|
| |||||||
EXCHANGE-TRADED FUNDS - 2.0% |
| |||||||
iShares iBoxx High Yield Corporate Bond | 18,984 | 1,463,097 | ||||||
SPDR Bloomberg Barclays High Yield Bond | 12,722 | 1,205,282 | ||||||
|
| |||||||
Total Exchange-Traded Funds |
| 2,668,379 | ||||||
|
| |||||||
Principal | ||||||||
CORPORATE BONDS & NOTES - 81.1% |
| |||||||
Basic Materials - 2.5% |
| |||||||
Alcoa Nederland Holding BV | $525,000 | 491,164 | ||||||
Barminco Finance Pty Ltd (Australia) | 550,000 | 534,875 | ||||||
Constellium SE | 515,000 | 467,347 | ||||||
Hecla Mining Co | 475,000 | 421,800 | ||||||
Hexion Inc | 400,000 | 343,030 | ||||||
JW Aluminum Continuous Cast Co | 475,000 | 417,308 | ||||||
Novelis Corp | 650,000 | 582,156 | ||||||
5.875% due 09/30/26 ~ | 100,000 | 98,833 | ||||||
|
| |||||||
| 3,356,513 | ||||||||
|
| |||||||
Principal | | |||||||
Communications - 16.7% |
| |||||||
Altice Financing SA (Luxembourg) | $725,000 | $709,086 | ||||||
Altice France SA (France) | 575,000 | 583,941 | ||||||
CCO Holdings LLC | 1,600,000 | 1,604,880 | ||||||
5.000% due 02/01/28 ~ | 100,000 | 100,956 | ||||||
CenturyLink Inc | 500,000 | 481,250 | ||||||
Clear Channel Worldwide Holdings Inc | 625,000 | 588,719 | ||||||
9.250% due 02/15/24 ~ | 990,000 | 857,592 | ||||||
CommScope Inc | 400,000 | 401,649 | ||||||
8.250% due 03/01/27 ~ | 550,000 | 533,198 | ||||||
CommScope Technologies LLC | 100,000 | 92,270 | ||||||
CSC Holdings LLC | 1,750,000 | 1,897,201 | ||||||
6.625% due 10/15/25 ~ | 1,350,000 | 1,429,353 | ||||||
Diamond Sports Group LLC | 1,650,000 | 1,112,595 | ||||||
Front Range BidCo Inc | 750,000 | 721,875 | ||||||
6.125% due 03/01/28 ~ | 75,000 | 71,672 | ||||||
Intelsat Jackson Holdings SA (Luxembourg) | 75,000 | 72,937 | ||||||
8.500% due 10/15/24 ~ | 650,000 | 413,371 | ||||||
9.750% due 07/15/25 ~ | 150,000 | 94,688 | ||||||
Lamar Media Corp | 575,000 | 543,306 | ||||||
4.000% due 02/15/30 ~ | 25,000 | 23,438 | ||||||
Level 3 Financing Inc | 850,000 | 849,532 | ||||||
5.250% due 03/15/26 | 1,150,000 | 1,155,664 | ||||||
Nexstar Broadcasting Inc | 675,000 | 663,559 | ||||||
Outfront Media Capital LLC | 50,000 | 44,778 | ||||||
5.000% due 08/15/27 ~ | 775,000 | 717,301 | ||||||
Radiate Holdco LLC | 425,000 | 390,467 | ||||||
Sprint Capital Corp | 500,000 | 664,025 | ||||||
Sprint Corp | 650,000 | 724,198 | ||||||
7.625% due 03/01/26 | 700,000 | 796,145 | ||||||
7.875% due 09/15/23 | 400,000 | 443,454 | ||||||
T-Mobile USA Inc | 1,500,000 | 1,533,705 | ||||||
The Interpublic Group of Cos Inc | 350,000 | 348,581 | ||||||
Townsquare Media Inc | 175,000 | 169,530 | ||||||
Uber Technologies Inc | 500,000 | 496,516 | ||||||
Virgin Media Secured Finance PLC (United Kingdom) | 950,000 | 970,869 | ||||||
|
| |||||||
| 22,302,301 | ||||||||
|
| |||||||
Consumer, Cyclical - 14.1% |
| |||||||
American Airlines Pass-Through Trust ‘B’ | 340,716 | 264,945 | ||||||
5.250% due 07/15/25 | 115,997 | 116,893 | ||||||
American Builders & Contractors Supply Co Inc | 600,000 | 549,330 | ||||||
Ashton Woods USA LLC | 595,000 | 474,512 | ||||||
| See Notes to Financial Statements | See explanation of symbols and terms, if any, on B-58 |
B-30
Table of Contents
PACIFIC FUNDS
PACIFIC FUNDS HIGH INCOME
Schedule of Investments (Continued)
March 31, 2020
Principal | | |||||||
Beazer Homes USA Inc | $ | 1,225,000 | $ | 934,154 | ||||
Brookfield Residential Properties Inc (Canada) | 50,000 | 38,173 | ||||||
Caesars Resort Collection LLC | 1,325,000 | 966,852 | ||||||
Cedar Fair LP 5.250% due 07/15/29 ~ | 250,000 | 212,637 | ||||||
5.375% due 04/15/27 | 500,000 | 433,484 | ||||||
Constellation Merger Sub Inc | 1,500,000 | 913,117 | ||||||
Core & Main Holdings LP | 250,000 | 230,936 | ||||||
Core & Main LP | 625,000 | 585,919 | ||||||
Downstream Development Authority of the Quapaw Tribe of Oklahoma | 725,000 | 586,340 | ||||||
eG Global Finance PLC (United Kingdom) | 450,000 | 403,315 | ||||||
Ford Motor Co | 350,000 | 271,250 | ||||||
Gateway Casinos & Entertainment Ltd (Canada) | 625,000 | 549,216 | ||||||
Golden Nugget Inc | 1,375,000 | 876,370 | ||||||
8.750% due 10/01/25 ~ | 725,000 | 379,697 | ||||||
Hilton Grand Vacations Borrower LLC | 1,000,000 | 908,745 | ||||||
Jacobs Entertainment Inc | 900,000 | 766,120 | ||||||
Lennar Corp | 600,000 | 581,253 | ||||||
4.750% due 11/29/27 | 100,000 | 100,305 | ||||||
Lowe’s Cos Inc | 450,000 | 497,501 | ||||||
Marriott Ownership Resorts Inc | 525,000 | 398,235 | ||||||
Mattamy Group Corp (Canada) | 125,000 | 108,203 | ||||||
Mattel Inc | 125,000 | 118,593 | ||||||
6.750% due 12/31/25 ~ | 825,000 | 846,660 | ||||||
Michaels Stores Inc | 690,000 | 514,430 | ||||||
New Red Finance Inc (Canada) | 100,000 | 95,555 | ||||||
4.375% due 01/15/28 ~ | 300,000 | 278,835 | ||||||
5.000% due 10/15/25 ~ | 725,000 | 696,903 | ||||||
Panther BF Aggregator 2 LP | 500,000 | 475,311 | ||||||
8.500% due 05/15/27 ~ | 250,000 | 219,487 | ||||||
Scientific Games International Inc | 150,000 | 93,083 | ||||||
7.250% due 11/15/29 ~ | 150,000 | 93,668 | ||||||
8.250% due 03/15/26 ~ | 450,000 | 290,579 | ||||||
Six Flags Entertainment Corp | 875,000 | 742,044 | ||||||
Tesla Inc | 650,000 | 615,062 | ||||||
The ScottsMiracle-Gro Co | 500,000 | 480,038 | ||||||
The TJX Cos Inc | 250,000 | 255,993 | ||||||
US Airways Pass-Through Trust ‘B’ | 161,573 | 154,471 | ||||||
Wynn Resorts Finance LLC | 625,000 | 572,266 | ||||||
Yum! Brands Inc | 50,000 | 52,625 | ||||||
|
| |||||||
| 18,743,105 | ||||||||
|
| |||||||
Principal | | |||||||
Consumer,Non-Cyclical - 17.9% |
| |||||||
Ahern Rentals Inc | $ | 2,801,000 | $ | 1,621,065 | ||||
Albertsons Cos Inc | 50,000 | 50,028 | ||||||
5.875% due 02/15/28 ~ | 1,200,000 | 1,228,020 | ||||||
Allied Universal Holdco LLC | 1,500,000 | 1,424,051 | ||||||
Bausch Health Americas Inc | 1,250,000 | 1,313,187 | ||||||
Bausch Health Cos Inc | 125,000 | 119,275 | ||||||
6.125% due 04/15/25 ~ | 275,000 | 272,595 | ||||||
9.000% due 12/15/25 ~ | 1,050,000 | 1,114,785 | ||||||
Centene Corp | 600,000 | 560,250 | ||||||
4.250% due 12/15/27 ~ | 100,000 | 100,745 | ||||||
4.625% due 12/15/29 ~ | 100,000 | 101,055 | ||||||
Charles River Laboratories International Inc 4.250% due 05/01/28 ~ | 600,000 | 581,670 | ||||||
5.500% due 04/01/26 ~ | 400,000 | 410,787 | ||||||
Chobani LLC | 400,000 | 366,988 | ||||||
Community Health Systems Inc | 1,375,000 | 1,282,187 | ||||||
Garda World Security Corp (Canada) | 497,000 | 447,027 | ||||||
HCA Inc | 150,000 | 155,636 | ||||||
5.625% due 09/01/28 | 100,000 | 105,225 | ||||||
5.875% due 02/01/29 | 1,525,000 | 1,618,406 | ||||||
Jaguar Holding Co II | 490,000 | 502,235 | ||||||
JBS Investments II GmbH | 200,000 | 195,210 | ||||||
7.000% due 01/15/26 ~ | 1,150,000 | 1,152,346 | ||||||
JBS USA LUX SA | 150,000 | 155,708 | ||||||
5.875% due 07/15/24 ~ | 400,000 | 406,500 | ||||||
6.500% due 04/15/29 ~ | 50,000 | 53,913 | ||||||
Kraft Heinz Foods Co | 400,000 | 394,008 | ||||||
4.375% due 06/01/46 | 750,000 | 679,968 | ||||||
5.000% due 07/15/35 | 900,000 | 900,812 | ||||||
5.200% due 07/15/45 | 400,000 | 386,848 | ||||||
LifePoint Health Inc | 100,000 | 94,950 | ||||||
Pilgrim’s Pride Corp | 550,000 | 551,072 | ||||||
Refinitiv US Holdings Inc | 100,000 | 105,750 | ||||||
RegionalCare Hospital Partners Holdings Inc | 525,000 | 501,231 | ||||||
Select Medical Corp | 750,000 | 754,129 | ||||||
Tenet Healthcare Corp | 180,000 | 172,125 | ||||||
6.250% due 02/01/27 ~ | 600,000 | 587,250 | ||||||
6.750% due 06/15/23 | 975,000 | 905,536 | ||||||
Tms International Holding Corp | 1,416,000 | 1,286,783 | ||||||
United Rentals North America Inc | 300,000 | 285,374 | ||||||
6.500% due 12/15/26 | 300,000 | 306,165 | ||||||
Verscend Escrow Corp | 650,000 | 653,702 | ||||||
|
| |||||||
| 23,904,597 | ||||||||
|
| |||||||
| See Notes to Financial Statements | See explanation of symbols and terms, if any, on B-58 |
B-31
Table of Contents
PACIFIC FUNDS
PACIFIC FUNDS HIGH INCOME
Schedule of Investments (Continued)
March 31, 2020
Principal | | |||||||
Energy - 7.2% | ||||||||
Antero Resources Corp | $ | 925,000 | $ | 677,988 | ||||
5.625% due 06/01/23 | 475,000 | 193,562 | ||||||
Archrock Partners LP | 25,000 | 17,438 | ||||||
6.875% due 04/01/27 ~ | 475,000 | 340,607 | ||||||
Ascent Resources Utica Holdings LLC | 525,000 | 155,422 | ||||||
10.000% due 04/01/22 ~ | 550,000 | 298,364 | ||||||
Buckeye Partners LP | 25,000 | 21,263 | ||||||
4.500% due 03/01/28 ~ | 525,000 | 434,437 | ||||||
Callon Petroleum Co | 400,000 | 67,417 | ||||||
Cheniere Corpus Christi Holdings LLC | 1,175,000 | 1,056,408 | ||||||
Cheniere Energy Partners LP | 675,000 | 631,545 | ||||||
Crestwood Midstream Partners LP | 75,000 | 41,796 | ||||||
5.750% due 04/01/25 | 250,000 | 145,007 | ||||||
6.250% due 04/01/23 | 325,000 | 184,098 | ||||||
Denbury Resources Inc | 9,000 | 675 | ||||||
6.375% due 12/31/24 ~ | 11,000 | 4,479 | ||||||
Endeavor Energy Resources LP | 50,000 | 34,859 | ||||||
5.750% due 01/30/28 ~ | 775,000 | 531,301 | ||||||
Energy Transfer Operating LP | 800,000 | 397,396 | ||||||
EnLink Midstream Partners LP | 100,000 | 49,096 | ||||||
Global Partners LP | 470,000 | 356,515 | ||||||
Gulfport Energy Corp | 550,000 | 112,177 | ||||||
Moss Creek Resources Holdings Inc | 635,000 | 189,574 | ||||||
MPLX LP | 650,000 | 396,818 | ||||||
Occidental Petroleum Corp | 100,000 | 80,080 | ||||||
Parsley Energy LLC | 225,000 | 172,968 | ||||||
5.375% due 01/15/25 ~ | 225,000 | 175,489 | ||||||
5.625% due 10/15/27 ~ | 25,000 | 17,764 | ||||||
SM Energy Co | 575,000 | 161,722 | ||||||
6.750% due 09/15/26 | 225,000 | 69,422 | ||||||
Targa Resources Partners LP | 500,000 | 429,935 | ||||||
5.375% due 02/01/27 | 50,000 | 41,428 | ||||||
5.875% due 04/15/26 | 1,275,000 | 1,068,606 | ||||||
6.500% due 07/15/27 | 50,000 | 43,000 | ||||||
Transocean Inc | 267,000 | 70,067 | ||||||
8.000% due 02/01/27 ~ | 200,000 | 95,750 | ||||||
USA Compression Partners LP | 775,000 | 484,801 | ||||||
WPX Energy Inc | 600,000 | 333,330 | ||||||
|
| |||||||
| 9,582,604 | ||||||||
|
| |||||||
Financial - 6.7% |
| |||||||
Air Lease Corp | 300,000 | 236,131 | ||||||
Ally Financial Inc | 900,000 | 887,130 | ||||||
Principal | | |||||||
CNO Financial Group Inc | $ | 600,000 | $ | 585,881 | ||||
GLP Capital LP REIT | 875,000 | 779,334 | ||||||
Iron Mountain Inc REIT | 600,000 | 567,808 | ||||||
5.250% due 03/15/28 ~ | 100,000 | 99,335 | ||||||
SBA Communications Corp REIT | 700,000 | 707,000 | ||||||
Springleaf Finance Corp | 225,000 | 207,241 | ||||||
5.625% due 03/15/23 | 375,000 | 370,312 | ||||||
6.125% due 03/15/24 | 625,000 | 621,925 | ||||||
6.875% due 03/15/25 | 25,000 | 25,365 | ||||||
7.125% due 03/15/26 | 1,350,000 | 1,328,906 | ||||||
The Howard Hughes Corp | 2,075,000 | 2,023,063 | ||||||
VICI Properties LP REIT | 175,000 | 165,922 | ||||||
4.250% due 12/01/26 ~ | 200,000 | 184,601 | ||||||
4.625% due 12/01/29 ~ | 200,000 | 183,110 | ||||||
|
| |||||||
| 8,973,064 | ||||||||
|
| |||||||
Industrial - 12.9% | ||||||||
Apex Tool Group LLC | 450,000 | 296,435 | ||||||
ARD Finance SA (Luxembourg) | 200,000 | 172,890 | ||||||
Bombardier Inc (Canada) | 325,000 | 247,923 | ||||||
7.500% due 03/15/25 ~ | 525,000 | 367,500 | ||||||
Brand Industrial Services Inc | 650,000 | 515,235 | ||||||
Cargo Aircraft Management Inc | 575,000 | 537,625 | ||||||
Deere & Co | 450,000 | 525,964 | ||||||
Flex Acquisition Co Inc | 810,000 | 751,706 | ||||||
Gates Global LLC | 675,000 | 601,091 | ||||||
General Dynamics Corp | 250,000 | 279,158 | ||||||
GFL Environmental Inc (Canada) | 25,000 | 24,563 | ||||||
5.625% due 05/01/22 ~ | 300,000 | 305,156 | ||||||
7.000% due 06/01/26 ~ | 620,000 | 605,404 | ||||||
Granite US Holdings Corp | 800,000 | 693,166 | ||||||
Huntington Ingalls Industries Inc | 450,000 | 466,834 | ||||||
Husky III Holding Ltd (Canada) | 175,000 | 129,847 | ||||||
Itron Inc | 1,425,000 | 1,365,923 | ||||||
Mauser Packaging Solutions Holding Co | 475,000 | 440,548 | ||||||
7.250% due 04/15/25 ~ | 1,375,000 | 1,051,916 | ||||||
Maxim Crane World Holdings Capital LLC | 475,000 | 377,034 | ||||||
Mueller Water Products Inc | 801,000 | 781,810 | ||||||
New Enterprise Stone & Lime Co Inc | 1,265,000 | 1,272,509 | ||||||
Sensata Technologies BV | 1,175,000 | 1,155,900 | ||||||
Sensata Technologies Inc | 450,000 | 408,409 | ||||||
| See Notes to Financial Statements | See explanation of symbols and terms, if any, on B-58 |
B-32
Table of Contents
PACIFIC FUNDS
PACIFIC FUNDS HIGH INCOME
Schedule of Investments (Continued)
March 31, 2020
Principal | | |||||||
Standard Industries Inc | $ | 1,300,000 | $ | 1,206,293 | ||||
Titan Acquisition Ltd (Canada) | 910,000 | 766,190 | ||||||
TransDigm Inc | 375,000 | 338,644 | ||||||
6.250% due 03/15/26 ~ | 700,000 | 700,435 | ||||||
TransDigm UK Holdings PLC | 825,000 | 774,298 | ||||||
|
| |||||||
| 17,160,406 | ||||||||
|
| |||||||
Technology - 1.1% |
| |||||||
Intel Corp | 600,000 | 689,424 | ||||||
Open Text Corp (Canada) | 100,000 | 94,469 | ||||||
Open Text Holdings Inc (Canada) | 100,000 | 94,587 | ||||||
Tempo Acquisition LLC | 700,000 | 645,771 | ||||||
|
| |||||||
| 1,524,251 | ||||||||
|
| |||||||
Utilities - 2.0% |
| |||||||
Calpine Corp | 200,000 | 194,600 | ||||||
5.125% due 03/15/28 ~ | 550,000 | 510,125 | ||||||
NRG Energy Inc | 300,000 | 310,665 | ||||||
7.250% due 05/15/26 | 390,000 | 410,690 | ||||||
Talen Energy Supply LLC | 650,000 | 426,429 | ||||||
7.250% due 05/15/27 ~ | 100,000 | 90,925 | ||||||
Vistra Operations Co LLC | 375,000 | 382,706 | ||||||
5.500% due 09/01/26 ~ | 200,000 | 207,394 | ||||||
5.625% due 02/15/27 ~ | 100,000 | 103,680 | ||||||
|
| |||||||
| 2,637,214 | ||||||||
|
| |||||||
Total Corporate Bonds & Notes |
| 108,184,055 | ||||||
|
| |||||||
SENIOR LOAN NOTES - 7.5% |
| |||||||
Basic Materials - 0.9% |
| |||||||
Aleris International Inc | 745,625 | 682,247 | ||||||
Messer Industries USA Inc Term B | 498,741 | 448,243 | ||||||
|
| |||||||
| 1,130,490 | ||||||||
|
| |||||||
Communications - 0.2% |
| |||||||
Sprint Communications Inc Term B | 246,875 | 244,920 | ||||||
|
| |||||||
Consumer, Cyclical - 2.9% |
| |||||||
18 Fremont Street Acquisition LLC | 250,000 | 211,250 | ||||||
Bass Pro Group LLC Term B | 1,286,575 | 1,093,588 | ||||||
PetSmart Inc TermB-2 | 600,000 | 578,250 | ||||||
SeaWorld Parks & Entertainment Inc TermB-5 | 987,277 | 829,313 | ||||||
Principal | | |||||||
Spectacle Gary Holdings LLC | $ | 582,770 | $ | 498,269 | ||||
SRS Distribution Inc Term B | 600,000 | 508,200 | ||||||
Tacala Investment Corp Term B (2nd Lien) | 250,000 | 201,250 | ||||||
|
| |||||||
| 3,920,120 | ||||||||
|
| |||||||
Consumer,Non-Cyclical - 0.2% |
| |||||||
Endo International PLC Term B | 239,385 | 214,848 | ||||||
North American Lifting Holdings Inc (2nd Lien) | 350,000 | 113,750 | ||||||
|
| |||||||
| 328,598 | ||||||||
|
| |||||||
Energy - 0.4% |
| |||||||
Prairie ECI Acquiror LP | 376,532 | 197,679 | ||||||
Traverse Midstream Partners LLC Term B | 497,475 | 289,365 | ||||||
|
| |||||||
| 487,044 | ||||||||
|
| |||||||
Industrial - 2.1% | ||||||||
Cornerstone Building Brands Inc Term B | 541,232 | 473,578 | ||||||
Dynasty Acquisition Co Inc | 647,098 | 509,913 | ||||||
Filtration Group Corp Term B | 598,413 | 528,847 | ||||||
Reynolds Group Holdings Inc Term B | 1,049,371 | 1,000,838 | ||||||
Standard Aero Ltd | 347,902 | 274,147 | ||||||
|
| |||||||
| 2,787,323 | ||||||||
|
| |||||||
Technology - 0.8% |
| |||||||
Kronos Inc Term B | 598,473 | 554,336 | ||||||
The Dun & Bradstreet Corp Term B | 600,000 | 552,000 | ||||||
|
| |||||||
| 1,106,336 | ||||||||
|
| |||||||
Total Senior Loan Notes |
| 10,004,831 | ||||||
|
| |||||||
ASSET-BACKED SECURITIES - 1.3% |
| |||||||
Benefit Street Partners CLO Ltd ‘D’ (Cayman) | 250,000 | 152,146 | ||||||
Benefit Street Partners CLO Ltd ‘E’ (Cayman) | 250,000 | 146,038 | ||||||
Dryden Senior Loan Fund ‘E’ (Cayman) | 425,000 | 283,275 | ||||||
Dryden Senior Loan Fund ‘F’ (Cayman) | 250,000 | 121,151 | ||||||
Magnetite XXII Ltd ‘E’ (Cayman) | 500,000 | 332,819 | ||||||
| See Notes to Financial Statements | See explanation of symbols and terms, if any, on B-58 |
B-33
Table of Contents
PACIFIC FUNDS
PACIFIC FUNDS HIGH INCOME
Schedule of Investments (Continued)
March 31, 2020
Principal | | |||||||
Neuberger Berman Loan Advisers CLO Ltd ‘E’ (Cayman) | $ | 300,000 | $ | 195,130 | ||||
8.569% (USD LIBOR + 6.750%) | 500,000 | 326,899 | ||||||
Voya CLO2019-4 Ltd ‘E’ (Cayman) | 300,000 | 207,934 | ||||||
|
| |||||||
Total Asset-Backed Securities |
| 1,765,392 | ||||||
|
| |||||||
| ||||||||
SHORT-TERM INVESTMENT - 9.1% | ||||||||
Money Market Fund - 9.1% |
| |||||||
BlackRock Liquidity FundsT-Fund Portfolio ‘Institutional’ 0.210% | 12,162,527 | 12,162,527 | ||||||
|
| |||||||
Total Short-Term Investment | 12,162,527 | |||||||
|
| |||||||
TOTAL INVESTMENTS - 102.2% | 136,414,803 | |||||||
OTHER ASSETS & LIABILITIES, NET - (2.2%) |
| (2,991,009 | ) | |||||
|
| |||||||
NET ASSETS - 100.0% |
| $133,423,794 | ||||||
|
| |||||||
Notes to Schedule of Investments
| (a) | As of March 31, 2020, the Fund’s composition by sector as a percentage of net assets was as follows: |
Consumer,Non-Cyclical | 18.2% | |||
Consumer, Cyclical | 17.2% | |||
Communications | 16.9% | |||
Industrial | 15.3% | |||
Short-Term Investment | 9.1% | |||
Energy | 7.7% | |||
Financial | 7.0% | |||
Basic Materials | 3.6% | |||
Others (each less than 3.0%) | 7.2% | |||
|
| |||
| 102.2% | ||||
Other Assets & Liabilities, Net | (2.2% | ) | ||
|
| |||
| 100.0% | ||||
|
|
| (b) | Pursuant to the terms of the following senior loan agreement, the Fund had an unfunded loan commitment which could be extended at the option of the borrower. |
| Borrower | Unfunded Loan Commitments | Value | Unrealized Appreciation (Depreciation) | |||||||||
Spectacle Gary Holdings LLC ± | $41,008 | $36,106 | ($4,902 | ) | ||||||||
|
|
|
|
|
| |||||||
| (c) | Fair Value Measurements |
The following is a summary of the Fund’s investments as categorized under the three-tier hierarchy of inputs used in valuing the Fund’s assets and liabilities as of March 31, 2020:
| Total Value at March 31, 2020 | Level 1 Quoted Price | Level 2 Significant Observable Inputs | Level 3 Significant Unobservable Inputs | |||||||||||||||
Assets | Common Stocks | $1,629,619 | $1,629,619 | $— | $— | |||||||||||||
Exchange-Traded Funds | 2,668,379 | 2,668,379 | — | — | ||||||||||||||
Corporate Bonds & Notes | 108,184,055 | — | 108,184,055 | — | ||||||||||||||
Senior Loan Notes | 10,004,831 | — | 7,215,467 | 2,789,364 | ||||||||||||||
Asset-Backed Securities | 1,765,392 | — | 1,765,392 | — | ||||||||||||||
Short-Term Investment | 12,162,527 | 12,162,527 | — | — | ||||||||||||||
Unfunded Loan Commitment | 36,106 | — | — | 36,106 | ||||||||||||||
|
|
|
|
|
|
|
| |||||||||||
Total | $136,450,909 | $16,460,525 | $117,164,914 | $2,825,470 | ||||||||||||||
|
|
|
|
|
|
|
| |||||||||||
The following is a reconciliation of investments for significant unobservable inputs (Level 3) used in valuing the fund’s assets and liabilities for the year ended March 31, 2020:
| Senior Loan Notes and Unfunded Loan Commitment | ||||
Value, Beginning of Year | $— | |||
Purchases | 1,607,705 | |||
Sales (Includes Paydowns) | (77,560 | ) | ||
Accrued Discounts (Premiums) | 277 | |||
Net Realized Gains (Losses) | (47,271 | ) | ||
Change in Net Unrealized Appreciation (Depreciation) | (338,598 | ) | ||
Transfers In | | 1,680,917 | | |
Transfers Out | | — | | |
|
| |||
Value, End of Year | $2,825,470 | |||
|
| |||
Change in Net Unrealized Appreciation (Depreciation) on | ($338,598 | ) | ||
|
| |||
| See Notes to Financial Statements | See explanation of symbols and terms, if any, on B-58 |
B-34
Table of Contents
PACIFIC FUNDS
PACIFIC FUNDS HIGH INCOME
Schedule of Investments (Continued)
March 31, 2020
The table below shows transfers within Level 3:
Amount Transferred | Level Transfer | Change in Fair Valuation Measurement Inputs | ||||||||||||
| From | To | From | To | |||||||||||
| $ | 1,680,917 | 2 | 3 | Vendor Price (Observable inputs) | Unobservable Single Broker Quote | |||||||||
All significant unobservable inputs were provided by a single broker quote.
| See Notes to Financial Statements | See explanation of symbols and terms, if any, on B-58 |
B-35
Table of Contents
PACIFIC FUNDS
PACIFIC FUNDSSM DIVERSIFIED INCOME
Schedule of Investments
March 31, 2020
| | |||||||
PREFERRED STOCKS - 0.1% |
| |||||||
Communications - 0.0% |
| |||||||
Telefonica Brasil SA (Brazil) | 600 | $5,711 | ||||||
|
| |||||||
Consumer, Cyclical - 0.0% |
| |||||||
Volkswagen AG (Germany) | 60 | 6,912 | ||||||
|
| |||||||
Consumer,Non-Cyclical - 0.0% |
| |||||||
Henkel AG & Co KGaA (Germany) | 87 | 6,959 | ||||||
|
| |||||||
Energy - 0.0% |
| |||||||
Petroleo Brasileiro SA (Brazil) | 2,200 | 5,906 | ||||||
|
| |||||||
Financial - 0.1% |
| |||||||
Itau Unibanco Holding SA (Brazil) | 1,600 | 7,150 | ||||||
|
| |||||||
Total Preferred Stocks |
| 32,638 | ||||||
|
| |||||||
COMMON STOCKS - 63.4% |
| |||||||
Basic Materials - 2.3% |
| |||||||
Air Liquide SA (France) | 190 | 24,253 | ||||||
Air Products & Chemicals Inc | 224 | 44,713 | ||||||
Akzo Nobel NV (Netherlands) | 65 | 4,275 | ||||||
Anglo American PLC (South Africa) | 457 | 8,008 | ||||||
Asahi Kasei Corp (Japan) | 600 | 4,204 | ||||||
BASF SE (Germany) | 633 | 29,588 | ||||||
BHP Group Ltd (Australia) | 1,124 | 20,391 | ||||||
BHP Group PLC (Australia) | 1,043 | 16,187 | ||||||
Boliden AB (Sweden) | 313 | 5,615 | ||||||
Cabot Corp | 69 | 1,802 | ||||||
Celanese Corp | 109 | 8,000 | ||||||
CF Industries Holdings Inc | 168 | 4,570 | ||||||
Constellium SE * | 1,134 | 5,908 | ||||||
Dow Inc | 622 | 18,187 | ||||||
DuPont de Nemours Inc | 526 | 17,937 | ||||||
Eastman Chemical Co | 225 | 10,480 | ||||||
Ecolab Inc | 91 | 14,181 | ||||||
EMS-Chemie Holding AG (Switzerland) | 9 | 5,613 | ||||||
Givaudan SA (Switzerland) | 4 | 12,308 | ||||||
Glencore PLC (Switzerland) | 5,824 | 8,815 | ||||||
Grupo Mexico SAB de CV ‘B’ (Mexico) | 2,757 | 5,112 | ||||||
Huntsman Corp | 150 | 2,164 | ||||||
International Flavors & Fragrances Inc | 124 | 12,658 | ||||||
International Paper Co | 1,742 | 54,228 | ||||||
Kuraray Co Ltd (Japan) | 500 | 5,031 | ||||||
Linde PLC (United Kingdom) | 176 | 30,448 | ||||||
LyondellBasell Industries NV ‘A’ | 284 | 14,095 | ||||||
Mitsubishi Chemical Holdings Corp (Japan) | 600 | 3,563 | ||||||
MMC Norilsk Nickel PJSC ADR (Russia) | 512 | 12,682 | ||||||
Nissan Chemical Corp (Japan) | 100 | 3,622 | ||||||
Nitto Denko Corp (Japan) | 200 | 8,884 | ||||||
Novozymes AS ‘B’ (Denmark) | 79 | 3,544 | ||||||
Nucor Corp | 264 | 9,509 | ||||||
Petronas Chemicals Group Bhd (Malaysia) | 5,700 | 6,648 | ||||||
PPG Industries Inc | 71 | 5,936 | ||||||
Reliance Steel & Aluminum Co | 53 | 4,642 | ||||||
Rio Tinto Ltd (Australia) | 197 | 10,149 | ||||||
Rio Tinto PLC (Australia) | 620 | 28,422 | ||||||
Shin-Etsu Chemical Co Ltd (Japan) | 310 | 30,469 | ||||||
Solvay SA (Belgium) | 40 | 2,883 | ||||||
South32 Ltd (Australia) | 1,780 | 1,965 | ||||||
Southern Copper Corp (Peru) | 109 | 3,069 | ||||||
Steel Dynamics Inc | 202 | 4,553 | ||||||
| | |||||||
Symrise AG (Germany) | 48 | $ | 4,440 | |||||
The Sherwin-Williams Co | 26 | 11,948 | ||||||
UPM-Kymmene OYJ (Finland) | 290 | 7,907 | ||||||
Valvoline Inc | 224 | 2,932 | ||||||
|
| |||||||
| 556,538 | ||||||||
|
| |||||||
Communications - 5.6% |
| |||||||
Alibaba Group Holding Ltd ADR (China) * | 290 | 56,399 | ||||||
Alphabet Inc ‘C’ * | 73 | 84,885 | ||||||
Amazon.com Inc * | 59 | 115,033 | ||||||
AT&T Inc | 2,351 | 68,532 | ||||||
Baidu Inc ADR (China) * | 221 | 22,275 | ||||||
Booking Holdings Inc * | 15 | 20,180 | ||||||
BT Group PLC (United Kingdom) | 1,865 | 2,713 | ||||||
CenturyLink Inc | 918 | 8,684 | ||||||
China Mobile Ltd (China) | 6,500 | 48,713 | ||||||
China Telecom Corp Ltd ‘H’ (China) | 12,000 | 3,636 | ||||||
Cisco Systems Inc | 3,254 | 127,915 | ||||||
Comcast Corp ‘A’ | 3,357 | 115,414 | ||||||
Corning Inc | 1,191 | 24,463 | ||||||
Deutsche Telekom AG (Germany) | 538 | 6,949 | ||||||
Facebook Inc ‘A’ * | 568 | 94,742 | ||||||
FactSet Research Systems Inc | 11 | 2,867 | ||||||
ITV PLC (United Kingdom) | 3,524 | 2,892 | ||||||
John Wiley & Sons Inc ‘A’ | 66 | 2,474 | ||||||
Juniper Networks Inc | 425 | 8,134 | ||||||
KDDI Corp (Japan) | 1,700 | 50,216 | ||||||
M3 Inc (Japan) | 400 | 11,799 | ||||||
Naspers Ltd ‘N’ (South Africa) | 238 | 33,823 | ||||||
Nexstar Media Group Inc ‘A’ | 32 | 1,847 | ||||||
Nice Ltd (Israel) * | 21 | 3,037 | ||||||
Nippon Telegraph & Telephone Corp (Japan) | 200 | 4,783 | ||||||
NortonLifeLock Inc | 350 | 6,548 | ||||||
NTT DOCOMO Inc (Japan) | 1,300 | 40,655 | ||||||
Omnicom Group Inc | 225 | 12,352 | ||||||
Orange SA (France) | 431 | 5,218 | ||||||
P.T. Telekomunikasi Indonesia Persero Tbk (Indonesia) | 32,600 | 6,331 | ||||||
Prosus NV (China) * | 242 | 16,855 | ||||||
Singapore Telecommunications Ltd (Singapore) | 6,900 | 12,301 | ||||||
Softbank Corp (Japan) | 400 | 5,095 | ||||||
Swisscom AG (Switzerland) | 8 | 4,284 | ||||||
Telefonica SA (Spain) | 1,054 | 4,797 | ||||||
Telia Co AB (Sweden) | 928 | 3,322 | ||||||
Telstra Corp Ltd (Australia) | 1,483 | 2,784 | ||||||
Tencent Holdings Ltd (China) | 1,300 | 64,256 | ||||||
The Interpublic Group of Cos Inc | 2,545 | 41,204 | ||||||
The Walt Disney Co | 446 | 43,084 | ||||||
Trend Micro Inc (Japan) | 200 | 9,876 | ||||||
VeriSign Inc * | 24 | 4,322 | ||||||
Verizon Communications Inc | 1,577 | 84,732 | ||||||
ViacomCBS Inc ‘B’ | 146 | 2,045 | ||||||
Vipshop Holdings Ltd ADR (China) * | 185 | 2,882 | ||||||
Vodacom Group Ltd (South Africa) | 488 | 3,193 | ||||||
Vodafone Group PLC (United Kingdom) | 7,168 | 9,917 | ||||||
WPP PLC (United Kingdom) | 1,376 | 9,355 | ||||||
Z Holdings Corp (Japan) | 3,800 | 12,115 | ||||||
|
| |||||||
| 1,329,928 | ||||||||
|
| |||||||
Consumer, Cyclical - 6.5% |
| |||||||
adidas AG (Germany) | 72 | 15,986 | ||||||
Alaska Air Group Inc | 98 | 2,790 | ||||||
American Airlines Group Inc | 272 | 3,316 | ||||||
ANTA Sports Products Ltd (China) | 1,000 | 7,257 | ||||||
AutoZone Inc * | 9 | 7,614 | ||||||
Bandai Namco Holdings Inc (Japan) | 100 | 4,850 | ||||||
Barratt Developments PLC (United Kingdom) | 436 | 2,357 | ||||||
Bayerische Motoren Werke AG (Germany) | 97 | 4,952 | ||||||
Beazer Homes USA Inc * | 1,193 | 7,683 | ||||||
Best Buy Co Inc | 190 | 10,830 | ||||||
BorgWarner Inc | 170 | 4,143 | ||||||
Bridgestone Corp (Japan) | 300 | 9,183 | ||||||
| See Notes to Financial Statements | See explanation of symbols and terms, if any, on B-58 |
B-36
Table of Contents
PACIFIC FUNDS
PACIFIC FUNDS DIVERSIFIED INCOME
Schedule of Investments (Continued)
March 31, 2020
| | |||||||
Carnival Corp | 503 | $ | 6,625 | |||||
Carter’s Inc | 40 | 2,629 | ||||||
Cedar Fair LP | 253 | 4,640 | ||||||
Cie Financiere Richemont SA (Switzerland) | 499 | 26,673 | ||||||
Cie Generale des Etablissements Michelin SCA (France) | 148 | 12,963 | ||||||
Cinemark Holdings Inc | 86 | 876 | ||||||
Clicks Group Ltd (South Africa) | 250 | 3,603 | ||||||
Compass Group PLC (United Kingdom) | 683 | 10,641 | ||||||
Continental AG (Germany) | 32 | 2,282 | ||||||
Copart Inc * | 62 | 4,248 | ||||||
Costco Wholesale Corp | 164 | 46,761 | ||||||
Cummins Inc | 183 | 24,764 | ||||||
Daimler AG (Germany) | 304 | 9,079 | ||||||
Daiwa House Industry Co Ltd (Japan) | 400 | 9,883 | ||||||
Darden Restaurants Inc | 75 | 4,084 | ||||||
Delta Air Lines Inc | 1,920 | 54,778 | ||||||
Denso Corp (Japan) | 200 | 6,391 | ||||||
Dick’s Sporting Goods Inc | 141 | 2,998 | ||||||
Dollar General Corp | 77 | 11,628 | ||||||
Dollar Tree Inc * | 68 | 4,996 | ||||||
DR Horton Inc | 99 | 3,366 | ||||||
Dunkin’ Brands Group Inc | 49 | 2,602 | ||||||
Extended Stay America Inc | 167 | 1,221 | ||||||
Fastenal Co | 632 | 19,750 | ||||||
Ferrari NV (Italy) | 43 | 6,623 | ||||||
Flutter Entertainment PLC (Ireland) | 59 | 5,307 | ||||||
Foot Locker Inc | 147 | 3,241 | ||||||
Ford Motor Co | 3,866 | 18,673 | ||||||
Galaxy Entertainment Group Ltd (Macao) | 1,000 | 5,267 | ||||||
Geely Automobile Holdings Ltd (China) | 8,000 | 11,610 | ||||||
General Motors Co | 935 | 19,429 | ||||||
Genuine Parts Co | 170 | 11,446 | ||||||
Guangzhou Automobile Group Co Ltd ‘H’ (China) | 4,000 | 3,979 | ||||||
Hanesbrands Inc | 437 | 3,439 | ||||||
Harley-Davidson Inc | 2,726 | 51,603 | ||||||
Hasbro Inc | 120 | 8,586 | ||||||
Hennes & Mauritz AB ‘B’ (Sweden) | 967 | 12,374 | ||||||
Hermes International (France) | 13 | 8,845 | ||||||
Honda Motor Co Ltd (Japan) | 700 | 15,664 | ||||||
Hoshizaki Corp (Japan) | 40 | 2,992 | ||||||
Industria de Diseno Textil SA (Spain) | 830 | 21,508 | ||||||
ITOCHU Corp (Japan) | 700 | 14,486 | ||||||
Kingfisher PLC (United Kingdom) | 1,842 | 3,235 | ||||||
Kohl’s Corp | 122 | 1,780 | ||||||
L Brands Inc | 142 | 1,642 | ||||||
Las Vegas Sands Corp | 288 | 12,231 | ||||||
Lear Corp | 168 | 13,650 | ||||||
Leggett & Platt Inc | 107 | 2,855 | ||||||
Lennar Corp ‘A’ | 198 | 7,564 | ||||||
Lojas Renner SA (Brazil) | 800 | 5,175 | ||||||
Lululemon Athletica Inc * | 33 | 6,255 | ||||||
LVMH Moet Hennessy Louis Vuitton SE (France) | 106 | 38,876 | ||||||
Macy’s Inc | 336 | 1,650 | ||||||
Marubeni Corp (Japan) | 900 | 4,467 | ||||||
McDonald’s Corp | 708 | 117,068 | ||||||
MGM Resorts International | 371 | 4,378 | ||||||
Mitsubishi Corp (Japan) | 600 | 12,691 | ||||||
Mitsui & Co Ltd (Japan) | 800 | 11,107 | ||||||
Mr Price Group Ltd (South Africa) | 335 | 2,126 | ||||||
MSC Industrial Direct Co Inc ‘A’ | 84 | 4,617 | ||||||
Newell Brands Inc | 1,120 | 14,874 | ||||||
Next PLC (United Kingdom) | 55 | 2,759 | ||||||
NIKE Inc ‘B’ | 413 | 34,172 | ||||||
Nitori Holdings Co Ltd (Japan) | 100 | 13,514 | ||||||
Nordstrom Inc | 107 | 1,641 | ||||||
NVR Inc * | 1 | 2,569 | ||||||
O’Reilly Automotive Inc * | 23 | 6,924 | ||||||
Oriental Land Co Ltd (Japan) | 200 | 25,531 | ||||||
Panasonic Corp (Japan) | 1,000 | 7,570 | ||||||
| | |||||||
Pandora AS (Denmark) | 84 | $ | 2,699 | |||||
Persimmon PLC (United Kingdom) | 290 | 6,855 | ||||||
Peugeot SA (France) | 244 | 3,177 | ||||||
Polaris Inc | 73 | 3,515 | ||||||
Raia Drogasil SA (Brazil) | 300 | 5,849 | ||||||
Ralph Lauren Corp | 58 | 3,876 | ||||||
Ross Stores Inc | 109 | 9,480 | ||||||
Royal Caribbean Cruises Ltd | 181 | 5,823 | ||||||
Sands China Ltd (Macao) | 1,200 | 4,366 | ||||||
Sekisui Chemical Co Ltd (Japan) | 500 | 6,587 | ||||||
Sekisui House Ltd (Japan) | 300 | 4,948 | ||||||
Shenzhou International Group Holdings Ltd (China) | 700 | 7,343 | ||||||
Shimano Inc (Japan) | 50 | 7,131 | ||||||
Six Flags Entertainment Corp | 594 | 7,449 | ||||||
Sodexo SA (France) | 35 | 2,350 | ||||||
Starbucks Corp | 395 | 25,967 | ||||||
Subaru Corp (Japan) | 300 | 5,735 | ||||||
Sumitomo Corp (Japan) | 600 | 6,843 | ||||||
Sumitomo Electric Industries Ltd (Japan) | 400 | 4,179 | ||||||
Tapestry Inc | 320 | 4,144 | ||||||
Target Corp | 452 | 42,022 | ||||||
Taylor Wimpey PLC (United Kingdom) | 2,620 | 3,770 | ||||||
The Gap Inc | 280 | 1,971 | ||||||
The Goodyear Tire & Rubber Co | 495 | 2,881 | ||||||
The Home Depot Inc | 755 | 140,966 | ||||||
The Swatch Group AG (Switzerland) | 27 | 5,303 | ||||||
The TJX Cos Inc | 454 | 21,706 | ||||||
Thor Industries Inc | 60 | 2,531 | ||||||
Tiffany & Co | 26 | 3,367 | ||||||
Toyota Motor Corp (Japan) | 500 | 30,132 | ||||||
Tractor Supply Co | 35 | 2,959 | ||||||
Tsuruha Holdings Inc (Japan) | 40 | 5,274 | ||||||
Ulta Beauty Inc * | 16 | 2,811 | ||||||
USS Co Ltd (Japan) | 400 | 5,485 | ||||||
Vail Resorts Inc | 45 | 6,647 | ||||||
VF Corp | 381 | 20,604 | ||||||
Volvo AB ‘B’ (Sweden) | 941 | 11,185 | ||||||
Wal-Mart de Mexico SAB de CV (Mexico) | 9,324 | 21,967 | ||||||
Walgreens Boots Alliance Inc | 965 | 44,149 | ||||||
Walmart Inc | 541 | 61,468 | ||||||
Watsco Inc | 41 | 6,479 | ||||||
Welcia Holdings Co Ltd (Japan) | 50 | 3,511 | ||||||
Whirlpool Corp | 49 | 4,204 | ||||||
Williams-Sonoma Inc | 81 | 3,444 | ||||||
WW Grainger Inc | 15 | 3,727 | ||||||
Wyndham Destinations Inc | 445 | 9,656 | ||||||
Wyndham Hotels & Resorts Inc | 61 | 1,922 | ||||||
Wynn Resorts Ltd | 78 | 4,695 | ||||||
Yum China Holdings Inc (China) | 270 | 11,510 | ||||||
|
| |||||||
| 1,559,097 | ||||||||
|
| |||||||
Consumer,Non-Cyclical - 17.0% |
| |||||||
a2 Milk Co Ltd (New Zealand) * | 370 | 3,780 | ||||||
AbbVie Inc | 894 | 68,114 | ||||||
Adecco Group AG (Switzerland) | 94 | 3,704 | ||||||
Adyen NV (Netherlands) * ~ | 3 | 2,550 | ||||||
Alexion Pharmaceuticals Inc * | 68 | 6,106 | ||||||
Alfresa Holdings Corp (Japan) | 200 | 3,722 | ||||||
Align Technology Inc * | 31 | 5,392 | ||||||
Altria Group Inc | 2,421 | 93,620 | ||||||
Ambev SA (Brazil) | 9,300 | 21,263 | ||||||
Amgen Inc | 567 | 114,948 | ||||||
Anheuser-Busch InBev SA NV (Belgium) | 625 | 27,606 | ||||||
Archer-Daniels-Midland Co | 688 | 24,204 | ||||||
Asahi Intecc Co Ltd (Japan) | 200 | 4,946 | ||||||
Associated British Foods PLC (United Kingdom) | 172 | 3,853 | ||||||
Astellas Pharma Inc (Japan) | 1,500 | 23,111 | ||||||
AstraZeneca PLC (United Kingdom) | 257 | 22,898 | ||||||
Automatic Data Processing Inc | 472 | 64,513 | ||||||
Bayer AG (Germany) | 568 | 32,546 | ||||||
| See Notes to Financial Statements | See explanation of symbols and terms, if any, on B-58 |
B-37
Table of Contents
PACIFIC FUNDS
PACIFIC FUNDS DIVERSIFIED INCOME
Schedule of Investments (Continued)
March 31, 2020
| | |||||||
Becton Dickinson and Co | 116 | $ | 26,653 | |||||
Beiersdorf AG (Germany) | 49 | 4,934 | ||||||
Bid Corp Ltd (South Africa) | 312 | 3,678 | ||||||
Biogen Inc * | 81 | 25,627 | ||||||
Bristol-Myers Squibb Co | 1,470 | 81,938 | ||||||
British American Tobacco PLC (United Kingdom) | 1,941 | 66,121 | ||||||
Brown-Forman Corp ‘B’ | 94 | 5,218 | ||||||
Bunge Ltd | 1,745 | 71,597 | ||||||
Campbell Soup Co | 118 | 5,447 | ||||||
Cardinal Health Inc | 254 | 12,177 | ||||||
Carlsberg AS ‘B’ (Denmark) | 30 | 3,377 | ||||||
Chocoladefabriken Lindt & Spruengli AG (Switzerland) | 1 | 8,393 | ||||||
Chugai Pharmaceutical Co Ltd (Japan) | 200 | 23,139 | ||||||
Church & Dwight Co Inc | 89 | 5,712 | ||||||
Cigna Corp | 147 | 26,045 | ||||||
Cintas Corp | 26 | 4,504 | ||||||
Coca-Cola European Partners PLC (United Kingdom) | 66 | 2,477 | ||||||
Colgate-Palmolive Co | 853 | 56,605 | ||||||
Coloplast AS ‘B’ (Denmark) | 42 | 6,091 | ||||||
Conagra Brands Inc | 347 | 10,181 | ||||||
Coty Inc ‘A’ | 333 | 1,718 | ||||||
CSL Ltd (Australia) | 162 | 29,366 | ||||||
CSPC Pharmaceutical Group Ltd (China) | 6,000 | 11,803 | ||||||
CVS Health Corp | 1,409 | 83,596 | ||||||
Danaher Corp | 237 | 32,803 | ||||||
Danone SA (France) | 222 | 14,208 | ||||||
Diageo PLC (United Kingdom) | 1,335 | 42,332 | ||||||
Edwards Lifesciences Corp * | 76 | 14,335 | ||||||
Eli Lilly & Co | 337 | 46,749 | ||||||
Equifax Inc | 35 | 4,181 | ||||||
EssilorLuxottica SA (France) | 102 | 10,799 | ||||||
Fisher & Paykel Healthcare Corp Ltd (New Zealand) | 184 | 3,345 | ||||||
FleetCor Technologies Inc * | 20 | 3,731 | ||||||
Flowers Foods Inc | 193 | 3,960 | ||||||
Fresenius Medical Care AG & Co KGaA (Germany) | 75 | 4,896 | ||||||
General Mills Inc | 666 | 35,145 | ||||||
Genmab AS (Denmark) * | 20 | 4,017 | ||||||
Gilead Sciences Inc | 736 | 55,023 | ||||||
GlaxoSmithKline PLC (United Kingdom) | 3,091 | 58,000 | ||||||
Global Payments Inc | 38 | 5,481 | ||||||
H&R Block Inc | 128 | 1,802 | ||||||
HCA Healthcare Inc | 154 | 13,837 | ||||||
Hengan International Group Co Ltd (China) | 1,000 | 7,469 | ||||||
Henkel AG & Co KGaA (Germany) | 51 | 3,746 | ||||||
Henry Schein Inc * | 56 | 2,829 | ||||||
Hormel Foods Corp | 127 | 5,923 | ||||||
Humana Inc | 49 | 15,387 | ||||||
IDEXX Laboratories Inc * | 31 | 7,509 | ||||||
Illumina Inc * | 57 | 15,568 | ||||||
Imperial Brands PLC (United Kingdom) | 427 | 7,880 | ||||||
Ingredion Inc | 115 | 8,682 | ||||||
Intuitive Surgical Inc * | 44 | 21,789 | ||||||
Japan Tobacco Inc (Japan) | 1,700 | 31,444 | ||||||
Johnson & Johnson | 1,360 | 178,337 | ||||||
Kao Corp (Japan) | 500 | 40,734 | ||||||
Kellogg Co | 241 | 14,458 | ||||||
Keurig Dr Pepper Inc | 109 | 2,645 | ||||||
Kikkoman Corp (Japan) | 200 | 8,480 | ||||||
Kimberly-Clark Corp | 361 | 46,161 | ||||||
Kimberly-Clark de Mexico SAB de CV ‘A’ (Mexico) | 2,275 | 3,458 | ||||||
Kirin Holdings Co Ltd (Japan) | 300 | 5,925 | ||||||
Kobayashi Pharmaceutical Co Ltd (Japan) | 50 | 4,626 | ||||||
Koninklijke Ahold Delhaize NV (Netherlands) | 1,192 | 27,770 | ||||||
Kose Corp (Japan) | 30 | 3,712 | ||||||
Kyowa Kirin Co Ltd (Japan) | 200 | 4,470 | ||||||
L’Oreal SA (France) | 130 | 33,645 | ||||||
Laboratory Corp of America Holdings * | 35 | 4,424 | ||||||
Lamb Weston Holdings Inc | 55 | 3,140 | ||||||
Lion Corp (Japan) | 300 | 6,398 | ||||||
ManpowerGroup Inc | 47 | 2,491 | ||||||
| | |||||||
MarketAxess Holdings Inc | 11 | $ | 3,658 | |||||
Masimo Corp * | 16 | 2,834 | ||||||
McCormick & Co Inc | 42 | 5,931 | ||||||
McKesson Corp | 70 | 9,468 | ||||||
Medtronic PLC | 1,342 | 121,022 | ||||||
Merck & Co Inc | 1,095 | 84,249 | ||||||
Moderna Inc * | 110 | 3,295 | ||||||
Molson Coors Beverage Co ‘B’ | 114 | 4,447 | ||||||
Monster Beverage Corp * | 148 | 8,326 | ||||||
Moody’s Corp | 54 | 11,421 | ||||||
Mowi ASA (Norway) | 170 | 2,570 | ||||||
Nestle SA (Switzerland) | 607 | 62,137 | ||||||
New Oriental Education & Technology Group Inc ADR (China) * | 74 | 8,010 | ||||||
Nisshin Seifun Group Inc (Japan) | 300 | 5,005 | ||||||
Nissin Foods Holdings Co Ltd (Japan) | 100 | 8,299 | ||||||
Novartis AG (Switzerland) | 1,067 | 88,026 | ||||||
Novo Nordisk AS ‘B’ (Denmark) | 946 | 56,491 | ||||||
Ono Pharmaceutical Co Ltd (Japan) | 300 | 6,894 | ||||||
P.T. Unilever Indonesia Tbk (Indonesia) | 7,000 | 3,095 | ||||||
PayPal Holdings Inc * | 341 | 32,647 | ||||||
PepsiCo Inc | 1,165 | 139,917 | ||||||
Pernod Ricard SA (France) | 115 | 16,323 | ||||||
Pfizer Inc | 4,701 | 153,441 | ||||||
Philip Morris International Inc | 1,410 | 102,874 | ||||||
Pigeon Corp (Japan) | 100 | 3,829 | ||||||
Quest Diagnostics Inc | 51 | 4,095 | ||||||
Randstad NV (Netherlands) | 80 | 2,823 | ||||||
Reckitt Benckiser Group PLC (United Kingdom) | 549 | 41,820 | ||||||
Recruit Holdings Co Ltd (Japan) | 940 | 24,281 | ||||||
Regeneron Pharmaceuticals Inc * | 28 | 13,672 | ||||||
RELX PLC (United Kingdom) | 825 | 17,607 | ||||||
ResMed Inc | 51 | 7,512 | ||||||
Robert Half International Inc | 128 | 4,832 | ||||||
Roche Holding AG (Switzerland) | 346 | 111,323 | ||||||
S&P Global Inc | 81 | 19,849 | ||||||
Sanofi (France) | 789 | 68,308 | ||||||
Santen Pharmaceutical Co Ltd (Japan) | 300 | 5,149 | ||||||
Secom Co Ltd (Japan) | 200 | 16,542 | ||||||
Seven & i Holdings Co Ltd (Japan) | 400 | 13,210 | ||||||
SGS SA (Switzerland) | 7 | 16,145 | ||||||
Shionogi & Co Ltd (Japan) | 200 | 9,852 | ||||||
Sino Biopharmaceutical Ltd (Hong Kong) | 9,000 | 11,746 | ||||||
Smith & Nephew PLC (United Kingdom) | 350 | 6,166 | ||||||
Sonic Healthcare Ltd (Australia) | 160 | 2,405 | ||||||
Sonova Holding AG (Switzerland) | 20 | 3,566 | ||||||
STERIS PLC | 30 | 4,199 | ||||||
Straumann Holding AG (Switzerland) | 6 | 4,387 | ||||||
Sysco Corp | 555 | 25,325 | ||||||
Sysmex Corp (Japan) | 100 | 7,237 | ||||||
Takeda Pharmaceutical Co Ltd (Japan) | 530 | 16,138 | ||||||
TAL Education Group ADR (China) * | 183 | 9,747 | ||||||
The Clorox Co | 134 | 23,216 | ||||||
The Coca-Cola Co | 3,160 | 139,830 | ||||||
The Cooper Cos Inc | 18 | 4,962 | ||||||
The Estee Lauder Cos Inc ‘A’ | 85 | 13,544 | ||||||
The Hershey Co | 55 | 7,288 | ||||||
The JM Smucker Co | 120 | 13,320 | ||||||
The Kraft Heinz Co | 872 | 21,573 | ||||||
The Procter & Gamble Co | 1,651 | 181,610 | ||||||
Thermo Fisher Scientific Inc | 130 | 36,868 | ||||||
Toyo Suisan Kaisha Ltd (Japan) | 100 | 4,833 | ||||||
Tyson Foods Inc ‘A’ | 207 | 11,979 | ||||||
Unicharm Corp (Japan) | 400 | 14,974 | ||||||
Unilever NV (United Kingdom) | 1,174 | 57,704 | ||||||
Unilever PLC (United Kingdom) | 583 | 29,401 | ||||||
UnitedHealth Group Inc | 304 | 75,812 | ||||||
Universal Health Services Inc ‘B’ | 32 | 3,171 | ||||||
Universal Robina Corp (Philippines) | 1,420 | 2,905 | ||||||
Varian Medical Systems Inc * | 33 | 3,388 | ||||||
| See Notes to Financial Statements | See explanation of symbols and terms, if any, on B-58 |
B-38
Table of Contents
PACIFIC FUNDS
PACIFIC FUNDS DIVERSIFIED INCOME
Schedule of Investments (Continued)
March 31, 2020
| | |||||||
Verisk Analytics Inc | 45 | $ | 6,272 | |||||
West Pharmaceutical Services Inc | 27 | 4,111 | ||||||
WH Group Ltd (Hong Kong) ~ | 8,500 | 7,846 | ||||||
Wirecard AG (Germany) | 39 | 4,394 | ||||||
Woolworths Group Ltd (Australia) | 788 | 17,136 | ||||||
Woolworths Holdings Ltd (South Africa) | 1,276 | 1,967 | ||||||
Zimmer Biomet Holdings Inc | 83 | 8,390 | ||||||
|
| |||||||
| 4,085,656 | ||||||||
|
| |||||||
Diversified - 0.0% |
| |||||||
CK Hutchison Holdings Ltd (United Kingdom) | 1,000 | 6,665 | ||||||
|
| |||||||
Energy - 7.6% |
| |||||||
Antero Midstream Corp | 12,607 | 26,475 | ||||||
Apache Corp | 267 | 1,116 | ||||||
Baker Hughes Co | 422 | 4,431 | ||||||
BP Midstream Partners LP | 2,203 | 20,510 | ||||||
BP PLC (United Kingdom) | 5,197 | 21,313 | ||||||
Cabot Oil & Gas Corp | 342 | 5,879 | ||||||
Chevron Corp | 1,157 | 83,836 | ||||||
China Petroleum & Chemical Corp ‘H’ (China) | 14,000 | 6,841 | ||||||
China Shenhua Energy Co Ltd ‘H’ (China) | 4,000 | 7,558 | ||||||
CNOOC Ltd (China) | 8,000 | 8,313 | ||||||
ConocoPhillips | 994 | 30,615 | ||||||
Crestwood Equity Partners LP | 867 | 3,667 | ||||||
DCP Midstream LP | 3,770 | 15,344 | ||||||
Diamondback Energy Inc | 347 | 9,091 | ||||||
Enbridge Inc (Canada) | 3,140 | 91,343 | ||||||
Energy Transfer LP | 18,625 | 85,675 | ||||||
Eni SPA (Italy) | 816 | 8,109 | ||||||
EnLink Midstream LLC | 14,200 | 15,620 | ||||||
Enterprise Products Partners LP | 8,501 | 121,564 | ||||||
EOG Resources Inc | 405 | 14,548 | ||||||
EQM Midstream Partners LP | 4,735 | 55,873 | ||||||
Equinor ASA (Norway) | 260 | 3,241 | ||||||
Exxon Mobil Corp | 3,312 | 125,757 | ||||||
Gazprom PJSC ADR (Russia) | 6,842 | 31,027 | ||||||
Genesis Energy LP | 1,665 | 6,527 | ||||||
Halliburton Co | 590 | 4,042 | ||||||
Hess Corp | 156 | 5,195 | ||||||
Holly Energy Partners LP | 1,429 | 20,049 | ||||||
HollyFrontier Corp | 101 | 2,476 | ||||||
Inpex Corp (Japan) | 500 | 2,805 | ||||||
JXTG Holdings Inc (Japan) | 1,200 | 4,089 | ||||||
Kinder Morgan Inc | 6,847 | 95,310 | ||||||
LUKOIL PJSC ADR (Russia) | 448 | 26,401 | ||||||
Magellan Midstream Partners LP | 3,510 | 128,080 | ||||||
Marathon Petroleum Corp | 836 | 19,746 | ||||||
MPLX LP | 8,654 | 100,559 | ||||||
Noble Energy Inc | 309 | 1,866 | ||||||
Noble Midstream Partners LP | 362 | 1,267 | ||||||
Novatek PJSC GDR (Russia) | 87 | 9,865 | ||||||
Occidental Petroleum Corp | 942 | 10,908 | ||||||
ONEOK Inc | 3,290 | 71,755 | ||||||
PetroChina Co Ltd ‘H’ (China) | 12,000 | 4,349 | ||||||
Phillips 66 | 452 | 24,250 | ||||||
Phillips 66 Partners LP | 2,217 | 80,765 | ||||||
Pioneer Natural Resources Co | 219 | 15,363 | ||||||
Plains All American Pipeline LP | 11,684 | 61,692 | ||||||
Repsol SA (Spain) | 596 | 5,317 | ||||||
Royal Dutch Shell PLC ‘A’ (Netherlands) | 839 | 14,576 | ||||||
Royal Dutch Shell PLC ‘B’ (Netherlands) | 711 | 11,926 | ||||||
Schlumberger Ltd | 1,793 | 24,188 | ||||||
Shell Midstream Partners LP | 4,578 | 45,688 | ||||||
Sunoco LP | 1,700 | 26,588 | ||||||
Targa Resources Corp | 2,700 | 18,657 | ||||||
TC Pipelines LP | 998 | 27,425 | ||||||
The Williams Cos Inc | 6,929 | 98,045 | ||||||
TOTAL SA (France) | 607 | 22,871 | ||||||
| | |||||||
Valero Energy Corp | 408 | $ | 18,507 | |||||
Viper Energy Partners LP | 800 | 5,304 | ||||||
Woodside Petroleum Ltd (Australia) | 310 | 3,440 | ||||||
|
| |||||||
| 1,817,637 | ||||||||
|
| |||||||
Financial - 10.4% |
| |||||||
Aflac Inc | 921 | 31,535 | ||||||
AGNC Investment Corp REIT | 429 | 4,539 | ||||||
Alexandria Real Estate Equities Inc REIT | 59 | 8,087 | ||||||
Allianz SE (Germany) | 73 | 12,432 | ||||||
Ally Financial Inc | 598 | 8,629 | ||||||
American Campus Communities Inc REIT | 76 | 2,109 | ||||||
American International Group Inc | 719 | 17,436 | ||||||
American Tower Corp REIT | 46 | 10,017 | ||||||
Americold Realty Trust REIT | 87 | 2,961 | ||||||
Ameriprise Financial Inc | 136 | 13,937 | ||||||
Aon PLC | 76 | 12,543 | ||||||
Apartment Investment & Management Co ‘A’ REIT | 79 | 2,777 | ||||||
Aroundtown SA (Germany) | 1,058 | 5,296 | ||||||
Arthur J Gallagher & Co | 53 | 4,320 | ||||||
Associated Banc-Corp | 206 | 2,635 | ||||||
ASX Ltd (Australia) | 88 | 4,131 | ||||||
Australia & New Zealand Banking Group Ltd (Australia) | 475 | 4,982 | ||||||
AvalonBay Communities Inc REIT | 68 | 10,008 | ||||||
AXA SA (France) | 489 | 8,280 | ||||||
Axis Capital Holdings Ltd | 61 | 2,358 | ||||||
B3 SA - Brasil Bolsa Balcao (Brazil) | 2,900 | 19,885 | ||||||
Banco Bilbao Vizcaya Argentaria SA (Spain) | 1,301 | 4,029 | ||||||
Banco Santander SA (Spain) | 3,209 | 7,634 | ||||||
Bank of America Corp | 3,339 | 70,887 | ||||||
Bank Of China Ltd ‘H’ (China) | 13,000 | 4,949 | ||||||
Bank of Hawaii Corp | 42 | 2,320 | ||||||
Bank OZK | 130 | 2,171 | ||||||
BankUnited Inc | 98 | 1,833 | ||||||
Barclays PLC (United Kingdom) | 2,989 | 3,397 | ||||||
BB Seguridade Participacoes SA (Brazil) | 1,100 | 5,314 | ||||||
BlackRock Inc | 139 | 61,156 | ||||||
BNP Paribas SA (France) | 202 | 5,897 | ||||||
Boston Properties Inc REIT | 49 | 4,519 | ||||||
Brown & Brown Inc | 72 | 2,608 | ||||||
Camden Property Trust REIT | 45 | 3,566 | ||||||
CapitaLand Commercial Trust REIT (Singapore) | 3,200 | 3,434 | ||||||
CapitaLand Mall Trust REIT (Singapore) | 3,200 | 4,012 | ||||||
Cboe Global Markets Inc | 32 | 2,856 | ||||||
CBRE Group Inc ‘A’ * | 83 | 3,130 | ||||||
China Construction Bank Corp ‘H’ (China) | 18,000 | 14,631 | ||||||
China Evergrande Group (China) | 3,000 | 4,917 | ||||||
China Jinmao Holdings Group Ltd (China) | 6,000 | 3,825 | ||||||
China Overseas Land & Investment Ltd (China) | 8,000 | 24,527 | ||||||
China Resources Land Ltd (China) | 6,000 | 24,489 | ||||||
China Vanke Co Ltd ‘H’ (China) | 1,100 | 3,583 | ||||||
Cincinnati Financial Corp | 86 | 6,489 | ||||||
CIT Group Inc | 101 | 1,743 | ||||||
CITIC Ltd (China) | 9,000 | 9,328 | ||||||
Citigroup Inc | 1,447 | 60,948 | ||||||
Citizens Financial Group Inc | 516 | 9,706 | ||||||
CK Asset Holdings Ltd (Hong Kong) | 3,500 | 18,990 | ||||||
CME Group Inc | 138 | 23,862 | ||||||
Comerica Inc | 827 | 24,264 | ||||||
Commonwealth Bank Of Australia (Australia) | 308 | 11,621 | ||||||
CoreSite Realty Corp REIT | 25 | 2,898 | ||||||
Country Garden Holdings Co Ltd (China) | 12,000 | 14,346 | ||||||
Cousins Properties Inc REIT | 100 | 2,927 | ||||||
Crown Castle International Corp REIT | 185 | 26,714 | ||||||
CubeSmart REIT | 101 | 2,706 | ||||||
Cullen/Frost Bankers Inc | 72 | 4,017 | ||||||
CyrusOne Inc REIT | 61 | 3,767 | ||||||
Daito Trust Construction Co Ltd (Japan) | 130 | 12,072 | ||||||
DBS Group Holdings Ltd (Singapore) | 800 | 10,439 | ||||||
| See Notes to Financial Statements | See explanation of symbols and terms, if any, on B-58 |
B-39
Table of Contents
PACIFIC FUNDS
PACIFIC FUNDS DIVERSIFIED INCOME
Schedule of Investments (Continued)
March 31, 2020
| | |||||||
Dexus REIT (Australia) | 521 | $ | 2,887 | |||||
Digital Realty Trust Inc REIT | 115 | 15,975 | ||||||
Discover Financial Services | 317 | 11,307 | ||||||
Douglas Emmett Inc REIT | 96 | 2,929 | ||||||
Duke Realty Corp REIT | 162 | 5,246 | ||||||
East West Bancorp Inc | 97 | 2,497 | ||||||
Eaton Vance Corp | 192 | 6,192 | ||||||
EPR Properties REIT | 46 | 1,114 | ||||||
Equinix Inc REIT | 7 | 4,372 | ||||||
Equitable Holdings Inc | 217 | 3,136 | ||||||
Equity Residential REIT | 193 | 11,910 | ||||||
Erie Indemnity Co ‘A’ | 20 | 2,965 | ||||||
Essex Property Trust Inc REIT | 22 | 4,845 | ||||||
Everest Re Group Ltd | 28 | 5,388 | ||||||
Extra Space Storage Inc REIT | 40 | 3,830 | ||||||
Federal Realty Investment Trust REIT | 27 | 2,014 | ||||||
Fidelity National Financial Inc | 191 | 4,752 | ||||||
Fifth Third Bancorp | 1,035 | 15,370 | ||||||
First American Financial Corp | 111 | 4,708 | ||||||
First Hawaiian Inc | 124 | 2,050 | ||||||
First Horizon National Corp | 376 | 3,031 | ||||||
First Republic Bank | 47 | 3,867 | ||||||
Franklin Resources Inc | 365 | 6,092 | ||||||
Gaming and Leisure Properties Inc REIT | 107 | 2,965 | ||||||
Gecina SA REIT (France) | 26 | 3,421 | ||||||
Healthcare Trust of America Inc ‘A’ REIT | 115 | 2,792 | ||||||
Healthpeak Properties Inc REIT | 259 | 6,177 | ||||||
Henderson Land Development Co Ltd (Hong Kong) | 3,000 | 11,355 | ||||||
Highwoods Properties Inc REIT | 78 | 2,763 | ||||||
Hong Kong Exchanges & Clearing Ltd (Hong Kong) | 600 | 17,976 | ||||||
Hongkong Land Holdings Ltd (Hong Kong) | 2,000 | 7,483 | ||||||
Host Hotels & Resorts Inc REIT | 219 | 2,418 | ||||||
HSBC Holdings PLC (United Kingdom) | 3,693 | 20,732 | ||||||
Hudson Pacific Properties Inc REIT | 106 | 2,688 | ||||||
Huntington Bancshares Inc | 892 | 7,323 | ||||||
Industrial & Commercial Bank of China Ltd ‘H’ (China) | 13,000 | 8,868 | ||||||
ING Groep NV (Netherlands) | 449 | 2,301 | ||||||
Intercontinental Exchange Inc | 176 | 14,212 | ||||||
Intesa Sanpaolo SPA (Italy) | 1,926 | 3,116 | ||||||
Invesco Ltd | 804 | 7,300 | ||||||
Iron Mountain Inc REIT | 170 | 4,046 | ||||||
Janus Henderson Group PLC (United Kingdom) | 200 | 3,064 | ||||||
Japan Post Bank Co Ltd (Japan) | 500 | 4,618 | ||||||
JBG SMITH Properties REIT | 79 | 2,515 | ||||||
Jefferies Financial Group Inc | 447 | 6,110 | ||||||
JPMorgan Chase & Co | 929 | 83,638 | ||||||
KBC Group NV (Belgium) | 53 | 2,405 | ||||||
KeyCorp | 1,108 | 11,490 | ||||||
Kilroy Realty Corp REIT | 51 | 3,249 | ||||||
Kimco Realty Corp REIT | 213 | 2,060 | ||||||
Lamar Advertising Co ‘A’ REIT | 45 | 2,308 | ||||||
Lazard Ltd ‘A’ | 104 | 2,450 | ||||||
Life Storage Inc REIT | 27 | 2,553 | ||||||
Lincoln National Corp | 837 | 22,030 | ||||||
Link REIT (Hong Kong) | 2,500 | 21,071 | ||||||
Lloyds Banking Group PLC (United Kingdom) | 13,795 | 5,393 | ||||||
Longfor Group Holdings Ltd (China) ~ | 3,000 | 14,439 | ||||||
M&T Bank Corp | 104 | 10,757 | ||||||
Macquarie Group Ltd (Australia) | 44 | 2,343 | ||||||
Marsh & McLennan Cos Inc | 176 | 15,217 | ||||||
Mastercard Inc ‘A’ | 227 | 54,834 | ||||||
Medical Properties Trust Inc REIT | 191 | 3,302 | ||||||
MetLife Inc | 678 | 20,726 | ||||||
Mid-America Apartment Communities Inc REIT | 56 | 5,770 | ||||||
Mitsubishi Estate Co Ltd (Japan) | 400 | 5,908 | ||||||
Mitsubishi UFJ Financial Group Inc (Japan) | 1,700 | 6,361 | ||||||
Mitsui Fudosan Co Ltd (Japan) | 300 | 5,194 | ||||||
Mizuho Financial Group Inc (Japan) | 3,400 | 3,901 | ||||||
Morgan Stanley | 1,392 | 47,328 | ||||||
| | |||||||
Muenchener Rueckversicherungs-Gesellschaft AG (Germany) | 27 | $ | 5,429 | |||||
Nasdaq Inc | 35 | 3,323 | ||||||
National Australia Bank Ltd (Australia) | 423 | 4,339 | ||||||
National Retail Properties Inc REIT | 92 | 2,961 | ||||||
New World Development Co Ltd (Hong Kong) | 7,000 | 7,464 | ||||||
New York Community Bancorp Inc | 353 | 3,315 | ||||||
Nordea Bank Abp (Finland) | 902 | 5,074 | ||||||
Northern Trust Corp | 227 | 17,129 | ||||||
Old Republic International Corp | 191 | 2,913 | ||||||
Omega Healthcare Investors Inc REIT | 131 | 3,477 | ||||||
Oversea-Chinese Banking Corp Ltd (Singapore) | 1,300 | 7,877 | ||||||
P.T. Bank Central Asia Tbk (Indonesia) | 10,400 | 17,523 | ||||||
P.T. Bank Rakyat Indonesia Persero Tbk (Indonesia) | 65,800 | 12,068 | ||||||
PacWest Bancorp | 231 | 4,140 | ||||||
Partners Group Holding AG (Switzerland) | 15 | 10,270 | ||||||
People’s United Financial Inc | 282 | 3,116 | ||||||
PICC Property & Casualty Co Ltd ‘H’ (China) | 6,000 | 5,745 | ||||||
Ping An Insurance Group Co of China Ltd ‘H’ (China) | 5,000 | 48,831 | ||||||
Popular Inc (Puerto Rico) | 90 | 3,150 | ||||||
Principal Financial Group Inc | 697 | 21,844 | ||||||
Prologis Inc REIT | 437 | 35,122 | ||||||
Prosperity Bancshares Inc | 68 | 3,281 | ||||||
Prudential Financial Inc | 1,231 | 64,184 | ||||||
Public Bank Bhd (Malaysia) | 3,000 | 11,036 | ||||||
Public Storage REIT | 122 | 24,230 | ||||||
Realty Income Corp REIT | 160 | 7,978 | ||||||
Regency Centers Corp REIT | 80 | 3,074 | ||||||
Regions Financial Corp | 1,123 | 10,073 | ||||||
Reinsurance Group of America Inc | 39 | 3,281 | ||||||
RMB Holdings Ltd (South Africa) | 890 | 2,434 | ||||||
Sampo Oyj ‘A’ (Finland) | 393 | 11,338 | ||||||
Sanlam Ltd (South Africa) | 1,695 | 4,827 | ||||||
Santander Consumer USA Holdings Inc | 139 | 1,933 | ||||||
Shimao Property Holdings Ltd (China) | 2,500 | 8,664 | ||||||
Simon Property Group Inc REIT | 151 | 8,284 | ||||||
Sino Land Co Ltd (Hong Kong) | 6,000 | 7,551 | ||||||
Skandinaviska Enskilda Banken AB ‘A’ (Sweden) * | 411 | 2,752 | ||||||
SL Green Realty Corp REIT | 45 | 1,940 | ||||||
Spirit Realty Capital Inc REIT | 63 | 1,647 | ||||||
Standard Bank Group Ltd (South Africa) | 1,513 | 8,659 | ||||||
Starwood Property Trust Inc REIT | 171 | 1,753 | ||||||
State Street Corp | 466 | 24,824 | ||||||
STORE Capital Corp REIT | 102 | 1,848 | ||||||
Sumitomo Mitsui Financial Group Inc (Japan) | 200 | 4,859 | ||||||
Sun Hung Kai Properties Ltd (Hong Kong) | 2,000 | 26,148 | ||||||
Sunac China Holdings Ltd (China) | 2,000 | 9,122 | ||||||
Svenska Handelsbanken AB ‘A’ (Sweden) * | 380 | 3,134 | ||||||
Swedbank AB ‘A’ (Sweden) | 236 | 2,603 | ||||||
Swire Properties Ltd (Hong Kong) | 3,000 | 8,381 | ||||||
Swiss Life Holding AG (Switzerland) | 10 | 3,356 | ||||||
Swiss Prime Site AG (Switzerland) | 45 | 4,380 | ||||||
Swiss Re AG (Switzerland) | 105 | 8,085 | ||||||
Synchrony Financial | 1,169 | 18,809 | ||||||
Synovus Financial Corp | 148 | 2,599 | ||||||
T Rowe Price Group Inc | 260 | 25,389 | ||||||
TCF Financial Corp | 175 | 3,966 | ||||||
The Bank of New York Mellon Corp | 2,132 | 71,806 | ||||||
The Goldman Sachs Group Inc | 392 | 60,599 | ||||||
The Hartford Financial Services Group Inc | 286 | 10,079 | ||||||
The PNC Financial Services Group Inc | 427 | 40,872 | ||||||
The Travelers Cos Inc | 387 | 38,448 | ||||||
The Western Union Co | 456 | 8,267 | ||||||
Tokio Marine Holdings Inc (Japan) | 100 | 4,575 | ||||||
Truist Financial Corp | 1,545 | 47,648 | ||||||
UBS Group AG (Switzerland) | 755 | 6,920 | ||||||
UDR Inc REIT | 142 | 5,189 | ||||||
Unibail-Rodamco-Westfield REIT (France) | 38 | 2,178 | ||||||
United Overseas Bank Ltd (Singapore) | 500 | 6,860 | ||||||
Unum Group | 1,145 | 17,186 | ||||||
| See Notes to Financial Statements | See explanation of symbols and terms, if any, on B-58 |
B-40
Table of Contents
PACIFIC FUNDS
PACIFIC FUNDS DIVERSIFIED INCOME
Schedule of Investments (Continued)
March 31, 2020
| | |||||||
US Bancorp | 1,385 | $ | 47,713 | |||||
Ventas Inc REIT | 104 | 2,787 | ||||||
VEREIT Inc REIT | 536 | 2,621 | ||||||
VICI Properties Inc REIT | 254 | 4,227 | ||||||
Visa Inc ‘A’ | 427 | 68,798 | ||||||
Vonovia SE (Germany) | 203 | 10,098 | ||||||
Vornado Realty Trust REIT | 67 | 2,426 | ||||||
Wells Fargo & Co | 2,838 | 81,451 | ||||||
Welltower Inc REIT | 385 | 17,625 | ||||||
Western Alliance Bancorp | 85 | 2,602 | ||||||
Westpac Banking Corp (Australia) | 602 | 6,183 | ||||||
Weyerhaeuser Co REIT | 438 | 7,424 | ||||||
Wharf Real Estate Investment Co Ltd (Hong Kong) | 1,000 | 4,079 | ||||||
WP Carey Inc REIT | 79 | 4,588 | ||||||
Zions Bancorp NA | 323 | 8,643 | ||||||
Zurich Insurance Group AG (Switzerland) | 52 | 18,268 | ||||||
|
| |||||||
| 2,502,557 | ||||||||
|
| |||||||
Industrial - 6.8% |
| |||||||
3M Co | 699 | 95,420 | ||||||
AAC Technologies Holdings Inc (China) | 1,000 | 5,100 | ||||||
ABB Ltd (Switzerland) | 1,973 | 34,293 | ||||||
Airports of Thailand PCL NVDR (Thailand) | 12,300 | 18,932 | ||||||
AMETEK Inc | 68 | 4,897 | ||||||
Amphenol Corp ‘A’ | 105 | 7,652 | ||||||
Anhui Conch Cement Co Ltd ‘H’ (China) | 2,000 | 13,739 | ||||||
Atlas Copco AB ‘A’ (Sweden) | 270 | 8,979 | ||||||
Atlas Copco AB ‘B’ (Sweden) | 145 | 4,218 | ||||||
Bouygues SA (France) | 95 | 2,757 | ||||||
Caterpillar Inc | 480 | 55,699 | ||||||
CH Robinson Worldwide Inc | 153 | 10,129 | ||||||
China Conch Venture Holdings Ltd (China) | 1,500 | 6,652 | ||||||
Cie de Saint-Gobain (France) | 245 | 5,879 | ||||||
ComfortDelGro Corp Ltd (Singapore) | 3,300 | 3,514 | ||||||
Crane Co | 46 | 2,262 | ||||||
CRH PLC (Ireland) | 160 | 4,327 | ||||||
Crown Holdings Inc * | 207 | 12,014 | ||||||
Deutsche Post AG (Germany) | 372 | 9,973 | ||||||
Disco Corp (Japan) | 20 | 3,891 | ||||||
DSV PANALPINA AS (Denmark) | 77 | 7,002 | ||||||
Eaton Corp PLC | 335 | 26,026 | ||||||
Emerson Electric Co | 705 | 33,593 | ||||||
Evoqua Water Technologies Corp * | 1,343 | 15,055 | ||||||
Expeditors International of Washington Inc | 50 | 3,336 | ||||||
FANUC Corp (Japan) | 140 | 18,708 | ||||||
Fortive Corp | 87 | 4,802 | ||||||
Garmin Ltd | 102 | 7,646 | ||||||
Geberit AG (Switzerland) | 17 | 7,449 | ||||||
General Dynamics Corp | 282 | 37,311 | ||||||
Grupo Aeroportuario del Pacifico SAB de CV ‘B’ (Mexico) | 1,933 | 10,451 | ||||||
Hexagon AB ‘B’ (Sweden) | 106 | 4,482 | ||||||
Hirose Electric Co Ltd (Japan) | 40 | 4,124 | ||||||
Hitachi Ltd (Japan) | 420 | 12,065 | ||||||
Honeywell International Inc | 697 | 93,252 | ||||||
Hoya Corp (Japan) | 310 | 26,360 | ||||||
Hubbell Inc | 90 | 10,327 | ||||||
IDEX Corp | 22 | 3,038 | ||||||
Illinois Tool Works Inc | 394 | 55,995 | ||||||
Jacobs Engineering Group Inc | 37 | 2,933 | ||||||
Johnson Controls International PLC | 645 | 17,389 | ||||||
JSR Corp (Japan) | 300 | 5,483 | ||||||
Keyence Corp (Japan) | 140 | 45,012 | ||||||
Kingspan Group PLC (Ireland) | 59 | 3,182 | ||||||
Komatsu Ltd (Japan) | 400 | 6,473 | ||||||
Kone OYJ ‘B’ (Finland) | 125 | 7,000 | ||||||
Kuehne + Nagel International AG (Switzerland) | 60 | 8,173 | ||||||
Kyocera Corp (Japan) | 100 | 5,901 | ||||||
L3Harris Technologies Inc | 66 | 11,888 | ||||||
LafargeHolcim Ltd (Switzerland) | 308 | 11,240 | ||||||
| | |||||||
Legrand SA (France) | 114 | $ | 7,271 | |||||
Lincoln Electric Holdings Inc | 66 | 4,554 | ||||||
Lockheed Martin Corp | 249 | 84,399 | ||||||
Makita Corp (Japan) | 200 | 6,101 | ||||||
Mettler-Toledo International Inc * | 10 | 6,905 | ||||||
MISUMI Group Inc (Japan) | 300 | 6,489 | ||||||
Mitsubishi Electric Corp (Japan) | 900 | 10,995 | ||||||
Mitsubishi Heavy Industries Ltd (Japan) | 100 | 2,520 | ||||||
MTR Corp Ltd (Hong Kong) | 1,000 | 5,144 | ||||||
MTU Aero Engines AG (Germany) | 20 | 2,892 | ||||||
Murata Manufacturing Co Ltd (Japan) | 200 | 9,943 | ||||||
Nabtesco Corp (Japan) | 200 | 4,575 | ||||||
National Instruments Corp | 120 | 3,970 | ||||||
Norfolk Southern Corp | 267 | 38,982 | ||||||
nVent Electric PLC | 160 | 2,699 | ||||||
Old Dominion Freight Line Inc | 24 | 3,150 | ||||||
Omron Corp (Japan) | 100 | 5,170 | ||||||
Packaging Corp of America | 65 | 5,644 | ||||||
Raytheon Co | 94 | 12,328 | ||||||
Rockwell Automation Inc | 136 | 20,524 | ||||||
Roper Technologies Inc | 34 | 10,602 | ||||||
Ryder System Inc | 137 | 3,622 | ||||||
Schindler Holding AG (Switzerland) | 15 | 3,282 | ||||||
Schneider Electric SE (France) | 204 | 17,243 | ||||||
Siemens AG (Germany) | 208 | 17,417 | ||||||
Sika AG (Switzerland) | 51 | 8,375 | ||||||
Skanska AB ‘B’ (Sweden) * | 399 | 6,005 | ||||||
SKF AB ‘B’ (Sweden) | 254 | 3,461 | ||||||
SMC Corp (Japan) | 40 | 16,770 | ||||||
Smiths Group PLC (United Kingdom) | 282 | 4,252 | ||||||
Snap-on Inc | 77 | 8,379 | ||||||
Sonoco Products Co | 90 | 4,172 | ||||||
Stanley Black & Decker Inc | 44 | 4,400 | ||||||
Sunny Optical Technology Group Co Ltd (China) | 300 | 3,968 | ||||||
TDK Corp (Japan) | 50 | 3,844 | ||||||
Techtronic Industries Co Ltd (Hong Kong) | 500 | 3,175 | ||||||
Teledyne Technologies Inc * | 9 | 2,675 | ||||||
The Boeing Co | 482 | 71,885 | ||||||
Trane Technologies PLC | 60 | 4,955 | ||||||
Trinity Industries Inc | 139 | 2,234 | ||||||
Union Pacific Corp | 711 | 100,279 | ||||||
United Parcel Service Inc ‘B’ | 942 | 88,002 | ||||||
United Technologies Corp * | 786 | 74,143 | ||||||
Venture Corp Ltd (Singapore) | 500 | 4,763 | ||||||
Vinci SA (France) | 418 | 34,155 | ||||||
Wartsila OYJ Abp (Finland) | 344 | 2,512 | ||||||
Waters Corp * | 26 | 4,733 | ||||||
WEG SA (Brazil) | 1,900 | 12,235 | ||||||
Westinghouse Air Brake Technologies Corp | 47 | 2,262 | ||||||
Westrock Co | 640 | 18,086 | ||||||
Xylem Inc | 280 | 18,236 | ||||||
ZTO Express Cayman Inc ADR (China) | 471 | 12,472 | ||||||
|
| |||||||
| 1,632,872 | ||||||||
|
| |||||||
Technology - 5.9% |
| |||||||
Accenture PLC ‘A’ | 238 | 38,856 | ||||||
Activision Blizzard Inc | 202 | 12,015 | ||||||
Adobe Inc * | 146 | 46,463 | ||||||
Akamai Technologies Inc * | 47 | 4,300 | ||||||
Analog Devices Inc | 318 | 28,509 | ||||||
ANSYS Inc * | 24 | 5,579 | ||||||
Apple Inc | 580 | 147,488 | ||||||
ASM Pacific Technology Ltd (Hong Kong) | 200 | 1,854 | ||||||
ASML Holding NV (Netherlands) | 171 | 45,078 | ||||||
Atos SE (France) | 69 | 4,597 | ||||||
Broadcom Inc | 336 | 79,666 | ||||||
Broadridge Financial Solutions Inc | 34 | 3,224 | ||||||
Cadence Design Systems Inc * | 63 | 4,161 | ||||||
Canon Inc (Japan) | 400 | 8,692 | ||||||
Cerner Corp | 106 | 6,677 | ||||||
| See Notes to Financial Statements | See explanation of symbols and terms, if any, on B-58 |
B-41
Table of Contents
PACIFIC FUNDS
PACIFIC FUNDS DIVERSIFIED INCOME
Schedule of Investments (Continued)
March 31, 2020
| | |||||||
Check Point Software Technologies Ltd (Israel) * | 42 | $ | 4,223 | |||||
Citrix Systems Inc | 46 | 6,511 | ||||||
Cognizant Technology Solutions Corp ‘A’ | 168 | 7,807 | ||||||
Dassault Systemes SE (France) | 43 | 6,278 | ||||||
DXC Technology Co | 220 | 2,871 | ||||||
EPAM Systems Inc * | 13 | 2,414 | ||||||
Fiserv Inc * | 140 | 13,299 | ||||||
Fortinet Inc * | 32 | 3,237 | ||||||
FUJIFILM Holdings Corp (Japan) | 200 | 9,856 | ||||||
Fujitsu Ltd (Japan) | 100 | 9,007 | ||||||
Hamamatsu Photonics KK (Japan) | 100 | 4,063 | ||||||
Hewlett Packard Enterprise Co | 2,077 | 20,168 | ||||||
HP Inc | 1,272 | 22,082 | ||||||
Infineon Technologies AG (Germany) | 488 | 7,045 | ||||||
Infosys Ltd ADR (India) | 2,503 | 20,550 | ||||||
Ingenico Group SA (France) | 24 | 2,509 | ||||||
Intel Corp | 2,610 | 141,253 | ||||||
International Business Machines Corp | 886 | 98,284 | ||||||
Intuit Inc | 76 | 17,480 | ||||||
Jack Henry & Associates Inc | 22 | 3,415 | ||||||
KLA Corp | 101 | 14,518 | ||||||
Maxim Integrated Products Inc | 365 | 17,743 | ||||||
Microsoft Corp | 972 | 153,294 | ||||||
NEC Corp (Japan) | 100 | 3,641 | ||||||
NetApp Inc | 255 | 10,631 | ||||||
NetEase Inc ADR (China) | 30 | 9,629 | ||||||
Nexon Co Ltd (Japan) | 500 | 8,170 | ||||||
Nomura Research Institute Ltd (Japan) | 400 | 8,449 | ||||||
NVIDIA Corp | 169 | 44,548 | ||||||
Obic Co Ltd (Japan) | 50 | 6,514 | ||||||
Oracle Corp | 557 | 26,920 | ||||||
Otsuka Corp (Japan) | 100 | 4,263 | ||||||
Paychex Inc | 323 | 20,323 | ||||||
Paycom Software Inc * | 12 | 2,424 | ||||||
QUALCOMM Inc | 777 | 52,564 | ||||||
SAP SE (Germany) | 536 | 59,843 | ||||||
Skyworks Solutions Inc | 50 | 4,469 | ||||||
Synopsys Inc * | 42 | 5,409 | ||||||
Texas Instruments Inc | 899 | 89,837 | ||||||
The Sage Group PLC (United Kingdom) | 361 | 2,625 | ||||||
Tokyo Electron Ltd (Japan) | 60 | 11,182 | ||||||
Tyler Technologies Inc * | 11 | 3,262 | ||||||
Veeva Systems Inc ‘A’ * | 44 | 6,880 | ||||||
Western Digital Corp | 220 | 9,156 | ||||||
Xerox Holdings Corp | 146 | 2,765 | ||||||
Xilinx Inc | 71 | 5,534 | ||||||
|
| |||||||
| 1,424,104 | ||||||||
|
| |||||||
Utilities - 1.3% |
| |||||||
AES Corp | 218 | 2,965 | ||||||
Alliant Energy Corp | 65 | 3,139 | ||||||
Ameren Corp | 59 | 4,297 | ||||||
American Electric Power Co Inc | 90 | 7,198 | ||||||
CenterPoint Energy Inc | 211 | 3,260 | ||||||
CLP Holdings Ltd (Hong Kong) | 500 | 4,580 | ||||||
CMS Energy Corp | 73 | 4,289 | ||||||
Consolidated Edison Inc | 62 | 4,836 | ||||||
Dominion Energy Inc | 309 | 22,307 | ||||||
DTE Energy Co | 31 | 2,944 | ||||||
Duke Energy Corp | 166 | 13,426 | ||||||
E.ON SE (Germany) | 420 | 4,308 | ||||||
Edison International | 80 | 4,383 | ||||||
EDP - Energias de Portugal SA (Portugal) | 1,854 | 7,459 | ||||||
Enagas SA (Spain) | 175 | 3,452 | ||||||
Enel SPA (Italy) | 1,967 | 13,568 | ||||||
Engie SA (France) | 574 | 5,878 | ||||||
Entergy Corp | 55 | 5,168 | ||||||
Evergy Inc | 77 | 4,239 | ||||||
Eversource Energy | 62 | 4,849 | ||||||
Exelon Corp | 184 | 6,773 | ||||||
| | |||||||
FirstEnergy Corp | 81 | $ | 3,246 | |||||
Guangdong Investment Ltd (China) | 12,000 | 23,029 | ||||||
Hawaiian Electric Industries Inc | 62 | 2,669 | ||||||
Hong Kong & China Gas Co Ltd (Hong Kong) | 5,000 | 8,187 | ||||||
Iberdrola SA (Spain) | 3,159 | 30,898 | ||||||
National Grid PLC (United Kingdom) | 1,115 | 13,028 | ||||||
OGE Energy Corp | 76 | 2,335 | ||||||
Pinnacle West Capital Corp | 33 | 2,501 | ||||||
PPL Corp | 160 | 3,949 | ||||||
Public Service Enterprise Group Inc | 90 | 4,042 | ||||||
Red Electrica Corp SA (Spain) | 381 | 6,846 | ||||||
Sempra Energy | 60 | 6,779 | ||||||
Snam SPA (Italy) | 1,431 | 6,540 | ||||||
SSE PLC (United Kingdom) | 295 | 4,740 | ||||||
The Southern Co | 236 | 12,777 | ||||||
Veolia Environnement SA (France) | 134 | 2,830 | ||||||
WEC Energy Group Inc | 59 | 5,200 | ||||||
Western Midstream Partners LP | 6,806 | 22,051 | ||||||
Xcel Energy Inc | 93 | 5,608 | ||||||
|
| |||||||
| 300,573 | ||||||||
|
| |||||||
Total Common Stocks |
| 15,215,627 | ||||||
|
| |||||||
EXCHANGE-TRADED FUNDS - 1.9% |
| |||||||
iShares MSCI India | 3,053 | 73,608 | ||||||
iShares MSCI South Korea | 4,569 | 214,378 | ||||||
iShares MSCI Taiwan | 5,054 | 166,630 | ||||||
|
| |||||||
Total Exchange-Traded Funds |
| 454,616 | ||||||
|
| |||||||
Principal | ||||||||
CORPORATE BONDS & NOTES - 20.8% |
| |||||||
Basic Materials - 0.7% | ||||||||
Anglo American Capital PLC (South Africa) | $50,000 | 50,853 | ||||||
Hecla Mining Co | 50,000 | 44,400 | ||||||
Hexion Inc | 25,000 | 21,439 | ||||||
JW Aluminum Continuous Cast Co | 25,000 | 21,964 | ||||||
Novelis Corp | 25,000 | 22,391 | ||||||
|
| |||||||
| 161,047 | ||||||||
|
| |||||||
Communications - 1.0% |
| |||||||
Charter Communications Operating LLC | 100,000 | 102,882 | ||||||
Diamond Sports Group LLC | 75,000 | 50,573 | ||||||
Front Range BidCo Inc | 25,000 | 24,062 | ||||||
Sprint Corp | 50,000 | 55,707 | ||||||
|
| |||||||
| 233,224 | ||||||||
|
| |||||||
Consumer, Cyclical - 2.6% |
| |||||||
American Airlines Pass-Through Trust ‘A’ | 49,230 | 41,389 | ||||||
American Airlines Pass-Through Trust ‘AA’ | 49,230 | 45,002 | ||||||
Ashton Woods USA LLC | 50,000 | 39,875 | ||||||
| See Notes to Financial Statements | See explanation of symbols and terms, if any, on B-58 |
B-42
Table of Contents
PACIFIC FUNDS
PACIFIC FUNDS DIVERSIFIED INCOME
Schedule of Investments (Continued)
March 31, 2020
Principal | | |||||||
Beazer Homes USA Inc | $ | 25,000 | $ | 19,064 | ||||
7.250% due 10/15/29 | 25,000 | 19,189 | ||||||
Caesars Resort Collection LLC | 50,000 | 36,485 | ||||||
Constellation Merger Sub Inc | 50,000 | 30,437 | ||||||
Core & Main Holdings LP | 25,000 | 23,094 | ||||||
General Motors Financial Co Inc | 75,000 | 67,318 | ||||||
Golden Nugget Inc | 50,000 | 31,868 | ||||||
Hasbro Inc | 50,000 | 47,821 | ||||||
Hyundai Capital America | 50,000 | 49,098 | ||||||
Las Vegas Sands Corp | 50,000 | 45,846 | ||||||
Michaels Stores Inc | 50,000 | 37,277 | ||||||
Scientific Games International Inc | 50,000 | 32,287 | ||||||
Tesla Inc | 75,000 | 70,969 | ||||||
|
| |||||||
| 637,019 | ||||||||
|
| |||||||
Consumer,Non-Cyclical - 3.0% |
| |||||||
AbbVie Inc | 50,000 | 51,063 | ||||||
Ahern Rentals Inc | 75,000 | 43,406 | ||||||
Allied Universal Holdco LLC | 50,000 | 47,468 | ||||||
Anheuser-Busch InBev Worldwide Inc (Belgium) | 75,000 | 82,631 | ||||||
Centene Corp | 25,000 | 25,186 | ||||||
Charles River Laboratories International Inc | 50,000 | 48,472 | ||||||
CVS Health Corp | 50,000 | 52,203 | ||||||
Garda World Security Corp (Canada) | 19,000 | 17,090 | ||||||
HCA Inc | 50,000 | 51,924 | ||||||
Kraft Heinz Foods Co | 25,000 | 24,626 | ||||||
5.000% due 07/15/35 | 25,000 | 25,023 | ||||||
5.200% due 07/15/45 | 25,000 | 24,178 | ||||||
Pilgrim’s Pride Corp | 50,000 | 50,097 | ||||||
Select Medical Corp | 50,000 | 50,275 | ||||||
Sysco Corp | 50,000 | 54,514 | ||||||
TMS International Holding Corp | 50,000 | 45,437 | ||||||
Verscend Escrow Corp | 25,000 | 25,142 | ||||||
|
| |||||||
| 718,735 | ||||||||
|
| |||||||
Energy - 3.4% |
| |||||||
Antero Resources Corp | 45,000 | 32,983 | ||||||
Ascent Resources Utica Holdings LLC | 50,000 | 27,124 | ||||||
Callon Petroleum Co | 50,000 | 8,427 | ||||||
Principal | | |||||||
Cheniere Corpus Christi Holdings LLC | $ | 50,000 | $ | 44,954 | ||||
Endeavor Energy Resources LP | 75,000 | 51,416 | ||||||
Energy Transfer Operating LP | 50,000 | 39,398 | ||||||
4.750% due 01/15/26 | 100,000 | 88,557 | ||||||
6.250% due 02/15/23 | 50,000 | 24,837 | ||||||
Enterprise Products Operating LLC | 50,000 | 45,719 | ||||||
Global Partners LP | 55,000 | 41,720 | ||||||
Kinder Morgan Energy Partners LP | 100,000 | 100,130 | ||||||
Moss Creek Resources Holdings Inc | 50,000 | 14,927 | ||||||
MPLX LP | 100,000 | 89,079 | ||||||
6.875% due 02/15/23 | 50,000 | 30,524 | ||||||
ONEOK Inc | 50,000 | 38,052 | ||||||
Range Resources Corp | 25,000 | 15,141 | ||||||
Sabine Pass Liquefaction LLC | 50,000 | 45,979 | ||||||
SM Energy Co | 25,000 | 7,714 | ||||||
Targa Resources Partners LP | 75,000 | 64,500 | ||||||
|
| |||||||
| 811,181 | ||||||||
|
| |||||||
Financial - 6.4% |
| |||||||
Air Lease Corp | 25,000 | 19,678 | ||||||
Athene Holding Ltd | 75,000 | 74,856 | ||||||
Avolon Holdings Funding Ltd (Ireland) | 50,000 | 39,416 | ||||||
Bank of America Corp | 175,000 | 181,299 | ||||||
Citigroup Inc | 175,000 | 188,534 | ||||||
CNO Financial Group Inc | 50,000 | 48,823 | ||||||
Crown Castle International Corp REIT | 50,000 | 49,450 | ||||||
Host Hotels & Resorts LP REIT | 50,000 | 42,265 | ||||||
Iron Mountain Inc REIT | 25,000 | 23,659 | ||||||
JPMorgan Chase & Co | 100,000 | 109,577 | ||||||
KeyCorp | 75,000 | 67,768 | ||||||
Morgan Stanley | 50,000 | 52,505 | ||||||
5.000% due 11/24/25 | 100,000 | 110,731 | ||||||
Service Properties Trust REIT | 75,000 | 56,987 | ||||||
Springleaf Finance Corp | 25,000 | 23,027 | ||||||
7.125% due 03/15/26 | 25,000 | 24,609 | ||||||
The Goldman Sachs Group Inc | 150,000 | 153,633 | ||||||
Ventas Realty LP REIT | 50,000 | 49,211 | ||||||
VICI Properties LP REIT | 25,000 | 23,703 | ||||||
4.625% due 12/01/29 ~ | 25,000 | 22,889 | ||||||
| See Notes to Financial Statements | See explanation of symbols and terms, if any, on B-58 |
B-43
Table of Contents
PACIFIC FUNDS
PACIFIC FUNDS DIVERSIFIED INCOME
Schedule of Investments (Continued)
March 31, 2020
Principal | | |||||||
Wells Fargo & Co | $ | 75,000 | $ | 95,909 | ||||
Weyerhaeuser Co REIT | 75,000 | 75,457 | ||||||
|
| |||||||
| 1,533,986 | ||||||||
|
| |||||||
Industrial - 1.9% |
| |||||||
Brand Industrial Services Inc | 25,000 | 19,817 | ||||||
Cargo Aircraft Management Inc | 75,000 | 70,125 | ||||||
Carrier Global Corp | 50,000 | 47,957 | ||||||
Flex Acquisition Co Inc | 25,000 | 23,201 | ||||||
Husky III Holding Ltd (Canada) | 25,000 | 18,550 | ||||||
Mauser Packaging Solutions Holding Co | 75,000 | 57,377 | ||||||
Penske Truck Leasing Co LP | 25,000 | 25,153 | ||||||
Textron Inc | 50,000 | 46,897 | ||||||
Titan Acquisition Ltd (Canada) | 50,000 | 42,098 | ||||||
TransDigm Inc | 25,000 | 22,576 | ||||||
WRKCo Inc | 75,000 | 77,168 | ||||||
|
| |||||||
| 450,919 | ||||||||
|
| |||||||
Technology - 1.1% |
| |||||||
Broadcom Inc | 75,000 | 76,370 | ||||||
Citrix Systems Inc | 75,000 | 70,205 | ||||||
Dell International LLC | 50,000 | 49,916 | ||||||
Oracle Corp | 75,000 | 75,839 | ||||||
|
| |||||||
| 272,330 | ||||||||
|
| |||||||
Utilities - 0.7% | ||||||||
Ameren Corp | 50,000 | 49,882 | ||||||
Dominion Energy Inc | 75,000 | 74,246 | ||||||
San Diego Gas & Electric Co | 50,000 | 50,642 | ||||||
|
| |||||||
| 174,770 | ||||||||
|
| |||||||
Total Corporate Bonds & Notes |
| 4,993,211 | ||||||
|
| |||||||
SENIOR LOAN NOTES - 5.2% |
| |||||||
Basic Materials - 0.5% |
| |||||||
Messer Industries USA Inc Term B | 124,685 | 112,061 | ||||||
|
| |||||||
Communications - 0.5% |
| |||||||
Sprint Communications Inc Term B | 123,747 | 122,767 | ||||||
|
| |||||||
Principal | | |||||||
Consumer, Cyclical - 1.2% |
| |||||||
Golden Nugget LLC Term B | $ | 120,455 | $ | 94,156 | ||||
Restaurant Brands International Inc Term B (Canada) | 113,748 | 105,501 | ||||||
SeaWorld Parks & Entertainment Inc TermB-5 | 123,724 | 103,929 | ||||||
|
| |||||||
| 303,586 | ||||||||
|
| |||||||
Consumer,Non-Cyclical - 0.5% |
| |||||||
Jaguar Holding Co II | 123,701 | 119,269 | ||||||
|
| |||||||
Industrial - 2.5% |
| |||||||
Cornerstone Building Brands Inc Term B | 90,433 | 79,128 | ||||||
Dynasty Acquisition Co Inc | 80,887 | 63,739 | ||||||
Engineered Machinery Holdings Inc | 124,681 | 104,732 | ||||||
Filtration Group Corp Term B | 119,040 | 105,202 | ||||||
GFL Environmental Inc Term B (Canada) | 98,910 | 96,499 | ||||||
Standard Aero Ltd | 43,488 | 34,268 | ||||||
TransDigm Inc Term G Term G | 123,741 | 114,254 | ||||||
|
| |||||||
| 597,822 | ||||||||
|
| |||||||
Total Senior Loan Notes |
| 1,255,505 | ||||||
|
| |||||||
U.S. TREASURY OBLIGATIONS - 7.4% |
| |||||||
U.S. Treasury Bonds - 1.5% |
| |||||||
2.875% due 05/15/49 | 265,000 | 361,963 | ||||||
|
| |||||||
U.S. Treasury Notes - 5.9% |
| |||||||
2.375% due 05/15/29 | 310,000 | 356,815 | ||||||
1.750% due 06/15/22 | 345,000 | 356,624 | ||||||
1.750% due 06/30/24 | 345,000 | 365,430 | ||||||
1.875% due 06/30/26 | 320,000 | 346,625 | ||||||
|
| |||||||
| 1,425,494 | ||||||||
|
| |||||||
Total U.S. Treasury Obligations |
| 1,787,457 | ||||||
|
| |||||||
| See Notes to Financial Statements | See explanation of symbols and terms, if any, on B-58 |
B-44
Table of Contents
PACIFIC FUNDS
PACIFIC FUNDS DIVERSIFIED INCOME
Schedule of Investments (Continued)
March 31, 2020
Shares | Value | |||||||
SHORT-TERM INVESTMENT - 2.1% | ||||||||
Money Market Fund - 2.1% |
| |||||||
BlackRock Liquidity FundsT-Fund Portfolio ���Institutional’ 0.210% | 498,439 | $ | 498,439 | |||||
|
| |||||||
Total Short-Term Investment | 498,439 | |||||||
|
| |||||||
TOTAL INVESTMENTS - 100.9% | 24,237,493 | |||||||
OTHER ASSETS & LIABILITIES, NET - (0.9%) |
| (222,021 | ) | |||||
|
| |||||||
NET ASSETS - 100.0% |
| $24,015,472 | ||||||
|
| |||||||
Notes to Schedule of Investments
| (a) | As of March 31, 2020, the Fund’s composition by sector as a percentage of net assets was as follows: |
Consumer,Non-Cyclical | 20.5% | |||
Financial | 16.9% | |||
Industrial | 11.2% | |||
Energy | 11.0% | |||
Consumer, Cyclical | 10.3% | |||
Communications | 7.1% | |||
Technology | 7.0% | |||
U.S. Treasury Obligations | 7.4% | |||
Basic Materials | 3.5% | |||
Others (each less than 3.0%) | 6.0% | |||
|
| |||
| 100.9% | ||||
Other Assets & Liabilities, Net | (0.9% | ) | ||
|
| |||
| 100.0% | ||||
|
|
| (b) | Fair Value Measurements |
The following is a summary of the Fund’s investments as categorized under the three-tier hierarchy of inputs used in valuing the Fund’s assets and liabilities as of March 31, 2020:
| Total Value at March 31, 2020 | Level 1 Quoted Price | Level 2 Significant Observable Inputs | Level 3 Significant Unobservable Inputs | |||||||||||||||
Preferred Stocks | ||||||||||||||||||
Communications | $5,711 | $5,711 | $— | $— | ||||||||||||||
Consumer, Cyclical | 6,912 | — | 6,912 | — | ||||||||||||||
Consumer, Non-Cyclical | 6,959 | — | 6,959 | — | ||||||||||||||
Energy | 5,906 | 5,906 | — | — | ||||||||||||||
Financial | 7,150 | 7,150 | — | — | ||||||||||||||
|
|
|
|
|
|
|
| |||||||||||
Total Preferred Stocks | 32,638 | 18,767 | 13,871 | — | ||||||||||||||
|
|
|
|
|
|
|
| |||||||||||
Common Stocks | ||||||||||||||||||
Basic Materials | 556,538 | 287,072 | 269,466 | — | ||||||||||||||
Communications | 1,329,928 | 971,061 | 358,867 | — | ||||||||||||||
Consumer, Cyclical | 1,559,097 | 1,079,104 | 479,993 | — | ||||||||||||||
Consumer, Non-Cyclical | 4,085,656 | 2,706,158 | 1,379,498 | — | ||||||||||||||
Diversified | 6,665 | — | 6,665 | — | ||||||||||||||
Energy | 1,817,637 | 1,625,596 | 192,041 | — | ||||||||||||||
Financial | 2,502,557 | 1,820,434 | 682,123 | — | ||||||||||||||
Industrial | 1,632,872 | 1,147,642 | 485,230 | — | ||||||||||||||
Technology | 1,424,104 | 1,220,438 | 203,666 | — | ||||||||||||||
Utilities | 300,573 | 165,230 | 135,343 | — | ||||||||||||||
|
|
|
|
|
|
|
| |||||||||||
Total Common Stocks | 15,215,627 | 11,022,735 | 4,192,892 | — | ||||||||||||||
|
|
|
|
|
|
|
| |||||||||||
Exchange-Traded Funds | 454,616 | 454,616 | — | — | ||||||||||||||
Corporate Bonds & Notes | 4,993,211 | — | 4,993,211 | — | ||||||||||||||
Senior Loan Notes | 1,255,505 | — | 1,071,645 | 183,860 | ||||||||||||||
U.S. Treasury Obligations | 1,787,457 | — | 1,787,457 | — | ||||||||||||||
Short-Term Investment | 498,439 | 498,439 | — | — | ||||||||||||||
|
|
|
|
|
|
|
| |||||||||||
Total | $24,237,493 | $11,994,557 | $12,059,076 | $183,860 | ||||||||||||||
|
|
|
|
|
|
|
| |||||||||||
| See Notes to Financial Statements | See explanation of symbols and terms, if any, on B-58 |
B-45
Table of Contents
PACIFIC FUNDS
PACIFIC FUNDSSM LARGE-CAP
Schedule of Investments
March 31, 2020
Shares | Value | |||||||
COMMON STOCKS - 97.0% | ||||||||
Basic Materials - 2.0% | ||||||||
Huntsman Corp | 8,731 | $125,988 | ||||||
Linde PLC (United Kingdom) | 1,650 | 285,450 | ||||||
|
| |||||||
| 411,438 | ||||||||
|
| |||||||
Communications - 16.8% | ||||||||
Alphabet Inc ‘A’ * | 587 | 682,065 | ||||||
Amazon.com Inc * | 535 | 1,043,100 | ||||||
Comcast Corp ‘A’ | 8,600 | 295,668 | ||||||
Discovery Inc ‘A’ * | 9,733 | 189,210 | ||||||
Expedia Group Inc | 2,688 | 151,254 | ||||||
Facebook Inc ‘A’ * | 3,489 | 581,965 | ||||||
Verizon Communications Inc | 7,844 | 421,458 | ||||||
|
| |||||||
| 3,364,720 | ||||||||
|
| |||||||
Consumer, Cyclical - 5.1% | ||||||||
AutoZone Inc * | 286 | 241,956 | ||||||
Best Buy Co Inc | 3,409 | 194,313 | ||||||
Delta Air Lines Inc | 4,653 | 132,750 | ||||||
Polaris Inc | 1,754 | 84,455 | ||||||
PulteGroup Inc | 6,468 | 144,366 | ||||||
Target Corp | 2,446 | 227,405 | ||||||
|
| |||||||
| 1,025,245 | ||||||||
|
| |||||||
Consumer, Non-Cyclical - 26.0% | ||||||||
Abbott Laboratories | 4,490 | 354,306 | ||||||
AmerisourceBergen Corp | 2,978 | 263,553 | ||||||
Biogen Inc * | 441 | 139,524 | ||||||
Cigna Corp | 1,478 | 261,872 | ||||||
Eli Lilly & Co | 2,356 | 326,824 | ||||||
General Mills Inc | 5,335 | 281,528 | ||||||
Gilead Sciences Inc | 3,623 | 270,855 | ||||||
Johnson & Johnson | 2,390 | 313,401 | ||||||
Kimberly-Clark Corp | 1,876 | 239,884 | ||||||
Medtronic PLC | 3,414 | 307,875 | ||||||
Merck & Co Inc | 5,554 | 427,325 | ||||||
Mondelez International Inc ‘A’ | 5,484 | 274,639 | ||||||
Quanta Services Inc | 5,675 | 180,068 | ||||||
The Procter & Gamble Co | 4,287 | 471,570 | ||||||
Thermo Fisher Scientific Inc | 1,027 | 291,257 | ||||||
UnitedHealth Group Inc | 1,595 | 397,761 | ||||||
US Foods Holding Corp * | 7,109 | 125,900 | ||||||
Vertex Pharmaceuticals Inc * | 1,167 | 277,688 | ||||||
|
| |||||||
| 5,205,830 | ||||||||
|
| |||||||
Energy - 1.8% | ||||||||
ConocoPhillips | 4,949 | 152,429 | ||||||
Phillips 66 | 3,826 | 205,265 | ||||||
|
| |||||||
| 357,694 | ||||||||
|
| |||||||
Financial - 16.3% | ||||||||
American Tower Corp REIT | 1,663 | 362,118 | ||||||
AvalonBay Communities Inc REIT | 1,265 | 186,170 | ||||||
Bank of America Corp | 15,435 | 327,685 | ||||||
BlackRock Inc | 585 | 257,382 | ||||||
Boston Properties Inc REIT | 2,361 | 217,755 | ||||||
E*TRADE Financial Corp | 4,373 | 150,081 | ||||||
JPMorgan Chase & Co | 4,970 | 447,449 | ||||||
The Charles Schwab Corp | 4,948 | 166,352 | ||||||
The Hartford Financial Services Group Inc | 4,699 | 165,593 | ||||||
Truist Financial Corp | 6,001 | 185,071 | ||||||
Visa Inc ‘A’ | 3,587 | 577,937 | ||||||
Willis Towers Watson PLC | 1,370 | 232,695 | ||||||
|
| |||||||
| 3,276,288 | ||||||||
|
| |||||||
Industrial - 6.2% | ||||||||
Honeywell International Inc | 2,026 | 271,059 | ||||||
Kansas City Southern | 839 | 106,704 | ||||||
Shares | Value | |||||||
Martin Marietta Materials Inc | 1,025 | $193,961 | ||||||
Northrop Grumman Corp | 798 | 241,435 | ||||||
Raytheon Co | 1,459 | 191,348 | ||||||
The Boeing Co | 737 | 109,916 | ||||||
Trane Technologies PLC | 1,601 | 132,227 | ||||||
|
| |||||||
| 1,246,650 | ||||||||
|
| |||||||
Technology - 19.6% | ||||||||
Adobe Inc * | 1,252 | 398,436 | ||||||
Apple Inc | 3,931 | 999,614 | ||||||
Broadcom Inc | 798 | 189,206 | ||||||
Cerner Corp | 4,383 | 276,085 | ||||||
Lam Research Corp | 954 | 228,960 | ||||||
Micron Technology Inc * | 4,058 | 170,679 | ||||||
Microsoft Corp | 7,578 | 1,195,126 | ||||||
Skyworks Solutions Inc | 2,540 | 227,025 | ||||||
Synopsys Inc * | 1,827 | 235,299 | ||||||
|
| |||||||
| 3,920,430 | ||||||||
|
| |||||||
Utilities - 3.2% | ||||||||
DTE Energy Co | 3,217 | 305,518 | ||||||
Duke Energy Corp | 4,120 | 333,226 | ||||||
|
| |||||||
| 638,744 | ||||||||
|
| |||||||
Total Common Stocks |
| 19,447,039 | ||||||
|
| |||||||
SHORT-TERM INVESTMENT - 1.6% | ||||||||
Money Market Fund - 1.6% | ||||||||
BlackRock Liquidity Funds T-Fund Portfolio ‘Institutional’ 0.210% | 319,314 | 319,314 | ||||||
|
| |||||||
Total Short-Term Investment |
| 319,314 | ||||||
|
| |||||||
TOTAL INVESTMENTS - 98.6% |
| 19,766,353 | ||||||
OTHER ASSETS & LIABILITIES, NET - 1.4% |
| 270,776 | ||||||
|
| |||||||
NET ASSETS - 100.0% |
| $20,037,129 | ||||||
|
| |||||||
Notes to Schedule of Investments
| (a) | As of March 31, 2020, the Fund’s composition by sector as a percentage of net assets was as follows: |
Consumer, Non-Cyclical | 26.0% | |||
Technology | 19.6% | |||
Communications | 16.8% | |||
Financial | 16.3% | |||
Industrial | 6.2% | |||
Consumer, Cyclical | 5.1% | |||
Utilities | 3.2% | |||
Others (each less than 3.0%) | 5.4% | |||
|
| |||
| 98.6% | ||||
Other Assets & Liabilities, Net | 1.4% | |||
|
| |||
| 100.0% | ||||
|
|
| See Notes to Financial Statements | See explanation of symbols and terms, if any, on B-58 |
B-46
Table of Contents
PACIFIC FUNDS
PACIFIC FUNDS LARGE-CAP
Schedule of Investments (Continued)
March 31, 2020
| (b) | Fair Value Measurements |
The following is a summary of the Fund’s investments as categorized under the three-tier hierarchy of inputs used in valuing the Fund’s assets and liabilities as of March 31, 2020:
| Total Value at March 31, 2020 | Level 1 Quoted Price | Level 2 Significant Observable Inputs | Level 3 Significant Unobservable Inputs | |||||||||||||||
Assets | Common Stocks | $19,447,039 | $19,447,039 | $— | $— | |||||||||||||
Short-Term Investment | 319,314 | 319,314 | — | — | ||||||||||||||
|
|
|
|
|
|
|
| |||||||||||
Total | $19,766,353 | $19,766,353 | $— | $— | ||||||||||||||
|
|
|
|
|
|
|
| |||||||||||
| See Notes to Financial Statements | See explanation of symbols and terms, if any, on B-58 |
B-47
Table of Contents
PACIFIC FUNDS
PACIFIC FUNDSSM LARGE-CAP VALUE
Schedule of Investments
March 31, 2020
Shares | Value | |||||||
COMMON STOCKS - 97.7% | ||||||||
Basic Materials - 2.6% | ||||||||
Air Products & Chemicals Inc | 1,120 | $223,563 | ||||||
CF Industries Holdings Inc | 2,621 | 71,291 | ||||||
Huntsman Corp | 8,215 | 118,542 | ||||||
|
| |||||||
| 413,396 | ||||||||
|
| |||||||
Communications - 13.0% | ||||||||
Alphabet Inc ‘A’ * | 170 | 197,532 | ||||||
AT&T Inc | 14,560 | 424,424 | ||||||
Cisco Systems Inc | 5,263 | 206,889 | ||||||
Comcast Corp ‘A’ | 9,694 | 333,280 | ||||||
Discovery Inc ‘A’ * | 9,644 | 187,479 | ||||||
The Walt Disney Co | 1,934 | 186,824 | ||||||
Verizon Communications Inc | 9,978 | 536,118 | ||||||
|
| |||||||
| 2,072,546 | ||||||||
|
| |||||||
Consumer, Cyclical - 3.0% | ||||||||
Best Buy Co Inc | 2,145 | 122,265 | ||||||
Delta Air Lines Inc | 5,206 | 148,527 | ||||||
Target Corp | 2,316 | 215,319 | ||||||
|
| |||||||
| 486,111 | ||||||||
|
| |||||||
Consumer, Non-Cyclical - 25.5% | ||||||||
Biogen Inc * | 296 | 93,648 | ||||||
Cigna Corp | 1,089 | 192,949 | ||||||
Eli Lilly & Co | 1,566 | 217,236 | ||||||
Gilead Sciences Inc | 2,777 | 207,609 | ||||||
Hill-Rom Holdings Inc | 2,109 | 212,165 | ||||||
Johnson & Johnson | 2,816 | 369,262 | ||||||
Kimberly-Clark Corp | 2,250 | 287,707 | ||||||
Medtronic PLC | 4,522 | 407,794 | ||||||
Merck & Co Inc | 3,430 | 263,904 | ||||||
Mondelez International Inc ‘A’ | 5,024 | 251,602 | ||||||
PepsiCo Inc | 2,581 | 309,978 | ||||||
Quanta Services Inc | 6,935 | 220,048 | ||||||
The Procter & Gamble Co | 5,040 | 554,400 | ||||||
Thermo Fisher Scientific Inc | 873 | 247,583 | ||||||
Tyson Foods Inc ‘A’ | 1,421 | 82,233 | ||||||
UnitedHealth Group Inc | 608 | 151,623 | ||||||
|
| |||||||
| 4,069,741 | ||||||||
|
| |||||||
Energy - 4.5% | ||||||||
Chevron Corp | 4,024 | 291,579 | ||||||
ConocoPhillips | 4,350 | 133,980 | ||||||
Diamondback Energy Inc | 2,908 | 76,190 | ||||||
EOG Resources Inc | 2,921 | 104,922 | ||||||
Phillips 66 | 2,095 | 112,397 | ||||||
|
| |||||||
| 719,068 | ||||||||
|
| |||||||
Financial - 25.8% | ||||||||
American Express Co | 1,388 | 118,827 | ||||||
AvalonBay Communities Inc REIT | 679 | 99,928 | ||||||
Bank of America Corp | 22,193 | 471,157 | ||||||
Berkshire Hathaway Inc ‘B’ * | 1,098 | 200,747 | ||||||
Boston Properties Inc REIT | 2,181 | 201,154 | ||||||
E*TRADE Financial Corp | 4,233 | 145,277 | ||||||
Equity LifeStyle Properties Inc REIT | 1,636 | 94,037 | ||||||
Highwoods Properties Inc REIT | 2,454 | 86,921 | ||||||
Intercontinental Exchange Inc | 2,857 | 230,703 | ||||||
JPMorgan Chase & Co | 6,746 | 607,342 | ||||||
Prologis Inc REIT | 3,325 | 267,230 | ||||||
Prudential Financial Inc | 3,694 | 192,605 | ||||||
State Street Corp | 3,997 | 212,920 | ||||||
The Allstate Corp | 2,226 | 204,191 | ||||||
The Charles Schwab Corp | 4,525 | 152,131 | ||||||
The Hartford Financial Services Group Inc | 5,152 | 181,556 | ||||||
The Travelers Cos Inc | 1,283 | 127,466 | ||||||
Truist Financial Corp | 6,169 | 190,252 | ||||||
Shares | Value | |||||||
Wells Fargo & Co | 2,957 | $84,866 | ||||||
Willis Towers Watson PLC | 1,493 | 253,586 | ||||||
|
| |||||||
| 4,122,896 | ||||||||
|
| |||||||
Industrial - 10.0% | ||||||||
Caterpillar Inc | 1,667 | 193,439 | ||||||
Honeywell International Inc | 1,638 | 219,148 | ||||||
Kansas City Southern | 792 | 100,727 | ||||||
Lockheed Martin Corp | 554 | 187,778 | ||||||
Martin Marietta Materials Inc | 1,285 | 243,161 | ||||||
Northrop Grumman Corp | 806 | 243,855 | ||||||
Owens Corning | 2,527 | 98,073 | ||||||
Textron Inc | 2,962 | 78,997 | ||||||
Trane Technologies PLC | 1,594 | 131,648 | ||||||
Westrock Co | 3,643 | 102,951 | ||||||
|
| |||||||
| 1,599,777 | ||||||||
|
| |||||||
Technology - 6.4% | ||||||||
Apple Inc | 512 | 130,196 | ||||||
Broadcom Inc | 527 | 124,952 | ||||||
Intel Corp | 3,307 | 178,975 | ||||||
Micron Technology Inc * | 3,336 | 140,312 | ||||||
Microsoft Corp | 1,263 | 199,188 | ||||||
ON Semiconductor Corp * | 8,763 | 109,012 | ||||||
Oracle Corp | 2,827 | 136,629 | ||||||
|
| |||||||
| 1,019,264 | ||||||||
|
| |||||||
Utilities - 6.9% | ||||||||
American Electric Power Co Inc | 3,634 | 290,647 | ||||||
DTE Energy Co | 2,631 | 249,866 | ||||||
Duke Energy Corp | 3,259 | 263,588 | ||||||
Xcel Energy Inc | 5,016 | 302,465 | ||||||
|
| |||||||
| 1,106,566 | ||||||||
|
| |||||||
Total Common Stocks |
| 15,609,365 | ||||||
|
| |||||||
SHORT-TERM INVESTMENT - 2.0% | ||||||||
Money Market Fund - 2.0% | ||||||||
BlackRock Liquidity Funds T-Fund Portfolio ‘Institutional’ 0.210% | 322,628 | 322,628 | ||||||
|
| |||||||
Total Short-Term Investment |
| 322,628 | ||||||
|
| |||||||
TOTAL INVESTMENTS - 99.7% |
| 15,931,993 | ||||||
OTHER ASSETS & LIABILITIES, NET - 0.3% |
| 41,212 | ||||||
|
| |||||||
NET ASSETS - 100.0% |
| $15,973,205 | ||||||
|
| |||||||
Notes to Schedule of Investments
| (a) | As of March 31, 2020, the Fund’s composition by sector as a percentage of net assets was as follows: |
Financial | 25.8% | |||
Consumer, Non-Cyclical | 25.5% | |||
Communications | 13.0% | |||
Industrial | 10.0% | |||
Utilities | 6.9% | |||
Technology | 6.4% | |||
Energy | 4.5% | |||
Consumer, Cyclical | 3.0% | |||
Others (each less than 3.0%) | 4.6% | |||
|
| |||
| 99.7% | ||||
Other Assets & Liabilities, Net | 0.3% | |||
|
| |||
| 100.0% | ||||
|
|
| See Notes to Financial Statements | See explanation of symbols and terms, if any, on B-58 |
B-48
Table of Contents
PACIFIC FUNDS
PACIFIC FUNDS LARGE-CAP VALUE
Schedule of Investments (Continued)
March 31, 2020
| (b) | Fair Value Measurements |
The following is a summary of the Fund's investments as categorized under the three-tier hierarchy of inputs used in valuing the Fund's assets and liabilities as of March 31, 2020:
| Total Value at March 31, 2020 | Level 1 Quoted Price | Level 2 Significant Observable Inputs | Level 3 Significant Unobservable Inputs | |||||||||||||||
Assets | Common Stocks | $15,609,365 | $15,609,365 | $— | $— | |||||||||||||
Short-Term Investment | 322,628 | 322,628 | — | — | ||||||||||||||
|
|
|
|
|
|
|
| |||||||||||
Total | $15,931,993 | $15,931,993 | $— | $— | ||||||||||||||
|
|
|
|
|
|
|
| |||||||||||
| See Notes to Financial Statements | See explanation of symbols and terms, if any, on B-58 |
B-49
Table of Contents
PACIFIC FUNDS
PACIFIC FUNDSSM SMALL/MID-CAP
Schedule of Investments
March 31, 2020
Shares | Value | |||||||
COMMON STOCKS - 99.3% | ||||||||
Basic Materials - 2.4% | ||||||||
Allegheny Technologies Inc * | 68,634 | $583,389 | ||||||
Axalta Coating Systems Ltd * | 87,310 | 1,507,844 | ||||||
Kaiser Aluminum Corp | 27,181 | 1,883,100 | ||||||
PolyOne Corp | 44,846 | 850,729 | ||||||
WR Grace & Co | 26,714 | 951,018 | ||||||
|
| |||||||
| 5,776,080 | ||||||||
|
| |||||||
Communications - 3.8% | ||||||||
Ciena Corp * | 69,488 | 2,766,317 | ||||||
Sinclair Broadcast Group Inc ‘A’ | 67,173 | 1,080,142 | ||||||
Viavi Solutions Inc * | 239,738 | 2,687,463 | ||||||
Vonage Holdings Corp * | 234,780 | 1,697,459 | ||||||
Yelp Inc * | 59,871 | 1,079,474 | ||||||
|
| |||||||
| 9,310,855 | ||||||||
|
| |||||||
Consumer, Cyclical - 8.8% | ||||||||
Aramark | 84,156 | 1,680,595 | ||||||
BJ’s Restaurants Inc | 53,744 | 746,504 | ||||||
BJ’s Wholesale Club Holdings Inc * | 102,520 | 2,611,184 | ||||||
Bloomin’ Brands Inc | 154,083 | 1,100,153 | ||||||
Dana Inc | 121,723 | 950,657 | ||||||
Deckers Outdoor Corp * | 17,613 | 2,360,142 | ||||||
Dine Brands Global Inc | 28,054 | 804,589 | ||||||
KB Home | 64,558 | 1,168,500 | ||||||
Lithia Motors Inc ‘A’ | 18,805 | 1,538,061 | ||||||
RH * | 14,206 | 1,427,277 | ||||||
SeaWorld Entertainment Inc * | 101,834 | 1,122,211 | ||||||
SkyWest Inc | 45,339 | 1,187,428 | ||||||
Sleep Number Corp * | 58,523 | 1,121,301 | ||||||
Steven Madden Ltd | 55,225 | 1,282,877 | ||||||
The Children’s Place Inc | 15,743 | 307,933 | ||||||
UniFirst Corp | 12,415 | 1,875,782 | ||||||
|
| |||||||
| 21,285,194 | ||||||||
|
| |||||||
Consumer, Non-Cyclical - 32.3% | ||||||||
Adtalem Global Education Inc * | 53,716 | 1,439,052 | ||||||
Amedisys Inc * | 20,741 | 3,806,803 | ||||||
Amicus Therapeutics Inc * | 171,627 | 1,585,833 | ||||||
AMN Healthcare Services Inc * | 31,384 | 1,814,309 | ||||||
BioTelemetry Inc * | 48,024 | 1,849,404 | ||||||
Cardtronics PLC ‘A’ * | 76,431 | 1,598,937 | ||||||
Charles River Laboratories International Inc * | 20,957 | 2,644,983 | ||||||
Deluxe Corp | 52,109 | 1,351,186 | ||||||
Esperion Therapeutics Inc * | 31,872 | 1,004,924 | ||||||
Euronet Worldwide Inc * | 24,761 | 2,122,513 | ||||||
Exact Sciences Corp * | 33,350 | 1,934,300 | ||||||
FTI Consulting Inc * | 26,930 | 3,225,406 | ||||||
Harsco Corp * | 81,175 | 565,790 | ||||||
Helen of Troy Ltd * | 11,983 | 1,725,911 | ||||||
Hill-Rom Holdings Inc | 32,297 | 3,249,078 | ||||||
Horizon Therapeutics PLC * | 120,075 | 3,556,621 | ||||||
Hostess Brands Inc * | 168,360 | 1,794,718 | ||||||
ICF International Inc | 34,301 | 2,356,479 | ||||||
Ionis Pharmaceuticals Inc * | 43,320 | 2,048,170 | ||||||
Iovance Biotherapeutics Inc * | 65,754 | 1,968,346 | ||||||
Jazz Pharmaceuticals PLC * | 23,303 | 2,324,241 | ||||||
Lamb Weston Holdings Inc | 39,866 | 2,276,349 | ||||||
LHC Group Inc * | 22,992 | 3,223,478 | ||||||
LiveRamp Holdings Inc * | 75,257 | 2,477,460 | ||||||
Merit Medical Systems Inc * | 64,379 | 2,011,844 | ||||||
Neurocrine Biosciences Inc * | 26,355 | 2,281,025 | ||||||
Option Care Health Inc * | 98,358 | 931,450 | ||||||
Performance Food Group Co * | 71,878 | 1,776,824 | ||||||
Post Holdings Inc * | 20,459 | 1,697,483 | ||||||
PRA Health Sciences Inc * | 24,976 | 2,074,007 | ||||||
Quanta Services Inc | 77,180 | 2,448,921 | ||||||
Shares | Value | |||||||
Quidel Corp * | 29,847 | $2,919,335 | ||||||
Service Corp International | 84,154 | 3,291,263 | ||||||
Syneos Health Inc * | 54,940 | 2,165,735 | ||||||
Teleflex Inc | 6,913 | 2,024,541 | ||||||
The Cooper Cos Inc | 10,354 | 2,854,287 | ||||||
|
| |||||||
| 78,421,006 | ||||||||
|
| |||||||
Energy - 0.3% | ||||||||
Diamondback Energy Inc | 19,529 | 511,660 | ||||||
WPX Energy Inc * | 103,827 | 316,672 | ||||||
|
| |||||||
| 828,332 | ||||||||
|
| |||||||
Financial - 20.6% | ||||||||
Air Lease Corp | 79,548 | 1,761,193 | ||||||
Alleghany Corp | 4,982 | 2,751,808 | ||||||
Blucora Inc * | 82,619 | 995,559 | ||||||
Douglas Emmett Inc REIT | 78,660 | 2,399,917 | ||||||
Everest Re Group Ltd | 16,209 | 3,118,936 | ||||||
Glacier Bancorp Inc | 49,046 | 1,667,809 | ||||||
Highwoods Properties Inc REIT | 59,489 | 2,107,100 | ||||||
Horace Mann Educators Corp | 62,772 | 2,296,827 | ||||||
Hudson Pacific Properties Inc REIT | 89,877 | 2,279,281 | ||||||
IBERIABANK Corp | 45,086 | 1,630,310 | ||||||
Invesco Mortgage Capital Inc REIT | 157,370 | 536,632 | ||||||
Investors Bancorp Inc | 240,311 | 1,920,085 | ||||||
Lamar Advertising Co ‘A’ REIT | 48,116 | 2,467,388 | ||||||
Life Storage Inc REIT | 27,327 | 2,583,768 | ||||||
Mid-America Apartment Communities Inc REIT | 25,476 | 2,624,792 | ||||||
Old Republic International Corp | 171,895 | 2,621,399 | ||||||
PacWest Bancorp | 67,291 | 1,205,855 | ||||||
Piedmont Office Realty Trust Inc ‘A’ REIT | 156,373 | 2,761,547 | ||||||
Radian Group Inc | 119,747 | 1,550,724 | ||||||
Ryman Hospitality Properties Inc REIT | 32,684 | 1,171,721 | ||||||
TCF Financial Corp | 71,207 | 1,613,551 | ||||||
The Hanover Insurance Group Inc | 28,617 | 2,592,128 | ||||||
Virtu Financial Inc ‘A’ | 126,551 | 2,634,792 | ||||||
Western Alliance Bancorp | 46,617 | 1,426,946 | ||||||
Wintrust Financial Corp | 37,671 | 1,237,869 | ||||||
|
| |||||||
| 49,957,937 | ||||||||
|
| |||||||
Industrial - 12.4% | ||||||||
Aerojet Rocketdyne Holdings Inc * | 68,649 | 2,871,588 | ||||||
Altra Industrial Motion Corp | 55,668 | 973,633 | ||||||
American Woodmark Corp * | 25,476 | 1,160,941 | ||||||
EnPro Industries Inc | 32,903 | 1,302,301 | ||||||
Generac Holdings Inc * | 29,320 | 2,731,744 | ||||||
Graphic Packaging Holding Co | 227,241 | 2,772,340 | ||||||
Hubbell Inc | 12,434 | 1,426,677 | ||||||
Itron Inc * | 38,333 | 2,140,131 | ||||||
ITT Inc | 41,018 | 1,860,576 | ||||||
Jacobs Engineering Group Inc | 36,454 | 2,889,709 | ||||||
MasTec Inc * | 53,297 | 1,744,411 | ||||||
Rexnord Corp | 52,364 | 1,187,092 | ||||||
Spirit AeroSystems Holdings Inc ‘A’ | 49,259 | 1,178,768 | ||||||
SPX Corp * | 75,016 | 2,448,522 | ||||||
US Ecology Inc | 38,373 | 1,166,539 | ||||||
Werner Enterprises Inc | 58,216 | 2,110,912 | ||||||
|
| |||||||
| 29,965,884 | ||||||||
|
| |||||||
Technology - 15.0% | ||||||||
Avaya Holdings Corp * | 192,122 | 1,554,267 | ||||||
Bottomline Technologies DE Inc * | 63,247 | 2,318,003 | ||||||
Box Inc ‘A’ * | 73,532 | 1,032,389 | ||||||
CommVault Systems Inc * | 38,514 | 1,559,047 | ||||||
Cornerstone OnDemand Inc * | 30,626 | 972,375 | ||||||
Glu Mobile Inc * | 192,440 | 1,210,448 | ||||||
J2 Global Inc | 36,516 | 2,733,223 | ||||||
Leidos Holdings Inc | 28,026 | 2,568,583 | ||||||
MKS Instruments Inc | 18,662 | 1,520,020 | ||||||
Nuance Communications Inc * | 117,545 | 1,972,405 | ||||||
ON Semiconductor Corp * | 148,822 | 1,851,346 | ||||||
| See Notes to Financial Statements | See explanation of symbols and terms, if any, on B-58 |
B-50
Table of Contents
PACIFIC FUNDS
PACIFIC FUNDS SMALL/MID-CAP
Schedule of Investments (Continued)
March 31, 2020
Shares | Value | |||||||
Qualys Inc * | 25,839 | $2,247,735 | ||||||
RealPage Inc * | 57,927 | 3,066,076 | ||||||
Silicon Laboratories Inc * | 32,860 | 2,806,573 | ||||||
SPS Commerce Inc * | 65,339 | 3,038,917 | ||||||
Synopsys Inc * | 25,268 | 3,254,266 | ||||||
Zebra Technologies Corp ‘A’ * | 15,162 | 2,783,743 | ||||||
|
| |||||||
| 36,489,416 | ||||||||
|
| |||||||
Utilities - 3.7% | ||||||||
Black Hills Corp | 53,750 | 3,441,613 | ||||||
Portland General Electric Co | 70,850 | 3,396,549 | ||||||
Southwest Gas Holdings Inc | 31,602 | 2,198,235 | ||||||
|
| |||||||
| 9,036,397 | ||||||||
|
| |||||||
Total Common Stocks |
| 241,071,101 | ||||||
|
| |||||||
SHORT-TERM INVESTMENT - 0.8% | ||||||||
Money Market Fund - 0.8% | ||||||||
BlackRock Liquidity Funds T-Fund Portfolio ‘Institutional’ 0.210% | 1,960,333 | 1,960,333 | ||||||
|
| |||||||
Total Short-Term Investment |
| 1,960,333 | ||||||
|
| |||||||
TOTAL INVESTMENTS - 100.1% |
| 243,031,434 | ||||||
OTHER ASSETS & LIABILITIES, NET - (0.1%) |
| (229,364 | ) | |||||
|
| |||||||
NET ASSETS - 100.0% |
| $242,802,070 | ||||||
|
| |||||||
Notes to Schedule of Investments
| (a) | As of March 31, 2020, the Fund’s composition by sector as a percentage of net assets was as follows: |
Consumer, Non-Cyclical | 32.3% | |||
Financial | 20.6% | |||
Technology | 15.0% | |||
Industrial | 12.4% | |||
Consumer, Cyclical | 8.8% | |||
Communications | 3.8% | |||
Utilities | 3.7% | |||
Others (each less than 3.0%) | 3.5% | |||
|
| |||
| 100.1% | ||||
Other Assets & Liabilities, Net | (0.1% | ) | ||
|
| |||
| 100.0% | ||||
|
|
| (b) | Fair Value Measurements |
The following is a summary of the Fund’s investments as categorized under the three-tier hierarchy of inputs used in valuing the Fund’s assets and liabilities as of March 31, 2020:
| Total Value at March 31, 2020 | Level 1 Quoted Price | Level 2 Significant Observable Inputs | Level 3 Significant Unobservable Inputs | |||||||||||||||
Assets | Common Stocks | $241,071,101 | $241,071,101 | $— | $— | |||||||||||||
Short-Term Investment | 1,960,333 | 1,960,333 | — | — | ||||||||||||||
|
|
|
|
|
|
|
| |||||||||||
Total | $243,031,434 | $243,031,434 | $— | $— | ||||||||||||||
|
|
|
|
|
|
|
| |||||||||||
| See Notes to Financial Statements | See explanation of symbols and terms, if any, on B-58 |
B-51
Table of Contents
PACIFIC FUNDS
PACIFIC FUNDSSM SMALL-CAP
Schedule of Investments
March 31, 2020
Shares | Value | |||||||
COMMON STOCKS - 98.8% | ||||||||
Basic Materials - 2.6% | ||||||||
Allegheny Technologies Inc * | 6,223 | $52,896 | ||||||
Commercial Metals Co | 6,783 | 107,104 | ||||||
PolyOne Corp | 5,226 | 99,136 | ||||||
Rogers Corp * | 676 | 63,828 | ||||||
|
| |||||||
| 322,964 | ||||||||
|
| |||||||
Communications - 3.8% | ||||||||
NETGEAR Inc * | 2,734 | 62,445 | ||||||
Perficient Inc * | 1,861 | 50,414 | ||||||
Sinclair Broadcast Group Inc ‘A’ | 2,986 | 48,015 | ||||||
Viavi Solutions Inc * | 13,313 | 149,239 | ||||||
Vonage Holdings Corp * | 10,658 | 77,057 | ||||||
Yelp Inc * | 5,182 | 93,431 | ||||||
|
| |||||||
| 480,601 | ||||||||
|
| |||||||
Consumer, Cyclical - 9.3% | ||||||||
BJ’s Restaurants Inc | 2,628 | 36,503 | ||||||
BJ’s Wholesale Club Holdings Inc * | 4,631 | 117,952 | ||||||
Bloomin’ Brands Inc | 6,164 | 44,011 | ||||||
Callaway Golf Co | 4,977 | 50,865 | ||||||
Dana Inc | 5,712 | 44,610 | ||||||
Deckers Outdoor Corp * | 886 | 118,724 | ||||||
Dine Brands Global Inc | 1,501 | 43,049 | ||||||
KB Home | 4,238 | 76,708 | ||||||
Lithia Motors Inc ‘A’ | 1,358 | 111,071 | ||||||
Marriott Vacations Worldwide Corp | 1,570 | 87,260 | ||||||
PetIQ Inc * | 685 | 15,913 | ||||||
RH * | 597 | 59,981 | ||||||
SeaWorld Entertainment Inc * | 3,668 | 40,422 | ||||||
SkyWest Inc | 2,091 | 54,763 | ||||||
Sleep Number Corp * | 3,182 | 60,967 | ||||||
Steven Madden Ltd | 3,726 | 86,553 | ||||||
The Children’s Place Inc | 1,462 | 28,597 | ||||||
UniFirst Corp | 542 | 81,891 | ||||||
|
| |||||||
| 1,159,840 | ||||||||
|
| |||||||
Consumer, Non-Cyclical - 31.1% | ||||||||
Acadia Healthcare Co Inc * | 3,700 | 67,895 | ||||||
Addus HomeCare Corp * | 1,293 | 87,406 | ||||||
Adtalem Global Education Inc * | 3,569 | 95,614 | ||||||
Amedisys Inc * | 1,194 | 219,147 | ||||||
Amicus Therapeutics Inc * | 11,961 | 110,520 | ||||||
AMN Healthcare Services Inc * | 2,507 | 144,930 | ||||||
Amphastar Pharmaceuticals Inc * | 5,158 | 76,545 | ||||||
BioTelemetry Inc * | 1,854 | 71,398 | ||||||
Blueprint Medicines Corp * | 1,882 | 110,059 | ||||||
Cardtronics PLC ‘A’ * | 4,214 | 88,157 | ||||||
Deluxe Corp | 2,743 | 71,126 | ||||||
Edgewell Personal Care Co * | 1,377 | 33,158 | ||||||
Esperion Therapeutics Inc * | 2,430 | 76,618 | ||||||
FibroGen Inc * | 2,403 | 83,504 | ||||||
FTI Consulting Inc * | 1,269 | 151,988 | ||||||
Harsco Corp * | 8,153 | 56,826 | ||||||
Helen of Troy Ltd * | 1,240 | 178,597 | ||||||
Heron Therapeutics Inc * | 9,131 | 107,198 | ||||||
Horizon Therapeutics PLC * | 6,519 | 193,093 | ||||||
Hostess Brands Inc * | 10,523 | 112,175 | ||||||
ICF International Inc | 2,174 | 149,354 | ||||||
Iovance Biotherapeutics Inc * | 5,563 | 166,528 | ||||||
LHC Group Inc * | 1,442 | 202,168 | ||||||
LivaNova PLC * | 646 | 29,232 | ||||||
LiveRamp Holdings Inc * | 4,394 | 144,650 | ||||||
Magellan Health Inc * | 1,426 | 68,605 | ||||||
NuVasive Inc * | 2,280 | 115,505 | ||||||
Option Care Health Inc * | 6,405 | 60,655 | ||||||
Orthofix Medical Inc * | 242 | 6,778 | ||||||
Shares | Value | |||||||
Performance Food Group Co * | 3,322 | $82,120 | ||||||
PTC Therapeutics Inc * | 2,328 | 103,852 | ||||||
Quidel Corp * | 2,434 | 238,070 | ||||||
Revance Therapeutics Inc * | 6,949 | 102,845 | ||||||
SP Plus Corp * | 2,440 | 50,630 | ||||||
Syneos Health Inc * | 3,114 | 122,754 | ||||||
Ultragenyx Pharmaceutical Inc * | 2,557 | 113,608 | ||||||
|
| |||||||
| 3,893,308 | ||||||||
|
| |||||||
Energy - 1.1% | ||||||||
Delek US Holdings Inc | 5,898 | 92,952 | ||||||
Magnolia Oil & Gas Corp ‘A’ * | 11,264 | 45,056 | ||||||
|
| |||||||
| 138,008 | ||||||||
|
| |||||||
Financial - 22.1% | ||||||||
Argo Group International Holdings Ltd | 2,368 | 87,758 | ||||||
Armada Hoffler Properties Inc REIT | 7,357 | 78,720 | ||||||
Berkshire Hills Bancorp Inc | 3,557 | 52,857 | ||||||
Blucora Inc * | 3,629 | 43,729 | ||||||
Brightsphere Investment Group Inc | 10,578 | 67,593 | ||||||
Cathay General Bancorp | 3,676 | 84,364 | ||||||
CenterState Bank Corp | 2,411 | 41,542 | ||||||
ConnectOne Bancorp Inc | 6,740 | 90,586 | ||||||
Enterprise Financial Services Corp | 3,175 | 88,614 | ||||||
Essent Group Ltd | 1,457 | 38,377 | ||||||
First Industrial Realty Trust Inc REIT | 5,048 | 167,745 | ||||||
Glacier Bancorp Inc | 2,983 | 101,437 | ||||||
Home BancShares Inc | 6,202 | 74,362 | ||||||
Horace Mann Educators Corp | 4,496 | 164,509 | ||||||
IBERIABANK Corp | 1,988 | 71,886 | ||||||
Invesco Mortgage Capital Inc REIT | 8,231 | 28,068 | ||||||
Investors Bancorp Inc | 20,588 | 164,498 | ||||||
Lexington Realty Trust REIT | 7,942 | 78,864 | ||||||
National Storage Affiliates Trust REIT | 5,120 | 151,552 | ||||||
NexPoint Residential Trust Inc REIT | 3,812 | 96,101 | ||||||
Northfield Bancorp Inc | 4,225 | 47,278 | ||||||
Old National Bancorp | 8,031 | 105,929 | ||||||
Piedmont Office Realty Trust Inc ‘A’ REIT | 7,511 | 132,644 | ||||||
PotlatchDeltic Corp REIT | 2,692 | 84,502 | ||||||
PS Business Parks Inc REIT | 1,073 | 145,413 | ||||||
Radian Group Inc | 7,196 | 93,188 | ||||||
Selective Insurance Group Inc | 2,891 | 143,683 | ||||||
STAG Industrial Inc REIT | 1,797 | 40,468 | ||||||
Two Harbors Investment Corp REIT | 8,523 | 32,473 | ||||||
United Community Banks Inc | 5,066 | 92,758 | ||||||
WSFS Financial Corp | 2,746 | 68,430 | ||||||
|
| |||||||
| 2,759,928 | ||||||||
|
| |||||||
Industrial - 13.5% | ||||||||
Air Transport Services Group Inc * | 5,395 | 98,621 | ||||||
Altra Industrial Motion Corp | 4,926 | 86,156 | ||||||
American Woodmark Corp * | 1,137 | 51,813 | ||||||
EMCOR Group Inc | 2,239 | 137,295 | ||||||
EnerSys | 1,754 | 86,858 | ||||||
Generac Holdings Inc * | 1,494 | 139,196 | ||||||
Itron Inc * | 2,323 | 129,693 | ||||||
Masonite International Corp * | 394 | 18,695 | ||||||
MasTec Inc * | 3,475 | 113,737 | ||||||
OSI Systems Inc * | 1,201 | 82,773 | ||||||
Rexnord Corp | 5,407 | 122,577 | ||||||
Saia Inc * | 1,895 | 139,358 | ||||||
SPX Corp * | 3,115 | 101,674 | ||||||
Universal Forest Products Inc | 2,889 | 107,442 | ||||||
US Ecology Inc | 1,295 | 39,368 | ||||||
Vishay Intertechnology Inc | 7,487 | 107,888 | ||||||
Watts Water Technologies Inc ‘A’ | 454 | 38,431 | ||||||
Werner Enterprises Inc | 2,423 | 87,858 | ||||||
|
| |||||||
| 1,689,433 | ||||||||
|
| |||||||
| See Notes to Financial Statements | See explanation of symbols and terms, if any, on B-58 |
B-52
Table of Contents
PACIFIC FUNDS
PACIFIC FUNDS SMALL-CAP
Schedule of Investments (Continued)
March 31, 2020
Shares | Value | |||||||
Technology - 11.8% | ||||||||
Allscripts Healthcare Solutions Inc * | 11,728 | $82,565 | ||||||
Avaya Holdings Corp * | 9,311 | 75,326 | ||||||
Bottomline Technologies DE Inc * | 2,270 | 83,196 | ||||||
Box Inc ‘A’ * | 4,606 | 64,668 | ||||||
CommVault Systems Inc * | 2,276 | 92,132 | ||||||
Cornerstone OnDemand Inc * | 3,174 | 100,775 | ||||||
Glu Mobile Inc * | 20,124 | 126,580 | ||||||
J2 Global Inc | 2,032 | 152,095 | ||||||
Qualys Inc * | 2,086 | 181,461 | ||||||
Silicon Laboratories Inc * | 1,232 | 105,225 | ||||||
SPS Commerce Inc * | 3,435 | 159,762 | ||||||
Ultra Clean Holdings Inc * | 2,251 | 31,064 | ||||||
Verint Systems Inc * | 4,189 | 180,127 | ||||||
Virtusa Corp * | 1,644 | 46,690 | ||||||
|
| |||||||
| 1,481,666 | ||||||||
|
| |||||||
Utilities - 3.5% | ||||||||
Alliant Energy Corp | 499 | 24,097 | ||||||
Black Hills Corp | 2,360 | 151,111 | ||||||
Portland General Electric Co | 2,354 | 112,851 | ||||||
Southwest Gas Holdings Inc | 2,083 | 144,893 | ||||||
|
| |||||||
| 432,952 | ||||||||
|
| |||||||
Total Common Stocks |
| 12,358,700 | ||||||
|
| |||||||
Shares | Value | |||||||
SHORT-TERM INVESTMENT - 1.0% | ||||||||
Money Market Fund - 1.0% | ||||||||
BlackRock Liquidity Funds T-Fund Portfolio ‘Institutional’ 0.210% | 127,345 | $127,345 | ||||||
|
| |||||||
Total Short-Term Investment |
| 127,345 | ||||||
|
| |||||||
TOTAL INVESTMENTS - 99.8% |
| 12,486,045 | ||||||
OTHER ASSETS & LIABILITIES, NET - 0.2% |
| 23,312 | ||||||
|
| |||||||
NET ASSETS - 100.0% |
| $12,509,357 | ||||||
|
| |||||||
Notes to Schedule of Investments
| (a) | As of March 31, 2020, the Fund’s composition by sector as a percentage of net assets was as follows: |
Consumer, Non-Cyclical | 31.1% | |||
Financial | 22.1% | |||
Industrial | 13.5% | |||
Technology | 11.8% | |||
Consumer, Cyclical | 9.3% | |||
Communications | 3.8% | |||
Utilities | 3.5% | |||
Others (each less than 3.0%) | 4.7% | |||
|
| |||
| 99.8% | ||||
Other Assets & Liabilities, Net | 0.2% | |||
|
| |||
| 100.0% | ||||
|
|
| (b) | Fair Value Measurements |
The following is a summary of the Fund’s investments as categorized under the three-tier hierarchy of inputs used in valuing the Fund’s assets and liabilities as of March 31, 2020:
| Total Value at March 31, 2020 | Level 1 Quoted Price | Level 2 Significant Observable Inputs | Level 3 Significant Unobservable Inputs | |||||||||||||||
Assets | Common Stocks | $12,358,700 | $12,358,700 | $— | $— | |||||||||||||
Short-Term Investment | 127,345 | 127,345 | — | — | ||||||||||||||
|
|
|
|
|
|
|
| |||||||||||
Total | $12,486,045 | $12,486,045 | $— | $— | ||||||||||||||
|
|
|
|
|
|
|
| |||||||||||
| See Notes to Financial Statements | See explanation of symbols and terms, if any, on B-58 |
B-53
Table of Contents
PACIFIC FUNDS
PACIFIC FUNDSSM SMALL-CAP VALUE
Schedule of Investments
March 31, 2020
Shares | Value | |||||||
COMMON STOCKS - 91.9% | ||||||||
Basic Materials - 2.5% | ||||||||
Allegheny Technologies Inc * | 6,468 | $54,978 | ||||||
Commercial Metals Co | 7,184 | 113,435 | ||||||
Kaiser Aluminum Corp | 1,668 | 115,559 | ||||||
WR Grace & Co | 1,683 | 59,915 | ||||||
|
| |||||||
| 343,887 | ||||||||
|
| |||||||
Communications - 2.2% | ||||||||
NETGEAR Inc * | 4,883 | 111,528 | ||||||
Viavi Solutions Inc * | 10,607 | 118,904 | ||||||
Yelp Inc * | 4,119 | 74,266 | ||||||
|
| |||||||
| 304,698 | ||||||||
|
| |||||||
Consumer, Cyclical - 8.0% | ||||||||
BJ’s Wholesale Club Holdings Inc * | 6,306 | 160,614 | ||||||
Bloomin’ Brands Inc | 5,929 | 42,333 | ||||||
Callaway Golf Co | 6,603 | 67,483 | ||||||
Dana Inc | 8,925 | 69,704 | ||||||
Deckers Outdoor Corp * | 797 | 106,798 | ||||||
Designer Brands Inc ‘A’ | 7,727 | 38,480 | ||||||
Dine Brands Global Inc | 845 | 24,235 | ||||||
KB Home | 5,617 | 101,668 | ||||||
Lithia Motors Inc ‘A’ | 1,168 | 95,531 | ||||||
Marriott Vacations Worldwide Corp | 1,330 | 73,921 | ||||||
RH * | 739 | 74,247 | ||||||
SkyWest Inc | 2,961 | 77,549 | ||||||
The Children’s Place Inc | 1,526 | 29,849 | ||||||
UniFirst Corp | 1,067 | 161,213 | ||||||
|
| |||||||
| 1,123,625 | ||||||||
|
| |||||||
|
| |||||||
Consumer, Non-Cyclical - 15.5% | ||||||||
Aaron’s Inc | 2,027 | 46,175 | ||||||
Acadia Healthcare Co Inc * | 4,278 | 78,501 | ||||||
Addus HomeCare Corp * | 1,998 | 135,065 | ||||||
Adtalem Global Education Inc * | 6,301 | 168,804 | ||||||
Cardtronics PLC ‘A’ * | 4,618 | 96,609 | ||||||
Central Garden & Pet Co ‘A’ * | 2,576 | 65,868 | ||||||
Deluxe Corp | 4,100 | 106,313 | ||||||
Edgewell Personal Care Co * | 3,447 | 83,004 | ||||||
Harsco Corp * | 8,021 | 55,906 | ||||||
Helen of Troy Ltd * | 1,620 | 233,329 | ||||||
Horizon Therapeutics PLC * | 4,661 | 138,059 | ||||||
Hostess Brands Inc * | 14,545 | 155,050 | ||||||
ICF International Inc | 2,560 | 175,872 | ||||||
Iovance Biotherapeutics Inc * | 3,814 | 114,172 | ||||||
Magellan Health Inc * | 2,714 | 130,571 | ||||||
Option Care Health Inc * | 9,146 | 86,613 | ||||||
Revance Therapeutics Inc * | 6,369 | 94,261 | ||||||
SP Plus Corp * | 4,300 | 89,225 | ||||||
Syneos Health Inc * | 2,809 | 110,731 | ||||||
|
| |||||||
| 2,164,128 | ||||||||
|
| |||||||
Energy - 1.0% | ||||||||
Delek US Holdings Inc | 3,778 | 59,541 | ||||||
Helix Energy Solutions Group Inc * | 10,055 | 16,490 | ||||||
Magnolia Oil & Gas Corp ‘A’ * | 16,735 | 66,940 | ||||||
|
| |||||||
| 142,971 | ||||||||
|
| |||||||
Financial - 37.1% | ||||||||
Agree Realty Corp REIT | 2,657 | 164,468 | ||||||
Argo Group International Holdings Ltd | 3,308 | 122,594 | ||||||
Armada Hoffler Properties Inc REIT | 12,082 | 129,277 | ||||||
Berkshire Hills Bancorp Inc | 7,521 | 111,762 | ||||||
Blucora Inc * | 4,294 | 51,743 | ||||||
Brightsphere Investment Group Inc | 11,301 | 72,213 | ||||||
Shares | Value | |||||||
Camden National Corp | 2,942 | $92,526 | ||||||
Cathay General Bancorp | 4,299 | 98,662 | ||||||
CenterState Bank Corp | 5,845 | 100,709 | ||||||
ConnectOne Bancorp Inc | 7,363 | 98,959 | ||||||
Enterprise Financial Services Corp | 4,066 | 113,482 | ||||||
Essent Group Ltd | 2,070 | 54,524 | ||||||
First Bancorp | 6,071 | 140,119 | ||||||
First Industrial Realty Trust Inc REIT | 7,990 | 265,508 | ||||||
First Interstate BancSystem Inc ‘A’ | 5,068 | 146,161 | ||||||
First Midwest Bancorp Inc | 3,959 | 52,397 | ||||||
Glacier Bancorp Inc | 5,185 | 176,316 | ||||||
Hilltop Holdings Inc | 9,496 | 143,579 | ||||||
Home BancShares Inc | 8,261 | 99,049 | ||||||
Horace Mann Educators Corp | 4,240 | 155,142 | ||||||
Horizon Bancorp Inc | 9,754 | 96,174 | ||||||
IBERIABANK Corp | 3,370 | 121,859 | ||||||
Invesco Mortgage Capital Inc REIT | 18,428 | 62,839 | ||||||
Investors Bancorp Inc | 21,822 | 174,358 | ||||||
Lexington Realty Trust REIT | 16,634 | 165,176 | ||||||
National Storage Affiliates Trust REIT | 7,485 | 221,556 | ||||||
NexPoint Residential Trust Inc REIT | 5,083 | 128,142 | ||||||
Northfield Bancorp Inc | 8,831 | 98,819 | ||||||
Old National Bancorp | 8,787 | 115,901 | ||||||
Old Second Bancorp Inc | 9,749 | 67,366 | ||||||
Piedmont Office Realty Trust Inc ‘A’ REIT | 13,589 | 239,982 | ||||||
PotlatchDeltic Corp REIT | 4,139 | 129,923 | ||||||
QCR Holdings Inc | 3,443 | 93,202 | ||||||
Radian Group Inc | 9,089 | 117,703 | ||||||
Ryman Hospitality Properties Inc REIT | 2,048 | 73,421 | ||||||
Sandy Spring Bancorp Inc | 5,707 | 129,206 | ||||||
Selective Insurance Group Inc | 3,620 | 179,914 | ||||||
STAG Industrial Inc REIT | 6,166 | 138,858 | ||||||
Stifel Financial Corp | 1,488 | 61,425 | ||||||
TCF Financial Corp | 3,852 | 87,286 | ||||||
Two Harbors Investment Corp REIT | 17,163 | 65,391 | ||||||
United Community Banks Inc | 6,889 | 126,138 | ||||||
WSFS Financial Corp | 4,452 | 110,944 | ||||||
|
| |||||||
| 5,194,773 | ||||||||
|
| |||||||
Industrial - 12.4% | ||||||||
Altra Industrial Motion Corp | 4,389 | 76,764 | ||||||
Astronics Corp * | 3,976 | 36,500 | ||||||
AZZ Inc | 3,254 | 91,502 | ||||||
EMCOR Group Inc | 2,976 | 182,488 | ||||||
EnerSys | 1,986 | 98,347 | ||||||
Knowles Corp * | 10,941 | 146,391 | ||||||
MYR Group Inc * | 4,148 | 108,636 | ||||||
Rexnord Corp | 5,557 | 125,977 | ||||||
Sanmina Corp * | 6,883 | 187,768 | ||||||
TriMas Corp * | 6,174 | 142,619 | ||||||
UFP Technologies Inc * | 3,121 | 118,879 | ||||||
Universal Forest Products Inc | 2,415 | 89,814 | ||||||
Vishay Intertechnology Inc | 7,221 | 104,055 | ||||||
Watts Water Technologies Inc ‘A’ | 599 | 50,705 | ||||||
Werner Enterprises Inc | 4,985 | 180,756 | ||||||
|
| |||||||
| 1,741,201 | ||||||||
|
| |||||||
Technology - 6.4% | ||||||||
Allscripts Healthcare Solutions Inc * | 13,976 | 98,391 | ||||||
Avaya Holdings Corp * | 14,293 | 115,630 | ||||||
CACI International Inc ‘A’ * | 522 | 110,220 | ||||||
CSG Systems International Inc | 2,192 | 91,735 | ||||||
Glu Mobile Inc * | 11,317 | 71,184 | ||||||
Insight Enterprises Inc * | 3,342 | 140,798 | ||||||
Ultra Clean Holdings Inc * | 7,026 | 96,959 | ||||||
Verint Systems Inc * | 3,926 | 168,818 | ||||||
|
| |||||||
| 893,735 | ||||||||
|
| |||||||
| See Notes to Financial Statements | See explanation of symbols and terms, if any, on B-58 |
B-54
Table of Contents
PACIFIC FUNDS
PACIFIC FUNDS SMALL-CAP VALUE
Schedule of Investments (Continued)
March 31, 2020
Shares | Value | |||||||
Utilities - 6.8% | ||||||||
Black Hills Corp | 4,966 | $317,973 | ||||||
Portland General Electric Co | 6,273 | 300,728 | ||||||
Southwest Gas Holdings Inc | 4,780 | 332,497 | ||||||
|
| |||||||
| 951,198 | ||||||||
|
| |||||||
Total Common Stocks | 12,860,216 | |||||||
|
| |||||||
EXCHANGE-TRADED FUND - 4.4% | ||||||||
iShares Russell 2000 Value | 7,546 | 618,998 | ||||||
|
| |||||||
Total Exchange-Traded Fund | 618,998 | |||||||
|
| |||||||
SHORT-TERM INVESTMENT - 4.5% | ||||||||
Money Market Fund - 4.5% | ||||||||
BlackRock Liquidity Funds T-Fund Portfolio ‘Institutional’ 0.210% | 628,679 | 628,679 | ||||||
|
| |||||||
Total Short-Term Investment | 628,679 | |||||||
|
| |||||||
TOTAL INVESTMENTS - 100.8% | 14,107,893 | |||||||
OTHER ASSETS & LIABILITIES, NET - (0.8%) | (108,869 | ) | ||||||
|
| |||||||
NET ASSETS - 100.0% | $13,999,024 | |||||||
|
| |||||||
Notes to Schedule of Investments
| (a) | As of March 31, 2020, the Fund’s composition by sector as a percentage of net assets was as follows: |
Financial | 37.1% | |||
Consumer, Non-Cyclical | 15.5% | |||
Industrial | 12.4% | |||
Consumer, Cyclical | 8.0% | |||
Utilities | 6.8% | |||
Technology | 6.4% | |||
Short-Term Investment | 4.5% | |||
Exchange-Traded Fund | 4.4% | |||
Others (each less than 3.0%) | 5.7% | |||
|
| |||
| 100.8% | ||||
Other Assets & Liabilities, Net | (0.8% | ) | ||
|
| |||
| 100.0% | ||||
|
|
| (b) | Fair Value Measurements |
The following is a summary of the Fund’s investments as categorized under the three-tier hierarchy of inputs used in valuing the Fund’s assets and liabilities as of March 31, 2020:
| Total Value at March 31, 2020 | Level 1 Quoted Price | Level 2 Significant Observable Inputs | Level 3 Significant Unobservable Inputs | |||||||||||||||
Assets | Common Stocks | $12,860,216 | $12,860,216 | $— | $— | |||||||||||||
Exchange-Traded Fund | 618,998 | 618,998 | — | — | ||||||||||||||
Short-Term Investment | 628,679 | 628,679 | — | — | ||||||||||||||
|
|
|
|
|
|
|
| |||||||||||
Total | $14,107,893 | $14,107,893 | $— | $— | ||||||||||||||
|
|
|
|
|
|
|
| |||||||||||
| See Notes to Financial Statements | See explanation of symbols and terms, if any, on B-58 |
B-55
Table of Contents
PACIFIC FUNDS
PACIFIC FUNDSSMSMALL-CAP GROWTH
Schedule of Investments
March 31, 2020
Shares | Value | |||||||
COMMON STOCKS - 98.1% | ||||||||
Basic Materials - 2.5% | ||||||||
Kaiser Aluminum Corp | 1,118 | $77,455 | ||||||
PolyOne Corp | 2,902 | 55,051 | ||||||
Rogers Corp * | 536 | 50,609 | ||||||
|
| |||||||
| 183,115 | ||||||||
|
| |||||||
Communications - 5.2% | ||||||||
NETGEAR Inc * | 3,068 | 70,073 | ||||||
Sinclair Broadcast Group Inc ‘A’ | 2,217 | 35,649 | ||||||
Viavi Solutions Inc * | 9,605 | 107,672 | ||||||
Vonage Holdings Corp * | 13,496 | 97,576 | ||||||
Yelp Inc * | 3,459 | 62,366 | ||||||
|
| |||||||
| 373,336 | ||||||||
|
| |||||||
Consumer, Cyclical - 11.2% | ||||||||
BJ’s Restaurants Inc | 2,636 | 36,614 | ||||||
BJ’s Wholesale Club Holdings Inc * | 5,394 | 137,385 | ||||||
Bloomin’ Brands Inc | 5,915 | 42,233 | ||||||
Deckers Outdoor Corp * | 770 | 103,180 | ||||||
Dine Brands Global Inc | 1,226 | 35,162 | ||||||
KB Home | 2,461 | 44,544 | ||||||
Lithia Motors Inc ‘A’ | 818 | 66,904 | ||||||
PetIQ Inc * | 2,516 | 58,447 | ||||||
RH * | 475 | 47,723 | ||||||
SeaWorld Entertainment Inc * | 4,769 | 52,554 | ||||||
Shake Shack Inc ‘A’ * | 1,307 | 49,326 | ||||||
Sleep Number Corp * | 2,129 | 40,792 | ||||||
Steven Madden Ltd | 2,936 | 68,203 | ||||||
The Children’s Place Inc | 1,041 | 20,362 | ||||||
|
| |||||||
| 803,429 | ||||||||
|
| |||||||
Consumer, Non-Cyclical - 41.0% | ||||||||
Aaron’s Inc | 1,815 | 41,346 | ||||||
Acadia Healthcare Co Inc * | 2,979 | 54,665 | ||||||
Addus HomeCare Corp * | 809 | 54,688 | ||||||
Amedisys Inc * | 937 | 171,977 | ||||||
Amicus Therapeutics Inc * | 9,603 | 88,732 | ||||||
AMN Healthcare Services Inc * | 1,923 | 111,169 | ||||||
Amphastar Pharmaceuticals Inc * | 3,516 | 52,177 | ||||||
BioTelemetry Inc * | 2,357 | 90,768 | ||||||
Blueprint Medicines Corp * | 1,214 | 70,995 | ||||||
Cardtronics PLC ‘A’ * | 3,040 | 63,597 | ||||||
Chegg Inc * | 4,314 | 154,355 | ||||||
Deluxe Corp | 2,633 | 68,274 | ||||||
Esperion Therapeutics Inc * | 1,659 | 52,308 | ||||||
FibroGen Inc * | 2,255 | 78,361 | ||||||
FTI Consulting Inc * | 846 | 101,325 | ||||||
Harsco Corp * | 4,345 | 30,285 | ||||||
Heron Therapeutics Inc * | 4,162 | 48,862 | ||||||
Horizon Therapeutics PLC * | 5,318 | 157,519 | ||||||
Iovance Biotherapeutics Inc * | 3,482 | 104,234 | ||||||
iRhythm Technologies Inc * | 1,309 | 106,487 | ||||||
LHC Group Inc * | 1,106 | 155,061 | ||||||
LivaNova PLC * | 1,475 | 66,744 | ||||||
LiveRamp Holdings Inc * | 2,151 | 70,811 | ||||||
Merit Medical Systems Inc * | 3,155 | 98,594 | ||||||
NuVasive Inc * | 1,777 | 90,023 | ||||||
Option Care Health Inc * | 4,399 | 41,658 | ||||||
Orthofix Medical Inc * | 1,970 | 55,180 | ||||||
Performance Food Group Co * | 3,885 | 96,037 | ||||||
PTC Therapeutics Inc * | 1,924 | 85,830 | ||||||
Quidel Corp * | 1,923 | 188,089 | ||||||
Revance Therapeutics Inc * | 4,346 | 64,321 | ||||||
Supernus Pharmaceuticals Inc * | 2,121 | 38,157 | ||||||
Syneos Health Inc * | 2,093 | 82,506 | ||||||
Ultragenyx Pharmaceutical Inc * | 2,124 | 94,369 | ||||||
|
| |||||||
| 2,929,504 | ||||||||
|
| |||||||
Shares | Value | |||||||
Financial - 5.2% | ||||||||
Blucora Inc * | 4,374 | $52,707 | ||||||
ConnectOne Bancorp Inc | 3,099 | 41,651 | ||||||
Essent Group Ltd | 2,487 | 65,508 | ||||||
Glacier Bancorp Inc | 1,577 | 53,626 | ||||||
PS Business Parks Inc REIT | 732 | 99,201 | ||||||
Ryman Hospitality Properties Inc REIT | 1,611 | 57,754 | ||||||
|
| |||||||
| 370,447 | ||||||||
|
| |||||||
Industrial - 15.4% | ||||||||
Aerojet Rocketdyne Holdings Inc * | 2,409 | 100,767 | ||||||
American Woodmark Corp * | 1,138 | 51,859 | ||||||
Astronics Corp * | 2,698 | 24,768 | ||||||
EnPro Industries Inc | 1,438 | 56,916 | ||||||
Generac Holdings Inc * | 1,788 | 166,588 | ||||||
Itron Inc * | 1,448 | 80,842 | ||||||
Masonite International Corp * | 1,352 | 64,152 | ||||||
MasTec Inc * | 2,331 | 76,294 | ||||||
MYR Group Inc * | 2,519 | 65,973 | ||||||
OSI Systems Inc * | 1,109 | 76,432 | ||||||
Saia Inc * | 1,089 | 80,085 | ||||||
SPX Corp * | 3,108 | 101,445 | ||||||
Tetra Tech Inc | 1,484 | 104,800 | ||||||
US Ecology Inc | 1,663 | 50,555 | ||||||
|
| |||||||
| 1,101,476 | ||||||||
|
| |||||||
Technology - 17.6% | ||||||||
Allscripts Healthcare Solutions Inc * | 9,590 | 67,514 | ||||||
Avaya Holdings Corp * | 6,151 | 49,762 | ||||||
Bottomline Technologies DE Inc * | 3,070 | 112,515 | ||||||
Box Inc ‘A’ * | 3,163 | 44,409 | ||||||
Cloudera Inc * | 9,545 | 75,119 | ||||||
CommVault Systems Inc * | 1,939 | 78,491 | ||||||
Cornerstone OnDemand Inc * | 2,893 | 91,853 | ||||||
Glu Mobile Inc * | 18,119 | 113,968 | ||||||
J2 Global Inc | 2,083 | 155,913 | ||||||
Qualys Inc * | 1,388 | 120,742 | ||||||
RealPage Inc * | 1,351 | 71,508 | ||||||
Silicon Laboratories Inc * | 1,281 | 109,410 | ||||||
SPS Commerce Inc * | 2,238 | 104,089 | ||||||
Virtusa Corp * | 2,165 | 61,486 | ||||||
|
| |||||||
| 1,256,779 | ||||||||
|
| |||||||
Total Common Stocks | 7,018,086 | |||||||
|
| |||||||
SHORT-TERM INVESTMENT - 2.2% | ||||||||
Money Market Fund - 2.2% | ||||||||
BlackRock Liquidity Funds T-Fund Portfolio ‘Institutional’ 0.210% | 154,877 | 154,877 | ||||||
|
| |||||||
Total Short-Term Investment | 154,877 | |||||||
|
| |||||||
TOTAL INVESTMENTS - 100.3% | 7,172,963 | |||||||
OTHER ASSETS & LIABILITIES, NET - (0.3%) | (20,996 | ) | ||||||
|
| |||||||
NET ASSETS - 100.0% | $7,151,967 | |||||||
|
| |||||||
| See Notes to Financial Statements | See explanation of symbols and terms, if any, on B-58 |
B-56
Table of Contents
PACIFIC FUNDS
PACIFIC FUNDSSMALL-CAP GROWTH
Schedule of Investments (Continued)
March 31, 2020
Notes to Schedule of Investments
| (a) | As of March 31, 2020, the Fund’s composition by sector as a percentage of net assets was as follows: |
Consumer, Non-Cyclical | 41.0% | |||
Technology | 17.6% | |||
Industrial | 15.4% | |||
Consumer, Cyclical | 11.2% | |||
Communications | 5.2% | |||
Financial | 5.2% | |||
Others (each less than 3.0%) | 4.7% | |||
|
| |||
| 100.3% | ||||
Other Assets & Liabilities, Net | (0.3% | ) | ||
|
| |||
| 100.0% | ||||
|
|
| (b) | Fair Value Measurements |
The following is a summary of the Fund’s investments as categorized under the three-tier hierarchy of inputs used in valuing the Fund’s assets and liabilities as of March 31, 2020:
| Total Value at March 31, 2020 | Level 1 Quoted Price | Level 2 Significant Observable Inputs | Level 3 Significant Unobservable Inputs | |||||||||||||||
Assets | Common Stocks | $7,018,086 | $7,018,086 | $— | $— | |||||||||||||
Short-Term Investment | 154,877 | 154,877 | — | — | ||||||||||||||
|
|
|
|
|
|
|
| |||||||||||
Total | $7,172,963 | $7,172,963 | $— | $— | ||||||||||||||
|
|
|
|
|
|
|
| |||||||||||
| See Notes to Financial Statements | See explanation of symbols and terms, if any, on B-58 |
B-57
Table of Contents
PACIFIC FUNDS
Schedule of Investments (Continued)
Explanation of Symbols and Terms
March 31, 2020
| * | Non-income producing investments. | |
| § | Variable rate investments. The rate shown is based on the latest available information as of March 31, 2020. For Senior Loan Notes, the rate shown may represent a weighted average interest rate. Interest rates for certain securities are subject to interest rate caps and floors, which would result in a period end rate being more, less or equal to the referenced rate plus spread. Certain variable rate securities are not based on a published reference rate and spread but are determined by the issuer or agent and are based on current market conditions. These securities do not indicate a reference rate and spread in their description. | |
| ¥ | All or a portion of this senior loan position has not settled. Rates do not take effect until settlement date. Rates shown, if any, are for the settled portion. | |
| ~ | Securities are not registered under the Securities Act of 1933 (1933 Act). These securities are either (1) exempt from registration pursuant to Rule 144A under the 1933 Act and may only be sold to “qualified institutional buyers”, or (2) the securities comply with Regulation S rules governing offers and sales made outside the United States without registration under the 1933 Act and contain certain restrictions as to public resale. | |
| W | The values of these investments were determined by the Trustee Valuation Committee or determined by a valuation committee established under the Valuation Policy and then subsequently submitted for approval or ratification to either the Trustee Valuation Committee or to the Board of Trustees (the “Board”). Each determination was made in good faith in accordance with the procedures established by the Board and the provisions of the Investment Company Act of 1940. | |
| ± | Investments categorized as a significant unobservable input (Level 3). | |
Currency Abbreviations: | ||
| USD | United States Dollar | |
Reference Rate Abbreviation: | ||
| LIBOR | London Interbank Offered Rate | |
| SOFR | Secured Overnight Financing Rate | |
Other Abbreviations: | ||
| ADR | American Depositary Receipt | |
| GDR | Global Depositary Receipt | |
| PIK | Payment In Kind | |
| REIT | Real Estate Investment Trust | |
Notes:
For debt investments, the interest rates disclosed in the Schedules of Investments reflect the stated coupon rate or for discounted investments or zero coupon bonds, the yield-to-maturity.
The countries listed in the Schedules of Investments are based on country of risk.
The sectors listed in the Schedules of Investments are obtained from a third party source (that is not affiliated with the Trust or the investment adviser) believed to be reliable. Sector names and weightings could be different if obtained from another source.
See Notes to Financial Statements
B-58
Table of Contents
PACIFIC FUNDS
STATEMENTS OF ASSETS AND LIABILITIES
MARCH 31, 2020
| Pacific Funds Portfolio Optimization | Pacific Funds Ultra Short Income | |||||||||||||||||||||||||||||
| Conservative | Moderate- Conservative | Moderate | Growth | Aggressive- Growth | ||||||||||||||||||||||||||
ASSETS | ||||||||||||||||||||||||||||||
Investments in affiliated mutual funds, at value | $214,341,523 | $286,718,705 | $879,940,322 | $660,434,469 | $236,595,786 | $— | ||||||||||||||||||||||||
Investments, at value (excluding derivatives) | — | — | — | — | — | 24,538,734 | ||||||||||||||||||||||||
Receivables: | ||||||||||||||||||||||||||||||
Dividends and interest | — | — | — | — | — | 109,517 | ||||||||||||||||||||||||
Fund shares sold | 105,408 | 153,123 | 495,692 | 259,976 | 73,152 | 15 | ||||||||||||||||||||||||
Securities sold | 46,228 | 61,924 | — | 411,214 | 1,901 | 1,239,885 | ||||||||||||||||||||||||
Due from adviser | 4,114 | 3,379 | — | — | 690 | 11,247 | ||||||||||||||||||||||||
Prepaid expenses and other assets | 12,254 | 12,745 | 23,420 | 18,061 | 12,503 | 11,009 | ||||||||||||||||||||||||
Total Assets | 214,509,527 | 286,949,876 | 880,459,434 | 661,123,720 | 236,684,032 | 25,910,407 | ||||||||||||||||||||||||
LIABILITIES | ||||||||||||||||||||||||||||||
Payables: | ||||||||||||||||||||||||||||||
Fund shares redeemed | 1,303,391 | 458,815 | 745,884 | 926,965 | 105,557 | — | ||||||||||||||||||||||||
Securities purchased | — | — | 248,490 | — | — | 1,048,995 | ||||||||||||||||||||||||
Due to custodian | — | — | — | — | — | 163,203 | ||||||||||||||||||||||||
Income distributions | — | — | — | — | — | 16 | ||||||||||||||||||||||||
Accrued advisory fees | 36,950 | 50,242 | 155,456 | 118,592 | 42,357 | 5,291 | ||||||||||||||||||||||||
Accrued administration fees | 27,712 | 37,681 | 116,059 | 88,125 | 31,768 | 3,175 | ||||||||||||||||||||||||
Accrued custodian fees and expenses | — | — | — | — | — | 400 | ||||||||||||||||||||||||
Accrued legal, audit and tax service fees | 13,557 | 16,646 | 41,154 | 31,698 | 14,074 | 5,442 | ||||||||||||||||||||||||
Accrued trustees’ fees and expenses and deferred compensation | 4,308 | 5,187 | 13,771 | 9,605 | 2,785 | 14 | ||||||||||||||||||||||||
Accrued distribution fees | 5,704 | 5,963 | 17,489 | 12,361 | 4,344 | — | ||||||||||||||||||||||||
Accrued service fees | 8,367 | 11,431 | 34,980 | 26,404 | 9,297 | — | ||||||||||||||||||||||||
Accrued other (1) | 20,560 | 26,340 | 64,188 | 51,890 | 24,459 | 10,133 | ||||||||||||||||||||||||
Total Liabilities | 1,420,549 | 612,305 | 1,437,471 | 1,265,640 | 234,641 | 1,236,669 | ||||||||||||||||||||||||
NET ASSETS | $213,088,978 | $286,337,571 | $879,021,963 | $659,858,080 | $236,449,391 | $24,673,738 | ||||||||||||||||||||||||
NET ASSETS CONSIST OF: | ||||||||||||||||||||||||||||||
Paid-in capital | $219,933,857 | $302,880,041 | $910,702,204 | $701,714,447 | $254,324,052 | $25,569,901 | ||||||||||||||||||||||||
Undistributed/accumulated earnings (deficit) | (6,844,879 | ) | (16,542,470 | ) | (31,680,241 | ) | (41,856,367 | ) | (17,874,661 | ) | (896,163 | ) | ||||||||||||||||||
NET ASSETS | $213,088,978 | $286,337,571 | $879,021,963 | $659,858,080 | $236,449,391 | $24,673,738 | ||||||||||||||||||||||||
Class A Shares: | ||||||||||||||||||||||||||||||
Net Assets | $159,186,357 | $231,749,097 | $714,447,092 | $544,604,936 | $191,505,025 | |||||||||||||||||||||||||
Shares of beneficial interest outstanding | 16,188,658 | 23,288,746 | 67,427,493 | 51,405,297 | 16,823,385 | |||||||||||||||||||||||||
Net Asset Value per share* | $9.83 | $9.95 | $10.60 | $10.59 | $11.38 | |||||||||||||||||||||||||
Sales Charge — Maximum is 5.50% of offering price | 0.57 | 0.58 | 0.62 | 0.62 | 0.66 | |||||||||||||||||||||||||
Maximum offering price per share | $10.40 | $10.53 | $11.22 | $11.21 | $12.04 | |||||||||||||||||||||||||
Class C Shares: | ||||||||||||||||||||||||||||||
Net Assets | $46,908,650 | $48,929,426 | $142,846,250 | $100,768,317 | $35,338,677 | |||||||||||||||||||||||||
Shares of beneficial interest outstanding | 4,890,376 | 5,033,274 | 13,751,514 | 9,759,453 | 3,220,365 | |||||||||||||||||||||||||
Net Asset Value per share* | $9.59 | $9.72 | $10.39 | $10.33 | $10.97 | |||||||||||||||||||||||||
Class I Shares: | ||||||||||||||||||||||||||||||
Net Assets | $12,272,661 | |||||||||||||||||||||||||||||
Shares of beneficial interest outstanding | 1,272,059 | |||||||||||||||||||||||||||||
Net Asset Value per share | $9.65 | |||||||||||||||||||||||||||||
Advisor Class: | ||||||||||||||||||||||||||||||
Net Assets | $6,993,971 | $5,659,048 | $21,728,621 | $14,484,827 | $9,605,689 | $12,401,077 | ||||||||||||||||||||||||
Shares of beneficial interest outstanding | 708,215 | 565,706 | 2,041,551 | 1,359,995 | 839,965 | 1,285,375 | ||||||||||||||||||||||||
Net Asset Value per share | $9.88 | $10.00 | $10.64 | $10.65 | $11.44 | $9.65 | ||||||||||||||||||||||||
Investments in affiliated mutual funds, at cost | $216,641,998 | $298,276,276 | $901,209,091 | $695,726,206 | $246,388,717 | $— | ||||||||||||||||||||||||
Investments, at cost (excluding derivatives) | — | — | — | — | — | 25,419,950 | ||||||||||||||||||||||||
| * | Redemption price per share is equal to the Net Asset Value per share less any applicable contingent deferred sales charge. |
| (1) | Accrued other for Pacific Funds Portfolio Optimization Aggressive-Growth includes $12,629 of printing fees. |
See Notes to Financial Statements
C-1
Table of Contents
PACIFIC FUNDS
STATEMENTS OF ASSETS AND LIABILITIES (Continued)
MARCH 31, 2020
| Pacific Funds Short Duration Income | Pacific Funds Core Income | Pacific Funds Strategic Income | Pacific Funds Floating Rate Income | Pacific Funds High Income | Pacific Funds Diversified Income | |||||||||||||||||||||||||
ASSETS | ||||||||||||||||||||||||||||||
Investments, at value (excluding derivatives) | $1,019,091,020 | $966,158,199 | $639,339,684 | $1,158,298,014 | $136,414,803 | $24,237,493 | ||||||||||||||||||||||||
Cash | 84,375 | 260,988 | 143,835 | 1,528,436 | 67,029 | 13,153 | ||||||||||||||||||||||||
Foreign currency held, at value | — | — | 4,733 | — | 592 | 15,962 | ||||||||||||||||||||||||
Receivables: | ||||||||||||||||||||||||||||||
Dividends and interest | 5,332,052 | 6,284,510 | 6,320,238 | 3,509,694 | 2,011,516 | 107,829 | ||||||||||||||||||||||||
Fund shares sold | 14,170,850 | 10,395,224 | 6,023,978 | 10,239,810 | 92,320 | — | ||||||||||||||||||||||||
Securities sold | 24,191,487 | 33,339,813 | 45,012,536 | 206,630,165 | 508,509 | 255,348 | ||||||||||||||||||||||||
Due from adviser | 139,958 | 190,212 | 92,381 | 159,510 | 22,754 | 8,117 | ||||||||||||||||||||||||
Prepaid expenses and other assets | 28,364 | 30,779 | 29,774 | 127,327 | 14,788 | 5,909 | ||||||||||||||||||||||||
Total Assets | 1,063,038,106 | 1,016,659,725 | 696,967,159 | 1,380,492,956 | 139,132,311 | 24,643,811 | ||||||||||||||||||||||||
LIABILITIES | ||||||||||||||||||||||||||||||
Payables: | ||||||||||||||||||||||||||||||
Fund shares redeemed | 11,789,138 | 9,167,156 | 4,310,936 | 18,875,133 | 51,922 | — | ||||||||||||||||||||||||
Securities purchased | 23,140,040 | 35,773,218 | 49,042,512 | 110,737,946 | 5,532,757 | 570,269 | ||||||||||||||||||||||||
Line of credit | — | — | — | 54,000,000 | — | — | ||||||||||||||||||||||||
Income distributions | 70,312 | 455,235 | 483,187 | 730,197 | 923 | — | ||||||||||||||||||||||||
Accrued advisory fees | 369,420 | 423,034 | 367,212 | 728,974 | 62,557 | 7,370 | ||||||||||||||||||||||||
Accrued administration fees | 139,299 | 127,078 | 91,803 | 169,872 | 15,639 | 3,158 | ||||||||||||||||||||||||
Accrued custodian fees and expenses | 12,822 | 22,763 | 12,554 | 32,497 | 2,446 | 4,386 | ||||||||||||||||||||||||
Accrued legal, audit and tax service fees | 47,935 | 44,357 | 31,581 | 56,709 | 9,710 | 5,358 | ||||||||||||||||||||||||
Accrued trustees’ fees and expenses and deferred compensation | 195 | 179 | 165 | 467 | 20 | 14 | ||||||||||||||||||||||||
Accrued distribution fees | 5,899 | 7,000 | 7,550 | 12,238 | 240 | — | ||||||||||||||||||||||||
Accrued service fees | 8,188 | 7,963 | 5,361 | 10,539 | 365 | — | ||||||||||||||||||||||||
Accrued other | 124,311 | 112,431 | 99,088 | 364,546 | 27,036 | 37,784 | ||||||||||||||||||||||||
Unfunded loan commitment depreciation | — | — | 27,452 | — | 4,902 | — | ||||||||||||||||||||||||
Total Liabilities | 35,707,559 | 46,140,414 | 54,479,401 | 185,719,118 | 5,708,517 | 628,339 | ||||||||||||||||||||||||
NET ASSETS | $1,027,330,547 | $970,519,311 | $642,487,758 | $1,194,773,838 | $133,423,794 | $24,015,472 | ||||||||||||||||||||||||
NET ASSETS CONSIST OF: |
| |||||||||||||||||||||||||||||
Paid-in capital | $1,060,837,518 | $996,290,539 | $732,254,378 | $1,442,494,482 | $159,221,158 | $28,611,778 | ||||||||||||||||||||||||
Undistributed/accumulated earnings (deficit) | (33,506,971 | ) | (25,771,228 | ) | (89,766,620 | ) | (247,720,644 | ) | (25,797,364 | ) | (4,596,306 | ) | ||||||||||||||||||
NET ASSETS | $1,027,330,547 | $970,519,311 | $642,487,758 | $1,194,773,838 | $133,423,794 | $24,015,472 | ||||||||||||||||||||||||
Class A Shares: | ||||||||||||||||||||||||||||||
Net Assets | $154,308,911 | $140,649,854 | $71,510,410 | $162,511,207 | $7,226,719 | |||||||||||||||||||||||||
Shares of beneficial interest outstanding | 15,359,951 | 13,274,686 | 7,359,552 | 18,468,543 | 826,007 | |||||||||||||||||||||||||
Net Asset Value per share* | $10.05 | $10.60 | $9.72 | $8.80 | $8.75 | |||||||||||||||||||||||||
Sales Charge (1) | 0.31 | 0.47 | 0.43 | 0.27 | 0.39 | |||||||||||||||||||||||||
Maximum offering price per share | $10.36 | $11.07 | $10.15 | $9.07 | $9.14 | |||||||||||||||||||||||||
Class C Shares: |
| |||||||||||||||||||||||||||||
Net Assets | $48,815,835 | $58,396,858 | $63,134,479 | $102,845,705 | $2,007,057 | |||||||||||||||||||||||||
Shares of beneficial interest outstanding | 4,868,835 | 5,509,539 | 6,512,760 | 11,704,425 | 229,687 | |||||||||||||||||||||||||
Net Asset Value per share* | $10.03 | $10.60 | $9.69 | $8.79 | $8.74 | |||||||||||||||||||||||||
Class I Shares: | ||||||||||||||||||||||||||||||
Net Assets | $106,402,146 | $60,354,931 | $16,621,634 | $415,170,372 | $53,966 | |||||||||||||||||||||||||
Shares of beneficial interest outstanding | 10,605,453 | 5,691,095 | 1,721,194 | 47,117,049 | 6,229 | |||||||||||||||||||||||||
Net Asset Value per share | $10.03 | $10.61 | $9.66 | $8.81 | $8.66 | |||||||||||||||||||||||||
Class P Shares: | ||||||||||||||||||||||||||||||
Net Assets | $31,830,791 | $7,900,041 | $120,807,281 | |||||||||||||||||||||||||||
Shares of beneficial interest outstanding | 2,992,215 | 896,733 | 13,944,180 | |||||||||||||||||||||||||||
Net Asset Value Per Share | $10.64 | $8.81 | $8.66 | |||||||||||||||||||||||||||
Advisor Class: | ||||||||||||||||||||||||||||||
Net Assets | $717,803,655 | $679,286,877 | $491,221,235 | $506,346,513 | $3,328,771 | $24,015,472 | ||||||||||||||||||||||||
Shares of beneficial interest outstanding | 71,426,295 | 63,963,523 | 50,547,170 | 57,345,817 | 380,090 | 2,862,136 | ||||||||||||||||||||||||
Net Asset Value per share | $10.05 | $10.62 | $9.72 | $8.83 | $8.76 | $8.39 | ||||||||||||||||||||||||
Investments, at cost (excluding derivatives) | $1,046,192,910 | $970,803,363 | $721,355,321 | $1,294,703,120 | $151,397,242 | $28,635,508 | ||||||||||||||||||||||||
Foreign currency held, at cost | — | — | 6,640 | — | 788 | 15,721 | ||||||||||||||||||||||||
| * | Redemption price per share is equal to the Net Asset Value per share less any applicable contingent deferred sales charge. |
| (1) | The Class A shares of Pacific Funds Short Duration Income and Pacific Funds Floating Rate Income are subject to a maximum 3.00%front-end sales charge. The Class A shares of Pacific Funds Core Income, Pacific Funds Strategic Income, and Pacific Funds High Income are subject to a maximum 4.25%front-end sales charge. |
See Notes to Financial Statements
C-2
Table of Contents
PACIFIC FUNDS
STATEMENTS OF ASSETS AND LIABILITIES (Continued)
MARCH 31, 2020
| Pacific Funds Large-Cap | Pacific Funds Large-Cap Value | Pacific Funds Small/Mid-Cap | Pacific Funds Small-Cap | Pacific Funds Small-Cap Value | Pacific Funds Small-Cap Growth | |||||||||||||||||||||||||
ASSETS | ||||||||||||||||||||||||||||||
Investments, at value (excluding derivatives) | $19,766,353 | $15,931,993 | $243,031,434 | $12,486,045 | $14,107,893 | $7,172,963 | ||||||||||||||||||||||||
Receivables: | ||||||||||||||||||||||||||||||
Dividends and interest | 28,281 | 30,911 | 191,520 | 12,041 | 23,018 | 6,101 | ||||||||||||||||||||||||
Fund shares sold | 257,654 | 964 | 497,746 | 8,817 | 105,572 | 3,230 | ||||||||||||||||||||||||
Securities sold | 536,717 | — | — | 150,049 | 58,331 | — | ||||||||||||||||||||||||
Due from adviser | 8,740 | 8,840 | 1,636 | 6,439 | 8,056 | 6,989 | ||||||||||||||||||||||||
Prepaid expenses and other assets | 12,634 | 23,121 | 27,395 | 23,107 | 23,122 | 11,639 | ||||||||||||||||||||||||
Total Assets | 20,610,379 | 15,995,829 | 243,749,731 | 12,686,498 | 14,325,992 | 7,200,922 | ||||||||||||||||||||||||
LIABILITIES | ||||||||||||||||||||||||||||||
Payables: | ||||||||||||||||||||||||||||||
Fund shares redeemed | 21,950 | 72 | 680,085 | 95,623 | 33,467 | 20,917 | ||||||||||||||||||||||||
Securities purchased | 527,003 | — | — | 58,423 | 268,918 | — | ||||||||||||||||||||||||
Accrued advisory fees | 7,591 | 7,904 | 168,607 | 8,570 | 9,585 | 11,450 | ||||||||||||||||||||||||
Accrued administration fees | 2,530 | 2,156 | 33,721 | 1,714 | 1,917 | 2,290 | ||||||||||||||||||||||||
Accrued custodian fees and expenses | 465 | 225 | 3,823 | 196 | 218 | 320 | ||||||||||||||||||||||||
Accrued legal, audit and tax service fees | 5,201 | 5,080 | 14,315 | 4,958 | 5,008 | 4,910 | ||||||||||||||||||||||||
Accrued trustees’ fees and expenses and deferred compensation | 5 | 7 | 69 | 5 | 6 | 14 | ||||||||||||||||||||||||
Accrued distribution fees | 420 | 295 | 1,155 | 68 | 79 | 72 | ||||||||||||||||||||||||
Accrued service fees | 544 | 258 | 983 | 160 | 69 | 110 | ||||||||||||||||||||||||
Accrued other (1) | 7,541 | 6,627 | 44,903 | 7,424 | 7,701 | 8,872 | ||||||||||||||||||||||||
Total Liabilities | 573,250 | 22,624 | 947,661 | 177,141 | 326,968 | 48,955 | ||||||||||||||||||||||||
NET ASSETS | $20,037,129 | $15,973,205 | $242,802,070 | $12,509,357 | $13,999,024 | $7,151,967 | ||||||||||||||||||||||||
NET ASSETS CONSIST OF: | ||||||||||||||||||||||||||||||
Paid-in capital | $19,673,377 | $16,847,377 | $307,057,273 | $16,434,148 | $19,642,168 | $13,474,750 | ||||||||||||||||||||||||
Undistributed/accumulated earnings (deficit) | 363,752 | (874,172 | ) | (64,255,203 | ) | (3,924,791 | ) | (5,643,144 | ) | (6,322,783 | ) | |||||||||||||||||||
NET ASSETS | $20,037,129 | $15,973,205 | $242,802,070 | $12,509,357 | $13,999,024 | $7,151,967 | ||||||||||||||||||||||||
Class A Shares: | ||||||||||||||||||||||||||||||
Net Assets | $9,986,283 | $3,892,219 | $14,378,769 | $3,342,716 | $1,022,751 | $2,106,839 | ||||||||||||||||||||||||
Shares of beneficial interest outstanding | 893,917 | 466,140 | 1,511,021 | 390,394 | 166,380 | 248,196 | ||||||||||||||||||||||||
Net Asset Value per share* | $11.17 | $8.35 | $9.52 | $8.56 | $6.15 | $8.49 | ||||||||||||||||||||||||
Sales Charge — Maximum is 4.25% of offering price | 0.50 | 0.37 | 0.42 | 0.38 | 0.27 | 0.38 | ||||||||||||||||||||||||
Maximum offering price per share | $11.67 | $8.72 | $9.94 | $8.94 | $6.42 | $8.87 | ||||||||||||||||||||||||
Class C Shares: | ||||||||||||||||||||||||||||||
Net Assets | $3,433,043 | $2,394,334 | $9,277,001 | $538,035 | $644,202 | $586,501 | ||||||||||||||||||||||||
Shares of beneficial interest outstanding | 308,937 | 288,660 | 1,004,451 | 64,218 | 106,733 | 71,525 | ||||||||||||||||||||||||
Net Asset Value per share* | $11.11 | $8.29 | $9.24 | $8.38 | $6.04 | $8.20 | ||||||||||||||||||||||||
Advisor Class: | ||||||||||||||||||||||||||||||
Net Assets | $5,931,583 | $8,667,447 | $214,344,288 | $7,897,333 | $10,018,112 | $3,083,461 | ||||||||||||||||||||||||
Shares of beneficial interest outstanding | 526,864 | 1,033,561 | 22,368,493 | 906,981 | 1,618,035 | 358,871 | ||||||||||||||||||||||||
Net Asset Value per share | $11.26 | $8.39 | $9.58 | $8.71 | $6.19 | $8.59 | ||||||||||||||||||||||||
Class R6 (formerly Class S): | ||||||||||||||||||||||||||||||
Net Assets | $686,220 | $1,019,205 | $4,802,012 | $731,273 | $2,313,959 | $1,375,166 | ||||||||||||||||||||||||
Shares of beneficial interest outstanding | 62,141 | 122,605 | 500,682 | 91,702 | 375,308 | 159,388 | ||||||||||||||||||||||||
Net Asset Value per share | $11.04 | $8.31 | $9.59 | $7.97 | $6.17 | $8.63 | ||||||||||||||||||||||||
Investments, at cost (excluding derivatives) | $18,978,576 | $16,430,357 | $288,696,067 | $15,071,587 | $18,338,381 | $7,766,544 | ||||||||||||||||||||||||
| * | Redemption price per share is equal to the Net Asset Value per share less any applicable contingent deferred sales charge. |
| (1) | Accrued other for Pacific Funds Large-Cap Value and Pacific Funds Small-Cap Growth includes $4,215 and $5,750, respectively, of portfolio accounting fees. |
See Notes to Financial Statements
C-3
Table of Contents
PACIFIC FUNDS
FOR THE YEAR ENDED MARCH 31, 2020
| Pacific Funds Portfolio Optimization | Pacific Funds Ultra Short Income (1) | |||||||||||||||||||||||||||||
| Conservative | Moderate- Conservative | Moderate | Growth | Aggressive- Growth | ||||||||||||||||||||||||||
INVESTMENT INCOME | ||||||||||||||||||||||||||||||
Dividends, net of foreign taxes withheld | $— | $— | $— | $— | $— | $21,379 | ||||||||||||||||||||||||
Dividends from affiliated mutual fund investments | $5,306,623 | $7,458,539 | $21,547,669 | $17,321,189 | $5,857,812 | — | ||||||||||||||||||||||||
Interest, net of foreign taxes withheld | — | — | — | — | — | 476,117 | ||||||||||||||||||||||||
Total Investment Income | 5,306,623 | 7,458,539 | 21,547,669 | 17,321,189 | 5,857,812 | 497,496 | ||||||||||||||||||||||||
EXPENSES | ||||||||||||||||||||||||||||||
Advisory fees | 481,289 | 694,932 | 2,171,773 | 1,692,832 | 614,838 | 47,997 | ||||||||||||||||||||||||
Administration fees | 360,967 | 521,199 | 1,628,830 | 1,269,624 | 461,128 | 38,442 | ||||||||||||||||||||||||
Support services expenses | 30,601 | 44,589 | 138,108 | 106,787 | 38,279 | 2,011 | ||||||||||||||||||||||||
Custodian fees and expenses | — | — | — | — | — | 900 | ||||||||||||||||||||||||
Portfolio accounting fees | 18,234 | 18,511 | 20,524 | 19,930 | 18,461 | 15,359 | ||||||||||||||||||||||||
Shareholder report expenses | 28,060 | 40,754 | 127,215 | 98,984 | 35,737 | 2,022 | ||||||||||||||||||||||||
Distribution fees (2) | ||||||||||||||||||||||||||||||
Class B (3) | 38,963 | 64,572 | 210,153 | 156,322 | 49,861 | |||||||||||||||||||||||||
Class C | 536,185 | 645,017 | 1,852,366 | 1,348,660 | 448,617 | |||||||||||||||||||||||||
Service fees (2) | ||||||||||||||||||||||||||||||
Class A | 390,359 | 614,457 | 1,960,647 | 1,566,609 | 572,292 | |||||||||||||||||||||||||
Class B (3) | 12,988 | 21,524 | 70,051 | 52,108 | 16,620 | |||||||||||||||||||||||||
Class C | 178,728 | 215,006 | 617,456 | 449,553 | 149,539 | |||||||||||||||||||||||||
Transfer agencyout-of-pocket expenses | 11,826 | 17,960 | 54,167 | 41,497 | 14,467 | 873 | ||||||||||||||||||||||||
Registration fees | 56,466 | 57,217 | 68,231 | 68,784 | 59,175 | 41,917 | ||||||||||||||||||||||||
Legal, audit and tax service fees | 32,225 | 42,096 | 118,141 | 89,309 | 34,448 | 7,212 | ||||||||||||||||||||||||
Trustees’ fees and expenses | 11,393 | 16,793 | 52,492 | 41,085 | 14,851 | 933 | ||||||||||||||||||||||||
Offering expenses | — | — | — | — | — | 16,949 | ||||||||||||||||||||||||
Other | 9,032 | 11,982 | 33,637 | 26,767 | 10,612 | 2,598 | ||||||||||||||||||||||||
Total Expenses | 2,197,316 | 3,026,609 | 9,123,791 | 7,028,851 | 2,538,925 | 177,213 | ||||||||||||||||||||||||
Adviser Expense Reimbursement | (197,838 | ) | (249,902 | ) | (612,516 | ) | (493,143 | ) | (226,029 | ) | (115,776 | ) | ||||||||||||||||||
Net Expenses | 1,999,478 | 2,776,707 | 8,511,275 | 6,535,708 | 2,312,896 | 61,437 | ||||||||||||||||||||||||
NET INVESTMENT INCOME (LOSS) | 3,307,145 | 4,681,832 | 13,036,394 | 10,785,481 | 3,544,916 | 436,059 | ||||||||||||||||||||||||
NET REALIZED AND UNREALIZED GAIN (LOSS) | ||||||||||||||||||||||||||||||
Net Realized Gain (Loss) On: | ||||||||||||||||||||||||||||||
Investment security transactions | — | — | — | — | — | (15,835 | ) | |||||||||||||||||||||||
Investment security transactions in affiliated mutual funds | (2,738,150 | ) | (4,110,009 | ) | (13,988,422 | ) | (8,228,433 | ) | (7,715,310 | ) | — | |||||||||||||||||||
Capital gain distributions from affiliated mutual fund investments | 1,969,923 | 4,940,934 | 19,378,602 | 17,879,821 | 7,423,829 | — | ||||||||||||||||||||||||
Net Realized Gain (Loss) | (768,227 | ) | 830,925 | 5,390,180 | 9,651,388 | (291,481 | ) | (15,835 | ) | |||||||||||||||||||||
Change In Net Unrealized Appreciation (Depreciation) On: | ||||||||||||||||||||||||||||||
Investment securities in affiliated mutual fund investments | (6,207,112 | ) | (18,767,202 | ) | (82,605,083 | ) | (99,881,388 | ) | (39,414,626 | ) | (881,216 | ) | ||||||||||||||||||
Change in Net Unrealized Appreciation (Depreciation) | (6,207,112 | ) | (18,767,202 | ) | (82,605,083 | ) | (99,881,388 | ) | (39,414,626 | ) | (881,216 | ) | ||||||||||||||||||
NET GAIN (LOSS) | (6,975,339 | ) | (17,936,277 | ) | (77,214,903 | ) | (90,230,000 | ) | (39,706,107 | ) | (897,051 | ) | ||||||||||||||||||
NET INCREASE (DECREASE) IN NET ASSETS RESULTING FROM OPERATIONS | ($3,668,194 | ) | ($13,254,445 | ) | ($64,178,509 | ) | ($79,444,519 | ) | ($36,161,191 | ) | ($460,992 | ) | ||||||||||||||||||
Foreign taxes withheld on dividends and interest | $— | $— | $— | $— | $— | $412 | ||||||||||||||||||||||||
| (1) | Pacific Funds Ultra Short Income commenced operations on June 28, 2019. |
| (2) | The Advisor Class shares are not subject to distribution and service fees. |
| (3) | Class B shares were converted to Class A shares on July 31, 2019. |
See Notes to Financial Statements
C-4
Table of Contents
PACIFIC FUNDS
STATEMENTS OF OPERATIONS (Continued)
FOR THE YEAR ENDED MARCH 31, 2020
| Pacific Funds Short Duration Income | Pacific Funds Core Income | Pacific Funds Strategic Income | Pacific Funds Floating Rate Income | Pacific Funds High Income | Pacific Funds Diversified Income (1) | |||||||||||||||||||||||
INVESTMENT INCOME | ||||||||||||||||||||||||||||
Dividends, net of foreign taxes withheld | $755,972 | $823,512 | $1,282,300 | $2,142,825 | $160,827 | $389,888 | ||||||||||||||||||||||
Interest, net of foreign taxes withheld | 29,123,739 | 28,667,240 | 33,571,736 | 89,127,406 | 7,608,783 | 291,596 | ||||||||||||||||||||||
Total Investment Income | 29,879,711 | 29,490,752 | 34,854,036 | 91,270,231 | 7,769,610 | 681,484 | ||||||||||||||||||||||
EXPENSES | ||||||||||||||||||||||||||||
Advisory fees | 3,879,833 | 4,157,814 | 4,277,778 | 10,470,412 | 769,882 | 75,313 | ||||||||||||||||||||||
Administration fees | 2,389,985 | 2,031,429 | 1,829,020 | 3,664,108 | 208,945 | 54,059 | ||||||||||||||||||||||
Support services expenses | 104,593 | 87,363 | 79,535 | 206,914 | 15,382 | 2,257 | ||||||||||||||||||||||
Custodian fees and expenses | 31,167 | 38,763 | 27,200 | 89,720 | 5,146 | 14,179 | ||||||||||||||||||||||
Portfolio accounting fees | 129,042 | 116,134 | 105,336 | 170,809 | 40,894 | 55,744 | ||||||||||||||||||||||
Shareholder report expenses | 104,404 | 85,482 | 77,609 | 192,897 | 15,037 | 2,312 | ||||||||||||||||||||||
Distribution fees (2) | ||||||||||||||||||||||||||||
Class C | 354,792 | 501,855 | 502,915 | 1,151,113 | 21,028 | |||||||||||||||||||||||
Service fees (2) | ||||||||||||||||||||||||||||
Class A | 366,933 | 297,951 | 187,553 | 493,986 | 17,752 | |||||||||||||||||||||||
Class C | 118,264 | 167,285 | 167,638 | 383,705 | 7,009 | |||||||||||||||||||||||
Transfer agencyout-of-pocket expenses | 43,818 | 36,500 | 33,209 | 85,288 | 6,447 | 980 | ||||||||||||||||||||||
Registration fees | 144,024 | 138,466 | 102,681 | 123,099 | 56,457 | — | ||||||||||||||||||||||
Legal, audit and tax service fees | 129,997 | 118,835 | 84,465 | 183,888 | 20,363 | 7,520 | ||||||||||||||||||||||
Trustees’ fees and expenses | 42,781 | 36,007 | 32,179 | 77,197 | 6,057 | 1,060 | ||||||||||||||||||||||
Offering expenses | — | — | — | — | — | 17,912 | ||||||||||||||||||||||
Interest expense | — | — | — | 599,315 | — | — | ||||||||||||||||||||||
Other | 24,308 | 23,935 | 20,854 | 49,212 | 5,423 | 1,543 | ||||||||||||||||||||||
Total Expenses | 7,863,941 | 7,837,819 | 7,527,972 | 17,941,663 | 1,195,822 | 232,879 | ||||||||||||||||||||||
Advisory Fee Waiver | (8,285 | ) | (1,152 | ) | — | (152,708 | ) | — | — | |||||||||||||||||||
Adviser Expense Reimbursement | (2,174,161 | ) | (2,204,086 | ) | (1,718,677 | ) | (3,637,709 | ) | (253,239 | ) | (136,048 | ) | ||||||||||||||||
Net Expenses | 5,681,495 | 5,632,581 | 5,809,295 | 14,151,246 | 942,583 | 96,831 | ||||||||||||||||||||||
NET INVESTMENT INCOME (LOSS) | 24,198,216 | 23,858,171 | 29,044,741 | 77,118,985 | 6,827,027 | 584,653 | ||||||||||||||||||||||
NET REALIZED AND UNREALIZED GAIN (LOSS) | ||||||||||||||||||||||||||||
Net Realized Gain (Loss) On: | ||||||||||||||||||||||||||||
Investment security transactions | (4,127,105 | ) | 1,462,888 | 2,330,691 | (56,634,350 | ) | (1,118,815 | ) | (172,987 | ) | ||||||||||||||||||
Foreign currency transactions | — | — | — | — | — | 1,724 | ||||||||||||||||||||||
Net Realized Gain (Loss) | (4,127,105 | ) | 1,462,888 | 2,330,691 | (56,634,350 | ) | (1,118,815 | ) | (171,263 | ) | ||||||||||||||||||
Change In Net Unrealized Appreciation (Depreciation) On: | ||||||||||||||||||||||||||||
Investment securities | (30,429,991 | ) | (10,034,877 | ) | (76,831,625 | ) | (111,851,382 | ) | (14,692,991 | ) | (4,398,015 | ) | ||||||||||||||||
Foreign currencies | — | — | (252 | ) | — | (31 | ) | 97 | ||||||||||||||||||||
Unfunded loan commitments | — | — | (27,452 | ) | 44,140 | (4,902 | ) | — | ||||||||||||||||||||
Change in Net Unrealized Appreciation (Depreciation) | (30,429,991 | ) | (10,034,877 | ) | (76,859,329 | ) | (111,807,242 | ) | (14,697,924 | ) | (4,397,918 | ) | ||||||||||||||||
NET GAIN (LOSS) | (34,557,096 | ) | (8,571,989 | ) | (74,528,638 | ) | (168,441,592 | ) | (15,816,739 | ) | (4,569,181 | ) | ||||||||||||||||
NET INCREASE (DECREASE) IN NET ASSETS | ($10,358,880 | ) | $15,286,182 | ($45,483,897 | ) | ($91,322,607 | ) | ($8,989,712 | ) | ($3,984,528 | ) | |||||||||||||||||
Foreign taxes withheld on dividends and interest | $5,734 | $2,548 | $— | $— | $27 | $10,786 | ||||||||||||||||||||||
| (1) | Pacific Funds Diversified Income commenced operations on June 28, 2019. |
| (2) | The Class I, Class P, and Advisor Class shares are not subject to distribution and service fees. |
See Notes to Financial Statements
C-5
Table of Contents
PACIFIC FUNDS
STATEMENTS OF OPERATIONS (Continued)
FOR THE YEAR ENDED MARCH 31, 2020
| Pacific Funds Large-Cap | Pacific Funds Large-Cap Value | Pacific Funds Small/Mid-Cap | Pacific Funds Small-Cap | Pacific Funds Small-Cap Value | Pacific Funds Small-Cap Growth | |||||||||||||||||||||||||
INVESTMENT INCOME | ||||||||||||||||||||||||||||||
Dividends, net of foreign taxes withheld | $398,929 | $480,044 | $4,228,544 | $185,787 | $303,634 | $134,505 | ||||||||||||||||||||||||
Total Investment Income | 398,929 | 480,044 | 4,228,544 | 185,787 | 303,634 | 134,505 | ||||||||||||||||||||||||
EXPENSES | ||||||||||||||||||||||||||||||
Advisory fees | 106,549 | 113,835 | 2,735,456 | 142,062 | 144,005 | 240,903 | ||||||||||||||||||||||||
Administration fees | 55,027 | 50,825 | 927,110 | 47,994 | 45,224 | 56,818 | ||||||||||||||||||||||||
Support services expenses | 2,505 | 2,350 | 44,132 | 2,324 | 2,184 | 4,159 | ||||||||||||||||||||||||
Custodian fees and expenses | 1,121 | 462 | 9,574 | 613 | 2,149 | 5,413 | ||||||||||||||||||||||||
Portfolio accounting fees | 13,410 | 13,422 | 42,901 | 13,810 | 13,764 | 14,785 | ||||||||||||||||||||||||
Shareholder report expenses | 2,428 | 2,166 | 41,993 | 2,108 | 2,196 | 3,654 | ||||||||||||||||||||||||
Distribution fees (1) | ||||||||||||||||||||||||||||||
Class C | 30,016 | 25,273 | 109,800 | 6,900 | 8,660 | 6,711 | ||||||||||||||||||||||||
Service fees (1) | ||||||||||||||||||||||||||||||
Class A | 23,088 | 11,544 | 50,905 | 11,480 | 3,619 | 7,504 | ||||||||||||||||||||||||
Class C | 10,005 | 8,424 | 36,600 | 2,300 | 2,887 | 2,237 | ||||||||||||||||||||||||
Transfer agencyout-of-pocket expenses | 1,027 | 920 | 18,475 | 965 | 899 | 1,689 | ||||||||||||||||||||||||
Registration fees | 48,194 | 49,106 | 58,121 | 49,005 | 48,006 | 47,886 | ||||||||||||||||||||||||
Legal, audit and tax service fees | 6,759 | 6,402 | 36,141 | 6,125 | 6,192 | 6,164 | ||||||||||||||||||||||||
Trustees’ fees and expenses | 984 | 905 | 17,023 | 884 | 864 | 1,513 | ||||||||||||||||||||||||
Other | 3,876 | 4,086 | 24,303 | 3,995 | 4,217 | 5,086 | ||||||||||||||||||||||||
Total Expenses | 304,989 | 289,720 | 4,152,534 | 290,565 | 284,866 | 404,522 | ||||||||||||||||||||||||
Advisory Fee Waiver | (5,055 | ) | — | — | — | — | — | |||||||||||||||||||||||
Adviser Expense Reimbursement | (93,139 | ) | (91,667 | ) | (516,716 | ) | (91,474 | ) | (89,955 | ) | (89,691 | ) | ||||||||||||||||||
Net Expenses | 206,795 | 198,053 | 3,635,818 | 199,091 | 194,911 | 314,831 | ||||||||||||||||||||||||
NET INVESTMENT INCOME (LOSS) | 192,134 | 281,991 | 592,726 | (13,304 | ) | 108,723 | (180,326 | ) | ||||||||||||||||||||||
NET REALIZED AND UNREALIZED GAIN (LOSS) | ||||||||||||||||||||||||||||||
Net Realized Gain (Loss) On: | ||||||||||||||||||||||||||||||
Investment security transactions | (97,339 | ) | 286,736 | (10,052,546 | ) | (532,292 | ) | (837,156 | ) | (3,401,859 | ) | |||||||||||||||||||
Net Realized Gain (Loss) | (97,339 | ) | 286,736 | (10,052,546 | ) | (532,292 | ) | (837,156 | ) | (3,401,859 | ) | |||||||||||||||||||
Change In Net Unrealized Appreciation (Depreciation) On: | ||||||||||||||||||||||||||||||
Investment securities | (2,121,765 | ) | (3,942,107 | ) | (80,601,333 | ) | (4,618,018 | ) | (5,723,381 | ) | (6,860,717 | ) | ||||||||||||||||||
Change in Net Unrealized Appreciation (Depreciation) | (2,121,765 | ) | (3,942,107 | ) | (80,601,333 | ) | (4,618,018 | ) | (5,723,381 | ) | (6,860,717 | ) | ||||||||||||||||||
NET GAIN (LOSS) | (2,219,104 | ) | (3,655,371 | ) | (90,653,879 | ) | (5,150,310 | ) | (6,560,537 | ) | (10,262,576 | ) | ||||||||||||||||||
NET INCREASE (DECREASE) IN NET ASSETS | ($2,026,970 | ) | ($3,373,380 | ) | ($90,061,153 | ) | ($5,163,614 | ) | ($6,451,814 | ) | ($10,442,902 | ) | ||||||||||||||||||
Foreign taxes withheld on dividends and interest | $366 | $28 | $— | $— | $— | $— | ||||||||||||||||||||||||
| (1) | The Class P, Advisor, and Class R6 shares are not subject to distribution and service fees. |
See Notes to Financial Statements
C-6
Table of Contents
PACIFIC FUNDS
STATEMENTS OF CHANGES IN NET ASSETS
| Pacific Funds Portfolio Optimization Conservative | Pacific Funds Portfolio Optimization Moderate-Conservative | Pacific Funds Portfolio Optimization Moderate | ||||||||||||||||||||||||||||||||||||
| Year Ended March 31, 2020 | Year Ended March 31, 2019 | Year Ended March 31, 2020 | Year Ended March 31, 2019 | Year Ended March 31, 2020 | Year Ended March 31, 2019 | |||||||||||||||||||||||||||||||||
OPERATIONS | ||||||||||||||||||||||||||||||||||||||
Net investment income (loss) | $3,307,145 | $4,003,570 | $4,681,832 | $4,918,107 | $13,036,394 | $10,407,470 | ||||||||||||||||||||||||||||||||
Net realized gain (loss) | (768,227 | ) | 8,999,746 | 830,925 | 26,569,697 | 5,390,180 | 109,430,792 | |||||||||||||||||||||||||||||||
Change in net unrealized appreciation (depreciation) | (6,207,112 | ) | (9,753,514 | ) | (18,767,202 | ) | (26,777,500 | ) | (82,605,083 | ) | (97,037,490 | ) | ||||||||||||||||||||||||||
Net Increase (Decrease) in Net Assets | (3,668,194 | ) | 3,249,802 | (13,254,445 | ) | 4,710,304 | (64,178,509 | ) | 22,800,772 | |||||||||||||||||||||||||||||
DIVIDENDS AND DISTRIBUTIONS TO SHAREHOLDERS |
| |||||||||||||||||||||||||||||||||||||
Total distributable earnings | ||||||||||||||||||||||||||||||||||||||
Class A | (3,496,340 | ) | (12,592,979 | ) | (6,237,238 | ) | (33,217,964 | ) | (42,583,183 | ) | (112,777,136 | ) | ||||||||||||||||||||||||||
Class B | — | (1,853,035 | ) | — | (4,924,308 | ) | — | (16,690,844 | ) | |||||||||||||||||||||||||||||
Class C | (595,692 | ) | �� | (12,087,506 | ) | (835,495 | ) | (23,842,136 | ) | (7,563,008 | ) | (71,737,804 | ) | |||||||||||||||||||||||||
Class R | (468,143 | ) | (814,614 | ) | (3,856,053 | ) | ||||||||||||||||||||||||||||||||
Advisor Class | (191,513 | ) | (827,847 | ) | (153,960 | ) | (1,073,763 | ) | (1,376,454 | ) | (4,965,609 | ) | ||||||||||||||||||||||||||
Net Decrease from Dividends and Distributions | (4,283,545 | ) | (27,829,510 | ) | (7,226,693 | ) | (63,872,785 | ) | (51,522,645 | ) | (210,027,446 | ) | ||||||||||||||||||||||||||
CAPITAL SHARE TRANSACTIONS | ||||||||||||||||||||||||||||||||||||||
Proceeds from sale of shares | ||||||||||||||||||||||||||||||||||||||
Class A | 68,282,930 | 17,040,384 | 85,904,282 | 22,266,413 | 230,940,135 | 67,659,104 | ||||||||||||||||||||||||||||||||
Class B | 60,979 | 644,833 | — | 298,059 | 204,522 | 811,986 | ||||||||||||||||||||||||||||||||
Class C | 12,063,848 | 10,935,788 | 6,566,839 | 10,682,389 | 15,051,904 | 24,399,313 | ||||||||||||||||||||||||||||||||
Class R | 659,721 | 620,066 | 3,956,944 | |||||||||||||||||||||||||||||||||||
Advisor Class | 4,070,418 | 3,309,815 | 2,698,255 | 5,901,913 | 7,307,742 | 17,181,484 | ||||||||||||||||||||||||||||||||
Dividends and distribution reinvestments | ||||||||||||||||||||||||||||||||||||||
Class A | 3,458,903 | 12,486,167 | 6,146,004 | 32,858,005 | 42,116,423 | 111,916,625 | ||||||||||||||||||||||||||||||||
Class B | — | 1,805,246 | — | 4,801,673 | — | 16,476,006 | ||||||||||||||||||||||||||||||||
Class C | 589,829 | 11,921,411 | 821,265 | 23,453,860 | 7,515,405 | 70,315,954 | ||||||||||||||||||||||||||||||||
Class R | 468,143 | 814,614 | 3,856,053 | |||||||||||||||||||||||||||||||||||
Advisor Class | 187,112 | 792,027 | 152,205 | 1,064,963 | 1,353,146 | 4,839,682 | ||||||||||||||||||||||||||||||||
Cost of shares repurchased | ||||||||||||||||||||||||||||||||||||||
Class A | (40,015,894 | ) | (33,270,001 | ) | (62,597,607 | ) | (57,777,975 | ) | (183,271,940 | ) | (141,741,982 | ) | ||||||||||||||||||||||||||
Class B | (2,780,740 | ) | (8,717,936 | ) | (6,205,936 | ) | (11,484,193 | ) | (17,119,821 | ) | (31,961,495 | ) | ||||||||||||||||||||||||||
Class C | (76,824,409 | ) | (37,513,896 | ) | (94,049,380 | ) | (49,618,847 | ) | (249,201,774 | ) | (113,479,765 | ) | ||||||||||||||||||||||||||
Class R | (1,421,688 | ) | (836,162 | ) | (6,285,146 | ) | ||||||||||||||||||||||||||||||||
Advisor Class | (3,762,031 | ) | (4,658,762 | ) | (4,549,650 | ) | (3,480,671 | ) | (10,907,094 | ) | (13,708,609 | ) | ||||||||||||||||||||||||||
Share class conversions | ||||||||||||||||||||||||||||||||||||||
Class A (1) (2) | 14,289,154 | 4,294,105 | 22,496,950 | 4,987,595 | 76,126,118 | 22,187,993 | ||||||||||||||||||||||||||||||||
Class B (1) | (14,289,154 | ) | — | (22,496,950 | ) | — | (76,126,118 | ) | — | |||||||||||||||||||||||||||||
Class R (2) |
|
| (4,294,105 | ) |
|
| (4,987,595 | ) |
|
| (22,187,993 | ) | ||||||||||||||||||||||||||
Net Increase (Decrease) in Net Assets from | (34,669,055 | ) | (25,518,748 | ) | (65,113,723 | ) | (20,435,893 | ) | (156,011,352 | ) | 14,236,154 | |||||||||||||||||||||||||||
NET INCREASE (DECREASE) IN NET ASSETS | (42,620,794 | ) | (50,098,456 | ) | (85,594,861 | ) | (79,598,374 | ) | (271,712,506 | ) | (172,990,520 | ) | ||||||||||||||||||||||||||
NET ASSETS | ||||||||||||||||||||||||||||||||||||||
Beginning of Year | 255,709,772 | 305,808,228 | 371,932,432 | 451,530,806 | 1,150,734,469 | 1,323,724,989 | ||||||||||||||||||||||||||||||||
End of Year | $213,088,978 | $255,709,772 | $286,337,571 | $371,932,432 | $879,021,963 | $1,150,734,469 | ||||||||||||||||||||||||||||||||
| (1) | Class B shares were converted to Class A shares on July 31, 2019. |
| (2) | Class R shares were converted to Class A shares on March 22, 2019. |
See Notes to Financial Statements
C-7
Table of Contents
PACIFIC FUNDS
STATEMENTS OF CHANGES IN NET ASSETS (Continued)
| Pacific Funds Portfolio Optimization Growth | Pacific Funds Portfolio Optimization Aggressive-Growth | Pacific Funds Ultra Short Income | ||||||||||||||||||||||||||||||||
| Year Ended March 31, 2020 | Year Ended March 31, 2019 | Year Ended March 31, 2020 | Year Ended March 31, 2019 | Period Ended March 31, 2020 (1) | ||||||||||||||||||||||||||||||
OPERATIONS | ||||||||||||||||||||||||||||||||||
Net investment income (loss) | $10,785,481 | $5,031,109 | $3,544,916 | $1,096,862 | $436,059 | |||||||||||||||||||||||||||||
Net realized gain (loss) | 9,651,388 | 116,508,679 | (291,481 | ) | 50,537,474 | (15,835 | ) | |||||||||||||||||||||||||||
Change in net unrealized appreciation (depreciation) | (99,881,388 | ) | (99,596,050 | ) | (39,414,626 | ) | (42,365,388 | ) | (881,216 | ) | ||||||||||||||||||||||||
Net Increase (Decrease) in Net Assets | (79,444,519 | ) | 21,943,738 | (36,161,191 | ) | 9,268,948 | (460,992 | ) | ||||||||||||||||||||||||||
DIVIDENDS AND DISTRIBUTIONS TO SHAREHOLDERS | ||||||||||||||||||||||||||||||||||
Total distributable earnings | ||||||||||||||||||||||||||||||||||
Class A | (46,228,345 | ) | (99,899,454 | ) | (19,254,539 | ) | (34,560,435 | ) | ||||||||||||||||||||||||||
Class B | — | (13,714,779 | ) | — | (4,182,986 | ) | ||||||||||||||||||||||||||||
Class C | (8,222,160 | ) | (54,931,185 | ) | (3,359,406 | ) | (16,772,422 | ) | ||||||||||||||||||||||||||
Class R | (2,517,415 | ) | (1,055,968 | ) | ||||||||||||||||||||||||||||||
Class I | (218,323 | ) | ||||||||||||||||||||||||||||||||
Advisor Class | (1,357,710 | ) | (4,602,497 | ) | (973,719 | ) | (2,356,107 | ) | (219,954 | ) | ||||||||||||||||||||||||
Net Decrease from Dividends and | (55,808,215 | ) | (175,665,330 | ) | (23,587,664 | ) | (58,927,918 | ) | (438,277 | ) | ||||||||||||||||||||||||
CAPITAL SHARE TRANSACTIONS | ||||||||||||||||||||||||||||||||||
Proceeds from sale of shares | ||||||||||||||||||||||||||||||||||
Class A | 162,348,601 | 53,017,761 | 52,506,286 | 21,090,137 | ||||||||||||||||||||||||||||||
Class B | 154,946 | 641,777 | 42,567 | 319,857 | ||||||||||||||||||||||||||||||
Class C | 12,285,335 | 19,642,987 | 5,606,823 | 8,385,039 | ||||||||||||||||||||||||||||||
Class R | 1,826,895 | 1,045,959 | ||||||||||||||||||||||||||||||||
Class I | 12,501,930 | |||||||||||||||||||||||||||||||||
Advisor Class | 6,183,135 | 15,584,736 | 4,313,407 | 6,990,405 | 13,037,214 | |||||||||||||||||||||||||||||
Dividends and distribution reinvestments | ||||||||||||||||||||||||||||||||||
Class A | 45,869,026 | 99,254,420 | 19,088,348 | 34,287,460 | ||||||||||||||||||||||||||||||
Class B | — | 13,510,901 | — | 4,169,079 | ||||||||||||||||||||||||||||||
Class C | 8,177,203 | 54,318,779 | 3,341,601 | 16,485,319 | ||||||||||||||||||||||||||||||
Class R | 2,517,415 | 1,055,968 | ||||||||||||||||||||||||||||||||
Class I | 218,323 | |||||||||||||||||||||||||||||||||
Advisor Class | 1,286,917 | 4,350,180 | 962,601 | 2,321,572 | 219,662 | |||||||||||||||||||||||||||||
Cost of shares repurchased | ||||||||||||||||||||||||||||||||||
Class A | (131,550,373 | ) | (106,383,272 | ) | (41,610,675 | ) | (29,140,734 | ) | ||||||||||||||||||||||||||
Class B | (11,696,472 | ) | (24,161,042 | ) | (3,188,133 | ) | (6,974,878 | ) | ||||||||||||||||||||||||||
Class C | (174,938,925 | ) | (71,029,532 | ) | (51,775,006 | ) | (22,731,074 | ) | ||||||||||||||||||||||||||
Class R | (4,117,896 | ) | (2,882,205 | ) | ||||||||||||||||||||||||||||||
Class I | — | |||||||||||||||||||||||||||||||||
Advisor Class | (9,275,777 | ) | (12,372,320 | ) | (3,896,732 | ) | (6,533,420 | ) | (404,122 | ) | ||||||||||||||||||||||||
Share class conversions | ||||||||||||||||||||||||||||||||||
Class A (2) (3) | 57,500,119 | 13,475,454 | 18,773,764 | 5,855,112 | ||||||||||||||||||||||||||||||
Class B (2) | (57,500,119 | ) | — | (18,773,764 | ) | — | ||||||||||||||||||||||||||||
Class R (3) |
|
| (13,475,454 | ) |
|
| (5,855,112 | ) |
|
| ||||||||||||||||||||||||
Net Increase (Decrease) in Net Assets from | (91,156,384 | ) | 46,601,789 | (14,608,913 | ) | 27,888,484 | 25,573,007 | |||||||||||||||||||||||||||
NET INCREASE (DECREASE) IN NET ASSETS | (226,409,118 | ) | (107,119,803 | ) | (74,357,768 | ) | (21,770,486 | ) | 24,673,738 | |||||||||||||||||||||||||
NET ASSETS | ||||||||||||||||||||||||||||||||||
Beginning of Year or Period | 886,267,198 | 993,387,001 | 310,807,159 | 332,577,645 | — | |||||||||||||||||||||||||||||
End of Year or Period | $659,858,080 | $886,267,198 | $236,449,391 | $310,807,159 | $24,673,738 | |||||||||||||||||||||||||||||
| (1) | Pacific Funds Ultra Short Income commenced operations on June 28, 2019. |
| (2) | Class B shares were converted to Class A shares on July 31, 2019. |
| (3) | Class R shares were converted to Class A shares on March 22, 2019. |
See Notes to Financial Statements
C-8
Table of Contents
PACIFIC FUNDS
STATEMENTS OF CHANGES IN NET ASSETS (Continued)
| Pacific Funds Short Duration Income | Pacific Funds Core Income | Pacific Funds Strategic Income | ||||||||||||||||||||||||||||||||||||
| Year Ended March 31, 2020 | Year Ended March 31, 2019 | Year Ended March 31, 2020 | Year Ended March 31, 2019 | Year Ended March 31, 2020 | Year Ended March 31, 2019 | |||||||||||||||||||||||||||||||||
OPERATIONS | ||||||||||||||||||||||||||||||||||||||
Net investment income (loss) | $24,198,216 | $13,656,044 | $23,858,171 | $20,638,993 | $29,044,741 | $25,647,966 | ||||||||||||||||||||||||||||||||
Net realized gain (loss) | (4,127,105 | ) | (868,315 | ) | 1,462,888 | (7,715,010 | ) | 2,330,691 | (2,204,849 | ) | ||||||||||||||||||||||||||||
Change in net unrealized appreciation (depreciation) | (30,429,991 | ) | 6,040,386 | (10,034,877 | ) | 10,264,861 | (76,859,329 | ) | (3,625,115 | ) | ||||||||||||||||||||||||||||
Net Increase (Decrease) in Net Assets | (10,358,880 | ) | 18,828,115 | 15,286,182 | 23,188,844 | �� | (45,483,897 | ) | 19,818,002 | |||||||||||||||||||||||||||||
DIVIDENDS AND DISTRIBUTIONS TO SHAREHOLDERS | ||||||||||||||||||||||||||||||||||||||
Total distributable earnings | ||||||||||||||||||||||||||||||||||||||
Class A | (3,444,872 | ) | (2,288,424 | ) | (3,203,265 | ) | (3,145,957 | ) | (2,963,544 | ) | (2,887,137 | ) | ||||||||||||||||||||||||||
Class C | (754,049 | ) | (761,316 | ) | (1,321,140 | ) | (2,167,183 | ) | (2,205,219 | ) | (2,122,133 | ) | ||||||||||||||||||||||||||
Class I | (2,616,147 | ) | (1,010,121 | ) | (1,322,424 | ) | (502,503 | ) | (531,090 | ) | (229,143 | ) | ||||||||||||||||||||||||||
Class P | (1,136,355 | ) | (1,845,313 | ) | ||||||||||||||||||||||||||||||||||
Advisor Class | (17,396,815 | ) | (9,439,029 | ) | (16,948,777 | ) | (13,013,000 | ) | (23,455,154 | ) | (20,322,895 | ) | ||||||||||||||||||||||||||
Net Decrease from Dividends and | (24,211,883 | ) | (13,498,890 | ) | (23,931,961 | ) | (20,673,956 | ) | (29,155,007 | ) | (25,561,308 | ) | ||||||||||||||||||||||||||
CAPITAL SHARE TRANSACTIONS | ||||||||||||||||||||||||||||||||||||||
Proceeds from sale of shares | ||||||||||||||||||||||||||||||||||||||
Class A | 93,279,607 | 70,623,211 | 94,149,630 | 18,564,517 | 53,489,986 | 24,665,776 | ||||||||||||||||||||||||||||||||
Class C | 23,745,351 | 15,901,633 | 20,678,627 | 7,830,292 | 32,011,033 | 16,877,365 | ||||||||||||||||||||||||||||||||
Class I | 61,788,420 | 84,288,064 | 44,429,026 | 23,761,756 | 14,860,399 | 2,795,211 | ||||||||||||||||||||||||||||||||
Class P | 901,272 | 5,903,182 | ||||||||||||||||||||||||||||||||||||
Advisor Class | 770,064,807 | 384,985,237 | 526,492,900 | 210,403,956 | 375,159,036 | 285,918,426 | ||||||||||||||||||||||||||||||||
Dividends and distribution reinvestments | ||||||||||||||||||||||||||||||||||||||
Class A | 2,873,615 | 2,000,466 | 3,000,000 | 2,830,461 | 2,472,512 | 2,432,833 | ||||||||||||||||||||||||||||||||
Class C | 742,931 | 726,149 | 1,220,132 | 1,967,047 | 1,967,242 | 1,826,650 | ||||||||||||||||||||||||||||||||
Class I | 2,615,434 | 1,009,574 | 1,321,741 | 501,767 | 526,364 | 226,671 | ||||||||||||||||||||||||||||||||
Class P | 1,136,355 | 1,845,313 | ||||||||||||||||||||||||||||||||||||
Advisor Class | 17,048,396 | 8,986,733 | 12,532,117 | 9,198,335 | 18,596,983 | 15,471,909 | ||||||||||||||||||||||||||||||||
Cost of shares repurchased | ||||||||||||||||||||||||||||||||||||||
Class A | (56,297,110 | ) | (48,667,567 | ) | (37,597,768 | ) | (71,051,776 | ) | (37,453,350 | ) | (36,906,963 | ) | ||||||||||||||||||||||||||
Class C | (20,526,432 | ) | (15,125,797 | ) | (45,754,653 | ) | (29,915,702 | ) | (23,169,082 | ) | (16,886,426 | ) | ||||||||||||||||||||||||||
Class I | (38,349,962 | ) | (6,860,042 | ) | (11,005,797 | ) | (2,653,440 | ) | (2,858,725 | ) | (1,123,649 | ) | ||||||||||||||||||||||||||
Class P | (11,016,166 | ) | (33,707,701 | ) | ||||||||||||||||||||||||||||||||||
Advisor Class | (527,097,707 | ) | (186,314,605 | ) | (245,376,101 | ) | (216,921,483 | ) | (300,790,959 | ) | (245,658,070 | ) | ||||||||||||||||||||||||||
Net Increase (Decrease) in Net Assets from | 329,887,350 | 311,553,056 | 355,111,315 | (71,443,476 | ) | 134,811,439 | 49,639,733 | |||||||||||||||||||||||||||||||
NET INCREASE (DECREASE) IN NET ASSETS | 295,316,587 | 316,882,281 | 346,465,536 | (68,928,588 | ) | 60,172,535 | 43,896,427 | |||||||||||||||||||||||||||||||
NET ASSETS | ||||||||||||||||||||||||||||||||||||||
Beginning of Year | 732,013,960 | 415,131,679 | 624,053,775 | 692,982,363 | 582,315,223 | 538,418,796 | ||||||||||||||||||||||||||||||||
End of Year | $1,027,330,547 | $732,013,960 | $970,519,311 | $624,053,775 | $642,487,758 | $582,315,223 | ||||||||||||||||||||||||||||||||
See Notes to Financial Statements
C-9
Table of Contents
PACIFIC FUNDS
STATEMENTS OF CHANGES IN NET ASSETS (Continued)
| Pacific Funds Floating Rate Income | Pacific Funds High Income | Pacific Funds Diversified Income | ||||||||||||||||||||||||||||||||
| Year Ended March 31, 2020 | Year Ended March 31, 2019 | Year Ended March 31, 2020 | Year Ended March 31, 2019 | Period Ended March 31, 2020 (1) | ||||||||||||||||||||||||||||||
OPERATIONS | ||||||||||||||||||||||||||||||||||
Net investment income (loss) | $77,118,985 | $89,321,214 | $6,827,027 | $3,977,048 | $584,653 | |||||||||||||||||||||||||||||
Net realized gain (loss) | (56,634,350 | ) | (16,678,087 | ) | (1,118,815 | ) | (1,030,376 | ) | (171,263 | ) | ||||||||||||||||||||||||
Change in net unrealized appreciation (depreciation) | (111,807,242 | ) | (28,107,047 | ) | (14,697,924 | ) | 86,556 | (4,397,918 | ) | |||||||||||||||||||||||||
Net Increase (Decrease) in Net Assets | (91,322,607 | ) | 44,536,080 | (8,989,712 | ) | 3,033,228 | (3,984,528 | ) | ||||||||||||||||||||||||||
DIVIDENDS AND DISTRIBUTIONS TO SHAREHOLDERS | ||||||||||||||||||||||||||||||||||
Total distributable earnings | ||||||||||||||||||||||||||||||||||
Class A | (9,176,534 | ) | (10,451,833 | ) | (357,231 | ) | (292,486 | ) | ||||||||||||||||||||||||||
Class C | (6,124,796 | ) | (8,439,626 | ) | (120,572 | ) | (195,304 | ) | ||||||||||||||||||||||||||
Class I | (25,266,290 | ) | (23,883,146 | ) | (6,775 | ) | (11,349 | ) | ||||||||||||||||||||||||||
Class P | (1,088,004 | ) | (2,709,538 | ) | (6,078,920 | ) | (3,340,878 | ) | ||||||||||||||||||||||||||
Advisor Class | (35,649,718 | ) | (44,322,870 | ) | (266,141 | ) | (148,700 | ) | (616,011 | ) | ||||||||||||||||||||||||
Net Decrease from Dividends and | (77,305,342 | ) | (89,807,013 | ) | (6,829,639 | ) | (3,988,717 | ) | (616,011 | ) | ||||||||||||||||||||||||
CAPITAL SHARE TRANSACTIONS | ||||||||||||||||||||||||||||||||||
Proceeds from sale of shares | ||||||||||||||||||||||||||||||||||
Class A | 83,933,804 | 104,234,100 | 6,114,560 | 3,220,786 | ||||||||||||||||||||||||||||||
Class C | 21,490,990 | 56,249,918 | 473,564 | 716,716 | ||||||||||||||||||||||||||||||
Class I | 232,174,855 | 418,708,224 | 600 | 42,055 | ||||||||||||||||||||||||||||||
Class P | 268,116 | 2,293,667 | 34,604,054 | 65,198,232 | ||||||||||||||||||||||||||||||
Advisor Class | 326,320,702 | 654,273,775 | 3,050,714 | 2,682,948 | 28,000,000 | |||||||||||||||||||||||||||||
Dividends and distribution reinvestments | ||||||||||||||||||||||||||||||||||
Class A | 8,731,691 | 9,440,707 | 349,879 | 284,987 | ||||||||||||||||||||||||||||||
Class C | 5,899,596 | 7,744,275 | 115,509 | 188,590 | ||||||||||||||||||||||||||||||
Class I | 18,384,219 | 14,404,875 | 6,511 | 11,283 | ||||||||||||||||||||||||||||||
Class P | 1,073,942 | 2,709,538 | 6,078,920 | 3,340,878 | ||||||||||||||||||||||||||||||
Advisor Class | 33,989,428 | 39,800,982 | 265,285 | 146,871 | 616,011 | |||||||||||||||||||||||||||||
Cost of shares repurchased | ||||||||||||||||||||||||||||||||||
Class A | (110,817,563 | ) | (114,633,080 | ) | (3,214,509 | ) | (3,703,876 | ) | ||||||||||||||||||||||||||
Class C | (108,359,450 | ) | (53,193,064 | ) | (2,032,207 | ) | (1,528,238 | ) | ||||||||||||||||||||||||||
Class I | (275,070,407 | ) | (219,420,364 | ) | (120,177 | ) | (85,863 | ) | ||||||||||||||||||||||||||
Class P | (24,107,910 | ) | (36,334,229 | ) | (19,463,586 | ) | (23,286,646 | ) | ||||||||||||||||||||||||||
Advisor Class | (610,484,330 | ) | (555,917,071 | ) | (3,047,072 | ) | (1,650,968 | ) | — | |||||||||||||||||||||||||
Net Increase (Decrease) in Net Assets from | (396,572,317 | ) | 330,362,253 | 23,182,045 | 45,577,755 | 28,616,011 | ||||||||||||||||||||||||||||
NET INCREASE (DECREASE) IN NET ASSETS | (565,200,266 | ) | 285,091,320 | 7,362,694 | 44,622,266 | 24,015,472 | ||||||||||||||||||||||||||||
NET ASSETS | ||||||||||||||||||||||||||||||||||
Beginning of Year or Period | 1,759,974,104 | 1,474,882,784 | 126,061,100 | 81,438,834 | — | |||||||||||||||||||||||||||||
End of Year or Period | $1,194,773,838 | $1,759,974,104 | $133,423,794 | $126,061,100 | $24,015,472 | |||||||||||||||||||||||||||||
| (1) | Pacific Funds Diversified Income commenced operations on June 28, 2019. |
See Notes to Financial Statements
C-10
Table of Contents
PACIFIC FUNDS
STATEMENTS OF CHANGES IN NET ASSETS (Continued)
| Pacific FundsLarge-Cap | Pacific FundsLarge-Cap Value | Pacific FundsSmall/Mid-Cap | ||||||||||||||||||||||||||||||||||||
| Year Ended March 31, 2020 | Year Ended March 31, 2019 | Year Ended March 31, 2020 | Year Ended March 31, 2019 | Year Ended March 31, 2020 | Year Ended March 31, 2019 | |||||||||||||||||||||||||||||||||
OPERATIONS | ||||||||||||||||||||||||||||||||||||||
Net investment income (loss) | $192,134 | $171,856 | $281,991 | $377,614 | $592,726 | $141,506 | ||||||||||||||||||||||||||||||||
Net realized gain (loss) | (97,339 | ) | 255,129 | 286,736 | 1,566,245 | (10,052,546 | ) | (1,202,028 | ) | |||||||||||||||||||||||||||||
Change in net unrealized appreciation (depreciation) | (2,121,765 | ) | 794,723 | (3,942,107 | ) | (1,146,418 | ) | (80,601,333 | ) | 8,050,964 | ||||||||||||||||||||||||||||
Net Increase (Decrease) in Net Assets | (2,026,970 | ) | 1,221,708 | (3,373,380 | ) | 797,441 | (90,061,153 | ) | 6,990,442 | |||||||||||||||||||||||||||||
DIVIDENDS AND DISTRIBUTIONS TO SHAREHOLDERS | ||||||||||||||||||||||||||||||||||||||
Total distributable earnings | ||||||||||||||||||||||||||||||||||||||
Class A | (107,522 | ) | (293,281 | ) | (462,603 | ) | (279,931 | ) | (49,996 | ) | (640,045 | ) | ||||||||||||||||||||||||||
Class C | (15,833 | ) | (166,794 | ) | (308,270 | ) | (230,757 | ) | — | (466,266 | ) | |||||||||||||||||||||||||||
Advisor Class | (102,239 | ) | (407,953 | ) | (1,101,343 | ) | (1,377,251 | ) | (1,391,644 | ) | (5,717,212 | ) | ||||||||||||||||||||||||||
Class R6 (formerly Class S) | (13,333 | ) | (31,514 | ) | (75,914 | ) | (45,410 | ) | (30,651 | ) | (187,396 | ) | ||||||||||||||||||||||||||
Net Decrease from Dividends and Distributions to | (238,927 | ) | (899,542 | ) | (1,948,130 | ) | (1,933,349 | ) | (1,472,291 | ) | (7,010,919 | ) | ||||||||||||||||||||||||||
CAPITAL SHARE TRANSACTIONS | ||||||||||||||||||||||||||||||||||||||
Proceeds from sale of shares | ||||||||||||||||||||||||||||||||||||||
Class A | 5,038,381 | 4,770,361 | 1,311,510 | 1,558,272 | 5,501,413 | 13,119,138 | ||||||||||||||||||||||||||||||||
Class C | 1,339,530 | 1,180,700 | 435,120 | 765,875 | 1,210,533 | 4,827,893 | ||||||||||||||||||||||||||||||||
Advisor Class | 2,133,716 | 1,509,946 | 5,547,680 | 284,501 | 57,620,873 | 228,165,055 | ||||||||||||||||||||||||||||||||
Investor Class | 21 | — | 637,610 | |||||||||||||||||||||||||||||||||||
Class R6 (formerly Class S) | — | 342,150 | 512,750 | 283,922 | 372,360 | 569,158 | ||||||||||||||||||||||||||||||||
Dividends and distribution reinvestments | ||||||||||||||||||||||||||||||||||||||
Class A | 107,044 | 291,142 | 453,589 | 271,766 | 49,767 | 637,748 | ||||||||||||||||||||||||||||||||
Class C | 15,774 | 166,366 | 307,690 | 229,197 | — | 466,266 | ||||||||||||||||||||||||||||||||
Advisor Class | 100,975 | 403,573 | 1,099,174 | 1,375,545 | 1,366,875 | 5,608,985 | ||||||||||||||||||||||||||||||||
Investor Class | — | — | — | |||||||||||||||||||||||||||||||||||
Class R6 (formerly Class S) | 13,333 | 31,514 | 75,914 | 45,410 | 30,651 | 187,396 | ||||||||||||||||||||||||||||||||
Cost of shares repurchased | ||||||||||||||||||||||||||||||||||||||
Class A | (2,080,517 | ) | (2,442,917 | ) | (1,054,663 | ) | (734,887 | ) | (8,030,487 | ) | (17,793,874 | ) | ||||||||||||||||||||||||||
Class C | (1,464,016 | ) | (1,029,023 | ) | (1,049,303 | ) | (1,680,413 | ) | (5,177,528 | ) | (3,349,491 | ) | ||||||||||||||||||||||||||
Advisor Class | (2,541,152 | ) | (3,153,984 | ) | (4,610,668 | ) | (10,646,030 | ) | (91,630,898 | ) | (83,368,175 | ) | ||||||||||||||||||||||||||
Investor Class | (138,888 | ) | (3,085 | ) | (2,180,734 | ) | ||||||||||||||||||||||||||||||||
Class R6 (formerly Class S) | (144,642 | ) | (171,384 | ) | (193,869 | ) | (1,479,100 | ) | (317,492 | ) | (4,167,845 | ) | ||||||||||||||||||||||||||
Share class conversions | ||||||||||||||||||||||||||||||||||||||
Class A (1) | 336,632 | 106,330 | 5,349,094 | |||||||||||||||||||||||||||||||||||
Investor Class (1) |
|
| (336,632 | ) |
|
| (106,330 | ) |
|
| (5,349,094 | ) | ||||||||||||||||||||||||||
Net Increase (Decrease) in Net Assets from | 2,518,426 | 1,759,577 | 2,834,924 | (9,729,027 | ) | (39,003,933 | ) | 143,359,130 | ||||||||||||||||||||||||||||||
NET INCREASE (DECREASE) IN NET ASSETS | 252,529 | 2,081,743 | (2,486,586 | ) | (10,864,935 | ) | (130,537,377 | ) | 143,338,653 | |||||||||||||||||||||||||||||
NET ASSETS | ||||||||||||||||||||||||||||||||||||||
Beginning of Year | 19,784,600 | 17,702,857 | 18,459,791 | 29,324,726 | 373,339,447 | 230,000,794 | ||||||||||||||||||||||||||||||||
End of Year | $20,037,129 | $19,784,600 | $15,973,205 | $18,459,791 | $242,802,070 | $373,339,447 | ||||||||||||||||||||||||||||||||
| (1) | Investor Class shares were converted to Class A shares on July 31, 2018. |
See Notes to Financial Statements
C-11
Table of Contents
PACIFIC FUNDS
STATEMENTS OF CHANGES IN NET ASSETS (Continued)
| Pacific FundsSmall-Cap | Pacific FundsSmall-Cap Value | Pacific Funds Small-Cap Growth | ||||||||||||||||||||||||||||||||||||
| Year Ended March 31, 2020 | Year Ended March 31, 2019 | Year Ended March 31, 2020 | Year Ended March 31, 2019 | Year Ended March 31, 2020 | Year Ended March 31, 2019 | |||||||||||||||||||||||||||||||||
OPERATIONS | ||||||||||||||||||||||||||||||||||||||
Net investment income (loss) | ($13,304 | ) | ($13,257 | ) | $108,723 | $131,421 | ($180,326 | ) | ($242,588 | ) | ||||||||||||||||||||||||||||
Net realized gain (loss) | (532,292 | ) | 293,078 | (837,156 | ) | 1,654,755 | (3,401,859 | ) | 1,869,965 | |||||||||||||||||||||||||||||
Change in net unrealized appreciation (depreciation) | (4,618,018 | ) | (434,380 | ) | (5,723,381 | ) | (3,313,252 | ) | (6,860,717 | ) | (622,046 | ) | ||||||||||||||||||||||||||
Net Increase (Decrease) in Net Assets | (5,163,614 | ) | (154,559 | ) | (6,451,814 | ) | (1,527,076 | ) | (10,442,902 | ) | 1,005,331 | |||||||||||||||||||||||||||
DIVIDENDS AND DISTRIBUTIONS TO SHAREHOLDERS | ||||||||||||||||||||||||||||||||||||||
Total distributable earnings | ||||||||||||||||||||||||||||||||||||||
Class A | (6,669 | ) | (266,919 | ) | (11,981 | ) | (184,456 | ) | — | (217,723 | ) | |||||||||||||||||||||||||||
Class C | — | (45,131 | ) | — | (205,173 | ) | — | (78,739 | ) | |||||||||||||||||||||||||||||
Class P | — | (2,593,389 | ) | |||||||||||||||||||||||||||||||||||
Advisor Class | (41,249 | ) | (724,054 | ) | (138,648 | ) | (2,622,348 | ) | — | (1,438,459 | ) | |||||||||||||||||||||||||||
Class R6 (formerly Class S) | (2,361 | ) | (22,537 | ) | (33,117 | ) | (970,543 | ) | — | (595,834 | ) | |||||||||||||||||||||||||||
Net Decrease from Dividends and | (50,279 | ) | (1,058,641 | ) | (183,746 | ) | (3,982,520 | ) | — | (4,924,144 | ) | |||||||||||||||||||||||||||
CAPITAL SHARE TRANSACTIONS | ||||||||||||||||||||||||||||||||||||||
Proceeds from sale of shares | ||||||||||||||||||||||||||||||||||||||
Class A | 1,045,701 | 976,454 | 505,054 | 521,330 | 266,840 | 1,002,273 | ||||||||||||||||||||||||||||||||
Class C | 184,876 | 439,449 | 79,420 | 581,842 | 147,505 | 671,100 | ||||||||||||||||||||||||||||||||
Class P | 174,705 | 14,581,877 | ||||||||||||||||||||||||||||||||||||
Advisor Class | 1,830,255 | 5,813,754 | 4,788,635 | 4,150,430 | 441,870 | 6,511,680 | ||||||||||||||||||||||||||||||||
Investor Class | 362,923 | 39,672 | 202 | |||||||||||||||||||||||||||||||||||
Class R6 (formerly Class S) | 365,125 | 273,636 | 297,375 | 220,011 | — | 505,875 | ||||||||||||||||||||||||||||||||
Dividends and distribution reinvestments | ||||||||||||||||||||||||||||||||||||||
Class A | 6,597 | 257,678 | 11,981 | 184,456 | — | 217,723 | ||||||||||||||||||||||||||||||||
Class C | — | 45,131 | — | 205,173 | — | 78,739 | ||||||||||||||||||||||||||||||||
Class P | — | 2,593,389 | ||||||||||||||||||||||||||||||||||||
Advisor Class | 39,840 | 701,863 | 138,592 | 2,591,080 | — | 1,436,386 | ||||||||||||||||||||||||||||||||
Investor Class | — | — | — | |||||||||||||||||||||||||||||||||||
Class R6 (formerly Class S) | 2,361 | 22,537 | 33,117 | 970,543 | — | 595,834 | ||||||||||||||||||||||||||||||||
Cost of shares repurchased | ||||||||||||||||||||||||||||||||||||||
Class A | (1,307,623 | ) | (1,562,670 | ) | (285,006 | ) | (479,587 | ) | (425,826 | ) | (179,852 | ) | ||||||||||||||||||||||||||
Class C | (290,914 | ) | (310,509 | ) | (392,165 | ) | (794,484 | ) | (263,998 | ) | (516,714 | ) | ||||||||||||||||||||||||||
Class P | (16,660,941 | ) | (18,163,421 | ) | ||||||||||||||||||||||||||||||||||
Advisor Class | (3,820,265 | ) | (7,275,080 | ) | (1,802,038 | ) | (7,174,364 | ) | (1,396,000 | ) | (15,180,871 | ) | ||||||||||||||||||||||||||
Investor Class | (168,462 | ) | (8,110 | ) | — | |||||||||||||||||||||||||||||||||
Class R6 (formerly Class S) | (99,670 | ) | (75,001 | ) | (123,707 | ) | (6,113,704 | ) | (303,387 | ) | (8,750,477 | ) | ||||||||||||||||||||||||||
Share class conversions | ||||||||||||||||||||||||||||||||||||||
Class A (1) | 3,512,299 | 201,962 | 1,611,351 | |||||||||||||||||||||||||||||||||||
Investor Class (1) |
|
| (3,512,299 | ) |
|
| (201,962 | ) |
|
| (1,611,351 | ) | ||||||||||||||||||||||||||
Net Increase (Decrease) in Net Assets | (2,043,717 | ) | (498,297 | ) | 3,251,258 | (5,105,712 | ) | (18,019,232 | ) | (14,596,257 | ) | |||||||||||||||||||||||||||
NET INCREASE (DECREASE) IN NET ASSETS | (7,257,610 | ) | (1,711,497 | ) | (3,384,302 | ) | (10,615,308 | ) | (28,462,134 | ) | (18,515,070 | ) | ||||||||||||||||||||||||||
NET ASSETS | ||||||||||||||||||||||||||||||||||||||
Beginning of Year | 19,766,967 | 21,478,464 | 17,383,326 | 27,998,634 | 35,614,101 | 54,129,171 | ||||||||||||||||||||||||||||||||
End of Year | $12,509,357 | $19,766,967 | $13,999,024 | $17,383,326 | $7,151,967 | $35,614,101 | ||||||||||||||||||||||||||||||||
| (1) | Investor Class shares were converted to Class A shares on July 31, 2018. |
See Notes to Financial Statements
C-12
Table of Contents
PACIFIC FUNDS
Selected per share, ratios and supplemental data for each year or period ended March 31, were as follows:
| Fund |
| Selected Per Share Data |
| Ratios to Average Net Assets | Supplemental Data | |||||||||||||||||||||||||||||||||||||||||||||||||||
| Investment Operations | Distributions | |||||||||||||||||||||||||||||||||||||||||||||||||||||||
| For the Year or Period Ended (1) | Net Asset Value, Beginning of Year or Period | Net Investment Income (Loss) (2) | Net Realized and Unrealized Gain (Loss) | Total | Net Investment Income | Capital Gains | Total | Net Asset Value, End of Year or Period | Expenses Before Reductions (3) | Expenses After Reductions (3), (4) | Net Investment Income (Loss) (3) | Total Returns (5) | Net Assets, End of Year or Period (in thousands) | Portfolio Turnover Rates | ||||||||||||||||||||||||||||||||||||||||||
Pacific Funds Portfolio Optimization Conservative (6) | ||||||||||||||||||||||||||||||||||||||||||||||||||||||||
Class A | ||||||||||||||||||||||||||||||||||||||||||||||||||||||||
| 4/1/2019 - 3/31/2020 | $10.23 | $0.17 | ($0.35 | ) | ($0.18 | ) | ($0.20 | ) | ($0.02 | ) | ($0.22 | ) | $9.83 | 0.68 | % | 0.60 | % | 1.60 | % | (1.95 | %) | $159,186 | 22 | % | ||||||||||||||||||||||||||||||||
| 4/1/2018 - 3/31/2019 | 11.24 | 0.20 | (0.04 | ) | 0.16 | (0.21 | ) | (0.96 | ) | (1.17 | ) | 10.23 | 0.68 | % | 0.60 | % | 1.83 | % | 1.88 | % | 121,012 | 30 | % | |||||||||||||||||||||||||||||||||
| 4/1/2017 - 3/31/2018 | 10.98 | 0.25 | 0.26 | 0.51 | (0.25 | ) | — | (0.25 | ) | 11.24 | 0.68 | % | 0.60 | % | 2.18 | % | 4.60 | % | 131,023 | 30 | % | |||||||||||||||||||||||||||||||||||
| 4/1/2016 - 3/31/2017 | 10.63 | 0.19 | 0.52 | 0.71 | (0.22 | ) | (0.14 | ) | (0.36 | ) | 10.98 | 0.68 | % | 0.60 | % | 1.70 | % | 6.59 | % | 136,881 | 57 | % | ||||||||||||||||||||||||||||||||||
| 4/1/2015 - 3/31/2016 | 11.22 | 0.22 | (0.43 | ) | (0.21 | ) | (0.28 | ) | (0.10 | ) | (0.38 | ) | 10.63 | 0.67 | % | 0.60 | % | 1.99 | % | (1.73 | %) | 154,762 | 42 | % | ||||||||||||||||||||||||||||||||
Class C | ||||||||||||||||||||||||||||||||||||||||||||||||||||||||
| 4/1/2019 - 3/31/2020 | $9.97 | $0.09 | ($0.35 | ) | ($0.26 | ) | ($0.10 | ) | ($0.02 | ) | ($0.12 | ) | $9.59 | 1.43 | % | 1.35 | % | 0.86 | % | (2.72 | %) | $46,909 | 22 | % | ||||||||||||||||||||||||||||||||
| 4/1/2018 - 3/31/2019 | 11.00 | 0.11 | (0.03 | ) | 0.08 | (0.15 | ) | (0.96 | ) | (1.11 | ) | 9.97 | 1.43 | % | 1.35 | % | 1.08 | % | 1.13 | % | 111,233 | 30 | % | |||||||||||||||||||||||||||||||||
| 4/1/2017 - 3/31/2018 | 10.76 | 0.16 | 0.26 | 0.42 | (0.18 | ) | — | (0.18 | ) | 11.00 | 1.43 | % | 1.35 | % | 1.43 | % | 3.89 | % | 137,036 | 30 | % | |||||||||||||||||||||||||||||||||||
| 4/1/2016 - 3/31/2017 | 10.44 | 0.10 | 0.51 | 0.61 | (0.15 | ) | (0.14 | ) | (0.29 | ) | 10.76 | 1.43 | % | 1.35 | % | 0.95 | % | 5.79 | % | 153,433 | 57 | % | ||||||||||||||||||||||||||||||||||
| 4/1/2015 - 3/31/2016 | 11.05 | 0.13 | (0.42 | ) | (0.29 | ) | (0.22 | ) | (0.10 | ) | (0.32 | ) | 10.44 | 1.42 | % | 1.35 | % | 1.24 | % | (2.51 | %) | 173,137 | 42 | % | ||||||||||||||||||||||||||||||||
Advisor Class | ||||||||||||||||||||||||||||||||||||||||||||||||||||||||
| 4/1/2019 - 3/31/2020 | $10.26 | $0.20 | ($0.35 | ) | ($0.15 | ) | ($0.21 | ) | ($0.02 | ) | ($0.23 | ) | $9.88 | 0.43 | % | 0.35 | % | 1.85 | % | (1.68 | %) | $6,994 | 22 | % | ||||||||||||||||||||||||||||||||
| 4/1/2018 - 3/31/2019 | 11.26 | 0.22 | (0.03 | ) | 0.19 | (0.23 | ) | (0.96 | ) | (1.19 | ) | 10.26 | 0.43 | % | 0.35 | % | 2.08 | % | 2.26 | % | 6,893 | 30 | % | |||||||||||||||||||||||||||||||||
| 4/1/2017 - 3/31/2018 | 11.00 | 0.28 | 0.25 | 0.53 | (0.27 | ) | — | (0.27 | ) | 11.26 | 0.43 | % | 0.35 | % | 2.43 | % | 4.79 | % | 8,135 | 30 | % | |||||||||||||||||||||||||||||||||||
| 4/1/2016 - 3/31/2017 | 10.65 | 0.21 | 0.52 | 0.73 | (0.24 | ) | (0.14 | ) | (0.38 | ) | 11.00 | 0.43 | % | 0.35 | % | 1.95 | % | 6.89 | % | 5,404 | 57 | % | ||||||||||||||||||||||||||||||||||
| 4/1/2015 - 3/31/2016 | 11.23 | 0.25 | (0.43 | ) | (0.18 | ) | (0.30 | ) | (0.10 | ) | (0.40 | ) | 10.65 | 0.42 | % | 0.35 | % | 2.24 | % | (1.53 | %) | 4,976 | 42 | % | ||||||||||||||||||||||||||||||||
Pacific Funds Portfolio Optimization Moderate-Conservative(6) | ||||||||||||||||||||||||||||||||||||||||||||||||||||||||
Class A | ||||||||||||||||||||||||||||||||||||||||||||||||||||||||
| 4/1/2019 - 3/31/2020 | $10.70 | $0.17 | ($0.66 | ) | ($0.49 | ) | ($0.22 | ) | ($0.04 | ) | ($0.26 | ) | $9.95 | 0.67 | % | 0.60 | % | 1.55 | % | (4.94 | %) | $231,749 | 20 | % | ||||||||||||||||||||||||||||||||
| 4/1/2018 - 3/31/2019 | 12.58 | 0.18 | (0.06 | ) | 0.12 | (0.20 | ) | (1.80 | ) | (2.00 | ) | 10.70 | 0.68 | % | 0.60 | % | 1.55 | % | 1.91 | % | 199,827 | 45 | % | |||||||||||||||||||||||||||||||||
| 4/1/2017 - 3/31/2018 | 12.21 | 0.25 | 0.53 | 0.78 | (0.27 | ) | (0.14 | ) | (0.41 | ) | 12.58 | 0.67 | % | 0.60 | % | 1.95 | % | 6.36 | % | 227,420 | 30 | % | ||||||||||||||||||||||||||||||||||
| 4/1/2016 - 3/31/2017 | 11.73 | 0.20 | 0.79 | 0.99 | (0.24 | ) | (0.27 | ) | (0.51 | ) | 12.21 | 0.67 | % | 0.60 | % | 1.68 | % | 8.49 | % | 236,725 | 53 | % | ||||||||||||||||||||||||||||||||||
| 4/1/2015 - 3/31/2016 | 12.61 | 0.25 | (0.50 | ) | (0.25 | ) | (0.29 | ) | (0.34 | ) | (0.63 | ) | 11.73 | 0.67 | % | 0.60 | % | 2.07 | % | (1.87 | %) | 255,376 | 34 | % | ||||||||||||||||||||||||||||||||
Class C | ||||||||||||||||||||||||||||||||||||||||||||||||||||||||
| 4/1/2019 - 3/31/2020 | $10.44 | $0.09 | ($0.66 | ) | ($0.57 | ) | ($0.11 | ) | ($0.04 | ) | ($0.15 | ) | $9.72 | 1.42 | % | 1.35 | % | 0.80 | % | (5.63 | %) | $48,929 | 20 | % | ||||||||||||||||||||||||||||||||
| 4/1/2018 - 3/31/2019 | 12.34 | 0.09 | (0.06 | ) | 0.03 | (0.13 | ) | (1.80 | ) | (1.93 | ) | 10.44 | 1.43 | % | 1.35 | % | 0.80 | % | 1.11 | % | 136,522 | 45 | % | |||||||||||||||||||||||||||||||||
| 4/1/2017 - 3/31/2018 | 12.00 | 0.15 | 0.52 | 0.67 | (0.19 | ) | (0.14 | ) | (0.33 | ) | 12.34 | 1.42 | % | 1.35 | % | 1.20 | % | 5.60 | % | 174,766 | 30 | % | ||||||||||||||||||||||||||||||||||
| 4/1/2016 - 3/31/2017 | 11.56 | 0.11 | 0.77 | 0.88 | (0.17 | ) | (0.27 | ) | (0.44 | ) | 12.00 | 1.42 | % | 1.35 | % | 0.93 | % | 7.74 | % | 200,105 | 53 | % | ||||||||||||||||||||||||||||||||||
| 4/1/2015 - 3/31/2016 | 12.45 | 0.16 | (0.48 | ) | (0.32 | ) | (0.23 | ) | (0.34 | ) | (0.57 | ) | 11.56 | 1.42 | % | 1.35 | % | 1.32 | % | (2.61 | %) | 221,192 | 34 | % | ||||||||||||||||||||||||||||||||
Advisor Class | ||||||||||||||||||||||||||||||||||||||||||||||||||||||||
| 4/1/2019 - 3/31/2020 | $10.75 | $0.20 | ($0.67 | ) | ($0.47 | ) | ($0.24 | ) | ($0.04 | ) | ($0.28 | ) | $10.00 | 0.42 | % | 0.35 | % | 1.80 | % | (4.67 | %) | $5,659 | 20 | % | ||||||||||||||||||||||||||||||||
| 4/1/2018 - 3/31/2019 | 12.62 | 0.21 | (0.06 | ) | 0.15 | (0.22 | ) | (1.80 | ) | (2.02 | ) | 10.75 | 0.42 | % | 0.35 | % | 1.80 | % | 2.10 | % | 7,701 | 45 | % | |||||||||||||||||||||||||||||||||
| 4/1/2017 - 3/31/2018 | 12.24 | 0.28 | 0.53 | 0.81 | (0.29 | ) | (0.14 | ) | (0.43 | ) | 12.62 | 0.42 | % | 0.35 | % | 2.20 | % | 6.62 | % | 5,196 | 30 | % | ||||||||||||||||||||||||||||||||||
| 4/1/2016 - 3/31/2017 | 11.75 | 0.23 | 0.79 | 1.02 | (0.26 | ) | (0.27 | ) | (0.53 | ) | 12.24 | 0.42 | % | 0.35 | % | 1.93 | % | 8.78 | % | 4,895 | 53 | % | ||||||||||||||||||||||||||||||||||
| 4/1/2015 - 3/31/2016 | 12.62 | 0.28 | (0.49 | ) | (0.21 | ) | (0.32 | ) | (0.34 | ) | (0.66 | ) | 11.75 | 0.42 | % | 0.35 | % | 2.32 | % | (1.60 | %) | 4,891 | 34 | % | ||||||||||||||||||||||||||||||||
Pacific Funds Portfolio Optimization Moderate (6) | ||||||||||||||||||||||||||||||||||||||||||||||||||||||||
Class A | ||||||||||||||||||||||||||||||||||||||||||||||||||||||||
| 4/1/2019 - 3/31/2020 | $12.01 | $0.17 | ($0.95 | ) | ($0.78 | ) | ($0.19 | ) | ($0.44 | ) | ($0.63 | ) | $10.60 | 0.66 | % | 0.60 | % | 1.38 | % | (7.24 | %) | $714,447 | 19 | % | ||||||||||||||||||||||||||||||||
| 4/1/2018 - 3/31/2019 | 14.26 | 0.16 | 0.04 | 0.20 | (0.23 | ) | (2.22 | ) | (2.45 | ) | 12.01 | 0.66 | % | 0.60 | % | 1.17 | % | 2.49 | % | 652,731 | 41 | % | ||||||||||||||||||||||||||||||||||
| 4/1/2017 - 3/31/2018 | 13.67 | 0.20 | 0.94 | 1.14 | (0.24 | ) | (0.31 | ) | (0.55 | ) | 14.26 | 0.66 | % | 0.60 | % | 1.40 | % | 8.36 | % | 690,689 | 36 | % | ||||||||||||||||||||||||||||||||||
| 4/1/2016 - 3/31/2017 | 12.99 | 0.22 | 1.17 | 1.39 | (0.24 | ) | (0.47 | ) | (0.71 | ) | 13.67 | 0.66 | % | 0.60 | % | 1.60 | % | 10.94 | % | 720,438 | 48 | % | ||||||||||||||||||||||||||||||||||
| 4/1/2015 - 3/31/2016 | 14.20 | 0.25 | (0.60 | ) | (0.35 | ) | (0.28 | ) | (0.58 | ) | (0.86 | ) | 12.99 | 0.66 | % | 0.60 | % | 1.85 | % | (2.50 | %) | 771,853 | 35 | % | ||||||||||||||||||||||||||||||||
Class C | ||||||||||||||||||||||||||||||||||||||||||||||||||||||||
| 4/1/2019 - 3/31/2020 | $11.77 | $0.08 | ($0.94 | ) | ($0.86 | ) | ($0.08 | ) | ($0.44 | ) | ($0.52 | ) | $10.39 | 1.41 | % | 1.35 | % | 0.63 | % | (7.97 | %) | $142,846 | 19 | % | ||||||||||||||||||||||||||||||||
| 4/1/2018 - 3/31/2019 | 14.04 | 0.05 | 0.06 | 0.11 | (0.16 | ) | (2.22 | ) | (2.38 | ) | 11.77 | 1.41 | % | 1.35 | % | 0.42 | % | 1.78 | % | 381,170 | 41 | % | ||||||||||||||||||||||||||||||||||
| 4/1/2017 - 3/31/2018 | 13.50 | 0.09 | 0.92 | 1.01 | (0.16 | ) | (0.31 | ) | (0.47 | ) | 14.04 | 1.41 | % | 1.35 | % | 0.65 | % | 7.47 | % | 465,913 | 36 | % | ||||||||||||||||||||||||||||||||||
| 4/1/2016 - 3/31/2017 | 12.85 | 0.11 | 1.17 | 1.28 | (0.16 | ) | (0.47 | ) | (0.63 | ) | 13.50 | 1.41 | % | 1.35 | % | 0.85 | % | 10.19 | % | 515,691 | 48 | % | ||||||||||||||||||||||||||||||||||
| 4/1/2015 - 3/31/2016 | 14.08 | 0.15 | (0.60 | ) | (0.45 | ) | (0.20 | ) | (0.58 | ) | (0.78 | ) | 12.85 | 1.41 | % | 1.35 | % | 1.10 | % | (3.22 | %) | 554,661 | 35 | % | ||||||||||||||||||||||||||||||||
| See Notes to Financial Statements | See explanation of references on C-21 |
C-13
Table of Contents
PACIFIC FUNDS
FINANCIAL HIGHLIGHTS (Continued)
Selected per share, ratios and supplemental data for each year or period ended March 31, were as follows:
| Fund |
| Selected Per Share Data |
| Ratios to Average Net Assets | Supplemental Data | |||||||||||||||||||||||||||||||||||||||||||||||||||
| Investment Operations | Distributions | |||||||||||||||||||||||||||||||||||||||||||||||||||||||
| For the Year or Period Ended (1) | Net Asset Value, Beginning of Year or Period | Net Investment Income (Loss) (2) | Net Realized and Unrealized Gain (Loss) | Total | Net Investment Income | Capital Gains | Total | Net Asset Value, End of Year or Period | Expenses Before Reductions (3) | Expenses After Reductions (3), (4) | Net Investment Income (Loss) (3) | Total Returns (5) | Net Assets, End of Year or Period (in thousands) | Portfolio Turnover Rates | ||||||||||||||||||||||||||||||||||||||||||
Pacific Funds Portfolio Optimization Moderate (Continued) (6) | ||||||||||||||||||||||||||||||||||||||||||||||||||||||||
Advisor Class | ||||||||||||||||||||||||||||||||||||||||||||||||||||||||
| 4/1/2019 - 3/31/2020 | $12.05 | $0.20 | ($0.96 | ) | ($0.76 | ) | ($0.21 | ) | ($0.44 | ) | ($0.65 | ) | $10.64 | 0.41 | % | 0.35 | % | 1.63 | % | (7.07 | %) | $21,729 | 19 | % | ||||||||||||||||||||||||||||||||
| 4/1/2018 - 3/31/2019 | 14.29 | 0.19 | 0.04 | 0.23 | (0.25 | ) | (2.22 | ) | (2.47 | ) | 12.05 | 0.41 | % | 0.35 | % | 1.42 | % | 2.75 | % | 26,959 | 41 | % | ||||||||||||||||||||||||||||||||||
| 4/1/2017 - 3/31/2018 | 13.69 | 0.24 | 0.94 | 1.18 | (0.27 | ) | (0.31 | ) | (0.58 | ) | 14.29 | 0.41 | % | 0.35 | % | 1.65 | % | 8.54 | % | 23,088 | 36 | % | ||||||||||||||||||||||||||||||||||
| 4/1/2016 - 3/31/2017 | 13.00 | 0.25 | 1.18 | 1.43 | (0.27 | ) | (0.47 | ) | (0.74 | ) | 13.69 | 0.41 | % | 0.35 | % | 1.85 | % | 11.30 | % | 17,983 | 48 | % | ||||||||||||||||||||||||||||||||||
| 4/1/2015 - 3/31/2016 | 14.20 | 0.29 | (0.60 | ) | (0.31 | ) | (0.31 | ) | (0.58 | ) | (0.89 | ) | 13.00 | 0.41 | % | 0.35 | % | 2.10 | % | (2.24 | %) | 19,835 | 35 | % | ||||||||||||||||||||||||||||||||
Pacific Funds Portfolio Optimization Growth (6) | ||||||||||||||||||||||||||||||||||||||||||||||||||||||||
Class A | ||||||||||||||||||||||||||||||||||||||||||||||||||||||||
| 4/1/2019 - 3/31/2020 | $12.77 | $0.19 | ($1.45 | ) | ($1.26 | ) | ($0.22 | ) | ($0.70 | ) | ($0.92 | ) | $10.59 | 0.66 | % | 0.60 | % | 1.45 | % | (11.24 | %) | $544,605 | 18 | % | ||||||||||||||||||||||||||||||||
| 4/1/2018 - 3/31/2019 | 15.46 | 0.12 | 0.13 | 0.25 | (0.21 | ) | (2.73 | ) | (2.94 | ) | 12.77 | 0.66 | % | 0.60 | % | 0.84 | % | 2.92 | % | 529,247 | 53 | % | ||||||||||||||||||||||||||||||||||
| 4/1/2017 - 3/31/2018 | 14.61 | 0.18 | 1.30 | 1.48 | (0.23 | ) | (0.40 | ) | (0.63 | ) | 15.46 | 0.66 | % | 0.60 | % | 1.14 | % | 10.10 | % | 555,328 | 39 | % | ||||||||||||||||||||||||||||||||||
| 4/1/2016 - 3/31/2017 | 13.74 | 0.22 | 1.54 | 1.76 | (0.23 | ) | (0.66 | ) | (0.89 | ) | 14.61 | 0.67 | % | 0.60 | % | 1.55 | % | 13.08 | % | 560,395 | 43 | % | ||||||||||||||||||||||||||||||||||
| 4/1/2015 - 3/31/2016 | 15.34 | 0.19 | (0.69 | ) | (0.50 | ) | (0.23 | ) | (0.87 | ) | (1.10 | ) | 13.74 | 0.66 | % | 0.60 | % | 1.29 | % | (3.35 | %) | 570,267 | 34 | % | ||||||||||||||||||||||||||||||||
Class C | ||||||||||||||||||||||||||||||||||||||||||||||||||||||||
| 4/1/2019 - 3/31/2020 | $12.45 | $0.09 | ($1.41 | ) | ($1.32 | ) | ($0.10 | ) | ($0.70 | ) | ($0.80 | ) | $10.33 | 1.41 | % | 1.35 | % | 0.70 | % | (11.81 | %) | $100,768 | 18 | % | ||||||||||||||||||||||||||||||||
| 4/1/2018 - 3/31/2019 | 15.18 | 0.01 | 0.13 | 0.14 | (0.14 | ) | (2.73 | ) | (2.87 | ) | 12.45 | 1.42 | % | 1.35 | % | 0.08 | % | 2.12 | % | 271,000 | 53 | % | ||||||||||||||||||||||||||||||||||
| 4/1/2017 - 3/31/2018 | 14.38 | 0.06 | 1.28 | 1.34 | (0.14 | ) | (0.40 | ) | (0.54 | ) | 15.18 | 1.41 | % | 1.35 | % | 0.39 | % | 9.29 | % | 317,342 | 39 | % | ||||||||||||||||||||||||||||||||||
| 4/1/2016 - 3/31/2017 | 13.55 | 0.11 | 1.53 | 1.64 | (0.15 | ) | (0.66 | ) | (0.81 | ) | 14.38 | 1.42 | % | 1.35 | % | 0.80 | % | 12.33 | % | 347,447 | 43 | % | ||||||||||||||||||||||||||||||||||
| 4/1/2015 - 3/31/2016 | 15.18 | 0.08 | (0.69 | ) | (0.61 | ) | (0.15 | ) | (0.87 | ) | (1.02 | ) | 13.55 | 1.41 | % | 1.35 | % | 0.54 | % | (4.13 | %) | 366,805 | 34 | % | ||||||||||||||||||||||||||||||||
Advisor Class | ||||||||||||||||||||||||||||||||||||||||||||||||||||||||
| 4/1/2019 - 3/31/2020 | $12.82 | $0.22 | ($1.45 | ) | ($1.23 | ) | ($0.24 | ) | ($0.70 | ) | ($0.94 | ) | $10.65 | 0.41 | % | 0.35 | % | 1.70 | % | (10.98 | %) | $14,485 | 18 | % | ||||||||||||||||||||||||||||||||
| 4/1/2018 - 3/31/2019 | 15.51 | 0.16 | 0.12 | 0.28 | (0.24 | ) | (2.73 | ) | (2.97 | ) | 12.82 | 0.41 | % | 0.35 | % | 1.09 | % | 3.12 | % | 19,458 | 53 | % | ||||||||||||||||||||||||||||||||||
| 4/1/2017 - 3/31/2018 | 14.64 | 0.22 | 1.31 | 1.53 | (0.26 | ) | (0.40 | ) | (0.66 | ) | 15.51 | 0.41 | % | 0.35 | % | 1.39 | % | 10.42 | % | 16,280 | 39 | % | ||||||||||||||||||||||||||||||||||
| 4/1/2016 - 3/31/2017 | 13.76 | 0.26 | 1.54 | 1.80 | (0.26 | ) | (0.66 | ) | (0.92 | ) | 14.64 | 0.42 | % | 0.35 | % | 1.80 | % | 13.34 | % | 13,275 | 43 | % | ||||||||||||||||||||||||||||||||||
| 4/1/2015 - 3/31/2016 | 15.35 | 0.22 | (0.68 | ) | (0.46 | ) | (0.26 | ) | (0.87 | ) | (1.13 | ) | 13.76 | 0.41 | % | 0.35 | % | 1.54 | % | (3.10 | %) | 12,084 | 34 | % | ||||||||||||||||||||||||||||||||
Pacific Funds Portfolio Optimization Aggressive-Growth (6) | ||||||||||||||||||||||||||||||||||||||||||||||||||||||||
| Class A | ||||||||||||||||||||||||||||||||||||||||||||||||||||||||
| 4/1/2019 - 3/31/2020 | $14.25 | $0.19 | ($1.89 | ) | ($1.70 | ) | ($0.23 | ) | ($0.94 | ) | ($1.17 | ) | $11.38 | 0.67 | % | 0.60 | % | 1.31 | % | (13.66 | %) | $191,505 | 19 | % | ||||||||||||||||||||||||||||||||
| 4/1/2018 - 3/31/2019 | 17.03 | 0.10 | 0.25 | 0.35 | (0.25 | ) | (2.88 | ) | (3.13 | ) | 14.25 | 0.68 | % | 0.60 | % | 0.61 | % | 3.39 | % | 193,470 | 55 | % | ||||||||||||||||||||||||||||||||||
| 4/1/2017 - 3/31/2018 | 15.79 | 0.12 | 1.81 | 1.93 | (0.20 | ) | (0.49 | ) | (0.69 | ) | 17.03 | 0.68 | % | 0.60 | % | 0.74 | % | 12.17 | % | 189,903 | 41 | % | ||||||||||||||||||||||||||||||||||
| 4/1/2016 - 3/31/2017 | 14.70 | 0.19 | 1.96 | 2.15 | (0.19 | ) | (0.87 | ) | (1.06 | ) | 15.79 | 0.68 | % | 0.60 | % | 1.25 | % | 15.06 | % | 179,825 | 41 | % | ||||||||||||||||||||||||||||||||||
| 4/1/2015 - 3/31/2016 | 15.85 | 0.16 | (0.85 | ) | (0.69 | ) | (0.28 | ) | (0.18 | ) | (0.46 | ) | 14.70 | 0.68 | % | 0.60 | % | 1.03 | % | (4.37 | %) | 170,874 | 35 | % | ||||||||||||||||||||||||||||||||
| Class C | ||||||||||||||||||||||||||||||||||||||||||||||||||||||||
| 4/1/2019 - 3/31/2020 | $13.76 | $0.08 | ($1.82 | ) | ($1.74 | ) | ($0.11 | ) | ($0.94 | ) | ($1.05 | ) | $10.97 | 1.42 | % | 1.35 | % | 0.56 | % | (14.25 | %) | $35,339 | 19 | % | ||||||||||||||||||||||||||||||||
| 4/1/2018 - 3/31/2019 | 16.59 | (0.02 | ) | 0.24 | 0.22 | (0.17 | ) | (2.88 | ) | (3.05 | ) | 13.76 | 1.43 | % | 1.35 | % | (0.14 | %) | 2.57 | % | 85,434 | 55 | % | |||||||||||||||||||||||||||||||||
| 4/1/2017 - 3/31/2018 | 15.43 | (0.00 | )(7) | 1.75 | 1.75 | (0.10 | ) | (0.49 | ) | (0.59 | ) | 16.59 | 1.43 | % | 1.35 | % | (0.01 | %) | 11.39 | % | 97,877 | 41 | % | |||||||||||||||||||||||||||||||||
| 4/1/2016 - 3/31/2017 | 14.41 | 0.07 | 1.93 | 2.00 | (0.11 | ) | (0.87 | ) | (0.98 | ) | 15.43 | 1.43 | % | 1.35 | % | 0.50 | % | 14.18 | % | 99,582 | 41 | % | ||||||||||||||||||||||||||||||||||
| 4/1/2015 - 3/31/2016 | 15.55 | 0.04 | (0.83 | ) | (0.79 | ) | (0.17 | ) | (0.18 | ) | (0.35 | ) | 14.41 | 1.43 | % | 1.35 | % | 0.28 | % | (5.13 | %) | 100,573 | 35 | % | ||||||||||||||||||||||||||||||||
| Advisor Class | ||||||||||||||||||||||||||||||||||||||||||||||||||||||||
| 4/1/2019 - 3/31/2020 | $14.29 | $0.23 | ($1.89 | ) | ($1.66 | ) | ($0.25 | ) | ($0.94 | ) | ($1.19 | ) | $11.44 | 0.42 | % | 0.35 | % | 1.56 | % | (13.34 | %) | $9,606 | 19 | % | ||||||||||||||||||||||||||||||||
| 4/1/2018 - 3/31/2019 | 17.07 | 0.14 | 0.23 | 0.37 | (0.27 | ) | (2.88 | ) | (3.15 | ) | 14.29 | 0.43 | % | 0.35 | % | 0.86 | % | 3.57 | % | 10,860 | 55 | % | ||||||||||||||||||||||||||||||||||
| 4/1/2017 - 3/31/2018 | 15.82 | 0.17 | 1.80 | 1.97 | (0.23 | ) | (0.49 | ) | (0.72 | ) | 17.07 | 0.43 | % | 0.35 | % | 0.99 | % | 12.48 | % | 10,067 | 41 | % | ||||||||||||||||||||||||||||||||||
| 4/1/2016 - 3/31/2017 | 14.71 | 0.23 | 1.97 | 2.20 | (0.22 | ) | (0.87 | ) | (1.09 | ) | 15.82 | 0.43 | % | 0.35 | % | 1.50 | % | 15.32 | % | 7,166 | 41 | % | ||||||||||||||||||||||||||||||||||
| 4/1/2015 - 3/31/2016 | 15.86 | 0.19 | (0.84 | ) | (0.65 | ) | (0.32 | ) | (0.18 | ) | (0.50 | ) | 14.71 | 0.43 | % | 0.35 | % | 1.28 | % | (4.13 | %) | 6,679 | 35 | % | ||||||||||||||||||||||||||||||||
Pacific Funds Ultra Short Income | ||||||||||||||||||||||||||||||||||||||||||||||||||||||||
Class I | ||||||||||||||||||||||||||||||||||||||||||||||||||||||||
| 6/28/2019 - 3/31/2020 | $10.00 | $0.17 | ($0.35 | ) | ($0.18 | ) | ($0.17 | ) | ($0.00 | )(7) | ($0.17 | ) | $9.65 | 0.87 | % | 0.32 | % | 2.27 | % | (1.81 | %) | $12,273 | 81 | % | ||||||||||||||||||||||||||||||||
Advisor Class | ||||||||||||||||||||||||||||||||||||||||||||||||||||||||
| 6/28/2019 - 3/31/2020 | $10.00 | $0.17 | ($0.35 | ) | ($0.18 | ) | ($0.17 | ) | ($0.00 | )(7) | ($0.17 | ) | $9.65 | 0.97 | % | 0.32 | % | 2.27 | % | (1.81 | %) | $12,401 | 81 | % | ||||||||||||||||||||||||||||||||
| See Notes to Financial Statements | See explanation of references on C-21 |
C-14
Table of Contents
PACIFIC FUNDS
FINANCIAL HIGHLIGHTS (Continued)
Selected per share, ratios and supplemental data for each year or period ended March 31, were as follows:
| Fund |
| Selected Per Share Data |
| Ratios to Average Net Assets | Supplemental Data | |||||||||||||||||||||||||||||||||||||||||||||||||||
| Investment Operations | Distributions | |||||||||||||||||||||||||||||||||||||||||||||||||||||||
| For the Year or Period Ended (1) | Net Asset Value, Beginning of Year or Period | Net Investment Income (Loss) (2) | Net Realized and Unrealized Gain (Loss) | Total | Net Investment Income | Capital Gains | Total | Net Asset Value, End of Year or Period | Expenses Before Reductions (3) | Expenses After Reductions (3), (4) | Net Investment Income (Loss) (3) | Total Returns (5) | Net Assets, End of Year or Period (in thousands) | Portfolio Turnover Rates | ||||||||||||||||||||||||||||||||||||||||||
Pacific Funds Short Duration Income | ||||||||||||||||||||||||||||||||||||||||||||||||||||||||
| Class A | ||||||||||||||||||||||||||||||||||||||||||||||||||||||||
| 4/1/2019 - 3/31/2020 | $10.30 | $0.24 | ($0.25 | ) | ($0.01 | ) | ($0.24 | ) | $— | ($0.24 | ) | $10.05 | 0.99 | % | 0.75 | % | 2.33 | % | (0.13 | %) | $154,309 | 56 | % | |||||||||||||||||||||||||||||||||
| 4/1/2018 - 3/31/2019 | 10.24 | 0.26 | 0.05 | 0.31 | (0.25 | ) | — | (0.25 | ) | 10.30 | 1.03 | % | 0.75 | % | 2.57 | % | 3.11 | % | 118,935 | 50 | % | |||||||||||||||||||||||||||||||||||
| 4/1/2017 - 3/31/2018 | 10.32 | 0.21 | (0.09 | ) | 0.12 | (0.20 | ) | — | (0.20 | ) | 10.24 | 1.04 | % | 0.75 | % | 2.03 | % | 1.18 | % | 94,197 | 76 | % | ||||||||||||||||||||||||||||||||||
| 4/1/2016 - 3/31/2017 | 10.26 | 0.18 | 0.06 | 0.24 | (0.18 | ) | — | (0.18 | ) | 10.32 | 1.05 | % | 0.83 | % | 1.77 | % | 2.36 | % | 66,901 | 86 | % | |||||||||||||||||||||||||||||||||||
| 4/1/2015 - 3/31/2016 | 10.41 | 0.17 | (0.15 | ) | 0.02 | (0.17 | ) | — | (0.17 | ) | 10.26 | 1.06 | % | 0.85 | % | 1.62 | % | 0.15 | % | 69,477 | 41 | % | ||||||||||||||||||||||||||||||||||
Class C | ||||||||||||||||||||||||||||||||||||||||||||||||||||||||
| 4/1/2019 - 3/31/2020 | $10.28 | $0.16 | ($0.25 | ) | ($0.09 | ) | ($0.16 | ) | $— | ($0.16 | ) | $10.03 | 1.74 | % | 1.50 | % | 1.58 | % | (0.87 | %) | $48,816 | 56 | % | |||||||||||||||||||||||||||||||||
| 4/1/2018 - 3/31/2019 | 10.22 | 0.19 | 0.05 | 0.24 | (0.18 | ) | — | (0.18 | ) | 10.28 | 1.78 | % | 1.50 | % | 1.82 | % | 2.35 | % | 46,167 | 50 | % | |||||||||||||||||||||||||||||||||||
| 4/1/2017 - 3/31/2018 | 10.30 | 0.13 | (0.09 | ) | 0.04 | (0.12 | ) | — | (0.12 | ) | 10.22 | 1.79 | % | 1.50 | % | 1.28 | % | 0.43 | % | 44,337 | 76 | % | ||||||||||||||||||||||||||||||||||
| 4/1/2016 - 3/31/2017 | 10.24 | 0.11 | 0.05 | 0.16 | (0.10 | ) | — | (0.10 | ) | 10.30 | 1.80 | % | 1.58 | % | 1.02 | % | 1.60 | % | 43,092 | 86 | % | |||||||||||||||||||||||||||||||||||
| 4/1/2015 - 3/31/2016 | 10.39 | 0.09 | (0.15 | ) | (0.06 | ) | (0.09 | ) | — | (0.09 | ) | 10.24 | 1.81 | % | 1.60 | % | 0.87 | % | (0.58 | %) | 44,180 | 41 | % | |||||||||||||||||||||||||||||||||
Class I | ||||||||||||||||||||||||||||||||||||||||||||||||||||||||
| 4/1/2019 - 3/31/2020 | $10.29 | $0.27 | ($0.26 | ) | $0.01 | ($0.27 | ) | $— | ($0.27 | ) | $10.03 | 0.63 | % | 0.50 | % | 2.58 | % | 0.03 | % | $106,402 | 56 | % | ||||||||||||||||||||||||||||||||||
| 4/1/2018 - 3/31/2019 | 10.22 | 0.29 | 0.06 | 0.35 | (0.28 | ) | — | (0.28 | ) | 10.29 | 0.63 | % | 0.50 | % | 2.82 | % | 3.47 | % | 83,436 | 50 | % | |||||||||||||||||||||||||||||||||||
| 4/1/2017 - 3/31/2018 | 10.30 | 0.24 | (0.09 | ) | 0.15 | (0.23 | ) | — | (0.23 | ) | 10.22 | 0.64 | % | 0.50 | % | 2.28 | % | 1.43 | % | 4,329 | 76 | % | ||||||||||||||||||||||||||||||||||
| 4/1/2016 - 3/31/2017 | 10.25 | 0.21 | 0.05 | 0.26 | (0.21 | ) | — | (0.21 | ) | 10.30 | 0.65 | % | 0.53 | % | 2.06 | % | 2.56 | % | 3,407 | 86 | % | |||||||||||||||||||||||||||||||||||
| 4/1/2015 - 3/31/2016 | 10.39 | 0.20 | (0.14 | ) | 0.06 | (0.20 | ) | — | (0.20 | ) | 10.25 | 0.66 | % | 0.55 | % | 1.92 | % | 0.54 | % | 1,695 | 41 | % | ||||||||||||||||||||||||||||||||||
Advisor Class | ||||||||||||||||||||||||||||||||||||||||||||||||||||||||
| 4/1/2019 - 3/31/2020 | $10.31 | $0.27 | ($0.26 | ) | $0.01 | ($0.27 | ) | $— | ($0.27 | ) | $10.05 | 0.73 | % | 0.50 | % | 2.58 | % | 0.02 | % | $717,804 | 56 | % | ||||||||||||||||||||||||||||||||||
| 4/1/2018 - 3/31/2019 | 10.24 | 0.29 | 0.06 | 0.35 | (0.28 | ) | — | (0.28 | ) | 10.31 | 0.78 | % | 0.50 | % | 2.82 | % | 3.46 | % | 483,476 | 50 | % | |||||||||||||||||||||||||||||||||||
| 4/1/2017 - 3/31/2018 | 10.32 | 0.24 | (0.09 | ) | 0.15 | (0.23 | ) | — | (0.23 | ) | 10.24 | 0.79 | % | 0.50 | % | 2.28 | % | 1.43 | % | 272,268 | 76 | % | ||||||||||||||||||||||||||||||||||
| 4/1/2016 - 3/31/2017 | 10.26 | 0.21 | 0.06 | 0.27 | (0.21 | ) | — | (0.21 | ) | 10.32 | 0.80 | % | 0.57 | % | 2.02 | % | 2.62 | % | 162,554 | 86 | % | |||||||||||||||||||||||||||||||||||
| 4/1/2015 - 3/31/2016 | 10.41 | 0.19 | (0.15 | ) | 0.04 | (0.19 | ) | — | (0.19 | ) | 10.26 | 0.81 | % | 0.60 | % | 1.87 | % | 0.40 | % | 129,455 | 41 | % | ||||||||||||||||||||||||||||||||||
Pacific Funds Core Income | ||||||||||||||||||||||||||||||||||||||||||||||||||||||||
Class A | ||||||||||||||||||||||||||||||||||||||||||||||||||||||||
| 4/1/2019 - 3/31/2020 | $10.52 | $0.29 | $0.08 | $0.37 | ($0.29 | ) | $— | ($0.29 | ) | $10.60 | 1.09 | % | 0.85 | % | 2.70 | % | 3.51 | % | $140,650 | 70 | % | |||||||||||||||||||||||||||||||||||
| 4/1/2018 - 3/31/2019 | 10.45 | 0.33 | 0.07 | 0.40 | (0.33 | ) | — | (0.33 | ) | 10.52 | 1.13 | % | 0.85 | % | 3.22 | % | 3.99 | % | 82,136 | 93 | % | |||||||||||||||||||||||||||||||||||
| 4/1/2017 - 3/31/2018 | 10.51 | 0.28 | (0.06 | ) | 0.22 | (0.28 | ) | — | (0.28 | ) | 10.45 | 1.12 | % | 0.85 | % | 2.62 | % | 2.05 | % | 132,006 | 91 | % | ||||||||||||||||||||||||||||||||||
| 4/1/2016 - 3/31/2017 | 10.45 | 0.28 | 0.06 | 0.34 | (0.28 | ) | — | (0.28 | ) | 10.51 | 1.13 | % | 0.93 | % | 2.63 | % | 3.23 | % | 160,226 | 82 | % | |||||||||||||||||||||||||||||||||||
| 4/1/2015 - 3/31/2016 | 10.79 | 0.31 | (0.34 | ) | (0.03 | ) | (0.31 | ) | — | (0.31 | ) | 10.45 | 1.14 | % | 0.95 | % | 2.92 | % | (0.27 | %) | 196,297 | 74 | % | |||||||||||||||||||||||||||||||||
Class C | ||||||||||||||||||||||||||||||||||||||||||||||||||||||||
| 4/1/2019 - 3/31/2020 | $10.52 | $0.21 | $0.08 | $0.29 | ($0.21 | ) | $— | ($0.21 | ) | $10.60 | 1.84 | % | 1.60 | % | 1.95 | % | 2.73 | % | $58,397 | 70 | % | |||||||||||||||||||||||||||||||||||
| 4/1/2018 - 3/31/2019 | 10.46 | 0.26 | 0.06 | 0.32 | (0.26 | ) | — | (0.26 | ) | 10.52 | 1.88 | % | 1.60 | % | 2.47 | % | 3.11 | % | 81,309 | 93 | % | |||||||||||||||||||||||||||||||||||
| 4/1/2017 - 3/31/2018 | 10.51 | 0.20 | (0.05 | ) | 0.15 | (0.20 | ) | — | (0.20 | ) | 10.46 | 1.87 | % | 1.60 | % | 1.87 | % | 1.38 | % | 101,156 | 91 | % | ||||||||||||||||||||||||||||||||||
| 4/1/2016 - 3/31/2017 | 10.45 | 0.20 | 0.06 | 0.26 | (0.20 | ) | — | (0.20 | ) | 10.51 | 1.88 | % | 1.68 | % | 1.88 | % | 2.46 | % | 120,546 | 82 | % | |||||||||||||||||||||||||||||||||||
| 4/1/2015 - 3/31/2016 | 10.79 | 0.23 | (0.34 | ) | (0.11 | ) | (0.23 | ) | — | (0.23 | ) | 10.45 | 1.89 | % | 1.70 | % | 2.17 | % | (1.03 | %) | 140,657 | 74 | % | |||||||||||||||||||||||||||||||||
Class I | ||||||||||||||||||||||||||||||||||||||||||||||||||||||||
| 4/1/2019 - 3/31/2020 | $10.53 | $0.33 | $0.07 | $0.40 | ($0.32 | ) | $— | ($0.32 | ) | $10.61 | 0.73 | % | 0.55 | % | 3.00 | % | 3.81 | % | $60,355 | 70 | % | |||||||||||||||||||||||||||||||||||
| 4/1/2018 - 3/31/2019 | 10.46 | 0.36 | 0.08 | 0.44 | (0.37 | ) | — | (0.37 | ) | 10.53 | 0.73 | % | 0.55 | % | 3.52 | % | 4.30 | % | 26,394 | 93 | % | |||||||||||||||||||||||||||||||||||
| 4/1/2017 - 3/31/2018 | 10.52 | 0.31 | (0.06 | ) | 0.25 | (0.31 | ) | — | (0.31 | ) | 10.46 | 0.72 | % | 0.55 | % | 2.92 | % | 2.35 | % | 4,339 | 91 | % | ||||||||||||||||||||||||||||||||||
| 4/1/2016 - 3/31/2017 | 10.46 | 0.31 | 0.06 | 0.37 | (0.31 | ) | — | (0.31 | ) | 10.52 | 0.73 | % | 0.62 | % | 2.93 | % | 3.54 | % | 4,563 | 82 | % | |||||||||||||||||||||||||||||||||||
| 4/1/2015 - 3/31/2016 | 10.80 | 0.34 | (0.34 | ) | 0.00 | (0.34 | ) | — | (0.34 | ) | 10.46 | 0.74 | % | 0.65 | % | 3.22 | % | 0.03 | % | 3,585 | 74 | % | ||||||||||||||||||||||||||||||||||
Class P | ||||||||||||||||||||||||||||||||||||||||||||||||||||||||
| 4/1/2019 - 3/31/2020 | $10.56 | $0.33 | $0.08 | $0.41 | ($0.33 | ) | $— | ($0.33 | ) | $10.64 | 0.73 | % | 0.55 | % | 3.00 | % | 3.80 | % | $31,831 | 70 | % | |||||||||||||||||||||||||||||||||||
| 4/1/2018 - 3/31/2019 | 10.49 | 0.37 | 0.07 | 0.44 | (0.37 | ) | — | (0.37 | ) | 10.56 | 0.73 | % | 0.55 | % | 3.52 | % | 4.29 | % | 40,570 | 93 | % | |||||||||||||||||||||||||||||||||||
| 4/1/2017 - 3/31/2018 | 10.55 | 0.31 | (0.07 | ) | 0.24 | (0.30 | ) | — | (0.30 | ) | 10.49 | 0.72 | % | 0.60 | % | 2.87 | % | 2.29 | % | 66,750 | 91 | % | ||||||||||||||||||||||||||||||||||
| 4/1/2016 - 3/31/2017 | 10.49 | 0.30 | 0.06 | 0.36 | (0.30 | ) | — | (0.30 | ) | 10.55 | 0.73 | % | 0.70 | % | 2.86 | % | 3.46 | % | 122,260 | 82 | % | |||||||||||||||||||||||||||||||||||
| 4/27/2015 - 3/31/2016 | 10.88 | 0.31 | (0.39 | ) | (0.08 | ) | (0.31 | ) | — | (0.31 | ) | 10.49 | 0.74 | % | 0.70 | % | 3.17 | % | (0.75 | %) | 15,964 | 74 | % | |||||||||||||||||||||||||||||||||
| See Notes to Financial Statements | See explanation of references on C-21 |
C-15
Table of Contents
PACIFIC FUNDS
FINANCIAL HIGHLIGHTS (Continued)
Selected per share, ratios and supplemental data for each year or period ended March 31, were as follows:
| Fund |
| Selected Per Share Data |
| Ratios to Average Net Assets | Supplemental Data | |||||||||||||||||||||||||||||||||||||||||||||||||||
| Investment Operations | Distributions | |||||||||||||||||||||||||||||||||||||||||||||||||||||||
| For the Year or Period Ended (1) | Net Asset Value, Beginning of Year or Period | Net Investment Income (Loss) (2) | Net Realized and Unrealized Gain (Loss) | Total | Net Investment Income | Capital Gains | Total | Net Asset Value, End of Year or Period | Expenses Before Reductions (3) | Expenses After Reductions (3), (4) | Net Investment Income (Loss) (3) | Total Returns (5) | Net Assets, End of Year or Period (in thousands) | Portfolio Turnover Rates | ||||||||||||||||||||||||||||||||||||||||||
Pacific Funds Core Income (Continued) | ||||||||||||||||||||||||||||||||||||||||||||||||||||||||
Advisor Class | ||||||||||||||||||||||||||||||||||||||||||||||||||||||||
| 4/1/2019 - 3/31/2020 | $10.54 | $0.33 | $0.08 | $0.41 | ($0.33 | ) | $— | ($0.33 | ) | $10.62 | 0.84 | % | 0.55 | % | 3.00 | % | 3.81 | % | $679,287 | 70 | % | |||||||||||||||||||||||||||||||||||
| 4/1/2018 - 3/31/2019 | 10.48 | 0.36 | 0.07 | 0.43 | (0.37 | ) | — | (0.37 | ) | 10.54 | 0.88 | % | 0.55 | % | 3.52 | % | 4.19 | % | 393,645 | 93 | % | |||||||||||||||||||||||||||||||||||
| 4/1/2017 - 3/31/2018 | 10.53 | 0.31 | (0.05 | ) | 0.26 | (0.31 | ) | — | (0.31 | ) | 10.48 | 0.87 | % | 0.55 | % | 2.92 | % | 2.45 | % | 388,730 | 91 | % | ||||||||||||||||||||||||||||||||||
| 4/1/2016 - 3/31/2017 | 10.47 | 0.31 | 0.05 | 0.36 | (0.30 | ) | — | (0.30 | ) | 10.53 | 0.88 | % | 0.66 | % | 2.90 | % | 3.50 | % | 337,844 | 82 | % | |||||||||||||||||||||||||||||||||||
| 4/1/2015 - 3/31/2016 | 10.81 | 0.33 | (0.34 | ) | (0.01 | ) | (0.33 | ) | — | (0.33 | ) | 10.47 | 0.89 | % | 0.70 | % | 3.17 | % | (0.02 | %) | 249,677 | 74 | % | |||||||||||||||||||||||||||||||||
Pacific Funds Strategic Income | ||||||||||||||||||||||||||||||||||||||||||||||||||||||||
Class A | ||||||||||||||||||||||||||||||||||||||||||||||||||||||||
| 4/1/2019 - 3/31/2020 | $10.60 | $0.43 | ($0.88 | ) | ($0.45 | ) | ($0.43 | ) | $— | ($0.43 | ) | $9.72 | 1.19 | % | 0.95 | % | 3.94 | % | (4.58 | %) | $71,510 | 98 | % | |||||||||||||||||||||||||||||||||
| 4/1/2018 - 3/31/2019 | 10.71 | 0.47 | (0.11 | ) | 0.36 | (0.47 | ) | — | (0.47 | ) | 10.60 | 1.23 | % | 0.95 | % | 4.43 | % | 3.43 | % | 61,503 | 99 | % | ||||||||||||||||||||||||||||||||||
| 4/1/2017 - 3/31/2018 | 10.68 | 0.40 | 0.02 | 0.42 | (0.39 | ) | — | (0.39 | ) | 10.71 | 1.23 | % | 0.95 | % | 3.70 | % | 3.95 | % | 71,948 | 94 | % | |||||||||||||||||||||||||||||||||||
| 4/1/2016 - 3/31/2017 | 10.09 | 0.39 | 0.59 | 0.98 | (0.39 | ) | — | (0.39 | ) | 10.68 | 1.25 | % | 1.02 | % | 3.71 | % | 9.82 | % | 66,765 | 116 | % | |||||||||||||||||||||||||||||||||||
| 4/1/2015 - 3/31/2016 | 10.75 | 0.43 | (0.66 | ) | (0.23 | ) | (0.43 | ) | — | (0.43 | ) | 10.09 | 1.26 | % | 1.05 | % | 4.20 | % | (2.17 | %) | 52,218 | 94 | % | |||||||||||||||||||||||||||||||||
Class C | ||||||||||||||||||||||||||||||||||||||||||||||||||||||||
| 4/1/2019 - 3/31/2020 | $10.58 | $0.35 | ($0.89 | ) | ($0.54 | ) | ($0.35 | ) | $— | ($0.35 | ) | $9.69 | 1.94 | % | 1.65 | % | 3.24 | % | (5.35 | %) | $63,134 | 98 | % | |||||||||||||||||||||||||||||||||
| 4/1/2018 - 3/31/2019 | 10.69 | 0.39 | (0.11 | ) | 0.28 | (0.39 | ) | — | (0.39 | ) | 10.58 | 1.98 | % | 1.65 | % | 3.73 | % | 2.73 | % | 58,634 | 99 | % | ||||||||||||||||||||||||||||||||||
| 4/1/2017 - 3/31/2018 | 10.66 | 0.32 | 0.02 | 0.34 | (0.31 | ) | — | (0.31 | ) | 10.69 | 1.98 | % | 1.65 | % | 3.00 | % | 3.25 | % | 57,389 | 94 | % | |||||||||||||||||||||||||||||||||||
| 4/1/2016 - 3/31/2017 | 10.07 | 0.31 | 0.59 | 0.90 | (0.31 | ) | — | (0.31 | ) | 10.66 | 2.00 | % | 1.76 | % | 2.97 | % | 9.03 | % | 50,016 | 116 | % | |||||||||||||||||||||||||||||||||||
| 4/1/2015 - 3/31/2016 | 10.73 | 0.36 | (0.67 | ) | (0.31 | ) | (0.35 | ) | — | (0.35 | ) | 10.07 | 2.01 | % | 1.80 | % | 3.45 | % | (2.90 | %) | 44,196 | 94 | % | |||||||||||||||||||||||||||||||||
Class I | ||||||||||||||||||||||||||||||||||||||||||||||||||||||||
| 4/1/2019 - 3/31/2020 | $10.54 | $0.46 | ($0.88 | ) | ($0.42 | ) | ($0.46 | ) | $— | ($0.46 | ) | $9.66 | 0.83 | % | 0.65 | % | 4.24 | % | (4.32 | %) | $16,622 | 98 | % | |||||||||||||||||||||||||||||||||
| 4/1/2018 - 3/31/2019 | 10.65 | 0.50 | (0.11 | ) | 0.39 | (0.50 | ) | — | (0.50 | ) | 10.54 | 0.83 | % | 0.65 | % | 4.73 | % | 3.77 | % | 5,750 | 99 | % | ||||||||||||||||||||||||||||||||||
| 4/1/2017 - 3/31/2018 | 10.62 | 0.43 | 0.02 | 0.45 | (0.42 | ) | — | (0.42 | ) | 10.65 | 0.83 | % | 0.65 | % | 4.00 | % | 4.28 | % | 3,882 | 94 | % | |||||||||||||||||||||||||||||||||||
| 4/1/2016 - 3/31/2017 | 10.03 | 0.42 | 0.59 | 1.01 | (0.42 | ) | — | (0.42 | ) | 10.62 | 0.85 | % | 0.71 | % | 4.01 | % | 10.20 | % | 2,446 | 116 | % | |||||||||||||||||||||||||||||||||||
| 4/1/2015 - 3/31/2016 | 10.70 | 0.46 | (0.67 | ) | (0.21 | ) | (0.46 | ) | — | (0.46 | ) | 10.03 | 0.86 | % | 0.75 | % | 4.50 | % | (1.98 | %) | 948 | 94 | % | |||||||||||||||||||||||||||||||||
Advisor Class | ||||||||||||||||||||||||||||||||||||||||||||||||||||||||
| 4/1/2019 - 3/31/2020 | $10.60 | $0.45 | ($0.87 | ) | ($0.42 | ) | ($0.46 | ) | $— | ($0.46 | ) | $9.72 | 0.94 | % | 0.70 | % | 4.19 | % | (4.34 | %) | $491,221 | 98 | % | |||||||||||||||||||||||||||||||||
| 4/1/2018 - 3/31/2019 | 10.71 | 0.49 | (0.11 | ) | 0.38 | (0.49 | ) | — | (0.49 | ) | 10.60 | 0.98 | % | 0.70 | % | 4.68 | % | 3.70 | % | 456,428 | 99 | % | ||||||||||||||||||||||||||||||||||
| 4/1/2017 - 3/31/2018 | 10.68 | 0.43 | 0.02 | 0.45 | (0.42 | ) | — | (0.42 | ) | 10.71 | 0.98 | % | 0.70 | % | 3.95 | % | 4.21 | % | 405,200 | 94 | % | |||||||||||||||||||||||||||||||||||
| 4/1/2016 - 3/31/2017 | 10.09 | 0.42 | 0.58 | 1.00 | (0.41 | ) | — | (0.41 | ) | 10.68 | 1.00 | % | 0.77 | % | 3.96 | % | 10.09 | % | 217,482 | 116 | % | |||||||||||||||||||||||||||||||||||
| 4/1/2015 - 3/31/2016 | 10.76 | 0.46 | (0.68 | ) | (0.22 | ) | (0.45 | ) | — | (0.45 | ) | 10.09 | 1.01 | % | 0.80 | % | 4.45 | % | (2.01 | %) | 115,565 | 94 | % | |||||||||||||||||||||||||||||||||
Pacific Funds Floating Rate Income | ||||||||||||||||||||||||||||||||||||||||||||||||||||||||
Class A | ||||||||||||||||||||||||||||||||||||||||||||||||||||||||
| 4/1/2019 - 3/31/2020 | $9.88 | $0.46 | ($1.08 | ) | ($0.62 | ) | ($0.46 | ) | $— | ($0.46 | ) | $8.80 | 1.27 | % | 1.02 | %(8) | 4.64 | % | (6.69 | %) | $162,511 | 116 | % | |||||||||||||||||||||||||||||||||
| 4/1/2018 - 3/31/2019 | 10.12 | 0.49 | (0.24 | ) | 0.25 | (0.49 | ) | — | (0.49 | ) | 9.88 | 1.29 | % | 1.01 | % | 4.92 | % | 2.57 | % | 202,929 | 122 | % | ||||||||||||||||||||||||||||||||||
| 4/1/2017 - 3/31/2018 | 10.15 | 0.42 | (0.04 | ) | 0.38 | (0.41 | ) | — | (0.41 | ) | 10.12 | 1.28 | % | 1.01 | % | 4.11 | % | 3.85 | % | 209,034 | 158 | % | ||||||||||||||||||||||||||||||||||
| 4/1/2016 - 3/31/2017 | 9.76 | 0.42 | 0.38 | 0.80 | (0.41 | ) | — | (0.41 | ) | 10.15 | 1.30 | % | 1.09 | % | 4.21 | % | 8.32 | % | 207,238 | 168 | % | |||||||||||||||||||||||||||||||||||
| 4/1/2015 - 3/31/2016 | 10.08 | 0.39 | (0.32 | ) | 0.07 | (0.39 | ) | — | (0.39 | ) | 9.76 | 1.30 | % | 1.12 | % | 3.92 | % | 0.72 | % | 191,376 | 99 | % | ||||||||||||||||||||||||||||||||||
Class C | ||||||||||||||||||||||||||||||||||||||||||||||||||||||||
| 4/1/2019 - 3/31/2020 | $9.86 | $0.39 | ($1.08 | ) | ($0.69 | ) | ($0.38 | ) | $— | ($0.38 | ) | $8.79 | 2.03 | % | 1.72 | %(8) | 3.94 | % | (7.31 | %) | $102,846 | 116 | % | |||||||||||||||||||||||||||||||||
| 4/1/2018 - 3/31/2019 | 10.10 | 0.42 | (0.24 | ) | 0.18 | (0.42 | ) | — | (0.42 | ) | 9.86 | 2.04 | % | 1.71 | % | 4.22 | % | 1.86 | % | 197,081 | 122 | % | ||||||||||||||||||||||||||||||||||
| 4/1/2017 - 3/31/2018 | 10.13 | 0.34 | (0.03 | ) | 0.31 | (0.34 | ) | — | (0.34 | ) | 10.10 | 2.03 | % | 1.71 | % | 3.41 | % | 3.14 | % | 191,239 | 158 | % | ||||||||||||||||||||||||||||||||||
| 4/1/2016 - 3/31/2017 | 9.74 | 0.35 | 0.37 | 0.72 | (0.33 | ) | — | (0.33 | ) | 10.13 | 2.05 | % | 1.83 | % | 3.47 | % | 7.54 | % | 180,612 | 168 | % | |||||||||||||||||||||||||||||||||||
| 4/1/2015 - 3/31/2016 | 10.06 | 0.31 | (0.31 | ) | 0.00 | (0.32 | ) | — | (0.32 | ) | 9.74 | 2.05 | % | 1.87 | % | 3.17 | % | (0.04 | %) | 161,326 | 99 | % | ||||||||||||||||||||||||||||||||||
Class I | ||||||||||||||||||||||||||||||||||||||||||||||||||||||||
| 4/1/2019 - 3/31/2020 | $9.90 | $0.49 | ($1.09 | ) | ($0.60 | ) | ($0.49 | ) | $— | ($0.49 | ) | $8.81 | 0.91 | % | 0.72 | %(8) | 4.94 | % | (6.49 | %) | $415,170 | 116 | % | |||||||||||||||||||||||||||||||||
| 4/1/2018 - 3/31/2019 | 10.14 | 0.52 | (0.23 | ) | 0.29 | (0.53 | ) | — | (0.53 | ) | 9.90 | 0.90 | % | 0.71 | % | 5.22 | % | 2.88 | % | 497,335 | 122 | % | ||||||||||||||||||||||||||||||||||
| 4/1/2017 - 3/31/2018 | 10.16 | 0.45 | (0.03 | ) | 0.42 | (0.44 | ) | — | (0.44 | ) | 10.14 | 0.88 | % | 0.71 | % | 4.41 | % | 4.25 | % | 294,352 | 158 | % | ||||||||||||||||||||||||||||||||||
| 4/1/2016 - 3/31/2017 | 9.77 | 0.45 | 0.38 | 0.83 | (0.44 | ) | — | (0.44 | ) | 10.16 | 0.89 | % | 0.78 | % | 4.52 | % | 8.63 | % | 249,811 | 168 | % | |||||||||||||||||||||||||||||||||||
| 4/1/2015 - 3/31/2016 | 10.09 | 0.42 | (0.32 | ) | 0.10 | (0.42 | ) | — | (0.42 | ) | 9.77 | 0.90 | % | 0.82 | % | 4.22 | % | 1.02 | % | 91,984 | 99 | % | ||||||||||||||||||||||||||||||||||
| See Notes to Financial Statements | See explanation of references on C-21 |
C-16
Table of Contents
PACIFIC FUNDS
FINANCIAL HIGHLIGHTS (Continued)
Selected per share, ratios and supplemental data for each year or period ended March 31, were as follows:
| Fund |
| Selected Per Share Data |
| Ratios to Average Net Assets | Supplemental Data | |||||||||||||||||||||||||||||||||||||||||||||||||||
| Investment Operations | Distributions | |||||||||||||||||||||||||||||||||||||||||||||||||||||||
| For the Year or Period Ended (1) | Net Asset Value, Beginning of Year or Period | Net Investment Income (Loss) (2) | Net Realized and Unrealized Gain (Loss) | Total | Net Investment Income | Capital Gains | Total | Net Asset Value, End of Year or Period | Expenses Before Reductions (3) | Expenses After Reductions (3), (4) | Net Investment Income (Loss) (3) | Total Returns (5) | Net Assets, End of Year or Period (in thousands) | Portfolio Turnover Rates | ||||||||||||||||||||||||||||||||||||||||||
Pacific Funds Floating Rate Income (Continued) | ||||||||||||||||||||||||||||||||||||||||||||||||||||||||
Class P | ||||||||||||||||||||||||||||||||||||||||||||||||||||||||
| 4/1/2019 - 3/31/2020 | $9.90 | $0.49 | ($1.09 | ) | ($0.60 | ) | ($0.49 | ) | $— | ($0.49 | ) | $8.81 | 0.91 | % | 0.72 | %(8) | 4.95 | % | (6.49 | %) | $7,900 | 116 | % | |||||||||||||||||||||||||||||||||
| 4/1/2018 - 3/31/2019 | 10.14 | 0.53 | (0.25 | ) | 0.28 | (0.52 | ) | — | (0.52 | ) | 9.90 | 0.89 | % | 0.71 | % | 5.22 | % | 2.87 | % | 32,176 | 122 | % | ||||||||||||||||||||||||||||||||||
| 4/1/2017 - 3/31/2018 | 10.16 | 0.44 | (0.02 | ) | 0.42 | (0.44 | ) | — | (0.44 | ) | 10.14 | 0.88 | % | 0.76 | % | 4.36 | % | 4.20 | % | 64,557 | 158 | % | ||||||||||||||||||||||||||||||||||
| 4/1/2016 - 3/31/2017 | 9.76 | 0.45 | 0.38 | 0.83 | (0.43 | ) | — | (0.43 | ) | 10.16 | 0.89 | % | 0.87 | % | 4.43 | % | 8.56 | % | 78,660 | 168 | % | |||||||||||||||||||||||||||||||||||
| 4/1/2015 - 3/31/2016 | 10.09 | 0.41 | (0.33 | ) | 0.08 | (0.41 | ) | — | (0.41 | ) | 9.76 | 0.90 | % | 0.87 | % | 4.17 | % | 0.97 | % | 568 | 99 | % | ||||||||||||||||||||||||||||||||||
Advisor Class | ||||||||||||||||||||||||||||||||||||||||||||||||||||||||
| 4/1/2019 - 3/31/2020 | $9.92 | $0.48 | ($1.09 | ) | ($0.61 | ) | ($0.48 | ) | $— | ($0.48 | ) | $8.83 | 1.03 | % | 0.77 | %(8) | 4.89 | % | (6.52 | %) | $506,347 | 116 | % | |||||||||||||||||||||||||||||||||
| 4/1/2018 - 3/31/2019 | 10.16 | 0.52 | (0.24 | ) | 0.28 | (0.52 | ) | — | (0.52 | ) | 9.92 | 1.04 | % | 0.76 | % | 5.17 | % | 2.83 | % | 830,452 | 122 | % | ||||||||||||||||||||||||||||||||||
| 4/1/2017 - 3/31/2018 | 10.18 | 0.44 | (0.02 | ) | 0.42 | (0.44 | ) | — | (0.44 | ) | 10.16 | 1.03 | % | 0.76 | % | 4.36 | % | 4.20 | % | 715,700 | 158 | % | ||||||||||||||||||||||||||||||||||
| 4/1/2016 - 3/31/2017 | 9.79 | 0.45 | 0.37 | 0.82 | (0.43 | ) | — | (0.43 | ) | 10.18 | 1.04 | % | 0.83 | % | 4.47 | % | 8.56 | % | 450,761 | 168 | % | |||||||||||||||||||||||||||||||||||
| 4/1/2015 - 3/31/2016 | 10.11 | 0.41 | (0.32 | ) | 0.09 | (0.41 | ) | — | (0.41 | ) | 9.79 | 1.05 | % | 0.87 | % | 4.17 | % | 0.96 | % | 231,437 | 99 | % | ||||||||||||||||||||||||||||||||||
Pacific Funds High Income | ||||||||||||||||||||||||||||||||||||||||||||||||||||||||
Class A | ||||||||||||||||||||||||||||||||||||||||||||||||||||||||
| 4/1/2019 - 3/31/2020 | $10.07 | $0.52 | ($1.33 | ) | ($0.81 | ) | ($0.51 | ) | $— | ($0.51 | ) | $8.75 | 1.24 | % | 0.95 | % | 5.11 | % | (8.61 | %) | $7,227 | 63 | % | |||||||||||||||||||||||||||||||||
| 4/1/2018 - 3/31/2019 | 10.23 | 0.55 | (0.16 | ) | 0.39 | (0.55 | ) | — | (0.55 | ) | 10.07 | 1.31 | % | 0.95 | % | 5.48 | % | 3.97 | % | 5,174 | 64 | % | ||||||||||||||||||||||||||||||||||
| 4/1/2017 - 3/31/2018 | 10.29 | 0.50 | (0.03 | ) | 0.47 | (0.53 | ) | — | (0.53 | ) | 10.23 | 1.46 | % | 0.95 | % | 4.82 | % | 4.66 | % | 5,463 | 72 | % | ||||||||||||||||||||||||||||||||||
| 4/1/2016 - 3/31/2017 | 9.44 | 0.48 | 0.92 | 1.40 | (0.55 | ) | — | (0.55 | ) | 10.29 | 1.32 | % | 1.03 | % | 4.81 | % | 15.16 | % | 5,626 | 61 | % | |||||||||||||||||||||||||||||||||||
| 4/1/2015 - 3/31/2016 | 10.48 | 0.50 | (1.10 | ) | (0.60 | ) | (0.44 | ) | — | (0.44 | ) | 9.44 | 1.28 | % | 1.05 | % | 5.05 | % | (5.79 | %) | 10,391 | 54 | % | |||||||||||||||||||||||||||||||||
Class C | ||||||||||||||||||||||||||||||||||||||||||||||||||||||||
| 4/1/2019 - 3/31/2020 | $10.06 | $0.45 | ($1.33 | ) | ($0.88 | ) | ($0.44 | ) | $— | ($0.44 | ) | $8.74 | 2.00 | % | 1.65 | % | 4.41 | % | (9.28 | %) | $2,007 | 63 | % | |||||||||||||||||||||||||||||||||
| 4/1/2018 - 3/31/2019 | 10.21 | 0.48 | (0.15 | ) | 0.33 | (0.48 | ) | — | (0.48 | ) | 10.06 | 2.06 | % | 1.65 | % | 4.78 | % | 3.35 | % | 3,726 | 64 | % | ||||||||||||||||||||||||||||||||||
| 4/1/2017 - 3/31/2018 | 10.28 | 0.43 | (0.04 | ) | 0.39 | (0.46 | ) | — | (0.46 | ) | 10.21 | 2.21 | % | 1.65 | % | 4.12 | % | 3.84 | % | 4,418 | 72 | % | ||||||||||||||||||||||||||||||||||
| 4/1/2016 - 3/31/2017 | 9.43 | 0.41 | 0.92 | 1.33 | (0.48 | ) | — | (0.48 | ) | 10.28 | 2.07 | % | 1.76 | % | 4.07 | % | 14.36 | % | 4,802 | 61 | % | |||||||||||||||||||||||||||||||||||
| 4/1/2015 - 3/31/2016 | 10.47 | 0.43 | (1.10 | ) | (0.67 | ) | (0.37 | ) | — | (0.37 | ) | 9.43 | 2.03 | % | 1.80 | % | 4.30 | % | (6.52 | %) | 4,324 | 54 | % | |||||||||||||||||||||||||||||||||
Class I | ||||||||||||||||||||||||||||||||||||||||||||||||||||||||
| 4/1/2019 - 3/31/2020 | $9.98 | $0.54 | ($1.33 | ) | ($0.79 | ) | ($0.53 | ) | $— | ($0.53 | ) | $8.66 | 0.88 | % | 0.70 | % | 5.36 | % | (8.36 | %) | $54 | 63 | % | |||||||||||||||||||||||||||||||||
| 4/1/2018 - 3/31/2019 | 10.14 | 0.57 | (0.16 | ) | 0.41 | (0.57 | ) | — | (0.57 | ) | 9.98 | 0.91 | % | 0.70 | % | 5.73 | % | 4.27 | % | 175 | 64 | % | ||||||||||||||||||||||||||||||||||
| 4/1/2017 - 3/31/2018 | 10.21 | 0.52 | (0.02 | ) | 0.50 | (0.57 | ) | — | (0.57 | ) | 10.14 | 1.07 | % | 0.70 | % | 5.07 | % | 4.95 | % | 211 | 72 | % | ||||||||||||||||||||||||||||||||||
| 4/1/2016 - 3/31/2017 | 9.37 | 0.51 | 0.91 | 1.42 | (0.58 | ) | — | (0.58 | ) | 10.21 | 0.90 | % | 0.73 | % | 5.10 | % | 15.52 | % | 5,204 | 61 | % | |||||||||||||||||||||||||||||||||||
| 4/1/2015 - 3/31/2016 | 10.41 | 0.54 | (1.11 | ) | (0.57 | ) | (0.47 | ) | — | (0.47 | ) | 9.37 | 0.88 | % | 0.75 | % | 5.35 | % | (5.57 | %) | 58 | 54 | % | |||||||||||||||||||||||||||||||||
Class P | ||||||||||||||||||||||||||||||||||||||||||||||||||||||||
| 4/1/2019 - 3/31/2020 | $9.98 | $0.54 | ($1.33 | ) | ($0.79 | ) | ($0.53 | ) | $— | ($0.53 | ) | $8.66 | 0.88 | % | 0.70 | % | 5.36 | % | (8.46 | %) | $120,807 | 63 | % | |||||||||||||||||||||||||||||||||
| 4/1/2018 - 3/31/2019 | 10.14 | 0.57 | (0.16 | ) | 0.41 | (0.57 | ) | — | (0.57 | ) | 9.98 | 0.91 | % | 0.70 | % | 5.73 | % | 4.27 | % | 113,317 | 64 | % | ||||||||||||||||||||||||||||||||||
| 4/1/2017 - 3/31/2018 | 10.20 | 0.52 | (0.02 | ) | 0.50 | (0.56 | ) | — | (0.56 | ) | 10.14 | 1.06 | % | 0.73 | % | 5.04 | % | 4.92 | % | 68,844 | 72 | % | ||||||||||||||||||||||||||||||||||
| 4/1/2016 - 3/31/2017 | 9.36 | 0.49 | 0.93 | 1.42 | (0.58 | ) | — | (0.58 | ) | 10.20 | 0.95 | % | 0.80 | % | 5.04 | % | 15.47 | % | 10,554 | 61 | % | |||||||||||||||||||||||||||||||||||
| 4/1/2015 - 3/31/2016 | 10.40 | 0.52 | (1.09 | ) | (0.57 | ) | (0.47 | ) | — | (0.47 | ) | 9.36 | 0.88 | % | 0.80 | % | 5.30 | % | (5.60 | %) | 113,998 | 54 | % | |||||||||||||||||||||||||||||||||
Advisor Class | ||||||||||||||||||||||||||||||||||||||||||||||||||||||||
| 4/1/2019 - 3/31/2020 | $10.08 | $0.54 | ($1.33 | ) | ($0.79 | ) | ($0.53 | ) | $— | ($0.53 | ) | $8.76 | 1.00 | % | 0.70 | % | 5.36 | % | (8.38 | %) | $3,329 | 63 | % | |||||||||||||||||||||||||||||||||
| 4/1/2018 - 3/31/2019 | 10.24 | 0.58 | (0.17 | ) | 0.41 | (0.57 | ) | — | (0.57 | ) | 10.08 | 1.06 | % | 0.70 | % | 5.73 | % | 4.23 | % | 3,669 | 64 | % | ||||||||||||||||||||||||||||||||||
| 4/1/2017 - 3/31/2018 | 10.30 | 0.53 | (0.03 | ) | 0.50 | (0.56 | ) | — | (0.56 | ) | 10.24 | 1.21 | % | 0.70 | % | 5.07 | % | 4.91 | % | 2,503 | 72 | % | ||||||||||||||||||||||||||||||||||
| 4/1/2016 - 3/31/2017 | 9.44 | 0.51 | 0.93 | 1.44 | (0.58 | ) | — | (0.58 | ) | 10.30 | 1.06 | % | 0.77 | % | 5.07 | % | 15.58 | % | 2,304 | 61 | % | |||||||||||||||||||||||||||||||||||
| 4/1/2015 - 3/31/2016 | 10.49 | 0.53 | (1.12 | ) | (0.59 | ) | (0.46 | ) | — | (0.46 | ) | 9.44 | 1.03 | % | 0.80 | % | 5.30 | % | (5.66 | %) | 1,666 | 54 | % | |||||||||||||||||||||||||||||||||
Pacific Funds Diversified Income | ||||||||||||||||||||||||||||||||||||||||||||||||||||||||
| Advisor Class | ||||||||||||||||||||||||||||||||||||||||||||||||||||||||
| 6/28/2019 - 3/31/2020 | $10.00 | $0.21 | ($1.60 | ) | ($1.39 | ) | ($0.21 | ) | ($0.01 | ) | ($0.22 | ) | $8.39 | 1.08 | % | 0.45 | % | 2.72 | % | (14.24 | %) | $24,015 | 34 | % | ||||||||||||||||||||||||||||||||
| See Notes to Financial Statements | See explanation of references on C-21 |
C-17
Table of Contents
PACIFIC FUNDS
FINANCIAL HIGHLIGHTS (Continued)
Selected per share, ratios and supplemental data for each year or period ended March 31, were as follows:
| Fund |
| Selected Per Share Data |
| Ratios to Average Net Assets | Supplemental Data | |||||||||||||||||||||||||||||||||||||||||||||||||||
| Investment Operations | Distributions | |||||||||||||||||||||||||||||||||||||||||||||||||||||||
| For the Year or Period Ended (1) | Net Asset Value, Beginning of Year or Period | Net Investment Income (Loss) (2) | Net Realized and Unrealized Gain (Loss) | Total | Net Investment Income | Capital Gains | Total | Net Asset Value, End of Year or Period | Expenses Before Reductions (3) | Expenses After Reductions (3), (4) | Net Investment Income (Loss) (3) | Total Returns (5) | Net Assets, End of Year or Period (in thousands) | Portfolio Turnover Rates | ||||||||||||||||||||||||||||||||||||||||||
Pacific Funds Large-Cap(9), (11) | ||||||||||||||||||||||||||||||||||||||||||||||||||||||||
| Class A | ||||||||||||||||||||||||||||||||||||||||||||||||||||||||
| 4/1/2019 - 3/31/2020 | $12.48 | $0.12 | ($1.28 | ) | ($1.16 | ) | ($0.12 | ) | ($0.03 | ) | ($0.15 | ) | $11.17 | 1.38 | % | 0.92 | % | 0.93 | % | (9.52 | %) | $9,986 | 74 | % | ||||||||||||||||||||||||||||||||
| 4/1/2018 - 3/31/2019 | 12.28 | 0.12 | 0.67 | 0.79 | (0.09 | ) | (0.50 | ) | (0.59 | ) | 12.48 | 1.54 | % | 1.00 | % | 0.93 | % | 6.74 | % | 8,080 | 79 | % | ||||||||||||||||||||||||||||||||||
| 4/1/2017 - 3/31/2018 | 11.08 | 0.08 | 1.30 | 1.38 | (0.10 | ) | (0.08 | ) | (0.18 | ) | 12.28 | 1.73 | % | 1.00 | % | 0.69 | % | 12.43 | % | 4,939 | 98 | % | ||||||||||||||||||||||||||||||||||
| 4/1/2016 - 3/31/2017 | 9.66 | 0.11 | 1.40 | 1.51 | (0.09 | ) | — | (0.09 | ) | 11.08 | 2.86 | % | 1.00 | % | 1.08 | % | 15.69 | % | 4,599 | 108 | % | |||||||||||||||||||||||||||||||||||
| 1/11/2016 - 3/31/2016 | 9.10 | 0.03 | 0.53 | 0.56 | — | — | — | 9.66 | 6.07 | % | 1.00 | % | 1.35 | % | 6.15 | % | 551 | 27 | % | |||||||||||||||||||||||||||||||||||||
| Class C | ||||||||||||||||||||||||||||||||||||||||||||||||||||||||
| 4/1/2019 - 3/31/2020 | $12.42 | $0.02 | ($1.28 | ) | ($1.26 | ) | ($0.02 | ) | ($0.03 | ) | ($0.05 | ) | $11.11 | 2.13 | % | 1.67 | % | 0.18 | % | (10.21 | %) | $3,433 | 74 | % | ||||||||||||||||||||||||||||||||
| 4/1/2018 - 3/31/2019 | 12.22 | 0.02 | 0.69 | 0.71 | (0.01 | ) | (0.50 | ) | (0.51 | ) | 12.42 | 2.30 | % | 1.75 | % | 0.19 | % | 5.97 | % | 3,900 | 79 | % | ||||||||||||||||||||||||||||||||||
| 4/1/2017 - 3/31/2018 | 11.03 | (0.01 | ) | 1.29 | 1.28 | (0.01 | ) | (0.08 | ) | (0.09 | ) | 12.22 | 2.48 | % | 1.75 | % | (0.06 | %) | 11.60 | % | 3,545 | 98 | % | |||||||||||||||||||||||||||||||||
| 4/1/2016 - 3/31/2017 | 9.65 | 0.03 | 1.39 | 1.42 | (0.04 | ) | — | (0.04 | ) | 11.03 | 3.61 | % | 1.75 | % | 0.33 | % | 14.74 | % | 2,804 | 108 | % | |||||||||||||||||||||||||||||||||||
| 1/11/2016 - 3/31/2016 | 9.10 | 0.01 | 0.54 | 0.55 | — | — | — | 9.65 | 6.82 | % | 1.75 | % | 0.60 | % | 6.04 | % | 525 | 27 | % | |||||||||||||||||||||||||||||||||||||
| Advisor Class | ||||||||||||||||||||||||||||||||||||||||||||||||||||||||
| 4/1/2019 - 3/31/2020 | $12.57 | $0.16 | ($1.29 | ) | ($1.13 | ) | ($0.15 | ) | ($0.03 | ) | ($0.18 | ) | $11.26 | 1.13 | % | 0.67 | % | 1.18 | % | (9.26 | %) | $5,932 | 74 | % | ||||||||||||||||||||||||||||||||
| 4/1/2018 - 3/31/2019 | 12.37 | 0.15 | 0.67 | 0.82 | (0.12 | ) | (0.50 | ) | (0.62 | ) | 12.57 | 1.30 | % | 0.75 | % | 1.19 | % | 6.97 | % | 6,896 | 79 | % | ||||||||||||||||||||||||||||||||||
| 4/1/2017 - 3/31/2018 | 11.11 | 0.12 | 1.30 | 1.42 | (0.08 | ) | (0.08 | ) | (0.16 | ) | 12.37 | 1.48 | % | 0.75 | % | 0.94 | % | 12.83 | % | 8,070 | 98 | % | ||||||||||||||||||||||||||||||||||
| 4/1/2016 - 3/31/2017 | 9.67 | 0.14 | 1.39 | 1.53 | (0.09 | ) | — | (0.09 | ) | 11.11 | 2.61 | % | 0.75 | % | 1.33 | % | 15.89 | % | 2,176 | 108 | % | |||||||||||||||||||||||||||||||||||
| 1/11/2016 - 3/31/2016 | 9.10 | 0.03 | 0.54 | 0.57 | — | — | — | 9.67 | 5.82 | % | 0.75 | % | 1.60 | % | 6.26 | % | 564 | 27 | % | |||||||||||||||||||||||||||||||||||||
| Class R6 | ||||||||||||||||||||||||||||||||||||||||||||||||||||||||
| 4/1/2019 - 3/31/2020 | $12.33 | $0.17 | ($1.26 | ) | ($1.09 | ) | ($0.17 | ) | ($0.03 | ) | ($0.20 | ) | $11.04 | 1.02 | % | 0.57 | % | 1.28 | % | (9.20 | %) | $686 | 74 | % | ||||||||||||||||||||||||||||||||
| 4/1/2018 - 3/31/2019 | 12.15 | 0.16 | 0.66 | 0.82 | (0.14 | ) | (0.50 | ) | (0.64 | ) | 12.33 | 1.15 | % | 0.65 | % | 1.28 | % | 7.06 | % | 909 | 79 | % | ||||||||||||||||||||||||||||||||||
| 4/1/2017 - 3/31/2018 | 11.03 | 0.12 | 1.30 | 1.42 | (0.22 | ) | (0.08 | ) | (0.30 | ) | 12.15 | 1.33 | % | 0.65 | % | 1.04 | % | 12.85 | % | 692 | 98 | % | ||||||||||||||||||||||||||||||||||
| 4/1/2016 - 3/31/2017 | 9.66 | 0.15 | 1.39 | 1.54 | (0.17 | ) | — | (0.17 | ) | 11.03 | 2.46 | % | 0.65 | % | 1.43 | % | 16.08 | % | 1,184 | 108 | % | |||||||||||||||||||||||||||||||||||
| 12/1/2015 - 3/31/2016 | 10.09 | 0.05 | (0.30 | ) | (0.25 | ) | (0.18 | )(10) | — | (0.18 | ) | 9.66 | 5.99 | % | 0.65 | % | 1.70 | % | (2.54 | %) | 1,879 | 27 | % | |||||||||||||||||||||||||||||||||
| 3/20/2015 - 11/30/2015 | 10.26 | 0.12 | (0.29 | ) | (0.17 | ) | — | — | — | 10.09 | 9.85 | % | 0.65 | % | 1.72 | % | (1.66 | %) | 1,895 | 45 | % | |||||||||||||||||||||||||||||||||||
Pacific Funds Large-Cap Value (9) | ||||||||||||||||||||||||||||||||||||||||||||||||||||||||
| Class A | ||||||||||||||||||||||||||||||||||||||||||||||||||||||||
| 4/1/2019 - 3/31/2020 | $10.89 | $0.15 | ($1.55 | ) | ($1.40 | ) | ($0.15 | ) | ($0.99 | ) | ($1.14 | ) | $8.35 | 1.49 | % | 1.02 | % | 1.39 | % | (15.34 | %) | $3,892 | 53 | % | ||||||||||||||||||||||||||||||||
| 4/1/2018 - 3/31/2019 | 11.34 | 0.14 | 0.18 | 0.32 | (0.13 | ) | (0.64 | ) | (0.77 | ) | 10.89 | 1.46 | % | 1.10 | % | 1.27 | % | 3.14 | % | 4,353 | 39 | % | ||||||||||||||||||||||||||||||||||
| 4/1/2017 - 3/31/2018 | 10.75 | 0.11 | 0.86 | 0.97 | (0.13 | ) | (0.25 | ) | (0.38 | ) | 11.34 | 1.47 | % | 1.10 | % | 0.96 | % | 9.03 | % | 3,304 | 50 | % | ||||||||||||||||||||||||||||||||||
| 4/1/2016 - 3/31/2017 | 9.46 | 0.14 | 1.27 | 1.41 | (0.10 | ) | (0.02 | ) | (0.12 | ) | 10.75 | 1.79 | % | 1.10 | % | 1.35 | % | 14.92 | % | 2,572 | 65 | % | ||||||||||||||||||||||||||||||||||
| 1/11/2016 - 3/31/2016 | 8.97 | 0.04 | 0.45 | 0.49 | — | — | — | 9.46 | 10.34 | % | 1.10 | % | 1.92 | % | 5.46 | % | 499 | 48 | % | |||||||||||||||||||||||||||||||||||||
| Class C | ||||||||||||||||||||||||||||||||||||||||||||||||||||||||
| 4/1/2019 - 3/31/2020 | $10.83 | $0.07 | ($1.55 | ) | ($1.48 | ) | ($0.07 | ) | ($0.99 | ) | ($1.06 | ) | $8.29 | 2.24 | % | 1.77 | % | 0.64 | % | (16.01 | %) | $2,394 | 53 | % | ||||||||||||||||||||||||||||||||
| 4/1/2018 - 3/31/2019 | 11.25 | 0.06 | 0.19 | 0.25 | (0.03 | ) | (0.64 | ) | (0.67 | ) | 10.83 | 2.21 | % | 1.85 | % | 0.53 | % | 2.40 | % | 3,475 | 39 | % | ||||||||||||||||||||||||||||||||||
| 4/1/2017 - 3/31/2018 | 10.69 | 0.02 | 0.86 | 0.88 | (0.07 | ) | (0.25 | ) | (0.32 | ) | 11.25 | 2.22 | % | 1.85 | % | 0.21 | % | 8.16 | % | 4,327 | 50 | % | ||||||||||||||||||||||||||||||||||
| 4/1/2016 - 3/31/2017 | 9.45 | 0.06 | 1.26 | 1.32 | (0.06 | ) | (0.02 | ) | (0.08 | ) | 10.69 | 2.54 | % | 1.85 | % | 0.60 | % | 14.03 | % | 3,056 | 65 | % | ||||||||||||||||||||||||||||||||||
| 1/11/2016 - 3/31/2016 | 8.97 | 0.02 | 0.46 | 0.48 | — | — | — | 9.45 | 11.09 | % | 1.85 | % | 1.17 | % | 5.35 | % | 477 | 48 | % | |||||||||||||||||||||||||||||||||||||
| Advisor Class | ||||||||||||||||||||||||||||||||||||||||||||||||||||||||
| 4/1/2019 - 3/31/2020 | $10.93 | $0.18 | ($1.55 | ) | ($1.37 | ) | ($0.18 | ) | ($0.99 | ) | ($1.17 | ) | $8.39 | 1.23 | % | 0.77 | % | 1.64 | % | (15.09 | %) | $8,667 | 53 | % | ||||||||||||||||||||||||||||||||
| 4/1/2018 - 3/31/2019 | 11.37 | 0.17 | 0.19 | 0.36 | (0.16 | ) | (0.64 | ) | (0.80 | ) | 10.93 | 1.21 | % | 0.85 | % | 1.53 | % | 3.47 | % | 9,799 | 39 | % | ||||||||||||||||||||||||||||||||||
| 4/1/2017 - 3/31/2018 | 10.78 | 0.14 | 0.87 | 1.01 | (0.17 | ) | (0.25 | ) | (0.42 | ) | 11.37 | 1.22 | % | 0.85 | % | 1.21 | % | 9.33 | % | 19,624 | 50 | % | ||||||||||||||||||||||||||||||||||
| 4/1/2016 - 3/31/2017 | 9.47 | 0.16 | 1.26 | 1.42 | (0.09 | ) | (0.02 | ) | (0.11 | ) | 10.78 | 1.54 | % | 0.85 | % | 1.60 | % | 15.10 | % | 24,779 | 65 | % | ||||||||||||||||||||||||||||||||||
| 1/11/2016 - 3/31/2016 | 8.97 | 0.04 | 0.46 | 0.50 | — | — | — | 9.47 | �� | 10.09 | % | 0.85 | % | 2.17 | % | 5.57 | % | 777 | 48 | % | ||||||||||||||||||||||||||||||||||||
| Class R6 | ||||||||||||||||||||||||||||||||||||||||||||||||||||||||
| 4/1/2019 - 3/31/2020 | $10.84 | $0.19 | ($1.54 | ) | ($1.35 | ) | ($0.19 | ) | ($0.99 | ) | ($1.18 | ) | $8.31 | 1.14 | % | 0.67 | % | 1.74 | % | (15.05 | %) | $1,019 | 53 | % | ||||||||||||||||||||||||||||||||
| 4/1/2018 - 3/31/2019 | 11.34 | 0.19 | 0.15 | 0.34 | (0.20 | ) | (0.64 | ) | (0.84 | ) | 10.84 | 1.06 | % | 0.75 | % | 1.63 | % | 3.39 | % | 832 | 39 | % | ||||||||||||||||||||||||||||||||||
| 4/1/2017 - 3/31/2018 | 10.75 | 0.15 | 0.86 | 1.01 | (0.17 | ) | (0.25 | ) | (0.42 | ) | 11.34 | 1.07 | % | 0.75 | % | 1.31 | % | 9.36 | % | 1,963 | 50 | % | ||||||||||||||||||||||||||||||||||
| 4/1/2016 - 3/31/2017 | 9.47 | 0.17 | 1.28 | 1.45 | (0.15 | ) | (0.02 | ) | (0.17 | ) | 10.75 | 1.39 | % | 0.75 | % | 1.70 | % | 15.35 | % | 1,365 | 65 | % | ||||||||||||||||||||||||||||||||||
| 1/11/2016 - 3/31/2016 | 8.97 | 0.04 | 0.46 | 0.50 | — | — | — | 9.47 | 9.93 | % | 0.75 | % | 2.27 | % | 5.57 | % | 210 | 48 | % | |||||||||||||||||||||||||||||||||||||
| See Notes to Financial Statements | See explanation of references on C-21 |
C-18
Table of Contents
PACIFIC FUNDS
FINANCIAL HIGHLIGHTS (Continued)
Selected per share, ratios and supplemental data for each year or period ended March 31, were as follows:
| Fund |
| Selected Per Share Data |
| Ratios to Average Net Assets | Supplemental Data | |||||||||||||||||||||||||||||||||||||||||||||||||||
| Investment Operations | Distributions | |||||||||||||||||||||||||||||||||||||||||||||||||||||||
| For the Year or Period Ended (1) | Net Asset Value, Beginning of Year or Period | Net Investment Income (Loss) (2) | Net Realized and Unrealized Gain (Loss) | Total | Net Investment Income | Capital Gains | Total | Net Asset Value, End of Year or Period | Expenses Before Reductions (3) | Expenses After Reductions (3), (4) | Net Investment Income (Loss) (3) | Total Returns (5) | Net Assets, End of Year or Period (in thousands) | Portfolio Turnover Rates | ||||||||||||||||||||||||||||||||||||||||||
Pacific Funds Small/Mid-Cap (9), (11) | ||||||||||||||||||||||||||||||||||||||||||||||||||||||||
| Class A | ||||||||||||||||||||||||||||||||||||||||||||||||||||||||
| 4/1/2019 - 3/31/2020 | $13.02 | ($0.00 | )(7) | ($3.47 | ) | ($3.47 | ) | ($0.03 | ) | $— | ($0.03 | ) | $9.52 | 1.37 | % | 1.23 | % | (0.03 | %) | (26.71 | %) | $14,379 | 36 | % | ||||||||||||||||||||||||||||||||
| 4/1/2018 - 3/31/2019 | 13.23 | (0.02 | ) | 0.16 | 0.14 | — | (0.35 | ) | (0.35 | ) | 13.02 | 1.48 | % | 1.30 | % | (0.11 | %) | 1.19 | % | 21,872 | 33 | % | ||||||||||||||||||||||||||||||||||
| 4/1/2017 - 3/31/2018 | 11.93 | (0.04 | ) | 1.35 | 1.31 | — | (0.01 | ) | (0.01 | ) | 13.23 | 1.51 | % | 1.30 | % | (0.28 | %) | 11.02 | % | 21,131 | 23 | % | ||||||||||||||||||||||||||||||||||
| 4/1/2016 - 3/31/2017 | 9.93 | (0.02 | ) | 2.05 | 2.03 | — | (0.03 | ) | (0.03 | ) | 11.93 | 1.71 | % | 1.30 | % | (0.19 | %) | 20.44 | % | 18,360 | 45 | % | ||||||||||||||||||||||||||||||||||
| 1/11/2016 - 3/31/2016 | 9.33 | 0.00 | (7) | 0.60 | 0.60 | — | — | — | 9.93 | 5.43 | % | 1.30 | % | 0.07 | % | 6.43 | % | 2,254 | 11 | % | ||||||||||||||||||||||||||||||||||||
| Class C | ||||||||||||||||||||||||||||||||||||||||||||||||||||||||
| 4/1/2019 - 3/31/2020 | $12.70 | ($0.10 | ) | ($3.36 | ) | ($3.46 | ) | $— | $— | $— | $9.24 | 2.13 | % | 1.98 | % | (0.78 | %) | (27.24 | %) | $9,277 | 36 | % | ||||||||||||||||||||||||||||||||||
| 4/1/2018 - 3/31/2019 | 13.01 | (0.11 | ) | 0.15 | 0.04 | — | (0.35 | ) | (0.35 | ) | 12.70 | 2.23 | % | 2.05 | % | (0.87 | %) | 0.43 | % | 16,875 | 33 | % | ||||||||||||||||||||||||||||||||||
| 4/1/2017 - 3/31/2018 | 11.81 | (0.13 | ) | 1.34 | 1.21 | — | (0.01 | ) | (0.01 | ) | 13.01 | 2.26 | % | 2.05 | % | (1.03 | %) | 10.28 | % | 15,458 | 23 | % | ||||||||||||||||||||||||||||||||||
| 4/1/2016 - 3/31/2017 | 9.91 | (0.10 | ) | 2.03 | 1.93 | — | (0.03 | ) | (0.03 | ) | 11.81 | 2.46 | % | 2.05 | % | (0.94 | %) | 19.47 | % | 7,383 | 45 | % | ||||||||||||||||||||||||||||||||||
| 1/11/2016 - 3/31/2016 | 9.33 | (0.01 | ) | 0.59 | 0.58 | — | — | — | 9.91 | 6.18 | % | 2.05 | % | (0.68 | %) | 6.22 | % | 527 | 11 | % | ||||||||||||||||||||||||||||||||||||
| Advisor Class | ||||||||||||||||||||||||||||||||||||||||||||||||||||||||
| 4/1/2019 - 3/31/2020 | $13.11 | $0.03 | ($3.50 | ) | ($3.47 | ) | ($0.06 | ) | $— | ($0.06 | ) | $9.58 | 1.12 | % | 0.98 | % | 0.22 | % | (26.61 | %) | $214,344 | 36 | % | |||||||||||||||||||||||||||||||||
| 4/1/2018 - 3/31/2019 | 13.28 | 0.02 | 0.16 | 0.18 | (0.00 | )(7) | (0.35 | ) | (0.35 | ) | 13.11 | 1.23 | % | 1.05 | % | 0.13 | % | 1.50 | % | 328,171 | 33 | % | ||||||||||||||||||||||||||||||||||
| 4/1/2017 - 3/31/2018 | 11.94 | 0.00 | (7) | 1.35 | 1.35 | — | (0.01 | ) | (0.01 | ) | 13.28 | 1.26 | % | 1.05 | % | (0.03 | %) | 11.34 | % | 176,897 | 23 | % | ||||||||||||||||||||||||||||||||||
| 4/1/2016 - 3/31/2017 | 9.92 | 0.01 | 2.05 | 2.06 | (0.01 | ) | (0.03 | ) | (0.04 | ) | 11.94 | 1.46 | % | 1.05 | % | 0.06 | % | 20.73 | % | 70,260 | 45 | % | ||||||||||||||||||||||||||||||||||
| 1/11/2016 - 3/31/2016 | 9.33 | 0.01 | 0.58 | 0.59 | — | — | — | 9.92 | 5.18 | % | 1.05 | % | 0.32 | % | 6.32 | % | 1,965 | 11 | % | |||||||||||||||||||||||||||||||||||||
| Class R6 | ||||||||||||||||||||||||||||||||||||||||||||||||||||||||
| 4/1/2019 - 3/31/2020 | $13.12 | $0.04 | ($3.50 | ) | ($3.46 | ) | ($0.07 | ) | $— | ($0.07 | ) | $9.59 | 1.01 | % | 0.93 | % | 0.27 | % | (26.57 | %) | $4,802 | 36 | % | |||||||||||||||||||||||||||||||||
| 4/1/2018 - 3/31/2019 | 13.29 | 0.02 | 0.16 | 0.18 | (0.00 | )(7) | (0.35 | ) | (0.35 | ) | 13.12 | 1.08 | % | 1.00 | % | 0.19 | % | 1.52 | % | 6,422 | 33 | % | ||||||||||||||||||||||||||||||||||
| 4/1/2017 - 3/31/2018 | 11.94 | 0.00 | (7) | 1.36 | 1.36 | — | (0.01 | ) | (0.01 | ) | 13.29 | 1.11 | % | 1.00 | % | 0.02 | % | 11.43 | % | 9,977 | 23 | % | ||||||||||||||||||||||||||||||||||
| 4/1/2016 - 3/31/2017 | 9.92 | 0.01 | 2.05 | 2.06 | (0.01 | ) | (0.03 | ) | (0.04 | ) | 11.94 | 1.31 | % | 1.00 | % | 0.11 | % | 20.78 | % | 8,531 | 45 | % | ||||||||||||||||||||||||||||||||||
| 12/1/2015 - 3/31/2016 | 10.48 | 0.01 | (0.49 | ) | (0.48 | ) | (0.03 | ) | (0.05 | ) | (0.08 | ) | 9.92 | 9.62 | % | 1.00 | % | 0.37 | % | (4.55 | %) | 711 | 11 | % | ||||||||||||||||||||||||||||||||
| 12/31/2014 - 11/30/2015 | 10.00 | 0.01 | 0.47 | 0.48 | — | — | — | 10.48 | 29.84 | % | 1.00 | % | 0.12 | % | 4.80 | % | 524 | 30 | % | |||||||||||||||||||||||||||||||||||||
Pacific Funds Small-Cap (9), (11) | ||||||||||||||||||||||||||||||||||||||||||||||||||||||||
| Class A | ||||||||||||||||||||||||||||||||||||||||||||||||||||||||
| 4/1/2019 - 3/31/2020 | $12.12 | ($0.03 | ) | ($3.51 | ) | ($3.54 | ) | ($0.02 | ) | $— | ($0.02 | ) | $8.56 | 1.73 | % | 1.23 | % | (0.21 | %) | (29.27 | %) | $3,343 | 42 | % | ||||||||||||||||||||||||||||||||
| 4/1/2018 - 3/31/2019 | 12.86 | (0.03 | ) | (0.06 | ) | (0.09 | ) | — | (0.65 | ) | (0.65 | ) | 12.12 | 1.72 | % | 1.30 | % | (0.21 | %) | (0.53 | %) | 4,986 | 56 | % | ||||||||||||||||||||||||||||||||
| 4/1/2017 - 3/31/2018 | 11.77 | (0.02 | ) | 1.33 | 1.31 | (0.01 | ) | (0.21 | ) | (0.22 | ) | 12.86 | 1.89 | % | 1.30 | % | (0.16 | %) | 11.17 | % | 2,367 | 62 | % | |||||||||||||||||||||||||||||||||
| 4/1/2016 - 3/31/2017 | 9.68 | (0.00 | )(7) | 2.19 | 2.19 | (0.10 | ) | — | (0.10 | ) | 11.77 | 3.44 | % | 1.30 | % | (0.04 | %) | 22.70 | % | 1,759 | 62 | % | ||||||||||||||||||||||||||||||||||
| 1/11/2016 - 3/31/2016 | 9.10 | 0.01 | 0.57 | 0.58 | — | — | — | 9.68 | 17.67 | % | 1.30 | % | 0.31 | % | 6.37 | % | 324 | 27 | % | |||||||||||||||||||||||||||||||||||||
| Class C | ||||||||||||||||||||||||||||||||||||||||||||||||||||||||
| 4/1/2019 - 3/31/2020 | $11.94 | ($0.11 | ) | ($3.45 | ) | ($3.56 | ) | $— | $— | $— | $8.38 | 2.48 | % | 1.98 | % | (0.96 | %) | (29.82 | %) | $538 | 42 | % | ||||||||||||||||||||||||||||||||||
| 4/1/2018 - 3/31/2019 | 12.76 | (0.12 | ) | (0.05 | ) | (0.17 | ) | — | (0.65 | ) | (0.65 | ) | 11.94 | 2.47 | % | 2.05 | % | (0.96 | %) | (1.17 | %) | 902 | 56 | % | ||||||||||||||||||||||||||||||||
| 4/1/2017 - 3/31/2018 | 11.76 | (0.11 | ) | 1.32 | 1.21 | — | (0.21 | ) | (0.21 | ) | 12.76 | 2.64 | % | 2.05 | % | (0.91 | %) | 10.32 | % | 797 | 62 | % | ||||||||||||||||||||||||||||||||||
| 4/1/2016 - 3/31/2017 | 9.66 | (0.09 | ) | 2.19 | 2.10 | — | — | — | 11.76 | 4.19 | % | 2.05 | % | (0.79 | %) | 21.74 | % | 641 | 62 | % | ||||||||||||||||||||||||||||||||||||
| 1/11/2016 - 3/31/2016 | 9.10 | (0.01 | ) | 0.57 | 0.56 | — | — | — | 9.66 | 18.42 | % | 2.05 | % | (0.44 | %) | 6.15 | % | 130 | 27 | % | ||||||||||||||||||||||||||||||||||||
| Advisor Class | ||||||||||||||||||||||||||||||||||||||||||||||||||||||||
| 4/1/2019 - 3/31/2020 | $12.32 | $0.00 | (7) | ($3.57 | ) | ($3.57 | ) | ($0.04 | ) | $— | ($0.04 | ) | $8.71 | 1.48 | % | 0.98 | % | 0.04 | % | (29.07 | %) | $7,897 | 42 | % | ||||||||||||||||||||||||||||||||
| 4/1/2018 - 3/31/2019 | 13.04 | 0.01 | (0.07 | ) | (0.06 | ) | (0.01 | ) | (0.65 | ) | (0.66 | ) | 12.32 | 1.47 | % | 1.05 | % | 0.04 | % | (0.26 | %) | 13,220 | 56 | % | ||||||||||||||||||||||||||||||||
| 4/1/2017 - 3/31/2018 | 11.90 | 0.01 | 1.35 | 1.36 | (0.01 | ) | (0.21 | ) | (0.22 | ) | 13.04 | 1.64 | % | 1.05 | % | 0.09 | % | 11.45 | % | 14,767 | 62 | % | ||||||||||||||||||||||||||||||||||
| 4/1/2016 - 3/31/2017 | 9.68 | 0.02 | 2.21 | 2.23 | (0.01 | ) | — | (0.01 | ) | 11.90 | 3.19 | % | 1.05 | % | 0.21 | % | 23.03 | % | 8,265 | 62 | % | |||||||||||||||||||||||||||||||||||
| 1/11/2016 - 3/31/2016 | 9.10 | 0.01 | 0.57 | 0.58 | — | — | — | 9.68 | 17.42 | % | 1.05 | % | 0.56 | % | 6.37 | % | 153 | 27 | % | |||||||||||||||||||||||||||||||||||||
| Class R6 | ||||||||||||||||||||||||||||||||||||||||||||||||||||||||
| 4/1/2019 - 3/31/2020 | $11.29 | $0.01 | ($3.28 | ) | ($3.27 | ) | ($0.05 | ) | $— | ($0.05 | ) | $7.97 | 1.37 | % | 0.93 | % | 0.09 | % | (29.05 | %) | $731 | 42 | % | |||||||||||||||||||||||||||||||||
| 4/1/2018 - 3/31/2019 | 12.00 | 0.01 | (0.06 | ) | (0.05 | ) | (0.01 | ) | (0.65 | ) | (0.66 | ) | 11.29 | 1.32 | % | 1.00 | % | 0.09 | % | (0.18 | %) | 658 | 56 | % | ||||||||||||||||||||||||||||||||
| 4/1/2017 - 3/31/2018 | 10.95 | 0.02 | 1.24 | 1.26 | — | (0.21 | ) | (0.21 | ) | 12.00 | 1.49 | % | 1.00 | % | 0.14 | % | 11.54 | % | 457 | 62 | % | |||||||||||||||||||||||||||||||||||
| 4/1/2016 - 3/31/2017 | 9.67 | 0.03 | 2.17 | 2.20 | (0.92 | ) | — | (0.92 | ) | 10.95 | 3.04 | % | 1.00 | % | 0.26 | % | 23.03 | % | 140 | 62 | % | |||||||||||||||||||||||||||||||||||
| 12/1/2015 - 3/31/2016 | 10.31 | 0.02 | (0.60 | ) | (0.58 | ) | (0.06 | ) | — | (0.06 | ) | 9.67 | 10.38 | % | 1.00 | % | 0.61 | % | (5.68 | %) | 497 | 27 | % | |||||||||||||||||||||||||||||||||
| 12/31/2014 - 11/30/2015 | 10.00 | 0.02 | 0.29 | 0.31 | — | — | — | 10.31 | 30.41 | % | 1.00 | % | 0.24 | % | 3.10 | % | 516 | 27 | % | |||||||||||||||||||||||||||||||||||||
| See Notes to Financial Statements | See explanation of references on C-21 |
C-19
Table of Contents
PACIFIC FUNDS
FINANCIAL HIGHLIGHTS (Continued)
Selected per share, ratios and supplemental data for each year or period ended March 31, were as follows:
| Fund |
| Selected Per Share Data |
| Ratios to Average Net Assets | Supplemental Data | |||||||||||||||||||||||||||||||||||||||||||||||||||
| Investment Operations | Distributions | |||||||||||||||||||||||||||||||||||||||||||||||||||||||
| For the Year or Period Ended (1) | Net Asset Value, Beginning of Year or Period | Net Investment Income (Loss) (2) | Net Realized and Unrealized Gain (Loss) | Total | Net Investment Income | Capital Gains | Total | Net Asset Value, End of Year or Period | Expenses Before Reductions (3) | Expenses After Reductions (3), (4) | Net Investment Income (Loss) (3) | Total Returns (5) | Net Assets, End of Year or Period (in thousands) | Portfolio Turnover Rates | ||||||||||||||||||||||||||||||||||||||||||
Pacific FundsSmall-Cap Value (9), (11) | ||||||||||||||||||||||||||||||||||||||||||||||||||||||||
| Class A | ||||||||||||||||||||||||||||||||||||||||||||||||||||||||
| 4/1/2019 - 3/31/2020 | $9.10 | $0.04 | ($2.92 | ) | ($2.88 | ) | ($0.07 | ) | $ — | ($0.07 | ) | $6.15 | 1.72 | % | 1.22 | % | 0.41 | % | (31.93 | %) | $1,023 | 45 | % | |||||||||||||||||||||||||||||||||
| 4/1/2018 - 3/31/2019 | 11.17 | 0.03 | (0.49 | ) | (0.46 | ) | (0.03 | ) | (1.58 | ) | (1.61 | ) | 9.10 | 1.67 | % | 1.30 | % | 0.30 | % | (3.68 | %) | 1,298 | 51 | % | ||||||||||||||||||||||||||||||||
| 4/1/2017 - 3/31/2018 | 11.52 | 0.02 | 0.62 | 0.64 | (0.03 | ) | (0.96 | ) | (0.99 | ) | 11.17 | 1.65 | % | 1.30 | % | 0.14 | % | 5.41 | % | 1,105 | 47 | % | ||||||||||||||||||||||||||||||||||
| 4/1/2016 - 3/31/2017 | 9.47 | 0.03 | 2.13 | 2.16 | (0.06 | ) | (0.05 | ) | (0.11 | ) | 11.52 | 1.90 | % | 1.30 | % | 0.23 | % | 22.65 | % | 743 | 76 | % | ||||||||||||||||||||||||||||||||||
| 1/11/2016 - 3/31/2016 | 8.80 | 0.02 | 0.65 | 0.67 | — | — | — | 9.47 | 15.99 | % | 1.30 | % | 0.97 | % | 7.73 | % | 148 | 17 | % | |||||||||||||||||||||||||||||||||||||
| Class C | ||||||||||||||||||||||||||||||||||||||||||||||||||||||||
| 4/1/2019 - 3/31/2020 | $8.94 | ($0.03 | ) | ($2.87 | ) | ($2.90 | ) | $ — | $ — | $ — | $6.04 | 2.47 | % | 1.97 | % | (0.35 | %) | (32.44 | %) | $644 | 45 | % | ||||||||||||||||||||||||||||||||||
| 4/1/2018 - 3/31/2019 | 11.06 | (0.05 | ) | (0.49 | ) | (0.54 | ) | — | (1.58 | ) | (1.58 | ) | 8.94 | 2.42 | % | 2.05 | % | (0.45 | %) | (4.47 | %) | 1,287 | 51 | % | ||||||||||||||||||||||||||||||||
| 4/1/2017 - 3/31/2018 | 11.46 | (0.07 | ) | 0.63 | 0.56 | — | (0.96 | ) | (0.96 | ) | 11.06 | 2.40 | % | 2.05 | % | (0.61 | %) | 4.72 | % | 1,568 | 47 | % | ||||||||||||||||||||||||||||||||||
| 4/1/2016 - 3/31/2017 | 9.46 | (0.06 | ) | 2.12 | 2.06 | (0.01 | ) | (0.05 | ) | (0.06 | ) | 11.46 | 2.65 | % | 2.05 | % | (0.52 | %) | 21.81 | % | 1,105 | 76 | % | |||||||||||||||||||||||||||||||||
| 1/11/2016 - 3/31/2016 | 8.80 | 0.00 | (7) | 0.66 | 0.66 | — | — | — | 9.46 | 16.74 | % | 2.05 | % | 0.22 | % | 7.50 | % | 121 | 17 | % | ||||||||||||||||||||||||||||||||||||
| Advisor Class | ||||||||||||||||||||||||||||||||||||||||||||||||||||||||
| 4/1/2019 - 3/31/2020 | $9.16 | $0.06 | ($2.94 | ) | ($2.88 | ) | ($0.09 | ) | $ — | ($0.09 | ) | $6.19 | 1.47 | % | 0.97 | % | 0.66 | % | (31.79 | %) | $10,018 | 45 | % | |||||||||||||||||||||||||||||||||
| 4/1/2018 - 3/31/2019 | 11.24 | 0.06 | (0.51 | ) | (0.45 | ) | (0.05 | ) | (1.58 | ) | (1.63 | ) | 9.16 | 1.42 | % | 1.05 | % | 0.55 | % | (3.51 | %) | 11,664 | 51 | % | ||||||||||||||||||||||||||||||||
| 4/1/2017 - 3/31/2018 | 11.59 | 0.05 | 0.63 | 0.68 | (0.07 | ) | (0.96 | ) | (1.03 | ) | 11.24 | 1.40 | % | 1.05 | % | 0.39 | % | 5.70 | % | 15,511 | 47 | % | ||||||||||||||||||||||||||||||||||
| 4/1/2016 - 3/31/2017 | 9.48 | 0.05 | 2.15 | 2.20 | (0.04 | ) | (0.05 | ) | (0.09 | ) | 11.59 | 1.65 | % | 1.05 | % | 0.48 | % | 23.02 | % | 20,617 | 76 | % | ||||||||||||||||||||||||||||||||||
| 1/11/2016 - 3/31/2016 | 8.80 | 0.02 | 0.66 | 0.68 | — | — | — | 9.48 | 15.74 | % | 1.05 | % | 1.22 | % | 7.84 | % | 261 | 17 | % | |||||||||||||||||||||||||||||||||||||
| Class R6 | ||||||||||||||||||||||||||||||||||||||||||||||||||||||||
| 4/1/2019 - 3/31/2020 | $9.12 | $0.07 | ($2.92 | ) | ($2.85 | ) | ($0.10 | ) | $ — | ($0.10 | ) | $6.17 | 1.36 | % | 0.92 | % | 0.70 | % | (31.67 | %) | $2,314 | 45 | % | |||||||||||||||||||||||||||||||||
| 4/1/2018 - 3/31/2019 | 11.21 | 0.07 | (0.52 | ) | (0.45 | ) | (0.06 | ) | (1.58 | ) | (1.64 | ) | 9.12 | 1.27 | % | 1.00 | % | 0.60 | % | (3.52 | %) | 3,134 | 51 | % | ||||||||||||||||||||||||||||||||
| 4/1/2017 - 3/31/2018 | 11.55 | 0.05 | 0.64 | 0.69 | (0.07 | ) | (0.96 | ) | (1.03 | ) | 11.21 | 1.25 | % | 1.00 | % | 0.44 | % | 5.78 | % | 9,657 | 47 | % | ||||||||||||||||||||||||||||||||||
| 4/1/2016 - 3/31/2017 | 9.47 | 0.06 | 2.13 | 2.19 | (0.06 | ) | (0.05 | ) | (0.11 | ) | 11.55 | 1.50 | % | 1.00 | % | 0.53 | % | 23.02 | % | 9,655 | 76 | % | ||||||||||||||||||||||||||||||||||
| 12/1/2015 - 3/31/2016 | 10.14 | 0.04 | (0.49 | ) | (0.45 | ) | (0.12 | ) | (0.10 | ) | (0.22 | ) | 9.47 | 16.02 | % | 1.00 | % | 1.27 | % | (4.37 | %) | 1,118 | 17 | % | ||||||||||||||||||||||||||||||||
| 12/31/2014 - 11/30/2015 | 10.00 | 0.06 | 0.08 | 0.14 | — | — | — | 10.14 | 26.85 | % | 1.00 | % | 0.63 | % | 1.40 | % | 706 | 29 | % | |||||||||||||||||||||||||||||||||||||
Pacific Funds Small-Cap Growth (9) | ||||||||||||||||||||||||||||||||||||||||||||||||||||||||
| Class A | ||||||||||||||||||||||||||||||||||||||||||||||||||||||||
| 4/1/2019 - 3/31/2020 | $11.97 | ($0.09 | ) | ($3.39 | ) | ($3.48 | ) | $— | $— | $— | $8.49 | 1.60 | % | 1.18 | % | (0.74 | %) | (29.01 | %) | $2,107 | 27 | % | ||||||||||||||||||||||||||||||||||
| 4/1/2018 - 3/31/2019 | 12.26 | (0.08 | ) | 0.73 | 0.65 | — | (0.94 | ) | (0.94 | ) | 11.97 | 1.56 | % | 1.26 | % | (0.63 | %) | 5.65 | % | 3,126 | 72 | % | ||||||||||||||||||||||||||||||||||
| 4/1/2017 - 3/31/2018 | 11.14 | (0.08 | ) | 1.68 | 1.60 | — | (0.48 | ) | (0.48 | ) | 12.26 | 1.62 | % | 1.30 | % | (0.65 | %) | 14.51 | % | 713 | 51 | % | ||||||||||||||||||||||||||||||||||
| 4/1/2016 - 3/31/2017 | 9.61 | (0.07 | ) | 1.80 | 1.73 | — | (0.20 | ) | (0.20 | ) | 11.14 | 1.93 | % | 1.30 | % | (0.68 | %) | 17.83 | % | 514 | 49 | % | ||||||||||||||||||||||||||||||||||
| 1/11/2016 - 3/31/2016 | 9.27 | (0.01 | ) | 0.35 | 0.34 | — | — | — | 9.61 | 12.44 | % | 1.30 | % | (0.70 | %) | 3.88 | % | 43 | 7 | % | ||||||||||||||||||||||||||||||||||||
| Class C | ||||||||||||||||||||||||||||||||||||||||||||||||||||||||
| 4/1/2019 - 3/31/2020 | $11.65 | ($0.17 | ) | ($3.28 | ) | ($3.45 | ) | $— | $— | $— | $8.20 | 2.35 | % | 1.98 | % | (1.54 | %) | (29.61 | %) | $587 | 27 | % | ||||||||||||||||||||||||||||||||||
| 4/1/2018 - 3/31/2019 | 12.06 | (0.17 | ) | 0.70 | 0.53 | — | (0.94 | ) | (0.94 | ) | 11.65 | 2.31 | % | 2.05 | % | (1.42 | %) | 4.82 | % | 959 | 72 | % | ||||||||||||||||||||||||||||||||||
| 4/1/2017 - 3/31/2018 | 11.05 | (0.16 | ) | 1.65 | 1.49 | — | (0.48 | ) | (0.48 | ) | 12.06 | 2.37 | % | 2.05 | % | (1.40 | %) | 13.62 | % | 759 | 51 | % | ||||||||||||||||||||||||||||||||||
| 4/1/2016 - 3/31/2017 | 9.61 | (0.15 | ) | 1.79 | 1.64 | — | (0.20 | ) | (0.20 | ) | 11.05 | 2.68 | % | 2.05 | % | (1.43 | %) | 17.14 | % | 187 | 49 | % | ||||||||||||||||||||||||||||||||||
| 1/11/2016 - 3/31/2016 | 9.27 | (0.03 | ) | 0.37 | 0.34 | — | — | — | 9.61 | 13.19 | % | 2.05 | % | (1.45 | %) | 3.67 | % | 34 | 7 | % | ||||||||||||||||||||||||||||||||||||
| Advisor Class | ||||||||||||||||||||||||||||||||||||||||||||||||||||||||
| 4/1/2019 - 3/31/2020 | $12.08 | ($0.06 | ) | ($3.43 | ) | ($3.49 | ) | $— | $— | $— | $8.59 | 1.35 | % | 0.98 | % | (0.54 | %) | (28.89 | %) | $3,083 | 27 | % | ||||||||||||||||||||||||||||||||||
| 4/1/2018 - 3/31/2019 | 12.35 | (0.05 | ) | 0.72 | 0.67 | — | (0.94 | ) | (0.94 | ) | 12.08 | 1.31 | % | 1.05 | % | (0.42 | %) | 5.86 | % | 5,288 | 72 | % | ||||||||||||||||||||||||||||||||||
| 4/1/2017 - 3/31/2018 | 11.19 | (0.05 | ) | 1.69 | 1.64 | — | (0.48 | ) | (0.48 | ) | 12.35 | 1.37 | % | 1.05 | % | (0.40 | %) | 14.80 | % | 13,574 | 51 | % | ||||||||||||||||||||||||||||||||||
| 4/1/2016 - 3/31/2017 | 9.64 | (0.05 | ) | 1.80 | 1.75 | — | (0.20 | ) | (0.20 | ) | 11.19 | 1.68 | % | 1.05 | % | (0.43 | %) | 18.23 | % | 13,321 | 49 | % | ||||||||||||||||||||||||||||||||||
| 1/11/2016 - 3/31/2016 | 9.27 | (0.01 | ) | 0.38 | 0.37 | — | — | — | 9.64 | 12.19 | % | 1.05 | % | (0.45 | %) | 3.99 | % | 234 | 7 | % | ||||||||||||||||||||||||||||||||||||
| Class R6 | ||||||||||||||||||||||||||||||||||||||||||||||||||||||||
| 4/1/2019 - 3/31/2020 | $12.12 | ($0.05 | ) | ($3.44 | ) | ($3.49 | ) | $— | $— | $— | $8.63 | 1.24 | % | 0.83 | % | (0.39 | %) | (28.80 | %) | $1,375 | 27 | % | ||||||||||||||||||||||||||||||||||
| 4/1/2018 - 3/31/2019 | 12.38 | (0.04 | ) | 0.72 | 0.68 | — | (0.94 | ) | (0.94 | ) | 12.12 | 1.16 | % | 0.90 | % | (0.27 | %) | 5.92 | % | 2,287 | 72 | % | ||||||||||||||||||||||||||||||||||
| 4/1/2017 - 3/31/2018 | 11.20 | (0.03 | ) | 1.69 | 1.66 | — | (0.48 | ) | (0.48 | ) | 12.38 | 1.22 | % | 0.90 | % | (0.25 | %) | 14.97 | % | 10,826 | 51 | % | ||||||||||||||||||||||||||||||||||
| 4/1/2016 - 3/31/2017 | 9.63 | (0.03 | ) | 1.80 | 1.77 | (0.00 | )(7) | (0.20 | ) | (0.20 | ) | 11.20 | 1.53 | % | 0.90 | % | (0.28 | %) | 18.47 | % | 9,680 | 49 | % | |||||||||||||||||||||||||||||||||
| 1/11/2016 - 3/31/2016 | 9.27 | (0.00 | )(7) | 0.36 | 0.36 | — | — | — | 9.63 | 12.04 | % | 0.90 | % | (0.29 | %) | 3.88 | % | 411 | 7 | % | ||||||||||||||||||||||||||||||||||||
| See Notes to Financial Statements | See explanation of references on C-21 |
C-20
Table of Contents
PACIFIC FUNDS
FINANCIAL HIGHLIGHTS (Continued)
| (1) | For share classes that commenced operations after April 1, 2015, the first date reported represents the commencement date of operations for that share class. |
| (2) | Net investment income (loss) per share has been calculated using the average shares method. |
| (3) | The ratios are annualized for periods of less than one full year. |
| (4) | The ratios of expenses after expense reductions to average net assets are after advisory fee waivers and adviser expense reimbursements, if any. The expense ratios for all the Portfolio Optimization Funds do not include fees and expenses of the underlying funds in which the Portfolio Optimization Funds invest. |
| (5) | The total returns include reinvestment of all dividends and capital gain distributions, if any, and do not include deductions of any applicable sales charges. Total returns are not annualized for periods less than one full year. |
| (6) | Class B shares were converted to Class A shares on July 31, 2019. |
| (7) | Reflects an amount rounding to less than $0.01 per share. |
| (8) | The annualized ratios of expenses, excluding interest expense, after expense reductions to average net assets for the year ended March 31, 2020 are as follows: |
| Fund | Class A | Class C | Class I | Class P | Advisor Class | |||||
Pacific Funds Floating Rate Income | 0.99% | 1.69% | 0.69% | 0.69% | 0.74% |
| (9) | Class S shares were renamed to Class R6 shares on January 1, 2020. |
| (10) | Includes $0.01 per share return of capital distribution. |
| (11) | Because of the change in fiscal year end from November 30 to March 31 for the Fund, the following periods are shown for the Fund prior to April 1, 2016: (i) the period from December 31, 2014 through November 30, 2015, which reflects the fiscal year end prior to the reorganization and (ii) the period from December 1, 2015 or class commencement date through March 31, 2016, which reflects the change in fiscal year end for the Fund upon the reorganization. |
| See Notes to Financial Statements |
C-21
Table of Contents
PACIFIC FUNDS
1. ORGANIZATION
Pacific Funds Series Trust (which may be referred to as “Pacific Funds” or the “Trust”) is registered under the Investment Company Act of 1940 (“1940 Act”), as amended, as a diversified,open-end, investment management company, and is organized as a Delaware statutory trust. Pacific Life Fund Advisors LLC (“PLFA” or the “Investment Adviser”) serves as investment adviser to the Trust. As of March 31, 2020, the Trust was comprised of thirty-three separate funds, eighteen of which are presented in these financial statements (each individually a “Fund”, and collectively the “Funds”):
| Fund |
| Pacific FundsSM Portfolio Optimization Conservative (1) |
| Pacific FundsSM Portfolio Optimization Moderate-Conservative (1) |
| Pacific FundsSM Portfolio Optimization Moderate (1) |
| Pacific FundsSM Portfolio Optimization Growth (1) |
| Pacific FundsSM Portfolio Optimization Aggressive-Growth (1) |
| Pacific FundsSM Ultra Short Income (2) |
| Pacific FundsSM Short Duration Income (2) |
| Pacific FundsSM Core Income (2) |
| Pacific FundsSM Strategic Income (2) |
| Fund |
| Pacific FundsSM Floating Rate Income (2) |
| Pacific FundsSM High Income (2) |
| Pacific FundsSM Diversified Income |
| Pacific FundsSMLarge-Cap (3) |
| Pacific FundsSMLarge-Cap Value (3) |
| Pacific FundsSMSmall/Mid-Cap (3) |
| Pacific FundsSMSmall-Cap (3) |
| Pacific FundsSMSmall-Cap Value (3) |
| Pacific FundsSMSmall-Cap Growth (3) |
| (1) | These Funds are collectively known as the “Portfolio Optimization Funds”. |
| (2) | These Funds are collectively known as the “PF Fixed Income Funds”. |
| (3) | These Funds are collectively known as the “PF U.S. Equity Funds”. |
The Portfolio Optimization Funds offer Class A, Class C, and Advisor Class shares. Each class is distinguished by its applicable sales charges and level of distribution and/or service fees (see Note 6) and in general: (i) Class A shares are subject to a maximum 5.50%front-end sales charge (ii) Class C shares are subject to a maximum 1.00% contingent deferred sales charge (“CDSC”); and (iii) Advisor Class shares are sold at net asset value without a sales charge. The sales charge for Class A shares is reduced for purchases of $50,000 or more and may be waived in certain circumstances. There is no sales charge for Class A shares for purchases of $1 million or more, although there is a CDSC of 1.00% on redemptions of such Class A shares within one year of purchase, which may be waived in certain circumstances. Class C shares automatically convert to Class A shares approximately six years after the original purchase date. Effective July 31, 2019, all Class B shares were converted to Class A shares within each Fund, and Class B shares were concurrently terminated.
The PF Fixed Income Funds offer Class A, Class C, Class I, and Advisor Class shares, except Pacific Funds Ultra Short Income (which offers Class I and Advisor Class shares only). Additionally, Pacific Funds Core Income, Pacific Funds Floating Rate Income, and Pacific Funds High Income offer Class P shares. Each class is distinguished by its applicable sales charges and level of distribution and/or service fees (see Note 6) and in general: (i) Class A shares of Pacific Funds Short Duration Income and Pacific Funds Floating Rate Income are subject to a maximum 3.00%front-end sales charge, and Class A shares of Pacific Funds Core Income, Pacific Funds Strategic Income, and Pacific Funds High Income are subject to a maximum 4.25%front-end sales charge; (ii) Class C shares are subject to a maximum 1.00% CDSC; and (iii) Class I, Class P, and Advisor Class shares are sold at net asset value without a sales charge. The sales charge for Class A shares is reduced for purchases of $100,000 or more and may be waived in certain circumstances. There is no sales charge for Class A shares for purchases of $500,000 or more, although there is a CDSC of 1.00% of such Class A shares within one year of purchase, which may be waived in certain circumstances. Class C shares automatically convert to Class A shares approximately six years after the original purchase date.
The Pacific Funds Diversified Income offers Advisor Class shares only.
The PF U.S. Equity Funds offer Class A, Class C, Advisor Class, and Class R6 (formerly named Class S) shares. Additionally, Pacific FundsSmall-Cap Growth offers Class P shares. Each class is distinguished by its applicable sales charges and level of distribution and/or service fees (see Note 6) and in general: (i) Class A shares are subject to a maximum 4.25%front-end sales charge; (ii) Class C shares are subject to a maximum 1.00% CDSC; and (iii) Class P, Advisor Class, and Class R6 shares are sold at net asset value without a sales charge. The sales charge for Class A shares is reduced for purchases of $100,000 or more and may be waived in certain circumstances. There is no sales charge for Class A shares for purchases of $500,000 or more, although there is a CDSC of 1.00% of such Class A shares within one year of purchase, which may be waived in certain circumstances. Class C shares automatically convert to Class A shares approximately six years after the original purchase date.
The Trust’s distributor receives all net commissions(front-end sales charges and CDSCs) from the sales of all applicable share classes (see Note 6).
The Portfolio Optimization Funds invest their assets in Class P shares of certain other funds of the Trust (collectively, the “PF Underlying Funds”) as well as Class P shares of Pacific Funds Core Income, Pacific Funds Floating Rate Income, Pacific Funds High Income, and Pacific FundsSmall-Cap Growth.
There is a separate annual report containing the financial statements for the PF Underlying Funds, which is available without charge.For information on how to obtain the annual report for these Funds, see the Where to Go for More Information section of this report on pageF-24.
On June 26, 2019 and March 20, 2020, the PF Underlying Funds of PF Equity Long/Short Fund and PF Currency Strategies Fund, respectively, were liquidated pursuant to plans of liquidation approved by the Trust’s Board of Trustees. Because the PF Equity Long/Short and
D-1
Table of Contents
PACIFIC FUNDS
NOTES TO FINANCIAL STATEMENTS (Continued)
PF Currency Strategies Funds were liquidated prior to March 31, 2020, no financial information is presented in this report except for the Transactions with Affiliates disclosure under Investments in Affiliated Funds.
2. SIGNIFICANT ACCOUNTING POLICIES
The following is a summary of the significant accounting policies followed by the Trust in the preparation of its financial statements in conformity with accounting principles generally accepted in the United States of America (“U.S. GAAP”), which may require management to make estimates and assumptions that affect the reported amounts of assets and liabilities and disclosures of contingent assets and liabilities at the date of the financial statements and the increases and decreases in net assets from operations during the reporting period. Actual results could differ from those estimates. Each Fund qualifies as an investment company under U.S. GAAP and follows the accounting and reporting guidance applicable to the Investment Companies Topic of U.S. GAAP.
A. INVESTMENT TRANSACTIONS AND INCOME
Investment transactions are recorded on a trade date basis. Securities purchased or sold on a when-issued or delayed-delivery basis as well as certain loan transactions and mortgage securities (such as Government National Mortgage Association (“GNMA”) securities) may be settled a month or more after the trade date. Dividend income is recorded on theex-dividend date, except certain dividends from foreign securities, which are recorded as soon as a Fund is informed of theex-dividend date or upon receipt of the dividend. A Fund’s estimated components of distributions received from real estate investment trusts may be considered income, return of capital distributions or capital gain distributions. Return of capital distributions are recorded as a reduction of cost of the related investments. Interest income, adjusted for amortization of premium and accretion of discount, is recorded daily on an accrual basis. Investment income is recorded net of foreign taxes withheld, if any. A Fund may be subject to foreign taxes on income, gains on investments, or currency repatriation, a portion of which may be recoverable. A Fund will accrue such taxes and reclaims as applicable, based upon the current interpretation of tax rules and regulations that exist in the markets in which that Fund invests. Facility fees and other fees (such as origination fees) received from floating rate senior loan notes purchased (see Note 4) by a Fund are amortized over the expected term of each applicable senior loan. Commitment fees received by a Fund relating to unfunded senior loan commitments are amortized to income over the period of the commitment. Consent fees, which are compensation for agreeing to changes in the terms of debt instruments, are recorded as interest income when received. Realized gains and losses from investment transactions are recorded on the basis of identified cost. Gains and losses realized on principal paydowns from mortgage-backed and asset-backed securities are recorded as interest income. Litigation settlements on securities that were previously held are recorded as realized gains on investment securities.
B. DISTRIBUTIONS TO SHAREHOLDERS
For the Portfolio Optimization Funds and PF U.S. Equity Funds, dividends on net investment income, if any, are generally declared and paid annually. For the PF Fixed Income Funds (except Pacific Funds Floating Rate Income and Pacific Funds Ultra Short Income), and Pacific Funds Diversified Income, dividends on net investment income, if any, are generally declared and paid monthly. For Pacific Funds Floating Rate Income and Pacific Funds Ultra Short Income, dividends, if any, are generally declared daily and paid monthly. Dividends may be declared more or less frequently if advantageous to the specific Fund and its shareholders.
All realized capital gains are distributed at least annually for each Fund. Dividends and distributions paid to shareholders are recorded on theex-dividend date.
C. FOREIGN CURRENCY TRANSLATION
The Trust’s accounting records are maintained in U.S. dollars. The market value of investments and other assets and liabilities, which are denominated innon-U.S. currencies, are translated into U.S. dollars based on the applicable exchange rates at the end of each business day. Purchases and sales of investments and income and expenses, denominated in foreign currencies, are translated into U.S. dollars at the exchange rates in effect on the transaction date.
None of the Funds separately report the effect of changes in foreign exchange rates from changes in market prices of investments held. Such changes are included with the net realized gain or loss and change in net unrealized appreciation or depreciation on investments. Other foreign currency transactions resulting in realized and unrealized gain or loss, if any, are reported separately as net realized gain or loss on foreign currency transactions and change in net unrealized appreciation or depreciation on foreign currencies.
D. ALLOCATION OF INCOME, EXPENSES, GAINS AND LOSSES
Income,non-class specific expenses, and realized and unrealized gains and losses are allocated on a daily basis to each class of shares based upon the relative portion of net assets of each class. Certain Trust expenses directly attributable to a particular Fund are charged to that Fund (such as fund-specific transactional fees, proxies, liquidations, litigation, andorganizational/start-up costs) and class-specific fees and expenses are charged directly to the respective share class within each Fund. Generally, other Trust expenses are allocated proportionately among all the Funds in relation to the net assets of each Fund.
E. OFFERING COSTS
A new Fund bears all costs (or the applicablepro-rata share if there is more than one new Fund) associated with the offering expenses of the Fund including legal, printing, and support services (see Notes 6 and 7A). All such costs are amortized as an expense of the new Fund on a straight-line basis over twelve months from commencement of operations.
F. NEW ACCOUNTING PRONOUNCEMENTS
In March 2017, the Financial Accounting Standards Board (“FASB”) issued Accounting Standards Update (“ASU”)2017-08, Premium Amortization on Purchased Callable Debt Securities, which amends the amortization period for certain callable debt securities purchased at a premium, shortening the period to the earliest call date. ASU2017-08 is effective for fiscal years beginning after December 15, 2019, including
D-2
Table of Contents
PACIFIC FUNDS
NOTES TO FINANCIAL STATEMENTS (Continued)
interim periods within those fiscal years. Management has evaluated ASU2017-08 and concluded that it does not have a material impact on the financial statements or disclosures.
In March 2020, FASB issued ASU 2020-04, Reference Rate Reform (Topic 848) – Facilitation of the Effects of Reference Rate Reform on Financial Reporting. The amendments in ASU 2020-04 provides optional temporary financial reporting relief from the effect of certain types of contract modifications due to the planned discontinuation of the London Interbank Offered Rate (“LIBOR”) and other interbank-offered based reference rates as of the end of 2021. ASU 2020-04 is effective for certain reference rate-related contract modifications that occur during the period March 12, 2020 through December 31, 2022. Management is currently evaluating the impact, if any, of applying this ASU.
3. VALUATION AND FAIR VALUE MEASUREMENTS
A. VALUATION POLICY
The Trust’s Board of Trustees (the “Board”) has adopted a policy (“Valuation Policy”) for determining the value of the Trust’s investments each business day. Under the Valuation Policy, the Board has delegated certain functions to the Trustee Valuation Committee (“TVC”) and/or the Valuation Oversight Committee (“VOC”) or its delegate to determine the fair value of certain investments, which includes using third party pricing services. Each valuation committee that values the Funds’ investments does so in accordance with the Valuation Policy.
B. DETERMINATION OF NET ASSET VALUE (“NAV”)
Each Fund presented in these financial statements is divided into shares and share classes. The price per share of each class of a Fund’s shares is called the NAV. The NAV forms the basis for all transactions involving buying, selling, exchanging or reinvesting shares. Each Fund’s NAV is calculated by taking the total value of a Fund’s assets, subtracting a Fund’s liabilities, and dividing by the total number of shares outstanding.
Each Fund’s NAV is calculated once per day on each day that the New York Stock Exchange (“NYSE”) is open, including days when foreign markets and/or bond markets are closed. Based on information obtained from the NYSE, it is anticipated that the NYSE will be closed when the following annual holidays are observed: New Year’s Day; Martin Luther King, Jr. Day; Presidents’ Day; Good Friday; Memorial Day; Independence Day; Labor Day; Thanksgiving; and Christmas Day. The NYSE is normally closed on the preceding Friday or subsequent Monday when one of these holidays falls on a Saturday or Sunday, respectively. In addition, the NYSE typically closes early (usually 1:00 p.m. Eastern Time) on the day after Thanksgiving and the day before Christmas Day. Although the Trust expects the same holidays to be observed in the future, the NYSE may modify its holiday schedule or hours of operation at any time.
Each Fund’s NAV will not be calculated on days when the NYSE is closed. There may be a delay in calculating the NAV if: (i) the NYSE is closed on a day other than a regular holiday or weekend, (ii) trading on the NYSE is restricted or halted, (iii) an emergency exists (as determined by the SEC), making the sale of investments or determinations of NAV not practicable, or (iv) the SEC permits a delay for the protection of shareholders.
Each Fund’s NAV is generally determined as of 4:00 p.m. Eastern Time on days that the NYSE is open. Information that becomes known to the Trust or its agents after the determination of the Fund’s NAV on a particular day will not normally be used to retroactively adjust the price of a Fund’s investment for that same business day. Such information may include late dividend notifications, legal or regulatory matters, corporate actions, and corrected/adjusted last sales prices or official closing prices from an exchange.
In the event the NYSE closes prior to 4:00 p.m. Eastern Time, whether due to a scheduled or unscheduled early close, certain other markets or exchanges may remain open. Generally, the valuation of the securities in those markets or exchanges will follow the valuation procedures described below, which may be after the official closing time of the NYSE.
Certain Funds may hold investments that are primarily listed on foreign exchanges. Because those investments trade on weekends and other days when the Funds do not calculate their NAVs, the value of those investments may change on days when a shareholder will not be able to purchase or redeem shares of those Funds.
C. INVESTMENT VALUATION
The value of each security or other investment is the amount which a Fund might reasonably expect to receive for the investment upon its current sale in the ordinary course of business. For purposes of calculating the NAV, the value of investments held by each Fund is based primarily on pricing data obtained from various sources approved by the Board.
Domestic Equity Investments
For domestic equity investments (including exchange-traded funds), the Trust generally uses the official closing price or last reported sale price from an exchange and does not normally take into account trading, clearances or settlements that take place after the close of the NYSE. Investments for which no official closing price or last reported sales price are reported are generally valued at the mean between the most recent bid and ask prices obtained from approved pricing services, established market makers, or from broker-dealers.
Over-the-Counter (“OTC”) Investments
OTC investments (including forward commitments, swap agreements and option contracts) are generally valued by approved pricing services that use evaluated prices from various observable market and other factors. Certain OTC swap agreements are valued using industry pricing models, broker quotes or other methodologies pursuant to the Trust’s Valuation Policy.
Domestic and Foreign Debt Investments
Debt investments are generally valued using the mean between bid and ask prices provided by approved pricing and quotation services, which are based upon evaluated prices determined from various observable market and other factors. Certain debt investments are valued by using a benchmark, matrix, or other pricing methodology approved pursuant to the Valuation Policy. Generally, the prices are obtained from approved pricing sources or services as of 4:00 p.m. Eastern Time.
D-3
Table of Contents
PACIFIC FUNDS
NOTES TO FINANCIAL STATEMENTS (Continued)
Investments in Mutual Funds
Fund investments in affiliated or unaffiliated mutual funds are valued at their respective published NAVs.
Investment Values Determined by a Valuation Committee
The Trust’s Valuation Policy includes methodologies approved for valuing investments in circumstances where market quotations are not readily available. In such circumstances, the Valuation Policy provides that the value of such investments may be determined in accordance with Board approved formulas and methodologies (“Alternate Valuation Methodologies”). Under the Valuation Policy these Alternate Valuation Methodologies may include, among others, amortized cost, the use of broker quotes, the use of purchase prices, last reported sale/trade prices, and benchmark, proxy, and matrix pricing. In the event market quotations or Alternate Valuation Methodologies are not readily available or are determined to be unreliable, the value of the investments will be determined in good faith by the TVC, or determined by the VOC or its delegate pursuant to the Valuation Policy and then subsequently submitted for approval or ratification to either the TVC or the Board. Valuations determined by the TVC or the VOC or its delegate may require subjective inputs about the value of such investments. While these valuations are intended to estimate the value a Fund might reasonably expect to receive upon the current sale of the investments in the ordinary course of business, such values may differ from the value that a Fund would actually realize if the investments were sold or values that would be obtained if a different valuation methodology had been used.
Market quotations are considered not readily available if: (i) the market quotations received are deemed unreliable or inaccurate, (ii) approved pricing services do not provide a valuation for a particular investment, or (iii) material events occur after the close of the principal market for a particular investment but prior to the scheduled close of the NYSE.
D. FAIR VALUE MEASUREMENTS AND DISCLOSURES
The Trust characterizes its investments as Level 1, Level 2, or Level 3 based upon the various inputs or methodologies used to value the investments. Under the Valuation Policy, the VOC determines the level in which each investment is characterized. The VOC includes investment, legal, and compliance members of the Trust’s Investment Adviser, accounting members of the Trust’s Administrator (see Note 6), and the Trust’s Chief Compliance Officer (“CCO”). The three-tier hierarchy of inputs is summarized in the three broad levels listed below:
| • Level 1 - | Quoted prices (unadjusted) in active markets for identical investments |
| • Level 2 - | Significant observable market-based inputs, other than Level 1 quoted prices, or unobservable inputs that are corroborated by market data |
| • Level 3 - | Significant unobservable inputs that are not corroborated by observable market data |
The VOC reviews the Valuation Policy periodically (at least annually) to determine the appropriateness of the pricing methodologies used to value each Fund’s investments. The VOC also periodically evaluates how the Trust’s investments are characterized within the three-tier hierarchy and the appropriateness of third party pricing sources. The VOC also periodically (at least annually) conducts back-testing of the value of various Level 2 and Level 3 investments to evaluate the effectiveness of the pricing methodologies including the unobservable inputs used to value those investments. Such back-testing includes comparing Level 2 and Level 3 investment values to subsequently available exchange- traded prices, transaction prices, and/or observable vendor prices. All changes to the Valuation Policy are reported to the Board on a quarterly basis with material policy changes, as determined by the Trust’s CCO, requiring approval by the Board.
The inputs or methodologies used for characterizing each Fund’s investments within the three-tier hierarchy are not necessarily an indication of the relative risks associated with investing in those investments. Foreign equity investments that are valued with the assistance of a statistical research service approved by the Board and based on significant observable inputs are reflected as Level 2. Changes in valuation techniques may result in transfers into or out of an assigned level within the hierarchy. A summary of each Fund’s investments as of March 31, 2020, as categorized under the three-tier hierarchy of inputs, can be found in each Fund’s Schedule of Investments.
The following is a description of valuation inputs and techniques that the Trust currently utilizes to fair value each major category of assets and liabilities:
Equity Securities (Common and Preferred Stock) and Mutual Funds
Equity securities (foreign or domestic) that are actively traded on a securities exchange are fair valued based on quoted prices from the applicable exchange, and to the extent valuation adjustments are not applied to these securities, they are categorized as Level 1. Equity securities traded on inactive markets are fair valued using significant other observable inputs which include broker-dealer quotes, recently executed transactions adjusted for changes in the benchmark index, or evaluated price quotes received from pricing vendors that take into account the integrity of the market sector and issuer, the individual characteristics of the security, and information received from broker-dealers and other market sources pertaining to the issuer or security. To the extent that these inputs are observable and timely, the fair values of these securities would be categorized as Level 2; otherwise the fair values would be categorized as Level 3.
Investments in registered mutual funds, including affiliated registered mutual funds, are valued at their respective published NAV and are categorized as Level 1.
U.S. Treasury Obligations
U.S. Treasuries are fair valued based on pricing models that evaluate the mean between the most recently published bid and ask price from market data sources. The models also take into consideration yield curves and data received from active market makers and inter-dealer brokers. Yield curves change daily in response to market conditions and are generally obtained from the new issue market and broker-dealer sources. To the extent that these inputs are observable and timely, the fair values of U.S. Treasury obligations would be categorized as Level 2; otherwise the fair values would be categorized as Level 3.
D-4
Table of Contents
PACIFIC FUNDS
NOTES TO FINANCIAL STATEMENTS (Continued)
Mortgage-Backed and Asset-Backed Securities
Mortgage-backed securities, including government sponsored enterprises, are fair valued using pricing models based on inputs that include issuer type, coupon, and cash flows, mortgage prepayment projection tables and adjustable rate mortgage evaluations that incorporate index data, periodic and life caps, the next coupon reset date, and the convertibility of the bond. To the extent that these inputs are observable and timely, the fair values of mortgage-backed securities would be categorized as Level 2; otherwise the fair value would be categorized as Level 3.
Asset-backed securities and collateralized mortgage obligations are fair valued using pricing models based on a security’s average life volatility. The models also take into account tranche characteristics such as coupon average life, collateral types, ratings, the issuer and tranche type, underlying collateral and performance of the collateral, and discount margin for certain floating rate issues. To the extent that these inputs are observable and timely, the fair values of asset-backed securities and collateralized mortgage obligations would be categorized as Level 2; otherwise the fair values would be categorized as Level 3.
Municipal Bonds
Municipal bonds are fair valued based on pricing models that take into account, among other factors, information received from market makers and broker-dealers, current trades, bid lists, offerings, market movements, the callability of the bond, state of issuance, benchmark yield curves, and bond insurance. To the extent that these inputs are observable and timely, the fair values of municipal bonds would be categorized as Level 2; otherwise the fair values would be categorized as Level 3.
Foreign Government Bonds and Notes
Foreign government bonds and notes are fair valued based on discounted cash flow models that incorporate option adjusted spreads along with benchmark curves and credit spreads. In addition, international bond markets are monitored daily for information pertaining to the issuer and/or the specific issue. To the extent that these inputs are observable and timely, the fair values of foreign government bonds and notes would be categorized as Level 2; otherwise the fair values would be categorized as Level 3.
Corporate Bonds and Notes and U.S. Government Agency Issues
Corporate bonds held by a Fund are generally comprised of two main categories: investment grade bonds and high yield bonds. Investment grade bonds are reported at fair value using various inputs and techniques, which include broker-dealer quotations, live trading levels, recently executed transactions in securities of the issuer or comparable issuers, issuer credit information, and option-adjusted spread models where applicable. Fair values for high yield bonds are based primarily on broker-dealer quotations from relevant market makers and recently executed transactions in securities of the issuer or comparable issuers. The broker-dealer quotations received are supported by credit analysis of the issuer that takes into consideration credit quality assessments, daily trading activity, and the activity of the underlying equities, listed bonds, and sector-specific trends. To the extent that these inputs are observable and timely, the fair values of corporate bonds would be categorized as Level 2; otherwise the fair values would be categorized as Level 3.
U.S. Government Agency Issues are reported at fair value using various inputs and techniques, which include broker-dealer quotations, live trading levels, recently executed transactions in securities of the issuer, issuer credit information, and option-adjusted spread models where applicable. To the extent that these inputs are observable and timely, the fair values of U.S. Government Agency Issues would be categorized as Level 2; otherwise the fair values would be categorized as Level 3.
Swap Agreements
Total Return Swaps– Total return swaps are fair valued using pricing models that take into account among other factors, index spread curves, nominal values, modified duration values and cash flows. To the extent that these inputs are observable and timely, the fair values of total return swaps would be categorized as Level 2; otherwise the fair values would be categorized as Level 3.
Senior Loan Notes
Floating rate senior loan notes (“Senior Loans”) are fair valued based on a quoted price received from a single broker-dealer or an average of quoted prices received from multiple broker-dealers or valued relative to other benchmark securities when broker-dealer quotes are unavailable. To the extent that these inputs are observable, the fair values of Senior Loans would be categorized as Level 2; otherwise the fair values would be categorized as Level 3.
Unfunded loan commitments on senior loan participations and assignments, if any, are marked to market daily and valued according to the Trust’s valuation policies and procedures. Any outstanding unfunded loan commitments are presented in each applicable Fund’s Schedule of Investments. Any applicable net unrealized appreciation or depreciation at the end of the reporting period is recorded as an asset (unfunded loan commitment appreciation) or a liability (unfunded loan commitment depreciation) and any change in net unrealized appreciation or depreciation for the reporting period is recorded as a change in net unrealized appreciation or depreciation on unfunded loan commitment. As of March 31, 2020, Pacific Funds Strategic Income and Pacific Funds High Income had unfunded loan commitments of $229,648, and $41,008, respectively (see details in the Notes to Schedules of Investments).
4. INVESTMENTS AND RISKS
General Investment Risks
An investment in each Fund represents an indirect investment in the assets owned by that Fund. As with any mutual fund, the value of the assets owned by each Fund may move up or down, and as a result, an investment in a Fund at any point in time may be worth more or less than the original amount invested.
A Fund’s transactions in listed securities are settled/paid for upon delivery to or from their counterparties; therefore, the risk of counterparty default for listed securities is considered minimal, as delivery of securities sold is only made once a Fund has received payment. Payment is made on a purchase once the securities have been delivered by the counterparty. The trade will fail if either party fails to meet its obligations.
D-5
Table of Contents
PACIFIC FUNDS
NOTES TO FINANCIAL STATEMENTS (Continued)
Market and Regulatory Risks
Events in the financial markets and economy may cause volatility and uncertainty and affect Fund performance. Such adverse effects on performance could include a decline in the value and liquidity of securities held by a Fund, unusually high and unanticipated levels of redemptions, an increase in portfolio turnover, a decrease in NAV, and an increase in Fund expenses. It may also be unusually difficult to identify investment risks and opportunities, in which case investment goals may not be met. Market events may affect a single issuer, industry, sector, or the market as a whole. In addition, because of interdependencies between markets, events in one market may adversely impact other markets or issuers in which a Fund invests in unforeseen ways. Traditionally liquid investments may experience periods of diminished liquidity. During a general downturn in the financial markets, multiple asset classes may decline in value and a Fund may lose value, regardless of the individual results of the securities and other instruments in which a Fund invests. It is impossible to predict whether or for how long such market events will continue, particularly if they are unprecedented, unforeseen or widespread events or conditions. Therefore, it is important to understand that the value of your investment may fall, sometimes sharply and for extended periods, and you could lose money. Governmental and regulatory actions, including tax law changes, may also impair Fund management and have unexpected or adverse consequences on particular markets, strategies, or investments. Future market or regulatory events may impact a Fund in unforeseen ways, such as causing the Fund to alter its existing strategies or potentially, to liquidate and close.
Natural Disasters Risk
Natural disasters occur throughout the world and include events such as blizzards and ice storms, earthquakes, floods, hurricanes, pandemics, tidal waves, tornadoes, tsunamis, typhoons, volcanic eruptions, and wildfires. Although specific types of natural disasters may occur more frequently in certain geographic locations, such events are by their nature unpredictable and may cause sudden, severe and widespread damage that negatively impacts issuers, regions and economies in which a Fund invests. Should a Fund hold significant investments in, or have significant exposure to, an issuer, region or economy affected by a natural disaster, the Fund may lose money. Due to the interconnectedness of the global economy, natural disasters in one location may negatively impact issuers in other locations.
An outbreak of infectious respiratory illness caused by the novel coronavirus known asCOVID-19 was declared a global pandemic by the World Health Organization in March 2020.COVID-19 has resulted in travel restrictions, closed international borders, enhanced health screenings, disruption and delays in healthcare services, prolonged quarantines, cancellations, temporary store closures, social distancing, government ordered curfews and business closures, disruptions to supply chains and consumer activity, shortages, highly volatile financial markets, and general concern and uncertainty. The impact ofCOVID-19 could adversely affect the economies and capital markets of many nations or the entire global economy, as well as individual companies, entire sectors, and securities and commodities markets (including liquidity), in ways that may not necessarily be foreseen at the present time, which could result in losses to a Fund.
LIBOR Phaseout Risk
In 2017, the United Kingdom’s Financial Conduct Authority, which regulates LIBOR, announced that it will no longer compel the banks to continue to submit the daily rates for the calculation of LIBOR after 2021 and warned that LIBOR may cease to be available or appropriate for use beyond 2021. After the global financial crisis, regulators globally determined that existing interest rate benchmarks should be reformed based on concerns that LIBOR and other Interbank Offered Rates (“IBOR”) were susceptible to manipulation. Replacement rates for various IBORs have been identified and include the Secured Overnight Financing Rate, which is intended to replace U.S. dollar LIBOR and measures the cost of overnight borrowings through repurchase agreement transactions collateralized with U.S. Treasury securities.
While various regulators and industry bodies are working globally on transitioning to selected alternative rates, there remains uncertainty regarding the future utilization of LIBOR and other IBORs, including the transition to, and nature of, any selected replacement rates. The transition process away from LIBOR may involve, among other things, increased volatility or illiquidity in markets for instruments that currently rely on LIBOR. The transition process may also result in a reduction in the value of certain instruments held by a Fund or reduce the effectiveness of related Fund transactions such as hedges. Volatility, the potential reduction in value, and/or the hedge effectiveness of financial instruments may be heightened for financial instruments that do not include fallback provisions that address the cessation of LIBOR. Any potential effects of the transition away from LIBOR on any of the Funds or on financial instruments in which a Fund invests, as well as other unforeseen effects, could result in losses to a Fund.
Fund of Funds Investments
The Portfolio Optimization Funds are exposed to the same risks as the applicable PF Underlying Funds, Pacific Funds Core Income, Pacific Funds Floating Rate Income, Pacific Funds High Income, and Pacific FundsSmall-Cap Growth in direct proportion to the allocation of assets among those funds. This annual report contains information about the risks associated with investing in Pacific Funds Core Income, Pacific Funds Floating Rate Income, Pacific Funds High Income, and Pacific FundsSmall-Cap Growth. The annual report for the PF Underlying Funds contains information about the risks associated with investing in the PF Underlying Funds. Allocations among the PF Underlying Funds, Pacific Funds Core Income, Pacific Funds Floating Rate Income, Pacific Funds High Income, and Pacific FundsSmall-Cap Growth are determined using an asset allocation process, which seeks to optimize returns by allocating among different asset classes given various levels of risk tolerance. The allocations of the Portfolio Optimization Funds may not effectively decrease risk or increase returns for investors, and the selection and weighting of allocations to asset classes and/or PF Underlying Funds, Pacific Funds Core Income, Pacific Funds Floating Rate Income, Pacific Funds High Income, and Pacific FundsSmall-Cap Growth may cause them to underperform other mutual funds with a similar investment objective. Although the Portfolio Optimization Funds seek to provide diversification across major asset classes, they may invest a significant portion of their assets in any one or several PF Underlying Funds, Pacific Funds Core Income, Pacific Funds Floating Rate Income, Pacific Funds High Income, and Pacific FundsSmall-Cap Growth (See Note 7C).
D-6
Table of Contents
PACIFIC FUNDS
NOTES TO FINANCIAL STATEMENTS (Continued)
Equity Investments
Stock markets are volatile. Equity investments tend to go up or down in value, sometimes rapidly and unpredictably, in response to many factors, including a company’s historical and prospective earnings, the value of its assets, general economic conditions, interest rates, investor perceptions, and market liquidity. Due to the complexities of markets, events in one market or sector may adversely impact other markets or sectors.
Debt Investments
Debt investments are subject to many risks, including, but not limited to, interest rate risk, credit risk, market and regulatory risk, price volatility, and liquidity risk, which may affect their value. Many debt securities give the issuer the right to redeem (“call”) the security prior to maturity. If an issuer calls a security in which a Fund has invested, the Fund may not recoup the full amount of its initial investment in the security and may be forced to reinvest prepayment proceeds at a time when yields on securities available in the market are lower than the yield on the called security. There is a risk that an issuer or guarantor of a debt investment might be unable or unwilling to meet its financial obligations and might not make interest or principal payments on an instrument when those payments are due (“default”). Defaults may potentially reduce a Fund’s income or ability to recover amounts due and may reduce the value of the debt investment, sometimes dramatically. High yield/high risk or “junk” securities may be more volatile than higher rated securities. High yield/high risk securities (including loans) are typically issued by companies that are highly leveraged, less creditworthy, or financially distressed and are considered to be mostly speculative in nature (high risk), subject to greater liquidity risk, and subject to a greater risk of default than higher rated securities, especially during periods of economic uncertainty or during economic downturns. Debt investments, including bonds, fixed rate loans, and short-term instruments may be affected by changes in interest rates. Debt investments with longer durations tend to be more sensitive to changes in interest rates, making them more volatile than debt investments with shorter durations or floating or adjustable interest rates. The value of debt investments may fall when interest rates rise. Certain debt investments may be difficult to value, purchase, and sell, particularly during adverse market conditions, because there is a limited market for the investment or there are restrictions on resale.
Given the historically low interest rate environment in the U.S., risks associated with rising interest rates are heightened. The negative impact on debt investments from potential interest rate increases could be swift and significant, including falling market values, increased redemptions and reduced liquidity. Substantial redemptions from bond and other income funds may worsen that impact. Additionally, regulations applicable to and changing business practices of broker-dealers that make markets in debt investments may result in those broker-dealers restricting their market making activities for certain debt investments, which may reduce the liquidity and increase the volatility of such debt investments.
Certain asset-backed instruments, such as collateralized debt obligations, collateralized mortgage obligations, and other mortgage-related securities, structured investment vehicles, and other debt investments may have exposure to subprime loans or subprime mortgages, which are loans to persons with lower credit ratings. These instruments may present credit risk that is not transparent and that is greater than indicated by their ratings. The value of these instruments may be more acutely affected by downturns in the credit markets or the real estate market than certain other investments, and it may be difficult to value these instruments because of a thin secondary market.
Foreign and Emerging Markets Investments
Exposure to foreign markets can involve additional risks relating to market, economic, political, regulatory, geopolitical, or other conditions. These factors can make foreign investments more volatile and less liquid than U.S. investments. In addition, foreign markets can react differently to these conditions than the U.S. market. Markets and economies throughout the world are becoming increasingly interconnected, and conditions or events in one market, country or region may adversely impact investments or issuers in another market, country or region. Investments in or exposure to investments in emerging market countries may be riskier than investments in or exposure to investments in U.S. and certain developed markets. Risk may be more enhanced for investments in or exposure to investments in frontier market countries.
The Funds may face potential risks associated with the United Kingdom’s vote on June 23, 2016 to leave the European Union (the “EU”), commonly referred to as “Brexit.” There are considerable uncertainties about the repercussions resulting from Brexit, including the impact on trade agreements, regulations, and treaties. While the United Kingdom stopped being a member of the European Union as of January 31, 2020, the exact time frame for the full implementation of the Brexit transition is unknown and may change. Brexit may also increase the likelihood that other EU members may decide to leave the EU. These potential consequences may result in increased market volatility and illiquidity in the United Kingdom, the EU, and other financial markets, as well as slower economic growth and fluctuations in exchange rates. Any of these events may have a significant adverse effect on global markets and economies, which in turn could negatively impact the value of the Funds’ investments.
The countries listed in the Schedules of Investments for individual investment holdings (each a “Holding”) are each considered the country of risk to which a Holding, and therefore the Fund, is exposed. Each Holding’s country of risk is obtained from a third-party source that uses factors such as reporting currency, sales/revenue and location of management of the Holding’s issuer to determine country of risk. The country of risk may not be exclusive, however, as there may be other countries of risk to which a Holding is exposed that are not disclosed, although the country identified is expected to be the primary country of risk for that Holding. A Holding is generally subject to greater country risk based on where it conducts business or is economically tied to rather than where it is formed or incorporated. Foreign markets risks may include currency risk, market and regulatory risk, liquidity risk, emerging markets risk, frontier markets risk, and geographic focus risk, among other risks.
Senior Loan Participations and Assignments
Certain Funds may invest in Senior Loans of domestic or foreign corporations, partnerships, and other entities (“Borrowers”), the interest rates of which float or adjust periodically based upon a specified adjustment schedule, benchmark indicator, or prevailing interest rates. Senior Loans generally pay interest at rates which are periodically redetermined by reference to a base lending rate plus a premium. These base lending rates generally include prime rates of one or more major U.S. banks, LIBOR, Secured Overnight Financing Rate, or certificates of deposit rates. Senior Loans often require prepayments from excess cash flow or permit the Borrower to repay at its election. The degree to which Borrowers repay cannot be predicted with accuracy. As a result, the actual maturity may be substantially less than the stated maturities. Senior Loans are exempt
D-7
Table of Contents
PACIFIC FUNDS
NOTES TO FINANCIAL STATEMENTS (Continued)
from registration under the Securities Act of 1933, may contain certain restrictions on resale, and cannot be sold publicly. A Fund’s investments in Senior Loans may be in the form of participations in loans or assignments of all or a portion of loans from third parties.
A significant portion of the floating rate loans held by a Fund may be “covenant lite” loans that contain fewer or less restrictive constraints on the borrower or other borrower-friendly characteristics and offer less protections for investors than covenant loans. As compared to a loan instrument that contains numerous covenants that allow lenders the option to force the borrowers to negotiate terms if risks became elevated, the majority of new floating rate loans that are issued are “covenant lite” loans which tend to have fewer or no financial maintenance covenants and restrictions. A covenant lite loan typically contains fewer clauses which allow an investor to proactively enforce financial covenants or prevent undesired actions by the borrower/issuer, including the ability to make an acquisition, pay dividends or issue additional debt if they have met certain loan terms. Covenant lite loans also generally provide fewer investor protections if certain criteria are breached, such as permitting an investor to declare a default (and therefore receive collateral), or to force restructurings and other capital changes on struggling borrowers/issuers. A Fund may experience losses or delays in enforcing its rights on its holdings of covenant lite loans.
When a Fund purchases assignments, it acquires all the rights and obligations under the loan agreement of the assigning lender. Assignments may, however, be arranged through private negotiations between potential assignees and potential assignors, and the rights and obligations acquired by the purchaser of an assignment may differ from, and be more limited than those held by the assigning lender.
When a Fund purchases a participation of a Senior Loan interest, the Fund typically enters into a contractual agreement with the lender or other third party selling the participation. A participation interest in Senior Loans includes the right to receive payments of principal, interest, and any fees to which it is entitled from the lender and only upon receipt by the lender of payments from the Borrower, but not from the Borrower directly. When investing in a participation interest, if a Borrower is unable to meet its obligations under a loan agreement, a Fund generally has no right to enforce compliance with the terms of the loan agreement. As a result, the Fund assumes the credit risk of the Borrower, the selling participant, and any other persons that are interpositioned between the Fund and the Borrower. If the lead lender in a typical lending syndicate becomes insolvent, enters Federal Deposit Insurance Corporation (“FDIC”) receivership or, if not FDIC insured, enters into bankruptcy, the Fund may incur certain costs and delays in receiving payment or may suffer a loss of principal and/or interest. As of March 31, 2020, no participation interest in Senior Loans was held by any of the Funds presented in these financial statements.
Mortgage-Related and Other Asset-Backed Securities
Certain Funds may invest in mortgage-related and other asset-backed securities. These securities could include mortgage pass-through securities, collateralized mortgage obligations (“CMOs”), collateralized loan obligations (“CLOs”), mortgage dollar rolls, CMO residuals, stripped mortgage-backed securities (“SMBS”), and other securities that directly or indirectly represent a participation in, or are secured by and payable from, mortgage loans secured by real property. Mortgage-related and other asset-backed securities are debt securities issued by a corporation, trust, or custodian, or by a U.S. Government agency or instrumentality, that are collateralized by a pool of mortgages, mortgage pass-through securities, U.S. Government securities or other assets. The value of some mortgage-related and asset-backed securities may be particularly sensitive to changes in prevailing interest rates. Early repayment of principal on some mortgage-related securities may expose a Fund to a lower rate of return upon reinvestment of principal. The value of these securities may fluctuate in response to the market’s perception of the creditworthiness of the issuers. Additionally, although mortgage and mortgage-related securities are generally supported by some form of government or private guarantee and/or insurance, there is no assurance that private guarantors or issuers will meet their obligations.
U.S. Government Securities
Certain Funds may invest in securities issued by U.S. Government agencies or government-sponsored enterprises. U.S. Government securities are obligations of, and in certain cases, guaranteed by the U.S. Government, its agencies, or instrumentalities. Some U.S. Government securities, such as Treasury Bills, Treasury Notes, Treasury Bonds, and securities guaranteed by GNMA (or “Ginnie Mae”), are supported by the full faith and credit of the U.S. Government; others, such as those of the Federal Home Loan Bank, are supported by the right of the issuer to borrow from the U.S. Department of the Treasury (the “U.S. Treasury”); others, such as those of the Federal National Mortgage Association (“FNMA” or “Fannie Mae”), are supported by the discretionary authority of the U.S. Government to purchase the agency’s obligations. Securities not backed by the full faith and credit of the U.S. Government may be subject to a greater risk of default. U.S. Government securities may include zero coupon securities, which do not distribute interest on a current basis and tend to be subject to greater risk than interest-paying securities of similar maturities.
Government-related guarantors (i.e., not backed by the full faith and credit of the U.S. Government) include FNMA and the Federal Home Loan Mortgage Corporation (“FHLMC” or “Freddie Mac”). FNMA and FHLMC are government-sponsored corporations, the common stocks of which are owned entirely by private stockholders. FNMA purchases conventional (i.e., not insured or guaranteed by any government agency) residential mortgages from a list of approved seller/servicers which include state and federally chartered savings and loan associations, mutual savings banks, commercial banks and credit unions, and mortgage bankers. Pass-through securities issued by FNMA are guaranteed as to timely payment of principal and interest by FNMA, but are not backed by the full faith and credit of the U.S. Government. FHLMC issues Participation Certificates (“PCs”), which are pass-through securities, each representing an undivided interest in a pool of residential mortgages. FHLMC guarantees the timely payment of interest and ultimate collection of principal, but PCs are not backed by the full faith and credit of the U.S. Government.
When-Issued Securities
Certain Funds may purchase and sell securities on a when-issued basis, including To Be Announced (“TBA”) securities. These transactions are made conditionally because a security, although authorized, has not yet been issued in the market. A commitment by a Fund is made regarding these transactions to purchase or sell securities for a predetermined price or yield, with payment and delivery taking place beyond the customary settlement period. A Fund may sell when-issued securities before they are delivered, which may result in a capital gain or loss. Risk
D-8
Table of Contents
PACIFIC FUNDS
NOTES TO FINANCIAL STATEMENTS (Continued)
may arise upon entering these contracts from the potential inability of a counterparty to meet the terms of their contracts, or if the issuer does not issue the securities due to political, economic, or other factors.
Segregation and Collateral Risk
If a Fund engages in certain transactions, such as derivative investments or repurchase agreements, it may require collateral in the form of cash or investments to be held in segregated accounts at the Trust’s custodian, with an exchange or clearing member firm, or segregated on the Fund’s books and records maintained by the custodian and/or the manager of the Fund. In each instance that segregation of collateral is required, it is done so in accordance with the 1940 Act and/or any interpretive guidance issued by the SEC. In the event of the counterparty default on the transaction, a Fund has the right to liquidate the collateral and apply the proceeds to the counterparty’s obligations to that Fund. Upon an event of default, if the seller defaults and the value of the collateral declines, or if the seller enters an insolvency proceeding, realization of the collateral by the Fund may be delayed, limited or wholly denied. There is also a possibility that a Fund could experience a delay in selling investments that are segregated as collateral.
5. DERIVATIVE INVESTMENTS AND RISKS, AND ENFORCEABLE MASTER NETTING ARRANGEMENTS
A. PRINCIPAL MARKET RISKS MANAGED BY INVESTING IN DERIVATIVES
Derivative instruments are investments whose values are tied to the value of an underlying security or asset, a group of assets, interest rates, exchange rates, currency or an index. Certain Funds are permitted to invest in derivative instruments, including, but not limited to, futures contracts, option contracts, forward foreign currency contracts, and swap agreements. Derivatives may have little or no initial cash investment value relative to their market value exposure and therefore can produce significant gains or losses in excess of their cost. This is sometimes referred to as leverage. Leverage can magnify a Fund’s gains and losses and therefore increase its volatility. A Fund’s investments in derivatives may increase, decrease or change the level or types of exposure to certain risk factors. The primary risks a Fund may attempt to manage through investing in derivative instruments include, but are not limited to, interest rate, foreign investments and currency, price volatility, and credit (including counterparty) risks.
Interest Rate Risk– A Fund may be exposed to interest rate risk through investments in debt securities. Interest rate risk is the risk that debt securities will decline in value as a result of changes in interest rates. For example, the value of bonds, fixed rate loans and short-term money market instruments may decline in value when interest rates rise. In a low interest rate environment, the risks associated with rising interest rates are heightened. Debt securities with longer durations tend to be more sensitive to changes in interest rates, making them more volatile than debt securities with shorter durations or money market instruments. Therefore, duration is a potentially useful tool to measure the sensitivity of a debt security’s yield (market price to interest rate movement). To manage these risks, certain Funds may invest in derivative instruments tied to interest rates.
Foreign Investments and Currency Risk– A Fund may be exposed to foreign investments and/or currency risk through direct investment in securities or through options, futures or currency transactions. The prices of foreign securities that are denominated in foreign currencies are affected by the value of the U.S. dollar. With respect to securities denominated in foreign currencies, in general, as the value of the U.S. dollar rises, the U.S. dollar price of a foreign security will fall. As the value of the U.S. dollar falls, the U.S. dollar value of the foreign security will rise. Currency rates in foreign countries may fluctuate significantly over short periods of time for a number of reasons. Foreign investments may be riskier than U.S. investments for many reasons, including changes in currency exchange rates, unstable political and economic conditions, a lack of adequate and timely company information, differences in the way securities markets operate, relatively lower market liquidity, less stringent financial reporting and accounting guidance and controls, less secure foreign banks or securities depositories than those in the U.S., foreign taxation issues, and foreign controls on investments. As a result, a Fund’s investments in foreign currency-denominated securities and other foreign investments may reduce the returns of the Fund. To manage these risks, certain Funds may invest in derivative instruments tied to foreign investments and/or currencies.
Price Volatility Risk– Derivatives tied to equity and debt securities are exposed to potential price volatility. Debt securities are affected by many factors, including prevailing interest rates, market conditions, and market liquidity. Volatility of below investment grade debt securities (including loans) may be relatively greater than for investment grade debt securities. Equity securities tend to go up or down in value, sometimes rapidly and unpredictably. The prices of equity securities change in response to many factors, including a company’s historical and prospective earnings, the value of its assets, general economic conditions, interest rates, investor perceptions, and market liquidity. Due to the complexities of markets, events in one market or sector may adversely impact other markets or sectors. To manage these risks, certain Funds may invest in various derivative instruments. Derivative instruments may be used to manage a Fund’s exposure to price volatility risk but may also be subject to greater price volatility than investments in traditional securities. The value of commodity-linked derivative instruments may be affected by changes in overall market movements, commodity index volatility, changes in interest rates, or factors affecting a particular industry or commodity, such as drought, floods, weather, livestock disease, embargoes, tariffs, and international economic, political, and regulatory developments.
Credit and Counterparty Risk– Credit risk is the risk that a debt security’s issuer (or borrower or counterparty) will be unable or unwilling to meet its financial obligations (e.g., may not be able to make principal and/or interest payments when they are due or otherwise default on other financial terms) and/or may go bankrupt. This is also sometimes described as counterparty risk. A Fund may lose money if the issuer or guarantor of debt security, or counterparty of a derivative contract, repurchase or reverse repurchase agreement, or a loan of Fund securities, is unable or unwilling to make timely principal and/or interest payments, or to otherwise honor its obligations. A Fund may attempt to minimize concentrations of credit risk by undertaking transactions with a large number of borrowers or counterparties on recognized and reputable exchanges. A Fund’s investments in debt investments may range in quality from those rated in the lowest category in which it is permitted to invest to those rated in the highest category by a rating agency, or if unrated, determined by the manager to be of comparable quality.
Similar to credit risk, a Fund may be exposed to counterparty risk, or the risk that an institution or other entity with which a Fund has unsettled or open transactions will default. Financial assets of counterparties, which potentially expose a Fund to counterparty risk, consist mainly of cash
D-9
Table of Contents
PACIFIC FUNDS
NOTES TO FINANCIAL STATEMENTS (Continued)
due from counterparties and investments. Certain managers may attempt to minimize credit risks to the Funds by performing extensive reviews of each counterparty, entering into transactions with counterparties that the manager believes to be creditworthy at the time of the transaction and requiring the posting of collateral in applicable transactions. To manage these risks, certain Funds may invest in derivative instruments tied to a security issuers’ financial strength.
B. DERIVATIVE INVESTMENTS
In addition to managing the market risks described above, certain Funds, if permitted by their investment objectives, may also invest in derivatives for purposes of hedging, duration management, to gain exposure to specific investment opportunities, as a substitute for securities, to enhance returns, or to otherwise help achieve a Fund’s investment goal. Each derivative instrument and the reasons a Fund invested in derivatives during the reporting period are discussed in further detail below. The Portfolio Optimization Funds are exposed to the same derivative risks as the applicable PF Underlying Funds, Pacific Funds Core Income, Pacific Funds Floating Rate Income, Pacific Funds High Income, and/or Pacific FundsSmall-Cap Growth in direct proportion to the allocation of assets among those funds. The annual report of the PF Underlying Funds discusses in further detail the derivative instruments and the reasons a PF Underlying Fund invested in derivatives during the reporting period.
Swap Agreements– Swap agreements are bilaterally negotiated agreements between the Funds and their counterparties to exchange swap investment cash flows, assets, foreign currencies or market-linked returns at specified intervals. Swap agreements are privately negotiated in the OTC market or are executed in a multilateral or other execution facility platform, such as a registered commodities exchange (“centrally cleared swaps”). In connection with these agreements, cash and securities may be identified as collateral in accordance with the terms of the respective swap agreements to provide assets of value and recourse in the event of default or bankruptcy/insolvency. Swaps aremarked-to-market daily based upon values received from third party vendors or quotations from market makers. Market values greater than zero are recorded as an asset and market values less than zero are recorded as a liability. The change in value of swaps, including accruals of periodic amounts of interest to be paid or received on swaps, is recorded as unrealized appreciation or depreciation. Daily changes in valuation of centrally cleared swaps, if any, are recorded as variation margin receivable or payable. OTC swap payments received or made at the beginning of the measurement period are recorded as an asset or liability and represent payments made or received upon entering into the swap agreement to compensate for differences between the stated terms of the swap agreement and prevailing market conditions (credit spreads, currency exchange rates, interest rates, and other relevant factors). These upfront payments are recorded as realized gain or loss when the swap is closed. A liquidation payment received or made at the termination of the swap is recorded as realized gain or loss. Net periodic payments received by a Fund are recorded as realized gain.
Total Return Swaps– A Fund investing in total return swaps is subject to the risk that there is no liquid market for these agreements, that the counterparties may default on their obligations to perform or that there may be unfavorable changes in the value of the underlying index or reference instrument (generally caused by changes in interest rates or declines in credit quality). A total return swap agreement is one in which one party makes payments based on a set rate, either fixed or variable, while the other party makes payments based on the return of an underlying index or reference instrument, which includes both the income it generates and any capital gains. To the extent the total return of the index or reference instrument underlying the transaction exceeds or falls short of the offsetting interest rate obligation, a Fund will receive a payment from or make a payment to the counterparty. A Fund’s maximum risk of loss from counterparty credit risk related to total return swaps is the discounted net value of the cash flows to be received from or paid to the counterparty over the contract’s remaining life, to the extent that the amount is positive. The risk may be mitigated to some extent if a master netting arrangement between a Fund and the counterparty is in place and to the extent a Fund obtains collateral to cover a Fund’s exposure to the counterparty.
A Fund may enter into fully funded total return swaps which involves one party making an initial payment equal to the estimated value of the reference instrument. The parties to the swap then exchange respective commitments to pay or receive a net amount based on the change in the fair value of a reference instrument and a specified notional amount.
None of the Funds presented in these financial statements held total return swaps as of March 31, 2020.
C. ENFORCEABLE MASTER NETTING ARRANGEMENTS
Master Agreements and Netting Arrangements– Certain Funds are parties to various agreements, including but not limited to International Swaps and Derivatives Association Agreements and related Credit Support Annex, Master Repurchase Agreements, and Master Securities Forward Transactions Agreements (collectively “Master Agreements”), which govern the terms of certain transactions with select counterparties. These Master Agreements generally include provisions for general obligations, representations, agreements, collateral, and certain events of default or termination. These Master Agreements also include provisions for netting arrangements that help reduce credit and counterparty risk associated with relevant transactions (“netting arrangements”). The netting arrangements are generally tied to credit related events that, if triggered, would cause an event of default or termination giving a Fund or counterparty the right to terminate early and cause settlement, on a net basis, of all transactions under the applicable Master Agreement. In the event of an early termination as a result of an event of default under the Master Agreement, the total value exposure of all transactions will be offset against collateral exchanged to date, which would result in a net receivable or payable that would be due from or to the counterparty. However, bankruptcy or insolvency laws of a particular jurisdiction may impose restrictions on or prohibitions against the right of offset in the event of a bankruptcy or insolvency. Credit related events include, but are not limited to, bankruptcy, failure to make timely payments, restructuring, obligation acceleration, obligation default, a material decline in net assets, decline in credit rating or repudiation/moratorium. Any election made by a counterparty to early terminate the transactions under a Master Agreement could have a material adverse impact on a Fund’s financial statements. A Fund’s overall exposure to credit risk, subject to netting arrangements can change substantially within a short period, as it is affected by each transaction subject to the arrangement.
Master Agreements can also help limit counterparty risk by specifying collateral posting arrangements atpre-arranged exposure levels. Under the Master Agreements, collateral is routinely transferred if the total net exposure to certain transactions under the relevant Master Agreement
D-10
Table of Contents
PACIFIC FUNDS
NOTES TO FINANCIAL STATEMENTS (Continued)
with a counterparty in a given Fund exceeds a specified threshold, net of collateral already in place, which typically ranges from $0 to $250,000 depending on the counterparty and the type of Master Agreement. Collateral under the Master Agreements is usually in the form of cash or U.S. Treasury Bills but could include other types of securities. If permitted under the Master Agreement, certain funds may rehypothecate cash collateral received from a counterparty. The value of all derivative transactions outstanding under a Master Agreement is calculated daily to determine the amount of collateral to be received or pledged by the counterparty. Posting of collateral for OTC derivative transactions are covered undertri-party collateral agreements between the Trust, the Trust’s custodian, and each counterparty. Collateral for centrally cleared derivatives transactions are posted with the applicable derivatives clearing organization.
None of the Funds presented in these financial statements were subject to enforceable master agreements with netting arrangements as of March 31, 2020.
6. INVESTMENT ADVISORY, ADMINISTRATION AND SHAREHOLDER SERVICES, SUPPORT SERVICES, AND DISTRIBUTION AGREEMENTS
Pursuant to an Investment Advisory Agreement, PLFA, a wholly-owned subsidiary of Pacific Life Insurance Company (“Pacific Life”), serves as Investment Adviser to each Fund of the Trust. PLFA directly manages the Portfolio Optimization Funds. PLFA also managed the PF Fixed Income Funds under the name Pacific Asset Management (the Pacific Funds Diversified Income was managed by both Pacific Asset Management andsub-adviser Cadence Capital Management LLC), through December 30, 2019. PLFA has retained other investment management firms tosub-advise the PF Fixed Income Funds, the PF U.S. Equity Funds, and Pacific Funds Diversified Income. Pursuant toSub-Advisory Agreements, the Trust and PLFA engage various investment management firms under PLFA’s supervision tosub-advise certain Funds presented in these financial statements. PLFA, as Investment Adviser of the Trust, pays related management fees to thesesub-advisers as compensation for theirsub-advisory services provided to the Trust. PLFA receives investment advisory fees from each Fund which are based on the following annual percentage of the average daily net assets of each Fund:
| Fund | Advisory Fee Rate | Advisory Fee Waiver through July 31, 2020 | Sub-Adviser(s) | |||
Pacific Funds Portfolio Optimization Conservative Pacific Funds Portfolio Optimization Moderate-Conservative Pacific Funds Portfolio Optimization Moderate Pacific Funds Portfolio Optimization Growth Pacific Funds Portfolio Optimization Aggressive-Growth | 0.20% | 0.025% above $2 billion to $3 billion 0.050% on next $2 billion 0.075% on next $2.5 billion 0.100% on excess | ||||
| Pacific Funds Ultra Short Income | 0.25% | Pacific Asset Management LLC (effective December 31, 2019) | ||||
| Pacific Funds Short Duration Income | 0.40% | 0.025% above $1 billion to $2 billion 0.050% on next $1 billion 0.075% on excess | Pacific Asset Management LLC (effective December 31, 2019) | |||
| Pacific Funds Core Income | 0.50% | 0.025% above $1 billion to $2 billion 0.050% on next $1 billion 0.075% on excess | Pacific Asset Management LLC (effective December 31, 2019) | |||
Pacific Funds Strategic Income Pacific Funds High Income | 0.60% | 0.025% above $1 billion to $2 billion 0.050% on next $1 billion 0.075% on excess | Pacific Asset Management LLC (effective December 31, 2019) | |||
| Pacific Funds Floating Rate Income | 0.65% | 0.025% above $1 billion to $2 billion 0.050% on next $1 billion 0.075% on excess | Pacific Asset Management LLC (effective December 31, 2019) | |||
| Pacific Funds Diversified Income | 0.35% | Cadence Capital Management LLC and Pacific Asset Management LLC (effective December 31, 2019) | ||||
| Pacific FundsLarge-Cap (1) | 0.45% | Rothschild & Co Asset Management US Inc. | ||||
| Pacific FundsLarge-Cap Value (1) | 0.55% | Rothschild & Co Asset Management US Inc. | ||||
Pacific FundsSmall/Mid-Cap (1) Pacific FundsSmall-Cap (1) Pacific FundsSmall-Cap Value (1) Pacific FundsSmall-Cap Growth (1) | 0.75% | Rothschild & Co Asset Management US Inc. |
| (1) | Reflects new advisory fee rates effective June 28, 2019. |
The advisory fee and advisory fee waiver rates for the PF U.S. Equity Funds prior to June 28, 2019 were:
| Fund | Advisory Fee Rate | Advisory Fee Waiver | ||
| Pacific FundsLarge-Cap | 0.65% | 0.10% | ||
| Pacific FundsLarge-Cap Value | 0.65% | |||
Pacific FundsSmall/Mid-Cap Pacific FundsSmall-Cap Pacific FundsSmall-Cap Value Pacific FundsSmall-Cap Growth | 0.85% |
Prior to January 1, 2020, the Trust compensated Pacific Life (the “Administrator”) for procuring or providing administrative, transfer agency, and shareholder services pursuant to an Administration and Shareholder Services Agreement. In addition, Pacific Life and PLFA provided support services to the Trust that were outside the scope of the Administrator’s and Investment Adviser’s responsibilities under the Administration and Shareholder Services Agreement and Investment Advisory Agreement.
D-11
Table of Contents
PACIFIC FUNDS
NOTES TO FINANCIAL STATEMENTS (Continued)
Effective January 1, 2020, pursuant to the PF Administration Agreement with the Trust, the Administrator and PLFA perform, procure and/or oversee administrative services for each of the Funds. These services include, but are not limited to, procuring and overseeing transfer agency, dividend disbursement and sub-transfer agency services for the Trust, and any and all legal, compliance, and accounting support provided by Pacific Life and PLFA for the operations of the Trust and to permit the Trust to conduct business as described in its registration statement; and other services necessary for the administration of the Funds’ affairs.
Prior to January 1, 2020, under the Support Services Agreement, the Trust compensated Pacific Life and PLFA for their expenses in providing support services to the Trust in connection with various matters, some of which include the time spent by legal, accounting, and compliance personnel of Pacific Life and PLFA (including individuals who may be officers or Trustees of the Trust), to attend meetings of the Board and to provide assistance with the coordination and supervision in connection with the services procured for the Trust. Support services did not include services for which PLFA is responsible pursuant to the Investment Advisory Agreement. The Trust reimbursed Pacific Life and PLFA for these support services on an approximate cost basis. Effective January 1, 2020, the Support Services Agreement was terminated.
Pacific Life receives an administration fee from each Fund and applicable share class presented in these financial statements, based on a annual rate of 0.15% of average daily net assets of each Fund. Prior to January 1, 2020, Pacific Life received an administration fee from each Fund and applicable share class presented in these financial statements, based on the following annual percentage of average daily net assets of each Fund:
| Fund | Share Class (1) | Administration Fee Rate | ||
| Portfolio Optimization Funds | A, B, C, and Advisor | 0.15% | ||
| Pacific Funds Ultra Short Income | Advisor | 0.30% | ||
| I | 0.15% | |||
Pacific Funds Short Duration Income | A, C, and Advisor | 0.30% | ||
| Pacific Funds Strategic Income | I | 0.15% | ||
Pacific Funds Core Income | A, C, and Advisor | 0.30% | ||
Pacific Funds Floating Rate Income Pacific Funds High Income | I and P | 0.15% | ||
| Pacific Funds Diversified Income | Advisor | 0.30% | ||
| PF U.S. Equity Funds | A, C, and Advisor | 0.30% | ||
| R6 | 0.15% | |||
| Pacific FundsSmall-Cap Growth | P | 0.15% |
| (1) | Class B shares were converted to Class A shares on July 31, 2019 (see Note 1 in Notes to Financial Statements). |
Pursuant to a Distribution Agreement, Pacific Select Distributors, LLC (the “Distributor”), a wholly-owned subsidiary of Pacific Life, serves as distributor of the Trust’s shares. Under the Distribution Agreement, the Distributor bears all expenses of providing services, including costs of sales presentations, mailings, advertisements, and other marketing efforts by the Distributor in connection with the distribution or sale of the Trust’s shares and makes distribution and/or service payments to selling groups in connection with the sale of certain of the Trust’s shares and subsequent servicing needs of shareholders provided by selling groups. The Distributor receives distribution and service fees pursuant to class- specific distribution and service plans, each adopted in accordance with Rule12b-1(“12b-1”) under the 1940 Act (together the“12b-1 Plans”) for Class B, C, and R shares. The Distributor also receives service fees pursuant to anon-12b-1 service plan for Class A shares (“Class A Plan”). The Distributor receives distribution and/or service fees from each Fund and applicable share class presented in these financial statements, which are based on the following annual percentages of average daily net assets:
| Plan | Share Class | Distribution Fee Rate | Service Fee Rate | |||
| 12b-1 Plans | B (1) and C | 0.75% | 0.25% | |||
| Class A Plan | A | 0.25% |
| (1) | Class B shares were converted to Class A shares on July 31, 2019 (see Note 1 in Notes to Financial Statements). |
There are no distribution and service fees for Class I, Class P, Advisor Class, and Class R6 shares. The distribution and service fees are accrued daily. For the fiscal year ended March 31, 2020, the Distributor, acting as underwriter, received net commissions(front-end sales charges) of $5,114,592 from the sale of Class A shares and received $40,950 in CDSC from redemptions of Class A, B, and C shares.
7. TRANSACTIONS WITH AFFILIATES
A. ADVISORY FEES, ADMINISTRATION FEES, DISTRIBUTION AND/OR SERVICE FEES, AND EXPENSES FOR SUPPORT SERVICES
The Investment Adviser, the Distributor, and Pacific Life are related parties. The advisory fees earned by the Investment Adviser, including any advisory fee waiver, the administration fees earned by Pacific Life, the distribution and/or service fees earned by the Distributor, and expenses for support services recovered by PLFA and Pacific Life (see Note 6) from each Fund presented in these financial statements for the fiscal year ended March 31, 2020 are presented in the Statements of Operations. The amounts of each of these fees that remained payable as of March 31, 2020 are presented in the Statements of Assets and Liabilities.
B. EXPENSE LIMITATION AGREEMENTS
To help limit the Trust’s expenses, PLFA has contractually agreed to reimburse each Fund presented in these financial statements for certain operating expenses that exceed an annual rate based on a percentage of a Fund’s average daily net assets (“expense cap”). These operating
D-12
Table of Contents
PACIFIC FUNDS
NOTES TO FINANCIAL STATEMENTS (Continued)
expenses include, but are not limited to: the administration fee and expenses; organizational expenses; custody expenses; expenses for external audit, tax, legal and accounting andsub-administration services; the preparation, printing, filing and mailing costs of prospectuses, shareholder reports, and other regulatory documents to existing shareholders, as applicable; and independent trustees’ fees and expenses. These operating expenses do not include: advisory fees; distribution and/or service fees; dividends on securities sold short; acquired fund fees and expenses; interest (including commitment fees); taxes (including foreign taxes on dividends, interest or gains); brokerage commissions and other transactional expenses; and expenses for extraordinary matters such as litigation expenses, liquidation expenses, reorganization expenses, and other expenses not incurred in the ordinary course of a Fund’s business. The expense caps for each Fund and share class presented in these financial statements are as follows:
| Fund | Share Class (1) | Expense Caps | ||
| Portfolio Optimization Funds | A, B, C, and Advisor | 0.15% through 7/31/2020 and 0.30% thereafter through 7/31/2023 | ||
| Pacific Funds Ultra Short Income | I and Advisor | 0.07% through 7/31/2022 | ||
| Pacific Funds Short Duration Income | A, C, I, and Advisor | 0.10% through 7/31/2020 | ||
| Pacific Funds Core Income | A and C | 0.10% through 7/31/2020 | ||
| I, Advisor, and P | 0.05% through 7/31/2020 | |||
| Pacific Funds Strategic Income | A and Advisor | 0.10% through 7/31/2020 | ||
| C and I | 0.05% through 7/31/2020 | |||
| Pacific Funds Floating Rate Income | A and Advisor | 0.10% through 7/31/2020 | ||
| C, I, and P | 0.05% through 7/31/2020 | |||
| Pacific Funds High Income | A, I, Advisor, and P | 0.10% through 7/31/2020 | ||
| C | 0.05% through 7/31/2020 | |||
| Pacific Funds Diversified Income | Advisor | 0.10% through 7/31/2022 | ||
Pacific FundsLarge-Cap | A | 0.20% through 7/31/2020 | ||
| Pacific FundsLarge-Cap Value | C and Advisor | 0.20% through 7/31/2020 | ||
| R6 | 0.10% through 7/31/2020 | |||
Pacific FundsSmall/Mid-Cap | A | 0.20% through 7/31/2020 | ||
| Pacific FundsSmall-Cap | C and Advisor | 0.20% through 7/31/2020 | ||
| Pacific FundsSmall-Cap Value | R6 | 0.15% through 7/31/2020 | ||
| Pacific FundsSmall-Cap Growth | A | 0.15% through 7/31/2020 | ||
| C, Advisor, and P | 0.20% through 7/31/2020 | |||
| R6 | 0.05% through 7/31/2020 |
| (1) | Class B shares were converted to Class A shares on July 31, 2019 (see Note 1 in Notes to Financial Statements). |
There is no guarantee that PLFA will continue to cap expenses for a Fund upon the expiration of the expense cap. In addition, any expense reimbursements made by PLFA to a Fund are subject to recoupment by PLFA from such Fund in future periods, not to exceed three years from the date on which the reimbursement took place, provided that the recoupment, along with the other expenses subject to the expense cap, would be limited to the lesser of: (i) the expense cap in effect at the time of the reimbursement or (ii) the expense cap in effect at the time of recoupment. Any amounts repaid to PLFA will have the effect of increasing such expenses of the applicable Fund, but not above the expense cap. The amounts of adviser reimbursement to each applicable Fund presented in these financial statements for the fiscal year ended March 31, 2020 are presented in the Statements of Operations. Any amounts that remained due from the Investment Adviser as of March 31, 2020 are presented in the Statements of Assets and Liabilities.
The cumulative expense reimbursement amounts, if any, as of March 31, 2020 that are subject to recoupment by PLFA from the Funds presented in these financial statements are as follows:
| Fund | 3/31/2021 | 3/31/2022 | 3/31/2023 | |||||||||
Pacific Funds Portfolio Optimization Conservative | $250,155 | $230,770 | $197,838 | |||||||||
Pacific Funds Portfolio Optimization Moderate-Conservative | 334,819 | 305,325 | 249,902 | |||||||||
Pacific Funds Portfolio Optimization Moderate | 841,944 | 774,354 | 612,516 | |||||||||
Pacific Funds Portfolio Optimization Growth | 646,561 | 602,203 | 493,143 | |||||||||
Pacific Funds Portfolio Optimization Aggressive-Growth | 256,481 | 253,140 | 226,029 | |||||||||
Pacific Funds Ultra Short Income | 115,776 | |||||||||||
Pacific Funds Short Duration Income | 1,000,932 | 1,385,844 | 2,174,161 | |||||||||
Pacific Funds Core Income | 2,102,504 | 1,843,904 | 2,204,086 | |||||||||
Pacific Funds Strategic Income | 1,246,313 | 1,612,421 | 1,718,677 | |||||||||
Pacific Funds Floating Rate Income | 3,114,566 | 4,391,138 | 3,637,709 | |||||||||
Pacific Funds High Income | 119,953 | 169,374 | 253,239 | |||||||||
Pacific Funds Diversified Income | 136,048 | |||||||||||
Pacific Funds Large-Cap | 87,705 | 85,164 | 93,139 | |||||||||
Pacific Funds Large-Cap Value | 111,953 | 98,891 | 91,667 | |||||||||
Pacific Funds Small/Mid-Cap | 341,697 | 493,273 | 516,716 | |||||||||
Pacific Funds Small-Cap | 88,698 | 94,696 | 91,474 | |||||||||
Pacific Funds Small-Cap Value | 104,441 | 90,131 | 89,955 | |||||||||
Pacific Funds Small-Cap Growth | 107,736 | 103,024 | 89,691 | |||||||||
|
|
|
|
|
| |||||||
Total | $10,756,458 | $12,533,652 | $12,991,766 | |||||||||
|
|
|
|
|
| |||||||
There was no recoupment of expense reimbursement by PLFA from any Funds presented in these financial statements for the fiscal year ended March 31, 2020.
D-13
Table of Contents
PACIFIC FUNDS
NOTES TO FINANCIAL STATEMENTS (Continued)
C. INVESTMENTS IN AFFILIATED FUNDS
As of March 31, 2020, each of the Portfolio Optimization Funds (aggregate of all share classes) owned Class P shares in each of the applicable affiliated PF Underlying Funds, Pacific Funds Core Income, Pacific Funds Floating Rate Income, Pacific Funds High Income, and/or Pacific FundsSmall-Cap Growth. A summary of holdings and transactions with affiliated mutual fund investments as of and for the fiscal year ended March 31, 2020 is as follows:
| Fund/Underlying Fund | Beginning Value as of April 1, 2019 | Purchase Cost (1) | Distributions Received and Reinvested (2) | Sales Proceeds | Net Realized Gain (Loss) (3) | Change in Unrealized Appreciation (Depreciation) | As of March 31, 2020 | |||||||||||||||||||||||||
Ending Value | Shares Balance | |||||||||||||||||||||||||||||||
| Pacific Funds Portfolio Optimization Conservative |
| |||||||||||||||||||||||||||||||
Pacific Funds Core Income | $7,598,484 | $165,516 | $206,672 | $2,167,762 | ($6,206 | ) | $73,416 | $5,870,120 | 551,703 | |||||||||||||||||||||||
Pacific Funds Floating Rate Income | 6,356,221 | 122,448 | 244,433 | 4,101,053 | (314,307 | ) | (139,183 | ) | 2,168,559 | 246,147 | ||||||||||||||||||||||
Pacific Funds High Income | 16,618,804 | 10,123,454 | 919,486 | 3,022,651 | (78,563 | ) | (1,715,752 | ) | 22,844,778 | 2,637,965 | ||||||||||||||||||||||
PF Inflation Managed | 14,124,612 | 309,488 | 160,475 | 3,672,288 | 65,055 | 405,365 | 11,392,707 | 1,247,832 | ||||||||||||||||||||||||
PF Managed Bond | 93,902,067 | 2,256,212 | 1,059,118 | 29,604,044 | 1,277,854 | 3,356,032 | 72,247,239 | 6,550,067 | ||||||||||||||||||||||||
PF Short Duration Bond | 37,048,639 | 8,502,543 | 1,047,627 | 12,035,769 | (240,252 | ) | (559,131 | ) | 33,763,657 | 3,455,850 | ||||||||||||||||||||||
PF Emerging Markets Debt | 12,751,835 | 5,662,502 | 585,300 | 2,044,022 | (51,366 | ) | (2,327,440 | ) | 14,576,809 | 2,030,196 | ||||||||||||||||||||||
Pacific Funds Small-Cap Growth | 760,923 | 26,279 | — | 521,644 | (358,896 | ) | 93,338 | — | — | |||||||||||||||||||||||
PF Developing Growth | 498,405 | 711,489 | — | 91,143 | 39,576 | 40 | 1,158,367 | 81,633 | ||||||||||||||||||||||||
PF Growth | 2,323,716 | 467,270 | 229 | 564,404 | 106,649 | 37,846 | 2,371,306 | 87,502 | ||||||||||||||||||||||||
PF Large-Cap Value | 4,668,784 | 1,121,072 | 59,022 | 943,817 | 250,553 | (679,568 | ) | 4,476,046 | 463,359 | |||||||||||||||||||||||
PF Multi-Asset | 37,434,469 | 9,200,032 | 887,820 | 7,717,214 | 90,970 | (4,225,655 | ) | 35,670,422 | 4,334,195 | |||||||||||||||||||||||
PF Small-Cap Value | 1,255,559 | 397,373 | 7,118 | 206,444 | 37,691 | (337,016 | ) | 1,154,281 | 223,265 | |||||||||||||||||||||||
PF Emerging Markets | 5,103,493 | 2,489,060 | 33,930 | 3,129,643 | 659,139 | (866,131 | ) | 4,289,848 | 437,740 | |||||||||||||||||||||||
PF International Large-Cap | 1,396,039 | 22,414 | 10,001 | 1,345,271 | (86,742 | ) | 3,559 | — | — | |||||||||||||||||||||||
PF International Small-Cap | 1,272,421 | 1,032,602 | — | 1,297,956 | (95,124 | ) | 251,021 | 1,162,964 | 166,614 | |||||||||||||||||||||||
PF International Value | 1,375,816 | 30,021 | 20,214 | 1,176,043 | (273,770 | ) | 23,762 | — | — | |||||||||||||||||||||||
PF Real Estate | 3,877,366 | 81,382 | 65,178 | 2,154,862 | (511,684 | ) | (162,960 | ) | 1,194,420 | 115,963 | ||||||||||||||||||||||
PF Currency Strategies (4) | 3,796,527 | 3,735,370 | — | 6,995,225 | (629,749 | ) | 93,077 | — | — | |||||||||||||||||||||||
PF Equity Long/Short (4) | 3,802,632 | 8,714 | — | 3,630,548 | (649,066 | ) | 468,268 | — | — | |||||||||||||||||||||||
| $255,966,812 | $46,465,241 | $5,306,623 | $86,421,803 | ($768,238 | ) | ($6,207,112 | ) | $214,341,523 | ||||||||||||||||||||||||
| Pacific Funds Portfolio Optimization Moderate-Conservative |
| |||||||||||||||||||||||||||||||
Pacific Funds Core Income | $8,822,165 | $58,408 | $243,102 | $2,446,956 | ($9,822 | ) | $80,839 | $6,747,736 | 634,186 | |||||||||||||||||||||||
Pacific Funds Floating Rate Income | 7,416,217 | 71,633 | 269,216 | 5,857,374 | (457,868 | ) | (11,080 | ) | 1,430,744 | 162,400 | ||||||||||||||||||||||
Pacific Funds High Income | 22,357,375 | 9,705,177 | 1,253,540 | 4,524,479 | (122,433 | ) | (2,878,856 | ) | 25,790,324 | 2,978,097 | ||||||||||||||||||||||
PF Inflation Managed | 9,357,278 | 63,401 | 104,955 | 4,343,575 | 74,409 | 200,369 | 5,456,837 | 597,682 | ||||||||||||||||||||||||
PF Managed Bond | 109,150,939 | 721,607 | 1,266,827 | 34,284,761 | 1,357,672 | 4,029,101 | 82,241,385 | 7,456,155 | ||||||||||||||||||||||||
PF Short Duration Bond | 29,791,079 | 7,490,911 | 862,141 | 11,912,758 | (185,300 | ) | (443,998 | ) | 25,602,075 | 2,620,479 | ||||||||||||||||||||||
PF Emerging Markets Debt | 16,726,117 | 4,996,827 | 756,676 | 2,975,608 | (77,980 | ) | (2,970,737 | ) | 16,455,295 | 2,291,824 | ||||||||||||||||||||||
Pacific Funds Small-Cap Growth | 1,108,836 | 11,233 | — | 747,621 | (186,895 | ) | (185,553 | ) | — | — | ||||||||||||||||||||||
PF Developing Growth | 726,274 | 902,876 | — | 149,075 | 81,530 | (35,875 | ) | 1,525,730 | 107,521 | |||||||||||||||||||||||
PF Growth | 9,783,262 | 2,238,709 | 945 | 2,748,661 | 489,499 | 199,581 | 9,963,335 | 367,651 | ||||||||||||||||||||||||
PF Large-Cap Value | 21,330,322 | 4,274,479 | 264,659 | 4,852,530 | 1,127,544 | (2,988,482 | ) | 19,155,992 | 1,983,022 | |||||||||||||||||||||||
PF Multi-Asset | 81,552,140 | 13,701,497 | 1,837,667 | 19,028,135 | 557,254 | (8,687,243 | ) | 69,933,180 | 8,497,349 | |||||||||||||||||||||||
PF Small-Cap Value | 3,659,180 | 36,530 | 20,487 | 1,137,273 | (303,396 | ) | (755,393 | ) | 1,520,135 | 294,030 | ||||||||||||||||||||||
PF Emerging Markets | 13,015,087 | 6,082,706 | 100,078 | 7,286,892 | 2,026,527 | (2,639,297 | ) | 11,298,209 | 1,152,878 | |||||||||||||||||||||||
PF International Large-Cap | 6,473,127 | 40,785 | 61,349 | 3,578,783 | 425,533 | (750,037 | ) | 2,671,974 | 295,246 | |||||||||||||||||||||||
PF International Small-Cap | 3,708,606 | 374,490 | 94,610 | 2,262,355 | (107,298 | ) | (276,387 | ) | 1,531,666 | 219,436 | ||||||||||||||||||||||
PF International Value | 7,108,208 | 69,275 | 136,394 | 3,635,394 | (462,636 | ) | (968,352 | ) | 2,247,495 | 437,256 | ||||||||||||||||||||||
PF Real Estate | 9,418,586 | 1,792,807 | 185,893 | 6,187,099 | (1,540,020 | ) | (523,574 | ) | 3,146,593 | 305,494 | ||||||||||||||||||||||
PF Currency Strategies (4) | 5,533,000 | 5,197,117 | — | 9,976,040 | (928,814 | ) | 174,737 | — | — | |||||||||||||||||||||||
PF Equity Long/Short (4) | 5,541,750 | 10,489 | — | 5,288,677 | (926,597 | ) | 663,035 | — | — | |||||||||||||||||||||||
| $372,579,548 | $57,840,957 | $7,458,539 | $133,224,046 | $830,909 | ($18,767,202 | ) | $286,718,705 | |||||||||||||||||||||||||
| Pacific Funds Portfolio Optimization Moderate |
| |||||||||||||||||||||||||||||||
Pacific Funds Core Income | $18,006,462 | $87,056 | $504,530 | $4,718,950 | ($62,492 | ) | $171,137 | $13,987,743 | 1,314,637 | |||||||||||||||||||||||
Pacific Funds Floating Rate Income | 11,459,848 | 83,698 | 419,333 | 7,055,479 | (286,918 | ) | (319,564 | ) | 4,300,918 | 488,186 | ||||||||||||||||||||||
Pacific Funds High Income | 46,123,452 | 12,546,342 | 2,466,175 | 7,885,661 | (201,052 | ) | (5,528,341 | ) | 47,520,915 | 5,487,404 | ||||||||||||||||||||||
PF Inflation Managed | 11,582,422 | 72,095 | 131,478 | 7,940,281 | 112,287 | 155,244 | 4,113,245 | 450,520 | ||||||||||||||||||||||||
PF Managed Bond | 219,577,492 | 18,024,371 | 2,803,740 | 80,605,283 | 2,376,580 | 8,303,027 | 170,479,927 | 15,456,022 | ||||||||||||||||||||||||
PF Short Duration Bond | 69,140,691 | 5,899,948 | 1,751,900 | 26,759,549 | (343,701 | ) | (929,225 | ) | 48,760,064 | 4,990,795 | ||||||||||||||||||||||
PF Emerging Markets Debt | 23,004,631 | 16,705,528 | 1,049,243 | 3,702,258 | (112,296 | ) | (3,868,481 | ) | 33,076,367 | 4,606,736 | ||||||||||||||||||||||
Pacific Funds Small-Cap Growth | 6,862,909 | 48,935 | — | 4,554,655 | (1,524,288 | ) | (832,901 | ) | — | — | ||||||||||||||||||||||
PF Developing Growth | 4,495,080 | 1,232,258 | — | 765,519 | 369,986 | (732,755 | ) | 4,599,050 | 324,105 | |||||||||||||||||||||||
PF Growth | 86,169,450 | 342,038 | 8,449 | 27,257,463 | 3,768,863 | (715,733 | ) | 62,315,604 | 2,299,469 | |||||||||||||||||||||||
PF Large-Cap Value | 75,681,904 | 14,945,829 | 1,025,801 | 15,552,650 | (667,944 | ) | (7,909,607 | ) | 67,523,333 | 6,989,993 | ||||||||||||||||||||||
PF Multi-Asset | 401,029,374 | 52,913,209 | 9,165,475 | 85,204,810 | 1,822,969 | (45,167,550 | ) | 334,558,667 | 40,651,114 | |||||||||||||||||||||||
PF Small-Cap Value | 22,646,588 | 142,666 | 95,299 | 9,002,288 | 278,580 | (4,996,129 | ) | 9,164,716 | 1,772,672 | |||||||||||||||||||||||
PF Emerging Markets | 46,031,557 | 13,463,039 | 398,104 | 22,751,962 | 8,356,498 | (11,437,138 | ) | 34,060,098 | 3,475,520 | |||||||||||||||||||||||
PF International Large-Cap | 19,459,547 | 77,964 | 249,818 | 6,008,652 | 1,738,042 | (3,434,840 | ) | 12,081,879 | 1,335,014 | |||||||||||||||||||||||
PF International Small-Cap | 11,476,951 | 4,937,647 | 300,389 | 6,804,050 | (329,791 | ) | (347,060 | ) | 9,234,086 | 1,322,935 | ||||||||||||||||||||||
PF International Value | 21,997,625 | 137,844 | 597,568 | 6,231,779 | (2,118,748 | ) | (4,446,670 | ) | 9,935,840 | 1,933,043 | ||||||||||||||||||||||
PF Real Estate | 29,145,205 | 5,539,397 | 580,367 | 14,969,793 | (3,370,286 | ) | (2,697,020 | ) | 14,227,870 | 1,381,347 | ||||||||||||||||||||||
PF Currency Strategies (4) | 14,268,549 | 13,378,201 | — | 26,040,667 | (1,999,638 | ) | 393,555 | — | — | |||||||||||||||||||||||
PF Equity Long/Short (4) | 14,291,047 | — | — | 13,609,493 | (2,416,522 | ) | 1,734,968 | — | — | |||||||||||||||||||||||
| $1,152,450,784 | $160,578,065 | $21,547,669 | $377,421,242 | $5,390,129 | ($82,605,083 | ) | $879,940,322 | |||||||||||||||||||||||||
D-14
Table of Contents
PACIFIC FUNDS
NOTES TO FINANCIAL STATEMENTS (Continued)
| Fund/Underlying Fund | Beginning Value as of April 1, 2019 | Purchase Cost (1) | Distributions Received and Reinvested (2) | Sales Proceeds | Net Realized Gain (Loss) (3) | Change in Unrealized Appreciation (Depreciation) | As of March 31, 2020 | |||||||||||||||||||||||||
Ending Value | Shares Balance | |||||||||||||||||||||||||||||||
| Pacific Funds Portfolio Optimization Growth |
| |||||||||||||||||||||||||||||||
Pacific Funds Core Income | $5,821,489 | $433,637 | $171,227 | $1,435,012 | ($32,937 | ) | $51,205 | $5,009,609 | 470,828 | |||||||||||||||||||||||
Pacific Funds Floating Rate Income | 4,417,354 | 11,087 | 118,879 | 4,536,824 | (123,649 | ) | 113,153 | — | — | |||||||||||||||||||||||
Pacific Funds High Income | 26,669,108 | 1,298,401 | 1,354,559 | 3,848,541 | (99,450 | ) | (3,035,702 | ) | 22,338,375 | 2,579,489 | ||||||||||||||||||||||
PF Inflation Managed | 4,464,711 | 15,223 | 51,884 | 4,594,605 | 61,357 | 1,430 | — | — | ||||||||||||||||||||||||
PF Managed Bond | 70,124,800 | 16,923,646 | 1,067,446 | 31,460,043 | 602,576 | 2,764,583 | 60,023,008 | 5,441,796 | ||||||||||||||||||||||||
PF Short Duration Bond | 17,767,979 | 8,494,283 | 633,684 | 14,212,404 | (408,496 | ) | (269,477 | ) | 12,005,569 | 1,228,820 | ||||||||||||||||||||||
PF Emerging Markets Debt | 13,301,449 | 11,651,449 | 618,067 | 1,904,639 | (47,513 | ) | (2,240,556 | ) | 21,378,257 | 2,977,473 | ||||||||||||||||||||||
Pacific Funds Small-Cap Growth | 10,582,026 | 36,420 | — | 7,805,800 | (2,559,418 | ) | (253,228 | ) | — | — | ||||||||||||||||||||||
PF Developing Growth | 6,930,939 | 2,718,127 | — | 2,603,636 | 368,759 | (620,248 | ) | 6,793,941 | 478,784 | |||||||||||||||||||||||
PF Growth | 56,556,688 | 9,156,321 | 6,599 | 13,822,731 | 4,246,816 | (2,167,387 | ) | 53,976,306 | 1,991,746 | |||||||||||||||||||||||
PF Large-Cap Value | 52,644,228 | 10,696,944 | 734,764 | 9,572,276 | 3,065,742 | (9,333,327 | ) | 48,236,075 | 4,993,382 | |||||||||||||||||||||||
PF Multi-Asset | 439,328,375 | 16,969,455 | 10,129,377 | 87,243,942 | 1,833,357 | (56,029,229 | ) | 324,987,393 | 39,488,140 | |||||||||||||||||||||||
PF Small-Cap Value | 26,189,940 | 90,485 | 152,612 | 8,080,738 | (2,652,503 | ) | (5,545,440 | ) | 10,154,356 | 1,964,092 | ||||||||||||||||||||||
PF Emerging Markets | 48,795,883 | 8,865,945 | 506,948 | 19,344,664 | 8,506,149 | (12,737,161 | ) | 34,593,100 | 3,529,908 | |||||||||||||||||||||||
PF International Large-Cap | 23,827,393 | 5,854,247 | 203,296 | 11,643,889 | 2,594,770 | (2,656,664 | ) | 18,179,153 | 2,008,746 | |||||||||||||||||||||||
PF International Small-Cap | 8,848,134 | 3,816,326 | 489,063 | 1,218,168 | (109,159 | ) | (1,594,865 | ) | 10,231,331 | 1,465,807 | ||||||||||||||||||||||
PF International Value | 26,526,020 | 3,987,283 | 472,647 | 11,724,052 | (78,854 | ) | (4,171,702 | ) | 15,011,342 | 2,920,495 | ||||||||||||||||||||||
PF Real Estate | 26,963,249 | 8,488,547 | 610,137 | 12,234,998 | (3,048,093 | ) | (3,262,188 | ) | 17,516,654 | 1,700,646 | ||||||||||||||||||||||
PF Currency Strategies (4) | 8,800,318 | 8,232,668 | — | 16,090,978 | (1,106,890 | ) | 164,882 | — | — | |||||||||||||||||||||||
PF Equity Long/Short (4) | 8,814,136 | — | — | 8,393,453 | (1,361,216 | ) | 940,533 | — | — | |||||||||||||||||||||||
| $887,374,219 | $117,740,494 | $17,321,189 | $271,771,393 | $9,651,348 | ($99,881,388 | ) | $660,434,469 | |||||||||||||||||||||||||
| Pacific Funds Portfolio Optimization Aggressive-Growth |
| |||||||||||||||||||||||||||||||
Pacific Funds Core Income | $314,307 | $156,653 | $10,824 | $247,486 | ($11,754 | ) | ($580 | ) | $221,964 | 20,861 | ||||||||||||||||||||||
Pacific Funds Floating Rate Income | 3,801 | — | 2 | 3,815 | 12 | — | — | — | ||||||||||||||||||||||||
Pacific Funds High Income | 1,559,871 | 930,681 | 85,158 | 182,252 | (2,758 | ) | (128,513 | ) | 2,262,187 | 261,223 | ||||||||||||||||||||||
PF Managed Bond | 4,388,991 | 1,428,092 | 72,799 | 4,009,689 | 76,697 | 17,184 | 1,974,074 | 178,973 | ||||||||||||||||||||||||
PF Short Duration Bond | 1,558,880 | 4,700,228 | 114,163 | 4,132,320 | (71,277 | ) | (41,751 | ) | 2,127,923 | 217,802 | ||||||||||||||||||||||
PF Emerging Markets Debt | 1,556,007 | 991,571 | 75,350 | 162,461 | (6,279 | ) | (289,066 | ) | 2,165,122 | 301,549 | ||||||||||||||||||||||
Pacific Funds Small-Cap Growth | 4,641,966 | 51,839 | — | 3,031,215 | (1,369,772 | ) | (292,818 | ) | — | — | ||||||||||||||||||||||
PF Developing Growth | 3,040,477 | 1,165,757 | — | 364,471 | 260,815 | (491,082 | ) | 3,611,496 | 254,510 | |||||||||||||||||||||||
PF Growth | 31,504,514 | 8,358,742 | 3,807 | 6,395,630 | 1,962,950 | (461,913 | ) | 34,972,470 | 1,290,497 | |||||||||||||||||||||||
PF Large-Cap Value | 16,781,066 | 7,453,181 | 226,463 | 2,163,133 | 1,037,608 | (2,402,968 | ) | 20,932,217 | 2,166,896 | |||||||||||||||||||||||
PF Multi-Asset | 176,778,623 | 1,198,274 | 4,316,051 | 35,934,486 | (3,653,531 | ) | (22,737,214 | ) | 119,967,717 | 14,576,879 | ||||||||||||||||||||||
PF Small-Cap Value | 16,849,568 | 184,137 | 91,227 | 6,199,325 | (1,608,342 | ) | (3,319,691 | ) | 5,997,574 | 1,160,072 | ||||||||||||||||||||||
PF Emerging Markets | 18,680,820 | 2,787,460 | 210,220 | 6,476,603 | 3,600,645 | (5,427,199 | ) | 13,375,343 | 1,364,831 | |||||||||||||||||||||||
PF International Large-Cap | 6,968,174 | 4,171,334 | 74,603 | 2,415,508 | 1,038,042 | (934,113 | ) | 8,902,532 | 983,705 | |||||||||||||||||||||||
PF International Small-Cap | 4,657,643 | 2,409,258 | 172,642 | 1,946,166 | (101,204 | ) | (357,853 | ) | 4,834,320 | 692,596 | ||||||||||||||||||||||
PF International Value | 7,935,351 | 3,407,109 | 179,867 | 2,288,758 | (11,450 | ) | (1,419,869 | ) | 7,802,250 | 1,517,948 | ||||||||||||||||||||||
PF Real Estate | 9,462,486 | 3,136,666 | 224,636 | 3,155,911 | (824,934 | ) | (1,394,346 | ) | 7,448,597 | 723,165 | ||||||||||||||||||||||
PF Currency Strategies (4) | 2,316,273 | 2,210,765 | — | 4,298,487 | (244,924 | ) | 16,373 | — | — | |||||||||||||||||||||||
PF Equity Long/Short (4) | 2,319,912 | 6,216 | — | 2,214,881 | (362,040 | ) | 250,793 | — | — | |||||||||||||||||||||||
| $311,318,730 | $44,747,963 | $5,857,812 | $85,622,597 | ($291,496 | ) | ($39,414,626 | ) | $236,595,786 | ||||||||||||||||||||||||
| (1) | Purchase cost excludes distributions received and reinvested, if any. |
| (2) | Distributions received include distributions from net investment income, if any, from the PF Underlying Funds, Pacific Funds Core Income, Pacific Funds Floating Rate Income, Pacific Funds High Income, and/or Pacific FundsSmall-Cap Growth. |
| (3) | Net realized gain (loss) includes capital gains distributions from the PF Underlying Funds, Pacific Funds Core Income, Pacific Funds Floating Rate Income, Pacific Funds High Income, and/or Pacific FundsSmall-Cap Growth, if any. |
| (4) | All shares in the PF Currency Strategies and PF Equity Long/Short Funds were fully redeemed during the fiscal year ended March 31, 2020. |
As of March 31, 2020, Pacific Life owned the following percentages of the total shares outstanding (aggregate of all share classes) of each of the following Funds:
| Fund | Ownership Percentage | |||
Pacific Funds Ultra Short Income | 99.64% | |||
Pacific Funds Diversified Income | 100.00% | |||
Pacific FundsLarge-Cap Value | 39.42% | |||
Pacific FundsSmall-Cap Value | 31.57% | |||
Pacific FundsSmall-Cap Growth | 33.83% | |||
D. INDEPENDENT TRUSTEES
The Trust pays each independent trustee of the Board retainer fees and specified amounts as compensation for various Board and committee services and for chairing those committees. The fees and expenses of the independent trustees of the Board are presented in the Statements of Operations. Each independent trustee of the Board is eligible to participate in the Trust’s Deferred Compensation Plan (the “Plan”). The Plan allows each independent trustee to voluntarily defer receipt of all or a percentage of fees, which otherwise would be payable for services performed. Amounts in the deferral account are obligations of certain Funds of the Trust at the time of such deferral and are payable in accordance with the Plan. A Trustee who defers compensation has the ability to select credit rate options that track the performance, at NAV of Class A and Class P shares of certain series of the Trust without a sales load or at NAV of Class I shares of the Pacific Select Fund.
D-15
Table of Contents
PACIFIC FUNDS
NOTES TO FINANCIAL STATEMENTS (Continued)
Pacific Select Fund is a Delaware statutory trust and is registered under the 1940 Act as anopen-end management investment company. PLFA is the Investment Adviser to Pacific Select Fund. The obligation of certain Funds of the Trust under the Plan (the “DCP Liability”) is recorded as a liability (accrued trustees’ fees and expenses and deferred compensation). Accordingly, the market value appreciation or depreciation on a Fund’s DCP Liability account will cause the expenses of that Fund to increase or decrease due to market fluctuation. The change in net unrealized appreciation or depreciation on a Fund’s DCP Liability account is recorded as an increase or decrease to expenses (trustees’ fees and expenses). For the fiscal year ended March 31, 2020, such expenses decreased by $1,649 for all applicable Funds presented in these financial statements as a result of the market value depreciation on such accounts. As of March 31, 2020, the total amount in the DCP Liability accounts for all applicable Funds presented in these financial statements was $40,631.
E. OFFICERS OF THE TRUST
None of the officers of the Trust received compensation from the Trust.
F. INDEMNIFICATIONS
Under the Trust’s organizational documents, its officers and trustees are indemnified against certain liabilities arising out of performance of their duties to the Trust. In addition, the Trust entered into an agreement with each of the trustees which provides that the Trust will indemnify and hold harmless each trustee against any expenses actually and reasonably incurred by any trustee in any proceeding arising out of or in connection with the trustee’s services to the Trust, to the fullest extent permitted by the Trust’s Declaration of Trust andBy-Laws, the general trust law of the State of Delaware, the Securities Act of 1933, and the 1940 Act, each as now or hereinafter in force. In the normal course of business, the Trust enters into contracts with service providers and others that contain general indemnification clauses. The Trust’s maximum exposure under these arrangements and agreements is dependent on future claims that may be made against the Trust and/or the trustees and, therefore, cannot be estimated; however, based on experience, the risk of loss from such claims is considered remote.
G. INTERFUND TRANSACTIONS
In accordance with Rule17a-7 under the 1940 Act and applicable Trust policies and procedures, purchase and sale transactions may be conducted between a Fund of the Trust and another Fund of the Trust or certain affiliates of the Trust if conducted at the independent “current market price” (the last sales price,intra-day price, or average of highest bid/lowest offer, as applicable) on a commission-free basis with no remuneration paid in connection with the transaction (other than cash payment against prompt delivery). At the quarterly Board meeting subsequent to the purchase and sale transactions taking place, the Board will be asked to determine that the transactions were conducted in compliance with applicable Trust policies and procedures.
For the fiscal year ended March 31, 2020, there were no purchase and sale transactions with an affiliated Fund within the Trust. There were purchase and sale transactions with affiliated funds outside of the Trust, which were transacted at the current market price and conducted in compliance with Rule17a-7 under the 1940 Act.
8. COMMITTED LINE OF CREDIT
The Trust has an unsecured $200,000,000 committed revolving line of credit agreement with a syndicate of banks, which is renewed annually. The committed line of credit applies to Pacific Funds Floating Rate Income only. The interest rate on borrowing under the line of credit agreement is the Federal Funds effective rate, plus 1.20%. Pacific Funds Floating Rate Income paid an upfront fee of 0.025% and pays a commitment fee equal to 0.20% per annum on the daily unused portion of the committed line up to a maximum, including upfront fee, of $450,000. As of March 31, 2020, the actual interest rate on borrowing by the Trust was 2.19%. The commitment fees and interest incurred by Pacific Funds Floating Rate Income are recorded as an expense. During the reporting period, the weighted average interest rate and the average dollar amount of borrowings on the days that Pacific Funds Floating Rate Income had a loan outstanding were 2.13% and $83,894,737, respectively. As of March 31, 2020, Pacific Funds Floating Rate Income had loans outstanding in the amount of $54,000,000.
9. PURCHASES AND SALES OF INVESTMENTS
The cost of purchases and proceeds from sales of investments (excluding short-term investments) for the fiscal year ended March 31, 2020, are summarized in the following table:
| U.S. Government Securities | Other Securities | |||||||||||||||
| Fund | Purchases | Sales | Purchases | Sales | ||||||||||||
| Pacific Funds Portfolio Optimization Conservative | $— | $— | $53,741,787 | $86,421,803 | ||||||||||||
| Pacific Funds Portfolio Optimization Moderate-Conservative | — | — | 70,240,430 | 133,224,046 | ||||||||||||
| Pacific Funds Portfolio Optimization Moderate | — | — | 201,504,336 | 377,421,242 | ||||||||||||
| Pacific Funds Portfolio Optimization Growth | — | — | 152,941,504 | 271,771,393 | ||||||||||||
| Pacific Funds Portfolio Optimization Aggressive-Growth | — | — | 58,029,604 | 85,622,597 | ||||||||||||
| Pacific Funds Ultra Short Income | 2,366,498 | 650,651 | 36,852,454 | 15,324,933 | ||||||||||||
| Pacific Funds Short Duration Income | 117,169,922 | 31,634,414 | 736,885,708 | 487,760,671 | ||||||||||||
| Pacific Funds Core Income | 176,035,625 | 96,137,061 | 741,724,960 | 461,648,074 | ||||||||||||
| Pacific Funds Strategic Income | — | — | 805,082,558 | 652,333,506 | ||||||||||||
| Pacific Funds Floating Rate Income | 495,000 | 497,500 | 1,834,760,053 | 2,285,244,254 | ||||||||||||
| Pacific Funds High Income | — | — | 104,797,335 | 76,535,031 | ||||||||||||
| Pacific Funds Diversified Income | 2,102,447 | 548,142 | 34,690,164 | 7,841,175 | ||||||||||||
| Pacific Funds Large-Cap | — | — | 17,672,334 | 15,418,044 | ||||||||||||
| Pacific Funds Large-Cap Value | — | — | 11,307,666 | 10,199,622 | ||||||||||||
| Pacific Funds Small/Mid-Cap | — | — | 124,492,778 | 156,832,552 | ||||||||||||
| Pacific Funds Small-Cap | — | — | 7,520,046 | 9,443,694 | ||||||||||||
| Pacific Funds Small-Cap Value | — | — | 11,075,035 | 8,090,723 | ||||||||||||
| Pacific Funds Small-Cap Growth | — | — | 7,857,795 | 25,540,779 | ||||||||||||
D-16
Table of Contents
PACIFIC FUNDS
NOTES TO FINANCIAL STATEMENTS (Continued)
10. FEDERAL INCOME TAX INFORMATION
Each Fund intends to qualify each year as a regulated investment company (“RIC”) under Subchapter M of the Internal Revenue Code (the “Code”). A Fund that qualifies as a RIC does not have to pay income tax as long as it distributes sufficient taxable income and net capital gains. Each Fund declared and paid sufficient dividends on net investment income and capital gains distributions during the fiscal year ended March 31, 2020, to qualify as a RIC and is not required to pay Federal income tax under the Code. Accordingly, no provision for Federal income taxes is required in the financial statements. Required distributions are based on net investment income and net realized gains determined in accordance with income tax regulations, which may differ from U.S. GAAP for financial reporting purposes. These differences are primarily due to differing treatments for short-term capital gain distributions received, late year ordinary and post-October capital losses, capital loss carryforwards, and losses deferred due to wash sales. Permanent book and tax differences relating to shareholder distributions will result in reclassifications of capital accounts. In addition, the year in which amounts are distributed may differ from the year in which the net investment income is earned and the net gains are realized by each Fund.
The following table shows the accumulated capital losses and components of distributable earnings on a tax basis, and late year ordinary losses and post-October capital losses deferred, if any, for tax purposes as of March 31, 2020:
| Distributable Earning | Late-Year Ordinary and Post-October Losses Deferrals | |||||||||||||||||||||||||||||||
| Fund | Accumulated Capital Losses | Undistributed Ordinary Income | Undistributed Long-Term Capital Gains | Late-Year Ordinary Losses | Short-Term Capital Losses | Long-Term Capital Losses | Total | |||||||||||||||||||||||||
Pacific Funds Portfolio Optimization Conservative | ($2,102,994 | ) | $576,381 | $— | $— | $— | $— | $— | ||||||||||||||||||||||||
Pacific Funds Portfolio Optimization Moderate-Conservative | — | — | — | 176,141 | 507,944 | — | 684,085 | |||||||||||||||||||||||||
Pacific Funds Portfolio Optimization Moderate | — | 717,405 | 2,628,057 | — | — | — | — | |||||||||||||||||||||||||
Pacific Funds Portfolio Optimization Growth | — | — | 5,155,940 | 1,079,540 | — | — | 1,079,540 | |||||||||||||||||||||||||
Pacific Funds Portfolio Optimization Aggressive-Growth | — | — | — | 490,471 | 1,535,881 | 1,149,743 | 3,176,095 | |||||||||||||||||||||||||
Pacific Funds Ultra Short Income | — | 2,944 | — | — | 17,459 | — | 17,459 | |||||||||||||||||||||||||
Pacific Funds Short Duration Income | (6,444,892 | ) | 234,768 | — | — | — | — | — | ||||||||||||||||||||||||
Pacific Funds Core Income | (21,043,536 | ) | 630,161 | — | — | — | — | — | ||||||||||||||||||||||||
Pacific Funds Strategic Income | (7,307,629 | ) | 714,373 | — | — | — | — | — | ||||||||||||||||||||||||
Pacific Funds Floating Rate Income | (100,945,158 | ) | 932,021 | — | — | — | — | — | ||||||||||||||||||||||||
Pacific Funds High Income | (10,810,422 | ) | 90,864 | — | — | — | — | — | ||||||||||||||||||||||||
Pacific Funds Diversified Income | — | — | — | — | 171,123 | — | 171,123 | |||||||||||||||||||||||||
Pacific FundsLarge-Cap | — | 46,675 | — | — | 363,968 | — | 363,968 | |||||||||||||||||||||||||
Pacific FundsLarge-Cap Value | — | 81,213 | — | — | 377,720 | — | 377,720 | |||||||||||||||||||||||||
Pacific FundsSmall/Mid-Cap | (15,852,377 | ) | 725,132 | — | — | — | — | — | ||||||||||||||||||||||||
Pacific FundsSmall-Cap | (1,220,925 | ) | 8,302 | — | — | — | — | — | ||||||||||||||||||||||||
Pacific FundsSmall-Cap Value | (1,366,170 | ) | 24,400 | — | — | — | — | — | ||||||||||||||||||||||||
Pacific FundsSmall-Cap Growth | (5,342,980 | ) | — | — | 56,300 | — | — | 56,300 | ||||||||||||||||||||||||
Accumulated capital losses represent net capital loss carryovers as of March 31, 2020 that may be available to offset future realized capital gains and thereby reduce future capital gains distributions. The following table shows the amounts of capital loss carryover, if any, by each of the applicable Funds as of March 31, 2020 and capital loss carryover from prior years utilized during the fiscal year ended March 31, 2020:
| Unlimited Period of Net Capital Loss Carryover | Accumulated Capital Loss Carryover | Capital Loss Carryover Utilized During the Year Ended March 31, 2020 | ||||||||||||||
| Fund | Short Term | Long Term | ||||||||||||||
Pacific Funds Portfolio Optimization Conservative | ($538,878 | ) | ($1,564,116 | ) | ($2,102,994 | ) | $— | |||||||||
Pacific Funds Short Duration Income | (2,080,266 | ) | (4,364,626 | ) | (6,444,892 | ) | — | |||||||||
Pacific Funds Core Income | (8,057,999 | ) | (12,985,537 | ) | (21,043,536 | ) | 1,530,658 | |||||||||
Pacific Funds Strategic Income | — | (7,307,629 | ) | (7,307,629 | ) | 2,944,637 | ||||||||||
Pacific Funds Floating Rate Income | (24,711,408 | ) | (76,233,750 | ) | (100,945,158 | ) | — | |||||||||
Pacific Funds High Income | (4,442,718 | ) | (6,367,704 | ) | (10,810,422 | ) | — | |||||||||
Pacific FundsSmall/Mid-Cap | (9,508,347 | ) | (6,344,030 | ) | (15,852,377 | ) | — | |||||||||
Pacific FundsSmall-Cap | (981,546 | ) | (239,379 | ) | (1,220,925 | ) | — | |||||||||
Pacific FundsSmall-Cap Value | (1,366,170 | ) | — | (1,366,170 | ) | — | ||||||||||
Pacific FundsSmall-Cap Growth | (5,209,139 | ) | (133,841 | ) | (5,342,980 | ) | — | |||||||||
D-17
Table of Contents
PACIFIC FUNDS
NOTES TO FINANCIAL STATEMENTS (Continued)
The aggregate cost of investments and the composition of unrealized appreciation and depreciation on investments and net unrealized appreciation and/or depreciation on derivatives for Federal income tax purposes as of March 31, 2020, were as follows:
| Fund | Total Cost of Investments on Tax Basis (1) | Gross Unrealized Appreciation on Investments | Gross Unrealized Depreciation on Investments | Net Appreciation (Depreciation) on Investments | Net Appreciation (Depreciation) on Other (2) | Net Appreciation (Depreciation) | ||||||||||||||||||
Pacific Funds Portfolio Optimization Conservative | $219,653,919 | $6,064,716 | ($11,377,112 | ) | ($5,312,396 | ) | $— | ($5,312,396 | ) | |||||||||||||||
Pacific Funds Portfolio Optimization Moderate-Conservative | 302,569,855 | 6,417,712 | (22,268,862 | ) | (15,851,150 | ) | — | (15,851,150 | ) | |||||||||||||||
Pacific Funds Portfolio Optimization Moderate | 914,945,547 | 43,209,867 | (78,215,092 | ) | (35,005,225 | ) | — | (35,005,225 | ) | |||||||||||||||
Pacific Funds Portfolio Optimization Growth | 706,353,151 | 35,003,349 | (80,922,031 | ) | (45,918,682 | ) | — | (45,918,682 | ) | |||||||||||||||
Pacific Funds Portfolio Optimization Aggressive-Growth | 251,289,988 | 16,314,034 | (31,008,236 | ) | (14,694,202 | ) | — | (14,694,202 | ) | |||||||||||||||
Pacific Funds Ultra Short Income | 25,420,366 | 22,447 | (904,079 | ) | (881,632 | ) | — | (881,632 | ) | |||||||||||||||
Pacific Funds Short Duration Income | 1,046,317,555 | 7,821,591 | (35,048,126 | ) | (27,226,535 | ) | — | (27,226,535 | ) | |||||||||||||||
Pacific Funds Core Income | 971,060,817 | 37,455,741 | (42,358,359 | ) | (4,902,618 | ) | — | (4,902,618 | ) | |||||||||||||||
Pacific Funds Strategic Income | 722,000,502 | 4,886,427 | (87,547,245 | ) | (82,660,818 | ) | (29,359 | ) | (82,690,177 | ) | ||||||||||||||
Pacific Funds Floating Rate Income | 1,305,275,324 | 511,104 | (147,488,414 | ) | (146,977,310 | ) | — | (146,977,310 | ) | |||||||||||||||
Pacific Funds High Income | 151,486,588 | 2,647,080 | (17,718,865 | ) | (15,071,785 | ) | (5,098 | ) | (15,076,883 | ) | ||||||||||||||
Pacific Funds Diversified Income | 28,662,827 | 610,106 | (5,035,440 | ) | (4,425,334 | ) | 151 | (4,425,183 | ) | |||||||||||||||
Pacific FundsLarge-Cap | 19,085,308 | 2,986,862 | (2,305,817 | ) | 681,045 | — | 681,045 | |||||||||||||||||
Pacific FundsLarge-Cap Value | 16,509,658 | 1,678,320 | (2,255,985 | ) | (577,665 | ) | — | (577,665 | ) | |||||||||||||||
Pacific FundsSmall/Mid-Cap | 292,159,392 | 20,233,406 | (69,361,364 | ) | (49,127,958 | ) | — | (49,127,958 | ) | |||||||||||||||
Pacific FundsSmall-Cap | 15,198,213 | 1,025,427 | (3,737,595 | ) | (2,712,168 | ) | — | (2,712,168 | ) | |||||||||||||||
Pacific FundsSmall-Cap Value | 18,409,267 | 560,123 | (4,861,497 | ) | (4,301,374 | ) | — | (4,301,374 | ) | |||||||||||||||
Pacific FundsSmall-Cap Growth | 8,096,466 | 1,211,674 | (2,135,177 | ) | (923,503 | ) | — | (923,503 | ) | |||||||||||||||
| (1) | The difference between the total cost of investments on tax basis and investments, at cost, as presented in the Statements of Assets and Liabilities is primarily due to wash sale loss deferrals. |
| (2) | Other includes net appreciation or depreciation on derivatives, short sales, unfunded loan commitments, and foreign currencies, if any. |
Each Fund recognizes the financial statement effects of a tax position taken or expected to be taken in a tax return when it is more likely than not, based on the technical merits, that the position will be sustained upon examination by the applicable tax authority. Tax positions not deemed to meet themore-likely-than-not threshold would be recorded as a tax liability for unrecognized tax benefits with a corresponding income tax expense. Management has analyzed all open tax years, as defined by the statute of limitations, for all major jurisdictions and has determined that no provision for income tax is required in the financial statements. Each Fund remains subject to examination by Federal and State tax authorities for the returns filed for tax years ended as of and after March 31, 2016.
11. TAX CHARACTER OF DISTRIBUTIONS
The tax character of income and capital gains distributions to shareholders during the fiscal year ended March 31, 2020 and the fiscal year ended March 31, 2019, were as follows:
| For the Year Ended March 31, 2020 | For the Year Ended March 31, 2019 | |||||||||||||||||||||||||||||||
| Fund | Ordinary Income | Long-Term Capital Gains | Return of Capital | Total Distributions | Ordinary Income | Long-Term Capital Gains | Total Distributions | |||||||||||||||||||||||||
Pacific Funds Portfolio Optimization Conservative | $3,809,492 | $474,053 | — | $4,283,545 | $4,642,221 | $23,187,289 | $27,829,510 | |||||||||||||||||||||||||
Pacific Funds Portfolio Optimization Moderate-Conservative | 6,035,647 | 1,191,046 | — | 7,226,693 | 6,200,006 | 57,672,779 | 63,872,785 | |||||||||||||||||||||||||
Pacific Funds Portfolio Optimization Moderate | 14,938,594 | 36,584,051 | — | 51,522,645 | 19,771,780 | 190,255,666 | 210,027,446 | |||||||||||||||||||||||||
Pacific Funds Portfolio Optimization Growth | 12,750,292 | 43,057,923 | — | 55,808,215 | 13,505,156 | 162,160,174 | 175,665,330 | |||||||||||||||||||||||||
Pacific Funds Portfolio Optimization Aggressive-Growth | 4,686,703 | 18,900,961 | — | 23,587,664 | 4,899,802 | 54,028,116 | 58,927,918 | |||||||||||||||||||||||||
Pacific Funds Ultra Short Income | 438,277 | — | — | 438,277 | ||||||||||||||||||||||||||||
Pacific Funds Short Duration Income | 24,211,883 | — | — | 24,211,883 | 13,498,890 | — | 13,498,890 | |||||||||||||||||||||||||
Pacific Funds Core Income | 23,931,961 | — | — | 23,931,961 | 20,673,956 | — | 20,673,956 | |||||||||||||||||||||||||
Pacific Funds Strategic Income | 29,155,007 | — | — | 29,155,007 | 25,561,308 | — | 25,561,308 | |||||||||||||||||||||||||
Pacific Funds Floating Rate Income | 77,305,342 | — | — | 77,305,342 | 89,807,013 | — | 89,807,013 | |||||||||||||||||||||||||
Pacific Funds High Income | 6,829,639 | — | — | 6,829,639 | 3,988,717 | — | 3,988,717 | |||||||||||||||||||||||||
Pacific Funds Diversified Income | 616,011 | — | — | 616,011 | ||||||||||||||||||||||||||||
Pacific FundsLarge-Cap | 188,839 | 50,088 | — | 238,927 | 262,635 | 636,907 | 899,542 | |||||||||||||||||||||||||
Pacific FundsLarge-Cap Value | 278,641 | 1,669,489 | — | 1,948,130 | 468,565 | 1,464,784 | 1,933,349 | |||||||||||||||||||||||||
Pacific FundsSmall/Mid-Cap | 1,472,291 | — | — | 1,472,291 | 23,990 | 6,986,929 | 7,010,919 | |||||||||||||||||||||||||
Pacific FundsSmall-Cap | 50,279 | — | — | 50,279 | 171,014 | 887,627 | 1,058,641 | |||||||||||||||||||||||||
Pacific FundsSmall-Cap Value | 183,746 | — | — | 183,746 | 528,529 | 3,453,991 | 3,982,520 | |||||||||||||||||||||||||
Pacific FundsSmall-Cap Growth | — | — | — | — | 555,700 | 4,368,444 | 4,924,144 | |||||||||||||||||||||||||
D-18
Table of Contents
PACIFIC FUNDS
NOTES TO FINANCIAL STATEMENTS (Continued)
12. RECLASSIFICATION OF ACCOUNTS
During the fiscal year ended March 31, 2020, reclassifications as shown in the following table have been made in each Fund’s capital accounts to report these balances on a tax basis, excluding certain temporary differences, as of March 31, 2020. Additional adjustments may be required in subsequent reporting periods. These reclassifications, which have no impact on the NAV of the Funds, are primarily attributable tonon-deductible expenses, swap income, redesignation of dividends paid, partnerships, defaulted bonds, and short-term capital gains received under Federal tax rules, versus U.S. GAAP. The calculation net investment income per share in the financial highlights excludes these adjustments.
| Fund | Paid-In Capital | Undistributed/ Accumulated Net Investment Income (Loss) | Undistributed/ Accumulated Net Realized Gain (Loss) | |||||||||
Pacific Funds Portfolio Optimization Conservative | $— | $1,004,715 | ($1,004,715) | |||||||||
Pacific Funds Portfolio Optimization Moderate-Conservative | (22) | 1,437,340 | (1,437,318) | |||||||||
Pacific Funds Portfolio Optimization Moderate | — | 3,993,463 | (3,993,463) | |||||||||
Pacific Funds Portfolio Optimization Growth | — | 2,599,262 | (2,599,262) | |||||||||
Pacific Funds Portfolio Optimization Aggressive-Growth | — | 820,755 | (820,755) | |||||||||
Pacific Funds Ultra Short Income | (3,106) | 279 | 2,827 | |||||||||
Pacific Funds Short Duration Income | — | (95,867) | 95,867 | |||||||||
Pacific Funds Core Income | — | (17,542) | 17,542 | |||||||||
Pacific Funds Strategic Income | (381) | (6,622) | 7,003 | |||||||||
Pacific Funds Floating Rate Income | — | — | — | |||||||||
Pacific Funds High Income | (456) | 8,628 | (8,172) | |||||||||
Pacific Funds Diversified Income | (4,233) | 4,954 | (721) | |||||||||
Pacific FundsLarge-Cap | — | (198) | 198 | |||||||||
Pacific FundsLarge-Cap Value | — | (118) | 118 | |||||||||
Pacific FundsSmall/Mid-Cap | (383) | 1,487,181 | (1,486,798) | |||||||||
Pacific FundsSmall-Cap | — | 88,339 | (88,339) | |||||||||
Pacific FundsSmall-Cap Value | — | 103,475 | (103,475) | |||||||||
Pacific FundsSmall-Cap Growth | (182,362) | 182,362 | — | |||||||||
D-19
Table of Contents
PACIFIC FUNDS
NOTES TO FINANCIAL STATEMENTS (Continued)
13. SHARES OF BENEFICIAL INTEREST
Each Fund is authorized to issue an unlimited number of shares of beneficial interest with no par value unless otherwise determined by the trustees of the Board. Changes in shares of beneficial interest of each Fund for the fiscal year or period ended March 31, 2020 and the fiscal year ended March 31, 2019, were as follows:
| Pacific Funds Portfolio Optimization Conservative (1) (2) | Pacific Funds Portfolio Optimization Moderate- Conservative (1) (2) | Pacific Funds Portfolio Optimization Moderate (1) (2) | Pacific Funds Portfolio Optimization Growth (1) (2) | |||||||||||||||||||||||||||||||||||||||||
| Year Ended 3/31/2020 | Year Ended 3/31/2019 | Year Ended 3/31/2020 | Year Ended 3/31/2019 | Year Ended 3/31/2020 | Year Ended 3/31/2019 | Year Ended 3/31/2020 | Year Ended 3/31/2019 | |||||||||||||||||||||||||||||||||||||
Class A | ||||||||||||||||||||||||||||||||||||||||||||
Shares sold | 6,495,722 | 1,597,168 | 7,767,556 | 1,937,860 | 18,537,632 | 5,162,968 | 12,271,667 | 3,767,426 | ||||||||||||||||||||||||||||||||||||
Dividends and distribution reinvested | 324,224 | 1,257,417 | 544,560 | 3,178,474 | 3,374,243 | 9,730,329 | 3,493,220 | 8,167,065 | ||||||||||||||||||||||||||||||||||||
Shares repurchased | (3,817,604 | ) | (3,103,888 | ) | (5,723,129 | ) | (4,994,834 | ) | (14,928,645 | ) | (10,845,624 | ) | (10,132,943 | ) | (7,456,705 | ) | ||||||||||||||||||||||||||||
Converted from Class B shares | 1,355,707 | — | 2,032,245 | — | 6,090,089 | — | 4,316,826 | �� | — | |||||||||||||||||||||||||||||||||||
Converted from Class R shares | — | 420,991 | — | 468,319 | — | 1,861,409 | — | 1,066,096 | ||||||||||||||||||||||||||||||||||||
Net increase (decrease) | 4,358,049 | 171,688 | 4,621,232 | 589,819 | 13,073,319 | 5,909,082 | 9,948,770 | 5,543,882 | ||||||||||||||||||||||||||||||||||||
Beginning shares outstanding | 11,830,609 | 11,658,921 | 18,667,514 | 18,077,695 | 54,354,174 | 48,445,092 | 41,456,527 | 35,912,645 | ||||||||||||||||||||||||||||||||||||
Ending shares outstanding | 16,188,658 | 11,830,609 | 23,288,746 | 18,667,514 | 67,427,493 | 54,354,174 | 51,405,297 | 41,456,527 | ||||||||||||||||||||||||||||||||||||
Class B | ||||||||||||||||||||||||||||||||||||||||||||
Shares sold | 6,011 | 63,288 | — | 26,848 | 17,102 | 64,612 | 12,085 | 46,713 | ||||||||||||||||||||||||||||||||||||
Dividends and distribution reinvested | 235 | 186,621 | — | 476,846 | — | 1,460,526 | — | 1,137,653 | ||||||||||||||||||||||||||||||||||||
Shares repurchased | (274,318 | ) | (825,329 | ) | (581,852 | ) | (994,617 | ) | (1,418,786 | ) | (2,427,834 | ) | (915,455 | ) | (1,701,102 | ) | ||||||||||||||||||||||||||||
Converted to Class A shares | (1,392,882 | ) | — | (2,086,509 | ) | — | (6,218,286 | ) | — | (4,419,822 | ) | — | ||||||||||||||||||||||||||||||||
Net increase (decrease) | (1,660,954 | ) | (575,420 | ) | (2,668,361 | ) | (490,923 | ) | (7,619,970 | ) | (902,696 | ) | (5,323,192 | ) | (516,736 | ) | ||||||||||||||||||||||||||||
Beginning shares outstanding | 1,660,954 | 2,236,374 | 2,668,361 | 3,159,284 | 7,619,970 | 8,522,666 | 5,323,192 | 5,839,928 | ||||||||||||||||||||||||||||||||||||
Ending shares outstanding | — | 1,660,954 | — | 2,668,361 | — | 7,619,970 | — | 5,323,192 | ||||||||||||||||||||||||||||||||||||
Class C | ||||||||||||||||||||||||||||||||||||||||||||
Shares sold | 1,179,580 | 1,043,597 | 621,381 | 960,955 | 1,255,885 | 1,880,807 | 973,016 | 1,424,262 | ||||||||||||||||||||||||||||||||||||
Dividends and distribution reinvested | 56,670 | 1,232,997 | 74,501 | 2,331,644 | 618,266 | 6,244,815 | 642,952 | 4,590,292 | ||||||||||||||||||||||||||||||||||||
Shares repurchased | (7,507,366 | ) | (3,578,110 | ) | (8,742,296 | ) | (4,376,803 | ) | (20,517,810 | ) | (8,912,732 | ) | (13,625,537 | ) | (5,149,545 | ) | ||||||||||||||||||||||||||||
Net increase (decrease) | (6,271,116 | ) | (1,301,516 | ) | (8,046,414 | ) | (1,084,204 | ) | (18,643,659 | ) | (787,110 | ) | (12,009,569 | ) | 865,009 | |||||||||||||||||||||||||||||
Beginning shares outstanding | 11,161,492 | 12,463,008 | 13,079,688 | 14,163,892 | 32,395,173 | 33,182,283 | 21,769,022 | 20,904,013 | ||||||||||||||||||||||||||||||||||||
Ending shares outstanding | 4,890,376 | 11,161,492 | 5,033,274 | 13,079,688 | 13,751,514 | 32,395,173 | 9,759,453 | 21,769,022 | ||||||||||||||||||||||||||||||||||||
Class R | ||||||||||||||||||||||||||||||||||||||||||||
Shares sold | 61,451 | 52,493 | 298,466 | 128,201 | ||||||||||||||||||||||||||||||||||||||||
Dividends and distribution reinvested | 47,513 | 79,531 | 337,098 | 208,360 | ||||||||||||||||||||||||||||||||||||||||
Shares repurchased | (133,625 | ) | (71,303 | ) | (465,670 | ) | (271,319 | ) | ||||||||||||||||||||||||||||||||||||
Converted to Class A shares | (424,537 | ) | (472,409 | ) | (1,870,573 | ) | (1,070,764 | ) | ||||||||||||||||||||||||||||||||||||
Net increase (decrease) | (449,198 | ) | (411,688 | ) | (1,700,679 | ) | (1,005,522 | ) | ||||||||||||||||||||||||||||||||||||
Beginning shares outstanding | 449,198 | 411,688 | 1,700,679 | 1,005,522 | ||||||||||||||||||||||||||||||||||||||||
Ending shares outstanding | — | — | — | — | ||||||||||||||||||||||||||||||||||||||||
Advisor Class | ||||||||||||||||||||||||||||||||||||||||||||
Shares sold | 381,144 | 299,940 | 242,251 | 508,196 | 585,368 | 1,257,594 | 469,064 | 1,022,418 | ||||||||||||||||||||||||||||||||||||
Dividends and distribution reinvested | 17,475 | 79,399 | 13,425 | 102,586 | 107,909 | 418,832 | 97,427 | 356,472 | ||||||||||||||||||||||||||||||||||||
Shares repurchased | (362,084 | ) | (429,827 | ) | (406,495 | ) | (306,020 | ) | (888,951 | ) | (1,054,902 | ) | (724,434 | ) | (910,814 | ) | ||||||||||||||||||||||||||||
Net increase (decrease) | 36,535 | (50,488 | ) | (150,819 | ) | 304,762 | (195,674 | ) | 621,524 | (157,943 | ) | 468,076 | ||||||||||||||||||||||||||||||||
Beginning shares outstanding | 671,680 | 722,168 | 716,525 | 411,763 | 2,237,225 | 1,615,701 | 1,517,938 | 1,049,862 | ||||||||||||||||||||||||||||||||||||
Ending shares outstanding | 708,215 | 671,680 | 565,706 | 716,525 | 2,041,551 | 2,237,225 | 1,359,995 | 1,517,938 | ||||||||||||||||||||||||||||||||||||
D-20
Table of Contents
PACIFIC FUNDS
NOTES TO FINANCIAL STATEMENTS (Continued)
| Pacific Funds Portfolio Optimization Aggressive-Growth (1) (2) | Pacific Funds Ultra Short Income (3) | Pacific Funds Short Duration Income | Pacific Funds Core Income | |||||||||||||||||||||||||||||||||||||||||
| Year Ended 3/31/2020 | Year Ended 3/31/2019 | Year Ended 3/31/2020 | Year Ended 3/31/2019 | Year Ended 3/31/2020 | Year Ended 3/31/2019 | Year Ended 3/31/2020 | Year Ended 3/31/2019 | |||||||||||||||||||||||||||||||||||||
Class A | ||||||||||||||||||||||||||||||||||||||||||||
Shares sold | 3,562,121 | 1,335,888 | 8,970,742 | 6,906,877 | 8,665,893 | 1,795,140 | ||||||||||||||||||||||||||||||||||||||
Dividends and distribution reinvested | 1,308,345 | 2,541,596 | 276,592 | 195,764 | 275,501 | 274,431 | ||||||||||||||||||||||||||||||||||||||
Shares repurchased | (2,887,321 | ) | (1,862,315 | ) | (5,431,153 | ) | (4,760,683 | ) | (3,473,506 | ) | (6,891,164 | ) | ||||||||||||||||||||||||||||||||
Converted from Class B shares | 1,259,139 | — | — | — | — | — | ||||||||||||||||||||||||||||||||||||||
Converted from Class R shares | — | 415,846 | — | — | — | — | ||||||||||||||||||||||||||||||||||||||
Net increase (decrease) | 3,242,284 | 2,431,015 | 3,816,181 | 2,341,958 | 5,467,888 | (4,821,593 | ) | |||||||||||||||||||||||||||||||||||||
Beginning shares outstanding | 13,581,101 | 11,150,086 | 11,543,770 | 9,201,812 | 7,806,798 | 12,628,391 | ||||||||||||||||||||||||||||||||||||||
Ending shares outstanding | 16,823,385 | 13,581,101 | 15,359,951 | 11,543,770 | 13,274,686 | 7,806,798 | ||||||||||||||||||||||||||||||||||||||
Class B | ||||||||||||||||||||||||||||||||||||||||||||
Shares sold | 2,950 | 19,924 | ||||||||||||||||||||||||||||||||||||||||||
Dividends and distribution reinvested | — | 319,371 | ||||||||||||||||||||||||||||||||||||||||||
Shares repurchased | (225,144 | ) | (449,268 | ) | ||||||||||||||||||||||||||||||||||||||||
Converted to Class A shares | (1,302,603 | ) | — | |||||||||||||||||||||||||||||||||||||||||
Net increase (decrease) | (1,524,797 | ) | (109,973 | ) | ||||||||||||||||||||||||||||||||||||||||
Beginning shares outstanding | 1,524,797 | 1,634,770 | ||||||||||||||||||||||||||||||||||||||||||
Ending shares outstanding | — | 1,524,797 | ||||||||||||||||||||||||||||||||||||||||||
Class C | ||||||||||||||||||||||||||||||||||||||||||||
Shares sold | 407,119 | 536,522 | 2,291,836 | 1,561,216 | 1,900,796 | 758,103 | ||||||||||||||||||||||||||||||||||||||
Dividends and distribution reinvested | 239,008 | 1,266,010 | 71,673 | 71,193 | 112,580 | 190,738 | ||||||||||||||||||||||||||||||||||||||
Shares repurchased | (3,633,527 | ) | (1,494,004 | ) | (1,984,227 | ) | (1,482,348 | ) | (4,230,187 | ) | (2,896,942 | ) | ||||||||||||||||||||||||||||||||
Net increase (decrease) | (2,987,400 | ) | 308,528 | 379,282 | 150,061 | (2,216,811 | ) | (1,948,101 | ) | |||||||||||||||||||||||||||||||||||
Beginning shares outstanding | 6,207,765 | 5,899,237 | 4,489,553 | 4,339,492 | 7,726,350 | 9,674,451 | ||||||||||||||||||||||||||||||||||||||
Ending shares outstanding | 3,220,365 | 6,207,765 | 4,868,835 | 4,489,553 | 5,509,539 | 7,726,350 | ||||||||||||||||||||||||||||||||||||||
Class I | ||||||||||||||||||||||||||||||||||||||||||||
Shares sold | 1,250,192 | 5,954,247 | 8,258,360 | 4,083,029 | 2,299,766 | |||||||||||||||||||||||||||||||||||||||
Dividends and distribution reinvested | 21,867 | 252,068 | 98,905 | 121,234 | 48,616 | |||||||||||||||||||||||||||||||||||||||
Shares repurchased | — | (3,709,630 | ) | (671,956 | ) | (1,019,595 | ) | (256,700 | ) | |||||||||||||||||||||||||||||||||||
Net increase (decrease) | 1,272,059 | 2,496,685 | 7,685,309 | 3,184,668 | 2,091,682 | |||||||||||||||||||||||||||||||||||||||
Beginning shares outstanding | — | 8,108,768 | 423,459 | 2,506,427 | 414,745 | |||||||||||||||||||||||||||||||||||||||
Ending shares outstanding | 1,272,059 | 10,605,453 | 8,108,768 | 5,691,095 | 2,506,427 | |||||||||||||||||||||||||||||||||||||||
Class P | ||||||||||||||||||||||||||||||||||||||||||||
Shares sold | 82,318 | 572,904 | ||||||||||||||||||||||||||||||||||||||||||
Dividends and distribution reinvested | 104,194 | 178,230 | ||||||||||||||||||||||||||||||||||||||||||
Shares repurchased | (1,035,481 | ) | (3,271,812 | ) | ||||||||||||||||||||||||||||||||||||||||
Net increase (decrease) | (848,969 | ) | (2,520,678 | ) | ||||||||||||||||||||||||||||||||||||||||
Beginning shares outstanding | 3,841,184 | 6,361,862 | ||||||||||||||||||||||||||||||||||||||||||
Ending shares outstanding | 2,992,215 | 3,841,184 | ||||||||||||||||||||||||||||||||||||||||||
Class R | ||||||||||||||||||||||||||||||||||||||||||||
Shares sold | 67,161 | |||||||||||||||||||||||||||||||||||||||||||
Dividends and distribution reinvested | 79,068 | |||||||||||||||||||||||||||||||||||||||||||
Shares repurchased | (173,616 | ) | ||||||||||||||||||||||||||||||||||||||||||
Converted to Class A shares | (419,559 | ) | ||||||||||||||||||||||||||||||||||||||||||
Net increase (decrease) | (446,946 | ) | ||||||||||||||||||||||||||||||||||||||||||
Beginning shares outstanding | 446,946 | |||||||||||||||||||||||||||||||||||||||||||
Ending shares outstanding | — | |||||||||||||||||||||||||||||||||||||||||||
Advisor Class | ||||||||||||||||||||||||||||||||||||||||||||
Shares sold | 293,957 | 438,835 | 1,303,584 | 74,015,215 | 37,658,195 | 48,237,571 | 20,320,549 | |||||||||||||||||||||||||||||||||||||
Dividends and distribution reinvested | 65,623 | 171,437 | 22,001 | 1,640,194 | 879,181 | 1,148,219 | 890,108 | |||||||||||||||||||||||||||||||||||||
Shares repurchased | (279,435 | ) | (440,195 | ) | (40,210 | ) | (51,140,510 | ) | (18,219,176 | ) | (22,754,430 | ) | (20,984,812 | ) | ||||||||||||||||||||||||||||||
Net increase (decrease) | 80,145 | 170,077 | 1,285,375 | 24,514,899 | 20,318,200 | 26,631,360 | 225,845 | |||||||||||||||||||||||||||||||||||||
Beginning shares outstanding | 759,820 | 589,743 | — | 46,911,396 | 26,593,196 | 37,332,163 | 37,106,318 | |||||||||||||||||||||||||||||||||||||
Ending shares outstanding | 839,965 | 759,820 | 1,285,375 | 71,426,295 | 46,911,396 | 63,963,523 | 37,332,163 | |||||||||||||||||||||||||||||||||||||
D-21
Table of Contents
PACIFIC FUNDS
NOTES TO FINANCIAL STATEMENTS (Continued)
| Pacific Funds Strategic Income | Pacific Funds Floating Rate Income | Pacific Funds High Income | Pacific Funds Diversified Income (3) | |||||||||||||||||||||||||||||||||||||||||
| Year Ended 3/31/2020 | Year Ended 3/31/2019 | Year Ended 3/31/2020 | Year Ended 3/31/2019 | Year Ended 3/31/2020 | Year Ended 3/31/2019 | Year Ended 3/31/2020 | Year Ended 3/31/2019 | |||||||||||||||||||||||||||||||||||||
Class A | ||||||||||||||||||||||||||||||||||||||||||||
Shares sold | 4,914,682 | 2,341,369 | 8,486,582 | 10,387,541 | 601,052 | 318,509 | ||||||||||||||||||||||||||||||||||||||
Dividends and distribution reinvested | 229,703 | 230,963 | 889,857 | 945,317 | 34,793 | 28,421 | ||||||||||||||||||||||||||||||||||||||
Shares repurchased | (3,585,612 | ) | (3,490,755 | ) | (11,440,196 | ) | (11,448,005 | ) | (323,463 | ) | (367,358 | ) | ||||||||||||||||||||||||||||||||
Net increase (decrease) | 1,558,773 | (918,423 | ) | (2,063,757 | ) | (115,147 | ) | 312,382 | (20,428 | ) | ||||||||||||||||||||||||||||||||||
Beginning shares outstanding | 5,800,779 | 6,719,202 | 20,532,300 | 20,647,447 | 513,625 | 534,053 | ||||||||||||||||||||||||||||||||||||||
Ending shares outstanding | 7,359,552 | 5,800,779 | 18,468,543 | 20,532,300 | 826,007 | 513,625 | ||||||||||||||||||||||||||||||||||||||
Class C | ||||||||||||||||||||||||||||||||||||||||||||
Shares sold | 2,962,272 | 1,602,978 | 2,175,673 | 5,608,379 | 49,822 | 70,178 | ||||||||||||||||||||||||||||||||||||||
Dividends and distribution reinvested | 183,388 | 173,947 | 600,424 | 777,998 | 11,465 | 18,823 | ||||||||||||||||||||||||||||||||||||||
Shares repurchased | (2,175,238 | ) | (1,605,346 | ) | (11,051,710 | ) | (5,331,948 | ) | (201,951 | ) | (151,227 | ) | ||||||||||||||||||||||||||||||||
Net increase (decrease) | 970,422 | 171,579 | (8,275,613 | ) | 1,054,429 | (140,664 | ) | (62,226 | ) | |||||||||||||||||||||||||||||||||||
Beginning shares outstanding | 5,542,338 | 5,370,759 | 19,980,038 | 18,925,609 | 370,351 | 432,577 | ||||||||||||||||||||||||||||||||||||||
Ending shares outstanding | 6,512,760 | 5,542,338 | 11,704,425 | 19,980,038 | 229,687 | 370,351 | ||||||||||||||||||||||||||||||||||||||
Class I | ||||||||||||||||||||||||||||||||||||||||||||
Shares sold | 1,394,002 | 266,253 | 23,549,454 | 41,819,219 | 60 | 4,184 | ||||||||||||||||||||||||||||||||||||||
Dividends and distribution reinvested | 49,381 | 21,679 | 1,870,245 | 1,441,669 | 649 | 1,133 | ||||||||||||||||||||||||||||||||||||||
Shares repurchased | (267,743 | ) | (106,987 | ) | (28,551,536 | ) | (22,046,425 | ) | (12,014 | ) | (8,590 | ) | ||||||||||||||||||||||||||||||||
Net increase (decrease) | 1,175,640 | 180,945 | (3,131,837 | ) | 21,214,463 | (11,305 | ) | (3,273 | ) | |||||||||||||||||||||||||||||||||||
Beginning shares outstanding | 545,554 | 364,609 | 50,248,886 | 29,034,423 | 17,534 | 20,807 | ||||||||||||||||||||||||||||||||||||||
Ending shares outstanding | 1,721,194 | 545,554 | 47,117,049 | 50,248,886 | 6,229 | 17,534 | ||||||||||||||||||||||||||||||||||||||
Class P | ||||||||||||||||||||||||||||||||||||||||||||
Shares sold | 27,233 | 228,488 | 3,937,512 | 6,546,223 | ||||||||||||||||||||||||||||||||||||||||
Dividends and distribution reinvested | 108,649 | 270,242 | 611,005 | 335,872 | ||||||||||||||||||||||||||||||||||||||||
Shares repurchased | (2,490,782 | ) | (3,616,047 | ) | (1,959,911 | ) | (2,318,220 | ) | ||||||||||||||||||||||||||||||||||||
Net increase (decrease) | (2,354,900 | ) | (3,117,317 | ) | 2,588,606 | 4,563,875 | ||||||||||||||||||||||||||||||||||||||
Beginning shares outstanding | 3,251,633 | 6,368,950 | 11,355,574 | 6,791,699 | ||||||||||||||||||||||||||||||||||||||||
Ending shares outstanding | 896,733 | 3,251,633 | 13,944,180 | 11,355,574 | ||||||||||||||||||||||||||||||||||||||||
Advisor Class | ||||||||||||||||||||||||||||||||||||||||||||
Shares sold | 34,558,879 | 27,129,988 | 33,194,835 | 64,917,350 | 300,223 | 268,474 | 2,800,000 | |||||||||||||||||||||||||||||||||||||
Dividends and distribution reinvested | 1,726,826 | 1,470,432 | 3,446,801 | 3,974,259 | 26,234 | 14,645 | 62,136 | |||||||||||||||||||||||||||||||||||||
Shares repurchased | (28,779,765 | ) | (23,396,524 | ) | (63,030,625 | ) | (55,606,814 | ) | (310,272 | ) | (163,761 | ) | — | |||||||||||||||||||||||||||||||
Net increase (decrease) | 7,505,940 | 5,203,896 | (26,388,989 | ) | 13,284,795 | 16,185 | 119,358 | 2,862,136 | ||||||||||||||||||||||||||||||||||||
Beginning shares outstanding | 43,041,230 | 37,837,334 | 83,734,806 | 70,450,011 | 363,905 | 244,547 | — | |||||||||||||||||||||||||||||||||||||
Ending shares outstanding | 50,547,170 | 43,041,230 | 57,345,817 | 83,734,806 | 380,090 | 363,905 | 2,862,136 | |||||||||||||||||||||||||||||||||||||
D-22
Table of Contents
PACIFIC FUNDS
NOTES TO FINANCIAL STATEMENTS (Continued)
| Pacific Funds Large Cap (4) (5) | Pacific Funds Large-Cap Value (4) (5) | Pacific Funds Small/Mid-Cap (4) (5) | Pacific Funds Small Cap (4) (5) | |||||||||||||||||||||||||||||||||||||||||
| Year Ended 3/31/2020 | Year Ended 3/31/2019 | Year Ended 3/31/2020 | Year Ended 3/31/2019 | Year Ended 3/31/2020 | Year Ended 3/31/2019 | Year Ended 3/31/2020 | Year Ended 3/31/2019 | |||||||||||||||||||||||||||||||||||||
Class A | ||||||||||||||||||||||||||||||||||||||||||||
Shares sold | 399,621 | 386,615 | 121,213 | 139,398 | 454,542 | 959,599 | 86,023 | 74,585 | ||||||||||||||||||||||||||||||||||||
Dividends and distribution reinvested | 7,595 | 24,568 | 41,021 | 25,810 | 3,558 | 50,979 | 517 | 22,024 | ||||||||||||||||||||||||||||||||||||
Shares repurchased | (160,927 | ) | (191,324 | ) | (95,805 | ) | (65,874 | ) | (626,661 | ) | (1,308,902 | ) | (107,452 | ) | (124,092 | ) | ||||||||||||||||||||||||||||
Converted from Investor Class shares | — | 25,599 | — | 9,042 | — | 381,261 | — | 254,699 | ||||||||||||||||||||||||||||||||||||
Net increase (decrease) | 246,289 | 245,458 | 66,429 | 108,376 | (168,561 | ) | 82,937 | (20,912 | ) | 227,216 | ||||||||||||||||||||||||||||||||||
Beginning shares outstanding | 647,628 | 402,170 | 399,711 | 291,335 | 1,679,582 | 1,596,645 | 411,306 | 184,090 | ||||||||||||||||||||||||||||||||||||
Ending shares outstanding | 893,917 | 647,628 | 466,140 | 399,711 | 1,511,021 | 1,679,582 | 390,394 | 411,306 | ||||||||||||||||||||||||||||||||||||
Class C | ||||||||||||||||||||||||||||||||||||||||||||
Shares sold | 107,673 | 92,449 | 40,821 | 67,413 | 95,408 | 360,736 | 15,340 | 33,490 | ||||||||||||||||||||||||||||||||||||
Dividends and distribution reinvested | 1,143 | 13,973 | 28,181 | 21,776 | — | 38,125 | — | 3,907 | ||||||||||||||||||||||||||||||||||||
Shares repurchased | (113,938 | ) | (82,407 | ) | (101,321 | ) | (152,752 | ) | (419,242 | ) | (258,364 | ) | (26,702 | ) | (24,258 | ) | ||||||||||||||||||||||||||||
Net increase (decrease) | (5,122 | ) | 24,015 | (32,319 | ) | (63,563 | ) | (323,834 | ) | 140,497 | (11,362 | ) | 13,139 | |||||||||||||||||||||||||||||||
Beginning shares outstanding | 314,059 | 290,044 | 320,979 | 384,542 | 1,328,285 | 1,187,788 | 75,580 | 62,441 | ||||||||||||||||||||||||||||||||||||
Ending shares outstanding | 308,937 | 314,059 | 288,660 | 320,979 | 1,004,451 | 1,328,285 | 64,218 | 75,580 | ||||||||||||||||||||||||||||||||||||
Advisor Class | ||||||||||||||||||||||||||||||||||||||||||||
Shares sold | 159,720 | 116,828 | 494,623 | 25,082 | 4,483,757 | 17,674,456 | 154,768 | 445,685 | ||||||||||||||||||||||||||||||||||||
Dividends and distribution reinvested | 7,127 | 33,826 | 98,931 | 130,404 | 97,217 | 446,050 | 3,072 | 59,142 | ||||||||||||||||||||||||||||||||||||
Shares repurchased | (188,562 | ) | (254,493 | ) | (456,957 | ) | (983,832 | ) | (7,251,475 | ) | (6,398,099 | ) | (323,883 | ) | (564,333 | ) | ||||||||||||||||||||||||||||
Net increase (decrease) | (21,715 | ) | (103,839 | ) | 136,597 | (828,346 | ) | (2,670,501 | ) | 11,722,407 | (166,043 | ) | (59,506 | ) | ||||||||||||||||||||||||||||||
Beginning shares outstanding | 548,579 | 652,418 | 896,964 | 1,725,310 | 25,038,994 | 13,316,587 | 1,073,024 | 1,132,530 | ||||||||||||||||||||||||||||||||||||
Ending shares outstanding | 526,864 | 548,579 | 1,033,561 | 896,964 | 22,368,493 | 25,038,994 | 906,981 | 1,073,024 | ||||||||||||||||||||||||||||||||||||
Investor Class | ||||||||||||||||||||||||||||||||||||||||||||
Shares sold | 1 | — | 47,147 | 26,848 | ||||||||||||||||||||||||||||||||||||||||
Dividends and distribution reinvested | — | — | — | — | ||||||||||||||||||||||||||||||||||||||||
Shares repurchased | (11,710 | ) | — | (160,177 | ) | (12,459 | ) | |||||||||||||||||||||||||||||||||||||
Converted to Class A shares | (25,899 | ) | (9,411 | ) | (382,123 | ) | (253,088 | ) | ||||||||||||||||||||||||||||||||||||
Net increase (decrease) | (37,608 | ) | (9,411 | ) | (495,153 | ) | (238,699 | ) | ||||||||||||||||||||||||||||||||||||
Beginning shares outstanding | 37,608 | 9,411 | 495,153 | 238,699 | ||||||||||||||||||||||||||||||||||||||||
Ending shares outstanding | — | — | — | — | ||||||||||||||||||||||||||||||||||||||||
Class R6 | ||||||||||||||||||||||||||||||||||||||||||||
Shares sold | — | 27,885 | 57,938 | 26,017 | 35,711 | 43,496 | 43,519 | 24,159 | ||||||||||||||||||||||||||||||||||||
Dividends and distribution reinvested | 959 | 2,694 | 6,883 | 4,341 | 2,177 | 14,903 | 199 | 2,072 | ||||||||||||||||||||||||||||||||||||
Shares repurchased | (12,565 | ) | (13,797 | ) | (18,933 | ) | (126,709 | ) | (26,796 | ) | (319,577 | ) | (10,347 | ) | (6,013 | ) | ||||||||||||||||||||||||||||
Net increase (decrease) | (11,606 | ) | 16,782 | 45,888 | (96,351 | ) | 11,092 | (261,178 | ) | 33,371 | 20,218 | |||||||||||||||||||||||||||||||||
Beginning shares outstanding | 73,747 | 56,965 | 76,717 | 173,068 | 489,590 | 750,768 | 58,331 | 38,113 | ||||||||||||||||||||||||||||||||||||
Ending shares outstanding | 62,141 | 73,747 | 122,605 | 76,717 | 500,682 | 489,590 | 91,702 | 58,331 | ||||||||||||||||||||||||||||||||||||
D-23
Table of Contents
PACIFIC FUNDS
NOTES TO FINANCIAL STATEMENTS (Continued)
| Pacific Funds Small-Cap Value (4) (5) | Pacific Funds Small-Cap Growth (4) (5) | |||||||||||||||||||
| Year Ended 3/31/2020 | Year Ended 3/31/2019 | Year Ended 3/31/2020 | Year Ended 3/31/2019 | |||||||||||||||||
Class A | ||||||||||||||||||||
Shares sold | 54,584 | 50,481 | 23,446 | 77,662 | ||||||||||||||||
Dividends and distribution reinvested | 1,211 | 20,866 | — | 19,251 | ||||||||||||||||
Shares repurchased | (32,035 | ) | (44,430 | ) | (36,469 | ) | (15,565 | ) | ||||||||||||
Converted from Investor Class shares | — | 16,830 | — | 121,703 | ||||||||||||||||
Net increase (decrease) | 23,760 | 43,747 | (13,023 | ) | 203,051 | |||||||||||||||
Beginning shares outstanding | 142,620 | 98,873 | 261,219 | 58,168 | ||||||||||||||||
Ending shares outstanding | 166,380 | 142,620 | 248,196 | 261,219 | ||||||||||||||||
Class C | ||||||||||||||||||||
Shares sold | 8,774 | 51,115 | 12,981 | 54,538 | ||||||||||||||||
Dividends and distribution reinvested | — | 23,610 | — | 7,132 | ||||||||||||||||
Shares repurchased | (46,057 | ) | (72,522 | ) | (23,805 | ) | (42,292 | ) | ||||||||||||
Net increase (decrease) | (37,283 | ) | 2,203 | (10,824 | ) | 19,378 | ||||||||||||||
Beginning shares outstanding | 144,016 | 141,813 | 82,349 | 62,971 | ||||||||||||||||
Ending shares outstanding | 106,733 | 144,016 | 71,525 | 82,349 | ||||||||||||||||
Class P | ||||||||||||||||||||
Shares sold | 14,769 | 1,061,823 | ||||||||||||||||||
Dividends and distribution reinvested | — | 227,291 | ||||||||||||||||||
Shares repurchased | (1,997,936 | ) | (1,473,699 | ) | ||||||||||||||||
Net increase (decrease) | (1,983,167 | ) | (184,585 | ) | ||||||||||||||||
Beginning shares outstanding | 1,983,167 | 2,167,752 | ||||||||||||||||||
Ending shares outstanding | — | 1,983,167 | ||||||||||||||||||
Advisor Class | ||||||||||||||||||||
Shares sold | 546,781 | 366,798 | 37,148 | 507,082 | ||||||||||||||||
Dividends and distribution reinvested | 13,929 | 290,957 | — | 125,778 | ||||||||||||||||
Shares repurchased | (215,844 | ) | (764,333 | ) | (115,880 | ) | (1,294,013 | ) | ||||||||||||
Net increase (decrease) | 344,866 | (106,578 | ) | (78,732 | ) | (661,153 | ) | |||||||||||||
Beginning shares outstanding | 1,273,169 | 1,379,747 | 437,603 | 1,098,756 | ||||||||||||||||
Ending shares outstanding | 1,618,035 | 1,273,169 | 358,871 | 437,603 | ||||||||||||||||
Investor Class | ||||||||||||||||||||
Shares sold | 3,432 | 15 | ||||||||||||||||||
Dividends and distribution reinvested | — | — | ||||||||||||||||||
Shares repurchased | (703 | ) | — | |||||||||||||||||
Converted to Class A shares | (16,862 | ) | (121,841 | ) | ||||||||||||||||
Net increase (decrease) | (14,133 | ) | (121,826 | ) | ||||||||||||||||
Beginning shares outstanding | 14,133 | 121,826 | ||||||||||||||||||
Ending shares outstanding | — | — | ||||||||||||||||||
Class R6 | ||||||||||||||||||||
Shares sold | 43,667 | 23,929 | — | 41,602 | ||||||||||||||||
Dividends and distribution reinvested | 3,342 | 109,327 | — | 51,992 | ||||||||||||||||
Shares repurchased | (15,200 | ) | (650,921 | ) | (29,345 | ) | (779,220 | ) | ||||||||||||
Net increase (decrease) | 31,809 | (517,665 | ) | (29,345 | ) | (685,626 | ) | |||||||||||||
Beginning shares outstanding | 343,499 | 861,164 | 188,733 | 874,359 | ||||||||||||||||
Ending shares outstanding | 375,308 | 343,499 | 159,388 | 188,733 | ||||||||||||||||
| (1) | Class B shares were converted to Class A shares on July 31, 2019. |
| (2) | Class R shares were converted to Class A shares on March 22, 2019. |
| (3) | See footnote (1) in Financial Highlights from pages C-13 through C-21 for the commencement date of operations of each share class. |
| (4) | Investor Class shares were converted to Class A shares on July 31, 2018. |
| (5) | Class S shares were renamed to Class R6 shares on January 1, 2020. |
D-24
Table of Contents
REPORT OF INDEPENDENT REGISTERED PUBLIC ACCOUNTING FIRM
To the Board of Trustees and Shareholders of
Pacific Funds Series Trust:
Opinion on the Financial Statements and Financial Highlights
We have audited the accompanying statements of assets and liabilities of Pacific FundsSM Portfolio Optimization Conservative, Pacific FundsSM Portfolio Optimization Moderate-Conservative, Pacific FundsSM Portfolio Optimization Moderate, Pacific FundsSM Portfolio Optimization Growth, Pacific FundsSM Portfolio Optimization Aggressive-Growth, Pacific FundsSM Ultra Short Income, Pacific FundsSM Short Duration Income, Pacific FundsSM Core Income, Pacific FundsSM Strategic Income, Pacific FundsSM Floating Rate Income, Pacific FundsSM High Income, Pacific FundsSM Diversified Income, Pacific FundsSMLarge-Cap, Pacific FundsSMLarge-Cap Value, Pacific FundsSMSmall/Mid-Cap, Pacific FundsSMSmall-Cap, Pacific FundsSMSmall-Cap Value, and Pacific FundsSMSmall-Cap Growth (the “Funds”) (eighteen of the funds comprising Pacific Funds Series Trust), including the schedules of investments, as of March 31, 2020; the related statements of operations for the year then ended, the statements of changes in net assets for each of the two years in the period then ended, and the financial highlights for each of the periods indicated in the table below; and the related notes. In our opinion, the financial statements and financial highlights present fairly, in all material respects, the financial position of each of the Funds as of March 31, 2020, and the results of their operations for the year then ended, the changes in their net assets for each of the two years in the period then ended, and the financial highlights for the periods listed in the table below, in conformity with accounting principles generally accepted in the United States of America.
| Individual Fund Comprising the Pacific Funds Series Trust | Financial Highlights | |
| Pacific FundsSM Portfolio Optimization Conservative, Pacific FundsSM Portfolio Optimization Moderate-Conservative, Pacific FundsSM Portfolio Optimization Moderate, Pacific FundsSM Portfolio Optimization Growth, Pacific FundsSM Portfolio Optimization Aggressive-Growth, Pacific FundsSM Short Duration Income, Pacific FundsSM Core Income, Pacific FundsSM Strategic Income, Pacific FundsSM Floating Rate Income, and Pacific FundsSM High Income | For the years ended March 31, 2020, 2019, 2018, 2017, and 2016 | |
| Pacific FundsSMLarge-Cap, Pacific FundsSMSmall/Mid-Cap, Pacific FundsSMSmall-Cap, and Pacific FundsSMSmall-Cap Value | For the years ended March 31, 2020, 2019, 2018, and 2017 and the period from December 1, 2015 through March 31, 2016. | |
| Pacific FundsSMLarge-Cap Value and Pacific FundsSMSmall-Cap Growth | For the years ended March 31, 2020, 2019, 2018, and 2017 and the period from January 11, 2016 (commencement of operations) through March 31, 2016 | |
| Pacific FundsSM Ultra Short Income and Pacific FundsSM Diversified Income | For the period from June 28, 2019 (commencement of operations) through March 31, 2020. |
The financial statements of Pacific FundsSMLarge-Cap, for the period from March 20, 2015 (commencement of operations) through November 30, 2015, Pacific FundsSMSmall/Mid-Cap, Pacific FundsSMSmall-Cap, and Pacific FundsSMSmall-Cap Value, for the period from December 31, 2014 (commencement of operations) through November 30, 2015 were audited by other auditors whose report, dated January 28, 2016, expressed an unqualified opinion on those statements.
Basis for Opinion
These financial statements and financial highlights are the responsibility of the Funds’ management. Our responsibility is to express an opinion on the Funds’ financial statements and financial highlights based on our audits. We are a public accounting firm registered with the Public Company Accounting Oversight Board (United States) (PCAOB) and are required to be independent with respect to the Funds in accordance with the U.S. federal securities laws and the applicable rules and regulations of the Securities and Exchange Commission and the PCAOB.
We conducted our audits in accordance with the standards of the PCAOB. Those standards require that we plan and perform the audit to obtain reasonable assurance about whether the financial statements and financial highlights are free of material misstatement, whether due to error or fraud. The Funds are not required to have, nor were we engaged to perform, an audit of their internal control over financial reporting. As part of our audits we are required to obtain an understanding of internal control over financial reporting but not for the purpose of expressing an opinion on the effectiveness of the Funds’ internal control over financial reporting. Accordingly, we express no such opinion.
Our audits included performing procedures to assess the risks of material misstatement of the financial statements and financial highlights, whether due to error or fraud, and performing procedures that respond to those risks. Such procedures included examining, on a test basis, evidence regarding the amounts and disclosures in the financial statements and financial highlights. Our audits also included evaluating the accounting principles used and significant estimates made by management, as well as evaluating the overall presentation of the financial statements and financial highlights. Our procedures included confirmation of securities owned as of March 31, 2020, by correspondence with the custodian and brokers; when replies were not received from brokers, we performed other auditing procedures. We believe that our audits provide a reasonable basis for our opinion.

Costa Mesa, CA
May 26, 2020
We have served as the auditor of one or more affiliated investment companies of Pacific Funds Series Trust since 1988.
E-1
Table of Contents
PACIFIC FUNDS
(Unaudited)
For corporate shareholders, the percentage of investment income (dividend income and short-term gains, if any) for each of the Funds that qualify for the dividends-received deductions for the year ended March 31, 2020 is as follows:
| Fund | Percentage | |||
Pacific Funds Portfolio Optimization Conservative | 1.89% | |||
Pacific Funds Portfolio Optimization Moderate-Conservative | 5.55% | |||
Pacific Funds Portfolio Optimization Moderate | 9.30% | |||
Pacific Funds Portfolio Optimization Growth | 9.42% | |||
Pacific Funds Portfolio Optimization Aggressive-Growth | 10.52% | |||
Pacific Funds Diversified Income | 40.57% | |||
Pacific FundsLarge-Cap | 100.00% | |||
Pacific FundsLarge-Cap Value | 100.00% | |||
Pacific FundsSmall/Mid-Cap | 100.00% | |||
Pacific FundsSmall-Cap | 100.00% | |||
Pacific FundsSmall-Cap Value | 98.74% | |||
For the year ended March 31, 2020, certain dividends paid by the Funds may be subject to a maximum tax rate of 15%, as provided by the Jobs and Growth Tax Relief Reconciliation Act of 2003. Of the distributions made by the following Funds, the corresponding percentages represent the amount of each distribution which may qualify for the 15% dividend income tax rate.
| Fund | Percentage | |||
Pacific Funds Portfolio Optimization Conservative | 3.86% | |||
Pacific Funds Portfolio Optimization Moderate-Conservative | 13.72% | |||
Pacific Funds Portfolio Optimization Moderate | 21.94% | |||
Pacific Funds Portfolio Optimization Growth | 25.36% | |||
Pacific Funds Portfolio Optimization Aggressive-Growth | 27.27% | |||
Pacific Funds Diversified Income | 58.25% | |||
Pacific FundsLarge-Cap | 100.00% | |||
Pacific FundsLarge-Cap Value | 100.00% | |||
Pacific FundsSmall/Mid-Cap | 100.00% | |||
Pacific FundsSmall-Cap | 100.00% | |||
Pacific FundsSmall-Cap Value | 100.00% | |||
Shareholders should not use the above tax information to prepare their tax returns. The information will be included with your Form 1099 DIV which will be sent to you separately in January 2021. The Funds intend to pass through the maximum allowable percentages to shareholders.
The following Funds designated the listed amounts as long-term capital gains distributions during the year ended March 31, 2020. Distributable long-term gains are based on net realized long-term gains determined on a tax basis and may differ from such amounts for financial reporting purposes.
| Fund | Amount | |||
Pacific Funds Portfolio Optimization Conservative | $474,053 | |||
Pacific Funds Portfolio Optimization Moderate-Conservative | 1,191,046 | |||
Pacific Funds Portfolio Optimization Moderate | 36,584,051 | |||
Pacific Funds Portfolio Optimization Growth | 43,057,923 | |||
Pacific Funds Portfolio Optimization Aggressive-Growth | 18,900,961 | |||
Pacific FundsLarge-Cap | 50,088 | |||
Pacific FundsLarge-Cap Value | 1,669,489 | |||
F-1
Table of Contents
PACIFIC FUNDS
(Unaudited)
We believe it is important for you to understand the impact of fees and expenses regarding your investment. All mutual funds have operating expenses. As a shareholder of a mutual fund, you incur two types of costs: (1) transactions costs such as initial sales charges (loads) on purchase payments and/or contingent deferred sales charges on redemptions; and (2) ongoing costs, which include advisory fees, administration fees, distribution and/or service fees, and other fund expenses. The following example is intended to help you understand your ongoing costs (in dollars) of investing in each fund and to compare these costs with those of other mutual funds. The example is based on an investment of $1,000.00 made at the beginning of the period and held for the entiresix-month period from October 1, 2019 to March 31, 2020.
ACTUAL EXPENSES
The first section of the table for each fund entitled “Actual Fund Return”, provides information about actual account values and actual expenses based on each fund’s actual performance and each fund’s actual expenses, after any applicable fee waivers and expense reimbursements (See Notes 6 and 7B in Notes to Financial Statements). The “Ending Account Value at 03/31/20” column shown is derived from the fund’s actual performance; the “Annualized Expense Ratio” column shows the fund’s actual annualized expense ratio; and the “Expenses Paid During the Period 10/01/19-03/31/20” column shows the dollar amount that would have been paid by you. All the information illustrated in the following table is based on the pastsix-month period from October 1, 2019 to March 31, 2020.
You may use the information in this section, together with the amount you invested, to estimate the expenses that you paid over the period. To do so, for each fund in your account, simply divide that fund’s value by $1,000.00 (for example, an $8,600.00 fund value divided by $1,000.00 = 8.6), then multiply the result by the number given for your fund(s) in the “Expenses Paid During the Period 10/01/19-03/31/20.”
HYPOTHETICAL EXAMPLE FOR COMPARISON PURPOSES
The second section of the table for each fund, entitled “Hypothetical”, provides information about hypothetical account values and hypothetical expenses based on a 5% per year hypothetical rate of return and actual fund’s expenses, after any applicable fee waivers and expense reimbursements (See Notes 6 and 7B in Notes to Financial Statements). It assumes that the fund had an annual 5% rate of return before expenses, but that the expense ratio is unchanged. The hypothetical account values and expenses may not be used to estimate the actual ending account values or expenses you paid for the period.
You may use the hypothetical example information to compare the ongoing costs of investing in the fund compared to other mutual funds. To do so, compare this 5% hypothetical example with the 5% hypothetical examples that appear in the shareholder reports of other mutual funds.
Please note that the expenses shown in the table are meant to highlight your ongoing costs only and do not reflect any transactional costs, such as initial sales charges (loads) or contingent deferred sales charges. Therefore, the second section of the table is useful in comparing ongoing costs only, and will not help you determine the relative total costs of owning different mutual funds. In addition, if these other costs were included, your costs would have been higher.
Beginning Account Value at 10/01/19 | Ending Account Value at 03/31/20 | Annualized Expense Ratio | Expenses Paid During the Period 10/01/19 - 03/31/20 (1) | |||||||||||||
| Pacific Funds Portfolio Optimization Conservative(2) |
| |||||||||||||||
Actual Fund Return | ||||||||||||||||
Class A | $1,000.00 | $942.70 | 0.60% | $2.91 | ||||||||||||
Class C | 1,000.00 | 939.80 | 1.35% | 6.55 | ||||||||||||
Advisor Class | 1,000.00 | 944.50 | 0.35% | 1.70 | ||||||||||||
Hypothetical | ||||||||||||||||
Class A | $1,000.00 | $1,022.00 | 0.60% | $3.03 | ||||||||||||
Class C | 1,000.00 | 1,018.25 | 1.35% | 6.81 | ||||||||||||
Advisor Class | 1,000.00 | 1,023.25 | 0.35% | 1.77 | ||||||||||||
| Pacific Funds Portfolio Optimization Moderate-Conservative(2) |
| |||||||||||||||
Actual Fund Return | ||||||||||||||||
Class A | $1,000.00 | $913.10 | 0.60% | $2.87 | ||||||||||||
Class C | 1,000.00 | 909.80 | 1.35% | 6.45 | ||||||||||||
Advisor Class | 1,000.00 | 914.10 | 0.35% | 1.67 | ||||||||||||
Hypothetical | ||||||||||||||||
Class A | $1,000.00 | $1,022.00 | 0.60% | $3.03 | ||||||||||||
Class C | 1,000.00 | 1,018.25 | 1.35% | 6.81 | ||||||||||||
Advisor Class | 1,000.00 | 1,023.25 | 0.35% | 1.77 | ||||||||||||
| Pacific Funds Portfolio Optimization Moderate(2) |
| |||||||||||||||
Actual Fund Return | ||||||||||||||||
Class A | $1,000.00 | $888.40 | 0.60% | $2.83 | ||||||||||||
Class C | 1,000.00 | 885.00 | 1.35% | 6.36 | ||||||||||||
Advisor Class | 1,000.00 | 888.70 | 0.35% | 1.65 | ||||||||||||
Hypothetical | ||||||||||||||||
Class A | $1,000.00 | $1,022.00 | 0.60% | $3.03 | ||||||||||||
Class C | 1,000.00 | 1,018.25 | 1.35% | 6.81 | ||||||||||||
Advisor Class | 1,000.00 | 1,023.25 | 0.35% | 1.77 | ||||||||||||
| Pacific Funds Portfolio Optimization Growth(2) |
| |||||||||||||||
Actual Fund Return | ||||||||||||||||
Class A | $1,000.00 | $851.50 | 0.60% | $2.78 | ||||||||||||
Class C | 1,000.00 | 849.20 | 1.35% | 6.24 | ||||||||||||
Advisor Class | 1,000.00 | 853.00 | 0.35% | 1.62 | ||||||||||||
Hypothetical | ||||||||||||||||
Class A | $1,000.00 | $1,022.00 | 0.60% | $3.03 | ||||||||||||
Class C | 1,000.00 | 1,018.25 | 1.35% | 6.81 | ||||||||||||
Advisor Class | 1,000.00 | 1,023.25 | 0.35% | 1.77 | ||||||||||||
| Pacific Funds Portfolio Optimization Aggressive-Growth(2) |
| |||||||||||||||
Actual Fund Return | ||||||||||||||||
Class A | $1,000.00 | $828.50 | 0.60% | $2.74 | ||||||||||||
Class C | 1,000.00 | 825.10 | 1.35% | 6.16 | ||||||||||||
Advisor Class | 1,000.00 | 830.00 | 0.35% | 1.60 | ||||||||||||
Hypothetical | ||||||||||||||||
Class A | $1,000.00 | $1,022.00 | 0.60% | $3.03 | ||||||||||||
Class C | 1,000.00 | 1,018.25 | 1.35% | 6.81 | ||||||||||||
Advisor Class | 1,000.00 | 1,023.25 | 0.35% | 1.77 | ||||||||||||
| Pacific Funds Ultra Short Income |
| |||||||||||||||
Actual Fund Return | ||||||||||||||||
Class I | $1,000.00 | $974.90 | 0.32% | $1.58 | ||||||||||||
Advisor Class | 1,000.00 | 974.90 | 0.32% | 1.58 | ||||||||||||
Hypothetical | ||||||||||||||||
Class I | $1,000.00 | $1,023.40 | 0.32% | $1.62 | ||||||||||||
Advisor Class | 1,000.00 | 1,023.40 | 0.32% | 1.62 | ||||||||||||
See explanation of references on page F-4
F-2
Table of Contents
PACIFIC FUNDS
DISCLOSURE OF FUND EXPENSES (Continued)
(Unaudited)
Beginning Account Value at 10/01/19 | Ending Account Value at 03/31/20 | Annualized Expense Ratio | Expenses Paid During the Period 10/01/19 - 03/31/20 (1) | |||||||||||||
| Pacific Funds Short Duration Income |
| |||||||||||||||
Actual Fund Return | ||||||||||||||||
Class A | $1,000.00 | $973.90 | 0.75% | $3.70 | ||||||||||||
Class C | 1,000.00 | 970.20 | 1.50% | 7.39 | ||||||||||||
Class I | 1,000.00 | 975.10 | 0.50% | 2.47 | ||||||||||||
Advisor Class | 1,000.00 | 975.10 | 0.50% | 2.47 | ||||||||||||
Hypothetical | ||||||||||||||||
Class A | $1,000.00 | $1,021.25 | 0.75% | $3.79 | ||||||||||||
Class C | 1,000.00 | 1,017.50 | 1.50% | 7.57 | ||||||||||||
Class I | 1,000.00 | 1,022.50 | 0.50% | 2.53 | ||||||||||||
Advisor Class | 1,000.00 | 1,022.50 | 0.50% | 2.53 | ||||||||||||
| Pacific Funds Core Income |
| |||||||||||||||
Actual Fund Return | ||||||||||||||||
Class A | $1,000.00 | $979.20 | 0.85% | $4.21 | ||||||||||||
Class C | 1,000.00 | 975.60 | 1.60% | 7.90 | ||||||||||||
Class I | 1,000.00 | 980.70 | 0.55% | 2.72 | ||||||||||||
Class P | 1,000.00 | 980.80 | 0.55% | 2.72 | ||||||||||||
Advisor Class | 1,000.00 | 980.70 | 0.55% | 2.72 | ||||||||||||
Hypothetical | ||||||||||||||||
Class A | $1,000.00 | $1,020.75 | 0.85% | $4.29 | ||||||||||||
Class C | 1,000.00 | 1,017.00 | 1.60% | 8.07 | ||||||||||||
Class I | 1,000.00 | 1,022.25 | 0.55% | 2.78 | ||||||||||||
Class P | 1,000.00 | 1,022.25 | 0.55% | 2.78 | ||||||||||||
Advisor Class | 1,000.00 | 1,022.25 | 0.55% | 2.78 | ||||||||||||
| Pacific Funds Strategic Income |
| |||||||||||||||
Actual Fund Return | ||||||||||||||||
Class A | $1,000.00 | $907.20 | 0.95% | $4.53 | ||||||||||||
Class C | 1,000.00 | 903.80 | 1.65% | 7.85 | ||||||||||||
Class I | 1,000.00 | 908.90 | 0.65% | 3.10 | ||||||||||||
Advisor Class | 1,000.00 | 908.40 | 0.70% | 3.34 | ||||||||||||
Hypothetical | ||||||||||||||||
Class A | $1,000.00 | $1,020.25 | 0.95% | $4.80 | ||||||||||||
Class C | 1,000.00 | 1,016.75 | 1.65% | 8.32 | ||||||||||||
Class I | 1,000.00 | 1,021.75 | 0.65% | 3.29 | ||||||||||||
Advisor Class | 1,000.00 | 1,021.50 | 0.70% | 3.54 | ||||||||||||
| Pacific Funds Floating Rate Income |
| |||||||||||||||
Actual Fund Return | ||||||||||||||||
Class A | $1,000.00 | $906.90 | 1.03% | $4.91 | ||||||||||||
Class C | 1,000.00 | 903.90 | 1.73% | 8.23 | ||||||||||||
Class I | 1,000.00 | 908.50 | 0.73% | 3.48 | ||||||||||||
Class P | 1,000.00 | 908.60 | 0.73% | 3.48 | ||||||||||||
Advisor Class | 1,000.00 | 908.50 | 0.78% | 3.72 | ||||||||||||
Hypothetical | ||||||||||||||||
Class A | $1,000.00 | $1,019.85 | 1.03% | $5.20 | ||||||||||||
Class C | 1,000.00 | 1,016.35 | 1.73% | 8.72 | ||||||||||||
Class I | 1,000.00 | 1,021.35 | 0.73% | 3.69 | ||||||||||||
Class P | 1,000.00 | 1,021.35 | 0.73% | 3.69 | ||||||||||||
Advisor Class | 1,000.00 | 1,021.10 | 0.78% | 3.94 | ||||||||||||
Beginning Account Value at 10/01/19 | Ending Account Value at 03/31/20 | Annualized Expense Ratio | Expenses Paid During the Period 10/01/19 - 03/31/20 (1) | |||||||||||||
| Pacific Funds High Income |
| |||||||||||||||
Actual Fund Return | ||||||||||||||||
Class A | $1,000.00 | $877.20 | 0.95% | $4.46 | ||||||||||||
Class C | 1,000.00 | 874.00 | 1.65% | 7.73 | ||||||||||||
Class I | 1,000.00 | 879.10 | 0.70% | 3.29 | ||||||||||||
Class P | 1,000.00 | 878.00 | 0.70% | 3.29 | ||||||||||||
Advisor Class | 1,000.00 | 878.40 | 0.70% | 3.29 | ||||||||||||
Hypothetical | ||||||||||||||||
Class A | $1,000.00 | $1,020.25 | 0.95% | $4.80 | ||||||||||||
Class C | 1,000.00 | 1,016.75 | 1.65% | 8.32 | ||||||||||||
Class I | 1,000.00 | 1,021.50 | 0.70% | 3.54 | ||||||||||||
Class P | 1,000.00 | 1,021.50 | 0.70% | 3.54 | ||||||||||||
Advisor Class | 1,000.00 | 1,021.50 | 0.70% | 3.54 | ||||||||||||
| Pacific Funds Diversified Income |
| |||||||||||||||
Actual Fund Return | ||||||||||||||||
Advisor Class | $1,000.00 | $848.60 | 0.45% | $2.08 | ||||||||||||
Hypothetical | ||||||||||||||||
Advisor Class | $1,000.00 | $1,022.75 | 0.45% | $2.28 | ||||||||||||
| Pacific Funds Large-Cap (3) |
| |||||||||||||||
Actual Fund Return | ||||||||||||||||
Class A | $1,000.00 | $864.60 | 0.90% | $4.20 | ||||||||||||
Class C | 1,000.00 | 861.20 | 1.65% | 7.68 | ||||||||||||
Advisor Class | 1,000.00 | 865.40 | 0.65% | 3.03 | ||||||||||||
Class R6 | 1,000.00 | 865.90 | 0.55% | 2.57 | ||||||||||||
Hypothetical | ||||||||||||||||
Class A | $1,000.00 | $1,020.50 | 0.90% | $4.55 | ||||||||||||
Class C | 1,000.00 | 1,016.75 | 1.65% | 8.32 | ||||||||||||
Advisor Class | 1,000.00 | 1,021.75 | 0.65% | 3.29 | ||||||||||||
Class R6 | 1,000.00 | 1,022.25 | 0.55% | 2.78 | ||||||||||||
| Pacific Funds Large-Cap Value (3) |
| |||||||||||||||
Actual Fund Return | ||||||||||||||||
Class A | $1,000.00 | $799.60 | 1.00% | $4.50 | ||||||||||||
Class C | 1,000.00 | 796.50 | 1.75% | 7.86 | ||||||||||||
Advisor Class | 1,000.00 | 801.50 | 0.75% | 3.38 | ||||||||||||
Class R6 | 1,000.00 | 800.80 | 0.65% | 2.93 | ||||||||||||
Hypothetical | ||||||||||||||||
Class A | $1,000.00 | $1,020.00 | 1.00% | $5.05 | ||||||||||||
Class C | 1,000.00 | 1,016.25 | 1.75% | 8.82 | ||||||||||||
Advisor Class | 1,000.00 | 1,021.25 | 0.75% | 3.79 | ||||||||||||
Class R6 | 1,000.00 | 1,021.75 | 0.65% | 3.29 | ||||||||||||
| Pacific Funds Small/Mid-Cap(3) |
| |||||||||||||||
Actual Fund Return | ||||||||||||||||
Class A | $1,000.00 | $732.40 | 1.20% | $5.20 | ||||||||||||
Class C | 1,000.00 | 729.90 | 1.95% | 8.43 | ||||||||||||
Advisor Class | 1,000.00 | 732.70 | 0.95% | 4.12 | ||||||||||||
Class R6 | 1,000.00 | 733.20 | 0.90% | 3.90 | ||||||||||||
Hypothetical | ||||||||||||||||
Class A | $1,000.00 | $1,019.00 | 1.20% | $6.06 | ||||||||||||
Class C | 1,000.00 | 1,015.25 | 1.95% | 9.82 | ||||||||||||
Advisor Class | 1,000.00 | 1,020.25 | 0.95% | 4.80 | ||||||||||||
Class R6 | 1,000.00 | 1,020.50 | 0.90% | 4.55 | ||||||||||||
| See explanation of references on page F-4 |
F-3
Table of Contents
PACIFIC FUNDS
DISCLOSURE OF FUND EXPENSES (Continued)
(Unaudited)
Beginning Account Value at 10/01/19 | Ending Account Value at 03/31/20 | Annualized Expense Ratio | Expenses Paid During the Period 10/01/19 - 03/31/20 (1) | |||||||||||||
| Pacific Funds Small-Cap(3) |
| |||||||||||||||
Actual Fund Return | ||||||||||||||||
Class A | $1,000.00 | $717.30 | 1.20% | $5.15 | ||||||||||||
Class C | 1,000.00 | 715.00 | 1.95% | 8.36 | ||||||||||||
Advisor Class | 1,000.00 | 718.60 | 0.95% | 4.08 | ||||||||||||
Class R6 | 1,000.00 | 719.10 | 0.90% | 3.87 | ||||||||||||
Hypothetical | ||||||||||||||||
Class A | $1,000.00 | $1,019.00 | 1.20% | $6.06 | ||||||||||||
Class C | 1,000.00 | 1,015.25 | 1.95% | 9.82 | ||||||||||||
Advisor Class | 1,000.00 | 1,020.25 | 0.95% | 4.80 | ||||||||||||
Class R6 | 1,000.00 | 1,020.50 | 0.90% | 4.55 | ||||||||||||
| Pacific Funds Small-Cap Value(3) |
| |||||||||||||||
Actual Fund Return | ||||||||||||||||
Class A | $1,000.00 | $655.50 | 1.20% | $4.97 | ||||||||||||
Class C | 1,000.00 | 653.70 | 1.95% | 8.06 | ||||||||||||
Advisor Class | 1,000.00 | 656.30 | 0.95% | 3.93 | ||||||||||||
Class R6 | 1,000.00 | 656.70 | 0.90% | 3.73 | ||||||||||||
Hypothetical | ||||||||||||||||
Class A | $1,000.00 | $1,019.00 | 1.20% | $6.06 | ||||||||||||
Class C | 1,000.00 | 1,015.25 | 1.95% | 9.82 | ||||||||||||
Advisor Class | 1,000.00 | 1,020.25 | 0.95% | 4.80 | ||||||||||||
Class R6 | 1,000.00 | 1,020.50 | 0.90% | 4.55 | ||||||||||||
Beginning Account Value at 10/01/19 | Ending Account Value at 03/31/20 | Annualized Expense Ratio | Expenses Paid During the Period 10/01/19 - 03/31/20 (1) | |||||||||||||
| Pacific Funds Small-Cap Growth(3) |
| |||||||||||||||
Actual Fund Return | ||||||||||||||||
Class A | $ 1,000.00 | $ 750.00 | 1.15% | $5.03 | ||||||||||||
Class C | 1,000.00 | 746.80 | 1.95% | 8.52 | ||||||||||||
Advisor Class | 1,000.00 | 750.20 | 0.95% | 4.16 | ||||||||||||
Class R6 | 1,000.00 | 751.10 | 0.80% | 3.50 | ||||||||||||
Hypothetical | ||||||||||||||||
Class A | $1,000.00 | $1,019.25 | 1.15% | $5.81 | ||||||||||||
Class C | 1,000.00 | 1,015.25 | 1.95% | 9.82 | ||||||||||||
Advisor Class | 1,000.00 | 1,020.25 | 0.95% | 4.80 | ||||||||||||
Class R6 | 1,000.00 | 1,021.00 | 0.80% | 4.04 | ||||||||||||
| (1) | Expenses paid during the period are equal to the fund’s annualized expense ratio (shown in table above), multiplied by the average account value over the period, multiplied by the number of days in the most recent fiscal half-year or applicable period, then divided by 366 days. |
| (2) | The annualized expense ratios for the Portfolio Optimization Funds do not include fees and expenses of their respective PF Underlying Funds and the Class P shares of Pacific Funds Core Income, Pacific Funds Floating Rate Income, Pacific Funds High Income, and Pacific Funds Small-Cap Growth in which the Portfolio Optimization Funds invest (see Note 1 in Notes to Financial Statements). |
| (3) | Class S shares were renamed to Class R6 shares on January 1, 2020. |
F-4
Table of Contents
PACIFIC FUNDS
TRUSTEES AND OFFICERS INFORMATION
(Unaudited)
The business and affairs of the Pacific Funds Series Trust (which may be referred to as “Pacific Funds” or the “Trust”) are managed under the direction of the Board of Trustees under the Declaration of Trust. Information pertaining to the trustees and officers of the Trust is set forth below. Trustees who are not deemed to be “interested persons” of the Trust, as defined in the 1940 Act, are referred to as “Independent Trustees.” Certain trustees and officers are deemed to be “interested persons” of the Trust and thus are referred to as “Interested Persons”, because of their positions with Pacific Life Insurance Company (“Pacific Life”) and Pacific Life Fund Advisors LLC, a wholly-owned subsidiary of Pacific Life. The Trust’s Statement of Additional Information includes additional information about the trustees. For information on availability of the Trust’s Statement of Additional Information, refer to the WHERE TO GO FOR MORE INFORMATION section of this report.
The address of each trustee and officer is c/o Pacific Funds Series Trust, 700 Newport Center Drive, Newport Beach, CA 92660.
Name and Age | Position(s) with the Fund and Length of Time Served* | Current Directorship(s) Held and Principal Occupation(s) (and certain additional occupation information) During Past 5 years | Number of Funds in Fund Complex Overseen** | |||
INDEPENDENT TRUSTEES | ||||||
Gale K. Caruso Year of birth 1957 | Trustee since 1/01/06 | Trustee (1/06 to present) of Pacific Select Fund; Independent Trustee (2/15 to present) of Matthews Asia Funds.
Formerly: Member of the Board of Directors of LandAmerica Financial Group, Inc.; President and Chief Executive Officer of Zurich Life; Chairman, President and Chief Executive Officer of Scudder Canada Investor Services, Ltd.; Managing Director of Scudder Kemper Investments; Member of the Advisory Council to the Trust for Public Land in Maine; Member of the Board of Directors ofMake-A-Wish of Maine. | 85 | |||
Andrew J. Iseman Year of birth 1964 | Trustee since 6/10/19 | Trustee (3/19 to present) of Pacific Select Fund; Consultant (3/19 to 6/19) to the Trust; Chief Executive Officer (8/10 to 9/18) and Senior Adviser (10/18 to 1/19) of Scout Investments; President (11/10 to 11/17) of Scout Funds; Interested Trustee (4/13 to 11/17) of Scout Funds. | 85 | |||
Paul A. Keller Year of birth 1954 | Trustee since 6/20/16 | Trustee (6/16 to present) of Pacific Select Fund; Consultant to the Trust and Pacific Select Fund (11/15 to 6/16); Independent Trustee (8/10 to present) of Fenimore Asset Management Trust (FAM Funds); Business Consultant (7/10 to present) (sole proprietor); Certified Public Accountant in New York (1982 to present).
Formerly: Partner of PricewaterhouseCoopers LLP; Partner of McGladrey & Pullen LLP; Adjunct Professor of Accounting (2011 to 2015), SUNY College at Old Westbury; Interim Chief Financial Officer (2014 to 2015) of The Leon Levy Foundation. | 85 | |||
Lucie H. Moore Year of birth 1956 | Trustee since 6/13/01 | Trustee (10/98 to present) of Pacific Select Fund; Member of the Board of Trustees (2014 to present) of Azusa Pacific University; Member of the Board of Trustees (2016 to present) of Pacifica Christian High School Orange County.
Formerly: Partner of Gibson, Dunn & Crutcher (Law); Member of the Board of Trustees of Sage Hill School; Member of the Board of Trustees of The Pegasus School; and Member of the Advisory Board of Court Appointed Special Advocates (CASA) of Orange County. | 85 | |||
Nooruddin (Rudy) Veerjee Year of birth 1958 | Trustee since 9/13/05 | Trustee (1/05 to present) of Pacific Select Fund.
Formerly: President of Transamerica Insurance and Investment Group; President of Transamerica Asset Management; Chairman and Chief Executive Officer of Transamerica Premier Funds (Mutual Fund); and Director of various Transamerica Life Companies. | 85 | |||
F-5
Table of Contents
PACIFIC FUNDS
TRUSTEES AND OFFICERS INFORMATION (Continued)
(Unaudited)
Name and Age | Position(s) with the Fund and Length of Time Served* | Current Directorship(s) Held and Principal Occupation(s) During Past 5 years | Number of Funds in Fund Complex Overseen** | |||||
INTERESTED PERSONS | ||||||||
James T. Morris Year of birth 1960 | Chairman of the Board and Trustee since 1/11/07 | Director (4/07 to present), Chairman (5/08 to present), Chief Executive Officer (4/07 to present) and President (1/16 to present) of Pacific Mutual Holding Company and Pacific LifeCorp; Director (4/07 to present), Chairman (5/08 to present), Chief Executive Officer (4/07 to present) and President (1/16 to present) of Pacific Life; Chief Executive Officer (5/07 to 10/15) of Pacific Life Fund Advisors LLC; Director (4/16 to present) of Edison International (a public utility holding company); and Chairman of the Board and Trustee (1/07 to present) of Pacific Select Fund. | 85 | |||||
Adrian S. Griggs Year of birth 1966 | Chief Executive Officer since 1/01/18 | Chief Operating Officer (1/17 to present), Executive Vice President (4/12 to present) and Chief Financial Officer (4/12 to 2/17) of Pacific Mutual Holding Company and Pacific LifeCorp; Chief Operating Officer (1/17 to present), Executive Vice President (4/12 to present), Chief Financial Officer (4/12 to 2/17) and Director (1/16 to present) of Pacific Life; Chief Financial Officer (4/12 to 10/15) and Executive Vice President (4/12 to 10/15) of Pacific Life Fund Advisors LLC; Chief Executive Officer (1/15 to present) of Pacific Select Distributors, LLC; and Chief Executive Officer (1/18 to present) of Pacific Select Fund. | 85 | |||||
Howard T. Hirakawa Year of birth 1962 | Senior Vice President since 12/10/14 | Senior Vice President (4/14 to present), Vice President (5/07 to 3/14) of Pacific Life Fund Advisors LLC; and Senior Vice President (12/14 to present) of Pacific Select Fund. | 85 | |||||
Robin S. Yonis Year of birth 1954 | Vice President and General Counsel since 6/13/01 and Assistant Secretary since 9/17/15 | Vice President, Fund Advisor General Counsel and Assistant Secretary (5/07 to present) of Pacific Life Fund Advisors LLC; and Vice President and General Counsel (4/05 to present) and Assistant Secretary (9/15 to present) of Pacific Select Fund. | 85 | |||||
Sharon E. Pacheco Year of birth 1957 | Vice President and Chief Compliance & Ethics Officer since 6/04/04 | Vice President and Chief Compliance & Ethics Officer (11/03 to present) of Pacific Mutual Holding Company and Pacific LifeCorp; Vice President (2/00 to present) and Chief Compliance Officer (1/03 to present) of Pacific Life; Vice President and Chief Compliance Officer (5/07 to present) of Pacific Life Fund Advisors LLC; and Vice President and Chief Compliance Officer (6/04 to present) of Pacific Select Fund. | 85 | |||||
Jane M. Guon Year of birth 1964 | Vice President and Secretary since 1/01/11 | Vice President and Secretary (1/11 to present) of Pacific Mutual Holding Company, Pacific LifeCorp and Pacific Life; Director (1/11 to 3/17) of Pacific Life; Vice President and Secretary (1/11 to present) of Pacific Life Fund Advisors LLC; Vice President and Secretary (1/11 to present) of Pacific Select Distributors, LLC; and Vice President and Secretary (1/11 to present) of Pacific Select Fund. | 85 | |||||
Laurene E. MacElwee Year of birth 1966 | Vice President since 4/04/05 and Assistant Secretary since 6/13/01 | Vice President (4/11 to present) and Assistant Secretary (5/07 to present) of Pacific Life Fund Advisors LLC; and Vice President (12/11 to present), Assistant Secretary (4/05 to present) of Pacific Select Fund. | 85 | |||||
Carleton J. Muench Year of birth 1973 | Vice President since 11/30/06 | Vice President (4/14 to present) of Pacific Life Fund Advisors LLC; and Vice President (12/14 to present) and Assistant Vice President (11/06 to 12/14) of Pacific Select Fund. | 85 | |||||
F-6
Table of Contents
PACIFIC FUNDS
TRUSTEES AND OFFICERS INFORMATION (Continued)
(Unaudited)
Name and Age | Position(s) with the Fund and Length of Time Served* | Current Directorship(s) Held and Principal Occupation(s) During Past 5 years | Number of Funds in Fund Complex Overseen** | |||
INTERESTED PERSONS (Continued) | ||||||
Trevor T. Smith Year of birth 1975 | Vice President since 3/23/16 and Treasurer since 4/01/18 | Assistant Vice President (1/17 to present) and Director of Variable Products Accounting (4/09 to 12/16) of Pacific Life; Assistant Vice President (3/16 to present), Treasurer (4/18 to present) and Assistant Treasurer (3/16 to 3/18) of Pacific Select Fund. | 85 | |||
Bonnie J. Boyle Year of birth 1974 | Vice President and Assistant Treasurer since 1/1/20 | Director (6/17 to present) and Accounting Manager (7/13 to 5/17) of Pacific Life; Assistant Vice President and Assistant Treasurer (1/20 to present) of Pacific Select Fund. | 85 | |||
Kevin W. Steiner Year of birth 1975 | Vice President since 1/01/13 | Assistant Vice President (4/12 to present) of Pacific Life Fund Advisors LLC; and Assistant Vice President (1/13 to present) of Pacific Select Fund. | 85 | |||
Audrey L. Cheng Year of birth 1975 | Vice President since 12/11/13 and Assistant Secretary since 1/1/20 | Assistant Vice President (9/11 to present) of Pacific Life; Assistant Vice President (12/13 to present) and Assistant Secretary (1/20) of Pacific Select Fund. | 85 | |||
| * | A trustee serves until he or she resigns, retires, or his or her successor is elected and qualified. |
| ** | As of March 31, 2020, the “Fund Complex” consisted of Pacific Select Fund (52 funds) and Pacific Funds (33 funds). |
F-7
Table of Contents
PACIFIC FUNDS
STATEMENT REGARDING LIQUIDITY RISK MANAGEMENT PROGRAM
(Unaudited)
The Trust has adopted a liquidity risk management program (the “Program”). The Trust’s Board of Trustees (the “Board”) has designated the Liquidity Oversight Committee (the “Committee”) of Pacific Life Fund Advisors LLC (the “Investment Adviser”) as the administrator of the Program. Personnel of the Investment Adviser conduct the day-to-day operation of the Program pursuant to policies and procedures administered by the Committee.
Under the Program, the Committee manages the liquidity risk of each Fund of the Trust. Liquidity risk is the risk that a Fund could not meet shareholder redemption requests without significant dilution of remaining shareholders’ interests in that Fund. This risk is managed by monitoring the degree of liquidity of each Fund’s investments, limiting the amount of the Fund’s illiquid investments, and utilizing various risk management tools and facilities available to the Fund for meeting shareholder redemptions, among other means. The Committee’s process for determining the degree of liquidity of each Fund’s investments is supported by one or more third-party liquidity assessment vendors.
The Board reviewed a report prepared by the Committee regarding the operation and effectiveness of the Program for the period June 1, 2019 through December 31, 2019. The report included, among other information, each Fund’s (i) investment strategy and the liquidity of its portfolio investments during both normal and reasonably foreseeable stressed market conditions; (ii) short-term and long- term cash flow projections during both normal and reasonably foreseeable stressed conditions; and (iii) holdings of cash and cash equivalents, as well as relevant borrowing arrangements.
No significant liquidity events impacting any Fund were noted in the report. In addition, the Committee provided its assessment that the Program had been effective in managing each Fund’s liquidity risk.
F-8
Table of Contents
PACIFIC FUNDS
APPROVAL OF INVESTMENT ADVISORY
AND SUB-ADVISORY AGREEMENTS
(Unaudited)
I. Introduction and Background
The Board of Trustees (the “Trustees” or “Board”) of Pacific Funds Series Trust (“Pacific Funds” or the “Trust”) oversees the management of each of the separate funds of the Trust (each a “Fund” and collectively, the “Funds”) and, as required by Section 15(c) of the Investment Company Act of 1940, as amended (the “1940 Act”), initially approves and, after the initial period, determines annually whether to renew the investment advisory agreement (the “Advisory Agreement”) with Pacific Life Fund Advisors LLC (“PLFA”) and eachsub-advisory agreement (the“Sub-Advisory Agreements,” together with the Advisory Agreement, as may be amended from time to time, the “Agreements”) between the Trust, PLFA and the varioussub-advisers, including affiliatedsub-advisers, if any (each a“Sub-Adviser” and collectively, the“Sub-Advisers”). PLFA serves as the investment adviser for all of the Funds. PLFA also currently directly manages Pacific Funds Portfolio Optimization Conservative, Pacific Funds Portfolio Optimization Moderate-Conservative, Pacific Funds Portfolio Optimization Moderate, Pacific Funds Portfolio Optimization Growth and Pacific Funds Portfolio Optimization Aggressive-Growth (the “Asset Allocation Funds”), as well as the PF Multi-Asset Fund (together with the PAM Managed Funds (defined below) and Asset Allocation Funds, the “Directly Managed Funds”). Until December 31, 2019, PLFA also directly managed Pacific Funds Short Duration Income, Pacific Funds Core Income, Pacific Funds Strategic Income, Pacific Funds Floating Rate Income and Pacific Funds High Income, as well as the collateral portion of the PF Multi-Asset Fund (together, the “PAM Managed Funds”), under the name Pacific Asset Management (“PAM”). At its December 10, 2019 meeting, the Board took into account PAM’s scheduled reorganization into Pacific Asset Management LLC (“PAM LLC”), a newly formed indirect wholly-owned subsidiary of Pacific Life Insurance Company (“Pacific Life”) on January 1, 2020 and approved a newSub-Advisory Agreement with PAM LLC with respect to the PAM Managed Funds. Therefore, going forward, the PAM Managed Funds will no longer be directly managed by PLFA as PAM LLC will be aSub-Adviser to those Funds. For all other Funds, PLFA has retained third-party firms to serve asSub-Advisers under PLFA’s oversight. The Board, including all of the Trustees who are not “interested persons” of the Trust, PLFA, theSub-Advisers or the distributor, as that term is defined in the 1940 Act (“Independent Trustees”), last renewed the Agreements at anin-person meeting of the Trustees held on December 10, 2019.1
At this meeting and other meetings, the Board considered information (both written and oral) provided to assist it in its review of the Agreements and made assessments with respect to each Agreement. The Board requested, received and reviewed written materials from PLFA and eachSub-Adviser that were submitted in response to requests from the Independent Trustees and supporting materials relating to those questions and responses. In addition, the Board receivedin-person presentations about the Funds throughout the year, and the Independent Trustees were advised by independent legal counsel with respect to these and other relevant matters. The Board reviewed a variety of factors and considered a significant amount of information, including information received on an ongoing basis at Board and committee meetings, which included reports on Fund performance, expenses, fee comparisons, investment advisory, compliance, and other services provided to the Funds by PLFA and theSub-Advisers. The Board also reviewed financial and profitability information regarding PLFA and theSub-Advisers and information regarding the organization and operations of each entity, such as their compliance monitoring, portfolio trading and brokerage practices, risk management and the personnel providing investment management and administrative services to each Fund. The Board considered the services provided to the Funds under the Agreements and the fees and expenses incurred by and charged to (or expected to be incurred by and charged to) the Funds under the Agreements.
The Board noted that as Adviser, PLFA provides a broad range of services to the Trust, including among others: overseeing and coordinating the activities ofSub-Advisers and other third-party service providers, making regulatory filings (including disclosure and financial filings) on behalf of the Trust, monitoring fund performance, performing risk oversight of the Funds, providing the Board with information and reports as may be requested, providing valuation support, administering the Trust’s liquidity risk management program, providing compliance-related services and providing personnel and office space to the Trust. These responsibilities are described in more detail below. The Trustees also considered that PLFA incurs substantial reputational, financial, litigation, regulatory and business risks by serving as investment adviser. The Board took into account that PLFA and its affiliates provide additional services to the Funds under other affiliated service agreements that are essential for the operation of the Funds and that although PLFA and its affiliates are separately compensated under those affiliated service agreements, these additional services are provided in connection with PLFA’s advisory relationship with the Funds. The Board reviewed data provided by PLFA that was gathered from various independent providers of investment company data to provide the Board with information concerning the Funds’ investment performance, advisory fees and expense information (both on an absolute basis and compared to peers). Additionally, the Independent Trustees retained an independent consultant (“Independent Consultant”) with substantial industry experience in providing investment company boards with analysis to assist directors and trustees with their annual 15(c) review process, to assist the Trustees with certain of their analyses and to provide other relevant information. In connection with the analysis, the Independent Consultant utilized and provided the Independent Trustees with information obtained from independent service providers as well as from other sources.
The Trustees’ determinations were made on the basis of each Trustee’s business judgment after consideration of all the information presented. In reviewing the materials presented and in considering the information in the management presentations, the Trustees did not identify any single issue or particular information that, in isolation, would be a controlling factor in making a final decision regarding the proposed Agreements. Individual Trustees may have given different weights to certain factors and assigned various degrees of materiality to information received in connection with the approval process. The following summary describes the most important, but not all, of the factors considered by the Trustees in approving the Agreements. In the case of the Independent Trustees, certain factors were considered in light of the legal advice furnished to them by independent legal counsel and information from the Independent Consultant that they had retained. This discussion is not intended to beall-inclusive.
| 1 | At the December 10th meeting, the Board did not consider the continuance of theSub-Advisory Agreements relating to the PF Currency Strategies Fund (with respect to Neuberger Berman Investment Advisors LLC (“Neuberger Berman”)) or PF Emerging Markets Fund, as those agreements were not up for renewal at that time. In addition, as theSub-Advisory Agreement for the PAM Managed Funds is a new agreement, it has not been previously approved. |
F-9
Table of Contents
PACIFIC FUNDS
APPROVAL OF INVESTMENT ADVISORY
AND SUB-ADVISORY AGREEMENTS (Continued)
(Unaudited)
II. Annual Consideration and Approval of Investment Advisory andSub-Advisory Agreements
In evaluating the Advisory Agreement and eachSub-Advisory Agreement, the Board, including all the Independent Trustees, considered the following factors, among others:
A. Nature, Extent and Quality of Services
PLFA – The Trustees considered the depth and quality of PLFA’s investment management process, including its process to evaluateSub-Advisers (including, going forward, PAM LLC) in connection with its recommendations to the Board to hire or terminateSub-Advisers, its monitoring and oversight of theSub-Advisers, and the benefits to shareholders of retaining PLFA and continuing the Advisory Agreement in light of the nature, extent, and quality of the services that have been provided by PLFA, since the Advisory Agreement was last renewed. The Trustees considered the overall financial strength and stability of PLFA and its ability to continue to provide a high level and quality of services to the Funds. They also considered PLFA’s responsiveness to questions or concerns raised by the Trustees throughout the year, including PLFA’s willingness to consider and implement investment and operational changes designed to improve investment results and the services provided to the Funds and their shareholders.
The Trustees noted that officers and employees of PLFA regularly consult with, and report to, the Board regarding the investment management services provided to the Funds. The Trustees considered the experience, capability and integrity of PLFA’s senior management and other personnel and the low turnover rates of its key personnel. The Trustees noted that the investment, legal, compliance, risk management and accounting professionals of PLFA and its affiliates have access to and utilize a variety of resources and systems relating to investment management, compliance, trading, performance and risk analysis, security valuation and fund accounting. The Trustees took into account the scope of services provided by PLFA under the Advisory Agreement. The Trustees considered that although PLFA is separately compensated under an administration agreement for time spent on Fund matters by certain legal, compliance and accounting professionals of PLFA and its affiliates for services outside of the scope of the Advisory Agreement, these services are being provided as a result of PLFA’s advisory relationship with the Funds. The Trustees further considered PLFA’s continuing need and ability to attract and retain qualified personnel and to maintain and enhance its resources and systems to provide appropriate investment management, compliance, risk management and monitoring services for the Funds. The Trustees also considered the additional resources that PLFA has continued to invest in to enhance its management and oversight of the Funds, including additional tools designed to ensure the Funds’ compliance with new laws and regulations. The Trustees considered that PLFA employs a well-defined method of comparing and evaluating the performance of the asset allocation funds and continues to employ resources to refine that method. In addition, the Trustees considered PLFA’ssub-adviser research process and the role of PLFA’s internal conflicts review committee in considering and evaluating potential conflicts of interest with regard toSub-Adviser selection and monitoring.
Directly Managed Funds – The Trustees considered the services provided by PLFA in rendering investment management services for those Funds for which theday-to-day investment management is provided by PLFA2. The Trustees considered that PLFA, is responsible for identifying investments for each Directly Managed Fund and determining when and what securities, cash and/or other investments to purchase, retain, or sell for each Directly Managed Fund. The Trustees also considered that PLFA, is responsible for the valuation of portfolio securities, including, but not limited to, the review of custodian pricing files, research and analysis related to fair valued securities and due diligence oversight of pricing vendors. The Trustees additionally noted that PLFA is responsible for evaluating and voting proxies for portfolio holdings of the Directly Managed Funds. With respect to the Asset Allocation Funds, the Trustees also considered, among other things, PLFA’s experience, resources and expertise in analyzing the composition of the various Funds that serve as investment options for the Asset Allocation Funds (collectively, the “Underlying Funds”) and in developing an asset allocation that is appropriate for each Asset Allocation Fund’s investment objectives and risk profile. The Trustees considered, in this regard, the tools and resources used by PLFA in constructing its asset allocation models. The Trustees considered that PLFA had engaged a third-party consulting firm in 2016 to review PLFA’s asset allocation process, and that the firm had reported favorably on PLFA’s asset allocation capabilities. With respect to the PF Multi-Asset Fund, the Trustees also considered PLFA’s trading-related and valuation responsibilities. With respect to the PAM Managed Funds, the Trustees also considered the investment oversight and monitoring of PAM discussed below under“Sub-Advised Funds.”
The Trustees also considered that PLFA provides certain additional services to the Funds outside of the scope of the Advisory Agreement under an administration agreement and that such services are essential for the administration and operation of the Funds, including administration of the Funds’ compliance program. In this regard, the Trustees considered PLFA’s policies, procedures and systems to ensure compliance with applicable laws and regulations with respect to the Directly Managed Funds, its attention to matters that may involve conflicts of interest between itself and a Fund, and that all material rebalancing of PLFA’s asset allocation models are presented to PLFA’s internal conflicts review committee that considers and evaluates potential conflicts of interest in the allocation among the Underlying Funds. The Trustees considered the report of PLFA’s internal conflicts review committee and also reviewed information provided throughout the year on PLFA’s compliance policies and procedures, its compliance history, and received reports from the Trust’s Chief Compliance Officer (“CCO”) on compliance by PLFA with applicable laws and regulations. The Trustees also reviewed information on any responses by PLFA to regulatory and compliance developments throughout the year. The Trustees further noted the compliance monitoring conducted by PLFA on an ongoing basis and noted the development of additional procedures and systems necessary to maintain compliance with applicable laws and regulations as well as the resources that PLFA dedicates to these programs. The Trustees considered that the CCO has in place a systematic process for periodically reviewing PLFA’s written compliance policies and procedures, including the assessment of PLFA’s compliance program as required
| 2 | As discussed further below, in reviewing the nature, extent and quality of services to be provided by PAM LLC in connection with the newSub-Advisory Agreement for the PAM Managed Funds, the Board took into account that these services had been provided by PAM as a division of PLFA prior to January 1, 2020 and that PLFA and PAM have each represented to the Board that the nature, extent and quality of these services will not be impacted by the reorganization of PAM into PAM LLC. |
F-10
Table of Contents
PACIFIC FUNDS
APPROVAL OF INVESTMENT ADVISORY
AND SUB-ADVISORY AGREEMENTS (Continued)
(Unaudited)
under Rule38a-1 of the 1940 Act and PLFA’s code of ethics. The Trustees also considered that PLFA continues to cooperate with the CCO in reviewing its compliance operations.
Sub-Advised Funds3 – The Trustees considered that PLFA recommends to the Board the hiring and termination ofSub-Advisers and performs the associated due diligence relating to such recommendations, the risk and performance oversight of theSub-Advisers performed by PLFA and the fact that PLFA provides valuation support forSub-Advised Funds. The Trustees noted PLFA’s responsibilities in rendering services to theSub-Advised Funds and the fact that PLFA monitors and evaluates the performance of theSub-Advisers in comparison to each Fund’s investment objective as well as to appropriate benchmark indices and groups of peer funds. The Trustees also considered that PLFA monitors eachSub-Advised Fund’s adherence to its investment objectives and policies. The Trustees noted that PLFA provides the Board with periodic and special reports related to eachSub-Advised Fund’s performance and PLFA’s investment monitoring and evaluation. The Trustees also considered PLFA’s process in continuously analyzing and, from time to time as necessary and appropriate, recommending for consideration by the Board, the termination of aSub-Advisory Agreement with aSub-Adviser and the replacement of aSub-Adviser.
For both the Directly Managed Funds andSub-Advised Funds, the Trustees considered the high quality of the products, information, analysis and services provided by PLFA to the Funds, including return analysis, attribution analysis, risk analysis and stress testing, preparation of periodic performance and other reports, assessment of liquidity, analysis of derivatives, and coordination and oversight of other service providers to the Trust. The Trustees also noted that PLFA regularly informs the Trustees about matters relevant to the Trust and its shareholders, including relationships with financial intermediaries.
The Trustees considered the analyses conducted by PLFA of the Underlying Funds and aSub-Adviser’s management of an Underlying Fund in the broader context of asset allocation strategies intended to target certain return and risk characteristics. The Trustees noted that PLFA has historically recommended new Underlying Funds or changes to existing Underlying Funds that PLFA believed would contribute to the Asset Allocation Funds’ targeted return and risk objectives. The Trustees also took into account PLFA’s continuing analysis of the Underlying Funds and eachSub-Adviser’s investment performance for the impact on broader asset allocation strategies for the Asset Allocation Funds.
The Trustees considered the depth and quality of PLFA’s monitoring and oversight of theSub-Advisers. The Board noted that PLFA monitors numerous investment, performance, and risk metrics for the Funds. The Trustees considered PLFA’s continued investment in, and development of, its research and analytical capabilities, including investments in personnel and enhanced analytical tools for assessing Fund performance and the performance of theSub-Advisers, including analytical tools relating to return analysis, risk analysis, and Fund performance attribution and reporting on such matters to the Trustees. The Trustees noted that PLFA uses these tools to analyze a Fund’s performance and risk profile and identify Funds that are underperforming as well as those that are performing well, and to analyze the Funds’ performance records against various measures. The Board considered that PLFA also conducts various analyses to assess the sources of and reasons for performance. The Trustees noted that PLFA has developed, and continues to enhance, processes to oversee and monitor the performance ofSub-Advisers, including the use of analytical methods to review Fund performance and execution of investment strategies. The Board noted that PLFA provides the Board with analyses of these data over rolling periods to assist the Board in identifying trends in Fund performance and other areas, and periodically provides the Trustees with information on economic and market trends to provide a context for assessing recent performance. The Trustees also noted that PLFA has developed effective methods for tracking theSub-Advisers’ investment style consistency, for analyzing the use of derivatives bySub-Advisers and for monitoring Fund liquidity. With respect to the PAM Managed Funds, the Board considered that PLFA has historically provided oversight, diligence and reporting with regard to its PAM unit that is similar to the process it employs with regard to theSub-Advisers and that going forward it will continue to employ the same process for PAM LLC as for all otherSub-Advisors. In making their assessments, the Trustees considered that PLFA has historically exercised diligence in monitoring the performance of theSub-Advisers, and has recommended and taken measures to attempt to remedy relative underperformance by a Fund when PLFA and the Trustees believed it to be appropriate. The Trustees also considered the significant work performed by PLFA in conducting searches for newSub-Advisers to replace existingSub-Advisers where appropriate or to manage new Funds in the Trust.
The Board also noted that PLFA conducts regular due diligence onSub-Advisers involving onsite visits,in-person meetings and telephonic meetings to gather information that PLFA uses to gain anin-depth understanding of aSub-Adviser’s investment process and to seek to identify issues that may be relevant to aSub-Adviser’s services to a Fund or a Fund’s performance, including, but not limited to, aSub-Adviser’s investment process, investment capabilities, resources and personnel, the financial strength of aSub-Adviser, significant staffing changes that could affect a Fund, material changes in aSub-Adviser’s assets under management, compliance and regulatory concerns, best execution review and portfolio security valuation support.
The Trustees considered the time and attention paid by PLFA to matters involving the valuation of Fund securities for theSub-Advised Funds. The Trustees considered that PLFA has established a Valuation Oversight Committee that is responsible for, among other things, researching and evaluating information concerning securities that are not actively or publicly traded, valuing securities subject to a trading halt or for which a market quotation is not readily available, the valuation of equity securities traded in foreign markets, oversight of and due diligence on pricing vendors and the development of alternate valuation methodologies. The Trustees also considered the information and support provided by PLFA in connection with the Trustees’ fair valuation responsibilities.
The Trustees considered PLFA’s oversight, review and analysis of trade execution reports and trends in trade execution for theSub-Advised Funds. The Trustees noted that PLFA works with a third-party transaction cost analysis consultant that provides statistical analysis on portfolio trading, and that PLFA presents information about the Funds’ portfolio trading costs to the Board annually and, where warranted, engages in a
| 3 | For purposes of this discussion, the PAM Managed Funds are consideredSub-Advised Funds with respect to the newSub-Advisory Agreement between the Trust, PLFA and PAM LLC effective January 1, 2020. |
F-11
Table of Contents
PACIFIC FUNDS
APPROVAL OF INVESTMENT ADVISORY
AND SUB-ADVISORY AGREEMENTS (Continued)
(Unaudited)
dialogue with personnel of aSub-Adviser on trading costs and the quality of execution. The Board also noted that PLFA conducts regular review and analysis of eachSub-Adviser’s use of research obtained with commissions paid to broker-dealers for executing portfolio transactions (“soft dollars”) and presents information about theSub-Advisers’ use of soft dollars to the Board annually and, where deemed necessary, discusses such soft dollar use withSub-Advisers.
The Trustees also considered PLFA’s implementation of transition management programs when handling significant changes in the Funds, such as cash movements between the Funds arising from reallocations byfunds-of-funds and the transition of Fund assets from oneSub-Adviser to another, including steps taken by PLFA to reduce transaction costs associated with a Fund transition. The Trustees considered that PLFA coordinates the onboarding process for newSub-Advisers and oversees the establishment of necessary accounts and documentation for theSub-Advisers to begin managing Fund assets.
In addition to the services described above, the Trustees also considered the compliance monitoring that PLFA and its affiliates conduct on theSub-Advisers and the commitment of PLFA and its affiliates to those programs and PLFA’s efforts to keep the Trustees informed about the compliance programs ofSub-Advisers. In this regard, the Trustees reviewed information and reports from the Trust’s CCO on compliance by theSub-Advisers with applicable laws and regulations. The Trustees considered that the CCO has in place a systematic process for periodically reviewing eachSub-Adviser’s written compliance policies and procedures, including the assessment of eachSub-Adviser’s compliance program as required under Rule38a-1 of the 1940 Act, and eachSub-Adviser’s code of ethics. The Trustees considered that PLFA is compensated under the administration agreement for the administration of the Funds’ compliance program. The Trustees also considered that eachSub-Adviser continues to cooperate with the CCO in reviewing its compliance operations.
Sub-Advisers. The Trustees considered the benefits to shareholders of retaining eachSub-Adviser, in approving theSub-Advisory Agreement for the PAM Managed Funds and in continuing theSub-Advisory Agreements for the otherSub-Advisers, particularly in light of the nature, extent, and quality of the services that have been provided by theSub-Advisers. The Trustees considered the services provided by eachSub-Adviser in rendering investment management services to aSub-Advised Fund. The Trustees considered that eachSub-Adviser is responsible for identifying investments for aSub-Advised Fund and determining when and what securities, cash and/or other investments to purchase, retain, or sell for aSub-Advised Fund. The Trustees also considered that eachSub-Adviser is responsible for evaluating and voting proxies for portfolio holdings of aSub-Advised Fund. The Trustees considered the quality of the portfolio management services which have benefited and should continue to benefit theSub-Advised Funds and their shareholders, the organizational depth and resources of theSub-Advisers, including the background and experience of eachSub-Adviser’s management personnel, and the expertise of eachSub-Adviser’s portfolio management team, as well as the investment methodology used by theSub-Adviser. The Trustees also considered that eachSub-Adviser provides PLFA with information that assists PLFA in performing its oversight role, including information about theSub-Adviser’s compliance program.
Pacific Funds Short Duration Income, Pacific Funds Core Income, Pacific Funds Strategic Income, Pacific Funds Floating Rate Income, Pacific Funds High Income and PF Multi-Asset Fund
With respect to Pacific Funds Short Duration Income, Pacific Funds Core Income, Pacific Funds Strategic Income, Pacific Funds Floating Rate Income, Pacific Funds High Income and the collateral portion of PF Multi-Asset, each directly managed by the fixed income business division of PLFA under the name PAM, the Trustees considered that, in approving a newSub-Advisory Agreement for PAM LLC due to PAM’s scheduled reorganization into PAM LLC on January 1, 2020, PLFA and PAM LLC had represented that the investment teams responsible for managing the Funds will not change as a result of the reorganization, nor will the nature, extent or quality of services currently provided to the PAM Managed Funds.
PFSmall-Cap Value
With respect to PFSmall-Cap Valuesub-advised by AllianceBernstein L.P. (“AllianceBernstein”), the Trustees noted that rather than approving the renewal of the priorSub-Advisory Agreement, they were approving a newSub-Advisory Agreement due to a change in control of AllianceBernstein’s parent company, which resulted in the automatic termination of the currentSub-Advisory Agreement. In this regard, the Trustees noted that AllianceBernstein had represented that there would be no changes to the Fund’s portfolio management team and that there is expected to be no change in the nature, extent or quality of services provided to the Fund.
The Board concluded that it was satisfied with the nature, extent and quality of the investment management services provided, or to be provided, by PLFA and eachSub-Adviser.
B. Investment Results
The Trustees considered the investment results of each Fund in light of its objective, strategies and market conditions. The Trustees compared each Fund’s total returns with the total returns of a group of appropriate peer funds (each a “Selected Performance Peer Group”), which were selected by an Independent Consultant using data from third-party data vendor Morningstar, and the Trustees reviewed a description of the Independent Consultant’s methodology for selecting the peer funds in each Selected Performance Peer Group. In addition, with respect to Funds other than the Asset Allocation Funds, the Trustees compared each Fund’s total returns with the total returns of the Fund’s broad-based market index, sector index, composite index or an alternative index selected by the Independent Consultant, as applicable (each, a “primary benchmark”). With respect to the Asset Allocation Funds, the Trustees compared each Fund’s total returns with the total returns of a custom benchmark that is comprised of certain broad-based market indices based on the broad asset class target allocations for the Fund. The Trustees took into account the views of the Independent Consultant that these custom benchmarks appeared to be reasonable benchmarks for performance reporting purposes.
F-12
Table of Contents
PACIFIC FUNDS
APPROVAL OF INVESTMENT ADVISORY
AND SUB-ADVISORY AGREEMENTS (Continued)
(Unaudited)
The information provided to the Trustees included each Fund’s performance record for theone-, three-, five- andten-year or since inception periods ended September 30, 2019, as available, compared to the applicable benchmark and Selected Performance Peer Group. The Trustees placed greater emphasis on a Fund’s performance against peers as opposed to an unmanaged index.
The Trustees considered the performance of each Fund on acase-by-case basis and noted that some Funds had outperformed their Selected Performance Peer Group over certain periods and/or exceeded the return of their respective benchmark while others underperformed their Selected Performance Peer Group over certain periods and/or trailed the return of their respective benchmark. In considering each Fund’s investment results, the Board placed greater emphasis on each Fund’s longer-term performance track record rather than shorter-term performance. The Board also took into account that each Fund’s track record is measured as of a specific date, and that track records can vary as of different measurement dates. Therefore, in reviewing a Fund that is currently underperforming, the Trustees also considered the broader perspective of the Fund’s performance over varying time periods, the market conditions experienced during the periods under review, as well as the outlook for the Fund going forward in light of expected future market conditions. In the case of the Underlying Funds, the Board also took into account the views of PLFA about the role of a particular Fund within a broader asset allocation strategy for the Asset Allocation Funds. Where there had been a change inSub-Adviser for a Fund, the Board took into account that the currentSub-Adviser was only responsible for certain portions of the Fund’s performance record. The Trustees discussed with PLFA the fact that certain periods of underperformance may be transitory while other periods of underperformance may be reflective of broader issues that may warrant consideration of corrective action. The Trustees discussed these Funds with representatives of PLFA, including an assessment of the approach used by theSub-Advisers, and the approach used by PLFA and PAM with respect to the Directly Managed Funds, as well as the oversight and monitoring by PLFA as the investment adviser, to gain an understanding of underperformance and to assess whether any actions would be appropriate. In addition, the Board considered any specific actions that PLFA, PAM or aSub-Adviser has taken, or agreed to take, to enhance the investment performance of a Fund, and the results of those actions. In reviewing the performance of each Fund, the Board took into account, among other things, each Fund’s performance track record. A summary of each Fund’s track record is provided below.
PF Growth Fund
The Fund: (1) outperformed its Selected Performance Peer Group median for theone-, three-, five- andten-year periods; (2) outperformed its primary benchmark for theone-, three- and five-year periods and underperformed for theten-year period; and (3) is ranked in the first quintile of its Selected Performance Peer Group for theone-, three- and five-year periods, and the second quintile for theten-year period. In evaluating the performance of the Fund, the Board also considered that the currentSub-Adviser has managed the Fund since 2013.
PFLarge-Cap Value Fund
The Fund: (1) outperformed its Selected Performance Peer Group median for theone-, three-, five- andten-year periods; (2) outperformed its primary benchmark for theone- and three-year periods and underperformed for the five- andten-year periods; and (3) is ranked in the first quintile of its Selected Performance Peer Group for theone-year period, the second quintile for the three-year period and the third quintile for the five- andten-year periods.
Pacific FundsLarge-Cap
The Fund: (1) underperformed its Selected Performance Peer Group median for theone- and three-year periods; (2) underperformed its primary benchmark for theone- and three-year periods; and (3) is ranked in the fourth quintile of its Selected Performance Peer Group for theone-year period and the third quintile for the three-year period. In evaluating the performance of the Fund, the Board also considered PLFA’s views as to the reasons for the Fund’s relative performance against peers and its benchmark over various time periods and PLFA’s future outlook for the Fund.
Pacific FundsLarge-Cap Value
The Fund: (1) outperformed its Selected Performance Peer Group median for theone-year period and underperformed for the three-year period; (2) underperformed its primary benchmark for theone- and three-year periods; and (3) is ranked in the second quintile of its Selected Performance Peer Group for theone-year period and the third quintile for the three-year period.
PF Developing Growth Fund
The Fund: (1) outperformed its Selected Performance Peer Group median for the one, three- and five-year periods and underperformed for theten-year period; (2) outperformed its primary benchmark for theone-, three- and five-year periods and underperformed for theten-year period; and (3) is ranked in the third quintile of its Selected Performance Peer Group for theone- and five-year periods, the first quintile for the three-year period and the fourth quintile for theten-year period. In evaluating the performance of the Fund, the Board also considered that the currentSub-Adviser has managed the Fund since 2014.
PFMid-Cap Equity Fund
The Fund: (1) outperformed its Selected Performance Peer Group median for theone-, three-, five- andten-year periods; (2) underperformed its primary benchmark for theone- andten-year periods and outperformed for the three- and five-year periods; and (3) is ranked in the second quintile of its Selected Performance Peer Group for the one -year period and the first quintile for the three-, five- andten-year periods. In evaluating the performance of the Fund, the Board also considered that the currentSub-Adviser has managed the Fund since 2018.
Pacific FundsSmall/Mid-Cap
The Fund: (1) performed in line with its Selected Performance Peer Group median for theone-year period and outperformed for the three-year period; (2) underperformed its primary benchmark for theone- and three-year periods; and (3) is ranked in the third quintile of its Selected Performance Peer Group for theone-year period and the second quintile for the three-year period.
F-13
Table of Contents
PACIFIC FUNDS
APPROVAL OF INVESTMENT ADVISORY
AND SUB-ADVISORY AGREEMENTS (Continued)
(Unaudited)
Pacific FundsSmall-Cap
The Fund: (1) underperformed its Selected Performance Peer Group median for theone-year period and slightly outperformed for the three-year period; (2) underperformed its primary benchmark for theone- and three-year periods; and (3) is ranked in the fourth quintile of its Selected Performance Peer Group for theone-year period and the third quintile for the three-year period.
Pacific FundsSmall-Cap Growth
The Fund: (1) underperformed its Selected Performance Peer Group median for theone- and three-year periods; (2) underperformed its primary benchmark for theone- and three-year periods; and (3) is ranked in the fifth quintile of its Selected Performance Peer Group for theone- and three-year periods. In evaluating the performance of the Fund, the Board also considered PLFA’s views as to the reasons for the Fund’s relative performance against peers and its benchmark over various time periods and PLFA’s future outlook for the Fund. The Board also considered that PLFA has added the Fund to its performance “watch list,” will be monitoring the Fund closely for improved performance and may have a course of action to recommend for the Fund at an upcoming Board meeting.
PFSmall-Cap Value Fund
The Fund: (1) underperformed its Selected Performance Peer Group median for theone-year period and outperformed for the three-, five- andten-year periods; (2) underperformed its primary benchmark for theone- and three-year periods and outperformed for the five- andten-year periods; and (3) is ranked in the third quintile of its Selected Performance Peer Group for theone-year period, the second quintile for the three-year period and the first quintile for the five- andten-year periods. In evaluating the performance of the Fund, the Board also considered that the currentSub-Adviserco-managed the Fund with another firm from May 2014 to October 2015 and since October 2015 has been the soleSub-Adviser, and that prior to May 2014 another firm managed the Fund.
Pacific FundsSmall-Cap Value
The Fund: (1) outperformed its Selected Performance Peer Group median for theone- and three-year periods; (2) outperformed its primary benchmark for theone-year period and underperformed for the three-year period; and (3) is ranked in the second quintile of its Selected Performance Peer Group for theone-year period and the third quintile for the three-year period.
PF Emerging Markets Fund
The Fund: (1) outperformed its Selected Performance Peer Group median for theone-, three-, five- andten-year periods; (2) outperformed its primary benchmark for theone-, three-, five- andten-year periods; and (3) is ranked in the second quintile of its Selected Performance Peer Group for theone- and five-year periods and the first quintile for the three- andten-year periods. In evaluating the performance of the Fund, the Board also considered that it had recently approved a newSub-Advisory Agreement for the Fund effective May 2019 in connection with the acquisition of the previousSub-Adviser by theSub-Adviser’s parent and, therefore, theSub-Advisory Agreement was not up for renewal at this time.
PF Emerging Markets Debt Fund
The Fund: (1) underperformed its Selected Performance Peer Group median for theone-year period and outperformed for the three- and five-year periods; (2) underperformed its primary benchmark for theone- and three-year periods and outperformed for the five-year period; and (3) is ranked in the fourth quintile of its Selected Performance Peer Group for theone-year period and the second quintile for the three- and five-year periods.
PF InternationalLarge-Cap Fund
The Fund: (1) outperformed its Selected Performance Peer Group median for theone-, three-, five- andten-year periods; (2) outperformed its primary benchmark for theone-, three-, five- andten-year periods; and (3) is ranked in the second quintile of its Selected Performance Peer Group for theone-, three- and five-year periods and the third quintile for theten-year period.
PF InternationalSmall-Cap Fund
The Fund: (1) underperformed the Selected Performance Peer Group median for theone- and three-year periods; (2) underperformed its primary benchmark for theone- and three-year periods; and (3) is ranked in the fourth quintile of its Selected Performance Peer Group for theone- and three-year periods. In evaluating the performance of the Fund, the Board also considered PLFA’s views as to the reasons for the Fund’s relative performance against peers and its benchmark over various time periods and PLFA’s future outlook for the Fund. The Board also considered PLFA’s views as to the competitive nature of theSub-Adviser’s longer-term performance (as demonstrated by the similarly managed fund in Pacific Select Fund) and its confidence in theSub-Adviser’s investment process. The Board also considered that PLFA has added the Fund to its performance “watch list” and will be monitoring the Fund closely for improved performance.
PF International Value Fund
The Fund: (1) underperformed its Selected Performance Peer Group median for theone- andten-year periods and outperformed for the three- and five-year periods; (2) underperformed its primary benchmark for theone-, three-, five- andten-year periods; and (3) is ranked in the fourth quintile of its Selected Performance Peer Group for theone- andten-year periods, the first quintile for the three-year period and the second quintile for the five-year period. In evaluating the performance of the Fund, the Board also considered that the currentSub-Adviser has managed the Fund since 2017.
PF Currency Strategies Fund
The Fund: (1) underperformed its Selected Performance Peer Group median for theone- and three-year periods and outperformed for the five-year period; (2) underperformed its primary benchmark for theone-, three- and five-year periods; and (3) is ranked in the third quintile of its
F-14
Table of Contents
PACIFIC FUNDS
APPROVAL OF INVESTMENT ADVISORY
AND SUB-ADVISORY AGREEMENTS (Continued)
(Unaudited)
Selected Performance Peer Group for theone- and three-year periods and the first quintile for the five-year period. In evaluating the performance of the Fund, the Board also considered that the Fund had aco-Sub-Adviser from 2014 until 2018. The Board also considered that the currentSub-Adviser had been the soleSub-Adviser from 2018 until May 2019 and that it had recently approved a newSub-Advisory Agreement for the Fund with Neuberger Berman effective May 2019 in connection with the addition of aco-Sub-Adviser and, therefore, theSub-Advisory Agreement with Neuberger Berman was not up for renewal at this time.
PF Multi-Asset Fund
The Fund: (1) outperformed its Selected Performance Peer Group median for theone-year period; (2) outperformed its primary benchmark for theone-year period; and (3) is ranked in the second quintile for theone-year period. In evaluating the performance of the Fund, the Board also considered that the Fund had not been in operation for a sufficient time period to establish a meaningful track record. The Board also considered the Fund’s contribution to the performance of the Asset Allocation Funds.
PF Real Estate Fund
The Fund: (1) outperformed its Selected Performance Peer Group median for theone- and three-year periods, underperformed for the five-year period and slightly outperformed for theten-year period; (2) outperformed its primary benchmark for theone-year period and underperformed for the three-, five- andten-year periods; and (3) is ranked in the first quintile of its Selected Performance Peer Group for theone-year period and the third quintile for the three-, five- andten-year periods. In evaluating the performance of the Fund, the Board also considered that the currentSub-Adviser has managed the Fund since 2018.
Pacific Funds Core Income
The Fund: (1) slightly underperformed its Selected Performance Peer Group median for theone-year period and outperformed for the three- and five-year periods; (2) underperformed its primary benchmark for theone-year period, outperformed for the three-year period and slightly outperformed for the five-year period; and (3) is ranked in the third quintile of its Selected Performance Peer Group for theone-year period, the first quintile for the three-year period and the second quintile for the five-year period.
Pacific Funds Floating Rate Income
The Fund: (1) outperformed its Selected Performance Peer Group median for theone-, three- and five-year periods; (2) underperformed its primary benchmark for theone-, three- and five-year periods; and (3) is ranked in the first quintile of its Selected Performance Peer Group for theone-, three- and five-year periods.
Pacific Funds High Income
The Fund: (1) outperformed its Selected Performance Peer Group median for theone-, three- and five-year periods; (2) underperformed its primary benchmark for theone-, three- and five-year periods; and (3) is ranked in the third quintile of its Selected Performance Peer Group for theone- and five-year periods and the first quintile for the three-year period.
PF Inflation Managed Fund
The Fund: (1) outperformed its Selected Performance Peer Group median for theone-, three-, five- andten-year periods; (2) underperformed its primary benchmark for theone-, five- andten-year periods and outperformed for the three-year period; and (3) is ranked in the first quintile of its Selected Performance Peer Group for theone-, three- andten-year periods and the second quintile for the five-year period. In evaluating the performance of the Fund, the Board also considered that the currentSub-Adviserco-managed the Fund with another firm from January 2015 to October 2016 and since October 2016 has been the soleSub-Adviser.
PF Managed Bond Fund
The Fund: (1) outperformed its Selected Performance Peer Group median for theone-, three-, five- andten-year periods; (2) outperformed its primary benchmark for theone-, three-, five- andten-year periods; and (3) is ranked in the first quintile of its Selected Performance Peer Group for theone-, three- and five-year periods and the second quintile for theten-year period. In evaluating the performance of the Fund, the Board also considered that one of the Fund’sco-Sub-Advisers was the soleSub-Adviser from the Fund’s inception until 2014, and that the otherco-Sub-Adviser hasco-managed the Fund since 2014.
PF Short Duration Bond Fund
The Fund: (1) underperformed its Selected Performance Peer Group median for theone-, three-, five- andten-year periods; (2) underperformed its primary benchmark for theone-year period, outperformed for the three-year period and slightly outperformed for the five- andten-year periods; and (3) is ranked in the third quintile of its Selected Performance Peer Group for theone- and three-year periods, the fourth quintile for the five-year period and the fifth quintile for theten-year period. In evaluating the performance of the Fund, the Board also considered that the currentSub-Adviser has managed the Fund since 2011.
Pacific Funds Short Duration Income
The Fund: (1) performed in line with its Selected Performance Peer Group median for theone-year period and outperformed for the three- and five-year periods; (2) underperformed its primary benchmark for theone-year period and outperformed for the three- and five-year periods; and (3) is ranked in the third quintile of its Selected Performance Peer Group for theone-year period, the first quintile for the three-year period and the second quintile for the five-year period.
F-15
Table of Contents
PACIFIC FUNDS
APPROVAL OF INVESTMENT ADVISORY
AND SUB-ADVISORY AGREEMENTS (Continued)
(Unaudited)
Pacific Funds Strategic Income
The Fund: (1) outperformed its Selected Performance Peer Group median for theone-, three- and five-year periods; (2) underperformed its primary benchmark for theone-year period and outperformed for the three- and five-year periods; and (3) is ranked in the third quintile of its Selected Performance Peer Group for theone-year period and the second quintile for the three- and five-year periods.
Pacific Funds Portfolio Optimization Aggressive-Growth
The Fund: (1) outperformed its Selected Performance Peer Group median for theone- and three-year periods and performed in line for the five- andten-year periods; (2) underperformed its custom benchmark for theone-, three-, five- andten-year periods; and (3) is ranked in the second quintile of its Selected Performance Peer Group for theone- and three-year periods and the third quintile for the five- andten-year periods.
Pacific Funds Portfolio Optimization Conservative
The Fund: (1) outperformed its Selected Performance Peer Group median for theone- year period and underperformed for the three-, five- andten-year periods; (2) underperformed its custom benchmark for theone-, three-, five- andten-year periods; and (3) is ranked in the third quintile of its Selected Performance Peer Group for theone-, three- andten-year periods and the fourth quintile for the five-year period.
Pacific Funds Portfolio Optimization Growth
The Fund: (1) outperformed its Selected Performance Peer Group median for theone-, three- and five-year periods and underperformed for theten-year period; (2) underperformed its custom benchmark for theone-, three-, five- andten-year periods; and (3) is ranked in the second quintile of its Selected Performance Peer Group for theone- and three-year periods, the third quintile for the five-year period and the fourth quintile for theten-year period.
Pacific Funds Portfolio Optimization Moderate-Conservative
The Fund: (1) underperformed its Selected Performance Peer Group median for theone-, three-, five- andten-year periods; (2) underperformed its custom benchmark for theone-, three-, five- andten-year periods; and (3) is ranked in the third quintile of its Selected Performance Peer Group for theone-, three- and five-year periods and the fourth quintile for theten-year period. In evaluating the performance of the Fund, the Board also considered PLFA’s views as to the reasons for the Fund’s relative performance against peers and its benchmark over various time periods and PLFA’s future outlook for the Fund.
Pacific Funds Portfolio Optimization Moderate
The Fund: (1) underperformed its Selected Performance Peer Group median for theone-, three-, five- andten-year periods; (2) underperformed its custom benchmark for theone-, three-, five- andten-year periods; and (3) is ranked in the third quintile of its Selected Performance Peer Group for theone-year period, the fourth quintile for the three- and five-year periods and the fifth quintile for theten-year period. In evaluating the performance of the Fund, the Board also considered PLFA’s views as to the reasons for the Fund’s relative performance against peers and its benchmark over various time periods and PLFA’s future outlook for the Fund.
The Trustees reviewed the monitoring of eachSub-Advisers’ investment results by PLFA, including PLFA’s historical practice of recommending to the Trustees a change inSub-Adviser when circumstances warrant. Generally, the Trustees noted that there continues to be a record of well-managed Funds that are appropriate to serve as Underlying Funds in the Asset Allocation Funds and that the Asset Allocation Funds provide a range of professionally managed asset allocation investment options. The Trustees considered the steps PLFA has taken to seek to improve performance of the Asset Allocation Funds, including ongoing assessment of asset allocation determinations, diversifying asset class investment options by adding additional Underlying Funds, and adding or changingSub-Advisers to the Underlying Funds. The Trustees also noted that the Funds continue to deliver the investment style as disclosed to shareholders. The Trustees also noted the use by investors of the Asset Allocation Funds and the benefits the Asset Allocation Funds provide for shareholders generally.
The Board concluded that PLFA continues to have a long record of effectively managing a multi-manager fund group and asset allocation funds designed to give shareholders a reasonable array of choices through which to implement their investment programs. The Board further concluded that PLFA was appropriately implementing each Fund’s investment objective either directly or through the selection ofSub-Advisers and that PLFA’s record in managing each Fund indicates that PLFA’s continued management, as well as the continuation of the respectiveSub-Advisory Agreements, will benefit each Fund and its shareholders.
C. Advisory Fees and Total Expense Ratios
The Trustees requested, received and reviewed information from PLFA relating to the advisory fees paid by the Funds and thesub-advisory fees paid by PLFA, including the portion of the advisory fees paid to eachSub-Adviser as compared to the portion retained by PLFA4. The Trustees considered the nature and quality of the services provided by PLFA and also considered the nature and quality of services provided by eachSub-Adviser. The Independent Trustees also requested and reviewed information from the Independent Consultant along with the Independent Consultant’s analysis of advisory fees,sub-advisory fees and certain Fund net expenses, excluding any applicable service or distribution fees, which were selected by the Independent Consultant for purposes of the peer group expense comparisons (“Operating Expenses”). The Trustees reviewed the advisory fees,sub-advisory fees and Operating Expenses of each Fund and compared advisory fees and expenses with the fees and expense levels of a group of appropriate peer funds identified by the Independent Consultant (each a “Selected Expense Peer Group”). The Trustees reviewed a description of the Independent Consultant’s methodology for constructing the Selected
| 4 | With respect to the PAM Managed Funds, the Trustees considered the level of the proposedsub-advisory fee to be paid to PAM LLC. |
F-16
Table of Contents
PACIFIC FUNDS
APPROVAL OF INVESTMENT ADVISORY
AND SUB-ADVISORY AGREEMENTS (Continued)
(Unaudited)
Expense Peer Groups, noting that each Selected Expense Peer Group includes a group ofsimilarly-sized funds with comparable strategies from a universe of funds that (i) included bothsub-advised and directly managed funds; (ii) excluded funds that are managed withnon-standard business models and expense structures; and (iii) excluded index funds. With respect to the Asset Allocation Funds, the Trustees also compared the net expense ratio (including acquired fund fees and expenses) with the average net expense ratio of funds in the Morningstar Category determined to be similar to the relevant Asset Allocation Fund (“Comparable Peer Fund Average”).
A summary of certain comparative fee and expense information considered by the Trustees for each Fund is provided below.
PF Growth Fund
The Trustees considered that (a) the advisory fee for the Fund is less than the median advisory fee rate of the funds in its Selected Expense Peer Group and ranked in the first quintile of its Selected Expense Peer Group; and (b) the Operating Expenses for the Fund are less than the median Operating Expenses of the funds in its Selected Expense Peer Group and ranked in the first quintile of its Selected Expense Peer Group.
PFLarge-Cap Value Fund
The Trustees considered that (a) the advisory fee for the Fund is in line with the median advisory fee rate of the funds in its Selected Expense Peer Group and ranked in the third quintile of its Selected Expense Peer Group; and (b) the Operating Expenses for the Fund are slightly less than the median Operating Expenses of the funds in its Selected Expense Peer Group and ranked in the third quintile of its Selected Expense Peer Group.
Pacific FundsLarge-Cap
The Trustees considered that (a) the advisory fee for the Fund is less than the median advisory fee rate of the funds in its Selected Expense Peer Group and ranked in the second quintile of its Selected Expense Peer Group; and (b) the Operating Expenses for the Fund are less than the median Operating Expenses of the funds in its Selected Expense Peer Group and ranked in the second quintile of its Selected Expense Peer Group. The Trustees also considered that PLFA had recently reduced the advisory fee by 0.10%.
Pacific FundsLarge-Cap Value
The Trustees considered that (a) the advisory fee for the Fund is less than the median advisory fee rate of the funds in its Selected Expense Peer Group and ranked in the second quintile of its Selected Expense Peer Group; and (b) the Operating Expenses for the Fund are less than the median Operating Expenses of the funds in its Selected Expense Peer Group and ranked in the second quintile of its Selected Expense Peer Group. The Trustees also considered that PLFA had recently reduced the advisory fee by 0.10%.
PF Developing Growth Fund
The Trustees considered that (a) the advisory fee for the Fund is less than the median advisory fee rate of the funds in its Selected Expense Peer Group and ranked in the first quintile of its Selected Expense Peer Group; and (b) the Operating Expenses for the Fund are less than the median Operating Expenses of the funds in its Selected Expense Peer Group and ranked in the first quintile of its Selected Expense Peer Group.
PFMid-Cap Equity Fund
The Trustees considered that (a) the advisory fee for the Fund is less than the median advisory fee rate of the funds in its Selected Expense Peer Group and ranked in the first quintile of its Selected Expense Peer Group; and (b) the Operating Expenses for the Fund are less than the median Operating Expenses of the funds in its Selected Expense Peer Group and ranked in the first quintile of its Selected Expense Peer Group.
Pacific FundsSmall/Mid-Cap
The Trustees considered that (a) the advisory fee for the Fund is slightly greater than the median advisory fee rate of the funds in its Selected Expense Peer Group and ranked in the third quintile of its Selected Expense Peer Group; and (b) the Operating Expenses for the Fund are greater than the median Operating Expenses of the funds in its Selected Expense Peer Group and ranked in the third quintile of its Selected Expense Peer Group. The Trustees also considered that PLFA had recently reduced the advisory fee by 0.10%.
Pacific FundsSmall-Cap
The Trustees considered that (a) the advisory fee for the Fund is in line with the median advisory fee rate of the funds in its Selected Expense Peer Group and ranked in the third quintile of its Selected Expense Peer Group; and (b) the Operating Expenses for the Fund are less than the median Operating Expenses of the funds in its Selected Expense Peer Group and ranked in the second quintile of its Selected Expense Peer Group. The Trustees also considered that PLFA had recently reduced the advisory fee by 0.10%.
Pacific FundsSmall-Cap Growth
The Trustees considered that (a) the advisory fee for the Fund is less than the median advisory fee rate of the funds in its Selected Expense Peer Group and ranked in the second quintile of its Selected Expense Peer Group; and (b) the Operating Expenses for the Fund are less than the median Operating Expenses of the funds in its Selected Expense Peer Group and ranked in the second quintile of its Selected Expense Peer Group. The Trustees also considered that PLFA had recently reduced the advisory fee by 0.10%.
PFSmall-Cap Value Fund
The Trustees considered that (a) the advisory fee for the Fund is less than the median advisory fee rate of the funds in its Selected Expense Peer Group and ranked in the first quintile of its Selected Expense Peer Group; and (b) the Operating Expenses for the Fund are less than the
F-17
Table of Contents
PACIFIC FUNDS
APPROVAL OF INVESTMENT ADVISORY
AND SUB-ADVISORY AGREEMENTS (Continued)
(Unaudited)
median Operating Expenses of the funds in its Selected Expense Peer Group and ranked in the first quintile of its Selected Expense Peer Group.
Pacific FundsSmall-Cap Value
The Trustees considered that (a) the advisory fee for the Fund is greater than the median advisory fee rate of the funds in its Selected Expense Peer Group and ranked in the fourth quintile of its Selected Expense Peer Group; and (b) the Operating Expenses for the Fund are less than the median Operating Expenses of the funds in its Selected Expense Peer Group and ranked in the third quintile of its Selected Expense Peer Group. The Trustees also considered that PLFA had recently reduced the advisory fee by 0.10%.
PF Emerging Markets Fund
The Trustees considered that (a) the advisory fee for the Fund is less than the median advisory fee rate of the funds in its Selected Expense Peer Group and ranked in the first quintile of its Selected Expense Peer Group; and (b) the Operating Expenses for the Fund are less than the median Operating Expenses of the funds in its Selected Expense Peer Group and ranked in the second quintile of its Selected Expense Peer Group.
PF Emerging Markets Debt Fund
The Trustees considered that (a) the advisory fee for the Fund is in line with the median advisory fee rate of the funds in its Selected Expense Peer Group and ranked in the third quintile of its Selected Expense Peer Group; and (b) the Operating Expenses for the Fund are slightly greater than the median Operating Expenses of the funds in its Selected Expense Peer Group and ranked in the third quintile of its Selected Expense Peer Group. The Trustees considered that PLFA currently has contractually agreed to waive 0.02% of its advisory fee.
PF InternationalLarge-Cap Fund
The Trustees considered that (a) the advisory fee for the Fund is slightly less than the median advisory fee rate of the funds in its Selected Expense Peer Group and ranked in the third quintile of its Selected Expense Peer Group; and (b) the Operating Expenses for the Fund are less than the median Operating Expenses of the funds in its Selected Expense Peer Group and ranked in the second quintile of its Selected Expense Peer Group.
PF InternationalSmall-Cap Fund
The Trustees considered that (a) the advisory fee for the Fund is less than the median advisory fee rate of the funds in its Selected Expense Peer Group and ranked in the first quintile of its Selected Expense Peer Group; and (b) the Operating Expenses for the Fund are less than the median Operating Expenses of the funds in its Selected Expense Peer Group and ranked in the first quintile of its Selected Expense Peer Group.
PF International Value Fund
The Trustees considered that (a) the advisory fee for the Fund is less than the median advisory fee rate of the funds in its Selected Expense Peer Group and ranked in the first quintile of its Selected Expense Peer Group; and (b) the Operating Expenses for the Fund are less than the median Operating Expenses of the funds in its Selected Expense Peer Group and ranked in the first quintile of its Selected Expense Peer Group.
PF Currency Strategies Fund
The Trustees considered that (a) the advisory fee for the Fund is less than the median advisory fee rate of the funds in its Selected Expense Peer Group and ranked in the first quintile of its Selected Expense Peer Group; and (b) the Operating Expenses for the Fund are slightly less than the median Operating Expenses of the funds in its Selected Expense Peer Group and ranked in the second quintile of its Selected Expense Peer Group.
PF Multi-Asset Fund
The Trustees considered that (a) the advisory fee for the Fund is less than the median advisory fee rate of the funds in its Selected Expense Peer Group and ranked in the first quintile of its Selected Expense Peer Group; and (b) the Operating Expenses for the Fund are less than the median Operating Expenses of the funds in its Selected Expense Peer Group and ranked in the first quintile of its Selected Expense Peer Group.
PF Real Estate Fund
The Trustees considered that (a) the advisory fee for the Fund is slightly less than the median advisory fee rate of the funds in its Selected Expense Peer Group and ranked in the third quintile of its Selected Expense Peer Group; and (b) the Operating Expenses for the Fund are less than the median Operating Expenses of the funds in its Selected Expense Peer Group and ranked in the first quintile of its Selected Expense Peer Group. The Trustees considered that PLFA currently has contractually agreed to waive 0.15% of its advisory fee.
Pacific Funds Core Income
The Trustees considered that (a) the advisory fee for the Fund is slightly greater than the median advisory fee rate of the funds in its Selected Expense Peer Group and ranked in the third quintile of its Selected Expense Peer Group; and (b) the Operating Expenses for the Fund are less than the median Operating Expenses of the funds in its Selected Expense Peer Group and ranked in the second quintile of its Selected Expense Peer Group. The Trustees noted that pursuant to a fee waiver agreement, PLFA has agreed to a breakpoint schedule that will reduce its advisory fee once the Fund attains varying higher asset levels, but that the Fund has not yet reached the first breakpoint.
F-18
Table of Contents
PACIFIC FUNDS
APPROVAL OF INVESTMENT ADVISORY
AND SUB-ADVISORY AGREEMENTS (Continued)
(Unaudited)
Pacific Funds Floating Rate Income
The Trustees considered that (a) the advisory fee for the Fund is slightly greater than the median advisory fee rate of the funds in its Selected Expense Peer Group and ranked in the fifth quintile of its Selected Expense Peer Group; and (b) the Operating Expenses for the Fund are less than the median Operating Expenses of the funds in its Selected Expense Peer Group and ranked in the second quintile of its Selected Expense Peer Group. The Trustees noted that pursuant to a fee waiver agreement, PLFA has agreed to a breakpoint schedule that had the effect of reducing the Fund’s advisory fee based on the Fund having attained varying higher asset levels.
Pacific Funds High Income
The Trustees considered that (a) the advisory fee for the Fund is less than the median advisory fee rate of the funds in its Selected Expense Peer Group and ranked in the first quintile of its Selected Expense Peer Group; and (b) the Operating Expenses for the Fund are less than the median Operating Expenses of the funds in its Selected Expense Peer Group and ranked in the first quintile of its Selected Expense Peer Group. The Trustees noted that pursuant to a fee waiver agreement, PLFA has agreed to a breakpoint schedule that will reduce its advisory fee once the Fund attains varying higher asset levels, but that the Fund has not yet reached the first breakpoint.
PF Inflation Managed Fund
The Trustees considered that (a) the advisory fee for the Fund is less than the median advisory fee rate of the funds in its Selected Expense Peer Group and ranked in the second quintile of its Selected Expense Peer Group; and (b) the Operating Expenses for the Fund are in line with the median Operating Expenses of the funds in its Selected Expense Peer Group and ranked in the third quintile of its Selected Expense Peer Group.
PF Managed Bond Fund
The Trustees considered that (a) the advisory fee for the Fund is less than the median advisory fee rate of the funds in its Selected Expense Peer Group and ranked in the first quintile of its Selected Expense Peer Group; and (b) the Operating Expenses for the Fund are less than the median Operating Expenses of the funds in its Selected Expense Peer Group and ranked in the first quintile of its Selected Expense Peer Group.
PF Short Duration Bond Fund
The Trustees considered that (a) the advisory fee for the Fund is in line with the median advisory fee rate of the funds in its Selected Expense Peer Group and ranked in the third quintile of its Selected Expense Peer Group; and (b) the Operating Expenses for the Fund are slightly greater than the median Operating Expenses of the funds in its Selected Expense Peer Group and ranked in the fourth quintile of its Selected Expense Peer Group.
Pacific Funds Short Duration Income
The Trustees considered that (a) the advisory fee for the Fund is in line with the median advisory fee rate of the funds in its Selected Expense Peer Group and ranked in the third quintile of its Selected Expense Peer Group; and (b) the Operating Expenses for the Fund are less than the median Operating Expenses of the funds in its Selected Expense Peer Group and ranked in the second quintile of its Selected Expense Peer Group. The Trustees noted that pursuant to a fee waiver agreement, PLFA has agreed to a breakpoint schedule that will reduce its advisory fee once the Fund attains varying higher asset levels, but that the Fund has not yet reached the first breakpoint.
Pacific Funds Strategic Income
The Trustees considered that (a) the advisory fee for the Fund is greater than the median advisory fee rate of the funds in its Selected Expense Peer Group and ranked in the fourth quintile of its Selected Expense Peer Group; and (b) the Operating Expenses for the Fund are in line with the median Operating Expenses of the funds in its Selected Expense Peer Group and ranked in the third quintile of its Selected Expense Peer Group. The Trustees further noted that pursuant to a fee waiver agreement, PLFA has agreed to a breakpoint schedule that will reduce its advisory fee once the Fund attains varying higher asset levels, but that the Fund has not yet reached the first breakpoint. The Trustees considered that the Selected Expense Peer Group also contains intermediate-term bond funds which generally have a lower advisory fee than multisector bond funds, such as the Fund.
Pacific Funds Portfolio Optimization Aggressive-Growth
The Trustees considered that (a) the advisory fee for the Fund is in line with the median advisory fee rate of the funds in its Selected Expense Peer Group and ranked in the third quintile of its Selected Expense Peer Group; (b) the Operating Expenses for the Fund are greater than the median Operating Expenses of the funds in its Selected Expense Peer Group and ranked in the fourth quintile of its Selected Expense Peer Group; and (c) the net expense ratio was slightly greater than the Comparable Peer Fund Average. The Trustees noted that pursuant to a fee waiver agreement, PLFA has agreed to a breakpoint schedule that will reduce its advisory fee once the Fund attains varying higher asset levels, but that the Fund has not yet reached the first breakpoint.
Pacific Funds Portfolio Optimization Conservative
The Trustees considered that (a) the advisory fee for the Fund is in line with the median advisory fee rate of the funds in its Selected Expense Peer Group and ranked in the third quintile of its Selected Expense Peer Group; (b) the Operating Expenses for the Fund are greater than the median Operating Expenses of the funds in its Selected Expense Peer Group and ranked in the fourth quintile of its Selected Expense Peer Group; and (c) the net expense ratio was greater than the Comparable Peer Fund Average. The Trustees noted that pursuant to a fee waiver agreement, PLFA has agreed to a breakpoint schedule that will reduce its advisory fee once the Fund attains varying higher asset levels, but that the Fund has not yet reached the first breakpoint.
F-19
Table of Contents
PACIFIC FUNDS
APPROVAL OF INVESTMENT ADVISORY
AND SUB-ADVISORY AGREEMENTS (Continued)
(Unaudited)
Pacific Funds Portfolio Optimization Growth
The Trustees considered that (a) the advisory fee for the Fund is in line with the median advisory fee rate of the funds in its Selected Expense Peer Group and ranked in the third quintile of its Selected Expense Peer Group; (b) the Operating Expenses for the Fund are greater than the median Operating Expenses of the funds in its Selected Expense Peer Group and ranked in the fourth quintile of its Selected Expense Peer Group; and (c) the net expense ratio was greater than the Comparable Peer Fund Average. The Trustees noted that pursuant to a fee waiver agreement, PLFA has agreed to a breakpoint schedule that will reduce its advisory fee once the Fund attains varying higher asset levels, but that the Fund has not yet reached the first breakpoint.
Pacific Funds Portfolio Optimization Moderate-Conservative
The Trustees considered that (a) the advisory fee for the Fund is in line with the median advisory fee rate of the funds in its Selected Expense Peer Group and ranked in the third quintile of its Selected Expense Peer Group; (b) the Operating Expenses for the Fund are greater than the median Operating Expenses of the funds in its Selected Expense Peer Group and ranked in the fourth quintile of its Selected Expense Peer Group; and (c) the net expense ratio was in line with the Comparable Peer Fund Average. The Trustees noted that pursuant to a fee waiver agreement, PLFA has agreed to a breakpoint schedule that will reduce its advisory fee once the Fund attains varying higher asset levels, but that the Fund has not yet reached the first breakpoint.
Pacific Funds Portfolio Optimization Moderate
The Trustees considered that (a) the advisory fee for the Fund is in line with the median advisory fee rate of the funds in its Selected Expense Peer Group and ranked in the third quintile of its Selected Expense Peer Group;(b) the Operating Expenses for the Fund are greater than the median Operating Expenses of the funds in its Selected Expense Peer Group and ranked in the fourth quintile of its Selected Expense Peer Group; and (c) the net expense ratio was less than the Comparable Peer Fund Average. The Trustees noted that pursuant to a fee waiver agreement, PLFA has agreed to a breakpoint schedule that will reduce its advisory fee once the Fund attains varying higher asset levels, but that the Fund has not yet reached the first breakpoint.
During their review, the Trustees considered that all of the Funds were subject to contractual expense limitations on certain operating expenses agreed to by PLFA.
The Trustees also considered information from theSub-Advisers regarding the comparativesub-advisory fees charged under other investment advisory contracts for similarly managed accounts, such as contracts of eachSub-Adviser with other similarly managed registered investment companies or other types of clients. The Trustees noted that in many cases there were differences in the level of services provided to the Funds by theSub-Advisers and that the level of services provided by theseSub-Advisers on these other accounts differed due to the nature of the accounts or because there were other reasons to support the difference in fees, such as an affiliation between theSub-Adviser and the account. These differences often explained variations in fee schedules. The Trustees were mindful that, with the exception of the PAM Managed Funds, theSub-Advised Funds’ fee rates were the result of arms’-length negotiations between PLFA and theSub-Advisers. For the PAM Managed Funds, the Trustees took into account the fact that thesub-advisory fee was not the subject of an arms’-length negotiation with PLFA, but considered information relating to comparative fees charged by similarly managed funds. In all cases, the Trustees considered that allsub-advisory fees are paid by PLFA and are not paid directly by a Fund.
The Board concluded that the advisory fees,sub-advisory fees and total expenses of each Fund were fair and reasonable.
D. Costs, Level of Profits and Economies of Scale
The Trustees reviewed information provided by PLFA regarding PLFA’s costs of sponsoring and operating the Funds and information regarding the profitability of PLFA from each Fund. For purposes of analyzing PLFA’s costs and profitability with respect to the Funds, the Trustees assigned credibility to PLFA’s view that little weight should be given to the fees of Pacific Select Fund, anotheropen-end investment company advised by PLFA that consists of multiple funds, on the basis that there are significant differences between Pacific Funds and Pacific Select Fund, including differences in fund size and platforms on which the funds are offered. For theSub-Advised Funds, the Trustees also reviewed information provided by theSub-Advisers regarding their costs in managing theSub-Advised Funds and their profitability from the Funds5.
PLFA and theSub-Advisers’ Costs and Profitability. The Trustees noted that, based on the data available, PLFA appears to be providing and operating products that are competitively priced with other funds, especially other multi-manager and asset allocation funds. The Trustees noted PLFA’s willingness to build its investment capabilities and to sponsor new funds that PLFA believed would benefit the Asset Allocation Funds, despite the potential subsidies required by PLFA during a new Fund’sstart-up phase. The Trustees also noted that the analysis of the Trust’s profitability to PLFA supported a conclusion that PLFA’s costs and profitability are reasonable, whether considered inclusive or exclusive of distribution costs.
The Trustees also reviewed information provided regarding the structure and manner in which PLFA’s investment professionals were compensated and their respective views of the relationship of such compensation to the attraction and retention of quality personnel. The Trustees considered PLFA’s willingness to invest in technology, infrastructure and staff to reinforce and offer new services and to accommodate changing regulatory requirements. The Trustees also considered the organizational strengths of theSub-Advisers and their ability to attract and retain investment personnel over time and to sustain the staffing of investment teams that provide services to theSub-Advised Funds.
With respect to theSub-Advisers, the Trustees noted that it was difficult in many cases to accurately determine or evaluate theSub-Advisers’ costs and the profitability of theSub-Advisory Agreements to theSub-Advisers because of, among other things, the differences in the types and
| 5 | With respect to the PAM Managed Funds, this information was provided on a pro forma basis. |
F-20
Table of Contents
PACIFIC FUNDS
APPROVAL OF INVESTMENT ADVISORY
AND SUB-ADVISORY AGREEMENTS (Continued)
(Unaudited)
content of information provided by theSub-Advisers, the fact that manySub-Advisers manage substantial assets other than the Funds and, further, that any such assessment would involve assumptions regarding theSub-Advisers’ expense allocation policies, capital structure, cost of capital, business mix and other factors.
Accordingly, in the case of theSub-Advisers, the Trustees considered the data described above in light of the arms’ length nature of the relationship (for thenon-PAM ManagedSub-Advised Funds) between PLFA and suchSub-Advisers with respect to the negotiation of fundsub-advisory fees and the fact that such fees are paid by PLFA. For the PAM Managed Funds, the Trustees took into account the fact that thesub-advisory fee was not the subject of an arms’-length negotiation with PLFA, but consideredpro-forma information regarding the anticipated costs and profitability of the newSub-Advisory Agreement to PAM LLC.
Economies of Scale. The Trustees noted and considered the extent to which economies of scale are realized by PLFA and theSub-Advisers as each Fund grows, and whether advisory fee levels reflect economies of scale if the Funds grow in size. The Trustees noted PLFA’s commitment to competitive total expenses of certain Funds through expense limitation agreements and, for certain Asset Allocation Funds and PAM Managed Funds, through advisory fee waivers. The Trustees also noted PLFA’s and its affiliates’ consistent reinvestment in the business in the form of adding to investment capabilities and resources, improvements in technology, product innovations and customer service. The Trustees considered information relating to economies of scale provided by PLFA, PLFA’s willingness to discuss and evaluate the topic of economies of scale with the Trustees, and PLFA’s agreement to enter into advisory fee waivers for certain PAM Managed Funds and Asset Allocation Funds that create effective breakpoints at asset levels at which PLFA believes it will have attained a level of profit that can be shared with these Funds.
With respect to theSub-Advised Funds, the Trustees considered that the advisory fee for each Fund was originally set at an amount that was intended to be lower than peers to attract assets at the Fund’s inception. The Trustees noted that because fees for the Funds started relatively low from the first dollar under management in relation to peers, economies of scale will be realized at higher asset levels than would otherwise be the case. The Trustees also considered that someSub-Advisers have agreed to breakpoints in theirsub-advisory fee schedules. The Trustees noted that in setting its advisory fees relatively low at inception as compared to peers, and in subsidizing the expenses of the Funds from their inception and for many years, PLFA’s economics from theSub-Advised Funds should be considered separate and apart from the economics of theSub-Advisers. The Trustees noted PLFA’s view that thesub-advisory fee breakpoints were important for PLFA’s economics to overcome its expenses from the Funds. The Trustees also noted that shareholders will benefit from effective breakpoints for the Asset Allocation Funds.
The Trustees also considered PLFA’s willingness to reduce its own fees through certain advisory fee waivers and expense limitation agreements, whereby PLFA will reimburse the Funds for certain expenses that exceed stated expense caps. The Trustees considered that the advisory fee waivers effectively implement breakpoints in PLFA’s advisory fees at higher asset levels of these Funds, which are intended to share economies of scale that PLFA has attained.
The Trustees noted that PLFA and its affiliates had consistently reinvested in the business in the form of improvements in technology, product innovations, personnel and resources. The Trustees additionally noted that economies of scale were difficult to measure with precision, particularly on a Fund by Fund basis. This analysis is complicated by the additional services and content provided by PLFA and its affiliates through reinvestment in the business, as discussed above. The Trustees considered that the Funds are well managed, and provide shareholders with sophisticated asset allocation investment options at reasonable fee levels. The Board noted that PLFA had taken steps to ensure that shareholders benefit by negotiating favorable terms with service providers.
The Board determined that PLFA and its affiliates are sharing economies of scale given its agreement to reduce its own fees through fee waivers as assets grow for certain Funds, its commitment to competitive total expenses of the Funds, and the consistent reinvestment in the business in the form of improvements in technology and other resources and investments in personnel. The Board considered that PLFA has not yet attained levels of profitability that warrant sharing of economies of scale for some Funds, including theSub-Advised Funds, but noted that shareholders will benefit in the future from the effective breakpoints for the Asset Allocation Funds. The Board further considered that it will continue to review whether there are additional economies of scale that will be realized as the Funds grow that can be shared with shareholders. The Board concluded that the Funds’ cost structures were reasonable and that overall profitability appeared reasonable at the current time. The Board further concluded that PLFA was sharing economies of scale with each Fund and its shareholders to their benefit.
E. Ancillary Benefits
The Trustees requested and received from PLFA and theSub-Advisers information concerning other benefits received by PLFA, Pacific Life, theSub-Advisers, and their affiliates as a result of their respective relationship with the Funds, including various service arrangements with PLFA affiliates, as well as commissions paid to broker-dealers affiliated with certainSub-Advisers and the use of soft-dollars by certain of theSub-Advisers. The Trustees also considered ancillary benefits received by Pacific Life and its affiliates from the Funds. The Trustees considered information concerning other significant economic relations between theSub-Advisers and their affiliates and with PLFA and its affiliates and noted PLFA’s processes and procedures to identify and disclose such relationships and any potential conflicts of interest to the Board. The Trustees also considered PLFA’s and eachSub-Adviser’s strong practices and procedures with regard to managing conflicts of interest and ensuring that such conflicts do not prevent PLFA or theSub-Advisers from acting in the best interests of the Funds and their shareholders.
The Board concluded that such benefits were consistent with those generally derived by investment advisers to mutual funds or were otherwise not unusual.
F-21
Table of Contents
PACIFIC FUNDS
APPROVAL OF INVESTMENT ADVISORY
AND SUB-ADVISORY AGREEMENTS (Continued)
(Unaudited)
F. Conclusion
Based on their review, including their consideration of each of the factors referred to above, and assisted by the advice of the Independent Consultant and independent counsel to the Independent Trustees, the Board, including the Independent Trustees, concluded that: (i) the Advisory Agreement and each applicableSub-Advisory Agreement are fair and reasonable with respect to each applicable Fund and its shareholders; (ii) that the renewal of the Advisory Agreement and each applicableSub-Advisory Agreement and the approval of theSub-Advisory Agreement for the PAM Managed Funds would be in the best interests of each Fund and its shareholders; and (iii) the recommendation by PLFA to the Board to enter into eachSub-Advisory Agreement with respect to each unaffiliatedSub-Adviser was not inappropriately influenced by conflicts of interest. The Board did not indicate that any single factor was determinative of its decision to approve the Advisory Agreement and each applicableSub-Advisory Agreement, but indicated that the Board based its determination on the total mix of information available to it.
III. OtherSub-Advisory Agreement Approval
In addition to considering the renewal of the Advisory Agreement and existingSub-Advisory Agreements during the period, the Board considered and approved theSub-Advisory Agreement with respect to Pacific Funds Diversified Income and Pacific Funds Ultra Short Income as discussed below.
Pacific Funds Diversified Income and Pacific Funds Ultra Short Income
At anin-person meeting on December 10, 2019, the Board approved a newsub-advisory agreement with Pacific Asset Management LLC (“PAM LLC”) with respect to Pacific Funds Diversified Income and Pacific Funds Ultra Short Income, effective on or about December 31, 2019. The Trustees considered that the fixed income business division of PLFA currently manages each of Pacific Funds Diversified Income and Pacific Funds Ultra Short Income under the name Pacific Asset Management (“PAM”) and that they were being asked to evaluate a newsub-advisory agreement with PAM LLC for the Funds (the “PAMSub-Advisory Agreement”) in light of PAM’s scheduled reorganization out of PLFA into PAM LLC, a newly formed, indirect wholly-owned subsidiary of Pacific Life Insurance Company on January 1, 2020. Therefore, going forward, these Funds will no longer be directly managed by PLFA as PAM LLC will be aSub-Adviser to them.
In evaluating the PAMSub-Advisory Agreement, the Board, including all the Independent Trustees, considered the following factors, among others:
| • | The advisory agreement for the Funds was initially approved by the Board, including all the Independent Trustees, at anin-person meeting on March 27, 2019. In connection with that approval, the Trustees reviewed information regarding the nature, extent and quality of services to be provided by each of PLFA and PAM; the historical performance of similar investment strategies managed by PAM; the advisory fees to be paid to PLFA; PLFA’s projected costs in managing the Funds and its anticipated projected profitability from the Funds; and other benefits that may be received by PLFA and its affiliates as a result of their relationship with the Funds. |
| • | PLFA and PAM LLC each represented to the Board that the investment teams responsible for managing the Funds will not change as a result of the reorganization, nor will the nature, extent or quality of services currently provided to the Funds. |
| • | PLFA, and not the Funds, will be responsible for paying PAM LLC under the PAMSub-Advisory Agreement, and the advisory fees payable by the Funds to PLFA under the Advisory Agreement will not increase as a result of the reorganization. In this regard, the Trustees considered the level of the proposedsub-advisory fees to be paid by PLFA to PAM LLC and thepro-forma profitability information. The Trustees also considered that thesub-advisory fees are not the subject of an arms’-length negotiation with PLFA. As a result, in reviewing these Agreements, the Board placed greater emphasis on the total advisory fees paid to PLFA. |
The Trustees also considered information regarding the proposedsub-advisory fee rates under the PAMSub-Advisory Agreement compared to applicable peer group averages.
Based on its review, including the consideration of each of the factors referred to above, the Board found that: (i) the PAMSub-Advisory Agreement is in the best interests of the Funds and their shareholders; and (ii) the compensation payable under the PAMSub-Advisory Agreement is fair and reasonable and that the amount of the advisory fees retained by PLFA after paying thesub-advisory fees to PAM is fair and reasonable. No single factor was determinative of the Board’s findings, but rather the Trustees based their determination on the total mix of information available to them.
F-22
Table of Contents
PACIFIC FUNDS
SPECIAL MEETING OF SHAREHOLDERS
(Unaudited)
In accordance with Rule30e-1(b), under the Investment Company Act of 1940, Pacific Funds (the “Trust”) is required to furnish certain information regarding any matters submitted to a vote of the Trust’s shareholders during the period covered by this report.
Shareholders of record on April 5, 2019 representing 775,971,738 shares of the Trust, were notified that a Special Meeting of Shareholders (the “Meeting”) would be held at the offices of the Trust on June 17, 2019. 100.00% of the outstanding shares of the Trust were voted at the meeting. A brief description of the matter voted upon as well as the voting results of the aforementioned Meeting are outlined as follows:
Proposal for all shareholders of Pacific Funds:
To elect three nominees to the Trust’s Board of Trustees (1)
| Votes For | Votes Withheld | Total Outstanding | ||||||||||||||||||
| Number | Percent* | Number | Percent* | Shares | ||||||||||||||||
| James T. Morris | 761,415,261 | 98.12% | 14,556,477 | 1.88% | 775,971,738 | |||||||||||||||
| Paul A. Keller | 746,253,136 | 96.17% | 29,718,602 | 3.83% | 775,971,738 | |||||||||||||||
| Andrew J. Iseman | 745,912,258 | 96.13% | 30,059,480 | 3.87% | 775,971,738 | |||||||||||||||
| (1) | Lucy H. Moore, Gale K. Caruso, Nooruddin (Rudy) Veerjee continue to serve as trustees and were not required to be presented for election. |
| * | Based on total shares outstanding as of the record date April 5, 2019. |
F-23
Table of Contents
PACIFIC FUNDS
WHERE TO GO FOR MORE INFORMATION
(Unaudited)
Availability of Quarterly Holdings
The Trust files Part F of Form N-PORT (complete schedules of fund holdings) with the Securities and Exchange Commission (the “SEC”) for the first and third quarters of each fiscal year not later than 60 days after the close of the applicable quarter end. The Trust’s Part F of FormN-PORT (when required) is filed pursuant to applicable regulations and is available after filing on the SEC’s website at http://www.sec.gov.
Availability of Proxy Voting Record
By August 31 of each year, the Trust files information regarding how the Trust’s managers voted proxies relating to fund securities during the most recent twelve-month period ended June 30. Such information is available after filing on the Trust’s’ website and on the SEC’s website noted below.
Information Relating to Investments Held by the Trust
For complete descriptions of the various securities and other instruments held by the Trust and their risks, please see the Trust’s prospectus and Statement of Additional Information (“SAI”). The prospectus and SAI are available as noted below.
Availability of Proxy Voting Policies
A description of the Proxy Voting Policies and Procedures that the Trust uses to determine how to vote proxies relating to fund securities is described in the Trust’s SAI.
How to obtain Information
The Trust’s prospectus, SAI (including Proxy Voting Policies) and annual and semi-annual reports are available:
| • | On the Trust’s website at https://www.pacificlife.com/pacificfunds.html |
| • | On the SEC’s website at http://www.sec.gov |
| • | Upon request by calling, without charge, 1-800-722-2333, 7 a.m. through 5 p.m. Pacific Time |
F-24
Table of Contents
Pacific Funds
Mailing address:
P.O. Box 9768
Providence, RI 02940-9768
ADDRESS SERVICE REQUESTED
Annual Report as of March 31, 2020 for:
• Pacific Funds
| Form Nos. | 3012-20A |
Table of Contents

PF Underlying Funds
Annual Report
As of March 31, 2020
Table of Contents
PACIFIC FUNDS
ANNUAL REPORT
AS OF MARCH 31, 2020
| A-2 | ||||
| B-1 | ||||
Financial Statements: | ||||
| C-1 | ||||
| C-4 | ||||
| C-7 | ||||
| C-10 | ||||
| C-11 | ||||
| D-1 | ||||
| E-1 | ||||
| F-1 | ||||
| F-2 | ||||
| F-4 | ||||
| F-7 | ||||
| F-8 | ||||
| F-22 | ||||
Pacific Funds Series Trust, which is a Delaware statutory trust, may be referred to as “Pacific Funds” or the “Trust”.
Table of Contents
PACIFIC FUNDS
| Sub-Adviser/Adviser | Fund | Page Number | ||
| Pacific Investment Management Company LLC (PIMCO) | PF Inflation Managed Fund | A-4 | ||
| Pacific Investment Management Company LLC (PIMCO)/Western Asset Management Company, LLC (Western Asset) | PF Managed Bond Fund | A-5 | ||
| T. Rowe Price Associates, Inc. (T. Rowe Price) | PF Short Duration Bond Fund | A-6 | ||
| Ashmore Investment Management Limited (Ashmore) | PF Emerging Markets Debt Fund | A-7 | ||
| Lord, Abbett & Co. LLC (Lord Abbett) | PF Developing Growth Fund | A-9 | ||
| MFS Investment Management (MFS) | PF Growth Fund | A-10 | ||
| ClearBridge Investments, LLC (ClearBridge) | PFLarge-Cap Value Fund | A-11 | ||
| Rothschild & Co Asset Management US Inc. (Rothschild & Co) | PFMid-Cap Equity Fund | A-12 | ||
| Pacific Life Fund Advisors LLC (PLFA)/ Pacific Asset Management LLC (Pacific Asset Management) | PF Multi-Asset Fund | A-13 | ||
| AllianceBernstein L.P. (AB) | PFSmall-Cap Value Fund | A-14 | ||
| Invesco Advisers, Inc. (Invesco) | PF Emerging Markets Fund | A-15 | ||
| MFS Investment Management (MFS) | PF InternationalLarge-Cap Fund | A-16 | ||
| QS Investors, LLC (QS Investors) | PF InternationalSmall-Cap Fund | A-17 | ||
| Wellington Management Company LLP (Wellington) | PF International Value Fund | A-18 | ||
| Principal Real Estate Investors, LLC (Principal REI) | PF Real Estate Fund | A-19 | ||
A-1
Table of Contents
PACIFIC FUNDS PERFORMANCE DISCUSSION
This Annual Report is provided for the general information of investors with beneficial interests in Pacific Funds Series Trust (the “Trust”) and contains information on certain funds (the “Funds” or “Underlying Funds”) of the Trust. This report is not authorized for distribution to prospective investors unless preceded or accompanied by a current Trust prospectus, as supplemented, which contains information about the Trust and each of its Funds, including their investment objectives, risks, charges and expenses. You should read the prospectus carefully before investing. There is no assurance that a Fund will achieve its investment objective. Each Fund is subject to market risk. The value of a Fund changes as its asset values go up or down. The value of a Fund’s shares will fluctuate, and when redeemed, may be worth more or less than their original cost. The total return for each Fund of the Trust is net of fees and includes reinvestment of all dividends and capital gain distributions, if any. Past performance is not predictive of future performance. This report shows you the performance of the Funds compared to benchmark indices. Index performance is provided for illustrative and comparative purposes only and does not predict or depict the performance of the Funds. Indices are unmanaged, do not incur transaction costs, do not include fees and expenses and cannot be purchased directly by investors. Index returns include reinvested dividends.
Pacific Life Fund Advisors LLC (“PLFA” or the “Adviser”) supervises the management of the Funds contained in this report, subject to the oversight of the Trust’s Board of Trustees (Board). PLFA also directlyco-manages the PF Multi-Asset Fund with Pacific Asset Management. PLFA has written the general market conditions commentary which expresses PLFA’s opinions and views on how the market generally performed for the fiscal year ended March 31, 2020 (the reporting period) as well as separate commentary specific to the Fund that it directlyco-manages that is based on its opinion of how this Fund performed during the year.
For the other Funds of the Trust, PLFA has retained other firms to serve assub-advisers under its supervision(Sub-Advisers). Each of theSub-Advisers has written a separate commentary specific to the Fund(s) that they manage that is based on their opinions of how their Fund(s) performed during the year. The views expressed in those commentaries reflect those of theSub-Advisers for the fiscal year ended March 31, 2020.
All views and opinions expressed in the management discussion of fund performance are subject to change at any time based upon market, economic or other conditions, and the Trust, its Adviser and theSub-Advisers disclaim any responsibility to update such views. These views and options may not be relied upon as investment advice or recommendations, or as an offer for any particular security. Any references to “we”, “I”, or “ours” are references to theSub-Adviser or Adviser, as applicable. Any sectors referenced are provided by the applicableSub-Adviser or Adviser and could be different from the sectors listed in the Schedules of Investments if obtained from another source. The Adviser andSub-Advisers may include statements that constitute “forward-looking statements” under the United States (U.S.) securities laws. Forward-looking statements include information concerning possible or assumed future results of the Trust’s investment operations, asset levels, earnings, expenses, industry or market conditions, regulatory developments and other aspects of the Trust’s operations or general economic conditions. In addition, when used in this report, words such as “believes”, “expects”, “anticipates”, “intends”, “plans”, “estimates”, “projects” and future or conditional verbs such as “will”, “may”, “could”, “should” and “would,” or any other statement that necessarily depends on future events, are intended to identify forward-looking statements. Forward-looking statements are not guarantees of performance or economic results. They involve risks, uncertainties and assumptions. Although such statements are based on expectations that the Adviser or aSub-Adviser believes to be reasonable, actual results may differ materially from expectations. Investors must not rely on any forward- looking statements. Statements of facts and performance data are from sources considered reliable, but no representation or warranty is made as to their completeness or accuracy.
In connection with any forward-looking statements and any investment in the Trust, investors should carefully consider the investment objectives, policies and risks described in the Trust’s current prospectus, as supplemented, and Statement of Additional Information, as supplemented, as filed with the United States (U.S.) Securities and Exchange Commission (SEC), which may be obtained from the SEC’s website atwww.sec.gov.
Market Conditions (for the year ended March 31, 2020)
Executive Summary
While global markets kicked off the new decade with steady gains, risk assets got bombarded in March of 2020 by natural and geopolitical hazards that fueled market volatility. At the start of 2020, economic and business indicators showed that U.S. equities were on track for another positive year. Historically, low employment rates boosted consumer confidence—a key factor behind the rising stock market. This support from American households kept the longest economic expansion in U.S. history going, despite mounting external and operational challenges businesses faced such as rising input costs. However, those stock-market gains over much of the reporting period quickly evaporated with the spread of the coronavirus, or COVID-19.
Fixed Income
As coronavirus threatened to throw the U.S. economy into a deep recession or worse, the Fed unexpectedly and aggressively lowered the Fed Funds-rate target range from 0% to 0.25% and unleashed multiple credit facilities to maintain ample liquidity in the marketplace. The10-year U.S. Treasury yield slid from nearly 2.5% to 0.70% over the reporting period. The bond market (as defined by the Bloomberg Barclays US Aggregate Bond Index) returned 8.93% for the reporting period. Like equities, spread sectors faced headwinds over the volatile period as the number of coronavirus-related cases and deaths surged, causing elevated risk concerns. Spikes in credit spreads hurt both emerging-market and high-yield bonds, which coincided with the plunge in risk appetite.
Domestic Equity
On the way down, growth stocks continued to outperform value stocks. Value styles and factors tend to have material exposures to financial and energy sectors, both of which performed badly. In the energy sector, a combination of low profit margins, high leverage and tumbling crude prices triggered an outflow of capital. Extremely low interest rates continued to suppress profitability among financial institutions. Amid a flight to quality, investors shifted from small-capitalization stocks to large-capitalization stocks with healthier balance sheets.
| See benchmark definitions on A-20 – A-21 |
A-2
Table of Contents
PACIFIC FUNDS PERFORMANCE DISCUSSION (Continued)
International Equity
Internationally, trade tensions between the U.S. and China improved, although the Trump administration maintained most of its tariffs. Russia and Saudi Arabia had been engaging in acrude-oil price war that caused oil prices to plunge as markets prepared for an oncoming glut of oil. Many experts questioned the validity, rationale and strategic motives for engaging in this conflict as well as the possibility of a potential pact between Saudi Arabia and Russia. While Russian President Vladimir Putin maintained a strong interest in the Middle East region, theoil-for-military bilateral relationship between the Saudis and the U.S. has faded over the last several years, particularly after the Crown Prince Mohammed bin Salman become the second most powerful figure in Saudi Arabia behind his father, King Salman.
International equities continued to lag their U.S. counterparts, as both the MSCI EAFE (Europe, Australasia, and Far East) Index (Net) and the MSCI Emerging Markets (EM) Index (Net) experienced double-digit losses(-14.38% and-17.69%, respectively) over the reporting period. International developed- and emerging-market equities tend to have more exposure than U.S. markets to the financial sector, whose performance was lackluster as major central banks maintained exceptionally loose monetary policies. Additionally, both Asian and European economies were hit by the coronavirus outbreak earlier than the U.S., contributing to the relative underperformance.
Concluding Remarks
These unfolding events have caused many countries to take wartime-like measures to fight the spread of the coronavirus and address its effects on the global economy. The Fed and Trump administration unleashed an extraordinary monetary and$2-trillion fiscal-stimulus package in an attempt to offset the snowballing effects ofCOVID-19 and other geopolitical issues.
The Trump administration has found itself simultaneously battling the unprecedented impacts of coronavirus, a trade war with China, falling crude oil prices and cracks in cybersecurity. We think the$2-trillion stimulus won’t be enough to fully stabilize the economy, and Congress will be forced to pass another package to further bolster markets. We believe the domestic economy and asset prices may begin recovering in the latter half of 2020 if appropriate measures are taken. In particular, we’ll need to see American businesses and consumers regain some optimism after we come out on the other side of the outbreak.
Globally, the energy sector felt the blow delivered by Putin’s drive to regain market share from U.S. shale. Putin also continues to increase Russia’s global influence, especially in the Middle East where the Trump administration has sent mixed messages about the U.S.’s military commitment in the energy-rich region. Russia has been strategically building its key energy infrastructure projects, though construction of its Nord Stream 2 gas pipeline—designed to run from Russia to Germany—has been halted after the U.S. recently announced it would impose sanctions on vessels that help lay the pipeline in the Baltic Sea.
A minefield of issues threatens the European economy. Once the coronavirus crisis fades, the European Union (EU) will still need to finalize terms of Britain’s exit from the EU; deal with a Eurosceptic and battered Italy; and wrestle with political upheavals in Poland and Hungary. The EU faces these issues with less support from key allies, most notably the U.S. In addition to the coronavirus and geopolitical issues, regulatory pressures to restrict stockholder payouts could add to the mounting headwinds for European dividend-paying stocks such as those in the banking and energy industries, including value sectors, styles and factors.
The economic outlook for Japan, another key international market, remains cloudy. The latest blow was the postponement of the 2020 Olympics due to the coronavirus. Japan’s economic difficulties (e.g. declining population, perpetual deflation and monumental debt levels) will likely push the government to reluctantly pass another fiscal stimulus package to address some of the challenges.
China appears to be in the early recovery phase from the coronavirus, and the Trump administration has started to show a willingness to lower trade barriers to help revive economic activity. The Trump administration’s actions indicate that it will consider extraordinary measures in an attempt to revive the U.S. equity market. We anticipate that President Trump will place an emphasis on boosting the stock market ahead of November’s presidential election. Those measures could potentially lift risk assets, specifically U.S. and Chinese equities over the medium term.
Forward-lookingprice-to-earnings multiples appear to be fairly reasonable at current levels; however, we have noticed slow downward revisions to analyst earnings estimates amid heightened levels of uncertainty. While the exceptional amount of stimulus could provide a jolt to equity markets, longer-term management of the U.S. government’s finances will likely become a highly complex issue as it will need to address rapidly surging debt levels from bailout packages on top of the Fed’s diminished ability to further loosen monetary policy.
Though the U.S. and other countries currently face multiple headwinds, diligent and careful asset-allocation decisions should help investors navigate through the maze of investment threats and opportunities.
| See benchmark definitions on A-20 – A-21 |
A-3
Table of Contents
PACIFIC FUNDS PERFORMANCE DISCUSSION (Continued)
PF Inflation Managed Fund(sub-advised by Pacific Investment Management Company LLC)
Q. How did the Fund perform for the year ended March 31, 2020?
A. For the year ended March 31, 2020, the PF Inflation Managed Fund’s Class P returned 4.94%, compared to a 6.85% return for its benchmark, the Bloomberg Barclays US TIPS Index.
The following graph compares the performance of a hypothetical $10,000 investment in Class P shares of the Fund to its benchmark for the ten-year period ended March 31, 2020. The Fund’s performance reflects reinvestments of all dividends and capital gains distributions, if any.
Performance Comparison
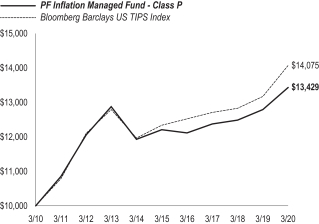
Average Annual Total Returns for the Periods Ended March 31, 2020(1)
| 1 Year | 5 Years | 10 Years | ||||||||||
Fund’s Class P | 4.94% | 1.92% | 2.99% | |||||||||
Bloomberg Barclays US TIPS Index | 6.85% | 2.67% | 3.48% | |||||||||
| (1) | Effective October 31, 2016, Pacific Investment Management Company LLC (“PIMCO”) became the sole sub-adviser to the Fund. Between January 15, 2015 and October 31, 2016, Western Asset Management Company, LLC served as co-sub-adviser of the Fund with PIMCO. Prior to January 15, 2015, PIMCO served as the solesub-adviser. |
Performance data shown represents past performance. Investment return and principal value will fluctuate so that shares of the Fund when redeemed may be worth more or less than their original cost. Past performance is not predictive of future performance. |
Q. Discuss both positive and negative factors that materially affected the Fund’s performance during the year, including relevant market conditions, investment strategies and techniques, and particular sectors or securities.
A. For the reporting period, the Fund’s Class P underperformed the benchmark. We at PIMCO implement the Fund’s investment strategies by investing in bonds and derivative instruments, focusing on inflation-indexed debt securities.
An overweight to U.S breakeven inflation, the difference between nominal and real interest rates, detracted from performance. The Fund’s short position to core United Kingdom (U.K.) RPI and European break-evens was additive to performance. An underweight to nominal interest rates, particularly in the U.S. and U.K., detracted from performance as interest rates fell. Exposure to investment grade credit, emerging market debt, and securitized products detracted from performance, while defensive high yield credit exposure generated positive returns over the reporting period, contributing to performance.
During the reporting period the Fund purchased credit protection to reduce credit exposure to individual issuers, reduce broader credit risk, and to take advantage of the basis between the credit default swap and cash bond market. The Fund entered into interest rate swaps to manage nominal or real interest rate exposure in various global markets and as a substitute for cash bond exposure. The Fund entered into futures contracts to manage interest rate exposure, as a substitute for cash bond exposure, and for purposes of liquidity. Interest rate swaps and futures allow the portfolio manager to effectively manage risk and gain or reduce exposure by targeting specific markets and areas of the yield curve that may not otherwise be accessible through the use of cash bonds. The Fund sold/wrote options on futures, currencies, bond indices, and swaps as a means of capitalizing on anticipated changes in market volatility and to generate income. The Fund purchased and sold foreign currency contracts in connection with settling planned purchases or sales of securities, to hedge the currency exposure associated with some or all of a Fund’s securities, and to express certain views on currency markets. The Fund also held inflation caps and floors to hedge duration.
As of the end of the reporting period, we are “dealing with disruption” on an unprecedented scale. In this highly uncertain environment, we will focus on a defensive approach at a time of heightened volatility. We will look to position to take advantage of normalization of market conditions over time but, for now, we believe a caution-first approach is warranted in an effort to protect against permanent capital impairment.
| See benchmark definitions on A-20 – A-21 |
A-4
Table of Contents
PACIFIC FUNDS PERFORMANCE DISCUSSION (Continued)
PF Managed Bond Fund(co-sub-advised by Pacific Investment Management Company LLC and Western Asset Management Company, LLC)
Q. How did the Fund perform for the year ended March 31, 2020?
A. For the year ended March 31, 2020, the PF Managed Bond Fund’s Class P returned 6.98%, compared to an 8.93% return for its benchmark, the Bloomberg Barclays US Aggregate Bond Index.
The following graph compares the performance of a hypothetical $10,000 investment in Class P shares of the Fund to its benchmark for the ten-year period ended March 31, 2020. The Fund’s performance reflects reinvestments of all dividends and capital gains distributions, if any.
Performance Comparison
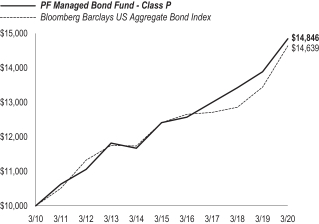
Average Annual Total Returns for the Periods Ended March 31, 2020(1)
| 1 Year | 5 Years | 10 Years | ||||||||||
Fund’s Class P | 6.89% | 3.65% | 4.03% | |||||||||
Bloomberg Barclays US Aggregate Bond Index | 8.93% | 3.36% | 3.88% | |||||||||
| (1) | Western Asset Management Company, LLC became co-sub-adviser to the Fund on August 1, 2014, and some investment policies changed at that time. Pacific Investment Management Company LLC was the sole sub-adviser to the Fund before that date. |
Performance data shown represents past performance. Investment return and principal value will fluctuate so that shares of the Fund when redeemed may be worth more or less than their original cost. Past performance is not predictive of future performance. |
Q. Discuss both positive and negative factors that materially affected the Fund’s performance during the year, including relevant market conditions, investment strategies and techniques, and particular sectors or securities.
A. For the reporting period, the Fund’s Class P underperformed the benchmark. The Fund isco-sub-advised by PIMCO and Western Asset. The following are separate discussions from eachco-sub-adviser.
PIMCO
We at PIMCO implement the Fund’s investment strategies by investing in bonds and derivative instruments with the characteristics of debt instruments. U.S. and Eurozone Core duration strategies added to performance, while tactical shorts to U.K., Japan, and Australia duration detracted from performance.
For our portion of the Fund, within spread sectors, exposure to and selection within Agency andnon-Agency mortgage backed securities (MBS) detracted from performance. Underweight positioning within investment grade credit added to performance; however, exposure to high yield credit detracted from performance. Exposure to Treasury Inflation Linked Securities (TIPS) also detracted from performance. Within currencies, exposure to the Japanese yen detracted from performance, while exposure to the British pound added to performance over the reporting period.
During the reporting period, our portion of the Fund sold credit protection through credit default swaps to obtain exposure to the credit risk of individual securities and to the broader investment grade, high yield, emerging market, mortgage, and other sectors through the use of credit default swaps and credit default swaps on credit indices. Our portion of the Fund also purchased credit protection during the reporting period to reduce credit exposure to individual issuers, reduce broader credit risk, and to take advantage of the basis between the credit default swap and cash bond market. Our portion of the Fund entered into interest rate swaps to manage nominal or real interest rate exposure in various global markets and as a substitute for cash bond exposure. Our portion of the Fund entered into futures contracts to manage interest rate exposure, as a substitute for cash bond exposure, and for purposes of liquidity. Our portion of the Fund sold/wrote options and swaptions on futures, bond indices, currencies, and swaps and also purchased options on futures, bond indices, currencies, andto-be-announced (TBAs) as a means of capitalizing on anticipated changes in market volatility and to generate income. Our portion of the Fund purchased and sold foreign currency contracts in connection with settling planned purchases or sales of securities, to hedge the currency exposure associated with some or all of a Fund’s securities, and to express certain views on currency markets. Lastly, our portion of the Fund also held inflation floors that were previously traded in the portfolio to hedge duration, though exposures were not adjusted during the period.
As of the end of the reporting period, we are “dealing with disruption” on an unprecedented scale. In this highly uncertain environment, we will focus on a defensive approach at a time of heightened volatility. We will look to position to take advantage of normalization of market conditions over time but, for now, we believe a caution-first approach is warranted in an effort to protect against permanent capital impairment.
Western Asset
For Western Asset’s portion of the Fund we seek to maximize total return consistent with prudent investment management. We at Western Asset utilize a long-term, fundamental value philosophy in conjunction with a global investment platform to build a diversified portfolio of
| See benchmark definitions on A-20 – A-21 |
A-5
Table of Contents
PACIFIC FUNDS PERFORMANCE DISCUSSION (Continued)
investment grade bonds with opportunistic allocations to high yield, emerging markets andnon-U.S. dollar securities to enhance returns. Value is added through sector rotation, yield curve positioning, issue selection and duration management.
For much of the Fund’s reporting period, which occurred largely in 2019, global growth was modest but positive and overall market sentiment was cautiously optimistic. Several geopolitical uncertainties that had weighed on markets during the second and third quarters of 2019 were resolved or reduced by the fourth quarter. First, the U.S. and China announced reaching a “Phase One” trade deal, second, the United States Mexico Canada Agreement (USMCA) trade deal passed the House of Representatives and last, Boris Johnson won a sizeable electoral majority in U.K. elections, clearing the path for Brexit. Throughout that period the U.S. Federal Reserve, and other global central banks, demonstrated their willingness to commit to accommodative monetary policy in an effort to sustain economic momentum.
Thus, at the outset of 2020 the Fund was positioned for another year similar to 2019 – one with slow, but still positive growth. Our portion of the Fund held an overweight to spread sectors and with regard to its yield curve positioning, the Fund shifted its exposure to concentrate on the front end of the yield curve. This was in keeping with the view that exposure to the front end of the curve could provide benefit if the Fed cut rates further.
Ultimately, the arrival of a “black swan” event in the form of theCOVID-19 pandemic in early 2020, followed by a surprise oil price war between Russia and Saudi Arabia, dramatically upended the global economic outlook and resulted in a current market backdrop which is unprecedented. Events occurring in the first quarter of 2020 have undone the Fund’s prior positive performance as recent weeks have recorded the quickest we have ever gone from bull to bear market in history.
The overall detractor from performance for the Fund has been the result of its overweight exposures to spread sectors, which have seen their spreads widen to levels not seen since the Global Financial Crisis. In particular, the Fund’s exposures to emerging markets have been the largest detractor as spreads have widened for U.S. dollar-denominated sovereigns and corporates. Additionally, local currency positions have been impacted by a generally stronger U.S. dollar. Structured product positions, in aggregate, have been the second largest detractor from performance. The sector overall, but in particularNon-Agency MBS and commercial mortgage-backed securities (CMBS), has faced considerable dislocation and negative pricing impact due to forced sales by levered real estate investment trusts (REITS) and other market participants. Finally, exposures to high-yield corporate credit have constituted the third largest detractor, as the sector has seen extreme spread widening, as the prospect of a potential U.S. recession is increasingly priced into valuations.
During the reporting period, our portion of the Fund’s exposures to investment grade corporate credit as well as its rates positioning (in aggregate) contributed to performance. During the Fund’s reporting period, the Federal Reserve moved to dramatically cut U.S. interest rates. These moves benefitted our portion of the Fund’s duration positioning, which has generally been long relative to its benchmark.
During the reporting period, our portion of the Fund primarily used U.S. Treasury futures and options, Eurodollar futures and options, and interest rate swaps to manage its duration and yield curve exposure. We also usednon-U.S. Interest Rate Futures to manage exposure to the international bond markets. Credit default swaps on both investment grade and high yield indices were used as an efficient, low cost way of adjusting exposures to these sectors on the margin. The Fund also used Mortgage (To Be Announced) TBAs to gain exposure to the Agency MBS market and other stripped MBS derivatives to gain exposure to specific characteristics of agency MBS. Finally, the Fund used foreign exchange futures, forwards, and options to take outright positions in a variety of currencies, including the Canadian dollar (CAD), the Mexican peso (MXN), Brazilian real (BRL), and British pound (GBP).
PF Short Duration Bond Fund(sub-advised by T. Rowe Price Associates, Inc.)
Q. How did the Fund perform for the year ended March 31, 2020?
A. For the year ended March 31, 2020, the PF Short Duration Bond Fund’s Class P returned 0.97%, compared to a 4.53% return for its benchmark, the Bloomberg Barclays1-3 Year US Government/Credit Bond Index.
The following graph compares the performance of a hypothetical $10,000 investment in Class P shares of the Fund to its benchmark for the ten-year period ended March 31, 2020. The Fund’s performance reflects reinvestments of all dividends and capital gains distributions, if any.
Performance Comparison
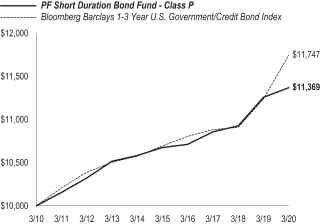
Average Annual Total Returns for the Periods Ended March 31, 2020(1)
| 1 Year | 5 Years | 10 Years | ||||||||||
Fund’s Class P | 0.97% | 1.27% | 1.29% | |||||||||
Bloomberg Barclays1-3 Year US Government/Credit Bond Index | 4.53% | 1.90% | 1.62% | |||||||||
| (1) | T. Rowe Price Associates, Inc. began managing the Fund on July 1, 2011, and some investment policies changed at that time. Another firm managed the Fund before that date. |
Performance data shown represents past performance. Investment return and principal value will fluctuate so that shares of the Fund when redeemed may be worth more or less than their original cost. Past performance is not predictive of future performance. |
| See benchmark definitions on A-20 – A-21 |
A-6
Table of Contents
PACIFIC FUNDS PERFORMANCE DISCUSSION (Continued)
Q. Discuss both positive and negative factors that materially affected the Fund’s performance during the year, including relevant market conditions, investment strategies and techniques, and particular sectors or securities.
A. For the reporting period, the Fund’s Class P underperformed the benchmark. We at T. Rowe Price maintain the Fund’s strategy by investing in debt securities (including derivatives on such securities). In our attempt to seek current income, the strategy focuses on high-quality, investment-grade securities, generally expecting to track the duration of the benchmark (plus or minus a half year). In addition to making active sector allocation and security selection decisions, we also monitor the Fund’s duration as part of our management of the Fund. Duration is often used to measure a bond’s sensitivity to interest rates.
Sector allocation (relative to the benchmark) was the primary detractor from the Fund’s relative performance. The Fund’s overweight to investment-grade corporate bonds, mixed with an underweight to U.S. Treasuries, detracted from performance. Short-maturity U.S. investment-grade corporate bonds underperformed Treasuries in the last part of the reporting period as rising coronavirus concerns sparked large outflows and investors moved to Treasuries or cash.
Ourout-of-benchmark allocation to the securitized sectors hurt relative results as investors moved into assets considered less risky. Similar to the corporate space, securitized sectors also suffered from the flight to quality, market liquidity concerns, and price discovery that characterized markets in the last months of the reporting period.
Security selection detracted in part because of our holdings in BBB rated energy names, which underperformed during the reporting period as oil prices tumbled to their lowest levels in decades as global economic activity rapidly decelerated and amid a price war between Saudi Arabia and Russia.
Yield-curve positioning contributed due to our duration position, which was longer than that of the benchmark. This longer position contributed to performance as interest rates fell faster in theshort-end of the curve than on the longer end.
As of March 31, 2020, the Fund held interest rate futures and credit default swap positions generating gross exposure of approximately 37.76% and 0.49% respectively. The fund also held currency forwards during the reporting period. The estimated return impact from employing currency forwards was negligible, 0.25% from futures and 0.01% from swaps for the reporting period.
PF Emerging Markets Debt Fund(sub-advised by Ashmore Investment Management Limited)
Q. How did the Fund perform for the year ended March 31, 2020?
A. For the year ended March 31, 2020, the PF Emerging Markets Debt Fund’s Class P returned-17.58%, compared to a-6.84% return for the broad-based J.P. Morgan Emerging Markets Bond Index (EMBI) Global Diversified Index and-6.21% for the Emerging Markets Debt Composite Benchmark.
The following graph compares the performance of a hypothetical $10,000 investment in Class P shares of the Fund to its benchmarks for the period from inception through March 31, 2020. The Fund’s performance reflects reinvestments of all dividends and capital gains distributions, if any.
Performance Comparison
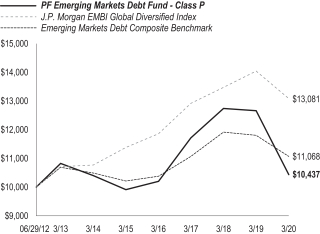
Average Annual Total Returns for the Periods Ended March 31, 2020
| 1 Year | 5 Years | Since | ||||||||||
Fund’s Class P | (17.58% | ) | 1.05% | 0.55% | ||||||||
J.P. Morgan EMBI Global Diversified Index | (6.84% | ) | 2.82% | 3.53% | ||||||||
Emerging Markets Debt Composite Benchmark | (6.21% | ) | 1.63% | 1.32% | ||||||||
Performance data shown represents past performance. Investment return and principal value will fluctuate so that shares of the Fund when redeemed may be worth more or less than their original cost. Past performance is not predictive of future performance. |
Q. Discuss both positive and negative factors that materially affected the Fund’s performance during the year, including relevant market conditions, investment strategies and techniques, and particular sectors or securities.
A. For the reporting period, the Fund’s Class P underperformed the broad-based J.P. Morgan EMBI Global Diversified Index and the sector-specific Emerging Markets Debt Composite Benchmark. The Fund invests its assets in debt instruments that are economically tied to emerging market countries, which are issued by governments (sovereigns), government-guaranteed or majority government-owned entities (quasi-sovereigns), government agencies and instrumentalities and corporate issuers, and may be denominated in any currency, including the local currency of the issuer. We at Ashmore tactically manage exposure to emerging market sovereign external debt, local currency sovereign debt and corporate debt in seeking to maximize total return consistent with prudent investment management.
| See benchmark definitions on A-20 – A-21 |
A-7
Table of Contents
PACIFIC FUNDS PERFORMANCE DISCUSSION (Continued)
Over the reporting period the Fund’s allocation to emerging markets sovereign external debt, started the reporting period at 58.70% and ended at around 59.92% of the Fund’s net asset value (NAV). Over the reporting period, the Fund’s exposure to corporate debt of issuers economically tied to emerging market countries increased, starting the reporting period at 8.52% and ending at around 11.22% of NAV. Finally, the Fund’s exposure to emerging market local bonds and net exchange rate positions decreased, starting the reporting period at 53.78%, and ending at around 49.78% of NAV.
The Fund’s overweight positions in hard currency sovereign external debt and local currency debt detracted from the Fund’s relative performance over the reporting period, while theoff-benchmark allocation to corporate debt contributed modestly to performance. Overall security selection detracted from performance driven by security selection in hard currency sovereign debt, most notably during the final quarter of the reporting period.
Overall, the largest country detractors over the reporting period were positions in Venezuela, Ecuador, Argentina, and Lebanon. The largest country contributor to Fund performance over the reporting period was an underweight position in South Africa.
The Fund’s positions in derivatives are mainly in foreign exchange (FX) forwards – notably to hedge the FX exposure of some local currency bond positions.
The following are summary developments in the various countries mentioned above in which the Fund invested during the reporting period:
In early March, Moody’s cut its forecast for South Africa’s 2020 Gross Domestic Product (GDP) growth from 0.70% to 0.40%, the first of several downward revisions to growth expectations. The South African Reserve Bank (SARB) cut policy rates to 5.25% and indicated that it saw a further contraction in growth by 2021. SARB also launched its first quantitative easing programme by buying government bonds in the secondary market. According to Moody’s, South Africa’s fiscal deficit will now exceed 8.50% in 2020. The budget will likely be further strained by expected needs for support by state-owned enterprises. Finance Minister Mboweni indicated the government may approach the IMF/World Bank. Moody’s downgraded South Africa tosub-investment grade in a long-anticipated move, citing the poor growth outlook and the fiscal impact, together with lack of notable fiscal adjustment. Local currency bonds will leave Investment Grade indices, with estimated outflows of $6.6 billion U.S. dollars.
In Ecuador, the economy was supported by the positive trend in oil prices over the reporting period. There were protests against the elimination of fuel price subsidies (intended to address expenditure cuts as part of the ongoing International Monetary Fund (IMF) program) which forced the government to reverse course and reinstate the subsidies. Further efforts to address expenditure cuts in the form of a tax reform proposal were rejected by their congress, as the package included multiple other reform proposals that proved too complicated to address in a short time frame. Bond prices dropped to levels that priced in an imminent default following a statement by leaders of most parties in Congress that asked the government to “suspend payment on external debt to creditors of the state” in advance of the March 24, 2020 maturity of a $325 million U.S. dollar bond. Payment was nevertheless made but Ecuador has announced that it would utilize the30-day grace period for interest payments on March coupons as it looked to financial support from the IMF, China and other sources. The IMF remains very supportive of Ecuador’s continued efforts to comply with its fiscal requirements.
Venezuelan bond prices trended downwards over the reporting period as JP Morgan continued to reweight the country in the index, targeting a zero weight in light of U.S. sanctions and the resulting difficulty in trading Venezuelan debt. This was completed at the end of November of 2019. The state-owned oil company Petroleos de Venezuela, S.A. (PDVSA) missed the coupon and amortization payment due on its 2020 bond maturity in late October of 2019, leading to legal challenges with regard to the collateral backing the bond. Over the first quarter of 2020, Venezuela continued to see its access to the outside world curtailed by ever-increasing sanctions, as the country’s deteriorated healthcare infrastructure looked incapable of addressing theCOVID-19 pandemic. An appeal to the IMF for $5 billion U.S. dollars in financial assistance was denied as Nicolas Maduro lacks official recognition as president. With revenues from oil exports continuing to fall, a proposal from the U.S. that would install a five member governing council as a transitory step towards democratic elections was met with a cool reception by the de facto Maduro administration.
In Argentina, there was a significant mark-down in bond prices in the immediate aftermath of the presidential primary in August of 2019, in which opposition Peronist candidate Alberto Fernandez surprised pollsters and the market with a15-point lead. The actual election occurred in late October of 2019 with Fernandez emerging as winner. Although Fernandez’s transition team constructively engaged with President Mauricio Macri’s team to ensure a smooth handover, the market remained spooked by concerns, ultimately realized, that Argentina would announce that a debt restructuring would be required to get the country’s debt to a “sustainable” level. By the end of the reporting period, the market was still awaiting a proposal from the government on how its external debt would be treated. During the period, however, Argentina remained current on all of its external debt obligations.
Lebanon’s sovereign credit rating was cut to CC with a negative outlook over the reporting period. The government committed plans for a reform of the electricity sector, which we believed would have improved public finances and permitted the economy to begin a slow pace of improvement. However, widespread public protests leading to the resignation of the government continued to put pressure on asset prices. Lebanon became the first sovereign issuer to default on its external debt in 2020, declaring a moratorium on $31.3 billion U.S. dollars in outstanding debt.
| See benchmark definitions on A-20 – A-21 |
A-8
Table of Contents
PACIFIC FUNDS PERFORMANCE DISCUSSION (Continued)
PF Developing Growth Fund (sub-advised by Lord, Abbett & Co. LLC)
Q. How did the Fund perform for the year ended March 31, 2020?
A. For the year ended March 31, 2020, the PF Developing Growth Fund’s Class P returned -14.67%, compared to a -18.58% return for its benchmark, the Russell 2000 Growth Index.
The following graph compares the performance of a hypothetical $10,000 investment in Class P shares of the Fund to its benchmark for the ten-year period ended March 31, 2020. The Fund’s performance reflects reinvestments of all dividends and capital gains distributions, if any.
Performance Comparison
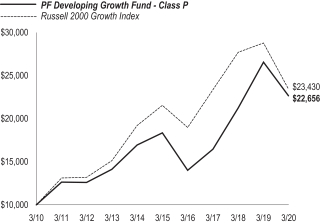
Average Annual Total Returns for the Periods Ended March 31, 2020(1)
| 1 Year | 5 Years | 10 Years | ||||||||||
Fund’s Class P | (14.67% | ) | 4.31% | 8.52% | ||||||||
Russell 2000 Growth Index | (18.58% | ) | 1.70% | 8.89% | ||||||||
| (1) | Effective October 31, 2016, the Fund changed its name from PF Small-Cap Growth Fund. Lord, Abbett & Co. LLC began managing the Fund on May 1, 2014 and some investment policies changed at that time. Other firms managed the Fund before that date. |
Performance data shown represents past performance. Investment return and principal value will fluctuate so that shares of the Fund when redeemed may be worth more or less than their original cost. Past performance is not predictive of future performance. |
Q. Discuss both positive and negative factors that materially affected the Fund’s performance during the year, including relevant market conditions, investment strategies and techniques, and particular sectors or securities.
A. For the reporting period, the Fund’s Class P outperformed the benchmark. The Fund seeks capital appreciation by investing in small-capitalization growth companies that we at Lord Abbett believe have above-average long-term growth potential and that are strongly positioned in the “developing growth” phase, which we define as the period of swift development after a company’s start-up phase when growth occurs at a rate generally not equaled by established companies in their mature years. These types of companies include companies that we believe can transform markets through innovative products and services.
The leading contributor to the Fund’s relative performance during the reporting period was security selection and positioning in the information technology sector. Within this sector, the Fund’s holdings of Inphi Corp., a provider of analog and mixed signal semiconductor solutions, contributed to relative performance. Inphi’s acquisition of engineering talent, leading edge silicon expertise, and a next-generation bandwidth roadmap helped the company execute well, despite facing much larger competitors. Additionally, the significant increase in work-from-home employees, online shopping, and e-learning has increased demand for connectivity within datacenters. Another contributor within this sector during the reporting period was the Fund’s position in Coupa Software, Inc., a provider of business spend management solutions. Shares of Coupa appreciated rapidly as the company emerged as a leading platform for business spend management and began to enhance its business-to-business capabilities.
Security selection within the health care sector also contributed to the Fund’s relative performance during the reporting period. Within this sector, the Fund’s holdings of Forty Seven, Inc., a developer of therapies that target cancer immune evasion pathways, contributed during the reporting period. In early March of 2020, Forty Seven announced that it had agreed to be acquired by Gilead Sciences, Inc. for a large premium. The Fund’s holdings of Repligen Corp., a provider of bioprocessing solutions for the development of biologic drugs, contributed as the company posted its best organic growth rate in over three years, with all segments contributing to its substantial growth.
Additionally, security selection within the consumer staples sector was a major contributor to the Fund’s performance during the reporting period. Specifically, the Fund’s holding of Freshpet, Inc., a manufacturer and distributor of pet food for dogs and cats, contributed. Shares of Freshpet rose as consumer adoption of the company’s pet food brand increased and retailers put more Freshpet refrigerators on their floors.
The leading detractor from the Fund’s performance relative to the benchmark during the reporting period was security selection and positioning within the consumer discretionary sector. Within this sector, the Fund’s position in LGI Homes, Inc., a designer and seller of new homes, detracted from relative performance. Shares of LGI Homes plummeted as the spread of the novel coronavirus and the crash of oil prices disproportionately affected their business relative to peers due to their high exposure to the Texas housing market. Another detractor within the sector was the Fund’s position in Planet Fitness, Inc., a fitness center franchise, which suffered as social distancing and the impact from temporary closures weighed on shares.
| See benchmark definitions on A-20 – A-21 |
A-9
Table of Contents
PACIFIC FUNDS PERFORMANCE DISCUSSION (Continued)
Security selection in the communication services sector also detracted from the Fund’s performance relative to the benchmark during the reporting period. Within this sector, the Fund’s holdings of Cardlytics, Inc., a developer of marketing solutions, detracted. Shares of Cardlytics fell precipitously as the spread of the coronavirus greatly impacted restaurants, retailers, and the travel and hospitality industries. These businesses make up a significant portion of Cardlytics clients, and are expected to cut advertising budgets as consumer spending and demand in those areas plummet.
PF Growth Fund(sub-advised by MFS Investment Management)
Q. How did the Fund perform for the year ended March 31, 2020?
A. For the year ended March 31, 2020, the PF Growth Fund’s Class P returned 3.04%, compared to a 0.91% return for its benchmark, the Russell 1000 Growth Index.
The following graph compares the performance of a hypothetical $10,000 investment in Class P shares of the Fund to its benchmark for the ten-year period ended March 31, 2020. The Fund’s performance reflects reinvestments of all dividends and capital gains distributions, if any.
Performance Comparison
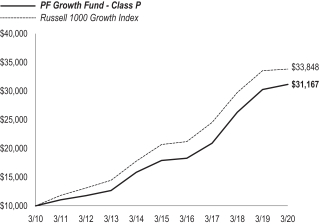
Average Annual Total Returns for the Periods Ended March 31, 2020(1)
| 1 Year | 5 Years | 10 Years | ||||||||||
Fund’s Class P | 3.04% | 11.74% | 12.04% | |||||||||
Russell 1000 Growth Index | 0.91% | 10.36% | 12.97% | |||||||||
| (1) | MFS Investment Management began managing the Fund on May 1, 2013, and some investment policies changed at that time. Another firm managed the Fund before that date. |
Performance data shown represents past performance. Investment return and principal value will fluctuate so that shares of the Fund when redeemed may be worth more or less than their original cost. Past performance is not predictive of future performance. |
Q. Discuss both positive and negative factors that materially affected the Fund’s performance during the year, including relevant market conditions, investment strategies and techniques, and particular sectors or securities.
A. For the reporting period, the Fund’s Class P outperformed the benchmark. The strategy is an actively managed, research-driven growth fund. We, the MFS investment management team, build the Fund from the bottom up, selecting companies with the best opportunities for growth two to three years into the future. When applying the Fund’s valuation analysis, we consider the magnitude and potential growth rate of a company against what the market has discounted. At the sector level, we typically limit significant over- and under-weights relative to the benchmark, allowingbottom-up stock selection to drive performance results over time.
Stock selection in the technology sector contributed to performance relative to the benchmark, led by the Fund’s overweight position in software company Adobe Systems and not holding shares of network equipment company Cisco Systems.
Stock selection and, to a lesser extent, an underweight allocation to the industrial sector also benefited relative returns, driven by avoiding shares of aerospace company Boeing and industrial conglomerate 3M.
Compared to the benchmark, the Fund’s stock selection in both the financial and consumer cyclicals sectors supported performance. Within the financial sector, an overweight position in index data provider MSCI and not holding shares of real estate investment trust Simon Property Group contributed to returns. Within the consumer cyclicals sector, the timing of the Fund’s ownership in shares of online travel company Booking Holdings (security was not held in the Fund at reporting period end) helped relative results.
Elsewhere, the Fund’s overweight positions in animal health products manufacturer Zoetis and cable services provider Charter Communications, and not holding shares of tobacco giant Altria Group, supported relative returns.
An underweight allocation and, to a lesser extent, stock selection in the communications sector detracted from relative performance, primarily driven by the Fund’s underweight position in computer and personal electronics maker Apple and not holding shares of diversified entertainment company Walt Disney.
Investments in other sectors that hindered relative results included the timing of the Fund’s ownership in shares of computer graphics processors maker NVIDIA and alcoholic beverages company Constellation Brands(security was not held in the Fund at reporting period end) and not holding shares of electric vehicle manufacturer Tesla. In addition, the Fund’s overweight positions in shares of diversified industrial conglomerate Fortive (security was not held in the Fund at reporting period end), hotel operator Marriott International, business payments solutions provider FleetCor Technologies, discount variety store operator Dollar Tree and financial management solutions provider Intuit all further dampened relative performance
| See benchmark definitions on A-20 – A-21 |
A-10
Table of Contents
PACIFIC FUNDS PERFORMANCE DISCUSSION (Continued)
PFLarge-Cap Value Fund(sub-advised by ClearBridge Investments, LLC)
Q. How did the Fund perform for the year ended March 31, 2020?
A. For the year ended March 31, 2020, the PFLarge-Cap Value Fund’s Class P returned-13.51%, compared to a-17.17% return for its benchmark, the Russell 1000 Value Index.
The following graph compares the performance of a hypothetical $10,000 investment in Class P shares of the Fund to its benchmark for the ten-year period ended March 31, 2020. The Fund’s performance reflects reinvestments of all dividends and capital gains distributions, if any.
Performance Comparison
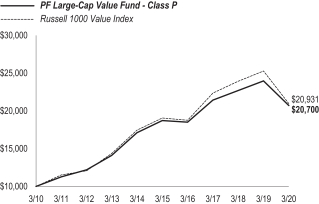
Average Annual Total Returns for the Periods Ended March 31, 2020
| 1 Year | 5 Years | 10 Years | ||||||||||
Fund’s Class P | (13.51% | ) | 2.04% | 7.55% | ||||||||
Russell 1000 Value Index | (17.17% | ) | 1.90% | 7.67% | ||||||||
Performance data shown represents past performance. Investment return and principal value will fluctuate so that shares of the Fund when redeemed may be worth more or less than their original cost. Past performance is not predictive of future performance. |
Q. Discuss both positive and negative factors that materially affected the Fund’s performance during the year, including relevant market conditions, investment strategies and techniques, and particular sectors or securities.
A. For the reporting period, the Fund’s Class P outperformed the benchmark. We, the ClearBridge large-capitalization value team, use an interactive, research-driven approach to identify large-capitalization companies with strong business franchises and attractive valuations. We look for companies with proven business models and sustainable competitive advantages capable of generating superior returns over time across a range of potential scenarios. We place an emphasis on near- and medium-term cash flows over those with a longer projected time frames when discounting earnings from emerging business models or products. We consider valuations relative to normalized earnings power. There is no change to our disciplined investment approach that focuses on competitively well-positioned companies with strong business franchises capable of generating superior returns across cycles.
Relative to the benchmark, overall stock selection and sector allocation contributed to performance for the reporting period. The Fund’s stock selection in the real estate, industrials, financials and materials sectors contributed the most to relative performance for the reporting period. In terms of allocation, the Fund’s underweight position in the consumer discretionary sector and overweight position in the information technology (IT) sector contributed to relative performance for the reporting period. The Fund’s cash position also helped performance. On an individual stock basis, the leading contributors to relative performance included positions in Microsoft in the IT sector, AT&T, Charter Communications in the communication services sector, Exxon Mobil in the energy sector and Capital One in the financials sector.
Stock selection in the consumer staples sector and underweights to the consumer staples and utilities sectors detracted the most from relative performance. On an individual stock basis, the leading detractors from relative Fund performance for the reporting period included our holdings in Dish Network in the communication services sector, Suncor Energy and Enterprise Products Partners LP in the energy sector, Anheuser-Busch InBev in the consumer staples sector and United Technologies in the industrials sector.
During the reporting period, we established several new positions, the largest among them being Apple in the IT sector, Reynolds Consumer Products in the consumer staples sector,T-Mobile in the communication services sector, Northrop Grumman in the industrials sector and Edison International in the utilities sector. Positions we exited during the reporting period included Wells Fargo and Capital One in the financials sector, Philip Morris and Anheuser-Busch InBev in the consumer staples sector and AT&T in the communication services sector.
| See benchmark definitions on A-20 – A-21 |
A-11
Table of Contents
PACIFIC FUNDS PERFORMANCE DISCUSSION (Continued)
PFMid-Cap Equity Fund(sub-advised by Rothschild & Co Asset Management US Inc.)
Q. How did the Fund perform for the year ended March 31, 2020?
A. For the year ended March 31, 2020, the PFMid-Cap Equity Fund’s Class P returned-21.28%, compared to a-18.31% return for its benchmark, the Russell Midcap Index.
The following graph compares the performance of a hypothetical $10,000 investment in Class P shares of the Fund to its benchmark for the ten-year period ended March 31, 2020. The Fund’s performance reflects reinvestments of all dividends and capital gains distributions, if any.
Performance Comparison
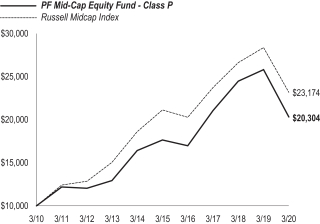
Average Annual Total Returns for the Periods Ended March 31, 2020(1)
| 1 Year | 5 Years | 10 Years | ||||||||||
Fund’s Class P | (21.28% | ) | 2.85% | 7.34% | ||||||||
Russell Midcap Index | (18.31% | ) | 1.85% | 8.77% | ||||||||
| (1) | Rothschild & Co AMUS began managing the Fund on June 13, 2018. Scout Investment, Inc. managed the Fund from January 1, 2013 through June 12, 2018. Another firm managed the Fund before that date. |
Performance data shown represents past performance. Investment return and principal value will fluctuate so that shares of the Fund when redeemed may be worth more or less than their original cost. Past performance is not predictive of future performance. | ||||||
Q. Discuss both positive and negative factors that materially affected the Fund’s performance during the year, including relevant market conditions, investment strategies and techniques, and particular sectors or securities.
A. For the reporting period, the Fund’s Class P underperformed the benchmark. Rothschild & Co implements the Fund’s strategy by investing in common stocks and other equity securities of medium capitalization U.S. companies. We analyze a variety of quantitative and fundamental inputs in making stock decisions and seek to build a portfolio that is well diversified at the issuer level and by economic sector. Our focus remains on identifying stocks with attractive relative valuations and the ability to exceed investors’ expectations.
Leading sectors contributing to the Fund’s performance included information technology, communication services, and consumer staples. Conversely, the industrials, real estate, and consumer discretionary sectors were the most significant detractors from the Fund’s performance. Sector allocation was modestly positive, with tailwinds from an overweight to the health care sector and the Fund’s small cash position exceeding the headwinds from an underweight to the information technology sector and an underweight to the utilities sector. Stock selection was the primary driver of the Fund’s relative underperformance, with the effects of contributors in the financials, information technology, and communication services sectors falling short of those of detractors in the industrials, health care, and materials sectors.
Turning to individual stocks, detractors from the Fund’s performance included Diamondback Energy, an independent exploration and production company, which underperformed in the final quarter of the reporting period due to the rout in oil prices that fell from $60 per barrel at the beginning of the first quarter of 2020 to $20 per barrel. Another detractor from the Fund’s performance was PVH Corp, a clothing company, whose fall was driven by estimate cuts as theCOVID-19 situation developed, with risks tied to lower global tourism spending as more than half of the company’s revenues originated from outside the U.S. market. Adding to the pressure on estimates was PVH’s exposure to U.S. mall and department store closures. Also detracting from the Fund’s performance was Ryman Hospitality Properties, a real estate investment trust (REIT) specializing in group-oriented destination hotels. which also operates media and entertainment assets including the Grand Ole Opry, the Ryman Auditorium, radio stationWSM-AM and other entertainment venues. During the reporting period the stock was initially down on concerns that general economic weakness and trade-related tensions would negatively impact the hospitality industry, and then shares sold off sharply in the first quarter of 2020 when Ryman was forced to temporarily suspend operations due to the spread of COVID-19.
Top individual stock contributors to the Fund’s performance included RingCentral, a cloud communication software provider, which reported better-than-expected results and guidance at the close of 2019. In addition, the company is viewed as a potential beneficiary of theCOVID-19 virus, which could drive an increase in demand due to the new work/life paradigm in a “shelter in place environment”. While the initial uptake could be temporary, there is a high potential of a behavioral change and a more permanent shift to the cloud. Also contributing to the Fund’s performance was MarketAxess, an electronic fixed income trading platform provider, which continued to post strong results as the company continued to take market share as the platform benefits from a network effect along with the broader shift to electronic execution. More recently, the company has benefited from increased fixed income volume driven by elevated market volatility.
| See benchmark definitions on A-20 – A-21 |
A-12
Table of Contents
PACIFIC FUNDS PERFORMANCE DISCUSSION (Continued)
PF Multi-Asset Fund(managed by Pacific Life Fund Advisors LLC, collateral portion managed by Pacific Asset Management LLC)
Q. How did the Fund perform for the year ended March 31, 2020?
A. For the year ended March 31, 2020, the PF Multi-Asset Fund’s Class P returned-14.09%, compared to a-10.39% return for its benchmark, the MSCI World Index (Net).
The following graph compares the performance of a hypothetical $10,000 investment in Class P shares of the Fund to its benchmarks for the period from inception through March 31, 2020. The Fund’s performance reflects reinvestments of all dividends and capital gains distributions, if any.
Performance Comparison
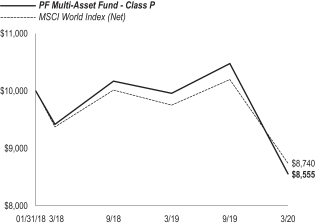
Average Annual Total Returns for the Periods Ended March 31, 2020(1)
| 1 Year | Since Inception (1/31/18) | |||||||
Fund’s Class P | (14.09% | ) | (6.96% | ) | ||||
MSCI World Index (Net) | (10.39% | ) | (6.04% | ) | ||||
| (1) | Pacific Asset Management LLC began co-managing the Fund with Pacific Life Fund Advisors LLC effective December 31, 2019. Prior to that date, Pacific Life Fund Advisors LLC doing business under the name Pacific Asset Management co-managed the Fund with Pacific Life Fund Advisors LLC. |
Performance data shown represents past performance. Investment return and principal value will fluctuate so that shares of the Fund when redeemed may be worth more or less than their original cost. Past performance is not predictive of future performance. | ||||||
Q. Discuss both positive and negative factors that materially affected the Fund’s performance during the year, including relevant market conditions, investment strategies and techniques, and particular sectors or securities.
A. For the reporting period, the Fund’s Class P underperformed the benchmark. The Fund buys and sells total return swap agreements to gain exposure to the large-capitalization andmid-capitalization asset classes of the U.S. and developednon-U.S. equity markets, including growth and value styles, that may be denominated in foreign currencies. We at PLFA actively manage the Fund’s exposures in these asset classes in seeking to contribute to overall returns for the Fund.
The primary driver of the Fund’s underperformance versus the benchmark during the reporting period was the Fund’s overweight to U.S. mid-capitalization equities, as they were particularly sensitive to sectors that were battered over the reporting period, which include energy, financials and real estate. In addition, the Fund’s collateral portion detracted from performance as it returned less than the Fund’s derivatives financing expenses over the reporting period. The collateral portion’s exposure toBBB-rated issuers primarily detracted from performance. In addition to total return swap agreements, the Fund used futures contracts to gain or reduce exposures to certain asset classes during the reporting period.
| See benchmark definitions on A-20 – A-21 |
A-13
Table of Contents
PACIFIC FUNDS PERFORMANCE DISCUSSION (Continued)
PFSmall-Cap Value Fund(sub-advised by AllianceBernstein L.P.)
Q. How did the Fund perform for the year ended March 31, 2020?
A. For the year ended March 31, 2020, the PFSmall-Cap Value Fund’s Class P returned-31.62%, compared to a-29.64% return for its benchmark, the Russell 2000 Value Index.
The following graph compares the performance of a hypothetical $10,000 investment in Class P shares of the Fund to its benchmark for the ten-year period ended March 31, 2020. The Fund’s performance reflects reinvestments of all dividends and capital gains distributions, if any.
Performance Comparison
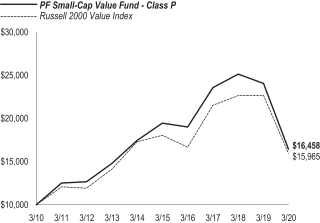
Average Annual Total Returns for the Periods Ended March 31, 2020(1)
| 1 Year | 5 Years | 10 Years | ||||||||||
Fund’s Class P | (31.62% | ) | (3.31% | ) | 5.11% | |||||||
Russell 2000 Value Index | (29.64% | ) | (2.42% | ) | 4.79% | |||||||
| (1) | AllianceBernstein L.P. began managing the Fund on May 1, 2014 and some investment policies changed at that time. Another firm managed the Fund before that date. |
Performance data shown represents past performance. Investment return and principal value will fluctuate so that shares of the Fund when redeemed may be worth more or less than their original cost. Past performance is not predictive of future performance. |
Q. Discuss both positive and negative factors that materially affected the Fund’s performance during the year, including relevant market conditions, investment strategies and techniques, and particular sectors or securities.
A. For the reporting period, the Fund’s Class P underperformed the benchmark. We at AllianceBernstein maintain the Fund’s investment goal by seeking long-term growth of capital. The Fund seeks undervalued small-capitalization stocks with attractive long-term earnings prospects. We believe that small-capitalization stocks offer greater opportunity for fundamental stock selection since they are covered by fewer industry analysts. The Fund invests primarily in equity securities of small-capitalization U.S. companies.
During the reporting period, overall security selection detracted from performance, owing mainly to the Fund’s industrials, financials and technology holdings. Stock selection in real estate contributed positively to performance during the reporting period.
Overall sector allocation contributed to the Fund’s performance. An overweight position in technology contributed, while underweights to utilities, healthcare and financials detracted.
Oil States International, a services provider to the oil and gas industry, detracted from the Fund’s performance after the company announced disappointing results driven by weakness in its completion services business. Its shares were also caught up in the broadersell-off in energy companies as the price of oil fell sharply following the novel coronavirus outbreak. Hair salon chain Regis also detracted, driven by investor concerns that, while haircuts are still in demand, store closures mandated by state governments in an effort to contain the coronavirus would dramatically reduce the company’s revenues in the near term.
Shares of Unisys contributed to the Fund’s performance after the information technology consulting firm reported stronger than expected third quarter 2019 results driven by strong revenue growth and improved margins. Unisys has also benefited from the announced sale of its U.S. federal business to Science Applications International Corporation. Unisys indicated that it will use the proceeds to pay down debt and reduce its pension obligations. Food and personal-care products company Hain Celestial also contributed, reflecting both the ongoing progress of its long-term turnaround strategy and the strength in consumer spending on packaged goods. The new management team has continued to implement structural improvements in product innovation, manufacturing and marketing, which have positioned the company well to meet the sudden surge in consumer demand.
| See benchmark definitions on A-20 – A-21 |
A-14
Table of Contents
PACIFIC FUNDS PERFORMANCE DISCUSSION (Continued)
PF Emerging Markets Fund(sub-advised by Invesco Advisers, Inc.)
Q. How did the Fund perform for the year ended March 31, 2020?
A. For the year ended March 31, 2020, the PF Emerging Markets Fund’s Class P returned-14.07%, compared to a-17.69% return for its benchmark, the MSCI Emerging Markets Index (Net).
The following graph compares the performance of a hypothetical $10,000 investment in Class P shares of the Fund to its benchmark for the ten-year period ended March 31, 2020. The Fund’s performance reflects reinvestments of all dividends and capital gains distributions, if any.
Performance Comparison
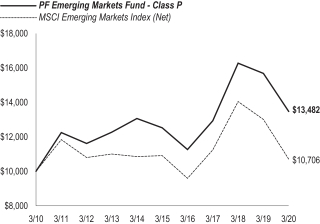
Average Annual Total Returns for the Periods Ended March 31, 2020
| 1 Year | 5 Years | 10 Years | ||||||||||
Fund’s Class P | (14.07% | ) | 1.49% | 3.03% | ||||||||
MSCI Emerging Markets Index (Net) | (17.69% | ) | (0.37% | ) | 0.68% | |||||||
Performance data shown represents past performance. Investment return and principal value will fluctuate so that shares of the Fund when redeemed may be worth more or less than their original cost. Past performance is not predictive of future performance. |
Q. Discuss both positive and negative factors that materially affected the Fund’s performance during the year, including relevant market conditions, investment strategies and techniques, and particular sectors or securities.
A. For the reporting period, the Fund’s Class P outperformed the benchmark. We, the Invesco Emerging Markets Equity team, are long-term investors in what we view as extraordinary companies that have massive competitive advantages and real options that manifest themselves over many years. We have exposure to sectors and industries where we see dynamic change and real value being extracted, includinge-commerce, cloud computing, internet services, health care, travel, and education.
Top performing stocks for the Fund this reporting period included Meituan Dianping (consumer discretionary) (China), Jiangsu Hengrui Medicine Co. Ltd. (health care) (China), Alibaba Group Holding Ltd. (consumer discretionary) (China) and Taiwan Semiconductor Manufacturing Co. Ltd. (informational technology) (Taiwan).
Meituan Dianping is a Chinese technology company that facilitates delivery, shopping, and bookings in several service categories, including food delivery, restaurant reservations, beauty services and hotel and travel reservations through itsweb-based platform. Since its initial listing in December 2018, Meituan has succeeded in improving several key operational metrics: the food delivery business achieved positive operating profit due to improved economies of scale, the number of transacting users and the number of active merchants saw a healthy increase, and gross transaction value (GTV) increased. The stock performed strongly, particularly in the second half of 2019, as the company reported revenue ahead of expectations. We trimmed the Fund’s position in this stock in the fourth quarter of 2019.
Alibaba is the long-standing leader in the Chinesee-commerce market and we believe leading positions in fintech, cloud computing, digital content and other growth areas in the Chinese online ecosystem should contribute to growth over the next several years. Thus far, we have seen positive trends in coree-commerce – growth in the number of active users, strong revenue increase and margin expansion. Additionally, the majority of new users are coming from smaller towns, which opens up markets with historically low penetration rates. We believe that over the next few years, areas of large investment that have been loss-making, such as fintech, cloud, etc. will begin to contribute to earnings. We trimmed the Fund’s position in this stock over the last few months of the reporting period after a period of outperformance.
Jiangsu Hengrui Medicine (Hengrui) is a Chinese pharmaceutical company. While the company began as a generics manufacturer, it is now a leading player in the development of innovative drugs. Hengrui boasts a diversified drug portfolio, a strong R&D product pipeline and a knowledgeable sales force that allow the company to capitalize on new reforms and regulations implemented by the Chinese Food and Drug Administration that focus on encouraging innovation, improving drug quality and lowering drug costs. The stock has benefited from investor’s appreciation of the company’s growth opportunities that are underpinned by an increase in government healthcare spending, expanding health insurance coverage, rising disposable incomes and healthcare education. We believe that Hengrui’s strong management and sales force should be able to capitalize on the reforms and structural changes in the Chinese pharmaceutical market.
Taiwan Semiconductor Manufacturing Co. Ltd. (TSMC) is the world’s preeminent semiconductor foundry. TSMC has made inhouse design and innovation a priority while placing a large emphasis on client service, allowing them to capture market share. The company continues to deliver solid revenue growth on the back of strong demand in themid-range smartphone segment, increased graphic chip demand for AI (artificial intelligence) and the HPC (high power computing) division. The demands for faster and more efficient computation utilizing lower power
| See benchmark definitions on A-20 – A-21 |
A-15
Table of Contents
PACIFIC FUNDS PERFORMANCE DISCUSSION (Continued)
show no signs of abating as 5G and IoT (internet of things), platforms-wearables, smart homes, smart cities, etc., continue to proliferate the modern landscape. Continued acceleration in these areas, pared with limited supply, should support TSMC’s high levels of profitability, resulting in strong free cash flow and healthy dividend payouts.
Top detractors from Fund performance for the reporting period included an underweight to information technology as well as holdings Glencore plc (materials) (U.K.), Housing Development Finance Corporation (financials) (India), and Fomento Economico Mexicano SAB de CV (consumer staples) (Mexico)
An underweight to information technology detracted from performance. The portfolio is typically underweight information technology due to its avoidance of product cycle/gadget companies, as well as companies that have undifferentiated or low margin products.
Glencore is one of the world’s leading producers and marketers of commodities and one of the most diversified. Base metals continue to face headwinds from the United States/China trade war, which has led to an environment of uncertainty that has created a drag on global growth. Glencore’s copper holdings have also been impacted by operational challenges in the African arm of their business. Operational issues are also impacting nickel production. We believe the company’s diversified portfolio provides it with the resilience to battle these headwinds, but we trimmed the position over the reporting period as the risk/rewardtrade-off became less attractive relative to other opportunities.
Housing Development Finance Corporation (HDFC), a long-term holding of the Fund, provides financial services to consumer and corporations in India. The Indian financial sector has three structural trends which underpin its strong growth and returns on investment, including market share gains by private sector banks, continuing penetration of formal banking services and widespread digital adoption which allows the more innovative private banks to disrupt the status quo. HDFC has faced several macroeconomic headwinds that have adversely affected the company’s share price, including a weak real estate market and development stagnation along with increased competition. We believe HDFC has been among the most prudent credit underwriters in India for decades and feel comfortable with the quality of their books and the sustainability of their growth.
Fomento Economico Mexicano (FEMSA) has transformed itself over the past several years from one of the largest beverage companies in Latin America to a leading retail operator. FEMSA’s legacy beverage businesses include a stake in one of the largest Coca-Cola bottlers in Latin America and a stake in Heineken. The area of focus and growth for FEMSA over the last few years has been retail. It owns and operates OXXO, one of the largest and fastest growing retail chains in Latin America. More recently, they have moved into the pharmacy business. Mexico and other Latin American countries have a low penetration of chain drugstores, which creates a good source of growth, particularly given FEMSA’s strong logistics and distribution capabilities. While the company has strong expansion and long-term growth opportunities, the Mexican economy has created a challenging backdrop in the near term and has weighed on the stock over the reporting period.
PF InternationalLarge-Cap Fund(sub-advised by MFS Investment Management)
Q. How did the Fund perform for the year ended March 31, 2020?
A. For the year ended March 31, 2020, the PF InternationalLarge-Cap Fund’s Class P returned-8.84%, compared to a-14.38% return for its benchmark, the MSCI EAFE Index (Net)
The following graph compares the performance of a hypothetical $10,000 investment in Class P shares of the Fund to its benchmark for the ten-year period ended March 31, 2020. The Fund’s performance reflects reinvestments of all dividends and capital gains distributions, if any.
Performance Comparison
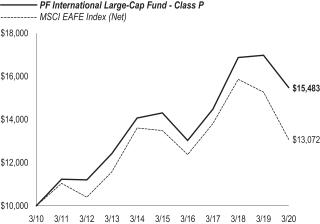
Average Annual Total Returns for the Periods Ended March 31, 2020
| 1 Year | 5 Years | 10 Years | ||||||||||
Fund’s Class P | (8.84% | ) | 1.59% | 4.47% | ||||||||
MSCI EAFE Index (Net) | (14.38% | ) | (0.62% | ) | 2.72% | |||||||
Performance data shown represents past performance. Investment return and principal value will fluctuate so that shares of the Fund when redeemed may be worth more or less than their original cost. Past performance is not predictive of future performance. | ||||||
Q. Discuss both positive and negative factors that materially affected the Fund’s performance during the year, including relevant market conditions, investment strategies and techniques, and particular sectors or securities.
A. For the reporting period, the Fund’s Class P outperformed the benchmark. We at MFS use abottom-up investment style, which involves the research of the fundamentals of each individual opportunity and analyzing certain aspects of a company such as earnings, cash flows, growth potential and management abilities. In managing the Fund, we invest primarily in the securities of foreign issuers with large market capitalizations.
| See benchmark definitions on A-20 – A-21 |
A-16
Table of Contents
PACIFIC FUNDS PERFORMANCE DISCUSSION (Continued)
A combination of an overweight allocation and stock selection in the consumer,non-cyclical sector contributed to performance relative to the benchmark for the reporting period. Within this sector, the Fund’s overweight positions in imaging products and medical-related equipment manufacturer HOYA (Japan), precision instruments and machines manufacturer Olympus Corporation (Japan), pharmaceutical and diagnostic company Roche Holding (Switzerland), medical products and equipment manufacturer Terumo (Japan), global food company Nestle (Switzerland) and pharmaceutical company Novo Nordisk (Denmark) contributed to relative performance.
A combination of an underweight allocation and stock selection in the financial sector also contributed to relative returns.
Security selection in the basic materials sector further strengthened relative performance led by an overweight position in industrial and medical gas supplier Air Liquide (France).
Other top relative contributors during the reporting period included the Fund’s overweight position in electrical distribution equipment manufacturer Schneider Electric (France) and holdings of semiconductor manufacturer Taiwan Semiconductor Manufacturing Co. Ltd (security is not a benchmark constituent), (Taiwan). Additionally, not owning global energy and petrochemicals company Royal Dutch Shell (United Kingdom) supported relative results.
During the reporting period, the Fund’s relative currency exposure, resulting primarily from differences between the Fund’s and the benchmark’s exposures to holdings of securities denominated in foreign currencies, was another contributor to relative performance. The Fund’s investment decisions are driven by the fundamentals of each individual opportunity and as such, it is common for the Fund to have different currency exposure than the benchmark.
A combination of an underweight allocation and stock selection in the utilities sector detracted from relative performance for the reporting period.
Stock selection in the technology sector also detracted from relative performance led by the Fund’s overweight position in tourism and travel IT solutions provider Amadeus IT (Spain). Additionally, not owning shares electronic equipment manufacturer Sony (Japan) further detracted from relative results.
Other top relative detractors during the reporting period included Fund’s position in integrated energy company Suncor Energy (security is not a benchmark constituent) (Canada) and overweight positions in diversified industrial manufacturer Rolls-Royce (United Kingdom), financial services firm ING Groep (Netherlands) and banking firm KBC Group (Belgium). Additionally, not owning shares of lithography systems manufacturer for the semiconductor industry ASML (Netherlands), biopharmaceutical company AstraZeneca (United Kingdom) and biopharmaceutical company CSL (Australia) further detracted from relative results.
The Fund’s cash and/or cash equivalents position during the reporting period was also a detractor from relative performance. Under normal market conditions, the Fund strives to be fully invested and generally holds cash to buy new holdings and to provide liquidity. Holding cash hurt performance versus the benchmark, which has no cash position.
PF InternationalSmall-Cap Fund(sub-advised by QS Investors, LLC)
Q. How did the Fund perform for the year ended March 31, 2020?
A. For the year ended March 31, 2020, the PF InternationalSmall-Cap Fund’s Class P returned-22.94%, compared to a-19.44% return for its benchmark, the S&P DevelopedEx-U.S. SmallCap Index.
The following graph compares the performance of a hypothetical $10,000 investment in Class P shares of the Fund to its benchmark for the period from inception through March 31, 2020. The Fund’s performance reflects reinvestments of all dividends and capital gains distributions, if any.
Performance Comparison
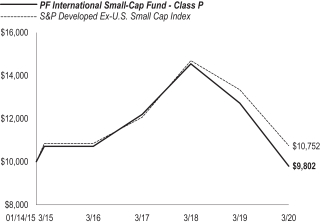
Average Annual Total Returns for the Periods Ended March 31, 2020(1)
| 1 Year | 5 Years | Since | ||||||||||
Fund’s Class P | (22.94% | ) | (1.72% | ) | (0.38% | ) | ||||||
S&P DevelopedEx-US SmallCap Index | (19.44% | ) | 0.22% | 1.40% | ||||||||
| (1) | Effective April 1, 2016, QS Investors, LLC (“QS Investors”) began managing the Fund. QS Batterymarch Financial Management, Inc., which was named Batterymarch Financial Management, Inc. prior to June 30, 2014 and which came under common management with QS Investors as of May 31, 2014, managed the Fund prior to that date. |
Performance data shown represents past performance. Investment return and principal value will fluctuate so that shares of the Fund when redeemed may be worth more or less than their original cost. Past performance is not predictive of future performance. | ||||||
| See benchmark definitions on A-20 – A-21 |
A-17
Table of Contents
PACIFIC FUNDS PERFORMANCE DISCUSSION (Continued)
Q. Discuss both positive and negative factors that materially affected the Fund’s performance during the year, including relevant market conditions, investment strategies and techniques, and particular sectors or securities.
A. For the reporting period, the Fund’s Class P underperformed the benchmark. We at QS Investors seek to manage a well-diversified, style neutral portfolio with modest region and sector allocations versus the benchmark through bottom up stock selection based on fundamentals and implemented with quantitative tools, risk controls and cost-efficient trading. Our focus is securities of companies with small market capitalizations that are located in developed foreign countries. We continue to invest the Fund in excess of 200 companies and generally expects to invest in about the same number ofnon-U.S. countries as the benchmark (which is comprised of developed countries outside the U.S).
For the reporting period, allocation effects (relative to the benchmark) were mixed but detracted overall from relative returns. The overweight allocation to United Kingdom (U.K.) banks, underweight allocation to continental Europe health care, overweight allocation to (U.K.) consumer discretionary, underweight allocation to continental Europe utilities and underweight allocation to Japan consumer staples all detracted from relative performance. The overweight allocations to Japan health care, Continental Europe information technology, and underweight allocation to materials in Australia, New Zealand and Canada all contributed to relative performance, though not enough to offset the results in other regions.
Stock selection detracted from relative returns in Japan, continental Europe, and in Asia Developed ex Japan. Selection in Japanese industrials, continental Europe communication services and industrials, as well as Japanese information technology stocks were the primary detractors at the industry group level. Stock selection contributed to relative returns within continental Europe consumer discretionary and information technology industry groups, as well as Japanese consumer staples and (U.K.) information technology stocks, though not enough to offset the results in other stocks.
At the security level, the largest detractor was a position in Fevertree Drinks PLC(non-benchmark holding), a producer of premium drink mixes in the United Kingdom, which struggled after multiple profit warnings during 2019 from slowing sales growth. In addition, not holding Delivery Hero SE (a strong performer in the underlying benchmark), a multi-national food delivery service, also detracted from performance after it performed well as it experienced strong growth in foreign markets and acquired its key rival in South Korea. An overweight position in Seegene, Inc., a South Korean biotech firm, contributed strongly to relative returns, as its diagnostic products have been used recently in theCOVID-19 outbreak. Evolution Gaming Group AB, an online casino solutions provider based in Sweden, enjoyed strong returns due to rapid earnings growth from the expansion of its online casino platform in new countries, which also contributed to relative performance.
PF International Value Fund(sub-advised by Wellington Management Company LLP)
Q. How did the Fund perform for the year ended March 31, 2020?
A. For the year ended March 31, 2020, the PF International Value Fund’s Class P returned-28.94%, compared to a-14.38% return for its benchmark, the MSCI EAFE Index (Net).
The following graph compares the performance of a hypothetical $10,000 investment in Class P shares of the Fund to its benchmark for the ten-year period ended March 31, 2020. The Fund’s performance reflects reinvestments of all dividends and capital gains distributions, if any.
Performance Comparison
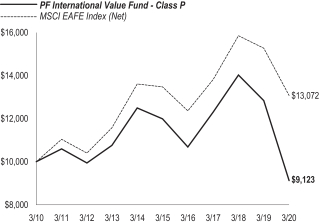
Average Annual Total Returns for the Periods Ended March 31, 2020(1)
| 1 Year | 5 Years | 10 Years | ||||||||||
Fund’s Class P | (28.94% | ) | (5.32% | ) | (0.91% | ) | ||||||
MSCI EAFE Index (Net) | (14.38% | ) | (0.62% | ) | 2.72% | |||||||
| (1) | Wellington Management Company LLP began managing the Fund on May 1, 2017 and some investment policies changed at that time. Other firms managed the Fund before that date. |
Performance data shown represents past performance. Investment return and principal value will fluctuate so that shares of the Fund when redeemed may be worth more or less than their original cost. Past performance is not predictive of future performance. | ||||||
Q. Discuss both positive and negative factors that materially affected the Fund’s performance during the year, including relevant market conditions, investment strategies and techniques, and particular sectors or securities.
A. For the reporting period, the Fund’s Class P underperformed the benchmark. The Fund invests primarily in a diversified portfolio of equity securities of largenon-U.S. companies that we at Wellington believe to be undervalued. We use a “contrarian value” approach to selecting securities, applying fundamental analysis to identify securities that we believe are undervalued by the market.
The Fund’s underperformance relative to its benchmark was largely driven by security selection. Weak security selection within the consumer discretionary, communication services, and financials sectors drove relative underperformance, but was partially offset by stronger selection in
| See benchmark definitions on A-20 – A-21 |
A-18
Table of Contents
PACIFIC FUNDS PERFORMANCE DISCUSSION (Continued)
the materials sector. Sector allocation, which is a residual of our fundamental stock selection process, also detracted from relative performance. The Fund’s overweight positions in energy and finance and underweight position in health care detracted most from relative performance.
On acountry-by-country basis, weak security selection in Japan, the United Kingdom, and France detracted most from relative performance.
Among the top detractors from relative performance were China Unicom (communication services) and Renault (consumer discretionary). China Unicom is a Chinese telecommunication company. The stock traded down throughout the reporting period after reporting multiple declines in revenue during the reporting period. Net profit rose over the reporting period, but the results disappointed due to declines in total service revenue, a key metric in indicating operational health. Shares of Renault, a French automobile manufacturer, traded down amid concerns over the spread ofCOVID-19. The French company suspended its productions at all twelve factories within the country until further notice during March 2020. We continued to hold positions in both companies as of the end of the reporting period.
Top contributors to benchmark-relative returns included Z Holdings (communication services) and Barrick Gold (materials). Shares of Z Holdings, formerly known as Yahoo Japan, rose at the end of 2019 following news of a merger agreement with Line Corp. Investors believed the combined entity could become Japan’s leader in mobile payments ande-commerce, and would allow for heavy investment in artificial intelligence. Barrick Gold, based in Canada, is one of the world’s largest gold miners. Shares traded higher throughout the reporting period after the company reported multiple strong earnings, beating consensus, and an increase in its dividend. We continued to hold positions in both companies as of the end of the reporting period.
PF Real Estate Fund(sub-advised by Principal Real Estate Investors, LLC)
Q. How did the Fund perform for the year ended March 31, 2020?
A. For the year ended March 31, 2020, the PF Real Estate Fund’s Class P returned-13.44%, compared to a-6.98% return for the broad- based S&P 500 Index, and-21.96% return for the sector-specific benchmark the MSCI U.S. REIT Index (Net).
The following graph compares the performance of a hypothetical $10,000 investment in Class P shares of the Fund to its benchmarks for the ten-year period ended March 31, 2020. The Fund’s performance reflects reinvestments of all dividends and capital gains distributions, if any.
Performance Comparison

Average Annual Total Returns for the Periods Ended March 31, 2020(1)
| 1 Year | 5 Years | 10 Years | ||||||||||
Fund’s Class P | (13.44% | ) | 0.29% | 7.27% | ||||||||
S&P 500 Index | (6.98% | ) | 6.73% | 10.53% | ||||||||
MSCI U.S. REIT Index (Net) | (21.96% | ) | (1.70% | ) | 6.12% | |||||||
| (1) | Principal Real Estate Investors LLC began managing the Fund on May 1, 2018, and some investment policies changed at that time. Another firm managed the Fund before that date. |
Performance data shown represents past performance. Investment return and principal value will fluctuate so that shares of the Fund when redeemed may be worth more or less than their original cost. Past performance is not predictive of future performance. | ||||||
Q. Discuss both positive and negative factors that materially affected the Fund’s performance during the year, including relevant market conditions, investment strategies and techniques, and particular sectors or securities.
A. For the reporting period, the Fund’s Class P underperformed the broad-based S&P 500 Index and outperformed the sector-specific MSCI U.S. REIT Index (Net). At Principal REI, our real estate securities team utilizes a fundamental style of investing. We rely on skilled portfolio managers and analysts to provide deep forward-looking perspectives and carry out rigorous, fundamental research on all investment opportunities. Security selection focuses on identifying relative stock mispricings amongst groups of comparable stocks. Excess return generation isbottom-up, as we believe security selection is the most reliable and repeatable source of consistent outperformance. We construct portfolios to diversify risk and sources of outperformance, which we believe leads to consistent excess return generation over the long term.Top-down and quantitative elements are incorporated but represent a minor role in our investment process.
The MSCI U.S. REIT Index (Net) underperformed the S&P 500 index as broader equities rallied late in 2019 in response to a combination ofde-escalating trade tensions, dampened recession fears, and accommodative monetary policy. During the first quarter of 2020, the U.S. REIT market plunged, trailing U.S. equities, as investment markets were confronted with the health and economic consequences of the evolvingCOVID-19 pandemic. Property stocks underperformed as real estate is often a place that brings people together and facilitates social interactions. Consequently, REITs did not perform as defensively relative to equities as might have been expected.
| See benchmark definitions on A-20 – A-21 |
A-19
Table of Contents
PACIFIC FUNDS PERFORMANCE DISCUSSION (Continued)
Relative to the MSCI U.S. REIT Index (Net), the Fund outperformed due to strong allocation decisions and good stock selection during the reporting period. An underweight to retail (within the financials sector) had the largest contribution to the Fund’s performance, as these stocks suffered fromCOVID-19 social-distancing recommendations that kept shoppers at home and in response to concerns about tenants’ ability to pay rent after forced store closures. Strong stock selection in office (within the financials sector) contributed to excess returns, due to our overweight position in Alexandria Real Estate Equities, a company focused on lab office space. The stock benefitted from strong credit tenants, long lease duration, and resilience of demand for lab office space from the biotech and life sciences sector that gives this stock more defensive attributes. The Fund benefitted from an overweight to the secular trends and robust fundamentals in specialized residential (within the financials sector), as well as strong stock selection. An overweight to industrial stocks (within the financial sector) and strong stock selection also contributed to excess returns during the reporting period, as industrial stocks benefitted from risinge-commerce distribution and strong operating results. Stock selection in data centers (within the technology and financial sectors) was another top contributor to the Fund’s relative performance, attributed mainly to an overweight position in Equinix. The stock benefitted from the positive investor sentiment surrounding the sector, which was enhanced by its solid balance sheet and potential to see immediate benefits in its business driven by remote working. Hospitality stocks continued to be hit hard due to travel restrictions andshelter-in-place mandates due toCOVID-19, however, our selection within hotels (within the consumer sector) also added to outperformance. Stock selection in net lease names (within the financial sector) was the largest detractor from the Fund’s performance, as we were overweight to EPR Properties and STORE Capital. EPR’s heavy exposure to movie theater operators caused the stock to fall underCOVID-19 conditions. The market was concerned about tenant credit safety due to STORE Capital’s exposure to small, unrated tenants.
Benchmark Definitions
Bloomberg Barclays1-3 Year US Government/Credit Bond Indexmeasures the performance of a subset of the Bloomberg Barclays US Aggregate Bond Index and includes investment grade U.S. dollar-denominated, fixed-rate Treasuries, government-related and corporate securities with maturities of one to three years. Results include the reinvestment of all distributions.
Bloomberg Barclays US Aggregate Bond Indexmeasures the performance of the investment grade, U.S. dollar-denominated, fixed-rate taxable bond market, which includes Treasuries, government-related and corporate securities, mortgage-backed securities, asset-backed securities and commercial mortgage-backed securities. Results include the reinvestment of all distributions.
Bloomberg Barclays US Treasury Inflation-Protected Securities (TIPS) Index(also known as Bloomberg Barclays US Treasury Inflation-Linked Bond Index) is an index of all outstanding treasury inflation protected securities issued by the U.S. government. Results include the reinvestment of all distributions.
Emerging Markets Debt Composite BenchmarkThis composite benchmark combines three emerging markets indices as follows: 50% J.P. Morgan EMBI Global Diversified, 25% J.P. Morgan ELMI+ and 25% J.P. MorganGBI-EM Global Diversified. Results include the reinvestment of all distributions.
ICE BofAML U.S.3-Month Treasury Bill(T-Bill) Index (formerly named ICE BofA Merrill Lynch U.S.3-Month Treasury Bill(T-Bill) Index)is an index comprised of a single issue purchased at the beginning of the month and held for a full month. At the end of the month that issue is sold and rolled into a newly selected issue. The issue selected at eachmonth-end rebalancing is the outstanding Treasury Bill that matures closest to, but not beyond, three months from the rebalancing date. To qualify for selection, an issue must have settled on or before themonth-end rebalancing date. Results include the reinvestment of all distributions.
J.P. Morgan Emerging Local Markets Index Plus (ELMI+)is a performance benchmark for emerging markets money market instruments and tracks total returns for local-currency denominated money market instruments. The index consists of foreign exchange forward contracts laddered with maturities ranging from one to three months. Country weights are based on a trade-weighted allocation, with a maximum weight of 10% per country. Results include the reinvestment of all distributions.
J.P. Morgan Emerging Markets Bond Index (EMBI) Global Diversifiedtracks total returns of U.S. dollar-denominated debt instruments issued by emerging markets sovereign and quasi-sovereign entities: Brady bonds, loans, and Eurobonds. This diversified index limits the exposure of some of the larger countries. Results include the reinvestment of all distributions.
J.P. Morgan Government Bond Index-Emerging Markets(GBI-EM) Global Diversifiedtracks total returns of emerging markets local currency denominated fixed income instruments. The instruments of the index are regularly traded, fixed-rate local sovereign bonds to which international investors can gain exposure. Country weights are based on a trade-weighted allocation, with a maximum weight of 10% per country. Results include the reinvestment of all distributions.
MSCI Emerging Markets Index (Net)is a free float-adjusted market capitalization weighted index that is designed to measure equity market performance of large- andmid-capitalization securities in emerging markets. As of March 31, 2020, the MSCI Emerging Markets Index (Net) consists of the following emerging market country indices: Argentina, Brazil, Chile, China, Colombia, Czech Republic, Egypt, Greece, Hungary, India, Indonesia, Korea, Malaysia, Mexico, Pakistan, Peru, Philippines, Poland, Qatar, Russia, Saudi Arabia, South Africa, Taiwan, Thailand, Turkey, and United Arab Emirates. The word “(Net)” in the index name means the net total return for the index, which includes the reinvestment of dividends after the deduction of withholding tax, applying the tax rate tonon-resident individuals who do not benefit from double taxation treaties.
MSCI EAFE (Europe, Australasia and Far East) Index (Net)is a free float-adjusted market capitalization weighted index that is designed to measure the equity market performance of developed markets, excluding the U.S. & Canada. As of March 31, 2020, the MSCI EAFE Index (Net) consists of the following developed market country indices: Australia, Austria, Belgium, Denmark, Finland, France, Germany, Hong Kong, Ireland, Israel, Italy, Japan, the Netherlands, New Zealand, Norway, Portugal, Singapore, Spain, Sweden, Switzerland, and the U.K. The word “(Net)” in the index name means the net total return for the index, which includes the reinvestment of dividends after the deduction of withholding tax, applying the tax rate tonon-resident individuals who do not benefit from double taxation treaties.
A-20
Table of Contents
PACIFIC FUNDS PERFORMANCE DISCUSSION (Continued)
MSCI U.S. Real Estate Investment Trust (“REIT”) Index (Net)is a free float-adjusted market capitalization index that is comprised of equity REITs and represents approximately 99% of the U.S. REIT universe and securities that are classified in the Equity REITs Industry (under the Real Estate sector) according to the Global Industry Classification Standard (GICS). The word “(Net)” in the index name means the net total return for the index, which includes the reinvestment of dividends after the deduction of withholding tax, applying the tax rate tonon-resident individuals who do not benefit from double taxation treaties.
MSCI World Index (Net)is a free float-adjusted market capitalization weighted index that is designed to measure the equity market performance of developed markets. As of March 31, 2020, the MSCI World Index (Net) consists of the following developed market country indices: Australia, Austria, Belgium, Canada, Denmark, Finland, France, Germany, Hong Kong, Ireland, Israel, Italy, Japan, Netherlands, New Zealand, Norway, Portugal, Singapore, Spain, Sweden, Switzerland, the U.K., and the U.S. The word “(Net)” in the index name means the net total return for the index, which includes the reinvestment of dividends after the deduction of withholding tax, applying the tax rate tonon- resident individuals who do not benefit from double taxation treaties.
Russell 1000 Growth Indexmeasures the performance of thelarge-cap growth segment of the U.S. equity universe. It includes those Russell 1000 Index companies with higher growth earning potential as defined by the index provider. The Russell 1000 Growth Index is constructed to provide a comprehensive and unbiased barometer for thelarge-cap growth segment and is completely reconstituted annually to ensure new and growing equities are included and that the represented companies continue to reflect growth characteristics. Results include the reinvestment of all distributions.
Russell 1000 Indexmeasures the performance of the large-capitalization segment of the U.S. equity universe. It is a subset of the Russell 3000 Index and includes approximately 1,000 of the largest securities based on a combination of their market capitalization and current index membership. The Russell 1000 Index represents approximately 92% of the investable U.S. equity market. The Russell 1000 Index is constructed to provide a comprehensive and unbiased barometer for thelarge-cap segment and is completely reconstituted annually to ensure new and growing equities are reflected. Results include the reinvestment of all distributions.
Russell 1000 Value Indexmeasures the performance of thelarge-cap value segment of the U.S. equity universe. It includes those Russell 1000 Index companies that are considered more value oriented relative to the overall market as defined by the index provider. The Russell 1000 Value Index is constructed to provide a comprehensive and unbiased barometer for thelarge-cap value segment and is completely reconstituted annually to ensure new and growing equities are included and that the represented companies continue to reflect value characteristics. Results include the reinvestment of all distributions.
Russell 2000 Growth Indexmeasures the performance of thesmall-cap growth segment of the U.S. equity universe. It includes those Russell 2000 Index companies with higher growth earning potential as defined by the index provider. The Russell 2000 Growth Index is constructed to provide a comprehensive and unbiased barometer for thesmall-cap growth segment and is completely reconstituted annually to ensure larger stocks do not distort the performance and characteristics of the truesmall-cap opportunity set and that the represented companies continue to reflect growth characteristics. Results include the reinvestment of all distributions.
Russell 2000 Indexmeasures the performance of thesmall-cap segment of the U.S. equity universe. The Russell 2000 Index is a subset of the Russell 3000 Index representing approximately 10% of the total market capitalization of that index. It includes approximately 2,000 of the smallest securities based on a combination of their market cap and current index membership. The Russell 2000 Index is constructed to provide a comprehensive and unbiasedsmall-cap barometer and is completely reconstituted annually to ensure larger stocks do not distort the performance and characteristics of the truesmall-cap opportunity set. Results include the reinvestment of all distributions.
Russell 2000 Value Indexmeasures the performance of thesmall-cap value segment of the U.S. equity universe. It includes those Russell 2000 Index companies that are considered more value oriented relative to the overall market as defined by the index provider. The Russell 2000 Value Index is constructed to provide a comprehensive and unbiased barometer for thesmall-cap value segment. The Index is completely reconstituted annually to ensure larger stocks do not distort the performance and characteristics of the truesmall-cap opportunity set and that the represented companies continue to reflect value characteristics. Results include the reinvestment of all distributions.
Russell 3000 Indexmeasures the performance of the largest 3,000 U.S. companies representing approximately 98% of the investable U.S. equity market. Results include the reinvestment of all distributions.
Russell Midcap Indexmeasures the performance of themid-cap segment of the U.S. equity universe. The Russell Midcap is a subset of the Russell 1000 Index. It includes approximately 800 of the smallest securities based on a combination of their market cap and current index membership. The Russell Midcap represents approximately 31% of the total market capitalization of the Russell 1000 companies. The Russell Midcap Index is constructed to provide a comprehensive and unbiased barometer for themid-cap segment and is completely reconstituted annually to ensure larger stocks do not distort the performance and characteristics of the truemid-cap opportunity set. Results include the reinvestment of all distributions.
Russell Midcap Value Indexmeasures the performance of themid-cap value segment of the U.S. equity universe. It includes those Russell Midcap Index companies that are considered more value oriented relative to the overall market as defined by the index provider. The Russell Midcap Value Index is constructed to provide a comprehensive and unbiased barometer of themid-cap value market. The Index is completely reconstituted annually to ensure larger stocks do not distort the performance and characteristics of the truemid-cap value market. Results include the reinvestment of all distributions.
S&P 500 Indexis a capitalization-weighted index of 500 stocks. The index is designed to measure performance of the broad domestic economy through changes in the aggregate market value of 500 stocks representing all major industries. Results include the reinvestment of all distributions.
S&P DevelopedEx-U.S. SmallCap Indexis an index which is comprised of the stocks representing the lowest 15% of float-adjusted market cap in each developed country, excluding the United States. Results include the reinvestment of all distributions.
A-21
Table of Contents
PF INFLATION MANAGED FUND
Schedule of Investments
March 31, 2020
Principal Amount | Value | |||||||
CORPORATE BONDS & NOTES - 6.6% |
| |||||||
Communications - 0.4% |
| |||||||
AT&T Inc | $100,000 | $97,116 | ||||||
|
| |||||||
Consumer, Cyclical - 0.5% |
| |||||||
BMW US Capital LLC (Germany) | 100,000 | 99,896 | ||||||
|
| |||||||
Energy - 1.1% |
| |||||||
Petrobras Global Finance BV (Brazil) | 244,000 | 223,565 | ||||||
YPF SA (Argentina) | ARS 160,000 | 1,835 | ||||||
|
| |||||||
| 225,400 | ||||||||
|
| |||||||
Financial - 2.3% |
| |||||||
Avolon Holdings Funding Ltd (Ireland) | $100,000 | 83,850 | ||||||
Bank of America Corp | 10,000 | 10,142 | ||||||
BOC Aviation Ltd (Singapore) | 200,000 | 200,478 | ||||||
Royal Bank of Scotland Group PLC | 200,000 | 184,441 | ||||||
|
| |||||||
| 478,911 | ||||||||
|
| |||||||
Industrial - 2.3% |
| |||||||
Aviation Capital Group LLC | 200,000 | 180,899 | ||||||
General Electric Co | 100,000 | 101,153 | ||||||
Komatsu Finance America Inc | 200,000 | 200,939 | ||||||
|
| |||||||
| 482,991 | ||||||||
|
| |||||||
Total Corporate Bonds & Notes |
| 1,384,314 | ||||||
|
| |||||||
MORTGAGE-BACKED SECURITIES - 14.5% |
| |||||||
Collateralized Mortgage Obligations - Residential - 9.2% |
| |||||||
Alternative Loan Trust | 113,296 | 96,551 | ||||||
6.000% due 03/25/37 | 153,997 | 94,362 | ||||||
Banc of America Mortgage Trust | 31,005 | 24,305 | ||||||
Chevy Chase Funding LLC Mortgage-Backed | 108,062 | 98,792 | ||||||
Citigroup Mortgage Loan Trust | 80,278 | 66,969 | ||||||
Countrywide Home Loan Mortgage | 8,890 | 7,745 | ||||||
Credit Suisse Mortgage Trust | 281,548 | 264,684 | ||||||
Principal Amount | Value | |||||||
Fannie Mae REMICS | $ | 18,385 | $ | 18,250 | ||||
1.327% (USD LIBOR + 0.380%) | 28,400 | 28,125 | ||||||
1.387% (USD LIBOR + 0.440%) | 13,794 | 13,581 | ||||||
1.392% (USD LIBOR + 0.445%) | 5,330 | 5,385 | ||||||
Government National Mortgage Association | 245,956 | 243,547 | ||||||
2.266% (USD LIBOR + 0.150%) | 91,620 | 88,442 | ||||||
GreenPoint Mortgage Funding Trust | 21,113 | 17,151 | ||||||
GSR Mortgage Loan Trust | 8,269 | 7,828 | ||||||
Hawksmoor Mortgages PLC (United Kingdom) | GBP 231,070 | 275,176 | ||||||
JP Morgan Alternative Loan Trust | $58,523 | 51,501 | ||||||
JP Morgan Mortgage Trust | 27,811 | 25,107 | ||||||
Merrill Lynch Mortgage Investors Trust | 31,796 | 29,436 | ||||||
Residential Accredit Loans Inc Trust | 86,875 | 25,708 | ||||||
Residential Asset Securitization Trust | 178,827 | 106,112 | ||||||
Structured Adjustable Rate Mortgage Loan Trust | 10,515 | 8,674 | ||||||
Structured Asset Mortgage Investments II Trust | 52,540 | 43,631 | ||||||
Towd Point Mortgage Funding PLC | GBP 209,416 | 252,293 | ||||||
WaMu Mortgage Pass-Through Certificates | $38,628 | 34,769 | ||||||
|
| |||||||
| 1,928,124 | ||||||||
|
| |||||||
Fannie Mae - 5.3% |
| |||||||
2.500% due 06/01/50 | 600,000 | 619,269 | ||||||
3.000% due 06/01/50 | 100,000 | 104,504 | ||||||
3.500% due 05/01/50 | 370,000 | 391,355 | ||||||
|
| |||||||
| 1,115,128 | ||||||||
|
| |||||||
Total Mortgage-Backed Securities |
| 3,043,252 | ||||||
|
| |||||||
ASSET-BACKED SECURITIES - 12.0% |
| |||||||
Asset Backed Funding Corp Trust | 21,723 | 20,166 | ||||||
B&M CLO Ltd (Cayman) | 63,092 | 62,801 | ||||||
| See Notes to Financial Statements | See explanation of symbols and terms, if any, on B-76 and B-77 |
B-1
Table of Contents
PF INFLATION MANAGED FUND
Schedule of Investments (Continued)
March 31, 2020
Principal Amount | Value | |||||||
Countrywide Asset-Backed Certificates | $ | 263,932 | $ | 213,754 | ||||
1.137% (USD LIBOR + 0.190%) | 133,769 | 117,948 | ||||||
1.147% (USD LIBOR + 0.200%) | 70,086 | 53,932 | ||||||
Credit-Based Asset Servicing & Securitization LLC | 310,196 | 186,408 | ||||||
Crown Point CLO Ltd (Cayman) | 200,000 | 192,312 | ||||||
Freddie Mac Structured Pass-Through Certificates | 765 | 758 | ||||||
Home Equity Asset Trust | 22,974 | 21,851 | ||||||
Home Equity Mortgage Loan Asset-Backed Trust | 84,347 | 64,661 | ||||||
Latitude Management Real Estate Capital Inc | 7,099 | 6,810 | ||||||
LoanCore Issuer Ltd (Cayman) | 100,000 | 97,312 | ||||||
Long Beach Mortgage Loan Trust | 83,661 | 38,578 | ||||||
Loomis Sayles CLO II Ltd (Cayman) | 280,000 | 272,066 | ||||||
MidOcean Credit CLO IV (Cayman) | 377,934 | 371,253 | ||||||
Option One Mortgage Loan Trust | 74,158 | 51,190 | ||||||
1.087% (USD LIBOR + 0.140%) | 88,868 | 61,982 | ||||||
Saxon Asset Securities Trust | 22,270 | 20,056 | ||||||
Soundview Home Loan Trust | 71,665 | 53,718 | ||||||
SpringCastle Funding Asset-Backed Notes | 78,662 | 74,142 | ||||||
TICP CLO Ltd (Cayman) | 450,000 | 438,765 | ||||||
Venture CLO Ltd (Cayman) | 100,000 | 96,492 | ||||||
|
| |||||||
Total Asset-Backed Securities |
| 2,516,955 | ||||||
|
| |||||||
U.S. TREASURY OBLIGATIONS - 101.8% |
| |||||||
U.S. Treasury Inflation Protected Securities - 101.8% |
| |||||||
0.125% due 04/15/22 ^ | 912,254 | 899,355 | ||||||
0.125% due 07/15/22 ^ | 246,794 | 244,479 | ||||||
0.125% due 01/15/23 ^ | 682,866 | 674,559 | ||||||
0.125% due 07/15/26 ^ | 322,866 | 326,001 | ||||||
0.125% due 01/15/30 ^ | 130,347 | 134,490 | ||||||
0.375% due 07/15/25 ^ | 5,439 | 5,551 | ||||||
Principal Amount | Value | |||||||
0.375% due 01/15/27 ^ | $ | 768,917 | $ | 787,691 | ||||
0.375% due 07/15/27 ^ | 2,225,185 | 2,291,134 | ||||||
0.500% due 01/15/28 ^ | 972,622 | 1,014,365 | ||||||
0.625% due 07/15/21 ^ | 2,005,322 | 1,986,529 | ||||||
0.625% due 04/15/23 ^ | 1,080,113 | 1,088,442 | ||||||
0.625% due 01/15/24 ^ | 1,344,410 | 1,366,810 | ||||||
0.625% due 02/15/43 ^ | 22,441 | 24,643 | ||||||
0.750% due 07/15/28 ^ | 1,294,915 | 1,386,709 | ||||||
0.750% due 02/15/42 ^ | 114,166 | 127,957 | ||||||
0.750% due 02/15/45 ^ | 175,280 | 200,548 | ||||||
0.875% due 02/15/47 ^ | 47,022 | 56,017 | ||||||
1.000% due 02/15/46 ^ | 714,213 | 868,541 | ||||||
1.000% due 02/15/49 ^ | 51,259 | 63,818 | ||||||
1.375% due 02/15/44 ^ | 2,125,229 | 2,728,807 | ||||||
2.000% due 01/15/26 ^ | 3,914,847 | 4,356,785 | ||||||
2.125% due 02/15/41 ^ | 353,400 | 492,426 | ||||||
3.375% due 04/15/32 ^ | 85,748 | 121,288 | ||||||
3.875% due 04/15/29 ^ | 54,923 | 74,115 | ||||||
|
| |||||||
| 21,321,060 | ||||||||
|
| |||||||
Total U.S. Treasury Obligations |
| 21,321,060 | ||||||
|
| |||||||
FOREIGN GOVERNMENT BONDS & NOTES - 6.8% |
| |||||||
Argentina POM Politica Monetaria (Argentina) | ARS 870,000 | 6,489 | ||||||
Australia Government (Australia) | AUD 979,374 | 706,999 | ||||||
Bonos del Tesoro Nacional en Pesos Badlar (Argentina) | ARS 32,000 | 259 | ||||||
Letras del Tesoro en Pesos Badlar (Argentina) | 137,000 | 1,366 | ||||||
Mexican Bonos (Mexico) | MXN 493,000 | 21,329 | ||||||
New Zealand Government (New Zealand) | NZD 850,000 | 614,456 | ||||||
Peruvian Government International (Peru) | PEN 200,000 | 63,019 | ||||||
|
| |||||||
Total Foreign Government Bonds & Notes |
| 1,413,917 | ||||||
|
| |||||||
SHORT-TERM INVESTMENTS - 2.3% |
| |||||||
Foreign Government Issue - 0.0% |
| |||||||
Argentina Treasury Bill (Argentina) | ARS 60,000 | 455 | ||||||
|
| |||||||
Shares |
| |||||||
Money Market Fund - 2.3% |
| |||||||
BlackRock Liquidity FundsT-Fund Portfolio ‘Institutional’ 0.210% | 478,930 | 478,930 | ||||||
|
| |||||||
Total Short-Term Investments |
| 479,385 | ||||||
|
| |||||||
TOTAL INVESTMENTS - 144.0% |
| 30,158,883 | ||||||
DERIVATIVES – (0.1%) |
| (11,897 | ) | |||||
|
| |||||||
OTHER ASSETS & LIABILITIES, NET - (43.9%) |
| (9,196,848 | ) | |||||
|
| |||||||
NET ASSETS - 100.0% |
| $20,950,138 | ||||||
|
| |||||||
| See Notes to Financial Statements | See explanation of symbols and terms, if any, on B-76 and B-77 |
B-2
Table of Contents
PF INFLATION MANAGED FUND
Schedule of Investments (Continued)
March 31, 2020
Notes to Schedule of Investments
| (a) | As of March 31, 2020, the Fund’s composition as a percentage of net assets was as follows: |
U.S. Treasury Obligations | 101.8% | |||
Mortgage-Backed Securities | 14.5% | |||
Asset-Backed Securities | 12.0% | |||
Foreign Government Bonds & Notes | 6.8% | |||
Corporate Bonds & Notes | 6.6% | |||
Others (each less than 3.0%) | 2.3% | |||
|
| |||
| 144.0% | ||||
Derivatives | (0.1% | ) | ||
Other Assets & Liabilities, Net | (43.9% | ) | ||
|
| |||
| 100.0% | ||||
|
|
| (b) | Investments with a total aggregate value of $8,569 or less than 0.1% of the Fund’s net assets were valued by the Trustee Valuation Committee or determined by a valuation committee established under the Valuation Policy and then subsequently submitted for approval or ratification to either the Trustee Valuation Committee or to the Board of Trustees. |
| (c) | The average amount of borrowings by the Fund on reverse repurchase agreements during the year ended March 31, 2020 was $3,006,500 at a weighted average interest rate of 2.100%. The average amount of borrowings by the Fund on sale-buyback financing transactions during the year ended March 31, 2020 was $11,703,733 at a weighted average interest rate of 1.534%. |
| (d) | Open futures contracts outstanding as of March 31, 2020 were as follows: |
Long Futures Outstanding | Expiration Month | Number of Contracts | Notional Amount | Value | Unrealized Appreciation (Depreciation) | |||||||||||||||
U.S. Treasury 2-Year Notes | 06/20 | 6 | $1,301,820 | $1,322,297 | $20,477 | |||||||||||||||
U.S. Treasury Ultra 30-Year Bonds | 06/20 | 6 | 1,250,550 | 1,331,250 | 80,700 | |||||||||||||||
|
| |||||||||||||||||||
| 101,177 | ||||||||||||||||||||
|
| |||||||||||||||||||
Short Futures Outstanding | ||||||||||||||||||||
Australia 3-Year Bonds | 06/20 | 13 | 931,576 | 936,440 | (4,864 | ) | ||||||||||||||
U.S. Treasury 5-Year Notes | 06/20 | 24 | 2,898,156 | 3,008,625 | (110,469 | ) | ||||||||||||||
U.S. Treasury 10-Year Notes | 06/20 | 15 | 2,032,931 | 2,080,313 | (47,382 | ) | ||||||||||||||
U.S. Treasury Long Bonds | 06/20 | 4 | 662,961 | 716,250 | (53,289 | ) | ||||||||||||||
|
| |||||||||||||||||||
| (216,004 | ) | |||||||||||||||||||
|
| |||||||||||||||||||
Total Futures Contracts | ($114,827 | ) | ||||||||||||||||||
|
| |||||||||||||||||||
| (e) | Forward foreign currency contracts outstanding as of March 31, 2020 were as follows: |
Currency Purchased | Currency Sold | Settlement Month | Counterparty | Unrealized Appreciation | Unrealized Depreciation | |||||||||||||||||||||||||||
| AUD | 1,144,000 | USD | 696,925 | 04/20 | GSC | $6,759 | $— | |||||||||||||||||||||||||
| BRL | 362,155 | USD | 82,550 | 04/20 | GSC | — | (12,862 | ) | ||||||||||||||||||||||||
| BRL | 2,955 | USD | 575 | 05/20 | DUB | — | (8 | ) | ||||||||||||||||||||||||
| EUR | 325,000 | USD | 363,752 | 04/20 | BRC | — | (5,280 | ) | ||||||||||||||||||||||||
| EUR | 34,000 | USD | 36,679 | 04/20 | GSC | 822 | — | |||||||||||||||||||||||||
| EUR | 11,000 | USD | 11,893 | 04/20 | JPM | 240 | — | |||||||||||||||||||||||||
| EUR | 16,000 | USD | 17,884 | 04/20 | UBS | — | (236 | ) | ||||||||||||||||||||||||
| GBP | 454,000 | USD | 554,036 | 04/20 | BRC | 9,903 | — | |||||||||||||||||||||||||
| IDR | 2,904,296,420 | USD | 209,470 | 06/20 | SCB | — | (33,669 | ) | ||||||||||||||||||||||||
| MXN | 2,900,000 | USD | 151,735 | 06/20 | JPM | — | (30,890 | ) | ||||||||||||||||||||||||
| NZD | 1,047,000 | USD | 620,122 | 04/20 | UBS | 4,614 | — | |||||||||||||||||||||||||
| RUB | 12,164,588 | USD | 190,135 | 04/20 | GSC | — | (35,086 | ) | ||||||||||||||||||||||||
| USD | 748,113 | AUD | 1,144,000 | 04/20 | SCB | 44,429 | — | |||||||||||||||||||||||||
| USD | 697,039 | AUD | 1,144,000 | 05/20 | GSC | — | (6,763 | ) | ||||||||||||||||||||||||
| USD | 576 | BRL | 2,955 | 04/20 | DUB | 7 | — | |||||||||||||||||||||||||
| USD | 80,000 | BRL | 359,200 | 04/20 | JPM | 10,881 | — | |||||||||||||||||||||||||
| USD | 17,303 | EUR | 16,000 | 04/20 | BRC | — | (345 | ) | ||||||||||||||||||||||||
| USD | 21,232 | EUR | 19,000 | 04/20 | JPM | 275 | — | |||||||||||||||||||||||||
| USD | 373,123 | EUR | 339,000 | 04/20 | SCB | — | (791 | ) | ||||||||||||||||||||||||
| USD | 9,874 | EUR | 9,000 | 05/20 | BRC | — | (65 | ) | ||||||||||||||||||||||||
| USD | 4,434 | EUR | 4,000 | 05/20 | JPM | 16 | — | |||||||||||||||||||||||||
| USD | 562,820 | GBP | 440,000 | 04/20 | BRC | 16,272 | — | |||||||||||||||||||||||||
| USD | 10,330 | GBP | 8,000 | 04/20 | GSC | 393 | — | |||||||||||||||||||||||||
| USD | 7,129 | GBP | 6,000 | 04/20 | SCB | — | (323 | ) | ||||||||||||||||||||||||
| USD | 526,087 | GBP | 430,000 | 05/20 | BRC | — | (8,424 | ) | ||||||||||||||||||||||||
| USD | 197,000 | IDR | 2,822,714,500 | 06/20 | BRC | 26,137 | — | |||||||||||||||||||||||||
| USD | 147,920 | MXN | 3,378,000 | 04/20 | BRC | 5,807 | — | |||||||||||||||||||||||||
| USD | 36,674 | NZD | 58,000 | 04/20 | JPM | 2,066 | — | |||||||||||||||||||||||||
| USD | 619,147 | NZD | 989,000 | 04/20 | UBS | 29,018 | — | |||||||||||||||||||||||||
| USD | 619,980 | NZD | 1,047,000 | 05/20 | UBS | — | (4,599 | ) | ||||||||||||||||||||||||
| USD | 60,696 | PEN | 214,925 | 05/20 | GSC | — | (1,768 | ) | ||||||||||||||||||||||||
| USD | 178,806 | RUB | 11,941,753 | 04/20 | GSC | 26,597 | — | |||||||||||||||||||||||||
|
|
|
| |||||||||||||||||||||||||||||
Total Forward Foreign Currency Contracts | $184,236 | ($141,109 | ) | |||||||||||||||||||||||||||||
|
|
|
| |||||||||||||||||||||||||||||
| See Notes to Financial Statements | See explanation of symbols and terms, if any, on B-76 and B-77 |
B-3
Table of Contents
PF INFLATION MANAGED FUND
Schedule of Investments (Continued)
March 31, 2020
| (f) | Purchased options outstanding as of March 31, 2020 were as follows: |
Interest Rate Swaptions
| Description | Pay/Receive Floating Rate | Floating Rate Index | Exercise Rate | Expiration Date | Counter- party | Notional Amount | Cost | Value | ||||||||||||||||||||
Call - 2-Year Interest Rate Swap | Pay | 3-Month USD-LIBOR | 1.066% | 10/02/20 | JPM | $5,200,000 | $20,756 | $75,893 | ||||||||||||||||||||
|
|
|
| |||||||||||||||||||||||||
Options on Futures
| Description | Exercise Price | Expiration Date | Exchange | Number of Contracts | Notional Amount | Cost | Value | |||||||||||||||||||||
Call - Euro-Schatz (05/20) | EUR 130.00 | 05/22/20 | EUX | 50 | EUR 6,500,000 | $580 | $276 | |||||||||||||||||||||
Call - U.S. Treasury 5-Year Notes (06/20) | $146.00 | 05/22/20 | CME | 24 | $3,504,000 | 405 | 187 | |||||||||||||||||||||
Call - U.S. Treasury 10-Year Notes (06/20) | 205.00 | 05/22/20 | CME | 36 | 7,380,000 | 608 | 563 | |||||||||||||||||||||
|
|
|
| |||||||||||||||||||||||||
| 1,593 | 1,026 | |||||||||||||||||||||||||||
|
|
|
| |||||||||||||||||||||||||
Put - U.S. Treasury 2-Year Notes (05/20) | 106.00 | 04/24/20 | CME | 6 | 1,272,000 | 195 | — | |||||||||||||||||||||
|
|
|
| |||||||||||||||||||||||||
Total Options on Futures | $1,788 | $1,026 | ||||||||||||||||||||||||||
|
|
|
| |||||||||||||||||||||||||
Total Purchased Options | $22,544 | $76,919 | ||||||||||||||||||||||||||
|
|
|
| |||||||||||||||||||||||||
| (g) | Premiums received and value of written options outstanding as of March 31, 2020 were as follows: |
Credit Default Swaptions on Credit Indices - Buy Protection
| Description | Exercise Rate | Expiration Date | Counter- party | Notional Amount | Premium | Value | ||||||||||||||||||
Call - CDX IG33 5Y | 0.475% | 04/15/20 | GSC | $100,000 | $48 | $— | ||||||||||||||||||
|
|
|
| |||||||||||||||||||||
Credit Default Swaptions on Credit Indices – Sell Protection | ||||||||||||||||||||||||
Put - CDX IG33 5Y | 0.700% | 04/15/20 | GSC | 100,000 | 85 | (1,815 | ) | |||||||||||||||||
Put - CDX IG33 5Y | 0.800% | 06/17/20 | GSC | 100,000 | 121 | (1,745 | ) | |||||||||||||||||
Put - CDX IG33 5Y | 0.850% | 06/17/20 | DUB | 100,000 | 115 | (1,609 | ) | |||||||||||||||||
Put - CDX IG33 5Y | 0.850% | 06/17/20 | MSC | 100,000 | 129 | (1,609 | ) | |||||||||||||||||
Put - CDX IG33 5Y | 2.500% | 03/17/21 | GSC | 100,000 | 70 | (838 | ) | |||||||||||||||||
Put - iTraxx Main 32 5Y | 2.500% | 03/17/21 | GSC | EUR 100,000 | 77 | (1,676 | ) | |||||||||||||||||
|
|
|
| |||||||||||||||||||||
| 597 | (9,292 | ) | ||||||||||||||||||||||
|
|
|
| |||||||||||||||||||||
Total Credit Default Swaptions on Credit Indices | $645 | ($9,292 | ) | |||||||||||||||||||||
|
|
|
| |||||||||||||||||||||
Inflation Floor/Cap Options
| Description | Initial Index | Floating Rate | Expiration Date | Counter- party | Notional Amount | Premium | Value | |||||||||||||||||||
Cap - U.S. CPI Urban Consumers | 233.92 | Maximum of [0, Final Index/ Initial Index - (1 + 4.000%)10] | 04/22/24 | JPM | $1,900,000 | $13,823 | ($13 | ) | ||||||||||||||||||
Cap - U.S. CPI Urban Consumers | 234.78 | Maximum of [0, Final Index/ Initial Index - (1 + 4.000%)10] | 05/16/24 | JPM | 200,000 | 1,390 | — | |||||||||||||||||||
|
|
|
| |||||||||||||||||||||||
| 15,213 | (13 | ) | ||||||||||||||||||||||||
|
|
|
| |||||||||||||||||||||||
Floor - U.S. CPI Urban Consumers | 216.69 | Maximum of [0, (1 + 0.000%)10 - Final Index/Initial Index] | 04/07/20 | CIT | 1,800,000 | 15,960 | — | |||||||||||||||||||
|
|
|
| |||||||||||||||||||||||
Total Inflation Floor/Cap Options | $31,173 | ($13 | ) | |||||||||||||||||||||||
|
|
|
| |||||||||||||||||||||||
Interest Rate Swaptions
| Description | Pay/Receive Floating Rate | Floating Rate Index | Exercise Rate | Expiration Date | Counter- party | Notional Amount | Premium | Value | ||||||||||||||||||||||||
Call - 30-Year Interest Rate Swap | Receive | 6-Month EUR-LIBOR | 0.000% | 08/24/20 | MSC | EUR 100,000 | $3,283 | ($4,854 | ) | |||||||||||||||||||||||
Call - 30-Year Interest Rate Swap | Receive | 6-Month EUR-LIBOR | 0.000% | 08/27/20 | GSC | 100,000 | 3,076 | (4,928 | ) | |||||||||||||||||||||||
Call - 10-Year Interest Rate Swap | Receive | 3-Month USD-LIBOR | 1.302% | 10/02/20 | JPM | $1,100,000 | 20,900 | (67,334 | ) | |||||||||||||||||||||||
|
|
|
| |||||||||||||||||||||||||||||
| $27,259 | ($77,116 | ) | ||||||||||||||||||||||||||||||
|
|
|
| |||||||||||||||||||||||||||||
Total Written Options | $59,077 | ($86,421 | ) | |||||||||||||||||||||||||||||
|
|
|
| |||||||||||||||||||||||||||||
| See Notes to Financial Statements | See explanation of symbols and terms, if any, on B-76 and B-77 |
B-4
Table of Contents
PF INFLATION MANAGED FUND
Schedule of Investments (Continued)
March 31, 2020
| (h) | Swap agreements outstanding as of March 31, 2020 were as follows: |
Credit Default Swaps on Corporate Issues - Sell Protection (1)
| Referenced Obligation | Payment Frequency | Fixed Deal Receive Rate | Expiration Date | Exchange | Implied Credit Spread at 03/31/20 (2) | Notional Amount (3) | Value | Upfront Premiums Paid (Received) | Unrealized Appreciation (Depreciation) | |||||||||||||||||||||||||||
Daimler AG | Q | 1.000% | 12/20/20 | ICE | 0.604% | EUR 10,000 | $36 | $153 | ($117 | ) | ||||||||||||||||||||||||||
|
|
|
|
|
| |||||||||||||||||||||||||||||||
Credit Default Swaps on Credit Indices - Buy Protection (4)
| Referenced Obligation | Payment Frequency | Fixed Deal Pay Rate | Expiration Date | Exchange | Notional Amount (3) | Value (5) | Upfront Premiums Paid (Received) | Unrealized Appreciation (Depreciation) | ||||||||||||||||||||||||
CDX IG32 5Y | Q | 1.000% | 06/20/24 | ICE | $2,900,000 | $1,357 | ($57,961 | ) | $59,318 | |||||||||||||||||||||||
CDX IG33 5Y | Q | 1.000% | 12/20/24 | ICE | 180,000 | 594 | (3,486 | ) | 4,080 | |||||||||||||||||||||||
CDX HY34 5Y | Q | 5.000% | 06/20/25 | ICE | 500,000 | 31,064 | 19,900 | 11,164 | ||||||||||||||||||||||||
|
|
|
|
|
| |||||||||||||||||||||||||||
| $33,015 | ($41,547 | ) | $74,562 | |||||||||||||||||||||||||||||
|
|
|
|
|
| |||||||||||||||||||||||||||
Total Credit Default Swaps | $33,051 | ($41,394 | ) | $74,445 | ||||||||||||||||||||||||||||
|
|
|
|
|
| |||||||||||||||||||||||||||
| (1) | If the Fund is a seller of protection and a credit event occurs, as defined under the terms of that particular swap agreement, the Fund will either (i) pay to the buyer of protection an amount equal to the notional amount of the swap and take delivery of the referenced obligation or underlying investments comprising the referenced index or (ii) pay a net settlement amount in the form of cash or investments equal to the notional amount of the swap less the recovery value of the referenced obligation or underlying investments comprising the referenced index. |
| (2) | An implied credit spread is the spread in yield between a U.S. Treasury security and the referenced obligation or underlying investment that are identical in all respects except for the quality rating. Implied credit spreads, represented in absolute terms, utilized in determining the value of credit default swap agreements on corporate issues as of year end serve as an indicator of the current status of the payment/performance risk and represent the likelihood of risk of default for the credit derivative. The implied credit spread of a particular referenced entity reflects the cost of buying/selling protection and may include upfront payments required to be made to enter into the agreement. Wider credit spreads, in comparison to narrower credit spreads, represent a deterioration of the referenced entity’s credit soundness and a greater likelihood of risk of default or other credit event occurring as defined under the terms of the agreement. A credit spread identified as “Defaulted” indicates a credit event has occurred for the referenced entity or obligation. |
| (3) | The maximum potential amount the Fund could be required to pay as a seller of credit protection or receive as a buyer of credit protection if a credit event occurs as defined under the terms of that particular swap agreement. |
| (4) | If the Fund is a buyer of protection and a credit event occurs, as defined under the terms of that particular swap agreement, the Fund will either (i) receive from the seller of protection an amount equal to the notional amount of the swap and deliver the referenced obligation or underlying investments comprising the referenced index or (ii) receive a net settlement amount in the form of cash or investments equal to the notional amount of the swap less the recovery value of the referenced obligation or underlying investments comprising the referenced index. |
| (5) | The quoted market prices and resulting values for credit default swap agreements on credit indices serve as an indicator of the current status of the payment/performance risk and represent the expected amount paid or received for the credit derivative had the notional amount of the swap agreement been closed/sold as of year end. Increasing values (buy protection) or decreasing values (sell protection), when compared to the notional amount of the swap, represent a deterioration of the referenced entity’s credit soundness and a greater likelihood of risk of default or other credit event occurring as defined under the terms of the agreement. |
Interest Rate Swaps - Long
| Receive | Pay | Payment Frequency Receive Rate/ Pay Rate | Exchange | Expiration Date | Notional Amount | Value | Upfront Premiums Paid (Received) | Unrealized Appreciation (Depreciation) | ||||||||||||||||||||||
| 1.235% | U.S. CPI Urban Consumers | Z / Z | LCH | 02/27/21 | $400,000 | $8,296 | $— | $8,296 | ||||||||||||||||||||||
| 1.500% | 3-Month USD-LIBOR | S / Q | CME | 03/12/21 | 9,520,000 | 93,919 | — | 93,919 | ||||||||||||||||||||||
| 1.535% | Eurostat Eurozone HICP | Z / Z | LCH | 06/15/23 | EUR 300,000 | 18,972 | — | 18,972 | ||||||||||||||||||||||
| 2.500% | 3-Month USD-LIBOR | S / Q | CME | 12/19/23 | $120,000 | 9,957 | (305 | ) | 10,262 | |||||||||||||||||||||
| 2.750% | 3-Month USD-LIBOR | S / Q | LCH | 12/19/23 | 400,000 | 37,182 | (2,706 | ) | 39,888 | |||||||||||||||||||||
| 3.850% | GBP Retail Price | Z / Z | LCH | 09/15/24 | GBP 200,000 | 12,634 | — | 12,634 | ||||||||||||||||||||||
| 1.250% | 3-Month USD-LIBOR | S / Q | CME | 06/17/25 | $2,100,000 | 79,589 | 42,949 | 36,640 | ||||||||||||||||||||||
| 2.335% | U.S. CPI Urban Consumers | Z / Z | LCH | 02/05/28 | 190,000 | 26,035 | 338 | 25,697 | ||||||||||||||||||||||
| 2.364% | U.S. CPI Urban Consumers | Z / Z | LCH | 05/10/28 | 50,000 | 7,178 | — | 7,178 | ||||||||||||||||||||||
| 2.379% | U.S. CPI Urban Consumers | Z / Z | LCH | 07/09/28 | 500,000 | 72,279 | (288 | ) | 72,567 | |||||||||||||||||||||
| 3.593% | GBP Retail Price | Z / Z | LCH | 11/15/28 | GBP 45,000 | 3,082 | — | 3,082 | ||||||||||||||||||||||
| 2.165% | U.S. CPI Urban Consumers | Z / Z | LCH | 04/16/29 | $100,000 | 11,465 | — | 11,465 | ||||||||||||||||||||||
| 1.998% | U.S. CPI Urban Consumers | Z / Z | LCH | 07/25/29 | 100,000 | 9,851 | — | 9,851 | ||||||||||||||||||||||
| 1.760% | U.S. CPI Urban Consumers | Z / Z | LCH | 11/04/29 | 400,000 | 27,822 | (708 | ) | 28,530 | |||||||||||||||||||||
| 3.400% | GBP Retail Price | Z / Z | LCH | 06/15/30 | GBP 200,000 | 15,864 | 2,555 | 13,309 | ||||||||||||||||||||||
| 3.530% | GBP Retail Price | Z / Z | LCH | 10/15/31 | 50,000 | 4,155 | 493 | 3,662 | ||||||||||||||||||||||
| 3.500% | GBP Retail Price | Z / Z | LCH | 09/15/33 | 60,000 | 5,847 | 47 | 5,800 | ||||||||||||||||||||||
| 3.579% | GBP Retail Price | Z / Z | LCH | 10/15/33 | 170,000 | 21,592 | — | 21,592 | ||||||||||||||||||||||
| 3.572% | GBP Retail Price | Z / Z | LCH | 05/15/34 | 50,000 | 5,393 | — | 5,393 | ||||||||||||||||||||||
| 3.580% | GBP Retail Price | Z / Z | LCH | 06/15/39 | 30,000 | 6,598 | 30 | 6,568 | ||||||||||||||||||||||
| 3.590% | GBP Retail Price | Z / Z | LCH | 06/15/39 | 40,000 | 8,979 | — | 8,979 | ||||||||||||||||||||||
| 1.243% | Eurostat Eurozone HICP | Z / Z | LCH | 08/15/39 | EUR 40,000 | 3,316 | — | 3,316 | ||||||||||||||||||||||
| 1.387% | Eurostat Eurozone HICP | Z / Z | LCH | 08/15/49 | 20,000 | 2,769 | — | 2,769 | ||||||||||||||||||||||
|
|
|
|
|
| |||||||||||||||||||||||||
| $492,774 | $42,405 | $450,369 | ||||||||||||||||||||||||||||
|
|
|
|
|
| |||||||||||||||||||||||||
| See Notes to Financial Statements | See explanation of symbols and terms, if any, on B-76 and B-77 |
B-5
Table of Contents
PF INFLATION MANAGED FUND
Schedule of Investments (Continued)
March 31, 2020
Interest Rate Swaps - Short
| Pay | Receive | Payment Frequency Pay Rate/ Receive Rate | Exchange | Expiration Date | Notional Amount | Value | Upfront Premiums Paid (Received) | Unrealized Appreciation (Depreciation) | ||||||||||||||||||||||
1.160% | France CPI Ex Tobacco | Z / Z | LCH | 08/15/20 | EUR 80,000 | ($1,189 | ) | $57 | ($1,246 | ) | ||||||||||||||||||||
1.875% | U.S. CPI Urban Consumers | Z / Z | LCH | 03/14/21 | $2,700,000 | (66,827 | ) | — | (66,827 | ) | ||||||||||||||||||||
1.250% | 3-Month USD-LIBOR | S / Q | CME | 06/17/21 | 9,500,000 | (82,522 | ) | (47,046 | ) | (35,476 | ) | |||||||||||||||||||
1.432% | U.S. CPI Urban Consumers | Z / Z | LCH | 08/06/21 | 100,000 | (2,434 | ) | — | (2,434 | ) | ||||||||||||||||||||
1.580% | U.S. CPI Urban Consumers | Z / Z | LCH | 09/20/21 | 200,000 | (5,651 | ) | — | (5,651 | ) | ||||||||||||||||||||
1.592% | U.S. CPI Urban Consumers | Z / Z | LCH | 09/20/21 | 200,000 | (5,700 | ) | (39 | ) | (5,661 | ) | |||||||||||||||||||
2.210% | U.S. CPI Urban Consumers | Z / Z | LCH | 02/05/23 | 120,000 | (7,704 | ) | — | (7,704 | ) | ||||||||||||||||||||
2.263% | U.S. CPI Urban Consumers | Z / Z | LCH | 04/27/23 | 60,000 | (4,351 | ) | — | (4,351 | ) | ||||||||||||||||||||
2.263% | U.S. CPI Urban Consumers | Z / Z | LCH | 05/09/23 | 120,000 | (8,693 | ) | — | (8,693 | ) | ||||||||||||||||||||
2.281% | U.S. CPI Urban Consumers | Z / Z | LCH | 05/10/23 | 180,000 | (13,539 | ) | — | (13,539 | ) | ||||||||||||||||||||
1.030% | France CPI Ex Tobacco | Z / Z | LCH | 03/15/24 | EUR 140,000 | (6,240 | ) | (53 | ) | (6,187 | ) | |||||||||||||||||||
1.404% | 3-Month USD-LIBOR | S / Q | CME | 03/12/25 | $2,110,000 | (95,796 | ) | — | (95,796 | ) | ||||||||||||||||||||
3.250% | 3-Month NZD-Bank Bills | S / Q | CME | 03/21/28 | NZD 100,000 | (11,573 | ) | 290 | (11,863 | ) | ||||||||||||||||||||
3.598% | GBP Retail Price | Z / Z | LCH | 09/15/34 | GBP 210,000 | (26,063 | ) | 156 | (26,219 | ) | ||||||||||||||||||||
2.000% | U.S. Fed Funds | A / A | LCH | 12/15/47 | $40,000 | (14,030 | ) | (72 | ) | (13,958 | ) | |||||||||||||||||||
2.250% | 3-Month USD-LIBOR | S / Q | CME | 12/11/49 | 300,000 | (112,775 | ) | (692 | ) | (112,083 | ) | |||||||||||||||||||
1.625% | 3-Month USD-LIBOR | S / Q | CME | 01/16/50 | 100,000 | (19,800 | ) | (1,423 | ) | (18,377 | ) | |||||||||||||||||||
1.625% | 3-Month USD-LIBOR | S / Q | CME | 02/03/50 | 40,000 | (7,937 | ) | (1 | ) | (7,936 | ) | |||||||||||||||||||
2.000% | 3-Month USD-LIBOR | S / Q | CME | 03/20/50 | 40,000 | (12,139 | ) | (631 | ) | (11,508 | ) | |||||||||||||||||||
|
|
|
|
|
| |||||||||||||||||||||||||
| ($504,963 | ) | ($49,454 | ) | ($455,509 | ) | |||||||||||||||||||||||||
|
|
|
|
|
| |||||||||||||||||||||||||
Total Interest Rate Swaps |
| ($12,189 | ) | ($7,049 | ) | ($5,140 | ) | |||||||||||||||||||||||
|
|
|
|
|
| |||||||||||||||||||||||||
Total Swap Agreements |
| $20,862 | ($48,443 | ) | $69,305 | |||||||||||||||||||||||||
|
|
|
|
|
| |||||||||||||||||||||||||
Balances reported in the Statement of Assets and Liabilities for Centrally Cleared Swaps
| Upfront Premium Paid (Received) | Unrealized Appreciation (Deprecation) | |||||||
Centrally Cleared Swap Agreements (1) | ||||||||
Assets | $66,968 | $524,931 | ||||||
Liabilities | (115,411 | ) | (455,626 | ) | ||||
|
|
|
| |||||
| ($48,443 | ) | $69,305 | ||||||
|
|
|
| |||||
| (1) | Includes cumulative value on centrally cleared swaps, as reported in the Schedule of Investments. Only variation margin is reported within the Statement of Assets and Liabilities. |
| See Notes to Financial Statements | See explanation of symbols and terms, if any, on B-76 and B-77 |
B-6
Table of Contents
PF INFLATION MANAGED FUND
Schedule of Investments (Continued)
March 31, 2020
| (i) | Fair Value Measurements |
The following is a summary of the Fund’s investments as categorized under the three-tier hierarchy of inputs used in valuing the Fund’s assets and liabilities as of March 31, 2020:
Total Value at March 31, 2020 | Level 1 Quoted Price | Level 2 Significant Observable Inputs | Level 3 Significant Unobservable Inputs | |||||||||||||||
Assets | Corporate Bonds & Notes | $1,384,314 | $— | $1,384,314 | $— | |||||||||||||
Mortgage-Backed Securities | 3,043,252 | — | 3,043,252 | — | ||||||||||||||
Asset-Backed Securities | 2,516,955 | — | 2,516,955 | — | ||||||||||||||
U.S. Treasury Obligations | 21,321,060 | — | 21,321,060 | — | ||||||||||||||
Foreign Government Bonds & Notes | 1,413,917 | — | 1,413,917 | — | ||||||||||||||
Short-Term Investments | 479,385 | 478,930 | 455 | — | ||||||||||||||
Derivatives: | ||||||||||||||||||
Credit Contracts |
| |||||||||||||||||
Swaps | 74,562 | — | 74,562 | — | ||||||||||||||
Foreign Currency Contracts |
| |||||||||||||||||
Forward Foreign Currency Contracts | 184,236 | — | 184,236 | — | ||||||||||||||
Interest Rate Contracts |
| |||||||||||||||||
Futures | 101,177 | 101,177 | — | — | ||||||||||||||
Purchased Options | 76,919 | — | 76,919 | — | ||||||||||||||
Swaps | 450,369 | — | 450,369 | — | ||||||||||||||
|
|
|
|
|
|
|
| |||||||||||
Total Interest Rate Contracts | 628,465 | 101,177 | 527,288 | — | ||||||||||||||
|
|
|
|
|
|
|
| |||||||||||
Total Assets - Derivatives | 887,263 | 101,177 | 786,086 | — | ||||||||||||||
|
|
|
|
|
|
|
| |||||||||||
Total Assets | 31,046,146 | 580,107 | 30,466,039 | — | ||||||||||||||
|
|
|
|
|
|
|
| |||||||||||
Liabilities | Sale-buyback Financing Transactions | (11,585,269 | ) | — | (11,585,269 | ) | — | |||||||||||
Derivatives: | ||||||||||||||||||
Credit Contracts |
| |||||||||||||||||
Written Options | (9,292 | ) | — | (9,292 | ) | — | ||||||||||||
Swaps | (117 | ) | — | (117 | ) | — | ||||||||||||
|
|
|
|
|
|
|
| |||||||||||
Total Credit Contracts | (9,409 | ) | — | (9,409 | ) | — | ||||||||||||
|
|
|
|
|
|
|
| |||||||||||
Foreign Currency Contracts |
| |||||||||||||||||
Forward Foreign Currency Contracts | (141,109 | ) | — | (141,109 | ) | — | ||||||||||||
Interest Rate Contracts |
| |||||||||||||||||
Futures | (216,004 | ) | (216,004 | ) | — | — | ||||||||||||
Written Options | (77,129 | ) | — | (77,129 | ) | — | ||||||||||||
Swaps | (455,509 | ) | — | (455,509 | ) | — | ||||||||||||
|
|
|
|
|
|
|
| |||||||||||
Total Interest Rate Contracts | (748,642 | ) | (216,004 | ) | (532,638 | ) | — | |||||||||||
|
|
|
|
|
|
|
| |||||||||||
Total Liabilities - Derivatives | (899,160 | ) | (216,004 | ) | (683,156 | ) | — | |||||||||||
|
|
|
|
|
|
|
| |||||||||||
Total Liabilities | (12,484,429 | ) | (216,004 | ) | (12,268,425 | ) | — | |||||||||||
|
|
|
|
|
|
|
| |||||||||||
Total | $18,561,717 | $364,103 | $18,197,614 | $— | ||||||||||||||
|
|
|
|
|
|
|
| |||||||||||
| See Notes to Financial Statements | See explanation of symbols and terms, if any, on B-76 and B-77 |
B-7
Table of Contents
PACIFIC FUNDS
PF MANAGED BOND FUND
Schedule of Investments
March 31, 2020
Principal Amount | Value | |||||||
CORPORATE BONDS & NOTES - 48.6% | ||||||||
Basic Materials - 0.9% | ||||||||
Anglo American Capital PLC (South Africa) | $250,000 | $235,694 | ||||||
ArcelorMittal SA (Luxembourg) | 70,000 | 63,937 | ||||||
4.550% due 03/11/26 | 10,000 | 8,996 | ||||||
6.125% due 06/01/25 | 80,000 | 79,345 | ||||||
7.000% due 10/15/39 | 80,000 | 79,747 | ||||||
Barrick Gold Corp (Canada) | 30,000 | 35,578 | ||||||
Barrick North America Finance LLC (Canada) | 90,000 | 111,329 | ||||||
BHP Billiton Finance USA Ltd (Australia) | 270,000 | 286,741 | ||||||
Freeport-McMoRan Inc | ||||||||
3.550% due 03/01/22 | 10,000 | 9,647 | ||||||
5.450% due 03/15/43 | 170,000 | 153,476 | ||||||
Glencore Funding LLC (Switzerland) | ||||||||
2.875% due 04/16/20 ~ | 60,000 | 59,997 | ||||||
3.875% due 10/27/27 ~ | 30,000 | 27,536 | ||||||
4.000% due 03/27/27 ~ | 250,000 | 228,140 | ||||||
4.125% due 03/12/24 ~ | 160,000 | 147,365 | ||||||
Indonesia Asahan Aluminium Persero PT (Indonesia) | 700,000 | 749,057 | ||||||
Newcrest Finance Pty Ltd (Australia) | 500,000 | 513,019 | ||||||
Sasol Financing USA LLC (South Africa) | 500,000 | 210,231 | ||||||
Southern Copper Corp (Peru) | 260,000 | 306,191 | ||||||
Vale Overseas Ltd (Brazil) | 48,000 | 53,799 | ||||||
Yamana Gold Inc (Brazil) | 90,000 | 90,463 | ||||||
|
| |||||||
| 3,450,288 | ||||||||
|
| |||||||
Communications - 4.0% | ||||||||
Altice France SA (France) | 200,000 | 203,110 | ||||||
Amazon.com Inc | ||||||||
3.875% due 08/22/37 | 70,000 | 84,219 | ||||||
4.950% due 12/05/44 | 60,000 | 83,214 | ||||||
AT&T Inc | ||||||||
3.400% due 05/15/25 | 200,000 | 207,231 | ||||||
3.800% due 03/15/22 | 800,000 | 826,924 | ||||||
4.350% due 06/15/45 | 120,000 | 127,470 | ||||||
CCO Holdings LLC | ||||||||
4.500% due 05/01/32 ~ | 30,000 | 29,425 | ||||||
5.125% due 05/01/27 ~ | 130,000 | 131,563 | ||||||
Charter Communications Operating LLC | ||||||||
3.579% due 07/23/20 | 2,060,000 | 2,053,722 | ||||||
4.464% due 07/23/22 | 1,000,000 | 1,034,168 | ||||||
4.800% due 03/01/50 | 20,000 | 20,939 | ||||||
5.375% due 04/01/38 | 20,000 | 21,660 | ||||||
5.750% due 04/01/48 | 10,000 | 11,402 | ||||||
6.384% due 10/23/35 | 20,000 | 23,844 | ||||||
6.834% due 10/23/55 | 30,000 | 35,665 | ||||||
Comcast Corp | ||||||||
3.250% due 11/01/39 | 10,000 | 10,606 | ||||||
3.375% due 08/15/25 | 20,000 | 21,280 | ||||||
3.400% due 04/01/30 | 30,000 | 32,542 | ||||||
3.450% due 02/01/50 | 40,000 | 44,100 | ||||||
3.700% due 04/15/24 | 1,000,000 | 1,075,290 | ||||||
3.750% due 04/01/40 | 10,000 | 11,075 | ||||||
3.950% due 10/15/25 | 110,000 | 121,346 | ||||||
3.999% due 11/01/49 | 51,000 | 60,519 | ||||||
Principal Amount | Value | |||||||
4.000% due 03/01/48 | $ | 10,000 | $ | 11,584 | ||||
4.250% due 10/15/30 | 100,000 | 117,494 | ||||||
4.700% due 10/15/48 | 10,000 | 12,984 | ||||||
5.650% due 06/15/35 | 20,000 | 27,115 | ||||||
DISH DBS Corp | 90,000 | 88,208 | ||||||
eBay Inc | ||||||||
2.750% due 01/30/23 | 500,000 | 491,001 | ||||||
3.800% due 03/09/22 | 800,000 | 812,034 | ||||||
Expedia Group Inc | 800,000 | 693,739 | ||||||
Fox Corp | 80,000 | 93,078 | ||||||
Netflix Inc | 20,000 | 20,285 | ||||||
Sprint Capital Corp | 130,000 | 172,647 | ||||||
Sprint Corp | 400,000 | 414,464 | ||||||
Sprint Spectrum Co LLC | ||||||||
3.360% due 03/20/23 ~ | 75,000 | 74,906 | ||||||
4.738% due 09/20/29 ~ | 450,000 | 462,935 | ||||||
Telefonica Emisiones SAU (Spain) | 150,000 | 169,087 | ||||||
Telstra Corp Ltd (Australia) | 800,000 | 825,190 | ||||||
The Interpublic Group of Cos Inc | 800,000 | 829,226 | ||||||
Time Warner Cable LLC | ||||||||
4.125% due 02/15/21 | 770,000 | 772,442 | ||||||
5.875% due 11/15/40 | 50,000 | 52,909 | ||||||
6.550% due 05/01/37 | 110,000 | 123,905 | ||||||
6.750% due 06/15/39 | 20,000 | 22,758 | ||||||
7.300% due 07/01/38 | 60,000 | 73,902 | ||||||
Time Warner Entertainment Co LP | 20,000 | 27,583 | ||||||
United Group BV (Netherlands) | EUR 600,000 | 600,794 | ||||||
Verizon Communications Inc | ||||||||
2.625% due 08/15/26 | $20,000 | 20,702 | ||||||
3.150% due 03/22/30 | 50,000 | 53,882 | ||||||
3.376% due 02/15/25 | 49,000 | 52,656 | ||||||
3.850% due 11/01/42 | 20,000 | 22,443 | ||||||
4.000% due 03/22/50 | 30,000 | 35,768 | ||||||
4.125% due 08/15/46 | 30,000 | 34,885 | ||||||
4.329% due 09/21/28 | 5,000 | 5,774 | ||||||
4.400% due 11/01/34 | 90,000 | 105,709 | ||||||
4.500% due 08/10/33 | 220,000 | 265,379 | ||||||
4.862% due 08/21/46 | 20,000 | 26,185 | ||||||
5.500% due 03/16/47 | 30,000 | 41,291 | ||||||
Vodafone Group PLC (United Kingdom) | ||||||||
3.750% due 01/16/24 | 1,300,000 | 1,356,194 | ||||||
4.375% due 05/30/28 | 120,000 | 126,424 | ||||||
|
| |||||||
| 15,408,876 | ||||||||
|
| |||||||
Consumer, Cyclical - 4.9% | ||||||||
BMW Finance NV (Germany) | 900,000 | 862,294 | ||||||
Daimler Finance North America LLC (Germany) | ||||||||
2.550% due 08/15/22 ~ | 1,100,000 | 1,056,058 | ||||||
2.850% due 01/06/22 ~ | 900,000 | 876,609 | ||||||
3.400% due 02/22/22 ~ | 1,100,000 | 1,069,879 | ||||||
Delta Air Lines Inc | 60,000 | 48,172 | ||||||
Delta Air Lines Pass-Through Trust ‘A’ | 753,268 | 796,519 | ||||||
Ford Motor Co | 10,000 | 5,725 | ||||||
| See Notes to Financial Statements | See explanation of symbols and terms, if any, on B-76 and B-77 |
B-8
Table of Contents
PACIFIC FUNDS
PF MANAGED BOND FUND
Schedule of Investments (Continued)
March 31, 2020
Principal Amount | Value | |||||||
Ford Motor Credit Co LLC | ||||||||
2.109% (EUR LIBOR + 0.370%) due 12/01/21 § | EUR 800,000 | $ | 777,263 | |||||
2.134% (USD LIBOR + 0.930%) due 09/24/20 § | $800,000 | 760,062 | ||||||
2.927% (USD LIBOR + 1.235%) due 02/15/23 § | 300,000 | 236,892 | ||||||
3.200% due 01/15/21 | 900,000 | 874,125 | ||||||
4.424% (USD LIBOR + 2.550%) due 01/07/21 § | 1,000,000 | 950,157 | ||||||
5.085% due 01/07/21 | 600,000 | 579,372 | ||||||
5.875% due 08/02/21 | 200,000 | 197,000 | ||||||
General Motors Co | ||||||||
5.150% due 04/01/38 | 20,000 | 14,529 | ||||||
5.950% due 04/01/49 | 20,000 | 14,849 | ||||||
6.250% due 10/02/43 | 40,000 | 31,887 | ||||||
General Motors Financial Co Inc | ||||||||
0.177% (EUR LIBOR + 0.550%) due 03/26/22 § ~ | EUR 700,000 | 725,137 | ||||||
2.450% due 11/06/20 | $480,000 | 465,829 | ||||||
3.200% due 07/13/20 | 600,000 | 598,284 | ||||||
4.250% due 05/15/23 | 30,000 | 27,161 | ||||||
4.350% due 01/17/27 | 20,000 | 16,559 | ||||||
5.100% due 01/17/24 | 800,000 | 738,116 | ||||||
Harley-Davidson Financial Services Inc | 500,000 | 508,588 | ||||||
Hilton Worldwide Finance LLC | 130,000 | 124,221 | ||||||
Las Vegas Sands Corp | 50,000 | 45,110 | ||||||
Latam Airlines Pass Through Trust ‘A’ (Chile) | 765,170 | 695,189 | ||||||
Lowe’s Cos Inc | ||||||||
4.500% due 04/15/30 | 20,000 | 22,111 | ||||||
5.000% due 04/15/40 | 10,000 | 11,353 | ||||||
5.125% due 04/15/50 | 50,000 | 60,475 | ||||||
McDonald’s Corp | ||||||||
3.500% due 03/01/27 | 10,000 | 10,434 | ||||||
3.600% due 07/01/30 | 30,000 | 31,485 | ||||||
3.700% due 01/30/26 | 50,000 | 52,461 | ||||||
3.800% due 04/01/28 | 30,000 | 31,857 | ||||||
4.200% due 04/01/50 | 40,000 | 44,512 | ||||||
MGM Resorts International | 800,000 | 796,688 | ||||||
New Red Finance Inc (Canada) | 50,000 | 50,187 | ||||||
Newell Brands Inc | ||||||||
3.850% due 04/01/23 | 20,000 | 20,165 | ||||||
4.200% due 04/01/26 | 10,000 | 9,803 | ||||||
NIKE Inc | ||||||||
2.850% due 03/27/30 | 50,000 | 52,918 | ||||||
3.250% due 03/27/40 | 30,000 | 31,392 | ||||||
3.375% due 03/27/50 | 100,000 | 109,907 | ||||||
Nissan Motor Acceptance Corp | 1,000,000 | 972,836 | ||||||
Sands China Ltd (Macau) | 310,000 | 294,111 | ||||||
The Home Depot Inc | ||||||||
2.700% due 04/15/30 | 40,000 | 40,818 | ||||||
3.300% due 04/15/40 | 30,000 | 30,834 | ||||||
3.350% due 04/15/50 | 40,000 | 43,620 | ||||||
3.900% due 06/15/47 | 10,000 | 11,295 | ||||||
VOC Escrow Ltd | 140,000 | 103,138 | ||||||
Volkswagen Group of America Finance LLC (Germany) | ||||||||
2.653% (USD LIBOR + 0.940%) due 11/12/21 § ~ | 800,000 | 783,088 | ||||||
4.750% due 11/13/28 ~ | 1,000,000 | 1,024,875 | ||||||
Principal Amount | Value | |||||||
Volkswagen International Finance NV (Germany) | EUR 500,000 | $ | 521,960 | |||||
Volkswagen Leasing GmbH (Germany) | 100,000 | 109,183 | ||||||
Walmart Inc | $60,000 | 67,596 | ||||||
ZF North America Capital Inc (Germany) | 500,000 | 467,127 | ||||||
|
| |||||||
| 18,901,815 | ||||||||
|
| |||||||
Consumer,Non-Cyclical - 6.6% | ||||||||
Abbott Laboratories | ||||||||
3.750% due 11/30/26 | 38,000 | 42,519 | ||||||
4.750% due 11/30/36 | 70,000 | 88,898 | ||||||
4.900% due 11/30/46 | 40,000 | 54,887 | ||||||
AbbVie Inc | ||||||||
2.300% due 11/21/22 ~ | 230,000 | 230,110 | ||||||
2.600% due 11/21/24 ~ | 270,000 | 274,855 | ||||||
2.950% due 11/21/26 ~ | 50,000 | 51,063 | ||||||
3.200% due 11/21/29 ~ | 160,000 | 164,220 | ||||||
3.375% due 11/14/21 | 700,000 | 714,092 | ||||||
3.600% due 05/14/25 | 70,000 | 73,882 | ||||||
4.250% due 11/21/49 ~ | 10,000 | 10,926 | ||||||
Aetna Inc | 40,000 | 40,299 | ||||||
Allergan Funding SCS | ||||||||
3.450% due 03/15/22 | 80,000 | 83,115 | ||||||
3.800% due 03/15/25 | 90,000 | 92,320 | ||||||
Allergan Sales LLC | 700,000 | 725,651 | ||||||
Altria Group Inc | ||||||||
2.850% due 08/09/22 | 20,000 | 20,119 | ||||||
3.490% due 02/14/22 | 40,000 | 40,471 | ||||||
3.800% due 02/14/24 | 40,000 | 40,627 | ||||||
3.875% due 09/16/46 | 20,000 | 18,178 | ||||||
4.400% due 02/14/26 | 290,000 | 300,913 | ||||||
4.800% due 02/14/29 | 290,000 | 304,077 | ||||||
5.800% due 02/14/39 | 90,000 | 98,961 | ||||||
5.950% due 02/14/49 | 50,000 | 58,431 | ||||||
6.200% due 02/14/59 | 30,000 | 33,170 | ||||||
Amgen Inc | ||||||||
2.125% due 05/01/20 | 20,000 | 19,988 | ||||||
3.625% due 05/22/24 | 30,000 | 31,605 | ||||||
4.663% due 06/15/51 | 11,000 | 13,914 | ||||||
5.375% due 05/15/43 | 30,000 | 41,263 | ||||||
Anheuser-Busch Cos LLC (Belgium) | ||||||||
3.650% due 02/01/26 | 110,000 | 115,790 | ||||||
4.900% due 02/01/46 | 100,000 | 109,641 | ||||||
Anheuser-Busch InBev Worldwide Inc (Belgium) | ||||||||
4.150% due 01/23/25 | 90,000 | 97,249 | ||||||
4.750% due 01/23/29 | 230,000 | 253,401 | ||||||
Anthem Inc | ||||||||
3.125% due 05/15/22 | 30,000 | 30,539 | ||||||
3.350% due 12/01/24 | 40,000 | 40,810 | ||||||
3.650% due 12/01/27 | 30,000 | 31,050 | ||||||
Bacardi Ltd (Bermuda) | 600,000 | 605,539 | ||||||
BAT Capital Corp (United Kingdom) | ||||||||
3.557% due 08/15/27 | 100,000 | 94,394 | ||||||
4.540% due 08/15/47 | 170,000 | 155,954 | ||||||
Bayer US Finance II LLC (Germany) | 600,000 | 615,072 | ||||||
Becton Dickinson & Co | ||||||||
3.363% due 06/06/24 | 110,000 | 110,443 | ||||||
3.700% due 06/06/27 | 100,000 | 101,840 | ||||||
3.734% due 12/15/24 | 50,000 | 51,357 | ||||||
4.685% due 12/15/44 | 32,000 | 33,814 | ||||||
Bristol-Myers Squibb Co | ||||||||
2.900% due 07/26/24 ~ | 50,000 | 53,095 | ||||||
3.200% due 06/15/26 ~ | 120,000 | 128,449 | ||||||
| See Notes to Financial Statements | See explanation of symbols and terms, if any, on B-76 and B-77 |
B-9
Table of Contents
PACIFIC FUNDS
PF MANAGED BOND FUND
Schedule of Investments (Continued)
March 31, 2020
Principal Amount | Value | |||||||
3.550% due 08/15/22 ~ | $ | 90,000 | $ | 94,969 | ||||
3.875% due 08/15/25 ~ | 50,000 | 54,350 | ||||||
5.000% due 08/15/45 ~ | 150,000 | 202,021 | ||||||
Campbell Soup Co | 229,000 | 233,534 | ||||||
Centene Corp | 10,000 | 9,338 | ||||||
Cigna Corp | ||||||||
1.493% (USD LIBOR + 0.650%) | 1,200,000 | 1,153,197 | ||||||
2.721% (USD LIBOR + 0.890%) | 700,000 | 651,275 | ||||||
3.750% due 07/15/23 | 100,000 | 103,115 | ||||||
4.125% due 11/15/25 | 40,000 | 42,904 | ||||||
4.375% due 10/15/28 | 360,000 | 388,177 | ||||||
Constellation Brands Inc | ||||||||
2.250% due 11/06/20 | 800,000 | 795,591 | ||||||
4.250% due 05/01/23 | 30,000 | 30,310 | ||||||
CVS Health Corp | ||||||||
3.625% due 04/01/27 | 10,000 | 10,263 | ||||||
3.700% due 03/09/23 | 1,050,000 | 1,094,370 | ||||||
3.750% due 04/01/30 | 30,000 | 31,104 | ||||||
4.100% due 03/25/25 | 60,000 | 63,255 | ||||||
4.125% due 04/01/40 | 20,000 | 20,172 | ||||||
4.250% due 04/01/50 | 10,000 | 10,441 | ||||||
5.050% due 03/25/48 | 100,000 | 114,004 | ||||||
5.125% due 07/20/45 | 60,000 | 69,103 | ||||||
Danone SA (France) | 200,000 | 198,586 | ||||||
DP World PLC (United Arab Emirates) | 200,000 | 169,543 | ||||||
Gilead Sciences Inc | ||||||||
3.650% due 03/01/26 | 30,000 | 32,764 | ||||||
4.750% due 03/01/46 | 30,000 | 38,518 | ||||||
HCA Inc | 40,000 | 41,276 | ||||||
Humana Inc | ||||||||
3.150% due 12/01/22 | 50,000 | 49,946 | ||||||
3.950% due 03/15/27 | 50,000 | 50,983 | ||||||
4.625% due 12/01/42 | 50,000 | 55,175 | ||||||
4.800% due 03/15/47 | 20,000 | 22,466 | ||||||
4.950% due 10/01/44 | 20,000 | 22,829 | ||||||
IHS Markit Ltd | 900,000 | 948,707 | ||||||
Imperial Brands Finance PLC (United Kingdom) | 1,000,000 | 941,545 | ||||||
Johnson & Johnson | 100,000 | 115,071 | ||||||
Keurig Dr Pepper Inc | 1,000,000 | 1,042,781 | ||||||
Kraft Heinz Foods Co | ||||||||
2.304% (USD LIBOR + 0.570%) | 900,000 | 851,382 | ||||||
3.950% due 07/15/25 | 120,000 | 118,202 | ||||||
Mars Inc | �� | |||||||
2.700% due 04/01/25 ~ | 40,000 | 41,204 | ||||||
3.200% due 04/01/30 ~ | 40,000 | 41,888 | ||||||
Medtronic Inc | 52,000 | 56,112 | ||||||
Mondelez International Holdings Netherlands BV | 900,000 | 896,799 | ||||||
Mylan NV | EUR 900,000 | 994,367 | ||||||
PayPal Holdings Inc | $900,000 | 898,850 | ||||||
PepsiCo Inc | ||||||||
2.875% due 10/15/49 | 20,000 | 20,860 | ||||||
3.875% due 03/19/60 | 10,000 | 12,609 | ||||||
Pernod Ricard SA (France) | ||||||||
4.250% due 07/15/22 ~ | 800,000 | 807,423 | ||||||
5.750% due 04/07/21 ~ | 750,000 | 771,939 | ||||||
Principal Amount | Value | |||||||
Pfizer Inc | $ | 40,000 | $ | 42,028 | ||||
Philip Morris International Inc | ||||||||
2.500% due 08/22/22 | 90,000 | 91,250 | ||||||
2.500% due 11/02/22 | 80,000 | 80,412 | ||||||
4.500% due 03/20/42 | 30,000 | 35,309 | ||||||
Prime Security Services Borrower LLC | 50,000 | 49,281 | ||||||
Reckitt Benckiser Treasury Services PLC (United Kingdom) | 600,000 | 589,408 | ||||||
Reynolds American Inc (United Kingdom) | ||||||||
3.250% due 06/12/20 | 81,000 | 80,760 | ||||||
5.850% due 08/15/45 | 50,000 | 54,021 | ||||||
6.150% due 09/15/43 | 30,000 | 32,719 | ||||||
6.875% due 05/01/20 | 400,000 | 401,052 | ||||||
Takeda Pharmaceutical Co Ltd (Japan) | 1,000,000 | 1,054,397 | ||||||
Teva Pharmaceutical Finance Co BV (Israel) | 140,000 | 129,102 | ||||||
Teva Pharmaceutical Finance IV BV (Israel) | 100,000 | 96,729 | ||||||
Teva Pharmaceutical Finance Netherlands II BV (Israel) | EUR 900,000 | 881,344 | ||||||
Teva Pharmaceutical Finance Netherlands III BV (Israel) | ||||||||
2.200% due 07/21/21 | $490,000 | 470,714 | ||||||
2.800% due 07/21/23 | 140,000 | 128,624 | ||||||
The Coca-Cola Co | ||||||||
4.125% due 03/25/40 | 10,000 | 12,346 | ||||||
4.200% due 03/25/50 | 50,000 | 65,693 | ||||||
The Procter & Gamble Co | ||||||||
3.550% due 03/25/40 | 10,000 | 11,689 | ||||||
3.600% due 03/25/50 | 20,000 | 24,743 | ||||||
United Rentals North America Inc | ||||||||
5.500% due 07/15/25 | 50,000 | 49,313 | ||||||
5.875% due 09/15/26 | 90,000 | 91,834 | ||||||
UnitedHealth Group Inc | ||||||||
3.750% due 07/15/25 | 80,000 | 86,948 | ||||||
3.875% due 08/15/59 | 50,000 | 54,748 | ||||||
Wm Wrigley Jr Co | 70,000 | 69,576 | ||||||
|
| |||||||
| 25,394,349 | ||||||||
|
| |||||||
Energy - 2.4% | ||||||||
Apache Corp | ||||||||
3.250% due 04/15/22 | 24,000 | 18,489 | ||||||
4.250% due 01/15/44 | 170,000 | 74,329 | ||||||
4.375% due 10/15/28 | 20,000 | 10,713 | ||||||
4.750% due 04/15/43 | 40,000 | 17,779 | ||||||
5.100% due 09/01/40 | 80,000 | 35,481 | ||||||
Baker Hughes LLC | 900,000 | 857,752 | ||||||
BG Energy Capital PLC (United Kingdom) | 800,000 | 803,701 | ||||||
Blue Racer Midstream LLC | 30,000 | 22,660 | ||||||
BP Capital Markets America Inc | 200,000 | 187,556 | ||||||
BP Capital Markets PLC (United Kingdom) | ||||||||
3.506% due 03/17/25 | 130,000 | 135,558 | ||||||
3.535% due 11/04/24 | 40,000 | 42,296 | ||||||
Cameron LNG LLC | ||||||||
2.902% due 07/15/31 ~ | 20,000 | 17,591 | ||||||
3.302% due 01/15/35 ~ | 120,000 | 104,428 | ||||||
Cimarex Energy Co | ||||||||
3.900% due 05/15/27 | 200,000 | 145,368 | ||||||
4.375% due 03/15/29 | 20,000 | 13,431 | ||||||
| See Notes to Financial Statements | See explanation of symbols and terms, if any, on B-76 and B-77 |
B-10
Table of Contents
PACIFIC FUNDS
PF MANAGED BOND FUND
Schedule of Investments (Continued)
March 31, 2020
Principal Amount | Value | |||||||
Concho Resources Inc | ||||||||
3.750% due 10/01/27 | $ | 30,000 | $ | 25,521 | ||||
4.300% due 08/15/28 | 180,000 | 164,909 | ||||||
4.375% due 01/15/25 | 50,000 | 42,735 | ||||||
ConocoPhillips | 10,000 | 12,659 | ||||||
Continental Resources Inc | ||||||||
3.800% due 06/01/24 | 70,000 | 35,438 | ||||||
4.375% due 01/15/28 | 80,000 | 37,322 | ||||||
4.500% due 04/15/23 | 70,000 | 38,574 | ||||||
DCP Midstream Operating LP | 20,000 | 9,800 | ||||||
Devon Energy Corp | 220,000 | 141,237 | ||||||
Diamondback Energy Inc | ||||||||
2.875% due 12/01/24 | 20,000 | 14,015 | ||||||
3.250% due 12/01/26 | 20,000 | 14,174 | ||||||
3.500% due 12/01/29 | 20,000 | 14,185 | ||||||
5.375% due 05/31/25 | 10,000 | 7,398 | ||||||
Enbridge Inc (Canada) | 800,000 | 743,739 | ||||||
Energy Transfer Operating LP | ||||||||
2.900% due 05/15/25 | 10,000 | 8,473 | ||||||
3.750% due 05/15/30 | 190,000 | 149,711 | ||||||
4.950% due 06/15/28 | 50,000 | 41,488 | ||||||
5.250% due 04/15/29 | 20,000 | 16,971 | ||||||
6.250% due 04/15/49 | 20,000 | 16,988 | ||||||
6.750% due 05/15/25 | 50,000 | 30,625 | ||||||
Enterprise Products Operating LLC | ||||||||
2.800% due 01/31/30 | 60,000 | 54,863 | ||||||
3.700% due 01/31/51 | 40,000 | 36,168 | ||||||
3.950% due 01/31/60 | 30,000 | 25,596 | ||||||
4.150% due 10/16/28 | 180,000 | 183,005 | ||||||
4.200% due 01/31/50 | 30,000 | 28,441 | ||||||
4.800% due 02/01/49 | 10,000 | 10,050 | ||||||
4.850% due 03/15/44 | 10,000 | 10,465 | ||||||
7.550% due 04/15/38 | 20,000 | 23,259 | ||||||
EOG Resources Inc | ||||||||
3.900% due 04/01/35 | 30,000 | 30,328 | ||||||
4.150% due 01/15/26 | 70,000 | 71,803 | ||||||
Exxon Mobil Corp | ||||||||
2.992% due 03/19/25 | 70,000 | 73,809 | ||||||
3.043% due 03/01/26 | 140,000 | 148,284 | ||||||
3.482% due 03/19/30 | 50,000 | 55,475 | ||||||
4.114% due 03/01/46 | 50,000 | 59,678 | ||||||
KazMunayGas National Co JSC (Kazakhstan) | 200,000 | 197,800 | ||||||
Kinder Morgan Energy Partners LP | ||||||||
3.500% due 03/01/21 | 80,000 | 78,992 | ||||||
5.500% due 03/01/44 | 10,000 | 10,037 | ||||||
Kinder Morgan Inc | ||||||||
4.300% due 06/01/25 | 50,000 | 51,121 | ||||||
4.300% due 03/01/28 | 30,000 | 29,513 | ||||||
5.050% due 02/15/46 | 30,000 | 30,534 | ||||||
5.200% due 03/01/48 | 10,000 | 10,610 | ||||||
5.550% due 06/01/45 | 30,000 | 30,924 | ||||||
MPLX LP | ||||||||
1.899% (USD LIBOR + 0.900%) | 1,000,000 | 945,186 | ||||||
4.500% due 04/15/38 | 100,000 | 78,468 | ||||||
4.700% due 04/15/48 | 60,000 | 46,672 | ||||||
4.800% due 02/15/29 | 40,000 | 35,332 | ||||||
Noble Energy Inc | ||||||||
3.850% due 01/15/28 | 70,000 | 49,665 | ||||||
5.250% due 11/15/43 | 80,000 | 47,183 | ||||||
Oasis Petroleum Inc | 10,000 | 2,125 | ||||||
Occidental Petroleum Corp | ||||||||
2.600% due 08/13/21 | 40,000 | 32,032 | ||||||
Principal Amount | Value | |||||||
2.684% (USD LIBOR + 0.950%) | $ | 40,000 | $ | 31,703 | ||||
2.700% due 08/15/22 | 70,000 | 49,940 | ||||||
2.900% due 08/15/24 | 100,000 | 54,601 | ||||||
3.000% due 02/15/27 | 30,000 | 14,300 | ||||||
3.200% due 08/15/26 | 60,000 | 29,340 | ||||||
3.500% due 08/15/29 | 30,000 | 14,130 | ||||||
4.100% due 02/15/47 | 120,000 | 51,445 | ||||||
4.200% due 03/15/48 | 10,000 | 4,324 | ||||||
4.400% due 04/15/46 | 20,000 | 8,416 | ||||||
4.625% due 06/15/45 | 50,000 | 21,545 | ||||||
4.850% due 03/15/21 | 24,000 | 20,111 | ||||||
5.550% due 03/15/26 | 190,000 | 101,507 | ||||||
6.450% due 09/15/36 | 310,000 | 148,574 | ||||||
Petrobras Global Finance BV (Brazil) | ||||||||
5.299% due 01/27/25 | 555,000 | 532,109 | ||||||
6.900% due 03/19/49 | 30,000 | 29,407 | ||||||
Petroleos Mexicanos (Mexico) | 220,000 | 169,079 | ||||||
Range Resources Corp | ||||||||
4.875% due 05/15/25 | 10,000 | 6,025 | ||||||
5.000% due 03/15/23 | 150,000 | 112,164 | ||||||
Shell International Finance BV (Netherlands) | ||||||||
2.875% due 05/10/26 | 50,000 | 51,644 | ||||||
4.375% due 05/11/45 | 130,000 | 150,962 | ||||||
4.550% due 08/12/43 | 50,000 | 58,817 | ||||||
Sinopec Group Overseas Development Ltd (China) | 290,000 | 310,227 | ||||||
Targa Resources Partners LP | ||||||||
4.250% due 11/15/23 | 60,000 | 52,017 | ||||||
5.375% due 02/01/27 | 20,000 | 16,571 | ||||||
5.500% due 03/01/30 ~ | 20,000 | 15,625 | ||||||
5.875% due 04/15/26 | 20,000 | 16,762 | ||||||
6.500% due 07/15/27 | 10,000 | 8,600 | ||||||
6.875% due 01/15/29 | 10,000 | 8,125 | ||||||
Tennessee Gas Pipeline Co LLC | 150,000 | 127,653 | ||||||
The Williams Cos Inc | ||||||||
3.750% due 06/15/27 | 90,000 | 82,692 | ||||||
7.500% due 01/15/31 | 190,000 | 221,424 | ||||||
Transcontinental Gas Pipe Line Co LLC | 30,000 | 34,225 | ||||||
Western Midstream Operating LP | ||||||||
2.698% (USD LIBOR + 0.850%) | 20,000 | 10,554 | ||||||
3.100% due 02/01/25 | 30,000 | 15,742 | ||||||
4.050% due 02/01/30 | 100,000 | 44,233 | ||||||
4.500% due 03/01/28 | 30,000 | 14,585 | ||||||
4.650% due 07/01/26 | 100,000 | 51,049 | ||||||
5.250% due 02/01/50 | 50,000 | 20,632 | ||||||
WPX Energy Inc | ||||||||
4.500% due 01/15/30 | 10,000 | 5,468 | ||||||
5.250% due 10/15/27 | 10,000 | 5,556 | ||||||
|
| |||||||
| 9,262,395 | ||||||||
|
| |||||||
Financial - 21.5% | ||||||||
AerCap Ireland Capital DAC (Ireland) | ||||||||
3.950% due 02/01/22 | 800,000 | 697,422 | ||||||
4.450% due 10/01/25 | 500,000 | 441,117 | ||||||
4.625% due 07/01/22 | 800,000 | 648,614 | ||||||
AIB Group PLC (Ireland) | 500,000 | 495,891 | ||||||
Aircastle Ltd | 500,000 | 496,467 | ||||||
Ambac LSNI LLC (Cayman) | 312,885 | 299,581 | ||||||
American Express Co | 700,000 | 726,118 | ||||||
| See Notes to Financial Statements | See explanation of symbols and terms, if any, on B-76 and B-77 |
B-11
Table of Contents
PACIFIC FUNDS
PF MANAGED BOND FUND
Schedule of Investments (Continued)
March 31, 2020
Principal Amount | Value | |||||||
American Express Credit Corp | $ | 80,000 | $ | 79,999 | ||||
American Homes 4 Rent LP REIT | 100,000 | 99,417 | ||||||
American International Group Inc | 630,000 | 631,847 | ||||||
American Tower Corp REIT | ||||||||
2.400% due 03/15/25 | 700,000 | 692,142 | ||||||
3.375% due 05/15/24 | 1,000,000 | 1,006,485 | ||||||
Atrium European Real Estate Ltd (Poland) | EUR 800,000 | 885,236 | ||||||
AvalonBay Communities Inc REIT | ||||||||
2.300% due 03/01/30 | $900,000 | 839,745 | ||||||
3.450% due 06/01/25 | 300,000 | 308,496 | ||||||
Banco Bilbao Vizcaya Argentaria SA (Spain) | EUR 800,000 | 864,264 | ||||||
Banco Santander SA (Spain) | ||||||||
3.848% due 04/12/23 | $200,000 | 205,047 | ||||||
4.379% due 04/12/28 | 200,000 | 205,254 | ||||||
Bank of America Corp | ||||||||
2.104% (USD LIBOR + 0.790%) | 700,000 | 655,970 | ||||||
3.004% due 12/20/23 | 155,000 | 158,123 | ||||||
3.419% due 12/20/28 | 203,000 | 210,028 | ||||||
3.500% due 04/19/26 | 110,000 | 117,374 | ||||||
3.550% due 03/05/24 | 90,000 | 93,423 | ||||||
3.593% due 07/21/28 | 100,000 | 102,545 | ||||||
3.974% due 02/07/30 | 240,000 | 259,635 | ||||||
4.083% due 03/20/51 | 220,000 | 250,415 | ||||||
4.100% due 07/24/23 | 500,000 | 533,644 | ||||||
4.200% due 08/26/24 | 70,000 | 74,539 | ||||||
4.250% due 10/22/26 | 420,000 | 449,192 | ||||||
4.330% due 03/15/50 | 20,000 | 23,564 | ||||||
4.450% due 03/03/26 | 90,000 | 97,536 | ||||||
Bank of Montreal (Canada) | 60,000 | 58,327 | ||||||
Banque Federative du Credit Mutuel SA (France) | 600,000 | 612,254 | ||||||
Barclays Bank PLC (United Kingdom) | 800,000 | 818,792 | ||||||
Barclays PLC (United Kingdom) | ||||||||
3.122% (USD LIBOR + 1.430%) | 1,000,000 | 941,847 | ||||||
4.972% due 05/16/29 | 900,000 | 972,914 | ||||||
8.000% due 12/15/20 | EUR 600,000 | 631,846 | ||||||
Berkshire Hathaway Finance Corp | $120,000 | 148,436 | ||||||
BNP Paribas SA (France) | ||||||||
4.375% due 03/01/33 ~ | 250,000 | 274,596 | ||||||
4.705% due 01/10/25 ~ | 230,000 | 240,030 | ||||||
5.198% due 01/10/30 ~ | 200,000 | 221,368 | ||||||
Boston Properties LP REIT | 500,000 | 551,039 | ||||||
BPCE SA (France) | 850,000 | 873,808 | ||||||
Brandywine Operating Partnership LP REIT | 800,000 | 752,264 | ||||||
Capital One Financial Corp | 500,000 | 513,270 | ||||||
Carlyle Finance LLC | 150,000 | 166,772 | ||||||
CBL & Associates LP REIT | 1,200,000 | 230,361 | ||||||
Citigroup Inc | ||||||||
2.750% due 04/25/22 | 800,000 | 804,772 | ||||||
4.075% due 04/23/29 | 150,000 | 159,411 | ||||||
4.400% due 06/10/25 | 170,000 | 184,270 | ||||||
4.412% due 03/31/31 | 70,000 | 77,177 | ||||||
5.300% due 05/06/44 | 102,000 | 124,324 | ||||||
5.500% due 09/13/25 | 220,000 | 244,855 | ||||||
Principal Amount | Value | |||||||
5.950% due 01/30/23 | $ | 300,000 | $ | 290,307 | ||||
5.950% due 05/15/25 | 200,000 | 193,889 | ||||||
6.675% due 09/13/43 | 70,000 | 95,035 | ||||||
8.125% due 07/15/39 | 70,000 | 110,783 | ||||||
Cooperatieve Rabobank UA (Netherlands) | ||||||||
4.625% due 12/01/23 | 290,000 | 300,445 | ||||||
5.500% due 06/29/20 ~ | EUR 700,000 | 743,033 | ||||||
6.625% due 06/29/21 ~ | 400,000 | 423,404 | ||||||
CPI Property Group SA (Czech Republic) | $800,000 | 833,200 | ||||||
Credit Suisse AG (Switzerland) | 1,200,000 | 1,226,767 | ||||||
Credit Suisse Group AG (Switzerland) | ||||||||
2.024% (USD LIBOR + 1.240%) | 750,000 | 662,979 | ||||||
4.194% due 04/01/31 ~ | 250,000 | 256,618 | ||||||
Credit Suisse Group Funding Guernsey Ltd | 800,000 | 814,394 | ||||||
CyrusOne LP REIT | EUR 100,000 | 96,809 | ||||||
Danske Bank AS (Denmark) | ||||||||
5.000% due 01/12/22 ~ | $200,000 | 204,930 | ||||||
5.375% due 01/12/24 ~ | 200,000 | 210,929 | ||||||
Deutsche Bank AG (Germany) | ||||||||
2.818% (USD LIBOR + 0.970%) | 500,000 | 492,744 | ||||||
3.150% due 01/22/21 | 600,000 | 586,491 | ||||||
3.961% due 11/26/25 | 1,000,000 | 926,500 | ||||||
4.250% due 10/14/21 | 900,000 | 856,803 | ||||||
5.000% due 02/14/22 | 900,000 | 888,246 | ||||||
EPR Properties REIT | 400,000 | 373,244 | ||||||
GE Capital International Funding Co | 1,183,000 | 1,176,480 | ||||||
GE Capital UK Funding Unlimited Co | GBP 800,000 | 1,010,321 | ||||||
GLP Capital LP REIT | $900,000 | 802,755 | ||||||
Goodman US Finance Three LLC REIT (Australia) | 200,000 | 188,803 | ||||||
Host Hotels & Resorts LP REIT | 200,000 | 186,329 | ||||||
HSBC Holdings PLC (United Kingdom) | ||||||||
2.292% (USD LIBOR + 0.600%) | 500,000 | 489,821 | ||||||
3.400% due 03/08/21 | 1,500,000 | 1,508,735 | ||||||
4.583% due 06/19/29 | 560,000 | 597,287 | ||||||
4.950% due 03/31/30 | 200,000 | 220,832 | ||||||
6.875% due 06/01/21 | 400,000 | 393,054 | ||||||
Hudson Pacific Properties LP REIT | 800,000 | 822,751 | ||||||
ING Groep NV (Netherlands) | ||||||||
3.150% due 03/29/22 | 800,000 | 804,223 | ||||||
4.625% due 01/06/26 ~ | 700,000 | 739,265 | ||||||
International Lease Finance Corp | 150,000 | 134,253 | ||||||
Intesa Sanpaolo SPA (Italy) | ||||||||
3.375% due 01/12/23 ~ | 220,000 | 210,305 | ||||||
5.017% due 06/26/24 ~ | 370,000 | 378,313 | ||||||
JPMorgan Chase & Co | ||||||||
3.509% due 01/23/29 | 150,000 | 154,890 | ||||||
4.203% due 07/23/29 | 170,000 | 187,078 | ||||||
4.452% due 12/05/29 | 220,000 | 247,330 | ||||||
4.950% due 06/01/45 | 250,000 | 323,021 | ||||||
KEB Hana Bank (South Korea) | 900,000 | 932,193 | ||||||
Kimco Realty Corp REIT | 900,000 | 893,873 | ||||||
| See Notes to Financial Statements | See explanation of symbols and terms, if any, on B-76 and B-77 |
B-12
Table of Contents
PACIFIC FUNDS
PF MANAGED BOND FUND
Schedule of Investments (Continued)
March 31, 2020
Principal Amount | Value | |||||||
KKR Group Finance Co II LLC | $30,000 | $33,184 | ||||||
Lifestorage LP REIT | 800,000 | 764,456 | ||||||
Lloyds Bank PLC (United Kingdom) | 500,000 | 500,239 | ||||||
Lloyds Banking Group PLC (United Kingdom) | AUD 800,000 | 477,654 | ||||||
4.000% due 03/07/25 | 900,000 | 597,762 | ||||||
4.450% due 05/08/25 | $500,000 | 536,501 | ||||||
7.625% due 06/27/23 ~ | GBP 600,000 | 633,285 | ||||||
Metropolitan Life Global Funding | $700,000 | 738,164 | ||||||
Mid-America Apartments LP REIT | 700,000 | 728,765 | ||||||
Mitsubishi UFJ Financial Group Inc (Japan) | ||||||||
3.407% due 03/07/24 | 700,000 | 723,544 | ||||||
3.455% due 03/02/23 | 600,000 | 615,101 | ||||||
Mizuho Financial Group Inc (Japan) | ||||||||
2.226% due 05/25/26 | 800,000 | 785,742 | ||||||
3.922% due 09/11/24 | 600,000 | 633,815 | ||||||
Morgan Stanley | ||||||||
2.699% due 01/22/31 | 70,000 | 68,763 | ||||||
3.125% due 07/27/26 | 200,000 | 207,212 | ||||||
3.622% due 04/01/31 | 170,000 | 177,297 | ||||||
3.737% due 04/24/24 | 100,000 | 103,110 | ||||||
3.772% due 01/24/29 | 10,000 | 10,573 | ||||||
4.431% due 01/23/30 | 10,000 | 11,135 | ||||||
5.597% due 03/24/51 | 20,000 | 28,369 | ||||||
MPT Operating Partnership LP REIT | GBP 700,000 | 851,062 | ||||||
Nasdaq Inc | $800,000 | 827,498 | ||||||
National Retail Properties Inc REIT | ||||||||
2.500% due 04/15/30 | 900,000 | 804,811 | ||||||
3.500% due 10/15/27 | 200,000 | 198,085 | ||||||
Oversea-Chinese Banking Corp Ltd (Singapore) | 400,000 | 398,225 | ||||||
Park Aerospace Holdings Ltd (Ireland) | 850,000 | 769,118 | ||||||
Reliance Standard Life Global Funding II | 900,000 | 906,070 | ||||||
Royal Bank of Scotland Group PLC (United Kingdom) | ||||||||
3.875% due 09/12/23 | 800,000 | 809,664 | ||||||
5.125% due 05/28/24 | 570,000 | 576,685 | ||||||
7.500% due 08/10/20 | 800,000 | 737,764 | ||||||
8.625% due 08/15/21 | 600,000 | 588,195 | ||||||
Santander Holdings USA Inc | ||||||||
3.244% due 10/05/26 | 1,000,000 | 894,933 | ||||||
4.500% due 07/17/25 | 130,000 | 132,889 | ||||||
Santander UK PLC (United Kingdom) | 1,000,000 | 973,997 | ||||||
Simon Property Group LP REIT | 400,000 | 397,150 | ||||||
Skandinaviska Enskilda Banken AB (Sweden) | 500,000 | 503,305 | ||||||
Societe Generale SA (France) | 500,000 | 512,973 | ||||||
Spirit Realty LP REIT | 800,000 | 689,820 | ||||||
Standard Chartered PLC (United Kingdom) | 900,000 | 891,176 | ||||||
Sumitomo Mitsui Financial Group Inc (Japan) | 120,000 | 119,106 | ||||||
Teachers Insurance & Annuity Association of America | ||||||||
4.900% due 09/15/44 ~ | 40,000 | 45,684 | ||||||
6.850% due 12/16/39 ~ | 18,000 | 25,088 | ||||||
Principal Amount | Value | |||||||
The Depository Trust & Clearing Corp | $ | 250,000 | $ | 215,054 | ||||
The Goldman Sachs Group Inc | ||||||||
1.941% (USD LIBOR + 1.200%) | 500,000 | 499,679 | ||||||
2.557% (USD LIBOR + 0.780%) | 500,000 | 481,859 | ||||||
2.862% (USD LIBOR + 1.170%) | 1,000,000 | 920,001 | ||||||
3.200% due 02/23/23 | 60,000 | 61,307 | ||||||
3.500% due 01/23/25 | 700,000 | 718,969 | ||||||
3.750% due 05/22/25 | 600,000 | 622,306 | ||||||
3.850% due 07/08/24 | 160,000 | 167,535 | ||||||
4.223% due 05/01/29 | 170,000 | 181,889 | ||||||
4.250% due 10/21/25 | 470,000 | 495,098 | ||||||
5.150% due 05/22/45 | 340,000 | 403,843 | ||||||
6.250% due 02/01/41 | 70,000 | 97,278 | ||||||
UBS Group AG (Switzerland) | ||||||||
2.859% due 08/15/23 ~ | 200,000 | 198,538 | ||||||
3.000% due 04/15/21 ~ | 1,000,000 | 1,002,235 | ||||||
3.491% due 05/23/23 ~ | 260,000 | 263,034 | ||||||
4.125% due 09/24/25 ~ | 1,000,000 | 1,040,960 | ||||||
4.253% due 03/23/28 ~ | 270,000 | 283,714 | ||||||
7.000% due 01/31/24 ~ | 250,000 | 235,174 | ||||||
UniCredit SPA (Italy) | ||||||||
6.572% due 01/14/22 ~ | 350,000 | 356,766 | ||||||
7.830% due 12/04/23 ~ | 1,800,000 | 1,924,625 | ||||||
VEREIT Operating Partnership LP REIT | 200,000 | 190,480 | ||||||
Vesteda Finance BV (Netherlands) | EUR 600,000 | 680,751 | ||||||
Visa Inc | ||||||||
3.150% due 12/14/25 | $80,000 | 87,348 | ||||||
4.300% due 12/14/45 | 100,000 | 126,622 | ||||||
Washington Prime Group LP REIT | 950,000 | 564,067 | ||||||
Wells Fargo & Co | ||||||||
2.164% due 02/11/26 | 800,000 | 781,874 | ||||||
2.879% due 10/30/30 | 110,000 | 109,306 | ||||||
3.000% due 10/23/26 | 200,000 | 205,370 | ||||||
3.007% (USD LIBOR + 1.230%) | 2,000,000 | 1,909,400 | ||||||
3.450% due 02/13/23 | 40,000 | 41,182 | ||||||
3.584% due 05/22/28 | 100,000 | 104,912 | ||||||
3.750% due 01/24/24 | 850,000 | 901,590 | ||||||
4.400% due 06/14/46 | 30,000 | 33,924 | ||||||
4.750% due 12/07/46 | 110,000 | 127,561 | ||||||
4.900% due 11/17/45 | 190,000 | 226,160 | ||||||
5.013% due 04/04/51 | 380,000 | 485,941 | ||||||
5.375% due 11/02/43 | 80,000 | 95,975 | ||||||
5.606% due 01/15/44 | 150,000 | 184,005 | ||||||
Westpac Banking Corp (Australia) | 40,000 | 39,959 | ||||||
|
| |||||||
| 83,335,585 | ||||||||
|
| |||||||
Industrial - 3.4% | ||||||||
3M Co | ||||||||
2.375% due 08/26/29 | 60,000 | 60,433 | ||||||
3.050% due 04/15/30 | 10,000 | 10,486 | ||||||
3.700% due 04/15/50 | 30,000 | 33,664 | ||||||
Aviation Capital Group LLC | ||||||||
2.875% due 01/20/22 ~ | 500,000 | 452,247 | ||||||
4.125% due 08/01/25 ~ | 600,000 | 517,244 | ||||||
Carrier Global Corp | 20,000 | 19,729 | ||||||
2.242% due 02/15/25 ~ | 50,000 | 48,996 | ||||||
2.493% due 02/15/27 ~ | 10,000 | 9,591 | ||||||
2.722% due 02/15/30 ~ | 100,000 | 92,598 | ||||||
3.377% due 04/05/40 ~ | 30,000 | 26,611 | ||||||
3.577% due 04/05/50 ~ | 30,000 | 27,101 | ||||||
| See Notes to Financial Statements | See explanation of symbols and terms, if any, on B-76 and B-77 |
B-13
Table of Contents
PACIFIC FUNDS
PF MANAGED BOND FUND
Schedule of Investments (Continued)
March 31, 2020
Principal Amount | Value | |||||||
CNH Industrial Capital LLC | $ | 400,000 | $ | 391,228 | ||||
Deere & Co | ||||||||
3.100% due 04/15/30 | 20,000 | 21,233 | ||||||
3.750% due 04/15/50 | 30,000 | 35,064 | ||||||
Eaton Corp | ||||||||
2.750% due 11/02/22 | 130,000 | 131,557 | ||||||
4.150% due 11/02/42 | 20,000 | 22,274 | ||||||
GATX Corp | ||||||||
2.461% (USD LIBOR + 0.720%) | 1,000,000 | 980,520 | ||||||
4.750% due 06/15/22 | 400,000 | 418,597 | ||||||
4.850% due 06/01/21 | 290,000 | 297,954 | ||||||
General Dynamics Corp | 10,000 | 12,452 | ||||||
General Electric Co | ||||||||
3.150% due 09/07/22 | 77,000 | 77,888 | ||||||
5.300% due 02/11/21 | 200,000 | 203,058 | ||||||
5.875% due 01/14/38 | 40,000 | 47,088 | ||||||
6.750% due 03/15/32 | 30,000 | 36,426 | ||||||
6.875% due 01/10/39 | 298,000 | 372,842 | ||||||
L3Harris Technologies Inc | 60,000 | 66,513 | ||||||
Lockheed Martin Corp | ||||||||
3.100% due 01/15/23 | 20,000 | 20,309 | ||||||
3.550% due 01/15/26 | 70,000 | 75,853 | ||||||
4.500% due 05/15/36 | 30,000 | 34,504 | ||||||
Northrop Grumman Corp | ||||||||
2.930% due 01/15/25 | 40,000 | 40,796 | ||||||
3.250% due 01/15/28 | 160,000 | 168,269 | ||||||
5.250% due 05/01/50 | 40,000 | 54,686 | ||||||
NTT Finance Corp (Japan) | 800,000 | 796,263 | ||||||
Otis Worldwide Corp | ||||||||
2.056% due 04/05/25 ~ | 30,000 | 29,430 | ||||||
2.293% due 04/05/27 ~ | 30,000 | 28,842 | ||||||
2.565% due 02/15/30 ~ | 90,000 | 87,734 | ||||||
Penske Truck Leasing Co LP | ||||||||
4.125% due 08/01/23 ~ | 600,000 | 620,767 | ||||||
4.250% due 01/17/23 ~ | 800,000 | 820,561 | ||||||
Raytheon Co | 70,000 | 70,367 | ||||||
Republic Services Inc | 50,000 | 50,443 | ||||||
Rockwell Collins Inc | ||||||||
2.800% due 03/15/22 | 500,000 | 505,533 | ||||||
3.100% due 11/15/21 | 800,000 | 806,394 | ||||||
3.200% due 03/15/24 | 1,000,000 | 1,033,532 | ||||||
SMBC Aviation Capital Finance DAC (Ireland) | ||||||||
3.000% due 07/15/22 ~ | 1,100,000 | 1,109,358 | ||||||
The Boeing Co | ||||||||
2.700% due 02/01/27 | 30,000 | 27,599 | ||||||
2.800% due 03/01/27 | 30,000 | 26,835 | ||||||
3.100% due 05/01/26 | 10,000 | 9,267 | ||||||
3.200% due 03/01/29 | 90,000 | 83,305 | ||||||
3.250% due 02/01/35 | 160,000 | 139,475 | ||||||
3.550% due 03/01/38 | 20,000 | 17,382 | ||||||
3.750% due 02/01/50 | 40,000 | 36,691 | ||||||
TTX Co | 550,000 | 548,388 | ||||||
Union Pacific Corp | ||||||||
2.150% due 02/05/27 | 50,000 | 49,100 | ||||||
2.400% due 02/05/30 | 50,000 | 48,978 | ||||||
3.750% due 02/05/70 | 70,000 | 73,581 | ||||||
United Technologies Corp | ||||||||
3.950% due 08/16/25 | 60,000 | 65,773 | ||||||
4.125% due 11/16/28 | 20,000 | 22,125 | ||||||
4.500% due 06/01/42 | 60,000 | 69,984 | ||||||
Waste Management Inc | ||||||||
3.200% due 06/15/26 | 30,000 | 31,291 | ||||||
3.450% due 06/15/29 | 20,000 | 21,452 | ||||||
Principal Amount | Value | |||||||
3.500% due 05/15/24 | $ | 20,000 | $ | 20,815 | ||||
4.150% due 07/15/49 | 50,000 | 57,753 | ||||||
WRKCo Inc | 1,000,000 | 1,068,151 | ||||||
|
| |||||||
| 13,184,980 | ||||||||
|
| |||||||
Technology - 2.2% | ||||||||
Activision Blizzard Inc | 900,000 | 907,068 | ||||||
Apple Inc | 80,000 | 84,017 | ||||||
Broadcom Corp | ||||||||
2.650% due 01/15/23 | 700,000 | 684,509 | ||||||
3.000% due 01/15/22 | 700,000 | 694,114 | ||||||
Broadcom Inc | 900,000 | 892,325 | ||||||
Dell International LLC | ||||||||
4.420% due 06/15/21 ~ | 1,000,000 | 1,011,064 | ||||||
5.450% due 06/15/23 ~ | 500,000 | 513,723 | ||||||
Hewlett Packard Enterprise Co | 600,000 | 565,144 | ||||||
Intel Corp | ||||||||
3.700% due 07/29/25 | 50,000 | 55,249 | ||||||
4.600% due 03/25/40 | 10,000 | 12,144 | ||||||
4.750% due 03/25/50 | 170,000 | 224,127 | ||||||
4.950% due 03/25/60 | 30,000 | 41,807 | ||||||
Microsoft Corp | ||||||||
3.300% due 02/06/27 | 200,000 | 222,475 | ||||||
3.450% due 08/08/36 | 20,000 | 22,933 | ||||||
3.950% due 08/08/56 | 30,000 | 37,638 | ||||||
NVIDIA Corp | ||||||||
2.850% due 04/01/30 | 30,000 | 31,220 | ||||||
3.500% due 04/01/40 | 70,000 | 74,628 | ||||||
3.500% due 04/01/50 | 140,000 | 153,274 | ||||||
3.700% due 04/01/60 | 30,000 | 32,602 | ||||||
NXP BV (Netherlands) | ||||||||
4.625% due 06/01/23 ~ | 700,000 | 721,360 | ||||||
4.875% due 03/01/24 ~ | 800,000 | 855,640 | ||||||
VMware Inc | 500,000 | 501,863 | ||||||
|
| |||||||
| 8,338,924 | ||||||||
|
| |||||||
Utilities - 2.7% | ||||||||
Consolidated Edison Co of New York Inc | ||||||||
3.350% due 04/01/30 | 20,000 | 20,672 | ||||||
3.950% due 04/01/50 | 10,000 | 10,460 | ||||||
Duke Energy Carolinas LLC | 60,000 | 76,172 | ||||||
Duke Energy Corp | ||||||||
3.150% due 08/15/27 | 200,000 | 197,450 | ||||||
3.550% due 09/15/21 | 800,000 | 811,304 | ||||||
Duke Energy Ohio Inc | 20,000 | 21,290 | ||||||
Emera US Finance LP (Canada) | 800,000 | 809,412 | ||||||
Entergy Corp | 400,000 | 399,940 | ||||||
FirstEnergy Corp | ||||||||
3.900% due 07/15/27 | 90,000 | 91,162 | ||||||
7.375% due 11/15/31 | 590,000 | 794,360 | ||||||
IPALCO Enterprises Inc | 800,000 | 799,939 | ||||||
LG&E & KU Energy LLC | 500,000 | 503,019 | ||||||
National Fuel Gas Co | 2,000,000 | 1,959,969 | ||||||
NextEra Energy Capital Holdings Inc | ||||||||
2.399% (USD LIBOR + 0.720%) | 900,000 | 875,407 | ||||||
2.403% due 09/01/21 | 900,000 | 899,135 | ||||||
3.200% due 02/25/22 | 900,000 | 911,764 | ||||||
| See Notes to Financial Statements | See explanation of symbols and terms, if any, on B-76 and B-77 |
B-14
Table of Contents
PACIFIC FUNDS
PF MANAGED BOND FUND
Schedule of Investments (Continued)
March 31, 2020
Principal Amount | Value | |||||||
Niagara Mohawk Power Corp | $ | 1,100,000 | $ | 1,180,859 | ||||
Virginia Electric & Power Co | 160,000 | 215,115 | ||||||
|
| |||||||
| 10,577,429 | ||||||||
|
| |||||||
Total Corporate Bonds & Notes | 187,854,641 | |||||||
|
| |||||||
SENIOR LOAN NOTES - 1.7% | ||||||||
Communications - 0.3% | ||||||||
Altice France SA TermB-12 (France) | 243,453 | 226,412 | ||||||
Charter Communications Operating LLC | ||||||||
2.740% (USD LIBOR + 1.750%) | 19,891 | 19,195 | ||||||
TermB-2 2.740% (USD LIBOR + 1.750%) | 158,933 | 153,635 | ||||||
CSC Holdings LLC TermB-5 | 30,000 | 29,050 | ||||||
Diamond Sports Group LLC Term B | ||||||||
4.180% (USD LIBOR + 3.250%) | 29,850 | 23,432 | ||||||
iHeartCommunications Inc Term B | ||||||||
3.989% (USD LIBOR + 3.000%) | 59,675 | 51,112 | ||||||
Level 3 Financing Inc Term B | ||||||||
2.739% (USD LIBOR + 1.750%) | 53,972 | 51,004 | ||||||
Nexstar Broadcasting Inc Term B | ||||||||
4.331% (USD LIBOR + 2.750%) | 182,519 | 172,480 | ||||||
Sprint Communications Inc Term B | ||||||||
3.500% (USD LIBOR + 2.500%) | 59,692 | 59,468 | ||||||
Univision Communications Inc TermC-5 | ||||||||
3.750% (USD LIBOR + 2.750%) | 139,353 | 119,147 | ||||||
Virgin Media Bristol LLC Term N | ||||||||
3.205% (USD LIBOR + 2.500%) | 160,000 | 152,400 | ||||||
Ziggo Financing Partnership Term I (Netherlands) | ||||||||
3.205% (USD LIBOR + 2.500%) | 99,750 | 93,142 | ||||||
|
| |||||||
| 1,150,477 | ||||||||
|
| |||||||
Consumer, Cyclical - 0.4% | ||||||||
Alterra Mountain Co Term B | ||||||||
3.750% (USD LIBOR + 2.750%) | 78,990 | 70,827 | ||||||
American Airlines Inc Term B | ||||||||
2.705% (USD LIBOR + 2.000%) | 39,592 | 33,099 | ||||||
Boyd Gaming Corp Term B | ||||||||
2.934% (USD LIBOR + 2.250%) | 12,850 | 11,329 | ||||||
Caesars Resort Collection LLC Term B | ||||||||
3.739% (USD LIBOR + 2.750%) | 119,703 | 98,328 | ||||||
CEOC LLC Term B | ||||||||
2.989% (USD LIBOR + 2.000%) | 74,389 | 61,619 | ||||||
CityCenter Holdings LLC Term B | ||||||||
3.239% (USD LIBOR + 2.250%) | 91,648 | 81,223 | ||||||
Principal Amount | Value | |||||||
Clarios Global LP Term B | $ | 89,550 | $ | 82,386 | ||||
Four Seasons Hotels Ltd Term B (Canada) | 59,564 | 54,799 | ||||||
Golden Nugget LLC Term B | 117,398 | 91,766 | ||||||
Hilton Worldwide Finance LLC TermB-2 | 150,000 | 140,625 | ||||||
Michaels Stores Inc Term B | 106,200 | 89,739 | ||||||
Party City Holdings Inc | 39,170 | 20,212 | ||||||
PCI Gaming Authority Term B | 35,131 | 28,230 | ||||||
Restaurant Brands International Inc Term B | 199,500 | 185,036 | ||||||
Scientific Games International Inc TermB-5 | 184,177 | 149,643 | ||||||
Stars Group Holdings BV Term B (Canada) | 8,591 | 8,237 | ||||||
TKC Holdings Inc | 69,277 | 56,115 | ||||||
UFC Holdings LLC Term B | 118,871 | 106,390 | ||||||
Wynn Resorts Finance LLC Term A | 185,250 | 152,831 | ||||||
|
| |||||||
| 1,522,434 | ||||||||
|
| |||||||
Consumer,Non-Cyclical - 0.6% | ||||||||
Allied Universal Holdco LLC | 138,697 | 128,295 | ||||||
Bausch Health Americas Inc Term B | 44,595 | 42,736 | ||||||
Change Healthcare Holdings LLC Term B | 201,601 | 186,145 | ||||||
Elanco Animal Health Inc Term B | 150,000 | 143,906 | ||||||
Eyecare Partners LLC | 32,432 | 26,811 | ||||||
Froneri US Inc Term B (United Kingdom) | 60,000 | 57,600 | ||||||
Garda World Security Corp Term B (Canada) | 34,353 | 32,807 | ||||||
Global Medical Response Inc Term B | 303,918 | 281,124 | ||||||
Grifols Worldwide Operations USA Inc Term B | 149,625 | 143,391 | ||||||
| See Notes to Financial Statements | See explanation of symbols and terms, if any, on B-76 and B-77 |
B-15
Table of Contents
PACIFIC FUNDS
PF MANAGED BOND FUND
Schedule of Investments (Continued)
March 31, 2020
Principal Amount | Value | |||||||
Jaguar Holding Co II | $ | 89,452 | $ | 86,247 | ||||
LifePoint Health Inc Term B | 177,066 | 166,147 | ||||||
MPH Acquisition Holdings LLC Term B | 186,441 | 169,662 | ||||||
Option Care Health Inc | 79,800 | 67,830 | ||||||
Phoenix Guarantor Inc Term B | 101,056 | 92,971 | ||||||
Prime Security Services Borrower LLC Term B | 158,828 | 144,534 | ||||||
Reynolds Consumer Products LLC Term B | 66,204 | 62,853 | ||||||
Sotera Health Holdings LLC | 200,000 | 178,333 | ||||||
Trans Union LLC TermB-5 | 48,433 | 46,697 | ||||||
VVC Holding Corp Term B | 178,299 | 167,602 | ||||||
|
| |||||||
| 2,225,691 | ||||||||
|
| |||||||
Diversified - 0.0% | ||||||||
First Eagle Holdings Inc Term B | 39,526 | 33,547 | ||||||
|
| |||||||
Financial - 0.2% | ||||||||
Asurion LLC | ||||||||
TermB-4 | 125,827 | 117,019 | ||||||
TermB-7 | 69,170 | 65,135 | ||||||
Citadel Securities LP Term B | 29,925 | 26,783 | ||||||
Deerfield Dakota Holding LLC Term B | 130,000 | 111,800 | ||||||
Focus Financial Partners LLC TermB-3 | 79,520 | 73,158 | ||||||
Jane Street Group LLC Term B | 49,424 | 44,482 | ||||||
RPI 2019 Intermediate Finance Trust TermB-1 | 149,625 | 139,650 | ||||||
The Edelman Financial Center LLC Term B | 59,250 | 51,153 | ||||||
VFH Parent LLC | 39,747 | 36,832 | ||||||
VICI Properties 1 LLC Term B | 60,000 | 55,450 | ||||||
|
| |||||||
| 721,462 | ||||||||
|
| |||||||
Principal Amount | Value | |||||||
Industrial - 0.1% | ||||||||
APi Group DE Inc Term B | $ | 79,800 | $ | 73,416 | ||||
Atlantic Aviation FBO Inc Term B | 19,750 | 18,664 | ||||||
Berry Global Inc Term W | 70,000 | 67,585 | ||||||
Genesee & Wyoming Inc | 140,000 | 135,625 | ||||||
GFL Environmental Inc Term B (Canada) | 15,906 | 15,518 | ||||||
Reynolds Group Holdings Inc Term B | 127,726 | 121,818 | ||||||
|
| |||||||
| 432,626 | ||||||||
|
| |||||||
Technology - 0.1% | ||||||||
Dcert Buyer Inc | 170,000 | 152,858 | ||||||
Dell International LLC TermB-1 | 167,245 | 160,904 | ||||||
McAfee LLC Term B | 178,641 | 166,732 | ||||||
|
| |||||||
| 480,494 | ||||||||
|
| |||||||
Total Senior Loan Notes | 6,566,731 | |||||||
|
| |||||||
MORTGAGE-BACKED SECURITIES - 56.0% | ||||||||
Collateralized Mortgage Obligations - Commercial - 3.1% |
| |||||||
Ashford Hospitality Trust | 600,000 | 477,093 | ||||||
BAMLLRe-REMIC Trust | 1,624,540 | 659,596 | ||||||
BBCCRE Trust | 320,000 | 279,456 | ||||||
BX Commercial Mortgage Trust | 98,000 | 87,932 | ||||||
Commercial Mortgage Trust | 90,000 | 79,863 | ||||||
Credit Suisse Commercial Mortgage Trust | 77,556 | 35,994 | ||||||
CSMC Trust | ||||||||
4.373% due 09/15/37 ~ | 830,000 | 617,213 | ||||||
4.764% due 12/15/21 | 430,000 | 398,539 | ||||||
DBGS Mortgage Trust | 900,000 | 918,449 | ||||||
DBUBS Mortgage Trust | 260,000 | 255,727 | ||||||
Fannie Mae | ||||||||
2.444% due 09/25/29 | 800,000 | 856,053 | ||||||
3.273% due 01/25/29 | 140,000 | 158,409 | ||||||
3.450% due 01/01/29 | 150,000 | 170,685 | ||||||
3.555% due 09/25/28 § | 310,000 | 360,037 | ||||||
3.610% due 02/25/31 | 70,000 | 81,309 | ||||||
3.700% due 01/25/36 | 100,000 | 117,820 | ||||||
| See Notes to Financial Statements | See explanation of symbols and terms, if any, on B-76 and B-77 |
B-16
Table of Contents
PACIFIC FUNDS
PF MANAGED BOND FUND
Schedule of Investments (Continued)
March 31, 2020
Principal Amount | Value | |||||||
FREMF Mortgage Trust | $ | 299,529 | $ | 259,114 | ||||
Government National Mortgage Association | 94,561 | 98,465 | ||||||
Government National Mortgage Association (IO) | ||||||||
0.403% due 01/16/53 § | 9,969,221 | 226,173 | ||||||
0.547% due 04/16/47 § | 3,527,600 | 108,224 | ||||||
GRACE Mortgage Trust | 600,000 | 603,222 | ||||||
GS Mortgage Securities Trust | ||||||||
2.005% (USD LIBOR + 1.300%) | 1,120,000 | 1,050,706 | ||||||
3.203% due 02/10/29 ~ | 400,000 | 399,234 | ||||||
5.622% due 11/10/39 | 93,803 | 71,722 | ||||||
JP Morgan Chase Commercial Mortgage | ||||||||
3.705% (USD LIBOR + 3.000%) | 380,000 | 308,450 | ||||||
4.705% (USD LIBOR + 4.000%) | 300,000 | 243,927 | ||||||
5.683% due 02/12/49 § | 894,480 | 340,547 | ||||||
ML-CFC Commercial Mortgage Trust | 39,033 | 23,152 | ||||||
Morgan Stanley Bank of America Merrill Lynch | 1,000,000 | 1,025,263 | ||||||
Morgan Stanley Capital I Trust | ||||||||
3.402% due 07/13/29 § ~ | 600,000 | 595,682 | ||||||
3.446% due 07/13/29 § ~ | 700,000 | 695,263 | ||||||
Waterfall Commercial Mortgage Trust | 175,781 | 174,701 | ||||||
Wells Fargo Commercial Mortgage Trust (IO) | 4,653,771 | 324,724 | ||||||
|
| |||||||
| 12,102,744 | ||||||||
|
| |||||||
Collateralized Mortgage Obligations - Residential - 7.6% |
| |||||||
Alternative Loan Trust | ||||||||
1.117% (USD LIBOR + 0.170%) | 151,272 | 157,766 | ||||||
1.157% (USD LIBOR + 0.210%) | 243,231 | 200,862 | ||||||
3.510% due 06/25/37 § | 92,761 | 72,898 | ||||||
American Home Mortgage Investment Trust | 1,360,683 | 400,524 | ||||||
Banc of America Funding Trust | 15,046 | 14,184 | ||||||
BCAP LLC Trust | ||||||||
2.061% due 03/28/37 § ~ | 1,449,785 | 1,419,064 | ||||||
4.841% due 03/26/37 ~ | 34,976 | 34,004 | ||||||
Bear Stearns Adjustable Rate Mortgage Trust | ||||||||
4.220% due 08/25/33 § | 20,088 | 18,797 | ||||||
4.252% due 01/25/35 § | 289,248 | 249,734 | ||||||
4.317% due 10/25/36 § | 5,251 | 4,837 | ||||||
Bear StearnsALT-A Trust | ||||||||
3.775% due 11/25/36 § | 47,145 | 35,545 | ||||||
3.882% due 05/25/35 § | 15,567 | 14,089 | ||||||
Chase Mortgage Finance Trust | ||||||||
4.030% due 09/25/36 § | 60,502 | 48,124 | ||||||
4.363% due 02/25/37 § | 188,103 | 174,195 | ||||||
ChaseFlex Trust | 352,181 | 345,435 | ||||||
Chevy Chase Funding LLC | 14,730 | 13,446 | ||||||
2.134% due 05/25/35 § ~ | 719,717 | 512,669 | ||||||
Citigroup Mortgage Loan Trust Inc | 7,337 | 6,832 | ||||||
Principal Amount | Value | |||||||
Countrywide Home Loan Mortgage | $ | 8,274 | $ | 7,144 | ||||
Credit Suisse First Boston Mortgage | 45,513 | 33,954 | ||||||
Downey Saving & Loan Association Mortgage | 91,094 | 71,863 | ||||||
Eurosail-UK PLC (United Kingdom) | GBP 658,386 | 772,556 | ||||||
Fannie Mae | $468,460 | 471,414 | ||||||
3.125% (US PRIME - 1.625%) | 49,589 | 49,726 | ||||||
5.500% due 04/25/35 | 369,148 | 447,130 | ||||||
Fannie Mae (IO) | ||||||||
4.000% due 03/25/43 | 348,763 | 42,843 | ||||||
4.000% due 04/25/43 | 1,350,788 | 139,003 | ||||||
5.053% (6.000% - USD LIBOR) | 1,535,988 | 325,332 | ||||||
5.153% (6.100% - USD LIBOR) | 438,369 | 81,361 | ||||||
5.153% (6.100% - USD LIBOR) | 518,330 | 102,097 | ||||||
Freddie Mac (IO) | ||||||||
3.500% due 04/15/43 | 415,614 | 43,426 | ||||||
4.000% due 04/15/43 | 283,576 | 16,625 | ||||||
5.395% (6.100% - USD LIBOR) | 248,091 | 51,191 | ||||||
Freddie Mac REMICS | ||||||||
3.000% due 08/15/48 | 295,043 | 305,243 | ||||||
8.000% due 04/15/30 | 62,899 | 75,346 | ||||||
Freddie Mac Structured Agency Credit Risk Debt | 1,120,000 | 428,939 | ||||||
5.627% (USD LIBOR + 4.000%) | 327,733 | 314,588 | ||||||
GMACM Mortgage Loan Trust | 641,062 | 589,298 | ||||||
Government National Mortgage Association | 404,310 | 397,571 | ||||||
2.262% (USD LIBOR + 0.600%) | 618,547 | 608,304 | ||||||
2.462% (USD LIBOR + 0.800%) | 716,417 | 709,865 | ||||||
2.462% (USD LIBOR + 0.800%) | 1,141,361 | 1,131,542 | ||||||
3.629% (USD LIBOR + 0.750%) | 700,918 | 700,211 | ||||||
4.943% due 09/20/66 § | 842,698 | 914,527 | ||||||
Government National Mortgage Association (IO) | ||||||||
4.000% due 11/20/44 | 843,880 | 107,714 | ||||||
4.500% due 11/16/45 | 302,563 | 48,252 | ||||||
5.377% (6.150% - USD LIBOR) | 1,368,862 | 295,297 | ||||||
5.395% (6.100% - USD LIBOR) | 224,357 | 56,282 | ||||||
Great Hall Mortgages PLC (United Kingdom) | 253,112 | 236,933 | ||||||
GSR Mortgage Loan Trust | ||||||||
6.000% due 11/25/35 | 592,481 | 403,072 | ||||||
6.000% due 07/25/37 | 312,298 | 253,458 | ||||||
| See Notes to Financial Statements | See explanation of symbols and terms, if any, on B-76 and B-77 |
B-17
Table of Contents
PACIFIC FUNDS
PF MANAGED BOND FUND
Schedule of Investments (Continued)
March 31, 2020
Principal Amount | Value | |||||||
HarborView Mortgage Loan Trust | $ | 176,518 | $ | 144,534 | ||||
1.107% (USD LIBOR + 0.160%) | 296,978 | 230,227 | ||||||
1.190% (USD LIBOR + 0.440%) | 245,410 | 228,958 | ||||||
4.104% due 08/19/36 § | 123,276 | 102,349 | ||||||
4.216% due 02/25/36 § | 47,364 | 24,134 | ||||||
Hawksmoor Mortgages (United Kingdom) | GBP 3,142,552 | 3,742,388 | ||||||
JP Morgan Mortgage Trust | ||||||||
3.500% due 10/25/48 § ~ | $402,652 | 416,458 | ||||||
3.500% due 10/25/48 § ~ | 1,312,188 | 1,345,263 | ||||||
4.067% due 07/25/35 § | 26,167 | 25,482 | ||||||
5.750% due 01/25/36 | 14,437 | 9,785 | ||||||
Ludgate Funding PLC (United Kingdom) | GBP 457,680 | 492,677 | ||||||
Merrill Lynch Mortgage Investors Trust | $301,008 | 269,551 | ||||||
Morgan Stanley Resecuritization Trust | 1,665,944 | 1,171,550 | ||||||
New Residential Mortgage Loan Trust | 349,499 | 346,516 | ||||||
Nomura Resecuritization Trust | 1,850,129 | 1,804,022 | ||||||
RBSSP Resecuritization Trust | 56,025 | 55,306 | ||||||
Reperforming Loan REMIC Trust | 28,441 | 25,680 | ||||||
1.287% (USD LIBOR + 0.340%) | 167,681 | 154,067 | ||||||
Ripon Mortgages PLC (United Kingdom) | GBP 705,484 | 854,079 | ||||||
Silverstone Master Issuer PLC (United Kingdom) | $774,000 | 766,275 | ||||||
Towd Point Mortgage Funding (United Kingdom) | GBP 1,451,265 | 1,749,298 | ||||||
Towd Point Mortgage Funding PLC | 1,256,495 | 1,513,761 | ||||||
WaMu Mortgage Pass-Through Certificates Trust | $138,702 | 112,744 | ||||||
|
| |||||||
| 29,540,216 | ||||||||
|
| |||||||
Fannie Mae - 19.9% | ||||||||
2.310% due 08/01/22 | 494,243 | 507,717 | ||||||
2.500% due 06/01/50 | 12,500,000 | 12,901,445 | ||||||
2.520% due 10/01/29 | 20,000 | 21,644 | ||||||
2.740% due 08/01/29 | 100,000 | 110,187 | ||||||
2.765% due 08/01/31 | 100,000 | 110,972 | ||||||
2.770% due 08/01/31 | 100,000 | 111,019 | ||||||
2.790% due 08/01/29 | 100,000 | 110,949 | ||||||
2.810% due 04/01/25 - 08/01/31 | 130,000 | 144,005 | ||||||
2.850% due 08/01/31 | 100,000 | 111,833 | ||||||
3.000% due 09/01/21 - 03/01/50 | 3,512,228 | 3,701,784 | ||||||
3.000% due 03/01/50 ± | 100,000 | 105,944 | ||||||
3.000% due 05/01/50 | 30,400,000 | 31,835,607 | ||||||
3.160% due 05/01/29 | 39,582 | 44,618 | ||||||
3.160% due 06/01/29 | 4,200,000 | 4,769,397 | ||||||
3.240% due 05/01/29 | 80,000 | 91,167 | ||||||
3.253% (US FED + 1.200%) | 10,036 | 9,887 | ||||||
Principal Amount | Value | |||||||
3.260% due 05/01/29 | $ | 30,000 | $ | 34,163 | ||||
3.350% due 05/01/29 | 10,000 | 11,468 | ||||||
3.500% due 09/01/42 - 03/01/50 | 2,627,925 | 2,801,563 | ||||||
3.500% due 05/01/50 | 5,600,000 | 5,923,204 | ||||||
3.579% (USD LIBOR + 1.512%) | 29,052 | 29,258 | ||||||
3.640% due 11/01/28 | 100,000 | 115,378 | ||||||
3.737% (USD LIBOR + 1.737%) | 4,745 | 4,793 | ||||||
4.000% due 06/01/25 - 06/01/57 | 3,463,856 | 3,710,264 | ||||||
4.119% (UST + 2.043%) | 23,424 | 23,862 | ||||||
4.146% (US FED + 1.927%) | 1,954 | 2,012 | ||||||
4.349% (UST + 2.360%) | 24,792 | 25,268 | ||||||
4.500% due 06/01/24 - 09/01/57 | 6,147,374 | 6,641,618 | ||||||
5.000% due 02/01/35 - 05/01/50 | 1,339,526 | 1,448,812 | ||||||
5.500% due 07/01/21 - 08/01/39 | 1,144,586 | 1,276,614 | ||||||
6.000% due 02/01/33 - 06/01/40 | 181,788 | 208,990 | ||||||
|
| |||||||
| 76,945,442 | ||||||||
|
| |||||||
Freddie Mac - 3.3% | ||||||||
3.000% due 10/01/46 - 03/01/50 | 3,236,953 | 3,415,764 | ||||||
3.500% due 10/01/42 - 03/01/50 | 1,527,436 | 1,627,210 | ||||||
3.751% (USD LIBOR + 1.345%) | 4,559 | 4,555 | ||||||
4.000% due 10/01/46 - 02/01/50 | 5,004,474 | 5,369,097 | ||||||
4.152% (USD LIBOR + 1.870%) | 14,701 | 14,856 | ||||||
4.500% due 11/01/44 - 09/01/48 | 582,801 | 630,194 | ||||||
4.500% due 04/01/50 ± | 100,000 | 108,079 | ||||||
4.579% (USD LIBOR + 1.724%) | 42,824 | 43,298 | ||||||
4.689% (UST + 2.250%) | 1,937 | 1,960 | ||||||
4.763% (UST + 2.250%) | 9,931 | 10,032 | ||||||
5.000% due 08/01/48 - 01/01/49 | 918,733 | 994,319 | ||||||
5.500% due 03/01/23 - 05/01/40 | 479,811 | 544,127 | ||||||
6.000% due 03/01/23 | 6,430 | 7,126 | ||||||
|
| |||||||
| 12,770,617 | ||||||||
|
| |||||||
|
| |||||||
Government National Mortgage Association - 22.1% |
| |||||||
3.000% due 09/15/42 - 05/20/50 | 1,023,869 | 1,086,320 | ||||||
3.500% due 03/20/45 - 02/20/49 | 907,607 | 968,483 | ||||||
3.500% due 05/20/50 | 7,500,000 | 7,897,467 | ||||||
4.000% due 06/20/47 - 04/20/48 | 754,137 | 810,920 | ||||||
4.000% due 04/20/50 | 7,200,000 | 7,649,845 | ||||||
4.000% due 05/20/50 | 37,700,000 | 40,090,784 | ||||||
4.500% due 06/20/48 - 04/20/49 | 2,163,955 | 2,309,610 | ||||||
4.500% due 05/20/50 | 14,100,000 | 14,970,785 | ||||||
5.000% due 10/15/38 - 02/20/49 | 2,641,991 | 2,836,728 | ||||||
5.000% due 05/20/50 | 6,400,000 | 6,816,000 | ||||||
|
| |||||||
| 85,436,942 | ||||||||
|
| |||||||
Total Mortgage-Backed Securities | 216,795,961 | |||||||
|
| |||||||
ASSET-BACKED SECURITIES - 5.2% | ||||||||
Applebee’s Funding LLC | 270,000 | 245,902 | ||||||
Argent Securities Inc | 598,687 | 526,204 | ||||||
2.072% (USD LIBOR + 1.125%) | 469,638 | 430,566 | ||||||
Asset-Backed Funding Certificates Trust | 51,736 | 47,452 | ||||||
| See Notes to Financial Statements | See explanation of symbols and terms, if any, on B-76 and B-77 |
B-18
Table of Contents
PACIFIC FUNDS
PF MANAGED BOND FUND
Schedule of Investments (Continued)
March 31, 2020
Principal Amount | Value | |||||||
Basic Asset Backed Securities Trust | $ | 358,528 | $ | 348,564 | ||||
Bear Stearns Asset Backed Securities I Trust | 151,402 | 150,478 | ||||||
1.867% (USD LIBOR + 0.240%) | 1,226,713 | 841,477 | ||||||
1.952% (USD LIBOR + 1.005%) | 264,326 | 245,936 | ||||||
Chesapeake Funding II LLC (Canada) | 386,066 | 378,924 | ||||||
3.230% due 08/15/30 ~ | 386,066 | 387,183 | ||||||
Citigroup Mortgage Loan Trust | 69,086 | 68,539 | ||||||
1.397% (USD LIBOR + 0.450%) | 328,606 | 321,595 | ||||||
CLNC Ltd (Cayman) | 900,000 | 838,632 | ||||||
Community Funding CLO (Cayman) | 649,859 | 659,688 | ||||||
Countrywide Asset-Backed Certificates | 329,915 | 267,193 | ||||||
1.347% (USD LIBOR + 0.400%) | 500,000 | 468,434 | ||||||
Credit Acceptance Auto Loan Trust | 600,000 | 595,442 | ||||||
Dividend Solar Loans LLC | 292,997 | 277,731 | ||||||
Evergreen Credit Card Trust (Canada) | 1,100,000 | 1,087,811 | ||||||
First Franklin Mortgage Loan Trust | 186,889 | 185,960 | ||||||
Freddie Mac Structured Pass-Through Certificates | 200,000 | 223,658 | ||||||
Gallatin CLO (Cayman) | 500,000 | 487,636 | ||||||
GM Financial Consumer Automobile Receivables | 22,887 | 22,893 | ||||||
GSAA Home Equity Trust | 444,926 | 152,964 | ||||||
6.000% due 08/25/47 | 331,122 | 302,067 | ||||||
Home Equity Asset Trust | 318,652 | 313,915 | ||||||
LoanCore Issuer Ltd (Cayman) | 500,000 | 411,803 | ||||||
Long Beach Mortgage Loan Trust | 1,012,858 | 842,058 | ||||||
Mastr Asset Backed Securities Trust | 654,046 | 255,398 | ||||||
Merrill Lynch Mortgage Investors Trust | 393,269 | 208,468 | ||||||
Monarch Grove CLO (Cayman) | 500,000 | 484,954 | ||||||
Principal Amount | Value | |||||||
Morgan Stanley Home Equity Loan Trust | $ | 984,502 | $ | 499,309 | ||||
1.087% (USD LIBOR + 0.140%) | 777,111 | 396,713 | ||||||
Mountain View CLO Ltd (Cayman) | 395,281 | 391,181 | ||||||
Navient Student Loan Trust | 150,000 | 137,930 | ||||||
3.430% due 12/15/59 ~ | 449,581 | 450,990 | ||||||
Option One Mortgage Loan Trust | 933,324 | 643,214 | ||||||
SBA Small Business Investment Cos | 248,695 | 265,559 | ||||||
Securitized Asset-Backed Receivables LLC Trust | 74,841 | 56,964 | ||||||
1.087% (USD LIBOR + 0.140%) | 174,637 | 98,437 | ||||||
SMB Private Education Loan Trust | 550,000 | 551,208 | ||||||
Sofi Professional Loan Program Trust | 127,328 | 126,642 | ||||||
Structured Asset Investment Loan Trust | 148,931 | 148,911 | ||||||
Structured Asset Securities Corp Mortgage | 1,000,000 | 898,078 | ||||||
STWD Ltd (Cayman) | 900,000 | 824,177 | ||||||
TRTX Issuer Ltd (Cayman) | 900,000 | 840,495 | ||||||
United States Small Business Administration | 59,081 | 60,991 | ||||||
2.980% due 04/01/39 | 58,329 | 60,912 | ||||||
Venture XII CLO Ltd (Cayman) | 449,194 | 436,761 | ||||||
Venture XVI CLO Ltd (Cayman) | 700,000 | 683,817 | ||||||
Westlake Automobile Receivables Trust | 144,289 | 144,129 | ||||||
Zais CLO 1 Ltd (Cayman) | 500,000 | 487,405 | ||||||
|
| |||||||
Total Asset-Backed Securities | 20,283,348 | |||||||
|
| |||||||
U.S. TREASURY OBLIGATIONS - 31.4% | ||||||||
U.S. Treasury Bonds - 11.7% | ||||||||
2.000% due 02/15/50 | 1,400,000 | 1,626,816 | ||||||
2.875% due 05/15/43 ‡ | 4,700,000 | 6,194,820 | ||||||
2.875% due 08/15/45 | 1,300,000 | 1,738,598 | ||||||
3.000% due 05/15/42 | 1,800,000 | 2,417,062 | ||||||
3.000% due 08/15/48 | 300,000 | 417,211 | ||||||
3.125% due 02/15/43 | 3,500,000 | 4,787,891 | ||||||
3.125% due 08/15/44 | 1,800,000 | 2,481,961 | ||||||
3.375% due 05/15/44 | 900,000 | 1,286,930 | ||||||
| See Notes to Financial Statements | See explanation of symbols and terms, if any, on B-76 and B-77 |
B-19
Table of Contents
PACIFIC FUNDS
PF MANAGED BOND FUND
Schedule of Investments (Continued)
March 31, 2020
Principal Amount | Value | |||||||
3.625% due 08/15/43 | $ | 11,800,000 | $ | 17,403,156 | ||||
3.625% due 02/15/44 ‡ | 1,538,000 | 2,276,120 | ||||||
3.750% due 11/15/43 | 1,500,000 | 2,255,859 | ||||||
4.250% due 05/15/39 | 200,000 | 310,977 | ||||||
4.375% due 05/15/40 | 1,000,000 | 1,590,312 | ||||||
4.625% due 02/15/40 | 400,000 | 653,453 | ||||||
|
| |||||||
| 45,441,166 | ||||||||
|
| |||||||
U.S. Treasury Inflation Protected Securities - 6.2% |
| |||||||
0.125% due 07/15/26 ^ | 860,976 | 869,335 | ||||||
0.250% due 07/15/29 ^ | 1,210,212 | 1,258,116 | ||||||
0.250% due 02/15/50 ^ | 110,375 | 113,963 | ||||||
0.375% due 07/15/23 ^ | 2,549,573 | 2,565,175 | ||||||
0.375% due 01/15/27 ^ | 2,349,468 | 2,406,833 | ||||||
0.625% due 01/15/26 ^ | 2,497,064 | 2,580,584 | ||||||
0.750% due 07/15/28 ^ | 3,329,780 | 3,565,823 | ||||||
0.750% due 02/15/42 ^ | 833,412 | 934,088 | ||||||
0.750% due 02/15/45 ^ | 328,650 | 376,028 | ||||||
0.875% due 01/15/29 ^ | 919,494 | 1,000,174 | ||||||
0.875% due 02/15/47 ^ | 1,175,548 | 1,400,414 | ||||||
1.000% due 02/15/46 ^ | 903,654 | 1,098,916 | ||||||
1.000% due 02/15/48 ^ | 1,150,743 | 1,418,750 | ||||||
1.000% due 02/15/49 ^ | 1,281,475 | 1,595,441 | ||||||
1.375% due 02/15/44 ^ ‡ | 2,136,298 | 2,743,019 | ||||||
|
| |||||||
| 23,926,659 | ||||||||
|
| |||||||
U.S. Treasury Notes - 13.5% | ||||||||
1.750% due 06/30/24 | 1,900,000 | 2,012,516 | ||||||
1.750% due 12/31/24 ‡ | 69,000 | 73,488 | ||||||
1.875% due 07/31/22 ‡ | 1,700,000 | 1,763,551 | ||||||
1.875% due 08/31/22 | 4,000,000 | 4,156,719 | ||||||
2.000% due 10/31/22 | 1,000,000 | 1,044,844 | ||||||
2.125% due 09/30/24 | 2,100,000 | 2,265,703 | ||||||
2.250% due 01/31/24 | 2,000,000 | 2,147,344 | ||||||
2.250% due 02/15/27 | 600,000 | 669,586 | ||||||
2.250% due 08/15/27 ‡ | 300,000 | 336,820 | ||||||
2.625% due 02/15/29 | 2,000,000 | 2,339,062 | ||||||
2.750% due 05/31/23 | 2,000,000 | 2,155,156 | ||||||
2.750% due 02/15/24 | 400,000 | 437,438 | ||||||
2.875% due 10/31/23 ‡ | 30,000,000 | 32,724,609 | ||||||
|
| |||||||
| 52,126,836 | ||||||||
|
| |||||||
|
| |||||||
Total U.S. Treasury Obligations | 121,494,661 | |||||||
|
| |||||||
FOREIGN GOVERNMENT BONDS & NOTES - 5.9% |
| |||||||
Abu Dhabi Government International Bond | 230,000 | 215,050 | ||||||
Argentina Treasury Bond (Argentina) | ARS 8,704,755 | 63,618 | ||||||
Argentine Bonos del Tesoro (Argentina) | 4,750,000 | 32,073 | ||||||
Argentine Republic Government International | $250,000 | 75,829 | ||||||
5.625% due 01/26/22 | 430,000 | 126,850 | ||||||
Brazil Notas do Tesouro Nacional ‘F’ (Brazil) | BRL 3,538,000 | 713,856 | ||||||
10.000% due 01/01/23 | 940,000 | 201,865 | ||||||
Brazilian Government International (Brazil) | $270,000 | 288,630 | ||||||
5.625% due 01/07/41 | 120,000 | 123,121 | ||||||
5.625% due 02/21/47 | 200,000 | 207,202 | ||||||
China Government (China) | CNY 3,000,000 | 439,762 | ||||||
3.380% due 11/21/24 ~ | 500,000 | 73,086 | ||||||
3.390% due 05/21/25 ~ | 1,000,000 | 146,661 | ||||||
Colombia Government (Colombia) | $200,000 | 221,561 | ||||||
Principal Amount | Value | |||||||
Egypt Government International Bond (Egypt) | $ | 200,000 | $ | 185,939 | ||||
Indonesia Government (Indonesia) | 200,000 | 198,168 | ||||||
4.875% due 05/05/21 ~ | 300,000 | 303,774 | ||||||
Indonesia Treasury (Indonesia) | IDR 7,665,000,000 | 448,185 | ||||||
7.500% due 06/15/35 | 1,622,000,000 | 93,415 | ||||||
Israel Government International Bond (Israel) | $600,000 | 645,310 | ||||||
Japan Bank for International Cooperation | 700,000 | 725,998 | ||||||
Japanese Government CPI Linked (Japan) | JPY 291,316,862 | 2,710,649 | ||||||
Kuwait International Government (Kuwait) | $270,000 | 281,423 | ||||||
Mexican Bonos (Mexico) | ||||||||
7.750% due 11/13/42 | MXN 34,520,000 | 1,423,232 | ||||||
8.000% due 11/07/47 | 13,110,000 | 552,375 | ||||||
8.500% due 05/31/29 | 6,780,000 | 308,746 | ||||||
Peru Government Bond (Peru) | PEN 3,000,000 | 940,798 | ||||||
Peruvian Government International (Peru) | ||||||||
5.625% due 11/18/50 | $30,000 | 45,009 | ||||||
5.940% due 02/12/29 ~ | PEN 1,300,000 | 409,626 | ||||||
6.550% due 03/14/37 | $50,000 | 72,078 | ||||||
Province of Ontario (Canada) | CAD 900,000 | 669,439 | ||||||
Province of Quebec (Canada) | $600,000 | 605,069 | ||||||
Qatar Government International Bond (Qatar) | ||||||||
4.500% due 04/23/28 ~ | 1,000,000 | 1,098,146 | ||||||
4.817% due 03/14/49 ~ | 300,000 | 354,797 | ||||||
Republic of Poland Government International | 170,000 | 185,632 | ||||||
Russian Federal (Russia) | ||||||||
6.900% due 05/23/29 | RUB 13,110,000 | 170,260 | ||||||
7.000% due 08/16/23 | 26,040,000 | 337,466 | ||||||
7.050% due 01/19/28 | 48,792,000 | 638,505 | ||||||
7.250% due 05/10/34 | 5,970,000 | 79,477 | ||||||
7.650% due 04/10/30 | 26,100,000 | 356,059 | ||||||
7.700% due 03/16/39 | 15,630,000 | 217,069 | ||||||
Spain Government (Spain) | ||||||||
0.600% due 10/31/29 ~ | EUR 2,100,000 | 2,310,394 | ||||||
1.850% due 07/30/35 ~ | 1,900,000 | 2,339,139 | ||||||
Tokyo Metropolitan Government (Japan) | $1,000,000 | 1,037,845 | ||||||
|
| |||||||
Total Foreign Government Bonds & Notes | 22,673,186 | |||||||
|
| |||||||
MUNICIPAL BONDS - 0.4% | ||||||||
City of Chicago IL ‘B’ | 185,000 | 189,795 | ||||||
The University of Arizona ‘A’ | 1,300,000 | 1,323,049 | ||||||
|
| |||||||
Total Municipal Bonds | 1,512,844 | |||||||
|
| |||||||
Shares | ||||||||
SHORT-TERM INVESTMENTS - 1.0% | ||||||||
Money Market Fund - 0.9% | ||||||||
BlackRock Liquidity FundsT-Fund Portfolio | 3,457,477 | 3,457,477 | ||||||
|
| |||||||
| See Notes to Financial Statements | See explanation of symbols and terms, if any, on B-76 and B-77 |
B-20
Table of Contents
PACIFIC FUNDS
PF MANAGED BOND FUND
Schedule of Investments (Continued)
March 31, 2020
Principal Amount | Value | |||||||
U. S. Government Agency Issue - 0.1% | ||||||||
Federal Home Loan Bank | $370,000 | $ | 369,764 | |||||
|
| |||||||
Total Short-Term Investments | 3,827,241 | |||||||
|
| |||||||
TOTAL INVESTMENTS - 150.2% | 581,008,613 | |||||||
TOTAL SECURITIES SOLD SHORT - (2.5%) | (9,829,190 | ) | ||||||
DERIVATIVES - (0.3%) | (1,117,825 | ) | ||||||
OTHER ASSETS & LIABILITIES, NET - (47.4%) |
| (183,228,600 | ) | |||||
|
| |||||||
NET ASSETS - 100.0% | $386,832,998 | |||||||
|
| |||||||
Notes to Schedule of Investments
| (a) | As of March 31, 2020, the Fund’s composition as a percentage of net assets was as follows: |
Mortgage-Backed Securities | 56.0% | |||
Corporate Bonds & Notes | 48.6% | |||
U.S. Treasury Obligations | 31.4% | |||
Foreign Government Bonds & Notes | 5.9% | |||
Asset-Backed Securities | 5.2% | |||
Others (each less than 3.0%) | 3.1% | |||
|
| |||
| 150.2% | ||||
Securities Sold Short | (2.5% | ) | ||
Derivatives | (0.3% | ) | ||
Other Assets & Liabilities, Net | (47.4% | ) | ||
|
| |||
| 100.0% | ||||
|
|
| (b) | Investments with a total aggregate value of $95,691 or less than 0.1% of the Fund’s net assets were valued by the Trustee Valuation Committee or determined by a valuation committee established under the Valuation Policy and then subsequently submitted for approval or ratification to either the Trustee Valuation Committee or to the Board of Trustees. |
| (c) | As of March 31, 2020, investments with a total aggregate value of $9,040,640 were fully or partially segregated with the broker(s)/custodian as collateral for a reverse repurchase agreement, open futures contracts, forward foreign currency contracts, option contracts and swap agreements. |
| (d) | Pursuant to the terms of the following senior loan agreement, the Fund had an unfunded loan commitment which could be extended at the option of the borrower. |
| Borrower | Unfunded Loan Commitment | Value | Unrealized Appreciation (Depreciation) | |||||||||
Eyecare Partners LLC | $7,558 | $6,256 | ($1,302 | ) | ||||||||
|
|
|
|
|
| |||||||
| (e) | The average amount of borrowings by the Fund on reverse repurchase agreements during the year ended March 31, 2020 was $3,350,268 at a weighted average interest rate of 2.011%. The average amount of borrowings by the Fund on sale-buyback financing transactions during the year ended March 31, 2020 was $48,635,912 at a weighted average interest rate of 1.659%. |
| (f) | A reverse repurchase agreement outstanding as of March 31, 2020 was as follows: |
| Counterparty | Collateral Pledged | Interest Rate | Settlement Date | Maturity Date | Repurchase Amount | Principal Amount | Value | |||||||||||||||||
BOA | U S Treasury Bond 2.875% due 05/15/43 | 0.960% | 03/27/20 | 04/15/20 | ($6,183,631 | ) | $6,180,500 | ($6,180,500 | ) | |||||||||||||||
|
| |||||||||||||||||||||||
| (g) | Securities sold short outstanding as of March 31, 2020 were as follows: |
| Description | Principal Amount | Value | ||||||
Mortgage-Backed Securities - (2.5%) | ||||||||
Fannie Mae | ||||||||
2.500% due 05/13/50 | $2,000,000 | ($2,069,468 | ) | |||||
4.500% due 04/15/50 | 4,500,000 | (4,843,828 | ) | |||||
5.000% due 04/15/50 | 2,700,000 | (2,915,894 | ) | |||||
|
| |||||||
Total Securities Sold Short | ||||||||
(Proceeds $9,749,238) | ($9,829,190 | ) | ||||||
|
| |||||||
| See Notes to Financial Statements | See explanation of symbols and terms, if any, on B-76 and B-77 |
B-21
Table of Contents
PACIFIC FUNDS
PF MANAGED BOND FUND
Schedule of Investments (Continued)
March 31, 2020
| (h) | Open futures contracts outstanding as of March 31, 2020 were as follows: |
| Long Futures Outstanding | Expiration Month | Number of Contracts | Notional Amount | Value | Unrealized Appreciation (Depreciation) | |||||||||||||||
30-Day U.S. Fed Funds | 04/20 | 37 | $15,217,954 | $15,406,722 | $188,768 | |||||||||||||||
AUD FX | 06/20 | 43 | 2,766,649 | 2,641,490 | (125,159 | ) | ||||||||||||||
CAD FX | 06/20 | 35 | 2,567,543 | 2,486,575 | (80,968 | ) | ||||||||||||||
EUR FX | 06/20 | 9 | 1,292,585 | 1,243,069 | (49,516 | ) | ||||||||||||||
Euro-Bobl | 06/20 | 7 | 1,050,511 | 1,043,862 | (6,649 | ) | ||||||||||||||
Euro-BTP | 06/20 | 142 | 23,100,233 | 22,146,487 | (953,746 | ) | ||||||||||||||
Euro-Bund | 06/20 | 2 | 382,554 | 380,523 | (2,031 | ) | ||||||||||||||
Euro-Buxl | 06/20 | 9 | 2,162,511 | 2,083,490 | (79,021 | ) | ||||||||||||||
Eurodollar | 06/20 | 189 | 46,882,110 | 47,001,938 | 119,828 | |||||||||||||||
Eurodollar | 12/20 | 52 | 12,805,656 | 12,955,800 | 150,144 | |||||||||||||||
Eurodollar | 03/21 | 1 | 246,627 | 249,287 | 2,660 | |||||||||||||||
Euro-OAT | 06/20 | 6 | 1,133,271 | 1,106,496 | (26,775 | ) | ||||||||||||||
JPY FX | 06/20 | 3 | 358,661 | 349,481 | (9,180 | ) | ||||||||||||||
MXN FX | 06/20 | 16 | 339,240 | 335,280 | (3,960 | ) | ||||||||||||||
RUB FX | 06/20 | 13 | 477,982 | 409,987 | (67,995 | ) | ||||||||||||||
Short Euro-BTP | 06/20 | 37 | 4,609,447 | 4,552,465 | (56,982 | ) | ||||||||||||||
U.S. Treasury 2-Year Notes | 06/20 | 82 | 17,889,275 | 18,071,391 | 182,116 | |||||||||||||||
U.S. Treasury 5-Year Notes | 06/20 | 1,180 | 143,592,623 | 147,924,068 | 4,331,445 | |||||||||||||||
U.S. Treasury Long Bonds | 06/20 | 247 | 41,227,269 | 44,228,438 | 3,001,169 | |||||||||||||||
U.S. Ultra Long Bonds | 06/20 | 5 | 1,014,227 | 1,109,375 | 95,148 | |||||||||||||||
|
| |||||||||||||||||||
| 6,609,296 | ||||||||||||||||||||
|
| |||||||||||||||||||
Short Futures Outstanding | ||||||||||||||||||||
Australia 10-Year Bonds | 06/20 | 7 | 647,853 | 648,486 | (633 | ) | ||||||||||||||
Euribor | 09/20 | 7 | 1,942,227 | 1,937,796 | 4,431 | |||||||||||||||
Euribor | 12/20 | 7 | 1,940,973 | 1,938,086 | 2,887 | |||||||||||||||
Euro-Bobl | 06/20 | 63 | 9,453,755 | 9,394,761 | 58,994 | |||||||||||||||
Euro-Bund | 06/20 | 65 | 12,385,543 | 12,366,990 | 18,553 | |||||||||||||||
Euro-Buxl | 06/20 | 6 | 1,421,785 | 1,388,993 | 32,792 | |||||||||||||||
Eurodollar | 06/21 | 72 | 17,748,974 | 17,947,800 | (198,826 | ) | ||||||||||||||
Eurodollar | 12/21 | 83 | 20,577,576 | 20,682,563 | (104,987 | ) | ||||||||||||||
Euro-Schatz | 06/20 | 21 | 2,596,664 | 2,598,423 | (1,759 | ) | ||||||||||||||
GBP FX | 06/20 | 2 | 157,708 | 155,700 | 2,008 | |||||||||||||||
Japan 10-Year Bonds | 06/20 | 3 | 4,336,085 | 4,256,777 | 79,308 | |||||||||||||||
Long Gilt | 06/20 | 25 | 4,164,733 | 4,229,030 | (64,297 | ) | ||||||||||||||
U.S. Treasury 10-Year Notes | 06/20 | 529 | 70,781,625 | 73,365,687 | (2,584,062 | ) | ||||||||||||||
U.S. Treasury Long Bonds | 06/20 | 75 | 12,430,518 | 13,429,688 | (999,170 | ) | ||||||||||||||
|
| |||||||||||||||||||
| (3,754,761 | ) | |||||||||||||||||||
|
| |||||||||||||||||||
Total Futures Contracts | $2,854,535 | |||||||||||||||||||
|
| |||||||||||||||||||
| See Notes to Financial Statements | See explanation of symbols and terms, if any, on B-76 and B-77 |
B-22
Table of Contents
PACIFIC FUNDS
PF MANAGED BOND FUND
Schedule of Investments (Continued)
March 31, 2020
| (i) | Forward foreign currency contracts outstanding as of March 31, 2020 were as follows: |
Currency Purchased | Currency Sold | Settlement Month | Counterparty | Unrealized Appreciation | Unrealized Depreciation | |||||||||||||||||||||||||||||
| AUD | 1,368,000 | USD | 909,144 | 04/20 | BRC | $— | ($67,676 | ) | ||||||||||||||||||||||||||
| AUD | 746,000 | USD | 459,682 | 04/20 | JPM | — | (811 | ) | ||||||||||||||||||||||||||
| BRL | 9,178,542 | USD | 2,241,641 | 04/20 | CIT | — | (477,281 | ) | ||||||||||||||||||||||||||
| CAD | 1,650,762 | USD | 1,271,637 | 04/20 | CIT | — | (98,387 | ) | ||||||||||||||||||||||||||
| CAD | 978,000 | USD | 729,775 | 04/20 | SCB | — | (34,810 | ) | ||||||||||||||||||||||||||
| CAD | 973,824 | USD | 725,863 | 04/20 | UBS | — | (33,865 | ) | ||||||||||||||||||||||||||
| CNY | 23,561 | USD | 3,385 | 04/20 | JPM | — | (62 | ) | ||||||||||||||||||||||||||
| EUR | 1,287,000 | USD | 1,379,646 | 04/20 | BRC | 39,904 | — | |||||||||||||||||||||||||||
| EUR | 2,086,090 | USD | 2,313,764 | 04/20 | CIT | — | (10,866 | ) | ||||||||||||||||||||||||||
| EUR | 3,705,000 | USD | 4,110,248 | 04/20 | JPM | — | (23,665 | ) | ||||||||||||||||||||||||||
| EUR | 2,628,000 | USD | 2,975,186 | 04/20 | SCB | — | (76,524 | ) | ||||||||||||||||||||||||||
| EUR | 1,026,000 | USD | 1,129,101 | 04/20 | UBS | 2,568 | — | |||||||||||||||||||||||||||
| EUR | 13,750,000 | USD | 15,228,125 | 06/20 | GSC | — | (18,099 | ) | ||||||||||||||||||||||||||
| GBP | 1,528,456 | USD | 2,006,922 | 04/20 | CIT | — | (107,670 | ) | ||||||||||||||||||||||||||
| GBP | 1,900,000 | USD | 2,423,667 | 05/20 | BRC | — | (61,499 | ) | ||||||||||||||||||||||||||
| GBP | 4,242,000 | USD | 5,186,969 | 05/20 | JPM | 86,882 | — | |||||||||||||||||||||||||||
| IDR | 19,938,229,759 | USD | 1,417,074 | 04/20 | BRC | — | (196,824 | ) | ||||||||||||||||||||||||||
| INR | 103,090,302 | USD | 1,416,338 | 04/20 | BRC | — | (59,318 | ) | ||||||||||||||||||||||||||
| JPY | 728,800,000 | USD | 6,676,361 | 05/20 | JPM | 115,999 | — | |||||||||||||||||||||||||||
| MXN | 24,995,293 | USD | 1,269,829 | 04/20 | CIT | — | (218,912 | ) | ||||||||||||||||||||||||||
| MXN | 7,634,000 | USD | 389,162 | 05/20 | RBS | — | (69,061 | ) | ||||||||||||||||||||||||||
| MXN | 75,000,000 | USD | 3,161,889 | 06/20 | CIT | — | (36,585 | ) | ||||||||||||||||||||||||||
| PEN | 1,722,411 | USD | 487,866 | 05/20 | JPM | 12,725 | — | |||||||||||||||||||||||||||
| RUB | 41,170,000 | USD | 522,774 | 04/20 | JPM | 2,050 | — | |||||||||||||||||||||||||||
| TWD | 807,700 | USD | 27,109 | 04/20 | JPM | — | (333 | ) | ||||||||||||||||||||||||||
| USD | 159,949 | AUD | 230,000 | 04/20 | CIT | 18,461 | — | |||||||||||||||||||||||||||
| USD | 2,960,664 | AUD | 4,377,122 | 04/20 | JPM | 268,134 | — | |||||||||||||||||||||||||||
| USD | 1,175,792 | AUD | 1,798,000 | 04/20 | SCB | 69,828 | — | |||||||||||||||||||||||||||
| USD | 555,727 | BRL | 2,342,000 | 04/20 | BNP | 105,718 | — | |||||||||||||||||||||||||||
| USD | 1,149,938 | BRL | 5,945,333 | 04/20 | GSC | 7,087 | — | |||||||||||||||||||||||||||
| USD | 194,844 | BRL | 820,000 | 04/20 | JPM | 37,294 | — | |||||||||||||||||||||||||||
| USD | 2,317,281 | CAD | 3,103,029 | 04/20 | UBS | 112,273 | — | |||||||||||||||||||||||||||
| USD | 1,668,411 | CNH | 11,614,807 | 04/20 | BNP | 31,257 | — | |||||||||||||||||||||||||||
| USD | 14,410,745 | EUR | 12,900,900 | 04/20 | BNP | 172,367 | — | |||||||||||||||||||||||||||
| USD | 294,085 | EUR | 267,000 | 04/20 | CIT | — | (596 | ) | ||||||||||||||||||||||||||
| USD | 3,077,389 | EUR | 2,751,228 | 04/20 | CIT | 40,932 | — | |||||||||||||||||||||||||||
| USD | 106,759 | EUR | 100,000 | 04/20 | GSC | — | (3,608 | ) | ||||||||||||||||||||||||||
| USD | 1,055,045 | EUR | 930,000 | 04/20 | JPM | 29,205 | — | |||||||||||||||||||||||||||
| USD | 18,086,018 | EUR | 16,432,000 | 04/20 | SCB | — | (38,337 | ) | ||||||||||||||||||||||||||
| USD | 3,632,876 | EUR | 3,284,000 | 04/20 | UBS | 10,652 | — | |||||||||||||||||||||||||||
| USD | 261,317 | EUR | 238,000 | 05/20 | JPM | — | (1,536 | ) | ||||||||||||||||||||||||||
| USD | 13,090,256 | EUR | 11,915,000 | 05/20 | SCB | — | (69,425 | ) | ||||||||||||||||||||||||||
| USD | 320,594 | GBP | 250,000 | 04/20 | CIT | 9,945 | — | |||||||||||||||||||||||||||
| USD | 8,191,317 | GBP | 6,345,000 | 05/20 | BRC | 302,919 | — | |||||||||||||||||||||||||||
| USD | 12,015,395 | GBP | 9,318,000 | 05/20 | JPM | 430,826 | — | |||||||||||||||||||||||||||
| USD | 346,995 | GBP | 265,000 | 05/20 | UBS | 17,535 | — | |||||||||||||||||||||||||||
| USD | 12,039 | INR | 910,000 | 04/20 | CIT | 61 | — | |||||||||||||||||||||||||||
| USD | 1,005,992 | INR | 76,260,000 | 04/20 | JPM | 2,151 | — | |||||||||||||||||||||||||||
| USD | 3,451,558 | JPY | 376,392,363 | 04/20 | CIT | — | (52,178 | ) | ||||||||||||||||||||||||||
| USD | 84,417 | JPY | 9,000,000 | 04/20 | JPM | 638 | — | |||||||||||||||||||||||||||
| USD | 994,040 | JPY | 108,700,000 | 05/20 | BRC | — | (19,036 | ) | ||||||||||||||||||||||||||
| USD | 189,099 | JPY | 20,800,000 | 05/20 | JPM | — | (4,755 | ) | ||||||||||||||||||||||||||
| USD | 1,350,819 | JPY | 148,600,000 | 05/20 | SCB | — | (34,122 | ) | ||||||||||||||||||||||||||
| USD | 4,286,536 | JPY | 475,000,000 | 05/20 | UBS | — | (140,428 | ) | ||||||||||||||||||||||||||
| USD | 1,120,389 | MXN | 27,218,748 | 04/20 | CIT | — | (24,013 | ) | ||||||||||||||||||||||||||
| USD | 3,581,555 | MXN | 68,150,907 | 04/20 | CIT | 716,178 | — | |||||||||||||||||||||||||||
| USD | 324,822 | MXN | 7,404,000 | 04/20 | HSB | 13,334 | — | |||||||||||||||||||||||||||
| USD | 875,063 | MXN | 17,440,000 | 06/20 | MSC | 146,941 | — | |||||||||||||||||||||||||||
| USD | 1,664,844 | PHP | 85,401,489 | 04/20 | JPM | — | (7,031 | ) | ||||||||||||||||||||||||||
| USD | 574,594 | RUB | 35,631,741 | 04/20 | CIT | 120,371 | — | |||||||||||||||||||||||||||
|
|
|
| |||||||||||||||||||||||||||||||
Total Forward Foreign Currency Contracts | $2,924,235 | ($1,987,313 | ) | |||||||||||||||||||||||||||||||
|
|
|
| |||||||||||||||||||||||||||||||
| See Notes to Financial Statements | See explanation of symbols and terms, if any, on B-76 and B-77 |
B-23
Table of Contents
PACIFIC FUNDS
PF MANAGED BOND FUND
Schedule of Investments (Continued)
March 31, 2020
| (j) | Purchased options outstanding as of March 31, 2020 were as follows: |
Foreign Currency Options
| Description | Exercise Price | Expiration Date | Counter- party | Notional Amount | Cost | Value | ||||||||||||||||||
Call - EUR versus USD | $1.09 | 04/15/20 | CIT | $410,000 | $3,235 | $1,591 | ||||||||||||||||||
Call - EUR versus USD | 1.08 | 04/24/20 | CIT | 2,270,000 | 18,228 | 10,107 | ||||||||||||||||||
Call - EUR versus USD | 1.11 | 04/27/20 | CIT | 1,120,000 | 10,164 | 14,180 | ||||||||||||||||||
|
|
|
| |||||||||||||||||||||
| 31,627 | 25,878 | |||||||||||||||||||||||
|
|
|
| |||||||||||||||||||||
Put - BRL versus USD | BRL 4.13 | 04/22/20 | JPM | 540,000 | 6,091 | 1 | ||||||||||||||||||
Put - BRL versus USD | 4.14 | 04/20/20 | BNP | 1,590,000 | 17,688 | 1 | ||||||||||||||||||
Put - MXN versus USD | MXN 19.32 | 06/02/20 | MSC | 1,670,000 | 18,637 | 1,659 | ||||||||||||||||||
|
|
|
| |||||||||||||||||||||
| 42,416 | 1,661 | |||||||||||||||||||||||
|
|
|
| |||||||||||||||||||||
Total Foreign Currency Options | $74,043 | $27,539 | ||||||||||||||||||||||
|
|
|
| |||||||||||||||||||||
Credit Default Swaptions on Credit Indices - Buy Protection
| Description | Exercise Rate | Expiration Date | Counter- party | Notional Amount | Cost | Value | ||||||||||||||||||
Put - CDX IG 33 5Y | 4.000% | 04/15/20 | BNP | $15,000,000 | $5,250 | $17 | ||||||||||||||||||
Put - CDX IG 34 5Y | 4.100% | 04/15/20 | BNP | 2,000,000 | 900 | 1 | ||||||||||||||||||
|
|
|
| |||||||||||||||||||||
| $6,150 | $18 | |||||||||||||||||||||||
|
|
|
| |||||||||||||||||||||
Interest Rate Swaptions
| Description | Pay/Receive Floating Rate | Floating Rate Index | Exercise Rate | Expiration Date | Counter- party | Notional Amount | Cost | Value | ||||||||||||||||||||||||
Put - 30-Year Interest Rate Swap | Receive | 6-Month USD-LIBOR | 1.880% | 07/30/20 | MSC | $120,000 | $3,255 | $451 | ||||||||||||||||||||||||
Put - 30-Year Interest Rate Swap | Receive | 6-Month USD-LIBOR | 1.880% | 07/30/20 | MSC | 370,000 | 9,632 | 1,389 | ||||||||||||||||||||||||
Put - 30-Year Interest Rate Swap | Receive | 6-Month USD-LIBOR | 1.923% | 07/30/20 | MSC | 390,000 | 8,982 | 1,292 | ||||||||||||||||||||||||
Put - 30-Year Interest Rate Swap | Receive | 6-Month USD-LIBOR | 1.913% | 08/19/20 | MSC | 540,000 | 11,610 | 2,274 | ||||||||||||||||||||||||
|
|
|
| |||||||||||||||||||||||||||||
| $33,479 | $5,406 | |||||||||||||||||||||||||||||||
|
|
|
| |||||||||||||||||||||||||||||
Options on Futures
| Description | Exercise Price | Expiration Date | Exchange | Number of Contracts | Notional Amount | Cost | Value | |||||||||||||||||||||
Call - EUR-FX (04/20) | $1.10 | 04/03/20 | CME | 1 | $137,500 | $752 | $1,000 | |||||||||||||||||||||
Call - EUR-FX (04/20) | 1.11 | 04/03/20 | CME | 1 | 138,750 | 728 | 375 | |||||||||||||||||||||
Call - AUD-FX (04/20) | 67.50 | 04/03/20 | CME | 1 | 67,500 | 683 | 10 | |||||||||||||||||||||
Call - U.S. Treasury 10-Year Notes (05/20) | 151.50 | 04/24/20 | CME | 22 | 3,333,000 | 1,132 | 687 | |||||||||||||||||||||
Call - U.S. Treasury 10-Year Notes (05/20) | 152.00 | 04/24/20 | CME | 50 | 7,600,000 | 2,368 | 781 | |||||||||||||||||||||
Call - U.S. Treasury 10-Year Notes (05/20) | 161.00 | 04/24/20 | CME | 105 | 16,905,000 | 3,463 | 1,641 | |||||||||||||||||||||
Call - U.S. Treasury 10-Year Notes (05/20) | 162.00 | 04/24/20 | CME | 3 | 486,000 | 99 | 47 | |||||||||||||||||||||
Call - U.S. Treasury 10-Year Notes (05/20) | 164.00 | 04/24/20 | CME | 230 | 37,720,000 | 7,585 | 3,594 | |||||||||||||||||||||
Call - Euro-Bund (05/20) | EUR 188.00 | 04/24/20 | EUX | 66 | EUR 12,408,000 | 2,271 | 1,456 | |||||||||||||||||||||
Call - Euro-Schatz (05/20) | 113.50 | 05/22/20 | EUX | 2 | 227,000 | 12 | 44 | |||||||||||||||||||||
Call - U.S. Treasury 30-Year Bonds (06/20) | $196.00 | 05/22/20 | CME | 76 | $14,896,000 | 654 | 46,312 | |||||||||||||||||||||
|
|
|
| |||||||||||||||||||||||||
| 19,747 | 55,947 | |||||||||||||||||||||||||||
|
|
|
| |||||||||||||||||||||||||
Put - U.S. Treasury 2-Year Notes (05/20) | 107.00 | 04/24/20 | CME | 20 | 4,280,000 | 660 | — | |||||||||||||||||||||
Put - U.S. Treasury 2-Year Notes (05/20) | 108.63 | 04/24/20 | CME | 11 | 2,389,750 | 363 | 172 | |||||||||||||||||||||
Put - U.S. Treasury 5-Year Notes (05/20) | 112.00 | 04/24/20 | CME | 300 | 33,600,000 | 5,206 | 7,031 | |||||||||||||||||||||
Put - U.S. Treasury 5-Year Notes (05/20) | 114.00 | 04/24/20 | CME | 11 | 1,254,000 | 277 | 258 | |||||||||||||||||||||
Put - U.S. Treasury 5-Year Notes (05/20) | 115.00 | 04/24/20 | CME | 16 | 1,840,000 | 403 | 375 | |||||||||||||||||||||
Put - U.S. Treasury 5-Year Notes (05/20) | 116.00 | 04/24/20 | CME | 41 | 4,756,000 | 1,032 | 961 | |||||||||||||||||||||
Put - U.S. Treasury 5-Year Notes (05/20) | 117.00 | 04/24/20 | CME | 11 | 1,287,000 | 277 | 344 | |||||||||||||||||||||
Put - U.S. Treasury 5-Year Notes (05/20) | 118.00 | 04/24/20 | CME | 49 | 5,782,000 | 1,233 | 1,531 | |||||||||||||||||||||
Put - U.S. Treasury 5-Year Notes (05/20) | 118.50 | 04/24/20 | CME | 34 | 4,029,000 | 590 | 1,062 | |||||||||||||||||||||
Put - U.S. Treasury 2-Year Notes (06/20) | 106.50 | 05/22/20 | CME | 125 | 26,625,000 | 2,169 | — | |||||||||||||||||||||
Put - U.S. Treasury 5-Year Notes (06/20) | 113.00 | 05/22/20 | CME | 255 | 28,815,000 | 2,195 | 9,961 | |||||||||||||||||||||
Put - U.S. Treasury 5-Year Notes (06/20) | 114.75 | 05/22/20 | CME | 1,000 | 114,750,000 | 17,355 | 46,875 | |||||||||||||||||||||
Put - U.S. Treasury 5-Year Notes (05/20) | 118.00 | 05/22/20 | CME | 8 | 944,000 | 201 | 500 | |||||||||||||||||||||
Put - U.S. Treasury 10-Year Notes (06/20) | 118.00 | 05/22/20 | CME | 19 | 2,242,000 | 163 | 891 | |||||||||||||||||||||
Put - U.S. Treasury 5-Year Notes (06/20) | 119.00 | 05/22/20 | CME | 15 | 1,785,000 | 378 | 1,055 | |||||||||||||||||||||
Put - U.S. Treasury 10-Year Notes (06/20) | 119.50 | 05/22/20 | CME | 5 | 597,500 | 43 | 234 | |||||||||||||||||||||
Put - U.S. Treasury 30-Year Bonds (06/20) | 140.00 | 05/22/20 | CME | 271 | 37,940,000 | 8,938 | 29,641 | |||||||||||||||||||||
|
|
|
| |||||||||||||||||||||||||
| 41,483 | 100,891 | |||||||||||||||||||||||||||
|
|
|
| |||||||||||||||||||||||||
Total Options on Futures | $61,230 | $156,838 | ||||||||||||||||||||||||||
|
|
|
| |||||||||||||||||||||||||
Total Purchased Options | $174,902 | $189,801 | ||||||||||||||||||||||||||
|
|
|
| |||||||||||||||||||||||||
| See Notes to Financial Statements | See explanation of symbols and terms, if any, on B-76 and B-77 |
B-24
Table of Contents
PACIFIC FUNDS
PF MANAGED BOND FUND
Schedule of Investments (Continued)
March 31, 2020
| (k) | Premiums received and value of written options outstanding as of March 31, 2020 were as follows: |
Foreign Currency Options
| Description | Exercise Price | Expiration Date | Counter- party | Notional Amount | Premium | Value | ||||||||||||||||||
Call - MXN versus USD | MXN 20.94 | 06/02/20 | MSC | $1,670,000 | $18,637 | ($209,670 | ) | |||||||||||||||||
|
|
|
| |||||||||||||||||||||
Put - MXN versus USD | 24.15 | 04/23/20 | MSC | 546,837 | 10,850 | (26,806 | ) | |||||||||||||||||
|
|
|
| |||||||||||||||||||||
Total Foreign Currency Options | $29,487 | ($236,476 | ) | |||||||||||||||||||||
|
|
|
| |||||||||||||||||||||
Credit Default Swaptions on Credit Indices - Sell Protection
| Description | Exercise Rate | Expiration Date | Counter- party | Notional Amount | Premium | Value | ||||||||||||||||||
Put - CDX IG 33 5Y | 0.850% | 06/17/20 | DUB | $300,000 | $345 | ($4,826 | ) | |||||||||||||||||
Put - CDX IG 33 5Y | 0.850% | 06/17/20 | MSC | 500,000 | 645 | (8,043 | ) | |||||||||||||||||
|
|
|
| |||||||||||||||||||||
| $990 | ($12,869 | ) | ||||||||||||||||||||||
|
|
|
| |||||||||||||||||||||
Inflation Floor/Cap Options
| Description | Initial Index | Floating Rate | Expiration Date | Counter- party | Notional Amount | Premium | Value | |||||||||||||||||
Floor - U.S. CPI Urban Consumers | 217.97 | Maximum of [0, (1 + 0.000%)10 - | 09/29/20 | CIT | $600,000 | $7,740 | $— | |||||||||||||||||
|
|
|
| |||||||||||||||||||||
Interest Rate Swaptions
| Description | Pay/Receive Floating Rate | Floating Rate Index | Exercise Rate | Expiration Date | Counter- party | Notional Amount | Premium | Value | ||||||||||||||||||||||||
Put - 2-Year Interest Rate Swap | Pay | 3-Month USD-LIBOR | 0.615% | 06/05/20 | MSC | $2,910,000 | $8,803 | ($261 | ) | |||||||||||||||||||||||
Put - 5-Year Interest Rate Swap | Pay | 3-Month USD-LIBOR | 0.733% | 06/05/20 | MSC | 2,910,000 | 24,080 | (4,322 | ) | |||||||||||||||||||||||
Put - 5-Year Interest Rate Swap | Pay | 6-Month USD-LIBOR | 1.550% | 07/30/20 | MSC | 2,680,000 | 12,562 | (97 | ) | |||||||||||||||||||||||
Put - 5-Year Interest Rate Swap | Pay | 6-Month USD-LIBOR | 1.600% | 07/30/20 | MSC | 1,940,000 | 8,936 | (54 | ) | |||||||||||||||||||||||
Put - 5-Year Interest Rate Swap | Pay | 6-Month USD-LIBOR | 1.600% | 08/19/20 | MSC | 2,720,000 | 11,696 | (122 | ) | |||||||||||||||||||||||
|
|
|
| |||||||||||||||||||||||||||||
| $66,077 | ($4,856 | ) | ||||||||||||||||||||||||||||||
|
|
|
| |||||||||||||||||||||||||||||
Options on Futures
| Description | Exercise Price | Expiration Date | Exchange | Number of Contracts | Notional Amount | Premium | Value | |||||||||||||||||||||
Call - U.S. Treasury 5-Year Notes (05/20) | $125.00 | 04/24/20 | CME | 8 | $1,000,000 | $2,705 | ($5,000 | ) | ||||||||||||||||||||
Call - U.S. Treasury 5-Year Notes (05/20) | 125.50 | 04/24/20 | CME | 6 | 753,000 | 1,443 | (2,016 | ) | ||||||||||||||||||||
Call - U.S. Treasury 5-Year Notes (05/20) | 126.00 | 04/24/20 | CME | 1 | 126,000 | 194 | (164 | ) | ||||||||||||||||||||
Call - U.S. Treasury 10-Year Notes (05/20) | 135.50 | 04/24/20 | CME | 5 | 677,500 | 4,085 | (16,797 | ) | ||||||||||||||||||||
Call - U.S. Treasury 10-Year Notes (05/20) | 136.00 | 04/24/20 | CME | 2 | 272,000 | 2,387 | (5,812 | ) | ||||||||||||||||||||
Call - U.S. Treasury 10-Year Notes (05/20) | 137.00 | 04/24/20 | CME | 10 | 1,370,000 | 10,670 | (20,469 | ) | ||||||||||||||||||||
Call - U.S. Treasury 10-Year Notes (05/20) | 137.50 | 04/24/20 | CME | 2 | 275,000 | 1,997 | (3,312 | ) | ||||||||||||||||||||
Call - U.S. Treasury 10-Year Notes (05/20) | 138.00 | 04/24/20 | CME | 14 | 1,932,000 | 14,210 | (18,375 | ) | ||||||||||||||||||||
Call - U.S. Treasury 10-Year Notes (05/20) | 139.00 | 04/24/20 | CME | 5 | 695,000 | 6,132 | (3,750 | ) | ||||||||||||||||||||
Call - U.S. Treasury 30-Year Bonds (05/20) | 172.00 | 04/24/20 | CME | 6 | 1,032,000 | 12,646 | (46,125 | ) | ||||||||||||||||||||
Call - U.S. Treasury 30-Year Bonds (05/20) | 178.00 | 04/24/20 | CME | 8 | 1,424,000 | 34,986 | (25,125 | ) | ||||||||||||||||||||
Call - U.S. Treasury 30-Year Bonds (05/20) | 180.00 | 04/24/20 | CME | 2 | 360,000 | 9,809 | (4,281 | ) | ||||||||||||||||||||
Call - EUR-FX (05/20) | 1.11 | 05/08/20 | CME | 1 | 138,125 | 1,560 | (1,613 | ) | ||||||||||||||||||||
Call - EUR-FX (05/20) | 1.12 | 05/08/20 | CME | 2 | 280,000 | 2,407 | (1,725 | ) | ||||||||||||||||||||
|
|
|
| |||||||||||||||||||||||||
| 105,231 | (154,564 | ) | ||||||||||||||||||||||||||
|
|
|
| |||||||||||||||||||||||||
Put - U.S. Treasury 5-Year Notes (05/20) | 122.50 | 04/24/20 | CME | 10 | 1,225,000 | 2,913 | (547 | ) | ||||||||||||||||||||
Put - U.S. Treasury 5-Year Notes (05/20) | 122.75 | 04/24/20 | CME | 7 | 859,250 | 2,293 | (438 | ) | ||||||||||||||||||||
Put - U.S. Treasury 5-Year Notes (05/20) | 123.00 | 04/24/20 | CME | 23 | 2,829,000 | 9,538 | (1,437 | ) | ||||||||||||||||||||
Put - U.S. Treasury 5-Year Notes (05/20) | 124.00 | 04/24/20 | CME | 46 | 5,704,000 | 32,772 | (4,672 | ) | ||||||||||||||||||||
Put - U.S. Treasury 5-Year Notes (05/20) | 124.25 | 04/24/20 | CME | 33 | 4,100,250 | 19,896 | (4,125 | ) | ||||||||||||||||||||
Put - U.S. Treasury 10-Year Notes (05/20) | 132.00 | 04/24/20 | CME | 3 | 396,000 | 745 | (188 | ) | ||||||||||||||||||||
Put - U.S. Treasury 10-Year Notes (05/20) | 134.00 | 04/24/20 | CME | 8 | 1,072,000 | 3,502 | (875 | ) | ||||||||||||||||||||
Put - U.S. Treasury 10-Year Notes (05/20) | 135.00 | 04/24/20 | CME | 15 | 2,025,000 | 8,514 | (2,109 | ) | ||||||||||||||||||||
Put - U.S. Treasury 10-Year Notes (05/20) | 135.50 | 04/24/20 | CME | 1 | 135,500 | 568 | (141 | ) | ||||||||||||||||||||
Put - U.S. Treasury 10-Year Notes (05/20) | 136.00 | 04/24/20 | CME | 13 | 1,768,000 | 10,946 | (2,844 | ) | ||||||||||||||||||||
Put - U.S. Treasury 10-Year Notes (05/20) | 137.00 | 04/24/20 | CME | 3 | 411,000 | 4,307 | (1,078 | ) | ||||||||||||||||||||
Put - U.S. Treasury 30-Year Bonds (05/20) | 175.00 | 04/24/20 | CME | 1 | 175,000 | 1,592 | (1,094 | ) | ||||||||||||||||||||
Put - U.S. Treasury 30-Year Bonds (05/20) | 178.00 | 04/24/20 | CME | 1 | 178,000 | 2,123 | (2,078 | ) | ||||||||||||||||||||
| See Notes to Financial Statements | See explanation of symbols and terms, if any, on B-76 and B-77 |
B-25
Table of Contents
PACIFIC FUNDS
PF MANAGED BOND FUND
Schedule of Investments (Continued)
March 31, 2020
| Description | Exercise Price | Expiration Date | Exchange | Number of Contracts | Notional Amount | Premium | Value | |||||||||||||||||||||
Put - U.S. Treasury 5-Year Notes (06/20) | $124.00 | 05/22/20 | CME | 47 | $5,828,000 | $32,270 | ($10,281 | ) | ||||||||||||||||||||
Put - U.S. Treasury 5-Year Notes (06/20) | 124.50 | 05/22/20 | CME | 23 | 2,863,500 | 10,835 | (6,828 | ) | ||||||||||||||||||||
Put - U.S. Treasury 5-Year Notes (06/20) | 124.75 | 05/22/20 | CME | 1 | 124,750 | 686 | (352 | ) | ||||||||||||||||||||
|
|
|
| |||||||||||||||||||||||||
| 143,500 | (39,087 | ) | ||||||||||||||||||||||||||
|
|
|
| |||||||||||||||||||||||||
Total Options on Futures | $248,731 | ($193,651 | ) | |||||||||||||||||||||||||
|
|
|
| |||||||||||||||||||||||||
Total Written Options | $353,025 | ($447,852 | ) | |||||||||||||||||||||||||
|
|
|
| |||||||||||||||||||||||||
| (l) | Swap agreements outstanding as of March 31, 2020 were as follows: |
Credit Default Swaps on Corporate and Sovereign Issues - Sell Protection (1)
| Referenced Obligation | Payment Frequency | Fixed Deal Receive Rate | Expiration Date | Counter- party | Implied Credit Spread at 03/31/20 (2) | Notional Amount (3) | Value | Upfront Premiums Paid (Received) | Unrealized Appreciation (Depreciation) | |||||||||||||||||||||||||||
Italy Government | Q | 1.000% | 06/20/24 | BRC | 1.149% | $2,600,000 | ($14,965 | ) | ($69,273 | ) | $54,308 | |||||||||||||||||||||||||
Russian Federation | Q | 1.000% | 12/20/24 | JPM | 1.825% | 400,000 | (14,749 | ) | 1,972 | (16,721 | ) | |||||||||||||||||||||||||
|
|
|
|
|
| |||||||||||||||||||||||||||||||
| (29,714 | ) | (67,301 | ) | 37,587 | ||||||||||||||||||||||||||||||||
|
|
|
|
|
| |||||||||||||||||||||||||||||||
| Exchange | ||||||||||||||||||||||||||||||||||||
AT&T Inc | Q | 1.000% | 12/20/20 | ICE | 1.262% | 500,000 | (781 | ) | 3,189 | (3,970 | ) | |||||||||||||||||||||||||
Citigroup Inc | Q | 1.000% | 12/20/20 | ICE | 0.800% | 900,000 | 1,604 | 18,995 | (17,391 | ) | ||||||||||||||||||||||||||
The Boeing Co | Q | 1.000% | 12/20/20 | ICE | 4.518% | 900,000 | (22,191 | ) | 5,179 | (27,370 | ) | |||||||||||||||||||||||||
Tesco PLC | Q | 1.000% | 06/20/22 | ICE | 0.408% | EUR 800,000 | 12,041 | 3,661 | 8,380 | |||||||||||||||||||||||||||
Rolls-Royce PLC | Q | 1.000% | 12/20/24 | ICE | 4.101% | 800,000 | (114,623 | ) | (4,034 | ) | (110,589 | ) | ||||||||||||||||||||||||
|
|
|
|
|
| |||||||||||||||||||||||||||||||
| (123,950 | ) | 26,990 | (150,940 | ) | ||||||||||||||||||||||||||||||||
|
|
|
|
|
| |||||||||||||||||||||||||||||||
Total Credit Default Swaps on Corporate and Sovereign Issues - Sell Protection |
| ($153,664 | ) | ($40,311 | ) | ($113,353 | ) | |||||||||||||||||||||||||||||
|
|
|
|
|
| |||||||||||||||||||||||||||||||
Credit Default Swaps on Credit Indices - Sell Protection (1)
| Referenced Obligation | Payment Frequency | Fixed Receive Rate | Expiration Date | Exchange | Notional Amount (3) | Value (4) | Upfront Premiums Paid (Received) | Unrealized Appreciation (Depreciation) | ||||||||||||||||||||||||
CDX IG 25 5Y | Q | 1.000% | 12/20/20 | ICE | $2,271,680 | $2,733 | $41,644 | ($38,911 | ) | |||||||||||||||||||||||
CDX IG 33 5Y | Q | 1.000% | 12/20/24 | ICE | 14,180,000 | (46,781 | ) | 76,161 | (122,942 | ) | ||||||||||||||||||||||
CDX IG 34 5Y | Q | 1.000% | 06/20/25 | ICE | 3,300,000 | (21,316 | ) | (5,918 | ) | (15,398 | ) | |||||||||||||||||||||
CDX HY 34 5Y | Q | 5.000% | 06/20/25 | ICE | 1,160,000 | (72,069 | ) | (46,400 | ) | (25,669 | ) | |||||||||||||||||||||
CDX IG 33 10Y | Q | 1.000% | 12/20/29 | ICE | 620,000 | (20,466 | ) | (4,031 | ) | (16,435 | ) | |||||||||||||||||||||
|
|
|
|
|
| |||||||||||||||||||||||||||
| ($157,899 | ) | $61,456 | ($219,355 | ) | ||||||||||||||||||||||||||||
|
|
|
|
|
| |||||||||||||||||||||||||||
Total Credit Default Swaps | ($311,563 | ) | $21,145 | ($332,708 | ) | |||||||||||||||||||||||||||
|
|
|
|
|
| |||||||||||||||||||||||||||
| (1) | If the Fund is a seller of protection and a credit event occurs, as defined under the terms of that particular swap agreement, the Fund will either (i) pay to the buyer of protection an amount equal to the notional amount of the swap and take delivery of the referenced obligation or underlying investments comprising the referenced index or (ii) pay a net settlement amount in the form of cash or investments equal to the notional amount of the swap less the recovery value of the referenced obligation or underlying investments comprising the referenced index. |
| (2) | An implied credit spread is the spread in yield between a U.S. Treasury security and the referenced obligation or underlying investment that are identical in all respects except for the quality rating. Implied credit spreads, represented in absolute terms, utilized in determining the value of credit default swap agreements on corporate and sovereign issues as of year end serve as an indicator of the current status of the payment/performance risk and represent the likelihood of risk of default for the credit derivative. The implied credit spread of a particular referenced entity reflects the cost of buying/selling protection and may include upfront payments required to be made to enter into the agreement. Wider credit spreads, in comparison to narrower credit spreads, represent a deterioration of the referenced entity’s credit soundness and a greater likelihood of risk of default or other credit event occurring as defined under the terms of the agreement. A credit spread identified as “Defaulted” indicates a credit event has occurred for the referenced entity or obligation. |
| (3) | The maximum potential amount the Fund could be required to pay as a seller of credit protection or receive as a buyer of credit protection if a credit event occurs as defined under the terms of that particular swap agreement. |
| (4) | The quoted market prices and resulting values for credit default swap agreements on credit indices serve as an indicator of the current status of the payment/performance risk and represent the expected amount paid or received for the credit derivative had the notional amount of the swap agreement been closed/sold as of year end. Increasing values (buy protection) or decreasing values (sell protection), when compared to the notional amount of the swap, represent a deterioration of the referenced entity’s credit soundness and a greater likelihood of risk of default or other credit event occurring as defined under the terms of the agreement. |
| See Notes to Financial Statements | See explanation of symbols and terms, if any, on B-76 and B-77 |
B-26
Table of Contents
PACIFIC FUNDS
PF MANAGED BOND FUND
Schedule of Investments (Continued)
March 31, 2020
Interest Rate Swaps - Long
| Receive | Pay | Payment Frequency Receive Rate/ Pay Rate | Counterparty | Expiration Date | Notional Amount | Value | Upfront Premiums Paid (Received) | Unrealized Appreciation (Depreciation) | ||||||||||||||||||||||||
7.024% | Brazil CETIP Interbank | Z / Z | CIT | 01/04/27 | BRL 5,712,000 | $2,368 | $2,294 | $74 | ||||||||||||||||||||||||
7.044% | Brazil CETIP Interbank | Z / Z | JPM | 01/04/27 | 1,400,000 | 834 | — | 834 | ||||||||||||||||||||||||
|
|
|
|
|
| |||||||||||||||||||||||||||
| 3,202 | 2,294 | 908 | ||||||||||||||||||||||||||||||
|
|
|
|
|
| |||||||||||||||||||||||||||
| Exchange | ||||||||||||||||||||||||||||||||
1.671% | 3-Month USD-LIBOR | S / Q | CME | 06/14/20 | $12,160,000 | 78,758 | (3,504 | ) | 82,262 | |||||||||||||||||||||||
0.600% | 3-Month USD-LIBOR | S / Q | CME | 03/23/22 | 6,158,000 | 19,203 | 962 | 18,241 | ||||||||||||||||||||||||
2.800% | 3-Month USD-LIBOR | S / Q | CME | 08/22/23 | 500,000 | 40,187 | — | 40,187 | ||||||||||||||||||||||||
0.100% | 6-Month JPY-LIBOR | S / S | LCH | 03/20/24 | JPY 2,790,000,000 | 164,930 | 88,986 | 75,944 | ||||||||||||||||||||||||
0.700% | 3-Month USD-LIBOR | S / Q | CME | 03/23/25 | $3,590,000 | 35,138 | (2,898 | ) | 38,036 | |||||||||||||||||||||||
0.645% | 3-Month USD-LIBOR | S / Q | CME | 09/18/25 | 1,245,000 | 9,275 | — | 9,275 | ||||||||||||||||||||||||
0.658% | 3-Month USD-LIBOR | S / Q | CME | 09/18/25 | 966,000 | 7,821 | — | 7,821 | ||||||||||||||||||||||||
(0.095%) | 6-Month JPY-LIBOR | S / S | LCH | 09/13/26 | JPY 140,000,000 | (3,336 | ) | — | (3,336 | ) | ||||||||||||||||||||||
(0.092%) | 6-Month JPY-LIBOR | S / S | LCH | 09/13/26 | 70,000,000 | (1,540 | ) | — | (1,540 | ) | ||||||||||||||||||||||
(0.068%) | 6-Month JPY-LIBOR | S / S | LCH | 09/18/26 | 120,000,000 | (976 | ) | — | (976 | ) | ||||||||||||||||||||||
(0.062%) | 6-Month JPY-LIBOR | S / S | LCH | 09/18/26 | 190,000,000 | (859 | ) | (84 | ) | (775 | ) | |||||||||||||||||||||
(0.064%) | 6-Month JPY-LIBOR | S / S | LCH | 09/19/26 | 67,000,000 | (480 | ) | — | (480 | ) | ||||||||||||||||||||||
(0.063%) | 6-Month JPY-LIBOR | S / S | LCH | 09/19/26 | 67,000,000 | (439 | ) | — | (439 | ) | ||||||||||||||||||||||
(0.087%) | 6-Month JPY-LIBOR | S / S | LCH | 09/20/26 | 34,000,000 | (747 | ) | — | (747 | ) | ||||||||||||||||||||||
(0.097%) | 6-Month JPY-LIBOR | S / S | LCH | 09/24/26 | 82,000,000 | (2,323 | ) | 111 | (2,434 | ) | ||||||||||||||||||||||
0.770% | 3-Month USD-LIBOR | S / Q | CME | 03/24/27 | $3,940,000 | 47,203 | 29,461 | 17,742 | ||||||||||||||||||||||||
7.450% | 28-Day MXN TIIE | L / L | CME | 07/18/29 | MXN 63,630,000 | 95,543 | 26,769 | 68,774 | ||||||||||||||||||||||||
0.036% | 6-Month JPY-LIBOR | S / S | LCH | 03/10/38 | JPY 19,000,000 | (1,999 | ) | — | (1,999 | ) | ||||||||||||||||||||||
0.040% | 6-Month JPY-LIBOR | S / S | LCH | 03/10/38 | 19,000,000 | (1,870 | ) | — | (1,870 | ) | ||||||||||||||||||||||
0.122% | 6-Month JPY-LIBOR | S / S | LCH | 08/22/39 | 370,000,000 | 8,323 | 49,345 | (41,022 | ) | |||||||||||||||||||||||
0.103% | 6-Month JPY-LIBOR | S / S | LCH | 08/28/39 | 90,000,000 | (1,027 | ) | — | (1,027 | ) | ||||||||||||||||||||||
1.000% | 6-Month JPY-LIBOR | S / S | LCH | 03/21/48 | 20,000,000 | 43,609 | 48,803 | (5,194 | ) | |||||||||||||||||||||||
|
|
|
|
|
| |||||||||||||||||||||||||||
| 534,394 | 237,951 | 296,443 | ||||||||||||||||||||||||||||||
|
|
|
|
|
| |||||||||||||||||||||||||||
Total Interest Rate Swaps - Long |
| $537,596 | $240,245 | $297,351 | ||||||||||||||||||||||||||||
|
|
|
|
|
| |||||||||||||||||||||||||||
Interest Rate Swaps - Short
| Pay | Receive | Payment Frequency Pay Rate/ Receive Rate | Exchange | Expiration Date | Notional Amount | Value | Upfront Premiums Paid (Received) | Unrealized Appreciation (Depreciation) | ||||||||||||||||||
0.300% | 6-Month JPY-LIBOR | S / S | CME | 03/18/26 | JPY 1,160,000,000 | ($232,896 | ) | ($100,560 | ) | ($132,336 | ) | |||||||||||||||
0.300% | 6-Month JPY-LIBOR | S / S | LCH | 03/18/26 | 410,000,000 | (82,317 | ) | (23,718 | ) | (58,599 | ) | |||||||||||||||
1.550% | 3-Month USD-LIBOR | S / Q | CME | 06/30/26 | $11,825,000 | (765,983 | ) | 41,498 | (807,481 | ) | ||||||||||||||||
1.520% | 3-Month USD-LIBOR | S / Q | CME | 07/31/26 | 4,634,000 | (271,972 | ) | 20,175 | (292,147 | ) | ||||||||||||||||
1.600% | 3-Month USD-LIBOR | S / Q | CME | 11/15/26 | 1,022,000 | (68,361 | ) | (110 | ) | (68,251 | ) | |||||||||||||||
1.650% | 3-Month USD-LIBOR | S / Q | CME | 11/15/26 | 383,000 | (26,879 | ) | (1,449 | ) | (25,430 | ) | |||||||||||||||
0.300% | 1 Day U.S. Fed Funds | A / A | CME | 02/15/27 | 5,436,000 | 12,821 | (16,653 | ) | 29,474 | |||||||||||||||||
0.750% | 3-Month USD-LIBOR | S / Q | CME | 02/15/27 | 6,787,000 | (84,384 | ) | (5,879 | ) | (78,505 | ) | |||||||||||||||
0.300% | 6-Month JPY-LIBOR | S / S | LCH | 09/20/27 | JPY 440,000,000 | (103,968 | ) | (16,687 | ) | (87,281 | ) | |||||||||||||||
0.300% | 6-Month JPY-LIBOR | S / S | LCH | 03/20/28 | 100,000,000 | (24,609 | ) | 7,084 | (31,693 | ) | ||||||||||||||||
0.399% | 6-Month JPY-LIBOR | S / S | LCH | 06/18/28 | 50,000,000 | (16,729 | ) | (42 | ) | (16,687 | ) | |||||||||||||||
0.450% | 6-Month JPY-LIBOR | S / S | LCH | 03/20/29 | 710,000,000 | (275,572 | ) | (86,980 | ) | (188,592 | ) | |||||||||||||||
0.750% | 6-Month GBP-LIBOR | S / S | LCH | 03/18/30 | GBP 200,000 | (4,093 | ) | 2,068 | (6,161 | ) | ||||||||||||||||
0.750% | 6-Month JPY-LIBOR | S / S | LCH | 03/20/38 | JPY 230,000,000 | (249,381 | ) | 19,811 | (269,192 | ) | ||||||||||||||||
0.800% | 6-Month JPY-LIBOR | S / S | LCH | 10/22/38 | 10,000,000 | (12,309 | ) | — | (12,309 | ) | ||||||||||||||||
0.705% | 6-Month JPY-LIBOR | S / S | LCH | 10/31/38 | 50,000,000 | (53,103 | ) | 3,203 | (56,306 | ) | ||||||||||||||||
0.785% | 6-Month JPY-LIBOR | S / S | LCH | 11/12/38 | 20,000,000 | (24,021 | ) | 68 | (24,089 | ) | ||||||||||||||||
0.750% | 6-Month JPY-LIBOR | S / S | LCH | 12/20/38 | 346,300,000 | (393,636 | ) | (36,792 | ) | (356,844 | ) | |||||||||||||||
2.875% | 3-Month USD-LIBOR | S / Q | CME | 05/15/44 | $223,000 | (102,362 | ) | 2,745 | (105,107 | ) | ||||||||||||||||
1.810% | 3-Month USD-LIBOR | S / Q | CME | 11/15/44 | 493,000 | (107,241 | ) | 660 | (107,901 | ) | ||||||||||||||||
1.850% | 3-Month USD-LIBOR | S / Q | CME | 11/15/44 | 4,720,000 | (1,072,284 | ) | 9,931 | (1,082,215 | ) | ||||||||||||||||
0.641% | 6-Month JPY-LIBOR | S / S | CME | 05/09/46 | JPY 187,300,000 | (207,454 | ) | — | (207,454 | ) | ||||||||||||||||
1.498% | 6-Month EUR-LIBOR | A / S | CME | 08/23/47 | EUR 543,000 | (219,904 | ) | (813 | ) | (219,091 | ) | |||||||||||||||
0.900% | 3-Month USD-LIBOR | S / Q | CME | 03/17/50 | $535,000 | (1,561 | ) | 9,076 | (10,637 | ) | ||||||||||||||||
0.792% | 3-Month USD-LIBOR | S / Q | CME | 03/18/50 | 268,000 | 7,225 | — | 7,225 | ||||||||||||||||||
0.818% | 3-Month USD-LIBOR | S / Q | CME | 03/19/50 | 274,000 | 5,599 | — | 5,599 | ||||||||||||||||||
1.000% | 6-Month GBP-LIBOR | S / S | LCH | 06/17/50 | GBP 2,600,000 | (371,711 | ) | 47,663 | (419,374 | ) | ||||||||||||||||
| See Notes to Financial Statements | See explanation of symbols and terms, if any, on B-76 and B-77 |
B-27
Table of Contents
PACIFIC FUNDS
PF MANAGED BOND FUND
Schedule of Investments (Continued)
March 31, 2020
| Pay | Receive | Payment Frequency Pay Rate/ Receive Rate | Exchange | Expiration Date | Notional Amount | Value | Upfront Premiums Paid (Received) | Unrealized Appreciation (Depreciation) | ||||||||||||||||||||||
0.838% | 3-Month USD-LIBOR | S / Q | CME | 09/18/50 | $227,000 | $3,391 | $— | $3,391 | ||||||||||||||||||||||
0.855% | 3-Month USD-LIBOR | S / Q | CME | 09/18/50 | 175,000 | 1,775 | (344 | ) | 2,119 | |||||||||||||||||||||
|
|
|
|
|
| |||||||||||||||||||||||||
| ($4,741,919 | ) | ($126,045 | ) | ($4,615,874 | ) | |||||||||||||||||||||||||
|
|
|
|
|
| |||||||||||||||||||||||||
Total Interest Rate Swaps |
| ($4,204,323 | ) | $114,200 | ($4,318,523 | ) | ||||||||||||||||||||||||
|
|
|
|
|
| |||||||||||||||||||||||||
Total Swap Agreements |
| ($4,515,886 | ) | $135,345 | ($4,651,231 | ) | ||||||||||||||||||||||||
|
|
|
|
|
| |||||||||||||||||||||||||
Balances reported in the Statement of Assets and Liabilities for Over the Counter (OTC) Swaps and Centrally Cleared Swaps
| Upfront Premium Paid (Received) | Unrealized Appreciation (Deprecation) | |||||||
OTC Swap Agreements | ||||||||
Assets | $4,266 | $55,216 | ||||||
Liabilities | (69,273 | ) | (16,721 | ) | ||||
Centrally Cleared Swap Agreements (1) | ||||||||
Assets | 557,248 | 414,470 | ||||||
Liabilities | (356,896 | ) | (5,104,196 | ) | ||||
|
|
|
| |||||
| $135,345 | ($4,651,231 | ) | ||||||
|
|
|
| |||||
| (1) | Includes cumulative value on centrally cleared swaps, as reported in the Schedule of Investments. Only variation margin is reported within the Statement of Assets and Liabilities. |
| See Notes to Financial Statements | See explanation of symbols and terms, if any, on B-76 and B-77 |
B-28
Table of Contents
PACIFIC FUNDS
PF MANAGED BOND FUND
Schedule of Investments (Continued)
March 31, 2020
| (m) | Fair Value Measurements |
The following is a summary of the Fund’s investments as categorized under the three-tier hierarchy of inputs used in valuing the Fund’s assets and liabilities as of March 31, 2020:
Total Value at March 31, 2020 | Level 1 Quoted Price | Level 2 Significant Observable Inputs | Level 3 Significant Unobservable Inputs | |||||||||||||||
Assets | Corporate Bonds & Notes | $187,854,641 | $— | $187,854,641 | $— | |||||||||||||
Senior Loan Notes | 6,566,731 | — | 5,717,788 | 848,943 | ||||||||||||||
Mortgage-Backed Securities | 216,795,961 | — | 216,795,961 | — | ||||||||||||||
Asset-Backed Securities | 20,283,348 | — | 20,283,348 | — | ||||||||||||||
U.S. Treasury Obligations | 121,494,661 | — | 121,494,661 | — | ||||||||||||||
Foreign Government Bonds & Notes | 22,673,186 | — | 22,673,186 | — | ||||||||||||||
Municipal Bonds | 1,512,844 | — | 1,512,844 | — | ||||||||||||||
Short-Term Investments | 3,827,241 | 3,457,477 | 369,764 | — | ||||||||||||||
Unfunded Loan Commitments | 6,256 | — | 6,256 | — | ||||||||||||||
Derivatives: | ||||||||||||||||||
Credit Contracts | ||||||||||||||||||
Purchased Options | 18 | — | 18 | — | ||||||||||||||
Swaps | 62,688 | — | 62,688 | — | ||||||||||||||
|
|
|
|
|
|
|
| |||||||||||
Total Credit Contracts | 62,706 | — | 62,706 | — | ||||||||||||||
|
|
|
|
|
|
|
| |||||||||||
Foreign Currency Contracts | ||||||||||||||||||
Futures | 2,008 | 2,008 | — | — | ||||||||||||||
Forward Foreign Currency Contracts | 2,924,235 | — | 2,924,235 | — | ||||||||||||||
Purchased Options | 28,924 | — | 28,924 | — | ||||||||||||||
|
|
|
|
|
|
|
| |||||||||||
Total Foreign Currency Contracts | 2,955,167 | 2,008 | 2,953,159 | — | ||||||||||||||
|
|
|
|
|
|
|
| |||||||||||
Interest Rate Contracts | ||||||||||||||||||
Futures | 8,268,243 | 8,268,243 | — | — | ||||||||||||||
Purchased Options | 160,859 | — | 160,859 | — | ||||||||||||||
Swaps | 406,998 | — | 406,998 | — | ||||||||||||||
|
|
|
|
|
|
|
| |||||||||||
Total Interest Rate Contracts | 8,836,100 | 8,268,243 | 567,857 | — | ||||||||||||||
|
|
|
|
|
|
|
| |||||||||||
Total Assets - Derivatives | 11,853,973 | 8,270,251 | 3,583,722 | — | ||||||||||||||
|
|
|
|
|
|
|
| |||||||||||
Total Assets | 592,868,842 | 11,727,728 | 580,292,171 | 848,943 | ||||||||||||||
|
|
|
|
|
|
|
| |||||||||||
Liabilities | Reverse Repurchase Agreement | (6,180,500 | ) | — | (6,180,500 | ) | — | |||||||||||
Sale-buyback Financing Transactions | (64,666,795 | ) | — | (64,666,795 | ) | — | ||||||||||||
Securities Sold Short: | ||||||||||||||||||
Mortgaged-Backed Securities | (9,829,190 | ) | — | (9,829,190 | ) | — | ||||||||||||
Derivatives: | ||||||||||||||||||
Credit Contracts | ||||||||||||||||||
Written Options | (12,869 | ) | — | (12,869 | ) | — | ||||||||||||
Swaps | (395,396 | ) | — | (395,396 | ) | — | ||||||||||||
|
|
|
|
|
|
|
| |||||||||||
Total Credit Contracts | (408,265 | ) | — | (408,265 | ) | — | ||||||||||||
|
|
|
|
|
|
|
| |||||||||||
Foreign Currency Contracts | ||||||||||||||||||
Futures | (336,778 | ) | (336,778 | ) | — | — | ||||||||||||
Forward Foreign Currency Contracts | (1,987,313 | ) | — | (1,987,313 | ) | — | ||||||||||||
Written Options | (239,814 | ) | — | (239,814 | ) | — | ||||||||||||
|
|
|
|
|
|
|
| |||||||||||
Total Foreign Currency Contracts | (2,563,905 | ) | (336,778 | ) | (2,227,127 | ) | — | |||||||||||
|
|
|
|
|
|
|
| |||||||||||
Interest Rate Contracts | ||||||||||||||||||
Futures | (5,078,938 | ) | (5,078,938 | ) | — | — | ||||||||||||
Written Options | (195,169 | ) | — | (195,169 | ) | — | ||||||||||||
Swaps | (4,725,521 | ) | — | (4,725,521 | ) | — | ||||||||||||
|
|
|
|
|
|
|
| |||||||||||
Total Interest Rate Contracts | (9,999,628 | ) | (5,078,938 | ) | (4,920,690 | ) | — | |||||||||||
|
|
|
|
|
|
|
| |||||||||||
Total Liabilities - Derivatives | (12,971,798 | ) | (5,415,716 | ) | (7,556,082 | ) | — | |||||||||||
|
|
|
|
|
|
|
| |||||||||||
Total Liabilities | (93,648,283 | ) | (5,415,716 | ) | (88,232,567 | ) | — | |||||||||||
|
|
|
|
|
|
|
| |||||||||||
Total | $499,220,559 | $6,312,012 | $492,059,604 | $848,943 | ||||||||||||||
|
|
|
|
|
|
|
| |||||||||||
| See Notes to Financial Statements | See explanation of symbols and terms, if any, on B-76 and B-77 |
B-29
Table of Contents
PACIFIC FUNDS
PF SHORT DURATION BOND FUND
Schedule of Investments
March 31, 2020
Principal Amount | | |||||||
CORPORATE BONDS & NOTES - 57.1% |
| |||||||
Basic Materials - 1.1% |
| |||||||
Anglo American Capital PLC (South Africa) | $250,000 | $243,756 | ||||||
CNAC HK Finbridge Co Ltd (China) | 200,000 | 199,760 | ||||||
International Flavors & Fragrances Inc | 65,000 | 65,297 | ||||||
LyondellBasell Industries NV | 400,000 | 414,544 | ||||||
POSCO (South Korea) | 450,000 | 452,010 | ||||||
|
| |||||||
| 1,375,367 | ||||||||
|
| |||||||
Communications - 2.1% |
| |||||||
Axiata SPV2 Bhd (Malaysia) | 220,000 | 220,376 | ||||||
Charter Communications Operating LLC |
| |||||||
3.579% due 07/23/20 | 370,000 | 368,872 | ||||||
4.908% due 07/23/25 | 265,000 | 285,993 | ||||||
Comcast Corp | 250,000 | 268,822 | ||||||
Crown Castle Towers LLC | 55,000 | 55,440 | ||||||
CSC Holdings LLC | 200,000 | 216,625 | ||||||
Expedia Group Inc | 65,000 | 64,124 | ||||||
Fox Corp | 90,000 | 91,987 | ||||||
4.030% due 01/25/24 ~ | 105,000 | 109,298 | ||||||
JD.com Inc (China) | 560,000 | 561,093 | ||||||
The Interpublic Group of Cos Inc | 45,000 | 44,320 | ||||||
Verizon Communications Inc | 180,000 | 200,399 | ||||||
WPP Finance 2010 (United Kingdom) | 69,000 | 68,702 | ||||||
|
| |||||||
| 2,556,051 | ||||||||
|
| |||||||
Consumer, Cyclical - 8.4% |
| |||||||
American Airlines Pass-Through Trust ‘B’ | 161,185 | 137,661 | ||||||
Daimler Finance North America LLC (Germany) |
| |||||||
1.750% due 03/10/23 ~ | 410,000 | 386,539 | ||||||
2.200% due 05/05/20 ~ | 350,000 | 348,969 | ||||||
2.300% due 02/12/21 ~ | 805,000 | 784,899 | ||||||
Delta Air Lines Inc | 65,000 | 62,066 | ||||||
DR Horton Inc | 125,000 | 123,280 | ||||||
Ford Motor Credit Co LLC |
| |||||||
2.134% (USD LIBOR + 0.930%) | 450,000 | 427,535 | ||||||
3.087% due 01/09/23 | 435,000 | 393,675 | ||||||
3.350% due 11/01/22 | 305,000 | 282,125 | ||||||
3.470% due 04/05/21 | 200,000 | 192,940 | ||||||
3.813% due 10/12/21 | 200,000 | 192,000 | ||||||
General Motors Co | 165,000 | 147,255 | ||||||
General Motors Financial Co Inc |
| |||||||
2.728% (USD LIBOR + 0.850%) | 200,000 | 180,073 | ||||||
2.900% due 02/26/25 | 435,000 | 377,230 | ||||||
3.200% due 07/13/20 | 435,000 | 433,756 | ||||||
4.200% due 11/06/21 | 65,000 | 61,846 | ||||||
Principal Amount | | |||||||
Harley-Davidson Financial Services Inc |
| |||||||
2.196% (USD LIBOR + 0.500%) | $135,000 | $134,555 | ||||||
2.520% (USD LIBOR + 0.940%) | 270,000 | 269,802 | ||||||
2.550% due 06/09/22 ~ | 85,000 | 81,576 | ||||||
4.050% due 02/04/22 ~ | 340,000 | 332,630 | ||||||
Hasbro Inc |
| |||||||
2.600% due 11/19/22 | 205,000 | 202,513 | ||||||
3.000% due 11/19/24 | 280,000 | 287,158 | ||||||
Hyundai Capital America |
| |||||||
2.375% due 02/10/23 ~ | 445,000 | 420,367 | ||||||
2.850% due 11/01/22 ~ | 121,000 | 118,285 | ||||||
3.000% due 06/20/22 ~ | 235,000 | 228,456 | ||||||
3.950% due 02/01/22 ~ | 405,000 | 408,427 | ||||||
Lennar Corp | 775,000 | 762,368 | ||||||
McDonald’s Corp | 135,000 | 128,753 | ||||||
Nissan Motor Acceptance Corp |
| |||||||
2.600% due 09/28/22 ~ | 115,000 | 109,695 | ||||||
3.150% due 03/15/21 ~ | 375,000 | 369,630 | ||||||
O’Reilly Automotive Inc | 240,000 | 241,650 | ||||||
Panasonic Corp (Japan) | 200,000 | 197,169 | ||||||
QVC Inc |
| |||||||
4.375% due 03/15/23 | 145,000 | 137,305 | ||||||
5.125% due 07/02/22 | 325,000 | 272,953 | ||||||
United Airlines Pass-Through Trust ‘B’ | 90,000 | 76,019 | ||||||
Volkswagen Group of America Finance LLC (Germany) |
| |||||||
2.500% due 09/24/21 ~ | 200,000 | 195,068 | ||||||
2.700% due 09/26/22 ~ | 200,000 | 193,638 | ||||||
3.875% due 11/13/20 ~ | 425,000 | 423,677 | ||||||
Walgreen Co | 100,000 | 100,305 | ||||||
|
| |||||||
| 10,223,848 | ||||||||
|
| |||||||
Consumer,Non-Cyclical - 10.0% |
| |||||||
AbbVie Inc | ||||||||
2.300% due 05/14/21 | 295,000 | 294,202 | ||||||
2.900% due 11/06/22 | 375,000 | 379,848 | ||||||
3.200% due 11/06/22 | 45,000 | 46,028 | ||||||
Allergan Finance LLC | 40,000 | 40,149 | ||||||
Allergan Funding SCS | 130,000 | 135,062 | ||||||
Altria Group Inc | 255,000 | 258,000 | ||||||
AmerisourceBergen Corp | 150,000 | 151,226 | ||||||
Anthem Inc | 245,000 | 244,155 | ||||||
BAT Capital Corp (United Kingdom) | 825,000 | 813,548 | ||||||
Baxalta Inc | 95,000 | 97,032 | ||||||
Bayer US Finance II LLC (Germany) |
| |||||||
1.846% (USD LIBOR + 0.630%) | 210,000 | 203,315 | ||||||
3.500% due 06/25/21 ~ | 530,000 | 531,175 | ||||||
Becton Dickinson and Co |
| |||||||
2.250% (USD LIBOR + 0.875%) | 56,000 | 54,119 | ||||||
2.894% due 06/06/22 | 165,000 | 165,269 | ||||||
3.125% due 11/08/21 | 150,000 | 150,605 | ||||||
Bristol-Myers Squibb Co |
| |||||||
2.600% due 05/16/22 ~ | 95,000 | 97,015 | ||||||
2.750% due 02/15/23 ~ | 155,000 | 160,432 | ||||||
| See Notes to Financial Statements | See explanation of symbols and terms, if any, on B-76 and B-77 |
B-30
Table of Contents
PACIFIC FUNDS
PF SHORT DURATION BOND FUND
Schedule of Investments (Continued)
March 31, 2020
Principal Amount | | |||||||
2.875% due 02/19/21 ~ | $165,000 | $168,275 | ||||||
2.900% due 07/26/24 ~ | 205,000 | 217,690 | ||||||
3.250% due 02/20/23 ~ | 45,000 | 47,306 | ||||||
3.625% due 05/15/24 ~ | 40,000 | 42,342 | ||||||
Bunge Ltd Finance Corp |
| |||||||
3.000% due 09/25/22 | 630,000 | 623,431 | ||||||
3.500% due 11/24/20 | 855,000 | 862,218 | ||||||
4.350% due 03/15/24 | 30,000 | 31,134 | ||||||
Cardinal Health Inc |
| |||||||
2.616% due 06/15/22 | 125,000 | 125,642 | ||||||
3.079% due 06/15/24 | 150,000 | 148,840 | ||||||
3.200% due 03/15/23 | 210,000 | 211,316 | ||||||
3.500% due 11/15/24 | 270,000 | 275,772 | ||||||
Cigna Corp |
| |||||||
1.493% (USD LIBOR + 0.650%) | 110,000 | 105,710 | ||||||
3.000% due 07/15/23 ~ | 175,000 | 179,354 | ||||||
3.400% due 09/17/21 | 185,000 | 187,910 | ||||||
3.750% due 07/15/23 | 177,000 | 182,513 | ||||||
3.900% due 02/15/22 ~ | 125,000 | 127,870 | ||||||
Conagra Brands Inc | 36,000 | 35,622 | ||||||
CVS Health Corp | 75,000 | 75,376 | ||||||
EMD Finance LLC (Germany) | 95,000 | 96,428 | ||||||
Equifax Inc |
| |||||||
2.300% due 06/01/21 | 255,000 | 248,073 | ||||||
2.562% (USD LIBOR + 0.870%) | 105,000 | 102,494 | ||||||
3.600% due 08/15/21 | 255,000 | 254,524 | ||||||
Express Scripts Holding Co | 440,000 | 436,266 | ||||||
Global Payments Inc | 170,000 | 168,851 | ||||||
Humana Inc |
| |||||||
2.900% due 12/15/22 | 40,000 | 39,844 | ||||||
3.150% due 12/01/22 | 105,000 | 104,886 | ||||||
3.850% due 10/01/24 | 15,000 | 15,283 | ||||||
Imperial Brands Finance PLC (United Kingdom) |
| |||||||
2.950% due 07/21/20 ~ | 525,000 | 524,027 | ||||||
3.750% due 07/21/22 ~ | 400,000 | 400,355 | ||||||
Keurig Dr Pepper Inc | 255,000 | 258,174 | ||||||
Kraft Heinz Foods Co | 235,000 | 233,707 | ||||||
Pernod Ricard SA (France) |
| |||||||
4.450% due 01/15/22 ~ | 260,000 | 267,286 | ||||||
5.750% due 04/07/21 ~ | 240,000 | 247,021 | ||||||
Perrigo Finance Unlimited Co |
| |||||||
3.500% due 12/15/21 | 375,000 | 387,475 | ||||||
3.900% due 12/15/24 | 455,000 | 447,628 | ||||||
Takeda Pharmaceutical Co Ltd (Japan) | 400,000 | 405,439 | ||||||
Tyson Foods Inc | 160,000 | 161,005 | ||||||
|
| |||||||
| 12,268,267 | ||||||||
|
| |||||||
Energy - 5.6% |
| |||||||
Aker BP ASA (Norway) | 230,000 | 183,191 | ||||||
Cenovus Energy Inc (Canada) | 265,000 | 189,089 | ||||||
Columbia Pipeline Group Inc | 380,000 | 378,468 | ||||||
Diamondback Energy Inc | 620,000 | 434,471 | ||||||
Principal Amount | | |||||||
Energy Transfer Operating LP |
| |||||||
2.900% due 05/15/25 | $60,000 | $50,839 | ||||||
4.250% due 03/15/23 | 250,000 | 224,356 | ||||||
5.875% due 01/15/24 | 560,000 | 530,172 | ||||||
Eni SPA (Italy) | 270,000 | 262,532 | ||||||
Enterprise Products Operating LLC | 95,000 | 93,789 | ||||||
EOG Resources Inc | 66,000 | 64,777 | ||||||
EQT Corp |
| |||||||
3.000% due 10/01/22 | 525,000 | 442,312 | ||||||
4.875% due 11/15/21 | 66,000 | 54,101 | ||||||
Marathon Oil Corp | 510,000 | 390,861 | ||||||
MPLX LP |
| |||||||
1.899% (USD LIBOR + 0.900%) | 60,000 | 56,711 | ||||||
2.099% (USD LIBOR + 1.100%) | 180,000 | 167,542 | ||||||
Occidental Petroleum Corp |
| |||||||
2.600% due 08/13/21 | 315,000 | 252,253 | ||||||
2.700% due 08/15/22 | 200,000 | 142,686 | ||||||
Phillips 66 | 165,000 | 154,362 | ||||||
Plains All American Pipeline LP | 120,000 | 117,103 | ||||||
Reliance Holding USA Inc (India) | 250,000 | 255,080 | ||||||
Sabine Pass Liquefaction LLC |
| |||||||
5.625% due 02/01/21 | 780,000 | 767,617 | ||||||
6.250% due 03/15/22 | 565,000 | 548,415 | ||||||
Schlumberger Holdings Corp | 210,000 | 199,116 | ||||||
The Williams Cos Inc |
| |||||||
3.350% due 08/15/22 | 120,000 | 114,968 | ||||||
3.700% due 01/15/23 | 515,000 | 476,731 | ||||||
Western Midstream Operating LP | 425,000 | 275,903 | ||||||
|
| |||||||
| 6,827,445 | ||||||||
|
| |||||||
Financial - 17.5% |
| |||||||
AerCap Ireland Capital DAC (Ireland) | ||||||||
3.950% due 02/01/22 | 400,000 | 348,711 | ||||||
4.450% due 12/16/21 | 220,000 | 196,253 | ||||||
4.625% due 10/30/20 | 430,000 | 417,162 | ||||||
AIG Global Funding |
| |||||||
2.300% due 07/01/22 ~ | 165,000 | 164,384 | ||||||
3.350% due 06/25/21 ~ | 138,000 | 139,047 | ||||||
Air Lease Corp |
| |||||||
2.250% due 01/15/23 | 175,000 | 146,381 | ||||||
2.500% due 03/01/21 | 70,000 | 64,401 | ||||||
3.500% due 01/15/22 | 90,000 | 82,081 | ||||||
American International Group Inc |
| |||||||
4.875% due 06/01/22 | 165,000 | 170,724 | ||||||
6.400% due 12/15/20 | 365,000 | 375,451 | ||||||
Aon Corp | 95,000 | 94,666 | ||||||
Avolon Holdings Funding Ltd (Ireland) |
| |||||||
2.875% due 02/15/25 ~ | 225,000 | 174,991 | ||||||
3.625% due 05/01/22 ~ | 335,000 | 297,327 | ||||||
3.950% due 07/01/24 ~ | 65,000 | 54,503 | ||||||
Bank of America Corp |
| |||||||
1.866% (USD LIBOR + 0.650%) | 405,000 | 395,712 | ||||||
2.186% (USD LIBOR + 0.380%) | 660,000 | 633,715 | ||||||
2.503% due 10/21/22 | 345,000 | 346,068 | ||||||
2.979% (USD LIBOR + 1.160%) | 295,000 | 282,253 | ||||||
| See Notes to Financial Statements | See explanation of symbols and terms, if any, on B-76 and B-77 |
B-31
Table of Contents
PACIFIC FUNDS
PF SHORT DURATION BOND FUND
Schedule of Investments (Continued)
March 31, 2020
Principal Amount | | |||||||
Banque Federative du Credit Mutuel SA (France) | $335,000 | $311,505 | ||||||
BDO Unibank Inc (Philippines) | 400,000 | 397,029 | ||||||
BPCE SA (France) | 250,000 | 240,536 | ||||||
Brixmor Operating Partnership LP REIT | 35,000 | 33,655 | ||||||
Capital One Financial Corp |
| |||||||
3.200% due 01/30/23 | 180,000 | 178,144 | ||||||
3.500% due 06/15/23 | 130,000 | 129,405 | ||||||
3.900% due 01/29/24 | 170,000 | 170,803 | ||||||
Capital One NA |
| |||||||
2.150% due 09/06/22 | 260,000 | 253,807 | ||||||
2.250% due 09/13/21 | 250,000 | 245,287 | ||||||
Citibank NA | 305,000 | 305,625 | ||||||
Citigroup Inc |
| |||||||
2.312% due 11/04/22 | 310,000 | 308,433 | ||||||
2.700% due 03/30/21 | 245,000 | 246,103 | ||||||
2.900% due 12/08/21 | 585,000 | 590,775 | ||||||
Citizens Bank NA |
| |||||||
2.250% due 10/30/20 | 250,000 | 250,584 | ||||||
2.550% due 05/13/21 | 250,000 | 249,802 | ||||||
3.250% due 02/14/22 | 305,000 | 309,239 | ||||||
Cooperatieve Rabobank UA (Netherlands) | 375,000 | 377,695 | ||||||
Credit Suisse AG (Switzerland) | 340,000 | 338,725 | ||||||
Crown Castle International Corp REIT |
| |||||||
2.250% due 09/01/21 | 255,000 | 251,619 | ||||||
3.400% due 02/15/21 | 285,000 | 286,996 | ||||||
Danske Bank AS (Denmark) |
| |||||||
3.001% due 09/20/22 ~ | 455,000 | 450,807 | ||||||
5.000% due 01/12/22 ~ | 245,000 | 251,039 | ||||||
Deutsche Bank AG (Germany) |
| |||||||
2.950% due 08/20/20 | 200,000 | 198,207 | ||||||
3.041% (USD LIBOR + 1.290%) | 250,000 | 240,531 | ||||||
3.150% due 01/22/21 | 175,000 | 171,060 | ||||||
3.375% due 05/12/21 | 160,000 | 151,617 | ||||||
First Niagara Financial Group Inc | 120,000 | 128,663 | ||||||
Highwoods Realty LP REIT | 175,000 | 174,483 | ||||||
HSBC Holdings PLC (United Kingdom) | 200,000 | 195,928 | ||||||
ING Groep NV (Netherlands) | 205,000 | 197,719 | ||||||
Marsh & McLennan Cos Inc |
| |||||||
3.500% due 12/29/20 | 240,000 | 241,902 | ||||||
3.875% due 03/15/24 | 190,000 | 199,345 | ||||||
Morgan Stanley |
| |||||||
2.500% due 04/21/21 | 175,000 | 174,931 | ||||||
2.750% due 05/19/22 | 245,000 | 247,800 | ||||||
5.500% due 07/24/20 | 125,000 | 126,231 | ||||||
Nordea Bank Abp (Finland) | 200,000 | 203,723 | ||||||
Park Aerospace Holdings Ltd (Ireland) |
| |||||||
3.625% due 03/15/21 ~ | 230,000 | 218,105 | ||||||
5.250% due 08/15/22 ~ | 190,000 | 171,920 | ||||||
Regions Bank | 535,000 | 523,792 | ||||||
Reinsurance Group of America Inc | 35,000 | 36,310 | ||||||
Santander UK Group Holdings PLC | 405,000 | 404,951 | ||||||
Principal Amount | | |||||||
Santander UK PLC (United Kingdom) |
| |||||||
2.100% due 01/13/23 | $435,000 | $422,420 | ||||||
2.125% due 11/03/20 | 385,000 | 382,828 | ||||||
SBA Tower Trust REIT |
| |||||||
2.836% due 01/15/50 ~ | 405,000 | 400,532 | ||||||
3.168% due 04/09/47 ~ | 370,000 | 368,243 | ||||||
3.448% due 03/15/48 ~ | 320,000 | 327,515 | ||||||
Standard Chartered PLC (United Kingdom) | 200,000 | 198,039 | ||||||
Swedbank AB (Sweden) | 680,000 | 680,533 | ||||||
Synchrony Financial | 801,000 | 764,062 | ||||||
The Goldman Sachs Group Inc |
| |||||||
2.557% (USD LIBOR + 0.780%) | 100,000 | 96,372 | ||||||
2.875% due 02/25/21 | 255,000 | 255,971 | ||||||
2.904% (USD LIBOR + 1.110%) | 295,000 | 287,036 | ||||||
3.000% due 04/26/22 | 85,000 | 85,649 | ||||||
Trinity Acquisition PLC | 115,000 | 110,944 | ||||||
Truist Bank | 230,000 | 233,061 | ||||||
UBS Group AG (Switzerland) |
| |||||||
2.903% (USD LIBOR + 1.220%) | 255,000 | 238,660 | ||||||
3.000% due 04/15/21 ~ | 680,000 | 681,520 | ||||||
US Bank NA | 275,000 | 271,020 | ||||||
Ventas Realty LP REIT | 60,000 | 58,859 | ||||||
Wells Fargo & Co |
| |||||||
2.550% due 12/07/20 | 23,000 | 23,066 | ||||||
3.500% due 03/08/22 | 170,000 | 173,412 | ||||||
Wells Fargo Bank NA | 250,000 | 249,010 | ||||||
Willis Towers Watson PLC | 470,000 | 481,773 | ||||||
|
| |||||||
| 21,359,186 | ||||||||
|
| |||||||
Industrial - 6.0% |
| |||||||
Amphenol Corp | 210,000 | 199,281 | ||||||
Avnet Inc | 197,000 | 200,922 | ||||||
Boral Finance Pty Ltd (Australia) | 35,000 | 35,362 | ||||||
Carrier Global Corp | 425,000 | 416,469 | ||||||
CNH Industrial Capital LLC |
| |||||||
3.875% due 10/15/21 | 475,000 | 472,960 | ||||||
4.375% due 11/06/20 | 480,000 | 475,758 | ||||||
DAE Funding LLC (United Arab Emirates) |
| |||||||
4.000% due 08/01/20 ~ | 210,000 | 207,619 | ||||||
5.250% due 11/15/21 ~ | 220,000 | 201,162 | ||||||
Eagle Materials Inc | 50,000 | 45,846 | ||||||
Eastern Creation II Investment Holdings Ltd (China) | 400,000 | 400,000 | ||||||
General Electric Co |
| |||||||
2.700% due 10/09/22 | 245,000 | 241,299 | ||||||
3.150% due 09/07/22 | 130,000 | 131,498 | ||||||
3.450% due 05/15/24 | 135,000 | 133,626 | ||||||
4.650% due 10/17/21 | 138,000 | 140,799 | ||||||
5.300% due 02/11/21 | 30,000 | 30,459 | ||||||
Jabil Inc | 115,000 | 114,848 | ||||||
| See Notes to Financial Statements | See explanation of symbols and terms, if any, on B-76 and B-77 |
B-32
Table of Contents
PACIFIC FUNDS
PF SHORT DURATION BOND FUND
Schedule of Investments (Continued)
March 31, 2020
Principal Amount | | |||||||
Martin Marietta Materials Inc | $220,000 | $218,432 | ||||||
Northrop Grumman Corp | 165,000 | 165,130 | ||||||
Otis Worldwide Corp | 250,000 | 245,247 | ||||||
Penske Truck Leasing Co LP |
| |||||||
3.200% due 07/15/20 ~ | 50,000 | 49,752 | ||||||
3.300% due 04/01/21 ~ | 325,000 | 326,553 | ||||||
3.650% due 07/29/21 ~ | 115,000 | 116,496 | ||||||
Republic Services Inc | 185,000 | 186,638 | ||||||
Roper Technologies Inc |
| |||||||
2.350% due 09/15/24 | 80,000 | 77,925 | ||||||
2.800% due 12/15/21 | 195,000 | 195,331 | ||||||
3.000% due 12/15/20 | 315,000 | 315,236 | ||||||
3.125% due 11/15/22 | 410,000 | 402,872 | ||||||
3.650% due 09/15/23 | 95,000 | 97,837 | ||||||
SMBC Aviation Capital Finance DAC (Ireland) |
| |||||||
3.550% due 04/15/24 ~ | 200,000 | 213,858 | ||||||
4.125% due 07/15/23 ~ | 265,000 | 286,375 | ||||||
Vulcan Materials Co |
| |||||||
1.341% (USD LIBOR + 0.600%) | 640,000 | 634,975 | ||||||
2.230% (USD LIBOR + 0.650%) | 390,000 | 375,181 | ||||||
|
| |||||||
| 7,355,746 | ||||||||
|
| |||||||
Technology - 2.1% |
| |||||||
Apple Inc | 165,000 | 171,831 | ||||||
Broadcom Corp | 415,000 | 411,510 | ||||||
Fiserv Inc | 380,000 | 378,585 | ||||||
International Business Machines Corp | 320,000 | 328,966 | ||||||
Microchip Technology Inc | 515,000 | 502,163 | ||||||
NXP BV (Netherlands) |
| |||||||
3.875% due 09/01/22 ~ | 200,000 | 200,967 | ||||||
4.125% due 06/01/21 ~ | 200,000 | 201,942 | ||||||
4.625% due 06/01/23 ~ | 200,000 | 206,103 | ||||||
Texas Instruments Inc | 125,000 | 124,037 | ||||||
|
| |||||||
| 2,526,104 | ||||||||
|
| |||||||
Utilities - 4.3% |
| |||||||
American Electric Power Co Inc | 50,000 | 50,646 | ||||||
CenterPoint Energy Inc | 75,000 | 74,889 | ||||||
Dominion Energy Inc | 260,000 | 259,702 | ||||||
Edison International |
| |||||||
2.125% due 04/15/20 | 385,000 | 384,524 | ||||||
3.125% due 11/15/22 | 155,000 | 152,520 | ||||||
Enel Finance International NV (Italy) |
| |||||||
2.875% due 05/25/22 ~ | 520,000 | 503,380 | ||||||
4.250% due 09/14/23 ~ | 205,000 | 210,078 | ||||||
Exelon Generation Co LLC | 219,000 | 218,249 | ||||||
FirstEnergy Corp | 240,000 | 234,343 | ||||||
Israel Electric Corp Ltd (Israel) | 300,000 | 315,001 | ||||||
NextEra Energy Capital Holdings Inc | 210,000 | 205,799 | ||||||
Principal Amount | | |||||||
NRG Energy Inc | $130,000 | $129,055 | ||||||
San Diego Gas & Electric Co | 55,715 | 55,985 | ||||||
Sempra Energy |
| |||||||
2.331% (USD LIBOR + 0.500%) | 320,000 | 303,165 | ||||||
2.850% due 11/15/20 | 410,000 | 408,877 | ||||||
2.875% due 10/01/22 | 25,000 | 25,113 | ||||||
Sinosing Services Pte Ltd (Singapore) | 500,000 | 496,916 | ||||||
State Grid Overseas Investment Ltd (China) | 615,000 | 615,318 | ||||||
Vistra Operations Co LLC | 705,000 | 664,850 | ||||||
|
| |||||||
| 5,308,410 | ||||||||
|
| |||||||
Total Corporate Bonds & Notes |
| 69,800,424 | ||||||
|
| |||||||
MORTGAGE-BACKED SECURITIES - 20.3% |
| |||||||
Collateralized Mortgage Obligations - Commercial - 4.3% |
| |||||||
BAMLL Commercial Mortgage Securities Trust 1.555% (USD LIBOR + 0.850%) | 600,000 | 525,112 | ||||||
3.490% due 04/14/33 ~ | 130,000 | 135,921 | ||||||
Banc of America Commercial Mortgage Trust | 45,897 | 45,772 | ||||||
Bank 2019-BNK19 | 104,937 | 105,598 | ||||||
Bank 2019-BNK24 | 124,508 | 125,234 | ||||||
BX Commercial Mortgage Trust |
| |||||||
1.825% (USD LIBOR + 1.120%) | 190,000 | 175,564 | ||||||
1.955% (USD LIBOR + 1.250%) | 180,000 | 164,676 | ||||||
BX Trust | 360,000 | 326,552 | ||||||
CGDB Commercial Mortgage Trust | 350,000 | 293,410 | ||||||
Commercial Mortgage Trust | ||||||||
1.443% due 08/10/49 | 29,444 | 29,293 | ||||||
1.770% due 02/10/49 | 1,833 | 1,827 | ||||||
1.965% due 02/10/50 | 41,824 | 41,781 | ||||||
3.221% due 10/10/48 | 200,000 | 200,406 | ||||||
3.633% due 02/10/37 § ~ | 120,000 | 97,144 | ||||||
4.701% due 03/10/47 | 130,000 | 133,372 | ||||||
4.731% due 08/10/47 § ~ | 100,000 | 86,214 | ||||||
Credit Suisse Mortgage Capital Certificates Trust | 210,000 | 192,116 | ||||||
CSAIL Commercial Mortgage Trust |
| |||||||
2.025% due 09/15/50 | 110,051 | 110,011 | ||||||
2.360% due 06/15/52 | 138,858 | 140,422 | ||||||
Fontainebleau Miami Beach Trust | 330,000 | 271,940 | ||||||
Great Wolf Trust | 145,000 | 129,809 | ||||||
GS Mortgage Securities Trust | 16,076 | 16,015 | ||||||
InTown Hotel Portfolio Trust |
| |||||||
1.405% (USD LIBOR + 0.700%) | 100,000 | 92,837 | ||||||
1.955% (USD LIBOR + 1.250%) | 100,000 | 90,012 | ||||||
| See Notes to Financial Statements | See explanation of symbols and terms, if any, on B-76 and B-77 |
B-33
Table of Contents
PACIFIC FUNDS
PF SHORT DURATION BOND FUND
Schedule of Investments (Continued)
March 31, 2020
Principal Amount | | |||||||
JP Morgan Chase Commercial Mortgage Securities Trust |
| |||||||
2.055% (USD LIBOR + 1.350%) | $380,000 | $357,807 | ||||||
2.305% (USD LIBOR + 1.600%) | 120,000 | 113,208 | ||||||
JPMDB Commercial Mortgage Securities Trust | 5,067 | 5,049 | ||||||
Morgan Stanley Bank of America Merrill Lynch Trust |
| |||||||
1.597% due 05/15/49 | 2,397 | 2,391 | ||||||
1.706% due 05/15/48 | 18,662 | 18,616 | ||||||
4.110% due 10/15/47 § | 195,000 | 203,584 | ||||||
Morgan Stanley Capital I Trust |
| |||||||
1.638% due 05/15/48 | 15,436 | 15,392 | ||||||
3.177% due 11/10/36 ~ | 255,000 | 221,974 | ||||||
New Orleans Hotel Trust | 385,000 | 334,734 | ||||||
RETL RVP ‘A’ | 24,763 | 23,154 | ||||||
SLIDE Fund Trust | 124,765 | 112,878 | ||||||
Wells Fargo Commercial Mortgage Trust |
| |||||||
1.968% due 07/15/50 | 86,962 | 87,005 | ||||||
1.975% due 09/15/50 | 88,239 | 88,161 | ||||||
WFRBS Commercial Mortgage Trust | 195,000 | 198,577 | ||||||
|
| |||||||
| 5,313,568 | ||||||||
|
| |||||||
Collateralized Mortgage Obligations - Residential - 12.6% |
| |||||||
COLT Mortgage Loan Trust | ||||||||
2.764% due 08/25/49 § ~ | 268,184 | 262,051 | ||||||
3.337% due 05/25/49 § ~ | 108,074 | 105,877 | ||||||
3.470% due 07/27/48 § ~ | 92,656 | 91,778 | ||||||
3.542% due 07/27/48 § ~ | 45,243 | 44,815 | ||||||
4.006% due 12/28/48 § ~ | 171,646 | 170,841 | ||||||
4.108% due 12/28/48 § ~ | 166,923 | 166,348 | ||||||
Connecticut Avenue Securities Trust |
| |||||||
1.697% (USD LIBOR + 0.750%) | 39,589 | 38,708 | ||||||
1.697% (USD LIBOR + 0.750%) | 1,510 | 1,495 | ||||||
1.697% (USD LIBOR + 0.750%) | 138,109 | 134,927 | ||||||
1.747% (USD LIBOR + 0.800%) | 192,961 | 186,063 | ||||||
Deephaven Residential Mortgage Trust |
| |||||||
2.577% due 10/25/47 § ~ | 73,728 | 73,999 | ||||||
2.711% due 10/25/47 § ~ | 19,402 | 19,473 | ||||||
2.813% due 10/25/47 § ~ | 19,402 | 19,472 | ||||||
2.964% due 07/25/59 § ~ | 232,304 | 224,107 | ||||||
2.976% due 12/25/57 § ~ | 58,217 | 57,786 | ||||||
3.479% due 04/25/58 § ~ | 107,234 | 105,370 | ||||||
3.485% due 12/26/46 § ~ | 14,604 | 14,383 | ||||||
3.763% due 04/25/59 § ~ | 119,969 | 116,886 | ||||||
3.921% due 04/25/59 § ~ | 100,000 | 94,335 | ||||||
3.963% due 08/25/58 § ~ | 43,546 | 42,910 | ||||||
4.080% due 10/25/58 § ~ | 350,945 | 357,197 | ||||||
Ellington Financial Mortgage Trust | 361,782 | 350,697 | ||||||
Fannie Mae Connecticut Avenue Securities |
| |||||||
1.627% (USD LIBOR + 0.680%) | 40,232 | 39,576 | ||||||
1.667% (USD LIBOR + 0.720%) | 15,596 | 15,508 | ||||||
1.797% (USD LIBOR + 0.850%) | 25,719 | 25,499 | ||||||
1.797% (USD LIBOR + 0.850%) | 360,000 | 302,794 | ||||||
Principal Amount | | |||||||
2.047% (USD LIBOR + 1.100%) | $400,000 | $357,827 | ||||||
2.147% (USD LIBOR + 1.200%) | 214,383 | 195,273 | ||||||
2.297% (USD LIBOR + 1.350%) | 150,000 | 142,722 | ||||||
Fannie Mae REMICS | 23,801 | 24,623 | ||||||
Flagstar Mortgage Trust |
| |||||||
1.797% (USD LIBOR + 0.850%) | 181,968 | 171,275 | ||||||
4.000% due 09/25/48 § ~ | 301,672 | 310,291 | ||||||
Freddie Mac Stacr Remic Trust |
| |||||||
1.697% (USD LIBOR + 0.750%) | 160,000 | 154,773 | ||||||
1.697% (USD LIBOR + 0.750%) | 160,000 | 153,458 | ||||||
1.717% (USD LIBOR + 0.770%) | 90,279 | 87,565 | ||||||
3.911% (USD LIBOR + 3.100%) | 210,000 | 137,957 | ||||||
Freddie Mac STACR Trust | 135,000 | 114,721 | ||||||
Freddie Mac Structured Agency Credit Risk Debt |
| |||||||
1.697% (USD LIBOR + 0.750%) | 99,234 | 97,827 | ||||||
1.747% (USD LIBOR + 0.800%) | 30,694 | 30,341 | ||||||
2.147% (USD LIBOR + 1.200%) | 1,093 | 1,088 | ||||||
3.147% (USD LIBOR + 2.200%) | 293,922 | 292,932 | ||||||
3.811% due 05/25/48 § ~ | 34,682 | 33,558 | ||||||
3.980% due 09/25/47 § ~ | 7,890 | 7,686 | ||||||
4.148% due 08/25/48 § ~ | 17,680 | 17,266 | ||||||
Freddie Mac Whole Loan Securities Trust | 31,812 | 31,465 | ||||||
FWD Securitization Trust | 393,493 | 388,634 | ||||||
Galton Funding Mortgage Trust |
| |||||||
2.310% due 01/25/60 § ~ | 165,156 | 159,276 | ||||||
2.832% due 01/25/60 § ~ | 145,000 | 115,663 | ||||||
3.339% due 10/25/59 § ~ | 140,000 | 119,973 | ||||||
3.500% due 11/25/57 § ~ | 115,171 | 114,570 | ||||||
4.000% due 02/25/59 § ~ | 154,545 | 153,314 | ||||||
Government National Mortgage Association | 33,304 | 32,963 | ||||||
GS Mortgage-Backed Securities Trust | 17,172 | 15,637 | ||||||
Homeward Opportunities Fund I Trust |
| |||||||
2.675% due 11/25/59 § ~ | 230,095 | 221,291 | ||||||
3.454% due 01/25/59 § ~ | 232,433 | 225,589 | ||||||
3.606% due 01/25/59 § ~ | 159,383 | 154,703 | ||||||
3.766% due 06/25/48 § ~ | 87,832 | 85,521 | ||||||
3.897% due 06/25/48 § ~ | 71,863 | 69,975 | ||||||
Metlife Securitization Trust | 109,472 | 109,014 | ||||||
New Residential Mortgage Loan Trust |
| |||||||
2.464% due 01/26/60 § ~ | 177,647 | 176,461 | ||||||
2.710% due 11/25/59 § ~ | 284,921 | 283,259 | ||||||
2.802% due 07/25/49 § ~ | 233,256 | 229,260 | ||||||
3.086% due 07/25/49 § ~ | 95,802 | 94,172 | ||||||
3.675% due 01/25/49 § ~ | 337,902 | 335,420 | ||||||
3.986% due 11/25/48 § ~ | 153,321 | 153,304 | ||||||
OBX 2019-EXP2 Trust |
| |||||||
1.847% (USD LIBOR + 0.900%) | 139,228 | 135,990 | ||||||
2.147% (USD LIBOR + 1.200%) | 236,604 | 226,765 | ||||||
| See Notes to Financial Statements | See explanation of symbols and terms, if any, on B-76 and B-77 |
B-34
Table of Contents
PACIFIC FUNDS
PF SHORT DURATION BOND FUND
Schedule of Investments (Continued)
March 31, 2020
Principal Amount | | |||||||
OBX 2020-EXP1 Trust |
| |||||||
1.897% (USD LIBOR + 0.950%) | $97,177 | $92,423 | ||||||
3.500% due 02/25/60 § ~ | 257,445 | 253,021 | ||||||
OBX 2020-INV1 Trust | 118,657 | 121,393 | ||||||
Sequoia Mortgage Trust |
| |||||||
3.500% due 02/25/48 § ~ | 157,084 | 156,298 | ||||||
4.000% due 06/25/48 § ~ | 457,569 | 462,965 | ||||||
4.000% due 08/25/48 § ~ | 274,700 | 277,301 | ||||||
4.500% due 08/25/48 § ~ | 45,783 | 46,408 | ||||||
SG Residential Mortgage Trust |
| |||||||
2.703% due 09/25/59 § ~ | 131,598 | 128,067 | ||||||
2.877% due 09/25/59 § ~ | 328,995 | 320,199 | ||||||
STACR Trust |
| |||||||
1.747% (USD LIBOR + 0.800%) | 144,525 | 142,589 | ||||||
1.847% (USD LIBOR + 0.900%) | 110,000 | 98,846 | ||||||
1.897% (USD LIBOR + 0.950%) | 70,000 | 62,240 | ||||||
2.197% (USD LIBOR + 1.250%) | 199,598 | 189,933 | ||||||
Starwood Mortgage Residential Trust |
| |||||||
2.408% due 02/25/50 § ~ | 119,612 | 114,898 | ||||||
2.610% due 09/27/49 § ~ | 85,307 | 82,151 | ||||||
2.941% due 06/25/49 § ~ | 194,190 | 194,034 | ||||||
3.299% due 06/25/49 § ~ | 134,744 | 134,668 | ||||||
3.468% due 02/25/49 § ~ | 339,938 | 338,685 | ||||||
4.121% due 10/25/48 § ~ | 449,357 | 443,754 | ||||||
Verus Securitization Trust |
| |||||||
2.417% due 01/25/60 § ~ | 397,920 | 382,412 | ||||||
2.724% due 01/25/60 § ~ | 162,116 | 155,834 | ||||||
2.913% due 07/25/59 § ~ | 327,245 | 323,769 | ||||||
2.929% due 02/25/48 § ~ | 31,725 | 30,460 | ||||||
3.000% due 11/25/59 § ~ | 388,573 | 394,194 | ||||||
3.100% due 11/25/59 § ~ | 158,710 | 153,886 | ||||||
3.117% due 07/25/59 § ~ | 200,710 | 198,548 | ||||||
3.211% due 05/25/59 § ~ | 169,255 | 165,931 | ||||||
3.402% due 12/25/59 § ~ | 94,833 | 91,717 | ||||||
3.677% due 06/01/58 § ~ | 111,353 | 109,037 | ||||||
3.779% due 06/01/58 § ~ | 48,414 | 47,384 | ||||||
3.830% due 06/01/58 § ~ | 48,414 | 47,348 | ||||||
3.836% due 02/25/59 § ~ | 301,806 | 293,247 | ||||||
4.148% due 10/25/58 § ~ | 355,464 | 347,155 | ||||||
|
| |||||||
| 15,427,092 | ||||||||
|
| |||||||
Fannie Mae - 1.8% |
| |||||||
4.500% due 04/01/26 - 01/01/50 | 834,111 | 899,830 | ||||||
5.000% due 09/01/25 - 02/01/49 | 774,422 | 851,161 | ||||||
6.000% due 11/01/35 - 02/01/49 | 386,696 | 445,907 | ||||||
|
| |||||||
| 2,196,898 | ||||||||
|
| |||||||
Freddie Mac - 0.3% |
| |||||||
4.500% due 03/01/49 - 12/01/49 | 259,241 | 279,538 | ||||||
7.000% due 03/01/39 | 36,128 | 42,775 | ||||||
7.500% due 06/01/38 | 39,515 | 46,881 | ||||||
|
| |||||||
| 369,194 | ||||||||
|
| |||||||
Government National Mortgage Association - 1.3% |
| |||||||
5.000% due 01/20/48 - 06/20/49 | 1,035,655 | 1,114,124 | ||||||
5.500% due 09/15/45 - 02/20/49 | 374,106 | 414,587 | ||||||
|
| |||||||
| 1,528,711 | ||||||||
|
| |||||||
Total Mortgage-Backed Securities |
| 24,835,463 | ||||||
|
| |||||||
Principal Amount | | |||||||
ASSET-BACKED SECURITIES - 19.1% |
| |||||||
Allegro CLO Ltd (Cayman) | $244,116 | $241,241 | ||||||
Ally Auto Receivables Trust |
| |||||||
2.460% due 09/15/22 | 40,000 | 39,886 | ||||||
2.930% due 11/15/23 | 70,000 | 69,918 | ||||||
American Express Credit Account Master Trust | 865,000 | 888,456 | ||||||
AmeriCredit Automobile Receivables Trust |
| |||||||
1.590% due 10/20/25 | 165,000 | 155,032 | ||||||
1.800% due 12/18/25 | 160,000 | 150,100 | ||||||
2.690% due 06/19/23 | 110,000 | 109,226 | ||||||
2.710% due 08/18/22 | 100,000 | 99,453 | ||||||
2.710% due 09/08/22 | 315,000 | 303,557 | ||||||
2.740% due 12/08/22 | 535,000 | 528,479 | ||||||
3.080% due 12/18/23 | 522,000 | 512,736 | ||||||
3.820% due 03/18/24 | 860,000 | 837,212 | ||||||
Applebee’s Funding LLC | 150,000 | 136,612 | ||||||
ARI Fleet Lease Trust |
| |||||||
1.910% due 04/15/26 ~ | 8,372 | 8,357 | ||||||
2.060% due 11/15/28 ~ | 190,000 | 182,763 | ||||||
2.550% due 10/15/26 ~ | 251,646 | 251,074 | ||||||
Ascentium Equipment Receivables Trust | 29,794 | 29,697 | ||||||
Avis Budget Rental Car Funding AESOP LLC |
| |||||||
2.330% due 08/20/26 ~ | 125,000 | 111,256 | ||||||
2.500% due 07/20/21 ~ | 183,333 | 183,072 | ||||||
2.650% due 03/20/26 ~ | 425,000 | 367,093 | ||||||
2.720% due 11/20/22 ~ | 535,000 | 525,828 | ||||||
3.330% due 03/20/24 ~ | 260,000 | 252,409 | ||||||
3.700% due 03/20/23 ~ | 100,000 | 98,491 | ||||||
4.530% due 03/20/23 ~ | 130,000 | 128,586 | ||||||
4.950% due 03/20/25 ~ | 100,000 | 65,642 | ||||||
Bayview Mortgage Fund Trust | 145,249 | 143,717 | ||||||
Bayview Opportunity Master Fund Trust | 88,269 | 88,089 | ||||||
BlueMountain CLO Ltd (Cayman) | 270,000 | 264,841 | ||||||
BRE Grand Islander Timeshare Issuer LLC | 335,360 | 333,104 | ||||||
Capital Auto Receivables Asset Trust |
| |||||||
2.700% due 09/20/22 ~ | 65,000 | 64,305 | ||||||
3.360% due 11/21/22 ~ | 160,000 | 158,640 | ||||||
3.480% due 10/20/23 ~ | 60,000 | 60,083 | ||||||
3.690% due 12/20/23 ~ | 80,000 | 80,287 | ||||||
Carmax Auto Owner Trust | 105,000 | 105,479 | ||||||
CBAM Ltd (Cayman) | 760,000 | 730,994 | ||||||
CNH Equipment Trust |
| |||||||
1.930% due 03/15/24 | 315,000 | 312,960 | ||||||
3.010% due 04/15/24 | 195,000 | 194,027 | ||||||
Cole Park CLO Ltd (Cayman) | 435,000 | 426,612 | ||||||
Daimler Trucks Retail Trust | 265,000 | 269,215 | ||||||
Driven Brands Funding LLC | 416,513 | 420,520 | ||||||
Elara HGV Timeshare Issuer LLC |
| |||||||
2.530% due 02/25/27 ~ | 24,361 | 24,168 | ||||||
2.690% due 03/25/30 ~ | 50,094 | 49,179 | ||||||
2.730% due 04/25/28 ~ | 157,753 | 154,783 | ||||||
| See Notes to Financial Statements | See explanation of symbols and terms, if any, on B-76 and B-77 |
B-35
Table of Contents
PACIFIC FUNDS
PF SHORT DURATION BOND FUND
Schedule of Investments (Continued)
March 31, 2020
Principal Amount | | |||||||
Enterprise Fleet Financing LLC | $91,292 | $91,062 | ||||||
Ford Credit Auto Owner Trust |
| |||||||
2.030% due 12/15/27 ~ | 350,000 | 350,827 | ||||||
3.520% due 07/15/30 ~ | 545,000 | 565,870 | ||||||
GM Financial Automobile Leasing Trust |
| |||||||
3.110% due 12/20/21 | 105,000 | 104,963 | ||||||
3.370% due 10/20/22 | 245,000 | 244,733 | ||||||
3.500% due 04/20/22 | 80,000 | 80,296 | ||||||
3.560% due 12/20/22 | 275,000 | 277,544 | ||||||
GM Financial Consumer Automobile Trust | 100,000 | 99,855 | ||||||
GMF Floorplan Owner Revolving Trust |
| |||||||
2.630% due 07/15/22 ~ | 190,000 | 187,714 | ||||||
2.700% due 04/15/24 ~ | 170,000 | 169,503 | ||||||
3.240% due 03/15/23 ~ | 352,000 | 350,809 | ||||||
GreatAmerica Leasing Receivables Funding LLC | 57,208 | 57,296 | ||||||
Hardee’s Funding LLC | 133,010 | 127,828 | ||||||
Hilton Grand Vacations Trust |
| |||||||
1.770% due 11/25/26 ~ | 36,622 | 36,346 | ||||||
2.660% due 12/26/28 ~ | 38,954 | 38,396 | ||||||
2.960% due 12/26/28 ~ | 38,954 | 38,388 | ||||||
Hyundai Auto Receivables Trust |
| |||||||
2.380% due 04/17/23 | 395,000 | 397,069 | ||||||
2.940% due 05/15/25 | 165,000 | 165,900 | ||||||
Madison Park Funding Ltd (Cayman) |
| |||||||
3.009% (USD LIBOR + 1.190%) | 500,000 | 478,750 | ||||||
3.131% (USD LIBOR + 1.300%) | 250,000 | 238,890 | ||||||
Mill City Mortgage Loan Trust | 33,063 | 32,990 | ||||||
MMAF Equipment Finance LLC |
| |||||||
2.040% due 02/16/22 ~ | 35,769 | 35,674 | ||||||
3.200% due 09/12/22 ~ | 210,000 | 209,774 | ||||||
MVW Owner Trust |
| |||||||
2.150% due 04/22/30 ~ | 10,549 | 10,543 | ||||||
2.420% due 12/20/34 ~ | 345,576 | 338,033 | ||||||
2.890% due 11/20/36 ~ | 382,917 | 359,887 | ||||||
Navient Private Education Refi Loan Trust |
| |||||||
2.150% due 11/15/68 ~ | 605,000 | 596,125 | ||||||
2.400% due 10/15/68 ~ | 206,149 | 208,970 | ||||||
2.530% due 02/18/42 ~ | 26,702 | 26,686 | ||||||
2.640% due 05/15/68 ~ | 360,000 | 369,925 | ||||||
Navient Private Education Refi Loan Trust ‘A1’ | 177,228 | 177,530 | ||||||
Navient Private Education Refi Loan Trust ‘A2A’ | 195,000 | 199,237 | ||||||
Neuberger Berman CLO Ltd (Cayman) | 250,000 | 243,582 | ||||||
OCP CLO Ltd (Cayman) |
| |||||||
2.614% (USD LIBOR + 0.820%) | 295,906 | 289,638 | ||||||
2.939% (USD LIBOR + 1.120%) | 415,000 | 401,054 | ||||||
OZLM VIII Ltd (Cayman) | 250,000 | 241,216 | ||||||
Planet Fitness Master Issuer LLC | 197,000 | 188,062 | ||||||
Santander Drive Auto Receivables Trust |
| |||||||
2.460% due 03/15/22 | 32,172 | 32,074 | ||||||
2.580% due 05/16/22 | 6,435 | 6,431 | ||||||
3.210% due 09/15/23 | 210,000 | 209,825 | ||||||
3.270% due 01/17/23 | 85,173 | 85,260 | ||||||
4.020% due 04/15/22 | 81,755 | 81,759 | ||||||
Principal Amount | | |||||||
Santander Retail Auto Lease Trust |
| |||||||
2.520% due 11/20/24 ~ | $165,000 | $160,207 | ||||||
2.880% due 06/20/24 ~ | 410,000 | 407,117 | ||||||
2.960% due 11/21/22 ~ | 85,000 | 84,874 | ||||||
3.010% due 05/22/23 ~ | 180,000 | 181,203 | ||||||
Sierra Timeshare Conduit Receivables Funding LLC | 557,133 | 550,354 | ||||||
Sierra Timeshare Receivables Funding LLC |
| |||||||
2.330% due 07/20/33 ~ | 14,638 | 14,468 | ||||||
2.430% due 10/20/33 ~ | 40,427 | 39,914 | ||||||
2.580% due 09/20/32 ~ | 137,488 | 136,488 | ||||||
3.080% due 03/21/33 ~ | 110,225 | 109,729 | ||||||
SLM Student Loan Trust |
| |||||||
1.347% (USD LIBOR + 0.400%) | 106,863 | 102,184 | ||||||
3.294% (USD LIBOR + 1.500%) | 19,509 | 19,340 | ||||||
3.494% (USD LIBOR + 1.700%) | 30,426 | 28,766 | ||||||
SMB Private Education Loan Trust |
| |||||||
1.705% (USD LIBOR + 1.000%) | 51,076 | 49,777 | ||||||
1.855% (USD LIBOR + 1.150%) | 93,502 | 93,461 | ||||||
2.205% (USD LIBOR + 1.500%) | 225,000 | 225,494 | ||||||
3.050% due 05/15/26 ~ | 44,001 | 44,239 | ||||||
3.600% due 01/15/37 ~ | 141,910 | 141,566 | ||||||
Synchrony Card Funding LLC | 430,000 | 424,944 | ||||||
Synchrony Credit Card Master Note Trust |
| |||||||
2.620% due 09/15/23 | 85,000 | 84,796 | ||||||
3.360% due 03/15/24 | 780,000 | 780,895 | ||||||
Towd Point Mortgage Trust |
| |||||||
2.250% due 07/25/56 § ~ | 40,007 | 39,249 | ||||||
2.750% due 02/25/55 § ~ | 24,750 | 24,804 | ||||||
2.750% due 04/25/55 § ~ | 35,810 | 35,859 | ||||||
2.750% due 05/25/55 § ~ | 36,846 | 36,773 | ||||||
2.750% due 08/25/55 § ~ | 37,571 | 37,089 | ||||||
2.750% due 10/25/56 § ~ | 48,419 | 48,741 | ||||||
2.750% due 04/25/57 § ~ | 102,409 | 100,448 | ||||||
3.000% due 01/25/58 § ~ | 76,966 | 77,795 | ||||||
3.750% due 05/25/58 § ~ | 101,499 | 102,019 | ||||||
Verizon Owner Trust |
| |||||||
2.530% due 04/20/22 ~ | 120,000 | 116,192 | ||||||
2.650% due 09/20/21 ~ | 100,000 | 99,680 | ||||||
Volvo Financial Equipment LLC | 265,000 | 257,951 | ||||||
World Omni Auto Receivables Trust | 120,000 | 116,629 | ||||||
|
| |||||||
Total Asset-Backed Securities |
| 23,376,538 | ||||||
|
| |||||||
SHORT-TERM INVESTMENTS - 2.9% |
| |||||||
Commercial Paper - 1.1% |
| |||||||
Boeing Co | 345,000 | 332,337 | ||||||
2.343% due 11/04/20 | 360,000 | 347,345 | ||||||
Ford Motor Credit Co LLC | 260,000 | 253,405 | ||||||
Syngenta Wilmington Inc | 430,000 | 426,810 | ||||||
|
| |||||||
| 1,359,897 | ||||||||
|
| |||||||
| See Notes to Financial Statements | See explanation of symbols and terms, if any, on B-76 and B-77 |
B-36
Table of Contents
PACIFIC FUNDS
PF SHORT DURATION BOND FUND
Schedule of Investments (Continued)
March 31, 2020
Shares | Value | |||||||
Money Market Fund - 1.8% |
| |||||||
BlackRock Liquidity FundsT-Fund Portfolio ‘Institutional’ 0.210% | 2,180,777 | $2,180,777 | ||||||
|
| |||||||
Total Short-Term Investments |
| 3,540,674 | ||||||
|
| |||||||
TOTAL INVESTMENTS - 99.4% |
| 121,553,099 | ||||||
DERIVATIVES - 0.3% | 402,438 | |||||||
|
| |||||||
OTHER ASSETS & LIABILITIES, NET - 0.3% |
| 324,571 | ||||||
|
| |||||||
NET ASSETS - 100.0% |
| $122,280,108 | ||||||
|
| |||||||
Notes to Schedule of Investments
| (a) | As of March 31, 2020, the Fund’s composition as a percentage of net assets was as follows: |
Corporate Bonds & Notes | 57.1% | |||
Mortgage-Backed Securities | 20.3% | |||
Asset-Backed Securities | 19.1% | |||
Others (each less than 3.0%) | 2.9% | |||
|
| |||
| 99.4% | ||||
|
| |||
Derivatives | 0.3% | |||
Other Assets & Liabilities, Net | 0.3% | |||
|
| |||
| 100.0% | ||||
|
|
| (b) | Open futures contracts outstanding as of March 31, 2020 were as follows: |
| Long Futures Outstanding | Expiration Month | Number of Contracts | Notional Amount | Value | Unrealized Appreciation (Depreciation) | |||||||||||||||
U.S. Treasury2-Year Notes | 06/20 | 216 | $46,891,374 | $47,602,687 | $711,313 | |||||||||||||||
U.S. Treasury Ultra10-Year Notes | 06/20 | 2 | 294,410 | 312,063 | 17,653 | |||||||||||||||
|
| |||||||||||||||||||
| 728,966 | ||||||||||||||||||||
|
| |||||||||||||||||||
Short Futures Outstanding | ||||||||||||||||||||
U.S. Treasury5-Year Notes | 06/20 | 37 | 4,485,908 | 4,638,297 | (152,389 | ) | ||||||||||||||
U.S. Treasury10-Year Notes | 06/20 | 35 | 4,676,384 | 4,854,063 | (177,679 | ) | ||||||||||||||
|
| |||||||||||||||||||
| (330,068 | ) | |||||||||||||||||||
|
| |||||||||||||||||||
Total Futures Contracts | $398,898 | |||||||||||||||||||
|
| |||||||||||||||||||
| (c) | Swap agreements outstanding as of March 31, 2020 were as follows: |
Credit Default Swaps on Credit Indices – Sell Protection (1)
Referenced Obligation | Payment Frequency | Fixed Deal Receive Rate | Expiration Date | Exchange | Notional Amount (2) | Value (3) | Upfront Premiums Paid (Received) | Unrealized Appreciation (Depreciation) | ||||||||||||||||||||
CDX IG 33 5Y | Q | 1.000% | 12/20/24 | ICE | $861,000 | ($2,840 | ) | ($6,380 | ) | $3,540 | ||||||||||||||||||
|
|
|
|
|
| |||||||||||||||||||||||
| (1) | If the Fund is a seller of protection and a credit event occurs, as defined under the terms of that particular swap agreement, the Fund will either (i) pay to the buyer of protection an amount equal to the notional amount of the swap and take delivery of the referenced obligation or underlying investments comprising the referenced index or (ii) pay a net settlement amount in the form of cash or investments equal to the notional amount of the swap less the recovery value of the referenced obligation or underlying investments comprising the referenced index. |
| (2) | The maximum potential amount the Fund could be required to pay as a seller of credit protection or receive as a buyer of credit protection if a credit event occurs as defined under the terms of that particular swap agreement. |
| (3) | The quoted market prices and resulting values for credit default swap agreements on credit indices serve as an indicator of the current status of the payment/performance risk and represent the expected amount paid or received for the credit derivative had the notional amount of the swap agreement been closed/sold as of year end. Increasing values (buy protection) or decreasing values (sell protection), when compared to the notional amount of the swap, represent a deterioration of the referenced entity’s credit soundness and a greater likelihood of risk of default or other credit event occurring as defined under the terms of the agreement. |
Balances reported in the Statement of Assets and Liabilities for Centrally Cleared Swaps
Upfront Paid | Unrealized Appreciation (Deprecation) | |||||||
Centrally Cleared Swap Agreements (1) | ||||||||
Assets | $— | $3,540 | ||||||
Liabilities | (6,380 | ) | — | |||||
|
|
|
| |||||
| ($6,380 | ) | $3,540 | ||||||
|
|
|
| |||||
| (1) | Includes cumulative value on centrally cleared swaps, as reported in the Schedule of Investments. Only variation margin is reported within the Statement of Assets and Liabilities. |
| See Notes to Financial Statements | See explanation of symbols and terms, if any, on B-76 and B-77 |
B-37
Table of Contents
PACIFIC FUNDS
PF SHORT DURATION BOND FUND
Schedule of Investments (Continued)
March 31, 2020
| (d) | Fair Value Measurements |
The following is a summary of the Fund’s investments as categorized under the three-tier hierarchy of inputs used in valuing the Fund’s assets and liabilities as of March 31, 2020:
Total Value at March 31, 2020 | Level 1 Quoted Price | Level 2 Significant Observable Inputs | Level 3 Significant Unobservable Inputs | |||||||||||||||
Assets | Corporate Bonds & Notes | $69,800,424 | $— | $69,800,424 | $— | |||||||||||||
Mortgage-Backed Securities | 24,835,463 | — | 24,835,463 | — | ||||||||||||||
Asset-Backed Securities | 23,376,538 | — | 23,376,538 | — | ||||||||||||||
Short-Term Investments | 3,540,674 | 2,180,777 | 1,359,897 | — | ||||||||||||||
Derivatives: | ||||||||||||||||||
Credit Contracts | ||||||||||||||||||
Swaps | 3,540 | — | 3,540 | — | ||||||||||||||
Interest Rate Contracts |
| |||||||||||||||||
Futures | 728,966 | 728,966 | — | — | ||||||||||||||
|
|
|
|
|
|
|
| |||||||||||
Total Assets - Derivatives | 732,506 | 728,966 | 3,540 | — | ||||||||||||||
|
|
|
|
|
|
|
| |||||||||||
Total Assets | 122,285,605 | 2,909,743 | 119,375,862 | — | ||||||||||||||
|
|
|
|
|
|
|
| |||||||||||
Liabilities | Derivatives: | |||||||||||||||||
Interest Rate Contracts |
| |||||||||||||||||
Futures | (330,068 | ) | (330,068 | ) | — | — | ||||||||||||
|
|
|
|
|
|
|
| |||||||||||
Total Liabilities | (330,068 | ) | (330,068 | ) | — | — | ||||||||||||
|
|
|
|
|
|
|
| |||||||||||
Total | $121,955,537 | $2,579,675 | $119,375,862 | $— | ||||||||||||||
|
|
|
|
|
|
|
| |||||||||||
| See Notes to Financial Statements | See explanation of symbols and terms, if any, on B-76 and B-77 |
B-38
Table of Contents
PACIFIC FUNDS
PF EMERGING MARKETS DEBT FUND
Schedule of Investments
March 31, 2020
Principal Amount | Value | |||||||
CORPORATE BONDS & NOTES - 20.9% |
| |||||||
Argentina - 0.1% |
| |||||||
MSU Energy SA | $150,000 | $58,502 | ||||||
YPF SA | 50,000 | 26,237 | ||||||
|
| |||||||
| 84,739 | ||||||||
|
| |||||||
Azerbaijan - 0.7% |
| |||||||
Southern Gas Corridor CJSC | 437,000 | 448,222 | ||||||
State Oil Co of the Azerbaijan Republic | 200,000 | 200,500 | ||||||
|
| |||||||
| 648,722 | ||||||||
|
| |||||||
Bahrain - 0.2% |
| |||||||
The Oil and Gas Holding Co BSCC | 200,000 | 177,516 | ||||||
|
| |||||||
Brazil - 2.2% |
| |||||||
Braskem Netherlands Finance BV | 200,000 | 156,125 | ||||||
CSN Islands XI Corp | 200,000 | 128,998 | ||||||
NBM US Holdings Inc | 400,000 | 365,847 | ||||||
Petrobras Global Finance BV | 176,000 | 160,380 | ||||||
6.850% due 06/05/15 | 325,000 | 310,474 | ||||||
6.875% due 01/20/40 | 190,000 | 187,445 | ||||||
Rumo Luxembourg Sarl | 200,000 | 186,249 | ||||||
Vale Overseas Ltd | 165,000 | 184,934 | ||||||
6.875% due 11/10/39 | 255,000 | 283,768 | ||||||
|
| |||||||
| 1,964,220 | ||||||||
|
| |||||||
Chile - 1.4% |
| |||||||
Corp Nacional del Cobre de Chile | 246,000 | 238,324 | ||||||
4.500% due 08/01/47 ~ | 275,000 | 269,926 | ||||||
4.875% due 11/04/44 ~ | 200,000 | 204,792 | ||||||
5.625% due 10/18/43 ~ | 200,000 | 219,848 | ||||||
Empresa Nacional del Petroleo | 200,000 | 159,383 | ||||||
VTR Finance BV | 180,000 | 164,474 | ||||||
|
| |||||||
| 1,256,747 | ||||||||
|
| |||||||
China - 1.3% |
| |||||||
Amber Circle Funding Ltd | 200,000 | 210,257 | ||||||
China Evergrande Group | 200,000 | 143,000 | ||||||
China SCE Group Holdings Ltd | 200,000 | 180,495 | ||||||
Scenery Journey Ltd | 200,000 | 190,627 | ||||||
Sinochem Overseas Capital Co Ltd | 100,000 | 99,863 | ||||||
6.300% due 11/12/40 ~ | 100,000 | 144,014 | ||||||
Sunac China Holdings Ltd | 225,000 | 203,617 | ||||||
|
| |||||||
| 1,171,873 | ||||||||
|
| |||||||
Colombia - 1.3% |
| |||||||
Banco de Bogota SA | 200,000 | 190,791 | ||||||
Principal Amount | Value | |||||||
Bancolombia SA | $200,000 | $176,500 | ||||||
Empresas Publicas de Medellin ESP | COP 336,000,000 | 75,688 | ||||||
Grupo Aval Ltd | $200,000 | 161,250 | ||||||
Millicom International Cellular SA | 200,000 | 175,709 | ||||||
6.000% due 03/15/25 ~ | 200,000 | 195,001 | ||||||
6.625% due 10/15/26 ~ | 200,000 | 190,890 | ||||||
|
| |||||||
| 1,165,829 | ||||||||
|
| |||||||
Congo - 0.2% |
| |||||||
HTA Group Ltd | 200,000 | 187,540 | ||||||
|
| |||||||
Georgia - 0.2% |
| |||||||
Georgian Railway JSC | 200,000 | 199,765 | ||||||
|
| |||||||
India - 0.4% |
| |||||||
Bharti Airtel Ltd | 200,000 | 186,564 | ||||||
Greenko Solar Mauritius Ltd | 200,000 | 168,003 | ||||||
|
| |||||||
| 354,567 | ||||||||
|
| |||||||
Indonesia - 1.6% |
| |||||||
P.T. Indonesia Asahan Aluminium Persero | 200,000 | 204,811 | ||||||
P.T. Pertamina Persero | 283,000 | 244,459 | ||||||
6.000% due 05/03/42 ~ | 200,000 | 212,976 | ||||||
6.500% due 11/07/48 ~ | 221,000 | 245,141 | ||||||
P.T. Perusahaan Listrik Negara | 230,000 | 233,151 | ||||||
6.150% due 05/21/48 ~ | 202,000 | 220,242 | ||||||
|
| |||||||
| 1,360,780 | ||||||||
|
| |||||||
Ireland - 0.6% |
| |||||||
C&W Senior Financing DAC | 400,000 | 347,787 | ||||||
7.500% due 10/15/26 ~ | 200,000 | 184,607 | ||||||
|
| |||||||
| 532,394 | ||||||||
|
| |||||||
Israel - 0.4% |
| |||||||
Teva Pharmaceutical Finance Netherlands III BV | 330,000 | 303,186 | ||||||
|
| |||||||
Jamaica - 0.1% |
| |||||||
Digicel Ltd | 200,000 | 109,492 | ||||||
|
| |||||||
Kazakhstan - 1.1% |
| |||||||
Development Bank of Kazakhstan JSC | 220,000 | 216,124 | ||||||
Halyk Savings Bank of Kazakhstan JSC | 66,249 | 65,336 | ||||||
Kazakhstan Temir Zholy Finance BV | 500,000 | 522,500 | ||||||
KazMunayGas National Co JSC | 200,000 | 197,800 | ||||||
|
| |||||||
| 1,001,760 | ||||||||
|
| |||||||
Luxembourg - 0.4% |
| |||||||
Altice Financing SA | 400,000 | 389,780 | ||||||
|
| |||||||
| See Notes to Financial Statements | See explanation of symbols and terms, if any, on B-76 and B-77 |
B-39
Table of Contents
PACIFIC FUNDS
PF EMERGING MARKETS DEBT FUND
Schedule of Investments (Continued)
March 31, 2020
Principal Amount | Value | |||||||
Malaysia - 0.3% |
| |||||||
Wakala Global Sukuk Bhd | $250,000 | $257,657 | ||||||
|
| |||||||
Mexico - 3.9% |
| |||||||
Alfa SAB de CV | 200,000 | 182,061 | ||||||
Axtel SAB de CV | 200,000 | 166,355 | ||||||
BBVA Bancomer SA | 400,000 | 334,230 | ||||||
Cemex SAB de CV | 225,000 | 184,444 | ||||||
7.750% due 04/16/26 ~ | 200,000 | 180,112 | ||||||
Comision Federal de Electricidad | 200,000 | 187,000 | ||||||
8.180% due 12/23/27 ~ | MXN 950,000 | 37,752 | ||||||
Petroleos Mexicanos | $243,000 | 169,746 | ||||||
6.350% due 02/12/48 | 203,000 | 128,967 | ||||||
6.750% due 09/21/47 | 853,000 | 554,190 | ||||||
6.950% due 01/28/60 ~ | 966,000 | 655,382 | ||||||
7.190% due 09/12/24 ~ | MXN 3,170,000 | 106,903 | ||||||
7.690% due 01/23/50 ~ | $466,000 | 326,342 | ||||||
Trust Fibra Uno | 200,000 | 186,061 | ||||||
|
| |||||||
| 3,399,545 | ||||||||
|
| |||||||
Morocco - 0.3% |
| |||||||
OCP SA | 200,000 | 219,500 | ||||||
|
| |||||||
Pakistan - 0.2% |
| |||||||
The Third Pakistan International Sukuk Co Ltd | 200,000 | 187,622 | ||||||
|
| |||||||
Peru - 0.3% |
| |||||||
Banco de Credito del Peru | PEN 48,000 | 14,063 | ||||||
Patrimonio EN Fideicomiso | $40,000 | 35,142 | ||||||
Petroleos del Peru SA | 200,000 | 182,271 | ||||||
|
| |||||||
| 231,476 | ||||||||
|
| |||||||
Philippines - 0.4% |
| |||||||
Power Sector Assets & Liabilities Management Corp | 308,000 | 361,699 | ||||||
|
| |||||||
Russia - 0.3% |
| |||||||
SCF Capital Designated Activity Co | 232,000 | 233,551 | ||||||
|
| |||||||
Saudi Arabia - 0.2% |
| |||||||
Acwa Power Management And Investments One Ltd | 200,000 | 182,000 | ||||||
|
| |||||||
South Africa - 0.8% |
| |||||||
Absa Group Ltd | 200,000 | 176,600 | ||||||
Principal Amount | Value | |||||||
Eskom Holdings SOC Ltd | $400,000 | $288,158 | ||||||
Gold Fields Orogen Holdings BVI Ltd | 200,000 | 190,110 | ||||||
|
| |||||||
| 654,868 | ||||||||
|
| |||||||
Ukraine - 1.0% |
| |||||||
Metinvest BV | 200,000 | 144,000 | ||||||
MHP Lux SA | 200,000 | 162,276 | ||||||
MHP SE | 200,000 | 170,123 | ||||||
Ukreximbank Via Biz Finance PLC | 200,000 | 187,914 | ||||||
VF Ukraine PAT via VFU Funding PLC | 200,000 | 168,000 | ||||||
|
| |||||||
| 832,313 | ||||||||
|
| |||||||
United Kingdom - 0.2% |
| |||||||
Standard Chartered Bank | IDR 270,000,000 | 14,258 | ||||||
8.125% due 05/17/24 ~ | 369,000,000 | 23,338 | ||||||
8.250% due 05/19/36 ~ | 980,000,000 | 58,544 | ||||||
8.375% due 03/17/34 ~ | 810,000,000 | 49,390 | ||||||
9.000% due 03/20/29 ~ | 311,000,000 | 20,137 | ||||||
11.000% due 09/17/25 ~ | 432,000,000 | 30,431 | ||||||
12.800% due 06/17/21 ~ | 157,000,000 | 10,441 | ||||||
|
| |||||||
| 206,539 | ||||||||
|
| |||||||
United States - 0.5% |
| |||||||
JBS Investments II GmbH | $400,000 | 390,420 | ||||||
|
| |||||||
Venezuela - 0.3% |
| |||||||
Petroleos de Venezuela SA | 113,000 | 7,910 | ||||||
8.500% due 10/27/20Y ~ | 1,460,500 | 235,506 | ||||||
9.000% due 11/17/21 *Y ~ | 239,354 | 16,755 | ||||||
9.750% due 05/17/35 *Y ~ | 306,278 | 21,439 | ||||||
12.750% due 02/17/22 *Y ~ | 117,000 | 8,190 | ||||||
|
| |||||||
| 289,800 | ||||||||
|
| |||||||
Total Corporate Bonds & Notes |
| 18,355,900 | ||||||
|
| |||||||
SENIOR LOAN NOTES - 0.7% |
| |||||||
United Arab Emirates - 0.7% |
| |||||||
Dubai World Corp Term B1 | 647,498 | 603,792 | ||||||
|
| |||||||
Total Senior Loan Notes |
| 603,792 | ||||||
|
| |||||||
FOREIGN GOVERNMENT BONDS & NOTES - 72.0% |
| |||||||
Angola - 0.7% |
| |||||||
Angolan Government | 281,000 | 117,318 | ||||||
8.250% due 05/09/28 ~ | 200,000 | 83,313 | ||||||
9.125% due 11/26/49 ~ | 400,000 | 162,272 | ||||||
9.375% due 05/08/48 ~ | 400,000 | 159,495 | ||||||
9.500% due 11/12/25 ~ | 232,000 | 99,962 | ||||||
|
| |||||||
| 622,360 | ||||||||
|
| |||||||
| See Notes to Financial Statements | See explanation of symbols and terms, if any, on B-76 and B-77 |
B-40
Table of Contents
PACIFIC FUNDS
PF EMERGING MARKETS DEBT FUND
Schedule of Investments (Continued)
March 31, 2020
Principal Amount | Value | |||||||
Argentina - 2.3% |
| |||||||
Argentina POM Politica Monetaria | ARS 13,175,899 | $98,276 | ||||||
Argentine Republic Government | $726,217 | 220,272 | ||||||
4.625% due 01/11/23 | 702,000 | 203,587 | ||||||
5.625% due 01/26/22 | 565,000 | 166,675 | ||||||
5.875% due 01/11/28 | 389,000 | 106,395 | ||||||
6.875% due 04/22/21 | 1,247,000 | 364,748 | ||||||
6.875% due 01/11/48 | 1,267,000 | 334,184 | ||||||
7.500% due 04/22/26 | 443,000 | 125,152 | ||||||
7.625% due 04/22/46 | 527,000 | 137,025 | ||||||
8.280% due 12/31/33 | 420,600 | 151,025 | ||||||
Bonos del Tesoro Nacional en Pesos Badlar | ARS 4,931,267 | 39,900 | ||||||
Ciudad Autonoma De Buenos Aires | 2,641,873 | 20,925 | ||||||
Provincia de Buenos Aires | 3,804,000 | 26,011 | ||||||
|
| |||||||
| 1,994,175 | ||||||||
|
| |||||||
Bahrain - 0.6% |
| |||||||
Bahrain Government | $200,000 | 183,273 | ||||||
7.500% due 09/20/47 ~ | 402,000 | 340,152 | ||||||
|
| |||||||
| 523,425 | ||||||||
|
| |||||||
Belarus - 0.7% |
| |||||||
Republic of Belarus | 200,000 | 182,955 | ||||||
6.875% due 02/28/23 ~ | 260,000 | 256,001 | ||||||
7.625% due 06/29/27 ~ | 200,000 | 201,778 | ||||||
|
| |||||||
| 640,734 | ||||||||
|
| |||||||
Brazil - 6.4% |
| |||||||
Brazil Letras do Tesouro Nacional | BRL 1,135,000 | 196,213 | ||||||
5.842% due 07/01/23 | 13,439,000 | 2,150,326 | ||||||
Brazil Notas do Tesouro Nacional ‘F’ | 6,840,000 | 1,504,047 | ||||||
10.000% due 01/01/29 | 2,441,000 | 539,380 | ||||||
10.000% due 01/01/31 | 2,520,000 | 602,477 | ||||||
Brazilian Government | $200,000 | 213,800 | ||||||
5.625% due 01/07/41 | 100,000 | 102,601 | ||||||
7.125% due 01/20/37 | 130,000 | 154,185 | ||||||
8.250% due 01/20/34 | 90,000 | 114,751 | ||||||
|
| |||||||
| 5,577,780 | ||||||||
|
| |||||||
Chile - 0.6% |
| |||||||
Bonos de la Tesoreria de la Republica | CLP 286,011,500 | 360,627 | ||||||
1.900% due 09/01/30 ^ | 14,300,575 | 19,145 | ||||||
2.000% due 03/01/35 ^ | 14,300,600 | 19,438 | ||||||
Bonos de la Tesoreria de la Republica en pesos 4.700% due 09/01/30 ~ | 130,000,000 | 166,916 | ||||||
|
| |||||||
| 566,126 | ||||||||
|
| |||||||
Colombia - 3.5% |
| |||||||
Colombia Government | $220,000 | 219,239 | ||||||
4.000% due 02/26/24 | 200,000 | 203,132 | ||||||
5.000% due 06/15/45 | 200,000 | 207,000 | ||||||
5.625% due 02/26/44 | 200,000 | 221,561 | ||||||
6.125% due 01/18/41 | 283,000 | 327,103 | ||||||
7.375% due 09/18/37 | 110,000 | 138,084 | ||||||
8.125% due 05/21/24 | 290,000 | 337,118 | ||||||
Principal Amount | Value | |||||||
Colombian TES | COP 1,240,907,286 | $326,972 | ||||||
5.750% due 11/03/27 | 66,900,000 | 15,284 | ||||||
6.000% due 04/28/28 | 128,200,000 | 29,477 | ||||||
6.250% due 11/26/25 | 119,600,000 | 28,558 | ||||||
7.000% due 05/04/22 | 1,656,100,000 | 423,461 | ||||||
7.250% due 10/18/34 | 495,200,000 | 122,373 | ||||||
7.500% due 08/26/26 | 1,168,100,000 | 294,613 | ||||||
10.000% due 07/24/24 | 700,000,000 | 197,047 | ||||||
|
| |||||||
| 3,091,022 | ||||||||
|
| |||||||
Costa Rica - 0.4% |
| |||||||
Costa Rica Government | $200,000 | 146,061 | ||||||
6.125% due 02/19/31 ~ | 200,000 | 169,900 | ||||||
|
| |||||||
| 315,961 | ||||||||
|
| |||||||
Croatia - 0.7% |
| |||||||
Croatia Government | 310,000 | 336,505 | ||||||
6.625% due 07/14/20 ~ | 260,000 | 262,039 | ||||||
|
| |||||||
| 598,544 | ||||||||
|
| |||||||
Czech Republic - 0.5% |
| |||||||
Czech Republic Government | CZK 1,690,000 | 65,406 | ||||||
1.000% due 06/26/26 ~ | 130,000 | 5,204 | ||||||
2.000% due 10/13/33 | 8,180,000 | 338,358 | ||||||
4.200% due 12/04/36 ~ | 240,000 | 13,153 | ||||||
|
| |||||||
| 422,121 | ||||||||
|
| |||||||
Dominican Republic - 2.8% |
| |||||||
Dominican Republic | $100,000 | 96,875 | ||||||
5.875% due 04/18/24 ~ | 325,000 | 322,967 | ||||||
6.000% due 07/19/28 ~ | 436,000 | 413,569 | ||||||
6.600% due 01/28/24 ~ | 200,000 | 197,751 | ||||||
6.850% due 01/27/45 ~ | 795,000 | 737,362 | ||||||
6.875% due 01/29/26 ~ | 440,000 | 441,559 | ||||||
7.450% due 04/30/44 ~ | 130,000 | 127,400 | ||||||
7.500% due 05/06/21 ~ | 109,339 | 109,668 | ||||||
|
| |||||||
| 2,447,151 | ||||||||
|
| |||||||
Ecuador - 2.7% |
| |||||||
Ecuador Government | 939,000 | 266,883 | ||||||
7.950% due 06/20/24 ~ | 568,000 | 161,880 | ||||||
8.750% due 06/02/23 ~ | 258,000 | 77,400 | ||||||
8.875% due 10/23/27 ~ | 966,000 | 247,547 | ||||||
9.500% due 03/27/30 ~ | 747,000 | 224,100 | ||||||
9.625% due 06/02/27 ~ | 650,000 | 178,750 | ||||||
9.650% due 12/13/26 ~ | 1,491,000 | 395,115 | ||||||
10.750% due 03/28/22 ~ | 1,106,000 | 347,019 | ||||||
10.750% due 01/31/29 ~ | 1,551,000 | 445,912 | ||||||
|
| |||||||
| 2,344,606 | ||||||||
|
| |||||||
Egypt - 2.5% |
| |||||||
Egypt Government | 400,000 | 342,500 | ||||||
7.500% due 01/31/27 ~ | 464,000 | 423,783 | ||||||
7.600% due 03/01/29 ~ | 488,000 | 438,575 | ||||||
7.903% due 02/21/48 ~ | 300,000 | 244,873 | ||||||
8.500% due 01/31/47 ~ | 447,000 | 368,615 | ||||||
8.700% due 03/01/49 ~ | 339,000 | 283,021 | ||||||
15.900% due 07/02/24 | EGP 730,000 | 49,680 | ||||||
16.100% due 05/07/29 | 731,000 | 52,405 | ||||||
|
| |||||||
| 2,203,452 | ||||||||
|
| |||||||
| See Notes to Financial Statements | See explanation of symbols and terms, if any, on B-76 and B-77 |
B-41
Table of Contents
PACIFIC FUNDS
PF EMERGING MARKETS DEBT FUND
Schedule of Investments (Continued)
March 31, 2020
Principal Amount | Value | |||||||
El Salvador - 1.6% |
| |||||||
El Salvador Government | $153,000 | $135,595 | ||||||
6.375% due 01/18/27 ~ | 425,000 | 375,506 | ||||||
7.125% due 01/20/50 ~ | 284,000 | 221,236 | ||||||
7.625% due 02/01/41 ~ | 300,000 | 249,095 | ||||||
7.650% due 06/15/35 ~ | 149,000 | 128,185 | ||||||
8.250% due 04/10/32 ~ | 142,000 | 130,818 | ||||||
8.625% due 02/28/29 ~ | 201,000 | 196,687 | ||||||
|
| |||||||
| 1,437,122 | ||||||||
|
| |||||||
Gabon - 0.9% |
| |||||||
Gabon Government | 453,000 | 317,666 | ||||||
6.625% due 02/06/31 ~ | 705,000 | 436,279 | ||||||
|
| |||||||
| 753,945 | ||||||||
|
| |||||||
Ghana - 0.8% |
| |||||||
Ghana Government | 200,000 | 144,709 | ||||||
8.125% due 03/26/32 ~ | 200,000 | 142,741 | ||||||
8.627% due 06/16/49 ~ | 200,000 | 141,521 | ||||||
8.950% due 03/26/51 ~ | 326,000 | 231,709 | ||||||
|
| |||||||
| 660,680 | ||||||||
|
| |||||||
Hungary - 1.3% |
| |||||||
Hungary Government | HUF 14,560,000 | 47,046 | ||||||
3.000% due 08/21/30 | 60,920,000 | 190,726 | ||||||
5.375% due 02/21/23 | $262,000 | 282,587 | ||||||
5.375% due 03/25/24 | 154,000 | 170,050 | ||||||
5.750% due 11/22/23 | 220,000 | 242,930 | ||||||
6.750% due 10/22/28 | HUF 32,050,000 | 129,668 | ||||||
7.625% due 03/29/41 | $30,000 | 46,953 | ||||||
|
| |||||||
| 1,109,960 | ||||||||
|
| |||||||
India - 0.2% |
| |||||||
Export-Import Bank of India | $200,000 | 201,046 | ||||||
|
| |||||||
Indonesia - 5.7% |
| |||||||
Indonesia Government | 200,000 | 206,396 | ||||||
4.750% due 07/18/47 ~ | 200,000 | 210,158 | ||||||
5.125% due 01/15/45 ~ | 200,000 | 224,041 | ||||||
5.250% due 01/17/42 ~ | 200,000 | 229,606 | ||||||
5.250% due 01/08/47 ~ | 221,000 | 245,810 | ||||||
5.950% due 01/08/46 ~ | 200,000 | 236,966 | ||||||
6.625% due 02/17/37 ~ | 100,000 | 126,550 | ||||||
7.750% due 01/17/38 ~ | 130,000 | 180,645 | ||||||
8.500% due 10/12/35 ~ | 100,000 | 144,064 | ||||||
Indonesia Treasury | IDR 1,352,000,000 | 73,056 | ||||||
6.625% due 05/15/33 | 3,646,000,000 | 192,538 | ||||||
7.000% due 05/15/27 | 5,122,000,000 | 299,492 | ||||||
7.000% due 09/15/30 | 4,192,000,000 | 240,956 | ||||||
7.500% due 08/15/32 | 3,906,000,000 | 221,560 | ||||||
7.500% due 06/15/35 | 2,582,000,000 | 148,703 | ||||||
7.500% due 05/15/38 | 689,000,000 | 38,441 | ||||||
8.250% due 05/15/29 | 8,136,000,000 | 507,552 | ||||||
8.250% due 05/15/36 | 2,421,000,000 | 144,628 | ||||||
8.375% due 03/15/24 | 5,770,000,000 | 368,516 | ||||||
8.375% due 09/15/26 | 7,888,000,000 | 499,259 | ||||||
8.375% due 04/15/39 | 3,886,000,000 | 239,026 | ||||||
Perusahaan Penerbit SBSN Indonesia III | $200,000 | 206,190 | ||||||
|
| |||||||
| 4,984,153 | ||||||||
|
| |||||||
Principal Amount | Value | |||||||
Ivory Coast - 0.7% |
| |||||||
Ivory Coast Government |
| |||||||
5.875% due 10/17/31 ~ | EUR 225,000 | $213,086 | ||||||
6.375% due 03/03/28 ~ | $200,000 | 184,276 | ||||||
6.875% due 10/17/40 ~ | EUR 229,000 | 217,774 | ||||||
|
| |||||||
| 615,136 | ||||||||
|
| |||||||
Kenya - 0.5% |
| |||||||
Kenya Government | $246,000 | 228,162 | ||||||
8.250% due 02/28/48 ~ | 200,000 | 185,617 | ||||||
|
| |||||||
| 413,779 | ||||||||
|
| |||||||
Lebanon - 0.9% |
| |||||||
Lebanon Government | 312,000 | 61,776 | ||||||
6.000% due 01/27/23Y ~ | 60,000 | 11,732 | ||||||
6.100% due 10/04/22Y ~ | 1,046,000 | 201,355 | ||||||
6.150% due 06/19/20Y | 540,000 | 104,533 | ||||||
6.375% due 03/09/21Y | 438,000 | 87,600 | ||||||
6.600% due 11/27/26Y ~ | 152,000 | 29,488 | ||||||
6.850% due 03/23/27Y ~ | 421,000 | 81,144 | ||||||
7.000% due 03/23/32Y ~ | 253,000 | 49,224 | ||||||
7.050% due 11/02/35Y ~ | 9,000 | 1,742 | ||||||
7.250% due 03/23/37 *Y ~ | 159,000 | 29,326 | ||||||
8.250% due 04/12/21Y ~ | 873,000 | 170,217 | ||||||
|
| |||||||
| 828,137 | ||||||||
|
| |||||||
Malaysia - 1.4% |
| |||||||
Malaysia Government | MYR 1,634,000 | 385,913 | ||||||
3.733% due 06/15/28 | 530,000 | 124,967 | ||||||
3.828% due 07/05/34 | 524,000 | 122,999 | ||||||
3.844% due 04/15/33 | 73,000 | 17,235 | ||||||
3.885% due 08/15/29 | 185,000 | 44,618 | ||||||
3.899% due 11/16/27 | 51,000 | 12,177 | ||||||
3.900% due 11/30/26 | 512,000 | 122,580 | ||||||
3.906% due 07/15/26 | 510,000 | 122,218 | ||||||
4.181% due 07/15/24 | 217,000 | 52,496 | ||||||
4.232% due 06/30/31 | 201,000 | 48,667 | ||||||
4.498% due 04/15/30 | 527,000 | 129,248 | ||||||
4.642% due 11/07/33 | 180,000 | 45,503 | ||||||
4.921% due 07/06/48 | 66,000 | 17,171 | ||||||
4.935% due 09/30/43 | 28,000 | 7,211 | ||||||
|
| |||||||
| 1,253,003 | ||||||||
|
| |||||||
Mexico - 2.9% |
| |||||||
Mexican Bonos | MXN 1,720,000 | 73,764 | ||||||
7.750% due 11/23/34 | 7,130,000 | 306,771 | ||||||
8.000% due 11/07/47 | 5,100,000 | 214,883 | ||||||
8.500% due 05/31/29 | 6,840,000 | 311,478 | ||||||
8.500% due 11/18/38 | 8,040,000 | 358,488 | ||||||
10.000% due 12/05/24 | 13,950,000 | 665,054 | ||||||
Mexico Government | $126,000 | 128,205 | ||||||
5.550% due 01/21/45 | 151,000 | 170,781 | ||||||
5.750% due 10/12/10 | 168,000 | 174,932 | ||||||
6.050% due 01/11/40 | 92,000 | 109,956 | ||||||
|
| |||||||
| 2,514,312 | ||||||||
|
| |||||||
Morocco - 0.4% |
| |||||||
Morocco Government | 320,000 | 318,566 | ||||||
|
| |||||||
Nigeria - 0.8% |
| |||||||
Nigeria Government | 200,000 | 139,966 | ||||||
7.625% due 11/28/47 ~ | 374,000 | 251,291 | ||||||
8.747% due 01/21/31 ~ | 200,000 | 145,550 | ||||||
9.248% due 01/21/49 ~ | 200,000 | 142,350 | ||||||
|
| |||||||
| 679,157 | ||||||||
|
| |||||||
| See Notes to Financial Statements | See explanation of symbols and terms, if any, on B-76 and B-77 |
B-42
Table of Contents
PACIFIC FUNDS
PF EMERGING MARKETS DEBT FUND
Schedule of Investments (Continued)
March 31, 2020
Principal Amount | Value | |||||||
Oman - 0.8% |
| |||||||
Oman Government | $600,000 | $395,311 | ||||||
6.750% due 01/17/48 ~ | 466,000 | 311,055 | ||||||
|
| |||||||
| 706,366 | ||||||||
|
| |||||||
Pakistan - 1.2% |
| |||||||
Pakistan Government | 600,000 | 501,450 | ||||||
8.250% due 04/15/24 ~ | 459,000 | 408,349 | ||||||
8.250% due 09/30/25 ~ | 200,000 | 176,173 | ||||||
|
| |||||||
| 1,085,972 | ||||||||
|
| |||||||
Panama - 1.2% |
| |||||||
Panama Government | 200,000 | 217,313 | ||||||
4.500% due 05/15/47 | 200,000 | 221,063 | ||||||
6.700% due 01/26/36 | 206,000 | 266,578 | ||||||
8.875% due 09/30/27 | 116,000 | 157,882 | ||||||
9.375% due 04/01/29 | 118,000 | 168,274 | ||||||
|
| |||||||
| 1,031,110 | ||||||||
|
| |||||||
Paraguay - 0.2% |
| |||||||
Paraguay Government | 200,000 | 203,002 | ||||||
|
| |||||||
Peru - 2.9% |
| |||||||
Fondo MIVIVIENDA SA | PEN 236,000 | 73,405 | ||||||
Peruvian Government | 523,000 | 147,752 | ||||||
5.400% due 08/12/34 ~ | 767,000 | 223,465 | ||||||
5.625% due 11/18/50 | $520,000 | 780,159 | ||||||
6.950% due 08/12/31 ~ | PEN 1,595,000 | 533,810 | ||||||
7.350% due 07/21/25 | $278,000 | 354,104 | ||||||
8.750% due 11/21/33 | 288,000 | 459,003 | ||||||
|
| |||||||
| 2,571,698 | ||||||||
|
| |||||||
Philippines - 1.2% |
| |||||||
Philippine Government | 200,000 | 267,089 | ||||||
7.750% due 01/14/31 | 270,000 | 383,760 | ||||||
9.500% due 02/02/30 | 170,000 | 257,098 | ||||||
10.625% due 03/16/25 | 123,000 | 162,419 | ||||||
|
| |||||||
| 1,070,366 | ||||||||
|
| |||||||
Poland - 1.2% |
| |||||||
Republic of Poland | PLN 1,011,000 | 263,052 | ||||||
2.750% due 10/25/29 | 3,073,000 | 814,541 | ||||||
|
| |||||||
| 1,077,593 | ||||||||
|
| |||||||
Qatar - 2.5% |
| |||||||
Qatar Government | $400,000 | 406,078 | ||||||
4.000% due 03/14/29 ~ | 338,000 | 362,873 | ||||||
4.817% due 03/14/49 ~ | 735,000 | 869,254 | ||||||
5.103% due 04/23/48 ~ | 446,000 | 543,014 | ||||||
|
| |||||||
| 2,181,219 | ||||||||
|
| |||||||
Romania - 0.5% |
| |||||||
Romanian Government | EUR 92,000 | 91,158 | ||||||
4.375% due 08/22/23 ~ | $184,000 | 190,838 | ||||||
6.125% due 01/22/44 ~ | 38,000 | 43,873 | ||||||
6.750% due 02/07/22 ~ | 104,000 | 109,006 | ||||||
|
| |||||||
| 434,875 | ||||||||
|
| |||||||
Principal Amount | Value | |||||||
Russia - 3.3% |
| |||||||
Russia Federal | RUB 12,484,000 | $162,130 | ||||||
7.050% due 01/19/28 | 19,434,000 | 254,318 | ||||||
7.250% due 05/10/34 | 1,769,000 | 23,550 | ||||||
7.400% due 07/17/24 | 12,036,000 | 158,456 | ||||||
7.700% due 03/23/33 | 22,247,000 | 307,096 | ||||||
7.750% due 09/16/26 | 24,385,000 | 330,294 | ||||||
7.950% due 10/07/26 | 3,126,000 | 42,760 | ||||||
8.500% due 09/17/31 | 30,324,000 | 441,872 | ||||||
Russia Foreign | $200,000 | 214,488 | ||||||
4.375% due 03/21/29 ~ | 400,000 | 428,975 | ||||||
5.250% due 06/23/47 ~ | 400,000 | 485,920 | ||||||
|
| |||||||
| 2,849,859 | ||||||||
|
| |||||||
Saudi Arabia - 1.3% |
| |||||||
Saudi Government | 258,000 | 238,717 | ||||||
5.000% due 04/17/49 ~ | 400,000 | 433,774 | ||||||
5.250% due 01/16/50 ~ | 400,000 | 449,499 | ||||||
|
| |||||||
| 1,121,990 | ||||||||
|
| |||||||
South Africa - 2.2% |
| |||||||
Republic of South Africa Government | 435,000 | 358,660 | ||||||
5.650% due 09/27/47 | 230,000 | 170,775 | ||||||
5.750% due 09/30/49 | 250,000 | 182,495 | ||||||
5.875% due 05/30/22 | 103,000 | 104,939 | ||||||
7.000% due 02/28/31 | ZAR 339,000 | 14,024 | ||||||
8.000% due 01/31/30 | 5,584,000 | 256,339 | ||||||
8.250% due 03/31/32 | 5,959,000 | 265,124 | ||||||
8.750% due 01/31/44 | 1,792,140 | 75,887 | ||||||
8.750% due 02/28/48 | 6,653,450 | 279,392 | ||||||
8.875% due 02/28/35 | 1,333,690 | 60,158 | ||||||
9.000% due 01/31/40 | 3,027,760 | 133,273 | ||||||
10.500% due 12/21/26 | 331,000 | 18,900 | ||||||
|
| |||||||
| 1,919,966 | ||||||||
|
| |||||||
Sri Lanka - 0.8% |
| |||||||
Sri Lanka Government | $200,000 | 124,000 | ||||||
7.550% due 03/28/30 ~ | 465,000 | 265,066 | ||||||
7.850% due 03/14/29 ~ | 502,000 | 301,218 | ||||||
|
| |||||||
| 690,284 | ||||||||
|
| |||||||
Suriname - 0.1% |
| |||||||
Republic of Suriname | 200,000 | 108,214 | ||||||
|
| |||||||
Thailand - 0.7% |
| |||||||
Thailand Government | THB 333,000 | 11,077 | ||||||
3.300% due 06/17/38 | 5,804,000 | 213,775 | ||||||
3.400% due 06/17/36 | 3,361,000 | 125,855 | ||||||
3.600% due 06/17/67 | 4,149,000 | 161,293 | ||||||
3.775% due 06/25/32 | 3,394,000 | 127,405 | ||||||
|
| |||||||
| 639,405 | ||||||||
|
| |||||||
Turkey - 3.8% |
| |||||||
Turkey Government | TRY 319,735 | 48,386 | ||||||
3.250% due 03/23/23 | $200,000 | 179,339 | ||||||
4.250% due 03/13/25 | 605,000 | 518,697 | ||||||
4.875% due 04/16/43 | 200,000 | 139,984 | ||||||
5.600% due 11/14/24 | 422,000 | 388,609 | ||||||
5.625% due 03/30/21 | 100,000 | 99,575 | ||||||
5.750% due 03/22/24 | 200,000 | 186,860 | ||||||
5.750% due 05/11/47 | 200,000 | 148,043 | ||||||
6.000% due 03/25/27 | 200,000 | 179,000 | ||||||
| See Notes to Financial Statements | See explanation of symbols and terms, if any, on B-76 and B-77 |
B-43
Table of Contents
PACIFIC FUNDS
PF EMERGING MARKETS DEBT FUND
Schedule of Investments (Continued)
March 31, 2020
Principal Amount | Value | |||||||
6.125% due 10/24/28 | $200,000 | $176,578 | ||||||
6.250% due 09/26/22 | 200,000 | 195,354 | ||||||
6.350% due 08/10/24 | 200,000 | 190,133 | ||||||
6.750% due 05/30/40 | 108,000 | 92,518 | ||||||
6.875% due 03/17/36 | 50,000 | 44,305 | ||||||
7.000% due 06/05/20 | 91,000 | 91,188 | ||||||
7.250% due 12/23/23 | 200,000 | 196,186 | ||||||
7.375% due 02/05/25 | 130,000 | 128,103 | ||||||
10.500% due 08/11/27 | TRY 240,000 | 32,263 | ||||||
10.600% due 02/11/26 | 722,000 | 98,803 | ||||||
10.700% due 08/17/22 | 1,019,000 | 149,770 | ||||||
11.000% due 02/24/27 | 81,000 | 11,170 | ||||||
|
| |||||||
| 3,294,864 | ||||||||
|
| |||||||
Ukraine - 3.3% |
| |||||||
Ukraine Government | $1,219,000 | 1,112,348 | ||||||
7.750% due 09/01/22 ~ | 100,000 | 95,123 | ||||||
7.750% due 09/01/23 ~ | 214,000 | 201,476 | ||||||
7.750% due 09/01/24 ~ | 103,000 | 95,280 | ||||||
7.750% due 09/01/25 ~ | 601,000 | 549,314 | ||||||
7.750% due 09/01/26 ~ | 200,000 | 184,750 | ||||||
7.750% due 09/01/27 ~ | 126,000 | 115,895 | ||||||
8.994% due 02/01/24 ~ | 312,000 | 289,950 | ||||||
9.750% due 11/01/28 ~ | 200,000 | 195,222 | ||||||
15.840% due 02/26/25 ~ | UAH 1,247,000 | 39,739 | ||||||
16.000% due 08/11/21 ~ | 413,000 | 14,207 | ||||||
17.000% due 05/11/22 ~ | 397,000 | 13,567 | ||||||
17.250% due 01/05/22 ~ | 365,000 | 12,635 | ||||||
|
| |||||||
| 2,919,506 | ||||||||
|
| |||||||
United Arab Emirates - 0.2% |
| |||||||
Abu Dhabi Government | $200,000 | 187,000 | ||||||
|
| |||||||
Uruguay - 1.6% |
| |||||||
Uruguay Government | 151,548 | 156,142 | ||||||
4.375% due 12/15/28 ^ | UYU 849,719 | 19,866 | ||||||
4.975% due 04/20/55 | $384,082 | 438,935 | ||||||
5.100% due 06/18/50 | 130,000 | 149,378 | ||||||
7.625% due 03/21/36 | 177,000 | 246,750 | ||||||
7.875% due 01/15/33 | 225,000 | 311,862 | ||||||
8.500% due 03/15/28 ~ | UYU 2,269,000 | 42,440 | ||||||
9.875% due 06/20/22 ~ | 1,102,000 | 23,998 | ||||||
|
| |||||||
| 1,389,371 | ||||||||
|
| |||||||
Venezuela - 0.3% |
| |||||||
Venezuela Government | $85,000 | 8,500 | ||||||
8.250% due 10/13/24 *Y ~ | 166,100 | 16,610 | ||||||
9.000% due 05/07/23 *Y ~ | 73,000 | 7,300 | ||||||
9.250% due 09/15/27 *Y | 252,000 | 25,200 | ||||||
9.250% due 05/07/28 *Y ~ | 121,000 | 12,100 | ||||||
11.750% due 10/21/26 *Y ~ | 768,700 | 76,870 | ||||||
11.950% due 08/05/31 *Y ~ | 1,255,900 | 125,590 | ||||||
12.750% due 08/23/22 *Y ~ | 211,000 | 21,100 | ||||||
|
| |||||||
| 293,270 | ||||||||
|
| |||||||
Zambia - 0.2% |
| |||||||
Zambia Government | 200,000 | 80,959 | ||||||
8.970% due 07/30/27 ~ | 307,000 | 121,660 | ||||||
|
| |||||||
| 202,619 | ||||||||
|
| |||||||
Total Foreign Government Bonds & Notes |
| 63,095,002 | ||||||
|
| |||||||
Principal Amount | Value | |||||||
SHORT-TERM INVESTMENTS - 4.5% |
| |||||||
Foreign Government Issues - 0.3% |
| |||||||
Argentina Treasury Bill (Argentina) | ARS 2,828,259 | $21,456 | ||||||
0.000% due 07/29/20W | 1,310,601 | 16,911 | ||||||
0.000% due 08/27/20W | 1,547,638 | 16,142 | ||||||
0.000% due 10/29/20W | 5,244,404 | 55,591 | ||||||
Uruguay Monetary Regulation Bill (Uruguay) 9.772% due 07/03/20 | UYU 2,903,000 | 65,833 | ||||||
10.419% due 12/08/21 | 573,000 | 11,257 | ||||||
10.631% due 06/09/21 | 669,000 | 13,777 | ||||||
10.672% due 03/10/21 | 864,000 | 18,241 | ||||||
13.473% due 02/05/21 | 363,000 | 7,571 | ||||||
13.560% due 02/19/21 | 299,000 | 6,202 | ||||||
13.910% due 12/18/20 | 146,000 | 3,089 | ||||||
|
| |||||||
| 236,070 | ||||||||
|
| |||||||
Shares | ||||||||
Money Market Fund - 4.2% |
| |||||||
BlackRock Liquidity FundsT-Fund Portfolio ‘Institutional’ 0.210% | 3,694,654 | 3,694,654 | ||||||
|
| |||||||
Total Short-Term Investments |
| 3,930,724 | ||||||
|
| |||||||
TOTAL INVESTMENTS - 98.1% |
| 85,985,418 | ||||||
DERIVATIVES - (0.8%) |
| (704,282 | ) | |||||
|
| |||||||
OTHER ASSETS & LIABILITIES, NET - 2.7% |
| 2,341,531 | ||||||
|
| |||||||
NET ASSETS - 100.0% |
| $87,622,667 | ||||||
|
| |||||||
Notes to Schedule of Investments
| (a) | As of March 31, 2020, the Fund’s composition as a percentage of net assets was as follows: |
Foreign Government Bonds & Notes | 72.0% | |||
Corporate Bonds & Notes | 20.9% | |||
Short-Term Investments | 4.5% | |||
Others (each less than 3.0%) | 0.7% | |||
|
| |||
| 98.1% | ||||
Derivatives | (0.8% | ) | ||
Other Assets & Liabilities, Net | 2.7% | |||
|
| |||
| 100.0% | ||||
|
|
| (b) | As of March 31, 2020, the Fund’s composition by country of risk as a percentage of net assets was as follows: |
Brazil | 8.6% | |||
Indonesia | 7.3% | |||
Mexico | 6.8% | |||
Colombia | 4.8% | |||
United States (Includes Short-Term Investments) | 4.7% | |||
Ukraine | 4.3% | |||
Turkey | 3.8% | |||
Russia | 3.6% | |||
Peru | 3.2% | |||
Others (each less than 3.0%) | 51.0% | |||
|
| |||
| 98.1% | ||||
Derivatives | (0.8% | ) | ||
Other Assets & Liabilities, Net | 2.7% | |||
|
| |||
| 100.0% | ||||
|
|
| See Notes to Financial Statements | See explanation of symbols and terms, if any, on B-76 and B-77 |
B-44
Table of Contents
PACIFIC FUNDS
PF EMERGING MARKETS DEBT FUND
Schedule of Investments (Continued)
March 31, 2020
| (c) | Investments with a total aggregate value of $295,212 or 0.3% of the Fund’s net assets were valued by the Trustee Valuation Committee or determined by a valuation committee established under the Valuation Policy and then subsequently submitted for approval or ratification to either the Trustee Valuation Committee or to the Board of Trustees. |
| (d) | Investments with a total aggregate value of $1,411,207 or 1.6% of the Fund’s net assets were in default as of March 31, 2020. |
| (e) | Forward foreign currency contracts outstanding as of March 31, 2020 were as follows: |
| Currency Purchased | Currency Sold | Settlement Month | Counterparty | Unrealized Appreciation | Unrealized Depreciation | |||||||||||||||||||||||||
| BRL | 1,941,075 | USD | 440,413 | 04/20 | HSB | $— | ($66,900 | ) | ||||||||||||||||||||||
| BRL | 5,733,711 | USD | 1,130,575 | 04/20 | JPM | — | (27,263 | ) | ||||||||||||||||||||||
| BRL | 5,759,940 | USD | 1,130,575 | 05/20 | DUB | — | (24,718 | ) | ||||||||||||||||||||||
| BRL | 6,778,116 | USD | 1,334,052 | 05/20 | HSB | — | (32,714 | ) | ||||||||||||||||||||||
| CLP | 129,057,689 | USD | 150,724 | 04/20 | CSF | 194 | — | |||||||||||||||||||||||
| CLP | 122,447,650 | USD | 146,600 | 04/20 | MSC | — | (3,412 | ) | ||||||||||||||||||||||
| CNH | 1,480,174 | USD | 209,759 | 04/20 | DUB | — | (1,129 | ) | ||||||||||||||||||||||
| CNH | 15,418,472 | USD | 2,178,887 | 04/20 | HSB | — | (5,659 | ) | ||||||||||||||||||||||
| CNH | 7,401,551 | USD | 1,061,763 | 05/20 | HSB | — | (18,857 | ) | ||||||||||||||||||||||
| CNY | 7,238,000 | USD | 1,022,751 | 04/20 | HSB | — | (1,550 | ) | ||||||||||||||||||||||
| COP | 1,801,185,120 | USD | 450,240 | 04/20 | BSC | — | (7,779 | ) | ||||||||||||||||||||||
| CZK | 15,934,038 | USD | 636,080 | 04/20 | BNP | 5,096 | — | |||||||||||||||||||||||
| CZK | 4,325,024 | USD | 189,646 | 04/20 | JPM | — | (15,610 | ) | ||||||||||||||||||||||
| CZK | 9,968,598 | USD | 427,883 | 04/20 | SCB | — | (26,752 | ) | ||||||||||||||||||||||
| CZK | 2,594,320 | USD | 101,794 | 05/20 | BRC | 2,661 | — | |||||||||||||||||||||||
| HUF | 152,523,076 | USD | 470,642 | 04/20 | BNP | — | (3,978 | ) | ||||||||||||||||||||||
| HUF | 94,287,770 | USD | 293,070 | 04/20 | HSB | — | (4,585 | ) | ||||||||||||||||||||||
| IDR | 3,300,260,000 | USD | 200,000 | 04/20 | BNP | 1,703 | — | |||||||||||||||||||||||
| IDR | 4,220,587,886 | USD | 304,956 | 04/20 | JPM | — | (47,005 | ) | ||||||||||||||||||||||
| IDR | 2,404,987,885 | USD | 140,437 | 05/20 | DUB | 5,972 | — | |||||||||||||||||||||||
| ILS | 369,727 | USD | 102,830 | 04/20 | HSB | 1,677 | — | |||||||||||||||||||||||
| ILS | 552,567 | USD | 152,189 | 04/20 | MSC | 3,999 | — | |||||||||||||||||||||||
| INR | 36,571,188 | USD | 486,481 | 05/20 | ANZ | — | (9,732 | ) | ||||||||||||||||||||||
| INR | 71,705,541 | USD | 927,659 | 05/20 | BRC | 7,108 | — | |||||||||||||||||||||||
| KRW | 2,371,761,591 | USD | 1,980,995 | 04/20 | HSB | — | (33,315 | ) | ||||||||||||||||||||||
| MXN | 3,090,986 | USD | 128,240 | 04/20 | DUB | 1,462 | — | |||||||||||||||||||||||
| MXN | 25,805,727 | USD | 1,347,859 | 04/20 | MER | — | (265,018 | ) | ||||||||||||||||||||||
| MXN | 48,186,917 | USD | 1,908,600 | 04/20 | MSC | 113,384 | — | |||||||||||||||||||||||
| MYR | 1,033,489 | USD | 248,047 | 04/20 | DUB | — | (8,259 | ) | ||||||||||||||||||||||
| PEN | 929,865 | USD | 279,659 | 04/20 | CSF | — | (9,070 | ) | ||||||||||||||||||||||
| PHP | 7,119,055 | USD | 138,100 | 04/20 | DUB | 807 | — | |||||||||||||||||||||||
| PHP | 13,371,707 | USD | 261,125 | 04/20 | SCB | — | (217 | ) | ||||||||||||||||||||||
| PLN | 4,042,592 | USD | 1,018,157 | 04/20 | BNP | — | (41,143 | ) | ||||||||||||||||||||||
| PLN | 3,716,956 | USD | 894,750 | 04/20 | CIT | 3,565 | — | |||||||||||||||||||||||
| PLN | 989,345 | USD | 258,456 | 04/20 | MER | — | (19,351 | ) | ||||||||||||||||||||||
| PLN | 530,035 | USD | 124,786 | 05/20 | BNP | 3,298 | — | |||||||||||||||||||||||
| RON | 1,399,442 | USD | 317,100 | 04/20 | CIT | 1,355 | — | |||||||||||||||||||||||
| RON | 389,044 | USD | 90,086 | 04/20 | JPM | — | (1,556 | ) | ||||||||||||||||||||||
| RON | 932,822 | USD | 209,505 | 05/20 | MER | 2,388 | — | |||||||||||||||||||||||
| RON | 937,210 | USD | 210,870 | 06/20 | JPM | 1,565 | — | |||||||||||||||||||||||
| RUB | 808,000 | USD | 12,001 | 04/20 | BNP | — | (1,691 | ) | ||||||||||||||||||||||
| RUB | 30,004,183 | USD | 375,850 | 04/20 | BRC | 6,989 | — | |||||||||||||||||||||||
| RUB | 58,900,600 | USD | 931,300 | 04/20 | HSB | — | (179,758 | ) | ||||||||||||||||||||||
| RUB | 82,156,584 | USD | 1,036,310 | 04/20 | SCB | 11,967 | — | |||||||||||||||||||||||
| RUB | 62,436,892 | USD | 958,200 | 05/20 | MER | — | (165,821 | ) | ||||||||||||||||||||||
| SGD | 754,292 | USD | 526,260 | 04/20 | BNP | 4,707 | — | |||||||||||||||||||||||
| SGD | 1,344,863 | USD | 966,811 | 04/20 | HSB | — | (20,124 | ) | ||||||||||||||||||||||
| THB | 6,932,543 | USD | 218,029 | 04/20 | DUB | — | (6,759 | ) | ||||||||||||||||||||||
| THB | 18,968,240 | USD | 578,300 | 04/20 | HSB | — | (242 | ) | ||||||||||||||||||||||
| THB | 9,224,407 | USD | 290,657 | 04/20 | JPM | — | (9,543 | ) | ||||||||||||||||||||||
| THB | 6,772,660 | USD | 213,730 | 04/20 | MER | — | (7,333 | ) | ||||||||||||||||||||||
| THB | 2,144,706 | USD | 65,248 | 05/20 | BNP | 119 | — | |||||||||||||||||||||||
| THB | 6,000,000 | USD | 190,186 | 05/20 | BRC | — | (7,316 | ) | ||||||||||||||||||||||
| THB | 3,000,000 | USD | 95,178 | 05/20 | DUB | — | (3,743 | ) | ||||||||||||||||||||||
| THB | 1,000,000 | USD | 30,359 | 05/20 | HSB | 119 | — | |||||||||||||||||||||||
| TRY | 2,742,547 | USD | 425,020 | 04/20 | CIT | — | (14,133 | ) | ||||||||||||||||||||||
| TRY | 2,588,258 | USD | 394,371 | 04/20 | HSB | — | (6,599 | ) | ||||||||||||||||||||||
| TWD | 23,423,156 | USD | 780,824 | 04/20 | BNP | — | (2,827 | ) | ||||||||||||||||||||||
| TWD | 13,179,797 | USD | 440,060 | 04/20 | CIT | — | (2,295 | ) | ||||||||||||||||||||||
| UAH | 1,334,370 | USD | 44,700 | 04/20 | MER | 2,514 | — | |||||||||||||||||||||||
| UAH | 1,567,190 | USD | 53,000 | 05/20 | BRC | 1,755 | — | |||||||||||||||||||||||
| UAH | 1,256,224 | USD | 42,440 | 05/20 | GSC | 1,259 | — | |||||||||||||||||||||||
| UAH | 1,156,020 | USD | 39,630 | 05/20 | JPM | 583 | — | |||||||||||||||||||||||
| See Notes to Financial Statements | See explanation of symbols and terms, if any, on B-76 and B-77 |
B-45
Table of Contents
PACIFIC FUNDS
PF EMERGING MARKETS DEBT FUND
Schedule of Investments (Continued)
March 31, 2020
| Currency Purchased | Currency Sold | Settlement Month | Counterparty | Unrealized Appreciation | Unrealized Depreciation | |||||||||||||||||||||||||||
| UAH | 1,031,087 | USD | 34,900 | 05/20 | MER | $1,393 | $— | |||||||||||||||||||||||||
| USD | 180,000 | BRL | 896,670 | 04/20 | DUB | 7,458 | — | |||||||||||||||||||||||||
| USD | 1,336,248 | BRL | 6,778,116 | 04/20 | HSB | 31,965 | — | |||||||||||||||||||||||||
| USD | 1,111,294 | BRL | 5,659,819 | 05/20 | BSC | 24,659 | — | |||||||||||||||||||||||||
| USD | 1,102,073 | BRL | 5,560,619 | 05/20 | JPM | 34,484 | — | |||||||||||||||||||||||||
| USD | 65,978 | CLP | 55,147,973 | 04/20 | BSC | 1,489 | — | |||||||||||||||||||||||||
| USD | 25,000 | CLP | 20,592,500 | 04/20 | CSF | 919 | — | |||||||||||||||||||||||||
| USD | 71,077 | CLP | 54,836,340 | 04/20 | JPM | 6,952 | — | |||||||||||||||||||||||||
| USD | 35,000 | CLP | 29,935,500 | 04/20 | MER | — | (6 | ) | ||||||||||||||||||||||||
| USD | 1,029,503 | CNY | 7,238,000 | 04/20 | HSB | 8,303 | — | |||||||||||||||||||||||||
| USD | 207,781 | COP | 696,525,010 | 04/20 | BRC | 36,680 | — | |||||||||||||||||||||||||
| USD | 70,000 | COP | 246,748,600 | 04/20 | CIT | 9,386 | — | |||||||||||||||||||||||||
| USD | 60,000 | COP | 246,360,000 | 04/20 | DUB | — | (518 | ) | ||||||||||||||||||||||||
| USD | 665,957 | COP | 2,679,812,256 | 04/20 | JPM | 7,662 | — | |||||||||||||||||||||||||
| USD | 158,995 | CZK | 4,033,482 | 04/20 | CIT | — | (3,310 | ) | ||||||||||||||||||||||||
| USD | 197,550 | CZK | 4,605,537 | 04/20 | MER | 12,226 | — | |||||||||||||||||||||||||
| USD | 382,596 | EUR | 344,495 | 04/20 | BNP | 2,418 | — | |||||||||||||||||||||||||
| USD | 94,106 | EUR | 85,475 | 04/20 | DUB | — | (223 | ) | ||||||||||||||||||||||||
| USD | 52,281 | EUR | 47,156 | 04/20 | JPM | 240 | — | |||||||||||||||||||||||||
| USD | 70,000 | HUF | 21,005,908 | 04/20 | MER | 5,730 | — | |||||||||||||||||||||||||
| USD | 1,558 | IDR | 25,291,224 | 04/20 | BRC | 12 | — | |||||||||||||||||||||||||
| USD | 2,944 | IDR | 50,457,708 | 04/20 | DUB | — | (140 | ) | ||||||||||||||||||||||||
| USD | 3,137 | IDR | 51,010,410 | 04/20 | MER | 19 | — | |||||||||||||||||||||||||
| USD | 45,000 | KRW | 53,532,000 | 04/20 | DUB | 1,040 | — | |||||||||||||||||||||||||
| USD | 130,000 | KRW | 160,576,000 | 04/20 | MSC | — | (1,864 | ) | ||||||||||||||||||||||||
| USD | 235,000 | MXN | 5,398,045 | 04/20 | BNP | 8,491 | — | |||||||||||||||||||||||||
| USD | 65,000 | MXN | 1,296,100 | 04/20 | BRC | 10,614 | — | |||||||||||||||||||||||||
| USD | 766,939 | MXN | 19,377,490 | 04/20 | HSB | — | (46,165 | ) | ||||||||||||||||||||||||
| USD | 114,989 | MYR | 490,626 | 04/20 | DUB | 1,154 | — | |||||||||||||||||||||||||
| USD | 300,846 | PEN | 1,042,734 | 04/20 | DUB | — | (2,588 | ) | ||||||||||||||||||||||||
| USD | 45,000 | PHP | 2,337,300 | 04/20 | MER | — | (605 | ) | ||||||||||||||||||||||||
| USD | 527,827 | PLN | 2,156,457 | 04/20 | BNP | 6,654 | — | |||||||||||||||||||||||||
| USD | 90,547 | PLN | 351,985 | 04/20 | BRC | 5,479 | — | |||||||||||||||||||||||||
| USD | 36,320 | PLN | 143,512 | 04/20 | HSB | 1,636 | — | |||||||||||||||||||||||||
| USD | 139,000 | PLN | 552,017 | 04/20 | JPM | 5,588 | — | |||||||||||||||||||||||||
| USD | 30,000 | RON | 129,330 | 04/20 | CIT | 570 | — | |||||||||||||||||||||||||
| USD | 19,154 | RUB | 1,425,725 | 04/20 | CSF | 962 | — | |||||||||||||||||||||||||
| USD | 13,217 | RUB | 1,079,129 | 04/20 | MER | — | (552 | ) | ||||||||||||||||||||||||
| USD | 151,653 | RUB | 11,556,436 | 04/20 | MSC | 4,199 | — | |||||||||||||||||||||||||
| USD | 135,000 | SGD | 190,573 | 04/20 | MSC | 850 | — | |||||||||||||||||||||||||
| USD | 115,000 | TWD | 3,452,070 | 04/20 | ANZ | 340 | — | |||||||||||||||||||||||||
| USD | 53,679 | UAH | 1,334,370 | 04/20 | MER | 6,465 | — | |||||||||||||||||||||||||
| USD | 53,031 | UAH | 1,333,339 | 05/20 | CIT | 6,438 | — | |||||||||||||||||||||||||
| USD | 8,371 | UAH | 214,380 | 05/20 | JPM | 914 | — | |||||||||||||||||||||||||
| USD | 70,276 | UAH | 1,775,242 | 05/20 | MER | 8,098 | — | |||||||||||||||||||||||||
| USD | 632,905 | ZAR | 11,076,215 | 04/20 | DUB | 16,594 | — | |||||||||||||||||||||||||
| USD | 30,900 | ZAR | 540,539 | 04/20 | HSB | 823 | — | |||||||||||||||||||||||||
| USD | 162,004 | ZAR | 2,834,904 | 04/20 | JPM | 4,262 | — | |||||||||||||||||||||||||
| ZAR | 2,780,489 | USD | 182,258 | 04/20 | MER | — | (27,544 | ) | ||||||||||||||||||||||||
| ZAR | 5,530,766 | USD | 316,380 | 04/20 | MSC | — | (8,633 | ) | ||||||||||||||||||||||||
|
|
|
| |||||||||||||||||||||||||||||
Total Forward Foreign Currency Contracts | $469,412 | ($1,195,904 | ) | |||||||||||||||||||||||||||||
|
|
|
| |||||||||||||||||||||||||||||
| (f) | Swap agreements outstanding as of March 31, 2020 were as follows: |
Interest Rate Swaps – Long
| Receive | Pay | Payment Frequency Receive Rate / Pay Rate | Exchange | Expiration Date | Notional Amount | Value | Upfront Premiums Paid (Received) | Unrealized Appreciation (Depreciation) | ||||||||||||||||||||
2.400% | 6-Month PLN-WIBOR | A / S | LCH | 03/26/23 | PLN 1,060,000 | $12,538 | $— | $12,538 | ||||||||||||||||||||
2.535% | 7-DayCNY-RRR | Q / Q | LCH | 03/18/25 | CNY 751,180 | 1,516 | — | 1,516 | ||||||||||||||||||||
2.575% | 7-DayCNY-RRR | Q / Q | LCH | 03/18/25 | 1,437,000 | 3,285 | — | 3,285 | ||||||||||||||||||||
2.580% | 7-DayCNY-RRR | Q / Q | LCH | 03/18/25 | 1,376,000 | 3,191 | — | 3,191 | ||||||||||||||||||||
2.582% | 7-DayCNY-RRR | Q / Q | LCH | 03/18/25 | 721,000 | 1,680 | — | 1,680 | ||||||||||||||||||||
|
|
|
|
|
| |||||||||||||||||||||||
| $22,210 | $— | $22,210 | ||||||||||||||||||||||||||
|
|
|
|
|
| |||||||||||||||||||||||
| See Notes to Financial Statements | See explanation of symbols and terms, if any, on B-76 and B-77 |
B-46
Table of Contents
PACIFIC FUNDS
PF EMERGING MARKETS DEBT FUND
Schedule of Investments (Continued)
March 31, 2020
Balances reported in the Statement of Assets and Liabilities for Centrally Cleared Swaps
| Upfront Premium Paid (Received) | Unrealized Appreciation (Deprecation) | |||||||
Centrally Cleared Swap Agreements (1) | ||||||||
Assets | $— | $22,210 | ||||||
Liabilities | — | — | ||||||
|
|
|
| |||||
| $— | $22,210 | |||||||
|
|
|
| |||||
| (1) | Includes cumulative value on centrally cleared swaps, as reported in the Schedule of Investments. Only variation margin is reported within the Statement of Assets and Liabilities. |
| (g) | Fair Value Measurements |
The following is a summary of the Fund’s investments as categorized under the three-tier hierarchy of inputs used in valuing the Fund’s assets and liabilities as of March 31, 2020:
| Total Value at March 31, 2020 | Level 1 Quoted Price | Level 2 Significant Observable Inputs | Level 3 Significant Unobservable Inputs | |||||||||||||||
Assets | Corporate Bonds & Notes | $18,355,900 | $— | $18,355,900 | $— | |||||||||||||
Senior Loan Notes | 603,792 | — | 603,792 | — | ||||||||||||||
Foreign Government Bonds & Notes | 63,095,002 | — | 63,095,002 | — | ||||||||||||||
Short-Term Investments | 3,930,724 | 3,694,654 | 236,070 | — | ||||||||||||||
Derivatives: | ||||||||||||||||||
Foreign Currency Contracts | ||||||||||||||||||
Forward Foreign Currency Contracts | 469,412 | — | 469,412 | — | ||||||||||||||
Interest Rate Contracts | ||||||||||||||||||
Swaps | 22,210 | — | 22,210 | — | ||||||||||||||
|
|
|
|
|
|
|
| |||||||||||
Total Assets - Derivatives | 491,622 | — | 491,622 | — | ||||||||||||||
|
|
|
|
|
|
|
| |||||||||||
Total Assets | 86,477,040 | 3,694,654 | 82,782,386 | — | ||||||||||||||
|
|
|
|
|
|
|
| |||||||||||
Liabilities | Derivatives: | |||||||||||||||||
Foreign Currency Contracts | ||||||||||||||||||
Forward Foreign Currency Contracts | (1,195,904 | ) | — | (1,195,904 | ) | — | ||||||||||||
|
|
|
|
|
|
|
| |||||||||||
Total Liabilities | (1,195,904 | ) | — | (1,195,904 | ) | — | ||||||||||||
|
|
|
|
|
|
|
| |||||||||||
Total | $85,281,136 | $3,694,654 | $81,586,482 | $— | ||||||||||||||
|
|
|
|
|
|
|
| |||||||||||
| See Notes to Financial Statements | See explanation of symbols and terms, if any, on B-76 and B-77 |
B-47
Table of Contents
PACIFIC FUNDS
PF DEVELOPING GROWTH FUND
Schedule of Investments
March 31, 2020
Shares | Value | |||||||
COMMON STOCKS - 96.4% | ||||||||
Communications - 2.4% | ||||||||
Cardlytics Inc * | 1,948 | $68,102 | ||||||
Etsy Inc * | 2,464 | 94,716 | ||||||
Limelight Networks Inc * | 7,170 | 40,869 | ||||||
Lyft Inc ‘A’ * | 3,359 | 90,189 | ||||||
Q2 Holdings Inc * | 2,160 | 127,570 | ||||||
|
| |||||||
| 421,446 | ||||||||
|
| |||||||
Consumer, Cyclical - 9.1% | ||||||||
Carvana Co * | 1,215 | 66,934 | ||||||
Deckers Outdoor Corp * | 971 | 130,114 | ||||||
Freshpet Inc * | 4,018 | 256,630 | ||||||
LGI Homes Inc * | 4,177 | 188,592 | ||||||
Malibu Boats Inc ‘A’ * | 5,200 | 149,708 | ||||||
National Vision Holdings Inc * | 5,534 | 107,470 | ||||||
Peloton Interactive Inc ‘A’ * | 3,372 | 89,527 | ||||||
Planet Fitness Inc ‘A’ * | 2,273 | 110,695 | ||||||
Wingstop Inc | 3,100 | 247,070 | ||||||
YETI Holdings Inc * | 13,937 | 272,050 | ||||||
|
| |||||||
| 1,618,790 | ||||||||
|
| |||||||
Consumer, Non-Cyclical - 43.3% | ||||||||
10X Genomics Inc ‘A’ * | 2,864 | 178,484 | ||||||
Acceleron Pharma Inc * | 2,217 | 199,242 | ||||||
Arena Pharmaceuticals Inc * | 2,428 | 101,976 | ||||||
Argenx SE ADR (Netherlands) * | 1,775 | 233,821 | ||||||
Avalara Inc * | 2,171 | 161,957 | ||||||
Axonics Modulation Technologies Inc * | 4,280 | 108,755 | ||||||
Blueprint Medicines Corp * | 2,553 | 149,299 | ||||||
Bridgebio Pharma Inc * | 8,469 | 245,601 | ||||||
Bright Horizons Family Solutions Inc * | 804 | 82,008 | ||||||
Chegg Inc * | 10,104 | 361,521 | ||||||
ChemoCentryx Inc * | 4,087 | 164,216 | ||||||
Coherus Biosciences Inc * | 6,078 | 98,585 | ||||||
CRISPR Therapeutics AG (Switzerland) * | 2,567 | 108,866 | ||||||
Deciphera Pharmaceuticals Inc * | 1,885 | 77,605 | ||||||
Forty Seven Inc * | 2,735 | 260,974 | ||||||
FTI Consulting Inc * | 1,204 | 144,203 | ||||||
Grocery Outlet Holding Corp * | 3,506 | 120,396 | ||||||
Guardant Health Inc * | 2,504 | 174,278 | ||||||
GW Pharmaceuticals PLC ADR (United Kingdom) * | 1,068 | 93,525 | ||||||
Helen of Troy Ltd * | 1,545 | 222,526 | ||||||
Inspire Medical Systems Inc * | 4,218 | 254,261 | ||||||
Insulet Corp * | 1,474 | 244,212 | ||||||
Iovance Biotherapeutics Inc * | 5,159 | 154,435 | ||||||
iRhythm Technologies Inc * | 2,010 | 163,513 | ||||||
Karuna Therapeutics Inc * | 1,707 | 122,904 | ||||||
Masimo Corp * | 1,525 | 270,108 | ||||||
Mirati Therapeutics Inc * | 3,064 | 235,530 | ||||||
Myovant Sciences Ltd * | 7,047 | 53,205 | ||||||
Natera Inc * | 3,148 | 93,999 | ||||||
Nevro Corp * | 2,864 | 286,343 | ||||||
NextCure Inc * | 2,288 | 84,816 | ||||||
Paylocity Holding Corp * | 2,548 | 225,039 | ||||||
Penumbra Inc * | 1,434 | 231,347 | ||||||
PTC Therapeutics Inc * | 2,164 | 96,536 | ||||||
Quanta Services Inc | 4,324 | 137,201 | ||||||
Repligen Corp * | 2,899 | 279,869 | ||||||
Rocket Pharmaceuticals Inc * | 7,495 | 104,555 | ||||||
Sarepta Therapeutics Inc * | 1,749 | 171,087 | ||||||
Strategic Education Inc | 1,756 | 245,419 | ||||||
Teladoc Health Inc * | 2,661 | 412,482 | ||||||
The Boston Beer Co Inc ‘A’ * | 512 | 188,191 | ||||||
Turning Point Therapeutics Inc * | 3,062 | 136,749 | ||||||
uniQure NV (Netherlands) * | 1,762 | 83,607 | ||||||
Zymeworks Inc (Canada) * | 2,758 | 97,826 | ||||||
|
| |||||||
| 7,661,072 | ||||||||
|
| |||||||
Shares | Value | |||||||
Energy - 1.4% | ||||||||
SolarEdge Technologies Inc * | 3,019 | $247,196 | ||||||
|
| |||||||
Financial - 6.9% | ||||||||
Assetmark Financial Holdings Inc * | 8,561 | 174,559 | ||||||
eHealth Inc * | 3,334 | 469,494 | ||||||
Goosehead Insurance Inc ‘A’ * | 3,369 | 150,358 | ||||||
Pagseguro Digital Ltd ‘A’ (Brazil) * | 5,066 | 97,926 | ||||||
Redfin Corp * | 15,066 | 232,318 | ||||||
Western Alliance Bancorp | 3,007 | 92,044 | ||||||
|
| |||||||
| 1,216,699 | ||||||||
|
| |||||||
Industrial - 11.7% | ||||||||
AeroVironment Inc * | 1,666 | 101,559 | ||||||
Axon Enterprise Inc * | 4,103 | 290,369 | ||||||
Comtech Telecommunications Corp | 595 | 7,908 | ||||||
Evoqua Water Technologies Corp * | 11,511 | 129,038 | ||||||
Federal Signal Corp | 9,922 | 270,672 | ||||||
Generac Holdings Inc * | 4,576 | 426,346 | ||||||
MasTec Inc * | 3,045 | 99,663 | ||||||
Novanta Inc * | 1,509 | 120,539 | ||||||
Tetra Tech Inc | 2,936 | 207,340 | ||||||
Trex Co Inc * | 2,517 | 201,712 | ||||||
Universal Display Corp | 982 | 129,408 | ||||||
XPO Logistics Inc * | 1,656 | 80,730 | ||||||
|
| |||||||
| 2,065,284 | ||||||||
|
| |||||||
Technology - 21.6% | ||||||||
Alteryx Inc ‘A’ * | 2,070 | 197,002 | ||||||
Appian Corp * | 3,151 | 126,765 | ||||||
Blackline Inc * | 2,796 | 147,098 | ||||||
Cirrus Logic Inc * | 2,323 | 152,458 | ||||||
Coupa Software Inc * | 1,488 | 207,918 | ||||||
Endava PLC ADR (United Kingdom) * | 650 | 22,854 | ||||||
Everbridge Inc * | 2,744 | 291,852 | ||||||
Five9 Inc * | 5,627 | 430,240 | ||||||
Globant SA (Argentina) * | 2,304 | 202,476 | ||||||
HubSpot Inc * | 751 | 100,026 | ||||||
Inphi Corp * | 6,212 | 491,804 | ||||||
Lumentum Holdings Inc * | 3,445 | 253,897 | ||||||
Medallia Inc * | 4,024 | 80,641 | ||||||
MKS Instruments Inc | 2,867 | 233,517 | ||||||
Monolithic Power Systems Inc | 2,323 | 389,010 | ||||||
Semtech Corp * | 2,810 | 105,375 | ||||||
Silicon Laboratories Inc * | 1,196 | 102,150 | ||||||
SVMK Inc * | 20,835 | 281,481 | ||||||
|
| |||||||
| 3,816,564 | ||||||||
|
| |||||||
Total Common Stocks | 17,047,051 | |||||||
|
| |||||||
SHORT-TERM INVESTMENT - 3.8% | ||||||||
Money Market Fund - 3.8% | ||||||||
BlackRock Liquidity Funds T-Fund Portfolio ‘Institutional’ 0.210% | 680,871 | 680,871 | ||||||
|
| |||||||
Total Short-Term Investment | 680,871 | |||||||
|
| |||||||
TOTAL INVESTMENTS - 100.2% | 17,727,922 | |||||||
OTHER ASSETS & LIABILITIES, NET - (0.2%) | (37,116 | ) | ||||||
|
| |||||||
NET ASSETS - 100.0% | $17,690,806 | |||||||
|
| |||||||
| See Notes to Financial Statements | See explanation of symbols and terms, if any, on B-76 and B-77 |
B-48
Table of Contents
PACIFIC FUNDS
PF DEVELOPING GROWTH FUND
Schedule of Investments (Continued)
March 31, 2020
Notes to Schedule of Investments
| (a) | As of March 31, 2020, the Fund’s composition by sector as a percentage of net assets was as follows: |
Consumer, Non-Cyclical | 43.3% | |||
Technology | 21.6% | |||
Industrial | 11.7% | |||
Consumer, Cyclical | 9.1% | |||
Financial | 6.9% | |||
Short-Term Investment | 3.8% | |||
Others (each less than 3.0%) | 3.8% | |||
|
| |||
| 100.2% | ||||
Other Assets & Liabilities, Net | (0.2% | ) | ||
|
| |||
| 100.0% | ||||
|
|
| (b) | Fair Value Measurements |
The following is a summary of the Fund’s investments as categorized under the three-tier hierarchy of inputs used in valuing the Fund’s assets and liabilities as of March 31, 2020:
| Total Value at March 31, 2020 | Level 1 Quoted Price | Level 2 Significant Observable Inputs | Level 3 Significant Unobservable Inputs | |||||||||||||||
Assets | Common Stocks | $17,047,051 | $17,047,051 | $— | $— | |||||||||||||
Short-Term Investment | 680,871 | 680,871 | — | — | ||||||||||||||
|
|
|
|
|
|
|
| |||||||||||
Total | $17,727,922 | $17,727,922 | $— | $— | ||||||||||||||
|
|
|
|
|
|
|
| |||||||||||
| See Notes to Financial Statements | See explanation of symbols and terms, if any, on B-76 and B-77 |
B-49
Table of Contents
PACIFIC FUNDS
PF GROWTH FUND
Schedule of Investments
March 31, 2020
Shares | Value | |||||||
COMMON STOCKS - 99.3% | ||||||||
Basic Materials - 1.4% | ||||||||
The Sherwin-Williams Co | 4,912 | $2,257,162 | ||||||
|
| |||||||
Communications - 20.0% | ||||||||
Alibaba Group Holding Ltd ADR (China) * | 5,584 | 1,085,976 | ||||||
Alphabet Inc ‘A’ * | 5,827 | 6,770,683 | ||||||
Alphabet Inc ‘C’ * | 2,073 | 2,410,505 | ||||||
Amazon.com Inc * | 5,842 | 11,390,264 | ||||||
Charter Communications Inc ‘A’ * | 5,765 | 2,515,327 | ||||||
Comcast Corp ‘A’ | 13,491 | 463,820 | ||||||
Facebook Inc ‘A’ * | 21,008 | 3,504,134 | ||||||
Netflix Inc * | 9,685 | 3,636,717 | ||||||
Shopify Inc ‘A’ (Canada) * | 1,366 | 569,526 | ||||||
Spotify Technology SA * | 3,036 | 368,692 | ||||||
|
| |||||||
| 32,715,644 | ||||||||
|
| |||||||
Consumer, Cyclical - 5.6% | ||||||||
Chipotle Mexican Grill Inc * | 1,066 | 697,590 | ||||||
Costco Wholesale Corp | 5,476 | 1,561,372 | ||||||
Dollar General Corp | 8,468 | 1,278,753 | ||||||
Dollar Tree Inc * | 11,123 | 817,207 | ||||||
Hilton Worldwide Holdings Inc | 5,590 | 381,462 | ||||||
Lululemon Athletica Inc * | 3,239 | 613,952 | ||||||
Marriott International Inc ‘A’ | 3,601 | 269,391 | ||||||
NIKE Inc ‘B’ | 17,684 | 1,463,174 | ||||||
O’Reilly Automotive Inc * | 603 | 181,533 | ||||||
Ross Stores Inc | 18,134 | 1,577,114 | ||||||
Starbucks Corp | 4,270 | 280,710 | ||||||
|
| |||||||
| 9,122,258 | ||||||||
|
| |||||||
Consumer, Non-Cyclical - 24.5% | ||||||||
Abbott Laboratories | 19,645 | 1,550,187 | ||||||
Becton Dickinson and Co | 4,473 | 1,027,761 | ||||||
Boston Scientific Corp * | 59,874 | 1,953,689 | ||||||
Clarivate Analytics PLC (United Kingdom) * | 42,030 | 872,123 | ||||||
Colgate-Palmolive Co | 41,413 | 2,748,167 | ||||||
CoStar Group Inc * | 1,358 | 797,431 | ||||||
Danaher Corp | 24,146 | 3,342,048 | ||||||
Edwards Lifesciences Corp * | 5,372 | 1,013,267 | ||||||
Eli Lilly & Co | 6,098 | 845,915 | ||||||
Equifax Inc | 1,998 | 238,661 | ||||||
FleetCor Technologies Inc * | 1,832 | 341,741 | ||||||
Global Payments Inc | 24,424 | 3,522,674 | ||||||
IHS Markit Ltd | 15,740 | 944,400 | ||||||
Illumina Inc * | 3,241 | 885,182 | ||||||
Medtronic PLC | 27,340 | 2,465,521 | ||||||
Merck & Co Inc | 14,739 | 1,134,019 | ||||||
PayPal Holdings Inc * | 20,987 | 2,009,295 | ||||||
Square Inc ‘A’ * | 16,068 | 841,642 | ||||||
The Estee Lauder Cos Inc ‘A’ | 7,492 | 1,193,775 | ||||||
Thermo Fisher Scientific Inc | 14,595 | 4,139,142 | ||||||
TransUnion | 15,957 | 1,056,034 | ||||||
Verisk Analytics Inc | 19,865 | 2,768,784 | ||||||
Vertex Pharmaceuticals Inc * | 6,409 | 1,525,022 | ||||||
Zoetis Inc | 24,885 | 2,928,716 | ||||||
|
| |||||||
| 40,145,196 | ||||||||
|
| |||||||
Financial - 12.4% | ||||||||
American Tower Corp REIT | 11,196 | 2,437,929 | ||||||
Aon PLC | 14,514 | 2,395,391 | ||||||
Intercontinental Exchange Inc | 21,852 | 1,764,549 | ||||||
Mastercard Inc ‘A’ | 25,637 | 6,192,874 | ||||||
Visa Inc ‘A’ | 46,244 | 7,450,833 | ||||||
|
| |||||||
| 20,241,576 | ||||||||
|
| |||||||
Shares | Value | |||||||
Industrial - 4.4% | ||||||||
AMETEK Inc | 13,389 | $964,276 | ||||||
Amphenol Corp ‘A’ | 11,971 | 872,446 | ||||||
Canadian Pacific Railway Ltd (Canada) | 5,447 | 1,196,107 | ||||||
Roper Technologies Inc | 5,780 | 1,802,262 | ||||||
Union Pacific Corp | 2,695 | 380,103 | ||||||
Vulcan Materials Co | 18,472 | 1,996,269 | ||||||
|
| |||||||
| 7,211,463 | ||||||||
|
| |||||||
Technology - 31.0% | ||||||||
Activision Blizzard Inc * | 26,286 | 1,563,491 | ||||||
Adobe Inc * | 23,332 | 7,425,176 | ||||||
Apple Inc | 12,384 | 3,149,127 | ||||||
Black Knight Inc * | 6,506 | 377,738 | ||||||
Cadence Design Systems Inc * | 12,309 | 812,886 | ||||||
Electronic Arts Inc * | 22,896 | 2,293,492 | ||||||
Fidelity National Information Services Inc | 26,934 | 3,276,252 | ||||||
Fiserv Inc * | 41,434 | 3,935,816 | ||||||
Intuit Inc | 12,443 | 2,861,890 | ||||||
Microsoft Corp | 100,326 | 15,822,413 | ||||||
MSCI Inc | 9,193 | 2,656,409 | ||||||
NVIDIA Corp | 4,584 | 1,208,342 | ||||||
salesforce.com Inc * | 23,792 | 3,425,572 | ||||||
ServiceNow Inc * | 3,613 | 1,035,414 | ||||||
Take-Two Interactive Software Inc * | 8,136 | 965,011 | ||||||
|
| |||||||
| 50,809,029 | ||||||||
|
| |||||||
Total Common Stocks | 162,502,328 | |||||||
|
| |||||||
SHORT-TERM INVESTMENT - 1.2% | ||||||||
Money Market Fund - 1.2% | ||||||||
BlackRock Liquidity Funds T-Fund Portfolio ‘Institutional’ 0.210% | 1,889,860 | 1,889,860 | ||||||
|
| |||||||
Total Short-Term Investment | 1,889,860 | |||||||
|
| |||||||
TOTAL INVESTMENTS - 100.5% | 164,392,188 | |||||||
OTHER ASSETS & LIABILITIES, NET - (0.5%) | (817,269 | ) | ||||||
|
| |||||||
NET ASSETS - 100.0% | $163,574,919 | |||||||
|
| |||||||
Notes to Schedule of Investments
| (a) | As of March 31, 2020, the Fund’s composition by sector as a percentage of net assets was as follows: |
Technology | 31.0% | |||
Consumer, Non-Cyclical | 24.5% | |||
Communications | 20.0% | |||
Financial | 12.4% | |||
Consumer, Cyclical | 5.6% | |||
Industrial | 4.4% | |||
Others (each less than 3.0%) | 2.6% | |||
|
| |||
| 100.5% | ||||
Other Assets & Liabilities, Net | (0.5% | ) | ||
|
| |||
| 100.0% | ||||
|
|
| See Notes to Financial Statements | See explanation of symbols and terms, if any, on B-76 and B-77 |
B-50
Table of Contents
PACIFIC FUNDS
PF GROWTH FUND
Schedule of Investments (Continued)
March 31, 2020
| (b) | Fair Value Measurements |
The following is a summary of the Fund’s investments as categorized under the three-tier hierarchy of inputs used in valuing the Fund’s assets and liabilities as of March 31, 2020:
| Total Value at March 31, 2020 | Level 1 Quoted Price | Level 2 Significant Observable Inputs | Level 3 Significant Unobservable Inputs | |||||||||||||||
Assets | Common Stocks | $162,502,328 | $162,502,328 | $— | $— | |||||||||||||
Short-Term Investment | 1,889,860 | 1,889,860 | — | — | ||||||||||||||
|
|
|
|
|
|
|
| |||||||||||
Total | $164,392,188 | $164,392,188 | $— | $— | ||||||||||||||
|
|
|
|
|
|
|
| |||||||||||
| See Notes to Financial Statements | See explanation of symbols and terms, if any, on B-76 and B-77 |
B-51
Table of Contents
PACIFIC FUNDS
PF LARGE-CAP VALUE FUND
Schedule of Investments
March 31, 2020
Shares | Value | |||||||
COMMON STOCKS - 97.4% | ||||||||
Basic Materials - 3.5% | ||||||||
Air Products & Chemicals Inc | 18,308 | $3,654,460 | ||||||
PPG Industries Inc | 23,830 | 1,992,188 | ||||||
|
| |||||||
| 5,646,648 | ||||||||
|
| |||||||
Communications - 14.9% | ||||||||
Alphabet Inc ‘A’ * | 1,698 | 1,972,991 | ||||||
Charter Communications Inc ‘A’ * | 13,117 | 5,723,078 | ||||||
Comcast Corp ‘A’ | 166,528 | 5,725,233 | ||||||
DISH Network Corp ‘A’ * | 150,310 | 3,004,697 | ||||||
Motorola Solutions Inc | 36,843 | 4,897,172 | ||||||
T-Mobile US Inc * | 30,201 | 2,533,864 | ||||||
|
| |||||||
| 23,857,035 | ||||||||
|
| |||||||
Consumer, Cyclical - 2.4% | ||||||||
The Home Depot Inc | 20,294 | 3,789,093 | ||||||
|
| |||||||
Consumer, Non-Cyclical - 19.9% | ||||||||
AmerisourceBergen Corp | 27,419 | 2,426,581 | ||||||
Amgen Inc | 12,951 | 2,625,556 | ||||||
Anthem Inc | 14,263 | 3,238,272 | ||||||
CVS Health Corp | 37,117 | 2,202,152 | ||||||
Johnson & Johnson | 29,929 | 3,924,590 | ||||||
Keurig Dr Pepper Inc | 86,139 | 2,090,594 | ||||||
Merck & Co Inc | 49,849 | 3,835,382 | ||||||
Novartis AG ADR (Switzerland) | 24,959 | 2,057,870 | ||||||
PepsiCo Inc | 16,600 | 1,993,660 | ||||||
Pfizer Inc | 64,144 | 2,093,660 | ||||||
Reynolds Consumer Products Inc | 91,380 | 2,665,555 | ||||||
UnitedHealth Group Inc | 11,143 | 2,778,841 | ||||||
|
| |||||||
| 31,932,713 | ||||||||
|
| |||||||
Energy - 5.7% | ||||||||
Chevron Corp | 32,630 | 2,364,370 | ||||||
Enterprise Products Partners LP | 114,823 | 1,641,969 | ||||||
Exxon Mobil Corp | 43,859 | 1,665,326 | ||||||
Royal Dutch Shell PLC ‘A’ ADR (Netherlands) | 42,716 | 1,490,361 | ||||||
Suncor Energy Inc (Canada) | 124,397 | 1,965,473 | ||||||
|
| |||||||
| 9,127,499 | ||||||||
|
| |||||||
Financial - 22.9% | ||||||||
American Express Co | 43,964 | 3,763,758 | ||||||
American Tower Corp REIT | 25,470 | 5,546,092 | ||||||
Bank of America Corp | 190,626 | 4,046,990 | ||||||
Berkshire Hathaway Inc ‘B’ * | 15,100 | 2,760,733 | ||||||
JPMorgan Chase & Co | 78,116 | 7,032,783 | ||||||
Marsh & McLennan Cos Inc | 32,768 | 2,833,121 | ||||||
The Bank of New York Mellon Corp | 41,676 | 1,403,648 | ||||||
The Charles Schwab Corp | 57,259 | 1,925,048 | ||||||
The Progressive Corp | 33,569 | 2,478,735 | ||||||
The Travelers Cos Inc | 21,917 | 2,177,454 | ||||||
US Bancorp | 82,279 | 2,834,512 | ||||||
|
| |||||||
| 36,802,874 | ||||||||
|
| |||||||
Shares | Value | |||||||
Industrial - 16.2% | ||||||||
Deere & Co | 25,075 | $3,464,362 | ||||||
Honeywell International Inc | 34,039 | 4,554,078 | ||||||
Illinois Tool Works Inc | 19,697 | 2,799,338 | ||||||
Martin Marietta Materials Inc | 11,485 | 2,173,305 | ||||||
Northrop Grumman Corp | 7,659 | 2,317,230 | ||||||
TE Connectivity Ltd | 43,760 | 2,756,005 | ||||||
United Parcel Service Inc ‘B’ | 39,327 | 3,673,928 | ||||||
United Technologies Corp | 44,899 | 4,235,323 | ||||||
|
| |||||||
| 25,973,569 | ||||||||
|
| |||||||
Technology - 7.6% | ||||||||
Apple Inc | 13,784 | 3,505,133 | ||||||
Lam Research Corp | 5,133 | 1,231,920 | ||||||
Microsoft Corp | 35,585 | 5,612,110 | ||||||
Oracle Corp | 39,000 | 1,884,870 | ||||||
|
| |||||||
| 12,234,033 | ||||||||
|
| |||||||
Utilities - 4.3% | ||||||||
Edison International | 45,510 | 2,493,493 | ||||||
Sempra Energy | 38,806 | 4,384,690 | ||||||
|
| |||||||
| 6,878,183 | ||||||||
|
| |||||||
Total Common Stocks | 156,241,647 | |||||||
|
| |||||||
SHORT-TERM INVESTMENT - 2.5% | ||||||||
Money Market Fund - 2.5% | ||||||||
BlackRock Liquidity Funds T-Fund Portfolio ‘Institutional’ 0.210% | 3,955,054 | 3,955,054 | ||||||
|
| |||||||
Total Short-Term Investment | 3,955,054 | |||||||
|
| |||||||
TOTAL INVESTMENTS - 99.9% | 160,196,701 | |||||||
OTHER ASSETS & LIABILITIES, NET - 0.1% | 168,314 | |||||||
|
| |||||||
NET ASSETS - 100.0% | $160,365,015 | |||||||
|
| |||||||
Notes to Schedule of Investments
| (a) | As of March 31, 2020, the Fund’s composition by sector as a percentage of net assets was as follows: |
Financial | 22.9% | |||
Consumer, Non-Cyclical | 19.9% | |||
Industrial | 16.2% | |||
Communications | 14.9% | |||
Technology | 7.6% | |||
Energy | 5.7% | |||
Utilities | 4.3% | |||
Basic Materials | 3.5% | |||
Others (each less than 3.0%) | 4.9% | |||
|
| |||
| 99.9% | ||||
Other Assets & Liabilities, Net | 0.1% | |||
|
| |||
| 100.0% | ||||
|
|
| (b) | Fair Value Measurements |
The following is a summary of the Fund’s investments as categorized under the three-tier hierarchy of inputs used in valuing the Fund’s assets and liabilities as of March 31, 2020:
| Total Value at March 31, 2020 | Level 1 Quoted Price | Level 2 Significant Observable Inputs | Level 3 Significant Unobservable Inputs | |||||||||||||||
Assets | Common Stocks | $156,241,647 | $156,241,647 | $— | $— | |||||||||||||
Short-Term Investment | 3,955,054 | 3,955,054 | — | — | ||||||||||||||
|
|
|
|
|
|
|
| |||||||||||
Total | $160,196,701 | $160,196,701 | $— | $— | ||||||||||||||
|
|
|
|
|
|
|
| |||||||||||
| See Notes to Financial Statements | See explanation of symbols and terms, if any, on B-76 and B-77 |
B-52
Table of Contents
PACIFIC FUNDS
PF MID-CAP EQUITY FUND
Schedule of Investments
March 31, 2020
Shares | Value | |||||||
COMMON STOCKS - 97.6% | ||||||||
Basic Materials - 1.6% | ||||||||
Axalta Coating Systems Ltd * | 3,410 | $58,891 | ||||||
Huntsman Corp | 4,400 | 63,492 | ||||||
|
| |||||||
| 122,383 | ||||||||
|
| |||||||
Communications - 3.9% | ||||||||
Ciena Corp * | 2,975 | 118,435 | ||||||
Discovery Inc ‘A’ * | 5,006 | 97,317 | ||||||
Expedia Group Inc | 800 | 45,016 | ||||||
Sinclair Broadcast Group Inc ‘A’ | 2,740 | 44,059 | ||||||
|
| |||||||
| 304,827 | ||||||||
|
| |||||||
Consumer, Cyclical - 6.7% | ||||||||
Alaska Air Group Inc | 1,970 | 56,086 | ||||||
Aramark | 2,840 | 56,715 | ||||||
Best Buy Co Inc | 1,660 | 94,620 | ||||||
Lululemon Athletica Inc * | 785 | 148,796 | ||||||
Pool Corp | 610 | 120,030 | ||||||
PulteGroup Inc | 2,015 | 44,975 | ||||||
|
| |||||||
| 521,222 | ||||||||
|
| |||||||
Consumer, Non-Cyclical - 27.2% | ||||||||
AmerisourceBergen Corp | 1,120 | 99,120 | ||||||
Amicus Therapeutics Inc * | 7,000 | 64,680 | ||||||
Booz Allen Hamilton Holding Corp | 2,040 | 140,025 | ||||||
Euronet Worldwide Inc * | 1,128 | 96,692 | ||||||
General Mills Inc | 1,625 | 85,751 | ||||||
Hill-Rom Holdings Inc | 1,200 | 120,720 | ||||||
Horizon Therapeutics PLC * | 3,275 | 97,006 | ||||||
Ionis Pharmaceuticals Inc * | 2,050 | 96,924 | ||||||
Jazz Pharmaceuticals PLC * | 995 | 99,241 | ||||||
Lamb Weston Holdings Inc | 2,015 | 115,056 | ||||||
ManpowerGroup Inc | 1,125 | 59,614 | ||||||
MarketAxess Holdings Inc | 310 | 103,097 | ||||||
Neurocrine Biosciences Inc * | 1,010 | 87,416 | ||||||
Post Holdings Inc * | 1,370 | 113,669 | ||||||
Quanta Services Inc | 3,850 | 122,160 | ||||||
Service Corp International | 3,750 | 146,662 | ||||||
Syneos Health Inc * | 2,330 | 91,849 | ||||||
Teleflex Inc | 500 | 146,430 | ||||||
The Cooper Cos Inc | 600 | 165,402 | ||||||
Tyson Foods Inc ‘A’ | 1,340 | 77,546 | ||||||
|
| |||||||
| 2,129,060 | ||||||||
|
| |||||||
Energy - 1.4% | ||||||||
Cabot Oil & Gas Corp | 3,256 | 55,971 | ||||||
Diamondback Energy Inc | 2,145 | 56,199 | ||||||
|
| |||||||
| 112,170 | ||||||||
|
| |||||||
Financial - 18.8% | ||||||||
Alleghany Corp * | 265 | 146,373 | ||||||
AvalonBay Communities Inc REIT | 695 | 102,283 | ||||||
Boston Properties Inc REIT | 1,370 | 126,355 | ||||||
Discover Financial Services | 1,850 | 65,990 | ||||||
Douglas Emmett Inc REIT | 3,685 | 112,429 | ||||||
E*TRADE Financial Corp | 2,213 | 75,950 | ||||||
Everest Re Group Ltd | 540 | 103,907 | ||||||
Highwoods Properties Inc REIT | 3,175 | 112,458 | ||||||
Hudson Pacific Properties Inc REIT | 4,150 | 105,244 | ||||||
Mid-America Apartment Communities Inc REIT | 1,066 | 109,830 | ||||||
TCF Financial Corp | 2,725 | 61,749 | ||||||
The Hanover Insurance Group Inc | 885 | 80,163 | ||||||
Western Alliance Bancorp | 2,000 | 61,220 | ||||||
Willis Towers Watson PLC | 815 | 138,428 | ||||||
Zions Bancorp NA | 2,380 | 63,689 | ||||||
|
| |||||||
| 1,466,068 | ||||||||
|
| |||||||
Shares | Value | |||||||
Industrial - 13.3% | ||||||||
Acuity Brands Inc | 750 | $64,245 | ||||||
Graphic Packaging Holding Co | 5,700 | 69,540 | ||||||
Howmet Aerospace Inc | 3,370 | 54,122 | ||||||
Hubbell Inc | 850 | 97,529 | ||||||
ITT Inc | 1,800 | 81,648 | ||||||
Kansas City Southern | 500 | 63,590 | ||||||
L3Harris Technologies Inc | 910 | 163,909 | ||||||
Martin Marietta Materials Inc | 605 | 114,484 | ||||||
Stanley Black & Decker Inc | 770 | 77,000 | ||||||
Textron Inc | 2,855 | 76,143 | ||||||
Trane Technologies PLC | 1,407 | 116,204 | ||||||
Westrock Co | 2,300 | 64,998 | ||||||
|
| |||||||
| 1,043,412 | ||||||||
|
| |||||||
Technology - 17.9% | ||||||||
Cerner Corp | 2,100 | 132,279 | ||||||
J2 Global Inc | 1,120 | 83,832 | ||||||
Lam Research Corp | 540 | 129,600 | ||||||
Nuance Communications Inc * | 7,600 | 127,528 | ||||||
NXP Semiconductors NV (Netherlands) | 1,024 | 84,920 | ||||||
RealPage Inc * | 2,340 | 123,856 | ||||||
RingCentral Inc ‘A’ * | 1,000 | 211,910 | ||||||
Skyworks Solutions Inc | 1,245 | 111,278 | ||||||
Synopsys Inc * | 1,315 | 169,359 | ||||||
Take-Two Interactive Software Inc * | 1,200 | 142,332 | ||||||
Zebra Technologies Corp ‘A’ * | 430 | 78,948 | ||||||
|
| |||||||
| 1,395,842 | ||||||||
|
| |||||||
Utilities - 6.8% | ||||||||
Ameren Corp | 2,670 | 194,456 | ||||||
American Water Works Co Inc | 1,200 | 143,472 | ||||||
CMS Energy Corp | 3,300 | 193,875 | ||||||
|
| |||||||
| 531,803 | ||||||||
|
| |||||||
Total Common Stocks | 7,626,787 | |||||||
|
| |||||||
SHORT-TERM INVESTMENT - 2.5% | ||||||||
Money Market Fund - 2.5% | ||||||||
BlackRock Liquidity Funds T-Fund Portfolio ‘Institutional’ 0.210% | 198,148 | 198,148 | ||||||
|
| |||||||
Total Short-Term Investment | 198,148 | |||||||
|
| |||||||
TOTAL INVESTMENTS - 100.1% | 7,824,935 | |||||||
OTHER ASSETS & LIABILITIES, NET - (0.1%) | (6,889 | ) | ||||||
|
| |||||||
NET ASSETS - 100.0% | $7,818,046 | |||||||
|
| |||||||
| See Notes to Financial Statements | See explanation of symbols and terms, if any, on B-76 and B-77 |
B-53
Table of Contents
PACIFIC FUNDS
PF MID-CAP EQUITY FUND
Schedule of Investments (Continued)
March 31, 2020
Notes to Schedule of Investments
| (a) | As of March 31, 2020, the Fund’s composition by sector as a percentage of net assets was as follows: |
Consumer, Non-Cyclical | 27.2% | |||
Financial | 18.8% | |||
Technology | 17.9% | |||
Industrial | 13.3% | |||
Utilities | 6.8% | |||
Consumer, Cyclical | 6.7% | |||
Communications | 3.9% | |||
Others (each less than 3.0%) | 5.5% | |||
|
| |||
| 100.1% | ||||
Other Assets & Liabilities, Net | (0.1% | ) | ||
|
| |||
| 100.0% | ||||
|
|
| (b) | Fair Value Measurements |
The following is a summary of the Fund’s investments as categorized under the three-tier hierarchy of inputs used in valuing the Fund’s assets and liabilities as of March 31, 2020:
| Total Value at March 31, 2020 | Level 1 Quoted Price | Level 2 Significant Observable Inputs | Level 3 Significant Unobservable Inputs | |||||||||||||||
Assets | Common Stocks | $7,626,787 | $7,626,787 | $— | $— | |||||||||||||
Short-Term Investment | 198,148 | 198,148 | — | — | ||||||||||||||
|
|
|
|
|
|
|
| |||||||||||
Total | $7,824,935 | $7,824,935 | $— | $— | ||||||||||||||
|
|
|
|
|
|
|
| |||||||||||
| See Notes to Financial Statements | See explanation of symbols and terms, if any, on B-76 and B-77 |
B-54
Table of Contents
PACIFIC FUNDS
PF MULTI-ASSET FUND
Schedule of Investments
March 31, 2020
Principal Amount | Value | |||||||
CORPORATE BONDS & NOTES - 53.3% | ||||||||
Basic Materials - 1.1% | ||||||||
Anglo American Capital PLC (South Africa) | ||||||||
4.125% due 04/15/21 ~ | $1,600,000 | $1,577,137 | ||||||
5.375% due 04/01/25 ~ | 2,500,000 | 2,529,392 | ||||||
DuPont de Nemours Inc | 5,000,000 | 4,375,810 | ||||||
Glencore Funding LLC (Switzerland) | 1,600,000 | 1,464,278 | ||||||
|
| |||||||
| 9,946,617 | ||||||||
|
| |||||||
Communications - 2.7% | ||||||||
AT&T Inc | ||||||||
1.964% (USD LIBOR + 1.180%) | 7,750,000 | 7,202,113 | ||||||
2.781% (USD LIBOR + 0.950%) | 1,800,000 | 1,769,250 | ||||||
3.000% due 06/30/22 | 3,200,000 | 3,230,967 | ||||||
eBay Inc | 3,060,000 | 3,106,031 | ||||||
Sprint Spectrum Co LLC | 3,740,625 | 3,735,949 | ||||||
Verizon Communications Inc | 4,800,000 | 4,569,940 | ||||||
|
| |||||||
| 23,614,250 | ||||||||
|
| |||||||
Consumer, Cyclical - 4.9% | ||||||||
Alimentation Couche-Tard Inc (Canada) | 2,000,000 | 1,979,242 | ||||||
Daimler Finance North America LLC (Germany) | ||||||||
2.300% due 02/12/21 ~ | 3,600,000 | 3,510,108 | ||||||
3.750% due 11/05/21 ~ | 2,900,000 | 2,877,018 | ||||||
Ford Motor Credit Co LLC | ||||||||
2.843% (USD LIBOR + 1.080%) | 3,200,000 | 2,624,000 | ||||||
3.087% due 01/09/23 | 1,250,000 | 1,131,250 | ||||||
3.336% due 03/18/21 | 2,000,000 | 1,920,000 | ||||||
General Motors Financial Co Inc | ||||||||
2.685% (USD LIBOR + 1.310%) | 5,700,000 | 4,531,217 | ||||||
4.200% due 03/01/21 | 3,000,000 | 2,888,079 | ||||||
Hasbro Inc | 1,520,000 | 1,491,782 | ||||||
Marriott International Inc | ||||||||
1.649% (USD LIBOR + 0.650%) | 3,000,000 | 2,564,740 | ||||||
2.125% due 10/03/22 | 1,325,000 | 1,193,762 | ||||||
McDonald’s Corp | 1,100,000 | 1,140,013 | ||||||
NIKE Inc | 1,500,000 | 1,556,006 | ||||||
Nissan Motor Acceptance Corp | ||||||||
1.825% (USD LIBOR + 0.630%) | 2,500,000 | 2,432,837 | ||||||
2.498% (USD LIBOR + 0.650%) | 1,700,000 | 1,632,655 | ||||||
Toyota Motor Credit Corp | 5,050,000 | 5,085,318 | ||||||
Volkswagen Group of America Finance LLC (Germany) | 5,000,000 | 4,984,440 | ||||||
|
| |||||||
| 43,542,467 | ||||||||
|
| |||||||
Principal Amount | Value | |||||||
Consumer, Non-Cyclical - 9.1% | ||||||||
AbbVie Inc | $ | 6,100,000 | $ | 6,079,958 | ||||
Anheuser-Busch InBev Finance Inc (Belgium) | 3,416,000 | 3,519,547 | ||||||
Anheuser-Busch InBev Worldwide Inc (Belgium) | 1,300,000 | 1,357,773 | ||||||
BAT Capital Corp (United Kingdom) | 2,500,000 | 2,465,296 | ||||||
BAT International Finance PLC (United Kingdom) | 3,200,000 | 3,189,415 | ||||||
Bayer US Finance II LLC (Germany) | ||||||||
1.751% (USD LIBOR + 1.010%) | 2,000,000 | 1,852,657 | ||||||
3.500% due 06/25/21 ~ | 1,750,000 | 1,753,878 | ||||||
Bristol-Myers Squibb Co | 2,000,000 | 2,123,806 | ||||||
Cigna Corp | ||||||||
2.721% (USD LIBOR + 0.890%) | 8,678,000 | 8,073,948 | ||||||
3.200% due 09/17/20 | 8,000,000 | 8,012,181 | ||||||
Conagra Brands Inc | 1,048,000 | 1,037,003 | ||||||
Constellation Brands Inc | 2,500,000 | 2,357,227 | ||||||
DH Europe Finance II Sarl | 4,100,000 | 4,026,401 | ||||||
General Mills Inc | 7,061,000 | 6,829,994 | ||||||
Keurig Dr Pepper Inc | 7,000,000 | 7,087,135 | ||||||
Moody’s Corp | 3,000,000 | 3,002,303 | ||||||
PayPal Holdings Inc | 7,500,000 | 7,473,253 | ||||||
Reynolds American Inc (United Kingdom) | 2,347,000 | 2,340,043 | ||||||
Smithfield Foods Inc | 2,500,000 | 2,434,778 | ||||||
Suntory Holdings Ltd (Japan) | 1,000,000 | 1,009,462 | ||||||
UnitedHealth Group Inc | 4,400,000 | 4,475,442 | ||||||
|
| |||||||
| 80,501,500 | ||||||||
|
| |||||||
Energy - 2.2% | ||||||||
Energy Transfer Operating LP | ||||||||
3.600% due 02/01/23 | 3,400,000 | 3,026,559 | ||||||
4.250% due 03/15/23 | 1,519,000 | 1,363,189 | ||||||
4.500% due 04/15/24 | 900,000 | 804,266 | ||||||
Exxon Mobil Corp | 2,750,000 | 2,523,812 | ||||||
Kinder Morgan Energy Partners LP | 2,000,000 | 1,984,160 | ||||||
Kinder Morgan Inc | 915,000 | 957,515 | ||||||
Midwest Connector Capital Co LLC | 1,250,000 | 1,201,732 | ||||||
| See Notes to Financial Statements | See explanation of symbols and terms, if any, on B-76 and B-77 |
B-55
Table of Contents
PACIFIC FUNDS
PF MULTI-ASSET FUND
Schedule of Investments (Continued)
March 31, 2020
Principal Amount | Value | |||||||
MPLX LP | ||||||||
1.899% (USD LIBOR + 0.900%) | $ | 2,000,000 | $ | 1,890,372 | ||||
3.375% due 03/15/23 | 1,500,000 | 1,388,483 | ||||||
3.500% due 12/01/22 ~ | 1,606,000 | 1,539,290 | ||||||
Occidental Petroleum Corp | 4,150,000 | 3,289,197 | ||||||
|
| |||||||
| 19,968,575 | ||||||||
|
| |||||||
Financial - 26.8% | ||||||||
AerCap Ireland Capital DAC (Ireland) | 960,000 | 836,907 | ||||||
AIG Global Funding | 2,000,000 | 1,981,961 | ||||||
Air Lease Corp | ||||||||
2.625% due 07/01/22 | 1,500,000 | 1,287,839 | ||||||
3.500% due 01/15/22 | 2,650,000 | 2,416,843 | ||||||
American Express Co | ||||||||
2.288% (USD LIBOR + 0.650%) | 5,000,000 | 4,785,609 | ||||||
3.700% due 11/05/21 | 3,050,000 | 3,147,770 | ||||||
Banco Santander SA (Spain) | 2,900,000 | 2,877,731 | ||||||
Bank of America Corp | ||||||||
2.503% due 10/21/22 | 600,000 | 601,857 | ||||||
2.979% (USD LIBOR + 1.160%) | 9,321,000 | 8,918,225 | ||||||
Boston Properties LP REIT | 737,000 | 776,447 | ||||||
Canadian Imperial Bank of Commerce (Canada) | 1,200,000 | 1,144,416 | ||||||
Capital One Financial Corp | 5,000,000 | 5,009,586 | ||||||
Capital One NA | 2,000,000 | 1,952,365 | ||||||
Citibank NA | 6,000,000 | 6,037,419 | ||||||
Citigroup Inc | 2,000,000 | 1,958,739 | ||||||
Citizens Bank NA | 4,000,000 | 3,827,410 | ||||||
Cooperatieve Rabobank UA (Netherlands) | 2,500,000 | 2,322,182 | ||||||
Duke Realty LP REIT | 2,000,000 | 2,074,891 | ||||||
Fifth Third Bank | 5,000,000 | 4,934,069 | ||||||
HSBC Bank USA NA | 4,000,000 | 4,029,923 | ||||||
HSBC Holdings PLC (United Kingdom) | 6,290,000 | 6,326,630 | ||||||
ING Bank NV (Netherlands) | 2,200,000 | 2,221,361 | ||||||
Intercontinental Exchange Inc | 2,200,000 | 2,317,374 | ||||||
Jackson National Life Global Funding | ||||||||
2.500% due 06/27/22 ~ | 1,850,000 | 1,818,441 | ||||||
3.300% due 02/01/22 ~ | 2,650,000 | 2,705,258 | ||||||
JPMorgan Chase & Co | ||||||||
2.694% (USD LIBOR + 0.900%) | 2,000,000 | 1,929,900 | ||||||
2.972% due 01/15/23 | 2,500,000 | 2,547,396 | ||||||
3.250% due 09/23/22 | 1,200,000 | 1,238,016 | ||||||
Principal Amount | Value | |||||||
JPMorgan Chase Bank NA | $ | 2,000,000 | $ | 1,949,263 | ||||
Metropolitan Life Global Funding I | 2,100,000 | 2,116,971 | ||||||
Mid-America Apartments LP REIT | 2,000,000 | 1,992,216 | ||||||
Mitsubishi UFJ Financial Group Inc (Japan) | ||||||||
2.320% (USD LIBOR + 0.740%) | 5,300,000 | 5,040,647 | ||||||
2.584% (USD LIBOR + 0.790%) | 4,000,000 | 3,829,529 | ||||||
2.623% due 07/18/22 | 1,050,000 | 1,049,797 | ||||||
Mitsubishi UFJ Trust & Banking Corp (Japan) | 6,000,000 | 6,000,730 | ||||||
Morgan Stanley | ||||||||
0.924% (SOFR + 0.830%) | 2,500,000 | 2,386,958 | ||||||
3.201% (USD LIBOR + 1.400%) | 1,500,000 | 1,456,783 | ||||||
5.750% due 01/25/21 | 3,458,000 | 3,551,216 | ||||||
New York Life Global Funding | ||||||||
1.416% (USD LIBOR + 0.520%) | 2,000,000 | 1,940,041 | ||||||
2.288% (USD LIBOR + 0.440%) | 2,000,000 | 1,921,866 | ||||||
3.250% due 08/06/21 ~ | 1,500,000 | 1,525,163 | ||||||
PNC Bank NA | ||||||||
2.004% (USD LIBOR + 0.325%) | 3,350,000 | 3,158,703 | ||||||
2.252% (USD LIBOR + 0.450%) | 1,900,000 | 1,842,686 | ||||||
Protective Life Global Funding | 3,000,000 | 2,899,930 | ||||||
Reliance Standard Life Global Funding II | 2,100,000 | 2,052,849 | ||||||
Royal Bank of Canada (Canada) | ||||||||
2.033% (USD LIBOR + 0.660%) | 6,000,000 | 5,948,172 | ||||||
3.700% due 10/05/23 | 400,000 | 421,910 | ||||||
State Street Corp | 2,000,000 | 2,019,619 | ||||||
Sumitomo Mitsui Financial Group Inc (Japan) | ||||||||
2.576% (USD LIBOR + 0.740%) | 3,130,000 | 2,809,981 | ||||||
2.643% (USD LIBOR + 0.800%) | 7,500,000 | 7,083,158 | ||||||
2.679% (USD LIBOR + 0.860%) | 5,000,000 | 4,930,551 | ||||||
2.784% due 07/12/22 | 2,500,000 | 2,514,714 | ||||||
Synchrony Bank | 1,000,000 | 987,901 | ||||||
The Bank of New York Mellon Corp | 3,000,000 | 3,058,876 | ||||||
The Goldman Sachs Group Inc | ||||||||
2.433% (USD LIBOR + 0.750%) | 7,089,000 | 6,801,975 | ||||||
3.625% due 02/20/24 | 2,300,000 | 2,383,992 | ||||||
The PNC Financial Services Group Inc | 1,700,000 | 1,766,627 | ||||||
The Toronto-Dominion Bank (Canada) | 10,000,000 | 9,248,249 | ||||||
| See Notes to Financial Statements | See explanation of symbols and terms, if any, on B-76 and B-77 |
B-56
Table of Contents
PACIFIC FUNDS
PF MULTI-ASSET FUND
Schedule of Investments (Continued)
March 31, 2020
Principal Amount | Value | |||||||
Truist Bank | ||||||||
0.883% (SOFR + 0.730%) | $ | 2,250,000 | $ | 2,050,381 | ||||
2.282% (USD LIBOR + 0.590%) | 10,000,000 | 9,754,362 | ||||||
2.353% (USD LIBOR + 0.590%) | 6,000,000 | 5,664,783 | ||||||
UBS Group AG (Switzerland) | 2,500,000 | 2,498,254 | ||||||
US Bank NA | 10,000,000 | 9,683,435 | ||||||
Ventas Realty LP REIT | 1,650,000 | 1,587,641 | ||||||
Wells Fargo & Co | ||||||||
2.625% due 07/22/22 | 7,000,000 | 7,091,237 | ||||||
2.911% (USD LIBOR + 1.110%) | 9,800,000 | 9,133,779 | ||||||
Wells Fargo Bank NA | 5,000,000 | 5,009,103 | ||||||
Westpac Banking Corp (Australia) | ||||||||
2.085% (USD LIBOR + 0.710%) | 2,750,000 | 2,698,181 | ||||||
2.412% (USD LIBOR + 0.720%) | 1,750,000 | 1,681,242 | ||||||
3.650% due 05/15/23 | 3,251,000 | 3,394,498 | ||||||
|
| |||||||
| 236,964,534 | ||||||||
|
| |||||||
Industrial - 1.9% | ||||||||
Carrier Global Corp | 4,800,000 | 4,735,017 | ||||||
John Deere Capital Corp | ||||||||
1.263% (USD LIBOR + 0.490%) | 3,000,000 | 2,905,826 | ||||||
1.399% (USD LIBOR + 0.400%) | 6,000,000 | 5,889,274 | ||||||
Otis Worldwide Corp | ||||||||
1.823% (USD LIBOR + 0.450%) | 1,400,000 | 1,333,045 | ||||||
2.056% due 04/05/25 ~ | 2,000,000 | 1,961,976 | ||||||
|
| |||||||
| 16,825,138 | ||||||||
|
| |||||||
Technology - 1.9% | ||||||||
Broadcom Inc | ||||||||
3.125% due 04/15/21 ~ | 2,000,000 | 1,976,082 | ||||||
3.125% due 10/15/22 ~ | 6,000,000 | 5,948,830 | ||||||
Fiserv Inc | 2,200,000 | 2,297,778 | ||||||
Hewlett Packard Enterprise Co | ||||||||
1.464% (USD LIBOR + 0.680%) | 2,145,000 | 2,075,687 | ||||||
2.093% (USD LIBOR + 0.720%) | 2,100,000 | 1,978,003 | ||||||
Oracle Corp | 2,450,000 | 2,504,018 | ||||||
|
| |||||||
| 16,780,398 | ||||||||
|
| |||||||
Utilities - 2.7% | ||||||||
American Electric Power Co Inc | 1,250,000 | 1,266,162 | ||||||
Consolidated Edison Co of New York Inc | 3,000,000 | 2,913,515 | ||||||
Dominion Energy Inc | ||||||||
2.579% due 07/01/20 | 3,100,000 | 3,096,447 | ||||||
2.715% due 08/15/21 | 1,000,000 | 987,232 | ||||||
Edison International | 1,500,000 | 1,496,535 | ||||||
Principal Amount | Value | |||||||
Enel Finance International NV (Italy) | $ | 2,500,000 | $ | 2,420,097 | ||||
Evergy Inc | 4,176,000 | 4,104,867 | ||||||
Florida Power & Light Co | ||||||||
2.137% (USD LIBOR + 0.400%) | 3,000,000 | 2,829,932 | ||||||
2.850% due 04/01/25 | 550,000 | 578,790 | ||||||
Oncor Electric Delivery Co LLC | 1,800,000 | 1,741,644 | ||||||
WEC Energy Group Inc | 2,100,000 | 2,109,229 | ||||||
|
| |||||||
| 23,544,450 | ||||||||
|
| |||||||
Total Corporate Bonds & Notes | 471,687,929 | |||||||
|
| |||||||
ASSET-BACKED SECURITIES - 11.2% | ||||||||
AIMCO CLO (Cayman) | 850,000 | 834,459 | ||||||
Ally Auto Receivables Trust | ||||||||
1.750% due 12/15/21 | 711,868 | 712,390 | ||||||
1.930% due 10/17/22 | 5,000,000 | 5,005,600 | ||||||
2.850% due 03/15/22 | 2,185,707 | 2,189,516 | ||||||
AmeriCredit Automobile Receivables Trust | ||||||||
0.912% (USD LIBOR + 0.300%) | 1,935,468 | 1,935,508 | ||||||
1.980% due 12/20/21 | 98,283 | 98,174 | ||||||
2.040% due 07/18/22 | 521,325 | 521,824 | ||||||
2.240% due 06/19/23 | 6,066,000 | 6,024,760 | ||||||
2.300% due 02/18/22 | 2,385,539 | 2,375,248 | ||||||
2.860% due 11/18/21 | 738,673 | 738,302 | ||||||
2.930% due 06/20/22 | 1,610,276 | 1,610,105 | ||||||
Capital Auto Receivables Asset Trust | ||||||||
2.020% due 08/20/21 ~ | 299,324 | 298,827 | ||||||
3.020% due 02/22/21 ~ | 383,288 | 383,079 | ||||||
Carmax Auto Owner Trust | 1,078,223 | 1,078,748 | ||||||
CNH Equipment Trust | 2,045,615 | 2,043,559 | ||||||
Ford Credit Auto Owner Trust | ||||||||
0.945% (USD LIBOR + 0.240%) | 1,082,029 | 1,076,823 | ||||||
1.880% due 07/15/22 | 4,250,000 | 4,236,967 | ||||||
2.780% due 02/15/22 | 2,199,325 | 2,200,542 | ||||||
2.960% due 09/15/21 | 1,384,197 | 1,381,868 | ||||||
GM Financial Consumer Automobiles Receivables Trust | ||||||||
0.935% (USD LIBOR + 0.230%) | 4,399,528 | 4,388,305 | ||||||
1.830% due 01/17/23 | 500,000 | 502,063 | ||||||
2.740% due 07/16/21 | 263,394 | 263,457 | ||||||
2.930% due 11/16/21 | 658,036 | 658,705 | ||||||
Honda Auto Receivables Owner Trust | 1,303,353 | 1,303,015 | ||||||
Hyundai Auto Receivables Trust | 2,250,000 | 2,247,298 | ||||||
John Deere Owner Trust | 10,060 | 10,058 | ||||||
Mercedes-Benz Auto Receivables Trust | ||||||||
2.040% due 06/15/22 | 3,250,000 | 3,254,937 | ||||||
2.710% due 04/15/21 | 4,362 | 4,362 | ||||||
Navient Private Education Loan Trust | 17,474 | 17,471 | ||||||
| See Notes to Financial Statements | See explanation of symbols and terms, if any, on B-76 and B-77 |
B-57
Table of Contents
PACIFIC FUNDS
PF MULTI-ASSET FUND
Schedule of Investments (Continued)
March 31, 2020
Principal Amount | Value | |||||||
Navient Private Education Refi Loan Trust | ||||||||
1.055% (USD LIBOR + 0.350%) | $ | 805,037 | $ | 792,223 | ||||
1.105% (USD LIBOR + 0.400%) | 4,909,667 | 4,857,902 | ||||||
1.800% due 01/15/69 ~ | 6,550,000 | 6,539,698 | ||||||
2.180% due 08/15/68 ~ | 2,068,227 | 2,067,674 | ||||||
Navient Student Loan Trust | 567,697 | 567,522 | ||||||
Nelnet Student Loan Trust | ||||||||
1.793% (USD LIBOR + 0.110%) | 857,976 | 855,517 | ||||||
2.174% (USD LIBOR + 0.380%) | 378,139 | 374,200 | ||||||
Nissan Auto Receivables Owner Trust | ||||||||
1.590% due 07/15/22 | 396,907 | 396,719 | ||||||
2.820% due 01/18/22 | 2,454,217 | 2,461,754 | ||||||
3.070% due 10/15/21 | 1,029,289 | 1,032,781 | ||||||
Santander Drive Auto Receivables Trust | ||||||||
2.280% due 02/15/22 | 2,390,835 | 2,386,656 | ||||||
2.460% due 03/15/22 | 765,993 | 763,656 | ||||||
2.580% due 05/16/22 | 429,028 | 428,738 | ||||||
2.630% due 07/15/22 | 4,002,021 | 3,999,839 | ||||||
SLC Student Loan Trust | 729,838 | 728,442 | ||||||
SLM Student Loan Trust | ||||||||
1.884% (USD LIBOR + 0.090%) | 109,710 | 109,660 | ||||||
1.884% (USD LIBOR + 0.090%) | 1,082,270 | 1,059,847 | ||||||
1.894% (USD LIBOR + 0.100%) | 257,413 | 256,940 | ||||||
2.344% (USD LIBOR + 0.550%) | 298,294 | 298,202 | ||||||
SMB Private Education Loan Trust | ||||||||
1.005% (USD LIBOR + 0.300%) | 92,397 | 92,330 | ||||||
1.055% (USD LIBOR + 0.350%) | 166,845 | 166,669 | ||||||
1.055% (USD LIBOR + 0.350%) | 3,604,253 | 3,553,814 | ||||||
Toyota Auto Receivables Owner Trust | ||||||||
2.590% due 02/15/22 | 6,939,991 | 6,958,203 | ||||||
2.640% due 03/15/21 | 93,673 | 93,707 | ||||||
2.830% due 10/15/21 | 2,145,123 | 2,148,912 | ||||||
2.980% due 08/15/21 | 1,507,996 | 1,509,963 | ||||||
Verizon Owner Trust | ||||||||
1.920% due 12/20/21 ~ | 4,527,386 | 4,513,574 | ||||||
2.060% due 09/20/21 ~ | 559,431 | 559,493 | ||||||
2.060% due 04/20/22 ~ | 2,186,927 | 2,189,648 | ||||||
|
| |||||||
Total Asset-Backed Securities | 99,160,253 | |||||||
|
| |||||||
U.S. TREASURY OBLIGATIONS - 39.7% | ||||||||
U.S. Treasury Notes - 39.7% | ||||||||
0.500% due 03/15/23 | 5,000,000 | 5,031,836 | ||||||
1.125% due 02/28/22 | 15,000,000 | 15,257,227 | ||||||
1.375% due 05/31/20 | 7,000,000 | 7,014,854 | ||||||
1.375% due 01/31/22 ‡ | 27,000,000 | 27,571,113 | ||||||
Principal Amount | Value | |||||||
1.500% due 01/15/23 ‡ | $ | 30,000,000 | $ | 31,031,836 | ||||
1.625% due 06/30/21 ‡ | 18,000,000 | 18,333,984 | ||||||
1.750% due 03/31/22 ‡ | 20,000,000 | 20,610,938 | ||||||
1.750% due 07/15/22 | 10,000,000 | 10,346,680 | ||||||
1.750% due 06/30/24 ‡ | 10,000,000 | 10,592,188 | ||||||
1.750% due 07/31/24 | 10,000,000 | 10,598,828 | ||||||
2.000% due 01/15/21 ‡ | 10,000,000 | 10,150,781 | ||||||
2.000% due 07/31/22 | 10,000,000 | 10,412,500 | ||||||
2.250% due 03/31/21 ‡ | 15,000,000 | 15,315,527 | ||||||
2.500% due 05/31/20 ‡ | 15,500,000 | 15,561,467 | ||||||
2.500% due 12/31/20 ‡ | 20,000,000 | 20,355,469 | ||||||
2.625% due 02/28/23 | 2,100,000 | 2,243,227 | ||||||
2.750% due 09/30/20 | 9,000,000 | 9,117,246 | ||||||
2.750% due 11/30/20 ‡ | 80,000,000 | 81,389,062 | ||||||
2.875% due 11/15/21 ‡ | 29,000,000 | 30,252,324 | ||||||
|
| |||||||
| 351,187,087 | ||||||||
|
| |||||||
Total U.S. Treasury Obligations |
| 351,187,087 | ||||||
|
| |||||||
Shares | ||||||||
SHORT-TERM INVESTMENTS - 8.2% | ||||||||
Money Market Fund - 5.2% |
| |||||||
BlackRock Liquidity Funds T-Fund Portfolio ‘Institutional’ 0.210% | 45,962,337 | 45,962,337 | ||||||
|
| |||||||
Principal Amount | ||||||||
U.S. Treasury Bills - 3.0% | ||||||||
1.516% due 07/30/20 ‡ | $27,000,000 | 26,990,528 | ||||||
|
| |||||||
Total Short-Term Investments |
| 72,952,865 | ||||||
|
| |||||||
TOTAL INVESTMENTS - 112.4% | 994,988,134 | |||||||
DERIVATIVES - (12.0%) |
| (106,252,319 | ) | |||||
|
| |||||||
OTHER ASSETS & LIABILITIES, Net - (0.4%) |
| (3,819,610 | ) | |||||
|
| |||||||
NET ASSETS - 100.0% |
| $884,916,205 | ||||||
|
| |||||||
Notes to Schedule of Investments
| (a) | As of March 31, 2020, the Fund’s composition as a percentage of net assets was as follows: |
Corporate Bonds & Notes | 53.3% | |||
U.S. Treasury Obligations | 39.7% | |||
Asset-Backed Securities | 11.2% | |||
Short-Term Investments | 8.2% | |||
|
| |||
| 112.4% | ||||
Derivatives | (12.0% | ) | ||
Other Assets & Liabilities, Net | (0.4% | ) | ||
|
| |||
| 100.0% | ||||
|
|
| (b) | As of March 31, 2020, investments with a total aggregate value of $102,470,188 were fully or partially segregated with the broker(s)/ custodian as collateral for open futures contracts and swap agreements. |
| See Notes to Financial Statements | See explanation of symbols and terms, if any, on B-76 and B-77 |
B-58
Table of Contents
PACIFIC FUNDS
PF MULTI-ASSET FUND
Schedule of Investments (Continued)
March 31, 2020
| (c) | Open futures contracts outstanding as of March 31, 2020 were as follows: |
| Long Futures Outstanding | Expiration Month | Number of Contracts | Notional Amount | Value | Unrealized Appreciation (Depreciation) | |||||||||||||||
S&P 500 E-Mini Index | 06/20 | 95 | $10,359,849 | $12,206,075 | $1,846,226 | |||||||||||||||
|
| |||||||||||||||||||
Short Futures Outstanding | ||||||||||||||||||||
MSCI EAFE Index | 06/20 | 50 | 3,416,114 | 3,898,250 | (482,136 | ) | ||||||||||||||
|
| |||||||||||||||||||
Total Futures Contracts | $1,364,090 | |||||||||||||||||||
|
| |||||||||||||||||||
| (d) | Swap agreements outstanding as of March 31, 2020 were as follows: |
Total Return Swaps – Long
| Receive | Pay | Payment Frequency | Counter- party | Expiration Date | Notional Amount | Value | Upfront Premiums Paid (Received) | Unrealized Appreciation (Depreciation) | ||||||||||||||||||||||||
Russell 1000 Growth Index | 3-Month USD-LIBOR + 0.160% | Z | BOA | 06/11/20 | $92,443,636 | ($1,301,366 | ) | $— | ($1,301,366 | ) | ||||||||||||||||||||||
Russell 1000 Value Index | 3-Month USD-LIBOR + 0.170% | Z | BOA | 06/11/20 | 105,900,145 | (20,488,946 | ) | — | (20,488,946 | ) | ||||||||||||||||||||||
Russell Mid-Cap Growth Index | 3-Month USD-LIBOR + 0.100% | Z | BOA | 06/11/20 | 41,248,117 | (4,933,513 | ) | — | (4,933,513 | ) | ||||||||||||||||||||||
Russell Mid-Cap Value Index | 3-Month USD-LIBOR + 0.120% | Z | BOA | 06/11/20 | 58,739,864 | (15,437,799 | ) | — | (15,437,799 | ) | ||||||||||||||||||||||
MSCI EAFE Index | 3-Month USD-LIBOR - 0.230% | Z | JPM | 06/11/20 | 72,900,725 | (11,290,510 | ) | — | (11,290,510 | ) | ||||||||||||||||||||||
Russell 1000 Growth Index | 3-Month USD-LIBOR + 0.200% | Z | BOA | 09/17/20 | 59,746,808 | (3,723,470 | ) | — | (3,723,470 | ) | ||||||||||||||||||||||
Russell 1000 Value Index | 3-Month USD-LIBOR + 0.210% | Z | BOA | 09/17/20 | 87,593,998 | (17,453,364 | ) | — | (17,453,364 | ) | ||||||||||||||||||||||
Russell Mid-Cap Growth Index | 3-Month USD-LIBOR + 0.160% | Z | BOA | 09/17/20 | 41,594,361 | (6,599,010 | ) | — | (6,599,010 | ) | ||||||||||||||||||||||
MSCI EAFE Index | 3-Month USD-LIBOR - 0.190% | Z | CIT | 09/17/20 | 47,147,102 | (6,845,546 | ) | — | (6,845,546 | ) | ||||||||||||||||||||||
Russell 1000 Growth Index | 3-Month USD-LIBOR + 0.210% | Z | BRC | 01/14/21 | 39,326,460 | (3,987,282 | ) | — | (3,987,282 | ) | ||||||||||||||||||||||
Russell 1000 Value Index | 3-Month USD-LIBOR + 0.210% | Z | BRC | 01/14/21 | 44,898,775 | (11,104,706 | ) | — | (11,104,706 | ) | ||||||||||||||||||||||
Russell Mid-Cap Growth Index | 3-Month USD-LIBOR + 0.190% | Z | BRC | 01/14/21 | 18,019,431 | (3,112,197 | ) | — | (3,112,197 | ) | ||||||||||||||||||||||
Russell Mid-Cap Value Index | 3-Month USD-LIBOR + 0.180% | Z | BRC | 01/14/21 | 25,364,802 | (7,529,107 | ) | — | (7,529,107 | ) | ||||||||||||||||||||||
MSCI EAFE Index | 3-Month USD-LIBOR - 0.110% | Z | MSC | 01/14/21 | 31,282,446 | (6,516,546 | ) | — | (6,516,546 | ) | ||||||||||||||||||||||
Russell 1000 Growth Index | 3-Month USD-LIBOR + 0.030% | Z | BRC | 03/23/21 | 13,202,035 | 1,659,173 | — | 1,659,173 | ||||||||||||||||||||||||
Russell 1000 Value Index | 3-Month USD-LIBOR + 0.030% | Z | BRC | 03/23/21 | 14,889,803 | 1,811,723 | — | 1,811,723 | ||||||||||||||||||||||||
Russell Mid-Cap Value Index | 3-Month USD-LIBOR + 0.010% | Z | BRC | 03/23/21 | 6,879,292 | 944,038 | — | 944,038 | ||||||||||||||||||||||||
Russell Mid-Cap Growth Index | 3-Month USD-LIBOR - 0.350% | Z | CIT | 03/23/21 | 4,986,834 | 698,077 | — | 698,077 | ||||||||||||||||||||||||
MSCI EAFE Index | 3-Month USD-LIBOR - 0.060% | Z | GSC | 03/23/21 | 21,857,125 | 1,938,195 | — | 1,938,195 | ||||||||||||||||||||||||
Russell 1000 Growth Index | 3-Month USD-LIBOR + 0.010% | Z | JPM | 03/23/21 | 48,124,753 | 2,043,063 | — | 2,043,063 | ||||||||||||||||||||||||
Russell 1000 Value Index | 3-Month USD-LIBOR + 0.010% | Z | JPM | 03/23/21 | 54,727,530 | 302,683 | — | 302,683 | ||||||||||||||||||||||||
Russell Mid-Cap Growth Index | 3-Month USD-LIBOR - 0.050% | Z | SGN | 03/23/21 | 18,050,024 | 728,701 | — | 728,701 | ||||||||||||||||||||||||
Russell Mid-Cap Value Index | 3-Month USD-LIBOR - 0.050% | Z | SGN | 03/23/21 | 24,721,778 | 104,334 | — | 104,334 | ||||||||||||||||||||||||
|
|
|
|
|
| |||||||||||||||||||||||||||
| ($110,093,375 | ) | $— | ($110,093,375 | ) | ||||||||||||||||||||||||||||
|
|
|
|
|
| |||||||||||||||||||||||||||
| Total Return Swaps – Short |
| |||||||||||||||||||||||||||||||
| Pay | Receive | Payment Frequency | Counter- party | Expiration Date | Notional Amount | Value | Upfront Premiums Paid (Received) | Unrealized Appreciation (Depreciation) | ||||||||||||||||||||||||
Russell Mid-Cap Value Index | 3-Month USD-LIBOR + 0.160% | Z | BRC | 09/17/20 | $9,555,317 | $2,476,966 | $— | $2,476,966 | ||||||||||||||||||||||||
|
|
|
|
|
| |||||||||||||||||||||||||||
Total Swap Agreements |
| ($107,616,409 | ) | $— | ($107,616,409 | ) | ||||||||||||||||||||||||||
|
|
|
|
|
| |||||||||||||||||||||||||||
Balances reported in the Statement of Assets and Liabilities for Over the Counter (OTC) Swaps
| Upfront Premium Paid (Received) | Unrealized Appreciation (Deprecation) | |||||||
OTC Swap Agreements | ||||||||
Assets | $— | $12,706,953 | ||||||
Liabilities | — | (120,323,362 | ) | |||||
|
|
|
| |||||
| $— | ($107,616,409 | ) | ||||||
|
|
|
| |||||
| See Notes to Financial Statements | See explanation of symbols and terms, if any, on B-76 and B-77 |
B-59
Table of Contents
PACIFIC FUNDS
PF MULTI-ASSET FUND
Schedule of Investments (Continued)
March 31, 2020
| (e) | Fair Value Measurements |
The following is a summary of the Fund's investments as categorized under the three-tier hierarchy of inputs used in valuing the Fund's assets and liabilities as of March 31, 2020:
| Total Value at March 31, 2020 | Level 1 Quoted Price | Level 2 Significant | Level 3 Significant | |||||||||||||||
Assets | Corporate Bonds & Notes | $471,687,929 | $— | $471,687,929 | $— | |||||||||||||
Asset-Backed Securities | 99,160,253 | — | 99,160,253 | — | ||||||||||||||
U.S. Treasury Obligations | 351,187,087 | — | 351,187,087 | — | ||||||||||||||
Short-Term Investments | 72,952,865 | 45,962,337 | 26,990,528 | — | ||||||||||||||
Derivatives: | ||||||||||||||||||
Equity Contracts | ||||||||||||||||||
Futures | 1,846,226 | 1,846,226 | — | — | ||||||||||||||
Swaps | 12,706,953 | — | 12,706,953 | — | ||||||||||||||
|
|
|
|
|
|
|
| |||||||||||
Total Equity Contracts | 14,553,179 | 1,846,226 | 12,706,953 | — | ||||||||||||||
|
|
|
|
|
|
|
| |||||||||||
Total Assets - Derivatives | 14,553,179 | 1,846,226 | 12,706,953 | — | ||||||||||||||
|
|
|
|
|
|
|
| |||||||||||
Total Assets | 1,009,541,313 | 47,808,563 | 961,732,750 | — | ||||||||||||||
|
|
|
|
|
|
|
| |||||||||||
Liabilities | Derivatives: | |||||||||||||||||
Equity Contracts | ||||||||||||||||||
Futures | (482,136 | ) | (482,136 | ) | — | — | ||||||||||||
Swaps | (120,323,362 | ) | — | (120,323,362 | ) | — | ||||||||||||
|
|
|
|
|
|
|
| |||||||||||
Total Equity Contracts | (120,805,498 | ) | (482,136 | ) | (120,323,362 | ) | — | |||||||||||
|
|
|
|
|
|
|
| |||||||||||
Total Liabilities - Derivatives | (120,805,498 | ) | (482,136 | ) | (120,323,362 | ) | — | |||||||||||
|
|
|
|
|
|
|
| |||||||||||
Total Liabilities | (120,805,498 | ) | (482,136 | ) | (120,323,362 | ) | — | |||||||||||
|
|
|
|
|
|
|
| |||||||||||
Total | $888,735,815 | $47,326,427 | $841,409,388 | $— | ||||||||||||||
|
|
|
|
|
|
|
| |||||||||||
| See Notes to Financial Statements | See explanation of symbols and terms, if any, on B-76 and B-77 |
B-60
Table of Contents
PACIFIC FUNDS
PF SMALL-CAP VALUE FUND
Schedule of Investments
March 31, 2020
Shares | Value | |||||||
COMMON STOCKS - 96.8% | ||||||||
Basic Materials - 1.6% | ||||||||
Carpenter Technology Corp | 11,939 | $232,810 | ||||||
Orion Engineered Carbons SA (Luxembourg) | 27,551 | 205,530 | ||||||
|
| |||||||
| 438,340 | ||||||||
|
| |||||||
Communications - 4.2% | ||||||||
A10 Networks Inc * | 61,561 | 382,294 | ||||||
Casa Systems Inc * | 86,975 | 304,412 | ||||||
Criteo SA ADR (France) * | 27,878 | 221,630 | ||||||
Extreme Networks Inc * | 51,804 | 160,074 | ||||||
Houghton Mifflin Harcourt Co * | 52,394 | 98,501 | ||||||
|
| |||||||
| 1,166,911 | ||||||||
|
| |||||||
Consumer, Cyclical - 11.8% | ||||||||
BMC Stock Holdings Inc * | 3,557 | 63,066 | ||||||
Callaway Golf Co | 28,262 | 288,838 | ||||||
Citi Trends Inc | 17,544 | 156,142 | ||||||
Cooper-Standard Holdings Inc * | 2,113 | 21,701 | ||||||
Dana Inc | 27,470 | 214,541 | ||||||
El Pollo Loco Holdings Inc * | 39,263 | 331,772 | ||||||
Knoll Inc | 13,764 | 142,044 | ||||||
Malibu Boats Inc ‘A’ * | 6,009 | 172,999 | ||||||
Papa John’s International Inc | 9,976 | 532,419 | ||||||
Regis Corp * | 29,950 | 177,004 | ||||||
REV Group Inc | 16,136 | 67,287 | ||||||
Ruth’s Hospitality Group Inc | 14,033 | 93,740 | ||||||
Signet Jewelers Ltd | 11,123 | 71,743 | ||||||
Skechers U.S.A. Inc ‘A’ * | 6,979 | 165,681 | ||||||
SkyWest Inc | 9,459 | 247,731 | ||||||
Spartan Motors Inc | 21,910 | 282,858 | ||||||
Taylor Morrison Home Corp * | 26,238 | 288,618 | ||||||
|
| |||||||
| 3,318,184 | ||||||||
|
| |||||||
Consumer, Non-Cyclical - 9.4% | ||||||||
Fresh Del Monte Produce Inc | 10,750 | 296,808 | ||||||
ICON PLC (Ireland) * | 2,912 | 396,032 | ||||||
Molina Healthcare Inc * | 3,417 | 477,389 | ||||||
Nomad Foods Ltd (United Kingdom) * | 29,344 | 544,625 | ||||||
Primo Water Corp | 37,728 | 341,816 | ||||||
The Hain Celestial Group Inc * | 20,139 | 523,010 | ||||||
Viad Corp | 2,782 | 59,062 | ||||||
|
| |||||||
| 2,638,742 | ||||||||
|
| |||||||
Energy - 2.3% | ||||||||
Dril-Quip Inc * | 10,720 | 326,960 | ||||||
Helix Energy Solutions Group Inc * | 39,260 | 64,386 | ||||||
MRC Global Inc * | 24,016 | 102,308 | ||||||
Oil States International Inc * | 24,656 | 50,052 | ||||||
Patterson-UTI Energy Inc | 25,060 | 58,891 | ||||||
RPC Inc | 25,391 | 52,305 | ||||||
|
| |||||||
| 654,902 | ||||||||
|
| |||||||
Financial - 36.7% | ||||||||
1st Source Corp | 7,722 | 250,424 | ||||||
Armada Hoffler Properties Inc REIT | 20,572 | 220,120 | ||||||
Associated Banc-Corp | 25,892 | 331,159 | ||||||
Bank of Marin Bancorp | 6,218 | 186,540 | ||||||
BankUnited Inc | 17,799 | 332,841 | ||||||
Carter Bank & Trust | 22,894 | 210,167 | ||||||
City Office REIT Inc | 37,090 | 268,161 | ||||||
Cousins Properties Inc REIT | 14,586 | 426,932 | ||||||
Easterly Government Properties Inc REIT | 16,493 | 406,388 | ||||||
Empire State Realty Trust Inc ‘A’ REIT | 7,726 | 69,225 | ||||||
Essent Group Ltd | 10,304 | 271,407 | ||||||
First American Financial Corp | 7,049 | 298,948 | ||||||
HarborOne Bancorp Inc * | 38,260 | 288,098 | ||||||
Heritage Financial Corp | 20,226 | 404,520 | ||||||
Shares | Value | |||||||
IBERIABANK Corp | 8,412 | $304,178 | ||||||
Independence Realty Trust Inc REIT | 42,616 | 380,987 | ||||||
Independent Bank Group Inc | 9,549 | 226,120 | ||||||
Kemper Corp | 6,782 | 504,377 | ||||||
National Storage Affiliates Trust REIT | 18,146 | 537,122 | ||||||
Opus Bank | 15,322 | 265,530 | ||||||
Physicians Realty Trust REIT | 21,861 | 304,742 | ||||||
RLJ Lodging Trust REIT | 25,350 | 195,702 | ||||||
Sandy Spring Bancorp Inc | 13,723 | 310,689 | ||||||
Selective Insurance Group Inc | 6,225 | 309,383 | ||||||
STAG Industrial Inc REIT | 21,522 | 484,675 | ||||||
State Auto Financial Corp | 7,817 | 217,234 | ||||||
Sterling Bancorp | 21,564 | 225,344 | ||||||
Synovus Financial Corp | 14,410 | 253,040 | ||||||
Texas Capital Bancshares Inc * | 8,351 | 185,142 | ||||||
TriCo Bancshares | 11,539 | 344,093 | ||||||
Umpqua Holdings Corp | 33,072 | 360,485 | ||||||
Webster Financial Corp | 11,033 | 252,656 | ||||||
WSFS Financial Corp | 14,430 | 359,596 | ||||||
Zions Bancorp NA | 10,837 | 289,998 | ||||||
|
| |||||||
| 10,276,023 | ||||||||
|
| |||||||
Industrial - 14.8% | ||||||||
AAR Corp | 12,247 | 217,507 | ||||||
Belden Inc | 11,498 | �� | 414,848 | |||||
Cactus Inc ‘A’ | 3,316 | 38,466 | ||||||
Covenant Transportation Group Inc ‘A’ * | 10,161 | 88,096 | ||||||
EnerSys | 6,653 | 329,457 | ||||||
Graphic Packaging Holding Co | 15,988 | 195,054 | ||||||
Hub Group Inc ‘A’ * | 9,149 | 416,005 | ||||||
KEMET Corp | 6,910 | 166,946 | ||||||
Kennametal Inc | 18,458 | 343,688 | ||||||
Masonite International Corp * | 7,703 | 365,507 | ||||||
Primoris Services Corp | 19,937 | 316,998 | ||||||
Regal Beloit Corp | 4,920 | 309,714 | ||||||
Terex Corp | 12,986 | 186,479 | ||||||
Trinseo SA | 9,059 | 164,058 | ||||||
TTM Technologies Inc * | 32,523 | 336,288 | ||||||
Tutor Perini Corp * | 20,690 | 139,037 | ||||||
Vishay Intertechnology Inc | 7,360 | 106,058 | ||||||
|
| |||||||
| 4,134,206 | ||||||||
|
| |||||||
Technology - 13.1% | ||||||||
CommVault Systems Inc * | 12,919 | 522,961 | ||||||
CSG Systems International Inc | 1,763 | 73,782 | ||||||
Kulicke & Soffa Industries Inc (Singapore) | 23,650 | 493,576 | ||||||
MagnaChip Semiconductor Corp (South Korea) * | 31,662 | 349,865 | ||||||
MaxLinear Inc * | 25,157 | 293,582 | ||||||
NCR Corp * | 16,938 | 299,803 | ||||||
NetScout Systems Inc * | 20,636 | 488,454 | ||||||
Onto Innovation Inc * | 2,569 | 76,222 | ||||||
Unisys Corp * | 31,732 | 391,890 | ||||||
Verint Systems Inc * | 9,873 | 424,539 | ||||||
WNS Holdings Ltd ADR (India) * | 5,796 | 249,112 | ||||||
|
| |||||||
| 3,663,786 | ||||||||
|
| |||||||
Utilities - 2.9% | ||||||||
Black Hills Corp | 6,079 | 389,238 | ||||||
PNM Resources Inc | 10,242 | 389,196 | ||||||
Portland General Electric Co | 910 | 43,625 | ||||||
|
| |||||||
| 822,059 | ||||||||
|
| |||||||
Total Common Stocks | 27,113,153 | |||||||
|
| |||||||
| See Notes to Financial Statements | See explanation of symbols and terms, if any, on B-76 and B-77 |
B-61
Table of Contents
PACIFIC FUNDS
PF SMALL-CAP VALUE FUND
Schedule of Investments (Continued)
March 31, 2020
Shares | Value | |||||||
SHORT-TERM INVESTMENT - 3.6% | ||||||||
Money Market Fund - 3.6% | ||||||||
BlackRock Liquidity Funds T-Fund Portfolio ‘Institutional’ 0.210% | 1,007,109 | $1,007,109 | ||||||
|
| |||||||
Total Short-Term Investment | 1,007,109 | |||||||
|
| |||||||
TOTAL INVESTMENTS - 100.4% | 28,120,262 | |||||||
OTHER ASSETS & LIABILITIES, NET - (0.4%) | (104,517 | ) | ||||||
|
| |||||||
NET ASSETS - 100.0% | $28,015,745 | |||||||
|
| |||||||
Notes to Schedule of Investments
| (a) | As of March 31, 2020, the Fund’s composition by sector as a percentage of net assets was as follows: |
Financial | 36.7% | |||
Industrial | 14.8% | |||
Technology | 13.1% | |||
Consumer, Cyclical | 11.8% | |||
Consumer, Non-Cyclical | 9.4% | |||
Communications | 4.2% | |||
Short-Term Investment | 3.6% | |||
Others (each less than 3.0%) | 6.8% | |||
|
| |||
| 100.4% | ||||
Other Assets & Liabilities, Net | (0.4% | ) | ||
|
| |||
| 100.0% | ||||
|
|
| (b) | Fair Value Measurements |
The following is a summary of the Fund’s investments as categorized under the three-tier hierarchy of inputs used in valuing the Fund’s assets and liabilities as of March 31, 2020:
| Total Value at March 31, 2020 | Level 1 Quoted Price | Level 2 Significant Observable Inputs | Level 3 Significant Unobservable Inputs | |||||||||||||||
Assets | Common Stocks | $27,113,153 | $27,113,153 | $— | $— | |||||||||||||
Short-Term Investment | 1,007,109 | 1,007,109 | — | — | ||||||||||||||
|
|
|
|
|
|
|
| |||||||||||
Total | $28,120,262 | $28,120,262 | $— | $— | ||||||||||||||
|
|
|
|
|
|
|
| |||||||||||
| See Notes to Financial Statements | See explanation of symbols and terms, if any, on B-76 and B-77 |
B-62
Table of Contents
PACIFIC FUNDS
PF EMERGING MARKETS FUND
Schedule of Investments
March 31, 2020
Shares | Value | |||||||
PREFERRED STOCKS - 2.1% | ||||||||
Brazil - 2.1% | ||||||||
Itau Unibanco Holding SA ADR | 211,465 | $949,478 | ||||||
Lojas Americanas SA | 326,429 | 1,142,103 | ||||||
|
| |||||||
| 2,091,581 | ||||||||
|
| |||||||
India - 0.0% | ||||||||
Zee Entertainment Enterprises Ltd | 390,884 | 15,242 | ||||||
|
| |||||||
Total Preferred Stocks | 2,106,823 | |||||||
|
| |||||||
COMMON STOCKS - 96.9% | ||||||||
Argentina - 0.1% | ||||||||
MercadoLibre Inc * | 185 | 90,387 | ||||||
|
| |||||||
Brazil - 4.9% | ||||||||
Ambev SA | 202,425 | 462,810 | ||||||
Ambev SA ADR | 35,055 | 80,627 | ||||||
Atacadao SA | 229,500 | 902,789 | ||||||
B3 SA - Brasil Bolsa Balcao | 114,693 | 786,457 | ||||||
Pagseguro Digital Ltd * | 46,334 | 895,636 | ||||||
StoneCo Ltd ‘A’ * | 15,804 | 344,053 | ||||||
Vale SA ADR * | 152,725 | 1,266,090 | ||||||
|
| |||||||
| 4,738,462 | ||||||||
|
| |||||||
Chile - 0.7% | ||||||||
SACI Falabella | 303,477 | 668,720 | ||||||
|
| |||||||
China - 33.0% | ||||||||
Alibaba Group Holding Ltd ADR * | 27,503 | 5,348,783 | ||||||
Baozun Inc ADR * | 18,068 | 504,820 | ||||||
Budweiser Brewing Co APAC Ltd * ~ | 702,100 | 1,805,611 | ||||||
China International Capital Corp Ltd ‘H’ ~ | 288,400 | 461,581 | ||||||
Hansoh Pharmaceutical Group Co Ltd * ~ | 94,000 | 314,098 | ||||||
Huazhu Group Ltd ADR | 99,064 | 2,846,109 | ||||||
Innovent Biologics Inc * ~ | 136,500 | 569,568 | ||||||
Jiangsu Hengrui Medicine Co Ltd ‘A’ | 240,607 | 3,088,514 | ||||||
Meituan Dianping ‘B’ * | 112,800 | 1,344,717 | ||||||
OneConnect Financial Technology Co Ltd ADR * | 47,910 | 486,287 | ||||||
Ping An Insurance Group Co of China Ltd ‘A’ | 158,771 | 1,536,555 | ||||||
Shanghai Junshi Biosciences Co Ltd ‘H’ * ~ | 19,600 | 72,603 | ||||||
Tencent Holdings Ltd ADR | 144,381 | 7,136,408 | ||||||
Wuxi Biologics Cayman Inc * ~ | 42,000 | 536,207 | ||||||
Yum China Holdings Inc | 78,486 | 3,345,858 | ||||||
ZTO Express Cayman Inc ADR | 107,285 | 2,840,907 | ||||||
|
| |||||||
| 32,238,626 | ||||||||
|
| |||||||
Colombia - 0.4% | ||||||||
Grupo Aval Acciones y Valores SA ADR | 88,429 | 387,319 | ||||||
|
| |||||||
Egypt - 0.5% | ||||||||
Commercial International Bank Egypt SAE | 142,613 | 528,895 | ||||||
|
| |||||||
France - 6.6% | ||||||||
Kering SA | 12,229 | 6,376,364 | ||||||
LVMH Moet Hennessy Louis Vuitton SE | 100 | 36,675 | ||||||
|
| |||||||
| 6,413,039 | ||||||||
|
| |||||||
Shares | Value | |||||||
Hong Kong - 6.2% | ||||||||
AIA Group Ltd | 540,600 | $4,840,879 | ||||||
Hutchison China MediTech Ltd ADR * | 9,961 | 177,804 | ||||||
Jardine Strategic Holdings Ltd | 46,870 | 1,047,482 | ||||||
|
| |||||||
| 6,066,165 | ||||||||
|
| |||||||
India - 9.8% | ||||||||
Housing Development Finance Corp Ltd | 181,967 | 3,927,639 | ||||||
Kotak Mahindra Bank Ltd | 174,914 | 2,985,575 | ||||||
Oberoi Realty Ltd | 47,839 | 209,967 | ||||||
Tata Consultancy Services Ltd | 87,812 | 2,112,498 | ||||||
Zee Entertainment Enterprises Ltd | 185,526 | 301,925 | ||||||
|
| |||||||
| 9,537,604 | ||||||||
|
| |||||||
Indonesia - 1.0% | ||||||||
P.T. Bank Central Asia Tbk | 355,600 | 599,157 | ||||||
P.T. Indocement Tunggal Prakarsa Tbk | 335,518 | 255,528 | ||||||
P.T. Semen Indonesia Persero Tbk | 328,500 | 152,597 | ||||||
|
| |||||||
| 1,007,282 | ||||||||
|
| |||||||
Italy - 2.1% | ||||||||
Brunello Cucinelli SPA | 82 | 2,483 | ||||||
Moncler SPA | 26,635 | 967,882 | ||||||
PRADA SPA | 370,400 | 1,072,681 | ||||||
|
| |||||||
| 2,043,046 | ||||||||
|
| |||||||
Mexico - 6.6% | ||||||||
Alsea SAB de CV * | 239,740 | 152,096 | ||||||
America Movil SAB de CV ‘L’ ADR | 59,005 | 695,079 | ||||||
Fomento Economico Mexicano SAB de CV | 392,477 | 2,386,214 | ||||||
Fomento Economico Mexicano SAB de CV ADR | 10,170 | 615,387 | ||||||
Grupo Aeroportuario del Sureste SAB de CV ‘B’ | 39,358 | 370,991 | ||||||
Grupo Financiero Banorte SAB de CV ‘O’ | 153,865 | 421,592 | ||||||
Grupo Financiero Inbursa SAB de CV ‘O’ | 570,110 | 408,552 | ||||||
Grupo Mexico SAB de CV ‘B’ | 755,715 | 1,401,366 | ||||||
|
| |||||||
| 6,451,277 | ||||||||
|
| |||||||
Peru - 1.8% | ||||||||
Credicorp Ltd | 12,250 | 1,752,608 | ||||||
|
| |||||||
Philippines - 2.6% | ||||||||
Ayala Land Inc | 1,469,000 | 866,864 | ||||||
SM Investments Corp | 90,132 | 1,441,853 | ||||||
SM Prime Holdings Inc | 415,456 | 230,721 | ||||||
|
| |||||||
| 2,539,438 | ||||||||
|
| |||||||
Russia - 8.4% | ||||||||
LUKOIL PJSC ADR | 7,614 | 448,706 | ||||||
MMC Norilsk Nickel PJSC | 998 | 241,893 | ||||||
MMC Norilsk Nickel PJSC ADR | 13,674 | 338,710 | ||||||
Novatek PJSC GDR | 30,920 | 3,506,115 | ||||||
Polyus PJSC GDR ~ | 4,151 | 282,569 | ||||||
Sberbank of Russia PJSC | 815,321 | 1,892,978 | ||||||
Yandex NV ‘A’ * | 44,909 | 1,529,151 | ||||||
|
| |||||||
| 8,240,122 | ||||||||
|
| |||||||
South Africa - 1.7% | ||||||||
FirstRand Ltd | 720,493 | 1,616,882 | ||||||
|
| |||||||
South Korea - 2.3% | ||||||||
Amorepacific Corp | 3,720 | 510,150 | ||||||
AMOREPACIFIC Group | 5,045 | 227,732 | ||||||
Samsung Biologics Co Ltd * ~ | 3,971 | 1,556,435 | ||||||
|
| |||||||
| 2,294,317 | ||||||||
|
| |||||||
| See Notes to Financial Statements | See explanation of symbols and terms, if any, on B-76 and B-77 |
B-63
Table of Contents
PACIFIC FUNDS
PF EMERGING MARKETS FUND
Schedule of Investments (Continued)
March 31, 2020
Shares | Value | |||||||
Switzerland - 0.1% | ||||||||
Glencore PLC * | 43,548 | $65,912 | ||||||
|
| |||||||
Taiwan - 6.4% | ||||||||
Taiwan Semiconductor Manufacturing Co Ltd | 698,995 | 6,292,574 | ||||||
|
| |||||||
Turkey - 1.7% | ||||||||
Akbank T.A.S. * | 724,700 | 608,522 | ||||||
Anadolu Efes Biracilik Ve Malt Sanayii AS | 122,672 | 317,848 | ||||||
BIM Birlesik Magazalar AS | 41,729 | 316,442 | ||||||
Turkiye Garanti Bankasi AS * | 305,657 | 374,869 | ||||||
|
| |||||||
| 1,617,681 | ||||||||
|
| |||||||
Total Common Stocks | 94,590,356 | |||||||
|
| |||||||
SHORT-TERM INVESTMENT - 0.6% | ||||||||
Money Market Fund - 0.6% | ||||||||
BlackRock Liquidity Funds T-Fund Portfolio ‘Institutional’ 0.210% | 568,596 | 568,596 | ||||||
|
| |||||||
Total Short-Term Investment | 568,596 | |||||||
|
| |||||||
TOTAL INVESTMENTS - 99.6% | 97,265,775 | |||||||
OTHER ASSETS & LIABILITIES, NET - 0.4% | 352,037 | |||||||
|
| |||||||
NET ASSETS - 100.0% | $97,617,812 | |||||||
|
| |||||||
Notes to Schedule of Investments
| (a) | As of March 31, 2020, the Fund’s composition by sector as a percentage of net assets was as follows: |
Financial | 26.9% | |||
Consumer, Cyclical | 19.4% | |||
Communications | 17.4% | |||
Consumer, Non-cyclical | 14.8% | |||
Technology | 9.1% | |||
Energy | 4.0% | |||
Industrial | 3.7% | |||
Basic Materials | 3.7% | |||
Others (each less than 3.0%) | 0.6% | |||
|
| |||
| 99.6% | ||||
Other Assets & Liabilities, Net | 0.4% | |||
|
| |||
| 100.0% | ||||
|
|
| (b) | As of March 31, 2020, the Fund’s composition by country of risk as a percentage of net assets was as follows: |
China | 33.0% | |||
India | 9.8% | |||
Russia | 8.4% | |||
Brazil | 7.0% | |||
Mexico | 6.6% | |||
France | 6.6% | |||
Taiwan | 6.4% | |||
Hong Kong | 6.2% | |||
Others (each less than 3.0%) | 15.6% | |||
|
| |||
| 99.6% | ||||
Other Assets & Liabilities, Net | 0.4% | |||
|
| |||
| 100.0% | ||||
|
|
| (c) | Fair Value Measurements |
The following is a summary of the Fund’s investments as categorized under the three-tier hierarchy of inputs used in valuing the Fund’s assets and liabilities as of March 31, 2020:
| Total Value at March 31, 2020 | Level 1 Quoted Price | Level 2 Significant Observable Inputs | Level 3 Significant Unobservable Inputs | |||||||||||||||
Assets | Preferred Stocks | $2,106,823 | $2,106,823 | $— | $— | |||||||||||||
Common Stocks | ||||||||||||||||||
Argentina | 90,387 | 90,387 | — | — | ||||||||||||||
Brazil | 4,738,462 | 4,738,462 | — | — | ||||||||||||||
Chile | 668,720 | — | 668,720 | — | ||||||||||||||
China | 32,238,626 | 15,372,764 | 16,865,862 | — | ||||||||||||||
Colombia | 387,319 | 387,319 | — | — | ||||||||||||||
Egypt | 528,895 | — | 528,895 | — | ||||||||||||||
France | 6,413,039 | — | 6,413,039 | — | ||||||||||||||
Hong Kong | 6,066,165 | 177,804 | 5,888,361 | — | ||||||||||||||
India | 9,537,604 | — | 9,537,604 | — | ||||||||||||||
Indonesia | 1,007,282 | — | 1,007,282 | — | ||||||||||||||
Italy | 2,043,046 | — | 2,043,046 | — | ||||||||||||||
Mexico | 6,451,277 | 6,451,277 | — | — | ||||||||||||||
Peru | 1,752,608 | 1,752,608 | — | — | ||||||||||||||
Philippines | 2,539,438 | — | 2,539,438 | — | ||||||||||||||
Russia | 8,240,122 | 1,529,151 | 6,710,971 | — | ||||||||||||||
South Africa | 1,616,882 | — | 1,616,882 | — | ||||||||||||||
South Korea | 2,294,317 | — | 2,294,317 | — | ||||||||||||||
Switzerland | 65,912 | — | 65,912 | — | ||||||||||||||
Taiwan | 6,292,574 | — | 6,292,574 | — | ||||||||||||||
Turkey | 1,617,681 | 316,442 | 1,301,239 | — | ||||||||||||||
|
|
|
|
|
|
|
| |||||||||||
Total Common Stocks | 94,590,356 | 30,816,214 | 63,774,142 | — | ||||||||||||||
|
|
|
|
|
|
|
| |||||||||||
Short-Term Investment | 568,596 | 568,596 | — | — | ||||||||||||||
|
|
|
|
|
|
|
| |||||||||||
Total | $97,265,775 | $33,491,633 | $63,774,142 | $— | ||||||||||||||
|
|
|
|
|
|
|
| |||||||||||
| See Notes to Financial Statements | See explanation of symbols and terms, if any, on B-76 and B-77 |
B-64
Table of Contents
PACIFIC FUNDS
PF INTERNATIONAL LARGE-CAP FUND
Schedule of Investments
March 31, 2020
Shares | Value | |||||||
COMMON STOCKS - 97.5% |
| |||||||
Australia - 0.9% |
| |||||||
Rio Tinto PLC | 8,310 | $380,948 | ||||||
|
| |||||||
Belgium - 1.2% | ||||||||
KBC Group NV | 10,992 | 498,764 | ||||||
|
| |||||||
Brazil - 0.3% | ||||||||
Ambev SA ADR | 60,894 | 140,056 | ||||||
|
| |||||||
Canada - 2.9% | ||||||||
Canadian National Railway Co | 10,956 | 850,514 | ||||||
Suncor Energy Inc | 21,774 | 347,505 | ||||||
|
| |||||||
| 1,198,019 | ||||||||
|
| |||||||
China - 1.5% | ||||||||
Tencent Holdings Ltd | 4,000 | 197,710 | ||||||
Yum China Holdings Inc | 10,414 | 443,949 | ||||||
|
| |||||||
| 641,659 | ||||||||
|
| |||||||
Denmark - 3.0% | ||||||||
Carlsberg AS ‘B’ | 2,781 | 313,084 | ||||||
Novo Nordisk AS ‘B’ | 15,616 | 932,526 | ||||||
|
| |||||||
| 1,245,610 | ||||||||
|
| |||||||
France - 16.6% | ||||||||
Air Liquide SA | 10,037 | 1,281,199 | ||||||
Capgemini SE | 3,735 | 312,106 | ||||||
Danone SA | 8,479 | 542,641 | ||||||
Dassault Systemes SE | 1,631 | 238,112 | ||||||
Engie SA | 37,280 | 381,765 | ||||||
EssilorLuxottica SA | 4,207 | 445,416 | ||||||
Hermes International | 158 | 107,505 | ||||||
L’Oreal SA | 1,993 | 515,810 | ||||||
Legrand SA | 5,988 | 381,927 | ||||||
LVMH Moet Hennessy Louis Vuitton SE | 2,119 | 777,147 | ||||||
Pernod Ricard SA | 5,090 | 722,456 | ||||||
Schneider Electric SE | 14,690 | 1,241,642 | ||||||
|
| |||||||
| 6,947,726 | ||||||||
|
| |||||||
Germany - 9.2% | ||||||||
Bayer AG | 13,079 | 749,408 | ||||||
Beiersdorf AG | 8,521 | 857,987 | ||||||
Deutsche Boerse AG | 3,222 | 442,652 | ||||||
Merck KGaA | 4,853 | 489,969 | ||||||
MTU Aero Engines AG | 1,355 | 195,929 | ||||||
SAP SE | 9,965 | 1,112,573 | ||||||
|
| |||||||
| 3,848,518 | ||||||||
|
| |||||||
Hong Kong - 3.0% | ||||||||
AIA Group Ltd | 138,626 | 1,241,346 | ||||||
|
| |||||||
India - 2.2% | ||||||||
Housing Development Finance Corp Ltd | 15,914 | 343,493 | ||||||
Tata Consultancy Services Ltd | 23,378 | 562,406 | ||||||
|
| |||||||
| 905,899 | ||||||||
|
| |||||||
Ireland - 0.8% | ||||||||
Ryanair Holdings PLC ADR * | 6,105 | 324,114 | ||||||
|
| |||||||
Israel - 1.4% | ||||||||
Check Point Software Technologies Ltd * | 5,669 | 569,961 | ||||||
|
| |||||||
Shares | Value | |||||||
Italy - 1.5% | ||||||||
Eni SPA | 28,123 | $279,472 | ||||||
Intesa Sanpaolo SPA | 223,408 | 361,488 | ||||||
|
| |||||||
| 640,960 | ||||||||
|
| |||||||
Japan - 16.1% | ||||||||
Daikin Industries Ltd | 6,200 | 748,427 | ||||||
Denso Corp | 6,100 | 194,922 | ||||||
FANUC Corp | 1,000 | 133,626 | ||||||
Hitachi Ltd | 17,600 | 505,585 | ||||||
Hoya Corp | 13,400 | 1,139,423 | ||||||
Japan Tobacco Inc | 22,900 | 423,574 | ||||||
Koito Manufacturing Co Ltd | 5,400 | 181,544 | ||||||
Kubota Corp | 39,900 | 507,490 | ||||||
Kyocera Corp | 10,700 | 631,415 | ||||||
Olympus Corp | 61,500 | 886,541 | ||||||
Shin-Etsu Chemical Co Ltd | 2,600 | 255,547 | ||||||
SMC Corp | 400 | 167,697 | ||||||
Terumo Corp | 28,400 | 973,023 | ||||||
|
| |||||||
| 6,748,814 | ||||||||
|
| |||||||
Netherlands - 2.4% | ||||||||
Akzo Nobel NV | 6,945 | 456,764 | ||||||
ING Groep NV | 43,331 | 222,032 | ||||||
Randstad NV | 8,702 | 307,111 | ||||||
|
| |||||||
| 985,907 | ||||||||
|
| |||||||
Portugal - 0.5% | ||||||||
Galp Energia SGPS SA | 19,419 | 222,079 | ||||||
|
| |||||||
Singapore - 0.9% | ||||||||
DBS Group Holdings Ltd | 30,200 | 394,054 | ||||||
|
| |||||||
Spain - 1.6% | ||||||||
Amadeus IT Group SA | 14,010 | 659,435 | ||||||
|
| |||||||
Sweden - 1.0% | ||||||||
Essity AB ‘B’ | 13,967 | 427,859 | ||||||
|
| |||||||
Switzerland - 15.7% | ||||||||
Alcon Inc * | 1,995 | 102,205 | ||||||
Cie Financiere Richemont SA | 5,882 | 314,416 | ||||||
Julius Baer Group Ltd | 7,645 | 256,088 | ||||||
Nestle SA | 18,357 | 1,879,166 | ||||||
Novartis AG | 9,981 | 823,421 | ||||||
Roche Holding AG | 5,102 | 1,641,528 | ||||||
Sika AG | 1,921 | 315,453 | ||||||
UBS Group AG | 63,282 | 580,050 | ||||||
Zurich Insurance Group AG | 1,902 | 668,185 | ||||||
|
| |||||||
| 6,580,512 | ||||||||
|
| |||||||
Taiwan - 1.4% | ||||||||
Taiwan Semiconductor Manufacturing Co Ltd ADR | 12,106 | 578,546 | ||||||
|
| |||||||
United Kingdom - 12.1% | ||||||||
Barclays PLC | 134,715 | 153,094 | ||||||
Compass Group PLC | 33,559 | 522,852 | ||||||
Diageo PLC | 21,932 | 695,452 | ||||||
Experian PLC | 30,353 | 843,549 | ||||||
Linde PLC | 2,497 | 433,075 | ||||||
Reckitt Benckiser Group PLC | 7,866 | 599,196 | ||||||
RELX PLC | 36,339 | 776,487 | ||||||
Rolls-Royce Holdings PLC * | 62,823 | 265,518 | ||||||
Smiths Group PLC | 15,486 | 233,485 | ||||||
| See Notes to Financial Statements | See explanation of symbols and terms, if any, on B-76 and B-77 |
B-65
Table of Contents
PACIFIC FUNDS
PF INTERNATIONAL LARGE-CAP FUND
Schedule of Investments (Continued)
March 31, 2020
Shares | Value | |||||||
Tesco PLC | 124,249 | $350,882 | ||||||
WPP PLC | 28,877 | 196,332 | ||||||
|
| |||||||
| 5,069,922 | ||||||||
|
| |||||||
United States - 1.3% | ||||||||
Amcor PLC CDI | 19,495 | 156,078 | ||||||
QIAGEN NV * | 9,070 | 366,221 | ||||||
|
| |||||||
| 522,299 | ||||||||
|
| |||||||
Total Common Stocks | 40,773,007 | |||||||
|
| |||||||
SHORT-TERM INVESTMENT - 1.6% | ||||||||
Money Market Fund - 1.6% | ||||||||
BlackRock Liquidity Funds T-Fund Portfolio ‘Institutional’ 0.210% | 662,397 | 662,397 | ||||||
|
| |||||||
Total Short-Term Investment | 662,397 | |||||||
|
| |||||||
TOTAL INVESTMENTS - 99.1% | 41,435,404 | |||||||
OTHER ASSETS & LIABILITIES, NET - 0.9% | 382,709 | |||||||
|
| |||||||
NET ASSETS - 100.0% | $41,818,113 | |||||||
|
| |||||||
Notes to Schedule of Investments
| (a) | As of March 31, 2020, the Fund’s composition by sector as a percentage of net assets was as follows: |
Consumer, Non-cyclical | 41.8% | |||
Industrial | 17.9% | |||
Financial | 12.3% | |||
Technology | 8.1% | |||
Consumer, Cyclical | 6.9% | |||
Basic Materials | 6.7% | |||
Others (each less than 3.0%) | 5.4% | |||
|
| |||
| 99.1% | ||||
Other Assets & Liabilities, Net | 0.9% | |||
|
| |||
| 100.0% | ||||
|
|
| (b) | As of March 31, 2020, the Fund’s composition by country of risk as a percentage of net assets was as follows: |
France | 16.6% | |||
Japan | 16.1% | |||
Switzerland | 15.7% | |||
United Kingdom | 12.1% | |||
Germany | 9.2% | |||
Denmark | 3.0% | |||
Hong Kong | 3.0% | |||
Others (each less than 3.0%) | 23.4% | |||
|
| |||
| 99.1% | ||||
Other Assets & Liabilities, Net | 0.9% | |||
|
| |||
| 100.0% | ||||
|
|
| (c) | Fair Value Measurements |
The following is a summary of the Fund’s investments as categorized under the three-tier hierarchy of inputs used in valuing the Fund’s assets and liabilities as of March 31, 2020:
| Total Value at March 31, 2020 | Level 1 Quoted Price | Level 2 Significant Observable Inputs | Level 3 Significant Unobservable Inputs | |||||||||||||||
Assets | Common Stocks | |||||||||||||||||
Australia | $380,948 | $— | $380,948 | $— | ||||||||||||||
Belgium | 498,764 | — | 498,764 | — | ||||||||||||||
Brazil | 140,056 | 140,056 | — | — | ||||||||||||||
Canada | 1,198,019 | 1,198,019 | — | — | ||||||||||||||
China | 641,659 | 443,949 | 197,710 | — | ||||||||||||||
Denmark | 1,245,610 | — | 1,245,610 | — | ||||||||||||||
France | 6,947,726 | — | 6,947,726 | — | ||||||||||||||
Germany | 3,848,518 | — | 3,848,518 | — | ||||||||||||||
Hong Kong | 1,241,346 | — | 1,241,346 | — | ||||||||||||||
India | 905,899 | — | 905,899 | — | ||||||||||||||
Ireland | 324,114 | 324,114 | — | — | ||||||||||||||
Israel | 569,961 | 569,961 | — | — | ||||||||||||||
Italy | 640,960 | — | 640,960 | — | ||||||||||||||
Japan | 6,748,814 | — | 6,748,814 | — | ||||||||||||||
Netherlands | 985,907 | — | 985,907 | — | ||||||||||||||
Portugal | 222,079 | — | 222,079 | — | ||||||||||||||
Singapore | 394,054 | — | 394,054 | — | ||||||||||||||
Spain | 659,435 | — | 659,435 | — | ||||||||||||||
Sweden | 427,859 | — | 427,859 | — | ||||||||||||||
Switzerland | 6,580,512 | — | 6,580,512 | — | ||||||||||||||
Taiwan | 578,546 | 578,546 | — | — | ||||||||||||||
United Kingdom | 5,069,922 | — | 5,069,922 | — | ||||||||||||||
United States | 522,299 | 366,221 | 156,078 | — | ||||||||||||||
|
|
|
|
|
|
|
| |||||||||||
Total Common Stocks | 40,773,007 | 3,620,866 | 37,152,141 | — | ||||||||||||||
|
|
|
|
|
|
|
| |||||||||||
Short-Term Investment | 662,397 | 662,397 | — | — | ||||||||||||||
|
|
|
|
|
|
|
| |||||||||||
Total | $41,435,404 | $4,283,263 | $37,152,141 | $— | ||||||||||||||
|
|
|
|
|
|
|
| |||||||||||
| See Notes to Financial Statements | See explanation of symbols and terms, if any, on B-76 and B-77 |
B-66
Table of Contents
PACIFIC FUNDS
PF INTERNATIONAL SMALL-CAP FUND
Schedule of Investments
March 31, 2020
Shares | Value | |||||||
COMMON STOCKS - 99.0% | ||||||||
Australia - 3.6% | ||||||||
Accent Group Ltd | 49,656 | $24,002 | ||||||
Appen Ltd | 3,041 | 36,313 | ||||||
Asaleo Care Ltd | 103,554 | 64,333 | ||||||
Charter Hall Long Wale REIT | 32,598 | 88,183 | ||||||
Growthpoint Properties Australia Ltd REIT | 43,250 | 66,900 | ||||||
IGO Ltd | 35,912 | 92,256 | ||||||
IPH Ltd | 17,393 | 76,362 | ||||||
Karoon Energy Ltd * | 279,214 | 75,161 | ||||||
McMillan Shakespeare Ltd | 18,545 | 79,702 | ||||||
Nanosonics Ltd * | 24,597 | 84,395 | ||||||
Netwealth Group Ltd | 9,000 | 36,950 | ||||||
Perseus Mining Ltd * | 62,000 | 35,235 | ||||||
Pro Medicus Ltd | 7,352 | 86,896 | ||||||
Select Harvests Ltd | 19,181 | 82,078 | ||||||
Shopping Centres Australasia Property Group REIT | 39,058 | 54,170 | ||||||
|
| |||||||
| 982,936 | ||||||||
|
| |||||||
Austria - 1.0% | ||||||||
ams AG * | 6,159 | 60,201 | ||||||
AT&S Austria Technologie & Systemtechnik AG | 2,573 | 37,270 | ||||||
BAWAG Group AG ~ | 2,439 | 68,036 | ||||||
S IMMO AG | 4,936 | 95,813 | ||||||
|
| |||||||
| 261,320 | ||||||||
|
| |||||||
Belgium - 1.0% | ||||||||
Bekaert SA | 4,186 | 69,762 | ||||||
D’ieteren SA | 1,411 | 69,987 | ||||||
KBC Ancora | 1,200 | 33,319 | ||||||
Orange Belgium SA | 5,008 | 88,049 | ||||||
|
| |||||||
| 261,117 | ||||||||
|
| |||||||
Brazil - 0.3% | ||||||||
Yamana Gold Inc | 29,035 | 80,670 | ||||||
|
| |||||||
Canada - 8.3% | ||||||||
Alaris Royalty Corp | 4,600 | 26,967 | ||||||
Artis REIT | 11,475 | 65,068 | ||||||
B2Gold Corp | 35,589 | 107,731 | ||||||
Canaccord Genuity Group Inc | 18,339 | 56,426 | ||||||
Canadian Solar Inc * | 5,638 | 89,701 | ||||||
Celestica Inc * | 21,958 | 77,079 | ||||||
Centerra Gold Inc * | 13,494 | 80,256 | ||||||
CI Financial Corp | 6,052 | 60,077 | ||||||
Cogeco Inc | 1,226 | 75,687 | ||||||
Cominar REIT | 11,277 | 64,987 | ||||||
Corus Entertainment Inc ‘B’ | 40,006 | 71,353 | ||||||
Crescent Point Energy Corp | 35,319 | 27,356 | ||||||
CT REIT | 8,395 | 69,794 | ||||||
Dundee Precious Metals Inc | 23,050 | 72,722 | ||||||
Empire Co Ltd ‘A’ | 3,800 | 74,337 | ||||||
European REIT | 27,458 | 72,581 | ||||||
Extendicare Inc | 15,917 | 65,374 | ||||||
Genworth MI Canada Inc | 3,042 | 67,593 | ||||||
H&R REIT | 9,520 | 60,409 | ||||||
High Liner Foods Inc | 14,270 | 65,200 | ||||||
Knight Therapeutics Inc * | 17,744 | 78,173 | ||||||
Medical Facilities Corp | 35,452 | 87,918 | ||||||
Northview Apartment REIT | 2,600 | 60,487 | ||||||
Parex Resources Inc * | 9,688 | 81,921 | ||||||
Points International Ltd * | 5,888 | 48,458 | ||||||
Polaris Infrastructure Inc | 9,400 | 74,610 | ||||||
Precision Drilling Corp * | 18,900 | 5,909 | ||||||
Real Matters Inc * | 9,403 | 93,542 | ||||||
Ritchie Bros Auctioneers Inc | 4,032 | 138,096 | ||||||
SEMAFO Inc * | 44,125 | 85,597 | ||||||
Shares | Value | |||||||
Seven Generations Energy Ltd ‘A’ * | 8,000 | $8,811 | ||||||
TFI International Inc | 2,200 | 48,540 | ||||||
Torex Gold Resources Inc * | 7,950 | 76,997 | ||||||
|
| |||||||
| 2,239,757 | ||||||||
|
| |||||||
China - 0.4% | ||||||||
Gemdale Properties & Investment Corp Ltd | 629,886 | 103,348 | ||||||
|
| |||||||
Denmark - 1.6% | ||||||||
NKT AS * | 3,605 | 63,428 | ||||||
Pandora AS | 2,577 | 82,802 | ||||||
Royal Unibrew AS | 1,700 | 122,200 | ||||||
Scandinavian Tobacco Group AS ~ | 6,500 | 65,267 | ||||||
SimCorp AS | 755 | 62,951 | ||||||
Spar Nord Bank AS | 6,975 | 42,107 | ||||||
|
| |||||||
| 438,755 | ||||||||
|
| |||||||
Egypt - 0.4% | ||||||||
Centamin PLC | 77,666 | 115,312 | ||||||
|
| |||||||
Finland - 1.3% | ||||||||
Huhtamaki Oyj | 2,276 | 72,872 | ||||||
Outokumpu Oyj | 29,359 | 71,168 | ||||||
Uponor Oyj | 9,530 | 85,816 | ||||||
Valmet Oyj | 6,315 | 122,594 | ||||||
|
| |||||||
| 352,450 | ||||||||
|
| |||||||
France - 3.2% | ||||||||
Atos SE | 2,132 | 142,045 | ||||||
Criteo SA ADR * | 2,700 | 21,465 | ||||||
Eiffage SA | 1,313 | 93,202 | ||||||
Elior Group SA ~ | 10,630 | 69,580 | ||||||
Eutelsat Communications SA | 2,809 | 29,200 | ||||||
Kaufman & Broad SA | 1,540 | 47,310 | ||||||
Klepierre SA REIT | 4,585 | 87,397 | ||||||
Metropole Television SA | 6,339 | 70,157 | ||||||
SCOR SE | 4,827 | 106,200 | ||||||
Teleperformance | 217 | 44,944 | ||||||
Trigano SA | 1,297 | 82,293 | ||||||
Virbac SA * | 437 | 76,773 | ||||||
|
| |||||||
| 870,566 | ||||||||
|
| |||||||
Georgia - 0.2% | ||||||||
Bank of Georgia Group PLC | 5,456 | 61,929 | ||||||
|
| |||||||
Germany - 7.7% | ||||||||
Affimed NV * | 35,158 | 55,550 | ||||||
AIXTRON SE * | 10,517 | 90,510 | ||||||
Brenntag AG | 3,870 | 140,606 | ||||||
Cewe Stiftung & Co KGaA | 748 | 65,811 | ||||||
CTS Eventim AG & Co KGaA | 871 | 39,855 | ||||||
Deutsche Pfandbriefbank AG ~ | 10,085 | 76,133 | ||||||
DIC Asset AG | 6,254 | 65,111 | ||||||
DWS Group GmbH & Co KGaA ~ | 3,354 | 81,430 | ||||||
Eckert & Ziegler Strahlen- und Medizintechnik AG | 608 | 94,430 | ||||||
GEA Group AG | 5,947 | 122,852 | ||||||
GFT Technologies SE | 9,664 | 80,399 | ||||||
HelloFresh SE * | 3,981 | 130,001 | ||||||
JOST Werke AG ~ | 2,685 | 64,739 | ||||||
KION Group AG | 2,322 | 99,934 | ||||||
LANXESS AG | 2,900 | 115,432 | ||||||
LEG Immobilien AG | 1,243 | 139,387 | ||||||
LPKF Laser & Electronics AG * | 5,085 | 94,588 | ||||||
Software AG | 3,416 | 101,809 | ||||||
Stroeer SE & Co KGaA | 1,596 | 82,010 | ||||||
TAG Immobilien AG | 5,542 | 108,992 | ||||||
Talanx AG | 2,054 | 69,109 | ||||||
Telefonica Deutschland Holding AG | 26,122 | 64,132 | ||||||
| See Notes to Financial Statements | See explanation of symbols and terms, if any, on B-76 and B-77 |
B-67
Table of Contents
PACIFIC FUNDS
PF INTERNATIONAL SMALL-CAP FUND
Schedule of Investments (Continued)
March 31, 2020
Shares | Value | |||||||
Wacker Chemie AG | 1,892 | $94,243 | ||||||
|
| |||||||
| 2,077,063 | ||||||||
|
| |||||||
Hong Kong - 1.6% | ||||||||
Dah Sing Financial Holdings Ltd | 22,656 | 63,989 | ||||||
Hysan Development Co Ltd | 28,917 | 93,385 | ||||||
K Wah International Holdings Ltd | 186,470 | 80,119 | ||||||
Shun Tak Holdings Ltd | 217,390 | 73,496 | ||||||
Stella International Holdings Ltd | 65,665 | 68,971 | ||||||
VTech Holdings Ltd | 6,000 | 43,206 | ||||||
|
| |||||||
| 423,166 | ||||||||
|
| |||||||
Ireland - 0.9% | ||||||||
Bank of Ireland Group PLC | 25,664 | 47,840 | ||||||
Greencore Group PLC | 50,486 | 103,096 | ||||||
Hibernia REIT PLC | 85,559 | 98,703 | ||||||
|
| |||||||
| 249,639 | ||||||||
|
| |||||||
Israel - 1.3% | ||||||||
Allot Ltd * | 8,580 | 81,081 | ||||||
AudioCodes Ltd | 4,201 | 100,362 | ||||||
Gazit-Globe Ltd | 9,048 | 69,076 | ||||||
Plus500 Ltd | 7,952 | 105,186 | ||||||
|
| |||||||
| 355,705 | ||||||||
|
| |||||||
Italy - 3.0% | ||||||||
ACEA SPA | 5,319 | 84,422 | ||||||
Avio SPA | 5,606 | 69,465 | ||||||
Banca Farmafactoring SPA ~ | 9,373 | 48,174 | ||||||
Banca IFIS SPA | 6,401 | 61,525 | ||||||
Banca Sistema SPA ~ | 54,623 | 64,295 | ||||||
doValue SPA ~ | 10,970 | 67,205 | ||||||
Enav SPA ~ | 18,184 | 80,177 | ||||||
Esprinet SPA | 19,958 | 70,617 | ||||||
Italgas SPA | 17,500 | 95,749 | ||||||
Sesa SPA | 1,770 | 76,131 | ||||||
Unipol Gruppo SPA | 23,729 | 80,922 | ||||||
|
| |||||||
| 798,682 | ||||||||
|
| |||||||
Japan - 24.0% | ||||||||
Altech Corp | 5,100 | 68,744 | ||||||
Aoyama Trading Co Ltd | 2,800 | 23,955 | ||||||
Asahi Co Ltd | 8,400 | 87,325 | ||||||
Asahi Diamond Industrial Co Ltd | 8,800 | 37,745 | ||||||
ASKUL Corp | 2,700 | 79,557 | ||||||
Capcom Co Ltd | 2,500 | 78,387 | ||||||
Citizen Watch Co Ltd | 9,700 | 34,224 | ||||||
Cybernet Systems Co Ltd | 14,500 | 74,771 | ||||||
Denka Co Ltd | 2,200 | 46,028 | ||||||
Dexerials Corp | 12,300 | 78,798 | ||||||
DMG Mori Co Ltd | 5,200 | 43,125 | ||||||
Eagle Industry Co Ltd | 4,500 | 27,970 | ||||||
EPS Holdings Inc | 7,400 | 76,989 | ||||||
ESPEC Corp | 5,400 | 81,651 | ||||||
FCC Co Ltd | 5,100 | 74,046 | ||||||
Financial Products Group Co Ltd | 13,800 | 69,676 | ||||||
Foster Electric Co Ltd | 9,200 | 94,036 | ||||||
Fuji Media Holdings Inc | 3,000 | 29,798 | ||||||
Fukui Computer Holdings Inc | 4,600 | 92,665 | ||||||
FULLCAST Holdings Co Ltd | 5,000 | 57,183 | ||||||
Furyu Corp | 9,700 | 73,775 | ||||||
Glory Ltd | 2,900 | 66,632 | ||||||
Invincible Investment Corp REIT | 100 | 22,560 | ||||||
IR Japan Holdings Ltd | 1,500 | 80,238 | ||||||
Izumi Co Ltd | 2,700 | 74,372 | ||||||
Kaken Pharmaceutical Co Ltd | 2,200 | 102,555 | ||||||
Kamigumi Co Ltd | 4,000 | 67,518 | ||||||
Kato Sangyo Co Ltd | 2,100 | 66,041 | ||||||
Kenedix Inc | 22,900 | 86,911 | ||||||
Kissei Pharmaceutical Co Ltd | 1,500 | 38,456 | ||||||
Shares | Value | |||||||
Kito Corp | 3,800 | $34,906 | ||||||
Kozo Keikaku Engineering Inc | 2,900 | 67,750 | ||||||
Kyoei Steel Ltd | 2,000 | 22,974 | ||||||
Kyudenko Corp | 3,300 | 88,911 | ||||||
Lacto Japan Co Ltd | 2,600 | 79,917 | ||||||
Look Holdings Inc | 4,526 | 31,768 | ||||||
Marvelous Inc | 14,900 | 73,789 | ||||||
Meitec Corp | 2,000 | 79,313 | ||||||
Mitsui E&S Holdings Co Ltd * | 5,300 | 25,455 | ||||||
Mitsui Matsushima Holdings Co Ltd | 9,400 | 76,257 | ||||||
Mochida Pharmaceutical Co Ltd | 2,300 | 88,832 | ||||||
Morinaga & Co Ltd | 1,800 | 73,686 | ||||||
NichiiGakkan Co Ltd | 4,632 | 44,151 | ||||||
Nihon Unisys Ltd | 2,500 | 66,683 | ||||||
Nikkon Holdings Co Ltd | 4,200 | 81,889 | ||||||
Nippon Carbon Co Ltd | 2,300 | 68,111 | ||||||
Nippon Electric Glass Co Ltd | 1,900 | 25,302 | ||||||
Nippon Piston Ring Co Ltd | 5,100 | 53,360 | ||||||
NIPPON REIT Investment Corp | 37 | 109,572 | ||||||
Nippon Yakin Kogyo Co Ltd | 3,450 | 53,398 | ||||||
Nishio Rent All Co Ltd | 3,400 | 71,046 | ||||||
Noevir Holdings Co Ltd | 1,500 | 76,284 | ||||||
Obara Group Inc | 3,200 | 68,030 | ||||||
Optorun Co Ltd | 3,400 | 80,052 | ||||||
OSJB Holdings Corp | 21,900 | 48,368 | ||||||
PAL GROUP Holdings Co Ltd | 6,300 | 76,524 | ||||||
Premium Group Co Ltd | 5,600 | 84,042 | ||||||
Prima Meat Packers Ltd | 3,500 | 79,237 | ||||||
Rengo Co Ltd | 8,400 | 65,294 | ||||||
Restar Holdings Corp | 2,000 | 27,661 | ||||||
Riso Kyoiku Co Ltd | 26,400 | 69,970 | ||||||
Roland DG Corp | 2,300 | 24,766 | ||||||
Ryobi Ltd | 3,500 | 42,675 | ||||||
Ryosan Co Ltd | 3,200 | 70,396 | ||||||
Sangetsu Corp | 5,500 | 81,407 | ||||||
Sanki Engineering Co Ltd | 6,500 | 72,771 | ||||||
Sankyo Co Ltd | 2,200 | 63,801 | ||||||
Sankyu Inc | 1,900 | 70,794 | ||||||
Sanwa Holdings Corp | 11,600 | 90,086 | ||||||
Sawai Pharmaceutical Co Ltd | 1,900 | 101,804 | ||||||
Seikagaku Corp | 7,700 | 79,920 | ||||||
Shinoken Group Co Ltd | 6,700 | 46,543 | ||||||
Ship Healthcare Holdings Inc | 2,800 | 114,287 | ||||||
Star Micronics Co Ltd | 7,000 | 70,062 | ||||||
Starts Proceed Investment Corp REIT | 48 | 79,796 | ||||||
Sumitomo Mitsui Construction Co Ltd | 10,100 | 44,409 | ||||||
Sumitomo Osaka Cement Co Ltd | 2,600 | 77,415 | ||||||
Sumitomo Seika Chemicals Co Ltd | 3,100 | 75,940 | ||||||
Takara Leben Co Ltd | 10,800 | 34,743 | ||||||
Tama Home Co Ltd | 6,800 | 76,507 | ||||||
The Okinawa Electric Power Co Inc | 5,506 | 100,787 | ||||||
TOA ROAD Corp | 3,200 | 88,677 | ||||||
Toho Zinc Co Ltd * | 1,500 | 16,594 | ||||||
Tokyo Electron Device Ltd | 3,200 | 66,275 | ||||||
Tokyo Individualized Educational Institute Inc | 14,400 | 60,654 | ||||||
Tokyu Construction Co Ltd | 6,400 | 33,613 | ||||||
Tomy Co Ltd | 8,700 | 61,056 | ||||||
Topy Industries Ltd | 2,500 | 31,669 | ||||||
Tosei Corp | 8,400 | 72,174 | ||||||
Towa Pharmaceutical Co Ltd | 2,100 | 43,896 | ||||||
Toyo Corp | 8,700 | 78,004 | ||||||
Toyo Kanetsu KK | 2,200 | 39,322 | ||||||
TS Tech Co Ltd | 3,400 | 79,879 | ||||||
Ube Industries Ltd | 1,700 | 25,933 | ||||||
ValueCommerce Co Ltd | 5,700 | 93,566 | ||||||
Warabeya Nichiyo Holdings Co Ltd | 4,500 | 72,890 | ||||||
Yamaguchi Financial Group Inc | 15,200 | 85,704 | ||||||
Yuasa Trading Co Ltd | 3,800 | 99,970 | ||||||
Zeon Corp | 9,400 | 70,367 | ||||||
|
| |||||||
| 6,467,415 | ||||||||
|
| |||||||
| See Notes to Financial Statements | See explanation of symbols and terms, if any, on B-76 and B-77 |
B-68
Table of Contents
PACIFIC FUNDS
PF INTERNATIONAL SMALL-CAP FUND
Schedule of Investments (Continued)
March 31, 2020
Shares | Value | |||||||
Jordan - 0.5% | ||||||||
Hikma Pharmaceuticals PLC | 4,935 | $124,097 | ||||||
|
| |||||||
Luxembourg - 0.3% | ||||||||
APERAM SA | 4,272 | 90,348 | ||||||
|
| |||||||
Netherlands - 2.8% | ||||||||
ASM International NV | 1,391 | 141,523 | ||||||
ASR Nederland NV | 4,651 | 116,942 | ||||||
BE Semiconductor Industries NV | 3,222 | 98,680 | ||||||
Heijmans NV * | 11,841 | 71,305 | ||||||
Intertrust NV ~ | 5,702 | 71,775 | ||||||
SBM Offshore NV | 8,330 | 110,126 | ||||||
Signify NV ~ | 4,505 | 87,308 | ||||||
Vastned Retail NV REIT | 3,619 | 60,732 | ||||||
|
| |||||||
| 758,391 | ||||||||
|
| |||||||
Norway - 0.9% | ||||||||
Austevoll Seafood ASA | 8,984 | 63,935 | ||||||
Europris ASA ~ | 27,028 | 78,403 | ||||||
Grieg Seafood ASA | 8,061 | 74,483 | ||||||
SpareBank 1 SMN | 5,000 | 31,831 | ||||||
|
| |||||||
| 248,652 | ||||||||
|
| |||||||
Singapore - 1.1% | ||||||||
AEM Holdings Ltd | 61,600 | 72,029 | ||||||
Ascendas India Trust | 67,200 | 56,544 | ||||||
First REIT | 141,400 | 67,225 | ||||||
Hi-P International Ltd | 46,900 | 28,112 | ||||||
UMS Holdings Ltd | 149,000 | 64,633 | ||||||
|
| |||||||
| 288,543 | ||||||||
|
| |||||||
South Korea - 6.0% | ||||||||
Binggrae Co Ltd | 1,939 | 76,876 | ||||||
Com2uSCorp | 1,113 | 76,713 | ||||||
Dong-A ST Co Ltd | 1,120 | 73,686 | ||||||
Doosan Bobcat Inc | 1,708 | 25,042 | ||||||
DY POWER Corp | 3,701 | 17,689 | ||||||
F&F Co Ltd | 972 | 73,007 | ||||||
Handsome Co Ltd | 4,132 | 65,653 | ||||||
Hanwha Aerospace Co Ltd * | 1,400 | 23,417 | ||||||
HDC Holdings Co Ltd | 7,407 | 44,628 | ||||||
Huchems Fine Chemical Corp | 5,544 | 66,907 | ||||||
Hyundai Wia Corp | 1,098 | 23,853 | ||||||
InBody Co Ltd | 2,000 | 25,619 | ||||||
Interflex Co Ltd * | 10,827 | 80,327 | ||||||
INTOPS Co Ltd | 9,706 | 78,341 | ||||||
JW Life Science Corp | 2,225 | 25,927 | ||||||
KEPCO Plant Service & Engineering Co Ltd | 2,864 | 68,043 | ||||||
Korea Circuit Co Ltd * | 14,569 | 82,334 | ||||||
Korea Petrochemical Ind Co Ltd | 319 | 22,693 | ||||||
Korean Reinsurance Co | 14,266 | 85,119 | ||||||
Kumho Petrochemical Co Ltd | 1,832 | 96,714 | ||||||
LG Hausys Ltd | 2,516 | 72,323 | ||||||
Lotte Chilsung Beverage Co Ltd | 694 | 48,339 | ||||||
Moorim P&P Co Ltd | 9,970 | 23,746 | ||||||
Poongsan Corp | 5,735 | 82,326 | ||||||
Seegene Inc | 1,100 | 100,390 | ||||||
SK Discovery Co Ltd | 1,773 | 30,615 | ||||||
Tovis Co Ltd | 14,490 | 81,169 | ||||||
Value Added Technology Co Ltd | 2,433 | 42,763 | ||||||
|
| |||||||
| 1,614,259 | ||||||||
|
| |||||||
Spain - 2.7% | ||||||||
Acerinox SA | 8,754 | 58,922 | ||||||
Atlantica Yield PLC | 3,682 | 82,109 | ||||||
Cia de Distribucion Integral Logista Holdings SA | 5,348 | 85,850 | ||||||
Shares | Value | |||||||
Enagas SA | 6,275 | $123,788 | ||||||
Faes Farma SA | 15,859 | 61,043 | ||||||
Lar Espana Real Estate Socimi SA REIT | 15,262 | 67,751 | ||||||
Sacyr SA | 20,762 | 31,431 | ||||||
Talgo SA * ~ | 13,258 | 59,795 | ||||||
Vidrala SA | 587 | 52,286 | ||||||
Viscofan SA | 1,965 | 107,590 | ||||||
|
| |||||||
| 730,565 | ||||||||
|
| |||||||
Sweden - 5.1% | ||||||||
Betsson AB | 22,956 | 90,190 | ||||||
Bilia AB ‘A’ | 5,583 | 34,428 | ||||||
Bravida Holding AB ~ | 13,862 | 97,200 | ||||||
Evolution Gaming Group AB ~ | 2,600 | 88,153 | ||||||
Inwido AB | 14,876 | 84,500 | ||||||
JM AB | 4,114 | 70,899 | ||||||
Kungsleden AB | 12,817 | 96,412 | ||||||
Lindab International AB | 10,819 | 82,725 | ||||||
NCC AB ‘B’ | 6,506 | 85,041 | ||||||
Nyfosa AB * | 15,863 | 79,457 | ||||||
Orexo AB * | 11,218 | 62,012 | ||||||
Pricer AB ‘B’ | 45,574 | 70,938 | ||||||
Resurs Holding AB ~ | 7,550 | 25,628 | ||||||
Sectra AB ‘B’ | 1,840 | 68,510 | ||||||
Sweco AB ‘B’ | 3,443 | 97,762 | ||||||
Tethys Oil AB | 15,692 | 74,425 | ||||||
Trelleborg AB ‘B’ | 6,416 | 68,257 | ||||||
Wihlborgs Fastigheter AB | 6,864 | 94,936 | ||||||
|
| |||||||
| 1,371,473 | ||||||||
|
| |||||||
Switzerland - 6.0% | ||||||||
AC Immune SA * | 12,651 | 87,418 | ||||||
Adecco Group AG | 3,670 | 144,622 | ||||||
Allreal Holding AG | 520 | 96,534 | ||||||
ALSO Holding AG | 506 | 79,531 | ||||||
Baloise Holding AG | 551 | 71,835 | ||||||
BKW AG | 1,009 | 82,164 | ||||||
Cembra Money Bank AG | 905 | 82,520 | ||||||
CRISPR Therapeutics AG * | 1,890 | 80,155 | ||||||
Forbo Holding AG | 69 | 83,947 | ||||||
Huber + Suhner AG | 1,389 | 86,094 | ||||||
Interroll Holding AG | 46 | 76,101 | ||||||
Julius Baer Group Ltd | 1,573 | 52,692 | ||||||
Landis+Gyr Group AG | 650 | 44,475 | ||||||
Logitech International SA | 3,533 | 151,309 | ||||||
PSP Swiss Property AG | 1,093 | 136,679 | ||||||
Siegfried Holding AG | 224 | 90,147 | ||||||
Sonova Holding AG | 1,040 | 185,447 | ||||||
|
| |||||||
| 1,631,670 | ||||||||
|
| |||||||
United Kingdom - 12.7% | ||||||||
4imprint Group PLC | 3,101 | 72,979 | ||||||
Aggreko PLC | 15,981 | 95,511 | ||||||
Auto Trader Group PLC ~ | 23,856 | 128,913 | ||||||
Bellway PLC | 4,446 | 117,783 | ||||||
boohoo Group PLC * | 32,157 | 75,642 | ||||||
Brewin Dolphin Holdings PLC | 33,598 | 91,213 | ||||||
Coats Group PLC | 123,008 | 64,066 | ||||||
Computacenter PLC | 6,798 | 120,521 | ||||||
Dialog Semiconductor PLC * | 2,534 | 65,866 | ||||||
Drax Group PLC | 41,870 | 79,184 | ||||||
Empiric Student Property PLC REIT | 104,707 | 85,186 | ||||||
Fevertree Drinks PLC | 2,437 | 36,343 | ||||||
Frasers Group PLC * | 9,000 | 20,279 | ||||||
Great Portland Estates PLC REIT | 12,927 | 108,912 | ||||||
Gulf Keystone Petroleum Ltd | 87,014 | 72,954 | ||||||
Howden Joinery Group PLC | 21,815 | 137,231 | ||||||
IMI PLC | 10,831 | 99,987 | ||||||
Inchcape PLC | 16,971 | 90,571 | ||||||
Intermediate Capital Group PLC | 10,701 | 118,108 | ||||||
| See Notes to Financial Statements | See explanation of symbols and terms, if any, on B-76 and B-77 |
B-69
Table of Contents
PACIFIC FUNDS
PF INTERNATIONAL SMALL-CAP FUND
Schedule of Investments (Continued)
March 31, 2020
Shares | Value | |||||||
International Personal Finance PLC | 56,793 | $53,753 | ||||||
Jupiter Fund Management PLC | 12,000 | 29,422 | ||||||
Keller Group PLC | 8,285 | 54,369 | ||||||
Man Group PLC | 66,092 | 101,143 | ||||||
Mitchells & Butlers PLC * | 17,751 | 39,697 | ||||||
Oxford Instruments PLC | 5,182 | 80,098 | ||||||
Paragon Banking Group PLC | 13,200 | 53,989 | ||||||
Pets at Home Group PLC | 27,162 | 86,242 | ||||||
Quilter PLC ~ | 77,054 | 111,655 | ||||||
Reach PLC | 56,257 | 71,401 | ||||||
Redrow PLC | 17,309 | 76,729 | ||||||
Rightmove PLC | 22,677 | 136,764 | ||||||
Rotork PLC | 35,004 | 92,613 | ||||||
Safestore Holdings PLC REIT | 12,573 | 99,422 | ||||||
Spirent Communications PLC | 41,609 | 105,538 | ||||||
St Modwen Properties PLC | 18,516 | 75,629 | ||||||
Stagecoach Group PLC | 58,940 | 50,472 | ||||||
Tate & Lyle PLC | 20,655 | 168,045 | ||||||
Team17 Group PLC * | 11,507 | 82,041 | ||||||
Ultra Electronics Holdings PLC | 4,338 | 107,326 | ||||||
Vistry Group PLC | 10,989 | 78,328 | ||||||
|
| |||||||
| 3,435,925 | ||||||||
|
| |||||||
United States - 1.1% | ||||||||
Argonaut Gold Inc * | 34,300 | 26,323 | ||||||
CyberArk Software Ltd * | 790 | 67,592 | ||||||
IMAX Corp * | 6,698 | 60,617 | ||||||
Inmode Ltd * | 3,226 | 69,359 | ||||||
Oxford Immunotec Global PLC * | 6,814 | 63,098 | ||||||
|
| |||||||
| 286,989 | ||||||||
|
| |||||||
Total Common Stocks | 26,720,742 | |||||||
|
| |||||||
SHORT-TERM INVESTMENT - 0.1% | ||||||||
Money Market Fund - 0.1% | ||||||||
BlackRock Liquidity Funds T-Fund ‘Institutional’ 0.210% | 21,547 | 21,547 | ||||||
|
| |||||||
Total Short-Term Investment | 21,547 | |||||||
|
| |||||||
TOTAL INVESTMENTS - 99.1% | 26,742,289 | |||||||
OTHER ASSETS & LIABILITIES, NET - 0.9% | 239,323 | |||||||
|
| |||||||
NET ASSETS - 100.0% | $26,981,612 | |||||||
|
| |||||||
Notes to Schedule of Investments
| (a) | As of March 31, 2020, the Fund’s composition by sector as a percentage of net assets was as follows: |
Financial | 21.6% | |||
Industrial | 19.2% | |||
Consumer, Non-Cyclical | 18.9% | |||
Consumer, Cyclical | 12.0% | |||
Technology | 8.5% | |||
Basic Materials | 8.0% | |||
Communications | 5.6% | |||
Others (each less than 3.0%) | 5.3% | |||
|
| |||
| 99.1% | ||||
Other Assets & Liabilities, Net | 0.9% | |||
|
| |||
| 100.0% | ||||
|
|
| (b) | As of March 31, 2020, the Fund’s composition by country of risk as a percentage of net assets was as follows: |
Japan | 24.0% | |||
United Kingdom | 12.7% | |||
Canada | 8.3% | |||
Germany | 7.7% | |||
Switzerland | 6.0% | |||
South Korea | 6.0% | |||
Sweden | 5.1% | |||
Australia | 3.6% | |||
France | 3.2% | |||
Italy | 3.0% | |||
Others (each less than 3.0%) | 19.5% | |||
|
| |||
| 99.1% | ||||
Other Assets & Liabilities, Net | 0.9% | |||
|
| |||
| 100.0% | ||||
|
|
| See Notes to Financial Statements | See explanation of symbols and terms, if any, on B-76 and B-77 |
B-70
Table of Contents
PACIFIC FUNDS
PF INTERNATIONAL SMALL-CAP FUND
Schedule of Investments (Continued)
March 31, 2020
| (c) | Fair Value Measurements |
The following is a summary of the Fund's investments as categorized under the three-tier hierarchy of inputs used in valuing the Fund's assets and liabilities as of March 31, 2020:
| Total Value at March 31, 2020 | Level 1 Quoted Price | Level 2 Significant | Level 3 Significant Unobservable Inputs | |||||||||||||||
Assets | Common Stocks | |||||||||||||||||
Australia | $982,936 | $64,333 | $918,603 | $— | ||||||||||||||
Austria | 261,320 | 95,813 | 165,507 | — | ||||||||||||||
Belgium | 261,117 | — | 261,117 | — | ||||||||||||||
Brazil | 80,670 | 80,670 | — | — | ||||||||||||||
Canada | 2,239,757 | 2,239,757 | — | — | ||||||||||||||
China | 103,348 | — | 103,348 | — | ||||||||||||||
Denmark | 438,755 | — | 438,755 | — | ||||||||||||||
Egypt | 115,312 | — | 115,312 | — | ||||||||||||||
Finland | 352,450 | — | 352,450 | — | ||||||||||||||
France | 870,566 | 21,465 | 849,101 | — | ||||||||||||||
Georgia | 61,929 | — | 61,929 | — | ||||||||||||||
Germany | 2,077,063 | 55,550 | 2,021,513 | — | ||||||||||||||
Hong Kong | 423,166 | — | 423,166 | — | ||||||||||||||
Ireland | 249,639 | — | 249,639 | — | ||||||||||||||
Israel | 355,705 | 181,443 | 174,262 | — | ||||||||||||||
Italy | 798,682 | — | 798,682 | — | ||||||||||||||
Japan | 6,467,415 | — | 6,467,415 | — | ||||||||||||||
Jordan | 124,097 | — | 124,097 | — | ||||||||||||||
Luxembourg | 90,348 | — | 90,348 | — | ||||||||||||||
Netherlands | 758,391 | 71,305 | 687,086 | — | ||||||||||||||
Norway | 248,652 | — | 248,652 | — | ||||||||||||||
Singapore | 288,543 | — | 288,543 | — | ||||||||||||||
South Korea | 1,614,259 | 100,390 | 1,513,869 | — | ||||||||||||||
Spain | 730,565 | 149,860 | 580,705 | — | ||||||||||||||
Sweden | 1,371,473 | — | 1,371,473 | — | ||||||||||||||
Switzerland | 1,631,670 | 251,520 | 1,380,150 | — | ||||||||||||||
United Kingdom | 3,435,925 | 208,748 | 3,227,177 | — | ||||||||||||||
United States | 286,989 | 286,989 | — | — | ||||||||||||||
|
|
|
|
|
|
|
| |||||||||||
Total Common Stocks | 26,720,742 | 3,807,843 | 22,912,899 | — | ||||||||||||||
|
|
|
|
|
|
|
| |||||||||||
Short-Term Investment | 21,547 | 21,547 | — | — | ||||||||||||||
|
|
|
|
|
|
|
| |||||||||||
Total | $26,742,289 | $3,829,390 | $22,912,899 | $— | ||||||||||||||
|
|
|
|
|
|
|
| |||||||||||
| See Notes to Financial Statements | See explanation of symbols and terms, if any, on B-76 and B-77 |
B-71
Table of Contents
PACIFIC FUNDS
PF INTERNATIONAL VALUE FUND
Schedule of Investments
March 31, 2020
Shares | Value | |||||||
COMMON STOCKS - 96.2% | ||||||||
Argentina - 0.2% | ||||||||
YPF SA ADR | 19,782 | $82,491 | ||||||
|
| |||||||
Austria - 0.5% | ||||||||
Erste Group Bank AG * | 9,305 | 170,353 | ||||||
|
| |||||||
Belgium - 1.1% | ||||||||
Ageas | 9,265 | 386,091 | ||||||
|
| |||||||
Canada - 3.0% | ||||||||
ARC Resources Ltd | 19,143 | 55,091 | ||||||
Barrick Gold Corp | 33,857 | 622,143 | ||||||
Cameco Corp | 12,948 | 98,923 | ||||||
Kinross Gold Corp * | 55,830 | 222,203 | ||||||
Tourmaline Oil Corp | 10,270 | 63,052 | ||||||
|
| |||||||
| 1,061,412 | ||||||||
|
| |||||||
China - 5.2% | ||||||||
China Mobile Ltd | 73,597 | 551,557 | ||||||
China Telecom Corp Ltd ‘H’ | 1,351,724 | 409,552 | ||||||
China Unicom Hong Kong Ltd | 721,739 | 420,955 | ||||||
Dongfeng Motor Group Co Ltd ‘H’ | 649,585 | 422,951 | ||||||
|
| |||||||
| 1,805,015 | ||||||||
|
| |||||||
Denmark - 1.3% | ||||||||
AP Moller - Maersk AS ‘B’ | 485 | 429,887 | ||||||
The Drilling Co of 1972 AS * | 735 | 14,003 | ||||||
|
| |||||||
| 443,890 | ||||||||
|
| |||||||
Finland - 1.3% | ||||||||
Nokia OYJ | 143,230 | 441,129 | ||||||
|
| |||||||
France - 9.9% | ||||||||
BNP Paribas SA | 15,156 | 442,483 | ||||||
Cie de Saint-Gobain | 28,826 | 691,693 | ||||||
Engie SA | 39,116 | 400,566 | ||||||
Renault SA | 10,403 | 197,706 | ||||||
Rexel SA | 47,683 | 351,108 | ||||||
Societe Generale SA | 21,804 | 357,197 | ||||||
TOTAL SA | 26,845 | 1,011,488 | ||||||
|
| |||||||
| 3,452,241 | ||||||||
|
| |||||||
Germany - 2.5% | ||||||||
CECONOMY AG * | 31,148 | 67,621 | ||||||
Daimler AG | 14,920 | 445,574 | ||||||
Deutsche Lufthansa AG | 23,983 | 224,317 | ||||||
METRO AG | 10,070 | 85,768 | ||||||
Salzgitter AG | 3,657 | 43,024 | ||||||
|
| |||||||
| 866,304 | ||||||||
|
| |||||||
Hong Kong - 0.8% | ||||||||
CK Asset Holdings Ltd | 53,918 | 292,542 | ||||||
|
| |||||||
India - 1.0% | ||||||||
Canara Bank * | 80,145 | 95,766 | ||||||
NTPC Ltd | 30,248 | 33,643 | ||||||
Oil & Natural Gas Corp Ltd | 135,111 | 120,970 | ||||||
Zee Entertainment Enterprises Ltd | 65,015 | 105,805 | ||||||
|
| |||||||
| 356,184 | ||||||||
|
| |||||||
Ireland - 0.9% | ||||||||
AIB Group PLC * | 132,557 | 146,983 | ||||||
Bank of Ireland Group PLC | 95,043 | 177,167 | ||||||
|
| |||||||
| 324,150 | ||||||||
|
| |||||||
Shares | Value | |||||||
Italy - 4.9% | ||||||||
Assicurazioni Generali SPA | 19,743 | $267,415 | ||||||
BPER Banca | 36,660 | 111,555 | ||||||
Eni SPA | 71,480 | 710,331 | ||||||
Saipem SPA * | 80,510 | 194,102 | ||||||
UniCredit SPA | 54,934 | 425,002 | ||||||
|
| |||||||
| 1,708,405 | ||||||||
|
| |||||||
Japan - 29.1% | ||||||||
Benesse Holdings Inc | 3,569 | 90,824 | ||||||
Canon Inc | 9,601 | 208,639 | ||||||
Chiyoda Corp * | 18,371 | 35,709 | ||||||
Citizen Watch Co Ltd | 43,414 | 153,174 | ||||||
Dai-ichi Life Holdings Inc | 32,184 | 382,189 | ||||||
DeNA Co Ltd | 17,031 | 186,548 | ||||||
Eisai Co Ltd | 2,978 | 217,833 | ||||||
Fuji Media Holdings Inc | 9,676 | 96,108 | ||||||
Fujitsu Ltd | 2,837 | 255,525 | ||||||
Gree Inc | 39,331 | 151,605 | ||||||
Honda Motor Co Ltd | 40,275 | 901,211 | ||||||
Inpex Corp | 61,067 | 342,590 | ||||||
JGC Holdings Corp | 33,363 | 266,304 | ||||||
JSR Corp | 25,804 | 471,632 | ||||||
Mitsubishi Estate Co Ltd | 22,980 | 339,395 | ||||||
Mitsubishi Heavy Industries Ltd | 11,656 | 293,754 | ||||||
Mitsubishi Motors Corp | 64,194 | 180,870 | ||||||
Mitsubishi UFJ Financial Group Inc | 179,538 | 671,751 | ||||||
Nikon Corp | 29,229 | 268,272 | ||||||
Nippon Television Holdings Inc | 18,279 | 203,688 | ||||||
Nissan Motor Co Ltd | 75,568 | 252,829 | ||||||
Nitto Denko Corp | 6,866 | 304,981 | ||||||
Nomura Holdings Inc | 82,994 | 350,243 | ||||||
Resona Holdings Inc | 126,392 | 378,962 | ||||||
Shimamura Co Ltd | 6,379 | 385,507 | ||||||
Sumitomo Mitsui Financial Group Inc | 23,746 | 576,871 | ||||||
Sumitomo Mitsui Trust Holdings Inc | 15,656 | 449,799 | ||||||
T&D Holdings Inc | 70,345 | 570,261 | ||||||
Takeda Pharmaceutical Co Ltd | 21,260 | 647,327 | ||||||
THK Co Ltd | 11,047 | 222,582 | ||||||
Z holdings Corp | 96,772 | 308,524 | ||||||
|
| |||||||
| 10,165,507 | ||||||||
|
| |||||||
Luxembourg - 0.4% | ||||||||
RTL Group SA | 4,714 | 157,862 | ||||||
|
| |||||||
Malaysia - 0.5% | ||||||||
CIMB Group Holdings Bhd | 196,488 | 163,507 | ||||||
|
| |||||||
Netherlands - 4.9% | ||||||||
ABN AMRO Bank NV ~ | 44,129 | 358,097 | ||||||
ING Groep NV | 83,859 | 429,702 | ||||||
PostNL NV | 83,555 | 105,727 | ||||||
Royal Dutch Shell PLC ‘B’ | 48,038 | 805,791 | ||||||
|
| |||||||
| 1,699,317 | ||||||||
|
| |||||||
Norway - 1.9% | ||||||||
Equinor ASA | 29,202 | 364,036 | ||||||
Norsk Hydro ASA | 145,929 | 314,647 | ||||||
|
| |||||||
| 678,683 | ||||||||
|
| |||||||
Russia - 2.1% | ||||||||
Gazprom PJSC ADR | 63,229 | 288,324 | ||||||
LUKOIL PJSC ADR | 1,675 | 99,093 | ||||||
Sberbank of Russia PJSC ADR | 20,145 | 189,363 | ||||||
VEON Ltd ADR | 97,484 | 147,201 | ||||||
|
| |||||||
| 723,981 | ||||||||
|
| |||||||
| See Notes to Financial Statements | See explanation of symbols and terms, if any, on B-76 and B-77 |
B-72
Table of Contents
PACIFIC FUNDS
PF INTERNATIONAL VALUE FUND
Schedule of Investments (Continued)
March 31, 2020
Shares | Value | |||||||
South Africa - 1.9% | ||||||||
Anglo American PLC | 18,415 | $322,697 | ||||||
Gold Fields Ltd ADR | 33,811 | 160,602 | ||||||
Impala Platinum Holdings Ltd * | 22,743 | 94,761 | ||||||
MTN Group Ltd | 38,123 | 102,221 | ||||||
|
| |||||||
| 680,281 | ||||||||
|
| |||||||
South Korea - 3.4% | ||||||||
KB Financial Group Inc | 15,829 | 445,175 | ||||||
KT Corp ADR | 46,390 | 360,914 | ||||||
Shinhan Financial Group Co Ltd | 16,040 | 375,243 | ||||||
|
| |||||||
| 1,181,332 | ||||||||
|
| |||||||
Spain - 1.2% | ||||||||
CaixaBank SA | 222,411 | 411,596 | ||||||
|
| |||||||
Switzerland - 6.6% | ||||||||
Adecco Group AG | 14,040 | 553,269 | ||||||
Julius Baer Group Ltd | 12,804 | 428,902 | ||||||
LafargeHolcim Ltd | 16,983 | 619,769 | ||||||
UBS Group AG | 76,649 | 702,574 | ||||||
|
| |||||||
| 2,304,514 | ||||||||
|
| |||||||
Taiwan - 0.9% | ||||||||
Innolux Corp | 789,767 | 136,120 | ||||||
Shin Kong Financial Holding Co Ltd * | 787,750 | 197,574 | ||||||
|
| |||||||
| 333,694 | ||||||||
|
| |||||||
Thailand - 0.9% | ||||||||
Kasikornbank PCL NVDR | 110,904 | 308,451 | ||||||
|
| |||||||
United Kingdom - 9.7% | ||||||||
Babcock International Group PLC | 51,250 | 241,874 | ||||||
BP PLC | 165,601 | 679,119 | ||||||
BT Group PLC | 216,942 | 315,556 | ||||||
Centrica PLC | 298,944 | 140,860 | ||||||
HSBC Holdings PLC | 3,720 | 20,883 | ||||||
J Sainsbury PLC | 206,085 | 533,225 | ||||||
Kingfisher PLC | 167,800 | 294,742 | ||||||
Land Securities Group PLC REIT | 24,924 | 171,873 | ||||||
Marks & Spencer Group PLC | 112,945 | 136,916 | ||||||
Standard Chartered PLC | 91,729 | 507,150 | ||||||
The British Land Co PLC REIT | 37,216 | 155,197 | ||||||
WPP PLC | 28,640 | 194,721 | ||||||
|
| |||||||
| 3,392,116 | ||||||||
|
| |||||||
United States - 0.1% | ||||||||
Ovintiv Inc | 18,336 | 50,293 | ||||||
|
| |||||||
Total Common Stocks | 33,641,341 | |||||||
|
| |||||||
EXCHANGE-TRADED FUND - 0.9% | ||||||||
iShares Core MSCI EAFE | 6,310 | 314,806 | ||||||
|
| |||||||
Total Exchange-Traded Fund | 314,806 | |||||||
|
| |||||||
Shares | Value | |||||||
SHORT-TERM INVESTMENT - 1.5% | ||||||||
Money Market Fund - 1.5% | ||||||||
BlackRock Liquidity Funds T-Fund Portfolio ‘Institutional’ 0.210% | 518,350 | $518,350 | ||||||
|
| |||||||
Total Short-Term Investment | 518,350 | |||||||
|
| |||||||
TOTAL INVESTMENTS - 98.6% | 34,474,497 | |||||||
OTHER ASSETS & LIABILITIES, NET - 1.4% | 496,076 | |||||||
|
| |||||||
NET ASSETS - 100.0% | $34,970,573 | |||||||
|
| |||||||
Notes to Schedule of Investments
| (a) | As of March 31, 2020, the Fund’s composition by sector as a percentage of net assets was as follows: |
Financial | 32.8% | |||
Energy | 14.0% | |||
Consumer, Cyclical | 11.5% | |||
Communications | 10.9% | |||
Industrial | 9.7% | |||
Consumer, Non-cyclical | 6.8% | |||
Basic Materials | 6.2% | |||
Others (each less than 3.0%) | 6.7% | |||
|
| |||
| 98.6% | ||||
Other Assets & Liabilities, Net | 1.4% | |||
|
| |||
| 100.0% | ||||
|
|
| (b) | As of March 31, 2020, the Fund’s composition by country of risk as a percentage of net assets was as follows: |
Japan | 29.1% | |||
France | 9.9% | |||
United Kingdom | 9.7% | |||
Switzerland | 6.6% | |||
China | 5.2% | |||
Italy | 4.9% | |||
Netherlands | 4.9% | |||
South Korea | 3.4% | |||
Canada | 3.0% | |||
Others (each less than 3.0%) | 21.9% | |||
|
| |||
| 98.6% | ||||
Other Assets & Liabilities, Net | 1.4% | |||
|
| |||
| 100.0% | ||||
|
|
| See Notes to Financial Statements | See explanation of symbols and terms, if any, on B-76 and B-77 |
B-73
Table of Contents
PACIFIC FUNDS
PF INTERNATIONAL VALUE FUND
Schedule of Investments (Continued)
March 31, 2020
| (c) | Fair Value Measurements |
The following is a summary of the Fund’s investments as categorized under the three-tier hierarchy of inputs used in valuing the Fund’s assets and liabilities as of March 31, 2020:
| Total Value at March 31, 2020 | Level 1 Quoted Price | Level 2 Significant Observable Input | Level 3 Significant Unobservable Input | |||||||||||||||
Assets | Common Stocks | |||||||||||||||||
Argentina | $82,491 | $82,491 | $— | $— | ||||||||||||||
Austria | 170,353 | — | 170,353 | — | ||||||||||||||
Belgium | 386,091 | — | 386,091 | — | ||||||||||||||
Canada | 1,061,412 | 1,061,412 | — | — | ||||||||||||||
China | 1,805,015 | — | 1,805,015 | — | ||||||||||||||
Denmark | 443,890 | — | 443,890 | — | ||||||||||||||
Finland | 441,129 | — | 441,129 | — | ||||||||||||||
France | 3,452,241 | — | 3,452,241 | — | ||||||||||||||
Germany | 866,304 | — | 866,304 | — | ||||||||||||||
Hong Kong | 292,542 | — | 292,542 | — | ||||||||||||||
India | 356,184 | — | 356,184 | — | ||||||||||||||
Ireland | 324,150 | — | 324,150 | — | ||||||||||||||
Italy | 1,708,405 | — | 1,708,405 | — | ||||||||||||||
Japan | 10,165,507 | — | 10,165,507 | — | ||||||||||||||
Luxembourg | 157,862 | — | 157,862 | — | ||||||||||||||
Malaysia | 163,507 | — | 163,507 | — | ||||||||||||||
Netherlands | 1,699,317 | — | 1,699,317 | — | ||||||||||||||
Norway | 678,683 | — | 678,683 | — | ||||||||||||||
Russia | 723,981 | 723,981 | — | — | ||||||||||||||
South Africa | 680,281 | 160,602 | 519,679 | — | ||||||||||||||
South Korea | 1,181,332 | 360,914 | 820,418 | — | ||||||||||||||
Spain | 411,596 | — | 411,596 | — | ||||||||||||||
Switzerland | 2,304,514 | — | 2,304,514 | — | ||||||||||||||
Taiwan | 333,694 | — | 333,694 | — | ||||||||||||||
Thailand | 308,451 | — | 308,451 | — | ||||||||||||||
United Kingdom | 3,392,116 | — | 3,392,116 | — | ||||||||||||||
United States | 50,293 | 50,293 | — | — | ||||||||||||||
|
|
|
|
|
|
|
| |||||||||||
Total Common Stocks | 33,641,341 | 2,439,693 | 31,201,648 | — | ||||||||||||||
|
|
|
|
|
|
|
| |||||||||||
Exchange-Traded Fund | 314,806 | 314,806 | — | — | ||||||||||||||
|
|
|
|
|
|
|
| |||||||||||
Short-Term Investment | 518,350 | 518,350 | — | — | ||||||||||||||
|
|
|
|
|
|
|
| |||||||||||
Total | $34,474,497 | $3,272,849 | $31,201,648 | $— | ||||||||||||||
|
|
|
|
|
|
|
| |||||||||||
| See Notes to Financial Statements | See explanation of symbols and terms, if any, on B-76 and B-77 |
B-74
Table of Contents
PACIFIC FUNDS
PF REAL ESTATE FUND
Schedule of Investments
March 31, 2020
Shares | Value | |||||||
COMMON STOCKS - 98.0% | ||||||||
Consumer, Cyclical - 0.6% | ||||||||
Hilton Worldwide Holdings Inc | 4,065 | $277,396 | ||||||
|
| |||||||
Financial - 97.4% | ||||||||
Alexandria Real Estate Equities Inc REIT | 14,433 | 1,978,187 | ||||||
American Homes 4 Rent ‘A’ REIT | 74,798 | 1,735,314 | ||||||
American Tower Corp REIT | 5,830 | 1,269,483 | ||||||
Americold Realty Trust REIT | 18,154 | 617,962 | ||||||
Apartment Investment & Management Co ‘A’ REIT | 27,821 | 977,908 | ||||||
AvalonBay Communities Inc REIT | 18,038 | 2,654,653 | ||||||
Boston Properties Inc REIT | 7,684 | 708,694 | ||||||
Brandywine Realty Trust REIT | 27,387 | 288,111 | ||||||
CoreSite Realty Corp REIT | 6,111 | 708,265 | ||||||
Cousins Properties Inc REIT | 30,419 | 890,364 | ||||||
CubeSmart REIT | 28,840 | 772,623 | ||||||
Digital Realty Trust Inc REIT | 5,963 | 828,254 | ||||||
Duke Realty Corp REIT | 23,732 | 768,441 | ||||||
EPR Properties REIT | 4,947 | 119,815 | ||||||
Equinix Inc REIT | 7,097 | 4,432,573 | ||||||
Equity LifeStyle Properties Inc REIT | 16,274 | 935,429 | ||||||
Equity Residential REIT | 6,196 | 382,355 | ||||||
Essential Properties Realty Trust REIT | 52,068 | 680,007 | ||||||
Essex Property Trust Inc REIT | 8,435 | 1,857,724 | ||||||
Extra Space Storage Inc REIT | 12,861 | 1,231,569 | ||||||
First Industrial Realty Trust Inc REIT | 13,959 | 463,859 | ||||||
Healthcare Realty Trust Inc REIT | 17,219 | 480,927 | ||||||
Healthcare Trust of America Inc ‘A’ REIT | 63,839 | 1,550,011 | ||||||
Healthpeak Properties Inc REIT | 34,355 | 819,367 | ||||||
Invitation Homes Inc REIT | 100,683 | 2,151,596 | ||||||
Kilroy Realty Corp REIT | 13,703 | 872,881 | ||||||
Park Hotels & Resorts Inc REIT | 28,102 | 222,288 | ||||||
Prologis Inc REIT | 52,537 | 4,222,399 | ||||||
Public Storage REIT | 2,665 | 529,296 | ||||||
Regency Centers Corp REIT | 23,390 | 898,879 | ||||||
Sabra Health Care REIT Inc | 28,966 | 316,309 | ||||||
Simon Property Group Inc REIT | 9,734 | 534,007 | ||||||
STORE Capital Corp REIT | 55,259 | 1,001,293 | ||||||
Sun Communities Inc REIT | 12,236 | 1,527,666 | ||||||
Sunstone Hotel Investors Inc REIT | 24,266 | 211,357 | ||||||
Terreno Realty Corp REIT | 20,197 | 1,045,195 | ||||||
VICI Properties Inc REIT | 36,281 | 603,716 | ||||||
Welltower Inc REIT | 19,796 | 906,261 | ||||||
Weyerhaeuser Co REIT | 11,521 | 195,281 | ||||||
|
| |||||||
| 42,390,319 | ||||||||
|
| |||||||
Total Common Stocks | 42,667,715 | |||||||
|
| |||||||
Shares | Value | |||||||
SHORT-TERM INVESTMENT - 1.9% | ||||||||
Money Market Fund - 1.9% | ||||||||
BlackRock Liquidity Funds T-Fund Portfolio ‘Institutional’ 0.210% | 836,354 | $836,354 | ||||||
|
| |||||||
Total Short-Term Investment | 836,354 | |||||||
|
| |||||||
TOTAL INVESTMENTS - 99.9% | 43,504,069 | |||||||
OTHER ASSETS & LIABILITIES, NET - 0.1% | 27,883 | |||||||
|
| |||||||
NET ASSETS - 100.0% | $43,531,952 | |||||||
|
| |||||||
Notes to Schedule of Investments
| (a) | As of March 31, 2020, the Fund’s composition by property sector as a percentage of net assets was as follows: |
REITS-Apartments | 22.4% | |||
REITS-Diversified | 20.5% | |||
REITS-Warehouse/Industrial | 14.6% | |||
REITS-Office Property | 10.9% | |||
REITS-Health Care | 9.4% | |||
REITS-Storage | 5.8% | |||
REITS-Manufactured Homes | 5.6% | |||
REITS-Single Tenant | 3.9% | |||
Others (each less than 3.0%) | 4.9% | |||
|
| |||
| 98.0% | ||||
Short-Term Investment | 1.9% | |||
Other Assets & Liabilities, Net | 0.1% | |||
|
| |||
| 100.0% | ||||
|
|
| (b) | Fair Value Measurements |
The following is a summary of the Fund's investments as categorized under the three-tier hierarchy of inputs used in valuing the Fund's assets and liabilities as of March 31, 2020:
| Total Value at March 31, 2020 | Level 1 Quoted Price | Level 2 Significant Observable Inputs | Level 3 Significant Unobservable Inputs | |||||||||||||||
Assets | Common Stocks | $42,667,715 | $42,667,715 | $— | $— | |||||||||||||
Short-Term Investment | 836,354 | 836,354 | — | — | ||||||||||||||
|
|
|
|
|
|
|
| |||||||||||
Total | $43,504,069 | $43,504,069 | $— | $— | ||||||||||||||
|
|
|
|
|
|
|
| |||||||||||
| See Notes to Financial Statements | See explanation of symbols and terms, if any, on B-76 and B-77 |
B-75
Table of Contents
PACIFIC FUNDS
Schedule of Investments (Continued)
Explanation of Symbols and Terms
March 31, 2020
Explanation of Symbols: | ||
| * | Non-income producing investments. | |
| ^ | Investments with their principal amount adjusted for inflation. | |
| § | Variable rate investments. The rate shown is based on the latest available information as of March 31, 2020. For Senior Loan Notes, the rate shown may represent a weighted average interest rate. Interest rates for certain securities are subject to interest rate caps and floors, which would result in a period end rate being more, less or equal to the referenced rate plus spread. Certain variable rate securities are not based on a published reference rate and spread but are determined by the issuer or agent and are based on current market conditions. These securities do not indicate a reference rate and spread in their description. | |
| Y | Issuer filed bankruptcy and/or is in default as of March 31, 2020. | |
| ¥ | All or a portion of this senior loan position has not settled. Rates do not take effect until settlement date. Rates shown, if any, are for the settled portion. | |
| ~ | Securities are not registered under the Securities Act of 1933 (1933 Act) and these securities are either (1) exempt from registration pursuant to Rule 144A of the 1933 Act and may only be sold to “qualified institutional buyers”, or (2) the securities comply with Regulation S rules governing offers and sales made outside the United States without registration under the 1933 Act and contain certain restrictions as to public resale. | |
| ‡ | Investments were fully or partially segregated with the broker(s)/custodian as collateral for reverse repurchase agreements, futures contracts, forward foreign currency contracts, option contracts and/or swap agreements as of March 31, 2020. | |
| W | The values of these investments were determined by the Trustee Valuation Committee or determined by a valuation committee established under the Valuation Policy and then subsequently submitted for approval or ratification to either the Trustee Valuation Committee or to the Board of Trustees (the “Board”). Each determination was made in good faith in accordance with the procedures established by the Board and the provisions of the Investment Company Act of 1940. | |
| ± | Investments categorized as a significant unobservable input (Level 3). | |
Counterparty & Exchange Abbreviations: | ||
| ANZ | Australia and New Zealand Banking Group | |
| BNP | BNP Paribas | |
| BOA | Bank of America | |
| BRC | Barclays | |
| BSC | Banco Santander Central Hispano | |
| CIT | Citigroup | |
| CME | Chicago Mercantile Exchange | |
| CSF | Credit Suisse | |
| DUB | Deutsche Bank | |
| EUX | Eurex Exchange | |
| GSC | Goldman Sachs | |
| HSB | HSBC | |
| ICE | Intercontinental Exchange Inc | |
| JPM | JPMorgan Chase | |
| LCH | London Clearing House | |
| MER | Merrill Lynch | |
| MSC | Morgan Stanley | |
| RBS | Royal Bank of Scotland | |
| SCB | Standard Chartered Bank | |
| SGN | Societe Generale | |
| UBS | UBS | |
Currency Abbreviations: | ||
| ARS | Argentine Peso | |
| AUD | Australian Dollar | |
| BRL | Brazilian Real | |
| CAD | Canadian Dollar | |
| CHF | Swiss Franc | |
| CLP | Chilean Peso | |
| CNH | Renminbi Offshore (Hong Kong) | |
| CNY | Chinese Renminbi | |
| COP | Colombian Peso | |
| CZK | Czech Koruna | |
| EGP | Egyptian Pound | |
| EUR | Euro | |
| GBP | British Pound | |
| HUF | Hungarian Forint | |
| IDR | Indonesian Rupiah | |
| ILS | Israeli Shekel | |
| INR | Indian Rupee | |
| JPY | Japanese Yen | |
| KRW | Korean Won | |
| MXN | Mexican Peso | |
| MYR | Malaysian Ringgit | |
| NZD | New Zealand Dollar | |
| PEN | Peruvian Nuevo Sol | |
| PHP | Philippine Peso | |
| PLN | Polish Zloty | |
| RON | Romanian Leu | |
| RUB | Russian Ruble | |
| SGD | Singapore Dollar | |
| THB | Thai Baht | |
| TRY | Turkish Lira | |
| TWD | Taiwan Dollar | |
| UAH | Ukrainian Hryvnia | |
| USD | United States Dollar | |
| UYU | Uruguayan Peso | |
| ZAR | South African Rand | |
Payment Frequency Abbreviations: | ||
| A | Annual | |
| L | Lunar | |
| Q | Quarterly | |
| S | Semiannual | |
| Z | At Maturity | |
Reference Rate Abbreviations: | ||
| ARS Deposit | Argentina Deposit Rate | |
| ARS Reference | Argentina Reference Rate | |
| AUD Bank Bill | Australian Dollar Bank Bill Rate | |
| LIBOR | London Interbank Offered Rate | |
| SOFR | Secured Overnight Financing Rate | |
| SONIA | Sterling Overnight Interbank Average Rate | |
| US FED | United States Federal Reserve Bank Rate | |
| US PRIME | United States Prime Rate | |
| UST | United States Treasury Rate | |
Other Abbreviations: | ||
| ADR | American Depositary Receipt | |
| CDI | Chess Depositary Interests | |
| GDR | Global Depositary Receipt | |
| IO | Interest Only | |
| NVDR | Non-Voting Depositary Receipt | |
| PIK | Payment In Kind | |
| REIT | Real Estate Investment Trust | |
| See Notes to Financial Statements |
B-76
Table of Contents
PACIFIC FUNDS
Schedule of Investments (Continued)
Explanation of Symbols and Terms (Continued)
March 31, 2020
Notes:
For debt investments, the interest rates disclosed in the Schedules of Investments reflect the stated coupon rate or for discounted investments or zero coupon bonds, the yield-to-maturity.
The countries listed in the Schedules of Investments are based on country of risk.
The sectors listed in the Schedules of Investments are obtained from a third party source (that is not affiliated with the Trust or the investment adviser) believed to be reliable. Sector names and weightings could be different if obtained from another source.
The credit spreads, if any, shown in the Schedules of Investments were obtained from published reports or other sources believed to be reliable, and are not audited by the Independent Registered Public Accounting Firm.
| See Notes to Financial Statements |
B-77
Table of Contents
STATEMENTS OF ASSETS AND LIABILITIES
MARCH 31, 2020
| PF Inflation Managed Fund | PF Managed Bond Fund | PF Short Duration Bond Fund | PF Emerging Markets Debt Fund | PF Developing Growth Fund | ||||||||||||||||||||||
ASSETS | ||||||||||||||||||||||||||
Investments, at value (excluding derivatives) | $30,158,883 | $581,008,613 | $121,553,099 | $85,985,418 | $17,727,922 | |||||||||||||||||||||
Outstanding purchased options, at value | 76,919 | 189,801 | — | — | — | |||||||||||||||||||||
Cash | — | 2,043,321 | — | 3,505,386 | — | |||||||||||||||||||||
Cash (segregated for derivative instruments) | 334,000 | 3,215,466 | 185,300 | 850,000 | — | |||||||||||||||||||||
Foreign currency held, at value | 29,064 | 2,946,130 | 3,491 | 483,845 | — | |||||||||||||||||||||
Receivables: | ||||||||||||||||||||||||||
Dividends and interest | 64,801 | 2,988,373 | 671,855 | 1,562,773 | 1,542 | |||||||||||||||||||||
Fund shares sold | 1,242 | 50,568 | 14,909 | 9,940 | 1,243 | |||||||||||||||||||||
Securities sold | 25,633,639 | 381,252,018 | 1,614,559 | — | 386,885 | |||||||||||||||||||||
Variation margin on swap agreements | 55,382 | 1,626,991 | — | 120,202 | — | |||||||||||||||||||||
Swap agreements | 1,856 | — | — | — | — | |||||||||||||||||||||
Due from adviser | 10,918 | 43,932 | 17,698 | 19,225 | 8,003 | |||||||||||||||||||||
Forward foreign currency contracts appreciation | 184,236 | 2,924,235 | — | 469,412 | — | |||||||||||||||||||||
Swap premiums paid | — | 4,266 | — | — | — | |||||||||||||||||||||
Swap agreements appreciation | — | 55,216 | — | — | — | |||||||||||||||||||||
Prepaid expenses and other assets | 293 | 3,922 | 1,391 | 501 | 105 | |||||||||||||||||||||
Total Assets | 56,551,233 | 978,352,852 | 124,062,302 | 93,006,702 | 18,125,700 | |||||||||||||||||||||
LIABILITIES | ||||||||||||||||||||||||||
Payables: | ||||||||||||||||||||||||||
Fund shares redeemed | 3,781 | 74,067 | 21,754 | 21,363 | 4,681 | |||||||||||||||||||||
Securities purchased | 23,734,492 | 503,126,097 | 1,626,330 | 4,052,959 | 405,685 | |||||||||||||||||||||
Securities sold short, at value | — | 9,829,190 | — | — | — | |||||||||||||||||||||
Sale-buyback financing transactions | 11,585,269 | 64,666,795 | — | — | — | |||||||||||||||||||||
Reverse repurchase agreement | — | 6,180,500 | — | — | — | |||||||||||||||||||||
Swap agreements | — | 143,285 | — | 17,628 | — | |||||||||||||||||||||
Variation margin on futures contracts | 5,651 | 345,183 | 750 | — | — | |||||||||||||||||||||
Variation margin on swap agreements | — | — | 4,269 | — | — | |||||||||||||||||||||
Due to brokers | — | 4,250,000 | — | — | — | |||||||||||||||||||||
Accrued advisory fees | 10,570 | 153,079 | 52,692 | 41,273 | 6,495 | |||||||||||||||||||||
Accrued administration fees | 3,964 | 57,404 | 19,760 | 8,093 | 1,624 | |||||||||||||||||||||
Accrued custodian fees and expenses | 2,743 | 21,592 | 3,889 | 14,492 | 134 | |||||||||||||||||||||
Accrued legal, audit and tax service fees | 5,497 | 21,624 | 10,050 | 8,031 | 5,094 | |||||||||||||||||||||
Accrued trustees’ fees and expenses and deferred compensation | 2,775 | 14,701 | 2,151 | 21 | 2,258 | |||||||||||||||||||||
Accrued foreign capital gains tax | — | — | — | 1,194 | — | |||||||||||||||||||||
Accrued other | 18,823 | 113,876 | 40,549 | 23,077 | 8,923 | |||||||||||||||||||||
Forward foreign currency contracts depreciation | 141,109 | 1,987,313 | — | 1,195,904 | — | |||||||||||||||||||||
Outstanding options written, at value | 86,421 | 447,852 | — | — | — | |||||||||||||||||||||
Swap premiums received | — | 69,273 | — | — | — | |||||||||||||||||||||
Swap agreements depreciation | — | 16,721 | — | — | — | |||||||||||||||||||||
Unfunded loan commitment depreciation | — | 1,302 | — | — | — | |||||||||||||||||||||
Total Liabilities | 35,601,095 | 591,519,854 | 1,782,194 | 5,384,035 | 434,894 | |||||||||||||||||||||
NET ASSETS | $20,950,138 | $386,832,998 | $122,280,108 | $87,622,667 | $17,690,806 | |||||||||||||||||||||
NET ASSETS CONSIST OF: | ||||||||||||||||||||||||||
Paid-in capital | $29,632,003 | $378,354,953 | $126,631,669 | $108,626,232 | $15,957,728 | |||||||||||||||||||||
Undistributed/accumulated earnings (deficit) | (8,681,865 | ) | 8,478,045 | (4,351,561 | ) | (21,003,565 | ) | 1,733,078 | ||||||||||||||||||
NET ASSETS | $20,950,138 | $386,832,998 | $122,280,108 | $87,622,667 | $17,690,806 | |||||||||||||||||||||
Class P Shares: | ||||||||||||||||||||||||||
Shares of beneficial interest outstanding | 2,296,035 | 35,083,009 | 12,513,744 | 12,207,778 | 1,246,552 | |||||||||||||||||||||
Net Asset Value Per Share | $9.12 | $11.03 | $9.77 | $7.18 | $14.19 | |||||||||||||||||||||
Investments, at cost (excluding derivatives) | $29,673,065 | $577,641,089 | $125,130,799 | $98,139,694 | $15,921,015 | |||||||||||||||||||||
Outstanding purchased options, at cost | 22,544 | 174,902 | — | — | — | |||||||||||||||||||||
Foreign currency held, at cost | 30,224 | 2,929,451 | 3,529 | 492,764 | — | |||||||||||||||||||||
Proceeds from securities sold short | — | 9,749,238 | — | — | — | |||||||||||||||||||||
Premiums received from outstanding options written | 59,077 | 353,025 | — | — | — | |||||||||||||||||||||
See Notes to Financial Statements
C-1
Table of Contents
PACIFIC FUNDS
STATEMENTS OF ASSETS AND LIABILITIES (Continued)
MARCH 31, 2020
| PF Growth Fund | PF Large-Cap Value Fund | PF Mid-Cap Equity Fund | PF Multi-Asset Fund | PF Small-Cap Value Fund | ||||||||||||||||||||||
ASSETS | ||||||||||||||||||||||||||
Investments, at value (excluding derivatives) | $164,392,188 | $160,196,701 | $7,824,935 | $994,988,134 | $28,120,262 | |||||||||||||||||||||
Cash | — | — | — | — | 6,338 | |||||||||||||||||||||
Receivables: | ||||||||||||||||||||||||||
Dividends and interest | 36,966 | 314,826 | 7,906 | 4,724,075 | 38,294 | |||||||||||||||||||||
Fund shares sold | 17,270 | 18,885 | — | 90,699 | 2,485 | |||||||||||||||||||||
Securities sold | 1,270,771 | — | — | 6,851,484 | 78,785 | |||||||||||||||||||||
Due from adviser | 13,583 | 13,211 | 5,002 | 52,823 | 5,723 | |||||||||||||||||||||
Swap agreements appreciation | — | — | — | 12,706,953 | — | |||||||||||||||||||||
Prepaid expenses and other assets | 1,590 | 1,451 | 89 | 9,022 | 510 | |||||||||||||||||||||
Total Assets | 165,732,368 | 160,545,074 | 7,837,932 | 1,019,423,190 | 28,252,397 | |||||||||||||||||||||
LIABILITIES | ||||||||||||||||||||||||||
Payables: | ||||||||||||||||||||||||||
Fund shares redeemed | 36,357 | 35,345 | — | 219,718 | 6,757 | |||||||||||||||||||||
Securities purchased | 1,976,159 | — | — | 13,241,591 | 178,078 | |||||||||||||||||||||
Variation margin on futures contracts | — | — | — | 152,730 | — | |||||||||||||||||||||
Accrued advisory fees | 78,041 | 80,488 | 4,630 | 259,375 | 24,836 | |||||||||||||||||||||
Accrued administration fees | 21,284 | 18,574 | 1,068 | 111,161 | 4,967 | |||||||||||||||||||||
Accrued custodian fees and expenses | 2,272 | 2,028 | 114 | 14,411 | 647 | |||||||||||||||||||||
Accrued legal, audit and tax service fees | 10,996 | 10,791 | 4,740 | 39,788 | 5,737 | |||||||||||||||||||||
Accrued trustees’ fees and expenses and deferred compensation | 3,788 | 8,055 | 1,303 | 285 | 1,145 | |||||||||||||||||||||
Accrued other (1) | 28,552 | 24,778 | 8,031 | 144,564 | 14,485 | |||||||||||||||||||||
Swap agreements depreciation | — | — | — | 120,323,362 | — | |||||||||||||||||||||
Total Liabilities | 2,157,449 | 180,059 | 19,886 | 134,506,985 | 236,652 | |||||||||||||||||||||
NET ASSETS | $163,574,919 | $160,365,015 | $7,818,046 | $884,916,205 | $28,015,745 | |||||||||||||||||||||
NET ASSETS CONSIST OF: | ||||||||||||||||||||||||||
Paid-in capital | $79,209,309 | $113,372,667 | $9,504,440 | $1,016,160,541 | $44,427,539 | |||||||||||||||||||||
Undistributed/accumulated earnings (deficit) | 84,365,610 | 46,992,348 | (1,686,394 | ) | (131,244,336 | ) | (16,411,794 | ) | ||||||||||||||||||
NET ASSETS | $163,574,919 | $160,365,015 | $7,818,046 | $884,916,205 | $28,015,745 | |||||||||||||||||||||
Class P Shares: | ||||||||||||||||||||||||||
Shares of beneficial interest outstanding | 6,036,864 | 16,596,656 | 884,919 | 107,547,682 | 5,414,146 | |||||||||||||||||||||
Net Asset Value Per Share | $27.10 | $9.66 | $8.83 | $8.23 | $5.17 | |||||||||||||||||||||
Investments, at cost (excluding derivatives) | $86,248,893 | $117,949,921 | $8,744,619 | $1,000,480,627 | $35,909,763 | |||||||||||||||||||||
| (1) | Accrued other for the PF Large-Cap Value Fund includes $12,130 of accrued accounting fees. Accrued other for the PF Mid-Cap Equity Fund includes $6,586 of accrued accounting fees. |
See Notes to Financial Statements
C-2
Table of Contents
PACIFIC FUNDS
STATEMENTS OF ASSETS AND LIABILITIES (Continued)
MARCH 31, 2020
| PF Emerging Markets Fund | PF International Large-Cap Fund | PF International Small-Cap Fund | PF International Value Fund | PF Real Estate Fund | ||||||||||||||||||||||
ASSETS | ||||||||||||||||||||||||||
Investments, at value (excluding derivatives) | $97,265,775 | $41,435,404 | $26,742,289 | $34,474,497 | $43,504,069 | |||||||||||||||||||||
Cash | — | 3,150 | — | — | 3,787 | |||||||||||||||||||||
Foreign currency held, at value | 1,313,730 | 7,054 | 52,365 | 100,730 | — | |||||||||||||||||||||
Receivables: | ||||||||||||||||||||||||||
Dividends and interest | 97,704 | 486,992 | 224,231 | 466,087 | 183,253 | |||||||||||||||||||||
Fund shares sold | 9,940 | 3,355 | 2,485 | 2,733 | 3,727 | |||||||||||||||||||||
Securities sold | 163,866 | 108,684 | 19,324 | 275,684 | 134,274 | |||||||||||||||||||||
Due from adviser | 40,200 | 24,371 | 15,311 | 30,514 | 7,936 | |||||||||||||||||||||
Accrued foreign capital gain tax | — | 752 | — | 95 | — | |||||||||||||||||||||
Prepaid expenses and other assets | 695 | 370 | 156 | 413 | 732 | |||||||||||||||||||||
Total Assets | 98,891,910 | 42,070,132 | 27,056,161 | 35,350,753 | 43,837,778 | |||||||||||||||||||||
LIABILITIES | ||||||||||||||||||||||||||
Payables: | ||||||||||||||||||||||||||
Fund shares redeemed | 26,132 | 11,938 | 6,747 | 9,779 | 11,188 | |||||||||||||||||||||
Securities purchased | 1,081,413 | 154,899 | 18,614 | 289,736 | 219,525 | |||||||||||||||||||||
Variation margin on futures contracts | 160 | — | — | — | — | |||||||||||||||||||||
Accrued advisory fees | 52,596 | 27,218 | 12,682 | 19,293 | 42,657 | |||||||||||||||||||||
Accrued administration fees | 9,862 | 4,803 | 2,238 | 4,452 | 8,532 | |||||||||||||||||||||
Accrued custodian fees and expenses | 50,355 | 18,185 | 6,838 | 13,213 | 1,998 | |||||||||||||||||||||
Accrued legal, audit and tax service fees | 8,411 | 6,134 | 5,528 | 5,950 | 6,240 | |||||||||||||||||||||
Accrued trustees’ fees and expenses and deferred compensation | 1,522 | 4,069 | 16 | 5,182 | 592 | |||||||||||||||||||||
Accrued foreign capital gains tax | 5,982 | — | — | — | — | |||||||||||||||||||||
Accrued other (1) | 37,665 | 24,773 | 21,886 | 32,575 | 15,094 | |||||||||||||||||||||
| Total Liabilities | 1,274,098 | 252,019 | 74,549 | 380,180 | 305,826 | ||||||||||||||||||||
| NET ASSETS | $97,617,812 | $41,818,113 | $26,981,612 | $34,970,573 | $43,531,952 | ||||||||||||||||||||
NET ASSETS CONSIST OF: | ||||||||||||||||||||||||||
Paid-in capital | $80,049,117 | $28,226,826 | $34,806,064 | $51,587,736 | $50,421,377 | |||||||||||||||||||||
Undistributed/accumulated earnings (deficit) | 17,568,695 | 13,591,287 | (7,824,452 | ) | (16,617,163 | ) | (6,889,425 | ) | ||||||||||||||||||
NET ASSETS | $97,617,812 | $41,818,113 | $26,981,612 | $34,970,573 | $43,531,952 | |||||||||||||||||||||
Class P Shares: | ||||||||||||||||||||||||||
Shares of beneficial interest outstanding | 9,960,877 | 4,622,711 | 3,867,388 | 6,808,740 | 4,226,615 | |||||||||||||||||||||
Net Asset Value Per Share | $9.80 | $9.05 | $6.98 | $5.14 | $10.30 | |||||||||||||||||||||
Investments, at cost (excluding derivatives) | $79,828,690 | $27,868,110 | $27,881,340 | $48,131,336 | $40,196,349 | |||||||||||||||||||||
Foreign currency held, at cost | 1,317,145 | 7,050 | 51,589 | 100,703 | — | |||||||||||||||||||||
| (1) | Accrued other for the PF International Small-Cap Fund includes $16,878 of accrued accounting fees. |
See Notes to Financial Statements
C-3
Table of Contents
STATEMENTS OF OPERATIONS
FOR THE YEAR ENDED MARCH 31, 2020
| PF Inflation Managed Fund | PF Managed Bond Fund | PF Short Duration Bond Fund | PF Emerging Markets Debt Fund | PF Developing Growth Fund | ||||||||||||||||||||||
INVESTMENT INCOME | ||||||||||||||||||||||||||
Dividends, net of foreign taxes withheld | $5,900 | $84,221 | $26,919 | $35,413 | $21,576 | |||||||||||||||||||||
Interest, net of foreign taxes withheld | 1,426,978 | 17,959,425 | 4,750,807 | 4,198,710 | — | |||||||||||||||||||||
Total Investment Income | 1,432,878 | 18,043,646 | 4,777,726 | 4,234,123 | 21,576 | |||||||||||||||||||||
EXPENSES | ||||||||||||||||||||||||||
Advisory fees | 149,064 | 1,974,107 | 652,586 | 507,386 | 86,009 | |||||||||||||||||||||
Administration fees | 55,899 | 740,290 | 244,720 | 96,953 | 21,502 | |||||||||||||||||||||
Support services expenses | 4,865 | 62,505 | 19,613 | 8,437 | 1,924 | |||||||||||||||||||||
Custodian fees and expenses | 8,251 | 44,511 | 8,920 | 41,111 | 413 | |||||||||||||||||||||
Portfolio accounting fees | 31,655 | 182,517 | 67,706 | 41,004 | 19,234 | |||||||||||||||||||||
Shareholder report expenses | 4,292 | 57,103 | 19,426 | 7,683 | 1,747 | |||||||||||||||||||||
Transfer agencyout-of-pocket expenses | 1,981 | 26,006 | 8,118 | 3,472 | 803 | |||||||||||||||||||||
Registration fees | 16 | 115 | 43 | 20 | 3 | |||||||||||||||||||||
Legal, audit and tax service fees | 7,791 | 57,430 | 21,321 | 15,382 | 6,451 | |||||||||||||||||||||
Trustees’ fees and expenses | 1,915 | 23,467 | 7,624 | 3,128 | 656 | |||||||||||||||||||||
Interest expense | 198,395 | 868,437 | — | — | — | |||||||||||||||||||||
Other | 880 | 19,049 | 3,714 | 13,141 | 457 | |||||||||||||||||||||
Total Expenses | 465,004 | 4,055,537 | 1,053,791 | 737,717 | 139,199 | |||||||||||||||||||||
Advisory Fee Waiver | — | — | — | (12,927 | ) | — | ||||||||||||||||||||
Adviser Expense Reimbursement | (61,646 | ) | (472,703 | ) | (156,485 | ) | (133,378 | ) | (31,688 | ) | ||||||||||||||||
Net Expenses | 403,358 | 3,582,834 | 897,306 | 591,412 | 107,511 | |||||||||||||||||||||
NET INVESTMENT INCOME (LOSS) | 1,029,520 | 14,460,812 | 3,880,420 | 3,642,711 | (85,935 | ) | ||||||||||||||||||||
NET REALIZED AND UNREALIZED GAIN (LOSS) | ||||||||||||||||||||||||||
Net Realized Gain (Loss) On: | ||||||||||||||||||||||||||
Investment security transactions, net of foreign capital gains tax withheld | 834,691 | 14,046,482 | 794,403 | 944,246 | 1,474,942 | |||||||||||||||||||||
Closed short positions | — | (360,329 | ) | — | — | — | ||||||||||||||||||||
Foreign currency transactions | (106,768 | ) | (404,737 | ) | (52 | ) | (877,294 | ) | — | |||||||||||||||||
Forward foreign currency contract transactions | 326,378 | 1,118,001 | 1,839 | (632,799 | ) | — | ||||||||||||||||||||
Futures contract transactions | (661,406 | ) | 4,119,982 | 92,477 | — | — | ||||||||||||||||||||
Purchased option transactions | 189,266 | (852,304 | ) | — | — | — | ||||||||||||||||||||
Swap transactions | 25,162 | (1,805,786 | ) | 239 | (23,817 | ) | — | |||||||||||||||||||
Written option transactions | (130,095 | ) | 1,395,370 | — | — | — | ||||||||||||||||||||
Net Realized Gain (Loss) | 477,228 | 17,256,679 | 888,906 | (589,664 | ) | 1,474,942 | ||||||||||||||||||||
Change In Net Unrealized Appreciation (Depreciation) On: | ||||||||||||||||||||||||||
Investment securities, net of deferred foreign capital gains tax | 10,744 | (1,947,159 | ) | (4,205,163 | ) | (11,224,475 | ) | (2,141,858 | ) | |||||||||||||||||
Short positions | — | (79,952 | ) | — | — | — | ||||||||||||||||||||
Foreign currencies | (6,301 | ) | 114,070 | (8 | ) | (24,903 | ) | — | ||||||||||||||||||
Forward foreign currency contracts | (2,294 | ) | (209,741 | ) | (1,839 | ) | (668,078 | ) | — | |||||||||||||||||
Futures contracts | 12,470 | 3,497,824 | 321,512 | — | — | |||||||||||||||||||||
Purchased options | 32,592 | 47,793 | — | — | — | |||||||||||||||||||||
Swaps | 36,836 | (2,984,316 | ) | 3,540 | 39,792 | — | ||||||||||||||||||||
Written options | (46,194 | ) | (70,478 | ) | — | — | — | |||||||||||||||||||
Unfunded loan commitments | — | (1,302 | ) | — | — | — | ||||||||||||||||||||
Change in Net Unrealized Appreciation (Depreciation) | 37,853 | (1,633,261 | ) | (3,881,958 | ) | (11,877,664 | ) | (2,141,858 | ) | |||||||||||||||||
NET GAIN (LOSS) | 515,081 | 15,623,418 | (2,993,052 | ) | (12,467,328 | ) | (666,916 | ) | ||||||||||||||||||
NET INCREASE (DECREASE) IN NET ASSETS | $1,544,601 | $30,084,230 | $887,368 | ($8,824,617 | ) | ($752,851 | ) | |||||||||||||||||||
Foreign taxes withheld on dividends and interest | $— | $9,289 | $472 | $61,887 | $— | |||||||||||||||||||||
Foreign capital gains tax withheld | — | — | — | 21,942 | — | |||||||||||||||||||||
Change in deferred foreign capital gains tax | — | — | — | (1,049 | ) | — | ||||||||||||||||||||
See Notes to Financial Statements
C-4
Table of Contents
PACIFIC FUNDS
STATEMENTS OF OPERATIONS (Continued)
FOR THE YEAR ENDED MARCH 31, 2020
| PF Growth Fund | PF Large-Cap Value Fund | PF Mid-Cap Equity Fund | PF Multi-Asset Fund | PF Small-Cap Value Fund | ||||||||||||||||||||||
INVESTMENT INCOME | ||||||||||||||||||||||||||
Dividends, net of foreign taxes withheld | $1,194,906 | $4,068,547 | $147,309 | $184,717 | $901,771 | |||||||||||||||||||||
Interest, net of foreign taxes withheld | 2,516 | — | — | 28,933,664 | — | |||||||||||||||||||||
Total Investment Income | 1,197,422 | 4,068,547 | 147,309 | 29,118,381 | 901,771 | |||||||||||||||||||||
EXPENSES | ||||||||||||||||||||||||||
Advisory fees | 1,028,088 | 1,106,095 | 66,719 | 3,805,260 | 474,512 | |||||||||||||||||||||
Administration fees | 280,388 | 255,253 | 15,397 | 1,630,825 | 94,903 | |||||||||||||||||||||
Support services expenses | 22,496 | 20,879 | 1,238 | 137,013 | 8,433 | |||||||||||||||||||||
Custodian fees and expenses | 5,233 | 4,475 | — | 34,884 | 1,693 | |||||||||||||||||||||
Portfolio accounting fees | 32,939 | 28,544 | 9,973 | 142,256 | 23,918 | |||||||||||||||||||||
Shareholder report expenses | 21,550 | 19,575 | 1,177 | 126,813 | 7,583 | |||||||||||||||||||||
Transfer agencyout-of-pocket expenses | 9,379 | 8,649 | 516 | 56,903 | 3,505 | |||||||||||||||||||||
Registration fees | 37 | 44 | 2 | 264 | 16 | |||||||||||||||||||||
Legal, audit and tax service fees | 24,518 | 23,698 | 5,401 | 114,543 | 8,929 | |||||||||||||||||||||
Trustees’ fees and expenses | 8,587 | 7,961 | 488 | 52,151 | 3,355 | |||||||||||||||||||||
Other | 11,510 | 11,287 | 6,421 | 32,745 | 3,113 | |||||||||||||||||||||
Total Expenses | 1,444,725 | 1,486,460 | 107,332 | 6,133,657 | 629,960 | |||||||||||||||||||||
Adviser Expense Reimbursement | (136,249 | ) | (125,113 | ) | (25,216 | ) | (588,849 | ) | (60,545 | ) | ||||||||||||||||
Net Expenses | 1,308,476 | 1,361,347 | 82,116 | 5,544,808 | 569,415 | |||||||||||||||||||||
NET INVESTMENT INCOME (LOSS) | (111,054 | ) | 2,707,200 | 65,193 | 23,573,573 | 332,356 | ||||||||||||||||||||
NET REALIZED AND UNREALIZED GAIN (LOSS) | ||||||||||||||||||||||||||
Net Realized Gain (Loss) On: | ||||||||||||||||||||||||||
Investment security transactions, net of foreign capital gains tax withheld | 10,518,544 | 10,208,535 | (703,474 | ) | 2,465,359 | (4,231,585 | ) | |||||||||||||||||||
Foreign currency transactions | (373 | ) | — | — | — | — | ||||||||||||||||||||
Futures contract transactions | — | — | — | 13,542,264 | — | |||||||||||||||||||||
Swap transactions | — | — | — | (37,586,652 | ) | — | ||||||||||||||||||||
Net Realized Gain (Loss) | 10,518,171 | 10,208,535 | (703,474 | ) | (21,579,029 | ) | (4,231,585 | ) | ||||||||||||||||||
Change In Net Unrealized Appreciation (Depreciation) On: | ||||||||||||||||||||||||||
Investment securities, net of deferred foreign capital gains tax | (2,937,337 | ) | (29,003,736 | ) | (1,472,751 | ) | (10,652,135 | ) | (14,927,697 | ) | ||||||||||||||||
Foreign currencies | 51 | — | (8 | ) | — | — | ||||||||||||||||||||
Futures contracts | — | — | — | 1,377,300 | — | |||||||||||||||||||||
Swaps | — | — | — | (103,071,576 | ) | — | ||||||||||||||||||||
Change in Net Unrealized Appreciation (Depreciation) | (2,937,286 | ) | (29,003,736 | ) | (1,472,759 | ) | (112,346,411 | ) | (14,927,697 | ) | ||||||||||||||||
NET GAIN (LOSS) | 7,580,885 | (18,795,201 | ) | (2,176,233 | ) | (133,925,440 | ) | (19,159,282 | ) | |||||||||||||||||
NET INCREASE (DECREASE) IN NET ASSETS | $7,469,831 | ($16,088,001 | ) | ($2,111,040 | ) | ($110,351,867 | ) | ($18,826,926 | ) | |||||||||||||||||
Foreign taxes withheld on dividends and interest | $3,742 | $73,251 | $211 | $— | $6,239 | |||||||||||||||||||||
See Notes to Financial Statements
C-5
Table of Contents
PACIFIC FUNDS
STATEMENTS OF OPERATIONS (Continued)
FOR THE YEAR ENDED MARCH 31, 2020
| PF Emerging Markets Fund | PF International Large-Cap Fund | PF International Small-Cap Fund | PF International Value Fund | PF Real Estate Fund | ||||||||||||||||||||||
INVESTMENT INCOME | ||||||||||||||||||||||||||
Dividends, net of foreign taxes withheld | $1,696,415 | $1,248,876 | $788,378 | $2,253,975 | $1,966,092 | |||||||||||||||||||||
Interest, net of foreign taxes withheld | — | 402 | — | — | — | |||||||||||||||||||||
Total Investment Income | 1,696,415 | 1,249,278 | 788,378 | 2,253,975 | 1,966,092 | |||||||||||||||||||||
EXPENSES | ||||||||||||||||||||||||||
Advisory fees | 733,737 | 431,883 | 205,360 | 355,562 | 749,790 | |||||||||||||||||||||
Administration fees | 137,576 | 76,214 | 36,240 | 82,053 | 124,965 | |||||||||||||||||||||
Support services expenses | 12,273 | 7,065 | 3,703 | 7,770 | 9,818 | |||||||||||||||||||||
Custodian fees and expenses | 148,659 | 67,879 | 36,529 | 61,207 | 5,638 | |||||||||||||||||||||
Portfolio accounting fees | 35,265 | 29,795 | 40,104 | 35,748 | 20,846 | |||||||||||||||||||||
Shareholder report expenses | 11,168 | 6,188 | 2,812 | 6,745 | 9,824 | |||||||||||||||||||||
Transfer agency out-of-pocket expenses | 5,016 | 2,939 | 1,471 | 3,217 | 4,121 | |||||||||||||||||||||
Registration fees | 32 | 13 | 18 | 16 | 12 | |||||||||||||||||||||
Legal, audit and tax service fees | 16,652 | 9,843 | 7,728 | 9,438 | 10,429 | |||||||||||||||||||||
Trustees’ fees and expenses | 4,372 | 2,581 | 1,218 | 2,942 | 3,997 | |||||||||||||||||||||
Other | 75,762 | 36,885 | 10,033 | 43,071 | 4,828 | |||||||||||||||||||||
Total Expenses | 1,180,512 | 671,285 | 345,216 | 607,769 | 944,268 | |||||||||||||||||||||
Advisory Fee Waiver | — | — | — | — | (124,965 | ) | ||||||||||||||||||||
Adviser Expense Reimbursement | (309,200 | ) | (163,188 | ) | (79,456 | ) | (170,154 | ) | (69,513 | ) | ||||||||||||||||
Net Expenses | 871,312 | 508,097 | 265,760 | 437,615 | 749,790 | |||||||||||||||||||||
NET INVESTMENT INCOME (LOSS) | 825,103 | 741,181 | 522,618 | 1,816,360 | 1,216,302 | |||||||||||||||||||||
NET REALIZED AND UNREALIZED GAIN (LOSS) | ||||||||||||||||||||||||||
Net Realized Gain (Loss) On: | ||||||||||||||||||||||||||
Investment security transactions, net of foreign capital gains tax withheld | 18,993,950 | 2,090,703 | (48,844 | ) | (955,767 | ) | (8,571,709 | ) | ||||||||||||||||||
Foreign currency transactions | (102,336 | ) | (13,158 | ) | (4,838 | ) | (8,674 | ) | — | |||||||||||||||||
Futures contract transactions | (432,810 | ) | — | — | — | — | ||||||||||||||||||||
Net Realized Gain (Loss) | 18,458,804 | 2,077,545 | (53,682 | ) | (964,441 | ) | (8,571,709 | ) | ||||||||||||||||||
Change In Net Unrealized Appreciation (Depreciation) On: | ||||||||||||||||||||||||||
Investment securities, net of deferred foreign capital gains tax | (27,975,772 | ) | (4,338,840 | ) | (2,497,830 | ) | (13,413,488 | ) | (8,199,240 | ) | ||||||||||||||||
Foreign currencies | 13,976 | 11,426 | 871 | 306 | — | |||||||||||||||||||||
Change in Net Unrealized Appreciation (Depreciation) | (27,961,796 | ) | (4,327,414 | ) | (2,496,959 | ) | (13,413,182 | ) | (8,199,240 | ) | ||||||||||||||||
NET GAIN (LOSS) | (9,502,992 | ) | (2,249,869 | ) | (2,550,641 | ) | (14,377,623 | ) | (16,770,949 | ) | ||||||||||||||||
NET INCREASE (DECREASE) IN NET ASSETS | ($8,677,889 | ) | ($1,508,688 | ) | ($2,028,023 | ) | ($12,561,263 | ) | ($15,554,647 | ) | ||||||||||||||||
Foreign taxes withheld on dividends and interest | $189,957 | $182,466 | $109,373 | $249,111 | $— | |||||||||||||||||||||
Foreign capital gains tax withheld | 79,851 | 55,949 | — | — | — | |||||||||||||||||||||
Change in deferred foreign capital gains tax | (234,060 | ) | (127,657 | ) | — | (739 | ) | — | ||||||||||||||||||
See Notes to Financial Statements
C-6
Table of Contents
STATEMENTS OF CHANGES IN NET ASSETS
| Year Ended March 31, 2020 | Year Ended March 31, 2019 | Year Ended March 31, 2020 | Year Ended March 31, 2019 | Year Ended March 31, 2020 | Year Ended March 31, 2019 | |||||||||||||||||||||||||||||||||
| PF Inflation Managed Fund | PF Managed Bond Fund | PF Short Duration Bond Fund | ||||||||||||||||||||||||||||||||||||
OPERATIONS | ||||||||||||||||||||||||||||||||||||||
Net investment income (loss) | $1,029,520 | $1,247,551 | $14,460,812 | $15,817,298 | $3,880,420 | $3,249,065 | ||||||||||||||||||||||||||||||||
Net realized gain (loss) | 477,228 | (495,056 | ) | 17,256,679 | (9,185,832 | ) | 888,906 | 364,899 | ||||||||||||||||||||||||||||||
Change in net unrealized appreciation (depreciation) | 37,853 | 488,741 | (1,633,261 | ) | 7,631,064 | (3,881,958 | ) | 1,401,355 | ||||||||||||||||||||||||||||||
Net Increase (Decrease) in Net Assets | 1,544,601 | 1,241,236 | 30,084,230 | 14,262,530 | 887,368 | 5,015,319 | ||||||||||||||||||||||||||||||||
DIVIDENDS AND DISTRIBUTIONS TO SHAREHOLDERS |
| |||||||||||||||||||||||||||||||||||||
Total distributable earnings - Class P | (448,792 | ) | (2,002,797 | ) | (11,614,415 | ) | (15,588,848 | ) | (4,409,514 | ) | (2,654,646 | ) | ||||||||||||||||||||||||||
Net Decrease from Dividends and | (448,792 | ) | (2,002,797 | ) | (11,614,415 | ) | (15,588,848 | ) | (4,409,514 | ) | (2,654,646 | ) | ||||||||||||||||||||||||||
CAPITAL SHARE TRANSACTIONS | ||||||||||||||||||||||||||||||||||||||
Proceeds from sale of shares - Class P | 462,054 | 2,259,623 | 39,353,926 | 65,397,455 | 35,087,913 | 127,240,312 | ||||||||||||||||||||||||||||||||
Dividends and distribution reinvestments - Class P | 448,792 | 2,002,797 | 11,614,415 | 15,588,848 | 4,409,514 | 2,654,646 | ||||||||||||||||||||||||||||||||
Cost of shares repurchased - Class P | (22,005,907 | ) | (38,323,765 | ) | (179,963,820 | ) | (180,977,802 | ) | (69,052,801 | ) | (89,166,761 | ) | ||||||||||||||||||||||||||
Net Increase (Decrease) in Net Assets from | (21,095,061 | ) | (34,061,345 | ) | (128,995,479 | ) | (99,991,499 | ) | (29,555,374 | ) | 40,728,197 | |||||||||||||||||||||||||||
NET INCREASE (DECREASE) IN NET ASSETS | (19,999,252 | ) | (34,822,906 | ) | (110,525,664 | ) | (101,317,817 | ) | (33,077,520 | ) | 43,088,870 | |||||||||||||||||||||||||||
NET ASSETS | ||||||||||||||||||||||||||||||||||||||
Beginning of Year | 40,949,390 | 75,772,296 | 497,358,662 | 598,676,479 | 155,357,628 | 112,268,758 | ||||||||||||||||||||||||||||||||
End of Year | $20,950,138 | $40,949,390 | $386,832,998 | $497,358,662 | $122,280,108 | $155,357,628 | ||||||||||||||||||||||||||||||||
| PF Emerging Markets Debt Fund | PF Developing Growth Fund | |||||||||||||||||||||||||||||||||||||
OPERATIONS | ||||||||||||||||||||||||||||||||||||||
Net investment income (loss) | $3,642,711 | $4,389,534 | ($85,935 | ) | ($65,948 | ) | ||||||||||||||||||||||||||||||||
Net realized gain (loss) | (589,664 | ) | (3,589,948 | ) | 1,474,942 | 920,420 | ||||||||||||||||||||||||||||||||
Change in net unrealized appreciation (depreciation) | (11,877,664 | ) | (1,576,741 | ) | (2,141,858 | ) | 1,206,745 | |||||||||||||||||||||||||||||||
Net Increase (Decrease) in Net Assets | (8,824,617 | ) | (777,155 | ) | (752,851 | ) | 2,061,217 | |||||||||||||||||||||||||||||||
DIVIDENDS AND DISTRIBUTIONS TO SHAREHOLDERS |
| |||||||||||||||||||||||||||||||||||||
Total distributable earnings - Class P | (3,084,637 | ) | (1,235,277 | ) | (1,213,285 | ) | (95,677 | ) | ||||||||||||||||||||||||||||||
Net Decrease from Dividends and | (3,084,637 | ) | (1,235,277 | ) | (1,213,285 | ) | (95,677 | ) | ||||||||||||||||||||||||||||||
CAPITAL SHARE TRANSACTIONS | ||||||||||||||||||||||||||||||||||||||
Proceeds from sale of shares - Class P | 40,890,590 | 18,582,694 | 6,730,507 | 8,879,889 | ||||||||||||||||||||||||||||||||||
Dividends and distribution reinvestments - Class P | 3,084,637 | 1,235,277 | 1,213,285 | 95,677 | ||||||||||||||||||||||||||||||||||
Cost of shares repurchased - Class P | (16,042,032 | ) | (31,964,603 | ) | (3,973,844 | ) | (4,717,570 | ) | ||||||||||||||||||||||||||||||
Net Increase (Decrease) in Net Assets from | 27,933,195 | (12,146,632 | ) | 3,969,948 | 4,257,996 | |||||||||||||||||||||||||||||||||
NET INCREASE (DECREASE) IN NET ASSETS | 16,023,941 | (14,159,064 | ) | 2,003,812 | 6,223,536 | |||||||||||||||||||||||||||||||||
NET ASSETS | ||||||||||||||||||||||||||||||||||||||
Beginning of Year | 71,598,726 | 85,757,790 | 15,686,994 | 9,463,458 | ||||||||||||||||||||||||||||||||||
End of Year | $87,622,667 | $71,598,726 | $17,690,806 | $15,686,994 | ||||||||||||||||||||||||||||||||||
See Notes to Financial Statements
C-7
Table of Contents
PACIFIC FUNDS
STATEMENTS OF CHANGES IN NET ASSETS (Continued)
| Year Ended March 31, 2020 | Year Ended March 31, 2019 | Year Ended March 31, 2020 | Year Ended March 31, 2019 | Year Ended March 31, 2020 | Year Ended March 31, 2019 | |||||||||||||||||||||||||||||||||
| PF Growth Fund | PFLarge-Cap Value Fund | PF Mid-Cap | ||||||||||||||||||||||||||||||||||||
OPERATIONS | ||||||||||||||||||||||||||||||||||||||
Net investment income (loss) | ($111,054 | ) | $13,415 | $2,707,200 | $2,903,553 | $65,193 | $78,309 | |||||||||||||||||||||||||||||||
Net realized gain (loss) | 10,518,171 | 6,959,823 | 10,208,535 | 12,044,515 | (703,474 | ) | 9,353,760 | |||||||||||||||||||||||||||||||
Change in net unrealized appreciation (depreciation) | (2,937,286 | ) | 19,702,601 | (29,003,736 | ) | (6,152,759 | ) | (1,472,759 | ) | (7,615,837 | ) | |||||||||||||||||||||||||||
Net Increase (Decrease) in Net Assets | 7,469,831 | 26,675,839 | (16,088,001 | ) | 8,795,309 | (2,111,040 | ) | 1,816,232 | ||||||||||||||||||||||||||||||
DIVIDENDS AND DISTRIBUTIONS TO SHAREHOLDERS | ||||||||||||||||||||||||||||||||||||||
Total distributable earnings - Class P | (6,248,695 | ) | (10,767,593 | ) | (11,717,437 | ) | (65,461,743 | ) | (61,466 | ) | (19,252 | ) | ||||||||||||||||||||||||||
Net Decrease from Dividends and | (6,248,695 | ) | (10,767,593 | ) | (11,717,437 | ) | (65,461,743 | ) | (61,466 | ) | (19,252 | ) | ||||||||||||||||||||||||||
CAPITAL SHARE TRANSACTIONS | ||||||||||||||||||||||||||||||||||||||
Proceeds from sale of shares - Class P | 20,563,082 | 43,746,338 | 38,491,501 | 96,163,101 | — | 10,035,915 | ||||||||||||||||||||||||||||||||
Dividends and distribution reinvestments - Class P | 6,248,695 | 10,767,593 | 11,717,437 | 65,461,743 | 61,466 | 19,252 | ||||||||||||||||||||||||||||||||
Cost of shares repurchased - Class P | (50,788,891 | ) | (90,823,136 | ) | (33,084,403 | ) | (88,855,637 | ) | — | (33,232,671 | ) | |||||||||||||||||||||||||||
Net Increase (Decrease) in Net Assets from | (23,977,114 | ) | (36,309,205 | ) | 17,124,535 | 72,769,207 | 61,466 | (23,177,504 | ) | |||||||||||||||||||||||||||||
NET INCREASE (DECREASE) IN NET ASSETS | (22,755,978 | ) | (20,400,959 | ) | (10,680,903 | ) | 16,102,773 | (2,111,040 | ) | (21,380,524 | ) | |||||||||||||||||||||||||||
NET ASSETS | ||||||||||||||||||||||||||||||||||||||
Beginning of Year | 186,330,897 | 206,731,856 | 171,045,918 | 154,943,145 | 9,929,086 | 31,309,610 | ||||||||||||||||||||||||||||||||
End of Year | $163,574,919 | $186,330,897 | $160,365,015 | $171,045,918 | $7,818,046 | $9,929,086 | ||||||||||||||||||||||||||||||||
| PF Multi-Asset Fund | PF Small-Cap Value Fund | |||||||||||||||||||||||||||||||||||||
OPERATIONS | ||||||||||||||||||||||||||||||||||||||
Net investment income (loss) | $23,573,573 | $24,578,789 | $332,356 | $268,454 | ||||||||||||||||||||||||||||||||||
Net realized gain (loss) | (21,579,029 | ) | (2,528,979 | ) | (4,231,585 | ) | 8,893,312 | |||||||||||||||||||||||||||||||
Change in net unrealized appreciation (depreciation) | (112,346,411 | ) | 17,447,805 | (14,927,697 | ) | (11,477,373 | ) | |||||||||||||||||||||||||||||||
Net Increase (Decrease) in Net Assets | (110,351,867 | ) | 39,497,615 | (18,826,926 | ) | (2,315,607 | ) | |||||||||||||||||||||||||||||||
DIVIDENDS AND DISTRIBUTIONS TO SHAREHOLDERS | ||||||||||||||||||||||||||||||||||||||
Total distributable earnings - Class P | (26,336,391 | ) | (15,433,139 | ) | (4,860,855 | ) | (16,428,676 | ) | ||||||||||||||||||||||||||||||
Net Decrease from Dividends and | (26,336,391 | ) | (15,433,139 | ) | (4,860,855 | ) | (16,428,676 | ) | ||||||||||||||||||||||||||||||
CAPITAL SHARE TRANSACTIONS | ||||||||||||||||||||||||||||||||||||||
Proceeds from sale of shares - Class P | 93,982,467 | 601,760,853 | 851,192 | 16,035,351 | ||||||||||||||||||||||||||||||||||
Dividends and distribution reinvestments - Class P | 26,336,391 | 15,433,139 | 4,860,855 | 16,428,676 | ||||||||||||||||||||||||||||||||||
Cost of shares repurchased - Class P | (235,128,587 | ) | (238,144,754 | ) | (24,626,067 | ) | (24,616,740 | ) | ||||||||||||||||||||||||||||||
Net Increase (Decrease) in Net Assets from | (114,809,729 | ) | 379,049,238 | (18,914,020 | ) | 7,847,287 | ||||||||||||||||||||||||||||||||
NET INCREASE (DECREASE) IN NET ASSETS | (251,497,987 | ) | 403,113,714 | (42,601,801 | ) | (10,896,996 | ) | |||||||||||||||||||||||||||||||
NET ASSETS | ||||||||||||||||||||||||||||||||||||||
Beginning of Year | 1,136,414,192 | 733,300,478 | 70,617,546 | 81,514,542 | ||||||||||||||||||||||||||||||||||
End of Year | $884,916,205 | $1,136,414,192 | $28,015,745 | $70,617,546 | ||||||||||||||||||||||||||||||||||
See Notes to Financial Statements
C-8
Table of Contents
PACIFIC FUNDS
STATEMENTS OF CHANGES IN NET ASSETS (Continued)
| Year Ended March 31, 2020 | Year Ended March 31, 2019 | Year Ended March 31, 2020 | Year Ended March 31, 2019 | Year Ended March 31, 2020 | Year Ended March 31, 2019 | |||||||||||||||||||||||||||||||||
| PF Emerging Markets Fund | PF International Large-Cap Fund | PF International Small-Cap Fund | ||||||||||||||||||||||||||||||||||||
OPERATIONS | ||||||||||||||||||||||||||||||||||||||
Net investment income (loss) | $825,103 | $1,218,468 | $741,181 | $1,555,077 | $522,618 | $1,197,488 | ||||||||||||||||||||||||||||||||
Net realized gain (loss) | 18,458,804 | 10,877,865 | 2,077,545 | 36,177,793 | (53,682 | ) | (6,811,636 | ) | ||||||||||||||||||||||||||||||
Change in net unrealized appreciation (depreciation) | (27,961,796 | ) | (19,711,594 | ) | (4,327,414 | ) | (36,938,400 | ) | (2,496,959 | ) | (6,345,071 | ) | ||||||||||||||||||||||||||
Net Increase (Decrease) in Net Assets | (8,677,889 | ) | (7,615,261 | ) | (1,508,688 | ) | 794,470 | (2,028,023 | ) | (11,959,219 | ) | |||||||||||||||||||||||||||
DIVIDENDS AND DISTRIBUTIONS TO SHAREHOLDERS |
| |||||||||||||||||||||||||||||||||||||
Total distributable earnings - Class P | (18,657,302 | ) | (15,394,527 | ) | (6,575,782 | ) | (24,018,845 | ) | (1,056,704 | ) | (1,873,319 | ) | ||||||||||||||||||||||||||
Net Decrease from Dividends and | (18,657,302 | ) | (15,394,527 | ) | (6,575,782 | ) | (24,018,845 | ) | (1,056,704 | ) | (1,873,319 | ) | ||||||||||||||||||||||||||
CAPITAL SHARE TRANSACTIONS | ||||||||||||||||||||||||||||||||||||||
Proceeds from sale of shares - Class P | 33,691,167 | 39,212,019 | 10,166,745 | 24,020,771 | 12,615,119 | 13,122,384 | ||||||||||||||||||||||||||||||||
Dividends and distribution reinvestments - Class P | 18,657,302 | 15,394,527 | 6,575,782 | 24,018,845 | 1,056,704 | 1,873,319 | ||||||||||||||||||||||||||||||||
Cost of shares repurchased - Class P | (61,282,250 | ) | (76,101,427 | ) | (24,992,104 | ) | (92,047,573 | ) | (15,539,152 | ) | (59,045,777 | ) | ||||||||||||||||||||||||||
Net Increase (Decrease) in Net Assets from | (8,933,781 | ) | (21,494,881 | ) | (8,249,577 | ) | (44,007,957 | ) | (1,867,329 | ) | (44,050,074 | ) | ||||||||||||||||||||||||||
NET INCREASE (DECREASE) IN NET ASSETS | (36,268,972 | ) | (44,504,669 | ) | (16,334,047 | ) | (67,232,332 | ) | (4,952,056 | ) | (57,882,612 | ) | ||||||||||||||||||||||||||
NET ASSETS | ||||||||||||||||||||||||||||||||||||||
Beginning of Year | 133,886,784 | 178,391,453 | 58,152,160 | 125,384,492 | 31,933,668 | 89,816,280 | ||||||||||||||||||||||||||||||||
End of Year | $97,617,812 | $133,886,784 | $41,818,113 | $58,152,160 | $26,981,612 | $31,933,668 | ||||||||||||||||||||||||||||||||
| PF International Value Fund | PF Real Estate Fund | |||||||||||||||||||||||||||||||||||||
OPERATIONS | ||||||||||||||||||||||||||||||||||||||
Net investment income (loss) | $1,816,360 | $2,517,011 | $1,216,302 | $1,059,830 | ||||||||||||||||||||||||||||||||||
Net realized gain (loss) | (964,441 | ) | 5,364,607 | (8,571,709 | ) | 4,602,459 | ||||||||||||||||||||||||||||||||
Change in net unrealized appreciation (depreciation) | (13,413,182 | ) | (16,069,439 | ) | (8,199,240 | ) | 1,960,973 | |||||||||||||||||||||||||||||||
Net Increase (Decrease) in Net Assets | (12,561,263 | ) | (8,187,821 | ) | (15,554,647 | ) | 7,623,262 | |||||||||||||||||||||||||||||||
DIVIDENDS AND DISTRIBUTIONS TO SHAREHOLDERS |
| |||||||||||||||||||||||||||||||||||||
Total distributable earnings - Class P | (1,866,805 | ) | (13,896,218 | ) | (2,727,199 | ) | (6,470,668 | ) | ||||||||||||||||||||||||||||||
Net Decrease from Dividends and | (1,866,805 | ) | (13,896,218 | ) | (2,727,199 | ) | (6,470,668 | ) | ||||||||||||||||||||||||||||||
CAPITAL SHARE TRANSACTIONS | ||||||||||||||||||||||||||||||||||||||
Proceeds from sale of shares - Class P | 7,631,533 | 23,359,226 | 19,042,495 | 51,075,260 | ||||||||||||||||||||||||||||||||||
Dividends and distribution reinvestments - Class P | 1,866,805 | 13,896,218 | 2,727,199 | 6,470,668 | ||||||||||||||||||||||||||||||||||
Cost of shares repurchased - Class P | (25,056,026 | ) | (93,840,625 | ) | (41,668,519 | ) | (18,505,117 | ) | ||||||||||||||||||||||||||||||
Net Increase (Decrease) in Net Assets from | (15,557,688 | ) | (56,585,181 | ) | (19,898,825 | ) | 39,040,811 | |||||||||||||||||||||||||||||||
NET INCREASE (DECREASE) IN NET ASSETS | (29,985,756 | ) | (78,669,220 | ) | (38,180,671 | ) | 40,193,405 | |||||||||||||||||||||||||||||||
NET ASSETS | ||||||||||||||||||||||||||||||||||||||
Beginning of Year | 64,956,329 | 143,625,549 | 81,712,623 | 41,519,218 | ||||||||||||||||||||||||||||||||||
End of Year | $34,970,573 | $64,956,329 | $43,531,952 | $81,712,623 | ||||||||||||||||||||||||||||||||||
See Notes to Financial Statements
C-9
Table of Contents
PACIFIC FUNDS
FOR THE YEAR ENDED MARCH 31, 2020
| PF Inflation Managed Fund | ||||||||||
CASH FLOWS FROM OPERATING ACTIVITIES(2): | ||||||||||
Net increase (decrease) in net assets resulting from operations | $1,544,601 | |||||||||
Adjustments to reconcile net increase (decrease) in net assets from operations to net cash provided by (used in) operating activities: | ||||||||||
| �� | Purchases of long-term securities | (123,330,660 | ) | |||||||
Proceeds from disposition of long-term securities | 151,200,501 | |||||||||
Proceeds (purchases) of short-term securities, net | 196,992 | |||||||||
Proceeds (purchases) from foreign currency transactions | (6,302 | ) | ||||||||
(Increase) decrease in dividends and interest receivable | 82,965 | |||||||||
(Increase) decrease in receivable for securities sold | (8,634,140 | ) | ||||||||
(Increase) decrease in receivable for swap agreements | (1,856 | ) | ||||||||
(Increase) decrease in receivable due from adviser | (5,476 | ) | ||||||||
(Increase) decrease in prepaid expenses and other assets | (119 | ) | ||||||||
(Increase) decrease in variation margin on futures contracts | 17,700 | |||||||||
(Increase) decrease in variation margin on swap agreements | (50,543 | ) | ||||||||
Increase (decrease) in swap premiums | (413 | ) | ||||||||
Increase (decrease) in payable for securities purchased | 11,394,778 | |||||||||
Increase (decrease) in payable for swap agreements | (2,503 | ) | ||||||||
Increase (decrease) in accrued advisory fees | (6,840 | ) | ||||||||
Increase (decrease) in accrued administration fees | (2,565 | ) | ||||||||
Increase (decrease) in accrued support services expenses | (2,789 | ) | ||||||||
Increase (decrease) in accrued custodian fees and expenses | (3,661 | ) | ||||||||
Increase (decrease) in accrued legal, audit and tax service fees | (1,444 | ) | ||||||||
Increase (decrease) in accrued trustees’ fees and expenses and deferred compensation | 56 | |||||||||
Increase (decrease) in accrued other payable | 4,842 | |||||||||
Change in net unrealized (appreciation) depreciation on investment securities | (10,744 | ) | ||||||||
Change in net unrealized (appreciation) depreciation on foreign currencies | 6,301 | |||||||||
Change in net unrealized (appreciation) depreciation on forward foreign currency contracts | 2,294 | |||||||||
Change in net unrealized (appreciation) depreciation on purchased options | (32,592 | ) | ||||||||
Change in net unrealized (appreciation) depreciation on swaps (3) | 168 | |||||||||
Change in net unrealized (appreciation) depreciation on written options | 46,194 | |||||||||
Net realized (gain) loss on investment security transactions | (834,691 | ) | ||||||||
Net realized (gain) loss on foreign currency transactions | 50,792 | |||||||||
Net realized (gain) loss on purchased option transactions | (189,266 | ) | ||||||||
Net realized (gain) loss on written option transactions | 130,095 | |||||||||
Net amortization on investments | 174,332 | |||||||||
Net cash provided by (used in) operating activities | 31,736,007 | |||||||||
CASH FLOWS FROM FINANCING ACTIVITIES: | ||||||||||
Proceeds from shares sold | 460,812 | |||||||||
Payment of shares redeemed | (22,024,181 | ) | ||||||||
Proceeds from sale-buyback financing activities | 940,861,317 | |||||||||
Payment on sale-buyback financing transactions | (951,247,066 | ) | ||||||||
Net cash provided by (used in) financing activities | (31,949,118 | ) | ||||||||
NET INCREASE (DECREASE) IN CASH AND FOREIGN CURRENCY | (213,111 | ) | ||||||||
CASH AND FOREIGN CURRENCY: | ||||||||||
Beginning of Year | 576,175 | |||||||||
End of Year (4) | $363,064 | |||||||||
| (1) | Information on financial transactions which have been settled through the receipt or disbursement of cash is presented in the Statement of Cash Flows. The cash amounts shown in the Statement of Cash Flows are the amount included within the Statements of Assets and Liabilities and include cash and foreign currency, if any, but does not include any short-term investments. The PF Inflation Managed Fund has not met the exemption criteria under the Financial Accounting Standards Board Accounting Standards Codification Topic 230, Statement of Cash Flows, and therefore includes a Statement of Cash Flows. All other funds have met the exemption criteria. |
| (2) | Interest paid by the PF Inflation Managed Fund was $198,395. |
| (3) | Excludes centrally cleared swaps included in variation margin. |
| (4) | Includes cash (segregated for derivative instruments) of $334,000. |
See Notes to Financial Statements
C-10
Table of Contents
PACIFIC FUNDS
Selected per share, ratios and supplemental data for each year or period ended March 31, were as follows:
| Fund | Selected Per Share Data | Ratios to Average Net Assets | Supplemental Data | |||||||||||||||||||||||||||||||||||||||||||||||||||||
| Investment Operations | Distributions | |||||||||||||||||||||||||||||||||||||||||||||||||||||||
| For the Year or Period Ended (1) | Net Asset Value, Beginning of Year or Period | Net Investment Income (Loss) (2) | Net Realized and Unrealized Gain (Loss) | Total | Net Investment Income | Capital Gains | Total | Net Asset Value, End of Year or Period | Expenses Before Reductions (3) | Expenses After Reductions (3), (4) | Net Investment Income (Loss) (3) | Total Returns (5) | Net Assets, End of Year or Period (in thousands) | Portfolio Turnover Rates | ||||||||||||||||||||||||||||||||||||||||||
PF Inflation Managed Fund | ||||||||||||||||||||||||||||||||||||||||||||||||||||||||
| 4/1/2019 - 3/31/2020 | $8.81 | $0.25 | $0.18 | $0.43 | ($0.12 | ) | $— | ($0.12 | ) | $9.12 | 1.25 | % | 1.08 | %(6) | 2.76 | % | 4.94 | % | $20,950 | 249 | % | |||||||||||||||||||||||||||||||||||
| 4/1/2018 - 3/31/2019 | 8.88 | 0.16 | 0.05 | 0.21 | (0.28 | ) | — | (0.28 | ) | 8.81 | 1.15 | % | 1.07 | % | 1.86 | % | 2.50 | % | 40,949 | 126 | % | |||||||||||||||||||||||||||||||||||
| 4/1/2017 - 3/31/2018 | 8.92 | 0.27 | (0.19 | ) | 0.08 | (0.12 | ) | — | (0.12 | ) | 8.88 | 1.06 | % | 0.94 | % | 3.08 | % | 0.87 | % | 75,772 | 108 | % | ||||||||||||||||||||||||||||||||||
| 4/1/2016 - 3/31/2017 | 8.73 | 0.29 | (0.10 | ) | 0.19 | — | — | — | 8.92 | 0.98 | % | 0.80 | % | 3.35 | % | 2.18 | % | 13,130 | 194 | % | ||||||||||||||||||||||||||||||||||||
| 4/1/2015 - 3/31/2016 | 8.80 | 0.20 | (0.27 | ) | (0.07 | ) | — | — | — | 8.73 | 0.79 | % | 0.64 | % | 2.36 | % | (0.80 | %) | 52,190 | 89 | % | |||||||||||||||||||||||||||||||||||
PF Managed Bond Fund | ||||||||||||||||||||||||||||||||||||||||||||||||||||||||
| 4/1/2019 - 3/31/2020 | $10.56 | $0.32 | $0.41 | $0.73 | ($0.14 | ) | ($0.12 | ) | ($0.26 | ) | $11.03 | 0.82 | % | 0.73 | %(6) | 2.93 | % | 6.89 | % | $386,833 | 512 | % | ||||||||||||||||||||||||||||||||||
| 4/1/2018 - 3/31/2019 | 10.58 | 0.31 | 0.03 | 0.34 | (0.36 | ) | — | (0.36 | ) | 10.56 | 0.72 | % | 0.63 | % | 3.02 | % | 3.43 | % | 497,359 | 520 | % | |||||||||||||||||||||||||||||||||||
| 4/1/2017 - 3/31/2018 | 10.67 | 0.29 | 0.05 | 0.34 | (0.42 | ) | (0.01 | ) | (0.43 | ) | 10.58 | 0.64 | % | 0.57 | % | 2.63 | % | 3.29 | % | 598,676 | 364 | % | ||||||||||||||||||||||||||||||||||
| 4/1/2016 - 3/31/2017 | 10.57 | 0.26 | 0.10 | 0.36 | (0.15 | ) | (0.11 | ) | (0.26 | ) | 10.67 | 0.64 | % | 0.56 | % | 2.39 | % | 3.42 | % | 742,216 | 372 | % | ||||||||||||||||||||||||||||||||||
| 4/1/2015 - 3/31/2016 | 11.06 | 0.28 | (0.16 | ) | 0.12 | (0.25 | ) | (0.36 | ) | (0.61 | ) | 10.57 | 0.64 | % | 0.55 | % | 2.58 | % | 1.31 | % | 421,377 | 370 | % | |||||||||||||||||||||||||||||||||
PF Short Duration Bond Fund | ||||||||||||||||||||||||||||||||||||||||||||||||||||||||
| 4/1/2019 - 3/31/2020 | $9.93 | $0.24 | ($0.14 | ) | $0.10 | ($0.26 | ) | $— | ($0.26 | ) | $9.77 | 0.65 | % | 0.55 | % | 2.38 | % | 0.97 | % | $122,280 | 109 | % | ||||||||||||||||||||||||||||||||||
| 4/1/2018 - 3/31/2019 | 9.79 | 0.23 | 0.07 | 0.30 | (0.16 | ) | — | (0.16 | ) | 9.93 | 0.64 | % | 0.55 | % | 2.34 | % | 3.05 | % | 155,358 | 164 | % | |||||||||||||||||||||||||||||||||||
| 4/1/2017 - 3/31/2018 | 9.88 | 0.15 | (0.09 | ) | 0.06 | (0.15 | ) | — | (0.15 | ) | 9.79 | 0.63 | % | 0.55 | % | 1.56 | % | 0.65 | % | 112,269 | 67 | % | ||||||||||||||||||||||||||||||||||
| 4/1/2016 - 3/31/2017 | 9.84 | 0.12 | 0.01 | 0.13 | (0.09 | ) | — | (0.09 | ) | 9.88 | 0.68 | % | 0.55 | % | 1.16 | % | 1.36 | % | 167,639 | 233 | % | |||||||||||||||||||||||||||||||||||
| 4/1/2015 - 3/31/2016 | 10.01 | 0.12 | (0.09 | ) | 0.03 | (0.20 | ) | — | (0.20 | ) | 9.84 | 0.65 | % | 0.55 | % | 1.18 | % | 0.35 | % | 75,899 | 98 | % | ||||||||||||||||||||||||||||||||||
PF Emerging Markets Debt Fund | ||||||||||||||||||||||||||||||||||||||||||||||||||||||||
| 4/1/2019 - 3/31/2020 | $9.17 | $0.51 | ($2.02 | ) | ($1.51 | ) | ($0.48 | ) | $— | ($0.48 | ) | $7.18 | 1.14 | % | 0.92 | % | 5.64 | % | (17.58 | %) | $87,623 | 73 | % | |||||||||||||||||||||||||||||||||
| 4/1/2018 - 3/31/2019 | 9.37 | 0.47 | (0.54 | ) | (0.07 | ) | (0.13 | ) | — | (0.13 | ) | 9.17 | 1.09 | % | 0.93 | % | 5.37 | % | (0.61 | %) | 71,599 | 60 | % | |||||||||||||||||||||||||||||||||
| 4/1/2017 - 3/31/2018 | 9.39 | 0.51 | 0.30 | 0.81 | (0.83 | ) | — | (0.83 | ) | 9.37 | 1.11 | % | 0.94 | % | 5.28 | % | 8.76 | % | 85,758 | 68 | % | |||||||||||||||||||||||||||||||||||
| 4/1/2016 - 3/31/2017 | 9.14 | 0.72 | 0.58 | 1.30 | (1.05 | ) | — | (1.05 | ) | 9.39 | 1.10 | % | 0.94 | % | 7.58 | % | 14.88 | % | 42,614 | 75 | % | |||||||||||||||||||||||||||||||||||
| 4/1/2015 - 3/31/2016 | 8.89 | 0.61 | (0.35 | ) | 0.26 | (0.01 | ) | — | (0.01 | ) | 9.14 | 1.07 | % | 0.94 | % | 6.91 | % | 2.93 | % | 108,161 | 80 | % | ||||||||||||||||||||||||||||||||||
PF Developing Growth Fund | ||||||||||||||||||||||||||||||||||||||||||||||||||||||||
| 4/1/2019 - 3/31/2020 | $18.43 | ($0.11 | ) | ($2.31 | ) | ($2.42 | ) | $— | ($1.82 | ) | ($1.82 | ) | $14.19 | 0.97 | % | 0.75 | % | (0.60 | %) | (14.67 | %) | $17,691 | 126 | % | ||||||||||||||||||||||||||||||||
| 4/1/2018 - 3/31/2019 | 14.84 | (0.09 | ) | 3.80 | 3.71 | — | (0.12 | ) | (0.12 | ) | 18.43 | 0.87 | % | 0.75 | % | (0.55 | %) | 25.05 | % | 15,687 | 127 | % | ||||||||||||||||||||||||||||||||||
| 4/1/2017 - 3/31/2018 | 11.50 | (0.06 | ) | 3.40 | 3.34 | — | — | — | 14.84 | 0.90 | % | 0.75 | % | (0.45 | %) | 29.04 | % | 9,463 | 86 | % | ||||||||||||||||||||||||||||||||||||
| 4/1/2016 - 3/31/2017 | 9.80 | (0.04 | ) | 1.74 | 1.70 | — | — | — | 11.50 | 0.90 | % | 0.75 | % | (0.40 | %) | 17.35 | % | 8,805 | 123 | % | ||||||||||||||||||||||||||||||||||||
| 4/1/2015 - 3/31/2016 | 14.80 | (0.07 | ) | (3.18 | ) | (3.25 | ) | — | (1.75 | ) | (1.75 | ) | 9.80 | 0.82 | % | 0.75 | % | (0.51 | %) | (23.59 | %) | 42,196 | 229 | % | ||||||||||||||||||||||||||||||||
PF Growth Fund | ||||||||||||||||||||||||||||||||||||||||||||||||||||||||
| 4/1/2019 - 3/31/2020 | $27.18 | ($0.02 | ) | $0.93 | $0.91 | ($0.00 | )(7) | ($0.99 | ) | ($0.99 | ) | $27.10 | 0.77 | % | 0.70 | % | (0.06 | %) | 3.04 | % | $163,575 | 20 | % | |||||||||||||||||||||||||||||||||
| 4/1/2018 - 3/31/2019 | 25.38 | 0.00 | (7) | 3.62 | 3.62 | (0.01 | ) | (1.81 | ) | (1.82 | ) | 27.18 | 0.77 | % | 0.70 | % | 0.01 | % | 14.99 | % | 186,331 | 28 | % | |||||||||||||||||||||||||||||||||
| 4/1/2017 - 3/31/2018 | 20.94 | 0.04 | 5.33 | 5.37 | (0.04 | ) | (0.89 | ) | (0.93 | ) | 25.38 | 0.76 | % | 0.70 | % | 0.16 | % | 25.93 | % | 206,732 | 34 | % | ||||||||||||||||||||||||||||||||||
| 4/1/2016 - 3/31/2017 | 18.82 | 0.02 | 2.61 | 2.63 | (0.02 | ) | (0.49 | ) | (0.51 | ) | 20.94 | 0.77 | % | 0.70 | % | 0.12 | % | 14.25 | % | 135,132 | 43 | % | ||||||||||||||||||||||||||||||||||
| 4/1/2015 - 3/31/2016 | 19.30 | 0.02 | 0.43 | 0.45 | (0.09 | ) | (0.84 | ) | (0.93 | ) | 18.82 | 0.76 | % | 0.70 | % | 0.11 | % | 2.17 | % | 122,698 | 35 | % | ||||||||||||||||||||||||||||||||||
PF Large-Cap Value Fund | ||||||||||||||||||||||||||||||||||||||||||||||||||||||||
| 4/1/2019 - 3/31/2020 | $11.95 | $0.20 | ($1.62 | ) | ($1.42 | ) | ($0.17 | ) | ($0.70 | ) | ($0.87 | ) | $9.66 | 0.87 | % | 0.80 | % | 1.59 | % | (13.51 | %) | $160,365 | 28 | % | ||||||||||||||||||||||||||||||||
| 4/1/2018 - 3/31/2019 | 17.14 | 0.24 | 0.46 | 0.70 | (0.17 | ) | (5.72 | ) | (5.89 | ) | 11.95 | 0.86 | % | 0.80 | % | 1.55 | % | 5.49 | % | 171,046 | 43 | % | ||||||||||||||||||||||||||||||||||
| 4/1/2017 - 3/31/2018 | 16.60 | 0.22 | 0.79 | 1.01 | (0.23 | ) | (0.24 | ) | (0.47 | ) | 17.14 | 0.86 | % | 0.80 | % | 1.27 | % | 6.01 | % | 154,943 | 7 | % | ||||||||||||||||||||||||||||||||||
| 4/1/2016 - 3/31/2017 | 14.78 | 0.22 | 2.11 | 2.33 | (0.20 | ) | (0.31 | ) | (0.51 | ) | 16.60 | 0.86 | % | 0.80 | % | 1.40 | % | 15.88 | % | 433,551 | 21 | % | ||||||||||||||||||||||||||||||||||
| 4/1/2015 - 3/31/2016 | 16.46 | 0.23 | (0.43 | ) | (0.20 | ) | (0.22 | ) | (1.26 | ) | (1.48 | ) | 14.78 | 0.86 | % | 0.80 | % | 1.45 | % | (1.29 | %) | 299,971 | 10 | % | ||||||||||||||||||||||||||||||||
PF Mid-Cap Equity Fund | ||||||||||||||||||||||||||||||||||||||||||||||||||||||||
| 4/1/2019 - 3/31/2020 | $11.28 | $0.07 | ($2.45 | ) | ($2.38 | ) | ($0.07 | ) | $— | ($0.07 | ) | $8.83 | 1.05 | % | 0.80 | % | 0.64 | % | (21.28 | %) | $7,818 | 42 | % | |||||||||||||||||||||||||||||||||
| 4/1/2018 - 3/31/2019 | 10.73 | 0.06 | 0.51 | 0.57 | (0.02 | ) | — | (0.02 | ) | 11.28 | 0.93 | % | 0.80 | % | 0.56 | % | 5.37 | % | 9,929 | 119 | % | |||||||||||||||||||||||||||||||||||
| 4/1/2017 - 3/31/2018 | 11.00 | 0.05 | 1.75 | 1.80 | (0.04 | ) | (2.03 | ) | (2.07 | ) | 10.73 | 0.88 | % | 0.80 | % | 0.40 | % | 16.31 | % | 31,310 | 77 | % | ||||||||||||||||||||||||||||||||||
| 4/1/2016 - 3/31/2017 | 10.63 | 0.05 | 2.43 | 2.48 | (0.17 | ) | (1.94 | ) | (2.11 | ) | 11.00 | 0.89 | % | 0.80 | % | 0.45 | % | 24.02 | % | 66,011 | 101 | % | ||||||||||||||||||||||||||||||||||
| 4/1/2015 - 3/31/2016 | 12.15 | 0.15 | (0.59 | ) | (0.44 | ) | (0.12 | ) | (0.96 | ) | (1.08 | ) | 10.63 | 0.86 | % | 0.80 | % | 1.34 | % | (3.79 | %) | 169,595 | 184 | % | ||||||||||||||||||||||||||||||||
| See Notes to Financial Statements | See explanation of references, if any, on C-12 |
C-11
Table of Contents
PACIFIC FUNDS
FINANCIAL HIGHLIGHTS(Continued)
Selected per share, ratios and supplemental data for each year or period ended March 31, were as follows:
| Fund | Selected Per Share Data | Ratios to Average Net Assets | Supplemental Data | |||||||||||||||||||||||||||||||||||||||||||||||||||||
| Investment Operations | Distributions | |||||||||||||||||||||||||||||||||||||||||||||||||||||||
| For the Year or Period Ended (1) | Net Asset Value, Beginning of Year or Period | Net Investment Income (Loss) (2) | Net Realized and Unrealized Gain (Loss) | Total | Net Investment Income | Capital Gains | Total | Net Asset Value, End of Year or Period | Expenses Before Reductions (3) | Expenses After Reductions (3), (4) | Net Investment Income (Loss) (3) | Total Returns (5) | Net Assets, End of Year or Period (in thousands) | Portfolio Turnover Rates | ||||||||||||||||||||||||||||||||||||||||||
PF Multi-Asset Fund | ||||||||||||||||||||||||||||||||||||||||||||||||||||||||
| 4/1/2019 - 3/31/2020 | $9.81 | $0.22 | ($1.54 | ) | ($1.32 | ) | ($0.26 | ) | $— | ($0.26 | ) | $8.23 | 0.56 | % | 0.51 | % | 2.17 | % | (14.09 | %) | $884,916 | 57 | % | |||||||||||||||||||||||||||||||||
| 4/1/2018 - 3/31/2019 | 9.42 | 0.21 | 0.31 | 0.52 | (0.13 | ) | — | (0.13 | ) | 9.81 | 0.56 | % | 0.51 | % | 2.21 | % | 5.72 | % | 1,136,414 | 75 | % | |||||||||||||||||||||||||||||||||||
| 1/31/2018 - 3/31/2018 | 10.00 | 0.03 | (0.61 | ) | (0.58 | ) | — | — | — | 9.42 | 0.59 | % | 0.51 | % | 1.68 | % | (5.80 | %) | 733,300 | 37 | % | |||||||||||||||||||||||||||||||||||
PF Small-Cap Value Fund | ||||||||||||||||||||||||||||||||||||||||||||||||||||||||
| 4/1/2019 - 3/31/2020 | $8.21 | $0.04 | ($2.39 | ) | ($2.35 | ) | ($0.05 | ) | ($0.64 | ) | ($0.69 | ) | $5.17 | 1.00 | % | 0.90 | % | 0.53 | % | (31.62 | %) | $28,016 | 36 | % | ||||||||||||||||||||||||||||||||
| 4/1/2018 - 3/31/2019 | 11.22 | 0.04 | (0.56 | ) | (0.52 | ) | (0.03 | ) | (2.46 | ) | (2.49 | ) | 8.21 | 0.97 | % | 0.90 | % | 0.35 | % | (4.23 | %) | 70,618 | 56 | % | ||||||||||||||||||||||||||||||||
| 4/1/2017 - 3/31/2018 | 12.09 | 0.02 | 0.79 | 0.81 | (0.02 | ) | (1.66 | ) | (1.68 | ) | 11.22 | 0.97 | % | 0.90 | % | 0.17 | % | 6.54 | % | 81,515 | 30 | % | ||||||||||||||||||||||||||||||||||
| 4/1/2016 - 3/31/2017 | 10.14 | 0.01 | 2.44 | 2.45 | (0.07 | ) | (0.43 | ) | (0.50 | ) | 12.09 | 0.98 | % | 0.90 | % | 0.12 | % | 23.99 | % | 118,590 | 49 | % | ||||||||||||||||||||||||||||||||||
| 4/1/2015 - 3/31/2016 | 10.45 | 0.03 | (0.27 | ) | (0.24 | ) | (0.01 | ) | (0.06 | ) | (0.07 | ) | 10.14 | 0.96 | % | 0.90 | % | 0.33 | % | (2.29 | %) | 199,324 | 55 | % | ||||||||||||||||||||||||||||||||
PF Emerging Markets Fund | ||||||||||||||||||||||||||||||||||||||||||||||||||||||||
| 4/1/2019 - 3/31/2020 | $14.71 | $0.13 | ($1.50 | ) | ($1.37 | ) | ($0.19 | ) | ($3.35 | ) | ($3.54 | ) | $9.80 | 1.29 | % | 0.95 | % | 0.90 | % | (14.07 | %) | $97,618 | 65 | % | ||||||||||||||||||||||||||||||||
| 4/1/2018 - 3/31/2019 | 17.30 | 0.13 | (0.95 | ) | (0.82 | ) | (0.09 | ) | (1.68 | ) | (1.77 | ) | 14.71 | 1.16 | % | 0.95 | % | 0.84 | % | (3.61 | %) | 133,887 | 46 | % | ||||||||||||||||||||||||||||||||
| 4/1/2017 - 3/31/2018 | 13.81 | 0.10 | 3.49 | 3.59 | (0.10 | ) | — | (0.10 | ) | 17.30 | 1.20 | % | 0.95 | % | 0.63 | % | 25.93 | % | 178,391 | 34 | % | |||||||||||||||||||||||||||||||||||
| 4/1/2016 - 3/31/2017 | 12.09 | 0.08 | 1.71 | 1.79 | (0.07 | ) | — | (0.07 | ) | 13.81 | 1.20 | % | 0.95 | % | 0.64 | % | 14.83 | % | 200,620 | 69 | % | |||||||||||||||||||||||||||||||||||
| 4/1/2015 - 3/31/2016 | 13.58 | 0.10 | (1.47 | ) | (1.37 | ) | (0.12 | ) | — | (0.12 | ) | 12.09 | 1.23 | % | 0.95 | % | 0.84 | % | (10.09 | %) | 118,049 | 65 | % | |||||||||||||||||||||||||||||||||
PF International Large-Cap Fund | ||||||||||||||||||||||||||||||||||||||||||||||||||||||||
| 4/1/2019 - 3/31/2020 | $11.63 | $0.17 | ($0.87 | ) | ($0.70 | ) | ($0.15 | ) | ($1.73 | ) | ($1.88 | ) | $9.05 | 1.32 | % | 1.00 | % | 1.46 | % | (8.84 | %) | $41,818 | 22 | % | ||||||||||||||||||||||||||||||||
| 4/1/2018 - 3/31/2019 | 20.85 | 0.41 | (1.09 | ) | (0.68 | ) | (0.24 | ) | (8.30 | ) | (8.54 | ) | 11.63 | 1.19 | % | 1.00 | % | 2.32 | % | 0.62 | % | 58,152 | 41 | % | ||||||||||||||||||||||||||||||||
| 4/1/2017 - 3/31/2018 | 18.19 | 0.26 | 2.74 | 3.00 | (0.34 | ) | — | (0.34 | ) | 20.85 | 1.14 | % | 1.00 | % | 1.28 | % | 16.54 | % | 125,384 | 10 | % | |||||||||||||||||||||||||||||||||||
| 4/1/2016 - 3/31/2017 | 16.69 | 0.25 | 1.58 | 1.83 | (0.33 | ) | — | (0.33 | ) | 18.19 | 1.13 | % | 1.00 | % | 1.46 | % | 11.17 | % | 176,670 | 16 | % | |||||||||||||||||||||||||||||||||||
| 4/1/2015 - 3/31/2016 | 18.50 | 0.20 | (1.85 | ) | (1.65 | ) | (0.16 | ) | — | (0.16 | ) | 16.69 | 1.10 | % | 1.00 | % | 1.17 | % | (8.93 | %) | 289,863 | 24 | % | |||||||||||||||||||||||||||||||||
PF International Small-Cap Fund | ||||||||||||||||||||||||||||||||||||||||||||||||||||||||
| 4/1/2019 - 3/31/2020 | $9.59 | $0.20 | ($2.23 | ) | ($2.03 | ) | ($0.58 | ) | $— | ($0.58 | ) | $6.98 | 1.43 | % | 1.10 | % | 2.16 | % | (22.94 | %) | $26,982 | 90 | % | |||||||||||||||||||||||||||||||||
| 4/1/2018 - 3/31/2019 | 11.24 | 0.17 | (1.58 | ) | (1.41 | ) | (0.05 | ) | (0.19 | ) | (0.24 | ) | 9.59 | 1.18 | % | 1.10 | % | 1.61 | % | (12.54 | %) | 31,934 | 50 | % | ||||||||||||||||||||||||||||||||
| 4/1/2017 - 3/31/2018 | 10.50 | 0.19 | 1.79 | 1.98 | (0.29 | ) | (0.95 | ) | (1.24 | ) | 11.24 | 1.16 | % | 1.10 | % | 1.63 | % | 19.24 | % | 89,816 | 52 | % | ||||||||||||||||||||||||||||||||||
| 4/1/2016 - 3/31/2017 | 10.27 | 0.21 | 1.10 | 1.31 | (0.41 | ) | (0.67 | ) | (1.08 | ) | 10.50 | 1.18 | % | 1.09 | % | 2.07 | % | 13.85 | % | 42,798 | 53 | % | ||||||||||||||||||||||||||||||||||
| 4/1/2015 - 3/31/2016 | 10.69 | 0.15 | (0.12 | ) | 0.03 | (0.32 | ) | (0.13 | ) | (0.45 | ) | 10.27 | 1.11 | % | 1.08 | % | 1.37 | % | 0.22 | % | 118,558 | 51 | % | |||||||||||||||||||||||||||||||||
PF International Value Fund | ||||||||||||||||||||||||||||||||||||||||||||||||||||||||
| 4/1/2019 - 3/31/2020 | $7.51 | $0.25 | ($2.32 | ) | ($2.07 | ) | ($0.23 | ) | ($0.07 | ) | ($0.30 | ) | $5.14 | 1.11 | % | 0.80 | % | 3.32 | % | (28.94 | %) | $34,971 | 33 | % | ||||||||||||||||||||||||||||||||
| 4/1/2018 - 3/31/2019 | 10.17 | 0.28 | (1.20 | ) | (0.92 | ) | (0.34 | ) | (1.40 | ) | (1.74 | ) | 7.51 | 0.98 | % | 0.80 | % | 2.99 | % | (8.51 | %) | 64,956 | 54 | % | ||||||||||||||||||||||||||||||||
| 4/1/2017 - 3/31/2018 | 9.31 | 0.30 | 0.99 | 1.29 | (0.43 | ) | — | (0.43 | ) | 10.17 | 0.92 | % | 0.80 | % | 2.95 | % | 14.01 | % | 143,626 | 111 | % | |||||||||||||||||||||||||||||||||||
| 4/1/2016 - 3/31/2017 | 8.35 | 0.21 | 1.03 | 1.24 | (0.28 | ) | — | (0.28 | ) | 9.31 | 0.90 | % | 0.80 | % | 2.43 | % | 15.15 | % | 174,630 | 67 | % | |||||||||||||||||||||||||||||||||||
| 4/1/2015 - 3/31/2016 | 9.51 | 0.16 | (1.19 | ) | (1.03 | ) | (0.13 | ) | — | (0.13 | ) | 8.35 | 0.92 | % | 0.80 | % | 1.80 | % | (10.87 | %) | 140,760 | 73 | % | |||||||||||||||||||||||||||||||||
PF Real Estate Fund | ||||||||||||||||||||||||||||||||||||||||||||||||||||||||
| 4/1/2019 - 3/31/2020 | $12.26 | $0.19 | ($1.74 | ) | ($1.55 | ) | ($0.25 | ) | ($0.16 | ) | ($0.41 | ) | $10.30 | 1.13 | % | 0.90 | % | 1.46 | % | (13.44 | %) | $43,532 | 48 | % | ||||||||||||||||||||||||||||||||
| 4/1/2018 - 3/31/2019 | 11.86 | 0.28 | 1.75 | 2.03 | (0.21 | ) | (1.42 | ) | (1.63 | ) | 12.26 | 1.12 | % | 0.98 | % | 2.31 | % | 18.20 | % | 81,713 | 104 | % | ||||||||||||||||||||||||||||||||||
| 4/1/2017 - 3/31/2018 | 14.94 | 0.30 | (0.75 | ) | (0.45 | ) | (0.22 | ) | (2.41 | ) | (2.63 | ) | 11.86 | 1.13 | % | 1.05 | % | 2.12 | % | (4.15 | %) | 41,519 | 47 | % | ||||||||||||||||||||||||||||||||
| 4/1/2016 - 3/31/2017 | 15.99 | 0.16 | (0.18 | ) | (0.02 | ) | (0.39 | ) | (0.64 | ) | (1.03 | ) | 14.94 | 1.12 | % | 1.05 | % | 1.01 | % | (0.14 | %) | 39,038 | 27 | % | ||||||||||||||||||||||||||||||||
| 4/1/2015 - 3/31/2016 | 16.87 | 0.36 | 0.15 | 0.51 | (0.23 | ) | (1.16 | ) | (1.39 | ) | 15.99 | 1.12 | % | 1.05 | % | 2.33 | % | 3.61 | % | 70,717 | 26 | % | ||||||||||||||||||||||||||||||||||
| (1) | For share classes that commenced operations after April 1, 2015, the first date reported represents the commencement date of operations for that share class. |
| (2) | Net investment income (loss) per share has been calculated using the average shares method. |
| (3) | The ratios are annualized for periods of less than one full year. |
| (4) | The ratios of expenses after expense reductions to average net assets are after advisory fee waivers and adviser expense reimbursements, if any. |
| (5) | The total returns include reinvestment of all dividends and capital gains distribution, if any. Total returns are not annualized for periods less than one full year. |
| (6) | The annualized ratios of expenses, excluding interest expense, after expense reductions to average net assets for the year ended March 31, 2020 are as follows: |
Fund | Class P | |||
PF Inflation Managed Fund | 0.55% | |||
PF Managed Bond Fund | 0.55% | |||
| (7) | Reflects an amount rounding to less than $0.01 per share. |
| See Notes to Financial Statements |
C-12
Table of Contents
PACIFIC FUNDS
1. ORGANIZATION
Pacific Funds Series Trust (which may be referred to as “Pacific Funds” or the “Trust”) is registered under the Investment Company Act of 1940 (“1940 Act”), as amended, as a diversified,open-end, investment management company, and is organized as a Delaware statutory trust. Pacific Life Fund Advisors LLC (“PLFA” or the “Investment Adviser”) serves as investment adviser to the Trust. As of March 31, 2020, the Trust was comprised of thirty-three separate active funds, fifteen of which are presented in these financial statements (each individually a “Fund”, and collectively the “Funds”). All of the Funds listed in the table below (collectively known as the “PF Underlying Funds”) offer Class P shares only, which are sold at net asset value:
| PF Underlying Funds | ||||
| PF Inflation Managed Fund | PF Growth Fund | PF Emerging Markets Fund | ||
| PF Managed Bond Fund | PFLarge-Cap Value Fund | PF InternationalLarge-Cap Fund | ||
| PF Short Duration Bond Fund | PFMid-Cap Equity Fund (1) | PF InternationalSmall-Cap Fund | ||
| PF Emerging Markets Debt Fund | PF Multi-Asset Fund | PF International Value Fund | ||
| PF Developing Growth Fund | PFSmall-Cap Value Fund | PF Real Estate Fund | ||
| (1) | Class P shares of the PFMid-Cap Equity Fund are currently not available for investment by any fund of funds of the Trust. |
Presently, only the following “Funds of Funds,” the Investment Adviser, and certain of its affiliates can invest in Class P shares of the PF Underlying Funds.
| Fund of Funds (collectively, the “Portfolio Optimization Funds”) | ||
| Pacific FundsSM Portfolio Optimization Conservative | Pacific FundsSM Portfolio Optimization Growth | |
| Pacific FundsSM Portfolio Optimization Moderate-Conservative | Pacific FundsSM Portfolio Optimization Aggressive-Growth | |
| Pacific FundsSM Portfolio Optimization Moderate | ||
There is a separate annual report containing the financial statements for the Portfolio Optimization Funds, which is available without charge.For information on how to obtain the annual report for these Funds, see the Where to Go for More Information section of this report on pageF-22.
2. SIGNIFICANT ACCOUNTING POLICIES
The following is a summary of the significant accounting policies followed by the Trust in the preparation of its financial statements in conformity with accounting principles generally accepted in the United States of America (“U.S. GAAP”), which may require management to make estimates and assumptions that affect the reported amounts of assets and liabilities and disclosures of contingent assets and liabilities at the date of the financial statements and the increases and decreases in net assets from operations during the reporting period. Actual results could differ from those estimates. Each Fund qualifies as an investment company under U.S. GAAP and follows the accounting and reporting guidance applicable to the Investment Companies Topic of U.S. GAAP.
A. INVESTMENT TRANSACTIONS AND INCOME
Investment transactions are recorded on a trade date basis. Securities purchased or sold on a when-issued or delayed-delivery basis as well as certain loan transactions and mortgage securities (such as Government National Mortgage Association (“GNMA”) securities) may be settled a month or more after the trade date. Dividend income is recorded on theex-dividend date, except certain dividends from foreign securities, which are recorded as soon as a Fund is informed of theex-dividend date or upon receipt of the dividend. A Fund’s estimated components of distributions received from real estate investment trusts may be considered income, return of capital distributions or capital gain distributions. Return of capital distributions are recorded as a reduction of cost of the related investments. Interest income, adjusted for amortization of premium and accretion of discount, is recorded daily on an accrual basis. Investment income is recorded net of foreign taxes withheld, if any. A Fund may be subject to foreign taxes on income, gains on investments, or currency repatriation, a portion of which may be recoverable. A Fund will accrue such taxes and reclaims as applicable, based upon the current interpretation of tax rules and regulations that exist in the markets in which that Fund invests. Facility fees and other fees (such as origination fees) received from floating rate senior loan notes purchased (see Note 4) by a Fund are amortized over the expected term of each applicable senior loan. Commitment fees received by a Fund relating to unfunded senior loan commitments are amortized to income over the period of the commitment. Consent fees, which are compensation for agreeing to changes in the terms of debt instruments, are recorded as interest income when received. Realized gains and losses from investment transactions are recorded on the basis of identified cost. Gains and losses realized on principal paydowns from mortgage-backed and asset-backed securities are recorded as interest income. Litigation settlements on securities that were previously held are recorded as realized gains on investment securities.
B. DISTRIBUTIONS TO SHAREHOLDERS
Each Fund presented in these financial statements distributes all of its net investment income and realized capital gains, if any, to shareholders at least annually, although distributions could occur more often if advantageous to the applicable Fund and its shareholders. Dividends and distributions paid to shareholders are recorded on theex-dividend date. Each Fund may utilize the consent dividend provision of Section 565 of the Internal Revenue Code to effectively distribute income and capital gains for tax purposes even though they are not actually paid by the Fund.
D-1
Table of Contents
PACIFIC FUNDS
NOTES TO FINANCIAL STATEMENTS (Continued)
C. FOREIGN CURRENCY TRANSLATION
The Trust’s accounting records are maintained in U.S. dollars. The market value of investments and other assets and liabilities, which are denominated innon-U.S. currencies, are translated into U.S. dollars based on the applicable exchange rates at the end of each business day. Purchases and sales of investments and income and expenses, denominated in foreign currencies, are translated into U.S. dollars at the exchange rates in effect on the transaction date.
None of the Funds separately report the effect of changes in foreign exchange rates from changes in market prices of investments held. Such changes are included with the net realized gain or loss and change in net unrealized appreciation or depreciation on investments. Other foreign currency transactions resulting in realized and unrealized gain or loss, if any, are reported separately as net realized gain or loss on foreign currency transactions and change in net unrealized appreciation or depreciation on foreign currencies.
D. ALLOCATION OF INCOME, EXPENSES, GAINS AND LOSSES
Certain Trust expenses directly attributable to a particular Fund are charged to that Fund (such as fund-specific transactional fees, proxies, liquidations, litigation, andorganizational/start-up costs). Generally, other Trust expenses are allocated proportionately among all the Funds in relation to the net assets of each Fund.
E. OFFERING COSTS
A new Fund bears all costs (or the applicablepro-rata share if there is more than one new Fund) associated with the offering expenses of the Fund, including legal, printing, and support services (see Notes 6 and 7A). All such costs are amortized as an expense of the new Fund on a straight-line basis over twelve months from commencement of operations.
F. NEW ACCOUNTING PRONOUNCEMENTS
In March 2017, the Financial Accounting Standards Board (“FASB”) issued Accounting Standards Update (“ASU”)2017-08, Premium Amortization on Purchased Callable Debt Securities, which amends the amortization period for certain callable debt securities purchased at a premium, shortening the period to the earliest call date. ASU2017-08 is effective for fiscal years beginning after December 15, 2019, including interim periods within those fiscal years. Management evaluated the impact and concluded that the ASU does not have a material impact on the financial statements or disclosures.
In March 2020, FASB issued ASU 2020-04, Reference Rate Reform (Topic 848) - Facilitation of the Effects of Reference Rate Reform on Financial Reporting. The amendments in ASU 2020-04 provides optional temporary financial reporting relief from the effect of certain types of contract modifications due to the planned discontinuation of the London Interbank Offered Rate (“LIBOR”) and other interbank-offered based reference rates as of the end of 2021. ASU 2020-04 is effective for certain reference rate-related contract modifications that occur during the period March 12, 2020 through December 31, 2022. Management is currently evaluating the impact, if any, of applying this ASU.
3. VALUATION AND FAIR VALUE MEASUREMENTS
A. VALUATION POLICY
The Trust’s Board of Trustees (the “Board”) has adopted a policy (“Valuation Policy”) for determining the value of the Trust’s investments each business day. Under the Valuation Policy, the Board has delegated certain functions to the Trustee Valuation Committee (“TVC”) and/or the Valuation Oversight Committee (“VOC”) or its delegate to determine the fair value of certain investments, which includes using third party pricing services. Each valuation committee that values the Funds’ investments does so in accordance with the Valuation Policy.
B. DETERMINATION OF NET ASSET VALUE (“NAV”)
Each Fund presented in these financial statements is divided into shares. The price per share of a Fund’s shares is called its NAV. The NAV forms the basis for all transactions involving buying, selling, exchanging or reinvesting shares. Each Fund’s NAV is calculated by taking the total value of a Fund’s assets, subtracting a Fund’s liabilities, and dividing by the total number of shares outstanding.
Each Fund’s NAV is calculated once per day on each day that the New York Stock Exchange (“NYSE”) is open, including days when foreign markets and/or bond markets are closed. Based on information obtained from the NYSE, it is anticipated that the NYSE will be closed when the following annual holidays are observed: New Year’s Day; Martin Luther King, Jr. Day; Presidents’ Day; Good Friday; Memorial Day; Independence Day; Labor Day; Thanksgiving; and Christmas Day. The NYSE is normally closed on the preceding Friday or subsequent Monday when one of these holidays falls on a Saturday or Sunday, respectively. In addition, the NYSE typically closes early (usually 1:00 p.m. Eastern Time) on the day after Thanksgiving and the day before Christmas Day. Although the Trust expects the same holidays to be observed in the future, the NYSE may modify its holiday schedule or hours of operation at any time.
Each Fund’s NAV will not be calculated on days when the NYSE is closed. There may be a delay in calculating the NAV if: (i) the NYSE is closed on a day other than a regular holiday or weekend, (ii) trading on the NYSE is restricted or halted, (iii) an emergency exists (as determined by the SEC), making the sale of investments or determinations of NAV not practicable, or (iv) the SEC permits a delay for the protection of shareholders.
Each Fund’s NAV is generally determined as of 4:00 p.m. Eastern Time on days that the NYSE is open. Information that becomes known to the Trust or its agents after the determination of the Fund’s NAV on a particular day will not normally be used to retroactively adjust the price of a Fund’s investment for that same business day. Such information may include late dividend notifications, legal or regulatory matters, corporate actions, and corrected/adjusted last sales prices or official closing prices from an exchange.
In the event the NYSE closes prior to 4:00 p.m. Eastern Time, whether due to a scheduled or unscheduled early close, certain other markets or exchanges may remain open. Generally, the valuation of the securities in those markets or exchanges will follow the valuation procedures described below, which may be after the official closing time of the NYSE.
D-2
Table of Contents
PACIFIC FUNDS
NOTES TO FINANCIAL STATEMENTS (Continued)
Certain Funds may hold investments that are primarily listed on foreign exchanges. Because those investments trade on weekends and other days when the Funds do not calculate their NAVs, the value of those investments may change on days when a shareholder will not be able to purchase or redeem shares of those Funds.
C. INVESTMENT VALUATION
The value of each security or other investment is the amount which a Fund might reasonably expect to receive for the investment upon its current sale in the ordinary course of business. For purposes of calculating the NAV, the value of investments held by each Fund is based primarily on pricing data obtained from various sources approved by the Board.
Domestic Equity Investments
For domestic equity investments (including exchange-traded funds), the Trust generally uses the official closing price or last reported sale price from an exchange and does not normally take into account trading, clearances or settlements that take place after the close of the NYSE. Investments for which no official closing price or last reported sales price are reported are generally valued at the mean between the most recent bid and ask prices obtained from approved pricing services, established market makers, or from broker-dealers.
Foreign Equity Investments
For foreign equity investments, the Trust generally uses the official closing price or the last reported sale price from the principal foreign exchanges. The Trust then may adjust for market events occurring between the close of certain foreign exchanges and the close of the NYSE. The Trust has retained an independent statistical analysis service approved by the Board to assist in determining the value of certain foreign equity investments. This service utilizes proprietary computer models based on historical performance of markets and other considerations to determine adjustments for market events. Quotations of foreign investments in foreign currencies and those valued using forward currency rates are converted into U.S. dollar equivalents using a foreign exchange quotation from an approved source.
Exchange Traded Futures Contracts, Option Contracts, and Swap Agreements
Exchange traded futures contracts, option contracts, and swap agreements are generally valued at the mean between the most recent bid and ask prices obtained from approved pricing services, established market makers, or from broker-dealers. Exchange traded futures contracts, option contracts, and swap agreements for which no approved pricing services are available, are generally valued using the settlement price determined by the relevant exchange.
Over-the-Counter (“OTC”) Investments
OTC investments (including forward commitments, swap agreements and option contracts) are generally valued by approved pricing services that use evaluated prices from various observable market and other factors. Certain OTC swap agreements are valued using industry pricing models, broker quotes or other methodologies pursuant to the Trust’s Valuation Policy. Forward foreign currency contracts are generally valued using the mean between broker-dealer bid and ask quotations, and foreign currency exchange rates are gathered from approved pricing services.
Domestic and Foreign Debt Investments
Debt investments, including short-term debt, are generally valued using the mean between bid and ask prices provided by approved pricing and quotation services, which are based upon evaluated prices determined from various observable market and other factors. Certain debt investments are valued by using a benchmark, matrix, or other pricing methodology approved pursuant to the Valuation Policy. Generally, the prices are obtained from approved pricing sources or services as of 4:00 p.m. Eastern Time.
Investments in Mutual Funds
Fund investments in affiliated or unaffiliated mutual funds are valued at their respective published NAVs.
Investment Values Determined by a Valuation Committee
The Trust’s Valuation Policy includes methodologies approved for valuing investments in circumstances where market quotations are not readily available. In such circumstances, the Valuation Policy provides that the value of such investments may be determined in accordance with Board approved formulas and methodologies (“Alternate Valuation Methodologies”). Under the Valuation Policy these Alternate Valuation Methodologies may include, among others, amortized cost, the use of broker quotes, the use of purchase prices, last reported sale/trade prices, and benchmark, proxy, and matrix pricing. In the event market quotations or Alternate Valuation Methodologies are not readily available or are determined to be unreliable, the value of the investments will be determined in good faith by the TVC, or determined by the VOC or its delegate pursuant to the Valuation Policy and then subsequently submitted for approval or ratification to either the TVC or the Board. Valuations determined by the TVC or the VOC or its delegate may require subjective inputs about the value of such investments. While these valuations are intended to estimate the value, a Fund might reasonably expect to receive upon the current sale of the investments in the ordinary course of business, such values may differ from the value that a Fund would actually realize if the investments were sold or values that would be obtained if a different valuation methodology had been used.
Market quotations are considered not readily available if: (i) the market quotations received are deemed unreliable or inaccurate, (ii) approved pricing services do not provide a valuation for a particular investment, or (iii) material events occur after the close of the principal market for a particular investment but prior to the scheduled close of the NYSE.
D. FAIR VALUE MEASUREMENTS AND DISCLOSURES
The Trust characterizes its investments as Level 1, Level 2, or Level 3 based upon the various inputs or methodologies used to value the investments. Under the Valuation Policy, the VOC determines the level in which each investment is characterized. The VOC includes
D-3
Table of Contents
PACIFIC FUNDS
NOTES TO FINANCIAL STATEMENTS (Continued)
investment, legal, and compliance members of the Trust’s Investment Adviser, accounting members of the Trust’s Administrator (see Note 6), and the Trust’s Chief Compliance Officer (“CCO”). The three-tier hierarchy of inputs is summarized in the three broad levels listed below:
| • Level 1 - | Quoted prices (unadjusted) in active markets for identical investments |
| • Level 2 - | Significant observable market-based inputs, other than Level 1 quoted prices, or unobservable inputs that are corroborated by market data |
| • Level 3 - | Significant unobservable inputs that are not corroborated by observable market data |
The VOC reviews the Valuation Policy periodically (at least annually) to determine the appropriateness of the pricing methodologies used to value each Fund’s investments. The VOC also periodically evaluates how the Trust’s investments are characterized within the three-tier hierarchy and the appropriateness of third party pricing sources. The VOC also periodically (at least annually) conducts back-testing of the value of various Level 2 and Level 3 investments to evaluate the effectiveness of the pricing methodologies including the unobservable inputs used to value those investments. Such back-testing includes comparing Level 2 and Level 3 investment values to subsequently available exchange- traded prices, transaction prices, and/or observable vendor prices. All changes to the Valuation Policy are reported to the Board on a quarterly basis with material policy changes, as determined by the Trust’s CCO, requiring approval by the Board.
The inputs or methodologies used for characterizing each Fund’s investments within the three-tier hierarchy are not necessarily an indication of the relative risks associated with investing in those investments. Foreign equity investments that are valued with the assistance of a statistical research service approved by the Board (as described in Note 3C) and based on significant observable inputs are reflected as Level 2. Changes in valuation techniques may result in transfers into or out of an assigned level within the hierarchy. A summary of each Fund’s investments as of March 31, 2020, as categorized under the three-tier hierarchy of inputs, can be found in each Fund’s Schedule of Investments.
The following is a description of valuation inputs and techniques that the Trust currently utilizes to fair value each major category of assets and liabilities:
Equity Securities (Common and Preferred Stock) and Mutual Funds
Equity securities (foreign or domestic) that are actively traded on a securities exchange are fair valued based on quoted prices from the applicable exchange, and to the extent valuation adjustments are not applied to these securities, they are categorized as Level 1. Equity securities traded on inactive markets and certain foreign equity securities are fair valued using significant other observable inputs which include broker-dealer quotes, recently executed transactions adjusted for changes in the benchmark index, or evaluated price quotes received from pricing vendors that take into account the integrity of the market sector and issuer, the individual characteristics of the security, and information received from broker-dealers and other market sources pertaining to the issuer or security. To the extent that these inputs are observable and timely, the fair values of these securities would be categorized as Level 2; otherwise the fair values would be categorized as Level 3.
Investments in registered mutual funds, including affiliated registered mutual funds, are valued at their respective published NAV and are categorized as Level 1.
U.S. Treasury Obligations
U.S. Treasuries are fair valued based on pricing models that evaluate the mean between the most recently published bid and ask price from market data sources. The models also take into consideration yield curves and data received from active market makers and inter-dealer brokers. Yield curves change daily in response to market conditions and are generally obtained from the new issue market and broker-dealer sources. To the extent that these inputs are observable and timely, the fair values of U.S. Treasury obligations would be categorized as Level 2; otherwise the fair values would be categorized as Level 3.
Mortgage-Backed and Asset-Backed Securities
Mortgage-backed securities, including government sponsored enterprises, are fair valued using pricing models based on inputs that include issuer type, coupon, and cash flows, mortgage prepayment projection tables and adjustable rate mortgage evaluations that incorporate index data, periodic and life caps, the next coupon reset date, and the convertibility of the bond. To the extent that these inputs are observable and timely, the fair values of mortgage-backed securities would be categorized as Level 2; otherwise the fair value would be categorized as Level 3.
Asset-backed securities and collateralized mortgage obligations are fair valued using pricing models based on a security’s average life volatility. The models also take into account tranche characteristics such as coupon average life, collateral types, ratings, the issuer and tranche type, underlying collateral and performance of the collateral, and discount margin for certain floating rate issues. To the extent that these inputs are observable and timely, the fair values of asset-backed securities and collateralized mortgage obligations would be categorized as Level 2; otherwise the fair values would be categorized as Level 3.
Municipal Bonds
Municipal bonds are fair valued based on pricing models that take into account, among other factors, information received from market makers and broker-dealers, current trades, bid lists, offerings, market movements, the callability of the bond, state of issuance, benchmark yield curves, and bond insurance. To the extent that these inputs are observable and timely, the fair values of municipal bonds would be categorized as Level 2; otherwise the fair values would be categorized as Level 3.
Foreign Government Bonds and Notes
Foreign government bonds and notes are fair valued based on discounted cash flow models that incorporate option adjusted spreads along with benchmark curves and credit spreads. In addition, international bond markets are monitored daily for information pertaining to the issuer and/or the specific issue. To the extent that these inputs are observable and timely, the fair values of foreign government bonds and notes would be categorized as Level 2; otherwise the fair values would be categorized as Level 3.
D-4
Table of Contents
PACIFIC FUNDS
NOTES TO FINANCIAL STATEMENTS (Continued)
Corporate Bonds and Notes and U.S. Government Agency Issues
Corporate bonds held by a Fund are generally comprised of two main categories: investment grade bonds and high yield bonds. Investment grade bonds are reported at fair value using various inputs and techniques, which include broker-dealer quotations, live trading levels, recently executed transactions in securities of the issuer or comparable issuers, issuer credit information, and option-adjusted spread models where applicable. Fair values for high yield bonds are based primarily on broker-dealer quotations from relevant market makers and recently executed transactions in securities of the issuer or comparable issuers. The broker-dealer quotations received are supported by credit analysis of the issuer that takes into consideration credit quality assessments, daily trading activity, and the activity of the underlying equities, listed bonds, and sector-specific trends. To the extent that these inputs are observable and timely, the fair values of corporate bonds would be categorized as Level 2; otherwise the fair values would be categorized as Level 3.
U.S. Government Agency Issues are reported at fair value using various inputs and techniques, which include broker-dealer quotations, live trading levels, recently executed transactions in securities of the issuer, issuer credit information, and option-adjusted spread models where applicable. To the extent that these inputs are observable and timely, the fair values of U.S. Government Agency Issues would be categorized as Level 2; otherwise the fair values would be categorized as Level 3.
Futures Contracts
Futures contracts and options on futures contracts that are actively traded on commodity exchanges are fair valued based on quoted prices from the applicable exchange, and to the extent valuation adjustments are not applied to futures contracts, they are categorized as Level 1. To the extent that valuation adjustments are observable and timely, the fair values of futures contracts would be categorized as Level 2; otherwise the fair values would be categorized as Level 3.
Option Contracts
Exchange listed option contracts that are traded on securities exchanges are categorized as Level 2 if they are fair valued based on quoted prices from the applicable exchange, or when valuation adjustments are applied to option contracts, or such valuation adjustments are observable and timely, otherwise the fair values would be categorized as Level 3. OTC option contracts are fair valued based on either broker- dealer quotations or pricing models that incorporate various inputs such as interest rates, credit spreads, currency exchange rates and volatility measurements forin-the-money,at-the-money, andout-of-the-money contracts based on a given strike price. To the extent that these inputs are observable and timely, the fair values of OTC option contracts would be categorized as Level 2; otherwise the fair values would be categorized as Level 3.
Forward Foreign Currency Contracts
Forward foreign currency contracts are fair valued using the mean between broker-dealer bid and ask quotations, and forward foreign currency exchange rates gathered from leading market makers. To the extent that these inputs are observable and timely, the fair values of forward foreign currency contracts would be categorized as Level 2; otherwise the fair values would be categorized as Level 3.
Swap Agreements
Interest Rate Swaps –Interest rate swaps are fair valued using pricing models that are based on real-time snap shots of relevant interest rate curves that are built using the most actively traded securities for a given maturity. The pricing models also incorporate cash and money market rates. In addition, market data pertaining to interest rate swaps are monitored regularly to ensure that interest rates are properly depicting the current market rate. To the extent that these inputs are observable and timely, the fair values of interest rate swaps would be categorized as Level 2; otherwise the fair values would be categorized as Level 3.
Credit Default Swaps– Credit default swaps are fair valued using pricing models that take into account, among other factors, information received from market makers and broker-dealers, default probabilities from index specific credit spread curves, recovery rates, and cash flows. To the extent that these inputs are observable and timely, the fair values of credit default swaps would be categorized as Level 2; otherwise the fair values would be categorized as Level 3.
Total Return Swaps– Total return swaps are fair valued using pricing models that take into account among other factors, index spread curves, nominal values, modified duration values and cash flows. To the extent that these inputs are observable and timely, the fair values of total return swaps would be categorized as Level 2; otherwise the fair values would be categorized as Level 3.
Senior Loan Notes
Floating rate senior loan notes (“Senior Loans”) are fair valued based on a quoted price received from a single broker-dealer or an average of quoted prices received from multiple broker-dealers or valued relative to other benchmark securities when broker-dealer quotes are unavailable. To the extent that these inputs are observable, the fair values of Senior Loans would be categorized as Level 2; otherwise the fair values would be categorized as Level 3.
Unfunded loan commitments on senior loan participations and assignments, if any, are marked to market daily and valued according to the Trust’s valuation policies and procedures. Any outstanding unfunded loan commitments are presented in each applicable Fund’s Schedule of Investments. Any applicable net unrealized appreciation or depreciation at the end of the reporting period is recorded as an asset (unfunded loan commitment appreciation) or a liability (unfunded loan commitment depreciation) and any change in net unrealized appreciation or depreciation for the reporting period is recorded as a change in net unrealized appreciation or depreciation on unfunded loan commitment. As of March 31, 2020, the PF Managed Bond Fund had unfunded loan commitments of $7,558 (see details in the Notes to Schedules of Investments).
D-5
Table of Contents
PACIFIC FUNDS
NOTES TO FINANCIAL STATEMENTS (Continued)
4. INVESTMENTS AND RISKS
General Investment Risks
An investment in each Fund represents an indirect investment in the assets owned by that Fund. As with any mutual fund, the value of the assets owned by each Fund may move up or down, and as a result, an investment in a Fund at any point in time may be worth more or less than the original amount invested.
A Fund’s transactions in listed securities are settled/paid for upon delivery to or from their counterparties; therefore, the risk of counterparty default for listed securities is considered minimal, as delivery of securities sold is only made once a Fund has received payment. Payment is made on a purchase once the securities have been delivered by the counterparty. The trade will fail if either party fails to meet its obligations.
Market and Regulatory Risks
Events in the financial markets and economy may cause volatility and uncertainty and affect Fund performance. Such adverse effects on performance could include a decline in the value and liquidity of securities held by a Fund, unusually high and unanticipated levels of redemptions, an increase in portfolio turnover, a decrease in NAV, and an increase in Fund expenses. It may also be unusually difficult to identify investment risks and opportunities, in which case investment goals may not be met. Market events may affect a single issuer, industry, sector, or the market as a whole. In addition, because of interdependencies between markets, events in one market may adversely impact other markets or issuers in which a Fund invests in unforeseen ways. Traditionally liquid investments may experience periods of diminished liquidity. During a general downturn in the financial markets, multiple asset classes may decline in value and a Fund may lose value, regardless of the individual results of the securities and other instruments in which a Fund invests. It is impossible to predict whether or for how long such market events will continue, particularly if they are unprecedented, unforeseen or widespread events or conditions. Therefore, it is important to understand that the value of your investment may fall, sometimes sharply and for extended periods, and you could lose money.
Governmental and regulatory actions, including tax law changes, may also impair Fund management and have unexpected or adverse consequences on particular markets, strategies, or investments. Future market or regulatory events may impact a Fund in unforeseen ways, such as causing the Fund to alter its existing strategies or potentially, to liquidate and close.
Natural Disasters Risk
Natural disasters occur throughout the world and include events such as blizzards and ice storms, earthquakes, floods, hurricanes, pandemics, tidal waves, tornadoes, tsunamis, typhoons, volcanic eruptions, and wildfires. Although specific types of natural disasters may occur more frequently in certain geographic locations, such events are by their nature unpredictable and may cause sudden, severe and widespread damage that negatively impacts issuers, regions and economies in which a Fund invests. Should a Fund hold significant investments in, or have significant exposure to, an issuer, region or economy affected by a natural disaster, the Fund may lose money. Due to the interconnectedness of the global economy, natural disasters in one location may negatively impact issuers in other locations.
An outbreak of infectious respiratory illness caused by the novel coronavirus known as COVID-19 was declared a global pandemic by the World Health Organization in March 2020. COVID-19 has resulted in travel restrictions, closed international borders, enhanced health screenings, disruption and delays in healthcare services, prolonged quarantines, cancellations, temporary store closures, social distancing, government ordered curfews and business closures, disruptions to supply chains and consumer activity, shortages, highly volatile financial markets, and general concern and uncertainty. The impact of COVID-19 could adversely affect the economies and capital markets of many nations or the entire global economy, as well as individual companies, entire sectors, and securities and commodities markets (including liquidity), in ways that may not necessarily be foreseen at the present time, which could result in losses to a Fund.
LIBOR Phaseout Risk
In 2017, the United Kingdom’s Financial Conduct Authority, which regulates London Interbank Offered Rate (“LIBOR”), announced that it will no longer compel the banks to continue to submit the daily rates for the calculation of LIBOR after 2021 and warned that LIBOR may cease to be available or appropriate for use beyond 2021. After the global financial crisis, regulators globally determined that existing interest rate benchmarks should be reformed based on concerns that LIBOR and other Interbank Offered Rates (“IBOR”) were susceptible to manipulation. Replacement rates for various IBORs have been identified and include the Secured Overnight Financing Rate, which is intended to replace U.S. dollar LIBOR and measures the cost of overnight borrowings through repurchase agreement transactions collateralized with U.S. Treasury securities.
While various regulators and industry bodies are working globally on transitioning to selected alternative rates, there remains uncertainty regarding the future utilization of LIBOR and other IBORs, including the transition to, and nature of, any selected replacement rates. The transition process away from LIBOR may involve, among other things, increased volatility or illiquidity in markets for instruments that currently rely on LIBOR. The transition process may also result in a reduction in the value of certain instruments held by a Fund or reduce the effectiveness of related Fund transactions such as hedges. Volatility, the potential reduction in value, and/or the hedge effectiveness of financial instruments may be heightened for financial instruments that do not include fallback provisions that address the cessation of LIBOR. Any potential effects of the transition away from LIBOR on any of the Funds or on financial instruments in which a Fund invests, as well as other unforeseen effects, could result in losses to a Fund.
Equity Investments
Stock markets are volatile. Equity investments tend to go up or down in value, sometimes rapidly and unpredictably, in response to many factors, including a company’s historical and prospective earnings, the value of its assets, general economic conditions, interest rates, investor perceptions, and market liquidity. Due to the complexities of markets, events in one market or sector may adversely impact other markets or sectors.
D-6
Table of Contents
PACIFIC FUNDS
NOTES TO FINANCIAL STATEMENTS (Continued)
Debt Investments
Debt investments are subject to many risks, including, but not limited to, interest rate risk, credit risk, market and regulatory risk, price volatility, and liquidity risk, which may affect their value. Many debt securities give the issuer the right to redeem (“call”) the security prior to maturity. If an issuer calls a security in which a Fund has invested, the Fund may not recoup the full amount of its initial investment in the security and may be forced to reinvest prepayment proceeds at a time when yields on securities available in the market are lower than the yield on the called security. There is a risk that an issuer or guarantor of a debt investment might be unable or unwilling to meet its financial obligations and might not make interest or principal payments on an instrument when those payments are due (“default”). Defaults may potentially reduce a Fund’s income or ability to recover amounts due and may reduce the value of the debt investment, sometimes dramatically. High yield/high risk or “junk” securities may be more volatile than higher rated securities. High yield/high risk securities (including loans) are typically issued by companies that are highly leveraged, less creditworthy, or financially distressed and are considered to be mostly speculative in nature (high risk), subject to greater liquidity risk, and subject to a greater risk of default than higher rated securities, especially during periods of economic uncertainty or during economic downturns. Debt investments, including bonds, fixed rate loans, and short-term instruments may be affected by changes in interest rates. Debt investments with longer durations tend to be more sensitive to changes in interest rates, making them more volatile than debt investments with shorter durations or floating or adjustable interest rates. The value of debt investments may fall when interest rates rise. Certain debt investments may be difficult to value, purchase, and sell, particularly during adverse market conditions, because there is a limited market for the investment or there are restrictions on resale.
Given the historically low interest rate environment in the U.S., risks associated with rising interest rates are heightened. The negative impact on debt investments from potential interest rate increases could be swift and significant, including falling market values, increased redemptions and reduced liquidity. Substantial redemptions from bond and other income funds may worsen that impact. Additionally, regulations applicable to and changing business practices of broker-dealers that make markets in debt investments may result in those broker-dealers restricting their market making activities for certain debt investments, which may reduce the liquidity and increase the volatility of such debt investments.
Certain asset-backed instruments, such as collateralized debt obligations, collateralized mortgage obligations, and other mortgage-related securities, structured investment vehicles, and other debt investments may have exposure to subprime loans or subprime mortgages, which are loans to persons with lower credit ratings. These instruments may present credit risk that is not transparent and that is greater than indicated by their ratings. The value of these instruments may be more acutely affected by downturns in the credit markets or the real estate market than certain other investments, and it may be difficult to value these instruments because of a thin secondary market.
Foreign and Emerging Markets Investments
Exposure to foreign markets can involve additional risks relating to market, economic, political, regulatory, geopolitical, or other conditions. These factors can make foreign investments more volatile and less liquid than U.S. investments. In addition, foreign markets can react differently to these conditions than the U.S. market. Markets and economies throughout the world are becoming increasingly interconnected, and conditions or events in one market, country or region may adversely impact investments or issuers in another market, country, or region. Investments in or exposure to investments in emerging market countries may be riskier than investments in or exposure to investments in U.S. and certain developed markets. Risk may be more enhanced for investments in or exposure to investments in frontier market countries.
The Funds may face potential risks associated with the United Kingdom’s vote on June 23, 2016 to leave the European Union (the “EU”), commonly referred to as “Brexit.” There are considerable uncertainties about the repercussions resulting from Brexit, including the impact on trade agreements, regulations, and treaties. While the United Kingdom stopped being a member of the European Union as of January 31, 2020, the exact time frame for the full implementation of the Brexit transition is unknown and may change. Brexit may also increase the likelihood that other EU members may decide to leave the EU. These potential consequences may result in increased market volatility and illiquidity in the United Kingdom, the EU, and other financial markets, as well as slower economic growth and fluctuations in exchange rates. Any of these events may have a significant adverse effect on global markets and economies, which in turn could negatively impact the value of the Funds’ investments.
The countries listed in the Schedules of Investments for individual investment holdings (each a “Holding”) are each considered the country of risk to which a Holding, and therefore the Fund, is exposed. Each Holding’s country of risk is obtained from a third-party source that uses factors such as reporting currency, sales/revenue and location of management of the Holding’s issuer to determine country of risk. The country of risk may not be exclusive, however, as there may be other countries of risk to which a Holding is exposed that are not disclosed, although the country identified is expected to be the primary country of risk for that Holding. A Holding is generally subject to greater country risk based on where it conducts business or is economically tied to rather than where it is formed or incorporated. Foreign markets risks may include currency risk, market and regulatory risk, liquidity risk, emerging markets risk, frontier markets risk and geographic focus risk, among other risks.
Senior Loan Participations and Assignments
Certain Funds may invest in Senior Loans of domestic or foreign corporations, partnerships, and other entities (“Borrowers”), the interest rates of which float or adjust periodically based upon a specified adjustment schedule, benchmark indicator, or prevailing interest rates. Senior Loans generally pay interest at rates which are periodically redetermined by reference to a base lending rate plus a premium. These base lending rates generally include prime rates of one or more major U.S. banks, LIBOR, Secured Overnight Financing Rate, or certificates of deposit rates. Senior Loans often require prepayments from excess cash flow or permit the Borrower to repay at its election. The degree to which Borrowers repay cannot be predicted with accuracy. As a result, the actual maturity may be substantially less than the stated maturities. Senior Loans are exempt from registration under the Securities Act of 1933, may contain certain restrictions on resale, and cannot be sold publicly. A Fund’s investments in Senior Loans may be in the form of participations in loans or assignments of all or a portion of loans from third parties.
A significant portion of the floating rate loans held by a Fund may be “covenant lite” loans that contain fewer or less restrictive constraints on the borrower or other borrower-friendly characteristics and offer less protections for investors than covenant loans. As compared to a loan instrument that contains numerous covenants that allow lenders the option to force the borrowers to negotiate terms if risks became elevated,
D-7
Table of Contents
PACIFIC FUNDS
NOTES TO FINANCIAL STATEMENTS (Continued)
the majority of new floating rate loans that are issued are “covenant lite” loans which tend to have fewer or no financial maintenance covenants and restrictions. A covenant lite loan typically contains fewer clauses which allow an investor to proactively enforce financial covenants or prevent undesired actions by the borrower/issuer, including the ability to make an acquisition, pay dividends or issue additional debt if they have met certain loan terms. Covenant lite loans also generally provide fewer investor protections if certain criteria are breached, such as permitting an investor to declare a default (and therefore receive collateral), or to force restructurings and other capital changes on struggling borrowers/issuers. A Fund may experience losses or delays in enforcing its rights on its holdings of covenant lite loans.
When a Fund purchases assignments, it acquires all the rights and obligations under the loan agreement of the assigning lender. Assignments may, however, be arranged through private negotiations between potential assignees and potential assignors, and the rights and obligations acquired by the purchaser of an assignment may differ from, and be more limited than those held by the assigning lender.
When a Fund purchases a participation of a Senior Loan interest, the Fund typically enters into a contractual agreement with the lender or other third party selling the participation. A participation interest in Senior Loans includes the right to receive payments of principal, interest, and any fees to which it is entitled from the lender and only upon receipt by the lender of payments from the Borrower, but not from the Borrower directly. When investing in a participation interest, if a Borrower is unable to meet its obligations under a loan agreement, a Fund generally has no right to enforce compliance with the terms of the loan agreement. As a result, the Fund assumes the credit risk of the Borrower, the selling participant, and any other persons that are interpositioned between the Fund and the Borrower. If the lead lender in a typical lending syndicate becomes insolvent, enters Federal Deposit Insurance Corporation (“FDIC”) receivership or, if not FDIC insured, enters into bankruptcy, the Fund may incur certain costs and delays in receiving payment or may suffer a loss of principal and/or interest. As of March 31, 2020, no participation interest in Senior Loans was held by any of the Funds presented in these financial statements.
Inflation-Indexed Bonds
Certain Funds may invest in inflation-indexed bonds. Inflation-indexed bonds are debt securities whose principal value is periodically adjusted to the rate of inflation. The interest rate on these bonds is generally fixed at issuance at a rate lower than typical bonds. Over the life of an inflation-indexed bond, however, interest will be paid based on a principal value, which is adjusted for inflation. Any increase or decrease in the principal amount of an inflation-indexed bond will result in an adjustment to interest income.
Mortgage-Related and Other Asset-Backed Securities
Certain Funds may invest in mortgage-related and other asset-backed securities. These securities could include mortgage pass-through securities, collateralized mortgage obligations (“CMOs”), collateralized loan obligations (“CLOs”), mortgage dollar rolls, CMO residuals, stripped mortgage-backed securities (“SMBS”), and other securities that directly or indirectly represent a participation in, or are secured by and payable from, mortgage loans secured by real property. Mortgage-related and other asset-backed securities are debt securities issued by a corporation, trust, or custodian, or by a U.S. Government agency or instrumentality, that are collateralized by a pool of mortgages, mortgage pass-through securities, U.S. Government securities or other assets. The value of some mortgage-related and asset-backed securities may be particularly sensitive to changes in prevailing interest rates. Early repayment of principal on some mortgage-related securities may expose a Fund to a lower rate of return upon reinvestment of principal. The value of these securities may fluctuate in response to the market’s perception of the creditworthiness of the issuers. Additionally, although mortgage and mortgage-related securities are generally supported by some form of government or private guarantee and/or insurance, there is no assurance that private guarantors or issuers will meet their obligations.
SMBS represent a participation in, or are secured by and payable from, mortgage loans on real property, and may be structured in classes with rights to receive varying proportions of principal and interest. SMBS include interest-only securities (“IOs”), which receive all of the interest, and principal-only securities (“POs”), which receive the entire principal. The cash flows and yields on IOs are extremely sensitive to the rate of principal payments (including prepayments) on the underlying mortgage loans. If the underlying mortgages experience higher than anticipated prepayments, an investor in IOs of SMBS may fail to recoup fully its initial investment, even if the IOs are highly rated or are derived from securities guaranteed by the U.S. Government. Unlike other debt and other mortgage-backed securities, the market value of IOs tends to move in the same direction as interest rates. As prepayments on the underlying mortgages of POs increase, the yields on POs increase. Payments received from IOs are recorded as interest income. Because principal will not be received at the maturity of an IO, adjustments are made to the book value of the security on the coupon date until maturity. These adjustments are included in interest income. Payments received from POs are treated as reductions to the cost and par value of the securities. Any excess principal paydown gains or losses associated with the payments received are recorded as interest income.
U.S. Government Securities
Certain Funds may invest in securities issued by U.S. Government agencies or government-sponsored enterprises. U.S. Government securities are obligations of, and in certain cases, guaranteed by the U.S. Government, its agencies, or instrumentalities. Some U.S. Government securities, such as Treasury Bills, Treasury Notes, Treasury Bonds, and securities guaranteed by GNMA (or “Ginnie Mae”), are supported by the full faith and credit of the U.S. Government; others, such as those of the Federal Home Loan Bank, are supported by the right of the issuer to borrow from the U.S. Department of the Treasury (the “U.S. Treasury”); others, such as those of the Federal National Mortgage Association (“FNMA” or “Fannie Mae”), are supported by the discretionary authority of the U.S. Government to purchase the agency’s obligations. Securities not backed by the full faith and credit of the U.S. Government may be subject to a greater risk of default. U.S. Government securities may include zero coupon securities, which do not distribute interest on a current basis and tend to be subject to greater risk than interest-paying securities of similar maturities.
Government-related guarantors (i.e., not backed by the full faith and credit of the U.S. Government) include FNMA and the Federal Home Loan Mortgage Corporation (“FHLMC” or “Freddie Mac”). FNMA and FHLMC are government-sponsored corporations, the common stocks of which are owned entirely by private stockholders. FNMA purchases conventional (i.e., not insured or guaranteed by any government agency) residential mortgages from a list of approved seller/servicers which include state and federally chartered savings and loan associations, mutual savings banks,
D-8
Table of Contents
PACIFIC FUNDS
NOTES TO FINANCIAL STATEMENTS (Continued)
commercial banks and credit unions, and mortgage bankers. Pass-through securities issued by FNMA are guaranteed as to timely payment of principal and interest by FNMA, but are not backed by the full faith and credit of the U.S. Government. FHLMC issues Participation Certificates (“PCs”), which are pass-through securities, each representing an undivided interest in a pool of residential mortgages. FHLMC guarantees the timely payment of interest and ultimate collection of principal, but PCs are not backed by the full faith and credit of the U.S. Government.
When-Issued Securities
Certain Funds may purchase and sell securities on a when-issued basis, including To Be Announced (“TBA”) securities. These transactions are made conditionally because a security, although authorized, has not yet been issued in the market. A commitment by a Fund is made regarding these transactions to purchase or sell securities for a predetermined price or yield, with payment and delivery taking place beyond the customary settlement period. A Fund may sell when-issued securities before they are delivered, which may result in a capital gain or loss. Risk may arise upon entering these contracts from the potential inability of a counterparty to meet the terms of their contracts, or if the issuer does not issue the securities due to political, economic, or other factors.
Delayed-Delivery Transactions Risk
Certain Funds may purchase or sell securities on a delayed-delivery basis, including TBA securities. Payment and delivery may take place after the customary settlement period for that security. The price or yield of the underlying securities is fixed at the time the transaction is negotiated. When delayed-delivery purchases are outstanding, a Fund will set aside, and maintain until the settlement date in a segregated account, liquid assets in an amount sufficient to meet the purchase price. When purchasing a security on a delayed-delivery basis, a Fund assumes the rights and risks of ownership of the security, including the risk of price and yield fluctuations, and takes such fluctuations into account when determining its NAV. A Fund may dispose of or renegotiate a delayed-delivery transaction after it is entered into, and may sell delayed-delivery securities before they are delivered, which may result in a capital gain or loss. When a Fund has sold a security on a delayed- delivery basis, the Fund does not participate in future gains and losses with respect to the security.
Repurchase Agreements
Certain Funds may enter into repurchase agreements with institutions that the Investment Adviser orsub-adviser has determined are creditworthy. Under the terms of a typical repurchase agreement, a Fund takes possession of an underlying security (collateral) subject to an obligation of the seller to repurchase, and a Fund to resell the security at an agreed upon price and time. Repurchase agreements permit a Fund to maintain liquidity and potentially earn income over periods of time that may be as short as overnight. The collateral for all repurchase agreements are held in safekeeping for the benefit of the Funds at the Trust’s custodian, or broker-dealer, or a designatedsub-custodian under atri-party repurchase agreement. All repurchase agreements entered into by a Fund are collateralized with cash or securities of a type that the Fund is permitted to hold. The collateral is evaluated daily to ensure its market value equals or exceeds the current market value of the repurchase agreements, including accrued interest, except in the case of a repurchase agreement entered into for the purposes of selling a security short, where the value of the collateral delivered to a Fund must equal or exceed 95% of the value of the repurchase price during the term of the repurchase agreement. The terms of a repurchase agreement entered into for the purposes of selling a security short may provide that the cash purchase price paid by a Fund is more than the value of the collateral received that it is obligated to return to the counterparty under the repurchase agreement. Since in such a transaction, a Fund normally will have used the collateral received to settle the short sale, a Fund will segregate liquid assets equal to the marked to market value of the collateral received that it is obligated to return to the counterparty under the repurchase agreement.
In the event of default on the obligation to repurchase a security held by a Fund as collateral, the Fund has the right to liquidate the security and apply the proceeds to the counterparty’s obligations to the Fund under the repurchase agreement. Upon an event of default under the repurchase agreement, if the seller defaults and the value of the collateral declines or if the seller enters an insolvency proceeding, realization of the collateral by the Fund may be delayed, limited, or wholly denied.
Borrowings and Other Financing Transactions
The following disclosures contain information on a Fund’s ability to lend or borrow cash or securities to the extent permitted under the 1940 Act, which may be viewed as borrowing or financing transactions by a Fund. The location and fair value amounts of these instruments are described below. For a detailed description of credit and counterparty risks that can be associated with borrowings and other financing transactions, see Note 5.
Reverse Repurchase Agreements –Certain Funds may enter into reverse repurchase agreements. In a reverse repurchase agreement, a Fund sells a security that it holds to a financial institution with an agreement to repurchase the same security at an agreed-upon price and date. Securities sold under reverse repurchase agreements are recorded as a liability. Interest payments made are recorded as a component of interest expense. In periods of increased demand for the security, a Fund may receive a fee for use of the security by the counterparty, which may result in interest income to the Fund. A reverse repurchase agreement involves the risk that the market value of the security sold by a Fund may decline below the repurchase price of the security. A Fund will segregate assets determined to be liquid by the manager or otherwise cover its obligations under reverse repurchase agreements.
Sale-Buybacks Financing Transactions– Certain Funds may enter into transactions referred to as sale-buybacks. A sale-buyback transaction consists of a sale of a security by a Fund to a financial institution, the counterparty, with a simultaneous agreement to repurchase the same or substantially the same security at an agreed-upon price and date. Such transactions are recorded as secured borrowings. A Fund is not entitled to receive principal and interest payments, if any, made on the security sold to the counterparty during the term of the agreement. The agreed- upon proceeds for securities to be repurchased by a Fund are recorded as a liability. A Fund will recognize net income represented by the price differential between the price received for the transferred security and the agreed-upon repurchase price. This is commonly referred to as the price drop. A price drop consists of (i) the foregone interest and inflationary income adjustments, if any, a Fund would have otherwise received had the security not been sold and (ii) the negotiated financing terms between a Fund and counterparty. Foregone interest and inflationary
D-9
Table of Contents
PACIFIC FUNDS
NOTES TO FINANCIAL STATEMENTS (Continued)
income adjustments, if any, are recorded as components of interest income. Interest payments based upon negotiated financing terms made by the Fund to counterparties are recorded as a component of interest expense. In periods of increased demand for the security, a Fund may receive a fee for use of the security by the counterparty, which may result in interest income to a Fund. A Fund will segregate assets determined to be liquid or otherwise cover its obligations under sale-buyback transactions.
Short Sales –Certain Funds may enter into short sales. A short sale is a transaction in which a Fund sells securities it does not own. A Fund’s use of short sales involves the risk that the price of the security in the open market may be higher when purchased to close out the Fund’s short position, resulting in a loss to the Fund. Such a loss is theoretically unlimited because there is no limit on the potential increase in the price of a security or guarantee as to the price at which the manager would be able to purchase the security in the open market.
When a Fund sells securities short, it must borrow those securities to make delivery to the buyer. The Fund incurs an expense for such borrowing. The Fund may be required to pledge a portion of its assets to the broker as collateral for the borrowed securities. The Fund may not be able to purchase a security that it needs to deliver to close out a short position at an acceptable price. This may result in losses and/or require the Fund to sell long positions before the manager had intended. A Fund may not be able to successfully implement its short sale strategy, which may limit its ability to achieve its investment goal, due to limited availability of desired or eligible securities, the cost of borrowing securities, regulatory changes limiting or barring short sales, or for other reasons. Securities sold in short sale transactions and the interest and dividends payable on such securities, if any, are recorded as a liability.
The use of proceeds received from selling short to purchase additional securities (long positions) results in leverage, which may increase a Fund’s exposure to long positions. Leverage could magnify gains and losses and, therefore, increase a Fund’s volatility.
Segregation and Collateral Risk
If a Fund engages in certain transactions, such as derivative investments, repurchase agreements, orrepurchase-to-maturity transactions accounted for as secured borrowings, it may require collateral in the form of cash or investments to be held in segregated accounts at the Trust’s custodian, with an exchange or clearing member firm, or segregated on the Fund’s books and records maintained by the custodian and/ or the manager of the Fund. In each instance that segregation of collateral is required, it is done so in accordance with the 1940 Act and/or any interpretive guidance issued by the SEC. In the event of the counterparty default on the transaction, a Fund has the right to liquidate the collateral and apply the proceeds to the counterparty’s obligations to that Fund. Upon an event of default, if the seller defaults and the value of the collateral declines, or if the seller enters an insolvency proceeding, realization of the collateral by the Fund may be delayed, limited or wholly denied. There is also a possibility that a Fund could experience a delay in selling investments that are segregated as collateral.
5. DERIVATIVE INVESTMENTS AND RISKS, AND ENFORCEABLE MASTER NETTING ARRANGEMENTS
A. PRINCIPAL MARKET RISKS MANAGED BY INVESTING IN DERIVATIVES
Derivative instruments are investments whose values are tied to the value of an underlying security or asset, a group of assets, interest rates, exchange rates, currency or an index. Certain Funds are permitted to invest in derivative instruments, including, but not limited to, futures contracts, option contracts, forward foreign currency contracts, and swap agreements. Derivatives may have little or no initial cash investment value relative to their market value exposure and therefore can produce significant gains or losses in excess of their cost. This is sometimes referred to as leverage. Leverage can magnify a Fund’s gains and losses and therefore increase its volatility. A Fund’s investments in derivatives may increase, decrease or change the level or types of exposure to certain risk factors. The primary risks a Fund may attempt to manage through investing in derivative instruments include, but are not limited to, interest rate, foreign investments and currency, price volatility, and credit (including counterparty) risks.
Interest Rate Risk– A Fund may be exposed to interest rate risk through investments in debt securities. Interest rate risk is the risk that debt securities will decline in value as a result of changes in interest rates. For example, the value of bonds, fixed rate loans and short-term money market instruments may decline in value when interest rates rise. In a low interest rate environment, the risks associated with rising interest rates are heightened. Debt securities with longer durations tend to be more sensitive to changes in interest rates, making them more volatile than debt securities with shorter durations or money market instruments. Therefore, duration is a potentially useful tool to measure the sensitivity of a debt security’s yield (market price to interest rate movement). To manage these risks, certain Funds may invest in derivative instruments tied to interest rates.
Foreign Investments and Currency Risk –A Fund may be exposed to foreign investments and/or currency risk through direct investment in securities or through options, futures or currency transactions. The prices of foreign securities that are denominated in foreign currencies are affected by the value of the U.S. dollar. With respect to securities denominated in foreign currencies, in general, as the value of the U.S. dollar rises, the U.S. dollar price of a foreign security will fall. As the value of the U.S. dollar falls, the U.S. dollar value of the foreign security will rise. Currency rates in foreign countries may fluctuate significantly over short periods of time for a number of reasons. Foreign investments may be riskier than U.S. investments for many reasons, including changes in currency exchange rates, unstable political and economic conditions, a lack of adequate and timely company information, differences in the way securities markets operate, relatively lower market liquidity, less stringent financial reporting and accounting guidance and controls, less secure foreign banks or securities depositories than those in the U.S., foreign taxation issues, and foreign controls on investments. As a result, a Fund’s investments in foreign currency-denominated securities and other foreign investments may reduce the returns of the Fund. To manage these risks, certain Funds may invest in derivative instruments tied to foreign investments and/or currencies.
Price Volatility Risk –Derivatives tied to equity and debt securities are exposed to potential price volatility. Debt securities are affected by many factors, including prevailing interest rates, market conditions, and market liquidity. Volatility of below investment grade debt securities (including loans) may be relatively greater than for investment grade debt securities. Equity securities tend to go up or down in value, sometimes rapidly and unpredictably. The prices of equity securities change in response to many factors, including a company’s historical and prospective earnings, the value of its assets, general economic conditions, interest rates, investor perceptions, and market liquidity. Due to the complexities of markets,
D-10
Table of Contents
PACIFIC FUNDS
NOTES TO FINANCIAL STATEMENTS (Continued)
events in one market or sector may adversely impact other markets or sectors. To manage these risks, certain Funds may invest in various derivative instruments. Derivative instruments may be used to manage a Fund’s exposure to price volatility risk but may also be subject to greater price volatility than investments in traditional securities. The value of commodity-linked derivative instruments may be affected by changes in overall market movements, commodity index volatility, changes in interest rates, or factors affecting a particular industry or commodity, such as drought, floods, weather, livestock disease, embargoes, tariffs, and international economic, political, and regulatory developments.
Credit and Counterparty Risk –Credit risk is the risk that a debt security’s issuer (or borrower or counterparty) will be unable or unwilling to meet its financial obligations (e.g., may not be able to make principal and/or interest payments when they are due or otherwise default on other financial terms) and/or may go bankrupt. This is also sometimes described as counterparty risk. A Fund may lose money if the issuer or guarantor of debt security, or counterparty of a derivative contract, repurchase or reverse repurchase agreement, or a loan of Fund securities, is unable or unwilling to make timely principal and/or interest payments, or to otherwise honor its obligations. A Fund may attempt to minimize concentrations of credit risk by undertaking transactions with a large number of borrowers or counterparties on recognized and reputable exchanges. A Fund’s investments in debt investments may range in quality from those rated in the lowest category in which it is permitted to invest to those rated in the highest category by a rating agency, or if unrated, determined by the manager to be of comparable quality.
Similar to credit risk, a Fund may be exposed to counterparty risk, or the risk that an institution or other entity with which a Fund has unsettled or open transactions will default. Financial assets of counterparties, which potentially expose a Fund to counterparty risk, consist mainly of cash due from counterparties and investments. Certain managers may attempt to minimize credit risks to the Funds by performing extensive reviews of each counterparty, entering into transactions with counterparties that the manager believes to be creditworthy at the time of the transaction and requiring the posting of collateral in applicable transactions. To manage these risks, certain Funds may invest in derivative instruments tied to a security issuers’ financial strength.
B. DERIVATIVE INVESTMENTS
In addition to managing the market risks described above, certain Funds, if permitted by their investment objectives, may also invest in derivatives for purposes of hedging, duration management, to gain exposure to specific investment opportunities, as a substitute for securities, to enhance returns, or to otherwise help achieve a Fund’s investment goal. Each derivative instrument and the reasons a Fund invested in derivatives during the reporting period are discussed in further detail below.
Futures Contracts –A futures contract is a commitment to buy or sell a specific amount of a financial instrument or commodity at a negotiated price on a specified future date. Futures contracts are subject to the possibility of illiquid markets, and the possibility of an imperfect correlation between the value of the instruments and the underlying securities. Initial margin is deposited with a futures broker upon entering into futures contracts and can be funded with either cash or securities, in accordance with the initial margin requirements of the broker or the exchange. During the period a futures contract is open, changes in the value of the contract are recognized as unrealized appreciation or depreciation bymarking-to-market on a daily basis to reflect the market value of the contract at the end of each day’s trading. Variation margin receivables or payables represent the difference between the change in unrealized appreciation and depreciation on the open contracts and the cash deposits made on the margin accounts. When the contract is closed, a Fund records a realized gain or loss equal to the difference between the proceeds from (or cost of) the closing transaction and the Fund’s cost of the contract. Futures contracts are valued at the settlement price established each day by the board of trade or exchange on which they are traded.
During the reporting period, the following Funds entered into futures contracts for the following reasons: the PF Inflation Managed and PF Managed Bond Funds used futures contracts to manage interest rate risk exposure, as a substitute for cash bond exposure, and for purposes of liquidity. The PF Short Duration Bond Fund entered into interest rate futures to manage duration and yield curve exposure. The PF Multi-Asset Fund entered into futures contracts to gain exposure to various markets, for purposes of hedging, and as part of the Fund’s investment strategy. The PF Emerging Markets Fund utilized futures to gain market exposure with the cash generated during PLFA’s reallocation of assets for the funds-of-funds.
Option Contracts –An option contract is a commitment that gives the purchaser of the contract the right, but not the obligation, to buy or sell an underlying reference asset at a specific price on or before a specified future date. On the other hand, the writer of an option contract is obligated, upon the exercise of the option, to buy or sell an underlying reference asset at a specific price on or before a specified future date. A swaption is an option contract granting the owner the right to enter into an underlying swap. Inflation-capped options are options on U.S. inflation rates at a stated strike price. The seller of an inflation-capped option receives an upfront premium and in return the buyer receives the right to receive a payment at the expiration of the option if the cumulative annualized inflation rate over the life of the option is above (for caps) or below (for floors) the stated strike price. The purpose of inflation-capped options is to protect the buyer from inflation erosion above a certain rate on a given notional exposure. A floor can be used to give downside protection to investments in inflation-linked products below a certain rate on a given notional exposure. Writing put options or purchasing call options tends to increase a Fund’s exposure to the underlying instrument. Writing call options or purchasing put options tends to decrease a Fund’s exposure to the underlying instrument. When a Fund writes or purchases a call, put, or inflation-capped option, an amount equal to the premium received or paid by the Fund is recorded as a liability or an investment, respectively, and subsequently adjusted to the current market value, based on the quoted daily settlement price of the option written or purchased. Certain options may be written or purchased with premiums to be determined on a future date. The premiums for these options are based upon implied volatility parameters at specified terms. Premiums received or paid from writing or purchasing options, which expire unexercised, are treated by a Fund on the expiration date as realized gains or losses. The difference between the premium and the amount paid or received on a closing purchase or sale transaction, including brokerage commissions, is also treated as a realized gain or loss. If an option is exercised, the premium paid or realized is added to the cost of the purchase or proceeds from the sale in determining whether the Fund has realized a gain or loss on investment transactions. A Fund, as a writer of an option, may have no control over whether the underlying instrument may be sold (call) or purchased (put) and as a result bears the market risk of an unfavorable change in the price of the underlying written option. In addition, an illiquid market may make it difficult for a Fund to close out an option contract.
D-11
Table of Contents
PACIFIC FUNDS
NOTES TO FINANCIAL STATEMENTS (Continued)
The maximum risk of loss associated with writing put options is limited to the exercised fair value of the option contract. The maximum risk of loss associated with writing call options is potentially unlimited. Listed option contracts present minimal counterparty credit risk since they are exchange traded and the exchange’s clearinghouse, as counterparty to all exchange-traded options, guarantees the options against default. A Fund’s maximum risk of loss from counterparty credit risk related to OTC option contracts is limited to the premium paid.
During the reporting period, the following Funds entered into option contracts for the following reasons: the PF Inflation Managed Fund purchased and wrote options on futures, currencies, bond indices, and swaps as a means of capitalizing on anticipated changes in market volatility and to generate income. The PF Managed Bond Fund purchased and wrote options and swaptions on futures, bond indices, currencies, and swaps and also purchased options on TBAs as a means of capitalizing on anticipated changes in market volatility and to generate income. The PF Managed Bond Fund held inflation floors, and the PF Inflation Managed Fund held inflation caps and floors, to hedge duration.
Forward Foreign Currency Contracts –A forward foreign currency contract (“Forward Contract”) is a commitment to buy or sell a specific amount of a foreign currency at a negotiated price on a specified future date. Forward Contracts can help a Fund manage the risk of changes in currency exchange rates. The market value of a Forward Contract fluctuates with changes in foreign currency rates. These contracts aremarked-to-market daily at the applicable forward currency translation rates. A Fund records realized gains or losses at the time the Forward Contract is closed. A Forward Contract is extinguished through a closing transaction or upon delivery of the currency or entering an offsetting contract. A Fund’s maximum risk of loss from counterparty credit risk related to Forward Contracts is the fair value of the contract. The risk may be mitigated to some extent if a master netting arrangement between a Fund and the counterparty is in place and to the extent a Fund obtains collateral to cover the Fund’s exposure to the counterparty.
During the reporting period, the following Funds entered into forward foreign currency contracts for the following reasons: the PF Inflation Managed and PF Managed Bond Funds purchased and sold forward contracts in connection with settling planned purchases or sales of investments, to hedge and manage the currency exposure associated with some or all of the Funds’ investments, to manage interest rate risk and yield curve exposures, and as part of the investment strategy of these Funds. The PF Short Duration Bond Fund entered into Forward Contracts in order to decrease currency exposure. The PF Emerging Markets Debt Fund entered into Forward Contracts to gain exposure to various markets, for purposes of hedging, and as part of the Fund’s investment strategy.
Swap Agreements –Swap agreements are bilaterally negotiated agreements between the Funds and their counterparties to exchange swap investment cash flows, assets, foreign currencies or market-linked returns at specified intervals. Swap agreements are privately negotiated in the OTC market or are executed in a multilateral or other execution facility platform, such as a registered commodities exchange (“centrally cleared swaps”). In connection with these agreements, cash and securities may be identified as collateral in accordance with the terms of the respective swap agreements to provide assets of value and recourse in the event of default or bankruptcy/insolvency. Swaps aremarked-to-market daily based upon values received from third party vendors or quotations from market makers. Market values greater than zero are recorded as an asset and market values less than zero are recorded as a liability. The change in value of swaps, including accruals of periodic amounts of interest to be paid or received on swaps, is recorded as unrealized appreciation or depreciation. Daily changes in valuation of centrally cleared swaps, if any, are recorded as variation margin receivable or payable. OTC swap payments received or made at the beginning of the measurement period are recorded as an asset or liability and represent payments made or received upon entering into the swap agreement to compensate for differences between the stated terms of the swap agreement and prevailing market conditions (credit spreads, currency exchange rates, interest rates, and other relevant factors). These upfront payments are recorded as realized gain or loss when the swap is closed. A liquidation payment received or made at the termination of the swap is recorded as realized gain or loss. Net periodic payments received by a Fund are recorded as realized gain.
Interest Rate Swaps– Interest rate swap agreements involve the exchange by a Fund with another party of their respective commitments to pay or receive interest with respect to the notional amount of principal. Certain forms of interest rate swap agreements may include: (i) interest rate caps, under which, in return for a premium, one party agrees to make payments to the other to the extent that interest rates exceed a specified rate, or “cap”, (ii) interest rate floors, under which, in return for a premium, one party agrees to make payments to the other to the extent that interest rates fall below a specified rate, or “floor”, (iii) interest rate collars, under which a party sells a cap and purchases a floor or vice versa in an attempt to protect itself against interest rate movements exceeding given minimum or maximum levels, (iv) callable interest rate swaps, under which the counterparty may terminate the swap transaction in whole at zero cost by a predetermined date and time prior to the maturity date, (v) spreadlocks, which allow the interest rate swap users to lock in the forward differential (or spread) between the interest rate swap rate and a specified benchmark, or (vi) basis swaps, under which two parties can exchange variable interest rates based on different money markets.
A Fund investing in interest rate swaps is subject to the risk that there is no liquid market for these agreements, that the counterparties may default on their obligations to perform or disagree as to the meaning of the contractual terms in the agreements, or that there may be unfavorable changes in interest rates. A Fund’s maximum risk of loss from counterparty credit risk related to interest rate swaps is the discounted net value of the cash flows to be received from/paid to the counterparty over the contract’s remaining life, to the extent that the amount is positive. The risk may be mitigated to some extent if a master netting arrangement between a Fund and the counterparty is in place and to the extent a Fund obtains collateral to cover the Fund’s exposure to the counterparty.
During the reporting period, the following Funds entered into interest rate swap agreements for the following reasons: the PF Inflation Managed and PF Managed Bond Funds entered into interest rate swaps to manage nominal or real interest rate risk in various global markets, and as a substitute for cash bond exposure. The PF Emerging Markets Debt Fund entered into interest rate swaps to gain exposure to various markets, for purposes of hedging, and as part of the Fund’s investment strategy.
D-12
Table of Contents
PACIFIC FUNDS
NOTES TO FINANCIAL STATEMENTS (Continued)
Credit Default Swaps– Credit default swap agreements involve one party making a stream of payments (referred to as the buyer of protection) to another party (the seller of protection) in exchange for the right to receive a specified return in the event of a default or other credit event for the referenced entity, obligation or index. A Fund investing in credit default swaps is subject to the risk that there is no liquid market for these agreements, that the counterparties may default on their obligations to perform or disagree as to the meaning of the contractual terms in the agreements, or that there may be unfavorable changes in interest rates.
As a seller of protection, a Fund generally receives an upfront payment and/or a fixed rate of income throughout the term of the swap provided there is no credit event. As the seller, a Fund would effectively add leverage to the Fund because, in addition to the total net assets, a Fund would be subject to investment exposure on the notional amount of the swap.
If a Fund is a seller of protection and a credit event occurs, as defined under the terms of that particular swap agreement, a Fund will either (i) pay to the buyer of protection an amount equal to the notional amount of the swap and take delivery of the referenced obligation, other deliverable obligations or underlying securities comprising the referenced index, or (ii) pay a net settlement amount in the form of cash or securities equal to the notional amount of the swap less the recovery value of the referenced obligation or underlying securities comprising the referenced index. If a Fund is a buyer of protection and a credit event occurs, as defined under the terms of that particular swap agreement, a Fund will either (i) receive from the seller of protection an amount equal to the notional amount of the swap and deliver the referenced obligation, other deliverable obligations or underlying securities comprising the referenced index, or (ii) receive a net settlement amount in the form of cash or securities equal to the notional amount of the swap less the recovery value of the referenced obligation or underlying securities comprising the referenced index. Recovery values are assumed by market makers considering either industry standard recovery rates or entity specific factors and considerations until a credit event occurs. If a credit event has occurred, the recovery value is determined by a facilitated auction whereby a minimum number of allowable broker bids, together with a specified valuation method, are used to calculate the settlement value.
Credit default swap agreements on corporate and sovereign issues involve one party making a stream of payments to another party in exchange for the right to receive a specified return in the event of a default or other credit event. If a credit event occurs and cash settlement is not elected, a variety of other deliverable obligations may be delivered in lieu of the specific referenced obligation. The ability to deliver other obligations may result in acheapest-to-deliver option (the buyer of protection’s right to choose the deliverable obligation with the lowest value following a credit event).
Credit default swap agreements on asset-backed securities involve one party making a stream of payments to another party in exchange for the right to receive a specified return in the event of a default or other credit event. Unlike credit default swaps on corporate and sovereign issues, deliverable obligations in most instances would be limited to the specific referenced obligation as performance for asset-backed securities can vary across deals. Prepayments, principal paydowns, and other writedowns or loss events on the underlying mortgage loans will reduce the outstanding principal balance of the referenced obligation. These reductions may be temporary or permanent as defined under the terms of the swap agreement and the notional amount for the swap agreement will be adjusted by corresponding amounts.
Credit default swap agreements on credit indices involve one party making a stream of payments to another party in exchange for the right to receive a specified return in the event of a write-down, principal shortfall, interest shortfall or default of all or part of the referenced entities comprising the credit index. Credit default swap agreements on indices are benchmarks for protecting investors owning bonds against default. A credit index is a list of a basket of credit instruments or exposures designed to be representative of some part of the credit market as a whole. These indices are made up of reference credits that are judged by a poll of dealers to be the most liquid entities in the credit default swap market based on the sector of the index. Components of the indices may include, but are not limited to, investment grade securities, high yield securities, asset-backed securities, emerging markets, and/or various credit ratings within each sector. Credit indices are traded using credit default swaps with standardized terms including a fixed spread and standard maturity dates. An index credit default swap references all the names in the index, and if there is a default, the credit event is settled based on that name’s weight in the index. The composition of the indices changes periodically, usually every six months, and for most indices, each name has an equal weight in the index.
An implied credit spread is the spread in yield between a U.S. Treasury security and the referenced obligation or underlying investment that are identical in all respects except for the quality rating. Wider credit spreads, in absolute terms when compared to the notional amount of the swap, represent a deterioration of the referenced entity’s credit soundness and a greater likelihood or risk of default or other credit event occurring as defined under the terms of the agreement. Implied credit spreads, represented in absolute terms, utilized in determining the market value of credit default swap agreements on corporate and sovereign issues or U.S. Treasury obligation issues as of period end, are disclosed in the Notes to Schedules of Investments and serve as an indicator of the current status of the payment/performance risk and represent the likelihood or risk of default for the credit derivative. The implied credit spread of a particular referenced entity reflects the cost of buying/selling protection and may include upfront payments required to be made to enter into the agreement. For credit default swap agreements on asset- backed securities and credit indices, the quoted market prices and resulting values serve as the indicator of the current status of the payment/ performance risk.
A Fund may use pair trades of credit default swaps. Pair trades attempt to match a long position with a short position of two securities in the same market sector for hedging purposes. Pair trades of credit default swaps attempt to gain exposure to credit risk while hedging or offsetting the effects of overall market movements. For example, a Fund may purchase protection through a credit default swap referenced to the debt of an issuer, and simultaneously selling protection through a credit default swap referenced to the debt of a different issuer with the intent to realize gains from the pricing differences of the two issuers who are expected to have similar market risks.
A Fund may use spread curve trades by simultaneously purchasing and selling protection through credit default swaps referenced to the same issuer but with different maturities. Spread curves attempt to gain exposure to credit risk on a forward basis by realizing gains on the expected differences in spreads.
D-13
Table of Contents
PACIFIC FUNDS
NOTES TO FINANCIAL STATEMENTS (Continued)
A Fund’s maximum risk of loss from counterparty credit risk related to credit default swaps, either as the buyer or seller of protection, is the fair value of the contract. The risk may be mitigated to some extent if a master netting arrangement between a Fund and the counterparty is in place and to the extent a Fund obtains collateral to cover the Fund’s exposure to the counterparty.
The aggregate fair value of credit default swaps in a net liability position is reflected as unrealized depreciation and is disclosed in the Notes to Schedules of Investments. The collateral posted, net of assets received as collateral, for swap agreements is also disclosed in the Notes to Schedules of Investments. The maximum potential amount of future payments (undiscounted) that a Fund as a seller of protection could be required to make under a credit default swap agreement is an amount equal to the notional amount of the agreement. Notional amounts of all credit default swap agreements outstanding as of March 31, 2020 for which a Fund is the seller of protection are disclosed in the Notes to Schedules of Investments. These potential amounts are partially offset by any recovery values of the respective referenced obligations, upfront payments received upon entering into the agreement, or net amounts received from the settlement of buy protection credit default swap agreements entered into by a Fund for the same referenced entity or entities.
During the reporting period, the following Funds entered into credit default swap agreements for the following reasons: the PF Inflation Managed and PF Managed Bond Funds purchased credit protection through credit default swaps to reduce credit exposure to individual issuers, reduce broad credit risk, and to benefit from price differences between the credit default swap and cash bonds markets. The PF Managed Bond Fund also entered into credit default swaps and credit default swaps on credit indices to obtain exposure to the credit risk of individual securities or to the broader investment grade, high yield, emerging market, mortgage, or other asset classes. The PF Short Duration Bond Fund held index credit default swaps to add exposure to corporate credit risk.
Total Return Swaps– A Fund investing in total return swaps is subject to the risk that there is no liquid market for these agreements, that the counterparties may default on their obligations to perform or that there may be unfavorable changes in the value of the underlying index or reference instrument (generally caused by changes in interest rates or declines in credit quality). A total return swap agreement is one in which one party makes payments based on a set rate, either fixed or variable, while the other party makes payments based on the return of an underlying index or reference instrument, which includes both the income it generates and any capital gains. To the extent the total return of the index or reference instrument underlying the transaction exceeds or falls short of the offsetting interest rate obligation, a Fund will receive a payment from or make a payment to the counterparty. A Fund’s maximum risk of loss from counterparty credit risk related to total return swaps is the discounted net value of the cash flows to be received from or paid to the counterparty over the contract’s remaining life, to the extent that the amount is positive. The risk may be mitigated to some extent if a master netting arrangement between a Fund and the counterparty is in place and to the extent a Fund obtains collateral to cover a Fund’s exposure to the counterparty.
A Fund may enter into fully funded total return swaps which involves one party making an initial payment equal to the estimated value of the reference instrument. The parties to the swap then exchange respective commitments to pay or receive a net amount based on the change in the fair value of a reference instrument and a specified notional amount.
During the reporting period, the following Funds entered into total return swap agreements for the following reasons: the PF Multi-Asset Fund entered into total return swaps to gain exposure to various markets, for purposes of hedging, and as part of the Fund’s investment strategy.
The following is a summary of the location of fair value amounts of derivative investments, if any, disclosed in the Trust’s Statements of Assets and Liabilities. An exchange traded investment’s value reflects the cumulative value. Only the current day’s variation margin is reported on the Statements of Assets and Liabilities.
| Location on the Statements of Assets and Liabilities | ||||
| Derivative Investments Risk Type | Asset Derivative Investments | Liability Derivative Investments | ||
| Credit contracts | Outstanding purchased options, at value | Outstanding options written, at value | ||
| Equity contracts | Receivable: Variation margin on futures contracts | Payable: Variation margin on futures contracts | ||
| Interest rate contracts | Receivable: Variation margin on swap agreements Swap premiums paid Swap agreements appreciation | Payable: Variation margin on swap agreements Swap premiums received Swap agreements depreciation | ||
| Foreign currency contracts | Outstanding purchased options, at value | Outstanding options written, at value | ||
Receivable: Variation margin on futures contracts Receivable: Variation margin on swap agreements Swap premiums paid | Payable: Variation margin on futures contracts Payable: Variation margin on swap agreements Swap premiums received | |||
| Swap agreements appreciation | Swap agreements depreciation | |||
| Forward foreign currency contracts appreciation | Forward foreign currency contracts depreciation | |||
The following is a summary of fair values of derivative investments disclosed in the Trust’s Statements of Assets and Liabilities, categorized by primary risk exposure as of March 31, 2020:
Asset Derivative Investments Value | ||||||||||||||||||||
| Fund | Total Value at March 31, 2020 | Credit Contracts | Equity Contracts | Foreign Currency Contracts | Interest Rate Contracts | |||||||||||||||
| PF Inflation Managed | $887,263 | $74,562 | $— | $184,236 | $628,465 | |||||||||||||||
| PF Managed Bond | 11,853,973 | 62,706 | — | 2,955,167 | 8,836,100 | |||||||||||||||
| PF Short Duration Bond | 732,506 | 3,540 | — | — | 728,966 | |||||||||||||||
| PF Emerging Markets Debt | 491,622 | — | — | 469,412 | 22,210 | |||||||||||||||
| PF Multi-Asset | 14,553,179 | — | 14,553,179 | — | — | |||||||||||||||
D-14
Table of Contents
PACIFIC FUNDS
NOTES TO FINANCIAL STATEMENTS (Continued)
| Liability Derivative Investments Value | ||||||||||||||||||||
| Fund | Total Value at March 31, 2020 | Credit Contracts | Equity Contracts | Foreign Currency Contracts | Interest Rate Contracts | |||||||||||||||
| PF Inflation Managed | ($899,160 | ) | ($9,409 | ) | $— | ($141,109 | ) | ($748,642 | ) | |||||||||||
| PF Managed Bond | (12,971,798 | ) | (408,265 | ) | — | (2,563,905 | ) | (9,999,628 | ) | |||||||||||
| PF Short Duration Bond | (330,068 | ) | — | — | — | (330,068 | ) | |||||||||||||
| PF Emerging Markets Debt | (1,195,904 | ) | — | — | (1,195,904 | ) | — | |||||||||||||
| PF Multi-Asset | (120,805,498 | ) | — | (120,805,498 | ) | — | — | |||||||||||||
The following is a summary of the location of realized gains and losses and changes in net unrealized appreciation and depreciation on derivative investments, if any, disclosed in the Trust’s Statements of Operations:
| Derivative Investments Risk Type | Location of Gain (Loss) on Derivative Investments Recognized in the Statements of Operations | |
| Credit contracts | Net realized gain (loss) on futures contract transactions | |
| Equity contracts | Net realized gain (loss) on purchased option transactions | |
| Interest rate contracts | Net realized gain (loss) on swap transactions Net realized gain (loss) on written option transactions | |
| Change in net unrealized appreciation (depreciation) on futures contracts | ||
| Change in net unrealized appreciation (depreciation) on purchased options | ||
Change in net unrealized appreciation (depreciation) on swaps Change in net unrealized appreciation (depreciation) on written options | ||
| Foreign currency contracts | Net realized gain (loss) on forward foreign currency contract transactions | |
| Net realized gain (loss) on futures contract transactions | ||
Net realized gain (loss) on purchased option transactions Net realized gain (loss) on swap transactions | ||
| Net realized gain (loss) on written option transactions | ||
| Change in net unrealized appreciation (depreciation) on forward foreign currency contracts | ||
| Change in net unrealized appreciation (depreciation) on futures contracts | ||
| Change in net unrealized appreciation (depreciation) on purchased options | ||
| Change in net unrealized appreciation (depreciation) on swaps | ||
| Change in net unrealized appreciation (depreciation) on written options |
The following is a summary of each Fund’s net realized gain and/or loss and change in net unrealized appreciation and/or depreciation on derivative investments recognized in the Trust’s Statements of Operations categorized by primary risk exposure for the fiscal year ended March 31, 2020:
Realized Gain (Loss) on Derivative Investments Recognized in the Statements of Operations | ||||||||||||||||||||
| Fund | Total | Credit Contracts | Equity Contracts | Foreign Currency Contracts | Interest Rate Contracts | |||||||||||||||
| PF Inflation Managed | ($250,695 | ) | $27,753 | $— | $326,378 | ($604,826 | ) | |||||||||||||
| PF Managed Bond | 3,975,263 | 654,384 | — | (219,581 | ) | 3,540,460 | ||||||||||||||
| PF Short Duration Bond | 94,555 | 239 | — | 1,839 | 92,477 | |||||||||||||||
| PF Emerging Markets Debt | (656,616 | ) | — | — | (632,799 | ) | (23,817 | ) | ||||||||||||
| PF Multi-Asset | (24,044,388 | ) | — | (24,044,388 | ) | — | — | |||||||||||||
| PF Emerging Markets | (432,810 | ) | — | (432,810 | ) | — | — | |||||||||||||
Change in Net Unrealized Appreciation (Depreciation) on Derivative Investments Recognized in the Statements of Operations | ||||||||||||||||||||
| Fund | Total | Credit Contracts | Equity Contracts | Foreign Currency Contracts | Interest Rate Contracts | |||||||||||||||
| PF Inflation Managed | $33,410 | $66,272 | $— | ($2,294 | ) | ($30,568 | ) | |||||||||||||
| PF Managed Bond | 281,082 | (419,853 | ) | — | (754,291 | ) | 1,455,226 | |||||||||||||
| PF Short Duration Bond | 323,213 | 3,540 | — | (1,839 | ) | 321,512 | ||||||||||||||
| PF Emerging Markets Debt | (628,286 | ) | — | — | (668,078 | ) | 39,792 | |||||||||||||
| PF Multi-Asset | (101,694,276 | ) | — | (101,694,276 | ) | — | — | |||||||||||||
For financial reporting purposes, the Trust does not offset fair value amounts recognized for derivative instruments and fair value amounts recognized for the right to reclaim cash collateral (receivables) or the obligation to return cash collateral (payables) arising from derivative instruments recognized at fair value executed with the same counterparty under a master netting arrangement.
D-15
Table of Contents
PACIFIC FUNDS
NOTES TO FINANCIAL STATEMENTS (Continued)
The following is a summary of the average number of positions and values of derivative investments by derivative type for the fiscal year ended March 31, 2020:
| Average Positions and Values of Derivative Investments by Derivative Type | ||||||||||||||||||||||||||||||||||||||||||||
| Futures Contracts | Forward Contracts | Options Contracts | Swap Agreements | |||||||||||||||||||||||||||||||||||||||||
| Fund | Number of Positions | Value | Number of Positions | Value | Number of Positions | Value | Number of Positions | Value | ||||||||||||||||||||||||||||||||||||
PF Inflation Managed | 11 | ($60,746 | ) | 33 | ($4,688 | ) | 27 | ($13,357 | ) | 52 | ($15,130 | ) | ||||||||||||||||||||||||||||||||
PF Managed Bond | 35 | 571,687 | 66 | 263,690 | 91 | (142,384 | ) | 61 | (2,754,051 | ) | ||||||||||||||||||||||||||||||||||
PF Short Duration Bond | 4 | 118,069 | 1 | 368 | — | — | 1 | 708 | ||||||||||||||||||||||||||||||||||||
PF Emerging Markets Debt | — | — | 118 | (95,441 | ) | — | — | 4 | 2,296 | |||||||||||||||||||||||||||||||||||
PF Multi-Asset | 2 | 128,632 | — | — | — | — | 32 | 14,454,013 | ||||||||||||||||||||||||||||||||||||
The table shown above and the amounts of net realized gains and losses and changes in net unrealized appreciation and depreciation on derivative investments as disclosed in the Statements of Operations serve as indicators of volume of derivative activity for each applicable Fund for the fiscal year ended March 31, 2020.
C. ENFORCEABLE MASTER NETTING ARRANGEMENTS
Master Agreements and Netting Arrangements– Certain Funds are parties to various agreements, including but not limited to International Swaps and Derivatives Association Agreements and related Credit Support Annex, Master Repurchase Agreements, and Master Securities Forward Transactions Agreements (collectively “Master Agreements”), which govern the terms of certain transactions with select counterparties. These Master Agreements generally include provisions for general obligations, representations, agreements, collateral, and certain events of default or termination. These Master Agreements also include provisions for netting arrangements that help reduce credit and counterparty risk associated with relevant transactions (“netting arrangements”). The netting arrangements are generally tied to credit related events that, if triggered, would cause an event of default or termination giving a Fund or counterparty the right to terminate early and cause settlement, on a net basis, of all transactions under the applicable Master Agreement. In the event of an early termination as a result of an event of default under the Master Agreement, the total value exposure of all transactions will be offset against collateral exchanged to date, which would result in a net receivable or payable that would be due from or to the counterparty. However, bankruptcy or insolvency laws of a particular jurisdiction may impose restrictions on or prohibitions against the right of offset in the event of a bankruptcy or insolvency of the counterparty. Credit related events include, but are not limited to, bankruptcy, failure to make timely payments, restructuring, obligation acceleration, obligation default, a material decline in net assets, decline in credit rating or repudiation/moratorium. Any election made by a counterparty to early terminate the transactions under a Master Agreement could have a material adverse impact on a Fund’s financial statements. A Fund’s overall exposure to credit risk, subject to netting arrangements can change substantially within a short period, as it is affected by each transaction subject to the arrangement.
Master Agreements can also help limit counterparty risk by specifying collateral posting arrangements atpre-arranged exposure levels. Under the Master Agreements, collateral is routinely transferred if the total net exposure to certain transactions under the relevant Master Agreement with a counterparty in a given Fund exceeds a specified threshold, net of collateral already in place, which typically ranges from $0 to $250,000 depending on the counterparty and the type of Master Agreement. Collateral under the Master Agreements is usually in the form of cash or U.S. Treasury Bills but could include other types of securities. If permitted under the Master Agreement, certain funds may rehypothecate cash collateral received from a counterparty. The value of all derivative transactions outstanding under a Master Agreement is calculated daily to determine the amount of collateral to be received or pledged by the counterparty. Posting of collateral for OTC derivative transactions are covered undertri-party collateral agreements between the Trust, the Trust’s custodian, and each counterparty. Collateral for centrally cleared derivatives transactions are posted with the applicable derivatives clearing organization.
The following is a summary of financial and derivative instruments that are subject to enforceable master agreements with netting arrangements (or similar arrangements) and collateral received and pledged in connection with the master agreements with netting arrangements (or similar arrangements) as of March 31, 2020:
| Gross Amounts Presented in the Statements of Assets and Liabilities | Gross Amounts Not Offset in Statements of Assets and Liabilities | Gross Amounts Presented in the Statements of Assets and Liabilities | Gross Amounts Not Offset in Statements of Assets and Liabilities | ||||||||||||||||||||||||||||||||||||||||||
Description | Financial Instruments | Collateral Received | Net Amount | Financial Instruments | Collateral Pledged | Net Amount | |||||||||||||||||||||||||||||||||||||||
| Assets | Liabilities | ||||||||||||||||||||||||||||||||||||||||||||
PF Inflation Managed | |||||||||||||||||||||||||||||||||||||||||||||
Forward foreign currency contracts | $184,236 | ($101,788 | ) | $— | $82,448 | ($141,109 | ) | $101,788 | $— | ($39,321 | ) | ||||||||||||||||||||||||||||||||||
Option contracts | 75,893 | (67,347 | ) | — | 8,546 | (86,421 | ) | 67,347 | — | (19,074 | ) | ||||||||||||||||||||||||||||||||||
Sale-buyback financing transactions | (11,585,269 | ) | 11,585,269 | — | — | ||||||||||||||||||||||||||||||||||||||||
PF Managed Bond | |||||||||||||||||||||||||||||||||||||||||||||
Forward foreign currency contracts | 2,924,235 | (1,506,907 | ) | (931,824 | ) | 485,504 | (1,987,313 | ) | 1,506,907 | — | (480,406 | ) | |||||||||||||||||||||||||||||||||
Option contracts | 32,963 | (7,065 | ) | (1 | ) | 25,897 | (254,201 | ) | 7,065 | — | (247,136 | ) | |||||||||||||||||||||||||||||||||
Swap agreements | 55,216 | (834 | ) | (54,382 | ) | — | (16,721 | ) | 834 | — | (15,887 | ) | |||||||||||||||||||||||||||||||||
Sale-buyback financing transactions | (64,666,795 | ) | 64,187,729 | — | (479,066 | ) | |||||||||||||||||||||||||||||||||||||||
Reverse repurchase agreements | (6,180,500 | ) | — | 6,180,500 | — | ||||||||||||||||||||||||||||||||||||||||
D-16
Table of Contents
PACIFIC FUNDS
NOTES TO FINANCIAL STATEMENTS (Continued)
| Gross Amounts Presented in the Statements of Assets and Liabilities | Gross Amounts Not Offset in Statements of Assets and Liabilities | Gross Amounts Presented in the Statements of Assets and Liabilities | Gross Amounts Not Offset in Statements of Assets and Liabilities | ||||||||||||||||||||||||||||||||||||||||||
Description | Financial Instruments | Collateral Received | Net Amount | Financial Instruments | Collateral Pledged | Net Amount | |||||||||||||||||||||||||||||||||||||||
| Assets | Liabilities | ||||||||||||||||||||||||||||||||||||||||||||
PF Emerging Markets Debt | |||||||||||||||||||||||||||||||||||||||||||||
Forward foreign currency contracts | $ | 469,412 | ($275,703 | ) | $ | — | $ | 193,709 | ($1,195,904 | ) | $ | 275,703 | $ | 503,277 | ($416,924 | ) | |||||||||||||||||||||||||||||
PF Multi-Asset | |||||||||||||||||||||||||||||||||||||||||||||
Swap agreements | 12,706,953 | (9,935,723 | ) | (2,723,035 | ) | 48,195 | (120,323,362 | ) | 9,935,723 | 100,079,146 | (10,308,493 | ) | |||||||||||||||||||||||||||||||||
During the reporting period, certain Funds may have had investments in repurchase agreements. The gross value and related collateral received for these investments, if any, are presented in each applicable Fund’s Schedule of Investments and the value of these investments is also presented in the Statements of Assets and Liabilities. The value of the related collateral, if any, held by each applicable Fund presented in these financial statements, exceeded the value of the repurchase agreements as of March 31, 2020.
6. INVESTMENT ADVISORY, ADMINISTRATION AND SHAREHOLDER SERVICES, SUPPORT SERVICES, AND DISTRIBUTION AGREEMENTS
Pursuant to an Investment Advisory Agreement, PLFA, a wholly-owned subsidiary of Pacific Life Insurance Company (“Pacific Life”) serves as Investment Adviser to each Fund of the Trust. PLFA manages the PF Multi-Asset Fund. PLFA receives investment advisory fees from each Fund which are based on annual percentages of the average daily net assets of each Fund. Pursuant toSub-Advisory Agreements, the Trust and PLFA engage various investment management firms under PLFA’s supervision tosub-advise certain PF Underlying Funds presented in these financial statements. PLFA, as Investment Adviser of the Trust, pays related management fees to thesesub-advisers as compensation for theirsub-advisory services provided to the Trust. As of March 31, 2020, the investment advisory fees that PLFA receives from each Fund presented in these financial statements based upon an annual percentage of the average daily net assets of each Fund, and thesub-adviser of each Fund, are as follows:
| Fund | Advisory Fee Rate | Advisory Fee Waiver through July 31, 2020 | Sub-Adviser(s) | |||
| PF Inflation Managed | 0.40% | Pacific Investment Management Company LLC | ||||
| PF Managed Bond | 0.40% | Pacific Investment Management Company LLC and Western Asset Management Company, LLC(co-sub-advisers) | ||||
| PF Short Duration Bond | 0.40% | T. Rowe Price Associates, Inc. | ||||
| PF Emerging Markets Debt | 0.785% | 0.02% | Ashmore Investment Management Limited | |||
| PF Developing Growth | 0.60% | Lord, Abbett & Co. LLC | ||||
| PF Growth | 0.55% | MFS Investment Management | ||||
| PFLarge-Cap Value | 0.65% | ClearBridge Investments, LLC | ||||
| PFMid-Cap Equity | 0.65% | Rothschild & Co Asset Management US Inc. | ||||
| PF Multi-Asset | 0.35% | Pacific Asset Management LLC (effective December 31, 2019) | ||||
| PFSmall-Cap Value | 0.75% | AllianceBernstein L.P. | ||||
| PF Emerging Markets | 0.80% | Invesco Advisers, Inc. | ||||
| PF InternationalLarge-Cap | 0.85% | MFS Investment Management | ||||
| PF InternationalSmall-Cap | 0.85% | QS Investors, LLC | ||||
| PF International Value | 0.65% | Wellington Management Company LLP | ||||
| PF Real Estate | 0.90% | 0.15% | Principal Real Estate Investors, LLC |
Prior to January 1, 2020, the Trust compensated Pacific Life (the “Administrator”) for procuring or providing administrative, transfer agency, and shareholder services pursuant to an Administration and Shareholder Services Agreement. In addition, Pacific Life and PLFA provided support services to the Trust that were outside the scope of the Administrator’s and Investment Adviser’s responsibilities under the Administration and Shareholder Services Agreement and Investment Advisory Agreement.
Effective January 1, 2020, pursuant to the PF Administration Agreement with the Trust, the Administrator and PLFA perform, procure and/or oversee administrative services for each of the Funds. These services include, but are not limited to, procuring and overseeing transfer agency, dividend disbursement andsub-transfer agency services for the Trust, and any and all legal, compliance, and accounting support provided by Pacific Life and PLFA for the operations of the Trust and to permit the Trust to conduct business as described in its registration statement; and other services necessary for the administration of the Funds’ affairs.
Prior to January 1, 2020, under the Support Services Agreement, the Trust compensated Pacific Life and PLFA for their expenses in providing support services to the Trust in connection with various matters, some of which include the time spent by legal, accounting, and compliance personnel of Pacific Life and PLFA (including individuals who may be officers or Trustees of the Trust), to attend meetings of the Board and to provide assistance with the coordination and supervision in connection with the services procured for the Trust. Support services did not include services for which PLFA is responsible pursuant to the Investment Advisory Agreement. The Trust reimbursed Pacific Life and PLFA for these support services on an approximate cost basis. Effective January 1, 2020, the Support Services Agreement was terminated.
Pacific Life receives an administration fee from each Fund presented in these financial statements, based on an annual rate of 0.15% of average daily net assets of each Fund.
D-17
Table of Contents
PACIFIC FUNDS
NOTES TO FINANCIAL STATEMENTS (Continued)
Pursuant to a Distribution Agreement, Pacific Select Distributors, LLC (the “Distributor”), a wholly-owned subsidiary of Pacific Life, serves as distributor of the Trust’s shares. Under the Distribution Agreement, the Distributor bears all expenses of providing services, including costs of sales presentations, mailings, advertisements, and other marketing efforts by the Distributor in connection with the distribution or sale of the Trust’s shares and makes distribution and/or service payments to selling groups in connection with the sale of certain of the Trust’s shares and subsequent servicing needs of shareholders provided by selling groups. The Class P shares of the PF Underlying Funds presented in these financial statements are not subject to a distribution and/or service fee.
7. TRANSACTIONS WITH AFFILIATES
A. ADVISORY FEES, ADMINISTRATION FEES AND EXPENSES FOR SUPPORT SERVICES
The Investment Adviser, the Distributor, and Pacific Life are related parties. The advisory fees earned by the Investment Adviser, including any advisory fee waiver, the administration fees earned by Pacific Life, and expenses for support services recovered by PLFA and Pacific Life from each Fund presented in these financial statements for the fiscal year ended March 31, 2020 are presented in the Statements of Operations. The amounts of each of these fees that remained payable as of March 31, 2020 are presented in the Statements of Assets and Liabilities.
B. EXPENSE LIMITATION AGREEMENTS
To help limit the Trust’s expenses, PLFA has contractually agreed to reimburse each Fund presented in these financial statements for certain operating expenses that exceed an annual rate based on a percentage of a Fund’s average daily net assets (“expense cap”). These operating expenses include, but are not limited to: the administration fee and expenses; organizational expenses; custody expenses; expenses for external audit, tax, legal and accounting andsub-administration services; the preparation, printing, filing and mailing costs of prospectuses, shareholder reports, and other regulatory documents to existing shareholders, as applicable; and independent trustees’ fees and expenses. These operating expenses do not include: advisory fees; distribution and/or service fees; dividends on securities sold short; acquired fund fees and expenses; interest (including commitment fees); taxes (including foreign taxes on dividends, interest or gains); brokerage commissions and other transactional expenses; and expenses for extraordinary matters such as litigation expenses, liquidation expenses, reorganization expenses, and other expenses not incurred in the ordinary course of a Fund’s business. The expense cap for the PF Underlying Funds (except the PF Multi-Asset and PF InternationalSmall-Cap Funds) is 0.15% through July 31, 2020 and 0.30% thereafter through July 31, 2023. The expense cap for the PF Multi-Asset Fund is 0.16% through July 31, 2020. The expense cap for the PF InternationalSmall-Cap Fund is 0.25% through July 31, 2020.
There is no guarantee that PLFA will continue to cap expenses for a Fund upon the expiration of the expense cap. In addition, any expense reimbursements made by PLFA to a Fund are subject to recoupment by PLFA from such Fund in future periods, not to exceed three years from the date on which the reimbursement took place, provided that the recoupment, along with the other expenses subject to the expense cap, would be limited to the lesser of: (i) the expense cap in effect at the time of the reimbursement or (ii) the expense cap in effect at the time of recoupment. Any amounts repaid to PLFA will have the effect of increasing such expenses of the applicable Fund, but not above the expense cap. The amounts of adviser reimbursement to each applicable Fund presented in these financial statements for the fiscal year ended March 31, 2020 are presented in the Statements of Operations. Any amounts that remained due from the Investment Adviser as of March 31, 2020 are presented in the Statements of Assets and Liabilities.
The cumulative expense reimbursement amounts, if any, as of March 31, 2020 that are subject to recoupment by PLFA from the Funds presented in these financial statements are as follows:
| Fund | 3/31/2021 | 3/31/2022 | 3/31/2023 | |||||||||
PF Inflation Managed | $19,621 | $58,726 | $61,646 | |||||||||
PF Managed Bond | 540,942 | 443,715 | 472,703 | |||||||||
PF Short Duration Bond | 131,342 | 119,957 | 156,485 | |||||||||
PF Emerging Markets Debt | 77,724 | 124,856 | 133,378 | |||||||||
PF Developing Growth | 13,829 | 14,826 | 31,688 | |||||||||
PF Growth | 89,652 | 112,913 | 136,249 | |||||||||
PFLarge-Cap Value | 247,008 | 118,375 | 125,113 | |||||||||
PFMid-Cap Equity | 49,499 | 18,220 | 25,216 | |||||||||
PF Multi-Asset | 48,872 | 609,033 | 588,849 | |||||||||
PFSmall-Cap Value | 75,777 | 53,658 | 60,545 | |||||||||
PF Emerging Markets | 516,488 | 310,434 | 309,200 | |||||||||
PF InternationalLarge-Cap | 256,803 | 124,692 | 163,188 | |||||||||
PF InternationalSmall-Cap | 28,196 | 60,110 | 79,456 | |||||||||
PF International Value | 213,419 | 154,717 | 170,154 | |||||||||
PF Real Estate | 30,103 | 30,395 | 69,513 | |||||||||
|
|
|
|
|
| |||||||
Total | $2,339,275 | $2,354,627 | $2,583,383 | |||||||||
|
|
|
|
|
| |||||||
There was no recoupment of expense reimbursement by PLFA from any Funds presented in these financial statements for the fiscal year ended March 31, 2020.
C. INVESTMENTS IN AFFILIATED FUNDS
As of March 31, 2020, Pacific Life owned 100.00% of the total shares outstanding (aggregate of all share classes) of the PFMid-Cap Equity Fund.
D-18
Table of Contents
PACIFIC FUNDS
NOTES TO FINANCIAL STATEMENTS (Continued)
D. INDEPENDENT TRUSTEES
The Trust pays each independent trustee of the Board retainer fees and specified amounts as compensation for various Board and committee services and for chairing those committees. The fees and expenses of the independent trustees of the Board are presented in the Statements of Operations. Each independent trustee of the Board is eligible to participate in the Trust’s Deferred Compensation Plan (the “Plan”). The Plan allows each independent trustee to voluntarily defer receipt of all or a percentage of fees, which otherwise would be payable for services performed. Amounts in the deferral account are obligations of certain Funds of the Trust at the time of such deferral and are payable in accordance with the Plan. A Trustee who defers compensation has the ability to select credit rate options that track the performance, at NAV of Class A and Class P shares of certain series of the Trust without a sales load or at NAV of Class I shares of the Pacific Select Fund. Pacific Select Fund is a Delaware statutory trust and is registered under the 1940 Act as anopen-end management investment company. PLFA is the Investment Adviser to Pacific Select Fund. The obligation of certain Funds of the Trust under the Plan (the “DCP Liability”) is recorded as a liability (accrued trustees’ fees and expenses and deferred compensation). Accordingly, the market value appreciation or depreciation on a Fund’s DCP Liability account will cause the expenses of that Fund to increase or decrease due to market fluctuation. The change in net unrealized appreciation or depreciation on a Fund’s DCP Liability account is recorded as an increase or decrease to expenses (trustees’ fees and expenses). For the fiscal year ended March 31, 2020, such expenses decreased by $955 for all applicable Funds of the Trust presented in these financial statements as a result of the market value depreciation on such accounts. As of March 31, 2020 the total amount in the DCP Liability accounts was $50,103 for all applicable Funds of the Trust presented in these financial statements.
E. OFFICERS OF THE TRUST
None of the officers of the Trust received compensation from the Trust.
F. INDEMNIFICATIONS
Under the Trust’s organizational documents, its officers and trustees are indemnified against certain liabilities arising out of performance of their duties to the Trust. In addition, the Trust entered into an agreement with each of the trustees which provides that the Trust will indemnify and hold harmless each trustee against any expenses actually and reasonably incurred by any trustee in any proceeding arising out of or in connection with the trustee’s services to the Trust, to the fullest extent permitted by the Trust’s Declaration of Trust andBy-Laws, the general trust law of the State of Delaware, the Securities Act of 1933, and the 1940 Act, each as now or hereinafter in force. In the normal course of business, the Trust enters into contracts with service providers and others that contain general indemnification clauses. The Trust’s maximum exposure under these arrangements and agreements is dependent on future claims that may be made against the Trust and/or the trustees and, therefore, cannot be estimated; however, based on experience, the risk of loss from such claims is considered remote.
G. INTERFUND TRANSACTIONS
In accordance with Rule17a-7 under the 1940 Act and applicable Trust policies and procedures, purchase and sale transactions may be conducted between a Fund of the Trust and another Fund of the Trust or certain affiliates of the Trust if conducted at the independent “current market price” (the last sales price,intra-day price, or average of highest bid/lowest offer, as applicable) on a commission-free basis with no remuneration paid in connection with the transaction (other than cash payment against prompt delivery). At the quarterly Board meeting subsequent to the purchase and sale transactions taking place, the Board will be asked to determine that the transactions were conducted in compliance with applicable Trust policies and procedures.
For the fiscal year ended March 31, 2020, there were no purchase and sale transactions with an affiliated Fund within the Trust. There were purchase and sale transactions with affiliated funds outside of the Trust, which were transacted at the current market price and conducted in compliance with Rule17a-7 under the 1940 Act.
8. PURCHASES AND SALES OF INVESTMENTS
The cost of purchases and proceeds from sales of investments (excluding short-term investments) for the fiscal year ended March 31, 2020, are summarized in the following table:
| U.S. Government Securities | Other Securities | |||||||||||||||
| Fund | Purchases | Sales | Purchases | Sales | ||||||||||||
| PF Inflation Managed | $116,226,646 | $141,023,864 | $7,104,014 | $10,176,637 | ||||||||||||
| PF Managed Bond | 3,356,315,537 | 3,410,361,947 | 77,872,073 | 121,876,002 | ||||||||||||
| PF Short Duration Bond | 99,523,183 | 124,332,787 | 71,991,118 | 74,665,322 | ||||||||||||
| PF Emerging Markets Debt | — | — | 69,409,352 | 45,321,033 | ||||||||||||
| PF Developing Growth | — | — | 20,217,451 | 18,019,221 | ||||||||||||
| PF Growth | — | — | 37,086,097 | 67,909,578 | ||||||||||||
| PFLarge-Cap Value | — | — | 56,845,288 | 47,116,675 | ||||||||||||
| PFMid-Cap Equity | — | — | 4,175,794 | 4,133,693 | ||||||||||||
| PF Multi-Asset | 196,234,961 | 137,404,873 | 361,359,618 | 469,816,984 | ||||||||||||
| PFSmall-Cap Value | — | — | 21,733,711 | 43,325,340 | ||||||||||||
| PF Emerging Markets | — | — | 58,817,494 | 83,863,195 | ||||||||||||
| PF InternationalLarge-Cap | — | — | 10,919,233 | 24,812,325 | ||||||||||||
| PF InternationalSmall-Cap | — | — | 21,945,182 | 24,008,094 | ||||||||||||
| PF International Value | — | — | 17,254,859 | 31,399,284 | ||||||||||||
| PF Real Estate | — | — | 38,773,136 | 59,993,448 | ||||||||||||
D-19
Table of Contents
PACIFIC FUNDS
NOTES TO FINANCIAL STATEMENTS (Continued)
9. SECURED BORROWINGS
The contractual maturity of secured borrowings and type of collateral pledged as of March 31, 2020, are summarized in the following table:
Collateral Type | Remaining Contractual Maturity of the Agreements | |||||||||||||||||||||
| Secured Borrowings | Overnight and Continuous | Up to 30 days | 31-90 days | Greater Than 90 Days | Total | |||||||||||||||||
PF Inflation Managed | ||||||||||||||||||||||
Sale-buyback financing transactions | U.S. Treasury Obligations | $— | $11,585,269 | $— | $— | $11,585,269 | ||||||||||||||||
|
|
|
|
|
|
|
|
|
| |||||||||||||
Total borrowings | $— | $11,585,269 | $— | $— | $11,585,269 | |||||||||||||||||
|
|
|
|
|
|
|
|
|
| |||||||||||||
PF Managed Bond | ||||||||||||||||||||||
Sale-buyback financing transactions | U.S. Treasury Obligations | $— | $64,666,795 | $— | $— | $64,666,795 | ||||||||||||||||
Reverse repurchase agreement | U.S. Treasury Obligations | — | 6,180,500 | — | — | 6,180,500 | ||||||||||||||||
|
|
|
|
|
|
|
|
|
| |||||||||||||
Total borrowings | $— | $70,847,295 | $— | $— | $70,847,295 | |||||||||||||||||
|
|
|
|
|
|
|
|
|
| |||||||||||||
10. FEDERAL INCOME TAX INFORMATION
Each Fund intends to qualify each year as a regulated investment company (“RIC”) under Subchapter M of the Internal Revenue Code (the “Code”). A Fund that qualifies as a RIC does not have to pay income tax as long as it distributes sufficient taxable income and net capital gains. Each Fund declared and paid sufficient dividends on net investment income and capital gains distributions during the fiscal year ended March 31, 2020, to qualify as a RIC and is not required to pay Federal income tax under the Code. Accordingly, no provision for Federal income taxes is required in the financial statements. Required distributions are based on net investment income and net realized gains determined in accordance with income tax regulations, which may differ from U.S. GAAP for financial reporting purposes. These differences are primarily due to differing treatments for sale-buyback financing transactions, futures and options, swap income, paydown gain/loss, partnership income, foreign currency transactions, passive foreign investment companies, late year ordinary and post-October capital losses, capital loss carryforwards, and losses deferred due to wash sales. Permanent book and tax differences relating to shareholder distributions will result in reclassifications of capital accounts. In addition, the year in which amounts are distributed may differ from the year in which the net investment income is earned and the net gains are realized by each Fund.
The following table shows the accumulated capital losses and components of distributable earnings on a tax basis, and late year ordinary losses and post-October capital losses deferred, if any, as of March 31, 2020:
| Distributable Earnings | Late-Year Ordinary and Post-October Losses Deferral | |||||||||||||||||||||||||||||||
| Fund | Accumulated Capital Losses | Undistributed Ordinary Income | Undistributed Long-Term Capital Gains | Late-Year Ordinary Losses | Short-Term Capital Losses | Long-Term Capital Losses | Total | |||||||||||||||||||||||||
PF Inflation Managed | ($8,091,636 | ) | $411,238 | $— | $— | $— | $— | $— | ||||||||||||||||||||||||
PF Managed Bond | — | 16,657,083 | — | — | — | — | — | |||||||||||||||||||||||||
PF Short Duration Bond | (1,762,713 | ) | 1,007,947 | — | — | — | — | — | ||||||||||||||||||||||||
PF Emerging Markets Debt | (6,348,212 | ) | — | — | 1,501,516 | — | — | 1,501,516 | ||||||||||||||||||||||||
PF Developing Growth | — | — | 173,231 | 18,421 | — | — | 18,421 | |||||||||||||||||||||||||
PF Growth | — | 585,381 | 6,050,666 | — | — | — | — | |||||||||||||||||||||||||
PFLarge-Cap Value | — | 689,617 | 4,499,732 | — | — | — | — | |||||||||||||||||||||||||
PFMid-Cap Equity | (733,296 | ) | 3,785 | — | — | — | — | — | ||||||||||||||||||||||||
PF Multi-Asset | (22,988,577 | ) | 4,856,231 | — | — | — | — | — | ||||||||||||||||||||||||
PFSmall-Cap Value | — | — | — | 33,599 | 1,796,579 | 5,246,409 | 7,076,587 | |||||||||||||||||||||||||
PF Emerging Markets | — | 544,382 | 2,094,893 | — | — | — | — | |||||||||||||||||||||||||
PF InternationalLarge-Cap | — | 262,935 | 608,401 | — | — | — | — | |||||||||||||||||||||||||
PF InternationalSmall-Cap | (7,208,962 | ) | 658,805 | — | — | — | — | — | ||||||||||||||||||||||||
PF International Value | (85,421 | ) | — | — | 185 | — | — | 185 | ||||||||||||||||||||||||
PF Real Estate | — | — | — | 245,971 | 5,553,843 | 2,409,122 | 8,208,936 | |||||||||||||||||||||||||
Accumulated capital losses represent net capital loss carryovers as of March 31, 2020 that may be available to offset future realized capital gains and thereby reduce future capital gains distributions. The following table shows the amounts of capital loss carryover, if any, by each of the applicable Funds as of March 31, 2020 and capital loss carryover from prior years utilized during the fiscal year ended March 31, 2020:
| Unlimited Period of Net Capital Loss Carryover | Accumulated Capital Loss Carryover | Capital Loss Carryover Utilized During the Year Ended March 31, 2020 | ||||||||||||||
| Fund | Short-Term | Long-Term | ||||||||||||||
PF Inflation Managed | $— | ($8,091,636 | ) | ($8,091,636 | ) | $1,089,997 | ||||||||||
PF Managed Bond | — | — | — | 10,615,626 | ||||||||||||
PF Short Duration Bond | — | (1,762,713 | ) | (1,762,713 | ) | 1,062,661 | ||||||||||
PF Emerging Markets Debt | (2,883,489 | ) | (3,464,723 | ) | (6,348,212 | ) | 1,184,827 | |||||||||
PFMid-Cap Equity | (328,817 | ) | (404,479 | ) | (733,296 | ) | — | |||||||||
PF Multi-Asset | — | (22,988,577 | ) | (22,988,577 | ) | 3,531,127 | ||||||||||
PF InternationalSmall-Cap | (7,208,962 | ) | — | (7,208,962 | ) | — | ||||||||||
PF International Value | (85,421 | ) | — | (85,421 | ) | — | ||||||||||
D-20
Table of Contents
PACIFIC FUNDS
NOTES TO FINANCIAL STATEMENTS (Continued)
The aggregate cost of investments and the composition of unrealized appreciation and depreciation on investments and net unrealized appreciation and/or depreciation on derivatives for Federal income tax purposes as of March 31, 2020, were as follows:
| Fund | Total Cost of Investments on Tax Basis (1) | Gross Unrealized Appreciation on Investments | Gross Unrealized Depreciation on Investments | Net Unrealized Appreciation (Depreciation) on Investments | Net Unrealized Appreciation (Depreciation) on Other (2) | Net Unrealized Appreciation (Depreciation) | ||||||||||||||||||||||
PF Inflation Managed | $31,144,691 | $1,364,423 | ($2,350,231 | ) | ($985,808 | ) | $8,564 | ($977,244 | ) | |||||||||||||||||||
PF Managed Bond | 588,623,594 | 13,696,270 | (21,311,251 | ) | (7,614,981 | ) | (279,656 | ) | (7,894,637 | ) | ||||||||||||||||||
PF Short Duration Bond | 125,146,772 | 450,283 | (4,043,956 | ) | (3,593,673 | ) | 250 | (3,593,423 | ) | |||||||||||||||||||
PF Emerging Markets Debt | 98,892,928 | 1,667,705 | (14,575,215 | ) | (12,907,510 | ) | (116,235 | ) | (13,023,745 | ) | ||||||||||||||||||
PF Developing Growth | 16,147,274 | 2,632,978 | (1,052,330 | ) | 1,580,648 | — | 1,580,648 | |||||||||||||||||||||
PF Growth | 86,657,704 | 79,723,586 | (1,989,102 | ) | 77,734,484 | — | 77,734,484 | |||||||||||||||||||||
PFLarge-Cap Value | 118,384,562 | 50,753,053 | (8,940,914 | ) | 41,812,139 | — | 41,812,139 | |||||||||||||||||||||
PFMid-Cap Equity | 8,780,456 | 794,248 | (1,749,769 | ) | (955,521 | ) | (8 | ) | (955,529 | ) | ||||||||||||||||||
PF Multi-Asset | 1,000,483,715 | 11,324,654 | (16,820,235 | ) | (5,495,581 | ) | (107,616,409 | ) | (113,111,990 | ) | ||||||||||||||||||
PFSmall-Cap Value | 37,454,145 | 2,599,949 | (11,933,832 | ) | (9,333,883 | ) | — | (9,333,883 | ) | |||||||||||||||||||
PF Emerging Markets | 82,337,957 | 25,410,497 | (10,482,679 | ) | 14,927,818 | 3,821 | 14,931,639 | |||||||||||||||||||||
PF InternationalLarge-Cap | 28,706,906 | 16,219,851 | (3,491,353 | ) | 12,728,498 | (4,191 | ) | 12,724,307 | ||||||||||||||||||||
PF InternationalSmall-Cap | 28,010,859 | 2,798,165 | (4,066,735 | ) | (1,268,570 | ) | (5,725 | ) | (1,274,295 | ) | ||||||||||||||||||
PF International Value | 50,988,995 | 1,171,829 | (17,686,327 | ) | (16,514,498 | ) | (11,644 | ) | (16,526,142 | ) | ||||||||||||||||||
PF Real Estate | 42,183,689 | 6,105,481 | (4,785,101 | ) | 1,320,380 | — | 1,320,380 | |||||||||||||||||||||
| (1) | The difference between the total cost of investments on tax basis and investments, at cost, as presented in the Statements of Assets and Liabilities is primarily due to wash sale loss deferrals, investments in passive foreign investment companies, straddle loss deferrals, partnerships, defaulted securities, and differing treatments for sale-buyback financing transactions and U.S. Treasury Inflation Protected Securities. |
| (2) | Other includes net appreciation or depreciation on derivatives, short sales, unfunded loan commitments, and foreign currencies, if any. |
Each Fund recognizes the financial statement effects of a tax position taken or expected to be taken in a tax return when it is more likely than not, based on the technical merits, that the position will be sustained upon examination by the applicable tax authority. Tax positions not deemed to meet themore-likely-than-not threshold would be recorded as a tax liability for unrecognized tax benefits with a corresponding income tax expense. Management has analyzed all open tax years, as defined by the statute of limitations, for all major jurisdictions and has determined that no provision for income tax is required in the financial statements. Each Fund remains subject to examination by Federal and State tax authorities for the returns filed for tax years ended as of and after March 31, 2016.
11. TAX CHARACTER OF DISTRIBUTIONS
The tax character of income and capital gain distributions to shareholders during the fiscal years ended March 31, 2020 and 2019, were as follows:
For the Year Ended March 31, 2020 | For the Year Ended March 31, 2019 | |||||||||||||||||||||||||||
| Funds | Ordinary Income | Long-Term Capital Gains | Total Distributions | Ordinary Income | Long-Term Capital Gains | Total Distributions | ||||||||||||||||||||||
PF Inflation Managed | $448,792 | $— | $448,792 | $2,002,797 | $— | $2,002,797 | ||||||||||||||||||||||
PF Managed Bond | 11,614,415 | — | 11,614,415 | 15,588,848 | — | 15,588,848 | ||||||||||||||||||||||
PF Short Duration Bond | 4,409,514 | — | 4,409,514 | 2,654,646 | — | 2,654,646 | ||||||||||||||||||||||
PF Emerging Markets Debt | 3,084,637 | — | 3,084,637 | 1,235,277 | — | 1,235,277 | ||||||||||||||||||||||
PF Developing Growth | — | 1,213,285 | 1,213,285 | — | 95,677 | 95,677 | ||||||||||||||||||||||
PF Growth | 710,327 | 5,538,368 | 6,248,695 | 562,295 | 10,205,298 | 10,767,593 | ||||||||||||||||||||||
PFLarge-Cap Value | 2,395,784 | 9,321,653 | 11,717,437 | 3,580,330 | 61,881,413 | 65,461,743 | ||||||||||||||||||||||
PFMid-Cap Equity | 61,466 | — | 61,466 | 446,362 | 5,318,107 | 5,764,469 | ||||||||||||||||||||||
PF Multi-Asset | 26,336,391 | — | 26,336,391 | 15,433,139 | — | 15,433,139 | ||||||||||||||||||||||
PF Small Cap Value | 841,075 | 4,019,780 | 4,860,855 | 1,150,556 | 15,278,120 | 16,428,676 | ||||||||||||||||||||||
PF Emerging Markets | 3,103,562 | 15,553,740 | 18,657,302 | 833,161 | 14,561,366 | 15,394,527 | ||||||||||||||||||||||
PF InternationalLarge-Cap | 1,035,846 | 5,539,936 | 6,575,782 | 1,238,466 | 22,780,379 | 24,018,845 | ||||||||||||||||||||||
PF InternationalSmall-Cap | 1,056,704 | — | 1,056,704 | 374,460 | 1,498,859 | 1,873,319 | ||||||||||||||||||||||
PF International Value | 1,866,805 | — | 1,866,805 | 7,861,965 | 6,034,253 | 13,896,218 | ||||||||||||||||||||||
PF Real Estate | 1,986,246 | 740,953 | 2,727,199 | 900,002 | 5,570,666 | 6,470,668 | ||||||||||||||||||||||
D-21
Table of Contents
PACIFIC FUNDS
NOTES TO FINANCIAL STATEMENTS (Continued)
12. RECLASSIFICATION OF ACCOUNTS
During the fiscal year ended March 31, 2020, reclassifications as shown in the following table have been made in each Fund’s capital accounts to report these balances on a tax basis, excluding certain temporary differences, as of March 31, 2020. Additional adjustments may be required in subsequent reporting periods. These reclassifications, which have no impact on the NAV of the Funds, are primarily attributable to reclassifications of sale-buyback financing transactions, paydown gain/loss, partnership income, foreign currency transactions,non-deductible expenses, swap income, futures gain/loss, investments in passive foreign investment companies, foreign capital gain tax, redesignation of dividends paid, treatment of net operating losses and capital gains under Federal tax rules versus U.S. GAAP. The calculation of net investment income per share in the financial highlights excludes these adjustments.
| Fund | Paid-In Capital | Undistributed/ Accumulated Net Investment Income (Loss) | Undistributed/ Accumulated Net Realized Gain (Loss) | |||||||||
PF Inflation Managed | $— | $62,188 | ($62,188 | ) | ||||||||
PF Managed Bond | — | (2,381,397 | ) | 2,381,397 | ||||||||
PF Short Duration Bond | — | 162,064 | (162,064 | ) | ||||||||
PF Emerging Markets Debt | — | (1,555,855 | ) | 1,555,855 | ||||||||
PF Developing Growth | (92,487 | ) | 92,487 | — | ||||||||
PF Growth | — | 130,070 | (130,070 | ) | ||||||||
PFLarge-Cap Value | (151 | ) | (84,923 | ) | 85,074 | |||||||
PF Multi-Asset | — | 9,002,038 | (9,002,038 | ) | ||||||||
PFSmall-Cap Value | (704 | ) | 382 | 322 | ||||||||
PF Emerging Markets | — | 92,041 | (92,041 | ) | ||||||||
PF InternationalLarge-Cap | — | (43,828 | ) | 43,828 | ||||||||
PF InternationalSmall-Cap | — | 155,877 | (155,877 | ) | ||||||||
PF International Value | (268,473 | ) | (182,828 | ) | 451,301 | |||||||
PF Real Estate | (3,491 | ) | (97,844 | ) | 101,335 | |||||||
13. SHARES OF BENEFICIAL INTEREST
Each Fund is authorized to issue an unlimited number of shares of beneficial interest with no par value unless otherwise determined by the trustees of the Board. Changes in shares of beneficial interest of each Fund for the fiscal years ended March 31, 2020 and March 31, 2019, were as follows:
| Year ended 3/31/2020 | Year ended 3/31/2019 | Year ended 3/31/2020 | Year ended 3/31/2019 | Year ended 3/31/2020 | Year ended 3/31/2019 | Year ended 3/31/2020 | Year ended 3/31/2019 | |||||||||||||||||||||||||||||||||||||
| PF Inflation Managed Fund | PF Managed Bond Fund | PF Short Duration Bond Fund | PF Emerging Markets Debt Fund | |||||||||||||||||||||||||||||||||||||||||
Class P | ||||||||||||||||||||||||||||||||||||||||||||
Shares sold | 50,345 | 256,207 | 3,615,077 | 6,352,160 | 3,472,022 | 12,928,251 | 5,812,009 | 2,106,584 | ||||||||||||||||||||||||||||||||||||
Dividends and distributions reinvested | 49,102 | 236,457 | 1,054,428 | 1,537,362 | 443,167 | 271,714 | 340,844 | 143,304 | ||||||||||||||||||||||||||||||||||||
Shares repurchased | (2,451,976 | ) | (4,377,223 | ) | (16,664,549 | ) | (17,374,944 | ) | (7,041,652 | ) | (9,029,155 | ) | (1,751,480 | ) | (3,595,690 | ) | ||||||||||||||||||||||||||||
Net increase (decrease) | (2,352,529 | ) | (3,884,559 | ) | (11,995,044 | ) | (9,485,422 | ) | (3,126,463 | ) | 4,170,810 | 4,401,373 | (1,345,802 | ) | ||||||||||||||||||||||||||||||
Beginning shares outstanding | 4,648,564 | 8,533,123 | 47,078,053 | 56,563,475 | 15,640,207 | 11,469,397 | 7,806,405 | 9,152,207 | ||||||||||||||||||||||||||||||||||||
Ending shares outstanding | 2,296,035 | 4,648,564 | 35,083,009 | 47,078,053 | 12,513,744 | 15,640,207 | 12,207,778 | 7,806,405 | ||||||||||||||||||||||||||||||||||||
| PF Developing Growth Fund | PF Growth Fund | PFLarge-Cap Value Fund | PFMid-Cap Equity Fund | |||||||||||||||||||||||||||||||||||||||||
Class P | ||||||||||||||||||||||||||||||||||||||||||||
Shares sold | 540,745 | 477,855 | 744,195 | 1,636,305 | 4,035,833 | 6,177,036 | — | 881,298 | ||||||||||||||||||||||||||||||||||||
Dividends and distributions reinvested | 71,962 | 6,044 | 209,732 | 437,817 | 930,979 | 5,625,143 | 4,906 | 2,011 | ||||||||||||||||||||||||||||||||||||
Shares repurchased | (217,548 | ) | (270,382 | ) | (1,772,752 | ) | (3,363,434 | ) | (2,688,678 | ) | (6,523,746 | ) | — | (2,921,454 | ) | |||||||||||||||||||||||||||||
Net increase (decrease) | 395,159 | 213,517 | (818,825 | ) | (1,289,312 | ) | 2,278,134 | 5,278,433 | 4,906 | (2,038,145 | ) | |||||||||||||||||||||||||||||||||
Beginning shares outstanding | 851,393 | 637,876 | 6,855,689 | 8,145,001 | 14,318,522 | 9,040,089 | 880,013 | 2,918,158 | ||||||||||||||||||||||||||||||||||||
Ending shares outstanding | 1,246,552 | 851,393 | 6,036,864 | 6,855,689 | 16,596,656 | 14,318,522 | 884,919 | 880,013 | ||||||||||||||||||||||||||||||||||||
| PF Multi-Asset Fund | PFSmall-Cap Value Fund | PF Emerging Markets Fund | PF International Large-Cap Fund | |||||||||||||||||||||||||||||||||||||||||
Class P | ||||||||||||||||||||||||||||||||||||||||||||
Shares sold | 12,776,406 | 61,114,150 | 139,026 | 1,765,846 | 3,623,219 | 2,603,510 | 1,242,672 | 1,907,404 | ||||||||||||||||||||||||||||||||||||
Dividends and distributions reinvested | 2,407,348 | 1,819,946 | 601,184 | 2,034,155 | 1,506,175 | 1,152,531 | 589,059 | 2,217,372 | ||||||||||||||||||||||||||||||||||||
Shares repurchased | (23,448,818 | ) | (24,969,892 | ) | (3,925,447 | ) | (2,466,137 | ) | (4,270,606 | ) | (4,965,180 | ) | (2,211,109 | ) | (5,136,988 | ) | ||||||||||||||||||||||||||||
Net increase (decrease) | (8,265,064 | ) | 37,964,204 | (3,185,237 | ) | 1,333,864 | 858,788 | (1,209,139 | ) | (379,378 | ) | (1,012,212 | ) | |||||||||||||||||||||||||||||||
Beginning shares outstanding | 115,812,746 | 77,848,542 | 8,599,383 | 7,265,519 | 9,102,089 | 10,311,228 | 5,002,089 | 6,014,301 | ||||||||||||||||||||||||||||||||||||
Ending shares outstanding | 107,547,682 | 115,812,746 | 5,414,146 | 8,599,383 | 9,960,877 | 9,102,089 | 4,622,711 | 5,002,089 | ||||||||||||||||||||||||||||||||||||
| PF International Small-Cap Fund |
| PF International Value Fund | PF Real Estate Fund | |||||||||||||||||||||||||||||||||||||||||
Class P | ||||||||||||||||||||||||||||||||||||||||||||
Shares sold | 2,064,523 | 1,285,828 | 1,635,474 | 2,962,401 | 1,392,030 | 4,140,280 | ||||||||||||||||||||||||||||||||||||||
Dividends and distributions reinvested | 106,308 | 208,299 | 236,077 | 1,854,451 | 204,529 | 562,033 | ||||||||||||||||||||||||||||||||||||||
Shares repurchased | (1,634,018 | ) | (6,156,842 | ) | (3,710,349 | ) | (10,296,096 | ) | (4,036,771 | ) | (1,536,045 | ) | ||||||||||||||||||||||||||||||||
Net increase (decrease) | 536,813 | (4,662,715 | ) | (1,838,798 | ) | (5,479,244 | ) | (2,440,212 | ) | 3,166,268 | ||||||||||||||||||||||||||||||||||
Beginning shares outstanding | 3,330,575 | 7,993,290 | 8,647,538 | 14,126,782 | 6,666,827 | 3,500,559 | ||||||||||||||||||||||||||||||||||||||
Ending shares outstanding | 3,867,388 | 3,330,575 | 6,808,740 | 8,647,538 | 4,226,615 | 6,666,827 | ||||||||||||||||||||||||||||||||||||||
D-22
Table of Contents
REPORT OF INDEPENDENT REGISTERED PUBLIC ACCOUNTING FIRM
To the Shareholders and the Board of Trustees of Pacific Funds Series Trust:
Opinion on the Financial Statements and Financial Highlights
We have audited the accompanying statements of assets and liabilities of PF Inflation Managed Fund, PF Managed Bond Fund, PF Short Duration Bond Fund, PF Emerging Markets Debt Fund, PF Developing Growth Fund, PF Growth Fund, PFLarge-Cap Value Fund, PFMid-Cap Equity Fund, PF Multi-Asset Fund,PF Small-Cap Value Fund, PF Emerging Markets Fund, PF InternationalLarge-Cap Fund, PF InternationalSmall-Cap Fund, PF International Value Fund and PF Real Estate Fund, (the “Funds”) (fifteen of the funds comprising Pacific Funds Series Trust), including the schedules of investments, as of March 31, 2020; the related statements of operations and cash flows (for PF Inflation Managed Fund), changes in net assets, and the financial highlights for the periods indicated in the table below; and the related notes. In our opinion, the financial statements and financial highlights present fairly, in all material respects, the financial position of each of the Funds as of March 31, 2020, and the results of their operations and its cash flows (for the PF Inflation Managed Fund), the changes in their net assets, and the financial highlights for the periods listed in the table below, in conformity with accounting principles generally accepted in the United States of America.
| Individual Fund Comprising the Pacific Funds Series Trust | Statements of Operations and Cash Flows (for PF Inflation Managed Fund) | Statements of Changes in Net Assets | Financial Highlights | |||
| PF Inflation Managed Fund, PF Managed Bond Fund, PF Short Duration Bond Fund, PF Emerging Markets Debt Fund, PF Developing Growth Fund, PF Growth Fund, PFLarge-Cap Value Fund, PFMid-Cap Equity Fund,PF Small-Cap Value Fund, PF Emerging Markets Fund, PF InternationalLarge-Cap Fund, PF InternationalSmall-Cap Fund, PF International Value Fund, PF Real Estate Fund | For the year ended March 31, 2020 | For the years ended March 31, 2020 and 2019 | For the years ended March 31, 2020, 2019, 2018, 2017 and 2016 | |||
| PF Multi-Asset Fund | For the year ended March 31, 2020 | For the years ended March 31, 2020 and 2019 | For the years ended March 31, 2020, 2019 and the period from January 31, 2018 (commencement of operations) through March 31, 2018 |
Basis for Opinion
These financial statements and financial highlights are the responsibility of the Funds’ management. Our responsibility is to express an opinion on the Funds’ financial statements and financial highlights based on our audits. We are a public accounting firm registered with the Public Company Accounting Oversight Board (United States) (PCAOB) and are required to be independent with respect to the Funds in accordance with the U.S. federal securities laws and the applicable rules and regulations of the Securities and Exchange Commission and the PCAOB.
We conducted our audits in accordance with the standards of the PCAOB. Those standards require that we plan and perform the audit to obtain reasonable assurance about whether the financial statements and financial highlights are free of material misstatement, whether due to error or fraud. The Funds are not required to have, nor were we engaged to perform, an audit of their internal control over financial reporting. As part of our audits we are required to obtain an understanding of internal control over financial reporting but not for the purpose of expressing an opinion on the effectiveness of the Funds’ internal control over financial reporting. Accordingly, we express no such opinion.
Our audits included performing procedures to assess the risks of material misstatement of the financial statements and financial highlights, whether due to error or fraud, and performing procedures that respond to those risks. Such procedures included examining, on a test basis, evidence regarding the amounts and disclosures in the financial statements and financial highlights. Our audits also included evaluating the accounting principles used and significant estimates made by management, as well as evaluating the overall presentation of the financial statements and financial highlights. Our procedures included confirmation of securities owned as of March 31, 2020, by correspondence with the custodian and brokers; when replies were not received from brokers, we performed other auditing procedures. We believe that our audits provide a reasonable basis for our opinion.

Costa Mesa, CA
May 26, 2020
We have served as the auditor of one or more affiliated investment companies of Pacific Funds Series Trust since 1988.
E-1
Table of Contents
PACIFIC FUNDS
(Unaudited)
For corporate shareholders, the percentage of investment income (dividend income and short-term gains, if any) for each of the Funds that qualify for the dividends-received deductions for the fiscal year ended March 31, 2020 is as follows:
| Fund | Percentage | |||
PF Growth | 77.16% | |||
PFLarge-Cap Value | 100.00% | |||
PFMid-Cap Equity | 100.00% | |||
PFSmall-Cap Value | 73.86% | |||
For the fiscal year ended March 31, 2020 certain dividends paid by the Funds may be subject to a maximum tax rate of 15% as provided by the Jobs and Growth Relief Reconciliation Act of 2003. Of the distributions made by the following Funds, the corresponding percentages represent the amount of each distribution which may qualify for the 15% dividend income tax rate.
| Fund | Percentage | |||
PF Growth | 86.07% | |||
PFLarge-Cap Value | 100.00% | |||
PFMid-Cap Equity | 100.00% | |||
PFSmall-Cap Value | 86.48% | |||
PF Emerging Markets | 50.81% | |||
PF InternationalLarge-Cap | 98.95% | |||
PF InternationalSmall-Cap | 100.00% | |||
PF International Value | 100.00% | |||
Shareholders should not use the above tax information to prepare their tax returns. The information will be included in your Form 1099 DIV, which will be sent to you separately in January 2021. The Funds intend to pass through the maximum allowable percentages to shareholders.
The following Funds designated the listed amounts as long-term capital gain dividends during the fiscal year ended March 31, 2020. Distributable long-term gains are based on net realized long-term gains determined on a tax basis and may differ from such amounts for financial reporting purposes.
| Fund | Amount | |||
PF Developing Growth | $1,386,516 | |||
PF Growth | 9,094,798 | |||
PFLarge-Cap Value | 10,318,053 | |||
PFSmall-Cap Value | 4,019,780 | |||
PF Emerging Markets | 15,553,740 | |||
PF InternationalLarge-Cap | 5,539,936 | |||
PF Real Estate | 740,953 | |||
F-1
Table of Contents
PACIFIC FUNDS
(Unaudited)
We believe it is important for you to understand the impact of fees and expenses regarding your investment. All mutual funds have operating expenses. As a shareholder of a mutual fund, you incur ongoing costs, which include advisory fees, administration fees and other fund expenses. The following example is intended to help you understand your ongoing costs (in dollars) of investing in each fund and to compare these costs with those of other mutual funds. The example is based on an investment of $1,000.00 made at the beginning of the period and held for the entire six-month period from October 1, 2019 to March 31, 2020.
ACTUAL EXPENSES
The first section of the table for each fund entitled “Actual Fund Return”, provides information about actual account values and actual expenses based on each fund’s actual performance and each fund’s actual expenses, after any applicable advisory fee waivers and adviser expense reimbursements (See Notes 6 and 7B in Notes to Financial Statements). The “Ending Account Value at 03/31/20” column shown is derived from the fund’s actual performance; the “Annualized Expense Ratio” column shows the fund’s actual annualized expense ratio; and the “Expenses Paid During the Period 10/01/19-03/31/20” column shows the dollar amount that would have been paid by you. All the information illustrated in the following table is based on the past six-month period from October 1, 2019 to March 31, 2020.
You may use the information in this section, together with the amount you invested, to estimate the expenses that you paid over the period. To do so, for each fund in your account, simply divide that fund’s value by $1,000.00 (for example, an $8,600.00 fund value divided by $1,000.00 = 8.6), then multiply the result by the number given for your fund(s) in the “Expenses Paid During the Period 10/01/19-03/31/20.”
HYPOTHETICAL EXAMPLE FOR COMPARISON PURPOSES
The second section of the table for each fund, entitled “Hypothetical”, provides information about hypothetical account values and hypothetical expenses based on a 5% per year hypothetical rate of return and actual fund’s expenses, after any applicable advisory fee waivers and adviser expense reimbursements (See Notes 6 and 7B in Notes to Financial Statements). It assumes that the fund had an annual 5% rate of return before expenses, but that the expense ratio is unchanged. The hypothetical account values and expenses may not be used to estimate the actual ending account values or expenses you paid for the period.
You may use the hypothetical example information to compare the ongoing costs of investing in the fund compared to other mutual funds. To do so, compare this 5% hypothetical example with the 5% hypothetical examples that appear in the shareholder reports of other mutual funds.
Please note that the expenses shown in the table are meant to highlight your ongoing costs only and do not reflect any transactional costs. Therefore, the second section of the table is useful in comparing ongoing costs only, and will not help you determine the relative total costs of owning different mutual funds. In addition, if these other costs were included, your costs would have been higher.
| Beginning Account Value at 10/01/19 | Ending Account Value at 03/31/20 | Annualized Expense Ratio | Expenses Paid During the Period 10/01/19 - 03/31/20 (1) | |||||||||||||
PF Inflation Managed Fund |
| |||||||||||||||
Actual Fund Return | ||||||||||||||||
Class P | $1,000.00 | $1,007.10 | 0.99% | $4.97 | ||||||||||||
Hypothetical | ||||||||||||||||
Class P | $1,000.00 | $1,020.05 | 0.99% | $5.00 | ||||||||||||
PF Managed Bond Fund |
| |||||||||||||||
Actual Fund Return | ||||||||||||||||
Class P | $1,000.00 | $1,010.60 | 0.77% | $3.87 | ||||||||||||
Hypothetical | ||||||||||||||||
Class P | $1,000.00 | $1,021.15 | 0.77% | $3.89 | ||||||||||||
PF Short Duration Bond Fund |
| |||||||||||||||
Actual Fund Return | ||||||||||||||||
Class P | $1,000.00 | $987.80 | 0.55% | $2.73 | ||||||||||||
Hypothetical | ||||||||||||||||
Class P | $1,000.00 | $1,022.25 | 0.55% | $2.78 | ||||||||||||
PF Emerging Markets Debt Fund |
| |||||||||||||||
Actual Fund Return | ||||||||||||||||
Class P | $1,000.00 | $816.20 | 0.92% | $4.18 | ||||||||||||
Hypothetical | ||||||||||||||||
Class P | $1,000.00 | $1,020.40 | 0.92% | $4.65 | ||||||||||||
PF Developing Growth Fund |
| |||||||||||||||
Actual Fund Return | ||||||||||||||||
Class P | $1,000.00 | $881.50 | 0.75% | $3.53 | ||||||||||||
Hypothetical | ||||||||||||||||
Class P | $1,000.00 | $1,021.25 | 0.75% | $3.79 | ||||||||||||
PF Growth Fund |
| |||||||||||||||
Actual Fund Return | ||||||||||||||||
Class P | $1,000.00 | $954.90 | 0.70% | $3.42 | ||||||||||||
Hypothetical | ||||||||||||||||
Class P | $1,000.00 | $1,021.50 | 0.70% | $3.54 | ||||||||||||
PF Large-Cap Value Fund |
| |||||||||||||||
Actual Fund Return | ||||||||||||||||
Class P | $1,000.00 | $811.90 | 0.80% | $3.62 | ||||||||||||
Hypothetical | ||||||||||||||||
Class P | $1,000.00 | $1,021.00 | 0.80% | $4.04 | ||||||||||||
PF Mid-Cap Equity Fund |
| |||||||||||||||
Actual Fund Return | ||||||||||||||||
Class P | $1,000.00 | $758.30 | 0.80% | $3.52 | ||||||||||||
Hypothetical | ||||||||||||||||
Class P | $1,000.00 | $1,021.00 | 0.80% | $4.04 | ||||||||||||
PF Multi-Asset Fund |
| |||||||||||||||
Actual Fund Return | ||||||||||||||||
Class P | $1,000.00 | $816.60 | 0.51% | $2.32 | ||||||||||||
Hypothetical | ||||||||||||||||
Class P | $1,000.00 | $1,022.45 | 0.51% | $2.58 | ||||||||||||
PF Small-Cap Value Fund |
| |||||||||||||||
Actual Fund Return | ||||||||||||||||
Class P | $1,000.00 | $670.70 | 0.90% | $3.76 | ||||||||||||
Hypothetical | ||||||||||||||||
Class P | $1,000.00 | $1,020.50 | 0.90% | $4.55 | ||||||||||||
See explanation of references on page F-3
F-2
Table of Contents
PACIFIC FUNDS
DISCLOSURE OF FUND EXPENSES (Continued)
(Unaudited)
| Beginning Account Value at 10/01/19 | Ending Account Value at 03/31/20 | Annualized Expense Ratio | Expenses Paid During the Period 10/01/19 - 03/31/20 (1) | |||||||||||||
PF Emerging Markets Fund |
| |||||||||||||||
Actual Fund Return | ||||||||||||||||
Class P | $1,000.00 | $861.60 | 0.95% | $4.42 | ||||||||||||
Hypothetical | ||||||||||||||||
Class P | $1,000.00 | $1,020.25 | 0.95% | $4.80 | ||||||||||||
PF International Large-Cap Fund |
| |||||||||||||||
Actual Fund Return | ||||||||||||||||
Class P | $1,000.00 | $864.10 | 1.00% | $4.66 | ||||||||||||
Hypothetical | ||||||||||||||||
Class P | $1,000.00 | $1,020.00 | 1.00% | $5.05 | ||||||||||||
PF International Small-Cap Fund |
| |||||||||||||||
Actual Fund Return | ||||||||||||||||
Class P | $1,000.00 | $781.10 | 1.10% | $4.90 | ||||||||||||
Hypothetical | ||||||||||||||||
Class P | $1,000.00 | $1,019.50 | 1.10% | $5.55 | ||||||||||||
PF International Value Fund |
| |||||||||||||||
Actual Fund Return | ||||||||||||||||
Class P | $1,000.00 | $716.30 | 0.80% | $3.43 | ||||||||||||
Hypothetical | ||||||||||||||||
Class P | $1,000.00 | $1,021.00 | 0.80% | $4.04 | ||||||||||||
PF Real Estate Fund |
| |||||||||||||||
Actual Fund Return | ||||||||||||||||
Class P | $1,000.00 | $778.60 | 0.90% | $4.00 | ||||||||||||
Hypothetical | ||||||||||||||||
Class P | $1,000.00 | $1,020.50 | 0.90% | $4.55 | ||||||||||||
| (1) | Expenses paid during the period are equal to the fund’s annualized expense ratio (shown in table above), multiplied by the average account value over the period, multiplied by the number of days in the most recent fiscal half-year or applicable period, then divided by 366 days. |
F-3
Table of Contents
PACIFIC FUNDS
TRUSTEES AND OFFICERS INFORMATION
(Unaudited)
The business and affairs of the Pacific Funds Series Trust (which may be referred to as “Pacific Funds” or the “Trust”) are managed under the direction of the Board of Trustees under the Declaration of Trust. Information pertaining to the trustees and officers of the Trust is set forth below. Trustees who are not deemed to be “interested persons” of the Trust, as defined in the 1940 Act, are referred to as “Independent Trustees.” Certain trustees and officers are deemed to be “interested persons” of the Trust and thus are referred to as “Interested Persons”, because of their positions with Pacific Life Insurance Company (“Pacific Life”) and Pacific Life Fund Advisors LLC, a wholly-owned subsidiary of Pacific Life. The Trust’s Statement of Additional Information includes additional information about the trustees. For information on availability of the Trust’s Statement of Additional Information, refer to the WHERE TO GO FOR MORE INFORMATION section of this report.
The address of each trustee and officer is c/o Pacific Funds Series Trust, 700 Newport Center Drive, Newport Beach, CA 92660.
Name and Age | Position(s) with | Current Directorship(s) Held and Principal Occupation(s) | Number of | |||||
INDEPENDENT TRUSTEES | ||||||||
Gale K. Caruso Year of birth 1957 | Trustee since 1/01/06 | Trustee (1/06 to present) of Pacific Select Fund; Independent Trustee (2/15 to present) of Matthews Asia Funds. | 85 | |||||
| Formerly: Member of the Board of Directors of LandAmerica Financial Group, Inc.; President and Chief Executive Officer of Zurich Life; Chairman, President and Chief Executive Officer of Scudder Canada Investor Services, Ltd.; Managing Director of Scudder Kemper Investments; Member of the Advisory Council to the Trust for Public Land in Maine; Member of the Board of Directors of Make-A-Wish of Maine. | ||||||||
Andrew J. Iseman Year of birth 1964 | Trustee since 6/10/19 | Trustee (3/19 to present) of Pacific Select Fund; Consultant (3/19 to 6/19) to the Trust; Chief Executive Officer (8/10 to 9/18) and Senior Adviser (10/18 to 1/19) of Scout Investments; President (11/10 to 11/17) of Scout Funds; Interested Trustee (4/13 to 11/17) of Scout Funds. | 85 | |||||
Paul A. Keller Year of birth 1954 | Trustee since 6/20/16 | Trustee (6/16 to present) of Pacific Select Fund; Consultant to the Trust and Pacific Select Fund (11/15 to 6/16); Independent Trustee (8/10 to present) of Fenimore Asset Management Trust (FAM Funds); Business Consultant (7/10 to present) (sole proprietor); Certified Public Accountant in New York (1982 to present). | 85 | |||||
| Formerly: Partner of PricewaterhouseCoopers LLP; Partner of McGladrey & Pullen LLP; Adjunct Professor of Accounting (2011 to 2015), SUNY College at Old Westbury; Interim Chief Financial Officer (2014 to 2015) of The Leon Levy Foundation. | ||||||||
Lucie H. Moore Year of birth 1956 | Trustee since 6/13/01 | Trustee (10/98 to present) of Pacific Select Fund; Member of the Board of Trustees (2014 to present) of Azusa Pacific University; Member of the Board of Trustees (2016 to present) of Pacifica Christian High School Orange County. | 85 | |||||
| Formerly: Partner of Gibson, Dunn & Crutcher (Law); Member of the Board of Trustees of Sage Hill School; Member of the Board of Trustees of The Pegasus School; and Member of the Advisory Board of Court Appointed Special Advocates (CASA) of Orange County. | ||||||||
Nooruddin (Rudy) Veerjee Year of birth 1958 | Trustee since 9/13/05 | Trustee (1/05 to present) of Pacific Select Fund.
Formerly: President of Transamerica Insurance and Investment Group; President of Transamerica Asset Management; Chairman and Chief Executive Officer of Transamerica Premier Funds (Mutual Fund); and Director of various Transamerica Life Companies. | 85 | |||||
F-4
Table of Contents
PACIFIC FUNDS
TRUSTEES AND OFFICERS INFORMATION (Continued)
(Unaudited)
Name and Age | Position(s) with the Fund and Length of Time Served* | Current Directorship(s) Held and Principal Occupation(s) During Past 5 years | Number of Funds In Fund Complex Overseen** | |||||
INTERESTED PERSONS | ||||||||
James T. Morris Year of birth 1960 | Chairman of the Board and Trustee since 1/11/07 | Director (4/07 to present), Chairman (5/08 to present), Chief Executive Officer (4/07 to present) and President (1/16 to present) of Pacific Mutual Holding Company and Pacific LifeCorp; Director (4/07 to present), Chairman (5/08 to present), Chief Executive Officer (4/07 to present) and President (1/16 to present) of Pacific Life; Chief Executive Officer (5/07 to 10/15) of Pacific Life Fund Advisors LLC; Director (4/16 to present) of Edison International (a public utility holding company); and Chairman of the Board and Trustee (1/07 to present) of Pacific Select Fund. | 85 | |||||
Adrian S. Griggs Year of birth 1966 | Chief Executive Officer since 1/01/18 | Chief Operating Officer (1/17 to present), Executive Vice President (4/12 to present) and Chief Financial Officer (4/12 to 2/17) of Pacific Mutual Holding Company and Pacific LifeCorp; Chief Operating Officer (1/17 to present), Executive Vice President (4/12 to present), Chief Financial Officer (4/12 to 2/17) and Director (1/16 to present) of Pacific Life; Chief Financial Officer (4/12 to 10/15) and Executive Vice President (4/12 to 10/15) of Pacific Life Fund Advisors LLC; Chief Executive Officer (1/15 to present) of Pacific Select Distributors, LLC; and Chief Executive Officer (1/18 to present) of Pacific Select Fund. | 85 | |||||
Howard T. Hirakawa Year of birth 1962 | Senior Vice President since 12/10/14 | Senior Vice President (4/14 to present), Vice President (5/07 to 3/14) of Pacific Life Fund Advisors LLC; and Senior Vice President (12/14 to present) of Pacific Select Fund. | 85 | |||||
Robin S. Yonis Year of birth 1954 | Vice President and General Counsel since 6/13/01 and Assistant Secretary since 9/17/15 | Vice President, Fund Advisor General Counsel and Assistant Secretary (5/07 to present) of Pacific Life Fund Advisors LLC; and Vice President and General Counsel (4/05 to present) and Assistant Secretary (9/15 to present) of Pacific Select Fund. | 85 | |||||
Sharon E. Pacheco Year of birth 1957 | Vice President and Chief Compliance & Ethics Officer since 6/04/04 | Vice President and Chief Compliance & Ethics Officer (11/03 to present) of Pacific Mutual Holding Company and Pacific LifeCorp; Vice President (2/00 to present) and Chief Compliance Officer (1/03 to present) of Pacific Life; Vice President and Chief Compliance Officer (5/07 to present) of Pacific Life Fund Advisors LLC; and Vice President and Chief Compliance Officer (6/04 to present) of Pacific Select Fund. | 85 | |||||
Jane M. Guon Year of birth 1964 | Vice President and Secretary since 1/01/11 | Vice President and Secretary (1/11 to present) of Pacific Mutual Holding Company, Pacific LifeCorp and Pacific Life; Director (1/11 to 3/17) of Pacific Life; Vice President and Secretary (1/11 to present) of Pacific Life Fund Advisors LLC; Vice President and Secretary (1/11 to present) of Pacific Select Distributors, LLC; and Vice President and Secretary (1/11 to present) of Pacific Select Fund. | 85 | |||||
Laurene E. MacElwee Year of birth 1966 | Vice President since 4/04/05 and Assistant Secretary since 6/13/01 | Vice President (4/11 to present) and Assistant Secretary (5/07 to present) of Pacific Life Fund Advisors LLC; and Vice President (12/11 to present), Assistant Secretary (4/05 to present) of Pacific Select Fund. | 85 | |||||
Carleton J. Muench Year of birth 1973 | Vice President since 11/30/06 | Vice President (4/14 to present) of Pacific Life Fund Advisors LLC; and Vice President (12/14 to present) and Assistant Vice President (11/06 to 12/14) of Pacific Select Fund. | 85 | |||||
Trevor T. Smith Year of birth 1975 | Vice President since 3/23/16 and Treasurer since 4/01/18 | Assistant Vice President (1/17 to present) and Director of Variable Products Accounting (4/09 to 12/16) of Pacific Life; Assistant Vice President (3/16 to present), Treasurer (4/18 to present) and Assistant Treasurer (3/16 to 3/18) of Pacific Select Fund. | 85 | |||||
F-5
Table of Contents
PACIFIC FUNDS
TRUSTEES AND OFFICERS INFORMATION (Continued)
(Unaudited)
Name and Age | Position(s) with the Fund and Length of Time Served* | Current Directorship(s) Held and Principal Occupation(s) During Past 5 years | Number of Funds In Fund Complex Overseen** | |||||
INTERESTED PERSONS (Continued) | ||||||||
Bonnie J. Boyle Year of birth 1974 | Vice President and Assistant Treasurer since 1/1/20 | Director (6/17 to present) and Accounting Manager (7/13 to 5/17) of Pacific Life; Assistant Vice President and Assistant Treasurer (1/20 to present) of Pacific Select Fund. | 85 | |||||
Kevin W. Steiner Year of birth 1975 | Vice President since 1/01/13 | Assistant Vice President (4/12 to present) of Pacific Life Fund Advisors LLC; and Assistant Vice President (1/13 to present) of Pacific Select Fund. | 85 | |||||
Audrey L. Cheng Year of birth 1975 | Vice President since 12/11/13 and Assistant Secretary since 1/1/20 | Assistant Vice President (9/11 to present) of Pacific Life; Assistant Vice President (12/13 to present) and Assistant Secretary (1/20) of Pacific Select Fund. | 85 | |||||
| * | A trustee serves until he or she resigns, retires, or his or her successor is elected and qualified. |
| ** | As of March 31, 2020, the “Fund Complex” consisted of Pacific Select Fund (52 funds) and Pacific Funds (33 funds). |
F-6
Table of Contents
PACIFIC FUNDS
STATEMENT REGARDING LIQUIDITY RISK MANAGEMENT PROGRAM
(Unaudited)
The Trust has adopted a liquidity risk management program (the “Program”). The Trust’s Board of Trustees (the “Board”) has designated the Liquidity Oversight Committee (the “Committee”) of Pacific Life Fund Advisors LLC (the “Investment Adviser”) as the administrator of the Program. Personnel of the Investment Adviser conduct theday-to-day operation of the Program pursuant to policies and procedures administered by the Committee.
Under the Program, the Committee manages the liquidity risk of each Fund of the Trust. Liquidity risk is the risk that a Fund could not meet shareholder redemption requests without significant dilution of remaining shareholders’ interests in that Fund. This risk is managed by monitoring the degree of liquidity of each Fund’s investments, limiting the amount of the Fund’s illiquid investments, and utilizing various risk management tools and facilities available to the Fund for meeting shareholder redemptions, among other means. The Committee’s process for determining the degree of liquidity of each Fund’s investments is supported by one or more third-party liquidity assessment vendors.
The Board reviewed a report prepared by the Committee regarding the operation and effectiveness of the Program for the period June 1, 2019 through December 31, 2019. The report included, among other information, each Fund’s (i) investment strategy and the liquidity of its portfolio investments during both normal and reasonably foreseeable stressed market conditions; (ii) short-term and long-term cash flow projections during both normal and reasonably foreseeable stressed conditions; and (iii) holdings of cash and cash equivalents, as well as relevant borrowing arrangements.
No significant liquidity events impacting any Fund were noted in the report. In addition, the Committee provided its assessment that the Program had been effective in managing each Fund’s liquidity risk.
F-7
Table of Contents
PACIFIC FUNDS
APPROVAL OF INVESTMENT ADVISORY
AND SUB-ADVISORY AGREEMENTS
(Unaudited)
I. Introduction and Background
The Board of Trustees (the “Trustees” or “Board”) of Pacific Funds Series Trust (“Pacific Funds” or the “Trust”) oversees the management of each of the separate funds of the Trust (each a “Fund” and collectively, the “Funds”) and, as required by Section 15(c) of the Investment Company Act of 1940, as amended (the “1940 Act”), initially approves and, after the initial period, determines annually whether to renew the investment advisory agreement (the “Advisory Agreement”) with Pacific Life Fund Advisors LLC (“PLFA”) and eachsub-advisory agreement (the“Sub-Advisory Agreements,” together with the Advisory Agreement, as may be amended from time to time, the “Agreements”) between the Trust, PLFA and the varioussub-advisers, including affiliatedsub-advisers, if any (each a“Sub-Adviser” and collectively, the“Sub-Advisers”). PLFA serves as the investment adviser for all of the Funds. PLFA also currently directly manages Pacific Funds Portfolio Optimization Conservative, Pacific Funds Portfolio Optimization Moderate-Conservative, Pacific Funds Portfolio Optimization Moderate, Pacific Funds Portfolio Optimization Growth and Pacific Funds Portfolio Optimization Aggressive-Growth (the “Asset Allocation Funds”), as well as the PF Multi-Asset Fund (together with the PAM Managed Funds (defined below) and Asset Allocation Funds, the “Directly Managed Funds”). Until December 31, 2019, PLFA also directly managed Pacific Funds Short Duration Income, Pacific Funds Core Income, Pacific Funds Strategic Income, Pacific Funds Floating Rate Income and Pacific Funds High Income, as well as the collateral portion of the PF Multi-Asset Fund (together, the “PAM Managed Funds”), under the name Pacific Asset Management (“PAM”). At its December 10, 2019 meeting, the Board took into account PAM’s scheduled reorganization into Pacific Asset Management LLC (“PAM LLC”), a newly formed indirect wholly-owned subsidiary of Pacific Life Insurance Company (“Pacific Life”) on January 1, 2020 and approved a newSub-Advisory Agreement with PAM LLC with respect to the PAM Managed Funds. Therefore, going forward, the PAM Managed Funds will no longer be directly managed by PLFA as PAM LLC will be aSub-Adviser to those Funds. For all other Funds, PLFA has retained third-party firms to serve asSub-Advisers under PLFA’s oversight. The Board, including all of the Trustees who are not “interested persons” of the Trust, PLFA, theSub-Advisers or the distributor, as that term is defined in the 1940 Act (“Independent Trustees”), last renewed the Agreements at anin-person meeting of the Trustees held on December 10, 2019.1
At this meeting and other meetings, the Board considered information (both written and oral) provided to assist it in its review of the Agreements and made assessments with respect to each Agreement. The Board requested, received and reviewed written materials from PLFA and eachSub-Adviser that were submitted in response to requests from the Independent Trustees and supporting materials relating to those questions and responses. In addition, the Board receivedin-person presentations about the Funds throughout the year, and the Independent Trustees were advised by independent legal counsel with respect to these and other relevant matters. The Board reviewed a variety of factors and considered a significant amount of information, including information received on an ongoing basis at Board and committee meetings, which included reports on Fund performance, expenses, fee comparisons, investment advisory, compliance, and other services provided to the Funds by PLFA and theSub-Advisers. The Board also reviewed financial and profitability information regarding PLFA and theSub-Advisers and information regarding the organization and operations of each entity, such as their compliance monitoring, portfolio trading and brokerage practices, risk management and the personnel providing investment management and administrative services to each Fund. The Board considered the services provided to the Funds under the Agreements and the fees and expenses incurred by and charged to (or expected to be incurred by and charged to) the Funds under the Agreements.
The Board noted that as Adviser, PLFA provides a broad range of services to the Trust, including among others: overseeing and coordinating the activities ofSub-Advisers and other third-party service providers, making regulatory filings (including disclosure and financial filings) on behalf of the Trust, monitoring fund performance, performing risk oversight of the Funds, providing the Board with information and reports as may be requested, providing valuation support, administering the Trust’s liquidity risk management program, providing compliance-related services and providing personnel and office space to the Trust. These responsibilities are described in more detail below. The Trustees also considered that PLFA incurs substantial reputational, financial, litigation, regulatory and business risks by serving as investment adviser. The Board took into account that PLFA and its affiliates provide additional services to the Funds under other affiliated service agreements that are essential for the operation of the Funds and that although PLFA and its affiliates are separately compensated under those affiliated service agreements, these additional services are provided in connection with PLFA’s advisory relationship with the Funds. The Board reviewed data provided by PLFA that was gathered from various independent providers of investment company data to provide the Board with information concerning the Funds’ investment performance, advisory fees and expense information (both on an absolute basis and compared to peers). Additionally, the Independent Trustees retained an independent consultant (“Independent Consultant”) with substantial industry experience in providing investment company boards with analysis to assist directors and trustees with their annual 15(c) review process, to assist the Trustees with certain of their analyses and to provide other relevant information. In connection with the analysis, the Independent Consultant utilized and provided the Independent Trustees with information obtained from independent service providers as well as from other sources.
The Trustees’ determinations were made on the basis of each Trustee’s business judgment after consideration of all the information presented. In reviewing the materials presented and in considering the information in the management presentations, the Trustees did not identify any single issue or particular information that, in isolation, would be a controlling factor in making a final decision regarding the proposed Agreements. Individual Trustees may have given different weights to certain factors and assigned various degrees of materiality to information received in connection with the approval process. The following summary describes the most important, but not all, of the factors considered by the Trustees in approving the Agreements. In the case of the Independent Trustees, certain factors were considered in light of the legal advice furnished to them by independent legal counsel and information from the Independent Consultant that they had retained. This discussion is not intended to beall-inclusive.
| 1 | At the December 10th meeting, the Board did not consider the continuance of theSub-Advisory Agreements relating to the PF Currency Strategies Fund (with respect to Neuberger Berman Investment Advisors LLC (“Neuberger Berman”)) or PF Emerging Markets Fund, as those agreements were not up for renewal at that time. In addition, as theSub-Advisory Agreement for the PAM Managed Funds is a new agreement, it has not been previously approved. |
F-8
Table of Contents
PACIFIC FUNDS
APPROVAL OF INVESTMENT ADVISORY
AND SUB-ADVISORY AGREEMENTS (Continued)
(Unaudited)
II. Annual Consideration and Approval of Investment Advisory andSub-Advisory Agreements
In evaluating the Advisory Agreement and eachSub-Advisory Agreement, the Board, including all the Independent Trustees, considered the following factors, among others:
A. Nature, Extent and Quality of Services
PLFA – The Trustees considered the depth and quality of PLFA’s investment management process, including its process to evaluateSub-Advisers (including, going forward, PAM LLC) in connection with its recommendations to the Board to hire or terminateSub-Advisers, its monitoring and oversight of theSub-Advisers, and the benefits to shareholders of retaining PLFA and continuing the Advisory Agreement in light of the nature, extent, and quality of the services that have been provided by PLFA, since the Advisory Agreement was last renewed. The Trustees considered the overall financial strength and stability of PLFA and its ability to continue to provide a high level and quality of services to the Funds. They also considered PLFA’s responsiveness to questions or concerns raised by the Trustees throughout the year, including PLFA’s willingness to consider and implement investment and operational changes designed to improve investment results and the services provided to the Funds and their shareholders.
The Trustees noted that officers and employees of PLFA regularly consult with, and report to, the Board regarding the investment management services provided to the Funds. The Trustees considered the experience, capability and integrity of PLFA’s senior management and other personnel and the low turnover rates of its key personnel. The Trustees noted that the investment, legal, compliance, risk management and accounting professionals of PLFA and its affiliates have access to and utilize a variety of resources and systems relating to investment management, compliance, trading, performance and risk analysis, security valuation and fund accounting. The Trustees took into account the scope of services provided by PLFA under the Advisory Agreement. The Trustees considered that although PLFA is separately compensated under an administration agreement for time spent on Fund matters by certain legal, compliance and accounting professionals of PLFA and its affiliates for services outside of the scope of the Advisory Agreement, these services are being provided as a result of PLFA’s advisory relationship with the Funds. The Trustees further considered PLFA’s continuing need and ability to attract and retain qualified personnel and to maintain and enhance its resources and systems to provide appropriate investment management, compliance, risk management and monitoring services for the Funds. The Trustees also considered the additional resources that PLFA has continued to invest in to enhance its management and oversight of the Funds, including additional tools designed to ensure the Funds’ compliance with new laws and regulations. The Trustees considered that PLFA employs a well-defined method of comparing and evaluating the performance of the asset allocation funds and continues to employ resources to refine that method. In addition, the Trustees considered PLFA’ssub-adviser research process and the role of PLFA’s internal conflicts review committee in considering and evaluating potential conflicts of interest with regard toSub-Adviser selection and monitoring.
Directly Managed Funds – The Trustees considered the services provided by PLFA in rendering investment management services for those Funds for which theday-to-day investment management is provided by PLFA2. The Trustees considered that PLFA, is responsible for identifying investments for each Directly Managed Fund and determining when and what securities, cash and/or other investments to purchase, retain, or sell for each Directly Managed Fund. The Trustees also considered that PLFA, is responsible for the valuation of portfolio securities, including, but not limited to, the review of custodian pricing files, research and analysis related to fair valued securities and due diligence oversight of pricing vendors. The Trustees additionally noted that PLFA is responsible for evaluating and voting proxies for portfolio holdings of the Directly Managed Funds. With respect to the Asset Allocation Funds, the Trustees also considered, among other things, PLFA’s experience, resources and expertise in analyzing the composition of the various Funds that serve as investment options for the Asset Allocation Funds (collectively, the “Underlying Funds”) and in developing an asset allocation that is appropriate for each Asset Allocation Fund’s investment objectives and risk profile. The Trustees considered, in this regard, the tools and resources used by PLFA in constructing its asset allocation models. The Trustees considered that PLFA had engaged a third-party consulting firm in 2016 to review PLFA’s asset allocation process, and that the firm had reported favorably on PLFA’s asset allocation capabilities. With respect to the PF Multi-Asset Fund, the Trustees also considered PLFA’s trading-related and valuation responsibilities. With respect to the PAM Managed Funds, the Trustees also considered the investment oversight and monitoring of PAM discussed below under“Sub-Advised Funds.”
The Trustees also considered that PLFA provides certain additional services to the Funds outside of the scope of the Advisory Agreement under an administration agreement and that such services are essential for the administration and operation of the Funds, including administration of the Funds’ compliance program. In this regard, the Trustees considered PLFA’s policies, procedures and systems to ensure compliance with applicable laws and regulations with respect to the Directly Managed Funds, its attention to matters that may involve conflicts of interest between itself and a Fund, and that all material rebalancing of PLFA’s asset allocation models are presented to PLFA’s internal conflicts review committee that considers and evaluates potential conflicts of interest in the allocation among the Underlying Funds. The Trustees considered the report of PLFA’s internal conflicts review committee and also reviewed information provided throughout the year on PLFA’s compliance policies and procedures, its compliance history, and received reports from the Trust’s Chief Compliance Officer (“CCO”) on compliance by PLFA with applicable laws and regulations. The Trustees also reviewed information on any responses by PLFA to regulatory and compliance developments throughout the year. The Trustees further noted the compliance monitoring conducted by PLFA on an ongoing basis and noted the development of additional procedures and systems necessary to maintain compliance with applicable laws and regulations as well as the resources that PLFA dedicates to these programs. The Trustees considered that the CCO has in place a systematic process for
| 2 | As discussed further below, in reviewing the nature, extent and quality of services to be provided by PAM LLC in connection with the newSub-Advisory Agreement for the PAM Managed Funds, the Board took into account that these services had been provided by PAM as a division of PLFA prior to January 1, 2020 and that PLFA and PAM have each represented to the Board that the nature, extent and quality of these services will not be impacted by the reorganization of PAM into PAM LLC. |
F-9
Table of Contents
PACIFIC FUNDS
APPROVAL OF INVESTMENT ADVISORY
AND SUB-ADVISORY AGREEMENTS (Continued)
(Unaudited)
periodically reviewing PLFA’s written compliance policies and procedures, including the assessment of PLFA’s compliance program as required under Rule38a-1 of the 1940 Act and PLFA’s code of ethics. The Trustees also considered that PLFA continues to cooperate with the CCO in reviewing its compliance operations.
Sub-Advised Funds3 – The Trustees considered that PLFA recommends to the Board the hiring and termination ofSub-Advisers and performs the associated due diligence relating to such recommendations, the risk and performance oversight of theSub-Advisers performed by PLFA and the fact that PLFA provides valuation support forSub-Advised Funds. The Trustees noted PLFA’s responsibilities in rendering services to theSub-Advised Funds and the fact that PLFA monitors and evaluates the performance of theSub-Advisers in comparison to each Fund’s investment objective as well as to appropriate benchmark indices and groups of peer funds. The Trustees also considered that PLFA monitors eachSub-Advised Fund’s adherence to its investment objectives and policies. The Trustees noted that PLFA provides the Board with periodic and special reports related to eachSub-Advised Fund’s performance and PLFA’s investment monitoring and evaluation. The Trustees also considered PLFA’s process in continuously analyzing and, from time to time as necessary and appropriate, recommending for consideration by the Board, the termination of aSub-Advisory Agreement with aSub-Adviser and the replacement of aSub-Adviser.
For both the Directly Managed Funds andSub-Advised Funds, the Trustees considered the high quality of the products, information, analysis and services provided by PLFA to the Funds, including return analysis, attribution analysis, risk analysis and stress testing, preparation of periodic performance and other reports, assessment of liquidity, analysis of derivatives, and coordination and oversight of other service providers to the Trust. The Trustees also noted that PLFA regularly informs the Trustees about matters relevant to the Trust and its shareholders, including relationships with financial intermediaries.
The Trustees considered the analyses conducted by PLFA of the Underlying Funds and aSub-Adviser’s management of an Underlying Fund in the broader context of asset allocation strategies intended to target certain return and risk characteristics. The Trustees noted that PLFA has historically recommended new Underlying Funds or changes to existing Underlying Funds that PLFA believed would contribute to the Asset Allocation Funds’ targeted return and risk objectives. The Trustees also took into account PLFA’s continuing analysis of the Underlying Funds and eachSub-Adviser’s investment performance for the impact on broader asset allocation strategies for the Asset Allocation Funds.
The Trustees considered the depth and quality of PLFA’s monitoring and oversight of theSub-Advisers. The Board noted that PLFA monitors numerous investment, performance, and risk metrics for the Funds. The Trustees considered PLFA’s continued investment in, and development of, its research and analytical capabilities, including investments in personnel and enhanced analytical tools for assessing Fund performance and the performance of theSub-Advisers, including analytical tools relating to return analysis, risk analysis, and Fund performance attribution and reporting on such matters to the Trustees. The Trustees noted that PLFA uses these tools to analyze a Fund’s performance and risk profile and identify Funds that are underperforming as well as those that are performing well, and to analyze the Funds’ performance records against various measures. The Board considered that PLFA also conducts various analyses to assess the sources of and reasons for performance. The Trustees noted that PLFA has developed, and continues to enhance, processes to oversee and monitor the performance ofSub-Advisers, including the use of analytical methods to review Fund performance and execution of investment strategies. The Board noted that PLFA provides the Board with analyses of these data over rolling periods to assist the Board in identifying trends in Fund performance and other areas, and periodically provides the Trustees with information on economic and market trends to provide a context for assessing recent performance. The Trustees also noted that PLFA has developed effective methods for tracking theSub-Advisers’ investment style consistency, for analyzing the use of derivatives bySub-Advisers and for monitoring Fund liquidity. With respect to the PAM Managed Funds, the Board considered that PLFA has historically provided oversight, diligence and reporting with regard to its PAM unit that is similar to the process it employs with regard to theSub-Advisers and that going forward it will continue to employ the same process for PAM LLC as for all otherSub-Advisors. In making their assessments, the Trustees considered that PLFA has historically exercised diligence in monitoring the performance of theSub-Advisers, and has recommended and taken measures to attempt to remedy relative underperformance by a Fund when PLFA and the Trustees believed it to be appropriate. The Trustees also considered the significant work performed by PLFA in conducting searches for newSub-Advisers to replace existingSub-Advisers where appropriate or to manage new Funds in the Trust.
The Board also noted that PLFA conducts regular due diligence onSub-Advisers involving onsite visits,in-person meetings and telephonic meetings to gather information that PLFA uses to gain anin-depth understanding of aSub-Adviser’s investment process and to seek to identify issues that may be relevant to aSub-Adviser’s services to a Fund or a Fund’s performance, including, but not limited to, aSub-Adviser’s investment process, investment capabilities, resources and personnel, the financial strength of aSub-Adviser, significant staffing changes that could affect a Fund, material changes in aSub-Adviser’s assets under management, compliance and regulatory concerns, best execution review and portfolio security valuation support.
The Trustees considered the time and attention paid by PLFA to matters involving the valuation of Fund securities for theSub-Advised Funds. The Trustees considered that PLFA has established a Valuation Oversight Committee that is responsible for, among other things, researching and evaluating information concerning securities that are not actively or publicly traded, valuing securities subject to a trading halt or for which a market quotation is not readily available, the valuation of equity securities traded in foreign markets, oversight of and due diligence on pricing vendors and the development of alternate valuation methodologies. The Trustees also considered the information and support provided by PLFA in connection with the Trustees’ fair valuation responsibilities.
The Trustees considered PLFA’s oversight, review and analysis of trade execution reports and trends in trade execution for theSub-Advised Funds. The Trustees noted that PLFA works with a third-party transaction cost analysis consultant that provides statistical analysis on portfolio
| 3 | For purposes of this discussion, the PAM Managed Funds are considered Sub-Advised Funds with respect to the new Sub-Advisory Agreement between the Trust, PLFA and PAM LLC effective January 1, 2020. |
F-10
Table of Contents
PACIFIC FUNDS
APPROVAL OF INVESTMENT ADVISORY
AND SUB-ADVISORY AGREEMENTS (Continued)
(Unaudited)
trading, and that PLFA presents information about the Funds’ portfolio trading costs to the Board annually and, where warranted, engages in a dialogue with personnel of aSub-Adviser on trading costs and the quality of execution. The Board also noted that PLFA conducts regular review and analysis of eachSub-Adviser’s use of research obtained with commissions paid to broker-dealers for executing portfolio transactions (“soft dollars”) and presents information about theSub-Advisers’ use of soft dollars to the Board annually and, where deemed necessary, discusses such soft dollar use withSub-Advisers.
The Trustees also considered PLFA’s implementation of transition management programs when handling significant changes in the Funds, such as cash movements between the Funds arising from reallocations byfunds-of-funds and the transition of Fund assets from oneSub-Adviser to another, including steps taken by PLFA to reduce transaction costs associated with a Fund transition. The Trustees considered that PLFA coordinates the onboarding process for newSub-Advisers and oversees the establishment of necessary accounts and documentation for theSub-Advisers to begin managing Fund assets.
In addition to the services described above, the Trustees also considered the compliance monitoring that PLFA and its affiliates conduct on theSub-Advisers and the commitment of PLFA and its affiliates to those programs and PLFA’s efforts to keep the Trustees informed about the compliance programs ofSub-Advisers. In this regard, the Trustees reviewed information and reports from the Trust’s CCO on compliance by theSub-Advisers with applicable laws and regulations. The Trustees considered that the CCO has in place a systematic process for periodically reviewing eachSub-Adviser’s written compliance policies and procedures, including the assessment of eachSub-Adviser’s compliance program as required under Rule38a-1 of the 1940 Act, and eachSub-Adviser’s code of ethics. The Trustees considered that PLFA is compensated under the administration agreement for the administration of the Funds’ compliance program. The Trustees also considered that eachSub-Adviser continues to cooperate with the CCO in reviewing its compliance operations.
Sub-Advisers. The Trustees considered the benefits to shareholders of retaining eachSub-Adviser, in approving theSub-Advisory Agreement for the PAM Managed Funds and in continuing theSub-Advisory Agreements for the otherSub-Advisers, particularly in light of the nature, extent, and quality of the services that have been provided by theSub-Advisers. The Trustees considered the services provided by eachSub-Adviser in rendering investment management services to aSub-Advised Fund. The Trustees considered that eachSub-Adviser is responsible for identifying investments for aSub-Advised Fund and determining when and what securities, cash and/or other investments to purchase, retain, or sell for aSub-Advised Fund. The Trustees also considered that eachSub-Adviser is responsible for evaluating and voting proxies for portfolio holdings of aSub-Advised Fund. The Trustees considered the quality of the portfolio management services which have benefited and should continue to benefit theSub-Advised Funds and their shareholders, the organizational depth and resources of theSub-Advisers, including the background and experience of eachSub-Adviser’s management personnel, and the expertise of eachSub-Adviser’s portfolio management team, as well as the investment methodology used by theSub-Adviser. The Trustees also considered that eachSub-Adviser provides PLFA with information that assists PLFA in performing its oversight role, including information about theSub-Adviser’s compliance program.
Pacific Funds Short Duration Income, Pacific Funds Core Income, Pacific Funds Strategic Income, Pacific Funds Floating Rate Income, Pacific Funds High Income and PF Multi-Asset Fund
With respect to Pacific Funds Short Duration Income, Pacific Funds Core Income, Pacific Funds Strategic Income, Pacific Funds Floating Rate Income, Pacific Funds High Income and the collateral portion of PF Multi-Asset, each directly managed by the fixed income business division of PLFA under the name PAM, the Trustees considered that, in approving a newSub-Advisory Agreement for PAM LLC due to PAM’s scheduled reorganization into PAM LLC on January 1, 2020, PLFA and PAM LLC had represented that the investment teams responsible for managing the Funds will not change as a result of the reorganization, nor will the nature, extent or quality of services currently provided to the PAM Managed Funds.
PFSmall-Cap Value
With respect to PFSmall-Cap Valuesub-advised by AllianceBernstein L.P. (“AllianceBernstein”), the Trustees noted that rather than approving the renewal of the priorSub-Advisory Agreement, they were approving a newSub-Advisory Agreement due to a change in control of AllianceBernstein’s parent company, which resulted in the automatic termination of the currentSub-Advisory Agreement. In this regard, the Trustees noted that AllianceBernstein had represented that there would be no changes to the Fund’s portfolio management team and that there is expected to be no change in the nature, extent or quality of services provided to the Fund.
The Board concluded that it was satisfied with the nature, extent and quality of the investment management services provided, or to be provided, by PLFA and eachSub-Adviser.
B. Investment Results
The Trustees considered the investment results of each Fund in light of its objective, strategies and market conditions. The Trustees compared each Fund’s total returns with the total returns of a group of appropriate peer funds (each a “Selected Performance Peer Group”), which were selected by an Independent Consultant using data from third-party data vendor Morningstar, and the Trustees reviewed a description of the Independent Consultant’s methodology for selecting the peer funds in each Selected Performance Peer Group. In addition, with respect to Funds other than the Asset Allocation Funds, the Trustees compared each Fund’s total returns with the total returns of the Fund’s broad-based market index, sector index, composite index or an alternative index selected by the Independent Consultant, as applicable (each, a “primary benchmark”). With respect to the Asset Allocation Funds, the Trustees compared each Fund’s total returns with the total returns of a custom benchmark that is comprised of certain broad-based market indices based on the broad asset class target allocations for the Fund. The Trustees took into account the views of the Independent Consultant that these custom benchmarks appeared to be reasonable benchmarks for performance reporting purposes.
F-11
Table of Contents
PACIFIC FUNDS
APPROVAL OF INVESTMENT ADVISORY
AND SUB-ADVISORY AGREEMENTS (Continued)
(Unaudited)
The information provided to the Trustees included each Fund’s performance record for theone-, three-, five- andten-year or since inception periods ended September 30, 2019, as available, compared to the applicable benchmark and Selected Performance Peer Group. The Trustees placed greater emphasis on a Fund’s performance against peers as opposed to an unmanaged index.
The Trustees considered the performance of each Fund on acase-by-case basis and noted that some Funds had outperformed their Selected Performance Peer Group over certain periods and/or exceeded the return of their respective benchmark while others underperformed their Selected Performance Peer Group over certain periods and/or trailed the return of their respective benchmark. In considering each Fund’s investment results, the Board placed greater emphasis on each Fund’s longer-term performance track record rather than shorter-term performance. The Board also took into account that each Fund’s track record is measured as of a specific date, and that track records can vary as of different measurement dates. Therefore, in reviewing a Fund that is currently underperforming, the Trustees also considered the broader perspective of the Fund’s performance over varying time periods, the market conditions experienced during the periods under review, as well as the outlook for the Fund going forward in light of expected future market conditions. In the case of the Underlying Funds, the Board also took into account the views of PLFA about the role of a particular Fund within a broader asset allocation strategy for the Asset Allocation Funds. Where there had been a change inSub-Adviser for a Fund, the Board took into account that the currentSub-Adviser was only responsible for certain portions of the Fund’s performance record. The Trustees discussed with PLFA the fact that certain periods of underperformance may be transitory while other periods of underperformance may be reflective of broader issues that may warrant consideration of corrective action. The Trustees discussed these Funds with representatives of PLFA, including an assessment of the approach used by theSub-Advisers, and the approach used by PLFA and PAM with respect to the Directly Managed Funds, as well as the oversight and monitoring by PLFA as the investment adviser, to gain an understanding of underperformance and to assess whether any actions would be appropriate. In addition, the Board considered any specific actions that PLFA, PAM or aSub-Adviser has taken, or agreed to take, to enhance the investment performance of a Fund, and the results of those actions. In reviewing the performance of each Fund, the Board took into account, among other things, each Fund’s performance track record. A summary of each Fund’s track record is provided below.
PF Growth Fund
The Fund: (1) outperformed its Selected Performance Peer Group median for theone-, three-, five- andten-year periods; (2) outperformed its primary benchmark for theone-, three- and five-year periods and underperformed for theten-year period; and (3) is ranked in the first quintile of its Selected Performance Peer Group for theone-, three- and five-year periods, and the second quintile for theten-year period. In evaluating the performance of the Fund, the Board also considered that the currentSub-Adviser has managed the Fund since 2013.
PFLarge-Cap Value Fund
The Fund: (1) outperformed its Selected Performance Peer Group median for theone-, three-, five- andten-year periods; (2) outperformed its primary benchmark for theone- and three-year periods and underperformed for the five- andten-year periods; and (3) is ranked in the first quintile of its Selected Performance Peer Group for theone-year period, the second quintile for the three-year period and the third quintile for the five- andten-year periods.
Pacific FundsLarge-Cap
The Fund: (1) underperformed its Selected Performance Peer Group median for theone- and three-year periods; (2) underperformed its primary benchmark for theone- and three-year periods; and (3) is ranked in the fourth quintile of its Selected Performance Peer Group for theone-year period and the third quintile for the three-year period. In evaluating the performance of the Fund, the Board also considered PLFA’s views as to the reasons for the Fund’s relative performance against peers and its benchmark over various time periods and PLFA’s future outlook for the Fund.
Pacific FundsLarge-Cap Value
The Fund: (1) outperformed its Selected Performance Peer Group median for theone-year period and underperformed for the three-year period; (2) underperformed its primary benchmark for theone- and three-year periods; and (3) is ranked in the second quintile of its Selected Performance Peer Group for theone-year period and the third quintile for the three-year period.
PF Developing Growth Fund
The Fund: (1) outperformed its Selected Performance Peer Group median for the one, three- and five-year periods and underperformed for theten-year period; (2) outperformed its primary benchmark for theone-, three- and five-year periods and underperformed for theten-year period; and (3) is ranked in the third quintile of its Selected Performance Peer Group for theone- and five-year periods, the first quintile for the three-year period and the fourth quintile for theten-year period. In evaluating the performance of the Fund, the Board also considered that the currentSub-Adviser has managed the Fund since 2014.
PFMid-Cap Equity Fund
The Fund: (1) outperformed its Selected Performance Peer Group median for theone-, three-, five- andten-year periods; (2) underperformed its primary benchmark for theone- andten-year periods and outperformed for the three- and five-year periods; and (3) is ranked in the second quintile of its Selected Performance Peer Group for the one-year period and the first quintile for the three-, five- andten-year periods. In evaluating the performance of the Fund, the Board also considered that the currentSub-Adviser has managed the Fund since 2018.
Pacific FundsSmall/Mid-Cap
The Fund: (1) performed in line with its Selected Performance Peer Group median for theone-year period and outperformed for the three-year period; (2) underperformed its primary benchmark for theone- and three-year periods; and (3) is ranked in the third quintile of its Selected Performance Peer Group for theone-year period and the second quintile for the three-year period.
F-12
Table of Contents
PACIFIC FUNDS
APPROVAL OF INVESTMENT ADVISORY
AND SUB-ADVISORY AGREEMENTS (Continued)
(Unaudited)
Pacific FundsSmall-Cap
The Fund: (1) underperformed its Selected Performance Peer Group median for theone-year period and slightly outperformed for the three-year period; (2) underperformed its primary benchmark for theone- and three-year periods; and (3) is ranked in the fourth quintile of its Selected Performance Peer Group for theone-year period and the third quintile for the three-year period.
Pacific FundsSmall-Cap Growth
The Fund: (1) underperformed its Selected Performance Peer Group median for theone- and three-year periods; (2) underperformed its primary benchmark for theone- and three-year periods; and (3) is ranked in the fifth quintile of its Selected Performance Peer Group for theone- and three-year periods. In evaluating the performance of the Fund, the Board also considered PLFA’s views as to the reasons for the Fund’s relative performance against peers and its benchmark over various time periods and PLFA’s future outlook for the Fund. The Board also considered that PLFA has added the Fund to its performance “watch list,” will be monitoring the Fund closely for improved performance and may have a course of action to recommend for the Fund at an upcoming Board meeting.
PFSmall-Cap Value Fund
The Fund: (1) underperformed its Selected Performance Peer Group median for theone-year period and outperformed for the three-, five- andten-year periods; (2) underperformed its primary benchmark for theone- and three-year periods and outperformed for the five- andten-year periods; and (3) is ranked in the third quintile of its Selected Performance Peer Group for theone-year period, the second quintile for the three-year period and the first quintile for the five- andten-year periods. In evaluating the performance of the Fund, the Board also considered that the currentSub-Adviserco-managed the Fund with another firm from May 2014 to October 2015 and since October 2015 has been the soleSub-Adviser, and that prior to May 2014 another firm managed the Fund.
Pacific FundsSmall-Cap Value
The Fund: (1) outperformed its Selected Performance Peer Group median for theone- and three-year periods; (2) outperformed its primary benchmark for theone-year period and underperformed for the three-year period; and (3) is ranked in the second quintile of its Selected Performance Peer Group for theone-year period and the third quintile for the three-year period.
PF Emerging Markets Fund
The Fund: (1) outperformed its Selected Performance Peer Group median for theone-, three-, five- andten-year periods; (2) outperformed its primary benchmark for theone-, three-, five- andten-year periods; and (3) is ranked in the second quintile of its Selected Performance Peer Group for theone- and five-year periods and the first quintile for the three- andten-year periods. In evaluating the performance of the Fund, the Board also considered that it had recently approved a newSub-Advisory Agreement for the Fund effective May 2019 in connection with the acquisition of the previousSub-Adviser by theSub-Adviser’s parent and, therefore, theSub-Advisory Agreement was not up for renewal at this time.
PF Emerging Markets Debt Fund
The Fund: (1) underperformed its Selected Performance Peer Group median for theone-year period and outperformed for the three- and five-year periods; (2) underperformed its primary benchmark for theone- and three-year periods and outperformed for the five-year period; and (3) is ranked in the fourth quintile of its Selected Performance Peer Group for theone-year period and the second quintile for the three- and five-year periods.
PF InternationalLarge-Cap Fund
The Fund: (1) outperformed its Selected Performance Peer Group median for theone-, three-, five- andten-year periods; (2) outperformed its primary benchmark for theone-, three-, five- andten-year periods; and (3) is ranked in the second quintile of its Selected Performance Peer Group for theone-, three- and five-year periods and the third quintile for theten-year period.
PF InternationalSmall-Cap Fund
The Fund: (1) underperformed the Selected Performance Peer Group median for theone- and three-year periods; (2) underperformed its primary benchmark for theone- and three-year periods; and (3) is ranked in the fourth quintile of its Selected Performance Peer Group for theone- and three-year periods. In evaluating the performance of the Fund, the Board also considered PLFA’s views as to the reasons for the Fund’s relative performance against peers and its benchmark over various time periods and PLFA’s future outlook for the Fund. The Board also considered PLFA’s views as to the competitive nature of theSub-Adviser’s longer-term performance (as demonstrated by the similarly managed fund in Pacific Select Fund) and its confidence in theSub-Adviser’s investment process. The Board also considered that PLFA has added the Fund to its performance “watch list” and will be monitoring the Fund closely for improved performance.
PF International Value Fund
The Fund: (1) underperformed its Selected Performance Peer Group median for theone- andten-year periods and outperformed for the three- and five-year periods; (2) underperformed its primary benchmark for theone-, three-, five- andten-year periods; and (3) is ranked in the fourth quintile of its Selected Performance Peer Group for theone- andten-year periods, the first quintile for the three-year period and the second quintile for the five-year period. In evaluating the performance of the Fund, the Board also considered that the currentSub-Adviser has managed the Fund since 2017.
PF Currency Strategies Fund
The Fund: (1) underperformed its Selected Performance Peer Group median for theone- and three-year periods and outperformed for the five-year period; (2) underperformed its primary benchmark for theone-, three- and five-year periods; and (3) is ranked in the third quintile of its
F-13
Table of Contents
PACIFIC FUNDS
APPROVAL OF INVESTMENT ADVISORY
AND SUB-ADVISORY AGREEMENTS (Continued)
(Unaudited)
Selected Performance Peer Group for theone- and three-year periods and the first quintile for the five-year period. In evaluating the performance of the Fund, the Board also considered that the Fund had aco-Sub-Adviser from 2014 until 2018. The Board also considered that the currentSub-Adviser had been the soleSub-Adviser from 2018 until May 2019 and that it had recently approved a newSub-Advisory Agreement for the Fund with Neuberger Berman effective May 2019 in connection with the addition of aco-Sub-Adviser and, therefore, theSub-Advisory Agreement with Neuberger Berman was not up for renewal at this time.
PF Multi-Asset Fund
The Fund: (1) outperformed its Selected Performance Peer Group median for theone-year period; (2) outperformed its primary benchmark for theone-year period; and (3) is ranked in the second quintile for theone-year period. In evaluating the performance of the Fund, the Board also considered that the Fund had not been in operation for a sufficient time period to establish a meaningful track record. The Board also considered the Fund’s contribution to the performance of the Asset Allocation Funds.
PF Real Estate Fund
The Fund: (1) outperformed its Selected Performance Peer Group median for theone- and three-year periods, underperformed for the five-year period and slightly outperformed for theten-year period; (2) outperformed its primary benchmark for theone-year period and underperformed for the three-, five- andten-year periods; and (3) is ranked in the first quintile of its Selected Performance Peer Group for theone-year period and the third quintile for the three-, five- andten-year periods. In evaluating the performance of the Fund, the Board also considered that the currentSub-Adviser has managed the Fund since 2018.
Pacific Funds Core Income
The Fund: (1) slightly underperformed its Selected Performance Peer Group median for theone-year period and outperformed for the three- and five-year periods; (2) underperformed its primary benchmark for theone-year period, outperformed for the three-year period and slightly outperformed for the five-year period; and (3) is ranked in the third quintile of its Selected Performance Peer Group for theone-year period, the first quintile for the three-year period and the second quintile for the five-year period.
Pacific Funds Floating Rate Income
The Fund: (1) outperformed its Selected Performance Peer Group median for theone-, three- and five-year periods; (2) underperformed its primary benchmark for theone-, three- and five-year periods; and (3) is ranked in the first quintile of its Selected Performance Peer Group for theone-, three- and five-year periods.
Pacific Funds High Income
The Fund: (1) outperformed its Selected Performance Peer Group median for theone-, three- and five-year periods; (2) underperformed its primary benchmark for theone-, three- and five-year periods; and (3) is ranked in the third quintile of its Selected Performance Peer Group for theone- and five-year periods and the first quintile for the three-year period.
PF Inflation Managed Fund
The Fund: (1) outperformed its Selected Performance Peer Group median for theone-, three-, five- andten-year periods; (2) underperformed its primary benchmark for theone-, five- andten-year periods and outperformed for the three-year period; and (3) is ranked in the first quintile of its Selected Performance Peer Group for theone-, three- andten-year periods and the second quintile for the five-year period. In evaluating the performance of the Fund, the Board also considered that the currentSub-Adviserco-managed the Fund with another firm from January 2015 to October 2016 and since October 2016 has been the soleSub-Adviser.
PF Managed Bond Fund
The Fund: (1) outperformed its Selected Performance Peer Group median for theone-, three-, five- andten-year periods; (2) outperformed its primary benchmark for theone-, three-, five- andten-year periods; and (3) is ranked in the first quintile of its Selected Performance Peer Group for theone-, three- and five-year periods and the second quintile for theten-year period. In evaluating the performance of the Fund, the Board also considered that one of the Fund’sco-Sub-Advisers was the soleSub-Adviser from the Fund’s inception until 2014, and that the otherco-Sub-Adviser hasco-managed the Fund since 2014.
PF Short Duration Bond Fund
The Fund: (1) underperformed its Selected Performance Peer Group median for theone-, three-, five- andten-year periods; (2) underperformed its primary benchmark for theone-year period, outperformed for the three-year period and slightly outperformed for the five- andten-year periods; and (3) is ranked in the third quintile of its Selected Performance Peer Group for theone- and three-year periods, the fourth quintile for the five-year period and the fifth quintile for theten-year period. In evaluating the performance of the Fund, the Board also considered that the currentSub-Adviser has managed the Fund since 2011.
Pacific Funds Short Duration Income
The Fund: (1) performed in line with its Selected Performance Peer Group median for theone-year period and outperformed for the three- and five-year periods; (2) underperformed its primary benchmark for theone-year period and outperformed for the three- and five-year periods; and (3) is ranked in the third quintile of its Selected Performance Peer Group for theone-year period, the first quintile for the three-year period and the second quintile for the five-year period.
F-14
Table of Contents
PACIFIC FUNDS
APPROVAL OF INVESTMENT ADVISORY
AND SUB-ADVISORY AGREEMENTS (Continued)
(Unaudited)
Pacific Funds Strategic Income
The Fund: (1) outperformed its Selected Performance Peer Group median for theone-, three- and five-year periods; (2) underperformed its primary benchmark for theone-year period and outperformed for the three- and five-year periods; and (3) is ranked in the third quintile of its Selected Performance Peer Group for theone-year period and the second quintile for the three- and five-year periods.
Pacific Funds Portfolio Optimization Aggressive-Growth
The Fund: (1) outperformed its Selected Performance Peer Group median for theone- and three-year periods and performed in line for the five- andten-year periods; (2) underperformed its custom benchmark for theone-, three-, five- andten-year periods; and (3) is ranked in the second quintile of its Selected Performance Peer Group for theone- and three-year periods and the third quintile for the five- andten-year periods.
Pacific Funds Portfolio Optimization Conservative
The Fund: (1) outperformed its Selected Performance Peer Group median for theone- year period and underperformed for the three-, five- andten-year periods; (2) underperformed its custom benchmark for theone-, three-, five- andten-year periods; and (3) is ranked in the third quintile of its Selected Performance Peer Group for theone-, three- andten-year periods and the fourth quintile for the five-year period.
Pacific Funds Portfolio Optimization Growth
The Fund: (1) outperformed its Selected Performance Peer Group median for theone-, three- and five-year periods and underperformed for theten-year period; (2) underperformed its custom benchmark for theone-, three-, five- andten-year periods; and (3) is ranked in the second quintile of its Selected Performance Peer Group for theone- and three-year periods, the third quintile for the five-year period and the fourth quintile for theten-year period.
Pacific Funds Portfolio Optimization Moderate-Conservative
The Fund: (1) underperformed its Selected Performance Peer Group median for theone-, three-, five- andten-year periods; (2) underperformed its custom benchmark for theone-, three-, five- andten-year periods; and (3) is ranked in the third quintile of its Selected Performance Peer Group for theone-, three- and five-year periods and the fourth quintile for theten-year period. In evaluating the performance of the Fund, the Board also considered PLFA’s views as to the reasons for the Fund’s relative performance against peers and its benchmark over various time periods and PLFA’s future outlook for the Fund.
Pacific Funds Portfolio Optimization Moderate
The Fund: (1) underperformed its Selected Performance Peer Group median for theone-, three-, five- andten-year periods; (2) underperformed its custom benchmark for theone-, three-, five- andten-year periods; and (3) is ranked in the third quintile of its Selected Performance Peer Group for theone-year period, the fourth quintile for the three- and five-year periods and the fifth quintile for theten-year period. In evaluating the performance of the Fund, the Board also considered PLFA’s views as to the reasons for the Fund’s relative performance against peers and its benchmark over various time periods and PLFA’s future outlook for the Fund.
The Trustees reviewed the monitoring of eachSub-Advisers’ investment results by PLFA, including PLFA’s historical practice of recommending to the Trustees a change inSub-Adviser when circumstances warrant. Generally, the Trustees noted that there continues to be a record of well-managed Funds that are appropriate to serve as Underlying Funds in the Asset Allocation Funds and that the Asset Allocation Funds provide a range of professionally managed asset allocation investment options. The Trustees considered the steps PLFA has taken to seek to improve performance of the Asset Allocation Funds, including ongoing assessment of asset allocation determinations, diversifying asset class investment options by adding additional Underlying Funds, and adding or changingSub-Advisers to the Underlying Funds. The Trustees also noted that the Funds continue to deliver the investment style as disclosed to shareholders. The Trustees also noted the use by investors of the Asset Allocation Funds and the benefits the Asset Allocation Funds provide for shareholders generally.
The Board concluded that PLFA continues to have a long record of effectively managing a multi-manager fund group and asset allocation funds designed to give shareholders a reasonable array of choices through which to implement their investment programs. The Board further concluded that PLFA was appropriately implementing each Fund’s investment objective either directly or through the selection ofSub-Advisers and that PLFA’s record in managing each Fund indicates that PLFA’s continued management, as well as the continuation of the respectiveSub-Advisory Agreements, will benefit each Fund and its shareholders.
C. Advisory Fees and Total Expense Ratios
The Trustees requested, received and reviewed information from PLFA relating to the advisory fees paid by the Funds and thesub-advisory fees paid by PLFA, including the portion of the advisory fees paid to eachSub-Adviser as compared to the portion retained by PLFA4. The Trustees considered the nature and quality of the services provided by PLFA and also considered the nature and quality of services provided by eachSub-Adviser. The Independent Trustees also requested and reviewed information from the Independent Consultant along with the Independent Consultant’s analysis of advisory fees,sub-advisory fees and certain Fund net expenses, excluding any applicable service or distribution fees, which were selected by the Independent Consultant for purposes of the peer group expense comparisons (“Operating Expenses”). The Trustees reviewed the advisory fees,sub-advisory fees and Operating Expenses of each Fund and compared advisory fees and expenses with the fees and expense levels of a group of appropriate peer funds identified by the Independent Consultant (each a “Selected Expense Peer Group”). The Trustees reviewed a description of the Independent Consultant’s methodology for constructing the Selected
Expense Peer Groups, noting that each Selected Expense Peer Group includes a group ofsimilarly-sized funds with comparable strategies from
| 4 | With respect to the PAM Managed Funds, the Trustees considered the level of the proposed sub-advisory fee to be paid to PAM LLC. |
F-15
Table of Contents
PACIFIC FUNDS
APPROVAL OF INVESTMENT ADVISORY
AND SUB-ADVISORY AGREEMENTS (Continued)
(Unaudited)
a universe of funds that (i) included bothsub-advised and directly managed funds; (ii) excluded funds that are managed withnon-standard business models and expense structures; and (iii) excluded index funds. With respect to the Asset Allocation Funds, the Trustees also compared the net expense ratio (including acquired fund fees and expenses) with the average net expense ratio of funds in the Morningstar Category determined to be similar to the relevant Asset Allocation Fund (“Comparable Peer Fund Average”).
A summary of certain comparative fee and expense information considered by the Trustees for each Fund is provided below.
PF Growth Fund
The Trustees considered that (a) the advisory fee for the Fund is less than the median advisory fee rate of the funds in its Selected Expense Peer Group and ranked in the first quintile of its Selected Expense Peer Group; and (b) the Operating Expenses for the Fund are less than the median Operating Expenses of the funds in its Selected Expense Peer Group and ranked in the first quintile of its Selected Expense Peer Group.
PFLarge-Cap Value Fund
The Trustees considered that (a) the advisory fee for the Fund is in line with the median advisory fee rate of the funds in its Selected Expense Peer Group and ranked in the third quintile of its Selected Expense Peer Group; and (b) the Operating Expenses for the Fund are slightly less than the median Operating Expenses of the funds in its Selected Expense Peer Group and ranked in the third quintile of its Selected Expense Peer Group.
Pacific FundsLarge-Cap
The Trustees considered that (a) the advisory fee for the Fund is less than the median advisory fee rate of the funds in its Selected Expense Peer Group and ranked in the second quintile of its Selected Expense Peer Group; and (b) the Operating Expenses for the Fund are less than the median Operating Expenses of the funds in its Selected Expense Peer Group and ranked in the second quintile of its Selected Expense Peer Group. The Trustees also considered that PLFA had recently reduced the advisory fee by 0.10%.
Pacific FundsLarge-Cap Value
The Trustees considered that (a) the advisory fee for the Fund is less than the median advisory fee rate of the funds in its Selected Expense Peer Group and ranked in the second quintile of its Selected Expense Peer Group; and (b) the Operating Expenses for the Fund are less than the median Operating Expenses of the funds in its Selected Expense Peer Group and ranked in the second quintile of its Selected Expense Peer Group. The Trustees also considered that PLFA had recently reduced the advisory fee by 0.10%.
PF Developing Growth Fund
The Trustees considered that (a) the advisory fee for the Fund is less than the median advisory fee rate of the funds in its Selected Expense Peer Group and ranked in the first quintile of its Selected Expense Peer Group; and (b) the Operating Expenses for the Fund are less than the median Operating Expenses of the funds in its Selected Expense Peer Group and ranked in the first quintile of its Selected Expense Peer Group.
PFMid-Cap Equity Fund
The Trustees considered that (a) the advisory fee for the Fund is less than the median advisory fee rate of the funds in its Selected Expense Peer Group and ranked in the first quintile of its Selected Expense Peer Group; and (b) the Operating Expenses for the Fund are less than the median Operating Expenses of the funds in its Selected Expense Peer Group and ranked in the first quintile of its Selected Expense Peer Group.
Pacific FundsSmall/Mid-Cap
The Trustees considered that (a) the advisory fee for the Fund is slightly greater than the median advisory fee rate of the funds in its Selected Expense Peer Group and ranked in the third quintile of its Selected Expense Peer Group; and (b) the Operating Expenses for the Fund are greater than the median Operating Expenses of the funds in its Selected Expense Peer Group and ranked in the third quintile of its Selected Expense Peer Group. The Trustees also considered that PLFA had recently reduced the advisory fee by 0.10%.
Pacific FundsSmall-Cap
The Trustees considered that (a) the advisory fee for the Fund is in line with the median advisory fee rate of the funds in its Selected Expense Peer Group and ranked in the third quintile of its Selected Expense Peer Group; and (b) the Operating Expenses for the Fund are less than the median Operating Expenses of the funds in its Selected Expense Peer Group and ranked in the second quintile of its Selected Expense Peer Group. The Trustees also considered that PLFA had recently reduced the advisory fee by 0.10%.
Pacific FundsSmall-Cap Growth
The Trustees considered that (a) the advisory fee for the Fund is less than the median advisory fee rate of the funds in its Selected Expense Peer Group and ranked in the second quintile of its Selected Expense Peer Group; and (b) the Operating Expenses for the Fund are less than the median Operating Expenses of the funds in its Selected Expense Peer Group and ranked in the second quintile of its Selected Expense Peer Group. The Trustees also considered that PLFA had recently reduced the advisory fee by 0.10%.
PFSmall-Cap Value Fund
The Trustees considered that (a) the advisory fee for the Fund is less than the median advisory fee rate of the funds in its Selected Expense Peer Group and ranked in the first quintile of its Selected Expense Peer Group; and (b) the Operating Expenses for the Fund are less than the median Operating Expenses of the funds in its Selected Expense Peer Group and ranked in the first quintile of its Selected Expense Peer Group.
F-16
Table of Contents
PACIFIC FUNDS
APPROVAL OF INVESTMENT ADVISORY
AND SUB-ADVISORY AGREEMENTS (Continued)
(Unaudited)
Pacific FundsSmall-Cap Value
The Trustees considered that (a) the advisory fee for the Fund is greater than the median advisory fee rate of the funds in its Selected Expense Peer Group and ranked in the fourth quintile of its Selected Expense Peer Group; and (b) the Operating Expenses for the Fund are less than the median Operating Expenses of the funds in its Selected Expense Peer Group and ranked in the third quintile of its Selected Expense Peer Group. The Trustees also considered that PLFA had recently reduced the advisory fee by 0.10%.
PF Emerging Markets Fund
The Trustees considered that (a) the advisory fee for the Fund is less than the median advisory fee rate of the funds in its Selected Expense Peer Group and ranked in the first quintile of its Selected Expense Peer Group; and (b) the Operating Expenses for the Fund are less than the median Operating Expenses of the funds in its Selected Expense Peer Group and ranked in the second quintile of its Selected Expense Peer Group.
PF Emerging Markets Debt Fund
The Trustees considered that (a) the advisory fee for the Fund is in line with the median advisory fee rate of the funds in its Selected Expense Peer Group and ranked in the third quintile of its Selected Expense Peer Group; and (b) the Operating Expenses for the Fund are slightly greater than the median Operating Expenses of the funds in its Selected Expense Peer Group and ranked in the third quintile of its Selected Expense Peer Group. The Trustees considered that PLFA currently has contractually agreed to waive 0.02% of its advisory fee.
PF InternationalLarge-Cap Fund
The Trustees considered that (a) the advisory fee for the Fund is slightly less than the median advisory fee rate of the funds in its Selected Expense Peer Group and ranked in the third quintile of its Selected Expense Peer Group; and (b) the Operating Expenses for the Fund are less than the median Operating Expenses of the funds in its Selected Expense Peer Group and ranked in the second quintile of its Selected Expense Peer Group.
PF InternationalSmall-Cap Fund
The Trustees considered that (a) the advisory fee for the Fund is less than the median advisory fee rate of the funds in its Selected Expense Peer Group and ranked in the first quintile of its Selected Expense Peer Group; and (b) the Operating Expenses for the Fund are less than the median Operating Expenses of the funds in its Selected Expense Peer Group and ranked in the first quintile of its Selected Expense Peer Group.
PF International Value Fund
The Trustees considered that (a) the advisory fee for the Fund is less than the median advisory fee rate of the funds in its Selected Expense Peer Group and ranked in the first quintile of its Selected Expense Peer Group; and (b) the Operating Expenses for the Fund are less than the median Operating Expenses of the funds in its Selected Expense Peer Group and ranked in the first quintile of its Selected Expense Peer Group.
PF Currency Strategies Fund
The Trustees considered that (a) the advisory fee for the Fund is less than the median advisory fee rate of the funds in its Selected Expense Peer Group and ranked in the first quintile of its Selected Expense Peer Group; and (b) the Operating Expenses for the Fund are slightly less than the median Operating Expenses of the funds in its Selected Expense Peer Group and ranked in the second quintile of its Selected Expense Peer Group.
PF Multi-Asset Fund
The Trustees considered that (a) the advisory fee for the Fund is less than the median advisory fee rate of the funds in its Selected Expense Peer Group and ranked in the first quintile of its Selected Expense Peer Group; and (b) the Operating Expenses for the Fund are less than the median Operating Expenses of the funds in its Selected Expense Peer Group and ranked in the first quintile of its Selected Expense Peer Group.
PF Real Estate Fund
The Trustees considered that (a) the advisory fee for the Fund is slightly less than the median advisory fee rate of the funds in its Selected Expense Peer Group and ranked in the third quintile of its Selected Expense Peer Group; and (b) the Operating Expenses for the Fund are less than the median Operating Expenses of the funds in its Selected Expense Peer Group and ranked in the first quintile of its Selected Expense Peer Group. The Trustees considered that PLFA currently has contractually agreed to waive 0.15% of its advisory fee.
Pacific Funds Core Income
The Trustees considered that (a) the advisory fee for the Fund is slightly greater than the median advisory fee rate of the funds in its Selected Expense Peer Group and ranked in the third quintile of its Selected Expense Peer Group; and (b) the Operating Expenses for the Fund are less than the median Operating Expenses of the funds in its Selected Expense Peer Group and ranked in the second quintile of its Selected Expense Peer Group. The Trustees noted that pursuant to a fee waiver agreement, PLFA has agreed to a breakpoint schedule that will reduce its advisory fee once the Fund attains varying higher asset levels, but that the Fund has not yet reached the first breakpoint.
F-17
Table of Contents
PACIFIC FUNDS
APPROVAL OF INVESTMENT ADVISORY
AND SUB-ADVISORY AGREEMENTS (Continued)
(Unaudited)
Pacific Funds Floating Rate Income
The Trustees considered that (a) the advisory fee for the Fund is slightly greater than the median advisory fee rate of the funds in its Selected Expense Peer Group and ranked in the fifth quintile of its Selected Expense Peer Group; and (b) the Operating Expenses for the Fund are less than the median Operating Expenses of the funds in its Selected Expense Peer Group and ranked in the second quintile of its Selected Expense Peer Group. The Trustees noted that pursuant to a fee waiver agreement, PLFA has agreed to a breakpoint schedule that had the effect of reducing the Fund’s advisory fee based on the Fund having attained varying higher asset levels.
Pacific Funds High Income
The Trustees considered that (a) the advisory fee for the Fund is less than the median advisory fee rate of the funds in its Selected Expense Peer Group and ranked in the first quintile of its Selected Expense Peer Group; and (b) the Operating Expenses for the Fund are less than the median Operating Expenses of the funds in its Selected Expense Peer Group and ranked in the first quintile of its Selected Expense Peer Group. The Trustees noted that pursuant to a fee waiver agreement, PLFA has agreed to a breakpoint schedule that will reduce its advisory fee once the Fund attains varying higher asset levels, but that the Fund has not yet reached the first breakpoint.
PF Inflation Managed Fund
The Trustees considered that (a) the advisory fee for the Fund is less than the median advisory fee rate of the funds in its Selected Expense Peer Group and ranked in the second quintile of its Selected Expense Peer Group; and (b) the Operating Expenses for the Fund are in line with the median Operating Expenses of the funds in its Selected Expense Peer Group and ranked in the third quintile of its Selected Expense Peer Group.
PF Managed Bond Fund
The Trustees considered that (a) the advisory fee for the Fund is less than the median advisory fee rate of the funds in its Selected Expense Peer Group and ranked in the first quintile of its Selected Expense Peer Group; and (b) the Operating Expenses for the Fund are less than the median Operating Expenses of the funds in its Selected Expense Peer Group and ranked in the first quintile of its Selected Expense Peer Group.
PF Short Duration Bond Fund
The Trustees considered that (a) the advisory fee for the Fund is in line with the median advisory fee rate of the funds in its Selected Expense Peer Group and ranked in the third quintile of its Selected Expense Peer Group; and (b) the Operating Expenses for the Fund are slightly greater than the median Operating Expenses of the funds in its Selected Expense Peer Group and ranked in the fourth quintile of its Selected Expense Peer Group.
Pacific Funds Short Duration Income
The Trustees considered that (a) the advisory fee for the Fund is in line with the median advisory fee rate of the funds in its Selected Expense Peer Group and ranked in the third quintile of its Selected Expense Peer Group; and (b) the Operating Expenses for the Fund are less than the median Operating Expenses of the funds in its Selected Expense Peer Group and ranked in the second quintile of its Selected Expense Peer Group. The Trustees noted that pursuant to a fee waiver agreement, PLFA has agreed to a breakpoint schedule that will reduce its advisory fee once the Fund attains varying higher asset levels, but that the Fund has not yet reached the first breakpoint.
Pacific Funds Strategic Income
The Trustees considered that (a) the advisory fee for the Fund is greater than the median advisory fee rate of the funds in its Selected Expense Peer Group and ranked in the fourth quintile of its Selected Expense Peer Group; and (b) the Operating Expenses for the Fund are in line with the median Operating Expenses of the funds in its Selected Expense Peer Group and ranked in the third quintile of its Selected Expense Peer Group. The Trustees further noted that pursuant to a fee waiver agreement, PLFA has agreed to a breakpoint schedule that will reduce its advisory fee once the Fund attains varying higher asset levels, but that the Fund has not yet reached the first breakpoint. The Trustees considered that the Selected Expense Peer Group also contains intermediate-term bond funds which generally have a lower advisory fee than multisector bond funds, such as the Fund.
Pacific Funds Portfolio Optimization Aggressive-Growth
The Trustees considered that (a) the advisory fee for the Fund is in line with the median advisory fee rate of the funds in its Selected Expense Peer Group and ranked in the third quintile of its Selected Expense Peer Group; (b) the Operating Expenses for the Fund are greater than the median Operating Expenses of the funds in its Selected Expense Peer Group and ranked in the fourth quintile of its Selected Expense Peer Group; and (c) the net expense ratio was slightly greater than the Comparable Peer Fund Average. The Trustees noted that pursuant to a fee waiver agreement, PLFA has agreed to a breakpoint schedule that will reduce its advisory fee once the Fund attains varying higher asset levels, but that the Fund has not yet reached the first breakpoint.
Pacific Funds Portfolio Optimization Conservative
The Trustees considered that (a) the advisory fee for the Fund is in line with the median advisory fee rate of the funds in its Selected Expense Peer Group and ranked in the third quintile of its Selected Expense Peer Group; (b) the Operating Expenses for the Fund are greater than the median Operating Expenses of the funds in its Selected Expense Peer Group and ranked in the fourth quintile of its Selected Expense Peer Group; and (c) the net expense ratio was greater than the Comparable Peer Fund Average. The Trustees noted that pursuant to a fee waiver agreement, PLFA has agreed to a breakpoint schedule that will reduce its advisory fee once the Fund attains varying higher asset levels, but that the Fund has not yet reached the first breakpoint.
F-18
Table of Contents
PACIFIC FUNDS
APPROVAL OF INVESTMENT ADVISORY
AND SUB-ADVISORY AGREEMENTS (Continued)
(Unaudited)
Pacific Funds Portfolio Optimization Growth
The Trustees considered that (a) the advisory fee for the Fund is in line with the median advisory fee rate of the funds in its Selected Expense Peer Group and ranked in the third quintile of its Selected Expense Peer Group; (b) the Operating Expenses for the Fund are greater than the median Operating Expenses of the funds in its Selected Expense Peer Group and ranked in the fourth quintile of its Selected Expense Peer Group; and (c) the net expense ratio was greater than the Comparable Peer Fund Average. The Trustees noted that pursuant to a fee waiver agreement, PLFA has agreed to a breakpoint schedule that will reduce its advisory fee once the Fund attains varying higher asset levels, but that the Fund has not yet reached the first breakpoint.
Pacific Funds Portfolio Optimization Moderate-Conservative
The Trustees considered that (a) the advisory fee for the Fund is in line with the median advisory fee rate of the funds in its Selected Expense Peer Group and ranked in the third quintile of its Selected Expense Peer Group; (b) the Operating Expenses for the Fund are greater than the median Operating Expenses of the funds in its Selected Expense Peer Group and ranked in the fourth quintile of its Selected Expense Peer Group; and (c) the net expense ratio was in line with the Comparable Peer Fund Average. The Trustees noted that pursuant to a fee waiver agreement, PLFA has agreed to a breakpoint schedule that will reduce its advisory fee once the Fund attains varying higher asset levels, but that the Fund has not yet reached the first breakpoint.
Pacific Funds Portfolio Optimization Moderate
The Trustees considered that (a) the advisory fee for the Fund is in line with the median advisory fee rate of the funds in its Selected Expense Peer Group and ranked in the third quintile of its Selected Expense Peer Group;(b) the Operating Expenses for the Fund are greater than the median Operating Expenses of the funds in its Selected Expense Peer Group and ranked in the fourth quintile of its Selected Expense Peer Group; and (c) the net expense ratio was less than the Comparable Peer Fund Average. The Trustees noted that pursuant to a fee waiver agreement, PLFA has agreed to a breakpoint schedule that will reduce its advisory fee once the Fund attains varying higher asset levels, but that the Fund has not yet reached the first breakpoint.
During their review, the Trustees considered that all of the Funds were subject to contractual expense limitations on certain operating expenses agreed to by PLFA.
The Trustees also considered information from theSub-Advisers regarding the comparativesub-advisory fees charged under other investment advisory contracts for similarly managed accounts, such as contracts of eachSub-Adviser with other similarly managed registered investment companies or other types of clients. The Trustees noted that in many cases there were differences in the level of services provided to the Funds by theSub-Advisers and that the level of services provided by theseSub-Advisers on these other accounts differed due to the nature of the accounts or because there were other reasons to support the difference in fees, such as an affiliation between theSub-Adviser and the account. These differences often explained variations in fee schedules. The Trustees were mindful that, with the exception of the PAM Managed Funds, theSub-Advised Funds’ fee rates were the result of arms’-length negotiations between PLFA and theSub-Advisers. For the PAM Managed Funds, the Trustees took into account the fact that thesub-advisory fee was not the subject of an arms’-length negotiation with PLFA, but considered information relating to comparative fees charged by similarly managed funds. In all cases, the Trustees considered that allsub-advisory fees are paid by PLFA and are not paid directly by a Fund.
The Board concluded that the advisory fees,sub-advisory fees and total expenses of each Fund were fair and reasonable.
D. Costs, Level of Profits and Economies of Scale
The Trustees reviewed information provided by PLFA regarding PLFA’s costs of sponsoring and operating the Funds and information regarding the profitability of PLFA from each Fund. For purposes of analyzing PLFA’s costs and profitability with respect to the Funds, the Trustees assigned credibility to PLFA’s view that little weight should be given to the fees of Pacific Select Fund, anotheropen-end investment company advised by PLFA that consists of multiple funds, on the basis that there are significant differences between Pacific Funds and Pacific Select Fund, including differences in fund size and platforms on which the funds are offered. For theSub-Advised Funds, the Trustees also reviewed information provided by theSub-Advisers regarding their costs in managing theSub-Advised Funds and their profitability from the Funds5.
PLFA and theSub-Advisers’ Costs and Profitability. The Trustees noted that, based on the data available, PLFA appears to be providing and operating products that are competitively priced with other funds, especially other multi-manager and asset allocation funds. The Trustees noted PLFA’s willingness to build its investment capabilities and to sponsor new funds that PLFA believed would benefit the Asset Allocation Funds, despite the potential subsidies required by PLFA during a new Fund’sstart-up phase. The Trustees also noted that the analysis of the Trust’s profitability to PLFA supported a conclusion that PLFA’s costs and profitability are reasonable, whether considered inclusive or exclusive of distribution costs.
The Trustees also reviewed information provided regarding the structure and manner in which PLFA’s investment professionals were compensated and their respective views of the relationship of such compensation to the attraction and retention of quality personnel. The Trustees considered PLFA’s willingness to invest in technology, infrastructure and staff to reinforce and offer new services and to accommodate changing regulatory requirements. The Trustees also considered the organizational strengths of theSub-Advisers and their ability to attract and retain investment personnel over time and to sustain the staffing of investment teams that provide services to theSub-Advised Funds.
With respect to theSub-Advisers, the Trustees noted that it was difficult in many cases to accurately determine or evaluate theSub-Advisers’ costs and the profitability of theSub-Advisory Agreements to theSub-Advisers because of, among other things, the differences in the types and
| 5 | With respect to the PAM Managed Funds, this information was provided on a pro forma basis. |
F-19
Table of Contents
PACIFIC FUNDS
APPROVAL OF INVESTMENT ADVISORY
AND SUB-ADVISORY AGREEMENTS (Continued)
(Unaudited)
content of information provided by theSub-Advisers, the fact that manySub-Advisers manage substantial assets other than the Funds and, further, that any such assessment would involve assumptions regarding theSub-Advisers’ expense allocation policies, capital structure, cost of capital, business mix and other factors.
Accordingly, in the case of theSub-Advisers, the Trustees considered the data described above in light of the arms’ length nature of the relationship (for thenon-PAM ManagedSub-Advised Funds) between PLFA and suchSub-Advisers with respect to the negotiation of fundsub-advisory fees and the fact that such fees are paid by PLFA. For the PAM Managed Funds, the Trustees took into account the fact that thesub-advisory fee was not the subject of an arms’-length negotiation with PLFA, but consideredpro-forma information regarding the anticipated costs and profitability of the newSub-Advisory Agreement to PAM LLC.
Economies of Scale. The Trustees noted and considered the extent to which economies of scale are realized by PLFA and theSub-Advisers as each Fund grows, and whether advisory fee levels reflect economies of scale if the Funds grow in size. The Trustees noted PLFA’s commitment to competitive total expenses of certain Funds through expense limitation agreements and, for certain Asset Allocation Funds and PAM Managed Funds, through advisory fee waivers. The Trustees also noted PLFA’s and its affiliates’ consistent reinvestment in the business in the form of adding to investment capabilities and resources, improvements in technology, product innovations and customer service. The Trustees considered information relating to economies of scale provided by PLFA, PLFA’s willingness to discuss and evaluate the topic of economies of scale with the Trustees, and PLFA’s agreement to enter into advisory fee waivers for certain PAM Managed Funds and Asset Allocation Funds that create effective breakpoints at asset levels at which PLFA believes it will have attained a level of profit that can be shared with these Funds.
With respect to theSub-Advised Funds, the Trustees considered that the advisory fee for each Fund was originally set at an amount that was intended to be lower than peers to attract assets at the Fund’s inception. The Trustees noted that because fees for the Funds started relatively low from the first dollar under management in relation to peers, economies of scale will be realized at higher asset levels than would otherwise be the case. The Trustees also considered that someSub-Advisers have agreed to breakpoints in theirsub-advisory fee schedules. The Trustees noted that in setting its advisory fees relatively low at inception as compared to peers, and in subsidizing the expenses of the Funds from their inception and for many years, PLFA’s economics from theSub-Advised Funds should be considered separate and apart from the economics of theSub-Advisers. The Trustees noted PLFA’s view that thesub-advisory fee breakpoints were important for PLFA’s economics to overcome its expenses from the Funds. The Trustees also noted that shareholders will benefit from effective breakpoints for the Asset Allocation Funds.
The Trustees also considered PLFA’s willingness to reduce its own fees through certain advisory fee waivers and expense limitation agreements, whereby PLFA will reimburse the Funds for certain expenses that exceed stated expense caps. The Trustees considered that the advisory fee waivers effectively implement breakpoints in PLFA’s advisory fees at higher asset levels of these Funds, which are intended to share economies of scale that PLFA has attained.
The Trustees noted that PLFA and its affiliates had consistently reinvested in the business in the form of improvements in technology, product innovations, personnel and resources. The Trustees additionally noted that economies of scale were difficult to measure with precision, particularly on a Fund by Fund basis. This analysis is complicated by the additional services and content provided by PLFA and its affiliates through reinvestment in the business, as discussed above. The Trustees considered that the Funds are well managed, and provide shareholders with sophisticated asset allocation investment options at reasonable fee levels. The Board noted that PLFA had taken steps to ensure that shareholders benefit by negotiating favorable terms with service providers.
The Board determined that PLFA and its affiliates are sharing economies of scale given its agreement to reduce its own fees through fee waivers as assets grow for certain Funds, its commitment to competitive total expenses of the Funds, and the consistent reinvestment in the business in the form of improvements in technology and other resources and investments in personnel. The Board considered that PLFA has not yet attained levels of profitability that warrant sharing of economies of scale for some Funds, including theSub-Advised Funds, but noted that shareholders will benefit in the future from the effective breakpoints for the Asset Allocation Funds. The Board further considered that it will continue to review whether there are additional economies of scale that will be realized as the Funds grow that can be shared with shareholders. The Board concluded that the Funds’ cost structures were reasonable and that overall profitability appeared reasonable at the current time. The Board further concluded that PLFA was sharing economies of scale with each Fund and its shareholders to their benefit.
E. Ancillary Benefits
The Trustees requested and received from PLFA and theSub-Advisers information concerning other benefits received by PLFA, Pacific Life, theSub-Advisers, and their affiliates as a result of their respective relationship with the Funds, including various service arrangements with PLFA affiliates, as well as commissions paid to broker-dealers affiliated with certainSub-Advisers and the use of soft-dollars by certain of theSub-Advisers. The Trustees also considered ancillary benefits received by Pacific Life and its affiliates from the Funds. The Trustees considered information concerning other significant economic relations between theSub-Advisers and their affiliates and with PLFA and its affiliates and noted PLFA’s processes and procedures to identify and disclose such relationships and any potential conflicts of interest to the Board. The Trustees also considered PLFA’s and eachSub-Adviser’s strong practices and procedures with regard to managing conflicts of interest and ensuring that such conflicts do not prevent PLFA or theSub-Advisers from acting in the best interests of the Funds and their shareholders.
The Board concluded that such benefits were consistent with those generally derived by investment advisers to mutual funds or were otherwise not unusual.
F-20
Table of Contents
PACIFIC FUNDS
APPROVAL OF INVESTMENT ADVISORY
AND SUB-ADVISORY AGREEMENTS (Continued)
(Unaudited)
F. Conclusion
Based on their review, including their consideration of each of the factors referred to above, and assisted by the advice of the Independent Consultant and independent counsel to the Independent Trustees, the Board, including the Independent Trustees, concluded that: (i) the Advisory Agreement and each applicableSub-Advisory Agreement are fair and reasonable with respect to each applicable Fund and its shareholders; (ii) that the renewal of the Advisory Agreement and each applicableSub-Advisory Agreement and the approval of theSub-Advisory Agreement for the PAM Managed Funds would be in the best interests of each Fund and its shareholders; and (iii) the recommendation by PLFA to the Board to enter into eachSub-Advisory Agreement with respect to each unaffiliatedSub-Adviser was not inappropriately influenced by conflicts of interest. The Board did not indicate that any single factor was determinative of its decision to approve the Advisory Agreement and each applicableSub-Advisory Agreement, but indicated that the Board based its determination on the total mix of information available to it.
F-21
Table of Contents
PACIFIC FUNDS
WHERE TO GO FOR MORE INFORMATION
(Unaudited)
Availability of Quarterly Holdings
The Trust files Part F of Form N-PORT (complete schedules of fund holdings) with the Securities and Exchange Commission (the “SEC”) for the first and third quarters of each fiscal year not later than 60 days after the close of the applicable quarter end. The Trust’s Part F of FormN-PORT, (when required) is filed pursuant to applicable regulations and is available after filing on the SEC’s website at http://www.sec.gov.
Availability of Proxy Voting Record
By August 31 of each year, the Trust files information regarding how the Trust’s managers voted proxies relating to fund securities during the most recent twelve-month period ended June 30. Such information is available after filing on the Trust’s’ website and on the SEC’s website noted below.
Information Relating to Investments Held by the Trust
For complete descriptions of the various securities and other instruments held by the Trust and their risks, please see the Trust’s prospectus and Statement of Additional Information (“SAI”). The prospectus and SAI are available as noted below.
Availability of Proxy Voting Policies
A description of the Proxy Voting Policies and Procedures that the Trust uses to determine how to vote proxies relating to fund securities is described in the Trust’s SAI.
How to obtain Information
The Trust’s prospectus, SAI (including Proxy Voting Policies) and annual and semi-annual reports are available:
| • | On the Trust’s website at https://www.pacificlife.com/pacificfunds.html |
| • | On the SEC’s website at http://www.sec.gov |
| • | Upon request by calling, without charge, 1-800-722-2333, 7 a.m. through 5 p.m. Pacific Time |
F-22
Table of Contents
Item 2. Code of Ethics.
As of the end of the period covered by this report, the Registrant has adopted a code of ethics that applies to the Registrant’s principal executive officer, principal financial officer, principal accounting officer or controller, or persons performing similar functions. There were no substantive amendments or waivers to the Code of Ethics during the period covered by this report.
A copy of the registrant’s Code of Ethics is filed as Exhibit 99.CODE ETH to this FormN-CSR.
Item 3. Audit Committee Financial Expert.
The Registrant’s Board has determined that Paul A. Keller, a member of the Registrant’s Audit Committee, is an “audit committee financial expert” and “independent,” as such terms are defined in this Item. This designation does not increase the designee’s duties, obligations or liability as compared to his duties, obligations and liability as a member of the Audit Committee and of the Board; nor does it reduce the responsibility of the other Audit Committee members. There may be other individuals who, through education or experience, would qualify as “audit committee financial experts” if the Board had designated them as such. Most importantly, the Board believes each member of the Audit Committee contributes significantly to the effective oversight of the Registrant’s financial statements and condition. Mr. Keller is a retired partner of PricewaterhouseCoopers LLP.
Item 4. Principal Accountant Fees and Services.
Audit Fees
| (a) | The aggregate fees billed for the fiscal years ended March 31, 2020 and 2019 for professional services rendered by the principal accountant for the audit of the registrant’s annual financial statements or services that are normally provided by the accountant in connection with statutory and regulatory filings or engagements for those fiscal years are $802,000 and $800,000, respectively. |
Audit-Related Fees
| (b) | There were no aggregate fees billed for the fiscal years ended March 31, 2020 and 2019 for assurance and related services by the principal accountant that are reasonably related to the performance of the audit of the registrant’s financial statements and are not reported under paragraph (a) of this Item. |
Table of Contents
Tax Fees
| (c) | The aggregate fees billed for the fiscal years ended March 31, 2020 and 2019 for professional services rendered by the principal accountant for tax compliance, tax advice, and tax planning are $164,792 and $178,143, respectively. The nature of the services comprising the fees was the review of income tax returns and excise tax. |
All Other Fees
| (d) | There were no aggregate fees billed for the fiscal years ended March 31, 2020 and 2019 for products and services provided by the principal accountant, other than the services reported in paragraphs (a) through (c) of this Item. |
| (e)(1) | The Audit Committee is required topre-approve audit andnon-audit services performed for the Registrant by the independent auditor as outlined below in order to assure that the provision of such services does not impair the auditor’s independence: |
| A. | Pre-Approval Requirements for Services to Registrant. Before the Auditor is engaged by the Registrant to render audit related or permissiblenon-audit services, either: |
| (i) | The Audit Committee shallpre-approve such engagement; or |
| (ii) | Such engagement shall be entered into pursuant topre-approval policies and procedures established by the Audit Committee. Any such policies and procedures must (1) be detailed as to the particular service and (2) not involve any delegation of the Audit Committee’s responsibilities to the Adviser. The Audit Committee hereby delegates authority to its Chairperson, and may delegate to one or more of its other members, the authority to grantpre-approvals. In the event of apre-approval by the Chairperson or other authorized member of the Audit Committee, the person to whom authority is delegated under this Section shall report on suchpre-approval to the full Audit Committee at its next regularly scheduled meeting. |
| (iii) | De Minimis Exceptions toPre-Approval Requirements.Pre-approval for a service provided to the Registrant other than audit, review or attest services is not required if: (1) the aggregate amount of all suchnon-audit services provided to the Registrant constitutes not more than 5 percent of the total amount of revenues paid by the Registrant to the Auditor during the fiscal year in which thenon-audit services are provided; (2) such services were not recognized by the Registrant at the time of the engagement to benon-audit services; and (3) such services are promptly brought to the attention of the Audit Committee and are approved by the Audit Committee or by one or more members of the Audit Committee to whom authority to grant such approvals has been delegated by the Audit Committee. |
| B. | Pre-Approval ofNon-Audit Services Provided to the Adviser and Others. The Audit Committee shallpre-approve anynon-audit services proposed to be provided by the Auditor to (i) the Adviser and (ii) any entity in the investment company complex, if the nature of the services provided relate directly to the operations or financial reporting of the Registrant. Investment company complex means the Pacific Select Fund, the Pacific Funds Series Trust, the Adviser and any entity controlled by or under common control |
Table of Contents
| with the Adviser if such entity is an investment adviser or is engaged in the business of providing administrative, custodian, underwriting or transfer agent services to the Trusts or the Adviser. |
| (i) | De Minimis Exception: The De Minimis exceptions set forth above under Section (e)(1)A.(iii) apply topre-approvals under this Section (e)(1)B. as well, except that the “total amount of revenues” calculation for this Section’s (e)(1)B. services is based on the total amount of revenues paid to the Auditor by the Registrant and any other entity that has its services approved under this Section (i.e., the Adviser or any control person). |
| C. | Pre-Approval of Program and Subscription Services Provided to the Registrants and their Affiliates. The Audit Committee is deemed to havepre-approved Program and Subscription Services (“Programs”) provided to the Registrant and their affiliates, entities within the Registrant’s investment company complex or their affiliates, including employees of Pacific Life and Pacific Life Fund Advisors LLC (collectively, “Fund Persons”) so long as: (1) such Programs are free to Fund Persons or if there is a charge, Fund Persons pay: (a) the going rate for such Programs, or (b) the Fund Persons receive a discount of $500 or less; or (2) the Program is approved under or covered by and in compliance with the policies and/or procedures of Pacific Life’s Audit Committee with respect to the provision of educational services by the Auditor or other parties. Any Programs that do not meet the above criteria require approval by the Audit Committee, its Chairperson or other delegates as provided in Section (e)(1)A.(iii). Programs are educational programs and seminars provided by the Auditor or its affiliates and include live programs, webcasts, podcasts, websites, database subscriptions, checklists, research reports, local office seminars, Debrief webcast series, Technical library and similar or related items. Any Programs that do not meet the above criteria require approval by the Audit Committee, its Chairperson or other delegates as provided in this Section. |
| (e)(2) | No services included in (b)-(d) above were approved pursuant to paragraph (c)(7)(i)(C) of Rule2-01 of RegulationS-X. |
| (f) | Not applicable. |
| (g) | The aggregate fees billed for the years ended March 31, 2020 and 2019 by the Registrant’s principal accountant fornon-audit services rendered to the Registrant, its investment adviser, and any entity controlling, controlled by, or under common control with the investment adviser that provides ongoing services to the Registrant were $1,282,272 and $1,636,451, respectively. |
| (h) | The Registrant’s Audit Committee has considered whether the provision ofnon-audit services that were rendered to the Registrant’s investment adviser, and any entity controlling, controlled by, or under common control with the investment adviser that provides ongoing services to the Registrant which were notpre-approved (not requiringpre-approval) is compatible with maintaining the principal accountant’s independence. |
Item 5. Audit Committee of Listed Registrants.
Not applicable.
Table of Contents
Item 6. Investments.
| (a) | Schedule of Investments in securities of unaffiliated issuers as of the close of the reporting period is included as part of the report to shareholders filed under Item 1 of this form. |
| (b) | Not applicable. |
Item 7. Disclosure of Proxy Voting Policies and Procedures forClosed-End Management Investment Companies.
Not applicable.
Item 8. Portfolio Managers ofClosed-End Management Investment Companies.
Not applicable.
Item 9. Purchases of Equity Securities byClosed-End Management Investment Company and Affiliated Purchasers.
Not applicable.
Item 10. Submission of Matters to a Vote of Security Holders.
There have been no material changes to the procedures by which shareholders may recommend nominees to the Registrant’s Board of Directors.
Item 11. Controls and Procedures.
| (a) | The Chief Executive Officer and Treasurer have concluded that the Registrant’s disclosure controls and procedures (as defined in Rule30a-3(c) under the Investment Company Act) provide reasonable assurances that material information relating to the Registrant is made known to them by the appropriate persons, based on their evaluation of these controls and procedures as of a date within 90 days of the filing of this report. |
| (b) | There were no changes in the Registrant’s internal control over financial reporting (as defined in Rule30a-3(d) under the Investment Company Act) that occurred during the period covered by this report that has materially affected, or is reasonably likely to materially affect, the Registrant’s internal control over financial reporting. |
Item 12. Disclosure of Securities Lending Activities forClosed-End Management Investment Companies.
Not applicable.
Item 13. Exhibits.
(a)(3) Not applicable.
(a)(4) Not applicable.
Table of Contents
Table of Contents
SIGNATURES
Pursuant to the requirements of the Securities Exchange Act of 1934 and the Investment Company Act of 1940, the registrant has duly caused this report to be signed on its behalf by the undersigned, thereunto duly authorized.
| Pacific Funds Series Trust | ||||||
| By: | /s/ Adrian S. Griggs | |||||
| Adrian S. Griggs | ||||||
| Chief Executive Officer | ||||||
| Date: | June 4, 2020 | |||||
Pursuant to the requirements of the Securities Exchange Act of 1934 and the Investment Company Act of 1940, this report has been signed below by the following persons on behalf of the registrant and in the capacities and on the dates indicated.
| By: | /s/ Adrian S. Griggs | |||||
| Adrian S. Griggs | ||||||
| Chief Executive Officer | ||||||
| Date: | June 4, 2020 | |||||
| By: | /s/ Trevor T. Smith | |||||
| Trevor T. Smith | ||||||
| Treasurer (Principal Financial and Accounting Officer) | ||||||
| Date: | June 4, 2020 | |||||