SECURITIES AND EXCHANGE COMMISSION
Washington, D.C. 20549
Form 20-F
(Mark one)
| _ | REGISTRATION STATEMENT PURSUANT TO SECTION 12(b) OR 12 (g)OF THE SECURITIES EXCHANGE ACT OF 1934OR |
| X | ANNUAL REPORT PURSUANT TO SECTION 13 OR 15(d)OF THE SECURITIES EXCHANGE ACT OF 1934For the fiscal year ended December 31, 2003OR |
| _ | TRANSITION REPORT PURSUANT TO SECTION 13 OR 15(d) OF THESECURITIES EXCHANGE ACT OF 1934 (NO FEE REQUIRED) |
For the Transaction period from _________ to ____________
Commission File No. 1-15200
Statoil ASA
(Exact name of registrant as specified in its charter)
Norway
(Jurisdiction of incorporation or organization)
Forusbeen 50, N-4035 Stavanger, Norway
(Address of principal executive offices) (Zip Code)
Registrant's telephone number, including area code + 47 51 99 00 00
Securities to be registered pursuant to Section 12(b) of the Exchange Act:
| Title of each class | Name of each exchange on which registered |
| Ordinary shares of NOK 2.50 each | New York Stock Exchange* |
* Listed, not for trading, but only in connection with the registration of American Depositary Shares, pursuant to the requirements of the Securities and Exchange Commission
Securities to be registered pursuant to Section 12(g) of the Exchange Act: None
Securities for which there is a reporting obligation pursuant to Section 15 (d) of the Exchange Act: None
Indicate the number of outstanding shares of each of the issuer's classes of capital or common stock as of the close of the period covered by the Annual Report:
| Ordinary shares of NOK 2.50 each | 2,166,143,715 |
Indicate by check mark whether the registrant (1) has filed all reports to be filed by Section 13 or 15(d) of the Securities Exchange Act of 1934 during the preceding 12 months (or for such shorter period that the registrant was required to file such reports), and (2), has been subject to such filing requirements for the past 90 days. Yes __X___ No ______
Indicate by check mark which statement item the registrant has elected to follow. Item 17 ______Item 18 ___X__
Table of contents
Terms and Measurements relating to the Oil and Gas Industry
Item 1 Identity of Directors, Senior Management and Advisors
Item 2 Offer Statistics and Expected Timetable
Item 4 Information on the Company
History and Development of the Company
Property, Plants and Equipment
Item 5 Operating and Financial Review and Prospects
Liquidity and Capital Resources
Use of Non-GAAP Financial Measures
Item 6 Directors, Senior Management and Employees
Directors and Senior Management
Item 7 Major Shareholders and Related Party Transactions
Consolidated Statements and Other Financial Information
Item 10 Additional Information
Memorandum and Articles of Association
Exchange Controls and Other Limitations Affecting Shareholders
Report of DeGolyer and MacNaughton
Item 11 Quantitative and Qualitative Disclosures about Market Risk
Item 12 Description of Securities Other Than Equity Securities
Item 13 Defaults, Dividend Arrearages and Delinquencies
Item 14 Material Modifications to the Rights of Security Holders and Use of Proceeds
Item 15 Controls and Procedures
Item 16A Audit Committee Financial Expert
Item 16C Principal Accountant Fees and Services
Item 16D Exemptions from the Listing Standards for Audit Committees
Item 16E Purchases of Equity Securities by the Issuer and Affiliated Purchasers
Terms and Measurements relating to the Oil and Gas Industry
References to:
Equivalent measurements are based upon:
Miscellaneous terms:
lean gas, primarily methane but often containing some ethane and smaller quantities of heavier hydrocarbons (also called sales gas) and
wet gas, primarily ethane, propane and butane as well as smaller amounts of heavier hydrocarbons; partially liquid under atmospheric pressure
PART I
Item 1 Identity of Directors, Senior Management and Advisors
Not applicable.
Item 2 Offer Statistics and Expected Timetable
Not applicable.
Item 3 Key Information
Selected Financial Data
The following tables set forth selected consolidated financial and statistical data of Statoil.
You should read the following data together with Item 5–Operating and Financial Review and Prospects and Item 11–Quantitative and Qualitative Disclosures about Market Risk and our consolidated financial statements, including the notes to those financial statements included in this Annual Report on Form 20-F.
Solely for the convenience of the reader, the financial data at the twelve months ended December 31, 2003 have been translated into US dollars at the rate of NOK 6.666 to USD 1.00, the noon buying rate on December 31, 2003. The financial data has been derived from our financial statements, which have been prepared in accordance with generally accepted accounting principles in the United States, or US GAAP. The financial, reserve, production and sales information in these tables reflects our acquisition of the Norwegian State’s direct financial interest (SDFI) assets in 2001 and were prepared as if the SDFI assets acquired by us had been part of Statoil throughout the financial periods presented. Such information in these tables, however, assumes that our purchase of the SDFI assets was financed with equity and, therefore, does not reflect the impact of the actual financing of the purchase of the SDFI assets. The actual financing, including our transfer of pipeline and other assets, is reflected in the consolidated financial information as from and including the year ended December 31, 2001.
(in millions, except per share amounts) | Year ended December 31, | |||||
| 1999 | 2000 | 2001 | 2002 | 2003 | ||
| NOK | NOK | NOK | NOK | NOK | USD | |
Income Statement | ||||||
| Revenues: | ||||||
| Sales | 149,598 | 229,832 | 231,712 | 242,178 | 248,527 | 37,283 |
Equity in net income (loss) of affiliates | (745) | 523 | 439 | 366 | 616 | 92 |
Other income | 1,279 | 70 | 4,810 | 1,270 | 232 | 35 |
| Total revenues | 150,132 | 230,425 | 236,961 | 243,814 | 249,375 | 37,410 |
| Expenses: | ||||||
Cost of goods sold | (79,508) | (119,469) | (126,153) | (147,899) | (149,645) | (22,449) |
| Operating expenses | (25,657) | (28,883) | (29,422) | (28,308) | (26,651) | (3,998) |
| Selling, general and administrative expenses | (6,688) | (3,891) | (4,297) | (5,251) | (5,517) | (827) |
| Depreciation, depletion and amortization | (17,579) | (15,739) | (18,058) | (16,844) | (16,276) | (2,442) |
| Exploration expenses | (3,122) | (2,452) | (2,877) | (2,410) | (2,370) | (356) |
Total expenses before financial items | (132,554) | (170,434) | (180,807) | (200,712) | (200,459) | (30,072) |
Income before financial items, other items, income taxes and minority interest | 17,578 | 59,991 | 56,154 | 43,102 | 48,916 | 7,338 |
Net financial items | 1,431 | (2,898) | 65 | 8,233 | 1,399 | 210 |
| Other items | 0 | 0 | 0 | 0 | (6,025) | (904) |
Income before income taxes and minority interest | 19,009 | 57,093 | 56,219 | 51,335 | 44,290 | 6,644 |
| Income taxes | (12,856) | (40,456) | (38,486) | (34,336) | (27,447) | 4,117 |
Minority interest | 256 | (484) | (488) | (153) | (289) | (43) |
| Net income | 6,409 | 16,153 | 17,245 | 16,846 | 16,554 | 2,483 |
Net income per ordinary share(1), (2) | 3.24 | 8.18 | 8.31 | 7.78 | 7.64 | 1.15 |
Dividend paid per ordinary share(2), (3) | 3.47 | 10.81 | 26.69 | 2.85 | 2.90 | 0.44 |
(1) The weighted average number of shares outstanding was 1,975,885,600 up to and including the year 2000, and 2,076,180,942, 2,165,422,239 and 2,166,143,693 in 2001, 2002 and 2003, respectively.
(2) There is no notional impact on the number of ordinary shares resulting from the assumed equity financing of the SDFI transaction.
(3) See Item 8–Financial Information–Dividend Policy and Item 3–Key Information–Dividends below for a description of how dividends are determined.
(in millions) | At December 31, | |||||
| 1999 | 2000 | 2001 | 2002 | 2003 | ||
| NOK | NOK | NOK | NOK | NOK | USD | |
Balance Sheet | ||||||
| Assets: | ||||||
Cash and cash equivalents | 4,061 | 9,745 | 4,395 | 6,702 | 7,316 | 1,098 |
Short-term investments | 3,604 | 3,857 | 2,063 | 5,267 | 9,314 | 1,397 |
Accounts receivable | 28,421 | 29,871 | 26,208 | 32,057 | 28,048 | 4,208 |
Accounts receivable - related parties | 1,972 | 2,177 | 1,531 | 1,893 | 2,144 | 322 |
| Inventories | 4,294 | 4,226 | 5,276 | 5,422 | 4,993 | 749 |
Prepaid expenses and other current assets | 11,235 | 5,447 | 9,184 | 6,856 | 7,354 | 1,103 |
Total current assets | 53,587 | 55,323 | 48,657 | 58,197 | 59,169 | 8,876 |
Investments in affiliates | 9,852 | 10,214 | 9,951 | 9,629 | 11,022 | 1,653 |
Long-term receivables | 4,789 | 8,165 | 7,166 | 7,138 | 14,261 | 2,139 |
Net properties, plants and equipments | 128,967 | 132,278 | 126,500 | 122,379 | 126,528 | 18,981 |
| Other assets | 7,287 | 7,669 | 7,421 | 8,087 | 10,620 | 1,593 |
TOTAL ASSETS | 204,482 | 213,649 | 199,695 | 205,430 | 221,600 | 33,243 |
Liabilities and Shareholders’ Equity: | ||||||
| Short-term debt | 9,190 | 2,785 | 6,613 | 4,323 | 4,287 | 643 |
Accounts payable | 19,324 | 15,266 | 10,970 | 19,603 | 17,977 | 2,697 |
| Accounts payable –related parties | 10,083 | 11,454 | 10,164 | 5,649 | 6,114 | 917 |
Accrued liabilities | 8,666 | 11,228 | 13,831 | 11,590 | 11,454 | 1,718 |
Income taxes payable | 6,366 | 14,877 | 16,618 | 18,358 | 17,676 | 2,652 |
Total current liabilities | 53,629 | 55,610 | 58,196 | 59,523 | 57,508 | 8,627 |
| Long-term debt | 41,307 | 34,197 | 35,182 | 32,805 | 32,991 | 4,949 |
Deferred income taxes | 43,020 | 43,331 | 42,354 | 43,153 | 37,849 | 5,678 |
Other liabilities | 8,831 | 10,205 | 10,693 | 11,382 | 21,595 | 3,240 |
Total liabilities | 146,787 | 143,343 | 146,425 | 146,863 | 92,435 | 13,867 |
Minority interest | 1,590 | 2,480 | 1,496 | 1,550 | 1,483 | 222 |
Common stock (NOK 2.50 nominal value) 2,189,585,600 shares authorized and issued (1,975,885,600 prior to initial public offering) | 4,940 | 4,940 | 5,474 | 5,474 | 5,474 | 821 |
Treasury shares (23,441,885 and 25,000,000 shares) | – | – | (63) | (59) | (59) | (9) |
Additional paid-in capital | 29,759 | 45,628 | 37,728 | 37,728 | 37,728 | 5,660 |
Retained earnings | 19,978 | 14,768 | 6,682 | 17,355 | 27,627 | 4,144 |
Accumulated other comprehensive income | 1,428 | 2,490 | 1,953 | (3,481) | (596) | (89) |
| Total shareholders’equity | 56,105 | 67,826 | 51,774 | 57,017 | 70,174 | 10,527 |
TOTAL LIABILITIES AND SHAREHOLDERS’ EQUITY | 204,482 | 213,649 | 199,695 | 205,430 | 221,600 | 33,243 |
Other financial information | Year ended December 31, | ||||
1999 | 2000 | 2001 | 2002 | 2003 | |
Net debt to capital employed (GAAP basis)(1) | 42.6% | 25.0% | 39.9% | 30.2% | 22.3% |
Net debt to capital employed(2) | 42.6% | 25.0% | 39.0% | 28.7% | 22.6% |
After-tax return on average capital employed (GAAP basis)(3) | 6.4% | 18.7% | 19.7% | 14.7% | 18.6% |
After-tax return on average capital employed(4) | 6.4% | 18.7% | 19.9% | 14.9% | 18.7% |
(1) As calculated according to GAAP. Net debt to capital employed is the net debt divided by capital employed. Net debt is interest-bearing debt less cash and cash equivalents and short-term investments., Capital employed is net debt, shareholders’ equity and minority interest.
(2) As adjusted. In order to calculate the net debt to capital employed ratio that our management makes use of internally and which we report to the market, we make adjustments to capital employed as it would be reported under GAAP, to adjust for project financing exposure that does not correlate to the underlying exposure (adjustements amount toNOK 1,500 million in 2003, NOK 1,567 million in 2002 and NOK 1,257 in 2001), and to add into the capital employed measure interest–bearing elements which are classified together with non-interest bearing elements under GAAP. See Item 5-Operating and Financial Review and Prospects-Use of Non-GAAP financial measures for a reconciliation of capital employed and a description of why we make use of this measure.
(3) As calculated in accordance with GAAP. After-tax return on average capital employed (ROACE) is equal to net income before minority interest and before after tax net financial items, divided by average capital employed over the last 12 months.
(4) As adjusted. This figure represents ROACE computed on the basis of capital employed, as adjusted as indicated in footnote 2 above. See Item 5–Operating and Financial Review and Prospects–Use of Non-GAAP Financial Measures for a reconciliation of return on average capital employed and a description of why we make use of this measure.
Summary Oil and Gas Production Information
The following table sets forth our Norwegian and international production of crude oil and natural gas for the periods indicated. The stated production volumes are the volumes that Statoil is entitled to in accordance with conditions laid down in concession agreements and production sharing agreements, or PSAs. The production volumes are net of royalty oil paid in kind and of gas used for fuel and flare. Our production is based on our proportionate participation in fields with multiple owners and does not include production of the Norwegian State’s oil and natural gas.
| Production | Year ended December 31, | ||
2001 | 2002 | 2003 | |
| Norway: | |||
Crude oil (mmbbls)(1) | 252 | 245 | 241 |
Natural gas (bcf) | 511 | 653 | 677 |
Natural gas (bcm) | 14.5 | 18.5 | 19.2 |
Combined oil and gas (mmboe) | 343 | 361 | 362 |
| International: | |||
Crude oil (mmbbls)(1) | 22 | 29 | 32 |
Natural gas (bcf) | 16 | 12 | 7 |
Natural gas (bcm) | 0.4 | 0.3 | 0.2 |
Combined oil and gas (mmboe) | 25 | 31 | 33 |
| Total: | |||
Crude oil (mmbbls)(1) | 274 | 274 | 273 |
Natural gas (bcf) | 527 | 665 | 684 |
Natural gas (bcm) | 14.9 | 18.8 | 19.3 |
Combined oil and gas (mmboe) | 368 | 392 | 394 |
(1) Crude oil includes NGL and condensate production.
Sales Volume Information
We have historically marketed and sold oil and gas owned by the Norwegian State through the Norwegian State’s share in production licenses, known as the State’s direct financial interest, or SDFI, together with our own production. The Norwegian State has elected to continue this arrangement. For additional information see Item 7–Major Shareholders and Related Party Transactions. The following table sets forth SDFI and Statoil sales volume information for crude oil and natural gas for the periods indicated. The sales volumes for Statoil shown below include royalty oil we sell on behalf of the Norwegian State and volumes purchased from third parties for resale.
Sales Volumes | Year ended December 31, | ||
2001 | 2002 | 2003 | |
| Statoil: | |||
Crude oil (mmbbls)(1) | 466 | 506 | 488 |
Natural gas (bcf) | 533 | 704 | 740 |
Natural gas (bcm) | 15.1 | 19.9 | 20.8 |
Combined oil and gas (mmboe) | 561 | 631 | 620 |
SDFI assets owned by the Norwegian State: | |||
Crude oil (mmbbls)(1) | 395 | 381 | 339 |
Natural gas (bcf) | 667 | 830 | 903 |
Natural gas (bcm) | 18.9 | 23.5 | 25.6 |
Combined oil and gas (mmboe) | 514 | 529 | 500 |
| Total: | |||
Crude oil (mmbbls)(1) | 861 | 887 | 827 |
Natural gas (bcf) | 1,200 | 1,535 | 1,643 |
Natural gas (bcm) | 34.0 | 43.4 | 46.5 |
Combined oil and gas (mmboe) | 1,075 | 1,160 | 1,120 |
(1) Sales volumes of crude oil include NGL and condensate.
Exchange Rates
The table below shows the high, low, average and period end noon buying rates in The City of New York for cable transfers in foreign currencies as certified for customs purposes by the Federal Reserve Bank of New York for Norwegian kroner per USD 1.00. The average is computed using the noon buying rate on the last business day of each month during the period indicated.
Year ended December 31, | Low | High | Average | End of Period |
| 1999 | 7.3970 | 8.0970 | 7.8351 | 8.0100 |
| 2000 | 7.9340 | 9.5890 | 8.8307 | 8.8010 |
| 2001 | 8.5400 | 9.4638 | 9.0330 | 8.9724 |
| 2002 | 6.9375 | 9.1110 | 7.9253 | 6.9375 |
| 2003 | 6.6440 | 7.6560 | 7.0627 | 6.6660 |
The table below shows the high and low noon buying rates for each month during the six months prior to the date of this Annual Report on Form 20-F.
Year 2003 | Low | High |
| September | 7.0000 | 7.5970 |
| October | 6.9670 | 7.1120 |
| November | 6.8240 | 7.2240 |
| December | 6.6440 | 6.8285 |
Year 2004 | Low | High |
| January | 6.6586 | 7.0730 |
| February | 6.8416 | 7.0675 |
March (up to and including March 25) | 6.8150 | 7.1408 |
On March 25, 2004 the noon buying rate for Norwegian kroner was USD 1.00 = NOK 6.9550
Fluctuations in the exchange rate between the Norwegian kroner and the US dollar will affect the US dollar amounts received by holders of ADSs on conversion of dividends, if any, paid in Norwegian kroner on the ordinary shares and may affect the US dollar price of the ADSs on the New York Stock Exchange.
Dividends
Dividends in respect of the fiscal year are declared at our annual general meeting in the following year. Under Norwegian law, dividends may only be paid in respect of a financial period as to which audited financial statements have been approved by the annual general meeting of shareholders, and any proposal to pay a dividend must be recommended by the board of directors, accepted by the corporate assembly and approved by the shareholders at a general meeting. The shareholders at the annual general meeting may vote to reduce, but may not increase, the dividend proposed by the board of directors.
Dividends may be paid in cash or in kind and are payable only out of our distributable reserves. The amount of our distributable reserves is defined by the Norwegian Public Limited Companies Act, which requires such reserves to be calculated under Norwegian GAAP and consist of:
after deduction for uncovered losses, book value of research and development, goodwill and net deferred tax assets as recorded in the balance sheet for the preceding financial year, and the aggregate value of treasury shares that we have purchased or been granted security in and of credit and security given by us pursuant to sections 8-7 to 8-9 of the Norwegian Public Limited Companies Act during preceding financial years.
We cannot distribute any dividends if our equity, according to the Statoil ASA unconsolidated balance sheet, amounts to less than 10% of the total assets reflected on our unconsolidated balance sheet without following a creditor notice procedure as required for reducing the share capital. Furthermore, we can only distribute dividends to the extent compatible with good and careful business practice with due regard to any losses which we may have incurred after the last balance sheet date or which we may expect to incur. Finally, the amount of dividends we can distribute is calculated on the basis of our unconsolidated financial statements. Retained earnings available for distribution is based on Norwegian accounting principles and legal regulations and amounts to NOK 49,511 million (before provisions for dividend for the year ended December 31, 2003 of NOK 6,390 million) at December 31, 2003.
Although we currently intend to pay annual dividends on our ordinary shares, we cannot assure you that dividends will be paid or as to the amount of any dividends. Future dividends will depend on a number of factors prevailing at the time our board of directors considers any dividend payment.
Dividends paid historically are not representative of dividends to be paid in the future. Dividends paid prior to 2002 include 100% of the cash flows from the SDFI assets transferred from the Norwegian State, and a percentage of net income after tax (calculated on a Norwegian GAAP basis) for all other activities. The following table shows the amounts paid to the Norwegian State on a per share basis and in the aggregate, during each of the four fiscal years from 1999 to 2002, and dividends to be paid in 2004 on our ordinary shares for the fiscal year 2003.
Per ordinary share(1) | Total (in millions) | |||
| Year | NOK | USD(2) | NOK | USD(2) |
| 1999 | 3.47 | 0.52 | 6,853 | 1,028 |
| 2000 | 10.81 | 1.62 | 21,363 | 3,205 |
| 2001(3) | 26.69 | 4.00 | 55,415 | 8,313 |
| 2002 | 2.90 | 0.44 | 6,282 | 942 |
| 2003 | 2.95 | 0.44 | 6,390 | 959 |
(1) Based on 2,166,143,693 shares in 2003, 2,165,422,239 shares in 2002, 2,076,180,942 shares in 2001 and 1,975,885,600 shares prior to 2001, being the weighted average number of ordinary shares for each year.
(2) The USD amounts are based on the noon buying rate for Norwegian kroner on December 31, 2003, which was NOK 6.6660 to USD 1.00.
(3) Total dividends paid in 2001 include a cash settlement for the SDFI assets amounting to NOK 19.65 (USD 2.83) per share. An ordinary dividend for 2001 of NOK 2.85 was declared on May 7, 2002, and paid to shareholders registered in the Norwegian Central Securities Depository as of that date on May 28, 2002.
The increases in dividends for 2000 and 2001 were due to increase in cash flows generated from SDFI properties transferred from the Norwegian State and increased net income after tax for all other activities.
Dividends we paid in periods prior to 2002 reflected our status as wholly owned by the Norwegian State and should not be considered indicative of our future dividend policy.
Since we will only pay dividends in Norwegian kroner, exchange rate fluctuations will affect the US dollar amounts received by holders of ADSs after the ADR depositary converts cash dividends into US dollars.
Risk Factors
Risks Related to Our Business
A substantial or extended decline in oil or natural gas prices would have a material adverse effect on us.
Historically, prices for oil and natural gas have fluctuated widely in response to changes in many factors. We do not and will not have control over the factors affecting prices for oil and natural gas. These factors include:
It is impossible to predict future oil and natural gas price movements with certainty. Declines in oil and natural gas prices will adversely affect our business, results of operations and financial condition, liquidity and our ability to finance planned capital expenditures. For an analysis of the impact on income before financial items, taxes and minority interest from changes in oil and gas prices, see Item 5–Operating and Financial Review and Prospects–Operating Results–Factors Affecting Our Results of Operations. Lower oil and natural gas prices also may reduce the amount of oil and natural gas that we can produce economically or reduce the economic viability of projects planned or in development.
Exploratory drilling involves numerous risks, including the risk that we will encounter no commercially productive oil or natural gas reservoirs, which could materially adversely affect our results.
We are exploring in various geographic areas, including new resource provinces such as the Norwegian Sea, the Barents Sea and deepwater offshore Angola, where environmental conditions are challenging and costs can be high. We are also considering exploration activities in additional international areas where costs may be high. In addition, our use of advanced technologies requires greater pre-drilling expenditures than traditional drilling strategies. The cost of drilling, completing and operating wells is often uncertain. As a result, we may incur cost overruns or may be required to curtail, delay, or cancel drilling operations because of a variety of factors, including unexpected drilling conditions, pressure or irregularities in geological formations, equipment failures or accidents, adverse weather conditions, compliance with governmental requirements and shortages or delays in the availability of drilling rigs and the delivery of equipment. For example, we have entered into long-term leases on drilling rigs which are not required for the originally intended operations and we cannot be certain that these rigs will be re-employed or at what rate they will be re-employed. Our overall drilling activity or drilling activity within a particular project area may be unsuccessful. Such failure will have a material adverse effect on our results of operations and financial condition.
If we fail to acquire or find and develop additional reserves, our reserves and production will decline materially from their current levels.
The majority of our proved reserves are on the Norwegian Continental Shelf (NCS), a maturing resource province. Except to the extent we conduct successful exploration and development activities or acquire properties containing proved reserves, or both, our proved reserves will decline as reserves are produced. In addition, the volume of production from oil and natural gas properties generally declines as reserves are depleted. For example, two of our major fields, Statfjord and Gullfaks, are dependent on satellite fields to maintain production, and, unless efforts to improve the development of satellite fields are successful, production will gradually decline. Our future production is highly dependent upon our success in finding or acquiring and developing additional reserves. If we are unsuccessful, we may not meet our long-term ambitions for growth in production, and our future total proved reserves and production will decline and adversely affect our results of operations and financial condition.
We encounter competition from other oil and natural gas companies in all areas of our operations, including the acquisition of licenses, exploratory prospects and producing properties.
The oil and gas industry is extremely competitive, especially with regard to exploration for, and exploitation and development of new sources of oil and natural gas.
Some of our competitors are much larger, well-established companies with substantially greater resources, and in many instances they have been engaged in the oil and gas business for much longer than we have. These larger companies are developing strong market power through a combination of different factors, including:
These companies may be able to pay more for exploratory prospects and productive oil and natural gas properties and may be able to define, evaluate, bid for and purchase a greater number of properties and prospects, including operatorships and licenses, than our financial or human resources permit. For more information on the competitive environment, see Item 4–Information on the Company–Business Overview.
As we face a variety of challenges in executing our strategic objective of successfully exploiting growth opportunities available to us, the growth of our business may be compromised if we are unable to execute on our strategy and our financial and production targets may be revised as a result of acquisitions made in accordance with our strategy.
An important element of our strategy is to continue to pursue attractive growth opportunities available to us, both in enhancing our asset portfolio and expanding into new markets. The opportunities that we are actively pursuing may involve acquisitions of businesses or properties that complement or expand our existing portfolio. Our ability to implement this strategy successfully will depend upon a variety of factors, including our ability to:
..
As we pursue business opportunities in new and existing markets, we anticipate that significant investments and costs will be related to the development of such opportunities. We may incur or assume unanticipated liabilities, losses or costs associated with assets or businesses acquired. Any failure by us to pursue and execute new business opportunities successfully could result in financial losses, and could inhibit growth.
If we are successful in the pursuit of our strategy and the making of such acquisitions, and no assurances can be given that we will be, our ability to achieve our financial, capital expenditure and production targets may be materially affected. Any such new projects we acquire will require additional capital expenditure and will increase our finding and development expenditure. It is likely that such acquisitions will be in the exploratory or development phase and not in the production phase, which will have a material adverse effect on our net return in proportion to our average capital employed. These projects may also have different risk profiles than our existing portfolio. These and other effects of such acquisitions could result in us having to revise some or all of our targets with respect to ROACE, capital expenditure amounts and allocations, unit production costs, finding and development costs, reserves replacement rate and production.
In addition, the pursuit of acquisitions or new business opportunities could divert financial and management resources away from our day-to-day operations to the integration of acquired operations or properties. We have no current intention to issue additional equity; we may, however, require additional debt or equity financing to undertake or consummate future acquisitions or projects, which financing may not be available on terms satisfactory to us, if at all, and may, in the case of equity, be dilutive to our earnings per share.
Our development projects involve many uncertainties and operating risks that can prevent us from realizing profits and can cause substantial losses.
Our development projects may be delayed or unsuccessful for many reasons, including cost overruns, lower oil and gas prices, equipment shortages, mechanical and technical difficulties and industrial action. These projects will also often require the use of new and advanced technologies, which can be expensive to develop, purchase and implement, and may not function as expected. In addition, some of our development projects will be located in deepwater or other hostile environments, such as the Barents Sea, or produced from challenging reservoirs, which can exacerbate such problems. For example, developing the large and complex facilities of the Åsgard chain was one of the most demanding developments we have undertaken. We experienced substantial cost overruns caused by changes in the scope and magnitude of the project, delays in the final stages of the project, employee strikes and several unforeseen technical problems. As a result, we had problems associated with volume and regularity, and had to fulfill our delivery commitments associated with Åsgard by providing the volumes required from other fields. There is a risk that other development projects that we undertake may suffer from similar or additional problems, such as the Snøhvit project where we have encountered cost overruns and face a challenging timetable for the assembly and transportation of the LNG plant, and the Kristin development, where we are facing difficult drilling conditions.
Our development projects on the NCS also face the challenge of remaining profitable where we are increasingly developing smaller satellite fields in mature areas and our projects are subject to the Norwegian State’s relatively high taxes on offshore activities. Our other development projects in mature fields in Western Europe also face potentially higher operating costs. In addition, our development projects, particularly those in remote areas, could become less profitable, or unprofitable, if we experience a prolonged period of low oil or gas prices.
Many of our mature fields are producing increasing quantities of water with oil and gas. Our ability to dispose of this water in acceptable ways may impact our oil and gas production.
We may not be able to produce some of our oil and gas economically due to a lack of necessary transportation infrastructure when a field is in a remote location.
Our ability to exploit economically any discovered petroleum resources beyond our proved reserves will be dependent upon, among other factors, the availability of the necessary infrastructure to transport oil and gas to potential buyers at a commercially acceptable price. Oil is usually transported by tankers to refineries, and gas is usually transported by pipeline to processing plants and end-users. We may not be successful in our efforts to secure transportation and markets for all of our potential production.
Some of our international interests are located in politically, economically and socially unstable areas, which could disrupt our operations.
We have assets located in unstable regions around the world. For example, there was war and civil strife in the Caspian region through much of the 1990s. In addition, the states bordering the Caspian Sea dispute ownership and distribution of proceeds from the Caspian’s seabed and subsoil resources. Our activities in the Persian Gulf may be subject to disruption due to, for example, war and terrorism. Other countries, such as Venezuela, Nigeria and Angola, where we also have operations, have experienced expropriation or nationalization of property, civil strife, strikes, acts of war, guerrilla activities and insurrections.
Our activities in Iran and Libya could lead to US sanctions.
In August 1996, the United States adopted the Iran and Libya Sanctions Act, referred to as ILSA, which authorizes the President of the United States to impose sanctions (from a list that includes denial of financing by the export-import bank and limitations on the amount of loans or credits available from US financial institutions) against persons found by the President to have knowingly made investments in Iran or Libya of USD 20 million or more that directly and significantly contribute to the enhancement of such countries' ability to develop their petroleum resources. We take part in certain exploration projects or study activities with respect to Iran. In October 2002, we signed a participation agreement with Petropars of Iran which provides that we assume the operatorship for the offshore part of phases six, seven and eight of the South Pars gas development project in the Persian Gulf, and our capital commitment over the period of the contract is anticipated to amount to USD 300 million. We cannot predict interpretations of or the implementation policy of the US Government under ILSA with respect to our current or future activities in Iran or other areas. It is possible that the United States may determine that these or other activities will constitute activity covered by ILSA and will subject us to sanctions.
United Nations sanctions on Libya were lifted in the fall of 2003. We are currently assessing opportunities for participating in exploration and development activities in Libya. US companies have been authorized to negotiate terms of re-entry into operations in Libya. However, if the US sanctions regime with respect to Libya is not lifted, then sanctions could be imposed as a result of any activity that we undertake in Libya.
We are exposed to potentially adverse changes in the tax regimes of each jurisdiction in which we operate.
We operate in 28 countries around the world, and any of these countries could modify its tax laws in ways that would adversely affect us. Most of our operations are subject to changes in tax regimes in a similar manner as other companies in our industry. In addition, in the long-term, the marginal tax rate in the oil and gas industry tends to change in correlation with the price of crude oil. Significant changes in the tax regimes of countries in which we operate could have a material adverse affect on our liquidity and results of operation.
We are not insured against all potential losses and could be seriously harmed by natural disasters or operational catastrophes.
Exploration for and production of oil and natural gas is hazardous, and natural disasters, operator error or other occurrences can result in oil spills, blowouts, cratering, fires, equipment failure, and loss of well control, which can injure or kill people, damage or destroy wells and production facilities, and damage property and the environment. Offshore operations are subject to marine perils, including severe storms and other adverse weather conditions, vessel collisions, and governmental regulations as well as interruptions or termination by governmental authorities based on environmental and other considerations. Losses and liabilities arising from such events would significantly reduce our revenues or increase our costs and have a material adverse effect on our operations or financial condition.
The crude oil and natural gas reserve data in this Annual Report on Form 20-F are only estimates, and our actual production, revenues and expenditures with respect to our reserves may differ materially from these estimates.
The reliability of proved reserve estimates depends on:
Many of the factors, assumptions and variables involved in estimating reserves are beyond our control and may prove to be incorrect over time. Results of drilling, testing and production after the date of the estimates may require substantial upward or downward revisions in our reserve data. Any downward adjustment could lead to lower future production and thus adversely affect our financial condition, future prospects and market value.
We face foreign exchange risks that could adversely affect our results of operations.
Our business faces foreign exchange risks because a large percentage of our revenues and cash receipts are denominated in US dollars while a significant portion of our operating expenses and income taxes accrue in Norwegian kroner, reflecting our operations on the NCS. Movements between the US dollar and Norwegian kroner may adversely affect our business. While an increase in the value of the US dollar against the Norwegian kroner can be expected to increase our reported earnings, such an increase would also be expected to increase our operating expenses and the value of our debt, which would be recorded as a financial expense, and, accordingly, would adversely affect our net income. See Item 5–Operating and Financial Review and Prospects–Liquidity and Capital Resources–Risk Management.
Public authorities in Norway, the U.S. and Iran are investigating a consultancy arrangement we entered into with respect to business development in Iran, which, if proceedings are brought and determined against us, could result in fines, penalties, sanctions or other restrictions that could have a material adverse effect on our business.
The Norwegian National Authority for Investigation and Prosecution of Economic and Environmental Crime (Økokrim) has issued a preliminary charge alleging violations of the Norwegian General Penal Code provisions concerning illegal influencing of foreign government officials and is conducting an investigation concerning a consultancy agreement entered into in 2002 between Statoil and Horton Investments Ltd. The U.S. Securities and Exchange Commission is also conducting an inquiry into this consultancy arrangement to determine if there have been any violations of U.S. federal securities laws. In addition, certain Iranian authorities are carrying out inquires into the matter. See Item 8—Financial Information—Legal Proceedings.
We continue to provide information to Økokrim and the Securities and Exchange Commission in order to assist them with their respective ongoing reviews of our contract with Horton Investments Ltd. We have commissioned independent reviews into the Horton matter and our past international business practices. Responding to the requests of the public authorities and cooperating with their review and the independent reviews we have commissioned continues to divert management’s attention and resources, and any developments or requests by the authorities for additional information will engage more of management’s attention and resources. We cannot predict the outcome of these inquiries or the resulting effect that they might have on our business. If proceedings are brought and determined against us this may result in fines, penalties, sanctions or restrictions that could have a material adverse effect on our business or financial results.
Risks Related to the Regulatory Regime
Competition is expected to increase in the European gas market, currently our main market for gas sales, as a result of new European Union, or EU, directives which could adversely affect our ability to expand or even maintain our current market position or result in reduction in prices in our gas sales contracts.
Fundamental changes are now taking place in the organization and operation of the European gas market, with the objective of opening national markets to competition and integrating them into a single market for natural gas. This process started with the EU Gas Directive, which became effective in August 2000. The Directive was included into the EEA Agreement in June 2002, and all necessary changes in order to implement the Directive into Norwegian legislation were made during 2002. The Directive requires EEA states to take certain minimum steps to open their gas markets to greater competition. Each state must specify annually the wholesale and final gas customers inside its territory that have the legal capacity to contract for or be sold natural gas by the gas supplier of their choice.
The Directive also requires that eligible customers be given the right to negotiate agreements for using gas transport systems directly or rights of access based on tariffs or other mechanisms. A new Gas Directive is now approved by the EU. The new Gas Directive provides for accelerated requirements for market opening, which means that both large users and households will now be free to choose their supplier earlier than previously allowed.
Most of our gas is sold under long-term gas contracts to customers in the EU, a gas market that will be affected by changes in EU regulations. As a result of the Directive, our ability to expand or even maintain our current market position could be materially adversely affected and quantities sold under our gas sales contracts may be subject to a material reduction in gas prices.
We may incur material costs to comply with, or as a result of, health, safety and environmental laws and regulations.
Compliance with environmental laws and regulations in Norway and abroad could materially increase our costs. We incur and expect to continue to incur, substantial capital and operating costs to comply with increasingly complex laws and regulations covering the protection of the environment and human health and safety, including costs to reduce certain types of air emissions and discharges to the sea and to remediate contamination at various owned and previously-owned facilities and at third-party sites where our products or wastes have been handled or disposed. The new Petroleum Safety Authority Norway (PSA) was established on January 1, 2004, with the regulatory responsibility for safety, emergency preparedness and the working environment for all petroleum-related activities. Although existing regulations relating to HSE in petroleum activities continue with the PSA as the responsible authority, the PSA's sphere of responsibility has been expanded. See Item 4–Information on the Company—Regulation.
In our capacity as holder of licenses on the NCS under the Norwegian Petroleum Act of November 29, 1996, we are subject to statutory strict liability in respect of losses or damages suffered as a result of pollution caused by spills or discharges of petroleum from petroleum facilities covered by any of our licenses. This means that anyone who suffers losses or damages as a result of pollution caused by operations at any of our NCS license areas can claim compensation from us without needing to demonstrate that the damage is due to any fault on our part.
Whether in Norway or abroad, new laws and regulations, the imposition of tougher requirements in licenses, increasingly strict enforcement of or new interpretations of existing laws and regulations, or the discovery of previously unknown contamination may require future expenditures to:
In particular, we may be required to incur significant costs to comply with the 1997 Kyoto Protocol to the United Nations Framework Convention on Climate Change, known as the Kyoto Protocol, and other pending EU laws and directives. In addition, increasingly strict environmental requirements, including those relating to gasoline sulphur levels and diesel quality, affect product specifications and operational practices. Future expenditures to meet such specifications could have a material adverse effect on our operations or financial condition.
Political and economic policies of the Norwegian State could affect our business.
The Norwegian State plays an active role in the management of NCS hydrocarbon resources. In addition to its direct participation in petroleum activities through the SDFI and its indirect impact through tax and environmental laws and regulations, the Norwegian State awards licenses for reconnaissance, production and transportation and approves, among other things, exploration and development projects, gas sales contracts and applications for (gas) production rates for individual fields. The Norwegian State may also, if important public interests are at stake, direct us and other oil companies to reduce production of petroleum. Reductions of up to 7.5% have been imposed in the past. By a royal decree of December 19, 2001, the Norwegian government decided that Norwegian oil production should be reduced by 150,000 barrels per day from January 1, 2002 until June 30, 2002. This amounted to roughly a 5% reduction in output. Further, in the production licenses in which the SDFI holds an interest, the Norwegian State retains the ability to direct petroleum licensees’ actions in certain circumstances.
If the Norwegian State were to take additional action pursuant to its extensive powers over activities on the NCS or to change laws, regulations, policies or practices relating to the oil and gas industry, our NCS exploration, development and production activities and results of operations could be materially and adversely affected. For more information about the Norwegian State’s regulatory powers, see Item 4–Information on the Company—Regulation.
Risks Related to Our Ownership by the Norwegian State
The interests of our majority shareholder, the Norwegian State, may not always be aligned with the interests of our other shareholders, which may affect our decisions relating to the NCS.
The Norwegian Parliament, known as the Storting, and the Norwegian State have resolved that the Norwegian State’s shares in Statoil and the SDFI’s interests in NCS licenses must be managed pursuant to a coordinated ownership strategy for the Norwegian State’s oil and gas interests. Under this strategy, the Norwegian State has required us to continue to market the Norwegian State’s oil and gas together with our own as a single economic unit.
Pursuant to the coordinated ownership strategy for the Norwegian State’s shares in us and the SDFI, the Norwegian State requires us in our activities on the NCS to take account of the Norwegian State’s interests in all decisions which may affect the development and marketing of our own and the Norwegian State’s oil and gas.
The Norwegian State holds more than a two-thirds majority of our shares. Accordingly, the Norwegian State has the power to determine matters submitted for a vote of shareholders, including amending our articles of association and electing all of the members of the corporate assembly except employee representatives. The employees may claim the right to be represented by up to one third of the members of the board of directors as well as the corporate assembly. The corporate assembly is responsible for electing our board of directors and communicates its recommendations concerning the board of directors’ proposals about the annual accounts, balance sheets, allocation of profits and coverage of losses of our company to the general meeting. The interests of the Norwegian State in deciding these and other matters and the factors it considers in exercising its votes, especially pursuant to the coordinated ownership strategy for the SDFI and our shares held by the Norwegian State, could be different from the interests of our other shareholders. Accordingly, when making commercial decisions relating to the NCS, we have to take into account the Norwegian State’s coordinated ownership strategy and we may not be able to fully pursue our own commercial interests, including those relating to our strategy on development, production and marketing of oil and gas.
If the Norwegian State’s coordinated ownership strategy is not implemented and pursued in the future, then our mandate to continue to sell the Norwegian State’s oil and gas together with our own as a single economic unit is likely to be prejudiced. Loss of the mandate to sell the SDFI’s oil and gas could have an adverse effect on our position in our markets. For further information about the Norwegian State’s coordinated ownership strategy, see Item 7–Major Shareholders and Related Party Transactions–Major Shareholders.
Forward-Looking Statements
This Annual Report on Form 20-F contains forward-looking statements that involve risks and uncertainties, in particular under Item 4–Information on the Company and Item 5–Operating and Financial Review and Prospects. In some cases, we use words such as “believe”, “intend”, “expect”, “anticipate”, “plan”, “target”and similar expressions to identify forward-looking statements. All statements other than statements of historical facts, including, among others, statements regarding our future financial position, business strategy, budgets, reserve information, reserve replacement rates, projected levels of capacity and production, projected operating costs, finding and development costs, estimates of capital expenditure, expected exploration and development activities and plans and objectives of management for future operations, are forward-looking statements. You should not place undue reliance on these forward-looking statements. Our actual results could differ materially from those anticipated in the forward-looking statements for many reasons, including the risks described above in Item 3–Key Information, below in Item 5–Operating and Financial Review and Prospects, and elsewhere in this Annual Report on Form 20-F.
These forward-looking statements reflect current views with respect to future events and are, by their nature, subject to significant risks and uncertainties because they relate to events and depend on circumstances that will occur in the future. There are a number of factors that could cause actual results and developments to differ materially from those expressed or implied by these forward-looking statements, including levels of industry product supply, demand and pricing; currency exchange rates; political and economic policies of Norway and other oil-producing countries;general economic conditions; political stability and economic growth in relevant areas of the world; global political events and actions, including war, terrorism and sanctions; the timing of bringing new fields on stream; material differences from reserves estimates; inability to find and develop reserves; adverse changes in tax regimes; development and use of new technology; geological or technical difficulties; the actions of competitors; the actions of field partners; natural disasters and other changes to business conditions; and other factors discussed elsewhere in this report.
Although we believe that the expectations reflected in the forward-looking statements are reasonable, we cannot assure you that our future results, level of activity, performance or achievements will meet these expectations. Moreover, neither we nor any other person assumes responsibility for the accuracy and completeness of the forward-looking statements. Unless we are required by law to update these statements, we will not necessarily update any of these statements after the date of this Annual Report, either to conform them to actual results or to changes in our expectations.
Statements Regarding Competitive Position
Statements made in Item 4–Information on the Company, referring to Statoil’s competitive position, are based on our belief, and in some cases rely on a range of sources, including investment analysts’reports, independent market studies and our internal assessments of market share based on publicly available information about the financial results and performance of market participants.
Item 4 Information on the Company
History and Development of the Company
Statoil ASA is a public limited company organized under the laws of Norway with its registered office at Forusbeen 50, N-4035 Stavanger, Norway. Our telephone number is +47 51 99 00 00. Our registration number in the Norwegian Register of Business Enterprises is 923 609 016. Statoil ASA was incorporated on September 18, 1972 under the name Den norske stats oljeselskap a.s. At an extraordinary general meeting held on February 27, 2001, it was resolved to change our company name to Statoil ASA and convert into a public listed company, or ASA.
Business Overview
We are an integrated oil and gas company, headquartered in Stavanger, Norway. Based on both production and reserves we are a major international oil and gas company and the largest in Scandinavia. Our proved reserves as of December 31, 2003 consisted of 1,789 mmbbls of oil, or mmbbls, and 393 bcm (equivalent to 13.9 tcf) of natural gas, which represents an aggregate of 4,264 mmboe. Our operations commenced in 1972 with a primary focus on the exploration, development and production of oil and natural gas from the Norwegian Continental Shelf, or NCS. Since then, we have grown both domestically and internationally into a company with 19,326 employees and business operations in 28 countries as of December 31, 2003.
We review our petroleum reserves routinely in the course of business from time to time as new information becomes available. This information can relate to remaining reserves, existing production performance, decisions related to development, production, acquisition and divestment of reserves and changes in economic conditions. In addition, information on proved oil and gas reserves, standardized measure of discounted net cash flows relating to proved oil and gas reserves, and other information related to proved oil and gas reserves reported in the Supplementary Information on Oil and Gas Producing Activities is collected and checked for consistency and conformity with applicable standards by a central group that is independent of the E&P business units. Although this group reviews the information centrally, each asset is responsible for ensuring that it is in compliance with the requirements of the SEC and our corporate standards. Before presenting the aggregated results to the management of the relevant business units and the Chief Executive Officer for approval, this central group asks DeGolyer and MacNaughton, independent petroleum engineering consultants, to perform an independent evaluation of proved reserves, which was performed as of December 31, 2003 for our properties. The results obtained by DeGolyer and MacNaughton do not differ materially from those reported by us when compared on the basis of net equivalent barrels of oil. DeGolyer and MacNaughton has delivered to us its summary letter report describing its procedures and conclusions, a copy of which appears as Appendix A hereto. Reserve engineering is a process of forecasting the recovery and sale of oil and gas from a reservoir and is in part subjective. It is clearly associated with considerable uncertainty, often positive, but also negative. The accuracy of any reserve information is a function of the quality of available data and of engineering and requires interpretation and judgment. The requirements of the SEC with respect to the calculation of proved reserves set a standard for estimating reserves, which results in amounts that are reasonably certain technically, and consistent with the economic, regulatory and operating conditions at the time the estimates are made.See Supplementary Information on Oil and Gas Producing Activities beginning on page F-31 for further details of our proved reserves.
We are the leading producer of crude oil and gas on the technologically demanding NCS and are well positioned internationally, having participated in a number of high-quality discoveries outside the NCS. We are the largest supplier of natural gas from the NCS (including sales we make on behalf of the Norwegian State) to the growing Western European gas market. We are one of the market leaders, with a market share of 22%, in the retail gasoline business in Scandinavia through our 50% holding in Statoil Detaljhandel Skandinavia AS. We have signed a letter of intent to buy the remaining 50% holding, pending negotiation and board approval. We are one of the largest net sellers of crude oil worldwide, including sales of crude oil purchased from the Norwegian State.
We divide our operations into four business segments: Exploration and Production Norway, International Exploration and Production, Natural Gas and Manufacturing and Marketing.
The following table sets forth the income before financial items, income taxes and minority interest for each segment for the periods indicated.
(in millions) | Year ended December 31, | |||
2001 | 2002 | 2003 | ||
NOK | NOK | NOK | USD | |
Income before financial items, income taxes and minority interest of: | ||||
E&P Norway | 42,287 | 33,953 | 37,589 | 5,639 |
| International E&P | 1,291 | 1,086 | 1,702 | 255 |
Natural Gas | 8,039 | 6,428 | 6,350 | 953 |
| Manufacturing and Marketing | 4,480 | 1,637 | 3,555 | 533 |
| Other | 57 | (2) | (280) | (42) |
| Total | 56,154 | 43,102 | 48,916 | 7,338 |
The segment information included in this table and throughout this Annual Report on Form 20-F reflects the implementation of a new method for calculating the inter-segment price for deliveries of natural gas from Exploration and Production Norway to Natural Gas adopted during the first quarter of 2003. The new price amounts to NOK 0.32 per standard cubic meter, adjusted quarterly by the average USD oil price over the last six months in proportion to USD 15. The new price applies to all volumes, including associated gas, while previously the price was calculated on a field-by-field basis. The new method is partly a result of the Norwegian Gas Negotiating Committee being abolished, and replaced by company-based sales. Prior periods have been adjusted to reflect the new pricing formula.
Exploration and Production Norway. E&P Norway includes our exploration, development and production operations on the NCS. Our NCS operations are organized in four core areas, of which three are currently producing hydrocarbons: Troll/Sleipner, Halten-Nordland, Tampen, and one, Tromsøflaket, which is expected to begin production in 2006. We operate 21 developed fields in our three producing core areas. These fields produced a total of 2.7 mmboe per day in 2003, 60% of total NCS daily production. Throughout 2003, our daily equity oil production was 661 mbbls of oil and daily equity gas production was 52.5 mmcm (1,854 mmcf), compared to 670 mbbls of oil and daily equity gas production of 50.7 mmcm (1,790 mmcf) in 2002. We are also well positioned in three promising but less mature areas: the Møre/Vøring and Lofoten areas of the Norwegian Sea and the Barents Sea. As of December 31, 2003, E&P Norway had proved reserves of 1,184 mmbbls of crude oil and 378 bcm (13.3 tcf) of natural gas, which represents an aggregate of 3,560 mmboe. Our experience over the last 30 years in the challenging NCS environment has helped us develop expertise in managing complex, integrated projects. We are continuously seeking to improve our returns through both an aggressive cost saving program and portfolio management. We believe that this business segment will continue to provide strong returns, and, as a large source of natural gas, allow us to capitalize on anticipated increased demand for natural gas across Europe and in the United States.
International Exploration and Production. International E&P includes all of our exploration, development and production operations outside Norway. We have established positions in four producing core areas: Caspian, Western Africa (Angola and Nigeria), Western Europe and Venezuela. As of December 31, 2003, International E&P had proved reserves of 605 mmbbls of crude oil and 15.7 bcm (552 bcf) of natural gas, which represents an aggregate of 703 mmboe. In 2003 we produced 86,500 barrels of oil and 0.4 mmcm (14 mmcf) of gas per day from our international operations, compared to 79,700 barrels of oil and 0.94 mmcm (33 mmcf) of gas for 2002. Statoil believes that this business segment is important in providing long-term profitable growth for our company. As part of a reorganization effective January 1, 2004, all midstream and downstream gas projects associated with our international activities were transferred from International E&P to the Natural Gas business segment. This includes midstream and commercial activities in Shah Deniz, Azerbaijan, downstream activities in Turkey, and our position in Cove Point in the U.S.
Natural Gas. The Natural Gas segment transports, processes and sells natural gas from our upstream positions on the NCS and certain assets abroad. We are one of the leading suppliers of natural gas to the European market and the largest corporate owner in the world’s largest offshore pipeline network. This network, Gassled, allows us flexibility in the way we source, blend and deliver our natural gas to any one of four landing points in Europe and through to the European gas transmission system. We have a 21.133% interest in the Gassled joint venture. As from February 1, 2004 the Kollsnes Gas Plant is included in Gassled. Given our upstream reserves, access to a flexible transportation network and security of supply, we believe that we can expand our sales and market share in the expected environment of increased demand and market deregulation. We believe that this business segment will provide significant opportunities for growth in the near to medium term. In 2003 we sold approximately 46.4 bcm (1.6 tcf) of natural gas, which includes natural gas sold by us on behalf of the Norwegian State, compared to 43.1 bcm (1.5 tcf) in 2002.
Manufacturing and Marketing. The Manufacturing and Marketing segment comprises downstream activities including sales and trading of crude oil, NGL and petroleum products, refining, methanol production, retail and industrial marketing of oil products and petrochemical operations through our 50%-owned joint venture Borealis. We believe that further benefits will result from continued operational integration of our downstream and upstream activities and from further capitalizing on our brand name and strong marketing presence in the Scandinavian region, Poland, Ireland and the Baltic states. We sold our shares in our shipping subsidiary Navion to Norsk Teekay AS, which is a wholly owned subsidiary of Teekay Shipping Corporation, effective January 1, 2003, and closed the sale on April 7, 2003.
Strategy and Opportunities
Our strategic objective is to exploit the profitable options as an integrated oil and gas company with emphasis on developing growth opportunities available to us on the NCS and internationally while maintaining strict capital discipline. Factors crucial to our competitiveness include:
In pursuit of our strategic objectives, we intend to:
Maximize shareholder value through strict capital discipline. Our key financial target for 2004 is to achieve an underlying return on average capital employed, or ROACE, of 12% by 2004, adjusting our actual return assuming a long-term oil price of USD 16 per barrel, natural gas price of NOK 0.70 per scm, refining margin of USD 3.0 per barrel, Borealis margin of EUR 150 per tonne, and a NOK/USD exchange rate of NOK 8.20. All prices are measured in real 2000 terms. We intend to deliver underlying returns at or above this target through organic growth based on our stringent allocation of capital resources, continuing cost reduction and ongoing restructuring of our asset portfolio. However, this target is subject to revision and excludes the possible effects of acquisitions as set forth below in Item 5—Operating Review and Prospects—Corporate Target. ROACE and ROACE as calculated on a normalized basis are both non-GAAP financial measures. See Item 5—Operating Review and Prospects—Use of Non-GAAP Financial Measures. We have increased the focus on our managers’ performance by introducing performance related bonus schemes. We will continue to strengthen the use of our remuneration scheme to have a strong linkage between managers’ rewards and our financial results.
Continue to grow returns in E&P Norway. We are the leading operator and producer of oil and gas on the NCS, a region with significant remaining resources. We intend to sustain the present production level at 1 mmboe per day towards 2007. Our portfolio of discovered reserves allows us to fulfill this target without being dependant on additional discoveries. Our long-term ambition is to sustain this level towards 2012. Fulfillment of this ambition will require new discoveries through focused exploration efforts on the NCS.
In 2004 we will continue to reduce costs in our three core producing areas Tampen, Troll/Sleipner and Halten/Nordland. In the mature Tampen area we have recommended to our partners that removing bottlenecks and upgrading existing installations is the most cost effective solution for the Statfjord Late Life phase. The work on an optimized area plan for the late life production from Gullfaks, Snorre, Visund and development of the smaller oil and gas finds in the area will be continued.
In order to increase production in the Troll/Sleipner area and thus secure sufficient new reserves to supply the growing gas markets in Europe, we plan to increase step-by-step the total capacity throughout the related onshore facilities at Kollsnes to a level of 150 mmcm per day. Furthermore the partners of the Ormen Lange license have submitted a plan for development and operation, or PDO, of the Ormen Lange field and the associated gas pipeline via Sleipner to the UK market. This is a major milestone in our efforts to supply the UK with additional Norwegian gas.
In the Halten/Nordland area, our growth area, we see that maximum value creation is closely linked to long-term utilization of the infrastructure investments that we have made so far. The infrastructure consists of both the gas production from our offshore facilities on Åsgard, Norne and Heidrun, the Haltenpipe gas line and Tjeldbergodden facilities and the gas transportation infrastructure out of the Halten/Nordland area, i.e., Åsgard Transport and the onshore facilities at Kårstø.
Our longer-term options are primarily in the Norwegian Sea and in the Barents Sea region. In the Norwegian Sea we made an oil discovery at Ellida only one year after the license award. Additional wells and analysis are required to conclude whether this is a commercial discovery or not. In the Barents Sea the Snøhvit LNG project is scheduled to be on stream during 2006. The Snøhvit LNG project is our initial step in developing the Barents Sea region.
Grow our international production through further developing existing quality assets and leveraging our strengths. Having targeted and concentrated our international exploration and production activities in selected areas, and having participated in six of the largest oil and gas discoveries since 1997, we are focusing our efforts on establishing significant production and increasing our influence in our core producing areas: Caspian, Western Africa, Western Europe and Venezuela. We are also exploring additional opportunities in other areas that support our strategy and leverage our skills and competence from the NCS. Future potential core areas include North Africa and the Middle East. In 2003 Statoil established a position in Algeria with the acquisition of direct ownership interests in the projects In Salah and In Amenas. We will pursue attractive opportunities as they arise and as our capital budgets permit. These opportunities may include acquisitions of companies or oil or gas assets in development phase or production phase that complement or expand our existing portfolio. We will also continue to manage our portfolio of assets to seek to further increase profitability and secure operating influence and, where beneficial, operatorships.
Capitalize on our strong positions in European gas markets to take advantage of expected growth in demand, and expand beyond traditional markets and supply areas. As a leading supplier of gas to Europe, we are well positioned to benefit from growing demand for gas and the deregulation of gas markets, and will adapt to new commercial opportunities. We intend to actively manage our upstream portfolio and transportation capacities to maximize the income from existing long-term natural gas contracts. We aim to exploit economies of scale in marketing of gas, and in particular, we intend to capitalize on the trading and optimization opportunities that will arise with the anticipated increase in demand for imports of gas in the United Kingdom, a market we are well positioned to supply. We will also increase our ability to realize additional margin and optimize synergies by extracting and commercializing NGL streams to meet internal and external demand for NGL. Moreover, we aim to build gas value chains from supply areas other than the Norwegian Continental Shelf into Europe, and proceed from our positions in the Caspian and in the Barents Sea (the Snøhvit LNG project). Our position in the Cove Point LNG terminal will enable us to build an Atlantic LNG business and a US gas marketing business. We may also leverage our natural gas value chain and marketing expertise to capture exploration and development opportunities elsewhere.
Enhance our downstream position through increased focus on core activities. Emphasis will be put on integration with our upstream businesses, and more efficient distribution of our products to the end user. We are the largest retailer of gasoline in Scandinavia and if we, pending negotiation of definitive agreements and approval by the supervisory boards of ICA and Statoil, complete the purchase of the remaining interest in Statoil Detaljhandel Skandinavia AS (SDS) we expect to be able to strengthen our position further with the integration of our Scandinavian and international retail operations. In refining, partially through our joint venture with the Shell group at Mongstad and Pernis, we intend to continue with our cost reductions and productivity improvements to increase utilization and efficiency of existing capacity and develop the refineries in order to meet the EU’s product specification requirements for the year 2005. Borealis plans to improve its position in petrochemicals based on cost improvement programs and site restructuring.
Exploration and Production Norway
Introduction
E&P Norway is the cornerstone of our business, consisting of exploration, development and production operations on the NCS. We participate in the majority of the 47 producing oil and gas fields on the NCS and as of December 31, 2003, we were the operator for 21 of these. Effective January 1, 2003, we took over the operatorship of Visund, Snorre, Tordis and Vigdis, and thereby became the sole operator in the Tampen area. We are also the operator of the Troll gas field in the Troll/Sleipner area. Other major oil and gas fields in the Troll/Sleipner area include Sleipner, where we are operator, and Oseberg. The main producing fields in the Halten/Nordland area include Heidrun, Åsgard and Norne, all of which we operate. E&P Norway reported income before financial items, income taxes and minority interest of NOK 37,589 million, an increase of 11% compared to 2002. In the year ended December 31, 2003, we produced 991 mboe per day compared with 989 mboe per day in 2002.
The following table presents key financial information about this business segment.
(in millions) | Year ended December 31, | |||
2001 | 2002 | 2003 | ||
NOK | NOK | NOK | USD | |
| Revenues | 67,245 | 58,780 | 62,494 | 9,375 |
Depreciation, depletion and amortization | 11,805 | 11,861 | 12,102 | 1,815 |
Exploration expenditure | 2,020 | 1,350 | 1,215 | 182 |
Income before financial items, income taxes and minority interest | 42,287 | 33,953 | 37,589 | 5,639 |
Capital expenditure | 10,759 | 11,023 | 13,412 | 2,012 |
Long-term assets | 77,550 | 77,001 | 80,681 | 12,103 |
Further details on the financial results can be found in Item 5—Operating and Financial Review and Prospects—Operating Results.
The NCS. We are the leading exploration, production and transport company on the NCS. We currently hold exploration licenses covering a total area of approximately 40,000 square kilometers, and production licenses in respect of approximately 3,560 mmboe of proved reserves as of December 31, 2003, compared to 3,641 mmboe as of December 31, 2002.
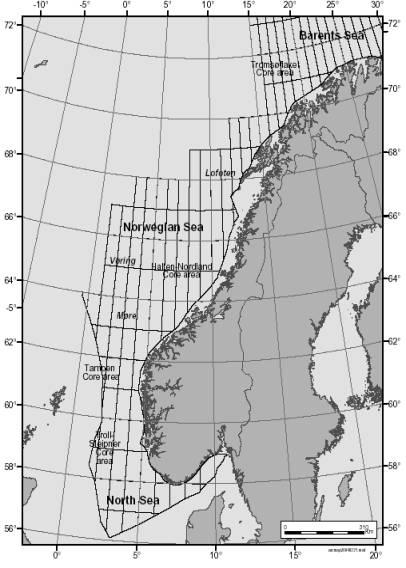 Commercial petroleum deposits were first proved on the NCS in the late 1960’s. Norwegian oil production began in 1971 and accounted for most of the production growth until the late 1990’s. Since then, the growth has been in gas production. Production from the NCS is expected to plateau over the next five to ten years before going into a gradual decline. In order to counteract this in coming years, our recovery rate must continue to be improved, resources not presently covered by development plans must be brought on stream and new oil and gas discoveries must be made. We believe that significant opportunities remain on the NCS. In addition to the possibility of large discoveries, production will focus on a large number of smaller fields, many of which will be characterized by complex geology. These fields will require the innovative application of advanced technologies, for which we have a proven record of success. The map to the right indicates the location of the areas referred to within this section.
Core Producing Areas. We have three core producing areas on the NCS: Troll/Sleipner, Halten/Nordland and Tampen. The fields in each area use common infrastructure, such as production installations, and oil and gas transport facilities where possible, which together reduce the investment necessary to develop new fields. Our efforts in the core areas will also focus on developing smaller fields through the use of existing infrastructure and enhancing production by improving recovery factors. We are working actively to extend the production from our fields through improved reservoir management and application of new technology. Key elements in our improved recovery efforts include:
We believe that much of the improvement in expected ultimate recovery factors that we have seen over the last decade can be attributed to our systematic reservoir and production management and the use of improved oil recovery methods.
Potential Producing Areas
In addition to our three producing core areas, we are well positioned in the central and southern parts of the North Sea, in the Møre/Vøring (Norwegian Sea) and the Lofoten areas of Norwegian Sea and in the Barents Sea, all of which we believe to have significant hydrocarbon resource potential.
North Sea. Total licensed acreage in the North Sea covers approximately 13,690 square kilometers, of which we are the operator of 7,540 square kilometers. Within this region, one exploration well was drilled in each of our producing core areas, Tampen and Troll/Sleipner, in 2003. The well in the Troll/Sleipner area was dry. The Tampen well was drilled as an extension of a production well from the Gullfaks B platform and was a minor gas/condensate discovery. The well will be converted to a production well. Outside these areas we have further interests in the central and southern parts of the North Sea. Two new licenses were awarded to us in 2003. In addition we bought interests in two existing licenses and sold all our interests in one. Three exploration wells were drilled in 2003 in this area. An appraisal, operated by ConocoPhillips, confirmed a chalk discovery and further development studies might be initiated in 2004. We operated the drilling of the other two wells. A minor gas discovery was made in the first one, but the second appraisal well was dry. Evaluation of the discovery will continue in 2004.
Norwegian Sea. We have interests in approximately 20,930 square kilometers of licensed acreage in the Norwegian Sea of which we are the operator for 7,750 square kilometers. We were the operator for two exploration wells in our producing core area Halten/Nordland, which in 2003 resulted in one discovery. Oil was discovered in a well located northeast of the Norne field. The discovery is in an area with several other oil discoveries and prospects. Exploration and evaluation of the area will continue in 2004. The responsibility for the Ormen Lange gas discovery, which was included in the Møre/Vøring area, has been transferred to the Halten/Nordland Core area in 2003. In the Møre/Vøring region, which is the deepwater part of the area with depths ranging from 400 meters to 2,000 meters, we have interests in licenses covering approximately 13,650 square kilometers. We drilled one exploration well in PL281 Ellida in 2003. The well penetrated a 52 meters oil column but a test rate of only 250 bbl/day indicated poor production properties within the reservoir. Further appraisal drilling is needed before a conclusion can be drawn regarding this oil discovery. The first appraisal well may be drilled in 2005. The Lofoten area, in which we have interests in 250 square kilometers of licensed acreage, is one of several major oil provinces left to explore on the NCS. The Norwegian Government decided late in 2003 not to go on with further petroleum activity in the area due to its special character as a spawning ground for important fish stocks and as a fishing ground. The Government has found that, at present, it has not been demonstrated that adequate protection of the fisheries and the environment can be maintained if petroleum activities are allowed in the area. This entails that the two production licenses which have been awarded in the area cannot resume their activities, and that no new awards will be given. The question of all-year petroleum activity in the Lofoten area will be considered again when the integrated management plan for the Barents Sea is completed in 2005.
Barents Sea. Our fourth core area, Tromsøflaket, includes our gas discovery Snøhvit, which is currently under development and is scheduled to be on stream in 2006. In addition to acreage of 950 square kilometers in this core area, we have further interests in 4,350 square kilometers of licensed acreage and 13,500 square kilometers consisting of three seismic option areas. Under the terms of the seismic option agreement, the license group is committed to perform specified seismic evaluation of the area and at any time prior to May 15, 2007, the license group has the right to obtain a production license with the obligation to drill exploration wells. New seismic data of the area have been acquired and interpretation of the data is ongoing. The new evaluation will be completed in 2004. The Government has decided to allow for further all-year petroleum activity in the South Barents Sea, except for certain especially valuable areas. This implies that all existing licenses in the Barents Sea can now resume their activities. Preparations are ongoing for a common drilling campaign in the area to start in 2004 and continue into 2005. Four exploration wells are included in the campaign, operated by ENI, Norsk Hydro and Statoil, respectively.
Although most companies active on the NCS have interests in licenses and seismic areas in the Barents Sea, activity and competition have been modest for some years. As new petroleum reserves are discovered, we expect competition for new licenses to increase. The development of the Snøhvit field, described below in Exploration and Development, could serve as a cornerstone for the area’s future development.
Portfolio Management
In 2003 we have primarily focused our strategy on long-term production. The most important transaction was the acquisition of 10% share in the Snøhvit field from Norsk Hydro, which included a transfer of a 2% share in Kristin to Norsk Hydro as part payment. We acquired a 1.24% interest in Snøhvit from Svenska Petroleum, both effective January 1, 2004. These transactions are intended to add long-term production and reserves to our portfolio. In addition, we purchased nine exploration licenses, of which seven have been completed, with Norwegian authority approval. These transactions represent acreage that potentially can provide production and reserves in the future.
Exploration and Development
We have been engaged in exploration and drilling on the NCS since 1975 and have drilled a total of 285 exploration and appraisal wells as of December 31, 2003. Approximately 73% of all exploration and appraisal wells that we drilled in the last three years have yielded discoveries or positive appraisals that have confirmed our assessments regarding hydrocarbons in-place.
Our exploration and development program is designed to strengthen our position on the NCS through increasing reserves and leveraging of existing infrastructure and to enable the development of new core areas. We coordinate the development of new fields so as to minimize required new investments in infrastructure. In the Tampen area, new fields were developed on a schedule to allow existing infrastructure to be used continuously at near peak capacity, thereby limiting the need for new infrastructure.
In 2003, we participated in nine exploration and appraisal wells, of which one was an exploration extension on a production well. We were the operator for six of these wells. In 2002, we participated in 20 exploration and appraisal wells of which we were the operator of 13. Of the six Statoil-operated wells in 2003, four were successful, and of the three partner-operated wells, two were successful. Our exploration expenditure on the NCS in 2003, including expenditure in respect of field development studies for the Halten/Nordland prospects, totaled NOK 1,215 million, of which NOK 106 million was capitalized. The corresponding figures for 2002 were NOK 1,350 million and NOK 481 million respectively. The reduction from 2002 was due to a lack of identified drilling prospects which we believed would be successful and being unable to gain approval from partners to drill Statoil operated wells. Additionally, exploration expenditure of NOK 256 million, which was capitalized in earlier years, was expensed in 2003 compared to NOK 551 million in 2002.
Of our 2003 NCS exploration expenditures, approximately 46% was spent in our three core producing areas and the remainder mostly in our potential production areas in the North Sea and Norwegian Sea. Our expenditure on development on the NCS totaled NOK 13.3 billion in 2003 and NOK 10.3 billion in 2002. In 2003 we participated in 99 development wells, and in 2002 we participated in 144 development wells. Of our 2003 NCS development budget, approximately 87% was spent in our three core producing areas and the remainder in our potential production areas in the Barents and Norwegian Seas. The allocation of our exploration and development budgets among the areas may be revised to reflect the results of our exploration activities.
Of our 2004 NCS development budget, approximately 75% will be spent in our three core producing areas and the remainder in our new core area Tromsøflaket and potential producing areas in the Barents Sea and the Norwegian Sea.
The following table sets forth our exploratory and development wells drilled on the NCS, including a breakdown of successful or productive wells and dry wells, drilled by core area for the three years ended 2001, 2002 and 2003.
Year ended December 31, | |||
2001 | 2002 | 2003 | |
| North Sea | |||
Statoil Operated Exploratory | |||
| Successful | 3 | 7 | 2 |
| Dry | 3 | 2 | 1 |
| Total | 6 | 9 | 3 |
| Development | 33 | 37 | 49 |
Partner Operated Exploratory | |||
| Successful | 4 | 1 | 2 |
| Dry | 2 | 2 | 1 |
| Total | 6 | 3 | 3 |
| Development | 82 | 87 | 39 |
Norwegian Sea | |||
Statoil Operated Exploratory | |||
| Successful | 3 | 3 | 2 |
| Dry | — | 1 | 1 |
| Total | 3 | 4 | 3 |
| Development | 23 | 20 | 11 |
Partner Operated Exploratory | |||
| Successful | 3 | 2 | — |
| Dry | — | — | — |
| Total | 3 | 2 | — |
| Development | — | — | — |
| Barents Sea | |||
Statoil Operated Exploratory | |||
| Successful | 1 | — | — |
| Dry | 1 | — | — |
| Total | 2 | — | — |
| Development | — | — | — |
Partner Operated Exploratory | |||
| Successful | 1 | — | — |
| Dry | — | — | — |
| Total | 1 | — | — |
| Development | — | — | — |
| Totals | |||
| Exploratory | |||
| Successful | 15 | 14 | 6 |
| Dry | 6 | 6 | 3 |
| Total | 21 | 20 | 9 |
| Development | 138 | 144 | 99 |
We calculate our finding costs as a three-year average. We define these costs as total exploration expenditure divided by changes in proved reserves attributable to improved recovery, revisions, and extensions and discoveries. Our finding costs in Norway have been relatively low compared to other operators on the NCS, as much of our activity has been concentrated in the mature areas. In 2001, 2002 and 2003 our finding costs were USD 1.53, USD 0.81 and USD 0.63 per boe, respectively. The 17% decrease in the three-year average finding cost in 2003 compared to previous years is mainly due to removal of the 2000 figure from the three-year average.
We are currently the operator of five ongoing field development projects on the NCS, which are in order of scheduled production: Sleipner West Alfa North, Kvitebjørn, Kristin, Visund Gas and Snøhvit. In addition, we have interests in two Oseberg satellite developments operated by Norsk Hydro, Oseberg Sør J structure and Oseberg Vestflanken, the ConocoPhillips operated Ekofisk Area Growth (EAG) project and the Ormen Lange deepwater gas field, currently operated by Norsk Hydro with Norske Shell as operator in the production phase.
Sleipner West Alfa North. Sleipner West Alfa North in which we hold a 49.5%, interest is part of the overall Sleipner West development. The owners approved the Alfa North development in July 2002, and it will be produced through subsea facilities with the well stream tied back with an 18-kilometer flow line to Sleipner T. Production is planned to start in October 2004, with a total development cost for Alfa North estimated at approximately NOK 2.8 billion, of which NOK 1.2 billion has been invested as of December 31, 2003. Production from Alfa North is being phased in as a part of the total Sleipner West production profile, with a reached gas export capacity of 21 mmcm per day (731 mmcf).
Kvitebjørn. Kvitebjørn, in which we hold a 50% interest is in the Tampen area. The PDO was approved in 2000, and an extension covering a large part of the Kvitebjørn reservoirs was approved in 2001. The field is being developed with a fixed steel platform for production, drilling and quarters. Initial processed gas and condensate will be transported in separate pipelines to receiving facilities for final processing and transport. Gas is transported through a pipeline to the treatment plant at Kollsnes. In addition, a new oil pipeline is being built connecting the Kvitebjørn development to the Mongstad refinery in the same region. We expect to reach an estimated production of 16 mmcm (565 mmcf) of gas per day in 2006. Commercial gas deliveries are scheduled to start in October 2004. Total investment is estimated to be NOK 9.9 billion, of which NOK 7.6 billion has been invested as of December 31, 2003.
Kristin.Kristin,in which we hold a 44.6% interest as of January 1, 2004, is a gas condensate field in the southwestern part of the Halten/Nordland area, about 20 km southwest of Åsgard’s Smørbukk field. The Kristin development, approved by the Storting (the Norwegian Parliament) in 2001, will drain a reservoir almost 5,000 meters beneath the seabed through the use of 12 subsea production wells. The reservoir is characterized by very high temperature and pressure. The Kristin project will be the first high temperature and pressure field developed with subsea installations. To reduce the pressure, the well stream is choked down at the subsea production stations before transportation through infield pipelines and flexible risers to a floating processing platform. The stabilized condensate will be exported to a joint Åsgard and Kristin storage vessel and the rich gas will be transported to shore via the Åsgard transportation pipeline to the gas processing facility at Kårstø. Commercial gas deliveries are scheduled to start in October 2005. The estimated total investment cost for this project is NOK 17.2 billion, of which NOK 8.1 billion has been invested as of December 31, 2003. Due to the challenging nature of the reservoir a new drainage strategy for boosting condensate recovery is under evaluation which may lead to a total cost increase of NOK 1-2 billion. The field production capacity is expected to reach 13 mmcm (459 mmcf) per day by 2006. Further work is under way on a possible development of the other discoveries in the area using the Kristin processing facilities as a field center.
Visund Gas.The Visund field, in which we hold a 32.9% interest, is in the Tampen area. The development of the Visund field was separated into an oil production phase, which came on stream in 1999, and a later gas production phase, Visund Gas, which was approved by the Ministry of Petroleum and Energy in October 2002. We took over as the operator of the field from Norsk Hydro on January 1, 2003. Gas export will be made possible by modifying the platform with new gas-compressor and export facilities to allow gas export and at the same time keeping the initial gas injection rate. In addition, a new pipeline will be laid from Visund to the Kvitebjørn pipeline in order to transport the gas to the treatment plant at Kollsnes for final processing. Commercial gas deliveries are scheduled to start in October 2005, and a gas production level of about 6 mmcm (208 mmcf) gas per day is forecasted for 2006. The gas export capacity can be increased when gas injection is reduced and more gas compression capacity becomes available currently expected to occur in 2011. Total development costs are estimated to be NOK 2.6 billion, of which NOK 0.4 billion has been invested as of December 31, 2003.
Snøhvit. Snøhvit is the largest gas field in the Norwegian sector of the Barents Sea. After the acquisition of the 10% interest from Norsk Hydro and 1.24% interest from Svenska Petroleum, both with effect as of January 1, 2004, our interest in Snøhvit is 33.53%. We are now the operator of all the unitized licenses in the field. The unitization agreement for the area was approved by the Ministry of Petroleum and Energy in July 2000. The field is being developed with subsea production installations connected to an onshore gas liquefaction plant. The main product, LNG, will be shipped to customers in purpose-built vessels. Carbon dioxide separated from the gas will be piped back to the field and injected. Some LPG and condensate will also be produced. Long-term sales contracts for the LNG were entered into in October 2001 and the Storting approved the PDO in March 2002. The total development costs for the project are estimated to be NOK 45.3 billion for all phases, of which NOK 9.6 billion has been invested as of December 31, 2003. In addition, four new vessels will be purpose built for transportation of the LNG from the field. Statoil will lease capacity and be a part owner in three of the vessels. Our commitment as charterer will be equal to title to the gas to be transported, while our ownership share will, on average, be 32%. The present value of the lease rentals for our share is about NOK 2.1 billion. The field development plan calls for production to start in 2006. The production capacity is expected to reach about 17.4 mmcm (614 mmcf) of LNG per day by October 2006. The field will be further developed with more wells and compression facilities in a second and third phase, in 2011-2014/2015 and 2018-2021/2022, respectively. All three phases are included in the PDO/Plan for Installation and Operation and investment estimates.
Other developments
We are also a partner with a 15.3% interest in two Oseberg satellite developments operated by Norsk Hydro, Oseberg Sør J structure and Oseberg Vestflanken. The J structure is a part of the Oseberg Sør Field, and a revised PDO for this structure was approved by the Ministry of Petroleum and Energy in May 2003. The project is a subsea oil development tied-in to the Oseberg Sør platform with an expected start of production in October 2004. The production capacity is expected to reach 21 mbbls per day and the total investment is estimated to NOK 1.5 billion. The revised PDO was approved by the Ministry of Petroleum and Energy in May 2003. The PDO of Oseberg Vestflanken was approved by the Ministry of Petroleum and Energy in December 2003. The project is a subsea oil and gas development with tieback to the Oseberg Field Center. The expected start of production is September 2005 and the oil/condensate production capacity is expected to reach 30 mbbls per day. The investment cost is estimated to be NOK 2.2 billion. In addition, Statoil has a 0.95% share in the ConocoPhillips operated Ekofisk, where the Ministry of Petroleum and Energy in June 2003 approved a PDO for the Ekofisk Area Growth project (EAG). Total investments, which include a new wellhead and processing platform, and large scale modifications on several of the existing platforms, are estimated to be NOK 8.2 billion and the expected start up is in October 2005. The project will increase the production on Ekofisk by up to 70 mbbls of oil per day.
On December 4, 2003, Norsk Hydro as operator for the development phase submitted to the Ministry of Petroleum and Energy a PDO for the Ormen Lange deepwater gas field, the second largest gas field on the NCS. Norske Shell will act as operator in the production phase. Ormen Lange extends across three production licenses, and our interest in the field is 10.8441%. The selected development concept is an extensive seabed development at depths ranging from 800 to 1,000 meters. The well stream will be transported to an onshore processing and export plant on Nyhamna. Sales gas will then be transported through a dry gas pipeline, named Langeled, via Sleipner to Easington in UK. Total investments are estimated to be NOK 66 billion, including the export gas pipeline to Easington, UK. Current plans expect production to start in October 2007 with a daily plateau production estimated at 70 mmcm of gas per day, while condensate production is expected to plateau at approximately 32 mbbls per day.
Major modification projects
In addition to the field development projects described above, there are several major modification projects ongoing at producing fields and facilities.
TheSleipner West compression project is an ongoing project estimated to cost NOK 1 billion that aims to modify the Sleipner facilities to prepare for low-pressure production in the later stages of the field life. The project is to be accomplished in two phases with the first rebuilding successfully finalized in October 2002. The second phase will be finalized in October 2004.
In connection with the decision to land the rich gas from the Kvitebjørn field at theTroll facilities at Kollsnes, the Troll owners have decided to build a new NGL fractionation plant at Kollsnes. A PDO of such a plant was approved by the Ministry of Petroleum and Energy in May 2002. Total investment for the plant is estimated to be approximately NOK 2.4 billion, of which NOK 2.0 billion has been invested as of December 31, 2003. According to the development plan, production is expected to start in October 2004. The NGL plant will treat rich gas from the Kvitebjørn field and gas from other future field developments in the northern part of the North Sea. Processing capacity for the plant will be 26 mmcm (918 mmcf) gas per day.
A similar modification as the Sleipner West compression project is described in theTroll Gas PDO. Preparation for installation of pre-compression facilities at Troll A is ongoing. The cost estimate is approximately NOK 3.6 billion, of which NOK 1.8 billion has been invested as of December 31, 2003.
Other development projects
Åsgard Q-project is a new satellite tieback to the Åsgard A platform based on a revised Increased Oil Recovery (IOR) strategy for the Smørbukk Sør field in Åsgard Unit. The estimated investment cost for the project is NOK 1.8 billion with an expected start of production in January 2005. A revised Åsgard PDO was submitted to the Ministry of Petroleum and Energy in January 2004.
A long reach well will be drilled from the Gullfaks A-platform to develop the Gulltopp field, which is located in the Gullfaks license 8 km west of Gullfaks A. Gulltopp was discovered in 2002 and is a small oil field. Drilling is due to begin in October 2004 and production is expected to commence in early 2005.
The statements regarding our exploration projects and production estimates contained in the above section are forward-looking and subject to significant risks and uncertainties. Although we believe that the expectations reflected in the forward-looking statements are reasonable, we cannot assure you that our actual levels of activity, production or performance will meet these expectations. See Item 3—Key Information—Risk Factors.
Oil and Gas Reserves
As of the end of 2003, we had a total of 1,184 mmbbls of proved oil reserves and 378 bcm (13.3 tcf) of proved natural gas reserves in Norway. Based on boe, our proved reserves consist of 33% oil and 67% natural gas, based on total proved reserves in Norway of 3,560 mmboe.
The following table sets forth our Norwegian crude oil and natural gas proved reserves as of the end of the periods indicated. The data are stated net of royalties in kind, but including reserves attributable to our account based on our proportionate participation in fields with multiple participants. Royalty obligations from Statfjord were abolished effective January 1, 2003, and royalty obligations from Gullfaks and Oseberg will be abolished by 2006. Further details are given below under —Regulation—Taxation of Statoil—Royalty. No major discovery or other favorable or adverse event has occurred since December 31, 2003 that would cause a significant change in the estimated proved reserves as of that date. Further information on reserves can be found in the Financial Statements—Supplementary Information on Oil and Gas Producing Activities.
Year | Oil/NGL | Natural Gas | Total | ||
mmbbls | bcm | bcf | mmboe | ||
| 2001 | Proved reserves end of year | 1,398 | 360.3 | 12,718 | 3,664 |
of which, proved developed reserves | 948 | 256.9 | 9,069 | 2,564 | |
| 2002 | Proved reserves end of year | 1,286 | 374.4 | 13,215 | 3,641 |
of which, proved developed reserves | 919 | 264.1 | 9,321 | 2,580 | |
| 2003 | Proved reserves end of year | 1,184 | 377.7 | 13,334 | 3,560 |
of which, proved developed reserves | 876 | 271.4 | 9,582 | 2,584 | |
Production
In Norway in 2003, our total equity oil production was 241 mmbbls, after deductions for royalty oil in kind, and gas production for our own account was 19.2 bcm (677 bcf), which represents an aggregate 362 mmboe. Currently, our production is in our three core producing areas of Troll/Sleipner, Halten/Nordland and Tampen. We participate in the majority of the 47 producing fields in the NCS. As of December 31, 2003, we were the operator for 21 of them. Effective January 1, 2003, we took over the operatorship of Visund, Snorre, Tordis, Vigdis and Borg, and thereby became the sole operator in the Tampen area. In October 2003 three new fields, Mikkel, Fram and Vigdis Extension, started production. Mikkel and Fram started according to plan, while production on Vigdis Extension started October 18, 2003, two months ahead of the PDO. We are responsible, as operator, for approximately 51% of Norway’s current oil output and approximately 82% of current gas output.
The following table shows the NCS production fields and field areas in which we currently participate. Amounts are stated net of royalties in kind. Field areas are groups of fields operated as a single entity.
| Area | Statoil’s Equity Interest | Operator | On stream | License Expiry Date | Producing wells | Average Daily Production In 2003 Mboe/day | |
Oil | Gas | ||||||
| Troll/Sleipner | |||||||
| Sleipner East | 49.60% | Statoil | 1993 | 2014 | — | 17 | 25.0 |
| Sleipner West | 49.50% | Statoil | 1996 | 2014 | — | 14 | 107.2 |
| Glitne | 58.90% | Statoil | 2001 | 2013 | 5 | — | 17.1 |
| Gungne | 52.60% | Statoil | 1996 | 2014 | — | 2 | 17.7 |
| Huldra[1] | 19.87% | Statoil | 2001 | 2009 | — | 6 | 13.8 |
Troll Phase 1 | 20.80% | Statoil | 1996 | 2030 | — | 39 | 98.6 |
Troll Phase 2 | 20.80% | Norsk Hydro | 1995 | 2030 | 101 | — | 75.6 |
| Veslefrikk | 18.00% | Statoil | 1989 | 2015 | 14 | — | 5.6 |
| Oseberg | 15.30% | Norsk Hydro | 1988 | 2031 | 47 | — | 31.2 |
Oseberg South | 15.30% | Norsk Hydro | 2000 | 2031 | 13 | — | 13.3 |
Oseberg East | 15.30% | Norsk Hydro | 1999 | 2031 | 9 | — | 5.8 |
| Heimdal | 20.00% | Norsk Hydro | 1985 | 2021 | — | 5 | 2.3 |
Ekofisk area | 0.95% | ConocoPhillips | 1971 | 2028 | 115 | — | 3.9 |
| Frigg | 12.16% | Total | 1977 | 2015 | — | 9 | 0.6 |
| Brage | 12.70% | Norsk Hydro | 1993 | 2017 | 20 | — | 4.6 |
| Sigyn | 50.00% | ExxonMobil | 2002 | 2018 | 1 | 2 | 22.6 |
| Fram | 20.00% | Norsk Hydro | 2003 | 2024 | 4 | — | 2.3 |
Total Troll/Sleipner | 329 | 99 | 447.2 | ||||
| Halten/Nordland | |||||||
| Heidrun | 12.41% | Statoil | 1995 | 2024 | 32 | — | 22.5 |
| Åsgard | 25.00% | Statoil | 1999 | 2027 | 26 | 9 | 104.1 |
| Norne | 25.00% | Statoil | 1997 | 2026 | 11 | — | 40.4 |
| Mikkel | 41.62% | Statoil | 2003 | 2022 | — | 3 | 6.2 |
Total Halten/Nordland | 69 | 12 | 173.2 | ||||
| Tampen | |||||||
| Statfjord Unit (Norwegian Part) | 51.88% | Statoil | 1979 | 2009 | 90 | — | 84.6 |
| Statfjord North | 21.88% | Statoil | 1995 | 2009 | 8 | — | 11.9 |
| Statfjord East | 25.05% | Statoil | 1994 | 2009 | 8 | — | 10.5 |
| Sygna | 24.73% | Statoil | 2000 | 2009 | 3 | — | 7.0 |
| Gullfaks | 61.00% | Statoil | 1986 | 2016 | 108 | 4 | 168.7 |
| Snorre | 14.40% | Statoil | 1992 | 2024 | 33 | — | 36.3 |
Tordis area | 28.22% | Statoil | 1994 | 2024 | 9 | — | 22.7 |
Vigdis area | 28.22% | Statoil | 1997 | 2024 | 8 | — | 16.6 |
| Visund | 32.90% | Statoil | 1999 | 2023 | 7 | — | 11.5 |
| Murchison (Norwegian Part) | 51.88% | CNR | 1980 | 2009 | 21 | — | 1.0 |
| Total Tampen | 295 | 4 | 370.8 | ||||
| Total NCS | 693 | 115 | 991.2 | ||||
(1) Our share in Huldra increased from 19.66% to 19.87% on the purchase of the 0.21% interest held by Svenska Petroleum Exploration A/S, effective January 1, 2004.
The following table sets forth our average daily equity production for oil, including NGL and condensates, and natural gas for the years ended December 31, 2001, 2002 and 2003.
| Area | Year ended December 31, | ||||||||
| 2001 | 2002 | 2003 | |||||||
Oil and NGL mbbls | Natural Gas mmcm | boe mboe | Oil and NGL mbbls | Natural Gas mmcm | boe mboe | Oil and NGL mbbls | Natural Gas mmcm | boe mboe | |
| Troll/Sleipner | 219 | 30 | 408 | 227 | 37 | 459 | 223 | 36 | 447 |
| Halten-Nordland | 118 | 4 | 145 | 119 | 6 | 158 | 119 | 9 | 173 |
| Tampen | 354 | 5 | 387 | 324 | 8 | 372 | 319 | 8 | 371 |
| Total | 692 | 39 | 940 | 670 | 51 | 989 | 661 | 53 | 991 |
Troll/Sleipner
The Troll, Sleipner and Oseberg fields are the main oil and gas fields within this area. Our share of the area’s production in 2003 was 223 mbbls of oil and 36 mmcm (1,270 mmcf) of gas per day, or 447 mboe in total per day. In 2003 the Kvitebjørn platform was installed at the field and the production drilling campaign started in mid-September. Fram Vest started production in October 2003. PDOs for the Oseberg Sør J-structure, Oseberg Vestflanke and Ekofisk Area Growth were approved.
Troll. Troll lies in the North Sea and has large gas and oil reserves. Troll is the primary source of supply for gas sales from the NCS to Europe. Our interest in Troll is 20.80%. The Troll field comprises two main structures: Troll East and Troll West. An oil layer underlies the whole Troll area but is thick enough for commercial recovery in the Troll West region only. A staged development has therefore taken place with Phase I covering gas reserves in Troll East and Phase 2 focusing on the oil reserves in Troll West. Statoil is the operator of the Troll East facilities and Norsk Hydro is the operator of the Troll Phase II oil production in Troll West.
The Troll East development comprises the Troll A platform, the gas processing plant at Kollsnes, and the 60 km pipelines linking the Troll A platform with the onshore processing plant at Kollsnes. The production capacity of the Troll A platform is approximately 100 mmcm (3.53 bcf) per day. As from 2005, the Troll A gas production capacity is expected to be approximately 120 mmcm (4.24 bcf).
Troll was one of the first major installations to transfer multiphase product streams (rich gas and condensate) from offshore to an onshore facility for processing. The Troll A gas is processed at Kollsnes, where the gas is dried and compressed for pipeline export to continental Europe. The NGL portion of the gas stream is transported to the Mongstad refinery.
Norsk Hydro is the operator for the oil production of Troll Phase 2 in Troll West. The Troll West development comprises the Troll B and Troll C floating production platforms. Crude oil is produced from the oil province with horizontal wells tied back to the two platforms. The oil produced from Troll B and Troll C is transported through Troll Oil Pipeline I and Troll Oil Pipeline 2 to the oil terminal at Mongstad. The associated gas from Troll B and Troll C is exported via Troll A to Kollsnes.
Sleipner. Sleipner includes Sleipner West and Sleipner East and our interests are 49.50% and 49.60%, respectively. We are the operator of both fields. Condensates from the Sleipner fields are transported to the gas processing plant at Kårstø. Transportation rights have been secured through existing transportation systems. Sleipner East is produced through the Sleipner A platform. Sleipner West is produced through two installations: the Sleipner B wellhead platform and the Sleipner T gas treatment facility. Sleipner West is tied back to Sleipner East. Unprocessed well streams from Sleipner B are piped 12 km to Sleipner T, which is linked by a bridge to Sleipner A. Sleipner West has large reserves of carbon dioxide-rich gas. We extract the CO2 at the field and re-inject it into a sand layer that lies underneath the seabed, thereby reducing the CO2 emissions into the air, which has environmental benefits and, insofar as it reduces environmental taxes, financial benefits.
Oseberg. Oseberg, the third main field in the Troll/Sleipner area, is operated by Norsk Hydro. We have a 15.30% interest in all Oseberg licenses.
Glitne. Glitne is the smallest field development on the NCS using a stand-alone floating production system. Our interest in this field is 58.9%.
Huldra. Our interest in Huldra, a high temperature and high-pressure gas and condensate field, as of January 1, 2004, is 19.87%. The development concept for the field includes an unmanned platform in 125 meters of water, tied back to processing facilities for condensate and gas at Veslefrikk and Heimdal, respectively.
Veslefrikk. Our interest in Veslefrikk is 18%. Oil is exported to the Sture terminal via the Oseberg Field Center while gas is exported to Kårstø. Since November 2001, Veslefrikk has been processing condensate from the Huldra field for further export through the OTS oil transportation system. Veslefrikk is preparing for the tail production phase and we are at present implementing several actions to obtain significant reductions in yearly costs and to enhance the oil production. The target for the actions is to sustain economical production until 2010-2014.
Sigyn. Sigyn, operated by ExxonMobil, is a gas/condensate field located 12 km southeast of the Sleipner A installation. The gas is exported from Sleipner A and the condensate is delivered at Kårstø. Our interest is 50%. The development consists of three production wells on one subsea template, with two pipelines and one umbilical connecting it to the Sleipner A platform. Production started in December 2002.
Fram Vest. Our interest in the Fram oil field, operated by Norsk Hydro, is 20%. The Fram field development is a subsea tie-in to existing infrastructure (Troll C) for processing and transport. Production started in October 2003. The oil production capacity is expected to reach 60 mbbls per day by 2004. Total development cost was NOK 3.6 billion, NOK 0.5 billion below the original PDO budget.
Halten/Nordland
Our producing fields in the Halten/Nordland area are Åsgard, Heidrun, Norne and Mikkel, all of which we operate. Our share of the area’s production in 2003 was 119 mbbls per day of oil and 9 mmcm per day (318 mmcf per day) of gas, or 173 mboe per day in total.
This region is characterized by petroleum reserves located at water depths reaching between 250 and 500 meters. The reserves are to some extent under high pressure and at high temperatures. These conditions may make development and production more difficult and have challenged the participants to develop new kinds of platforms and new technology, such as floating processing systems with subsea production templates. We plan to increase efficiency by further coordinating our operations in the area and by stemming the declining production from the mature fields by increasing seismic activity and well maintenance. In addition, we will expand our activities by utilizing our installed production and transportation capacity before building new infrastructure.
Åsgard. Our interest in the Åsgard development is 25%. The field was developed with the Åsgard A production ship for oil, the Åsgard B semi-submersible floating production platform for gas and the Åsgard C storage vessel. The subsea production installations on the field are the most extensive in the world, with a total of 50 wells grouped in 16 seabed templates. Further, the Åsgard B platform is the largest floating gas processing center, and Åsgard A is one of the largest floating production ships ever built.
The Åsgard development links the Haltenbank area to Norway’s gas transport system in the North Sea, realizing long-standing plans for a pipeline connection to continental Europe. Gas from the field is piped through the Åsgard Transport pipeline to the processing plant at Kårstø and on to receiving terminals in Emden and Dornum in Germany. Oil produced at the Åsgard A vessel and condensate from the Åsgard C storage vessel is shipped from the field by shuttle tanker.
Åsgard B has had stable production during 2003. The Mikkel satellite field, which is tied-in to the Åsgard B sub-sea installation, commenced production in October 2003.
Heidrun. The Heidrun platform is the largest concrete tension leg platform ever built. Our interest in this field is 12.41%. Oil from this field is primarily shipped by shuttle tankers to our Mongstad crude oil terminal for onward transport to customers. Gas from Heidrun provides the feedstock for our methanol plant at Tjeldbergodden, Norway. Export of gas to Europe is linked with the Åsgard Transport pipeline. The Heidrun field is in need of pressure support to keep up volumes from its production wells. The installation of a water re-injection module and a sulphate removal module as part of the Heidrun water injection project initiated in 2001 was completed in 2003.
Norne. The Norne field lies about 80 km north of the Heidrun field and roughly 200 km from the Norwegian coast. Our interest in this field is 25%. The field has been developed with a production and storage ship tied to subsea templates. Flexible risers carry the reservoir’s output to the vessel, which swivels around a cylindrical turret moored to the seabed. This ship carries processing facilities on its deck and storage tanks for oil. Processed crude oil can be transferred over the stern to shuttle tankers. Like Heidrun, Norne is connected to gas markets in continental Europe through a link with the Åsgard Transport system.
Mikkel. This gas and condensate field lies about 40 km away from both Åsgard’s Midgard deposit and Draugen. Our interest in this field is 41.62%. Production commenced according to plan in October 2003. Production from two seabed templates is tied to the sub-sea installation at Midgard for onward transport to the Åsgard B gas-processing platform. Commercial gas deliveries are scheduled to reach a capacity of 5.8 mmcm (212 mmcf) per day by 2004. Total development cost was NOK 1.8 billion, NOK 0.6 billion below the original PDO budget.
Tampen
The Tampen area offers rich petroleum resources in a compact geographic area. Our main producing fields in the Tampen area are Statfjord, Gullfaks and Snorre. Our share of the area’s production in 2003 was 319 mbbls of oil and 8 mmcm (282 mmcf) of gas, or 371 mboe per day. We became the sole operator of all the Tampen fields from January 1, 2003, when we took over the operatorship of Visund, Snorre, Tordis and Vigdis. Tampen is the leading oil producing area on the NCS, and even after twenty years of production we believe there are substantial opportunities remaining.
Accumulated investments in Tampen are about NOK 300 billion. Several of the production facilities will be closed down before 2010 unless we change the way we operate these facilities. We have taken several initiatives to identify and implement measures to increase and prolong production from the Tampen area. However, we believe that there will be substantial opportunities for synergy of operations, such as better utilization of drilling completion units, common contracts and common logistics and transportation services. Taking over as operator for Snorre and Visund is the first step in an area optimization of the operations in the area plan for production. We are also looking at introducing new drainage strategies for producing field area solutions starting with the ‘Statfjord late life’ project and will continue with increased IOR efforts on Snorre and Gullfaks through their respective IOR projects. The project also includes looking at different infrastructure solutions for optimization of the whole area. These studies have revealed that continued utilization and de-bottlenecking of the exiting platforms are the best solution and alternative ways of operating the platforms in order to maximize the future income and production from the Tampen area.
Statfjord. Our interest in the Statfjord Unit is 44.34%. Statfjord has been developed with three fully integrated platforms supported by gravity base structures featuring concrete storage cells. Each platform is tied to offshore loading systems for loading oil into tankers. Three satellite fields (Statfjord North, Statfjord East and Sygna) have been developed and are each tied back to the C platform.
Gullfaks. Gullfaks was developed with three large concrete production platforms. Our interest in the field is 61%. Oil is loaded directly into shuttle tankers on the field, while associated gas is piped to our Kårstø gas processing plant and then on to continental Europe. Three satellite fields, Gullfaks South, Rimfaks and Gullveig, have been developed with subsea wells remotely controlled from the Gullfaks A and C platforms.
Snorre. The field has been developed with two platforms and one subsea production system connected to one of the platforms (Snorre A). Oil and gas is exported to Statfjord for final processing, storage and loading. Our interest in the field is 14.4%. One satellite field, Vigdis, has been developed with a subsea tie-back to Snorre A. Production from the new development, Vigdis Extension, connected to Snorre A, started in October 2003. Norsk Hydro operated the Snorre field until January 1, 2003, at which time Statoil took over as operator.
Visund. The field is developed with one platform and two subsea satellites wells. The oil is exported to Gullfaks A for storage and loading. The gas produced is now injected in the reservoir. Our interest in Visund is 32.9%. Norsk Hydro operated the field until January 1, 2003, at which time we took over as operator. Gas export will be made possible by increasing the compressor capacity and by installing gas metering equipment and an exporting pipeline. The gas will be exported to Kollsnes via the Kvitebjørn pipeline. Gas export is planned to start in October 2005. The project is further described in ‘Exploration and Development’.
PL089. The asset includes the Vigdis field and the fields in the Tordis Area, Tordis, Tordis East, Tordis Southeast and Borg. The Vigdis field is developed with three subsea templates with well stream through pipelines connected to Snorre A where the oil is stabilized and exported to Gullfaks for storage and loading. The Tordis area is developed with seven subsea satellites and two templates tied back to Gullfaks C where the oil and gas is processed and stored for offshore loading and export. Our interest in the PL089 asset is 28.22%. Norsk Hydro operated the fields until January 1, 2003, at which time Statoil took over as operator. The Vigdis Extension development was sanctioned by the license partnership in July 2002, and started production in October 2003.
Vigdis Extension.The Vigdis extension development is based on a cluster of small oil discoveries located in the central part of the Tampen area, 7 km southwest of the Snorre A platform. The water depth in the area is 220-300 meters. The Vigdis extension is developed by subsea stations and satellites tied into the Snorre A via existing subsea production facilities at the Vigdis field. The oil is exported to Gullfaks A for storage and loading. Production started in October 2003, two months ahead of schedule, and is expected to reach a plateau production of 44 mbbls oil per day by the end of 2004. Total development costs were NOK 2.6 billion, NOK 0.4 billion below the original PDO budget.
Decommissioning
The Norwegian government has set forth strict procedures for the removal and disposal of offshore oil and gas installations under the Convention for the Protection of the Marine Environment of the Northeast Atlantic, or the OSPAR Convention. The decommissioning of Yme, completed in December 2001, took into account considerations relating to the environment, fisheries and safety. This included removal of all structures and equipment on the field except for buried flow lines and suction anchors. Total cost for the project was NOK 305 million, of which our share was approximately NOK 198 million, equal to our share in the field of 65%.
Tommeliten, a gas field which ceased production in 1998, was decommissioned during the second half of 2001. The sub sea template was removed and the six wells were plugged, at a total cost of NOK 113 million, of which our share was approximately NOK 80 million, equal to our participation in the field of 70.64%. Tommeliten made use of facilities on the Edda platform (PL018), and we are, therefore, committed to participate in the decommissioning of this platform. As of December 31, 2003 we have recorded a provision of NOK 54 million to account for this commitment, covering modifications made on the Edda platform and the facilities for transportation of oil.
Domestic Production Costs Data
Production costs are influenced by the distribution between new and mature fields in the portfolio and the cost effectiveness of the different installations. We calculate this indicator as annual production-related costs compared with the volume of oil and gas produced in the same period. As the figures below show, we continue to reduce cost per barrel in NOK and, based on industry benchmarks, we believe that we are one of the lowest cost producers on the NCS.
The following table sets forth our average production costs per boe consistent with FASB statement 69, our average sales price per barrel of oil, and average sales price by Statoil per scm of gas sold for the years ended December 31, 2001, 2002 and 2003.
Production costs data | Year ended December 31, | ||
2001 | 2002 | 2003 | |
Average cost per boe | |||
| NOK | 23.9 | 22.9 | 22.3 |
| USD | 2.66 | 2.87 | 3.15 |
Average sales price per barrel of oil | |||
| NOK | 216.7 | 196.5 | 206.0 |
| USD | 24.1 | 24.7 | 29.1 |
Average sales price per scm of gas | |||
| NOK | 1.22 | 0.95 | 1.02 |
| USD | 0.14 | 0.12 | 0.14 |
NOK/USD (average daily exchange rate) | 8.99 | 7.97 | 7.08 |
Oil and Gas Transportation
Most of our oil production is lifted offshore by shuttle tankers and transported to oil terminals in Norway and abroad. Troll and Oseberg crude oil is transported by pipeline to the Mongstad and Sture terminals, respectively, and Ekofisk production is transferred by pipeline to Teesside, UK. We transport gas through the gas pipeline system established on the NCS.
We, together with other Norwegian oil and gas producers, have built an extensive transportation infrastructure network to transport crude oil and gas produced on the North Sea to terminals in Norway, the UK and the continental Europe. For details about our interests in Gassled, see below under Natural Gas—Norwegian Gas Transportation System and Other Facilities. The following are oil pipelines in which E&P Norway has an ownership interest:
Troll Oil Pipelines I & II. The Troll Oil Pipeline I transports oil from the Troll B platform to the terminal at Mongstad near Bergen. The Troll Oil Pipeline II carries oil from Troll C to the terminal at Mongstad. The Troll Oil Pipelines I & II have a transport capacity of 265 and 300 mbbls per day, respectively. We are the operator and 20.85% owner of Troll Oil Pipelines I & II.
Norpipe Oil AS. We own 20% of the ConocoPhillips operated Norpipe oil pipeline, which starts at Ekofisk Center and crosses the UK continental shelf to come ashore at Teesside in the UK. The Norpipe oil pipeline has a transport capacity of 900 mbbls per day. By October 2005 Statoil's ownership will be reduced to 15%, as 5% is handed over to the SDFI.
Frostpipe. Frostpipe, operated by Total, is used to transport oil and condensate from Frigg to Oseberg where it links to the Oseberg Transport System. Frostpipe covers 82 km and can carry 100 mbbls per day. The pipeline has not been in use since March 2001. Although we have a 20% interest in this pipeline, we currently have no plans to use it for our own oil or condensate.
Oseberg Transportation System. The Oseberg Transportation System transports oil from Veslefrikk, Brage, Oseberg Unit, Oseberg South, Oseberg East, Tune and Huldra via Oseberg A to Sture. The Grane field has a separate pipeline to the onshore facilities. Our interest in the Oseberg Transportation System is 14%. The Oseberg Transportation System has a capacity of 765 mbbls per day.
International Exploration and Production
Introduction
International E&P consists of exploration, development and production operations outside of Norway. We are focusing our efforts on establishing significant production and increasing our influence in our core producing areas. We are also actively pursuing additional opportunities in other areas to expand our international portfolio, which support our strategy and leverage our skills and competence from the NCS. We hold interests in 13 producing fields in the Caspian, Western Africa (Angola), Western Europe, Venezuela and China. In addition, we are the operator of a development project in Iran and the Plataforma Deltana exploration project off Venezuela. We are joint operators in the In Salah and In Amenas projects in Algeria. We also have exploration or production licenses in Brazil and the Faroes.
As part of a reorganization effective January 1, 2004, all midstream and downstream gas projects associated with our international activities were transferred from International E&P to the Natural Gas division. This includes midstream and commercial activities in Shah Deniz, Azerbaijan, downstream activities in Turkey, and our position in Cove Point in the U.S.
International E&P reported income before financial items, income taxes and minority interest of NOK 1,702 million in 2003 compared to NOK 1,086 million in 2002.
The following table presents key financial information about this business segment. The changes from 2002 to 2003 are primarily a result of higher realized oil and gas prices and lower writedown of assets (NOK 0.2 billion in 2003 versus NOK 0.8 billion in 2002).
(in millions) | Year ended December 31, | |||
2001 | 2002 | 2003 | ||
NOK | NOK | NOK | USD | |
| Revenues | 7,693 | 6,769 | 6,980 | 1,047 |
Depreciation, depletion and amortization | 3,371 | 2,355 | 1,784 | 268 |
Exploration expenditure | 683 | 1,159(1) | 1,230 | 185 |
Income before financial items, income taxes and minority interest | 1,291 | 1,086 | 1,702 | 255 |
Capital expenditure | 5,027 | 5,995 | 8,147(2) | 1,222(2) |
Long-term assets | 21,530 | 20,655 | 33,102 | 4,966 |
(1) Includes reclassification of the geological and geophysical costs from business development activities of NOK 218 million.
(2) Does not include the expenditures related to our acquisition of In Salah and In Amenas, which was accounted for as a long-term prepayment at year-end 2003.
Further details on the financial results can be found in Item 5—Operating and Financial Review and Prospects—Operating Results.
We plan to increase our investment in international upstream and midstream development projects significantly in 2004 compared to 2003. We also plan on significant increases in exploration expenditures in 2004.
We believe that we are well positioned to continue to secure attractive international investment projects that will allow us opportunities to exploit the group’s technology and expertise developed on the NCS. The technology and expertise includes maximum field recovery through improved oil recovery techniques, subsea solutions and conversion of GTL (Gas to Liquids). Our expertise also includes the management of large complex development projects and in gas chain development.
Portfolio Management
Through asset swaps, sales and acquisitions, we have been restructuring our international interests in order to focus on core areas where we own quality assets, develop new attractive commercial opportunities, and optimize our capital employed.
In May 2001 we sold our 4.76% interest in the Kashagan oil field discoveryoff Kazakhstan in the Caspian Sea and realized a pre-tax profit of NOK 1.6 billion (NOK 1.2 billion after tax).
In December 2001 we sold our operations in Vietnam for a gain before taxes of NOK 1.3 billion (NOK 0.9 billion after tax). We relinquished our licenses in Greenland by the end of 2001.
In July 2002 we sold our operations in Denmark for a gain before taxes of NOK 1.0 billion (0.7 billion NOK after tax).
In December 2002 Statoil acquired El Paso's capacity rights at the LNG regasification terminal at Cove Point, Maryland in the U.S. At the same time, Statoil also purchased from El Paso the purchase contract for delivery of an annual volume of 2.4 bcm of LNG for the period 2006 to 2023, which initially entered into in October 2001 between El Paso and the Snøhvit seller group. Statoil’s interest in the Snøhvit seller group is 48.18% as of January 1, 2004. The payment to El Paso was USD 210 million in cash. Further details are given below under –Natural Gas on the letter of intent that has been signed with Dominion Resources Inc. which if consummated will secure additional capacity at Cove Point.
In June 2003 Statoil agreed to acquire direct ownership interests in two Algerian assets, In Salah (31.85%) and In Amenas (50%), from BP for USD 740 million. Statoil will in addition be responsible for expenditures of approximately USD 285 million incurred after January 1, 2003 related to the acquired interests. The total expenditures related to this acquisition have been accounted for as long-term prepayments at year-end 2003. This transaction and the related expenditures are pending final approval of the transaction from the Algerian Ministry of Energy and Mining and the Council of Ministers.
Reserves
In 2003, we increased our proved reserves by 12%. The change principally reflects booking of new reserves in Azerbaijan related to the Stage 1 Development of the Shah Deniz field and an increase in Sincor in Venezuela. Our international proved oil and NGL reserves were 605 mmbbls oil, and we had 15.7 bcm (552 bcf) of proved natural gas reserves at the end of 2003. Over the period 2001-2003, we had an international reserve replacement rate, calculated based on a three year average, of 3.0. Our unit finding costs in our international operations were USD 1.58 per boe in 2003, calculated as an average number over the last three years.
The following table sets forth our total international proved reserves as at December 31 of each of the last three years. Further information on reserves can be found in the Supplementary Information on Oil and Gas Producing Activities contained in our consolidated financial statements beginning on page F-1.
Year | Oil/NGL | Natural Gas | Total | ||
mmboe | bcm | bcf | mmboe | ||
| 2001 | Proved reserves at end of year | 565 | 7.6 | 267 | 612 |
of which, proved developed reserves | 166 | 1.2 | 42 | 173 | |
| 2002 | Proved reserves at end of year | 580 | 7.2 | 255 | 626 |
of which, proved developed reserves | 137 | 0.8 | 30 | 143 | |
| 2003 | Proved reserves at end of year | 605 | 15.7 | 552 | 703 |
of which, proved developed reserves | 163 | 0.7 | 25 | 167 | |
Production
Our petroleum production outside Norway amounted to an average of 89.1 mboe per day in 2003. Total annual production in 2003 was approximately 33 mmboe compared to 31 mmboe in 2002. The following table sets forth our total international production for each of the last three years. The Girassol field in Angola started production in December 2001 and reached plateau production capacity of 200 mbbls of oil per day in February 2002. The commercial production of syncrude for the Sincor project began in March 2002. During the initial production period, diluted heavy oil was exported.Sincor production was temporarily shut down for 71 days due to the political situation in the country. The shutdown caused a reduction in our 2002 production of approximately 450 mbbls. Production was restarted on February 23, 2003. The effect of the shutdown on production in 2003 is approximately 1.43 mmbbls. Stronger than anticipated production levels following the strike partially offset the lost production. New fields that came on stream in 2003 are Caledonia in the UK, and Jasmim and Xikomba in Angola.
Year ended December 31, | |||
2001 | 2002 | 2003 | |
Average daily oil (mbbls) | 60 | 80 | 86.5 |
Average daily natural gas (mmcm/mmcf) | 1.2 /41 | 0.9/34 | 0.4/14 |
Average daily boe (mboe) | 67 | 86 | 89.1 |
The following table shows the production fields in which we currently participate and the producing wells as at, and production for the year ended, December 31, 2003.
| Field | Statoil’s Equity interest | Operator | On stream | License Expiry | Producing wells | Production(1) mboe/d |
| Caspian | ||||||
| Azerbaijan:Azeri-Chirag-Gunashli (early oil production) | 8.56% | AIOC (BP) | 1997 | 2024 | 15 | 9.7 |
Western Europe | ||||||
| UK: Alba | 17.00% | ChevronTexaco | 1994 | 2018 | 31 | 14.1 |
| UK:Schiehallion | 5.88% | BP | 1998 | 2017 | 17 | 6.1 |
| UK: Merlin | 2.35% | Shell | 1997 | 2017 | 3 | 0.1 |
| UK: Dunlin | 28.76% | Shell | 1978 | 2017 | 18 | 2.0 |
| UK: Jupiter | 30.00% | ConocoPhillips | 1995 | 2010 | 12 | 2.5 |
| UK: Caledonia | 21.32% | ChevronTexaco | 2003 | 2018 | 1 | 2.5 |
Western Africa | ||||||
| Angola:Girassol | 13.33% | Total | 2001 | 2023 | 15 | 23.4 |
| Angola: Jasmim | 13.33% | Total | 2003 | 2023 | 1 | 0.2 |
| Angola: Xikomba | 13.33% | ExxonMobil | 2003 | 2027 | 4 | 1.1 |
| Venezuela | ||||||
LL 652 reactivation | 27.00% | ChevronTexaco | 1998 | 2018 | 168 | 1.3 |
Sincor(2) | 15.00% | Sincor JV | 2001 | 2037 | 339 | 20.3 |
| Other | ||||||
China: CA 17/22 Lufeng | 75.00% | Statoil | 1997 | 2013 | 5 | 3.9 |
Total International E&P | 629 | 89.1 |
(1) Production figures are after deductions for royalties, production sharing and profit sharing.
(2) Initial production commenced in January 2001 and commercial production started in March 2002.
Our unit cost for international production averaged approximately USD 3.9 per boe in 2002. The unit production cost remained essentially unchanged from the restated 2002 costs.
Core Areas
We are currently active in four core producing areas;Caspian, Western Africa (comprising Angola along with Nigeria, which is not a producing area yet), Western Europe and Venezuela. Our international portfolio, with the exception of some fields in Western Europe, consists primarily of new and developing areas that have either not yet commenced production or are in early stages. Accordingly, we describe all of our operations by area as opposed to stage of development.
Caspian
The discovery of large oil fields in the Caspian region, the latest being Kashagan in Kazakhstan, shows that despite 150 years of oil production, the Caspian region still contains significant reserves of oil, NGL and gas. In September 1994, Azerbaijan signed the first production sharing agreement, or PSA, with foreign oil companies. Azerbaijan has since entered into another 20 PSAs, of which 15 PSAs are offshore in the Caspian Sea. The Caspian Sea is regarded as a promising exploration area, boosted by the large Shah Deniz gas and condensate discovery in 1999 in which we participated. Recent exploration results have not met expectations, but the Southern Caspian is still in an early phase of exploration.
We established a presence as one of the first international oil companies in the Caspian Sea in 1992. Since then, we have entered into three PSAs in Azerbaijan, and we are among the largest foreign oil companies in the country in terms of proved reserves and production. At present, we hold interests in three PSAs offshore in the Azeri sector of the Caspian Sea: the Azeri-Chirag-Gunashli, or ACG, oil field, the Shah Deniz gas and condensate field and the Alov, Araz and Sharg prospects. We are the commercial operator of the South Caucasus Pipeline, managed by the Natural Gas division as of January 1, 2004, as well as being a partner in the Baku-Tbilisi-Ceyhan (BTC) Pipeline.
There is still risk for increased economic, social and political instability in the Caspian region. However, the general situation has improved in recent years, with the war and civil strife that characterized this region in the early 1990s having largely abated. Still, some disputes remain unresolved:
For the energy industry, three issues relating to political and economic development are particularly important: political succession, Caspian title issue and export of hydrocarbons. In addition, there is a shortage of construction and yard capacity, as the region is faced with several major oil and gas developments.
Political succession. Both Azerbaijan and Georgia went through presidential succession in late 2003, reducing political uncertainty in the region. In Azerbaijan, Ilham Aliyev – son of the former president Heydar Aliyev – took the helm in October 2003. His father passed away at the age of 80 in December 2003 after a long period in executive office. In Georgia, Eduard Shevardnadze was forced to resign after protests against flawed elections in November 2003. The 36-year-old leader of the opposition grouping nicknamed "The Young Reformers", Mikheil Saakashvili, won a landslide victory in the Georgian presidential election in January 2004. The new regimes in Azerbaijan and Georgia are facing high popular expectations of socio-economic progress and the consolidation of democratic, market-based systems. With regard to the oil and gas projects in the Caspian region, both leaders have made strong public statements of continued support and commitment. We do not expect any significant change in this area under the new governments. All the major Western players in the region – i.e., the US, the UK and EU– were quick to put their support behind Aliyev and Saakahsvili.
Caspian title issue. A binding legal regime governing the division of the Caspian Sea among the five border states of Azerbaijan, Iran, Kazakhstan, Turkmenistan and Russia is yet to be found. This has on occasion led to disputes over rights to hydrocarbon resources between Azerbaijan and Iran and between Turkmenistan and Azerbaijan. The principal point of dispute is whether the Caspian Sea is to be considered a “lake” or a “sea”. If the Caspian is treated as a “lake”, then sovereign borders are recognized through the water, thereby dividing up not only underlying hydrocarbon reserves but also shipping and fishing rights along these borders. If the Caspian is treated as a “sea”, then the concepts of territorial waters and continental shelves would apply, although the rights of the littoral states would overlap.
Despite ongoing high-level negotiations, no major progress has been made in 2003, and a permanent solution does not appear imminent. There are currently bilateral agreements in place between Russia and Azerbaijan, between Russia and Kazakhstan and between Kazakhstan and Azerbaijan. Turkmenistan and Iran have to date been unwilling to enter into similar agreements.
Iran's naval intervention against a research vessel on Alov in July 2001 has left further fieldwork pending an agreement where work can commence under safe circumstances. Technical evaluations of the field are continuing in accordance with obligations under the relevant production sharing agreements. We do not expect these title issues to be resolved in the near future.
Export of hydrocarbons. The Caspian Sea is landlocked without direct access to open sea. The export of oil is therefore dependent on onshore pipelines. Currently, crude oil from ACG is transported through a pipeline from Azerbaijan through Georgia to the Black Sea Port at Supsa, with an alternative route to Novorossiysk in Russia. The export capacity of the current infrastructure will be insufficient as the production volumes increase from the next stages of development on ACG and other fields. To secure transportation capacity, we are participating in the BTC Pipeline with an 8.71% share. Development of the 1,750 kilometer BTC Pipeline will ensure export flexibility through multiple pipelines, and thereby diversify risk involved in commercializing the land-locked upstream resources. The BTC Pipeline was sanctioned in 2002 and the land acquisition and construction phase is currently ongoing. The BTC Pipeline is expected to commence operations by year-end 2004 when ACG Phase I is ready to go on stream. The pipeline is estimated to cost USD 3.6 billion including linefill and loan interest during construction, with about 30% of this total covered by equity contributions from the BTC sponsors and the remainder by third-party debt funding and debt funding from sponsors. On February 3, 2004, the consortium of partners sponsoring the BTC project, together with the governments of Azerbaijan, Georgia and Turkey, signed agreements covering third-party financing for the pipeline totaling USD1.67 billion.
Azeri-Chirag-Gunashli. Statoil is a partner with an 8.56% share in the BP operated ACG PSA. ACG is currently in the early oil production phase, which is based on an existing steel substructure, a rebuilt topside of the Chirag 1 platform and the installation of a 24-inch oil pipeline to a newly built oil terminal at Sangachal. From the terminal, the oil is currently transported through a dedicated 850-kilometer pipeline, the Western Route, with a daily capacity of 140 mbbls from Sangachal to Supsa for tanker shipment through the Bosphorous and the Mediterranean to the international markets. Oil production from the Chirag field began in November 1997 and in 2003 gross field production exceeded 130 mbbls per day. Continuous work is being undertaken to increase productivity, and we expect that the field will have the capacity to produce an annual average exceeding 130 mbbls per day during 2004. The ACG fields will be further developed in three phases.
The ACG Phase I development plan calls for the construction of a new production, drilling and quarter platform with a design capacity of roughly 400 mbbls per day. In addition, a bridge-linked gas compression and water injection platform, as well as additional pipelines for oil and gas to Sangachal and oil terminal expansion, will be installed. ACG Phase I is estimated to cost USD 3.3 billion from 2001 to 2004. We expect the ACG Phase I production platform and infrastructure to be completed during late 2004, and the injection platform approximately one year later. The partnership sanctioned ACG Phase I in August 2001.
ACG Phase II development was sanctioned in September 2002, and we expect that the development will be completed by 2006, including a new 30-inch oil pipeline to shore and a production capacity of up to an additional 450 mbbls of oil per day. This development will concentrate on West Azeri and Far East Azeri reservoirs, including required development drilling and processing capacity expansions with a total investment estimate of USD 5 billion. The ACG Phase I and ACG Phase II projects are now managed jointly as, the Azeri Development Project.
ACG Phase III will complete the full development of the ACG fields with the development of the deepwater Gunashli field. After completion, we expect overall daily production from the ACG field to exceed one mmbbls per day from seven installed platforms by 2010/2011. The partnership is working toward sanctioning of the Phase III project during the third quarter of 2004.
We estimate overall investments for the ACG full field development to be approximately USD 15 billion. This estimate covers all three phases of upstream development and early oil production, but excludes the BTC Pipeline.
Shah Deniz. The Shah Deniz area covers 860 square kilometers and lies in a water depth between 50 and 500 meters. We have completed a four-year exploration phase involving a three-dimensional seismic survey and the drilling of three wells. Gas and condensate were encountered in the first exploration well drilled in 1999. The partnership submitted a Notification of Discovery and its Commerciality in March 2001 and entered into a 30-year development and production period. We are the commercial operator of the development, responsible for gas sales, contract administration and business development for the South Caucasus Pipeline, and hold a 25.5% interest in Shah Deniz. BP is the field operator.
The field will be developed in stages. The Stage 1 development on the east flank of the reservoir and a 680 km 42” pipeline, from the landing terminal through Azerbaijan and Georgia to the Turkish border (the South Caucasus Pipeline – SCP), was sanctioned by the partnership in February 2003, and Statoil was appointed as commercial operator of the pipeline. Turkey is the main market for gas from Shah Deniz, Stage 1. A Gas Sales and Purchase Agreement (SPA) was signed between SOCAR and the Turkish gas company Botas in March 2001, covering a contractual level of 6.6 bcm annually. At the time of project sanction, the Turkish SPA, together with gas sales agreements to Georgia and Azerbaijan, were assigned to the Stage 1 sales company, Azerbaijan Gas Supply Company (AGSC). AGSC is fully operated by Statoil, with the Shah Deniz partners and the Azeri state as owners.
During the fall of 2001, intergovernmental and host governmental agreements between Turkey, Georgia and Azerbaijan were signed. In order to further secure a long-term market for our Shah Deniz gas, we have, together with the Turkish KOÇ group, opened a gas marketing office in Turkey. As of January 1, 2004, the Natural Gas business segment manages the Turkish gas marketing activities.
We expect first production to commence in the second half of 2006. The plateau production level of Stage 1 is expected to be approximately 8.5 bcm (300 bcf) per year and will be reached after three to four years of production. The SCP system will be prepared for expanded capacity to facilitate future development stages. The partnership estimates the total capital investment for the development to be approximately USD 3.3 billion, which includes offshore facilities, wells, pipelines to shore, gas processing plant and the SCP. Statoil’s total investment at the end of 2003 is USD 384 million.
Alov, Araz and Sharg. We signed an exploration, development and production sharing agreement, with BP as operator, covering the structures Alov, Araz and Sharg in July 1998. We have a 15% interest in the fields located roughly 150 km southeast of the Azeri capital of Baku, the contract area covers about 1,400 square kilometers and is located at water depths of 450 to 800 meters. The structures are located in the area of the Caspian Sea that is disputed between Azerbaijan and Iran, and Iran has claimed parts of the area to be in Iranian waters since the contract was signed. Work has ceased following the Iranian naval intervention in 2001, as described above. The first well out of three in the area is planned to be drilled within 12 months of the settlement of the border issue. Negotiations with SOCAR have granted an extension of the exploration period until six months after the completion of the third well.
Western Africa
Angola. Current Angolan production is about 910 mboe per day, most of which comes from shallow water fields. The civil war, which ravaged Angola for 30 years, came to an end in February 2002. The country has to date provided a stable fiscal environment for the oil companies.
The Girassol discovery made by Total in 1996 in block 17 was the first Angolan deepwater discovery. Since then the deepwater area has yielded more than 50 discoveries of varying sizes. For each block, a PSA with the state oil company Sonangol is in effect. Production licenses have for the last few years generally been granted for a period of 25 years from when the partners declare a discovery commercial.
Block 15. This block, operated by ExxonMobil, is approximately 4,000 square kilometers and includes developments at Kizomba A, B and Xikomba. The water depth varies between 250 and 1,600 meters. The first discovery was made in 1997. A total of 19 exploration wells and 11 appraisal wells have been drilled to date and 17 discoveries have been announced. Statoil has a 13.33% interest in the block.
Xikomba is a small isolated discovery being developed and produced by a leased floating production, storage and off take facility (FPSO). The first oil was produced November 1, 2003. At year end the field was producing 65.7 mbbls of oil per day, nearing the expected production plateau of approximately 70 mbbls per day. Statoil’s investment in the project up until the end of 2003 is approximately USD 51 million out of an expected total investment for the life of the field of approximately USD 63 million.
Kizomba A was declared commercial in February 2001 and sanctioned for development in June 2001. The production license expires in 2026. The development plan is based on a tension leg wellhead platform with a nearby moored FPSO. Production is expected to start late in 2004 and we expect peak production of 250 mbbls of oil per day by the end of 2006. We estimate total investment for the field to be approximately USD 3.7 billion. Statoil’s investment up until the end of 2003 is approximately USD 330 million.
Kizomba B was sanctioned in December 2002. The field encompasses the Kissanje and Dikanza discoveries, which will be co-developed with a floating wellhead platform on Kissanje, with a nearby moored FPSO. Dikanza will be a subsea installation, tied back to Kissanje. The FPSO and wellhead platform are to a large extent identical to the facilities planned for Kizomba A. Production is expected to start early 2006, with peak production of 250 mbbls per day by end of 2006. We estimate total investments for the field at USD 3 billion. Statoil’s investment at end 2003 is approximately USD 130 million.
Four exploration wildcats were drilled in 2003. In addition three appraisal/segment wells were drilled. All four wildcats were discoveries.
The three appraisal wells confirmed the Saxi, Batuque and Mondo discoveries. Together, these three discoveries form the basis for a possible Kizomba C development.
Block 17. Exploration started in 1994. A total of 25 exploration and appraisal wells have been drilled. All exploration commitments in the PSA have been met, and the exploration license expired December 31, 2002. The water depth varies between 350 and 1,600 meters. We have a 13.33% interest in this block, which is operated by Total.
Girassol was the first development project in this block. The production license expires in 2023. The development includes an FPSO and subsea tieback wells for production and injection. Girassol reached plateau production capacity of 200 mbbls of oil per day on February 15, 2002.
Jasmim, a subsea tieback to the Girassol FPSO, was sanctioned for development in 2001 and came on stream on November 6, 2003. The production license expires in 2026. The development included minor tie-in modifications on the FPSO and subsea tieback wells for production and injection. Total production from this field is expected to peak at 50 to 60 mbbls of oil per day by 2005. Girassol and Jasmim combined currently have a capacity of 235 mbbls of oil per day.
The Great Dalia Area covering the Development Areas given for the reservoirs Lower Main Channel, Upper Main Channel and Camelia, was sanctioned in April 2003. Dalia is scheduled to reach its plateau production of 225 mbbls of oil per day by 2007. We expect that the investments for the field will be USD 2.7 billion in the period 2003 to 2006. The production license expires in 2024. The oil in this discovery is heavier than at Girassol, approximately 22 degrees API.
Rosa is expected to be developed as a subsea tieback to the Girassol FPSO. Total is currently working on the development and timing. Sanction of the project is expected in early 2004. Total is also evaluating the discoveries Cravo, Lirio, Orchidea, Violetta and others for development.
Block 31. This ultra deepwater block is located west of Block 15 at the northern end of Angola’s continental shelf and covers approximately 5,500 square kilometers. The water depth is between 1,600 and 2,500 meters. The block was awarded in 1999, and three-dimensional seismic surveys were performed in 2000. The first commitment well of a four well commitment was drilled in 2001 with disappointing results. The second commitment well, Plutao-1, completed in August 2002, was the first discovery in ultra deep water off Angola. Two additional exploration wells were drilled in 2003, Saturno-1 and Marte-1, both of which produced discoveries. Further exploration success will be necessary to form the basis for a potential clustered development. Sonangol has approved a two-year extension of the exploration period. We hold a 13.33% interest in Block 31.
Gas utilization. All discoveries in Angola contain significant volumes of associated gas. The gas can be used for gas injection or stored for a limited period. Sonangol has rights to the associated gas not required for the production facilities.
Nigeria. Nigeria’s political development is affected by many strong forces, based on factors such as ethnicity, religion and economic inequality, which have led to political unrest and violence, and such occurrences cause difficulties and disruptions for the oil industry, particularly in the Delta area. Projects on the Nigerian continental shelf may also be influenced by potential political instability. All of our activities are in the deepwater areas off Nigeria.
We operate two exploration licenses, in Blocks 217 and 218, with an interest of 53.85% in each. The exploration licenses were granted for a period of ten years, and expired in mid 2003. We have submitted an application to convert each exploration license to a mining license (i.e., production license), and are waiting on a response from the Nigerian authorities. If granted, the production licenses will be valid for 20 years. We have drilled a total of seven exploration wells in the two license areas, resulting in one oil discovery, Ekoli, and one gas discovery, Nnwa.
The Ekoli 1 well proved oil and confirmed the extension of ChevronTexaco’s adjacent Agbami discovery in Block 216. ChevronTexaco is currently doing field development work in which we are participating. Partner discussions are ongoing to determine the final unitization between license Blocks 216 and 217.
The Nnwa-2 well, drilled in 2002, proved a significant gas discovery and small amounts of oil in Block 218. The discovery extends into the Shell operated Block 219 (known as the Doro structure), as confirmed by the Doro-1 exploration well drilled in 2000. At present, fiscal terms for deep-water gas development do not exist in Nigeria, but an announcement of terms is expected in 2004. Under an MOU with Shell, the Nigerian Government and other companies, a feasibility study for floating LNG was completed in 2003. Future plans for NnwaDoro include seismic reprocessing and evaluation. The plan is for Shell as operator of Block 219 to drill the Doro 2 well in 2005/2006 on the basis of this evaluation.
In December 2003, Statoil was awarded a 25% interest in Block 324 deep water Nigeria. Statoil is committed to participate in one exploration well during the first phase to establish the resource potential in the block.
Western Europe
We have interests in Ireland, the Faroes and the UK. We believe that future discoveries on the Atlantic Margin, the outer part of the continental shelf running from Norway’s Lofoten Islands to west of Ireland, will contain both oil and gas. We have an exploration portfolio of licenses on the Atlantic Margin with gross acreage of approximately 15,000 square kilometers.
Ireland. In Ireland, we have interests in three exploration licenses, including operatorship of one large exploration license, 5/94 (Slyne-Erris), with an interest of 49.9%, immediately north of the Corrib field development in which we are a partner. During 2003, we drilled a well, 19/11-1A, in this license on the Cong prospect. Although it was dry, it revealed important geological information that will be integrated into our understanding of the remaining prospects in this large license.
Corrib. The Corrib gas field lies on the Atlantic Margin north west of Ireland. It was discovered in 1996 and was the first significant discovery offshore Ireland since Kinsale Head in 1973. The Corrib field development, operated by Shell, was sanctioned in February 2001, and the production license was granted in late 2001 with a 30-year duration.
The development will incorporate seven subsea wells and the unprocessed gas will be transported through a pipeline to an onshore gas terminal. This receiving facility will be constructed on the coast of County Mayo. The Corrib project was sanctioned for scheduled production start-up in October 2003. Due to the rejection of the application for planning permission for the gas terminal, the start-up has been delayed until January 2007. A new revised planning application for the gas terminal was submitted to the Irish Authorities on December 17, 2003. The development cost of the Corrib field is estimated at Euro 0.9 billion, of which approximately Euro 0.36 billion has been spent from 2001 to 2003.
Ireland is increasingly dependent on imported gas as the Kinsale Head gas field is in decline. Total Irish gas demand is now approximately 4.2 bcm (148 bcf) per year and is expected to grow, primarily due to new gas-fired power stations being built. An interconnector between the UK and continental Europe today supplies approximately 75% of the market. We are currently in discussions with gas buyers but have decided not to enter into any firm gas sales contract at this time. We are co-owners in the Synergen gas-fired power plant, which began regular operations in July 2002. Our share of the Corrib gas could be delivered to this plant, which would be able to accommodate approximately 60% of peak production. The gas from the Corrib field will be transported via a link in to Ireland’s existing gas transmission system. The state-owned Bord Gáis Éireann is responsible for the completion of the link.
Faroes. We were awarded the operatorships for two exploration licenses in the first licensing round on the Faroes Shelf in the North Atlantic in 2000. A total of seven licenses were granted to 12 oil companies organized in five groups. We have been evaluating the potential of the Faroes area of the continental shelf since the early 1990s. The area presents technical challenges, primarily seismic imaging, as much of the area has been covered by thick layers of basalt.
The Statoil operated License 003, in which we have a 35% interest, lies in the Foinaven sub-basin and was granted in 2000 for a period of six years. The terms of the license require us to drill two exploration wells. We drilled the first well in late summer 2001, at a location about 180 km south of Torshavn and 60 km northwest of the producing UK oil field Schiehallion, with disappointing results. Three-dimensional seismic data were acquired on the license towards the end of 2002 and processed in 2003. We are currently interpreting this new data. In addition, the Amerada Hess Group made a gas and light oil discovery in License 001 named Marjun, and we are also evaluating if this discovery has any direct impact on our adjacent License 003.
The Statoil operated License 006 lies on the East Faroe Ridge, and was awarded during 2000 for a period of nine years. The license obligation requires us to perform seismic surveys. In 2003, we negotiated a two-year extension to the first phase of the license and acquired a 3D survey over the crestal areas of the Kappa Prospect, a large four-way dip-closed feature lying beneath thick basalts. The survey is currently being processed. Statoil acquired PetroCanada's 10% interest in the license during 2003 giving us a 37.5% interest.
United Kingdom. We are a partner in several producing licenses on the UK continental shelf, and our exploration focus is on the less explored Atlantic Margin. We participate in 10 exploration licenses and one production license (Schiehallion) within the UK part of the Atlantic Margin. During 2003, we participated in one well by means of a bottom hole contribution. This well, 219/21-1, was drilled by Shell on the Ben Nevis prospect. The well is located in Statoil's operated license P.971 and we have a 33.33% interest.
Schiehallion. This field currently produces approximately 110 mboe per day. The Schiehallion license will expire in August 2017. We have a 5.88% interest in the field. The Schiehallion field has been developed as a subsea development tied back to a new FPSO, which is owned by the field participants. The FPSO also acts as the host facility for the BP and Shell-owned Loyal field, which is located north of Schiehallion. The original sanctioned development drilling was completed in 2000; however, additional phases are planned to fully recover the reserve volumes. Oil is exported by a dedicated shuttle tanker to the Sullom Voe terminal. Associated gas is currently used for power generation with the residual being exported via a pipeline to Sullom Voe and onto the BP-operated Magnus field where it will be used for enhanced oil recovery.
Alba. Peak production of 72 to 80 mbbls of oil per day is expected to continue until the end of 2004. The Alba license, in which we hold a 17% interest, expires in March 2018. The Alba field is under-going a multi-phase development. The second phase, completed during 2002, includes the development of the extreme south area of the field by subsea tieback to the Alba platform. Additional gas management and debottlenecking improvements were undertaken during 2003 and will continue during 2004. The next development phase, sanctioned during 2003 and also exploiting the extreme south area of the field, represents continued operational investment to maximize reserves recovery as production comes off plateau. The drilling and subsea engineering aspects of this project represent the main activity focus during 2004 leading to first oil in the fourth quarter.
Caledonia. The Caledonia field is a new development located immediately north of the Alba field and contained within the same block. The single horizontal production well was drilled in the third quarter of 2002 and tied back via a subsea template and pipeline to the Britannia platform where the fluids are processed and oil exported through the Forties Pipeline. Production commenced in February 2003 at approximately 11 mbbls of oil per day and declined to less than 10 mbbls per day by the end of 2003. We have a 21.32% interest in the ChevronTexaco operated field.
Dunlin. The Shell operated field is currently in tail-end production with an average daily rate in 2003 of less than 10 mbbls of oil. The Dunlin license in which we hold a 28.76% interest expires in August 2017. The platform receives tariff income from processing satellite Merlin and Osprey oil accumulations. The co-mingled production stream is exported via the Brent System Pipeline to the Sullom Voe Terminal located on the Shetland Islands.
Merlin. The Shell operated field, in which we hold a 2.35% interest, is now in decline, with an average production during 2003 of less than 6 mbbls of oil per day. No further appraisal of the accumulation is envisaged. The Merlin license will expire in August 2017.
Jupiter. The Jupiter field, operated by ConocoPhillips, consists of six gas accumulations: Ganymede, Callisto South, Callisto North, Europa, Sinope North and Bell. BP's adjacent Bessemar field will also be produced via Jupiter facilities. Current production is approximately 18 mboe per day. The Jupiter license, in which we hold a 30% interest, will expire in 2010.
Venezuela
Venezuela has the largest oil reserves in the western hemisphere and has traditionally been one of the most important oil provinces in the Americas. Considerable exploration potential is thought to remain, especially offshore. Statoil considers Venezuela to be a core area for its portfolio and is actively evaluating opportunities.
The country was opened to foreign investments during the period of 1994 to 1997 in order to give new impetus to the development of the oil industry. This resulted in a number of large new projects, mainly in heavy oil (Orinoco belt). The former political establishment was replaced by a new coalition in 1998, led by President Hugo Chávez. The political situation in the country resulted in a general strike at the end of 2002 and early 2003 that caused serious disruptions in the production and shipment of oil.
The new Hydrocarbon Law was introduced on January 1, 2002. It prescribes higher royalties and taxes for many oil (not gas) industry activities, as well as a minimum 51% national participation. There is ongoing dialogue with the authorities with respect to the specifics and the ramifications of the new law.
LL652. Statoil has a 27% interest in the ChevronTexaco operated LL652 oil field located in Venezuela’s Lake Maracaibo. In 2001 and 2002, the LL652 book value was written down based on a new geological assessment performed after a slower than anticipated response to water and gas injection projects and development wells. The LL652 field is currently producing around 10 mbbls of oil per day.
Sincor.The Sincor project involves producing heavy crude oil in the Orinoco Belt, transporting the crude to the coast and upgrading it into a light, low-sulphur syncrude. We hold a 15% interest in the project, which is a strategic joint venture with PDVSA and Total. Sincor is the operator and is responsible for development, operation, upgrading and oil marketing. The project is expected to reach plateau production by 2006 at a production level of 180 mboe per stream day of 30-32 degree API, low sulphur syncrude, which Sincor markets under the name of Zuata Sweet. In addition, Sincor produces sulphur and petroleum coke, known as petcoke, for sale on the international market.
Sincor started normal production in March 2002 and conducted normal operations until it was shut down for a 10-week period between December 2002 and February 2003 due to political unrest and strikes in Venezuela's oil industry. This resulted in a production loss of 17% of the 2003 expected volumes. Exceptional operational performance in 2003 has allowed Sincor to recover 35% of the production lost during the strike.
In 2003 Sincor successfully passed the First Stage Completion Test according to the provisions established in the Project Financing Agreement. As a result, the USD 1,200 million Senior Debt Guarantee originally provided by the Sincor partners was released as of September 30, 2003 and replaced by a USD 43 million Debt Guarantee.
Plataforma Deltana. In February 2003, Statoil was awarded the operatorship for Block 4 in Plataforma Deltana off the eastern coast of Venezuela. Statoil committed to drill three exploration wells during the coming four years to establish the resource potential in the block. The drilling of the first well is planned to start in May 2004.
New Areas
We are also exploring additional opportunities outside our four core producing areas. We have recently been focusing on our efforts on Iran and Algeria, and are also considering opportunities in Russia, the Caspian Region, Latin America, the U.S., North Africa and the Middle East.
Iran. We consider Iran to be a promising country for business opportunities given the large undeveloped reserves and the large estimated remaining undiscovered hydrocarbon resources.
In November 2000, Statoil signed an Exploration Study Agreement with the National Iranian Oil Company, or NIOC, a company owned by the Iranian government, for the Hormoz Strait and Oman Sea areas. This study was finalized in 2003, and we have an option to negotiate an extension into a second phase. At the same time we signed a non-binding protocol with NIOC to evaluate several projects in Iran within the areas of increased oil recovery, GTL processing and field developments. During 2001 we entered into three agreements with NIOC for increased oil recovery study activities for the Ahwaz, the Marun and the Bibi Hakimeh fields. Together these fields currently produce around 1.5 mmbbls of oil per day. It is expected that the increased oil recovery study phases for the three fields will be completed in the first half of 2004. In 2003 Statoil, together with South African PetroSA, signed an agreement defining the commercial framework for investing in a GTL processing plant in Iran with NIOC. A plant is being constructed with PetroSA in South Africa to test the Statoil technology of GTL with an aim to build a 60 mbbls per day plant in Iran.
See Item 8—Financial Information—Legal Proceedings for information on the investigation by the Norwegian National Authority for Investigation and Prosecution of Economic and Environmental Crime (Økokrim) and other regulatory bodies into the consulting agreement that Statoil entered into in 2002 with Horton Investments Ltd. See also Item 3—Key Information—Risk Factors.
South Pars phases 6, 7 and 8. On December 12, 2002, Statoil became operator for the development of the offshore part of the South Pars 6, 7 and 8 project with up to a 40% share during the development phase. Statoil’s share of total investment in the project is planned to be USD 335 million, of which USD 75 million was invested by the end of 2003. The South Pars phase 6, 7 and 8 offshore project’s scope consists of three wellhead platforms with three pipelines, condensate loading line and associated single buoy mooring, drilling of 27 production wells, hook-up of 3 pre-drilled wells, and required reservoir management. The project is managed from Tehran, and drilling commenced January 26, 2004 after the first jacket was successfully deployed in a water depth of 65 meters in the Persian Gulf on January 5, 2004. The project is in accordance with Norwegian foreign policy of increased trade relations with Iran. See Item 3—Key Information—Risk Factors for additional information concerning the risk of US sanctions because of our activities in Iran.
Algeria. Statoil's position as a significant gas seller in Europe, our ambition to serve this market from multiple sources, and the short distance to the southern European gas market makes Algeria an attractive country to pursue new opportunities. The decision to enter into Algeria is, by nature, based on a long-term perspective and includes an assessment of both the security and political situation. Statoil recognizes the need for a different level of protection for personnel and property compared with many European countries. To reduce the risk of injury and serious incidents, it is considered necessary to make additional security arrangements in line with those of other international companies. Statoil evaluates the risk level as acceptable, subject to the precautions that have been taken, and we remain committed to conducting our business in accordance with our core values.
TheIn Salah development project is the third largest gas development in Algeria. Statoil and BP signed an agreement in June 2003 whereby Statoil will acquire a 31.85% interest in the In Salah gas project. The project is being built and operated through a joint operatorship between Sonatrach, BP and, after consummation of the transaction, Statoil. A Contract of Association, an agreement similar to a revenue sharing contract, governs the rights and obligations. A joint marketing company sells the gas produced in the project, and all gas produced until 2017 has been sold under long-term contracts. First gas from the project is expected in 2004, with Statoil’s entitlement plateau production estimated to reach approximately 32 mboe per day. Statoil’s total expected investment in the project, excluding the acquisition price, is approximately USD 250 million.
TheIn Amenas development project is the fourth largest gas development in Algeria containing significant liquid volumes. Statoil will acquire a 50% interest in the In Amenas project pursuant to the same agreement with BP in June 2003. This project is also built and operated through a joint operatorship between Sonatrach, BP and Statoil. The rights and obligations are governed by a production-sharing contract, giving the contractors access to liquid volumes only. First gas is expected in 2005, with Statoil’s entitlement plateau production estimated to reach approximately 19 mboe per day. Statoil’s total expected investment in the project, excluding acquisition price, is approximately USD 500 million.
The acquisition of In Salah and In Amenas is pending final approval from the Algerian Ministry of Energy and Mining, the Algerian petroleum industry regulator, and the Council of Ministers, to be evidenced by final authorization of the transaction through gazettal publication.
In addition to the acquired development projects, Statoil submitted a technical bid for the Gassi Touil Integrated Gas Project in December 2002 and has started evaluation of the first commercial bid term draft.
Additional Potential Areas
Russia. Statoil has been present in Russia since the early 1990s with a representation office in Moscow in addition to the petrol station business in the Murmansk area. Business development activity in Russia has grown in 2003, focusing on access to both exploration acreage and existing fields. Statoil considers Russia a natural long-term potential core area as it forms a natural extension of our activities in the Barents Sea on the Norwegian Shelf and in the Caspian Sea.
Kazakhstan. Throughout most of 2003 the former state oil company of Kazakhstan, Kazakhoil, was in the process of reorganization into a new state company, KazMunayGaz (KMG). The Kazakh government announced their Offshore Development Plan in June 2003, which sets out the government’s plans for the long-term development of the Kazakh sector of the Caspian Sea and defines the role of KMG in the process. Statoil has reaffirmed with KMG that the protocol signed with Kazakhoil promoting cooperation between our two companies would continue to be in effect. Statoil is working to understand the impact of the Offshore Development Plan on future opportunities. In addition, the changing tax regulations in Kazakhstan are being closely monitored.
Brazil. In 2001 we acquired a 25% interest in two Santos Basin blocks in the 3rd Licensing Round. BM-S-17, operated by Petrobras, and BM-S-19, operated by Repsol. Three-dimensional seismic surveys have been acquired in both blocks, and decisions are due in 2004 to either relinquish the blocks or enter the next exploration phase, which includes commitments to drill exploration wells.
In 2002, through the 4th Licensing Round, we acquired a 40% interest in Block BM-J-3 with Petrobras as operator. A 3D seismic survey is planned for 2004. Our fourth license was acquired in 2002 through a 30% farm-in to the ConocoPhillips operated block BM-ES-11 in the Espirito Santo Basin. ConocoPhillips and Statoil have agreed that Statoil will acquire the outstanding 70% of the equity in the block (increasing the holding to 100%) and take over the operatorship. Approval is currently being sought from the authorities for this transaction. A decision is due in 2004 whether to relinquish the block or to enter the next exploration phase, which carries a drilling commitment.
During 2003, Statoil participated in an exploration well on Block BM-C-10 under a farm-in with the operator Shell. As the well was not successful, the block was relinquished.
U.S. Statoil holds capacity rights at the LNG regasification terminal at Cove Point, Maryland. Prior to first deliveries of Snøhvit LNG in 2006, Statoil intends to utilize the capacity through the purchase of third party LNG. Statoil's import capacity is 2.4 bcm per year, which is one third of the total import capacity in the terminal. The Cove Point Terminal was reopened at the end of August 2003. Statoil unloaded eight LNG cargoes, a total of approximately 23 bcf, during the four months of operations in 2003. Statoil's LNG was imported from Trinidad (seven cargoes) and Algeria (one cargo). The Natural Gas business segment, as of January 1, 2004, manages these activities. More details are given below under Natural Gas regarding the letter of intent Statoil has signed with the US-based energy company Dominion Resources Inc.
In December 2003, Statoil signed an agreement with ChevronTexaco that should enable it to secure up to 25% equity in a small number of selected deepwater exploration opportunities in the Gulf of Mexico. It is expected that this will lead to participation in one or two exploration wells during 2004.
Mexico. Since March 2001, Statoil has cooperated with Pemex regarding the possibility for future exploration and production operation.
Libya. We are currently assessing opportunities for participating in exploration and development activities in Libya.
Other Existing Areas
China. We operate the Lufeng 22-1 oil field and hold a 75% interest in the project. Our partner is the China National Offshore Oil Company (25%). Assuming high crude oil prices, the field will stay on production until August 2004. In August 2004 the Munin FPSO will be relocated to a neighboring field for a six-month period. Further production after this six-month shutdown is currently being evaluated.
Natural Gas
Introduction
Our Natural Gas business segment transports, processes and sells natural gas from production fields to purchasers. In 2003, we sold on our own behalf 20.8 bcm (734 bcf) of natural gas, as well as approximately 25.6 bcm (904 bcf) on behalf of the Norwegian State. We are the largest exporter and marketer of Norwegian natural gas. Our volumes and volumes sold on behalf of the Norwegian State represent approximately two-thirds of the entire NCS contract portfolio.
We expect Norwegian natural gas production to increase over the next few years. Given our strong existing position as a producer, transporter and marketer of natural gas from the NCS, we expect to play a key role in supplying the growing European gas market.
Statoil has signed a letter of intent with the US-based energy company Dominion Resources Inc. This would secure access for Statoil to additional capacity at the Cove Point LNG terminal in Maryland in the U.S., for a 20-year period. The transaction is subject to the successful negotiation of a final agreement and approval by the supervisory bodies of both companies.
We have a significant interest in the world’s largest offshore gas pipeline transportation system that extends more than 5,000 km. This extensive network links Norway’s offshore gas fields with gas treatment plants on the Norwegian mainland and to terminals at four landing points located in France, Germany, Belgium and the United Kingdom, providing us with flexible access to customers throughout Europe.
Effective January 1, 2003, the ownership of a majority of these transportation and processing facilities was unitized into a single joint venture Gassled. The technical operation of most of the natural gas transport system (including the Kårstø Gas Treatment Plant), such as system maintenance, is still carried out by us on a cost-recovery basis. As from February 1, 2004 the Kollsnes Gas Plant is included in Gassled, with the technical operation performed by E&P Norway. See below under Regulation—The Norwegian Gas Sales Organization.
As part of a reorganization effective January 1, 2004, all midstream and downstream gas projects associated with our international activities were transferred from International E&P to the Natural Gas division. This includes midstream and commercial activities in Shah Deniz, downstream activities in Turkey, and our position in Cove Point in the U.S.
We have a large long-term gas sales contract portfolio, described below, and are currently evaluating midstream and downstream opportunities to take further advantage of our existing infrastructure, large supply and experience in marketing natural gas. Our downstream strategies may differ from region to region depending on our particular position in the area. In Europe, we intend to extract greater efficiency from our existing infrastructure in order to deliver larger volumes and to enter into a wider range of sales arrangements in order to reach a broader customer base. We intend to focus on supplying the commercial, industrial and wholesale markets and currently have no plans to enter the residential gas market.
The following table sets forth key financial information about this business segment.
(in millions) | Year ended December 31, | |||
2001 | 2002 | 2003 | ||
NOK | NOK | NOK | USD | |
| Revenues | 23,468 | 24,536 | 25,087 | 3,763 |
Depreciation, depletion and amortization | 664 | 592 | 486 | 73 |
Income before financial items, income taxes and minority interest | 8,039 | 6,428 | 6,350 | 953 |
Capital expenditure | 671 | 465 | 456 | 68 |
Long-term assets | 10,500 | 10,312 | 10,555 | 1,583 |
Further details on the financial results can be found in Item 5—Operating and Financial Review and Prospects—Operating Results.
European Gas Market
According to the International Energy Agency (IEA) annual natural gas consumption in OECD-Europe was 490 bcm (17.3 tcf) in 2003. Preliminary figures from IEA for the first three quarters of 2003 show an estimated growth of 6.5% for 2003 as compared to the same period in 2002. The estimated annual growth in gas consumption in the period 2000-2010 is 3%. The gas share of total primary energy consumption represented 22.5% in 2001, and is expected to grow to 26% in 2010. Around 60% of the growth in gas consumption in the period 2000-2010 is assumed to come from the electricity sector. OECD Europe includes Austria, Belgium, the Czech Republic, Denmark, Finland, France, Germany, Greece, Hungary, Iceland, Ireland, Italy, Luxembourg, the Netherlands, Norway, Poland, Portugal, the Slovak Republic, Spain, Sweden, Switzerland, Turkey and the United Kingdom. The IEA expects a growth in demand for all sub sectors of the OECD-Europe natural gas market.
We market and sell our gas together with the Norwegian State’s natural gas, and taken together, we are one of the four major suppliers to the European market. The other major suppliers are Gazprom from Russia, Sonatrach from Algeria and Gasunie from the Netherlands. We believe that the Norwegian natural gas we market is competitive because of its reliability, access to the transportation infrastructure and proximity to the European market.
As the European energy market undergoes deregulation and structural changes, we believe that natural gas will play an increasingly important role. In particular, the use of natural gas as a source for electricity generation is growing.
Our analysis, based on data released by Wood Mackenzie, an industry consultant, and National Grid Transco (NGT), the UK gas transportation company, suggests that the United Kingdom’s own natural gas supply, excluding exports, will fall short of annual domestic demand starting in 2004 or 2005. This analysis indicates that the significant and sustained drop in indigenous supplies will trigger the need for new imports. Given our current and planned infrastructure, we believe that we are well positioned to take advantage of the UK’s increased demand for imported natural gas and to participate in Europe’s largest and most liberalized natural gas markets. A joint venture has been created to build a new export pipeline, Langeled, from the NCS to Easington in the UK of which Statoil and the Norwegian state will have 50% of the capacity. Langeled is scheduled to be operational from the fourth quarter of 2006. Other UK import projects that are going ahead, but in which we do not take part, are the Bacton Zeebrugge Interconnector enhancement and an LNG import terminal at the Isle of Grain (close to London), which is contracted to BP-Sonatrach. In addition, three other projects are proposed to go ahead, two LNG terminals at Milford Haven (South Wales) financed by Exxon-Mobil, British Gas Group and Petronas, and the Balgzand-Bacton pipeline from Holland.
Although we expect to face a more competitive downstream natural gas market in continental Europe as the August 1998 EU Gas Directive concerning deregulation and market liberalization takes increased effect, we believe that our established market positions, long-term relationships with large customers, experience in the marketing of natural gas and established points of entry will place us in a strong competitive position. For more information about the EU Gas Directive, please refer to —Regulation below.
Gas Sales and Marketing
Our major export markets for NCS gas are Germany, France, the United Kingdom, Belgium, Italy and the Netherlands. Our customers are mainly large national or regional gas companies, such as Ruhrgas, Gaz de France, ENI Gas & Power, Distrigaz and Gasunie. In addition, we sell to large end-users. Natural gas is sold to these customers mostly under long-term, take-or-pay contracts. Our long-term contract portfolio, including sales of SDFI gas, will increase by approximately 40% from 2000 to 2005. In 2005, we have contracted to sell approximately 50 bcm (1.8 tcf) on our behalf and for the Norwegian State, of which approximately 45% will be for our own account. In 2003, our three largest customers represented approximately half of our total sales volumes. These contracts expire between 2025 and 2029.
The gas sales and marketing activities carried out by Statoil are for the benefit of Statoil and the SDFI. These activities include marketing of gas sourced from the NCS as well as marketing of gas from other areas towards markets already penetrated by Statoil and the SDFI.
Statoil has existing gas sales agreements with several electricity companies in Europe. In 2003 Statoil concluded a gas sales agreement with the French electricity company Electricité de France National (EDF) for delivery of 1 bcm gas annually for a period of 15 years. Deliveries are scheduled to commence on October 1, 2005. In addition a contract has been concluded with EDF’s subsidiary, EDF Trading Limited, for deliveries of 0.9 bcm gas in the period January 1, 2004 to October 1, 2005. Both agreements are an integral part of the pan-European gas strategy in supplying gas to one of the largest electricity companies in the world. EDF will be an important customer in addition to Statoil's present leading gas and electricity customers.
In the United Kingdom, we market our gas towards large industrial customers, power generators and wholesalers, and participate in the UK spot market. In 2003, we exported 4.85 bcm (17.2 tcf) of NCS gas to the UK via the Heimdal-St. Fergus pipeline and delivered close to 1.7 bcm (60 bcf) to the industrial and commercial sector in the UK. Our group-wide gas trading activity is mainly focused around the UK gas market which is a significant market in terms of size and one of the most progressive in terms of deregulation when compared with other European markets. Our UK trading activities were focused on optimizing NCS volumes to the UK and Europe by profiling NCS deliveries to match the highest priced spot market periods. This strategy leads to additional value above and beyond average sales contract profit. However, as the Heimdal-St. Fergus link will likely become fully utilized in 2004 and 2005, optimization opportunities in the UK will become more limited until the fourth quarter of 2006 when Langeled is due to become operational. Nevertheless, the UK Trading function will still work closely with upstream operations and European marketing units to add value to Statoil’s sales portfolio.
In August 2003 we signed a new medium-term gas contract with Centrica, the largest marketer of gas in the UK. The 3-year deal, which started on October 1, 2003, is for 2 bcm (71 bcf) per year of natural gas, which represents approximately 2% of total forecasted UK demand. The gas sales contract is for a flat volume delivered to the UK’s liquid trading hub (national balancing point) and priced to a UK market gas price index. Statoil views the UK market as a key area for future growth.
Statoil and Scottish and Southern Energy (SSE) began collaborating on forming a joint venture for the Aldbrough gas storage facility in 2003. With 9,000 employees, SSE ranks as one of the largest energy companies in the UK and operates an existing gas storage facility, SSE Hornsea. SSE and Statoil began work independently in late 2002 on the development of two separate storage installations, but joined forces in the third quarter of 2003. This collaboration has led to a common development, which aims to avoid duplication of facilities and lessen the environmental impact. SSE is to act as the operator for development and construction of the plant, which will be remotely operated from the SSE Hornsea facility. The final decision to develop the Aldbrough facility will be made in the second quarter of 2004. Statoil’s holds a 33.33% interest in this potential development.
Synergen, the power project located at Dublin in the Republic of Ireland in which we have a 30% interest, with Electricity Supply Board (ESB) owning the remaining 70%, formally took over the Dublin Bay Power Plant in August 2002. The Ringsend plant has been operating commercially since then.
In Germany, we hold a 21.8% stake in the Norddeutsche Erdgas-Transversale, or Netra, overland gas transmission pipeline, a 25% stake in HubCo –North West European Hub Service Company, a provider of hub services in the Emden and Bunde/Oude area, and a 20.1% stake in Etzel Gas Storage. The 5.26% stake in VNG Verbundnetz Gas AG, a German gas merchant company, was sold to EWE AG in December 2003. This divestment was made in connection with the major changes of the ownership structure of VNG as a result of the Ruhrgas/E.ON merger conditions. The sale was completed in January 2004.
As a result of the conditions to effectiveness of the contract for major gas deliveries to Poland between Statoil and the state-owned Polish Oil and Gas Company not being met, the parties mutually agreed in December 2003 that the agreement, signed on September 3, 2001, did not become effective.
Norwegian Gas Transportation System and Other Facilities
In order to transport Norwegian natural gas to European customers, we and other Norwegian gas producers have built an extensive gas pipeline system, connecting gas fields to gas processing plants on the Norwegian mainland and to Europe. The system is operated by Gassco AS, which is wholly owned by the Norwegian State. We are carrying out most of the technical aspects of operating parts of the transportation systems on a cost recovery basis. We, together with the SDFI, are the largest owner of these operated facilities. In 2003, the system transported 71.3 bcm (2.5 tcf) of Norwegian gas and has additional capacity to transport 14 to 18 bcm (0.5 to 0.6 tcf) per year.
To cater for existing commitments and expected new gas sales to the UK, increased transportation capacity will be required. The construction of a new pipeline from the Ormen Lange field via Sleipner to Easington in UK has been sanctioned by the Langeled investor group. Approval by the Norwegian and UK authorities is expected in the spring of 2004. The two governments have agreed the key principles which will be incorporated in a new treaty between the two nations.
As from January 1, 2003 the ownership interests of the Zeepipe, Franpipe, Europipe II, Åsgard Transport, Statpipe, Oseberg Gas Transport and Vesterled joint ventures and Norpipe AS were transferred to a new joint venture called Gassled. This also includes the terminals in Statpipe and Vesterled, the Europipe Receiving Facilities and the Europipe Metering Station. The ownership interest in Zeepipe Terminal JV and Dunkerque Terminal DA has been adjusted. As from February 1, 2004 the Kollsnes Gas Plant was included in Gassled. Gassco AS is the operator of Gassled. Our interests in Gassled and other pipelines and terminals are listed in the tables below.
From January 1, 2011, our ownership interest in Gassled will be reduced due to an increased ownership interest for the SDFI. Similar adjustments of the ownership interest in Zeepipe Terminal JV and Dunkerque Terminal DA will also be made. In addition, our ownership interest in Gassled may change as a result of the inclusion of existing or new infrastructure or if Gassled undertakes further investments without participation from its owners in the same ratio as their ownership interests in Gassled. Gassled has a license period to 2028.
Gassled is divided into five areas; area A is the Statfjord –Kårstø pipeline, area B is the Åsgard –Kårstø Pipeline, area C is the Kårstø Gas Treatment Plant, area D is all the dry gas pipelines and area E is the Kollsnes Gas Plant, as illustrated in the figure below.

Our ability to transport our own supply of natural gas from our various field interests enables us to provide regular and reliable gas deliveries to our customers. The pipelines intersect at platforms, tie-in locations and processing plants, providing a flexible network to transport natural gas from various fields and gas processing plants to our entry points into the European market, depending on our customers’ contracted daily and annual natural gas sales requirements. Each field operates with an account system, permitting fields to borrow and repay gas volumes as needed to meet their supply needs. If, for instance, one platform is forced to shut down production temporarily, another field can increase production to temporarily cover the supply shortfall, thereby providing the end user with uninterrupted supply. This supply and source flexibility is also advantageous since it permits us to blend natural gas from different fields to modulate natural gas quality.
The major costs associated with running a pipeline system are maintenance and compression costs that result from operating compression facilities to increase gas throughput. Most transport agreements are based on a tariff per unit transported, which covers the operating cost of the transport system and provides a return on the capital invested. The Ministry of Petroleum and Energy sets such tariffs. The pipelines are maintained under an annual maintenance plan approved by the Norwegian Petroleum Directorate.
The following table sets out the major NCS gas transportation systems in which we have an interest, the transportation routes and capacities. All of the pipelines and terminals are operated by Gassco AS, except for Norpipe and the Norsea Gas AS terminals, which are operated by ConocoPhillips.
Transportation systems included in Gassled
| Former Joint Venture | Startup Date | Product | Start point | End point | Transport Capacity MMSm3/d |
| Zeepipe | |||||
Zeepipe 1 | 1993 | Dry gas | Sleipner riser platform | Zeebrugge | 41.7 |
Zeepipe 2A | 1996 | Dry gas | Kollsnes | Sleipner riser platform | 55.4 |
Zeepipe 2B | 1997 | Dry gas | Kollsnes | Draupner E | 59.5 |
| Europipe 1 | 1995 | Dry gas | Draupner E | Dornum/Emden | 53.6 |
| Franpipe | 1998 | Dry gas | Draupner E | Dunkerque | 52.2 |
| Europipe II | 1999 | Dry gas | Kårstø | Dornum | 68.1 |
| Norpipe AS | 1977 | Dry gas | Norpipe Y (Ekofisk Area) | Emden | 43.0 |
Åsgard Transport | 2000 | Rich gas | Åsgard | Kårstø | 66.0 |
| Statpipe | |||||
Zone 1 | 1985 | Rich gas | Statfjord | Kårstø | 29.0 |
Zone 4A | 1985 | Dry gas | Heimdal | Draupner S | 29.0 |
| Kårstø | Draupner S | 23.0 | |||
Zone 4B | 1985 | Dry gas | Draupner S | Norpipe Y (Ekofisk Area) | 43.0 |
Oseberg Gas Transport | 2000 | Dry gas | Oseberg | Heimdal | 41.0 |
| Vesterled | |||||
(Frigg transport) | 2001 | Dry gas | Heimdal | St. Fergus | 33.0 |
Terminals included in Gassled
Terminal facilities | Startup Date | Product | Location |
| Zeepipe JV | |||
| Europipe receiving facilities | 1995 | Dry gas | Dornum, Germany |
| Europipe metering station | 1995 | Dry gas | Emden, Germany |
| Norsea Gas AS | 1977 | Dry gas | Gas Terminal, Emden, Germany |
Statpipe JV (Kårstø gas treatment plant) | 1985 | Dry gas/NGL | Kårstø, Norway |
Etanor DA (Ethane plant at Kårstø) | 2000 | Ethane | Kårstø, Norway |
Vesterled JV (Frigg terminal) | 1978 | Dry gas | St. Fergus, Scotland |
Kollsnes Gas Plant * | 1996 | Dry gas/NGL | Kollsnes, Øygarden Norway |
* Included as from February 1, 2004
Pipelines not included in Gassled
Joint Venture | Startup Date | Product | Start point | End point | Transport Capacity MMSm3/d | Statoil Share |
Norne gas transportation system | 2001 | Rich gas | Norne field | Åsgard transport | 11.0 | 25.00% |
| Haltenpipe | 1996 | Rich gas | Heidrun field | Tjeldbergodden/ Åsgard transport | 7.1 | 19.06% |
Sleipner Condensate Pipeline * | 1993 | Unstabilized Condensate | Sleipner field | Kårstø | 0.03 | 49.60 % |
* Owned by E&P Norway.
Terminals not included in Gassled(1) (2)
| Terminal | Startup Date | Product | Location | Statoil Share (2003-2005) | Statoil Share (2005-2010) (3) | Statoil Share (2011-2028) |
Zeepipe terminal JV(4) | 1993 | Dry gas | Zeebrugge, Belgium | 10.35542% | 10.44386% | 8.97472% |
Dunkerque terminal DA(5) | 1998 | Dry gas | Dunkerque, France | 13.73678% | 13.85410% | 11.90524% |
(1) These interests include Statoil’s 25% interest in Norsea Gas AS.
(2) The changes in ownership structure over time are caused by changes in the underlying ownership in Gassled.
(3) This change is effective from October 1, 2005.
(4) This interest is held through our ownership in Gassled. Gassled owns 49% of the terminal.
(5) This interest is held through our ownership in Gassled. Gassled owns 65% of the terminal.
Ownership structure Gassled
Period 2003-2005 | PerIOD 2005-2010(1) | Period 2011-2028 | |
Petoro AS(2) | 38.293% | 38.619% | 48.173% |
| Statoil ASA | 20.379% | 20.553% | 17.662% |
| Norsk Hydro | 11.134% | 11.185% | 9.565% |
| Total | 9.038% | 8.681% | 6.990% |
| ExxonMobil | 9.755% | 9.755% | 8.293% |
| Shell | 4.681% | 4.447% | 3.526% |
| Norsea Gas AS | 3.018% | 3.044% | 2.615% |
| ConocoPhillips | 2.033% | 2.033% | 1.729% |
| Eni | 1.669% | 1.683% | 1.447% |
Statoil interest including 25% of Norsea Gas AS | 21.133% | 21.314% | 18.316% |
(1) There will be some minor adjustments in the Gassled ownership structure when the Kårstø Expansion Project is finished in 2005.
(2) Petoro holds the participating interest on behalf of the SDFI.
Kårstø Gas Treatment Plant (Area C)
We are responsible for the technical aspects of the operation of the Kårstø gas treatment plant. Kårstøprocesses rich gas and condensate, or light oil, from the NCS received via the Statfjord – Kårstøpipeline (area A) pipe, the Åsgard - Kårstøpipeline (area B) and the Sleipner condensate pipeline. Products produced at Kårstø include ethane, propane, iso-butane, normal butane and naphtha and stabilized condensate. In 2003, Kårstø produced 0.5 million tones of ethane, 4.4 million tonnes of LPG and 3.7 million tonnes of condensate/naphtha exported to customers worldwide.
We entered into a 15-year contract on June 2, 1997 to sell ethane from Kårstø to Borealis at its plant in Stenungsund, Sweden and to Borealis and Norsk Hydro at their plants in Rafnes, Norway. Of the ethane extracted at Kårstø, half is shipped by Navion to Stenungsund and sold to Borealis, and half is shipped to Rafnes.
A modification of the Kårstø Gas Treatment Plant to accommodate gas from the Mikkel field was completed in 2003 and we are modifying the plant to accommodate gas from the Kristin field from 2005. With these expansions, processing capacity will be increased to approximately 85% of the capacity of the gas pipelines connected to the plant.
After the expansion in 2000, which entailed taking in gas from the Åsgard field, the Norwegian Pollution Control Authority (SFT) required Kårstø to reduce its NOx emissions. The final permit was received in January 2004 and requires a reduction of 189 tonnes of NOx per year (from 1,220 tonnes per year to 1,031 tonnes per year) starting in October 2005. The permit requires a further reduction of 291 tonnes of NOx per year (from 1,031 tonnes per year to 740 tonnes per year) from November 2007. Alternative initiatives to meet this requirement have been identified and applications have been submitted to the SFT. The estimated installation costs are between NOK 50 million and NOK 190 million.
Kollsnes Gas Treatment Plant (Area E)
Statoil is responsible for the technical aspects of the operation of the Kollsnes gas treatment plant. The plant was built to receive gas landed from the Troll field through two 36-inch pipelines. The current gas processing capacity is approximately 120 mmcm per day. At Kollsnes, the Troll gas is dried and compressed for export to Europe. NGLs extracted are transported through a pipeline to the Mongstad refinery for further processing.
Currently, the plant is being expanded by the construction of a new gas processing train designed for enhanced recovery of NGL. The new processing trains will primarily be used to process gas from the Kvitebjørn and Visund fields. The two fields will start gas export to the Kollsnes plant in 2004 and 2005 respectively. See above under —Exploration & Production Norway—Exploration and Developments—Major Modification Projects for further information.
Gas Sales Agreements
All NCS gas sales agreements are subject to the approval of the Ministry of Petroleum and Energy, whether for domestic use or export. Generally, Statoil and other NCS gas producers have in the past not developed natural gas fields for production until after contractual commitments have been secured for the purchase of the natural gas. From 1977 to 1986, gas sales contracts were generally structured as depletion contracts and covered all of the natural gas reserves from a particular field. A depletion contract places risk on the buyer that the stipulated supply is contained in the reserves of the field in question. The reserves in the Ekofisk, Frigg, Statfjord, Gullfaks and Heimdal fields have all been sold under depletion contracts to buyers on the European continent and in the UK.
In 1986, the Troll licensees entered into several gas sales agreements with European buyers, commonly known as the Troll gas sales agreements. These agreements cover the majority of the present Norwegian gas sales agreements. These Troll agreements are a supply type where the seller carries the main risk for the content of the reservoir, allowing for delivery of a certain share of gas from sources other than Troll, such as associated gas from oil and condensate fields. The supply type agreements facilitate the selling of “tailor made” products to the market with regard to plateau levels and duration.
In 1987, the Norwegian State established the Gas Negotiation Committee, known as the GFU, as an integrated resource management instrument. In the period from 1987 to 2001, the GFU, chaired by Statoil, was given the task to negotiate all NCS gas sales contracts. All GFU contracts entered into have been subject to the approval and allocation of the contract to specific fields by the Ministry of Petroleum and Energy, based on recommendation by the Norwegian Gas Supply Committee.
The structural changes in the European gas market prompted the Norwegian State to abolish the GFU gas resource management system in June, 2001 and allowed the individual oil and gas companies on the NCS to market and sell their own gas, regardless of which field the gas originated from. Necessary changes have thus been made to the institutional, legal and commercial arrangements, including existing license, supply and transportation agreements, and were made effective as of October 1, 2002. As a part of this restructuring the Troll Commercial Model, which distributed rights and obligations under the Troll gas sales agreement, has been abandoned. In addition, the licensees have established new lifting arrangements in the individual licenses. The Ministry of Petroleum and Energy still has the right to approve all new gas sales from the NCS, but no longer has the right to decide the allocation of new agreement to fields as each company now negotiates these agreements individually. (See also—Regulation—The Norwegian Gas Sales Organization).
Statoil is instructed by the Norwegian State to manage, transport and sell the gas owned by the SDFI, resulting in Statoil managing, transporting and marketing about two-thirds of all NCS gas.
Due to the relatively large size of NCS gas fields and the extensive cost in developing new fields and gas transportation pipelines, virtually all NCS gas sales contracts are long-term supply contracts in which the purchasers agree to take daily and annual quantities of gas and, if the gas is not taken, are obliged to pay for the contracted quantity. This applies to the initial depletion contracts, Troll and GFU contracts and generally applies to the new individual company sales contracts.
Our long-term contracts generally run for 10 to 20 years or more. A significant portion of our current long-term sales contracts, reach plateau level between 2005 and 2008. We are on track to deliver in 2004 a growth of approximately 40% in the quantities that we are committed to supply together with the SDFI in the period 2000 to 2004. We expect further growth between 2004 and 2008.
Prices in these contracts are generally tied to a formula based on prevailing prices of a customer’s principal alternative fuels to natural gas, mainly heavy fuel oil and gas oil. Consequently, there can be significant price fluctuations during the life of the contract. Prices in these contracts are generally adjusted quarterly and are calculated on the basis of prices prevailing in the three to nine months prior to the date of adjustment as published in reference indices. By contrast, a recent long-term gas sales contract in the UK is priced with reference to a daily UK market gas price index. The price formula, calling for monthly or quarterly adjustment, however, is not able to capture all trends in the market place in either the gas or competing fuel markets, i.e., changes in taxation of gas and competing fuels imposed by national governments. Therefore, most of our long-term gas contracts contain contractual price adjustment mechanisms that can be triggered at regular intervals by either the buyer or the seller. Under our long-term sales contracts either party has the right to initiate a price review process under certain circumstances as set forth in these contracts.
Several price reviews have occurred since 1986, and historically we have found that the reviews have adjusted the price formula without materially altering the commercial value of the contract. Approximately two-thirds of the quantities represented in our existing long-term sales contracts were eligible for potential price review in October 2001 and we reached agreement with almost all of the buyers during 2002 and 2003 with close to neutral effect on value. Approximately 60% of the quantities of our long-term sales contracts are eligible for potential price review in 2004.
Manufacturing and Marketing
Introduction
The Manufacturing and Marketing business segment comprises our downstream activities, including sales and trading of crude oil and refined products, refining and methanol production, retail and industrial marketing of oil products and petrochemical operations through our 50% interest in Borealis. We sold our shares in Navion to Norsk Teekay AS in 2003. We continue to hold a 50% interest in theWest Navigator drill ship, which has been transferred to the E&P Norway business segment. In March 2004, Statoil signed a contract to sell the multipurpose shuttle tankerMST Odin to Marathon Petroleum and its Alvheim project partners. TheMST Odin was held in the Other business segment and as a result the sale will have no impact on the 2004 financial results for the Manufacturing and Marketing business segment. The sale is contingent upon the partners' approval of the development of the Alvheim area following approval of the PDO by the Norwegian authorities.
The following table sets forth key financial information about this business unit.
Year ended December 31, | ||||
2001 | 2002 | 2003 | ||
(in millions) | NOK | NOK | NOK | USD |
| Revenues | 203,387 | 211,152 | 218,642 | 32,800 |
Depreciation, depletion and amortization | 1,855 | 1,686 | 1,419 | 213 |
Income before net financial items, income taxes and minority interest | 4,480 | 1,637 | 3,555 | 533 |
Capital expenditure | 811 | 1,771 | 1,546 | 232 |
Long-term assets | 30,432 | 27,958 | 23,351 | 3,503 |
Further details on the financial results can be found in Item 5—Operating and Financial Review and Prospects—Operating Results.
Oil Sales, Trading and Supply
We are one of the largest net sellers of crude oil in the world, operating out of sales offices in Stavanger, London, Singapore and Stamford, Connecticut, selling and trading crude oil, NGL and refined products. We market and sell the Norwegian State’s crude oil together with our own. In 2003, we sold 738 mmbbls of crude, or slightly above 2.0 mmbbls per day, including sales to our own refineries and other internal divisions. Crude oil sales in 2003 were 6% lower than sales in 2002 as a result of lower production on the NCS. Our main crude oil market is in northwest Europe, and we also sell large volumes into North America and Asia. Most of our oil volumes are sold on spot market terms, based on worldwide prices and quotations. Of the volumes we sold in 2003, approximately 32% were our own volumes. We purchase crude oil from third parties in order to obtain other qualities of oil for sale and blending, and to increase our flexibility with respect to shipping and storage.
The main markets for our refined products, NGLs and condensate are in northwest Europe and the countries around the Baltic Sea rim. We are a large supplier of condensate in Europe, providing this very light crude oil to refiners and the petrochemical industry. In addition, condensate cargoes are sold in the US and Far East markets. In 2003, we sold approximately 27.3 million tonnes of refined oil products, the majority of which was refined at our refineries at Mongstad and Kalundborg, and approximately 10.6 million tonnes of NGL, including condensate.
Manufacturing
The Refining and Methanol business clusters have been merged into one new business cluster “Manufacturing” with effect from April 1, 2003. We are majority owner (79%) and operator of the Mongstad refinery in Norway, which has a crude oil distillation capacity of 179 mbbls per day, and owner (100%) and operator of the Kalundborg refinery in Denmark, which has a crude oil and condensate distillation capacity of 118 mbbls per day. In addition, we have the right to own 10% of the production capacity at the Shell-operated refinery in Pernis, the Netherlands, which has a crude oil distillation capacity of 400 mbbls per day. Our methanol operations consist of our 81.7% stake in Europe’s newest gas-based methanol plant at Tjeldbergodden, Norway, which came into production in 1997 and has a design capacity of 830,000 tonnes per year.
The following table gives operating characteristics of the plants at Mongstad, Kalundborg and Tjeldbergodden. Throughput was reduced in refining in 2002 due to low margins, and both refineries had planned turnarounds (major maintenance shutdowns) in part of the refineries. Throughput at Tjeldbergodden was also reduced in 2002 due to a planned turnaround.
All data for year ended December 31, | ||||||||||||
Throughput(1) | Distillation Capacity(2) | Utilization Rate(3) | On stream factor(4) | |||||||||
| Refinery | 2001 | 2002 | 2003 | 2001 | 2002 | 2003 | 2001 | 2002 | 2003 | 2001 | 2002 | 2003 |
| Mongstad | 9.5 | 8.9 | 9.8 | 8.7 | 8.7 | 8.7 | 91.9% | 92.4% | 98.1% | 93.9% | 96.5% | 98.2% |
| Kalundborg | 5.0 | 4.7 | 5.0 | 5.5 | 5.5 | 7.5 | 88.2% | 84.0% | 90.2% | 95.8% | 96.2% | 94.4% |
| Tjeldbergodden | 0.9 | 0.8 | 0.9 | 0.8 | 0.8 | 0.8 | 103.1% | 103.0% | 106.0% | 96.0% | 97.0% | 98.6% |
(1) Actual throughput of crude oils, condensates, feed and blendstock, measured in million tonnes
(2) Nominal crude oil and condensate distillation capacity, for Tjeldbergodden total design capacity
(3) Composite rate for all processing units, stream day utilization
(4) Composite factor for all processing units, excluding turnarounds.
Mongstad.The Mongstad refinery is directly linked to offshore fields through two crude oil pipelines and indirectly linked through an NGL/condensate pipeline from the crude oil terminal at Sture and the gas terminal at Kollsnes, making Mongstad an attractive site for landing and processing hydrocarbons and for further development of our oil and gas reserves. The main facilities at Mongstad, in addition to the refinery, are a crude oil terminal, owned 65% by Statoil and an NGL terminal, owned by Vestprosess where Statoil has an ownership share of 17%.
Effective January 1, 2000, we swapped 21% of our holding in Mongstad with Shell for a 10% interest in its refinery at Pernis in the Netherlands. As a result of this transaction, we have access to products in Rotterdam, and Shell is able to supply the Norwegian market. In addition, we have a service agreement with Shell Global Solutions, Shell’s subsidiary, which will provide technical operational support, project development support and general technical advice for Mongstad. Through this agreement, we can access support from a world-leading refiner.
The Mongstad refinery, built in 1975 and significantly expanded and upgraded in the late 1980s, is a medium-sized, modern and sophisticated refinery. The products are principally high value light products such as naphtha, gasoline, jet fuel, diesel and light heating oil. The refinery does not produce low value residue because this crude oil component is upgraded to gasoline and gasoils in the residue cracker and the delayed coker. More recent upgrading projects include an NGL/condensate project involving a pipeline to Mongstad plus NGL terminal and refinery expansion and revamp at Mongstad and a cracker naphtha desulphurization project that started production in March 2003. The NGL/condensate plant capacity is now being doubled and more efficient stream boilers are being installed. Planned startup is May and September 2004.
As a result of the swap with Shell, an increased share of Mongstad’s products is delivered to Scandinavian markets. Approximately 60% of Mongstad’s total production is exported to northwest Europe and the United States. Although the transportation costs are higher than those of refineries located closer to these markets, Mongstad’s overall competitive position benefits from its proximity to feedstock supplies, which results in lower transportation costs included in the cost of feedstock.
The following table sets forth approximate quantities of refined products (million tonnes) manufactured by Mongstad for the periods indicated. In addition to crude, as shown below, the Mongstad refinery upgrades large volumes of fuel feedstock (up to one million tonnes per year) and, from the end of 1999, Oseberg NGL and Troll condensate.
Mongstad product yields and feedstock | Years ended December 31, | |||||
| 2001 | 2002 | 2003 | ||||
| LPG | 289 | 3% | 303 | 3% | 351 | 4% |
| Gasoline/naphtha | 3,755 | 40% | 3,611 | 40% | 4,095 | 42% |
| Jet/kero | 543 | 6% | 516 | 6% | 503 | 5% |
| Gasoil | 3,696 | 40% | 3,534 | 40% | 3,819 | 39% |
| Fuel oil | 262 | 3% | 200 | 2% | 212 | 2% |
| Coke/sulphur | 223 | 2% | 224 | 2% | 233 | 2% |
Fuel, flare and loss | 584 | 6% | 555 | 6% | 597 | 6% |
Total throughput | 9,352 | 100% | 8,943 | 100% | 9,810 | 100% |
North Sea crude oils: | ||||||
Troll, Yme (FOB crude oils) | 2,382 | 25% | 2,261 | 25% | 2,722 | 28% |
Other North Sea crude oils (CIF crude oil) | 5,213 | 56% | 5,125 | 57% | 5,273 | 54% |
| Residue | 768 | 8% | 654 | 7% | 867 | 9% |
Other fuel and blendstock | 989 | 11% | 902 | 10% | 948 | 10% |
Note: Changes in throughput and yields are partly due to maintenance shutdowns. There were two extraordinary cracker shutdowns in 2001, and one planned maintenance shutdown in the cracker unit in 2002.
The Mongstad refinery is geared for efficient production of commodity fuels and has considerable flexibility in producing products to different specifications through its ability to do in-line blending during ship loading. Given stricter EU and US product specifications expected to be implemented in 2005, we decided to invest significantly in improvements at Mongstad. The costs incurred in bringing the facilities up to the 2005 requirements were approximately NOK 1 billion.
We have a cost improvement program in place, supported by the technical services agreement with Shell, which focuses on maintenance, procurement and cost management. We are also identifying measures in order to improve energy efficiency. After high losses due to two cracker breakdowns in 2001, a number of minor modifications have been carried out, and the unit had high reliability in 2002 and 2003. The refinery reliability in 2003 was the highest ever, since it was upgraded in the 1980s.
Kalundborg.Kalundborg produces products such as gasoline, jet fuel, diesel oil, propane, and fuel oil to supply markets in Denmark and Sweden. The refinery is connected through a pipeline to our terminal at Hedehusene close to Copenhagen. Kalundborg’s refined products are also supplied to the northwest European market, mainly Germany and France.
The following table gives approximate quantities of refined products (in million tonnes) manufactured by Kalundborg for the periods indicated.
Kalundborg product yields and feedstock | Year ended December 31, | |||||
| 2001 | 2002 | 2003 | ||||
| LPG | 103 | 2% | 101 | 2% | 110 | 2% |
| Gasoline/naphtha | 1,683 | 34% | 1,533 | 32% | 1,517 | 30% |
| Jet/kero | 268 | 5% | 232 | 5% | 265 | 5% |
| Gasoil | 1,843 | 37% | 1,825 | 39% | 1,991 | 40% |
| Fuel oil | 923 | 18% | 866 | 18% | 922 | 18% |
| Coke/sulphur | 4 | 0% | 3 | 0% | 5 | 0% |
Fuel, flare and loss | 177 | 4% | 170 | 4% | 183 | 4% |
Total throughput | 5,001 | 100% | 4,731 | 100% | 4,993 | 100% |
North Sea crude oils: | ||||||
Sleipner, Åsgard condensates | 1,146 | 23% | 1,270 | 27% | 1,215 | 24% |
Other North Sea crude oils | 3,511 | 70% | 3,076 | 65% | 3,481 | 70% |
Other fuel and blendstock | 344 | 7% | 385 | 8% | 297 | 6% |
Note: Changes in throughput and yields are partly due to maintenance shutdowns and expansions. There was no maintenance shutdown in 2001, but a maintenance shutdown occurred in the old part of the refinery in 2002, and also some longer, unplanned shutdowns. In 2003 there was a longer shutdown in September/October in the crude unit due to consequential damages after power failure in Sweden and Denmark late September.
Although it is a relatively small and simple refinery, Kalundborg is a plant with high-energy efficiency and relatively low cash operating costs for a plant of its size and configuration. The refinery has improved its performance significantly in the last years through several small investment projects to increase flexibility and improve yield/product quality. It produces high quality products including low sulphur gasoline in accordance with EU specifications. In addition, we invested a total of NOK 400 million in 2001 and 2002 to upgrade the refinery in order to increase our feedstock flexibility and to enable us to produce refined products that meet the EU requirements for low sulphur diesel expected to become effective in 2005. The new unit started production in June 2002. We are now increasing the capacity for low sulphur diesel and jet, and planned startup is in May 2005.
Tjeldbergodden. Our methanol operations at Tjeldbergodden, Norway, of which we own 81.7%, has a design capacity of 830,000 tonnes per year (average over turnaround cycle) and actual output during 2003 was 916,000 tonnes compared with 814,000 tonnes in 2002. The increase in production compared with 2002 is partly due to a regular four-week maintenance stop every second year, but also due to an all time high plant reliability (98.6%) and capacity utilization (106 tonnes per hour) in 2003. Actual output in 2003 equaled approximately 14% of Western European consumption.
The MTP (Methanol to Propylene) pilot plant at Tjeldbergodden, which was built in 2001 with the German company Lurgi AG, has performed according to expectations. The testing results are so far successful, and the test program will be concluded in April 2004.
We also hold 50.9% of Tjeldbergodden Luftgassfabrikk DA, the largest Air Separation Unit (ASU) in Scandinavia, which also owns the first Norwegian natural gas liquefaction plant located at Tjeldbergodden with an annual gas capacity of 35 mmcm (1,236 mmcf). Our partners are AGA (37.8%) and ConocoPhillips (11.3%). The ASU supplies oxygen to the methanol plant and AGA markets and sells industrial gases produced.
In addition, at Tjeldbergodden we have commissioned the world’s first bioprotein plant based on natural gas. The plant is designed to produce approximately 10,000 tonnes of bioproteins annually using natural gas as feedstock. Bioproteins’ initial application is for animal and fish feed, but it can also be used for human consumption. On February 13, 2003 Du Pont and Statoil signed an agreement to form a joint venture on a 50/50 basis to further develop the business. Statoil's part of the new company will still report to the Technology and Development unit.
Nordic Energy
Our Nordic Energy unit, with approximately 1,300 employees, consists of three national sales organizations for refined products to consumer and industrial markets in Scandinavia. Nordic Energy sells Statoil-branded refined products for heating, such as fuel oil, LPG, environmentally friendly energy solutions, and transportation fuel, such as diesel, jet fuel, marine fuel and lubricants. We also have operations for lubricants and LPG in Poland and the Baltic States. In addition, we manage the logistics of petrol delivery for Statoil-branded service stations in Scandinavia. We have a strong market position in Scandinavia based on our approximately 300,000 customers and annual sales of six billion liters. In the LPG market, we have approximately 40% of the Scandinavian market share. Our portfolio also includes ownership interests in gas distribution companies and planned gas-fired power generation sites in several locations in Norway.
Due mainly to lower demand for heating oil and gas oils and resulting reduced margins, Nordic Energy’s profitability has suffered in recent years. To address the profitability gap, we have focused our business on areas where we can utilize Statoil’s resources and brand name, and improve cost efficiency in our existing business. The latter is starting to show effects with improved results in the last three years as compared to 2000. In the longer term, we are evaluating opportunities to expand our energy product offerings. Nordic Energy’s competence and customer portfolio in the LPG market will provide additional leverage as we evaluate options relating to the future marketing of gas.
In March 2003 we announced that we had entered into a joint venture with Naturgas Fyn of Denmark. We will initially own 30% of the joint venture, named Statoil Gazelle, but we have an option to increase the share. Statoil Gazelle will focus on marketing and selling gas and oil products in the Danish market.
Retailing
Our retail distribution network consists of almost 2,000 Statoil-branded service stations in nine countries, including one of the two largest networks of stations in Scandinavia. These stations provide automotive fuels, car accessories and simple vehicle service, and nearly all offer goods such as fast food, convenience products and basic groceries. In 2003, these stations sold approximately 4.9 billion liters of gasoline and diesel.
The following table lists these retail outlets by region or country as of December 31, 2003, and our volume of automotive fuel sales for the year ended December 31, 2003.
Scandinavia | Ireland | Poland | Baltics | Russia | Total | |
Retail outlets | ||||||
Statoil or SDS-owned and operated | 286 | 51 | 155 | 143 | 6 | 641 |
Statoil or SDS-owned and dealer-operated | 554 | 13 | 0 | 1 | 0 | 568 |
Dealer owned and Statoil or SDS operated | 0 | 15 | 9 | 0 | 0 | 24 |
Dealer owned and operated | 428 | 158 | 43 | 0 | 0 | 629 |
123- (automate) stations | 115 | 0 | 0 | 12 | 0 | 127 |
| Total | 1,383 | 237 | 207 | 156 | 6 | 1,989 |
Volume of petrol sold | ||||||
Gasoline (millions of liters) | 2,183 | 483 | 371 | 356 | 22 | 3,415 |
Diesel (millions of liters) | 520 | 572 | 185 | 212 | 2 | 1,491 |
| Total | 2,703 | 1,055 | 556 | 568 | 24 | 4,906 |
Scandinavia is our home retail market, where Statoil-branded stations have a gasoline market share of approximately 22%, according to data from the petroleum institutes in each country. All of the Scandinavian stations are owned or franchised by a separate company established in 1999, Statoil Detaljhandel Skandinavia AS, or SDS. SDS is owned equally by the ICA/Ahold supermarket group and Statoil. SDS has a cost-efficiency program in place aimed at reducing unit costs and SDS is also renegotiating the terms of its franchise contracts with the dealers, to align the incentives between the franchisees and SDS. In December 2003 Statoil signed a letter of intent to buy back ICA’s share in SDS. Pending negotiation and approval by the supervisory boards of the respective companies, the possible acquisition is expected to be completed during the first half of 2004. The focus on convenience shopping will be maintained under Statoil ownership, and it is Statoil’s intention to continue to cooperate with ICA/Ahold in the future regarding shop development and procurement of non-fuel products. To effect these goals, we will seek to enter into agreements between SDS and ICA/Ahold.
SDS has introduced ICA Express convenience stores, which are significantly larger and aim to meet a wider range of customer needs than the more limited convenience supplies offered at SDS’s other service stations. SDS co-brands service stations where ICA Express stores are located, meaning that the overall site and fueling station is branded Statoil while the convenience store is branded ICA Express. There were 213 ICA Express convenience stores as of December 31, 2003, compared with 161 at December 31, 2002 and 99 at December 31, 2001, and we have plans for further expansion at primary locations in the coming years.
Statoil’s other service stations are located in Ireland, Poland, Russia and the Baltics, which includes Estonia, Lithuania and Latvia. We rank as a market leader, measured by volumes sold, in Ireland, Estonia and Latvia with approximately 21%, 30% and 23%, respectively, of the retail gasoline market in 2003. The acquisition of Shell’s retail network in the three Baltic countries, effective in April 2003, has strengthened Statoil’s position in the Baltic area. As of December 31, 2003, 60 of the Irish stations included our convenience stores. We have introduced automated, unmanned stations under the name 1-2-3 in the Baltics and Scandinavia. To date we have 12 automated stations in the Baltics and 115 in Scandinavia. In Poland we had a market share of 3%, but we believe that Poland has significant growth potential, and that we are well positioned for future growth. The acquisition of Preem’s retail network in Poland, effective February 2003, contributed to an increase of our market share in 2003 to about 5%, thus strengthening Statoil’s position in Poland.
We are focusing on increasing profitability and earnings in our existing network by increasing non-fuel sales, lowering costs and using customer loyalty schemes in all countries.
Borealis
Borealis was established in 1994 by merging our petrochemical operations with those of the Finnish company, Neste. We own 50% of Borealis, with the remaining interests held equally by our partners OMV, the Austrian oil and gas company, and the International Petroleum Investment Company (IPIC), Abu Dhabi’s national company for foreign investment in the petroleum business. Borealis has 5,100 employees and operations in 11 countries. In 2003, Borealis’s gross sales were EUR 3.7 billion (NOK 29 billion), in 2002 EUR 3.5 billion (NOK 26 billion at the exchange rate as of that end of the period), and in 2001 EUR 3.7 billion (NOK 30 billion at the exchange rate as of that end of the period).
Borealis is a stand-alone company, managed independently by its own supervisory board, executive board and management. It conducts all of its business with Statoil on a commercial, arm’s-length basis.
The following table shows Borealis’s total annual production volumes (in million tonnes) for major products for 2001, 2002 and 2003.
Product | Year ended December 31, | ||
2001 | 2002 | 2003 | |
| Ethylene | 1,233 | 1,242 | 1,307 |
| Propylene | 620 | 673 | 749 |
| Polyethylene | 1,889 | 1,851 | 1,966 |
| Polypropylene | 1,566 | 1,561 | 1,630 |
Borealis’s production capacity for 2003 was 1.5 million tonnes of ethylene, 0.9 million tonnes of propylene, 2.2 million tonnes of polyethylene and 1.4 million tonnes of polypropylene. In addition Borealis has 0.2 million tonnes of production capacity of compounded products, which is a further processing of polyolefins. Borealis has six main production areas in Norway, Sweden, Finland, Belgium, Austria and Portugal, and additional production facilities in Germany, Italy, Brazil and the US.
In Abu Dhabi, Borealis and the Abu Dhabi National Oil Company, ADNOC, have established a joint venture, Borouge, which includes an ethylene plant and two polyethylene facilities. The polyethylene plants are based on Borealis’ proprietary Borstar technology. Borouge benefits from locally-sourced, lower cost feedstock. All three facilities started production at the end of 2001, and in 2003 it was decided to expand the polyethylene capacity by 30%, expected to come into effect 2005.
Statoil and Borealis collaborate to exploit feedstock opportunities based on geographical proximity of our facilities, currently achieved in two major projects. In 2003 an expansion of the ethane supply agreement at Kårstø was agreed, allowing for increased deliveries from 2005 onwards to support expansion of Borealis’ 50%-owned olefin plant in Norway. Statoil and Borealis are currently evaluating further possible feedstock supply options from Statoil to Borealis.
Navion
In December 2002 Statoil entered into an agreement to sell our shipping subsidiary Navion to Norsk Teekay AS, which is a wholly owned subsidiary of Teekay Shipping Corporation (NYSE: TK). The net sales price was approximately USD 800 million in cash. The effective date for the transaction was January 1, 2003 and the closing date was April 7, 2003.
Health, Safety and EnvironmentOur operations are subject to a number of environmental laws and regulations in each of the jurisdictions in which we operate, governing, among other things, air emissions, wastewater discharges and discharges to the sea, the use, handling and disposal of hazardous substances and wastes, soil and groundwater contamination and employee health and safety. As with our competitors, liability risks are inherent in our operations. Requirements under environmental laws and regulations can be expected to increase in the future. We also have long-term obligations concerning the decommissioning of operational facilities and the remediation of soil or groundwater at certain of our facilities and liability for waste disposal or contamination on properties owned by others. We have established financial reserves for estimated environmental liabilities based on our current information with respect to those liabilities. We have also made significant expenditures to comply with environmental regulations. However, significant additional financial reserves or compliance expenditures could be required in the future due to changes in law, new information on environmental conditions or other events, and those expenditures could have a material adverse effect on our financial condition or results of operations.
Health, safety and the environment, or HSE, comprises health and working environment, safety and emergency preparedness, the environment and security. Statoil’s management system for HSE forms an integrated part of the group’s total management system. Statoil’s management system relating to corporate governance is certified to the international ISO 9001 standard. In addition, several units are certified according to the same standard, and also to the environmental standard ISO 14001 (an updated list is available www.statoil.com). By the end of 2004, all central operating units are to be certified in accordance with one or both of those standards. Statoil is listed in the Dow Jones sustainability index (DJSI) and the FTSE4Good Index.
Our approach to HSE is risk-based, which means that risks are identified, appropriate criteria are established and measures are implemented in order to meet these criteria. We aim to carry out our operations without harm to the environment and according to the principles for sustainable development.
Our corporate indicators for environmental performance include:
The EU Directive on Sulphur (99/32/EC) is intended to reduce emissions of sulphur dioxide resulting from the combustion of certain types of liquid fuels (heavy fuel oil and heating oil). The EU member states must ensure that the use of heavy fuel and gas oil falls below specific levels of sulphur content within their territory. Lower levels of sulphur content than stipulated in the Directive for heavy fuel and gas oil may be imposed by the EU member states separately.
The EU is also imposing stricter requirements for automotive fuels. The Fuels Directive 98/70/EC specifies a set of emissions reducing parameters in gasoline and auto diesel (olefins, aromatics, benzene etc.), to limit air pollution from road traffic. The Fuels Directive became effective January 1, 2000, and is scheduled for amendment from January 1, 2005. The Directive is specifically stricter than the previous regulatory regime with respect to sulphur, and the limit has been set to a maximum of 50 ppm in both gasoline and automotive diesel, but products with less then 10 ppm should also be available. Although Norway is not an EU member, as a result of Norway’s participation in the EEA and our sales of products to EU member states, our business activities are subject to this Directive. For more information, see Regulation—EU Regulation below. We have made the required investments at our two refineries during the last years to meet the new stricter EU-regulations on product quality specifications.
Our CO2 emissions (from Statoil operations) totaled 10.0 million tonnes in 2003 up from the 8.9 million tonnes emitted in 2002. Our NOX emissions were 29,800 tonnes, against 26,400 tonnes in 2002. This increase is largely due to taking over the operatorship for the Snorre, Tordis, Vigdis and Visund fields on the NCS as of January 1, 2003 as well as a high production rate at our land facilities in the Manufacturing and Marketing business area. Historically, our NCS emissions of CO2 and NOX, measured in tonnes per delivered quantity, have been below the NCS average. Compared to other oil regions in the world the NCS is the area with the lowest relative emissions, with an average of 7.3 kg CO2/boe compared to an industry average of 14.6 kg CO2/boe produced. Changes in laws regulating greenhouse gas emissions could cause us to incur additional expenditures for pollution control equipment.
Our industry is working closely with the Norwegian authorities with the goal of preventing harmful discharges to the sea caused by operations by 2005. Plans for meeting this ambition were submitted to the authorities in June 2003, committing to implementation of measures leading to a planned reduction of 80% in environmental risk by 2005.
The total number of unintentional oil spills in the Statoil group in 2003 amounts to 542 with a corresponding volume of 288 cubic meters. Our upstream activities had 87 spills amounting to 26.3 cubic meters. For 2002 the corresponding numbers were 432 spills and 200 cubic meters for the group of which 74 spills amounting to 56.8 cubic meters were from our upstream activities.
Our corporate indicators within safety are currently:
Two fatalities were suffered by contractors working for Statoil in 2003. The number of serious incidents (undesirable events of a very serious nature) in 2003 was 299, up from 297 in 2002. However, the serious incident frequency (the number of incidents per million working hours) has improved to 3.2 from 3.8 in 2002. The total recordable injury frequency (the number of injuries per million working hours) is 6.0 in 2003, the same as in 2002. The lost-time injury frequency (the number of total recordable injuries causing loss of time at work per million working hours) was 2.6 in 2003 against 2.8 in 2002. Our safety indicators include both Statoil employees and contractors working for Statoil.
Through the technical safety review project, completed in 2001, where all major Statoil-operated plants and facilities were reviewed, Statoil has been a leader in developing a systematic approach to reviewing and monitoring the condition of technical safety barriers. The developed methodology is in compliance with the latest regulations issued by the Petroleum Safety Authority Norway. The systematic review will continue on a regular basis such that no review will be older than five years. We believe this approach will reduce the risk of major incidents and be the basis for improved regularity.
Within the health and working environment area, our principal objective is to secure a sound, challenging and rewarding working environment for the benefit of both the employee and Statoil. The corporate indicator within the health and working environment is the percentage of sickness absences, which, for the Statoil group, came to 3.5% in 2003, against 3.4% in 2002 (including self certification and medical certificate of sickness). The general level in Norwegian industry is 6.9% according to an official study (NHO 2002) (including only medical certificate of sickness). We also carry out regular health and working environment and organization surveys to track our working environment.
We incurred penalties of NOK 1.2 million in 2003 for violations within the HSE area (of which NOK 1.0 million related to a fatal accident in 2002). A penalty of NOK 1.0 million has been imposed in January 2004 for an environmental offence that occurred in 2000.
Technology, Research and Development
Background
The success of our business is closely connected to our access to and application of advanced technological competence. Operating under the harsh weather and environmentally sensitive conditions in the Norwegian Sea, transporting oil and gas across the deep Norwegian trench and draining complex petroleum reservoirs with high pressures and high temperatures all represent challenges on the NCS that we have overcome. The necessary technological capabilities have to a large extent been developed through our experience as an operator within exploration, project development and operations.
In addition to the technology developed through field development projects, a substantial amount of our research is carried out at our research and technology development center in Trondheim, Norway. Our internal research and development is done in close cooperation with universities, research institutions, other operators and the supplier industry. As of the end of 2003, we had more than 600 employees engaged in our research and development sector, of which approximately 500 hold advanced degrees. Group research development expenditures through our research center in 2001, 2002 and 2003 amounted to approximately NOK 633 million, NOK 736 million and NOK 1,004 million, respectively. In addition, we have a technical staff that function within each of our operating units where we also conduct research and development. Our patent portfolio reflects our range of technological developments, and we actively manage our portfolio to ensure that we protect any proprietary technology we may have.
Within the oil and gas industry Statoil is one of the leading research and development investors, at least in terms of R&D investment per annual production volumes. Our absolute R&D investment is however significantly less than several of the major oil and gas companies with whom we are competing. However, Statoil is widely recognized as a leader in technology based innovative solutions in conjunction with our business activities. In order to further improve our competitive ability Statoil has revised its technology strategy in 2003 and developed a more explicit technology cooperation model. The cooperation model focuses on core teams organized around similar objectives or operating environments and on extended cooperation between internal researchers and the best external sources, be they academia, the supplier industry or other oil companies, and encourages collaboration between these sources as opposed to the traditional single source approach.
Technologies and competencies
We invest in technology and competence development as part of our overall short and long-term business development plans. A brief description of some of these developments is given below.
Health, Safety and the Environment. Our overarching ambition within our technology development is to contribute to our HSE goals, which are zero accidents or losses and no harm to people or the environment. Our innovations include:
Exploration. In order to meet the company’s reserve replacement target we must improve our ability to find new reserves and development of new exploration technologies will play an important role. The most important achievement in 2003 has been:
Improved recovery. New methods and technologies have led to considerable increases in estimated recovery factors. The key technologies include:
Subsea technology. Statoil is one of the world’s largest subsea field operator and is a recognized technology developer in this field. Key achievements this year include:
Gas chain management. Gas chain management comprises gas technologies such as pipeline based gas solutions, LNG and GTL. Key achievements this year include:
Benchmark. In order to measure progress since 2001 a new benchmark study has been carried out by Charles River Associates. In 2001 Statoil was ranked as a clear leader in CO2 disposal; strong in all of reservoir management - including well construction, subsea systems and floating production, pipeline technologies and maintenance;favorable in exploration (weak/tenable internationally), water management, HSE risk management, hydrogen and GTL and tenable in LNG.
The main conclusion from this new study is that we have maintained our positions, with just two exceptions - international exploration, where our position has improved from weak/tenable to favorable, and well construction, where we have moved from strong to favorable. With respect to well construction, the change is a consequence of all other companies’ application of new technology converging, i.e., companies that were rated strong in 2001 have weakened to favorable.
Future Technology. The technology strategy is designed to help meet our corporate business targets. Our technology ambitions are:
In order to achieve these technology ambitions, Statoil will focus on the following technologies:
o Floating LNG
o Pipeline based gas transport
o GTL; and
Ambitious performance goals have been set for these high priority or focus areas to ensure that we are at least competitive with the largest oil companies.
Introduction
The principal Norwegian legislation applying to petroleum activities in Norway and on the NCS is currently the Norwegian Petroleum Act of November 29, 1996, and a number of regulations promulgated thereunder, as well as the Petroleum Taxation Act of June 13, 1975. The Petroleum Act states the principle that the Norwegian State is the owner of all subsea petroleum on the NCS, that the exclusive right to resource management is vested in the Norwegian State and that the Norwegian State alone is authorized to award licenses concerning the petroleum activities.
Under the Petroleum Act, the Norwegian Ministry of Petroleum and Energy is responsible for resource management and for administering petroleum activities on the NCS. The main task of the Ministry of Petroleum and Energy is to ensure that petroleum activities are conducted in accordance with the applicable legislation, the policies adopted by the Storting, and relevant decisions of the Norwegian State. The Ministry of Petroleum and Energy primarily implements petroleum policy through its power to administer the award of licenses and approve operators’ field and pipeline development plans, as well as petroleum transport and gas sales contracts. Only those plans that conform to the policies and regulations set by the Storting are approved. As set forth in the Petroleum Act, if a plan involves an important principle or will have a significant economic or social impact, it must also be submitted to the Storting for acceptance before being approved by the Ministry of Petroleum and Energy.
We are not required to submit any decisions relating to our operations to the Storting. However, the Storting’s role with respect to major policy issues in the petroleum sector may affect us in two ways: first, when the Norwegian State acts in the capacity as the majority owner of our shares and second, when the Norwegian State acts in its capacity as regulator:
Although Norway is not a member of the European Union, or EU, it is a member of the European Free Trade Association (EFTA). The EU and its member states have entered into the Agreement on the European Economic Area, referred to as the EEA Agreement, with the members of EFTA (except Switzerland).
The EEA Agreement makes certain provisions of EU law binding as between the states of the EU and the EFTA states, and also as between the EFTA states themselves. An increasing volume of regulation affecting us is adopted within the EU and is then applied to Norway under the EEA Agreement. As a Norwegian company operating both within EFTA and the EU, our business activities are regulated by both EU law and EEA law to the extent that EU law has been accepted into EEA law under the EEA Agreement.
The Norwegian Licensing System
The most important type of license awarded under the Petroleum Act is the production license. The Ministry of Petroleum and Energy holds executive discretionary power to award a production license and to determine the terms of that license. In exercising this power, the Ministry of Petroleum and Energy is obliged to implement the policy and objectives of the relevant Storting reports. The Government is not entitled to award a license in an area until the Storting has decided to open the area in question for exploration. A company refusing to abide by the terms of the Ministry of Petroleum and Energy’s decision, the Petroleum Act or the license conditions may face severe consequences, including a refusal by the Ministry of Petroleum and Energy to grant a production license or the revocation of a license already granted.
A production license grants the holders an exclusive right to explore for and produce petroleum within a specified geographical area. The licensees become the owners of the petroleum produced from the field covered by the license. Notwithstanding the exclusive rights granted under a production license, the Ministry of Petroleum and Energy has the power to, in exceptional cases, permit third parties to carry out exploration in the area covered by a production license. For a list of our shares in production licenses, see –Business Overview–Operations–Exploration and Production Norway above.
Production licenses are normally awarded through licensing rounds. The first licensing round for NCS production licenses was announced in 1965. Licenses under the 17th licensing round were awarded in May 2002. In recent years, the principal licensing rounds have mainly included licenses in the Norwegian Sea. Licenses in the North Sea area have been awarded in separate yearly rounds. The Ministry of Petroleum and Energy has announced that this policy will continue in a report to the Storting.
Traditionally, the Norwegian State only accepted license applications from individual companies, and, therefore, companies were not able to choose their partners in an individual block. In recent years, however, the Norwegian State has, to a larger degree, permitted group applications, enabling us to choose our exploration and development partners.
Production licenses are awarded to joint ventures consisting of several companies. The members of the joint venture are jointly and severally responsible to the Norwegian State for obligations arising from petroleum operations carried out under the license. Once a production license is awarded, the licensees are required to enter into a joint operating agreement and an accounting agreement which regulate the relationship between the partners. The Ministry of Petroleum and Energy decides the form of the joint operating agreements and accounting agreements.
The governing body of the joint venture is the management committee. Each member is entitled to one seat on the management committee. The management committee’s tasks are set out in the joint operating agreement and include setting guidelines for the operator of the field, exercising control over the activities of the operator, and making decisions on the activities of the joint venture. Votes in the management committee are counted by a combination of the number of members in the joint venture and their ownership interest. The number of votes required to make a decision varies from license to license, but a decision is normally reached when a certain number of the members and a percentage of the ownership interests, specified individually in each license, have voted in favor of a proposal. The voting rules are structured so that a licensee holding more than 50% of a license normally cannot vote through a proposal on its own, but will need the support of one or more of the other licensees. In licenses awarded since 1996 where the SDFI holds an interest, the Norwegian State, acting through the SDFI management company, may veto decisions made by the joint venture management committee, which, in the opinion of the Norwegian State, would not be in compliance with the obligations of the license as to the Norwegian State’s exploitation policies or financial interests. This veto right has never been used.
Under the joint operating agreements covering licenses awarded prior to 1996, the management company that supervises the Norwegian State’s SDFI interest, Petoro AS, has the power, with certain exceptions, to make decisions unilaterally in matters which are assumed to be of political or principal importance, or which may have significant social or socio-economic consequences, if Petoro AS is acting under the direction of its shareholder. Prior to the establishment of the SDFI management company, Statoil held this right, which was exercised three times, most recently in 1988. In autumn 2002, the Storting approved that the individual license groups may substitute this special voting rule for the SDFI with a veto rule similar to the veto rules which have applied to licenses awarded since 1996. Such a substitution is subject to approval from the Ministry of Petroleum and Energy.
The day-to-day management of a field is the responsibility of an operator appointed by the Ministry of Petroleum and Energy. The operator is in practice always a member of the joint venture holding the production license, although this is not legally required. The terms of engagement of the operator are set out in the joint operating agreement. Under the joint operating agreement, an operator may normally terminate its engagement upon six months’ notice. The management committee may, however, with the consent of the Ministry of Petroleum and Energy, instruct the operator to continue performing its duties until a new operator has been appointed. The management committee can terminate the operator’s engagement upon six months’ notice on an affirmative vote by all members of the management committee other than the operator. A change of operator requires the consent of the Ministry of Petroleum and Energy. In special cases the Ministry of Petroleum and Energy can order a change of operator.
Licensees are required to submit a plan for development and operation, or PDO, to the Ministry of Petroleum and Energy for approval. In respect of fields of a certain size, the Storting has to accept the PDO before it is formally approved by the Ministry of Petroleum and Energy. Until the PDO has been approved by the Ministry of Petroleum and Energy, the licensees cannot, without the prior consent of the Ministry of Petroleum and Energy, undertake material contractual obligations or commence construction work.
Production licenses are normally awarded for an initial exploration period which is typically six years, but which can be either for a shorter period or for a maximum period of ten years. During this exploration period the licensees must meet a specified work obligation set out in the license. The work obligation will typically include seismic surveying and/or exploration drilling. If the licensees fulfill the obligations set out in the production license, they are entitled to require that the license be prolonged for a period specified at the time when the license is awarded, typically 30 years. The right to prolong the license does not apply as a main rule to the whole of the geographical area covered by the initial license, but only to a percentage, typically 50%. The size of the area which must be relinquished is determined at the time the license is awarded. In special cases, the Ministry of Petroleum and Energy may extend the duration of a production license.
If natural resources other than petroleum are discovered in the area covered by a production license, the Norwegian State may decide to delay petroleum production in the area. If such a delay is imposed, the licensees are, with certain exceptions, entitled to a corresponding extension of the period of the license. To date, such a delay has never been imposed.
The Norwegian State may, if important public interests are at stake, direct us and other licensees on the NCS to reduce production of petroleum. From July 15, 1987 until the end of 1989, licensees were directed to curtail oil production by 7.5%. Between January 1, 1990 and June 30, 1990, licensees were directed to curtail oil production by 5%. In 1998, the Norwegian State resolved to reduce Norwegian oil production by about 3%, or 100 mbbls per day. In March 1999, the Norwegian State decided to increase the reduction to 200 mbbls per day. In the second quarter of 2000, the reduction was brought back to 100 mbbls per day. On July 1, 2000, this restriction was removed. By a royal decree of December 19, 2001, the Norwegian government decided that Norwegian oil production should be reduced by 150 mbbls per day from January 1, 2002 until June 30, 2002. This amounted to roughly a 5% reduction in output.
Licensees may buy or sell interests in production licenses subject to the consent of the Ministry of Petroleum and Energy and the approval of the Ministry of Finance of a corresponding tax treatment position. The Ministry of Petroleum and Energy must also approve indirect transfers of interest in a license, including changes in the ownership of a licensee, if they result in a third party obtaining a decisive influence over the licensee. There are in most licenses no pre-emption rights in favor of the other licensees. The SDFI, or the Norwegian State, as appropriate, however, still holds pre-emption rights in all licenses.
A license from the Ministry of Petroleum and Energy is also required in order to establish facilities for transport and utilization of petroleum. When applying for such licenses, the owners, which are in practice licensees under a production license, must prepare a plan for installation and operation. Licenses to establish facilities for transport and utilization of petroleum will normally be awarded subject to certain conditions. Typically, these conditions require the facility owners to enter into a participants’ agreement. The ownership of most facilities for transport and utilization of petroleum in Norway and on the NCS are organized as a joint venture of a group of license holders, and the participants’agreements are similar to the joint operating agreements entered into among the members of joint ventures holding production licenses.
Licensees are required to prepare a decommissioning plan before a production license or a license to establish and use facilities for transportation and utilization of petroleum expires or is relinquished, or the use of a facility ceases. The decommissioning plan must be submitted to the Ministry of Petroleum and Energy no sooner than five and no later than two years prior to the expiry of the license or the cessation of the use of the facility, and must include a proposal for the disposal of facilities on the field. On the basis of the decommissioning plan, the Ministry of Petroleum and Energy makes a decision as to the disposal of the facilities.
The Norwegian State is entitled to take over the fixed facilities of the licensees when a production license expires, is relinquished or revoked. In respect of facilities on the NCS, the Norwegian State decides whether any compensation will be payable for facilities thus taken over. If the Norwegian State should choose to take over onshore facilities, the ordinary rules of compensation in connection with expropriation of private property apply.
Licenses for the establishment of facilities for transport and utilization of petroleum typically include a clause whereby the Norwegian State can require that the facilities be transferred to it free of charge at the expiration of the license period.
The Norwegian Gas Sales Organization
Until recently, gas sales contracts with buyers for the supply of Norwegian gas were required by Norwegian authorities to be concluded with the Gas Negotiation Committee, known as theGassforhandlingsutvalget or GFU.
The structural changes taking place in the European gas market prompted the Norwegian State to consider whether changes to the gas resource management system on the NCS could contribute to further enhancing the efficiency for Norwegian gas producers. Accordingly, the Norwegian State by royal decree dated June 1, 2001, abandoned the GFU system and put in place a system whereby the individual licensees can manage the disposal of their own gas. Necessary adjustments in legislation, license agreements and other existing contracts in order to implement the new system were finalized during 2002. For more information, see above under —Business Overview—Operations—Gas Sales Agreements.
From January 1, 2003 the ownership of the Zeepipe, Franpipe, Europipe II, Åsgard Transport, Statpipe, Oseberg Gas Transport and Vesterled joint ventures and Norpipe AS was transferred to a new joint venture called Gassled. As from February 1, 2004, the Kollsnes Plant has also been included in Gassled.
Together with the approval of Gassled, Norwegian authorities have by a royal decree of December 20, 2002 issued regulations for access to and tariffs for capacity in the upstream gas transportation system. There are three main considerations behind the regulations. Firstly it shall, together with the law adopted by the Storting in June 2002, implement the Gas Directive of the European Union. Further, it shall establish a system for access to the upstream gas transportation system that is compatible with company based gas sales from the Norwegian Continental Shelf. Thirdly, it provided for the new ownership structure of the upstream gas transportation system (Gassled).
Parts of the regulations have a general application and parts – including the tariffs – are applicable only to the upstream gas transportation system owned by the Gassled joint venture.
The new regulations set the main principles for access to the upstream gas transportation system. The access regime consists of a regulated primary market where the right to book free capacity, in accordance with regulations, is allocated to users with a duly substantiated reasonable need for transportation of natural gas. Further, the access regime consists of a secondary market where the capacity can be transferred between the users after the allocation in the primary market if the need for transportation changes.
The capacity in the primary market will be released and booked through Gassco AS on the internet. Spare capacity will be released for pre-defined time periods at announced points in time and with specific time limits for reservations. If the reservations exceed the spare capacity, the spare capacity will be allocated based on a distribution formula. However, consideration shall in case of spare capacity first be given to the owners' duly substantiated needs for capacity, which is limited to twice the owner's equity interest in the upstream pipeline network in question.
Based upon an authorization given under the new regulation, tariffs for use of capacity in Gassled are determined by the Ministry of Petroleum and Energy. The Ministry’s policy for determining the tariffs is to avoid excessive returns being created on the capital invested in the transportation system, allowing the return on the Norwegian petroleum activity to be taken out on the fields instead of in the transportation systems. The tariffs are to be paid for booked capacity and not in respect of the actually transported volume.
HSE Regulation
Petroleum operations in Norway are subject to extensive regulation with regard to health, safety and the environment, or HSE. Under the Petroleum Act, which is in this respect administered by the Ministry of Labor and Government Administration, all petroleum operations must be conducted in compliance with a reasonable standard of care, taking into consideration the safety of employees, the environment and the economic values represented by installations and vessels. The Petroleum Act specifically requires that petroleum operations be carried out in such a manner that a high level of safety is maintained and developed in accordance with technological developments.
Licensees and other persons engaged in petroleum operations are required to maintain at all times a plan to deal with emergency situations. During an emergency, the Ministry of Labor and Government Administration may decide that other parties should provide the necessary resources, or otherwise adopt measures to obtain the necessary resources, to deal with the emergency for the account of the licensees.
The new Petroleum Safety Authority Norway (PSA) was established on January 1, 2004 as a consequence of the Storting process surrounding the Storting White Paper No.17 (2002-2003) on State supervision bodies. The PSA has the regulatory responsibility for safety, emergency preparedness and the working environment for all petroleum-related activities. This responsibility was transferred from the Norwegian Petroleum Directorate (NPD) effective January 1, 2004. With the establishment of the PSA, regulations relating to HSE in petroleum activities continue with the PSA as the responsible authority. In addition, the PSA's sphere of responsibility has been expanded to include supervision of safety, emergency preparedness and the working environment at the petroleum facilities and connected pipeline systems on land such as Kårstø, Kollsnes, Tjeldbergodden, Mongstad, and Melkøya, as well as potential future integrated petroleum facilities.
In our capacity as a holder of licenses under the Petroleum Act, we are subject to strict statutory liability in respect of losses or damages suffered as a result of pollution caused by spills or discharges of petroleum from petroleum facilities covered by any of our licenses. This means that anyone who suffers losses or damages as a result of pollution caused by any of our NCS license areas can claim compensation from us without needing to demonstrate that the damage is due to any fault on our part. If the pollution is caused by a force majeure event, a Norwegian court may reduce the level of damages to the extent it considers reasonable.
Taxation of Statoil
We are subject to ordinary Norwegian corporate income tax as well as to a special petroleum tax relating to our offshore activities. We are also subject to a special carbon dioxide emissions tax. Under our production licenses we are obligated to pay royalties and an area fee to the Norwegian State. Set forth below is a summary of certain key aspects of the Norwegian tax rules that apply to our operations.
Corporate income tax . Our profits, both from offshore oil and natural gas activities and from onshore activities, are subject to Norwegian corporate income tax. The corporate income tax rate is currently 28%. Our profits are computed in accordance with ordinary Norwegian corporate income tax rules, subject to certain modifications that apply to companies engaged in petroleum operations. Gross revenue from oil production and the value of lifted stocks of oil are determined on the basis of norm prices which are decided on a monthly basis by the Petroleum Price Board, a body whose members are appointed by the Ministry of Petroleum and Energy, and published quarterly. The Petroleum Taxation Act provides that the norm prices shall correspond to the prices that could have been obtained in case of a sale of petroleum between independent parties in a free market. When adopting norm prices, the Petroleum Price Board takes into consideration a number of factors, including spot market prices and contract prices within the industry.
The maximum rate for depreciation of development costs related to offshore production installations and pipelines is 16 2/3% per year. The depreciation starts when the expense is incurred. Exploration costs may be deducted in the year in which they are incurred. Most financial items are allocated to onshore and offshore activities in proportion to the remaining tax balances of assets related to onshore and offshore activities, respectively. There is an adjustment factor allowing companies with an equity ratio of more than 0.2 to allocate a higher share of net financial items to the offshore tax regime.
Any NCS losses may be carried forward indefinitely against subsequent income earned. Any onshore losses may be carried forward for 10 years. Fifty percent of losses relating to activity conducted onshore in Norway may be deducted from NCS income subject to the 28% tax rate. Losses from foreign activities may not be deducted against NCS income. Losses from offshore activities are fully deductible against onshore income.
Abandonment costs. In June 2003 the taxation treatment of abandonment costs was changed from a system with Government grant to a system with tax deduction. Abandonment costs incurred after June 19, 2003 can be deducted as operating expenditures. Provisions for abandonment costs are not tax deductible.
By use of group contributions between Norwegian companies in which we hold more than 90% of the shares and the votes, tax losses and taxable income can, to a great extent, be offset. Group distributions are not deductible in our offshore income.
As a result of tax credits granted against tax levied on dividends received from Norwegian companies, we are effectively not subject to tax on dividends from Norwegian companies. Dividends from foreign companies are normally subject to income tax in both Norway and the foreign company’s state of residence. If Norway has entered into a tax treaty with the foreign company’s state of residence, the tax of the foreign company’s state of residence is normally limited to a withholding tax at a specified rate. We are entitled to credit such withholding taxes against Norwegian income tax payable on the dividends.
Furthermore, if we own more than 10% of the capital of a foreign company, we are also entitled to a tax credit for a proportionate part of the foreign company’s income tax. This tax credit is only available against Norwegian taxes payable on the dividends received from the company. To obtain credit for taxes paid in the foreign company’s state of residence, we must provide documentation proving that income taxes actually have been paid in the foreign state, and that the foreign taxes are creditable against Norwegian taxes.
Special petroleum tax. A special petroleum tax is levied on profits derived from petroleum production and pipeline transportation on the NCS. The special petroleum tax is currently levied at a rate of 50%. The special tax is applied to relevant income in addition to the standard 28% income tax, resulting in a 78% marginal tax rate on income subject to petroleum tax. The basis for computing the special petroleum tax is the same as for income subject to ordinary corporate income tax, except that onshore losses are not deductible against the special petroleum tax, and a tax-free allowance, or uplift, is granted at a rate of 5% per year. The uplift is computed on the basis of the original capitalized cost, of offshore production installations. The uplift may be deducted from taxable income for a period of six years, starting in the year in which the capital expenditures are incurred. Unused uplift may be carried forward indefinitely. Special provisions apply to investments made prior to 1992.
Carbon dioxide emissions tax. A special carbon dioxide emissions tax applies to petroleum activities on the NCS. The tax is currently NOK 0.76 per standard cubic meter of gas burned or directly released, and per liter of oil burned.
Area fee. After the expiration of the initial exploration period, the holders of production licenses are required to pay an area fee. The amount of the area fee is set out in regulations promulgated under the Petroleum Act. In respect of most of the production licenses, the initial annual area fee is currently NOK 7,000 per square kilometer. The annual area fee is increased yearly by NOK 7,000 until it reaches NOK 70,000 per square kilometer.
Royalty. We and other oil companies have an obligation to pay a royalty to the Norwegian State for oil produced on fields for which a plan for development and operation was approved prior to January 1, 1986. The royalty varies from 8% to 16% of the gross production value, and increases with the level of production. The Ministry of Petroleum and Energy may, on six months’ notice, require that the royalty be paid in kind by delivery of petroleum. The Ministry of Petroleum and Energy has exercised this right so that we are currently required to pay royalty by delivering oil. Such royalty oil is repurchased by us at a calculated market price. No royalty is charged on natural gas or NGL production.
In a 1999 Government proposal, the Norwegian State announced that the remaining royalty obligations would be gradually abolished. The obligation to pay royalty currently only remains for the Gullfaks and Oseberg fields and will be abolished completely by the end of 2005.
EU Regulation
EU Gas Directive
Fundamental changes are now taking place in the organization and operation of the European gas market, with the objective of opening up national markets to competition and integrating them into a single internal market for natural gas. It is difficult to predict the effect of liberalization measures on the evolution of gas prices, but the main objective of the single gas market is to bring greater choice and reduced prices for customers through increased competition.
The EU Gas Directive was included in the EEA Agreement in June 2002 and was incorporated into Norwegian legislation in 2002.
On June 26, 2003, the EU approved a new Gas Directive, Directive 2003/55/EC. The Directive is not yet incorporated into Norwegian legislation.
The new Directive provides for accelerated requirements for market opening, which imply that both large users and households will now be free to choose their supplier earlier than before. Large users are free to choose their supplier from July 2004, and households from July 2007.
Competition
The integrated oil and gas industry is characterized by intense competition for customers, production licenses, operatorships, capital and experienced human resources. The industry is currently subject to several important influences, which we must deal with effectively if we are to remain competitive and achieve our goals.
Consolidation. In the past few years, the strategic and competitive landscape of the oil and gas industry has been transformed by a wave of mergers and acquisitions. This activity has been driven mainly by the need to enhance shareholder returns, to respond to the growing competitive threat of national oil companies and to achieve greater operational scale to capture new, attractive business opportunities. In 1998, the following mergers took place: BP/Amoco, Exxon/Mobil and Total/Fina. In 1999, further merger activity involved BPAmoco/ARCO, Repsol/YPF and TotalFina/Elf. In addition, Norsk Hydro acquired all the outstanding shares in Saga Petroleum after which we acquired certain Saga assets. In 2000, Chevron and Texaco announced a merger, while ENI acquired British Borneo and Lasmo. In 2001, Phillips announced the acquisition of Tosco and a merger with Conoco.
Deregulation. The establishment of free, competitive and integrated markets has become an important governmental objective in many countries. Initiatives such as the Directive aim to alter the framework of laws and institutions that govern the European gas industry. This includes, among others, the obligation on owners or operators of gas transportation facilities to offer non-discriminatory access to third parties wishing to use the infrastructure, and the opening of the industry to new participants. The relationship between customers and suppliers of gas is expected to change as a result of greater competition, with the emphasis on bringing down costs for energy purchasers.
International Opportunities. Significant shifts in the global political climate have provided oil and gas companies with access to previously inaccessible hydrocarbon resources in regions such as the former Soviet Union and the Middle East. New licensing rounds such as in the deepwater offshore sector of Western Africa have also created new exploration and development opportunities. Most recoverable oil and gas resources are believed to be located in such areas, where the political risk mostly remains high. Long-term growth in our reserves and production will require us to capture international opportunities in the face of significant competition.
Technological Advances. Technological innovations in the oil and gas industry have improved the industry’s performance in finding and developing hydrocarbon resources. Exploration success rates have improved, field life and recovery rates from existing and marginal fields have been increased, and full project cycle costs have generally been reduced. These have been achieved by applying advanced technology more effectively. In addition, the exploitation of hydrocarbon reserves in remote deepwater and harsh environment offshore regions has been made possible by improvements in subsea development capabilities and sophisticated floating production and storage units. In general, there is comparable access to technology across the industry, and, in order to achieve our strategic and financial goals, we will need to compete on the basis of applying available technology to complex projects in the most skillful manner.
Environmental and Social Concerns. Oil and gas companies are facing increasing demand to conduct their operations in the context of and consistent with environmental and social goals. Investors, customers and governments are more actively following companies’ performance on environmental responsibility and human rights, including performance with respect to the development of alternative and renewable sources of energy.
Organizational Structure
The following table sets forth our significant subsidiaries in alphabetical order, equity interest and the subsidiaries’country of incorporation. In all cases our voting interest is equivalent to our equity interest.
| Subsidiary | Equity Interest % | Country of Incorporation |
Mongstad Refining DA | 79 | Norway |
| Statoil AB | 100 | Sweden |
Statoil Angola Block 15 AS | 100 | Norway |
Statoil Angola Block 17 AS | 100 | Norway |
Statoil Apsheron AS | 100 | Norway |
Statoil Coordination Center N.V. | 100 | Belgium |
Statoil Danmark A/S | 100 | Denmark |
Statoil Dublin Bay AS | 100 | Norway |
Statoil Forsikring AS | 100 | Norway |
Statoil Ireland Ltd | 100 | Ireland |
Statoil Metanol ANS | 82 | Norway |
Statoil Norge AS | 100 | Norway |
Statoil North Africa Gas AS | 100 | Norway |
Statoil North Africa Oil AS | 100 | Norway |
Statoil North America Inc. | 100 | United States of America |
Statoil Pernis Invest AS | 100 | Norway |
Statoil Sincor AS | 100 | Norway |
| Statoil UK Ltd | 100 | Great Britain |
Statoil Venezuela AS | 100 | Norway |
Property, Plants and Equipment
Our principal executive offices are located at Forusbeen 50, N-4035, Stavanger, Norway, and comprise 103,000 square meters of office space, and are owned by Statoil.
We have interests in real estate in numerous countries throughout the world, but no one individual property is significant to us as a whole. We have no significant ongoing construction projects or plans to add new office space. See Item 4—Information on the Company for a description of our significant reserves and sources of oil and natural gas.
Item 5 Operating and Financial Review and Prospects
You should read the following discussion of our financial condition and results of operations in connection with our audited financial statements and relevant notes and the other information contained elsewhere in this Annual Report on Form 20-F.
Operating Results
Overview of Our Results of Operations
In the year ended December 31, 2003, we had total revenues of NOK 249.4 billion and net income of NOK 16.6 billion. In the year ended December 31, 2003, we produced 273 million barrels of oil and 19.3 bcm (683 bcf) of natural gas, resulting in a total production of 395 million boe. Our proved reserves as of December 31, 2003 consisted of approximately 1.8 billion barrels of crude oil and NGL and 393 bcm (13.9 tcf) of natural gas, resulting in a total of approximately 4.3 billion boe.
We divide our operations into the following four business segments:
Portfolio changes. An overall review of our strategy and asset portfolio has been carried out over the last few years and we will continue to seek to engage in portfolio management in order to optimize the value of our asset portfolio. This resulted in the restructuring of our asset portfolio both on the NCS and internationally, and included provisions and writedowns against some of our upstream and downstream assets. See —Combined Results of Operations—Years ended December 31, 2003, 2002 and 2001—Income before financial items, other items, income taxes and minority interest.
In 2003 we have sold 7.9% of our interest in the Tyrihans field and farmed out 13% of our interests in exploration license 261B. We also purchased a 0.21% interest in Huldra, bringing our total interest in Huldra to 19.87% as at December 31, 2003. There have also been minor changes in the portfolio of exploration licenses. In addition, a 1.24% interest in the Snøhvit field was purchased from Svenska Petroleum and effective from January 1, 2004, subject to government approval, a 10% interest in the Snøhvit field was purchased from Norsk Hydro increasing our interest in the Snøhvit field to 33.53%. Further, 2% of the Kristin field was sold to Hydro, effective from January 1, 2004.
In 2002, we sold our entire interest in the Varg field and a 14.9% interest in the Mikkel Unit (reducing our interest to 41.62%). Related to these agreements we realized a non-taxable gain of approximately NOK 0.2 billion. We also aligned interests in 2002 in the Oseberg licenses with the SDFI, resulting in a Statoil share of 15.3% in each of the three licenses. In June 2001, we realized a non-taxable gain of approximately NOK 1.4 billion related to the sale of our interests in our non-core assets in the Grane, Jotun and Njord fields and a 12% interest in the Snøhvit field in Norway.
We restructured our International E&P portfolio as follows:
In June 2003 we agreed to acquire direct ownership interests in two Algerian assets, In Salah (a 31.85% interest) and In Amenas (a 50% interest), from BP. Statoil paid USD 740 million for these assets, which was paid in 2003 as well and has in addition covered the expenditures incurred after January 1, 2003 related to the acquired interests. The agreement remains subject to necessary approval by Algerian authorities.
With an effective date of July 1, 2002 we sold our E&P operations in Denmark (the Siri and Lulita fields) to the Danish company DONG Efterforskning og Produktion with a realized pre-tax profit of NOK 1.0 billion (NOK 0.7 billion after tax). In 2001 these assets accounted for revenues of NOK 1.0 billionand contributed NOK 0.5 billion to our depreciation charge. At December 31, 2001 these interests represented 3.0 mmboe of proved reserves.
In May 2001, we sold our 4.76% interest in the Kashagan oil field discovery off Kazakhstan in the Caspian Sea and realized a pre-tax profit of NOK 1.6 billion (NOK 1.2 billion after tax).
In December 2001, we sold our operations in Vietnam for a gain before taxes of NOK 1.3 billion (NOK 0.9 billion after tax).
In December 2001, we decided to write down the book value of our interests in the LL652 oil field in Venezuela due to a slower-than-expected reservoir repressurization resulting in a reduction of the projected volumes of oil recoverable during the remaining contract. Through the writedown we recognized a pre-tax loss of NOK 2.0 billion (NOK 1.4 billion after tax) in 2001. In December 2002, we decided to further write down the book value of our interests in the LL652 oil field to zero due to new geologic assessments as a result of less than anticipated effect of the water and gas injection. Through the last writedown we recognized a pre-tax loss of NOK 0.8 billion (NOK 0.6 billion after tax) in 2002.
In Natural Gas, we restructured our portfolio as follows:
We signed a contract to sell our 5.26% stake in the VNG Verbundnetz Gas AG, a German gas merchant company, to EWE AG in December 2003. The sale was completed in January 2004 with a gain of approximately NOK 0.6 billion before tax (approximately NOK 0.4 after tax).
In October 2001, we implemented a new strategy for our UK business with the effect that we sold our small customer portfolio to Shell Gas Direct, and we shifted from an end user sales focus towards sales to larger, industrial customers. As part of the SDFI transaction in 2001, our ownership in Statpipe was reduced from 58.25% to 25% from June 1, 2001.
In Manufacturing and Marketing, we restructured our portfolio as follows:
In December 2002, our 100% owned subsidiary Navion was sold to Norsk Teekay AS, which is a wholly owned subsidiary of Teekay Shipping Corporation, forapproximately USD 800 million, effective from January 1, 2003. The closing date was April 7, 2003. In 2002 Navion accounted for revenues of NOK 7.2 billion and depreciation of NOK 0.5 billion. Statoil continues to own 50% of the drillshipWest Navigator and 100% of the multi-purpose vesselOdin, although we have agreed to sellOdin to Marathon Petroleum and its Alvheim project partners as more fully described under Item 4- Business Overview- Manufacturing and Marketing.Odin is no longer in the Manufacturing and Marketing business segment, and the expected sale will consequently have no impact on the segment’s results.
In October 2001, we increased our ownership in Navion from 80% to 100%. In addition, we sold our interests in the production shipsNavion Munin andBerge Hugin to Bluewater in the second half of 2001.
Subsequent Events
In January 2004, Statoil signed a letter of intent with Dominion Resources Inc, concerning increased access to capacity at the LNG terminal Cove Point in Maryland, USA.
In 2003, Statoil ASA and ICA AB have, initiated by ICA, signed a Letter of Intent regarding sale of ICA’s 50% ownership in Statoil Detaljhandel Skandinavia (SDS) to Statoil. Final agreement has to be approved by the board of directors of each of Statoil and ICA, and pending such approval the transaction is expected to be completed during the first half of 2004.
Factors Affecting Our Results of Operations
Our results of operations substantially depend on:
Our results will also be affected by trends in the international oil industry, including:
The following table shows the yearly average crude oil trading prices, natural gas contract prices and NOK/USD exchange rates for 2001, 2002 and 2003.
2001 | 2002 | 2003 | |
Crude oil (USD/bbl Brent blend) | 24.4 | 25.0 | 28.8 |
Natural gas(1) (NOK per scm) | 1.22 | 0.95 | 1.02 |
NOK/USD average daily exchange rate | 8.99 | 7.97 | 7.08 |
(1) From the Norwegian Continental Shelf.
The following table illustrates how certain changes in the crude oil price, natural gas contract prices, refining margins and the NOK/USD exchange rate may impact our income before financial items, other items, income taxes and minority interest and our net income assuming activity at levels achieved in 2003.
Sensitivities on 2003 results
(in NOK billion) | Change in Income before financial items, other items, income taxes and minority interest | Change in Net income |
Oil price (+/- USD 1/bbl) | 1.9 | 0.5 |
Gas price (+/- NOK 0.1/scm) | 1.9 | 0.4 |
Refining margins (+/- USD 1/bbl) | 0.8 | 0.6 |
US dollar exchange rate impact on revenues and costs (+/- NOK 0.50) | 3.7 | 1.0 |
US dollar exchange rate impact on financial debt (+/- NOK 0.50) | - | 1.3 |
The sensitivities on our financial results shown in the table above would differ from those that would actually appear in our consolidated financial statements because our consolidated financial statements would also reflect the effect on proved reserves, trading margins in the Natural Gas and Manufacturing and Marketing business segments, our exploration expenditures, development and exploration success rate, inflation, potential tax system changes, and the effect of any hedging programs in place.
Our oil and gas price hedging activities are designed to assist our long-term strategic development and attainment of targets by protecting financial flexibility and cash flow, allowing the corporation to be able to undertake profitable projects/ acquisitions and avoiding forced divestments during periods of adverse market conditions. For the oil price, we entered into a downside protection structure for some of our production, reducing price risk below USD 18 per barrel for 2002 and below USD 16 per barrel for 2003. No such protection has been entered into for 2004, but we have entered into downside protection for prices below USD 18 per barrel for some of our production for the last three quarters of 2005. Natural gas is primarily sold under price formulas that establish time lags for the change of the gas price. For 2004, approximately 25% of the refining margin was hedged to reflect our view of the markets.
Fluctuating foreign exchange rates can have a significant impact on our operating results. Our revenues and cash flows are mainly denominated in or driven by US dollars, while our operating expenses and income taxes payable accrue to a large extent in NOK. We seek to manage this currency mismatch by issuing or swapping long-term debt into US dollars. This debt policy is an integrated part of our total risk management program. We are also engaging in foreign currency hedging to cover our non-USD needs, which are primarily in NOK. We manage the risk arising from our interest rate exposures through the use of interest rate derivatives, primarily interest rate swaps, based on a benchmark for the interest reset profile of our total loan portfolio. See —Liquidity and Capital Resources—Risk Management and Item 11—Quantitative and Qualitative Disclosures about Market Risk. In general, an increase in the value of the US dollar against the NOK can be expected to increase our reported earnings. However, because currently our debt outstanding is in US dollars, the benefit to Statoil would be offset in the near term by an increase in the value of our debt, which would be recorded as a financial expense and, accordingly, would adversely affect our net income. See —Liquidity and Capital Resources—Risk Management and Item 11—Quantitative and Qualitative Disclosures about Market Risk.
We market and sell the Norwegian State's oil and gas together with our own production. Historically, when we took SDFI production of oil and gas into our own inventory, for example for use in our downstream operations (e.g., in our refining business or our downstream retail operations), we included the proceeds from the sale of such production in our revenues and the price we paid to the Norwegian State in our cost of goods sold. When we sold the SDFI oil and gas on to external customers directly, however, we did not take SDFI production into our own inventory, and we included only the net result of this trading activity in our revenues.
Anticipating our initial public offering, the Norwegian State, acting as sole shareholder, held an extraordinary general meeting on February 27, 2001 and approved a resolution stating that Statoil shall continue to market and sell the Norwegian State’s oil and gas. The terms that apply to our marketing and sale of the SDFI oil and gas after the Norwegian State’s restructuring of its oil and gas assets are set out in the owner’s instruction which was adopted by our annual general meeting on May 25, 2001 and became effective on June 17, 2001. Pursuant to the owner’s instruction, we agreed to purchase all of the SDFI oil and NGL produced and, therefore, include the proceeds from the sale of the SDFI production as revenue and the price that we pay to the Norwegian State as cost of goods sold. The treatment of our sales of SDFI natural gas has remained the same as prior to the initial public offering.
Historically, we paid to the Norwegian State the “norm price” for crude oil set by the Norwegian Petroleum Price Board, an independent panel of assessors, based on an average of spot market prices and contract prices for NCS oil during the recent month. The price we paid to the Norwegian State for NGL and natural gas was equal to the price actually obtained from the sale to third parties. After June 17, 2001, the price that we pay to the Norwegian State for natural gas, however, is either the market value, if we take the natural gas into our own inventory, or, if we sell the natural gas directly to external customers or to us, our payment to the Norwegian State is based on either achieved prices, a net back formula or market value. We now purchase all of the Norwegian State’s oil and NGL. Pricing of the crude oil is based on market reflective prices. NGL prices are based on either achieved prices, market value or market reflective prices.
Total purchases of oil and NGL from the Norwegian State by Statoil amounted to NOK 68,479 million (336 mmboe), NOK72,298 million (374 mmboe), and NOK 53,291 million (265 mmboe) in 2003, 2002 and 2001, respectively. See Item 7—Major Shareholders and Related Party Transactions—Major Shareholders—The Norwegian State as Shareholder—Marketing and Sale of the SDFI's Oil and Gas.
As with all producers on the NCS, we pay a royalty to the Norwegian State for NCS oil produced from fields approved for development prior to January 1, 1986. Oil fields in our portfolio that paid royalty in 2003 are Gullfaks and Oseberg, which together represented 27%, 24% and 16% of our total NCS petroleum production in 2001, 2002 and 2003 respectively. The change from 2002 to 2003 was primarily the result of the royalty being abolished at Statfjord, as of January 1, 2003. The royalty is generally paid in kind, and varies from 8% to 16% of the oil produced. We purchase from the Norwegian government at “norm price” all royalty oil paid in kind by producers on the NCS. We include the costs of purchase and the proceeds from the sale of the royalty oil, which we resell or refine, in our cost of goods sold and sales revenue, respectively. No royalty is paid from fields approved for development on or after January 1, 1986. Royalty obligations from Gullfaks and Oseberg will be abolished by 2006.
Historically, our revenues have largely been generated from the production of oil and natural gas from the NCS. Norway imposes a 78% marginal tax rate on income from offshore oil and gas activities. See Item 4—Information on the Company—Regulation—Norwegian Regulation—Taxation of Statoil—Corporate income tax. Our earnings volatility is moderated as a result of the significant amount of our Norwegian offshore income that is subject to a 78% tax rate in profitable periods and the significant tax assets generated by our Norwegian offshore operations in any loss-making periods. A significant part of the taxes we pay are paid to the Norwegian State. In June 2001, the Storting (The Norwegian Parliament) enacted certain changes in the taxation of petroleum operations. For details, see Item 4—Information on the Company Regulation—Norwegian Regulation—Taxation of Statoil.
Combined Results of Operations
The following table shows certain income statement data, expressed in each case as a percentage of total revenues.
CONSOLIDATED STATEMENTS OF INCOME | Year ended December 31, | ||
2001 | 2002 | 2003 | |
| Revenues: | |||
| Sales | 97.8% | 99.3% | 99.7% |
Equity in net income (loss) of affiliates | 0.2% | 0.2% | 0.2% |
Other income | 2.0% | 0.5% | 0.1% |
Total revenues | 100% | 100% | 100% |
| Expenses: | |||
Cost of goods sold | 53.4% | 60.7% | 60.0% |
Operating expenses | 12.5% | 11.6% | 10.7% |
Selling, general and administrative expenses | 1.5% | 2.2% | 2.2% |
Depreciation, depletion and amortization | 7.6% | 6.9% | 6.5% |
Exploration expenses | 1.2% | 0.9% | 1.0% |
Total expenses before financial items | 76.2% | 82.3% | 80.4% |
Income before financial items, other items, income taxes and minority interest | 23.8% | 17.7% | 19.6% |
Years ended December 31, 2003, 2002 and 2001
Sales. Statoil markets and sells the Norwegian State’s share of oil and gas production from the NCS. From June 2001, Statoil no longer acts as an agent to sell SDFI oil production to third parties. As such, all purchases and sales of SDFI oil production are recorded as cost of goods sold and sales, respectively, whereas before, the net result of any trading activity was included in sales.
All oil received by the Norwegian State as royalty in kind from fields on the NCS is purchased by Statoil. Statoil includes the costs of purchase and proceeds from the sale of this royalty oil in its Cost of goods sold and Sales respectively.
Our sales revenue totaled NOK 248.5 billion in 2003, compared to NOK 242.2 billion in 2002 and NOK 231.7 billion in 2001. The 3% increase in sales revenues from 2002 to 2003 was mainly due to 5% increased oil prices (contributing NOK 8 billion) and 7% increased realized prices of natural gas (contributing NOK 1.5 billion) measured in NOK as well as increased sales of third party oil and a 5% increase in sales of equity natural gas (contributing NOK 1.0 billion). A significant increase in the refining margin (FCC-margin) from USD 2.2 in 2002 to USD 4.4 in 2003 and other improvements in the downstream activity also contributed to the increased sales revenues in 2003 compared to 2002. This is partly offset by the reduction of oil volumes sold, reducing revenues by NOK 9.0 billion, mainly related to volumes sold on behalf of the Norwegian State (SDFI).
The sale of the shipping activity in the subsidiary Navion, reduced sales revenues by NOK 2.0 billion compared to 2002. The sale of the activity on the Danish continental shelf in 2002, reduced sales revenues by NOK 1.0 billion in 2003, compared to 2002.
Our average daily oil production (lifting) decreased from 748,200 barrels in 2002 to 737,500 barrels in 2003. The 1% decrease in average daily oil production from 2002 to 2003 was primarily due to lower production from declining fields including Statfjord, Sleipner East, Norne and Lufeng. Some operational difficulties at Snorre, Gullfaks, Visund and Åsgard reduced regularity of production somewhat in 2003 compared to 2002. This reduction was partly offset by production from new fields coming on stream in the fourth quarter of 2003, Xikomba, Jasmim, Fram West, as well as increased production from the fields Sincor in Venezuela and Girassol in Angola and Sigyn coming on stream in the fourth quarter of 2002. At the end of 2003, we are in an underlift position of 9,000 boe per day compared to a minor underlift position in 2002.
Our average daily oil production (lifting) decreased from 754,900 barrels in 2001 to 748,200 barrels in 2002. The 1% decrease in average daily oil production from 2001 to 2002 was primarily due to lower production from declining fields including Gullfaks, Statfjord, Sleipner, Oseberg, Alba and Lufeng. Yme was decommissioned during 2001 and Njord and Jotun were sold in 2001. In addition, Varg and Siri were sold in 2002. The planned maintenance period in 2002 was longer and included more fields than in 2001. In addition, the Norwegian government on December 17, 2001 decided to reduce oil production on the NCS by 150,000 barrels per day, covering the period January 1 to June 30, 2002. Our proportional share of this reduction was approximately 18,500 barrels per day.
The decrease in average daily oil production was partly offset by the start of production from the Girassol field in Angola, increased production from the Sincor field due to start up of the Sincorupgrading plant in the first quarter of 2002, higher production from Åsgard due to operating difficulties in 2001 and the fact that Glitne and Huldra both began producing in late 2001. In addition, as a result of an overlifting position on the NCS in 2001, as compared to an underlifting position for 2002, we lifted a lower volume of oil on the NCS than that represented by our total equity interest in 2002, while in 2001, we lifted a higher volume of oil than that represented by our total equity interest. See below for a description of the difference between produced volumes and lifted volumes.
Our gas volumes sold of own produced gas were 19.3 bcm (683 bcf) in 2003, compared to 18.8 bcm (666 bcf) in 2002 and 14.9 bcm (527 bcf) in 2001. Gas volumes increased primarily due to an increase in long-term contracted gas volumes to continental Europe as well as an increase in short-term sales, mainly to the UK.
We record revenues from sales of production based on lifted volumes. The term “production” as used in this section means lifted volumes. The term “production“ used in Item 4 —Information on the Company, means produced volumes, which include lifted volumes adjusted for under- and overlifting. Overlifting and underlifting positions are a result of Statoil lifting either a higher or a lower volume of oil than that represented by our total equity interest in that field.
Equity in net income (loss) of affiliates. Equity in net income (loss) of affiliates principally includes our 50% equity interest in Borealis, our 50% equity interest in Statoil Detaljhandel Skandinavia (SDS), our 50% equity interest in the drill shipWest Navigator, our former 15% interest in the Melaka refinery which was sold in 2001, and miscellaneous other affiliates. Our share of equity in net income of affiliates was NOK 616 million in 2003, NOK 366 million in 2002 and NOK 439 million in 2001. The increase from 2002 to 2003 was primarily due to increased contribution from Borealis, due to increased margins and volumes, and increased contribution from miscellaneous interest related to the natural gas business. This increase waspartly offset by reduced contribution from the retail business in SDS in 2003 as compared to 2002. The reduction from 2001 to 2002 was primarily due to increased losses from investments inWest Navigator as well as decreased income from miscellaneous other affiliates.
Other income. Other income was NOK 0.2 billion in 2003, NOK 1.3 billion in 2002 and NOK 4.8 billion in 2001. The NOK 0.2 billion income in 2003 is mainly related to the sale of the Navion assets. The NOK 1.3 billion income in 2002 is primarily related to the gain on the sale of the E&P operations off Denmark, including the Siri and Lulita fields. The NOK 4.8 billion income in 2001 primarily comprises the gain realized on the sale of non-core assets in the Grane, Njord and Jotun fields and a 12% interest in the Snøhvit field to Gaz de France, the sale of our 4.76% interest in the Kashagan oil field discovery in the Caspian Sea and the sale of our operations in Vietnam.
Cost of goods sold. Historically, our cost of goods sold included the cost of oil and gas production that we purchased for resale or refining, including SDFI oil and gas purchased for our own inventory, including royalty oil. Beginning on June 17, 2001, our cost of goods sold includes the cost of the SDFI oil and NGL production that we purchase pursuant to the owner’s instruction, regardless of whether it is for resale to external customers directly or for our own inventory. See —Factors Affecting Our Results of Operations above for more information.
Cost of goods sold increased to NOK 149.6 billion in 2003 from NOK 147.9 billion in 2002 and NOK 126.2 billion in 2001. The 1% increase in 2003 compared to 2002, is mainly due to increased oil prices measured in NOK. This was partly offset by the 11% weakening of the NOK/USD exchange rate, as well as reduced volumes purchased from the SDFI.
The 17% increase in 2002 is mainly due to increased purchase of SDFI volumes and third party volumes. This was partly offset by a reduction in crude oil prices measured in NOK.
Operating expenses. Our operating expenses include production costs in fields and transport systems related to our share of oil and gas production. Operating expenses decreased to NOK 26.7 billion in 2003 compared to NOK 28.3 billion in 2002 and NOK 29.4 billion in 2001.
The 6% decrease from 2002 to 2003 is mainly related to the shipping activities in Navion being sold in 2003, as well as reduced processing costs. The 4% decrease from 2001 to 2002 was mainly related to reduced platform costs and lower future site removal costs due to updated removal estimates. This was partly offset by increased insurance costs and variable costs due to the higher production volume in 2002 compared with 2001.
Selling, general and administrative expenses. Our selling, general and administrative expenses include costs relating to the selling and marketing of our products, including business development costs, payroll and employee benefits. Our selling, general and administrative expenses increased to NOK 5.5 billion in 2003, compared to NOK 5.3 billion in 2002 and NOK 4.3 billion in 2001.
The increase from 2002 to 2003 was primarily due to increased spending in Manufacturing and Marketing business as compared to 2002, mainly due to expansion of the retail network into Poland and the Baltic countries. This is partly offset by a reduction in business development spending in International E&P. The rig provisions increased by NOK 0.4 billion during 2003, most of which affected selling, general and administrative expenses. This is NOK 0.2 billion higher than the provisions made for such losses in 2002.
The increase from 2001 to 2002 was primarily due to increased business development in International E&P and increases in the rig provisions within E&P Norway, most of which affected selling, general and administrative expenses. This is partly offset by a reduction in selling, general and administrative expenses in our Manufacturing and Marketing business segment.
Over the period 1998-2003 we provided approximately NOK 2.1 billion for the anticipated reduction in market value of company exposed fixed-price mobile drilling rig contracts. At December 31, 2003, the remaining provision for these losses was approximately NOK 1.4 billion based on our assumptions regarding our own utilization of the rigs and the rate and duration at which we could sublet these rigs in the Norwegian market to third parties and the development of the NOK/USD exchange rate. These assumptions reflect management judgment and were reassessed based on the most current information as of the end of the year 2003. Contracts have been entered into for both drilling rigs for most of 2004.
Depreciation, depletion and amortization expenses. Our depreciation, depletion and amortization expenses include depreciation of production installations and transport systems, depletion of fields in production, amortization of intangible assets and depreciation of capitalized exploration costs as well as write-down of impaired long-lived assets. Depreciation, depletion and amortization expenses were NOK 16.3 billion in 2003, NOK 16.8 billion in 2002 and NOK 18.1 billion in 2001.
The decrease is mainly related to the write-down of the LL652 field in Venezuela of NOK 0.8 billion in 2002, while the 2003 figure includes the NOK 0.2 billion write-down of the Dunlin field in the UK. This decrease was partly offset by the increase related to the repeal of the Removal Grants Act, which entails that depreciation related to asset retirement increased by NOK 0.6 billion compared to 2002. New fields coming on stream in 2003 also increased deprecation. The NOK 2.0 billion write-down on the LL652 field in 2001 accounts for most of the reduction from 2001 to 2002. This was however, partly offset by higher depreciation from new fields coming on stream.
Exploration expenses. Our exploration expenditure is capitalized to the extent our exploration efforts are deemed successful and is otherwise expensed as incurred. Our exploration expenses consist of the expensed portion of our current-period exploration expenditures and write-offs of exploration expenditures capitalized in prior periods. Exploration expenses were NOK 2.4 billion in 2003, NOK 2.4 billion in 2002, and NOK 2.9 billion in 2001.
Exploration (IN NOK MILLIONS) | Year ended December 31, | ||
2001 | 2002 | 2003 | |
Exploration expenditure (activity) | 2,703 | 2,507 | 2,445 |
Expensed, previously capitalized exploration costs | 937 | 554 | 256 |
Capitalized share of current period's exploration activity | (765) | (651) | (331) |
Exploration expenses | 2,877 | 2,410 | 2,370 |
The reduction of 2% in exploration expense from 2002 to 2003 was mainly due to a lower level of exploration activity within E&P Norway, partly offset by higher exploration activity within International E&P. Exploration expenditure capitalized in previous years but written off in 2003 was NOK 0.3 billion lower than in 2002. A total of 23 exploration and appraisal wells were completed in 2003, of which 17 resulted in discoveries.
The reduction of 16% from 2001 to 2002 was mainly due to a lower level of exploration activity within E&P Norway, partly offset by higher exploration activity within International E&P. In addition there was a decrease in exploration expenditure capitalized in previous years but written off in 2002 as compared to 2001. Including sidetracks from exploration wells and exploration extensions derived from production wells, a total of 28 wells were completed in 2002, 21 of which resulted in discoveries.
Income before financial items, other items, income taxes and minority interest. Income before financial items, other items, income taxes and minority interest totaled NOK 48.9 billion in 2003, NOK 43.1 billion in 2002 and NOK 56.2 billion in 2001.
The 13% increase from 2002 to 2003 is mainly related to increased oil and natural gas prices measured in NOK and higher margins in the downstream segment. Oil prices in 2003 measured in USD increased by 18% compared to 2002. Measured in NOK, however, the oil price increased by 5%, and the natural gas prices increased by 7% compared with 2002. Refining and petrochemical margins were also higher in 2003 compared to 2002, which contributed to increased contribution from downstream activities totaling NOK 1.9 billion.
The 23% decline from 2001 to 2002 is mainly related to lower oil and natural gas prices measured in NOK and lower margins in the downstream segment. Oil prices in 2002 measured in USD increased by 2% compared to 2001. However, measured in NOK, the oil price decreased by 9% and the natural gas price decreased by 22%, compared to 2001. Refining, petrochemical and shipping margins were also lower in 2002 compared to 2001, due to weaker markets. The income for the downstream area was also negatively affected by the stronger NOK measured against the USD.
Income before financial items, other items, income taxes and minority interest for 2002 included a gain of NOK 1.0 billion before tax related to the sale of the upstream activity in Denmark, partly offset by an impairment of LL652 in Venezuela in 2002 of NOK 0.8 billion before tax. 2001 included net gains of NOK 2.3 billion before tax.
In 2003, 2002 and 2001, our income before financial items, other items, income taxes and minority interest margins, measured as a percentage of revenues, was approximately 20%, 18%, and 24%, respectively, for the reasons discussed above.
Net financial items. In 2003 we reported net financial items of NOK 1.4 billion, compared to NOK 8.2 billion in 2002 and NOK 0.1 billion in 2001. The changes from year to year resulted principally from changes in unrealized currency gains and losses on the US dollar portions of our long-term debt outstanding due to changes in the NOK/USD exchange rate. During 2002, the NOK strengthened by NOK 2.05, while the NOK strengthened by NOK 0.29 during 2003. The reduction in net financial items from 2002 to 2003 is mainly related to fluctuations in the NOK/USD exchange rate. The currency mix of the debt portfolio changed during 2001, from 80% to nearly 100% US dollar-denomination. The debt portfolio including the effect of swaps was as at year-end 2003 nearly 100% held in US dollars.
Interest income and other financial income amounted to NOK 1.2 billion in 2003 compared to NOK 1.8 billion in 2002. The reduction is mainly due to lower interest income following the general reduction in interest rates in 2003 compared to 2002. In 2001 Interest income and other financial income was NOK 2.1 billion.
Interest costs and other financial costs amounted to NOK 0.9 billion in 2003 compared to NOK 2.0 billion in 2002. The reduced costs are mainly due to lower short-term USD interest rates, which reduced the interest charge on the group’s long-term debt, as well as shorter interest reset profiles and reduced average NOK/USD exchange rate in 2003 compared to 2002. In 2001 Interest cost and other financial cost amounted to NOK 2.7 billion.
The result from management of the portfolio of security investments, mainly in equity securities and held by our insurance captive Statoil Forsikring AS, provided a gain in 2003 of NOK 0.9 billion compared to a loss in 2002 of 0.6 billion, and a loss in 2001 of 0.3 billion.
The Central Bank of Norway’s closing rate for NOK/USD was 9.01 on December 31, 2001, 6.97 on December 31, 2002, and 6.68 on December 31, 2003. These exchange rates have been applied in Statoil’s financial statements.
Other items. The Norwegian parliament voted in June 2003 to replace grants for costs related to the removal of installations on the NCS with an equivalent tax deduction for such costs. Previously, removal costs were refunded by the Norwegian state based on a percentage of the taxes paid over the productive life of the removed installation. As a consequence of the changes in legislation, we charged the receivable of NOK 6.0 billion from the Norwegian State related to the refund of removal costs to income under Other items in the second quarter of 2003. Furthermore, the resulting deferred tax benefit of NOK 6.7 billion was recognized. As a result the net effect on the income in 2003 was NOK 0.7 billion.
Income taxes. Our effective tax rates were 62.0%, 66.9% and 68.5% in 2003, 2002 and 2001, respectively. The reduction in tax rate from 2002 to 2003 is mainly related to the repeal of the Removal Grants Act, which entailed NOK 6.7 billion being recorded as income and reduced deferred taxes, whereas NOK 6.0 billion was recorded as an expense under other items. Adjusted to exclude the effect of the repeal of the Removal Grants Act in 2003, the effective tax rate would have been 67.9%. Our effective tax rate is calculated as our income taxes divided by our income before income taxes and minority interest. Fluctuations in the effective tax rates from year to year are principally a result of changes in the components of income between Norwegian oil and gas production, taxed at a marginal rate of 78%, other Norwegian income, including onshore portion of net financial items, taxed at 28%, and income in other countries taxed at the applicable income tax rates.
Minority interest. Minority interest in net profit in 2003 was NOK 289 million, compared to NOK 153 million in 2002 and NOK 488 million in 2001. Minority interest consists primarily of Shell’s 21% interest in the Mongstad crude oil refinery, and the Norwegian State’s 35% interest in the crude oil terminal at Mongstad, which was transferred to the Norwegian State effective June 1, 2001 as part of the SDFI transaction. Minority interest also included Rasmussengruppen’s 20% equity interest in Navion until October 1, 2001, when we, as part of restructuring our ownership in Navion, acquired the Rasmussengruppen’s equity interest in the company.
Net income. Net income in 2003 was NOK 16.6 billion compared to NOK 16.8 billion in 2002 and NOK 17.2 billion in 2001 for the reasons discussed above.
Improvement Program. Statoil has specified a set of improvement efforts necessary to reach its target of return on average capital employed in 2004 of 12%, based on normalized assumptions. To meet this target, Statoil determined that, among other improvements, it would need to reduce certain costs and increase revenue items by a total of NOK 3.5 billion in 2004, compared to 2001. As at the end of 2003, Statoil has identified annual, sustainable improvements in both costs and revenues, which it estimates will contribute NOK 2.8 billion toward the NOK 3.5 billion target for 2004. For further discussion of the improvement program, see Item 5- Operating Review and Prospects- Use of Non-GAAP Financial Measures.
Business Segments
The following table details certain financial information for our four business segments. In combining segment results, we eliminate inter-company sales. These include transactions recorded in connection with our oil and natural gas production in the E&P Norway or International E&P segments and also in connection with the sale, transport or refining of our oil and natural gas production in the Manufacturing and Marketing or Natural Gas segments. Our E&P Norway business segment produces oil, which it sells internally to the trading arm of our Manufacturing and Marketing business segment, which then sells the oil on the market. E&P Norway also produces natural gas, which it sells internally to our Natural Gas business segment, also to be sold on the market. As a result, we have established a market price-based transfer pricing policy whereby we set an internal price at which our E&P Norway business area sells oil and natural gas to the Manufacturing and Marketing and the Natural Gas business segments.
Historically, for sales of oil from E&P Norway to Manufacturing and Marketing, the transfer price with respect to oil types where prices are quoted on the market consists of the applicable market price less a margin of NOK 2.15 per barrel and, for all other oil types, the transfer price consists of the estimated “norm price”less a margin of NOK 2.15 per barrel. As of June 17, 2001, the transfer price with respect to all types of oil is the applicable market reflective price less a margin of NOK 0.70 per barrel. As of the first quarter of 2003, a new method for calculating the transfer price for sales of gas from E&P Norway to Natural Gas has been adopted. The new price amounts to NOK 0.32 per standard cubic meter, adjusted quarterly by the average USD oil price over the last six months in proportion to USD 15 per barrel. Segment reporting for prior periods has been adjusted to reflect the new pricing formula.
The table below sets forth certain financial information for our business segments, including inter-company eliminations for each of the years in the three-year period ending December 31, 2003.
(in million) | Year ended December 31, | |||
2001 | 2002 | 2003 | ||
NOK | NOK | NOK | USD | |
E&P Norway | ||||
| Revenues | 67,245 | 58,780 | 62,494 | 9,375 |
Income before financial items, other items, income taxes and minority interest | 42,287 | 33,953 | 37,589 | 5,639 |
Long-Term Assets | 77,550 | 77,001 | 80,681 | 12,103 |
International E&P | ||||
| Revenues | 7,693 | 6,769 | 6,980 | 1,047 |
Income before financial items, other items, income taxes and minority interest | 1,291 | 1,086 | 1,702 | 255 |
Long-Term Assets | 21,530 | 20,655 | 33,102 | 4,966 |
Natural Gas | ||||
| Revenues | 23,468 | 24,536 | 25,087 | 3,763 |
Income before financial items, other items, income taxes and minority interest | 8,039 | 6,428 | 6,350 | 953 |
Long-Term Assets | 10,500 | 10,312 | 10,555 | 1,583 |
Manufacturing and Marketing | ||||
| Revenues | 203,387 | 211,152 | 218,642 | 32,800 |
Income before financial items, other items, income taxes and minority interest | 4,480 | 1,637 | 3,555 | 533 |
Long-Term Assets | 30,432 | 27,958 | 23,351 | 3,503 |
Other and Eliminations | ||||
| Revenues | (64,832) | (57,423) | (63,828) | 9,574 |
Income before financial items, other items, income taxes and minority interest | 57 | (2) | (280) | (42) |
Long-Term Assets | 11,026 | 11,307 | 14,742 | 2,211 |
Total income before financial items, other items, income taxes and minority interest | 56,154 | 43,102 | 48,916 | 7,338 |
E&P Norway
The following table sets forth certain financial and operating data regarding our E&P Norway business segment and percentage change for the three years ended December 31, 2003.
Income statement data (in NOK millions) | Year ended December 31, | ||||
2001 | 2002 | change | 2003 | change | |
| Total revenues | 67,245 | 58,780 | (13%) | 62,494 | 6% |
Operating, general and administrative expenses | 11,145 | 11,546 | 4% | 11,438 | (1%) |
Depreciation, depletion and amortization | 11,805 | 11,861 | 0% | 12,102 | 2% |
Exploration expense | 2,008 | 1,420 | (29%) | 1,365 | 4% |
Income before financial items, other items, income taxes and minority interest | 42,287 | 33,953 | (20%) | 37,589 | 11% |
Production (lifting): | |||||
| Oil (mbbl/day) | 697.1 | 666.7 | (4%) | 651.9 | (2%) |
| Natural gas (mmcf/day) | 1,380 | 1,784 | 29% | 1,857 | 4% |
| Total Production (lifting) (mboe/day) | 942.7 | 985.5 | 5% | 982.4 | 0% |
Reserve replacement ratio(1)(2) | 0.77 | 0.63 | (18%) | 0.79 | 25% |
Finding cost (USD per boe)(1) | 1.53 | 0.81 | (47%) | 0.63 | (17%) |
Finding and Development Costs (USD per boe)(1) | 9.35 | 5.89 | (37%) | 5.24 | (11%) |
Unit Production (lifting) Cost (USD per boe)(3) | 2.66 | 2.87 | 8% | 3.15 | 10% |
Unit Production (lifting) Cost (NOK per boe)(3) | 23.91 | 22.85 | (4%) | 22.30 | (2%) |
(1) Reserve replacement rate, finding cost and finding and development costs are calculated as a rolling three-year average based on our proved reserves estimated in accordance with the SEC definitions.
(2) The reserve replacement rate is defined as the total additions to proved reserves, including acquisitions and disposals, divided by produced reserves.
(3) Our unit production (lifting) cost is calculated by dividing operating costs relating to the production of oil and natural gas by total production (lifting) of petroleum in a given year. Figures for 2001 and 2002 have been restated. See Supplementary Information on Oil and Gas Producing Activities beginning on page F-31 for further details.
Years ended December 31, 2003, 2002 and 2001
E&P Norway generated revenues of NOK 62.5 billion in 2003, compared to NOK 58.8 billion in 2002 and NOK 67.2 billion in 2001. The 6% increase in revenues from 2002 to 2003 resulted primarily from an 18% increase in the average realized crude oil price in USD, a 19% increase in the transfer price in NOK of natural gas sold from E&P Norway to Natural Gas. This was partly offset by a 13% decrease in the NOK/USD exchange rate and a reduction in lifted volumes of oil. The 13% decrease in revenues from 2001 to 2002 resulted primarily from an 11% decrease in the NOK/USD exchange rate and a decrease in the transfer price of natural gas sold from E&P Norway to Natural Gas of 16%. This was partly offset by a 2% increase in average realized crude oil prices.
Average daily oil production (lifting) in E&P Norway decreased to 651,900 barrels in 2003 from 666,700 barrels in 2002 and from 697,100 barrels in 2001. The 2% decrease in average daily oil production from 2002 to 2003 was primarily due to decline from large fields like Statfjord, Sleipner Øst and Norne being past production plateau. The new fields Mikkel, Fram Vest and Vigdis Extension, which started production in the fourth quarter could not fully replace the production decline from the old fields.
The 4% decrease in average daily oil production from 2001 to 2002 was primarily due to lower production from fields like Statfjord, Sleipner and Oseberg, which are on decline. Yme was decommissioned during 2001 and Njord and Jotun were sold in 2001. Varg was sold in 2002. The planned maintenance periods in 2002 were longer and included more fields than in 2001. In addition the Norwegian government decided on December 17, 2001 to reduce oil production on the NCS by 150,000 barrels per day, covering the period January 1, to June 30, 2002. Our share of this reduction was approximately 18,500 barrels per day over that period.This decrease was partly offset by higher production from Åsgard where we experienced operating difficulties on Åsgard B in 2001 and the fact that Glitne and Huldra both began producing in late 2001.
Average daily gas production was 52.6 mmcm (1,857 mmcf) in 2003, as compared to 50.7 mmcm (1,784 mmcf) in 2002, and 39.1 mmcm (1,380 mmcf) in 2001. Gas production increased by 4% between 2002 and 2003 and by 29% between 2001 and 2002, primarily due to an increase in long-term contracted gas volumes to continental Europe and an increase in short-term sales, mainly to the UK.
Unit production cost was USD 2.66 per boe in 2001, USD 2.87 per boe in 2002 and USD 3.15 per boe in 2003. The increase from 2002 to 2003 is due primarily to the effect of a weaker USD against the NOK since costs are primarily incurred in NOK. However, production costs measured in NOK have decreased from NOK 23.91 per boe in 2001, to NOK 22.85 per boe in 2002 and to NOK 22.30 per boe in 2003.
Depreciation, depletion and amortization expenses were NOK 12.1 billion in 2003, NOK 11.9 billion in 2002 and NOK 11.8 billion in 2001. The increase from 2002 to 2003 is mainly due to depreciation of asset retirement assets pursuant to new removal accounting principle, which increased the depreciation base, and start of production from new fields in late 2002 and 2003, namely Sigyn, Mikkel, Fram Vest and Vigdis Extension. This was partly offset by increased reserves and lower lifted oil volumes. The minor increase from 2001 to 2002 resulted primarily from higher production.
Exploration expenditure (activity) decreased both from 2002 to 2003 and from 2001 to 2002. Exploration expenditure was NOK 1.2 billion in 2003, compared to NOK 1.4 billion in 2002 and NOK 2.0 billion in 2001. The 14% decrease from 2002 to 2003 is mainly due to fewer identified drilling opportunities which we believe would be successful in some of the areas where we have interests in acreage and lack of support for drilling of wells suggested by Statoil in the licenses. This resulted in fewer wells being drilled in 2003 than in 2002. The 30% decrease from 2001 to 2002 is primarily due to postponement of three wells to 2003, which resulted in fewer wildcat exploration wells drilled from floating drilling rigs in 2002 compared to 2001. This reduction was to some extent due to fewer identified drilling opportunities. We still have confidence in the NCS and expect our exploration activity, given access to acreage, to exceed the 2002 and 2003 level in coming years.
Exploration expense both in 2003 and 2002 was NOK 1.4 billion, compared to NOK 2.0 billion in 2001. The difference in activity in 2003 and 2002 was offset by lower capitalized exploration in 2003 than in 2002 and lower expenditure capitalized in previous years, but written off in 2003 than in 2002. In 2003 nine exploration and appraisal wells were completed, of which six resulted in discoveries. In comparison, 15 exploration and appraisal wells were completed in 2002, of which ten resulted in discoveries. In addition, five extensions on production wells were completed in 2002, of which four resulted in discoveries. The 30% decrease in expensed exploration from 2001 to 2002 is consistent with changes in expenditure levels due to variations in exploration activity. Eighteen exploration and appraisal wells and two extensions on production wells were completed in 2001, of which 15 resulted in discoveries. Exploration expense in 2003 included NOK 0.3 billion of expenditure capitalized in previous years, but written off in 2003, compared to NOK 0.5 billion of expenditure written off in 2002 and NOK 0.7 billion in 2001.
Income before financial items, other items, income taxes, and minority interest for E&P Norway was NOK 37.6 billion, compared to NOK 34.0 billion in 2002 and NOK 42.3 billion in 2001. The 11% increase in income before financial items, other items, income taxes and minority interest from 2002 to 2003 was primarily the result of an increase in revenues due to the 5% increase in the average realized crude oil price measured in NOK and the 19% increase in the transfer price of natural gas sold from E&P Norway to Natural Gas. Operating expenses are reduced by 2%, but the reduction was offset by a 2% increase in depreciation, depletion and amortization expenses.
The 23% decrease in income before financial items, other items, income taxes and minority interest from 2001 to 2002 was primarily the result of the reduction in sales revenues. Excluding the gains on sale from the Njord, Grane and Jotun fields and a 12% interest in the Snøhvit field, the income before financial items, other items, income taxes and minority interest in 2001 was NOK 39.3 billion, compared to NOK 31.5 billion in 2002.This was primarily due to lower oil prices in NOK, and the lower transfer price of natural gas sold from E&P Norway to Natural Gas. In addition, there have been lower production of crude oil, and higher costs related to accruals for future rig losses. The decline in income before financial items, other items, income taxes and minority interest was partly offset by increased sales of natural gas, decreased exploration expenses and reduced operating costs.
International E&P
The following table sets forth certain financial and operating data regarding our International E&P business segment and percentage change in each of the three years ended December 31, 2003.
Income statement data (in NOK millions) | Year ended December 31, | ||||
2001 | 2002 | change | 2003 | change | |
| Total revenues | 7,693 | 6,769 | (12%) | 6,980 | 3% |
Depreciation, depletion and amortization | 3,371 | 2,355 | (30%) | 1,784 | (24%) |
Operating, general and administrative expenses | 2,165 | 2,338 | 8% | 2,489 | 6% |
Exploration expense(1) | 866 | 990 | 14% | 1,005 | 2% |
Income before financial items, other items, income taxes and minority interest | 1,291 | 1,086 | (16%) | 1,702 | 57% |
Production (lifting): | |||||
| Oil (mbbl/day) | 57.8 | 81.5 | 41% | 85.6 | 5% |
| Natural Gas (mmcf/day) | 41 | 33 | (20%) | 14 | (58%) |
| Total Production (lifting) (mboe/day) | 65.2 | 87.4 | 34% | 88.2 | 1% |
Reserve replacement ratio(2)(3) | 2.14 | 2.79 | 30% | 2.96 | 6% |
Finding Cost (USD per boe)(2) | 2.15 | 1.72 | (20%) | 1.58 | (8%) |
Finding and Development Costs (USD per boe)(2) | 8.60 | 7.15 | (17%) | 7.88 | 10% |
Unit Production (lifting) Cost (USD per boe)(4) | 4.78 | 3.85 | (19%) | 3.93 | 2% |
(1) Geology and Geophysics related costs of NOK 0.2 billion reclassified in 2002 from business development to exploration costs.
(2) Reserve replacement rate, finding cost and finding and development costs are calculated as a rolling three-year average based on our proved reserves estimated in accordance with the SEC definitions. Finding costs does not include effects of acquisitions and disposals.
(3) The reserve replacement rate is defined as the total additions to proved reserves, including acquisitions and disposals, divided by produced reserves. Reserve replacement rate for International E&P was adjusted for the sale of Statoil Energy Inc in the year 2000.
(4) Our unit production (lifting) cost is calculated by dividing operating costs relating to the production of oil and gas by total production (lifting) of petroleum in a given year. Figures for 2001 and 2002 have been restated. See Supplementary Information on Oil and Gas Producing Activities beginning on page F-31 for further details.
Years ended December 31, 2003, 2002 and 2001
International E&P generated revenues of NOK 7.0 billion in 2003, compared to NOK 6.8 billion in 2002 and NOK 7.7 billion in 2001. The 3% increase from 2002 to 2003 was mainly due to higher prices for crude oil contributing to an increase of NOK 1.3 billion and revenues from the LNG terminal at Cove Point of NOK 0.3 billion. This increase was partly offset by the NOK 1.0 billion divestment of the Denmark assets in 2002. The 12% decrease from 2001 to 2002 was mainly due to the gain of NOK 2.9 billion from the divestments of the Kashagan and Vietnam assets in 2001, compared to a gain of NOK 1.0 billion related to the divestment of the assets on the Danish Continental Shelf in 2002. The gains from divestments are included as other income under Total revenues. In addition, the decrease was affected by lower oil and natural gas prices measured in NOK. This was partly offset by a 34% increase in total lifting of oil and natural gas.
Average daily oil production (lifting) was 85,600 barrels per day in 2003, compared to 81,500 barrels per day in 2002 and 57,800 barrels per day in 2001. The 5% increase in average daily production of oil from 2002 to 2003 resulted primarily from increased production of 6,500 boe per day from the Sincor field in Venezuela, 3,600 boe per day from the Girassol field in Angola and 3,000 boe per day from the Alba field in the UK. New fields came into production in 2003 both in the UK, -the Caledonia field, -and in Angola, -the Jasmim field and the Xikomba field. These increases were partly offset by the declining production of 1,400 boe per day from the Lufeng field in China and the sales of the Siri field and Lulita field in Denmark, which in 2002 contributed production of 6,600 boe per day. The 41% increase in average daily production of oil from 2001 to 2002 resulted primarily from increased production from the Girassol field in Angola of 23,200 boe per day and the Sincor field in Venezuela of 9,700 boe per day due to start up of the upgrading plant. The Girassol field started production in December 2001. These increases were partly offset by declining production of 4,000 boe per day from the Siri field in Denmark, which we sold as of July 1, 2002, 1,400 boe per day of the Lufeng field in China, and 2,100 boe per day from the Alba field in the UK.
Average daily gas production in 2003 was 0.4 mmcm (14 mmcf) compared to 0.9 mmcm (33 mmcf) in 2002 and 1.2 mmcm (41 mmcf) in 2001. The 58% decrease from 2002 to 2003 resulted from the Jupiter gas field in the UK being in decline. The 20% decrease from 2001 to 2002 also resulted from the Jupiter gas field in the UK being in decline.
Unit production cost on a 12-month average increased by 2% from 2002 to 2003, mainly due to cost increases on the UK fields measured in USD due to the changes in the GBP/USD exchange rate. Unit production cost on a 12 month average decreased by 19% from 2001 to 2002 due to more cost effective fields coming on stream, primarily Girassol.
Depreciation, depletion and amortization expenses were NOK 1.8 billion in 2003, compared to NOK 2.4 billion in 2002 and NOK 3.4 billion in 2001. The 24% decrease in 2003 as compared to 2002 is primarily related to the NOK 0.8 billion impairment charge for writing down the LL652 field in Venezuela in 2002, partly offset by a NOK 0.2 billion write-down of the Dunlin field in the UK in 2003. The 30% decrease in 2002 as compared to 2001 is primarily related to the NOK 2.0 billion write-down of the LL652 oil field in Venezuela in 2001, partly offset by a NOK 0.8 billion impairment charge for writing down the LL652 field in 2002. The write-downs were mainly due to reductions in the projected volumes of oil recoverable during the remaining contract period of operation.
Exploration expenditure (activity) was NOK 1.2 billion in 2003, compared to NOK 1.2 billion in 2002 and NOK 0.7 billion in 2001. The 71% increase in exploration expenditure from 2001 to 2002 was mostly related to increased exploration activity in 2002, including geological and geophysical work related to surveying opportunities in potential new areas.
Exploration expense in 2003 was NOK 1.0 billion compared to NOK 1.0 billion in 2002 and NOK 0.9 billion in 2001. In total, 14 exploration and appraisal wells were completed in 2003, of which 11 resulted in discoveries and remained capitalized. The 14% increase in exploration expense from 2001 to 2002 is due to the inclusion of geological and geophysical work related to potential new areas, and by expensing the Nnwa-2 well in license 218 in Nigeria in 2002. This was partly offset by greater success in exploration activity in Angola. In total, eight exploration and appraisal wells were completed in 2002, of which seven resulted in discoveries and six remain capitalized. In 2001 a total of nine exploration – and appraisal wells were completed, of which three resulted in discoveries.
Income before financial items, other items, income taxes and minority interest for International E&P in 2003 was NOK 1.7 billion compared to NOK 1.1 billion in 2002 and NOK 1.3 billion in 2001. The oil and gas price development measured in USD contributed NOK 1.3 billion and decreased business development costs contributed NOK 0.1 billion in 2003 compared to 2002. In addition, there was a NOK 0.8 billion write-down of the LL652 oil field in Venezuela in 2002. These positive effects are partly offset by the weakening of the USD measured against the NOK of NOK 0.8 billion, the net effect of asset divestments in 2002 of NOK 1.0 billion and 2003, and the write-down of the Dunlin field in the UK of NOK 0.2 billion. The higher average lifted volumes in 2002 compared to 2001 contributed approximately NOK 1.6 billion, while the oil and gas price development measured in USD contributed NOK 0.2 billion. These positive effects are offset by the weakening of the USD measured against NOK and the net effect of asset divestments in 2001 and 2002. Excluding the effect of asset sales and write-downs, Income before financial items, other items, income taxes and minority interest was NOK 1.9 billion in 2003, compared to NOK 0.9 billion in 2002.
Natural Gas
The following table sets forth certain financial and operating data for our Natural Gas business segment and percentage change in each of the last three years ended December 31, 2003.
Income statement data (in NOK millions) | Year ended December 31, | ||||
2001 | 2002 | change | 2003 | change | |
| Total revenues | 23,468 | 24,536 | 5% | 25,087 | 2% |
| Natural gas sales | 18,984 | 20,844 | 10% | 20,728 | (1%) |
Processing and transportation | 4,484 | 3,692 | (18%) | 4,359 | 18% |
Cost of goods sold | 9,898 | 11,859 | 19.8% | 12,629 | 6% |
Operating, selling and administrative expenses | 4,867 | 5,657 | (16%) | 5,622 | (1%) |
Depreciation, depletion and amortization | 664 | 592 | (10.8%) | 486 | (18%) |
Income before financial items, other items, income taxes and minority interest | 8,039 | 6,428 | (20%) | 6,350 | (1%) |
| Prices: | |||||
Natural gas price (NOK/scm) | 1.22 | 0.95 | (22%) | 1.02 | 7% |
Transfer price natural gas (NOK/scm) | 0.59 | 0.50 | (15%) | 0.59 | 18% |
Volumes marketed: | |||||
For our own account (bcf) | 517.8 | 691.4 | 34% | 734.5 | 6% |
For the account of the SDFI (bcf) | 666.9 | 829.5 | 24% | 903.7 | 9% |
For our own account (bcm) | 14.7 | 19.6 | 34% | 20.8 | 6% |
For the account of the SDFI (bcm) | 18.9 | 23.5 | 24% | 25.6 | 9% |
Years ended December 31, 2003, 2002 and 2001
Revenues in the Natural Gas business consist mainly of gas sales derived from long-term gas sales contracts and tariff revenues from transportation and processing facilities. Natural Gas generated revenues of NOK 25.1 billion in 2003, compared to NOK 24.5 billion in 2002 and NOK 23.5 billion in 2001. The 2% increase in 2003 over 2002 was mainly caused by an 18% increase in processing and transportation revenues. From January 1, 2004, total revenues will include revenues from Cove Point and other international mid- and downstream gas activities, which were transferred from International E&P to Natural Gas as of January 1, 2004.
Natural gas sales were 20.8 bcm (734.5 bcf) in 2003, 19.6 bcm (691.4 bcf) in 2002 and 14.7 bcm (517.8 bcf) in 2001. The 6% increase in gas volumes sold from 2002 to 2003 was mainly caused by an increase in the gas sales contract portfolio, partially due to the start up of delivery under the Centrica contract. Of the total natural gas sales in 2003, Statoil produced 19.1 bcm (674.4 bcf). Average gas prices were NOK 1.02 per scm in 2003 compared to NOK 0.95 per scm in 2002, an increase of 7%. The increased price is mainly due to the increase in the NOK/EUR exchange rate. Cost of goods sold increased by 6%, mainly due to a higher transfer price to E&P Norway for gas as well as higher volumes of both Statoil produced volumes and third party volumes.
Some of the UK volumes, which in 2003 were accounted net, meaning that the sale of such volumes is accounted for by crediting natural gas sales with the margin or spread associated with the sale, were in 2002 accounted gross, meaning that the costs of such volumes were included in costs of goods sold and the total revenue generated by selling such volumes were included in natural gas sales as if the volumes had been taken into inventory. The change has no effect on income before financial items, other items, income taxes and minority interest, but affects comparisons on revenues and costs between the years.
Our long-term gas sales contracts specify a minimum volume of gas to be purchased by a customer during a particular year and in each day of that year, in each case within a particular range. By the end of each gas-year, a customer is obligated to purchase at least the volume agreed to or to compensate us for the difference between the minimum volumes contracted for and the volumes actually taken. Under these contracts, the range of gas volumes that, a customer may purchase per day is considerably wider than the corresponding range for gas volumes that must be purchased by year-end. Accordingly, a customer is free to vary the volume he takes in each day within the agreed range, and as a result also in each quarter, as long as he has purchased at least the specified volume by year-end. Additional long-term gas sales contracts have been entered into in 2003. We expect our currently contracted gas volumes to increase until 2008 because our gas sales contracts contain scheduled annual volume delivery increases. As customers may contractually vary their daily gas purchases, quarterly gas sales may increase or decrease without affecting the total contracted volume that a customer must purchase by the end of a given gas year.
Income before financial items, other items, income taxes and minority interest for Natural Gas in 2003 was NOK 6.35 billion, compared to NOK 6.43 billion in 2002 and NOK 8.04 billion in 2001. The 1% decrease in income before financial items was primarily a result of increased sales and a 7% increased external gas price, which was more than offset by an increase in cost of goods mainly due to a higher transfer price for gas.
In 2003, a total of NOK 62 million was expensed related to an estimated change in the value of certain gas sales contracts viewed as derivatives that are valued at market price, compared to a loss related to these contracts of NOK 115 million in 2002.
Manufacturing and Marketing
Income statement data (in NOK millions) | Year ended December 31, | ||||
2001 | 2002 | change | 2003 | change | |
| Total revenues | 203,387 | 211,152 | 4% | 218,642 | 4% |
Cost of goods sold | 180,732 | 193,353 | 7% | 200,453 | 4% |
Operating, selling and administrative expenses | 16,320 | 14,476 | 11% | 13,215 | (9%) |
Depreciation, depletion and amortization | 1,855 | 1,686 | (9%) | 1,419 | (16%) |
| Total expenses | 198,907 | 209,515 | 5% | 215,087 | 3% |
Income before financial items, other items, income taxes and minority interest | 4,480 | 1,637 | (63%) | 3,555 | 117% |
Operational data: | |||||
FCC margin (USD/bbl) | 3.6 | 2.2 | (39%) | 4.4 | 100% |
Contract price methanol (EUR/ton) | 220 | 172 | (22%) | 226 | 31% |
Petrochemical margin (EUR/ton) | 132 | 107 | (19%) | 119 | 11% |
Years ended December 31, 2003, 2002 and 2001
Manufacturing and Marketing generated revenues of NOK 218.6 billion in 2003, compared with NOK 211.2 billion in 2002 and NOK 203.4 billion in 2001. The 4% increase in revenue in 2003 over 2002 resulted primarily from higher prices in USD for crude oil, but was partly offset by the strengthening of the NOK versus the USD and a decrease in total sold volumes of crude oil of 6%. The 4% increase in revenues in 2002 over 2001 resulted primarily from higher sold volumes of crude and higher prices in USD for crude oil, but was partly offset by the strengthening of the NOK versus the USD.
Cost of goods sold increased from NOK 180.7 billion in 2001 to NOK 193.4 billion in 2002 and to NOK 200.5 billion in 2003. The increase from 2002 to 2003 resulted primarily from higher prices in USD for crude oil.
Depreciation, depletion and amortization totaled NOK 1.4 billion in 2003, compared with NOK 1.7 billion in 2002 and NOK 1.9 billion in 2001. The NOK 0.3 billion decrease from 2002 to 2003 was mainly due to the effects of the divestment of Navion, effective from April 7, 2003.
Income before financial items, income taxes and minority interest for Manufacturing and Marketing was NOK 3.6 billion in 2003, compared with NOK 1.6 billion in 2002 and NOK 4.5 billion in 2001. Higher refining margins from manufacturing activity were the main reason for the increase in income contributing NOK 1.3 billion from 2002 to 2003. Average refining margin (FCC-margin) was 100% higher, equaling USD 2.2 per barrel, from 2002 to 2003, but due to the strengthening of the NOK versus the US dollar, the effect in NOK on the FCC-margin was an increase of 78%. Average contract price on methanol was about 40% higher in NOK in 2003 than in 2002. In oil trading, profits increased by NOK 0.3 billion in 2003, compared with 2002, mainly due to better results from leased refinery capacity. The retail marketing profit increased by NOK 0.1 billion in 2003, compared with 2002. The increase was due to higher volumes, improved margins and cost reductions.
Lower refining margins were the main reason for a reduction in income from manufacturing activity by NOK 1.6 billion from 2001 to 2002. Average refining margin (FCC-margin) was 39% lower, equal to USD 1.4 per barrel, from 2001 to 2002, and the effect of this margin decrease was even greater measured in NOK due to the strong NOK. Average contract price on methanol was about 30% lower in 2002 in NOK than in 2001. The result was also negatively affected by planned maintenance shut downs at the refineries at Mongstad and at Kalundborg. In oil trading, profits in 2002 were on the same level as in 2001. The retail marketing profit increased by NOK 0.1 billion in 2002, compared to 2001. The increase was mainly due to higher volumes and cost reductions. The 2001 result was also affected by a small gain from the sale of an office building in Denmark.
On December 15, 2002, Statoil signed a contract to sell 100% of the shares in Navion ASA to Norsk Teekay AS, which is a wholly owned subsidiary of Teekay Shipping Corporation. The sales price for the fixed assets of Navion, excludingOdin and Navion’s 50% share in theWest Navigator[2]drill ship, which were not included in the sale, was approximately USD 800 million. The effective date of the transaction was January 1, 2003, and the sale was booked at closing on April 7, 2003. The income from the sales transaction was immaterial, but Navion contributed NOK 0.5 billion to income before financial items, income taxes and minority interest of the Manufacturing and Marketing business segment, compared with NOK 0.4 billion for the whole of 2002 and NOK 1.5 billion in 2001. The net result for 2002 was negatively affected by lower shipping rates and lower capacity utilization of the offshore loading fleet in 2002, compared to 2001.
The contribution from our retail affiliate Statoil Detaljhandel Skandinavia (SDS) to Manufacturing and Marketing’s income before financial items, income taxes and minority interest was NOK 152 million in 2003, compared with NOK 221 million in 2002 and NOK 222 million in 2001. The decrease of NOK 69 million from 2002 to 2003 was primarily due to bad results in the Danish retail business related to reduced margins, mainly as a consequence of fierce competition in the Danish retail market. Statoil ASA and ICA AB have, initiated by ICA, signed a letter of intent regarding the sale of ICA’s 50% ownership in SDS to Statoil. Final agreement has to be approved by the Board of Directors of each of Statoil and ICA, and the transaction is intended to be completed in the first half of 2004 subject to negotiation of definitive agreements.
The contribution from our affiliate Borealis to Manufacturing and Marketing’s income before financial items, other items, income taxes and minority interest was an income of NOK 106 billion in 2003, an income of NOK 53 million in 2002 and a loss of NOK 146 million in 2001. The contribution from Borealis increased from 2002 to 2003 mainly due to an increase in margins by EUR 12 per tonne equal to NOK 148 per tonne due to the weakening of the NOK versus the Euro, as well as a 2% increase in production. The contribution from Borealis increased from 2001 to 2002 mainly due to an increase in volumes sold by 4% and contribution from an ongoing improvement program. The margins, however, were reduced by EUR 25 per tonne, approximately 19%, from 2001 to 2002.
[2] Following the sale of the shipping activity in the subsidiary Navion, the drilling shipWest Navion was renamed as theWest Navigator. Statoil continues to own 50% of the drilling ship through P/R West Navigator DA.
Other operations
Years ended December 31, 2003, 2002 and 2001
Our other operations consist of the activities of Corporate Services, Corporate Center, Group Finance and Technology. In connection with our other operations, we recorded a loss before financial items, other items, income taxes and minority interest of NOK 280 million in 2003. Income before financial items, income taxes and minority interest was a loss of NOK 2 million in 2002 and an income before financial items, other items, income taxes and minority interest of NOK 57 million in 2001.
Liquidity and Capital Resources
Cash Flows Provided by Operating Activities
Our primary source of cash flow is funds generated from operations. Net funds generated from operations for 2003 was NOK 30.8 billion, as compared to NOK 24.0 billion in 2002, and NOK 39.2 billion for 2001.
The increase of NOK 6.8 billion from 2002 to 2003 is primarily due to an increase of NOK 8.9 billion in cash flow before tax, mainly due to higher prices and margins, as well as increased working capital items of NOK 0.2 billion (excluding taxes payable, short-term debt and cash). Changes in working capital items resulting from the disposal of the subsidiary Navion in the second quarter of 2003, are excluded from cash flows provided by operating activities and classified as proceeds from sale of assets. This is partly offset by a NOK 2.3 billion increase in taxes payable. In 2003 a NOK 6.2 billion increase in deferred tax assets was recorded as income, of which the repeal of the Removal Grants Act represented NOK 6.7 billion. The deferred tax income was NOK 0.6 billion in 2002. As a result of the changes in legislation, Statoil’s claim against the Norwegian state totaled NOK 6.0 billion. The net recording to income related to the repeal of the Removal Grants Act in the second quarter of 2003 amounted to NOK 0.7 billion, which had no cash effect in the period.
Cash flows in 2001 were significantly affected by the SDFI transaction in which the Norwegian state transferred interests in certain SDFI properties to Statoil. The decline in cash flows provided by operating activities in 2002 of NOK 15.2 billion, compared to 2001, is partly due to increased working capital of NOK 1.1 billion (excluding taxes payable, short-term interest-bearing debt and cash). In addition, NOK 12.0 billion of the reduction is related to the decrease in cash flow from operations before tax, mainly due to lower prices, margins and the decline in the NOK/ USD exchange rate, as well as NOK 2.0 billion in increased tax payments.
Cash Flows used in Investing Activities
Net cash flows used in investing activities amounted to NOK 23.2 billion in 2003, as compared to NOK 16.8 billion in 2002, and NOK 12.8 billion for 2001.
Gross investments, defined as additions to property, plant and equipment and capitalized exploration expenditures, increased from NOK 17.4 billion in 2001, to NOK 20.1 billion in 2002 and to NOK 24.1 billion in 2003. Gross investments also include investments in intangible assets and long-term share investments. The increase from 2002 to 2003 is mainly related to increased investments in the E&P Norway and International E&P business areas as a result of an increased number of development projects. The difference between cash flows to investment activities and gross investments is mainly related to the divestment of Navion in the second quarter of 2003. Furthermore the prepayment made in 2003 of USD 1.0 billion for the two assets in Algeria, In Salah and In Amenas, is included in Cash flow used in investment activities, but is not reported as investment in 2003, as the transaction is subject to approval by Algerian authorities.
The 31% increase in net cash flows used in investment activities from 2001 to 2002 was primarily related to higher investment levels in E&P Norway, International E&P and Manufacturing and Marketing, as well as reduced cash flow from sale of assets compared to 2001.
Cash Flows used in Financing Activities
Net cash flows used in financing activities amounted to NOK 7.9 billion for 2003, as compared to NOK 4.6 billion for 2002 and NOK 31.5 billion in 2001. New long-term borrowing in 2003 decreased by NOK 2.2 billion compared to 2002, while repayment of long-term debt decreased by NOK 2.1 billion. The NOK 3.3 billion increase in cash flows used in financing activities from 2002 to 2003 is mainly related to changes in cash flow related to net short-term borrowings and bank overdrafts. The amount reported in 2003 includes a dividend paid to shareholders of NOK 6.3 billion, while the dividend paid to shareholders in 2002 was NOK 6.2 billion. In 2001, an additional NOK 12.9 billion in proceeds were received from the issuance of new shares in our initial public offering. We used the proceeds to repay the Norwegian State for the subordinated debt incurred in the restructuring of the SDFI assets. The change in net cash flows from financing activities from 2001 to 2002 was due primarily to the restructuring of the SDFI assets and proceeds from the issuance of new shares in 2001.
We paid dividends amounting to NOK 6.3 billion in 2003. Dividends paid in 2002 totaled NOK 6.2 billion, while dividends paid in 2001 amounted to NOK 55.4 billion. The dividend for 2001 includes payment of the transferred SDFI assets of approximately NOK 40.8 billion. The dividends we paid in the past reflected our status as wholly owned by the Norwegian State and should not be considered indicative of our future dividend policy.
Working Capital
Working capital (total current assets less current liabilities) increased by NOK 3.0 billion from 2002 to 2003, from a negative working capital of NOK 1.3 billion as of December 31, 2002 to a positive working capital of NOK 1.7 billion as of December 31, 2003. Working capital as of December 31, 2001 was negative by NOK 9.5 billion. We believe that, taking into consideration Statoil's established liquidity reserves (including committed credit facilities), credit rating and access to capital markets, we have sufficient liquidity and working capital to meet our present and future requirements. Our sources of liquidity are described below.
Liquidity
Our cash flow from operations is highly dependent on oil and gas prices and our levels of production, and is only to a small degree influenced by seasonality. Fluctuations in oil and gas prices, which are outside of our control will cause changes in our cash flows. We will use available liquidity to finance Norwegian petroleum tax payments (due April 1 and October 1 each year) and any dividend payment. Our investment program is spread across the year. The level of oil and gas prices as well as levels of production will consequently influence the financing of investments. The level of investments in the coming years is expected to increase from its current level. This is expected to be accompanied by growth in cash flow from operations as well due to the anticipated increase in production, assuming no significant decreases in oil and gas prices.It is expected that projected funds from operations will, however, not supply sufficient cash flow to fund the planned investment level;there will most likely be a gap between funds from operations and funds necessary to cover the cash needed to fund investments. As a result, in 2004, Statoil prepares for funding from external sources, but it is our intention to maintain the level of net debt to capital below 40%- 45%. The absolute level of debt issued will depend highly on the oil and gas prices throughout the year, influencing available cash.
As of December 31, 2003, we had liquid assets of NOK 16.6 billion, including approximately NOK 9.3 billion of domestic and international capital market investments, primarily government bonds, but also other investment grade short-term debt securities, and NOK 7.3 billion in cash and cash equivalents. As of December 31, 2003, approximately 70% of our cash and cash equivalents were held in NOK, 10% in US dollars, 15% in euro and 5% in other currencies, before the effect of currency swaps and forward contracts. Euros and US dollars are sold in order to meet our obligations in NOK. Capital market investments increased by NOK 4.0 billion during 2003, as compared to year-end 2002. Cash and cash equivalents increased by NOK 0.6 billion during 2003, as compared to year-end 2002. The reason for this increase is mainly related to liquidity management.
As of December 31, 2002, we had liquid assets of NOK 12.0 billion, including approximately NOK 5.3 billion of domestic and international capital market investments, primarily government bonds, but also other investment grade short- and long-term debt securities, and NOK 6.7 billion in cash and cash equivalents. As of December 31, 2002, approximately 75% of our cash and cash equivalents were held in NOK, 15% in US dollars, 5% in euro and 5% in other currencies, before the effect of currency swaps and forward contracts.
As of December 31, 2001, we had liquid assets of NOK 6.5 billion, including NOK 2.1 billion of domestic and international capital market investments and NOK 4.4 billion in cash and cash equivalents. As of December 31, 2001, approximately 60% of our cash and cash equivalents were held in euro, 15% in US dollars, 10% in NOK and 15% in other currencies, before the effect of currency swaps and forward contracts. The high level of euros held at year-end 2001 was mostly related to the effects of slight delays in the scheduled and regular exchanges to NOK in anticipation of the tax payment in April 2002.
Our general policy is to maintain a liquidity reserve in the form of cash and cash equivalents on our balance sheet and committed, unused credit facilities and credit lines to ensure that we have sufficient financial resources to meet our short-term requirements. Long-term funding is raised when we identify a need for such financing based on our business activities and cash flows as well as when market conditions are considered favorable.
As of December 31, 2003, the Group had available USD 1.6 billion in committed revolving credit facilities from international banks, including a USD 500 million swingline facility. The facilities were entered into by us in 2000 (USD 1.0 billion) and 2003 (USD 0.6 billion), and are available for drawdowns until November 2005 and January 2008, respectively. At year-end 2003 no amounts had been drawn under either facility. Our short- and long-term ratings from Moody’s and Standard & Poor’s, respectively, are P-1/A1 and A-1/A. In June 2003 Standard & Poor’s revised their outlook on Statoil from stable to negative.
Interest-bearing debt. Gross interest-bearing debt was NOK 37.3 billion at the end of 2003 compared to NOK 37.1 billion at the end 2002. Despite new investments, interest-bearing debt was maintained at a relatively stable level, mainly due to the access to liquidity due to increased cash flow from operations. At December 31, 2001 gross interest-bearing debt was NOK 41.8 billion.
Net interest bearing debt is calculated as interest-bearing debt excluding cash, cash equivalents and short-term investments. Net interest-bearing debtwas NOK 20.9 billion as of December 31, 2003 compared to NOK 23.6 billion as of December 31, 2002. Although total interest-bearing debt has slightly increased, net interest-bearing debt has been reduced, which is mainly due to an increase in cash, cash equivalents and short-term investments of NOK 2.9 billion during the period. At December 31, 2001 net interest-bearing debt was NOK 34.1 billion.
Net debt to capital employed ratio, defined as net interest-bearing debt to capital employed, was 22.6% as of December 31, 2003, compared to 28.7% as of December 31, 2002 and 39.0% as of December 31, 2001. The decrease in the net debt to capital ratio is mainly due to an increase in cash, cash equivalents and short-term investments, as well as increased shareholders’ equity. The net debt to capital ratio for 2003 also reflects the prepayment of certain expenditures related to Statoil’s intended share of the In Salah and In Amenas assets in Algeria, which reduced cash, cash equivalent and short term-investments by NOK 6.8 billion. Our methodology of calculating the net debt to capital ratio makes certain adjustments outlined below and may therefore be considered to be a Non-GAAP financial measure. See- Use of Non-GAAP Financial Measures.
TheGroup’s borrowing needs are mainly covered through short-term and long-term securities issues, including utilization of a US Commercial Paper Program and a Euro Medium Term Note (EMTN) Program, and through draw downs under committed credit facilities and credit lines. In 2003, a total of JPY 10 billion and USD 30 million of fixed rate notes and EUR 200 million of floating rate notes were issued under our EMTN Program, equivalent to a total of NOK 2.8 billion. Maturities range from two to seven years. NOK 500 million of five-year bonds was issued in the Norwegian market in 2003. After the effect of currency swaps, our borrowings are nearly 100% in US dollars. As of December 31, 2003, our long-term debt portfolio totaled NOK 33.0 billion, with a weighted average maturity of approximately 11 years and a weighted average interest rate of approximately 4.8% per annum. As of December 31, 2002, our long-term debt portfolio totaled NOK 32.8 billion with a weighted average maturity of approximately 11.2 years and a weighted average interest rate of approximately 5.2% per annum.
Ourfinancing strategy considers funding sources, maturity profile, currency mix, interest rate risk management instruments and the liquidity reserve and we use a multicurrency liability model (MLM) to manage debt-related risks. Accordingly, in general, we select the currencies of our debt obligations, either directly when borrowing or through currency swap agreements, in order to help hedge our foreign currency exposures with the objective of optimizing our debt portfolio based on underlying cash flow. Our borrowings are denominated in, or have been swapped into, US dollars, because the most significant part of our net cash flow is denominated in that currency. In addition, we hedge our interest rate exposures through the use of interest rate derivatives, primarily interest rate swaps, based on an approved range for the interest reset profile of our total loan portfolio.
New long-term borrowings totaled NOK 3.2 billion in 2003, NOK 5.4 billion in 2002 and NOK 9.6 billion in 2001. We repaid approximately NOK 2.8 billion in 2003, approximately NOK 4.8 billion in 2002 and approximately NOK 4.5 billion in 2001. At December 31, 2003, NOK 3.2 billion of our borrowings were due for repayment within one year, NOK 9.3 billion were due for repayment between two and five years and NOK 23.7 billion were due for repayment after five years. This compares to NOK 2.0 billion, NOK 8.5 billion and NOK 24.3 billion, respectively, as of December 31, 2002, and NOK 5.4 billion, NOK 8.6 billion and NOK 26.6 billion, respectively, as of December 31, 2001.
The treasury function provides a centralized service for overall funding activities, foreign exchange and interest rate management. Treasury operations are conducted within a framework of policies and guidelines authorized and reviewed regularly by our Board of directors. Our debt portfolio is managed in cooperation with our corporate risk management department, and we use a number of derivative instruments. The internal control is reviewed regularly for risk assessment by our internal auditors. Further details regarding our risk management is provided in —Risk Management below.
Table of Principal Contractual Obligations and Other Commercial Commitments
The following table summarizes our principal contractual obligations and other commercial commitments as at December 31, 2003. The table below includes contractual obligations, but excludes derivatives and other hedging instruments. See Item 11—Quantitative and Qualitative Disclosures About Market Risk.
Contractual obligations (in NOK million) | Payment due by period | ||||
Total | Less than 1 year | 1-3 years | 4-5 years | After 5 years | |
| Long-term debt | 36,159 | 3,168 | 4,819 | 4,479 | 23,693 |
Finance lease obligations | 75 | 19 | 36 | 19 | 1 |
Operating leases | 9,170 | 2,999 | 3,373 | 845 | 1,953 |
Transport capacity and similar obligations | 47,155 | 3,002 | 6,859 | 6,106 | 31,188 |
Total contractual obligations | 92,559 | 9,188 | 15,087 | 11,449 | 56,835 |
Other commercial commitments (in NOK million) | Amount of commitments expiration per period | ||||
Total | Less than 1 year | 1-3 Years | 4-5 Years | After 5 Years | |
Standby Letters of Credit | 1,777 | 457 | 418 | 0 | 902 |
Contractual obligations in respect of capital expenditure amount to NOK 20.9 billion of which payments of NOK 13.1 billion are due within one year. Pension obligations are NOK 17.6 billion, of which Statoil has an existing pension fund of NOK 15.1 billion as at December 31, 2003. Total prepaid pensions amount to NOK 2.1 billion.
Impact of Inflation
Our results in recent years have not been substantially affected by inflation. Inflation in Norway as measured by the general consumer price index during the years ended December 31, 2003, 2002, and 2001 was 1.5%, 1.3% and 3.0%, respectively.
Critical Accounting Policies
The consolidated financial statements are prepared in accordance with accounting principles generally accepted in the United States, which require Statoil to make estimates and assumptions. Statoil believes that of its significant accounting policies (see Note 2 to the consolidated financial statements), the following may involve a higher degree of judgment and complexity, which in turn could materially affect the net income if various assumptions were changed significantly.
Proved oil and gas reserves. Statoil’s oil and gas reserves have been estimated by its experts in accordance with industry standards under the requirements of the US Securities and Exchange Commission (SEC). An independent third party has evaluated Statoil’s proved reserves estimates and the results of such evaluation do not differ materially from Statoil’s estimates. Proved oil and gas reserves are the estimated quantities of crude oil, natural gas, and natural gas liquids which geological and engineering data demonstrate with reasonable certainty to be recoverable in future years from known reservoirs under existing economic and operating conditions, i.e., prices and costs as of the date the estimate is made. Prices include consideration of changes in existing prices provided only by contractual arrangements but not on escalations based upon future conditions.
Proved reserves are used when calculating the unit of production rates used for depreciation, depletion, and amortization. Reserve estimates are also used when testing upstream assets for impairment. Future changes in proved oil and gas reserves, for instance as a result of changes in prices, could have a material impact on unit of production rates used for depreciation, depletion and amortization and for decommissioning and removal provisions, as well as for the impairment testing of upstream assets, which could have a material adverse effect on net income as a result of increased deprecation, depletion and amortization or impairment charges.
Exploration and leasehold acquisition costs. In accordance with Statement of Financial Accounting Standards (FAS) No. 19, Statoil temporarily capitalizes the costs of drilling exploratory wells pending determination of whether the wells have found proved oil and gas reserves. Statoil also capitalizes leasehold acquisition costs and signature bonuses paid to obtain access to undeveloped oil and gas acreage. Exploratory wells that are believed to contain potentially economic quantities of oil and gas in an area where a major capital expenditure (i.e., a pipeline or an offshore platform) would be required before production could begin are often dependent on Statoil finding additional reserves to justify a development of the potential oil and gas field. Exploratory wells may therefore remain in "suspense" on the balance sheet for several years while the company performs additional appraisal drilling and seismic work on the potential field. Management continuously reviews the results of the additional drilling and seismic work and expenses the suspended exploration costs if no further activity is planned for the near future.
Leasehold acquisition costs are periodically assessed to determine whether they have been impaired. This assessment is based on the result of exploration activity on the leasehold and adjacent leasehold. As at year-end 2003 Statoil had recognized NOK 3.8 billion in capitalized exploration costs on assets in the exploration phase.
Decommissioning and removal liabilities. Statoil has significant legal obligations to decommission and remove offshore installations at the end of the production period. In June 2001, the FASB issued FAS 143, Accounting for Asset Retirement Obligations, which is effective for fiscal years beginning after June 15, 2002. The Statement requires legal obligations associated with the retirement of long-lived assets to be recognized at their fair value at the time that the obligations are incurred. Upon initial recognition of a liability, that cost should be capitalized as part of the related long-lived asset and allocated to expense over the useful life of the asset. Statoil adopted the new rules on asset retirement obligations on January 1, 2003. Application of the new standard resulted in an increase in net property, plant and equipment of NOK 2.8 billion, an increase in accrued asset retirement obligation of NOK 7.1 billion, a reduction in deferred tax assets of NOK 1.5 billion, and a long-term receivable of NOK 5.8 billion. The receivable represents the expected refund by the Norwegian State of an amount equivalent to the actual removal costs multiplied by the effective tax rate over the productive life of the assets. Until changes in the legislation in June 2003 removal costs on the Norwegian continental shelf were, unlike decommissioning costs, not deductible for tax purposes. The implementation effect of NOK 33 million after tax is recorded as Operating expenses in the segment Other and eliminations.
It is difficult to estimate the costs of these decommissioning and removal activities, which are based on current regulations and technology. Most of the removal activities are many years into the future and the removal technology and costs are constantly changing. As a result, the initial recognition of the liability and the capitalized cost associated with decommissioning and removal obligations, and the subsequent adjustment of these balance sheet items, involves the application of significant judgment. As at year-end 2003 Statoil had recognized NOK 2.8 billion in increased assets and liabilities related to asset retirement obligations amounting to NOK 16.5 billion.
Derivative financial instruments and hedging activities. In June 1998, the Financial Accounting Standards Board (FASB) issued Statement No. 133, Accounting for Derivative Instruments and Hedging Activities. The Statement requires Statoil to recognize all derivatives on the balance sheet at fair value. Changes in fair value of derivatives that do not qualify as hedges are included in income.
The application of relevant rules requires extensive judgment and the choice of designation of individual contracts as qualifying hedges can impact the timing of recognition of gains and losses associated with the derivative contracts, which may or may not correspond to changes in the fair value of our corresponding physical positions, contracts and anticipated transactions, which are not required to be recorded at market value in accordance with Statement No. 133. Establishment of non-functional currency swaps in our debt portfolio to match expected underlying cash flows may result in gains or losses in the profit and loss statement as hedge accounting is not allowed, even if the associated economical risk of the transactions are considered.
When not directly observable in the market or available through broker quotes, the fair value of derivative contracts must be computed internally based on internal assumptions as well as directly observable market information, including forward and yield curves for commodities, currencies and interest. Although the use of models and assumptions are according to prevailing guidance provided by FASB and best estimates, changes in internal assumptions and forward curves could have material effects on the internally computed fair value of derivative contracts, particularly long-term contracts, resulting in corresponding income or loss in the profit and loss statement.
See —Risk Management section below and Item 11—Quantitative and qualitative disclosures about market risk for details on the sensitivities of recognized assets and liabilities to market risks and the extent to which we assess market values of derivatives on other sources than quoted market prices.
Off-Balance Sheet Arrangements
As a condition for being awarded oil and gas exploration and production licenses, participants may be committed to drill a certain number of wells. At the end of 2003, Statoil was committed to participate in 6 wells off Norway and 9 wells abroad, with an average ownership interest of approximately 35 per cent. Statoil’s share of expected costs to drill these wells amounts to approximately NOK 1.9 billion.
Statoil has entered into agreements for pipeline transportation for most of its prospective gas sale contracts. These agreements ensure the right to transport the production of gas through the pipelines, but also impose an obligation to cover Statoil’s proportional share of the transportation costs based on booked volume capacity. In addition the Group has entered into certain obligations for entry capacity fees and terminal capacity commitments. The expense for 2003 was NOK 2,712 million.
Transport capacity and similar obligations at December 31, 2003 are specified in “Table of Principal Contractual Obligations and Other Commercial Commitments” above.
Risk Management
Overview. We are exposed to a number of different market risks arising from our normal business activities. Market risk is the possibility that changes in currency exchange rates, interest rates, refining margins, petrochemical margins and oil and natural gas prices will affect the value of our assets, liabilities or expected future cash flows. We are also exposed to operational risk, which is the possibility that we may experience, among others, a loss in oil and gas production or an offshore catastrophe. Accordingly, we use a “top-down”approach to risk management, which highlights our most important market and operational risks and then use a sophisticated risk optimization model to manage these risks.
We have developed a comprehensive model, which encompasses our most significant market and operational risks and takes into account correlation, different tax regimes, capital allocation on various levels and value at risk, or VaR, figures on different levels, with the goal of optimizing risk exposure and return. Our model also utilizes Sharpe ratios, which provide a risk-adjusted return measure in the context of a specific risk taken, rather than an absolute rate of return, to measure the potential risks of various business activities. See details of our financing strategy above concerning the objective of our debt portfolio to mitigate currency exchange risks. Our Corporate Risk Committee, which is headed by our Chief Financial Officer and which includes, among others, representatives from our principal business segments, is responsible for reviewing, defining and developing our strategic market risk policies. The Corporate Risk Committee meets monthly to determine our risk management strategies, including hedging and trading strategies and valuation methodologies.
We divide risk management into insurable risks which are managed by our captive insurance company operating in the Norwegian and international insurance markets, tactical risks, which are short-term trading risks based on underlying exposures and which are managed by line management, and strategic risks, which are long-term fundamental risks and are monitored by our Corporate Risk Committee, who advises and recommends specific actions to our Executive Committee. To address our tactical and strategic risks, we have developed policies aimed at managing the volatility inherent in certain of these natural business exposures and in accordance with these policies we enter into various transactions using derivative financial and commodity instruments (derivatives). Derivatives are contracts whose value is derived from one or more underlying financial instruments, indices or prices, which are defined in the contract.
Strategic Market Risks. We are exposed to strategic risks, which we define as long-term risks fundamental to the operation of our business. Strategic market risks are reviewed by our Corporate Risk Committee with the objective of avoiding sub optimization, reducing the likelihood of experiencing financial distress and supporting the group’s ability to finance future growth even under adverse market conditions. Based on these objectives, we have implemented policies and procedures designed to reduce our overall exposure to strategic risks. For example, our multicurrency liability management model discussed under —Liquidity above seeks to optimize our debt portfolio based on expected future corporate cash flow and thereby serves as a significant strategic risk management tool. In addition, our downside protection program for crude oil price risk is intended to ensure that our business will remain robust even in the case of a drop in the price of crude oil.
Tactical Market Risks. All tactical risk management activities occur within and are continuously monitored against established mandates.
Commodity price risk. Commodity price risk constitutes our most important tactical risk. To minimize the commodities price volatility and conform costs to revenues, we enter into commodity-based derivative contracts, which consist of futures, options, over-the-counter (OTC) forward contracts, market swaps and contracts for differences related to crude oil, petroleum products, natural gas and electricity.
Derivatives associated with crude oil and petroleum products are traded mainly on the International Petroleum Exchange (IPE) in London, the New York Mercantile Exchange (NYMEX), in the OTC Brent market, and in crude and refined products swaps markets. Derivatives associated with natural gas and electricity are mainly OTC physical forwards and options, Nordpool forwards, as well as futures traded on the IPE.
Foreign exchange and interest rate risk. We are also subject to interest rate risk and foreign exchange risk. Interest rate risk and currency risk are assessed against mandates based on a pre-defined scenario. In market risk management and in trading, we use only well-understood, conventional derivative instruments. These include futures and options traded on regulated exchanges, and OTC swaps, options and forward contracts.
Foreign exchange risk. Fluctuations in exchange rates can have significant effects on our results. Our cash flows are largely in currencies other than NOK, primarily US dollars. Cash receipts in connection with oil and gas sales are mainly in foreign currencies while cash disbursements are to a large extent in NOK. Accordingly, our exposure to foreign currency rates exists primarily with US dollars versus NOK, European euro, Danish kroner, Swedish kroner and UK pounds sterling. We enter into various types of foreign exchange contracts in managing our foreign exchange risk. We use forward foreign exchange contracts primarily to risk manage existing receivables and payables, including deposits and borrowing denominated in foreign currencies.
Interest rate risk. The existence of assets and liabilities earning or paying variable rates of interest expose us to the risk of interest rate fluctuations. We enter into various types of interest rate contracts in managing our interest rate risk. We enter into interest rate derivatives, particularly interest rate swaps, to alter interest rate exposures, to lower funding costs and to diversify sources of funding. Under interest rate swaps, we agree with other parties to exchange, at specified intervals, the difference between interest amounts calculated by reference to an agreed notional principal amount and agreed fixed or floating interest rates.
Fair market values of financial and commodity derivatives. Fair market values of commodity based futures and exchange traded option contracts are based on quoted market prices obtained from the New York Mercantile Exchange or the International Petroleum Exchange. The fair values of swaps and other commodity over-the counter arrangements are established based on quoted market prices, estimates obtained from brokers, and other appropriate valuation techniques. Where Statoil records elements of long-term physical delivery commodity contracts at fair market value under the requirements of FAS 133, such fair market value estimates are based on quoted forward prices in the market, underlying indexes in the contracts, and assumptions of forward prices and margins where market prices are not available. Fair market values of interest and currency swaps and other instruments are estimated based on quoted market prices, estimates obtained from brokers, prices of comparable instruments, and other appropriate valuation techniques. The fair value estimates approximate the gain or loss that would have been realized if the contracts had been closed out at year-end, although actual results could vary due to assumptions used.
The following table contains the net fair market value of non-exchange traded (i.e., over-the-counter) commodity and financial derivatives as so accounted for under FAS 133, as at December 31, 2003, based on maturity of contracts and the source of determining the fair market value of contracts, respectively:
Source of Fair Market Value | Net Fair Market Value | ||||
| Maturity | |||||
At December 31, 2003 (in NOK million) | less than 1 year | 1 – 3 years | 4 –5 years | in excess of 5 years | Total net fair value |
Commodity based derivatives: | |||||
23 | 0 | 0 | 0 | 23 | |
Prices provided by other external sources | 62 | 8 | 0 | 0 | 70 |
Prices based on models or other valuation techniques | 3 | 6 | 5 | 2 | 16 |
Total commodity based derivatives | 88 | 14 | 5 | 2 | 109 |
Financial derivatives: | |||||
Prices actively quoted | 788 | 254 | 857 | 2,652 | 4,551 |
Prices provided by other external sources | 0 | 0 | 0 | 0 | 0 |
Prices based on models or other valuation techniques | 0 | 0 | 0 | 0 | 0 |
Total financial derivatives | 788 | 254 | 857 | 2,652 | 4,551 |
In the above table, other external sources for commodities mainly relate to broker quotes. The fair market values of interest and currency swaps and other financial derivatives are computed internally by means of standard financial system models and based consistently on quoted market yield and currency curves.
The following table contains a reconciliation of changes in the fair market values of all commodity and financial derivatives, including exchange traded derivatives in the books at either December 31, 2003, or December 31, 2002, net of margin calls. Derivatives entered into and subsequently terminated during the course of the year 2003 have not been included in the table:
Amounts in NOK million | Commodity derivatives | Financial Derivatives |
Net fair value of derivative contracts outstanding as at December 31, 2002 | 37 | 2,142 |
158 | (221) | |
Fair value of new contracts entered into during the period | 16 | 830 |
Changes in fair value attributable to changes in valuation techniques or assumptions | 0 | 0 |
Other changes in fair values | (85) | 1,799 |
Net fair value of derivative contracts outstanding as at December 31, 2003 | 126 | 4,551 |
For further information, see Item 11–Quantitative and Qualitative Disclosures about Market Risk.
Derivatives and Credit risk. Futures contracts have little credit risk because organized exchanges are the counter-parties. The credit risk from Statoil’s OTC commodity-based derivative contracts derives from the counter-party to the transaction. Brent forwards, other forwards, swaps and all other OTC instruments are traded subject to internal assessment of creditworthiness of counter-parties, which are primarily oil and gas companies and trading companies.
Credit risk related to derivative instruments is managed by maintaining, reviewing and updating lists of authorized counter-parties by assessing their financial position, by monitoring credit exposure for counter-parties, by establishing internal credit lines for counter-parties, and by requiring collateral or guarantees when appropriate under contracts and required by internal policies. Collateral will typically be in the form of cash or bank guarantees from first class international banks. As at year-end 2003, we had called and received a total of NOK 1,758 million in cash as collateral for unrealized gains on OTC derivatives.
Credit risk from interest rate swaps and currency swaps, which are OTC transactions, derive from the counter-parties to these transactions. Counter-parties are highly rated financial institutions. The credit ratings are, at a minimum, reviewed annually and counter-party exposure is monitored to ensure exposure does not exceed credit lines and complies with internal policies. Non debt related foreign currency swaps usually have terms of less than one year, and the terms of debt related interest swaps and currency swaps are up to 25 years, in line with that of corresponding hedged or risk managed long-term loans.
The following table contains the fair market value of OTC commodity and financial derivative assets, net of netting agreements and collateral as at December 31, 2003, split by our assessment of the counter-party’s credit risk:
OTC derivative assets split per counter- party (in NOK million) | Fair Market Value |
Counter-party rated: | |
Investment grade, rated A or above | 3,354 |
Other investment grade | 89 |
Non investment grade or not rated | 80 |
Credit rating categories in the table above are based on the Statoil Group’s internal credit rating policies, and do not correspond directly with ratings issued by the major Credit Rating Agencies. Internal ratings are harmonized with external ratings where available, but could occasionally vary somewhat due to internal assessments. Consistent with Statoil policies, commodity derivative counter-parties have been assigned credit ratings corresponding to those of their respective parent companies, while there will not necessarily be a parent company guarantee from such parent companies if highly rated.
Operational Risks. We are also exposed to operational risks, including reservoir risk, risk of loss of oil and gas production and offshore catastrophe risk. All of our installations are insured, which means that replacement cost will be covered by our captive insurance company, which also has a reinsurance program. Under this reinsurance program, as of December 31, 2003, approximately 67% of the approximately NOK 122 billion total insured amount was reinsured in the international reinsurance markets. Our captive insurance company also works with our corporate risk management department to manage other insurable operational risks.
Research and Development
In addition to the technology developed through field development projects, substantial amounts of our research is carried out at our research and technology development center in Trondheim, Norway. Our internal research and development is done in close cooperation with Norwegian universities, research institutions, other operators and the supplier industry.
Research expenditures were NOK 1,004 million, NOK 736 million and NOK 633 million in 2003, 2002 and 2001, respectively.
Corporate Targets
This section contains a discussion of our corporate targets. We use these targets in order to measure our progress in enhancing production, utilizing capital efficiently and enhancing operational efficiencies. We have announced targets for the fiscal year 2004 for the measures normalized return on average capital employed (normalized ROACE), production, finding and development cost, normalized production cost and reserve replacement rate. We have announced targets for the fiscal year 2007 for the measures normalized return on average capital employed (normalized ROACE), production, reserve replacement rate, finding and development cost and normalized production cost. This section contains a discussion of those target measures and reports the results of those measures for the current period. For a discussion of historical and projected gross investment and capital expenditure, see —Trend Information below.
The following discussion of corporate targets uses several measures, which are “non-GAAP financial measures” as defined by the U.S. Securities and Exchange Commission. These are return on average capital employed (ROACE), normalized return on average capital employed (normalized ROACE), normalized production cost per barrel and net debt to capital ratio. For more information on these measures and for a reconciliation of these measures to measures calculated in accordance with US GAAP, see —Use of Non-GAAP Financial Measures below.
Summary of targets –2004
We are targeting:
Further, we are committed to pursuing the following objectives to enhance operational efficiencies from 2004:
The 2004 targets (other than the reserve replacement rate target) are based on a continued organic development of Statoil and exclude possible effects related to acquisitions.
Summary of targets –2007
We are targeting:
Further, we are committed to pursuing the following objectives to enhance operational efficiencies through 2007:
The 2007 targets include the effects of the Algerian transaction with respect to the In Salah and In Amenas fields, due to the fact that the transaction was known, when we set the targets and when we will start reporting towards the 2007 target. However, on a going-forward basis the 2007 targets (other than the reserve replacement rate target) are based on a continued organic development of Statoil and exclude possible effects related to any additional, but not known, acquisitions, which may affect our targets materially and cause us to revise our targets as a result of the impact of such acquisitions.
For the sake of comparability, the targets for 2007 are shown in the third column in the table below, with the equivalents of the 2007 targets calculated based on the 2004 normalization shown in the fourth column.
Corporate targets | 2004 | 2007 (new normalization) | 2007 (based on 2004 normalization) |
| ROACE* | 12.0% | 12.5% | 13% |
Production (1000 boe per day) | 1,120 | 1,350 | 1,350 |
Reserve replacement rate** | >1.0 | >1.3 | >1.3 |
Finding and development cost (USD/boe)** | <6.0 | <6.0 | <5.25 |
Production cost* (USD/boe) | <2.7 | <3.1 | <2.7 |
* Normalized
** 3-year average
The forecasted production growth to 2007 is based on the current characteristics of our reservoirs, our planned capital expenditures and our development budget. There are a number of factors that could cause actual results and developments to differ materially from the targets included here, including levels of industry product supply, demand and pricing; currency exchange rates; political and economic policies of Norway and other oil-producing countries; general economic conditions; political stability and economic growth in relevant areas of the world; global political events and actions, including war, terrorism and sanctions; the timing of bringing new fields on stream; material differences from reserves estimates;inability to find and develop reserves; adverse changes in tax regimes; development and use of new technology; geological or technical difficulties; the actions of competitors; the actions of field partners; natural disasters and other changes to business conditions. One of the main factors which could cause results to differ from our expectations would be possible delays in sanctioned development projects.
Return on Average Capital Employed
Our business is capital intensive. Furthermore, our capital expenditures include several significant projects that are characterized by lead times of several years and expenditures that individually may involve large amounts. Given this capital intensity, we use Return on Average Capital Employed, or ROACE, as a key performance indicator to measure our success in utilizing capital. We define ROACE as follows:
Return on Average Capital Employed = | Net Income + Minority Interest - After Tax Net Financial items |
Net Financial Debt + Shareholders’ Equity + Minority Interest |
Average capital employed reflects an average of capital employed at the beginning and the end of the financial period. In the calculation of average capital employed, Statoil makes certain adjustments to net interest bearing debt, which makes the number a Non-GAAP financial measure. For a reconciliation of the adjusted net interest bearing debt to the most comparable GAAP measure, see Use of Non –GAAP Financial Measures. Using average capital employed without these adjustments to net interest-bearing debt, our ROACE for 2003 was 18.6%, Our historic ROACE using average capital employed with these adjustments for 2001, 2002 and 2003 was 19.9%, 14.9% and 18.7%, respectively.
ROACE and normalized ROACE are non-GAAP financial measures. See –Use of Non-GAAP Financial Measures.
For purposes of measuring our performance against our 2004 ROACE target, we are assuming an average realized oil price of USD 16 per barrel, natural gas price of NOK 0.70 per scm, refining margin of USD 3.0 per barrel, Borealis margin of EUR 150 per tonne, and a NOK/USD exchange rate of 8.20. All prices and margins are adjusted for inflation from 2000. In the calculation of the normalized return, adjustments are made to exclude items of a non-frequent nature. These items are viewed as activities or events which management considers as being of such a nature, that their inclusion into the ROACE calculation will not provide indications on the company’s underlying performance. The 2004 target is based on organic development and therefore the effects of the acquisition of the Algerian assets In Salah and In Amenas are excluded. Normalization is done in order to exclude factors that Statoil cannot influence from its performance targets. For reconciliation of the ROACE and normalized ROACE figures to items calculated in accordance with GAAP, see the table below. We are targeting a 12% ROACE on a normalized basis.
Normalized ROACE was 9.4% for the year ended December 31,2001, 10.8% in 2002, and 12.4% in 2003. When we started out measuring the ROACE in 2000, using the assumptions mentioned, the ROACE was 7.5% adjusted on a pro forma basis for our transfer in 2001 of certain assets to the Norwegian State. In order to achieve our targeted ROACE by 2004, we aim to allocate capital only to those projects that meet our strict financial return criteria. Net present value is calculated by discounting projected future real after-tax cash flows from the project by 8% per annum for projects on the NCS or by 9% per annum for projects outside the NCS. Projects must have a positive net present value, and must also meet our robustness criteria.
While continuing to focus on our overall objective of strict capital discipline, we believe that through additional efforts, including the improvement program from 2001 to 2004 targeting an improvement of both costs and revenues of NOK 3.5 billion from 2004 as compared to 2001, our organic production growth and enhanced operating efficiencies, will help us reach our 12% ROACE target for 2004.
Our ROACE in any financial period and our ability to meet our target ROACE will be affected by our ability to generate net income. Our level of net income is subject to numerous risks and uncertainties as described above. These risks include, among others, fluctuation in demand, retail margin, changes in our oil and gas production volumes and trends in the international oil industry.
As described above, Statoil introduced new targets for 2007, where a normalized ROACE of 12.5% was one of the targets. When normalizing the reported ROACE we assume an oil price of USD 18 per barrel, natural gas price of NOK 0.80 per scm, refining margin (FCC) of USD 3.3 per barrel, Borealis margin of 165 EUR/ton and a NOK/USD exchange rate of 7.50. All prices and margins are adjusted for inflation from 2004. These changed assumptions for purposes of our 2007 targets reflect changes in the underlying prices and margins from the assumptions made when we set our targets for 2004. These assumptions do not reflect actual prices and margins at the time the assumptions were set or at any specific point in time and do not comprise our expectations with respect to the future movements of such prices and margins, but are based on movements over a broader time frame and function to allow comparability across periods.
Production cost per boe for the last 12 months was USD 3.2 per boe for the year 2003, compared to USD 3.0 per boe for the year 2002 and USD 2.8 for the year 2001. The increase compared to 2002 and 2001 is due to a lower NOK/USD exchange rate, because costs are primarily incurred in NOK. Correspondingly, the production costs in NOK were NOK 22.8 per boe for the year 2003, compared to NOK 23.5 per boe in 2002 and NOK 25.2 for the year 2001. Normalized to a NOK/USD exchange rate of 8.20, in order to exclude currency effects, the production cost for 2003 is USD 2.8 per boe compared to USD 2.9 per boe for 2002 and USD 3.0 for 2001. Normalized production cost is a non-GAAP financial measure as a result of its normalization at a set NOK/USD exchange rate. See —Use of Non-GAAP Financial Measures.
Finding and development cost
Statoil’s finding and development costs in 2003 were USD 7.7 per boe, compared to USD 5.3 per boe in 2002 and USD 4.6 per boe in 2001. The average finding and development cost for the last three years was USD 5.9 per boe, as compared to USD 6,2 in 2002 and USD 9.1 in 2001 The year 2001 was a very good year, mainly due to increased booking of proved reserves, compared to previous years.
The target for 2004 is below USD 6.0. The finding and development costs are calculated using costs of exploration and development divided by new proved reserves, according to the SEC definition, excluding reserves purchases and sales.
Finding and development costs (USD/boe) * | 2001 | 2002 | 2003 |
| Corporate | 9.12 | 6.20 | 5.87 |
E&P Norway | 9.35 | 5.89 | 5.24 |
International E&P | 8.60 | 7.15 | 7.88 |
* Three years average
Reserve replacement rate
Proved oil and gas reserves were 4,264 million boe at the end of 2003, compared with 4,267 million boe at the end of 2002 and 4,277 million boe at the end of 2001. The reserve replacement rate was 99 per cent in 2003, compared to 98 per cent in 2002 and 89 per cent in 2001. The average replacement rate for the last three years was 95 per cent. Reserve replacement rate includes the effect of transactions and was lower in 2001, than in 2002 and 2003, although production has increased throughout the three year period, mainly due to transactions made on the NCS in 2001. The target for reserve replacement is an average of 100% for the three years from 2002-2004.
Reserve replacement rate (3-year average) | 2001 | 2002 | 2003 |
| Corporate | 0.68 | 0.78 | 0.95 |
E&P Norway | 0.77 | 0.63 | 0.79 |
International E&P* | 2.14 | 2.79 | 2.96 |
* Reserve replacement rate for International E&P is adjusted for the sale of Statoil Energy Inc. in 2000.
Production
Total oil and gas production in 2003 was 1,080,000 barrels of oil equivalent (boe) per day compared to 1,074,000 boe per day in 2002, and 1,007,000 boe per day in 2001. The target production for 2004 is 1,120,000 boe per day.
Our expected production growth through 2007 is based on the current characteristics of our reservoirs, our planned capital expenditure and our development budget. Including acquisition of interest in the two assets In Salah and In Amenas, the production target for 2007 is set at 1,350,000 boe per day.
Trend Information
The forecasted growth in the coming years will require an increase in investments from its current level and will consequently depress ROACE in 2005 and 2006. However, based on current projections we currently do not expect that the normalized ROACE will go below 10%. Based on current projections we currently expect the normalized ROACE to increase in 2007. Out of the projects expected to contribute to reaching this production target for 2007 nearly 95% are already sanctioned projects.
Capital Expenditures
Set forth below are our capital expenditures in our four principal business segments for 2001-2003, including the allocation per segment as a percentage of gross investments.
Capital expenditures(1) per segment (amounts in million) | Year ended December 31, | |||||
2001 | 2002 | 2003 | ||||
NOK | % | NOK | % | NOK | % | |
E&P Norway | 10,759 | 60.0 | 11,023 | 55.0 | 13,412 | 55.7 |
International E&P | 5,027 | 28.0 | 5,995 | 29.9 | 8,147 | 33.8 |
Natural Gas | 671 | 3.7 | 465 | 2.3 | 456 | 1.9 |
Manufacturing and Marketing | 811 | 4.5 | 1,771 | 8.8 | 1,546 | 6.4 |
| Other | 685 | 3.8 | 799 | 4.0 | 530 | 2.2 |
| Total | 17,953(1) | 100 | 20,053 | 100 | 24,091 | 100 |
(1) Gross investments, which represent cash flow spent on property, plant and equipment and capitalized exploration expenditures amount to NOK 17,414 million in 2001. For 2001 these gross investments are included in our NOK 95 billion target and guidance for the period 2001-2004 which was disclosed at the time of the initial public offering. The difference between capital expenditures and gross investments in 2001 is mainly related to Change in long term loans granted and other long-term items of NOK 0.5 billion, which was included in the capital expenditure figure for 2001, but not included in the definition of the gross investments figure.
The year 2004
This section describes our estimated capital expenditure for 2004 in respect of potential capital expenditure requirements for the principal investment opportunities available to us and other capital projects currently under consideration. The figure is based on an organic development of Statoil and excludes possible expenditures related to acquisitions. Therefore, the expenditure estimates and descriptions with respect to investments in the segment descriptions below could differ materially from the actual expenditures.
Our opportunities and projects under consideration could be sold, delayed or postponed in implementation, reduced in scope or rejected. Accordingly, the figure for 2004 is only an estimate and our actual capital expenditures will change based on decisions by our management and our board of directors, who expect to exploit these restructuring and asset trading opportunities and respond to changes in our business environment as they occur. Total capital expenditure for 2004 is expected to be NOK 30 billion excluding the investments related to the two Algerian assets, In Salah and In Amenas and the possible repurchase of the 50% interest in SDS from ICA AB. This will bring the total investment level for 2001-2004 to NOK 92 billion. Of the investments related to the two Algerian assets, a prepayment of USD 1 billion was made in 2003, which will be included in investments for 2004, subject to the necessary approval of Algerian authorities. Including these investments, capital expenditure is expected to be at the level of NOK 40 billion in 2004. Excluding the investments in Algeria, we expect the allocation of capital expenditures between the segments to be in line with previous years.
E&P Norway. A substantial portion of our 2004 capital expenditure is allocated to the ongoing development projects in Kvitebjørn, Kristin and Snøhvit. For more information on these projects, see Item 4–Information on the Company–Business Overview–Operations–Exploration and Production Norway.
International E&P. We currently estimate that a substantial portion of our 2004 capital expenditure will be allocated to the ongoing and planned development projects:In Salah, In Amenas, Azeri-Chirag-Gunashli including the Baku-Tbilisi-Ceyhan pipeline, Shah Deniz, Dalia, Kizomba A and B. For more information on these projects, see Item 4–Information on the Company–Business Overview–Operations–International Exploration and Production.
Natural Gas. Our main focus will be to increase the capacity and flexibility of our gas transportation and processing infrastructure. This will be done through expansion of the Kårstø processing plant, the development of a new pipeline to the UK, and the Aldbrough gas storage project on the east coast of England and the South Caucasus pipeline related to the Shah Deniz field.
Manufacturing and Marketing. We are focusing our capital expenditure on expanding our retail network in Poland and the Baltics, upgrading the service stations in Ireland, and possible upgrading of the refineries to increase flexibility and meet expected EU and US refined product environmental requirements, as well as the possible acquisition of 50% share of SDS.
Finally, it should be noted that we may alter the amount, timing or segmental or project allocation of our capital expenditures in anticipation or as a result of a number of factors outside our control including, but not limited to:
Use of Non-GAAP Financial Measures
The U.S. Securities and Exchange Commission adopted regulations regarding the use of “non-GAAP financial measures” in public disclosures, effective March 28, 2003. Non-GAAP financial measures are defined as numerical measures that either exclude or include amounts that are not excluded or included in the comparable measures calculated and presented in accordance with GAAP.
These non-GAAP financial measures are:
Statoil usesROACE to measure the return on capital employed regardless of whether the financing is through equity or debt. This measure is viewed by management as providing useful information, both for management and investors, regarding performance for the period under evaluation. Statoil’s management makes regular use of this measure to evaluate its operations. Statoil’s use of ROACE, should not be viewed as an alternative to income before financial items, other items, income taxes and minority interest, or to net income, which are the measures calculated in accordance with generally accepted accounting principles.
Statoil usesnormalized ROACE to measure the return on capital employed, while excluding the effects of the market development over which Statoil has no control. Therefore the effects of oil price, natural gas price, refining margin, Borealis margin and the NOK/USD exchange rate are excluded from the normalized figure.
This measure is viewed by management as providing a better understanding of Statoil’s underlying performance over time and across periods, by excluding from the performance measure factors that Statoil cannot influence. Statoil’s management makes regular use of this measure to evaluate its operations.
The figures used for calculating the normalized ROACE towards the 2004 target are (each adjusted for inflation from 2000):
By keeping certain prices which are key value drivers, as well as the important NOK/USD exchange rate, constant Statoil is able to utilize this measure to focus on operating cost and efficiency improvements, and is able to measure performance on a comparable basis across periods. Such a focus would be more challenging to maintain in periods in which prices are high and exchange rates are favorable. In the period 2001 to 2003, during which Statoil has been using normalized ROACE, as a tool of measuring performance, the normalization procedures have on average resulted in lower normalized earnings compared to the earnings based on realized prices. Normalized results, however, should not be seen as an alternative to measures calculated in accordance with GAAP when measuring financial performance. Management reviews both realized and normalized results, when measuring performance. However, management finds the normalized results to be especially useful when realized prices, margins and exchange rates are above the normalized set of assumptions.
Normalized ROACE is based on organic development and 2003 figures exclude the effects related to the acquisition of the two Algerian assets from BP, In Salah and In Amenas. For future measurement towards the 2007 targets, this acquisition is not excluded from the figures, since the acquisition was known when starting reporting towards the new targets, which, however, was not the case with the 2004 targets.
Statoil also defines certain items as of such a nature that will not provide good indications of the company’s underlying performance when included in the key indicators. These items are therefore excluded from calculations of ROACE.
The following table shows our ROACE calculation based on reported figures, adjusted figures, which in 2003 consisted of the repeal of the Removal Grants Act, and normalized figures:
Calculation of nominator and denominator used in roace Calculations (in nok millions) | 2003 | 2002 | 2001 |
Net income for the last 12 months | 16,554 | 16,846 | 17,245 |
Minority interests for the last 12 months | 289 | 153 | 488 |
After tax net financial items for the last 12 months | (496) | (4,352) | 262 |
Net income adjusted for minority interests and after tax net financial items (A1) | 16,347 | 12,647 | 17,995 |
Adjustments for effects of changes in the Removal Grants Act | (687) | 0 | 0 |
Adjustments made in 2002 and 2001* | 0 | (144) | (2,100) |
Net income adjusted for items above (A2) | 15,660 | 12,503 | 15,895 |
Numerator adjustments for costs In Salah, In Amenas | 35 | 0 | 0 |
Effect of normalized prices and margins | (6,998) | (3,832) | (6,237) |
Effect of normalized NOK/USD exchange rate | 1,712 | 446 | (1,112) |
Normalized net income (A3) | 10,410 | 9,117 | 8,546 |
Computed average capital employed | |||
Average capital employed (B1) ** | 88,016 | 86,167 | 91,147 |
Adjusted average capital employed (B2) ** | 87,361 | 84,755 | 90,518 |
Denominator adjustments on average capital employed In Salah, In Amenas *** | (3,422) | 0 | 0 |
Average capital employed adjusted for In Salah, In Amenas (B3) | 83,939 | 84,755 | 90,518 |
* Adjustments on the nominator made in 2001 consisted of a gain related to the sale of the operations in Vietnam of NOK 1.3 billion before tax and NOK 0.9 billion after tax, and the write-down of LL652 oil field in Venezuela NOK 2.0 billion before tax and NOK 1.4 billion after tax, and also included a non-taxable gain of NOK 1.4 billion related to the sale of the Grane, Njord, Jotun fields and a 12 per cent interest in the Snøhvit field off Norway and a gain related to the sale of the 4.76 per cent interest in the Kashagan oil discovery in the Caspian Sea (NOK 1.6 billion before tax, NOK 1.2 billion after tax). Adjustments made in the 2002 figures consisted of the sale of the exploration and operations activity on the Danish continental shelf (profit NOK 1.0 billion before tax and NOK 0.7 billion after tax), as well as a write-down of the LL652 field in Venezuela of NOK 0.8 billion before tax (NOK 0.6 billion after tax).
** See Use of Non-GAAP Financial Measures – Net debt to capital employed below for a reconciliation of average capital employed and adjusted average capital employed. Average capital employed used when calculating the ROACE is the average of the opening and closing balance of a year.
*** Corresponds to 50% of the prepayment. The prepayment was made in 2003 and is therefore excluded from the closing balance of 2003, which implies a net effect of 50% of the prepayment on average capital employed.
ROACE calculation | 2003 | 2002 | 2001 |
Calculated ROACE using average capital employed (A1/B1) | 18.6% | 14.7% | 19.7% |
Calculated ROACE using adjusted average capital employed (A1/B2) | 18.7% | 14.9% | 19.9% |
Calculated adjusted ROACE (A2/B2) | 17.9% | 14.8% | 17.6% |
Normalized ROACE (A3/B3) | 12.4% | 10.8% | 9.4% |
Improvement program
The information contained herein on the improvement program may contain forward-looking non-GAAP financial information for which at this time there is no comparable GAAP measure and which at this time cannot be quantitatively reconciled to comparable GAAP financial information.
Normalized production cost per barrel in USD is used to evaluate the underlying development in the production cost. Statoil’s production costs are mainly incurred in NOK. In order to exclude currency effects and to reflect the change in the underlying production cost, the NOK/USD exchange rate is held constant.
Normalized production costs per boe is in the table below reconciled to the most comparable GAAP measure, production cost ber boe.
Production costs per boe | 2001 | 2002 | 2003 |
Total production costs last 12 months (in NOK million) | 9,257 | 9,196 | 8,892 |
Lifted volumes last 12 months (mill. boe) | 368 | 392 | 391 |
Average NOK/USD exchange rate | 8.99 | 7.97 | 7.08 |
Production cost per boe | 2.8 | 3.0 | 3.2 |
Normalization of production cost per boe | |||
Total production costs last 12 months (in NOK million) | 9,257 | 9,196 | 8,892 |
Production costs last 12 months E&P Norway (in NOK million) | 8,233 | 8,217 | 7,998 |
Normalized exchange rate (NOK/USD) | 8.20 | 8.20 | 8.20 |
Production costs last 12 months E&P Norway, normalized at NOK/USD 8.20 | 1,004 | 1,002 | 975 |
Production costs last 12 months International E&P (in USD million) | 114 | 123 | 127 |
Total production costs last 12 months in USD (normalized) | 1,118 | 1,125 | 1,102 |
Lifted volumes last 12 months (mill. boe) | 368 | 392 | 391 |
Production cost per boe normalized at NOK/USD 8.20 | 3.0 | 2.9 | 2.8 |
Net debt to capital employed ratio
The calculated net debt to capital employed ratio is by management viewed to provide a more complete picture of the company’s current debt situation. The calculation uses balance sheet items related to total debt and adjusts for current liquidity.
Two further adjustments are made for two different reasons:
The net interest-bearing debt adjusted for these two items is included in the adjusted average capital employed, which is used in the calculation of ROACE.
The table below reconciles net interest bearing debt, capital employed and net debt to capital employed ratio to the most directly comparable financial measure or measures calculated in accordance with GAAP.
Calculation of capital employed (in NOK million) | 2001 | 2002 | 2003 |
Total shareholders’ equity | 51,774 | 57,017 | 70,174 |
Minority interest | 1,496 | 1,550 | 1,483 |
Total equity and minority interest (A) | 53,270 | 58,567 | 71,657 |
Net interest bearing debt | |||
Short-term debt | 6,613 | 4,323 | 4,287 |
Long-term debt | 35,182 | 32,805 | 32,991 |
Gross interest bearing debt | 41,795 | 37,128 | 37,278 |
Cash and cash equivalents | (4,395) | (6,702) | (7,316) |
Short-term investments | (2,063) | (5,267) | (9,314) |
Cash, cash equivalents and short-term investments | (6,458) | (11,969) | (16,630) |
Net interest bearing debt (B) | 35,337 | 25,159 | 20,648 |
Capital employed (A+B) | 88,607 | 83,726 | 92,305 |
Average capital employed | 91,147 | 86,167 | 88,016 |
Net debt to capital employed (B/(A+B)) | 39.9% | 30.2% | 22.3% |
Calculation of adjusted net interest bearing debt | |||
Adjustment of net interest bearing debt for project loan* | (1,257) | (1,567) | (1,500) |
Adjustment of net interest bearing debt for other items** | 0 | 0 | 1,758 |
Net interest bearing debt after adjustments (C) | 34,080 | 23,592 | 20,906 |
Calculation of adjusted capital employed | |||
Adjusted capital employed (A+C) | 87,350 | 82,159 | 92,563 |
Average adjusted capital employed | 90,518 | 84,755 | 87,361 |
Net debt to capital employed A/(A+C) | 39.0% | 28.7% | 22.6% |
* Adjustment for intercompany project financing through an external bank.
** Adjustment made for deposits received for financial derivatives. Although these deposits are classified as liquid assets, they are interest bearing and are therefore not excluded from gross interest bearing debt when calculating our net interest bearing debt.
Item 6 Directors, Senior Management and Employees
Directors and Senior Management
Management
Our management is vested in our board of directors and our Chief Executive Officer. The Chief Executive Officer is responsible for the day-to-day management of our company in accordance with the instructions, policies and operating guidelines set out by our board of directors.
The business address of the directors, executive officers and corporate assembly members is c/o Statoil at the corporate headquarters in Stavanger, Norway.
Board of Directors
Our articles of association require that our board of directors consists of a minimum of five and a maximum of 11 members. Currently, we have 9 directors. The members of the board have extensive and relevant experience from Norwegian and international business activities. Members of the board of directors serve two-year terms. The members of the board are primarily recruited from the Norwegian business community, and our executive management is not represented on the board. As required by Norwegian companies law, our employees are entitled to be represented by three board members. The corporate assembly has elected the current board of directors. The current term of office for the directors expires in May 2004, other than Kaci Kullmann Five, whose term of office expires in August 2004, and Jannik Lindbæk, whose term of office expires in December 2006. There are no directors’ service contracts that provide for benefits upon termination of employment.
Our directors, their place of residence, age and their position are identified below.
| Name | Place of Residence | Age | Position |
Jannik Lindbæk | Oslo, Norway | 65 | Chairman |
Kaci Kullmann Five | Bærum, Norway | 52 | Director |
Finn A Hvistendahl | Oslo, Norway | 62 | Director |
| Grace Skaugen | Oslo, Norway | 50 | Director |
Eli Sætersmoen | Oslo, Norway | 39 | Director |
| Knut Åm | Stavanger, Norway | 60 | Director |
Marit Bakke(1) | Bergen, Norway | 38 | Director |
Stein Bredal(1) | Finnøy, Norway | 54 | Director |
Bjørn Erik Egeland(1) | Bergen, Norway | 60 | Director |
(1) Elected by the employees.
Jannik Lindbæk was appointed Chairman of the board with effect from November 1, 2003. Mr. Lindbæk has extensive experience both as a business leader and from international activities, as well as knowledge of the oil and gas business. He has from 1985 to 1995 been Senior Vice President and Chief Executive Officer in the Storebrand Group, a leading player in the Norwegian markets for pensions, life- and health insurance, banking and asset management. From 1986 to 1994 Mr. Lindbæk was Chief Executive Officer in Nordiska Investeringsbanken (Nordic Investment Bank) and from 1994 to 1999 he was Executive Vice President of International Finance Corporation (World Bank Group). He has been Chairman of the board in Gaz de France Norge, Saga Petroleum and Den norske Bank. He also holds positions as Chairman of the board of Bergen International Festival and Transparency International Norge.
Kaci Kullmann Five was elected to the board of directors in August 2002. In the period September 29, 2003 to November 1, 2003 she was acting chairman of the board of directors and from November 1, 2003, she has been appointed Deputy Chairman of the board of directors. Ms. Five is a public affairs consultant. In the period 1981 to 1997 she was a member of the Norwegian Parliament and in the period 1989 to 1990 she was minister for Trade and Shipping in the Norwegian Government. Ms. Five was in the period 1991 – 1994 leader of the Norwegian Conservative Party. Currently, Ms. Five is a director of the boards of NMD Grossisthandel, Vitus Apotek AS and Asker og Bærum Budstikke ASA, and a member of the control committee of Carnegie Fondsforsikring ASA and the Norwegian Nobel Committee appointed by the Norwegian Parliament. Previously, she was director of the board of Norsk Medisinaldepot.
Finn A Hvistendahl was elected to the board of directors in April 1999 and re-elected in May 2002. Mr. Hvistendahl is a business development consultant in Oslo. Previously, he held senior positions in Norsk Hydro and was Chief Executive Officer of Den norske Bank ASA. Currently, he is Chairman of the board of directors of Kredittilsynet (The Financial Supervisory Authority of Norway) and director of Dyno Nobel AS.
Grace Skaugen was elected to the board of directors in June 2002. Ms. Skaugen was Director, Corporate Finance - Orkla Enskilda Securities, Oslo, from 1994 until she joined the board of Statoil in 2002. Previously, she was a special project advisor to AS Aircontactgruppen, Oslo, a venture capital consultant to Fearnley Finance Ltd., London and a microelectronics research officer - Columbia University, New York. Ms. Skaugen has previously also been director to the boards of Hilmar Rekstens Almennyttige Fond (Art Foundation), Geelmuyden-Kiese and member of the WWF Council and Fundraising Committee. Currently, Ms. Skaugen is chairman of the board of AS Netkubator, Oslo and is a board member of Tandberg ASA and Storebrand ASA, both listed on the Oslo Stock Exchange.
Eli Sætersmoen was elected to the board of directors in May 2002. Eli Sætersmoen is Chief Financial Officers and Executive Vice President in Selvaag Gruppen (Selvaag Group of Companies) in Oslo. Previously, she held positions in Cell Network ASA, Orkla Securities, GE-Capital, London, McKinsey & Company and in Norsk Hydro ASA. In McKinsey & Company she was responsible for strategic developments for the oil industry. Eli Sætersmoen has been a board member and Deputy Chairman of the board of SND (Government Organization for Regional Development). She is a board member of several boards, including A/S Selvaagbygg and Selvaag Invest.
Knut Åm was elected to the board of directors in April 1999 and re-elected in June 2002. Mr. Åm is a former Senior Vice President of Phillips Petroleum. Previously he has held positions with the Geological Survey of Norway, the Norwegian Petroleum Directorate and Statoil. He has also been Chairman of the board of the Norwegian Oil Industry Association, Christian Michelsen Research and Hitec ASA and President of the Norwegian Petroleum Society and the Norwegian Geological Council.
Marit Bakke was elected to the board of directors in April 2000, re-elected in June 2002, and serves as an employee-elected representative to the board. Ms. Bakke is a Staff Engineer in the Visund field reservoir department and has been employed at Statoil since 1992. Previously, she held a position i Petrotech Knowledge. Marit Bakke is member of and has been a deputy board member of the labour organization Tekna; The Norwegian Society of Chartered Technical and Scientific Professionals in Private Sector.
Stein Bredal was elected to the board of directors in April 2000 and re-elected in June 2002 and serves as an employee-elected representative to the board. He is Materials Coordinator on the Gullfaks field and has worked with Statoil since 1985. Mr. Bredal represents the Confederation of Vocational Unions where he is a full-time union official.
Bjørn Erik Egeland was elected to the board of directors in June 2002 and serves as an employee-elected representative. Mr. Egeland was also a director in our board in the period 1996 to 2000. He is a Logistics Manager on the Gullfaks field and has worked with Statoil since 1985. Previously, he worked as manager on the Statfjord field, which Statoil later took over, since 1981. Mr. Egeland represents the Norwegian Association for Supervisors.
Audit Committee
The board of Directors established an audit committee in August 2003, consisting of three directors. The current members of the audit committee are Finn A Hvistendahl (chairman), Eli Sætersmoen and Marit Bakke. The audit committee is a sub-committee under the board of directors and is established primarily for the purpose of assisting the board in overseeing the accounting and financial reporting processes of the company and audits of the financial statements of the company. The audit committee is instructed to assist the board’s oversight of such issues as (1) the quality and integrity of the company’s financial statements and related disclosure, (2) the external auditor’s qualifications and independence, (3) the performance of the external auditor subject to the requirements of Norwegian law, (4) the performance of the company’s internal audit function, internal controls and risk management and risk audit function, and (5) the company’s compliance with legal and regulatory requirements, including the requirements related to the listing on stock exchanges. The internal audit function reports directly to the board of directors and to the Chief Executive Officer. The audit committee assists the board in overseeing this function.
Under Norwegian law, our external auditor is elected by our shareholders at the Annual General Meeting. The audit committee makes a recommendation to the board of directors in respect of the appointment of the external auditor based upon its evaluation of the qualifications and independence of the auditor to be proposed for election or re-election. The audit committee meets separately with the representatives of the management, internal auditor and the external auditor at least five times a year.
The audit committee is also charged with reviewing the scope of the audit and the nature of any non-audit services provided by external auditors. The external auditors report directly to the audit committee on a regular basis. The audit committee also maintains procedures for the receipt, retention and treatment of complaints received by the company regarding accounting, internal controls, or auditing matters and for the confidential, anonymous submission by employees of the company of concerns regarding accounting or auditing matters. The audit committee has the authority to engage independent advisers to assist it in carrying out its duties.
Executive Committee
An executive committee is not required under Norwegian corporate law, but we established the committee as part of the overall organization of our company. Each member of the executive committee supervises separate business areas or staff units. Although the CEO is responsible for making decisions on important matters not requiring the decision of the board of directors, as well as all matters referred to him by the board, the executive committee has an advisory role. The board of directors has granted Erling Øverland the power of procuration, which under Norwegian law essentially empowers him to act on behalf of our company in all matters relating to our normal operations.
The members of our executive committee, their place of residence, age and position are identified below.
| Name | Place of Residence | Age | Position |
| Helge Lund | Bærum, Norway | 42 | Appointed President and Chief Executive Officer |
Erling Øverland | Stavanger, Norway | 51 | Acting President and Chief Executive Officer |
Eldar Sætre | Sandnes, Norway | 48 | Acting Chief Financial Officer and Executive Vice President |
| Henrik Carlsen | Stavanger, Norway | 57 | Executive Vice President, Exploration and Production Norway |
Ottar Inge Rekdal | Stavanger, Norway | 54 | Acting Executive Vice President, International Exploration and Production |
| Peter Mellbye | Stavanger, Norway | 54 | Executive Vice President, Natural Gas |
Einar Strømsvåg | Sandnes, Norway | 48 | Acting Executive Vice President, Manufacturing and Marketing |
| Elisabeth Berge | Oslo, Norway | 49 | Executive Vice President, Communications & Public Affairs |
| Terje Overvik | Stavanger, Norway | 52 | Executive Vice President, Technology |
Helge Lund was appointed President and Chief Executive Officer on March 7, 2004, and assumes his position on August 15, 2004. Mr. Lund comes from the position as Chief Executive of Aker Kværner, and he has since 1999 held a number of positions in the Aker RGI system, amongst them the position as Deputy President and COO and Deputy Chairman of Aker Maritime. For a period, he was also appointed the Board of Kvaerner. Mr. Lund joined the Hafslund Nycomed industrial company in 1993, and from 1997, he was deputy managing director of Nycomed Pharma for a period of two years. Before then, Mr. Lund was a political adviser in the Conservative Party's parliamentary group and a consultant at McKinsey & Co. Mr. Lund graduated as a business economist at the Norwegian School of Economics and Business Administration in Bergen. He also has a master of business administration (MBA) from the Insead business school in France.
Erling Øverland has been acting President and Chief Executive Officer since March 7, 2004. He previously served as Executive Vice President of Manufacturing and Marketing since 2000. Employed at Statoil since 1976, Mr. Øverland has previously served as Chief Financial Officer from 1995 to 2000, and as President of Refining and Marketing from 1994 to 1995 and as President of Statoil Norge AS from 1992 to 1994. He was also a member of the board of directors of Hafslund ASA and the Foundation for Scientific and Industrial Research of the Norwegian University of Science and Technology. Currently, Mr. Øverland is Vice Chairman of the board of Borealis. He also is Chairman of the Norwegian Federation of Process Industry and member of the executive committee in the Employers’ Organization (NHO). He graduated in 1976 with a MS in Business from the Norwegian School of Economics and Business Administration (NHH).
Eldar Sætre became acting Chief Financial Officer and Executive Vice President on September 30, 2003. This position entails responsibility for the following staff functions: corporate control, planning and accounting; group finance; investor relations; corporate services; information management and technology; legal affairs and administrative issues related to corporate audit. Mr. Sætre was senior vice president for corporate control, planning and accounting since 1998. Before then, his positions included controller for Gullfaks (1985-1989), commercial manager for Bergen Operations (1989-1992) and controller in E&P Norway (1992-1995). Mr. Sætre joined the group in 1980. He graduated with an MS degree in Business from the Norwegian School of Economics and Business Administration (NHH) in 1980.
Henrik Carlsen has served as Executive Vice President of E&P – Norway since 1999. Employed at Statoil since 1974, Mr. Carlsen has held numerous positions. Most recently, Mr. Carlsen served as Senior Vice President of Natural Gas Production and Transport from 1995 to 1999, as Vice President of Statfjord from 1992 to 1995 and as Vice President of Technology E&P from 1990 to 1992. He graduated from the Norwegian University of Technology in 1970 and the University of Bergen in 1974.
Ottar Inge Rekdal became acting Executive Vice President, International Exploration &Production, on September 12, 2003. Mr. Rekdal previously held the post of Senior Vice President for the group's international gas and power (IGAS) business cluster. He joined Statoil in 1975. In addition to a number of key manager positions in E&P International, Mr. Rekdal has held central posts in the Natural Gas business area and in the group's development and technology units. He was educated at NTNU, University of Trondheim in 1972 with a degree in Chemical Engineering.
Peter Mellbye has served as Executive Vice President of Natural Gas since 1992. Employed at Statoil since 1982, Mr. Mellbye has held numerous positions. Most recently, Mr. Mellbye served as President of the Natural Gas business segment from 1990 to 1992 and as Vice President of Natural Gas Marketing from 1982 to 1990. Currently, Mr. Mellbye is a member of the board of Siemens AS, Institut Francais du Pétrole in France, and of the Energy Policy Foundation of Norway. Mr. Mellbye graduated from the Universities of Oslo and Bergen with a degree in political science in 1977.
Einar Strømsvåg is acting Executive vice president, Manufacturing and Marketing from March 2004. He has previously filled positions as Vice president, Commercial affairs in Natural gas business development, Executive vice president &chief financial officer in Statoil Energy in USA, Chief of staff in Manufacturing and Marketing and before his last assignment, he was Senior vice president Manufacturing. In 1995-1997 he was Managing Director at Kverneland Klepp, preceded by ten years as Chief Financial Controller and Managing Director at Gilde Agro. He also worked with Statoil from 1983 to 1984 as a Financial Controller. Furthermore, Mr. Strømsvåg worked as a chemical engineer at the University of Bergen from 1979 to 1981. Mr. Strømsvåg received an MBA in 1983 from the Norwegian School of Business and Administration in Bergen and a B. Sc. from Bergen Technical College in 1978.
Elisabeth Berge has served as Executive Vice President of Communications & Public Affairs since July 1, 2001 and she was also responsible for the State’s direct financial interest since 1999 until this function was transferred to Petoro in 2001. Employed at Statoil since 1990, Ms. Berge has previously served as Senior Vice President of our Natural Gas business segment from 1996 to 1999, as Executive Assistant to the Executive Board from 1993 to 1996 and as Marketing Manager of Natural Gas Marketing from 1990 to 1993. Currently, Ms. Berge is a member of the board of Kavli Holding. Ms. Berge received her MBA from the Norwegian School of Economics and Business Administration in 1978 and an MA in Economics from the University of California in 1979.
Terje Overvik has served as Executive Vice President for Technology since August 19, 2002. He holds a PhD from the former Norwegian Institute of Technology (NTH) in Trondheim, he also worked there as an associate professor and researcher before joining Statoil in 1983. Mr. Overvik has held a number of different posts in Statoil, including platform manager for the Statfjord A platform in the North Sea from 1992-2000, and vice president for Statfjord operations from 2000-2002.
Our corporate assembly consists of 12 members. The general meeting elects eight members, and our employees elect an additional four members.
Our corporate assembly has a duty to control the board of directors and our Chief Executive Officer in their management of our company. Norwegian companies law imposes a fiduciary duty on the corporate assembly to our shareholders. The corporate assembly communicates its recommendations concerning the board of directors’ proposals about the annual accounts, balance sheets, allocation of profits and coverage of losses of our company to the general meeting. The corporate assembly renders decisions, based on the board’s proposals, in matters related to substantial investments, measured in terms of the total resources of our company, and matters regarding rationalizations or restructurings of the operations of the company which will result in a major change or reorganization of the workforce. The corporate assembly is also responsible for electing and removing our board of directors. The term of office of the corporate assembly members is two years and the current term of office expires in May 2004.
Set forth below is a list of the current members of our corporate assembly, their place of residence, age and occupation.
| Name | Place of Residence | Age | Position |
Anne Kathrine Slungård | Trondheim, Norway | 40 | Director of communications, SINTEF, Trondheim, Norway |
Kjell Bjørndalen | Skotselv, Norway | 57 | Chairman of the Norwegian Trade Union; Fellesforbundet |
Kirsti Høegh Bjørneset | Ålesund, Norway | 41 | Attorney, Tømmerdal & Co, Ålesund, Norway |
| Erlend Grimstad | Oslo, Norway | 46 | Executive Vice President, Umoe AS, Oslo, Norway |
| Gunnar Mathisen | Oslo, Norway | 53 | Senior Advisor, Geelmuyden-Kiese, Oslo, Norway |
| Wenche Meldahl | Stavanger, Norway | 58 | Siviløkonom, Stavanger, Norway |
| Anita Roarsen | Oslo, Norway | 46 | Finance Director, Aon Grieg AS, Oslo, Norway |
Asbjørn Rolstadås | Trondheim, Norway | 60 | Professor at NTNU (Technical and Scientific University of Norway), Trondheim, Norway |
Arvid Færaas | Vormedal, Norway | 41 | Union official, NOPEF (Statoil) |
Einar Arne Iversen | Stavanger, Norway | 41 | Union official, NITO (Statoil) |
| Hans M Saltveit | Stavanger, Norway | 32 | Union official, YS (Statoil) |
Åse Karin Staupe | Stavanger, Norway | 37 | Project Manager, NIF (Statoil) |
Compensation
Compensation to the Board of Directors, Executive Committee and Corporate Assembly
In 2003, total remuneration of NOK 365 thousand was paid to the members of the corporate assembly, NOK 1,873 thousand to the board of directors and NOK 20,973 thousand to the members of the executive committee, excluding CEO’s compensation.
The former Chief Executive Officer Olav Fjell received NOK 3,227,000 in salary and other remuneration (including pension premium paid) until his resignation on September 22, 2003. According to contract, Olav Fjell was entitled to severance compensation equaling two annual salaries, as well as an exclusive term of notice of six months, when the resignation is requested by the board. In addition, Olav Fjell is entitled, under specific terms, to a pension amounting to 66 per cent of pensionable salary after reaching the age of 60.
Inge K Hansen, who was acting Chief Executive Officer until March 7, 2004, received NOK 1,015,000 in salary and other remuneration (included pension premium paid) for the period from September 22 through December 31, 2003.
Former Executive Vice President Richard John Hubbard was given a severance pay equal to one –year’s salary and compensation when he left the company.
Recently appointed Chief Executive Officer Helge Lund will earn an annual salary of NOK 4.4 million and the board may award a bonus of up to 30% of base salary. He is entitled, under specific terms, to a pension amounting to 66 per cent of pensionable salary after 15 years as CEO, and may retire at the age of 62.
Erling Øverland and Peter Mellbye are also entitled to a severance payment equaling two years’ and three months and two years’ salary, respectively, and, under specific terms, to a pension after reaching the age of 60. The pension paid will amount to 66% of their pensionable salaries.
A performance pay system has been established for the other members of the executive committee, senior vice presidents and vice presidents. This entails a variable remuneration based on pre-determined goals. For those employed in the parent company, the scheme allows for a bonus of 10 % of basic salary on achieving set goals, with a ceiling of 20 % for results that clearly exceeds these goals.
We have made an office in Oslo available to our Chairman, Mr. Jannik Lindbæk. See Item 7–Major Shareholders and Related Party Transactions–Related Party Transactions.
Pension Benefits
We provide pension benefits to the majority of the group’s employees entitling them to defined future pension benefits. The amounts of benefits provided are dependent on the number of years of their pensionable service, their final salary level, and the size of public insurance benefits.
Employees in the parent company, and the majority of Norwegian subsidiaries, are insured mainly through Statoil’s pension funds. These funds are organized as independent trusts. The major part of their assets are invested in Norwegian and foreign bonds and shares, as well as in real estate in Norway. Employees in subsidiaries are insured through their own pension funds or through collective pension schemes in various insurance companies.
The projected benefit obligation at the end of the year is NOK 17,642 million whereas the estimated fair value of plan assets at the end of the year amounts to NOK 15,143 million.
Employee Incentive Plan
Statoil ASA has a common bonus scheme for its employees. This bonus scheme will have a maximum payment of 5%, calculated on each employee’s base salary.
Board Practices
In keeping with business practice in Norway, the board of directors of Statoil does not adopt its decisions through committees, but in the full board, even though Statoil has an audit committee to prepare certain issues for the board of directors and support the board of directors in their responsibilities for management and control of the company.
Employees
As of December 31, 2003, we had 19,326 employees, of whom we employed 11,835 in Norway. The remaining 7,491employees were employed outside of Norway, with more than 100 employees in each of Poland, Ireland, Denmark, Sweden, Lithuania, Latvia, Estonia, UK, Russia and the Faroe Island.
The tables below set forth the number of employees in each of our business areas at the end of 2001, 2002 and 2003, and the numbers of employees inside and outside of Norway. The table does not include employees of affiliated companies.
Number of Employees AS OF | |||||||||
December 31, 2001 | December 31, 2002 | December 31, 2003 | |||||||
Norway | Outside Norway | Total | Norway | Outside Norway | Total | Norway | Outside Norway | Total | |
| E&P-Norway | 5,603 | 0 | 5,603 | 5,774 | 0 | 5,744 | 6,405 | 0 | 6,405 |
International E&P | 276 | 245 | 521 | 355 | 243 | 598 | 338 | 268 | 606 |
| Natural Gas | 844 | 130 | 974 | 805 | 132 | 937 | 847 | 147 | 994 |
Manufacturing and Marketing | 1,744 | 5,262 | 7,006 | 1,632 | 5,461 | 7,093 | 1,506 | 6,941 | 8,447 |
| SDFI | 5 | 0 | 5 | 0 | 0 | 0 | NA | NA | NA |
Other Operations | 2,522 | 55 | 2,577 | 2,648 | 65 | 2,713 | 2,739 | 135 | 2,874 |
| Total | 10,994 | 5,692 | 16,686 | 11,214 | 5,901 | 17,115 | 11,835 | 7,491 | 19,326 |
We intend to limit our recruitment to growth areas and focus on young professionals and specific key competencies. We have a set of union/employer agreements at national, industry and local levels, which is the typical way of organizing union agreements in Norwegian industry. We take part in agreements at the national level as a member of the Norwegian Employers Association and at the industry level as a member of Norwegian Oil Industry Association and the Federation of Norwegian Process Industry, both of which are branches of the Norwegian Employers Association.
At the local level, we have agreements with the trade unions. Our employees are represented by five trade unions: the Norwegian Oil and Petrochemical Workers Union, Confederation of Vocational Unions, Norwegian Association for Supervisors, Norwegian Society of Chartered Engineers and Norwegian Society of Engineers. Approximately 70%of our employees are union members. The unions are entitled to appoint three members to our board of directors. Labor contracts with the unions were renewed in 2002 for a period of two years.Overall, we consider our relations with our employees as well as the unions to be good, and there are currently no major labor disputes.
We continually seek to improve the skills and development of our employees in each of our business units. Employees participate in various training programs. Our training organization provides different development programs, and we cooperate with selected colleges and universities as well as other educational and research institutions in Norway and abroad.
Share Ownership
The number of shares owned by the members of the board of directors, the executive committee, and the corporate assembly is shown below. Board members and members of the executive committee, including closely related parties, who own shares are set forth below. Each owns less than 1% of the Statoil shares outstanding.
Board of directors | No. of shares owned as of March 25, 2004 |
Bjørn Erik Egeland | 1,234 |
Finn A Hvistendahl | 2,947 |
Kaci Kullmann Five | 1,242 |
Knut Åm | 14,594 |
Marit Bakke | 165 |
Stein Bredal | 165 |
Executive committee | No. of shares owned as of March 25, 2004 |
Einar Strømsvåg | 165 |
Eldar Sætre | 825 |
Elisabeth Berge | 1,603 |
Erling Øverland | 2,464 |
Henrik Carlsen | 1,243 |
Ottar Inge Rekdal | 825 |
Peter Mellbye | 2,843 |
Terje Overvik | 825 |
Members of the corporate assembly owned as of March 25, 2004 a total of 1,738 shares.
Item 7 Major Shareholders and Related Party Transactions
Major Shareholders
The Norwegian State as a Shareholder
The following table shows the number of Statoil shares owned by the Norwegian State as of December 31, 2003. The State did not buy or sell any shares in the period from December 31, 2003 to March 25, 2004. We have not been notified of any other beneficial owner of 5% or more of our ordinary shares as of March 25, 2004.
Number of shares | % of shares | |
Kingdom of Norway | 1,770,168,598 | 80.84(1) |
(1) Based upon 2,166,143,715 ordinary shares outstanding and 23,441,885 ordinary shares held in treasury.
In June 2001, in connection with the initial public offering of our ordinary shares, we established a sponsored American Depositary Receipt facility with The Bank of New York as depositary pursuant to which American Depositary Receipts (ADRs) representing American Depositary Shares (ADSs) are issued. We have been informed by The Bank of New York that in the United States, as of March 25, 2004, there were 21,925,001 ADRs outstanding (representing approximately 1.01% of the ordinary shares outstanding). As of March 25, 2004 there were 70 registered holders resident in the United States.
On April 26, 2001 the Storting (the Norwegian parliament) authorized the Ministry of Petroleum and Energy to reduce its shareholding in us by up to one-third of our value through the sale of its existing shares or the issuance by us of new shares to new investors. Following the initial public offering, the Norwegian State owned 80.84% of the shares of Statoil. This percentage was calculated based on shares authorized and issued.
The Norwegian State does not have any different voting rights from the rights of other ordinary shareholders as described in Item 10–Additional Information–Memorandum and Articles of Association. However, as the Norwegian State, acting through the Minister of Petroleum and Energy, continues to own in excess of two-thirds of the shares in us following completion of the initial public offering, it has the sole power to amend our articles of association. As long as the Norwegian State owns more than one-third of our shares, it will be able to prevent any amendments to our articles of association. In addition, as a majority shareholder, the Norwegian State has the power to control any decision at general meetings of our shareholders that requires a majority vote, including the election of the majority of the corporate assembly, which has the power to elect our board of directors and approve the dividend proposal by the board of directors.
The Norwegian State has stated that as one of our several shareholders, it will concentrate on issues relating to return on capital and dividend policy, emphasizing long-term profitable business development and the creation of value for all shareholders. The Norwegian State will exercise its ownership position based on a coordinated ownership strategy to maximize the value of the Norwegian State’s aggregate holdings in Statoil and the SDFI.
The Norwegian State as a Regulatory Authority
As a corporation based in Norway, we are subject to the laws and regulations of the Kingdom of Norway. Changes to relevant laws and regulations could have a significant impact on our operations. Various agencies and departments of the Kingdom of Norway exercise regulatory functions over our activities. The Ministry of Petroleum and Energy also exercises important regulatory powers over all petroleum operations of the companies of the NCS, including those of Statoil. For additional information about the Ministry of Petroleum and Energy’s role, see the section entitled Item 4–Information on the Company–Regulation–Norwegian Regulation. A number of other agencies and departments, such as the Norwegian Petroleum Directorate, the Ministry of Finance, the Ministry of Labor and Government Administration, the Ministry of the Environment and the Norwegian Pollution Control Authority, exercise regulatory powers which affect important parts of our operations.
A significant part of the taxes we pay are paid to the Norwegian State, see Item 4–Information on the Company–Business Review–Regulation–Norwegian Regulation–Taxation of Statoil.
The Norwegian State’s Direct Participation in Petroleum Operations on the NCS
The Norwegian State’s policy as an owner has been, and continues to be, to ensure that petroleum activities create the highest possible value for the Norwegian State. Initially, the Norwegian State’s participation in petroleum operations was organized mainly through us. In 1985, the Norwegian State established the State’s direct financial interest, or SDFI, through which the Norwegian State has taken direct participating interests in licenses and petroleum facilities on the NCS. As a result, the Norwegian State holds interests in a number of licenses and petroleum facilities in which we also hold interests. Until June 17, 2001, we acted as manager of the SDFI’s interests in licenses and petroleum facilities.
As a result of changes in global markets and competitive conditions in the petroleum industry, the Norwegian State implemented a strategic review of its oil and gas policy in 2000. Based on the results of this strategic review, the Norwegian State prepared a plan to restructure its petroleum holdings on the NCS that was approved by the Storting on April 26, 2001. The key elements of the restructuring plan include:
Sale of Petroleum Assets between the Norwegian State and us
The Norwegian State owns directly a substantial portion of the total oil and gas reserves on the NCS, through the SDFI. As a part of the Norwegian State’s decision in 2001 to restructure its oil and gas assets on the NCS, the Norwegian State sold a portion of its SDFI assets to us and other oil and gas companies. In a single transaction with the Norwegian State, we purchased a significant number of production license interests and certain pipeline ownership interests from the Norwegian State.
As a part of the single transaction with the Norwegian State we transferred to the Norwegian State a 33.25% interest in Statpipe (including a 33.25% interest in Statpipe’s processing plant at Kårstø), a 25% interest in Norsea Gas A/S (Norpipe) and a 35% interest in the crude oil terminal at Mongstad.
The transaction between Statoil and the SDFI was completed on June 1, 2001 with a valuation date of January 1, 2001 with the exception of the sale of an interest in the Mongstad terminal which had a valuation date of June 1, 2001 and, as a result, we made a net balancing cash payment to the Norwegian State of NOK 25.0 billion and incurred NOK 13.6 billion in subordinated debt to the Norwegian State, calculated as of January 1, 2001.
Marketing and Sale of the SDFI’s Oil and Gas
Introduction. We have historically marketed and sold the Norwegian State’s oil and gas as a part of our own production. The Norwegian State has elected to continue this arrangement. Accordingly, at an extraordinary general meeting held on February 27, 2001, the Norwegian State, as sole shareholder, revised our articles of association by adding a new article which requires us to continue to market and sell the Norwegian State’s oil and gas together with our own oil and gas in accordance with an instruction established in shareholder resolutions in effect from time to time. At an extraordinary general meeting held on May 25, 2001, the Norwegian State, as sole shareholder, approved a resolution containing the instructions referred to in the new article. This resolution is referred to as the owner’s instruction.
The Norwegian State has a coordinated ownership strategy to maximize the aggregate value of its ownership interests in Statoil and the Norwegian State’s oil and gas. This is reflected in the owner’s instruction, which contains a general requirement that, in our activities on the NCS we are required to take account of these ownership interests in decisions that may affect the execution of this marketing arrangement.
The owner’s instruction sets forth specific terms for the marketing and sale of the Norwegian State’s oil and gas. The principal provisions of the owner’s instruction are as set forth below.
Objectives. The overall objective of the marketing arrangement is to obtain the highest possible total value for our oil and gas and the Norwegian State’s oil and gas and ensure an equitable distribution of the total value creation between the Norwegian State and us. In addition, the following considerations are important:
Our tasks. Our tasks under the owner’s instruction are to market and sell the Norwegian State’s oil and gas and to carry out all necessary tasks, other than those carried out jointly with other licensees under the production license, in relation to the marketing and sale of the Norwegian State’s oil and gas, including, but not limited to, the responsibility for processing, transport and marketing. In the event that the owner’s instruction is terminated, in whole or in part, by the Norwegian State, the owner’s instruction provides a mechanism under which contracts for the marketing and sale of the Norwegian State’s oil and gas to which we are a party may be assigned to the Norwegian State or its nominee. Alternatively, the Norwegian State may require that the contracts be continued in our name, but to the effect that in the underlying relationship between the Norwegian State and us, the Norwegian State receives all rights and obligations related to the Norwegian State’s oil and gas.
Costs. The Norwegian State does not pay us specific consideration for executing these tasks, but the Norwegian State reimburses us for its proportionate share of certain costs, which under the owner’s instruction may be our actual costs or an amount specifically agreed.
Price mechanisms. For sales of the Norwegian State’s natural gas, both to us and to third parties, the payment to the Norwegian State is based on either achieved prices, a net back formula or market value. We now purchase all of the Norwegian State’s oil and NGL. Pricing of the crude oil is based on market reflective prices. NGL prices are based on either achieved prices, market value or market reflective prices.
Lifting mechanism. As part of the coordinated ownership strategy, a lifting mechanism for the Norwegian State’s and our oil and gas is established in accordance with rules set out in the owner’s instruction.
To ensure a neutral weighting between the Norwegian State’s and our natural gas volumes, a list has been established for deciding the priority between each individual field. To decide the ranking, a mathematical optimization model is used which describes existing and planned production facilities, infrastructure and processing terminals where the Norwegian State and we have ownership interests. The list yields a result giving the highest total net present value for the Norwegian State’s and our oil and gas. In the evaluation, the following objective criteria shall, among other things, apply:
The different fields are ranked in accordance with the assumed total value creation of the Norwegian State and us, assuming all of the fields meet our profitability requirements if we participate as a licensee, and the Norwegian State’s profitability requirements if the State is a licensee. The list is updated annually or more frequently if incidents occur that may significantly influence the ranking. Within each individual field where both the Norwegian State and we are licensees, the Norwegian State and we will deliver volumes and share income in accordance with our respective participating interests.
The Norwegian State’s oil and NGL are lifted together with our oil and NGL in accordance with applicable lifting procedures for each individual field and terminal.
Withdrawal or Amendment. The Norwegian State may utilize its position as majority shareholder of Statoil, at any time, to withdraw or amend the instruction requiring us to market and sell the SDFI oil and natural gas together with our own.
Petoro - The New SDFI Management Company
Since the establishment of Statoil in 1972, the participation of the Norwegian State in production licenses and facilities for transport and utilization of petroleum took place entirely through us. As of January 1, 1985, the Norwegian State’s participation was reorganized through the establishment of the SDFI. Through this reorganization the Norwegian State began taking a direct financial interest in production licenses. The establishment of the SDFI entailed a transfer of a substantial part of our participation in most of our then-existing licenses to the SDFI, although formally such licenses continued to be held wholly in our name. Since its establishment in 1985, the SDFI has taken shares in most licenses awarded. The SDFI also holds shares in a number of oil and gas pipelines and land-based terminal facilities.
We were, until June 17, 2001, registered as licensee for all SDFI shares in licenses. In accordance with a decision made in an extraordinary general meeting on May 10, 2001, we were until this time also the manager of the SDFI shares in these licenses on behalf of the Norwegian State. Where both the SDFI and we had an interest in the same license, the department managing our interest also managed the SDFI interest. In fields with SDFI interests only, the interests were managed by a separate unit that we established for this purpose. Our tasks as the manager of the SDFI’s interests have included attending management committee meetings for both the SDFI’s and our own share in licenses, and votes cast by us in management committee meetings have represented both the SDFI’s and our own interests in the licenses. We have also been responsible for marketing the petroleum of which the Norwegian State becomes the owner through the SDFI shares in production licenses.
In connection with the restructuring, the Norwegian State on May 9, 2001 established a new State-owned company, Petoro AS, which took over responsibility for and the management of the SDFI assets as licensee, in accordance with a new chapter of the Petroleum Act. The Norwegian State continues to be the beneficial owner of these assets. We continue to market and sell the Norwegian State’s oil and gas together with our own oil and gas, pursuant to the owner’s instruction described under –Marketing and Sale of the SDFI’s Oil and Gas above. One of the tasks of Petoro AS is to supervise our compliance with the owner’s instruction.
Petoro AS does not own any of the oil and gas produced under the license interests it holds, does not receive any revenues from sales of the State’s oil and gas, and is not be permitted to obtain an operator role. However, Petoro AS may become a participant in new licenses awarded by the Norwegian State.
Gassco – The New Gas Transportation Operating Company
In connection with the restructuring of the Norwegian State’s oil and gas interests, on May 14, 2001 the Norwegian State established a separate company, Gassco AS, which on January 1, 2002 took over as operator of the natural gas transportation system previously operated by us. Gassco AS is wholly owned by the Norwegian State. The owners of the infrastructure systems appointed Gassco AS as the new operator.
The transfer of the operatorship to Gassco AS was made without consideration and does not affect existing arrangements with respect to ownership or access to the natural gas transportation system or tariffs for transport. However, in accordance with the joint venture agreements relating to each of the gas transportation assets, the operator is entitled to be reimbursed for its costs as operator. Accordingly, since Gassco AS was appointed as operator, we no longer receive such reimbursement, and we will, as other users of the infrastructure, be required to pay our portion of Gassco AS’s expenses associated with the operation of the natural gas pipelines in which we hold interests.
Gassco AS has entered into contracts with us for each infrastructure joint venture, pursuant to which we will carry out technical operating activities on behalf of Gassco AS, such as system maintenance, for which we will receive reimbursement of costs. Either Gassco or we may terminate without cause each of these contracts, except the contract for the Statpipe joint venture, after five years. Either Gassco or we may also terminate the part of the Statpipe contract, which refers to the offshore pipelines, after five years. Currently, Gassco may terminate the part of the Statpipe contract that refers to the Kårstø plant, at any time, provided that 2/3 of the owners, representing more than 2/3 of the ownership interests, have supported such termination.
As from January 1, 2003 the ownership of the Zeepipe, Franpipe, Europipe II, Åsgard Transport, Statpipe, Oseberg Gas Transport and Vesterled joint ventures and Norpipe AS were transferred to a new joint venture called Gassled. This also includes the terminals in Statpipe and Vesterled, the Europipe Receiving Facilities and the Europipe Metering Station. The ownership interest in Zeepipe Terminal JV and Dunkerque Terminal DA will also be adjusted. Gassco AS is the operator of the Gassled joint venture.
Our initial direct ownership interest will be 20.379% in Gassled (21.133% including our indirect interest through our 25% holding in Norsea Gas AS), 9.98571% in Zeepipe Terminal JV and 13.24635% in Dunkerque Terminal DA. From January 1, 2011, our ownership interest in Gassled will be reduced to 17.179% due to an increased ownership interest for SDFI. In addition, our ownership interest in Gassled may also change as a result of inclusion of existing or new infrastructure or if Gassled undertakes further investments without participation from its owners in the same ratio as their ownership interests in Gassled. For more information on the Gassled joint venture, see Item 4–Information on the Company–Business Overview–Operations–Natural Gas.
Related Party Transactions
Transactions with the Norwegian State
For a description of transactions with the Norwegian State, see –Major Shareholders–The Norwegian State as a Shareholder above.
Transactions with other entities controlled by the Norwegian State
Norsk Hydro. In 2003, we purchased a 10% interest in the Snøhvit field from Norsk Hydro, with such transaction being effective January 1, 2004. Further, a 2% interest in the Kristin field was sold to Hydro effective from January 1, 2004. In addition, we hold interests in a number of the licenses and petroleum facilities in which Norsk Hydro also holds interests, and for many of these licenses and petroleum facilities Norsk Hydro or we serve as operator. Norsk Hydro has an indirect participating interest in the Gassled joint venture. Further, we from time to time engage in common drilling campaigns, exploration and development projects with Norsk Hydro. In addition, Norsk Hydro is a party to the 15-year agreement for the sale of ethane described below in —Transactions with associated companies.
Others. As a result of the substantial percentage of industry in Norway controlled by the Norwegian State, there are many state-controlled entities with which we do business. The financial value of most such transactions is relatively small, and the ownership interest of the Norwegian State of such counter parties has not had any effect on the arm’s-length nature of the transactions. In particular, in respect of the goods and services that we purchase, we purchase telephone services from Telenor ASA, a telecommunications company in which the Norwegian State holds a 77.63% interest. Such purchases are made pursuant to standard tariff rates applicable to public and private companies in Norway.
Transactions with associated companies
Borealis. On November 28, 2000, we entered into a long-term Sales and Purchase Agreement with Borealis for the sale of LPG derived from Statoil and SDFI’s share of crude oil from the Oseberg field in which the combined participating interest is now 48.90%. The LPG is made available after the crude oil from Oseberg has gone through the transportation, separation and storage processes in the Vestprosess facility at Mongstad, our refinery in Norway. The agreement provides for regular deliveries of LPG to Borealis’s Rafnes plant. The price is based on the content of isobutane in the delivered LPG and is set in relation to the market price for naphtha. Certain quality specifications regulate the methanol, butane and isobutane content in the delivered product. The initial period for the contract is 15 years. In 2003, we sold 158,976 tonnes of LPG under this contract for an approximate consideration of NOK 251 million.
On June 2, 1997, we entered into a 15-year agreement for the sale of ethane between the participants in the Troll field, including us, as sellers and Borealis, Noretyl ANS and Norsk Hydro Produksjon AS as buyers. This contract provides for the purchase and sale of ethane feedstock for the Borealis plant in Stenungsund, Sweden, the Noretyl plant in Rafnes, Norway, and the Hydro Agri Ammonia plant at Herøya in Porsgrunn, Norway from the Gassled owned Kårstøplant. Currently, 50% of production is delivered to Stenungsund and 50% to Rafnes.At Rafnes, 50% is delivered to Hydro Agri Ammonia plant, 25% to Hydro Polymers and 25% to Borealis. It is a take-or-pay contract whereby the buyers are obligated to pay for all ethane made available by the sellers under the contract. The price for the ethane is based on the market price of naphtha and is adjusted to reflect changes in the Norwegian consumer price index and the market price of marine fuel. Deliveries under the contract began in October 2000, and the initial term of the agreement lasts until October 1, 2015. In 2003, the seller group sold 518,641 tonnes of ethane under this contract for an approximate consideration of NOK 750 million. This arrangement is also described under Item 4–Information on the Company–Business Overview–Operations–Natural Gas–Kårstø Processing Plant.
Statoil Detaljhandel Skandinavia. On June 1, 1999, we entered into a Fuel Supply Agreement with SDS whereby we became the sole supplier of refined petroleum products to SDS for its retail petroleum activities in Scandinavia. The three-year agreement was renewed in 2002 with an effective date of January 1, 2002. The agreement encompasses bulk products sold at SDS’s service stations such as gasoline and automotive diesel oil, burning kerosene and LPG, as well as marginal bulk products such as RME, biogas and bioethanol and the volume of products contracted for shall be enough to cover the sales of SDS’s service stations. We deliver the products to the individual service stations. Prices paid by SDS are based on market prices for the different products, adjusted for changes that occur to the products during transportation, storage and distribution, and are negotiated annually with the intention that SDS shall enjoy competitive market prices and conditions in respect of the products. In addition to the product prices, SDS pays to us an amount to cover the cost of distribution per service station location, which is also negotiated annually. In 2003, we received NOK 18.6 billion, of which NOK 12.6 billion were excise taxes, pursuant to this Fuel Supply Agreement.
Other Transactions with the Norwegian State
Total purchases of oil and NGL from the Norwegian State by Statoil amounted to NOK 68,479 million (336 mmboe), NOK 72,298 million (374 mmboe), and NOK 53,291 million (265 mmboe), in 2003, 2002 and 2001, respectively. The prices paid by Statoil for the oil purchased from the Norwegian State are estimated market prices. In addition, Statoil sells the Norwegian State’s natural gas, in its own name, but for the account and risk of the Norwegian State.
The Norwegian State compensates Statoil for its relative share of the costs related to certain Statoil natural gas storage and terminal investments and related activities.
Employee Loans
Some of our employees are eligible for an interest-free car loan. The loan is limited to the price of the car purchased, and is capped at NOK 250,000, NOK 375,000 or NOK 475,000, depending on the seniority of the employee.
Executive vice presidents, Henrik Carlsen, Elisabeth Berge, Terje Overvik, Ottar Rekdal, and Eldar Sætre have interest-free loans of NOK 243,000, 21,000, 347 000, 394,000, and 239,000, respectively. These loans have been approved with a repayment period of up to 10 years.
We have an arrangement with DnB Nor whereby DnB Nor makes available to each of our employees personal loans of up to NOK 100,000. The employees pay the “norm interest rate”, which is set by the Norwegian State, and we pay the difference between the norm interest rate and the then-current market interest rate. We also guarantee these loans up to an aggregate maximum amount of NOK 5 million. The repayment period is up to eight years. Our obligations for paying the interest rate difference will be dependent on the loan volume, but based on current interest rates would not exceed NOK 5 million per year.
The three employee elected members of the board of directors each entered into loan agreements under this facility prior to July 30, 2002, and had as of December 31, 2003 an aggregate total balance outstanding payable to DnB Nor under this loan facility of NOK 104,455.
Members of the executive committee, the board of directors and the corporate assembly may not renew existing loans or enter into new loans under the foregoing programs.
Transactions with chairman of the board
We have made an office in Oslo available to our Chairman, Mr. Jannik Lindbæk. The office is used both in relation to his work as Chairman and to his other business activities unrelated to Statoil. We have estimated that 40% of the use of the office is related to his capacity as Chairman. For the remaining 60%, Mr. Lindbæk pays a rent at normal market rate.
Item 8 Financial Information
Consolidated Statements and Other Financial Information
See Item 18–Financial Statements.
Legal Proceedings
We are involved in a number of judicial, regulatory and arbitration proceedings concerning matters arising in connection with the conduct of our business. Except as set forth below, we are currently not aware of any legal proceedings or claims that we believe could have, individually or in the aggregate, significant effects on our financial position or profitability or our results of operations or liquidity.
The Horton Case
In June 2002 Statoil entered into an agreement with Horton Investments Ltd. relating to our business development in Iran. The contract was terminated in September 2003. Prior to the termination of the contract, the Norwegian National Authority for Investigation and Prosecution of Economic and Environmental Crime (Økokrim) issued a preliminary charge alleging violations of the Norwegian General Penal Code provisions concerning illegal influencing of foreign government officials and is conducting an investigation concerning the consultancy agreement between Statoil and Horton Investments Ltd. The U.S. Securities and Exchange Commission is also conducting an inquiry into this consultancy arrangement to determine if there have been any violations of U.S. federal securities laws. In addition, certain Iranian authorities are carrying out inquiries into the matter. We continue to provide information to Økokrim and the Securities and Exchange Commission in order to assist them with their respective ongoing reviews of our contract with Horton Investments Ltd.
In October 2003, our board of directors commissioned a review of the Horton matter which is being conducted by the Norwegian law firm, Hjort, headed by Supreme Court Attorney Erik Keiserud. In November 2003, our board of directors authorized the engagement of Deloitte & Touche, Supreme Court Attorneys Jan-Fredrik Wilhelmsen of the Norwegian law firm Sørlie Wilhelmsen and Jørgen Stang Heffermehl of the Norwegian law firm Simonsen Føyen to conduct an independent review into whether there has been any use of, or attempts to use, improper influence to obtain or retain any international business. This review will not cover the Horton matter.
Dividend Policy
We currently intend to pay an annual, aggregate dividend to shareholders of an amount in the range of 45% to 50% of our net income as determined in accordance with USGAAP. In any one year, however, the aggregate dividends paid to shareholders may be lower or higher than 45% to 50% of USGAAP net income, reflecting our view of the cyclical outlook for energy product prices as well as our operating cash flows, financing requirements and capital expenditure plans to ensure we maintain appropriate financial flexibility. Further, our ability to pay dividends is restricted by law to amounts calculated under Norwegian GAAP. See Item 3—Key Information–Dividends.
Significant Changes
None.
Item 9 The Offer and Listing
Markets and Market Prices
The principal trading market for Statoil’s ordinary shares is the Oslo Stock Exchange on which they have been listed since the initial public offering of Statoil on June 18, 2001. The ordinary shares are also listed on the New York Stock Exchange trading in the form of American Depositary Shares, or ADSs, evidenced by American Depositary Receipts, or ADRs. Each ADS represents one ordinary share. Statoil has a sponsored ADR facility with the Bank of New York as Depositary.
The following tables provide, for the periods indicated, the reported high and low market quotations for the ordinary shares on the Oslo Stock Exchange, as derived from its Daily Official List, and the highest and lowest sales prices of the ADSs as reported on the New York Stock Exchange composite tape.
Year ended december 31, | NOK per Ordinary share | USD per ADS | ||
High | Low | High | Low | |
| 2001 | 71.00 | 58.00 | 7.64 | 6,15 |
| 2002 | 73.50 | 50.00 | 9.35 | 6.31 |
| 2003 | 74.75 | 51.50 | 11.30 | 7.29 |
Quarter ended | NOK per Ordinary share | USD per ADS | ||
High | Low | High | Low | |
March 31, 2002 | 70.00 | 56.50 | 7.90 | 6.31 |
June 30, 2002 | 73.50 | 64.00 | 8.92 | 7.80 |
September 30, 2002 | 69.00 | 54.00 | 9.35 | 6.80 |
December 31, 2002 | 59.00 | 50.00 | 8.39 | 6.80 |
March 31, 2003 | 59.50 | 51.50 | 8.70 | 7.29 |
June 30, 2003 | 64.00 | 55.50 | 9.11 | 7.62 |
September 30, 2003 | 71.00 | 59.00 | 9.60 | 8.13 |
December 31, 2003 | 74.75 | 66.50 | 11.30 | 10.02 |
March 2004 (up to and including March 25 only) | 89.00 | 74.00 | 12.78 | 10.85 |
| Month of | NOK per Ordinary share | USD per ADS | ||
High | Low | High | Low | |
September 2003 | 71.00 | 62.25 | 9.60 | 8.90 |
October 2003 | 67.75 | 64.75 | 9.67 | 9.30 |
November 2003 | 70.00 | 67.50 | 10.17 | 9.48 |
December 2003 | 74.75 | 66.50 | 11.30 | 10.02 |
January 2004 | 79.00 | 74.00 | 11.77 | 10.85 |
February 2004 | 83.50 | 75.50 | 11.97 | 10.93 |
March 2004 (up to and including March 25) | 89.00 | 82.75 | 12.78 | 11.93 |
Item 10 Additional Information
Memorandum and Articles of Association
Summary of our Articles of Association
Name of the Company
Our registered name is Statoil ASA. We are a Norwegian public limited company.
Registered office
Our registered office is in Stavanger, Norway, registered with the Norwegian Register of Business Enterprises under number
913 609 016.
Object of the company
The object of our company is, either by us or through participation in or together with other companies, to carry out exploration, production, transportation, refining and marketing of petroleum and petroleum derived products, as well as other businesses.
Share capital
Our share capital is NOK 5,473,964,000 divided into 2,189,585,600 ordinary shares.
Nominal value of shares
The nominal value of each ordinary share is NOK 2.50.
Board of directors
Our articles of association provide that our board of directors shall be composed of a minimum of five and a maximum of 11 directors.
Corporate Assembly
We have a corporate assembly of 12 members who are elected for two-year terms. The general meeting elects eight members with three alternates and four members with four alternates are elected by and among the employees.
Annual general meeting
Our annual general meeting is held no later than June 30 each year upon at least two weeks’ written notice.
The meeting will deal with the Annual Report and accounts, including distribution of dividends, and any other matters as required by law or our articles of association.
Marketing of petroleum on behalf of the Norwegian State
Our articles of association provide that we are responsible for marketing and selling petroleum produced under the SDFI’s shares in production licenses on the NCS as well as petroleum received by the Norwegian State as royalty together with our own production. Our general meeting adopted an instruction in respect of such marketing on May 25, 2001.
Election Committee
The general meeting decided to amend our articles of association on May 7, 2002 in order to establish an election committee. The tasks of the election committee are to make recommendations to the general meeting regarding the election of shareholder-elected members and deputy members of the corporate assembly, and to make recommendations to the corporate assembly regarding the election of shareholder-elected members and deputy members of the board of directors.
The election committee shall consist of four members who shall be shareholders or representatives of shareholders. The chairman of the corporate assembly shall be a permanent member and chairman of the election committee. The general meeting shall elect two members, and one member shall be elected by and among the corporate assembly's shareholder-elected members.
General Meetings
In accordance with Norwegian law, our annual general meeting of shareholders is required to be held each year on or prior to June 30. Norwegian law requires that written notice of general meetings be sent to all shareholders whose addresses are known at least two weeks prior to the date of the meeting. A shareholder may vote at the general meeting either in person or by proxy.
Although Norwegian law does not require us to send proxy forms to our shareholders for general meetings, we plan to include a proxy form with future notices of general meetings.
In addition to the annual general meeting, extraordinary general meetings of shareholders may be held if deemed necessary by the board of directors, the corporate assembly or the chairman of the corporate assembly. An extraordinary general meeting must also be convened for the consideration of specific matters at the written request of our auditors or of shareholders representing a total of at least 5% of the outstanding share capital.
Voting Rights
All of our ordinary shares carry equal right to vote at general meetings. Except as otherwise provided, decisions which shareholders are entitled to make pursuant to Norwegian law or our articles of association may be made by a simple majority of the votes cast. In the case of elections, the persons who obtain the most votes cast are deemed elected. However, certain decisions, including resolutions to waive preferential rights in connection with any share issue, to approve a merger or demerger, to amend our articles of association or to authorize an increase or reduction in our share capital, must receive the approval of at least two-thirds of the aggregate number of votes cast as well as two-thirds of the share capital represented at a shareholders’ meeting. The Norwegian State continues to hold more than two-thirds of our share capital. See Item 7–Major Shareholders and Related Party Transactions–Major Shareholders–The Norwegian State as a Shareholder.
In general, in order to be entitled to vote, a shareholder must be registered as the owner of shares in the share register kept by the Norwegian Central Securities Depository, referred to as the VPS System (described below), or, alternatively, report and show evidence of its share acquisition to us prior to the general meeting.
Beneficial owners of shares that are registered in the name of a nominee are generally not entitled to vote under Norwegian law, nor are any persons who are designated in the register as holding such shares as nominees. The beneficial owners of ADSs are therefore only able to vote at meetings by surrendering their ADSs, withdrawing their ordinary shares from the ADS depositary and registering their ownership of such ordinary shares directly in our share register in the VPS System. Alternatively, the ADS holder may instruct the ADR depositary to vote the ordinary shares underlying the ADSs on behalf of the holder, provided that the ADS holder instructs the ADR depositary to execute a temporary transfer of the underlying ordinary shares in the VPS System to the beneficial owner. Similarly, beneficial owners of ordinary shares registered through other VPS-registered nominees may not be able to vote their shares unless their ownership is reregistered in the name of the beneficial owner prior to the relevant shareholders’meeting.
The VPS System and Transfer of Shares
The VPS System is Norway’s paperless centralized securities registry. It is a computerized bookkeeping system that is operated by an independent body in which the ownership of, and all transactions relating to, Norwegian listed shares must be recorded. Our share register is operated through the VPS System.
All transactions relating to securities registered with the VPS are made through computerized book entries. No physical share certificates are or can be issued. The VPS System confirms each entry by sending a transcript to the registered shareholder regardless of beneficial ownership. To effect these entries, the individual shareholder must establish a securities’ account with a Norwegian account agent. Norwegian banks, the Central Bank of Norway, authorized investment firms in Norway, bond issuing mortgage companies, management companies for securities funds (insofar as units in securities funds they manage are concerned), and Norwegian branches of credit institutions established within the EEA are allowed to act as account agents.
The entry of a transaction in the VPS System is prima facie evidence in determining the legal rights of parties as against the issuing company or a third party claiming an interest in the subject security. The VPS System is strictly liable for any loss resulting from an error in connection with registering, altering or canceling a right, except in the event of contributory negligence, in which event compensation owed by the VPS System may be reduced or withdrawn. A transferee or assignee of shares may not exercise the rights of a shareholder with respect to his or her shares unless that transferee or assignee has registered his or her shareholding or has reported and shown evidence of such share acquisition and the acquisition of such shares is not prevented by law, our articles of association or otherwise.
Amendments to our Articles of Association, including Variation of Rights
The affirmative vote of two-thirds of the votes cast as well as two-thirds of the aggregate share capital represented at the general meeting is required to amend our articles of association. Any amendment which would reduce any shareholder’s right in respect of dividends payments or other rights to our assets or restrict the transferability of shares requires a majority vote of at least 90% of the aggregate share capital represented in a general meeting. Certain types of changes in the rights of our shareholders require the consent of all affected shareholders as well as the percentage threshold otherwise required to amend our articles of association.
Additional Issuances and Preferential Rights
If we issue any new shares, including bonus share issues, our articles of association must be amended, which requires the same vote as other amendments to our articles of association. In addition, under Norwegian law, our shareholders have a preferential right to subscribe to issues of new shares by us. The preferential rights to subscribe to an issue may be waived by a resolution in a general meeting passed by the same percentage threshold required to approve amendments to our articles of association.
The general meeting may, with a vote as described above, authorize the board of directors to issue new shares, and to waive the preferential rights of shareholders in connection with such issuances. Such authorization may be effective for a maximum of two years, and the par value of the shares to be issued may not exceed 50% of the nominal share capital when the authorization was granted.
The issuance of shares to holders who are citizens or residents of the United States upon the exercise of preferential rights may require us to file a registration statement in the United States under United States securities laws. If we decide not to file a registration statement, these holders may not be able to exercise their preferential rights.
Under Norwegian law, bonus share issues may be distributed, subject to shareholder approval, by transfer from Statoil’s distributable equity or from our share premium reserve. Any bonus issues may be affected either by issuing shares or by increasing the par value of the shares outstanding.
Minority Rights
Norwegian law contains a number of protections for minority shareholders against oppression by the majority including but not limited to those described in this paragraph. Any shareholder may petition the courts to have a decision of the board of directors or general meeting declared invalid on the grounds that it unreasonably favors certain shareholders or third parties to the detriment of other shareholders or the company itself. In certain grave circumstances shareholders may require the courts to dissolve the company as a result of such decisions. Minority shareholders holding 5% or more of our share capital have a right to demand that we hold an extraordinary general meeting to discuss or resolve specific matters. In addition, any shareholder may demand that we place an item on the agenda for any shareholders’ meeting if we are notified in time for such item to be included in the notice of the meeting.
Mandatory Bid Requirement
Norwegian law requires any person, entity or group acting in concert that acquires more than 40% of the voting rights of a Norwegian company listed on the Oslo Stock Exchange, or OSE, to make an unconditional general offer to acquire the whole of the outstanding share capital of that company. The offer is subject to approval by the OSE before submission of the offer to the shareholders. The offer must be in cash or contain a cash alternative at least equivalent to any other consideration offered. The offering price per share must be at least as high as the highest price paid by the offeror in the six-month period prior to the date the 40% threshold was exceeded, but equal to the market price if it is clear that the market price was higher when the 40% threshold was exceeded. A shareholder who fails to make the required offer must within four weeks dispose of sufficient shares so that the obligation ceases to apply. Otherwise, the OSE may cause the shares exceeding the 40% limit to be sold by public auction. A shareholder who fails to make such bid cannot, as long as the mandatory bid requirement remains in force, vote the portion of his shares which exceed the 40% limit or exercise any rights of share ownership in respect of such shares, unless a majority of the remaining shareholders approve, other than the right to receive dividends and preferential rights in the event of a share capital increase. In addition, the OSE may impose a daily fine upon a shareholder who fails to make the required offer.
Compulsory Acquisition
A shareholder who, directly or via subsidiaries, acquires shares representing more than 90% of the total number of issued shares as well as more than 90% of the total voting rights has the right (and each remaining minority shareholder of that company would have the right to require the majority shareholder) to effect a compulsory acquisition for cash of any shares not already owned by the majority shareholder. A compulsory acquisition has the effect that the majority shareholder becomes the owner of the shares of the minority shareholders with immediate effect.
A majority shareholder who effects a compulsory acquisition is required to offer the minority shareholders a specific price per share. The determination of the offer price is at the discretion of the majority shareholder. Should any minority shareholder not accept the offered price, such minority shareholder may, within a specified period of not less than two months, request that the price be set by the Norwegian courts. The cost of such court procedure would normally be charged to the account of the majority shareholder, and the courts would have full discretion in determining the consideration due to the minority shareholder as a result of the compulsory acquisition.
Election and Removal of Directors and Corporate Assembly
At the general meeting of shareholders, two-thirds of the members of the corporate assembly are elected, together with alternate members, while the remaining one-third, together with alternate members, are elected by and from among our employees. There is no quorum requirement, and nominees who receive the most votes are elected. Any shareholder at the meeting may place nominations before the meeting.
We have an election committee that makes recommendations to the general meeting regarding the election of shareholder-elected members of the corporate assembly and their alternates. The committee consists of four members who are shareholders or representatives of shareholders. The chairman of the corporate assembly is a permanent member of the committee and acts as its chairman. The general meeting elects two members and one member is elected by and from among the corporate assembly's shareholder-elected members. Each member is elected for a two-year term. A member of the corporate assembly (other than a member elected by employees) may be removed by the shareholders at any time without cause.
Our directors are elected to the Board and may be removed from office by our corporate assembly. If requested by at least one third of the members of the corporate assembly, up to one-third of the directors must be employee representatives. Our election committee makes recommendations to the corporate assembly regarding the election of shareholder-elected directors of the board and their alternates. Half of the corporate assembly members elected by the employees may demand that the members of the board of directors be elected by the shareholder-elected members of the corporate assembly and the employee-elected members of the corporate assembly, each voting as a separate group. A director (other than a director elected directly by the employees) may be removed at any time by the corporate assembly without cause.
The corporate assembly makes decisions by majority vote, and more than half of its members must be present for a quorum. If votes are tied, the chairman of the meeting casts the deciding vote. The members of the corporate assembly and the board of directors have fiduciary duties to the shareholders, see –Liability of Directors and–Corporate Assembly.
Payment of Dividends
For a discussion of the declaration and payment of dividends on our ordinary shares, see Item 3–Key Information–Dividends and Item 8–Financial Information–Dividend Policy.
Rights of Redemption and Repurchase of Shares
Our articles of association do not authorize the redemption of shares. In the absence of authorization, the redemption of shares may still be decided by a general meeting of shareholders by a two-thirds majority under certain conditions. However, the share redemption would, for all practical purposes, depend on the consent of all shareholders whose shares are redeemed.
A Norwegian company may purchase its own shares if an authorization to do so has been given by a general meeting with the approval of at least two-thirds of the aggregate number of votes cast as well as two thirds of the share capital represented at the general meeting. The aggregate par value of treasury shares held by the company must not exceed 10% of the company’s share capital and treasury shares may only be acquired if the company’s distributable equity, according to the latest adopted balance sheet, exceeds the consideration to be paid for the shares. The authorization by the general meeting cannot be given for a period exceeding 18 months.
Shareholders’ Votes on Certain Reorganizations
A decision to merge with another company or to demerge requires a resolution of our shareholders at a general meeting passed by a two-thirds majority of the aggregate votes cast as well as two-thirds of the aggregate share capital represented at the general meeting. A merger plan or demerger plan signed by the board of directors along with certain other required documentation would have to be sent to all shareholders at least one month prior to the shareholders’meeting.
The general meeting must approve any agreement by which we acquire assets or services from a shareholder or a shareholder’s related party against a consideration exceeding the equivalent of 5% of our share capital. This does not apply to acquisition of listed securities at market price or to agreements in the ordinary course of business entered into on normal commercial terms.
Liability of Directors
Our directors, the chief executive officer and the corporate assembly owe a fiduciary duty to the company and its shareholders. Their fiduciary duty requires that they act in our best interests when exercising their functions and to exercise a general duty of loyalty and care toward us. Their principal task is to safeguard the interests of the company.
Our directors, the chief executive officer and the members of the corporate assembly can each be held liable for any damage they negligently or willfully cause us. Norwegian law permits the general meeting to exempt any such person from liability, but the exemption is not binding if substantially correct and complete information was not provided at the general meeting when the decision was taken. If a resolution to grant such exemption from liability or to not pursue claims against such a person has been passed by a general meeting with a smaller majority than that required to amend our articles of association, shareholders representing more than 10% of the share capital or (if there are more than 100 shareholders) more than 10% of the number of shareholders may pursue the claim on our behalf and in our name. The cost of any such action is not our responsibility, but can be recovered by any proceeds we receive as a result of the action. If the decision to grant exemption from liability or not to pursue claims is made by the majority necessary to amend the articles of association, the minority shareholders cannot pursue the claim in our name.
Indemnification of Directors and Officers
Neither Norwegian law nor our articles of association contain any provision concerning indemnification by us of our board of directors.
Distribution of Assets on Liquidation
Under Norwegian law, a company may be wound-up by a resolution of the company’s shareholders in a general meeting passed by both a two-thirds majority of the aggregate votes cast and two-thirds of the aggregate share capital represented at the general meeting. The shares rank equal in the event of a return on capital by the company upon a winding-up or otherwise.
Material Contracts
See Item 7–Major Shareholders and Related Party Transactions.
Exchange Controls and Other Limitations Affecting Shareholders
Under Norwegian foreign exchange controls currently in effect, transfers of capital to and from Norway are not subject to prior government approval except for the physical transfer of payments in currency, which is restricted to licensed banks. This means that non-Norwegian resident shareholders may receive dividend payments without a Norwegian exchange control consent as long as the payment is made through a licensed bank.
There are presently no restrictions affecting the rights of non-residents or foreign owners to hold or vote our shares.
Taxation
Norwegian Tax Matters
This section describes the material Norwegian tax consequences that apply to shareholders resident in Norway as well as non-resident shareholders in connection with the acquisition, ownership, and disposition of the shares and ADSs. This section does not provide a complete description of all tax regulations, which might be relevant (i.e., for investors for whom special regulations may be applicable). This section is based on current law and practice. Shareholders should consult their professional tax advisors for advice concerning individual tax consequences.
In 2002, the Norwegian government appointed a commission to evaluate the Norwegian tax system. The commission delivered its report on February 6, 2003. The commission did not propose any changes in the tax system that will have a significant impact on Statoil. The most important changes proposed are improved credit rules for tax paid abroad and introduction of Norwegian rules similar to EU Directive 90/434 regarding cross border mergers, demergers and asset and share swaps. These proposed changes will be positive for Statoil's international activity if enacted. It is expected that any new legislation will be proposed later in 2004.
Taxation of Dividends. Dividends distributed are subject to taxation in Norway as general income at a flat rate, currently 28%. Shareholders that are residents of Norway for tax purposes are entitled to a tax credit (‘‘godtgjørelse’’) against the Norwegian tax levied on dividends distributed from Norwegian companies equal to the tax to be levied on the dividends received, and will effectively not be subject to tax on dividend distributions from Norwegian companies.
Non-resident shareholders are subject to a withholding tax at a rate of 25% on dividends distributed by Norwegian companies. The withholding rate of 25% is often reduced in tax treaties between Norway and the country in which the shareholder is resident. Generally, the treaty rate does not exceed 15%, and in cases where a corporate shareholder holds a qualifying percentage of the shares of the distributing company, the withholding tax rate on dividends may be further reduced. The treaty rate in the treaty between the United States and Norway is 15% in all cases. The withholding tax does not apply to shareholders that carry on business activities in Norway and whose shares are effectively connected to such activities. In that case, the rules described in the foregoing paragraph apply. We are obliged by law to deduct any applicable withholding tax when paying dividends to non-resident shareholders.
The 15% withholding rate under the tax treaty between Norway and the United States will apply to dividends paid on shares held directly by holders properly demonstrating to the company that they are entitled to the benefits of the tax treaty.
Dividends paid to the depositary for redistribution to shareholders holding ADSs will at the outset be subject to a withholding tax of 25%. The beneficial owners will in this case have to apply with the Norwegian Directorate of Taxes for refund of the excess amount of tax withheld. As yet there is no standardized application form to obtain a refund of Norwegian withholding tax. An application must contain the following information:
1. the company from which dividends were received and the date and amount of payment, the exact number of shares, the amount of tax withheld by Norway and the amount claimed for refund from Norway. All amounts are to be stated in Norwegian kroner;
2. confirmation from a central tax authority stating that, in the year the dividends were declared or received, the refund claimant was resident for tax purposes in the country with respect to which such claimant claims the benefits of a tax treaty with Norway, and original documentation that the claimant was the beneficial owner of the shares when the dividends were declared; and
3. evidence that the dividends were actually received by the applicant and the rate at which Norwegian withholding tax was withheld on the dividends.
The application must be signed by the applicant. If the application is signed by proxy, a copy of the letter of authorization must be enclosed.
However, pursuant to agreements with the Norwegian Banking, Insurance and Securities Commission and the Norwegian Directorate of Taxes, The Bank of New York, acting as depositary, is entitled to receive dividends from us for redistribution to a beneficial owner of shares or ADSs at the applicable treaty withholding rate, provided the beneficial holder has furnished The Bank of New York appropriate certification to establish such holder’s eligibility for the benefits under an applicable tax treaty with Norway.
Wealth Tax. The shares are included when computing the wealth tax imposed on individuals who for tax purposes are considered resident in Norway. Norwegian joint stock companies and certain other similar entities are not subject to wealth tax. Currently, the marginal wealth tax rate is 1.1% of the value assessed. The value for assessment purposes for shares listed on the Oslo Stock Exchange is 100% of the listed value of such shares as of January 1 in the year of assessment. Non-resident shareholders are not subject to wealth tax in Norway for shares in Norwegian joint stock companies unless the shareholder is an individual and the shareholding is effectively connected with his business activities in Norway.
Inheritance Tax and Gift Tax. When shares or ADSs are transferred, either through inheritance or as a gift, such transfer may give rise to inheritance tax in Norway if the deceased, at the time of death, or the donor, at the time of the gift, is a resident or citizen of Norway. If a Norwegian citizen at the time of death, however, is not a resident of Norway, Norwegian inheritance tax will not be levied if an inheritance tax or a similar tax is levied by the country of residence. Irrespective of citizenship, Norwegian inheritance tax may be levied if the shares or ADSs are effectively connected with the conduct of a trade or business through a permanent establishment in Norway.
Taxation upon Disposition of Shares. A shareholder who is resident for tax purposes in Norway will realize a taxable gain or loss upon a sale, redemption or other disposition of shares. Such capital gain or loss is included in or deducted upon computation of general income in the year of disposal. General income is taxed at a flat tax rate of 28%. The gain is subject to tax and the loss is deductible irrespective of the length of the ownership and the number of shares disposed of.
The taxable gain or loss is computed as the sales price adjusted for transactional expenses less the taxable basis. A shareholder’s tax basis is normally equal to the acquisition costs of the shares. The tax basis is adjusted according to the so-called RISK-rules (RISK is the Norwegian abbreviation for the variation in the company’s retained earnings after tax less dividend distributed during the ownership of the shareholder). The RISK amount is computed at the end of each fiscal year. If the shareholder owns shares acquired at different times, the shares that were acquired first will be regarded as the first to be sold for the purpose of calculating capital gains or losses.
Shareholders not resident in Norway are generally not subject to tax in Norway on capital gains, and losses are not deductible upon sale, redemption or other disposition of shares or ADSs in Norwegian companies, unless the shareholder has been resident for tax purposes in Norway and the disposal takes place within five years after the end of the calendar year in which the shareholder ceased to be a resident of Norway for tax purposes, or, alternatively, the shareholder is carrying on business activities in Norway and such shares or ADSs are or have been effectively connected with such activities.
Transfer Tax. There is no transfer tax imposed in Norway in connection with the sale or purchase of shares.
United States Tax Matters
This section describes the material United States federal income tax consequences of owning shares or ADSs. It applies to you only if you hold your shares or ADSs as capital assets for tax purposes. This section does not apply to you if you are a member of a special class of holders subject to special rules, including:
This section is based on the Internal Revenue Code of 1986, as amended, its legislative history, existing and proposed regulations, published rulings and court decisions, and the Convention between the United States of America and the Kingdom of Norway for the Avoidance of Double Taxation and the Prevention of Fiscal Evasion with Respect to Taxes on Income and Property (the ‘‘Treaty’’). These laws are subject to change, possibly on a retroactive basis. In addition, this section is based in part upon the representations of the depositary and the assumption that each obligation in the deposit agreement and any related agreement will be performed in accordance with its terms. For United States federal income tax purposes, if you hold ADRs evidencing ADSs, you generally will be treated as the owner of the ordinary shares represented by those ADRs. Exchanges of shares for ADRs, and ADRs for shares generally will not be subject to United States federal income tax.
You are a ‘‘US holder’’ if you are a beneficial owner of shares or ADSs and you are for United States federal income tax purposes:
You should consult your own tax advisor regarding the United States federal, state and local and other tax consequences of owning and disposing of shares and ADSs in your particular circumstances.
Taxation of Dividends. If you are a US holder, you must include in your gross income the gross amount of any dividend paid by Statoil out of its current or accumulated earnings and profits (as determined for United States federal income tax purposes) is subject to United States federal income taxation. If you are a non-corporate US holder, dividends paid to you in taxable years beginning after December 31, 2002 and before January 1, 2009 that constitute qualified dividend income will be taxable to you at a maximum tax rate of 15% if you hold the shares or ADSs for more than 60 days during the 120-day period beginning 60 days before the ex-dividend date and meet other holding-period requirements. The Internal Revenue Service recently announced that it will permit taxpayers to apply a proposed legislative change to this holding period requirement as if such change were already effective. This legislative “technical correction” would change the minimum required holding period, retroactive to January 1, 2003, to more than 60 days during the 121-day period beginning 60 days before the ex-dividend date. Dividends we pay with respect to shares or ADSs generally will be qualified dividend income.
You must include any Norwegian tax withheld from the dividend payment in this gross amount even though you do not in fact receive the amount withheld as tax. The dividend is taxable to you when you, in the case of shares, or the depositary, in the case of ADSs, receive the dividend, actually or constructively. The dividend will not be eligible for the dividends-received deduction generally allowed to United States corporations in respect of dividends received from other United States corporations.
The amount of the dividend distribution that you must include in your income as a US holder will be the US dollar value of the Norwegian kroner payments made, determined at the spot Norwegian kroner/US dollar rate on the date the dividend distribution is included in your income, regardless of whether the payment is in fact converted into US dollars. Distributions in excess of current and accumulated earnings and profits, as determined for United States federal income tax purposes, will be treated as a non-taxable return of capital to the extent of your tax basis in the shares or ADSs and, to the extent in excess of your tax basis, will be treated as capital gain.
Subject to certain limitations, the 15% Norwegian tax withheld in accordance with the Treaty and paid over to Norway will be creditable against your United States federal income tax liability. Special rules apply in determining the foreign tax credit with respect to dividends that are subject to the maximum 15% rate. Dividends will be income from sources outside the United States, and generally will be ‘‘passive income’’ or ‘‘financial services income’’, which is treated separately from other types of income for purposes of computing the foreign tax credit allowable to you.
Any gain or loss resulting from currency exchange fluctuations during the period from the date you include the dividend payment in income to the date you convert the payment into US dollars generally will be treated as ordinary income or loss. and will not be eligible for the special tax rate applicable to qualified dividend income. Such gain or loss generally will be income or loss from sources within the United States for foreign tax credit limitation purposes.
Taxation of Capital Gains. If you are a US holder and you sell or otherwise dispose of your shares or ADSs, you generally will recognize capital gain or loss for United States federal income tax purposes equal to the difference between the US dollar value of the amount that you realize and your tax basis, determined in US dollars, in your shares or ADSs. Capital gain of a non-corporate US holder that is recognized on or after May 6, 2003 and before January 1, 2009 is generally taxed at a maximum rate of 15% where the holder has a holding period greater than one year. The gain or loss will generally be income or loss from sources within the United States for foreign tax credit limitation purposes.
If you receive any foreign currency on the sale of shares or ADSs, you may recognize ordinary income or loss from sources within the United States as a result of currency fluctuations between the date of the sale of the shares or ADSs and the date the sales proceeds are converted into US dollars.
Report of DeGolyer and MacNaughton
DeGolyer and MacNaughton, independent petroleum engineering consultants, performs an independent evaluation of proved reserves, which was performed as of December 31, 2003 for our properties. DeGolyer and MacNaughton has delivered to us its summary letter report describing its procedures and conclusions, a copy of which appears as Appendix A hereto.
Documents on Display
It is possible to read and copy documents referred to in this Annual Report on Form 20-F that have been filed with the SEC at the SEC’s public reference room located at 450 Fifth Street, NW, Washington D.C. 20549. Please call the SEC at 1-800-SEC-0330 for further information on the public reference rooms and their copy charges.
Item 11 Quantitative and Qualitative Disclosures about Market Risk
Statoil operates in the worldwide crude oil, refined products and natural gas markets and is exposed to fluctuations in hydrocarbon prices, foreign currency rates and interest rates that can affect the revenues and cost of operating, investing and financing. Our management has used and intends to use financial and commodity-based derivative contracts to reduce the risks in overall earnings and cash flows. Statoil also uses derivatives to establish certain limited speculative positions based on market movements.
Statoil has established an Enterprise-Wide Risk Management Program, which establishes guidelines for entering into contractual arrangements (derivatives) to manage its commodity price, foreign currency rate, and interest rate risk. Our Corporate Risk Committee meets on a regular basis to review the existing policies and implementation of the guidelines. These procedures establish control over the use of derivatives, routine monitoring and reporting requirements, as well as counter-party credit approval processes.
Commodity Risk. The following table contains the fair market value and related price risk sensitivity of our commodity-based derivatives, as accounted for under FAS 133, all amounts in NOK million:
Fair Market Value Asset | Fair Market Value Liability | 10% Sensitivity | |
At December 31, 2003 | |||
Crude Oil and Refined Products | 470 | (426) | 21 |
Natural Gas and Electricity | 314 | (230) | 38 |
At December 31, 2002 | |||
Crude Oil and Refined Products | 1,464 | (1,691) | 427 |
Natural Gas and Electricity | 1,205 | (941) | 65 |
Substantially all these fair market value assets and liabilities are related to over-the-counter (OTC) derivatives. The term of crude oil and refined products derivatives is usually less than one year. The term of natural gas forwards is usually three years or less. The net fair market value of FAS 133 derivatives associated with long-term natural gas contracts (10 years or more) and included in the table above was NOK 91 million as of December 31, 2002, and zero as of December 31, 2003. Also included in the fair market values and basis for sensitivity figures are immaterial derivative positions held for speculative purposes.
Price risk sensitivities for 2003 and 2002 were calculated by assuming a hypothetical across-the-board 10% adverse change in all commodity prices regardless of the term or historical relationships between the contractual price of the instrument and the underlying commodity prices. In the event of an actual 10% change in all underlying prices, the change in the fair value of the derivative portfolio at the two respective year ends would typically be different from that shown above due to expected correlations between risk categories. In addition, there would be expected offsetting effects from changes in the fair value of our corresponding physical positions, contracts and anticipated transactions, which are not required to be recorded at market, and which are not reflected in the above table.
A 10% relative change of certain underlying commodity prices in relation to other prices would typically yield other sensitivities than those provided in the table above. Natural Gas sensitivities may for instance be adversely impacted by certain relative commodity price changes, due to pricing elements in long-term physical delivery contracts and assumptions used in arriving at the fair market value of FAS 133 derivatives related to long-term contracts.
Interest and Currency Risk. Interest and currency risks constitute significant financial risks for the Statoil group. Total exposure is managed at a portfolio level in accordance with approved strategies and mandates. Interest rate risk and currency risk are assessed against mandates on a regular basis. The fair market value of assets and liabilities, respectively, related to our fixed interest long-term debt, interest rate swaps and currency swaps were NOK 4,551 million and NOK 26,281 million as of December 31, 2003, and NOK 2,154 million and NOK 28,625 million as of December 31, 2002.
The estimated loss associated with a 10% adverse change in NOK currency rates would result in a loss of fair value of approximately NOK 3.9 billion and NOK 4.0 billion as of December 31, 2003 and 2002 respectively. A hypothetical one percentage point adverse change in interest rates would result in a loss of NOK 0.4 billion and NOK 0.9 billion related to interest bearing liabilities, investments in debt securities and related financial instruments as of December 31, 2003 and 2002, respectively. These estimated currency and interest rate sensitivities are based on an uncorrelated loss scenario and actual results could vary due to assumptions used and offsetting account correlations not reflected within this analysis.
Statoil’s cash flows are largely in US dollars and euro but also significant amounts in NOK, Swedish kroner, Danish kroner and UK pounds sterling. The currencies in the debt portfolio are managed in connection with our expected future net cash flows per currency. Our debt, after considering currency swaps, is mainly in US dollars.
Equity Securities. Equity securities, mainly of the portfolio in Statoil Forsikring AS, are recorded at fair value and have exposure to price risk. The fair value of equity securities is based on quoted market prices. Risk is estimated as the potential loss in fair value resulting from a hypothetical 10% adverse change in quoted market prices. Actual results may vary due to assumptions utilized and risk correlations.
Fair Market Value at December 31, amounts in NOK million | 2003 | 2002 |
Equity securities | 1,934 | 1,270 |
Market risk on equity securities, amounts in NOK million | 2003 | 2002 |
10% change in share prices | 193 | 127 |
Item 12 Description of Securities Other Than Equity Securities
Not applicable.
PART II
Item 13 Defaults, Dividend Arrearages and Delinquencies
None.
Item 14 Material Modifications to the Rights of Security Holders and Use of Proceeds
None.
Item 15 Controls and Procedures
Our management, with the participation of our Acting Chief Executive Officer and Acting Chief Financial Officer, have evaluated the effectiveness of the design and operation of our disclosure controls and procedures pursuant to Exchange Act Rules 13a-15(b) as of the end of the period covered by this Form 20-F. Based on that evaluation, the Acting Chief Executive Officer and Acting Chief Financial Officer have concluded that these disclosure controls and procedures are effective at the reasonable assurance level.
In designing and evaluating our disclosure controls and procedures, our management, with the participation of the Acting Chief Executive Officer and Acting Chief Financial Officer, recognized that any controls and procedures, no matter how well designed and operated, can provide only reasonable assurance of achieving the desired control objectives, and our management necessarily was required to apply its judgment in evaluating the cost-benefit relationship of possible controls and procedures. Because of the inherent limitations in all control systems, no evaluation of controls can provide absolute assurance that all control issues and instances of fraud, if any, within the company have been detected.
There were no changes to our internal control over financial reporting that occurred during the period covered by this Form 20-F that have materially affected, or are reasonably likely to materially affect, our internal control over financial reporting.
Item 16A Audit Committee Financial Expert
Our board of directors has determined that a member of our Audit Committee, Mr. Finn Hvistendahl, qualifies as an “audit committee financial expert”, as defined in Item 16A of Form 20-F.
Item 16B Code of Ethics
Statoil has adopted a code of ethics that applies to the Chief Executive Officer, Chief Financial Officer and the principal accounting officer. We have published our code of ethics on our website. It is accessible at www.statoil.com/ethics.
Statoil also has ethical guidelines that apply to all employees. The guidelines are principle-based and describe corporate values and required standards of business conduct and ethics. The ethical guidelines are designed to deter wrongdoing and to promote honest and ethical conduct, compliance with applicable laws and regulations, internal reporting of violations of the guidelines and accountability for adherence of the guidelines.
Item 16C Principal Accountant Fees and Services
Ernst & Young has served as our independent public auditor for each of the fiscal years in the three-year period ended December 31, 2003, for which audited consolidated financial statements appear in this annual report on Form 20-F.
The following table shows information about fees paid by Statoil to Ernst &Young.
(in NOK million) | For the year ended December 31, | |
2003 | 2002 | |
| Audit fees | 27.0 | 26.2 |
Audit-related fees | 2.8 | 1.8 |
| Tax fees | 14.5 | 8.5 |
| All other fees | 0.9 | 0.0 |
| Total | 45.2 | 36.5 |
Audit Services are defined as the standard audit work that needs to be performed each year in order to issue an opinion on the consolidated financial statements of Statoil, and to issue reports on the Norwegian GAAP statutory financial statements. It also includes other audit services which are those services that only the external auditor reasonably can provide, such as auditing of non-recurring transactions and application of new accounting policies, audits of significant and newly implemented system controls and pre-issuance reviews of quarterly financial results
Audit Related Services include those other assurance and related services provided by auditors, but not restricted to those that can only reasonably be provided by the external auditor signing the audit report, that are reasonably related to the performance of the audit or review of the company's financial statements such as acquisition due diligence, audits of pension and benefit plans, consultations concerning financial accounting and reporting standards.
Tax Services include the assistance with compliance and reporting of exercise and value added taxes, assistance with our assessment of new or changing tax regimes, assessment of our transfer pricing policies and practices, and assistance with assessing relevant rules, regulations and facts going into our correspondence with tax authorities.
Other Services consist primarily of consultancy services provide to improve certain processes and tools related to economic modeling, analysis, and budget control, as well as some limited assistance with our filing in a legal case.
Audit Committee Pre-approval Policies and Procedures
Effective from the appointment of the audit committee by the board of directors, all services provided by the external auditor must be pre-approved by the audit committee. Provided that the suggested types of services are permissible under SEC guidelines, pre approval is usually granted in a regular audit committee meeting. The Chairman has been given the authority to pre-approve when deemed necessary, provided that the full audit committee is presented to the case at its next meeting. Some pre-approvals may therefore be granted on an ad hoc basis by the Chairman of the audit committee if an urgent reply is deemed necessary.
Some of the costs incurred in 2003 related to services agreed upon prior to the adoption of the new rules as set forth by the Sarbanes Oxley Act in May 2003. Subsequent to our implementation of the new rules and appointment of the audit committee, all audit related, tax and other services were pre-approved by the audit committee, respectively.
Item 16D Exemptions from the Listing Standards for Audit Committees
Not applicable.
Item 16E Purchases of Equity Securities by the Issuer and Affiliated Purchasers
Not applicable.
PART III
Item 17 Financial Statements
Not applicable.
Item 18 Financial Statements
The consolidated financial statements beginning on page F-1 and the related notes, together with the report thereon of Ernst & Young, are filed as part of this Annual Report on Form 20-F.
Item 19 Exhibits
The following exhibits are filed as part of this Annual Report:
| Exhibit 1 | Articles of Association of Statoil ASA, as amended (English translation) (Incorporated by reference to exhibit 1 to Statoil’s Annual Report on Form 20-F for the fiscal year ended December 31, 2002) (File no 1-15200). |
Exhibit 2(b)(i) | Instruments Defining the Rights of Holders of Long-Term Debt: The total amount of long-term securities of Statoil authorized under any instrument, does not exceed 10% of the total assets of Statoil on a consolidated basis. Statoil agrees to furnish copies of any or all such instruments to the Securities and Exchange Commission upon request. |
Exhibit 4(a) (i) | Technical Service Agreement between Gassco AS and Statoil ASA, dated February 27, 2002 (Incorporated by reference to exhibit 4 to Statoil’s Annual Report on Form 20-F for the fiscal year ended December 31, 2001)(File no 1-15200). |
Exhibit 4(a) (ii) | Agreement relating to purchase and sale of SDFI assets (Incorporated by reference to Exhibit 10.1 to Statoil’s Registration Statement on Form F-1, filed on May 14, 2001) (File no. 333-13502). |
| Exhibit 4(c) | Employment agreements with Helge Lund and Erling Øverland (English translation) |
| Exhibit 8 | Subsidiaries. |
| Exhibit 12 | Rule 13a-14(a) Certifications. |
| Exhibit 13 | Rule 13a-14(b) Certifications. |
SIGNATURE
The registrant hereby certifies that it meets all of the requirements for filing on Form 20-F and that it has duly caused and authorized the undersigned to sign this Annual Report on its behalf.
STATOIL ASA
(Registrant)
By: /s/ Eldar Sætre
Eldar Sætre
Acting Chief Financial Officer
Dated: April 2, 2004
Appendix A – Report of DeGolyer and MacNaughton
DeGolyer and MacNaughton
4925 Greenville Avenue, Suite 400
One Energy Square
Dallas, Texas 75206
February 16, 2004
Statoil ASA
Forusbeen 50
N-4035 Stavanger
Norway
Gentlemen:
Pursuant to your request, we have prepared estimates of the proved oil, condensate, liquefied petroleum gas (LPG), and natural gas reserves, as of December 31, 2003, of certain properties in Angola, Azerbaijan, China, Iran, Norway, the United Kingdom, and Venezuela owned by Statoil ASA (STATOIL). The estimates are discussed in our “Report as of December 31, 2003 on Proved Reserves of Certain Properties owned by Statoil ASA” (the Report). We also have reviewed STATOIL’s estimates of the reserves, as of December 31, 2003, of the same properties included in the Report.
In our opinion, the information relating to proved reserves estimated by us and referred to herein has been prepared in accordance with Paragraphs 10–13, 15, and 30(a)–(b) of Statement of Financial Accounting Standards No. 69 (November 1982) of the Financial Accounting Standards Board and Rules 4–10(a) (1)–(13) of Regulation S–X of the United States Securities and Exchange Commission (SEC).
STATOIL represents that its estimates of the proved reserves, as of December 31, 2003, attributable to STATOIL’s interests in the properties included in the Report are as follows, expressed in millions of barrels (MMbbl) or billions of cubic feet (Bcf):
| Oil, Condensate, and LPG (MMbbl) | Natural Gas (Bcf) | Net Equivalent (MMbbl) | ||
| 1,789 | 13,886 | 4,264 | ||
Note: Net equivalent million barrels is based on 5,612 cubic feet of gas being equivalent to 1 barrel of oil, condensate, or LPG. | ||||
STATOIL has advised us that its estimates of proved oil, condensate, LPG, and natural gas reserves are in accordance with the rules and regulations of the SEC. It is our opinion that the guidelines and procedures that STATOIL has adopted to prepare its estimates are in accordance with generally accepted petroleum reserves evaluation practices and are in accordance with the requirements of the SEC.
Our estimates of the proved reserves, as of December 31, 2003, attributable to STATOIL’s interests in the properties included in the Report are as follows, expressed in millions of barrels (MMbbl) or billions of cubic feet (Bcf):
| Oil, Condensate, and LPG (MMbbl) | Natural Gas (Bcf) | Net Equivalent (MMbbl) | ||
| 1,774 | 13,849 | 4,242 | ||
Note:Net-equivalent million barrels is based on 5,612 cubic feet of gas being equivalent to 1 barrel of oil, condensate, or LPG. | ||||
In comparing the detailed reserves estimates prepared by us and those prepared by STATOIL for the properties involved, we have found differences, both positive and negative, in reserves estimates for individual properties. These differences appear to be compensating to a great extent when considering the reserves of STATOIL in the properties included in the Report, resulting in overall differences not being substantial. It is our opinion that the reserves estimates prepared by STATOIL on the properties reviewed by us and referred to above, when compared on the basis of net equivalent million barrels of oil do not differ materially from those prepared by us.
Submitted,
DeGOLYER and MacNAUGHTON
Financial Statements
Table of Contents
Audited Consolidated Financial Statements for the year ended December 31, 2003 |
Supplementary Information on Oil and Gas Producing Activities (unaudited) |
Report of independent auditors – USGAAP accounts
We have audited the accompanying consolidated balance sheets of Statoil ASA and subsidiaries as of December 31, 2003 and 2002, and the related consolidated statements of income, shareholders' equity and cash flows for each of the three years in the period ended December 31, 2003. These financial statements are the responsibility of the Company's management. Our responsibility is to express an opinion on these financial statements based on our audits.
We conducted our audits in accordance with auditing standards generally accepted in the United States. Those standards require that we plan and perform the audit to obtain reasonable assurance about whether the financial statements are free of material misstatements. An audit includes examining, on a test basis, evidence supporting the amounts and disclosures in the financial statements. An audit also includes assessing the accounting principles used and significant estimates made by the management, as well as evaluating the overall financial statement presentation. We believe that our audits provide a reasonable basis for our opinion.
In our opinion the financial statements referred to above present fairly, in all material respects, the consolidated financial position of Statoil ASA and subsidiaries at December 31, 2003 and 2002, and the consolidated results of their operations and their cash flows for each of the three years in the period ended December 31, 2003, in conformity with accounting principles generally accepted in the United States.
ERNST & YOUNG AS
Gustav Eriksen
State Authorised Public Accountant
(Norway)
Jostein Johannessen
State Authorised Public Accountant
(Norway)
Consolidated statements of income - USGAAP
| Year ended December 31, | |||
| (in NOK million) | 2003 | 2002 | 2001 |
| REVENUES | |||
| Sales | 248,527 | 242,178 | 231,712 |
| Equity in net income of affiliates | 616 | 366 | 439 |
| Other income | 232 | 1,270 | 4,810 |
| Total revenues | 249,375 | 243,814 | 236,961 |
| EXPENSES | |||
| Cost of goods sold | (149,645) | (147,899) | (126,153) |
| Operating expenses | (26,651) | (28,308) | (29,422) |
| Selling, general and administrative expenses | (5,517) | (5,251) | (4,297) |
| Depreciation, depletion and amortization | (16,276) | (16,844) | (18,058) |
| Exploration expenses | (2,370) | (2,410) | (2,877) |
| Total expenses before financial items | (200,459) | (200,712) | (180,807) |
| Income before financial items, other items, income taxes and minority interest | 48,916 | 43,102 | 56,154 |
| Net financial items | 1,399 | 8,233 | 65 |
| Other items | (6,025) | 0 | 0 |
| Income before income taxes and minority interest | 44,290 | 51,335 | 56,219 |
| Income taxes | (27,447) | (34,336) | (38,486) |
| Minority interest | (289) | (153) | (488) |
| Net income | 16,554 | 16,846 | 17,245 |
| Net income per ordinary share | 7.64 | 7.78 | 8.31 |
| Weighted average number of ordinary shares outstanding | 2,166,143,693 | 2,165,422,239 | 2,076,180,942 |
Revenues are net of excise tax of NOK 20,753 million, NOK 18,745 million and NOK 18,571 million in 2003, 2002 and 2001, respectively.
See notes to the consolidated financial statements.
Consolidated balance sheets - USGAAP
| At December 31, | ||
| (in NOK million) | 2003 | 2002 |
| ASSETS | ||
| Cash and cash equivalents | 7,316 | 6,702 |
| Short-term investments | 9,314 | 5,267 |
| Cash, cash equivalents and short-term investments | 16,630 | 11,969 |
| Accounts receivable | 28,048 | 32,057 |
| Accounts receivable - related parties | 2,144 | 1,893 |
| Inventories | 4,993 | 5,422 |
| Prepaid expenses and other current assets | 7,354 | 6,856 |
| Total current assets | 59,169 | 58,197 |
| Investments in affiliates | 11,022 | 9,629 |
| Long-term receivables | 14,261 | 7,138 |
| Net property, plant and equipment | 126,528 | 122,379 |
| Other assets | 10,620 | 8,087 |
| TOTAL ASSETS | 221,600 | 205,430 |
| LIABILITIES AND SHAREHOLDERS' EQUITY | ||
| Short-term debt | 4,287 | 4,323 |
| Accounts payable | 17,977 | 19,603 |
| Accounts payable - related parties | 6,114 | 5,649 |
| Accrued liabilities | 11,454 | 11,590 |
| Income taxes payable | 17,676 | 18,358 |
| Total current liabilities | 57,508 | 59,523 |
| Long-term debt | 32,991 | 32,805 |
| Deferred income taxes | 37,849 | 43,153 |
| Other liabilities | 21,595 | 11,382 |
| Total liabilities | 149,943 | 146,863 |
| Minority interest | 1,483 | 1,550 |
| Common stock (NOK 2.50 nominal value), 2,189,585,600 shares authorized and issued | 5,474 | 5,474 |
| Treasury shares, 23,441,885 shares | (59) | (59) |
| Additional paid-in capital | 37,728 | 37,728 |
| Retained earnings | 27,627 | 17,355 |
| Accumulated other comprehensive income | (596) | (3,481) |
| Total shareholders' equity | 70,174 | 57,017 |
| TOTAL LIABILITIES AND SHAREHOLDERS' EQUITY | 221,600 | 205,430 |
See notes to the consolidated financial statements.
Consolidated statements of shareholders' equity - USGAAP
| (in NOK million, except share data) | Numbers of shares issued | Share capital | Treasury shares | Additional paid-in capital | Retained earnings | Accum other comprehensive income | Total |
| At January 1, 2001 | 1,975,885,600 | 4,940 | 0 | 45,628 | 14,768 | 2,490 | 67,826 |
| Net income | 17,245 | 17,245 | |||||
| Translation adjustment and other | |||||||
| comprehensive income | (537) | (537) | |||||
| Total comprehensive income | 16,708 | ||||||
| Issuance of treasury shares | 25,000,000 | 63 | (63) | 0 | |||
| Issuance of shares | 188,700,000 | 471 | 12,419 | 12,890 | |||
| Contribution from shareholder | 9,440 | 9,440 | |||||
| Dividends related to SDFI properties | (30,084) | (19,663) | (49,747) | ||||
| Adjustment related to the SDFI transaction | 325 | 325 | |||||
| Ordinary dividend | (5,668) | (5,668) | |||||
| At December 31, 2001 | 2,189,585,600 | 5,474 | (63) | 37,728 | (6,682) | 1,953 | 51,774 |
| Net income | 16,846 | 16,846 | |||||
| Translation adjustment and other | |||||||
| comprehensive income | (5,434) | (5,434) | |||||
| Total comprehensive income | 11,412 | ||||||
| Bonus shares distributed | 4 | (4) | 0 | ||||
| Ordinary dividend | (6,169) | (6,169) | |||||
| At December 31, 2002 | 2,189,585,600 | 5,474 | (59) | 37,728 | 17,355 | (3,481) | 57,017 |
| Net income | 16,554 | 16,554 | |||||
| Translation adjustment and other | |||||||
| comprehensive income | 2,885 | 2,885 | |||||
| Total comprehensive income | 19,439 | ||||||
| Ordinary dividend | (6,282) | (6,282) | |||||
| At December 31, 2003 | 2,189,585,600 | 5,474 | (59) | 37,728 | 27,627 | (596) | 70,174 |
Other comprehensive income amounts are net of income tax benefit of NOK 81 million, NOK 78 million and NOK 4 million at 2003, 2002 and 2001, respectively.
Dividends paid per share were NOK 2.90, NOK 2.85 and NOK 26.69 in 2003, 2002 and 2001, respectively. The dividends prior to the public offering are strongly affected by cash flows relating to the SDFI transaction.
Contributions from shareholder represent primarily income taxes for properties transferred from SDFI which are imputed but not paid. See note 1 Organization and Basis of Presentation for further details.
Consolidated statements of cash flows - USGAAP
Year ended December 31, | |||
| (in NOK million) | 2003 | 2002 | 2001 |
| OPERATING ACTIVITIES | |||
| Consolidated net income | 16,554 | 16,846 | 17,245 |
| Adjustments to reconcile net income to net cash flows provided by operating activities: | |||
| Minority interest in income | 289 | 153 | 488 |
| Depreciation, depletion and amortization | 16,276 | 16,844 | 18,058 |
| Exploration costs written off | 256 | 554 | 935 |
| (Gains) losses on foreign currency transactions | 781 | (8,771) | 180 |
| Deferred taxes | (6,177) | 628 | 848 |
| Income taxes of transferred SDFI properties | 0 | 0 | 5,952 |
| (Gains) losses on sales of assets and other items | 5,719 | (1,589) | (4,990) |
| Changes in working capital (other than Cash and cash equivalents): | |||
| - (Increase) decrease in inventories | 349 | (146) | (1,050) |
| - (Increase) decrease in accounts receivable | 2,054 | (6,211) | 4,522 |
| - (Increase) decrease in other receivables | (1,511) | 3,107 | (1,543) |
| - (Increase) decrease in short-term investments | (4,047) | (3,204) | 1,794 |
| - Increase (decrease) in accounts payable | (949) | 4,118 | (3,852) |
| - Increase (decrease) in other payables | 2,436 | (645) | (3,370) |
| - Increase (decrease) in taxes payable | (682) | 1,740 | 1,741 |
| (Increase) decrease in non-current items related to operating activities | (551) | 599 | 2,215 |
| Cash flows provided by operating activities | 30,797 | 24,023 | 39,173 |
| INVESTING ACTIVITIES | |||
| Additions to property, plant and equipment | (22,075) | (17,907) | (16,649) |
| Exploration expenditures capitalized | (331) | (652) | (765) |
| Change in long-term loans granted and other long-term items | (7,682) | (1,495) | (539) |
| Proceeds from sale of assets | 6,890 | 3,298 | 5,115 |
| Cash flows used in investing activities | (23,198) | (16,756) | (12,838) |
| FINANCING ACTIVITIES | |||
| New long-term borrowings | 3,206 | 5,396 | 9,609 |
| Repayment of long-term borrowings | (2,774) | (4,831) | (4,548) |
| Distribution to minority shareholders | (356) | (173) | (1,878) |
| Dividends paid | (6,282) | (6,169) | (5,668) |
| Amounts paid to shareholder, related to SDFI properties | 0 | 0 | (49,747) |
| Capital contribution related to SDFI properties | 0 | 0 | 8,460 |
| Net proceeds from issuance of new shares | 0 | 0 | 12,890 |
| Net short-term borrowings, bank overdrafts and other | (1,656) | 1,146 | (588) |
| Cash flows used in financing activities | (7,862) | (4,631) | (31,470) |
| Net increase (decrease) in cash and cash equivalents | (263) | 2,636 | (5,135) |
| Effect of exchange rate changes on cash and cash equivalents | 877 | (329) | (215) |
| Cash and cash equivalents at January 1 | 6,702 | 4,395 | 9,745 |
| Cash and cash equivalents at December 31 | 7,316 | 6,702 | 4,395 |
| Interest paid | 1,336 | 1,782 | 3,793 |
| Taxes paid | 34,230 | 31,634 | 33,320 |
Imputed income taxes related to transferred SDFI properties, are included in financing activities as cashflows to shareholder until May 31, 2001 when the transaction became effective, and result in an ajustment to reconcile net income to net cash flows provided by operating activities. Changes in working capital items resulting from the disposal of the subsidiary Navion in 2003 are excluded from Cash flows provided by operating activities and classified as Proceeds from sale of assets.
See notes to the consolidated financial statements.
1. Organization and Basis of Presentation
Statoil ASA was founded in 1972, as a 100 per cent Norwegian State-owned company. Statoil's business consists principally of the exploration, production, transportation, refining and marketing of petroleum and petroleum-derived products. In 1985, the Norwegian State transferred certain properties from Statoil to the State's direct financial interest (SDFI), which were also 100 per cent owned by the Norwegian State.
In conjunction with a partial privatization of Statoil in June 2001, the Norwegian State restructured its holdings in oil and gas properties on the Norwegian Continental Shelf. In this restructuring, the Norwegian State transferred to Statoil certain SDFI properties with a book value of approximately NOK 30 billion, in consideration for which NOK 38.6 billion in cash plus interest and currency fluctuation from the valuation date of NOK 2.2 billion (NOK 0.7 billion after tax), and certain pipeline and other assets with a net book value of NOK 1.5 billion were transferred to the Norwegian State. The transaction was completed June 1, 2001 with a valuation date of January 1, 2001 with the exception of the sale of an interest in the Mongstad terminal which had a valuation date of
June 1, 2001.
The total amount paid to the Norwegian State was financed through a public offering of shares of NOK 12.9 billion, issuance of new debt of NOK 9 billion and the remainder from existing cash and short-term borrowings.
The transfers of properties from the SDFI have been accounted for as transactions among entities under common control and, accordingly, the results of operations and financial position of these properties have been combined with those of Statoil at their historical book value for all periods presented. However, certain adjustments have been made to the historical results of operations and financial position of the properties transferred to present them as if they had been Statoil's for all periods presented. These adjustments primarily relate to imputing of income taxes and capitalized interest, and calculation of royalty paid in kind consistent with the accounting policies used to prepare the consolidated financial statements of Statoil. Income taxes, capitalized interest and royalty paid in kind are imputed in the same manner as if the properties transferred to Statoil had been Statoil's for all periods presented. Income taxes have been imputed at the applicable income tax rate. Interest is capitalized on construction in progress based on Statoil's weighted average borrowing rate and royalties paid in kind are imputed based on the percentage applicable to the production for each field. Properties transferred from Statoil to the Norwegian State are not given retroactive treatment as these properties were not historically managed and financed as if they were autonomous. As such, the contribution of properties is considered a contribution of capital and is presented as additional paid-in capital in shareholder's equity at the beginning of January 1, 1996. The cash payment and net book value of properties transferred to the Norwegian State in excess of the net book value of the properties transferred to Statoil, is shown as a dividend. The final cash payment is contingent upon review by the Norwegian State, which is expected to be completed in 2004. The adjustment to the cash payment, if any, will be recorded as a capital contribution or dividend as applicable.
2. Summary of Significant Accounting Policies
The consolidated financial statements of Statoil ASA and its subsidiaries (the Company or the group) are prepared in accordance with United States generally accepted accounting principles (USGAAP).
Consolidation
The consolidated financial statements include the accounts of Statoil ASA and subsidiary companies owned directly or indirectly more than 50 per cent. Inter-company transactions and balances have been eliminated. Investments in companies in which Statoil does not have control, but has the ability to exercise significant influence over operating and financial policies (generally 20 to 50 per cent ownership), are accounted for by the equity method. Undivided interests in unincorporated joint ventures in the oil and gas business, including pipeline transportation, are consolidated on a pro rata basis.
Foreign currency translation
Each foreign entity's financial statements are prepared in the currency in which that entity primarily conducts its business (the functional currency). For Statoil's foreign subsidiaries the local currency is the functional currency, with the exception of some upstream subsidiaries, where the US dollar is the functional currency.
When translating foreign functional currency financial statements to Norwegian kroner, year-end exchange rates are applied to asset and liability accounts, and average rates are applied to income statement accounts. Adjustments resulting from this process are included in the Accumulated other comprehensive income account in shareholders' equity, and do not affect net income.
Transactions denominated in currencies other than the entity's functional currency are re-measured into the functional currency using current exchange rates. Gains or losses from this re-measurement are included in income.
Revenue recognition
Revenues associated with sales and transportation of crude oil, natural gas, petroleum and chemical products and other merchandise are recorded when title passes to the customer at the point of delivery of the goods based on the contractual terms of the agreements. Revenue is recorded net of customs, excise taxes and royalties paid in kind on petroleum products. Revenues from the production by oil and gas properties are recorded on the basis of sales to customers.
Cash and cash equivalents
Cash and cash equivalents include cash, bank deposits and all other monetary instruments with three months or less to maturity at the date of purchase.
Short-term investments
Short-term investments include bank deposits and all other monetary instruments and marketable equity and debt securities with a maturity of between three and twelve months at the date of purchase. The portfolios of securities are considered trading securities and are valued at fair value (market). The resulting unrealized holding gains and losses are included in Net financial items. Income from short-term investments is recorded when earned.
Inventories
Inventories are valued at the lower of cost or market. Costs of crude oil held at refineries and the majority of refined products are determined under the last-in, first-out (LIFO) method. Certain inventories of crude oil, refined products and non-petroleum products are determined under the first-in, first-out (FIFO) method.
Use of estimates
Preparation of the financial statements requires the Company to make estimates and assumptions that affect the reported amounts of assets, liabilities, revenues and expenses, as well as disclosures of contingencies. Actual results may ultimately differ from the estimates and assumptions used.
The nature of Statoil's operations, and the many countries in which Statoil operates, are subject to changing economic, regulatory and political conditions. Statoil does not believe it is vulnerable to the risk of a near-term severe impact as a result of any concentration of its activities.
Property, plant and equipment
Property, plant and equipment are carried at historical cost less accumulated depreciation, depletion and amortization. Expenditures for significant renewals and improvements are capitalized. Ordinary maintenance and repairs are charged to income when performed. Provisions are made for costs related to periodic maintenance programs.
Depreciation of production installations and field-dedicated transport systems for oil and gas is calculated using the unit of production method based on proved reserves expected to be recovered during the concession period. Ordinary depreciation of other assets and of transport systems used by several fields is calculated on the basis of their economic life expectancy, using the straight-line method. The economic life of nonfield-dedicated transport systems is normally the production period of the related fields, limited by the concession period. Straight-line depreciation of other assets is based on the following estimated useful lives:
| Machinery and equipment Production plants onshore Buildings Vessels | 5 — 10 years 15 — 20 years 20 — 25 years 20 — 25 years |
Oil and gas accounting
Statoil uses the "Successful efforts"- method of accounting for oil and gas producing activities. Costs to acquire mineral interests in oil and gas properties, to drill and equip exploratory wells that find proved reserves, and to drill and equip development wells are capitalized. Costs to drill exploratory wells that do not find proved reserves, and geological and geophysical and other exploration costs are expensed. Pre-production costs are expensed as incurred.
Unproved oil and gas properties are periodically assessed on a property-by-property basis, and a loss is recognized to the extent, if any, that the cost of the property has been impaired. Capitalized expenditures of producing oil and gas properties are depreciated and depleted by the unit of production method.
Impairment of long-lived assets
Long-lived assets, identifiable intangible assets and goodwill, are written down when events or a change in circumstances during the year indicate that their carrying amount may not be recoverable.
Impairment is determined for each autonomous group of assets (oil and gas fields or licenses, or independent operating units) by comparing their carrying value with the undiscounted cash flows they are expected to generate based upon management's expectations of future economic and operating conditions.
Should the above comparison indicate that an asset is impaired, the asset is written down to fair value, generally determined based on discounted cash flows.
Assets held for sale
Assets held for sale are classified as short-term if the appropriate accounting criteria are met. The main criteria are that management with the authority to do so commit to a plan to sell the assets and expects to record the transfer of the assets as a completed sale within one year. Assets held for sale are measured at the lower of its carrying amount or fair value less costs to sell.
Asset retirement obligation
Financial Accounting Standard (FAS) 143, Accounting for Asset Retirement Obligations was effective from January 1, 2003. The Statement requires legal obligations associated with the retirement of long-lived assets to be recognized at their fair value at the time that the obligations are incurred. Fair value is estimated based on existing technology and regulation. Upon initial recognition of a liability, the costs are capitalized as part of the related long-lived asset and allocated to expense over the useful life of the asset. Changes in asset retirement obligation estimates are capitalized as part of the long-lived asset and expensed prospectively over the remaining useful life of the asset.
The discount rate used when estimating the fair value of the asset retirement obligation is credit-adjusted risk-free interest rate with the same expected maturity as the removal obligation.
Prior to application of FAS 143 the estimated costs of decommissioning and removal of major producing facilities were accrued using the unit-of-production method. These costs represented the estimated future undiscounted costs of decommissioning and removal based on existing regulations and technology.
Leased assets
Capital leases, which provide Statoil with substantially all the rights and obligations of ownership, are classified as assets under Property, plant and equipment and as liabilities under Long-term debt valued at the present value of minimum lease payments. The assets are subsequently depreciated over their expected economic life, and the liability is reduced for lease payments less the effective interest expense.
Employee retirement plans
Pension liabilities are calculated in accordance with FAS 87. Prior service costs, due to plan amendments, are amortized on a straight-line basis over the average remaining service period of active participants. Accumulated gains and losses in excess of 10 per cent of the greater of the benefit obligation or the fair value of assets are amortized over the remaining service period of active plan participants.
Research and development
Research and development expenditures are expensed when incurred.
Transactions with the Norwegian State
Statoil markets and sells the Norwegian State's share of oil and gas production from the Norwegian continental shelf (NCS). From June 2001, Statoil no longer acts as an agent to sell SDFI oil production to third parties. As such all purchases and sales of SDFI oil production are recorded as Cost of goods sold and Sales, respectively, whereas before, the net result of any trading activity was included in Sales.
All oil received by the Norwegian State as royalty in kind from fields on the NCS is purchased by Statoil. Statoil includes the costs of purchase and proceeds from the sale of this royalty oil in its Cost of goods sold and Sales respectively.
Income taxes
Deferred income tax expense is calculated using the liability method. Under this method, deferred tax assets and liabilities are determined by applying the enacted statutory tax rates applicable to future years to the temporary differences between the carrying values of assets and liabilities for financial reporting and their tax basis. Deferred income tax expense is the change during the year in the deferred tax assets and liabilities relating to the operations during the year. Effects of changes in tax laws and tax rates are recognized at the date the tax law changes.
Derivative financial instruments and hedging activities
Statoil operates in the worldwide crude oil, refined products, and natural gas markets and is exposed to fluctuations in hydrocarbon prices, foreign currency rates and interest rates that can affect the revenues and cost of operating, investing and financing. Statoil's management has used and intends to use financial and commodity-based derivative contracts to reduce the risks in overall earnings and cash flows. Statoil applies hedge accounting in certain circumstances as allowed by the Statement, and enters into derivatives which economically hedge certain of its risks even though hedge accounting is not allowed by the Statement or is not applied by Statoil.
For derivatives where hedge accounting is used, Statoil formally designates the derivative as either a fair value hedge of a recognized asset or liability or unrecognized firm commitment, or a cash flow hedge of an anticipated transaction. Statoil also documents the designated hedging relationship upon entering into the derivative, including identification of the hedging instrument and the hedged item or transaction, strategy and risk management objective for undertaking the hedge, and the nature of the risk being hedged. Furthermore, each derivative is assessed for hedge effectiveness both at the inception of the hedging relationship and on a quarterly basis, for as long as the derivative is outstanding. Hedge accounting is only applied when the derivative is deemed to be highly effective at offsetting changes in fair values or anticipated cash flows of the hedged item or transaction. For hedged forecasted transactions, hedge accounting is discontinued if the forecasted transaction is no longer probable of occurring. Any previously deferred hedging gains or losses would be recorded to earnings when the transaction is considered to be probable of not occurring. Earnings impacts for all designated hedges are recorded in the Consolidated Statement of Income generally on the same line item as the gain or loss on the item being hedged.
Statoil records all derivatives that do not qualify for the normal purchase and normal sales exemption at fair value as assets or liabilities in the Consolidated Balance Sheets. For fair value hedges, the effective and ineffective portions of the change in fair value of the derivative, along with the gain or loss on the hedged item attributable to the risk being hedged, are recorded in earnings as incurred. For cash flow hedges, the effective portion of the change in fair value of the derivative is deferred in accumulated Other comprehensive income in the Consolidated Balance Sheets until the transaction is reflected in the Consolidated Statements of Income, at which time any deferred hedging gains or losses are recorded in earnings. The ineffective portion of the change in the fair value of a derivative used as a cash flow hedge is recorded in earnings in Sales or Cost of goods sold as incurred.
Reclassifications
Statoil has adjusted the formula for calculating the inter-segment price for deliveries of natural gas from Exploration and Production Norway to Natural Gas, see note 3.
Certain reclassifications have been made to prior years' figures to be consistent with current year's presentation.
New Accounting Standards
In June 2001, the FASB issued Statements of Financial Accounting Standards (FAS) No. 141, Business Combinations, and No. 142, Goodwill and Other Intangible Assets, effective for fiscal years beginning after December 15, 2001. Under the new rules, goodwill and intangible assets deemed to have indefinite lives will no longer be amortized but will be subject to annual impairment tests as described in the Statements. Other intangible assets will continue to be amortized over their useful lives. The impact of the adoption of FAS 141 and FAS 142 from January 1, 2002, was immaterial.
In June 2001, the FASB issued FAS 143, Accounting for Asset Retirement Obligations, effective for fiscal years beginning after June 15, 2002. The Statement requires legal obligations associated with the retirement of long-lived assets to be recognized at their fair value at the time that the obligations are incurred. Upon initial recognition of a liability, that cost should be capitalized as part of the related long-lived asset and allocated to expense over the useful life of the asset. The Company adopted the new rules on asset retirement obligations on January 1, 2003. Application of the new standard resulted in an increase in net property, plant and equipment of NOK 2.8 billion, an increase in accrued asset retirement obligation of NOK 7.1 billion, a reduction in deferred tax assets of NOK 1.5 billion, and a long-term receivable of NOK 5.8 billion. The receivable represented the expected refund by the Norwegian State of an amount equivalent to the actual removal costs multiplied by the effective tax rate over the productive life of the assets. Removal costs on the Norwegian continental shelf were, unlike decommissioning costs, not deductible for tax purposes. The implementation effect of NOK 33 million after tax is expensed as Operating expenses in the segment Other and eliminations. If the standard had been applied as of the beginning of 2001 the effect on net income and shareholders' equity for the years ended 2001 and 2002 would have been immaterial.
The Norwegian Parliament decided in June 2003 to replace governmental refunds for removal costs on the Norwegian continental shelf with ordinary tax deduction for such costs. Previously, removal costs were refunded by the Norwegian State based on the company's percentage for income taxes payable over the productive life of the removed installation. As a consequence of the changes in legislation, Statoil has charged the receivable of NOK 6.0 billion against the Norwegian State related to refund of removal costs to income under Other items in the second quarter of 2003. Furthermore, the resulting deferred tax benefit of NOK 6.7 billion has been taken to income under Income taxes.
In August 2001, the FASB issued FAS 144, Accounting for the Impairment or Disposal of Long-Lived Assets, which addresses financial accounting and reporting for the impairment or disposal of long-lived assets and supersedes FAS 121, Accounting for the Impairment of Long-Lived Assets and for Long-Lived Assets to be Disposed of, and the accounting and reporting provisions of APB Opinion No. 30, Reporting the Results of Operations for a disposal of a segment of a business. FAS 144 is effective for fiscal years beginning after December 15, 2001. The adoption of FAS 144 from January 1, 2002, did not have any impact on the Company's financial position and results of operations.
3. Segments
Statoil operates in four segments; Exploration and Production Norway, International Exploration and Production, Natural Gas and Manufacturing and Marketing.
Operating segments are determined based on differences in the nature of their operations, geographic location and internal management reporting. The composition of segments and measure of segment income are consistent with that used by management in making strategic decisions.
A new method for calculating the inter-segment price for deliveries of natural gas from Exploration and Production Norway to Natural Gas was adopted from January 1, 2003. The new price amounts to NOK 0.32 per standard cubic meter, adjusted quarterly by the average USD oil price over the last six months in proportion to USD 15. The new price applies to all volumes, while previously the price was calculated on a field-by-field basis, and the formula used differentiated between gas fields and fields delivering associated gas. The new method is partly a result of the Norwegian Gas Negotiating Committee being abolished, and replaced by company-based sales. Prior periods have been adjusted to reflect the new pricing formula.
Segment data for the years ended December 31, 2003, 2002 and 2001 is presented below:
| (in NOK million) | Exploration and Production Norway | International Exploration and Production | Natural Gas | Manufacturing and Marketing | Other and eliminations | Total |
| Year ended December 31, 2003 | ||||||
| Revenues third party | 2,250 | 2,522 | 24,420 | 218,169 | 1,398 | 248,759 |
| Revenues inter-segment | 60,170 | 4,458 | 445 | 120 | (65,193) | 0 |
| Income (loss) from equity investments | 74 | 0 | 222 | 353 | (33) | 616 |
| Total revenues | 62,494 | 6,980 | 25,087 | 218,642 | (63,828) | 249,375 |
| Depreciation, depletion and amortization | 12,102 | 1,784 | 486 | 1,419 | 485 | 16,276 |
| Income before financial items, other items, | ||||||
| income taxes and minority interest | 37,589 | 1,702 | 6,350 | 3,555 | (280) | 48,916 |
| Segment income taxes | (27,869) | (653) | (4,416) | (755) | (15) | (33,708) |
| Segment net income | 9,720 | 1,049 | 1,934 | 2,800 | (295) | 15,208 |
| Year ended December 31, 2002 | ||||||
| Revenues third party | 1,706 | 5,749 | 24,236 | 210,653 | 1,104 | 243,448 |
| Revenues inter-segment | 57,075 | 1,020 | 168 | 194 | (58,457) | 0 |
| Income (loss) from equity investments | (1) | 0 | 132 | 305 | (70) | 366 |
| Total revenues | 58,780 | 6,769 | 24,536 | 211,152 | (57,423) | 243,814 |
| Depreciation, depletion and amortization | 11,861 | 2,355 | 592 | 1,686 | 350 | 16,844 |
| Income before financial items, other items, | ||||||
| income taxes and minority interest | 33,953 | 1,086 | 6,428 | 1,637 | (2) | 43,102 |
| Segment income taxes | (25,297) | (381) | (4,687) | (401) | (20) | (30,786) |
| Segment net income | 8,656 | 705 | 1,741 | 1,236 | (22) | 12,316 |
| Year ended December 31, 2001 | ||||||
| Revenues third party | 3,622 | 5,926 | 23,297 | 202,264 | 1,413 | 236,522 |
| Revenues inter-segment | 63,503 | 1,767 | 36 | 936 | (66,242) | 0 |
| Income (loss) from equity investments | 120 | 0 | 135 | 187 | (3) | 439 |
| Total revenues | 67,245 | 7,693 | 23,468 | 203,387 | (64,832) | 236,961 |
| Depreciation, depletion and amortization | 11,806 | 3,371 | 664 | 1,855 | 362 | 18,058 |
| Income before financial items, other items, | ||||||
| income taxes and minority interest | 42,287 | 1,291 | 8,039 | 4,480 | 57 | 56,154 |
| Segment income taxes | (30,829) | (387) | (5,679) | (1,305) | (18) | (38,218) |
| Segment net income | 11,458 | 904 | 2,360 | 3,175 | 39 | 17,936 |
Borrowings are managed at a corporate level and interest expense is not allocated to segments. Income tax is calculated on income before financial items, other items, income taxes and minority interest. Additionally, income tax benefit on segments with net losses is not recorded. As such, segment income tax and net income can be reconciled to income taxes and net income per the Consolidated Statements of Income as follows:
Year ended December 31, | |||
| (in NOK million) | 2003 | 2002 | 2001 |
| Segment net income | 15,208 | 12,316 | 17,936 |
| Net financial items | 1,399 | 8,233 | 65 |
| Other items (see note 2) | (6,025) | 0 | 0 |
| Change in deferred tax due to new legislation (see note 2) | 6,712 | 0 | 0 |
| Tax on financial items and other tax adjustments | (451) | (3,550) | (268) |
| Minority interest | (289) | (153) | (488) |
| Net income | 16,554 | 16,846 | 17,245 |
| Segment income taxes | 33,708 | 30,786 | 38,218 |
| Change in deferred tax due to new legislation (see note 2) | (6,712) | 0 | 0 |
| Tax on financial items and other tax adjustments | 451 | 3.550 | 268 |
| Income taxes | 27,447 | 34,336 | 38,486 |
The Exploration and Production Norway and International Exploration and Production Segments explore for, develop and produce crude oil and natural gas, and extract natural gas liquids, sulfur and carbon dioxide. The Natural Gas segment transports and markets natural gas and natural gas products. Manufacturing and Marketing is responsible for petroleum refining operations and the marketing of crude oil and refined petroleum products.
Inter-segment revenues are sales to other business segments within Statoil and are at estimated market prices. These inter-company transactions are eliminated for consolidation purposes. Segment income taxes are calculated on the basis of Income before financial items, other items, income taxes and minority interest.
| (in NOK million) | Addition to long-lived assets | Investments in affiliates | Other long-term assets |
| At December 31, 2003 | |||
| Exploration and Production Norway | 13,412 | 1,324 | 79,357 |
| International Exploration and Production | 8,147 | 370 | 32,732 |
| Natural Gas | 456 | 1,636 | 8,919 |
| Manufacturing and Marketing | 1,546 | 7,655 | 15,696 |
| Other | 530 | 37 | 14,705 |
| Total | 24,091 | 11,022 | 151,409 |
| At December 31, 2002 | |||
| Exploration and Production Norway | 11,023 | 1,284 | 75,717 |
| International Exploration and Production | 5,995 | 0 | 20,655 |
| Natural Gas | 465 | 1,423 | 8,889 |
| Manufacturing and Marketing | 1,771 | 6,868 | 21,090 |
| Other | 800 | 54 | 11,253 |
| Total | 20,054 | 9,629 | 137,604 |
| At December 31, 2001 | |||
| Exploration and Production Norway | 10,759 | 212 | 77,338 |
| International Exploration and Production | 5,027 | 0 | 21,530 |
| Natural Gas | 671 | 1,506 | 8,994 |
| Manufacturing and Marketing | 811 | 8,222 | 22,210 |
| Other | 685 | 11 | 11,015 |
| Total | 17,953 | 9,951 | 141,087 |
| Revenues by geographic areas | |||
Year ended December 31, | |||
| (in NOK million) | 2003 | 2002 | 2001 |
| Norway | 223,139 | 215,231 | 204,791 |
| Europe (excluding Norway) | 30,152 | 31,449 | 36,002 |
| United States | 26,524 | 27,655 | 27,164 |
| Other areas | 8,014 | 9,253 | 6,206 |
| Eliminations | (39,070) | (40,140) | (37,641) |
| Total revenues (excluding equity in net income (loss) of affiliates) | 248,759 | 243,448 | 236,522 |
| Long-lived assets by geographic areas | |||
| At December 31, | |||
| (in NOK million) | 2003 | 2002 | 2001 |
| Norway | 112,672 | 113,629 | 114,355 |
| Europe (excluding Norway) | 39,845 | 28,550 | 32,010 |
| United States | 638 | 25 | 70 |
| Other areas | 21,563 | 11,586 | 13,755 |
| Eliminations | (12,913) | (7,043) | (9,746) |
| Total long-lived assets (excludes long-term deferred tax assets) | 161,805 | 146,747 | 150,444 |
4. Significant Acquisitions and Dispositions
In 2001, Statoil sold specific interests in Norwegian oil and gas licenses, its 4.76 per cent interest in the Kashagan oil field in Kazahkstan and its activity in Vietnam which resulted in total gains of NOK 4.3 billion before tax and NOK 3.5 billion after tax.
In 2002, Statoil sold its interests in the Siri and Lulita oil fields on the Danish continental shelf. The sale resulted in a gain included in the International Exploration and Production segment of NOK 1.0 billion before tax and NOK 0.7 billion after tax.
Effective January 1, 2003 Statoil sold 100 per cent of the shares in Navion ASA to Norsk Teekay AS, a wholly-owned subsidiary of Teekay Shipping Corporation. The operations of Navion are shuttle tanking and conventional shipping. The sales price for the fixed assets of Navion, excluding Navion Odin and Navion's 50 per cent share in the West Navigator drillship which were not included in the sale, was approximately USD 800 million. The sale was accounted for in the second quarter of 2003, and the effect on net income was immaterial.
Statoil and BP signed an agreement in June 2003 whereby Statoil will acquire 49 per cent of BP's interests in the In Salah gas project and 50 per cent of BP's interest in the In Amenas gas condensate project, both in Algeria. Statoil has paid BP USD 740 million, and has in addition covered the expenditures incurred after January 1, 2003 related to the acquired interests. As part of the agreement, the two companies will work together with Sonatrach, the Algerian State Oil and Gas Company, in a joint operation of the two projects under development in Algeria. Following this transaction, Statoil will have a 31.85 per cent interest in the In Salah revenue sharing contract and a 50 per cent interest in the In Amenas production sharing contract. In September 2003 Sonatrach confirmed that they will not exercise their pre-emption rights. The terms of the agreement were submitted to the European Commission for clearance of change of control of the In Salah gas project under the EU Merger Control Regulation, and were approved by EU in December 2003. In addition, amendments to the two projects' co-operation agreements implementing Statoil as participant in the projects will be submitted to the Algerian Ministry of Energy and Mining, the Algerian petroleum industry regulator, for necessary approval by the Council of Ministers and final authorization of the transaction through gazettal publication. The payments made by Statoil have been accounted for as long-term prepayments at year-end 2003, pending such final approval.
In January 2004, Statoil sold its 5.26 per cent shareholding in the German company Verbundnetz Gas, generating a gain of approximately NOK 0.6 billion before tax (approximately NOK 0.4 billion after tax). The shares are classified as assets held for sale in Prepaid expenses and other current assets in the balance sheet at year-end 2003.
5. Asset Impairments
In 2001, a charge of NOK 2 billion before tax (NOK 1.4 billion after tax) was recorded in Depreciation, depletion and amortization in the International Exploration and Production segment to write down the Company's 27 per cent interest in the LL652 oil field in Venezuela to fair value. In 2002 an additional impairment charge of NOK 0.8 billion before tax (NOK 0.6 billion after tax) was recorded related to the Company's interest in LL652. The write-downs are mainly due to reductions in the projected volumes of oil recoverable during the remaining contract period of operation. Fair value is calculated based on discounted estimated future cash flows.
6. Provision for Rig Rental Contracts
Statoil provides for estimated losses on long-term fixed price rental agreements for mobile drilling rigs. The losses are calculated as the difference between estimated market rates and the fixed price rental agreements.
| (in NOK million) | 2003 | 2002 | 2001 |
| Provision at January 1 | 960 | 734 | 960 |
| Increase (decrease) during the year | 454 | 231 | (150) |
| Cost incurred during the year | (54) | (5) | (76) |
| Provision at December 31 | 1,360 | 960 | 734 |
7. Inventories
Inventories are valued at the lower of cost or market. Costs of crude oil held at refineries and the majority of refined products are determined under the last-in, first-out (LIFO) method. Certain inventories of crude oil, refined products and non-petroleum products are determined under the first-in, first-out (FIFO) method. There have been no liquidations of LIFO layers which resulted in a material impact to net income for the reported periods.
At December 31, | ||
| (in NOK million) | 2003 | 2002 |
| Crude oil | 2,192 | 2,766 |
| Petroleum products | 2,470 | 2,647 |
| Other | 1,065 | 844 |
| Total - inventories valued on a FIFO basis | 5,727 | 6,257 |
| Excess of current cost over LIFO value | (734) | (835) |
| Total | 4,993 | 5,422 |
8. Summary Financial Information of Unconsolidated Equity Affiliates
Statoil's investment in affiliates includes a 50 per cent interest in Borealis A/S, a petrochemical production company, and a 50 per cent interest in Statoil Detaljhandel Skandinavia AS (SDS), a group of retail petroleum service stations.
Summary of financial information for affiliated companies accounted for by the equity method is shown below. Statoil's investment in these companies is included in Investments in affiliates. Accounts receivable - related parties in the Consolidated Balance Sheets relate to amounts due from equity affiliates. In addition Statoil has given a long-term sub-ordinated loan of EUR 30 million to Borealis A/S.
Equity method affiliates - gross amounts
Borealis A/S | SDS | |||||
| (in NOK million) | 2003 | 2002 | 2001 | 2003 | 2002 | 2001 |
| At December 31, | ||||||
| Current assets | 7,286 | 5,909 | 7,694 | 2,799 | 2,798 | 3,189 |
| Non-current assets | 19,085 | 17,432 | 19,710 | 6,787 | 6,029 | 6,105 |
| Current liabilities | 7,058 | 6,063 | 6,108 | 3,717 | 3,288 | 2,894 |
| Long-term debt | 6,140 | 5,787 | 8,787 | 1,951 | 2,488 | 3,382 |
| Other liabilities | 2,375 | 2,187 | 2,201 | 444 | 0 | 0 |
| Net assets | 10,798 | 9,304 | 10,310 | 3,474 | 3,051 | 3,018 |
| Year ended December 31, | ||||||
| Gross revenues | 30,936 | 25,617 | 29,819 | 24,615 | 23,112 | 24,563 |
| Income before taxes | 126 | 215 | (193) | 210 | 423 | 411 |
| Net income | 135 | 43 | (330) | 148 | 302 | 290 |
| Capital expenditures | 1,002 | 978 | 1,182 | 779 | 721 | 552 |
No dividends have been received from Borealis for 2003 and 2002. For 2001 the dividend amounted to NOK 16 million. Statoil received NOK 65 million in dividend from SDS in 2003. No dividends have been received from SDS for the years 2001 and 2002.
Equity method affiliates - detailed information
| (amounts in million) | Currency | Par value | Share capital | Ownership | Book value | Profit share |
| Borealis A/S | EUR | 268 | 536 | 50% | 5,405 | 106 |
| Statoil Detaljhandel Skandinavia AS | NOK | 1,300 | 2,600 | 50% | 1,173 | 152 |
| P/R West Navigator DA | NOK | - | - | 50% | 1,100 | (78) |
| Other companies | - | - | - | - | 3,344 | 436 |
| Total | 11,022 | 616 | ||||
Ownership corresponds to voting rights.
The difference between the book value and equity interest of the investment in SDS represents the difference between the book value and the fair value on the sale of Statoil's 50 per cent interest in SDS in 1999 which is being amortized. P/R West Navigator DA owns the drillshipWest Navigator, and its only activity pertains to this drillship.
9. Investments
Short-term investmentsAt December 31, | ||
| (in NOK million) | 2003 | 2002 |
| Short-term deposits | 1,358 | 51 |
| Certificates | 7,848 | 5,073 |
| Bonds | 35 | 50 |
| Other | 73 | 93 |
| Total short-term investments | 9,314 | 5,267 |
The cost price of short-term investments for the years ended December 31, 2003 and 2002 was NOK 9,284 million and NOK 5,261 million, respectively. All short-term investments are considered to be trading securities and are recorded at fair value with unrealized gains and losses included in income.
Long-term investments included in Other assets
At December 31, | ||
| (in NOK million) | 2003 | 2002 |
| Shares in other companies | 1,608 | 1,166 |
| Certificates | 2,005 | 1,031 |
| Bonds | 2,291 | 2,749 |
| Marketable equity securities | 1,934 | 1,270 |
| Total long-term investments | 7,838 | 6,216 |
10. Property, Plant and Equipment
| (in NOK million) | Machinery, equipment and transportation equipment | Production plants oil and gas, incl pipelines | Production plants onshore | Buildings and land | Vessels | Construction in progress | Capitalized exploration cost | Total |
| Cost at January 1* | 9,301 | 222,586 | 31,356 | 6,626 | 7,317 | 12,223 | 3,490 | 292,899 |
| Acc depr depletion and amortization | ||||||||
| at January 1* | (6,310) | (139,413) | (18,213) | (2,260) | (1,670) | (6) | 0 | (167,872) |
| Additions and transfers | 824 | 9,928 | 1,804 | 540 | 15 | 9,605 | 651 | 23,367 |
| Disposal at booked value | (36) | (29) | (304) | (92) | (5,064) | (6) | (40) | (5,571) |
| Expensed expl costs capitalized earlier year | 0 | 0 | 0 | 0 | 0 | 0 | (256) | (256) |
| Depr, depletion and amortization for the year | (718) | (14,108) | (1,174) | (220) | (2) | 0 | 0 | (16,222) |
| Foreign currency translation | 286 | (181) | (73) | 306 | 0 | (102) | (53) | 183 |
| Balance specified at December 31, 2003 | 3,347 | 78,783 | 13,396 | 4,900 | 596 | 21,714 | 3,792 | 126,528 |
| Estimated useful life (years) | 5-10 | ** | 15-20 | 20-25 | 20-25 | |||
* The impact of new accounting principle regarding decommissioning and removal costs is included in acquisition cost, and accumulated depreciation, depletion and amortization at January 1, 2003.
** Depreciation according to Unit of production, see note 2.
Capitalized exploration costs in suspense include signature bonuses and other aquired exploration rights of NOK 940 million and NOK 1,045 million as at the end of 2002 and 2003, respectively. Should a balance sheet reclassification of such exploration rights to intangible assets be required, an issue currently being adressed by the FASB Emerging IssuesTask Force (EITF), it is not expected to affect the statements of income and cash flows.
In 2003, 2002 and 2001, NOK 442 million, NOK 382 million and NOK 723 million, respectively, of interests were capitalized. In addition to depreciation, depletion and amortization specified above intangible assets have been amortized by NOK 54 million in 2003.
11. Provisions
Provisions against assets (other than property, plant and equipment and intangible assets) recorded during the past three years are as follows:
| (in NOK million) | Balance at January 1, | Expense | Recovery | Write-off | Other 1) | Balance at December 31, |
| Year 2003 | ||||||
| Provisions against other long-term assets | 0 | 0 | 0 | 0 | 0 | 0 |
| Provisions against accounts receivable | 153 | 59 | (5) | (5) | 73 | 275 |
| Year 2002 | ||||||
| Provisions against other long-term assets | 16 | 0 | (16) | 0 | 0 | 0 |
| Provisions against accounts receivable | 212 | 47 | (59) | (33) | (14) | 153 |
| Year 2001 | ||||||
| Provisions against other long-term assets | 90 | 0 | 0 | 0 | (74) | 16 |
| Provisions against accounts receivable | 224 | 44 | 0 | (12) | (44) | 212 |
1) Other in 2003 is primarly related to provisions against accounts receivable in acquired companies.
12. Financial Items
For the year ended December 31, | |||
| (in NOK million) | 2003 | 2002 | 2001 |
| Interest and other financial income | 1,057 | 1,311 | 2,107 |
| Currency exchange adjustments, net | 98 | 9,009 | 912 |
| Interest and other financial expenses | (877) | (1,952) | (2,713) |
| Dividends received | 179 | 457 | 18 |
| Gain (loss) on sale of securities | 205 | (228) | (97) |
| Unrealized gain (loss) on securities | 737 | (364) | (162) |
| Net financial items | 1,399 | 8,233 | 65 |
13. Income taxes
Net income before income taxes and minority interest consists ofYear ended December 31, | |||
| (in NOK million) | 2003 | 2002 | 2001 |
| Norway | |||
| - Offshore | 43,516 | 42,519 | 49,651 |
| - Onshore | 3,121 | 5,394 | 5,843 |
| Other countries 1) | 3,678 | 3,422 | 725 |
| Other items (see note 2) | (6,025) | 0 | 0 |
| Total | 44,290 | 51,335 | 56,219 |
Significant components of income tax expense were as follows
Year ended December 31, | |||
| (in NOK million) | 2003 | 2002 | 2001 |
| Norway | |||
| - Offshore | 34,754 | 34,253 | 37,942 |
| - Onshore | 2 | 885 | 1,169 |
| Other countries 1) | 737 | 352 | 253 |
| Uplift benefit | (1,869) | (1,782) | (1,726) |
| Current income tax expense | 33,624 | 33,708 | 37,638 |
| Norway | |||
| - Offshore | (376) | (707) | 317 |
| - Onshore | 859 | 250 | 383 |
| Other countries 1) | 52 | 1,085 | 148 |
| Change in deferred tax due to new legislation (see note 2) | (6,712) | 0 | 0 |
| Deferred tax expense | (6,177) | 628 | 848 |
| Total income tax expense | 27,447 | 34,336 | 38,486 |
1) Includes taxes in Norway on activities in other countries.
Significant components of deferred tax assets and liabilities were as follows
At December 31, | At December 31, | |
| (in NOK million) | 2003 | 2002 |
| Net operating loss carry-forwards | 1,612 | 1,157 |
| Impairment | 1,071 | 1,058 |
| Decommissioning | 12,204 | 4,733 |
| Other | 4,918 | 3,665 |
| Valuation allowance | (1,775) | (2,140) |
| Total deferred tax assets | 18,030 | 8,473 |
| Property, plant and equipment | 40,532 | 35,518 |
| Capitalized exploration expenditures and interest | 8,236 | 8,914 |
| Other | 6,491 | 6,293 |
| Total deferred tax liabilities | 55,259 | 50,725 |
| Net deferred tax liability | 37,229 | 42,252 |
| Deferred taxes are classified as follows |
At December 31, | At December 31, | |
| (in NOK million) | 2003 | 2002 |
| Short-term deferred tax asset | 0 | (415) |
| Long-term deferred tax asset | (620) | (486) |
| Long-term deferred tax liability | 37,849 | 43,153 |
| Net deferred tax liability | 37,229 | 42,252 |
A valuation allowance has been provided as Statoil believes that available evidence creates uncertainty as to the realizability of certain deferred tax assets. Statoil will continue to assess the valuation allowance and to the extent it is determined that such allowance is no longer required, the tax benefit of the remaining net deferred tax assets will be recognized in the future.
Reconciliation of Norwegian nominal statutory tax rate of 28 per cent to effective tax rate
Year ended December 31, | |||
| (in NOK million) | 2003 | 2002 | 2001 |
| Calculated income taxes at statutory rate | 14,088 | 14,374 | 15,741 |
| Petroleum surtax | 22,579 | 20,538 | 24,342 |
| Uplift benefit | (1,869) | (1,782) | (1,726) |
| Other | (639) | 1,206 | 129 |
| Change in deferred tax due to new legislation | (6,712) | 0 | 0 |
| Income tax expense | 27,447 | 34,336 | 38,486 |
Revenue from oil and gas activities on the NCS is taxed according to the Petroleum tax law. This stipulates a surtax of 50 per cent after deducting uplift, a special investment tax credit, in addition to normal corporate taxation. Uplift credits are deducted as the credits arises, 5 per cent each year for six years, as from initial year of investment. Uplift credits not utilized of NOK 9.0 billion can be carried forward indefinitely.
At the end of 2003, Statoil had tax losses carry-forwards of NOK 5.3 billion, primarily in the US and Ireland. Only a minor part of the carry-forward amounts expires before 2006.
14. Short-Term Debt
| At December 31, | ||
| (in NOK million) | 2003 | 2002 |
| Bank loans and overdraft facilities | 1,071 | 2,258 |
| Current portion of long-term debt | 3,168 | 2,018 |
| Other | 48 | 47 |
| Total | 4,287 | 4,323 |
| Weighted average interest rate (per cent) | 4.06 | 5.28 |
15. Long-Term Debt
Weighted average interest rates in per cent | Balance in NOK million at December 31, | ||||||||
2003 | 2002 | 2003 | 2002 | ||||||
| Unsecured debentures bonds | |||||||||
| US dollar (USD) | 6.62 | 5.74 | 11,052 | 14,404 | |||||
| Norwegian kroner (NOK) | 2.85 | 7.50 | 499 | 21 | |||||
| Euro (EUR) | 4.11 | 4.66 | 8,282 | 5,616 | |||||
| Swiss franc (CHF) | 3.15 | 3.14 | 3,665 | 3,443 | |||||
| Japanese yen (JPY) | 1.47 | 1.83 | 3,391 | 2,633 | |||||
| Great British pounds (GBP) | 6.13 | 6.13 | 2,949 | 2,805 | |||||
| Total | 29,838 | 28,922 | |||||||
| Unsecured bank loans | |||||||||
| US dollar (USD) | 2.10 | 1.77 | 3,018 | 2,194 | |||||
| Secured bank loans | |||||||||
| US dollar (USD) | 3.10 | 3.82 | 2,638 | 2,945 | |||||
| Other currencies | 4.90 | - | 26 | - | |||||
| Other debt | 639 | 762 | |||||||
| Grand total debt outstanding | 36,159 | 34,823 | |||||||
| Less current portion | (3,168) | (2,018) | |||||||
| Total long-term debt | 32,991 | 32,805 | |||||||
The table above contains market values of loans per currency and loan type, and does therefore not illustrate the economic effects of agreements entered into to swap the various currencies to USD.
Statoil has an unsecured debenture bond agreement for USD 500 million with a fixed interest rate of 6.5 per cent, maturing in 2028, callable at par upon change in tax law. At December 31, 2003 and 2002, NOK 3,293 million and NOK 3,435 million were outstanding, respectively. The interest rate of the bond has been swapped to a LIBOR-based floating interest rate.
Statoil has also an unsecured debenture bond agreement for EUR 500 million, with a fixed interest rate of 5.125 per cent, maturing in 2011. At December 31, 2003 and 2002, NOK 4,166 million and NOK 3,601 million were outstanding, respectively. This bond has been swapped to USD dollars with a LIBOR-based floating interest rate.
Statoil has also an unsecured debenture bond agreement for USD 375 million, with a fixed interest rate of 5.75 per cent, maturing in 2009. At December 31, 2003 and 2002, NOK 2,486 million and NOK 2,591 million were outstanding, respectively. Net after buyback this amounts to NOK 2,156 million and NOK 2,244 million at year-end exchanges rates.
In addition to the unsecured debentures bond debt of NOK 11,052 million, denominated in US dollars, Statoil utilizes foreign currency swaps to manage foreign exchange risk on its long-term debt. As a result, an additional NOK 18,747 million of Statoil's unsecured debentures bond debt has been swapped to US dollars. The foreign currency swaps are not reflected in the table above as the swaps are separate legal agreements. The foreign currency swaps do not qualify as hedges according to FAS 133 as the swaps are not to functional currency, although they qualify as economic hedges. The stated interest rate on the majority of the long-term debt is fixed. Interest rate swaps are utilized to manage interest rate exposure.
Substantially all unsecured debenture bond and unsecured bank loan agreements contain provisions restricting the pledging of assets to secure future borrowings without granting a similar secured status to the existing bondholders and lenders.
Statoil's secured bankloan in USD has been secured by a guarantee commitment of USD 41.45 million, together with mortgage in shares in a subsidiary and a bank deposit with a book value of NOK 1,769 million and NOK 1,499 million, respectively.
Statoil has 24 debenture bond agreements outstanding, which contain provisions allowing Statoil to call the debt prior to its final redemption at par if there are changes to the Norwegian tax laws or at certain specified premiums. The agreements are, net after buyback, at the December 31, 2003 closing rate valued at NOK 25,527 million.
Reimbursements of long-term debt fall due as follows:
| (in NOK million) | |
| 2004 | 3,168 |
| 2005 | 3,261 |
| 2006 | 1,558 |
| 2007 | 2,356 |
| 2008 | 2,123 |
| Thereafter | 23,693 |
| Total | 36,159 |
Statoil has two agreements with international bank syndicates for committed long-term revolving credit facility totaling USD 1.6 billion, all undrawn. Commitment fee is 0.108 per cent per annum.
As of December 31, 2003 and 2002 respectively, Statoil had no committed short-term credit facilities available or drawn.
16. Financial Instruments and Risk Management
Statoil uses derivative financial instruments to manage risks resulting from fluctuations in underlying interest rates, foreign currency exchange rates and commodity (such as oil, natural gas and refined petroleum products) prices. Because Statoil operates in the international oil and gas markets and has significant financing requirements, it has exposure to these risks, which can affect the cost of operating, investing and financing. Statoil has used and intends to use financial and commodity-based derivative contracts to reduce the risks in overall earnings and cash flows. Derivative instruments creating essentially equal and offsetting market exposures are used to help manage certain of these risks. Management also uses derivatives to establish certain positions based on market movements although this activity is immaterial to the consolidated financial statements.
Interest and currency risks constitute significant financial risks for the Statoil group. Total exposure is managed at portfolio level in accordance with the strategies and mandates issued by the Enterprise-Wide Risk Management Program and monitored by the Corporate Risk Committee. Statoil's interest rate exposure is mainly associated with the group's debt obligations and management of the assets in Statoil Forsikring AS. Statoil mainly employs interest rate swap and currency swap agreements to manage interest rate and currency exposure.
Statoil uses swaps, options, futures, and forwards to manage its exposure to changes in the value of future cash flows from future purchases and sales of crude oil and refined oil products. The term of the oil and refined oil products derivatives is usually less than one year. Natural gas and electricity swaps, options, forwards, and futures are likewise utilized to manage Statoil's exposure to changes in the value of future sales of natural gas and electricity. These derivatives usually have terms of approximately three years or less. Most of the Derivative transactions are made in the over-the-counter (OTC) market.
Cash Flow Hedges
Statoil has designated certain derivative instruments as cash flow hedges to hedge against changes in the amount of future cash flows related to the sale of refined petroleum products over a period not exceeding 12 months and cash flows related to interest payments over a period not exceeding 13 months. Hedge ineffectiveness related to Statoil's outstanding cash flow hedges was immaterial and recorded to earnings during the year ended December 31, 2003. The net change in Other comprehensive income associated with the current year hedging transactions was immaterial, and the net amount reclassified into earnings during the year was NOK 97 million. At December 31, 2003 the net deferred hedging loss in Accumulated other comprehensive income was NOK 24 million (after tax), an immaterial amount of which will affect earnings over the next 12 months. There were no cash flow hedges discontinued during the year because it was probable that the original forecasted transaction would not occur by the end of the originally specified time period.
Fair Value Hedges
Statoil has designated certain derivative instruments as fair value hedges to hedge against changes in the value of financial liabilities. There was no gain or loss component of a derivative instrument excluded from the assessment of hedge effectiveness related to fair value hedges during the year ended December 31, 2003. The net gain recognized in earnings in Net financial items during the year for ineffectiveness of fair value hedges was NOK 17 million.
Fair Value of Financial Instruments
Except for the recorded amount of fixed interest long-term debt, the recorded amounts of cash and cash equivalents, receivables, bank loans, other interest bearing short-term debt, and other liabilities approximate their fair values. Marketable equity and debt securities are also recorded at their fair values.
The following table contains the carrying amounts and estimated fair values of financial derivative instruments, and the carrying amounts and estimated fair value of long-term debts. Commodity contracts capable of being settled by delivery of commodities (oil and oil products, natural gas and electricity) are excluded from the summary:
| (in NOK million) | Fair market value of assets | Fair market value of liabilities | Net carrying amount |
| At December 31, 2003 | |||
| Debt-related instruments | 4,235 | (36) | 4,200 |
| Non-debt-related instruments | 367 | (15) | 351 |
| Long-term fixed interest debt | 0 | (29,188) | (26,281) |
| Crude oil and Refined products | 282 | (246) | 36 |
| Gas and Electricity | 272 | (222) | 50 |
| At December 31, 2002 | |||
| Debt-related instruments | 2,153 | (150) | 2,003 |
| Non-debt-related instruments | 143 | (5) | 138 |
| Long-term fixed interest debt | 0 | (28,475) | (25,465) |
| Crude oil and Refined products | 568 | (844) | (276) |
| Gas and Electricity | 265 | (212) | 53 |
Fair values are estimated using quoted market prices, estimates obtained from brokers, prices of comparable instruments, and other appropriate valuation techniques. The fair value estimates approximate the gain or loss that would have been realized if the contracts had been closed out at year-end, although actual results could vary due to assumptions utilized.
Credit risk management
Statoil manages credit risk concentration with respect to financial instruments by holding only investment grade securities distributed among a variety of selected issuers. A list of authorized investment limits by commercial issuer is maintained and reviewed regularly along with guidelines which include an assessment of the financial position of counter-parties as well as requirements for collateral.
Credit risk related to commodity-based instruments is managed by maintaining, reviewing and updating lists of authorized counter-parties by assessing their financial position, by frequently monitoring credit exposure for counter-parties, by establishing internal credit lines for counterparties, and by requiring collateral or guarantees when appropriate under contracts and required in internal policies. Collateral will typically be in the form of cash or bank guarantees from first class international banks.
Credit risk from interest rate swaps and currency swaps, which are over-the-counter (OTC) transactions, derive from the counter-parties to these transactions. Counter-parties are highly rated financial institutions. The credit ratings are reviewed minimum annually and counter-party exposure is monitored on a continuous basis to ensure exposure does not exceed credit lines and complies with internal policies. Non-debt-related foreign currency swaps usually have terms of less than one year, and the terms of debt related interest swaps and currency swaps are up to 25 years, in line with that of corresponding hedged or risk managed long-term loans.
The credit risk concentration with respect to receivables is limited due to the large number of counter-parties spread worldwide in numerous industries.
The credit risk from Statoil's over-the-counter derivative contracts derives from the counter-party to the transaction, typically a major bank or financial institution, a major oil company or a trading company. Statoil does not anticipate non-performance by any of these counter-parties, and no material loss would be expected from any such unexpected non-performance. Futures contracts and exchange-traded options have a negligible credit risk as they are principally traded on the New York Mercantile Exchange or the International Petroleum Exchange of London.
Consequently, Statoil does not consider itself exposed to a significant concentration of credit risk.
17. Employee Retirement Plans
Pension benefits
Statoil and many of its subsidiaries have defined benefit retirement plans, which cover substantially all of their employees. Plan benefits are generally based on years of service and final salary levels. Some subsidiaries have defined contribution or multiemployer plans.
Net periodic pension cost
Year ended December 31, | |||
| (in NOK million) | 2003 | 2002 | 2001 |
| Benefit earned during the year, net of participants' contributions | 849 | 738 | 690 |
| Interest cost on prior years benefit obligation | 791 | 719 | 626 |
| Expected return on plan assets | (843) | (856) | (793) |
| Amortization of loss | 54 | 34 | 10 |
| Amortization of prior service cost | 34 | 44 | 44 |
| Amortization of net transition assets | (15) | (16) | (16) |
| Defined benefit plans | 870 | 663 | 561 |
| Defined contribution plans | 27 | 19 | 21 |
| Multiemployer plans | 0 | 4 | 4 |
| Total net pension cost for the year | 897 | 686 | 586 |
Change in projected benefit obligation (PBO)
| (in NOK million) | 2003 | 2002 |
| Projected benefit obligation at January 1 | 13,025 | 12,000 |
| Benefits earned during the year | 849 | 738 |
| Interest cost on prior years' benefit obligation | 791 | 719 |
| Actuarial loss (gain) | 3,310 | (13) |
| Benefits paid | (332) | (401) |
| Acquisitions | (95) | 0 |
| Foreign currency translation | 94 | (18) |
| Projected benefit obligation at December 31 | 17,642 | 13,025 |
Change in pension plan assets
| (in NOK million) | 2003 | 2002 |
| Fair value of plan assets at January 1 | 12,480 | 13,068 |
| Actual return on plan assets | 1,684 | (770) |
| Company contributions | 1,129 | 412 |
| Benefits paid | (169) | (183) |
| Acquisitions | (61) | 0 |
| Foreign currency translation | 80 | (47) |
| Fair value of plan assets at December 31 | 15,143 | 12,480 |
Status of pension plans reconciled to Consolidated Balance Sheet
| (in NOK million) | 2003 | 2002 |
| Defined benefit plans | ||
| Funded status of the plans at December 31 | (2,499) | (545) |
| Unrecognized net loss | 4,248 | 1,868 |
| Unrecognized prior service cost | 329 | 363 |
| Unrecognized net transition asset | 0 | (15) |
| Total net prepaid pension recognized at December 31 | 2,078 | 1,671 |
Amounts recognized in the Consolidated Balance Sheet:
| (in NOK million) | 2003 | 2002 |
| Prepaid pension | 4,881 | 3,861 |
| Accrued pension liabilities | (3,372) | (2,190) |
| Intangible assets | 331 | 0 |
| Other comprehensive income | 238 | 0 |
| Net amount recognized at December 31 | 2,078 | 1,671 |
Weighted-average assumptions at the end of year
| 2003 | 2002 | |
| Discount rate | 5.50% | 6.00% |
| Expected return on plan assets | 6.00% | 6.50% |
| Rate of compensation increase | 3.50% | 3.00% |
The projected benefit obligation, accumulated benefit obligation, and fair value of plan assets for pension plans with accumulated benefit obligations in excess of plan assets
At December 31, | ||
| (in NOK million) | 2003 | 2002 |
| Projected benefit obligation | 4,580 | 3,102 |
| Accumulated benefit obligation | 3,189 | 2,235 |
| Fair value on plan assets | 251 | 425 |
The accumulated benefit obligation was NOK 13,800 million at December 31, 2003.
Pension assets allocated on respective investments classes
At December 31, | ||
2003 | 2002 | |
| Equity securities | 17% | 9% |
| Debt securities | 25% | 38% |
| Sertificates | 39% | 36% |
| Real estate | 10% | 11% |
| Other assets | 9% | 6% |
| Total | 100% | 100% |
In its asset management, the pension fund aims at achieving long-term returns which contribute towards meeting future pension liabilities. Assets are managed to achieve a return as high as possible within a framework of public regulation and prudent risk management policies. The pension fund's target returns require a need to invest in riskier assets than risk-free investments. Risk is reduced through maintaining a well diversified asset portfolio. Assets are diversified both in terms of location and different asset classes. Derivatives are used within set limits to facilitate effective asset management.
Statoil's pension funds invest in both financal assets and real estate. The expected rate of return on real estate is expected to be something between the rate of return on equity securities and debt securities. The table below presents the portfolio weight and expected rate of return of the finance portfolio, as approved by the board of the Statoil pension funds for 2004.
| Finance portfolio Statoils pension funds | Portfolio weight 1) | Expected rate of return 2) | |
| Equity securities | 25% | (+/- 5%) | X + 4% |
| Debt securities | 37.5% | (+/- 5%) | X |
| Sertificates | 37.5% | (+19%/-5%) | X - 0.4% |
| Total finance portfolio | 100% | - | |
1) The brackets express the scope of tactical deviation by Statoil Kapitalforvaltning ASA (the asset manager).
2) The asset manager expect the long-term return on equities to be 4% higher than riskfree rate (debt securities), as well as the rate of return on sertificates to be 0.4% lower than the return on debt securities.
X = Long-term rate of return on debt securities
The long-term expected return on pension assets is based on long-term risk-free rate adjusted for the expected long-term risk premium for the respective investment classes.
Pension benefits paid are mainly related to employees in Norway. This payment may either be paid in cash or be deducted from the pension premium fund. Statoil has a relatively large amount classified as pension premium fund. The decision wether to pay in cash or deduct from pension premium fund is made on an annual basis. If the benefit payable for 2004 is decided to be paid, the payments the next five years will be approximately NOK 1 billion yearly. The benefit payment in 2003 was NOK 0.8 billion. The main reason for the increase is changes in constraints related to benefit payments from Norwegian authorities. This change will only affect the benefits paid.
18. Decommissioning and Removal Liabilities
On January 1, 2003 Statoil implemented Statement of Financial Standards no. 143, Accounting for Asset Retirement Obligations (ARO). The obligation is related to future well closure-, decommissioning- and removal-costs. The accretion expense is classified as Operating expenses.
| (in NOK million) | 2003 |
| Asset retirement obligation at January 1 | 15,049 |
| Liabilities incurred | 655 |
| Accretion expense | 539 |
| Revision in estimates | 307 |
| Incurred removal cost | (56) |
| Asset retirement at December 31 | 16,494 |
| (in NOK million) | 2003 |
| Long-lived asset related to ARO at January 1 | 2,451 |
| Assets incurred / revision in estimates | 962 |
| Depreciation | (656) |
| Long-lived asset related to ARO at December 31 | 2,757 |
19. Research Expenditure
Research expenditures were NOK 1,004 million, NOK 736 million and NOK 633 million in 2003, 2002 and 2001, respectively.
20. Leases
Statoil leases certain assets, notably shipping vessels and drilling rigs.
In 2003, rental expense was NOK 4,893 million. In 2002 and 2001 rental expenses were NOK 5,595 million and NOK 7,687 million, respectively.
The information in the table below shows future minimum lease payments under non-cancellable leases at December 31, 2003. In addition, subleases of certain assets amounting to a rental income of NOK 544 million have been entered into for 2004.
Statoil has entered into a number of general or field specific long-term frame agreements mainly related to loading and transport of crude oil. Main contracts expire in 2007 or later, up until the end of respective field lives. Such contracts are not included in the below table of future lease payments unless they entail specific minimum payment obligations.
Amounts related to capital leases include future lease payments for assets in the books at year-end 2003.
| (in NOK million) | Operating leases | Capital leases |
| 2004 | 2,999 | 19 |
| 2005 | 2,072 | 18 |
| 2006 | 1,301 | 18 |
| 2007 | 434 | 18 |
| 2008 | 411 | 1 |
| Thereafter | 1,953 | 1 |
| Total future lease payments | 9,170 | 75 |
| Interest component | (14) | |
| Net present value | 61 | |
Property, plant and equipment include the following amounts for leases that have been capitalized at December 31, 2003 and 2002:
At December 31, | ||
| (in NOK million) | 2003 | 2002 |
| Vessel and equipment | 119 | 107 |
| Accumulated depreciation | (86) | (80) |
| Capitalized amounts | 33 | 27 |
21. Other Commitments and Contingencies
Contractual commitments| (in NOK million) | In 2004 | Thereafter | Total |
| Contractual commitments made | 13,061 | 7,828 | 20,889 |
These contractual commitments comprise acquisition and construction of fixed assets.
Guarantees
The Group has provided guarantees of NOK 1.1 billion for commercial transactions and contractual commitments at year-end 2003.
Contingent liabilities and insurance
Like any other licensee, Statoil has unlimited liability for possible compensation claims arising from its offshore operations, including transport systems. The Company has taken out insurance to cover this liability up to about NOK 5.6 billion for each incident, including liability for claims arising from pollution damage. Most of the Group's production installations are covered through Statoil Forsikring AS, which reinsures a major part of the risk in the international insurance market. About 33 per cent is retained.
Other commitments
As a condition for being awarded oil and gas exploration and production licenses, participants may be committed to drill a certain number of wells. At the end of 2003, Statoil was committed to participate in 6 wells off Norway and 9 wells abroad, with an average ownership interest of approximately 35 per cent. Statoil's share of expected costs to drill these wells amounts to approximately NOK 1.9 billion.
Statoil has entered into agreements for pipeline transportation for most of its prospective gas sale contracts. These agreements ensure the right to transport the production of gas through the pipelines, but also impose an obligation to cover Statoil's proportional share of the transportation costs based on booked volume capacity. In addition the Group has entered into certain obligations for entry capacity fees and terminal capacity commitments. The following table outlines nominal minimum obligations for future years. Corresponding expense for 2003 was NOK 2,712 million. Where the Group reflects both ownership interests and transport capacity cost for a pipeline in the consolidated accounts, the amounts in the table include the transport commitments that exceed Statoil's ownership share.
Transport capacity and similar obligations at December 31, 2003:
| (in NOK million) | |
| 2004 | 3,002 |
| 2005 | 3,406 |
| 2006 | 3,453 |
| 2007 | 3,021 |
| 2008 | 3,085 |
| Thereafter | 31,188 |
| Total | 47,155 |
During the normal course of its business Statoil is involved in legal proceedings and a number of unresolved claims are currently outstanding. The ultimate liability in respect of litigation and claims cannot be determined at this time. Statoil has provided in its accounts for these items based on the Company's best judgement. Statoil does not expect that either the financial position, results of operations nor cash flows will be materially adversely affected by the resolution of these legal proceedings.
On October 10, 2003 the Norwegian Supreme Court ruled in the case raised by Statoil and several other companies against the Norwegian State, represented by the Ministry of Finance, regarding the tax assessment of income from the joint venture Statpipe for the years 1993 and 1994. The Supreme Court instructed the Oil Taxation Board to reassess the basis for taxation. The ruling will also affect subsequent years. The effect of the reassessment can not be estimated with a reasonable degree of certainty. For accounting purposes, the disputed taxes have been expensed.
The Norwegian National Authority for Investigation and Prosecution of Economic and Environmental Crime (Økokrim) has issued a preliminary charge against the Company alleging violations of the Norwegian General Civil Penal Code provision concerning illegal influencing of foreign government officials and is conducting an investigation concerning a consulting agreement which Statoil entered into in 2002 with Horton Investments Ltd. The Company has also been notified by the U.S. Securities and Exchange Commission that the Commission is conducting an inquiry into the consultancy arrangement to determine if there have been any violations of U.S. federal securities laws.
22. Related Parties
Total purchases of oil and natural gas liquid from the Norwegian State amounted to NOK 68,479 million (336 million barrels oil equivalents), NOK 72,298 million (374 million barrels oil equivalents), and NOK 53,291 million (265 million barrels oil equivalents), in 2003, 2002 and 2001, respectively. Amounts payable to the Norwegian State for these purchases are included as Accounts payable - related parties in the Consolidated Balance Sheets. The prices paid by Statoil for the oil purchased from the Norwegian State are estimated market prices. In addition Statoil sells the Norwegian State's natural gas, in its own name, but for the account and risk of the Norwegian State.
The Norwegian State compensates Statoil for its relative share of the expenditures related to certain Statoil natural gas storage and terminal investments and related activities.
23. Shareholders' Equity
Upon Statoil's inception in September 1972, 50,000 ordinary shares at NOK 100 nominal value were issued. There have been several subsequent issuances of ordinary shares, the last increase before the public offering of shares being in June 1989 for 19,962,140 ordinary shares issued at NOK 100 nominal value.
On May 10, 2001, an extraordinary general meeting approved a common stock split by which the existing 49,397,140 ordinary shares with nominal value of NOK 100 per share was replaced by 1,975,885,600 ordinary shares with nominal value of NOK 2.50 per share. All references to the number of ordinary shares and per share common amounts have been restated to give retroactive effect to the stock split for all periods presented.
At an extraordinary general meeting held on May 25, 2001, it was resolved to increase the share capital by NOK 62,500,000 through the issuance of 25 million ordinary shares through a transfer of capital from "Additional paid-in capital" to share capital (a bonus issue). Pursuant to this resolution, the Norwegian State waived its rights to receive the new shares, which was issued to the Company as treasury shares. During 2002 and 2003 a number of 1,558,115 of the treasury shares were distributed as bonus shares in favor of retail investors in the initial public offering in 2001. Distribution of treasury shares requires approval by the general meeting.
At an extraordinary general meeting, held on June 17, 2001 it was further resolved to increase the share capital by NOK 471,750,000 from NOK 5,002,214,000 to NOK 5,473,964,000 through the issuance of 188,700,000 new ordinary shares of NOK 2.50 nominal value each. In June 2001, the Company completed a public offering of shares, which raised NOK 12,890 million, net of expenses, on the issuance of 188,700,000 shares of common stock.
There exists only one class of shares and all shares have voting rights.
Retained earnings available for distribution of dividends at December 31, 2003 is limited to the retained earnings of the parent company based on Norwegian accounting principles and legal regulations and amounts to NOK 49,511 million (before provisions for proposed dividend for the year ended December 31, 2003 of NOK 6,390 million). This differs from retained earnings in the financial statements of NOK 27,627 million mainly due to the impact of the transfer of the SDFI properties to Statoil, which is not reflected in the Norwegian GAAP accounts until the second quarter of 2001. Distribution of dividends is not allowed to reduce the shareholders' equity in the unconsolidated accounts of the parent company below 10 per cent of total assets.
24. Auditors' Remuneration
Year ended December 31, | ||
| (in NOK million) | 2003 | 2002 |
| Audit fees | 27.0 | 26.2 |
| Audit-related fees | 2.8 | 1.8 |
| Tax fees | 14.5 | 8.5 |
| All other fees | 0.9 | 0.0 |
| Total | 45.2 | 36.5 |
25. Subsequent Events
In January 2004, Statoil acquired in all 11.24 per cent of the Snøhvit Field, 10 per cent from Norsk Hydro and 1.24 per cent from Svenska Petroleum, respectively. Following these transactions, Statoil will have an ownership share of 33.53 per cent of the Snøhvit Field. The transactions will be made with economic effect from January 1, 2004 and are subject to approval by the Norwegian authorities.
After year-end 2003 Statoil as an owner in BTC Co Ltd has entered into guarantee commitments for financing the development of the BTC pipeline amounting to USD 140 million (NOK 0.9 billion).
ICA AB and Statoil have signed a non-binding letter of intent covering the acquisition by Statoil of ICA's holding in Statoil Detaljhandel Skandinavia AS (SDS). ICA and Statoil currently own 50 per cent each of SDS. Subject to approval by the boards of Statoil and ICA, the finalized deal is expected to be implemented during the spring of 2004.
Statoil has signed a letter of intent with the US-based energy company Dominion. This will secure Statoil access to additional capacity at the Cove Point liquefied natural gas (LNG) terminal in Maryland, USA, for a 20-year period. The transaction is subject to the successful negotiation of a final agreement and approval by the supervisory bodies of both companies.
Supplementary information on oil and gas producing activities (unaudited)
In accordance with Statement of Financial Accounting Standards No. 69, Disclosures about Oil and Gas Producing Activities and regulations of the US Securities and Exchange Commission (SEC), Statoil is making certain supplemental disclosures about oil and gas exploration and production operations. While this information was developed with reasonable care and disclosed in good faith, it is emphasized that some of the data is necessarily imprecise and represents only approximate amounts because of the subjective judgment involved in developing such information. Accordingly, this information may not necessarily represent the present financial condition of Statoil or its expected future results.
All the tables presented include the impact from the SDFI transaction. See note 1.
Oil and gas reserve quantities
Statoil's oil and gas reserves have been estimated by its experts in accordance with industry standards under the requirements of the SEC. Reserves are net of royalty oil paid in kind, and quantities consumed during production. Statements of reserves are forward-looking statements.
The determination of these reserves is part of an ongoing process subject to continual revision as additional information becomes available.
Proved oil and gas reserves are the estimated quantities of crude oil, natural gas, and natural gas liquids which geological and engineering data demonstrate with reasonable certainty to be recoverable in future years from known reservoirs under existing economic and operating conditions, i.e., prices and costs as of the date the estimate is made. Prices include consideration of changes in existing prices provided only by contractual arrangements, but not on escalations based upon future conditions.
(i) Reservoirs are considered proved if economic producibility is supported by either actual production or conclusive formation test. The area of a reservoir considered proved includes (A) that portion delineated by drilling and defined by gas-oil and/or oil-water contacts, if any; and (B) the immediately adjoining portions not yet drilled, but which can be reasonably judged as economically productive on the basis of available geological and engineering data. In the absence of information on fluid contacts, the lowest known structural occurrence of hydrocarbons controls the lower proved limit of the reservoir.
(ii) Reserves which can be produced economically through application of improved recovery techniques (such as fluid injection) are included in the "proved" classification when successful testing by a pilot project, or the operation of an installed program in the reservoir, provides support for the engineering analysis on which the project or program was based.
(iii) Estimates of proved reserves do not include the following: (A) oil that may become available from known reservoirs but is classified separately as "indicated additional reserves"; (B) crude oil, natural gas, and natural gas liquids, the recovery of which is subject to reasonable doubt because of uncertainty as to geology, reservoir characteristics, or economic factors; (C) crude oil, natural gas, and natural gas liquids, that may occur in undrilled prospects; and (D) crude oil, natural gas, and natural gas liquids, that may be recovered from oil shales, coal, gilsonite and other such sources.
Proved developed oil and gas reserves are proved reserves that can be expected to be recovered through existing wells with existing equipment and operating methods. Additional oil and gas expected to be obtained through the application of fluid injection or other improved recovery techniques for supplementing the natural forces and mechanisms of primary recovery should be included as "proved developed reserves" only after testing by a pilot project or after the operation of an installed program has confirmed through production response that increased recovery will be achieved.
On the Norwegian Continental Shelf Statoil sells its oil and gas together with the oil and gas of the Norwegian state (SDFI).
Under this arrangement, Statoil and SDFI will deliver gas to its customers in accordance with certain supply type sales contracts. The commitments will be met using a schedule that provides the highest possible total value for our oil and gas and the Norwegian State's oil and gas. Our gas reserves will be drawn on to supply this gas in the proportion that we own production from the fields that from time to time are chosen to deliver gas against these commitments.
In addition, Statoil has entered into a gas sales contract with Turkey, Georgia and Azerbaijan where gas will be supplied from Shah Deniz.
The total commitments to be met by the Statoil/SDFI arrangement and Statoil's separate commitments were on December 31, 2003 to deliver a total of 37.0 tcf ..
Statoil's and SDFI's delivery commitments for the contract years 2003, 2004, 2005 and 2006 are 1,691, 1,690, 1,973 and 1,960 bcf. These commitments may be met by production of proved reserves from fields were Statoil and/or the Norwegian State participates.
The principles for booking of proved gas reserves are limited to contracted gas sales and gas with access to a market. New contracted sales from the Norwegian continental shelf are recorded as Extensions and discoveries, while shifts of forecasted deliveries between fields are recorded as Revisions and improved recovery.
In 2002, Statoil entered into a buy-back contract in Iran. Statoil also participates in a number of production sharing agreements (PSA). Reserves from such agreements are based on the volumes to which Statoil has access (cost oil and profit oil), limited to available market access. Proved reserves at end of year associated with PSA and buy-back agreements are disclosed separately.
The totals in the following tables may not equal the sum of the amounts shown due to rounding.
Net proved oil and NGL reserves in million barrels | Net proved gas reserves in billion standard cubic feet | Net proved oil, NGL and gas reserves in million barrels oil equivalents | |||||||
Norway | Outside Norway | Total | Norway | Outside Norway | Total | Norway | Outside Norway | Total | |
| Proved reserves at December 31, 2000 | 1,506 | 488 | 1,994 | 12,802 | 234 | 13,036 | 3,787 | 530 | 4,317 |
| Of which: | |||||||||
| Proved developed reserves | 940 | 187 | 1,127 | 8.630 | 65 | 8,695 | 2,478 | 198 | 2,677 |
| Proved reserves under PSA and buy-back agreements | 0 | 204 | 204 | 0 | 0 | 0 | 0 | 204 | 204 |
| Production from PSA and buy-back agreements | 0 | 3 | 3 | 0 | 0 | 0 | 0 | 3 | 3 |
| Revisions and improved recovery | 68 | 30 | 98 | 252 | (7) | 245 | 113 | 29 | 142 |
| Extensions and discoveries | 124 | 69 | 193 | 188 | 225 | 413 | 158 | 109 | 267 |
| Purchase of reserves-in-place | 0 | 0 | 0 | 0 | 0 | 0 | 0 | 0 | 0 |
| Sales of reserves-in-place | (54) | (1) | (55) | (1) | (170) | (171) | (54) | (31) | (85) |
| Production | (246) | (22) | (268) | (523) | (15) | (538) | (339) | (25) | (364) |
| Proved reserves at December 31, 2001 | 1,398 | 565 | 1,963 | 12,718 | 267 | 12,985 | 3,664 | 612 | 4,277 |
| Of which: | |||||||||
| Proved developed reserves | 948 | 166 | 1,113 | 9,069 | 42 | 9,112 | 2,564 | 173 | 2,737 |
| Proved reserves under PSA and buy-back agreements | 0 | 302 | 302 | 0 | 0 | 0 | 0 | 302 | 302 |
| Production from PSA and buy-back agreements | 0 | 3 | 3 | 0 | 0 | 0 | 0 | 3 | 3 |
| Revisions and improved recovery | 108 | (25) | 83 | 237 | 0 | 237 | 151 | (25) | 125 |
| Extensions and discoveries | 31 | 73 | 104 | 942 | 0 | 942 | 199 | 73 | 272 |
| Purchase of reserves-in-place | 4 | 0 | 4 | 35 | 0 | 35 | 10 | 0 | 10 |
| Sales of reserves-in-place | (13) | (2) | (16) | (73) | 0 | (73) | (26) | (2) | (29) |
| Production | (242) | (29) | (271) | (645) | (12) | (657) | (357) | (31) | (388) |
| Proved reserves at December 31, 2002 | 1,286 | 580 | 1,867 | 13,215 | 255 | 13,470 | 3,641 | 626 | 4,267 |
| Of which: | |||||||||
| Proved developed reserves | 919 | 137 | 1,056 | 9,321 | 30 | 9,351 | 2,580 | 143 | 2,722 |
| Proved reserves under PSA and buy-back agreements | 0 | 349 | 349 | 0 | 0 | 0 | 0 | 349 | 349 |
| Production from PSA and buy-back agreements | 0 | 12 | 12 | 0 | 0 | 0 | 0 | 12 | 12 |
| Revisions and improved recovery | 110 | 41 | 151 | 311 | 1 | 312 | 165 | 41 | 206 |
| Extensions and discoveries | 27 | 15 | 43 | 503 | 303 | 806 | 117 | 69 | 186 |
| Purchase of reserves-in-place | 0 | 0 | 0 | 0 | 0 | 0 | 0 | 0 | 0 |
| Sales of reserves-in-place | 0 | 0 | 0 | 0 | 0 | 0 | 0 | 0 | 0 |
| Production | (239) | (31) | (271) | (695) | (6) | (700) | (363) | (33) | (395) |
| Proved reserves at December 31, 2003 | 1,184 | 605 | 1,789 | 13,334 | 552 | 13,886 | 3,560 | 703 | 4,264 |
| Of which: | |||||||||
| Proved developed reserves | 876 | 163 | 1,039 | 9,582 | 25 | 9,606 | 2,584 | 167 | 2,751 |
| Proved reserves under PSA and buy-back agreements | 0 | 364 | 364 | 0 | 303 | 303 | 0 | 418 | 418 |
| Production from PSA and buy-back agreements | 0 | 13 | 13 | 0 | 0 | 0 | 0 | 13 | 13 |
The conversion rates used are 1 standard cubic meter = 35.3 standard cubic feet, 1 standard cubic meter oil equivalent = 6.29 barrels of oil equivalent and 1,000 standard cubic meter gas = 1 standard cubic meter oil equivalent.
Statoil has historically marketed and sold the Norwegian State's oil and gas as a part of its own production. The Norwegian State has elected to continue this arrangement. Accordingly, at an extraordinary general meeting held on February 27, 2001, the Norwegian State, as sole shareholder, revised Statoil's articles of association by adding a new article which requires Statoil to continue to market and sell the Norwegian State's oil and gas together with Statoil's own oil and gas in accordance with an instruction established in shareholder resolutions in effect from time to time. At an extraordinary general meeting held on May 25, 2001, the Norwegian State, as sole shareholder, approved a resolution containing the instructions referred to in the new article. This resolution is referred to as the owner's instruction. For natural gas acquired by Statoil for its own use, its payment to the Norwegian State will be based on market value. For all other sales of natural gas to Statoil or to third parties the payment to the Norwegian State will be based on either achieved prices, a net back formula or market value. All of the Norwegian State's oil and NGL will be acquired by Statoil. Pricing of the crude oil will be based on market reflective prices; NGL prices will be either based on achieved prices, market value or market reflective prices.
The Norwegian State may at any time cancel the owner's instruction. Due to this uncertainty and the Norwegian State's estimate of proved reserves not being available to Statoil, it is not possible to determine the total quantities to be purchased by Statoil under the owner's instruction from properties in which it participates in the operations.
Capitalized expenditures related to Oil and Gas producing activities
| At December 31, | ||
| (in NOK million) | 2003 | 2002 |
| Unproved Properties | 3,792 | 3,490 |
| Proved Properties, wells, plants and other equipment, including removal obligation assets | 244,621 | 230,510 |
| Total Capitalized Expenditures | 248,414 | 233,998 |
| Accumulated depreciation, depletion, amortization and valuation allowances | (147,441) | (139,337) |
| Net Capitalized Expenditures | 100,973 | 94,661 |
Costs incurred in Oil and Gas Property Acquisition, Exploration and Development Activities
These costs include both amounts capitalized and expensed. Certain reclassifications have been done from other operating expenses to exploration expenses in 2002.
| (in NOK million) | Norway | Outside Norway | Total |
| Year ended December 31, 2003 | |||
| Exploration costs, including signature-bonuses | 1,220 | 1,538 | 2,758 |
| Development costs 1) | 13,284 | 6,071 | 19,355 |
| Acquired unproved properties | 0 | 54 | 54 |
| Total | 14,504 | 7,663 | 22,167 |
| Year ended December 31, 2002 | |||
| Exploration costs, including signature-bonuses | 1,350 | 1,398 | 2,748 |
| Development costs | 10,269 | 4,088 | 14,357 |
| Total | 11,619 | 5,486 | 17,105 |
| Year ended December 31, 2001 | |||
| Exploration costs, including signature-bonuses | 2,020 | 683 | 2,703 |
| Development costs | 9,707 | 4,452 | 14,159 |
| Total | 11,727 | 5,135 | 16,862 |
1) Development costs include investments in Norway in facilities for liquefaction of natural gas and storage of LNG amounting to NOK 614 million.
Results of Operation for Oil and Gas Producing Activities
As required by Statement of Financial Accounting Standards No. 69, the revenues and expenses included in the following table reflect only those relating to the oil and gas producing operations of Statoil.
A new method for calculating the inter-segment price for deliveries of natural gas from E&P Norway to Natural Gas has been adopted as of the first quarter of 2003. The new price amounts to NOK 0.32 per standard cubic meter, adjusted quarterly by the average USD oil price over the last six months in proportion to USD 15. The new price applies to all volumes, including associated gas, while previously the price was calculated on a field-by-field basis. Prior periods segment reporting has been adjusted to reflect the new pricing formula.
The calculation of production cost has been changed as of the third quarter of 2003. Statoil decided to change the classification of administration cost and revenue and costs from the sale of processing capacity between fields. The reason for this change is that Statoil wants to better reflect the real costs of the underlying activity related to production.
Activities included in Statoil's segment disclosures in note 3 to the financial statements but excluded from the table below relates to gas trading activities, transportation and business development as well as effects of disposals of oil and gas interests. Income tax expense is calculated on the basis of statutory tax rates in addition to uplift and tax credits only. No deductions are made for interest or overhead. Transfers are recorded approximating market prices.
| (in NOK million) | Norway | Outside Norway | Total |
| Year ended December 31, 2003 | |||
| Sales | 352 | 1,944 | 2,296 |
| Transfers | 60,143 | 4,455 | 64,598 |
| Total revenues | 60,495 | 6,399 | 66,894 |
| Exploration expenses | (1,365) | (1,005) | (2,370) |
| Production costs | (7,998) | (894) | (8,892) |
| Accretion expense | (479) | (48) | (527) |
| Special items 1) | 0 | (151) | (151) |
| DD&A 3) | (12,104) | (1,625) | (13,729) |
| Total costs | (21,946) | (3,723) | (25,669) |
| Results of operations before taxes | 38,549 | 2,676 | 41,225 |
| Tax expense | (29,093) | (948) | (30,040) |
| Results of producing operations | 9,456 | 1,729 | 11,184 |
| Year ended December 31, 2002 | |||
| Sales | 351 | 4,672 | 5,024 |
| Transfers | 57,075 | 1,018 | 58,093 |
| Total revenues | 57,426 | 5,690 | 63,117 |
| Exploration expenses | (1,420) | (990) | (2,410) |
| Production costs | (8,217) | (979) | (9,196) |
| Special items 2) | 0 | (766) | (766) |
| DD&A 3) | (12,402) | (1,738) | (14,140) |
| Total costs | (22,039) | (4,473) | (26,512) |
| Results of operations before taxes | 35,387 | 1,218 | 36,605 |
| Tax expense | (26,484) | (723) | (27,207) |
| Results of producing operations | 8,903 | 495 | 9,398 |
| Year ended December 31, 2001 | |||
| Sales | 339 | 2,883 | 3,222 |
| Transfers | 63,503 | 1,766 | 65,269 |
| Total revenues | 63,842 | 4,649 | 68,491 |
| Exploration expenses | (2,008) | (866) | (2,874) |
| Production costs | (8,233) | (1,024) | (9,257) |
| Special items 2) | 0 | (2,000) | (2,000) |
| DD&A 3) | (12,636) | (1,477) | (14,113) |
| Total costs | (22,877) | (5,367) | (28,244) |
| Results of operations before taxes | 40,964 | (718) | 40,246 |
| Tax expense | (31,386) | 215 | (31,171) |
| Results of producing operations | 9,579 | (503) | 9,075 |
1) Impairment of the Dunlin field in the UK.
2) Impairment of the oil field LL652 in Venezuela.
3) Include provisions made for future decommissioning and removal costs in years 2001 and 2002. For 2003, the amount includes the amortization of removal assets recorded due to implementation of FAS 143 on January 1, 2003.
Standardized measure of discounted future net cash flows relating to proved oil and gas reserves
The table below shows the standardized measure of future net cash flows relating to proved reserves presented. The analysis is computed in accordance with FASB Statement No. 69, by applying year-end market prices, costs, and statutory tax rates, and a discount factor of 10 per cent to year-end quantities of net proved reserves. The standardized measure is a forward-looking statement.
Future price changes are limited to those provided by contractual arrangements in existence at the end of each reporting year. Future development and production costs are those estimated future expenditures necessary to develop and produce year-end estimated proved reserves based on year-end cost indices, assuming continuation of year-end economic conditions. Future net cash flow pre-tax is net of decommissioning and removal costs. Estimated future income taxes are calculated by applying appropriate year-end statutory tax rates. These rates reflect allowable deductions and tax credits and are applied to estimated future pretax net cash flows, less the tax basis of related assets. Discounted future net cash flows are calculated using 10 per cent mid-period discount factors. Discounting requires a year-by-year estimate of when future expenditures will be incurred and when reserves will be produced. The information provided does not represent management's estimate of Statoil's expected future cash flows or value of proved oil and gas reserves. Estimates of proved reserve quantities are imprecise and change over time as new information becomes available. Moreover, identified reserves and contingent resources, that may become proved in the future, are excluded from the calculations. The standardized measure of valuation prescribed under FASB Statement No. 69 requires assumptions as to the timing and amount of future development and production costs and income from the production of proved reserves. This does not reflect management's judgment and should not be relied upon as an indication of Statoil's future cash flow or value of its proved reserves.
| (in NOK million) | Norway | Outside Norway | Total |
| At December 31, 2003 | |||
| Future net cash inflows | 644,003 | 132,884 | 776,887 |
| Future development costs | (39,207) | (17,029) | (56,236) |
| Future production costs | (179,686) | (26,509) | (206,195) |
| Future net cash flow pre-tax | 425,110 | 89,346 | 514,456 |
| Future income tax expenses | (320,763) | (19,998) | (340,761) |
| Future net cash flows | 104,347 | 69,348 | 173,695 |
| 10% annual discount for estimated timing of cash flows | (47,303) | (37,810) | (85,113) |
| Standardized measure of discounted future net cash flows | 57,044 | 31,538 | 88,582 |
| At December 31, 2002 | |||
| Future net cash inflows | 644,327 | 127,460 | 771,787 |
| Future development costs | (44,983) | (17,396) | (62,379) |
| Future production costs | (192,779) | (22,146) | (214,925) |
| Future net cash flow pre-tax | 406,565 | 87,918 | 494,483 |
| Future income tax expenses | (302,254) | (17,468) | (319,722) |
| Future net cash flows | 104,311 | 70,450 | 174,761 |
| 10% annual discount for estimated timing of cash flows | (44,336) | (38,725) | (83,061) |
| Standardized measure of discounted future net cash flows | 59,975 | 31,725 | 91,700 |
| At December 31, 2001 | |||
| Future net cash inflows | 660,247 | 107,074 | 767,321 |
| Future development costs | (40,379) | (16,563) | (56,942) |
| Future production costs | (185,281) | (23,008) | (208,289) |
| Future net cash flow pre-tax | 434,587 | 67,503 | 502,090 |
| Future income tax expenses | (327,141) | (17,497) | (344,638) |
| Future net cash flows | 107,446 | 50,006 | 157,452 |
| 10% annual discount for estimated timing of cash flows | (49,566) | (28,669) | (78,235) |
| Standardized measure of discounted future net cash flows | 57,880 | 21,337 | 79,217 |
Of a total of NOK 56,236 million of estimated future development costs as of December 31, 2003, an amount of NOK 38,387 million is expected to be spent within the next three years, as allocated in the table below.
Future development costs
| (in NOK million) | 2004 | 2005 | 2006 | Total |
| Norway | 12,484 | 8,470 | 4,751 | 25,705 |
| Outside Norway | 6,608 | 3,985 | 2,089 | 12,682 |
| Total | 19,092 | 12,455 | 6,840 | 38,387 |
| Future development cost expected to be spent on proved undeveloped reserves | 16,208 | 10,422 | 5,431 | 32,061 |
In 2003, Statoil incurred NOK 19,355 million in development costs, of which NOK 14,355 million related to proved undeveloped reserves. The comparable amounts for 2002 were NOK 14,357 million and NOK 9,964 million, and for 2001 NOK 14,159 million and NOK 8,386 million, respectively.
Changes in the standardized measure of discounted future net cash flows from proved reserves:
| (in NOK million) | 2003 | 2002 | 2001 |
| Standardized measure at January 1 | 91,700 | 79,217 | 98,850 |
| Net change in sales and transfer prices and in production (lifting) costs related to future production | 28,007 | (297) | (70,193) |
| Changes in estimated future development costs | (6,971) | (6,115) | (10,560) |
| Sales and transfers of oil and gas produced during the period, net of production costs | (62,099) | (56,994) | (62,283) |
| Net change due to extensions, discoveries, and improved recovery | 7,907 | 9,790 | 2,064 |
| Net change due to purchases and sales of minerals in place | (19) | (1,802) | (1,652) |
| Net change due to revisions in quantity estimates | 24,675 | 9,791 | 11,604 |
| Previously estimated development costs incurred during the year | 19,355 | 14,357 | 14,159 |
| Accretion of discount | (3,877) | 33,342 | 57,721 |
| Net change in income taxes | (10,095) | 10,411 | 39,508 |
| Total change in the standardized measure during the year | (3,117) | 12,483 | (19,632) |
| Standardized measure at December 31 | 88,582 | 91,700 | 79,217 |
Operational statistics
Productive oil and gas wells and developed and undeveloped acreage
The following tables show the number of gross and net productive oil and gas wells and total gross and net developed and undeveloped oil and gas acreage in which Statoil had interests at December 31, 2003.
A "gross" value reflects to wells or acreage in which Statoil has interests (calculated as 100 per cent). The net value corresponds to the sum of whole or fractional working interest in gross wells or acreage.
| At December 31, 2003 | Norway | Outside Norway | Total | |
| Number of productive oil and gas wells | ||||
| Oil wells | — gross | 695 | 628 | 1,323 |
| — net | 180 | 119 | 299 | |
| Gas wells | — gross | 71 | 13 | 84 |
| — net | 26 | 4 | 30 | |
| At December 31, 2003 (in thousands of acres) | Norway | Outside Norway | Total | |
| Developed and undeveloped oil and gas acreage | ||||
| Acreage developed | — gross | 497 | 339 | 836 |
| — net | 111 | 71 | 182 | |
| Acreage undeveloped | — gross | 9,462 | 10,060 | 19,522 |
| — net | 3,323 | 2,695 | 6,018 | |
Remaining terms of leases and concessions are between one and 32 years.
Exploratory and development drilling activities
The following table shows the number of exploratory and development oil and gas wells in the process of being drilled by Statoil at December 31, 2003.
| (number of wells) | Norway | Outside Norway | Total |
| Number of wells in progress | |||
| — gross | 22 | 17 | 39 |
| — net | 6.7 | 2.0 | 8.7 |
Net productive and dry oil and gas wells
The following tables show the net productive and dry exploratory and development oil and gas wells completed or abandoned by Statoil in the past three years. Productive wells include wells in which hydrocarbons were found, and the drilling or completion of which, in the case of exploratory wells, has been suspended pending further drilling or evaluation. A dry well is one found to be incapable of producing in sufficient quantities to justify completion.
Norway | Outside Norway | Total | |
| Year 2003 | |||
| Net productive and dry exploratory wells drilled | 4.3 | 2.5 | 6.8 |
| Net dry exploratory wells drilled | 1.7 | 1.0 | 2.7 |
| Net productive exploratory wells drilled | 2.6 | 1.5 | 4.1 |
| Net productive and dry development wells drilled | 25.3 | 18.1 | 43.4 |
| Net dry development wells drilled | 2.4 | 0.0 | 2.4 |
| Net productive development wells drilled | 22.9 | 18.1 | 41.0 |
| Year 2002 | |||
| Net productive and dry exploratory wells drilled | 9.6 | 1.5 | 11.0 |
| Net dry exploratory wells drilled | 2.5 | 0.1 | 2.6 |
| Net productive exploratory wells drilled | 7.1 | 1.3 | 8.4 |
| Net productive and dry development wells drilled | 27.3 | 13.5 | 40.8 |
| Net dry development wells drilled | 0.0 | 0.3 | 0.3 |
| Net productive development wells drilled | 27.3 | 13.2 | 40.5 |
| Year 2001 | |||
| Net productive and dry exploratory wells drilled | 9.7 | 2.2 | 11.9 |
| Net dry exploratory wells drilled | 3.2 | 1.2 | 4.4 |
| Net productive exploratory wells drilled | 6.5 | 1.0 | 7.6 |
| Net productive and dry development wells drilled | 32.8 | 27.4 | 60.2 |
| Net dry development wells drilled | 0.7 | 0.3 | 1.0 |
| Net productive development wells drilled | 32.1 | 27.1 | 59.2 |
Average sales price and production cost per unit
Norway | Outside Norway | |
| Year ended December 31, 2003 | ||
| Average sales price crude in USD per bbl | 29.1 | 27.6 |
| Average sales price natural gas in NOK per Sm3 | 1.02 | 0.83 |
| Average production costs, in NOK per boe | 22.3 | 27.8 |
| Year ended December 31, 2002 | ||
| Average sales price crude in USD per bbl | 24.7 | 23.7 |
| Average sales price natural gas in NOK per Sm3 | 0.95 | 0.65 |
| Average production costs, in NOK per boe | 22.9 | 30.7 |
| Year ended December 31, 2001 | ||
| Average sales price crude in USD per bbl | 24.1 | 22.3 |
| Average sales price natural gas in NOK per Sm3 | 1.22 | 0.97 |
| Average production costs, in NOK per boe | 23.9 | 43.0 |