catalyst paper corporation
MANAGEMENT’S DISCUSSION AND ANALYSIS
Management’s Discussion and Analysis
The following management’s discussion and analysis (MD&A) of Catalyst Paper Corporation (the company, we, us, and our) should be read in conjunction with our consolidated financial statements for the years ended December 31, 2012, 2011 and 2010, and the notes thereto, which have been prepared in accordance with generally accepted accounting principles (GAAP) in the United States (U.S.). Additional information about the company, including our most recent Annual Information Form is available on our website atwww.catalystpaper.com, or the Canadian Securities Administrators’ electronic filing website atwww.sedar.com.
Throughout this discussion, references are made to certain measures that are not measures of performance under U.S. GAAP, including operating earnings, adjusted EBITDA, adjusted EBITDA before restructuring costs, average delivered cash costs per tonne before specific items, net earnings (loss) attributable to the company before specific items, net earnings (loss) per share attributable to the company’s common shareholders before specific items, and free cash flow. We believe that these non-GAAP measures are useful in evaluating our performance. These non-GAAP measures are defined and reconciled to their nearest GAAP measure in section 13,Non-GAAP measures.
In this MD&A, unless otherwise indicated, all dollar amounts are expressed in Canadian dollars. The term “dollars” and the symbols “$” and “CDN$” refer to Canadian dollars and the term “U.S. dollars” and the symbol “US$” refer to United States dollars.
In this MD&A, the term “tonne” and the symbol “MT” refer to a metric tonne and the term “ton” or the symbol “ST” refer to a short ton, a measure of weight equal to 0.9072 metric tonne. Use of these symbols is in accordance with industry practice.
The information in this report is as at March 5, 2013, which is the date of filing in conjunction with our press release announcing our results for the fourth quarter of 2012 and 12 months ended December 31, 2012. Disclosure contained in this document is current to March 5, 2013, unless otherwise stated.
CAUTIONARY STATEMENT REGARDING FORWARD-LOOKING STATEMENTS
Certain statements and information in this MD&A are not based on historical facts and constitute forward-looking statements or forward-looking information within the meaning of Canadian securities laws and the U.S. Private Securities Litigation Reform Act of 1995 (forward-looking statements), including but not limited to, statements about our strategy, plans, future operating performance, contingent liabilities and outlook.
Forward-looking statements:
| · | Are statements that address or discuss activities, events or developments that we expect or anticipate may occur in the future; |
| · | Can be identified by the use of words such as “believe”, “expect”, “anticipate”, “intend”, “plan”, “likely”, “predicts”, “estimates”, “forecasts”, and similar words or phrases or the negative of such words or phrases; |
| · | Reflect our current beliefs, intentions or expectations based on certain assumptions and estimates, including those identified below, which could prove to be significantly incorrect: |
| – | Our ability to develop, manufacture and sell new products and services that meet the needs of our customers and gain commercial acceptance; |
| – | Our ability to continue to sell our products and services in the expected quantities at the expected prices and expected times; |
| – | Our ability to successfully obtain cost savings from our cost reduction initiatives; |
| – | Our ability to implement business strategies and pursue opportunities; |
| – | Expected cost of goods sold; |
| – | Expected component supply costs and constraints; |
| – | Expected foreign exchange and tax rates. |
| · | While considered reasonable by management, are inherently subject to known and unknown risks and uncertainties and other factors that could cause actual results or events to differ from historical or anticipated results or events. These risk factors and others are discussed in this MD&A. Certain of these risks are: |
| – | The impact of general economic conditions in the countries in which we do business; |
| – | Conditions in the capital markets and our ability to obtain financing and refinance existing debt; |
| – | Market conditions and demand for our products (including declines in advertising and circulation); |
| – | The implementation of trade restrictions in jurisdictions where our products are marketed; |
| – | Fluctuations in foreign exchange or interest rates; |
| – | Raw material prices (including wood fibre, chemicals and energy); |
| – | The effect of, or change in, environmental and other governmental regulations; |
| – | Uncertainty relating to labour relations; |
| – | The availability of qualified personnel; |
| – | The availability of wood fibre; |
| – | The effects of competition from domestic and foreign producers; |
| – | The risk of natural disaster and other factors, many of which are beyond our control. |
As a result, no assurance can be given that any of the events or results anticipated by such forward-looking statements will occur or, if they do occur, what benefit they will have on our operations or financial condition. Readers are cautioned not to place undue reliance on these forward-looking statements. We disclaim any intention or obligation to update or revise any forward-looking statements, whether as a result of new information, future events or otherwise, except as required by law.
| MANAGEMENT’S DISCUSSION AND ANALYSIS | |
| 1 | Company profile | 5 |
| 2 | Annual overview - 2012 | 7 |
| 3 | Strategy | 17 |
| 4 | Consolidated results - annual | 26 |
| 5 | Segmented results - annual | 28 |
| 6 | Consolidated and segmented results - quarterly | 37 |
| 7 | Financial condition | 44 |
| 8 | Liquidity and capital resources | 45 |
| 9 | Related party transactions | 50 |
| 10 | Contingent liabilities | 51 |
| 11 | Off-balance sheet arrangements | 52 |
| 12 | Summary of quarterly results | 52 |
| 13 | Non-GAAP measures | 54 |
| 14 | Critical accounting policies and estimates | 59 |
| 15 | Changes in accounting policies | 64 |
| 16 | Impact of accounting pronouncements affecting future periods | 65 |
| 17 | Risks and uncertainties | 65 |
| 18 | Governance and management systems | 77 |
| 19 | Sensitivity analysis | 78 |
| 20 | Outlook | 79 |
| 21 | Disclosure controls and internal control over financial reporting | 82 |
| 4 | CATALYST PAPER 2012 ANNUAL REPORT |
We are the largest producer of mechanical printing papers in western North America. We also produce Northern Bleached Softwood Kraft (NBSK) pulp which is marketed primarily in Asia. Our business is comprised of three business segments: specialty printing papers, newsprint, and pulp. Specialty printing papers include coated mechanical, uncoated mechanical and directory paper. We are the only producer of coated mechanical paper and soft-calender (SC) paper in western North America. We operate three paper mills in British Columbia (B.C.) in Crofton, Port Alberni and Powell River. Our Crofton mill includes a two-line kraft pulp operation.
Our Snowflake recycle mill, located in northeastern Arizona, which produced 100% recycled-content paper, ceased production and was permanently closed on September 30, 2012. The Snowflake mill was sold to a third party on January 30, 2013.
Our products are sold by our sales and marketing personnel in North America and through distributors and agents in other geographic markets. These products are shipped by a combination of rail, truck, and barge for customers located in North America and by break-bulk and deep-sea container vessels for customers located overseas.
Specialty printing papers
Our largest business segment is specialty printing papers, which generated 64% of 2012 consolidated sales revenue; our papers are sold to a diversified customer base consisting of retailers, magazine and catalogue publishers, commercial printers and telephone directory publishers. In 2012, 86% of specialty printing papers sales volume was sold to customers in North America.
Newsprint
Newsprint sales generated 17% of 2012 consolidated sales revenue. The newsprint customer base consists primarily of newspaper publishers located in western and central North America, Asia and Latin America. In 2012, 43% of newsprint sales volume was sold to customers in North America.
Pulp
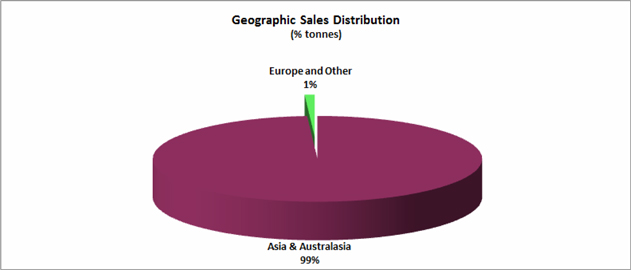
Pulp sales generated 19% of 2012 consolidated sales revenue. The pulp customer base is located primarily in Asia and includes producers of tissue, magazine papers, wood-free printing and writing papers, and certain specialty printing paper products. In 2012, 99% of pulp sales volume was sold to customers in Asia. The Crofton pulp mill is located on tidewater and has a deep-sea vessel loading facility, which enables direct-from-mill shipments to international buyers.
| CATALYST PAPER 2012 ANNUAL REPORT | 5 |
| 2013 PRODUCT APPLICATIONS |
| Segment | | Specialty printing papers | | Newsprint | | Market pulp |
| | | Uncoated mechanical | | Coated | | | | | | |
| Category | | Soft-calendered | | Machine-finished | | mechanical | | Directory | | Newsprint | | NBSK pulp |
| Brand names | | Electracal Electraprime | | Electrabrite Electrabrite Lite Electrastar Electra Max Electrabrite Book | | Electracote Electracote Brite Pacificote | | Catalyst | | Marathon Marathon Lite | | Crofton Kraft |
| Basis weight (g/m2) | | 45 – 52 | | 45 – 74 | | 47.3-74 | | 29 – 40 | | 40 – 48.8 | | n/a |
| Applications | | retail inserts, magazines, catalogues, flyers, direct mail, directories | | retail inserts, magazines, supplements, flyers, direct mail, books, corporate communication books/manuals | | retail inserts, magazines, catalogues, direct mail | | telephone books, catalogues | | newspapers, retail inserts, flyers, supplements, directories | | tissue, printing and writing papers, specialty paper products, containerboard |
| Total capacity (tonnes) | | 469,0001 | | 224,000 | | 173,0001 | | 270,0001 | | 350,0002 |
| % of total capacity | | 32% | | 15% | | 12% | | 18% | | 23% |
| 2013 CAPACITY BY MILL LOCATION AND PRODUCT LINE1 |
| | | Specialty printing papers 1 | | | Newsprint 1 | | | Market
pulp | | | Total | |
| Mill location | | Number of
paper machines | | | Uncoated
mechanical | | | Coated
mechanical | | | Directory | | | Newsprint | | | NBSK
pulp | | | | |
| Crofton, B.C. 3 | | | 2 | | | | – | | | | – | | | | 57,000 | | | | 270,000 | | | | 350,000 | 2 | | | 677,000 | |
| Port Alberni, B.C. | | | 2 | | | | – | | | | 224,000 | | | | 116,000 | | | | – | | | | – | | | | 340,000 | |
| Powell River, B.C. | | | 3 | | | | 469,000 | | | | – | | | | – | | | | – | | | | – | | | | 469,000 | |
| Total capacity (tonnes)4 | | | 7 | | | | 469,000 | | | | 224,000 | | | | 173,000 | | | | 270,000 | | | | 350,000 | | | | 1,486,000 | |
| % of total capacity | | | | | | | 32 | % | | | 15 | % | | | 12 | % | | | 18 | % | | | 23 | % | | | 100 | % |
| 1 | Capacities expressed in the above tables can vary as we are able to switch production between products, particularly newsprint, directory and machine-finished uncoated grades. |
| 2 | Total pulp capacity at Crofton is 393,000 tonnes, of which 350,000 tonnes are designated as market pulp with the remainder 43,000 tonnes being consumed internally. |
| 3 | No. 1 paper machine at Crofton remains indefinitely curtailed. |
| 4 | The Snowflake mill’s production capacity has been removed from total capacity due to the mill’s permanent closure on September 30, 2012. |
| 6 | CATALYST PAPER 2012 ANNUAL REPORT |
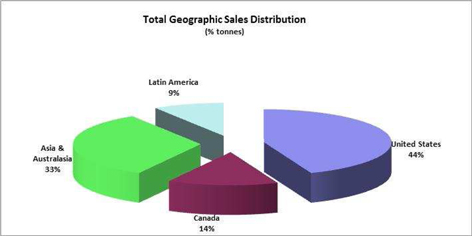
Geographic sales distribution
Our products are sold globally. North America continues to be our principal market, comprising 58% of consolidated sales volume for 2012.
Business overview
On September 13, 2012, we completed our restructuring under theCompanies’ Creditors Arrangement Act (CCAA) and emerged from creditor protection with significantly reduced debt and a more competitive cost structure. We successfully completed various cost reduction and cash savings initiatives in 2012, including new competitive five-year labour agreements expected to deliver annual savings of $18 to $20 million, reductions in municipal taxes of $6.1 million, pension funding relief expected to result in annual cash savings of approximately $7 million, and the closure of the Snowflake mill, allowing us to move forward in 2013 on stronger financial footing.
The table below identifies the major cost saving improvements achieved during 2012.
| | | Pre-Restructuring | | | Post
Restructuring | | | Improvement | |
| Catalyst Notes (Principal amount) | | US$ | 640.4 | | | US$ | 250.0 | | | US$ | (390.4 | ) |
| Annual Catalyst Cash Interest Expense | | US$ | 61.4 | | | Cash: US$ | 27.5 | | | US$ | (33.9 | ) |
| | | | | | | PIK: US$ | 18.8 | | | US$ | (42.6 | ) |
| Annual Property Tax Expense | | C$ | 18.3 | | | C$ | 12.2 | | | C$ | (6.1 | ) |
| Annual Labour Improvements | | C$ | 158.0 | | | C$ | 139.0 | | | C$ | (19.0 | ) |
| Annual Pension Funding Obligations | | C$ | 11.0 | | | C$ | 4.0 | | | C$ | (7.0 | ) |
| Annual Retiree Extended Health Benefits | | C$ | 2.4 | | | C$ | 1.2 | | | C$ | (1.2 | ) |
| Annual Impact of PRD Lease Rejection | | C$ | 2.4 | | | C$ | 0.0 | | | C$ | (2.4 | ) |
| CATALYST PAPER 2012 ANNUAL REPORT | 7 |
We continue to pursue sales of our non-core assets. We completed the sale of the Snowflake mill and the shares of The Apache Railway Company (Apache Railway) for US$13.5 million and other non-monetary consideration on January 30, 2013 and entered into an agreement on February 13, 2013 to sell our interest in Powell River Energy Inc. and Powell River Energy Limited Partnership (collectively “Powell River Energy”) for $33.0 million.
Operating earnings for the year were negatively impacted by a significant decline in pulp prices in China due to excess inventory and weak market conditions, as well as a decrease in average transaction prices for paper. This was partially offset by lower maintenance, labour, fibre, property taxes and selling, general and administrative (SG&A) cost.
Our net earnings reflect significant reorganization credits resulting from the forgiveness of pre-petition debt and accounts payable on emergence from creditor protection and fair value adjustments to our assets and liabilities in accordance with the requirements of fresh start accounting. This was partly offset by reorganization costs consisting of legal and consulting fees incurred under the creditor protection proceedings and one-time closure costs related to the Snowflake mill.
In accordance with U.S. GAAP, an enterprise value was established for the company as of September 30, 2012 (the end of the quarter following our emergence from protection under the CCAA) under fresh start accounting. This enterprise value was determined with the assistance of an independent financial advisor. For a discussion of the valuation methods used to determine enterprise value and additional information on fresh start accounting, see note 6, Creditor protection proceedings related disclosures in our annual consolidated financial statements for the year ended December 31, 2012.
Financial performance
We recorded a net gain attributable to the company of $583.2 million and a net loss attributable to the company before specific items of $37.8 million in 2012. This compared to losses of $974.0 million and $126.3 million, respectively, in 2011.
Significant specific items in 2012 included reorganization credits related to the forgiveness of pre-petition debt and accounts payable and fair value adjustments from the implementation of fresh start accounting, reorganization expenses related to legal and consulting fees, restructuring fees incurred prior to entering creditor protection, closure costs related to the discontinued Snowflake mill, and a foreign exchange gain on the translation of U.S. dollar denominated debt.
Significant specific items in the prior year included an impairment charge on the pulp and paper assets of our Canadian operations, an impairment charge on certain assets of the Snowflake mill, losses sustained due to fires at the Snowflake and Powell River mills, restructuring costs incurred on capital structure negotiations and a foreign exchange loss on the translation of U.S. dollar denominated debt.
| 8 | CATALYST PAPER 2012 ANNUAL REPORT |
Selected annual financial information
| (In millions of dollars, except where otherwise stated) | | 2012 ³ | | | 2011 | | | 2010 | |
| Sales2 | | $ | 1,058.2 | | | $ | 1,079.7 | | | $ | 1,051.4 | |
| Operating earnings (loss)2 | | | 19.1 | | | | (704.5 | ) | | | (351.6 | ) |
| Depreciation and amortization2 | | | 36.3 | | | | 105.5 | | | | 109.7 | |
| Adjusted EBITDA1 2 | | | 55.4 | | | | 62.8 | | | | 52.6 | |
| – before restructuring costs1 2 | | | 60.7 | | | | 68.7 | | | | 77.9 | |
| Net earnings (loss) attributable to the company | | | 583.2 | | | | (974.0 | ) | | | (396.9 | ) |
| – before specific items1 | | | (37.8 | ) | | | (126.3 | ) | | | (87.0 | ) |
| Total assets | | | 978.8 | | | | 737.6 | | | | 1,696.2 | |
| Total long-term liabilities | | | 720.6 | | | | 713.6 | | | | 1,094.2 | |
| Adjusted EBITDA margin1 2 | | | 5.2 | % | | | 5.8 | % | | | 5.0 | % |
| – before restructuring costs1 2 | | | 5.7 | % | | | 6.4 | % | | | 7.4 | % |
Net earnings (loss) per share attributable to the
company’s common shareholders (in dollars) | | | | | | | | | | | | |
| – basic and diluted from continuing operations | | | $ 41.654 | | | $ | (2.04 | ) | | $ | (0.99 | ) |
| – basic and diluted from discontinued operations | | | (1.15)4 | | | | (0.51 | ) | | | (0.05 | ) |
| – before specific items | | | (2.62)4 | | | | (0.33 | ) | | | (0.23 | ) |
| | | | | | | | | | | | | |
| (In thousands of tonnes) | | | | | | | | | | | | |
| Sales2 | | | 1,401.4 | | | | 1,351.2 | | | | 1,343.2 | |
| Production2 | | | 1,388.6 | | | | 1,365.1 | | | | 1,333.8 | |
| Common shares (millions) | | | | | | | | | | | | |
| At period-end | | | 14.54 | | | | 381.9 | | | | 381.8 | |
| Weighted average | | | 14.44 | | | | 381.9 | | | | 381.8 | |
| 1 | Refer to section 13, Non-GAAP measures. |
| 2 | Numbers exclude the Snowflake mill’s results from operations which have been reclassified as discontinued operations; losses from discontinued operations, net of tax, are shown separately from continuing operations in the consolidated statements of earnings (loss) in our annual consolidated financial statements for the year ended December 31, 2012. |
| 3 | We completed our restructuring under the CCAA proceedings on September 13, 2012, and adopted fresh start accounting in accordance with FASB ASC 852 on September 30, 2012. Selected financial information for 2012 therefore includes results for nine months preceding the adoption of fresh start accounting and three months subsequent to adoption. Reported sales and adjusted EBITDA were relatively unaffected, as the company’s physical operations were not impacted by the financial recapitalization. |
| 4 | All earnings per share data and weighted average common shares for 2012 are based on the new common shares issued to the company’s secured and unsecured creditors under the Plan. Earnings per share data in this MD&A is based on weighted average common shares calculated as if the 14.4 million common shares issued to the company’s secured creditors on September 13, 2012 were issued on January 1, 2012, and the former 381.9 million common shares cancelled on September 13, 2012 were cancelled on January 1, 2012. The 0.1 million common shares issued to the company’s unsecured creditors in December were included in weighted average common shares based on the number of days the shares were issued and outstanding divided by the number of days in the year. |
| CATALYST PAPER 2012 ANNUAL REPORT | 9 |
Market Overview
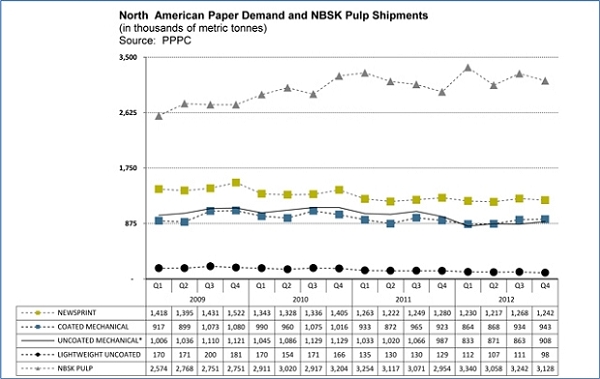
* Uncoated mechanical is comprised of high-gloss and standard grades.
North American demand for paper decreased in 2012 compared to the prior year. Inventory levels at the end of 2012 for coated mechanical were lower than the end of 2011 while uncoated mechanical and newsprint inventories were higher in part due to additional capacity added in the second half of 2012. North American demand for uncoated mechanical and directory paper declined significantly in the year while newsprint and lightweight coated (LWC) demand declined slightly. Benchmark prices increased for directory, remained flat for uncoated mechanical, and decreased for LWC and newsprint.
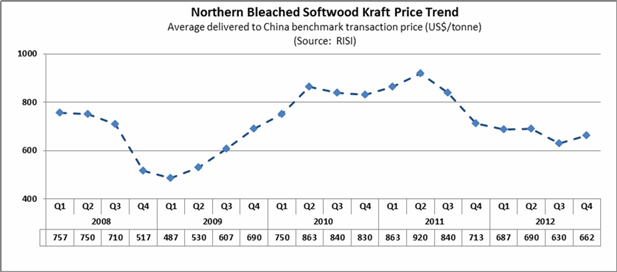
The global market for NBSK pulp increased due to increased demand in China. NBSK pulp benchmark prices declined significantly for most of the year due to excess inventory and weak market conditions in China due to an oversupply of pulp. Pulp prices improved moderately in the fourth quarter.
Restructuring Process
Proceedings under the CCAA
Following extensive discussion and negotiations in 2011 and early 2012 with certain holders of our 11% senior secured notes due 2016 (2016 Notes) and 7.375% notes due 2014 (2014 Notes) in an effort to implement a recapitalization transaction that would reduce our indebtedness and improve the company’s capital structure, the Board and management determined it was necessary to pursue a restructuring under court supervision.
| 10 | CATALYST PAPER 2012 ANNUAL REPORT |
On January 31, 2012 the company obtained an order from the Supreme Court of British Columbia under the CCAA and subsequently received a recognition order from the United States Court under Chapter 15 of the U.S. Bankruptcy Code. The company arranged debtor-in-possession financing (DIP Facility) of approximately $175 million to provide funding during the restructuring process under the CCAA for ongoing working capital, capital expenditure requirements and general corporate purposes. The company’s operating revenue combined with the DIP Facility provided sufficient liquidity to meet ongoing obligations to employees and suppliers and enabled normal operations to continue during the restructuring process. The DIP Facility was paid out on September 13, 2012.
The company’s secured and unsecured creditors approved the company’s proposed plan of arrangement under the CCAA (Plan) at meetings held on June 25, 2012. The Plan was approved by the Canadian Court on June 28, 2012 under the CCAA process and by the United States Court on July 27, 2012 under the Chapter 15 process.
The Plan became effective on September 12, 2012 and restructuring under the Plan completed on September 13, 2012.
Implementation of Plan
As a result of the reorganization under the Plan:
| § | Our operations have continued in substantially the same form. |
| § | Holders of 2016 Notes exchanged their US$390.4 million aggregate principal amount of 2016 Notes plus accrued and unpaid interest for: |
| - | US$250.0 million aggregate principal amount of senior secured notes due in 2017 (2017 Notes) that bear interest, at the option of the company, at a rate of 11% per annum in cash or 13% per annum payable 7.5% cash and 5.5% payment-in-kind (PIK); and |
| - | 14.4 million new common shares which represented 100% of the company’s issued and outstanding common shares subject to dilution for (i) the issuance of common shares to unsecured creditors who made an equity election pursuant to the terms of the Plan, and (ii) common shares that may be issued under a new management incentive plan should such a plan be adopted in the future. |
| § | Holders of 2014 Notes exchanged their US$250.0 million aggregate principal amount of 2014 Notes plus accrued and unpaid interest for: |
| - | Their pro rata share (calculated by reference to the aggregate amount of all claims of unsecured creditors allowed under the Plan) of 50% of the net proceeds (the PREI Proceeds Pool) following the sale of Catalyst Paper’s interest in Powell River Energy, or |
| - | If an equity election was made, their pro rata share of 600,000 new common shares (the Unsecured Creditor Share Pool). |
| § | General creditors exchanged their general unsecured claims for: |
| - | Their pro rata share of the PREI Proceeds Pool; or |
| - | If an equity election was made, their pro rata share of the Unsecured Creditor Share Pool; or |
| CATALYST PAPER 2012 ANNUAL REPORT | 11 |
| - | If the general unsecured claim was equal to or less than $10,000 (unless an equity election was made), or if a valid cash election were made and such creditor elected to reduce their claim to $10,000, cash in an amount equal to 50% of the creditor’s allowed claim (the Cash Convenience Pool). |
§On September 13, 2012 all previously outstanding common shares of the company were cancelled for no consideration and holders of such common shares did not, and will not, receive any distribution under the Plan.
We distributed $1.0 million to unsecured creditors in November, 2012 as full and final settlement of claims under the Cash Convenience Pool. We issued 14,400,000 new common shares to holders of 2016 Notes on September 13, 2012 and issued a further 127,571 common shares on December 19, 2012 to unsecured creditors who elected to receive common shares in lieu of participating in the PREI Proceeds Pool, as full and final settlement of their claims. We entered into an agreement on February 13, 2013 to sell our interest in Powell River Energy for $33.0 million and following completion of such sale will pay out approximately $13 million from the PREI Proceeds Pool to applicable unsecured creditors. We are required under the terms of the Exit Facility (defined below) to offer to purchase Exit Notes (defined below) at par from our portion of the proceeds from the sale of Powell River Energy.
Exit financing arrangements
On September 13, 2012 we entered into a new $175.0 million ABL Facility, which was a pre-condition for the company to implement the Plan and exit from protection under the CCAA. The ABL Facility provided financing for general corporate purposes, and for the repayment on exit of the DIP Facility that was in place throughout the CCAA proceedings.
The company also completed a US$35.0 million secured exit financing facility (Exit Facility) on September 13, 2012 and issued US$35.0 million of notes (Exit Notes) under the Exit Facility on its exit from protection under the CCAA. The Exit Facility provided the company with backstop financing to pay costs and expenses and manage other contingencies on exit from protection under CCAA.
See our discussion under heading 8, Liquidity and capital resources,for additional information on our exit financing.
Appointment of new board of directors
A new Board was appointed effective upon completion of restructuring under the Plan on September 13, 2012 comprised of John Brecker, Giorgio Caputo, John Charles, Kevin J. Clarke, Todd Dillabough, Walter Jones, and Leslie Lederer. Mr. Clarke, the CEO of the company, continued from the previous board. Mr. Lederer is the Chair of the Board.
New capital structure and TSX listing
As at March 5, 2013 the company has 14,527,571 common shares outstanding consisting of the 14,400,000 common shares issued to holders of 2016 Notes on September 13, 2012 under the Plan and the 127,571 additional common shares issued to certain unsecured creditors on December 19, 2012. On September 13, 2012 all of the company’s previously outstanding common shares were cancelled for no consideration.
| 12 | CATALYST PAPER 2012 ANNUAL REPORT |
On January 7, 2013 our new common shares were listed on the Toronto Stock Exchange (TSX) under the symbol “CYT”. The company initiated a small shareholder selling program that commenced on January 7, 2013 and ended February 28, 2013 that gave shareholders who held 99 or fewer new common shares the opportunity to sell their shares without incurring commission charges. The program was entirely voluntary and no recommendations were made by the company or its Board of directors in respect of the sale of shares pursuant to the program.
Previously the TSX delisted the company’s former common shares (symbol “CTL”) at the close of market on March 8, 2012 as we no longer met the TSX continued listing requirements based on our financial condition and commencement of the CCAA proceedings in January, 2012.
Defined Benefit Pension Plan
Funding Relief
In December, 2011, the B.C. Superintendent of Pensions granted us an extension of time for payment of the solvency deficits under certain of our defined benefit pension plans. This extension provided for payments necessary to amortize the solvency deficits over the seven-year period ending December 2017, including annual payments of $10.6 million for 2011, 2012 and 2013. As part of our CCAA proceedings we paid an additional $1.1 million in respect of the solvency deficiencies in 2012. During our CCAA proceedings, we obtained government approval (1) to offer a special portability election option in respect of our defined benefit pension plan for salaried employees and (2) for further funding relief in respect of our obligation to make payment to the solvency deficit for that pension plan. The funding relief provides for fixed annual contributions to the solvency deficit over a 15-year period ending in 2027 and a final payment of the remaining deficit in 2028. This change results in estimated annual cash savings of approximately $7 million per year commencing in 2013.
Special Portability Option
Under the special portability election option, we offered members of our defined benefit pension plan for salaried employees a one-time reduced lump-sum payment option as full settlement of their entitlements under the plan. Members had to make their elections by no later than December 15, 2012 and have until June 30, 2013 to revoke such elections in favour of continuing to receive monthly pension payments. As of March 5, 2013 approximately 42% of the total membership of the pension plan, representing approximately 48% of the pension liability, elected to take this option.
Members who exercise the election will receive a reduced lump-sum payment, calculated as the commuted value of future pension payments multiplied by the solvency ratio of the plan on December 31, 2012 plus additional top-up payments over the next four years totaling 8% of commuted value. Commuted value is defined as the amount a plan member needed to invest on December 31, 2012 to provide for future pension benefits, incorporating an interest rate based on Government of Canada bonds.
| CATALYST PAPER 2012 ANNUAL REPORT | 13 |
Closure and Sale of Snowflake Mill
The company permanently closed its Snowflake mill on September 30, 2012. On January 30, 2013 we completed the U.S. Court approved sale of the assets of the Snowflake facility and the shares of Apache Railway to a third party for US$13.5 million and other non-monetary consideration. We understand that the buyer intends to continue to operate the Apache Railway as a going concern, and the transaction was supported by the Town of Snowflake and various local interests. The sale process for the Snowflake mill and its associated assets was conducted in accordance with United States Court-approved sale and investor solicitation procedures.
The decision to close the mill was driven by continued financial losses resulting from intense supply input cost and market pressures. The mill closure will result in the elimination of future operating losses associated with the mill and savings of annualized selling, general and administrative expenses. The closure resulted in closure costs of $18.6 million including an estimated withdrawal liability of approximately US$11.7 million relating to the PACE Industry Union-Management Pension Fund, a multi-employer pension plan which we contributed to on behalf of hourly employees at the Snowflake mill. The company is in the process of verifying the actuarial information used to calculate this estimated withdrawal liability from the Pension Fund. It is typical for such withdrawal liabilities to be paid over 20 years although confirmation of that payment schedule has not been confirmed. US$3.5 million had been accrued for the withdrawal liability in Q3 2012. See section 6, Consolidated and segmented results – quarterly,for more information.
The Snowflake mill was treated as a discontinued operation in our annual consolidated financial statements for the year ended December 31, 2012 and comparative periods were restated accordingly. Where so indicated in this MD&A, Snowflake’s results were removed from sales and production volumes, operating earnings, and non-GAAP measures, both for the current period and for all comparative periods presented.
Other Asset Sales
We entered into an agreement on February 13, 2013 to sell our interest in Powell River Energy for $33.0 million. The company is required under the terms of the Planto distribute to unsecured creditors of the company who did not elect to receive shares in settlement of their claims, their pro rata share of 50% of the net proceeds of the sale (which, given that many creditors elected to instead receive shares, will result in a distribution of approximately 40% of the net proceeds of the sale). The company will offer to purchase a portion of its Exit Notes with the balance of the net proceeds. The sale is expected to complete in the first quarter of 2013 and is subject to various closing conditions. Electricity generated by Powell River Energy Inc. will continue to be sold to the company under the existing power purchase agreement which expires in 2016 with possible extension to 2021 in one-year renewal term increments at the option of the company.
We have reached an agreement-in-principle to sell our 13.4 hectare wastewater treatment facility located at our Port Alberni mill along with 3.9 hectares of land combined with a road dedication for proceeds of $5.8 million. The company has agreed to settle the mortgage receivable due from PRSC Limited Partnership and sell its interest in PRSC Land Developments Ltd. for proceeds of approximately $3.0 million. We continue to actively market our remaining poplar plantation land.
| 14 | CATALYST PAPER 2012 ANNUAL REPORT |
On December 19, 2012, we announced the termination of the agreement reached with Pacifica Deep Sea Terminals Inc. to sell the Elk Falls site for proceeds of $8.6 million. A non-refundable prepayment of a portion of the purchase price was received and the transaction timeline was extended multiple times up to the ultimate deadline of December 18, 2012. We continue to actively market the Elk Falls property.
New Labour Agreements
New five-year labour agreements with the Communications, Energy and Paperworkers Union (CEP) locals 1, 76, 592, 686 and 1132 and the Pulp, Paper and Woodworkers Union of Canada (PPWC ) local 2 representing more than 1,000 pulp and paper workers at our Crofton, Port Alberni and Powell River mills went into effect on May 1, 2012. These new agreements include a 10% reduction in hourly rates along with various adjustments to vacation, health benefits and work rules necessary to provide us with a competitive labour cost structure. The agreements also maintain hourly retiree health benefits. Annual savings in the range of $18 to $20 million are expected.
A new three-year labour agreement with the Christian Labour Association of Canada (CLAC) covering the hourly workers at our Surrey Distribution Centre went into effect on May 1, 2012. This new agreement maintains existing rates and benefits.
Harmonized Sales Tax Refund Claims Delayed
In response to our CCAA filing the Canada Revenue Agency commenced an audit of our Harmonized Sales Tax (HST) returns, resulting in a delay collecting our HST refund claims which negatively impacted our liquidity in the first quarter. Our outstanding HST refund claims were received at the end of the second quarter and payments reverted back to more normalized terms by the end of Q4 2012.
Repudiation of Operating Lease at Paper Recycling Operation
We disclaimed our obligations as lessee under the operating lease at the closed paper recycling operation effective March 23, 2012 as part of our CCAA proceedings. The lease would have otherwise continued until November 30, 2023 with annual lease payments of approximately $2.4 million and property taxes of approximately $0.6 million per year.
| CATALYST PAPER 2012 ANNUAL REPORT | 15 |
Canadian dollar
The chart below illustrates the movement of the US$/CDN$ average spot rate over the past three years:
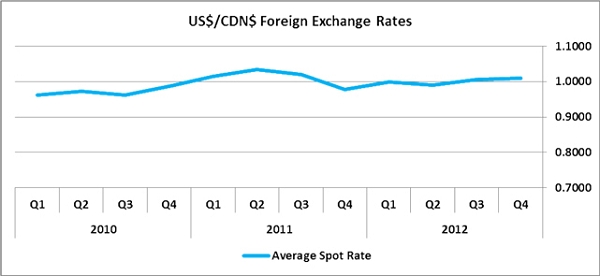
US$/CDN$ Exchange
| | | 2010 | | | 2011 | | | 2012 | |
| | | Q1 | | | Q2 | | | Q3 | | | Q4 | | | Q1 | | | Q2 | | | Q3 | | | Q4 | | | Q1 | | | Q2 | | | Q3 | | | Q4 | |
| Average spot rate | | | 0.961 | | | | 0.973 | | | | 0.962 | | | | 0.987 | | | | 1.015 | | | | 1.033 | | | | 1.020 | | | | 0.977 | | | | 0.999 | | | | 0.990 | | | | 1.005 | | | | 1.009 | |
| Average effective rate | | | 0.938 | | | | 0.949 | | | | 0.948 | | | | 0.982 | | | | 1.011 | | | | 1.032 | | | | 1.020 | | | | 0.977 | | | | 0.999 | | | | 0.990 | | | | 1.005 | | | | 1.009 | |
| Period-end spot rate | | | 0.985 | | | | 0.943 | | | | 0.971 | | | | 1.005 | | | | 1.029 | | | | 1.037 | | | | 0.963 | | | | 0.983 | | | | 1.001 | | | | 0.981 | | | | 1.017 | | | | 1.005 | |
The majority of our sales are denominated in U.S. dollars. The Canadian dollar traded mostly below par for the first half of 2012 before strengthening to above par against the U.S. dollar for the remainder of the year. There was no difference between our average effective exchange rate and the average spot rate in 2012. The US$/CDN$ exchange rate movement in 2012 compared to 2011 resulted in a positive variance of $7.8 million on revenue and a positive variance of $4.8 million on adjusted EBITDA. Year-end spot rate movement resulted in an after-tax foreign exchange gain of $20.8 million on the translation of U.S. dollar denominated debt in 2012, compared to an after-tax foreign exchange loss of $11.8 million in 2011. We have a program in place to hedge a portion of our anticipated U.S. dollar sales, although, effective April 1, 2010, we no longer designate the positions as hedges for accounting purposes. At December 31, 2012 we did not have any foreign currency options or forward contracts outstanding. Refer to our annual consolidated financial statements for the year ended December 31, 2012 note 30,Financial instruments, for additional details.
| 16 | CATALYST PAPER 2012 ANNUAL REPORT |
Our objective is to return to profitability and maximize cash flows through capital restructuring, reduced manufacturing costs and optimizing our brands and customer base.
Performance Metrics
The following performance drivers are key to achieving our strategic goals and creating value for our investors:
| (i) | Financial performance and flexibility |
Our ability to generate adequate liquidity and establish an appropriate capital structure enables us to maintain our operations, finance growth and service our debt and other obligations.
| (ii) | Cash Flows, Liquidity and Capital Structure |
| – | Continue to focus on cash flows, liquidity and cost reductions. |
| – | Implement a restructuring process or other reorganization under the CCAA that will significantly improve our capital structure, liquidity and competitive footing. |
| – | Evaluate every existing physical asset to maximize financial contributions, product flexibility and capital structure. |
| – | Achieve a new collective bargaining agreement with all six local B.C. unions that is market competitive and innovative to help position Catalyst Paper for the future. |
| · | Key performance indicators |
Key metrics to measure our ability to generate operating income and implement cost reduction and restructuring initiatives include:
| – | Cost structure before and after restructuring. |
| – | Adjusted EBITDA and adjusted EBITDA before restructuring costs1. |
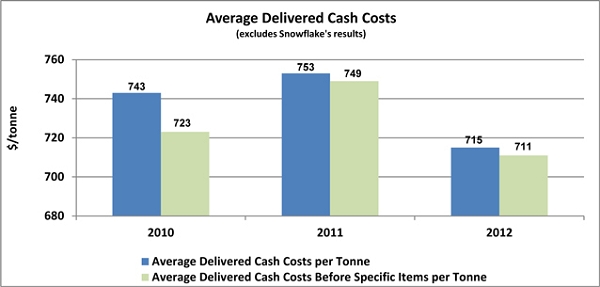
| – | Average delivered cash costs per tonne and average delivered cash costs per tonne before specific items1. |
1Refer to section 13,Non-GAAP measures, for definitions of these measures.
| CATALYST PAPER 2012 ANNUAL REPORT | 17 |
| – | We completed a comprehensive reorganization of the company’s cost and capital structure on September 13, 2012. Refer to section 2,Annual overview – 2012, for further information. |
| – | We completed sales of surplus or redundant assets, including the assets of the Snowflake mill and shares of Apache Railway for US$13.5 million, certain of our poplar lands for $4.2 million, assets of the discontinued paper recycling division (PRD) for $1.0 million and assets of the shutdown Elk Falls mill for $6.7 million. |
| – | We reached agreements-in-principle to sell PREI for $33.0 million, sell the Port Alberni wastewater treatment facility for $5.8 million, and sell our interest in PRSC Land Developments Ltd. for approximately $3.0 million. These agreements are expected to close in the first half of 2013. |
| 18 | CATALYST PAPER 2012 ANNUAL REPORT |
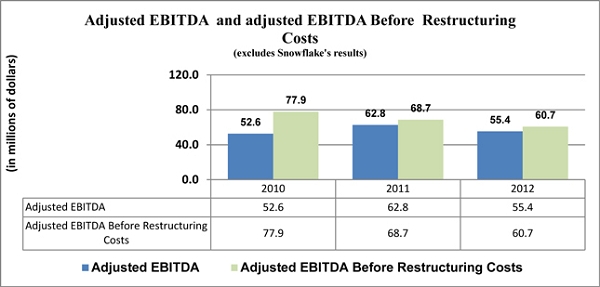
| – | Adjusted EBITDA declined in 2012 mostly due to a significant decline in pulp transaction prices and lower average transaction prices for paper. This was partially offset by increased pulp and paper sales, the positive impact of a weaker Canadian dollar, and lower fibre, labour, maintenance, property tax and SG&A costs. |
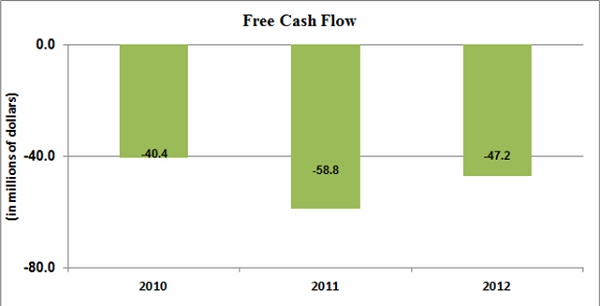
| – | Free cash flow for the year was negative $47.2 million. Adjusted EBITDA of $55.4 million was more than offset by reorganization cash costs of $37.5 million, interest expense (excluding non-cash amortization) of $22.7 million, capital expenditures of $22.6 million, cash contributions to pensions and other post-employment benefits in excess of the recorded expense of $11.8 million and net operating cash used by discontinued operations of $8.2 million. |
| CATALYST PAPER 2012 ANNUAL REPORT | 19 |
| – | We secured a $175.0 million DIP Credit Facility as a secure source of financing throughout the creditor protection process. |
| – | We secured a new $175.0 million ABL Facility and a US$35.0 million Exit Facility on emergence from creditor protection on September 13, 2012. |
| – | The Snowflake closure has resulted in a significant reduction in working capital requirements thereby improving our liquidity. |
| – | We continue to work with vendors to restore trade terms to pre-CCAA levels. |
| – | Successfully negotiated lower labour costs and property taxes as part of the restructuring process (as discussed above). |
| – | Closure of the Snowflake mill will result in substantial savings in future operating costs. |
| – | Capital spending for the year was $22.6 million which included $16.1 million for maintenance of business and $5.8 million related to PREI. Prior year capital spending of $19.7 million included $12.9 million for maintenance of business. |
| (iii) | Product mix and positioning |
Shifting our production mix to higher value grades, capturing a bigger share of the market, penetrating new markets and diversifying our product mix to manage fluctuations in demand to ensure that we remain competitive in a challenging marketplace.
Product Mix
Continue to expand sales reach into new markets and increase market share in key operating markets.
| · | Key performance indicators |
| 20 | CATALYST PAPER 2012 ANNUAL REPORT |
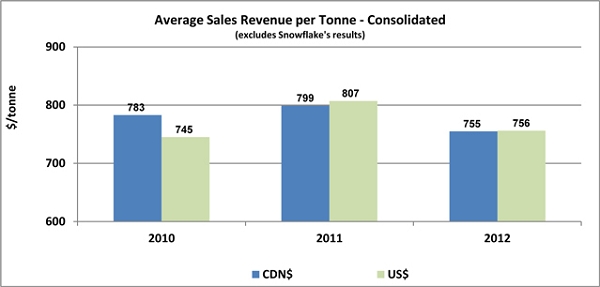
Key metrics include average sales revenue per tonne. Further details on 2012 results are provided in section 4,Consolidated results – annual,section 5,Segmented results – annual,and section 6,Consolidated and segmented results – quarterly.
| – | Our book paper, Electrabrite Book Sage, was positively received by book publishers and we continue to grow market share in this area. |
| – | Developed a 40-gram newsprint product, Marathon Lite, that is allowing us to grow sales while providing newspaper publishers with economic and environmental benefits. |
| – | Grew the sale of our Sage line of environmentally friendly papers. These grades which are manufactured carbon neutral and with certified fibre continue to gain traction in the North American market. |
| – | Successfully transitioned key customers for our specialty papers from Snowflake to our mills in British Columbia. |
| – | Increased sales of Pacificote, our higher-value coated four coated grade. |
Expand geographic reach of Catalyst Paper into emerging world markets of Latin America, India and Asia.
| · | Key performance indicators |
Key metrics include total sales tonnes. Further details on 2012 results are provided in section 4,Consolidated results – annual, section 5,Segmented results – annual, and section 6,Consolidated and segmented results – quarterly.
| CATALYST PAPER 2012 ANNUAL REPORT | 21 |
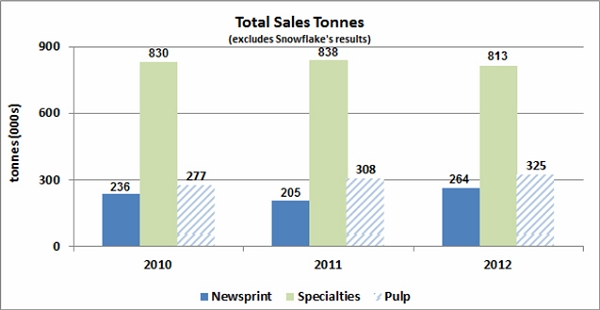
| – | Gained market share in all key grade categories. |
| – | Grew sales of all grades in key international markets that we are able to serve cost effectively from British Columbia. |
| – | Signed long-term contracts for telephone directory paper with a number of large publishers in North and Latin America. |
| (v) | Corporate Social Responsibility |
Corporate social responsibility is a core value. We are focused on improving workplace safety, promoting better communication with employees and following conservation practices that reduce our environmental impact.
Safety
Continue the progress made in 2011 in significantly improving our overall safety performance.
| · | Key performance indicators |
Key metrics include the medical incident rate (MIR) which is the number of incidents requiring medical attention per 200,000 hours worked, and the lost-time injury frequency (LTI) which is the number of lost-time injuries per 200,000 hours worked.
| 22 | CATALYST PAPER 2012 ANNUAL REPORT |
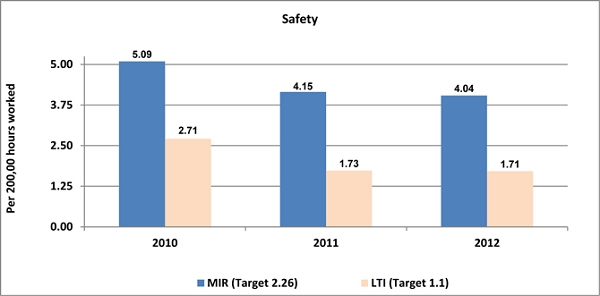
| – | Although there was an improvement in safety in 2012 our results fell short of our targets for the year. Numbers for both medical incidents and lost-time injuries held steady from 2011, with slight reductions in the frequency due to increased hours worked. |
| – | Improved web/IT based tools for safety training and incident investigation, inspection and corrective action. |
| – | Embedded workplace safety into recruitment and new hire selection criterion. |
| (vi) | Competitive Business Conditions |
| – | Continue to seek competitive business conditions in B.C., including joint municipal infrastructure agreements. |
| – | Work creatively with each of our municipalities to find “value based” opportunities to reduce/avoid costs which will result in reduced operating costs for Catalyst Paper and our municipalities. |
| · | Key performance indicators |
| – | Levelof municipal and provincial property taxes levied in respect of our operations in British Columbia. |
| – | Jointinfrastructureand other agreements entered into with local government in our respective operating communities. |
| CATALYST PAPER 2012 ANNUAL REPORT | 23 |
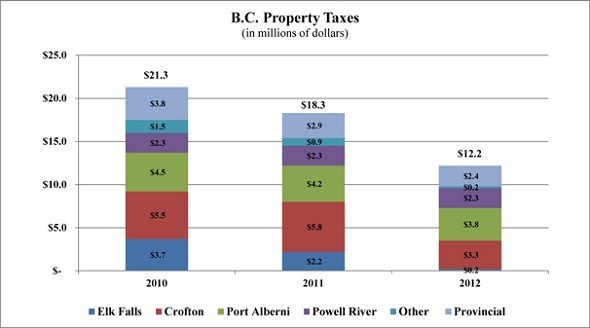
| – | Reductions in Class 4 municipal tax rates were confirmed for all three B.C. mills andtotal annual property taxes paid in 2012 of $12.2 million was $6.1 million lower thanthe prior year. |
| – | The joint infrastructure and tax agreement with the City of Powell River was finalized for expected proceeds of $3 million to transfer certain non-core interests, provide certain defined services under a long-term agreement, settle the mortgage receivable from PRSC Limited Partnership, and sell our interest in PRSC Land Development Ltd. |
| – | An agreement-in-principal was reached with the City of Port Alberni for the sale of the 13.4 hectare wastewater treatment facility and 3.9 hectare parcel of lands combined with a road dedication for proceeds of $5.8 million to facilitate the development of an industrial truck route along the waterfront. |
| (vii) | Conservation Practices and Processes |
| – | Achieve conservation targets in water and energy. |
| – | Maintain international disclosure standards as set out in the UN Global Compact. |
| – | Retain sales-supporting relationships with leading environmental groups. |
| · | Key performance indicators |
Key performance metrics include water, electricity and fuel usage. Water usage is measured as cubic meter per air-dried tonne (m3/adt). Electricity usage is measured in megawatt-hours per air-dried tonne (MWh/adt) and includes all purchased and self-generated electricity. Fuel energy usage is measured in gigajoules per air-dried tonne (GJ/adt) and includes all purchased fuels and self-generated biomass (black liquor).
| 24 | CATALYST PAPER 2012 ANNUAL REPORT |
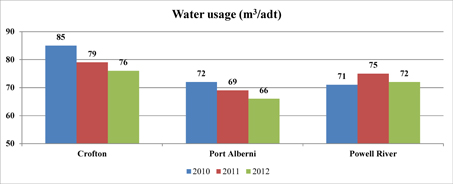
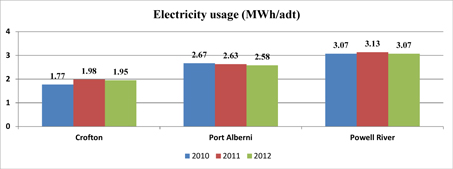

| – | Fuel energy and total energy use at Powell River were impacted by the higher-capacity operation of the mill’s main power boiler to generate low-carbon electricity for sale to BC Hydro. |
| – | A baseline water usage audit was completed at the Powell River mill in the fourth quarter and supports a company-wide water usage conservation program associated with energy efficiency. |
| – | Implemented conservation projects resulting in reduced energy usage and increased electricity self-generation at our Canadian operations of 20,900 MWh per year. |
| – | Our environmental, social and governance performance, and our reporting of progress on non-financial measures, earned us a place on the Corporate Knights list of Canada’s 50 Best Corporate Citizens for the sixth consecutive year. |
| – | Catalyst has become a founding member of the Council for Clean Capitalism, whose mandate is to improve access to capital and market recognition for superior business performance on ESG metrics. |
See section 20,Outlook,for details of our key priorities for 2013.
| CATALYST PAPER 2012 ANNUAL REPORT | 25 |
| 4 | CONSOLIDATED RESULTS - ANNUAL |
CONSOLIDATED RESULTS OF OPERATIONS
Year ended December 31, 2012 compared to year ended December 31, 2011
Sales
Sales decreased by $21.5 million in 2012 as the unfavourable impact of lower transaction prices for pulp and paper and reduced sales volumes for specialty paper were partially offset by increased sales volumes for pulp and newsprint and the favourable impact of the weaker Canadian dollar.
Adjusted EBITDA and adjusted EBITDA before restructuring costs
The following table provides variances between periods for adjusted EBITDA and adjusted EBITDA before restructuring costs:
| (In millions of dollars) | | Adjusted
EBITDA 1 2 3 | | | Adjusted EBITDA
before restructuring
costs1 2 3 | |
| 2011 | | $ | 62.8 | | | $ | 68.7 | |
| Paper prices | | | (3.4 | ) | | | (3.4 | ) |
| Pulp prices | | | (58.9 | ) | | | (58.9 | ) |
| Impact of Canadian dollar | | | 4.8 | | | | 4.8 | |
| Volume and mix | | | (1.2 | ) | | | (1.2 | ) |
| Furnish mix and costs | | | 22.7 | | | | 22.7 | |
| Power and fuel costs | | | (5.2 | ) | | | (5.2 | ) |
| Labour costs | | | 14.3 | | | | 14.3 | |
| Maintenance costs | | | 8.9 | | | | 8.9 | |
| Lower of cost or market impact on inventory, net of inventory change | | | 10.1 | | | | 10.1 | |
| Selling, general and administrative costs | | | 6.4 | | | | 6.4 | |
| Restructuring costs | | | 0.6 | | | | – | |
| Other, net | | | (6.5 | ) | | | (6.5 | ) |
| 2012 | | $ | 55.4 | | | $ | 60.7 | |
| 1 | Refer to section 13, Non-GAAP measures, for further details. |
| 2 | Numbers exclude the Snowflake mill’s results which have been reclassified as discontinued operations in the consolidated statements of earnings (loss) in the annual consolidated financial statements for the year ended December 31, 2012. |
| 3 | We completed our restructuring under the CCAA proceedings on September 13, 2012 and adopted fresh start accounting in accordance with FASB ASC 852 on September 30, 2012. Operating results for 2012 include results for nine months preceding the adoption of fresh start accounting and three months subsequent to adoption. Operating results were relatively unaffected, as the company’s physical operations were not impacted by the financial recapitalization. |
| 26 | CATALYST PAPER 2012 ANNUAL REPORT |
Operating earnings (loss)
Operating earnings increased by $723.6 million due to impairment and other closure costs incurred in 2011 of $661.8 million and lower depreciation of $69.2 million, partially offset by a reduction in adjusted EBITDA of $7.4 million. Impairment and other closure costs in the prior year consisted mostly of an impairment charge on the pulp and paper assets of our Canadian operations in Q4 2011.
Net earnings (loss) attributable to the company
Net earnings attributable to the company increased by $1,557.2 million. This was primarily due to higher after-tax operating earnings of $723.0 million, a net reorganization credit after tax of $663.7 million, a decrease in after-tax loss from discontinued operations of $179.0 million and an after-tax foreign exchange gain on the translation of our U.S. dollar denominated debt of $20.8 million compared to an after-tax loss of $11.8 million in the previous year, partially offset by an after-tax increase in net earnings attributable to non-controlling interest of $33.0 million.
The following table reconciles 2012 net earnings (loss) attributable to the company to 2011:
| (In millions of dollars) | | Pre-tax | | | After-tax | |
| 2011 net earnings (loss) attributable to the company | | $ | (981.4 | ) | | $ | (974.0 | ) |
| Lower adjusted EBITDA before restructuring costs | | | (8.0 | ) | | | (8.6 | ) |
| Lower restructuring costs | | | 0.6 | | | | 0.6 | |
| Lower depreciation and amortization expense | | | 69.2 | | | | 69.2 | |
| Lower impairment charge in 2012 | | | 661.8 | | | | 661.8 | |
| Change in foreign exchange gain (loss) on long-term debt | | | 30.5 | | | | 32.6 | |
| Powell River fire | | | 2.4 | | | | 2.0 | |
| Net gain related to reorganization in 2012 | | | 663.7 | | | | 663.7 | |
| Higher other expense, net | | | (2.8 | ) | | | (3.1 | ) |
| Lower interest expense | | | 1.3 | | | | (7.0 | ) |
| Change in discontinued operations earnings (loss) | | | 178.0 | | | | 179.0 | |
| Change in net earnings (loss) attributable to non-controlling interest | | | (33.0 | ) | | | (33.0 | ) |
| 2012 net earnings (loss) attributable to the company | | $ | 582.3 | | | $ | 583.2 | |
| CATALYST PAPER 2012 ANNUAL REPORT | 27 |
| 5 | SEGMENTED RESULTS – ANNUAL |
Specialty printing papers
| (In millions of dollars, except where otherwise stated) | | 201223 | | | 20112 | | | 20102 | |
| Sales | | $ | 675.6 | | | $ | 690.4 | | | $ | 674.0 | |
| Operating earnings (loss) | | | 20.5 | | | | (565.1 | ) | | | (149.7 | ) |
| Depreciation and amortization | | | 30.1 | | | | 81.3 | | | | 78.8 | |
| Adjusted EBITDA1 | | | 50.6 | | | | 23.4 | | | | 33.5 | |
| – before restructuring costs1 | | | 53.5 | | | | 27.4 | | | | 41.7 | |
| Adjusted EBITDA margin1 | | | 7.5 | % | | | 3.4 | % | | | 5.0 | % |
| – before restructuring costs1 | | | 7.9 | % | | | 4.0 | % | | | 6.2 | % |
| | | | | | | | | | | | | |
| (In thousands of tonnes) | | | | | | | | | | | | |
| Sales | | | 812.6 | | | | 837.5 | | | | 829.9 | |
| Production | | | 805.5 | | | | 842.0 | | | | 835.9 | |
| 1. | Refer to section 13,Non-GAAP measures. |
| 2. | Numbers exclude the Snowflake mill’s results from operations which have been reclassified as discontinued operations in the consolidated statements of earnings (loss) in the annual consolidated financial statements for the year ended December 31, 2012. |
| 3. | We completed our restructuring under the CCAA proceedings on September 13, 2012 and adopted fresh start accounting in accordance with FASB ASC 852 on September 30, 2012. Segmented results for 2012 include results for nine months preceding the adoption of fresh start accounting and three months subsequent to adoption. Reported sales and adjusted EBITDA were relatively unaffected, as the company’s physical operations were not impacted by the financial recapitalization. |
| 28 | CATALYST PAPER 2012 ANNUAL REPORT |
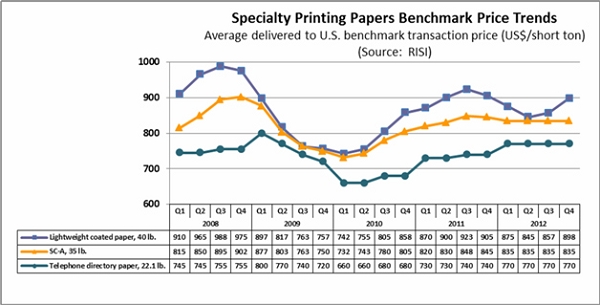
North American demand for coated mechanical decreased 2.3% for the year due to reduced advertising pages in magazines and a decrease in catalogues being mailed out. LWC inventories decreased significantly in 2012 as capacity reductions due to closures and curtailments more than offset the reduction in demand. The average benchmark price for LWC decreased to US$869 per short ton from US$900 per short ton in 2011. The LWC benchmark price declined in the first half of 2012 before recovering to US$898 per short ton in Q4.
North American uncoated mechanical demand (high-gloss and standard grades) decreased 15.3% due to declines in print advertising and lower circulation and page counts for retail inserts. Average benchmark prices for super-calendered A grade (SC-A) remained flat compared to the prior year at US$835 per short ton for 2012. Continuing reduction in capacity kept the uncoated mechanical market tight despite declining demand. The market weakened near the end of Q4 with the restart of a formerly idled mill which added significant capacity to the market, and the end of the seasonally busy retail advertising period.
For LWC, we implemented a US$40 per short ton price increase on August 1, 2012 and announced another US$60 per short ton increase effective October 1, 2012. For our uncoated paper, we announced a US$40 per short ton price increase on our soft-calendered paper effective October 1, 2012. The increases to LWC were partially implemented while the soft-calendered price increase was not implemented due to the restart of formerly idle capacity in early Q4.
North American directory demand decreased 18.4% in 2012 from the prior year due to reduced publication of white pages, smaller book sizes, lower circulation, and the continued migration from printed directory books to the Internet. At US$770 per short ton, the average directory benchmark price for the current year increased by 4.8% compared to the prior year reflecting higher 2012 contract prices. The majority of our directory pricing was largely fixed for the year based on 2012 contract pricing.
| CATALYST PAPER 2012 ANNUAL REPORT | 29 |
Operational performance
The following chart summarizes the operating performance of our specialty printing papers segment:
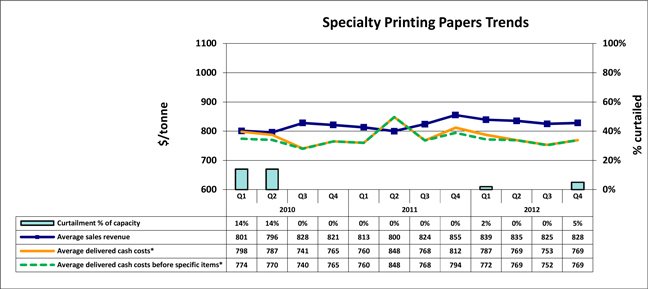
| * | Average delivered cash costs per tonne consist of cost of sales, excluding depreciation and amortization, and including the impact of SG&A and restructuring costs. Average delivered cash costs per tonne before specific items consist of cost of sales, excluding depreciation and amortization, and including the impact of SG&A, but excluding the impact of restructuring costs. |
The 2012 specialty printing papers product-grade distribution, based on sales volume, is depicted in the chart below:
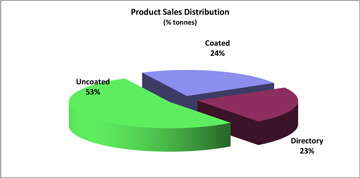
| 30 | CATALYST PAPER 2012 ANNUAL REPORT |
The 2012 specialty printing papers geographic sales distribution, based on sales volume, is depicted in the chart below.
| – | Sales volume decreased by 24,900 tonnes due to lower directory and uncoated sales volumes for the year, partially offset by higher coated sales volumes. |
| – | Average sales revenue increased $7 per tonne, reflecting higher average transaction prices for directory and uncoated mechanical paper, and the positive impact of a weaker Canadian dollar, partially offset by lower average transaction prices for LWC. |
| – | Average delivered cash costs decreased $27 per tonne due to lower maintenance, labour and kraft costs, as well as reduced SG&A costs, partially offset by higher cost of chemicals and electric power. The lower labour cost was mostly due to the positive impact of the new labour deal that went into effect on May 1, 2012. |
| CATALYST PAPER 2012 ANNUAL REPORT | 31 |
Newsprint
| (In millions of dollars, except where otherwise stated) | | 20122 3 | | | 20112 | | | 20102 | |
| Sales | | $ | 178.1 | | | $ | 141.3 | | | $ | 152.4 | |
| Operating earnings (loss) | | | 14.1 | | | | (69.2 | ) | | | (224.3 | ) |
| Depreciation and amortization | | | 4.1 | | | | 9.1 | | | | 16.6 | |
| Adjusted EBITDA1 | | | 18.2 | | | | 11.0 | | | | (17.6 | ) |
| – before restructuring costs1 | | | 19.0 | | | | 11.8 | | | | (1.5 | ) |
| Adjusted EBITDA margin1 | | | 10.2 | % | | | 7.8 | % | | | (11.5 | )% |
| – before restructuring costs1 | | | 10.7 | % | | | 8.4 | % | | | (1.0 | )% |
| | | | | | | | | | | | | |
| (In thousands of tonnes) | | | | | | | | | | | | |
| Sales | | | 264.0 | | | | 205.2 | | | | 236.7 | |
| Production | | | 265.1 | | | | 208.1 | | | | 224.5 | |
| 1 | Refer to section 13,Non-GAAP measures. |
| 2 | Numbers exclude the Snowflake mill’s results from operations which have been reclassified as discontinued operations in the consolidated statements of earnings (loss) in the annual consolidated financial statements for the year ended December 31, 2012. |
| 3 | We completed our restructuring under the CCAA proceedings on September 13, 2012 and adopted fresh start accounting in accordance with FASB ASC 852 on September 30, 2012. Segmented results for 2012 include results for nine months preceding the adoption of fresh start accounting and three months subsequent to adoption. Reported sales and adjusted EBITDA were relatively unaffected, as the company’s physical operations were not impacted by the financial recapitalization |
| 32 | CATALYST PAPER 2012 ANNUAL REPORT |
Segment overview
North American newsprint shipments were down by 1.2% in 2012. Operating rates remained similar to the prior year as North American newsprint capacity was shut at a rate to compensate for declining demand. Newsprint inventories increased in the current year compared to 2011 levels.
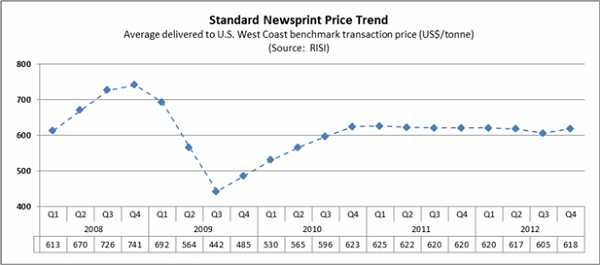
The average North American newsprint benchmark price decreased to US$615 per metric tonne or 1.1% compared to the previous year. We announced a US$30 per tonne price increase effective October 1, 2012. The increase was partially implemented in the U.S.; however, these gains were offset by lower prices in our international markets.
The Crofton No. 1 paper machine, originally curtailed in January 2010, remained indefinitely curtailed throughout 2012, resulting in 140,000 tonnes of curtailment on an annualized basis.
Operational performance
The following chart summarizes the operating performance of our newsprint segment:
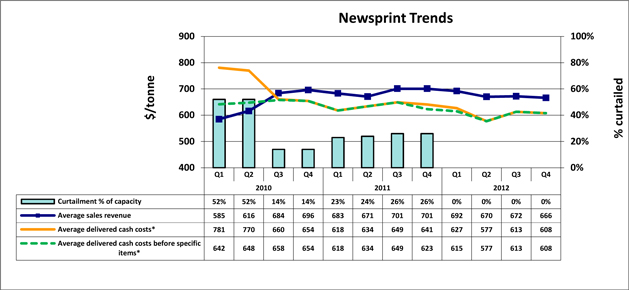
| * | Average delivered cash costs per tonne consist of cost of sales, excluding depreciation and amortization, and including the impact of SG&A and restructuring costs. Average delivered cash costs per tonne before specific items consist of cost of sales, excluding depreciation and amortization, and including the impact of SG&A, but excluding the impact of restructuring costs. |
| CATALYST PAPER 2012 ANNUAL REPORT | 33 |
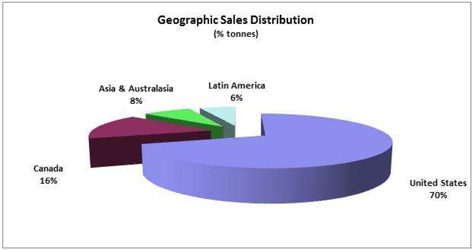
The 2012 newsprint geographic sales distribution, based on sales volume, is depicted in the chart below:
| – | Sales volume increased by 58,800 tonnes due to increased newsprint production which offset lower directory production in 2012. |
| – | Average sales revenue declined $14 per tonne due to lower transaction prices, partially offset by the positive impact of the weaker Canadian dollar. |
| – | Average delivered cash costs decreased $29 per tonne due to reduced cost of maintenance, labour, fibre, SG&A and property taxes, partially offset by higher electric power costs. |
Pulp
| (In millions of dollars, except where otherwise stated) | | 20122 3 | | | 20112 | | | 20102 | |
| Sales | | $ | 204.5 | | | $ | 248.0 | | | $ | 225.0 | |
| Operating earnings (loss) | | | (15.5 | ) | | | (70.2 | ) | | | 22.4 | |
| Depreciation and amortization | | | 2.1 | | | | 15.1 | | | | 14.3 | |
| Adjusted EBITDA1 | | | (13.4 | ) | | | 28.4 | | | | 36.7 | |
| – before restructuring costs1 | | | (11.8 | ) | | | 29.5 | | | | 37.7 | |
| Adjusted EBITDA margin1 | | | (6.6 | )% | | | 11.5 | % | | | 16.3 | % |
| – before restructuring costs1 | | | (5.8 | )% | | | 11.9 | % | | | 16.8 | % |
| | | | | | | | | | | | | |
| (In thousands of tonnes) | | | | | | | | | | | | |
| Sales | | | 324.8 | | | | 308.5 | | | | 276.6 | |
| Production | | | 318.0 | | | | 315.0 | | | | 273.3 | |
| 1 | Refer to section 13,Non-GAAP measures. |
| 2 | Numbers exclude the Snowflake mill’s results from operations which have been reclassified as discontinued operations in the consolidated statements of earnings (loss) in the annual consolidated financial statements for the year ended December 31, 2012. |
| 3 | We completed our restructuring under the CCAA proceedings on September 13, 2012 and adopted fresh start accounting in accordance with FASB ASC 852 on September 30, 2012. Segmented results for 2012 include results for nine months preceding the adoption of fresh start accounting and three months subsequent to adoption. Reported sales and adjusted EBITDA were relatively unaffected, as the company’s physical operations were not impacted by the financial recapitalization |
| 34 | CATALYST PAPER 2012 ANNUAL REPORT |
segment overview
Global shipments of NBSK pulp increased by 3% in 2012 compared to prior year shipments. There was a rapid decline in pulp prices in 2012 due to excess inventory and weak market conditions in China. The average NBSK benchmark price for China declined to US$630 per tonne in the third quarter before recovering moderately to US$662 per tonne in Q4. The average benchmark price for the year of US$667 per tonne was 20% lower than 2011.
Operational performance
The following chart summarizes the operating performance of our pulp segment:
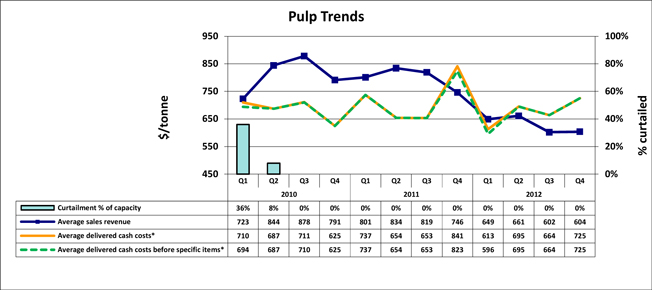
| * | Average delivered cash costs per tonne consist of cost of sales, excluding depreciation and amortization, and including the impact of SG&A and restructuring costs. Average delivered cash costs per tonne before specific items consist of cost of sales, excluding depreciation and amortization, and including the impact of SG&A, but excluding the impact of restructuring costs. |
| CATALYST PAPER 2012 ANNUAL REPORT | 35 |
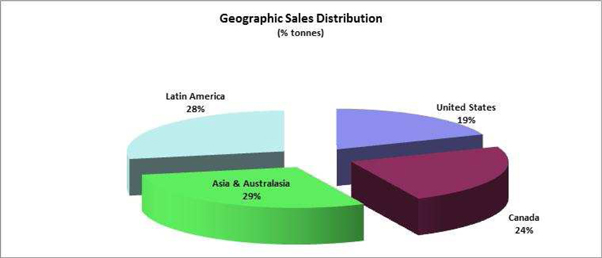
The primary market for our market pulp is Asia. The 2012 pulp geographic sales distribution, based on sales volume, is depicted in the chart below:
| – | Sales volume increased by 16,300 tonnes due to the inclusion of an 8,000 tonne shipment in current year sales that was delayed in December 2011 and slightly higher production in 2012. |
| – | Average sales revenue decreased by $174 per tonne due to lower average transaction prices, partially offset by the positive impact of a weaker Canadian dollar. Weak pulp prices in 2012 reflect soft demand and excess inventory in China. |
| – | Average delivered cash costs decreased by $42 per tonne due to lower fibre, SG&A and labour costs, partially offset by increased cost of chemicals. |
| 36 | CATALYST PAPER 2012 ANNUAL REPORT |
| 6 | CONSOLIDATED AND SEGMENTED RESULTS - QUARTERLY |
Selected quarterly financial information
| (In millions of dollars, | | 2012 | | | 2011 | |
| except where otherwise stated) | | TOTAL3 | | | Q4 | | | Q3 | | | Q2 | | | Q1 | | | TOTAL | | | Q4 | | | Q3 | | | Q2 | | | Q1 | |
| Sales2 | | $ | 1,058.2 | | | $ | 260.5 | | | $ | 265.7 | | | $ | 264.8 | | | $ | 267.2 | | | $ | 1,079.7 | | | $ | 272.2 | | | $ | 292.2 | | | $ | 257.4 | | | $ | 257.9 | |
| Operating earnings (loss)2 | | | 19.1 | | | | (5.7 | ) | | | 5.9 | | | | 9.3 | | | | 9.6 | | | | (704.5 | ) | | | (686.5 | ) | | | 5.1 | | | | (17.4 | ) | | | (5.7 | ) |
| Depreciation and amortization2 | | | 36.3 | | | | 12.9 | | | | 7.9 | | | | 7.7 | | | | 7.8 | | | | 105.5 | | | | 30.9 | | | | 25.5 | | | | 24.7 | | | | 24.4 | |
| Adjusted EBITDA1 2 | | | 55.4 | | | | 7.2 | | | | 13.8 | | | | 17.0 | | | | 17.4 | | | | 62.8 | | | | 6.9 | | | | 30.2 | | | | 7.0 | | | | 18.7 | |
| – before restructuring costs1 2 | | | 60.7 | | | | 7.2 | | | | 14.0 | | | | 16.9 | | | | 22.6 | | | | 68.7 | | | | 12.8 | | | | 30.2 | | | | 7.0 | | | | 18.7 | |
| Net earnings (loss) attributable to the company | | | 583.2 | | | | (35.2 | ) | | | 655.7 | | | | (11.7 | ) | | | (25.6 | ) | | | (974.0 | ) | | | (708.0 | ) | | | (205.7 | ) | | | (47.4 | ) | | | (12.9 | ) |
| – before specific items1 | | | (37.8 | ) | | | (15.7 | ) | | | (7.5 | ) | | | (5.0 | ) | | | (9.6 | ) | | | (126.3 | ) | | | (41.7 | ) | | | (14.1 | ) | | | (46.9 | ) | | | (23.6 | ) |
| Adjusted EBITDA margin1 2 | | | 5.2 | % | | | 2.8 | % | | | 5.2 | % | | | 6.4 | % | | | 6.5 | % | | | 5.8 | % | | | 2.5 | % | | | 10.3 | % | | | 2.7 | % | | | 7.3 | % |
| – before restructuring costs1 2 | | | 5.7 | % | | | 2.8 | % | | | 5.3 | % | | | 6.4 | % | | | 8.5 | % | | | 6.4 | % | | | 4.7 | % | | | 10.3 | % | | | 2.7 | % | | | 7.3 | % |
| Net earnings (loss) per share attributable to the company’s common shareholders (in dollars) | | | | | | | | | | | | | | | | | | | | | | | | | | | | | | | | | | | | | | | | |
| – basic and diluted from continuing operations4 | | $ | 41.65 | | | $ | (1.55 | ) | | $ | 1.73 | | | $ | (0.03 | ) | | $ | (0.07 | ) | | $ | (2.04 | ) | | $ | (1.81 | ) | | $ | (0.13 | ) | | $ | (0.08 | ) | | $ | (0.02 | ) |
| – basic and diluted from discontinued operations4 | | | (1.15 | ) | | | (0.89 | ) | | | (0.01 | ) | | | 0.00 | | | | 0.00 | | | | (0.51 | ) | | | (0.04 | ) | | | (0.41 | ) | | | (0.05 | ) | | | (0.01 | ) |
| – before specific items1 4 | | | (2.62 | ) | | | (1.09 | ) | | | (0.02 | ) | | | (0.01 | ) | | | (0.03 | ) | | | (0.33 | ) | | | (0.11 | ) | | | (0.04 | ) | | | (0.12 | ) | | | (0.06 | ) |
| | | | | | | | | | | | | | | | | | | | | | | | | | | | | | | | | | | | | | | | | |
| (In thousands of tonnes) | | | | | | | | | | | | | | | | | | | | | | | | | | | | | | | | | | | | | | | | |
| Sales (000 tonnes) | | | | | | | | | | | | | | | | | | | | | | | | | | | | | | | | | | | | | | | | |
| Specialty printing papers2 | | | 812.6 | | | | 207.4 | | | | 207.6 | | | | 202.9 | | | | 194.7 | | | | 837.5 | | | | 226.6 | | | | 218.9 | | | | 193.2 | | | | 198.8 | |
| Newsprint2 | | | 264.0 | | | | 66.2 | | | | 67.8 | | | | 67.0 | | | | 63.0 | | | | 205.2 | | | | 46.3 | | | | 51.9 | | | | 55.7 | | | | 51.3 | |
| Total paper2 | | | 1,076.6 | | | | 273.6 | | | | 275.4 | | | | 269.9 | | | | 257.7 | | | | 1,042.7 | | | | 272.9 | | | | 270.8 | | | | 248.9 | | | | 250.1 | |
| Pulp2 | | | 324.8 | | | | 74.0 | | | | 81.2 | | | | 76.5 | | | | 93.1 | | | | 308.5 | | | | 61.6 | | | | 92.2 | | | | 78.4 | | | | 76.3 | |
| Total sales2 | | | 1,401.4 | | | | 347.6 | | | | 356.6 | | | | 346.4 | | | | 350.8 | | | | 1,351.2 | | | | 334.5 | | | | 363.0 | | | | 327.3 | | | | 326.4 | |
| Production (000 tonnes) | | | | | | | | | | | | | | | | | | | | | | | | | | | | | | | | | | | | | | | | |
| Specialty printing papers2 | | | 805.5 | | | | 192.8 | | | | 206.5 | | | | 206.3 | | | | 199.9 | | | | 842.0 | | | | 225.6 | | | | 219.0 | | | | 191.6 | | | | 205.8 | |
| Newsprint2 | | | 265.1 | | | | 65.3 | | | | 67.3 | | | | 68.4 | | | | 64.1 | | | | 208.1 | | | | 49.7 | | | | 48.1 | | | | 55.4 | | | | 54.9 | |
| Total paper2 | | | 1,070.6 | | | | 258.1 | | | | 273.8 | | | | 274.7 | | | | 264.0 | | | | 1,050.1 | | | | 275.3 | | | | 267.1 | | | | 247.0 | | | | 260.7 | |
| Pulp2 | | | 318.0 | | | | 75.2 | | | | 79.6 | | | | 77.7 | | | | 85.5 | | | | 315.0 | | | | 73.5 | | | | 86.7 | | | | 83.5 | | | | 71.3 | |
| Total production2 | | | 1,388.6 | | | | 333.3 | | | | 353.4 | | | | 352.4 | | | | 349.5 | | | | 1,365.1 | | | | 348.8 | | | | 353.8 | | | | 330.5 | | | | 332.0 | |
| Common shares (millions) | | | | | | | | | | | | | | | | | | | | | | | | | | | | | | | | | | | | | | | | |
| At period-end | | | 14.5 | | | | 14.5 | | | | 14.4 | | | | 381.9 | | | | 381.9 | | | | 381.9 | | | | 381.9 | | | | 381.9 | | | | 381.8 | | | | 381.8 | |
| Weighted average | | | 14.4 | | | | 14.4 | | | | 381.9 | | | | 381.9 | | | | 381.9 | | | | 381.9 | | | | 381.9 | | | | 381.9 | | | | 381.8 | | | | 381.8 | |
| 1 | Refer to section 13, Non-GAAP measures. |
| 2 | Numbers exclude the Snowflake mill’s results from operations which have been reclassified as discontinued operations in the consolidated statements of earnings (loss) in the annual consolidated financial statements for the year ended December 31, 2012. |
| 3 | We completed our restructuring under the CCAA proceedings on September 13, 2012 and adopted fresh start accounting in accordance with FASB ASC 852 on September 30, 2012. The total column for 2012 therefore includes results for nine months preceding the adoption of fresh start accounting and three months subsequent to adoption. Reported sales and adjusted EBITDA were relatively unaffected, as the company’s physical operations were not impacted by the financial recapitalization. |
| 4 | Earnings per share data for periods prior to September 30, 2012 were based on our weighted average common shares outstanding prior to emergence from the CCAA proceedings. These shares were cancelled on September 30, 2012. Earnings per share data for periods ending on and subsequent to September 30, 2012 were based on our weighted average common shares issues pursuant to our reorganization under CCAA. |
| CATALYST PAPER 2012 ANNUAL REPORT | 37 |
Summary of selected segmented quarterly financial information
| (In millions of dollars, | | 2012 | | | 2011 | |
| except where otherwise stated) | | TOTAL3 4 | | | Q43 | | | Q33 | | | Q23 | | | Q13 | | | TOTAL3 | | | Q43 | | | Q33 | | | Q23 | | | Q13 | |
| Specialty printing papers | | | | | | | | | | | | | | | | | | | | | | | | | | | | | | | | | | | | | | | | |
| Sales | | $ | 675.6 | | | $ | 171.8 | | | $ | 171.2 | | | $ | 169.4 | | | $ | 163.2 | | | $ | 690.4 | | | $ | 193.7 | | | $ | 180.3 | | | $ | 154.7 | | | $ | 161.7 | |
| Operating earnings (loss) | | | 20.5 | | | | 1.2 | | | | 8.5 | | | | 7.2 | | | | 3.6 | | | | (565.1 | ) | | | (522.7 | ) | | | (6.9 | ) | | | (27.7 | ) | | | (7.8 | ) |
| Depreciation and amortization | | | 30.1 | | | | 11.2 | | | | 6.4 | | | | 6.2 | | | | 6.3 | | | | 81.3 | | | | 25.0 | | | | 19.4 | | | | 18.6 | | | | 18.3 | |
| Adjusted EBITDA1 | | | 50.6 | | | | 12.4 | | | | 14.9 | | | | 13.4 | | | | 9.9 | | | | 23.4 | | | | 9.9 | | | | 12.3 | | | | (9.3 | ) | | | 10.5 | |
| – before restructuring costs1 | | | 53.5 | | | | 12.4 | | | | 15.1 | | | | 13.3 | | | | 12.7 | | | | 27.4 | | | | 13.9 | | | | 12.3 | | | | (9.3 | ) | | | 10.5 | |
| Adjusted EBITDA margin1 | | | 7.5 | % | | | 7.2 | % | | | 8.7 | % | | | 7.9 | % | | | 6.1 | % | | | 3.4 | % | | | 5.1 | % | | | 6.8 | % | | | (6.0 | )% | | | 6.5 | % |
| – before restructuring costs1 | | | 7.9 | % | | | 7.2 | % | | | 8.8 | % | | | 7.9 | % | | | 7.8 | % | | | 4.0 | % | | | 7.2 | % | | | 6.8 | % | | | (6.0 | )% | | | 6.5 | % |
| Sales (000 tonnes) | | | 812.6 | | | | 207.4 | | | | 207.6 | | | | 202.9 | | | | 194.7 | | | | 837.5 | | | | 226.6 | | | | 218.9 | | | | 193.2 | | | | 198.8 | |
| Production (000 tonnes) | | | 805.5 | | | | 192.8 | | | | 206.5 | | | | 206.3 | | | | 199.9 | | | | 842.0 | | | | 225.6 | | | | 219.0 | | | | 191.6 | | | | 205.8 | |
| Curtailment (000 tonnes)2 | | | 17.6 | | | | 12.1 | | | | – | | | | – | | | | 5.5 | | | | – | | | | – | | | | – | | | | – | | | | – | |
| | | | | | | | | | | | | | | | | | | | | | | | | | | | | | | | | | | | | | | | | |
| Newsprint | | | | | | | | | | | | | | | | | | | | | | | | | | | | | | | | | | | | | | | | |
| Sales | | $ | 178.1 | | | $ | 44.0 | | | $ | 45.6 | | | $ | 44.9 | | | $ | 43.6 | | | $ | 141.3 | | | $ | 32.4 | | | $ | 36.5 | | | $ | 37.3 | | | $ | 35.1 | |
| Operating earnings (loss) | | | 14.1 | | | | 2.4 | | | | 3.1 | | | | 5.4 | | | | 3.2 | | | | (69.2 | ) | | | (70.9 | ) | | | 0.9 | | | | (0.1 | ) | | | 0.9 | |
| Depreciation and amortization | | | 4.1 | | | | 1.4 | | | | 0.9 | | | | 0.8 | | | | 1.0 | | | | 9.1 | | | | 2.2 | | | | 2.0 | | | | 2.4 | | | | 2.5 | |
| Adjusted EBITDA1 | | | 18.2 | | | | 3.8 | | | | 4.0 | | | | 6.2 | | | | 4.2 | | | | 11.0 | | | | 2.7 | | | | 2.7 | | | | 2.2 | | | | 3.4 | |
| – before restructuring costs1 | | | 19.0 | | | | 3.8 | | | | 4.0 | | | | 6.2 | | | | 5.0 | | | | 11.8 | | | | 3.5 | | | | 2.7 | | | | 2.2 | | | | 3.4 | |
| Adjusted EBITDA margin1 | | | 10.2 | % | | | 8.6 | % | | | 8.8 | % | | | 13.8 | % | | | 9.6 | % | | | 7.8 | % | | | 8.3 | % | | | 7.4 | % | | | 5.9 | % | | | 9.7 | % |
| – before restructuring costs1 | | | 10.7 | % | | | 8.6 | % | | | 8.8 | % | | | 13.8 | % | | | 11.5 | % | | | 8.4 | % | | | 10.8 | % | | | 7.4 | % | | | 5.9 | % | | | 9.7 | % |
| Sales (000 tonnes) | | | 264.0 | | | | 66.2 | | | | 67.8 | | | | 67.0 | | | | 63.0 | | | | 205.2 | | | | 46.3 | | | | 51.9 | | | | 55.7 | | | | 51.3 | |
| Production (000 tonnes) | | | 265.1 | | | | 65.3 | | | | 67.3 | | | | 68.4 | | | | 64.1 | | | | 208.1 | | | | 49.7 | | | | 48.1 | | | | 55.4 | | | | 54.9 | |
| Curtailment (000 tonnes)2 | | | – | | | | – | | | | – | | | | – | | | | – | | | | 140.0 | | | | 35.3 | | | | 35.3 | | | | 34.9 | | | | 34.5 | |
| | | | | | | | | | | | | | | | | | | | | | | | | | | | | | | | | | | | | | | | | |
| Pulp | | | | | | | | | | | | | | | | | | | | | | | | | | | | | | | | | | | | | | | | |
| Sales | | $ | 204.5 | | | $ | 44.7 | | | $ | 48.9 | | | $ | 50.5 | | | $ | 60.4 | | | $ | 248.0 | | | $ | 46.1 | | | $ | 75.4 | | | $ | 65.4 | | | $ | 61.1 | |
| Operating earnings (loss) | | | (15.5 | ) | | | (9.3 | ) | | | (5.7 | ) | | | (3.3 | ) | | | 2.8 | | | | (70.2 | ) | | | (92.9 | ) | | | 11.1 | | | | 10.4 | | | | 1.2 | |
| Depreciation and amortization | | | 2.1 | | | | 0.3 | | | | 0.6 | | | | 0.7 | | | | 0.5 | | | | 15.1 | | | | 3.7 | | | | 4.1 | | | | 3.7 | | | | 3.6 | |
| Adjusted EBITDA1 | | | (13.4 | ) | | | (9.0 | ) | | | (5.1 | ) | | | (2.6 | ) | | | 3.3 | | | | 28.4 | | | | (5.7 | ) | | | 15.2 | | | | 14.1 | | | | 4.8 | |
| – before restructuring costs1 | | | (11.8 | ) | | | (9.0 | ) | | | (5.1 | ) | | | (2.6 | ) | | | 4.9 | | | | 29.5 | | | | (4.6 | ) | | | 15.2 | | | | 14.1 | | | | 4.8 | |
| Adjusted EBITDA margin1 | | | (6.6 | )% | | | (20.1 | )% | | | (10.4 | )% | | | (5.1 | )% | | | 5.5 | % | | | 11.5 | % | | | (12.4 | )% | | | 20.2 | % | | | 21.6 | % | | | 7.9 | % |
| – before restructuring costs1 | | | (5.8 | )% | | | (20.1 | )% | | | (10.4 | )% | | | (5.1 | )% | | | 8.1 | % | | | 11.9 | % | | | (10.0 | )% | | | 20.2 | % | | | 21.6 | % | | | 7.9 | % |
| Sales (000 tonnes) | | | 324.8 | | | | 74.0 | | | | 81.2 | | | | 76.5 | | | | 93.1 | | | | 308.5 | | | | 61.6 | | | | 92.2 | | | | 78.4 | | | | 76.3 | |
| Production (000 tonnes) | | | 318.0 | | | | 75.2 | | | | 79.6 | | | | 77.7 | | | | 85.5 | | | | 315.0 | | | | 73.5 | | | | 86.7 | | | | 83.5 | | | | 71.3 | |
| Curtailment (000 tonnes)2 | | | – | | | | – | | | | – | | | | – | | | | – | | | | – | | | | – | | | | – | | | | – | | | | – | |
| 1 | Refer to section 13,Non-GAAP measures. |
| 2 | Curtailment consists of downtime related to market demand. |
| 3 | Numbers exclude the Snowflake mill’s results from operations which have been reclassified as discontinued operations in the consolidated statements of earnings (loss) in the annual consolidated financial statements for the year ended December 31, 2012. |
| 4 | We completed our restructuring under the CCAA proceedings on September 13, 2012 and adopted fresh start accounting in accordance with FASB ASC 852 on September 30, 2012. The total column for 2012 therefore includes results for nine months preceding the adoption of fresh start accounting and three months subsequent to adoption. Reported sales and adjusted EBITDA were relatively unaffected, as the company’s physical operations were not impacted by the financial recapitalization |
| 38 | CATALYST PAPER 2012 ANNUAL REPORT |
Fourth quarter overview
North American paper demand was down in the fourth quarter compared to the third quarter for newsprint and directory while increasing for LWC and uncoated mechanical. Global pulp shipments declined compared to the previous quarter. Directory and uncoated mechanical benchmark prices remained stable quarter-over-quarter while benchmark prices increased for LWC to US$898 per short ton and for newsprint to US$618 per tonne. Benchmark prices for pulp recovered moderately in the fourth quarter to US$662 per tonne from US$630 per tonne in Q3.
Our fourth quarter results were adversely affected by the negative impact of a stronger Canadian dollar, a decline in pulp and paper sales volumes, and an increase in manufacturing costs partly due to higher maintenance spending. This was partly offset by higher average transaction prices for pulp and paper. Maintenance costs in the quarter included our annual maintenance shut on the batch digester and recovery boiler at Crofton pulp. We took a market curtailment over the holidays at the Powell River mill of approximately 12,000 tonnes to balance our production with our orders. We incurred a net loss from discontinued operations of $12.9 million in Q4 which included closure costs related to the discontinued Snowflake mill and legal and consulting fees related to the Snowflake sales effort.
Snowflake closure costs included a US$8.2 million increase to our estimated withdrawal liability from the PACE Industry Union-Management Pension Fund. This liability was triggered by the Snowflake closure which resulted in us no longer participating in this multi-employer pension plan. We had accrued US$3.5 million in the third quarter for this withdrawal liability which reflected the most recent estimate of our withdrawal liability based on the plan’s funding deficit as of December 31, 2008. We received a new liability calculation of US$11.7 million in the fourth quarter from the United Steelworkers (USW) Union based on the plan’s funding deficit as of December 31, 2010. The company is in the process of verifying the actuarial information used to calculate this estimated withdrawal liability from the Pension Fund. It is typical for such withdrawal liabilities to be paid over 20 years although confirmation of that payment schedule has not been confirmed.
We recorded a net loss attributable to the company of $35.2 million and a net loss attributable to the company before specific items of $15.7 million in Q4. This compared to net earnings attributable to the company of $655.7 million and a net loss attributable to the company before specific items of $7.5 million, respectively, in Q3. Specific items in Q4 included reorganization costs related to finalizing the creditor protection proceedings, closure costs related to Snowflake, restructuring costs related to the Snowflake sales effort, and a foreign exchange loss on the translation of U.S. dollar denominated debt. Significant specific items in the prior quarter included reorganization items related to the forgiveness of pre-petition debt and accounts payable on emergence from the CCAA proceedings and fair value adjustments to our assets and liabilities in accordance with the requirements of fresh start accounting, closure costs related to our discontinued Snowflake mill, and a foreign exchange gain on the translation of U.S. dollar denominated debt.
Both adjusted EBITDA and adjusted EBITDA before restructuring costs were $7.2 million in Q4 compared to $13.8 million and $14.0 million for Q3 respectively. Refer to section 13,Non-GAAP measures,for additional information on specific items in the reported financial results.
| CATALYST PAPER 2012 ANNUAL REPORT | 39 |
Consolidated Results of Operations
Sales
Q4 2012 vs. Q3 2012
Sales revenues decreased by 2% due to lower average transaction prices for newsprint and uncoated mechanical, reduced sales volumes for pulp and all paper segments except uncoated mechanical, and the negative impact of a stronger Canadian dollar, partially offset by higher average transaction prices for LWC, directory and pulp, and higher sales volumes for uncoated mechanical.
Q4 2012 vs. Q4 2011
Sales revenues declined by 4.3% due to the negative impact of a stronger Canadian dollar, lower average transaction prices for pulp and all paper segments excluding directory paper, and reduced sales volumes for uncoated mechanical and directory, partially offset by higher average transaction prices for directory paper and increased sales volumes for newsprint, LWC and pulp.
Adjusted EBITDA and adjusted EBITDA before Restructuring Costs
The following table provides variances between periods for EBITDA and EBITDA before restructuring costs:
| (In millions of dollars) | | Q3 20122 | | | Q4 20112 | |
| Adjusted EBITDAin comparative period1 | | $ | 13.8 | | | $ | 6.9 | |
| Specific items: restructuring costs | | | 0.2 | | | | 5.9 | |
| Adjusted EBITDAbefore restructuring costs in comparative period1 | | | 14.0 | | | | 12.8 | |
| Paper prices | | | 0.8 | | | | (2.2 | ) |
| Pulp prices | | | 0.4 | | | | (9.1 | ) |
| Impact of Canadian dollar | | | (0.2 | ) | | | (6.3 | ) |
| Volume and mix | | | (3.5 | ) | | | (6.2 | ) |
| Furnish mix and costs | | | 1.8 | | | | 8.2 | |
| Power and fuel costs | | | (2.5 | ) | | | (1.5 | ) |
| Labour costs | | | (0.5 | ) | | | 6.0 | |
| Maintenance costs | | | (7.3 | ) | | | (2.9 | ) |
| Lower of cost or market impact on inventory, net of inventory change | | | 3.2 | | | | 6.7 | |
| Selling, general and administrative | | | 0.3 | | | | 3.7 | |
| Other, net | | | 0.7 | | | | (2.0 | ) |
| Adjusted EBITDAbefore restructuring costs in the current period1 | | | 7.2 | | | | 7.2 | |
| Specific items: restructuring costs | | | – | | | | – | |
| Adjusted EBITDAin the current period1 | | $ | 7.2 | | | $ | 7.2 | |
| 1 | Refer to section 13,Non-GAAP measures. |
| 2 | Numbers exclude the Snowflake mill’s results which have been reclassified as discontinued operations in the consolidated statements of earnings (loss) in the annual consolidated financial statements for the year ended December 31, 2012. |
| 40 | CATALYST PAPER 2012 ANNUAL REPORT |
Operating Earnings (Loss)
Q4 2012 vs. Q3 2012
Operating earnings decreased by $11.6 million primarily due to a decrease in adjusted EBITDA of $6.6 million, and increased depreciation of $5.0 million. In accordance with fresh start accounting, we adjusted the book value of our fixed assets on September 30, 2012 to fair value, which resulted in an increase to the depreciable base of these assets.
Q4 2012 vs. Q4 2011
Operating earnings increased by $680.8 million due to an impairment charge incurred in Q4 2011 of $662.5 million, higher adjusted EBITDA of $0.3 million and reduced depreciation of $18.0 million.
Net Earnings (Loss) Attributable to the Company
Q4 2012 vs. Q3 2012
Net earnings attributable to the company decreased $690.9 million primarily due to after-tax reorganization costs of $3.2 million compared to a net reorganization credit after tax of $685.3 million in the third quarter related to our emergence from creditor protection, a reduction in after-tax operating earnings of $11.6 million, an increase in loss from discontinued operations, net of tax of $7.8 million, and an after-tax foreign exchange loss on the translation of long-term debt of $3.2 million compared to an after-tax gain of $25.2 million in the third quarter, partially offset by lower after-tax interest expense of $2.9 million, an increase in other income after tax of $8.3 million, and an after-tax increase in net earnings attributable to non-controlling interest of $34.2 million.
Q4 2012 vs. Q4 2011
Net earnings attributable to the company increased by $672.8 million primarily due to increased after-tax operating earnings of $680.8 million, a decrease in after-tax interest expense of $6.1 million, a decrease in after-tax loss from discontinued operations of $2.1 million, and an increase in other income after tax of $4.2 million, partially offset by an after-tax foreign exchange loss on the translation of long-term debt of $3.2 million compared to an after-tax gain of $14.0 million in Q4 2011.
Operational performance – Specialty Printing Papers
Q4 2012 vs. Q3 2012
| · | Sales volume remained flat with increased shipments of uncoated mechanical being offset by lower demand for directory and LWC. |
| · | Average sales revenue increased $3 per tonne, reflecting an increase in average transaction prices for LWC and directory, partially offset by lower average transaction prices for uncoated mechanical and the negative impact of a stronger Canadian dollar. |
| · | Average delivered cash costs increased by $16 per tonne due to increases in the cost of maintenance and steam fuel, partially offset by lower fibre cost. |
| CATALYST PAPER 2012 ANNUAL REPORT | 41 |
Q4 2012 vs. Q4 2011
| · | Sales volume decreased by 19,200 tonnes due to lower sales volumes for directory and uncoated mechanical, partially offset by higher sales volumes for coated paper. |
| · | Average sales revenue decreased $27 per tonne, reflecting lower average transaction prices for LWC and uncoated mechanical and the negative impact of a stronger Canadian dollar, partially offset by higher average transaction prices for directory paper. |
| · | Average delivered cash costs decreased $43 per tonne primarily due to lower labour, fibre, kraft and SG&A costs, and the incurrence of restructuring costs in Q4 2011, partially offset by higher electric power cost and maintenance spending. |
Operational performance – Newsprint
Q4 2012 vs. Q3 2012
| · | Sales volumes decreased by 1,600 tonnes in Q4. |
| · | Average sales revenue per tonne declined $6 per tonne compared to Q3 due to lower average transaction prices and unfavourable exchange rate movement. |
| · | Average delivered cash costs decreased $5 per tonne due to lower fibre and distribution costs, partially offset by increases in other furnish costs and material and services cost. |
Q4 2012 vs. Q4 2011
| · | Sales volumes increased by 19,900 tonnes due to increased newsprint production which offset lower directory production in 2012. |
| · | Average sales revenue decreased $35 per tonne due to lower average transaction prices and the negative impact of a stronger Canadian dollar. |
| · | Average delivered cash costs decreased $33 per tonne primarily due to lower fibre and SG&A costs, and the incurrence of restructuring costs in Q4 2011, partially offset by increased cost of maintenance and fuel. |
Operational performance – Pulp
Q4 2012 vs. Q3 2012
| · | Sales volume decreased by 7,200 tonnes in the fourth quarter |
| · | Average sales revenue increased by $2 per tonne due to a moderate recovery in average transaction prices in the fourth quarter, partially offset by the negative impact of a stronger Canadian dollar. |
| · | Average delivered cash costs increased $61 per tonne due to increased maintenance spending and labour, and increases to the cost of fuel, partially offset by lower fibre cost. Planned maintenance in the quarter included our annual maintenance shut on the batch digester and recovery boiler. |
| 42 | CATALYST PAPER 2012 ANNUAL REPORT |
Q4 2012 vs. Q4 2011
| · | Sales volume increased by 12,400 tonnes mostly due to a delayed shipment in December 2011. |
| · | Average sales revenue decreased $142 per tonne due to significantly lower average transaction prices and the negative impact of a stronger Canadian dollar. |
| · | Average delivered cash costs decreased by $116 per tonne due tolower fibre and labour costs, and the incurrence of restructuring costs in Q4 2011, partially offset by increased cost of maintenance, chemicals and fuel. |
| CATALYST PAPER 2012 ANNUAL REPORT | 43 |
The following table highlights the significant changes between the consolidated balance sheets as at December 31, 2012 and December 31, 2011:
| (In millions of dollars) | | 2012 | | | 2011 | | | Variance | | | Comments |
| Working capital | | $ | 151.4 | | | $ | 152.4 | | | $ | (1.0 | ) | | Decrease in cash and cash equivalents of $8.5 million, accounts receivable of $20.9 million, inventories of $21.9 million, and prepaids of $11.1 million were offset by restricted cash of $0.7 million in 2012 and a decrease in accounts payable and accrued liabilities of $60.7 million. Working capital requirements have generally been reduced by the closure of the Snowflake mill. The curtailment at the Powell River mill in December resulted in reduced inventories, and trade accounts payable. Trade accounts receivable decreased due to improved collections and the impact of the Powell River curtailment on sales. The reduction in accounts payable and accrued liabilities reflects the forgiveness of pre-petition payables and accrued interest on pre-petition debt pursuant to our reorganization under the Plan. |
| Assets held for sale | | | 34.3 | | | | – | | | | 34.3 | | | Assets classified as held for sale in 2012 included the assets of Elk Falls, Snowflake, Poplars land, the Port Alberni wastewater lagoon, the mortgage receivable from PRSC Limited Partnership and our interest in PRSC Land Development Ltd. |
| Property, plant and equipment | | | 611.6 | | | | 386.3 | | | | 225.3 | | | Increase mainly due to the adjustment of property, plant and equipment to fair value in accordance with the requirements of fresh start accounting on the valuation date of September 30, 2012. |
| Goodwill | | | 56.7 | | | | – | | | | 56.7 | | | Goodwill recognized in accordance with the requirements of fresh start accounting at the amount that our enterprise value exceeded the fair value of identified assets and liabilities on the valuation date of September 30, 2012. |
| Other assets | | | 11.0 | | | | 24.4 | | | | (13.4 | ) | | Decrease mainly due to the reclassification of the mortgage receivable from PRSC Limited Partnership of $2.8 million and Snowflake’s long-term receivables of $1.5 million to assets held for sale, amortization of deferred financing costs of $2.2 million, a reduction in derivative financial instruments of $2.5 million, a decrease to deferred mill-related charges of $2.3 million, and the accelerated recognition of deferred financing costs on our pre-petition debt of $10.2 million, partially offset by the capitalization of debt issuance cost related to our new debt of $9.3 million. |
| Liabilities associated with assets held for sale | | | 15.2 | | | | – | | | | 15.2 | | | Accounts payable and other liabilities of the Snowflake mill which was classified as held for sale in 2012. |
| Total debt | | | 428.6 | | | | 842.3 | | | | (413.7 | ) | | Our debt was reduced by approximately US$390 million pursuant to our reorganization under the Plan, and the withdrawn balance of $24.0 million on our new ABL Facility as of December 31, 2012 is significantly lower than the $48.0 million withdrawn on the former ABL Facility in 2011. |
| Employee future benefits | | | 289.7 | | | | 305.7 | | | | (16.0 | ) | | Decrease reflects the elimination of extended health benefits of retirees pursuant to the reorganization under the CCAA and elimination of the company’s projected benefit obligation under the Snowflake Salaried Retiree Medical and Life Insurance Plan subsequent to the closure of the Snowflake mill. |
| Other long-term obligations | | | 8.9 | | | | 19.2 | | | | (10.3 | ) | | Decrease due primarily to the repudiation of the contractual lease obligation at PRD which was closed in 2010, and the de-recognition of a landfill rehabilitation obligation at our Elk Falls site in accordance with the requirements of fresh start accounting. |
| Deferred income taxes and deferred credits | | | – | | | | 13.2 | | | | (13.2 | ) | | In accordance with the requirements of fresh start accounting, we concluded that our deferred credits had negligible fair value as of the valuation date of September 30, 2012. |
| 44 | CATALYST PAPER 2012 ANNUAL REPORT |
| 8 | LIQUIDITY AND CAPITAL RESOURCES |
Selected annual financial information
| (In millions of dollars, except where otherwise stated) | | 20122 | | | 2011 | | | 2010 | |
Cash flows provided (used) by operations
before changes in non-cash working capital | | $ | (32.0 | ) | | $ | (51.5 | ) | | $ | (31.6 | ) |
| Changes in non-cash working capital | | | 40.1 | | | | (20.0 | ) | | | (12.5 | ) |
| Cash flows provided (used) by | | | | | | | | | | | | |
| Operations | | | 8.1 | | | | (71.5 | ) | | | (44.1 | ) |
| Investing activities | | | (9.6 | ) | | | (17.7 | ) | | | (4.5 | ) |
| Financing activities | | | (5.1 | ) | | | 18.9 | | | | 60.9 | |
| Capital spending | | | 22.6 | | | | 19.7 | | | | 11.2 | |
| Depreciation and amortization | | | 36.3 | | | | 112.4 | | | | 119.3 | |
| Impairment and other closure costs | | | 11.5 | | | | 823.6 | | | | 294.5 | |
| Capital spending as % of depreciation and amortization | | | 62 | % | | | 18 | % | | | 9 | % |
| Net debt to net capitalization at period-end1 | | | 78 | % | | | 366 | % | | | 63 | % |
| 1 | Net debt ratio equals net debt (total debt less cash) divided by net capitalization (shareholders’ equity attributable to the company and total debt less cash). |
| 2 | We completed our restructuring under the CCAA proceedings on September 13, 2012 and adopted fresh start accounting in accordance with FASB ASC 852 on September 30, 2012. Cash flow information for 2012 therefore includes results for nine months preceding the adoption of fresh start accounting and three months subsequent to adoption. |
Selected quarterly financial information
| | | 2012 | | | 2011 | |
(In millions of dollars,
except where otherwise stated) | | TOTAL2 | | | Q4 | | | Q3 | | | Q2 | | | Q1 | | | TOTAL | | | Q4 | | | Q3 | | | Q2 | | | Q1 | |
| Cash flows provided (used) by operations before changes in non-cash working capital | | $ | (32.0 | ) | | $ | (12.8 | ) | | $ | (15.8 | ) | | $ | (3.2 | ) | | $ | (0.2 | ) | | $ | (51.5 | ) | | $ | (21.3 | ) | | $ | 5.7 | | | $ | (30.1 | ) | | $ | (5.8 | ) |
| Changes in non-cash working capital | | | 40.1 | | | | 64.9 | | | | (5.3 | ) | | | (5.0 | ) | | | (14.5 | ) | | | (20.0 | ) | | | 17.3 | | | | (44.5 | ) | | | 14.4 | | | | (7.2 | ) |
| Cash flows provided (used) by | | | | | | | | | | | | | | | | | | | | | | | | | | | | | | | | | | | | | | | | |
| Operations | | | 8.1 | | | | 52.1 | | | | (21.1 | ) | | | (8.2 | ) | | | (14.7 | ) | | | (71.5 | ) | | | (4.0 | ) | | | (38.8 | ) | | | (15.7 | ) | | | (13.0 | ) |
| Investing activities | | | (9.6 | ) | | | (6.2 | ) | | | (0.6 | ) | | | 14.2 | | | | (17.0 | ) | | | (17.7 | ) | | | (5.0 | ) | | | (4.9 | ) | | | (5.2 | ) | | | (2.6 | ) |
| Financing activities | | | (5.1 | ) | | | (40.0 | ) | | | 16.5 | | | | (7.5 | ) | | | 25.9 | | | | 18.9 | | | | 16.3 | | | | 31.3 | | | | (2.7 | ) | | | (26.0 | ) |
| Capital spending | | | 22.6 | | | | 10.4 | | | | 7.3 | | | | 3.0 | | | | 1.9 | | | | 19.7 | | | | 6.2 | | | | 5.6 | | | | 5.6 | | | | 2.3 | |
| Depreciation and amortization | | | 36.3 | | | | 12.9 | | | | 7.9 | | | | 7.6 | | | | 7.9 | | | | 112.4 | | | | 30.8 | | | | 27.8 | | | | 27.0 | | | | 26.8 | |
| Impairment | | | 11.5 | | | | 8.2 | | | | 3.3 | | | | – | | | | – | | | | 823.6 | | | | 673.3 | | | | 150.6 | | | | (0.3 | ) | | | – | |
| Capital spending as % of depreciation and amortization | | | 62 | % | | | 81 | % | | | 92 | % | | | 39 | % | | | 24 | % | | | 18 | % | | | 20 | % | | | 20 | % | | | 21 | % | | | 9 | % |
| Net debt to net capitalization at period-end1 | | | 78 | % | | | 78 | % | | | 76 | % | | | 417 | % | | | 375 | % | | | 366 | % | | | 366 | % | | | 84 | % | | | 67 | % | | | 64 | % |
| 1 | Net debt ratio equals net debt (total debt less cash) divided by net capitalization (shareholders’ equity attributable to the company and total debt less cash). |
| 2 | We completed our restructuring under the CCAA proceedings on September 13, 2012 and adopted fresh start accounting in accordance with FASB ASC 852 on September 30, 2012. The total column for 2012 therefore includes results for nine months preceding the adoption of fresh start accounting and three months subsequent to adoption. |
Our principal cash requirements are for ongoing operating costs, working capital fluctuations, and capital expenditures as well as interest and principal payments on debt. We anticipate that future operating cash requirements can be funded through internally generated cash flows from operations and advances under our ABL Facility. Additional details are provided in “Capital resources” and in “Debt” below and in section 17,Risks and uncertainties, in the discussion on “Subsequent to our restructuring under the CCAA proceedings, we may not be able to generate sufficient cash to service all of our indebtedness and may be forced to take other actions to satisfy our obligations under our indebtedness, which may not be successful”.
| CATALYST PAPER 2012 ANNUAL REPORT | 45 |
Operating activities
Cash flows from operating activities in 2012 increased $79.6 million compared to 2011 due to a decrease in working capital requirements, interest paid, and net operating cash used by discontinued operations, partially offset by a decrease in adjusted EBITDA and reorganization costs paid under the CCAA proceedings. The $40.1 million change in non-cash working capital in the current year consisted of a decrease in accounts receivable of $18.2 million, a decrease in inventories of $20.3 million, and a decrease in prepaids of $4.0 million, partially offset by a reduction in accounts payable and accrued liabilities of $2.4 million.
Investing activities
Cash used by investing activities decreased by $8.1 million compared to the previous year. The decrease was largely due to increased proceeds from the sale of property, plant and equipment of $11.1 million, partially offset by increased fixed asset additions of $2.9 million. Asset sales in 2012 included Poplars land, assets of PRD, and scrap metal and equipment components of the Elk Falls site. Fixed asset additions in the current year related primarily to maintenance of the business.
Capital spending in 2012 was higher than 2011 levels especially as it related to maintenance of the business. The components are provided below:
| (In millions of dollars) | | 2012 | | | 2011 | |
| Safety | | $ | 1.2 | | | $ | 0.6 | |
| Environment | | | 3.1 | | | | 2.5 | |
| Maintenance of business | | | 16.1 | | | | 12.9 | |
| Profit adding | | | 2.2 | | | | 3.7 | |
| Total1 | | $ | 22.6 | | | $ | 19.7 | |
| 1 | Included $5.8 million related to PREI (2011 - $0.9 million) |
Financing activities
Cash used by financing activities in 2012 increased by $24.0 million compared to 2011. This was primarily due to a net repayment on the new ABL Facility of $24 million compared to a net draw on the former ABL Facility of $48.0 million in 2011, and an increase in financing costs paid of $10.7 million compared to the prior year, partially offset by the issuance of Exit Notes for net proceeds of $33.1 million, and the redemption of US$26.0 million 8.625% notes in the prior year.
| 46 | CATALYST PAPER 2012 ANNUAL REPORT |
Capital resources
Our capital resources include cash on hand and availability on our ABL Facility, with total liquidity at period-end summarized in the following table.
| | | ABL Facility | | | DIP Facility | | | ABL Facility | |
| | | 2012 | | | 2012 | | | 2011 | |
| (In millions of dollars) | | Q4 | | | Q3 | | | Q2 | | | Q1 | | | Q4 | | | Q3 | | | Q2 | | | Q1 | |
| Borrowing base1 | | $ | 125.2 | | | $ | 164.0 | | | $ | 159.6 | | | $ | 142.1 | | | $ | 151.8 | | | $ | 167.3 | | | $ | 134.3 | | | $ | 174.1 | |
| Letters of credit | | | (22.3 | ) | | | (17.8 | ) | | | (19.6 | ) | | | (17.8 | ) | | | (32.2 | ) | | | (27.7 | ) | | | (28.1 | ) | | | (25.5 | ) |
| Amount drawn, net | | | (24.0 | ) | | | (64.0 | ) | | | (70.5 | ) | | | (77.8 | ) | | | (48.0 | ) | | | (31.5 | ) | | | – | | | | – | |
| Minimum excess availability | | | – | | | | – | | | | (21.9 | )3 | | | – | | | | – | | | | – | | | | – | | | | (35.0 | ) |
| Available to be drawn2 | | | 78.9 | | | | 82.2 | | | | 47.6 | | | | 46.5 | | | | 71.6 | | | | 108.1 | | | | 106.2 | | | | 113.6 | |
| Cash on hand4 | | | 18.5 | | | | 12.6 | | | | 17.8 | | | | 19.3 | | | | 25.1 | | | | 17.8 | | | | 30.2 | | | | 53.8 | |
| Restricted cash5 | | | 0.5 | | | | 2.0 | | | | 6.4 | | | | 2.1 | | | | – | | | | – | | | | – | | | | – | |
| Total liquidity | | $ | 97.9 | | | $ | 96.8 | | | $ | 71.8 | | | $ | 67.9 | | | $ | 96.7 | | | $ | 125.9 | | | $ | 136.4 | | | $ | 167.4 | |
| 1 | The borrowing base at December 31, 2012 includes a reserve of $1.1 million for pension, $2.0 million for creditor insurance deductibles, $2.3 million for landlord waivers, $1.3 million for employee source deductions, $0.3 million related to WCB, and $0.2 million for purchasing card reserve. |
| 2 | Our ABL Facility is subject to certain financial covenants as disclosed in our annual consolidated financial statements for the year ended December 31, 2012 in note 18,Long-term debt. |
| 3 | The DIP Facility was subject to an excess availability condition as disclosed in our annual consolidated financial statements for the year ended December 31, 2012 in note 18,Long-term debt. |
| 4 | Cash on hand consists of $16.6 million per our consolidated balance sheet and $1.9 million included in assets held for sale. |
| 5 | Restricted cash consists of $0.5 million of cash held in trust. |
Our total liquidity increased by $1.2 million in 2012 from 2011 due to a reduction in the amount drawn on our ABL Facility and a reduction in letters of credit, partially offset by a reduced borrowing base on the ABL Facility and reduced cash on hand. The borrowing base decreased primarily due to a reduction in accounts receivable as of December 31, 2012. The reduction in cash on hand was due primarily to the payment of restructuring costs of $5.3 million, reorganization costs of $37.5 million incurred during the CCAA proceedings, and the payment of debt issuance cost of $9.3 million in the third quarter, partially offset by a net reduction in non-cash working capital of $40.1 million. The reduction in working capital was due primary to a reduction in inventory resulting from the closure of the Snowflake mill and curtailment at the Powell River mill in December, and a reduction in accounts receivable due to the Snowflake closure, improved collections and reduced sales in the second half of December.
For information related to the computation of our borrowing base and availability on the ABL Facility, refer to our annual consolidated financial statements for the year ended December 31, 2012 note 18,Long-term debt.
At March 5, 2013 we had 14,527,571 common shares issued and outstanding. All of the company’s former common shares and stock options were cancelled on September 13, 2012. The company’s new common shares have no par value and an unlimited number of shares are authorized for future issuance.
| CATALYST PAPER 2012 ANNUAL REPORT | 47 |
Debt
The following table illustrates the changes in our long-term debt for the year ended December 31, 2012:
ISSUE
| (In millions of dollars) | | January 1,
2012 | | | Net increase
(decrease) | | | Foreign
exchange | | | December 31,
2012 | |
| Recourse | | | | | | | | | | | | | | | | |
| Floating rate senior secured notes, due September 2016 (US$35.0 million) | | $ | ─ | | | $ | 33.1 | | | $ | 0.8 | | | $ | 33.9 | |
| Senior secured notes, 11.0% due October 2017 (US$250.0 million) | | | ─ | | | | 243.8 | | | | 4.9 | | | | 248.7 | |
| Senior notes, 7.375% due March 2014 (US$250.0 million; December 31, 2010 – US$250.0 million) | | | 256.4 | | | | (246.1 | ) | | | (10.3 | ) | | | ─ | |
| Senior secured notes, 11.0% due December 2016 (US$280.4 million) | | | 285.2 | | | | (273.5 | ) | | | (11.7 | ) | | | ─ | |
| Modification – difference in carrying value of 8.625% and 11.0% senior secured notes (US$38.3 million) on exchange | | | 31.2 | | | | (31.2 | ) | | | ─ | | | | ─ | |
| Class B senior secured notes, 11.0% due December 2016 (US$110.0 million) | | | 98.5 | | | | (94.0 | ) | | | (4.5 | ) | | | ─ | |
| Revolving asset-based loan facility of up to $175.0 million due July 2017 | | | ─ | | | | 24.0 | | | | ─ | | | | 24.0 | |
| Revolving asset-based loan facility of up to $175.0 million due May 2016 | | | 48.0 | | | | (48.0 | ) | | | ─ | | | | ─ | |
| Capital lease obligations | | | 9.2 | | | | (1.0 | ) | | | ─ | | | | 8.2 | |
| Non-recourse (PREI) | | | | | | | | | | | | | | | | |
| First mortgage bonds, 6.447% due July 2016 | | | 95.0 | | | | ─ | | | | ─ | | | | 95.0 | |
| Subordinated promissory notes | | | 18.8 | | | | ─ | | | | ─ | | | | 18.8 | |
| Total debt | | $ | 842.3 | | | $ | (392.9 | ) | | $ | (20.8 | ) | | $ | 428.6 | |
| Less: current portion | | | 466.8 | | | | (460.2 | ) | | | ─ | | | | 6.6 | |
| Total long-term debt | | $ | 375.5 | | | $ | 67.3 | | | $ | (20.8 | ) | | $ | 422.0 | |
On September 13, 2012 as part of the implementation of the Plan and emergence from creditor protection, we issued US$250.0 million of new senior secured notes (2017 Notes). The 2017 Notes, issued in a debt exchange transaction with holders of our former 2016 Notes, have a maturity date of October 30, 2017, and bear interest, payable quarterly, at a rate of 11% per annum in cash or, at the option of the company, 13% per annum payable 7.5% cash and 5.5% PIK.
On September 13, 2012 we entered into a new $175.0 million ABL Facility, which paid off the DIP Credit Facility on completion of the restructuring under the Plan. The collateral for the ABL Facility consists primarily of all present and future working capital assets of the company with a borrowing base calculated on the balance of eligible accounts receivable and inventory, less certain reserves. The ABL Facility matures on the earlier of July 31, 2017, and 90 days prior to maturity of any significant debt.
We also completed a US$35.0 million Exit Facility on September 13, 2012 and issued US$35.0 million of Exit Notes under that facility. The Exit Facility was provided by certain holders of the 2016 Notes and is secured by a charge on certain assets of the company and its subsidiaries ranking senior to the lien securing the US$250.0 million of 2017 Notes to be issued under the Plan. The Exit Facility matures on September 13, 2016, and can be prepaid in whole or in part at any time for a premium initially of 3% and declining annually thereafter.
| 48 | CATALYST PAPER 2012 ANNUAL REPORT |
We secured a DIP Credit Facility during the creditor protection proceedings which replaced the former ABL Facility. The DIP Credit Facility had an 18-month maturity and a maximum draw of approximately $175 million.
See note 18,Long-term debt, in our annual consolidated financial statements for the year ended December 31, 2012 for additional information on changes to our debt.
The following table presents the aggregate amount of future cash outflows for contractual obligations as of December 31, 2012:
Payments due by period
| (In millions of dollars) | | 2013 | | | 2014 | | | 2015 | | | 2016 | | | 2017 | | | Thereafter | |
| Total debt, excluding capital lease obligations | | $ | ─ | | | $ | ─ | | | $ | ─ | | | $ | 129.8 | | | $ | 272.7 | | | $ | 18.8 | |
| Capital lease obligations | | | 6.6 | | | | 1.6 | | | | ─ | | | | ─ | | | | ─ | | | | ─ | |
| Operating leases | | | 6.0 | | | | 4.3 | | | | 1.7 | | | | 1.7 | | | | 1.6 | | | | 0.7 | |
| Interest payments on long-term debt1 | | | 38.3 | | | | 38.2 | | | | 38.2 | | | | 37.6 | | | | 27.5 | | | | ─ | |
| Other commitments | | | ─ | | | | ─ | | | | ─ | | | | ─ | | | | ─ | | | | ─ | |
| Total | | $ | 50.9 | | | $ | 44.1 | | | $ | 39.9 | | | $ | 169.1 | | | $ | 301.8 | | | $ | 19.5 | |
| 1 | Based on 11% cash interest on the 2017 Notes and no drawings on the ABL facility. |
From time to time, we may purchase our debt securities in the open market.
Financial Instruments
Our financial instruments consist primarily of cash and cash equivalents, accounts receivable, accounts payable and accrued liabilities, long-term debt, and derivatives. Derivatives are used primarily to reduce exposure to currency risk on revenues, or occasionally debt, as well as price risk associated with revenue and energy costs. In accordance with our financial risk management program, we manage our exposure to risks through the use of financial instruments with counterparties that are of strong credit quality, normally being major financial institutions. We do not enter into financial instruments for speculative purposes.
At December 31, 2012 we did not have any foreign currency or commodity contracts outstanding.
For a description of the nature and extent of risk to the company from our financial instruments, as well as our respective accounting treatment of financial instruments, refer to our annual consolidated financial statements for the year ended December 31, 2012 note 30,Financial instruments. For the methods and assumptions we use to determine the fair value of financial instruments, refer to note 29,Fair value measurement, of those statements.
The following table reconciles the average spot exchange rate to our effective exchange rate for sales and operating expenses including the impact from cash flow hedges that were in place as at March 31, 2010 and were designated as hedging instruments at that time:
| CATALYST PAPER 2012 ANNUAL REPORT | 49 |
US$/CDN$ FOREIGN EXCHANGE
| | | 2012 | | | 2011 | |
| | | YTD | | | Q4 | | | Q3 | | | Q2 | | | Q1 | | | YTD | | | Q4 | | | Q3 | | | Q2 | | | Q1 | |
| Average Bank of Canada noon spot rate | | | 1.001 | | | | 1.009 | | | | 1.005 | | | | 0.990 | | | | 0.999 | | | | 1.011 | | | | 0.977 | | | | 1.020 | | | | 1.033 | | | | 1.015 | |
| (Favourable)/unfavourable impact of derivatives designated as effective hedges for accounting purposes1 | | | – | | | | – | | | | – | | | | – | | | | – | | | | (0.001 | ) | | | – | | | | – | | | | (0.001 | ) | | | (0.004 | ) |
| Average effective rate included in adjusted EBITDA | | | 1.001 | | | | 1.009 | | | | 1.005 | | | | 0.990 | | | | 0.999 | | | | 1.010 | | | | 0.977 | | | | 1.020 | | | | 1.032 | | | | 1.011 | |
| (Favourable)/unfavourable impact of derivatives, other than those designated as effective hedges for accounting purposes, included in other expenses2 | | | 0.001 | | | | – | | | | – | | | | 0.001 | | | | 0.004 | | | | 0.002 | | | | (0.004 | ) | | | 0.023 | | | | (0.002 | ) | | | (0.011 | ) |
| Foreign exchange (gain)/loss, on working capital balances, included in other expenses3 | | | 0.010 | | | | (0.002 | ) | | | 0.035 | | | | (0.017 | ) | | | 0.017 | | | | (0.003 | ) | | | 0.020 | | | | (0.043 | ) | | | 0.006 | | | | 0.007 | |
| Average effective rate in net earnings/(loss) before income taxes4 | | | 1.012 | | | | 1.007 | | | | 1.040 | | | | 0.974 | | | | 1.020 | | | | 1.009 | | | | 0.993 | | | | 1.000 | | | | 1.036 | | | | 1.007 | |
| (In millions of dollars) | | | | | | | | | | | | | | | | | | | | | | | | | | | | | | | | | | | | | | | | |
| 1 Favourable/(unfavourable) impact of derivatives designated as effective hedges for accounting purposes included in adjusted EBITDA | | $ | – | | | $ | – | | | $ | – | | | $ | – | | | $ | – | | | $ | 1.5 | | | $ | 0.1 | | | $ | 0.2 | | | $ | 0.3 | | | $ | 0.9 | |
| 2 Favourable/(unfavourable) impact of derivatives other than those designated as effective hedges for accounting purposes included in other expenses | | | (1.2 | ) | | | – | | | | – | | | | (0.2 | ) | | | (1.0 | ) | | | (2.1 | ) | | | 0.9 | | | | (5.8 | ) | | | 0.3 | | | | 2.5 | |
| 3 Foreign exchange gain/(loss) on working capital balances included in other expenses | | | (7.5 | ) | | | 0.4 | | | | (7.8 | ) | | | 3.9 | | | | (4.0 | ) | | | 3.2 | | | | (4.9 | ) | | | 10.9 | | | | (1.2 | ) | | | (1.6 | ) |
| 4 Excludes foreign exchange gain/(loss) on long-term debt and US$ interest expense | | | | | | | | | | | | | | | | | | | | | | | | | | | | | | | | | | | | | | | | |
| 9 | RELATED PARTY TRANSACTIONS |
Third Avenue Management LLC, which had control or direction over a significant number of our common shares since October 2006, disposed of its entire investment in the company on February 16, 2012 thereby ceasing to be a related party.
Directors and employees
We undertook certain transactions with companies affiliated with a former director. Payments for raw materials were made to Aspen Group, Flavelle Sawmill, and Mill and Timber. These transactions were in the normal course of business and were on the same terms to those accorded to third parties. Mr. Thomas S. Chambers served as director of these three companies during his tenure as director of the company. Mr. Chambers ceased to be a related party of the company when he ceased to be a director of the company on September 13, 2012. These transactions are accordingly not related party transactions going forward.
| 50 | CATALYST PAPER 2012 ANNUAL REPORT |
Claims Regarding Certain Post-Retirement Benefits
The Communications, Energy and Paperworkers Union of Canada Locals 1, 76, 592 and 686 (the Locals), representing hourly employees at our Powell River and Port Alberni mills, applied to the Labour Relations Board of B.C. for a declaration that the company is responsible for certain post-retirement medical and extended health benefits for some retired employees who were represented by the Locals and who retired from MacMillan Bloedel Limited (now named Weyerhaeuser Canada Ltd.) prior to the company’s acquisition of Pacifica Papers Inc. which had acquired the Powell River and Port Alberni mills in 1998. The Labour Relations Board declined to rule on the Locals’ application or our defense to the claim on the basis that this matter was a dispute under the collective agreement and, accordingly, a matter to be determined by arbitration. All four Locals subsequently filed grievances claiming that we are responsible for these post-retirement benefits. We did not agree with the Locals’ positions and contested the grievances. Local 76’s claim was dismissed by an arbitrator on December 23, 2010. The other three Locals withdrew their claims in 2011 and 2012. These claims are accordingly no longer outstanding.
Short-term Incentive Plan and Benefits Claim
In May 2010, one of our salaried employees commenced an action against us in the Supreme Court of B.C. seeking a payment under the company's 2009 Short-term Incentive Plan and damages in connection with the reduction of certain employee benefits announced in November 2009 and certification of the action as a class proceeding on behalf of all salaried employees who were entitled to Short-term Incentive Plan payments and affected by the reduction in benefits. The action was certified as a class proceeding on March 21, 2011, but only on behalf of those employees and former employees who had not provided us with releases of the claims. Except for 9 active employees and 12 employees who have left the company, all of our salaried employees released us from liability in respect of these claims or withdrew from the class action. The remaining claims were compromised under the Plan under the CCAA and payment made as unsecured claims in accordance with that process. This claim is accordingly no longer outstanding.
For additional information, refer to our annual consolidated financial statements for the year ended December 31, 2012 note 34,Contingent liabilities.
| CATALYST PAPER 2012 ANNUAL REPORT | 51 |
| 11 | OFF-BALANCE SHEET ARRANGEMENTS |
Guarantees
Loans
We entered into a building lease agreement in 2001 under which we would continue to make the prescribed lease payments directly to the financial institution holding the mortgage on the building in the event the lessor was no longer able to meet its contractual obligations. At December 31, 2012 the principal amount of the mortgage was $3.0 million. The agreement does not increase our liability beyond the obligations under the building lease.
Paper recycling plant acquisition
In connection with our acquisition of the paper recycling plant in Coquitlam, B.C. in December 2003, we provided indemnities with respect to environmental matters (other than pre-existing environmental conditions) under our lease of the land and buildings for all costs, claims and damages if we release any hazardous substances on the property or breach any of the environmental covenants under the lease or any environmental laws and an indemnity with respect to shares that were issued to the vendors as part of the purchase price. We do not expect any claims under these indemnities given that we disclaimed our liabilities under the lease under the CCAA process and that all of our outstanding shares as at September 13, 2012 were cancelled under the CCAA process.
| 12 | SUMMARY OF QUARTERLY RESULTS |
The following table highlights selected financial information for the eight consecutive quarters ended December 31, 2012:
| | | 2012 | | | 2011 | |
| (In millions of dollars, except per share amounts) | | Q42 | | | Q32 | | | Q22 | | | Q12 | | | Q42 | | | Q32 | | | Q22 | | | Q12 | |
| Sales | | $ | 260.5 | | | $ | 265.7 | | | $ | 264.8 | | | $ | 267.2 | | | $ | 272.2 | | | $ | 292.2 | | | $ | 257.4 | | | $ | 257.9 | |
| Adjusted EBITDA 1 | | | 7.2 | | | | 13.8 | | | | 17.0 | | | | 17.4 | | | | 6.9 | | | | 30.2 | | | | 7.0 | | | | 18.7 | |
| Net earnings (loss) attributable to the company | | | (35.2 | ) | | | 655.7 | | | | (11.7 | ) | | | (25.6 | ) | | | (708.0 | ) | | | (205.7 | ) | | | (47.4 | ) | | | (12.9 | ) |
| Net earnings (loss) per share attributable to the company’s common shareholders | | | | | | | | | | | | | | | | | | | | | | | | | | | | | | | | |
– basic and diluted from continuing operations | | $ | (1.55 | ) | | $ | 1.73 | | | $ | (0.03 | ) | | $ | (0.07 | ) | | $ | (1.81 | ) | | $ | (0.13 | ) | | $ | (0.08 | ) | | $ | (0.02 | ) |
| – basic and diluted from discontinued operations | | | (0.89 | ) | | | (0.01 | ) | | | – | | | | – | | | | (0.04 | ) | | | (0.41 | ) | | | (0.05 | ) | | | (0.01 | ) |
1 Refer to section 13, Non-GAAP measures.
| 2 | Numbers exclude the Snowflake mill’s results from operations which have been reclassified as discontinued operations in the consolidated statements of earnings (loss) in the annual consolidated financial statements for the year ended December 31, 2012. |
| 52 | CATALYST PAPER 2012 ANNUAL REPORT |
In Q1 2012, the net loss attributable to the company decreased $682.4 million, or $1.74 per common share from continuing operations, from Q4 2011, due largely to an after-tax impairment charge of $662.5 million in the fourth quarter of 2011, an increase in after-tax adjusted EBITDA of $10.5 million, an increase in after-tax earnings from discontinued operations of $15.8 million, and a reduction in after-tax depreciation of $23.1 million, partially offset by reduced after-tax foreign exchange gain on the translation of long-term debt of $2.4 million, and after-tax reorganization costs of $22.4 million incurred in the first quarter.
In Q2 2012, net loss attributable to the company decreased $13.9 million, or $0.04 per common share from continuing operations, from Q1, due largely to an after-tax increase in other income of $15.2 million, and a net after-tax reorganization credit of $4.0 million compared to after-tax reorganization expenses of $22.4 million in Q1, partially offset by an increase in after-tax interest expense of $3.3 million, and an after-tax foreign exchange loss on the translation of long-term debt of $12.8 million compared to an after-tax gain of $11.6 million in Q1.
In Q3 2012, net earnings attributable to the company increased $667.4 million, or $1.76 per common share from continuing operations, from Q2, due largely to an increase in net after-tax reorganization credit of $681.3 million related to our fresh start and reorganization adjustments on exit from the CCAA proceedings, a reduction in after-tax interest expense of $9.2 million, and an after-tax foreign exchange gain on the translation of long-term debt of $25.2 million compared to an after-tax loss of $12.8 million in Q2, partially offset by an after-tax decrease in other income of $18.6 million, a decrease in after-tax earnings from discontinued operations of $5.8 million, and an after-tax fair value adjustment of $41.2 million to our non-controlling interest.
In Q4 2012, net loss attributable to the company increased $690.9 million, or $3.28 per common share from continuing operations, from Q3. This was due primarily to after-tax reorganization costs of $3.2 million compared to net after-tax reorganization credit of $685.3 million in the third quarter, a reduction in after-tax operating earnings of $11.6 million, an increase in loss from discontinued operations, net of tax of $7.8 million and an after-tax foreign exchange loss on the translation of long-term debt of $3.2 million compared to an after-tax gain of $25.2 million in the third quarter, partially offset by lower after-tax interest expense of $2.9 million, an increase in other income after-tax of $8.3 million, and an after-tax increase in net earnings attributable to non-controlling interest of $34.2 million.
For summarized financial information about Powell River Energy Inc., a variable interest entity for which we are the primary beneficiary, refer to note 8,Variable interest entities, of our annual consolidated financial statements for the year ended December 31, 2012.
| CATALYST PAPER 2012 ANNUAL REPORT | 53 |
Management uses certain measures that are not defined by U.S. GAAP to evaluate our performance and, as a result, the measures as employed by management may not be comparable to similarly titled measures reported by other entities. These non-GAAP measures should not be considered by an investor as an alternative to their nearest respective GAAP measure. Our non-GAAP measures include operating earnings (loss), adjusted EBITDA (earnings before interest, taxes, depreciation and amortization, impairment and other closure costs, and before other non-operating income and expenses), adjusted EBITDA before restructuring costs, adjusted EBITDA margin, adjusted EBITDA margin before restructuring costs, average delivered cash costs per tonne before specific items, net earnings (loss) attributable to the company before specific items, net earnings (loss) per share attributable to the company’s common shareholders before specific items, and free cash flow.
Specific items are items that do not arise from the company’s day-to-day operating, investing and financing activities, or items that are subject to material volatility based on factors outside of management’s control. Specific items include: foreign exchange gain or loss on long-term debt, gain or loss on cancellation of long-term debt, asset impairment and other closure costs, restructuring costs, unusual non-recurring items, and certain income tax adjustments.
Adjusted EBITDA and adjusted EBITDA before Restructuring Costs
Adjusted EBITDA as defined equates to operating earnings (loss) plus depreciation and amortization and impairment and other closure costs. Adjusted EBITDA margin and adjusted EBITDA margin before restructuring costs are defined as adjusted EBITDA and adjusted EBITDA before restructuring costs as a percentage of sales.
These measures enable comparison of consolidated and segment operating results between periods without regard to debt service, income taxes, capital expenditure requirements, and specific items. These measures are provided to improve comparability between periods by eliminating the impact of financing (interest) and accounting (depreciation) items on our results.
| 54 | CATALYST PAPER 2012 ANNUAL REPORT |
Reconciliation of net earnings (loss) attributable
to the company by year:
| (In millions of dollars) | | 20122 | | | 2011 | | | 2010 | |
| Net earnings (loss) attributable to the company as reported | | $ | 583.2 | | | $ | (974.0 | ) | | $ | (396.9 | ) |
| Net earnings (loss) attributable to non-controlling interest | | | 30.4 | | | | (2.6 | ) | | | (1.3 | ) |
| Net earnings (loss) | | | 613.6 | | | | (976.6 | ) | | | (398.2 | ) |
| Depreciation and amortization1 | | | 36.3 | | | | 105.5 | | | | 109.7 | |
| Impairment1 | | | – | | | | 661.8 | | | | 294.5 | |
| (Gain) loss on cancellation of long-term debt1 | | | – | | | | – | | | | (0.6 | ) |
| Foreign exchange (gain) loss on long-term debt1 | | | (20.8 | ) | | | 9.7 | | | | (27.6 | ) |
| Loss on Powell River fire | | | – | | | | 2.4 | | | | – | |
| Other (income) expense, net1 | | | 2.5 | | | | (0.3 | ) | | | 3.2 | |
| Interest expense, net1 | | | 71.9 | | | | 73.2 | | | | 71.9 | |
| Income tax recovery1 | | | (0.9 | ) | | | (8.4 | ) | | | (19.8 | ) |
| Reorganization items, net1 | | | (663.7 | ) | | | – | | | | – | |
| (Earnings) loss from discontinued operations net of tax | | | 16.5 | | | | 195.5 | | | | 19.5 | |
| Adjusted EBITDA | | $ | 55.4 | | | $ | 62.8 | | | $ | 52.6 | |
| Restructuring costs | | | 5.3 | | | | 5.9 | | | | 25.3 | |
| Adjusted EBITDA before restructuring costs | | $ | 60.7 | | | $ | 68.7 | | | $ | 77.9 | |
| 1 | Numbers exclude the Snowflake mill’s results from operations which have been reclassified as discontinued operations in the consolidated statements of earnings (loss) in the annual consolidated financial statements for the year ended December 31, 2012. |
| 2 | We completed our restructuring under the CCAA proceedings on September 13, 2012 and adopted fresh start accounting in accordance with FASB ASC 852 on September 30, 2012. Numbers for 2012 therefore include results for nine months preceding the adoption of fresh start accounting and three months subsequent to adoption. |
Reconciliation to net earnings (loss) attributable
to the company by quarter:
| | | 2012 | | | 2011 | |
| (In millions of dollars) | | Total2 | | | Q4 | | | Q3 | | | Q2 | | | Q1 | | | Total | | | Q4 | | | Q3 | | | Q2 | | | Q1 | |
| Net earnings (loss) attributable to the company | | $ | 583.2 | | | $ | (35.2 | ) | | $ | 655.7 | | | $ | (11.7 | ) | | $ | (25.6 | ) | | $ | (974.0 | ) | | $ | (708.0 | ) | | $ | (205.7 | ) | | $ | (47.4 | ) | | $ | (12.9 | ) |
| Net earnings (loss) attributable to non-controlling interest | | | 30.4 | | | | (1.5 | ) | | | 32.7 | | | | (0.6 | ) | | | (0.2 | ) | | | (2.6 | ) | | | (2.3 | ) | | | – | | | | (0.3 | ) | | | – | |
| Net earnings (loss) | | | 613.6 | | | | (36.7 | ) | | | 688.4 | | | | (12.3 | ) | | | (25.8 | ) | | | (976.6 | ) | | | (710.3 | ) | | | (205.7 | ) | | | (47.7 | ) | | | (12.9 | ) |
| Depreciation and amortization1 | | | 36.3 | | | | 12.9 | | | | 7.9 | | | | 7.7 | | | | 7.8 | | | | 105.5 | | | | 30.9 | | | | 25.5 | | | | 24.7 | | | | 24.4 | |
| Impairment1 | | | – | | | | – | | | | – | | | | – | | | | – | | | | 661.8 | | | | 662.5 | | | | (0.4 | ) | | | (0.3 | ) | | | – | |
| Foreign exchange (gain) loss on long-term debt1 | | | (20.8 | ) | | | 3.2 | | | | (25.2 | ) | | | 12.8 | | | | (11.6 | ) | | | 9.7 | | | | (14.0 | ) | | | 41.0 | | | | (5.1 | ) | | | (12.2 | ) |
| Loss on Powell River fire | | | – | | | | – | | | | – | | | | – | | | | – | | | | 2.4 | | | | 0.8 | | | | – | | | | 1.6 | | | | – | |
| Other (income) expense, net1 | | | 2.5 | | | | (0.1 | ) | | | 8.2 | | | | (10.4 | ) | | | 4.8 | | | | (0.3 | ) | | | 4.1 | | | | (5.7 | ) | | | 0.8 | | | | 0.5 | |
| Interest expense, net1 | | | 71.9 | | | | 11.6 | | | | 16.3 | | | | 23.4 | | | | 20.6 | | | | 73.2 | | | | 18.4 | | | | 18.9 | | | | 18.6 | | | | 17.3 | |
| Income tax expense (recovery)1 | | | (0.9 | ) | | | 0.2 | | | | (1.6 | ) | | | 0.5 | | | | – | | | | (8.4 | ) | | | (0.5 | ) | | | (1.3 | ) | | | (3.0 | ) | | | (3.6 | ) |
| Reorganization items, net1 | | | (663.7 | ) | | | 3.2 | | | | (685.3 | ) | | | (4.0 | ) | | | 22.4 | | | | – | | | | – | | | | – | | | | – | | | | – | |
| (Earnings) loss from discontinued operations net of tax | | | 16.5 | | | | 12.9 | | | | 5.1 | | | | (0.7 | ) | | | (0.8 | ) | | | 195.5 | | | | 15.0 | | | | 157.9 | | | | 17.4 | | | | 5.2 | |
| Adjusted EBITDA | | $ | 55.4 | | | $ | 7.2 | | | $ | 13.8 | | | $ | 17.0 | | | $ | 17.4 | | | $ | 62.8 | | | $ | 6.9 | | | $ | 30.2 | | | $ | 7.0 | | | $ | 18.7 | |
| Restructuring costs | | | | | | | | | | | | | | | | | | | | | | | | | | | | | | | | | | | | | | | | |
| Specialty printing papers | | | 2.9 | | | | – | | | | 0.2 | | | | (0.1 | ) | | | 2.8 | | | | 4.0 | | | | 4.0 | | | | – | | | | – | | | | – | |
| Newsprint | | | 0.8 | | | | – | | | | – | | | | – | | | | 0.8 | | | | 0.8 | | | | 0.8 | | | | – | | | | – | | | | – | |
| Pulp | | | 1.6 | | | | – | | | | – | | | | – | | | | 1.6 | | | | 1.1 | | | | 1.1 | | | | – | | | | – | | | | – | |
| Total restructuring costs | | | 5.3 | | | | – | | | | 0.2 | | | | (0.1 | ) | | | 5.2 | | | | 5.9 | | | | 5.9 | | | | – | | | | – | | | | – | |
| Adjusted EBITDA before restructuring costs | | $ | 60.7 | | | $ | 7.2 | | | $ | 14.0 | | | $ | 16.9 | | | $ | 22.6 | | | $ | 68.7 | | | $ | 12.8 | | | $ | 30.2 | | | $ | 7.0 | | | $ | 18.7 | |
| 1 | Numbers exclude the Snowflake mill’s results from operations which have been reclassified as discontinued operations in the consolidated statements of earnings (loss) in the annual consolidated financial statements for the year ended December 31, 2012. |
| 2 | We completed our restructuring under the CCAA proceedings on September 13, 2012 and adopted fresh start accounting in accordance with FASB ASC 852 on September 30, 2012. The total column for 2012 therefore includes results for nine months preceding the adoption of fresh start accounting and three months subsequent to adoption. |
| CATALYST PAPER 2012 ANNUAL REPORT | 55 |
Net Earnings (Loss) Attributable to the Company
before Specific Items
Specific items are defined previously, and the exclusion of such items from net earnings (loss) attributable to the company facilitates the comparison of financial results between periods.
Reconciliation to Net Earnings (Loss) Attributable
to the Company by year:
(In millions of dollars and after-taxes,
except where otherwise stated) | | 20122 | | | 2011 | | | 2010 | |
| Net earnings (loss) attributable to the company as reported | | $ | 583.2 | | | $ | (974.0 | ) | | $ | (396.9 | ) |
| | | | | | | | | | | | | |
| Specific items: | | | | | | | | | | | | |
| (Gain) loss on cancellation of long-term debt | | | – | | | | – | | | | (0.5 | ) |
| Foreign exchange (gain) loss on long-term debt | | | (20.8 | ) | | | 11.8 | | | | (24.2 | ) |
| Loss on Snowflake fire1 | | | – | | | | 4.4 | | | | – | |
| Loss on Powell River fire | | | – | | | | 2.0 | | | | – | |
| Impairment and other closure costs1 | | | 19.7 | | | | 823.6 | | | | 291.4 | |
| Restructuring and change-of-control costs1 | | | 6.4 | | | | 5.9 | | | | 21.3 | |
| Reorganization items, net1 | | | (667.5 | ) | | | – | | | | – | |
| Fair market adjustment to non-controlling interest | | | 41.2 | | | | – | | | | – | |
| Note exchange costs | | | – | | | | – | | | | 5.9 | |
| Income tax adjustments | | | – | | | | – | | | | 16.0 | |
| Net earnings (loss) attributable to the company before specific items | | $ | (37.8 | ) | | $ | (126.3 | ) | | $ | (87.0 | ) |
| Net earnings (loss) per share attributable to the company’s common shareholders in dollars: | | | | | | | | | | | | |
| As reported (continuing operations) | | $ | 41.65 | | | $ | (2.04 | ) | | $ | (0.99 | ) |
| Before specific items | | | (2.62 | ) | | | (0.33 | ) | | | (0.23 | ) |
| 1 | Includes amount related to Snowflake which was included in discontinued operations, net of tax in the consolidated statements of earnings (loss) in the annual consolidated financial statements for the year ended December 31, 2012. |
| 2 | We completed our restructuring under the CCAA proceedings on September 13, 2012 and adopted fresh start accounting in accordance with FASB ASC 852 on September 30, 2012. Numbers for 2012 therefore include results for nine months preceding the adoption of fresh start accounting and three months subsequent to adoption. |
| 56 | CATALYST PAPER 2012 ANNUAL REPORT |
Reconciliation to Net Earnings (Loss) Attributable
to the Company by quarter:
| (In millions of Canadian dollars and after-taxes, | | 2012 | | | 2011 | |
| except where otherwise stated) | | Total3 | | | Q4 | | | Q3 | | | Q2 | | | Q1 | | | Total | | | Q4 | | | Q3 | | | Q2 | | | Q1 | |
| Net earnings (loss) attributable to the company | | $ | 583.2 | | | $ | (35.2 | ) | | $ | 655.7 | | | $ | (11.7 | ) | | $ | (25.6 | ) | | $ | (974.0 | ) | | $ | (708.0 | ) | | $ | (205.7 | ) | | $ | (47.4 | ) | | $ | (12.9 | ) |
| | | | | | | | | | | | | | | | | | | | | | | | | | | | | | | | | | | | | | | | | |
| Specific items: | | | | | | | | | | | | | | | | | | | | | | | | | | | | | | | | | | | | | | | | |
| Foreign exchange (gain) loss on long-term debt | | | (20.8 | ) | | | 3.2 | | | | (25.2 | ) | | | 12.8 | | | | (11.6 | ) | | | 11.8 | | | | (14.0 | ) | | | 41.0 | | | | (4.5 | ) | | | (10.7 | ) |
| Loss on Snowflake fire1 | | | – | | | | – | | | | – | | | | – | | | | – | | | | 4.4 | | | | 0.3 | | | | – | | | | 4.1 | | | | – | |
| Loss on Powell River fire | | | – | | | | – | | | | – | | | | – | | | | – | | | | 2.0 | | | | 0.8 | | | | – | | | | 1.2 | | | | – | |
| Impairment (recovery) and other closure costs2 | | | 19.7 | | | | 11.0 | | | | 8.7 | | | | – | | | | – | | | | 823.6 | | | | 673.3 | | | | 150.6 | | | | (0.3 | ) | | | – | |
| Restructuring costs | | | 6.4 | | | | 1.1 | | | | 0.2 | | | | (0.1 | ) | | | 5.2 | | | | 5.9 | | | | 5.9 | | | | – | | | | – | | | | – | |
| Reorganization items, net | | | (667.5 | ) | | | 4.2 | | | | (688.1 | ) | | | (6.0 | ) | | | 22.4 | | | | – | | | | – | | | | – | | | | – | | | | – | |
| Fair market adjustment to non-controlling interest | | | 41.2 | | | | – | | | | 41.2 | | | | – | | | | – | | | | – | | | | – | | | | – | | | | – | | | | – | |
Net earnings (loss) attributable to the company
before specific items | | $ | (37.8 | ) | | $ | (15.7 | ) | | $ | (7.5 | ) | | $ | (5.0 | ) | | $ | (9.6 | ) | | $ | (126.3 | ) | | $ | (41.7 | ) | | $ | (14.1 | ) | | $ | (46.9 | ) | | $ | (23.6 | ) |
| Net earnings (loss) per share attributable to the company’s common shareholders in dollars: | | | | | | | | | | | | | | | | | | | | | | | | | | | | | | | | | | | | | | | | |
| As reported (continuing operations) | | $ | 41.65 | | | $ | (1.55 | ) | | $ | 1.73 | | | $ | (0.03 | ) | | $ | (0.07 | ) | | $ | (2.04 | ) | | $ | (1.81 | ) | | $ | (0.13 | ) | | $ | (0.08 | ) | | $ | (0.02 | ) |
| Before specific items | | | (2.62 | ) | | | (1.09 | ) | | | (0.02 | ) | | | (0.01 | ) | | | (0.03 | ) | | | (0.33 | ) | | | (0.11 | ) | | | (0.04 | ) | | | (0.12 | ) | | | (0.06 | ) |
| 1 | Included in discontinued operations, net of tax in the consolidated statements of earnings (loss) in the annual consolidated financial statements for the year ended December 31, 2012. |
| 2 | Q4 2012 includes $11.0 million and Q3 2012 includes $8.7 million impairment and closure costs related to the closure of the Snowflake mill, and Q3 2011 includes $151.0 million impairment charge on the property, plant and equipment and inventory of the Snowflake mill; these expenses are included in discontinued operations, net of tax in the consolidated statements of earnings (loss) in the annual consolidated financial statements for the year ended December 31, 2012. |
| 3 | We completed our restructuring under the CCAA proceedings on September 13, 2012 and adopted fresh start accounting in accordance with FASB ASC 852 on September 30, 2012. The total column for 2012 therefore includes results for nine months preceding the adoption of fresh start accounting and three months subsequent to adoption. |
Free Cash Flow
Free cash flow excludes working capital and certain other sources and uses of cash, which are disclosed in the consolidated statements of cash flows. This measure allows us to assess our ability to generate funds to repay debt and assists in cash flow forecasting.
Reconciliation to Cash Provided by Operating Activities less Cash
Used by Investing Activities by year:
| (In millions of dollars) | | 20121 | | | 2011 | | | 2010 | |
| Cash provided (used) by operating activities | | $ | 8.1 | | | $ | (71.5 | ) | | $ | (44.1 | ) |
| Cash used by investing activities | | | (9.6 | ) | | | (17.7 | ) | | | (4.5 | ) |
| Proceeds from the sale of property, plant and equipment and other assets | | | (12.3 | ) | | | (1.2 | ) | | | (7.9 | ) |
| Other investing activities | | | (3.7 | ) | | | (0.8 | ) | | | 1.2 | |
| Non-cash working capital changes except changes in taxes and interest | | | (31.8 | ) | | | 42.0 | | | | 12.9 | |
| Other | | | 2.1 | | | | (9.6 | ) | | | 2.0 | |
| Free cash flow | | $ | (47.2 | ) | | $ | (58.8 | ) | | $ | (40.4 | ) |
| 1 | We completed our restructuring under the CCAA proceedings on September 13, 2012 and adopted fresh start accounting in accordance with FASB ASC 852 on September 30, 2012. Numbers for 2012 therefore include results for nine months preceding the adoption of fresh start accounting and three months subsequent to adoption. |
| CATALYST PAPER 2012 ANNUAL REPORT | 57 |
Reconciliation to Cash Provided by Operating Activities less Cash
Used by Investing Activities by Quarter:
| | | 2012 | | | 2011 | |
| (In millions of dollars) | | Total1 | | | Q4 | | | Q3 | | | Q2 | | | Q1 | | | Total | | | Q4 | | | Q3 | | | Q2 | | | Q1 | |
| Cash provided (used) by operating activities | | $ | 8.1 | | | $ | 52.1 | | | $ | (21.1 | ) | | $ | (8.2 | ) | | $ | (14.7 | ) | | $ | (71.5 | ) | | $ | (4.0 | ) | | $ | (38.8 | ) | | $ | (15.7 | ) | | $ | (13.0 | ) |
| Cash provided (used) by investing activities | | | (9.6 | ) | | | (6.2 | ) | | | (0.6 | ) | | | 14.2 | | | | (17.0 | ) | | | (17.7 | ) | | | (5.0 | ) | | | (4.9 | ) | | | (5.2 | ) | | | (2.6 | ) |
| Proceeds from the sale of property, plant and equipment and other assets | | | (12.3 | ) | | | (0.8 | ) | | | (3.6 | ) | | | (7.4 | ) | | | (0.5 | ) | | | (1.2 | ) | | | (0.4 | ) | | | (0.7 | ) | | | (0.1 | ) | | | – | |
| Other investing activities | | | (3.7 | ) | | | – | | | | (0.5 | ) | | | (3.6 | ) | | | 0.4 | | | | (0.8 | ) | | | (0.8 | ) | | | – | | | | (0.3 | ) | | | 0.3 | |
| Non-cash working capital changes except change in taxes and interest | | | (31.8 | ) | | | (58.8 | ) | | | 5.9 | | | | 7.3 | | | | 13.8 | | | | 42.0 | | | | (1.1 | ) | | | 50.2 | | | | (18.7 | ) | | | 11.6 | |
| Other | | | 2.1 | | | | (10.1 | ) | | | 4.8 | | | | (7.1 | ) | | | 14.5 | | | | (9.6 | ) | | | (15.1 | ) | | | (4.4 | ) | | | 11.7 | | | | (1.8 | ) |
| Free cash flow | | $ | (47.2 | ) | | $ | (23.8 | ) | | $ | (15.1 | ) | | $ | (4.8 | ) | | $ | (3.5 | ) | | $ | (58.8 | ) | | $ | (26.4 | ) | | $ | 1.4 | | | $ | (28.3 | ) | | $ | (5.5 | ) |
| 1 | We completed our restructuring under the CCAA proceedings on September 13, 2012 and adopted fresh start accounting in accordance with FASB ASC 852 on September 30, 2012. The total column for 2012 therefore includes results for nine months preceding the adoption of fresh start accounting and three months subsequent to adoption. |
Management’s Calculation of Free Cash Flow by Year:
| (In millions of dollars) | | 20122 | | | 2011 | | | 2010 | |
| Adjusted EBITDA | | $ | 55.4 | | | $ | 62.8 | | | $ | 52.6 | |
| Interest expense, excluding amortization | | | (22.7 | ) | | | (72.6 | ) | | | (72.7 | ) |
| Capital expenditures | | | (22.6 | ) | | | (19.7 | ) | | | (11.2 | ) |
| Reorganization costs | | | (37.5 | ) | | | – | | | | – | |
| Income taxes paid | | | 0.2 | | | | (0.1 | ) | | | (0.4 | ) |
| Employee future benefits, expense over (under) cash contributions1 | | | (11.8 | ) | | | (8.0 | ) | | | (2.4 | ) |
| Net operating cash flow from discontinued operations | | | (8.2 | ) | | | (21.2 | ) | | | (6.3 | ) |
| Free cash flow | | $ | (47.2 | ) | | $ | (58.8 | ) | | $ | (40.4 | ) |
| 1 | Free cash flow is adjusted to reflect the cash impact of employee future benefits rather than the accounting expense which is included in adjusted EBITDA. |
| 2 | We completed our restructuring under the CCAA proceedings on September 13, 2012 and adopted fresh start accounting in accordance with FASB ASC 852 on September 30, 2012. Numbers for 2012 therefore include results for nine months preceding the adoption of fresh start accounting and three months subsequent to adoption. |
Management’s Calculation of Free Cash Flow by Quarter:
| | | 2012 | | | 2011 | |
| (In millions of dollars) | | Total2 | | | Q4 | | | Q3 | | | Q2 | | | Q1 | | | Total | | | Q4 | | | Q3 | | | Q2 | | | Q1 | |
| Adjusted EBITDA | | $ | 55.4 | | | $ | 7.2 | | | $ | 13.8 | | | $ | 17.0 | | | $ | 17.4 | | | $ | 62.8 | | | $ | 6.9 | | | $ | 30.2 | | | $ | 7.0 | | | $ | 18.7 | |
| Interest expense, excluding amortization | | | (22.7 | ) | | | (11.0 | ) | | | (4.7 | ) | | | (3.7 | ) | | | (3.3 | ) | | | (72.6 | ) | | | (18.4 | ) | | | (19.0 | ) | | | (17.6 | ) | | | (17.6 | ) |
| Capital expenditures | | | (22.6 | ) | | | (10.4 | ) | | | (7.3 | ) | | | (3.0 | ) | | | (1.9 | ) | | | (19.7 | ) | | | (6.2 | ) | | | (5.6 | ) | | | (5.6 | ) | | | (2.3 | ) |
| Reorganization costs | | | (37.5 | ) | | | (1.8 | ) | | | (12.7 | ) | | | (9.5 | ) | | | (13.5 | ) | | | – | | | | – | | | | – | | | | – | | | | – | |
| Income taxes received (paid) | | | 0.2 | | | | – | | | | 0.2 | | | | – | | | | – | | | | (0.1 | ) | | | (0.2 | ) | | | 0.5 | | | | (0.1 | ) | | | (0.3 | ) |
| Employee future benefits, expense over (under) cash contributions1 | | | (11.8 | ) | | | (3.4 | ) | | | (2.3 | ) | | | (3.2 | ) | | | (2.9 | ) | | | (8.0 | ) | | | (4.4 | ) | | | (1.3 | ) | | | (1.1 | ) | | | (1.2 | ) |
| Net operating cash flow from discontinued operations | | | (8.2 | ) | | | (4.4 | ) | | | (2.1 | ) | | | (2.4 | ) | | | 0.7 | | | | (21.2 | ) | | | (4.1 | ) | | | (3.4 | ) | | | (10.9 | ) | | | (2.8 | ) |
| Free cash flow | | $ | (47.2 | ) | | $ | (23.8 | ) | | $ | (15.1 | ) | | $ | (4.8 | ) | | $ | (3.5 | ) | | $ | (58.8 | ) | | $ | (26.4 | ) | | $ | 1.4 | | | $ | (28.3 | ) | | $ | (5.5 | ) |
| 1 | Free cash flow is adjusted to reflect the cash impact of employee future benefits rather than the accounting expense which is included in adjusted EBITDA. |
| 2 | We completed our restructuring under the CCAA proceedings on September 13, 2012 and adopted fresh start accounting in accordance with FASB ASC 852 on September 30, 2012. The total column for 2012 therefore includes results for nine months preceding the adoption of fresh start accounting and three months subsequent to adoption. |
| 58 | CATALYST PAPER 2012 ANNUAL REPORT |
| 14 | CRITICAL ACCOUNTING POLICIES AND ESTIMATES |
The preparation of financial statements in conformity with U.S. GAAP requires companies to establish accounting policies and to make estimates that affect both the amount and timing of recording of assets, liabilities, revenues and expenses. Some of these estimates require judgments about matters that are inherently uncertain.
Note 3,Summary of significant accounting policies, in the December 31, 2012 consolidated financial statements includes a summary of the significant accounting policies used in their preparation. While all of the significant accounting policies are important to the annual consolidated financial statements, some of these policies may be viewed as involving a high degree of judgment. On an ongoing basis using currently available information, management reviews its estimates, including those related to environmental and legal liabilities, impairment of long-lived assets, pension and post-retirement benefits, provision for bad and doubtful accounts, fair value measurement, and income taxes. Actual results could differ from these estimates.
The following accounting policies require management’s most difficult, subjective and complex judgments, and are subject to measurement uncertainty.
Environmental and legal liabilities
Environmental and legal liabilities are recorded when it is considered probable that a liability has been incurred and the amount of the loss can be reasonably estimated. Liabilities for environmental matters require evaluation of applicable environmental regulations and estimates of remediation alternatives and the costs thereof. Provisions for liabilities relating to legal actions and claims require judgments about projected outcomes and the range of loss, based on such factors as historical experience and recommendations of legal counsel.
As at December 31, 2012 we had a provision of $17.4 million for environmental, remedial and other obligations. This amount included the US$11.7 million withdrawal liability from the PACE Industry Union-Management Pension Fund. We expect capital expenditures relating to known environmental matters, including compliance issues and the assessment and remediation of the environmental condition of the company’s properties, will total approximately $1.0 million in 2013.
Impairment of long-lived assets
We recognized goodwill on September 30, 2012 in accordance with fresh start accounting. Goodwill does not get amortized in subsequent periods, but will be tested annually for impairment using a two-step impairment test at the reporting unit level. An assessment may first be performed based on certain prescribed qualitative factors to determine whether it is necessary to perform the two-step goodwill impairment test.
We review other long-lived assets, primarily plant and equipment, for impairment when events or changes in circumstances indicate that the carrying value of these assets may not be recoverable. We test for impairment using a two-step methodology as follows:
| (i) | Determine whether the projected undiscounted future cash flows from operations exceed the net carrying amount of the assets as of the assessment date; and |
| CATALYST PAPER 2012 ANNUAL REPORT | 59 |
| (ii) | If assets are determined to be impaired in step (i), then such impaired assets are written down to their fair value, determined principally by using discounted future cash flows expected from their use and eventual disposition. |
Estimates of future cash flows and fair value require judgments, assumptions and estimates and may change over time. Due to the variables associated with judgments and assumptions used in these tests, the precision and accuracy of estimates of impairment charges are subject to significant uncertainties and may change significantly as additional information becomes known. The carrying values of long-lived assets and goodwill represented approximately 62.5% and 5.8% of total assets respectively as at December 31, 2012. If future developments were to differ adversely from management’s best estimate of key assumptions and associated cash flows, we could potentially experience future material impairment charges.
Assets held for sale and discontinued operations
Assets and liabilities that meet the held-for-sale criteria are reported separately from continuing operations in the consolidated balance sheet. Assets held for sale and liabilities associated with assets held for sale are reported separately under current assets and current liabilities and are not offset and reported as a single amount in the consolidated balance sheet. Assets and liabilities are classified prospectively in the consolidated balance sheet as held for sale.
Assets classified as held for sale in 2012 included:
| – | assets and liabilities of the Snowflake mill which was closed on September 30, 2012 and subsequently sold to Hackman Capital and its affiliates, |
| – | 13.4 hectare wastewater treatment facility located at Port Alberni, |
| – | land, buildings and equipment, and other assets of the Elk Falls site, |
| – | mortgage receivable from PRSC Limited Partnership and interest in PRSC Land Developments Ltd. |
The results of discontinued operations, net of tax, are presented separately from the results of continuing operations in the consolidated statements of earnings (loss). Per share information and changes to other comprehensive income (loss) related to discontinued operations are presented separately from continuing operations. Cash flows from discontinued operations are not presented separately from cash flows from continuing operations in the consolidated statements of cash flows. All comparative periods are restated in the period that a component is classified as a discontinued operation. The discontinued Snowflake mill met the definition of a discontinued operation in 2012 as a component of the company that was held for sale.
Enterprise valuation
In accordance with the requirements of fresh start accounting, we determined the enterprise value for the company with the assistance of an independent financial advisor. The enterprise value established as of the valuation date of September 30, 2012 incorporated numerous major assumptions including management’s best estimate of future operating performance, forecasts of future exchange rates and product prices, and a discount rate based on the estimated blended rate of return required by our debt and equity investors.
| 60 | CATALYST PAPER 2012 ANNUAL REPORT |
Pension and post-retirement benefits
We maintain various employee future benefit plans, which include defined benefit pension and post-retirement benefit plans. The company retains independent actuarial firms to perform actuarial valuations of the fair value of our defined benefit pension and post-retirement benefit plan assets and benefit obligations, and to advise on the amounts to be recorded in our financial statements. This information is determined using certain assumptions, based on historical and market data that have a direct impact on the fair value of the assets and obligations and on the charges disclosed in our financial statements. These assumptions include:
| · | The discount rate, which is used to estimate the actuarial present value of the various plan obligations. The company, assisted by independent actuarial advisors, sets the discount rate assumption annually to reflect the rates available on high-quality debt instruments, with cash flows that are expected to match the timing and amount of expected benefit payments. As at December 31, 2012 a discount rate of 4.0% per year was determined by us in consultation with our independent actuarial advisors. |
| · | The long-term return on assets used to estimate the growth in the value of invested assets available to satisfy certain obligations. The company, with the assistance of independent actuarial firms, sets the expected rate of return on plan assets annually to reflect the current view of long-term investment returns. For 2012, a rate of return of 6.5% per year was determined by management in consultation with our independent actuarial advisors. |
| · | Salary increases used to estimate the impact that future compensation increases would have on pension and other post-retirement obligations. As at December 31, 2012 a rate of compensation increase of 2.0% per year was determined by management in consultation with our independent actuarial advisors. |
| · | Health care trend rates and mortality rates used to estimate the impact that future health care costs would have on pension and post-retirement obligations. As at December 31, 2012 a health care trend rate of 6.0% per year was determined by management in consultation with our independent actuarial advisors. The health care trend rate is assumed to remain at 6.0% per year for 2013 and 2014 and is assumed to decline by 0.5% per year annually, until it reaches the ultimate health care trend rate assumption of 4.5% per year. Actual experience can vary significantly from estimates and could have a material impact on the estimated cost of employee benefit plans and future cash requirements. |
The following table provides a sensitivity analysis of the assumed overall health care cost trend rate used in measuring the net pension benefit obligation, and the net obligation for other employee future benefits and related net periodic benefit cost for 2012. This sensitivity analysis should be used with caution as it is hypothetical and changes in the health care cost trend rate may not be linear.
| CATALYST PAPER 2012 ANNUAL REPORT | 61 |
| 3 months ended December 31, 2012 | | Pension benefit plans | | Other benefit plans | |
| (In millions of dollars) | | Net benefit
obligation | | Net 2012
expense | | Net benefit
obligation | | | Net 2012
Expense | |
| Assumed overall health care cost trend Impact of: | | | | | | | | | | | | |
| 1% increase | | N/A | | N/A | | | 16.9 | | | | 0.3 | |
| 1% decrease | | N/A | | N/A | | | (14.6 | ) | | | (0.2 | ) |
| 9 months ended September 30, 2012 | | Pension benefit plans | | Other benefit plans | |
| (In millions of dollars) | | Net benefit
obligation | | Net 2012
expense | | Net benefit
obligation | | | Net 2012
Expense | |
| Assumed overall health care cost trend Impact of: | | | | | | | | | | | | |
| 1% increase | | N/A | | N/A | | | 16.9 | | | | 0.8 | |
| 1% decrease | | N/A | | N/A | | | (14.6 | ) | | | (0.7 | ) |
Provision for bad debts and allowance for doubtful accounts
We regularly review the collectability of our accounts receivable. We record our allowance for doubtful accounts based on our best estimate of any potentially uncollectible accounts by highlighting those that are specifically high risk and applying judgment to arrive at an estimate. Consideration is given to current economic conditions and specific customer circumstances to determine the amount of any bad debt expense to be recorded. Accounts receivable balances for individual customers could potentially be material at any given time. We manage our credit risk principally through credit policies, which include the analysis of the financial position of our customers and the regular review of their credit limits and payment terms. We also subscribe to credit insurance for a majority of our receivables, periodically purchase accounts receivable puts on certain customers, and obtain bank letters of credit for some export markets and customers. Our estimate of the required allowance is a matter of judgment and the actual loss eventually sustained may be more or less than estimated.
As at December 31, 2012Accounts receivable comprised 11.6% of total assets. Included in this balance was a provision of $2.2 million for doubtful accounts, or 1.9% of accounts receivable (as at December 31, 2011 - $2.0 million for doubtful accounts, or 1.5% of accounts receivable). We believe our allowance for doubtful accounts as at December 31, 2012 is adequate to provide for probable losses existing in accounts receivable.
| 62 | CATALYST PAPER 2012 ANNUAL REPORT |
Fair value measurement
We measure our derivative and non-derivative financial instruments at fair value, defined as the price that would be received from selling an asset or that would be paid to transfer a liability in an orderly transaction between market participants at the measurement date. When determining fair value measurements, we consider the principal or most advantageous market in which it would transact and consider assumptions that market participants would use when pricing the asset or liability, such as inherent risk, transfer restrictions and risk of non-performance.
An established fair value hierarchy requires the company to maximize the use of observable inputs and minimize the use of unobservable inputs when measuring fair value. A financial instrument’s categorization within the fair value hierarchy is based upon the lowest level of input that is both available and significant to the fair value measurement. Three levels of inputs may be used to measure fair value:
| Level 1 – | Quoted prices in active markets for identical assets or liabilities. |
| Level 2 – | Observable inputs other than quoted prices in active markets for identical assets and liabilities, such as quoted prices for identical or similar assets or liabilities in markets that are not active, or other inputs that are observable or can be corroborated by observable market data for substantially the full term of the assets or liabilities. |
| Level 3 – | Inputs that are generally unobservable and are supported by little or no market activity and that are significant to the fair value determination of the assets or liabilities. |
The determination of fair value requires judgments, assumptions and estimates and may change over time.
The following table presents information about the fair value of our derivative and non-derivative financial instruments not designated as hedging instruments and measured on a recurring basis at December 31:
| | | 2012 | | | 2011 | | | Fair value
hierarchy | | Balance sheet classification |
| Assets | | | | | | | | | | | | |
| Currency contracts | | $ | – | | | $ | 2.0 | | | 21 | | Prepaids and other |
| Currency contracts | | | – | | | | 2.5 | | | 21 | | Other assets |
| Commodity contracts | | | – | | | | 0.5 | | | 22 | | Prepaids and other |
| | | $ | – | | | $ | 5.0 | | | | | |
| Liabilities | | | | | | | | | | | | |
| Commodity contracts | | $ | – | | | $ | 0.4 | | | 22 | | Accounts payable and accrued liabilities |
| Commodity contracts | | | – | | | $ | 0.2 | | | 22 | | Other long-term obligations |
| | | $ | – | | | $ | 0.6 | | | | | |
Fair values of our derivatives are classified under Level 2 as they are measured as follows:
| 1 | The fair value of forward currency contracts is measured using the discounted difference between contractual rates and market future rates. Interest rates, forward market rates, and volatility are used as inputs for such valuation techniques. We incorporate credit valuation adjustments to appropriately reflect both our own non-performance risk and the counterparty’s non-performance risk in the fair value measurements. |
| 2 | The fair value of commodity swap contracts is measured using the discounted difference between contractual rates and market rates. The fair value of natural gas commodity options is measured using techniques derived from the Black-Scholes pricing model. We incorporate credit valuation adjustments to appropriately reflect both our own non-performance risk and the counterparty’s non-performance risk in the fair value measurements. |
| CATALYST PAPER 2012 ANNUAL REPORT | 63 |
We no longer designate U.S. dollar revenue risk management instruments as cash flow hedges for accounting purposes effective April 1, 2010. For cash flow hedges that were in place as at March 31, 2010, the effective portion of changes in the fair value accumulated as at March 31, 2010 were deferred and recorded inAccumulated other comprehensive loss. When the hedge item was recorded in earnings, the corresponding gain or loss on the hedge was reclassified fromAccumulated other comprehensive losstoSales.As of December 31, 2012 all deferred amounts on these cash flow hedges had been recognized inSales and circulated out ofAccumulated other comprehensive loss.
Income taxes
The amounts recorded for deferred income tax assets and liabilities are based on various judgments, assumptions and estimates. Deferred tax assets and liabilities are measured using enacted tax rates for the years in which assets and liabilities are expected to be recovered or settled. A projection of taxable income and estimates of the ultimate recovery or settlement of temporary differences are made for these years. The projection of future taxable income is based on management’s best estimate and may vary from actual.
At December 31, 2012 the company provided a full valuation allowance against its deferred tax assets. As a result, no net deferred tax asset was recorded. A one-percentage-point change in our reported effective income tax rate would have minimal effect on our income tax expense or recovery.
In addition, we record provisions for federal, provincial and foreign taxes based on the respective tax laws of the jurisdictions in which we operate and on our judgment as to the appropriate allocation of income and deductions to these jurisdictions. Canadian, U.S. and international tax laws are subject to interpretation, and our judgment may be challenged by taxation authorities. In such circumstances, the final resolution can result in settlements that differ from our estimated amounts.
| 15 | CHANGES IN ACCOUNTING POLICIES |
There were no recent amendments by the FASB to the Accounting Standards Codification that materially impacted the company’s consolidated financial statements or disclosures in 2012.
We adopted FASB ASC 852,Reorganizations for the duration of the CCAA proceedings. This standard requires that financial statements distinguish transactions and events that are directly associated with the reorganization from the ongoing operations of the business. Pre-petition obligations potentially impaired by the CCAA proceedings were classified as Liabilities subject to compromise.
We applied fresh start accounting in accordance with FASB ASC 852 as of the convenience date of September 30, 2012 whereby an enterprise value was established for the company, identified assets and liabilities were adjusted to fair value, goodwill was recognized at the amount that the enterprise value exceeded the fair value of identified assets and liabilities, and historical balances for the company’s equity accounts were eliminated. Consolidated financial statements prepared prior to the application of fresh start accounting are not comparable to our consolidated financial statements for the year ended December 31, 2012.
| 64 | CATALYST PAPER 2012 ANNUAL REPORT |
| 16 | IMPACT OF ACCOUNTING PRONOUNCEMENTS AFFECTING FUTURE PERIODS |
There were no new pronouncements issued by the FASB that may materially impact our consolidated financial statements for future periods.
| 17 | RISKS AND UNCERTAINTIES |
We face risks and uncertainties which fall into the general business areas of markets, international commodity prices, currency exchange rates, environmental issues, fibre supply, government regulation and policy and, for Canadian companies, trade barriers and potential impacts of Aboriginal rights, including unresolved Aboriginal land claims in B.C.
In order to address our business risks and effectively manage them, we have developed a process for managing risk and the interrelationship risks have with our strategic plan. We provide regular updates to the Audit Committee, work with corporate and operational management to identify, measure, and prioritize the critical risks facing the company and manage these risks by ensuring that they are adequately addressed through mitigating procedures where appropriate. The objectives of the risk-management function include developing a common framework for understanding what constitutes principal business risks, ensuring that risk management activities are aligned with business strategies, and providing an effective mechanism for governance in the area of risk management.
Subsequent to our restructuring under the CCAA proceedings, we may not be able to generate sufficient cash to service all of our indebtedness and may be forced to take other actions to satisfy our obligations under our indebtedness, which may not be successful
Our ability to service our debt obligations or to refinance our debt obligations depends on our financial condition and operating performance, which are subject to prevailing economic and competitive conditions and certain financial, business, legislative, regulatory and other factors beyond our control. We may be unable to maintain a level of cash flows from operating activities sufficient to permit us to fund our day-to-day operations or to pay the principal, premium, if any, and interest on our indebtedness.
| CATALYST PAPER 2012 ANNUAL REPORT | 65 |
If our cash flows and capital resources are insufficient to fund our debt service obligations, we could face substantial liquidity problems and could be forced to reduce or delay capital expenditures or to sell assets or operations, seek additional capital or restructure or refinance our indebtedness. We may not be able to affect any such alternative measures, if necessary, on commercially reasonable terms or at all and, even if successful, such alternative actions may not allow us to meet our scheduled debt service obligations. The credit agreement that governs the new ABL Facility and the note indentures that govern the 2017 Notes and the Exit Notes restrict our ability to dispose of assets and use the proceeds from any such dispositions and may also restrict our ability to raise debt or equity capital to be used to repay other indebtedness when it becomes due. We may not be able to consummate those dispositions or obtain proceeds in an amount sufficient to meet any debt service obligations when due. Our inability to generate sufficient cash flows to satisfy our debt obligations, or to refinance our indebtedness on commercially reasonable terms or at all, would materially and adversely affect our financial position and results of operations and our ability to satisfy our obligations under the 2017 Notes, the Exit Notes and the new ABL Facility.
If we cannot service our debt obligations, we will be in default and as a result, holders of the 2017 Notes and Exit Notes could declare all outstanding principal and interest to be due and payable, the lenders under the new ABL Facility could terminate their commitments to loan money, our secured lenders could foreclose against the assets securing such borrowings and we could be forced into bankruptcy or liquidation.
Our degree of leverage upon completion of our restructuring under the CCAA proceedings may limit our financial and operating activities
Our historical capital requirements have been considerable and our future capital requirements could vary significantly and may be affected by general economic conditions, wood fibre supply, currency exchange rates, industry trends, performance, interest rates and many other factors that are not within our control. Subject to the limits contained in the credit agreement that governs the new ABL Facility and the note indentures that govern the 2017 Notes and the Exit Notes, we may be able to incur additional debt from time to time to finance working capital, capital expenditures, investments or acquisitions, or for other purposes. If we do so, the risks related to our high level of debt could intensify. Our substantial level of indebtedness has had in the past, and could have in the future, important consequences, including the following:
| 66 | CATALYST PAPER 2012 ANNUAL REPORT |
| – | making it more difficult for us to satisfy our obligations with respect to our debt, |
| – | limiting our ability to obtain additional financing to fund future working capital, capital expenditures, product developments, acquisitions or other general corporate requirements, |
| – | requiring a substantial portion of our cash flows to be dedicated to debt service payments instead of other purposes, thereby reducing the amount of cash flows available for working capital, capital expenditures and other general corporate purposes, |
| – | increasing our vulnerability to general adverse economic and industry conditions, |
| – | exposing us to the risk of increased interest rates as certain of our borrowings, including the Exit Notes and borrowings under the new ABL Facility are at variable rates of interest, |
| – | limiting our flexibility in planning for and reacting to changes in our industry, |
| – | placing us at a disadvantage compared to other, less leveraged competitors, and |
| – | increasing our cost of borrowing. |
We may not realize our anticipated cost savings from our cost savings initiatives
As part of our restructuring under the CCAA proceedings, we have taken steps to lower operating costs by implementing various cost savings initiatives. Certain of these initiatives included, but were not limited to, new five-year competitive labour agreements in British Columbia to help reposition the business, lower property tax rates for all three mills located in British Columbia, provincial approval of our application for funding relief on our salaried pension plan solvency deficit, disposal of surplus assets, and closure of the Snowflake recycle mill operations. Estimates of cost savings are inherently uncertain, and we may not be able to achieve all of the cost savings or expense reductions that we have projected. Our ability to successfully realize savings and the timing of any realization may be affected by factors such as the need to ensure continuity in our operations, labour and other contracts, regulations and/or statutes governing employee/employer relationships, and other factors. In addition, our implementation of certain of these initiatives has and is expected to require upfront costs. There can be no assurances provided that we will be able to successfully contain our expenses or that even if our savings are achieved that implementation or other expenses will not offset any such savings. Our estimates of the future expenditures necessary to achieve the savings we have identified may not prove accurate, and any increase in such expenditures may affect our ability to achieve our anticipated savings. If these cost-control efforts do not reduce costs in line with our expectations, our financial position, results of operations and cash flows will be negatively affected.
There is a limited trading market for the company’s common shares
Although our new common shares are listed on the TSX certain holders of common shares may also be creditors of the company and there is no certainty that a viable trading market for the common shares will develop. The potential lack of liquidity for the common shares may make it more difficult for us to raise additional capital, if necessary, and it may affect the price volatility of the common shares. There can also be no assurance that a holder will be able to sell its common shares at a particular time or that the prices such holder receives when it sells will be favorable. Future trading prices of the common shares will depend on many factors, including our operating performance and financial condition.
| CATALYST PAPER 2012 ANNUAL REPORT | 67 |
As a result of the Plan, certain holders of common shares may also be creditors of the company and may seek to dispose of such securities to obtain liquidity. Such sales could cause the trading prices for these securities to be depressed. Further, the possibility that the holders of common shares may determine to sell all or a large portion of their shares in a short period of time may adversely affect the market price of the common shares.
Our business is of a cyclical nature and demand for our products
may fluctuate significantly
The markets for pulp and paper products are highly cyclical and are characterized by periods of excess product supply due to many factors, including additions to industry capacity, increased industry production, structural changes in the industry, periods of weak demand due to weak general economic activity or other causes, and reduced inventory levels maintained by customers.
Demand for forest products generally correlates to global economic conditions. Demand for pulp and paper products in particular is driven primarily by levels of advertising. In periods of economic weakness, reduced spending by consumers and businesses results in decreased demand for forest products, causing lower product prices and possible manufacturing downtime. The North American newsprint and directory paper market is mature with demand for newsprint declining significantly in the last five years.
We believe these declines in newsprint and directory paper demand will continue long term, although we have the ability to partially mitigate the impact by switching production from newsprint and directory paper to other paper grades. Demand for our products is traditionally weaker in the first half of the year.
As at December 31, 2012 one of the paper machines at our Crofton mill has been indefinitely curtailed. Should demand for our products weaken, additional indefinite or periodic production curtailments may be required, which could have an adverse impact on our financial condition and ability to generate sufficient cash flows to satisfy our operational needs and debt service requirements.
We operate in a commodity market where prices may fluctuate significantly
The pulp and paper industry is a commodity market in which producers compete primarily on the basis of price. Prices for our products have fluctuated significantly in the past and may fluctuate significantly in the future, principally as a result of market conditions of supply and demand, as well as changes in exchange rates. Our earnings are sensitive to price changes for our principal products, with the effect of price changes on newsprint and mechanical specialty printing paper grades being the greatest. Market prices for our products typically are not directly affected by input costs or other costs of sales and, consequently, we have limited ability to pass through increases in operating costs to our customers without an increase in market prices. Even though our costs may increase, our customers may not accept price increases for our products or the prices for our products may decline. As our financial performance is principally dependent on the prices we receive for our products, prolonged periods of low prices, customer refusal to accept announced price increases, or significant cost increases that cannot be passed on in product prices may be materially adverse to us.
| 68 | CATALYST PAPER 2012 ANNUAL REPORT |
Media trends may lead to long-term declines in demand for our products
Trends in advertising, Internet use and electronic data transmission and storage can have adverse effects on traditional print media. As our newsprint, telephone directory and retail customers increase their use of other forms of media and advertising, demand for our newsprint, uncoated mechanical and coated mechanical papers may decline on a long-term basis.
We are subject to exchange rate fluctuations
Nearly all of our sales are based upon prices set in U.S. dollars, while a substantial portion of our costs and expenses are incurred in Canadian dollars and our results of operations and financial condition are reported in Canadian dollars. The value of the Canadian dollar in relation to the U.S. dollar has increased significantly in recent years. Increases in the value of the Canadian dollar relative to the U.S. dollar reduce the amount of revenue in Canadian dollar terms from sales made in U.S. dollars, and would reduce cash flow available to fund operations and debt service obligations.
Since we have debt denominated in U.S. dollars, including our 2017 Notes and our Exit Notes, our reported earnings could fluctuate materially as a result of exchange rates given that changes in the value of the Canadian dollar against the U.S. dollar during a given financial reporting period result in a foreign currency gain or loss on the translation of U.S. dollar cash and debt into Canadian currency.
We have managed a part of our currency exposure in the past through the use of currency options and forward contracts to hedge anticipated future sales denominated in foreign currencies and U.S. dollar denominated debt. However, no assurance can be made that we will engage in any hedging transactions or, if we decide to engage in any such transactions, that we will be successful in eliminating or mitigating currency exchange risks. At March 5, 2013, we did not have any foreign currency options or forward contracts outstanding.
We face significant global competition
We compete with American, European and Asian producers in highly competitive global markets. Some of our competitors are larger and can accordingly achieve greater economies of scale, some have greater financial resources and some operate mills in locations that have lower energy, furnish or labour costs or have less stringent environmental and governmental regulations than the locations where we operate.
Our ability to compete is affected by a number of these factors as well as the quality of our products and customer service and our ability to maintain high plant efficiencies and operating rates and to control our manufacturing costs. If we were unable to compete effectively, there may be a materially adverse impact on our business.
| CATALYST PAPER 2012 ANNUAL REPORT | 69 |
We face risks related to our international sales
A significant portion of our sales are outside of Canada and the United States, 99% of our pulp sales and 24% of our paper sales in 2012. These international sales result in additional risks including restrictive government actions (including trade quotas, tariffs and other trade barriers and currency restrictions), local labour laws and regulations affecting our ability to hire, retain or dismiss employees, the need to comply with multiple and potentially conflicting laws and regulations, unfavourable national or regional business conditions or political or economic instability in some of these jurisdictions, higher transportation costs and difficulty in obtaining distribution and sales support.
We are exposed to fluctuations in the cost and supply of wood fibre
We have no significant timber holdings and are dependent on third parties for the supply of wood fibre required for our paper manufacturing operations.
Approximately 70% of our fibre is provided by five suppliers. Our fibre supply could be reduced as a result of events beyond our control, including industrial disputes, natural disasters and material curtailments and shutdown of operations by suppliers for market or other reasons. Market-related curtailments or shutdowns can be influenced by both seasonal and cyclical factors, such as raw material availability, finished goods inventory levels, interest rates and demand for lumber. Continued weakness in the U.S. housing market could lead to production curtailment for B.C. lumber producers and result in a reduction in residual fibre supply available to us.
We source a significant quantity of our fibre from the interior of B.C. The current mountain pine beetle infestation in the B.C. interior is expected to reduce the long-term fibre supply in the B.C. interior and could have a significant impact on the availability, quality and cost of fibre.
Approximately 69% of our fibre is sourced under long-term fibre agreements with third parties with pricing based on market prices or on prices determined under market-based formulas. Given that the market price for fibre varies due to external factors, there is a risk that we will not continue to have access to wood fibre at previous levels or pricing.
Aboriginal groups have claimed aboriginal title over substantial portions of B.C.’s timberlands, including areas where the forest tenures held by our suppliers are located. Although the renewal of forest tenures held by our suppliers may be adversely affected by claims of aboriginal title, the specific impact cannot be estimated at this time.
The permanent closure of our Snowflake mill, which produced 100% recycled newsprint from ONP, has eliminated our exposure to cost and supply fluctuations in ONP.
We are dependent on the supply of certain raw materials
In addition to wood fibre, we are dependent on the supply of certain chemicals and raw materials used in our manufacturing processes. Any material disruption in the supply of these chemicals or raw materials could affect our ability to meet customer demand in a timely manner and harm our reputation, and any material increase in the cost of these chemicals or other raw materials could negatively affect our business and the results of our operations.
| 70 | CATALYST PAPER 2012 ANNUAL REPORT |
We have incurred losses in recent periods and may incur losses in the future that may affect liquidity and ongoing operations
As of December 31, 2012 we had recorded net losses in 9 of the last 12 quarters. These losses were driven by reduced prices, weak market demand, production curtailments, general inflationary pressure and increased input costs and the strong Canadian dollar. Should we be unable to return to sustained profitability, cash generated through operations may be insufficient to meet operating cash requirements, requiring increased reliance on the ABL Facility to fund operating costs. If sufficient funding is not available under the ABL Facility, then additional funding sources may be required and there is no assurance that we will be able to access additional funding sources on favourable terms or at all to meet our cash requirements. The failure to obtain such funding could adversely affect our operations and our ability to maintain compliance with covenants under the ABL Facility, the 2017 Notes, and the Exit Notes.
Labour disruptions could have a negative impact on our business
Labour disruptions could occur and have a negative impact on our business. The new labour agreements with the CEP and PPWC expire on April 30, 2017 and the new labour agreement with CLAC expires on March 31, 2015. We do not anticipate labour disruptions in our operations in 2013.
Claims of aboriginal title and rights in Canada may affect our operations
The ability to operate our mills in Canada may be affected by claims of aboriginal rights and title by aboriginal groups. The governments of Canada and B.C. have established a formal process to negotiate settlements with aboriginal groups throughout B.C. in order to resolve these land claims. It is the policy of the governments that ownership of lands held in fee simple by third parties (such as us) will not be affected by treaty negotiations. The Powell River mill site has been included in areas to which an aboriginal group has asserted aboriginal title both through treaty negotiations with government and by commencing an action in 2005 in the Supreme Court of B.C. While we and other industrial companies have been named as parties in the court proceeding along with the governments of Canada and B.C., counsel for the aboriginal group has advised us that the plaintiffs are currently negotiating with these two governments and have no intention of proceeding with the action at this time. Based on the history of similar proceedings, we expect that it would be many years before a final court decision could be rendered if the proceeding were pursued.
Recent Supreme Court of Canada decisions have confirmed that the governments of Canada and B.C. are obligated to consult with and, in certain circumstances, accommodate aboriginal groups whenever there is a reasonable prospect decision, such as a decision to issue or amend a regulatory permit, which may affect aboriginal groups’ rights or title. This duty of consultation and accommodation may affect our ability to obtain or amend necessary regulatory permits on a timely basis and may influence the conditions set out in such permits.
| CATALYST PAPER 2012 ANNUAL REPORT | 71 |
Increases in energy costs could have a negative impact on our business
Our operations consume a significant amount of electricity, natural gas and fuel oil. Increases in prices for these commodities can increase manufacturing costs and have an adverse impact on our business and results of our operations.
Although our electricity supply agreements are provincially regulated and pricing has historically been stable, B.C. Hydro and Power Authority (“B.C. Hydro”) in recent years has sought, and to some extent achieved, rate increases above historical levels. B.C. Hydro raised its rates by 9.3% on an interim basis in April 2010 and a subsequent Negotiated Settlement Process resulted in the approval of a final effective rate increase of 7.3% on November 18, 2010. The difference between the interim and final approved rate increase was refunded through a credit on energy purchases in Q1 2011. The introduction of the Harmonized Sales Tax (“HST”) on July 1, 2010 substantially eliminated the 7% provincial sales tax on electricity, which reduced some of the impact of the rate increase. However, with the re-implementation of the B.C. provincial sales tax on April 1, 2013 and B.C. Hydro’s expressed intention to seek approval from the utilities commission to increase its rates in the range of 10% for the next three years in response to infrastructure maintenance and B.C. energy policy that includes mandating self-sufficiency by 2016, feed in tariffs, and the implementation of Smart Metering, our electricity prices could increase significantly and have an impact on our earnings. B.C. Hydro announced a 5.4% interim rate increase, effective April 1, 2012 subject to final approval by the British Columbia Utilities Commission (BCUC) later in the year. We have mitigated some of the impact of rate increases through reductions in usage at the highest incremental power rate and intend to further mitigate rate increases by implementing energy conservation projects and increasing our capacity to self-generate electricity, but there can be no assurance that we will be able to eliminate the effect of all such rate increases.
Since oil and natural gas are purchased on spot markets, their prices fluctuate significantly due to various external factors. We manage our exposure to the price volatility for these fuels through the use of financial instruments and physical supply agreements under a hedging program and also by using lower priced alternatives where feasible. There is, however, no assurance that we will be successful in eliminating or mitigating exposure to price volatility for these fuels.
We are subject to significant environmental regulation
We are subject to extensive environmental laws and regulations that impose stringent requirements on our operations, including, among other things, air emissions, liquid effluent discharges, the storage, handling and disposal of hazardous materials and wastes, remediation of contaminated sites and landfill operation and closure obligations. It may be necessary for us to incur substantial costs to comply with such environmental laws and regulations.
| 72 | CATALYST PAPER 2012 ANNUAL REPORT |
Some of our operations are subject to stringent permitting requirements and from time to time we face opposition to construction or expansion of proposed facilities, such as landfills. We may discover currently unknown environmental liabilities in relation to our past or present operations or at our current or former facilities, or we may be faced with difficulty in obtaining project approvals in the future. These occurrences may (i) require site or other remediation costs to maintain compliance or correct violations of environmental laws and regulations, (ii) result in denial of required permits, (iii) result in government or private claims for damage to person, property or the environment, or (iv) result in civil or criminal fines and penalties or other sanctions.
We permanently closed our Elk Falls paper mill in 2010. We may be required to conduct investigations and take remedial action for contaminated areas. We also permanently closed our paper recycling division in 2010 but do not currently expect any significant expenditures in respect of remediation of that site.
Our operations may be affected by the regulation of greenhouse gases (GHG) in Canada:
| · | The federal government has indicated its intent to regulate priority air pollutants, including particulate matter and sulphur oxides (SOx), and GHGs under theCanada Clean Air Act and theCanadian Environmental ProtectionAct. Under proposed targets, our Crofton mill may be required to reduce SOx emissions. The cost of making any such reductions is estimated between $4 and $8 million. The new standards are still being determined with compliance required within three to five years. In January 2010, the federal government, as part of its commitment to the Copenhagen Accord, announced a GHG reduction target of 17% by 2020 based on 2005 emissions. It is unknown what the federal government’s final position on these initiatives will be, as none have been enacted into law. |
| · | B.C. is a signatory to the Western Climate Initiative, a collaboration of four provinces and currently only one U.S. state (California), whose mandate is to achieve a 15% reduction in GHGs below 2005 levels among member entities by 2020. In addition, the B.C. government has announced its goal of reducing the provincial release of GHGs by 33% by 2020, based on 2007 levels, with interim reduction targets of 6% by 2012 and 18% by 2016. Quebec and California have initiated their regulatory processes in connection with implementation of a cap and trade system. B.C. has not issued regulations for its cap and trade program for GHGs and at this time and is reviewing its climate change and clean energy policies.It is too early to determine the impact on the company under any such cap and trade scheme. |
| · | Effective January 1, 2010, a GHG reporting regulation was brought into effect by the B.C. government which affects our three paper mills in B.C. The regulation includes requirements for calculating and reporting GHG emissions from facilities that release 10,000 tonnes or more of GHGs per year plus third-party verification at facilities that release 25,000 tonnes or more per year. The first reports and verification audits were successfully completed in 2011. |
The finalization of Canadian federal and provincial climate change regulation may depend on regulatory initiatives undertaken in the U.S.The United States has indicated its intention to introduce more stringent environmental regulation and implement policies designed to reduce GHG emissions through the Clean Air Act but the timing of the implementation of any national limits is uncertain. When limits are developed, it is expected that they will focus on the electricity generating sector.
| CATALYST PAPER 2012 ANNUAL REPORT | 73 |
Effective July 1, 2012 the carbon tax rates under the B.C. government’s carbon tax on fossil fuels increased by 25%. The B.C. government is currently reviewing the carbon tax regime and to date has indicated that no further increases are planned. The impact of increases in the carbon tax depends on our ability to decrease the use of fossil fuel. For the year ended December 31, 2012 we paid $6.5 million in carbon taxes on our fossil fuel purchases.
Additional regulatory initiatives may be implemented in other jurisdictions to address GHG emissions and other climate change-related concerns. If, to the extent we operate or offer our products for sale in such jurisdictions, we may be required to incur additional capital expenditures, operating costs or mitigating expenses, such as carbon taxes, to comply with any such initiatives.
Elimination of British Columbia Harmonized Sales Tax will negatively impact our future financial results
On April 1, 2013, the Province will revert back to provincial sales tax regime. We estimate that the additional annualized cost to our business from that date onward will be approximately $12 million, based on actual 2012 expenditures.
Equipment failures and the need to increase capital and maintenance expenditures could have a negative impact on our business
Our business is capital intensive. Our annual capital expenditure requirements vary due to differing requirements for current maintenance, expansion, business capital and environmental compliance and future projects. We regularly carry out maintenance on our manufacturing equipment but key components may still require repair or replacement. The costs associated with such maintenance and capital expenditures or our inability to source the necessary funds to enable us to maintain or upgrade our facilities as required could have an adverse effect on our business and operations.
In addition, we may from time to time temporarily suspend operations at one or more facilities to perform necessary maintenance or carry out capital projects. These temporary suspensions could affect the ability to meet customer demand in a timely manner and adversely affect our business.
We may be subject to litigation which could result in unexpected costs and expenditure of time and resources
We may from time to time be subject to claims and litigation proceedings generally associated with commercial and employment law issues. Given that these claims are subject to many uncertainties and the inability to predict with any certainty their outcomes and financial impacts, there is no guarantee that actions that may be brought against us in the future will be resolved in our favour or covered by our insurance. Any losses from settlements or adverse judgments arising out of these claims could be materially adverse to our operations and business.
| 74 | CATALYST PAPER 2012 ANNUAL REPORT |
The Snowflake mill sources water from groundwater wells in the vicinity of the Little Colorado River for its process requirements. The Little Colorado River Adjudication, filed in 1978, is pending in the Superior Court of Arizona, Apache County. The purpose of this adjudication is to determine the nature, extent and relative priority, if applicable, of the water rights of all claimants to the Little Colorado River system and sources. There are more than 3,500 participants, including Snowflake. Native American tribes and the United States government contend that Snowflake’s withdrawal and use of groundwater impermissibly interferes with water rights to the Little Colorado River. We dispute this contention. However, an adverse determination could result in claims for damages that may be materially adverse to us.
In addition, securities class-action litigation often has been brought against public companies following periods of volatility in the market price of their securities. It is possible that we could be the target of similar litigation in future. Securities litigation could result in substantial costs and damages and divert management’s attention and resources.
We extend trade credit to our customers and they may not pay us
promptly or in full
We extend trade credit to many purchasers of our products and rely on their creditworthiness. Some of these customers operate in highly competitive, mature, cyclical or low-margin businesses and some are highly leveraged financially or are experiencing negative cash flows which may result in them needing to refinance, restructure or file for bankruptcy protection or bankruptcy. We will typically have a greater number of such customers during economic downturns. The failure of such customers to pay us promptly and in full under the credit terms we extend to them could have a material adverse impact on our operating cash flows.
We are dependent upon certain of our management personnel
The success of our operations is influenced to a significant degree by our ability to attract and retain senior management with relevant industry experience. Successful implementation of our business strategy is dependent on our ability to attract and retain our executive officers and management team. The unexpected loss of services of any key management personnel or the inability to recruit and retain qualified personnel in the future could have an adverse effect on our business and financial results.
Consumer boycotts or increases in costs due to chain-of-custody programs may adversely affect demand for our products
Some of our customers are sensitive to issues associated with harvesting of old growth forests and require us to supply products that are not produced from these forests. A growing number of customers want to purchase products that originate from sustainable managed forests as validated by certification programs. We have implemented The Forest Stewardship Council chain-of-custody system to verify that selected paper products at our Crofton, Port Alberni and Powell River mills contain 100% certified wood fibre, but we may be required to implement additional or more stringent chain-of-custody certification programs with increased costs to meet our customers’ demands. Demand for our products may be adversely affected if we do not implement such programs or if we become subject to organized boycotts or similar actions by environmental or other groups.
| CATALYST PAPER 2012 ANNUAL REPORT | 75 |
Our insurance has limitations and exclusions
We maintain insurance coverage that we believe would ordinarily be maintained by an operator of facilities similar to our own. The insurance policies are subject to limits and exclusions. Damage to or destruction of our facilities could accordingly exceed the limits of our policies or be subject to policy exclusions.
Our mills are located in seismically active areas
Our three operating mills are situated adjacent to the ocean on the south coast of B.C. This is a seismically active area and these mills and the surrounding transportation infrastructure are accordingly susceptible to risk of damage or destruction caused by earthquakes and tsunamis. Our insurance may not cover the total losses associated with damage or destruction caused by an earthquake or tsunami, and this insurance is subject to limits and deductibles in respect of such damage that may limit the amount recoverable.
Post-retirement plan obligations may affect our financial condition
We maintain defined benefit pension plans and other post-retirement benefit plans for certain retired employees. As at December 31, 2012 the underfunded liability associated with the defined benefit pension plans $153.5 million and the underfunded liability associated with the other post-retirement benefit plans was $149.2 million. Funding requirements for these plans are dependent on various factors, including interest rates, asset returns, regulatory requirements for funding purposes, and changes to plan benefits. In 2013, we are required to contribute $4.5 million towards the underfunded liability of the defined benefit pension plans. Although we expect to continue to make contributions to fund post-retirement plan obligations and to meet legal funding obligations for the defined benefit pension plan, no assurance can be made that the underfunded liability under these plans will not be materially adverse to us in the future.
A change in our legal control could be materially adverse
We have outstanding US$250 million of 2017 Notes and US$35million of Exit Notes. If a Change of Control (as such term is defined in the indenture governing these notes) occurs, we are required to make an offer to purchase all outstanding notes at a price equal to 101% of their principal amount, plus accrued and unpaid interest to the date of payment, in accordance with the procedures set out in the indenture. We may not have sufficient financial resources to fund any such repurchase.
| 76 | CATALYST PAPER 2012 ANNUAL REPORT |
| 18 | GOVERNANCE AND MANAGEMENT SYSTEMS |
Corporate governance
Our senior governing body is made up of a seven-member Board of directors and three Board committees. The individuals who make up our Board and serve on our committees provide high-level stewardship, supervise corporate management, and ensure our information-disclosure requirements are met. A new Board was appointed as of September 13, 2012 on exit from the creditor protection proceedings.
Our corporate directors are responsible for increasing and preserving shareholder value and fostering our long-term success, while considering the interests of a range of shareholders. This involves assessing risks and performance relating to both financial and non-financial measures.
Board committees
Our three standing Board committees consist of an audit committee, an environmental health and safety committee and a governance, human resources and compensation committee. These committees establish principles, evaluate compliance and monitor performance in these areas. Designated executives and senior operational leaders report to these committees quarterly.
The governance, human resources and compensation committee is responsible for best-practices monitoring, annual board effectiveness evaluations, and director development.
As of the end of 2012, six of seven directors, including the Board chair and excepting only the president and CEO, were independent.
Risk and management systems
We recognize the importance of good risk and management systems. We maintain a comprehensive inventory of major risks and management responses, including probability and severity assessments, which is reviewed by our Board’s audit committee every year.
Code of conduct
We have a Code of Corporate Ethics and Behaviour that applies to directors, executives and employees, and is reviewed and committed to by salaried employees each year. Breaches of this code can be reported through an anonymous phone line or other methods, but no reports were received in 2012.
Our governance practices meet or exceed the effective governance guidelines of our listing stock exchange. For more information on our governance, visithttp://catalystpaper.com/about/governance.
| CATALYST PAPER 2012 ANNUAL REPORT | 77 |
Our earnings are sensitive to fluctuations in:
Product price
Our products are commodity-based and cyclical in nature. As a result, earnings are sensitive to price changes, with price changes on specialty printing paper grades and newsprint having the greatest effect.
Foreign exchange
Our products are primarily sold in Canada, the United States, Asia and Australasia, Latin America and Europe. The majority of sales are denominated in foreign currencies, principally the U.S. dollar. As a result, we are exposed to foreign currency risk on accounts receivable and future sales.
Energy costs
Our earnings could be significantly affected by changes in prices and terms of energy-supply contracts, as we are a significant consumer of electrical power, fossil fuels and input materials whose pricing is highly correlated to energy costs.
Freight costs
Our earnings could be significantly affected by changes in the cost of freight, which is highly corrected with fuel prices. Fuel prices fluctuate significantly and are sensitive to general economic factors such as supply shocks and global economic growth.
| 78 | CATALYST PAPER 2012 ANNUAL REPORT |
Fibre
Our supply of fibre is subject to market influences and has some degree of variability. Fibre supply includes wood chips, logs, hog fuel and ONP.
Our adjusted EBITDA, net earnings and earnings per share are estimated to be affected by changes in product prices, foreign exchange and input costs as follows:
| (In millions of dollars, except per share amounts) | | Adjusted
EBITDA1 | | | Net earnings2 | | | Earnings
per share | |
| | | | | | | | | | |
| Product prices3 | | | | | | | | | | | | |
| A US$10 per tonne change in the sales price of: | | | | | | | | | | | | |
| Specialty printing papers | | $ | 8 | | | $ | 6 | | | $ | 0.40 | |
| Newsprint | | | 3 | | | | 2 | | | | 0.15 | |
| Pulp | | | 3 | | | | 2 | | | | 0.15 | |
| | | | | | | | | | | | | |
| Foreign exchange4 | | | | | | | | | | | | |
| A US$0.01 change in the U.S. dollar relative to the Canadian dollar | | | 6 | | | | 5 | | | | 0.34 | |
| | | | | | | | | | | | | |
| Energy cost sensitivity5 | | | | | | | | | | | | |
| A 5% change in the price of: | | | | | | | | | | | | |
| Natural gas and oil – direct purchases | | | 2 | | | | 1 | | | | 0.09 | |
| Electricity – direct purchases | | | 7 | | | | 5 | | | | 0.34 | |
| | | | | | | | | | | | | |
| Freight cost sensitivity | | | | | | | | | | | | |
| A US$5/bbl change in the price of West Texas Int. (WTI) Oil | | | 3 | | | | 2 | | | | 0.15 | |
| | | | | | | | | | | | | |
| Fibre sensitivity5 | | | | | | | | | | | | |
| A US$5 per unit change in the price of: | | | | | | | | | | | | |
| Wood chips (bone dry tonnes) | | | 8 | | | | 6 | | | | 0.40 | |
| 1 | Refer to section 13,Non-GAAP measures. |
| 2 | Based on an expected long-term tax rate of 25%. |
| 3 | Based on annualized sales of Q4 2012 and foreign exchange rate of US$1.01. |
| 4 | Based on Q4 2012 annualized net cash flows and a movement to US$1.02 from US$1.01 and excluding our hedging program and the impact of the translation of U.S. dollar denominated debt. |
| 5 | Based on Q4 2012 annualized consumption levels and an exchange rate of US$1.01. |
Economy
The global economies struggled in 2012 due to a host of factors including the sovereign debt issues affecting Europe and North America, slow growth in the U.S. economy, and reduced economic growth in China. The U.S. economy is expected to improve in 2013 led by an employment recovery as well as a recovering housing market. Volatility is expected to continue due to ongoing fiscal issues in Europe and North America. The Canadian economy is expected to weaken due to a slowing housing market and generally slow economic growth. A mix of a strengthening U.S. economy and a weakening Canadian economy could result in some weakness in the Canadian dollar. The continued volatility of the Canadian dollar may significantly impact our operating and net earnings, cash flow and liquidity.
| CATALYST PAPER 2012 ANNUAL REPORT | 79 |
Markets
Specialty printing paper markets are expected to remain challenging in 2013 with the continued migration to electronic media. Demand for coated mechanical is expected to drop in 2013 while demand for uncoated mechanical is expected to increase slightly due to the restart of additional uncoated mechanical capacity in Q4, 2012. This additional capacity will lead to some grade switching from coated to uncoated mechanical. Operating rates for coated and uncoated mechanical are expected to decline unless the drop in demand is offset by additional mill closures and capacity reductions. Prices for coated and uncoated mechanical grades will be under pressure in the seasonally slower first of the year as a result of these lower operating rates. Demand for directory paper will continue to decline albeit at a slower rate than 2012 due to paper conservation moves by publishers and migration to electronic media. Poor demand conditions and weaker operating rates for directory paper are expected to lead to slightly lower prices for 2013 compared to 2012.
Newsprint demand in 2013 is expected to contract further due to declining circulation, page count reductions, conservation measures by publishers, and continued migration of information and advertising to the Internet. After a significant drop in exports from North America in 2012, exports may increase modestly as North American producers seek to find markets for their excess capacity. The restart of additional newsprint capacity in the 2nd half of 2012 resulted in the first signs of price weakness in quite some time. This price weakness is expected to continue through the first quarter of 2013. Newsprint prices for the remainder of the year will depend on the supply and demand balance.
The NBSK market improved slightly in the fourth quarter and this trend is expected to continue for the first half of 2013 as the Chinese economy rebounds from slower economic growth in 2012. Improved demand for pulp for woodfree paper and tissue are expected to increase demand and support higher prices for NBSK in 2013. Hardwood pulp capacity increases in 2013 may lead to more switching between softwood and hardwood. Chinese buying patterns and requirements are expected to continue to drive the market in 2013.
Operations and capital spending
Price pressure for key inputs is expected to be marginal with the exception of power where we are expecting to see rate increases from BC Hydro as well as the return of the PST. Labour, fibre, fossil fuel, chemicals are expected to be similar to 2012. We expect maintenance costs for 2013 to be higher than 2012 levels primarily due to the impact of total mill outages at Alberni in Q1 and Crofton in Q2. Crofton Pulp outages in 2013 are expected in Q2 and Q4, while mandatory annual boiler annual outages will take place throughout the year at all of our mills similar to 2012.
We anticipate that the Crofton No. 1 machine will remain indefinitely curtailed due to weak markets and high costs, removing approximately 140,000 tonnes on an annualized basis. We will continue to match production to our orders for all grades.
Capital spending is expected to be approximately $25 million in 2013; however, capital will be managed to balance cash flow.
Q1, 2013 costs are expected to be higher than Q1 2012 in part due to lower production and higher maintenance costs as a result of a number of reliability issues at the mills in Q1, 2013.
| 80 | CATALYST PAPER 2012 ANNUAL REPORT |
Liquidity, debt maturities and covenants
We do not currently anticipate any significant uses of cash in 2013 other than for our operations, working capital fluctuations, interest payments, pension funding of the Salaried DB Plan and the PACE Industry Union-Management multi-employer pension plan.
The company expects to close on the sale of PREI at the end of the first quarter subject to various closing conditions. The company is required under the terms of the Plan of Arrangement to distribute to unsecured creditors of the company who did not elect to receive shares in settlement of their claims, their pro rata share of 50% of the net proceeds of the sale (which, given that many creditors elected to instead receive shares, will result in a distribution of approximately 40% of the net proceeds of the sale). The company will offer to purchase a portion of its Exit Notes with the balance of the net proceeds.
2013 key objectives:
In 2013, we will focus on objectives and initiatives in four areas:
Social
| · | Significantly improve safety results reducing medical incidents by 50% and lost time injuries by 41% to achieve 2nd quartile or better industry ranking. |
| · | Establish Catalyst Paper as an employer-of-choice, and further strengthen linkages with training institutions and other recruitment-supporting initiatives. |
| · | Continue to seek competitive business conditions in B.C. including reductions in hydro and taxation rates and work with municipalities to achieve joint cost-saving service and infrastructure agreements. |
Financial
| · | Complete outstanding restructuring items and use proceeds of asset sales to pay down debt. |
| | | |
| · | Reduce operating costs, and focus on generating positive free cash flow. |
| · | Complete special portability option program developed to deal with the salaried pension deficit. |
Commercial
| · | Expand geographic reach of Catalyst Paper into emerging world markets of Latin America and Asia. |
| · | Gain market share and expand sales reach into new markets with new products. |
| · | Increase breadth of product range and solidify position as the most flexible and diverse producer and marketer of paper in the west. |
| CATALYST PAPER 2012 ANNUAL REPORT | 81 |
Environmental
| · | Work with community stakeholders to identify and implement sustainable watershed management solutions. |
| · | Adhere to high international standards for transparency and reporting of performance on social, governance and environmental factors. |
| · | Support revision of the BC Forest Stewardship Council standard to achieve increased access to FSC fibre. |
| 21 | DISCLOSURE CONTROLS AND INTERNAL CONTROL OVER FINANCIAL REPORTING |
We conducted an evaluation of the effectiveness of the design and operation of our disclosure controls and procedures. The evaluation was conducted under the supervision and with the participation of management, including the chief executive officer and chief financial officer, as of December 31, 2012. Based on the evaluation, our chief executive officer and chief financial officer concluded that such disclosure controls and procedures – as defined in Canada under National Instrument 52-109, Certification of Disclosure in Issuers’ Annual and Interim Filings, and in Rules 13a-15(e) and 15d-15(e) promulgated under theUnited States Securities Exchange Act of 1934, as amended (theU.S. Exchange Act) – are effective as at December 31, 2012.
It should be noted that while our disclosure controls and procedures are designed to provide a reasonable level of assurance of achieving their objectives, our chief executive officer and chief financial officer do not expect that our disclosure controls and procedures or internal control over financial reporting will prevent all errors and fraud. A control system, no matter how well conceived or operated, can provide only reasonable, not absolute, assurance that the objectives of the control system are met.
There were no changes in our internal control over financial reporting during the period ended December 31, 2012 that materially affected or are reasonably likely to materially affect our internal control over financial reporting. Management has limited the scope of the design and maintenance of adequate disclosure controls and procedures and internal control over financial reporting to exclude controls, policies and procedures of Powell River Energy Inc., a variable interest entity in which we are the primary beneficiary.
Section 404 of the United StatesSarbanes-Oxley Act, Management Assessment of Internal Controls (Section 404), continues to require that management (a) has the responsibility for establishing and maintaining an adequate internal control structure and procedure for financial reporting, and (b) assesses and reports on the effectiveness of internal control over financial reporting annually. As of December 31, 2012 management has assessed the effectiveness of the company’s internal control over financial reporting. Based on this assessment, management has determined the company’s internal control over financial reporting was effective as of December 31, 2012 and issued Management’s Report on Financial Statements and Assessment of Internal Control over Financial Statements dated March 5, 2013 to that effect.
| 82 | CATALYST PAPER 2012 ANNUAL REPORT |
The Board of directors’ Audit Committee, as part of its oversight role, has reviewed and recommended the approval of this MD&A to the Board of directors. The Board of directors has read and approved this MD&A. Through discussions with management, the Board of directors and the Audit Committee have satisfied themselves that management has implemented the necessary disclosure controls.
Additional information about the company, including our most recent Annual Information Form, is available on our website atwww.catalystpaper.com, or on the Canadian Securities Administrators’ electronic filing website atwww.sedar.com.
| CATALYST PAPER 2012 ANNUAL REPORT | 83 |