Exhibit 99.1

Key Highlights 1 Banco de Chile Earnings Report 2Q21

Key Highlights ‘After almost 18 months of lockdowns and mobility restrictions, vaccination seems to be bearing fruit . During the 2 Q 21 the health authority lifted restrictions for many neighbours and starting the 3 Q 21 Santiago and other main cities were passed to phase – 3 meaning that many economic activities could gradually return to on - site operations under certain health measures . Based on these developments, the 2 Q 21 certainly showed a sort of breakpoint in diverse business metrics . For instance, for first quarter since the 2 Q 20 income from loans posted positive QoQ growth of 2 . 6 % , trend that we are also seeing in transactional products as depicted by monthly credit card billing averaging Ch $ 380 Bn . and quarterly checking account openings reaching ~ 27 , 500 both in the 2 Q 21 . Likewise, mortgage loan origination is returning to pre - Covid 19 levels by totalling ~Ch $ 450 Bn . in the 2 Q 21 , while origination in consumer loans has improved though not enough to produce a loan portfolio expansion . Based on these figures, even though customer income continues to be below pre - Covid 19 levels, it keeps on growing steadily QoQ by advancing 4 . 5 % in the 2 Q 21 after bottoming out in the 4 Q 20 . This is good news considering that our top line mostly depends on customer income and not on short - term financial gains . Also, we have benefited from above - average inflation while maintaining healthy market risk exposures and reduced term mismatches, which should enable us to face monetary policy tightening and higher uncertainty better than our main peers . From the credit risk perspective, NPLs continue to be far below average levels, fostered by well - known temporary effects such as pension funds withdrawals and direct money transfers both underlying an improved payment capacity of individuals and SMEs . Accordingly, our core risk expenses remained low in the 2 Q 21 . However, we are aware this is likely to be a short - term behaviour, so lagged effects could arise in the coming quarters . Accordingly, during the 2 Q 21 we set Ch $ 50 Bn . in additional allowances to bolster our coverage in order to deal with potential disruptions in expected losses in a scenario of normalized liquidity . All in all, our ratio of loan loss provisions amounted to 1 . 0 % in the 2 Q 21 , which is to some extent aligned with mid - term figures for our loan portfolio . Based on the above, and also due to advances in efficiency that allowed us to maintain operating expenses all but flat YoY in the 2 Q 21 , we managed to post a bottom line of Ch $ 162 Bn . for second quarter in a row, which delivered ROAE of ~ 17 % . We believe that as long as the sanitary contingency continues to be under control and the local economy retakes reasonable dynamism, our business should be able to maintain this performance by leveraging on solid customer income and reactivation of core banking activities . The important thing is that our proven fundamentals, including our market - leading asset quality and the soundest capital structure of the banking system, even under Basel III, should enable us take advantage of the economic recovery in a sustainable fashion . ’ Eduardo Ebensperger - CEO As of Jun21, we reached a Return on Average Equity (ROAE) of 17.0%. 17% ROAE We remain the first private bank in Fogape Reactiva loans, which supports our 54 bps. YTD gain in market share in commercial loans. Ch$1,130 Bn. Fogape Reactiva loans We are the private bank with the greatest amount of additional allowances of Ch$410 Bn., representing a whole year of LLPs. 326% Coverage Ratio (including additional provisions) Our cost base continued to reflect the outcome of our efficiency program by decreasing 2% YoY in the 2Q21 while remaining flat YTD. 2% YoY Decrease in OpEx 2

Financial Snapshot 2Q21 (In billions of Ch$) Net Income 1 1 2 162 (27.3) 21 . 9 62 . 6 4 . 2 ( 10 . 7 ) 2 Q 2 0 2 Q 2 1 Non - c u s t o m e r Income Loa n Lo s s Prov. Op. E x pen s e s I n c o m e t a x & Others +45.4% C u s t o m e r Income (1) Including the whole market and not only subsidiaries of local banks. #1 Bank In the 2Q21, we ranked first among the banks that the customer would change, according to GFK Adimark 1.04% NPLs Lowest delinquency ratio Among peers as of Jun21 (>90 days past - due) Ratios 2Q21 1H21 ROAE 16.8% 17.0% NIM 3.4% 3.4% LLP / Avg. Loans 1.0% 0.8% Efficiency Ratio 43.6% 45.0% TIER I Ratio 12.5% 12.5% 16.9% share As of Jun21, we achieved the highest market share in total loans since the 2Q19 ~230,000 Checking and FAN accounts openings during the 2Q21. We have opened ~ 490,000 FAN accounts since launched 198% Average LCR Ratio in the 2Q21, based on a solid buffers and term mismatches management 16 . 4 % BIS Strongest Capital Adequacy among major local banks #1 in NPS We ranked first in Net Promoter Score in the 2Q21 with a 65%, according to Procalidad #1 in Net Income Banchile Stock Brokerage remained leader 1 among m a i n peers +23% QoQ Increase in origination of Residential Mortgag e Loans (~Ch $ 455 Bn . ) 3
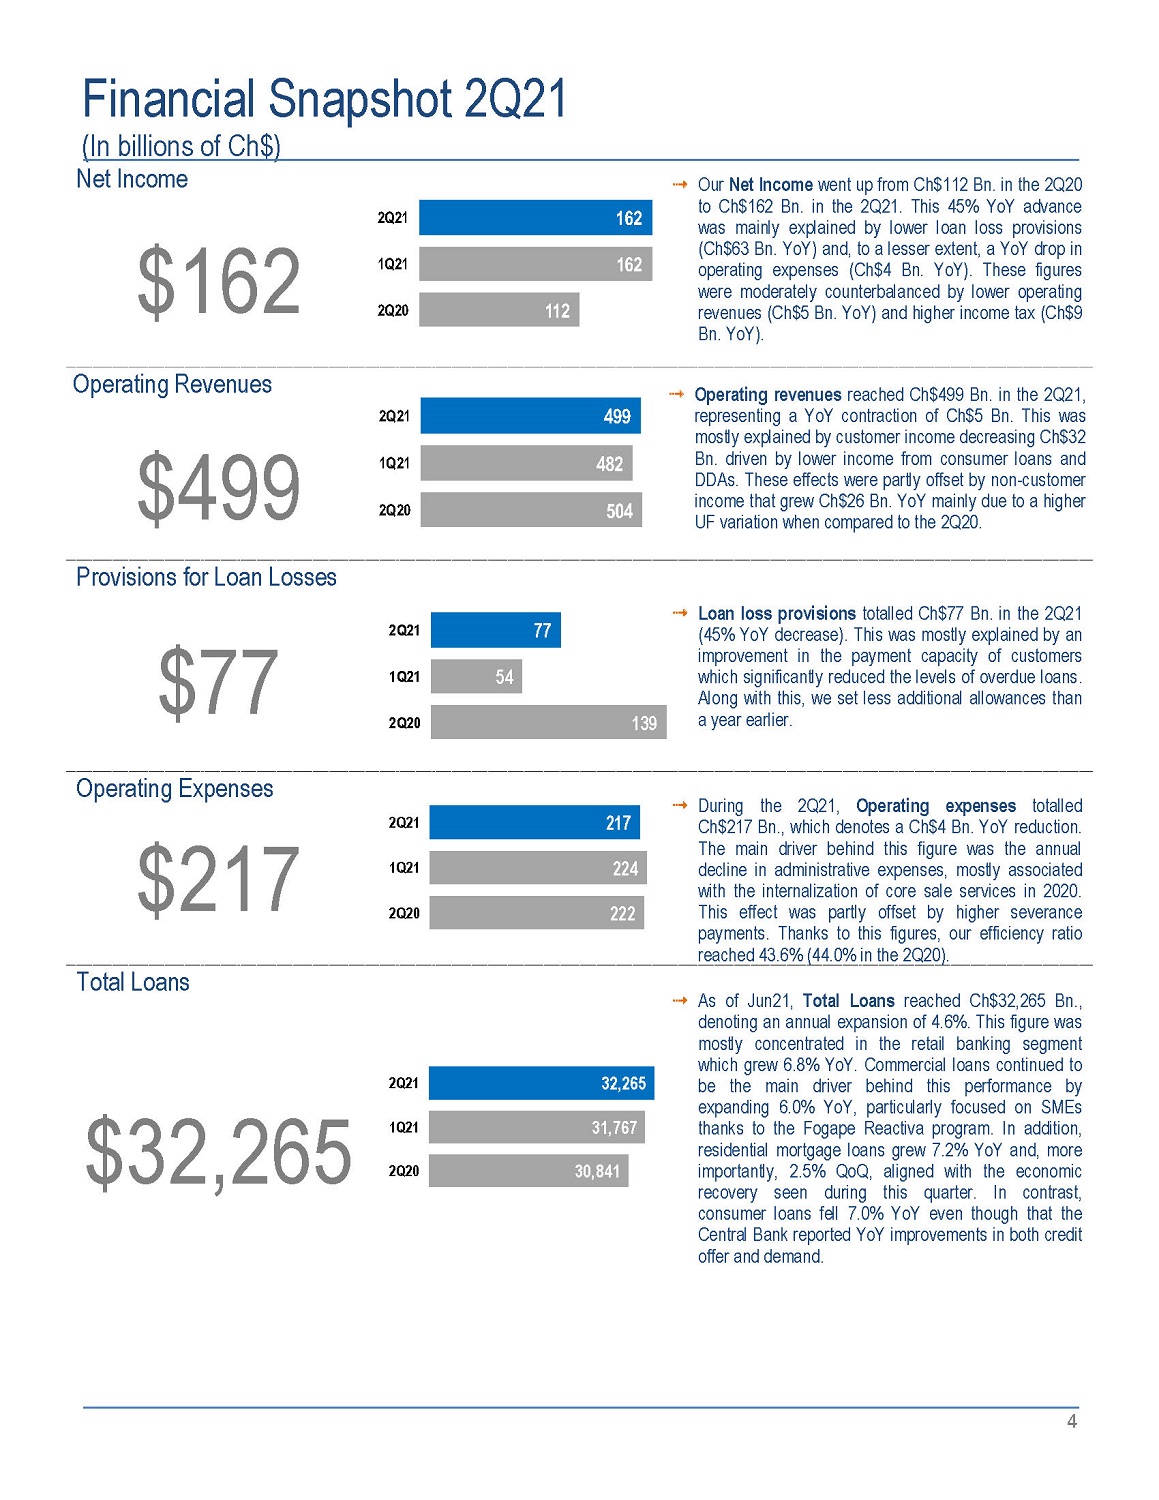
Financial Snapshot 2Q21 (In billions of Ch$) Net Income Our Net Income went up from Ch $ 112 Bn . in the 2 Q 20 to Ch $ 162 Bn . in the 2 Q 21 . This 45 % YoY advance was mainly explained by lower loan loss provisions (Ch $ 63 Bn . YoY) and, to a lesser extent, a YoY drop in operating expenses (Ch $ 4 Bn . YoY) . These figures were moderately counterbalanced by lower operating revenues (Ch $ 5 Bn . YoY) and higher income tax (Ch $ 9 Bn . YoY) . $162 Operating Revenues Operating revenues reached Ch $ 499 Bn . in the 2 Q 21 , representing a YoY contraction of Ch $ 5 Bn . This was mostly explained by customer income decreasing Ch $ 32 Bn . driven by lower income from consumer loans and DDAs . These effects were partly offset by non - customer income that grew Ch $ 26 Bn . YoY mainly due to a higher UF variation when compared to the 2 Q 20 . $499 2Q21 1Q21 2Q20 499 482 504 Provisions for Loan Losses $77 2Q21 1Q21 2Q20 54 77 139 Loan loss provisions totalled Ch $ 77 Bn . in the 2 Q 21 ( 45 % YoY decrease) . This was mostly explained by an improvement in the payment capacity of customers which significantly reduced the levels of overdue loans . Along with this, we set less additional allowances than a year earlier . Operating Expenses During the 2 Q 21 , Operating expenses totalled Ch $ 217 Bn . , which denotes a Ch $ 4 Bn . YoY reduction . The main driver behind this figure was the annual decline in administrative expenses, mostly associated with the internalization of core sale services in 2020 . This effect was partly offset by higher severance payments . Thanks to this figures, our efficiency ratio reached 43 . 6 % ( 44 . 0 % in the 2 Q 20 ) . $217 2Q21 1Q21 2Q20 217 224 222 Total Loans As of Jun 21 , Total Loans reached Ch $ 32 , 265 Bn . , denoting an annual expansion of 4 . 6 % . This figure was mostly concentrated in the retail banking segment which grew 6 . 8 % YoY . Commercial loans continued to be the main driver behind this performance by expanding 6 . 0 % YoY, particularly focused on SMEs thanks to the Fogape Reactiva program . In addition, residential mortgage loans grew 7 . 2 % YoY and, more importantly, 2 . 5 % QoQ, aligned with the economic recovery seen during this quarter . In contrast, consumer loans fell 7 . 0 % YoY even though that the Central Bank reported YoY improvements in both credit offer and demand . $32,265 2Q21 1Q21 2Q20 32,265 31,767 30,841 4
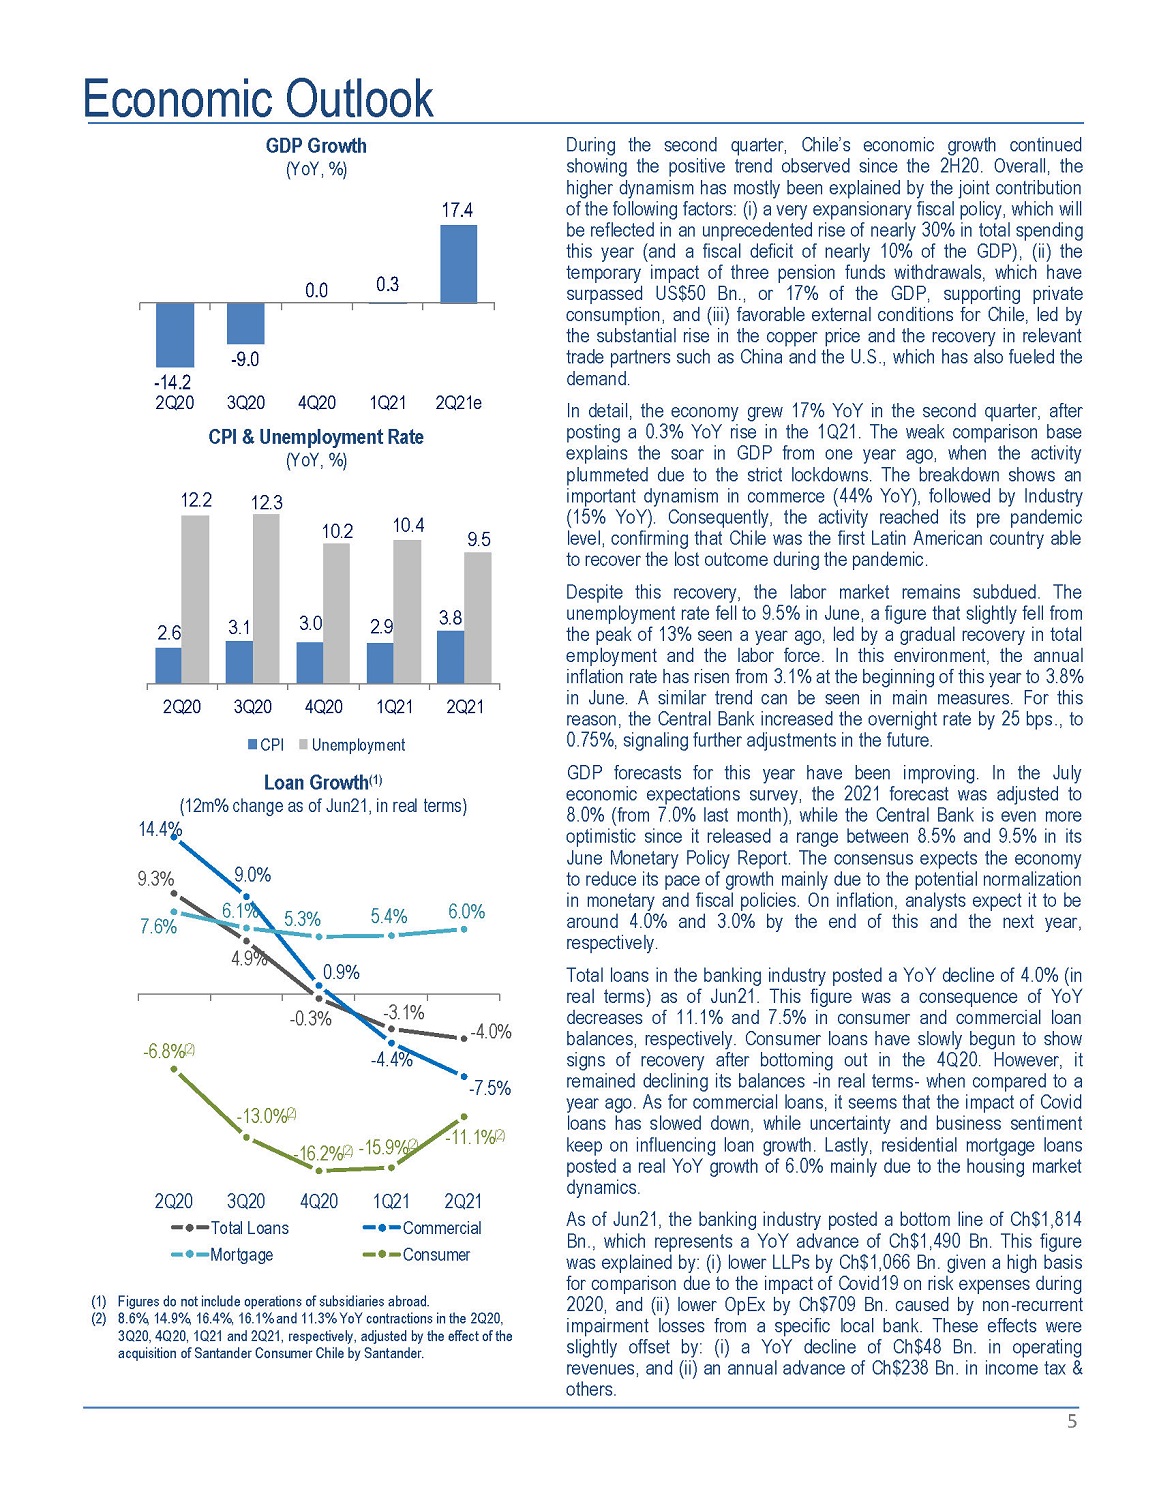
E conomic Outlook GDP Growth (YoY, %) 0 . 0 0 . 3 - 9.0 - 14.2 2Q20 3Q20 4Q20 1Q21 CPI & Unemployment Rate (YoY, %) 17 . 4 2 Q 2 1 e 2 . 6 3. 1 3. 0 2 . 9 3. 8 12. 2 12 . 3 10 . 2 10 . 4 9. 5 9.3 % 4.9 % - 0.3 % - 3 . 1 % - 4.0 % 2Q20 3Q20 4Q20 1Q21 2Q21 CPI Unemployment Loan Growth (1) (12m% change as of Jun21, in real terms) 14.4% 9.0 % 0.9 % - 4.4 % - 7.5 % 7 . 6 % 6.1 % 5.3 % 5.4 % 6 . 0 % - 6.8% (2) - 13.0% (2) - 16.2% (2) - 15.9% (2) - 11.1% (2) 4 Q 2 0 2Q20 3Q20 T o t a l L o an s Mortgage 1 Q 2 1 2 Q 2 1 C o m m e r ci a l Consumer 5 (1) Figures do not include operations of subsidiaries abroad. (2) 8.6%, 14.9%, 16.4%, 16.1% and 11.3% YoY contractions in the 2Q20, 3Q20, 4Q20, 1Q21 and 2Q21, respectively, adjusted by the effect of the acquisition of Santander Consumer Chile by Santander. During the second quarter, Chile’s economic growth continued showing the positive trend observed since the 2 H 20 . Overall, the higher dynamism has mostly been explained by the joint contribution of the following factors : (i) a very expansionary fiscal policy, which will be reflected in an unprecedented rise of nearly 30 % in total spending this year (and a fiscal deficit of nearly 10 % of the GDP), (ii) the temporary impact of three pension funds withdrawals, which have surpassed US $ 50 Bn . , or 17 % of the GDP, supporting private consumption, and (iii) favorable external conditions for Chile, led by the substantial rise in the copper price and the recovery in relevant trade partners such as China and the U . S . , which has also fueled the demand . In detail, the economy grew 17 % YoY in the second quarter, after posting a 0 . 3 % YoY rise in the 1 Q 21 . The weak comparison base explains the soar in GDP from one year ago, when the activity plummeted due to the strict lockdowns . The breakdown shows an important dynamism in commerce ( 44 % YoY), followed by Industry ( 15 % YoY) . Consequently, the activity reached its pre pandemic level, confirming that Chile was the first Latin American country able to recover the lost outcome during the pandemic . Despite this recovery, the labor market remains subdued . The unemployment rate fell to 9 . 5 % in June, a figure that slightly fell from the peak of 13 % seen a year ago, led by a gradual recovery in total employment and the labor force . In this environment, the annual inflation rate has risen from 3 . 1 % at the beginning of this year to 3 . 8 % in June . A similar trend can be seen in main measures . For this reason, the Central Bank increased the overnight rate by 25 bps . , to 0 . 75 % , signaling further adjustments in the future . GDP forecasts for this year have been improving . In the July economic expectations survey, the 2021 forecast was adjusted to 8 . 0 % (from 7 . 0 % last month), while the Central Bank is even more optimistic since it released a range between 8 . 5 % and 9 . 5 % in its June Monetary Policy Report . The consensus expects the economy to reduce its pace of growth mainly due to the potential normalization in monetary and fiscal policies . On inflation, analysts expect it to be around 4 . 0 % and 3 . 0 % by the end of this and the next year, respectively . Total loans in the banking industry posted a YoY decline of 4 . 0 % (in real terms) as of Jun 21 . This figure was a consequence of YoY decreases of 11 . 1 % and 7 . 5 % in consumer and commercial loan balances, respectively . Consumer loans have slowly begun to show signs of recovery after bottoming out in the 4 Q 20 . However, it remained declining its balances - in real terms - when compared to a year ago . As for commercial loans, it seems that the impact of Covid loans has slowed down, while uncertainty and business sentiment keep on influencing loan growth . Lastly, residential mortgage loans posted a real YoY growth of 6 . 0 % mainly due to the housing market dynamics . As of Jun 21 , the banking industry posted a bottom line of Ch $ 1 , 814 Bn . , which represents a YoY advance of Ch $ 1 , 490 Bn . This figure was explained by : (i) lower LLPs by Ch $ 1 , 066 Bn . given a high basis for comparison due to the impact of Covid 19 on risk expenses during 2020 , and (ii) lower OpEx by Ch $ 709 Bn . caused by non - recurrent impairment losses from a specific local bank . These effects were slightly offset by : (i) a YoY decline of Ch $ 48 Bn . in operating revenues, and (ii) an annual advance of Ch $ 238 Bn . in income tax & others .
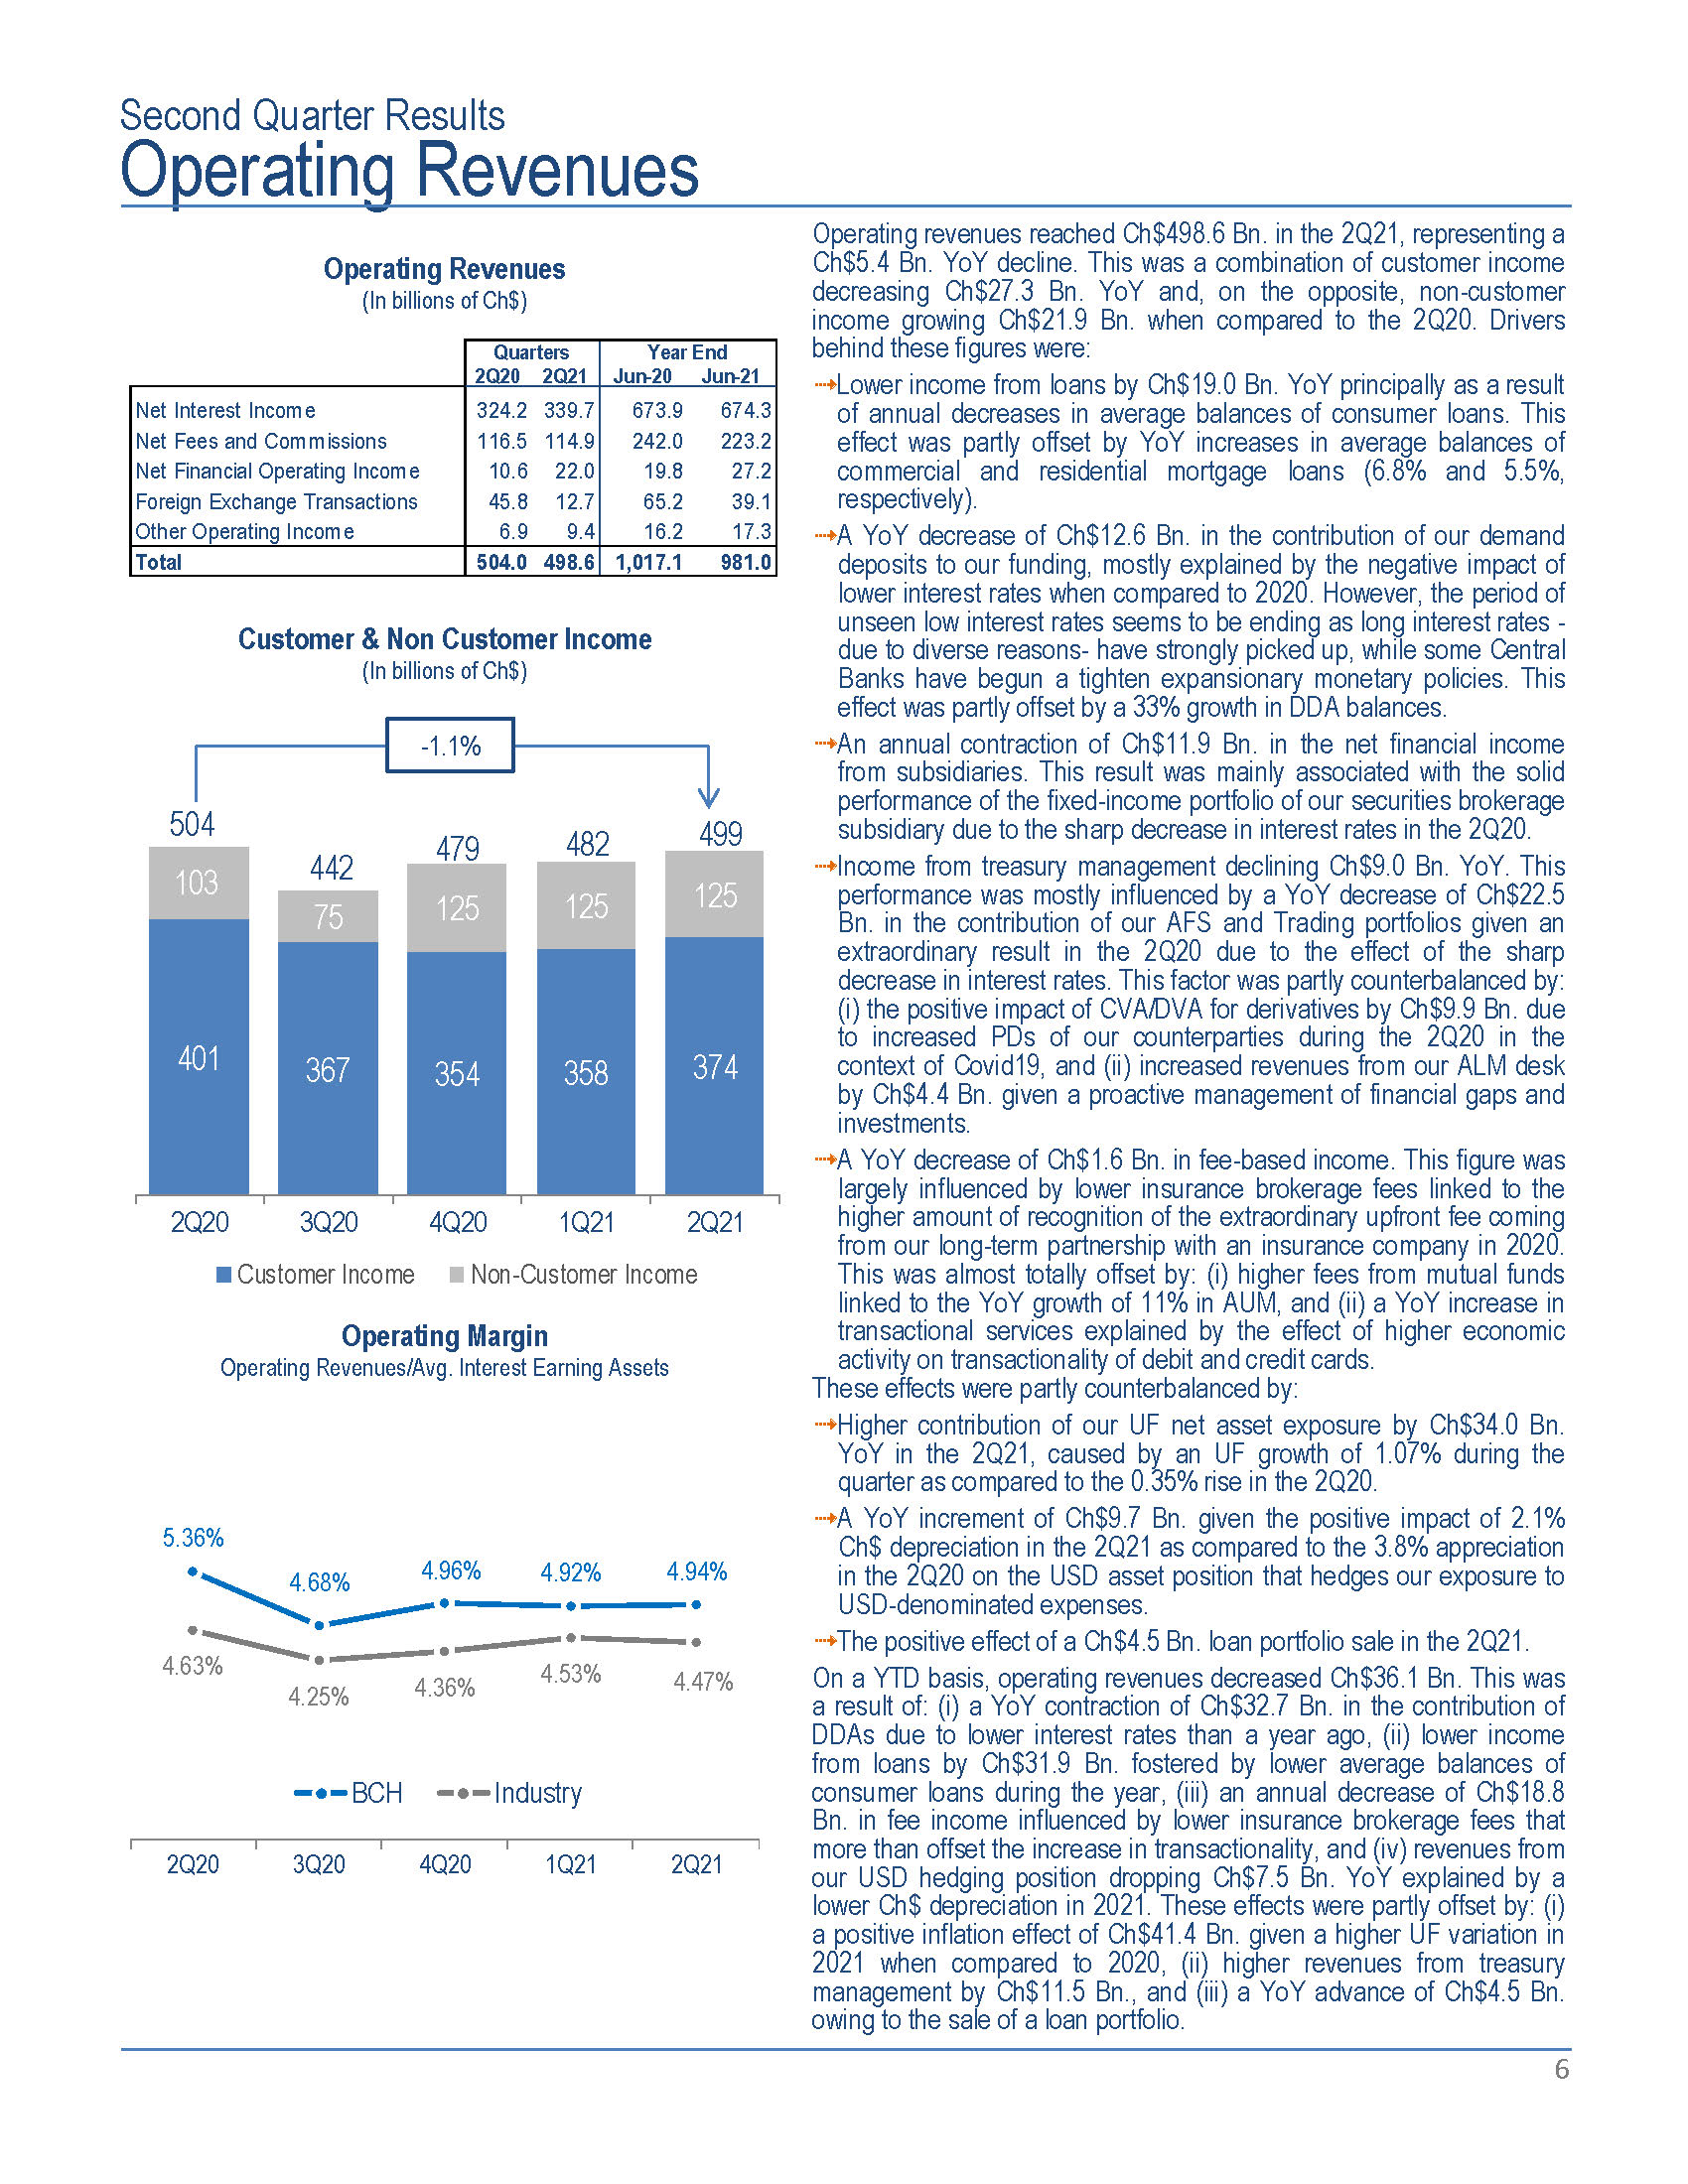
Second Quarter Results Operating Revenues Operating revenues reached Ch$498.6 Bn. in the 2Q21, representing a Ch$5.4 Bn. YoY decline. This was a combination of customer income decreasing Ch $ 27 . 3 Bn . YoY and, on the opposite, non - customer income growing Ch $ 21 . 9 Bn . when compared to the 2 Q 20 . Drivers behind these figures were : Lower income from loans by Ch $ 19 . 0 Bn . YoY principally as a result of annual decreases in average balances of consumer loans . This effect was partly offset by YoY increases in average balances of commercial and residential mortgage loans ( 6 . 8 % and 5 . 5 % , respectively) . A YoY decrease of Ch $ 12 . 6 Bn . in the contribution of our demand deposits to our funding, mostly explained by the negative impact of lower interest rates when compared to 2020 . However, the period of unseen low interest rates seems to be ending as long interest rates - due to diverse reasons - have strongly picked up, while some Central Banks have begun a tighten expansionary monetary policies . This effect was partly offset by a 33 % growth in DDA balances . An annual contraction of Ch $ 11 . 9 Bn . in the net financial income from subsidiaries . This result was mainly associated with the solid performance of the fixed - income portfolio of our securities brokerage subsidiary due to the sharp decrease in interest rates in the 2 Q 20 . Income from treasury management declining Ch $ 9 . 0 Bn . YoY . This performance was mostly influenced by a YoY decrease of Ch $ 22 . 5 Bn . in the contribution of our AFS and Trading portfolios given an extraordinary result in the 2 Q 20 due to the effect of the sharp decrease in interest rates . This factor was partly counterbalanced by : (i) the positive impact of CVA/DVA for derivatives by Ch $ 9 . 9 Bn . due to increased PDs of our counterparties during the 2 Q 20 in the context of Covid 19 , and (ii) increased revenues from our ALM desk by Ch $ 4 . 4 Bn . given a proactive management of financial gaps and investments . A YoY decrease of Ch $ 1 . 6 Bn . in fee - based income . This figure was largely influenced by lower insurance brokerage fees linked to the higher amount of recognition of the extraordinary upfront fee coming from our long - term partnership with an insurance company in 2020 . This was almost totally offset by : (i) higher fees from mutual funds linked to the YoY growth of 11 % in AUM, and (ii) a YoY increase in transactional services explained by the effect of higher economic activity on transactionality of debit and credit cards . These effects were partly counterbalanced by : Higher contribution of our UF net asset exposure by Ch $ 34 . 0 Bn . YoY in the 2 Q 21 , caused by an UF growth of 1 . 07 % during the quarter as compared to the 0 . 35 % rise in the 2 Q 20 . A YoY increment of Ch $ 9 . 7 Bn . given the positive impact of 2 . 1 % Ch $ depreciation in the 2 Q 21 as compared to the 3 . 8 % appreciation in the 2 Q 20 on the USD asset position that hedges our exposure to USD - denominated expenses . The positive effect of a Ch $ 4 . 5 Bn . loan portfolio sale in the 2 Q 21 . On a YTD basis, operating revenues decreased Ch $ 36 . 1 Bn . This was a result of : (i) a YoY contraction of Ch $ 32 . 7 Bn . in the contribution of DDAs due to lower interest rates than a year ago, (ii) lower income from loans by Ch $ 31 . 9 Bn . fostered by lower average balances of consumer loans during the year, (iii) an annual decrease of Ch $ 18 . 8 Bn . in fee income influenced by lower insurance brokerage fees that more than offset the increase in transactionality, and (iv) revenues from our USD hedging position dropping Ch $ 7 . 5 Bn . YoY explained by a lower Ch $ depreciation in 2021 . These effects were partly offset by : (i) a positive inflation effect of Ch $ 41 . 4 Bn . given a higher UF variation in 2021 when compared to 2020 , (ii) higher revenues from treasury management by Ch $ 11 . 5 Bn . , and (iii) a YoY advance of Ch $ 4 . 5 Bn . Operating Revenues (In billions of Ch$) Quarters 2Q20 2Q21 Year End Jun - 20 Jun - 21 Net Interest Income 324.2 339.7 673.9 674.3 Net Fees and Commissions 116.5 114.9 242.0 223.2 Net Financial Operating Income 10.6 22.0 19.8 27.2 Foreign Exchange Transactions 45.8 12.7 65.2 39.1 Other Operating Income 6.9 9.4 16.2 17.3 Total 504.0 498.6 1,017.1 981.0 Customer & Non Customer Income (In billions of Ch$) 401 367 354 358 374 103 75 125 125 125 504 442 479 482 499 2 Q 2 0 3 Q 2 0 4 Q 2 0 1 Q 2 1 2 Q 2 1 Customer Income Non - Customer Income Operating Margin Operating Revenues/Avg. Interest Earning Assets 5.36 % 4 . 68 % 4.96 % 4 . 92 % 4 . 94 % 4 . 63 % 4 . 25 % 4 . 36 % 4 . 53 % 4 . 47 % 2 Q 2 0 3 Q 2 0 4 Q 2 0 1 Q 2 1 2 Q 2 1 B C H Industry - 1.1% owing to the sale of a loan portfolio. 6
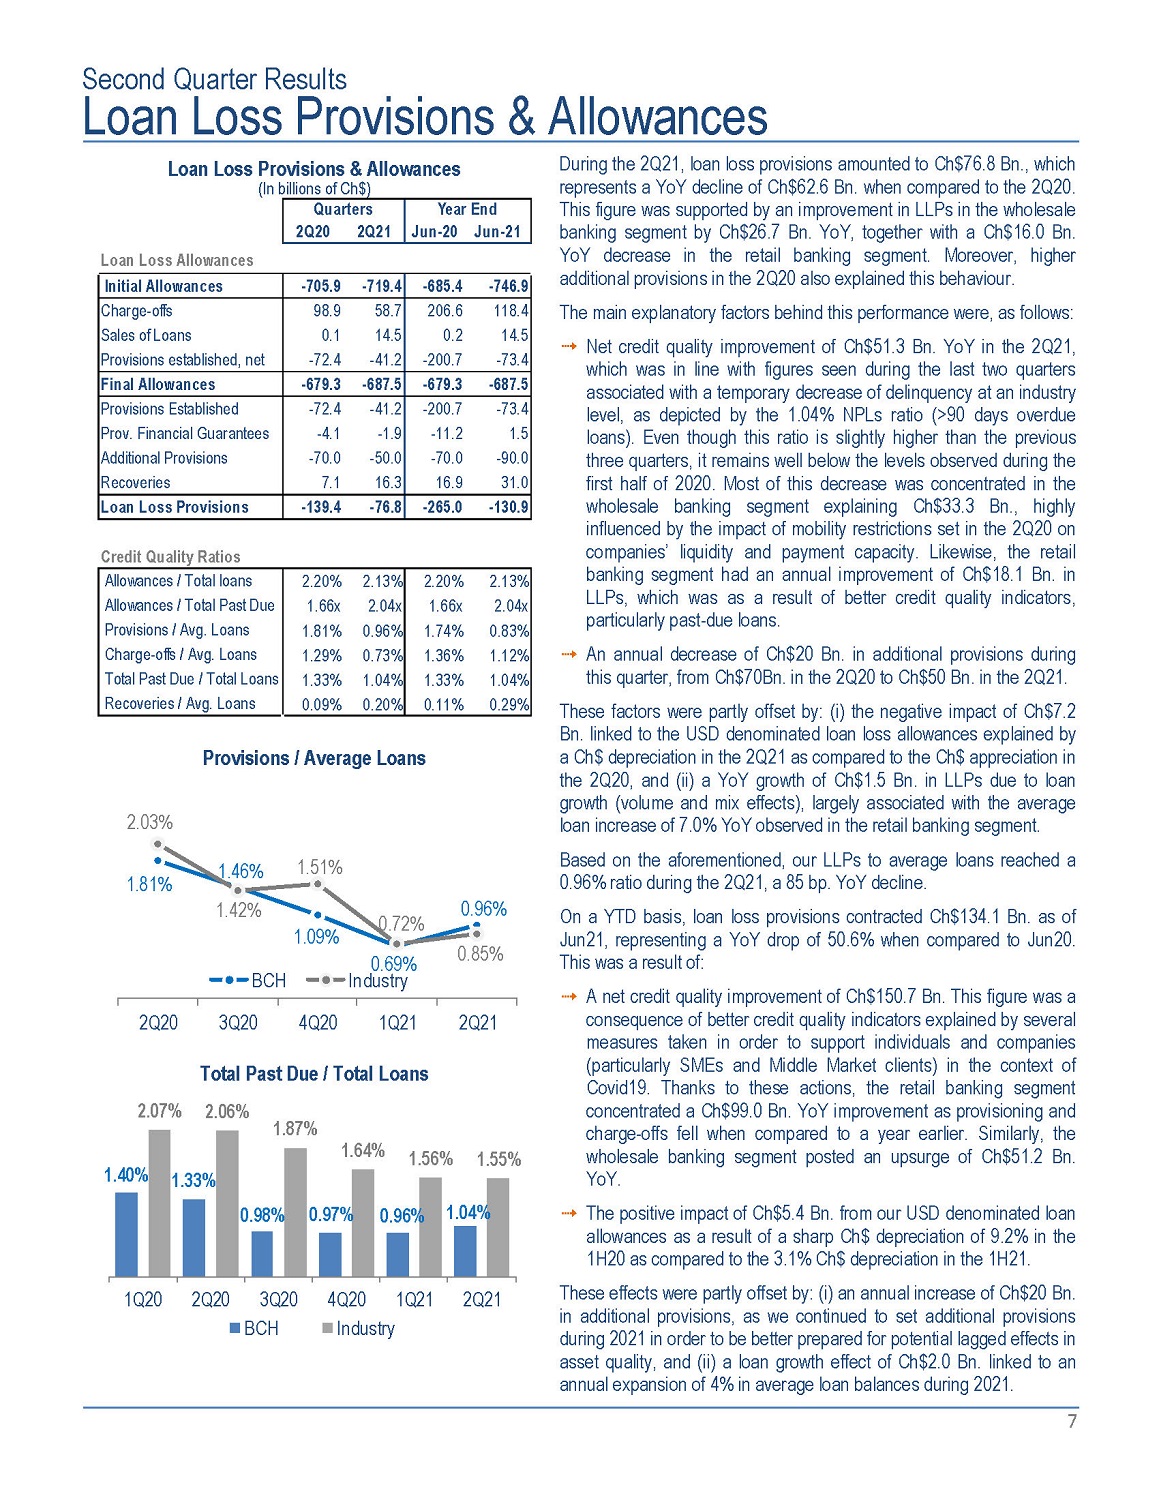
Second Quarter Results Loan Loss Provisions & Allowances During the 2 Q 21 , loan loss provisions amounted to Ch $ 76 . 8 Bn . , which represents a YoY decline of Ch $ 62 . 6 Bn . when compared to the 2 Q 20 . This figure was supported by an improvement in LLPs in the wholesale banking segment by Ch $ 26 . 7 Bn . YoY, together with a Ch $ 16 . 0 Bn . YoY decrease in the retail banking segment . Moreover, higher additional provisions in the 2 Q 20 also explained this behaviour . The main explanatory factors behind this performance were, as follows : Net credit quality improvement of Ch $ 51 . 3 Bn . YoY in the 2 Q 21 , which was in line with figures seen during the last two quarters associated with a temporary decrease of delinquency at an industry level, as depicted by the 1 . 04 % NPLs ratio (> 90 days overdue loans) . Even though this ratio is slightly higher than the previous three quarters, it remains well below the levels observed during the first half of 2020 . Most of this decrease was concentrated in the wholesale banking segment explaining Ch $ 33 . 3 Bn . , highly influenced by the impact of mobility restrictions set in the 2 Q 20 on companies’ liquidity and payment capacity . Likewise, the retail banking segment had an annual improvement of Ch $ 18 . 1 Bn . in LLPs, which was as a result of better credit quality indicators, particularly past - due loans . An annual decrease of Ch $ 20 Bn . in additional provisions during this quarter, from Ch $ 70 Bn . in the 2 Q 20 to Ch $ 50 Bn . in the 2 Q 21 . These factors were partly offset by : (i) the negative impact of Ch $ 7 . 2 Bn . linked to the USD denominated loan loss allowances explained by a Ch $ depreciation in the 2 Q 21 as compared to the Ch $ appreciation in the 2 Q 20 , and (ii) a YoY growth of Ch $ 1 . 5 Bn . in LLPs due to loan growth (volume and mix effects), largely associated with the average loan increase of 7 . 0 % YoY observed in the retail banking segment . Based on the aforementioned, our LLPs to average loans reached a 0 . 96 % ratio during the 2 Q 21 , a 85 bp . YoY decline . On a YTD basis, loan loss provisions contracted Ch $ 134 . 1 Bn . as of Jun 21 , representing a YoY drop of 50 . 6 % when compared to Jun 20 . This was a result of : A net credit quality improvement of Ch $ 150 . 7 Bn . This figure was a consequence of better credit quality indicators explained by several measures taken in order to support individuals and companies (particularly SMEs and Middle Market clients) in the context of Covid 19 . Thanks to these actions, the retail banking segment concentrated a Ch $ 99 . 0 Bn . YoY improvement as provisioning and charge - offs fell when compared to a year earlier . Similarly, the wholesale banking segment posted an upsurge of Ch $ 51 . 2 Bn . YoY . The positive impact of Ch $ 5 . 4 Bn . from our USD denominated loan allowances as a result of a sharp Ch $ depreciation of 9 . 2 % in the 1 H 20 as compared to the 3 . 1 % Ch $ depreciation in the 1 H 21 . These effects were partly offset by : (i) an annual increase of Ch $ 20 Bn . in additional provisions, as we continued to set additional provisions during 2021 in order to be better prepared for potential lagged effects in asset quality, and (ii) a loan growth effect of Ch $ 2 . 0 Bn . linked to an annual expansion of 4 % in average loan balances during 2021 . Loan Loss Provisions & Allowances (In billions of Ch$) Quarters 2Q2 0 2Q2 1 Year End J un - 2 0 J un - 2 1 Loan Loss Allowances Initial Allowances - 705.9 - 719.4 - 685.4 - 746.9 Charge - offs 98.9 58.7 206.6 118.4 S a l e s o f Loan s 0.1 14.5 0.2 14.5 Provisions established, net - 72.4 - 41.2 - 200.7 - 73.4 Final Allowances - 679.3 - 687.5 - 679.3 - 687.5 Provisions Established - 72.4 - 41.2 - 200.7 - 73.4 Prov. Financial Guarantees - 4.1 - 1.9 - 11.2 1.5 Additional Provisions - 70.0 - 50.0 - 70.0 - 90.0 Recoveries 7.1 16.3 16.9 31.0 Loan Loss Provisions - 139.4 - 76.8 - 265.0 - 130.9 Credit Quality Ratios Allowances / Total loans 2.20% 2.13% 2.20% 2.13% Allowances / Total Past Due 1.66x 2.04x 1.66x 2.04x Provisions / Avg. Loans 1.81% 0.96% 1.74% 0.83% Charge - offs / Avg. Loans 1.29% 0.73% 1.36% 1.12% Total Past Due / Total Loans 1.33% 1.04% 1.33% 1.04% Recoveries / Avg. Loans 0.09% 0.20% 0.11% 0.29% Provisions / Average Loans 1 . 81 % 1.09 % 0.96 % 1 . 46 % 1.42% 2 . 03 % 1.51 % 0.85 % BCH 2 Q 2 0 3 Q 2 0 4 Q 2 0 1 Q 2 1 2 Q 2 1 0 . 72 % 0.69% Industry 1 . 40 % 1 . 33 % 0 . 98 % 0 . 97 % 0 . 96 % 1 . 04 % Total Past Due / Total Loans 2.06% 2 . 07 % 1 . 87 % 1 . 64 % 1 . 56 % 1 . 55 % 1Q20 2Q20 3Q20 BCH 4Q20 I n du s t r y 1Q21 2Q21 7
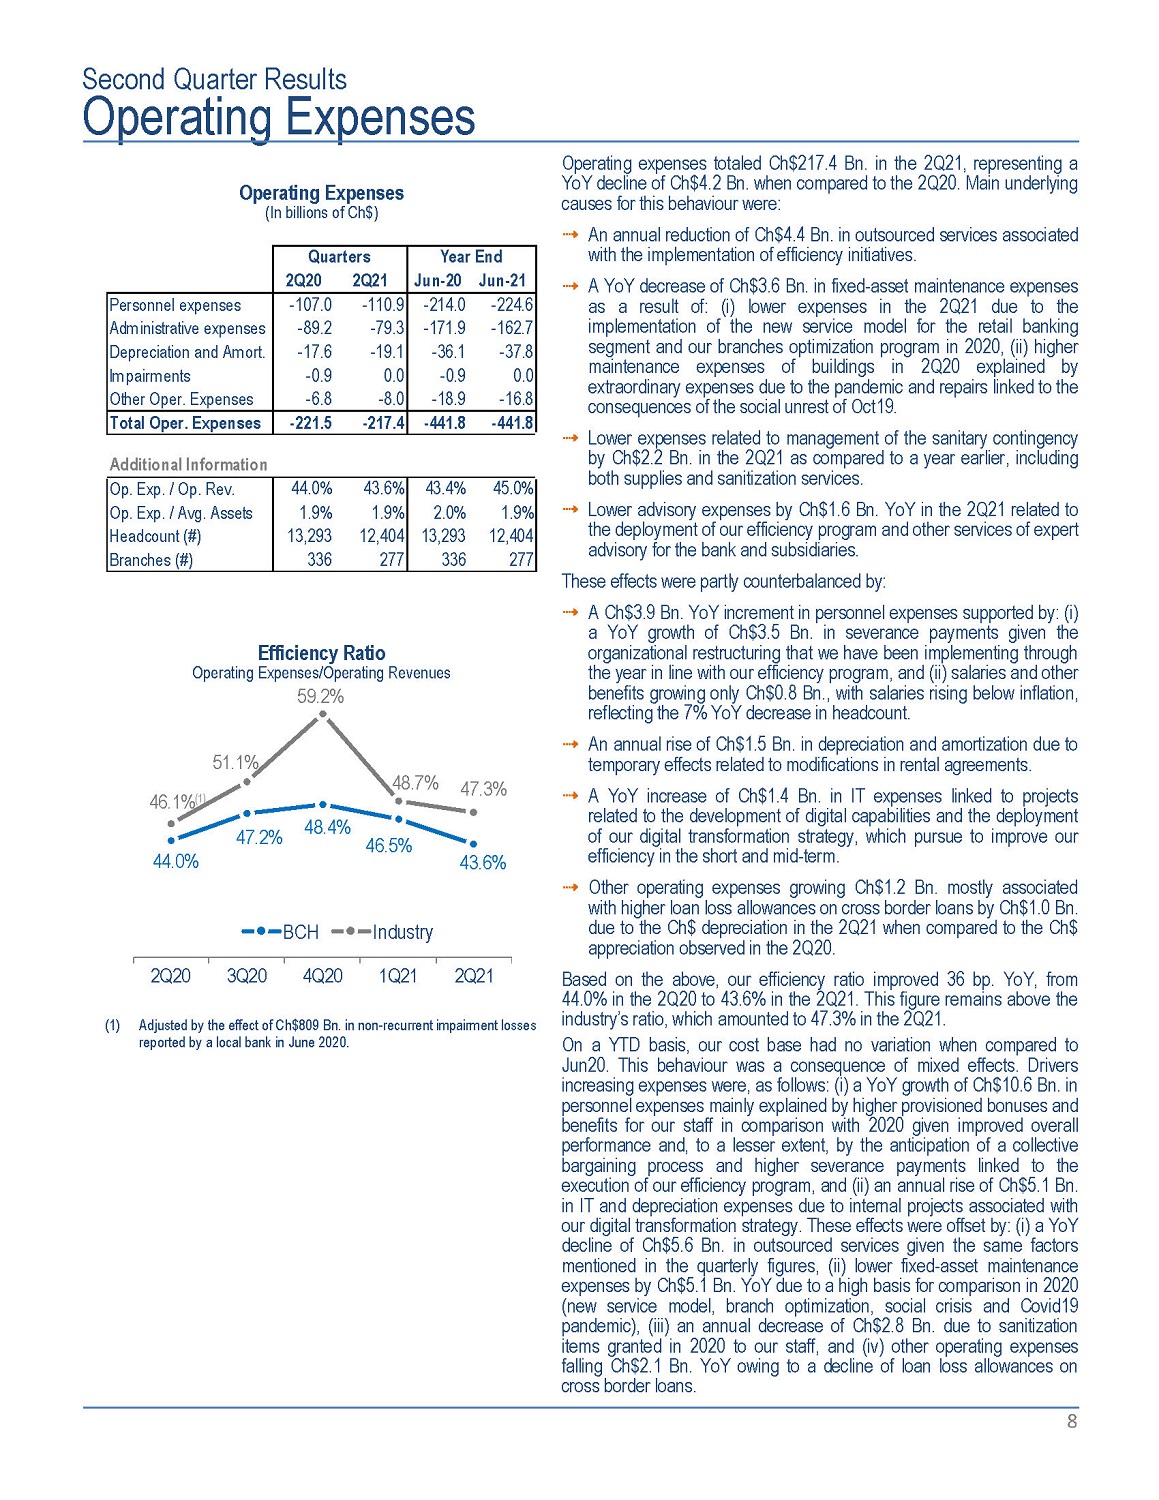
Second Quarter Results Operating Expenses Operating expenses totaled Ch $ 217 . 4 Bn . in the 2 Q 21 , representing a YoY decline of Ch $ 4 . 2 Bn . when compared to the 2 Q 20 . Main underlying causes for this behaviour were : An annual reduction of Ch $ 4 . 4 Bn . in outsourced services associated with the implementation of efficiency initiatives . A YoY decrease of Ch $ 3 . 6 Bn . in fixed - asset maintenance expenses as a result of : (i) lower expenses in the 2 Q 21 due to the implementation of the new service model for the retail banking segment and our branches optimization program in 2020 , (ii) higher maintenance expenses of buildings in 2 Q 20 explained by extraordinary expenses due to the pandemic and repairs linked to the consequences of the social unrest of Oct 19 . Lower expenses related to management of the sanitary contingency by Ch $ 2 . 2 Bn . in the 2 Q 21 as compared to a year earlier, including both supplies and sanitization services . Lower advisory expenses by Ch $ 1 . 6 Bn . YoY in the 2 Q 21 related to the deployment of our efficiency program and other services of expert advisory for the bank and subsidiaries . These effects were partly counterbalanced by : A Ch $ 3 . 9 Bn . YoY increment in personnel expenses supported by : (i) a YoY growth of Ch $ 3 . 5 Bn . in severance payments given the organizational restructuring that we have been implementing through the year in line with our efficiency program, and (ii) salaries and other benefits growing only Ch $ 0 . 8 Bn . , with salaries rising below inflation, reflecting the 7 % YoY decrease in headcount . An annual rise of Ch $ 1 . 5 Bn . in depreciation and amortization due to temporary effects related to modifications in rental agreements . A YoY increase of Ch $ 1 . 4 Bn . in IT expenses linked to projects related to the development of digital capabilities and the deployment of our digital transformation strategy, which pursue to improve our efficiency in the short and mid - term . Other operating expenses growing Ch $ 1 . 2 Bn . mostly associated with higher loan loss allowances on cross border loans by Ch $ 1 . 0 Bn . due to the Ch $ depreciation in the 2 Q 21 when compared to the Ch $ appreciation observed in the 2 Q 20 . Based on the above, our efficiency ratio improved 36 bp . YoY, from 44 . 0 % in the 2 Q 20 to 43 . 6 % in the 2 Q 21 . This figure remains above the industry’s ratio, which amounted to 47 . 3 % in the 2 Q 21 . On a YTD basis, our cost base had no variation when compared to Jun 20 . This behaviour was a consequence of mixed effects . Drivers increasing expenses were, as follows : (i) a YoY growth of Ch $ 10 . 6 Bn . in personnel expenses mainly explained by higher provisioned bonuses and benefits for our staff in comparison with 2020 given improved overall performance and, to a lesser extent, by the anticipation of a collective bargaining process and higher severance payments linked to the execution of our efficiency program, and (ii) an annual rise of Ch $ 5 . 1 Bn . in IT and depreciation expenses due to internal projects associated with our digital transformation strategy . These effects were offset by : (i) a YoY decline of Ch $ 5 . 6 Bn . in outsourced services given the same factors mentioned in the quarterly figures, (ii) lower fixed - asset maintenance expenses by Ch $ 5 . 1 Bn . YoY due to a high basis for comparison in 2020 (new service model, branch optimization, social crisis and Covid 19 pandemic), (iii) an annual decrease of Ch $ 2 . 8 Bn . due to sanitization items granted in 2020 to our staff, and (iv) other operating expenses falling Ch $ 2 . 1 Bn . YoY owing to a decline of loan loss allowances on cross border loans . Operating Expenses (In billions of Ch$) Quarters 2Q20 2Q21 Year End Jun - 20 Jun - 21 Personnel expenses - 107.0 - 110.9 - 214.0 - 224.6 Administrative expenses - 89.2 - 79.3 - 171.9 - 162.7 Depreciation and Amort. - 17.6 - 19.1 - 36.1 - 37.8 Impairments - 0.9 0.0 - 0.9 0.0 Other Oper. Expenses - 6.8 - 8.0 - 18.9 - 16.8 Total Oper. Expenses - 221.5 - 217.4 - 441.8 - 441.8 Additional Information Op. Exp. / Op. Rev. 44.0% 43.6% 43.4% 45.0% Op. Exp. / Avg. Assets 1.9% 1.9% 2.0% 1.9% H e ad c oun t ( # ) 13,293 12,404 13,293 12,404 Branches (#) 336 277 336 277 44 . 0 % 47 . 2 % 48.4 % 46 . 5 % 43.6 % Efficiency Ratio Operating Expenses/Operating Revenues 59.2% 51.1% 46.1% (1) 48 . 7 % 47 . 3 % 2Q20 3Q20 4Q20 1Q21 2Q21 (1) Adjusted by the effect of Ch$809 Bn. in non - recurrent impairment losses reported by a local bank in June 2020. B C H I n du s t ry 8
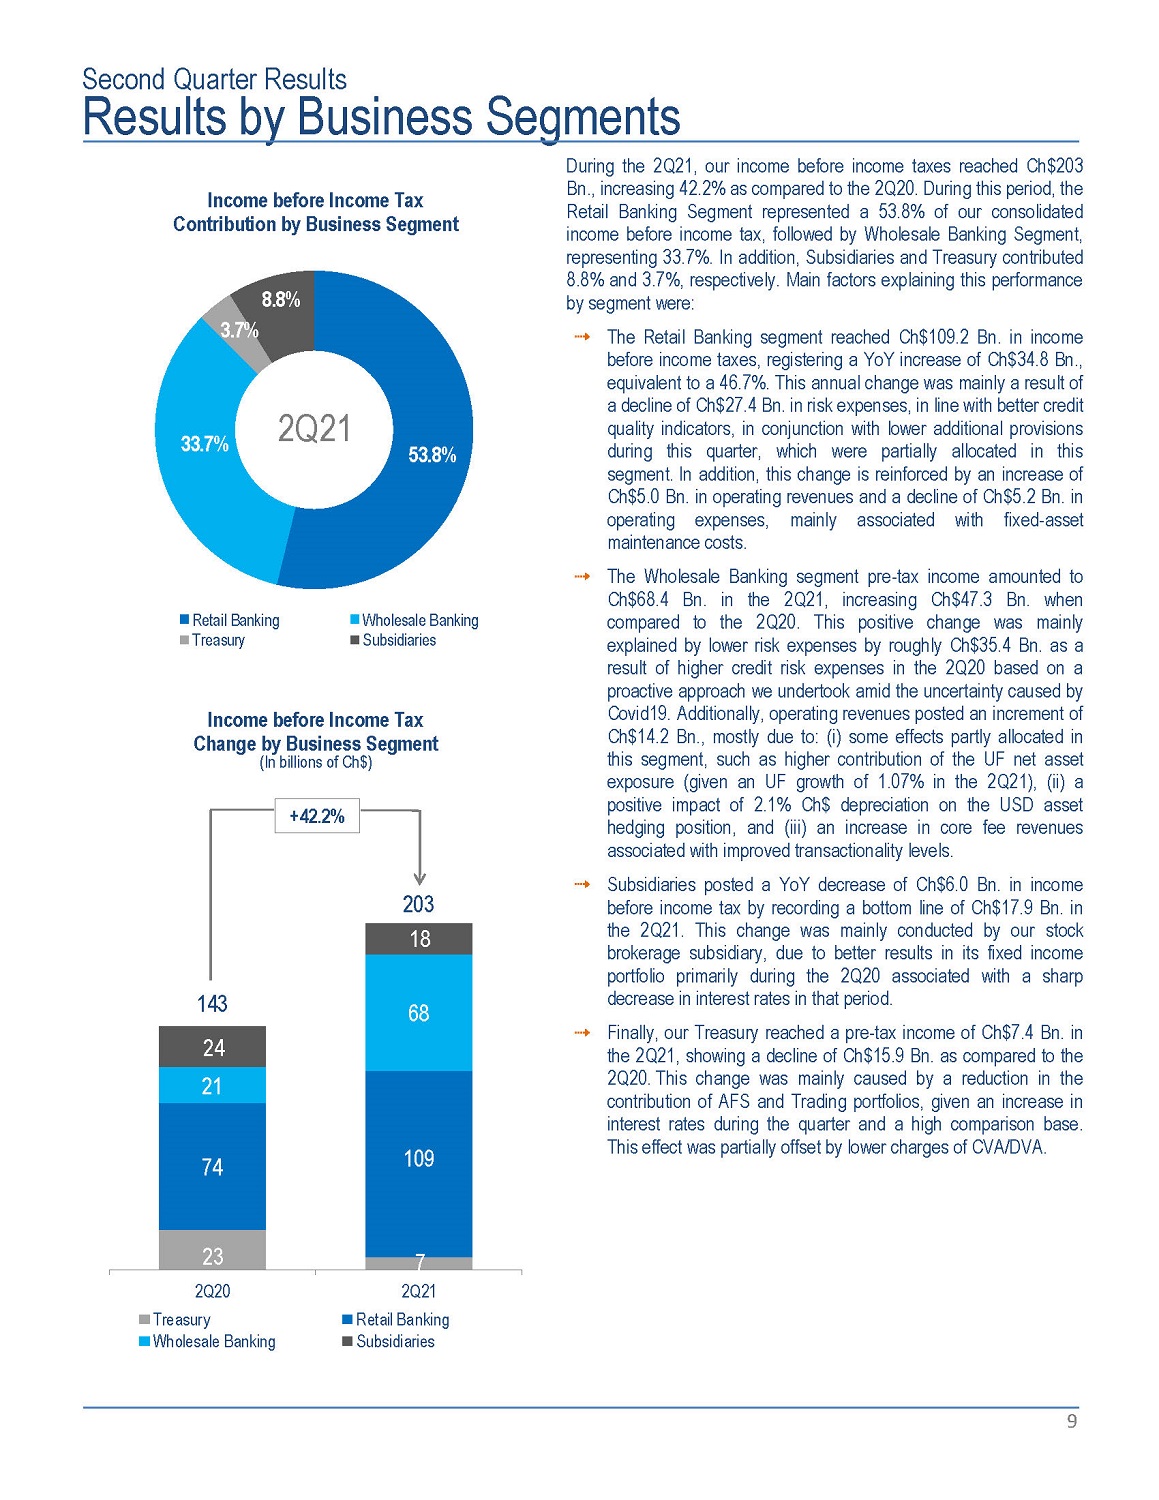
Second Quarter Results Results by Business Segments During the 2Q21, our income before income taxes reached Ch$203 Bn., increasing 42.2% as compared to the 2Q20. During this period, the Retail Banking Segment represented a 53 . 8 % of our consolidated income before income tax, followed by Wholesale Banking Segment, representing 33 . 7 % . In addition, Subsidiaries and Treasury contributed 8 . 8 % and 3 . 7 % , respectively . Main factors explaining this performance by segment were : The Retail Banking segment reached Ch $ 109 . 2 Bn . in income before income taxes, registering a YoY increase of Ch $ 34 . 8 Bn . , equivalent to a 46 . 7 % . This annual change was mainly a result of a decline of Ch $ 27 . 4 Bn . in risk expenses, in line with better credit quality indicators, in conjunction with lower additional provisions during this quarter, which were partially allocated in this segment . In addition, this change is reinforced by an increase of Ch $ 5 . 0 Bn . in operating revenues and a decline of Ch $ 5 . 2 Bn . in operating expenses, mainly associated with fixed - asset maintenance costs . The Wholesale Banking segment pre - tax income amounted to Ch $ 68 . 4 Bn . in the 2 Q 21 , increasing Ch $ 47 . 3 Bn . when compared to the 2 Q 20 . This positive change was mainly explained by lower risk expenses by roughly Ch $ 35 . 4 Bn . as a result of higher credit risk expenses in the 2 Q 20 based on a proactive approach we undertook amid the uncertainty caused by Covid 19 . Additionally, operating revenues posted an increment of Ch $ 14 . 2 Bn . , mostly due to : (i) some effects partly allocated in this segment, such as higher contribution of the UF net asset exposure (given an UF growth of 1 . 07 % in the 2 Q 21 ), (ii) a positive impact of 2 . 1 % Ch $ depreciation on the USD asset hedging position, and (iii) an increase in core fee revenues associated with improved transactionality levels . Subsidiaries posted a YoY decrease of Ch $ 6 . 0 Bn . in income before income tax by recording a bottom line of Ch $ 17 . 9 Bn . in the 2 Q 21 . This change was mainly conducted by our stock brokerage subsidiary, due to better results in its fixed income portfolio primarily during the 2 Q 20 associated with a sharp decrease in interest rates in that period . Finally, our Treasury reached a pre - tax income of Ch $ 7 . 4 Bn . in the 2 Q 21 , showing a decline of Ch $ 15 . 9 Bn . as compared to the 2 Q 20 . This change was mainly caused by a reduction in the contribution of AFS and Trading portfolios, given an increase in interest rates during the quarter and a high comparison base . This effect was partially offset by lower charges of CVA/DVA . Income before Income Tax Contribution by Business Segment 53 . 8 % 33 . 7 % 3 . 7 % 8 . 8 % R e t a i l B an k i n g Treasury W h ole s al e B an k in g Subsidiaries 2 Q 2 1 Income before Income Tax Change by Business Segment (In billions of Ch$) 23 7 74 109 21 68 24 18 143 203 2Q20 Treasury Wholesale Banking 2Q21 R e t a i l B a n k i ng Subsidiaries +42.2% 9

Loan Portfolio Loans by Segment (In Billions of Ch$ and %) 19 , 46 3 20 , 40 2 20 , 79 6 11 , 37 8 11 , 36 5 11 , 46 9 30,84 1 31 , 76 7 32 , 26 5 2 Q 2 0 1 Q 2 1 2 Q 2 1 Retail Wholesale Market Share in Loans (1) + 1.9 % + 0 . 9 % 1.6% R e t a i l Wholesale 64% 36% 4.6% 16 . 1 % 16 . 6 % 16 . 6 % 17 . 1 % 17 . 1 % 17 . 3 % 17 . 4 % 15 . 6 % 16 . 7 % 17.1 % 16.9% 17.3% 17.3% 16 . 9 % 16 . 5 % 16.5% 16 . 4 % 16 . 3 % 16 . 2 % 16 . 2 % 2 Q 2 0 4 Q 2 0 3Q20 Total Loans Commercial loans 1Q21 2Q21 C on s u m e r Loan s Mortgage loans 10 (1) Excluding operations of subsidiaries abroad. The loan portfolio amounted to Ch $ 32 , 265 Bn . as of June 30 , 2021 , which denotes a 4 . 6 % YoY expansion . This behaviour was fostered by YoY increases of 7 . 2 % and 6 . 0 % in residential mortgage and commercial loan balances, respectively, whilst consumer loan balances decreased 7 . 0 % when compared to Jun 20 . On a sequential basis, residential mortgage loan balances posted an increment of 2 . 5 % ( 10 . 4 % annualized), given specific housing market dynamics . Similarly, commercial loan balances increased 1 . 7 % QoQ ( 7 . 1 % annualized) that had to do with the Fogape Reactiva program deployed in Feb 21 . On the other hand, consumer loans posted a QoQ contraction of 1 . 5 % . At a segment level, the dynamics for loan growth were, as follows : In the Retail Banking segment, total loans reached Ch $ 20 , 796 Bn . , which entails a 6 . 8 % 12 - month increment . This was a result of : Loans granted to SMEs that total Ch $ 5 , 391 Bn . , reflecting YoY and QoQ increases of 14 . 2 % and 2 . 8 % , respectively . This behaviour was linked to the growth in commercial loans supported by the Fogape Reactiva program, a government initiative that mainly aids micro entrepreneurs and SMEs with working capital loans and long - term funding for investment projects . Personal banking loans (including consumer finance) went up by 4 . 5 % YoY by reaching Ch $ 15 , 405 Bn . as of Jun 21 . The main driver for this performance was the YoY increase of 7 . 4 % in residential mortgage loans balances . On the contrary, consumer loans posted a 7 . 0 % YoY contraction ( - 1 . 5 % QoQ) given the temporary effects of fiscal aids and pensions funds withdrawals on individuals’ liquidity and also due to stricter offer conditions in an environment of higher uncertainty . The Wholesale Banking segment reached a loan book of Ch $ 11 , 469 Bn . as of Jun 21 , representing slight increases of 0 . 8 % and 0 . 9 % YoY and QoQ, respectively . These figures were caused by : Total loans granted to our Middle Market clients posted a YoY rise of 1 . 3 % . This trend was influenced by a YoY increase in commercial credits related to the Covid loan program (which is partly focused in some segments of this unit), and was partly offset by lower Trade Finance loans when compared to a year earlier . In a similar fashion, this unit increased its total loan portfolio by 1 . 1 % QoQ . Loans managed by our Corporate and Wholesale units expanding 0 . 4 % and 0 . 8 % YoY and QoQ, respectively, due to the impact of economic sanitary and political uncertainty on investment projects . All in all, the annual increase was caused by : (i) a YoY advance in commercial credits due to a higher dynamism in demand for loans by this segment according to the last credit survey reported by the Central Bank, and (ii) an annual growth in Trade Finance explained by a sharp drop in international trade during 2020 due to the Covid 19 pandemic . As for market share, we held a total loans stake of 16 . 9 % as of Jun 21 , which represents a solid increment of 85 bp . when compared to the previous year, while positioning us one of the few banking players gaining market share YoY among main peers . The performance of commercial loans were the main explanatory factor for this behaviour as seen by the 17 . 3 % stake reached for this lending product during this quarter, an annual advance of 160 bp .
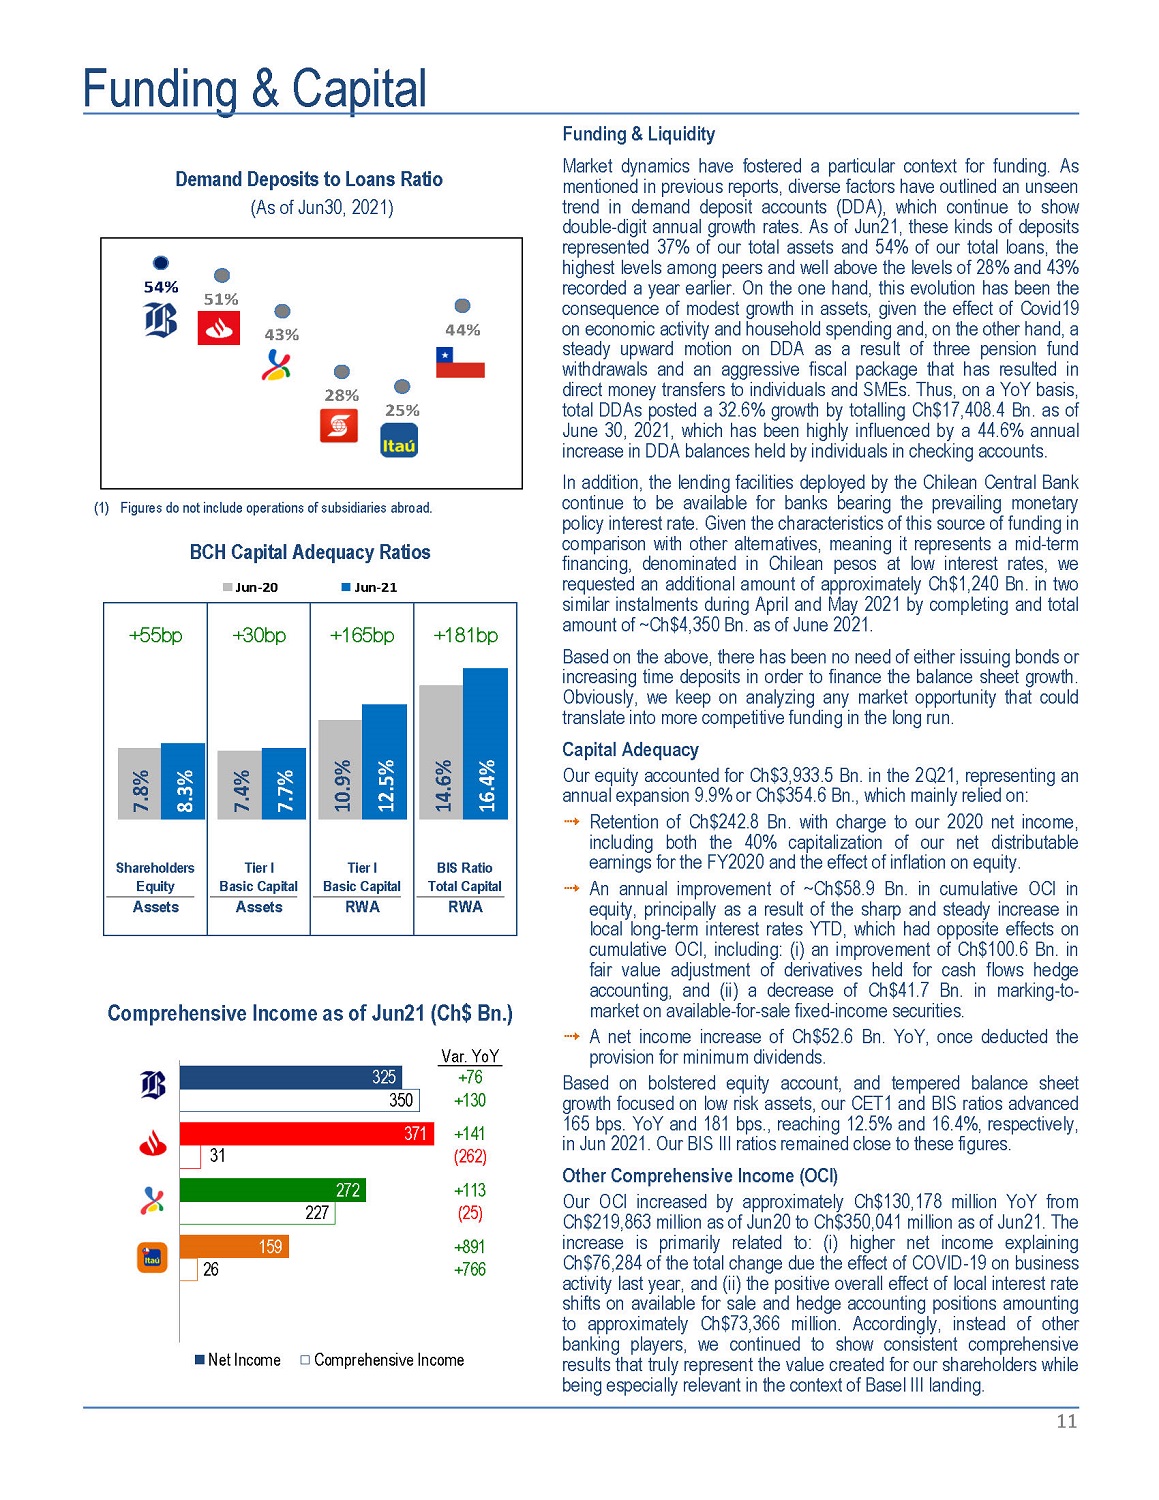
Funding & Capital flucuta Demand Deposits to Loans Ratio (As of Jun30, 2021) 54% 51% 43% 28% 25% 44% (1) Figures do not include operations of subsidiaries abroad. + 55b p +181bp Sh a r e h o l d e r s Equity Assets Tier I B as i c C a p i t a l Assets Tier I B as i c C a p i t a l RWA BIS Ratio T o t a l C a p i t a l RWA 7 . 8 % 7 . 4 % 10 . 9 % 14 . 6 % 8 . 3 % 7 . 7 % 12 . 5 % 16 . 4 % BCH Capital Adequacy Ratios Jun - 20 Jun - 21 +30bp +165bp Comprehensive Income as of Jun21 (Ch$ Bn.) Var. YoY 371 +141 31 (262) 272 +113 227 (25) 159 +891 26 +766 325 +76 350 +130 Net Income C om p r ehen siv e In c o m e Funding & Liquidity 11 Market dynamics have fostered a particular context for funding . As mentioned in previous reports, diverse factors have outlined an unseen trend in demand deposit accounts (DDA), which continue to show double - digit annual growth rates . As of Jun 21 , these kinds of deposits represented 37 % of our total assets and 54 % of our total loans, the highest levels among peers and well above the levels of 28 % and 43 % recorded a year earlier . On the one hand, this evolution has been the consequence of modest growth in assets, given the effect of Covid 19 on economic activity and household spending and, on the other hand, a steady upward motion on DDA as a result of three pension fund withdrawals and an aggressive fiscal package that has resulted in direct money transfers to individuals and SMEs . Thus, on a YoY basis, total DDAs posted a 32 . 6 % growth by totalling Ch $ 17 , 408 . 4 Bn . as of June 30 , 2021 , which has been highly influenced by a 44 . 6 % annual increase in DDA balances held by individuals in checking accounts . In addition, the lending facilities deployed by the Chilean Central Bank continue to be available for banks bearing the prevailing monetary policy interest rate . Given the characteristics of this source of funding in comparison with other alternatives, meaning it represents a mid - term financing, denominated in Chilean pesos at low interest rates, we requested an additional amount of approximately Ch $ 1 , 240 Bn . in two similar instalments during April and May 2021 by completing and total amount of ~Ch $ 4 , 350 Bn . as of June 2021 . Based on the above, there has been no need of either issuing bonds or increasing time deposits in order to finance the balance sheet growth . Obviously, we keep on analyzing any market opportunity that could translate into more competitive funding in the long run . Capital Adequacy Our equity accounted for Ch $ 3 , 933 . 5 Bn . in the 2 Q 21 , representing an annual expansion 9 . 9 % or Ch $ 354 . 6 Bn . , which mainly relied on : Retention of Ch $ 242 . 8 Bn . with charge to our 2020 net income, including both the 40 % capitalization of our net distributable earnings for the FY 2020 and the effect of inflation on equity . An annual improvement of ~Ch $ 58 . 9 Bn . in cumulative OCI in equity, principally as a result of the sharp and steady increase in local long - term interest rates YTD, which had opposite effects on cumulative OCI, including : (i) an improvement of Ch $ 100 . 6 Bn . in fair value adjustment of derivatives held for cash flows hedge accounting, and (ii) a decrease of Ch $ 41 . 7 Bn . in marking - to - market on available - for - sale fixed - income securities . A net income increase of Ch $ 52 . 6 Bn . YoY, once deducted the provision for minimum dividends . Based on bolstered equity account, and tempered balance sheet growth focused on low risk assets, our CET 1 and BIS ratios advanced 165 bps . YoY and 181 bps . , reaching 12 . 5 % and 16 . 4 % , respectively, in Jun 2021 . Our BIS III ratios remained close to these figures . Other Comprehensive Income (OCI) Our OCI increased by approximately Ch $ 130 , 178 million YoY from Ch $ 219 , 863 million as of Jun 20 to Ch $ 350 , 041 million as of Jun 21 . The increase is primarily related to : (i) higher net income explaining Ch $ 76 , 284 of the total change due the effect of COVID - 19 on business activity last year, and (ii) the positive overall effect of local interest rate shifts on available for sale and hedge accounting positions amounting to approximately Ch $ 73 , 366 million . Accordingly, instead of other banking players, we continued to show consistent comprehensive results that truly represent the value created for our shareholders while being especially relevant in the context of Basel III landing .

Consolidated Statement of Income (Chilean GAAP - In millions of Chilean pesos (MCh$) and US dollars (MUS$)) Quarters Year Ended 2Q20 MCh$ 1Q21 2Q21 MCh$ MCh$ 2Q21 MUS$ % Change 2Q21/2Q20 2Q21/1Q21 Jun - 20 MCh$ Jun - 21 MCh$ Jun - 21 MUS$ % Change Jun - 21/Jun - 20 12 Interest revenue and expense Interest revenue 440,777 487,481 488,563 665.6 10.8 % 0.2 % 995,051 976,044 1,329.8 (1.9) % Interest expense (116,579) (152,904) (148,866) (202.8) 27.7 % (2.6) % (321,156) (301,770) (411.1) (6.0) % Net interest income 324,198 334,577 339,697 462.8 4.8 % 1.5 % 673,895 674,274 918.6 0.1 % Fees and commissions Income from fees and commissions 136,930 136,771 140,423 191.3 2.6 % 2.7 % 298,601 277,194 377.6 (7.2) % Expenses from fees and commissions (20,422) (28,501) (25,512) (34.8) 24.9 % (10.5) % (56,622) (54,013) (73.6) (4.6) % Net fees and commissions income 116,508 108,270 114,911 156.6 (1.4) % 6.1 % 241,979 223,181 304.1 (7.8) % Net Financial Operating Income 10,639 5,210 21,970 29.9 106.5 % 321.7 % 19,793 27,180 37.0 37.3 % Foreign exchange transactions, net 45,813 26,412 12,668 17.3 (72.3) % (52.0) % 65,193 39,080 53.2 (40.1) % Other operating income 6,851 7,956 9,372 12.8 36.8 % 17.8 % 16,242 17,328 23.6 6.7 % Total Operating Revenues 504,009 482,425 498,618 679.3 (1.1) % 3.4 % 1,017,102 981,043 1,336.6 (3.5) % Provisions for loan losses (139,408) (54,067) (76,804) (104.6) (44.9) % 42.1 % (264,968) (130,871) (178.3) (50.6) % Operating revenues, net of provisions for loan losses 364,601 428,358 421,814 574.7 15.7 % (1.5) % 752,134 850,172 1,158.3 13.0 % Operating expenses Personnel expenses (106,964) (113,696) (110,898) (151.1) 3.7 % (2.5) % (214,007) (224,594) (306.0) 4.9 % Administrative expenses (89,232) (83,373) (79,290) (108.0) (11.1) % (4.9) % (171,920) (162,663) (221.6) (5.4) % Depreciation and amortization (17,643) (18,619) (19,149) (26.1) 8.5 % 2.8 % (36,112) (37,768) (51.5) 4.6 % Impairments (867) (1) (2) (0.0) (99.8) % 100.0 % (867) (3) (0.0) (99.7) % Other operating expenses (6,827) (8,785) (8,027) (10.9) 17.6 % (8.6) % (18,920) (16,812) (22.9) (11.1) % Total operating expenses (221,533) (224,474) (217,366) (296.1) (1.9) % (3.2) % (441,826) (441,840) (602.0) 0.0 % Net operating income 143,068 203,884 204,448 278.5 42.9 % 0.3 % 310,308 408,332 556.3 31.6 % Income attributable to affiliates (320) (657) (1,529) (2.1) 377.8 % 132.7 % 1,575 (2,186) (3.0) - Income before income tax 142,748 203,227 202,919 276.5 42.2 % (0.2) % 311,883 406,146 553.3 30.2 % Income tax (31,045) (40,735) (40,542) (55.2) 30.6 % (0.5) % (63,298) (81,277) (110.7) 28.4 % Net Income for the period 111,703 162,492 162,377 221.2 45.4 % (0.1) % 248,585 324,869 442.6 30.7 % Non - Controlling interest - - - 0.0 - - - - 0.0 0.0 % Net Income attributable to bank's owners 111,703 162,492 162,377 221.2 45.4 % (0.1) % 248,585 324,869 442.6 30.7 % FV Adjustment AFS Securities 15,630 507 (48,771) (66.4) - - 5,862 (48,264) (65.8) - FV Adjustment CF Hedge Accounting (47,054) 1,539 80,834 110.1 - 5,152.4 % (45,119) 82,373 112.2 - Other effects 8,369 (385) (8,552) (11.7) - 2,121.3 % 10,535 (8,937) (12.2) - Comprehensive Income 88,648 164,153 185,888 253.3 109.7 % 13.2 % 219,863 350,041 476.9 59.2 % These results have been prepared in accordance with Chilean GAAP on an unaudited, consolidated basis . All figures are expressed in nominal Chilean pesos (historical pesos), unless otherwise stated . All figures expressed in US dollars (except earnings per ADR) were converted using the exchange rate of Ch $ 734 . 0 per US $ 1 . 00 as of June 30 , 2021 . Earnings per ADR were calculated considering the nominal net income, the exchange rate and the number of shares outstanding at the end of each period . Banco de Chile files its consolidated financial statements, together with those of its subsidiaries, with the Financial Market Commission, on a monthly basis . In addition, Banco de Chile files its quarterly financial statements (notes included) with the SEC in form 6 K, simultaneously or previously to file this quarterly earnings report . Such documentation is equally available at Banco de Chile’s website both in Spanish and English .
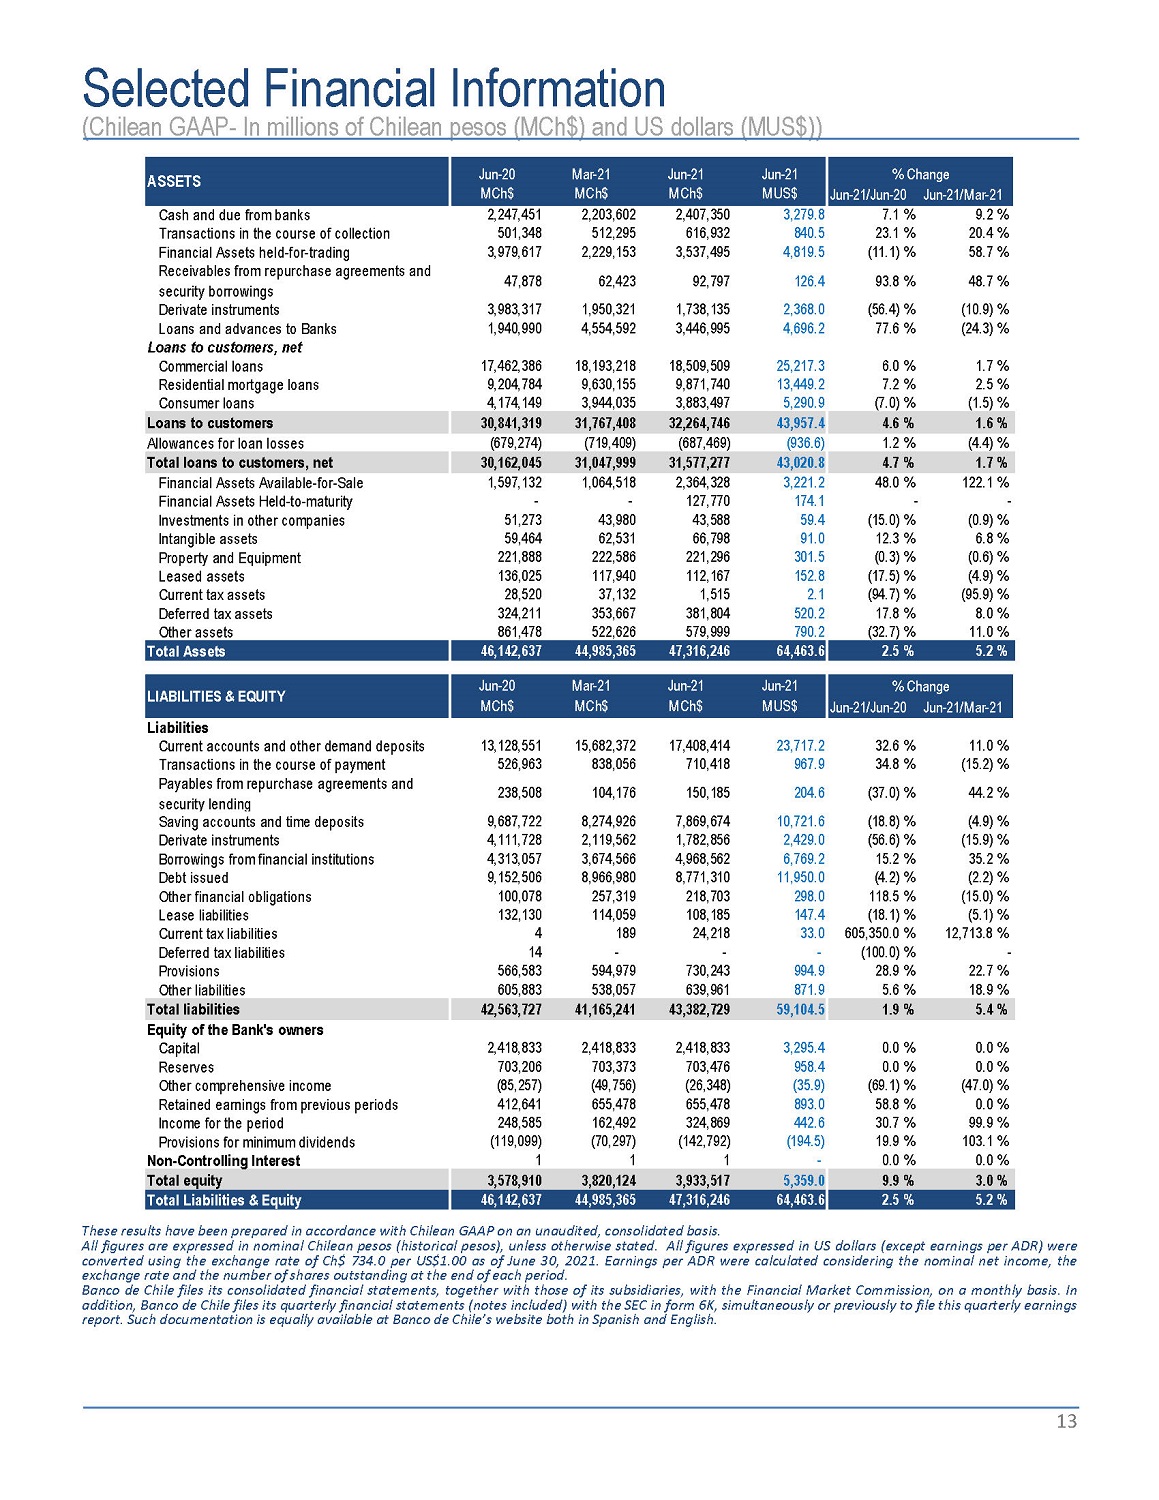
Selected Financial Information (Chilean GAAP - In millions of Chilean pesos (MCh$) and US dollars (MUS$)) ASSETS J un - 2 0 M C h $ M a r - 2 1 MCh$ J un - 2 1 M C h $ J un - 2 1 M U S$ % Change Jun - 21/Jun - 20 Jun - 21/Mar - 21 Cash and due from banks 2,247,451 2,203,602 2,407,350 3,279.8 7.1 % 9.2 % Transactions in the course of collection 501,348 512,295 616,932 840.5 23.1 % 20.4 % Financial Assets held - for - trading 3,979,617 2,229,153 3,537,495 4,819.5 (11.1) % 58.7 % Receivables from repurchase agreements and security borrowings 47,878 62,423 92,797 126.4 93.8 % 48.7 % Derivate instruments 3,983,317 1,950,321 1,738,135 2,368.0 (56.4) % (10.9) % Loans and advances to Banks 1,940,990 4,554,592 3,446,995 4,696.2 77.6 % (24.3) % Loans to customers, net Commercial loans 17,462,386 18,193,218 18,509,509 25,217.3 6.0 % 1.7 % Residential mortgage loans 9,204,784 9,630,155 9,871,740 13,449.2 7.2 % 2.5 % Consumer loans 4,174,149 3,944,035 3,883,497 5,290.9 (7.0) % (1.5) % Loans to customers 30,841,319 31,767,408 32,264,746 43,957.4 4.6 % 1.6 % Allowances for loan losses (679,274) (719,409) (687,469) (936.6) 1.2 % (4.4) % Total loans to customers, net 30,162,045 31,047,999 31,577,277 43,020.8 4.7 % 1.7 % Financial Assets Available - for - Sale 1,597,132 1,064,518 2,364,328 3,221.2 48.0 % 122.1 % Financial Assets Held - to - maturity - - 127,770 174.1 - - Investments in other companies 51,273 43,980 43,588 59.4 (15.0) % (0.9) % Intangible assets 59,464 62,531 66,798 91.0 12.3 % 6.8 % Property and Equipment 221,888 222,586 221,296 301.5 (0.3) % (0.6) % Leased assets 136,025 117,940 112,167 152.8 (17.5) % (4.9) % Current tax assets 28,520 37,132 1,515 2.1 (94.7) % (95.9) % Deferred tax assets 324,211 353,667 381,804 520.2 17.8 % 8.0 % Other assets 861,478 522,626 579,999 790.2 (32.7) % 11.0 % Total Assets 46,142,637 44,985,365 47,316,246 64,463.6 2.5 % 5.2 % LIABILITIES & EQUITY J un - 2 0 M a r - 2 1 J un - 2 1 J un - 2 1 M C h $ M C h $ M C h $ M U S$ % Change Jun - 21/Jun - 20 Jun - 21/Mar - 21 Liabilities Current accounts and other demand deposits Transactions in the course of payment Payables from repurchase agreements and security lending Saving accounts and time deposits Derivate instruments Borrowings from financial institutions Debt issued Other financial obligations Lease liabilities Current tax liabilities Deferred tax liabilities Provisions Other liabilities 13,128,551 15,682,372 17,408,414 23,717.2 526,963 838,056 710,418 967.9 238,508 104,176 150,185 204.6 9,687,722 8,274,926 7,869,674 10,721.6 4,111,728 2,119,562 1,782,856 2,429.0 4,313,057 3,674,566 4,968,562 6,769.2 9,152,506 8,966,980 8,771,310 11,950.0 100,078 257,319 218,703 298.0 132,130 114,059 108,185 147.4 4 189 24,218 33.0 14 - - - 566,583 594,979 730,243 994.9 605,883 538,057 639,961 871.9 32 . 6 % 11 . 0 % 34 . 8 % ( 15 . 2 ) % ( 37 . 0 ) % 44 . 2 % ( 18 . 8 ) % ( 4 . 9 ) % ( 56 . 6 ) % ( 15 . 9 ) % 15 . 2 % 35 . 2 % ( 4 . 2 ) % ( 2 . 2 ) % 118 . 5 % ( 15 . 0 ) % ( 18 . 1 ) % ( 5 . 1 ) % 605 , 350 . 0 % 12 , 713 . 8 % (100.0) % - 28 . 9 % 22 . 7 % 5 . 6 % 18 . 9 % Total liabilities 42,563,727 41,165,241 43,382,729 59,104.5 1.9 % 5.4 % Equity of the Bank's owners Capital R e s e rv e s Other comprehensive income Retained earnings from previous periods Income for the period Provisions for minimum dividends Non - Controlling Interest 2,418,833 2,418,833 2,418,833 3,295.4 703,206 703,373 703,476 958.4 (85,257) (49,756) (26,348) (35.9) 412,641 655,478 655,478 893.0 248,585 162,492 324,869 442.6 (119,099) (70,297) (142,792) (194.5) 1 1 1 - 0 . 0 % 0 . 0 % 0 . 0 % 0 . 0 % ( 69 . 1 ) % ( 47 . 0 ) % 58 . 8 % 0 . 0 % 30 . 7 % 99 . 9 % 19 . 9 % 103 . 1 % 0 . 0 % 0 . 0 % Total equity 3,578,910 3,820,124 3,933,517 5,359.0 9.9 % 3.0 % Total Liabilities & Equity 46,142,637 44,985,365 47,316,246 64,463.6 2.5 % 5.2 % These results have been prepared in accordance with Chilean GAAP on an unaudited, consolidated basis . All figures are expressed in nominal Chilean pesos (historical pesos), unless otherwise stated . All figures expressed in US dollars (except earnings per ADR) were converted using the exchange rate of Ch $ 734 . 0 per US $ 1 . 00 as of June 30 , 2021 . Earnings per ADR were calculated considering the nominal net income, the exchange rate and the number of shares outstanding at the end of each period . Banco de Chile files its consolidated financial statements, together with those of its subsidiaries, with the Financial Market Commission, on a monthly basis . In addition, Banco de Chile files its quarterly financial statements (notes included) with the SEC in form 6 K, simultaneously or previously to file this quarterly earnings report . Such documentation is equally available at Banco de Chile’s website both in Spanish and English . 13
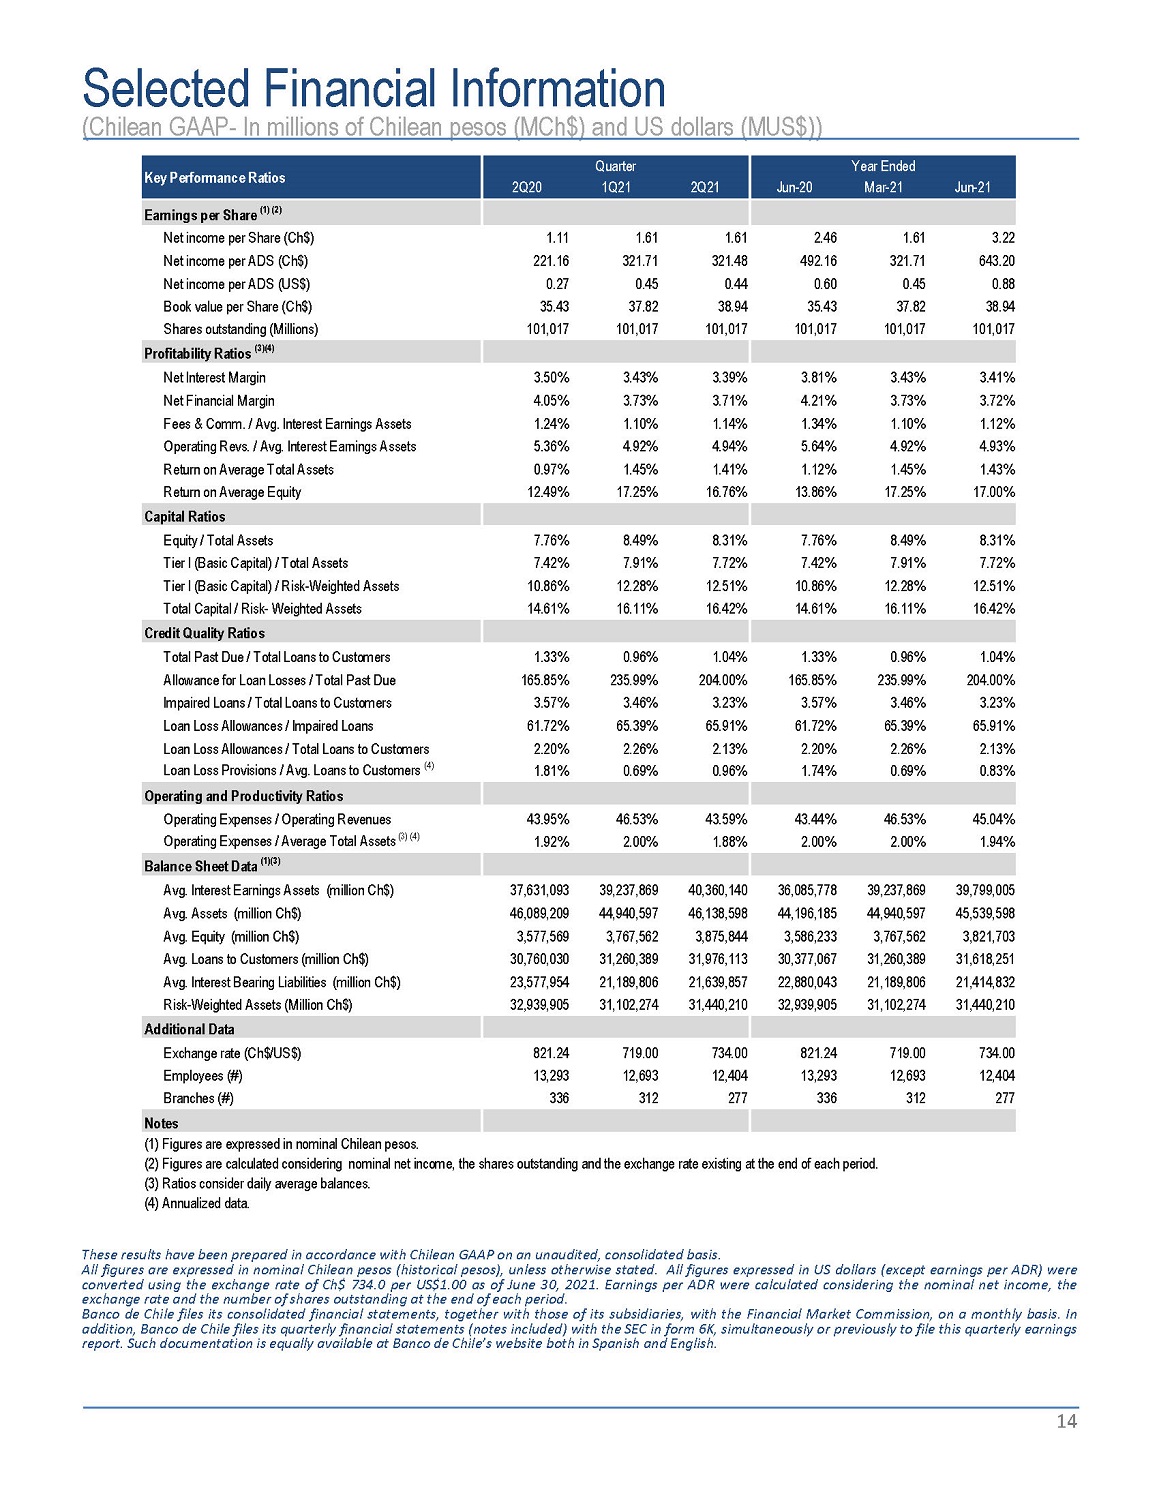
Selected Financial Information (Chilean GAAP - In millions of Chilean pesos (MCh$) and US dollars (MUS$)) K e y P e r f o r m a nc e R a ti o s 2Q20 Quarter 1Q21 2Q21 Jun - 20 Y ea r E nde d Mar - 21 Jun - 21 Earnings per Share (1) (2) N e t i nco m e pe r S ha r e ( C h$ ) 1.11 1.61 1.61 2.46 1.61 3.22 N e t i nco m e pe r AD S ( C h$ ) 221.16 321.71 321.48 492.16 321.71 643.20 N e t i nco m e pe r AD S ( US $ ) 0.27 0.45 0.44 0.60 0.45 0.88 B oo k va l u e pe r S ha r e ( C h$ ) 35.43 37.82 38.94 35.43 37.82 38.94 S ha r e s ou t s t and i n g ( M illi ons ) 101,017 101,017 101,017 101,017 101,017 101,017 P r o fit a b ilit y R a ti o s ( 3 )( 4 ) N e t I n t e r es t M a r g i n 3.50% 3.43% 3.39% 3.81% 3.43% 3.41% N e t F i nanc i a l M a r g i n 4.05% 3.73% 3.71% 4.21% 3.73% 3.72% Fees & Comm. / Avg. Interest Earnings Assets 1.24% 1.10% 1.14% 1.34% 1.10% 1.12% O pe r a ti n g R evs . / A vg . I n t e r es t E a r n i ng s A sse t s 5.36% 4.92% 4.94% 5.64% 4.92% 4.93% R e t u r n o n A ve r ag e T o t a l A sse t s 0.97% 1.45% 1.41% 1.12% 1.45% 1.43% R e t u r n o n A ve r ag e E qu it y 12.49% 17.25% 16.76% 13.86% 17.25% 17.00% C a p it a l R a ti o s E qu it y / T o t a l A sse t s 7.76% 8.49% 8.31% 7.76% 8.49% 8.31% T i e r I ( B as i c C ap it a l ) / T o t a l A sse t s 7.42% 7.91% 7.72% 7.42% 7.91% 7.72% Tier I (Basic Capital) / Risk - Weighted Assets 10.86% 12.28% 12.51% 10.86% 12.28% 12.51% T o t a l C ap it a l / R i sk - W e i gh t e d A sse t s 14.61% 16.11% 16.42% 14.61% 16.11% 16.42% C r e d i t Q u a lit y R a ti o s T o t a l P as t D u e / T o t a l Loan s t o C us t o m e r s 1.33% 0.96% 1.04% 1.33% 0.96% 1.04% A ll o w anc e f o r Loa n Losse s / T o t a l P as t D u e 165.85% 235.99% 204.00% 165.85% 235.99% 204.00% I m pa ir e d Loan s / T o t a l Loan s t o C us t o m e r s 3.57% 3.46% 3.23% 3.57% 3.46% 3.23% Loa n Los s A ll o w ance s / I m pa ir e d Loan s 61.72% 65.39% 65.91% 61.72% 65.39% 65.91% Loan Loss Allowances / Total Loans to Customers 2.20% 2.26% 2.13% 2.20% 2.26% 2.13% Loan Loss Provisions / Avg. Loans to Customers (4) 1.81% 0.69% 0.96% 1.74% 0.69% 0.83% Operating and Productivity Ratios Operating Expenses / Operating Revenues 43.95% 46.53% 43.59% 43.44% 46.53% 45.04% Operating Expenses / Average Total Assets (3) (4) 1.92% 2.00% 1.88% 2.00% 2.00% 1.94% B a l a nc e S h ee t D a t a ( 1 )( 3 ) A vg . I n t e r es t E a r n i ng s A sse t s ( m illi o n C h$ ) 37,631,093 39,237,869 40,360,140 36,085,778 39,237,869 39,799,005 A vg . A sse t s ( m illi o n C h$ ) 46,089,209 44,940,597 46,138,598 44,196,185 44,940,597 45,539,598 A vg . E qu it y ( m illi o n C h$ ) 3,577,569 3,767,562 3,875,844 3,586,233 3,767,562 3,821,703 A vg . Loan s t o C us t o m e r s ( m illi o n C h$ ) 30,760,030 31,260,389 31,976,113 30,377,067 31,260,389 31,618,251 A vg . I n t e r es t B ea ri n g L i ab iliti e s ( m illi o n C h$ ) 23,577,954 21,189,806 21,639,857 22,880,043 21,189,806 21,414,832 R i sk - W e i gh t e d A sse t s ( M illi o n C h$ ) 32,939,905 31,102,274 31,440,210 32,939,905 31,102,274 31,440,210 A dd iti on a l D a t a E xchang e r a t e ( C h$ / US $ ) 821.24 719.00 734.00 821.24 719.00 734.00 E m p l oyee s ( # ) 13,293 12,693 12,404 13,293 12,693 12,404 B r anche s ( # ) 336 312 277 336 312 277 Notes (1) Figures are expressed in nominal Chilean pesos. (2) Figures are calculated considering nominal net income, the shares outstanding and the exchange rate existing at the end of each period. (3) R a ti o s cons i de r da il y ave r ag e ba l ances . (4) A nnua li ze d da t a . 14 These results have been prepared in accordance with Chilean GAAP on an unaudited, consolidated basis . All figures are expressed in nominal Chilean pesos (historical pesos), unless otherwise stated . All figures expressed in US dollars (except earnings per ADR) were converted using the exchange rate of Ch $ 734 . 0 per US $ 1 . 00 as of June 30 , 2021 . Earnings per ADR were calculated considering the nominal net income, the exchange rate and the number of shares outstanding at the end of each period . Banco de Chile files its consolidated financial statements, together with those of its subsidiaries, with the Financial Market Commission, on a monthly basis . In addition, Banco de Chile files its quarterly financial statements (notes included) with the SEC in form 6 K, simultaneously or previously to file this quarterly earnings report . Such documentation is equally available at Banco de Chile’s website both in Spanish and English .
Summary of differences between Chile GAAP and IFRS The most significant differences are as follows : Under Chilean GAAP, the merger of Banco de Chile and Citibank Chile was accounted for under the pooling - of - interest method, while under IFRS, and for external financial reporting purposes, the merger of the two banks was accounted for as a business combination in which the Bank is the acquirer as required by IFRS 3 “Business Combinations” . Under IFRS 3 , the Bank recognised all acquired net assets at fair value as determined at the acquisition date, as well as the goodwill resulting from the purchase price consideration in excess of net assets recognised . Allowances for loan losses are calculated based on specific guidelines set by the Financial Market Commission based on an expected losses approach . Under IFRS 9 “Financial instruments” allowances for loan losses should be calculated on a discounted basis under the “expected credit loss” model that focuses on the risk that an asset will default rather than whether a loss has actually been incurred or not . Assets received in lieu of payments are measured at historical cost or fair value, less cost to sell, if lower, on a portfolio basis and written - off if not sold after a certain period in accordance with specific guidelines set by the Financial Market Commission . Under IFRS, these assets are deemed non - current assets held - for - sale and their accounting treatment is set by IFRS 5 “Non - current assets held for sale and Discontinued operations” . In accordance with IFRS 5 these assets are measured at historical cost or fair value, less cost to sell, if lower . Accordingly, under IFRS these assets are not written off unless impaired . Chilean companies are required to distribute at least 30 % of their net income to shareholders unless a majority of shareholders approve the retention of profits . In accordance with Chilean GAAP, the Bank records a minimum dividend allowance based on its distribution policy, which requires distribution of at least 60 % of the period net income, as permitted by the Financial Market Commission . Under IFRS, only the portion of dividends that is required to be distributed by Chilean Law must be recorded, i . e . , 30 % as required by Chilean Corporations Law . Forward - Looking Information The information contained herein incorporates by reference statements which constitute ‘‘forward - looking statements,’’ in that they include statements regarding the intent, belief or current expectations of our directors and officers with respect to our future operating performance . Such statements include any forecasts, projections and descriptions of anticipated cost savings or other synergies . You should be aware that any such forward - looking statements are not guarantees of future performance and may involve risks and uncertainties, and that actual results may differ from those set forth in the forward - looking statements as a result of various factors (including, without limitations, the actions of competitors, future global economic conditions, market conditions, foreign exchange rates, and operating and financial risks related to managing growth and integrating acquired businesses), many of which are beyond our control . The occurrence of any such factors not currently expected by us would significantly alter the results set forth in these statements . Factors that could cause actual results to differ materially and adversely include, but are not limited to : changes in general economic, business or political or other conditions in Chile or changes in general economic or business conditions in Latin America; changes in capital markets in general that may affect policies or attitudes toward lending to Chile or Chilean companies; unexpected developments in certain existing litigation; increased costs; unanticipated increases in financing and other costs or the inability to obtain additional debt or equity financing on attractive terms. Undue reliance should not be placed on such statements, which speak only as of the date that they were made . Our independent public accountants have not examined or compiled the forward - looking statements and, accordingly, do not provide any assurance with respect to such statements . These cautionary statements should be considered in connection with any written or oral forward - looking statements that we may issue in the future . We do not undertake any obligation to release publicly any revisions to such forward - looking statements to reflect later events or circumstances or to reflect the occurrence of unanticipated events . Contacts Pablo Mejia Head of Investor Relations Investor Relations | Banco de Chile pmejiar@bancochile.cl Daniel Galarce Head of Financial Control & Capital Financial Control & Capital Area | Banco de Chile dgalarce@bancochile.cl