Table of Contents
Exhibit 99.4
Table of Contents
Table of Contents
Table of Contents
Chairman’s Letter
April 8, 2016
Dear Shareholders,
The favorable oil transportation demand conditions, developed in the latter part of 2014, continued throughout calendar 2015, resulting to a record year for TEN’s financial results. A steadily declining oil price coupled with “lower for longer” interest rates and a strong US dollar, provided the ideal market framework, allowing TEN’s business model and strategy to fire on all cylinders for a full year.
The young, state of the art fleet, with vessels covering all sectors of crude and clean transportation, allowed our company to capture the rising charter rates across all of the industry’s sectors, servicing the needs of all its high quality customers.
At the same time, selected and timely Sale and Purchase activity, together with very effective management of the “time” and “spot” charter mix of the fleet, enabled TEN to further improve its operating performance. During most of the first half of the year, TEN was operating approximately 70% of its fleet in the spot market. Thereafter, in the latter part of the year, management gradually reduced its “spot” exposure to just below 50%, to lock-in more long term profitability for its shareholders, a trend that it will most probably continue during the current year.
In parallel to the prime performance of the crude and clean sector of our fleet, the specialized value added sector of TEN, made up of DP Shuttle tankers and LNG vessels, continued providing a highly accretive revenue base which supported the company during the earlier unprecedented five year market downturn.
On the new building front, the current year, marks the beginning of the delivery of TEN’s thirteen vessel new building program of nine Aframaxes, two LR product carriers, one DP Shuttle tanker and one LNG carrier, as well as the delivery of two new VLCC vessels, which will be completed by the end of 2017. All vessels are fully financed and have accretive time charters, with the exception of the VLCCs and the LNG carrier, the intention for which is to soon secure accretive time charters. The gradual delivery of these new state of the art vessels will allow management to make use of the current buoyant market and profitably dispose of older vessels, in order to continue to maintain a young and modern fleet.
The superior operating performance during 2015 driven by a strong market, an almost perfect vessel mix, lower financing cost and profitable S&P activity, places TEN in an ideal position for continued superior performance for the years to come. Our strong cash position will enable us to comfortably cover our equity commitments in our new building program, while our much reduced leverage and operating cost will continue to boost our profitability, offering higher value added to our shareholders.
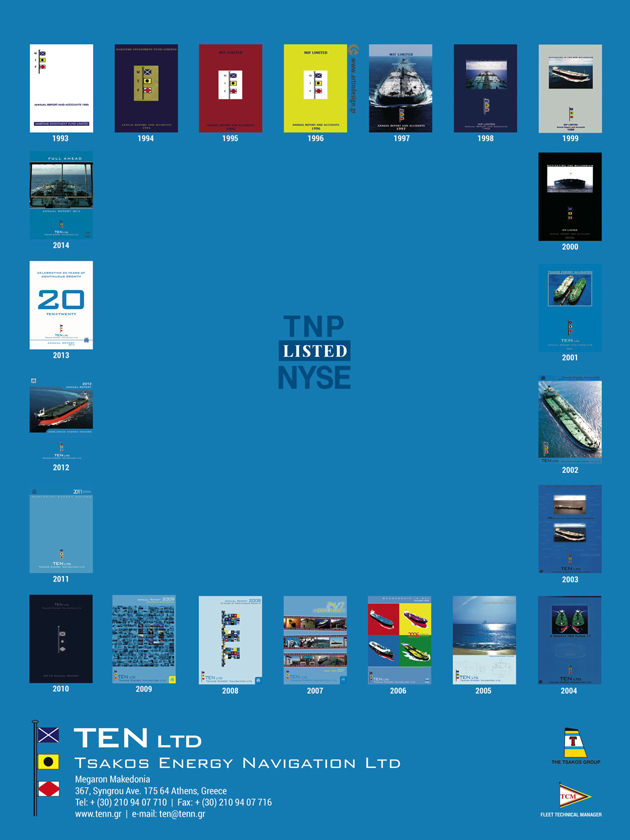
In addition, TEN’s employment strategy successfully navigated the company through three different market cycles since the NYSE listing and to an unbeatable record of profitability. It also provided for cash flow sustainability and visibility and uninterrupted dividend distributions irrespective of market cycles as evidenced by the 5.25% average dividend yield in the period between 2002 and 2015 (please refer to the graph on the last page of the Report).
4
Table of Contents
I wish to sincerely congratulate management and all TEN employees for delivering yet again such a superior performance. A performance not limited to financial results but also to maintaining a strong work ethic and team attitude and in delivering a perfect record in environmental protection.
The concerns over the dry cargo market, continued lack of understanding by investors of the effect of lower oil prices in the oil tanker business and a sluggish global growth, have resulted in a substantial and unjustifiable decline in the value of TEN shares. This is despite our maintained strong profitability and a generous 33% announced dividend increase. We expect that the oil transportation market will continue to be solid going forward and that investors will soon begin to distinguish among shipping stocks and recognize value in individual companies, instead of treating all companies in the shipping sector in the same way. In the meantime, we will continue using a measured part of our cash position to buy back TEN shares at a fraction of their NAV from the market, to further boost returns to our shareholders.
Annual General Meeting
The shareholders’ Annual General Meeting (AGM) will be held on Friday 20 May 2016 at the TEN headquarters in Athens, Greece. I look forward to seeing you all there.
Yours sincerely,

Takis Arapoglou

Table of Contents
Board of Directors and Officers
EFSTRATIOS GEORGIOS ARAPOGLOU | CHAIRMAN OF THE BOARD
Mr. Arapoglou is a Corporate Advisor with a long international executive career in Corporate and Investment Banking, International Capital Markets and in managing, restructuring and advising financial institutions. He was Chief Executive Officer of Commercial Banking at EFG Hermes Holding SAE Group, operating in the Middle East and Africa (2010-2013). Earlier, he was Chairman and Chief Executive Officer of the National Bank of Greece Group (2004-2009), Chairman of the Hellenic Banks Association (2005-2009) and Managing Director of the Global Banks and Securities Industry for Citigroup (1999-2004). He has served in several boards of publicly listed companies in Europe, the Middle East and Africa, as well as on Boards of Educational Foundations, including the Institute of Corporate Culture Affairs in Frankfurt, as Chairman. He is currently holding the following non-executive board positions: Vice Chairman and member of the compensation committee of Titan Cement SA, listed on the Athens SE; board member and member of the compensation committee of EFG Hermes Holding SAE, listed in Cairo and the London SE; board member of the audit and risk committee of Credit Libanais SAL and board member of Bank Alfalah, listed in Karachi, Pakistan -representing the International Finance Corporation (IFC) World Bank. He is Chairman of the International Board of Advisors of Tufts University in Boston, and a member of the Business Advisory Council for the International MBA program of Athens University of Economics and Business. He has degrees in Mathematics, Naval Architecture & Ocean Engineering and Management from Greek and British Universities.
MICHAEL G. JOLLIFFE | CO-FOUNDER AND VICE CHAIRMAN
Mr. Jolliffe has been joint Managing Director and then Vice Chairman of our Board since 1993. He is a director of a number of companies in shipping, agency representation, shipbroking capital services and mining. Mr. Jolliffe is Chief Executive Officer of Tsakos Containers Navigation LLC, a shipping company set up in joint venture between the Tsakos and Jolliffe families and Warwick Capital Partners, a London based fund manager. He is also Chairman of the Wighams Group owning companies involved in shipbroking, agency representation and capital markets businesses. Mr. Jolliffe is also the Chairman of Papua Mining Plc, a gold and copper mining company quoted on the London AIM. Michael Jolliffe is also Chairman of StealthGas, Inc., a shipping company which is quoted on the NASDAQ Stock Market and which owns 51 LPG ships, three product tankers, one crude oil tanker and has contracts for 5 LPG newbuildings. Mr. Jolliffe is also Trustee of Honeypot Children’s Charity.
EFTHIMIOS E. MITROPOULOS | DIRECTOR
Mr. Mitropoulos is Secretary-General Emeritus of the International Maritime Organization (IMO), the United Nations specialized agency responsible for the regulation of international shipping from the safety, security and environmental protection points of view. After 23 years of service at IMO (ten of which as Director of the Maritime Safety Division), he was elected Secretary-General in 2003 and re-elected in 2007 for a total of the maximum time permitted of eight years. As a graduate of both Merchant and Naval Academies of Greece, he spent time at sea as a navigation officer and twenty years as a commissioned Hellenic Coast Guard officer, retiring as a rear admiral, having represented Greece at IMO and various other international fora dealing with shipping matters over a twelve year period and having spent two years as Harbour Master of Corfu. Between 2004 and 2012, he was Chancellor of the World Maritime University, Malmô, Sweden and Chairman of the Governing Board of the International Maritime Law Institute in Malta. He is the author of several books on shipping, including books on tankers, modern types of merchant ships, safety of navigation and shipping economics and policy. He is Chairman of the Board of the “Maria Tsakos Foundation—International Centre for Maritime Research and Tradition” and Chancellor of the AMET Maritime University in Chennai, India.
PETER C. NICHOLSON, CBE | DIRECTOR
Mr. Nicholson is trained as a naval architect and spent the majority of his professional career with Camper & Nicholson Limited, the world-famous yacht builder. He became Managing Director of the firm and later, Chairman. When Camper & Nicholson merged with Crest Securities to form Crest Nicholson Plc in 1972, Mr. Nicholson became an executive director, a role he held until 1988 when he became a non-executive in order to pursue a wider range of business interests. Since that time, he has been a non-executive director of Lloyds TSB Group Plc (from 1990 to 2000) and Chairman of Carisbrooke Shipping Plc (from 1990 to 1999). He was a director of various companies in the Marsh Group of insurance brokers. He has served on the boards of a variety of small companies, has been active in the administration of the United Kingdom marine industry and is a trustee of the British Marine Federation. He is a Younger Brother of Trinity House. He was Chairman of the Royal National Lifeboat Institution from 2000 to 2004. In 2010, Mr. Nicholson became a partner and chairman of a limited liability partnership, R.M.G. Wealth Management.
FRANCIS T. NUSSPICKEL | DIRECTOR
Mr. Nusspickel is a retired partner of Arthur Andersen LLP with 35 years of public accounting experience. He is a Certified Public Accountant licensed in several U.S. states. During his years with Arthur Andersen, he served as a member of their Transportation Industry Group and was worldwide Industry Head for the Ocean Shipping segment. His responsibilities included projects for mergers and acquisitions, fraud investigations, arbitrations and debt and equity offerings. He was President of the New York State Society of Certified Public Accountants from 1996 to 1997, a member of the AICPA Council from 1992 to 1998, and from 2004 to 2007 was Chairman of the Professional Ethics Committee of the New York State Society of Certified Public Accountants. Mr. Nusspickel is also a Director of Symmetry Surgical Inc., a NASDAQ Stock Exchange listed surgical device distributer.
RICHARD L. PANIGUIAN, CBE | DIRECTOR
Mr. Paniguian became Chairman of C5 Holdings, a European based Private Equity fund specialising in cyber and big data technologies, in February 2015. Prior to that, he was Head of UK Defence and Security Organization, or DSO, which supports UK defense and security businesses seeking to export and develop joint ventures and partnerships overseas, as well as overseas defense and security businesses seeking to invest in the UK. Previously, Mr. Paniguian pursued a career with BP plc., where he worked for 37 years. He held a wide range of posts with BP, including, in the 1980s, as Commercial Director in the Middle East, Head of International Oil Trading in New York and Head of Capital Markets in London. In the 1990s he completed assignments as a Director of BP Europe, Chief Executive of BP Shipping and subsequently Head of Gas Development in the Middle East and Africa. In 2001 he was appointed Group Vice President for Russia, the Caspian, Middle East and Africa, where he was responsible for developing and delivering BP’s growth strategy in these regions. He played a leading role in support of the TNK-BP joint venture; in delivering the Baku Tbilisi Ceyhan pipeline project; in driving for new gas exploration in Libya, Egypt and Oman and, in completing BP’s first oil project in Angola. In 2007 he was appointed CBE for services to business. Between 2002 and 2007 he was Chairman of the Egyptian British Business Council, and between 2000 and 2002 President of the UK Chamber of Shipping. Mr. Paniguian has a degree in Arabic and Middle East politics and an MBA.
ARISTIDES A.N. PATRINOS, Ph.D. | DIRECTOR
Dr. Patrinos is currently the Deputy Director for Research of the Center for Urban Science and Progress (CUSP) and a Distinguished Professor of Mechanical and Biomolecular Engineering at New York University. Since 2006 he is also affiliated with Synthetic Genomics Inc. (SGI) serving as President (2006-2011), Senior Vice President for Corporate Affairs (2011-2012) and currently as a Consultant. SGI is a US-based privately held company dedicated to developing and commercializing clean and renewable fuels and chemicals; sustainable food products; and novel medical applications such as synthetic vaccines. From 1976 to 2006, Dr. Patrinos served in the U.S. Department of Energy (DOE) and several of the DOE National Laboratories and engaged in several facets of energy production and use and led key research programs in biology and the environment. He played a leading role in the Human Genome Project and has been a central architect in the “genomics” revolution. He is a member of many scientific societies and is a recipient of numerous awards and distinctions including three U.S. Presidential Rank Awards, and two Secretary of Energy Gold Medals. He holds a Diploma in Mechanical and Electrical Engineering from the National Technical University of Athens (Metsovion) and a Ph.D. in Mechanical Engineering and Astronautical Sciences from Northwestern University.
MARIA VASSALOU Ph.D. | DIRECTOR
Maria Vassalou is Partner and Portfolio Manager for the PWP Global Macro Strategy, a liquid strategy invested in global equities, fixed income, currencies, commodities and credit. Dr. Vassalou joined Perella Weinberg Partners in 2013 from MIO Partners, a subsidiary of McKinsey & Company, where as a Portfolio Manager she managed a similar global macro investment strategy in a dedicated legal entity, and as Head of Asset Allocation she provided counsel on allocation for liquid assets within MIO’s portfolio. Prior to joining MIO in 2012, Dr. Vassalou was a Global Macro Portfolio Manager at SAC Capital Advisors, LP. She joined SAC in 2008 from Soros Fund Management where she was responsible for global quantitative research, as well as the development and management of global quantitative trading strategies. Prior to her career in asset management, Dr. Vassalou was an Associate Professor of Finance at Columbia Business School which she joined in 1995. Dr. Vassalou is a Past President of the European Finance Association and was the Chair of the 2008 European Finance Association Meetings. A Research Affiliate of the Centre for Economic Policy Research (CEPR) in London for many years, Dr. Vassalou is a past member of the Academic Advisory Board of the Vienna-based Guttmann Centerof Competence in Portfolio Management. Dr. Vassalou received a Bachelor of Arts in Economics from the University of Athens and she holds a Ph.D. in Financial Economics from London Business School.
6
Table of Contents
NIKOLAS P. TSAKOS, Dr.
FOUNDER, PRESIDENT AND CHIEF EXECUTIVE OFFICER
Mr. Tsakos has been President, Chief Executive Officer and a director of the Company since inception. Mr. Tsakos is the sole shareholder of Tsakos Energy Management Limited. He has been involved in ship management since 1981 and has 36 months of seafaring experience. Mr. Tsakos served as an officer in the Hellenic Navy in 1988. Mr. Tsakos is the Chairman of the Independent Tanker Owners Association (INTERTANKO), an Executive Committee member and a council member. He is also Chairman of the Korean Registry, Hellenic Committee (KR). Mr. Tsakos is currently a board member of the UK P&I Club, a board member of the Union of Greek Shipowners (UGS), a member of the board of the Greek Shipping Co-operation Committee (GSCC) and a council member of the American Bureau of Shipping (ABS), Bureau Veritas (BV) and of the Greek Committee of Det Norske Veritas (DNV). Mr. Tsakos is the former President of the Hellenic Marine Environment Protection Association (HELMEPA). He graduated from Columbia University in New York in 1985 with a degree in Economics and Political Science and obtained a Masters Degree in Shipping, Trade and Finance from London’s City University Business School in 1987. In 2011, Mr. Tsakos was awarded an honorary doctorate from the City University Business School, for his pioneering work in the equity financial markets relating to shipping companies.
GEORGE V. SAROGLOU | CHIEF OPERATING OFFICER
Mr. Saroglou has been Chief Operating Officer of the Company since 1996. Mr. Saroglou worked for a private Greek information technology systems integrator from 1987 until 1994. From 1995 to 1996 he was employed in the Trading Department of the Tsakos Group. He graduated from McGill University in Canada in 1987 with a Bachelors Degree in Science (Mathematics).
PAUL DURHAM | CHIEF FINANCIAL OFFICER
Mr. Durham joined the Tsakos Group in 1999 and has served as its Chief Financial Officer and Chief Accounting Officer since 2000. Mr. Durham is a Fellow of the Institute of Chartered Accountants in England & Wales. From 1989 through 1998, Mr. Durham was employed in Athens with the Latsis Group, a shipping, refinery and banking enterprise, becoming Financial Director of Shipping in 1995. From 1983 to 1989, Mr. Durham was employed by RJR Nabisco Corporation, serving as audit manager for Europe, Asia and Africa until 1986 and then as financial controller of one of their United Kingdom food divisions. Mr. Durham worked with public accounting firms Ernst & Young (London and Paris) from 1972 to 1979 and Deloitte & Touche (Chicago and Athens) from 1979 to 1983. Mr. Durham is a graduate in Economics from the University of Exeter, England.
VLADIMIR JADRO | CHIEF MARINE OFFICER
Mr. Jadro joined Tsakos Energy Navigation Limited in February 2006. He was appointed Chief Marine Officer of the Company in June 2006. Mr. Jadro was employed by Exxon/ExxonMobil Corp. from 1980 until 2004 in various technical and operational positions including operations, repairs, new building constructions, off shore conversions and projects of the marine department of ExxonMobil Corp. He was in charge of various tankers and gas carriers from 28,000 dwt to 409,000 dwt, and responsible for the company vetting system. He was also involved in the development of oil companies’ international “SIRE” vessel inspection system. From 1978 until 1980 he was employed by the Bethlehem Steel shipyard. From 1967 until 1977, Mr. Jadro was employed on various tankers starting as third engineer and advancing to Chief Engineer. Mr. Jadro is a member of the Society of Naval Architects and Marine Engineers (SNAME) and Port Engineers of New York.
Board Committees
AUDIT COMMITTEE Francis T. Nusspickel - Chairman Efstratios Georgios Arapoglou Peter C. Nicholson Richard L. Paniguian | BUSINESS DEVELOPMENT AND CAPITAL | |
| MARKETS COMMITTEE | ||
| Michael G. Jolliffe - Chairman | ||
| Efstratios Georgios Arapoglou | ||
| Dimitris Bertolis* | ||
| Richard L. Paniguian | ||
CORPORATE GOVERNANCE | George V. Saroglou | |
NOMINATING | COMPENSATION | Nikolas P. Tsakos | |
COMMITTEE | Maria Vassalou | |
Peter C. Nicholson- Chairman | ||
Efstratios Georgios Arapoglou | OPERATIONAL, SAFETY AND | |
Efthimios E. Mitropoulos Francis T. Nusspickel Richard L. Paniguian Aristides A.N. Patrinos Maria Vassalou | ENVIRONMENTAL COMMITTEE | |
| Efthimios E. Mitropoulos - Chairman | ||
| Vladimir Jadro* | ||
| Michael G. Jolliffe | ||
| Aristides A. N. Patrinos | ||
| Vassilis Papageorgiou** | ||
* (Non-Director) | ||
** (Non-Director - Mr. Papageorgiou is the Deputy Chairman of Tsakos Shipping) | ||
Shareholder Information
TEN Ltd shares trade on the New York Stock Exchange and the Bermuda Stock Exchange under the symbol: NYSE - TNP BERMUDA - TEN
As of December 31, 2015 the Company had 87,338,652 shares issued and outstanding. The Company has issued three series of preferred shares that are listed in the NYSE, with the following details:
8.0% Series B - Ticker Symbol (TNP.B) - with 2,000,000 preferred shares issued and outstanding.
8.625% Series C - Ticker Symbol (TNP.C) - with 2,000,000 preferred shares issued and outstanding.
8.75% Series D - Ticker Symbol (TNP.D) - with 3,400,000 preferred shares issued and outstanding.
Transfer Agent & Registar for the shares | Independent Auditors | |
Computershare Trust Company, N.A. | Ernst & Young (Hellas) | |
P.O. Box 30170 | Certified Auditors-Accountants S.A. | |
College Station, TX 77842-3170 | 11th Km National Rd Athens - Lamia 114 51 Metamorphosi, Greece | |
Private Couriers/Registered Mail: | ||
Computershare Trust Company, N.A. | Legal Counsel (New York) | |
211 Quality Circle, Suite 210 | Morgan, Lewis & Bockius, LLP | |
College Station, TX 77845
Computershare Phone #: (800) 522-6645 | 101 Park Avenue New York, NY 10178 U.S.A | |
Outside the U.S. Phone: 1-201-680-6578 | Legal Counsel (London) | |
| Holman Fenwick & Willan | ||
Questions & Inquiries via our Website: | Friary Court, | |
http://www.computershare.com | 65 Crutched Friars | |
Hearing Impaired #: TDD: 1-800-952-9245 | London, EC3N 2AE | |
| United Kingdom |
Stock information may be accessed through:
Bloomberg under: | “ TNP US” | “TNP BH” | ||
Reuters under: | “ TNP.N” |
A copy of the Company’s Annual Report on Form 20-F, which is filed with the SEC and contains additional information can be obtained by contacting:
George V. Saroglou,
Chief Operating Officer: gsaroglou@tenn.gr
Paul Durham,
Chief Financial Officer: pdurham@tenn.gr
Harrys Kosmatos,
Corporate Development Officer: hkosmatos@tenn.gr
7
Table of Contents

Table of Contents

Table of Contents
Management’s Report on Internal Control over Financial Reporting
The management of Tsakos Energy Navigation Limited and its subsidiaries (the “Company”), according to Rule 13a-15(f) of the Securities Exchange Act of 1934, is responsible for the establishment and maintenance of adequate internal controls over financial reporting for the Company. Internal control over financial reporting is a process designed to provide reasonable assurance regarding the reliability of financial reporting and the preparation of the Company’s financial statements for external reporting purposes in accordance with U.S. generally accepted accounting principles. However, in any system of internal control there are inherent limitations and consequently internal control over financial reporting may not absolutely prevent or detect misstatements.
The Company’s system of internal control over financial reporting includes policies and procedures that:
| (i) | pertain to the maintenance of records that, in reasonable detail, accurately and fairly reflect the transactions and dispositions of the assets of the Company; |
| (ii) | provide reasonable assurance that transactions are recorded as necessary to permit preparation of financial statements in accordance with U.S. generally accepted accounting principles, and that receipts and expenditures of the Company are being made only in accordance with authorizations of management and directors of the Company, and |
| (iii) | provide reasonable assurance regarding prevention or timely detection of unauthorized acquisition, use, or disposition of the Company’s assets that could have a material effect on the financial statements. |
Management has performed an assessment of the effectiveness of the Company’s internal control over financial reporting as of December 31, 2015, based on the criteria established within Internal Control-Integrated Framework issued by the Committee of Sponsoring Organizations of the Treadway Commission (2013 framework).
Based on our assessment, management has determined that the Company’s internal control over financial reporting as of December 31, 2015 was effective.
| Nikolas P. Tsakos | Paul Durham | |
| President and Chief Executive Officer | Chief Financial Officer | |
 |  | |
Date: April 5, 2016
10
Table of Contents

TSAKOS ENERGY NAVIGATION LIMITED AND SUBSIDIARIES
CONSOLIDATED FINANCIAL STATEMENTS
2015
Table of Contents
TSAKOS ENERGY NAVIGATION LIMITED AND SUBSIDIARIES
INDEX TO CONSOLIDATED FINANCIAL STATEMENTS
12
Table of Contents

Report of Independent Registered Public Accounting Firm
To the Board of Directors and Shareholders of
TSAKOS ENERGY NAVIGATION LIMITED
We have audited the accompanying consolidated balance sheets of TSAKOS ENERGY NAVIGATION LIMITED and subsidiaries as of December 31, 2015 and 2014, and the related consolidated statements of comprehensive income / (loss), stockholders’ equity and cash flows for each of the three years in the period ended December 31, 2015. These financial statements are the responsibility of the Company’s management. Our responsibility is to express an opinion on these financial statements based on our audits.
We conducted our audits in accordance with the standards of the Public Company Accounting Oversight Board (United States). Those standards require that we plan and perform the audit to obtain reasonable assurance about whether the financial statements are free of material misstatement. An audit includes examining, on a test basis, evidence supporting the amounts and disclosures in the financial statements. An audit also includes assessing the accounting principles used and significant estimates made by management, as well as evaluating the overall financial statement presentation. We believe that our audits provide a reasonable basis for our opinion.
In our opinion, the financial statements referred to above present fairly, in all material respects, the consolidated financial position of TSAKOS ENERGY NAVIGATION LIMITED and subsidiaries at December 31, 2015 and 2014, and the consolidated results of their operations and their cash flows for each of the three years in the period ended December 31, 2015, in conformity with U.S. generally accepted accounting principles.
We also have audited, in accordance with the standards of the Public Company Accounting Oversight Board (United States), TSAKOS ENERGY NAVIGATION LIMITED and subsidiaries’ internal control over financial reporting as of December 31, 2015, based on criteria established in Internal Control-Integrated Framework issued by the Committee of Sponsoring Organizations of the Treadway Commission (2013 framework) and our report dated April 5, 2016 expressed an unqualified opinion thereon.

Athens, Greece
April 5, 2016
Table of Contents
Report of Independent Registered Public Accounting Firm
To the Board of Directors and Shareholders of
TSAKOS ENERGY NAVIGATION LIMITED
We have audited TSAKOS ENERGY NAVIGATION LIMITED and subsidiaries’ internal control over financial reporting as of December 31, 2015, based on criteria established in Internal Control-Integrated Framework issued by the Committee of Sponsoring Organizations of the Treadway Commission (2013 framework), (the COSO criteria). TSAKOS ENERGY NAVIGATION LIMITED and subsidiaries’ management is responsible for maintaining effective internal control over financial reporting, and for its assessment of the effectiveness of internal control over financial reporting included in the accompanying Management’s Report on Internal Controls over Financial Reporting. Our responsibility is to express an opinion on the company’s internal control over financial reporting based on our audit.
We conducted our audit in accordance with the standards of the Public Company Accounting Oversight Board (United States). Those standards require that we plan and perform the audit to obtain reasonable assurance about whether effective internal control over financial reporting was maintained in all material respects. Our audit included obtaining an understanding of internal control over financial reporting, assessing the risk that a material weakness exists, testing and evaluating the design and operating effectiveness of internal control based on the assessed risk, and performing such other procedures as we considered necessary in the circumstances. We believe that our audit provides a reasonable basis for our opinion.
A company’s internal control over financial reporting is a process designed to provide reasonable assurance regarding the reliability of financial reporting and the preparation of financial statements for external purposes in accordance with generally accepted accounting principles. A company’s internal control over financial reporting includes those policies and procedures that (1) pertain to the maintenance of records that, in reasonable detail, accurately and fairly reflect the transactions and dispositions of the assets of the company; (2) provide reasonable assurance that transactions are recorded as necessary to permit preparation of financial statements in accordance with generally accepted accounting principles, and that receipts and expenditures of the company are being made only in accordance with authorizations of management and directors of the company; and (3) provide reasonable assurance regarding prevention or timely detection of unauthorized acquisition, use, or disposition of the company’s assets that could have a material effect on the financial statements.
Because of its inherent limitations, internal control over financial reporting may not prevent or detect misstatements. Also, projections of any evaluation of effectiveness to future periods are subject to the risk that controls may become inadequate because of changes in conditions, or that the degree of compliance with the policies or procedures may deteriorate.
In our opinion, TSAKOS ENERGY NAVIGATION LIMITED and subsidiaries maintained, in all material respects, effective internal control over financial reporting as of December 31, 2015, based on the COSO criteria.
We also have audited, in accordance with the standards of the Public Company Accounting Oversight Board (United States), the consolidated balance sheets of TSAKOS ENERGY NAVIGATION LIMITED and subsidiaries as of December 31, 2015 and 2014, and the related consolidated statements of comprehensive income / (loss), stockholders’ equity and cash flows for each of the three years in the period ended December 31, 2015 and our report dated April 5, 2016 expressed an unqualified opinion thereon.
Athens, Greece
April 5, 2016
Table of Contents
TSAKOS ENERGY NAVIGATION LIMITED AND SUBSIDIARIES
DECEMBER 31, 2015 AND 2014
(Expressed in thousands of U.S. Dollars—except share and per share data)
| 2015 | 2014 | |||||||
ASSETS | ||||||||
CURRENT ASSETS: | ||||||||
Cash and cash equivalents | $ | 289,676 | $ | 202,107 | ||||
Restricted cash | 15,330 | 12,334 | ||||||
Accounts receivable, net | 45,461 | 42,047 | ||||||
Due from related parties (Note 2) | 4,169 | 1,895 | ||||||
Advances and other | 14,132 | 10,629 | ||||||
Vessels held for sale (Note lj) | 67,255 | — | ||||||
Inventories | 14,410 | 15,941 | ||||||
Prepaid insurance and other | 1,765 | 2,403 | ||||||
Current portion of financial instruments—Fair value (Note 15) | 28 | 2,443 | ||||||
|
|
|
| |||||
Total current assets | 452,226 | 289,799 | ||||||
|
|
|
| |||||
INVESTMENTS (Note 3) | 1,000 | 1,000 | ||||||
FINANCIAL INSTRUMENTS—FAIR VALUE, net of current portion (Note 15) | 126 | — | ||||||
FIXED ASSETS (Note 5) | ||||||||
Advances for vessels under construction | 371,238 | 188,954 | ||||||
Vessels | 2,748,330 | 2,834,289 | ||||||
Accumulated depreciation | (695,044 | ) | (635,135 | ) | ||||
|
|
|
| |||||
Vessels’ Net Book Value | 2,053,286 | 2,199,154 | ||||||
|
|
|
| |||||
Total fixed assets | 2,424,524 | 2,388,108 | ||||||
|
|
|
| |||||
DEFERRED CHARGES, net (Note 6) | 22,821 | 20,190 | ||||||
|
|
|
| |||||
Total assets | $ | 2,900,697 | $ | 2,699,097 | ||||
|
|
|
| |||||
LIABILITIES AND STOCKHOLDERS’ EQUITY | ||||||||
CURRENT LIABILITIES: | ||||||||
Current portion of long-term debt (Note 7) | $ | 319,560 | $ | 228,492 | ||||
Payables | 33,26 4 | 33,052 | ||||||
Due to related parties (Note 2) | 1,740 | 10,136 | ||||||
Dividends payable | — | 5,083 | ||||||
Accrued liabilities | 29,363 | 25,188 | ||||||
Unearned revenue | 12,277 | 9,897 | ||||||
Current portion of financial instruments—Fair value (Note 15) | 5,706 | 15,434 | ||||||
|
|
|
| |||||
Total current liabilities | 401,910 | 327,282 | ||||||
|
|
|
| |||||
LONG-TERM DEBT, net of current portion (Note 7) | 1,080,534 | 1,189,844 | ||||||
FINANCIAL INSTRUMENTS—FAIR VALUE, net of current portion (Note 15) | 3,181 | 4,059 | ||||||
STOCKHOLDERS’ EQUITY | ||||||||
Preferred shares, $ 1.00 par value; 15,000,000 shares authorized and 2,000,000 Series B Preferred Shares and 2,000,000 Series C Preferred Shares issued and outstanding at December 31, 2015 and December 31, 2014 and 3,400,000 Series D Preferred Shares issued and outstanding at December 31, 2015 | 7,400 | 4,000 | ||||||
Common shares, $ 1.00 par value; 185,000,000 shares authorized at December 31, 2015 and December 31, 2014; 87,338,652 and 84,712,295 shares issued and outstanding at December 31, 2015 and 2014 respectively | 87,339 | 84,712 | ||||||
Additional paid-in capital | 752,001 | 650,536 | ||||||
Accumulated other comprehensive loss | (10,727 | ) | (10,290 | ) | ||||
Retained earnings | 567,464 | 437,565 | ||||||
|
|
|
| |||||
Total Tsakos Energy Navigation Limited stockholders’ equity | 1,403,477 | 1,166,523 | ||||||
Noncontrolling Interest | 11,595 | 11,389 | ||||||
|
|
|
| |||||
Total stockholders’ equity | 1,415,072 | 1,177,912 | ||||||
|
|
|
| |||||
Total liabilities and stockholders’ equity | $ | 2,900,697 | $ | 2,699,097 | ||||
|
|
|
| |||||
The accompanying notes are an integral part of these consolidated financial statements.
F-3
Table of Contents
TSAKOS ENERGY NAVIGATION LIMITED AND SUBSIDIARIES
CONSOLIDATED STATEMENTS OF COMPREHENSIVE INCOME/(LOSS)
FOR THE YEARS ENDED DECEMBER 31, 2015, 2014 AND 2013
(Expressed in thousands of U.S. Dollars—except share and per share data)
| 2015 | 2014 | 2013 | ||||||||||
VOYAGE REVENUES: | $ | 587,715 | $ | 501,013 | $ | 418,379 | ||||||
EXPENSES: | ||||||||||||
Voyage expenses | 131,878 | 154,143 | 132,999 | |||||||||
Vessel operating expenses | 142,117 | 146,902 | 131,053 | |||||||||
Depreciation and amortization | 105,931 | 102,891 | 100,413 | |||||||||
General and administrative expenses | 21,787 | 21,029 | 20,731 | |||||||||
Gain on sale of vessels | (2,078 | ) | — | — | ||||||||
Vessel impairment charge | — | — | 28,290 | |||||||||
|
|
|
|
|
| |||||||
Total expenses | 399,635 | 424,965 | 413,486 | |||||||||
|
|
|
|
|
| |||||||
Operating income | 188,080 | 76,048 | 4,893 | |||||||||
|
|
|
|
|
| |||||||
OTHER INCOME/(EXPENSES): | ||||||||||||
Interest and finance costs, net (Note 8) | (30,019 | ) | (43,074 | ) | (40,917 | ) | ||||||
Interest income | 234 | 498 | 366 | |||||||||
Other, net | 128 | 246 | (2,912 | ) | ||||||||
|
|
|
|
|
| |||||||
Total other expenses, net | (29,657 | ) | (42,330 | ) | (43,463 | ) | ||||||
|
|
|
|
|
| |||||||
Net income/(loss) | 158,423 | 33,718 | (38,570 | ) | ||||||||
Less: Net income/(loss) attributable to the noncontrolling interest | (206 | ) | (191 | ) | 1,108 | |||||||
|
|
|
|
|
| |||||||
Net income/(loss) attributable to Tsakos Energy Navigation Limited | $ | 158,217 | $ | 33,527 | $ | (37,462 | ) | |||||
|
|
|
|
|
| |||||||
Effect of preferred dividends | (13,437 | ) | (8,438 | ) | (3,676 | ) | ||||||
Net income/(loss) attributable to common stockholders of Tsakos Energy Navigation Limited | 144,780 | 25,089 | (41,138 | ) | ||||||||
Earnings/(loss) per share, basic and diluted attributable to Tsakos Energy Navigation Limited common stockholders | $ | 1.69 | $ | 0.32 | $ | (0.73 | ) | |||||
|
|
|
|
|
| |||||||
Weighted average number of shares, basic and diluted | 85,827,597 | 79,114,401 | 56,698,955 | |||||||||
|
|
|
|
|
| |||||||
The accompanying notes are an integral part of these consolidated financial statements.
F-4
Table of Contents
TSAKOS ENERGY NAVIGATION LIMITED AND SUBSIDIARIES
STATEMENTS OF CONSOLIDATED OTHER COMPREHENSIVE INCOME/(LOSS)
FOR THE YEARS ENDED DECEMBER 31, 2015, 2014 AND 2013
(Expressed in thousands of U.S. Dollars)
| 2015 | 2014 | 2013 | ||||||||||
Net income/(loss) | $ | 158,423 | $ | 33,718 | $ | (38,570 | ) | |||||
Other comprehensive income/(loss) | ||||||||||||
Unrealized (losses)/gains from hedging financial instruments | ||||||||||||
Unrealized (loss)/gain on interest rate swaps, net | (437 | ) | (3,655 | ) | 7,230 | |||||||
Amortization of deferred loss on the de-designated financial instruments | — | 154 | 877 | |||||||||
|
|
|
|
|
| |||||||
Total unrealized (losses)/gains from hedging financial instruments | (437 | ) | (3,501 | ) | 8,107 | |||||||
Unrealized loss on marketable securities | — | — | (79 | ) | ||||||||
|
|
|
|
|
| |||||||
Realized gain on marketable securities reclassified to Statement of Comprehensive Income/(Loss) | — | — | (89 | ) | ||||||||
Other Comprehensive (loss)/income | (437 | ) | (3,501 | ) | 7,939 | |||||||
|
|
|
|
|
| |||||||
Comprehensive income/(loss) | 157,986 | 30,217 | (30,631 | ) | ||||||||
|
|
|
|
|
| |||||||
Less: comprehensive (income)/loss attributable to the noncontrolling interest | (206 | ) | (191 | ) | 1,108 | |||||||
|
|
|
|
|
| |||||||
Comprehensive income/(loss) attributable to Tsakos Energy Navigation Limited | $ | 157,780 | $ | 30,026 | $ | (29,523 | ) | |||||
|
|
|
|
|
| |||||||
The accompanying notes are an integral part of these consolidated financial statements.
F-5
Table of Contents
TSAKOS ENERGY NAVIGATION LIMITED AND SUBSIDIARIES
CONSOLIDATED STATEMENTS OF STOCKHOLDERS’ EQUITY
FOR THE YEARS ENDED DECEMBER 31, 2015, 2014 AND 2013
(Expressed in thousands of U.S. Dollars—except for share and per share data)
| Preferred Shares | Common Shares | Additional Paid-in Capital | Retained Earnings | Accumulated Other Comprehensive Income/(Loss) | Tsakos Energy Navigation Limited | Noncontrolling Interest | Total Stockholders’ Equity | |||||||||||||||||||||||||
BALANCE December 31, 2012 | $ | — | $ | 56,443 | $ | 404,391 | $ | 478,428 | $ | (14,728 | ) | $ | 924,534 | $ | 2,306 | $ | 926,840 | |||||||||||||||
Net loss | (37,462 | ) | (37,462 | ) | (1,108 | ) | (38,570 | ) | ||||||||||||||||||||||||
- Issuance of 8% Series B Preferred Shares | 2,000 | 45,043 | 47,043 | 47,043 | ||||||||||||||||||||||||||||
- Issuance of 8.875% Series C Preferred Shares | 2,000 | 45,315 | 47,315 | 47,315 | ||||||||||||||||||||||||||||
- Issuance of common stock under distribution agency agreement | 1,430 | 5,615 | 7,045 | 7,045 | ||||||||||||||||||||||||||||
- Issuance of 96,000 shares of restricted share units | 96 | (96 | ) | — | — | |||||||||||||||||||||||||||
- Capital contribution of noncontrolling interest owner | — | 10,000 | 10,000 | |||||||||||||||||||||||||||||
- Cash dividends paid ($0.15 per common share) | (8,529 | ) | (8,529 | ) | (8,529 | ) | ||||||||||||||||||||||||||
- Dividends paid on Series B Preferred Shares | (1,889 | ) | (1,889 | ) | (1,889 | ) | ||||||||||||||||||||||||||
- Other comprehensive income | 7,939 | 7,939 | 7,939 | |||||||||||||||||||||||||||||
- Amortization of restricted share units | 469 | 469 | 469 | |||||||||||||||||||||||||||||
|
|
|
|
|
|
|
|
|
|
|
|
|
|
|
| |||||||||||||||||
BALANCE December 31, 2013 | $ | 4,000 | $ | 57,969 | $ | 500,737 | $ | 430,548 | $ | (6,789 | ) | $ | 986,465 | $ | 11,198 | $ | 997,663 | |||||||||||||||
Net income | 33,527 | 33,527 | 191 | 33,718 | ||||||||||||||||||||||||||||
- Issuance of 25,654,000 common shares | 25,645 | 143,631 | 169,276 | 169,276 | ||||||||||||||||||||||||||||
- Issuance of common stock under distribution agency agreement | 1,078 | 6,046 | 7,124 | 7,124 | ||||||||||||||||||||||||||||
- Issuance of 20,000 shares of restricted share units | 20 | (20 | ) | — | — | |||||||||||||||||||||||||||
- Cash dividends paid ($0.15 per common share) | (12,623 | ) | (12,623 | ) | (12,623 | ) | ||||||||||||||||||||||||||
- Cash dividends declared ($0.06 per common share) | (5,083 | ) | (5,083 | ) | (5,083 | ) | ||||||||||||||||||||||||||
- Dividends paid on Series B Preferred Shares | (4,000 | ) | (4,000 | ) | (4,000 | ) | ||||||||||||||||||||||||||
- Dividends paid on Series C Preferred Shares | (4,804 | ) | (4,804 | ) | (4,804 | ) | ||||||||||||||||||||||||||
- Other comprehensive loss | (3,501 | ) | (3,501 | ) | (3,501 | ) | ||||||||||||||||||||||||||
- Amortization of restricted share units | 142 | 142 | 142 | |||||||||||||||||||||||||||||
|
|
|
|
|
|
|
|
|
|
|
|
|
|
|
| |||||||||||||||||
BALANCE December 31, 2014 | $ | 4,000 | $ | 84,712 | $ | 650,536 | $ | 437,565 | $ | (10,290 | ) | $ | 1,166,523 | $ | 11,389 | $ | 1,177,912 | |||||||||||||||
Net income | 158,217 | 158,217 | 206 | 158,423 | ||||||||||||||||||||||||||||
- Issuance of 2,626,357 common shares | 2,627 | 23,081 | 25,708 | 25,708 | ||||||||||||||||||||||||||||
- Issuance of 8.75% Series D preferred shares | 3,400 | 78,384 | 81,784 | 81,784 | ||||||||||||||||||||||||||||
- Cash dividends paid ($0.06 per common share) | (15,563 | ) | (15,563 | ) | (15,563 | ) | ||||||||||||||||||||||||||
- Dividends paid on Series B Preferred Shares | (4,000 | ) | (4,000 | ) | (4,000 | ) | ||||||||||||||||||||||||||
- Dividends paid on Series C Preferred Shares | (4,437 | ) | (4,437 | ) | (4,437 | ) | ||||||||||||||||||||||||||
- Dividends paid on Series D Preferred Shares | (4,318 | ) | (4,318 | ) | (4,318 | ) | ||||||||||||||||||||||||||
- Other comprehensive loss | (437 | ) | (437 | ) | (437 | ) | ||||||||||||||||||||||||||
|
|
|
|
|
|
|
|
|
|
|
|
|
|
|
| |||||||||||||||||
BALANCE December 31,2015 | $ | 7,400 | $ | 87,339 | $ | 752,001 | $ | 567,464 | $ | (10,727 | ) | $ | 1,403,477 | $ | 11,595 | $ | 1,415,072 | |||||||||||||||
|
|
|
|
|
|
|
|
|
|
|
|
|
|
|
| |||||||||||||||||
The accompanying notes are an integral part of these consolidated financial statements.
F-6
Table of Contents
TSAKOS ENERGY NAVIGATION LIMITED AND SUBSIDIARIES
CONSOLIDATED STATEMENTS OF CASH FLOWS
FOR THE YEARS ENDED DECEMBER 31, 2015, 2014 AND 2013
(Expressed in thousands of U.S. Dollars)
| 20 15 | 2014 | 2013 | ||||||||||
Cash Flows from Operating Activities: | ||||||||||||
Net income/(loss) | $ | 158,423 | $ | 33,718 | $ | (38,570 | ) | |||||
Adjustments to reconcile net income/(loss) to net cash provided by operating activities | ||||||||||||
Depreciation | 99,571 | 97,938 | 95,349 | |||||||||
Amortization of deferred dry-docking costs | 6,360 | 4,953 | 5,064 | |||||||||
Amortization of loan fees | 1,268 | 1,245 | 1,101 | |||||||||
Stock compensation expense | — | 142 | 469 | |||||||||
Change in fair value of derivative instruments | (8,908 | ) | 4,984 | (6,021 | ) | |||||||
Gain on sale of marketable securities | — | — | (89 | ) | ||||||||
Gain on sale of vessels | (2,078 | ) | — | — | ||||||||
Gain on extinguishment of debt, net | (3,208 | ) | — | — | ||||||||
Vessel impairment charge | — | — | 28,290 | |||||||||
Payments for dry-docking | (8,368 | ) | (6,055 | ) | (5,680 | ) | ||||||
(Increase)/Decrease in: | ||||||||||||
Receivables, net | (9,191 | ) | (15,948 | ) | 5,269 | |||||||
Inventories | 1,531 | 3,719 | (5,304 | ) | ||||||||
Prepaid insurance and other | 638 | (49 | ) | 1,214 | ||||||||
Increase/(Decrease) in: | ||||||||||||
Payables | (8,184 | ) | (16,061 | ) | 22,265 | |||||||
Accrued liabilities | 4,175 | 2,502 | 5,459 | |||||||||
Unearned revenue | 2,380 | (4,117 | ) | 9,107 | ||||||||
|
|
|
|
|
| |||||||
Net Cash provided by Operating Activities | 234,409 | 106,971 | 117,923 | |||||||||
|
|
|
|
|
| |||||||
Cash Flows from Investing Activities: | ||||||||||||
Advances for vessels under construction and acquisitions | (156,581 | ) | (130,436 | ) | (37,182 | ) | ||||||
Vessel acquisitions and/or improvements | (60,934 | ) | (123,871 | ) | (108,840 | ) | ||||||
Proceeds from sale of marketable securities | — | — | 1,585 | |||||||||
Proceeds from sale of vessels | 42,761 | — | — | |||||||||
|
|
|
|
|
| |||||||
Net Cash used in Investing Activities | (174,754 | ) | (254,307 | ) | (144,437 | ) | ||||||
|
|
|
|
|
| |||||||
Cash Flows from Financing Activities: | ||||||||||||
Proceeds from long-term debt | 227,437 | 158,533 | 110,000 | |||||||||
Financing costs | (2,543 | ) | (2,998 | ) | (1,067 | ) | ||||||
Payments of long-term debt | (242,367 | ) | (120,495 | ) | (172,129 | ) | ||||||
(Increase)/Decrease in restricted cash | (2,996 | ) | (2,807 | ) | 6,665 | |||||||
Proceeds from stock issuance program, net | — | 176,400 | 7,045 | |||||||||
Proceeds from preferred stock issuance, net | 81,784 | — | 94,358 | |||||||||
Cash dividends | (33,401 | ) | (21,427 | ) | (10,418 | ) | ||||||
Capital contribution from noncontrolling interest owners to subsidiary | — | — | 10,000 | |||||||||
|
|
|
|
|
| |||||||
Net Cash provided by Financing Activities | 27,914 | 187,206 | 44,454 | |||||||||
|
|
|
|
|
| |||||||
Net increase in cash and cash equivalents | 87,569 | 39,870 | 17,940 | |||||||||
Cash and cash equivalents at beginning of period | 202, 107 | 162,237 | 144,297 | |||||||||
|
|
|
|
|
| |||||||
Cash and cash equivalents at end of period | $289,676 | $202,107 | $162,237 | |||||||||
|
|
|
|
|
| |||||||
Interest paid | ||||||||||||
Cash paid for interest, net of amounts capitalized | $ | 29,564 | $ | 34,390 | $ | 44,057 | ||||||
The accompanying notes are an integral part of these consolidated financial statements.
F-7
Table of Contents
TSAKOS ENERGY NAVIGATION LIMITED AND SUBSIDIARIES
NOTES TO CONSOLIDATED FINANCIAL STATEMENTS
DECEMBER 31, 2015, 2014 AND 2013
(Expressed in thousands of U.S. Dollars, except for share and per share data, unless otherwise stated)
| 1. | Significant Accounting Policies |
| (a) | Basis of presentation and description of business:The accompanying consolidated financial statements have been prepared in accordance with U.S. generally accepted accounting principles (“U.S. GAAP”) and include the accounts of Tsakos Energy Navigation Limited (the “Holding Company”), and its wholly-owned and majority-owned subsidiaries (collectively, the “Company”). As at December 31, 2015, 2014 and 2013, the Holding Company consolidated one (two in 2014 and 2013) variable interest entity (“VIE”) for which it is deemed to be the primary beneficiary, i.e. it has a controlling financial interest in this entity. A VIE is an entity that in general does not have equity investors with voting rights or that has equity investors that do not provide sufficient financial resources for the entity to support its activities. A controlling financial interest in a VIE is present when a company has the power to direct the activities of a VIE that most significantly impact the entity’s economic performance and absorbs a majority of an entity’s expected losses, receives a majority of an entity’s expected residual returns, or both. |
All intercompany balances and transactions have been eliminated upon consolidation.
The Company follows the provisions of Accounting Standard Codification (ASC) 220, “Comprehensive Income,” which requires separate presentation of certain transactions, which are recorded directly as components of stockholders’ equity. The Company presents Other Comprehensive income / (loss) in a separate statement according to ASU 2011-05.
The Company owns and operates a fleet of crude and product oil carriers and one LNG carrier providing worldwide marine transportation services under long, medium or short-term charters.
As from January 1, 2015, the Company has reclassified certain categories within the Consolidated statement of comprehensive income/ (loss) in order to be consistent and comparable to other reporting entities within the peer group of tanker companies. Prior year data has been adjusted accordingly. Specifically, “Commissions” in the consolidated statements of comprehensive income/ (loss) of 2014 and 2013 respectively, have been reclassified as “Voyage expenses” in the accompanying 2015 consolidated statement of comprehensive income/(loss). Similarly, Amortization of deferred dry-docking costs is included within Depreciation and amortization in the accompanying 2015 consolidated statement of comprehensive income/(loss), amounts relating to Management fees, Stock compensation expense and Management incentive award are included in General and administrative expenses in the accompanying 2015 consolidated statement of comprehensive income/(loss), and Foreign currency losses/(gains) are included in Vessel operating expenses in the accompanying 2015 consolidated statement of comprehensive income/(loss).
| (b) | Use of Estimates:The preparation of financial statements in conformity with U.S. GAAP requires management to make estimates and assumptions that affect the amounts of assets and liabilities and expenses, reported in the consolidated financial statements and the accompanying notes. Although actual results could differ from those estimates, management does not believe that such differences would be material. |
| (c) | Comprehensive income/ (loss):The statement of comprehensive income/(loss) presents the change in equity (net assets) during a period from transactions and other events and circumstances from non-owner sources. It includes all changes in equity during a period except those resulting from investments by shareholders and distributions to shareholders. Reclassification adjustments are presented out of accumulated other comprehensive income/(loss) on the face of the statement in which the components of other comprehensive income/(loss) are presented or in the notes to the financial statements. The Company follows the provisions of ASC 220 “Comprehensive Income”, and presents items of net income/(loss), items of other comprehensive income/(loss) (“OCI”) and total comprehensive income/(loss) in two separate and consecutive statements. |
The accompanying notes are an integral part of these consolidated financial statements.
F-8
Table of Contents
TSAKOS ENERGY NAVIGATION LIMITED AND SUBSIDIARIES
NOTES TO CONSOLIDATED FINANCIAL STATEMENTS
DECEMBER 31, 2015, 2014 AND 2013
(Expressed in thousands of U.S. Dollars, except for share and per share data, unless otherwise stated)
| (d) | Foreign Currency Translation:The functional currency of the Company is the U.S. Dollar because the Company’s vessels operate in international shipping markets in which the U.S. Dollar is utilized to transact most business. The accounting books of the Company are also maintained in U.S. Dollars. Transactions involving other currencies during the year are converted into U.S. Dollars using the exchange rates in effect at the time of the transactions. At the balance sheet dates, monetary assets and liabilities, which are denominated in other currencies, are translated into U.S. Dollars at the year-end exchange rates. Resulting gains or losses are reflected within Operating expenses in the accompanying Consolidated Statements of Comprehensive income/ (loss). |
| (e) | Cash and Cash Equivalents:The Company classifies highly liquid investments such as time deposits and certificates of deposit and their equivalents with original maturities of three months or less as cash and cash equivalents. Cash deposits with certain banks that may only be used for special purposes (including loan repayments) are classified as Restricted cash. |
| (f) | Accounts Receivable, Net:Accounts receivable, net at each balance sheet date includes estimated recoveries from charterers for hire, freight and demurrage billings and revenue earned but not yet billed, net of an allowance for doubtful accounts (nil as of December 31, 2015 and 2014). The Company’s management at each balance sheet date reviews all outstanding invoices and provides allowances for receivables deemed uncollectible primarily based on the ageing of such balances and any amounts in dispute. |
| (g) | Inventories:Inventories consist of bunkers, lubricants, victualling and stores and are stated at the lower of cost or market value. The cost is determined primarily by the first-in, first-out method. |
| (h) | Fixed Assets:Fixed assets consist of vessels. Vessels are stated at cost, less accumulated depreciation. The cost of vessels includes the contract price and pre-delivery costs incurred during the construction and delivery of new buildings, including capitalized interest, and expenses incurred upon acquisition of second-hand vessels. Subsequent expenditures for conversions and major improvements are capitalized when they appreciably extend the life, increase the earning capacity or improve the efficiency or safety of the vessels; otherwise they are charged to expense as incurred. Expenditures for routine repairs and maintenance are expensed as incurred. |
Depreciation is provided on the straight-line method based on the estimated remaining economic useful lives of the vessels, less an estimated residual value based on a scrap price Economic useful lives are estimated at 25 years for crude and product oil carriers and 40 years for the LNG carrier from the date of original delivery from the shipyard.
| (i) | Impairment of Vessels:The Company reviews vessels for impairment whenever events or changes in circumstances indicate that the carrying amount of a vessel may not be recoverable, such as during severe disruptions in global economic and market conditions. When such indicators are present, a vessel to be held and used is tested for recoverability by comparing the estimate of future undiscounted net operating cash flows expected to be generated by the use of the vessel over its remaining useful life and its eventual disposition to its carrying amount. Net operating cash flows are determined by applying various assumptions regarding the use or possible disposition of each vessel, future revenues net of commissions, operating expenses, scheduled dry-dockings, expected off-hire and scrap values, and taking into account historical revenue data and published forecasts on future world economic growth and inflation. Should the carrying value of the vessel exceed its estimated future undiscounted net operating cash flows, impairment is measured based on the excess of the carrying amount over the fair market value of the asset. The Company determines the fair value of its vessels based on management estimates and assumptions and by making use of available market data and taking into consideration third party valuations. The review of the carrying amounts in connection with the estimated recoverable amount for certain of the Company’s vessels as of December 31, 2015 and December 31, 2014 did not indicate an impairment charge, whereas at December 31, 2013 there were impairment charges of $28,290 (Note 5). |
The accompanying notes are an integral part of these consolidated financial statements.
F-9
Table of Contents
TSAKOS ENERGY NAVIGATION LIMITED AND SUBSIDIARIES
NOTES TO CONSOLIDATED FINANCIAL STATEMENTS
DECEMBER 31, 2015, 2014 AND 2013
(Expressed in thousands of U.S. Dollars, except for share and per share data, unless otherwise stated)
| (j) | Reporting Assets held for sale:It is the Company’s policy to dispose of vessels when suitable opportunities occur and not necessarily to keep them until the end of their useful life. Long-lived assets are classified as held for sale when all applicable criteria enumerated under ASC 360 “Property, Plant, and Equipment” are met and are measured at the lower of their carrying amount or fair value less cost to sell. These assets are not depreciated once they meet the criteria to be held for sale. At December 31, 2015, the suezmaxesEurochampion 2004andEuronikewere classified as held for sale. At December 31, 2014 and 2013, there were no vessels held for sale. |
| (k) | Accounting for Special Survey and Dry-docking Costs:The Company follows the deferral method of accounting for dry-docking and special survey costs whereby actual costs incurred are reported in Deferred Charges and are amortized on a straight-line basis over the period through the date the next dry-docking is scheduled to become due (approximately every five years during the first fifteen years of vessels’ life and every two and a half years within the remaining useful life of the vessels). Until December 31, 2013, for vessels older than ten years the Company estimated that the next dry-docking would be due in two and a half years. However, according to Classification Society regulations, vessels can defer dry-docking costs for five years during their first fifteen years of life, instead of ten years as previously estimated. This change in estimate does not have a material effect in the years ended December 31, 2015 and 2014, and is not expected to have material effect in the following years. Costs relating to routine repairs and maintenance are expensed as incurred. The unamortized portion of special survey and dry-docking costs for a vessel that is sold is included as part of the carrying amount of the vessel in determining the gain on sale of the vessel. |
| (l) | Loan Costs:Costs incurred for obtaining new loans or refinancing existing loans are capitalized and included in deferred charges and amortized over the term of the respective loan, using the effective interest rate method. Any unamortized balance of costs relating to loans repaid or refinanced as debt extinguishments is expensed in the period the repayment or extinguishment is made. |
| (m) | Accounting for Revenue and Expenses:Voyage revenues are generated from freight billings and time charter hire. Time charter revenue, including bare-boat hire, is recorded over the term of the charter as the service is provided. Revenues from voyage charters on the spot market or under contract of affreightment are recognized ratably from when a vessel becomes available for loading (discharge of the previous charterer’s cargo) to when the next charterer’s cargo is discharged, provided an agreed non-cancelable charter between the Company and the charterer is in existence, the charter rate is fixed or determinable and collectability is reasonably assured. Revenue under voyage charters will not be recognized until a charter has been agreed even if the vessel has discharged its previous cargo and is proceeding to an anticipated port of loading. Revenues from variable hire arrangements are recognized to the extent the variable amounts earned beyond an agreed fixed minimum hire are determinable at the reporting date and all other revenue recognition criteria are met. Revenue from hire arrangements with an escalation clause is recognized on a straight-line basis over the charter term unless another systematic and rational basis is more representative of the time pattern in which the vessel is employed. Vessel voyage and operating expenses and charter hire expense are expensed when incurred. |
Unearned revenue represents cash received prior to the year end for which related service has not been provided, primarily relating to charter hire paid in advance to be earned over the applicable charter period. The operating revenues and voyage expenses of vessels operating under a tanker pool are pooled and are allocated to the pool participants on a time charter equivalent basis, according to an agreed formula. Voyage revenues for 2015, 2014 and 2013 included revenues derived from significant charterers as follows (in percentages of total voyage revenues):
The accompanying notes are an integral part of these consolidated financial statements.
F-10
Table of Contents
TSAKOS ENERGY NAVIGATION LIMITED AND SUBSIDIARIES
NOTES TO CONSOLIDATED FINANCIAL STATEMENTS
DECEMBER 31, 2015, 2014 AND 2013
(Expressed in thousands of U.S. Dollars, except for share and per share data, unless otherwise stated)
Charterer | 2015 | 2014 | 2013 | |||||||||
A | 14 | % | 19 | % | 21 | % | ||||||
B | 10 | % | 13 | % | 7 | % | ||||||
C | 9 | % | 9 | % | 11 | % | ||||||
D | 8 | % | 5 | % | — | |||||||
| (n) | Segment Reporting:The Company does not evaluate the operating results by type of vessel or by type of charter or by type of cargo. Although operating results may be identified by type of vessel, management, including the chief operating decision maker, reviews operating results primarily by revenue per day and operating results of the fleet. The Company operates a liquefied natural gas (LNG) carrier which meets the quantitative thresholds used to determine reportable segments. The chief operating decision maker does not review the operating results of this vessel separately, or makes any decisions about resources to be allocated to this vessel or assesses its performance separately; therefore, the LNG carrier does not constitute a separate reportable segment. The Company’s vessels operate on many trade routes throughout the world and, therefore, the provision of geographic information is considered impracticable by management. For the above reasons, the Company has determined that it operates in one reportable segment, the worldwide maritime transportation of liquid energy related products. |
| (o) | Derivative Financial Instruments:The Company regularly enters into interest rate swap contracts to manage its exposure to fluctuations of interest rates associated with its specific borrowings. Also, the Company enters into bunker swap contracts and put or call options to manage its exposure to fluctuations of bunker prices associated with the consumption of bunkers by its vessels. Interest rate and bunker price differentials paid or received under the swap agreements are recognized as part of Interest and finance costs, net. On the inception of a put or call option on bunkers an asset or liability is recognized. The subsequent changes in its the fair value, and realized payments or receipts upon exercise of the options are recognized in the Statement of Operations as part of the interest and finance costs, net. All derivatives are recognized in the consolidated financial statements at their fair value. On the inception date of the derivative contract, the Company evaluates the derivative as an accounting hedge of the variability of cash flow to be paid of a forecasted transaction (“cash flow” hedge). Changes in the fair value of a derivative that is qualified, designated and highly effective as a cash flow hedge are recorded in other comprehensive income/(loss) until earnings are affected by the forecasted transaction. Changes in the fair value of undesignated derivative instruments and the ineffective portion of designated derivative instruments are reported in earnings in the period in which those fair value changes occur. Realized gains or losses on early termination of undesignated derivative instruments are also classified in earnings in the period of termination of the respective derivative instrument. |
The Company formally documents all relationships between hedging instruments and hedged items, as well as the risk-management objective and strategy for undertaking various hedge transactions. This process includes linking all derivatives that are designated as cash flow hedges of the variable cash flows of a forecasted transaction to a specific forecasted transaction. The Company also formally assesses, both at the hedge’s inception and on an ongoing basis, whether the derivatives that are used in hedging transactions are highly effective in offsetting changes in cash flow of hedged items. When it is determined that a derivative is not highly effective as a hedge or that it has ceased to be a highly effective hedge, the Company discontinues hedge accounting prospectively. In accordance with ASC 815 “Derivatives and Hedging,” the Company may prospectively discontinue the hedge accounting for an existing hedge if the applicable criteria are no longer met, the derivative instrument expires, is sold, terminated or exercised or if the Company removes the designation of the respective cash flow hedge. In those circumstances, the net gain or loss remains in accumulated other comprehensive income and is reclassified into earnings in the same period or periods during which the hedged forecasted transaction affects earnings, unless the forecasted transaction is no longer probable in which case the net gain or loss is reclassified into earnings immediately.
The accompanying notes are an integral part of these consolidated financial statements.
F-11
Table of Contents
TSAKOS ENERGY NAVIGATION LIMITED AND SUBSIDIARIES
NOTES TO CONSOLIDATED FINANCIAL STATEMENTS
DECEMBER 31, 2015, 2014 AND 2013
(Expressed in thousands of U.S. Dollars, except for share and per share data, unless otherwise stated)
| (p) | Fair Value Measurements:The Company follows the provisions of ASC 820, “Fair Value Measurements and Disclosures” which defines, and provides guidance as to the measurement of fair value. ASC 820 applies when assets or liabilities in the financial statements are to be measured at fair value. Fair value is defined as the price that would be received to sell an asset or paid to transfer a liability in an orderly transaction between market participants (Note 15). Upon issuance of guidance on the fair value option in 2007, the Company elected not to report the then existing financial assets or liabilities at fair value that were not already reported as such. |
| (q) | Accounting for Leases:Leases of assets under which substantially all the risks and rewards of ownership are effectively retained by the lessor are classified as operating leases. Lease payments under an operating lease are recognized as an expense on a straight-line method over the lease term. The Company held no operating leases at December 31, 2015. |
| (r) | Stock Based Compensation:The Company has a share based incentive plan that covers directors and officers of the Company and employees of the related companies. Awards granted are valued at fair value and compensation cost is recognized on a straight line basis, net of estimated forfeitures, over the requisite service period of each award. The fair value of restricted stock issued to crew members, directors and officers of the Company at the grant date is equal to the closing stock price on that date and is amortized over the applicable vesting period using the straight-line method. The fair value of restricted stock issued to non-employees is equal to the closing stock price at the grant date adjusted by the closing stock price at each reporting date and is amortized over the applicable performance period (Note 9). |
| (s) | Marketable Securities:The Company from March 2011 until their disposal in July 2013 had investments in marketable securities that had readily determinable fair values and were classified as available for sale. Such investments were measured subsequently at fair value in the statement of financial position. Unrealized holding gains and losses for available for sale securities were excluded from earnings and were reported in Accumulated other comprehensive loss until realized (Note 4). |
| New | Accounting Pronouncements: |
| (a) | Going Concern:In August 2014, FASB issued ASU No. 2014-15 – “Presentation of Financial Statements - Going Concern”. ASU 2014-15 provides guidance about management’s responsibility to evaluate whether there is substantial doubt about an entity’s ability to continue as a going concern and to provide related footnote disclosures. ASU 2014-15 requires an entity’s management to evaluate at each reporting period based on the relevant conditions and events that are known at the date when financial statements are issued, whether there are conditions or events, that raise substantial doubt about the entity’s ability to continue as a going concern within one year after the date that the financial statements are issued and to disclose the necessary information. ASU 2014-15 is effective for the annual period ending after December 15, 2016, and for annual periods and interim periods thereafter. Early application is permitted. Management is in the process of assessing the impact of the new standard on the Company’s consolidated financial position and performance. |
| (b) | Consolidation:In February 2015, the FASB issued Accounting Standards Update (“ASU”) No. 2015-02-Consolidation. The amendments in this ASU affect reporting entities that are required to evaluate whether they should consolidate certain legal entities. All legal entities are subject to reevaluation under the revised consolidation model. Management believes that this standard will not have a material effect on the Company’s financial position. |
| (c) | Debt Issuance costs:In April 2015, the FASB issued ASU No. 2015-03-Interest-Imputation of Interest, to simplify the presentation of debt issuance costs. The amendments in this ASU would require that debt issuance costs be presented in the balance sheet as a direct deduction from the carrying amount of debt liability, consistent with debt discounts or premiums. Management believes that this standard will not have a material effect on the Company’s financial position. |
The accompanying notes are an integral part of these consolidated financial statements.
F-12
Table of Contents
TSAKOS ENERGY NAVIGATION LIMITED AND SUBSIDIARIES
NOTES TO CONSOLIDATED FINANCIAL STATEMENTS
DECEMBER 31, 2015, 2014 AND 2013
(Expressed in thousands of U.S. Dollars, except for share and per share data, unless otherwise stated)
| (d) | Inventory (subsequent to the adoption of ASU 2015-11, Simplifying the Measurement of Inventory):In July 2015, the FASB issued ASU 2015-11, Simplifying the Measurement of Inventory. ASU 2015-11 simplifies the subsequent measurement of inventory by replacing today’s lower of cost or market test with a lower of cost and net realizable value test. The guidance applies only to inventories for which cost is determined by methods other than last-in first-out (LIFO) and the retail inventory method (RIM). Entities that use LIFO or RIM will continue to use existing impairment models (e.g., entities using LIFO would apply the lower of cost or market test). The guidance is effective for public business entities for fiscal years beginning after December 15, 2016, and interim periods within those fiscal years. For all other entities, it is effective for fiscal years beginning after December 15, 2016, and interim periods within fiscal years beginning after December 15, 2017. Early adoption is permitted as of the beginning of an interim or annual reporting period. The new guidance must be applied prospectively after the date of adoption. Management believes that this standard will not have a material effect on the Company’s financial position. |
| (e) | Revenue from contracts with customers:In August 2015, the FASB issued ASU No. 2015-14-Revenue from Contracts with Customers, which defers the effective date of ASU No. 2014-09 for public business entities from annual reporting periods beginning after December 15, 2016, including interim periods within that reporting period, to December 15, 2017, including interim periods within that reporting period. Management is in the process of assessing the impact of the new standard on the Company’s financial position. |
| (f) | Business Combinations:In September 2015, the FASB issued ASU 2015-16, Business Combinations (Topic 805): Simplifying the Accounting for Measurement-Period Adjustments. ASU 2015-16 eliminates the requirement that an acquirer in a business combination account for measurement-period adjustment during the period in which it determines the amount of the adjustment. The guidance is effective for public business entities for fiscal years beginning after December 15, 2015, and interim periods within those fiscal years. For all other entities, it is effective for fiscal years beginning after December 15, 2016, and interim periods within fiscal years beginning after December 15, 2017. Early adoption is permitted. Management is in the process of assessing the impact of the new standard on the Company’s financial position and performance. |
| (g) | Leases:In February 2016, the FASB issued ASU 2016-02 Leases (Topic 842) which provides new guidance related to accounting for leases and supersedes existing U.S. GAAP on lease accounting. The ASU will require organizations that lease assets to recognize on the balance sheet the assets and liabilities for the rights and obligations created by those leases, unless the lease is a short term lease. Public business entities should apply the amendments in ASU 2016-02 for fiscal years beginning after December 15, 2018, including interim periods within those fiscal years. Early application is permitted for all public business entities upon issuance. Lessees (for capital and operating leases) and lessors (for sales-type, direct financing, and operating leases) must apply a modified retrospective transition approach for leases existing at, or entered into after, the beginning of the earliest comparative period presented in the financial statements. The modified retrospective approach would not require any transition accounting for leases that expired before the earliest comparative period presented. Lessees and lessors may not apply a full retrospective transition approach. Management is in the process of assessing the impact of the new standard on the Company’s consolidated financial position and performance. |
The accompanying notes are an integral part of these consolidated financial statements.
F-13
Table of Contents
TSAKOS ENERGY NAVIGATION LIMITED AND SUBSIDIARIES
NOTES TO CONSOLIDATED FINANCIAL STATEMENTS
DECEMBER 31, 2015, 2014 AND 2013
(Expressed in thousands of U.S. Dollars, except for share and per share data, unless otherwise stated)
| 2. | Transactions with Related Parties |
The following amounts were charged by related parties for services rendered:
| 2015 | 2014 | 2013 | ||||||||||
Tsakos Shipping and Trading S.A. (commissions) | 7,550 | 6,189 | 5,219 | |||||||||
Tsakos Energy Management Limited (management fees) | 16,032 | 15,840 | 15,487 | |||||||||
Tsakos Columbia Shipmanagement S.A | 2,234 | 2,091 | 1,621 | |||||||||
Argosy Insurance Company Limited | 9,386 | 9,529 | 9,129 | |||||||||
AirMania Travel S.A | 4,298 | 4,797 | 4,810 | |||||||||
|
|
|
|
|
| |||||||
Total expenses with related parties | 39,500 | 38,446 | 36,266 | |||||||||
|
|
|
|
|
| |||||||
Balances due from and due to related parties are as follows:
| December 31, | ||||||||
| 2015 | 2014 | |||||||
Due from related parties | ||||||||
Tsakos Columbia Shipmanagement S.A. | 4,169 | 1,895 | ||||||
|
|
|
| |||||
Total due from related parties | 4,169 | 1,895 | ||||||
|
|
|
| |||||
Due to related parties | ||||||||
Tsakos Energy Management Limited | 61 | 93 | ||||||
Tsakos Shipping and Trading S.A | 982 | 881 | ||||||
Argosy Insurance Company Limited | 410 | 8,766 | ||||||
AirMania Travel S.A | 287 | 396 | ||||||
|
|
|
| |||||
Total due to related parties | 1,740 | 10,136 | ||||||
|
|
|
| |||||
There is also, at December 31, 2015, an amount of $776 ($875 at December 31, 2014) due to Tsakos Shipping and Trading S.A. and $124 ($379 at December 31, 2014) due to Argosy Insurance Company Limited, included in accrued liabilities, which relate to services rendered by these related parties, but not yet invoiced.
| (a) | Tsakos Energy Management Limited (the “Management Company”):The Holding Company has a Management Agreement (“Management Agreement”) with the Management Company, a Liberian corporation, to provide overall executive and commercial management of its affairs for a monthly fee. Per the Management Agreement of March 8, 2007, effective from January 1, 2008, there is a prorated adjustment if at the beginning of each year the Euro has appreciated by 10% or more against the U.S. Dollar since January 1, 2007. In addition, there is an increase each year by a percentage figure reflecting 12 month Euribor, if both parties agree. In 2015 and 2014, the monthly fees for operating vessels are $27.5, $20.4 for vessels chartered in and on a bare-boat basis, and $35.8 for the LNG carrier, of which $10.0 is paid to the Management Company and $25.8 to a third party manager and $27.5 per month, of which $13.9 are payable to a third party manager for the VLCCMillenniumuntil November 5, 2015 when the vessel entered a bare-boat charter. From that date a monthly management fee of $20.4 is payable to the Company. Monthly management fees for the DP2 shuttle tankers are $35.0 per vessel. Management fees for the suezmaxEurochampion 2004are $27.5 per month, of which $12.0 is paid to a third party manager. In addition to the Management fee, the Management Agreement provides for an incentive award to the Management Company, which is at the absolute discretion of the Holding Company’s Board of Directors. In 2015, an award of $1,142 was granted to the Management Company and is included in the General and Administrative expenses in the accompanying |
The accompanying notes are an integral part of these consolidated financial statements.
F-14
Table of Contents
TSAKOS ENERGY NAVIGATION LIMITED AND SUBSIDIARIES
NOTES TO CONSOLIDATED FINANCIAL STATEMENTS
DECEMBER 31, 2015, 2014 AND 2013
(Expressed in thousands of U.S. Dollars, except for share and per share data, unless otherwise stated)
Consolidated Statement of Comprehensive income/ (loss). In addition, a special award of $425 was paid to the Management Company in relation to capital raising offerings in 2015 and in 2014, $860 was awarded for offerings in 2014. These awards relating to offerings have been included as a deduction of additional paid in capital in the accompanying Financial
Statements.
The Holding Company and the Management Company have certain officers and directors in common. The President, who is also the Chief Executive Officer and a Director of the Holding Company, is also the sole stockholder of the Management Company. The Management Company may unilaterally terminate its Management Agreement with the Holding Company at any time upon one year’s notice. In addition, if even one director was elected to the Holding Company’s Board of Directors without having been recommended by the existing Board, the Management Company would have the right to terminate the Management Agreement on ten days notice, and the Holding Company would be obligated as at December 31, 2015, to pay the Management Company an amount of approximately $170,159 calculated in accordance with the terms of the Management Agreement. Under the terms of the Management Agreement between the Holding Company and the Management Company, the Holding Company may terminate the Management Agreement only under specific circumstances, without the prior approval of the Holding Company’s Board of Directors.
Estimated future management fees payable over the next ten years under the Management Agreement, exclusive of any incentive awards and based on existing vessels and known vessels scheduled for future delivery as at December 31, 2015, are:
Year | Amount | |||
2016 | 20,053 | |||
2017 | 20,850 | |||
2018 | 21,057 | |||
2019 | 20,989 | |||
2020 | 20,989 | |||
2021 to 2025 | 94,449 | |||
|
| |||
| 198,387 | ||||
|
| |||
Management fees for vessels are included in the accompanying Consolidated Statements of Comprehensive income/ (loss). Also, under the terms of the Management Agreement, the Management Company provides supervisory services for the construction of new vessels for a monthly fee of $20.4 in 2015, 2014 and 2013. These fees in total amounted to $3,346, $2,224 and $492 for 2015, 2014 and 2013, respectively and are either accounted for as part of construction costs for delivered vessels or are included in Advances for vessels under construction.
| (b) | Tsakos Columbia Shipmanagement S.A. (“TCM”):The Management Company appointed TCM to provide technical management to the Company’s vessels from July 1, 2010. TCM is owned jointly and in equal part by related party interests and by a private German Group. TCM, at the consent of the Holding Company, may subcontract all or part of the technical management of any vessel to an alternative unrelated technical manager. |
Effective July 1, 2010, the Management Company, at its own expense, pays technical management fees to TCM, and the Company bears and pays directly to TCM most of its operating expenses, including repairs and maintenance, provisioning and crewing of the Company’s vessels, as well as certain charges which are capitalized or deferred, including reimbursement of the costs of TCM personnel sent overseas to supervise repairs and perform inspections on the Company’s vessels. The Company also pays to TCM certain fees to cover expenses relating to internal control procedures and information technology services which are borne by TCM on behalf of the Company.
TCM has a 25% share in a manning agency, located in the Philippines, named TCM Tsakos Maritime Philippines, which provides crew to certain of the Company’s vessels. The Company has no control or ownership directly in TCM Tsakos Maritime Philippines, nor had any direct transactions to date with the agency.
The accompanying notes are an integral part of these consolidated financial statements.
F-15
Table of Contents
TSAKOS ENERGY NAVIGATION LIMITED AND SUBSIDIARIES
NOTES TO CONSOLIDATED FINANCIAL STATEMENTS
DECEMBER 31, 2015, 2014 AND 2013
(Expressed in thousands of U.S. Dollars, except for share and per share data, unless otherwise stated)
| (c) | Tsakos Shipping and Trading S.A. (“Tsakos Shipping”):Tsakos Shipping provides chartering services for the Company’s vessels by communicating with third party brokers to solicit research and propose charters. For this service, the Company pays Tsakos Shipping a chartering commission of approximately 1.25% on all freights, hires and demurrages. Such commissions are included in Voyage expenses in the accompanying Consolidated Statements of Comprehensive income/ (loss). Tsakos Shipping also provides sale and purchase of vessels brokerage service. In 2015, the handysize tankerDelphiand the suezmax tankerTriathlonwere sold to client companies of Tsakos Shipping. For this service, Tsakos Shipping charged a brokerage commission of $215 which was 0.5% of the sale price of the vessels. Tsakos Shipping may also charge a fee of $200 (or such other sum as may be agreed) on delivery of each new-building vessel in payment for the cost of design and supervision of the new-building by Tsakos Shipping. In 2015, no such fee was charged. In 2014, $200 in aggregate was charged for supervision fees on the DP2 suezmax shuttle tankersRio 2016andBrasil 2014and $605 in total, as a brokerage commission of 0.5% on the purchase of the suezmax tankersEurovisionandEuro. |
Certain members of the Tsakos family are involved in the decision-making processes of Tsakos Shipping and of the Management Company, and are also shareholders of the Holding Company.
| (d) | Argosy Insurance Company Limited (“Argosy”):The Company places its hull and machinery insurance, increased value insurance, war risk insurance and certain other insurance through Argosy, a captive insurance company affiliated with Tsakos Shipping. |
| (e) | AirMania Travel S.A. (“AirMania”):Apart from third-party agents, the Company also uses an affiliated company, AirMania, for travel services. |
| 3. | Long-term Investments |
At December 31, 2015, 2014 and 2013, the Company held 125,000 common shares at a total cost of $1,000 in a private U.S. company which undertakes research into synthetic genomic processes which may have a beneficial environmental impact within the energy and maritime industries. Management has determined that there has been no impairment to the cost of this investment since its acquisition in 2007. A Director of the Company is a former officer and currently a shareholder and a consultant of this company. No income was received from this investment during 2015, 2014 and 2013.
| 4. | Marketable securities |
In July 2013, the Company sold its remaining marketable securities held since 2011 realizing a gain of $89, which was reclassified from Accumulated other Comprehensive loss to the Consolidated Statement of Comprehensive income/ (loss). At December 31, 2015 and 2014 there are no marketable securities.
| 5. | Vessels |
Acquisitions
On November 5, 2015, the Company acquired the suezmax tankerPentathlonfor $57,926 from a third-party. During 2014, the Company acquired the suezmax tankersEurovisionandEurofor $61,814 and $59,804 respectively (Note 2(c)), from companies that are subject to influence by certain members of the Tsakos family, who are also shareholders, officers and directors of the Holding Company. During 2013, the Company took delivery of two newbuilding DP2 suezmax shuttle tankersRio 2016andBrasil 2014,at a total cost of $203,908 of which $105,763 was incurred in 2013.
Sales
On July 16, 2015 and July 17, 2015, the Company sold the handysize tankerDelphiand the suezmax tankerTriathlon,for net proceeds of $42,761 in total, realizing a total net gain of $2,078. The capital gains or losses from the sale of vessels are separately reflected in the accompanying 2015 Consolidated Statement of Comprehensive Income/(Loss). There were no vessel sales in 2014 and 2013.
The accompanying notes are an integral part of these consolidated financial statements.
F-16
Table of Contents
TSAKOS ENERGY NAVIGATION LIMITED AND SUBSIDIARIES
NOTES TO CONSOLIDATED FINANCIAL STATEMENTS
DECEMBER 31, 2015, 2014 AND 2013
(Expressed in thousands of U.S. Dollars, except for share and per share data, unless otherwise stated)
Impairment
As of December 31, 2015, the Company reviewed the carrying amount in connection with the estimated recoverable amount for each of its vessels. This review did not indicate an impairment of the carrying value of the Company’s vessels. As of December 31, 2014, there was no indication of impairment. At December 31, 2013, the carrying amount for four of the Company’s vessels,Silia T, Triathlon, DelphiandMillenniumwas not fully recoverable. Consequently the carrying value of these four vessels, totaling $123,540 was written down to $95,250, based on level 2 inputs of the fair value hierarchy, as determined by management taking into consideration valuations from independent marine valuers (Note 15(c)). The resulting impairment charge was $28,290 and is reflected in the accompanying 2013 Consolidated Statement of Comprehensive income/ (loss).
| 6. | Deferred Charges |
Deferred charges, consisting of dry-docking and special survey costs, net of accumulated amortization, amounted to $15,290 and $13,830, at December 31, 2015 and 2014, respectively, and loan fees, net of accumulated amortization, amounted to $7,531 and $6,360 at December 31, 2015 and 2014, respectively. Amortization of deferred dry-docking costs is included in Depreciation and amortization in the accompanying Consolidated Statements of Comprehensive income/(loss), while amortization of loan fees is included in Interest and finance costs, net (Note 8).
| 7. | Long -Term Debt |
Facility | 2015 | 2014 | ||||||
(a) Credit Facilities (b) Term Bank Loans | | 538,208 861,886 | |
| 732,130 686,206 |
| ||
|
|
|
| |||||
Total | 1,400,094 | 1,418,336 | ||||||
Less—current portion | (319,560 | ) | (228,492 | ) | ||||
|
|
|
| |||||
Long-term portion | 1,080,534 | 1,189,844 | ||||||
|
|
|
| |||||
| (a) | Credit facilities |
As at December 31, 2015, the Company had five open reducing revolving credit facilities, all of which are reduced in semi-annual installments, and two open facilities which have both a reducing revolving credit component and a term bank loan component, with balloon payments due at maturity between January 2016 and April 2019. At December 31,
2015, there was no available unused amount.
On July 7, 2015, as part of its refinancing program, the Company repaid $46,488 to a lender for debt approaching maturity relating to the vesselsSocratesandSelecao.The outstanding balance of the loan facility at the repayment date was $49,800, leaving a total net gain of $3,208 (after deducting breakage costs of $104), which is included within
Interest and finance costs, net.
On July 15 and July 16, 2015, the Company prepaid an amount of $5,271 and $17,923, respectively, to lenders due to sale of the handysize tankerDelphiand the sale of the suezmax tankerTriathlon(Note 5).
Interest is payable at a rate based on LIBOR plus a margin. At December 31, 2015, interest on these facilities ranged from 1.02% to 5.19%.
The accompanying notes are an integral part of these consolidated financial statements.
F-17
Table of Contents
TSAKOS ENERGY NAVIGATION LIMITED AND SUBSIDIARIES
NOTES TO CONSOLIDATED FINANCIAL STATEMENTS
DECEMBER 31, 2015, 2014 AND 2013
(Expressed in thousands of U.S. Dollars, except for share and per share data, unless otherwise stated)
| (b) | Term bank loans |
Term loan balances outstanding at December 31, 2015, amounted to $861,886. These bank loans are payable in U.S. Dollars in quarterly or semi-annual installments with balloon payments due at maturity between May 2016 and February 2025. Interest rates on the outstanding loans as at December 31, 2015, are based on LIBOR plus a spread.
On April 22, 2015, the Company signed a new five-year term bank loan for $35,190 relating to the pre and post delivery financing of the first LR1 tanker under construction. The first drawdown of $7,038 was made on April 23, 2015, for the payment of the second installment to the ship building yard. The loan is repayable in ten consecutive semi-annual installments of $977.5, commencing six months after the delivery of the vessel, plus a balloon of $25,415 payable
together with the last installment.
On April 22, 2015, the Company signed a new seven-year term bank loan for $35,190 relating to the pre and post delivery financing of the second LR1 tanker under construction. The first drawdown of $7,038 was made on April 22,
2015, for the payment of the second installment to the ship building yard. The loan is repayable in fourteen consecutive semi-annual installments equal to 1/32nd of the amount drawn under the loan, commencing six months after the delivery of the vessel, plus a balloon sufficient to repay the loan in full.
On May 25, 2015, the Company signed a new eight-year term bank loan for $73,500 relating to the pre and post delivery financing of one shuttle tanker under construction. The first drawdown of $9,800 was made on May 26, 2015, for the payment of the second installment to the ship building yard. The loan is repayable in sixteen consecutive semi-annual
installments of $2,300, commencing six months after the delivery of the vessel, plus a balloon of $36,700 payable together with the last installment.
On July 29, 2015, the Company signed a new six-year term bank loan for $46,217 relating to the re-financing of the two panamax tankers,SocratesandSelecaoand on the same date drew down the full amount. The loan is repayable in twelve consecutive semi-annual installments of $2,310.87, commencing six months after the initial borrowing date, plus a balloon of $18,487 payable together with the last installment.
On October 22, 2015, the Company signed a new seven-year term bank loan for $39,900 relating to the financing of a 2009-built suezmax tankerPentathlon.The loan was drawn down on November 5, 2015. The loan is repayable in fourteen consecutive semi-annual installments of $1,813.64, commencing six months after the drawdown date, plus a balloon of $14,509 payable together with the last installment.
On November 27, 2015, the Company signed a new four and a half year term bank loan for $82,775 relating to the
refinancing of the debt maturity of the suezmax tanker,Silia T,the panamax tankerAndesand three handysize tankersDidimon, Byzantion and Bosporos.The loan was drawn down into two tranches with the first on December 1, 2015
amounting to $51,625 and the second on January 11, 2016 amounting to $31,150. The loan is repayable in nine equal consecutive semi-annual installments of $5,173.55 commencing six months after the final drawdown date, plus a balloon of $36,213 payable together with the last installment. On January 12, 2016 the Company made a balloon
payment of $47,147 for the repayment of the loan of the handysize tankersByzantionandBosporos.
On December 30, 2015, the Company signed a new seven-year term bank loan for $44,800 relating to the financing of the 2012-built suezmax tankerDecathlon.The loan was drawn on February 5, 2016. The loan is repayable in fourteen
equal semi-annual installments of $1,600, commencing six months after the drawdown date, plus a balloon of $22,400 payable together with the last installment.
At December 31, 2015, interest on these term bank loans ranged from 2.02% to 4.07%.
The accompanying notes are an integral part of these consolidated financial statements.
F-18
Table of Contents
TSAKOS ENERGY NAVIGATION LIMITED AND SUBSIDIARIES
NOTES TO CONSOLIDATED FINANCIAL STATEMENTS
DECEMBER 31, 2015, 2014 AND 2013
(Expressed in thousands of U.S. Dollars, except for share and per share data, unless otherwise stated)
The weighted-average interest rates on the above executed loans for the applicable periods were:
Year ended December 31, 2015 | 2.30 | % | ||
Year ended December 31, 2014 | 2.23 | % | ||
Year ended December 31, 2013 | 2.49 | % |
Loan movements for credit facilities and term loans throughout 2015:
Loan | Origination Date | Original Amount | Balance at January 1, 2015 | New Loans | Repaid | Gain on extinguishment of debt | Balance at December 31, 2015 | |||||||||||||||||||||
Credit facility | 2005 | 220,000 | 107,955 | — | 61,385 | 46,570 | ||||||||||||||||||||||
Credit facility1 | 2004 | 179,384 | 91,245 | — | 10,555 | 80,690 | ||||||||||||||||||||||
Credit facility2 | 2006 | 275,000 | 101,447 | — | 28,637 | 72,810 | ||||||||||||||||||||||
Credit facility | 2005 | 220,000 | 58,998 | — | 11,871 | 47,127 | ||||||||||||||||||||||
Credit facility | 2006 | 371,010 | 211,010 | — | 20,000 | 191,010 | ||||||||||||||||||||||
10-year term loan | 2004 | 71,250 | 25,782 | — | 3,125 | 22,657 | ||||||||||||||||||||||
Credit facility | 2006 | 70,000 | 26,875 | — | 4,375 | 22,500 | ||||||||||||||||||||||
Credit facility | 2007 | 120,000 | 82,500 | — | 5,000 | 77,500 | ||||||||||||||||||||||
10-year term loan | 2007 | 88,350 | 55,230 | — | 5,520 | 49,710 | ||||||||||||||||||||||
Credit facility | 2007 | 82,000 | 52,100 | — | 48,788 | 3,312 | — | |||||||||||||||||||||
10-year term loan | 2009 | 38,600 | 24,578 | — | 2,234 | 22,344 | ||||||||||||||||||||||
8-year term loan | 2009 | 40,000 | 26,680 | — | 2,664 | 24,016 | ||||||||||||||||||||||
12 year term loan | 2009 | 40,000 | 28,750 | — | 2,500 | 26,250 | ||||||||||||||||||||||
10-year term loan | 2010 | 39,000 | 27,300 | — | 2,600 | 24,700 | ||||||||||||||||||||||
7-year term loan | 2010 | 70,000 | 51,440 | — | 4,640 | 46,800 | ||||||||||||||||||||||
10-year term loan | 2010 | 43,924 | 31,053 | — | 3,218 | 27,835 | ||||||||||||||||||||||
9-year term loan | 2010 | 42,100 | 31,700 | — | 2,600 | 29,100 | ||||||||||||||||||||||
10-year term loan | 2011 | 48,000 | 36,800 | — | 3,200 | 33,600 | ||||||||||||||||||||||
9-year term loan | 2011 | 48,650 | 38,920 | — | 3,243 | 35,677 | ||||||||||||||||||||||
8-year term loan | 2012 | 73,600 | 66,700 | — | 4,600 | 62,100 | ||||||||||||||||||||||
8-year term loan | 2011 | 73,600 | 66,240 | — | 4,907 | 61,333 | ||||||||||||||||||||||
7- year term loan | 2013 | 18,000 | 16,500 | — | 1,305 | 15,195 | ||||||||||||||||||||||
7- year term loan | 2014 | 42,000 | 42,000 | — | 2,800 | 39,200 | ||||||||||||||||||||||
6-year term loan | 2014 | 193,239 | 25,610 | 25,610 | — | 51,220 | ||||||||||||||||||||||
6-year term loan | 2014 | 39,000 | 39,000 | — | 2,600 | 36,400 | ||||||||||||||||||||||
7-year term loan | 2014 | 38,800 | 5,172 | — | — | 5,172 | ||||||||||||||||||||||
6-year term loan | 2014 | 78,744 | 10,344 | 5,172 | — | 15,516 | ||||||||||||||||||||||
6-year term loan | 2014 | 39,954 | 5,172 | — | — | 5,172 | ||||||||||||||||||||||
19-month term loan | 2014 | 52,195 | 31,235 | 20,960 | 52,195 | |||||||||||||||||||||||
5-year term loan | 2015 | 35,190 | — | 16,423 | — | 16,423 | ||||||||||||||||||||||
7-year term loan | 2015 | 35,190 | — | 11,730 | — | 11,730 | ||||||||||||||||||||||
7-year term loan | 2015 | 39,900 | — | 39,900 | — | 39,900 | ||||||||||||||||||||||
5-year term loan | 2015 | 82,775 | — | 51,625 | — | 51,625 | ||||||||||||||||||||||
6-year term loan | 2015 | 46,217 | — | 46,217 | — | 46,217 | ||||||||||||||||||||||
8-year term loan | 2015 | 73,500 | — | 9,800 | — | 9,800 | ||||||||||||||||||||||
|
|
|
|
|
|
|
|
|
| |||||||||||||||||||
Total | 1,418,336 | 227,437 | 242,367 | 3,312 | 1,400,094 | |||||||||||||||||||||||
|
|
|
|
|
|
|
|
|
| |||||||||||||||||||
| 1 | This credit facility includes a fixed interest rate portion amounting to $32,132 as at December 31, 2015. |
| 2 | The Company contemplates selling two of its vessels(Eurochampion 2004andEuronike)secured under this credit facility within 2016 and accordingly, an amount of approximately $53 million is classified under current portion of long-term debt. |
The accompanying notes are an integral part of these consolidated financial statements.
F-19
Table of Contents
TSAKOS ENERGY NAVIGATION LIMITED AND SUBSIDIARIES
NOTES TO CONSOLIDATED FINANCIAL STATEMENTS
DECEMBER 31, 2015, 2014 AND 2013
(Expressed in thousands of U.S. Dollars, except for share and per share data, unless otherwise stated)
The above revolving credit facilities and term bank loans are secured by first priority mortgages on all vessels owned by our subsidiaries, by assignments of earnings and insurances of the respectively mortgaged vessels, and by corporate guarantees of the relevant ship-owning subsidiaries.
The loan agreements include, among other covenants, covenants requiring the Company to obtain the lenders’ prior consent in order to incur or issue any financial indebtedness, additional borrowings, pay dividends in an amount more than 50% of cumulative net income (as defined in the related agreements), sell vessels and assets, and change the beneficial ownership or management of the vessels. Also, the covenants require the Company to maintain a minimum liquidity, not legally restricted, of $74,110 at December 31, 2015 and $79,563 at December 31, 2014, a minimum hull value in connection with the vessels’ outstanding loans and insurance coverage of the vessels against all customary risks. Three loan agreements require the Company to maintain throughout the security period, an aggregate credit balance in a deposit account of $3,250. Two loan agreements require a monthly pro rata transfer to retention account of any principal due but unpaid.
As at December 31, 2015, the Company and its wholly owned subsidiaries were compliant with the financial covenants in its loan agreements, including the leverage ratio and the value-to-loan requirements and all other terms and covenants.
The Company’s liquidity requirements relate primarily to servicing its debt, funding the equity portion of investments in vessels and funding expected capital expenditure on dry-dockings and working capital. As of December 31, 2015 and December 31, 2014, the Company’s working capital (non-restricted net current assets), amounted to a $34,984 and ($49,817) respectively.
The annual principal payments required to be made after December 31, 2015, are as follows:
Period/Year | Amount | |||
2016 | 319,560 | |||
2017 | 202,121 | |||
2018 | 286,281 | |||
2019 | 178,327 | |||
2020 | 137,278 | |||
2021 and thereafter | 276,527 | |||
|
| |||
| 1,400,094 | ||||
|
| |||
8. Interest and Finance Costs, net
| 2015 | 2014 | 2013 | ||||||||||
Interest expense | 32,065 | 33,389 | 41,741 | |||||||||
Less: Interest capitalized | (3,430 | ) | (2,384 | ) | (1,945 | ) | ||||||
|
|
|
|
|
| |||||||
Interest expense, net | 28,635 | 31,005 | 39,796 | |||||||||
Interest swap cash settlements non-hedging | 2,201 | 3,231 | 5,012 | |||||||||
Bunkers swap cash settlements | 7,427 | 997 | (151 | ) | ||||||||
Bunker call options premium | 1,414 | 1,199 | — | |||||||||
Amortization of loan fees | 1,268 | 1,245 | 1,101 | |||||||||
Bank charges | 137 | 240 | 379 | |||||||||
Finance project costs expensed | 1,261 | — | — | |||||||||
Amortization of deferred loss on de-designated financial instruments | — | 154 | 877 | |||||||||
Change in fair value of non-hedging financial instruments | (9,116 | ) | 5,003 | (6,097 | ) | |||||||
Net gain on the prepayment of a loan | (3,208 | ) | — | — | ||||||||
Net total | ||||||||||||
|
|
|
|
|
| |||||||
| 30,019 | 43,074 | 40,917 | ||||||||||
|
|
|
|
|
| |||||||
The accompanying notes are an integral part of these consolidated financial statements.
F-20
Table of Contents
TSAKOS ENERGY NAVIGATION LIMITED AND SUBSIDIARIES
NOTES TO CONSOLIDATED FINANCIAL STATEMENTS
DECEMBER 31, 2015, 2014 AND 2013
(Expressed in thousands of U.S. Dollars, except for share and per share data, unless otherwise stated)
At December 31, 2015, the Company was committed to seven floating-to-fixed interest rate swaps with major financial institutions covering notional amounts aggregating to $287,299, maturing from March 2016 through March 2021, on which it pays fixed rates averaging 3.22% and receives floating rates based on the six-month London interbank offered rate (“LIBOR”) (Note 15).
At December 31, 2015, the Company held six of the seven interest rate swap agreements, designated and qualifying as cash
flow hedges, in order to hedge its exposure to interest rate fluctuations associated with its debt covering notional amounts
aggregating to $239,549. The fair values of such financial instruments as of December 31, 2015 and 2014, in aggregate amounted to $7,847 (negative) and $7,046 (negative), respectively. The net amount of cash flow hedge losses at December 31, 2015, that is estimated to be reclassified into earnings within the next twelve months is $3,688.
At December 31, 2015 and 2014, the Company held one interest rate swap that did not meet hedge accounting criteria. As
such, the changes in its fair value during the 2015 and 2014 have been included in Change in fair value of non-hedging financial instruments, and amounted to a gain of $2,178 and $1,960, respectively.
As of December 31, 2014, the Company held seven bunker swap agreements in order to hedge its exposure to bunker price
fluctuations associated with the consumption of bunkers by its vessels. The fair values of these financial instruments as of December 31, 2014, were $9,228 (negative). As of December 31, 2015 those bunker swaps were expired.
The changes in their fair values during 2015 and 2014 amounting to $9,228 (positive) and $9,405 (negative) respectively have been included in Change in fair value of non-hedging financial instruments in the table above, as such agreements do not meet the hedging criteria.
At December 31, 2014, the Company held three bunker put option agreements in order to reduce the losses of the bunker swap agreements, which expired during the 2015 year. The value of those put options at December 31, 2014 was $2,443
(positive). The change in their fair value during 2015 was $2,443 (negative). During 2015, the Company entered into seventeen
call option agreements for the same reasons as for the put options and premium paid for the call options was $1,414. During
2015, five call options were expired. The fair market value of the remaining twelve options at December 31, 2015, amounted
to $154.
| 9. | Stockholders’ Equity |
During 2015, the Company had a shareholder rights plan that authorized existing shareholders substantial preferred share
rights and additional common shares if any third party were to acquire 15% or more of the outstanding common shares or announced its intent to commence a tender offer for at least 15% of the common shares, in each case, in a transaction that
the Board of Directors has not approved. On October 10, 2015, the Company’s preferred share purchase rights, under this plan expired and have not been renewed as of April 5, 2016.
On April 22, 2015, the Company completed an offering of 3,400,000 of its 8.75% Series D Cumulative Perpetual Preferred Shares, par value $1.00 per share, liquidation preference $25.00 per share, raising $81,784, net of underwriter’s discount and
other expenses. Dividends on the Series D Preferred Shares are cumulative from the date of original issue and will be payable
quarterly in arrears on the 28th day of February, May, August and November of each year, commencing August 28, 2015, when, as and if declared by our board of directors. Dividends will be payable from cash available for dividends at a rate equal
to 8.75% per annum of the stated liquidation preference. At any time on or after April 29, 2020, the Series D Preferred Shares may be redeemed, in whole or in part, out of amounts available thereof, at a redemption price of $25.00 per share plus an amount equal to all accumulated and unpaid dividends thereon to the date of redemption, whether or not declared. On
August 28, 2015, the Company paid dividends of $0.72309 per share each or $2,459 in total, on its 8.75% Series D Preferred
Shares.
The accompanying notes are an integral part of these consolidated financial statements.
F-21
Table of Contents
TSAKOS ENERGY NAVIGATION LIMITED AND SUBSIDIARIES
NOTES TO CONSOLIDATED FINANCIAL STATEMENTS
DECEMBER 31, 2015, 2014 AND 2013
(Expressed in thousands of U.S. Dollars, except for share and per share data, unless otherwise stated)
On July 30, 2015, the Company issued 2,626,357 common shares at a value of $9.7881 per share so as to partially finance the acquisition of two resale contracts for the construction of VLCC tankers for delivery in 2016.
On December 8, 2015, the Company announced the resumption of the previously authorized by its Board of Directors stock repurchase program for open market purchases for its common and/ or its preferred shares. The Company had available up to $20.0 million from its previously authorized program. The program started on January 11, 2016. As at March 31, 2016, the Company has repurchased an aggregate of 1,187,089 of its common shares at an average price of $5.68 at an aggregate purchase price of $6,747.
On May 30, 2014, at the annual general meeting of shareholders, the shareholders approved the amendment of the Company’s Memorandum of Association in order to increase the authorized share capital from $100,000 consisting of 85 million common shares of a par value of $1.00 each and 15 million preferred shares of a par value of $1.00 each, to $200,000, consisting of 185 million common shares of a par value of $1.00 each and 15 million preferred shares of a par value of $1.00 each.
On April 29, 2014, the Company completed an offering of 11,000,000 common shares, at a price of $7.30 per share, for net proceeds of $75,821. On May 22, 2014, the underwriters exercised their option to purchase 1,650,000 additional shares at the same price for net proceeds of $11,503.
On February 5, 2014, the Company completed an offering of 12,995,000 common shares, including 1,695,000 common shares issued upon the exercise in full by the underwriters of their option to purchase additional shares, at a price of $6.65 per share, for net proceeds of $81,952.
In 2014 and 2013, the Company sold 1,077,847 and 1,430,211 common shares for proceeds, net of commissions, of $7,124 and $7,045 respectively, under a distribution agency agreement entered into in August 2013. This agreement provides for the offer and sale from time to time of up to 4,000,000 common shares of the Company, par value $1.00 per share, at market prices.
On May 10, 2013, the Company issued 2,000,000 8.00% Cumulative Redeemable Perpetual Series B Preferred Shares (the “Series B preferred shares”) for net proceeds of $47,043. The Series B preferred shares were issued for cash and pay cumulative quarterly dividends at a rate of 8% per annum from their date of issuance, i.e. $2.0 per preferred share or $4,000 in aggregate. At any time on or after July 30, 2018, the Series B preferred shares may be redeemed, at the option of the Company, in whole or in part at a redemption price of $25.00 per share plus unpaid dividends. If the Company fails to comply with certain covenants relating to the level of borrowings and net worth as these terms are defined in the applicable agreement, defaults on any of its credit facilities, fails to pay four quarterly dividends payable in arrears or if the Series B preferred shares are not redeemed at the option of the Company, in whole by July 30, 2019, the dividend rate payable on the Series B preferred shares increases quarterly to a rate that is 1.25 times the dividend rate payable on the series B preferred shares, subject to an aggregate maximum rate per annum of 25% prior to July 30, 2018 and 30% thereafter. The Series B preferred shares are not convertible into common shares and are not redeemable at the option of the holder.
On September 30, 2013, the Company issued 2,000,000 8.875% Cumulative Redeemable Perpetual Series C Preferred Shares (the “Series C preferred shares”) for net proceeds of $47,315. The Series C preferred shares were issued for cash and pay cumulative quarterly dividends at a rate of 8.875% per annum from their date of issuance, i.e. $2.21875 per preferred share or $4,437 in aggregate. At any time on or after October 30, 2018, the Series C preferred shares may be redeemed, at the option of the Company, in whole or in part at a redemption price of $25.00 per share plus unpaid dividends. If the Company fails to comply with certain covenants relating to the level of borrowings and net worth as these terms are defined in the applicable agreement, defaults on any of its credit facilities, fails to pay four quarterly dividends payable in arrears or if the Series C preferred shares are not redeemed at the option of the Company in whole by October 30, 2020, the dividend rate payable on the Series C preferred shares increases quarterly to a rate that is 1.25 times the dividend rate payable on the Series C preferred shares, subject to an aggregate maximum rate per annum of 25% prior to October 30, 2018 and 30% thereafter. The Series C preferred shares are not convertible into common shares and are not redeemable at the option of the holder.
The accompanying notes are an integral part of these consolidated financial statements.
F-22
Table of Contents
TSAKOS ENERGY NAVIGATION LIMITED AND SUBSIDIARIES
NOTES TO CONSOLIDATED FINANCIAL STATEMENTS
DECEMBER 31, 2015, 2014 AND 2013
(Expressed in thousands of U.S. Dollars, except for share and per share data, unless otherwise stated)
Under the Company’s share-based incentive plan, 20,000 restricted share units (RSUs) were granted and vested in 2014, at a fair value of $7.08 per share. In 2013, 96,000 RSUs were granted and vested at a weighted average fair value of $4.89 per share. There were no RSUs outstanding at the beginning or end of 2014 and 2013. The total fair value of shares vested during the years ended December 31, 2014, and 2013 were $142 and $469 respectively.
As at December 31, 2015, under the existing share-based incentive plan approved by the shareholders, a further 868,950 RSUs or other share-based awards may be issued in the future. No RSUs were granted in 2015. Total compensation expense recognized in 2014 amounted to $142 ($469 in 2013). As at December 31, 2014 and 2013, all granted RSUs were vested and the compensation expense recognized.
| 10. | Accumulated other comprehensive loss |
In 2015, Accumulated other comprehensive loss increased with unrealized losses from hedging financial instruments of $437 (loss of $3,501 and gain of $8,107 in 2014 and 2013 respectively) of which $437 (loss of $3,655 in 2014 and gain of $7,230 in 2013) related to unrealized losses on interest rate swaps, and $154 in 2014 and $877 in 2013 related to amortization of deferred loss on de-designated financial instruments. During 2013, unrealized losses on marketable securities were $79, of which a gain of $89 was realized and reclassified into earnings following the sale of the respective securities.
| 11. | Earnings per Common Share |
The computation of basic earnings per share is based on the weighted average number of common shares outstanding during the year. The computation of diluted earnings per share assumes the foregoing and the exercise of all granted RSUs (Note 9) using the treasury stock method.
Numerator
| 2015 | 2014 | 2013 | ||||||||||
Net income/(loss) attributable to Tsakos Energy Navigation Limited | $ | 158,217 | $ | 33,527 | $ | (37,462 | ) | |||||
Preferred share dividends, Series B | (4,000 | ) | (4,000 | ) | (2,567 | ) | ||||||
Preferred share dividends, Series C | (4,437 | ) | (4,438 | ) | (1,109 | ) | ||||||
Preferred share dividends, Series D | (5,000 | ) | — | — | ||||||||
Net income/(loss) attributable to common stock holders | 144,780 | 25,089 | (41,138 | ) | ||||||||
|
|
|
| �� |
|
| ||||||
Denominator | ||||||||||||
Weighted average common shares outstanding | 85,827,597 | 79,114,401 | 56,698,955 | |||||||||
|
|
|
|
|
| |||||||
Basic and diluted earnings/(loss) per common share | $ | 1.69 | $ | 0.32 | $ | (0.73 | ) | |||||
For 2015, 2014 and 2013 there were no non-vested RSUs.
| 12. | Noncontrolling Interest in Subsidiary |
In August 2006, the Company signed an agreement with Polaris Oil Shipping Inc. (Polaris), an affiliate of one of the Company’s major charterers, following which Polaris acquired 49% of Mare Success S.A., a previously wholly-owned subsidiary of the Holding Company. Mare Success S.A. is the holding-company of two Panamanian registered companies which own respectively the vesselsMayaandInca.The agreement became effective on November 30, 2006. Mare Success S.A. is fully consolidated in
The accompanying notes are an integral part of these consolidated financial statements.
F-23
Table of Contents
TSAKOS ENERGY NAVIGATION LIMITED AND SUBSIDIARIES
NOTES TO CONSOLIDATED FINANCIAL STATEMENTS
DECEMBER 31, 2015, 2014 AND 2013
(Expressed in thousands of U.S. Dollars, except for share and per share data, unless otherwise stated)
the accompanying financial statements. In the fourth quarter of 2013, Mare Success increased its paid-in capital by $20,408 of which $10,408 being the 51%, was contributed by the Company and $10,000 being the 49%, by Polaris. After the recapitalization, the shareholding of Mare Success S.A. remained at 51% for the Company and 49% for Polaris. There have been no transactions between Polaris and the Company since the incorporation of Mare Success S.A., whereas approximately 5.5% of the Company’s 2015 revenue (7.0% in 2014) was generated by the charterer affiliated to Polaris.
| 13. | Income Taxes |
Under the laws of the countries of the Company’s subsidiaries’ incorporation and/or vessels’ registration (Greece, Liberia, Marshall Islands, Panama, Bahamas), the companies are subject to registration and tonnage taxes, which have been included in the Vessel operating expenses.
The Company is not expected to be subject to United States Federal income tax on their gross income from the international
operations of ships. In general, foreign persons operating ships to and from the United States are subject to United States
Federal income tax of 4% of their United States source gross transportation income, which equals 50% of their gross income from transportation to or from the United States. The Company believes that it is exempt from United States Federal income
tax on its United States source gross transportation income, as each vessel-operating subsidiary is organized in a foreign country that grants an equivalent exemption to corporations organized in the United States, and derives income from the international operation of ships and satisfies the stock ownership test as defined by the Internal Revenue Code and related regulations as a result of the Company’s stock being primarily and regularly traded on an established securities market in the United States. Under the regulations, a Company’s stock is considered to be regularly traded on an established securities market if (i) one or more classes of its stock representing 50% or more of its outstanding shares, by voting power and value, is listed on the market and is traded on the market, other than in minimal quantities, on at least 60 days during the taxable year; and (ii) the aggregate number of shares of stock traded during the taxable year is at least 10% of the average number of shares of the stock outstanding during the taxable year. Other requirements such as the substantiation and reporting requirements under the regulations also must be satisfied to qualify for the exemption from United States Federal income tax.
| 14. | Commitments and Contingencies |
On July 10, 2015, the Company agreed to acquire two suezmax tankers built in 2009 and 2012 for $57,000 and $64,000 respectively. The first,Pentathlon,was delivered and fully paid in November 2015. On July 22, 2015, the Company agreed to acquire the new building contracts for two VLCC tankers for $96,900 each. As at December 31, 2015, the Company had under construction nine aframax tankers, two LR1 product tankers, one shuttle tanker, two VLCC tankers and one LNG carrier.
The total contracted amount remaining to be paid for the fifteen vessels under construction and theone second-hand suezmax tanker, plus the extra costs agreed as at December 31, 2015, was $805,687. Scheduled remaining payments as at December 31, 2015, were $584,422 in 2016 and $221,265 in 2017.
At December 31, 2015, there is a prepaid amount of $1,650 under an old shipbuilding contract which was terminated in 2014, which will be used against the contract price of future new buildings, currently being discussed between the Company and the
shipyard.
In the ordinary course of the shipping business, various claims and losses may arise from disputes with charterers, agents and
other suppliers relating to the operations of the Company’s vessels. Management believes that all such matters are either adequately covered by insurance or are not expected to have a material adverse effect on the Company’s results from operations or financial condition.
The accompanying notes are an integral part of these consolidated financial statements.
F-24
Table of Contents
TSAKOS ENERGY NAVIGATION LIMITED AND SUBSIDIARIES
NOTES TO CONSOLIDATED FINANCIAL STATEMENTS
DECEMBER 31, 2015, 2014 AND 2013
(Expressed in thousands of U.S. Dollars, except for share and per share data, unless otherwise stated)
Charters-out
The future minimum revenues of vessels in operation at December 31, 2015, before reduction for brokerage commissions, expected to be recognized on non-cancelable time charters are as follows:
Year | Amount | |||
2016 | 216,031 | |||
2017 | 224,495 | |||
2018 | 178,509 | |||
2019 | 156,680 | |||
2020 to 2028 | 649,520 | |||
|
| |||
Minimum charter payments | 1,425,235 | |||
|
| |||
These amounts do not assume any off-hire.
The Company has signed charter party agreements for twelve of its vessels under construction for periods ranging from 4.5 years to 8 years to commence on delivery of the vessels, delivered between the second quarter of 2016 and the third quarter of 2017. Revenues of $623,760 to be generated by these vessels have been included in the above table.
| 15. | Financial Instruments |
| (a) | Interest rate risk:The Company is subject to interest rate risk associated with changing interest rates with respect to its variable interest rate term loans and credit facilities as described in Notes 7 and 8. |
| (b) | Concentration of credit risk:Financial Instruments consist principally of cash, trade accounts receivable, investments, and derivatives. |
The Company places its temporary cash investments, consisting mostly of deposits, primarily with high credit qualified financial institutions. The Company performs periodic evaluations of the relative credit standing of those financial institutions that are considered in the Company’s investment strategy. The Company limits its credit risk with accounts receivable by performing ongoing credit evaluations of its customers’ financial condition and generally does not require collateral for its accounts receivable and does not have any agreements to mitigate credit risk. The Company limits the exposure of non-performance by counterparties to derivative instruments by diversifying among counterparties with high credit ratings, and performing periodic evaluations of the relative credit standing of the counterparties.
| (c) | Fair value:The carrying amounts reflected in the accompanying Consolidated Balance Sheet of cash and cash equivalents, restricted cash, trade receivables and accounts payable approximate their respective fair values due to the short maturity of these instruments. The fair value of long-term bank loans with variable interest rates approximate the recorded values, generally due to their variable interest rates. The present value of the future cash flows of the portion of one long-term bank loan with a fixed interest rate is estimated to be approximately $31,485 as compared to its carrying amount of $32,132 (Note 7). The Company performs relevant enquiries on a periodic basis to assess the recoverability of the long-term investment and estimates that the amount presented on the accompanying Balance sheet approximates the amount that is expected to be received by the Company in the event of sale of that investment. |
The fair values of the one long-term bank loan with a fixed interest rate, the interest rate swap agreements, and bunker
swap agreements, put option agreements and call option agreements discussed in Note 8 above are determined through Level 2 of the fair value hierarchy as defined in FASB guidance for Fair Value Measurements and are derived principally from or corroborated by observable market data, interest rates, yield curves and other items that allow value to be determined.
The accompanying notes are an integral part of these consolidated financial statements.
F-25
Table of Contents
TSAKOS ENERGY NAVIGATION LIMITED AND SUBSIDIARIES
NOTES TO CONSOLIDATED FINANCIAL STATEMENTS
DECEMBER 31, 2015, 2014 AND 2013
(Expressed in thousands of U.S. Dollars, except for share and per share data, unless otherwise stated)
The estimated fair values of the Company’s financial instruments, other than derivatives at December 31, 2015 and 2014 are as follows:
| 2015 | 2014 | |||||||||||||||
| Carrying Amount | Fair Value | Carrying Amount | Fair Value | |||||||||||||
Financial assets/(liabilities) | ||||||||||||||||
Cash and cash equivalents | 289,676 | 289,676 | 202,107 | 202,107 | ||||||||||||
Restricted cash | 15,330 | 15,330 | 12,334 | 12,334 | ||||||||||||
Investments | 1,000 | 1,000 | 1,000 | 1,000 | ||||||||||||
Debt | (1,400,094 | ) | (1,399,447 | ) | (1,418,336 | ) | (1,417,430 | ) | ||||||||
Tabular Disclosure of Derivatives Location
Derivatives are recorded in the balance sheet on a net basis by counterparty when a legal right of setoff exists. The following tables present information with respect to the fair values of derivatives reflected in the balance sheet on a gross basis by transaction. The tables also present information with respect to gains and losses on derivative positions reflected in the Statement of Comprehensive income/(loss) or in the Balance Sheet, as a component of Accumulated other comprehensive income/ (loss).
| Asset Derivatives | Liability Derivatives | |||||||||||||||||
| December 31, 2015 | December 31, 2014 | December 31, 2015 | December 31, 2014 | |||||||||||||||
Derivative | Balance Sheet Location | Fair Value | Fair Value | Fair Value | Fair Value | |||||||||||||
Derivatives designated as hedging instruments | ||||||||||||||||||
Interest rate swaps | Current portion of financial instruments—Fair value | — | — | 4,666 | 3,547 | |||||||||||||
| Financial instruments—Fair Value, net of current portion | — | — |
| 3,181 |
| 3,499 | ||||||||||||
|
|
|
|
|
|
|
| |||||||||||
Subtotal | — | — | 7,847 | 7,046 | ||||||||||||||
|
|
|
|
|
|
|
| |||||||||||
| Asset Derivatives | Liability Derivatives | |||||||||||||||||
| December 31, 2015 | December 31, 2014 | December 31, 2015 | December 31, 2014 | |||||||||||||||
Derivative | Balance Sheet Location | Fair Value | Fair Value | Fair Value | Fair Value | |||||||||||||
Derivatives not designated as hedging instruments |
| |||||||||||||||||
Interest rate swaps | Current portion of financial instruments—Fair value | — | — | 1,040 | 2,659 | |||||||||||||
| Financial instruments—Fair Value, net of current portion | — | — | — | 560 | ||||||||||||||
Bunker swaps | Current portion of financial instruments—Fair value | — | — | — | 9,228 | |||||||||||||
Bunker put options | Current portion of financial instruments—Fair value | — | 2,443 | — | — | |||||||||||||
Bunker call options | Current portion of financial instruments—Fair value | 28 | — | — | — | |||||||||||||
Bunker call options | Financial instruments—Fair Value, net of current portion | 126 | — | — | — | |||||||||||||
|
|
|
|
|
|
|
| |||||||||||
Subtotal | 154 | 2,443 | 1,040 | 12,447 | ||||||||||||||
|
|
|
|
|
|
|
| |||||||||||
Total derivatives | 154 | 2,443 | 8,887 | 19,493 | ||||||||||||||
|
|
|
|
|
|
|
| |||||||||||
The accompanying notes are an integral part of these consolidated financial statements.
F-26
Table of Contents
TSAKOS ENERGY NAVIGATION LIMITED AND SUBSIDIARIES
NOTES TO CONSOLIDATED FINANCIAL STATEMENTS
DECEMBER 31, 2015, 2014 AND 2013
(Expressed in thousands of U.S. Dollars, except for share and per share data, unless otherwise stated)
Derivatives designated as Hedging Instruments-Net effect on the Statements of Comprehensive Income/(loss)
Loss Recognized in Accumulated Other Comprehensive Loss on Derivative (Effective | Amount | |||||||||||||
Derivative | 2015 | 2014 | 2013 | |||||||||||
Interest rate swaps | (5,446 | ) | (7,042 | ) | (3,338 | ) | ||||||||
|
|
|
|
|
| |||||||||
Total | (5,446 | ) | (7,042 | ) | (3,338 | ) | ||||||||
|
|
|
|
|
| |||||||||
Loss Reclassified from Accumulated Other Comprehensive | Amount | |||||||||||||
Derivative | 2015 | 2014 | 2013 | |||||||||||
Interest rate swaps | Depreciation expense | (154 | ) | (154 | ) | (144 | ) | |||||||
Interest rate swaps | Interest and finance costs, net | (2,996 | ) | (3,388 | ) | (11,301 | ) | |||||||
|
|
|
|
|
| |||||||||
Total | (3,150 | ) | (3,542 | ) | (11,445 | ) | ||||||||
|
|
|
|
|
| |||||||||
The accumulated loss from Derivatives designated as Hedging instruments recognized in Accumulated Other comprehensive Loss as of December 31, 2015 and 2014 was $10,727 and $10,290 respectively.
Derivatives not designated as Hedging Instruments—Net effect on the Statement of Comprehensive Income/(loss)
Net Realized and Unrealized Gain (Loss) Recognized | Amount | |||||||||||||
Derivative | 2015 | 2014 | 2013 | |||||||||||
Interest rate swaps | Interest and finance costs, net | (24 | ) | (1,272 | ) | 1,012 | ||||||||
Bunker swaps | Interest and finance costs, net | (1,206 | ) | (10,402 | ) | 223 | ||||||||
Bunker put options | Interest and finance costs, net | 564 | 1,244 | — | ||||||||||
Bunker call options | Interest and finance costs, net | (1,260 | ) | — | — | |||||||||
|
|
|
|
|
| |||||||||
Total | (1,926 | ) | (10,430 | ) | 1,235 | |||||||||
|
|
|
|
|
| |||||||||
The following tables summarize the fair values for assets and liabilities measured on a recurring basis as of December 31, 2015 and 2014 using Level 2 inputs (significant other observable inputs):
Recurring measurements: | December 31, 2015 | December 31, 2014 | ||||||
Interest rate swaps | (8,887 | ) | (10,265 | ) | ||||
Bunker swaps | — | (9,228 | ) | |||||
Bunker put options | — | 2,443 | ||||||
Bunker call options | 154 | — | ||||||
|
|
|
| |||||
| (8,733 | ) | (17,050 | ) | |||||
|
|
|
| |||||
The accompanying notes are an integral part of these consolidated financial statements.
F-27
Table of Contents
TSAKOS ENERGY NAVIGATION LIMITED AND SUBSIDIARIES
NOTES TO CONSOLIDATED FINANCIAL STATEMENTS
DECEMBER 31, 2015, 2014 AND 2013
(Expressed in thousands of U.S. Dollars, except for share and per share data, unless otherwise stated)
| 16. | Subsequent Events |
| a) | On January 4, 2016, the Company drew down $9,800 for the pre-delivery financing of the shuttle tanker under construction, under a loan agreed in May 2015. The amount was paid to the yard on the same date. |
| b) | On January 29, 2016, the Company paid a dividend of $0.55469 per share for its 8.875% Series C Preferred Shares. |
| c) | On January 29, 2016, the Company paid a dividend of $0.50 per share for its 8.00% Series B Preferred Shares. |
| d) | On February 5, 2016, the Company took delivery of its suezmax tankerDecathlon. |
| e) | On February 16, 2016, the Company’s Board of Directors declared a quarterly dividend of $0.08 per common share outstanding to be paid on April 7, 2016 to shareholders of record as of March 30, 2016. |
| f) | On February 25, 2016, the Company drew down $5,122 for the pre-delivery financing of one of the aframax tankers under construction, under a loan agreed in June 2014 and the amount of $4,692 for the pre-delivery financing of the second LR1 product carrier under construction, under a loan agreed in February 2015. |
| g) | On February 29, 2016, the Company paid a dividend of $0.546875 per share for its Series D Preferred Shares. |
| h) | On March 22, 2016, the Company drew down $5,122 for the pre-delivery financing of one of the aframax tankers under construction, under a loan agreed in June 2014. |
| i) | On April 4, 2016, the Company drew down $5,122 for the pre-delivery financing of one of the aframax tankers under construction, under a loan agreed in June 2014. |
The accompanying notes are an integral part of these consolidated financial statements.
F-28
Table of Contents
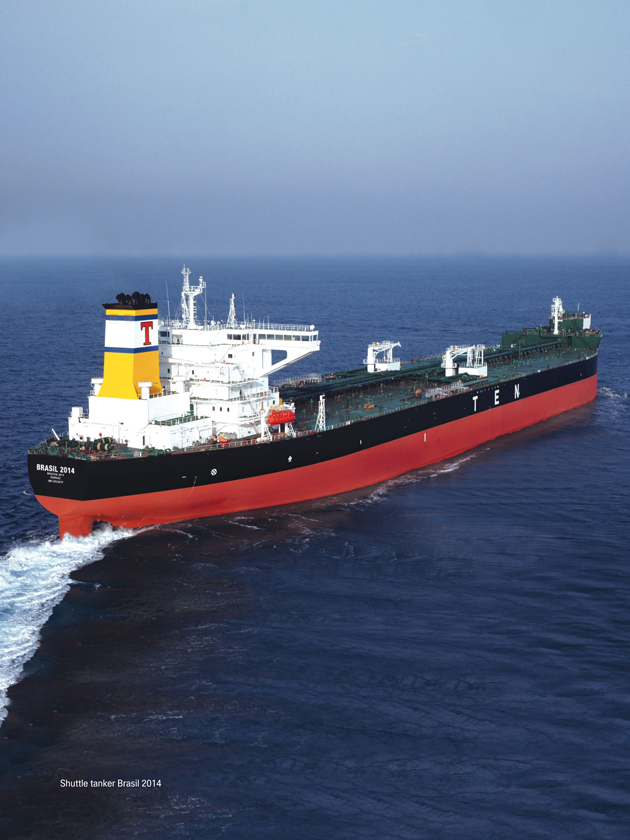
Table of Contents
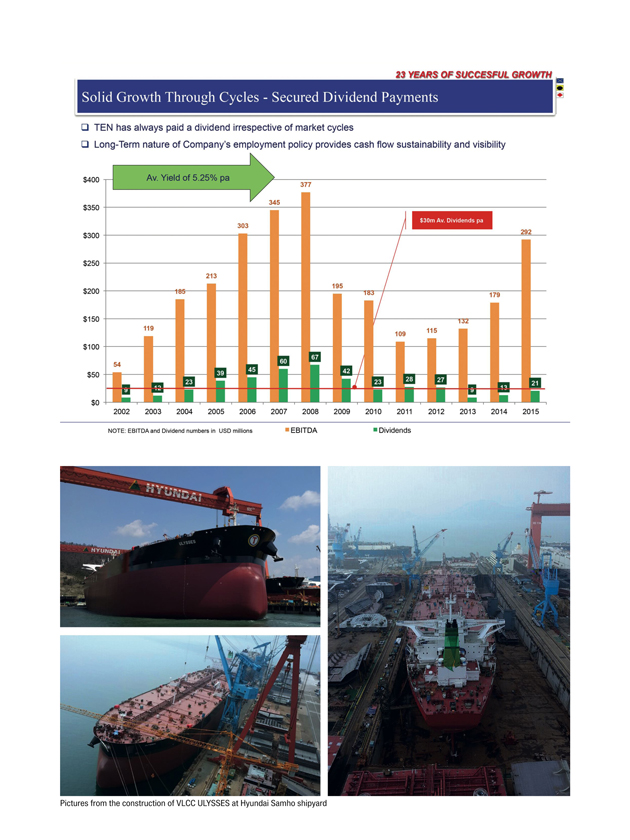
Table of Contents
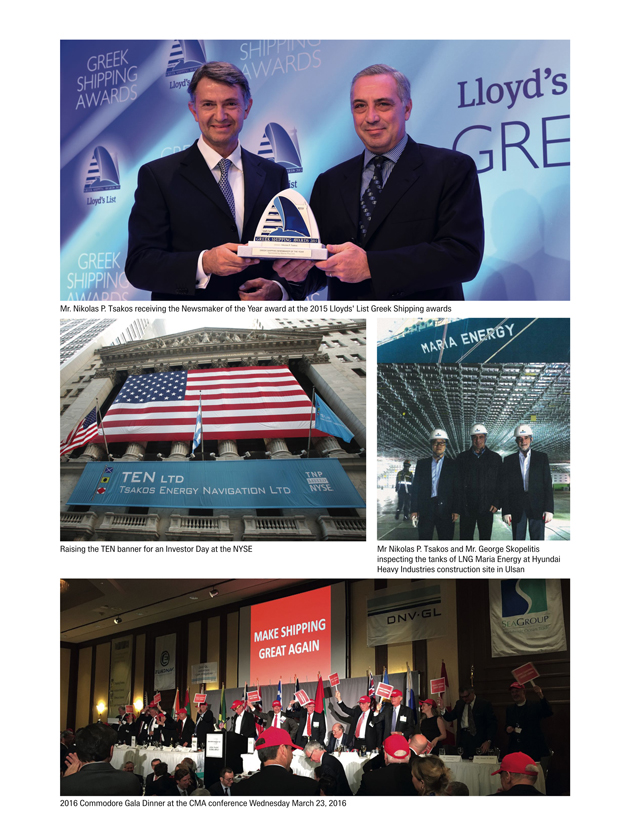
Table of Contents