PURSUANT TO RULE 13a-16 OR 15d-16 OF THE
São Paulo, S.P., 05429-900
Federative Republic of Brazil
annual reports under cover Form 20-F or Form 40-F.
Form 20-F ___X___ Form 40-F ______
in paper as permitted by Regulation S-T Rule 101(b)(1)__.
in paper as permitted by Regulation S-T Rule 101(b)(7)__.
Indicate by check mark whether the registrant by furnishing the
information contained in this Form is also thereby furnishing the
information to the Commission pursuant to Rule 12g3-2(b) under
the Securities Exchange Act of 1934.
Yes ______ No ___X___
registrant in connection with Rule 12g3-2(b):

1
![]()
1. 2019 Highlights
In 2019, the Company recorded net income of R$ 3,367.5 million, versus net income of R$ 2,835.1 million in 2018, an increase of R$ 532.4 million, or 18.8%.
Adjusted EBITDA totaled R$ 7,510.5 million, 14.8% higher than the R$ 6,540.6 million recorded in 2018 (an increase of R$ 969.9 million).
2019 result was impacted by several events during the period, mainly:
a) Start of operation in the municipality of Santo André
In July 2019, the Company entered into an agreement with the municipality of Santo André, starting operations in August. The initial impact of this agreement, together with the start of the operation, resulted in increases of R$ 1,357.3 million in the operating revenue and R$ 6.5 million in expenses, as follow:
R$ million | |||
Impacts of Santo André | 2019 | 2018 | Var. |
Revenue - Wholesale(1) | 1,261.7 | - | 1,261.7 |
Revenue - Wholesale (billing) | 22.9 | 67.5 | (44.6) |
Revenue - Retail(2) | 140.2 | - | 140.2 |
Total Revenue | 1,424.8 | 67.5 | 1,357.3 |
Costs and Expenses(3) | (58.0) | - | (58.0) |
Allowance for doubtful accounts(4) | 51.5 | - | 51.5 |
Total Expenses | (6.5) | - | (6.5) |
Net effect, before income tax and social contribution | 1,418.3 | 67.5 | 1,350.8 |
1. Non-recurring revenue in 2019 resulting from the agreement.
2. Revenue in 2019 referring to the start of operations, on August 11.
3. Expenses in 2019 related to the start of operations.
4. Reversal of non-recurring allowance for doubtful accounts resulting from the formalization of the agreement.
b) TAC - Retirees
On February 20, 2009, SABESP and the Public Prosecution Office of the State of São Paulo signed a Conduct Adjustment Term (TAC), in which the Company pledged to promote the gradual dismissal of retired employees. As a result of this TAC, the Company recorded a provision for the dismissal of these employees.
On October 11, 2019, the Public Prosecution Office closed the case regarding the TAC given its understanding that the legal requirements were achieved. Therefore, the Company reversed R$ 173.3 million in the Salaries and payroll charges and Pension plan obligations account, which is a non-recurring event.
c) Operations in the Municipality of Guarulhos
The operations in the municipality of Guarulhos positively impacted the results in 2019, with the recognition of R$ 424.6 million in operating revenues and R$ 192.9 million in costs and expenses, excluding revenue and construction costs. Net income before income tax and social contribution was R$ 231.7 million in the period.
2
![]()
R$ million | |||
Impacts of Guarulhos | 2019 | 2018 | Var. |
Revenue - Wholesale(1) | - | 928.0 | (928.0) |
Revenue - Wholesale (billing) | - | 30.3 | (30.3) |
Revenue - Retail(2) | 424.6 | - | 424.6 |
Total Revenue | 424.6 | 958.3 | (533.7) |
Costs and Expenses(3) | (189.9) | - | (189.9) |
Allowance for doubtful accounts(4) | (3.0) | (29.9) | 26.9 |
Total Expenses | (192.9) | (29.9) | (163.0) |
Net effect, before income tax and social contribution | 231.7 | 928.4 | (696.7) |
1. Non-recurring revenue in 2018 resulting from the formalization of the agreement.
2. Revenue in 2019 related to the start of operations.
3. Expenses in 2019 related to the start of operations.
4. Estimated losses in retail in 2019 and wholesale sector in 2018.
d) São Lourenço Production System
The São Lourenço Production System began its operations in the third quarter of 2018. The costs and expenses resulting from the startup of operations increased by R$ 137.9 million in 2019 comparing to 2018.
e) Signing of program contracts with the municipalities of São Bernardo do Campo and Guarujá
The Company signed program contracts with the municipalities of São Bernardo do Campo and Guarujá for 40 and 30 years, respectively, in order to comply to the current law. Within this context, all lawsuits were concluded, which were recorded as non-recurring expenses, in the amounts of R$ 39.0 million and R$ 46.4 million, respectively.
f) Signing of a new health plan with Fundação CESP - FUNCESP
In August 2019, a new health plan administered by Fundação CESP became effective, replacing the previous plan, administered by SABESPREV.
Expenses with health care in 2019 increased by R$ 28.6 million compared to 2018, and was related to the first half of 2019, as follow:
R$ million | |||
Expenses with Health Care | 2019 | 2018 | Var. |
1st half | 173.3 | 91.1 | 82.2 |
2nd half | 124.0 | 177.6 | (53.6) |
Total expenses with health care | 297.3 | 268.7 | 28.6 |
3
![]()
2. Financial Highlights
| R$ million | ||||||||
2019 | 2018 | Var. (R$) | % | 4Q19 | 4Q18 | Var. (R$) | % | ||
Gross operating revenue ¹ | 16,134.0 | 14,253.6 | 1,880.4 | 13.2 | 4,034.7 | 4,391.4 | (356.7) | (8.1) | |
Construction revenue | 2,946.5 | 2,802.7 | 143.8 | 5.1 | 955.0 | 764.3 | 190.7 | 25.0 | |
COFINS and PASEP and TRCF taxes ² | (1,096.9) | (971.2) | (125.7) | 12.9 | (293.1) | (253.3) | (39.8) | 15.7 | |
(=) | Net operating revenue | 17,983.6 | 16,085.1 | 1,898.5 | 11.8 | 4,696.6 | 4,902.4 | (205.8) | (4.2) |
Costs and expenses | (9,375.6) | (8,203.9) | (1,171.7) | 14.3 | (2,513.2) | (2,228.4) | (284.8) | 12.8 | |
Construction costs | (2,881.4) | (2,739.7) | (141.7) | 5.2 | (934.7) | (747.1) | (187.6) | 25.1 | |
Equity result | 3.7 | 6.5 | (2.8) | (43.1) | (4.6) | 2.3 | (6.9) | (300.0) | |
Other operating revenue (expenses), net | (18.7) | 28.7 | (47.4) | (165.2) | (37.1) | (33.4) | (3.7) | 11.1 | |
(=) | Earnings before financial result, income tax and social contribution | 5,711.6 | 5,176.7 | 534.9 | 10.3 | 1,207.0 | 1,895.8 | (688.8) | (36.3) |
Financial result | (1,033.7) | (1,264.3) | 230.6 | (18.2) | (7.7) | 29.6 | (37.3) | (126.0) | |
(=) | Earnings before income tax and social contribution | 4,677.9 | 3,912.4 | 765.5 | 19.6 | 1,199.3 | 1,925.4 | (726.1) | (37.7) |
Income tax and social contribution | (1,310.4) | (1,077.3) | (233.1) | 21.6 | (142.3) | (417.8) | 275.5 | (65.9) | |
(=) | Net income | 3,367.5 | 2,835.1 | 532.4 | 18.8 | 1,057.0 | 1,507.6 | (450.6) | (29.9) |
Earnings per share* (R$) | 4.93 | 4.15 | 1.55 | 2.21 |
1. Includes Regulation, Control and Inspection Fee (TRCF), totaling R$ 70.1 million in 2019 and R$ 63.9 million in 2018.
2. Includes TRCF transfers, totaling R$ 61.9 million in 2019 and R$ 54.4 million in 2018.
* Total shares = 683,509,869
Adjusted EBITDA Reconciliation (Non-accounting measures)
R$ million | |||||||||
2019, | 2018, | Var. (R$), | %, | 4Q19, | 4Q18, | Var. (R$) | %, | ||
Net income | 3,367.5 | 2,835.1 | 532.4 | 18.8 | 1,057.0 | 1,507.6 | (450.6) | (29.9) | |
Income tax and social contribution | 1,310.4 | 1,077.3 | 233.1 | 21.6 | 142.3 | 417.8 | (275.5) | (65.9) | |
Financial result | 1,033.7 | 1,264.3 | (230.6) | (18.2) | 7.7 | (29.6) | 37.3 | (126.0) | |
Other operating revenues (expenses), net | 18.7 | (28.7) | 47.4 | (165.2) | 37.1 | 33.4 | 3.7 | 11.1 | |
(=) | Adjusted EBIT* | 5,730.3 | 5,148.0 | 582.3 | 11.3 | 1,244.1 | 1,929.2 | (685.1) | (35.5) |
Depreciation and amortization | 1,780.2 | 1,392.6 | 387.6 | 27.8 | 480.7 | 395.1 | 85.6 | 21.7 | |
(=) | Adjusted EBITDA ** | 7,510.5 | 6,540.6 | 969.9 | 14.8 | 1,724.8 | 2,324.3 | (599.5) | (25.8) |
(%) Adjusted EBITDA margin | 41.8 | 40.7 | 36.7 | 47.4 |
* Adjusted EBIT corresponds to net income before: (i) other operating revenues/expenses, net; (ii) financial result; and (iii) income tax and social contribution.
** Adjusted EBITDA corresponds to net income before: (i) depreciation and amortization expenses; (ii) income tax and social contribution; (iii) financial result; and (iv) other operating revenues/expenses, net.
In 2019, net operating revenue, which considers construction revenue, totaled R$ 17,983.6 million, up 11.8% from 2018.
Costs and expenses, which consider construction costs, totaled R$ 12,257.0 million, up 12.0% from 2018.
Adjusted EBIT totaled R$ 5,730.3 million, up 11.3% from the R$ 5,148.0 million recorded in 2018.
Adjusted EBITDA totaled R$ 7,510.5 million, up 14.8% from the R$ 6,540.6 million recorded in 2018.
The adjusted EBITDA margin reached 41.8% in 2019, versus 40.7% in 2018.
Excluding the effects of revenues and construction costs, adjusted EBITDA margin reached 49.5% in 2019, compared to 48.8% in 2018.
In 2019, the Company recorded net income of R$ 3,367.5 million, versus net income of R$ 2,835.1 million in 2018.
3. Gross operating revenue
Gross operating revenue related to sanitation services, in the amount of R$ 16,134.0 million, which does not consider construction revenue, increased by R$ 1,880.4 million, or 13.2%, from the R$ 14,253.6 million recorded in 2018.
The main factors that led to this variation were:
· 3.5% tariff repositioning index since June 2018 and 4.7% tariff adjustment since May 2019, with an impact of approximately 4.4% on operating revenue;
· 2.7% increase in total billed volume, of which 2.4% in water and 3.1% in sewage, excluding the volumes of Guarulhos and Santo André;
· Agreement signed with the municipality of Santo André in July 2019, increasing operating revenue by R$ 1,357.3 million.
The increases above mentioned were mitigated by the R$ 533.7 million decrease resulting from the the agreement signed with the municipality of Guarulhos in 2018.
The Company’s operations are concentrated in the municipality of São Paulo. Excluding the non-recurring effects of Santo André in 2019 and Guarulhos in 2018, the percentage of the municipality of São Paulo share in gross revenue (without construction revenue) is 50.3% in 2019 and 48.3% in 2018.
4
![]()
4. Construction revenue
Construction revenue increased by R$ 143.8 million, or 5.1%, from 2018.The variation was mainly due to higher asset investments 2019.
5. Billed volume
The tables below show water and sewage billed volumes, quarter-over-quarter and YOY, according to the consumer category and region. The volumes from the municipalities of Guarulhos and Santo André are highlighted separately.
WATER AND SEWAGE BILLED VOLUME(1) PER CUSTOMER CATEGORY - million m3 | |||||||||
Water | Sewage | Water + Sewage | |||||||
Category | 2019 | 2018 | % | 2019 | 2018 | % | 2019 | 2018 | % |
Residential | 1,645.5 | 1,607.0 | 2.4 | 1,415.4 | 1,374.6 | 3.0 | 3,060.9 | 2,981.6 | 2.7 |
Commercial | 170.1 | 166.8 | 2.0 | 165.9 | 161.3 | 2.9 | 336.0 | 328.1 | 2.4 |
Industrial | 31.4 | 31.0 | 1.3 | 38.5 | 37.7 | 2.1 | 69.9 | 68.7 | 1.7 |
Public | 42.0 | 40.4 | 4.0 | 38.3 | 36.4 | 5.2 | 80.3 | 76.8 | 4.6 |
Total retail | 1,889.0 | 1,845.2 | 2.4 | 1,658.1 | 1,610.0 | 3.0 | 3,547.1 | 3,455.2 | 2.7 |
Wholesale(3) | 82.9 | 81.2 | 2.1 | 16.0 | 13.9 | 15.1 | 98.9 | 95.1 | 4.0 |
Subtotal | 1,971.9 | 1,926.4 | 2.4 | 1,674.1 | 1,623.9 | 3.1 | 3,646.0 | 3,550.3 | 2.7 |
Guarulhos(4) | 73.7 | 110.7 | (33.4) | 64.0 | - | - | 137.7 | 110.7 | 24.4 |
Santo André(5) | 67.1 | 70.8 | (5.2) | 28.9 | 17.2 | 68.0 | 96.0 | 88.0 | 9.1 |
Total | 2,112.7 | 2,107.9 | 0.2 | 1,767.0 | 1,641.1 | 7.7 | 3,879.7 | 3,749.0 | 3.5 |
Water | Sewage | Water + Sewage | |||||||
Category | 4Q19 | 4Q18 | % | 4Q19 | 4Q18 | % | 4Q19 | 4Q18 | % |
Residential | 419.0 | 407.4 | 2.8 | 360.9 | 349.0 | 3.4 | 779.9 | 756.4 | 3.1 |
Commercial | 43.4 | 42.0 | 3.3 | 42.4 | 40.7 | 4.2 | 85.8 | 82.7 | 3.7 |
Industrial | 8.0 | 7.8 | 2.6 | 9.7 | 9.5 | 2.1 | 17.7 | 17.3 | 2.3 |
Public | 10.7 | 10.2 | 4.9 | 9.6 | 9.2 | 4.3 | 20.3 | 19.4 | 4.6 |
Total retail | 481.1 | 467.4 | 2.9 | 422.6 | 408.4 | 3.5 | 903.7 | 875.8 | 3.2 |
Wholesale(3) | 20.9 | 20.5 | 2.0 | 3.6 | 3.9 | (7.7) | 24.5 | 24.4 | 0.4 |
Subtotal | 502.0 | 487.9 | 2.9 | 426.2 | 412.3 | 3.4 | 928.2 | 900.2 | 3.1 |
Guarulhos(4) | 20.4 | 28.3 | (27.9) | 18.0 | - | - | 38.4 | 28.3 | 35.7 |
Santo André(5) | 13.2 | 17.8 | (25.8) | 13.1 | 3.8 | 244.7 | 26.3 | 21.6 | 21.8 |
Total | 535.6 | 534.0 | 0.3 | 457.3 | 416.1 | 9.9 | 992.9 | 950.1 | 4.5 |
WATER AND SEWAGE BILLED VOLUME(1) PER REGION - million m3 | |||||||||
Water | Sewage | Water + Sewage | |||||||
Region | 2019 | 2018 | % | 2019 | 2018 | % | 2019 | 2018 | % |
Metropolitan | 1,222.7 | 1,194.5 | 2.4 | 1,073.8 | 1,043.8 | 2.9 | 2,296.5 | 2,238.3 | 2.6 |
Regional (2) | 666.3 | 650.7 | 2.4 | 584.3 | 566.2 | 3.2 | 1,250.6 | 1,216.9 | 2.8 |
Total retail | 1,889.0 | 1,845.2 | 2.4 | 1,658.1 | 1,610.0 | 3.0 | 3,547.1 | 3,455.2 | 2.7 |
Wholesale(3) | 82.9 | 81.2 | 2.1 | 16.0 | 13.9 | 15.1 | 98.9 | 95.1 | 4.0 |
Subtotal | 1,971.9 | 1,926.4 | 2.4 | 1,674.1 | 1,623.9 | 3.1 | 3,646.0 | 3,550.3 | 2.7 |
Guarulhos(4) | 73.7 | 110.7 | (33.4) | 64.0 | - | - | 137.7 | 110.7 | 24.4 |
Santo André(5) | 67.1 | 70.8 | (5.2) | 28.9 | 17.2 | 68.0 | 96.0 | 88.0 | 9.1 |
Total | 2,112.7 | 2,107.9 | 0.2 | 1,767.0 | 1,641.1 | 7.7 | 3,879.7 | 3,749.0 | 3.5 |
Water | Sewage | Water + Sewage | |||||||
Region | 9M19 | 9M18 | % | 9M19 | 9M18 | % | 9M19 | 9M18 | % |
Metropolitan | 311.1 | 301.3 | 3.3 | 273.4 | 263.7 | 3.7 | 584.5 | 565.0 | 3.5 |
Regional (2) | 170.0 | 166.1 | 2.3 | 149.2 | 144.7 | 3.1 | 319.2 | 310.8 | 2.7 |
Total retail | 481.1 | 467.4 | 2.9 | 422.6 | 408.4 | 3.5 | 903.7 | 875.8 | 3.2 |
Wholesale(3) | 20.9 | 20.5 | 2.0 | 3.6 | 3.9 | (7.7) | 24.5 | 24.4 | 0.4 |
Subtotal | 502.0 | 487.9 | 2.9 | 426.2 | 412.3 | 3.4 | 928.2 | 900.2 | 3.1 |
Guarulhos(4) | 20.4 | 28.3 | (27.9) | 18.0 | - | - | 38.4 | 28.3 | 35.7 |
Santo André(5) | 13.2 | 17.8 | (25.8) | 13.1 | 3.8 | 244.7 | 26.3 | 21.6 | 21.8 |
Total | 535.6 | 534.0 | 0.3 | 457.3 | 416.1 | 9.9 | 992.9 | 950.1 | 4.5 |
1. Unaudited
2. Including coastal and interior regions
3. Wholesale includes volumes of reuse water and non-domestic sewage
4. Billed volume in the retail segment in 2019 and in the wholesale segment in 2018
5. Billed volume in the retail segment as from October 2019 and in the wholesale segment until September 2019
5
![]()
6. Costs, administrative & selling expenses and construction costs
Costs, administrative & selling expenses and construction costs increased by R$ 1,313.4 million in 2019 (12.0%). Excluding construction costs, the increase was R$ 1,171.7 million (14.3%).
Costs, administrative & selling expenses and construction costs as a percentage of net revenue was 68.2% in 2019, versus 68.0% in 2018.
R$ million | ||||||||
2019 | 2018 | Var. (R$) | % | 4Q19 | 4Q18 | Var. (R$) | % | |
Salaries and payroll charges and Pension plan obligations | 2,681.9 | 2,673.6 | 8.3 | 0.3 | 712.3 | 671.3 | 41.0 | 6.1 |
General supplies | 272.9 | 249.3 | 23.6 | 9.5 | 76.9 | 79.3 | (2.4) | (3.0) |
Treatment materials | 310.4 | 265.1 | 45.3 | 17.1 | 80.5 | 69.7 | 10.8 | 15.5 |
Services | 1,808.4 | 1,474.7 | 333.7 | 22.6 | 482.0 | 411.4 | 70.6 | 17.2 |
Electricity | 1,142.9 | 959.4 | 183.5 | 19.1 | 297.9 | 267.3 | 30.6 | 11.4 |
General expenses | 1,177.6 | 963.8 | 213.8 | 22.2 | 288.1 | 278.8 | 9.3 | 3.3 |
Tax expenses | 73.2 | 58.7 | 14.5 | 24.7 | 17.6 | 14.8 | 2.8 | 18.9 |
Sub-total | 7,467.3 | 6,644.6 | 822.7 | 12.4 | 1,955.3 | 1,792.6 | 162.7 | 9.1 |
Depreciation and amortization | 1,780.2 | 1,392.6 | 387.6 | 27.8 | 480.7 | 395.1 | 85.6 | 21.7 |
Allowance for doubtful accounts | 128.1 | 166.7 | (38.6) | (23.2) | 77.2 | 40.7 | 36.5 | 89.7 |
Sub-total | 1,908.3 | 1,559.3 | 349.0 | 22.4 | 557.9 | 435.8 | 122.1 | 28.0 |
Costs, administrative and selling expenses | 9,375.6 | 8,203.9 | 1,171.7 | 14.3 | 2,513.2 | 2,228.4 | 284.8 | 12.8 |
Construction costs | 2,881.4 | 2,739.7 | 141.7 | 5.2 | 934.7 | 747.1 | 187.6 | 25.1 |
Costs, adm & selling expenses and construction costs | 12,257.0 | 10,943.6 | 1,313.4 | 12.0 | 3,447.9 | 2,975.5 | 472.4 | 15.9 |
% of net revenue | 68.2 | 68.0 | 73.4 | 60.7 |
Salaries and payroll charges and Pension plan obligations
In 2019, the R$ 8.3 million increase was due to:
· R$ 93.5 million, mainly due to the application of 1.0% referring to the Career and Salaries Plan (Plano de Cargos e Salários) in February 2019 and the 4.99% salary adjustment in May 2019;
· R$ 28.6 million in health care expenses, concentrated in the first months of 2019, when it was administered by SABESPREV;
· R$ 24.2 million in provision for defined benefits pension plan due to changes in the actuarial assumptions;
· R$ 19.1 million in overtime expenses; and
· R$ 18.7 million in foodassistance and meal voucher expenses.
The increases were offset by the reversal of R$ 173.3 million in the non-recurring of the TAC – Retirees, related to employees who retired after the signing of the commitment with the Public Prosecution Office of São Paulo, due to SABESP’s compliance with the legal requirements, recognized by the Public Prosecutor.
6
![]()
Treatment Materials
Increase of R$ 45.3 million, or 17.1%, mainly due to higher use of alkalinizers and coagulants in water treatment, especially in the ABV Water Treatment Station.
Services
Expenses with services totaled R$ 1,808.4 million, an increase of R$ 333.7 million, or 22.6%, from the R$ 1,474.7 million recorded in 2018.The main changes were:
· R$ 62.1 million, of which R$ 10.3 million in the municipality of Guarulhos, with maintenance services in water and sewage networks and connections;
· R$ 57.3 million in expenses with employees assigned by the municipality of Guarulhos, since January 2019;
· R$ 32.5 million with meter reading and bill delivery;
· R$ 27.5 million in the hiring of consulting services for improvements in IT systems;
· R$ 25.7 million in customer services;
· R$ 24.3 million in credit recovery contracts;
· R$ 24.1 million in surveillance expenses;
· R$ 23.9 million in labor expenses, related to the start of operations in the municipality of Santo André, in August 2019; and
· R$ 17.9 million in the paving and replacing of sidewalks.
Electricity
Electricity expenses totaled R$ 1,142.9 million in 2019, up R$ 183.5 million, or 19.1%, from the R$ 959.4 million recorded in 2018. Of total electricity expenses, the Free Market Tariffs (Ambiente de Contratação Livre - ACL) accounted for 36.7% (including the Grid Market Tariffs (Tarifas de Uso do Sistema de Distribuição - TUSD)) while the Regulated Market Tariffs (Ambiente de Contratação Regulada - ACR) accounted for 63.3%.
The main variations were mainly due to:
· Average decrease of 3.2% in ALC prices, with a 5.9% decrease in consumption; and
· Average increase of 11.1% in ACR tariffs, with a 10.3% increase in consumption.
The increase in consumption in 2019 was largely driven by the start of operations at the Jaguari-Atibainha Interconnection and the São Lourenço Production System, as well as the start of operations in the municipality of Guarulhos.
General expenses
Increase of R$ 213.8 million, or 22.2%, totaling R$ 1,177.6 million in 2019, versus the R$ 963.8 million recorded in 2018, due to:
· Higher provisioning for lawsuits in 2019, in the amount of R$ 88.8 million;
· Expenses related to the conclusion of lawsuits, in the amount of R$ 85.4 million, resulting from the signing of agreements with the municipalities of São Bernardo do Campo and Guarujá, in the amounts of R$ 39.0 million and R$ 46.4 million, respectively; and
· Higher provision for transfer to Municipal Sanitation Funds, in the amount of R$ 46.8 million, with the main increase referring to the municipality of São Paulo, totaling R$ 30.1 million.
7
![]()
Depreciation and amortization
Depreciation and amortization expenses increased by R$ 387.6 million, or 27.8%, due to the startup of intangible assets, totaling R$ 3.1 billion, and the effects of the amortization of the São Lourenço PPP that impacted the Company's result in 12 months of 2019 and in five months in 2018.
Allowance for doubtful accounts
Decrease of R$ 38.6 million, due to higher recovery of values by means of agreements signed in 2019, net of the defaults recorded in the period.
7. Other operating revenue (expenses), net
Other net operating revenues and expenses had a negative variation of R$ 47.4 million, mainly due to:
· R$ 20.1 million decrease in other operating revenues, mainly because of: (i) the non-recurring revenue from property expropriation in 2018, in the amount of R$ 8.1 million; and (ii) higher receipt of funds from the River Basin Depollution Program in 2018, in the amount of R$ 6.2 million; and
· Increase in the write-off of obsolete items in 2019, totaling R$ 15.6 million.
8. Financial result
R$ million | ||||
2019 | 2018 | Var. | % | |
Financial expenses, net of income | (698.6) | (364.3) | (334.3) | 91.8 |
Net monetary and exchange variation | (335.1) | (900.0) | 564.9 | (62.8) |
Financial result | (1,033.7) | (1,264.3) | 230.6 | (18.2) |
Financial expenses, net of income
R$ million | ||||
2019 | 2018 | Var. | % | |
Financial expenses | ||||
Interest and charges on domestic loans and financing | (331.4) | (332.1) | 0.7 | (0.2) |
Interest and charges on international loans and financing | (165.4) | (171.8) | 6.4 | (3.7) |
Other financial expenses | (483.5) | (200.8) | (282.7) | 140.8 |
Total financial expenses | (980.3) | (704.7) | (275.6) | 39.1 |
Financial income | 281.7 | 340.4 | (58.7) | (17.2) |
Financial expenses net of income | (698.6) | (364.3) | (334.3) | 91.8 |
Increase of R$ 334.3 million, mainly due to:
· R$ 282.7 million increase in other financial expenses, chiefly due to: (i) R$ 128.3 million increase in interest recognition in 2019, as a result of the definitive startup of the São Lourenço Production System, in July 2018; and (ii) higher recognition of interest on lawsuits, in the amount of R$ 127.9 million; and
· R$ 58.7 million decrease in financial income, mostly from the lower yield on financial investments in 2019, due to the lower amount invested and the reduction in the remuneration of the DI rate.
8
![]()
Monetary and exchange variation, net
R$ million | ||||
2019 | 2018 | Var. | % | |
Monetary exchange rate variation on liabilities | ||||
Monetary variation on loans and financing | (44.8) | (66.2) | 21.4 | (32.3) |
Currency exchange variation on loans and financing | (234.0) | (915.9) | 681.9 | (74.5) |
Other monetary variations | (148.3) | (37.1) | (111.2) | 299.7 |
Monetary/exchange rate variation on liabilities | (427.1) | (1,019.2) | 592.1 | (58.1) |
Monetary/exchange rate variation on assets | 92.0 | 119.2 | (27.2) | (22.8) |
Monetary/exchange rate variation, net | (335.1) | (900.0) | 564.9 | (62.8) |
The effect of net monetary and exchange variations in 2019 was R$ 564.9 million lower than in 2018, highlighting:
· Decrease of R$ 681.9 million in exchange variations on loans and financing, as a result of the lower appreciation of the US Dollar and Japanese Yen against the Brazilian Real in 2019 (4.0% and 5.3%, respectively), when compared to the amounts recorded in 2018 (17.1% and 20.0%, respectively);
· Decrease of R$ 21.4 million in monetary variations on loans and financing, mainly due to the total amortization of the 15th debenture issuance and the partial amortization of the 17th debenture issuance, in addition to the reduction in the IPCA index;
· Increase of R$ 111.2 million in other monetary variations, as a result of: (i) monetary variation on the liabilities of the São Lourenço Production System, in the amount of R$ 53.1 million; and (ii) higher monetary variation on lawsuits, in the amount of R$ 48.8 million; and
· Decrease of R$ 27.2 million in the monetary and exchange variations on assets, due to: (i) decrease of R$ 10.7 million in the adjustment for inflation over the agreement entered into with São Paulo State Government - GESP, because of the reduction in the IPCA index; and (ii) lower restatement of judicial deposits, in the amount of R$ 5.5 million.
9. Income tax and Social contribution
Increase of R$ 233.1 million, due to higher taxable income in 2019, mainly impacted by the increase in operating revenue, due to the agreement with the municipality of Santo André, the reduction in expenses from exchange variations and the reversal for the TAC – Retirees.
9
![]()
10. Indicators
a) Operating
The substantial increase in the number of water and sewage connections and the served population was due to the addition of the municipalities of Guarulhos and Santo André. Excluding these two municipalities, the number of water connections would have been 9.3 million and the number of sewage connections would have been 7.7 million. The population served with water supply and sewage collection would have totaled 25.2 million and 22.1 million, respectively.
Regarding to water loss indicators, of the Micromeasured Water Loss Index (IPM) of 29.0% at the end of 2019, 19.0% (or 65% of the total) refers to Real Losses (Physical) and 10% (or 35% of the total) refers to Apparent Losses (Non-physical). Meanwhile, of the total Water Loss per Connection Index (IPDt) of 285 liters/connectionxday, 185 liters/connectionxday refers to Real Losses (Physical) and 100 liters/connectionxday refers to Apparent Losses (Non-physical). It should be noted that Apparent Losses, in both indicators, represents water consumed but not measured by the Company.
Operating indicators * | 2019_ | 2018_ | %_ |
Water connections(1) | 9,933 | 9,053 | 9.7 |
Sewage connections(1) | 8,326 | 7,495 | 11.1 |
Population directly served - water(2) | 27.1 | 25.1 | 8.0 |
Population directly served - sewage(2) | 23.8 | 21.7 | 9.7 |
Number of employees | 13,945 | 14,449 | (3.5) |
Water volume produced in the year(3) | 2,873.0 | 2,800 | 2.6 |
IPM - Micromeasured water loss (%)(4) | 29.0 | 30.1 | (3.7) |
IPDt (liters/connection x day)(4) | 285 | 293 | (2.7) |
1. Total connections, active and inactive, in thousand units at the end of the period
2. In million inhabitants, at the end of the period. Does not include wholesale
3. In millions of cubic meters
4. Does not include Guarulhos and Santo André
* Unaudited
b) Management’s Indicators
Following are the Management Performance Indicators, namely Gross Revenue, Operating Expense and EBITDA, all of them measured per billed cubic meter.
The period shown goes back to 2014, based on the interim financial information disclosed by the Company and excludes some non-recurring and material events that would distort the result.
All indicators were calculated based on the average prices for the fourth quarter of 2019, adjusted by the IPCA index, in order to compare the period data on a same-price basis.
Gross Revenue per billed cubic meter showed an average growth, especially after the third quarter of 2015.
Operating Expenses per billed cubic meter grew in a controlled manner and compatible with the expansion of the operations, quarter on quarter, showing a stable average behavior and disciplined cost management.
Note the average increase in EBITDA per cubic meter in the period, basically due to the behavior of Gross Revenues and Operating Expenses.
10
![]()

The following were not considered:
- Construction revenue
- R$928 million referring to the agreement with Guarulhos in 4Q18
- R$1,254 million referring to agreement with Santo André in 3Q19
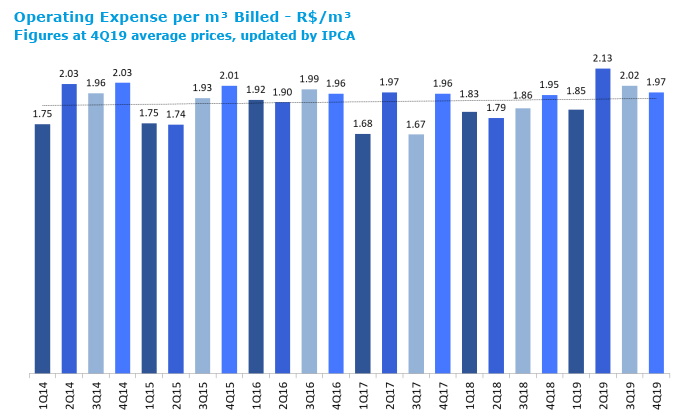
Expenses considered: personnel, general supplies, treatement materials, services,
electricity, general expenses and tax expenses.
Reversals excluded:
- R$696 million referring to agreement with the State Government in 1Q15
- R$307 million referring to the migration of the additional pension plan in 3Q16
- R$173 million referring to the TAC Retirees.
11
![]()

The following were not considered:
Revenue:
- R$928 million referring to the agreement with Guarulhos in 4Q18
- R$1,254 million referring to agreement with Santo André in 3Q19
Reversal of expenses:
- R$696 million referring to agreement with the State Government in 1Q15
- R$307 million referring to the migration of the additional pension plan in 3Q16
- R$173 million referring to the end of the TAC Retirees in 3Q19
c) Economic
Economic Variables at the close of the period* | 2019 | 2018 |
Amplified Consumer Price Index(1) | 4.31 | 3.75 |
National Consumer Price Index(1) | 4.48 | 3.43 |
Consumer Price Index(1) | 4.38 | 2.99 |
Referential Rate(1) | 0.0000 | 0.0000 |
Interbank Deposit Certificate(2) | 4.40 | 6.40 |
US DOLAR(3) | 4.0307 | 3.8748 |
IENE(3) | 0.03715 | 0.03527 |
1. Annual accrual, in %
2. Annual average
3. Ptax sale rate on the last day
* Unaudited
11. Loans and financing
The Company has frequent access to Brazilian and international credit markets, maintaining strong relationships with public banks and multilateral agencies. This diverse mix of sources results in an extremely long debt repayment profile, at costs compatible with the Company’s investment cycle, especially those granted by official Brazilian banks and multilateral credit agencies. On December 31, 2019, external debt accounted for 48% of total debt exposed to the exchange rate variation of the Brazilian real against the dollar and the Yen.
In November 2019, considering the international and national macroeconomic conditions and their impact on interest and exchange rates, the Board of Directors approved a new guideline for the management of the Company’s external debt, in order to include initiatives to capture opportunities that consequently decrease the currency exposure of its debt.
In the case of debts with multilateral agencies and official banks, some agreements already include a currency exchange clause. For other foreign currency-denominated debts, the Company may use private exchange rate hedging instruments.
12
![]()
R$ thousand | |||||||||
DEBT PROFILE | |||||||||
INSTITUTION | 2020 | 2021 | 2022 | 2023 | 2024 | 2025 | 2026 onwards | TOTAL | % of total |
Local Currency | |||||||||
Debentures | 601,861 | 484,363 | 563,291 | 366,330 | 700,583 | 280,062 | 644,924 | 3,641,414 | 27 |
Caixa Econômica Federal | 83,519 | 87,951 | 92,727 | 85,554 | 84,289 | 89,569 | 901,570 | 1,425,179 | 11 |
BNDES | 135,036 | 134,584 | 134,584 | 128,886 | 123,400 | 105,460 | 435,912 | 1,197,862 | 9 |
Leasing | 27,314 | 29,093 | 31,063 | 33,711 | 36,697 | 39,951 | 261,842 | 459,671 | 3 |
Leasing (IFRS 16) | 51,088 | 22,630 | 678 | 57 | - | - | - | 74,453 | 1 |
Others | 1,665 | 1,865 | 1,865 | 1,825 | 1,384 | 1,268 | - | 9,872 | 0 |
Interest and other charges | 77,460 | - | - | - | - | - | - | 77,460 | 1 |
Total Local Currency | 977,943 | 760,486 | 824,208 | 616,363 | 946,353 | 516,310 | 2,244,248 | 6,885,911 | 52 |
Foreign Currency | |||||||||
IADB | 170,051 | 170,051 | 170,051 | 170,051 | 170,051 | 170,051 | 1,271,183 | 2,291,489 | 17 |
IBRD | 24,505 | 24,505 | 24,505 | 24,505 | 24,505 | 24,505 | 208,373 | 355,403 | 3 |
Eurobond | 1,409,921 | - | - | - | - | - | - | 1,409,921 | 11 |
JICA | 161,144 | 154,857 | 154,857 | 154,857 | 154,857 | 154,857 | 1,158,756 | 2,094,185 | 16 |
IDB 1983AB | 71,312 | 31,005 | 31,005 | 29,511 | - | - | - | 162,833 | 1 |
Interest and other charges | 44,967 | - | - | - | - | - | - | 44,967 | 0 |
Total in Foreign Currency | 1,881,900 | 380,418 | 380,418 | 378,924 | 349,413 | 349,413 | 2,638,312 | 6,358,798 | 48 |
Total | 2,859,843 | 1,140,904 | 1,204,626 | 995,287 | 1,295,766 | 865,723 | 4,882,560 | 13,244,709 | 100 |
Covenants
Covenants | 2019 | |
Adjusted EBITDA / Adjusted Financial Expense | Equal to or higher than 2.80 | 6.33 |
Adjusted Net Debt / Adjusted EBITDA | Equal to or lower than 3.80 | 1.48 |
Total Adjusted Debt / Adjusted EBITDA | Lower than 3.65 | 1.75 |
Other Onerous Debt (1) / Adjusted EBITDA | Equal to or lower than 1.30 | 0.45 |
Adjusted Current Liquidity | Higher than 1.00 | 1.32 |
EBITDA / Financial Expense Paid | Equal to or higher than 2.35 | 10.19 |
Net Debt / Adjusted EBITDA | Equal to or lower than 3.50 | 1.45 |
1. “Other Onerous Debts” corresponds to the sum of social security liabilities and health care plan, installment payment of tax debts and installment payment of debts with the electricity supplier.
On December 31, 2019 and 2018, the Company complied with the requirements effective in its loan and financing agreements.
12. CAPEX
In 2019, the Company invested R$ 5.1 billion, R$ 2.5 billion of which in water and R$ 2.6 billion in sewage. Of this total, R$ 2.1 billion are non-cash investments.
13
![]()
The table below provides additional information on investments carried out, with a breakdown of water and sewage by region:
R$ million | |||
Investments by segment | Water | Sewage | Total |
Metropolitan Region | 2,033.0 | 2,084.3 | 4,117.3 |
Regional Systems | 419.9 | 530.8 | 950.7 |
Total | 2,452.9 | 2,615.1 | 5,068.0 |
2020 - 2024 Investment plan: R$ 20.2 billion
For the 2020 – 2024 period, the Company plans to directly invest approximately R$ 20.7 billion, of which R$ 8.1 billion in water and R$ 12.1 billion in sewage collection and treatment.
R$ million | ||||||
2020 | 2021 | 2022 | 2023 | 2024 | Total | |
Water | 1,677 | 1,640 | 1,505 | 1,586 | 1,693 | 8,101 |
Sewage Collection | 1,526 | 1,873 | 2,022 | 1,999 | 1,870 | 9,290 |
Sewage Treatment | 578 | 508 | 593 | 530 | 615 | 2,824 |
Total | 3,781 | 4,021 | 4,120 | 4,115 | 4,178 | 20,215 |
14
![]()

For more information, please contact:
Mario Arruda Sampaio
Head of Capital Markets and Investor Relations
Phone:(55 11) 3388-8664
E-mail:maasampaio@sabesp.com.br
Angela Beatriz Airoldi
Investor Relations Manager
Phone:(55 11) 3388-8793
E-mail: abairoldi@sabesp.com.br
Statements contained in this press release may contain information that is forward-looking and reflects management's current view and estimates of future economic circumstances, industry conditions, SABESP performance, and financial results. Any statements, expectations, capabilities, plans and assumptions contained in this press release that do not describe historical facts, such as statements regarding the declaration or payment of dividends, the direction of future operations, the implementation of principal operating and financing strategies and capital expenditure plans, the factors or trends affecting financial condition, liquidity or results of operations are forward-looking statements within the meaning of the U.S. Private Securities Litigation Reform Act of 1995 and involve a number of risks and uncertainties. There is no guarantee that these results will actually occur. The statements are based on many assumptions and factors, including general economic and market conditions, industry conditions, and operating factors. Any changes in such assumptions or factors could cause actual results to differ materially from current expectations.
15
![]()
Income Statement
Brazilian Corporate Law | R$ '000 | |
2019 | 2018 | |
Net Operating Income | 17,983,654 | 16,085,094 |
Operating Costs | (10,137,637) | (9,086,456) |
Gross Profit | 7,846,017 | 6,998,638 |
Operating Expenses | ||
Selling | (803,404) | (693,480) |
Estimated losses with doubtful accounts | (128,099) | (166,727) |
Administrative expenses | (1,187,844) | (996,877) |
Other operating revenue (expenses), net | (18,748) | 28,591 |
Operating Income Before Shareholdings | 5,707,922 | 5,170,145 |
Equity Result | 3,701 | 6,510 |
Earnings Before Financial Results, net | 5,711,623 | 5,176,655 |
Financial, net | (800,583) | (361,665) |
Exchange gain (loss), net | (233,098) | (902,671) |
Earnings before Income Tax and Social Contribution | 4,677,942 | 3,912,319 |
Income Tax and Social Contribution | ||
Current | (1,155,463) | (852,655) |
Deferred | (154,962) | (224,596) |
Net Income for the period | 3,367,517 | 2,835,068 |
Registered common shares ('000) | 683,509 | 683,509 |
Earnings per shares - R$ (per share) | 4.93 | 4.15 |
Depreciation and Amortization | (1,780,094) | (1,392,541) |
Adjusted EBITDA | 7,510,465 | 6,540,605 |
% over net revenue | 41.8% | 40.7% |
16
![]()
Balance Sheet
Brazilian Corporate Law | R$ '000 | ||
ASSETS | 12/31/2019 | 12/31/2018 | |
Current assets | |||
Cash and cash equivalents | 2,253,210 | 3,029,191 | |
Trade receivables | 2,137,752 | 1,843,333 | |
Related parties and transactions | 192,906 | 174,148 | |
Inventories | 70,454 | 65,596 | |
Restricted cash | 26,018 | 31,900 | |
Currrent recoverable taxes | 141,266 | 380,703 | |
Other receivables | 74,532 | 77,371 | |
Total current assets | 4,896,138 | 5,602,242 | |
Noncurrent assets | |||
Trade receivables | 215,275 | 209,083 | |
Related parties and transactions | 657,990 | 669,102 | |
Escrow deposits | 177,982 | 152,018 | |
Water National Agency – ANA | 32,466 | 49,136 | |
Other receivables | 119,646 | 103,310 | |
Equity investments | 53,187 | 44,587 | |
Investment properties | 47,562 | 47,620 | |
Contract assets | 7,617,714 | 7,407,948 | |
Intangible assets | 32,325,447 | 29,012,460 | |
Property, plant and equipment | 314,393 | 267,612 | |
Total noncurrent assets | 41,561,662 | 37,962,876 | |
Total assets | 46,457,800 | 43,565,118 | |
LIABILITIES AND EQUITY | 12/31/2019 | 12/31/2018 | |
Current liabilities | |||
Trade payables | 369,631 | 465,993 | |
Borrowings and financing | 2,859,843 | 2,103,612 | |
Accrued payroll and related charges | 594,279 | 564,830 | |
Taxes and contributions | 250,318 | 200,563 | |
Dividends and interest on capital payable | 800,352 | 673,765 | |
Provisions | 550,247 | 458,387 | |
Services payable | 474,078 | 454,022 | |
Public-Private Partnership – PPP | 110,291 | 137,827 | |
Program Contract Commitments | 273,932 | 230,695 | |
Other liabilities | 170,453 | 108,938 | |
Total current liabilities | 6,453,424 | 5,398,632 | |
Noncurrent liabilities | |||
Borrowings and financing | 10,384,866 | 11,049,184 | |
Deferred income tax and social contribution | 433,996 | 261,242 | |
Deferred Cofins and Pasep | 143,693 | 140,830 | |
Provisions | 485,561 | 434,475 | |
Pension obligations | 3,360,932 | 2,970,009 | |
Public-Private Partnership – PPP | 3,183,689 | 3,275,297 | |
Program Contract Commitments | 103,321 | 142,314 | |
Other liabilities | 272,535 | 341,447 | |
Total noncurrent liabilities | 18,368,593 | 18,614,798 | |
Total liabilities | 24,822,017 | 24,013,430 | |
Equity | |||
Paid-up capital | 15,000,000 | 15,000,000 | |
Profit reserve | 7,547,954 | 5,100,783 | |
Other comprehensive income | (912,171) | (549,095) | |
Total equity | 21,635,783 | 19,551,688 | |
Total equity and liabilities | 46,457,800 | 43,565,118 |
17
![]()
Cash Flow
Brazilian Corporate Law | R$ '000 | |||
Jan-Dec | Jan-Dec | |||
Cash flow from operating activities | ||||
Profit before income tax and social contribution | 4,677,942 | 3,912,319 | ||
Adjustment for: | ||||
Depreciation and amortization | 1,780,094 | 1,392,541 | ||
Residual value of property, plant and equipment and intangible assets written-off | 45,434 | 24,974 | ||
Allowance for doubtful accounts | 128,099 | 165,433 | ||
Guarulhos agreement | - | (928,014) | ||
Santo André agreement | (1,336,908) | - | ||
Provision and inflation adjustment | 384,620 | 111,940 | ||
Interest calculated on loans and financing payable | 568,679 | 563,902 | ||
Inflation adjustment and foreign exchange gains (losses) on loans and financing | 280,526 | 982,072 | ||
Interest and inflation adjustment losses | 46,038 | 30,103 | ||
Interest and inflation adjustment gains | (39,547) | (64,046) | ||
Financial charges from customers | (364,291) | (289,321) | ||
Margin on intangible assets arising from concession | (65,172) | (63,013) | ||
Provision for Consent Decree (TAC) and Knowledge retention program (KRP) | (130,345) | 80,245 | ||
Equity result | (3,701) | (6,510) | ||
Interest and inflation adjustment (Public-Private Partnership) | 397,576 | - | ||
Provision from São Paulo agreement | 135,013 | 135,735 | ||
Pension obligations | 267,423 | 243,569 | ||
Other adjustments | 5,863 | 33,349 | ||
6,777,343 | 6,325,278 | |||
Changes in assets | ||||
Trade accounts receivable | (72,538) | (71,679) | ||
Accounts receivable from related parties | 26,358 | 39,919 | ||
Inventories | (4,858) | 20,075 | ||
Recoverable taxes | 239,437 | (104,118) | ||
Escrow deposits | (12,302) | (1,639) | ||
Other accounts receivable | (1,966) | 11,760 | ||
Changes in liabilities | ||||
Trade payables and contractors | (349,037) | (176,826) | ||
Services payable | (114,957) | (89,988) | ||
Accrued payroll and related charges | 159,794 | (103,488) | ||
Taxes and contributions payable | 63,276 | (4,829) | ||
Deferred Cofins/Pasep | 2,863 | 10,648 | ||
Provisions | (241,674) | (297,282) | ||
Pension obligations | (221,784) | (217,000) | ||
Other liabilities | (92,637) | 122,214 | ||
Cash generated from operations | 6,157,318 | 5,463,045 | ||
Interest paid | (737,326) | (732,048) | ||
Income tax and contribution paid | (1,222,747) | (888,077) | ||
Net cash generated from operating activities | 4,197,245 | 3,842,920 | ||
Cash flows from investing activities | ||||
Acquisition of contract assets and intangible assets | (3,195,247) | (2,132,559) | ||
Restricted cash | 5,882 | (13,078) | ||
Increase/(decrease) in investment | 240 | (1,136) | ||
Purchases of tangible assets | (78,159) | (50,645) | ||
Cash receipts from the sale of assets | - | 8,131 | ||
Net cash used in investing activities | (3,267,284) | (2,189,287) | ||
Cash flow from financing activities | ||||
Loans and financing | ||||
Proceeds from loans | 1,793,388 | 1,634,553 | ||
Repayments of loans | (2,148,198) | (1,678,748) | ||
Payment of interest on shareholders'equity | (739,996) | (653,393) | ||
Public-Private Partnership – PPP | (548,079) | (178,333) | ||
Program Contract Commitments | (63,057) | (31,568) | ||
Net cash used in financing activities | (1,705,942) | (907,489) | ||
Increase/(decrease) in cash and cash equivalents | (775,981) | 746,144 | ||
Represented by: | ||||
Cash and cash equivalents at beginning of the year | 3,029,191 | 2,283,047 | ||
Cash and cash equivalents at end of the year | 2,253,210 | 3,029,191 | ||
Increase/(decrease) in cash and cash equivalents | (775,981) | 746,144 | ||
18
Companhia de Saneamento Básico do Estado de São Paulo - SABESP | ||
| By: | /s/ Rui de Britto Álvares Affonso | |
Name: Rui de Britto Álvares Affonso Title: Chief Financial Officer and Investor Relations Officer | ||
This press release may contain forward-looking statements. These statements are statements that are not historical facts, and are based on management's current view and estimates of future economic circumstances, industry conditions, company performance and financial results. The words "anticipates", "believes", "estimates", "expects", "plans" and similar expressions, as they relate to the company, are intended to identify forward-looking statements. Statements regarding the declaration or payment of dividends, the implementation of principal operating and financing strategies and capital expenditure plans, the direction of future operations and the factors or trends affecting financial condition, liquidity or results of operations are examples of forward-looking statements. Such statements reflect the current views of management and are subject to a number of risks and uncertainties. There is no guarantee that the expected events, trends or results will actually occur. The statements are based on many assumptions and factors, including general economic and market conditions, industry conditions, and operating factors. Any changes in such assumptions or factors could cause actual results to differ materially from current expectations.