Management’s Discussion and Analysis
The following Management’s Discussion and Analysis (“MD&A”) of the consolidated operating and financial performance of Claude Resources Inc. (“Claude” or the “Company”) for the three months ended March 31, 2013 with the corresponding period of 2012 is prepared as of May 8, 2013. This discussion is the responsibility of Management and has been prepared using International Financial Reporting Standards (“IFRS”), as issued by the International Accounting Standards Board. This discussion should be read in conjunction with the Company’s March 31, 2013 condensed consolidated interim financial statements and notes thereto and the Company’s 2012 audited consolidated financial statements and notes thereto. The Board of Directors has approved the disclosure presented herein. All amounts referred to in this discussion are expressed in Canadian dollars, except where otherwise indicated.
Overview
Claude Resources Inc., incorporated pursuant to the Canada Business Corporations Act, is a gold producer with shares listed on both the Toronto Stock Exchange (TSX-CRJ) and the NYSE MKT (NYSE MKT-CGR). The Company is also engaged in the exploration and development of gold mineral reserves and mineral resources. The Company’s entire asset base is located in Canada.
The Company’s revenue generating asset is the 100 percent owned Seabee Gold Operation, located in northern Saskatchewan, which includes 42,500 acres (17,200 hectares) and is comprised of five mineral leases and extensive surface infrastructure. Claude also owns 100 percent of the Amisk Gold Project in northeastern Saskatchewan. The Amisk Gold Project is located 20 kilometres southwest of Flin Flon, Manitoba and hosts the Amisk Gold Deposit and a large number of gold occurrences and prospects. At 99,800 acres (40,400 hectares), this gold and silver exploration property is one of the largest land positions in the Flin Flon mineral district. Claude also owns 100 percent of the Madsen Property located in the Red Lake gold camp of northwestern Ontario. The Madsen Project comprises over 10,000 acres (4,000 hectares) and boasts historical production in excess of 2.4 million ounces, making it the third largest gold producer in the Red Lake camp in Ontario, Canada. Infrastructure includes a fully functional 500 ton per day mill, a 4,125 foot deep shaft and permitted tailings facility. (1)
The Company’s Seabee, Amisk and Madsen properties contain large, long life mineral resources in the politically safe jurisdiction of Canada. All three properties, and their related deposits, contain over one million ounces of gold in the ground inventory and have significant leverage to the price of gold and provide valuable long-term opportunities for the Company and its shareholders. Management intends to maintain and advance these projects in a financially prudent manner, which will include the monitoring of the attractiveness of these projects and the evaluation of alternatives to improve their economics.
Subsequent to March 31, 2013, the price of gold witnessed its biggest plunge since 1980 (dropping below U.S. $1,400 an ounce). As of the date of this MD&A, despite a modest recovery, gold prices are below the Company’s fiscal 2013 budget and will have a material impact on full year revenues. Management is continuing its goal to improve unit operating costs at the Seabee Gold Operation with the implementation of its cash flow optimization plan, designed to maximize cash flow, while further developing satellite deposits including the Company’s Santoy Gap deposit.
As per Company policy, at the end of each reporting period, the Company assesses whether any indication of impairment exists at each of its mineral properties. At March 31, 2013, there were no such indicators and an impairment charge was not required. However, should this low gold price environment continue to exist at the end of the second quarter (June 30, 2013), there is a chance that an indication of impairment could exist; if any such indication exists, the recoverable amount of the Company’s mineral properties will then be estimated. Determining the recoverable amount will require the use of estimates and assumptions such as long-term commodity prices, discount rates, future capital requirements, exploration potential and operating performance. An impairment loss is recognized if the carrying amount of an asset or Cash Generating Unit exceeds its recoverable amount; in such an instance, the Company’s Mineral properties balance would be reduced by the amount of the impairment with a corresponding charge recognized in profit (loss).
| Q1 2013 Management’s Discussion and Analysis | |
| (in thousands of CDN dollars, except as otherwise noted) | Page 2 |
Production, Financial and Exploration Highlights
Seabee Gold Operation Production
| · | Production: 8,082 ounces produced during the first quarter (March 31, 2012: 9,574 ounces produced) and 9,301 ounces sold (March 31, 2012: 9,547 ounces sold). For fiscal 2013, the Company is forecasting production of 50,000 to 54,000 ounces. Claude expects significant reduction in total Company expenditures for fiscal 2013 which is largely attributable to the completion of major upgrades to the Seabee Operations (including equipment and facilities) in 2012, major projects such as the Seabee Mine Shaft Extension being completed, a reduced capital spend in 2013 ($12.4 million budgeted in 2013; $27.9 million in 2012) and continued focus on the Company’s cash flow optimization plan. |
| · | Seabee Mine Shaft Extension Project: After a 20 day shutdown, the shaft resumed hoisting ore from the 980 metre level early in the first quarter of 2013. The reduction of trucking distance and ore handling is anticipated to result in lower diesel consumption, reduced maintenance costs and improved ventilation. Overall, Seabee Deep and L62 mining costs are expected to improve by as much as 10 percent per tonne. |
Financial
| · | Revenue:Sales of 9,301 ounces (March 31, 2012 – 9,547 ounces) at an average price of $1,643 (U.S. $1,629) generated revenue of $15.3 million, a five percent decrease in revenue over the first quarter of 2012. |
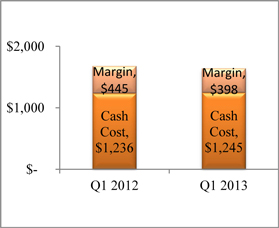
| · | Cash cost per ounce of gold(2): CDN $1,245 (U.S. $1,235) per ounce for the three months ended March 31, 2013 was comparable to the CDN $1,236 (U.S. $1,234) per ounce for the first quarter of 2012. The Company is continuing to pursue best practices with the intention of lowering these costs. In addition, the Company anticipates that the continued contribution of the Santoy Mine Complex (including the Santoy 8 and Santoy Gap deposits), ore feedstock from the L62 Zone and completion of the shaft extension will be positive catalysts in improving production and lowering overall unit operating costs at the Seabee Gold Operation. |
| · | Net cash margin: $398 per ounce (March 31, 2012 - $445 per ounce). |
| · | Net loss: $2.5 million, or $0.01 per share (March 31, 2012 – net loss of $0.5 million, or $0.00 per share) after a deferred income tax recovery of $0.8 million. |
| · | Cash flow from operations before net changes in non-cash operating working capital(3): $1.4 million, or $0.01 per share (March 31, 2012 - $2.6 million, or $0.02 per share). |
Exploration
Mineral Reserves and Mineral Resources:
| · | At December 31, 2012, the Company effectively upgraded nearly half of the Santoy Gap inferred resource into the indicated category while continuing to grow the deposit. Furthermore, the infill drill program demonstrated that a high grade core exists with widths of up to 20 metres. The Santoy Gap deposit, part of the Santoy Mine Complex, represents a great opportunity for the Company due to its proximity to permitted mine infrastructure, low development cost and near-term production potential. |
| · | Proven and Probable Mineral Reserves at December 31, 2012 were 311,100 ounces of gold. Measured and Indicated (“M&I”) Mineral Resources at December 31, 2012 were 344,200 ounces of contained gold. |
Seabee Gold Operation:
| · | Approximately 15,000 metres of underground drilling was completed during the first quarter of 2013. The Company’s focus was on Seabee Deep, L62 and the Santoy Mine Complex. |
| Q1 2013 Management’s Discussion and Analysis | |
| (in thousands of CDN dollars, except as otherwise noted) | Page 3 |
| · | Exploration at the Seabee Gold Operation focused on surface drilling at the Santoy Mine Complex and testing near the Seabee Mine. Regional target development continued preparation for the 2013 summer program and integration of the updated Santoy Gap resource into the 2013 exploration. |
Amisk Gold Project:
| · | During the first quarter, exploration activities at the Amisk Gold Project were minimal with planned expenditures for fiscal 2013 being deferred. |
| · | Advancement of the Preliminary Economic Assessment of the Amisk Gold Project (“Amisk PEA”) was ongoing during the first quarter. |
Madsen:
| · | Phase I and II drill programs at Madsen were successful in confirming and extending the 8 Zone and Austin and McVeigh systems. In addition, the Company has demonstrated that Madsen is a high grade gold project that has strong vertical continuity, remaining open at depth and along strike to the northeast. Based on these results, the significant existing resource base and advanced infrastructure, the Company commenced an internal scoping level analysis at the Madsen Project. The analysis will provide key input into a decision to advance Madsen towards a Preliminary Economic Assessment (“Madsen PEA”) and pre-feasibility study (which may include further field and underground work), conceptually evaluating the value and development potential of the project. |
| · | In response to the completion of the Company’s underground drilling, advancement of the internal scoping level study and the intention to reduce capital expenditures, Management has terminated its underground dewatering program at Madsen. |
Outlook
Looking forward, the Company expects to see a return from its investment in capital projects and equipment over the past two years. In the future, Claude will continue to:
| i) | Pursue best practices in the areas of safety, health and the environment in all of our operations; |
| ii) | Reduce capital and operating expenditures and improve unit operating costs at the Seabee Gold Operation by continuing to focus on the Company’s cash flow optimization plan designed to maximize cash flow while developing lower cost and higher grade satellite deposits including the Santoy Gap deposit; |
| iii) | Sustain or increase reserves and resources at the Seabee Gold Operation through targeted exploration and development; |
| iv) | Complete an internal scoping level analysis on the Company's 100 percent owned Madsen Exploration Project; and |
| v) | Complete the Amisk PEA on the Amisk Gold Project. |
The Company has aggressively taken steps to reduce corporate expenditures starting in the second quarter of 2012. Since full year 2012, Claude has identified and implemented annualized savings approximating 20 percent and will continue to review and adjust expenditures for the balance of 2013.
Operating and Financial Outlook
The Company completed its shaft extension project at the Seabee Mine in January 2013. During the remainder of 2013, the Company will see the completion of many milestones including:
| · | full production from the L62 deposit; |
| · | record mill and mine throughput; and |
| · | access to underground drill chambers to explore and infill drill the Santoy Gap deposit. |
For 2013, forecast gold production at the Seabee Gold Operation is estimated to range from 50,000 to 54,000 ounces. Unit costs for 2013 are expected to improve slightly from 2012’s unit cash costs of $997 CDN per ounce. Quarterly operating results are expected to fluctuate throughout 2013; as such, they will not necessarily be reflective of the full year average.
| Q1 2013 Management’s Discussion and Analysis | |
| (in thousands of CDN dollars, except as otherwise noted) | Page 4 |
Access to the Seabee Gold Operation is by fixed wing aircraft to an airstrip located on the property. Large consumables (including diesel and propane) and items related to the upgrading of the mining fleet and mine infrastructure are trucked to the site via a 60 kilometre annual winter ice road from Brabant Lake on Highway 102. The winter ice road is typically in use from January through March. This seasonal trend of purchasing and delivering inventories to the Seabee Gold Operation results in significant cash outflows during the first quarter of the year.
During 2013, when compared to 2012, the Company significantly reduced the number of semi-trailer loads over the winter ice road, a result of improved operating effectiveness and fewer capital projects in 2013. The Company has also benefited from lower prices on several of its consumable inventory items, period over period.
At current gold prices and forecast production, Management believes that operating cash flows, in addition to the increased credit facilities negotiated during the first and second quarters of 2013, will be sufficient to fund the 2014 Winter Ice Road resupply requirements and further development opportunities at the Seabee Gold Operation. With respect to the Company’s outstanding debentures that mature in May of 2013, the closing of the long-term debt financing on April 5, 2013 will provide sufficient funding for the redemption.
Capital Outlook
During 2013, capital expenditures are expected to include continued investment and expected upgrades at the Seabee Gold Operation.
Capital expenditures at the Seabee Gold Operation in 2013 are estimated to total approximately $31.9 million, funded from a combination of cash on hand, operating cash flow and debt. This reduction from 2012 is due to the completion of several major projects, including the shaft extension.
| Table 1: Estimate of 2013 Capital Expenditures (millions) |
| Capital | | | |
| Development | | $ | 16.7 | |
| Sustaining capital | | | 9.0 | |
| Expansion capital | | | 6.2 | |
| | | $ | 31.9 | |
Development expenditures are expected to be roughly equal between Seabee and Santoy. Sustaining capital costs include expenditures on equipment replacement and tailings water treatment facilities. Expansion capital is expected to focus in the Santoy Gap area to support the Company’s Life of Mine Plan and to generate future returns for the Company.
Exploration Outlook
Due to the success of its 2011 and 2012 exploration programs and in light of the current gold price environment, Claude has elected to reduce its exploration spending during 2013 to $1.6 million from the $2.7 million budgeted and the $14.2 million incurred in 2012.
At the Seabee Gold Operation, exploration expenditures will focus on low cost per ounce targets, proximal to infrastructure with the potential to materially impact near-term production, drive resource growth and to positively impact the Company’s Mineral Reserves and Mineral Resources. The Seabee Gold Operation, consisting of the producing Seabee Mine and Santoy Mine Complex, is Claude’s sole producing asset, has delivered consistent exploration results, remains underexplored and has a number of advanced resource-stage/near-infrastructure targets.
At the Amisk Gold Project, Claude will update its National Instrument 43-101 (“NI 43-101”) resource calculation in conjunction with the completion of the Amisk PEA.
| Q1 2013 Management’s Discussion and Analysis | |
| (in thousands of CDN dollars, except as otherwise noted) | Page 5 |
At Madsen, exploration and dewatering costs forecasted for 2013 have been reduced to approximately $1.5 million. Contingent on results of the internal scoping analysis, the operating budget will be re-evaluated.
Mining Operations Results
Seabee Gold Operation
At the Seabee Gold Operation, Claude is focused on executing the expansion of its production profile and lowering unit costs over the next several years by maximizing gold output from the near surface Santoy 8 and Santoy Gap deposits as well as increasing margins at the Seabee Mine via the shaft extension project which will provide more efficient transportation of ore and waste from the Seabee Deep and L62 deposits.
The Company is also continuing with its review of operating processes and procedures to identify and implement efficiencies designed to increase production and lower operating costs.
During the first quarter of 2013, the Company milled 61,877 tonnes at a grade of 4.31 grams of gold per tonne (March 31, 2012 – 66,556 tonnes at a grade of 4.74 grams of gold per tonne) for total production of 8,082 ounces of gold (March 31, 2012 – production of 9,574 ounces of gold). With mill recoveries relatively unchanged period over period, the decrease in ounces produced is attributable to a decrease in tonnes milled (which was consistent with the Company’s budget for the first quarter) and lower grade from the Seabee Mine period over period.
| Table 2: Seabee Gold Operation Quarterly Production and Cost Statistics |
| | | March 31 | | | March 31 | |
| | | 2013 | | | 2012 | |
| | | | | | | |
| Operating Data | | | | | | | | |
| Tonnes Milled | | | 61,877 | | | | 66,556 | |
| Head Grade (grams per tonne) | | | 4.31 | | | | 4.74 | |
| Recovery (%) | | | 94.3 | % | | | 94.4 | % |
| Gold Produced (ounces) | | | 8,082 | | | | 9,574 | |
| Gold Sold (ounces) | | | 9,301 | | | | 9,547 | |
| Financial Data | | | | | | | | |
| Revenues (CDN$ million) | | $ | 15.3 | | | $ | 16.1 | |
| Production Costs (CDN$ million) | | $ | 11.6 | | | $ | 11.8 | |
| Cash Operating Costs (CDN$/oz)(2) | | $ | 1,245 | | | $ | 1,236 | |
| Cash Operating Costs (U.S.$/oz)(2) | | $ | 1,235 | | | $ | 1,234 | |
Seabee Mine
During the first quarter of 2013, the Seabee Mine produced 4,287 ounces of gold (March 31, 2012 – 7,106 ounces). This increase was attributable to a 27 percent decrease in grade combined with an 18 percent decrease in tonnes milled – Mill throughput was impacted by the Shaft Extension Project.
| Table 3: Seabee Mine Quarterly Production Statistics |
| | | March 31 | | | March 31 | |
| | | 2013 | | | 2012 | |
| | | | | | | |
| Tonnes Milled | | | 33,070 | | | | 40,143 | |
| Tonnes per Day | | | 367 | | | | 441 | |
| Head Grade (grams per tonne) | | | 4.27 | | | | 5.81 | |
| Gold Produced (ounces) | | | 4,287 | | | | 7,106 | |
| Q1 2013 Management’s Discussion and Analysis | |
| (in thousands of CDN dollars, except as otherwise noted) | Page 6 |
Santoy Mine Complex
During the first quarter of 2013, the Santoy Mine Complex produced 3,795 ounces of gold (March 31, 2012 – 2,468). These results were attributable to increased tonnes and an increase in grade. Tonnage throughput per day was in line with Management’s expectation for the first quarter of 2013 and is expected to increase during the remainder of the year.
| Table 4: Santoy 8 Mine Quarterly Production Statistics |
| | | March 31 | | | March 31 | |
| | | 2013 | | | 2012 | |
| | | | | | | |
| Tonnes Milled | | | 28,807 | | | | 26,413 | |
| Tonnes per Day | | | 320 | | | | 290 | |
| Head Grade (grams per tonne) | | | 4.35 | | | | 3.12 | |
| Gold Produced (ounces) | | | 3,795 | | | | 2,468 | |
Capital Projects
Mill
The Seabee Gold Operation’s Mill consists of a single stage crushing circuit and a two stage grinding circuit, followed by leaching. The Mill has been expanded to a peak capacity of 1,050 tonnes, with the operation capable of sustaining approximately 850 tonnes per day on average under the Seabee Gold Operation’s current Life of Mine Plan. During the first half of 2012, major upgrade work on the #1 regrind ball mill and an upgrade to the CIP tanks was completed. During the first quarter of 2013, routine maintenance on the #2 regrind ball mill was ongoing.
Further expansions to the Mill are being evaluated to accommodate future sustained capacity and production increases expected from the L62 Zone and the Santoy Gap deposit.
Shaft Extension
The Company’s shaft extension project at the Seabee Mine deepened the shaft from 600 metres to 980 metres. After a 20 day shutdown, this project was completed early in the first quarter of 2013. During the 20 day shutdown the Company continued underground development and mining at Seabee Deep and L62 between the 900 and 1100 metre levels and was able to maintain production that averaged over 700 tonnes per day throughput to the Seabee Mill which originated from the Santoy Mine Complex and from the upper portions of the Seabee Mine.
The shaft extension project was undertaken to provide more efficient transportation of ore and waste from underground to surface. The reduction of trucking distance and ore handling are anticipated to result in lower diesel consumption, reduced maintenance costs and improved ventilation. Overall Seabee Deep and L62 mining costs are expected to improve by as much as 10 percent per tonne.
Financial Results of Operations
Highlights
| Table 5: Highlights of Financial Results of Operations |
| | | March 31 | | | March 31 | |
| | | 2013 | | | 2012 | |
| | | | | | | |
| Revenue | | $ | 15,278 | | | $ | 16,052 | |
| Divided by ounces sold | | | 9,301 | | | | 9,547 | |
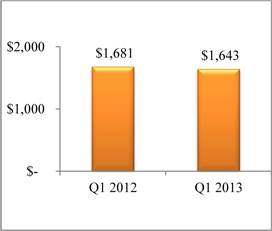
| Average Realized Price per Ounce (CDN$) | | $ | 1,643 | | | $ | 1,681 | |
| | | | | | | | | |
| Production costs | | $ | 11,584 | | | $ | 11,796 | |
| Divided by ounces sold | | | 9,301 | | | | 9,547 | |
| Total cash costs per ounce (CDN$) | | $ | 1,245 | | | $ | 1,236 | |
| | | | | | | | | |
| Net Cash Margin per Ounce Sold (CDN$) | | $ | 398 | | | $ | 445 | |
| | | | | | | | | |
| Depreciation and depletion | | $ | 4,549 | | | $ | 3,260 | |
| Gross (loss) profit | | $ | (855 | ) | | $ | 996 | |
| Net loss | | $ | (2,537 | ) | | $ | (491 | ) |
| Loss per share (basic and diluted) | | $ | (0.01 | ) | | $ | (0.00 | ) |
| Q1 2013 Management’s Discussion and Analysis | |
| (in thousands of CDN dollars, except as otherwise noted) | Page 7 |
The decrease in ounces sold and in average realized price per ounce, partially offset by decreased production costs, has negatively impacted net cash margin per ounce sold period over period. The Company intends to improve profitability of the Seabee Gold Operation through a combination of improved grade control, cost controls and developing the production profile at lower cost satellite ore bodies, including Santoy 8 and eventually the Santoy Gap deposit. Also, the Company anticipates that the continued contribution of the Santoy Mine Complex (including the Santoy 8 and Santoy Gap deposits), contribution of ore from the L62 Zone and completion of the shaft extension will be positive catalysts in improving production and lowering overall unit operating costs at the Seabee Gold Operation during the remainder of 2013.
 | |  |
| | | |
| Figure 1: Average Gold Price Realized (CDN$) | | Figure 2: Cash Cost and Margin Realized (CDN$) |
| Per Ounce Sold | | Per Ounce Sold |
Net Loss
For the three months ended March 31, 2013, the Company recorded a net loss of $2.5 million, or $0.01 per share, after a $0.8 million deferred income tax recovery. This compares to a net loss of $0.5 million, or $0.00 per share, for the three months ended March 31, 2012. Loss from continuing operations before a deferred income tax recovery of $0.8 million at March 31, 2013 was $3.3 million, or $0.01 per share (March 31, 2012 - $0.5 million loss, or $0.00 per share), reflecting a change in the Company’s deferred tax base period over period.
Revenue
Gold revenue from the Company’s Seabee Gold Operation for the three months ended March 31, 2013 decreased five percent to $15.3 million from $16.1 million reported for the first three months of 2012. The decrease in gold revenue period over period was attributable to a two percent decline in Canadian dollar gold prices realized (Q1 2012 - $1,643 (U.S. $1,629); Q1 2012 - $1,681 (U.S. $1,679)) and slightly lower gold sales volume (Q1 2013 – 9,301 ounces; Q1 2012 – 9,547 ounces).
Production Costs
For the three months ended March 31, 2013, mine production costs of $11.6 million were consistent with the comparable period of 2012.
For the first quarter of 2013, total cash cost per ounce of gold(2) of CDN $1,245 (U.S. $1,235) per ounce was consistent with the first quarter of 2012’s cash cost per ounce of CDN $1,236 (U.S. $1,234). The Company is continuing to pursue best practices with the intention of lowering these costs during the remainder of 2013 and beyond.
Depreciation and Depletion
For the three months ended March 31, 2013, depreciation and depletion was $4.5 million (March 31, 2012 - $3.3 million), up 36 percent period over period. These results are attributable to an increase in the Seabee Gold Operation’s asset base and a decrease in the Seabee Gold Operations reserves.
| Q1 2013 Management’s Discussion and Analysis | |
| (in thousands of CDN dollars, except as otherwise noted) | Page 8 |
General and Administrative Expense
General and administrative expense for the first three months of 2012 decreased to $2.4 million, down 11 percent from the $2.7 million reported for the first three months of 2012. The variances noted below primarily relate to a decrease in stock-based compensation offset by an increase in deferred share units.
| Table 6: Corporate General and Administrative Expense |
| | | March 31 | | | March 31 | |
| | | 2013 | | | 2012 | |
| | | | | | | |
| Direct administration | | $ | 1,561 | | | $ | 1,539 | |
| Stock-based compensation | | | 327 | | | | 846 | |
| Deferred share units | | | 510 | | | | 276 | |
| Total General and Administrative | | $ | 2,398 | | | $ | 2,661 | |
Finance Expense
Finance expense includes interest expense, accretion expense and derivative gains or losses (if any). For the three months ended March 31, 2013, finance expense of $0.4 million was relatively unchanged period over period.
Finance and Other Income
Finance and other income consists of interest income, production royalties pursuant to the Red Mile transactions and other income. For the three months ended March 31, 2013, finance and other income of was $0.3 million (March 31, 2012 - $0.7 million). This result was attributable to a decrease in interest and miscellaneous revenue, period over period, associated with the cash and short-term investments that the Company held during the first quarter of 2012.
Deferred Income Tax (Recovery) Expense
For the three months ended March 31, 2013, the Company has a deferred tax recovery of $0.8 million (March 31, 2012 - deferred income tax expense of $0.03 million). This variance is primarily due to an increase in the loss before taxes, as well as unrecognized deferred tax assets increasing the deferred income tax expense in the March 31, 2012 period.
Liquidity, Financial Resources and Capital Structure
The Company monitors its spending plans, repayment obligations and cash resources on a continuous basis with the objective of ensuring that there is sufficient capital within the Company to meet business requirements, after taking into account cash flows from operations and the Company’s holdings of cash and cash equivalents and short-term investments. The Company’s typical cash requirement over the first and second quarters of each year is significant because of the Seabee Gold Operation’s winter ice road resupply, which includes restocking diesel, propane and other large consumables as well as the continued investment in maintenance and growth capital relating to the mining fleet and mine infrastructure.
The Company had bank indebtedness of $10.7 million at March 31, 2013 (December 31, 2012 - $3.5 million).
At March 31, 2013, the Company had a working capital deficiency of $16.5 million (December 31, 2012 - working capital deficiency of $4.1 million). Included in the working capital calculation at March 31, 2013 are demand loans totaling $4.8 million, a revolving loan totaling $5.0 million and debentures outstanding totaling $9.7 million. Demand loans have been classified as current liabilities due to their demand feature. As the debenture is due in less than one year, its balance has been classified as a current liability.
| Table 7: Working Capital and Current Ratio |
| | | March 31 | | | December 31 | | | Percent | |
| | | 2013 | | | 2012 | | | Change | |
| | | | | | | | | | |
| Current assets | | $ | 33,092 | | | $ | 24,300 | | | | 36 | |
| Current liabilities | | $ | 49,548 | | | $ | 28,397 | | | | 74 | |
| Working capital deficiency | | $ | (16,456 | ) | | $ | (4,097 | ) | | | 302 | |
| Current ratio | | | 0.67 | | | | 0.86 | | | | (22 | ) |
The Company’s objective when managing capital is to safeguard its ability to continue as a going concern so that it can continue to provide adequate returns to shareholders and benefits to other stakeholders. The Company manages the capital structure and makes adjustments to it in light of changes in economic conditions and the risk characteristics of the underlying assets. In order to maintain or adjust the capital structure, the Company may issue new shares, sell assets or incur debt. The Company is not subject to externally imposed capital requirements.
The Company’s capital structure is comprised of a combination of short-term and long-term debt and shareholders’ equity.
| Q1 2013 Management’s Discussion and Analysis | |
| (in thousands of CDN dollars, except as otherwise noted) | Page 9 |
The Capital structure of the Company is as follows:
| Table 8: Schedule of Capital Structure of the Company |
| | | | | | | | March 31 | | | December 31 | |
| Capital Structure | | Interest | | | | Maturity | | | 2013 | | | 2012 | |
| | | | | | | | | | | | | |
| Demand loans | | | Prime + 1.50% | | | | Jan-Apr/2015 | | | $ | 4,750 | | | $ | 5,337 | |
| Revolving loan | | | Prime + 1.75% | | | | Dec 2013 | | | | 5,000 | | | | - | |
| Debenture | | | 12.00% | | | | May/2013 | | | | 9,719 | | | | 9,665 | |
| Total debt | | | | | | | | | | $ | 19,469 | | | $ | 15,002 | |
| | | | | | | | | | | | | | | | | |
| Shareholders’ equity | | | | | | | | | | | 190,742 | | | | 192,364 | |
| | | | | | | | | | | | | | | | | |
| Debt to equity | | | | | | | | | | | 10.2 | % | | | 7.8 | % |
In January 2013, the Company expanded its current debt facilities with its existing bank to $25.0 million. Further, on April 5, 2013, the Company executed an agreement with Crown Capital Partners Inc. (“CCP”) for an additional long-term debt facility of $25.0 million (please see financing section below). The new debt facilities are intended for the retirement of the Company’s outstanding debentures (which mature in May 2013), for expansion capital at the Seabee Gold Operation and for general working capital purposes.
Investing
Mineral property expenditures during the three months ended March 31, 2013 were $13.4 million, a $14.8 million decrease from the comparable period in 2012. Expenditures were comprised of Seabee Mine and shaft development of $5.5 million, exploration costs (focusing primarily on the Santoy Gap deposit, with minimal expenditures on the Seabee Regional, Amisk and Madsen exploration projects) of $2.7 million and property, plant and equipment additions of $5.2 million. Property, plant and equipment additions include mining equipment, camp infrastructure and tailings management facility expansion. The Company utilized its cash flow from operations and debt to fund these additions.
Financing
Financing activities during the first quarter of 2013 included the issuance of 2,065,812 common shares (Q1 2012 – 338,676) pursuant to the Company’s Employee Share Purchase Plan; no common shares were issued pursuant to the Company’s Stock Option Plan during the three months ended March 31, 2013 (Q1 2012 – 40,000).
During the first quarter of 2013, the Company repaid $1.0 million of its demand loans and capital leases outstanding. The proceeds and repayments of demand loans and capital leases relate to production equipment at the Seabee Gold Operation.
During the first quarter of 2013, the Company expanded its current debt facilities with its existing financial institution, Canadian Western Bank (“CWB”), to $25.0 million. On April 5, 2013, Claude executed an agreement with CCP for a new long-term debt facility on April 5, 2013.
CWB Financing Summary
The CWB facilities consist of leases, demand loans and of a line of credit. The debt expansion is structured as follows:
| Facility | | Previous Amount | | | Current Amount | |
| Line of Credit | | $ | 5,000,000 | | | $ | 10,000,000 | |
| Leases/Demand Loans | | $ | 7,000,000 | | | $ | 10,000,000 | |
| Revolving Loan | | | NIL | | | $ | 5,000,000 | |
Interest rates are both fixed and floating and carry a weighted average rate of approximately 4.5 percent.
| Q1 2013 Management’s Discussion and Analysis | |
| (in thousands of CDN dollars, except as otherwise noted) | Page 10 |
CCP Financing Summary
The CCP offering, which closed on April 5, 2013, consists of a five (5) year $25.0 million debt facility which carries an interest rate of 10 percent of the outstanding principal, compounded and payable monthly. Principal payments, due to begin in 2014, are payable monthly. The facility also includes 5.75 million warrants at a strike price of $0.70 which are exercisable at any time from the closing of the transaction to 5 years following the closing of the transaction.
Sources / Uses
| Sources of Funds | | | | | Use of Funds* | | | |
| CCP Term Loan | | $ | 25,000,000 | | | Refinancing | | $ | 10,000,000 | |
| | | | | | | Working Capital | | $ | 15,000,000 | |
| Total Sources | | $ | 25,000,000 | | | Total Use | | $ | 25,000,000 | |
* Approximate balances
Principal Repayment Terms
| Period | | Monthly Amount | | | Annual Amount | |
| Months 1 - 12 | | | NIL | | | | NIL | |
| Months 13 – 59 | | $ | 300,000 | | | $ | 3,600,000 | |
| Due at Maturity | | | | | | $ | 10,900,000 | |
Prepayment Terms
| Months Following Closing | | Prepayment Fee | |
| Months 13 – 24 | | | 2 | % |
| Months 25 – 36 | | | 1 | % |
| Months 37 – 60 | | | 0 | % |
Financial and Other Instruments
In the normal course of its operations, the Company is exposed to gold price, foreign exchange, interest rate, liquidity, equity price and counterparty risks. The overall financial risk management program focuses on preservation of capital and protecting current and future Company assets and cash flows by reducing exposure to risks posed by the uncertainties and volatilities of financial markets.
The Company may use derivative financial instruments to hedge some of its exposure to fluctuations in gold prices and foreign exchange rates. The Company does not acquire, hold or issue derivatives for trading purposes. The Company’s management of financial risks is aimed at ensuring that net cash flows are sufficient to meet all its financial commitments as and when they fall due and to maintain the capacity to fund its forecast project development and exploration strategies.
The value of the Company’s mineral resources is related to the price of gold and the outlook for this mineral. Gold and precious metal prices historically have fluctuated widely and are affected by numerous factors outside of the Company’s control, including, but not limited to, industrial and retail demand, central bank lending, forward sales by producers and speculators, levels of worldwide production, short-term changes in supply and demand because of speculative hedging activities and certain other factors related specifically to gold. The profitability of the Company’s operations is highly correlated to the market price of gold. If the gold price declines below the cost of production at the Company’s operations, for a prolonged period of time, it may not be economically feasible to continue production.
| Q1 2013 Management’s Discussion and Analysis | |
| (in thousands of CDN dollars, except as otherwise noted) | Page 11 |
The Company’s revenues from the production and sale of gold are denominated in U.S. dollars. However, the Company’s operating expenses are primarily incurred in Canadian dollars and its liabilities are primarily denominated in Canadian dollars. The results of the Company’s operations are subject to currency risks. The operating results and financial position of the Company are reported in Canadian dollars in the Company’s consolidated financial statements.
The Company did not have any derivative instruments outstanding at March 31, 2013 or March 31, 2012. The Company’s main interest rate risk arises from interest earning cash deposits that expose the Company to interest rate risk.
The Company’s liquidity position is managed to ensure sufficient liquid funds are available to meet its financial obligations in a timely manner. The Company manages liquidity risk by continuously monitoring forecast and actual cash flows and ensuring that the Company has the ability to access required funding.
The Company is exposed to equity securities price risk arising from investments classified on the balance sheet as available-for-sale. Investments in equity securities are approved by the Board on a case-by-case basis. All of the Company’s available-for-sale equity investments are in junior resource companies listed on the TSX Venture Exchange.
The Company is exposed to counterparty risk which is the risk that a counterparty will not complete its obligations under a financial instrument resulting in a financial loss for the Company. The Company does not generally obtain collateral or other security to support financial instruments subject to credit risk; however, the Company only deals with credit worthy counterparties. Accounts receivable comprise institutions purchasing gold under normal settlement terms of two working days. Counterparty risk under derivative financial instruments is to reputable institutions. All significant cash balances are on deposit with high-rated banking institutions. The carrying amount of financial assets recorded in the financial statements represents the Company’s maximum exposure to credit risk without taking account of the value of any collateral or other security obtained.
Contractual Obligations
At March 31, 2013, with the exception of the increase in the Company’s credit facilities at CWB, there were no significant changes to the Company’s contractual obligations from those reported in the Management’s Discussion and Analysis for the year ended December 31, 2012.
The Company continued updating its decommissioning and reclamation plans for the Madsen and Seabee properties during the first quarter of 2013. It is expected that additional security (approximately $6.5 million) will need to be provided to the applicable regulatory authorities. However, the timing of this security has not yet been determined.
As noted above, near-term funding requirements pursuant to the redemption of its outstanding debentures (due on May 23, 2013), have placed the Company in a working capital deficiency at March 31, 2013.In order to address this working capital deficiency, the Company, subsequentto December 31, 2012, increased its current debt facilities with CWB to the following:
| · | $10.0 million operating line of credit (previous amount: $5.0 million); |
| · | $10.0 million finance lease line (previous amount: $7.0 million); and |
| · | $5.0 million revolving loan (new). |
In addition to the above, on April 5, 2013, the Company executed an agreement with CCP for an additional long-term debt facility of $25.0 million (Note 14).
| Q1 2013 Management’s Discussion and Analysis | |
| (in thousands of CDN dollars, except as otherwise noted) | Page 12 |
Statements of Financial Position
| Table 9: Select Statements of Financial Position Data |
| | | March 31 | | | December 31 | | | Percent | |
| | | 2011 | | | 2012 | | | Change | |
| | | | | | | | | | |
| Total assets | | $ | 252,567 | | | $ | 234,517 | | | | 8 | |
| Long-term financial liabilities | | $ | 12,277 | | | $ | 13,756 | | | | (11 | ) |
The Company’s total assets were $252.6 million at March 31, 2013, compared to $234.5 million at December 31, 2012; Claude’s asset base primarily consists of non-current assets comprising mineral properties, reflecting the capital intensive nature of the exploration and mining business and the impact of the significant capital expenditures relating to its operations and exploration projects. The $18.1 million net increase resulted from increases of: $9.6 million in Inventories and $9.4 million in Mineral properties attributable to Seabee Mine development and shaft extension, exploration costs (focusing primarily on the Santoy Gap deposit with minimal expenditures on the Seabee Regional, Amisk and Madsen exploration projects) and additions to property, plant and equipment. These increases were offset by decreases of: $0.6 million in Accounts receivable, attributable to the timing of gold sales and receipt of funds; $0.1 million to prepaid expenses and deposits; and $0.1 million to Investments.
Total liabilities were $61.8 million at March 31, 2013, up $19.7 million from December 31, 2012. This result was attributable to a $7.2 million increase in bank indebtedness and a $9.5 million increase in Accounts payable and accrued liabilities, attributable to the timing and payment of expenditures relating to consumables (associated with the annual winter road resupply) at the Seabee Gold Operation; a net increase of $4.0 million in the Company’s current and non-current Loans and borrowings attributable to certain debt obtained to fund a portion of the capital resupply at the Seabee Gold Operation.These increases were offset by a decrease of $0.8 million in the Company’s Deferred income tax liability and a net decrease of $0.3 million in the Company's current and long-term Net royalty obligation.
Shareholders’ equity decreased by $1.6 million to $190.7 million at March 31, 2013, from $192.4 million at December 31, 2012. This variance is attributable to an increase in Share capital of $0.7 million due to the issuance of common shares pursuant to the Company’s Employee Share Purchase Program; an increase of $0.3 million to Contributed surplus, a $2.5 million decrease to Accumulated deficit, a result of the net loss for the period; and, a $0.1 million decrease to Accumulated other comprehensive income (loss).
Comprehensive income consists of net profit, together with certain other economic gains and losses that are collectively referred to as “other comprehensive income (loss)” or “OCI” and are excluded from the Income Statement. During the period ended March 31, 2013, other comprehensive income decreased to a loss of $0.1 million (December 31, 2012 – comprehensive income of $0.03 million) due to the Company’s disposition of certain available-for-sale securities.
Key Sensitivities
Earnings from Claude’s gold operation are sensitive to fluctuations in both commodity and currency prices. The key factors and their approximate effect on earnings, earnings per share and cash flow, based on assumptions comparable to first quarter 2013 actuals, are as follows:
Gold
For a U.S. $10 movement in gold price per ounce, earnings and cash flow will have a corresponding movement of CDN $0.4 million, or $0.00 per share. For a $0.01 movement in the US$/CDN$ exchange rate, earnings and cash flow will have a corresponding movement of $0.6 million, or $0.00 per share.
| Q1 2013 Management’s Discussion and Analysis | |
| (in thousands of CDN dollars, except as otherwise noted) | Page 13 |
Grade
For a 0.25 gram per tonne movement in grade, earnings and cash flow will have a corresponding movement of CDN $0.9 million, or $0.01 per share.
Selected Quarterly Financial Data
| | | Mar 31 | | | Dec 31 | | | Sept 30 | | | June 30 | | | Mar 31 | | | Dec 31 | | | Sept 30 | | | Jun 30 | |
| | | 2013 | | | 2012 | | | 2012 | | | 2012 | | | 2012 | | | 2011 | | | 2011 | | | 2011 | |
| | | | | | | | | | | | | | | | | | | | | | | | | |
| Tonnes milled | | | 61,877 | | | | 69,698 | | | | 66,173 | | | | 72,808 | | | | 66,556 | | | | 74,456 | | | | 66,722 | | | | 65,502 | |
| Grade processed (grams per tonne) | | | 4.31 | | | | 5.94 | | | | 7.34 | | | | 5.45 | | | | 4.74 | | | | 4.97 | | | | 5.51 | | | | 6.26 | |
| Ounces produced | | | 8,100 | | | | 12,700 | | | | 15,100 | | | | 12,200 | | | | 9,600 | | | | 11,300 | | | | 11,300 | | | | 12,600 | |
| Ounces sold | | | 9,300 | | | | 12,700 | | | | 14,100 | | | | 12,300 | | | | 9,500 | | | | 11,900 | | | | 10,900 | | | | 12,400 | |
| Gold sales ($ millions) | | | 15.3 | | | | 21.2 | | | | 23.4 | | | | 20.1 | | | | 16.1 | | | | 19.9 | | | | 18.2 | | | | 18.2 | |
| Net profit (loss) ($ millions) | | | (2.5 | ) | | | 2.4 | | | | 3.0 | | | | 0.7 | | | | (0.5 | ) | | | (0.2 | ) | | | 2.6 | | | | 5.2 | |
| Net profit (loss) per share(a) | | | (0.01 | ) | | | 0.01 | | | | 0.02 | | | | 0.00 | | | | (0.00 | ) | | | 0.00 | | | | 0.02 | | | | 0.03 | |
| Average realized gold price (CDN$ per ounce) | | | 1,643 | | | | 1,668 | | | | 1,663 | | | | 1,633 | | | | 1,681 | | | | 1,678 | | | | 1,670 | | | | 1,469 | |
| Average realized gold price (US$ per ounce) | | | 1,629 | | | | 1,683 | | | | 1,671 | | | | 1,616 | | | | 1,679 | | | | 1,641 | | | | 1,704 | | | | 1,518 | |
| Cash cost per ounce(b) (CDN$ per ounce) | | | 1,245 | | | | 822 | | | | 920 | | | | 1,082 | | | | 1,236 | | | | 1,130 | | | | 871 | | | | 717 | |
| Cash cost per ounce(b) (US$ per ounce) | | | 1,235 | | | | 829 | | | | 924 | | | | 1,071 | | | | 1,234 | | | | 1,105 | | | | 888 | | | | 741 | |
| Cash flow from operations before net changes in non-cash operating working capital ($ millions)(c) | | | 1.4 | | | | 9.4 | | | | 8.6 | | | | 5.3 | | | | 2.6 | | | | 7.2 | | | | 5.7 | | | | 8.3 | |
| Cash flow from operations per share | | | 0.01 | | | | 0.05 | | | | 0.05 | | | | 0.03 | | | | 0.02 | | | | 0.04 | | | | 0.03 | | | | 0.05 | |
| | | | | | | | | | | | | | | | | | | | | | | | | | | | | | | | | |
| Weighted average shares outstanding (basic) | | | 174,801 | | | | 173,746 | | | | 173,746 | | | | 173,741 | | | | 170,481 | | | | 164,351 | | | | 163,911 | | | | 155,275 | |
| | | | | | | | | | | | | | | | | | | | | | | | | | | | | | | | | |
| CDN$/US$ Exchange | | | 1.0086 | | | | 0.9914 | | | | 0.9949 | | | | 1.0101 | | | | 1.0012 | | | | 1.0230 | | | | 0.9804 | | | | 0.9676 | |
| (a) | Basic and diluted, calculated based on the number of shares issued and outstanding during the quarter. |
| (b) | Denotes a non-IFRS performance measure. For an explanation of non-IFRS performance measures, refer to the “Non-IFRS Performance Measures” section of this MD&A. |
| (c) | For an explanation of this performance measure, refer to the “Other Performance Measures” section of this MD&A. |
The financial results for the last eight quarters reflect the following general trends: consistent average realized gold price; lower grade attributable to more feedstock from the Santoy 8 deposit; and increasing cash cost per ounce.
Accounting Estimates
Certain of the Company’s accounting policies require that Management make decisions with respect to the formulation of estimates and assumptions that affect the reported amounts of assets, liabilities, revenues and expenses. For a discussion of those estimates, please refer to the Company’s Management’s Discussion and Analysis for the year ended December 31, 2012, available atwww.sedar.com.
New Accounting Pronouncements
Claude’s significant accounting policies are contained in Note 3 to the Company’s most recent annual consolidated financial statements for the year ended December 31, 2012, available atwww.sedar.com. A summary of new accounting policy changes is disclosed in Note 4 of the Company’s unaudited condensed consolidated interim financial statements.
| Q1 2013 Management’s Discussion and Analysis | |
| (in thousands of CDN dollars, except as otherwise noted) | Page 14 |
Future Accounting Pronouncements
Certain new accounting standards and interpretations have been published that are not mandatory for the March 31, 2013 reporting period:
| · | IFRS 9,Financial Instruments: effective for accounting periods commencing on or after January 1, 2015. The Company is currently evaluating the impact of IFRS 9 on its financial statements. |
Exploration Results
Due to the success of its 2011 and 2012 exploration programs and in light of the current gold price environment, Claude has elected to reduce its exploration spending during 2013 to $1.6 million from the $2.7 million budgeted and the $14.2 million incurred in 2012.
During the first quarter of 2013, the Company’s exploration department focused on:
| · | execution of the winter drill program at the Seabee Mine and the Santoy Mine Complex (which was completed in mid-April); |
| · | development and compilation of regional targets at the Seabee Gold Operation in preparation for 2013 summer and integration of the updated Santoy Gap resources; and |
| · | supporting the internal scoping analysis at Madsen. |
All exploration activities were carried out under the direction of Qualified Person, Brian Skanderbeg, P. Geo., Senior Vice President and Chief Operating Officer.
| Q1 2013 Management’s Discussion and Analysis | |
| (in thousands of CDN dollars, except as otherwise noted) | Page 15 |
Seabee Gold Operation
The Seabee Gold Operation is located northeast of La Ronge, Saskatchewan and is host to the producing Seabee Mine and Santoy Mine Complex as well as the L62 Zone, Santoy Gap and Regional exploration targets.
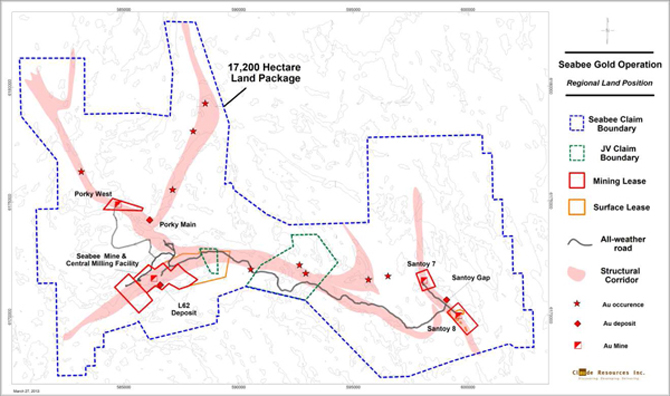
Figure 3: Seabee Property regional map showing significant gold deposits and occurrences.
At the Seabee Gold Operation, exploration expenditures during 2013 will focus on targets proximal to infrastructure with the potential to materially impact near-term production, drive resource growth and to positively impact the Company’s Mineral Reserves and Mineral Resources.
Santoy Region
The Santoy Region includes the Santoy 8 and Santoy Gap deposits, which are part of the Santoy Mine Complex. During 2013, exploration will focus on evaluating the down-plunge extension of the Santoy Gap and Santoy 8A deposits, expanding recently discovered parallel zones near the Santoy Region and on initial drill testing of several near-Seabee targets. Infill drilling at the Santoy Gap deposit will also be prioritized to convert additional ounces from the inferred to indicated category.
Gold mineralization at the Santoy Region is hosted in siliceous, shear structures with sulfide-chlorite-quartz veins and in silicified granitoid sills. The mineralized lenses dip moderately to steeply eastward and are amenable to bulk mining techniques. Gold mineralization of the Santoy 8 ore lens occurs over a strike length of 600 metres, a depth of 500 metres and remains open along strike and down plunge to the north. The Santoy 8E ore lens has been intercepted over a strike length of 200 metres, depth of 250 metres and remains open along strike and down plunge to the north. The true thickness of the Santoy 8 deposits varies from 1.5 metres to 15 metres.
The Santoy Gap deposit is located 400 to 900 metres north of underground infrastructure, immediately on strike and adjacent to the Santoy 8 deposit within the Santoy Mine Complex. Infill and exploration drilling continues to confirm and expand the Santoy Gap system.
| Q1 2013 Management’s Discussion and Analysis | |
| (in thousands of CDN dollars, except as otherwise noted) | Page 16 |
A total of 71 holes and 35,000 metres were completed in and around the Santoy Gap and along the Santoy Regional Shear Zone during 2012. In addition to extending the mineralized system, the program discovered a sub-parallel lens to the Santoy Gap, approximately 150 metres to the east and affirmed the high prospectivity of the Santoy Regional Shear Zone, hosting multiple deposits over a three kilometre strike length. The Santoy Gap system remains open down plunge to the north, along strike to the south and at depth. These recent intercepts at depth may link with the existing Santoy 8 resource 300 metres to the south.
During the first quarter of 2013, three of four surface holes at the Santoy Mine Complex were completed. Testing intercepted the Gap and or Santoy 8 structures. Down-plunge drilling testing the extension of Santoy 8 intercepted a vein system hosted in a thick package of highly altered shear zone. Results are pending.
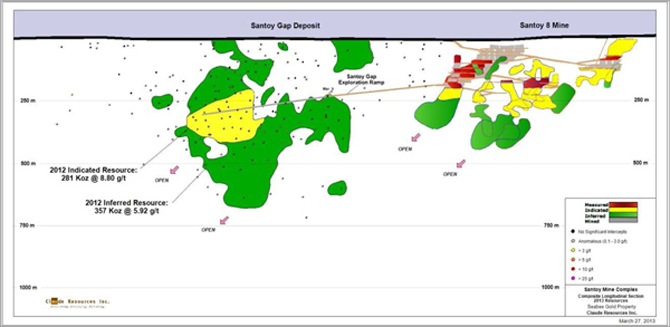
Figure 4: Santoy Region Composite Longitudinal Section.
Based on the Santoy Gap inferred resource, positive exploration results and proximity to the existing Santoy 8 infrastructure, the Company has initiated an 850 metre long exploration drift to allow for infill drilling and upgrading of the inferred resource.
| Q1 2013 Management’s Discussion and Analysis | |
| (in thousands of CDN dollars, except as otherwise noted) | Page 17 |
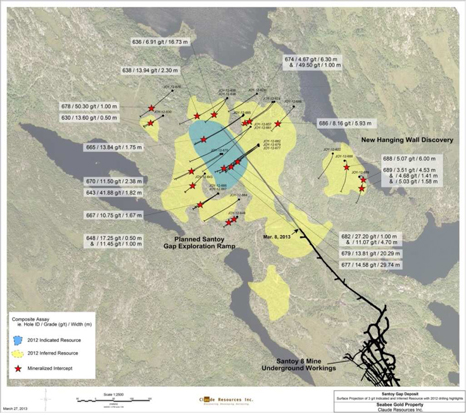
Figure 5: Map of the Santoy Region
Seabee Regional
Exploration of the Seabee Regional area has included work in the Pine, Pigeon and Laonil Lake areas. Grass roots work has focused on examining these prospective regional structures.
Drilling near the Seabee Mine during the first quarter consisted of four drill holes totaling 2,000 metres. The program was designed to evaluate four distinct Seabee parallel structures and their intersection with a prospective regional corridor beneath Laonil Lake. Assays for these holes are pending.
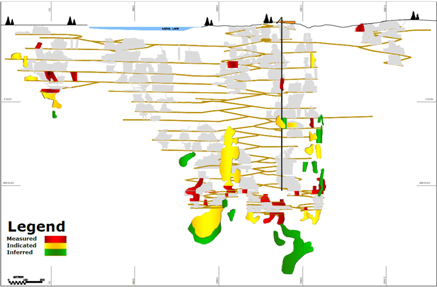
Figure 6: Seabee Mine Composite Longitudinal Section (L62 Zone Discovery)
| Q1 2013 Management’s Discussion and Analysis | |
| (in thousands of CDN dollars, except as otherwise noted) | Page 18 |
Amisk Gold Project
The potential of the Amisk Gold Project continues to be critically evaluated by the Company. The Amisk Gold Project is located in the Flin Flon-Snow Lake Greenstone Belt. The project is host to the Amisk Gold Deposit as well as a large number of gold occurrences and prospects.
While the Amisk PEA is advanced, future exploration at Amisk during 2013 has been reduced. The 2012 regional exploration campaign at Amisk investigated a number of high-priority targets, some of which may warrant further testing. Consultants will be used to re-interpret historical geophysical data in order to rank and prioritize regional drill targets. Regional potential remains high and exploration maturity low. Field work and extensive compilation in 2012 have resulted in the emergence of an extensive list of exploration targets that are currently being prioritized for assessment in 2013. Completion of the Amisk PEA is expected during Q2 2013.
The Company also staked an additional 16,033 hectares on the western portion of the Amisk Gold Project during 2012. During the second half of 2012, on the Company’s newly acquired claims and western block of the Amisk Gold Project, reconnaissance work occurred with the goal of identifying similarities to Amisk’s historical geology and for potential drill targets. The newly acquired claims host potential for Amisk-style gold-silver (“Au-Ag”) mineralization as well as conventional base-metal deposits typical of the Flin Flon belt. No drilling is planned for 2013 on the newly acquired claims; however, the Company expects to continue with target development, ranking and ground-base reconnaissance in the area.
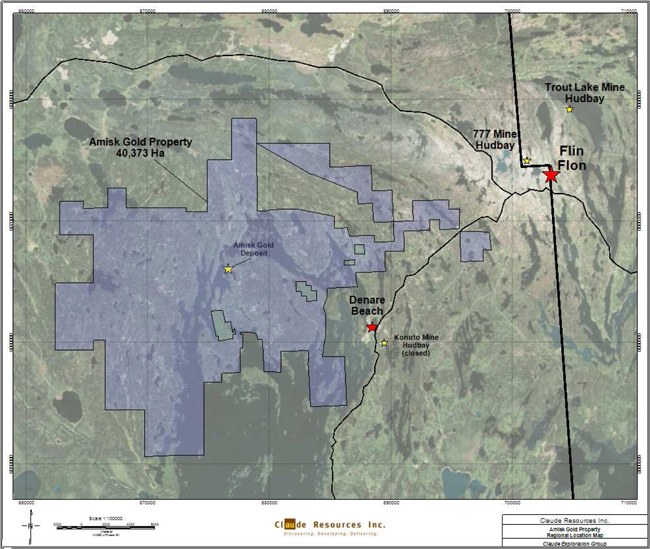
Figure 7: Amisk Gold Project
Gold and silver mineralization at the Amisk Gold Project is associated with a sequence of quartz porphyritic, rhyolitic lapilli tuffs and flows hosting disseminations and stringers of pyrite, sphalerite, galena, tetrahedrite and chalcopyrite. Drilling has intercepted the mineralized system over a strike length of 1,200 metres, width of 400 metres and depths of in excess of 600 metres. The system remains open to the southwest, southeast, northwest and at depth.
| Q1 2013 Management’s Discussion and Analysis | |
| (in thousands of CDN dollars, except as otherwise noted) | Page 19 |
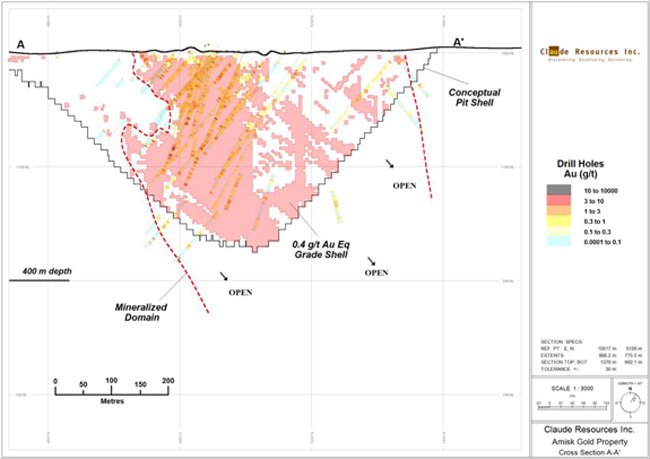
Figure 8: Cross Section A-A’ of the Amisk Gold Property
Drilling from the Company’s 2011 and 2012 drill programs successfully confirmed continuity of gold mineralization within the northern and eastern portion of the deposit as well as demonstrated the potential for expansion to the east and southeast. Mineralization intercepted in the drilling is consistent with the current resource model and is associated with a sequence of quartz porphyritic, rhyolitic lapilli tuffs and basaltic tuffs and argillite hosting disseminations, stringers and semi-massive intervals of pyrite, sphalerite, galena, tetrahedrite, pyrrhotite and chalcopyrite. Drill hole AL-11-319 confirmed continuity of gold mineralization within the southeastern portion of the deposit as well as demonstrated the potential for expansion to the east and southeast.
Madsen Project
During 2013, following the four year advanced exploration program, Claude plans to advance the Madsen project to an internal scoping level study as well as evaluate further surface exploration targets. The evaluation will provide key input into a decision to advance a Madsen PEA, conceptually evaluating the value and development potential of all significant resource domains.
The Madsen Mine property currently hosts a NI 43-101 compliant Indicated Resource of 928,000 ounces at 8.93 grams per tonne and an Inferred Resource of 297,000 ounces at 11.74 grams per tonne. The property also hosts significant surface and underground infrastructure including a permitted tailings facility, 500 ton per day mill and a 1,250 metre deep shaft.
In response to the completion of the Company’s underground drilling, advancement of the internal scoping level study and the intention to reduce capital expenditures, Management has terminated its underground dewatering program at Madsen. This decision will be re-evaluated depending on the results of the internal scoping study.
| Q1 2013 Management’s Discussion and Analysis | |
| (in thousands of CDN dollars, except as otherwise noted) | Page 20 |
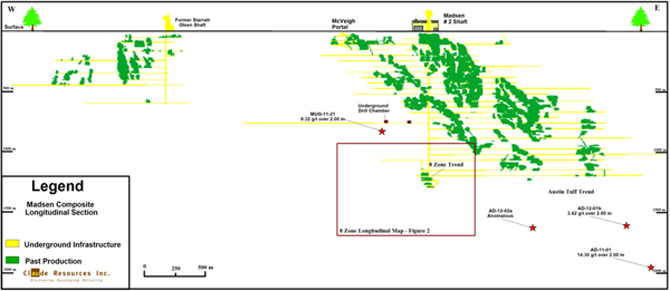
Figure 9: Madsen Longitudinal Section
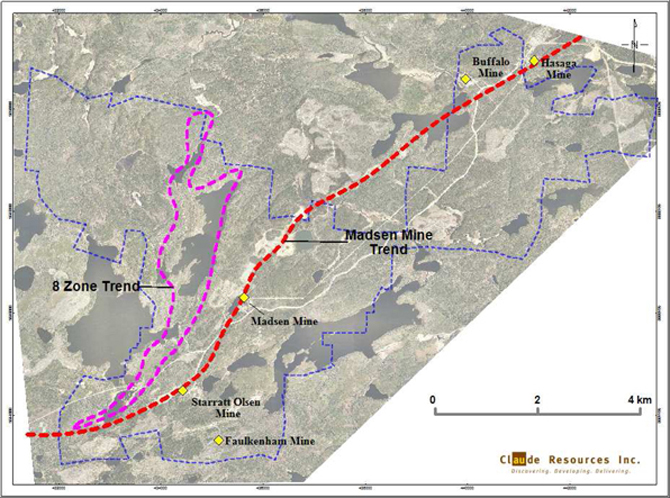
Figure 10: Madsen Property Overview
8 Zone
During 2012, Phase II underground drilling continued from the 16th level which provides the ideal drill platform to explore both at depth as well as the strike potential of the 8 Zone Trend. A total of nine drill holes, targeting the down plunge continuity of the 8 Zone, were completed in 2012. Drill holes MUG-12-20, -26, -28 and -30 confirmed plunge continuity, returning visible-gold bearing intercepts of up to 26.50 grams per tonne over 2.00 metres. Drill hole MUG-12-25b intercepted a strong footwall zone returning 14.55 grams per tonne over 2.00 metres. These intercepts confirmed the 8 Zone system 250 metres down plunge from historic mining as well as indicate potential for high grade, sub-parallel lenses. The system continues to remain open down plunge and along strike to the east.
| Q1 2013 Management’s Discussion and Analysis | |
| (in thousands of CDN dollars, except as otherwise noted) | Page 21 |
Drill holes targeting the western strike continuity of the 8 Zone include MUG-11-19, MUG-12-21, -22, -23 and -24 (Figure 9). Drill hole 21 intercepted silicified, biotite-altered basalt and returned gold assays of 9.53 grams per tonne over 2.00 metres, approximately 850 metres below surface. This intercept is in the hanging-wall of the 8 Zone system and interpreted to correlate with and be an extension of the Austin Tuff. Importantly, 2011 drilling in this area intercepted several high grade intervals within the McVeigh Tuff. The combination of well-mineralized Austin and McVeigh intercepts, 500 metres along strike and west from historic stopes, indicates the potential for a new shoot development.
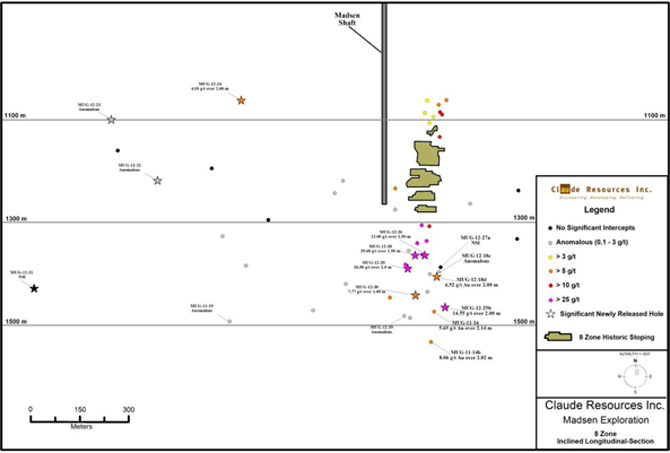
Figure 11: 8 Zone Longitudinal Section
Drill holes targeting the strike continuity of the 8 Zone included MUG-11-10, 11, 13, 15, 17 and 19. Drill hole 13 and drill hole 17 intercepted silicified, biotite-altered basalt and returned 15.70 grams per tonne over 2.00 metres and 53.70 grams per tonne over 0.70 metres, approximately 950 metres below surface. These intercepts are in the hanging-wall of the 8 Zone system and interpreted to correlate with and be an extension of the McVeigh Tuff, located approximately 650 metres up-dip. The McVeigh Tuff hosts a current Indicated Resource of 115,000 ounces at 9.59 grams per tonne and has seen very limited drill testing below 350 metres. In addition to the McVeigh mineralization, the 8 Zone structure is developed in all holes completed along strike and is characterized by anomalous gold associated with biotite-altered, variably silicified basaltic and ultramafic lithologies.
| Table 10: Summary of 2012 Phase II drill results from Madsen drilling |
| Hole-ID | | From | | | To | | | Width (m) | | | Grade (g/t) | | | Zone |
| | | | | | | | | | | | | | | |
| AD-11-01 | | | 2,376.0 | | | | 2,378.0 | | | | 2.0 | | | | 14.30 | | | Austin Tuff |
| AD-12-01b | | | 1,887.0 | | | | 1,889.0 | | | | 2.0 | | | | 3.43 | | | Austin Tuff |
| Q1 2013 Management’s Discussion and Analysis | |
| (in thousands of CDN dollars, except as otherwise noted) | Page 22 |
| Table 10: Summary of 2012 Phase II drill results from Madsen drilling |
| Hole-ID | | From | | | To | | | Width (m) | | | Grade (g/t) | | | Zone |
| | | | | | | | | | | | | | | |
| AD-12-02a | | | | | | | | | | | Anomalous | | | |
| MUG-11-18d | | | | | | | | | | | | | | | Anomalous | | | |
| MUG-12-18d | | | 821.0 | | | | 823.0 | | | | 2.0 | | | | 6.52 | | | 8 Zone – Main |
| MUG-11-19 | | | | | | | | | | | | | | | Anomalous | | | |
| MUG-12-20 | | | 795.0 | | | | 797.0 | | | | 2.0 | | | | 26.50 | | | 8 Zone - Main |
| and | | | 882.9 | | | | 884.2 | | | | 1.3 | | | | 8.12 | | | 8 Zone - FW |
| MUG-11-21 | | | 102.0 | | | | 104.0 | | | | 2.0 | | | | 9.53 | | | Austin Tuff |
| MUG-12-22 | | | | | | | | | | | | | | | Anomalous | | | |
| MUG-12-23 | | | | | | | | | | | | | | | Anomalous | | | |
| MUG-12-24 | | | 547.0 | | | | 549.0 | | | | 2.0 | | | | 4.55 | | | 8 Zone - Main |
| MUG-12-25b | | | 1,045.0 | | | | 1,047.0 | | | | 2.0 | | | | 14.55 | | | 8 Zone - FW |
| MUG-12-26 | | | 833.0 | | | | 834.5 | | | | 1.5 | | | | 12.00 | | | 8 Zone - Main |
| MUG-12-27 | | | | | | | | | | | | | | | NSI | | | |
| MUG-12-28 | | | 787.5 | | | | 789.0 | | | | 1.5 | | | | 4.75 | | | 8 Zone – HW |
| and | | | 834.0 | | | | 835.5 | | | | 1.5 | | | | 29.60 | | | 8 Zone - Main |
| MUG-12-29 | | | 361.0 | | | | 363.0 | | | | 2.0 | | | | 17.70 | | | McVeigh Tuff |
| MUG-12-30 | | | 951.0 | | | | 952.0 | | | | 1.0 | | | | 7.77 | | | 8 Zone - FW |
| * | Composites calculated using a 3 grams per tonne Au cut-off grade. Reported width is drilled length and interpreted to represent 65 - 85 percent of true width. NSI - No Significant Intercept. Anomalous - Assayed between 1 and 3 grams per tonne of gold. |
Results obtained from 2011 and 2012 drilling have been encouraging and continue to demonstrate that the 8 Zone is a high grade gold system that has strong vertical continuity and remains open at depth and along strike to the northeast. Furthermore, the discovery of economic grades and widths hosted within the depth continuity of the McVeigh Tuff opens up significant exploration potential.
Austin and McVeigh Tuffs
In addition to Phase II underground drilling, the Company completed three deep surface drill holes to evaluate the Austin Tuff at elevations of 1,200 to 2,000 metres below surface. Drill holes AD-11-01, AD-12-01b and -02a intercepted widespread alteration and mineralization, returning gold assays of up to 14.30 grams per tonne over 2.00 metres. These holes are the deepest completed to date on the property and confirm the development of the Austin Tuff 700 metres below historic mine stopes. The Austin Tuff continues to remain open down plunge and along strike to the east.
Quality Assurance and Quality Control Procedures
Rigorous quality assurance and quality control procedures have been implemented including the use of blanks, standards and duplicates. Geochemical analyses were submitted to ALS Chemex in Vancouver, British Columbia, TSL Laboratories in Saskatoon, Saskatchewan and or the Seabee minesite lab. ALS Chemex and TSL Laboratories are ISO approved. Core samples were analyzed by a 30 gram gold fire assay with an atomic absorption and gravimetric and or screen fire finish.
Mineral Reserves and Mineral Resources
The Mineral Reserves and Mineral Resources estimates are conducted under the direction of Qualified Persons Brian Skanderbeg, P.Geo., Senior Vice President and Chief Operating Officer and Peter Longo, P.Eng., Vice President, Operations.
| Q1 2013 Management’s Discussion and Analysis | |
| (in thousands of CDN dollars, except as otherwise noted) | Page 23 |
Seabee Gold Operation
At December 31, 2012, Proven and Probable Reserves in the Seabee Gold Operation were 1,575,200 tonnes, grading 6.14 grams per tonne or 311,100 ounces of gold. The Company’s Mineral Resources at its Seabee Gold Operation included Measured and Indicated Mineral Resources of 344,200 ounces and Inferred Mineral Resources totalling 603,400 ounces.
Results obtained from drilling completed during 2012 from the Santoy Gap deposit were incorporated into, and had a material impact on, the Seabee Operation’s updated December 31, 2012 NI 43-101 resource calculation (Please see Claude news release “Claude Resources Inc. Increases Resource Base and Grade at Santoy Gap” dated December 3, 2012).
| Table 11: Seabee Gold Operation Mineral Reserves and Mineral Resources |
| Proven and Probable Reserves |
| | | December 31, 2012 | | | December 31, 2011 | |
| Projects | | Tonnes | | | Grade (g/t) | | | Ozs | | | Tonnes | | | Grade (g/t) | | | Ozs | |
| Seabee | | | 947,100 | | | | 7.26 | | | | 221,100 | | | | 1,062,900 | | | | 6.58 | | | | 224,900 | |
| Santoy 8 | | | 628,100 | | | | 4.45 | | | | 89,900 | | | | 997,100 | | | | 4.08 | | | | 130,600 | |
| Totals | | | 1,575,200 | | | | 6.14 | | | | 311,100 | | | | 2,059,900 | | | | 5.37 | | | | 355,600 | |
| Measured and Indicated Mineral Resources |
| Projects | | Tonnes | | | Grade (g/t) | | | Ozs | | | Tonnes | | | Grade (g/t) | | | Ozs | |
| Seabee | | | 45,400 | | | | 4.86 | | | | 7,100 | | | | 127,400 | | | | 4.65 | | | | 19,000 | |
| Santoy 8 | | | 59,300 | | | | 3.28 | | | | 6,200 | | | | 12,600 | | | | 5.04 | | | | 2,000 | |
| Santoy Gap | | | 994,000 | | | | 8.80 | | | | 281,200 | | | | - | | | | - | | | | - | |
| Porky Main | | | 160,000 | | | | 7.50 | | | | 38,600 | | | | 160,000 | | | | 7.50 | | | | 38,600 | |
| Porky West | | | 111,000 | | | | 3.10 | | | | 11,000 | | | | 111,000 | | | | 3.10 | | | | 11,000 | |
| Totals | | | 1,369,600 | | | | 7.82 | | | | 344,200 | | | | 410,900 | | | | 5.35 | | | | 70,700 | |
| Inferred Mineral Resources |
| Projects | | Tonnes | | | Grade (g/t) | | | Ozs | | | Tonnes | | | Grade (g/t) | | | Ozs | |
| Seabee | | | 355,600 | | | | 8.55 | | | | 97,700 | | | | 813,900 | | | | 6.83 | | | | 178,800 | |
| Santoy 8 | | | 518,700 | | | | 5.91 | | | | 98,600 | | | | 850,000 | | | | 5.46 | | | | 149,300 | |
| Santoy Gap | | | 1,875,000 | | | | 5.92 | | | | 356,900 | | | | 2,321,000 | | | | 6.63 | | | | 495,000 | |
| Porky Main | | | 70,000 | | | | 10.43 | | | | 23,500 | | | | 70,000 | | | | 10.43 | | | | 23,500 | |
| Porky West | | | 138,300 | | | | 6.03 | | | | 26,800 | | | | 138,300 | | | | 6.03 | | | | 26,800 | |
| Totals | | | 2,957,600 | | | | 6.35 | | | | 603,400 | | | | 4,193,200 | | | | 6.48 | | | | 873,400 | |
For the above table of reserves, the following mining and economic factors have been applied:
| · | In 2012, Mineral Reserves and Mineral Resources estimates were conducted under the direction of Qualified Persons Brian Skanderbeg, P.Geo., Senior Vice President and Chief Operating Officer and Peter Longo, P.Eng., Vice President, Operations. |
| · | In 2011, mineral reserves and mineral resources were estimated by Claude personnel and audited by SRK. |
| · | Mineral Reserves and Mineral Resources estimates have been completed in accordance with CIM Standards and are reported in accordance with Canadian Securities Administrators’ NI 43-101. Mineral Resources are exclusive of Mineral Reserves. |
| · | Mineral Reserves and Mineral Resources are reported at a cut-off grade of 4.5 grams per tonne for the Seabee Mine and 3.0 grams per tonne for Santoy 8, Santoy Gap, Porky Main and Porky West. This is based on a gold price of CDN $1,500 per ounce. |
| · | A dilution factor averaging approximately 15 percent is applied. |
| · | Historic stope recovery averages 85 percent. |
| · | A specific gravity of 2.8 to 2.9 is utilized in tonnage estimates. |
| · | All figures are rounded to reflect the relative accuracy of the estimates. Totals may not represent the sum of the parts due to rounding. |
| · | Mineral resources are not mineral reserves and do not have demonstrated economic viability. |
| Q1 2013 Management’s Discussion and Analysis | |
| (in thousands of CDN dollars, except as otherwise noted) | Page 24 |
Amisk Gold Project
At the Amisk Gold Project, Claude’s independent NI 43-101 compliant resource calculation outlines an Indicated Resource of 921,000 ounces of 0.95 grams of Au Eq per tonne and an Inferred Resource of 645,000 ounces at 0.70 grams of Au Eq per tonne.
| Table 12: Amisk Gold Project Consolidated Mineral Resource Statement* |
| | | Quantity | | | Grade (g/tonne) | | | Contained Ounces (000’s) | |
| Resource Class | | (000’s tonnes) | | | Au | | | Ag | | | Au Eq | | | Au | | | Ag | | | Au Eq | |
| | | | | | | | | | | | | | | | | | | | | | |
| Indicated | | | 30,150 | | | | 0.85 | | | | 6.17 | | | | 0.95 | | | | 827 | | | | 5,978 | | | | 921 | |
| Inferred | | | 28,653 | | | | 0.64 | | | | 4.01 | | | | 0.70 | | | | 589 | | | | 3,692 | | | | 645 | |
* Reported at a cut-off of 0.40 grams of gold equivalent (Au Eq) per tonne using a price of U.S. $1,100 per ounce of gold and U.S. $16 per ounce of silver inside a conceptual pit shell optimized using metallurgical and process recovery of 87 percent, overall ore mining and processing costs of U.S. $15 per tonne and overall pit slope of 50 degrees. All figures are rounded to reflect the relative accuracy of the estimates. Mineral Resources are not Mineral Reserves and do not have demonstrated economic viability.
The mineral resources for the Amisk Gold Project are sensitive to the selection of cut-off grade. The table below presents the quantity and grade estimates at a range of cut-off grades inside the conceptual pit shell considered for reporting the Mineral Resource Statement. A cut-off value of 0.4 grams of gold equivalent per tonne was selected based on optimization results and benchmarking against similar deposits.
| Table 13: Global Block Model Quantity and Grade Estimates, Amisk Lake Gold Project at Various Cut-off Grades. | |
| Grade | | | Indicated | | | Inferred | |
Au Eq
(gpt) | | | Quantity
(tonnes) | | | Au Eq
(gpt) | | | Ounces
Au Eq | | | Quantity
(tonnes) | | | Au Eq
(gpt) | | | Ounces
Au Eq | |
| | 0.40 | | | | 30,150,090 | | | | 0.95 | | | | 920,881 | | | | 28,653,135 | | | | 0.70 | | | | 644,854 | |
| | 0.50 | | | | 23,533,117 | | | | 1.09 | | | | 824,702 | | | | 19,446,358 | | | | 0.82 | | | | 512,676 | |
| | 0.60 | | | | 18,322,858 | | | | 1.25 | | | | 736,367 | | | | 13,665,490 | | | | 0.94 | | | | 412,994 | |
| | 0.70 | | | | 14,359,129 | | | | 1.41 | | | | 650,936 | | | | 9,491,034 | | | | 1.07 | | | | 326,504 | |
| | 0.80 | | | | 11,418,785 | | | | 1.58 | | | | 580,054 | | | | 6,659,786 | | | | 1.20 | | | | 256,941 | |
| | 0.90 | | | | 9,206,976 | | | | 1.76 | | | | 520,980 | | | | 4,825,758 | | | | 1.34 | | | | 207,903 | |
| | 1.00 | | | | 7,606,617 | | | | 1.93 | | | | 471,998 | | | | 3,589,543 | | | | 1.48 | | | | 170,802 | |
| | 1.50 | | | | 3,472,946 | | | | 2.80 | | | | 312,642 | | | | 1,078,945 | | | | 2.16 | | | | 74,928 | |
Note: The reader is cautioned that the figures in this table should not be misconstrued with a Mineral Resource Statement. The figures are only presented to show the sensitivity of the block model estimates to the selection of cut-off grade.
For the Amisk Gold Project, an updated NI 43-101 resource statement, inclusive of all 2012 drilling, is will be completed in conjunction with the external Amisk PEA for the Amisk Gold Project.
Madsen Exploration Project
At the Madsen Exploration Project, Claude’s independent NI 43-101 compliant resource calculation outlines an Indicated Resource of 928,000 ounces of 8.93 grams per tonne and an Inferred Resource of 297,000 ounces at 11.74 grams per tonne.
| Q1 2013 Management’s Discussion and Analysis | |
| (in thousands of CDN dollars, except as otherwise noted) | Page 25 |
| Table 14: Consolidated Mineral Resource Statement (1) for the Madsen Mine, Ontario |
Resource
Class | | Zone | | | | | Tonnes | | | Grade
(g/tonne) | | | Grade
(oz/ton) | | | Contained
Gold (oz) | |
| | | | | | | | | | | | | | | | | | |
| Indicated | | Austin | | | | | | | 1,677,000 | | | | 7.92 | | | | 0.23 | | | 427,000 | |
| | | South Austin | | | | | | | 850,000 | | | | 9.32 | | | | 0.27 | | | 254,000 | |
| | | McVeigh | | | | | | | 374,000 | | | | 9.59 | | | | 0.28 | | | 115,000 | |
| | | 8 Zone | | | | | | | 335,000 | | | | 12.21 | | | | 0.36 | | | 132,000 | |
| | | | | | Total | | | | 3,236,000 | | | | 8.93 | | | | 0.26 | | | 928,000 | |
| Inferred | | Austin | | | | | | | 108,000 | | | | 6.30 | | | | 0.18 | | | 22,000 | |
| | | South Austin | | | | | | | 259,000 | | | | 8.45 | | | | 0.25 | | | 70,000 | |
| | | McVeigh | | | | | | | 104,000 | | | | 6.11 | | | | 0.18 | | | 20,000 | |
| | | 8 Zone | | | | | | | 317,000 | | | | 18.14 | | | | 0.53 | | | 185,000 | |
| | | | | | Total | | | | 788,000 | | | | 11.74 | | | | 0.34 | | | 297,000 | |
Note:mineral resources are not mineral reserves and do not have demonstrated economic viability. All figures have been rounded to reflect the relative accuracy of the estimates. Reported at a cut-off grade of 5.0 g/t gold based on U.S. $1,000 per troy ounce of gold and gold metallurgical recoveries of 94 percent.
The Company’s independent NI 43-101 Mineral Resource evaluation for the Madsen Mine was completed by SRK in December 2010. This Mineral Resource evaluation was based on historical exploration and mining data, Phase I underground drilling results up to September 27, 2009 and geological and resource modeling. The Mineral Resource evaluation was undertaken on the four separate zones, Austin, South Austin, McVeigh and 8 Zone that comprise the Madsen Gold Mine. The NI 43-101 Technical Report was filed on January 20, 2010.
The mineral resources of the Madsen Exploration Project are sensitive to the selection of cut-off grade. The global quantities and grade estimates at three gold cut-off grades are presented in Table 13. The reader is cautioned that the figures presented in this table should not be misconstrued with the mineral resource statement. The figures are only presented to show the sensitivity of the mineral resources to the selection of cut-off grade.
| Table 15: Global Block Model Quantities and Grade Estimates* at Various Cut-off Grades. |
| Class | | Zone | | Quantity
Tonnage (000’t) | | | Grade
Gold (gpt) | | | Contained Metal
Gold (000’oz) | |
| | | Cut-off (gpt Au) | | | 3 | | | | 4 | | | | 5 | | | | 3 | | | | 4 | | | | 5 | | | | 3 | | | | 4 | | | | 5 | |
| Indicated | | Austin‡ | | | 4,299 | | | | 2,565 | | | | 1,677 | | | | 5.40 | | | | 6.72 | | | | 7.92 | | | | 746 | | | | 554 | | | | 427 | |
| | | South Austin# | | | 1,553 | | | | 1,140 | | | | 850 | | | | 6.85 | | | | 8.08 | | | | 9.32 | | | | 342 | | | | 296 | | | | 254 | |
| | | McVeigh‡ | | | 637 | | | | 465 | | | | 374 | | | | 7.20 | | | | 8.57 | | | | 9.59 | | | | 148 | | | | 128 | | | | 115 | |
| | | Zone 8^ | | | 422 | | | | 370 | | | | 335 | | | | 10.49 | | | | 11.49 | | | | 12.21 | | | | 142 | | | | 136 | | | | 132 | |
| Inferred | | Austin‡ | | | 782 | | | | 288 | | | | 108 | | | | 4.04 | | | | 5.12 | | | | 6.30 | | | | 101 | | | | 47 | | | | 22 | |
| | | South Austin# | | | 630 | | | | 390 | | | | 259 | | | | 5.70 | | | | 7.09 | | | | 8.45 | | | | 116 | | | | 89 | | | | 70 | |
| | | McVeigh‡ | | | 155 | | | | 105 | | | | 104 | | | | 5.33 | | | | 6.09 | | | | 6.11 | | | | 27 | | | | 21 | | | | 20 | |
| | | Zone 8^ | | | 321 | | | | 320 | | | | 317 | | | | 17.93 | | | | 17.98 | | | | 18.14 | | | | 185 | | | | 185 | | | | 185 | |
* The reader is cautioned that the quantities and grade estimates in this table are not included in the resource statement for the MGP. The figures are presented to show the sensitivity of the block model estimates to the selection of cut-off grade.
‡ Reported considering a geotechnical buffer of 15 feet (4.6 metres).
# Reported considering a geotechnical buffer of 10 feet (3.0 metres).
^Reported with no geotechnical buffer.
| Q1 2013 Management’s Discussion and Analysis | |
| (in thousands of CDN dollars, except as otherwise noted) | Page 26 |
Business Risks
Risks and uncertainties related to economic and industry factors are described in detail in the Company’s Annual Information Form, available atwww.sedar.com, and remain substantially unchanged.
Outstanding Share Data
The authorized share capital of the Company consists of an unlimited number of common shares and two classes of unlimited preferred shares issuable in series. At March 31, 2013, there were 175,811,376 common shares outstanding. This compares to 173,745,564 common shares outstanding at December 31, 2012.
During the first quarter of 2013, the Company issued 2,065,812 common shares pursuant to the Company’s Employee Share Purchase Plan. At May 8, 2013, there were 175,811,376 common shares of the Company issued and outstanding.
Outstanding Stock Options and Warrants
At March 31, 2013, there were 6.5 million director, officer and key employee stock options outstanding with exercise prices ranging from $0.50 to $2.38 per share. This compares to 6.9 million director, officer and employee stock options outstanding at December 31, 2012 with similar prices.
| Table 16: Schedule of Stock Options Outstanding and Weighted Average Exercise Price |
| | | March 31, 2013 | | | December 31, 2012 | |
| | | Number | | | Weighted
Average
Exercise Price | | | Number | | | Weighted
Average
Exercise Price | |
| | | | | | | | | | | | | |
| Beginning of period | | | 6,948,527 | | | | 1.43 | | | | 5,484,250 | | | $ | 1.57 | |
| Options granted | | | - | | | | - | | | | 1,896,290 | | | | 1.04 | |
| Options exercised | | | - | | | | - | | | | (75,402 | ) | | | 0.78 | |
| Options forfeited | | | (399,225 | ) | | | 1.58 | | | | (316,611 | ) | | | 1.82 | |
| Options expired | | | - | | | | - | | | | (40,000 | ) | | | 1.51 | |
| End of period | | | 6,549,302 | | | | 1.42 | | | | 6,948,527 | | | $ | 1.43 | |
Subsequent to March 31, 2013, a total of 1,647,268 stock options were granted to the Company’s officers and certain employees.
For options outstanding at March 31, 2013, the range of exercise prices, the number vested, the weighted average exercise price and the weighted average remaining contractual life are as follows:
| Q1 2013 Management’s Discussion and Analysis | |
| (in thousands of CDN dollars, except as otherwise noted) | Page 27 |
| Table 17: Schedule of Outstanding Stock Options by Price Range |
| | | Options Outstanding | | | Options Exercisable | |
Option Price Per
Share | | Quantity | | | Weighted
Average
Remaining
Life | | | Weighted
Average
Exercise
Price | | | Quantity | | | Weighted
Average
Remaining
Life | | | Weighted
Average
Exercise
Price | |
| $0.50 - $1.00 | | | 1,329,845 | | | | 5.99 | | | $ | 0.72 | | | | 846,512 | | | | 5.78 | | | $ | 0.76 | |
| $1.01 - $1.50 | | | 2,526,339 | | | | 5.56 | | | | 1.21 | | | | 2,248,721 | | | | 5.52 | | | | 1.21 | |
| $1.51 - $2.00 | | | 2,158,000 | | | | 7.06 | | | | 1.87 | | | | 1,312,000 | | | | 6.30 | | | | 1.82 | |
| $2.01 - $2.38 | | | 535,118 | | | | 7.54 | | | | 2.30 | | | | 387,421 | | | | 7.37 | | | | 2.28 | |
| | | | 6,549,302 | | | | 6.31 | | | $ | 1.42 | | | | 4,794,654 | | | | 5.93 | | | $ | 1.38 | |
At March 31, 2013, there were 1.7 million common share purchase warrants outstanding. Each common share purchase warrant entitles the holder to acquire one common share of the Company at prices determined at the time of issue. The exercise price and date of expiration of the warrants outstanding are as follows:
| Table 18: Schedule of Warrants Outstanding | |
| | | | | | Number | | | | | | | | | Number | |
| Exercise | | | | | Outstanding at | | | | | | | | | Outstanding at | |
| Price | | | Expiry Date | | December 31, 2012 | | | Granted | | | Expired | | | March 31, 2013 | |
| | | | | | | | | | | | | | | | | | | | | |
| $ | 1.60 | | | May 22, 2013 | | | 1,693,200 | | | | - | | | | - | | | | 1,693,200 | |
Subsequent to March 31, 2013, in conjunction with the closing of the long-term debt arrangement with CCP, the Company granted an additional 5,750,000 common share purchase warrants priced at $0.70 per common share purchase warrant (Note 14). These common share purchase warrants can be exercisable by the holder, in whole or in part, at any time from closing until five years following closing.
Footnotes
| (1) | Historically, Madsen results have been reported in ounces per ton and feet (Imperial). |
| (2) | See description and reconciliation of non-IFRS measures in the “Non-IFRS Performance Measures and Reconciliations” section of this MD&A. |
| (3) | See description and reconciliation of this performance measure in the “Other Performance Measures and Reconciliations” section of this MD&A. |
Non-IFRS Performance Measures and Reconciliations
The Company utilizes non-IFRS financial measures as supplemental indicators of operating performance and financial position. These non-IFRS financial measures are used internally by the Company for comparing actual results from one period to another. The Company believes that, in addition to conventional measures prepared in accordance with IFRS, certain investors use this information to evaluate the Company’s performance and ability to generate cash flow. Accordingly, such information is intended to provide additional information and should not be considered in isolation or as a substitute for measures of performance prepared in accordance with IFRS.
Cash Cost Per Ounce
The Company reports its cash costs on a per-ounce basis, based on uniform standards developed by the Gold Institute, an independent researcher and evaluator of the gold market and gold industry. Management uses this measure to analyze the profitability, compared to average realized gold prices, of the Seabee Gold Operation. Investors are cautioned that the above measures may not be comparable to similarly titled measures of other companies, should these companies not follow Gold Institute standards.
| Q1 2013 Management’s Discussion and Analysis | |
| (in thousands of CDN dollars, except as otherwise noted) | Page 28 |
| Table 19: Total Cash Cost per Gold Ounce Sold |
| | | March 31 | | | March 31 | |
| | | 2013 | | | 2012 | |
| | | | | | | |
| Production cost (CDN$) | | $ | 11,584 | | | $ | 11,796 | |
| Divided by ounces sold | | | 9,301 | | | | 9,547 | |
| Total cash cost per ounce (CDN$) | | $ | 1,245 | | | $ | 1,236 | |
| | | | | | | | | |
| CDN$ Exchange Rate | | $ | 1.0086 | | | $ | 1.0012 | |
| Total cash cost per ounce (US$) | | $ | 1,235 | | | $ | 1,234 | |
Net Cash Margin
The Company uses net cash margin, which represents realized price per ounce less net cash costs per ounce. This measure is used by Management to analyze profitability trends and to assess the cash-generating capability from the sale of gold on a consolidated basis in each reporting period, expressed on a unit basis. Management believes that this measurement illustrates the performance of the Company’s business on a consolidated basis and enables investors to better understand Claude’s performance in comparison to other gold producers who present results on a similar basis and is an important indicator of expected performance in future periods.
The Company’s net cash margin is intended to provide additional information, does not have any standardized meaning prescribed by IFRS and should not be considered in isolation or as a substitute for measures of performance prepared in accordance with IFRS. This measure is not necessarily indicative of operating profit or cash flow from operations as determined under IFRS. Other companies may calculate net cash margin differently. This non-IFRS measure is calculated from realized gold price per ounce and total cash costs per ounce, as determined in the net cash cost reconciliation. Net cash margin could also be derived from realized price per ounce and net cash costs per ounce.
| Table 20: Net Cash Margin |
| | | March 31 | | | March 31 | |
| | | 2013 | | | 2012 | |
| | | | | | | |
| Revenue | | $ | 15,278 | | | $ | 16,052 | |
| Divided by ounces sold | | | 9,301 | | | | 9,547 | |
| Average Realized Price per Ounce (CDN$) | | $ | 1,643 | | | $ | 1,681 | |
| | | | | | | | | |
| Production costs | | $ | 11,584 | | | $ | 11,796 | |
| Divided by ounces sold | | | 9,301 | | | | 9,547 | |
| Total cash costs per ounce (CDN$) | | $ | 1,245 | | | $ | 1,236 | |
| | | | | | | | | |
| Net Cash Margin per Ounce Sold (CDN$) | | $ | 398 | | | $ | 445 | |
Other Performance Measures and Reconciliations
Cash Flow from Operations before Net Changes in Non-Cash Operating Working Capital
The Company uses Cash Flow from Operations before Net Changes in Non-Cash Operating Working Capital as a supplemental measure of its financial performance. The Company uses this measure to analyze the cash generated by its operations. These measures are not necessarily indicative of operating profit or cash flow from operations as determined under IFRS. Investors are cautioned that the above measures may not be comparable to similarly titled measures of other companies.
| Q1 2013 Management’s Discussion and Analysis | |
| (in thousands of CDN dollars, except as otherwise noted) | Page 29 |
| Table 21: Calculation of Cash Flow from Operations before Net Changes in Non-Cash Operating Working Capital |
| | | March 31 | | | March 31 | |
| | | 2013 | | | 2012 | |
| | | | | | | |
| Cash flows from operating activities | | | | | | | | |
| Net loss | | $ | (2,537 | ) | | $ | (491 | ) |
| Adjustments for non-cash items: | | | | | | | | |
| Depreciation and depletion | | | 4,549 | | | | 3,260 | |
| Finance expense | | | 94 | | | | 93 | |
| Finance and other income | | | (297 | ) | | | (360 | ) |
| Gain on investments | | | - | | | | (794 | ) |
| Stock-based compensation | | | 327 | | | | 846 | |
| Deferred income tax (recovery) expense | | | (770 | ) | | | 33 | |
| Total Cash flow from operations before net changes in non-cash operating working capital | | $ | 1,366 | | | $ | 2,587 | |
| Weighted average shares outstanding (basic and diluted) | | | 174,801 | | | | 170,481 | |
| Per share cash flows from operating activities (basic and diluted) | | $ | 0.01 | | | $ | 0.02 | |
Disclosure Controls and Internal Controls over Financial Reporting
Disclosure Controls and Procedures
As at March 31, 2013, we evaluated our disclosure controls and procedures as defined in the rules of the U.S. Securities and Exchange Commission (“SEC”) and the Canadian Securities Administrators. This evaluation was carried out under the supervision and participation of Management, including the President and Chief Executive Officer and the Chief Financial Officer. Based on that evaluation, the President and Chief Executive Officer and Chief Financial Officer concluded that the design and operation of these disclosure controls and procedures were effective.
Internal Control Over Financial Reporting
Management is responsible for establishing and maintaining adequate internal control over financial reporting. Internal control over financial reporting, no matter how well designed, has inherent limitations and can only provide reasonable assurance with respect to the preparation and fair presentation of published financial statements. Under the supervision and with the participation of the President and Chief Executive Officer and the Chief Financial Officer, management conducted an evaluation of the effectiveness of its internal control over financial reporting based on the framework in Internal Control – Integrated Framework issued by the Committee of Sponsoring Organizations of the Treadway Commission. Based on this evaluation, the President and Chief Executive Officer and the Chief Financial Officer concluded that internal control over financial reporting is effective as at March 31, 2013.
No significant changes were made in our internal controls over financial reporting during the period ended March 31, 2013 that have materially affected, or are reasonably likely to materially affect, our internal control over financial reporting.
Limitations of Controls and Procedures
The Company’s management, including the President and Chief Executive Officer and Vice President and Chief Financial Officer, believes that any disclosure controls and procedures or internal control over financial reporting, no matter how well conceived and operated, can provide only reasonable, not absolute, assurance that the objectives of the control system are met. Further, the design of a control system must reflect the fact that there are resource constraints, and the benefits of controls must be considered relative to their costs. Because of the inherent limitations in all control systems, they cannot provide absolute assurance that all control issues and instances of fraud, if any, within the Company have been prevented or detected. These inherent limitations include the realities that judgments in decision-making can be faulty, and that breakdowns can occur because of simple error or mistake. Additionally, controls can be circumvented by the individual acts of some persons, by collusion of two or more people, or by unauthorized override of the control. The design of any control system also is based in part upon certain assumptions about the likelihood of future events, and there can be no assurance that any design will succeed in achieving its stated goals under all potential future conditions. Accordingly, because of the inherent limitations in a cost effective control system, misstatements due to error or fraud may occur and not be detected.
| Q1 2013 Management’s Discussion and Analysis | |
| (in thousands of CDN dollars, except as otherwise noted) | Page 30 |
Cautionary Note to U.S. Investors Concerning Resource Estimates
Resource Estimates
The resource estimates in this Management’s Discussion and Analysis were prepared in accordance with National Instrument 43-101, adopted by the Canadian Securities Administrators. The requirements of National Instrument 43-101 differ significantly from the requirements of the SEC. In this Management’s Discussion and Analysis, the Company uses certain terms such as “measured”, “indicated” and “inferred” resources. Although these terms are recognized and required in Canada, the SEC does not recognize them. The SEC permits U.S. mining companies, in their filings with the SEC, to disclose only those mineral deposits that constitute “reserves”. Under U.S. standards, mineralization may not be classified as a reserve unless the determination has been made that the mineralization could be economically and legally extracted at the time the determination is made. U.S. investors should not assume that all or any portion of a measured or indicated resource will ever be converted into “reserves”. Further, “inferred resources” have a great amount of uncertainty as to their existence and whether they can be mined economically or legally, and U.S. investors should not assume that “inferred resources” exist or can be legally or economically mined, or that they will ever be upgraded to a more certain category.
Compliance with Canadian Securities Regulations
This quarterly report is intended to comply with the requirements of the Toronto Stock Exchange and applicable Canadian securities legislation, which differ in certain respects from the rules and regulations promulgated under the United States Securities Exchange Act of 1934, as amended (“Exchange Act”), as promulgated by the SEC.
U.S. investors are urged to consider the disclosure in our Annual Report on Form 40-F, File No. 001-31956, as filed with the SEC under the Exchange Act, which may be obtained from the Company (without cost) or from the SEC’s Web site:http://sec.gov/edgar.shtml.
Caution Regarding Forward-Looking Information
All statements, other than statements of historical fact, contained or incorporated by reference in this MD&A constitute “forward-looking information” within the meaning of applicable Canadian securities laws and “forward-looking statements” within the meaning of the United States Private Securities Litigation Reform Act of 1995 (referred to herein as “forward-looking statements”). Forward-looking statements include, but are not limited to, statements with respect to the future price of gold, the estimation of mineral reserves and resources, the realization of mineral reserve estimates, the timing and amount of estimated future production, costs of production, capital expenditures, costs and timing of the development of new deposits, success of exploration activities, permitting time lines, currency exchange rate fluctuations, requirements for additional capital, government regulation of mining operations, environmental risks, unanticipated reclamation expenses, title disputes or claims and limitations on insurance coverage. Generally, these forward-looking statements can be identified by the use of forward-looking terminology such as “plans”, “expects” or “does not expect”, “is expected”, “budget”, “scheduled”, “estimates”, “forecasts”, “intends”, “anticipates” or “does not anticipate” or “believes”, or the negative connotation thereof or variations of such words and phrases or state that certain actions, events or results, “may”, “could”, “would”, “might” or “will be taken”, “occur” or “be achieved” or the negative connotation thereof.
| Q1 2013 Management’s Discussion and Analysis | |
| (in thousands of CDN dollars, except as otherwise noted) | Page 31 |
All forward-looking statements are based on various assumptions, including, without limitation, the expectations and beliefs of management, the assumed long-term price of gold, that the Company will receive required permits and access to surface rights, that the Company can access financing, appropriate equipment and sufficient labour, and that the political environment within Canada will continue to support the development of mining projects in Canada.
Forward-looking statements are subject to known and unknown risks, uncertainties and other factors that may cause the actual results, level of activity, performance or achievements of Claude to be materially different from those expressed or implied by such forward-looking statements, including but not limited to: actual results of current exploration activities; environmental risks; future prices of gold; possible variations in ore reserves, grade or recovery rates; mine development and operating risks; accidents, labour issues and other risks of the mining industry; delays in obtaining government approvals or financing or in the completion of development or construction activities; and other risks and uncertainties, including but not limited to those discussed in the section entitled “Business Risk” in this MD&A. These risks and uncertainties are not, and should not be construed as being, exhaustive.
Although Claude has attempted to identify important factors that could cause actual results to differ materially from those contained in forward-looking statements, there may be other factors that cause results not to be as anticipated, estimated or intended. There can be no assurance that such statements will prove to be accurate, as actual results and future events could differ materially from those anticipated in such statements. Accordingly, readers should not place undue reliance on forward-looking statements.
Forward-looking statements in this MD&A are made as of the date of this MD&A, being May 8, 2013 and, accordingly, are subject to change after such date. Except as otherwise indicated by Claude, these statements do not reflect the potential impact of any non-recurring or other special items that may occur after the date hereof. Forward-looking statements are provided for the purpose of providing information about management’s current expectations and plans and allowing investors and others to get a better understanding of our operating environment.
Claude does not undertake to update any forward-looking statements that are incorporated by reference herein, except in accordance with applicable securities laws.
The forward-looking statements contained in this Management’s Discussion and Analysis are expressly qualified by these cautionary statements.
Additional Information
Additional information related to the Company, including its Annual Information Form (Form 40-F in the U.S.), is available on Canadian (www.sedar.com) and U.S. (www.sec.gov) securities regulatory authorities’ websites. Certain documents are also available on the Company’s website atwww.clauderesources.com.
| Q1 2013 Management’s Discussion and Analysis | |
| (in thousands of CDN dollars, except as otherwise noted) | Page 32 |
Conversion Multiples
For ease of reference, the following factors for converting metric measurements into imperial equivalents are provided:
| To Convert from Metric | | To Imperial | | Multiply Metric Units by | |
| Metres | | Feet (ft.) | | | 3.281 | |
| Kilometres (km) | | Miles | | | 0.621 | |
| Tonnes | | Tons (2,000 pounds) | | | 1.102 | |
| Grams | | Troy Ounces | | | 0.032 | |
| Hectares | | Acres | | | 2.471 | |
Glossary of Financial Terms
Current ratio = (current asset / current liabilities)
Debt to capital= (total debt – cash and cash equivalents) / (total debt – cash and cash equivalents + total shareholders’ equity)
Working capital = (current asset – current liabilities)
Glossary of Technical Terms
Alteration –any change in the mineral composition of a rock brought about by physical or chemical means.
Assaying- laboratory examination that determines the content or proportion of a specific metal (i.e.: silver) contained within a sample. Technique usually involves firing/smelting.
Au Eq (“gold equivalent”) –a measure of contained metal expressed in equivalent gold grade.
Biotite – a widely distributed and important rock-forming mineral of the mica group.
Brecciated – broken into sharp-angled fragments surrounded by finer-grained material.
Bulk Sample – a collection of representative mineralized material whose location, geologic character and metal assay content can be determined and then used for metallurgical or geotechnical testing purposes.
Chalcopyrite - a sulphide mineral of copper and iron.
Chlorite – a group of platy, monoclinic, usually greenish minerals.
Chloritic alteration – the replacement by, conversion into, or introduction of chlorite into a rock.
Core Samples- the cylindrical form of rock called “core” that is extracted from a diamond drill hole. Mineralized sections are separated and these samples are sent to a laboratory for analysis.
Cross-cut- a horizontal opening driven from a shaft or haulage drift at an oblique or right angle to the strike of a vein or other orebody.
Cut-off Grade - the lowest grade of mineralized material that qualifies as a reserve in a deposit (i.e.: contributing material of the lowest assay that is included in a reserve estimate).
| Q1 2013 Management’s Discussion and Analysis | |
| (in thousands of CDN dollars, except as otherwise noted) | Page 33 |
Diamond Drilling – a type of rotary drilling in which diamond bits are used as the rock-cutting tool to produce a recoverable drill core sample of rock for observation and analysis.
Dip – the angle that a structural surface, a bedding or fault plane makes with the horizontal, measured perpendicular to the strike of the structure.
Drift - a horizontal underground opening that follows along the length of a vein or rock formation.
Duty to Consult - governments in Canada may have a duty to consult with and potentially accommodate Aboriginal groups prior to making decisions which may impact lands and resources subject to established or potential treaty or Aboriginal rights, title or other claims. These governments, in turn, may delegate procedural aspects of this duty to industry.
Exploration– work involved in searching for ore, from prospecting to diamond drilling or driving a drift.
Fault – a fracture or break in rock along which there has been movement.
Feasibility Study – a comprehensive technical and economic study of the selected development option for a mineral project that includes appropriately detailed assessments of realistically assumed mining, processing, metallurgical, economic, marketing, legal, environmental, social and governmental considerations together with any other relevant operational factors and detailed financial analysis, that are necessary to demonstrate at the time of reporting that extraction is reasonably justified (economically mineable). The results of the study may reasonably serve as the basis for a final decision by a proponent or financial institution to proceed with, or finance, the development of the project. The confidence level of the study will be higher than that of a Prefeasibility Study.
Fire Assay - the assaying of metallic minerals by use of a miniature smelting procedure with various agents.
Footwall - the rock on the underside of a vein or ore structure.
Fracture – a break or crack in rock.
Geophysical Survey - a scientific method of prospecting that measures the physical properties of rock formations. Common properties investigated include magnetism, specific gravity, electrical conductivity and radioactivity.
Grade – the metal content of rock with precious metals, grade can be expressed as troy ounces or grams per tonne of rock.
Granitoid – a light-coloured, plutonic rock with quartz between 20 and 60 percent.
Head Grade – the average grade of ore fed into a mill.
Hydrothermal– the products or the actions of heated waters in a rock mass such as a mineral deposit precipitating from a hot solution.
Igneous– a primary type of rock formed by the cooling of molten material.
Indicated Mineral Resource – is that part of a Mineral Resource for which quantity, grade or quality, densities, shape and physical characteristics, can be estimated with a level of confidence sufficient to allow the appropriate application of technical and economic parameters, to support mine planning and evaluation of the economic viability of the deposit. The estimate is based on detailed and reliable exploration and testing information gathered through appropriate techniques from locations such as outcrops, trenches, pits, workings and drill holes that are spaced closely enough for geological and grade continuity to be reasonably assumed.
| Q1 2013 Management’s Discussion and Analysis | |
| (in thousands of CDN dollars, except as otherwise noted) | Page 34 |
Inferred Mineral Resource – is that part of a Mineral Resource for which quantity and grade or quality can be estimated on the basis of geological evidence and limited sampling and reasonably assumed, but not verified, geological and grade continuity. The estimate is based on limited information and sampling gathered through appropriate techniques from locations such as outcrops, trenches, pits, workings and drill holes.
Lens - a body of ore that is thick in the middle and tapers towards the ends.
Lithostructural– an assemblage of rocks that is unified on the basis of structural and lithological features.
Mafic - igneous rocks composed mostly of dark, iron and magnesium-rich minerals.
Measured Mineral Resource -is that part of a Mineral Resource for which quantity, grade or quality, densities, shape, and physical characteristics are so well established that they can be estimated with confidence sufficient to allow the appropriate application of technical and economic parameters, to support production planning and evaluation of the economic viability of the deposit. The estimate is based on detailed and reliable exploration, sampling and testing information gathered through appropriate techniques from locations such as outcrops, trenches, pits, workings and drill holes that are spaced closely enough to confirm both geological and grade continuity.
Metallurgy– the study of the extractive processes which produce minerals from their host rocks.
Mill - a processing facility where ore is finely ground and thereafter undergoes physical or chemical treatment to extract the valuable metals.
Mineral– a naturally formed chemical element or compound having a definitive chemical composition and usually a characteristic crystal form.
Mineralization– a natural concentration in rocks or soil of one or more minerals.
Mineral Reserve – the economically mineable part of a Measured or Indicated Mineral Resource demonstrated by at least a Prefeasibility Study. This study must include adequate information on mining, processing, metallurgical, economic and other relevant factors that demonstrate, at the time of reporting, that economic extraction can be justified. A Mineral Reserve includes diluting materials and allowances for losses that may occur when material is mined.
Mineral Resource – a concentration or occurrence of natural, solid, inorganic, or fossilized organic material in or on the Earth’s crust in such form and quantity and of such a grade or quality that it has reasonable prospects for economic extraction. The location, quantity, grade, geological characteristics, and continuity of a Mineral Resource are known, estimated or interpreted from specific geological evidence and knowledge.
National Instrument 43-101 or NI 43-101 – National Instrument 43-101 Standards of Disclosure for Mineral Projects of the Canadian Securities Administrators.
Ounces - troy ounces of a fineness of 999.9 parts per 1,000 parts.
Ore - rock, generally containing metallic or non-metallic minerals, which can be mined and processed at a profit.
Ore Body - a sufficiently large amount of ore that can be mined economically.
Plunge - the vertical angle a linear geological feature makes with the horizontal plane.
Porphyry - any igneous rock in which relatively large crystals are set in a fine-grained groundmass.
| Q1 2013 Management’s Discussion and Analysis | |
| (in thousands of CDN dollars, except as otherwise noted) | Page 35 |
Prefeasibility Study – a comprehensive study of the viability of a mineral project that has advanced to a stage where the mining method, in the case of underground mining, or the pit configuration, in the case of an open pit, has been established, and where an effective method of mineral processing has been determined. This study must include a financial analysis based on reasonable assumptions of technical engineering, operating, and economic factors, which are sufficient for a Qualified Person acting reasonably, to determine if all or part of the Mineral Resource may be classified as a Mineral Reserve.
Probable Mineral Reserve – the economically mineable part of an Indicated, and in some circumstances, a Measured Mineral Resource, demonstrated by at least a Prefeasibility Study. This study must include adequate information on mining, processing, metallurgical, economic and other relevant factors that demonstrate, at the time of reporting, that economic extraction can be justified.
Proven Mineral Reserve – the economically mineable part of a Measured Mineral Resource demonstrated by at least a Prefeasibility Study. This study must include adequate information on mining, processing, metallurgical, economic and other relevant factors that demonstrate, at the time of reporting, that economic extraction is justified.
Pulp - a mixture of ground ore and water.
Pyrite - an iron sulphide mineral (FeS2), the most common naturally occurring sulphide mineral.
Pyrrhotite - a bronze-colored, often magnetic iron sulphide mineral.
Qualified Person – an individual who is an engineer or geoscientist with at least five (5) years of experience in mineral exploration, mine development, mine operation, project assessment or any combination of these; has experience relevant to the subject matter of the mineral project and technical report; and is a member in good standing of a professional association.
Quartz – crystalline silica; often forming veins in fractures and faults within older rocks.
Raise -a vertical or inclined underground working that has been excavated from the bottom upward.
Ramp - an inclined underground opening.
Sericite – a fine-grained potassium mica found in various metamorphic rocks.
Shear Zone - a zone in which shearing has occurred on a large scale so that the rock is crushed and brecciated.
Showing - surface occurrence of mineral.
Sill - an intrusive sheet of igneous rock of roughly uniform thickness that has been forced between the bedding planes of existing rock; the initial horizontal drift along the strike of the ore vein.
Specific Gravity - the ratio between the weight of a unit volume of a substance and that of a unit volume of water.
Stope - an underground excavation from which ore has been extracted, either above or below a level. Access to stopes is usually by way of adjacent raises.
Stratigraphy – the sequence of bedded rocks in a particular area.
Tailings - Tailings consist of ground rock and process effluents that are generated in a mine processing plant or mill. Mechanical and chemical processes are used to extract gold from mine ore and produce a waste stream known as tailings. This process of product extraction is never 100 percent efficient, nor is it possible to reclaim all reusable and expended processing reagents and chemicals. The unrecoverable and uneconomic metals, minerals, chemicals, organics and process water are discharged, normally as slurry, to a final storage area commonly known as a Tailings Management Facility (TMF) or Tailings Storage Facility (TSF).
| Q1 2013 Management’s Discussion and Analysis | |
| (in thousands of CDN dollars, except as otherwise noted) | Page 36 |
Till - is unsorted glacial sediment. Its content may vary from clays to mixtures of clay, sand, gravel and boulders. This material is typically derived from the subglacial erosion and incorporated by the moving ice of the glaciers of previously available unconsolidated sediments.
Tonne – a metric ton or 2,204 pounds.
Trenching -the process of exploration by which till is removed from a trench cut from the earth’s surface.
Vein– a thin, sheet-like, cross-cutting body of hydrothermal mineralization, principally quartz.
Waste – barren rock in a mine, or mineralized material that is too low in grade to be mined and milled at a profit.
Working interestorWI - means the interest held by Claude in property. This interest normally bears its proportionate share of capital and operating costs as well as royalties or other production burdens. The working interest percentage is expressed before royalty interests.