UNITED STATES
SECURITIES AND EXCHANGE COMMISSION
Washington, D.C. 20549
FORM N-CSR
CERTIFIED SHAREHOLDER REPORT OF REGISTERED
MANAGEMENT INVESTMENT COMPANIES
Investment Company Act file number 811-21128
Legg Mason Partners Variable Equity Trust
(Exact name of registrant as specified in charter)
55 Water Street, New York, NY 10041
(Address of principal executive offices) (Zip code)
Robert I. Frenkel, Esq.
Legg Mason & Co., LLC
100 First Stamford Place
Stamford, CT 06902
(Name and address of agent for service)
Registrant’s telephone number, including area code: 1-877-721-1926
Date of fiscal year end: December 31
Date of reporting period: December 31, 2010
| ITEM 1. | REPORT TO STOCKHOLDERS. |
The Annual Report to Stockholders is filed herewith.
December 31, 2010

Annual
Repor t
Legg Mason
Variable Lifestyle Series
Legg Mason Variable Lifestyle Allocation 85%
Legg Mason Variable Lifestyle Allocation 70%
Legg Mason Variable Lifestyle Allocation 50%
INVESTMENT PRODUCTS: NOT FDIC INSURED • NO BANK GUARANTEE • MAY LOSE VALUE
| | |
| II | | Legg Mason Variable Lifestyle Series |
Legg Mason Variable Lifestyle Series
Legg Mason Variable Lifestyle Series (“Variable Lifestyle Series”) consists of separate investment Portfolios, each with its own investment objective and policies. Each Portfolio offers different levels of potential return and involves different levels of risk.
The Portfolios are separate investment series of the Legg Mason Partners Variable Equity Trust, a Maryland statutory trust.
| | | | |
| Letter from the chairman | | |  | |
Dear Shareholder,
We are pleased to provide the annual report of Legg Mason Variable Lifestyle Series for the twelve-month reporting period ended December 31, 2010. Please read on for a detailed look at prevailing economic and market conditions during the Portfolios’ reporting period and to learn how those conditions have affected each Portfolio’s performance.
As always, we remain committed to providing you with excellent service and a full spectrum of investment choices. We also remain committed to supplementing the support you receive from your financial advisor. One way we accomplish this is through our website, www.leggmason.com/individualinvestors. Here you can gain immediate access to market and investment information, including:
| Ÿ | | Market insights and commentaries from our portfolio managers and |
| Ÿ | | A host of educational resources. |
Special shareholder notice
At the Board of Trustees’ regular meeting held in February 2011, Western Asset Management Company (“Western Asset”) was appointed as an additional subadviser of each Portfolio within the Legg Mason Variable Lifestyle Series solely for cash management purposes. Western Asset personnel previously managed cash for the Portfolios through an arrangement with Legg Mason Partners Fund Advisor, LLC, the Portfolios’ investment manager.
We look forward to helping you meet your financial goals.
Sincerely,

R. Jay Gerken, CFA
Chairman, President and Chief Executive Officer
February 9, 2011
| | | | |
| Legg Mason Variable Lifestyle Series | | | III | |
Investment commentary
Economic review
Despite continued headwinds from high unemployment and issues in the housing market, the U.S. economy continued to expand over the twelve months ended December 31, 2010. Toward the end of the reporting period, fears regarding moderating economic growth were replaced with optimism for a strengthening economy in 2011. With investor sentiment improving, U.S. equities moved sharply higher in the fourth quarter, while rising interest rates negatively impacted some sectors of the fixed-income market. All told, during 2010, investors who took on additional risk in their portfolios were generally rewarded.
In September 2010, the National Bureau of Economic Research (“NBER”), the organization charged with determining when recessions start and end, announced that the recession that began in December 2007 had concluded in June 2009. However, the NBER said, “In determining that a trough occurred in June 2009, the committee did not conclude that economic conditions since that month have been favorable or that the economy has returned to operating at normal capacity.” The NBER’s point is well-taken given continued areas of weakness in the U.S. economy.
Although the U.S. Department of Commerce continued to report positive U.S. gross domestic product (“GDP”)i growth, the expansion has moderated since peaking at 5.0% in the fourth quarter of 2009. A slower drawdown in business inventories and renewed consumer spending were contributing factors spurring the economy’s solid growth at the end of 2009. However, the economy grew at a more modest pace in 2010. According to the Commerce Department, GDP growth was 3.7%, 1.7% and 2.6% during the first, second and third quarters of 2010, respectively. The initial estimate for fourth quarter GDP was a 3.2% expansion.
Turning to the job market, while the unemployment rate moved lower in December 2010, it remained elevated throughout the reporting period. While 384,000 new jobs were created during the fourth quarter and the unemployment rate fell from 9.8% in November to 9.4% in December 2010, there continued to be some disturbing trends in the labor market. The unemployment rate has now exceeded 9.0% for twenty consecutive months, the longest period since the government began tracking this data in 1949. In addition, the U.S. Department of Labor reported in December that a total of 14.5 million Americans looking for work have yet to
find a job, and 44% of these individuals have been out of work for more than six months.
There was mixed news in the housing market during the period. According to the National Association of Realtors (“NAR”), existing-home sales increased 7.0% and 8.0% in March and April, respectively, after sales had fallen for the period from December 2009 through February 2010. The rebound was largely attributed to people rushing to take advantage of the government’s $8,000 tax credit for first-time home buyers that expired at the end of April. However, with the end of the tax credit, existing-home sales then declined from May through July. Sales then generally rose from August through the end of the year. In total, existing-home sales volume in 2010 was 4.9 million, the lowest amount since 1997. Looking at home prices, the NAR reported that the median existing-home price for all housing types rose a tepid 0.3% in 2010. The inventory of unsold homes was an 8.1 month supply in December at the current sales level, versus a 9.5 month supply in November.
The manufacturing sector was one area of the economy that remained relatively strong during 2010. Based on the Institute for Supply Management’s PMIii, the manufacturing sector has grown seventeen consecutive months since it began expanding in August 2009. After reaching a six-year peak of 60.4 in April 2010 (a reading below 50 indicates a contraction, whereas a reading above 50 indicates an expansion), PMI data indicated somewhat more modest growth through the remainder of the year. However, in December, the manufacturing sector expanded at its fastest pace in seven months, with a reading of 57.0 versus 56.6 in November.
Outside of the U.S., economic news was largely dominated by the sovereign debt crisis in Europe. In May, the European Union (“EU”) and International Monetary Fund (“IMF”) announced a €750 billion ($955 billion) plan to aid fiscally troubled Eurozone countries. Investors were initially skeptical that the bailout plan would be sufficient to stem the contagion of the debt crisis to other peripheral European countries. However, the debt crisis largely moved to the back burner until November 2010, when Ireland’s economic issues took center stage and resulted in another rescue package from the EU and IMF. While final 2010 GDP data has not yet been released, given the economic strains in the Eurozone, the IMF projects that growth in the region will be a modest 1.7% in 2010. Expectations for Japan’s economy are better but still relatively tepid, as the IMF’s forecast for the country’s economy is a 2.8% expansion in 2010. In
| | |
| IV | | Legg Mason Variable Lifestyle Series |
Investment commentary (cont’d)
contrast, many emerging market countries are experiencing strong economic growth. The IMF projects that China’s economy will expand 10.5% in 2010 and that India’s economy will grow 9.7% during the year.
Financial market overview
The financial markets experienced several periods of volatility during the reporting period that tested the resolve of novice and experienced investors alike. During most of the first four months of the reporting period, the financial markets were largely characterized by healthy investor risk appetite and solid results by stocks and lower-quality bonds. The market then experienced sharp sell-offs in late April and in May, and again beginning in mid-November. During those periods, investors tended to favor the relative safety of U.S. Treasury securities. However, these setbacks proved to be only temporary and, in each case, risk aversion was replaced with solid demand for riskier assets.
Due to signs that certain areas of the economy were moderating in the second half of the reporting period, the Federal Reserve Board (“Fed”)iii took further actions to spur the economy. At its August 10th meeting, the Fed announced an ongoing program that calls for using the proceeds from expiring agency debt and agency mortgage-backed securities to purchase longer-dated Treasury securities.
In addition, the Fed remained cautious throughout the reporting period given pockets of weakness in the economy. At its meeting in September 2010, the Fed said, “The Committee will continue to monitor the economic outlook and financial developments and is prepared to provide additional accommodation if needed to support the economic recovery. . . .” This led to speculation that the Fed may again move to purchase large amounts of agency and Treasury securities in an attempt to avoid a double-dip recession and ward off deflation.
The Fed then took additional action in early November. Citing that “the pace of recovery in output and employment continues to be slow,” the Fed announced another round of quantitative easing to help stimulate the economy, entailing the purchase of $600 billion of long-term U.S. Treasury securities by the end of the second quarter of 2011. This, coupled with the Fed’s previously announced program to use the proceeds of expiring securities to purchase Treasuries, means it could buy a total of $850 billion to $900 billion of Treasury securities by the end of June 2011. At its final meeting of the year in December, the Fed said it “will regularly review the
pace of its securities purchases and the overall size of the asset-purchase program in light of incoming information and will adjust the program as needed to best foster maximum employment and price stability.”
Given the economic challenges in the Eurozone, the European Central Bank (“ECB”) kept interest rates at 1.0% during the reporting period. The ECB has kept rates at this historic low since the middle of 2009. A similar stance was taken by the Bank of England, as it kept rates on hold at 0.5% during the period. Japan, however, cut rates in October 2010 from 0.1% to a range of zero to 0.1%, the lowest level since 2006. In contrast, a number of emerging market countries, including China, India and Brazil, raised interest rates during the reporting period in an effort to ward off inflation.
Equity market review
U.S. stock prices, as measured by the S&P 500 Indexiv (the “Index”), moved higher during the twelve months ended December 31, 2010. The reporting period got off to a solid start, with the Index moving higher during three of the first four months covered by this report. The market’s ascent was the result of a number of factors, including optimism regarding the economy, better-than-expected corporate profits and increased investor risk appetite. However, robust investor appetite was replaced with heightened risk aversion in May and June. This was due to the escalating sovereign debt crisis in Europe, uncertainties regarding new financial reforms in the U.S. and some worse-than-expected economic data.
After reaching a nineteen-month high on April 23, 2010, the market, as measured by the Index, fell into “correction territory” in May and plunged more than 10%. Despite continued disappointing economic data, strong second quarter corporate profits helped the market to rally in July. The market then declined again in August, given some disappointing economic data. With the Fed indicating the possibility of another round of quantitative easing, stock prices then moved sharply higher in September and October. After posting solid results in early November, the market weakened later in the month as financial troubles in Ireland resulted in a re-emergence of the European sovereign debt crisis. However, investor sentiment was buoyed in December by a two-year extension of the Bush-era tax cuts and the Index gained 6.68% during the month. This represented its strongest month of
| | | | |
| Legg Mason Variable Lifestyle Series | | | V | |
December since 1991. All told, the Index returned 15.06% over the twelve months ended December 31, 2010.
The international developed equity market, as measured by the MSCI EAFE Indexv also posted a positive return but lagged its U.S. counterpart during the twelve months ended December 31, 2010, returning 7.75% for the period. This relative underperformance was the result of a number of factors, including concerns regarding the debt crisis in Greece and Ireland and fears that it could spread to other European countries. In addition, more subdued economic growth and the strengthening U.S. dollar negatively impacted the international developed equity market. Emerging market equities generated strong results during the reporting period, posting positive returns during eight of the twelve months covered by this report. This was largely due to stronger economic growth in many developing countries and generally robust investor demand. During the twelve months ended December 31, 2010, the MSCI Emerging Markets Indexvi returned 18.88%.
Fixed-income market review
Continuing the trend that began in the second quarter of 2009, nearly every spread sector (non-Treasury) outperformed equal-durationvii Treasuries during most of the first four months of the reporting period. Over that time, investor confidence was high given encouraging economic data, continued low interest rates, benign inflation and rebounding corporate profits. Robust investor appetite was then replaced with heightened risk aversion toward the end of April and during the month of May. This was due to the escalating sovereign debt crisis in Europe, uncertainties regarding new financial reforms in the U.S. and some worse-than-expected economic data. Most spread sectors then produced positive absolute returns in June and July, as investor demand for these securities again increased. There was another bout of risk aversion in August, given fears that the economy may slip back into a recession. However, due to expectations for additional quantitative easing, most spread sectors rallied in September and October. The spread sectors started to weaken again toward the middle of November as the European sovereign debt crisis again took center stage. While several spread sectors regained their footing in December, others remained weak given ongoing uncertainties in Europe and concerns regarding economic growth in China and its potential impact on the global economy.
Both short- and long-term Treasury yields fluctuated but, overall, moved lower during the twelve months ended December 31, 2010. When the period began, two- and ten-year Treasury yields were 1.14% and 3.85%, respectively. On April 5, 2010, two- and ten-year Treasury yields peaked at 1.18% and 4.01%, respectively. Subsequent to hitting their highs for the period, yields largely declined during much of the next six months, with two-year Treasuries hitting their low for the year of 0.33% on November 4, 2010. Ten-year Treasuries reached their 2010 trough of 2.41% in early October. Yields then moved sharply higher given expectations for stronger growth in 2011 and the potential for rising inflation. When the period ended on December 31, 2010, two-year Treasury yields were 0.61% and ten-year Treasury yields were 3.30%. For the twelve months ended December 31, 2010, the Barclays Capital U.S. Aggregate Indexviii returned 6.54%. In comparison, the Barclays Capital Global Aggregate Index (Hedged)ix returned 4.61% over the same time frame.
The U.S. high-yield bond market produced strong results during the reporting period. The asset class posted positive returns during each month, except for May and November 2010 when risk aversion rose sharply. The high-yield market was supported by better-than-expected corporate profits and overall strong investor demand. All told, the Barclays Capital U.S. High Yield — 2% Issuer Cap Indexx returned 14.94% for the twelve months ended December 31, 2010.
Emerging market debt prices rallied over the reporting period, posting positive returns each month during the period except for May, November and December 2010. This solid performance was triggered by strong economic growth in many emerging market countries, solid domestic demand and generally robust investor demand for the asset class. The JPMorgan Emerging Markets Bond Index Global (“EMBI Global”)xi returned 12.04% over the twelve months ended December 31, 2010.
As always, thank you for your confidence in our stewardship of your assets.
Sincerely,
R. Jay Gerken, CFA
Chairman, President and Chief Executive Officer
January 28, 2011
| | |
| VI | | Legg Mason Variable Lifestyle Series |
Investment commentary (cont’d)
All investments are subject to risk including the possible loss of principal. Past performance is no guarantee of future results. All index performance reflects no deduction for fees, expenses or taxes. Please note that an investor cannot invest directly in an index. Forecasts and predictions are inherently limited and should not be relied upon as an indication of actual or future performance.
| i | Gross domestic product (“GDP”) is the market value of all final goods and services produced within a country in a given period of time. |
| ii | The Institute for Supply Management’s PMI is based on a survey of purchasing executives who buy the raw materials for manufacturing at more than 350 companies. It offers an early reading on the health of the manufacturing sector. |
| iii | The Federal Reserve Board (“Fed”) is responsible for the formulation of policies designed to promote economic growth, full employment, stable prices and a sustainable pattern of international trade and payments. |
| iv | The S&P 500 Index is an unmanaged index of 500 stocks and is generally representative of the performance of larger companies in the U.S. |
| v | The MSCI EAFE Index is a free float-adjusted market capitalization index designed to measure developed market equity performance, excluding the U.S. and Canada. |
| vi | The MSCI Emerging Markets Index is a free float-adjusted market capitalization index that is designed to measure equity market performance in the global emerging markets. |
| vii | Duration is the measure of the price sensitivity of a fixed-income security to an interest rate change of 100 basis points. Calculation is based on the weighted average of the present values for all cash flows. |
| viii | The Barclays Capital U.S. Aggregate Index is a broad-based bond index comprised of government, corporate, mortgage- and asset-backed issues, rated investment grade or higher, and having at least one year to maturity. |
| ix | The Barclays Capital Global Aggregate Index (Hedged) is a broad-based bond index that measures a wide spectrum of global government, government-related agencies, corporate and securitized fixed-income investments, all with maturities greater than one year. |
| x | The Barclays Capital U.S. High Yield – 2% Issuer Cap Index is an index of the 2% Issuer Cap component of the Barclays Capital U.S. Corporate High Yield Index, which covers the U.S. dollar-denominated, non-investment grade, fixed-rate, taxable corporate bond market. |
| xi | The JPMorgan Emerging Markets Bond Index Global (“EMBI Global”) tracks total returns for U.S. dollar-denominated debt instruments issued by emerging market sovereign and quasi-sovereign entities: Brady bonds, loans, Eurobonds and local market instruments. |
| | | | |
| Legg Mason Variable Lifestyle Series 2010 Annual Report | | | 1 | |
Portfolios overview
Legg Mason Variable Lifestyle Series (the “Variable Lifestyle Series”) consists of three portfolio investment options (the “Portfolios”), each of which is a “fund of funds” that invests in a combination of equity and fixed-income mutual funds. The Variable Lifestyle Series offers a mix of equity funds categorized according to average market capitalization (size), investing style (e.g., value, core or growth) and global exposure (e.g., U.S. and/or international stocks). The various options within the Variable Lifestyle Series also offer a mix of bond asset classes such as U.S. and foreign government debt, corporate bonds, high-yield debt and emerging market debt — each of which carries a varying degree of risk/reward potential.
Q. What were the overall market conditions during the Portfolios’ reporting period?
A. Global equity markets generally moved sideways during the first half of the period, as investors worried about whether the global economy was going to experience a double dip back into recession, but then rose strongly in the second half of the year as those worries faded and economic data improved. For the twelve months ended December 31, 2010, the overall domestic stock market, as measured by the S&P 500 Indexi, returned 15.06%. Over the same time frame, the Russell 1000 Indexii of large-cap U.S. stocks produced a total return of 16.10%. Small-cap U.S. stocks performed even better, with the Russell 2000 Indexiii returning 26.85% over the same period. International stock markets rose, but not as much as U.S. markets. For the twelve months ended December 31, 2010, the MSCI EAFE Indexiv produced a total return of 7.75%.
In the fixed-income markets, government bond yields ended the period lower than where they started, despite a rise in yields in the last few months
of the year. The ten-year U.S. Treasury bond yield started the period at 3.85%. That yield fell steadily from early April through early October, reaching a low of 2.41%, as investors doubted the strength of the economic recovery and anticipated a new round of monetary policy easing by the Federal Reserve Board (“Fed”)v that would involve the Fed buying U.S. Treasuries. By the time the policy was actually announced, the economic outlook was starting to improve, and the ten-year U.S. Treasury yield rose to 3.30% by the end of the year. The two-year Treasury yield followed a similar pattern, starting the year at 1.14%, dipping to 0.33% in early November, and rising to 0.61% at the end of the period. Corporate bond yields also fell over the course of the reporting period — more so than the yields on Treasuries, in fact, so that the yield spread between corporate bonds and Treasuries narrowed. Bond prices move inversely with yields, so the fall in yields meant prices were rising. Overall, the Barclays Capital U.S. Aggregate Indexvi, which measures investment grade bonds (both government and corporate), returned 6.54% for the period.
Q. How did we respond to these changing market conditions?
A. At the beginning of the period, our weightings in underlying equity funds and underlying fixed-income funds were equal to the benchmark weights. In January, we became concerned that equities were anticipating too strong of an earnings rebound, and moved to an underweight position in equities and an overweight position in fixed income. In April, we saw evidence that the recovery in earnings had in fact been quite strong — so strong that we reversed our view. We decided that equities were actually undervalued relative to bonds, and moved to an overweight in equities and an underweight in fixed income. We maintained that position for the rest of the period.
| | |
| 2 | | Legg Mason Variable Lifestyle Series 2010 Annual Report |
Portfolios overview (cont’d)
Legg Mason Variable Lifestyle Allocation 85%
Target Asset Allocation1
| | |
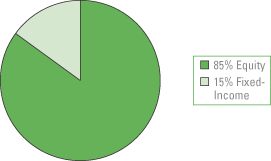 | | |
Legg Mason Variable Lifestyle Allocation 85% seeks capital appreciation by investing 85% of its assets in underlying funds that invest principally in equity securities and 15% in underlying funds that invest principally in fixed-income securities.
Performance review
For the twelve months ended December 31, 2010, Legg Mason Variable Lifestyle Allocation 85%2 returned 15.70%. The Portfolio’s unmanaged benchmarks, the Barclays Capital U.S. Aggregate Index, the Russell 3000 Indexvii and the Lifestyle Allocation 85% Composite Benchmarkviii, returned 6.54%, 16.93% and 15.82%, respectively, over the same time frame. The Lipper Variable Mixed-Asset Target Allocation Growth Funds Category Average3 returned 13.14% for the same period.
| | | | | | | | |
| Performance Snapshot as of December 31, 2010 (unaudited) | |
| | | 6 months | | | 12 months | |
| Legg Mason Variable Lifestyle Allocation 85%2 | | | 23.01 | % | | | 15.70 | % |
| Barclays Capital U.S. Aggregate Index | | | 1.15 | % | | | 6.54 | % |
| Russell 3000 Index | | | 24.46 | % | | | 16.93 | % |
| Lifestyle Allocation 85% Composite Benchmark | | | 22.08 | % | | | 15.82 | % |
| Lipper Variable Mixed-Asset Target Allocation Growth Funds Category Average3 | | | 18.35 | % | | | 13.14 | % |
The performance shown represents past performance. Past performance is no guarantee of future results and current performance may be higher or lower than the performance shown above. Principal value and investment returns will fluctuate and
investors’ shares, when redeemed, may be worth more or less than their original cost.
Portfolio returns assume the reinvestment of all distributions, including returns of capital, if any, at net asset value and the deduction of all Portfolio expenses. Performance figures for periods shorter than one year represent cumulative figures and are not annualized.
The portfolio managers periodically adjust the allocation of the Portfolio’s assets among different Legg Mason-affiliated funds depending upon the portfolio managers’ outlook for the equity and fixed-income markets in general, particular sectors of such markets and the performance outlook for the underlying funds. The Portfolio is not expected to be invested in all of the underlying funds at any time. The Portfolio may change its allocations among the underlying funds and may vary the allocation between equity and fixed-income funds within the Target Range4 without prior notice to shareholders.
Total Annual Operating Expenses† (unaudited)
As of the Portfolio’s most current prospectus dated April 30, 2010, the gross total operating expense ratio for the Portfolio was 1.00%.
Actual expenses may be higher. For example, expenses may be higher than those shown if average net assets decrease. Net assets are more likely to decrease and Portfolio expense ratios are more likely to increase when markets are volatile.
As a result of an expense limitation arrangement, the ratio of expenses, other than brokerage, interest, taxes, extraordinary expenses and acquired fund fees and expenses, to average net assets will not exceed 0.20%. This expense limitation arrangement cannot be terminated prior to December 31, 2012 without the Board of Trustees’ consent.
The manager is permitted to recapture amounts previously forgone or reimbursed to the Portfolio during the same fiscal year if the Portfolio’s total annual operating expenses have fallen to a level below the expense limitation in effect at the time the fees were earned or the expense incurred.
| 1 | The Target Asset Allocation set forth above represents an approximate mix of investments for Legg Mason Variable Lifestyle Allocation 85%. The allocation and investment mix of the Portfolio may vary depending upon market conditions, cash flows in and out of the Portfolio and other factors. In addition, the allocation and investment range of the Portfolio may be changed, from time to time, without prior notice to shareholders. |
| 2 | The Portfolio is an underlying investment option of various variable annuity and variable life insurance products. The Portfolio’s performance returns do not reflect the deduction of expenses imposed in connection with investing in variable annuity or variable life insurance contracts, such as administrative fees, account charges and surrender charges, which, if reflected, would reduce the performance of the Portfolio. Past performance is no guarantee of future results. |
| 3 | Lipper, Inc., a wholly-owned subsidiary of Reuters, provides independent insight on global collective investments. Returns are based on the period ended December 31, 2010, including the reinvestment of all distributions, including returns of capital, if any, calculated among the 251 funds for the six-month period and among the 245 funds for the twelve-month period in the Portfolio’s Lipper category. |
| 4 | The Target Range is the percentage range, as stated by the prospectus, within which the Portfolio may make tactical changes to its equity funds/fixed-income funds allocation. |
| † | Includes expenses of the underlying funds in which the Portfolio invests. |
| | | | |
| Legg Mason Variable Lifestyle Series 2010 Annual Report | | | 3 | |
Legg Mason Variable Lifestyle Allocation 70%
Target Asset Allocation1
| | |
 | | |
Legg Mason Variable Lifestyle Allocation 70% seeks long-term growth of capital by investing 70% of its assets in underlying funds that invest principally in equity securities and 30% in underlying funds that invest principally in fixed-income securities.
Performance review
For the twelve months ended December 31, 2010, Legg Mason Variable Lifestyle Allocation 70%2 returned 15.01%. The Portfolio’s unmanaged benchmarks, the Barclays Capital U.S. Aggregate Index, the Russell 3000 Index and the Lifestyle Allocation 70% Composite Benchmarkix, returned 6.54%, 16.93% and 14.45%, respectively, for the same period. The Lipper Variable Mixed-Asset Target Allocation Growth Funds Category Average3 returned 13.14% over the same time frame.
| | | | | | | | |
| Performance Snapsot as of December 31, 2010 (unaudited) | |
| | | 6 months | | | 12 months | |
| Legg Mason Variable Lifestyle Allocation 70%2 | | | 19.60 | % | | | 15.01 | % |
| Barclays Capital U.S. Aggregate Index | | | 1.15 | % | | | 6.54 | % |
| Russell 3000 Index | | | 24.46 | % | | | 16.93 | % |
| Lifestyle Allocation 70% Composite Benchmark | | | 18.26 | % | | | 14.45 | % |
| Lipper Variable Mixed-Asset Target Allocation Growth Funds Category Average3 | | | 18.35 | % | | | 13.14 | % |
The performance shown represents past performance. Past performance is no guarantee of future results and current performance may be higher or lower than the performance shown above. Principal value and investment returns will fluctuate and investors’ shares, when redeemed, may be worth more or less than their original cost.
Portfolio returns assume the reinvestment of all distributions, including returns of capital, if any, at net asset value and the deduction of all Portfolio expenses. Performance figures for periods shorter than one year represent cumulative figures and are not annualized.
Performance figures reflect expense reimbursements and/or fee waivers, without which the performance would have been lower.
The portfolio managers periodically adjust the allocation of the Portfolio’s assets among different Legg Mason-affiliated funds depending upon the portfolio managers’ outlook for the equity and fixed-income markets in general, particular sectors of such markets and the performance outlook for the underlying funds. The Portfolio is not expected to be invested in all of the underlying funds at any time. The Portfolio may change its allocations among the underlying funds and may vary the allocation between equity and fixed-income funds within the Target Range4 without prior notice to shareholders.
Total Annual Operating Expenses† (unaudited)
As of the Portfolio’s most current prospectus dated April 30, 2010, the gross total operating expense ratio for the Portfolio was 0.97%.
Actual expenses may be higher. For example, expenses may be higher than those shown if average net assets decrease. Net assets are more likely to decrease and Portfolio expense ratios are more likely to increase when markets are volatile.
As a result of an expense limitation arrangement, the ratio of expenses, other than brokerage, interest, taxes, extraordinary expenses and acquired fund fees and expenses, to average net assets will not exceed 0.20%. This expense limitation arrangement cannot be terminated prior to December 31, 2012 without the Board of Trustees’ consent.
The manager is permitted to recapture amounts previously forgone or reimbursed to the Portfolio during the same fiscal year if the Portfolio’s total annual operating expenses have fallen to a level below the expense limitation in effect at the time the fees were earned or the expense incurred.
| 1 | The Target Asset Allocation set forth above represents an approximate mix of investments for Legg Mason Variable Lifestyle Allocation 70%. The allocation and investment mix of the Portfolio may vary depending upon market conditions, cash flows in and out of the Portfolio and other factors. In addition, the allocation and investment ranges of the Portfolio may be changed, from time to time, without prior notice to shareholders. |
| 2 | The Portfolio is an underlying investment option of various variable annuity and variable life insurance products. The Portfolio’s performance returns do not reflect the deduction of expenses imposed in connection with investing in variable annuity or variable life insurance contracts, such as administrative fees, account charges and surrender charges, which, if reflected, would reduce the performance of the Portfolio. Past performance is no guarantee of future results. |
| 3 | Lipper, Inc., a wholly-owned subsidiary of Reuters, provides independent insight on global collective investments. Returns are based on the period ended December 31, 2010, including the reinvestment of all distributions, including returns of capital, if any, calculated among the 251 funds for the six-month period and among the 245 funds for the twelve-month period in the Portfolio’s Lipper category. |
| 4 | The Target Range is the percentage range, as stated by the prospectus, within which the Portfolio may make tactical changes to its equity funds/fixed-income funds allocation. |
| † | Includes expenses of the underlying funds in which the Portfolio invests. |
| | |
| 4 | | Legg Mason Variable Lifestyle Series 2010 Annual Report |
Portfolios overview (cont’d)
Legg Mason Variable Lifestyle Allocation 50%
Target Asset Allocation1
| | |
 | | |
Legg Mason Variable Lifestyle Allocation 50% seeks a balance of growth of capital and income by investing 50% of its assets in underlying funds that invest principally in equity securities and 50% in underlying funds that invest principally in fixed-income securities.
Performance review
For the twelve months ended December 31, 2010, Legg Mason Variable Lifestyle Allocation 50%2 returned 14.35%. The Portfolio’s unmanaged benchmarks, the Barclays Capital U.S. Aggregate Index, the Russell 1000 Index and the Lifestyle Allocation 50% Composite Benchmarkx, returned 6.54%, 16.10% and 12.87%, respectively, for the same period. The Lipper Variable Mixed-Asset Target Allocation Moderate Funds Category Average3 returned 11.28% over the same time frame.
| | | | | | | | |
| Performance Snapshot as of December 31, 2010 (unaudited) | |
| | | 6 months | | | 12 months | |
| Legg Mason Variable Lifestyle Allocation 50%2 | | | 15.61 | % | | | 14.35 | % |
| Barclays Capital U.S. Aggregate Index | | | 1.15 | % | | | 6.54 | % |
| Russell 1000 Index | | | 24.03 | % | | | 16.10 | % |
| Lifestyle Allocation 50% Composite Benchmark | | | 13.62 | % | | | 12.87 | % |
| Lipper Variable Mixed-Asset Target Allocation Moderate Funds Category Average3 | | | 14.16 | % | | | 11.28 | % |
The performance shown represents past performance. Past performance is no guarantee of future results and current performance may be higher or lower than the performance shown above. Principal value and investment returns will fluctuate and investors’ shares, when redeemed, may be worth more or less than their original cost.
Portfolio returns assume the reinvestment of all distributions, including returns of capital, if any, at net asset value and the deduction of all Portfolio expenses. Performance figures for periods shorter than one year represent cumulative figures and are not annualized.
The portfolio managers periodically adjust the allocation of the Portfolio’s assets among different Legg Mason-affiliated funds depending upon the portfolio managers’ outlook for the equity and fixed-income markets in general, particular sectors of such markets and the performance outlook for the underlying funds. The Portfolio is not expected to be invested in all of the underlying funds at any time. The Portfolio may change its allocations among the underlying funds and may vary the allocation between equity and fixed-income funds within the Target Range4 without prior notice to shareholders.
Total Annual Operating Expenses† (unaudited)
As of the Portfolio’s most current prospectus dated April 30, 2010, the gross total operating expense ratio for the Portfolio was 0.82%.
Actual expenses may be higher. For example, expenses may be higher than those shown if average net assets decrease. Net assets are more likely to decrease and Portfolio expense ratios are more likely to increase when markets are volatile.
| 1 | The Target Asset Allocation set forth above represents an approximate mix of investments for Legg Mason Variable Lifestyle Allocation 50%. The allocation and investment mix of the Portfolio may vary depending upon market conditions, cash flows in and out of the Portfolio and other factors. In addition, the allocation and investment range of the Portfolio may be changed, from time to time, without prior notice to shareholders. |
| 2 | The Portfolio is an underlying investment option of various variable annuity and variable life insurance products. The Portfolio’s performance returns do not reflect the deduction of expenses imposed in connection with investing in variable annuity or variable life insurance contracts, such as administrative fees, account charges and surrender charges, which, if reflected, would reduce the performance of the Portfolio. Past performance is no guarantee of future results. |
| 3 | Lipper, Inc., a wholly-owned subsidiary of Reuters, provides independent insight on global collective investments. Returns are based on the period ended December 31, 2010, including the reinvestment of all distributions, including returns of capital, if any, calculated among the 220 funds for the six-month period and among the 216 funds for the twelve-month period in the Portfolio’s Lipper category. |
| 4 | The Target Range is the percentage range, as stated by the prospectus, within which the Portfolio may make tactical changes to its equity funds/fixed-income funds allocation. |
| † | Includes expenses of the underlying funds in which the Portfolio invests. |
| | | | |
| Legg Mason Variable Lifestyle Series 2010 Annual Report | | | 5 | |
Q. What were the leading contributors and detractors to performance?
A. All of the underlying funds had positive returns for the period; therefore, they all contributed positively to absolute performance. Taking into account both the underlying fund returns and their weightings within the portfolios, the leading contributors to absolute performance were Western Asset Core Plus Bond Portfolio, Legg Mason Batterymarch U.S. Large Cap Equity Fund and Legg Mason ClearBridge Small Cap Growth Fund.
In relative terms (i.e., relative to the Portfolios’ blended benchmarks), the leading contributors to performance were Western Asset Core Plus Bond Portfolio and Legg Mason ClearBridge Aggressive Growth Fund.
No underlying fund detracted from performance in absolute terms. However, the funds that made the smallest positive contribution to absolute performance (again, taking into account underlying fund weightings as well as returns) were Legg Mason Capital Management Value Trust, Inc. and Legg Mason Batterymarch International Equity Trust.
In relative terms (i.e., relative to the Portfolios’ blended benchmarks), the leading detractors from performance were Legg Mason Capital Management Value Trust, Inc. and Legg Mason ClearBridge Appreciation Fund.
Thank you for your investment in the Variable Lifestyle Series. As always, we appreciate that you have chosen us to manage your assets and we remain focused on achieving the Portfolios’ investment goals.
Sincerely,

Steven Bleiberg
Portfolio Manager
Legg Mason Global Asset Allocation, LLC

Andrew D. Purdy
Portfolio Manager
Legg Mason Global Asset Allocation, LLC
January 18, 2011
RISKS: Equity securities are subject to price fluctuation. Fixed-income securities are subject to interest rate and credit risks. Foreign securities are subject to certain risks of overseas investing including currency fluctuations and changes in political and economic conditions, which could result in significant market fluctuations. These risks are magnified in emerging markets. Investments in small- and mid-capitalization companies may involve a higher degree of risk and volatility than investments in larger, more established companies. As interest rates rise, bond prices fall, reducing the value of the Portfolios’ share prices. High-yield bonds involve greater credit and liquidity risks than investment grade bonds. There are additional risks and other expenses associated with investing in other mutual funds rather than directly in portfolio securities. Certain underlying funds may use derivatives, such as options and futures, which can be illiquid, may disproportionately increase losses, and have a potentially large impact on Portfolio performance. Please see the Portfolios’ prospectuses for a more complete discussion of these and other risks, and the Portfolios’ investment strategies.
All investments are subject to risk including the possible loss of principal. Past performance is no guarantee of future results. All index performance reflects no deduction for fees, expenses or taxes. Please note that an investor cannot invest directly in an index.
The information provided is not intended to be a forecast of future events, a guarantee of future results or investment advice. Views expressed may differ from those of the firm as a whole.
| | |
| 6 | | Legg Mason Variable Lifestyle Series 2010 Annual Report |
Portfolios overview (cont’d)
| i | The S&P 500 Index is an unmanaged index of 500 stocks and is generally representative of the performance of larger companies in the U.S. |
| ii | The Russell 1000 Index measures the performance of the 1,000 largest companies in the Russell 3000 Index, which represents approximately 92% of the total market capitalization of the Russell 3000 Index. |
| iii | The Russell 2000 Index measures the performance of the 2,000 smallest companies in the Russell 3000 Index, which represents approximately 8% of the total market capitalization of the Russell 3000 Index. |
| iv | The MSCI EAFE Index is a free float-adjusted market capitalization index designed to measure developed market equity performance, excluding the U.S. and Canada. |
| v | The Federal Reserve Board (“Fed”) is responsible for the formulation of policies designed to promote economic growth, full employment, stable prices and a sustainable pattern of international trade and payments. |
| vi | The Barclays Capital U.S. Aggregate Index is a broad-based bond index comprised of government, corporate, mortgage- and asset-backed issues, rated investment grade or higher, and having at least one year to maturity. |
| vii | The Russell 3000 Index measures the performance of the 3,000 largest U.S. companies based on total market capitalization, which represents approximately 98% of the U.S. equity market. |
| viii | The Lifestyle Allocation 85% Composite Benchmark is a hypothetical representation of the performance of the Portfolio’s major asset classes. It consists of 45% Russell 1000 Index, 20% Russell 2000 Index, 20% MSCI EAFE Index, 10% Barclays Capital U.S. Aggregate Index and 5% Barclays Capital U.S. High Yield — 2% Issuer Cap Index. The Barclays Capital U.S. High Yield – 2% Issuer Cap Index is an index of the 2% Issuer Cap component of the Barclays Capital U.S. Corporate High Yield Index, which covers the U.S. dollar-denominated, non-investment grade, fixed-rate, taxable corporate bond market. |
| ix | The Lifestyle Allocation 70% Composite Benchmark is a hypothetical representation of the performance of the Portfolio’s major asset classes. It consists of 40% Russell 1000 Index, 15% Russell 2000 Index, 15% MSCI EAFE Index, 25% Barclays Capital U.S. Aggregate Index and 5% Barclays Capital U.S. High Yield — 2% Issuer Cap Index. |
| x | The Lifestyle Allocation 50% Composite Benchmark is a hypothetical representation of the performance of the Portfolio’s major asset classes. It consists of 28% Russell 1000 Index, 12% Russell 2000 Index, 10% MSCI EAFE Index, 43% Barclays Capital U.S. Aggregate Index and 7% Barclays Capital U.S. High Yield — 2% Issuer Cap Index. |
| | | | |
| Legg Mason Variable Lifestyle Series 2010 Annual Report | | | 7 | |
Portfolios at a glance (unaudited)
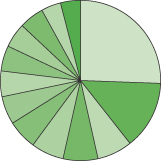
Legg Mason Variable Lifestyle Allocation 85% Breakdown† as of — December 31, 2010
As a Percent of Total Long-Term Investments

| | | | |
% of Total Long-Term
Investments | | Top 5 Sectors |
 | | 14.1 Legg Mason Partners Equity Trust — Legg Mason Batterymarch U.S. Large Cap Equity Fund, Class IS Shares | | Information technology Consumer discretionary Financials Health care Energy |
| | | 13.5 Legg Mason Partners Equity Trust — Legg Mason ClearBridge Appreciation Fund, Class IS Shares | | Information technology Financials Industrials Consumer staples Consumer discretionary |
| | | 10.0 Legg Mason Partners Equity Trust — Legg Mason Global Currents International All Cap Opportunity Fund, Class IS Shares | | Consumer discretionary Financials Industrials Information technology Consumer staples |
| | | 9.8 Legg Mason Global Trust, Inc. — Legg Mason Batterymarch International Equity Trust, Class IS Shares | | Financials Industrials Consumer discretionary Materials Consumers staples |
| | | 8.2 Legg Mason Partners Equity Trust — Legg Mason ClearBridge Small Cap Growth Fund, Class IS Shares | | Information technology Health care Consumer discretionary Industrials Financials |
| | | 8.2 The Royce Fund — Royce Value Fund, Institutional Class Shares | | Natural resources Technology Consumer services Financial intermediaries Industrial products |
| | | 6.9 Legg Mason Capital Management Value Trust, Inc., Class I Shares | | Financials Information technology Consumer discretionary Health care Utilities |
| † | Subject to change at any time. |
| | | | |
% of Total Long-Term
Investments | | Top 5 Sectors |
| | | 6.7 Legg Mason Partners Equity Trust — Legg Mason ClearBridge Aggressive Growth Fund, Class IS Shares | | Health care Energy Consumer discretionary Information technology Industrials |
| | | 6.2 Legg Mason Partners Equity Trust — Legg Mason ClearBridge Fundamental All Cap Value Fund, Class IS Shares | | Financials Information technology Industrials Energy Consumer discretionary |
| | | 5.1 Legg Mason Partners Equity Trust — Legg Mason ClearBridge Mid Cap Core Fund, Class IS Shares | | Information technology Financials Consumer discretionary Health care Industrials |
| | | 4.8 Western Asset Funds, Inc. — Western Asset High Yield Portfolio, Class IS Shares | | Consumer discretionary Energy Industrials Financials Materials |
| | | 4.7 Western Asset Funds, Inc. — Western Asset Absolute Return Portfolio, Class IS Shares | | U.S. government & agency obligations Financials Collateralized mortgage obligations Consumer discretionary Asset-backed securities |
| | | 1.8 Western Asset Funds, Inc. - Western Asset Core Plus Bond Portfolio, Class IS Shares | | Corporate bonds & notes Mortgage-backed securities Collateralized mortgage obligations U.S. government & agency obligations Asset-backed securities |
| | |
| 8 | | Legg Mason Variable Lifestyle Series 2010 Annual Report |
Portfolios at a glance (unaudited) (cont’d)
Legg Mason Variable Lifestyle Allocation 70% Breakdown† as of — December 31, 2010
As a Percent of Total Long-Term Investments

| | | | |
% of Total Long-Term
Investments | | Top 5 Sectors |
| | | 11.5 Legg Mason Partners Equity Trust — Legg Mason ClearBridge Appreciation Fund, Class IS Shares | | Information technology Financials Industrials Consumer staples Consumer discretionary |
| | | 11.1 Legg Mason Partners Equity Trust — Legg Mason Batterymarch U.S. Large Cap Equity Fund, Class IS Shares | | Information technology Consumer discretionary Financials Health care Energy |
| | | 10.8 Western Asset Funds, Inc. — Western Asset Absolute Return Portfolio, Class IS Shares | | U.S. government & agency obligations Financials Collateralized mortgage obligations Consumer discretionary Asset-backed securities |
| | | 10.4 Western Asset Funds, Inc. — Western Asset Core Plus Bond Portfolio, Class IS Shares | | Corporate bonds & notes Mortgage-backed securities Collateralized mortgage obligations U.S. government & agency obligations Asset-backed securities |
| | | 7.4 Legg Mason Partners Equity Trust — Legg Mason Global Currents International All Cap Opportunity Fund, Class IS Shares | | Consumer discretionary Financials Industrials Information technology Consumer staples |
| | | 7.4 Legg Mason Global Trust, Inc. — Legg Mason Batterymarch International Equity Trust, Class IS Shares | | Financials Industrials Consumer discretionary Materials Consumers staples |
| † | Subject to change at any time. |
| | | | |
% of Total Long-Term
Investments | | Top 5 Sectors |
| | | 6.9 Legg Mason Capital Management Value Trust, Inc., Class I Shares | | Financials Information technology Consumer discretionary Health care Utilities |
| | | 6.8 Legg Mason Partners Equity Trust — Legg Mason ClearBridge Aggressive Growth Fund, Class IS Shares | | Health care Energy Consumer discretionary Information technology Industrials |
| | | 6.2 Legg Mason Partners Equity Trust — Legg Mason ClearBridge Fundamental All Cap Value Fund, Class IS Shares | | Financials Information technology Industrials Energy Consumer discretionary |
| | | 5.7 Legg Mason Partners Equity Trust — Legg Mason ClearBridge Small Cap Growth Fund, Class IS Shares | | Information technology Health care Consumer discretionary Industrials Financials |
| | | 5.7 The Royce Fund — Royce Value Fund, Institutional Class Shares | | Natural resources Technology Consumer services Financial intermediaries Industrial products |
| | | 5.2 Legg Mason Partners Equity Trust — Legg Mason ClearBridge Mid Cap Core Fund, Class IS Shares | | Information technology Financials Consumer discretionary Health care Industrials |
| | | 4.9 Western Asset Funds, Inc. — Western Asset High Yield Portfolio, Class IS Shares | | Consumer discretionary Energy Industrials Financials Materials |
| | | | |
| Legg Mason Variable Lifestyle Series 2010 Annual Report | | | 9 | |
Legg Mason Variable Lifestyle Allocation 50% Breakdown† as of — December 31, 2010
As a Percent of Total Long-Term Investments
| | | | |
% of Total Long-Term
Investments | | Top 5 Sectors |
| | | 25.6 Western Asset Funds, Inc. — Western Asset Core Plus Bond Portfolio, Class IS Shares | | Corporate bonds & notes Mortgage-backed securities Collateralized mortgage obligations U.S. government & agency obligations Asset-backed securities |
| | | 13.8 Western Asset Funds, Inc. — Western Asset Absolute Return Portfolio, Class IS Shares | | U.S. government & agency obligations Financials Collateralized mortgage obligations Consumer discretionary Asset-backed securities |
| | | 7.1 Legg Mason Partners Equity Trust — Legg Mason Batterymarch U.S. Large Cap Equity Fund, Class IS Shares | | Information technology Consumer discretionary Financials Health care Energy |
| | | 7.0 Western Asset Funds, Inc. — Western Asset High Yield Portfolio, Class IS Shares | | Consumer discretionary Energy Industrials Financials Materials |
| | | 6.6 Legg Mason Partners Equity Trust — Legg Mason ClearBridge Appreciation Fund, Class IS Shares | | Information technology Financials Industrials Consumer staples Consumer discretionary |
| | | 6.0 Legg Mason Capital Management Value Trust, Inc., Class I Shares | | Financials Information technology Consumer discretionary Health care Utilities |
| † | Subject to change at any time. |
| | | | |
% of Total Long-Term
Investments | | Top 5 Sectors |
| | | 5.6 Legg Mason Partners Equity Trust — Legg Mason ClearBridge Aggressive Growth Fund, Class IS Shares | | Health care Energy Consumer discretionary Information technology Industrials |
| | | 5.2 Legg Mason Partners Equity Trust — Legg Mason ClearBridge Fundamental All Cap Value Fund, Class IS Shares | | Financials Information technology Industrials Energy Consumer discretionary |
| | | 5.1 Legg Mason Partners Equity Trust — Legg Mason Global Currents International All Cap Opportunity Fund, Class IS Shares | | Consumer discretionary Financials Industrials Information technology Consumer staples |
| | | 5.0 Legg Mason Partners Equity Trust — Legg Mason ClearBridge Mid Cap Core Fund, Class IS Shares | | Information technology Financials Consumer discretionary Health care Industrials |
| | | 5.0 Legg Mason Global Trust, Inc. — Legg Mason Batterymarch International Equity Trust, Class IS Shares | | Financials Industrials Consumer discretionary Materials Consumers staples |
| | | 4.0 The Royce Fund — Royce Value Fund, Institutional Class Shares | | Natural resources Technology Consumer services Financial intermediaries Industrial products |
| | | 4.0 Legg Mason Partners Equity Trust — Legg Mason ClearBridge Small Cap Growth Fund, Class IS Shares | | Information technology Health care Consumer discretionary Industrials Financials |
| | |
| 10 | | Legg Mason Variable Lifestyle Series 2010 Annual Report |
Portfolios expenses (unaudited)
Example
As a shareholder of the Portfolios, you may incur two types of costs: (1) transaction costs and (2) ongoing costs, including management fees; and other Portfolio expenses. This example is intended to help you understand your ongoing costs (in dollars) of investing in the Portfolios and to compare these costs with the ongoing costs of investing in other mutual funds.
This example is based on an investment of $1,000 invested on July 1, 2010 and held for the six months ended December 31, 2010.
Actual expenses
The table below titled “Based on Actual Total Return” provides information about actual account values and actual expenses. You may use the information provided in this table, together with the amount you invested, to estimate the expenses that you paid over the period. To estimate the expenses you paid on your account, divide your ending account value by $1,000 (for example, an $8,600 ending account value divided by $1,000 = 8.6), then multiply the result by the number under the heading entitled “Expenses Paid During the Period”.
Hypothetical example for comparison purposes
The table below titled “Based on Hypothetical Total Return” provides information about hypothetical account values and hypothetical expenses based on the actual expense ratio and an assumed rate of return of 5.00% per year before expenses, which is not each Portfolio’s actual return. The hypothetical account values and expenses may not be used to estimate the actual ending account balance or expenses you paid for the period. You may use the information provided in this table to compare the ongoing costs of investing in the Portfolios and other portfolios. To do so, compare the 5.00% hypothetical example relating to the Portfolios with the 5.00% hypothetical examples that appear in the shareholder reports of the other funds.
Please note that the expenses shown in the table below are meant to highlight your ongoing costs only and do not reflect any transactional costs, such as front-end or back-end sales charges (loads). Therefore, the table is useful in comparing ongoing costs only, and will not help you determine the relative total costs of owning different funds. In addition, if these transaction costs were included, your costs would have been higher.
| | | | | | | | | | | | | | | | | | | | | | | | | | | | | | | | | | | | | | | | | | | | | | |
| Based on actual total return1 | | | | | | Based on hypothetical total return1 | |
| | | Actual
Total
Return2 | | | Beginning
Account Value | | | Ending
Account Value | | | Annualized
Expense
Ratio3 | | | Expenses
Paid
During
the
Period4 | | | | | | | | Hypothetical
Annualized
Total Return | | | Beginning
Account Value | | | Ending
Account Value | | | Annualized
Expense
Ratio3 | | | Expenses
Paid During
the
Period4 | |
| Legg Mason Variable Lifestyle Allocation 85% | | | 23.01 | % | | $ | 1,000.00 | | | $ | 1,230.10 | | | | 0.18 | % | | $ | 1.01 | | | | | | | Legg Mason Variable Lifestyle Allocation 85% | | | 5.00 | % | | $ | 1,000.00 | | | $ | 1,024.30 | | | | 0.18 | % | | $ | 0.92 | |
Legg Mason Variable Lifestyle
Allocation 70% | | | 19.60 | | | | 1,000.00 | | | | 1,196.00 | | | | 0.20 | | | | 1.11 | | | | | | | Legg Mason Variable Lifestyle Allocation 70% | | | 5.00 | | | | 1,000.00 | | | | 1,024.20 | | | | 0.20 | | | | 1.02 | |
Legg Mason Variable Lifestyle
Allocation 50% | | | 15.61 | | | | 1,000.00 | | | | 1,156.10 | | | | 0.16 | | | | 0.87 | | | | | | | Legg Mason Variable Lifestyle Allocation 50% | | | 5.00 | | | | 1,000.00 | | | | 1,024.40 | | | | 0.16 | | | | 0.82 | |
| 1 | For the six months ended December 31, 2010. |
| 2 | Assumes the reinvestment of all distributions, including returns of capital, if any, at net asset value. Total return is not annualized, as it may not be representative of the total return for the year. Total returns do not reflect expenses associated with separate accounts such as administrative fees, account charges and surrender charges, which, if reflected, would reduce the total returns. Performance figures may reflect compensating balance arrangements, fee waivers and/or expense reimbursements. In the absence of fee compensating balance arrangements, waivers and/or expense reimbursements, the total return would have been lower. Past performance is no guarantee of future results. |
| 3 | The expense ratios do not include expenses of the underlying funds in which each Portfolio invests. |
| 4 | Expenses (net of fee waivers and/or expense reimbursements) are equal to each Portfolio’s annualized expense ratio multiplied by the average account value over the period, multiplied by the number of days in the most recent fiscal half-year (184), then divided by 365. |
| | | | |
| Legg Mason Variable Lifestyle Series 2010 Annual Report | | | 11 | |
Portfolios performance (unaudited)
Legg Mason Variable Lifestyle Allocation 85%
| | | | |
| Average annual total returns1 | |
| | | | |
| Twelve Months Ended 12/31/10 | | | 15.70 | % |
| Five Years Ended 12/31/10 | | | 1.65 | |
| Ten Years Ended 12/31/10 | | | 1.57 | |
| | | | |
| Cumulative total returns1 | |
| 12/31/00 through 12/31/10 | | | 16.83 | % |
Legg Mason Variable Lifestyle Allocation 70%
| | | | |
| Average annual total returns1 | |
| | | | |
| Twelve Months Ended 12/31/10 | | | 15.01 | % |
| Five Years Ended 12/31/10 | | | 3.04 | |
| Ten Years Ended 12/31/10 | | | 2.41 | |
| | | | |
| Cumulative total returns1 | |
| 12/31/00 through 12/31/10 | | | 26.89 | % |
Legg Mason Variable Lifestyle Allocation 50%
| | | | |
| Average annual total returns1 | |
| | | | |
| Twelve Months Ended 12/31/10 | | | 14.35 | % |
| Five Years Ended 12/31/10 | | | 4.19 | |
| Ten Years Ended 12/31/10 | | | 4.16 | |
| | | | |
| Cumulative total returns1 | |
| 12/31/00 through 12/31/10 | | | 50.29 | % |
All figures represent past performance and are not a guarantee of future results. Investment return and principal value of an investment will fluctuate so that an investor’s shares, when redeemed, may be worth more or less than their original cost. The returns shown do not reflect expenses associated with separate accounts such as administrative fees, account charges and surrender charges, which, if reflected, would reduce the total returns. Performance figures may reflect compensating balance arrangements, fee waivers and/or expense reimbursements. In the absence of compensating balance arrangements, fee waivers and/or expense reimbursements, the total return would have been lower.
| 1 | Assumes the reinvestment of all distributions, including returns of capital, if any, at net asset value. |
| | |
| 12 | | Legg Mason Variable Lifestyle Series 2010 Annual Report |
Portfolios performance (unaudited) (cont’d)
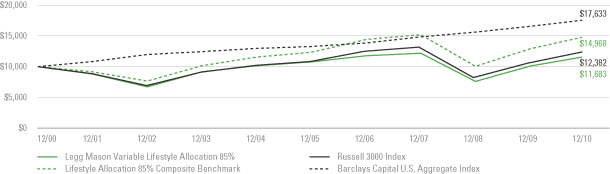
Historical performance
Value of $10,000 invested in
Legg Mason Variable Lifestyle Allocation 85% vs. Benchmark Indices† — December 2000 - December 2010
All figures represent past performance and are not a guarantee of future results. Investment return and principal value of an investment will fluctuate so that an investor’s shares, when redeemed, may be worth more or less than their original cost. The returns shown do not reflect expenses associated with separate accounts such as administrative fees, account charges and surrender charges, which, if reflected, would reduce the total returns. Performance figures may reflect compensating balance arrangements, fee waivers and/or expense reimbursements. In the absence of compensating balance arrangements, fee waivers and/or expense reimbursements, the total return would have been lower.
| † | Hypothetical illustration of $10,000 invested in Legg Mason Variable Lifestyle Allocation 85% on December 31, 2000, assuming the reinvestment of all distributions, including returns of capital, if any, at net asset value through December 31, 2010. The hypothetical illustration also assumes a $10,000 investment in the Barclays Capital U.S. Aggregate Index, Russell 3000 Index and Lifestyle Allocation 85% Composite Benchmark. The Barclays Capital U.S. Aggregate Index is a broad-based bond index comprised of government, corporate, mortgage- and asset-backed issues, rated investment grade or higher, and having at least one year to maturity. The Russell 3000 Index measures the performance of the 3,000 largest U.S. companies based on total market capitalization, which represents approximately 98% of the U.S. equity market. The Lifestyle Allocation 85% Composite Benchmark is a hypothetical representation of the performance of the Portfolio’s major asset classes. It consists of 45% Russell 1000 Index, 20% Russell 2000 Index, 20% MSCI EAFE Index, 10% Barclays Capital U.S. Aggregate Index and 5% Barclays Capital U.S. High Yield-2% Issuer Cap Index. The Russell 1000 Index measures the performance of the 1,000 largest companies in the Russell 3000 Index, which represents approximately 92% of the total market capitalization of the Russell 3000 Index. The Russell 2000 Index measures the performance of the 2,000 smallest companies in the Russell 3000 Index, which represents approximately 8% of the total market capitalization of the Russell 3000 Index. The MSCI EAFE Index is a free float-adjusted market capitalization index designed to measure developed market equity performance, excluding the U.S. and Canada. The Barclays Capital U.S. High Yield-2% Issuer Cap Index is an index of the 2% Issuer Cap component of the Barclays Capital U.S. Corporate High Yield Index, which covers the U.S. dollar-denominated, non-investment grade, fixed-rate, taxable corporate bond market. The Indices are unmanaged and are not subject to the same management and trading expenses of a mutual fund. Please note that an investor cannot invest directly in an index. |
| | | | |
| Legg Mason Variable Lifestyle Series 2010 Annual Report | | | 13 | |
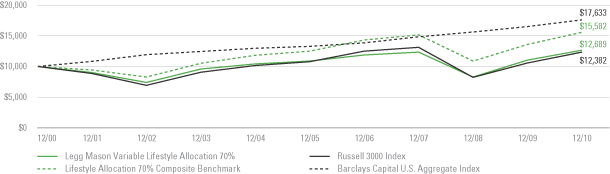
Historical Performance
Value of $10,000 invested in
Legg Mason Variable Lifestyle Allocation 70% vs. Benchmark Indices† — December 2000 - December 2010
All figures represent past performance and are not a guarantee of future results. Investment return and principal value of an investment will fluctuate so that an investor’s shares, when redeemed, may be worth more or less than their original cost. The returns shown do not reflect expenses associated with separate accounts such as administrative fees, account charges and surrender charges, which, if reflected, would reduce the total returns. Performance figures may reflect compensating balance arrangements, fee waivers and/or expense reimbursements. In the absence of compensating balance arrangements, fee waivers and/or expense reimbursements, the total return would have been lower.
| † | Hypothetical illustration of $10,000 invested in Legg Mason Variable Lifestyle Allocation 70% on December 31, 2000, assuming the reinvestment of all distributions, including returns of capital, if any, at net asset value through December 31, 2010. The hypothetical illustration also assumes a $10,000 investment in the Barclays Capital U.S. Aggregate Index, Russell 3000 Index and Lifestyle Allocation 70% Composite Benchmark. The Barclays Capital U.S. Aggregate Index is a broad-based bond index comprised of government, corporate, mortgage- and asset-backed issues, rated investment grade or higher, and having at least one year to maturity. The Russell 3000 Index measures the performance of the 3,000 largest U.S. companies based on total market capitalization, which represents approximately 98% of the U.S. equity market. The Lifestyle Allocation 70% Composite Benchmark is a hypothetical representation of the performance of the Portfolio’s major asset classes. It consists of 40% Russell 1000 Index, 15% Russell 2000 Index, 15% MSCI EAFE Index, 25% Barclays Capital U.S. Aggregate Index and 5% Barclays Capital U.S. High Yield-2% Issuer Cap Index. The Russell 1000 Index measures the performance of the 1,000 largest companies in the Russell 3000 Index, which represents approximately 92% of the total market capitalization of the Russell 3000 Index. The Russell 2000 Index measures the performance of the 2,000 smallest companies in the Russell 3000 Index, which represents approximately 8% of the total market capitalization of the Russell 3000 Index. The MSCI EAFE Index is a free float-adjusted market capitalization index designed to measure developed market equity performance, excluding the U.S. and Canada. The Barclays Capital U.S. High Yield-2% Issuer Cap Index is an index of the 2% Issuer Cap component of the Barclays Capital U.S. Corporate High Yield Index, which covers the U.S. dollar-denominated, non-investment grade, fixed-rate, taxable corporate bond market. The Indices are unmanaged and are not subject to the same management and trading expenses of a mutual fund. Please note that an investor cannot invest directly in an index. |
| | |
| 14 | | Legg Mason Variable Lifestyle Series 2010 Annual Report |
Portfolios performance (unaudited) (cont’d)
Historical performance
Value of $10,000 invested in
Legg Mason Variable Lifestyle Allocation 50% vs. Benchmark Indices† — December 2000 - December 2010
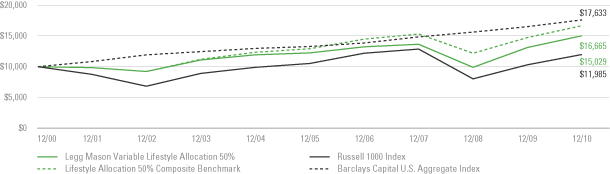
All figures represent past performance and are not a guarantee of future results. Investment return and principal value of an investment will fluctuate so that an investor’s shares, when redeemed, may be worth more or less than their original cost. The returns shown do not reflect expenses associated with separate account such as administrative fees, account charges and surrender charges, which, if reflected, would reduce the total returns. Performance figures may reflect compensating balance arrangements, fee waivers and/or expense reimbursements. In the absence of compensating balance arrangements, fee waivers and/or expense reimbursements, the total return would have been lower.
| † | Hypothetical illustration of $10,000 invested in Legg Mason Variable Lifestyle Allocation 50% on December 31, 2000, assuming the reinvestment of all distributions, including returns of capital, if any, at net asset value through December 31, 2010. The hypothetical illustration also assumes a $10,000 investment in the Barclays Capital U.S. Aggregate Index, Russell 1000 Index and Lifestyle Allocation 50% Composite Benchmark. The Barclays Capital U.S. Aggregate Index is a broad-based bond index comprised of government, corporate, mortgage- and asset-backed issues, rated investment grade or higher, and having at least one year to maturity. The Russell 1000 Index measures the performance of the 1,000 largest companies in the Russell 3000 Index, which represents approximately 92% of the total market capitalization of the Russell 3000 Index. The Lifestyle Allocation 50% Composite Benchmark is a hypothetical representation of the performance of the Portfolio’s major asset classes. It consists of 28% Russell 1000 Index, 12% Russell 2000 Index, 10% MSCI EAFE Index, 43% Barclays Capital U.S. Aggregate Index and 7% Barclays Capital U.S. High Yield-2% Issuer Cap Index. The Russell 2000 Index measures the performance of the 2,000 smallest companies in the Russell 3000 Index, which represents approximately 8% of the total market capitalization of the Russell 3000 Index. The MSCI EAFE Index is a free float-adjusted market capitalization index designed to measure developed market equity performance, excluding the U.S. and Canada. The Barclays Capital U.S. High Yield-2% Issuer Cap Index is an index of the 2% Issuer Cap component of the Barclays Capital U.S. Corporate High Yield Index, which covers the U.S. dollar-denominated, non-investment grade, fixed-rate, taxable corporate bond market. The Indices are unmanaged and are not subject to the same management and trading expenses of a mutual fund. Please note that an investor cannot invest directly in an index. |
| | | | |
| Legg Mason Variable Lifestyle Series 2010 Annual Report | | | 15 | |
Schedules of investments
December 31, 2010
Legg Mason Variable Lifestyle Allocation 85%
| | | | | | | | | | | | | | | | |
| Description | | | | | | | | Shares | | | Value | |
| Investments In Underlying Funds — 99.9% | | | | | | | | | | | | | | | | |
Legg Mason Capital Management Value Trust, Inc., Class I Shares | | | | | | | | | | | 156,334 | | | $ | 7,120,996 | * |
Legg Mason Global Trust, Inc. — Legg Mason Batterymarch International Equity Trust, Class IS Shares | | | | | | | | | | | 770,656 | | | | 10,157,252 | |
Legg Mason Partners Equity Trust: | | | | | | | | | | | | | | | | |
Legg Mason Batterymarch U.S. Large Cap Equity Fund, Class IS Shares | | | | | | | | | | | 1,400,981 | | | | 14,612,236 | |
Legg Mason ClearBridge Aggressive Growth Fund, Class IS Shares | | | | | | | | | | | 58,912 | | | | 6,956,299 | * |
Legg Mason ClearBridge Appreciation Fund, Class IS Shares | | | | | | | | | | | 1,023,153 | | | | 13,966,041 | |
Legg Mason ClearBridge Fundamental All Cap Value Fund, Class IS Shares | | | | | | | | | | | 453,783 | | | | 6,402,879 | |
Legg Mason ClearBridge Mid Cap Core Fund, Class IS Shares | | | | | | | | | | | 236,422 | | | | 5,352,597 | * |
Legg Mason ClearBridge Small Cap Growth Fund, Class IS Shares | | | | | | | | | | | 482,960 | | | | 8,543,554 | * |
Legg Mason Global Currents International All Cap Opportunity Fund, Class IS Shares | | | | | | | | | | | 1,184,997 | | | | 10,368,728 | |
The Royce Fund — Royce Value Fund, Institutional Class Shares | | | | | | | | | | | 671,197 | | | | 8,530,910 | |
Western Asset Funds, Inc.: | | | | | | | | | | | | | | | | |
Western Asset Absolute Return Portfolio, Class IS Shares | | | | | | | | | | | 474,250 | | | | 4,842,093 | |
Western Asset Core Plus Bond Portfolio, Class IS Shares | | | | | | | | | | | 176,267 | | | | 1,898,399 | |
Western Asset High Yield Portfolio, Class IS Shares | | | | | | | | | | | 567,427 | | | | 5,016,052 | |
Total Investments in Underlying Funds before Short-term Investments (Cost — $95,673,265) | | | | | | | | | | | | | | | 103,768,036 | |
| | | | |
| Security | | Rate | | | Maturity
Date | | | Face
Amount | | | | |
| Short-Term Investments — 0.2% | | | | | | | | | | | | | | | | |
Repurchase Agreements — 0.2% | | | | | | | | | | | | | | | | |
Interest in $150,000,000 joint tri-party repurchase agreement dated 12/31/10 with Deutsche Bank Securities Inc.; Proceeds at maturity — $160,003; (Fully collateralized by various U.S. government agency obligations, 4.125% to 4.750% due 2/24/11 to 11/19/12; Market value — $163,201) (Cost — $160,000) | | | 0.220 | % | | | 1/3/11 | | | $ | 160,000 | | | | 160,000 | |
Total Investments — 100.1% (Cost — $95,833,265#) | | | | | | | | | | | | | | | 103,928,036 | |
Liabilities in Excess of Other Assets — (0.1)% | | | | | | | | | | | | | | | (90,494 | ) |
Total Net Assets — 100.0% | | | | | | | | | | | | | | $ | 103,837,542 | |
| * | Non-income producing security. |
| # | Aggregate cost for federal income tax purposes is $102,863,066. |
See Notes to Financial Statements.
| | |
| 16 | | Legg Mason Variable Lifestyle Series 2010 Annual Report |
Schedules of investments (cont’d)
December 31, 2010
Legg Mason Variable Lifestyle Allocation 70%
| | | | | | | | | | | | | | | | |
| Description | | | | | | | | Shares | | | Value | |
| Investments In Underlying Funds — 99.9% | | | | | | | | | | | | | | | | |
Legg Mason Capital Management Value Trust, Inc., Class I Shares | | | | | | | | | | | 105,494 | | | $ | 4,805,230 | * |
Legg Mason Global Trust, Inc. — Legg Mason Batterymarch International Equity Trust,
Class IS Shares | | | | | | | | | | | 391,343 | | | | 5,157,900 | |
Legg Mason Partners Equity Trust: | | | | | | | | | | | | | | | | |
Legg Mason Batterymarch U.S. Large Cap Equity Fund, Class IS Shares | | | | | | | | | | | 744,531 | | | | 7,765,460 | |
Legg Mason ClearBridge Aggressive Growth Fund, Class IS Shares | | | | | | | | | | | 40,150 | | | | 4,740,921 | * |
Legg Mason ClearBridge Appreciation Fund, Class IS Shares | | | | | | | | | | | 586,950 | | | | 8,011,862 | |
Legg Mason ClearBridge Fundamental All Cap Value Fund, Class IS Shares | | | | | | | | | | | 306,072 | | | | 4,318,679 | |
Legg Mason ClearBridge Mid Cap Core Fund, Class IS Shares | | | | | | | | | | | 161,893 | | | | 3,665,257 | * |
Legg Mason ClearBridge Small Cap Growth Fund, Class IS Shares | | | | | | | | | | | 226,320 | | | | 4,003,602 | * |
Legg Mason Global Currents International All Cap Opportunity Fund, Class IS Shares | | | | | | | | | | | 594,381 | | | | 5,200,838 | |
The Royce Fund — Royce Value Fund, Institutional Class Shares | | | | | | | | | | | 313,782 | | | | 3,988,163 | |
Western Asset Funds, Inc.: | | | | | | | | | | | | | | | | |
Western Asset Absolute Return Portfolio, Class IS Shares | | | | | | | | | | | 736,926 | | | | 7,524,012 | |
Western Asset Core Plus Bond Portfolio, Class IS Shares | | | | | | | | | | | 678,204 | | | | 7,304,260 | |
Western Asset High Yield Portfolio, Class IS Shares | | | | | | | | | | | 386,566 | | | | 3,417,243 | |
Total Investments in Underlying Funds before Short-Term Investments (Cost — $65,532,519) | | | | | | | | | | | | | | | 69,903,427 | |
| | | | |
| Security | | Rate | | | Maturity
Date | | | Face
Amount | | | | |
| Short-Term Investments — 0.2% | | | | | | | | | | | | | | | | |
Repurchase Agreements — 0.2% | | | | | | | | | | | | | | | | |
Interest in $150,000,000 joint tri-party repurchase agreement dated 12/31/10 with Deutsche Bank Securities Inc.; Proceeds at maturity — $8,000; (Fully collateralized by various U.S. government agency obligations, 4.125% to 4.750% due 2/24/11 to 11/19/12; Market value — $8,160) | | | 0.220 | % | | | 1/3/11 | | | $ | 8,000 | | | | 8,000 | |
Interest in $425,401,000 joint tri-party repurchase agreement dated 12/31/10 with Barclays Capital Inc.; Proceeds at maturity — $98,002; (Fully collateralized by U.S. government obligations, 3.875% due 4/15/29; Market value — $99,960) | | | 0.250 | % | | | 1/3/11 | | | | 98,000 | | | | 98,000 | |
Total Short-Term Investments (Cost — $106,000) | | | | | | | | | | | | | | | 106,000 | |
Total Investments — 100.1% (Cost — $65,638,519#) | | | | | | | | | | | | | | | 70,009,427 | |
Liabilities in Excess of Other Assets — (0.1)% | | | | | | | | | | | | | | | (63,414 | ) |
Total Net Assets — 100.0% | | | | | | | | | | | | | | $ | 69,946,013 | |
| * | Non-income producing security. |
| # | Aggregate cost for federal income tax purposes is $70,575,581. |
See Notes to Financial Statements.
| | | | |
| Legg Mason Variable Lifestyle Series 2010 Annual Report | | | 17 | |
Legg Mason Variable Lifestyle Allocation 50%
| | | | | | | | | | | | | | | | |
| Description | | | | | | | | Shares | | | Value | |
| Investments In Underlying Funds — 99.9% | | | | | | | | | | | | | | | | |
Legg Mason Capital Management Value Trust, Inc., Class I Shares | | | | | | | | | | | 165,237 | | | $ | 7,526,529 | * |
Legg Mason Global Trust, Inc. — Legg Mason Batterymarch International Equity Trust,
Class IS Shares | | | | | | | | | | | 471,155 | | | | 6,209,816 | |
Legg Mason Partners Equity Trust: | | | | | | | | | | | | | | | | |
Legg Mason Batterymarch U.S. Large Cap Equity Fund, Class IS Shares | | | | | | | | | | | 853,535 | | | | 8,902,370 | |
Legg Mason ClearBridge Aggressive Growth Fund, Class IS Shares | | | | | | | | | | | 59,083 | | | | 6,976,512 | * |
Legg Mason ClearBridge Appreciation Fund, Class IS Shares | | | | | | | | | | | 609,529 | | | | 8,320,064 | |
Legg Mason ClearBridge Fundamental All Cap Value Fund, Class IS Shares | | | | | | | | | | | 458,385 | | | | 6,467,814 | |
Legg Mason ClearBridge Mid Cap Core Fund, Class IS Shares | | | | | | | | | | | 278,326 | | | | 6,301,300 | * |
Legg Mason ClearBridge Small Cap Growth Fund, Class IS Shares | | | | | | | | | | | 280,447 | | | | 4,961,113 | * |
Legg Mason Global Currents International All Cap Opportunity Fund, Class IS Shares | | | | | | | | | | | 732,144 | | | | 6,406,257 | |
The Royce Fund — Royce Value Fund, Institutional Class Shares | | | | | | | | | | | 397,219 | | | | 5,048,659 | |
Western Asset Funds, Inc.: | | | | | | | | | | | | | | | | |
Western Asset Absolute Return Portfolio, Class IS Shares | | | | | | | | | | | 1,696,505 | | | | 17,321,317 | |
Western Asset Core Plus Bond Portfolio, Class IS Shares | | | | | | | | | | | 2,969,020 | | | | 31,976,344 | |
Western Asset High Yield Portfolio, Class IS Shares | | | | | | | | | | | 986,483 | | | | 8,720,513 | |
Total Investments in Underlying Funds before Short-Term Investments (Cost —$111,864,130) | | | | | | | | | | | | | | | 125,138,608 | |
| | | | |
| Security | | Rate | | | Maturity
Date | | | Face
Amount | | | | |
| Short-Term Investments — 0.2% | | | | | | | | | | | | | | | | |
Repurchase Agreements — 0.2% | | | | | | | | | | | | | | | | |
Interest in $425,401,000 joint tri-party repurchase agreement dated 12/31/10 with Barclays Capital Inc.; Proceeds at maturity — $248,005; (Fully collateralized by U.S. government obligations, 3.875% due 4/15/29; Market value — $252,960)
(Cost — $248,000) | | | 0.250 | % | | | 1/3/11 | | | $ | 248,000 | | | | 248,000 | |
Total Investments — 100.1% (Cost — $112,112,130#) | | | | | | | | | | | | | | | 125,386,608 | |
Liabilities in Excess of Other Assets — (0.1)% | | | | | | | | | | | | | | | (72,108 | ) |
Total Net Assets — 100.0% | | | | | | | | | | | | | | $ | 125,314,500 | |
| * | Non-income producing security. |
| # | Aggregate cost for federal income tax purposes is $122,696,892. |
See Notes to Financial Statements.
| | |
| 18 | | Legg Mason Variable Lifestyle Series 2010 Annual Report |
Statements of assets and liabilities
December 31, 2010
| | | | | | | | | | | | |
| | | Legg Mason
Variable
Lifestyle
Allocation 85% | | | Legg Mason
Variable
Lifestyle
Allocation 70% | | | Legg Mason
Variable
Lifestyle
Allocation 50% | |
| | | |
| Assets: | | | | | | | | | | | | |
Investments, at cost | | $ | 95,833,265 | | | $ | 65,638,519 | | | $ | 112,112,130 | |
Investments, at value | | | 103,928,036 | | | | 70,009,427 | | | | 125,386,608 | |
Receivable for Underlying Funds sold | | | 29,639 | | | | 2,736 | | | | — | |
Receivable for Portfolio shares sold | | | 12,512 | | | | 31 | | | | 16,454 | |
Interest receivable | | | 1 | | | | 1 | | | | 2 | |
Prepaid expenses | | | 1,777 | | | | 1,459 | | | | 3,553 | |
Total Assets | | | 103,971,965 | | | | 70,013,654 | | | | 125,406,617 | |
| | | |
| Liabilities: | | | | | | | | | | | | |
Payable for Portfolio shares repurchased | | | 78,408 | | | | 7,680 | | | | 7,271 | |
Due to custodian | | | 1,190 | | | | 2,630 | | | | 10,665 | |
Trustees’ fees payable | | | 1,111 | | | | 924 | | | | 1,491 | |
Payable for Underlying Funds purchased | | | — | | | | — | | | | 13,873 | |
Investment management fee payable | | | — | | | | 5,559 | | | | — | |
Accrued expenses | | | 53,714 | | | | 50,848 | | | | 58,817 | |
Total Liabilities | | | 134,423 | | | | 67,641 | | | | 92,117 | |
| Total Net Assets | | $ | 103,837,542 | | | $ | 69,946,013 | | | $ | 125,314,500 | |
| | | |
| Net Assets: | | | | | | | | | | | | |
Par value (Note 5) | | $ | 86 | | | $ | 65 | | | $ | 108 | |
Paid-in capital in excess of par value | | | 120,807,594 | | | | 104,689,759 | | | | 144,163,193 | |
Undistributed net investment income | | | 274,313 | | | | 316,721 | | | | 464,215 | |
Accumulated net realized loss on sales of Underlying Funds | | | (25,339,222) | | | | (39,431,440) | | | | (32,587,494) | |
Net unrealized appreciation on Underlying Funds | | | 8,094,771 | | | | 4,370,908 | | | | 13,274,478 | |
| Total Net Assets | | $ | 103,837,542 | | | $ | 69,946,013 | | | $ | 125,314,500 | |
| Shares Outstanding | | | 8,572,564 | | | | 6,514,502 | | | | 10,807,506 | |
| Net Asset Value | | | $12.11 | | | | $10.74 | | | | $11.60 | |
See Notes to Financial Statements.
| | | | |
| Legg Mason Variable Lifestyle Series 2010 Annual Report | | | 19 | |
Statements of operations
For the Year Ended December 31, 2010
| | | | | | | | | | | | |
| | | Legg Mason
Variable
Lifestyle
Allocation 85% | | | Legg Mason
Variable
Lifestyle
Allocation 70% | | | Legg Mason
Variable
Lifestyle
Allocation 50% | |
| | | |
| Investment Income: | | | | | | | | | | | | |
Income distributions from Underlying Funds | | $ | 1,680,767 | | | $ | 1,517,378 | | | $ | 3,694,012 | |
Interest | | | 383 | | | | 209 | | | | 476 | |
Total Investment Income | | | 1,681,150 | | | | 1,517,587 | | | | 3,694,488 | |
| | | |
| Expenses: | | | | | | | | | | | | |
Legal fees | | | 55,961 | | | | 54,337 | | | | 60,145 | |
Shareholder reports | | | 44,653 | | | | 39,256 | | | | 53,020 | |
Audit and tax | | | 26,952 | | | | 26,751 | | | | 27,378 | |
Trustees’ fees | | | 7,598 | | | | 5,406 | | | | 11,272 | |
Transfer agent fees | | | 6,512 | | | | 6,522 | | | | 6,814 | |
Insurance | | | 2,368 | | | | 1,999 | | | | 3,018 | |
Custody fees | | | 37 | | | | 35 | | | | 182 | |
Miscellaneous expenses | | | 361 | | | | 487 | | | | 925 | |
Total Expenses | | | 144,442 | | | | 134,793 | | | | 162,754 | |
Less: Fee waivers and/or expense reimbursements (Note 2) | | | — | | | | (9,712) | | | | — | |
Net Expenses | | | 144,442 | | | | 125,081 | | | | 162,754 | |
| Net Investment Income | | | 1,536,708 | | | | 1,392,506 | | | | 3,531,734 | |
| | | |
| Realized and Unrealized Gain (Loss) on Sales of Underlying Funds and Underlying Funds (Notes 1 and 3): | | | | | | | | | | | | |
Net Realized Loss on Sales of Underlying Funds | | | (2,695,407) | | | | (3,225,503) | | | | (4,100,988) | |
Change in Net Unrealized Appreciation on Underlying Funds | | | 15,232,803 | | | | 11,380,327 | | | | 16,930,369 | |
| Net Gain on Sales of Underlying Funds and Underlying Funds | | | 12,537,396 | | | | 8,154,824 | | | | 12,829,381 | |
| Proceeds from Settlement of a Regulatory Matter (Note 7) | | | 8,502 | | | | 8,502 | | | | 13,301 | |
| Increase in Net Assets from Operations | | $ | 14,082,606 | | | $ | 9,555,832 | | | $ | 16,374,416 | |
See Notes to Financial Statements.
| | |
| 20 | | Legg Mason Variable Lifestyle Series 2010 Annual Report |
Statements of changes in net assets
Legg Mason Variable Lifestyle Allocation 85%
| | | | | | | | | | | | |
For the Year Ended December 31, 2010,
the Period Ended December 31, 2009 and the Year Ended January 31, 2009 | | 2010 | | | 2009† | | | 2009 | |
| | | |
| Operations: | | | | | | | | | | | | |
Net investment income | | $ | 1,536,708 | | | $ | 1,699,193 | | | $ | 1,759,735 | |
Net realized gain (loss) | | | (2,695,407) | | | | (3,400,026) | | | | 1,257,752 | |
Change in net unrealized appreciation (depreciation) | | | 15,232,803 | | | | 26,634,606 | | | | (37,342,679) | |
Proceeds from settlement of a regulatory matter (Note 7) | | | 8,502 | | | | — | | | | — | |
Increase (Decrease) in Net Assets From Operations | | | 14,082,606 | | | | 24,933,773 | | | | (34,325,192) | |
| | | |
| Distributions to Shareholders From (Note 1) | | | | | | | | | | | | |
Net investment income | | | (1,550,010) | | | | (1,800,012) | | | | (1,500,012) | |
Net realized gains | | | — | | | | — | | | | (550,965) | |
Decrease in Net Assets From Distributions to Shareholders | | | (1,550,010) | | | | (1,800,012) | | | | (2,050,977) | |
| | | |
| Portfolio Share Transactions (Note 5): | | | | | | | | | | | | |
Net proceeds from sale of shares | | | 9,353,247 | | | | 11,540,498 | | | | 21,884,362 | |
Reinvestment of distributions | | | 1,550,010 | | | | 1,800,012 | | | | 2,050,977 | |
Cost of shares repurchased | | | (9,061,714) | | | | (6,381,440) | | | | (11,866,149) | |
Increase in Net Assets From Portfolio Share Transactions | | | 1,841,543 | | | | 6,959,070 | | | | 12,069,190 | |
Increase (Decrease) in Net Assets | | | 14,374,139 | | | | 30,092,831 | | | | (24,306,979) | |
| | | |
| Net Assets: | | | | | | | | | | | | |
Beginning of year | | | 89,463,403 | | | | 59,370,572 | | | | 83,677,551 | |
End of year* | | $ | 103,837,542 | | | $ | 89,463,403 | | | $ | 59,370,572 | |
* Includes undistributed net investment income of: | | | $274,313 | | | | $279,113 | | | | $379,932 | |
| † | For the period February 1, 2009 through December 31, 2009. |
See Notes to Financial Statements.
| | | | |
| Legg Mason Variable Lifestyle Series 2010 Annual Report | | | 21 | |
Legg Mason Variable Lifestyle Allocation 70%
| | | | | | | | | | | | |
For the Year Ended December 31, 2010,
the Period Ended December 31, 2009 and the Year Ended January 31, 2009 | | 2010 | | | 2009† | | | 2009 | |
| | | |
| Operations: | | | | | | | | | | | | |
Net investment income | | $ | 1,392,506 | | | $ | 1,971,635 | | | $ | 2,516,195 | |
Net realized loss | | | (3,225,503) | | | | (5,282,906) | | | | (4,594,094) | |
Change in net unrealized appreciation (depreciation) | | | 11,380,327 | | | | 24,416,385 | | | | (29,852,359) | |
Proceeds from settlement of a regulatory matter (Note 7) | | | 8,502 | | | | — | | | | — | |
Increase (Decrease) in Net Assets From Operations | | | 9,555,832 | | | | 21,105,114 | | | | (31,930,258) | |
| | | |
| Distributions to Shareholders From (Note 1): | | | | | | | | | | | | |
Net investment income | | | (1,400,011) | | | | (2,250,008) | | | | (2,100,011) | |
Net realized gains | | | — | | | | — | | | | (91,511) | |
Decrease in Net Assets From Distributions to Shareholders | | | (1,400,011) | | | | (2,250,008) | | | | (2,191,522) | |
| | | |
| Portfolio Share Transactions (Note 5): | | | | | | | | | | | | |
Net proceeds from sale of shares | | | 436,460 | | | | 792,217 | | | | 3,020,631 | |
Reinvestment of distributions | | | 1,400,011 | | | | 2,250,008 | | | | 2,191,522 | |
Cost of shares repurchased | | | (12,028,438) | | | | (9,441,538) | | | | (20,064,505) | |
Decrease in Net Assets From Portfolio Share Transactions | | | (10,191,967) | | | | (6,399,313) | | | | (14,852,352) | |
Increase (Decrease) in Net Assets | | | (2,036,146) | | | | 12,455,793 | | | | (48,974,132) | |
| | | |
| Net Assets: | | | | | | | | | | | | |
Beginning of year | | | 71,982,159 | | | | 59,526,366 | | | | 108,500,498 | |
End of year* | | $ | 69,946,013 | | | $ | 71,982,159 | | | $ | 59,526,366 | |
* Includes undistributed net investment income of: | | | $316,721 | | | | $315,724 | | | | $594,097 | |
| † | For the period February 1, 2009 through December 31, 2009. |
See Notes to Financial Statements.
| | |
| 22 | | Legg Mason Variable Lifestyle Series 2010 Annual Report |
Statements of changes in net assets (cont’d)
Legg Mason Variable Lifestyle Allocation 50%
| | | | | | | | | | | | |
For the Year Ended December 31, 2010,
the Period Ended December 31, 2009 and the Year Ended January 31, 2009 | | 2010 | | | 2009† | | | 2009 | |
| | | |
| Operations: | | | | | | | | | | | | |
Net investment income | | $ | 3,531,734 | | | $ | 4,992,508 | | | $ | 6,387,819 | |
Net realized loss | | | (4,100,988) | | | | (12,743,271) | | | | (13,018,104) | |
Change in net unrealized appreciation (depreciation) | | | 16,930,369 | | | | 43,274,140 | | | | (42,252,094) | |
Proceeds from settlement of a regulatory matter (Note 7) | | | 13,301 | | | | — | | | | — | |
Increase (Decrease) in Net Assets From Operations | | | 16,374,416 | | | | 35,523,377 | | | | (48,882,379) | |
| | | |
| Distributions to Shareholders From (Note 1): | | | | | | | | | | | | |
Net investment income | | | (3,650,011) | | | | (5,750,010) | | | | (5,500,017) | |
Net realized gains | | | — | | | | — | | | | (5,988,993) | |
Decrease in Net Assets From Distributions to Shareholders | | | (3,650,011) | | | | (5,750,010) | | | | (11,489,010) | |
| | | |
| Portfolio Share Transactions (Note 5): | | | | | | | | | | | | |
Net proceeds from sale of shares | | | 6,637,283 | | | | 1,430,661 | | | | 4,381,491 | |
Reinvestment of distributions | | | 3,650,011 | | | | 5,750,010 | | | | 11,489,010 | |
Cost of shares repurchased | | | (23,990,913) | | | | (23,075,124) | | | | (41,946,028) | |
Decrease in Net Assets From Portfolio Share Transactions | | | (13,703,619) | | | | (15,894,453) | | | | (26,075,527) | |
Increase (Decrease) in Net Assets | | | (979,214) | | | | 13,878,914 | | | | (86,446,916) | |
| | | |
| Net Assets: | | | | | | | | | | | | |
Beginning of year | | | 126,293,714 | | | | 112,414,800 | | | | 198,861,716 | |
End of year* | | $ | 125,314,500 | | | $ | 126,293,714 | | | $ | 112,414,800 | |
* Includes undistributed net investment income of: | | | $464,215 | | | | $569,191 | | | | $1,326,693 | |
| † | For the period February 1, 2009 through December 31, 2009. |
See Notes to Financial Statements.
| | | | |
| Legg Mason Variable Lifestyle Series 2010 Annual Report | | | 23 | |
Financial highlights
Legg Mason Variable Lifestyle Allocation 85%
| | | | | | | | | | | | | | | | | | | | | | | | |
| For a share of beneficial interest outstanding throughout each year ended December 31, unless otherwise noted: | |
| | | 2010 | | | 20091 | | | 20092 | | | 20082 | | | 20072,3 | | | 20062,3 | |
| | | | | | |
| Net asset value, beginning of year | | | $10.63 | | | | $7.73 | | | | $12.75 | | | | $14.39 | | | | $13.46 | | | | $12.06 | |
| | | | | | |
| Income (loss) from operations: | | | | | | | | | | | | | | | | | | | | | | | | |
Net investment income | | | 0.18 | | | | 0.20 | 4 | | | 0.23 | 4 | | | 0.24 | 4 | | | 0.14 | 4 | | | 0.06 | 4 |
Net realized and unrealized gain (loss) | | | 1.48 | | | | 2.92 | | | | (4.97) | | | | (0.71) | | | | 0.94 | | | | 1.40 | |
Total income (loss) from operations | | | 1.66 | | | | 3.12 | | | | (4.74) | | | | (0.47) | | | | 1.08 | | | | 1.46 | |
| | | | | | |
| Less distributions from: | | | | | | | | | | | | | | | | | | | | | | | | |
Net investment income | | | (0.18) | | | | (0.22) | | | | (0.20) | | | | (0.22) | | | | (0.15) | | | | (0.06) | |
Net realized gains | | | — | | | | — | | | | (0.08) | | | | (0.95) | | | | — | | | | — | |
Total distributions | | | (0.18) | | | | (0.22) | | | | (0.28) | | | | (1.17) | | | | (0.15) | | | | (0.06) | |
| | | | | | |
| Net asset value, end of year | | | $12.11 | | | | $10.63 | | | | $7.73 | | | | $12.75 | | | | $14.39 | | | | $13.46 | |
Total return5 | | | 15.70 | %6 | | | 40.53 | %6 | | | (37.53) | % | | | (3.87) | % | | | 8.02 | % | | | 12.11 | % |
| | | | | | |
| Net assets, end of year (000s) | | | $103,838 | | | | $89,463 | | | | $59,371 | | | | $83,678 | | | | $81,954 | | | | $94,062 | |
| | | | | | |
| Ratios to average net assets: | | | | | | | | | | | | | | | | | | | | | | | | |
Gross expenses7 | | | 0.15 | %8 | | | 0.21 | %8,9 | | | 0.15 | %8 | | | 0.32 | %8,10 | | | 0.38 | %11 | | | 0.35 | % |
Net expenses7,12 | | | 0.15 | 8 | | | 0.19 | 8,9,13 | | | 0.12 | 8,13 | | | 0.32 | 8,10 | | | 0.37 | 11,13 | | | 0.35 | |
Net investment income | | | 1.65 | | | | 2.52 | 9 | | | 2.30 | | | | 1.87 | | | | 0.97 | | | | 0.50 | |
| | | | | | |
| Portfolio turnover rate | | | 17 | % | | | 10 | % | | | 34 | % | | | 19 | % | | | 108 | % | | | 50 | % |
| 1 | For the period February 1, 2009 through December 31, 2009. |
| 2 | For the year ended January 31. |
| 3 | Represents a share of capital stock outstanding prior to April 30, 2007. |
| 4 | Net investment income per share includes short-term capital gain distributions from Underlying Funds. |
| 5 | Performance figures may reflect compensating balance arrangements, fee waivers and/or expense reimbursements. In the absence of compensating balance arrangements, fee waivers and/or expense reimbursements, the total return would have been lower. Total returns do not reflect expenses associated with separate accounts such as administrative fees, account charges and surrender charges which, if reflected, would reduce the total return for all periods shown. Past performance is no guarantee of future results. Total returns for periods of less than one year are not annualized. |
| 6 | The total return includes gains from settlement of investment litigations. Without these gains, the total return would have been 15.60% and 39.87% for the year ended December 31, 2010 and the period ended December 31, 2009, respectively. |
| 7 | Does not include expenses of the Underlying Funds in which the Portfolio invests. |
| 8 | As a result of an expense limitation arrangement, effective December 1, 2007, the ratio of expenses, other than brokerage, interest, taxes, extraordinary expenses and acquired fund fees and expenses, to average net assets of shares did not exceed 0.20%. This expense limitation arrangement cannot be terminated prior to December 31, 2012 without the Board of Trustees’ consent. |
| 10 | The gross and net expense ratios include interest expense. Excluding interest expense, the gross and net expense ratios would have been the same. |
| 11 | Included in the expense ratios are certain non-recurring restructuring (and reorganization, if applicable) fees that were incurred by the Portfolio during the period. Without these fees, the gross and net expense ratios would have both been 0.35%. |
| 12 | The impact of compensating balance arrangements, if any, was less than 0.01%. |
| 13 | Reflects fee waivers and/or expense reimbursements. |
See Notes to Financial Statements.
| | |
| 24 | | Legg Mason Variable Lifestyle Series 2010 Annual Report |
Financial highlights (cont’d)
Legg Mason Variable Lifestyle Allocation 70%
| | | | | | | | | | | | | | | | | | | | | | | | |
| For a share of beneficial interest outstanding throughout each year ended December 31, unless otherwise noted: | |
| | | 2010 | | | 20091 | | | 20092 | | | 20082 | | | 20072,3 | | | 20062,3 | |
| | | | | | |
| Net asset value, beginning of year | | | $9.53 | | | | $7.09 | | | | $10.94 | | | | $11.62 | | | | $10.96 | | | | $10.20 | |
| | | | | | |
| Income (loss) from operations: | | | | | | | | | | | | | | | | | | | | | | | | |
Net investment income | | | 0.22 | | | | 0.27 | 4 | | | 0.30 | 4 | | | 0.33 | 4 | | | 0.22 | 4 | | | 0.16 | 4 |
Net realized and unrealized gain (loss) | | | 1.20 | | | | 2.47 | | | | (3.89) | | | | (0.50) | | | | 0.66 | | | | 0.76 | |
Total income (loss) from operations | | | 1.42 | | | | 2.74 | | | | (3.59) | | | | (0.17) | | | | 0.88 | | | | 0.92 | |
| | | | | | |
| Less distributions from: | | | | | | | | | | | | | | | | | | | | | | | | |
Net investment income | | | (0.21) | | | | (0.30) | | | | (0.25) | | | | (0.32) | | | | (0.22) | | | | (0.16) | |
Net realized gains | | | — | | | | — | | | | (0.01) | | | | (0.19) | | | | — | | | | — | |
Total distributions | | | (0.21) | | | | (0.30) | | | | (0.26) | | | | (0.51) | | | | (0.22) | | | | (0.16) | |
| | | | | | |
| Net asset value, end of year | | | $10.74 | | | | $9.53 | | | | $7.09 | | | | $10.94 | | | | $11.62 | | | | $10.96 | |
Total return5 | | | 15.01 | %6 | | | 38.90 | %6 | | | (33.03) | % | | | (1.64) | % | | | 8.06 | % | | | 9.08 | % |
| | | | | | |
| Net assets, end of year (000s) | | | $69,946 | | | | $71,982 | | | | $59,526 | | | | $108,500 | | | | $129,695 | | | | $146,642 | |
| | | | | | |
| Ratios to average net assets: | | | | | | | | | | | | | | | | | | | | | | | | |
Gross expenses7 | | | 0.20 | %8 | | | 0.23 | %8,9 | | | 0.14 | %8 | | | 0.32 | %8 | | | 0.38 | %10 | | | 0.35 | % |
Net expenses7,11 | | | 0.18 | 8,12 | | | 0.20 | 8,9,12 | | | 0.10 | 8,12 | | | 0.32 | 8 | | | 0.37 | 10,12 | | | 0.35 | |
Net investment income | | | 2.02 | | | | 3.32 | 9 | | | 2.89 | | | | 2.67 | | | | 1.82 | | | | 1.47 | |
| | | | | | |
| Portfolio turnover rate | | | 14 | % | | | 11 | % | | | 26 | % | | | 15 | % | | | 123 | % | | | 53 | % |
| 1 | For the period February 1, 2009 through December 31, 2009. |
| 2 | For the year ended January 31. |
| 3 | Represents a share of capital stock outstanding prior to April 30, 2007. |
| 4 | Net investment income per share includes short-term capital gain distributions from Underlying Funds. |
| 5 | Performance figures may reflect compensating balance arrangements, fee waivers and/or expense reimbursements. In the absence of compensating balance arrangements, fee waivers and/or expense reimbursements, the total return would have been lower. Total returns do not reflect expenses associated with separate accounts such as administrative fees, account charges and surrender charges which, if reflected, would reduce the total return for all periods shown. Past performance is no guarantee of future results. Total returns for periods of less than one year are not annualized. |
| 6 | The total return includes gains from settlement of investment litigations. Without these gains, the total return would have been 14.79% and 37.59% for the year ended December 31, 2010 and the period ended December 31, 2009, respectively. |
| 7 | Does not include expenses of the Underlying Funds in which the Portfolio invests. |
| 8 | As a result of an expense limitation arrangement, effective December 1, 2007, the ratio of expenses, other than brokerage, interest, taxes, extraordinary expenses and acquired fund fees and expenses, to average net assets of shares did not exceed 0.20%. This expense limitation arrangement cannot be terminated prior to December 31, 2012 without the Board of Trustees’ consent. |
| 10 | Included in the expense ratios are certain non-recurring restructuring (and reorganization, if applicable) fees that were incurred by the Portfolio during the period. Without these fees, the gross and net expense ratios would have both been 0.35%. |
| 11 | The impact of compensating balance arrangements, if any, was less than 0.01%. |
| 12 | Reflects fee waivers and/or expense reimbursements. |
See Notes to Financial Statements.
| | | | |
| Legg Mason Variable Lifestyle Series 2010 Annual Report | | | 25 | |
Legg Mason Variable Lifestyle Allocation 50%
| | | | | | | | | | | | | | | | | | | | | | | | |
| For a share of beneficial interest outstanding throughout each year ended December 31, unless otherwise noted: | |
| | | 2010 | | | 20091 | | | 20092 | | | 20082 | | | 20072,3 | | | 20062,3 | |
| | | | | | |
| Net asset value, beginning of year | | | $10.45 | | | | $8.06 | | | | $12.04 | | | | $12.61 | | | | $12.00 | | | | $11.71 | |
| | | | | | |
| Income (loss) from operations: | | | | | | | | | | | | | | | | | | | | | | | | |
Net investment income | | | 0.34 | | | | 0.43 | 4 | | | 0.46 | 4 | | | 0.47 | 4 | | | 0.35 | 4 | | | 0.28 | 4 |
Net realized and unrealized gain (loss) | | | 1.15 | | | | 2.44 | | | | (3.65) | | | | (0.45) | | | | 0.62 | | | | 0.29 | |
Total income (loss) from operations | | | 1.49 | | | | 2.87 | | | | (3.19) | | | | 0.02 | | | | 0.97 | | | | 0.57 | |
| | | | | | |
| Less distributions from: | | | | | | | | | | | | | | | | | | | | | | | | |
Net investment income | | | (0.34) | | | | (0.48) | | | | (0.40) | | | | (0.47) | | | | (0.36) | | | | (0.28) | |
Net realized gains | | | — | | | | — | | | | (0.39) | | | | (0.12) | | | | — | | | | — | |
Total distributions | | | (0.34) | | | | (0.48) | | | | (0.79) | | | | (0.59) | | | | (0.36) | | | | (0.28) | |
| | | | | | |
| Net asset value, end of year | | | $11.60 | | | | $10.45 | | | | $8.06 | | | | $12.04 | | | | $12.61 | | | | $12.00 | |
Total return5 | | | 14.35 | %6 | | | 35.93 | %6 | | | (27.51) | % | | | (0.01) | % | | | 8.09 | % | | | 4.87 | % |
| | | | | | |
| Net assets, end of year (000s) | | | $125,315 | | | | $126,294 | | | | $112,415 | | | | $198,862 | | | | $224,930 | | | | $247,470 | |
| | | | | | |
| Ratios to average net assets: | | | | | | | | | | | | | | | | | | | | | | | | |
Gross expenses7 | | | 0.13 | %8 | | | 0.14 | %8,9 | | | 0.09 | %8 | | | 0.31 | %8 | | | 0.37 | %10 | | | 0.35 | % |
Net expenses7,11 | | | 0.13 | 8 | | | 0.14 | 8,9 | | | 0.07 | 8,12 | | | 0.31 | 8 | | | 0.37 | 10,12 | | | 0.35 | |
Net investment income | | | 2.89 | | | | 4.66 | 9 | | | 3.96 | | | | 3.53 | | | | 2.69 | | | | 2.24 | |
| | | | | | |
| Portfolio turnover rate | | | 20 | % | | | 11 | % | | | 24 | % | | | 15 | % | | | 96 | % | | | 48 | % |
| 1 | For the period February 1, 2009 through December 31, 2009. |
| 2 | For the year ended January 31. |
| 3 | Represents a share of capital stock outstanding prior to April 30, 2007. |
| 4 | Net investment income per share includes short-term capital gain distributions from Underlying Funds. |
| 5 | Performance figures may reflect compensating balance arrangements, fee waivers and/or expense reimbursements. In the absence of compensating balance arrangements, fee waivers and/or expense reimbursements, the total return would have been lower. Total returns do not reflect expenses associated with separate accounts such as administrative fees, account charges and surrender charges which, if reflected, would reduce the total return for all periods shown. Past performance is no guarantee of future results. Total returns for periods of less than one year are not annualized. |
| 6 | The total return includes gains from settlement of investment litigations. Without these gains, the total return would have been 14.25% and 35.54% for the year ended December 31, 2010 and the period ended December 31, 2009, respectively. |
| 7 | Does not include expenses of the Underlying Funds in which the Portfolio invests. |
| 8 | As a result of an expense limitation arrangement, effective December 1, 2007, the ratio of expenses, other than brokerage, interest, taxes, extraordinary expenses and acquired fund fees and expenses, to average net assets of shares did not exceed 0.20%. This expense limitation arrangement cannot be terminated prior to December 31, 2012 without the Board of Trustees’ consent. |
| 10 | Included in the expense ratios are certain non-recurring restructuring (and reorganization, if applicable) fees that were incurred by the Portfolio during the period. Without these fees, the gross and net expense ratios would have both been 0.35%. |
| 11 | The impact of compensating balance arrangements, if any, was less than 0.01%. |
| 12 | Reflects fee waivers and/or expense reimbursements. |
See Notes to Financial Statements.
| | |
| 26 | | Legg Mason Variable Lifestyle Series 2010 Annual Report |
Notes to financial statements
1. Organization and significant accounting policies
Legg Mason Variable Lifestyle Allocation 85% (“Lifestyle Allocation 85%”), Legg Mason Variable Lifestyle Allocation 70% (“Lifestyle Allocation 70%”) and Legg Mason Variable Lifestyle Allocation 50% (“Lifestyle Allocation 50%”) (the “Portfolios”) are separate non-diversified investment series of Legg Mason Partners Variable Equity Trust (the “Trust”). The Trust, a Maryland statutory trust, is registered under the Investment Company Act of 1940, as amended (the “1940 Act”), as an open-end management investment company. The Portfolios invest in other mutual funds (“Underlying Funds”) which are affiliated with Legg Mason, Inc. (“Legg Mason”). Shares of the Portfolios are offered to separate accounts sponsored by certain life insurance companies and qualified pension and retirement plans, including affiliates of the investment manager.
The following are significant accounting policies consistently followed by the Portfolios and are in conformity with U.S. generally accepted accounting principles (“GAAP”). Estimates and assumptions are required to be made regarding assets, liabilities and changes in net assets resulting from operations when financial statements are prepared. Changes in the economic environment, financial markets and any other parameters used in determining these estimates could cause actual results to differ. Subsequent events have been evaluated through the date the financial statements were issued.
(a) Investment Valuation. Investments in the Underlying Funds are valued at the closing net asset value per share of each Underlying Fund on the day of valuation. Equity securities for which market quotations are available are valued at the last reported sales price or official closing price on the primary market or exchange on which they trade. Debt securities are valued at the mean between the last quoted bid and asked prices provided by an independent pricing service that are based on transactions in debt obligations, quotations from bond dealers, market transactions in comparable securities and various other relationships between securities. When reliable prices are not readily available, such as when the value of a security has been significantly affected by events after the close of the exchange or market on which the security is principally traded, but before the Portfolios calculate their net asset value, the Portfolios value these securities as determined in accordance with the procedures approved by the Portfolios’ Board of Trustees. Short-term obligations with maturities of 60 days or less are valued at amortized cost, which approximates fair value.
The Portfolios have adopted Financial Accounting Standards Board Codification Topic 820 (“ASC Topic 820”). ASC Topic 820 establishes a single definition of fair value, creates a three-tier hierarchy as a framework for measuring fair value based on inputs used to value the Portfolios’ investments, and requires additional disclosure about fair value. The hierarchy of inputs is summarized below.
| Ÿ | | Level 1 — quoted prices in active markets for identical investments |
| Ÿ | | Level 2 — other significant observable inputs (including quoted prices for similar investments, interest rates, prepayment speeds, credit risk, etc.) |
| Ÿ | | Level 3 — significant unobservable inputs (including the Portfolios’ own assumptions in determining the fair value of investments) |
The inputs or methodology used for valuing securities are not necessarily an indication of the risk associated with investing in those securities.
The Portfolios use valuation techniques to measure fair value that are consistent with the market approach and/or income approach, depending on the type of security and the particular circumstance. The market approach uses prices and other relevant information generated by market transactions involving identical or comparable securities. The income approach uses valuation techniques to discount estimated future cash flows to present value.
| | | | |
| Legg Mason Variable Lifestyle Series 2010 Annual Report | | | 27 | |
The following is a summary of the inputs used in valuing the Portfolios’ assets carried at fair value:
Lifestyle Allocation 85%
| | | | | | | | | | | | | | | | |
| ASSETS | |
| Description | | Quoted Prices
(Level 1) | | | Other Significant
Observable Inputs
(Level 2) | | | Significant
Unobservable
Inputs
(Level 3) | | | Total | |
| Investments in Underlying Funds† | | $ | 103,768,036 | | | | — | | | | — | | | $ | 103,768,036 | |
| Short-term investments† | | | — | | | $ | 160,000 | | | | — | | | | 160,000 | |
| Total investments | | $ | 103,768,036 | | | $ | 160,000 | | | | — | | | $ | 103,928,036 | |
| †See | Schedule of Investments for additional detailed categorizations. |
Lifestyle Allocation 70%
| | | | | | | | | | | | | | | | |
| ASSETS | |
| Description | | Quoted Prices
(Level 1) | | | Other Significant
Observable Inputs
(Level 2) | | | Significant
Unobservable
Inputs
(Level 3) | | | Total | |
| Investments in Underlying Funds† | | $ | 69,903,427 | | | | — | | | | — | | | $ | 69,903,427 | |
| Short-term investments† | | | — | | | $ | 106,000 | | | | — | | | | 106,000 | |
| Total investments | | $ | 69,903,427 | | | $ | 106,000 | | | | — | | | $ | 70,009,427 | |
| †See | Schedule of Investments for additional detailed categorizations. |
Lifestyle Allocation 50%
| | | | | | | | | | | | | | | | |
| ASSETS | |
| Description | | Quoted Prices
(Level 1) | | | Other Significant
Observable Inputs
(Level 2) | | | Significant
Unobservable
Inputs
(Level 3) | | | Total | |
| Investments in Underlying Funds† | | $ | 125,138,608 | | | | — | | | | — | | | $ | 125,138,608 | |
| Short-term investments† | | | — | | | $ | 248,000 | | | | — | | | | 248,000 | |
| Total investments | | $ | 125,138,608 | | | $ | 248,000 | | | | — | | | $ | 125,386,608 | |
| †See | Schedule of Investments for additional detailed categorizations. |
(b) Repurchase agreements. The Portfolios may enter into repurchase agreements with institutions that their investment adviser has determined are creditworthy. Each repurchase agreement is recorded at cost. Under the terms of a typical repurchase agreement, the Portfolios acquire a debt security subject to an obligation of the seller to repurchase, and of the Portfolios to resell, the security at an agreed-upon price and time, thereby determining the yield during the Portfolios’ holding period. When entering into repurchase agreements, it is the Portfolios’ policy that their custodian or a third party custodian, acting on the Portfolios’ behalf, take possession of the underlying collateral securities, the market value of which, at all times, at least equals the principal amount of the repurchase transaction, including accrued interest. To the extent that any repurchase transaction maturity exceeds one business day, the value of the collateral is marked-to-market and measured against the value of the agreement in an effort to ensure the adequacy of the collateral. If the counterparty defaults, the Portfolios generally have the right to use the collateral to satisfy the terms of the repurchase transaction. However, if the market value of the collateral declines during the period in which the Portfolios seek to assert their rights or if bankruptcy proceedings are commenced with respect to the seller of the security, realization of the collateral by the Portfolios may be delayed or limited.
(c) Security transactions and investment income. Security transactions are accounted for on a trade date basis. Net investment income distributions and short-term capital gain distributions, if any, from the Underlying Funds are recorded on the ex-dividend as investment income. Interest income is recorded on an accrual basis. Long-term capital gain distributions, if any, from the Underlying Funds are recorded on the ex-dividend date as realized gains. The cost of investments sold is determined by use of the specific identification method.
| | |
| 28 | | Legg Mason Variable Lifestyle Series 2010 Annual Report |
Notes to financial statements (cont’d)
(d) Distributions to shareholders. Distributions from net investment income and distributions of net realized gains, if any, are declared at least annually. Distributions to shareholders of the Portfolios are recorded on the ex-dividend date and are determined in accordance with income tax regulations, which may differ from GAAP.
(e) Compensating balance arrangements. The Portfolios have an arrangement with their custodian bank whereby a portion of the custodian’s fees is paid indirectly by credits earned on the Portfolios’ cash on deposit with the bank.
(f) Federal and other taxes. It is the Portfolios’ policy to comply with the federal income and excise tax requirements of the Internal Revenue Code of 1986 (the “Code”), as amended, applicable to regulated investment companies. Accordingly, the Portfolios intend to distribute their taxable income and net realized gains, if any, to shareholders in accordance with timing requirements imposed by the Code. Therefore, no federal or state income tax provision is required in the Portfolios’ financial statements.
Management has analyzed the Portfolios’ tax positions taken on income tax returns for all open tax years and has concluded that as of December 31, 2010, no provision for income tax would be required in the Portfolios’ financial statements. The Portfolios’ federal and state income and federal excise tax returns for tax years for which the applicable statutes of limitations have not expired are subject to examination by Internal Revenue Service and state departments of revenue.
(g) Reclassification. GAAP requires that certain components of net assets be reclassified to reflect permanent differences between financial and tax reporting. These reclassifications have no effect on net assets or net asset value per share. During the current year, the Portfolios had no reclassifications.
2. Investment management agreement and other transactions with affiliates
Legg Mason Partners Fund Advisor, LLC (“LMPFA”) is each Portfolio’s investment manager and Legg Mason Global Asset Allocation, LLC (“LMGAA”) is each Portfolio’s subadviser. LMPFA and LMGAA are wholly-owned subsidiaries of Legg Mason. The Portfolios do not pay a management fee or subadviser fee.
The Portfolios bear all expenses incurred in their operations, subject to LMPFA’s agreement to waive fees and/or reimburse expenses incurred directly by the Portfolios, such that each Portfolio’s total annual operating expenses (other than brokerage, interest, taxes, extraordinary expenses, acquired fund fees and expenses and Underlying Funds’ fees and expenses), did not exceed 0.20% of each Portfolios’ average net assets. The manager is also permitted to recapture amounts previously forgone or reimbursed to a Portfolio during the same fiscal year if the Portfolio’s total annual operating expenses have fallen to a level below the expense limitation (“expense cap”) in effect at the time the fees were earned or the expense incurred. In no case will the manager recapture any amount that would result, on any particular business day of the Portfolio, in the Portfolio’s total annual operating expenses exceeding the expense cap or any other lower limit then in effect. This expense limitation arrangement cannot be terminated prior to December 31, 2012 without the Board of Trustees’ consent.
LMPFA provides administrative and certain oversight services to the Portfolios. LMPFA delegates to the subadviser the day-to-day portfolio management of the Portfolios, except, in certain cases, for the management of cash and short term instruments.
In addition, the Portfolios indirectly pay management and/or administration fees to LMPFA and other wholly-owned subsidiaries of Legg Mason as a shareholder in the Underlying Funds. These management and administration fees ranged from 0.40% to 1.00% of the average daily net assets of the Underlying Funds.
For the year ended December 31, 2010, fees waived and/or expenses reimbursed amounted to $9,712 for Lifestyle Allocation 70%.
Legg Mason Investor Services, LLC, a wholly-owned broker-dealer subsidiary of Legg Mason, serves as the Portfolios’ sole and exclusive distributor.
All officers and one Trustee of the Trust are employees of Legg Mason or its affiliates and do not receive compensation from the Trust.
| | | | |
| Legg Mason Variable Lifestyle Series 2010 Annual Report | | | 29 | |
3. Investments
For the year ended December 31, 2010, the aggregate cost of purchases and proceeds from sales of investments (excluding short-term investments) were as follows:
| | | | | | | | |
| | | Purchases | | | Sales | |
| Lifestyle Allocation 85% | | $ | 17,603,970 | | | $ | 15,550,367 | |
| Lifestyle Allocation 70% | | | 9,376,458 | | | | 19,387,027 | |
| Lifestyle Allocation 50% | | | 24,783,138 | | | | 38,258,101 | |
At December 31, 2010, the aggregate gross unrealized appreciation and depreciation of investments for federal income tax purposes were as follows:
| | | | | | | | | | | | |
| | | Gross
Unrealized
Appreciation | | | Gross
Unrealized
Depreciation | | | Net
Unrealized
Appreciation
(Depreciation) | |
| Lifestyle Allocation 85% | | $ | 10,732,507 | | | $ | (9,667,537) | | | $ | 1,064,970 | |
| Lifestyle Allocation 70% | | | 6,541,076 | | | | (7,107,230) | | | | (566,154) | |
| Lifestyle Allocation 50% | | | 13,777,487 | | | | (11,087,771) | | | | 2,689,716 | |
4. Derivative instruments and hedging activities
Financial Accounting Standards Board Codification Topic 815 requires enhanced disclosure about an entity’s derivative and hedging activities.
During the year ended December 31, 2010, the Portfolios did not invest in any derivative instruments.
5. Shares of beneficial interest
At December 31, 2010, the Trust had an unlimited number of shares of beneficial interest authorized with a par value of $0.00001 per share.
Transactions in shares of the Portfolios were as follows:
| | | | | | | | | | | | |
| | | Year Ended
December 31, 2010 | | | Period Ended
December 31, 2009† | | | Year Ended
January 31, 2009 | |
| | | |
| Lifestyle Allocation 85% | | | | | | | | | | | | |
| Shares sold | | | 852,068 | | | | 1,288,694 | | | | 1,982,443 | |
| Shares issued on reinvestment | | | 131,956 | | | | 178,122 | | | | 220,862 | |
| Shares repurchased | | | (826,168) | | | | (728,811) | | | | (1,091,824) | |
| Net increase | | | 157,856 | | | | 738,005 | | | | 1,111,481 | |
| | | |
| Lifestyle Allocation 70% | | | | | | | | | | | | |
| Shares sold | | | 45,561 | | | | 99,691 | | | | 300,148 | |
| Shares issued on reinvestment | | | 134,735 | | | | 250,093 | | | | 281,755 | |
| Shares repurchased | | | (1,221,922) | | | | (1,190,007) | | | | (2,103,829) | |
| Net decrease | | | (1,041,626) | | | | (840,223) | | | | (1,521,926) | |
| | | |
| Lifestyle Allocation 50% | | | | | | | | | | | | |
| Shares sold | | | 598,092 | | | | 152,716 | | | | 407,864 | |
| Shares issued on reinvestment | | | 319,816 | | | | 572,187 | | | | 1,180,229 | |
| Shares repurchased | | | (2,195,384) | | | | (2,580,688) | | | | (4,165,358) | |
| Net decrease | | | (1,277,476) | | | | (1,855,785) | | | | (2,577,265) | |
| †For | the period February 1, 2009 through December 31, 2009. |
| | |
| 30 | | Legg Mason Variable Lifestyle Series 2010 Annual Report |
Notes to financial statements (cont’d)
6. Income tax information and distributions to shareholders
The tax character of distributions paid during the fiscal year ended December 31, 2010 were as follows:
| | | | | | | | | | | | |
| | | Lifestyle
Allocation 85% | | | Lifestyle
Allocation 70% | | | Lifestyle
Allocation 50% | |
| | | |
| Distributions Paid From: | | | | | | | | | | | | |
| Ordinary income | | $ | 1,550,010 | | | $ | 1,400,011 | | | $ | 3,650,011 | |
The tax character of distributions paid during the fiscal period ended December 31, 2009 were as follows:
| | | | | | | | | | | | |
| | | Lifestyle
Allocation 85% | | | Lifestyle
Allocation 70% | | | Lifestyle
Allocation 50% | |
| | | |
| Distributions Paid From: | | | | | | | | | | | | |
| Ordinary income | | $ | 1,800,012 | | | $ | 2,250,008 | | | $ | 5,750,010 | |
The tax character of distributions paid during the fiscal year ended January 31, 2009 were as follows:
| | | | | | | | | | | | |
| | | Lifestyle
Allocation 85% | | | Lifestyle
Allocation 70% | | | Lifestyle
Allocation 50% | |
| | | |
| Distributions Paid From: | | | | | | | | | | | | |
| Ordinary income | | $ | 1,500,012 | | | $ | 2,100,011 | | | $ | 5,500,017 | |
| Net long-term capital gains | | | 550,965 | | | | 91,511 | | | | 5,988,993 | |
| Total distributions paid | | $ | 2,050,977 | | | $ | 2,191,522 | | | $ | 11,489,010 | |
As of December 31, 2010, the components of accumulated earnings on a tax basis were as follows:
| | | | | | | | | | | | |
| | | Lifestyle
Allocation 85% | | | Lifestyle
Allocation 70% | | | Lifestyle
Allocation 50% | |
| Undistributed ordinary income — net | | $ | 316,156 | | | $ | 357,145 | | | $ | 509,122 | |
| Capital loss carryforward* | | | (18,309,421) | | | | (34,340,014) | | | | (21,944,141) | |
| Other book/tax temporary differences | | | (41,843) | (a) | | | (194,788) | (a) | | | (103,498) | (a) |
| Unrealized appreciation (depreciation) | | | 1,064,970 | (b) | | | (566,154) | (b) | | | 2,689,716 | (b) |
| Total accumulated earnings (losses) — net | | $ | (16,970,138) | | | $ | (34,743,811) | | | $ | (18,848,801) | |
| * | As of December 31, 2010, the Portfolios had the following net capital loss carryforwards remaining: |
| | | | | | | | | | | | |
| Year of Expiration | | Lifestyle
Allocation 85% | | | Lifestyle
Allocation 70% | | | Lifestyle
Allocation 50% | |
| 12/31/2011 | | $ | (12,312,804) | | | $ | (12,404,012) | | | | — | |
| 12/31/2012 | | | (3,119,343) | † | | | (10,439,486) | † | | | — | |
| 12/31/2013 | | | (1,280,698) | † | | | (3,049,716) | † | | | — | |
| 12/31/2016 | | | — | | | | (1,548,306) | | | $ | (6,640,552) | |
| 12/31/2017 | | | (1,217,675) | | | | (4,794,598) | | | | (12,981,017) | |
| 12/31/2018 | | | (378,901) | | | | (2,103,896) | | | | (2,322,572) | |
| | | $ | (18,309,421) | | | $ | (34,340,014) | | | $ | (21,944,141) | |
These amounts will be available to offset future taxable capital gains. Under the recently enacted Regulated Investment Company Modernization Act of 2010, the Portfolios will be permitted to carryforward capital losses incurred in taxable years beginning after December 22, 2010 for an unlimited period. However, any losses incurred during those future years will be required to be utilized prior to the losses incurred in pre-enactment taxable years. As a result of this ordering rule, pre-enactment capital loss carryforwards may be more likely to expire unused. Additionally, post-enactment capital losses that are carried forward will retain their character as either short-term or long-term capital losses rather than being considered all short-term as under previous law.
| † | A portion of these losses is subject to certain limitations for tax purposes due to an ownership change that took place in a previous year. |
| (a) | Other book/tax temporary differences are attributable primarily to the deferral of post-October capital losses for tax purposes and book/tax differences in the timing of the deductibility of various expenses. |
| (b) | The difference between book-basis and tax-basis unrealized appreciation (depreciation) is attributable primarily to the tax deferral of losses on wash sales. |
| | | | |
| Legg Mason Variable Lifestyle Series 2010 Annual Report | | | 31 | |
7. Regulatory matters
On May 31, 2005, the U.S. Securities and Exchange Commission (“SEC”) issued an order in connection with the settlement of an administrative proceeding against Smith Barney Fund Management LLC (“SBFM”), a wholly-owned subsidiary of Legg Mason and the then investment adviser or manager to the Portfolios, and Citigroup Global Markets Inc. (“CGM”), a former distributor of the Portfolios, relating to the appointment of an affiliated transfer agent for the Smith Barney family of mutual funds, including the Portfolios (the “Affected Funds”).
The SEC order found that SBFM and CGM willfully violated Section 206(1) of the Investment Advisers Act of 1940, as amended, and the rules promulgated there under (the “Advisers Act”). Specifically, the order found that SBFM and CGM knowingly or recklessly failed to disclose to the boards of the Affected Funds in 1999 when proposing a new transfer agent arrangement with an affiliated transfer agent that: First Data Investors Services Group (“First Data”), the Affected Funds’ then-existing transfer agent, had offered to continue as transfer agent and do the same work for substantially less money than before; and that Citigroup Asset Management (“CAM”), the Citigroup business unit that, at the time, included the Affected Funds’ investment manager and other investment advisory companies, had entered into a side letter with First Data under which CAM agreed to recommend the appointment of First Data as sub-transfer agent to the affiliated transfer agent in exchange for, among other things, a guarantee by First Data of specified amounts of asset management and investment banking fees to CAM and CGM. The order also found that SBFM and CGM willfully violated Section 206(2) of the Advisers Act by virtue of the omissions discussed above and other misrepresentations and omissions in the materials provided to the Affected Funds’ boards, including the failure to make clear that the affiliated transfer agent would earn a high profit for performing limited functions while First Data continued to perform almost all of the transfer agent functions, and the suggestion that the proposed arrangement was in the Affected Funds’ best interests and that no viable alternatives existed.
SBFM and CGM do not admit or deny any wrongdoing or liability. The settlement does not establish wrongdoing or liability for purposes of any other proceeding. The SEC censured SBFM and CGM and ordered them to cease and desist from violations of Sections 206(1) and 206(2) of the Advisers Act. The order required Citigroup to pay $208.1 million, including $109 million in disgorgement of profits, $19.1 million in interest, and a civil money penalty of $80 million. Approximately $24.4 million has already been paid to the Affected Funds, primarily through fee waivers. The remaining $183.7 million, including the penalty, has been paid to the U.S. Treasury and will be distributed pursuant to a plan submitted for the approval of the SEC. The order also required that transfer agency fees received from the Affected Funds since December 1, 2004, less certain expenses, be placed in escrow and provided that a portion of such fees might be subsequently distributed in accordance with the terms of the order. On April 3, 2006, an aggregate amount of approximately $9 million held in escrow was distributed to the Affected Funds.
The order required SBFM to recommend a new transfer agent contract to the Affected Funds’ boards within 180 days of the entry of the order; if a Citigroup affiliate submitted a proposal to serve as transfer agent or sub-transfer agent, SBFM and CGM would have been required, at their expense, to engage an independent monitor to oversee a competitive bidding process. On November 21, 2005, and within the specified timeframe, the Affected Funds’ boards selected a new transfer agent for the Affected Funds. No Citigroup affiliate submitted a proposal to serve as transfer agent. Under the order, SBFM also must comply with an amended version of a vendor policy that Citigroup instituted in August 2004.
Although there can be no assurance, LMPFA does not believe that this matter will have a material adverse effect on the Affected Funds.
On December 1, 2005, Citigroup completed the sale of substantially all of its global asset management business, including SBFM, to Legg Mason.
| | |
| 32 | | Legg Mason Variable Lifestyle Series 2010 Annual Report |
Notes to financial statements (cont’d)
On May 12, 2010, the SEC approved the disbursement of approximately $108.6 million previously paid to the U.S. Treasury, reflecting the disgorgement of Citigroup’s profits, plus interest. On May 26, 2010, these amounts were disbursed to the Affected Funds pursuant to a Plan of Distribution approved by the SEC. The Portfolios have received $8,502, $8,502 and $13,301 for the Lifestyle Allocation 85%, Lifestyle Allocation 70% and Lifestyle Allocation 50%, respectively, related to this distribution. All other amounts not previously distributed were retained by the U.S. Treasury.
8. Legal matters
Beginning in May 2004, class action lawsuits alleging violations of the federal securities laws were filed against CGM, a former distributor of the Portfolios, and other affiliated funds (collectively, the “Funds”) and a number of its then affiliates, including SBFM and Salomon Brothers Asset Management Inc. (“SBAM”), which were then investment adviser or manager to certain of the Funds (the “Managers”), substantially all of the mutual funds then managed by the Managers (the “Defendant Funds”), and Board members of the Defendant Funds (collectively, the “Defendants”). The complaints alleged, among other things, that CGM created various undisclosed incentives for its brokers to sell Smith Barney and Salomon Brothers funds. In addition, according to the complaints, the Managers caused the Defendant Funds to pay excessive brokerage commissions to CGM for steering clients towards proprietary funds. The complaints also alleged that the Defendants breached their fiduciary duty to the Defendant Funds by improperly charging Rule 12b-1 fees and by drawing on fund assets to make undisclosed payments of soft dollars and excessive brokerage commissions. The complaints also alleged that the Defendant Funds failed to adequately disclose certain of the allegedly wrongful conduct. The complaints sought injunctive relief and compensatory and punitive damages, rescission of the Defendant Funds’ contracts with the Managers, recovery of all fees paid to the Managers pursuant to such contracts and an award of attorneys’ fees and litigation expenses.
On December 15, 2004, a consolidated amended complaint (the “Complaint”) was filed alleging substantially similar causes of action. On May 27, 2005, all of the Defendants filed motions to dismiss the Complaint. On July 26, 2006, the court issued a decision and order (1) finding that plaintiffs lacked standing to sue on behalf of the shareholders of the Funds in which none of the plaintiffs had invested and dismissing those Funds from the case (although stating that they could be brought back into the case if standing as to them could be established), and (2) other than one stayed claim, dismissing all of the causes of action against the remaining Defendants, with prejudice, except for the cause of action under Section 36(b) of the 1940 Act, which the court granted plaintiffs leave to replead as a derivative claim.
On October 16, 2006, plaintiffs filed their Second Consolidated Amended Complaint (“Second Amended Complaint”) which alleges derivative claims on behalf of nine funds identified in the Second Amended Complaint, under Section 36(b) of the 1940 Act, against CAM, SBAM and SBFM as investment advisers to the identified funds, as well as CGM as a distributor for the identified funds (collectively, the “Second Amended Complaint Defendants”). The Portfolios was not identified in the Second Amended Complaint. The Second Amended Complaint alleges no claims against any of the funds or any of their Board Members. Under Section 36(b), the Second Amended Complaint alleges similar facts and seeks similar relief against the Second Amended Complaint Defendants as the Complaint.
On December 3, 2007, the court granted the Defendants’ motion to dismiss, with prejudice. On January 2, 2008, the plaintiffs filed a notice of appeal to the Second Circuit Court of Appeals. The appeal was fully briefed and oral argument before the U.S. Court of Appeals for the Second Circuit took place on March 5, 2009. The parties currently are awaiting a decision from the U.S. Court of Appeals for the Second Circuit.
Additional lawsuits arising out of these circumstances and presenting similar allegations and requests for relief may be filed in the future.
9. Other tax information
On December 22, 2010, President Obama signed into law the Regulated Investment Company Modernization Act of 2010 (the “Act”). The Act updates certain tax rules applicable to regulated investment companies (“RICs”). The various provisions of the Act will generally be effective for RICs with taxable years beginning after December 22, 2010. Additional information regarding the impact of the Act on the Portfolios, if any, will be contained within the relevant sections of the notes to the financial statements for the fiscal year ending December 31, 2011.
| | | | |
| Legg Mason Variable Lifestyle Series 2010 Annual Report | | | 33 | |
Report of independent registered public accounting firm
The Board of Trustees and Shareholders
Legg Mason Partners Variable Equity Trust:
We have audited the accompanying statements of assets and liabilities of Legg Mason Variable Lifestyle Allocation 85%, Legg Mason Variable Lifestyle Allocation 70%, and Legg Mason Variable Lifestyle Allocation 50%, each a series of Legg Mason Partners Variable Equity Trust, including the schedules of investments, as of December 31, 2010, and the related statement of operations for the year then ended, the statements of changes in net assets for the year then ended, the period from February 1, 2009 to December 31, 2009, and the year ended January 31, 2009, and the financial highlights for the year then ended, the period from February 1, 2009 to December 31, 2009, and each of the years in the four-year period ended January 31, 2009. These financial statements and financial highlights are the responsibility of the Portfolios’ management. Our responsibility is to express an opinion on these financial statements and financial highlights based on our audits.
We conducted our audits in accordance with the standards of the Public Company Accounting Oversight Board (United States). Those standards require that we plan and perform the audit to obtain reasonable assurance about whether the financial statements and financial highlights are free of material misstatement. An audit includes examining, on a test basis, evidence supporting the amounts and disclosures in the financial statements. Our procedures included confirmation of securities owned as of December 31, 2010, by correspondence with the investee funds’ transfer agent and brokers. An audit also includes assessing the accounting principles used and significant estimates made by management, as well as evaluating the overall financial statement presentation. We believe that our audits provide a reasonable basis for our opinion.
In our opinion, the financial statements and financial highlights referred to above present fairly, in all material respects, the financial position of Legg Mason Variable Lifestyle Allocation 85%, Legg Mason Variable Lifestyle Allocation 70%, and Legg Mason Variable Lifestyle Allocation 50%, as of December 31, 2010, the results of their operations, the changes in their net assets, and the financial highlights for the periods described above, in conformity with U.S. generally accepted accounting principles.

New York, New York
February 15, 2011
| | |
| 34 | | Legg Mason Variable Lifestyle Series |
Board approval of management and
subadvisory agreements (unaudited)
Legg Mason Variable Lifestyle Allocation 85%
At a meeting of the Trust’s Board of Trustees, the Board considered the re-approval for an annual period of the management agreement of Legg Mason Variable Lifestyle Allocation 85% (the “Fund”), pursuant to which Legg Mason Partners Fund Advisor, LLC (the “Manager”) provides the Fund with investment advisory and administrative services, and the Fund’s sub-advisory agreement, pursuant to which Legg Mason Global Asset Allocation, LLC (the “Sub-Adviser”) provides day-to-day management of the Fund’s portfolio. (The management agreement and sub-advisory agreement are collectively referred to as the “Agreements.”) The Manager and the Sub-Adviser are wholly-owned subsidiaries of Legg Mason, Inc. The Trustees who are not “interested persons” (as defined in the Investment Company Act of 1940, as amended (the “Independent Trustees”)) of the Fund were assisted in their review by Fund counsel and independent legal counsel and met with independent legal counsel in executive sessions separate from representatives of the Manager and the Sub-Adviser. The Independent Trustees requested and received information from the Manager and the Sub-Adviser they deemed reasonably necessary for their review of the Agreements and the performance of the Manager and the Sub-Adviser. Included was information about the Manager, the Sub-Adviser and the Fund’s distributor, as well as the management, sub-advisory and distribution arrangements for the Fund and other funds overseen by the Board. This information was initially reviewed by a special committee of the Independent Trustees and then by the full Board.
In voting to approve the Agreements, the Independent Trustees considered whether the approval of the Agreements would be in the best interests of the Fund and its shareholders, an evaluation based on several factors including those discussed below.
Nature, extent and quality of the services provided to the fund under the management agreement and sub-advisory agreement
The Board received and considered information regarding the nature, extent and quality of services provided to the Fund by the Manager and the Sub-Adviser under the Management Agreement and Sub-Advisory Agreement, respectively, during the past year. The Trustees also considered the Manager’s supervisory activities over the Sub-Adviser. In addition, the Independent Trustees received and considered other information regarding the administrative and other services rendered to the Fund and its shareholders by the Manager. The Board noted information received at regular meetings throughout the year related to the services rendered by the Manager in its management of the Fund’s affairs, including the management of cash and short-term instruments, and the Manager’s role in coordinating the activities of the Sub-Adviser and the Fund’s other service providers. The Board’s evaluation of the services provided by the Manager and the Sub-Adviser took into account the Board’s knowledge and familiarity gained as Trustees of funds in the Legg Mason fund complex, including the scope and quality of the investment management and other capabilities of the Manager and the Sub-Adviser and the quality of the Manager’s administrative and other services. The Board observed that the scope of services provided by the Manager had expanded over time as a result of regulatory and other developments, including maintaining and monitoring its own and the Fund’s compliance programs. The Board reviewed information received from the Manager and the Fund’s Chief Compliance Officer regarding the Fund’s compliance policies and procedures established pursuant to Rule 38a-1 under the Investment Company Act of 1940, as amended.
The Board reviewed the qualifications, backgrounds and responsibilities of the Fund’s senior personnel and the portfolio management team primarily responsible for the day-to-day portfolio management of the Fund. The Board considered the degree to which the Manager implemented organizational changes to improve investment results and the services provided to the Legg Mason fund complex. The Board also considered, based on its knowledge of the Manager and the Manager’s affiliates, the financial resources available to the Manager’s parent organization, Legg Mason, Inc.
The Board also considered the division of responsibilities between the Manager and the Sub-Adviser and the oversight provided by the Manager. The Board also considered the Manager’s and the Sub-Adviser’s brokerage policies and practices, the standards applied in seeking best execution, the Manager’s policies and practices regarding soft dollars, and the existence of quality controls applicable to brokerage allocation
| | | | |
| Legg Mason Variable Lifestyle Series | | | 35 | |
procedures. In addition, management also reported to the Board on, among other things, its business plans, recent organizational changes, portfolio manager compensation plan and policy regarding portfolio managers’ ownership of fund shares.
The Board concluded that, overall, it was satisfied with the nature, extent and quality of services provided (and expected to be provided) under the respective Agreement by the Manager and the Sub-Adviser.
Fund performance
The Board received and reviewed performance information for the Fund and for all mixed-asset target allocation growth funds underlying variable insurance products (the “Performance Universe”) selected by Lipper, Inc. (“Lipper”), an independent provider of investment company data. The Board was provided with a description of the methodology Lipper used to determine the similarity of the Fund with the funds included in the Performance Universe. The Trustees noted that they also had received and discussed with management information at periodic intervals comparing the Fund’s performance to that of its benchmark index. The information comparing the Fund’s performance to that of the Performance Universe was for the one-, three-, five- and ten-year periods ended June 30, 2010. The Fund performed better than the median for the one-year period, but below the median for the three-, five- and ten-year periods. The Board also reviewed performance information provided by the Manager for periods ended September 30, 2010, which showed that the Fund’s performance was better than the Lipper category average during the third quarter. The Trustees then discussed with representatives of management the portfolio management strategy of the Fund’s portfolio managers. The Trustees noted that the Manager and Sub-Adviser were committed to providing the resources necessary to assist the Fund’s portfolio managers and improve Fund performance. Based on its review, the Board generally was satisfied with the Fund’s recent performance and management’s efforts to continue to improve performance going forward. The Board determined to continue to evaluate the Fund’s performance and directed the Independent Trustees’ performance committee to continue to periodically review Fund performance with the Manager and report to the full Board during periods between Board meetings.
Expense ratios
The Board noted that the Fund bears indirectly its pro rata share of the expenses of the underlying funds in which it invests, including management fees payable by such underlying funds to the Manager or its affiliates. The Board noted that there is no management fee payable by the Fund to the Manager.
The Board received an analysis of complex-wide management fees provided by the Manager, which, among other things, set out a framework of fees based on asset classes. Management also discussed with the Board the Fund’s distribution arrangements, including how amounts received by the Fund’s distributor are expended, and the fees received and expenses incurred in connection with such arrangements by affiliates of the Manager.
Additionally, the Board received and considered information comparing the Fund’s overall expense ratio with those of a group of actively managed affiliated funds of funds underlying variable insurance products consisting of four mixed-asset target allocation growth funds and one mixed-asset target allocation moderate fund selected by Lipper as comparable to the Fund (the “Expense Group”), and a broader group of funds selected by Lipper consisting of all actively managed affiliated mixed-asset target allocation growth and mixed-asset target allocation moderate funds of funds underlying variable insurance products (the “Expense Universe”). This information showed that the Fund’s actual total expense ratio was higher than the median of the total expense ratios of the funds in the Expense Group and higher than the average total expense ratio of the funds in the Expense Universe.
Manager profitability
The Board received and considered a profitability analysis of the Manager and its affiliates in providing services to the Fund. The Board also received profitability information with respect to the Legg Mason fund
| | |
| 36 | | Legg Mason Variable Lifestyle Series |
Board approval of management and
subadvisory agreements (unaudited) (cont’d)
complex as a whole. In addition, the Board received information with respect to the Manager’s allocation methodologies used in preparing this profitability data as well as a report from an outside consultant that had reviewed the Manager’s methodology. The Board also noted the profitability percentage ranges determined by appropriate court cases to be reasonable given the services rendered to investment companies. The Board determined that the Manager’s profitability was not excessive in light of the nature, extent and quality of the services provided to the Fund.
Economies of scale
The Board received and considered information regarding whether there have been economies of scale with respect to the management of the Fund as the Fund’s assets grow, whether the Fund has appropriately benefited from any economies of scale, and whether there is potential for realization of any further economies of scale. The Board considered whether economies of scale in the provision of services to the Fund were being passed along to the shareholders.
The Board noted that to the extent the Fund’s assets increase over time, the Fund and its shareholders should realize economies of scale as certain expenses, such as fixed fund fees, become a smaller percentage of overall assets. The Board noted that it appeared that the benefits of any economies of scale also would be appropriately shared with shareholders through increased investment in fund management and administration resources.
Taking all of the above into consideration, the Board determined that the Fund’s expense ratio was reasonable in light of the comparative performance and expense information and the nature, extent and quality of the services provided to the Fund under the Agreements.
Other benefits to the manager
The Board considered other benefits received by the Manager and its affiliates, including the Sub-Adviser, as a result of the Manager’s relationship with the Fund, including the opportunity to offer additional products and services to Fund shareholders.
In light of the costs of providing investment management and other services to the Fund and the Manager’s ongoing commitment to the Fund, the profits and other ancillary benefits that the Manager and its affiliates received were considered reasonable.
Based on their discussions and considerations, including those described above, the Trustees approved the Management Agreement and the Sub-Advisory Agreement to continue for another year.
No single factor reviewed by the Board was identified by the Board as the principal factor in determining whether to approve the Management Agreement and the Sub-Advisory Agreement.
| | | | |
| Legg Mason Variable Lifestyle Series | | | 37 | |
Legg Mason Variable Lifestyle Allocation 70%
At a meeting of the Trust’s Board of Trustees, the Board considered the re-approval for an annual period of the management agreement of Legg Mason Variable Lifestyle Allocation 70% (the “Fund”), pursuant to which Legg Mason Partners Fund Advisor, LLC (the “Manager”) provides the Fund with investment advisory and administrative services, and the Fund’s sub-advisory agreement, pursuant to which Legg Mason Global Asset Allocation, LLC (the “Sub-Adviser”) provides day-to-day management of the Fund’s portfolio. (The management agreement and sub-advisory agreement are collectively referred to as the “Agreements.”) The Manager and the Sub-Adviser are wholly-owned subsidiaries of Legg Mason, Inc. The Trustees who are not “interested persons” (as defined in the Investment Company Act of 1940, as amended (the “Independent Trustees”)) of the Fund were assisted in their review by Fund counsel and independent legal counsel and met with independent legal counsel in executive sessions separate from representatives of the Manager and the Sub-Adviser. The Independent Trustees requested and received information from the Manager and the Sub-Adviser they deemed reasonably necessary for their review of the Agreements and the performance of the Manager and the Sub-Adviser. Included was information about the Manager, the Sub-Adviser and the Fund’s distributor, as well as the management, sub-advisory and distribution arrangements for the Fund and other funds overseen by the Board. This information was initially reviewed by a special committee of the Independent Trustees and then by the full Board.
In voting to approve the Agreements, the Independent Trustees considered whether the approval of the Agreements would be in the best interests of the Fund and its shareholders, an evaluation based on several factors including those discussed below.
Nature, extent and quality of the services provided to the fund under the management agreement and sub-advisory agreement
The Board received and considered information regarding the nature, extent and quality of services provided to the Fund by the Manager and the Sub-Adviser under the Management Agreement and Sub-Advisory Agreement, respectively, during the past year. The Trustees also considered the Manager’s supervisory activities over the Sub-Adviser. In addition, the Independent Trustees received and considered other information regarding the administrative and other services rendered to the Fund and its shareholders by the Manager. The Board noted information received at regular meetings throughout the year related to the services rendered by the Manager in its management of the Fund’s affairs, including the management of cash and short-term instruments, and the Manager’s role in coordinating the activities of the Sub-Adviser and the Fund’s other service providers. The Board’s evaluation of the services provided by the Manager and the Sub-Adviser took into account the Board’s knowledge and familiarity gained as Trustees of funds in the Legg Mason fund complex, including the scope and quality of the investment management and other capabilities of the Manager and the Sub-Adviser and the quality of the Manager’s administrative and other services. The Board observed that the scope of services provided by the Manager had expanded over time as a result of regulatory and other developments, including maintaining and monitoring its own and the Fund’s compliance programs. The Board reviewed information received from the Manager and the Fund’s Chief Compliance Officer regarding the Fund’s compliance policies and procedures established pursuant to Rule 38a-1 under the Investment Company Act of 1940, as amended.
The Board reviewed the qualifications, backgrounds and responsibilities of the Fund’s senior personnel and the portfolio management team primarily responsible for the day-to-day portfolio management of the Fund. The Board considered the degree to which the Manager implemented organizational changes to improve investment results and the services provided to the Legg Mason fund complex. The Board also considered, based on its knowledge of the Manager and the Manager’s affiliates, the financial resources available to the Manager’s parent organization, Legg Mason, Inc.
The Board also considered the division of responsibilities between the Manager and the Sub-Adviser and the oversight provided by the Manager. The Board also considered the Manager’s and the Sub-Adviser’s brokerage policies and practices, the standards applied in seeking best execution, the Manager’s policies and practices regarding soft dollars, and the existence of quality controls applicable to brokerage allocation
| | |
| 38 | | Legg Mason Variable Lifestyle Series |
Board approval of management and
subadvisory agreements (unaudited) (cont’d)
procedures. In addition, management also reported to the Board on, among other things, its business plans, recent organizational changes, portfolio manager compensation plan and policy regarding portfolio managers’ ownership of fund shares.
The Board concluded that, overall, it was satisfied with the nature, extent and quality of services provided (and expected to be provided) under the respective Agreement by the Manager and the Sub-Adviser.
Fund performance
The Board received and reviewed performance information for the Fund and for all mixed-asset target allocation growth funds underlying variable insurance products (the “Performance Universe”) selected by Lipper, Inc. (“Lipper”), an independent provider of investment company data. The Board was provided with a description of the methodology Lipper used to determine the similarity of the Fund with the funds included in the Performance Universe. The Trustees noted that they also had received and discussed with management information at periodic intervals comparing the Fund’s performance to that of its benchmark index. The information comparing the Fund’s performance to that of the Performance Universe was for the one-, three-, five- and ten-year periods ended June 30, 2010. The Fund performed better than the median for the one- and three-year periods, but below the median for the five- and ten-year periods. The Board also reviewed performance information provided by the Manager for periods ended September 30, 2010, which showed that the Fund’s performance was better than the Lipper category average during the third quarter. The Trustees then discussed with representatives of management the portfolio management strategy of the Fund’s portfolio managers. The Trustees noted that the Manager and Sub-Adviser were committed to providing the resources necessary to assist the Fund’s portfolio managers and continue to improve Fund performance. Based on its review, the Board generally was satisfied with the Fund’s performance and management’s efforts to continue to improve performance going forward. The Board determined to continue to evaluate the Fund’s performance and directed the Independent Trustees’ performance committee to continue to periodically review Fund performance with the Manager and report to the full Board during periods between Board meetings.
Expense ratios
The Board noted that the Fund bears indirectly its pro rata share of the expenses of the underlying funds in which it invests, including management fees payable by such underlying funds to the Manager or its affiliates. The Board noted that there is no management fee payable by the Fund to the Manager.
The Board received an analysis of complex-wide management fees provided by the Manager, which, among other things, set out a framework of fees based on asset classes. Management also discussed with the Board the Fund’s distribution arrangements, including how amounts received by the Fund’s distributor are expended, and the fees received and expenses incurred in connection with such arrangements by affiliates of the Manager.
Additionally, the Board received and considered information comparing the Fund’s overall expense ratio with those of a group of actively managed affiliated funds of funds underlying variable insurance products consisting of four mixed-asset target allocation growth funds and one mixed-asset target allocation moderate fund selected by Lipper as comparable to the Fund (the “Expense Group”), and a broader group of funds selected by Lipper consisting of all actively managed affiliated mixed-asset target allocation growth and mixed-asset target allocation moderate funds of funds underlying variable insurance products (the “Expense Universe”). This information showed that the Fund’s actual total expense ratio was slightly higher than the total expense ratios of the funds in the Expense Group and slightly higher than the average total expense ratio of the funds in the Expense Universe.
Manager profitability
The Board received and considered a profitability analysis of the Manager and its affiliates in providing services to the Fund. The Board also received profitability information with respect to the Legg Mason fund
| | | | |
| Legg Mason Variable Lifestyle Series | | | 39 | |
complex as a whole. In addition, the Board received information with respect to the Manager’s allocation methodologies used in preparing this profitability data as well as a report from an outside consultant that had reviewed the Manager’s methodology. The Board also noted the profitability percentage ranges determined by appropriate court cases to be reasonable given the services rendered to investment companies. The Board determined that the Manager’s profitability was not excessive in light of the nature, extent and quality of the services provided to the Fund.
Economies of scale
The Board received and considered information regarding whether there have been economies of scale with respect to the management of the Fund as the Fund’s assets grow, whether the Fund has appropriately benefited from any economies of scale, and whether there is potential for realization of any further economies of scale. The Board considered whether economies of scale in the provision of services to the Fund were being passed along to the shareholders.
The Board noted that to the extent the Fund’s assets increase over time, the Fund and its shareholders should realize economies of scale as certain expenses, such as fixed fund fees, become a smaller percentage of overall assets. The Board noted that it appeared that the benefits of any economies of scale also would be appropriately shared with shareholders through increased investment in fund management and administration resources.
Taking all of the above into consideration, the Board determined that the Fund’s expense ratio was reasonable in light of the comparative performance and expense information and the nature, extent and quality of the services provided to the Fund under the Agreements.
Other benefits to the manager
The Board considered other benefits received by the Manager and its affiliates, including the Sub-Adviser, as a result of the Manager’s relationship with the Fund, including the opportunity to offer additional products and services to Fund shareholders.
In light of the costs of providing investment management and other services to the Fund and the Manager’s ongoing commitment to the Fund, the profits and other ancillary benefits that the Manager and its affiliates received were considered reasonable.
Based on their discussions and considerations, including those described above, the Trustees approved the Management Agreement and the Sub-Advisory Agreement to continue for another year.
No single factor reviewed by the Board was identified by the Board as the principal factor in determining whether to approve the Management Agreement and the Sub-Advisory Agreement.
| | |
| 40 | | Legg Mason Variable Lifestyle Series |
Board approval of management and
subadvisory agreements (unaudited) (cont’d)
Legg Mason Variable Lifestyle Allocation 50%
At a meeting of the Trust’s Board of Trustees, the Board considered the re-approval for an annual period of the management agreement of Legg Mason Variable Lifestyle Allocation 50% (the “Fund”), pursuant to which Legg Mason Partners Fund Advisor, LLC (the “Manager”) provides the Fund with investment advisory and administrative services, and the Fund’s sub-advisory agreement, pursuant to which Legg Mason Global Asset Allocation, LLC (the “Sub-Adviser”) provides day-to-day management of the Fund’s portfolio. (The management agreement and sub-advisory agreement are collectively referred to as the “Agreements.”) The Manager and the Sub-Adviser are wholly-owned subsidiaries of Legg Mason, Inc. The Trustees who are not “interested persons” (as defined in the Investment Company Act of 1940, as amended (the “Independent Trustees”)) of the Fund were assisted in their review by Fund counsel and independent legal counsel and met with independent legal counsel in executive sessions separate from representatives of the Manager and the Sub-Adviser. The Independent Trustees requested and received information from the Manager and the Sub-Adviser they deemed reasonably necessary for their review of the Agreements and the performance of the Manager and the Sub-Adviser. Included was information about the Manager, the Sub-Adviser and the Fund’s distributor, as well as the management, sub-advisory and distribution arrangements for the Fund and other funds overseen by the Board. This information was initially reviewed by a special committee of the Independent Trustees and then by the full Board.
In voting to approve the Agreements, the Independent Trustees considered whether the approval of the Agreements would be in the best interests of the Fund and its shareholders, an evaluation based on several factors including those discussed below.
Nature, extent and quality of the services provided to the fund under the management agreement and sub-advisory agreement
The Board received and considered information regarding the nature, extent and quality of services provided to the Fund by the Manager and the Sub-Adviser under the Management Agreement and Sub-Advisory Agreement, respectively, during the past year. The Trustees also considered the Manager’s supervisory activities over the Sub-Adviser. In addition, the Independent Trustees received and considered other information regarding the administrative and other services rendered to the Fund and its shareholders by the Manager. The Board noted information received at regular meetings throughout the year related to the services rendered by the Manager in its management of the Fund’s affairs, including the management of cash and short-term instruments, and the Manager’s role in coordinating the activities of the Sub-Adviser and the Fund’s other service providers. The Board’s evaluation of the services provided by the Manager and the Sub-Adviser took into account the Board’s knowledge and familiarity gained as Trustees of funds in the Legg Mason fund complex, including the scope and quality of the investment management and other capabilities of the Manager and the Sub-Adviser and the quality of the Manager’s administrative and other services. The Board observed that the scope of services provided by the Manager had expanded over time as a result of regulatory and other developments, including maintaining and monitoring its own and the Fund’s compliance programs. The Board reviewed information received from the Manager and the Fund’s Chief Compliance Officer regarding the Fund’s compliance policies and procedures established pursuant to Rule 38a-1 under the Investment Company Act of 1940, as amended.
The Board reviewed the qualifications, backgrounds and responsibilities of the Fund’s senior personnel and the portfolio management team primarily responsible for the day-to-day portfolio management of the Fund. The Board considered the degree to which the Manager implemented organizational changes to improve investment results and the services provided to the Legg Mason fund complex. The Board also considered, based on its knowledge of the Manager and the Manager’s affiliates, the financial resources available to the Manager’s parent organization, Legg Mason, Inc.
The Board also considered the division of responsibilities between the Manager and the Sub-Adviser and the oversight provided by the Manager. The Board also considered the Manager’s and the Sub-Adviser’s brokerage policies and practices, the standards applied in seeking best execution, the Manager’s policies and practices regarding soft dollars, and the existence of quality controls applicable to brokerage allocation
| | | | |
| Legg Mason Variable Lifestyle Series | | | 41 | |
procedures. In addition, management also reported to the Board on, among other things, its business plans, recent organizational changes, portfolio manager compensation plan and policy regarding portfolio managers’ ownership of fund shares.
The Board concluded that, overall, it was satisfied with the nature, extent and quality of services provided (and expected to be provided) under the respective Agreement by the Manager and the Sub-Adviser.
Fund performance
The Board received and reviewed performance information for the Fund and for all mixed-asset target allocation moderate funds underlying variable insurance products (the “Performance Universe”) selected by Lipper, Inc. (“Lipper”), an independent provider of investment company data. The Board was provided with a description of the methodology Lipper used to determine the similarity of the Fund with the funds included in the Performance Universe. The Trustees noted that they also had received and discussed with management information at periodic intervals comparing the Fund’s performance to that of its benchmark index. The information comparing the Fund’s performance to that of the Performance Universe was for the one-, three-, five- and ten-year periods ended June 30, 2010. The Fund performed better than the median for the one-, three- and ten-year periods, but below the median for the five-year period. The Board also reviewed performance information provided by the Manager for periods ended September 30, 2010, which showed that the Fund’s performance was better than the Lipper category average during the third quarter. The Trustees then discussed with representatives of management the portfolio management strategy of the Fund’s portfolio managers. The Trustees noted that the Manager and Sub-Adviser were committed to providing the resources necessary to assist the Fund’s portfolio managers and continue to improve Fund performance. Based on its review, the Board generally was satisfied with the Fund’s performance and management’s efforts to continue to improve performance going forward. The Board determined to continue to evaluate the Fund’s performance and directed the Independent Trustees’ performance committee to continue to periodically review Fund performance with the Manager and report to the full Board during periods between Board meetings.
Expense ratios
The Board noted that the Fund bears indirectly its pro rata share of the expenses of the underlying funds in which it invests, including management fees payable by such underlying funds to the Manager or its affiliates. The Board noted that there is no management fee payable by the Fund to the Manager.
The Board received an analysis of complex-wide management fees provided by the Manager, which, among other things, set out a framework of fees based on asset classes. Management also discussed with the Board the Fund’s distribution arrangements, including how amounts received by the Fund’s distributor are expended, and the fees received and expenses incurred in connection with such arrangements by affiliates of the Manager.
Additionally, the Board received and considered information comparing the Fund’s overall expense ratio with those of a group of actively managed affiliated funds of funds underlying variable insurance products consisting of three mixed-asset target allocation moderate funds and two mixed-asset target allocation growth funds selected by Lipper as comparable to the Fund (the “Expense Group”), and a broader group of funds selected by Lipper consisting of all actively managed affiliated mixed-asset target allocation moderate and mixed-asset target allocation growth funds of funds underlying variable insurance products (the “Expense Universe”). This information showed that the Fund’s actual total expense ratio was lower than the median of the total expense ratios of the funds in the Expense Group and lower than the average total expense ratio of the funds in the Expense Universe.
Manager profitability
The Board received and considered a profitability analysis of the Manager and its affiliates in providing services to the Fund. The Board also received profitability information with respect to the Legg Mason fund
| | |
| 42 | | Legg Mason Variable Lifestyle Series |
Board approval of management and
subadvisory agreements (unaudited) (cont’d)
complex as a whole. In addition, the Board received information with respect to the Manager’s allocation methodologies used in preparing this profitability data as well as a report from an outside consultant that had reviewed the Manager’s methodology. The Board also noted the profitability percentage ranges determined by appropriate court cases to be reasonable given the services rendered to investment companies. The Board determined that the Manager’s profitability was not excessive in light of the nature, extent and quality of the services provided to the Fund.
Economies of scale
The Board received and considered information regarding whether there have been economies of scale with respect to the management of the Fund as the Fund’s assets grow, whether the Fund has appropriately benefited from any economies of scale, and whether there is potential for realization of any further economies of scale. The Board considered whether economies of scale in the provision of services to the Fund were being passed along to the shareholders.
The Board noted that to the extent the Fund’s assets increase over time, the Fund and its shareholders should realize economies of scale as certain expenses, such as fixed fund fees, become a smaller percentage of overall assets. The Board noted that it appeared that the benefits of any economies of scale also would be appropriately shared with shareholders through increased investment in fund management and administration resources.
Taking all of the above into consideration, the Board determined that the Fund’s expense ratio was reasonable in light of the comparative performance and expense information and the nature, extent and quality of the services provided to the Fund under the Agreements.
Other benefits to the manager
The Board considered other benefits received by the Manager and its affiliates, including the Sub-Adviser, as a result of the Manager’s relationship with the Fund, including the opportunity to offer additional products and services to Fund shareholders.
In light of the costs of providing investment management and other services to the Fund and the Manager’s ongoing commitment to the Fund, the profits and other ancillary benefits that the Manager and its affiliates received were considered reasonable.
Based on their discussions and considerations, including those described above, the Trustees approved the Management Agreement and the Sub-Advisory Agreement to continue for another year.
No single factor reviewed by the Board was identified by the Board as the principal factor in determining whether to approve the Management Agreement and the Sub-Advisory Agreement.
| | | | |
| Legg Mason Variable Lifestyle Series | | | 43 | |
Additional information (unaudited)
Information about Trustees and Officers
The business and affairs of Legg Mason Variable Lifestyle Series (the “Portfolios”) is conducted by management under the supervision and subject to the direction of its Board of Trustees. The business address of each Trustee is c/o R. Jay Gerken, 620 Eighth Avenue, New York, New York 10018. Information pertaining to the Trustees and officers of the Portfolios is set forth below.
The Statement of Additional Information includes additional information about Trustees and is available, without charge, upon request by calling the Portfolios at 1-877-721-1926.
| | |
| Independent Trustees†: |
|
| Paul R. Ades |
| |
| Year of birth | | 1940 |
| Position(s) with Trust | | Trustee |
| Term of office1 and length of time served2 | | Since 1983 |
| Principal occupation(s) during past five years | | Paul R. Ades, PLLC (law firm) (since 2000) |
Number of funds in fund complex overseen
by Trustee | | 53 |
| Other board memberships held by Trustee during past five years | | None |
|
| Andrew L. Breech |
| |
| Year of birth | | 1952 |
| Position(s) with Trust | | Trustee |
| Term of office1 and length of time served2 | | Since 1991 |
| Principal occupation(s) during past five years | | President, Dealer Operating Control Service, Inc. (automotive retail management) (since 1985) |
Number of funds in fund complex overseen
by Trustee | | 53 |
| Other board memberships held by Trustee during past five years | | None |
|
| Dwight B. Crane |
| |
| Year of birth | | 1937 |
| Position(s) with Trust | | Trustee |
| Term of office1 and length of time served2 | | Since 1981 |
| Principal occupation(s) during past five years | | Professor Emeritus, Harvard Business School (since 2007); formerly, Professor, Harvard Business School (1969 to 2007); Independent Consultant (since 1969) |
Number of funds in fund complex overseen
by Trustee | | 53 |
| Other board memberships held by Trustee during past five years | | None |
| | |
| 44 | | Legg Mason Variable Lifestyle Series |
Additional information (unaudited) (cont’d)
Information about Trustees and Officers
| | |
| Independent Trustees cont’d |
|
| Frank G. Hubbard |
| |
| Year of birth | | 1937 |
| Position(s) with Trust | | Trustee |
| Term of office1 and length of time served2 | | Since 1993 |
| Principal occupation(s) during past five years | | President, Avatar International Inc. (business development) (since 1998) |
Number of funds in fund complex overseen
by Trustee | | 53 |
| Other board memberships held by Trustee during past five years | | None |
|
| Howard J. Johnson |
| |
| Year of birth | | 1938 |
| Position(s) with Trust | | Trustee |
| Term of office1 and length of time served2 | | From 1981 to 1998 and since 2000 |
| Principal occupation(s) during past five years | | Chief Executive Officer, Genesis Imaging LLC (technology company) (since 2003) |
| Number of funds in fund complex overseen by Trustee | | 53 |
| Other board memberships held by Trustee during past five years | | None |
|
| David E. Maryatt |
| |
| Year of birth | | 1936 |
| Position(s) with Trust | | Trustee |
| Term of office1 and length of time served2 | | Since 1983 |
| Principal occupation(s) during past five years | | Private Investor; President and Director, ALS Co. (real estate management and development firm) (since 1992) |
| Number of funds in fund complex overseen by Trustee | | 53 |
| Other board memberships held by Trustee during past five years | | None |
|
| Jerome H. Miller |
| |
| Year of birth | | 1938 |
| Position(s) with Trust | | Trustee |
| Term of office1 and length of time served2 | | Since 1995 |
| Principal occupation(s) during past five years | | Retired |
| Number of funds in fund complex overseen by Trustee | | 53 |
| Other board memberships held by Trustee during past five years | | None |
| | | | |
| Legg Mason Variable Lifestyle Series | | | 45 | |
| | |
| Independent Trustees cont’d |
|
| Ken Miller |
| |
| Year of birth | | 1942 |
| Position(s) with Trust | | Trustee |
| Term of office1 and length of time served2 | | Since 1983 |
| Principal occupation(s) during past five years | | President, Young Stuff Apparel Group, Inc. (apparel manufacturer), division of Li & Fung (since 1963) |
| Number of funds in fund complex overseen by Trustee | | 53 |
| Other board memberships held by Trustee during past five years | | None |
|
| John J. Murphy |
| |
| Year of birth | | 1944 |
| Position(s) with Trust | | Trustee |
| Term of office1 and length of time served2 | | Since 2002 |
| Principal occupation(s) during past five years | | Founder and Senior Principal, Murphy Capital Management (investment management) (since 1983) |
| Number of funds in fund complex overseen by Trustee | | 53 |
| Other board memberships held by Trustee during past five years | | Trustee, UBS Funds (52 funds) (since 2008); Director, Nicholas Applegate Institutional Funds (12 funds) (since 2005); Trustee, Consulting Group Capital Markets Funds (11 funds) (since 2002); formerly, Director, Atlantic Stewardship Bank (2004 to 2005); formerly, Director, Barclays International Funds Group Ltd. and affiliated companies (1983 to 2003) |
|
| Thomas F. Schlafly |
| |
| Year of birth | | 1948 |
| Position(s) with Trust | | Trustee |
| Term of office1 and length of time served2 | | Since 1983 |
| Principal occupation(s) during past five years | | President, The Saint Louis Brewery, Inc. (brewery) (since 1989); Partner, Thompson Coburn LLP (law firm) (since 2009); formerly, Of Counsel, Husch Blackwell Sanders LLP (law firm) and its predecessor firms (1984 to 2009) |
| Number of funds in fund complex overseen by Trustee | | 53 |
| Other board memberships held by Trustee during past five years | | Director, Citizens National Bank of Greater St. Louis (since 2006) |
|
| Jerry A. Viscione |
| |
| Year of birth | | 1944 |
| Position(s) with Trust | | Trustee |
| Term of office1 and length of time served2 | | Since 1993 |
| Principal occupation(s) during past five years | | Retired |
| Number of funds in fund complex overseen by Trustee | | 53 |
| Other board memberships held by Trustee during past five years | | None |
| | |
| 46 | | Legg Mason Variable Lifestyle Series |
Additional information (unaudited) (cont’d)
Information about Trustees and Officers
| | |
| Interested Trustee and Officer: | | |
| |
| R. Jay Gerken, CFA3 | | |
| |
| Year of birth | | 1951 |
| Position(s) with Trust | | Trustee, President, Chairman and Chief Executive Officer |
| Term of office1 and length of time served2 | | Since 2002 |
| Principal occupation(s) during past five years | | Managing Director of Legg Mason & Co., LLC (“Legg Mason & Co.”) (since 2005); Officer and Trustee/Director of 148 funds associated with Legg Mason Partners Fund Advisor, LLC (“LMPFA”) or its affiliates (since 2006) and Legg Mason & Co. predecessors (prior to 2006); President and Chief Executive Officer (“CEO”) of LMPFA (since 2006); President and CEO of Smith Barney Fund Management LLC (“SBFM”) and Citi Fund Management, Inc. (“CFM”) (formerly registered investment advisers) (since 2002); formerly, Chairman, President and CEO, Travelers Investment Adviser Inc. (prior to 2005) |
| Number of funds in fund complex overseen by Trustee | | 136 |
| Other board memberships held by Trustee during past five years | | Former Trustee, Consulting Group Capital Markets Funds (11 funds) (prior to 2006) |
| Additional Officers | | |
| |
Ted P. Becker Legg Mason 620 Eighth Avenue, New York, NY 10018 | | |
| |
| Year of birth | | 1951 |
| Position(s) with Trust | | Chief Compliance Officer |
| Term of office1 and length of time served2 | | Since 2007 |
| Principal occupation(s) during past five years | | Director of Global Compliance at Legg Mason (since 2006); Chief Compliance Officer of LMPFA (since 2006); Managing Director of Compliance of Legg Mason & Co. (since 2005); Chief Compliance Officer of certain mutual funds associated with Legg Mason & Co. or its affiliates (since 2006) and Legg Mason & Co. predecessors (prior to 2006) |
| |
John Chiota Legg Mason 100 First Stamford Place, Stamford, CT 06902 | | |
| |
| Year of birth | | 1968 |
| Position(s) with Trust | | Chief Anti-Money Laundering Compliance Officer and Identity Theft Prevention Officer |
| Term of office1 and length of time served2 | | Since 2007 and 2008 |
| Principal occupation(s) during past five years | | Identity Theft Prevention Officer of certain mutual funds associated with Legg Mason & Co. or its affiliates (since 2008); Chief Anti-Money Laundering Compliance Officer of certain mutual funds associated with Legg Mason & Co. or its affiliates (since 2006); Vice President of Legg Mason & Co. (since 2006) and Legg Mason & Co. predecessors (prior to 2006); formerly, Chief Anti-Money Laundering Compliance Officer of TD Waterhouse (prior to 2004) |
| | | | |
| Legg Mason Variable Lifestyle Series | | | 47 | |
| | |
| Additional Officers cont’d | | |
| |
Robert I. Frenkel Legg Mason 100 First Stamford Place, Stamford, CT 06902 | | |
| |
| Year of birth | | 1954 |
| Position(s) with Trust | | Secretary and Chief Legal Officer |
| Term of office1 and length of time served2 | | Since 2007 |
| Principal occupation(s) during past five years | | Vice President and Deputy General Counsel of Legg Mason (since 2006); Managing Director and General Counsel of Global Mutual Funds for Legg Mason & Co. (since 2006) and Legg Mason & Co. predecessors (since 1994); Secretary and Chief Legal Officer of certain mutual funds associated with Legg Mason & Co. or its affiliates (since 2006) and Legg Mason & Co. predecessors (prior to 2006) |
| |
Thomas C. Mandia Legg Mason 100 First Stamford Place, Stamford, CT 06902 | | |
| |
| Year of birth | | 1962 |
| Position(s) with Trust | | Assistant Secretary |
| Term of office1 and length of time served2 | | Since 2007 |
| Principal occupation(s) during past five years | | Managing Director and Deputy General Counsel of Legg Mason & Co. (since 2005) and Legg Mason & Co. predecessors (prior to 2005); Secretary of LMPFA (since 2006); Assistant Secretary of certain mutual funds associated with Legg Mason & Co. or its affiliates (since 2006) and Legg Mason & Co. predecessors (prior to 2006); Secretary to SBFM and CFM (since 2002) |
| |
Kaprel Ozsolak Legg Mason 55 Water Street, New York, NY 10041 | | |
| |
| Year of birth | | 1965 |
| Position(s) with Trust | | Chief Financial Officer |
| Term of office1 and length of time served2 | | Since 2007 |
| Principal occupation(s) during past five years | | Director of Legg Mason & Co. (since 2005); Chief Financial Officer of certain mutual funds associated with Legg Mason & Co. or its affiliates (since 2007) and Legg Mason & Co. predecessors (prior to 2007); formerly, Treasurer of certain mutual funds associated with Legg Mason & Co. or its affiliates (prior to 2010) and Legg Mason & Co. predecessors (prior to 2005); formerly, Controller of certain mutual funds associated with Legg Mason & Co. predecessors (prior to 2004) |
| | |
| 48 | | Legg Mason Variable Lifestyle Series |
Additional information (unaudited) (cont’d)
Information about Trustees and Officers
| | |
| Additional Officers cont’d | | |
| |
Albert Laskaj Legg Mason 55 Water Street, New York, NY 10041 | | |
| |
| Year of birth | | 1977 |
| Position(s) with Trust | | Treasurer |
| Term of office1 and length of time served2 | | Since 2010 |
| Principal occupation(s) during past five years | | Vice President of Legg Mason & Co. (since 2008); Treasurer of certain mutual funds associated with Legg Mason & Co. or its affiliates (since 2010); formerly, Controller of certain mutual funds associated with Legg Mason & Co. or its affiliates (prior to 2010); formerly, Assistant Controller of certain mutual funds associated with Legg Mason & Co. or its affiliates (prior to 2007); formerly, Accounting Manager of certain mutual funds associated with Legg Mason & Co. predecessors (prior to 2005) |
| |
Jeanne M. Kelly Legg Mason 620 Eighth Avenue, New York, NY 10018 | | |
| |
| Year of birth | | 1951 |
| Position(s) with Trust | | Senior Vice President |
| Term of office1 and length of time served2 | | Since 2007 |
| Principal occupation(s) during past five years | | Senior Vice President of certain mutual funds associated with Legg Mason & Co. or its affiliates (since 2007); Senior Vice President of LMPFA (since 2006); Managing Director of Legg Mason & Co. (since 2005) and Legg Mason & Co. predecessors (prior to 2005) |
| † | Trustees who are not “interested persons” of the Portfolios within the meaning of Section 2(a)(19) of the 1940 Act. |
| 1 | Each Trustee and officer serves until his or her respective successor has been duly elected and qualified or until his or her earlier death, resignation, retirement or removal. |
| 2 | Indicates the earliest year in which the Trustee became a board member for a fund in the Legg Mason fund complex or the officer took such office. |
| 3 | Mr. Gerken is an “interested person” of the Portfolios , as defined in the 1940 Act, because of his position with LMPFA and/or certain of its affiliates. |
| | | | |
| Legg Mason Variable Lifestyle Series | | | 49 | |
Important tax information (unaudited)
The following information is provided with respect to the distributions paid during the taxable year ended December 31, 2010:
| | | | | | | | |
| | | Lifestyle Allocation 85% | |
| Record date: | | | 6/17/2010 | | | | 12/29/2010 | |
| Payable date: | | | 6/18/2010 | | | | 12/30/2010 | |
Dividends qualifying for the dividends received deduction for corporations | | | 28.85 | % | | | 36.65 | % |
| | | | | | | | |
| | | Lifestyle Allocation 70% | |
| Record date: | | | 6/17/2010 | | | | 12/29/2010 | |
| Payable date: | | | 6/18/2010 | | | | 12/30/2010 | |
Dividends qualifying for the dividends received deduction for corporations | | | 17.91 | % | | | 23.30 | % |
| | | | | | | | |
| | | Lifestyle Allocation 50% | |
| Record date: | | | 6/17/2010 | | | | 12/29/2010 | |
| Payable date: | | | 6/18/2010 | | | | 12/30/2010 | |
Dividends qualifying for the dividends received deduction for corporations | | | 8.45 | % | | | 10.93 | % |
Please retain this information for your records.
Legg Mason
Variable Lifestyle Series
Trustees
Paul R. Ades
Andrew L. Breech
Dwight B. Crane
R. Jay Gerken, CFA
Chairman
Frank G. Hubbard
Howard J. Johnson
David E. Maryatt
Jerome H. Miller
Ken Miller
John J. Murphy
Thomas F. Schlafly
Jerry A. Viscione
Investment manager
Legg Mason Partners Fund Advisor, LLC
Subadviser
Legg Mason Global Asset Allocation, LLC
Distributor
Legg Mason Investor Services, LLC
Custodian
State Street Bank and Trust Company
Transfer agent
Boston Financial Data Services, Inc. 2000 Crown Colony Drive
Quincy, MA 02169
Independent registered public accounting firm
KPMG LLP
345 Park Avenue
New York, NY 10154
Legg Mason Variable Lifestyle Series
Legg Mason Variable Lifestyle Allocation 85%
Legg Mason Variable Lifestyle Allocation 70%
Legg Mason Variable Lifestyle Allocation 50%
The Portfolios are separate investment series of Legg Mason Partners Variable Equity Trust, a Maryland statutory trust.
Legg Mason Variable Lifestyle Series
Legg Mason Funds
55 Water Street
New York, NY 10041
The Portfolios file their complete schedule of portfolio holdings with the Securities and Exchange Commission (“SEC”) for the first and third quarters of each fiscal year on Form N-Q. The Portfolios Forms N-Q are available on the SEC’s website at www.sec.gov. The Portfolios Forms N-Q may be reviewed and copied at the SEC’s Public Reference Room in Washington, D.C., and information on the operation of the Public Reference Room may be obtained by calling
1-800-SEC-0330. To obtain information on Form N-Q, shareholders can call the Portfolios at 1-877-721-1926.
Information on how the Portfolios voted proxies relating to portfolio securities during the prior 12-month period ended June 30th of each year and a description of the policies and procedures that the Portfolios use to determine how to vote proxies relating to portfolio transactions are available (1) without charge, upon request, by calling the Portfolios at 1-877-721-1926, (2) on the Portfolios’ website at www.leggmason.com/individualinvestors and (3) on the SEC’s website at www.sec.gov.
This report is submitted for the general information of the shareholders of Legg Mason Variable Lifestyle Allocation 85%, Legg Mason Variable Lifestyle Allocation 70% and Legg Mason Variable Lifestyle Allocation 50%. This report is not authorized for distribution to prospective investors in the Portfolios unless preceded or accompanied by a current prospectus.
Investors should consider each Portfolio’s investment objectives, risks, charges and expenses carefully before investing. Each prospectus contains this and other important information about the Portfolios. Please read the prospectus carefully before investing.
www.leggmason.com/individualinvestors
© 2011 Legg Mason Investor Services, LLC
Member FINRA, SIPC
Privacy policy
We are committed to keeping nonpublic personal information about you secure and confidential. This notice is intended to help you understand how we fulfill this commitment. From time to time, we may collect a variety of personal information about you, including:
| Ÿ | | Information we receive from you on applications and forms, via the telephone, and through our websites; |
| Ÿ | | Information about your transactions with us, our affiliates, or others (such as your purchases, sales, or account balances); and |
| Ÿ | | Information we receive from consumer reporting agencies. |
We do not disclose nonpublic personal information about our customers or former customers, except to our affiliates (such as broker-dealers or investment advisers within the Legg Mason family of companies) or as is otherwise permitted by applicable law or regulation. For example, we may share this information with others in order to process your transactions or service an account. We may also provide this information to companies that perform marketing services on our behalf, such as printing and mailing, or to other financial institutions with whom we have joint marketing agreements. When we enter into such agreements, we will require these companies to protect the confidentiality of this information and to use it only to perform the services for which we hired them.
With respect to our internal security procedures, we maintain physical, electronic, and procedural safeguards to protect your nonpublic personal information, and we restrict access to this information.
If you decide at some point either to close your account(s) or become an inactive customer, we will continue to adhere to our privacy policies and practices with respect to your nonpublic personal information
NOT PART OF THE ANNUAL REPORT
www.leggmason.com/individualinvestors
© 2011 Legg Mason Investor Services, LLC Member FINRA, SIPC
FD01436 2/11 SR11-1316
The registrant has adopted a code of ethics that applies to the registrant’s principal executive officer, principal financial officer, principal accounting officer or controller.
| ITEM 3. | AUDIT COMMITTEE FINANCIAL EXPERT. |
The Board of Directors of the registrant has determined that Jerry A. Viscione possesses the technical attributes identified in Instruction 2(b) of Item 3 to Form N-CSR to qualify as an “audit committee financial expert,” and has designated Mr. Viscione as the Audit Committee’s financial expert. Mr. Viscione is an “independent” Director pursuant to paragraph (a)(2) of Item 3 to Form N-CSR.
| ITEM 4. | PRINCIPAL ACCOUNTANT FEES AND SERVICES. |
a) Audit Fees. The aggregate fees billed in the previous fiscal years ending December 31, 2009 and December 31, 2010 (the “Reporting Periods”) for professional services rendered by the Registrant’s principal accountant (the “Auditor”) for the audit of the Registrant’s annual financial statements, or services that are normally provided by the Auditor in connection with the statutory and regulatory filings or engagements for the Reporting Periods, were $69,300 in December 31, 2009 and $301,400 in December 31, 2010.
b) Audit-Related Fees. The aggregate fees billed in the Reporting Period for assurance and related services by the Auditor that are reasonably related to the performance of the Registrant’s financial statements were $0 in December 31, 2009 and $0 in December 31, 2010. These services consisted of procedures performed in connection with the Re-domiciliation of the various reviews of Prospectus supplements, and consent issuances related to the N-1A filings for the Legg Mason Partners Variable Equity Trust.
In addition, there were no Audit-Related Fees billed in the Reporting Period for assurance and related services by the Auditor to the Registrant’s investment adviser (not including any sub-adviser whose role is primarily portfolio management and is subcontracted with or overseen by another investment adviser), and any entity controlling, controlled by or under common control with the investment adviser that provides ongoing services to the Legg Mason Partners Variable Equity Trust (“service affiliates”), that were reasonably related to the performance of the annual audit of the service affiliates.
(c) Tax Fees. The aggregate fees billed in the Reporting Periods for professional services rendered by the Auditor for tax compliance, tax advice and tax planning (“Tax Services”) were $43,200 in December 31, 2009 and $57,600 in December 31, 2010. These services consisted of (i) review or preparation of U.S. federal, state, local and excise tax returns; (ii) U.S. federal, state and local tax planning, advice and assistance regarding statutory, regulatory or administrative developments, and (iii) tax advice regarding tax qualification matters and/or treatment of various financial instruments held or proposed to be acquired or held.
There were no fees billed for tax services by the Auditors to service affiliates during the Reporting Periods that required pre-approval by the Audit Committee.
d) All Other Fees. There were no other fees billed in the Reporting Periods for products and services provided by the Auditor, other than the services reported in paragraphs (a) through (c) of this Item for the Legg Mason Partners Variable Equity Trust.
All Other Fees. There were no other non-audit services rendered by the Auditor to Legg Mason Partners Fund Advisors, LLC (“LMPFA”), and any entity controlling, controlled by or under common control with LMPFA that provided ongoing services to Legg Mason Partners Variable Equity Trust requiring pre-approval by the Audit Committee in the Reporting Period.
(e) Audit Committee’s pre-approval policies and procedures described in paragraph (c) (7) of Rule 2-01 of Regulation S-X.
(1) The Charter for the Audit Committee (the “Committee”) of the Board of each registered investment company (the “Fund”) advised by LMPFA or one of their affiliates (each, an “Adviser”) requires that the Committee shall approve (a) all audit and permissible non-audit services to be provided to the Fund and (b) all permissible non-audit services to be provided by the Fund’s independent auditors to the Adviser and any Covered Service Providers if the engagement relates directly to the operations and financial reporting of the Fund. The Committee may implement policies and procedures by which such services are approved other than by the full Committee.
The Committee shall not approve non-audit services that the Committee believes may impair the independence of the auditors. As of the date of the approval of this Audit Committee Charter, permissible non-audit services include any professional services (including tax services), that are not prohibited services as described below, provided to the Fund by the independent auditors, other than those provided to the Fund in connection with an audit or a review of the financial statements of the Fund. Permissible non-audit services may not include: (i) bookkeeping or other services related to the accounting records or financial statements of the Fund; (ii) financial information systems design and implementation; (iii) appraisal or valuation services, fairness opinions or contribution-in-kind reports; (iv) actuarial services; (v) internal audit outsourcing services; (vi) management functions or human resources; (vii) broker or dealer, investment adviser or investment banking services; (viii) legal services and expert services unrelated to the audit; and (ix) any other service the Public Company Accounting Oversight Board determines, by regulation, is impermissible.
Pre-approval by the Committee of any permissible non-audit services is not required so long as: (i) the aggregate amount of all such permissible non-audit services provided to the Fund, the Adviser and any service providers controlling, controlled by or under common control with the Adviser that provide ongoing services to the Fund (“Covered Service Providers”) constitutes not more than 5% of the total amount of revenues paid to the independent auditors during the fiscal year in which the permissible non-audit services are provided to (a) the Fund, (b) the Adviser and (c) any entity controlling, controlled by or under common control with the Adviser that provides ongoing services to the Fund during the fiscal year in which the services are provided that would have to be approved by the Committee; (ii) the permissible non-audit services were not recognized by the Fund at the time of the engagement to be non-audit services; and (iii) such services are promptly brought to the attention of the Committee and approved by the Committee (or its delegate(s)) prior to the completion of the audit.
(2) For the Legg Mason Partners Variable Equity Trust, the percentage of fees that were approved by the audit committee, with respect to: Audit-Related Fees were 100% and 100% for December 31, 2009 and December 31, 2010; Tax Fees were 100% and 100% for December 31, 2010 and December 31, 2009; and Other Fees were 100% and 100% for December 31, 2009 and December 31, 2010.
(f) N/A
(g) Non-audit fees billed by the Auditor for services rendered to Legg Mason Partners Variable Equity Trust, LMPFA and any entity controlling, controlled by, or under common control with LMPFA that provides ongoing services to Legg Mason Partners Variable Equity Trust during the reporting period were $0 in 2010.
(h) Yes. Legg Mason Partners Variable Equity Trust’s Audit Committee has considered whether the provision of non-audit services that were rendered to Service Affiliates, which were not pre-approved (not requiring pre-approval), is compatible with maintaining the Accountant’s independence. All services provided by the Auditor to the Legg Mason Partners Variable Equity Trust or to Service Affiliates, which were required to be pre-approved, were pre-approved as required.
| ITEM 5. | AUDIT COMMITTEE OF LISTED REGISTRANTS. |
a) The independent board members are acting as the registrant’s audit committee as specified in Section 3(a)(58)(B) of the Exchange Act. The Audit Committee consists of the following Board members:
Paul R. Ades
Andrew L. Breech
Dwight B. Crane
Frank G. Hubbard
Howard J. Johnson
David E. Maryatt
Jerome H. Miller
Ken Miller
John J. Murphy
Thomas F. Schlafly
Jerry A. Viscione
b) Not applicable.
| ITEM 6. | SCHEDULE OF INVESTMENTS. |
Included herein under Item 1.
| ITEM 7. | DISCLOSURE OF PROXY VOTING POLICIES AND PROCEDURES FOR CLOSED-END MANAGEMENT INVESTMENT COMPANIES. |
Not applicable.
| ITEM 8. | PORTFOLIO MANAGERS OF CLOSED-END MANAGEMENT INVESTMENT COMPANIES. |
Not applicable.
| ITEM 9. | PURCHASES OF EQUITY SECURITIES BY CLOSED-END MANAGEMENT INVESTMENT COMPANY AND AFFILIATED PURCHASERS. |
Not applicable.
| ITEM 10. | SUBMISSION OF MATTERS TO A VOTE OF SECURITY HOLDERS. |
Not applicable.
| ITEM 11. | CONTROLS AND PROCEDURES. |
| | (a) | The registrant’s principal executive officer and principal financial officer have concluded that the registrant’s disclosure controls and procedures (as defined in Rule 30a- 3(c) under the Investment Company Act of 1940, as amended (the “1940 Act”)) are effective as of a date within 90 days of the filing date of this report that includes the disclosure required by this paragraph, based on their evaluation of the disclosure controls and procedures required by Rule 30a-3(b) under the 1940 Act and 15d-15(b) under the Securities Exchange Act of 1934. |
| | (b) | There were no changes in the registrant’s internal control over financial reporting (as defined in Rule 30a-3(d) under the 1940 Act) that occurred during the registrant’s last fiscal half-year (the registrant’s second fiscal half-year in the case of an annual report) that have materially affected, or are likely to materially affect the registrant’s internal control over financial reporting. |
(a) (1) Code of Ethics attached hereto.
Exhibit 99.CODE ETH
(a) (2) Certifications pursuant to section 302 of the Sarbanes-Oxley Act of 2002 attached hereto.
Exhibit 99.CERT
(b) Certifications pursuant to Section 906 of the Sarbanes-Oxley Act of 2002 attached hereto.
Exhibit 99.906CERT
SIGNATURES
Pursuant to the requirements of the Securities Exchange Act of 1934 and the Investment Company Act of 1940, the registrant has duly caused this Report to be signed on its behalf by the undersigned, there unto duly authorized.
| | |
| Legg Mason Partners Variable Equity Trust |
| |
| By: | | /S/ R. JAY GERKEN |
| | (R. Jay Gerken) |
| | Chief Executive Officer of |
| | Legg Mason Partners Variable Equity Trust |
|
| Date: February 24, 2011 |
Pursuant to the requirements of the Securities Exchange Act of 1934 and the Investment Company Act of 1940, this report has been signed below by the following persons on behalf of the registrant and in the capacities and on the dates indicated.
| | |
| By: | | /S/ R. JAY GERKEN |
| | (R. Jay Gerken) |
| | Chief Executive Officer of Legg Mason Partners Variable Equity Trust |
|
| Date: February 24, 2011 |
| |
| By: | | /S/ KAPREL OZSOLAK |
| | (Kaprel Ozsolak) |
| | Chief Financial Officer of |
| | Legg Mason Partners Variable Equity Trust |
|
| Date: February 24, 2011 |