UNITED STATES
SECURITIES AND EXCHANGE COMMISSION
Washington, D.C. 20549
FORM N-CSR
CERTIFIED SHAREHOLDER REPORT OF REGISTERED
MANAGEMENT INVESTMENT COMPANIES
Investment Company Act file number 811-21128
Legg Mason Partners Variable Equity Trust
(Exact name of registrant as specified in charter)
55 Water Street, New York, NY 10041
(Address of principal executive offices) (Zip code)
Robert I. Frenkel, Esq.
Legg Mason & Co., LLC
100 First Stamford Place
Stamford, CT 06902
(Name and address of agent for service)
Registrant’s telephone number, including area code: 1-877-721-1926
Date of fiscal year end: December 31
Date of reporting period: December 31, 2010
| ITEM 1. | REPORT TO STOCKHOLDERS. |
The Annual Report to Stockholders is filed herewith.
December 31, 2010

Annual Repor t
Legg Mason
Investment Counsel
Variable
Social
Awareness
Portfolio
INVESTMENT PRODUCTS: NOT FDIC INSURED • NO BANK GUARANTEE • MAY LOSE VALUE
| | |
| II | | Legg Mason Investment Counsel Variable Social Awareness Portfolio |
Portfolio objective
The Portfolio seeks capital appreciation and retention of net investment income.
Dear Shareholder,
We are pleased to provide the annual report of Legg Mason Investment Counsel Variable Social Awareness Portfolio for the twelve-month reporting period ended December 31, 2010. Please read on for a detailed look at prevailing economic and market conditions during the Portfolio’s reporting period and to learn how those conditions have affected Portfolio performance.
As always, we remain committed to providing you with excellent service and a full spectrum of investment choices. We also remain committed to supplementing the support you receive from your financial advisor. One way we accomplish this is through our website, www.leggmason.com/individualinvestors. Here you can gain immediate access to market and investment information, including:
| Ÿ | | Market insights and commentaries from our portfolio managers and |
| Ÿ | | A host of educational resources. |
We look forward to helping you meet your financial goals.
Sincerely,

R. Jay Gerken, CFA
Chairman, President and Chief Executive Officer
February 9, 2011
| | | | |
| Legg Mason Investment Counsel Variable Social Awareness Portfolio | | | III | |
Investment commentary
Economic review
Despite continued headwinds from high unemployment and issues in the housing market, the U.S. economy continued to expand over the twelve months ended December 31, 2010. Toward the end of the reporting period, fears regarding moderating economic growth were replaced with optimism for a strengthening economy in 2011. With investor sentiment improving, U.S. equities moved sharply higher in the fourth quarter, while rising interest rates negatively impacted some sectors of the fixed-income market. All told, during 2010, investors who took on additional risk in their portfolios were generally rewarded.
In September 2010, the National Bureau of Economic Research (“NBER”), the organization charged with determining when recessions start and end, announced that the recession that began in December 2007 had concluded in June 2009. However, the NBER said, “In determining that a trough occurred in June 2009, the committee did not conclude that economic conditions since that month have been favorable or that the economy has returned to operating at normal capacity.” The NBER’s point is well-taken given continued areas of weakness in the U.S. economy.
Although the U.S. Department of Commerce continued to report positive U.S. gross domestic product (“GDP”)i growth, the expansion has moderated since peaking at 5.0% in the fourth quarter of 2009. A slower drawdown in business inventories and renewed consumer spending were contributing factors spurring the economy’s solid growth at the end of 2009. However, the economy grew at a more modest pace in 2010. According to the Commerce Department, GDP growth was 3.7%, 1.7% and 2.6% during the first, second and third quarters of 2010, respectively. The initial estimate for fourth quarter GDP was a 3.2% expansion.
Turning to the job market, while the unemployment rate moved lower in December 2010, it remained elevated throughout the reporting period. While 384,000 new jobs were created during the fourth quarter and the unemployment rate fell from 9.8% in November to 9.4% in December 2010, there continued to be some disturbing trends in the labor market. The unemployment rate has now exceeded 9.0% for twenty consecutive months, the longest period since the government began tracking this data in 1949. In addition, the U.S. Department of Labor reported in December that a total of 14.5 million Americans looking for work have yet to find a job, and 44% of these individuals have been out of work for more than six months.
There was mixed news in the housing market during the period. According to the National Association of Realtors (“NAR”), existing-home sales increased 7.0% and 8.0% in March and April, respectively, after sales had fallen for the period from December 2009 through February 2010. The rebound was largely attributed to people rushing to take advantage of the government’s $8,000 tax credit for first-time home buyers that expired at the end of April. However, with the end of the tax credit, existing-home sales then declined from May through July. Sales then generally rose from August through the end of the year. In total, existing-home sales volume in 2010 was 4.9 million, the lowest amount since 1997. Looking at home prices, the NAR reported that the median existing-home price for all housing types rose a tepid 0.3% in 2010. The inventory of unsold homes was an 8.1 month supply in December at the current sales level, versus a 9.5 month supply in November.
The manufacturing sector was one area of the economy that remained relatively strong during 2010. Based on the Institute for Supply Management’s PMIii, the manufacturing sector has grown seventeen
| | |
| IV | | Legg Mason Investment Counsel Variable Social Awareness Portfolio |
Investment commentary (cont’d)
consecutive months since it began expanding in August 2009. After reaching a six-year peak of 60.4 in April 2010 (a reading below 50 indicates a contraction, whereas a reading above 50 indicates an expansion), PMI data indicated somewhat more modest growth through the remainder of the year. However, in December, the manufacturing sector expanded at its fastest pace in seven months, with a reading of 57.0 versus 56.6 in November.
Financial market overview
The financial markets experienced several periods of volatility during the reporting period that tested the resolve of novice and experienced investors alike. During most of the first four months of the reporting period, the financial markets were largely characterized by healthy investor risk appetite and solid results by stocks and lower-quality bonds. The market then experienced sharp sell-offs in late April and in May, and again beginning in mid-November. During those periods, investors tended to favor the relative safety of U.S. Treasury securities. However, these setbacks proved to be only temporary and, in each case, risk aversion was replaced with solid demand for riskier assets.
Due to signs that certain areas of the economy were moderating in the second half of the reporting period, the Federal Reserve Board (“Fed”)iii took further actions to spur the economy. At its August 10th meeting, the Fed announced an ongoing program that calls for using the proceeds from expiring agency debt and agency mortgage-backed securities to purchase longer-dated Treasury securities.
In addition, the Fed remained cautious throughout the reporting period given pockets of weakness in the economy. At its meeting in September 2010, the Fed said, “The Committee will continue to monitor the economic outlook and financial developments and is prepared to provide
additional accommodation if needed to support the economic recovery. . . .” This led to speculation that the Fed may again move to purchase large amounts of agency and Treasury securities in an attempt to avoid a double-dip recession and ward off deflation.
The Fed then took additional action in early November. Citing that “the pace of recovery in output and employment continues to be slow,” the Fed announced another round of quantitative easing to help stimulate the economy, entailing the purchase of $600 billion of long-term U.S. Treasury securities by the end of the second quarter of 2011. This, coupled with the Fed’s previously announced program to use the proceeds of expiring securities to purchase Treasuries, means it could buy a total of $850 billion to $900 billion of Treasury securities by the end of June 2011. At its final meeting of the year in December, the Fed said it “will regularly review the pace of its securities purchases and the overall size of the asset-purchase program in light of incoming information and will adjust the program as needed to best foster maximum employment and price stability.”
Equity market review
U.S. stock prices, as measured by the S&P 500 Indexiv (the “Index”), moved higher during the twelve months ended December 31, 2010. The reporting period got off to a solid start, with the Index moving higher during three of the first four months covered by this report. The market’s ascent was the result of a number of factors, including optimism regarding the economy, better-than-expected corporate profits and increased investor risk appetite. However, robust investor appetite was replaced with heightened risk aversion in May and June. This was due to the escalating sovereign debt crisis in Europe, uncertainties regarding new financial reforms in the U.S. and some worse-than-expected economic data.
| | | | |
| Legg Mason Investment Counsel Variable Social Awareness Portfolio | | | V | |
After reaching a nineteen-month high on April 23, 2010, the market, as measured by the Index, fell into “correction territory” in May and plunged more than 10%. Despite continued disappointing economic data, strong second quarter corporate profits helped the market to rally in July. The market then declined again in August, given some disappointing economic data. With the Fed indicating the possibility of another round of quantitative easing, stock prices then moved sharply higher in September and October. After posting solid results in early November, the market weakened later in the month as financial troubles in Ireland resulted in a re-emergence of the European sovereign debt crisis. However, investor sentiment was buoyed in December by a two-year extension of the Bush-era tax cuts and the Index gained 6.68% during the month. This represented its strongest month of December since 1991. All told, the Index returned 15.06% over the twelve months ended December 31, 2010.
Fixed-income market review
Continuing the trend that began in the second quarter of 2009, nearly every spread sector (non-Treasury) outperformed equal-durationv Treasuries during most of the first four months of the reporting period. Over that time, investor confidence was high given encouraging economic data, continued low interest rates, benign inflation and rebounding corporate profits. Robust investor appetite was then replaced with heightened risk aversion toward the end of April and during the month of May. This was due to the escalating sovereign debt crisis in Europe, uncertainties regarding new financial reforms in the U.S. and some worse-than-expected economic data. Most spread sectors then produced positive absolute returns in June and July, as investor demand for these securities again increased. There was another bout of risk aversion in August, given fears that the economy may slip back into a recession.
However, due to expectations for additional quantitative easing, most spread sectors rallied in September and October. The spread sectors started to weaken again toward the middle of November as the European sovereign debt crisis again took center stage. While several spread sectors regained their footing in December, others remained weak given ongoing uncertainties in Europe and concerns regarding economic growth in China and its potential impact on the global economy.
Both short- and long-term Treasury yields fluctuated but, overall, moved lower during the twelve months ended December 31, 2010. When the period began, two- and ten-year Treasury yields were 1.14% and 3.85%, respectively. On April 5, 2010, two- and ten-year Treasury yields peaked at 1.18% and 4.01%, respectively. Subsequent to hitting their highs for the period, yields largely declined during much of the next six months, with two-year Treasuries hitting their low for the year of 0.33% on November 4, 2010. Ten-year Treasuries reached their 2010 trough of 2.41% in early October. Yields then moved sharply higher given expectations for stronger growth in 2011 and the potential for rising inflation. When the period ended on December 31, 2010, two-year Treasury yields were 0.61% and ten-year Treasury yields were 3.30%. For the twelve months ended December 31, 2010, the Barclays Capital U.S. Aggregate Indexvi returned 6.54%.
As always, thank you for your confidence in our stewardship of your assets.
Sincerely,
R. Jay Gerken, CFA
Chairman, President and
Chief Executive Officer
January 28, 2011
| | |
| VI | | Legg Mason Investment Counsel Variable Social Awareness Portfolio |
Investment commentary (cont’d)
All investments are subject to risk including the possible loss of principal. Past performance is no guarantee of future results. All index performance
reflects no deduction for fees, expenses or taxes. Please note that an investor cannot invest directly in an index.
| | |
i Gross domestic product (“GDP”) is the market value of all final goods and services produced within a country in a given period of time. ii The Institute for Supply Management's PMI is based on a survey of purchasing executives who buy the raw materials for manufacturing at more than 350 companies. It offers an early reading on the health of the manufacturing sector. iii The Federal Reserve Board ("Fed") is responsible for the formulation of policies designed to promote economic growth, full employment, stable prices and a sustainable pattern of international trade and payments. | | iv The S&P 500 Index is an unmanaged index of 500 stocks and is generally representative of the performance of larger companies in the U.S. v Duration is the measure of the price sensitivity of a fixed-income security to an interest rate change of 100 basis points. Calculation is based on the weighted average of the present values for all cash flows. vi The Barclays Capital U.S. Aggregate Index is a broad-based bond index comprised of government, corporate, mortgage- and asset-backed issues, rated investment grade or higher, and having at least one year to maturity. |
| | | | |
| Legg Mason Investment Counsel Variable Social Awareness Portfolio 2010 Annual Report | | | 1 | |
Portfolio overview
Q. What is the Portfolio’s investment strategy?
A. The Portfolio seeks capital appreciation and retention of net investment income.
The Portfolio invests primarily in common stocks and other equity securities of U.S. companies that we believe are undervalued and have above-average potential for growth. Our rigorous stock selection is based upon proprietary fundamental analysis combined with a top-down approach to portfolio construction. We seek to invest in a broad range of companies, without regard to market capitalization, that exhibit superior characteristics including solid long-term earnings growth, high sustainable profitability, quality management, sound capital structure, strong cash flow and reasonable valuation.
The Portfolio targets a 30% investment (normally between 25% and 35%) in fixed-income securities, primarily investment grade, which may be of any maturity. Our fixed-income strategy utilizes fundamental analysis and an assessment of relative value within the context of current market conditions, expected interest rate movements, changes in the shape of the yield curvei, and fluctuations in sector spreads. We employ a disciplined approach, constantly assessing market conditions in order to identify market anomalies. The Portfolio also may invest up to 25% (and generally invest less than 15%) in foreign securities, including those of issuers in emerging market countries.
For all securities in the Portfolio, we utilize our proprietary social research to determine whether, relative to other companies in their industry, selected companies make a positive contribution to society through their products and services and through the way they conduct business. Specifically, we focus on companies that:
| Ÿ | | Have fair and reasonable employment practices |
| Ÿ | | Contribute to the general well-being of the citizens of their host communities and countries and have respect for human rights |
| Ÿ | | Utilize strategies to minimize the negative impact of business activities on the environment |
| Ÿ | | Do not manufacture nuclear weapons or other weapons of mass destruction or derive more than 5% of their revenue from the production of non-nuclear weaponry |
| Ÿ | | Do not derive more than 5% of their revenue from the production or sale of tobacco products |
Q. What were the overall market conditions during the Portfolio’s reporting period?
A. After the strong results posted in the third quarter of 2010, by both stocks and bonds, the subsequent three months saw a divergence of fortunes. U.S. stocks, as measured by the S&P 500 Indexii, continued their strong advance, gaining 11.29% and 10.76% in the third and fourth quarters, respectively. In contrast, bonds declined during the final three months of the year as the Barclays Capital U.S. Aggregate Indexiii lost 1.30%. For both stocks and bonds, December proved to be an important month as a good bit of either the gain or loss was recorded then. On an annual basis, both of the major asset classes produced strong results with the S&P 500 Index returning 15.06% and the Barclays Capital U.S. Aggregate Index returning 6.54%.
For the first three quarters of 2010, asset returns were driven by macro concerns and an embracing or fleeing by investors from the risks stemming from these issues. For the most part, when risks appeared to be manageable, stocks did well and when the risks increased to a certain point, stocks sold off. Of particular concern was the growing crisis surrounding the potential
| | |
| 2 | | Legg Mason Investment Counsel Variable Social Awareness Portfolio 2010 Annual Report |
Portfolio overview (cont’d)
default by Greece on its government bonds and then, later, fears that the U.S. economy would slip into another recession. In contrast, bonds generally did well in either case as money continued to flow into bond mutual funds. Toward the end of the third quarter, the feeling among equity investors again switched and they were willing to embrace risk. Supporting this attitude was Federal Reserve Board (“Fed”)iv Chairman Bernanke who announced that the central bank was considering another round of buying a significant amount of assets. The goal of such a program would be to stave off any deflationary tendencies in the economy by hopefully fostering a bit of inflation. Possibly of equal importance would be an increase in investor outlook, which would translate into higher stock prices and then more consumption via the wealth effect.
Many economists do not have much hope that this new round of quantitative easing will actually have an effect on the economy. Nevertheless, stock prices began to rise after the idea was broached by Chairman Bernanke. Further support came from the growing perception, which became a reality, that the Republican Party would make significant gains in the mid-term elections. Subsequently, good news came from an upward revision for third quarter U.S. gross domestic product (“GDP”)v. The final piece of the puzzle arrived when the lame duck session of Congress, with the Republican Party leading the charge and President Obama agreeing, was able to craft a compromise extension of the soon-to-sunset Bush-era tax cuts. We had thought that such an agreement was highly unlikely as we could not see how the two sides could find the complementary legislation needed to pay for the extensions. However, in the end, the pay-as-you-go rules were ignored to keep the economy from being hit with a huge fiscal tightening. (We do note that the tax-cut extensions and the payroll tax holiday will increase the deficit and, thus, will
become an issue in the not-so-distant future as Washington is forced to deal with our ballooning national debt.)
Q. How did we respond to these changing market conditions?
A. The equity portion of the portfolio was actively managed during the time period. Actions taken included:
| Ÿ | | Increased exposure to stocks in the Consumer Discretionary and Materials sector. As the economic and market recovery continued, we believed that these sectors would outperform. We also increased exposure to stocks in the Industrials sector during the second and third quarters of the year and took profits in the sector during the fourth quarter. |
| Ÿ | | Reduced exposure to companies in the Health Care sector. During the second quarter of the year, we took profits in the Information Technology (“IT”) sector. |
The fixed-income portion of the portfolio was also actively managed during the time period. Actions taken included:
| Ÿ | | Remained overweighted in the corporate sector as improving (although slowly) economic growth was a positive for credit fundamentals over the year. |
| Ÿ | | Increased exposure to commercial mortgage-backed securities (“CMBS”) as the increased yield offset much of the price declines due to higher U.S. Treasury yields. Limited new issuance should keep demand high as high-quality alternatives offer lower yields. |
| Ÿ | | Remained underweighted in the U.S. Government & Agency Obligations sector which offers little relative value. We anticipate that U.S. Treasury securities will be pressured in the near term as accommodative monetary and fiscal policies produce favorable financial conditions. |
| | | | |
| Legg Mason Investment Counsel Variable Social Awareness Portfolio 2010 Annual Report | | | 3 | |
Performance review
For the twelve months ended December 31, 2010, Legg Mason Investment Counsel Variable Social Awareness Portfolio1 returned 12.15%. The Portfolio’s unmanaged benchmarks, the S&P 500 Index and the Barclays Capital U.S. Aggregate Index, returned 15.06% and 6.54%, respectively, over the same time frame. The Blended S&P 500 Index (70%) and Barclays Capital U.S. Aggregate Index (30%)vi returned 12.92% for the same period. The Lipper Variable Mixed-Asset Target Allocation Growth Funds Category Average2 returned 13.14% over the same time frame.
| | | | | | | | |
| Performance Snapshot as of December 31, 2010 | |
| (unaudited) | | 6 months | | | 12 months | |
| Legg Mason Investment Counsel Variable Social Awareness Portfolio1 | | | 17.24 | % | | | 12.15 | % |
| S&P 500 Index | | | 23.27 | % | | | 15.06 | % |
| Barclays Capital U.S. Aggregate Index | | | 1.15 | % | | | 6.54 | % |
| Blended S&P 500 Index (70%) and Barclays Capital U.S. Aggregate Index (30%) | | | 16.42 | % | | | 12.92 | % |
| Lipper Variable Mixed-Asset Target Allocation Growth Funds Category Average2 | | | 18.35 | % | | | 13.14 | % |
The performance shown represents past performance. Past performance is no guarantee of future results and current performance may be higher or lower than the performance shown above. Principal value and investment returns will fluctuate and investors’ shares, when redeemed, may be worth more or less than their original cost.
Portfolio returns assume the reinvestment of all distributions, including returns of capital, if any,
at net asset value and the deduction of all Portfolio expenses. Performance figures for periods shorter than one year represent cumulative figures and are not annualized.
Performance figures reflect compensating balance arrangements, expense reimbursements and/or fee waivers, without which the performance would have been lower.
Total Annual Operating Expenses (unaudited)
As of the Portfolio’s most current prospectus dated April 30, 2010, the gross total operating expense ratio for the Portfolio was 0.91%.
Actual expenses may be higher. For example, expenses may be higher than those shown if average net assets decrease. Net assets are more likely to decrease and Portfolio expense ratios are more likely to increase when markets are volatile.
Q. What were the leading contributors to performance?
A. In the equity portion of the Portfolio, our stock selection in the IT, Energy, Materials and Utilities sectors contributed to relative performance during the period. In terms of sector positioning, our overweighting in the Telecommunication Services sector and underweighting in the Financials sector also enhanced results. On an individual stock basis, the largest contributors to performance were National-Oilwell Varco Inc., FMC Technologies Inc., Rovi Corp., NetApp Inc. and Apple Inc.
In the fixed-income portion of the Portfolio, our overweighted allocation to the corporate sector, particularly the Financials segment, added value. Also, the addition of CMBS to the Portfolio added to relative performance for the year.
| 1 | The Portfolio is an underlying investment option of various variable annuity and variable life insurance products. The Portfolio’s performance returns do not reflect the deduction of expenses imposed in connection with investing in variable annuity or variable life insurance contracts, such as administrative fees, account charges and surrender charges, which, if reflected, would reduce the performance of the Portfolio. Past performance is no guarantee of future results. |
| 2 | Lipper, Inc., a wholly-owned subsidiary of Reuters, provides independent insight on global collective investments. Returns are based on the period ended December 31, 2010, including the reinvestment of all distributions, including returns of capital, if any, calculated among the 251 funds for the six-month period and among the 245 funds for the twelve-month period in the Portfolio’s Lipper category. |
| | |
| 4 | | Legg Mason Investment Counsel Variable Social Awareness Portfolio 2010 Annual Report |
Portfolio overview (cont’d)
Q. What were the leading detractors from performance?
A. In the equity portion of the Portfolio, our stock selection in the Industrials and Consumer Staples sectors detracted from relative results. In terms of sector positioning, our overweighting in the Utilities and Health Care sectors also detracted from performance. On an individual stock basis, the largest detractors from performance were BP PLC (ADR), Gilead Sciences Inc., Bank of America Corp., Marvell Technology Group Ltd. and Alere Inc.
In the fixed-income portion of the Portfolio, our underweight to U.S. Treasury securities in the spring and our average durationvii (which was less than that of the Barclays Capital U.S. Aggregate Index) hurt performance. However, the significant increase in yields during November and December reversed both of these impacts.
Thank you for your investment in Legg Mason Investment Counsel Variable Social Awareness Portfolio. As always, we appreciate that you have chosen us to manage your assets and we remain focused on achieving the Portfolio’s investment goals.
Sincerely,

Ronald T. Bates
Portfolio Manager (Equity Portion)
Legg Mason Investment Counsel, LLC

David K. Kafes,
CFA Portfolio Manager (Fixed-Income Portion)
Legg Mason Investment Counsel, LLC
January 18, 2011
RISKS: Stock prices are subject to market fluctuations and fixed-income securities are subject to credit and market risks. As interest rates rise, bond prices fall, reducing the value of the Portfolio’s share price. Also, because the Portfolio uses a social awareness criterion, there may be a smaller universe of investments. The Portfolio may use derivatives, such as options and futures, which can be illiquid, may disproportionately increase losses, and have a potentially large impact on Portfolio performance. Please see the Portfolio’s prospectus for a more complete discussion of these and other risks, and the Portfolio’s investment strategies.
Portfolio holdings and breakdowns are as of December 31, 2010 and are subject to change and may not be representative of the portfolio managers’ current or future investments. The Portfolio’s top ten holdings (as a percentage of net assets) as of this date were: National-Oilwell Varco Inc. (2.7%), Target Corp. (2.6%), Express Scripts Inc. (2.6%), Procter & Gamble Co. (2.4%), Apache Corp. (2.4%), PepsiCo Inc. (2.2%), Hess Corp. (2.2%), Celgene Corp. (2.0%), General Mills Inc. (2.0%) and Apple Inc. (1.9%). Please refer to pages 10 through 17 for a list and percentage breakdown of the Portfolio’s holdings.
The mention of sector breakdowns is for informational purposes only and should not be construed as a recommendation to purchase or sell any securities. The information provided regarding such sectors is
not a sufficient basis upon which to make an investment decision. Investors seeking financial advice regarding the appropriateness of investing in any securities or investment strategies discussed should consult their financial professional. The Portfolio’s top five sector holdings (as a percentage of net assets) as of December 31, 2010 were: Information Technology (15.3%), Financials (12.9%), Health Care (10.8%), Energy (10.5%) and Consumer Staples (9.0%). The Portfolio’s composition is subject to change at any time.
All investments are subject to risk including the possible loss of principal. Past performance is no guarantee of future results. All index performance reflects no deduction for fees, expenses or taxes. Please note that an investor cannot invest directly in an index.
The information provided is not intended to be a forecast of future events, a guarantee of future results or investment advice. Views expressed may differ from those of the firm as a whole.
| | | | |
| Legg Mason Investment Counsel Variable Social Awareness Portfolio 2010 Annual Report | | | 5 | |
| | |
i The yield curve is the graphical depiction of the relationship between the yield on bonds of the same credit quality but different maturities. ii The S&P 500 Index is an unmanaged index of 500 stocks and is generally representative of the performance of larger companies in the U.S. iii The Barclays Capital U.S. Aggregate Index is a broad-based bond index comprised of government, corporate, mortgage- and asset-backed issues, rated investment grade or higher, and having at least one year to maturity. iv The Federal Reserve Board ("Fed") is responsible for the formulation of policies designed to promote economic growth, full employment, stable prices and a sustainable pattern of international trade and payments. | | v Gross domestic product ("GDP") is the market value of all final goods and services produced within a country in a given period of time. vi The Blended S&P 500 Index (70%) and Barclays Capital U.S. Aggregate Index (30%) has been prepared by the managers. It consists of 70% of the performance of the S&P 500 Index and 30% of the Barclays Capital U.S. Aggregate Index. vii Duration is the measure of the price sensitivity of a fixed-income security to an interest rate change of 100 basis points. Calculation is based on the weighted average of the present values for all cash flows. |
| | |
| 6 | | Legg Mason Investment Counsel Variable Social Awareness Portfolio 2010 Annual Report |
Portfolio at a glance† (unaudited)
Investment breakdown (%) as a percent of total investments
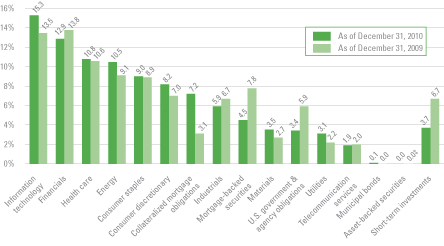
| † | The bar graph above represents the composition of the Portfolio’s investments as of December 31, 2010 and December 31, 2009. The Portfolio is actively managed. As a result, the composition of the Portfolio’s investments is subject to change at any time. |
| ‡ | Represents less than 0.1%. |
| | | | |
| Legg Mason Investment Counsel Variable Social Awareness Portfolio 2010 Annual Report | | | 7 | |
Portfolio expenses (unaudited)
Example
As a shareholder of the Portfolio, you may incur two types of costs: (1) transaction costs and (2) ongoing costs, including management fees and other Portfolio expenses. This example is intended to help you understand your ongoing costs (in dollars) of investing in the Portfolio and to compare these costs with the ongoing costs of investing in other mutual funds.
This example is based on an investment of $1,000 invested on July 1, 2010 and held for the six months ended December 31, 2010.
Actual expenses
The table below titled “Based on Actual Total Return” provides information about actual account values and actual expenses. You may use the information provided in this table, together with the amount you invested, to estimate the expenses that you paid over the period. To estimate the expenses you paid on your account, divide your ending account value by $1,000 (for example, an $8,600 ending account value divided by $1,000 = 8.6), then multiply the result by the number under the heading entitled “Expenses Paid During the Period.”
Hypothetical example for
comparison purposes
The table below titled “Based on Hypothetical Total Return” provides information about hypothetical account values and hypothetical expenses based on the actual expense ratio and an assumed rate of return of 5.00% per year before expenses, which is not the Portfolio’s actual return. The hypothetical account values and expenses may not be used to estimate the actual ending account balance or expenses you paid for the period. You may use the information provided in this table to compare the ongoing costs of investing in the Portfolio and other funds. To do so, compare the 5.00% hypothetical example relating to the Portfolio with the 5.00% hypothetical examples that appear in the shareholder reports of the other funds.
Please note that the expenses shown in the table below are meant to highlight your ongoing costs only and do not reflect any transactional costs. Therefore, the table is useful in comparing ongoing costs only, and will not help you determine the relative total costs of owning different funds. In addition, if these transaction costs were included, your costs would have been higher.
| | | | | | | | | | | | | | | | | | | | | | | | | | | | | | | | | | | | |
| Based on actual total return1 | | | | | Based on hypothetical total return1 | |
Actual
Total
Return2 | | Beginning
Account
Value | | | Ending
Account
Value | | | Annualized
Expense
Ratio | | | Expenses
Paid During
the Period3 | | | | | Hypothetical
Annualized
Total Return | | | Beginning
Account
Value | | Ending
Account
Value | | | Annualized
Expense
Ratio | | | Expenses
Paid During
the Period3 | |
| 17.24% | | $ | 1,000.00 | | | $ | 1,172.40 | | | | 1.00 | % | | $ | 5.48 | | | | | | 5.00 | % | | $1,000.00 | | $ | 1,020.16 | | | | 1.00 | % | | $ | 5.09 | |
| 1 | For the six months ended December 31, 2010. |
| 2 | Assumes the reinvestment of all distributions, including returns of capital, if any, at net asset value. Total return is not annualized, as it may not be representative of the total return for the year. Total return does not reflect expenses associated with separate accounts such as administrative fees, account charges and surrender charges, which, if reflected, would reduce the total return. Performance figures may reflect compensating balance arrangements, fee waivers and/or expense reimbursements. In the absence of compensating balance arrangements, fee waivers and/or expense reimbursements, the total return would have been lower. Past performance is no guarantee of future results. |
| 3 | Expenses (net of compensating balance arrangements, fee waivers and/or expense reimbursements) are equal to the Portfolio’s annualized expense ratio multiplied by the average account value over the period, multiplied by the number of days in the most recent fiscal half-year (184), then divided by 365. |
| | |
| 8 | | Legg Mason Investment Counsel Variable Social Awareness Portfolio 2010 Annual Report |
Portfolio performance (unaudited)
| | | | |
| Average annual total returns1 | | | |
| Twelve Months Ended 12/31/10 | | | 12.15 | % |
| Five Years Ended 12/31/10 | | | 4.24 | |
| Ten Years Ended 12/31/10 | | | 1.09 | |
| | | | |
| Cumulative total return1 | | | |
| 12/31/00 through 12/31/10 | | | 11.45 | % |
All figures represent past performance and are not a guarantee of future results. Investment return and principal value of an investment will fluctuate so that an investor’s shares, when redeemed, may be worth more or less than their original cost. The returns shown do not reflect expenses associated with separate accounts such as administrative fees, account charges and surrender charges, which, if reflected, would reduce the total returns. Performance figures may reflect compensating balance arrangements, fee waivers and/or expense reimbursements. In the absence of compensating balance arrangements, fee waivers and/or expense reimbursements, the total return would have been lower.
| 1 | Assumes the reinvestment of all distributions, including returns of capital, if any, at net asset value. |
| | | | |
| Legg Mason Investment Counsel Variable Social Awareness Portfolio 2010 Annual Report | | | 9 | |
Historical performance
Value of $10,000 invested in
Legg Mason Investment Counsel Variable Social Awareness Portfolio vs. S&P 500 Index, Barclays Capital U.S. Aggregate Index and Blended S&P 500 Index (70%) and Barclays Capital U.S. Aggregate Index (30%)† — December 2000 - December 2010
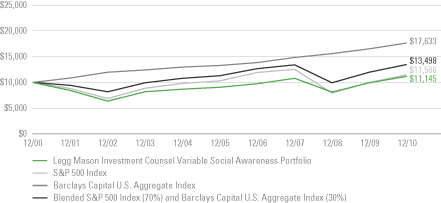
All figures represent past performance and are not a guarantee of future results. Investment return and principal value of an investment will fluctuate so that an investor’s shares, when redeemed, may be worth more or less than their original cost. The returns shown do not reflect expenses associated with separate accounts such as administrative fees, account charges and surrender charges, which, if reflected, would reduce the total returns. Performance figures may reflect compensating balance arrangements, fee waivers and/or expense reimbursements. In the absence of compensating balance arrangements, fee waivers and/or expense reimbursements, the total return would have been lower.
| † | Hypothetical illustration of $10,000 invested in Legg Mason Investment Counsel Variable Social Awareness Portfolio on December 31, 2000, assuming the reinvestment of all distributions, including returns of capital, if any, at net asset value through December 31, 2010. The hypothetical illustration also assumes a $10,000 investment in the S&P 500 Index, the Barclays Capital U.S. Aggregate Index and the Blended S&P 500 Index (70%) and Barclays Capital U.S. Aggregate Index (30%). The S&P 500 Index is an unmanaged index of 500 stocks and is generally representative of the performance of larger companies in the U.S. The Barclays Capital U.S. Aggregate Index is a broad-based bond index comprised of government, corporate, mortgage- and asset-backed issues, rated investment grade or higher, and having at least one year to maturity. The Blended S&P 500 Index (70%) and Barclays Capital U.S. Aggregate Index (30%) has been prepared by the managers. It consists of 70% of the performance of the S&P 500 Index and 30% of the Barclays Capital U.S. Aggregate Index. The Indices are unmanaged and are not subject to the same management and trading expenses as a mutual fund. Please note that an investor cannot invest directly in an index. |
| | |
| 10 | | Legg Mason Investment Counsel Variable Social Awareness Portfolio 2010 Annual Report |
Schedule of investments
December 31, 2010
Legg Mason Investment Counsel Variable Social Awareness Portfolio
| | | | | | | | | | | | | | | | |
| Security | | | | | | | | Shares | | | Value | |
| Common Stocks — 70.8% | | | | | | | | | | | | | | | | |
| Consumer Discretionary — 7.9% | | | | | | | | | | | | | | | | |
Hotels, Restaurants & Leisure —1.4% | | | | | | | | | | | | | | | | |
Yum! Brands Inc. | | | | | | | | | | | 17,660 | | | $ | 866,223 | |
Multiline Retail — 2.7% | | | | | | | | | | | | | | | | |
Target Corp. | | | | | | | | | | | 26,740 | | | | 1,607,876 | |
Specialty Retail — 1.1% | | | | | | | | | | | | | | | | |
Lowe’s Cos. Inc. | | | | | | | | | | | 27,570 | | | | 691,456 | |
Textiles, Apparel & Luxury Goods — 2.7% | | | | | | | | | | | | | | | | |
Coach Inc. | | | | | | | | | | | 13,140 | | | | 726,773 | |
V.F. Corp. | | | | | | | | | | | 10,530 | | | | 907,476 | |
Total Textiles, Apparel & Luxury Goods | | | | | | | | | | | | | | | 1,634,249 | |
Total Consumer Discretionary | | | | | | | | | | | | | | | 4,799,804 | |
| Consumer Staples — 8.4% | | | | | | | | | | | | | | | | |
Beverages — 2.2% | | | | | | | | | | | | | | | | |
PepsiCo Inc. | | | | | | | | | | | 20,310 | | | | 1,326,852 | |
Food & Staples Retailing — 1.2% | | | | | | | | | | | | | | | | |
CVS Caremark Corp. | | | | | | | | | | | 21,280 | | | | 739,906 | |
Food Products — 2.6% | | | | | | | | | | | | | | | | |
Darling International Inc. | | | | | | | | | | | 29,040 | | | | 385,651 | * |
General Mills Inc. | | | | | | | | | | | 33,480 | | | | 1,191,553 | |
Total Food Products | | | | | | | | | | | | | | | 1,577,204 | |
Household Products — 2.4% | | | | | | | | | | | | | | | | |
Procter & Gamble Co. | | | | | | | | | | | 23,037 | | | | 1,481,970 | |
Total Consumer Staples | | | | | | | | | | | | | | | 5,125,932 | |
| Energy — 9.9% | | | | | | | | | | | | | | | | |
Energy Equipment & Services — 5.3% | | | | | | | | | | | | | | | | |
FMC Technologies Inc. | | | | | | | | | | | 12,365 | | | | 1,099,372 | * |
National-Oilwell Varco Inc. | | | | | | | | | | | 24,399 | | | | 1,640,833 | |
Tetra Technology Inc. | | | | | | | | | | | 19,430 | | | | 486,916 | * |
Total Energy Equipment & Services | | | | | | | | | | | | | | | 3,227,121 | |
Oil, Gas & Consumable Fuels — 4.6% | | | | | | | | | | | | | | | | |
Apache Corp. | | | | | | | | | | | 12,200 | | | | 1,454,606 | |
Hess Corp. | | | | | | | | | | | 17,195 | | | | 1,316,105 | |
Total Oil, Gas & Consumable Fuels | | | | | | | | | | | | | | | 2,770,711 | |
Total Energy | | | | | | | | | | | | | | | 5,997,832 | |
See Notes to Financial Statements.
| | | | |
| Legg Mason Investment Counsel Variable Social Awareness Portfolio 2010 Annual Report | | | 11 | |
Legg Mason Investment Counsel Variable Social Awareness Portfolio
| | | | | | | | | | | | | | | | |
| Security | | | | | | | | Shares | | | Value | |
| Financials — 7.4% | | | | | | | | | | | | | | | | |
Capital Markets — 4.1% | | | | | | | | | | | | | | | | |
Affiliated Managers Group Inc. | | | | | | | | | | | 4,990 | | | $ | 495,108 | * |
Charles Schwab Corp. | | | | | | | | | | | 58,240 | | | | 996,486 | |
State Street Corp. | | | | | | | | | | | 21,240 | | | | 984,262 | |
Total Capital Markets | | | | | | | | | | | | | | | 2,475,856 | |
Consumer Finance — 1.5% | | | | | | | | | | | | | | | | |
American Express Co. | | | | | | | | | | | 21,105 | | | | 905,827 | |
Insurance — 1.8% | | | | | | | | | | | | | | | | |
Arch Capital Group Ltd. | | | | | | | | | | | 12,805 | | | | 1,127,480 | * |
Total Financials | | | | | | | | | | | | | | | 4,509,163 | |
| Health Care — 8.8% | | | | | | | | | | | | | | | | |
Biotechnology — 3.7% | | | | | | | | | | | | | | | | |
Celgene Corp. | | | | | | | | | | | 20,420 | | | | 1,207,639 | * |
Gilead Sciences Inc. | | | | | | | | | | | 29,665 | | | | 1,075,060 | * |
Total Biotechnology | | | | | | | | | | | | | | | 2,282,699 | |
Health Care Equipment & Supplies — 2.5% | | | | | | | | | | | | | | | | |
Alere Inc. | | | | | | | | | | | 15,050 | | | | 550,830 | * |
Covidien PLC | | | | | | | | | | | 20,970 | | | | 957,490 | |
Total Health Care Equipment & Supplies | | | | | | | | | | | | | | | 1,508,320 | |
Health Care Providers & Services — 2.6% | | | | | | | | | | | | | | | | |
Express Scripts Inc. | | | | | | | | | | | 29,300 | | | | 1,583,665 | * |
Total Health Care | | | | | | | | | | | | | | | 5,374,684 | |
| Industrials — 5.9% | | | | | | | | | | | | | | | | |
Building Products — 1.0% | | | | | | | | | | | | | | | | |
Masco Corp. | | | | | | | | | | | 48,470 | | | | 613,630 | |
Commercial Services & Supplies — 1.3% | | | | | | | | | | | | | | | | |
Republic Services Inc. | | | | | | | | | | | 26,235 | | | | 783,377 | |
Construction & Engineering — 1.4% | | | | | | | | | | | | | | | | |
Quanta Services Inc. | | | | | | | | | | | 42,780 | | | | 852,177 | * |
Electrical Equipment — 1.3% | | | | | | | | | | | | | | | | |
Emerson Electric Co. | | | | | | | | | | | 14,280 | | | | 816,388 | |
Machinery — 0.9% | | | | | | | | | | | | | | | | |
Deere & Co. | | | | | | | | | | | 6,340 | | | | 526,537 | |
Total Industrials | | | | | | | | | | | | | | | 3,592,109 | |
| Information Technology — 14.4% | | | | | | | | | | | | | | | | |
Communications Equipment — 0.9% | | | | | | | | | | | | | | | | |
Cisco Systems Inc. | | | | | | | | | | | 28,135 | | | | 569,171 | * |
See Notes to Financial Statements.
| | |
| 12 | | Legg Mason Investment Counsel Variable Social Awareness Portfolio 2010 Annual Report |
Schedule of investments (cont’d)
December 31, 2010
Legg Mason Investment Counsel Variable Social Awareness Portfolio
| | | | | | | | | | | | | | | | |
| Security | | | | | | | | Shares | | | Value | |
Computers & Peripherals — 3.2% | | | | | | | | | | | | | | | | |
Apple Inc. | | | | | | | | | | | 3,560 | | | $ | 1,148,314 | * |
NetApp Inc. | | | | | | | | | | | 15,015 | | | | 825,224 | * |
Total Computers & Peripherals | | | | | | | | | | | | | | | 1,973,538 | |
Electronic Equipment, Instruments & Components — 0.8% | | | | | | | | | | | | | | | | |
Corning Inc. | | | | | | | | | | | 24,010 | | | | 463,873 | |
Internet Software & Services — 2.5% | | | | | | | | | | | | | | | | |
eBay Inc. | | | | | | | | | | | 25,425 | | | | 707,578 | * |
Google Inc., Class A Shares | | | | | | | | | | | 1,405 | | | | 834,528 | * |
Total Internet Software & Services | | | | | | | | | | | | | | | 1,542,106 | |
IT Services — 1.6% | | | | | | | | | | | | | | | | |
Accenture PLC, Class A Shares | | | | | | | | | | | 19,760 | | | | 958,162 | |
Semiconductors & Semiconductor Equipment — 2.8% | | | | | | | | | | | | | | | | |
Broadcom Corp., Class A Shares | | | | | | | | | | | 21,070 | | | | 917,598 | |
Marvell Technology Group Ltd. | | | | | | | | | | | 41,810 | | | | 775,576 | * |
Total Semiconductors & Semiconductor Equipment | | | | | | | | | | | | | | | 1,693,174 | |
Software — 2.6% | | | | | | | | | | | | | | | | |
Amdocs Ltd. | | | | | | | | | | | 18,176 | | | | 499,295 | * |
Rovi Corp. | | | | | | | | | | | 17,405 | | | | 1,079,284 | * |
Total Software | | | | | | | | | | | | | | | 1,578,579 | |
Total Information Technology | | | | | | | | | | | | | | | 8,778,603 | |
| Materials — 3.1% | | | | | | | | | | | | | | | | |
Chemicals — 1.9% | | | | | | | | | | | | | | | | |
Air Products & Chemicals Inc. | | | | | | | | | | | 5,410 | | | | 492,040 | |
Potash Corp. of Saskatchewan Inc. | | | | | | | | | | | 4,200 | | | | 650,286 | |
Total Chemicals | | | | | | | | | | | | | | | 1,142,326 | |
Construction Materials — 0.4% | | | | | | | | | | | | | | | | |
Martin Marietta Materials Inc. | | | | | | | | | | | 2,500 | | | | 230,600 | |
Metals & Mining — 0.8% | | | | | | | | | | | | | | | | |
Cliffs Natural Resources Inc. | | | | | | | | | | | 6,840 | | | | 533,588 | |
Total Materials | | | | | | | | | | | | | | | 1,906,514 | |
| Telecommunication Services — 1.9% | | | | | | | | | | | | | | | | |
Wireless Telecommunication Services — 1.9% | | | | | | | | | | | | | | | | |
America Movil SAB de CV, Series L Shares, ADR | | | | | | | | | | | 9,895 | | | | 567,379 | |
American Tower Corp., Class A Shares | | | | | | | | | | | 10,930 | | | | 564,425 | * |
Total Telecommunication Services | | | | | | | | | | | | | | | 1,131,804 | |
| Utilities — 3.1% | | | | | | | | | | | | | | | | |
Electric Utilities — 1.6% | | | | | | | | | | | | | | | | |
Northeast Utilities | | | | | | | | | | | 30,500 | | | | 972,340 | |
See Notes to Financial Statements.
| | | | |
| Legg Mason Investment Counsel Variable Social Awareness Portfolio 2010 Annual Report | | | 13 | |
Legg Mason Investment Counsel Variable Social Awareness Portfolio
| | | | | | | | | | | | | | | | |
| Security | | | | | | | | Shares | | | Value | |
Water Utilities — 1.5% | | | | | | | | | | | | | | | | |
American Water Works Co. Inc. | | | | | | | | | | | 36,400 | | | $ | 920,556 | |
Total Utilities | | | | | | | | | | | | | | | 1,892,896 | |
Total Common Stocks (Cost — $30,958,471) | | | | | | | | | | | | | | | 43,109,341 | |
| | | Rate | | | Maturity
Date | | | Face
Amount | | | | |
| Asset-Backed Securities — 0.0% | | | | | | | | | | | | | | | | |
Honda Auto Receivables Owner Trust, 2008-1 A3 (Cost — $13,572) | | | 4.470 | % | | | 1/18/12 | | | $ | 13,400 | | | | 13,439 | |
| Collateralized Mortgage Obligations — 7.2% | | | | | | | | | |
Banc of America Commercial Mortgage Inc.,
2005-1 A4 | | | 5.060 | % | | | 11/10/42 | | | | 287,000 | | | | 301,034 | (a) |
Banc of America Commercial Mortgage Inc.,
2006-2 A1 | | | 5.611 | % | | | 5/10/45 | | | | 29,274 | | | | 29,405 | |
Banc of America Commercial Mortgage Inc.,
2007-2 A1 | | | 5.421 | % | | | 4/10/49 | | | | 32,813 | | | | 33,527 | |
Bear Stearns Commercial Mortgage Securities,
2003-T12 A3 | | | 4.240 | % | | | 8/13/39 | | | | 100,805 | | | | 102,403 | (a) |
Bear Stearns Commercial Mortgage Securities,
2005-T20 A2 | | | 5.127 | % | | | 10/12/42 | | | | 183,365 | | | | 185,260 | (a) |
Commercial Mortgage Pass-Through Certificates,
2004-LB3A A2 | | | 4.713 | % | | | 7/10/37 | | | | 33,040 | | | | 33,169 | |
Credit Suisse First Boston Mortgage Securities Corp., 2001-CF2 A4 | | | 6.505 | % | | | 2/15/34 | | | | 17,051 | | | | 17,043 | |
Federal Home Loan Bank (FHLB), 00-0606 Y | | | 5.270 | % | | | 12/28/12 | | | | 434,710 | | | | 460,639 | |
Federal Home Loan Mortgage Corp. (FHLMC), 2837 ED | | | 5.000 | % | | | 8/15/19 | | | | 44,274 | | | | 46,833 | |
First Union National Bank Commercial Mortgage,
2002-C1 A2 | | | 6.141 | % | | | 2/12/34 | | | | 126,393 | | | | 131,054 | |
GMAC Commercial Mortgage Securities Inc.,
2004-C2 A2 | | | 4.760 | % | | | 8/10/38 | | | | 259,932 | | | | 262,511 | |
Government National Mortgage Association (GNMA),
2009-22 AG | | | 4.000 | % | | | 10/16/32 | | | | 476,436 | | | | 501,875 | |
Government National Mortgage Association (GNMA),
2009-46 G | | | 4.500 | % | | | 9/20/34 | | | | 515,151 | | | | 545,440 | |
Government National Mortgage Association (GNMA),
2009-93 PB | | | 3.000 | % | | | 12/16/38 | | | | 540,166 | | | | 555,673 | |
Government National Mortgage Association (GNMA),
2010-56 BA | | | 4.500 | % | | | 2/20/36 | | | | 506,862 | | | | 537,128 | |
JPMorgan Chase Commercial Mortgage Securities Corp., 2004-C1 A2 | | | 4.302 | % | | | 1/15/38 | | | | 109,622 | | | | 111,720 | |
JPMorgan Chase Commercial Mortgage Securities Corp., 2005-CB11 ASB | | | 5.201 | % | | | 8/12/37 | | | | 141,324 | | | | 148,092 | (a) |
LB-UBS Commercial Mortgage Trust, 2005-C2 A3 | | | 4.912 | % | | | 4/15/30 | | | | 184,000 | | | | 184,942 | |
See Notes to Financial Statements.
| | |
| 14 | | Legg Mason Investment Counsel Variable Social Awareness Portfolio 2010 Annual Report |
Schedule of investments (cont’d)
December 31, 2010
Legg Mason Investment Counsel Variable Social Awareness Portfolio
| | | | | | | | | | | | | | | | |
| Security | | Rate | | | Maturity
Date | | | Face
Amount | | | Value | |
| Collateralized Mortgage Obligations — continued | | | | | | | | | |
Morgan Stanley Dean Witter Capital I Inc.,
2001-TOP3 A4 | | | 6.390 | % | | | 7/15/33 | | | $ | 97,200 | | | $ | 98,619 | |
TIAA Seasoned Commercial Mortgage Trust,
2007-C4 A1 | | | 5.646 | % | | | 8/15/39 | | | | 95,796 | | | | 97,571 | (a) |
Total Collateralized Mortgage Obligations (Cost — $4,342,733) | | | | 4,383,938 | |
| Corporate Bonds & Notes — 10.2% | | | | | | | | | | | | | | | | |
| Consumer Discretionary — 0.3% | | | | | | | | | | | | | | | | |
Media — 0.3% | | | | | | | | | | | | | | | | |
Comcast Corp., Senior Notes | | | 5.650 | % | | | 6/15/35 | | | | 200,000 | | | | 194,926 | |
| Consumer Staples — 0.6% | | | | | | | | | | | | | | | | |
Beverages — 0.6% | | | | | | | | | | | | | | | | |
Anheuser-Busch InBev Worldwide Inc., Senior Notes | | | 2.500 | % | | | 3/26/13 | | | | 95,000 | | | | 97,266 | |
PepsiCo Inc., Senior Notes | | | 5.000 | % | | | 6/1/18 | | | | 245,000 | | | | 270,877 | |
Total Consumer Staples | | | | | | | | | | | | | | | 368,143 | |
| Energy — 0.6% | | | | | | | | | | | | | | | | |
Oil, Gas & Consumable Fuels — 0.6% | | | | | | | | | | | | | | | | |
Apache Corp., Senior Notes | | | 5.250 | % | | | 4/15/13 | | | | 275,000 | | | | 299,386 | |
Statoil ASA, Senior Notes | | | 3.125 | % | | | 8/17/17 | | | | 70,000 | | | | 69,420 | |
Total Energy | | | | | | | | | | | | | | | 368,806 | |
| Financials — 5.5% | | | | | | | | | | | | | | | | |
Capital Markets — 0.7% | | | | | | | | | | | | | | | | |
BlackRock Inc., Senior Notes | | | 3.500 | % | | | 12/10/14 | | | | 160,000 | | | | 166,075 | |
Goldman Sachs Group Inc., Senior Notes | | | 5.700 | % | | | 9/1/12 | | | | 243,000 | | | | 259,471 | |
Total Capital Markets | | | | | | | | | | | | | | | 425,546 | |
Commercial Banks — 1.3% | | | | | | | | | | | | | | | | |
Bank of Nova Scotia, Senior Notes | | | 2.250 | % | | | 1/22/13 | | | | 35,000 | | | | 35,655 | |
Bank of Nova Scotia, Senior Notes | | | 2.375 | % | | | 12/17/13 | | | | 110,000 | | | | 113,411 | |
Bank of Nova Scotia, Senior Notes | | | 2.050 | % | | | 10/7/15 | | | | 100,000 | | | | 97,658 | |
Barclays Bank PLC, Senior Notes | | | 5.000 | % | | | 9/22/16 | | | | 170,000 | | | | 180,118 | |
Rabobank Nederland NV, Senior Notes | | | 2.125 | % | | | 10/13/15 | | | | 170,000 | | | | 164,593 | |
Westpac Banking Corp., Senior Notes | | | 4.200 | % | | | 2/27/15 | | | | 175,000 | | | | 183,846 | |
Total Commercial Banks | | | | | | | | | | | | | | | 775,281 | |
Consumer Finance — 1.9% | | | | | | | | | | | | | | | | |
HSBC Finance Corp., Notes | | | 6.375 | % | | | 10/15/11 | | | | 325,000 | | | | 338,880 | |
SLM Corp., Medium-Term Notes, Senior Notes | | | 5.000 | % | | | 10/1/13 | | | | 800,000 | | | | 802,577 | |
Total Consumer Finance | | | | | | | | | | | | | | | 1,141,457 | |
See Notes to Financial Statements.
| | | | |
| Legg Mason Investment Counsel Variable Social Awareness Portfolio 2010 Annual Report | | | 15 | |
Legg Mason Investment Counsel Variable Social Awareness Portfolio
| | | | | | | | | | | | | | | | |
| Security | | Rate | | | Maturity
Date | | | Face
Amount | | | Value | |
Diversified Financial Services — 1.2% | | | | | | | | | | | | | | | | |
Bank of America Corp., Senior Notes | | | 5.625 | % | | | 10/14/16 | | | $ | 250,000 | | | $ | 259,519 | |
IBM International Group Capital LLC, Senior Notes | | | 5.050 | % | | | 10/22/12 | | | | 225,000 | | | | 241,983 | |
National Rural Utilities Cooperative Finance Corp., Medium-Term Notes | | | 8.000 | % | | | 3/1/32 | | | | 200,000 | | | | 253,897 | |
Total Diversified Financial Services | | | | | | | | | | | | | | | 755,399 | |
Insurance — 0.3% | | | | | | | | | | | | | | | | |
Genworth Financial Inc., Senior Notes | | | 6.500 | % | | | 6/15/34 | | | | 200,000 | | | | 183,415 | |
Real Estate Investment Trusts (REITs) — 0.1% | | | | | | | | | | | | | | | | |
Simon Property Group LP, Senior Notes | | | 4.200 | % | | | 2/1/15 | | | | 40,000 | | | | 41,864 | |
Total Financials | | | | | | | | | | | | | | | 3,322,962 | |
| Health Care — 2.0% | | | | | | | | | | | | | | | | |
Health Care Equipment & Supplies — 0.2% | | | | | | | | | | | | | | | | |
Medtronic Inc., Senior Notes | | | 3.000 | % | | | 3/15/15 | | | | 70,000 | | | | 71,904 | |
Stryker Corp., Senior Notes | | | 3.000 | % | | | 1/15/15 | | | | 65,000 | | | | 66,475 | |
Total Health Care Equipment & Supplies | | | | | | | | | | | | | | | 138,379 | |
Pharmaceuticals — 1.8% | | | | | | | | | | | | | | | | |
Abbott Laboratories, Senior Notes | | | 5.600 | % | | | 11/30/17 | | | | 225,000 | | | | 257,618 | |
AstraZeneca PLC, Senior Notes | | | 5.400 | % | | | 9/15/12 | | | | 275,000 | | | | 296,667 | |
Merck & Co. Inc., Senior Notes | | | 4.000 | % | | | 6/30/15 | | | | 130,000 | | | | 139,621 | |
Novartis Capital Corp., Senior Notes | | | 4.125 | % | | | 2/10/14 | | | | 185,000 | | | | 197,575 | |
Wyeth, Notes | | | 5.500 | % | | | 2/15/16 | | | | 165,000 | | | | 186,870 | |
Total Pharmaceuticals | | | | | | | | | | | | | | | 1,078,351 | |
Total Health Care | | | | | | | | | | | | | | | 1,216,730 | |
| Information Technology — 0.9% | | | | | | | | | | | | | | | | |
Computers & Peripherals — 0.3% | | | | | | | | | | | | | | | | |
Hewlett-Packard Co., Senior Notes | | | 4.250 | % | | | 2/24/12 | | | | 160,000 | | | | 166,318 | |
Internet Software & Services — 0.2% | | | | | | | | | | | | | | | | |
eBay Inc., Senior Notes | | | 1.625 | % | | | 10/15/15 | | | | 125,000 | | | | 120,077 | |
Software — 0.4% | | | | | | | | | | | | | | | | |
Microsoft Corp., Senior Notes | | | 2.950 | % | | | 6/1/14 | | | | 80,000 | | | | 83,346 | |
Microsoft Corp., Senior Notes | | | 1.625 | % | | | 9/25/15 | | | | 160,000 | | | | 156,212 | |
Total Software | | | | | | | | | | | | | | | 239,558 | |
Total Information Technology | | | | | | | | | | | | | | | 525,953 | |
| Materials — 0.3% | | | | | | | | | | | | | | | | |
Chemicals — 0.3% | | | | | | | | | | | | | | | | |
Potash Corp. of Saskatchewan Inc., Senior Notes | | | 5.875 | % | | | 12/1/36 | | | | 200,000 | | | | 207,572 | |
Total Corporate Bonds & Notes (Cost — $5,955,576) | | | | | | | | | | | | | | | 6,205,092 | |
See Notes to Financial Statements.
| | |
| 16 | | Legg Mason Investment Counsel Variable Social Awareness Portfolio 2010 Annual Report |
Schedule of investments (cont’d)
December 31, 2010
Legg Mason Investment Counsel Variable Social Awareness Portfolio
| | | | | | | | | | | | | | | | |
| Security | | Rate | | | Maturity
Date | | | Face
Amount | | | Value | |
| Mortgage-Backed Securities — 4.5% | | | | | | | | | | | | | | | | |
FHLMC — 1.8% | | | | | | | | | | | | | | | | |
Federal Home Loan Mortgage Corp. (FHLMC) | | | 6.000 | % | | | 9/1/37 | | | $ | 232,945 | | | $ | 253,202 | |
Federal Home Loan Mortgage Corp. (FHLMC), Gold | | | 5.000 | % | | | 7/1/35-6/1/36 | | | | 749,014 | | | | 788,722 | |
Federal Home Loan Mortgage Corp. (FHLMC), Gold | | | 7.500 | % | | | 8/1/36 | | | | 12,790 | | | | 14,574 | |
Total FHLMC | | | | | | | | | | | | | | | 1,056,498 | |
FNMA — 2.7% | | | | | | | | | | | | | | | | |
Federal National Mortgage Association (FNMA) | | | 5.000 | % | | | 5/1/18 | | | | 206,716 | | | | 221,121 | |
Federal National Mortgage Association (FNMA) | | | 6.000 | % | | | 6/1/22-9/1/37 | | | | 382,600 | | | | 416,437 | |
Federal National Mortgage Association (FNMA) | | | 5.500 | % | | | 1/1/24-6/1/36 | | | | 810,053 | | | | 869,665 | |
Federal National Mortgage Association (FNMA) | | | 6.500 | % | | | 2/1/37 | | | | 132,602 | | | | 147,878 | |
Total FNMA | | | | | | | | | | | | | | | 1,655,101 | |
Total Mortgage-Backed Securities (Cost — $2,479,595) | | | | | | | | | | | | 2,711,599 | |
| Municipal Bonds — 0.1% | | | | | | | | | | | | | | | | |
Maryland — 0.1% | | | | | | | | | | | | | | | | |
Baltimore, MD, Revenue, Parking System Facilities | | | 2.904 | % | | | 7/1/13 | | | | 40,000 | | | | 39,709 | |
Baltimore, MD, Revenue, Parking System Facilities | | | 3.387 | % | | | 7/1/14 | | | | 40,000 | | | | 39,452 | |
Total Municipal Bonds (Cost — $79,980) | | | | | | | | | | | | | | | 79,161 | |
| U.S. Government & Agency Obligations — 3.4% | | | | | | | | | | | | | | | | |
U.S. Government Agencies — 1.0% | | | | | | | | | | | | | | | | |
Federal Home Loan Mortgage Corp. (FHLMC), Notes | | | 4.500 | % | | | 2/25/20 | | | | 157,000 | | | | 157,878 | |
Federal National Mortgage Association (FNMA), Bonds | | | 6.625 | % | | | 11/15/30 | | | | 365,000 | | | | 461,932 | |
Total U.S. Government Agencies | | | | | | | | | | | | | | | 619,810 | |
U.S. Government Obligations — 2.4% | | | | | | | | | | | | | | | | |
U.S. Treasury Bonds | | | 3.500 | % | | | 2/15/39 | | | | 466,000 | | | | 401,634 | |
U.S. Treasury Bonds | | | 4.375 | % | | | 11/15/39 | | | | 620,000 | | | | 623,391 | |
U.S. Treasury Notes | | | 2.250 | % | | | 11/30/17 | | | | 73,000 | | | | 70,998 | |
U.S. Treasury Notes | | | 3.625 | % | | | 2/15/20 | | | | 71,000 | | | | 73,696 | |
U.S. Treasury Notes | | | 2.625 | % | | | 8/15/20 | | | | 303,000 | | | | 287,305 | |
Total U.S. Government Obligations | | | | | | | | | | | | | | | 1,457,024 | |
Total U.S. Government & Agency Obligations (Cost — $2,068,628) | | | | | | | | 2,076,834 | |
Total Investments before Short-Term Investments (Cost — $45,898,555) | | | | | | | | 58,579,404 | |
See Notes to Financial Statements.
| | | | |
| Legg Mason Investment Counsel Variable Social Awareness Portfolio 2010 Annual Report | | | 17 | |
Legg Mason Investment Counsel Variable Social Awareness Portfolio
| | | | | | | | | | | | | | | | |
| Security | | Rate | | | Maturity
Date | | | Face
Amount | | | Value | |
| Short-Term Investments — 3.8% | | | | | | | | | | | | | | | | |
Repurchase Agreements — 3.8% | | | | | | | | | | | | | | | | |
Goldman Sachs & Co., repurchase agreement dated 12/31/10; Proceeds at maturity — $2,273,226; (Fully collateralized by U.S. government agency obligations, 0.180% due 11/9/11; Market value — $2,323,927) (Cost — $2,273,201) | | | 0.130 | % | | | 1/3/11 | | | $ | 2,273,201 | | | $ | 2,273,201 | |
Total Investments — 100.0% (Cost — $48,171,756#) | | | | | | | | | | | | | | | 60,852,605 | |
Other Assets in Excess of Liabilities — 0.0% | | | | | | | | | | | | | | | 12,845 | |
Total Net Assets — 100.0% | | | | | | | | | | | | | | $ | 60,865,450 | |
| * | Non-income producing security. |
| (a) | Variable rate security. Interest rate disclosed is that which is in effect at December 31, 2010. |
| # | Aggregate cost for federal income tax purposes is $48,445,180. |
| | |
Abbreviation used in this schedule: |
| ADR | | — American Depositary Receipt |
See Notes to Financial Statements.
| | |
| 18 | | Legg Mason Investment Counsel Variable Social Awareness Portfolio 2010 Annual Report |
Statement of assets and liabilities
December 31, 2010
| | | | |
| |
| Assets: | | | | |
Investments, at value (Cost — $48,171,756) | | $ | 60,852,605 | |
Dividends and interest receivable | | | 131,562 | |
Receivable for Portfolio shares sold | | | 6,345 | |
Prepaid expenses | | | 1,366 | |
Total Assets | | | 60,991,878 | |
| |
| Liabilities: | | | | |
Investment management fee payable | | | 44,284 | |
Trustees’ fees payable | | | 257 | |
Payable for Portfolio shares repurchased | | | 44 | |
Accrued expenses | | | 81,843 | |
Total Liabilities | | | 126,428 | |
| Total Net Assets | | $ | 60,865,450 | |
| |
| Net Assets: | | | | |
Par value (Note 5) | | $ | 25 | |
Paid-in capital in excess of par value | | | 58,006,102 | |
Overdistributed net investment income | | | (70,505) | |
Accumulated net realized loss on investments | | | (9,751,021) | |
Net unrealized appreciation on investments | | | 12,680,849 | |
| Total Net Assets | | $ | 60,865,450 | |
| |
| Shares Outstanding | | | 2,494,879 | |
| |
| Net Asset Value | | | $24.40 | |
See Notes to Financial Statements.
| | | | |
| Legg Mason Investment Counsel Variable Social Awareness Portfolio 2010 Annual Report | | | 19 | |
Statement of operations
For the Year Ended December 31, 2010
| | | | |
| |
| Investment Income: | | | | |
Interest | | $ | 716,264 | |
Dividends | | | 574,125 | |
Less: Foreign taxes withheld | | | (252) | |
Total Investment Income | | | 1,290,137 | |
| |
| Expenses: | | | | |
Investment management fee (Note 2) | | | 423,814 | |
Shareholder reports | | | 70,380 | |
Legal fees | | | 60,972 | |
Audit and tax | | | 25,889 | |
Transfer agent fees | | | 6,639 | |
Trustees’ fees | | | 5,347 | |
Insurance | | | 2,518 | |
Custody fees | | | 1,040 | |
Miscellaneous expenses | | | 622 | |
Total Expenses | | | 597,221 | |
Less: Fee waivers and/or expense reimbursements (Note 2) | | | (5,772) | |
Compensating balance arrangements (Note 1) | | | (188) | |
Net Expenses | | | 591,261 | |
| Net Investment Income | | | 698,876 | |
| |
| Realized and Unrealized Gain on Investments (Notes 1 and 3): | | | | |
Net Realized Gain From Investment Transactions | | | 655,566 | |
Change in Net Unrealized Appreciation (Depreciation) From Investments | | | 5,485,899 | |
| Net Gain on Investments | | | 6,141,465 | |
| Increase in Net Assets From Operations | | $ | 6,840,341 | |
See Notes to Financial Statements.
| | |
| 20 | | Legg Mason Investment Counsel Variable Social Awareness Portfolio 2010 Annual Report |
Statements of changes in net assets
| | | | | | | | | | | | |
For the Year Ended December 31, 2010, the Period Ended
December 31, 2009 and the Year Ended October 31, 2009 | | 2010 | | | 2009† | | | 2009 | |
| | | |
| Operations: | | | | | | | | | | | | |
Net investment income | | $ | 698,876 | | | $ | 173,411 | | | $ | 1,059,830 | |
Net realized gain (loss) | | | 655,566 | | | | (28,980) | | | | (4,090,202) | |
Change in net unrealized appreciation (depreciation) | | | 5,485,899 | | | | 3,500,952 | | | | 10,455,173 | |
Increase in Net Assets From Operations | | | 6,840,341 | | | | 3,645,383 | | | | 7,424,801 | |
| | | |
| Distributions to Shareholders from (Note 1): | | | | | | | | | | | | |
Net investment income | | | (785,004) | | | | (875,003) | | | | (1,400,001) | �� |
Decrease in Net Assets from Distributions to Shareholders | | | (785,004) | | | | (875,003) | | | | (1,400,001) | |
| | | |
| Portfolio Share Transactions (Note 5): | | | | | | | | | | | | |
Net proceeds from sale of shares | | | 378,638 | | | | 236,172 | | | | 438,050 | |
Reinvestment of distributions | | | 785,004 | | | | 875,003 | | | | 1,400,001 | |
Cost of shares repurchased | | | (10,347,880) | | | | (996,925) | | | | (7,815,129) | |
Increase (Decrease) in Net Assets From Portfolio Share Transactions | | | (9,184,238) | | | | 114,250 | | | | (5,977,078) | |
Increase (Decrease) in Net Assets | | | (3,128,901) | | | | 2,884,630 | | | | 47,722 | |
| | | |
| Net Assets: | | | | | | | | | | | | |
Beginning of year | | | 63,994,351 | | | | 61,109,721 | | | | 61,061,999 | |
End of year* | | $ | 60,865,450 | | | $ | 63,994,351 | | | $ | 61,109,721 | |
* Includes undistributed (overdistributed) net investment income of: | | | $(70,505) | | | | $(98,845) | | | | $600,130 | |
| † | For the period November 1, 2009 through December 31, 2009. |
See Notes to Financial Statements.
| | | | |
| Legg Mason Investment Counsel Variable Social Awareness Portfolio 2010 Annual Report | | | 21 | |
Financial highlights
| | | | | | | | | | | | | | | | | | | | | | | | |
| For a share of beneficial interest outstanding throughout each year ended December 31, unless otherwise noted: | |
| | | 2010† | | | 20091 | | | 20092 | | | 20082 | | | 20072 | | | 20062,3 | |
| | | | | | |
| Net asset value, beginning of year | | | $22.04 | | | | $21.08 | | | | $18.92 | | | | $30.39 | | | | $26.45 | | | | $24.58 | |
| | | | | | |
| Income (loss) from operations: | | | | | | | | | | | | | | | | | | | | | | | | |
Net investment income | | | 0.26 | | | | 0.06 | | | | 0.36 | | | | 0.42 | | | | 0.32 | | | | 0.15 | |
Net realized and unrealized gain (loss) | | | 2.42 | | | | 1.20 | | | | 2.24 | | | | (6.86) | | | | 3.76 | | | | 1.90 | |
Total income (loss) from operations | | | 2.68 | | | | 1.26 | | | | 2.60 | | | | (6.44) | | | | 4.08 | | | | 2.05 | |
| | | | | | |
| Less distributions from: | | | | | | | | | | | | | | | | | | | | | | | | |
Net investment income | | | (0.32) | | | | (0.30) | | | | (0.44) | | | | (0.40) | | | | (0.14) | | | | (0.18) | |
Net realized gains | | | — | | | | — | | | | — | | | | (4.63) | | | | — | | | | — | |
Total distributions | | | (0.32) | | | | (0.30) | | | | (0.44) | | | | (5.03) | | | | (0.14) | | | | (0.18) | |
| | | | | | |
| Net asset value, end of year | | | $24.40 | | | | $22.04 | | | | $21.08 | | | | $18.92 | | | | $30.39 | | | | $26.45 | |
Total return, based on NAV4 | | | 12.15 | %5 | | | 6.00 | %5 | | | 14.17 | % | | | (25.22) | % | | | 15.48 | % | | | 8.36 | % |
| | | | | | |
| Net assets, end of year (000s) | | | $60,865 | | | | $63,994 | | | | $61,110 | | | | $61,062 | | | | $92,103 | | | | $87,831 | |
| | | | | | |
| Ratios to average net assets: | | | | | | | | | | | | | | | | | | | | | | | | |
Gross expenses | | | 0.97 | % | | | 1.29 | %6 | | | 0.88 | % | | | 1.03 | % | | | 0.84 | %7 | | | 0.80 | % |
Net expenses8,9 | | | 0.96 | 10 | | | 0.99 | 6,10 | | | 0.88 | | | | 0.93 | 10 | | | 0.82 | 7,10 | | | 0.79 | 10 |
Net investment income | | | 1.14 | | | | 1.64 | 6 | | | 1.86 | | | | 1.62 | | | | 1.13 | | | | 0.56 | |
| | | | | | |
| Portfolio turnover rate | | | 30 | % | | | 4 | % | | | 30 | % | | | 42 | % | | | 122 | % | | | 13 | % |
| † | Per share amounts have been calculated using the average shares method. |
| 1 | For the period November 1, 2009 through December 31, 2009. |
| 2 | For the year ended October 31. |
| 3 | Represents a share of capital stock outstanding prior to April 30, 2007. |
| 4 | Performance figures may reflect compensating balance arrangements, fee waivers and/or expense reimbursements. In the absence of compensating balance arrangements, fee waivers and/or expense reimbursements, the total return would have been lower. Total returns do not reflect expenses associated with separate accounts such as administrative fees, account charges and surrender charges which, if reflected, would reduce the total return for all periods shown. Past performance is no guarantee of future results. Total returns for period of less than one year are not annualized. |
| 5 | The total return includes gains from settlement of security litigations. Without these gains, the total return would have been 12.01% and 5.95% for the year ended December 31, 2010 and the period ended December 31, 2009, respectively. |
| 7 | Included in the expense ratios are certain non-recurring restructuring (and reorganization, if applicable) fees that were incurred by the Portfolio during the period. Without these fees, the gross and net expense ratios would have been 0.83% and 0.81%, respectively. |
| 8 | As a result of an expense limitation arrangement, the ratio of expenses, other than brokerage, interest, taxes, extraordinary expenses and acquired fund fees and expenses, to average net assets of the Portfolio did not exceed 1.00%. This expense limitation arrangement cannot be terminated prior to December 31, 2012 without the Board of Trustees’ consent. Prior to April 30, 2007, the expense limitation was 1.25%. |
| 9 | The impact of compensating balance arrangements, if any, was less than 0.01%. |
| 10 | Reflects fee waivers and/or expense reimbursements. |
See Notes to Financial Statements.
| | |
| 22 | | Legg Mason Investment Counsel Variable Social Awareness Portfolio 2010 Annual Report |
Notes to financial statements
1. Organization and significant accounting policies
Legg Mason Investment Counsel Variable Social Awareness Portfolio (the “Portfolio”) is a separate diversified investment series of Legg Mason Partners Variable Equity Trust (the “Trust”). The Trust, a Maryland statutory trust, is registered under the Investment Company Act of 1940, as amended (the “1940 Act”), as an open-end management investment company.
Shares of the Portfolio may only be purchased or redeemed through variable annuity contracts and variable life insurance policies offered by the separate accounts of participating insurance companies or through eligible pension or other qualified plans.
The following are significant accounting policies consistently followed by the Portfolio and are in conformity with U.S. generally accepted accounting principles (“GAAP”). Estimates and assumptions are required to be made regarding assets, liabilities and changes in net assets resulting from operations when financial statements are prepared. Changes in the economic environment, financial markets and any other parameters used in determining these estimates could cause actual results to differ. Subsequent events have been evaluated through the date the financial statements were issued.
(a) Investment valuation. Equity securities for which market quotations are available are valued at the last reported sales price or official closing price on the primary market or exchange on which they trade. Debt securities are valued at the mean between the last quoted bid and asked prices provided by an independent pricing service that are based on transactions in debt obligations, quotations from bond dealers, market transactions in comparable securities and various other relationships between securities. When reliable prices are not readily available, such as when the value of a security has been significantly affected by events after the close of the exchange or market on which the security is principally traded, but before the Portfolio calculates its net asset value, the Portfolio values these securities as determined in accordance with procedures approved by the Portfolio’s Board of Trustees. Short-term obligations with maturities of 60 days or less are valued at amortized cost, which approximates fair value.
The Portfolio has adopted Financial Accounting Standards Board Codification Topic 820 (“ASC Topic 820”). ASC Topic 820 establishes a single definition of fair value, creates a three-tier hierarchy as a framework for measuring fair value based on inputs used to value the Portfolio’s investments, and requires additional disclosure about fair value. The hierarchy of inputs is summarized below.
| Ÿ | | Level 1 — quoted prices in active markets for identical investments |
| Ÿ | | Level 2 — other significant observable inputs (including quoted prices for similar investments, interest rates, prepayment speeds, credit risk, etc.) |
| Ÿ | | Level 3 — significant unobservable inputs (including the Portfolio’s own assumptions in determining the fair value of investments) |
The inputs or methodology used for valuing securities are not necessarily an indication of the risk associated with investing in those securities.
| | | | |
| Legg Mason Investment Counsel Variable Social Awareness Portfolio 2010 Annual Report | | | 23 | |
The Portfolio uses valuation techniques to measure fair value that are consistent with the market approach and/or income approach, depending on the type of security and the particular circumstance. The market approach uses prices and other relevant information generated by market transactions involving identical or comparable securities. The income approach uses valuation techniques to discount estimated future cash flows to present value.
The following is a summary of the inputs used in valuing the Portfolio’s assets carried at fair value:
| | | | | | | | | | | | | | | | |
| ASSETS | |
| Description | | Quoted Prices
(Level 1) | | | Other Significant
Observable Inputs
(Level 2) | | | Significant
Unobservable
Inputs
(Level 3) | | | Total | |
| Long-term investments†: | | | | | | | | | | | | | | | | |
Common stocks | | $ | 43,109,341 | | | | — | | | | — | | | $ | 43,109,341 | |
Asset-backed securities | | | — | | | $ | 13,439 | | | | — | | | | 13,439 | |
Collateralized mortgage obligations | | | — | | | | 4,383,938 | | | | — | | | | 4,383,938 | |
Corporate bonds & notes | | | — | | | | 6,205,092 | | | | — | | | | 6,205,092 | |
Mortgage-backed securities | | | — | | | | 2,711,599 | | | | — | | | | 2,711,599 | |
Municipal bonds | | | — | | | | 79,161 | | | | — | | | | 79,161 | |
U.S. government & agency obligations | | | — | | | | 2,076,834 | | | | — | | | | 2,076,834 | |
| Total long-term investments | | $ | 43,109,341 | | | $ | 15,470,063 | | | | — | | | $ | 58,579,404 | |
| Short-term investments† | | | — | | | | 2,273,201 | | | | — | | | | 2,273,201 | |
| Total investments | | $ | 43,109,341 | | | $ | 17,743,264 | | | | — | | | $ | 60,852,605 | |
| † | See Schedule of Investments for additional detailed categorizations. |
(b) Repurchase agreements. The Portfolio may enter into repurchase agreements with institutions that its investment adviser has determined are creditworthy. Each repurchase agreement is recorded at cost. Under the terms of a typical repurchase agreement, the Portfolio acquires a debt security subject to an obligation of the seller to repurchase, and of the Portfolio to resell, the security at an agreed-upon price and time, thereby determining the yield during the Portfolio’s holding period. When entering into repurchase agreements, it is the Portfolio’s policy that its custodian or a third party custodian, acting on the Portfolio’s behalf, take possession of the underlying collateral securities, the market value of which, at all times, at least equals the principal amount of the repurchase transaction, including accrued interest. To the extent that any repurchase transaction maturity exceeds one business day, the value of the collateral is marked-to-market and measured against the value of the agreement in an effort to ensure the adequacy of the collateral. If the counterparty defaults, the Portfolio generally has the right to use the collateral to satisfy the terms of the repurchase transaction. However, if the market value of the collateral declines during the period in which the Portfolio seeks to assert its rights or if bankruptcy proceedings are commenced with respect to the seller of the security, realization of the collateral by the Portfolio may be delayed or limited.
| | |
| 24 | | Legg Mason Investment Counsel Variable Social Awareness Portfolio 2010 Annual Report |
Notes to financial statements (cont’d)
(c) Foreign currency translation. Investment securities and other assets and liabilities denominated in foreign currencies are translated into U.S. dollar amounts based upon prevailing exchange rates on the date of valuation. Purchases and sales of investment securities and income and expense items denominated in foreign currencies are translated into U.S. dollar amounts based upon prevailing exchange rates on the respective dates of such transactions.
The Portfolio does not isolate that portion of the results of operations resulting from fluctuations in foreign exchange rates on investments from the fluctuations arising from changes in market prices of securities held. Such fluctuations are included with the net realized and unrealized gain or loss on investments.
Net realized foreign exchange gains or losses arise from sales of foreign currencies, including gains and losses on forward foreign currency contracts, currency gains or losses realized between the trade and settlement dates on securities transactions, and the difference between the amounts of dividends, interest, and foreign withholding taxes recorded on the Portfolio’s books and the U.S. dollar equivalent of the amounts actually received or paid. Net unrealized foreign exchange gains and losses arise from changes in the values of assets and liabilities, other than investments in securities, on the date of valuation, resulting from changes in exchange rates.
Foreign security and currency transactions may involve certain considerations and risks not typically associated with those of U.S. dollar denominated transactions as a result of, among other factors, the possibility of lower levels of governmental supervision and regulation of foreign securities markets and the possibility of political or economic instability.
(d) Security transactions and investment income. Security transactions are accounted for on a trade date basis. Interest income, adjusted for amortization of premium and accretion of discount, is recorded on the accrual basis. Dividend income is recorded on the ex-dividend date. Foreign dividend income is recorded on the ex-dividend date or as soon as practicable after the Portfolio determines the existence of a dividend declaration after exercising reasonable due diligence. The cost of investments sold is determined by use of the specific identification method. To the extent any issuer defaults or a credit event occurs that impacts the issuer, the Portfolio may halt any additional interest income accruals and consider the realizability of interest accrued up to the date of default or credit event.
(e) Distributions to shareholders. Distributions from net investment income and distributions of net realized gains, if any, are declared at least annually. Distributions to shareholders of the Portfolio are recorded on the ex-dividend date and are determined in accordance with income tax regulations, which may differ from GAAP.
(f) Compensating balance arrangements. The Portfolio has an arrangement with its custodian bank whereby a portion of the custodian’s fees is paid indirectly by credits earned on the Portfolio’s cash on deposit with the bank. The amount is shown as a reduction of expenses in the Statement of Operations.
| | | | |
| Legg Mason Investment Counsel Variable Social Awareness Portfolio 2010 Annual Report | | | 25 | |
(g) Federal and other taxes. It is the Portfolio’s policy to comply with the federal income and excise tax requirements of the Internal Revenue Code of 1986 (the “Code”), as amended, applicable to regulated investment companies. Accordingly, the Portfolio intends to distribute its taxable income and net realized gains, if any, to shareholders in accordance with timing requirements imposed by the Code. Therefore, no federal or state income tax provision is required in the Portfolio’s financial statements.
Management has analyzed the Portfolio’s tax positions taken on income tax returns for all open tax years and has concluded that as of December 31, 2010, no provision for income tax is required in the Portfolio’s financial statements. The Portfolio’s federal and state income and federal excise tax returns for tax years for which the applicable statutes of limitations have not expired are subject to examination by Internal Revenue Service and state departments of revenue.
Under the applicable foreign tax laws, a withholding tax may be imposed on interest, dividends and capital gains at various rates.
(h) Reclassification. GAAP requires that certain components of net assets be reclassified to reflect permanent differences between financial and tax reporting. These reclassifications have no effect on net assets or net asset values per share. During the current year, the following reclassifications have been made:
| | | | | | | | | | | | |
| | | Overdistributed Net Investment Income | | | Accumulated Net Realized Loss | | | Paid-in
Capital | |
| (a) | | $ | 65,937 | | | | — | | | $ | (65,937) | |
| (b) | | | 48,531 | | | $ | (48,531) | | | | — | |
| (a) | Reclassifications are primarily due to a taxable overdistribution. |
| (b) | Reclassifications are primarily due to losses from mortgage-backed securities treated as capital losses for tax purposes. |
2. Investment management agreement and other transactions with affiliates
Legg Mason Partners Fund Advisor, LLC (“LMPFA”) is the Portfolio’s investment manager and Legg Mason Investment Counsel, LLC (“LMIC”) is the Portfolio’s subadviser. LMPFA and LMIC are wholly-owned subsidiaries of Legg Mason, Inc. (“Legg Mason”).
Under the investment management agreement, the Portfolio pays an investment management fee, calculated daily and paid monthly in accordance with the following breakpoint schedule:
| | | | |
| Average Daily Net Assets | | Annual Rate | |
| First $50 million | | | 0.71 | % |
| Next $50 million | | | 0.61 | |
| Next $100 million | | | 0.51 | |
| Over $200 million | | | 0.46 | |
LMPFA provides administrative and certain oversight services to the Portfolio. LMPFA delegates to the subadviser the day-to-day portfolio management of the Portfolio, including the management of cash and short-term instruments. For its services, LMPFA pays LMIC 70% of the net management fee it receives from the Portfolio.
| | |
| 26 | | Legg Mason Investment Counsel Variable Social Awareness Portfolio 2010 Annual Report |
Notes to financial statements (cont’d)
As a result of an expense limitation arrangement between the Portfolio and LMPFA, the ratio of expenses, other than brokerage, interest, taxes, extraordinary expenses and acquired portfolio fees and expenses, to average net assets of the Portfolio did not exceed 1.00%. This expense limitation arrangement cannot be terminated prior to December 31, 2012 without the Board of Trustees’ consent..
During the year ended December 31, 2010, fees waived and/or expenses reimbursed amounted to $5,772.
The manager is permitted to recapture amounts previously forgone or reimbursed to the Portfolio during the same fiscal year if the Portfolio’s total annual operating expenses have fallen to a level below the expense limitation (“expense cap”) in effect at the time the fees were earned or the expense incurred. In no case will the manager recapture any amount that would result, on any particular business day of the Portfolio, in the Portfolio’s total annual operating expenses exceeding the expense cap or any other lower limit then in effect.
Legg Mason Investor Services, LLC, a wholly-owned broker-dealer subsidiary of Legg Mason, serves as the Portfolio’s sole and exclusive distributor.
All officers and one Trustee of the Trust are employees of Legg Mason or its affiliates and do not receive compensation from the Trust.
3. Investments
During the year ended December 31, 2010, the aggregate cost of purchases and proceeds from sales of investments (excluding short-term investments) and U.S Government & Agency Obligations were as follows:
| | | | | | | | |
| | | Investments | | | U.S. Government & Agency Obligations | |
| Purchases | | $ | 12,714,816 | | | $ | 4,979,021 | |
| Sales | | | 18,447,939 | | | | 6,334,079 | |
At December 31, 2010, the aggregate gross unrealized appreciation and depreciation of investments for federal income tax purposes were as follows:
| | | | |
| Gross unrealized appreciation | | $ | 12,996,290 | |
| Gross unrealized depreciation | | | (588,865) | |
| Net unrealized appreciation | | $ | 12,407,425 | |
4. Derivative instruments and hedging activities
Financial Accounting Standards Board Codification Topic 815 requires enhanced disclosure about an entity’s derivative and hedging activities.
During the year ended December 31, 2010, the Portfolio did not invest in any derivative instruments.
5. Shares of beneficial interest
At December 31, 2010, the Trust had an unlimited number of shares of beneficial interest authorized with a par value of $0.00001 per share.
| | | | |
| Legg Mason Investment Counsel Variable Social Awareness Portfolio 2010 Annual Report | | | 27 | |
Transactions in shares of the Portfolio were as follows:
| | | | | | | | | | | | |
| | | Year Ended
December 31, 2010 | | | Period Ended
December 31, 2009† | | | Year Ended
October 31, 2009 | |
| Shares sold | | | 16,976 | | | | 10,695 | | | | 23,294 | |
| Shares issued on reinvestment | | | 32,198 | | | | 39,683 | | | | 78,081 | |
| Shares repurchased | | | (458,240) | | | | (45,316) | | | | (430,169) | |
| Net increase (decrease) | | | (409,066) | | | | 5,062 | | | | (328,794) | |
| † | For the period November 1, 2009 through December 31, 2009. |
6. Income tax information and distributions to shareholders
The tax character of distributions paid during the fiscal year ended December 31, 2010, the fiscal period ended December 31, 2009 and the fiscal year ended October 31, 2009 was as follows:
| | | | | | | | | | | | |
| | | December 31, 2010 | | | December 31, 2009† | | | October 31, 2009 | |
| Distributions Paid From: | | | | | | | | | | | | |
| Ordinary income | | $ | 785,004 | | | $ | 875,003 | | | $ | 1,400,001 | |
| † | For the period November 1, 2009 through December 31, 2009. |
As of December 31, 2010, the components of accumulated earnings on a tax basis were as follows:
| | | | |
| Capital loss carryforward* | | $ | (9,058,098) | |
| Other book/tax temporary differences(a) | | | (490,004) | |
| Unrealized appreciation (depreciation)(b) | | | 12,407,425 | |
| Total accumulated earnings (losses) — net | | $ | 2,859,323 | |
| * | During the taxable year ended December 31, 2010, the Portfolio utilized $1,103,315 of its capital loss carryforward available from prior years. As of December 31, 2010, the Portfolio had the following net capital loss carryforwards remaining: |
| | | | |
| Year of Expiration | | Amount | |
| 12/31/2015 | | $ | (4,982,804 | ) |
| 12/31/2016 | | | (4,075,294 | ) |
| | | $ | (9,058,098 | ) |
These amounts will be available to offset future taxable capital gains. Under the recently enacted Regulated Investment Company Modernization Act of 2010, the Portfolio will be permitted to carry forward capital losses incurred in taxable years beginning after December 22, 2010 for an unlimited period. However, any losses incurred during those future years will be required to be utilized prior to the losses incurred in pre-enactment taxable years. As a result of this ordering rule, pre-enactment capital loss carryforwards may be more likely to expire unused. Additionally, post-enactment capital losses that are carried forward will retain their character as either short-term or long-term capital losses rather than being considered all short-term as under previous law.
| (a) | Other book/tax temporary differences are attributable primarily to the deferral of post-October capital losses for tax purposes and book/tax differences in the timing of the deductibility of various expenses. |
| (b) | The difference between book-basis and tax-basis unrealized appreciation (depreciation) is attributable primarily to the tax deferral of losses on wash sales. |
7. Legal matters
Beginning in May 2004, class action lawsuits alleging violations of the federal securities laws were filed against CGM, a former distributor of the Portfolio, and other affiliated funds (collectively, the “Funds”) and a number of its then affiliates, including SBFM and Salomon Brothers Asset Management Inc. (“SBAM”), which were then investment adviser or manager to certain of the Funds (the
| | |
| 28 | | Legg Mason Investment Counsel Variable Social Awareness Portfolio 2010 Annual Report |
Notes to financial statements (cont’d)
“Managers”), substantially all of the mutual funds then managed by the Managers (the “Defendant Funds”), and Board members of the Defendant Funds (collectively, the “Defendants”). The complaints alleged, among other things, that CGM created various undisclosed incentives for its brokers to sell Smith Barney and Salomon Brothers funds. In addition, according to the complaints, the Managers caused the Defendant Funds to pay excessive brokerage commissions to CGM for steering clients towards proprietary funds. The complaints also alleged that the Defendants breached their fiduciary duty to the Defendant Funds by improperly charging Rule 12b-1 fees and by drawing on fund assets to make undisclosed payments of soft dollars and excessive brokerage commissions. The complaints also alleged that the Defendant Funds failed to adequately disclose certain of the allegedly wrongful conduct. The complaints sought injunctive relief and compensatory and punitive damages, rescission of the Defendant Funds’ contracts with the Managers, recovery of all fees paid to the Managers pursuant to such contracts and an award of attorneys’ fees and litigation expenses.
On December 15, 2004, a consolidated amended complaint (the “Complaint”) was filed alleging substantially similar causes of action. On May 27, 2005, all of the Defendants filed motions to dismiss the Complaint. On July 26, 2006, the court issued a decision and order (1) finding that plaintiffs lacked standing to sue on behalf of the shareholders of the Funds in which none of the plaintiffs had invested and dismissing those Funds from the case (although stating that they could be brought back into the case if standing as to them could be established), and (2) other than one stayed claim, dismissing all of the causes of action against the remaining Defendants, with prejudice, except for the cause of action under Section 36(b) of the 1940 Act, which the court granted plaintiffs leave to replead as a derivative claim.
On October 16, 2006, plaintiffs filed their Second Consolidated Amended Complaint (“Second Amended Complaint”) which alleges derivative claims on behalf of nine funds identified in the Second Amended Complaint, under Section 36(b) of the 1940 Act, against CAM, SBAM and SBFM as investment advisers to the identified funds, as well as CGM as a distributor for the identified funds (collectively, the “Second Amended Complaint Defendants”). The Portfolio was not identified in the Second Amended Complaint. The Second Amended Complaint alleges no claims against any of the funds or any of their Board Members. Under Section 36(b), the Second Amended Complaint alleges similar facts and seeks similar relief against the Second Amended Complaint Defendants as the Complaint.
On December 3, 2007, the court granted the Defendants’ motion to dismiss, with prejudice. On January 2, 2008, the plaintiffs filed a notice of appeal to the Second Circuit Court of Appeals. The appeal was fully briefed and oral argument before the U.S. Court of Appeals for the Second Circuit took place on March 5, 2009. The parties currently are awaiting a decision from the U.S. Court of Appeals for the Second Circuit.
Additional lawsuits arising out of these circumstances and presenting similar allegations and requests for relief may be filed in the future.
| | | | |
| Legg Mason Investment Counsel Variable Social Awareness Portfolio 2010 Annual Report | | | 29 | |
8. Other tax information
On December 22, 2010, President Obama signed into law the Regulated Investment Company Modernization Act of 2010 (the “Act”). The Act updates certain tax rules applicable to regulated investment companies (“RICs”). The various provisions of the Act will generally be effective for RICs with taxable years beginning after December 22, 2010. Additional information regarding the impact of the Act on the Portfolio, if any, will be contained within the relevant sections of the notes to the financial statements for the fiscal year ending December 31, 2011.
| | |
| 30 | | Legg Mason Investment Counsel Variable Social Awareness Portfolio 2010 Annual Report |
Report of independent registered public accounting firm
The Board of Trustees and Shareholders
Legg Mason Partners Variable Equity Trust:
We have audited the accompanying statement of assets and liabilities of Legg Mason Investment Counsel Variable Social Awareness Portfolio, a series of Legg Mason Partners Variable Equity Trust, including the schedule of investments, as of December 31, 2010, and the related statement of operations for the year then ended, the statements of changes in net assets for the year then ended, the period from November 1, 2009 to December 31, 2009, and the year ended October 31, 2009, and the financial highlights for the year then ended, the period from November 1, 2009 to December 31, 2009, and each of the years in the four-year period ended October 31, 2009. These financial statements and financial highlights are the responsibility of the Portfolio’s management. Our responsibility is to express an opinion on these financial statements and financial highlights based on our audits.
We conducted our audits in accordance with the standards of the Public Company Accounting Oversight Board (United States). Those standards require that we plan and perform the audit to obtain reasonable assurance about whether the financial statements and financial highlights are free of material misstatement. An audit includes examining, on a test basis, evidence supporting the amounts and disclosures in the financial statements. Our procedures included confirmation of securities owned as of December 31, 2010, by correspondence with the custodian and broker. An audit also includes assessing the accounting principles used and significant estimates made by management, as well as evaluating the overall financial statement presentation. We believe that our audits provide a reasonable basis for our opinion.
In our opinion, the financial statements and financial highlights referred to above present fairly, in all material respects, the financial position of Legg Mason Investment Counsel Variable Social Awareness Portfolio as of December 31, 2010, the results of its operations, the changes in its net assets, and the financial highlights for the periods described above, in conformity with U.S. generally accepted accounting principles.

New York, New York
February 15, 2011
| | | | |
| Legg Mason Investment Counsel Variable Social Awareness Portfolio | | | 31 | |
Board approval of management and subadvisory agreements (unaudited)
At a meeting of the Trust’s Board of Trustees, the Board considered the re-approval for an annual period of the management agreement of Legg Mason Investment Counsel Variable Social Awareness Portfolio (the “Fund”), pursuant to which Legg Mason Partners Fund Advisor, LLC (the “Manager”) provides the Fund with investment advisory and administrative services, and the Fund’s sub-advisory agreement, pursuant to which Legg Mason Investment Counsel, LLC (the “Sub-Adviser”) provides day-to-day management of the Fund’s portfolio. (The management agreement and sub-advisory agreement are collectively referred to as the “Agreements.”) The Manager and the Sub-Adviser are wholly-owned subsidiaries of Legg Mason, Inc. The Trustees who are not “interested persons” (as defined in the Investment Company Act of 1940, as amended (the “Independent Trustees”)) of the Fund were assisted in their review by Fund counsel and independent legal counsel and met with independent legal counsel in executive sessions separate from representatives of the Manager and the Sub-Adviser. The Independent Trustees requested and received information from the Manager and the Sub-Adviser they deemed reasonably necessary for their review of the Agreements and the performance of the Manager and the Sub-Adviser. Included was information about the Manager, the Sub-Adviser and the Fund’s distributor, as well as the management, sub-advisory and distribution arrangements for the Fund and other funds overseen by the Board. This information was initially reviewed by a special committee of the Independent Trustees and then by the full Board.
In voting to approve the Agreements, the Independent Trustees considered whether the approval of the Agreements would be in the best interests of the Fund and its shareholders, an evaluation based on several factors including those discussed below.
Nature, Extent and Quality of the Services provided to the Fund under the Management Agreement and Sub-Advisory Agreement
The Board received and considered information regarding the nature, extent and quality of services provided to the Fund by the Manager and the Sub-Adviser under the Management Agreement and Sub-Advisory Agreement, respectively, during the past year. The Trustees also considered the Manager’s supervisory activities over the Sub-Adviser. In addition, the Independent Trustees received and considered other information regarding the administrative and other services rendered to the Fund and its shareholders by the Manager. The Board noted information received at regular meetings throughout the year related to the services rendered by the Manager in its management of the Fund’s affairs, and the Manager’s role in coordinating the activities of the Sub-Adviser and the Fund’s other service providers. The Board’s evaluation of the services provided by the Manager and the Sub-Adviser took into account the Board’s knowledge and familiarity gained as Trustees of funds in the Legg Mason fund complex, including the scope and quality of the investment management and other capabilities of the Manager and the Sub-Adviser and the quality of the Manager’s administrative and other services. The Board observed that the scope of services provided by the Manager had expanded over time as a result of regulatory and other developments, including maintaining and monitoring its
| | |
| 32 | | Legg Mason Investment Counsel Variable Social Awareness Portfolio |
Board approval of management and subadvisory agreements (unaudited) (cont’d)
own and the Fund’s compliance programs. The Board reviewed information received from the Manager and the Fund’s Chief Compliance Officer regarding the Fund’s compliance policies and procedures established pursuant to Rule 38a-1 under the Investment Company Act of 1940, as amended.
The Board reviewed the qualifications, backgrounds and responsibilities of the Fund’s senior personnel and the portfolio management team primarily responsible for the day-to-day portfolio management of the Fund. The Board considered the degree to which the Manager implemented organizational changes to improve investment results and the services provided to the Legg Mason fund complex. The Board also considered, based on its knowledge of the Manager and the Manager’s affiliates, the financial resources available to the Manager’s parent organization, Legg Mason, Inc.
The Board also considered the division of responsibilities between the Manager and the Sub-Adviser and the oversight provided by the Manager. The Board also considered the Manager’s and the Sub-Adviser’s brokerage policies and practices, the standards applied in seeking best execution, the Manager’s policies and practices regarding soft dollars, and the existence of quality controls applicable to brokerage allocation procedures. In addition, management also reported to the Board on, among other things, its business plans, recent organizational changes, portfolio manager compensation plan and policy regarding portfolio managers’ ownership of fund shares.
The Board concluded that, overall, it was satisfied with the nature, extent and quality of services provided (and expected to be provided) under the respective Agreement by the Manager and the Sub-Adviser.
Fund Performance
The Board received and reviewed performance information for the Fund and for all specialty & miscellaneous funds underlying variable insurance products (the “Performance Universe”) selected by Lipper, Inc. (“Lipper”), an independent provider of investment company data. The Board was provided with a description of the methodology Lipper used to determine the similarity of the Fund with the funds included in the Performance Universe. The Trustees noted that they also had received and discussed with management information at periodic intervals comparing the Fund’s performance to that of its benchmark index. The information comparing the Fund’s performance to that of the Performance Universe was for the one-, three-, five- and ten-year periods ended June 30, 2010. The Fund performed better than the median for the three- and five-year periods, but below the median for the one- and ten-year periods. The Board also reviewed performance information provided by the Manager for periods ended September 30, 2010, which showed the Fund’s performance was below the Lipper category average during the third quarter. The Trustees then discussed with representatives of management the portfolio management strategy of the Fund’s portfolio managers. The Trustees noted that the Manager and Sub-Adviser were committed to providing the resources necessary to assist the Fund’s portfolio managers and improve Fund performance. Based on its
| | | | |
| Legg Mason Investment Counsel Variable Social Awareness Portfolio | | | 33 | |
review, the Board generally was satisfied with management’s efforts to improve performance going forward. The Board determined to continue to evaluate the Fund’s performance and directed the Independent Trustees’ performance committee to continue to periodically review Fund performance with the Manager and report to the full Board during periods between Board meetings.
Management Fees and Expense Ratios
The Board reviewed and considered the contractual management fee (the “Contractual Management Fee”) payable by the Fund to the Manager in light of the nature, extent and quality of the management and sub-advisory services provided by the Manager and the Sub-Adviser, respectively. The Board noted that the Manager, and not the Fund, pays the sub-advisory fee to the Sub-Adviser and, accordingly, that the retention of the Sub-Adviser does not increase the fees and expenses incurred by the Fund.
The Board also reviewed information regarding the fees the Manager and the Sub-Adviser charged any of their U.S. clients investing primarily in an asset class similar to that of the Fund including, where applicable, institutional separate and commingled accounts and retail managed accounts. The Manager reviewed with the Board the significant differences in the scope of services provided to the Fund and to such other clients, noting that the Fund is provided with regulatory compliance and administrative services, office facilities and Fund officers (including the Fund’s chief financial, chief legal and chief compliance officers), and that the Manager coordinates and oversees the provision of services to the Fund by other fund service providers, including the Sub-Adviser. The Board considered the fee comparisons in light of the scope of services required to manage these different types of accounts.
The Board received an analysis of complex-wide management fees provided by the Manager, which, among other things, set out a framework of fees based on asset classes. Management also discussed with the Board the Fund’s distribution arrangements, including how amounts received by the Fund’s distributor are expended, and the fees received and expenses incurred in connection with such arrangements by affiliates of the Manager.
Additionally, the Board received and considered information comparing the Fund’s Contractual Management Fee and the Fund’s overall expense ratio with those of a group of seven specialty & miscellaneous funds underlying variable insurance products selected by Lipper as comparable to the Fund (the “Expense Group”), and a broader group of funds selected by Lipper consisting of all specialty & miscellaneous funds underlying variable insurance products (the “Expense Universe”). This information showed that the Fund’s Contractual Management Fee was slightly higher than the median of management fees paid by the other funds in the Expense Group and higher than the average management fee paid by the other funds in the Expense Universe, and that the Fund’s actual total expense ratio was higher than the median of the total expense ratios of the funds in the Expense Group, but lower than the average total expense ratio of the funds in the Expense Universe.
| | |
| 34 | | Legg Mason Investment Counsel Variable Social Awareness Portfolio |
Board approval of management and subadvisory agreements (unaudited) (cont’d)
Manager Profitability
The Board received and considered a profitability analysis of the Manager and its affiliates in providing services to the Fund. The Board also received profitability information with respect to the Legg Mason fund complex as a whole. In addition, the Board received information with respect to the Manager’s allocation methodologies used in preparing this profitability data as well as a report from an outside consultant that had reviewed the Manager’s methodology. The Board also noted the profitability percentage ranges determined by appropriate court cases to be reasonable given the services rendered to investment companies. The Board determined that the Manager’s profitability was not excessive in light of the nature, extent and quality of the services provided to the Fund.
Economies of Scale
The Board received and considered information regarding whether there have been economies of scale with respect to the management of the Fund as the Fund’s assets grow, whether the Fund has appropriately benefited from any economies of scale, and whether there is potential for realization of any further economies of scale. The Board considered whether economies of scale in the provision of services to the Fund were being passed along to the shareholders.
The Board noted that the Manager instituted breakpoints in the Fund’s Contractual Management Fee, reflecting the potential for reducing the Contractual Management Fee as the Fund’s assets grow. The Board noted that the Fund’s assets exceeded the specified asset level at which one or more breakpoints to its Contractual Management Fee are triggered. Accordingly, the Fund and its shareholders realized economies of scale because the total expense ratio of the Fund was lower than it would have been if no breakpoints were in place. The Board also noted that to the extent the Fund’s assets increase over time, the Fund and its shareholders should realize economies of scale as certain expenses, such as fixed fund fees, become a smaller percentage of overall assets. The Board noted that it appeared that the benefits of any economies of scale also would be appropriately shared with shareholders through increased investment in fund management and administration resources.
Taking all of the above into consideration, the Board determined that the management fee was reasonable in light of the comparative performance and expense information and the nature, extent and quality of the services provided to the Fund under the Agreements.
Other Benefits to the Manager
The Board considered other benefits received by the Manager and its affiliates, including the Sub-Adviser, as a result of the Manager’s relationship with the Fund, including the opportunity to offer additional products and services to Fund shareholders.
In light of the costs of providing investment management and other services to the Fund and the Manager’s ongoing commitment to the Fund, the profits and other ancillary benefits that the Manager and its affiliates received were considered reasonable.
| | | | |
| Legg Mason Investment Counsel Variable Social Awareness Portfolio | | | 35 | |
Based on their discussions and considerations, including those described above, the Trustees approved the Management Agreement and the Sub-Advisory Agreement to continue for another year.
No single factor reviewed by the Board was identified by the Board as the principal factor in determining whether to approve the Management Agreement and the Sub-Advisory Agreement.
| | |
| 36 | | Legg Mason Investment Counsel Variable Social Awareness Portfolio |
Additional information (unaudited)
Information about Trustees and Officers
The business and affairs of Legg Mason Investment Counsel Variable Social Awareness Portfolio (the “Portfolio”) are conducted by management under the supervision and subject to the direction of its Board of Trustees. The business address of each Trustee is c/o R. Jay Gerken, 620 Eighth Avenue, New York, New York 10018. Information pertaining to the Trustees and officers of the Portfolio is set forth below.
The Statement of Additional Information includes additional information about Trustees and is available, without charge, upon request by calling the Portfolio at 1-877-721-1926.
| | |
| Independent Trustees†: |
| Paul R. Ades |
| Year of birth | | 1940 |
| Position(s) with Trust | | Trustee |
| Term of office1 and length of time served2 | | Since 1983 |
| Principal occupation(s) during past five years | | Paul R. Ades, PLLC (law firm) (since 2000) |
Number of funds in fund complex overseen
by Trustee | | 53 |
| Other board memberships held by Trustee during past five years | | None |
| Andrew L. Breech |
| Year of birth | | 1952 |
| Position(s) with Trust | | Trustee |
| Term of office1 and length of time served2 | | Since 1991 |
| Principal occupation(s) during past five years | | President, Dealer Operating Control Service, Inc. (automotive retail management) (since 1985) |
Number of funds in fund complex overseen
by Trustee | | 53 |
| Other board memberships held by Trustee during past five years | | None |
| Dwight B. Crane |
| Year of birth | | 1937 |
| Position(s) with Trust | | Trustee |
| Term of office1 and length of time served2 | | Since 1981 |
| Principal occupation(s) during past five years | | Professor Emeritus, Harvard Business School (since 2007); formerly, Professor, Harvard Business School (1969 to 2007); Independent Consultant (since 1969) |
Number of funds in fund complex overseen
by Trustee | | 53 |
| Other board memberships held by Trustee during past five years | | None |
| | | | |
| Legg Mason Investment Counsel Variable Social Awareness Portfolio | | | 37 | |
| | |
| Independent Trustees cont’d |
| Frank G. Hubbard |
| Year of birth | | 1937 |
| Position(s) with Trust | | Trustee |
| Term of office1 and length of time served2 | | Since 1993 |
| Principal occupation(s) during past five years | | President, Avatar International Inc. (business development) (since 1998) |
Number of funds in fund complex overseen
by Trustee | | 53 |
| Other board memberships held by Trustee during past five years | | None |
| Howard J. Johnson |
| Year of birth | | 1938 |
| Position(s) with Trust | | Trustee |
| Term of office1 and length of time served2 | | From 1981 to 1998 and since 2000 |
| Principal occupation(s) during past five years | | Chief Executive Officer, Genesis Imaging LLC (technology company) (since 2003) |
Number of funds in fund complex overseen
by Trustee | | 53 |
| Other board memberships held by Trustee during past five years | | None |
| David E. Maryatt |
| Year of birth | | 1936 |
| Position(s) with Trust | | Trustee |
| Term of office1 and length of time served2 | | Since 1983 |
| Principal occupation(s) during past five years | | Private Investor; President and Director, ALS Co. (real estate management and development firm) (since 1992) |
Number of funds in fund complex overseen
by Trustee | | 53 |
| Other board memberships held by Trustee during past five years | | None |
| Jerome H. Miller |
| Year of birth | | 1938 |
| Position(s) with Trust | | Trustee |
| Term of office1 and length of time served2 | | Since 1995 |
| Principal occupation(s) during past five years | | Retired |
Number of funds in fund complex overseen
by Trustee | | 53 |
| Other board memberships held by Trustee during past five years | | None |
| | |
| 38 | | Legg Mason Investment Counsel Variable Social Awareness Portfolio |
Additional information (unaudited) (cont’d)
Information about Trustees and Officers
| | |
| Independent Trustees cont’d |
| Ken Miller |
| Year of birth | | 1942 |
| Position(s) with Trust | | Trustee |
| Term of office1 and length of time served2 | | Since 1983 |
| Principal occupation(s) during past five years | | President, Young Stuff Apparel Group, Inc. (apparel manufacturer), division of Li & Fung (since 1963) |
Number of funds in fund complex overseen
by Trustee | | 53 |
| Other board memberships held by Trustee during past five years | | None |
| John J. Murphy |
| Year of birth | | 1944 |
| Position(s) with Trust | | Trustee |
| Term of office1 and length of time served2 | | Since 2002 |
| Principal occupation(s) during past five years | | Founder and Senior Principal, Murphy Capital Management (investment management) (since 1983) |
Number of funds in fund complex overseen
by Trustee | | 53 |
| Other board memberships held by Trustee during past five years | | Trustee, UBS Funds (52 funds) (since 2008); Director, Nicholas Applegate Institutional Funds (12 funds) (since 2005); Trustee, Consulting Group Capital Markets Funds (11 funds) (since 2002); formerly, Director, Atlantic Stewardship Bank (2004 to 2005); formerly, Director, Barclays International Funds Group Ltd. and affiliated companies (1983 to 2003) |
| Thomas F. Schlafly |
| Year of birth | | 1948 |
| Position(s) with Trust | | Trustee |
| Term of office1 and length of time served2 | | Since 1983 |
| Principal occupation(s) during past five years | | President, The Saint Louis Brewery, Inc. (brewery) (since 1989); Partner, Thompson Coburn LLP (law firm) (since 2009); formerly, Of Counsel, Husch Blackwell Sanders LLP (law firm) and its predecessor firms (1984 to 2009) |
Number of funds in fund complex overseen
by Trustee | | 53 |
| Other board memberships held by Trustee during past five years | | Director, Citizens National Bank of Greater St. Louis (since 2006) |
| Jerry A. Viscione |
| Year of birth | | 1944 |
| Position(s) with Trust | | Trustee |
| Term of office1 and length of time served2 | | Since 1993 |
| Principal occupation(s) during past five years | | Retired |
Number of funds in fund complex overseen
by Trustee | | 53 |
| Other board memberships held by Trustee during past five years | | None |
| | | | |
| Legg Mason Investment Counsel Variable Social Awareness Portfolio | | | 39 | |
| | |
| Interested Trustee and Officer: | | |
| R. Jay Gerken, CFA3 | | |
| Year of birth | | 1951 |
| Position(s) with Trust | | Trustee, President, Chairman and Chief Executive Officer |
| Term of office1 and length of time served2 | | Since 2002 |
| Principal occupation(s) during past five years | | Managing Director of Legg Mason & Co., LLC (“Legg Mason & Co.”) (since 2005); Officer and Trustee/Director of 148 funds associated with Legg Mason Partners Fund Advisor, LLC (“LMPFA”) or its affiliates (since 2006) and Legg Mason & Co. predecessors (prior to 2006); President and Chief Executive Officer (“CEO”) of LMPFA (since 2006); President and CEO of Smith Barney Fund Management LLC (“SBFM”) and Citi Fund Management, Inc. (“CFM”) (formerly registered investment advisers) (since 2002); formerly, Chairman, President and CEO, Travelers Investment Adviser Inc. (prior to 2005) |
Number of funds in fund complex overseen
by Trustee | | 136 |
| Other board memberships held by Trustee during past five years | | Former Trustee, Consulting Group Capital Markets Funds (11 funds) (prior to 2006) |
| Additional Officers | | |
Ted P. Becker Legg Mason 620 Eighth Avenue, New York, NY 10018 | | |
| Year of birth | | 1951 |
| Position(s) with Trust | | Chief Compliance Officer |
| Term of office1 and length of time served2 | | Since 2007 |
| Principal occupation(s) during past five years | | Director of Global Compliance at Legg Mason (since 2006); Chief Compliance Officer of LMPFA (since 2006); Managing Director of Compliance of Legg Mason & Co. (since 2005); Chief Compliance Officer of certain mutual funds associated with Legg Mason & Co. or its affiliates (since 2006) and Legg Mason & Co. predecessors (prior to 2006) |
John Chiota Legg Mason 100 First Stamford Place, Stamford, CT 06902 | | |
| Year of birth | | 1968 |
| Position(s) with Trust | | Chief Anti-Money Laundering Compliance Officer and Identity Theft Prevention Officer |
| Term of office1 and length of time served2 | | Since 2007 and 2008 |
| Principal occupation(s) during past five years | | Identity Theft Prevention Officer of certain mutual funds associated with Legg Mason & Co. or its affiliates (since 2008); Chief Anti-Money Laundering Compliance Officer of certain mutual funds associated with Legg Mason & Co. or its affiliates (since 2006); Vice President of Legg Mason & Co. (since 2006) and Legg Mason & Co. predecessors (prior to 2006); formerly, Chief Anti-Money Laundering Compliance Officer of TD Waterhouse (prior to 2004) |
| | |
| 40 | | Legg Mason Investment Counsel Variable Social Awareness Portfolio |
Additional information (unaudited) (cont’d)
Information about Trustees and Officers
| | |
| Additional Officers cont’d | | |
Robert I. Frenkel Legg Mason 100 First Stamford Place, Stamford, CT 06902 | | |
| Year of birth | | 1954 |
| Position(s) with Trust | | Secretary and Chief Legal Officer |
| Term of office1 and length of time served2 | | Since 2007 |
| Principal occupation(s) during past five years | | Vice President and Deputy General Counsel of Legg Mason (since 2006); Managing Director and General Counsel of Global Mutual Funds for Legg Mason & Co. (since 2006) and Legg Mason & Co. predecessors (since 1994); Secretary and Chief Legal Officer of certain mutual funds associated with Legg Mason & Co. or its affiliates (since 2006) and Legg Mason & Co. predecessors (prior to 2006) |
Thomas C. Mandia Legg Mason 100 First Stamford Place, Stamford, CT 06902 | | |
| Year of birth | | 1962 |
| Position(s) with Trust | | Assistant Secretary |
| Term of office1 and length of time served2 | | Since 2007 |
| Principal occupation(s) during past five years | | Managing Director and Deputy General Counsel of Legg Mason & Co. (since 2005) and Legg Mason & Co. predecessors (prior to 2005); Secretary of LMPFA (since 2006); Assistant Secretary of certain mutual funds associated with Legg Mason & Co. or its affiliates (since 2006) and Legg Mason & Co. predecessors (prior to 2006); Secretary to SBFM and CFM (since 2002) |
Kaprel Ozsolak Legg Mason 55 Water Street, New York, NY 10041 | | |
| Year of birth | | 1965 |
| Position(s) with Trust | | Chief Financial Officer |
| Term of office1 and length of time served2 | | Since 2007 |
| Principal occupation(s) during past five years | | Director of Legg Mason & Co. (since 2005); Chief Financial Officer of certain mutual funds associated with Legg Mason & Co. or its affiliates (since 2007) and Legg Mason & Co. predecessors (prior to 2007); formerly, Treasurer of certain mutual funds associated with Legg Mason & Co. or its affiliates (prior to 2010) and Legg Mason & Co. predecessors (prior to 2005); formerly, Controller of certain mutual funds associated with Legg Mason & Co. predecessors (prior to 2004) |
| | | | |
| Legg Mason Investment Counsel Variable Social Awareness Portfolio | | | 41 | |
| | |
| Additional Officers cont’d | | |
Albert Laskaj Legg Mason 55 Water Street, New York, NY 10041 | | |
| Year of birth | | 1977 |
| Position(s) with Trust | | Treasurer |
| Term of office1 and length of time served2 | | Since 2010 |
| Principal occupation(s) during past five years | | Vice President of Legg Mason & Co. (since 2008); Treasurer of certain mutual funds associated with Legg Mason & Co. or its affiliates (since 2010); formerly, Controller of certain mutual funds associated with Legg Mason & Co. or its affiliates (prior to 2010); formerly, Assistant Controller of certain mutual funds associated with Legg Mason & Co. or its affiliates (prior to 2007); formerly, Accounting Manager of certain mutual funds associated with Legg Mason & Co. predecessors (prior to 2005) |
Jeanne M. Kelly Legg Mason 620 Eighth Avenue, New York, NY 10018 | | |
| Year of birth | | 1951 |
| Position(s) with Trust | | Senior Vice President |
| Term of office1 and length of time served2 | | Since 2007 |
| Principal occupation(s) during past five years | | Senior Vice President of certain mutual funds associated with Legg Mason & Co. or its affiliates (since 2007); Senior Vice President of LMPFA (since 2006); Managing Director of Legg Mason & Co. (since 2005) and Legg Mason & Co. predecessors (prior to 2005) |
| † | Trustees who are not “interested persons” of the Portfolio within the meaning of Section 2(a)(19) of the 1940 Act. |
| 1 | Each Trustee and officer serves until his or her respective successor has been duly elected and qualified or until his or her earlier death, resignation, retirement or removal. |
| 2 | Indicates the earliest year in which the Trustee became a board member for a fund in the Legg Mason fund complex or the officer took such office. |
| 3 | Mr. Gerken is an “interested person” of the Portfolio, as defined in the 1940 Act, because of his position with LMPFA and/or certain of its affiliates. |
| | |
| 42 | | Legg Mason Investment Counsel Variable Social Awareness Portfolio |
Important tax information (unaudited)
The following information is provided with respect to the distributions paid during the taxable year ended December 31, 2010:
| | | | | | | | |
| | | | | | | |
| Record date | | | 6/17/2010 | | | | 12/21/2010 | |
| Payable date | | | 6/18/2010 | | | | 12/22/2010 | |
Dividends qualifying for the dividends | | | | | | | | |
received deduction for corporations | | | 55.71 | % | | | 71.54 | % |
Please retain this information for your records.
Legg Mason Investment Counsel
Variable Social Awareness Portfolio
Trustees
Paul R. Ades
Andrew L. Breech
Dwight B. Crane
R. Jay Gerken, CFA Chairman
Frank G. Hubbard
Howard J. Johnson
David E. Maryatt
Jerome H. Miller
Ken Miller
John J. Murphy
Thomas F. Schlafly
Jerry A. Viscione
Investment manager
Legg Mason Partners Fund Advisor, LLC
Subadviser
Legg Mason Investment Counsel, LLC
Distributor
Legg Mason Investor Services, LLC
Custodian
State Street Bank and Trust Company
Transfer agent
Boston Financial Data Servicing, Inc. 2000 Crown Colony Drive Quincy, MA 02169
Independent registered public accounting firm
KPMG LLP 345 Park Avenue New York, NY 10154
Legg Mason Investment Counsel Variable Social Awareness Portfolio
The Portfolio is a separate investment series of Legg Mason Partners Variable Equity Trust, a Maryland statutory trust.
Legg Mason Investment Counsel Variable Social Awareness Portfolio
Legg Mason Funds
55 Water Street
New York, NY 10041
The Portfolio files its complete schedule of portfolio holdings with the Securities and Exchange Commission (“SEC”) for the first and third quarters of each fiscal year on Form N-Q. The Portfolio’s Forms N-Q are available on the SEC’s website at www.sec.gov. The Portfolio’s Forms N-Q may be reviewed and copied at the SEC’s Public Reference Room in Washington, D.C., and information on the operation of the Public Reference Room may be obtained by calling 1-800-SEC-0330. To obtain information on Form N-Q, shareholders can call Portfolio at 1-877-721-1926.
Information on how the Portfolio voted proxies relating to portfolio securities during the prior 12-month period ended June 30th of each year and a description of the policies and procedures that the Portfolio uses to determine how to vote proxies related to portfolio transactions are available (1) without charge, upon request, by calling the Portfolio at 1-877-721-1926, (2) on the Portfolio’s website at www.leggmason.com/individual investors and (3) on the SEC’s website at www.sec.gov.
This report is submitted for the general information of the shareholders of Legg Mason Investment Counsel Variable Social Awareness Portfolio. This report is not authorized for distribution to prospective investors in the Portfolio unless preceded or accompanied by a current prospectus.
Investors should consider the Portfolio’s investment objectives, risks, charges and expenses carefully before investing. The prospectus contains this and other important information about the Portfolio. Please read the prospectus carefully before investing.
www.leggmason.com/individualinvestors
© 2011 Legg Mason Investor Services, LLC Member FINRA, SIPC
Privacy policy
We are committed to keeping nonpublic personal information about you secure and confidential. This notice is intended to help you understand how we fulfill this commitment. From time to time, we may collect a variety of personal information about you, including:
| Ÿ | | Information we receive from you on applications and forms, via the telephone, and through our websites; |
| Ÿ | | Information about your transactions with us, our affiliates, or others (such as your purchases, sales, or account balances); and |
| Ÿ | | Information we receive from consumer reporting agencies. |
We do not disclose nonpublic personal information about our customers or former customers, except to our affiliates (such as broker-dealers or investment advisers within the Legg Mason family of companies) or as is otherwise permitted by applicable law or regulation. For example, we may share this information with others in order to process your transactions or service an account. We may also provide this information to companies that perform marketing services on our behalf, such as printing and mailing, or to other financial institutions with whom we have joint marketing agreements. When we enter into such agreements, we will require these companies to protect the confidentiality of this information and to use it only to perform the services for which we hired them.
With respect to our internal security procedures, we maintain physical, electronic, and procedural safeguards to protect your nonpublic personal information, and we restrict access to this information.
If you decide at some point either to close your account(s) or become an inactive customer, we will continue to adhere to our privacy policies and practices with respect to your nonpublic personal information.
|
| NOT PART OF THE ANNUAL REPORT |
www.leggmason.com/individualinvestors
©2011 Legg Mason Investor Services, LLC Member FINRA, SIPC
FD03332 2/11 SR11-1282
The registrant has adopted a code of ethics that applies to the registrant’s principal executive officer, principal financial officer, principal accounting officer or controller.
| ITEM 3. | AUDIT COMMITTEE FINANCIAL EXPERT. |
The Board of Directors of the registrant has determined that Jerry A. Viscione possesses the technical attributes identified in Instruction 2(b) of Item 3 to Form N-CSR to qualify as an “audit committee financial expert,” and has designated Mr. Viscione as the Audit Committee’s financial expert. Mr. Viscione is an “independent” Director pursuant to paragraph (a)(2) of Item 3 to Form N-CSR.
| ITEM 4. | PRINCIPAL ACCOUNTANT FEES AND SERVICES. |
a) Audit Fees. The aggregate fees billed in the previous fiscal years ending December 31, 2009 and December 31, 2010 (the “Reporting Periods”) for professional services rendered by the Registrant’s principal accountant (the “Auditor”) for the audit of the Registrant’s annual financial statements, or services that are normally provided by the Auditor in connection with the statutory and regulatory filings or engagements for the Reporting Periods, were $414,700 in December 31, 2009, $301,400 in December 31, 2010.
b) Audit-Related Fees. The aggregate fees billed in the Reporting Period for assurance and related services by the Auditor that are reasonably related to the performance of the Registrant’s financial statements were $1,427 in December 31, 2009 and $0 in December 31, 2010. These services consisted of procedures performed in connection with the Re-domiciliation of the various reviews of Prospectus supplements, and consent issuances related to the N-1A filings for the Legg Mason Partners Variable Equity Trust.
In addition, there were no Audit-Related Fees billed in the Reporting Period for assurance and related services by the Auditor to the Registrant’s investment adviser (not including any sub-adviser whose role is primarily portfolio management and is subcontracted with or overseen by another investment adviser), and any entity controlling, controlled by or under common control with the investment adviser that provides ongoing services to the Legg Mason Partners Variable Equity Trust (“service affiliates”), that were reasonably related to the performance of the annual audit of the service affiliates.
(c) Tax Fees. The aggregate fees billed in the Reporting Periods for professional services rendered by the Auditor for tax compliance, tax advice and tax planning (“Tax Services”) were $43,200 in December 31, 2009 and $57,600 in December 31, 2010. These services consisted of (i) review or preparation of U.S. federal, state, local and excise tax returns; (ii) U.S. federal, state and local tax planning, advice and assistance regarding statutory, regulatory or administrative developments, and (iii) tax advice regarding tax qualification matters and/or treatment of various financial instruments held or proposed to be acquired or held.
There were no fees billed for tax services by the Auditors to service affiliates during the Reporting Periods that required pre-approval by the Audit Committee.
d) All Other Fees. There were no other fees billed in the Reporting Periods for products and services provided by the Auditor, other than the services reported in paragraphs (a) through (c) of this Item for the Legg Mason Partners Variable Equity Trust.
All Other Fees. There were no other non-audit services rendered by the Auditor to Legg Mason Partners Fund Advisors, LLC (“LMPFA”), and any entity controlling, controlled by or under common control with LMPFA that provided ongoing services to Legg Mason Partners Variable Equity Trust requiring pre-approval by the Audit Committee in the Reporting Period.
(e) Audit Committee’s pre-approval policies and procedures described in paragraph (c) (7) of Rule 2-01 of Regulation S-X.
(1) The Charter for the Audit Committee (the “Committee”) of the Board of each registered investment company (the “Fund”) advised by LMPFA or one of their affiliates (each, an “Adviser”) requires that the Committee shall approve (a) all audit and permissible non-audit services to be provided to the Fund and (b) all permissible non-audit services to be provided by the Fund’s independent auditors to the Adviser and any Covered Service Providers if the engagement relates directly to the operations and financial reporting of the Fund. The Committee may implement policies and procedures by which such services are approved other than by the full Committee.
The Committee shall not approve non-audit services that the Committee believes may impair the independence of the auditors. As of the date of the approval of this Audit Committee Charter, permissible non-audit services include any professional services (including tax services), that are not prohibited services as described below, provided to the Fund by the independent auditors, other than those provided to the Fund in connection with an audit or a review of the financial statements of the Fund. Permissible non-audit services may not include: (i) bookkeeping or other services related to the accounting records or financial statements of the Fund; (ii) financial information systems design and implementation; (iii) appraisal or valuation services, fairness opinions or contribution-in-kind reports; (iv) actuarial services; (v) internal audit outsourcing services; (vi) management functions or human resources; (vii) broker or dealer, investment adviser or investment banking services; (viii) legal services and expert services unrelated to the audit; and (ix) any other service the Public Company Accounting Oversight Board determines, by regulation, is impermissible.
Pre-approval by the Committee of any permissible non-audit services is not required so long as: (i) the aggregate amount of all such permissible non-audit services provided to the Fund, the Adviser and any service providers controlling, controlled by or under common control with the Adviser that provide ongoing services to the Fund (“Covered Service Providers”) constitutes not more than 5% of the total amount of revenues paid to the independent auditors during the fiscal year in which the permissible non-audit services are provided to (a) the Fund, (b) the Adviser and (c) any entity controlling, controlled by or under common control with the Adviser that provides ongoing services to the Fund during the fiscal year in which the services are provided that would have to be approved by the Committee; (ii) the permissible non-audit services were not recognized by the Fund at the time of the engagement to be non-audit services; and (iii) such services are promptly brought to the attention of the Committee and approved by the Committee (or its delegate(s)) prior to the completion of the audit.
(2) For the Legg Mason Partners Variable Equity Trust, the percentage of fees that were approved by the audit committee, with respect to: Audit-Related Fees were 100% and 100% for December 31, 2009 and December 31, 2010; Tax Fees were 100% and 100% for December 31, 2009 and December 31, 2010; and Other Fees were 100% and 100% for December 31, 2009 and December 31, 2010.
(f) N/A
(g) Non-audit fees billed by the Auditor for services rendered to Legg Mason Partners Variable Equity Trust, LMPFA and any entity controlling, controlled by, or under common control with LMPFA that provides ongoing services to Legg Mason Partners Variable Equity Trust during the reporting period were $0 in 2010.
(h) Yes. Legg Mason Partners Variable Equity Trust’s Audit Committee has considered whether the provision of non-audit services that were rendered to Service Affiliates, which were not pre-approved (not requiring pre-approval), is compatible with maintaining the Accountant’s independence. All services provided by the Auditor to the Legg Mason Partners Variable Equity Trust or to Service Affiliates, which were required to be pre-approved, were pre-approved as required.
| ITEM 5. | AUDIT COMMITTEE OF LISTED REGISTRANTS. |
a) The independent board members are acting as the registrant’s audit committee as specified in Section 3(a)(58)(B) of the Exchange Act. The Audit Committee consists of the following Board members:
Paul R. Ades
Andrew L. Breech
Dwight B. Crane
Frank G. Hubbard
Howard J. Johnson
David E. Maryatt
Jerome H. Miller
Ken Miller
John J. Murphy
Thomas F. Schlafly
Jerry A. Viscione
b) Not applicable.
| ITEM 6. | SCHEDULE OF INVESTMENTS. |
Included herein under Item 1.
| ITEM 7. | DISCLOSURE OF PROXY VOTING POLICIES AND PROCEDURES FOR CLOSED-END MANAGEMENT INVESTMENT COMPANIES. |
Not applicable.
| ITEM 8. | PORTFOLIO MANAGERS OF CLOSED-END MANAGEMENT INVESTMENT COMPANIES. |
Not applicable.
| ITEM 9. | PURCHASES OF EQUITY SECURITIES BY CLOSED-END MANAGEMENT INVESTMENT COMPANY AND AFFILIATED PURCHASERS. |
Not applicable.
| ITEM 10. | SUBMISSION OF MATTERS TO A VOTE OF SECURITY HOLDERS. |
Not applicable.
| ITEM 11. | CONTROLS AND PROCEDURES. |
| | (a) | The registrant’s principal executive officer and principal financial officer have concluded that the registrant’s disclosure controls and procedures (as defined in Rule 30a- 3(c) under the Investment Company Act of 1940, as amended (the “1940 Act”)) are effective as of a date within 90 days of the filing date of this report that includes the disclosure required by this paragraph, based on their evaluation of the disclosure controls and procedures required by Rule 30a-3(b) under the 1940 Act and 15d-15(b) under the Securities Exchange Act of 1934. |
| | (b) | There were no changes in the registrant’s internal control over financial reporting (as defined in Rule 30a-3(d) under the 1940 Act) that occurred during the registrant’s last fiscal half-year (the registrant’s second fiscal half-year in the case of an annual report) that have materially affected, or are likely to materially affect the registrant’s internal control over financial reporting. |
(a) (1) Code of Ethics attached hereto.
Exhibit 99.CODE ETH
(a) (2) Certifications pursuant to section 302 of the Sarbanes-Oxley Act of 2002 attached hereto.
Exhibit 99.CERT
(b) Certifications pursuant to Section 906 of the Sarbanes-Oxley Act of 2002 attached hereto.
Exhibit 99.906CERT
SIGNATURES
Pursuant to the requirements of the Securities Exchange Act of 1934 and the Investment Company Act of 1940, the registrant has duly caused this Report to be signed on its behalf by the undersigned, there unto duly authorized.
| | |
| Legg Mason Partners Variable Equity Trust |
| |
| By: | | /S/ R. JAY GERKEN |
| | (R. Jay Gerken) |
| | Chief Executive Officer of |
| | Legg Mason Partners Variable Equity Trust |
|
| Date: February 25, 2011 |
Pursuant to the requirements of the Securities Exchange Act of 1934 and the Investment Company Act of 1940, this report has been signed below by the following persons on behalf of the registrant and in the capacities and on the dates indicated.
| | |
| By: | | /S/ R. JAY GERKEN |
| | (R. Jay Gerken) |
| | Chief Executive Officer of |
| | Legg Mason Partners Variable Equity Trust |
|
| Date: February 25, 2011 |
| |
| By: | | /S/ KAPREL OZSOLAK |
| | (Kaprel Ozsolak) |
| | Chief Financial Officer of |
| | Legg Mason Partners Variable Equity Trust |
|
| Date: February 25, 2011 |