UNITED STATES
SECURITIES AND EXCHANGE COMMISSION
Washington, D.C. 20549
FORM N-CSR
CERTIFIED SHAREHOLDER REPORT OF REGISTERED
MANAGEMENT INVESTMENT COMPANIES
Investment Company Act file number 811-21128
Legg Mason Partners Variable Equity Trust
(Exact name of registrant as specified in charter)
55 Water Street, New York, NY 10041
(Address of principal executive offices) (Zip code)
Robert I. Frenkel, Esq.
Legg Mason & Co., LLC
100 First Stamford Place
Stamford, CT 06902
(Name and address of agent for service)
Registrant’s telephone number, including area code: 1-877-721-1926
Date of fiscal year end: December 31
Date of reporting period: December 31, 2011
| ITEM 1. | REPORT TO STOCKHOLDERS. |
The Annual Report to Stockholders is filed herewith.
December 31, 2011

Annual
Repor t
Legg Mason
Global Currents
Variable International
All Cap Opportunity
Portfolio
INVESTMENT PRODUCTS: NOT FDIC INSURED • NO BANK GUARANTEE • MAY LOSE VALUE
| | |
| II | | Legg Mason Global Currents Variable International All Cap Opportunity Portfolio |
Portfolio objective
The Portfolio seeks total return on its assets from growth of capital and income.
Letter from the chairman

Dear Shareholder,
We are pleased to provide the annual report of Legg Mason Global Currents Variable International All Cap Opportunity Portfolio for the twelve-month reporting period ended December 31, 2011. Please read on for a detailed look at prevailing economic and market conditions during the Portfolio’s reporting period and to learn how those conditions have affected Portfolio performance.
As always, we remain committed to providing you with excellent service and a full spectrum of investment choices. We also remain committed to supplementing the support you receive from your financial advisor. One way we accomplish this is through our website, www.leggmason.com/individualinvestors. Here you can gain immediate access to market and investment information, including:
| Ÿ | | Market insights and commentaries from our portfolio managers and |
| Ÿ | | A host of educational resources. |
Special shareholder notice
The Board of Trustees of the Portfolio determined that it is in the best interests of the Portfolio and its shareholders to terminate and wind up the Portfolio. The Portfolio is expected to cease operations on or about April 30, 2012. At some point before that date, at the discretion of portfolio management, in preparation for the termination of the Portfolio, the assets of the Portfolio will be liquidated and the Portfolio will cease to pursue its investment objective.
Shareholders of the Portfolio who elect to redeem their shares prior to the completion of the liquidation will be redeemed in the ordinary course at the Portfolio’s net asset value (“NAV”)i per share. Each shareholder who remains in the Portfolio will receive a liquidating distribution equal to the aggregate NAV of the shares of the Portfolio that such shareholder then holds.
| | | | |
| Legg Mason Global Currents Variable International All Cap Opportunity Portfolio | | | III | |
We look forward to helping you meet your financial goals.
Sincerely,

R. Jay Gerken, CFA
Chairman, President and
Chief Executive Officer
January 27, 2012
| i | Net asset value (“NAV”) is the dollar value of a single mutual fund share, based on the value of the underlying assets of the fund minus its liabilities, divided by the number of shares outstanding. NAV is calculated at the end of each business day. |
| | |
| IV | | Legg Mason Global Currents Variable International All Cap Opportunity Portfolio |
Investment commentary
Economic review
Economic growth in the U.S. accelerated over the twelve months ended December 31, 2011. However, the pace of the expansion was less robust than during most other periods exiting a severe recession. U.S. gross domestic product (“GDP”)i growth, as reported by the U.S. Department of Commerce, was 0.4% and 1.3% in the first and second quarters of 2011, respectively. Third quarter GDP growth then rose to 1.8%. The economy then gathered further momentum late in the year, as the Commerce Department’s initial estimate for fourth quarter GDP growth was 2.8% — the fastest pace since the second quarter of 2010. This was attributed, in part, to higher consumer spending, which rose 2.0% in the fourth quarter, versus 1.7% and 0.7% gains in the third and second quarters, respectively.
Two factors holding back the economy were the weak job market and continued strains in the housing market. While there was some improvement in early 2011 and late in the reporting period, unemployment remained elevated. When 2011 began, unemployment, as reported by the U.S. Department of Labor, was 9.4%. After dipping below 9.0% in March 2011 (to 8.9%), unemployment moved back to 9.0% in April. Unemployment stayed above 9.0% over the next five months before declining to 8.9% in October. Unemployment then fell to 8.6% in November and 8.5% in December, the latter being the lowest rate since February 2009. The housing market showed some encouraging signs, although home prices still appear to be searching for a bottom. Looking back, existing-home sales moved somewhat higher in January 2011, according to the National Association of Realtors (“NAR”). Existing-home sales then fluctuated over the next eight months before rising during each of the last three months of the year. In addition, the year ended with the lowest inventory of unsold homes since April 2006. However, existing-home prices remained weak versus a year ago, with the NAR reporting that the median existing-home price for all housing types was $164,500 in December 2011, down 2.5% from December 2010.
While the manufacturing sector continued to expand, it experienced a soft patch during a portion of the reporting period. Based on the Institute for Supply Management’s PMI (“PMI”)ii, in February 2011, the manufacturing sector expanded at its fastest pace since May 2004, with a reading of 61.4 (a reading below 50 indicates a contraction, whereas a reading above 50 indicates an expansion). The PMI then generally moderated over the next several months and was 50.6 in August 2011, its lowest reading in two years. However, the manufacturing sector gained some momentum late in the period and ended December at 53.9, its highest reading in the last six months.
Disappointing economic news was not limited to the U.S. In January 2012 (after the reporting period ended), the International Monetary Fund (“IMF”) lowered its growth projections for the global economy. This was due, in part, to the IMF’s expectation that the Eurozone would experience “a mild recession in 2012 as a result of the rise in sovereign yields, the effects of bank deleveraging on the real economy, and the impact of additional fiscal consolidation.” The IMF now anticipates 2012 growth will be -0.5% in the Eurozone and 1.7% in Japan. While growth in emerging market countries is expected to remain higher than in their developed country counterparts, the IMF reduced its 2012 projection for the former from 6.1% to 5.4%.
The Federal Reserve Board (“Fed”)iii took a number of actions as it sought to meet its dual mandate of fostering maximum employment and price stability. As has been the case since December 2008, the Fed kept the federal funds rateiv at a historically low range between zero and 0.25%. In addition, in August 2011, the Fed declared
| | | | |
| Legg Mason Global Currents Variable International All Cap Opportunity Portfolio | | | V | |
its intention to keep the federal funds rate steady until mid-2013. Then, in September 2011, the Fed announced its intention to purchase $400 billion of longer-term Treasury securities and to sell an equal amount of shorter-term Treasury securities by June 2012 (often referred to as “Operation Twist”). At its meeting in December, the Fed potentially opened the door to another round of quantitative easing in 2012, saying it is “prepared to employ its tools to promote a stronger economic recovery in a context of price stability.” Finally, in January 2012 (after the reporting period ended), the Fed extended the period it expects to keep rates on hold, saying “economic conditions — including low rates of resource utilization and a subdued outlook for inflation over the medium run — are likely to warrant exceptionally low levels for the federal funds rate at least through late 2014.”
Due to mounting economic challenges in the Eurozone, the European Central Bank (“ECB”) shifted its monetary policy during the reporting period. Citing inflationary pressures, the ECB raised interest rates in April 2011 from 1.00% to 1.25%, and then to 1.50% in July. However, with growth moderating and given the ongoing European sovereign debt crisis, the ECB lowered interest rates to 1.25% in November and 1.00% in December, equaling its all-time low. In other developed countries, the Bank of England kept rates on hold at 0.50% during the reporting period, as did Japan at a range of zero to 0.10%, the lowest level since 2006. Elsewhere, a number of emerging market countries, including China and India, raised interest rates during the reporting period in an effort to ward off inflation.
As always, thank you for your confidence in our stewardship of your assets.
Sincerely,
R. Jay Gerken, CFA
Chairman, President and
Chief Executive Officer
January 27, 2012
All investments are subject to risk including the possible loss of principal. Past performance is no guarantee of future results. Forecasts and predictions are inherently limited and should not be relied upon as an indication of actual or future performance.
| i | Gross domestic product (“GDP”) is the market value of all final goods and services produced within a country in a given period of time. |
| ii | The Institute for Supply Management’s PMI is based on a survey of purchasing executives who buy the raw materials for manufacturing at more than 350 companies. It offers an early reading on the health of the manufacturing sector. |
| iii | The Federal Reserve Board (“Fed”) is responsible for the formulation of policies designed to promote economic growth, full employment, stable prices and a sustainable pattern of international trade and payments. |
| iv | The federal funds rate is the rate charged by one depository institution on an overnight sale of immediately available funds (balances at the Federal Reserve) to another depository institution; the rate may vary from depository institution to depository institution and from day to day. |
| | | | |
| Legg Mason Global Currents Variable International All Cap Opportunity Portfolio 2011 Annual Report | | | 1 | |
Portfolio overview
Q. What is the Portfolio’s investment strategy?
A. The Portfolio seeks total return on its assets from growth of capital and income. Under normal circumstances, the Portfolio invests at least 80% of its net assets in a diversified portfolio of equity securities of foreign companies and invests substantially all of its assets outside the United States. The Portfolio may invest in equity securities of small-, medium- and large-capitalization issuers. The Portfolio may invest up to 20% of the value of its net assets in debt securities. We leverage an integrated global research approach that seeks stocks in companies that we believe offer the best potential for capital appreciation. While we select investments primarily for their capital appreciation potential, some investments have an income component as well. The Portfolio may also invest in emerging markets on an opportunistic basis.
Q. What were the overall market conditions during the Portfolio’s reporting period?
A. During the twelve-month reporting period ending December 31, 2011, international and global equity markets reflected significant volatility and unpredictability and generated losses across varied investment styles, market capitalization and geography. Generally, market participants were mired in financial turmoil including Europe’s sovereign default issues, inflationary pressures in the developing markets, and lackluster growth in many regions of the globe. As the year drew to a close, most investors had concluded that the continuing woes of the Eurozone were unlikely to be fixed quickly. Policy and macroeconomic moves weighed heavily on equity markets and continued to be the key driver for performance with underlying stock fundamentals taking a back seat. Economic indicators in the U.S. seemed to reflect continued growth albeit at low levels. Overall, global economic markets have been reliant on consistent efforts from central banks to add liquidity into the financial system to prop up asset prices in an environment where deleveraging is required to deal with a long period of accumulated debt from both consumers and businesses.
During the reporting period, many investors rotated from a “risk on” to a “risk off” mentality, and back again, behavior that drove market volatility higher. Although many investment strategists and economists had been optimistic about economic growth at the beginning of the year, as 2011 progressed sentiment turned more cautious as the potential for the world’s economies to head into a double-dip recession and concerns about a global financial contagion rose. Adding to a stewpot of worries, continued weakness in emerging market economies impacted markets, especially China, which has been fighting inflation and slowing growth. Overall, the policy response of government officials in Europe, Asia and the U.S. seemed the key factor affecting capital markets and this intensified during the reporting period. As concerns elevated in the third quarter of 2011, money moved dramatically to cash and government bonds despite yields below the rate of inflation. Investors retreated from equities, high-yield bonds, and emerging market bonds. Even gold — frequently perceived to be a safe harbor — reflected a collapse in prices during the month of September. Moreover, serious declines in commodities seemed to indicate a reduction in demand worldwide. Despite a significant drawdown in prices during the third quarter of 2011, equity markets recovered in the fourth quarter of the year as investors responded positively to proposed solutions in Europe and favorable economic reports in the U.S. Overall, policy uncertainty coupled with stresses in both equity and credit markets and lackluster economic growth weighed on investors as the reporting period closed.
| | |
| 2 | | Legg Mason Global Currents Variable International All Cap Opportunity Portfolio 2011 Annual Report |
Portfolio overview (cont’d)
The international equity markets, as measured by the MSCI All Country World Index Ex-U.S. (“MSCI ACWI Ex-U.S.”)i, posted a loss of 13.71% during the twelve months ended December 31, 2011.
Q. How did we respond to these changing market conditions?
A. In the face of such a mixed investing environment during the reporting period, the investment team’s focus was to build a diversified portfolio of high-quality companies trading at attractive valuations based upon conservative levels of profits. While troubling, the decline in equity prices during the reporting period served to accelerate the team’s valuations-focused investment process and enhance portfolio construction while seeking to capture long-term returns for the Portfolio. Notably, the investment team’s research analysts spend considerable time seeking to invest in companies that can deliver sustainable cash flows and reflect high-quality internal growth drivers that can provide a competitive edge in their respective industry. The investment philosophy focuses on companies that reflect low valuations relative to the individual stock’s history, sector, and country.
The Portfolio was positioned in accordance with a disciplined, valuation focused approach that delivered bottom up, active stock selection using a combination of quantitative, qualitative and fundamental analysis. The investment team’s search for value during the reporting period led to an overweight in Europe ex United Kingdom, where the continent’s debt crisis and volatility have presented significant opportunities. Due to valuation, the investment team did not increase the allocation to emerging markets during the reporting period; however, the research analysts continually monitor the developing markets to seek opportunities to invest that meet valuation criteria.
In 2011, the investment team extracted significant benefits through investing in Materials, Telecommunication Services and Energy stocks within the Portfolio. For much of the year, the market was more driven by macroeconomic and policy factors, and alternatively, the value factors that the investment team focuses on lagged in performance. However, the Fund performed well during the fourth quarter when the market recovered and a greater number of stocks outperformed.
The investment team anticipates that market volatility will continue going forward as excess debt and leverage unwind and the market drives risk to be priced properly and governments to enact more realistic policies. However, the investment team does sense some fatigue in the risk-on, risk-off process and believes that volatility will settle down as the noise is cancelled and market participants are left with pure signal, which for the Portfolio is idiosyncratic, fundamental stock criteria that can be interpreted and acted upon for the benefit of clients. The market is reflecting consistent de-risking of earnings expectations with profit estimates declining — generally a positive for the contrarian value approach employed by the Portfolio. The investment team anticipates a winding down of insolvent institutions globally, the initiation of more austerity programs, and a general decline in capital allocation to inefficient uses and a rise in deployment of capital to the real economy. As a contrarian value manager operating in times of uncertainty, the investment team tends to rely upon low valuations, conservative profit expectations and solid balance sheets. Generally, the team believes that the macro risks in the U.S., Europe, Asia and the developing markets are increasingly well known and priced into stocks currently. Given this backdrop, the investment team believes that the high correlations of individual securities seen in 2011 will give way in 2012 to an environment where individual companies and stocks will tend to be evaluated by their underlying
| | | | |
| Legg Mason Global Currents Variable International All Cap Opportunity Portfolio 2011 Annual Report | | | 3 | |
free cash flow, earnings growth and the value of the products and services offered to customers.
The investment team is encouraged by the progress European leaders have made by taking constructive steps to remedy the unsustainable welfare state and accompanying reckless government spending. Over time, we believe it is likely that the Eurozone will allocate capital more effectively to the creative private sector that has the potential for real growth versus a capital destroying public sector. However, there is still significant risk in Europe and only time will tell whether the participating countries will be willing to put their respective houses in order to position Europe for recovery and growth going forward. Regarding concerns about the Eurozone, the investment team closely monitors credit markets and other indicators for signs of stress that would indicate rising solvency risk and can position the Portfolio to reduce or eliminate exposure to those stocks experiencing potentially damaging liquidity shortfalls. Despite the wall of worry in equity markets, the team continues to seek companies that exhibit low valuations, depressed profitability and low expectations, and believes that there are promising opportunities for individual stocks to deliver solid performance going forward. In emerging markets, generally the investment team’s view is that valuations have more room to decline relative to the developed world.
In terms of investment outlook, given the current phase of the global economic cycle, the investment team anticipates that early cycle investments will do better going forward, such as specific Financials, Global Cyclicals and Consumer stocks. The investment team is also evaluating individual companies with resilient cash flows — such as Health Care, Consumer Staples, Software, Commercial Services and Household Product companies. Currently, the investment team believes it is too soon to invest in the late cycle companies that led the market for much of 2011. Looking ahead, the focus is on building a diversified portfolio of high-quality, global industry leaders trading at attractive valuations based upon conservative levels of profits.
Performance review
For the twelve months ended December 31, 2011, Legg Mason Global Currents Variable International All Cap Opportunity Portfolio1 returned -11.59%. The Portfolio’s new unmanaged benchmark, the MSCI ACWI Ex-U.S., and its former unmanaged benchmark, the MSCI EAFE Indexii, returned -13.71% and -12.14%, respectively, for the same period. The Lipper Variable International Core Funds Category Average2 returned -13.08% over the same time frame.
| 1 | The Portfolio is an underlying investment option of various variable annuity and variable life insurance products. The Portfolio’s performance returns do not reflect the deduction of expenses imposed in connection with investing in variable annuity or variable life insurance contracts, such as administrative fees, account charges and surrender charges, which, if reflected, would reduce the performance of the Portfolio. Past performance is no guarantee of future results. |
| 2 | Lipper, Inc., a wholly-owned subsidiary of Reuters, provides independent insight on global collective investments. Returns are based on the twelve-month period ended December 31, 2011, including the reinvestment of all distributions, including returns of capital, if any, calculated among the 131 funds in the Portfolio’s Lipper category. |
| | |
| 4 | | Legg Mason Global Currents Variable International All Cap Opportunity Portfolio 2011 Annual Report |
Portfolio overview (cont’d)
| | | | | | | | |
Performance Snapshot as of December 31, 2011
(unaudited) | |
| | | 6 months | | | 12 months | |
| Legg Mason Global Currents Variable International All Cap Opportunity Portfolio1 | | | -15.12 | % | | | -11.59 | % |
| MSCI All Country World Index Ex-U.S. | | | -16.87 | % | | | -13.71 | % |
| MSCI EAFE Index | | | -16.31 | % | | | -12.14 | % |
| Lipper Variable International Core Funds Category Average2 | | | -16.97 | % | | | -13.08 | % |
The performance shown represents past performance. Past performance is no guarantee of future results and current performance may be higher or lower than the performance shown above. Principal value and investment returns will fluctuate and investors’ shares, when redeemed, may be worth more or less than their original cost.
Portfolio returns assume the reinvestment of all distributions at net asset value and the deduction of all Portfolio expenses. Performance figures for periods shorter than one year represent cumulative figures and are not annualized.
Portfolio performance figures reflect fee waivers and/or expense reimbursements, without which the performance would have been lower.
| | | | |
| Total Annual Operating Expenses (unaudited) |
As of the Portfolio’s current prospectus dated May 1, 2011, the gross total annual operating expense ratio for the Portfolio was 1.20%.
Actual expenses may be higher. For example, expenses may be higher than those shown if average net assets decrease. Net assets are more likely to decrease and Portfolio expense ratios are more likely to increase when markets are volatile.
Q. What were the leading contributors to performance?
A. Stock selection in the Materials, Telecommunication Services and Energy sectors significantly enhanced the Portfolio’s results during the period. An underweight to Energy and Materials also contributed positively to performance. On a country basis, performance benefited through stock selection in Japan, Canada, Brazil, China and South Korea. Over the reporting period, individual stocks that made a significant contribution to performance included BCE Inc. in the Telecommunications sector, Royal Dutch Shell in the Energy sector, and HeidelbergCement AG in the Materials sector.
| 1 | The Portfolio is an underlying investment option of various variable annuity and variable life insurance products. The Portfolio’s performance returns do not reflect the deduction of expenses imposed in connection with investing in variable annuity or variable life insurance contracts, such as administrative fees, account charges and surrender charges, which, if reflected, would reduce the performance of the Portfolio. Past performance is no guarantee of future results. |
| 2 | Lipper, Inc., a wholly-owned subsidiary of Reuters, provides independent insight on global collective investments. Returns are based on the period ended December 31, 2011, including the reinvestment of all distributions, including returns of capital, if any, calculated among the 133 funds for the six-month period and among the 131 funds for the twelve-month period in the Portfolio’s Lipper category. |
| | | | |
| Legg Mason Global Currents Variable International All Cap Opportunity Portfolio 2011 Annual Report | | | 5 | |
Q. What were the leading detractors from performance?
A. Stock selection in the Utilities, Financials and Health Care sectors negatively impacted performance during the reporting period. On a country basis, performance declined through stock selection in the United Kingdom, Australia and Hong Kong. Individual holdings that detracted from performance during the period included Veolia Environnement S.A. in the Utilities sector, Bayer AG in the Health Care sector and AXA S.A. in the Financials sector.
Thank you for your investment in Legg Mason Global Currents Variable International All Cap Opportunity Portfolio. As always, we appreciate that you have chosen us to manage your assets.
Sincerely,

Paul D. Ehrlichman
Head of Global Equity and
Portfolio Manager
Global Currents Investment
Management, LLC

Sean M. Bogda, CFA
Portfolio Manager
Global Currents Investment
Management, LLC

Elisa Mazen
Portfolio Manager
Global Currents Investment
Management, LLC

Safa R. Muhtaseb, CFA
Portfolio Manager
Global Currents Investment
Management, LLC
January 17, 2012
RISKS: The Portfolio is subject to certain risks of overseas investing not associated with domestic investing, including currency fluctuations, changes in political and economic conditions, differing securities regulations and periods of illiquidity, which could result in significant market fluctuations. These risks are magnified in emerging markets. Fixed-income securities involve interest rate, credit, inflation and reinvestment risks. As interest rates rise, the value of fixed-income securities falls, reducing the value of the Portfolio’s share price. Diversification does not assure against market loss. The Portfolio may use derivatives, such as options and futures, which can be illiquid, may disproportionately increase losses, and have a potentially large impact on Portfolio performance. Please see the Portfolio’s prospectus for a more complete discussion of these and other risks, and the Portfolio’s investment strategies.
| | |
| 6 | | Legg Mason Global Currents Variable International All Cap Opportunity Portfolio 2011 Annual Report |
Portfolio overview (cont’d)
Portfolio holdings and breakdowns are as of December 31, 2011 and are subject to change and may not be representative of the portfolio managers’ current or future investments. The Portfolio’s top ten holdings (as a percentage of net assets) as of this date were: Royal Dutch Shell PLC, Class A Shares (3.3%), China Mobile Ltd., ADR (2.8%), Sanofi (2.4%), Sumitomo Mitsui Financial Group Inc. (2.4%), Loomis AB, Class B Shares (2.3%), BCE Inc. (2.2%), Rhoen-Klinikum AG (2.1%), Canadian Natural Resources Ltd. (2.0%), Primary Health Care Ltd. (2.0%) and Publicis Groupe SA (1.9%). Please refer to pages 11 through 15 for a list and percentage breakdown of the Portfolio’s holdings.
The mention of sector breakdowns is for informational purposes only and should not be construed as a recommendation to purchase or sell any securities. The information provided regarding such sectors is not a sufficient basis upon which to make an investment decision. Investors seeking financial advice regarding the appropriateness of investing in any securities or investment strategies discussed should consult their financial professional. The Portfolio’s top five sector holdings (as a percentage of net assets) as of December 31, 2011 were: Consumer Discretionary (17.3%), Financials (14.3%), Industrials (13.8%), Health Care (13.6%) and Information Technology (8.3%). The Portfolio’s composition is subject to change at any time.
All investments are subject to risk including the possible loss of principal. Past performance is no guarantee of future results. All index performance reflects no deduction for fees, expenses or taxes. Please note that an investor cannot invest directly in an index.
The information provided is not intended to be a forecast of future events, a guarantee of future results or investment advice. Views expressed may differ from those of the firm as a whole.
| i | The MSCI All Country World Index Ex-U.S. (“MSCI ACWI Ex-U.S.”) is a market-capitalization-weighted index that is designed to measure performance of stocks throughout the world, with the exception of U.S.-based companies. The MSCI ACWI Ex-U.S. includes both developed and emerging markets. |
| ii | The MSCI EAFE Index is a free float-adjusted market capitalization index designed to measure developed market equity performance, excluding the U.S. and Canada. |
| | | | |
| Legg Mason Global Currents Variable International All Cap Opportunity Portfolio 2011 Annual Report | | | 7 | |
Portfolio at a glance† (unaudited)
Investment breakdown (%) as a percent of total investments
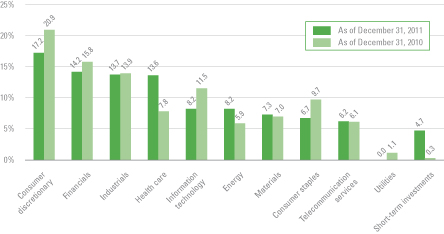
| † | The bar graph above represents the composition of the Portfolio’s investments as of December 31, 2011 and December 31, 2010. The Portfolio is actively managed. As a result, the composition of the Portfolio’s investments is subject to change at any time. |
| | |
| 8 | | Legg Mason Global Currents Variable International All Cap Opportunity Portfolio 2011 Annual Report |
Portfolio expenses (unaudited)
Example
As a shareholder of the Portfolio, you may incur two types of costs: (1) transaction costs and (2) ongoing costs, including management fees and other Portfolio expenses. This example is intended to help you understand your ongoing costs (in dollars) of investing in the Portfolio and to compare these costs with the ongoing costs of investing in other mutual funds.
This example is based on an investment of $1,000 invested on July 1, 2011 and held for the six months ended December 31, 2011.
Actual expenses
The table below titled “Based on Actual Total Return” provides information about actual account values and actual expenses. You may use the information provided in this table, together with the amount you invested, to estimate the expenses that you paid over the period. To estimate the expenses you paid on your account, divide your ending account value by $1,000 (for example, an $8,600 ending account value divided by $1,000 = 8.6), then multiply the result by the number under the heading entitled “Expenses Paid During the Period”.
Hypothetical example for comparison purposes
The table below titled “Based on Hypothetical Total Return” provides information about hypothetical account values and hypothetical expenses based on the actual expense ratio and an assumed rate of return of 5.00% per year before expenses, which is not the Portfolio’s actual return. The hypothetical account values and expenses may not be used to estimate the actual ending account balance or expenses you paid for the period. You may use the information provided in this table to compare the ongoing costs of investing in the Portfolio and other funds. To do so, compare the 5.00% hypothetical example relating to the Portfolio with the 5.00% hypothetical examples that appear in the shareholder reports of the other funds.
Please note that the expenses shown in the table below are meant to highlight your ongoing costs only and do not reflect any transactional costs. Therefore, the table is useful in comparing ongoing costs only, and will not help you determine the relative total costs of owning different funds. In addition, if these transaction costs were included, your costs would have been higher.
| | | | | | | | | | | | | | | | | | | | | | | | | | | | | | | | | | | | | | | | | | | | | | | | | | | | | |
| Based on actual total return1 | | | | Based on hypothetical total return1 |
Actual
Total
Return2 | | Beginning
Account Value | | Ending
Account
Value | | Annualized
Expense
Ratio | | Expenses
Paid During
The Period3 | | | | Hypothetical
Annualized
Total Return | | Beginning
Account
Value | | Ending
Account
Value | | Annualized
Expense
Ratio | | Expenses
Paid During
The Period3 |
| | | -15.12% | | | | $ | 1,000.00 | | | | $ | 848.80 | | | | | 1.45 | % | | | $ | 6.76 | | | | | | | 5.00 | % | | | | $1,000.00 | | | | $ | 1,017.90 | | | | | 1.45 | % | | | $ | 7.37 | |
| 1 | For the six months ended December 31, 2011. |
| 2 | Assumes the reinvestment of all distributions, including returns of capital, if any, at net asst value. Total return is not annualized, as it may not be representative of the total return for the year. Total return does not reflect expenses associated with separate accounts such as administrative fees, account charges and surrender charges, which, if reflected, would reduce the total return. Performance figures may reflect compensating balance arrangements, fee waivers and/or expense reimbursements. In the absence of compensating balance arrangements, fee waivers and/or expense reimbursements, the total return would have been lower. Past performance is no guarantee of future results. |
| 3 | Expenses (net of compensating balance arrangements, fee waivers and/or expense reimbursements) are equal to the Portfolio’s annualized expense ratio multiplied by the average account value over the period, multiplied by the number of days in the most recent fiscal half-year (184), then divided by 365. |
| | | | |
| Legg Mason Global Currents Variable International All Cap Opportunity Portfolio 2011 Annual Report | | | 9 | |
Portfolio performance (unaudited)
| | | | |
| Average annual total returns1 | | | |
| Twelve Months Ended 12/31/11 | | | -11.59 | % |
| Five Years Ended 12/31/11 | | | -6.63 | |
| Ten Years Ended 12/31/11 | | | 1.09 | |
| | | | |
| Cumulative total return1 | | | |
| 12/31/01 through 12/31/11 | | | 11.41 | % |
All figures represent past performance and are not a guarantee of future results. Investment return and principal value of an investment will fluctuate so that an investor’s shares, when redeemed, may be worth more or less then their original cost. The returns shown do not reflect expenses associated with separate accounts such as administrative fees, account charges and surrender charges, which if reflected, would reduce the total returns. Performance figures may reflect compensating balance arrangements, fee waives and/or expenses reimbursements. In the absence of compensating balance arrangements, fee waives and/or expenses reimbursements, the total return would have been lower.
| 1 | Assumes the reinvestment of all distributions, including returns of capital, if any, at net asset value. |
| | |
| 10 | | Legg Mason Global Currents Variable International All Cap Opportunity Portfolio 2011 Annual Report |
Portfolio performance (unaudited) (cont’d)
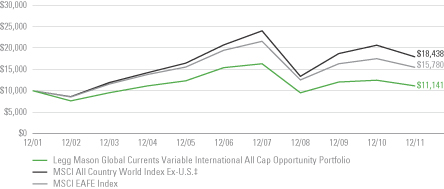
Historical performance
Value of $10,000 invested in
Legg Mason Global Currents Variable International All Cap Opportunity Portfolio vs. MSCI All Country World Index Ex-U.S. and MSCI EAFE Index†‡ — December 2001 - December 2011
All figures represent past performance and are not a guarantee of future results. Investment return and principal value of an investment will fluctuate so that an investor’s shares, when redeemed, may be worth more or less than their original cost. The returns shown do not reflect expenses associated with separate accounts such as administrative fees, account charges and surrender charges, which, if reflected, would reduce the total returns. Performance figures may reflect compensating balance arrangements, fee waivers and/or expense reimbursements. In the absence of compensating balance arrangements, fee waivers and/or expense reimbursements, the total return would have been lower.
| † | Hypothetical illustration of $10,000 invested in Legg Mason Global Currents Variable International All Cap Opportunity Portfolio on December 31, 2001, assuming the reinvestment of all distributions, including returns of capital, if any, at net asset value through December 31, 2011. The hypothetical illustration also assumes a $10,000 investment in the MSCI All Country World Index Ex-U.S. (“MSCI ACWI Ex-U.S.”) and the MSCI EAFE Index. The MSCI ACWI Ex-U.S. is a market-capitalization-weighted index that is designed to measure performance of stocks throughout the world, with the exception of U.S.-based companies. The MSCI ACWI Ex-U.S. includes both developed and emerging markets. The MSCI EAFE Index is a free float-adjusted market capitalization index designed to measure developed market equity performance, excluding the U.S. and Canada. These Indices are unmanaged and are not subject to the same management and trading expenses as a mutual fund. Please note that an investor cannot invest directly in an index. |
| ‡ | Effective July 1, 2011, the Portfolio’s benchmark changed from the MSCI EAFE Index to the MSCI ACWI Ex-U.S. Management believes the MSCI ACWI Ex-U.S. is a more appropriate benchmark for the Portfolio since the Index is broader and more diversified than the MSCI EAFE Index and as a result will provide shareholders with a better tool for assessing the Portfolio’s success relative to its investment objective and comparable funds. |
| | | | |
| Legg Mason Global Currents Variable International All Cap Opportunity Portfolio 2011 Annual Report | | | 11 | |
Schedule of investments
December 31, 2011
Legg Mason Global Currents Variable International All Cap Opportunity Portfolio
| | | | | | | | | | | | |
| Security | | | | | | Shares | | | Value | |
| Common Stocks — 95.8% | | | | | | | | | | | | |
| Consumer Discretionary — 17.3% | | | | | | | | | | | | |
Auto Components — 1.0% | | | | | | | | | | | | |
Bridgestone Corp. | | | | | | | 1,907 | | | $ | 43,234 | |
Automobiles — 1.2% | | | | | | | | | | | | |
DaimlerChrysler AG, Registered Shares | | | | | | | 1,105 | | | | 48,510 | |
Hotels, Restaurants & Leisure — 3.3% | | | | | | | | | | | | |
Carnival PLC | | | | | | | 2,280 | | | | 75,278 | |
Greene King PLC | | | | | | | 8,738 | | | | 66,114 | |
Total Hotels, Restaurants & Leisure | | | | | | | | | | | 141,392 | |
Household Durables — 0.5% | | | | | | | | | | | | |
Electrolux AB | | | | | | | 1,320 | | | | 21,041 | |
Media — 6.7% | | | | | | | | | | | | |
Grupo Televisa SA, ADR | | | | | | | 3,753 | | | | 79,038 | |
Publicis Groupe SA | | | | | | | 1,771 | | | | 81,474 | |
Reed Elsevier NV | | | | | | | 6,886 | | | | 80,272 | |
WPP PLC | | | | | | | 4,200 | | | | 44,060 | |
Total Media | | | | | | | | | | | 284,844 | |
Multiline Retail — 1.4% | | | | | | | | | | | | |
Myer Holdings Ltd. | | | | | | | 28,819 | | | | 57,036 | |
Specialty Retail — 3.2% | | | | | | | | | | | | |
SHIMAMURA Co., Ltd. | | | | | | | 632 | | | | 64,620 | |
Statoil Fuel & Retail ASA | | | | | | | 9,640 | | | | 71,871 | * |
Total Specialty Retail | | | | | | | | | | | 136,491 | |
Total Consumer Discretionary | | | | | | | | | | | 732,548 | |
| Consumer Staples — 6.7% | | | | | | | | | | | | |
Beverages — 1.6% | | | | | | | | | | | | |
Anheuser-Busch InBev NV, Strip VVPR | | | | | | | 1,997 | | | | 3 | *(a) |
C&C Group PLC | | | | | | | 18,263 | | | | 67,365 | |
Total Beverages | | | | | | | | | | | 67,368 | |
Food Products — 5.1% | | | | | | | | | | | | |
Aryzta AG | | | | | | | 1,550 | | | | 74,917 | |
Unilever NV, CVA | | | | | | | 2,027 | | | | 69,705 | |
Viterra Inc. | | | | | | | 6,896 | | | | 72,700 | |
Total Food Products | | | | | | | | | | | 217,322 | |
Total Consumer Staples | | | | | | | | | | | 284,690 | |
| Energy — 8.3% | | | | | | | | | | | | |
Oil, Gas & Consumable Fuels — 8.3% | | | | | | | | | | | | |
BG Group PLC | | | | | | | 3,542 | | | | 75,718 | |
Cairn Energy PLC | | | | | | | 100 | | | | 412 | * |
See Notes to Financial Statements.
| | |
| 12 | | Legg Mason Global Currents Variable International All Cap Opportunity Portfolio 2011 Annual Report |
Schedule of investments (cont’d)
December 31, 2011
Legg Mason Global Currents Variable International All Cap Opportunity Portfolio
| | | | | | | | | | | | |
| Security | | | | | | Shares | | | Value | |
Oil, Gas & Consumable Fuels — continued | | | | | | | | | | | | |
Canadian Natural Resources Ltd. | | | | | | | 2,322 | | | $ | 86,954 | |
Gazprom OAO, ADR | | | | | | | 4,376 | | | | 46,648 | |
Royal Dutch Shell PLC, Class A Shares | | | | | | | 3,865 | | | | 140,814 | |
Total Energy | | | | | | | | | | | 350,546 | |
| Financials — 14.3% | | | | | | | | | | | | |
Capital Markets — 3.0% | | | | | | | | | | | | |
F&C Asset Management PLC | | | | | | | 59,458 | | | | 60,435 | |
UBS AG, Registered Shares | | | | | | | 5,683 | | | | 67,642 | * |
Total Capital Markets | | | | | | | | | | | 128,077 | |
Commercial Banks — 6.8% | | | | | | | | | | | | |
Banco Santander SA | | | | | | | 9,036 | | | | 68,649 | |
Barclays PLC | | | | | | | 24,089 | | | | 65,861 | |
DBS Group Holdings Ltd. | | | | | | | 5,799 | | | | 51,505 | |
Sumitomo Mitsui Financial Group Inc. | | | | | | | 3,700 | | | | 103,063 | |
Total Commercial Banks | | | | | | | | | | | 289,078 | |
Insurance — 2.7% | | | | | | | | | | | | |
AXA SA | | | | | | | 5,531 | | | | 71,907 | |
Muenchener Rueckversicherungs-Gesellschaft AG (MunichRe), Registered Shares | | | | | | | 350 | | | | 42,934 | |
Total Insurance | | | | | | | | | | | 114,841 | |
Real Estate Management & Development — 1.8% | | | | | | | | | | | | |
Cheung Kong Holdings Ltd. | | | | | | | 3,670 | | | | 43,733 | |
GAGFAH SA | | | | | | | 6,241 | | | | 32,100 | |
Total Real Estate Management & Development | | | | | | | | | | | 75,833 | |
Total Financials | | | | | | | | | | | 607,829 | |
| Health Care — 13.6% | | | | | | | | | | | | |
Health Care Equipment & Supplies — 1.0% | | | | | | | | | | | | |
Nobel Biocare Holding AG, Registered Shares | | | | | | | 3,620 | | | | 42,085 | * |
Health Care Providers & Services — 4.0% | | | | | | | | | | | | |
Primary Health Care Ltd. | | | | | | | 26,890 | | | | 84,710 | |
Rhoen-Klinikum AG | | | | | | | 4,613 | | | | 87,884 | |
Total Health Care Providers & Services | | | | | | | | | | | 172,594 | |
Pharmaceuticals — 8.6% | | | | | | | | | | | | |
Bayer AG, Registered Shares | | | | | | | 1,212 | | | | 77,490 | |
H. Lundbeck A/S | | | | | | | 2,230 | | | | 41,934 | |
Meda AB, Class A Shares | | | | | | | 6,155 | | | | 64,036 | |
Sanofi | | | | | | | 1,410 | | | | 103,563 | |
Teva Pharmaceutical Industries Ltd., ADR | | | | | | | 1,923 | | | | 77,612 | |
Total Pharmaceuticals | | | | | | | | | | | 364,635 | |
Total Health Care | | | | | | | | | | | 579,314 | |
See Notes to Financial Statements.
| | | | |
| Legg Mason Global Currents Variable International All Cap Opportunity Portfolio 2011 Annual Report | | | 13 | |
Legg Mason Global Currents Variable International All Cap Opportunity Portfolio
| | | | | | | | | | | | |
| Security | | | | | | Shares | | | Value | |
| Industrials — 13.8% | | | | | | | | | | | | |
Aerospace & Defense — 1.0% | | | | | | | | | | | | |
Thales SA | | | | | | | 1,323 | | | $ | 41,780 | |
Airlines — 1.5% | | | | | | | | | | | | |
easyJet PLC | | | | | | | 10,174 | | | | 62,063 | * |
Commercial Services & Supplies — 6.8% | | | | | | | | | | | | |
Loomis AB, Class B Shares | | | | | | | 6,721 | | | | 96,683 | |
Mitie Group PLC | | | | | | | 11,290 | | | | 42,606 | |
Newalta Corp. | | | | | | | 5,222 | | | | 63,612 | |
Shanks Group PLC | | | | | | | 40,479 | | | | 57,081 | |
Séché Environnement | | | | | | | 738 | | | | 27,365 | |
Total Commercial Services & Supplies | | | | | | | | | | | 287,347 | |
Industrial Conglomerates — 1.4% | | | | | | | | | | | | |
Siemens AG, Registered Shares | | | | | | | 645 | | | | 61,725 | |
Machinery — 0.4% | | | | | | | | | | | | |
Interpump Group SpA | | | | | | | 2,858 | | | | 19,216 | |
Professional Services — 2.7% | | | | | | | | | | | | |
Adecco SA | | | | | | | 1,070 | | | | 44,826 | * |
Teleperformance | | | | | | | 3,121 | | | | 69,376 | |
Total Professional Services | | | | | | | | | | | 114,202 | |
Total Industrials | | | | | | | | | | | 586,333 | |
| Information Technology — 8.3% | | | | | | | | | | | | |
Communications Equipment — 1.9% | | | | | | | | | | | | |
Telefonaktiebolaget LM Ericsson, Class B Shares | | | | | | | 7,690 | | | | 78,665 | |
Electronic Equipment, Instruments & Components — 1.3% | | | | | | | | | | | | |
Ingenico SA | | | | | | | 1,563 | | | | 56,439 | |
IT Services — 4.1% | | | | | | | | | | | | |
Accenture PLC, Class A Shares | | | | | | | 990 | | | | 52,698 | |
Indra Sistemas SA | | | | | | | 3,337 | | | | 42,485 | |
ITOCHU Techno-Solutions Corp. | | | | | | | 1,803 | | | | 80,932 | |
Total IT Services | | | | | | | | | | | 176,115 | |
Software — 1.0% | | | | | | | | | | | | |
Square Enix Co., Ltd. | | | | | | | 2,066 | | | | 40,558 | |
Total Information Technology | | | | | | | | | | | 351,777 | |
| Materials — 7.3% | | | | | | | | | | | | |
Chemicals — 3.2% | | | | | | | | | | | | |
Akzo Nobel NV | | | | | | | 1,355 | | | | 65,519 | |
BASF SE | | | | | | | 534 | | | | 37,245 | |
Symrise AG | | | | | | | 1,198 | | | | 31,971 | |
Total Chemicals | | | | | | | | | | | 134,735 | |
See Notes to Financial Statements.
| | |
| 14 | | Legg Mason Global Currents Variable International All Cap Opportunity Portfolio 2011 Annual Report |
Schedule of investments (cont’d)
December 31, 2011
Legg Mason Global Currents Variable International All Cap Opportunity Portfolio
| | | | | | | | | | | | | | |
| Security | | | | | | | Shares | | | Value | |
Construction Materials — 1.0% | | | | | | | | | | | | | | |
HeidelbergCement AG | | | | | | | | | 1,020 | | | $ | 43,287 | |
Containers & Packaging — 1.3% | | | | | | | | | | | | | | |
Rexam PLC | | | | | | | | | 10,613 | | | | 58,148 | |
Metals & Mining — 1.8% | | | | | | | | | | | | | | |
Barrick Gold Corp. | | | | | | | | | 1,670 | | | | 75,568 | |
Total Materials | | | | | | | | | | | | | 311,738 | |
| Telecommunication Services — 6.2% | | | | | | | | | | | | | | |
Diversified Telecommunication Services — 2.2% | | | | | | | | | | | | | | |
BCE Inc. | | | | | | | | | 2,236 | | | | 93,215 | |
Wireless Telecommunication Services — 4.0% | | | | | | | | | | | | | | |
China Mobile Ltd., ADR | | | | | | | | | 2,410 | | | | 116,861 | |
Vodafone Group PLC | | | | | | | | | 18,930 | | | | 52,594 | |
Total Wireless Telecommunication Services | | | | | | | | | | | | | 169,455 | |
Total Telecommunication Services | | | | | | | | | | | | | 262,670 | |
Total Investments before Short-Term investments (Cost — $4,552,589) | | | | | | | 4,067,445 | |
| | | | |
| | | Rate | | | Maturity
Date | | Face
Amount | | | | |
| Short-Term Investments — 4.7% | | | | | | | | | | | | | | |
Repurchase Agreements — 4.7% | | | | | | | | | | | | | | |
Interest in $200,000,000 joint tri-party repurchase agreement dated 12/30/11 with RBS Securities Inc.; Proceeds at maturity — $201,001; (Fully collateralized by various U.S. government obligations, 1.375% to 4.375% due 11/30/15 to 11/15/39; Market value — $205,020) (Cost —$201,000) | | | 0.050 | % | | 1/3/12 | | | 201,000 | | | | 201,000 | |
Total Investments — 100.5% (Cost — $4,753,589#) | | | | | | | 4,268,445 | |
Liabilities in Excess of Other Assets — (0.5)% | | | | | | | | | | | | | (21,806 | ) |
Total Net Assets — 100.0% | | | | | | | | | | | | $ | 4,246,639 | |
| * | Non-income producing security. |
| (a) | Security is valued in good faith in accordance with procedures approved by the Board of Trustees (See Note 1). |
| # | Aggregate cost for federal income tax purposes is substantially the same. |
| | |
Abbreviations used in this schedule: |
| ADR | | — American Depositary Receipts |
| CVA | | — Certificaaten van aandelen (Share Certificates) |
| Strip VVPR | | — Verminderde Voorheffing Précompte Réduit (Belgium dividend coupon) |
See Notes to Financial Statements.
| | | | |
| Legg Mason Global Currents Variable International All Cap Opportunity Portfolio 2011 Annual Report | | | 15 | |
Legg Mason Global Currents Variable International All Cap Opportunity Portfolio
| | | | |
| Summary of Investments by Country† (unaudited) | | | |
| United Kingdom | | | 15.5 | % |
| France | | | 10.6 | |
| Germany | | | 10.1 | |
| Canada | | | 9.2 | |
| Netherlands | | | 8.3 | |
| Japan | | | 7.8 | |
| Sweden | | | 6.1 | |
| Switzerland | | | 5.4 | |
| Hong Kong | | | 3.8 | |
| Australia | | | 3.3 | |
| Ireland | | | 2.8 | |
| Spain | | | 2.6 | |
| Mexico | | | 1.8 | |
| Israel | | | 1.8 | |
| Norway | | | 1.7 | |
| Singapore | | | 1.2 | |
| Russia | | | 1.1 | |
| Denmark | | | 1.0 | |
| Luxembourg | | | 0.7 | |
| Italy | | | 0.5 | |
| Belgium | | | 0.0 | ‡ |
| Short-Term Investments | | | 4.7 | |
| | | | 100.0 | % |
| † | As a percentage of total investments. Please note that Portfolio holdings are as of December 31, 2011 and are subject to change. |
| ‡ | Represents less than 0.1%. |
See Notes to Financial Statements.
| | |
| 16 | | Legg Mason Global Currents Variable International All Cap Opportunity Portfolio 2011 Annual Report |
Statement of assets and liabilities
December 31, 2011
| | | | |
| |
| Assets: | | | | |
Investments, at value (Cost — $4,753,589) | | $ | 4,268,445 | |
Foreign currency, at value (Cost — $2,961) | | | 2,958 | |
Cash | | | 732 | |
Receivable from investment manager | | | 29,572 | |
Dividends and interest receivable | | | 28,339 | |
Prepaid expenses | | | 322 | |
Total Assets | | | 4,330,368 | |
| |
| Liabilities: | | | | |
Payable for securities purchased | | | 3,110 | |
Payable for Portfolio shares repurchased | | | 3,001 | |
Trustees’ fees payable | | | 370 | |
Accrued expenses | | | 77,248 | |
Total Liabilities | | | 83,729 | |
| Total Net Assets | | $ | 4,246,639 | |
| |
| Net Assets: | | | | |
Par value (Note 5) | | $ | 8 | |
Paid-in capital in excess of par value | | | 4,825,355 | |
Overdistributed net investment income | | | (62,177) | |
Accumulated net realized loss on investments and foreign currency transactions | | | (33,631) | |
Net unrealized depreciation on investments and foreign currencies | | | (482,916) | |
| Total Net Assets | | $ | 4,246,639 | |
| |
| Shares Outstanding | | | 836,784 | |
| |
| Net Asset Value | | | $5.07 | |
See Notes to Financial Statements.
| | | | |
| Legg Mason Global Currents Variable International All Cap Opportunity Portfolio 2011 Annual Report | | | 17 | |
Statement of operations
For the Year Ended December 31, 2011
| | | | |
| |
| Investment Income: | | | | |
Dividends | | $ | 818,493 | |
Interest | | | 291 | |
Less: Foreign taxes withheld | | | (77,967) | |
Total Investment Income | | | 740,817 | |
| |
| Expenses: | | | | |
Investment management fee (Note 2) | | | 229,988 | |
Audit and tax | | | 36,200 | |
Legal fees | | | 32,934 | |
Custody fees | | | 32,507 | |
Shareholder reports | | | 29,990 | |
Transfer agent fees | | | 6,154 | |
Fund accounting fees | | | 2,720 | |
Trustees’ fees | | | 2,074 | |
Insurance | | | 1,908 | |
Miscellaneous expenses | | | 1,214 | |
Total Expenses | | | 375,689 | |
Less: Fee waivers and/or expense reimbursements (Note 2) | | | (79,084) | |
Net Expenses | | | 296,605 | |
| Net Investment Income | | | 444,212 | |
| |
Realized and Unrealized Gain (Loss) on Investments and
Foreign Currency Transactions (Notes 1 and 3): | | | | |
Net Realized Gain From: | | | | |
Investment transactions | | | 11,855,920 | |
Foreign currency transactions | | | 19,393 | |
Net Realized Gain | | | 11,875,313 | |
Change in Net Unrealized Appreciation (Depreciation) From: | | | | |
Investments | | | (7,719,139) | |
Foreign currencies | | | (6,594) | |
Change in Net Unrealized Appreciation (Depreciation) | | | (7,725,733) | |
| Net Gain on Investments and Foreign Currency Transactions | | | 4,149,580 | |
| Increase in Net Assets from Operations | | $ | 4,593,792 | |
See Notes to Financial Statements.
| | |
| 18 | | Legg Mason Global Currents Variable International All Cap Opportunity Portfolio 2011 Annual Report |
Statements of changes in net assets
| | | | | | | | |
| For the Years Ended December 31, | | 2011 | | | 2010 | |
| | |
| Operations: | | | | | | | | |
Net investment income | | $ | 444,212 | | | $ | 974,972 | |
Net realized gain | | | 11,875,313 | | | | 2,781,040 | |
Change in net unrealized appreciation (depreciation) | | | (7,725,733) | | | | (1,771,188) | |
Proceeds from settlement of a regulatory matter | | | — | | | | 14,947 | |
Increase in Net Assets From Operations | | | 4,593,792 | | | | 1,999,771 | |
| | |
| Distributions to Shareholders From (Note 1): | | | | | | | | |
Net investment income | | | (581,507) | | | | (1,110,003) | |
Decrease in Net Assets From Distributions to Shareholders | | | (581,507) | | | | (1,110,003) | |
| | |
| Portfolio Share Transactions (Note 5): | | | | | | | | |
Net proceeds from sale of shares | | | 168,124 | | | | 450,621 | |
Reinvestment of distributions | | | 581,507 | | | | 1,110,003 | |
Cost of shares repurchased | | | (71,552,987) | | | | (12,602,509) | |
Decrease in Net Assets From Portfolio Share Transactions | | | (70,803,356) | | | | (11,041,885) | |
Decrease in Net Assets | | | (66,791,071) | | | | (10,152,117) | |
| | |
| Net Assets: | | | | | | | | |
Beginning of year | | | 71,037,710 | | | | 81,189,827 | |
End of year* | | $ | 4,246,639 | | | $ | 71,037,710 | |
* Includes overdistributed net investment income of: | | | $(62,177) | | | | $(283,074) | |
See Notes to Financial Statements.
| | | | |
| Legg Mason Global Currents Variable International All Cap Opportunity Portfolio 2011 Annual Report | | | 19 | |
Financial highlights
| | | | | | | | | | | | | | | | | | | | | | | | |
For a share of beneficial interest outstanding throughout each year ended December 31,
unless otherwise noted: | |
| | | 20111 | | | 20101 | | | 20091,2 | | | 20091,3 | | | 20081,3 | | | 20071,3 | |
| | | | | | |
| Net asset value, beginning of year | | | $6.38 | | | | $6.25 | | | | $5.94 | | | | $5.07 | | | | $19.31 | | | | $16.79 | |
| | | | | | |
| Income (loss) from operations: | | | | | | | | | | | | | | | | | | | | | | | | |
Net investment income (loss) | | | 0.11 | | | | 0.08 | | | | (0.00) | 4 | | | 0.08 | | | | 0.12 | | | | 0.24 | |
Net realized and unrealized gain (loss) | | | (0.86) | | | | 0.15 | | | | 0.37 | | | | 0.94 | | | | (5.02) | | | | 2.99 | |
Total income (loss) from operations | | | (0.75) | | | | 0.23 | | | | 0.37 | | | | 1.02 | | | | (4.90) | | | | 3.23 | |
| | | | | | |
| Less distributions from: | | | | | | | | | | | | | | | | | | | | | | | | |
Net investment income | | | (0.56) | | | | (0.10) | | | | (0.06) | | | | (0.15) | | | | (0.17) | | | | (0.35) | |
Net realized gains | | | — | | | | — | | | | — | | | | — | | | | (9.17) | | | | (0.36) | |
Total distributions | | | (0.56) | | | | (0.10) | | | | (0.06) | | | | (0.15) | | | | (9.34) | | | | (0.71) | |
| | | | | | |
| Net asset value, end of year | | | $5.07 | | | | $6.38 | | | | $6.25 | | | | $5.94 | | | | $5.07 | | | | $19.31 | |
Total return5 | | | (11.59) | % | | | 3.72 | % | | | 6.31 | % | | | 20.87 | % | | | (46.09) | % | | | 19.78 | % |
| | | | | | |
| Net assets, end of year (millions) | | | $4 | | | | $71 | | | | $81 | | | | $79 | | | | $76 | | | | $169 | |
| | | | | | |
| Ratios to average net assets: | | | | | | | | | | | | | | | | | | | | | | | | |
Gross expenses | | | 1.39 | % | | | 1.20 | % | | | 1.46 | %6 | | | 1.10 | % | | | 1.12 | % | | | 1.00 | %7 |
Net expenses8,9 | | | 1.10 | 10 | | | 1.20 | | | | 1.28 | 6,10 | | | 1.10 | | | | 1.12 | 10 | | | 1.00 | 7,10 |
Net investment income (loss) | | | 1.64 | | | | 1.36 | | | | (0.10) | 6 | | | 1.67 | | | | 1.41 | | | | 1.32 | |
| | | | | | |
| Portfolio turnover rate | | | 21 | % | | | 61 | % | | | 9 | % | | | 79 | % | | | 63 | % | | | 101 | % |
| 1 | Per share amounts have been calculated using the average shares method. |
| 2 | For the period November 1, 2009 through December 31, 2009. |
| 3 | For the year ended October 31. |
| 4 | Amount represents less than $0.01 per share. |
| 5 | Performance figures may reflect compensating balance arrangements, fee waivers and/or expense reimbursements. In the absence of compensating balance arrangements, fee waivers and/or expense reimbursements, the total return would have been lower. Total returns do not reflect expenses associated with separate accounts such as administrative fees, account charges and surrender charges which, if reflected, would reduce the total return for all periods shown. Past performance is no guarantee of future results. Total returns for periods of less than one year are not annualized. |
| 7 | Included in the expense ratios are certain non-recurring restructuring (and reorganization, if applicable) fees that were incurred by the Portfolio during the period. Without these fees, the gross and net expense ratios would have been 0.99% and 0.98%, respectively. |
| 8 | As a result of an expense limitation arrangement, the ratio of expenses, other than brokerage, interest, taxes, extraordinary expenses and acquired fund fees and expenses, to average net assets of the Portfolio did not exceed 1.50%. This expense limitation arrangement cannot be terminated prior to December 31, 2013 without the Board of Trustees’ consent. Effective May 2, 2011, this arrangement was modified by decreasing the expense limitation to 1.45% |
| 9 | The impact of compensating balance arrangements, if any, was less than 0.01%. |
| 10 | Reflects fee waivers and/or expense reimbursements. |
See Notes to Financial Statements.
| | |
| 20 | | Legg Mason Global Currents Variable International All Cap Opportunity Portfolio 2011 Annual Report |
Notes to financial statements
1. Organization and significant accounting policies
Legg Mason Global Currents Variable International All Cap Opportunity Portfolio (the “Portfolio”) is a separate diversified investment series of Legg Mason Partners Variable Equity Trust (the “Trust”). The Trust, a Maryland statutory trust, is registered under the Investment Company Act of 1940, as amended (the “1940 Act”), as an open-end management investment company.
Shares of the Portfolio may only be purchased or redeemed through variable annuity contracts and variable life insurance policies offered by the separate accounts of participating insurance companies or through eligible pension or other qualified plans.
The Board of Trustees of the Portfolio determined that it is in the best interests of the Portfolio and its shareholders to terminate and wind up the Portfolio. The Portfolio is expected to cease operations on or about April 30, 2012. At some point before that date, at the discretion of portfolio management, in preparation for the termination of the Portfolio, the assets of the Portfolio will be liquidated and the Portfolio will cease to pursue its investment objective. Shareholders of the Portfolio who elect to redeem their shares prior to the completion of the liquidation will be redeemed in the ordinary course at the Portfolio’s net asset value per share. Each shareholder who remains in the Portfolio will receive a liquidating distribution equal to the aggregate net asset value of the shares of the Portfolio that such shareholder then holds.
The following are significant accounting policies consistently followed by the Portfolio and are in conformity with U.S. generally accepted accounting principles (“GAAP”). Estimates and assumptions are required to be made regarding assets, liabilities and changes in net assets resulting from operations when financial statements are prepared. Changes in the economic environment, financial markets and any other parameters used in determining these estimates could cause actual results to differ. Subsequent events have been evaluated through the date the financial statements were issued.
(a) Investment valuation. Equity securities for which market quotations are available are valued at the last reported sales price or official closing price on the primary market or exchange on which they trade. The valuations for fixed income securities and certain derivative instruments are typically the prices supplied by independent third party pricing services, which may use market prices or broker/dealer quotations or a variety of fair valuation techniques and methodologies. Short-term fixed income securities that will mature in 60 days or less are valued at amortized cost, unless it is determined that using this method would not reflect an investment’s fair value. If independent third party pricing services are unable to supply prices for a portfolio investment, or if the prices supplied are deemed by the manager to be unreliable, the market price may be determined by the manager using quotations from one or more broker/dealers. When the Portfolio holds securities or other assets that are denominated in a foreign currency, the Portfolio will normally use the currency exchange rates as of 4:00 p.m. (Eastern Time). When reliable prices are not readily available, such as when the value of a security has been significantly affected
| | | | |
| Legg Mason Global Currents Variable International All Cap Opportunity Portfolio 2011 Annual Report | | | 21 | |
by events after the close of the exchange or market on which the security is principally traded, but before the Portfolio calculates its net asset value, the Portfolio values these securities as determined in accordance with procedures approved by the Portfolio’s Board of Trustees.
The Portfolio has adopted Financial Accounting Standards Board Codification Topic 820 (“ASC Topic 820”). ASC Topic 820 establishes a single definition of fair value, creates a three-tier hierarchy as a framework for measuring fair value based on inputs used to value the Portfolio’s investments, and requires additional disclosure about fair value. The hierarchy of inputs is summarized below.
| Ÿ | | Level 1 — quoted prices in active markets for identical investments |
| Ÿ | | Level 2 — other significant observable inputs (including quoted prices for similar investments, interest rates, prepayment speeds, credit risk, etc.) |
| Ÿ | | Level 3 — significant unobservable inputs (including the Portfolio’s own assumptions in determining the fair value of investments) |
The inputs or methodology used for valuing securities are not necessarily an indication of the risk associated with investing in those securities.
The Portfolio uses valuation techniques to measure fair value that are consistent with the market approach and/or income approach, depending on the type of security and the particular circumstance. The market approach uses prices and other relevant information generated by market transactions involving identical or comparable securities. The income approach uses valuation techniques to discount estimated future cash flows to present value.
The following is a summary of the inputs used in valuing the Portfolio’s assets carried at fair value:
| | | | | | | | | | | | | | | | |
| ASSETS | |
| Description | | Quoted Prices
(Level 1) | | | Other Significant
Observable Inputs
(Level 2) | | | Significant
Unobservable
Inputs
(Level 3) | | | Total | |
| Long-term investments†: | | | | | | | | | | | | | | | | |
Common stocks: | | | | | | | | | | | | | | | | |
Consumer staples | | $ | 284,687 | | | | — | | | $ | 3 | | | $ | 284,690 | |
Other common stocks | | | 3,782,755 | | | | — | | | | — | | | | 3,782,755 | |
| Total long-term investments | | $ | 4,067,442 | | | | — | | | $ | 3 | | | $ | 4,067,445 | |
| Short-term investments† | | | — | | | $ | 201,000 | | | | — | | | | 201,000 | |
| Total investments | | $ | 4,067,442 | | | $ | 201,000 | | | $ | 3 | | | $ | 4,268,445 | |
| † | See Schedule of Investments for additional detailed categorizations. |
For the year ended December 31, 2011, as a result of the fair value pricing procedures for international equities utilized by the Portfolio, certain securities have transferred in and out of Level 1 and Level 2 measurements during the year.
| | |
| 22 | | Legg Mason Global Currents Variable International All Cap Opportunity Portfolio 2011 Annual Report |
Notes to financial statements (cont’d)
The following is a reconciliation of investments in which significant unobservable inputs (Level 3) were used in determining fair value:
| | | | |
| | | Common
Stocks | |
| Investments in Securities | | Consumer
Staples | |
| Balance as of December 31, 2010 | | | — | |
| Accrued premium/discounts | | | — | |
| Realized gain (loss) | | | — | |
| Change in unrealized appreciation (depreciation) | | | — | |
| Purchases | | | — | |
| Sales | | | — | |
| Transfers into Level 31 | | $ | 3 | |
| Transfers out of Level 3 | | | — | |
| Balance as of December 31, 2011 | | $ | 3 | |
| Net change in unrealized appreciation (depreciation) for investments in securities still held at December 31, 2011 | | | — | |
| | The Fund’s policy is to recognize transfers between levels as of the end of the reporting period. |
| 1 | Transferred into Level 3 as a result of the unavailability of a quoted price in an active market for an identical investment or the unavailability of other significant observable inputs. |
(b) Repurchase agreements. The Portfolio may enter into repurchase agreements with institutions that its investment adviser has determined are creditworthy. Each repurchase agreement is recorded at cost. Under the terms of a typical repurchase agreement, the Portfolio acquires a debt security subject to an obligation of the seller to repurchase, and of the Portfolio to resell, the security at an agreed-upon price and time, thereby determining the yield during the Portfolio’s holding period. When entering into repurchase agreements, it is the Portfolio’s policy that its custodian or a third party custodian, acting on the Portfolio’s behalf, take possession of the underlying collateral securities, the market value of which, at all times, at least equals the principal amount of the repurchase transaction, including accrued interest. To the extent that any repurchase transaction maturity exceeds one business day, the value of the collateral is marked-to-market and measured against the value of the agreement in an effort to ensure the adequacy of the collateral. If the counterparty defaults, the Portfolio generally has the right to use the collateral to satisfy the terms of the repurchase transaction. However, if the market value of the collateral declines during the period in which the Portfolio seeks to assert its rights or if bankruptcy proceedings are commenced with respect to the seller of the security, realization of the collateral by the Portfolio may be delayed or limited.
(c) Foreign currency translation. Investment securities and other assets and liabilities denominated in foreign currencies are translated into U.S. dollar amounts based upon prevailing exchange rates on the date of valuation. Purchases and sales of investment securities and income and expense items denominated in foreign currencies are translated into U.S. dollar amounts based upon prevailing exchange rates on the respective dates of such transactions.
The Portfolio does not isolate that portion of the results of operations resulting from fluctuations in foreign exchange rates on investments from the fluctuations arising
| | | | |
| Legg Mason Global Currents Variable International All Cap Opportunity Portfolio 2011 Annual Report | | | 23 | |
from changes in market prices of securities held. Such fluctuations are included with the net realized and unrealized gain or loss on investments.
Net realized foreign exchange gains or losses arise from sales of foreign currencies, including gains and losses on forward foreign currency contracts, currency gains or losses realized between the trade and settlement dates on securities transactions, and the difference between the amounts of dividends, interest, and foreign withholding taxes recorded on the Portfolio’s books and the U.S. dollar equivalent of the amounts actually received or paid. Net unrealized foreign exchange gains and losses arise from changes in the values of assets and liabilities, other than investments in securities, on the date of valuation, resulting from changes in exchange rates.
Foreign security and currency transactions may involve certain considerations and risks not typically associated with those of U.S. dollar denominated transactions as a result of, among other factors, the possibility of lower levels of governmental supervision and regulation of foreign securities markets and the possibility of political or economic instability.
(d) Foreign investment risks. The Portfolio’s investments in foreign securities may involve risks not present in domestic investments. Since securities may be denominated in foreign currencies, may require settlement in foreign currencies or pay interest or dividends in foreign currencies, changes in the relationship of these foreign currencies to the U.S. dollar can significantly affect the value of the investments and earnings of the Portfolio. Foreign investments may also subject the Portfolio to foreign government exchange restrictions, expropriation, taxation or other political, social or economic developments, all of which affect the market and/or credit risk of the investments.
(e) Security transactions and investment income. Security transactions are accounted for on a trade date basis. Interest income, adjusted for amortization of premium and accretion of discount, is recorded on the accrual basis. Dividend income is recorded on the ex-dividend date. Foreign dividend income is recorded on the ex-dividend date or as soon as practicable after the Portfolio determines the existence of a dividend declaration after exercising reasonable due diligence. The cost of investments sold is determined by use of the specific identification method. To the extent any issuer defaults or a credit event occurs that impacts the issuer, the Portfolio may halt any additional interest income accruals and consider the realizability of interest accrued up to the date of default or credit event.
(f) Distributions to shareholders. Distributions from net investment income and distributions of net realized gains, if any, are declared at least annually. Distributions to shareholders of the Portfolio are recorded on the ex-dividend date and are determined in accordance with income tax regulations, which may differ from GAAP.
(g) Compensating balance arrangements. The Portfolio has an arrangement with its custodian bank whereby a portion of the custodian’s fees is paid indirectly by credits earned on the Portfolio’s cash on deposit with the bank.
| | |
| 24 | | Legg Mason Global Currents Variable International All Cap Opportunity Portfolio 2011 Annual Report |
Notes to financial statements (cont’d)
(h) Federal and other taxes. It is the Portfolio’s policy to comply with the federal income and excise tax requirements of the Internal Revenue Code of 1986 (the “Code”), as amended, applicable to regulated investment companies. Accordingly, the Portfolio intends to distribute its taxable income and net realized gains, if any, to shareholders in accordance with timing requirements imposed by the Code. Therefore, no federal or state income tax provision is required in the Portfolio’s financial statements.
Management has analyzed the Portfolio’s tax positions taken on income tax returns for all open tax years and has concluded that as of December 31, 2011, no provision for income tax is required in the Portfolio’s financial statements. The Portfolio’s federal and state income and federal excise tax returns for tax years for which the applicable statutes of limitations have not expired are subject to examination by Internal Revenue Service and state departments of revenue.
Under the applicable foreign tax laws, a withholding tax may be imposed on interest, dividends and capital gains at various rates.
(i) Reclassification. GAAP requires that certain components of net assets be reclassified to reflect permanent differences between financial and tax reporting. These reclassifications have no effect on net assets or net asset value per share. During the current year, the following reclassifications have been made:
| | | | | | | | | | | | |
| | | Overdistributed Net
Investment Income | | | Accumulated Net
Realized Loss | | | Paid-in
Capital | |
| (a) | | $ | 225,019 | | | $ | 35,653,247 | | | $ | (35,878,266) | |
| (b) | | | 133,173 | | | | (133,173) | | | | — | |
| (a) | Reclassifications are primarily due to book/tax differences in the treatment of an in-kind distribution of securities and the expiration of a prior year capital loss carryforward due to tax limitations caused by an ownership change. |
| (b) | Reclassifications are primarily due to foreign currency transactions treated as ordinary income for tax purposes and book/tax differences in the treatment of passive foreign investment companies. |
2. Investment management agreement and other transactions with affiliates
Legg Mason Partners Fund Advisor, LLC (“LMPFA”) is the Portfolio’s investment manager and Global Currents Investment Management, LLC (“Global Currents”) is the Portfolio’s subadviser. Western Asset Management Company (“Western Asset”) manages the Portfolio’s cash and short-term instruments. LMPFA, Global Currents and Western Asset are wholly-owned subsidiaries of Legg Mason, Inc. (“Legg Mason”).
Under the investment management agreement, the Portfolio pays a investment management fee, calculated daily and paid monthly, in accordance with the following breakpoint schedule:
| | | | |
| Average Daily Net Assets | | Annual Rate | |
| First $1 billion | | | 0.850 | % |
| Next $1 billion | | | 0.825 | |
| Next $3 billion | | | 0.800 | |
| Next $5 billion | | | 0.775 | |
| Over $10 billion | | | 0.750 | |
| | | | |
| Legg Mason Global Currents Variable International All Cap Opportunity Portfolio 2011 Annual Report | | | 25 | |
LMPFA provides administrative and certain oversight services to the Portfolio. LMPFA delegates to the subadviser the day-to-day portfolio management of the Portfolio, except for the management of cash and short-term instruments, which is provided by Western Asset. For their services, LMPFA pays Global Currents and Western Asset an aggregate fee equal to 70% of the net management fee it receives from the Portfolio.
As a result of an expense limitation arrangement between the Portfolio and LMPFA, the ratio of expenses other than brokerage, interest, taxes, extraordinary expenses and acquired fund fees and expenses, to average net assets of the Portfolio did not exceed 1.50%. This expense limitation arrangement cannot be terminated prior to December 31, 2013 without the Board of Trustees’ consent. Effective May 2, 2011, LMPFA modified this arrangement by decreasing the expense limitation from 1.50% to 1.45%.
During the year ended December 31, 2011, fees waived and/or expenses reimbursed amounted to $79,084.
The investment manager is permitted to recapture amounts previously waived or reimbursed to the Portfolio during the same fiscal year if the Portfolio’s total annual operating expenses have fallen to a level below the expense limitation (“expense cap”) in effect at the time the fees were earned or the expense incurred. In no case will the investment manager recapture any amount that would result, on any particular business day of the Portfolio, in the Portfolio’s total annual operating expenses exceeding the expense cap or any other lower limit then in effect.
Legg Mason Investor Services, LLC, a wholly-owned broker-dealer subsidiary of Legg Mason, serves as the Portfolio’s sole and exclusive distributor.
The Portfolio had adopted an unfunded, non-qualified deferred compensation plan (the “Plan”) which allowed non-interested trustees (“Independent Trustees”) to defer the receipt of all or a portion of their fees earned until a later date specified by the Independent Trustees. The deferred balances are reported in the Statement of Assets and Liabilities under Trustees’ fees payable and are considered a general obligation of the Portfolio and any payments made pursuant to the Plan will be made from the Portfolio’s general assets. The Plan was terminated effective January 1, 2007. This change had no effect on fees previously deferred. As of December 31, 2011, the Portfolio had accrued $365 as deferred compensation payable.
All officers and one Trustee of the Trust are employees of Legg Mason or its affiliates and do not receive compensation from the Trust.
| | |
| 26 | | Legg Mason Global Currents Variable International All Cap Opportunity Portfolio 2011 Annual Report |
Notes to financial statements (cont’d)
3. Investments
During the year ended December 31, 2011, the aggregate cost of purchases and proceeds from sales of investments (excluding short-term investments) were as follows:
| | | | |
| Purchases | | $ | 6,208,757 | |
| Sales | | | 11,112,515 | |
At December 31, 2011, the aggregate gross unrealized appreciation and depreciation of investments for federal income tax purposes were as follows:
| | | | |
| Gross unrealized appreciation | | $ | 272,719 | |
| Gross unrealized depreciation | | | (757,863) | |
| Net unrealized depreciation | | $ | (485,144) | |
4. Derivative instruments and hedging activities
Financial Accounting Standards Board Codification Topic 815 requires enhanced disclosure about an entity’s derivative and hedging activities.
During the year ended December 31, 2011, the Portfolio did not invest in any derivative instruments.
5. Shares of beneficial interest
At December 31, 2011, the Trust had an unlimited number of shares of beneficial interest authorized with a par value of $0.00001 per share.
Transactions in shares of the Portfolio were as follows:
| | | | | | | | |
| | | Year Ended
December 31, 2011 | | | Year Ended
December 31, 2010 | |
| Shares sold | | | 25,957 | | | | 75,895 | |
| Shares issued on reinvestment | | | 107,572 | | | | 176,471 | |
| Shares repurchased | | | (10,425,823) | | | | (2,117,140) | |
| Net decrease | | | (10,292,294) | | | | (1,864,774) | |
6. Redemptions-in-kind
The Portfolio may make payment for Portfolio shares redeemed wholly or in part by distributing portfolio securities to shareholders. For the year ended December 31, 2011, the Portfolio had redemptions-in-kind with total proceeds in the amount of $65,474,253. The net realized gains on these redemptions-in-kind amounted to $11,635,177, which will not be realized for tax purposes.
7. Income tax information and distributions to shareholders
The tax character of distributions paid during the fiscal years ended December 31 was as follows:
| | | | | | | | |
| | | 2011 | | | 2010 | |
| Distributions Paid From: | | | | | | | | |
| Ordinary income | | $ | 581,507 | | | $ | 1,110,003 | |
| | | | |
| Legg Mason Global Currents Variable International All Cap Opportunity Portfolio 2011 Annual Report | | | 27 | |
As of December 31, 2011, the components of accumulated earnings on a tax basis were as follows:
| | | | |
| Undistributed ordinary income — net | | $ | 3,205 | |
| Capital loss carryforward* | | | (33,631) | |
| Other book/tax temporary differences(a) | | | (65,382) | |
| Unrealized appreciation (depreciation) | | | (482,916) | |
| Total accumulated earnings (losses) — net | | $ | (578,724) | |
| * | During the taxable year ended December 31, 2011, the Portfolio utilized $106,963 of its capital loss carryforward available from prior years. As of December 31, 2011, the Portfolio had the following net capital loss carryforward remaining: |
| | | | |
| Year of Expiration | | Amount | |
| No expiration | | $ | (33,631 | ) |
This amount will be available to offset any future taxable capital gains.
| (a) | Other book/tax temporary differences are attributable primarily to the realization for tax purposes of unrealized losses on certain foreign currency transactions and book/tax differences in the timing of the deductibility of various expenses. |
8. Legal matters
Beginning in May 2004, class action lawsuits alleging violations of the federal securities laws were filed against Citigroup Global Markets Inc. (“CGM”), a former distributor of the Portfolio, and other affiliated funds (collectively, the “Funds”) and a number of its then affiliates, including Smith Barney Fund Management LLC (“SBFM”) and Salomon Brothers Asset Management Inc. (“SBAM”), which were then investment adviser or manager to certain of the Funds (the “Managers”), substantially all of the mutual funds then managed by the Managers (the “Defendant Funds”), and Board members of the Defendant Funds (collectively, the “Defendants”). The complaints alleged, among other things, that CGM created various undisclosed incentives for its brokers to sell Smith Barney and Salomon Brothers funds. In addition, according to the complaints, the Managers caused the Defendant Funds to pay excessive brokerage commissions to CGM for steering clients towards proprietary funds. The complaints also alleged that the Defendants breached their fiduciary duty to the Defendant Funds by improperly charging Rule 12b-1 fees and by drawing on fund assets to make undisclosed payments of soft dollars and excessive brokerage commissions. The complaints also alleged that the Defendant Funds failed to adequately disclose certain of the allegedly wrongful conduct. The complaints sought injunctive relief and compensatory and punitive damages, rescission of the Defendant Funds’ contracts with the Managers, recovery of all fees paid to the Managers pursuant to such contracts and an award of attorneys’ fees and litigation expenses.
On December 15, 2004, a consolidated amended complaint (the “Complaint”) was filed alleging substantially similar causes of action. On May 27, 2005, all of the Defendants filed motions to dismiss the Complaint. On July 26, 2006, the court issued a decision and order (1) finding that plaintiffs lacked standing to sue on behalf of the shareholders of the Funds in which none of the plaintiffs had invested and dismissing those Funds from the case (although stating that they could be brought back into the case if standing as to them could be established), and (2) other than
| | |
| 28 | | Legg Mason Global Currents Variable International All Cap Opportunity Portfolio 2011 Annual Report |
Notes to financial statements (cont’d)
one stayed claim, dismissing all of the causes of action against the remaining Defendants, with prejudice, except for the cause of action under Section 36(b) of the 1940 Act, which the court granted plaintiffs leave to replead as a derivative claim.
On October 16, 2006, plaintiffs filed their Second Consolidated Amended Complaint (“Second Amended Complaint”) which alleges derivative claims on behalf of nine funds identified in the Second Amended Complaint, under Section 36(b) of the 1940 Act, against Citigroup Asset Management, SBAM and SBFM as investment advisers to the identified funds, as well as CGM as a distributor for the identified funds (collectively, the “Second Amended Complaint Defendants”). The Portfolio was not identified in the Second Amended Complaint. The Second Amended Complaint alleges no claims against any of the funds or any of their Board Members. Under Section 36(b), the Second Amended Complaint alleges similar facts and seeks similar relief against the Second Amended Complaint Defendants as the Complaint.
On December 3, 2007, the court granted the Defendants’ motion to dismiss, with prejudice. On January 2, 2008, the plaintiffs filed a notice of appeal to the Second Circuit Court of Appeals. The appeal was fully briefed and oral argument before the U.S. Court of Appeals for the Second Circuit took place on March 5, 2009. On June 9, 2011, the Court of Appeals issued a Summary Order affirming the District Court’s dismissal of all claims with the exception of Plaintiffs’ Section 36(b) claim as it relates to Transfer Agent fees paid to an affiliate of the Managers. The case has been remanded to the District Court for further proceedings in accordance with the Summary Order.
Plaintiffs agreed to dismiss the case, and a Stipulation of Dismissal with Prejudice was filed with the Court on October 20, 2011, terminating the litigation.
9. Recent accounting pronouncement
In May 2011, the Financial Accounting Standards Board issued Accounting Standard Update No. 2011-04, Fair Value Measurement (Topic 820) — Amendments to Achieve Common Fair Value Measurement and Disclosure Requirements in U.S. GAAP and IFRSs (“ASU No. 2011-04”). ASU No. 2011-04 establishes common requirements for measuring fair value and for disclosing information about fair value measurements. ASU No. 2011-04 is effective during interim and annual periods beginning after December 15, 2011. Management is currently evaluating the impact the adoption of ASU No. 2011-04 will have on the Portfolio’s financial statements and related disclosures.
| | | | |
| Legg Mason Global Currents Variable International All Cap Opportunity Portfolio 2011 Annual Report | | | 29 | |
Report of independent registered public accounting firm
The Board of Trustees and Shareholders
Legg Mason Partners Variable Equity Trust:
We have audited the accompanying statement of assets and liabilities of Legg Mason Global Currents Variable International All Cap Opportunity Portfolio, a series of Legg Mason Partners Variable Equity Trust, including the schedule of investments, as of December 31, 2011, and the related statement of operations for the year then ended, the statements of changes in net assets for each of the years in the two-year period then ended, and the financial highlights for each of the years in the two-year period then ended, the period from November 1, 2009 to December 31, 2009, and each of the years in the three-year period ended October 31, 2009. These financial statements and financial highlights are the responsibility of the Portfolio’s management. Our responsibility is to express an opinion on these financial statements and financial highlights based on our audits.
We conducted our audits in accordance with the standards of the Public Company Accounting Oversight Board (United States). Those standards require that we plan and perform the audit to obtain reasonable assurance about whether the financial statements and financial highlights are free of material misstatement. An audit includes examining, on a test basis, evidence supporting the amounts and disclosures in the financial statements. Our procedures included confirmation of securities owned as of December 31, 2011, by correspondence with the custodian and brokers or by other appropriate auditing procedures. An audit also includes assessing the accounting principles used and significant estimates made by management, as well as evaluating the overall financial statement presentation. We believe that our audits provide a reasonable basis for our opinion.
In our opinion, the financial statements and financial highlights referred to above present fairly, in all material respects, the financial position of Legg Mason Global Currents Variable International All Cap Opportunity Portfolio as of December 31, 2011, and the results of its operations, the changes in its net assets, and the financial highlights for the periods described above, in conformity with U.S. generally accepted accounting principles.
The Board of Trustees of Legg Mason Global Currents Variable International All Cap Opportunity Portfolio approved a plan to liquidate and terminate the Portfolio. The plan of liquidation provides that the Portfolio will cease its business, liquidate its assets and distribute its liquidation proceeds to all shareholders of record of the Portfolio. Final liquidation of the Portfolio is expected to occur no later than April 30, 2012.

New York, New York
February 15, 2012
| | |
| 30 | | Legg Mason Global Currents Variable International All Cap Opportunity Portfolio |
Board approval of management and subadvisory agreements (unaudited)
At a meeting of the Trust’s Board of Trustees, the Board considered the re-approval for an annual period of the management agreement of Legg Mason Global Currents Variable International All Cap Opportunity Portfolio (the “Fund”), pursuant to which Legg Mason Partners Fund Advisor, LLC (the “Manager”) provides the Fund with investment advisory and administrative services, the sub-advisory agreement pursuant to which Global Currents Investment Management, LLC (“Global Currents”) provides day-to-day management of the Fund’s portfolio, and the sub-advisory agreement pursuant to which Western Asset Management Company (“Western Asset” and, together with Global Currents, the “Sub-Advisers”) provides day-to-day management of the Fund’s cash and short-term instruments. (The management agreement and sub-advisory agreements are collectively referred to as the “Agreements.”) The Manager and the Sub-Advisers are wholly-owned subsidiaries of Legg Mason, Inc. The Trustees who are not “interested persons” (as defined in the Investment Company Act of 1940, as amended (the “Independent Trustees”)) of the Fund were assisted in their review by Fund counsel and independent legal counsel and met with independent legal counsel in executive sessions separate from representatives of the Manager and the Sub-Advisers. The Independent Trustees requested and received information from the Manager and the Sub-Advisers they deemed reasonably necessary for their review of the Agreements and the performance of the Manager and the Sub-Advisers. Included was information about the Manager, the Sub-Advisers and the Fund’s distributor, as well as the management, sub-advisory and distribution arrangements for the Fund and other funds overseen by the Board. This information was initially reviewed by a special committee of the Independent Trustees and then by the full Board.
In voting to approve the Agreements, the Independent Trustees considered whether the approval of the Agreements would be in the best interests of the Fund and its shareholders, an evaluation based on several factors including those discussed below.
Nature, extent and quality of the services provided to the fund under the management agreement and sub-advisory agreements
The Board received and considered information regarding the nature, extent and quality of services provided to the Fund by the Manager and the Sub-Advisers under the Management Agreement and Sub-Advisory Agreements, respectively, during the past year. The Trustees also considered the Manager’s supervisory activities over the Sub-Advisers. In addition, the Independent Trustees received and considered other information regarding the administrative and other services rendered to the Fund and its shareholders by the Manager. The Board noted information received at regular meetings throughout the year related to the services rendered by the Manager in its management of the Fund’s affairs and the Manager’s role in coordinating the activities of the Sub-Advisers and the Fund’s other service providers. The Board’s evaluation of the services provided by the Manager and the Sub-Advisers took into account the Board’s knowledge and familiarity gained as Trustees of funds in the Legg Mason fund complex, including the scope and quality of the investment management and other capabilities of the Manager and the
| | | | |
| Legg Mason Global Currents Variable International All Cap Opportunity Portfolio | | | 31 | |
Sub-Advisers and the quality of the Manager’s administrative and other services. The Board observed that the scope of services provided by the Manager had expanded over time as a result of regulatory and other developments, including maintaining and monitoring its own and the Fund’s compliance programs. The Board reviewed information received from the Manager and the Fund’s Chief Compliance Officer regarding the Fund’s compliance policies and procedures established pursuant to Rule 38a-1 under the Investment Company Act of 1940, as amended.
The Board reviewed the qualifications, backgrounds and responsibilities of the Fund’s senior personnel and the portfolio management team primarily responsible for the day-to-day portfolio management of the Fund. The Board considered the degree to which the Manager implemented organizational changes to improve investment results and the services provided to the Legg Mason fund complex. The Board also considered, based on its knowledge of the Manager and the Manager’s affiliates, the financial resources available to the Manager’s parent organization, Legg Mason, Inc.
The Board also considered the division of responsibilities among the Manager and the Sub-Advisers and the oversight provided by the Manager. The Board also considered the Manager’s and Global Currents’ brokerage policies and practices, the standards applied in seeking best execution, their policies and practices regarding soft dollars, and the existence of quality controls applicable to brokerage allocation procedures. In addition, management also reported to the Board on, among other things, its business plans, recent organizational changes, portfolio manager compensation plan and policy regarding portfolio managers’ ownership of fund shares.
The Board concluded that, overall, it was satisfied with the nature, extent and quality of services provided (and expected to be provided) under the respective Agreement by the Manager and the Sub-Advisers.
Fund performance
The Board received and reviewed performance information for the Fund and for all international value funds underlying variable insurance products (the “Performance Universe”) selected by Lipper, Inc. (“Lipper”), an independent provider of investment company data. The Board was provided with a description of the methodology Lipper used to determine the similarity of the Fund with the funds included in the Performance Universe. The Trustees noted that they also had received and discussed with management information at periodic intervals comparing the Fund’s performance to that of its benchmark index. The information comparing the Fund’s performance to that of the Performance Universe was for the one-, three-, five- and ten-year periods ended June 30, 2011. The Fund performed below the median for each period. The Board also reviewed performance information provided by the Manager for periods ended September 30, 2011, which showed the Fund’s performance was better than the Lipper category average during the third quarter. The Trustees then discussed with representatives of management the portfolio management strategy of the Fund’s portfolio managers and the reasons for the
| | |
| 32 | | Legg Mason Global Currents Variable International All Cap Opportunity Portfolio |
Board approval of management and subadvisory agreements (unaudited) (cont’d)
Fund’s underperformance versus the Performance Universe during certain periods under review. The Trustees noted that management proposed liquidating the Fund as being in the best interests of the Fund and its shareholders and the Board concurred.
Management fees and expense ratios
The Board reviewed and considered the contractual management fee (the “Contractual Management Fee”) payable by the Fund to the Manager in light of the nature, extent and quality of the management and sub-advisory services provided by the Manager and the Sub-Advisers, respectively. The Board noted that the Manager, and not the Fund, pays the sub-advisory fees to the Sub-Advisers and, accordingly, that the retention of the Sub-Advisers does not increase the fees and expenses incurred by the Fund.
The Board also reviewed information regarding the fees the Manager and Global Currents charged any of their U.S. clients investing primarily in an asset class similar to that of the Fund including, where applicable, institutional separate and commingled accounts and retail managed accounts. The Manager reviewed with the Board the significant differences in the scope of services provided to the Fund and to such other clients, noting that the Fund is provided with regulatory compliance and administrative services, office facilities and Fund officers (including the Fund’s chief financial, chief legal and chief compliance officers), and that the Manager coordinates and oversees the provision of services to the Fund by other fund service providers, including the Sub-Advisers. The Board considered the fee comparisons in light of the scope of services required to manage these different types of accounts.
The Board received an analysis of complex-wide management fees provided by the Manager, which, among other things, set out a framework of fees based on asset classes. Management also discussed with the Board the Fund’s distribution arrangements, including how amounts received by the Fund’s distributor are expended, and the fees received and expenses incurred in connection with such arrangements by affiliates of the Manager.
Additionally, the Board received and considered information comparing the Fund’s Contractual Management Fee and the Fund’s overall expense ratio with those of a group of ten international value funds underlying variable insurance products selected by Lipper as comparable to the Fund (the “Expense Group”), and a broader group of funds selected by Lipper consisting of all international value funds underlying variable insurance products (the “Expense Universe”). This information showed that the Fund’s Contractual Management Fee was higher than the median of management fees paid by the funds in the Expense Group and higher than the average management fee paid by the funds in the Expense Universe, and that the Fund’s total expense ratio was higher than the median of the total expense ratios of the funds in the Expense Group and higher than the average total expense ratio of the funds in the Expense Universe.
| | | | |
| Legg Mason Global Currents Variable International All Cap Opportunity Portfolio | | | 33 | |
Manager profitability
The Board received and considered a profitability analysis of the Manager and its affiliates in providing services to the Fund. The Board also received profitability information with respect to the Legg Mason fund complex as a whole. In addition, the Board received information with respect to the Manager’s allocation methodologies used in preparing this profitability data as well as a report from an outside consultant that had reviewed the Manager’s methodology. The Board also noted the profitability percentage ranges determined by appropriate court cases to be reasonable given the services rendered to investment companies. The Board determined that the Manager’s profitability was not excessive in light of the nature, extent and quality of the services provided to the Fund.
Economies of scale
The Board received and considered information regarding whether there have been economies of scale with respect to the management of the Fund as the Fund’s assets grow, whether the Fund has appropriately benefited from any economies of scale, and whether there is potential for realization of any further economies of scale. The Board considered whether economies of scale in the provision of services to the Fund were being passed along to the shareholders.
The Board noted that the Manager instituted breakpoints in the Fund’s Contractual Management Fee, reflecting the potential for reducing the Contractual Management Fee as the Fund’s assets grow. The Board noted that the Fund’s assets had not yet reached the specified asset level at which a breakpoint to its Contractual Management Fee would be triggered. The Board noted, however, that the Contractual Management Fee increases the potential for sharing economies of scale with shareholders to the extent the Fund’s assets grow than if no breakpoints were in place. The Board also noted that to the extent the Fund’s assets increase over time, the Fund and its shareholders should realize other economies of scale as certain expenses, such as fixed fund fees, become a smaller percentage of overall assets. The Board noted that it appeared that the benefits of any economies of scale also would be appropriately shared with shareholders through increased investment in fund management and administration resources.
Taking all of the above into consideration, the Board determined that the management fee was reasonable in light of the comparative performance and expense information and the nature, extent and quality of the services provided to the Fund under the Agreements.
Other benefits to the manager
The Board considered other benefits received by the Manager and its affiliates, including the Sub-Advisers, as a result of the Manager’s relationship with the Fund, including the opportunity to offer additional products and services to Fund shareholders.
| | |
| 34 | | Legg Mason Global Currents Variable International All Cap Opportunity Portfolio |
Board approval of management and subadvisory agreements (unaudited) (cont’d)
In light of the costs of providing investment management and other services to the Fund and the Manager’s ongoing commitment to the Fund, the profits and other ancillary benefits that the Manager and its affiliates received were considered reasonable.
Based on their discussions and considerations, including those described above, the Trustees approved the Management Agreement and the Sub-Advisory Agreements to continue for another year or until the Fund is liquidated if sooner than a year.
No single factor reviewed by the Board was identified by the Board as the principal factor in determining whether to approve the Management Agreement and the Sub-Advisory Agreements.
| | | | |
| Legg Mason Global Currents Variable International All Cap Opportunity Portfolio | | | 35 | |
Additional information (unaudited)
Information about Trustees and Officers
The business and affairs of Legg Mason Global Currents Variable International All Cap Opportunity Portfolio (the “Portfolio”) are conducted by management under the supervision and subject to the direction of its Board of Trustees. The business address of each Trustee is c/o R. Jay Gerken, 620 Eighth Avenue, New York, New York 10018. Information pertaining to the Trustees and officers of the Portfolio is set forth below.
The Statement of Additional Information includes additional information about Trustees and is available, without charge, upon request by calling the Portfolio at 1-877-721-1926.
| | |
| Independent Trustees†: |
| Paul R. Ades |
| Year of birth | | 1940 |
| Position(s) with Trust | | Trustee |
| Term of office1 and length of time served2 | | Since 1983 |
| Principal occupation(s) during past five years | | Paul R. Ades, PLLC (law firm) (since 2000) |
| Number of funds in fund complex overseen by Trustee | | 49 |
| Other board memberships held by Trustee during past five years | | None |
| Andrew L. Breech |
| Year of birth | | 1952 |
| Position(s) with Trust | | Trustee |
| Term of office1 and length of time served2 | | Since 1991 |
| Principal occupation(s) during past five years | | President, Dealer Operating Control Service, Inc. (automotive retail management) (since 1985) |
| Number of funds in fund complex overseen by Trustee | | 49 |
| Other board memberships held by Trustee during past five years | | None |
| Dwight B. Crane |
| Year of birth | | 1937 |
| Position(s) with Trust | | Trustee |
| Term of office1 and length of time served2 | | Since 1981 |
| Principal occupation(s) during past five years | | Professor Emeritus, Harvard Business School (since 2007); formerly, Professor, Harvard Business School (1969 to 2007); Independent Consultant (since 1969) |
| Number of funds in fund complex overseen by Trustee | | 49 |
| Other board memberships held by Trustee during past five years | | None |
| | |
| 36 | | Legg Mason Global Currents Variable International All Cap Opportunity Portfolio |
Additional information (unaudited) (cont’d)
Information about Trustees and Officers
| | |
| Independent Trustees cont’d |
| Frank G. Hubbard |
| Year of birth | | 1937 |
| Position(s) with Trust | | Trustee |
| Term of office1 and length of time served2 | | Since 1993 |
| Principal occupation(s) during past five years | | President, Avatar International Inc. (business development) (since 1998) |
| Number of funds in fund complex overseen by Trustee | | 49 |
| Other board memberships held by Trustee during past five years | | None |
| Howard J. Johnson |
| Year of birth | | 1938 |
| Position(s) with Trust | | Trustee |
| Term of office1 and length of time served2 | | From 1981 to 1998 and since 2000 |
| Principal occupation(s) during past five years | | Chief Executive Officer, Genesis Imaging LLC (technology company) (since 2003) |
| Number of funds in fund complex overseen by Trustee | | 49 |
| Other board memberships held by Trustee during past five years | | None |
| Jerome H. Miller |
| Year of birth | | 1938 |
| Position(s) with Trust | | Trustee |
| Term of office1 and length of time served2 | | Since 1995 |
| Principal occupation(s) during past five years | | Retired |
| Number of funds in fund complex overseen by Trustee | | 49 |
| Other board memberships held by Trustee during past five years | | None |
| Ken Miller |
| Year of birth | | 1942 |
| Position(s) with Trust | | Trustee |
| Term of office1 and length of time served2 | | Since 1983 |
| Principal occupation(s) during past five years | | President, Young Stuff Apparel Group, Inc. (apparel manufacturer), division of Li & Fung (since 1963) |
| Number of funds in fund complex overseen by Trustee | | 49 |
| Other board memberships held by Trustee during past five years | | None |
| | | | |
| Legg Mason Global Currents Variable International All Cap Opportunity Portfolio | | | 37 | |
| | |
| Independent Trustees cont’d |
| John J. Murphy |
| Year of birth | | 1944 |
| Position(s) with Trust | | Trustee |
| Term of office1 and length of time served2 | | Since 2002 |
| Principal occupation(s) during past five years | | Founder and Senior Principal, Murphy Capital Management (investment management) (since 1983) |
| Number of funds in fund complex overseen by Trustee | | 49 |
| Other board memberships held by Trustee during past five years | | Trustee, UBS Funds (52 funds) (since 2008); Trustee, Consulting Group Capital Markets Funds (11 funds) (since 2002); formerly, Director, Nicholas Applegate Institutional Funds (12 funds) (2005 to 2010); formerly, Director, Atlantic Stewardship Bank (2004 to 2005); formerly, Director, Barclays International Funds Group Ltd. and affiliated companies (1983 to 2003) |
| Thomas F. Schlafly |
| Year of birth | | 1948 |
| Position(s) with Trust | | Trustee |
| Term of office1 and length of time served2 | | Since 1983 |
| Principal occupation(s) during past five years | | President, The Saint Louis Brewery, Inc. (brewery) (since 1989); Partner, Thompson Coburn LLP (law firm) (since 2009); formerly, Of Counsel, Husch Blackwell Sanders LLP (law firm) and its predecessor firms (1984 to 2009) |
| Number of funds in fund complex overseen by Trustee | | 49 |
| Other board memberships held by Trustee during past five years | | Director, Citizens National Bank of Greater St. Louis (since 2006) |
| Jerry A. Viscione |
| Year of birth | | 1944 |
| Position(s) with Trust | | Trustee |
| Term of office1 and length of time served2 | | Since 1993 |
| Principal occupation(s) during past five years | | Retired |
| Number of funds in fund complex overseen by Trustee | | 49 |
| Other board memberships held by Trustee during past five years | | None |
| | |
| 38 | | Legg Mason Global Currents Variable International All Cap Opportunity Portfolio |
Additional information (unaudited) (cont’d)
Information about Trustees and Officers
| | |
| Interested Trustee and Officer: | | |
| R. Jay Gerken3 | | |
| Year of birth | | 1951 |
| Position(s) with Trust | | Trustee, President, Chairman and Chief Executive Officer |
| Term of office1 and length of time served2 | | Since 2002 |
| Principal occupation(s) during past five years | | Managing Director of Legg Mason & Co., LLC (“Legg Mason & Co.”) (since 2005); Officer and Trustee/Director of 161 funds associated with Legg Mason Partners Fund Advisor, LLC (“LMPFA”) or its affiliates (since 2006) and Legg Mason & Co. predecessors (prior to 2006); President and Chief Executive Officer (“CEO”) of LMPFA (since 2006); President and CEO of Smith Barney Fund Management LLC (“SBFM”) and Citi Fund Management, Inc. (“CFM”) (formerly a registered investment adviser) (since 2002) |
| Number of funds in fund complex overseen by Trustee | | 161 |
| Other board memberships held by Trustee during past five years | | None |
| Additional Officers | | |
Ted P. Becker Legg Mason 620 Eighth Avenue, New York, NY 10018 | | |
| Year of birth | | 1951 |
| Position(s) with Trust | | Chief Compliance Officer |
| Term of office1 and length of time served2 | | Since 2007 |
| Principal occupation(s) during past five years | | Director of Global Compliance at Legg Mason (since 2006); Chief Compliance Officer of LMPFA (since 2006); Managing Director of Compliance of Legg Mason & Co. (since 2005); Chief Compliance Officer of certain mutual funds associated with Legg Mason & Co. or its affiliates (since 2006) and Legg Mason & Co. predecessors (prior to 2006) |
Vanessa A. Williams
Legg Mason 100 First Stamford Place, Stamford, CT 06902 | | |
| Year of birth | | 1979 |
| Position(s) with Trust | | Chief Anti-Money Laundering Compliance Officer and Identity Theft Prevention Officer |
| Term of office1 and length of time served2 | | Since 2011 |
| Principal occupation(s) during past five years | | Identity Theft Prevention Officer of certain mutual funds associated with Legg Mason & Co. or its affiliates (since 2011); Chief Anti-Money Laundering Compliance Officer of certain mutual funds associated with Legg Mason & Co. or its affiliates (since 2011); formerly, Assistant Vice President and Senior Compliance Officer of Legg Mason & Co. (2008 to 2011); formerly, Compliance Analyst of Legg Mason & Co. (2006 to 2008) and Legg Mason & Co. predecessors (prior to 2006) |
| | | | |
| Legg Mason Global Currents Variable International All Cap Opportunity Portfolio | | | 39 | |
| | |
| Additional Officers cont’d | | |
Robert I. Frenkel Legg Mason 100 First Stamford Place, Stamford, CT 06902 | | |
| Year of birth | | 1954 |
| Position(s) with Trust | | Secretary and Chief Legal Officer |
| Term of office1 and length of time served2 | | Since 2007 |
| Principal occupation(s) during past five years | | Vice President and Deputy General Counsel of Legg Mason (since 2006); Managing Director and General Counsel of Global Mutual Funds for Legg Mason & Co. (since 2006) and Legg Mason & Co. predecessors (since 1994); Secretary and Chief Legal Officer of certain mutual funds associated with Legg Mason & Co. or its affiliates (since 2006) and Legg Mason & Co. predecessors (prior to 2006) |
Thomas C. Mandia Legg Mason 100 First Stamford Place, Stamford, CT 06902 | | |
| Year of birth | | 1962 |
| Position(s) with Trust | | Assistant Secretary |
| Term of office1 and length of time served2 | | Since 2007 |
| Principal occupation(s) during past five years | | Managing Director and Deputy General Counsel of Legg Mason & Co. (since 2005) and Legg Mason & Co. predecessors (prior to 2005); Secretary of LMPFA (since 2006); Assistant Secretary of certain mutual funds associated with Legg Mason & Co. or its affiliates (since 2006) and Legg Mason & Co. predecessors (prior to 2006); Secretary to SBFM (since 2002) |
Richard F. Sennett Legg Mason 55 Water Street, New York, NY 10041 | | |
| Year of birth | | 1970 |
| Position(s) with Trust | | Principal Financial Officer |
| Term of office1 and length of time served2 | | Since 2011 |
| Principal occupation(s) during past five years | | Principal Financial Officer of certain mutual funds associated with Legg Mason & Co. or its affiliates (since 2011); Managing Director of Legg Mason & Co. and Senior Manager of the Treasury Policy group for Legg Mason & Co.’s Global Fiduciary Platform (since 2011); formerly, Chief Accountant within the SEC’s Division of Investment Management (2007 to 2011); formerly, Assistant Chief Accountant within the SEC’s Division of Investment Management (2002 to 2007) |
| | |
| 40 | | Legg Mason Global Currents Variable International All Cap Opportunity Portfolio |
Additional information (unaudited) (cont’d)
Information about Trustees and Officers
| | |
| Additional Officers cont’d | | |
Albert Laskaj Legg Mason 55 Water Street, New York, NY 10041 | | |
| Year of birth | | 1977 |
| Position(s) with Trust | | Treasurer |
| Term of office1 and length of time served2 | | Since 2010 |
| Principal occupation(s) during past five years | | Vice President of Legg Mason & Co. (since 2008); Treasurer of certain mutual funds associated with Legg Mason & Co. or its affiliates (since 2010); formerly, Controller of certain mutual funds associated with Legg Mason & Co. or its affiliates (prior to 2010); formerly, Assistant Controller of certain mutual funds associated with Legg Mason & Co. or its affiliates (prior to 2007); formerly, Accounting Manager of certain mutual funds associated with Legg Mason & Co. predecessors (prior to 2005) |
Jeanne M. Kelly Legg Mason 620 Eighth Avenue, New York, NY 10018 | | |
| Year of birth | | 1951 |
| Position(s) with Trust | | Senior Vice President |
| Term of office1 and length of time served2 | | Since 2007 |
| Principal occupation(s) during past five years | | Senior Vice President of certain mutual funds associated with Legg Mason & Co. or its affiliates (since 2007); Senior Vice President of LMPFA (since 2006); Managing Director of Legg Mason & Co. (since 2005) and Legg Mason & Co. predecessors (prior to 2005) |
| † | Trustees who are not “interested persons” of the Portfolio within the meaning of Section 2(a)(19) of the 1940 Act. |
| 1 | Each Trustee and officer serves until his or her respective successor has been duly elected and qualified or until his or her earlier death, resignation, retirement or removal. |
| 2 | Indicates the earliest year in which the Trustee became a board member for a fund in the Legg Mason fund complex or the officer took such office. |
| 3 | Mr. Gerken is an “interested person” of the Portfolio, as defined in the 1940 Act, because of his position with LMPFA and/or certain of its affiliates. |
| | | | |
| Legg Mason Global Currents Variable International All Cap Opportunity Portfolio | | | 41 | |
Important tax information (unaudited)
The following information is provided with respect to the distributions paid during the taxable year ended December 31, 2011:
| | | | | | | | |
| Record date: | | | 4/26/2011 | | | | 12/20/2011 | |
| Payable date: | | | 4/27/2011 | | | | 12/21/2011 | |
| Foreign source income | | | 86.26 | % | | | 100.00 | %* |
| Foreign taxes paid per share | | | — | | | $ | 0.102879 | |
| * | Expressed as a percentage of the cash distribution grossed-up for foreign taxes. |
The foreign taxes paid represent taxes incurred by the Portfolio on income received by the Portfolio from foreign sources. Foreign taxes paid may be included in taxable income with an offsetting deduction from gross income or may be taken as a credit for taxes paid to foreign governments. You should consult your tax adviser regarding the appropriate treatment of foreign taxes paid.
Please retain this information for your records.
Legg Mason Global Currents
Variable International All Cap Opportunity Portfolio
Trustees
Paul R. Ades
Andrew L. Breech
Dwight B. Crane
R. Jay Gerken
Chairman
Frank G. Hubbard
Howard J. Johnson
Jerome H. Miller
Ken Miller
John J. Murphy
Thomas F. Schlafly
Jerry A. Viscione
Investment manager
Legg Mason Partners Fund Advisor, LLC
Subadviser
Global Currents Investment Management, LLC
Distributor
Legg Mason Investor Services, LLC
Custodian
State Street Bank and Trust Company
Transfer agent
Boston Financial Data Services, Inc.
2000 Crown Colony Drive
Quincy, MA 02169
Independent registered public accounting firm
KPMG LLP
345 Park Avenue
New York, NY 10154
Legg Mason Global Currents Variable International All Cap Opportunity Portfolio
The Portfolio is a separate investment series of Legg Mason Partners Variable Equity Trust, a Maryland statutory trust.
Legg Mason Global Currents Variable International All Cap Opportunity Portfolio
Legg Mason Funds
55 Water Street
New York, NY 10041
The Portfolio files its complete schedule of portfolio holdings with the Securities and Exchange Commission (“SEC”) for the first and third quarters of each fiscal year on Form N-Q. The Portfolio’s Forms N-Q are available on the SEC’s website at www.sec.gov. The Portfolio’s Forms N-Q may be reviewed and copied at the SEC’s Public Reference Room in Washington, D.C., and information on the operation of the Public Reference Room may be obtained by calling 1-800-SEC-0330. To obtain information on Form N-Q, shareholders can call the Portfolio at 1-877-721-1926.
Information on how the Portfolio voted proxies relating to portfolio securities during the prior 12-month period ended June 30th of each year and a description of the policies and procedures that the Portfolio uses to determine how to vote proxies related to portfolio transactions are available (1) without charge, upon request, by calling the Portfolio at 1-877-721-1926, (2) on the Portfolio’s website at www.leggmason.com/individualinvestors and (3) on the SEC’s website at www.sec.gov.
This report is submitted for the general information of the shareholders of Legg Mason Global Currents Variable International All Cap Opportunity Portfolio. This report is not authorized for distribution to prospective investors in the Portfolio unless preceded or accompanied by a current prospectus.
Investors should consider the Portfolio’s investment objectives, risks, charges and expenses carefully before investing. The prospectus contains this and other important information about the Portfolio. Please read the prospectus carefully before investing.
www.leggmason.com/individualinvestors
©2012 Legg Mason Investor Services, LLC
Member FINRA, SIPC
Legg Mason Funds Privacy and Security Notice
Your Privacy and the Security of Your Personal Information is Very Important to the Legg Mason Funds
This Privacy and Security Notice (the “Privacy Notice”) addresses the Legg Mason Funds’ privacy and data protection practices with respect to nonpublic personal information the Funds receive. The Legg Mason Funds include any funds sold by the Funds’ distributor, Legg Mason Investor Services, LLC, as well as Legg Mason-sponsored closed-end funds and certain other closed-end funds managed or sub-advised by Legg Mason or its affiliates. The provisions of this Privacy Notice apply to your information both while you are a shareholder and after you are no longer invested with the Funds.
The Type of Nonpublic Personal Information the Funds Collect About You
The Funds collect and maintain nonpublic personal information about you in connection with your shareholder account. Such information may include, but is not limited to:
| Ÿ | | Personal information included on applications or other forms; |
| Ÿ | | Account balances, transactions, and mutual fund holdings and positions; |
| Ÿ | | Online account access user IDs, passwords, security challenge question responses; and |
| Ÿ | | Information received from consumer reporting agencies regarding credit history and creditworthiness (such as the amount of an individual’s total debt, payment history, etc.). |
How the Funds Use Nonpublic Personal Information About You
The Funds do not sell or share your nonpublic personal information with third parties or with affiliates for their marketing purposes, or with other financial institutions or affiliates for joint marketing purposes, unless you have authorized the Funds to do so. The Funds do not disclose any nonpublic personal information about you except as may be required to perform transactions or services you have authorized or as permitted or required by law. The Funds may disclose information about you to:
| Ÿ | | Employees, agents, and affiliates on a “need to know” basis to enable the Funds to conduct ordinary business or comply with obligations to government regulators; |
| Ÿ | | Service providers, including the Funds’ affiliates, who assist the Funds as part of the ordinary course of business (such as printing, mailing services, or processing or servicing your account with us) or otherwise perform services on the Funds’ behalf, including companies that may perform marketing services solely for the Funds; |
| Ÿ | | The Funds’ representatives such as legal counsel, accountants and auditors; and |
| Ÿ | | Fiduciaries or representatives acting on your behalf, such as an IRA custodian or trustee of a grantor trust. |
|
| NOT PART OF THE ANNUAL REPORT |
Legg Mason Funds Privacy and Security Notice (cont’d)
Except as otherwise permitted by applicable law, companies acting on the Funds’ behalf are contractually obligated to keep nonpublic personal information the Funds provide to them confidential and to use the information the Funds share only to provide the services the Funds ask them to perform.
The Funds may disclose nonpublic personal information about you when necessary to enforce their rights or protect against fraud, or as permitted or required by applicable law, such as in connection with a law enforcement or regulatory request, subpoena, or similar legal process. In the event of a corporate action or in the event a Fund service provider changes, the Funds may be required to disclose your nonpublic personal information to third parties. While it is the Funds’ practice to obtain protections for disclosed information in these types of transactions, the Funds cannot guarantee their privacy policy will remain unchanged.
Keeping You Informed of the Funds’ Privacy and Security Practices
The Funds will notify you annually of their privacy policy as required by federal law. While the Funds reserve the right to modify this policy at any time they will notify you promptly if this privacy policy changes.
The Funds’ Security Practices
The Funds maintain appropriate physical, electronic and procedural safeguards designed to guard your nonpublic personal information. The Funds’ internal data security policies restrict access to your nonpublic personal information to authorized employees, who may use your nonpublic personal information for Fund business purposes only.
Although the Funds strive to protect your nonpublic personal information, they cannot ensure or warrant the security of any information you provide or transmit to them, and you do so at your own risk. In the event of a breach of the confidentiality or security of your nonpublic personal information, the Funds will attempt to notify you as necessary so you can take appropriate protective steps. If you have consented to the Funds using electronic communications or electronic delivery of statements, they may notify you under such circumstances using the most current email address you have on record with them.
In order for the Funds to provide effective service to you, keeping your account information accurate is very important. If you believe that your account information is incomplete, not accurate or not current, or if you have questions about the Funds’ privacy practices, write the Funds using the contact information on your account statements, email the Funds by clicking on the Contact Us section of the Funds’ website at www.leggmason.com, or contact the Fund at 1-877-721-1926.
Revised April 2011
|
| NOT PART OF THE ANNUAL REPORT |
www.leggmason.com/individualinvestors
©2012 Legg Mason Investor Services, LLC Member FINRA, SIPC
FDXX010542 2/12 SR12-1597
The registrant has adopted a code of ethics that applies to the registrant’s principal executive officer, principal financial officer, principal accounting officer or controller.
| ITEM 3. | AUDIT COMMITTEE FINANCIAL EXPERT. |
The Board of Trustees of the registrant has determined that Jerry A. Viscione possesses the technical attributes identified in Instruction 2(b) of Item 3 to Form N-CSR to qualify as an “audit committee financial expert,” and has designated Mr. Viscione as the Audit Committee’s financial expert. Mr. Viscione is an “independent” Trustee pursuant to paragraph (a)(2) of Item 3 to Form N-CSR.
| ITEM 4. | PRINCIPAL ACCOUNTANT FEES AND SERVICES. |
a) Audit Fees. The aggregate fees billed in the previous fiscal years ending December 31, 2010 and December 31, 2011 (the “Reporting Periods”) for professional services rendered by the Registrant’s principal accountant (the “Auditor”) for the audit of the Registrant’s annual financial statements, or services that are normally provided by the Auditor in connection with the statutory and regulatory filings or engagements for the Reporting Periods, were $301,400 in December 31, 2010 and $330,000 in December 31, 2011.
b) Audit-Related Fees. The aggregate fees billed in the Reporting Period for assurance and related services by the Auditor that are reasonably related to the performance of the Registrant’s financial statements were $0 in December 31, 2010 and $0 in December 31, 2011.
In addition, there were no Audit-Related Fees billed in the Reporting Period for assurance and related services by the Auditor to the Registrant’s investment adviser (not including any sub-adviser whose role is primarily portfolio management and is subcontracted with or overseen by another investment adviser), and any entity controlling, controlled by or under common control with the investment adviser that provides ongoing services to the Legg Mason Partners Variable Equity Trust (“service affiliates”), that were reasonably related to the performance of the annual audit of the service affiliates. Accordingly, there were no such fees that required pre-approval by the Audit Committee for the Reporting Periods.
(c) Tax Fees. The aggregate fees billed in the Reporting Periods for professional services rendered by the Auditor for tax compliance, tax advice and tax planning (“Tax Services”) were $57,600 in December 31, 2010 and $61,000 in December 31, 2011. These services consisted of (i) review or preparation of U.S. federal, state, local and excise tax returns; (ii) U.S. federal, state and local tax planning, advice and assistance regarding statutory, regulatory or administrative developments, and (iii) tax advice regarding tax qualification matters and/or treatment of various financial instruments held or proposed to be acquired or held.
There were no fees billed for tax services by the Auditors to service affiliates during the Reporting Periods that required pre-approval by the Audit Committee.
d) All Other Fees. There were no other fees billed in the Reporting Periods for products and services provided by the Auditor, other than the services reported in paragraphs (a) through (c) of this Item for the Legg Mason Partners Variable Equity Trust.
All Other Fees. There were no other non-audit services rendered by the Auditor to Legg Mason Partners Fund Advisors, LLC (“LMPFA”), and any entity controlling, controlled by or under common control with LMPFA that provided ongoing services to Legg Mason Partners Variable Equity Trust requiring pre-approval by the Audit Committee in the Reporting Period.
(e) Audit Committee’s pre-approval policies and procedures described in paragraph (c) (7) of Rule 2-01 of Regulation S-X.
(1) The Charter for the Audit Committee (the “Committee”) of the Board of each registered investment company (the “Fund”) advised by LMPFA or one of their affiliates (each, an “Adviser”) requires that the Committee shall approve (a) all audit and permissible non-audit services to be provided to the Fund and (b) all permissible non-audit services to be provided by the Fund’s independent auditors to the Adviser and any Covered Service Providers if the engagement relates directly to the operations and financial reporting of the Fund. The Committee may implement policies and procedures by which such services are approved other than by the full Committee.
The Committee shall not approve non-audit services that the Committee believes may impair the independence of the auditors. As of the date of the approval of this Audit Committee Charter, permissible non-audit services include any professional services (including tax services), that are not prohibited services as described below, provided to the Fund by the independent auditors, other than those provided to the Fund in connection with an audit or a review of the financial statements of the Fund. Permissible non-audit services may not include: (i) bookkeeping or other services related to the accounting records or financial statements of the Fund; (ii) financial information systems design and implementation; (iii) appraisal or valuation services, fairness opinions or contribution-in-kind reports; (iv) actuarial services; (v) internal audit outsourcing services; (vi) management functions or human resources; (vii) broker or dealer, investment adviser or investment banking services; (viii) legal services and expert services unrelated to the audit; and (ix) any other service the Public Company Accounting Oversight Board determines, by regulation, is impermissible.
Pre-approval by the Committee of any permissible non-audit services is not required so long as: (i) the aggregate amount of all such permissible non-audit services provided to the Fund, the Adviser and any service providers controlling, controlled by or under common control with the Adviser that provide ongoing services to the Fund (“Covered Service Providers”) constitutes not more than 5% of the total amount of revenues paid to the independent auditors during the fiscal year in which the permissible non-audit services are provided to (a) the Fund, (b) the Adviser and (c) any entity controlling, controlled by or under common control with the Adviser that provides ongoing services to the Fund during the fiscal year in which the services are provided that would have to be approved by the Committee; (ii) the permissible non-audit services were not recognized by the Fund at the time of the engagement to be non-audit services; and (iii) such services are promptly brought to the attention of the Committee and approved by the Committee (or its delegate(s)) prior to the completion of the audit.
(2) For the Legg Mason Partners Variable Equity Trust, the percentage of fees that were approved by the audit committee, with respect to: Audit-Related Fees were 100% and 100% for December 31, 2010 and December 31, 2011; Tax Fees were 100% and 100% for December 31, 2010 and December 31, 2011; and Other Fees were 100% and 100% for December 31, 2010 and December 31, 2011.
(f) N/A
(g) Non-audit fees billed by the Auditor for services rendered to Legg Mason Partners Variable Equity Trust, LMPFA and any entity controlling, controlled by, or under common control with LMPFA that provides ongoing services to Legg Mason Partners Variable Equity Trust during the reporting period were $0 in 2011.
(h) Yes. Legg Mason Partners Variable Equity Trust’s Audit Committee has considered whether the provision of non-audit services that were rendered to Service Affiliates, which were not pre-approved (not requiring pre-approval), is compatible with maintaining the Accountant’s independence. All services provided by the Auditor to the Legg Mason Partners Variable Equity Trust or to Service Affiliates, which were required to be pre-approved, were pre-approved as required.
| ITEM 5. | AUDIT COMMITTEE OF LISTED REGISTRANTS. |
| | a) | The independent board members are acting as the registrant’s audit committee as specified in Section 3(a)(58)(B) of the Exchange Act. The Audit Committee consists of the following Board members: |
Paul R. Ades
Andrew L. Breech
Dwight B. Crane
Frank G. Hubbard
Howard J. Johnson
Jerome H. Miller
Ken Miller
John J. Murphy
Thomas F. Schlafly
Jerry A. Viscione
b) Not applicable.
| ITEM 6. | SCHEDULE OF INVESTMENTS. |
Included herein under Item 1.
| ITEM 7. | DISCLOSURE OF PROXY VOTING POLICIES AND PROCEDURES FOR CLOSED-END MANAGEMENT INVESTMENT COMPANIES. |
Not applicable.
| ITEM 8. | PORTFOLIO MANAGERS OF CLOSED-END MANAGEMENT INVESTMENT COMPANIES. |
Not applicable.
| ITEM 9. | PURCHASES OF EQUITY SECURITIES BY CLOSED-END MANAGEMENT INVESTMENT COMPANY AND AFFILIATED PURCHASERS. |
Not applicable.
| ITEM 10. | SUBMISSION OF MATTERS TO A VOTE OF SECURITY HOLDERS. |
Not applicable.
| ITEM 11. | CONTROLS AND PROCEDURES. |
| | (a) | The registrant’s principal executive officer and principal financial officer have concluded that the registrant’s disclosure controls and procedures (as defined in Rule 30a- 3(c) under the Investment Company Act of 1940, as amended (the “1940 Act”)) are effective as of a date within 90 days of the filing date of this report that includes the disclosure required by this paragraph, based on their evaluation of the disclosure controls and procedures required by Rule 30a-3(b) under the 1940 Act and 15d-15(b) under the Securities Exchange Act of 1934. |
| | (b) | There were no changes in the registrant’s internal control over financial reporting (as defined in Rule 30a-3(d) under the 1940 Act) that occurred during the second fiscal quarter of the period covered by this report that have materially affected, or are likely to materially affect the registrant’s internal control over financial reporting. |
(a) (1) Code of Ethics attached hereto.
Exhibit 99.CODE ETH
(a) (2) Certifications pursuant to section 302 of the Sarbanes-Oxley Act of 2002 attached hereto.
Exhibit 99.CERT
(b) Certifications pursuant to Section 906 of the Sarbanes-Oxley Act of 2002 attached hereto.
Exhibit 99.906CERT
SIGNATURES
Pursuant to the requirements of the Securities Exchange Act of 1934 and the Investment Company Act of 1940, the registrant has duly caused this Report to be signed on its behalf by the undersigned, there unto duly authorized.
Legg Mason Partners Variable Equity Trust
| | |
| By: | | /S/ R. JAY GERKEN |
| | (R. Jay Gerken) |
| | Chief Executive Officer of |
| | Legg Mason Partners Variable Equity Trust |
Date: February 27, 2012
Pursuant to the requirements of the Securities Exchange Act of 1934 and the Investment Company Act of 1940, this report has been signed below by the following persons on behalf of the registrant and in the capacities and on the dates indicated.
| | |
| By: | | /S/ R. JAY GERKEN |
| | (R. Jay Gerken) |
| | Chief Executive Officer of |
| | Legg Mason Partners Variable Equity Trust |
Date: February 27, 2012
| | |
| By: | | /S/ RICHARD F. SENNETT |
| | (Richard F. Sennett) |
| | Principal Financial Officer of |
| | Legg Mason Partners Variable Equity Trust |
Date: February 27, 2012