UNITED STATES
SECURITIES AND EXCHANGE COMMISSION
Washington, D.C. 20549
FORM N-CSR
CERTIFIED SHAREHOLDER REPORT OF REGISTERED
MANAGEMENT INVESTMENT COMPANIES
Investment Company Act file number 811-21128
Legg Mason Partners Variable Equity Trust
(Exact name of registrant as specified in charter)
620 Eighth Avenue, 47th Floor, New York, NY 10018
(Address of principal executive offices) (Zip code)
Marc A. De Oliveira.
Franklin Templeton
100 First Stamford Place
Stamford, CT 06902
(Name and address of agent for service)
Registrant’s telephone number, including area code: 877-6LM-FUND/656-3863
Date of fiscal year end: December 31
Date of reporting period: December 31, 2023
| ITEM 1. | REPORT TO STOCKHOLDERS. |
The Annual Report to Stockholders is filed herewith.
![]()
Annual Report
| December 31, 2023 |
CLEARBRIDGE
VARIABLE SMALL CAP GROWTH PORTFOLIO
The Securities and Exchange Commission has adopted new regulations that will result in changes to the design and delivery of annual and semi-annual shareholder reports beginning in July 2024.
If you have previously elected to receive shareholder reports electronically, you will continue to do so and need not take any action.
Otherwise, paper copies of the Fund’s shareholder reports will be mailed to you beginning in July 2024. If you would like to receive shareholder reports and other communications from the Fund electronically instead of by mail, you may make that request at any time by contacting your insurance company or your financial intermediary (such as a broker-dealer or bank).

| INVESTMENT PRODUCTS: NOT FDIC INSURED • NO BANK GUARANTEE • MAY LOSE VALUE |
Portfolio objective
The Portfolio seeks long-term growth of capital.

Dear Shareholder,
We are pleased to provide the annual report of ClearBridge Variable Small Cap Growth Portfolio for the twelve-month reporting period ended December 31, 2023. Please read on for a detailed look at prevailing economic and market conditions during the Portfolio’s reporting period and to learn how those conditions have affected Portfolio performance.
Special shareholder notice
Effective December 31, 2023, Jeffrey Bailin, CFA joined the Portfolio’s management team and Jeffrey J. Russell, CFA retired and stepped down as a member of the Portfolio’s management team.
As always, we remain committed to providing you with excellent service and a full spectrum of investment choices. We also remain committed to supplementing the support you receive from your financial advisor. One way we accomplish this is through our website, www.franklintempleton.com. Here you can gain immediate access to market and investment information, including:
| • | Market insights and commentaries from our portfolio managers and |
| • | A host of educational resources. |
We look forward to helping you meet your financial goals.
Sincerely,

Jane Trust, CFA
President and Chief Executive Officer
January 31, 2024
| II | ClearBridge Variable Small Cap Growth Portfolio |
Q. What is the Portfolio’s investment strategy?
A. The Portfolio seeks long-term growth of capital. Under normal circumstances, the Portfolio invests at least 80% of its assets in equity securities of companies with small market capitalizations and related investments. Small capitalization companies are companies whose market capitalizations at the time of investment are similar to market capitalizations of companies in the Russell 2000 Indexi, which varies due to market conditions and the composition of the index. Securities of companies whose market capitalization no longer meet this definition after purchase by the Portfolio are still be considered to be securities of small capitalization companies for purposes of the Portfolio’s 80% investment policy. The Portfolio may invest up to 20% of its assets in equity securities of companies that are not considered to be small capitalization companies. We use a growth-oriented investment style that emphasizes small U.S. companies.
In addition, the Portfolio may invest in companies that we believe to be emerging in new or existing markets. The Portfolio may also invest in companies we believe to be undervalued relative to their peers. The Portfolio may invest up to 20% of its net assets (at the time of investment) in foreign securities.
We generally use a “bottom-up” approach when selecting securities for the Portfolio. This mean that we look primarily at individual companies against the context of broader market forces.
Q. What were the overall market conditions during the Portfolio’s reporting period?
A. Positive performance for the large cap S&P 500 Indexii, which advanced 26.29% for the twelve months ended December 31, 2023, overlooked broader weakness across the rest of the U.S. equity market. Tightening financial conditions, sparked by aggressive interest rate increases by the Federal Reserve Board (the “Fed”) and the failure of two regional banks, weighed heavily on smaller cap companies before broadening out in the fourth quarter, with the Russell 2000 Index returning 16.93% for the reporting period. Small cap growth stocks held up better than their value counterparts, with the benchmark Russell 2000 Growth Indexiii returning 18.66% while the Russell 2000 Value Indexiv returned 14.65%.
Within the benchmark, the consumer staples (+28.61%) sector was the leading contributor to performance. Investor enthusiasm about the potential for artificial intelligence (“AI”) allowed the information technology (“IT”) (+27.84%) sector to generate strong performance and outperform the broader benchmark alongside the industrials (+24.19%), consumer discretionary (+21.56%) and financials (+19.26) sectors. Meanwhile, the more interest-rate sensitive utilities (-2.42%) sector was the sole detractor within the benchmark, while the energy (+8.77%) and materials (+10.83%) sectors also lagged the broader index’s performance.
| ClearBridge Variable Small Cap Growth Portfolio 2023 Annual Report | 1 |
Portfolio overview (cont’d)
Initial signs of progress in the Fed’s efforts to tame generationally high inflation supported equities in the first quarter of 2023, with strong performance among defensive and cyclical1 stocks.
In March, markets focused on the U.S. banking system after significant market losses in Silicon Valley Bank’s securities portfolio spurred a run on the bank’s deposits and resulted in the second-largest bank failure in U.S. history. This sparked a crisis of confidence across small and midsize regional banks, as consumers shifted their deposits to larger banks perceived to be more stable. Although contagion concerns had eased by the end of the month, the crisis intensified concern over the probability and severity of a recession as banks are likely to tighten lending standards.
Stocks rose in the second quarter as investors took cooling inflation to mean the Fed’s tightening cycle was nearing its conclusion. Simultaneously, enthusiasm grew over the potential applications and benefits of AI. The result was positive overall market performance with gains particularly concentrated in a handful of mega cap companies in the IT, consumer discretionary and communication services sectors.
Market leadership began to broaden by the beginning of the third quarter as better-than-expected corporate earnings and cooling inflation created a growing chorus for a soft landing for the economy (rather than a recession). This helped provide a bid to smaller and more economically sensitive stocks on the hopes that the Fed would reach its rate hike zenith, or even reduce rates, before the end of the year. However, as the quarter wore on, stubborn inflationary data, continued economic resiliency and surging Treasury yields pushed out rate cut expectations further into the future.
In the fourth quarter, signs of cooling inflation, a slowing labor market and favorable Treasury auction volumes caused bond yields to plummet, providing a strong bid to equities across the market with growth resuming its leadership position. A drastic shift in investor sentiment toward anticipation of an economic soft landing and a dovish pivot from the Fed, along with broadening market leadership, helped to swell the performance in small cap stocks, while the prospect of interest rate cuts as early as the first half of 2024 helped to spur a rally in more interest-rate sensitive market sectors.
Q. How did we respond to these changing market conditions?
A. In addition to the latest reporting period ended December 31, 2023, the Portfolio has had three prior periods of significant underperformance. Those occurred during the second half of 2008, the first half of 2015 and most recently the fourth quarter of 2020 into early 2021. Needless to say, we are disappointed and frustrated during these periods of subpar performance. Yet the small cap growth market (and the broader equity market) sometimes moves in mysterious ways during concentrated timeframes.
| 1 | Cyclical consists of the following industries: automotive, entertainment, gaming, home construction, lodging, retailers, restaurants, textiles and other consumer services. |
| 2 | ClearBridge Variable Small Cap Growth Portfolio 2023 Annual Report |
We have found that sticking to our investment disciplines has led to relative performance recovery for our shareholders. We have continued to exercise judgment and patience to ensure we have 1) the right balance of opportunity and risk in the Portfolio, and 2) properly capitalized investments with substantial intermediate- to long-term growth opportunities. Our activity during the year was guided by these principles, leading to sixteen new investments that remained in the Fund at the end of the reporting period.
One positive during the year was the reopening of the new issues market after a near standstill during the throes of the COVID-19 pandemic and recovery. We participated in the initial public offerings of Klaviyo, a software and database platform that provides marketing automation solutions primarily to smaller e-commerce customers that we had owned as a private placement, and Oddity Tech, an already profitable direct to consumer cosmetics business that uses AI and related technologies to connect with customers.
Another notable addition was BWX Technologies, a manufacturer of naval reactors and components for the U.S. Navy and commercial players. With roughly 80% of revenues tied to a highly visible & well-funded defense priority (nuclear submarines), the company should drive steady and defensive growth with multiple upside drivers from greater acceptance of nuclear energy’s role in the energy transition coupled with technology advances in micro-reactors and small modular reactors.
We also exited fourteen positions for both positive and negative reasons. On the constructive side, several stocks were the targets of acquisitions (New Relic, Syneos Health, AeroJet RocketDyne Holdings). We were expeditious in selling out of names due to new risks, such as the regional banking crisis in March that negatively impacted Western Alliance Bancorp, as well as the early August revelation that the GLP-1 diabetes and obesity treatments had potentially important cardiovascular benefits which led to pervasive selling of a plethora of medical technology stocks. In response to the negative sentiment across the health care sector, we closed out of Silk Road Medical and STARR Surgical. Similarly, the threat of disintermediation from AI led us to exit online education provider Chegg.
A combination of idiosyncratic individual stock moves, a lower-quality small cap rally and the Russell 2000 Growth Index rebalancing were among the main drivers of underperformance during the year. We have taken appropriate repositioning moves as described above while reaffirming the long-term appeal of many of the short-term stock underperformers. As such, we remain meaningful exposure to software and semiconductor stocks in IT and non-therapeutic areas of health care.
| ClearBridge Variable Small Cap Growth Portfolio 2023 Annual Report | 3 |
Portfolio overview (cont’d)
Performance review
For the twelve months ended December 31, 2023, Class I shares of ClearBridge Variable Small Cap Growth Portfolio1 returned 8.40%. The Portfolio’s unmanaged benchmark, the Russell 2000 Growth Index, returned 18.66% for the same period.
| Performance Snapshot as of December 31, 2023 (unaudited) | ||||||||
| 6 months | 12 months | |||||||
| ClearBridge Variable Small Cap Growth Portfolio: | ||||||||
Class I | 0.74 | % | 8.40 | % | ||||
Class II | 0.60 | % | 8.12 | % | ||||
| Russell 2000 Growth Index | 4.50 | % | 18.66 | % | ||||
The performance shown represents past performance. Past performance is no guarantee of future results and current performance may be higher or lower than the performance shown above. Principal value and investment returns will fluctuate and investors’ shares, when redeemed, may be worth more or less than their original cost.
All share class returns assume the reinvestment of all distributions at net asset value and the deduction of all Portfolio expenses. Performance figures for periods shorter than one year represent cumulative figures are not annualized.
Portfolio performance figures reflect fee waivers and/or expense reimbursements, without which the performance would have been lower.
| Total Annual Operating Expenses (unaudited) |
As of the Portfolio’s current prospectus dated May 1, 2023, the gross total annual fund operating expense ratios for Class I and Class II shares were 0.80% and 1.05%, respectively.
Actual expenses may be higher. For example, expenses may be higher than those shown if average net assets decrease. Net assets are more likely to decrease and Portfolio expense ratios are more likely to increase when markets are volatile.
Q. What were the leading contributors to performance?
A. On an absolute basis, the Portfolio had positive performance in six of the nine economic sectors in which it was invested for the reporting period (out of eleven economic sectors in total). The leading contributors were the industrials and IT sectors.
Relative to the benchmark, overall sector allocation effects positively contributed. In particular, underweight allocations to the energy and health care sectors, an overweight allocation to the consumer staples sector and a lack of exposure to the utilities sector were the primary drivers of results.
| 1 | The Portfolio is an underlying investment option of various variable annuity and variable life insurance products. The Portfolio’s performance returns do not reflect the deduction of expenses imposed in connection with investing in variable annuity or variable life insurance contracts, such as fees, account charges and surrender charges, which, if reflected, would reduce the performance of the Portfolio. Past performance is no guarantee of future results. |
| 4 | ClearBridge Variable Small Cap Growth Portfolio 2023 Annual Report |
In terms of individual holdings, leading contributors to performance for the reporting period included positions in Trex in the industrials sector, Wingstop in the consumer discretionary sector, Varonis Systems and Monolithic Power Systems in the IT sector and Hamilton Lane in the financials sector.
Q. What were the leading detractors from performance?
A. On an absolute basis, the Portfolio had negative performance in three of the nine economic sectors in which it was invested for the reporting period (out of eleven economic sectors in total). The largest detractors were the consumer discretionary and communication services sectors.
Relative to the benchmark, overall stock selection detracted from performance. Specifically, stock selection in the consumer discretionary, health care, consumer staples, IT, communication services, industrials, energy and financials sectors weighed on performance.
In terms of individual holdings, the leading detractors from performance for the reporting period included Portfolio positions in Silk Road Medical in the health care sector, National Vision Holdings and Fox Factory Holdings in the consumer discretionary sector, Western Alliance Bancorp in the financials sector and Forward Air in the industrials sector.
Q. Were there any significant changes to the Portfolio during the reporting period?
A. There were a number of positions bought and sold over the course of the reporting period. Among our sixteen purchases still held at reporting period end, the largest were nCino in the IT sector, Moog and McGrath RentCorp in the industrials sector and Element Solutions in the materials sector. The Portfolio also closed fourteen positions during the year with the largest sales being American Equity Investment Life Holding in the financials sector, Silk Road Medical, Syneos Health and STAAR Surgical in the health care sector and New Relic in the IT sector.
| ClearBridge Variable Small Cap Growth Portfolio 2023 Annual Report | 5 |
Portfolio overview (cont’d)
Thank you for your investment in the ClearBridge Variable Small Cap Growth Portfolio. As always, we appreciate that you have chosen us to manage your assets and we remain focused on achieving the Portfolio’s investment goals.
Sincerely,

Jeffrey J. Russell, CFA
Portfolio Manager
ClearBridge Investments, LLC

Aram E. Green
Portfolio Manager
ClearBridge Investments, LLC

Jeffrey Bailin, CFA
Portfolio Manager
ClearBridge Investments, LLC
January 16, 2024
RISKS: Equity securities are subject to price and market fluctuations. Investments in small capitalization companies may involve a higher degree of risk and volatility than investments in larger, more established companies. Investments in foreign securities are subject to certain risks of overseas investing, including currency fluctuations and changes in social, political and economic conditions, which could result in significant market fluctuations. These risks are magnified in emerging markets. Emerging market countries tend to have economic, political and legal systems that are less developed and are less stable than those of more developed countries. The Portfolio may use derivatives, such as options and futures, which can be illiquid, may disproportionately increase losses, and have a potentially large impact on Portfolio performance. The market values of securities or other assets will fluctuate, sometimes sharply and unpredictably, due to changes in general market conditions, overall economic trends or events, governmental actions or intervention, actions taken by the U.S. Federal Reserve or foreign central banks, market disruptions caused by trade disputes or other factors, political developments, armed conflicts, economic sanctions and countermeasures in response to sanctions, major cybersecurity events, investor sentiment, the global and domestic effects of a
| 6 | ClearBridge Variable Small Cap Growth Portfolio 2023 Annual Report |
pandemic, and other factors that may or may not be related to the issuer of the security or other asset. Please see the Portfolio’s prospectus for a more complete discussion of these and other risks and the Portfolio’s investment strategies.
Portfolio holdings and breakdowns are as of December 31, 2023 and are subject to change and may not be representative of the portfolio managers’ current or future investments. The Portfolio’s top ten holdings (as a percentage of net assets) as of December 31, 2023 were: Trex Co. Inc. (3.4%), RBC Bearings Inc. (3.2%), Casey’s General Stores Inc. (2.6%), BJ’s Wholesale Club Holdings Inc. (2.6%), Wingstop Inc. (2.5%), Hamilton Lane Inc., Class A Shares (2.5%), Penumbra Inc. (2.4%), Varonis Systems Inc. (2.4%), ICON PLC (2.2%) and Sprout Social Inc., Class A Shares (2.2%). Please refer to pages 13 through 17 for a list and percentage breakdown of the Portfolio’s holdings.
The mention of sector breakdowns is for informational purposes only and should not be construed as a recommendation to purchase or sell any securities. The information provided regarding such sectors is not a sufficient basis upon which to make an investment decision. Investors seeking financial advice regarding the appropriateness of investing in any securities or investment strategies discussed should consult their financial professional. The Portfolio’s top five sector holdings (as a percentage of net assets) as of December 31, 2023 were: information technology (24.1%), industrials (22.3%), health care (19.3%), consumer staples (8.2%) and financials (7.5%). The Portfolio’s composition is subject to change at any time.
All investments are subject to risk including the possible loss of principal. Past performance is no guarantee of future results. All index performance reflects no deduction for fees, expenses or taxes. Please note that an investor cannot invest directly in an index.
The information provided is not intended to be a forecast of future events, a guarantee of future results or investment advice. Views expressed may differ from those of the firm as a whole.
| i | The Russell 2000 Index measures the performance of the small-cap segment of the U.S. equity universe. The Russell 2000 Index is a subset of the Russell 3000 Index representing approximately 10% of the total market capitalization of that index. It includes approximately 2,000 of the smallest securities based on a combination of their market cap and current index membership. The Russell 3000 Index measures the performance of the 3,000 largest U.S. companies based on total market capitalization, which represents approximately 98% of the U.S. equity market. |
| ii | The S&P 500 Index is an unmanaged index of the stocks of 500 leading companies, and is generally representative of the performance of larger companies in the U.S. |
| iii | The Russell 2000 Growth Index measures the performance of the small-cap growth segment of the U.S. equity universe. It includes those Russell 2000 Index companies with higher price-to-book ratios and higher forecasted growth values. (A price-to-book ratio is the price of a stock compared to the difference between a company’s assets and liabilities.) |
| iv | The Russell 2000 Value Index measures the performance of those Russell 2000 Index companies with lower price-to-book ratios and lower forecasted growth values. |
| ClearBridge Variable Small Cap Growth Portfolio 2023 Annual Report | 7 |
Portfolio at a glance† (unaudited)
| Investment breakdown (%) as a percent of total investments |
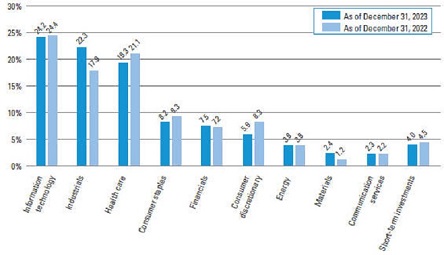
| † | The bar graph above represents the composition of the Portfolio’s investments as of December 31, 2023 and December 31, 2022. The Portfolio is actively managed. As a result, the composition of the Portfolio’s investments is subject to change at any time. |
| 8 | ClearBridge Variable Small Cap Growth Portfolio 2023 Annual Report |
Portfolio expenses (unaudited)
Example
As a shareholder of the Portfolio, you may incur two types of costs: (1) transaction costs and (2) ongoing costs, including management fees; service and/or distribution (12b-1) fees; and other Portfolio expenses. This example is intended to help you understand your ongoing costs (in dollars) of investing in the Portfolio and to compare these costs with the ongoing costs of investing in other funds.
This example is based on an investment of $1,000 invested on July 1, 2023 and held for the six months ended December 31, 2023.
Actual expenses
The table below titled “Based on actual total return” provides information about actual account values and actual expenses. You may use the information provided in this table, together with the amount you invested, to estimate the expenses that you paid over the period. To estimate the expenses you paid on your account, divide your ending account value by $1,000 (for example, an $8,600 ending account value divided by $1,000 = 8.6), then multiply the result by the number under the heading entitled “Expenses Paid During the Period”.
Hypothetical example for comparison purposes
The table below titled “Based on hypothetical total return” provides information about hypothetical account values and hypothetical expenses based on the actual expense ratio and an assumed rate of return of 5.00% per year before expenses, which is not the Portfolio’s actual return. The hypothetical account values and expenses may not be used to estimate the actual ending account balance or expenses you paid for the period. You may use the information provided in this table to compare the ongoing costs of investing in the Portfolio and other funds. To do so, compare the 5.00% hypothetical example relating to the Portfolio with the 5.00% hypothetical examples that appear in the shareholder reports of the other funds.
Please note that the expenses shown in the table below are meant to highlight your ongoing costs only and do not reflect any transactional costs. Therefore, the table is useful in comparing ongoing costs only, and will not help you determine the relative total costs of owning different funds. In addition, if these transaction costs were included, your costs would have been higher.
| Based on actual total return1 | Based on hypothetical total return1 | |||||||||||||||||||||||||||||||||||||||||||||
Actual Total Return2 | Beginning Account Value | Ending Account Value | Annualized Expense Ratio | Expenses Paid During the Period3 | Hypothetical Annualized Total Return | Beginning Account Value | Ending Account Value | Annualized Expense Ratio | Expenses Paid During the Period3 | |||||||||||||||||||||||||||||||||||||
| Class I | 0.74 | % | $ | 1,000.00 | $ | 1,007.40 | 0.80 | % | $ | 4.05 | Class I | 5.00 | % | $ | 1,000.00 | $ | 1,021.17 | 0.80 | % | $ | 4.08 | |||||||||||||||||||||||||
| Class II | 0.60 | 1,000.00 | 1,006.00 | 1.05 | 5.31 | Class II | 5.00 | 1,000.00 | 1,019.91 | 1.05 | 5.35 | |||||||||||||||||||||||||||||||||||
| ClearBridge Variable Small Cap Growth Portfolio 2023 Annual Report | 9 |
Portfolio expenses (unaudited) (cont’d)
| 1 | For the six months ended December 31, 2023. |
| 2 | Assumes the reinvestment of all distributions, including returns of capital, if any, at net asset value. Total return is not annualized, as it may not be representative of the total return for the year. Total returns do not reflect expenses associated with separate accounts such as administrative fees, account charges and surrender charges, which, if reflected, would reduce the total returns. Performance figures may reflect compensating balance arrangements, fee waivers and/or expense reimbursements. In the absence of compensating balance arrangements, fee waivers and/or expense reimbursements, the total return would have been lower. Past performance is no guarantee of future results. |
| 3 | Expenses (net of compensating balance arrangements, fee waivers and/or expense reimbursements) are equal to each class’ respective annualized expense ratio multiplied by the average account value over the period, multiplied by the number of days in the most recent fiscal half-year (184), then divided by 365. |
| 10 | ClearBridge Variable Small Cap Growth Portfolio 2023 Annual Report |
Portfolio performance (unaudited)
| Average annual total returns1 | ||||||||
| Class I | Class II | |||||||
| Twelve Months Ended 12/31/23 | 8.40 | % | 8.12 | % | ||||
| Five Years Ended 12/31/23 | 9.56 | 9.29 | ||||||
| Ten Years Ended 12/31/23 | 7.89 | 7.62 | ||||||
| Cumulative total returns1 | ||||
| Class I (12/31/13 through 12/31/23) | 113.68 | % | ||
| Class II (12/31/13 through 12/31/23) | 108.37 | |||
All figures represent past performance and are not a guarantee of future results. Investment return and principal value of an investment will fluctuate so that an investor’s shares, when redeemed, may be worth more or less than their original cost. The returns shown do not reflect expenses associated with separate accounts such as administrative fees, account charges and surrender charges, which, if reflected, would reduce the total returns. Performance figures may reflect compensating balance arrangements, fee waivers and/or expense reimbursements. In the absence of compensating balance arrangements, fee waivers and/or expense reimbursements, the total return would have been lower.
| 1 | Assumes the reinvestment of all distributions, including returns of capital, if any, at net asset value. |
| ClearBridge Variable Small Cap Growth Portfolio 2023 Annual Report | 11 |
Portfolio performance (unaudited) (cont’d)
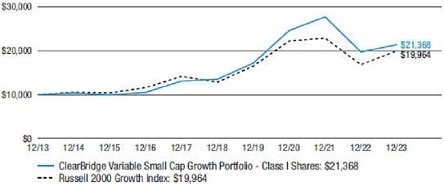
| Historical performance |
Value of $10,000 invested in
Class I Shares of ClearBridge Variable Small Cap Growth Portfolio vs Russell 2000 Growth Index† — December 2013 - December 2023
All figures represent past performance and are not a guarantee of future results. Investment return and principal value of an investment will fluctuate so that an investor’s shares, when redeemed, may be worth more or less than their original cost. The returns shown do not reflect expenses associated with separate accounts such as administrative fees, account charges and surrender charges, which, if reflected, would reduce the total returns. Performance figures may reflect compensating balance arrangements, fee waivers and/or expense reimbursements. In the absence of compensating balance arrangements, fee waivers and/or expense reimbursements, the total return would have been lower.
| † | Hypothetical illustration of $10,000 invested in Class I shares of ClearBridge Variable Small Cap Growth Portfolio on December 31, 2013, assuming the reinvestment of all distributions, including returns of capital, if any, at net asset value through December 31, 2023. The hypothetical illustration also assumes a $10,000 investment in the Russell 2000 Growth Index. The Russell 2000 Growth Index (the “Index”) measures the performance of the small-cap growth segment of the U.S. equity universe. It includes those Russell 2000 Index companies with higher price-to-value ratios and higher forecasted growth values. The Index is unmanaged and is not subject to the same management and trading expenses as a fund. Please note that an investor cannot invest directly in an index. The performance of the Portfolio’s other class may be greater or less than the Class I shares’ performance indicated on this chart, depending on whether greater or lesser fees were incurred by shareholders investing in the other class. |
| 12 | ClearBridge Variable Small Cap Growth Portfolio 2023 Annual Report |
December 31, 2023
ClearBridge Variable Small Cap Growth Portfolio
(Percentages shown based on Portfolio net assets)
| Security | Shares | Value | ||||||||||||||
| Common Stocks — 95.5% | ||||||||||||||||
| Communication Services — 2.3% | ||||||||||||||||
Diversified Telecommunication Services — 1.7% | ||||||||||||||||
Iridium Communications Inc. | 172,204 | $ | 7,087,917 | |||||||||||||
Media — 0.6% | ||||||||||||||||
Integral Ad Science Holding Corp. | 195,100 | 2,807,489 | * | |||||||||||||
Total Communication Services | 9,895,406 | |||||||||||||||
| Consumer Discretionary — 5.9% | ||||||||||||||||
Automobile Components — 1.3% | ||||||||||||||||
Fox Factory Holding Corp. | 79,139 | 5,340,300 | * | |||||||||||||
Hotels, Restaurants & Leisure — 3.0% | ||||||||||||||||
Dutch Bros Inc., Class A Shares | 63,305 | 2,004,869 | * | |||||||||||||
Wingstop Inc. | 41,741 | 10,709,906 | ||||||||||||||
Total Hotels, Restaurants & Leisure | 12,714,775 | |||||||||||||||
Household Durables — 0.3% | ||||||||||||||||
Installed Building Products Inc. | 6,800 | 1,243,176 | ||||||||||||||
Specialty Retail — 1.3% | ||||||||||||||||
National Vision Holdings Inc. | 261,742 | 5,478,260 | * | |||||||||||||
Total Consumer Discretionary | 24,776,511 | |||||||||||||||
| Consumer Staples — 8.2% | ||||||||||||||||
Consumer Staples Distribution & Retail — 7.9% | ||||||||||||||||
BJ’s Wholesale Club Holdings Inc. | 163,483 | 10,897,777 | * | |||||||||||||
Casey’s General Stores Inc. | 40,673 | 11,174,500 | ||||||||||||||
Grocery Outlet Holding Corp. | 224,686 | 6,057,534 | * | |||||||||||||
Performance Food Group Co. | 75,066 | 5,190,814 | * | |||||||||||||
Total Consumer Staples Distribution & Retail | 33,320,625 | |||||||||||||||
Food Products — 0.3% | ||||||||||||||||
Calavo Growers Inc. | 46,600 | 1,370,506 | ||||||||||||||
Personal Care Products — 0.0%†† | ||||||||||||||||
Oddity Tech Ltd., Class A Shares | 3,315 | 154,247 | * | |||||||||||||
Total Consumer Staples | 34,845,378 | |||||||||||||||
| Energy — 3.9% | ||||||||||||||||
Energy Equipment & Services — 3.1% | ||||||||||||||||
Cactus Inc., Class A Shares | 150,180 | 6,818,172 | ||||||||||||||
ChampionX Corp. | 213,848 | 6,246,500 | ||||||||||||||
Total Energy Equipment & Services | 13,064,672 | |||||||||||||||
Oil, Gas & Consumable Fuels — 0.8% | ||||||||||||||||
Matador Resources Co. | 62,000 | 3,525,320 | ||||||||||||||
Total Energy | 16,589,992 | |||||||||||||||
See Notes to Financial Statements.
| ClearBridge Variable Small Cap Growth Portfolio 2023 Annual Report | 13 |
Schedule of investments (cont’d)
December 31, 2023
ClearBridge Variable Small Cap Growth Portfolio
(Percentages shown based on Portfolio net assets)
| Security | Shares | Value | ||||||||||||||
| Financials — 7.5% | ||||||||||||||||
Capital Markets — 4.5% | ||||||||||||||||
Hamilton Lane Inc., Class A Shares | 92,003 | $ | 10,436,820 | |||||||||||||
PJT Partners Inc., Class A Shares | 83,901 | 8,546,995 | ||||||||||||||
Total Capital Markets | 18,983,815 | |||||||||||||||
Financial Services — 2.5% | ||||||||||||||||
NMI Holdings Inc., Class A Shares | 64,100 | 1,902,488 | * | |||||||||||||
Shift4 Payments Inc., Class A Shares | 118,425 | 8,803,715 | * | |||||||||||||
Total Financial Services | 10,706,203 | |||||||||||||||
Insurance — 0.5% | ||||||||||||||||
Trupanion Inc. | 64,239 | 1,959,932 | * | |||||||||||||
Total Financials | 31,649,950 | |||||||||||||||
| Health Care — 19.1% | ||||||||||||||||
Biotechnology — 1.0% | ||||||||||||||||
Biohaven Ltd. | 30,749 | 1,316,057 | * | |||||||||||||
Mirum Pharmaceuticals Inc. | 18,600 | 549,072 | * | |||||||||||||
Ultragenyx Pharmaceutical Inc. | 50,321 | 2,406,350 | * | |||||||||||||
Total Biotechnology | 4,271,479 | |||||||||||||||
Health Care Equipment & Supplies — 5.3% | ||||||||||||||||
Inari Medical Inc. | 16,000 | 1,038,720 | * | |||||||||||||
Insulet Corp. | 7,976 | 1,730,633 | * | |||||||||||||
Integra LifeSciences Holdings Corp. | 136,775 | 5,956,551 | * | |||||||||||||
Lantheus Holdings Inc. | 25,800 | 1,599,600 | * | |||||||||||||
Omnicell Inc. | 56,136 | 2,112,398 | * | |||||||||||||
Penumbra Inc. | 39,726 | 9,992,678 | * | |||||||||||||
Total Health Care Equipment & Supplies | 22,430,580 | |||||||||||||||
Health Care Providers & Services — 5.0% | ||||||||||||||||
HealthEquity Inc. | 82,932 | 5,498,392 | * | |||||||||||||
Progyny Inc. | 197,347 | 7,337,361 | * | |||||||||||||
Surgery Partners Inc. | 267,598 | 8,560,460 | * | |||||||||||||
Total Health Care Providers & Services | 21,396,213 | |||||||||||||||
Health Care Technology — 1.7% | ||||||||||||||||
Certara Inc. | 308,400 | 5,424,756 | * | |||||||||||||
Definitive Healthcare Corp. | 170,700 | 1,696,758 | * | |||||||||||||
Total Health Care Technology | 7,121,514 | |||||||||||||||
Life Sciences Tools & Services — 4.1% | ||||||||||||||||
Azenta Inc. | 70,583 | 4,597,777 | * | |||||||||||||
CryoPort Inc. | 89,325 | 1,383,644 | * | |||||||||||||
ICON PLC | 33,155 | 9,385,186 | * | |||||||||||||
Olink Holding AB, ADR | 75,110 | 1,889,016 | * | |||||||||||||
Total Life Sciences Tools & Services | 17,255,623 | |||||||||||||||
See Notes to Financial Statements.
| 14 | ClearBridge Variable Small Cap Growth Portfolio 2023 Annual Report |
ClearBridge Variable Small Cap Growth Portfolio
(Percentages shown based on Portfolio net assets)
| Security | Shares | Value | ||||||||||||||
Pharmaceuticals — 2.0% | ||||||||||||||||
Intra-Cellular Therapies Inc. | 75,648 | $ | 5,417,910 | * | ||||||||||||
Pacira BioSciences Inc. | 85,252 | 2,876,402 | * | |||||||||||||
Total Pharmaceuticals | 8,294,312 | |||||||||||||||
Total Health Care | 80,769,721 | |||||||||||||||
| Industrials — 22.3% | ||||||||||||||||
Aerospace & Defense — 1.3% | ||||||||||||||||
BWX Technologies Inc. | 30,200 | 2,317,246 | ||||||||||||||
Moog Inc., Class A Shares | 23,000 | 3,329,940 | ||||||||||||||
Total Aerospace & Defense | 5,647,186 | |||||||||||||||
Air Freight & Logistics — 2.4% | ||||||||||||||||
Forward Air Corp. | 45,012 | 2,829,904 | ||||||||||||||
GXO Logistics Inc. | 116,085 | 7,099,759 | * | |||||||||||||
Total Air Freight & Logistics | 9,929,663 | |||||||||||||||
Building Products — 4.8% | ||||||||||||||||
Hayward Holdings Inc. | 199,920 | 2,718,912 | * | |||||||||||||
Masonite International Corp. | 37,590 | 3,182,370 | * | |||||||||||||
Trex Co. Inc. | 171,527 | 14,200,720 | * | |||||||||||||
Total Building Products | 20,102,002 | |||||||||||||||
Electrical Equipment — 2.1% | ||||||||||||||||
Bloom Energy Corp., Class A Shares | 299,969 | 4,439,541 | * | |||||||||||||
Shoals Technologies Group Inc., Class A Shares | 270,315 | 4,200,695 | * | |||||||||||||
Total Electrical Equipment | 8,640,236 | |||||||||||||||
Ground Transportation — 1.5% | ||||||||||||||||
XPO Inc. | 74,380 | 6,514,944 | * | |||||||||||||
Machinery — 5.6% | ||||||||||||||||
Albany International Corp., Class A Shares | 45,480 | 4,467,046 | ||||||||||||||
RBC Bearings Inc. | 47,336 | 13,485,553 | * | |||||||||||||
Tennant Co. | 60,797 | 5,635,274 | ||||||||||||||
Total Machinery | 23,587,873 | |||||||||||||||
Professional Services — 1.4% | ||||||||||||||||
Paycor HCM Inc. | 277,226 | 5,985,309 | * | |||||||||||||
Trading Companies & Distributors — 3.2% | ||||||||||||||||
H&E Equipment Services Inc. | 148,622 | 7,775,903 | ||||||||||||||
McGrath RentCorp. | 24,800 | 2,966,576 | ||||||||||||||
Xometry Inc., Class A Shares | 81,487 | 2,926,198 | * | |||||||||||||
Total Trading Companies & Distributors | 13,668,677 | |||||||||||||||
Total Industrials | 94,075,890 | |||||||||||||||
| Information Technology — 23.9% | ||||||||||||||||
Communications Equipment — 0.6% | ||||||||||||||||
Viavi Solutions Inc. | 260,278 | 2,620,999 | * | |||||||||||||
See Notes to Financial Statements.
| ClearBridge Variable Small Cap Growth Portfolio 2023 Annual Report | 15 |
Schedule of investments (cont’d)
December 31, 2023
ClearBridge Variable Small Cap Growth Portfolio
(Percentages shown based on Portfolio net assets)
| Security | Shares | Value | ||||||||||||||
Electronic Equipment, Instruments & Components — 1.8% | ||||||||||||||||
Brain Corp. | 52,367 | $ | 304,188 | *(a)(b)(c) | ||||||||||||
nLight Inc. | 83,680 | 1,129,680 | * | |||||||||||||
Novanta Inc. | 15,000 | 2,526,150 | * | |||||||||||||
OSI Systems Inc. | 29,943 | 3,864,144 | * | |||||||||||||
Total Electronic Equipment, Instruments & Components | 7,824,162 | |||||||||||||||
IT Services — 1.8% | ||||||||||||||||
Wix.com Ltd. | 60,447 | 7,436,190 | * | |||||||||||||
Semiconductors & Semiconductor Equipment — 5.6% | ||||||||||||||||
Allegro MicroSystems Inc. | 215,215 | 6,514,558 | * | |||||||||||||
Lattice Semiconductor Corp. | 117,250 | 8,089,077 | * | |||||||||||||
Monolithic Power Systems Inc. | 14,291 | 9,014,477 | ||||||||||||||
Total Semiconductors & Semiconductor Equipment | 23,618,112 | |||||||||||||||
Software — 14.1% | ||||||||||||||||
Aspen Technology Inc. | 26,888 | 5,919,393 | * | |||||||||||||
Blackbaud Inc. | 20,200 | 1,751,340 | * | |||||||||||||
Envestnet Inc. | 87,374 | 4,326,761 | * | |||||||||||||
Jamf Holding Corp. | 155,995 | 2,817,270 | * | |||||||||||||
Klaviyo Inc. | 69,558 | 1,932,321 | *(a)(c) | |||||||||||||
Klaviyo Inc., Class A Shares | 57,591 | 1,599,878 | * | |||||||||||||
Model N Inc. | 190,807 | 5,138,433 | * | |||||||||||||
nCino Inc. | 85,100 | 2,861,913 | * | |||||||||||||
PagerDuty Inc. | 310,954 | 7,198,585 | * | |||||||||||||
Qualys Inc. | 25,865 | 5,076,782 | * | |||||||||||||
Sprout Social Inc., Class A Shares | 148,250 | 9,108,480 | * | |||||||||||||
Varonis Systems Inc. | 220,267 | 9,973,690 | * | |||||||||||||
Zeta Global Holdings Corp., Class A Shares | 220,170 | 1,941,899 | * | |||||||||||||
Total Software | 59,646,745 | |||||||||||||||
Total Information Technology | 101,146,208 | |||||||||||||||
| Materials — 2.4% | ||||||||||||||||
Chemicals — 2.4% | ||||||||||||||||
Balchem Corp. | 37,756 | 5,616,205 | ||||||||||||||
Element Solutions Inc. | 137,700 | 3,186,378 | ||||||||||||||
Livent Corp. | 78,748 | 1,415,889 | * | |||||||||||||
Total Materials | 10,218,472 | |||||||||||||||
Total Common Stocks (Cost — $267,536,321) | 403,967,528 | |||||||||||||||
See Notes to Financial Statements.
| 16 | ClearBridge Variable Small Cap Growth Portfolio 2023 Annual Report |
ClearBridge Variable Small Cap Growth Portfolio
(Percentages shown based on Portfolio net assets)
| Security | Rate | Shares | Value | |||||||||||||
| Preferred Stocks — 0.4% | ||||||||||||||||
| Health Care — 0.2% | ||||||||||||||||
Pharmaceuticals — 0.2% | ||||||||||||||||
Caris Life Sciences Inc., Series C | — | 183,481 | $ | 425,711 | *(a)(b)(c) | |||||||||||
Caris Life Sciences Inc., Series D | — | 31,383 | 204,199 | *(a)(b)(c) | ||||||||||||
Total Health Care | 629,910 | |||||||||||||||
| Information Technology — 0.2% | ||||||||||||||||
Electronic Equipment, Instruments & Components — 0.2% | ||||||||||||||||
Brain Corp. | — | 170,237 | 988,866 | *(a)(b)(c) | ||||||||||||
Total Preferred Stocks (Cost — $1,658,695) | 1,618,776 | |||||||||||||||
Total Investments before Short-Term Investments (Cost — $269,195,016) | 405,586,304 | |||||||||||||||
| Short-Term Investments — 4.0% | ||||||||||||||||
JPMorgan 100% U.S. Treasury Securities Money Market Fund, Institutional Class | 5.197% | 8,472,870 | 8,472,870 | (d) | ||||||||||||
Western Asset Premier Institutional U.S. Treasury Reserves, Premium Shares | 5.279% | 8,472,870 | 8,472,870 | (d)(e) | ||||||||||||
Total Short-Term Investments (Cost — $16,945,740) | 16,945,740 | |||||||||||||||
Total Investments — 99.9% (Cost — $286,140,756) | 422,532,044 | |||||||||||||||
Other Assets in Excess of Liabilities — 0.1% | 305,985 | |||||||||||||||
Total Net Assets — 100.0% | $ | 422,838,029 | ||||||||||||||
| †† | Represents less than 0.1%. |
| * | Non-income producing security. |
| (a) | Security is fair valued in accordance with procedures approved by the Board of Trustees (Note 1). |
| (b) | Security is valued using significant unobservable inputs (Note 1). |
| (c) | Restricted security (Note 9). |
| (d) | Rate shown is one-day yield as of the end of the reporting period. |
| (e) | In this instance, as defined in the Investment Company Act of 1940, an “Affiliated Company” represents Portfolio ownership of at least 5% of the outstanding voting securities of an issuer, or a company which is under common ownership or control with the Portfolio. At December 31, 2023, the total market value of investments in Affiliated Companies was $8,472,870 and the cost was $8,472,870 (Note 8). |
Abbreviation(s) used in this schedule: | ||
| ADR | — American Depositary Receipts | |
See Notes to Financial Statements.
| ClearBridge Variable Small Cap Growth Portfolio 2023 Annual Report | 17 |
Statement of assets and liabilities
December 31, 2023
| Assets: | ||||
Investments in unaffiliated securities, at value (Cost — $277,667,886) | $ | 414,059,174 | ||
Investments in affiliated securities, at value (Cost — $8,472,870) | 8,472,870 | |||
Receivable for Portfolio shares sold | 871,903 | |||
Dividends receivable from unaffiliated investments | 130,894 | |||
Dividends receivable from affiliated investments | 32,432 | |||
Prepaid expenses | 1,711 | |||
Total Assets | 423,568,984 | |||
| Liabilities: | ||||
Payable for Portfolio shares repurchased | 354,575 | |||
Investment management fee payable | 257,519 | |||
Service and/or distribution fees payable | 27,009 | |||
Trustees’ fees payable | 6,122 | |||
Accrued expenses | 85,730 | |||
Total Liabilities | 730,955 | |||
| Total Net Assets | $ | 422,838,029 | ||
| Net Assets: | ||||
Par value (Note 7) | $ | 159 | ||
Paid-in capital in excess of par value | 286,350,193 | |||
Total distributable earnings (loss) | 136,487,677 | |||
| Total Net Assets | $ | 422,838,029 | ||
| Net Assets: | ||||
Class I | $286,661,846 | |||
Class II | $136,176,183 | |||
| Shares Outstanding: | ||||
Class I | 10,481,396 | |||
Class II | 5,384,252 | |||
| Net Asset Value: | ||||
Class I | $27.35 | |||
Class II | $25.29 | |||
See Notes to Financial Statements.
| 18 | ClearBridge Variable Small Cap Growth Portfolio 2023 Annual Report |
For the Year Ended December 31, 2023
| Investment Income: | ||||
Dividends from unaffiliated investments | $ | 1,465,844 | ||
Dividends from affiliated investments | 185,997 | |||
Total Investment Income | 1,651,841 | |||
| Expenses: | ||||
Investment management fee (Note 2) | 2,980,329 | |||
Service and/or distribution fees (Notes 2 and 5) | 311,661 | |||
Fund accounting fees | 69,524 | |||
Shareholder reports | 32,647 | |||
Legal fees | 32,117 | |||
Audit and tax fees | 29,974 | |||
Trustees’ fees | 28,253 | |||
Commitment fees (Note 10) | 3,392 | |||
Insurance | 2,589 | |||
Transfer agent fees (Notes 2 and 5) | 2,412 | |||
Interest expense | 2,171 | |||
Custody fees | 1,692 | |||
Miscellaneous expenses | 5,357 | |||
Total Expenses | 3,502,118 | |||
Less: Fee waivers and/or expense reimbursements (Notes 2 and 5) | (3,153) | |||
Net Expenses | 3,498,965 | |||
| Net Investment Loss | (1,847,124) | |||
| Realized and Unrealized Gain on Investments and Written Options (Notes 1, 3 and 4): | ||||
Net Realized Gain From: | ||||
Investment transactions in unaffiliated securities | 7,109,558 | |||
Written options | 27,983 | |||
Net Realized Gain | 7,137,541 | |||
Change in Net Unrealized Appreciation (Depreciation) From Unaffiliated Investments | 25,330,717 | |||
| Net Gain on Investments and Written Options | 32,468,258 | |||
| Increase in Net Assets From Operations | $ | 30,621,134 | ||
See Notes to Financial Statements.
| ClearBridge Variable Small Cap Growth Portfolio 2023 Annual Report | 19 |
Statements of changes in net assets
| For the Years Ended December 31, | 2023 | 2022 | ||||||
| Operations: | ||||||||
Net investment loss | $ | (1,847,124) | $ | (2,088,744) | ||||
Net realized gain (loss) | 7,137,541 | (6,480,865) | ||||||
Change in net unrealized appreciation (depreciation) | 25,330,717 | (146,487,688) | ||||||
Increase (Decrease) in Net Assets From Operations | 30,621,134 | (155,057,297) | ||||||
| Distributions to Shareholders From (Notes 1 and 6): | ||||||||
Total distributable earnings | — | (8,288,384) | ||||||
Decrease in Net Assets From Distributions to Shareholders | — | (8,288,384) | ||||||
| Portfolio Share Transactions (Note 7): | ||||||||
Net proceeds from sale of shares | 103,773,800 | 91,072,998 | ||||||
Reinvestment of distributions | — | 8,288,384 | ||||||
Cost of shares repurchased | (89,733,194) | (100,739,076) | ||||||
Increase (Decrease) in Net Assets From Portfolio Share Transactions | 14,040,606 | (1,377,694) | ||||||
Increase (Decrease) in Net Assets | 44,661,740 | (164,723,375) | ||||||
| Net Assets: | ||||||||
Beginning of year | 378,176,289 | 542,899,664 | ||||||
End of year | $ | 422,838,029 | $ | 378,176,289 | ||||
See Notes to Financial Statements.
| 20 | ClearBridge Variable Small Cap Growth Portfolio 2023 Annual Report |
| For a share of each class of beneficial interest outstanding throughout each year ended December 31: | ||||||||||||||||||||
| Class I Shares1 | 2023 | 2022 | 2021 | 2020 | 2019 | |||||||||||||||
| Net asset value, beginning of year | $25.23 | $36.32 | $36.60 | $27.54 | $23.88 | |||||||||||||||
| Income (loss) from operations: | ||||||||||||||||||||
Net investment loss | (0.10) | (0.12) | (0.18) | (0.15) | (0.14) | |||||||||||||||
Net realized and unrealized gain (loss) | 2.22 | (10.42) | 4.70 | 11.83 | 6.50 | |||||||||||||||
Total income (loss) from operations | 2.12 | (10.54) | 4.52 | 11.68 | 6.36 | |||||||||||||||
| Less distributions from: | ||||||||||||||||||||
Net realized gains | — | (0.55) | (4.80) | (2.62) | (2.70) | |||||||||||||||
Total distributions | — | (0.55) | (4.80) | (2.62) | (2.70) | |||||||||||||||
| Net asset value, end of year | $27.35 | $25.23 | $36.32 | $36.60 | $27.54 | |||||||||||||||
Total return2 | 8.40 | % | (28.85) | % | 12.61 | % | 43.26 | % | 26.87 | % | ||||||||||
| Net assets, end of year (millions) | $287 | $261 | $368 | $351 | $267 | |||||||||||||||
| Ratios to average net assets: | ||||||||||||||||||||
Gross expenses | 0.80 | % | 0.80 | % | 0.80 | % | 0.81 | % | 0.81 | % | ||||||||||
Net expenses3,4 | 0.80 | 0.80 | 0.80 | 0.81 | 0.81 | |||||||||||||||
Net investment loss | (0.39) | (0.43) | (0.46) | (0.52) | (0.49) | |||||||||||||||
| Portfolio turnover rate | 15 | % | 8 | % | 16 | % | 21 | % | 21 | % | ||||||||||
| 1 | Per share amounts have been calculated using the average shares method. |
| 2 | Performance figures may reflect compensating balance arrangements, fee waivers and/or expense reimbursements. In the absence of compensating balance arrangements, fee waivers and/or expense reimbursements, the total return would have been lower. Total returns do not reflect expenses associated with separate accounts such as administrative fees, account charges and surrender charges which, if reflected, would reduce the total return for all periods shown. Past performance is no guarantee of future results. |
| 3 | Reflects fee waivers and/or expense reimbursements. |
| 4 | As a result of an expense limitation arrangement, the ratio of total annual fund operating expenses, other than interest, brokerage commissions, taxes, extraordinary expenses and acquired fund fees and expenses, to average net assets of Class I shares did not exceed 1.00%. This expense limitation arrangement cannot be terminated prior to December 31, 2025 without the Board of Trustees’ consent. In addition, the manager has agreed to waive the Portfolio’s management fee to an extent sufficient to offset the net management fee payable in connection with any investment in an affiliated money market fund. |
See Notes to Financial Statements.
| ClearBridge Variable Small Cap Growth Portfolio 2023 Annual Report | 21 |
Financial highlights (cont’d)
| For a share of each class of beneficial interest outstanding throughout each year ended December 31: | ||||||||||||||||||||
| Class II Shares1 | 2023 | 2022 | 2021 | 2020 | 2019 | |||||||||||||||
| Net asset value, beginning of year | $23.39 | $33.81 | $34.46 | $26.11 | $22.81 | |||||||||||||||
| Income (loss) from operations: | ||||||||||||||||||||
Net investment loss | (0.15) | (0.17) | (0.27) | (0.21) | (0.20) | |||||||||||||||
Net realized and unrealized gain (loss) | 2.05 | (9.70) | 4.42 | 11.18 | 6.20 | |||||||||||||||
Total income (loss) from operations | 1.90 | (9.87) | 4.15 | 10.97 | 6.00 | |||||||||||||||
| Less distributions from: | ||||||||||||||||||||
Net realized gains | — | (0.55) | (4.80) | (2.62) | (2.70) | |||||||||||||||
Total distributions | — | (0.55) | (4.80) | (2.62) | (2.70) | |||||||||||||||
| Net asset value, end of year | $25.29 | $23.39 | $33.81 | $34.46 | $26.11 | |||||||||||||||
Total return2 | 8.12 | % | (29.01) | % | 12.31 | % | 42.91 | % | 26.55 | % | ||||||||||
| Net assets, end of year (millions) | $136 | $117 | $175 | $153 | $105 | |||||||||||||||
| Ratios to average net assets: | ||||||||||||||||||||
Gross expenses | 1.05 | % | 1.05 | % | 1.05 | % | 1.06 | % | 1.06 | % | ||||||||||
Net expenses3,4 | 1.05 | 1.04 | 1.05 | 1.06 | 1.06 | |||||||||||||||
Net investment loss | (0.64) | (0.69) | (0.71) | (0.76) | (0.74) | |||||||||||||||
| Portfolio turnover rate | 15 | % | 8 | % | 16 | % | 21 | % | 21 | % | ||||||||||
| 1 | Per share amounts have been calculated using the average shares method. |
| 2 | Performance figures may reflect compensating balance arrangements, fee waivers and/or expense reimbursements. In the absence of compensating balance arrangements, fee waivers and/or expense reimbursements, the total return would have been lower. Total returns do not reflect expenses associated with separate accounts such as administrative fees, account charges and surrender charges which, if reflected, would reduce the total return for all periods shown. Past performance is no guarantee of future results. |
| 3 | Reflects fee waivers and/or expense reimbursements. |
| 4 | As a result of an expense limitation arrangement, the ratio of total annual fund operating expenses, other than interest, brokerage commissions, taxes, extraordinary expenses and acquired fund fees and expenses, to average net assets of Class II shares did not exceed 1.25%. This expense limitation arrangement cannot be terminated prior to December 31, 2025 without the Board of Trustees’ consent. In addition, the manager has agreed to waive the Portfolio’s management fee to an extent sufficient to offset the net management fee payable in connection with any investment in an affiliated money market fund. |
See Notes to Financial Statements.
| 22 | ClearBridge Variable Small Cap Growth Portfolio 2023 Annual Report |
1. Organization and significant accounting policies
ClearBridge Variable Small Cap Growth Portfolio (the “Portfolio”) is a separate diversified investment series of Legg Mason Partners Variable Equity Trust (the “Trust”). The Trust, a Maryland statutory trust, is registered under the Investment Company Act of 1940, as amended (the “1940 Act”), as an open-end management investment company.
Shares of the Portfolio may only be purchased or redeemed through variable annuity contracts and variable life insurance policies offered by the separate accounts of participating insurance companies or through eligible pension or other qualified plans.
The Portfolio follows the accounting and reporting guidance in Financial Accounting Standards Board (“FASB”) Accounting Standards Codification Topic 946, Financial Services – Investment Companies (“ASC 946”). The following are significant accounting policies consistently followed by the Portfolio and are in conformity with U.S. generally accepted accounting principles (“GAAP”), including, but not limited to, ASC 946. Estimates and assumptions are required to be made regarding assets, liabilities and changes in net assets resulting from operations when financial statements are prepared. Changes in the economic environment, financial markets and any other parameters used in determining these estimates could cause actual results to differ. Subsequent events have been evaluated through the date the financial statements were issued.
(a) Investment valuation. Equity securities for which market quotations are available are valued at the last reported sales price or official closing price on the primary market or exchange on which they trade. The valuations for fixed income securities (which may include, but are not limited to, corporate, government, municipal, mortgage-backed, collateralized mortgage obligations and asset-backed securities) and certain derivative instruments are typically the prices supplied by independent third party pricing services, which may use market prices or broker/dealer quotations or a variety of valuation techniques and methodologies. The independent third party pricing services typically use inputs that are observable such as issuer details, interest rates, yield curves, prepayment speeds, credit risks/spreads, default rates and quoted prices for similar securities. Investments in open-end funds are valued at the closing net asset value per share of each fund on the day of valuation. When the Portfolio holds securities or other assets that are denominated in a foreign currency, the Portfolio will normally use the currency exchange rates as of 4:00 p.m. (Eastern Time). If independent third party pricing services are unable to supply prices for a portfolio investment, or if the prices supplied are deemed by the manager to be unreliable, the market price may be determined by the manager using quotations from one or more broker/dealers or at the transaction price if the security has recently been purchased and no value has yet been obtained from a pricing service or pricing broker. When reliable prices are not readily available, such as when the value of a security has been significantly affected by events after the close of the exchange or market on which the security is principally traded, but before the Portfolio calculates its net asset
| ClearBridge Variable Small Cap Growth Portfolio 2023 Annual Report | 23 |
Notes to financial statements (cont’d)
value, the Portfolio values these securities as determined in accordance with procedures approved by the Portfolio’s Board of Trustees.
Pursuant to policies adopted by the Board of Trustees, the Portfolio’s manager has been designated as the valuation designee and is responsible for the oversight of the daily valuation process. The Portfolio’s manager is assisted by the Global Fund Valuation Committee (the “Valuation Committee”). The Valuation Committee is responsible for making fair value determinations, evaluating the effectiveness of the Portfolio’s pricing policies, and reporting to the Portfolio’s manager and the Board of Trustees. When determining the reliability of third party pricing information for investments owned by the Portfolio, the Valuation Committee, among other things, conducts due diligence reviews of pricing vendors, monitors the daily change in prices and reviews transactions among market participants.
The Valuation Committee will consider pricing methodologies it deems relevant and appropriate when making fair value determinations. Examples of possible methodologies include, but are not limited to, multiple of earnings; discount from market of a similar freely traded security; discounted cash-flow analysis; book value or a multiple thereof; risk premium/yield analysis; yield to maturity; and/or fundamental investment analysis. The Valuation Committee will also consider factors it deems relevant and appropriate in light of the facts and circumstances. Examples of possible factors include, but are not limited to, the type of security; the issuer’s financial statements; the purchase price of the security; the discount from market value of unrestricted securities of the same class at the time of purchase; analysts’ research and observations from financial institutions; information regarding any transactions or offers with respect to the security; the existence of merger proposals or tender offers affecting the security; the price and extent of public trading in similar securities of the issuer or comparable companies; and the existence of a shelf registration for restricted securities.
For each portfolio security that has been fair valued pursuant to the policies adopted by the Board of Trustees, the fair value price is compared against the last available and next available market quotations. The Valuation Committee reviews the results of such back testing monthly and fair valuation occurrences are reported to the Board of Trustees quarterly.
The Portfolio uses valuation techniques to measure fair value that are consistent with the market approach and/or income approach, depending on the type of security and the particular circumstance. The market approach uses prices and other relevant information generated by market transactions involving identical or comparable securities. The income approach uses valuation techniques to discount estimated future cash flows to present value.
| 24 | ClearBridge Variable Small Cap Growth Portfolio 2023 Annual Report |
GAAP establishes a disclosure hierarchy that categorizes the inputs to valuation techniques used to value assets and liabilities at measurement date. These inputs are summarized in the three broad levels listed below:
| • | Level 1 — unadjusted quoted prices in active markets for identical investments |
| • | Level 2 — other significant observable inputs (including quoted prices for similar investments, interest rates, prepayment speeds, credit risk, etc.) |
| • | Level 3 — significant unobservable inputs (including the Portfolio’s own assumptions in determining the fair value of investments) |
The inputs or methodologies used to value securities are not necessarily an indication of the risk associated with investing in those securities.
The following is a summary of the inputs used in valuing the Portfolio’s assets carried at fair value:
| ASSETS | ||||||||||||||||
| Description | Quoted Prices (Level 1) | Other Significant Observable Inputs (Level 2) | Significant Unobservable Inputs (Level 3) | Total | ||||||||||||
| Long-Term Investments†: | ||||||||||||||||
Common Stocks: | ||||||||||||||||
Information Technology | $ | 98,909,699 | $ | 1,932,321 | $ | 304,188 | $ | 101,146,208 | ||||||||
Other Common Stocks | 302,821,320 | — | — | 302,821,320 | ||||||||||||
Preferred Stocks: | ||||||||||||||||
Health Care | — | — | 629,910 | 629,910 | ||||||||||||
Information Technology | — | — | 988,866 | 988,866 | ||||||||||||
| Total Long-Term Investments | 401,731,019 | 1,932,321 | 1,922,964 | 405,586,304 | ||||||||||||
| Short-Term Investments† | 16,945,740 | — | — | 16,945,740 | ||||||||||||
| Total Investments | $ | 418,676,759 | $ | 1,932,321 | $ | 1,922,964 | $ | 422,532,044 | ||||||||
| † | See Schedule of Investments for additional detailed categorizations. |
(b) Written options. The Portfolio may write option contracts generally to gain or reduce exposure to types of investments or market factors or as a means of attempting to enhance returns. When the Portfolio writes an option, an amount equal to the premium received by the Portfolio is recorded as a liability, the value of which is marked-to-market daily to reflect the current market value of the option written. If the option expires, the premium received is recorded as a realized gain. When a written call option is exercised, the difference between the premium received plus the option exercise price and the Portfolio’s basis in the underlying security (in the case of a covered written call option), or the cost to purchase the underlying security (in the case of an uncovered written call option), including brokerage commission, is recognized as a realized gain or loss. When a written put option is exercised, the amount of the premium received is subtracted from the cost of the security purchased by the Portfolio from the exercise of the written put option to form the Portfolio’s
| ClearBridge Variable Small Cap Growth Portfolio 2023 Annual Report | 25 |
Notes to financial statements (cont’d)
basis in the underlying security purchased. The writer or buyer of an option traded on an exchange can liquidate the position before the exercise of the option by entering into a closing transaction. The cost of a closing transaction is deducted from the original premium received resulting in a realized gain or loss to the Portfolio.
The risk in writing a covered call option is that the Portfolio may forego the opportunity of profit if the market price of the underlying security increases and the option is exercised. The risk in writing a put option is that the Portfolio may incur a loss if the market price of the underlying security decreases and the option is exercised. The risk in writing an uncovered call option is that the Portfolio is exposed to the risk of loss if the market price of the underlying security increases. In addition, there is the risk that the Portfolio may not be able to enter into a closing transaction because of an illiquid secondary market.
(c) Foreign investment risks. The Portfolio’s investments in foreign securities may involve risks not present in domestic investments. Since securities may be denominated in foreign currencies, may require settlement in foreign currencies or may pay interest or dividends in foreign currencies, changes in the relationship of these foreign currencies to the U.S. dollar can significantly affect the value of the investments and earnings of the Portfolio. Foreign investments may also subject the Portfolio to foreign government exchange restrictions, expropriation, taxation or other political, social or economic developments, all of which affect the market and/or credit risk of the investments.
(d) Counterparty risk and credit-risk-related contingent features of derivative instruments. The Portfolio may invest in certain securities or engage in other transactions where the Portfolio is exposed to counterparty credit risk in addition to broader market risks. The Portfolio may invest in securities of issuers, which may also be considered counterparties as trading partners in other transactions. This may increase the risk of loss in the event of default or bankruptcy by the counterparty or if the counterparty otherwise fails to meet its contractual obligations. The Portfolio’s subadviser attempts to mitigate counterparty risk by (i) periodically assessing the creditworthiness of its trading partners, (ii) monitoring and/or limiting the amount of its net exposure to each individual counterparty based on its assessment and (iii) requiring collateral from the counterparty for certain transactions. Market events and changes in overall economic conditions may impact the assessment of such counterparty risk by the subadviser. In addition, declines in the values of underlying collateral received may expose the Portfolio to increased risk of loss.
With exchange traded and centrally cleared derivatives, there is less counterparty risk to the Portfolio since the exchange or clearinghouse, as counterparty to such instruments, guarantees against a possible default. The clearinghouse stands between the buyer and the seller of the contract; therefore, the credit risk is limited to failure of the clearinghouse. While offset rights may exist under applicable law, the Portfolio does not have a contractual right of offset against a clearing broker or clearinghouse in the event of a default of the clearing broker or clearinghouse.
| 26 | ClearBridge Variable Small Cap Growth Portfolio 2023 Annual Report |
The Portfolio has entered into master agreements, such as an International Swaps and Derivatives Association, Inc. Master Agreement (“ISDA Master Agreement”) or similar agreement, with certain of its derivative counterparties that govern over-the-counter (“OTC”) derivatives and provide for general obligations, representations, agreements, collateral posting terms, netting provisions in the event of default or termination and credit related contingent features. The credit related contingent features include, but are not limited to, a percentage decrease in the Portfolio’s net assets or net asset value per share over a specified period of time. If these credit related contingent features were triggered, the derivatives counterparty could terminate the positions and demand payment or require additional collateral.
Under an ISDA Master Agreement, the Portfolio may, under certain circumstances, offset with the counterparty certain derivative financial instruments’ payables and/or receivables with collateral held and/or posted and create one single net payment. However, absent an event of default by the counterparty or a termination of the agreement, the terms of the ISDA Master Agreements do not result in an offset of reported amounts of financial assets and financial liabilities in the Statement of Assets and Liabilities across transactions between the Portfolio and the applicable counterparty. The enforceability of the right to offset may vary by jurisdiction.
Collateral requirements differ by type of derivative. Collateral or margin requirements are set by the broker or exchange clearinghouse for exchange traded derivatives while collateral terms are contract specific for OTC traded derivatives. Cash collateral that has been pledged to cover obligations of the Portfolio under derivative contracts, if any, will be reported separately in the Statement of Assets and Liabilities. Securities pledged as collateral, if any, for the same purpose are noted in the Schedule of Investments.
As of December 31, 2023, the Portfolio did not have any open OTC derivative transactions with credit related contingent features in a net liability position.
(e) Security transactions and investment income. Security transactions are accounted for on a trade date basis. Interest income (including interest income from payment-in-kind securities) is recorded on the accrual basis. Amortization of premiums and accretion of discounts on debt securities are recorded to interest income over the lives of the respective securities, except for premiums on certain callable debt securities, which are amortized to the earliest call date. Dividend income is recorded on the ex-dividend date for dividends received in cash and/or securities. Foreign dividend income is recorded on the ex-dividend date or as soon as practicable after the Portfolio determines the existence of a dividend declaration after exercising reasonable due diligence. The cost of investments sold is determined by use of the specific identification method. To the extent any issuer defaults or a credit event occurs that impacts the issuer, the Portfolio may halt any additional interest income accruals and consider the realizability of interest accrued up to the date of default or credit event.
| ClearBridge Variable Small Cap Growth Portfolio 2023 Annual Report | 27 |
Notes to financial statements (cont’d)
(f) Distributions to shareholders. Distributions from net investment income and distributions of net realized gains, if any, are declared at least annually. Distributions to shareholders of the Portfolio are recorded on the ex-dividend date and are determined in accordance with income tax regulations, which may differ from GAAP.
(g) Share class accounting. Investment income, common expenses and realized/ unrealized gains (losses) on investments are allocated to the various classes of the Portfolio on the basis of daily net assets of each class. Fees relating to a specific class are charged directly to that share class.
(h) Compensating balance arrangements. The Portfolio has an arrangement with its custodian bank whereby a portion of the custodian’s fees is paid indirectly by credits earned on the Portfolio’s cash on deposit with the bank.
(i) Federal and other taxes. It is the Portfolio’s policy to comply with the federal income and excise tax requirements of the Internal Revenue Code of 1986 (the “Code”), as amended, applicable to regulated investment companies. Accordingly, the Portfolio intends to distribute its taxable income and net realized gains, if any, to shareholders in accordance with timing requirements imposed by the Code. Therefore, no federal or state income tax provision is required in the Portfolio’s financial statements.
Management has analyzed the Portfolio’s tax positions taken on income tax returns for all open tax years and has concluded that as of December 31, 2023, no provision for income tax is required in the Portfolio’s financial statements. The Portfolio’s federal and state income and federal excise tax returns for tax years for which the applicable statutes of limitations have not expired are subject to examination by the Internal Revenue Service and state departments of revenue.
(j) Reclassification. GAAP requires that certain components of net assets be reclassified to reflect permanent differences between financial and tax reporting. These reclassifications have no effect on net assets or net asset value per share. During the current year, the following reclassifications have been made:
Total Distributable Earnings (Loss) | Paid-in Capital | |||||||
| (a) | $ | 2,922,238 | $ | (2,922,238) | ||||
| (a) | Reclassifications are due to a tax net operating loss and the realization for tax purposes of unrealized gains on investments in passive foreign investment companies. |
2. Investment management agreement and other transactions with affiliates
Franklin Templeton Fund Adviser, LLC (“FTFA”) (formerly known as Legg Mason Partners Fund Advisor, LLC (“LMPFA”) prior to November 30, 2023) is the Portfolio’s investment manager and ClearBridge Investments, LLC (“ClearBridge”) is the Portfolio’s subadviser. Western Asset Management Company, LLC (“Western Asset”) manages the portion of the
| 28 | ClearBridge Variable Small Cap Growth Portfolio 2023 Annual Report |
Portfolio’s cash and short-term instruments allocated to it. FTFA, ClearBridge and Western Asset are indirect, wholly-owned subsidiaries of Franklin Resources, Inc. (“Franklin Resources”).
Under the investment management agreement, the Portfolio pays an investment management fee, calculated daily and paid monthly, at an annual rate of 0.75% of the Portfolio’s average daily net assets.
FTFA provides administrative and certain oversight services to the Portfolio. FTFA delegates to the subadviser the day-to-day portfolio management of the Portfolio, except for the management of the portion of the Portfolio’s cash and short-term instruments allocated to Western Asset. For its services, FTFA pays ClearBridge a fee monthly, at an annual rate equal to 70% of the net management fee it receives from the Portfolio. For Western Asset’s services to the Portfolio, FTFA pays Western Asset monthly 0.02% of the portion of the Portfolio’s average daily net assets that are allocated to Western Asset by FTFA.
As a result of expense limitation arrangements between the Portfolio and FTFA, the ratio of total annual fund operating expenses, other than interest, brokerage commissions, taxes, extraordinary expenses and acquired fund fees and expenses, to average net assets of Class I and Class II shares did not exceed 1.00% and 1.25%, respectively. These expense limitation arrangements cannot be terminated prior to December 31, 2025 without the Board of Trustees’ consent. In addition, the manager has agreed to waive the Portfolio’s management fee to an extent sufficient to offset the net management fee payable in connection with any investment in an affiliated money market fund (the “affiliated money market fund waiver”). The affiliated money market fund waiver is not subject to the recapture provision discussed below.
During the year ended December 31, 2023, fees waived and/or expenses reimbursed amounted to $3,153, all of which was an affiliated money market fund waiver.
FTFA is permitted to recapture amounts waived and/or reimbursed to a class during the same fiscal year if the class’ total annual fund operating expenses have fallen to a level below the expense limitation (“expense cap”) in effect at the time the fees were earned or the expenses incurred. In no case will FTFA recapture any amount that would result, on any particular business day of the Portfolio, in the class’ total annual fund operating expenses exceeding the expense cap or any other lower limit then in effect.
Franklin Distributors, LLC (“Franklin Distributors”) serves as the Portfolio’s sole and exclusive distributor. Franklin Distributors is an indirect, wholly-owned broker-dealer subsidiary of Franklin Resources. Franklin Templeton Investor Services, LLC (“Investor Services”) serves as the Portfolio’s shareholder servicing agent and acts as the Portfolio’s transfer agent and dividend-paying agent. Investor Services is an indirect, wholly-owned subsidiary of Franklin Resources. Each class of shares of the Portfolio pays transfer agent fees to Investor Services for its performance of shareholder servicing obligations. Investor Services charges account-based fees based on the number of individual shareholder
| ClearBridge Variable Small Cap Growth Portfolio 2023 Annual Report | 29 |
Notes to financial statements (cont’d)
accounts, as well as a fixed percentage fee based on the total account-based fees charged. In addition, each class reimburses Investor Services for out of pocket expenses incurred. For the year ended December 31, 2023, the Portfolio incurred transfer agent fees as reported on the Statement of Operations, of which $2,505 was earned by Investor Services.
All officers and one Trustee of the Trust are employees of Franklin Resources or its affiliates and do not receive compensation from the Trust.
3. Investments
During the year ended December 31, 2023, the aggregate cost of purchases and proceeds from sales of investments (excluding short-term investments) were as follows:
| Purchases | $ | 71,380,100 | ||
| Sales | 58,897,865 |
At December 31, 2023, the aggregate cost of investments and the aggregate gross unrealized appreciation and depreciation of investments for federal income tax purposes were as follows:
| Cost | Gross Unrealized Appreciation | Gross Unrealized Depreciation | Net Unrealized Appreciation | |||||||||||||
| Securities | $ | 286,312,618 | $ | 166,299,915 | $ | (30,080,489) | $ | 136,219,426 | ||||||||
4. Derivative instruments and hedging activities
The following table provides information about the effect of derivatives and hedging activities on the Portfolio’s Statement of Operations for the year ended December 31, 2023. The table provides additional detail about the amounts and sources of gains (losses) realized on derivatives during the period.
AMOUNT OF NET REALIZED GAIN (LOSS) ON DERIVATIVES RECOGNIZED | ||||
Equity Risk | ||||
| Written options | $ | 27,983 | ||
During the year ended December 31, 2023, the volume of derivative activity for the Portfolio was as follows:
Average Market Value | ||||
| Written options† | $ | 1,060 | ||
| † | At December 31, 2023, there were no open positions held in this derivative. |
5. Class specific expenses, waivers and/or expense reimbursements
The Portfolio has adopted a Rule 12b-1 shareholder services and distribution plan and under that plan the Portfolio pays service and/or distribution fees with respect to its Class II
| 30 | ClearBridge Variable Small Cap Growth Portfolio 2023 Annual Report |
shares calculated at the annual rate of 0.25% of the average daily net assets of the class. Service and/or distribution fees are accrued daily and paid monthly.
For the year ended December 31, 2023, class specific expenses were as follows:
Service and/or Distribution Fees | Transfer Agent Fees | |||||||
| Class I | — | $ | 2,167 | |||||
| Class II | $ | 311,661 | 245 | |||||
| Total | $ | 311,661 | $ | 2,412 | ||||
For the year ended December 31, 2023, waivers and/or expense reimbursements by class were as follows:
Waivers/Expense Reimbursements | ||||
| Class I | $ | 2,162 | ||
| Class II | 991 | |||
| Total | $ | 3,153 | ||
6. Distributions to shareholders by class
Year Ended December 31, 2023 | Year Ended December 31, 2022 | |||||||
| Net Realized Gains: | ||||||||
| Class I | — | $ | 5,600,474 | |||||
| Class II | — | 2,687,910 | ||||||
| Total | — | $ | 8,288,384 | |||||
7. Shares of beneficial interest
At December 31, 2023, the Trust had an unlimited number of shares of beneficial interest authorized with a par value of $0.00001 per share. The Portfolio has the ability to issue multiple classes of shares. Each class of shares represents an identical interest and has the same rights, except that each class bears certain direct expenses, including those specifically related to the distribution of its shares.
Transactions in shares of each class were as follows:
| Year Ended December 31, 2023 | Year Ended December 31, 2022 | |||||||||||||||
| Shares | Amount | Shares | Amount | |||||||||||||
| Class I | ||||||||||||||||
| Shares sold | 1,951,132 | $ | 51,419,251 | 1,775,547 | $ | 48,801,161 | ||||||||||
| Shares issued on reinvestment | — | — | 246,026 | 5,600,474 | ||||||||||||
| Shares repurchased | (1,819,083) | (47,643,235) | (1,805,995) | (49,977,723) | ||||||||||||
| Net increase | 132,049 | $ | 3,776,016 | 215,578 | $ | 4,423,912 | ||||||||||
| ClearBridge Variable Small Cap Growth Portfolio 2023 Annual Report | 31 |
Notes to financial statements (cont’d)
| Year Ended December 31, 2023 | Year Ended December 31, 2022 | |||||||||||||||
| Shares | Amount | Shares | Amount | |||||||||||||
| Class II | ||||||||||||||||
| Shares sold | 2,130,966 | $ | 52,354,549 | 1,679,774 | $ | 42,271,837 | ||||||||||
| Shares issued on reinvestment | — | — | 127,159 | 2,687,910 | ||||||||||||
| Shares repurchased | (1,752,872) | (42,089,959) | (1,971,847) | (50,761,353) | ||||||||||||
| Net increase (decrease) | 378,094 | $ | 10,264,590 | (164,914) | $ | (5,801,606) | ||||||||||
8. Transactions with affiliated company
As defined by the 1940 Act, an affiliated company is one in which the Portfolio owns 5% or more of the outstanding voting securities, or a company which is under common ownership or control with the Portfolio. The following company was considered an affiliated company for all or some portion of the year ended December 31, 2023. The following transactions were effected in such company for the year ended December 31, 2023.
| Affiliate Value at December 31, 2022 |
Purchased | Sold | ||||||||||||||||||
| Cost | Shares | Proceeds | Shares | |||||||||||||||||
| Western Asset Premier Institutional U.S. Treasury Reserves, Premium Shares | $ | 3,380,323 | $ | 37,797,522 | 37,797,522 | $ | 32,704,975 | 32,704,975 | ||||||||||||
| (cont’d) | Realized Gain (Loss) | Dividend Income | Net Increase (Decrease) in Unrealized Appreciation (Depreciation) | Affiliate Value at December 31, 2023 | ||||||||||||
| Western Asset Premier Institutional U.S. Treasury Reserves, Premium Shares | — | $ | 185,997 | — | $ | 8,472,870 | ||||||||||
9. Restricted securities
The following Portfolio investments are restricted as to resale and, in the absence of readily ascertainable market values, are valued in good faith in accordance with procedures approved by the Board of Trustees.
| Security | Number of Shares | Acquisition Date | Cost | Fair Value at 12/31/2023 | Value Per Share | Percent of Net Assets | ||||||||||||||||||
| Brain Corp., Common Shares | 52,367 | 3/21 | $ | 228,844 | $ | 304,188 | $ | 5.81 | 0.07 | % | ||||||||||||||
| Brain Corp., Preferred Shares | 170,237 | 4/20, 11/20 | 898,085 | 988,866 | 5.81 | 0.23 | ||||||||||||||||||
| Caris Life Sciences Inc., Series C, Preferred Shares | 183,481 | 10/20 | 506,408 | 425,711 | 2.32 | 0.10 | ||||||||||||||||||
| 32 | ClearBridge Variable Small Cap Growth Portfolio 2023 Annual Report |
| Security | Number of Shares | Acquisition Date | Cost | Fair Value at 12/31/2023 | Value Per Share | Percent of Net Assets | ||||||||||||||||||
| Caris Life Sciences Inc., Series D, Preferred Shares | 31,383 | 5/21 | $ | 254,202 | $ | 204,199 | $ | 6.51 | 0.05 | % | ||||||||||||||
| Klaviyo Inc., Common Shares(a) | 69,558 | 5/21 | 2,321,946 | 1,932,321 | 27.78 | 0.46 | ||||||||||||||||||
| $ | 4,209,485 | $ | 3,855,285 | 0.91 | % | |||||||||||||||||||
| (a) | Security is subject to a contractual sale restriction as a result of an IPO lockup. The remaining lockup period is generally less than one year. |
10. Redemption facility
The Portfolio, together with other U.S. registered and foreign investment funds (collectively, the “Borrowers”) managed by Franklin Resources or its affiliates, is a borrower in a joint syndicated senior unsecured credit facility totaling $2.675 billion (the “Global Credit Facility”). The Global Credit Facility provides a source of funds to the Borrowers for temporary and emergency purposes, including the ability to meet future unanticipated or unusually large redemption requests. Unless renewed, the Global Credit Facility will terminate on January 31, 2025.
Under the terms of the Global Credit Facility, the Portfolio shall, in addition to interest charged on any borrowings made by the Portfolio and other costs incurred by the Portfolio, pay its share of fees and expenses incurred in connection with the implementation and maintenance of the Global Credit Facility, based upon its relative share of the aggregate net assets of all the Borrowers, including an annual commitment fee of 0.15% based upon the unused portion of the Global Credit Facility. These fees are reflected in the Statement of Operations. The Portfolio did not utilize the Global Credit Facility during the year ended December 31, 2023.
11. Income tax information and distributions to shareholders
The tax character of distributions paid during the fiscal years ended December 31, was as follows:
| 2023 | 2022 | |||||||
| Distributions paid from: | ||||||||
| Net long-term capital gains | — | $ | 8,288,384 | |||||
As of December 31, 2023, the components of distributable earnings (loss) on a tax basis were as follows:
| Undistributed long-term capital gains — net | $ | 313,746 | ||
| Other book/tax temporary differences(a) | (45,495) | |||
| Unrealized appreciation (depreciation)(b) | 136,219,426 | |||
| Total distributable earnings (loss) — net | $ | 136,487,677 |
| ClearBridge Variable Small Cap Growth Portfolio 2023 Annual Report | 33 |
Notes to financial statements (cont’d)
| (a) | Other book/tax temporary differences are attributable to book/tax differences in the timing of the deductibility of various expenses. |
| (b) | The difference between book-basis and tax-basis unrealized appreciation (depreciation) is attributable to the tax deferral of losses on wash sales. |
12. Recent accounting pronouncement
In June 2022, the Financial Accounting Standards Board (FASB) issued Accounting Standards Update (ASU) No. 2022-03, Fair Value Measurement (Topic 820) – Fair Value Measurement of Equity Securities Subject to Contractual Sale Restrictions. The amendments in the ASU clarify that a contractual restriction on the sale of an equity security is not considered part of the unit of account of the equity security and, therefore, should not be considered in measuring fair value. The ASU is effective for interim and annual reporting periods beginning after December 15, 2023, with the option of early adoption. Management has reviewed the requirements and believes that the adoption of the ASU will not have a material impact on the financial statements.
| 34 | ClearBridge Variable Small Cap Growth Portfolio 2023 Annual Report |
Report of independent registered public accounting firm
To the Board of Trustees of Legg Mason Partners Variable Equity Trust and Shareholders of ClearBridge Variable Small Cap Growth Portfolio
Opinion on the Financial Statements
We have audited the accompanying statement of assets and liabilities, including the schedule of investments, of ClearBridge Variable Small Cap Growth Portfolio (one of the portfolios constituting Legg Mason Partners Variable Equity Trust, referred to hereafter as the “Portfolio”) as of December 31, 2023, the related statement of operations for the year ended December 31, 2023, the statement of changes in net assets for each of the two years in the period ended December 31, 2023, including the related notes, and the financial highlights for each of the five years in the period ended December 31, 2023 (collectively referred to as the “financial statements”). In our opinion, the financial statements present fairly, in all material respects, the financial position of the Portfolio as of December 31, 2023, the results of its operations for the year then ended, the changes in its net assets for each of the two years in the period ended December 31, 2023 and the financial highlights for each of the five years in the period ended December 31, 2023 in conformity with accounting principles generally accepted in the United States of America.
Basis for Opinion
These financial statements are the responsibility of the Portfolio’s management. Our responsibility is to express an opinion on the Portfolio’s financial statements based on our audits. We are a public accounting firm registered with the Public Company Accounting Oversight Board (United States) (PCAOB) and are required to be independent with respect to the Portfolio in accordance with the U.S. federal securities laws and the applicable rules and regulations of the Securities and Exchange Commission and the PCAOB.
We conducted our audits of these financial statements in accordance with the standards of the PCAOB. Those standards require that we plan and perform the audit to obtain reasonable assurance about whether the financial statements are free of material misstatement, whether due to error or fraud.
Our audits included performing procedures to assess the risks of material misstatement of the financial statements, whether due to error or fraud, and performing procedures that respond to those risks. Such procedures included examining, on a test basis, evidence regarding the amounts and disclosures in the financial statements. Our audits also included evaluating the accounting principles used and significant estimates made by management, as well as evaluating the overall presentation of the financial statements. Our procedures included confirmation of securities owned as of December 31, 2023 by correspondence with the custodian and portfolio company investees. We believe that our audits provide a reasonable basis for our opinion.
/s/PricewaterhouseCoopers LLP
Baltimore, Maryland
February 13, 2024
We have served as the auditor of one or more investment companies in the Franklin Templeton Group of Funds since 1948.
| ClearBridge Variable Small Cap Growth Portfolio 2023 Annual Report | 35 |
Additional information (unaudited)
Information about Trustees and Officers
The business and affairs of ClearBridge Variable Small Cap Growth Portfolio (the “Portfolio”) are conducted by management under the supervision and subject to the direction of its Board of Trustees. The business address of each Trustee is c/o Jane Trust, Franklin Templeton, 280 Park Avenue, 8th Floor, New York, New York 10017.
Information pertaining to the Trustees and officers of the Portfolio is set forth below. The Statement of Additional Information includes additional information about Trustees and is available, without charge, upon request by calling the Portfolio at 877-6LM-FUND/656-3863.
| Independent Trustees† | ||
| Andrew L. Breech | ||
| Year of birth | 1952 | |
| Position(s) with Trust | Trustee | |
| Term of office1 and length of time served2 | Since 1991 | |
| Principal occupation(s) during the past five years | President, Dealer Operating Control Service, Inc. (automotive retail management) (since 1985) | |
| Number of funds in fund complex overseen by Trustee | 55 | |
| Other board memberships held by Trustee during the past five years | None | |
| Althea L. Duersten* | ||
| Year of birth | 1951 | |
| Position(s) with Trust | Trustee and Chair of the Board | |
| Term of office1 and length of time served2 | Since 2014 (Chair of the Board since 2021) | |
| Principal occupation(s) during the past five years | Retired (since 2011); formerly, Chief Investment Officer, North America, JPMorgan Chase (investment bank) and member of JPMorgan Executive Committee (2007 to 2011) | |
| Number of funds in fund complex overseen by Trustee | 55 | |
| Other board memberships held by Trustee during the past five years | Formerly, Non-Executive Director, Rokos Capital Management LLP (2019 to 2020) | |
| Stephen R. Gross | ||
| Year of birth | 1947 | |
| Position(s) with Trust | Trustee | |
| Term of office1 and length of time served2 | Since 1986 | |
| Principal occupation(s) during the past five years | Chairman Emeritus (since 2011) and formerly, Chairman, HLB Gross Collins, P.C. (accounting and consulting firm) (1979 to 2011); Executive Director of Business Builders Team, LLC (since 2005); Principal, Gross Consulting Group, LLC (since 2011); CEO, Gross Capital Partners, LLC (since 2014); CEO, Trusted CFO Solutions, LLC (since 2011) | |
| Number of funds in fund complex overseen by Trustee | 55 | |
| Other board memberships held by Trustee during the past five years | None | |
| 36 | ClearBridge Variable Small Cap Growth Portfolio |
| Independent Trustees† (cont’d) | ||
| Susan M. Heilbron | ||
| Year of birth | 1945 | |
| Position(s) with Trust | Trustee | |
| Term of office1 and length of time served2 | Since 1991 | |
| Principal occupation(s) during the past five years | Retired; formerly, President, Lacey & Heilbron (communications consulting) (1990 to 2002); General Counsel and Executive Vice President, The Trump Organization (1986 to 1990); Senior Vice President, New York State Urban Development Corporation (1984 to 1986); Associate, Cravath, Swaine & Moore LLP (1980 to 1984 and 1977 to 1979) | |
| Number of funds in fund complex overseen by Trustee | 55 | |
| Other board memberships held by Trustee during the past five years | None | |
| Arnold L. Lehman | ||
| Year of birth | 1944 | |
| Position(s) with Trust | Trustee | |
| Term of office1 and length of time served2 | Since 1982 | |
| Principal occupation(s) during the past five years | Senior Advisor, Phillips (auction house) (since 2015); formerly, Fellow, Ford Foundation (2015 to 2016); Director of the Brooklyn Museum (1997 to 2015) | |
| Number of funds in fund complex overseen by Trustee | 55 | |
| Other board memberships held by Trustee during the past five years | Trustee of American Federation of Arts (since 2002) | |
| Robin J. W. Masters | ||
| Year of birth | 1955 | |
| Position(s) with Trust | Trustee | |
| Term of office1 and length of time served2 | Since 2002 | |
| Principal occupation(s) during the past five years | Retired; formerly, Chief Investment Officer of ACE Limited (insurance) (1986 to 2000) | |
| Number of funds in fund complex overseen by Trustee | 55 | |
| Other board memberships held by Trustee during the past five years | Director of HSBC Corporate Money Funds Limited, HSBC Managed Portfolios Limited and HSBC Specialist Funds Limited (since 2020); formerly, Director of Cheyne Capital International Limited (investment advisory firm) (2005 to 2020) | |
| Ken Miller | ||
| Year of birth | 1942 | |
| Position(s) with Trust | Trustee | |
| Term of office1 and length of time served2 | Since 1983 | |
| Principal occupation(s) during the past five years | Retired; formerly, President, Young Stuff Apparel Group, Inc. (apparel manufacturer), division of Li & Fung (1963 to 2012) | |
| Number of funds in fund complex overseen by Trustee | 55 | |
| Other board memberships held by Trustee during the past five years | None | |
| ClearBridge Variable Small Cap Growth Portfolio | 37 |
Additional information (unaudited) (cont’d)
Information about Trustees and Officers
| Independent Trustees† (cont’d) | ||
| G. Peter O’Brien** | ||
| Year of birth | 1945 | |
| Position(s) with Trust | Trustee | |
| Term of office1 and length of time served2 | Since 1999 | |
| Principal occupation(s) during the past five years | Retired, Trustee Emeritus of Colgate University (since 2005); Board Member, Hill House, Inc. (residential home care) (since 1999); formerly, Board Member, Bridges School (pre-school) (2006 to 2017); Managing Director, Equity Capital Markets Group of Merrill Lynch & Co. (1971 to 1999) | |
| Number of funds in fund complex overseen by Trustee | Trustee of Legg Mason funds consisting of 55 portfolios; Director/Trustee of the Royce Family of Funds consisting of 16 portfolios | |
| Other board memberships held by Trustee during the past five years | Formerly, Director of TICC Capital Corp. (2003 to 2017) | |
| Thomas F. Schlafly | ||
| Year of birth | 1948 | |
| Position(s) with Trust | Trustee | |
| Term of office1 and length of time served2 | Since 1983 | |
| Principal occupation(s) during the past five years | Chairman, The Saint Louis Brewery, LLC (brewery) (since 2012); formerly, President, The Saint Louis Brewery, Inc. (1989 to 2012); Senior Counsel (since 2017) and formerly, Partner (2009 to 2016), Thompson Coburn LLP (law firm) | |
| Number of funds in fund complex overseen by Trustee | 55 | |
| Other board memberships held by Trustee during the past five years | Director, CNB St. Louis Bank (since 2020); formerly, Director, Citizens National Bank of Greater St. Louis (2006 to 2020) | |
| Interested Trustee and Officer | ||
| Jane Trust, CFA3 | ||
| Year of birth | 1962 | |
| Position(s) with Trust | Trustee, President and Chief Executive Officer | |
| Term of office1 and length of time served2 | Since 2015 | |
| Principal occupation(s) during the past five years | Senior Vice President, Fund Board Management, Franklin Templeton (since 2020); Officer and/or Trustee/Director of 123 funds associated with FTFA or its affiliates (since 2015); President and Chief Executive Officer of FTFA (since 2015); formerly, Senior Managing Director (2018 to 2020) and Managing Director (2016 to 2018) of Legg Mason & Co., LLC (“Legg Mason & Co.”); and Senior Vice President of FTFA (2015) | |
| Number of funds in fund complex overseen by Trustee | 123 | |
| Other board memberships held by Trustee during the past five years | None | |
| 38 | ClearBridge Variable Small Cap Growth Portfolio |
| Additional Officers | ||
| Ted P. Becker | ||
Franklin Templeton 280 Park Avenue, 8th Floor, New York, NY 10017 | ||
| Year of birth | 1951 | |
| Position(s) with Trust | Chief Compliance Officer | |
| Term of office1 and length of time served2 | Since 2007 | |
| Principal occupation(s) during the past five years | Vice President, Global Compliance of Franklin Templeton (since 2020); Chief Compliance Officer of FTFA (since 2006); Chief Compliance Officer of certain funds associated with Legg Mason & Co. or its affiliates (since 2006); formerly, Director of Global Compliance at Legg Mason, Inc. (2006 to 2020); Managing Director of Compliance of Legg Mason & Co. (2005 to 2020) | |
| Susan Kerr | ||
Franklin Templeton 280 Park Avenue, 8th Floor, New York, NY 10017 | ||
| Year of birth | 1949 | |
| Position(s) with Trust | Chief Anti-Money Laundering Compliance Officer | |
| Term of office1 and length of time served2 | Since 2013 | |
| Principal occupation(s) during the past five years | Senior Compliance Analyst, Franklin Templeton (since 2020); Chief Anti-Money Laundering Compliance Officer of certain funds associated with Legg Mason & Co. or its affiliates (since 2013) and Anti-Money Laundering Compliance Officer (since 2012), Senior Compliance Officer (since 2011) and Assistant Vice President (since 2010) of Franklin Distributors, LLC; formerly, Assistant Vice President of Legg Mason & Co. (2010 to 2020) | |
| Marc A. De Oliveira | ||
Franklin Templeton 100 First Stamford Place, 6th Floor, Stamford, CT 06902 | ||
| Year of birth | 1971 | |
| Position(s) with Trust | Secretary and Chief Legal Officer | |
| Term of office1 and length of time served2 | Since 2020 | |
| Principal occupation(s) during the past five years | Associate General Counsel of Franklin Templeton (since 2020); Assistant Secretary of certain funds associated with Legg Mason & Co. or its affiliates (since 2006); formerly, Managing Director (2016 to 2020) and Associate General Counsel of Legg Mason & Co. (2005 to 2020) | |
| ClearBridge Variable Small Cap Growth Portfolio | 39 |
Additional information (unaudited) (cont’d)
Information about Trustees and Officers
| Additional Officers (cont’d) | ||
| Thomas C. Mandia | ||
Franklin Templeton 100 First Stamford Place, 6th Floor, Stamford, CT 06902 | ||
| Year of birth | 1962 | |
| Position(s) with Trust | Senior Vice President | |
| Term of office1 and length of time served2 | Since 2020 | |
| Principal occupation(s) during the past five years | Senior Associate General Counsel of Franklin Templeton (since 2020); Secretary of FTFA (since 2006); Assistant Secretary of certain funds associated with Legg Mason & Co. or its affiliates (since 2006); Secretary of LM Asset Services, LLC (“LMAS”) (since 2002) and Legg Mason Fund Asset Management, Inc. (“LMFAM”) (since 2013) (formerly registered investment advisers); formerly, Managing Director and Deputy General Counsel of Legg Mason & Co. (2005 to 2020) | |
| Christopher Berarducci | ||
Franklin Templeton 280 Park Avenue, 8th Floor, New York, NY 10017 | ||
| Year of birth | 1974 | |
| Position(s) with Trust | Treasurer and Principal Financial Officer | |
| Term of office1 and length of time served2 | Since 2014 and 2019 | |
| Principal occupation(s) during the past five years | Vice President, Fund Administration and Reporting, Franklin Templeton (since 2020); Treasurer (since 2010) and Principal Financial Officer (since 2019) of certain funds associated with Legg Mason & Co. or its affiliates; formerly, Managing Director (2020), Director (2015 to 2020), and Vice President (2011 to 2015) of Legg Mason & Co. | |
| Jeanne M. Kelly | ||
Franklin Templeton 280 Park Avenue, 8th Floor, New York, NY 10017 | ||
| Year of birth | 1951 | |
| Position(s) with Trust | Senior Vice President | |
| Term of office1 and length of time served2 | Since 2007 | |
| Principal occupation(s) during the past five years | U.S. Fund Board Team Manager, Franklin Templeton (since 2020); Senior Vice President of certain funds associated with Legg Mason & Co. or its affiliates (since 2007); Senior Vice President of FTFA (since 2006); President and Chief Executive Officer of LMAS and LMFAM (since 2015); formerly, Managing Director of Legg Mason & Co. (2005 to 2020); Senior Vice President of LMFAM (2013 to 2015) | |
FTFA, referenced above, was formerly known as LMPFA prior to November 30, 2023. |
| * | Effective February 7, 2024, Ms. Duersten retired from the Board. |
| ** | Effective February 7, 2024, Mr. O’Brien became Chair of the Board. |
| † | Trustees who are not “interested persons” of the Portfolio within the meaning of Section 2(a)(19) of the Investment Company Act of 1940, as amended (the “1940 Act”). |
| 40 | ClearBridge Variable Small Cap Growth Portfolio |
| 1 | Each Trustee and officer serves until his or her respective successor has been duly elected and qualified or until his or her earlier death, resignation, retirement or removal. |
| 2 | Indicates the earliest year in which the Trustee became a board member for a fund in the Legg Mason fund complex or the officer took such office. |
| 3 | Ms. Trust is an “interested person” of the Portfolio, as defined in the 1940 Act, because of her position with FTFA and/or certain of its affiliates. |
| ClearBridge Variable Small Cap Growth Portfolio | 41 |
Important tax information (unaudited)
By mid-February, tax information related to a shareholder’s proportionate share of distributions paid during the preceding calendar year will be received, if applicable. Please also refer to www.franklintempleton.com for per share tax information related to any distributions paid during the preceding calendar year. Shareholders are advised to consult with their tax advisors for further information on the treatment of these amounts on their tax returns.
The following tax information for the Portfolio is required to be furnished to shareholders with respect to income earned and distributions paid during its fiscal year.
The Portfolio hereby reports the following amounts, or if subsequently determined to be different, the maximum allowable amounts, for the fiscal year ended December 31, 2023:
| Pursuant to: | Amount Reported | |||
| Income Eligible for Dividends Received Deduction (DRD) | §854(b)(1)(A) | $1,127,626 |
| 42 | ClearBridge Variable Small Cap Growth Portfolio |
ClearBridge
Variable Small Cap Growth Portfolio
Trustees
Andrew L. Breech
Stephen R. Gross
Susan M. Heilbron
Arnold L. Lehman
Robin J. W. Masters
Ken Miller
G. Peter O’Brien*
Chair
Thomas F. Schlafly
Jane Trust
Investment manager
Franklin Templeton Fund Adviser, LLC**
Subadviser
ClearBridge Investments, LLC
Distributor
Franklin Distributors, LLC
Custodian
The Bank of New York Mellon
Transfer agent
Franklin Templeton Investor Services, LLC
3344 Quality Drive
Rancho Cordova, CA 95670-7313
Independent registered public accounting firm
PricewaterhouseCoopers LLP
Baltimore, MD
| * | Effective February 7, 2024, Mr. O’Brien became Chair of the Board. |
| ** | Formerly known as Legg Mason Partners Fund Advisor, LLC. |
ClearBridge Variable Small Cap Growth Portfolio
The Portfolio is a separate investment series of Legg Mason Partners Variable Equity Trust, a Maryland statutory trust.
ClearBridge Variable Small Cap Growth Portfolio
Legg Mason Funds
620 Eighth Avenue, 47th Floor
New York, NY 10018
The Portfolio files its complete schedule of portfolio holdings with the Securities and Exchange Commission (“SEC”) for the first and third quarters of each fiscal year as an exhibit to its reports on Form N-PORT. The Portfolio’s Forms N-PORT are available on the SEC’s website at www.sec.gov. To obtain information on Form N-PORT, shareholders can call the Portfolio at 877-6LM-FUND/656-3863.
Information on how the Portfolio voted proxies relating to portfolio securities during the prior 12-month period ended June 30th of each year and a description of the policies and procedures that the Portfolio uses to determine how to vote proxies related to portfolio transactions are available (1) without charge, upon request, by calling the Portfolio at 877-6LM-FUND/656-3863, (2) at www.franklintempleton.com and (3) on the SEC’s website at www.sec.gov.
This report is submitted for the general information of the shareholders of ClearBridge Variable Small Cap Growth Portfolio. This report is not authorized for distribution to prospective investors in the Portfolio unless preceded or accompanied by a current prospectus.
Investors should consider the Portfolio’s investment objectives, risks, charges and expenses carefully before investing. The prospectus contains this and other important information about the Portfolio. Please read the prospectus carefully before investing.
www.franklintempleton.com
© 2024 Franklin Distributors, LLC, Member FINRA/SIPC. All rights reserved.
Legg Mason Funds Privacy and Security Notice
Your Privacy Is Our Priority
Franklin Templeton* is committed to safeguarding your personal information. This notice is designed to provide you with a summary of the non-public personal information Franklin Templeton may collect and maintain about current or former individual investors; our policy regarding the use of that information; and the measures we take to safeguard the information. We do not sell individual investors’ non-public personal information to anyone and only share it as described in this notice.
Information We Collect
When you invest with us, you provide us with your non-public personal information. We collect and use this information to service your accounts and respond to your requests. The non-public personal information we may collect falls into the following categories:
| • | Information we receive from you or your financial intermediary on applications or other forms, whether we receive the form in writing or electronically. For example, this information may include your name, address, tax identification number, birth date, investment selection, beneficiary information, and your personal bank account information and/or email address if you have provided that information. |
| • | Information about your transactions and account history with us, or with other companies that are part of Franklin Templeton, including transactions you request on our website or in our app. This category also includes your communications to us concerning your investments. |
| • | Information we receive from third parties (for example, to update your address if you move, obtain or verify your email address or obtain additional information to verify your identity). |
| • | Information collected from you online, such as your IP address or device ID and data gathered from your browsing activity and location. (For example, we may use cookies to collect device and browser information so our website recognizes your online preferences and device information.) Our website contains more information about cookies and similar technologies and ways you may limit them. |
| • | Other general information that we may obtain about you such as demographic information. |
Disclosure Policy
To better service your accounts and process transactions or services you requested, we may share non-public personal information with other Franklin Templeton companies. From time to time we may also send you information about products/services offered by other Franklin Templeton companies although we will not share your non-public personal information with these companies without first offering you the opportunity to prevent that sharing.
We will only share non-public personal information with outside parties in the limited circumstances permitted by law. For example, this includes situations where we need to share information with companies who work on our behalf to service or maintain your account or process transactions you requested, when the disclosure is to companies assisting us with our own marketing efforts, when the disclosure is to a party representing you, or when required by law (for example, in response to legal process). Additionally, we will ensure that any outside
| NOT PART OF THE ANNUAL REPORT |
Legg Mason Funds Privacy and Security Notice (cont’d)
companies working on our behalf, or with whom we have joint marketing agreements, are under contractual obligations to protect the confidentiality of your information, and to use it only to provide the services we asked them to perform.
Confidentiality and Security
Our employees are required to follow procedures with respect to maintaining the confidentiality of our investors’ non-public personal information. Additionally, we maintain physical, electronic and procedural safeguards to protect the information. This includes performing ongoing evaluations of our systems containing investor information and making changes when appropriate.
At all times, you may view our current privacy notice on our website at franklintempleton.com or contact us for a copy at (800) 632-2301.
*For purposes of this privacy notice Franklin Templeton shall refer to the following entities:
Fiduciary Trust International of the South (FTIOS), as custodian for individual retirement plans Franklin Advisers, Inc.
Franklin Distributors, LLC, including as program manager of the Franklin Templeton 529 College Savings Plan and the NJBEST 529 College Savings Plan
Franklin Mutual Advisers, LLC
Franklin, Templeton and Mutual Series Funds
Franklin Templeton Institutional, LLC
Franklin Templeton Investments Corp., Canada
Franklin Templeton Investments Management, Limited UK
Franklin Templeton Portfolio Advisors, Inc.
Legg Mason Funds serviced by Franklin Templeton Investor Services, LLC
Templeton Asset Management, Limited
Templeton Global Advisors, Limited
Templeton Investment Counsel, LLC
If you are a customer of other Franklin Templeton affiliates and you receive notices from them, you will need to read those notices separately.
| NOT PART OF THE ANNUAL REPORT |
www.franklintempleton.com
© 2024 Franklin Distributors, LLC, Member FINRA/SIPC. All rights reserved.
FD04119 2/24 SR24-4822
| ITEM 2. | CODE OF ETHICS. |
The registrant has adopted a code of ethics that applies to the registrant’s principal executive officer, principal financial officer, principal accounting officer or controller.
| ITEM 3. | AUDIT COMMITTEE FINANCIAL EXPERT. |
The Board of Trustees of the registrant has determined that Stephen R. Gross possesses the technical attributes identified in Instruction 2(b) of Item 3 to Form N-CSR to qualify as an “audit committee financial expert,” and has designated Stephen R. Gross as the Audit Committee’s financial expert. Stephen R. Gross is an “independent” Trustees pursuant to paragraph (a)(2) of Item 3 to Form N-CSR.
| ITEM 4. | PRINCIPAL ACCOUNTANT FEES AND SERVICES. |
a) Audit Fees. The aggregate fees billed in the last two fiscal years ending December 31, 2022 and December 31, 2023 (the “Reporting Periods”) for professional services rendered by the Registrant’s principal accountant (the “Auditor”) for the audit of the Registrant’s annual financial statements, or services that are normally provided by the Auditor in connection with the statutory and regulatory filings or engagements for the Reporting Periods, were $349,206 in December 31, 2022 and $349,206 in December 31, 2023.
b) Audit-Related Fees. The aggregate fees billed in the Reporting Period for assurance and related services by the Auditor that are reasonably related to the performance of the Registrant’s financial statements were $0 in December 31, 2022 and $0 in December 31, 2023.
(c) Tax Fees. The aggregate fees billed in the Reporting Periods for professional services rendered by the Auditor for tax compliance, tax advice and tax planning (“Tax Services”) were $149,250 in December 31, 2022 and $149,250 in December 31, 2023. These services consisted of (i) review or preparation of U.S. federal, state, local and excise tax returns; (ii) U.S. federal, state and local tax planning, advice and assistance regarding statutory, regulatory or administrative developments, and (iii) tax advice regarding tax qualification matters and/or treatment of various financial instruments held or proposed to be acquired or held.
There were no fees billed for tax services by the Auditors to service affiliates during the Reporting Periods that required pre-approval by the Audit Committee.
d) All Other Fees. The aggregate fees billed in the Reporting Periods for products and services provided by the Auditor, other than the services reported in paragraphs (a) through (c) for the Item 4 for the Legg Mason Partners Variable Equity Trust., were $0 in December 31, 2022 and $0 in December 31, 2023.
All Other Fees. There were no other non-audit services rendered by the Auditor to Legg Mason Partners Fund Advisors, LLC (“LMPFA”), and any entity controlling, controlled by or under common control with LMPFA that provided ongoing services to Legg Mason Partners Variable Equity Trust requiring pre-approval by the Audit Committee in the Reporting Period.
(e) Audit Committee’s pre–approval policies and procedures described in paragraph (c) (7) of Rule 2-01 of Regulation S-X.
(1) The Charter for the Audit Committee (the “Committee”) of the Board of each registered investment company (the “Fund”) advised by LMPFA or one of their affiliates (each, an “Adviser”) requires that the Committee shall approve (a) all audit and permissible non-audit services to be provided to the Fund and (b) all permissible non-audit services to be provided by the Fund’s independent auditors to the Adviser and any Covered Service Providers if the engagement relates directly to the operations and financial reporting of the Fund. The
Committee may implement policies and procedures by which such services are approved other than by the full Committee.
The Committee shall not approve non-audit services that the Committee believes may impair the independence of the auditors. As of the date of the approval of this Audit Committee Charter, permissible non-audit services include any professional services (including tax services), that are not prohibited services as described below, provided to the Fund by the independent auditors, other than those provided to the Fund in connection with an audit or a review of the financial statements of the Fund. Permissible non-audit services may not include: (i) bookkeeping or other services related to the accounting records or financial statements of the Fund; (ii) financial information systems design and implementation; (iii) appraisal or valuation services, fairness opinions or contribution-in-kind reports; (iv) actuarial services; (v) internal audit outsourcing services; (vi) management functions or human resources; (vii) broker or dealer, investment adviser or investment banking services; (viii) legal services and expert services unrelated to the audit; and (ix) any other service the Public Company Accounting Oversight Board determines, by regulation, is impermissible.
Pre-approval by the Committee of any permissible non-audit services is not required so long as: (i) the aggregate amount of all such permissible non-audit services provided to the Fund, the Adviser and any service providers controlling, controlled by or under common control with the Adviser that provide ongoing services to the Fund (“Covered Service Providers”) constitutes not more than 5% of the total amount of revenues paid to the independent auditors during the fiscal year in which the permissible non-audit services are provided to (a) the Fund, (b) the Adviser and (c) any entity controlling, controlled by or under common control with the Adviser that provides ongoing services to the Fund during the fiscal year in which the services are provided that would have to be approved by the Committee; (ii) the permissible non-audit services were not recognized by the Fund at the time of the engagement to be non-audit services; and (iii) such services are promptly brought to the attention of the Committee and approved by the Committee (or its delegate(s)) prior to the completion of the audit.
(2) None of the services described in paragraphs (b) through (d) of this Item were performed in reliance on paragraph (c)(7)(i)(C) of Rule 2-01 of Regulation S-X.
(f) Not applicable.
(g) Non-audit fees billed by the Auditor for services rendered to Legg Mason Partners Variable Equity Trust, LMPFA and any entity controlling, controlled by, or under common control with LMPFA that provides ongoing services to Legg Mason Partners Variable Equity Trust during the reporting period were $785,604 in December 31, 2022 and $799,106 in December 31, 2023.
(h) Yes. Legg Mason Partners Variable Equity Trust’s Audit Committee has considered whether the provision of non-audit services that were rendered to Service Affiliates, which were not pre-approved (not requiring pre-approval), is compatible with maintaining the Accountant’s independence. All services provided by the Auditor to the Legg Mason Partners Variable Equity Trust or to Service Affiliates, which were required to be pre-approved, were pre-approved as required.
(i) Not applicable.
(j) Not applicable.
| ITEM 5. | AUDIT COMMITTEE OF LISTED REGISTRANTS. |
| a) | The independent board members are acting as the registrant’s audit committee as specified in Section 3(a)(58)(B) of the Exchange Act .The Audit Committee consists of the following Board members: |
Andrew L. Breech
Althea L. Duersten*
Stephen R. Gross
Susan M. Heilbron
Arnold L. Lehman
Robin J. W. Masters
Ken Miller
G. Peter O’Brien
Thomas F. Schlafly
* Effective February 7, 2024, Ms. Duersten retired from the Board.
| b) | Not applicable |
| ITEM 6. | SCHEDULE OF INVESTMENTS. |
Included herein under Item 1.
| ITEM 7. | DISCLOSURE OF PROXY VOTING POLICIES AND PROCEDURES FOR CLOSED-END MANAGEMENT INVESTMENT COMPANIES. |
Not applicable.
| ITEM 8. | PORTFOLIO MANAGERS OF CLOSED-END MANAGEMENT INVESTMENT COMPANIES. |
Not applicable.
| ITEM 9. | PURCHASES OF EQUITY SECURITIES BY CLOSED-END MANAGEMENT INVESTMENT COMPANY AND AFFILIATED PURCHASERS. |
Not applicable.
| ITEM 10. | SUBMISSION OF MATTERS TO A VOTE OF SECURITY HOLDERS. |
Not applicable.
| ITEM 11. | CONTROLS AND PROCEDURES. |
| (a) | The registrant’s principal executive officer and principal financial officer have concluded that the registrant’s disclosure controls and procedures (as defined in Rule 30a- 3(c) under the Investment Company Act of 1940, as amended (the “1940 Act”)) are effective as of a date within 90 days of the filing date of this report that includes the disclosure required by this paragraph, based on their evaluation of the disclosure controls and procedures required by Rule 30a-3(b) under the 1940 Act and 15d-15(b) under the Securities Exchange Act of 1934. |
| (b) | There were no changes in the registrant’s internal control over financial reporting (as defined in Rule 30a-3(d) under the 1940 Act) that occurred during the period covered by |
| this report that have materially affected, or are likely to materially affect the registrant’s internal control over financial reporting. |
| ITEM 12. | DISCLOSURE OF SECURITIES LENDING ACTIVITIES FOR CLOSED-END MANAGEMENT INVESTMENT COMPANIES. |
Not applicable.
| ITEM 13. | RECOVERY OF ERRONEOUSLY AWARDED COMPENSATION. |
| (a) | Not applicable. |
| (b) | Not applicable. |
| ITEM 14. | EXHIBITS. |
(a) (1) Code of Ethics attached hereto.
Exhibit 99.CODE ETH
(a) (2) Certifications pursuant to section 302 of the Sarbanes-Oxley Act of 2002 attached hereto.
Exhibit 99.CERT
(b) Certifications pursuant to Section 906 of the Sarbanes-Oxley Act of 2002 attached hereto.
Exhibit 99.906CERT
SIGNATURES
Pursuant to the requirements of the Securities Exchange Act of 1934 and the Investment Company Act of 1940, the registrant has duly caused this Report to be signed on its behalf by the undersigned, there unto duly authorized.
| Legg Mason Partners Variable Equity Trust | ||
| By: | /s/ Jane Trust | |
| Jane Trust | ||
| Chief Executive Officer | ||
| Date: | February 20, 2024 | |
Pursuant to the requirements of the Securities Exchange Act of 1934 and the Investment Company Act of 1940, this report has been signed below by the following persons on behalf of the registrant and in the capacities and on the dates indicated.
| By: | /s/ Jane Trust | |
| Jane Trust | ||
| Chief Executive Officer | ||
| Date: | February 20, 2024 | |
| By: | /s/ Christopher Berarducci | |
| Christopher Berarducci | ||
| Principal Financial Officer | ||
| Date: | February 20, 2024 | |