| OMB APPROVAL | ||
| OMB Number: | 3235-0570 | |
| Expires: | July 31, 2022 | |
Estimated average burden | ||
| Hours per response | 20.6 | |
UNITED STATES
SECURITIES AND EXCHANGE COMMISSION
Washington, DC 20549
FORM N-CSR
CERTIFIED SHAREHOLDER REPORT OF REGISTERED
MANAGEMENT INVESTMENT COMPANIES
Investment Company Act file number: 811-21296
BARON SELECT FUNDS
(Exact Name of Registrant as Specified in Charter)
767 Fifth Avenue, 49th Floor
New York, NY 10153
(Address of Principal Executive Offices) (Zip Code)
Patrick M. Patalino, General Counsel
c/o Baron Select Funds
767 Fifth Avenue, 49th Floor
New York, NY 10153
(Name and Address of Agent for Service)
(Registrant’s Telephone Number, including Area Code): 212-583-2000
Date of fiscal year end: December 31
Date of reporting period: June 30, 2020
Form N-CSR is to be used by management investment companies to file reports with the Commission not later than 10 days after the transmission to stockholders of any report that is required to be transmitted to stockholders under Rule 30e-1 under the Investment Company Act of 1940 (17CRF 270.30e-1). The Commission may use the information provided on Form N-CSR in its regulatory, disclosure review, inspection, and policymaking roles.
A registrant is required to disclose the information specified by Form N-CSR, and the Commission will make this information public. A registrant is not required to respond to the collection of information contained in Form N-CSR unless the Form displays a currently valid Office of Management and Budget (“OMB”) control number. Please direct comments concerning the accuracy of the information collection burden estimate and suggestions for reducing the burden to Secretary, Securities and Exchange Commission, 450 5th Street, NW, Washington, D.C. 20549-0609. The OMB has reviewed this collection of information under the clearance requirements of 44 U.S.C. Section 3507.
Persons who are to respond to the collection of information contained in this form are not required to respond unless the form displays a currently valid OMB control number.
SEC 2569 (5-07)
Item 1. Reports to Stockholders.
Baron Partners Fund
Baron Focused Growth Fund
Baron International Growth Fund
Baron Real Estate Fund
Baron Emerging Markets Fund
Baron Global Advantage Fund
Baron Real Estate Income Fund
Baron Health Care Fund
Baron FinTech Fund
June 30, 2020
Baron Funds®
Baron Select Funds
Semi-Annual Financial Report
Beginning on January 1, 2021, as permitted by regulations adopted by the U.S. Securities and Exchange Commission, paper copies of the Funds’ shareholder reports like this one will no longer be sent by mail, unless you specifically request paper copies of the reports from Baron Funds (“Baron”) or from your financial intermediary, such as a broker-dealer or bank. Instead, the reports will be made available on the Baron website, and you will be notified by mail each time a report is posted and provided with a website link to access the report.
If you already elected to receive shareholder reports electronically, you will not be affected by this change and you need not take any action. You may elect to receive shareholder reports and other communications from Baron or your financial intermediary electronically by contacting your financial intermediary or going to icsdelivery.com/baronfunds.
You may elect to receive all future reports in paper free of charge. You can inform Baron or your financial intermediary that you wish to continue receiving paper copies of your shareholder reports by following the instructions included on the envelope or slip inserted with this disclosure. Your election to receive reports in paper will apply to all funds held with Baron or your financial intermediary.
DEAR BARON SELECT FUNDS SHAREHOLDER:
In this report, you will find unaudited financial statements for Baron Partners Fund, Baron Focused Growth Fund, Baron International Growth Fund, Baron Real Estate Fund, Baron Emerging Markets Fund, Baron Global Advantage Fund, Baron Real Estate Income Fund, Baron Health Care Fund, and Baron FinTech Fund (the “Funds”) for the six months ended June 30, 2020. The U.S. Securities and Exchange Commission (the “SEC”) requires mutual funds to furnish these statements semi-annually to their shareholders. We hope you find these statements informative and useful.
We thank you for choosing to join us as fellow shareholders in Baron Funds. We will continue to work hard to justify your confidence.
Sincerely,
 |  |  | ||
Ronald Baron Chief Executive Officer August 25, 2020 | Linda S. Martinson Chairman, President and Chief Operating Officer August 25, 2020 | Peggy Wong Treasurer and Chief Financial Officer August 25, 2020 |
This Semi-Annual Financial Report is for the following nine series of Baron Select Funds: Baron Partners Fund, Baron Focused Growth Fund, Baron International Growth Fund, Baron Real Estate Fund, Baron Emerging Markets Fund, Baron Global Advantage Fund, Baron Real Estate Income Fund, Baron Health Care Fund, and Baron FinTech Fund. Baron WealthBuilder Fund is included in a separate Financial Report. If you are interested in Baron WealthBuilder Fund or Baron Investment Funds Trust, which contains the Baron Asset Fund, Baron Growth Fund, Baron Small Cap Fund, Baron Opportunity Fund, Baron Fifth Avenue Growth Fund, Baron Discovery Fund, and Baron Durable Advantage Fund, please visit the Funds’ website at www.BaronFunds.com or contact us at 1-800-99BARON.
The Funds’ Proxy Voting Policy is available without charge and can be found on the Funds’ website at www.BaronFunds.com, by clicking on the “Legal Notices” link at the bottom left corner of the homepage or by calling 1-800-99BARON and on the SEC’s website at www.sec.gov. The Funds’ most current proxy voting record, Form N-PX, is also available on the Funds’ website and on the SEC’s website.
The Funds file their complete schedules of portfolio holdings with the SEC for the first and third quarters of each fiscal year as an exhibit to their reports on Form N-PORT. The Funds’ Form N-PORT reports are available on the SEC’s website at www.sec.gov. Schedules of portfolio holdings current to the most recent quarter are also available on the Funds’ website.
Some of the comments contained in this report are based on current management expectations and are considered “forward-looking statements.” Actual future results, however, may prove to be different from our expectations. You can identify forward-looking statements by words such as “estimate,” “may,” “expect,” “should,” “could,” “believe,” “plan”, and other similar terms. We cannot promise future returns and our opinions are a reflection of our best judgment at the time this report is compiled.
The views expressed in this report reflect those of BAMCO, Inc. (“BAMCO” or the “Adviser”) only through the end of the period stated in this report. The views are not intended as recommendations or investment advice to any person reading this report and are subject to change at any time without notice based on market and other conditions.
Past performance is no guarantee of future results. The investment return and principal value of an investment will fluctuate; an investor’s shares, when redeemed, may be worth more or less than their original cost. For more complete information about Baron Funds, including charges and expenses, call, write or go to www.BaronFunds.com for a prospectus or summary prospectus. Read them carefully before you invest or send money. This report is not authorized for use as an offer of sale or a solicitation of an offer to buy shares of the Funds, unless accompanied or preceded by the Funds’ current prospectus or summary prospectus.

| Baron Partners Fund (Unaudited) | June 30, 2020 |
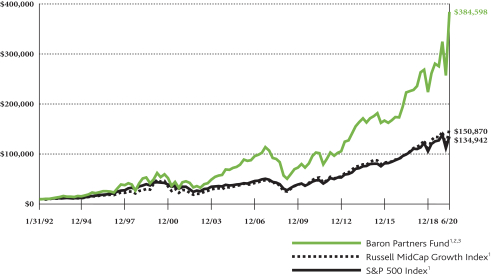
COMPARISONOFTHECHANGEIN VALUEOF $10,000INVESTMENTIN BARON PARTNERS FUND (RETAIL SHARES)
IN RELATIONTOTHE RUSSELL MIDCAP GROWTH INDEXANDTHE S&P 500 INDEX
| AVERAGE ANNUAL TOTAL RETURNSFORTHEPERIODS ENDED JUNE 30, 2020 |
| |||||||||||||||||||||||
| Six Months* | One Year | Three Years | Five Years | Ten Years | Since Inception (January 31, 1992) | |||||||||||||||||||
Baron Partners Fund — Retail Shares1,2,3 | 18.38% | 36.84% | 19.88% | 16.17% | 18.03% | 13.70% | ||||||||||||||||||
Baron Partners Fund — Institutional Shares1,2,3,4 | 18.53% | 37.23% | 20.19% | 16.47% | 18.35% | 13.82% | ||||||||||||||||||
Baron Partners Fund — R6 Shares1,2,3,4 | 18.53% | 37.21% | 20.19% | 16.47% | 18.35% | 13.82% | ||||||||||||||||||
Russell Midcap Growth Index1 | 4.16% | 11.91% | 14.76% | 11.60% | 15.09% | 10.02% | ||||||||||||||||||
S&P 500 Index1 | (3.08)% | 7.51% | 10.73% | 10.73% | 13.99% | 9.59% | ||||||||||||||||||
| * | Not Annualized. |
| 1 | The indexes are unmanaged. The index performance is not Fund performance; one cannot invest directly into an index. The Russell Midcap® Growth Index measures the performance of medium-sized U.S. companies that are classified as growth and the S&P 500 Index of 500 widely held large-cap U.S. companies. The indexes and Baron Partners Fund are with dividends, which positively impact the performance results. |
| 2 | Reflects the actual fees and expenses that were charged when the Fund was a partnership. The predecessor partnership charged a 20% performance fee after reaching a certain performance benchmark. If the annual returns for the Fund did not reflect the performance fees for the years the predecessor partnership charged a performance fee, returns would be higher. The Fund’s shareholders will not be charged a performance fee. The predecessor partnership’s performance is only for periods before the Fund’s registration statement was effective, which was April 30, 2003. During those periods, the predecessor partnership was not registered under the Investment Company Act of 1940 and was not subject to its requirements or the requirements of the Internal Revenue Code relating to regulated investment companies, which, if it were, might have adversely affected its performance. |
| 3 | Past performance is not predictive of future performance. The performance data does not reflect the deduction of taxes that a shareholder would pay on Fund distributions or redemption of Fund shares. The Fund’s transfer agency expenses may be reduced by expense offsets from an unaffiliated transfer agent, without which performance would have been lower. |
| 4 | Performance for the Institutional Shares prior to May 29, 2009 is based on the performance of the Retail Shares. Performance for the R6 Shares prior to August 31, 2016 is based on the performance of the Institutional Shares, and prior to May 29, 2009 is based on the Retail Shares. The Retail Shares have a distribution fee, but Institutional Shares and R6 Shares do not. If the annual returns for the Institutional Shares and R6 Shares prior to May 29, 2009 did not reflect this fee, the returns would be higher. |
2
| June 30, 2020 (Unaudited) | Baron Partners Fund |
TOP TEN HOLDINGSASOF JUNE 30, 2020
| Percent of Total Investments | ||||
Tesla, Inc. | 29.4% | |||
CoStar Group, Inc. | 13.2% | |||
IDEXX Laboratories, Inc. | 6.7% | |||
FactSet Research Systems, Inc. | 5.7% | |||
Arch Capital Group Ltd. | 4.7% | |||
Vail Resorts, Inc. | 4.2% | |||
Space Exploration Technologies Corp. | 4.0% | |||
Zillow Group, Inc. | 3.9% | |||
Hyatt Hotels Corp. | 3.6% | |||
The Charles Schwab Corp. | 3.2% | |||
| 78.6% | ||||
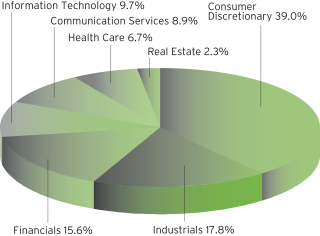
SECTOR BREAKDOWNASOF JUNE 30, 2020†
(as a percentage of total investments)
MANAGEMENT’S DISCUSSIONOF FUND PERFORMANCE
For the six-month period ended June 30, 2020, Baron Partners Fund1 increased 18.38%, outperforming the Russell Midcap Growth Index, which increased 4.16%.
Baron Partners Fund invests primarily in U.S. companies of any size with, in our view, significant long-term growth potential. We believe our process can identify investment opportunities that are attractively priced relative to future prospects. The Fund is non-diversified, so its top 10 holdings are expected to comprise a significant percentage of the portfolio, and the Fund uses leverage, both of which increase risk. Of course, there can be no assurance that we will be successful in achieving the Fund’s investment goals.
The past six months have been dominated by the COVID-19 pandemic, the resulting economic shutdown, and the impact of both on U.S. equity markets. The COVID-19 chapter of the 2020 book certainly is not finished, but the trajectory of U.S. equity markets has been a sharp “V” thus far and they are well on their way back to pre-COVID-19 levels. Several factors contributed to the dramatic recovery, including unprecedented fiscal and monetary stimulus, stepped up efforts to reopen the economy, optimism about a COVID-19 treatment, and various economic data (such as unemployment figures) that were more positive than expected.
At the sector level, Consumer Discretionary, Health Care, and Communication Services contributed the most to performance. Financials and Real Estate detracted.
Tesla, Inc. contributed the most to performance. Shares of this manufacturer of electric vehicles, solar products, and energy storage solutions increased more than 150% on strong delivery numbers, unit economics of mature and new vehicle programs that beat Street estimates, and significant growth in production from its new factory in Shanghai. With reduced business model risks, the stock is benefiting from Tesla’s investments in growth as evidenced by its opportunities around Model Y and CyberTruck and its localization of manufacturing in China and Europe.
Arch Capital Group Ltd., a specialty insurance company, detracted the most. While the property & casualty insurance segments are improving, economic-related headwinds in the mortgage business caused the shares to decline. Lender forbearance and rising unemployment are causing higher mortgage delinquencies, which pressured earnings due to Arch’s provision for credit losses even if these delinquencies do not ultimately result in cash losses. We continue to own the stock due to Arch’s strong management team and underwriting discipline.
We believe that the unprecedented social, political, and economic effects stemming from the COVID-19 pandemic, coupled with unrelenting advances in technology, will result in long-lasting benefits for certain businesses and challenges for others. We continue to adhere to our traditional investment methodology while working hard to identify these long-term corporate beneficiaries. We are optimistic that this approach will continue to lead to strong performance for our portfolio, no matter the economic climate.
| † | Sector levels are provided from the Global Industry Classification Standard (“GICS”), developed and exclusively owned by MSCI, Inc. and Standard & Poor’s Financial Services LLC, unless otherwise stated that they have been reclassified or classified by the Adviser. All GICS data is provided “as is” with no warranties. |
| 1 | Performance information reflects results of the Retail Shares. |
3
| Baron Focused Growth Fund (Unaudited) | June 30, 2020 |
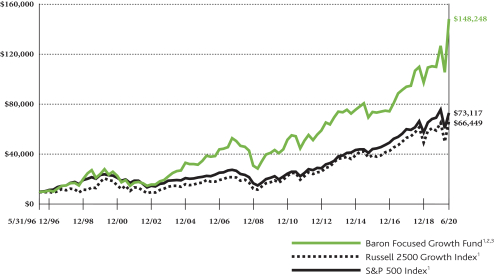
COMPARISONOFTHECHANGEIN VALUEOF $10,000INVESTMENTIN BARON FOCUSED GROWTH FUND (RETAIL SHARES)
INRELATIONTOTHE RUSSELL 2500 GROWTH INDEXANDTHE S&P 500 INDEX
| AVERAGE ANNUAL TOTAL RETURNS FOR THE PERIODS ENDED JUNE 30, 2020 |
| |||||||||||||||||||||||
| Six Months* | One Year | Three Years | Five Years | Ten Years | Since Inception (May 31, 1996) | |||||||||||||||||||
Baron Focused Growth Fund — Retail Shares1,2,3 | 17.00% | 34.37% | 18.66% | 12.96% | 13.77% | 11.85% | ||||||||||||||||||
Baron Focused Growth Fund — Institutional Shares1,2,3,4 | 17.13% | 34.64% | 18.96% | 13.24% | 14.05% | 11.97% | ||||||||||||||||||
Baron Focused Growth Fund — R6 Shares1,2,3,4 | 17.12% | 34.70% | 18.97% | 13.25% | 14.06% | 11.97% | ||||||||||||||||||
Russell 2500 Growth Index1 | 2.02% | 9.21% | 12.10% | 9.57% | 14.45% | 8.18% | ||||||||||||||||||
S&P 500 Index1 | (3.08)% | 7.51% | 10.73% | 10.73% | 13.99% | 8.61% | ||||||||||||||||||
| * | Not Annualized. |
| 1 | The indexes are unmanaged. The index performance is not Fund performance; one cannot invest directly into an index. The Russell 2500™ Growth Index measures the performance of small- to medium-sized U.S. companies that are classified as growth and the S&P 500 Index of 500 widely held large-cap U.S. companies. The indexes and Baron Focused Growth Fund are with dividends, which positively impact the performance results. |
| 2 | Reflects the actual fees and expenses that were charged when the Fund was a partnership. The predecessor partnership charged a 15% performance fee through 2003 after reaching a certain performance benchmark. If the annual returns for the Fund did not reflect the performance fees for the years the predecessor partnership charged a performance fee, the returns would be higher. The Fund’s shareholders will not be charged a performance fee. The predecessor partnership’s performance is only for periods before the Fund’s registration statement was effective, which was June 30, 2008. During those periods, the predecessor partnership was not registered under the Investment Company Act of 1940 and was not subject to its requirements or the requirements of the Internal Revenue Code relating to regulated investment companies, which, if it were, might have adversely affected its performance. |
| 3 | Past performance is not predictive of future performance. The performance data does not reflect the deduction of taxes that a shareholder would pay on Fund distributions or redemption of Fund shares. The Adviser reimburses certain Fund expenses pursuant to a contract expiring on August 29, 2030, unless renewed for another 11-year term and the Fund’s transfer agency expenses may be reduced by expense offsets from an unaffiliated transfer agent, without which performance would have been lower. |
| 4 | Performance for the Institutional Shares prior to May 29, 2009 is based on the performance of the Retail Shares. Performance for the R6 Shares prior to August 31, 2016 is based on the performance of the Institutional Shares, and prior to May 29, 2009 is based on the Retail Shares. The Retail Shares have a distribution fee, but Institutional Shares and R6 Shares do not. If the annual returns for the Institutional Shares and R6 Shares prior to May 29, 2009 did not reflect this fee, the returns would be higher. |
4
| June 30, 2020 (Unaudited) | Baron Focused Growth Fund |
TOP TEN HOLDINGSASOF JUNE 30, 2020
| Percent of Net Assets | ||||
Tesla, Inc. | 29.7% | |||
CoStar Group, Inc. | 13.5% | |||
FactSet Research Systems, Inc. | 7.5% | |||
Vail Resorts, Inc. | 7.5% | |||
Penn National Gaming, Inc. | 5.6% | |||
Hyatt Hotels Corp. | 5.2% | |||
Space Exploration Technologies Corp. | 3.9% | |||
Choice Hotels International, Inc. | 3.7% | |||
Guidewire Software, Inc. | 3.5% | |||
Iridium Communications Inc. | 3.1% | |||
| 83.2% | ||||
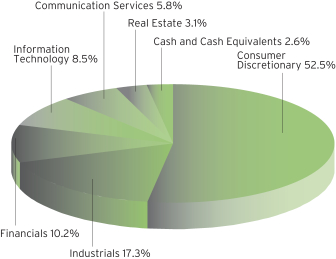
SECTOR BREAKDOWNASOF JUNE 30, 2020†
(as a percentage of net assets)
MANAGEMENT’S DISCUSSIONOF FUND PERFORMANCE
For the six months ended June 30, 2020, Baron Focused Growth Fund1 appreciated 17.00%, outperforming the Russell 2500 Growth Index, which increased 2.02%.
Baron Focused Growth Fund invests in a non-diversified portfolio of companies that we believe are well capitalized and have exceptional management, significant growth potential, and sustainable barriers to competition. The Fund is non-diversified, which is a riskier investment strategy. Of course, there can be no assurance that we will be successful in achieving the Fund’s investment goals.
The past six months have been dominated by the COVID-19 pandemic, the resulting economic shutdown, and the impact of both on U.S. equity markets. The COVID-19 chapter of the 2020 book certainly is not finished, but the trajectory of U.S. equity markets has been a sharp “V” thus far and they are well on their way back to pre-COVID-19 levels. Several factors contributed to the dramatic recovery, including unprecedented fiscal and monetary stimulus, stepped up efforts to reopen the economy, optimism about potential COVID-19 therapeutics and vaccine, and various economic data (such as unemployment figures) that were more positive than investors expected.
At the sector level, Consumer Discretionary, Industrials, and Information Technology contributed the most to performance. Communication Services, Financials, and Real Estate detracted.
Tesla, Inc. contributed the most to performance. Shares of this manufacturer of electric vehicles, solar products and energy storage solutions increased more than 150% on strong delivery numbers, unit economics of mature and new vehicle programs that beat Street estimates, and significant growth in production from its new factory in Shanghai. With reduced business model risks, the stock is benefiting from Tesla’s investments in growth as evidenced by its opportunities around Model Y and CyberTruck and its localization of manufacturing in China and Europe.
Hyatt Hotels Corp. detracted the most. Shares of this global hotelier declined in concert with other travel-related companies due to the almost complete shutdown in travel due to the COVID-19 pandemic. The company has a strong balance sheet and liquidity profile with an unborrowed $1.5 billion credit facility and $900 million of cash on the balance sheet. We believe valuations remain attractive and the company ultimately will be less vulnerable to declines as 60% of the business is fee-based and 40% is owned.
We believe that the unprecedented social, political, and economic effects stemming from the COVID-19 pandemic, coupled with unrelenting advances in technology, will result in long-lasting benefits for certain businesses and challenges for others. We continue to adhere to our traditional investment methodology while working hard to identify these long-term corporate beneficiaries. We are optimistic that this approach will continue to lead to strong performance for our portfolio, no matter the economic climate.
| † | Sector levels are provided from the Global Industry Classification Standard (“GICS”), developed and exclusively owned by MSCI, Inc. and Standard & Poor’s Financial Services LLC, unless otherwise stated that they have been reclassified or classified by the Adviser. All GICS data is provided “as is” with no warranties. |
| 1 | Performance information reflects results of the Retail Shares. |
5
| Baron International Growth Fund (Unaudited) | June 30, 2020 |
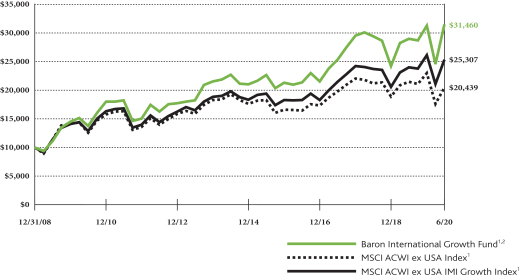
COMPARISONOFTHECHANGEIN VALUEOF $10,000INVESTMENTIN BARON INTERNATIONAL GROWTH FUND† (RETAIL SHARES)
INRELATIONTOTHE MSCI ACWIEX USA INDEXANDTHE MSCI ACWIEX USA IMI GROWTH INDEX
| AVERAGE ANNUAL TOTAL RETURNSFORTHEPERIODSENDED JUNE 30, 2020 |
| |||||||||||||||||||||||
| Six Months* | One Year | Three Years | Five Years | Ten Years | Since Inception (December 31, 2008)^ | |||||||||||||||||||
Baron International Growth Fund — Retail Shares1,2 | 0.65% | 8.54% | 7.46% | 6.82% | 8.65% | 10.48% | ||||||||||||||||||
Baron International Growth Fund — | 0.76% | 8.78% | 7.72% | 7.08% | 8.93% | 10.75% | ||||||||||||||||||
Baron International Growth Fund — R6 Shares1,2,3 | 0.76% | 8.78% | 7.72% | 7.08% | 8.93% | 10.75% | ||||||||||||||||||
MSCI ACWI ex USA Index1 | (11.00)% | (4.80)% | 1.13% | 2.26% | 4.97% | 6.41% | ||||||||||||||||||
MSCI ACWI ex USA IMI Growth Index1 | (3.06)% | 5.47% | 5.69% | 5.45% | 7.05% | 8.41% | ||||||||||||||||||
| * | Not Annualized. |
| ^ | Commencement of investment operations was January 2, 2009. |
| † | The Fund’s 3- and 10-year historical performance was impacted by gains from IPOs and/or secondary offerings, and there is no guarantee that these results can be repeated or that the Fund’s level of participation in IPOs and secondary offerings will be the same in the future. |
| 1 | The indexes are unmanaged. The index performance is not Fund performance; one cannot invest directly into an index. The MSCI ACWI ex USA Index Net USD is a free float-adjusted market capitalization weighted index that is designed to measure the equity market performance of large- and mid-cap securities across developed and emerging markets, excluding the United States. The MSCI ACWI ex USA IMI Growth Index Net USD is a free float-adjusted market capitalization weighted index that is designed to measure the performance of large-, mid-, and small-cap growth securities across developed and emerging markets, excluding the United States. The indexes and Baron International Growth Fund include reinvestment of dividends, net of foreign withholding taxes, which positively impact the performance results. |
| 2 | Past performance is not predictive of future performance. The performance data does not reflect the deduction of taxes that a shareholder would pay on Fund distributions or redemption of Fund shares. The Adviser reimburses certain Fund expenses pursuant to a contract expiring on August 29, 2030, unless renewed for another 11-year term and the Fund’s transfer agency expenses may be reduced by expense offsets from an unaffiliated transfer agent, without which performance would have been lower. |
| 3 | Performance for the Institutional Shares prior to May 29, 2009 is based on the performance of the Retail Shares. Performance for the R6 Shares prior to August 31, 2016 is based on the performance of the Institutional Shares, and prior to May 29, 2009 is based on the Retail Shares. The Retail Shares have a distribution fee, but Institutional Shares and R6 Shares do not. If the annual returns for the Institutional Shares and R6 Shares prior to May 29, 2009 did not reflect this fee, the returns would be higher. |
6
| June 30, 2020 (Unaudited) | Baron International Growth Fund |
TOP TEN HOLDINGSASOF JUNE 30, 2020
| Percent of Net Assets | ||||
argenx SE | 3.2% | |||
Zai Lab Limited | 2.2% | |||
AstraZeneca PLC | 2.1% | |||
Keyence Corporation | 2.0% | |||
Telefonaktiebolaget LM Ericsson | 2.0% | |||
TeamViewer AG | 1.9% | |||
NEXTDC Limited | 1.8% | |||
Wix.com Ltd. | 1.8% | |||
Constellation Software, Inc. | 1.7% | |||
Takeda Pharmaceutical Company Limited | 1.7% | |||
| 20.4% | ||||
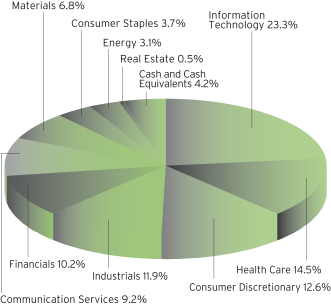
SECTOR BREAKDOWNASOF JUNE 30, 2020†
(as a percentage of net assets)
MANAGEMENT’S DISCUSSIONOF FUND PERFORMANCE
For the six months ended June 30, 2020, Baron International Growth Fund1 increased 0.65%, outperforming the MSCI ACWI ex USA Index, which fell 11.00%.
Baron International Growth Fund is a diversified fund that invests for the long term primarily in securities of non-U.S. growth companies. The Fund expects to diversify among several developed countries and developing countries throughout the world, although the Fund’s total exposure to developing countries will not exceed 35%. The Fund may purchase securities of companies of any size. Of course, there can be no guarantee that we will be successful in achieving the Fund’s investment goals.
The past six months have been dominated by the COVID-19 pandemic, the resulting global shutdown, and the impact of both on equity markets. The COVID-19 chapter of the 2020 book certainly is not finished, but the fall and recovery in international equities thus far has been a sharp “V” and they are well on their way back to pre-COVID-19 levels. Several factors contributed to the dramatic recovery. European countries, Japan, and China began reopening their economies without a major second wave of infections while Korea never went into full lockdown mode to start with. There has been some progress in clinical trials for COVID-19 vaccines and potential therapeutics. Finally, the global economy benefited from unprecedented fiscal and monetary stimulus, with the potential for further easing if needed in a number of regions.
On a country basis, holdings in China, Germany, and Japan contributed the most to performance. Investments in Brazil, India, and Norway detracted the most.
On a sector basis, Information Technology, Health Care, and Communication Services contributed the most. Financials, Energy, and Consumer Discretionary detracted the most.
Zai Lab Limited contributed the most in the period. Zai Lab is a China-based biotechnology company in-licensing drugs from developed countries to bring to the Chinese health care market that is still massively underdeveloped. Shares rose as Zai Lab benefits from its transition to a commercial stage company, with both Zejula and Optune launched or launching in cancer indications, and from increased investor awareness of the future potential of a Chinese health care/biotechnology market.
Azul S.A. was the top detractor. Shares of this leading Brazilian airline declined sharply due to the COVID-19 pandemic, with airlines in Brazil grounding up to 90% of flights. We exited our position.
We believe we are nearing the end of a protracted period of international underperformance and are confident that we own a portfolio of quality growth companies poised to benefit from competitive advantages and long-term tailwinds. We continue to believe that our forward-looking and bottom-up fundamental approach positions us to discover exciting long-term investment opportunities regardless of the market environment.
| † | Sector levels are provided from the Global Industry Classification Standard (“GICS”), developed and exclusively owned by MSCI, Inc. and Standard & Poor’s Financial Services LLC, unless otherwise stated that they have been reclassified or classified by the Adviser. All GICS data is provided “as is” with no warranties. |
| 1 | Performance information reflects results of the Retail Shares. |
7
| Baron Real Estate Fund (Unaudited) | June 30, 2020 |
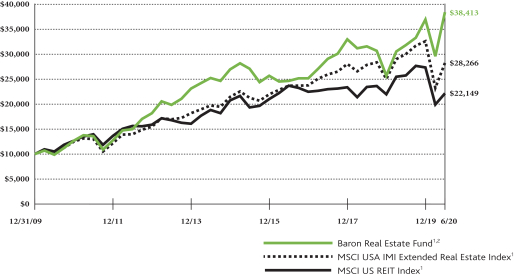
COMPARISONOFTHECHANGEIN VALUEOF $10,000INVESTMENTIN BARON REAL ESTATE FUND (RETAIL SHARES)
INRELATIONTOTHE MSCI USA IMI EXTENDED REAL ESTATE INDEXAND MSCI US REIT INDEX
| AVERAGE ANNUAL TOTAL RETURNSFORTHEPERIODSENDED JUNE 30, 2020 |
| |||||||||||||||||||||||
| Six Months* | One Year | Three Years | Five Years | Ten Years | Since Inception (December 31, 2009)^ | |||||||||||||||||||
Baron Real Estate Fund — Retail Shares1,2 | 3.93% | 20.81% | 9.70% | 7.23% | 14.59% | 13.67% | ||||||||||||||||||
Baron Real Estate Fund — Institutional Shares1,2 | 4.12% | 21.17% | 10.01% | 7.51% | 14.88% | 13.96% | ||||||||||||||||||
Baron Real Estate Fund — R6 Shares1,2,3 | 4.08% | 21.18% | 10.01% | 7.52% | 14.89% | 13.97% | ||||||||||||||||||
MSCI USA IMI Extended Real Estate Index1 | (13.30)% | (5.85)% | 2.94% | 5.84% | 10.93% | 10.40% | ||||||||||||||||||
MSCI US REIT Index1 | (18.95)% | (13.92)% | (1.19)% | 2.74% | 7.74% | 7.87% | ||||||||||||||||||
| * | Not Annualized. |
| ^ | Commencement of investment operations was January 4, 2010. |
| 1 | The indexes are unmanaged. The index performance is not Fund performance; one cannot invest directly into an index. The MSCI USA IMI Extended Real Estate Index is a custom index calculated by MSCI for, and as requested by, BAMCO, Inc. The index includes real estate and real estate-related GICS classification securities. MSCI makes no express or implied warranties or representation and shall have no liability whatsoever with respect to any MSCI data contained herein. The MSCI data may not be further redistributed or used as a basis for other indexes or any securities or financial products. This report is not approved, reviewed or produced by MSCI. The MSCI US REIT Index is a free float-adjusted market capitalization index that measures the performance of all equity REITs in the U.S. equity market, except for specialty equity REITs that do not generate a majority of their revenue and income from real estate rental and leasing operations. The indexes and Baron Real Estate Fund are with dividends, which positively impact the performance results. |
| 2 | Past performance is not predictive of future performance. The performance data does not reflect the deduction of taxes that a shareholder would pay on Fund distributions or redemption of Fund shares. The Adviser reimburses certain Fund expenses pursuant to a contract expiring on August 29, 2030, unless renewed for another 11-year term and the Fund’s transfer agency expenses may be reduced by expense offsets from an unaffiliated transfer agent, without which performance would have been lower. |
| 3 | Performance for the R6 Shares prior to January 29, 2016 is based on the performance of the Institutional Shares. |
8
| June 30, 2020 (Unaudited) | Baron Real Estate Fund |
TOP TEN HOLDINGSASOF JUNE 30, 2020
Percent of Net Assets | ||||
GDS Holdings Limited | 7.0% | |||
Equinix, Inc. | 4.5% | |||
Penn National Gaming, Inc. | 4.1% | |||
Lennar Corporation | 3.7% | |||
Brookfield Asset Management, Inc. | 3.6% | |||
American Tower Corp. | 3.5% | |||
Wynn Resorts Ltd. | 3.4% | |||
Zillow Group, Inc. | 3.1% | |||
Prologis, Inc. | 3.1% | |||
Installed Building Products, Inc. | 3.0% | |||
| 39.0% | ||||
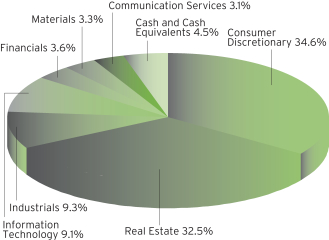
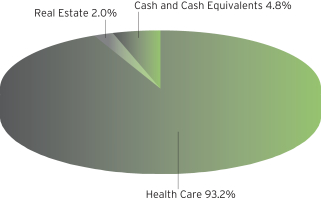
SECTOR BREAKDOWNASOF JUNE 30, 2020†
(as a percentage of net assets)
MANAGEMENT’S DISCUSSIONOF FUND PERFORMANCE
For the six-month period ended June 30, 2020, Baron Real Estate Fund1 appreciated 3.93%, outperforming the MSCI USA IMI Extended Real Estate Index, which declined 13.30%.
Baron Real Estate Fund is a diversified fund that under normal circumstances, invests 80% of its net assets in real estate and real estate-related companies of all sizes, and in companies which, in the opinion of the Adviser, own significant real estate assets at the time of investment. The Fund seeks to invest in well-managed
companies that we believe have significant long-term growth opportunities. The Fund’s investment universe extends beyond real estate investment trusts (REITs) to include hotels, senior housing operators, casino and gaming operators, tower operators, infrastructure-related companies and master limited partnerships, data centers, building products companies, real estate service companies, and real estate operating companies. Of course, there can be no guarantee that we will be successful in achieving the Fund’s investment goals.
After falling sharply on COVID-19-related fears during the first quarter, U.S. equity markets staged their largest quarterly gain in more than 20 years. REITs and other real estate stocks, however, lagged the broader market by a wide margin during the period. Investor concerns that tenants would not meet rent obligations, credit market turbulence, balance sheet concerns as many REITs maintain relatively high leverage levels, and fears of a prolonged slowdown in commercial real estate business fundamentals all pressured REITs. In addition, travel-related real estate categories such as cruise lines, hotels, and casinos were among the hardest hit in the pandemic due to the almost complete shutdown of travel.
Data centers, casinos & gaming operators, and building products/services contributed the most. Real estate service companies, real estate operating companies, and REITs detracted the most.
Penn National Gaming, Inc., a U.S. regional casino company, was the top contributor. After sinking along with other casinos at the start of the pandemic, shares rebounded as Penn completed an equity and convertible offering deal and increased its liquidity. Penn has seen a quick recovery in revenues at recently opened properties, and its margins are improving as revenue builds while it keeps costs low. Its online sports betting deal with Barstool Sports should be an additional positive over time.
Jones Lang LaSalle Incorporated was the top detractor. Jones Lang is a leading global provider of commercial real estate services. Weak performance was driven by concerns that near-term financial performance would be negatively impacted by the global slowdown in leasing and transaction activity. We retain conviction because of the company’s high-quality platform, scale advantages, and strong liquidity position.
We are mindful of the economic and real estate uncertainty generated by the pandemic. While the current increase in the number of COVID-19 cases is concerning, we know more about how the virus spreads and doctors are much better at treating patients than a few months ago, so we do not anticipate a return to a total shutdown. For the real estate market in particular, historically low interest rates should also help boost growth. We believe our philosophy of structuring a more inclusive and unique real estate fund – one that includes REITs but is more expansive, balanced, and diversified than a typical “REIT only” fund – is a compelling long-term strategy.
| † | Sector levels are provided from the Global Industry Classification Standard (“GICS”), developed and exclusively owned by MSCI, Inc. and Standard & Poor’s Financial Services LLC, unless otherwise stated that they have been reclassified or classified by the Adviser. All GICS data is provided “as is” with no warranties. |
| 1 | Performance information reflects results of the Retail Shares. |
9
| Baron Emerging Markets Fund (Unaudited) | June 30, 2020 |
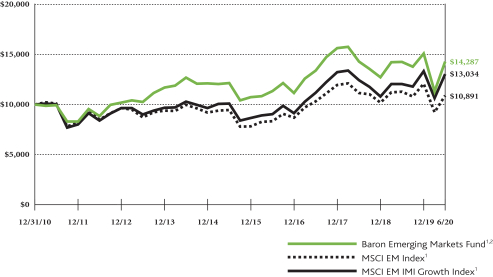
COMPARISONOFTHECHANGEIN VALUEOF $10,000INVESTMENTIN BARON EMERGING MARKETS FUND† (RETAIL SHARES)
INRELATIONTOTHE MSCI EM INDEXANDTHE MSCI EM IMI GROWTH INDEX
| AVERAGE ANNUAL TOTAL RETURNSFORTHEPERIODSENDED JUNE 30, 2020 |
| |||||||||||||||||||
| Six Months* | One Year | Three Years | Five Years | Since Inception (December 31, 2010)^ | ||||||||||||||||
Baron Emerging Markets Fund — Retail Shares1,2 | (5.16)% | 0.21% | 2.19% | 3.33% | 3.83% | |||||||||||||||
Baron Emerging Markets Fund — | (5.02)% | 0.56% | 2.46% | 3.61% | 4.09% | |||||||||||||||
Baron Emerging Markets Fund — R6 Shares1,2,3 | (5.02)% | 0.49% | 2.46% | 3.61% | 4.09% | |||||||||||||||
MSCI EM Index1 | (9.78)% | (3.39)% | 1.90% | 2.86% | 0.90% | |||||||||||||||
MSCI EM IMI Growth Index1 | (2.21)% | 8.32% | 5.30% | 5.28% | 2.83% | |||||||||||||||
| * | Not Annualized. |
| ^ | Commencement of investment operations was January 3, 2011. |
| † | The Fund’s 1-year historical performance was impacted by gains from IPOs and/or secondary offerings, and there is no guarantee that these results can be repeated or that the Fund’s level of participation in IPOs and secondary offerings will be the same in the future. |
| 1 | The indexes are unmanaged. The index performance is not Fund performance; one cannot invest directly into an index. The MSCI EM (Emerging Markets) Index and the MSCI EM (Emerging Markets) IMI Growth Index are free float-adjusted market capitalization weighted indexes. The MSCI EM (Emerging Markets) Index Net USD and the MSCI EM (Emerging Markets) IMI Growth Index Net USD are designed to measure the equity market performance of large-, mid-, and small-cap securities in the emerging markets. The MSCI EM (Emerging Markets) IMI Growth Index Net USD screens for growth-style securities. The indexes and Baron Emerging Markets Fund include reinvestment of dividends, net of withholding taxes, which positively impact the performance results. |
| 2 | Past performance is not predictive of future performance. The performance data does not reflect the deduction of taxes that a shareholder would pay on Fund distributions or redemption of Fund shares. The Adviser reimburses certain Fund expenses pursuant to a contract expiring on August 29, 2030, unless renewed for another 11-year term and the Fund’s transfer agency expenses may be reduced by expense offsets from an unaffiliated transfer agent without which performance would have been lower. |
| 3 | Performance for the R6 Shares prior to January 29, 2016 is based on the performance of the Institutional Shares. |
10
| June 30, 2020 (Unaudited) | Baron Emerging Markets Fund |
TOP TEN HOLDINGSASOF JUNE 30, 2020
Percent of Net Assets | ||||
Alibaba Group Holding Limited | 5.8% | |||
Tencent Holdings Limited | 5.0% | |||
Samsung Electronics Co., Ltd. | 3.4% | |||
Taiwan Semiconductor Manufacturing Company Ltd. | 3.0% | |||
Reliance Industries Limited | 2.7% | |||
Zai Lab Limited | 2.4% | |||
GDS Holdings Limited | 1.7% | |||
Techtronic Industries Co. Ltd. | 1.6% | |||
PagSeguro Digital Ltd. | 1.6% | |||
China Conch Venture Holdings Ltd. | 1.6% | |||
| 28.8% | ||||
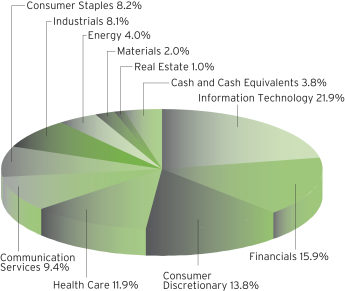
SECTOR BREAKDOWNASOF JUNE 30, 2020†
(as a percentage of net assets)
MANAGEMENT’S DISCUSSIONOF FUND PERFORMANCE
For the six months ended June 30, 2020, Baron Emerging Markets Fund1 declined 5.16%, outperforming the MSCI EM Index, which fell 9.78%.
Baron Emerging Markets Fund is a diversified fund that invests for the long term primarily in companies of any size that have their principal business activities or trading markets in developing countries. The Fund may invest up to 20% of its net assets in developed and frontier countries. The Fund seeks to invest in
companies that have significant long-term growth prospects and to purchase them at prices we believe to be favorable. Of course, there can be no guarantee that we will be successful in achieving the Fund’s investment goals.
The past six months have been dominated by the COVID-19 pandemic, the resulting global shutdown, and the impact of both on equity markets. The COVID-19 chapter of the 2020 book certainly is not finished, but the fall and recovery in emerging markets (EM) equities thus far has been a sharp “V” and they are well on their way back to pre-COVID-19 levels. Several factors contributed to the dramatic recovery. China and Japan began reopening their economies without a major second wave of infections, while Korea never went into full lockdown mode to start with. There has been some progress in clinical trials for COVID-19 vaccines and potential therapeutics. Finally, the global economy benefited from unprecedented fiscal and monetary stimulus, with the potential for further easing if needed in a number of regions.
On a country basis, China, Hong Kong, and Japan contributed the most to performance, while Brazil, India, and South Africa were the biggest detractors.
On a sector basis, Information Technology, Health Care, and Communication Services contributed the most, while Financials, Industrials, and Consumer Discretionary detracted the most.
Tencent Holdings Limited was the top contributor. Tencent operates the leading social network and messaging platforms in China (QQ, WeChat), the largest online entertainment and media business in China, and the largest online PC and mobile gaming business in China. Shares were up on strong financial results as the pandemic drove increased time spent on Tencent platforms and strong performance in smartphone gaming. Long term, we believe Tencent can grow each of its large business segments for years to come given its track record of execution, scale, and unique and diversified online assets.
Cogna Educacao SA was the top detractor. Cogna is a post-secondary company in Brazil offering on-site and distance learning programs for higher education as well as a smaller K-12 program. It has been a leader in its business with high Ministry of Education quality metrics for many years. However, the stock declined sharply after the company had to shut down its campuses due to the COVID-19 pandemic. We exited our position.
We believe EM equities are poised for outperformance after nearly a decade of underperformance. As always, we are confident that we have invested in many well-positioned and well-managed companies with the potential for attractive returns over the long term.
| † | Sector levels are provided from the Global Industry Classification Standard (“GICS”), developed and exclusively owned by MSCI, Inc. and Standard & Poor’s Financial Services LLC, unless otherwise stated that they have been reclassified or classified by the Adviser. All GICS data is provided “as is” with no warranties. |
| 1 | Performance information reflects results of the Retail Shares. |
11
| Baron Global Advantage Fund (Unaudited) | June 30, 2020 |
COMPARISONOFTHECHANGEIN VALUEOF $10,000INVESTMENTIN BARON GLOBAL ADVANTAGE FUND† (RETAIL SHARES)
INRELATIONTOTHE MSCI ACWI INDEXANDTHE MSCI ACWI GROWTH INDEX

| AVERAGE ANNUAL TOTAL RETURNSFORTHEPERIODSENDED JUNE 30, 2020 |
| |||||||||||||||||||
| Six Months* | One Year | Three Years | Five Years | Since Inception (April 30, 2012) | ||||||||||||||||
Baron Global Advantage Fund — Retail Shares1,2 | 35.08% | 45.53% | 30.68% | 20.94% | 18.09% | |||||||||||||||
Baron Global Advantage Fund — Institutional Shares1, 2 | 35.23% | 45.91% | 31.02% | 21.21% | 18.34% | |||||||||||||||
Baron Global Advantage Fund — R6 Shares1,2,3 | 35.21% | 45.87% | 31.01% | 21.22% | 18.35% | |||||||||||||||
MSCI ACWI Index Net1 | (6.25)% | 2.11% | 6.14% | 6.46% | 8.07% | |||||||||||||||
MSCI ACWI Growth Index Net1 | 5.48% | 16.58% | 13.18% | 10.83% | 11.07% | |||||||||||||||
| * | Not Annualized. |
| † | The Fund’s 3- and 5-year historical performance was impacted by gains from IPOs and/or secondary offerings, and there is no guarantee that these results can be repeated or that the Fund’s level of participation in IPOs and secondary offerings will be the same in the future. |
| 1 | The indexes are unmanaged. The index performance is not Fund performance; one cannot invest directly into an index. The MSCI ACWI Index and the MSCI ACWI Growth Index are free float-adjusted market capitalization weighted indexes. The MSCI ACWI Index Net USD and the MSCI ACWI Growth Index Net USD are designed to measure the equity market performance of large- and mid-cap securities across developed and emerging markets, including the United States. The MSCI ACWI Growth Index Net USD screens for growth-style securities. The indexes and Baron Global Advantage Fund include reinvestment of dividends, net of foreign withholding taxes, which positively impact the performance results. |
| 2 | Past performance is not predictive of future performance. The performance data does not reflect the deduction of taxes that a shareholder would pay on Fund distributions or redemption of Fund shares. The Adviser reimburses certain Fund expenses pursuant to a contract expiring on August 29, 2030, unless renewed for another 11-year term and the Fund’s transfer agency expenses may be reduced by expense offsets from an unaffiliated transfer agent, without which performance would have been lower. |
| 3 | Performance for the R6 Shares prior to August 31, 2016 is based on the performance of the Institutional Shares. |
12
| June 30, 2020 (Unaudited) | Baron Global Advantage Fund |
TOP TEN HOLDINGSASOF JUNE 30, 2020
Percent of Net Assets | ||||
Alibaba Group Holding Limited | 6.3% | |||
Amazon.com, Inc. | 6.0% | |||
Facebook, Inc. | 4.0% | |||
Wix.com Ltd. | 3.2% | |||
MercadoLibre, Inc. | 3.0% | |||
TAL Education Group | 2.9% | |||
GDS Holdings Limited | 2.8% | |||
Splunk, Inc. | 2.7% | |||
Twilio Inc. | 2.6% | |||
Veeva Systems Inc. | 2.6% | |||
| 36.1% | ||||
SECTOR BREAKDOWNASOF JUNE 30, 2020†
(as a percentage of net assets)

MANAGEMENT’S DISCUSSIONOF FUND PERFORMANCE
For the six months ended June 30, 2020, Baron Global Advantage Fund1 appreciated 35.08%, outperforming the MSCI ACWI Index, which declined 6.25%.
The Fund is a diversified fund that, under normal circumstances, invests primarily in equity securities in the form of common stock of established and emerging markets companies located
throughout the world, with capitalizations within the range of companies included in the MSCI ACWI Index. At all times, the Fund will have investments in equity securities of companies in at least three countries outside of the U.S. Under normal conditions, at least 40% of the Fund’s net assets will be invested in stocks of companies outside the U.S. (at least 30% if foreign market conditions are not favorable). The Adviser seeks to invest in businesses it believes have significant opportunities for growth, sustainable competitive advantages, exceptional management, and an attractive valuation. Of course, there can be no guarantee that we will be successful in achieving the Fund’s investment goals.
The past six months have been dominated by the COVID-19 pandemic, the resulting global shutdown, and the impact of both on equity markets. The COVID-19 chapter of the 2020 book certainly is not finished, but the trajectory in global equities has been a sharp “V” thus far and they are well on their way back to pre-COVID-19 levels. Several factors contributed to the dramatic recovery, including unprecedented fiscal and monetary stimulus, progress in clinical trials for vaccines and therapeutics, and the reopening of European countries, Japan, China, and parts of the U.S.
On a country basis, the United States, Israel, and China contributed most to performance. India, Brazil, and the U.K. detracted the most.
On a sector basis, Information Technology, Consumer Discretionary, and Health Care contributed most to performance, while Financials detracted.
Amazon.com, Inc. contributed the most. Shares of the world’s largest retailer and cloud services provider rose on strong financial results as it benefited from investments in logistics and distribution to meet increased COVID-19-related demand. While e-commerce penetration is rising rapidly and Amazon is growing its addressable market by entering new verticals, we believe the more material driver of growth is Amazon Web Services, the leader in the vast and growing cloud infrastructure market.
The largest detractor was Bajaj Finance Limited. Shares of this leading non-banking financial corporation sank as the COVID-19 pandemic spread into India. While we see Bajaj as a strong, well-run franchise, we believe banks will bear a large burden of the fallout from the pandemic as they support clients by offering temporary forbearance or moratoriums on loan repayments. We exited our investment.
The digitization phenomenon we believe will continue for years has only been accelerated by social distancing measures to contain the COVID-19 pandemic. We believe this development should favor many of the companies in which we are invested. Our goal remains to maximize long-term returns without taking significant risks of permanent loss of capital.
| † | Sector levels are provided from the Global Industry Classification Standard (“GICS”), developed and exclusively owned by MSCI, Inc. and Standard & Poor’s Financial Services LLC, unless otherwise stated that they have been reclassified or classified by the Adviser. All GICS data is provided “as is” with no warranties. |
| 1 | Performance information reflects results of the Retail Shares. |
13
| Baron Real Estate Income Fund (Unaudited) | June 30, 2020 |
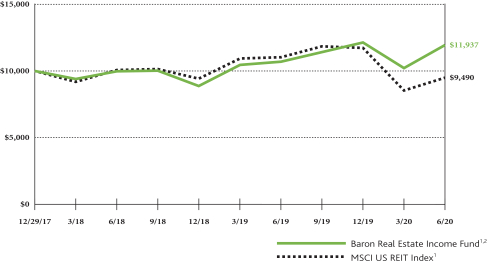
COMPARISONOFTHECHANGEIN VALUEOF $10,000INVESTMENTIN BARON REAL ESTATE INCOME FUND (RETAIL SHARES)
INRELATIONTOTHE MSCI US REIT INDEX
| AVERAGE ANNUAL TOTAL RETURNSFORTHEPERIODSENDED JUNE 30, 2020 |
| ||||||||||||||
| Six Months* | One Year | Since Inception (December 29, 2017)^ | |||||||||||||
Baron Real Estate Income Fund — | (1.50)% | 11.62% | 7.34% | ||||||||||||
Baron Real Estate Income Fund — | (1.41)% | 11.57% | 7.48% | ||||||||||||
Baron Real Estate Income Fund — R6 Shares1,2 | (1.41)% | 11.37% | 7.45% | ||||||||||||
MSCI US REIT Index1 | (18.95)% | (13.92)% | (2.07)% | ||||||||||||
| * | Not Annualized. |
| ^ | Commencement of investment operations was January 2, 2018. |
| 1 | The index is unmanaged. The index performance is not Fund performance; one cannot invest directly into an index. The MSCI US REIT Index is a free float-adjusted market capitalization index that measures the performance of all equity REITs in the US equity market, except for specialty equity REITs that do not generate a majority of their revenue and income from real estate rental and leasing operations. The index and Baron Real Estate Income Fund are with dividends, which positively impact the performance results. |
| 2 | Past performance is not predictive of future performance. The performance data does not reflect the deduction of taxes that a shareholder would pay on Fund distributions or redemption of Fund shares. The Adviser reimburses certain Fund expenses pursuant to a contract expiring on August 29, 2030, unless renewed for another 11-year term and the Fund’s transfer agency expenses may be reduced by expense offsets from an unaffiliated transfer agent, without which performance would have been lower. |
14
| June 30, 2020 (Unaudited) | Baron Real Estate Income Fund |
TOP TEN HOLDINGSASOF JUNE 30, 2020
Percent of Net Assets | ||||
GDS Holdings Limited | 7.2% | |||
American Tower Corp. | 6.7% | |||
Prologis, Inc. | 6.7% | |||
Equinix, Inc. | 5.7% | |||
Invitation Homes, Inc. | 5.2% | |||
Americold Realty Trust | 4.0% | |||
Rexford Industrial Realty, Inc. | 3.9% | |||
Penn National Gaming, Inc. | 3.7% | |||
Alexandria Real Estate Equities, Inc. | 3.4% | |||
MGM Growth Properties LLC | 3.1% | |||
| 49.6% | ||||
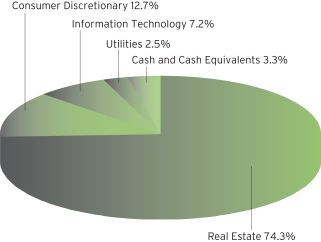
SECTOR BREAKDOWNASOF JUNE 30, 2020†
(as a percentage of net assets)
MANAGEMENT’S DISCUSSIONOF FUND PERFORMANCE
For the six-month period ended June 30, 2020, Baron Real Estate Income Fund1 declined 1.50%, outperforming the MSCI US REIT Index, which declined 18.95%.
Baron Real Estate Income Fund is a non-diversified fund that under normal circumstances, invests at least 80% of its net assets in real estate income-producing securities and other real estate securities of any market capitalization, including common stocks and equity securities, debt and preferred securities, non-U.S. real estate income-producing securities, and any other real estate-related yield securities. Of course, there is no guarantee we will succeed in achieving the Fund’s investment goals.
After falling sharply on COVID-19-related fears during the first quarter, U.S. equity markets staged their largest quarterly gain in more than 20 years. REITs, however, lagged the broader market by a wide margin during the period. Traditional REIT attributes – attractive dividends, contracted cash flows, and largely domestic portfolios – have not provided shelter during the extreme market volatility. Investor concerns that many tenants would not meet rent obligations, credit market turbulence, balance sheet concerns as many REITs maintain relatively high leverage, and fears of a prolonged slowdown in commercial real estate business fundamentals all pressured REITs.
Investments in non-REIT real estate companies, data center REITs, and wireless tower REITs contributed the most. Office REITs, multi-family REITs, and triple net REITs detracted the most.
Penn National Gaming, Inc., a U.S. regional casino company, was the top contributor. After falling sharply in concert with other casinos at the start of the pandemic, shares rebounded as the company completed an equity and convertible offering deal and increased its liquidity. Penn has seen a quick recovery in revenue at recently opened properties and margins are improving as revenue builds while it keeps costs low. Its online sports betting deal with Barstool should be an additional positive over time.
The top detractor was STORE Capital Corporation, a triple net lease REIT that is the leader in middle market service-oriented real estate such as gyms, restaurants, and gas stations. The stock price fell on concerns that tenants would not meet rent obligations and fears of a prolonged shutdown in this segment of real estate. We exited our position.
We are mindful of the economic and real estate uncertainty generated by the pandemic. While the current increase in the number of COVID-19 cases is concerning, we know more about how the virus spreads and doctors are much better at treating patients than a few months ago, so we do not anticipate a return to a total shutdown. For the REITs market in particular, historically low interest rates should also help boost growth.
| † | Sector levels are provided from the Global Industry Classification Standard (“GICS”), developed and exclusively owned by MSCI, Inc. and Standard & Poor’s Financial Services LLC, unless otherwise stated that they have been reclassified or classified by the Adviser. All GICS data is provided “as is” with no warranties. |
| 1 | Performance information reflects the results of Retail Shares. |
15
| Baron Health Care Fund (Unaudited) | June 30, 2020 |
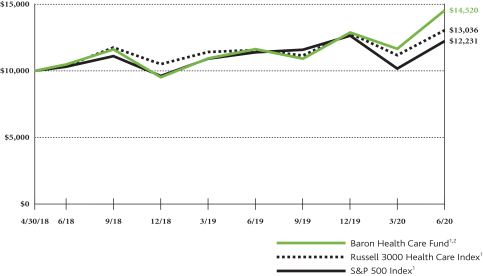
COMPARISONOFTHECHANGEIN VALUEOF $10,000INVESTMENTIN BARON HEALTH CARE FUND (RETAIL SHARES)
INRELATIONTOTHE RUSSELL 3000 HEALTH CARE INDEXANDTHE S&P 500 INDEX
| AVERAGE ANNUAL TOTAL RETURNSFORTHEPERIODSENDED JUNE 30, 2020 |
| ||||||||||||||
| Six Months* | One Year | Since Inception (April 30, 2018) | |||||||||||||
Baron Health Care Fund — Retail Shares1,2 | 12.91% | 24.96% | 18.78% | ||||||||||||
Baron Health Care Fund — Institutional Shares1,2 | 13.00% | 25.32% | 19.08% | ||||||||||||
Baron Health Care Fund — R6 Shares1,2 | 13.09% | 25.32% | 19.08% | ||||||||||||
Russell 3000 Health Care Index1 | 1.82% | 12.79% | 13.02% | ||||||||||||
S&P 500 Index1 | (3.08)% | 7.51% | 9.74% | ||||||||||||
| * | Not Annualized. |
| 1 | The indexes are unmanaged. The index performance is not Fund performance; one cannot invest directly into an index. The Russell 3000 Health Care Index is a free float-adjusted market capitalization index that measures the performance of all equity in the US equity market. The S&P 500 Index measures the performance of 500 widely held large-cap U.S. companies. The indexes and Baron Health Care Fund are with dividends, which positively impact the performance results. |
| 2 | Past performance is not predictive of future performance. The performance data does not reflect the deduction of taxes that a shareholder would pay on Fund distributions or redemption of Fund shares. The Adviser reimburses certain Fund expenses pursuant to a contract expiring on August 29, 2030, unless renewed for another 11-year term and the Fund’s transfer agency expenses may be reduced by expense offsets from an unaffiliated transfer agent, without which performance would have been lower. |
16
| June 30, 2020 (Unaudited) | Baron Health Care Fund |
TOP TEN HOLDINGSASOF JUNE 30, 2020
Percent of Net Assets | ||||
UnitedHealth Group Incorporated | 6.3% | |||
Sanofi | 5.0% | |||
Roche Holding AG | 4.9% | �� | ||
AstraZeneca PLC | 4.5% | |||
Abbott Laboratories | 4.5% | |||
Schrodinger, Inc. | 3.9% | |||
Vertex Pharmaceuticals Incorporated | 3.5% | |||
Thermo Fisher Scientific Inc. | 3.3% | |||
argenx SE | 3.3% | |||
Humana Inc. | 3.2% | |||
| 42.4% | ||||
SECTOR BREAKDOWNASOF JUNE 30, 2020†
(as a percentage of net assets)
MANAGEMENT’S DISCUSSIONOF FUND PERFORMANCE
For the six-month period ended June 30, 2020, Baron Health Care Fund1 appreciated 12.91%, outperforming the Russell 3000 Health Care Index, which rose 1.82%.
Baron Health Care Fund is a non-diversified fund that under normal circumstances, invests at least 80% of its net assets in equity securities in the form of common stock of companies engaged in the research, development, production, sale, delivery or distribution of products and services related to the health care industry. The Fund’s allocation among the different subsectors of the health care industry will vary depending upon the relative
potential the Fund sees within each area. The Adviser seeks to invest in businesses it believes have significant growth opportunities, sustainable competitive advantages, exceptional management, and attractive valuations. The Fund may purchase securities of companies of any market capitalization and may invest in foreign stocks. Of course, there can be no guarantee that we will be successful in achieving the Fund’s investment goals.
The Health Care sector was mostly in line with the broader market although it lagged later in the period as certain sub-industries were negatively impacted by the COVID-19 pandemic. The cancellation or deferral of elective procedures hurt profits of hospitals and medical device companies. As academic labs shut down, life sciences companies that sell products to these labs suffered. The shuttering of clinical trials negatively impacted contract research organizations. On the positive side, managed care companies benefited from lower costs as they did not have to pay for canceled procedures. Telemedicine benefited from strong demand, and we believe it will become more widely accepted after the pandemic subsides. Companies that provide remote monitoring technology also saw increased utilization.
Biotechnology, health care technology, and pharmaceuticals were the largest contributing sub-industries to performance. Managed health care and health care facilities detracted from performance.
The top contributor was Schrodinger, Inc. The company benefits from the widely held belief that it is bringing next generation computers into the biotechnology space. Shares of Schrodinger, which went public in February, increased over 438% given broad excitement relating to its ability to design better drugs. The COVID-19 pandemic reinforced the obvious advantage computer design has over in-lab drug screening given social distancing. We expect strong growth for years to come driven by both sides of its business.
Shares of HCA Healthcare, Inc., a large provider of health care services in urban markets in the South, declined along with other providers on concerns that COVID-19 represents a perfect storm of elevated expenses, lower payer mix, and cancellation/deferral of elective procedures with higher pay margins. We exited our position.
We think the pandemic will result in more investment in scientific research and pandemic preparedness. Even pre-COVID-19, we expected to see advancements in cures and treatments over the next decade driven by major breakthroughs in gene therapy, and we think the pandemic will accelerate these trends. NIH funding has been increasing. The FDA has implemented regulatory pathways that speed drug approvals. The increasing use of therapies that target genetic alterations or use biomarkers and predictive modeling and data analytics software drive higher probabilities of success and faster drug development timelines. For all these reasons, we think the long-term outlook for the sector is favorable.
| † | Sector levels are provided from the Global Industry Classification Standard (“GICS”), developed and exclusively owned by MSCI, Inc. and Standard & Poor’s Financial Services LLC, unless otherwise stated that they have been reclassified or classified by the Adviser. All GICS data is provided “as is” with no warranties. |
| 1 | Performance information reflects results of the Retail Shares. |
17
| Baron FinTech Fund (Unaudited) | June 30, 2020 |
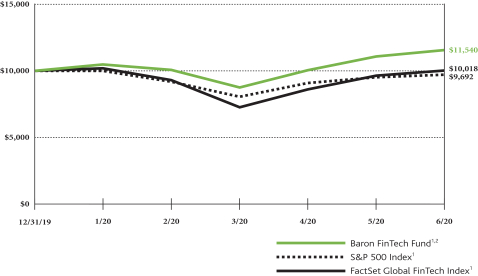
COMPARISONOFTHECHANGEIN VALUEOF $10,000INVESTMENTIN BARON FINTECH FUND (RETAIL SHARES)
INRELATIONTOTHE S&P 500 INDEXANDTHE FACTSET GLOBAL FINTECH INDEX
| TOTAL RETURNSFORTHEPERIODSENDED JUNE 30, 2020 | ||
| Six Months and Since Inception (December 31, 2019)*^ | ||
Baron FinTech Fund — Retail Shares1,2 | 15.40% | |
Baron FinTech Fund — Institutional Shares1,2 | 15.50% | |
Baron FinTech Fund — R6 Shares1,2 | 15.50% | |
S&P 500 Index1 | (3.08)% | |
FactSet Global FinTech Index1 | 0.18% | |
| * | Not Annualized. |
| ^ | Commencement of investment operations was January 2, 2020. |
| 1 | The indexes are unmanaged. The S&P 500 Index measures the performance of 500 widely held large-cap U.S. companies. The FactSet Global FinTech Index is an unmanaged and equal-weighted index that measures the equity market performance of companies engaged in Financial Technologies, primarily in the areas of software and consulting, data and analytics, digital payment processing, money transfer, and payment transaction-related hardware, across 30 developed and emerging markets. The indexes and Baron FinTech Fund are with dividends, which positively impact the performance results. |
| 2 | Past performance is not predictive of future performance. The performance data does not reflect the deduction of taxes that a shareholder would pay on Fund distributions or redemption of Fund shares. The Adviser reimburses certain Fund expenses pursuant to a contract expiring on August 29, 2030, unless renewed for another 11-year term and the Fund’s transfer agency expenses may be reduced by expense offsets from an unaffiliated transfer agent, without which performance would have been lower. |
18
| June 30, 2020 (Unaudited) | Baron FinTech Fund |
TOP TEN HOLDINGSASOF JUNE 30, 2020
Percent of Net Assets | ||||
PayPal Holdings, Inc. | 5.8% | |||
Adyen N.V. | 5.4% | |||
Visa, Inc. | 5.2% | |||
Mastercard Incorporated | 5.1% | |||
Fidelity National Information Services, Inc. | 4.9% | |||
S&P Global Inc. | 4.5% | |||
EPAM Systems, Inc. | 4.5% | |||
Endava plc | 4.4% | |||
MSCI, Inc. | 4.0% | |||
Moody’s Corporation | 3.8% | |||
| 47.6% | ||||
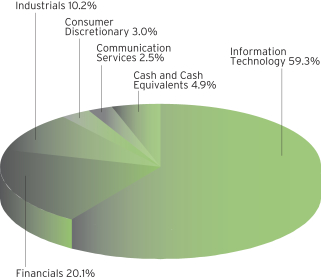
SECTOR BREAKDOWNASOF JUNE 30, 2020
(as a percentage of net assets)
MANAGEMENT’S DISCUSSIONOF FUND PERFORMANCE
For the six months ended June 30, 2020, Baron FinTech Fund1 appreciated 15.40%, outperforming the S&P 500 Index, which declined 3.08%.
Baron FinTech Fund invests in companies of any market capitalization that develop or use innovative technologies related in a significant way to financial services. The Fund invests principally in U.S. securities but may invest up to 25% in non-U.S. securities. The Fund is non-diversified, which is a riskier investment strategy. Of course, there can be no guarantee that we will be successful in achieving the Fund’s investment goals.
The past six months have been dominated by the COVID-19 pandemic, the resulting economic shutdown, and the impact of both on U.S. equity markets. The COVID-19 chapter of the 2020 book certainly is not finished, but the trajectory of U.S. equity markets has been a sharp “V” thus far and they are well on their way back to pre-COVID-19 levels. Several factors contributed to the dramatic recovery, including unprecedented fiscal and monetary stimulus, stepped up efforts to reopen the economy, optimism about potential COVID-19 therapeutics and vaccine, and various economic data (such as unemployment figures) that were more positive than investors expected.
At the sector level, Information Technology, Financials, and Communication Services contributed the most to performance. No sector detracted.
Adyen NV contributed the most to performance. Shares of this provider of technology that enables merchants to accept electronic payments appreciated on strong financial results and news of significant investments in headcount and marketing campaigns to sustain its high growth rate. Investors also expect COVID-19 disruptions to have relatively less impact on the stock due to Ayden’s mostly e-commerce clientele.
Network International Holdings Ltd. detracted the most. Shares of this payment processor in the Middle East and Africa fell in concert with the collapse in oil prices generated by the Russia-Saudi Arabia oil price war in March of this year. The stock price has recaptured a good portion of its losses with the subsequent rebound in oil prices after Saudi Arabia and Russia agreed to production cuts and as economic activity revived.
While being mindful of the economic environment, we focus on understanding the prospects for individual businesses rather than the broader economy. Effects from the pandemic and economic downturn will likely help certain companies and harm others. Our independent research is focused on identifying fintech companies with long runways for growth, sustainable competitive advantages, exceptional management teams, and attractive valuations. We believe the fintech universe is a fruitful area to find such companies, and we are optimistic that our approach will lead to strong performance for our portfolio.
| † | Sector levels are provided from the Global Industry Classification Standard (“GICS”), developed and exclusively owned by MSCI, Inc. and Standard & Poor’s Financial Services LLC, unless otherwise stated that they have been reclassified or classified by the Adviser. All GICS data is provided “as is” with no warranties. |
| 1 | Performance information reflects results of the Retail Shares. |
19
| Baron Partners Fund | June 30, 2020 |
STATEMENT OF NET ASSETS (Unaudited)
JUNE 30, 2020
|
| Shares | Cost | Value | ||||||||||
| Common Stocks (117.38%) | ||||||||||||
| Communication Services (10.88%) | ||||||||||||
Alternative Carriers (1.20%) | ||||||||||||
| 1,560,000 | Iridium Communications, Inc.1 | $ | 36,290,321 | $ | 39,686,400 | |||||||
Interactive Home Entertainment (1.79%) | ||||||||||||
| 780,000 | Activision Blizzard, Inc. | 45,293,524 | 59,202,000 | |||||||||
Interactive Media & Services (4.79%) | ||||||||||||
| 2,750,000 | Zillow Group, Inc., Cl A1 | 107,616,334 | 158,070,000 | |||||||||
Movies & Entertainment (3.10%) | ||||||||||||
| 5,000,000 | Manchester United plc, Cl A2 | 85,441,638 | 79,150,000 | |||||||||
| 90,000 | Spotify Technology SA1,2 | 17,973,997 | 23,237,100 | |||||||||
|
|
|
| |||||||||
| 103,415,635 | 102,387,100 | |||||||||||
|
|
|
| |||||||||
Total Communication Services | 292,615,814 | 359,345,500 | ||||||||||
|
|
|
| |||||||||
| Consumer Discretionary (47.69%) | ||||||||||||
Automobile Manufacturers (35.95%) | ||||||||||||
| 1,100,000 | Tesla, Inc.1 | 235,289,421 | 1,187,791,000 | |||||||||
Casinos & Gaming (0.23%) | ||||||||||||
| 700,000 | Red Rock Resorts, Inc., Cl A | 16,550,119 | 7,637,000 | |||||||||
Hotels, Resorts & | ||||||||||||
| 2,900,000 | Hyatt Hotels Corp., Cl A | 84,480,627 | 145,841,000 | |||||||||
| 800,000 | Marriott Vacations Worldwide Corp. | 90,536,838 | 65,768,000 | |||||||||
|
|
|
| |||||||||
| 175,017,465 | 211,609,000 | |||||||||||
Leisure Facilities (5.10%) | ||||||||||||
| 925,000 | Vail Resorts, Inc. | 27,786,371 | 168,488,750 | |||||||||
|
|
|
| |||||||||
Total Consumer Discretionary | 454,643,376 | 1,575,525,750 | ||||||||||
|
|
|
| |||||||||
| Financials (19.11%) | ||||||||||||
Asset Management & | ||||||||||||
| 1,200,000 | Brookfield Asset | 43,003,361 | 39,480,000 | |||||||||
Financial Exchanges & Data (8.22%) | ||||||||||||
| 700,000 | FactSet Research Systems, Inc. | 46,576,636 | 229,929,000 | |||||||||
| 125,000 | MSCI, Inc. | 26,834,524 | 41,727,500 | |||||||||
|
|
|
| |||||||||
| 73,411,160 | 271,656,500 | |||||||||||
Investment Banking & Brokerage (3.88%) | ||||||||||||
| 3,800,000 | The Charles Schwab Corp. | 82,735,789 | 128,212,000 | |||||||||
Property & Casualty Insurance (5.81%) | ||||||||||||
| 6,700,000 | Arch Capital Group Ltd.1,2 | 30,603,795 | 191,955,000 | |||||||||
|
|
|
| |||||||||
Total Financials | 229,754,105 | 631,303,500 | ||||||||||
|
|
|
| |||||||||
| Shares | Cost | Value | ||||||||||
| Common Stocks (continued) | ||||||||||||
| Health Care (8.15%) | ||||||||||||
Health Care Equipment (8.15%) |
| |||||||||||
| 815,000 | IDEXX Laboratories, Inc.1 | $ | 35,695,399 | $ | 269,080,400 | |||||||
|
|
|
| |||||||||
| Industrials (16.87%) | ||||||||||||
Aerospace & Defense (0.74%) |
| |||||||||||
| 125,625 | HEICO Corp. | 9,632,520 | 12,518,531 | |||||||||
| 116,875 | HEICO Corp., Cl A | 7,586,429 | 9,494,925 | |||||||||
| 150,000 | Virgin Galactic Holdings, Inc.1 | 1,560,000 | 2,451,000 | |||||||||
|
|
|
| |||||||||
| 18,778,949 | 24,464,456 | |||||||||||
Research & Consulting Services (16.13%) | ||||||||||||
| 750,000 | CoStar Group, Inc.1 | 99,556,853 | 533,002,500 | |||||||||
|
|
|
| |||||||||
Total Industrials | 118,335,802 | 557,466,956 | ||||||||||
|
|
|
| |||||||||
| Information Technology (11.91%) | ||||||||||||
Application Software (3.10%) | ||||||||||||
| 925,000 | Guidewire Software, Inc.1 | 74,997,711 | 102,536,250 | |||||||||
Data Processing & Outsourced Services (2.61%) | ||||||||||||
| 59,246 | Adyen N.V., 144A (Netherlands)1,2 | 53,544,382 | 86,232,179 | |||||||||
Internet Services & Infrastructure (1.69%) | ||||||||||||
| 700,000 | GDS Holdings Limited, ADR1,2 | 37,434,005 | 55,762,000 | |||||||||
Internet Software & Services (1.94%) | ||||||||||||
| 67,500 | Shopify, Inc., Cl A1,2 | 48,766,450 | 64,071,000 | |||||||||
IT Consulting & Other Services (2.57%) | ||||||||||||
| 700,000 | Gartner, Inc.1 | 83,980,674 | 84,931,000 | |||||||||
|
|
|
| |||||||||
Total Information Technology | 298,723,222 | 393,532,429 | ||||||||||
|
|
|
| |||||||||
| Real Estate (2.77%) | ||||||||||||
Office REITs (0.91%) | ||||||||||||
| 985,000 | Douglas Emmett, Inc. | 27,057,206 | 30,200,100 | |||||||||
Specialized REITs (1.86%) | ||||||||||||
| 1,771,952 | Gaming and Leisure Properties, Inc. | 55,738,392 | 61,309,539 | |||||||||
|
|
|
| |||||||||
Total Real Estate | 82,795,598 | 91,509,639 | ||||||||||
|
|
|
| |||||||||
Total Common Stocks | 1,512,563,316 | 3,877,764,174 | ||||||||||
|
|
|
| |||||||||
| Private Common Stocks (1.74%) | ||||||||||||
| Industrials (1.74%) | ||||||||||||
Aerospace & Defense (1.74%) | ||||||||||||
| 221,631 | Space Exploration | 29,920,185 | 50,753,499 | |||||||||
| 30,221 | Space Exploration | 4,079,835 | 6,920,609 | |||||||||
|
|
|
| |||||||||
Total Private Common Stocks | 34,000,020 | 57,674,108 | ||||||||||
|
|
|
| |||||||||
| 20 | See Notes to Financial Statements. |
| June 30, 2020 | Baron Partners Fund |
STATEMENT OF NET ASSETS (Unaudited) (Continued)
JUNE 30, 2020
|
| Shares | Cost | Value | ||||||||||
| Private Preferred Stocks (3.07%) | ||||||||||||
| Industrials (3.07%) | ||||||||||||
Aerospace & Defense (3.07%) | ||||||||||||
| 311,111 | Space Exploration Technologies Corp., Cl H1,3,4,6 | $ | 41,999,985 | $ | 71,244,419 | |||||||
| 131,657 | Space Exploration Technologies Corp., Cl I1,3,4,6 | 22,250,032 | 30,149,453 | |||||||||
|
|
|
| |||||||||
Total Private Preferred Stocks | 64,250,017 | 101,393,872 | ||||||||||
|
|
|
| |||||||||
| Private Partnerships (0.01%) | ||||||||||||
| Financials (0.01%) | ||||||||||||
Asset Management & Custody Banks (0.01%) | ||||||||||||
| 7,579,130 | Windy City Investments | 0 | 195,542 | |||||||||
|
|
|
| |||||||||
| Principal Amount | ||||||||||||
| Short Term Investments (0.01%) | ||||||||||||
| $188,737 | Repurchase Agreement with Fixed Income Clearing Corp., dated 6/30/2020, 0.00% due 7/1/2020; Proceeds at maturity-$188,737; (Fully collateralized by $177,600 U.S. Treasury Note, 2.125% due 11/30/2024; Market value - $192,561)5 | 188,737 | 188,737 | |||||||||
|
|
|
| |||||||||
Total Investments (122.21%) | $ | 1,611,002,090 | 4,037,216,433 | |||||||||
|
| |||||||||||
Liabilities Less Cash and Other Assets (-22.21%) | (733,678,574 | ) | ||||||||||
|
| |||||||||||
Net Assets | $ | 3,303,537,859 | ||||||||||
|
| |||||||||||
| | Retail Shares (Equivalent to $81.73 per share | $ | 1,582,769,538 | |||||||||
|
| |||||||||||
| | Institutional Shares (Equivalent to $83.94 per share | $ | 1,499,338,867 | |||||||||
|
| |||||||||||
| | R6 Shares (Equivalent to $83.94 per share | $ | 221,429,454 | |||||||||
|
| |||||||||||
| % | Represents percentage of net assets. |
| 1 | Non-income producing securities. |
| 2 | Foreign corporation. |
| 3 | At June 30, 2020, the market value of restricted and fair valued securities amounted to $159,263,522 or 4.82% of net assets. These securities are not deemed liquid. See Note 6 regarding Restricted Securities. |
| 4 | The Adviser has reclassified/classified certain securities in or out of this sub-industry. Such reclassifications/classifications are not supported by S&P or MSCI (unaudited). |
| 5 | Level 2 security. See Note 7 regarding Fair Value Measurements. |
| 6 | Level 3 security. See Note 7 regarding Fair Value Measurements. |
| ADR | American Depositary Receipt. |
| 144A | Security is exempt from registration pursuant to Rule 144A under the Securities Act of 1933. This security may be resold in transactions that are exempt from registration, normally to qualified institutional buyers. At June 30, 2020, the market value of Rule 144A securities amounted to $86,232,179 or 2.61% of net assets. |
All securities are Level 1, unless otherwise noted.
| See Notes to Financial Statements. | 21 |
| Baron Focused Growth Fund | June 30, 2020 |
STATEMENT OF NET ASSETS (Unaudited)
JUNE 30, 2020
|
| Shares | Cost | Value | ||||||||||
| Common Stocks (93.56%) | ||||||||||||
| Communication Services (5.79%) | ||||||||||||
Alternative Carriers (3.13%) | ||||||||||||
| 401,472 | Iridium Communications, Inc.1 | $ | 2,949,375 | $ | 10,213,448 | |||||||
Movies & Entertainment (2.66%) | ||||||||||||
| 550,000 | Manchester United plc, Cl A2 | 8,719,507 | 8,706,500 | |||||||||
|
|
|
| |||||||||
Total Communication Services | 11,668,882 | 18,919,948 | ||||||||||
|
|
|
| |||||||||
| Consumer Discretionary (52.47%) | ||||||||||||
Automobile Manufacturers (29.74%) | ||||||||||||
| 90,000 | Tesla, Inc.1 | 20,342,221 | 97,182,900 | |||||||||
Casinos & Gaming (6.28%) | ||||||||||||
| 600,000 | Penn National Gaming, Inc.1 | 11,565,191 | 18,324,000 | |||||||||
| 201,100 | Red Rock Resorts, Inc., Cl A | 1,154,579 | 2,194,001 | |||||||||
|
|
|
| |||||||||
| 12,719,770 | 20,518,001 | |||||||||||
Hotels, Resorts & | ||||||||||||
| 155,000 | Choice Hotels International, Inc. | 5,375,922 | 12,229,500 | |||||||||
| 340,000 | Hyatt Hotels Corp., Cl A | 12,201,302 | 17,098,600 | |||||||||
|
|
|
| |||||||||
| 17,577,224 | 29,328,100 | |||||||||||
Leisure Facilities (7.47%) | ||||||||||||
| 134,000 | Vail Resorts, Inc. | 8,130,896 | 24,408,100 | |||||||||
|
|
|
| |||||||||
Total Consumer Discretionary | 58,770,111 | 171,437,101 | ||||||||||
|
|
|
| |||||||||
| Financials (10.17%) | ||||||||||||
Financial Exchanges & Data (7.54%) | ||||||||||||
| 75,000 | FactSet Research Systems, Inc. | 5,828,282 | 24,635,250 | |||||||||
Property & Casualty Insurance (2.63%) | ||||||||||||
| 300,000 | Arch Capital Group Ltd.1,2 | 1,800,056 | 8,595,000 | |||||||||
|
|
|
| |||||||||
Total Financials | 7,628,338 | 33,230,250 | ||||||||||
|
|
|
| |||||||||
| Industrials (13.49%) | ||||||||||||
Research & Consulting Services (13.49%) | ||||||||||||
| 62,000 | CoStar Group, Inc.1 | 11,035,717 | 44,061,540 | |||||||||
|
|
|
| |||||||||
| Information Technology (8.51%) | ||||||||||||
Application Software (3.45%) | ||||||||||||
| 101,870 | Guidewire Software, Inc.1 | 4,816,691 | 11,292,289 | |||||||||
Data Processing & Outsourced Services (2.61%) | ||||||||||||
| 5,854 | Adyen N.V. (Netherlands), 144A1,2 | 5,352,874 | 8,520,460 | |||||||||
Internet Services & Infrastructure (2.45%) | ||||||||||||
| 100,400 | GDS Holdings Limited, ADR1,2 | 6,001,342 | 7,997,864 | |||||||||
|
|
|
| |||||||||
Total Information Technology | 16,170,907 | 27,810,613 | ||||||||||
|
|
|
| |||||||||
| Real Estate (3.13%) | ||||||||||||
Residential REITs (1.85%) | ||||||||||||
| 225,000 | American Homes 4 Rent, Cl A | 4,700,804 | 6,052,500 | |||||||||
Specialized REITs (1.28%) | ||||||||||||
| 115,000 | Americold Realty Trust4 | 3,907,872 | 4,174,500 | |||||||||
|
|
|
| |||||||||
Total Real Estate | 8,608,676 | 10,227,000 | ||||||||||
|
|
|
| |||||||||
Total Common Stocks | 113,882,631 | 305,686,452 | ||||||||||
|
|
|
| |||||||||
| Shares | Cost | Value | ||||||||||
| Private Common Stocks (1.66%) | ||||||||||||
| Industrials (1.66%) | ||||||||||||
Aerospace & Defense (1.66%) | ||||||||||||
| 20,859 | Space Exploration | $ | 2,815,965 | $ | 4,776,711 | |||||||
| 2,844 | Space Exploration | 383,940 | 651,276 | |||||||||
|
|
|
| |||||||||
Total Private Common Stocks | 3,199,905 | 5,427,987 | ||||||||||
|
|
|
| |||||||||
| Private Preferred Stocks (2.18%) | ||||||||||||
| Industrials (2.18%) | ||||||||||||
Aerospace & Defense (2.18%) | ||||||||||||
| 29,630 | Space Exploration | 4,000,050 | 6,785,270 | |||||||||
| 1,479 | Space Exploration | 249,951 | 338,691 | |||||||||
|
|
|
| |||||||||
Total Private Preferred Stocks | 4,250,001 | 7,123,961 | ||||||||||
|
|
|
| |||||||||
| Principal Amount | ||||||||||||
| Short Term Investments (2.60%) | ||||||||||||
| $8,480,477 | Repurchase Agreement with Fixed Income Clearing Corp., dated 6/30/2020, 0.00% due 7/1/2020; Proceeds at maturity - $8,480,477; (Fully collateralized by $7,978,100 U.S. Treasury Note, 2.125% due 11/30/2024; Market value - $8,650,190)5 | 8,480,477 | 8,480,477 | |||||||||
|
|
|
| |||||||||
Total Investments (100.00%) | $ | 129,813,014 | 326,718,877 | |||||||||
|
| |||||||||||
Cash and Other Assets Less Liabilities (0.00%) | 5,030 | |||||||||||
|
| |||||||||||
Net Assets | $ | 326,723,907 | ||||||||||
|
| |||||||||||
| | Retail Shares (Equivalent to $23.61 per share | $ | 66,683,382 | |||||||||
|
| |||||||||||
| | Institutional Shares (Equivalent to $24.21 per share | $ | 117,142,377 | |||||||||
|
| |||||||||||
| | R6 Shares (Equivalent to $24.22 per share | $ | 142,898,148 | |||||||||
|
| |||||||||||
| % | Represents percentage of net assets. |
| 1 | Non-income producing securities. |
| 2 | Foreign corporation. |
| 3 | At June 30, 2020, the market value of restricted and fair valued securities amounted to $12,551,948 or 3.84% of net assets. These securities are not deemed liquid. See Note 6 regarding Restricted Securities. |
| 4 | The Adviser has reclassified/classified certain securities in or out of this sub-industry. Such reclassifications/classifications are not supported by S&P or MSCI (unaudited). |
| 5 | Level 2 security. See Note 7 regarding Fair Value Measurements. |
| 6 | Level 3 security. See Note 7 regarding Fair Value Measurements. |
| ADR | American Depositary Receipt. |
| 144A | Security is exempt from registration pursuant to Rule 144A under the Securities Act of 1933. This security may be resold in transactions that are exempt from registration, normally to qualified institutional buyers. At June 30, 2020, the market value of Rule 144A securities amounted to $8,520,460 or 2.61% of net assets. |
All securities are Level 1, unless otherwise noted.
| 22 | See Notes to Financial Statements. |
| June 30, 2020 | Baron International Growth Fund |
STATEMENT OF NET ASSETS (Unaudited)
JUNE 30, 2020
|
| Shares | Cost | Value | ||||||||||
| Common Stocks (95.80%) | ||||||||||||
| Australia (2.57%) | ||||||||||||
| 865,608 | NEXTDC Limited1,2 | $ | 4,393,801 | $ | 5,953,851 | |||||||
| 342,513 | Treasury Wine Estates Ltd.2 | 3,323,461 | 2,492,082 | |||||||||
|
|
|
| |||||||||
Total Australia | 7,717,262 | 8,445,933 | ||||||||||
|
|
|
| |||||||||
| Brazil (4.26%) | ||||||||||||
| 175,207 | Afya Ltd., Cl A1 | 3,328,933 | 4,106,852 | |||||||||
| 66,966 | Arco Platform Limited, Cl A1 | 1,927,905 | 2,911,682 | |||||||||
| 152,071 | Notre Dame Intermedica Participacoes S.A. | 1,617,594 | 1,901,831 | |||||||||
| 78,867 | PagSeguro Digital Ltd., Cl A1 | 1,884,198 | 2,787,160 | |||||||||
| 53,853 | XP, Inc., Cl A1 | 1,685,943 | 2,262,364 | |||||||||
|
|
|
| |||||||||
Total Brazil | 10,444,573 | 13,969,889 | ||||||||||
|
|
|
| |||||||||
| Canada (3.01%) | ||||||||||||
| 44,187 | Brookfield Asset Management, Inc., Cl A | 1,404,965 | 1,453,752 | |||||||||
| 176,822 | CAE, Inc. | 2,229,397 | 2,868,018 | |||||||||
| 4,925 | Constellation Software, Inc. | 614,355 | 5,560,904 | |||||||||
|
|
|
| |||||||||
Total Canada | 4,248,717 | 9,882,674 | ||||||||||
|
|
|
| |||||||||
| China (14.08%) | ||||||||||||
| 530 | Agora, Inc., ADR1 | 10,600 | 23,410 | |||||||||
| 23,404 | Alibaba Group Holding Limited, ADR1 | 3,334,968 | 5,048,243 | |||||||||
| 585,171 | China Conch Venture Holdings Ltd.2 | 2,435,724 | 2,483,691 | |||||||||
| 103,310 | China Tourism Group Duty Free Corporation Limited, Cl A (formerly, China International Travel Service Limited)2 | 1,175,680 | 2,264,173 | |||||||||
| 309,309 | Galaxy Entertainment Group Ltd.1,2 | 2,274,451 | 2,121,781 | |||||||||
| 31,996 | GDS Holdings Limited, ADR1 | 1,431,520 | 2,548,801 | |||||||||
| 262,278 | Glodon Co. Ltd., Cl A2 | 1,331,253 | 2,596,154 | |||||||||
| 385,112 | Hangzhou Hikvision Digital | 1,887,160 | 1,663,950 | |||||||||
| 926,835 | Hua Hong Semiconductor Limited, 144A1,2 | 1,925,646 | 3,249,178 | |||||||||
| 1,463,374 | Kingdee International Software | 1,062,976 | 3,424,122 | |||||||||
| 536,932 | Kingsoft Corp. Ltd.2 | 1,880,592 | 2,515,013 | |||||||||
| 263,756 | Midea Group Co. Ltd., Cl A2 | 1,893,533 | 2,236,025 | |||||||||
| 52,272 | Shenzhen Mindray Bio-Medical Electronics Co. Ltd., Cl A2 | 1,348,925 | 2,259,048 | |||||||||
| 64,237 | Tencent Holdings Limited2 | 1,766,134 | 4,116,170 | |||||||||
| 16,051 | Tencent Holdings Limited, ADR | 729,171 | 1,027,264 | |||||||||
| 1,666,273 | WH Group Limited, 144A2 | 1,299,457 | 1,439,983 | |||||||||
| 87,473 | Zai Lab Limited, ADR1 | 1,928,984 | 7,184,158 | |||||||||
|
|
|
| |||||||||
Total China | 27,716,774 | 46,201,164 | ||||||||||
|
|
|
| |||||||||
| France (5.28%) | ||||||||||||
| 107,988 | BNP Paribas S.A.1,2 | 5,393,077 | 4,314,552 | |||||||||
| 8,080 | Eurofins Scientific SE2 | 1,476,848 | 5,096,333 | |||||||||
| 11,215 | LVMH Moët Hennessy | 3,246,049 | 4,951,366 | |||||||||
| 114,582 | Vivendi SA2 | 2,829,250 | 2,960,763 | |||||||||
|
|
|
| |||||||||
Total France | 12,945,224 | 17,323,014 | ||||||||||
|
|
|
| |||||||||
| Germany (3.17%) | ||||||||||||
| 34,919 | Symrise AG2 | 2,055,016 | 4,080,168 | |||||||||
| 116,000 | TeamViewer AG, 144A1 | 3,942,003 | 6,333,841 | |||||||||
|
|
|
| |||||||||
Total Germany | 5,997,019 | 10,414,009 | ||||||||||
|
|
|
| |||||||||
| Shares | Cost | Value | ||||||||||
| Common Stocks (continued) | ||||||||||||
| Hong Kong (1.34%) | ||||||||||||
| 32,271 | Hong Kong Exchanges & Clearing Ltd.2 | $ | 1,330,468 | $ | 1,374,476 | |||||||
| 306,500 | Techtronic Industries Co. Ltd.2 | 1,985,999 | 3,032,679 | |||||||||
|
|
|
| |||||||||
Total Hong Kong | 3,316,467 | 4,407,155 | ||||||||||
|
|
|
| |||||||||
| India (5.69%) | ||||||||||||
| 59,702 | Bajaj Finance Ltd.2 | 2,513,618 | 2,247,072 | |||||||||
| 152,665 | Godrej Properties Ltd.1,2 | 1,862,809 | 1,757,399 | |||||||||
| 122,844 | HDFC Bank Ltd.2 | 1,809,226 | 1,726,636 | |||||||||
| 1,668,609 | JM Financial Limited2 | 2,009,839 | 1,538,967 | |||||||||
| 94,447 | Kotak Mahindra Bank Ltd.2 | 1,634,339 | 1,704,769 | |||||||||
| 495,834 | Max Financial Services Limited1,2 | 3,465,414 | 3,568,290 | |||||||||
| 404,066 | Nippon Life India Asset | 1,347,702 | 1,684,565 | |||||||||
| 189,406 | Reliance Industries Ltd.2 | 3,741,182 | 4,308,308 | |||||||||
| 12,627 | Reliance Industries Ltd. PP | 52,525 | 133,388 | |||||||||
|
|
|
| |||||||||
Total India | 18,436,654 | 18,669,394 | ||||||||||
|
|
|
| |||||||||
| Israel (3.00%) | ||||||||||||
| 211,500 | Tower Semiconductor Ltd.1 | 4,700,710 | 4,037,535 | |||||||||
| 22,731 | Wix.com Ltd.1 | 1,052,666 | 5,824,137 | |||||||||
|
|
|
| |||||||||
Total Israel | 5,753,376 | 9,861,672 | ||||||||||
|
|
|
| |||||||||
| Japan (15.05%) | ||||||||||||
| 36,134 | Advantest Corporation2 | 2,023,135 | 2,062,185 | |||||||||
| 28,200 | FANUC Corp.2 | 4,633,004 | 5,055,411 | |||||||||
| 15,348 | Keyence Corporation2 | 4,164,729 | 6,431,757 | |||||||||
| 10,600 | KOSÉ Corporation2 | 1,359,228 | 1,283,099 | |||||||||
| 128,400 | MonotaRO Co, Ltd.2 | 2,106,987 | 5,158,909 | |||||||||
| 161,462 | Nexon Co, Ltd.2 | 2,462,306 | 3,642,006 | |||||||||
| 89,000 | Okamoto Industries, Inc.2 | 4,171,894 | 3,282,812 | |||||||||
| 134,400 | Recruit Holdings Co, Ltd.2 | 2,673,770 | 4,622,039 | |||||||||
| 100,500 | SMS Co. Ltd.2 | 2,500,772 | 2,261,603 | |||||||||
| 44,569 | Sony Corporation, ADR | 1,866,730 | 3,081,055 | |||||||||
| 61,000 | Square Enix Holdings Co, Ltd.2 | 1,973,504 | 3,090,511 | |||||||||
| 151,400 | Takeda Pharmaceutical Company Limited2 | 6,622,617 | 5,439,489 | |||||||||
| 31,000 | TechnoPro Holdings, Inc.2 | 2,146,501 | 1,789,617 | |||||||||
| 8,922 | Tokyo Electron Limited2 | 1,983,254 | 2,201,448 | |||||||||
|
|
|
| |||||||||
Total Japan | 40,688,431 | 49,401,941 | ||||||||||
|
|
|
| |||||||||
| Korea, Republic of (0.70%) | ||||||||||||
| 31,018 | Korea Shipbuilding & Offshore Engineering Co. Ltd.1,2 | 2,834,669 | 2,283,319 | |||||||||
|
|
|
| |||||||||
| Mexico (1.26%) | ||||||||||||
| 176,972 | GRUMA, S.A.B. de C.V., Cl B | 1,426,298 | 1,918,284 | |||||||||
| 953,827 | Grupo Mexico S.A.B. de C.V., Series B | 2,597,430 | 2,216,031 | |||||||||
|
|
|
| |||||||||
Total Mexico | 4,023,728 | 4,134,315 | ||||||||||
|
|
|
| |||||||||
| Netherlands (4.68%) | ||||||||||||
| 46,405 | argenx SE, ADR1 | 1,576,101 | 10,451,798 | |||||||||
| 23,947 | Koninklijke DSM NV2 | 2,592,696 | 3,324,273 | |||||||||
| 30,214 | Koninklijke Vopak N.V. | 1,513,448 | 1,598,150 | |||||||||
|
|
|
| |||||||||
Total Netherlands | 5,682,245 | 15,374,221 | ||||||||||
|
|
|
| |||||||||
| See Notes to Financial Statements. | 23 |
| Baron International Growth Fund | June 30, 2020 |
STATEMENT OF NET ASSETS (Unaudited) (Continued)
JUNE 30, 2020
|
| Shares | Cost | Value | ||||||||||
| Common Stocks (continued) | ||||||||||||
| Norway (0.57%) | ||||||||||||
| 258,027 | Golar LNG Ltd. | $ | 4,777,163 | $ | 1,868,115 | |||||||
|
|
|
| |||||||||
| Russia (2.47%) | ||||||||||||
| 2,506,735 | Detsky Mir PJSC, 144A2 | 3,761,518 | 3,553,318 | |||||||||
| 14,799 | Novatek PJSC, GDR | 1,737,561 | 2,104,418 | |||||||||
| 215,606 | Sberbank of Russia PJSC, ADR1,2 | 2,671,224 | 2,450,953 | |||||||||
|
|
|
| |||||||||
Total Russia | 8,170,303 | 8,108,689 | ||||||||||
|
|
|
| |||||||||
| Spain (0.94%) | ||||||||||||
| 115,745 | Industria de Diseno Textil, S.A.2 | 3,432,565 | 3,071,114 | |||||||||
|
|
|
| |||||||||
| Sweden (3.59%) | ||||||||||||
| 20,810 | Spotify Technology SA1 | 2,873,959 | 5,372,934 | |||||||||
| 687,534 | Telefonaktiebolaget LM Ericsson, ADR | 6,129,313 | 6,394,066 | |||||||||
|
|
|
| |||||||||
Total Sweden | 9,003,272 | 11,767,000 | ||||||||||
|
|
|
| |||||||||
| Switzerland (4.21%) | ||||||||||||
| 221,362 | Clariant AG1,2 | 4,623,269 | 4,356,598 | |||||||||
| 280,782 | Credit Suisse Group AG2 | 2,751,947 | 2,921,499 | |||||||||
| 39,485 | Julius Baer Group Ltd.2 | 1,398,659 | 1,658,274 | |||||||||
| 44,028 | Nestle S.A.2 | 4,190,549 | 4,881,412 | |||||||||
|
|
|
| |||||||||
Total Switzerland | 12,964,424 | 13,817,783 | ||||||||||
|
|
|
| |||||||||
| United Arab Emirates (0.51%) | ||||||||||||
| 304,067 | Network International | 1,974,987 | 1,664,558 | |||||||||
|
|
|
| |||||||||
| United Kingdom (15.60%) | ||||||||||||
| 130,732 | AstraZeneca PLC, ADR | 4,675,301 | 6,914,416 | |||||||||
| 1,034,000 | B&M European Value Retail S.A.2 | 4,787,142 | 5,089,767 | |||||||||
| 84,283 | Dechra Pharmaceuticals PLC2 | 2,730,743 | 2,968,677 | |||||||||
| 103,051 | Endava plc, ADR1 | 2,440,377 | 4,977,363 | |||||||||
| 154,158 | Experian plc2 | 2,944,074 | 5,410,769 | |||||||||
| 318,076 | Future PLC2 | 4,729,803 | 5,020,395 | |||||||||
| 855,549 | Horizon Discovery Group plc1,2 | 1,957,355 | 1,037,782 | |||||||||
| 23,510 | Linde Public Limited Company2 | 3,453,532 | 4,979,288 | |||||||||
| 650,000 | Rentokil Initial plc2 | 2,766,778 | 4,110,060 | |||||||||
| 1,479,945 | S4 Capital PLC1,2 | 3,641,489 | 4,950,295 | |||||||||
| 557,348 | Trainline Plc, 144A1,2 | 2,431,754 | 3,003,782 | |||||||||
| 353,638 | WANdisco plc1,2 | 3,237,730 | 2,735,135 | |||||||||
|
|
|
| |||||||||
Total United Kingdom | 39,796,078 | 51,197,729 | ||||||||||
|
|
|
| |||||||||
| United States (3.82%) | ||||||||||||
| 49,103 | Agilent Technologies, Inc. | 2,176,535 | 4,339,232 | |||||||||
| 160,854 | Arch Capital Group Ltd.1 | 3,180,720 | 4,608,467 | |||||||||
| 26,793 | Fidelity National Information Services, Inc. | 2,394,396 | 3,592,674 | |||||||||
|
|
|
| |||||||||
Total United States | 7,751,651 | 12,540,373 | ||||||||||
|
|
|
| |||||||||
Total Common Stocks | 237,675,582 | 314,404,061 | ||||||||||
|
|
|
| |||||||||
| Principal Amount | Cost | Value | ||||||||||
| Short Term Investments (3.85%) | ||||||||||||
| $12,644,314 | Repurchase Agreement with Fixed Income Clearing Corp., dated 6/30/2020, 0.00% due 7/1/2020; Proceeds at maturity - $12,644,314; (Fully collateralized by $11,895,200 U.S. Treasury Note, 2.125% due 11/30/2024; Market value - $12,897,273) 2 | $ | 12,644,314 | $ | 12,644,314 | |||||||
|
|
|
| |||||||||
Total Investments (99.65%) | $ | 250,319,896 | 327,048,375 | |||||||||
|
| |||||||||||
Cash and Other Assets Less Liabilities (0.35%) | 1,163,300 | |||||||||||
|
| |||||||||||
Net Assets | $ | 328,211,675 | ||||||||||
|
| |||||||||||
| | Retail Shares (Equivalent to $24.66 per share | $ | 57,778,522 | |||||||||
|
| |||||||||||
| | Institutional Shares (Equivalent to $25.07 per share | $ | 253,280,508 | |||||||||
|
| |||||||||||
| | R6 Shares (Equivalent to $25.07 per share | $ | 17,152,645 | |||||||||
|
| |||||||||||
| % | Represents percentage of net assets. |
| 1 | Non-income producing securities. |
| 2 | Level 2 security. See Note 7 regarding Fair Value Measurements. |
| ADR | American Depositary Receipt. |
| GDR | Global Depositary Receipt. |
| 144A | Security is exempt from registration pursuant to Rule 144A under the Securities Act of 1933. This security may be resold in transactions that are exempt from registration, normally to qualified institutional buyers. At June 30, 2020, the market value of Rule 144A securities amounted to $20,929,225 or 6.38% of net assets. |
All securities are Level 1, unless otherwise noted.
| Summary of Investments by Sector as of June 30, 2020 | Percentage of Net Assets | |||
Information Technology | 23.3 | % | ||
Health Care | 14.5 | |||
Consumer Discretionary | 12.6 | |||
Industrials | 11.9 | |||
Financials | 10.2 | |||
Communication Services | 9.2 | |||
Materials | 6.8 | |||
Consumer Staples | 3.7 | |||
Energy | 3.1 | |||
Real Estate | 0.5 | |||
Cash and Cash Equivalents* | 4.2 | |||
| 100.0 | % | |||
| * | Includes short term investments. |
| 24 | See Notes to Financial Statements. |
| June 30, 2020 | Baron Real Estate Fund |
STATEMENT OF NET ASSETS (Unaudited)
JUNE 30, 2020
|
| Shares | Cost | Value | ||||||||||
| Common Stocks (95.53%) | ||||||||||||
| Communication Services (3.14%) | ||||||||||||
Interactive Media & Services (3.14%) | ||||||||||||
| 341,360 | Zillow Group, Inc., Cl C1 | $ | 13,949,892 | $ | 19,665,749 | |||||||
|
|
|
| |||||||||
| Consumer Discretionary (34.64%) | ||||||||||||
Casinos & Gaming (12.66%) | ||||||||||||
| 720,700 | Boyd Gaming Corporation | 12,979,445 | 15,062,630 | |||||||||
| 255,700 | MGM Resorts International | 3,287,002 | 4,295,760 | |||||||||
| 849,978 | Penn National Gaming, Inc.1 | 7,406,799 | 25,958,328 | |||||||||
| 1,172,809 | Red Rock Resorts, Inc., Cl A | 13,247,869 | 12,795,346 | |||||||||
| 283,250 | Wynn Resorts Ltd. | 17,481,629 | 21,099,293 | |||||||||
|
|
|
| |||||||||
| 54,402,744 | 79,211,357 | |||||||||||
Distributors (1.56%) | ||||||||||||
| 35,900 | Pool Corp. | 7,275,005 | 9,760,133 | |||||||||
Home Improvement Retail (5.36%) | ||||||||||||
| 62,850 | Home Depot, Inc. | 9,615,813 | 15,744,553 | |||||||||
| 132,000 | Lowe’s Companies, Inc. | 13,929,522 | 17,835,840 | |||||||||
|
|
|
| |||||||||
| 23,545,335 | 33,580,393 | |||||||||||
Homebuilding (12.37%) | ||||||||||||
| 320,297 | D.R. Horton, Inc. | 12,845,221 | 17,760,469 | |||||||||
| 275,823 | Installed Building Products, Inc.1 | 15,162,532 | 18,971,106 | |||||||||
| 373,200 | Lennar Corp., Cl A | 16,873,667 | 22,996,584 | |||||||||
| 442,047 | Taylor Morrison Home Corp.1 | 6,539,003 | 8,527,086 | |||||||||
| 280,400 | Toll Brothers, Inc. | 9,509,424 | 9,138,236 | |||||||||
|
|
|
| |||||||||
| 60,929,847 | 77,393,481 | |||||||||||
Hotels, Resorts & Cruise Lines (2.69%) | ||||||||||||
| 84,550 | Hilton Worldwide Holdings, Inc. | 5,433,913 | 6,210,198 | |||||||||
| 129,600 | Marriott Vacations Worldwide Corp. | 6,329,690 | 10,654,416 | |||||||||
|
|
|
| |||||||||
| 11,763,603 | 16,864,614 | |||||||||||
|
|
|
| |||||||||
Total Consumer Discretionary | 157,916,534 | 216,809,978 | ||||||||||
|
|
|
| |||||||||
| Financials (3.62%) | ||||||||||||
Asset Management & Custody Banks (3.62%) |
| |||||||||||
| 687,672 | Brookfield Asset | 11,102,764 | 22,624,409 | |||||||||
|
|
|
| |||||||||
| Industrials (9.26%) | ||||||||||||
Building Products (4.55%) | ||||||||||||
| 34,975 | Armstrong World Industries, Inc. | 2,663,674 | 2,726,651 | |||||||||
| 386,601 | AZEK Co., Inc.1 | 8,891,823 | 12,317,108 | |||||||||
| 108,250 | Fortune Brands Home & Security, Inc. | 5,818,928 | 6,920,422 | |||||||||
| 50,150 | Trex Co., Inc.1 | 2,984,945 | 6,523,011 | |||||||||
|
|
|
| |||||||||
| 20,359,370 | 28,487,192 | |||||||||||
Research & Consulting Services (2.80%) | ||||||||||||
| 24,600 | CoStar Group, Inc. 1 | 9,198,766 | 17,482,482 | |||||||||
Trading Companies & Distributors (1.91%) |
| |||||||||||
| 105,051 | SiteOne Landscape Supply, Inc.1 | 4,980,142 | 11,972,662 | |||||||||
|
|
|
| |||||||||
Total Industrials | 34,538,278 | 57,942,336 | ||||||||||
|
|
|
| |||||||||
| Shares | Cost | Value | ||||||||||
| Common Stocks (continued) | ||||||||||||
| Information Technology (9.06%) | ||||||||||||
Internet Services & Infrastructure (9.06%) | ||||||||||||
| 547,450 | GDS Holdings Limited, ADR1,2 | $ | 14,768,297 | $ | 43,609,867 | |||||||
| 1,906,050 | NEXTDC Limited (Australia)1,2,4 | 9,504,588 | 13,110,251 | |||||||||
|
|
|
| |||||||||
Total Information Technology | 24,272,885 | 56,720,118 | ||||||||||
|
|
|
| |||||||||
| Materials (3.30%) | ||||||||||||
Construction Materials (1.68%) | ||||||||||||
| 90,450 | Vulcan Materials Co. | 9,654,956 | 10,478,632 | |||||||||
Specialty Chemicals (1.62%) | ||||||||||||
| 17,550 | The Sherwin-Williams Company | 5,375,802 | 10,141,268 | |||||||||
|
|
|
| |||||||||
Total Materials | 15,030,758 | 20,619,900 | ||||||||||
|
|
|
| |||||||||
| Real Estate (32.51%) | ||||||||||||
Hotel & Resort REITs (2.10%) | ||||||||||||
| 482,500 | MGM Growth Properties LLC, Cl A | 11,185,226 | 13,128,825 | |||||||||
Industrial REITs (5.25%) | ||||||||||||
| 205,550 | Prologis, Inc. | 12,482,839 | 19,183,982 | |||||||||
| 330,759 | Rexford Industrial Realty, Inc. | 13,836,145 | 13,703,345 | |||||||||
|
|
|
| |||||||||
| 26,318,984 | 32,887,327 | |||||||||||
Office REITs (0.46%) |
| |||||||||||
| 94,700 | Douglas Emmett, Inc. | 1,677,656 | 2,903,502 | |||||||||
Real Estate Development (0.87%) | ||||||||||||
| 104,400 | The Howard Hughes Corp.1 | 6,736,280 | 5,423,580 | |||||||||
Real Estate Services (2.70%) | ||||||||||||
| 359,000 | CBRE Group, Inc., Cl A1 | 7,157,427 | 16,233,980 | |||||||||
| 6,231 | Jones Lang LaSalle, Inc. | 617,848 | 644,659 | |||||||||
|
|
|
| |||||||||
| 7,775,275 | 16,878,639 | |||||||||||
Residential REITs (3.65%) |
| |||||||||||
| 149,600 | Equity LifeStyle Properties, Inc. | 7,525,381 | 9,347,008 | |||||||||
| 489,400 | Invitation Homes, Inc. | 11,779,347 | 13,473,182 | |||||||||
|
|
|
| |||||||||
| 19,304,728 | 22,820,190 | |||||||||||
Specialized REITs (17.48%) |
| |||||||||||
| 89,500 | Alexandria Real Estate Equities, Inc.3 | 5,631,564 | 14,521,375 | |||||||||
| 85,600 | American Tower Corp. | 9,058,046 | 22,131,024 | |||||||||
| 381,290 | Americold Realty Trust3 | 9,851,597 | 13,840,827 | |||||||||
| 70,178 | Digital Realty Trust, Inc. | 8,455,747 | 9,972,996 | |||||||||
| 40,140 | Equinix, Inc. | 7,327,412 | 28,190,322 | |||||||||
| 298,365 | Gaming and Leisure Properties, Inc. | 7,543,716 | 10,323,429 | |||||||||
| 35,050 | SBA Communications Corp. | 7,862,637 | 10,442,096 | |||||||||
|
|
|
| |||||||||
| 55,730,719 | 109,422,069 | |||||||||||
|
|
|
| |||||||||
Total Real Estate | 128,728,868 | 203,464,132 | ||||||||||
|
|
|
| |||||||||
Total Common Stocks | 385,539,979 | 597,846,622 | ||||||||||
|
|
|
| |||||||||
| See Notes to Financial Statements. | 25 |
| Baron Real Estate Fund | June 30, 2020 |
STATEMENT OF NET ASSETS (Unaudited) (Continued)
JUNE 30, 2020
|
| Principal Amount | Cost | Value | ||||||||||
| Short Term Investments (4.93%) | ||||||||||||
| $30,841,713 | Repurchase Agreement with Fixed Income Clearing Corp., dated 6/30/2020, 0.00% due 7/1/2020; Proceeds at maturity - $30,841,713;(Fully collateralized by $29,014,400 U.S. Treasury Note, 2.125% due 11/30/2024; Market value - $31,458,625)4 | $ | 30,841,713 | $ | 30,841,713 | |||||||
|
|
|
| |||||||||
Total Investments (100.46%) | $ | 416,381,692 | 628,688,335 | |||||||||
|
| |||||||||||
Liabilities Less Cash and Other Assets (-0.46%) | (2,851,608 | ) | ||||||||||
|
| |||||||||||
Net Assets | $ | 625,836,727 | ||||||||||
|
| |||||||||||
| | Retail Shares (Equivalent to $27.21 per share | $ | 225,916,902 | |||||||||
|
| |||||||||||
| | Institutional Shares (Equivalent to $27.78 per share | $ | 386,375,324 | |||||||||
|
| |||||||||||
| | R6 Shares (Equivalent to $27.78 per share | $ | 13,544,501 | |||||||||
|
| |||||||||||
| % | Represents percentage of net assets. |
| 1 | Non-income producing securities. |
| 2 | Foreign corporation. |
| 3 | The Adviser has reclassified/classified certain securities in or out of this sub-industry. Such reclassifications/classifications are not supported by S&P or MSCI (unaudited). |
| 4 | Level 2 security. See Note 7 regarding Fair Value Measurements. |
| ADR | American Depositary Receipt. |
All securities are Level 1, unless otherwise noted.
| 26 | See Notes to Financial Statements. |
| June 30, 2020 | Baron Emerging Markets Fund |
STATEMENT OF NET ASSETS (Unaudited)
JUNE 30, 2020
|
| Shares | Cost | Value | ||||||||||
| Common Stocks (96.00%) | ||||||||||||
| Argentina (0.43%) | ||||||||||||
| 80,603 | Globant S.A.1 | $ | 8,176,954 | $ | 12,078,359 | |||||||
| 8,949 | MercadoLibre, Inc.1 | 4,382,277 | 8,821,656 | |||||||||
|
|
|
| |||||||||
Total Argentina | 12,559,231 | 20,900,015 | ||||||||||
|
|
|
| |||||||||
| Brazil (7.92%) | ||||||||||||
| 1,350,321 | Afya Ltd., Cl A1 | 36,276,584 | 31,651,524 | |||||||||
| 4,508,727 | B3 S.A. — Brasil, Bolsa, Balcao | 17,384,178 | 45,675,102 | |||||||||
| 5,088,366 | Localiza Rent a Car SA | 32,554,486 | 38,279,004 | |||||||||
| 5,204,533 | Notre Dame Intermedica Participacoes S.A. | 59,818,208 | 65,088,963 | |||||||||
| 2,178,512 | PagSeguro Digital Ltd., Cl A1 | 52,374,071 | 76,988,614 | |||||||||
| 9,560,876 | Rumo S.A.1 | 34,356,599 | 39,540,299 | |||||||||
| 1,236,565 | StoneCo Ltd., Cl A1 | 32,466,744 | 47,929,260 | |||||||||
| 878,932 | XP, Inc., Cl A1 | 28,372,296 | 36,923,933 | |||||||||
|
|
|
| |||||||||
Total Brazil | 293,603,166 | 382,076,699 | ||||||||||
|
|
|
| |||||||||
| China (43.41%) | ||||||||||||
| 1,298,898 | Alibaba Group Holding Limited, ADR1 | 149,778,681 | 280,172,299 | |||||||||
| 4,481,311 | Beijing Oriental Yuhong Waterproof Technology Co. Ltd., Cl A3 | 25,939,800 | 25,844,881 | |||||||||
| 17,887,952 | China Conch Venture Holdings Ltd.3 | 67,683,851 | 75,923,344 | |||||||||
| 2,850,687 | China Literature Ltd., 144A1,3 | 18,732,555 | 19,329,997 | |||||||||
| 14,391,732 | China Mengniu Dairy Co. Ltd.3 | 30,506,005 | 55,186,242 | |||||||||
| 3,030,302 | China Tourism Group Duty Free Corporation Limited, Cl A (formerly, China International Travel Service Limited)1,3 | 32,318,688 | 66,413,020 | |||||||||
| 5,028,715 | Galaxy Entertainment Group Ltd.1,3 | 36,269,194 | 34,495,707 | |||||||||
| 1,025,322 | GDS Holdings Limited, ADR1 | 42,819,969 | 81,677,151 | |||||||||
| 6,934,808 | Glodon Co. Ltd., Cl A3 | 33,636,308 | 68,644,071 | |||||||||
| 11,811,700 | Hangzhou Hikvision Digital Technology Co., Ltd., Cl A3 | 47,881,900 | 51,034,704 | |||||||||
| 2,510,919 | Hangzhou Tigermed Consulting Co. Ltd., CI A3 | 27,748,507 | 36,144,403 | |||||||||
| 14,701,053 | Hua Hong Semiconductor Limited, 144A1,3 | 30,835,844 | 51,537,038 | |||||||||
| 26,203,166 | Kingdee International Software Group Co. Ltd.3 | 14,328,251 | 61,312,315 | |||||||||
| 12,022,546 | Kingsoft Corp. Ltd.3 | 42,629,432 | 56,314,134 | |||||||||
| 2,337,183 | LexinFintech Holdings Ltd., ADR1 | 28,514,768 | 24,867,627 | |||||||||
| 2,585,359 | Meituan Dianping, Cl B1,3 | 25,304,452 | 57,773,355 | |||||||||
| 7,723,051 | Midea Group Co., Ltd., Cl A3 | 42,640,229 | 65,473,147 | |||||||||
| 2,304,544 | New Frontier Health Corp.1 | 23,796,588 | 19,081,624 | |||||||||
| 357,734 | New Oriental Education & Technology Group, Inc., ADR1 | 22,791,182 | 46,587,699 | |||||||||
| 6,590,476 | Ping An Insurance (Group) Company of China, Ltd., CI H3 | 71,575,995 | 65,700,368 | |||||||||
| 6,375,722 | SF Holding Co. Ltd., Cl A3 | 45,056,330 | 49,389,022 | |||||||||
| 3,644,341 | Shanghai Henlius | 23,263,380 | 24,533,704 | |||||||||
| 1,184,946 | Shenzhen Mindray Bio-Medical Electronics Co. Ltd., Cl A3 | 32,176,706 | 51,210,019 | |||||||||
| 4,161,486 | Shenzhou International | 20,272,213 | 50,592,051 | |||||||||
| 36,562,365 | Sino Biopharmaceutical Ltd.3 | 35,404,757 | 68,912,560 | |||||||||
| 798,084 | Sunny Optical Technology | 2,482,754 | 12,844,748 | |||||||||
| 3,521,992 | Tencent Holdings Limited3 | 89,024,128 | 225,681,738 | |||||||||
| 231,573 | Tencent Holdings Limited, ADR | 11,222,716 | 14,820,672 | |||||||||
| 2,231,702 | Tencent Music Entertainment Group, ADR1 | 27,404,225 | 30,038,709 | |||||||||
| 5,692,380 | Venustech Group, Inc., Cl A3 | 31,430,407 | 33,945,706 | |||||||||
| 41,834,554 | WH Group Limited, 144A3 | 33,107,994 | 36,153,162 | |||||||||
| Shares | Cost | Value | ||||||||||
| Common Stocks (continued) | ||||||||||||
| China (continued) | ||||||||||||
| 31,012,658 | Xiaomi Corporation, Cl B, 144A1,3 | $ | 41,016,313 | $ | 51,535,331 | |||||||
| 4,381,148 | Yunnan Baiyao | 62,877,204 | 58,281,986 | |||||||||
| 1,412,279 | Zai Lab Limited, ADR1 | 31,897,617 | 115,990,474 | |||||||||
| 767,194 | ZTO Express Cayman, Inc., ADR1 | 25,040,310 | 28,163,692 | |||||||||
|
|
|
| |||||||||
Total China | 1,327,409,253 | 2,095,606,700 | ||||||||||
|
|
|
| |||||||||
| Hong Kong (2.03%) | ||||||||||||
| 472,766 | Hong Kong Exchanges & Clearing Ltd.3 | 19,497,295 | 20,135,904 | |||||||||
| 7,886,450 | Techtronic Industries Co. Ltd.3 | 35,829,362 | 78,032,857 | |||||||||
|
|
|
| |||||||||
Total Hong Kong | 55,326,657 | 98,168,761 | ||||||||||
|
|
|
| |||||||||
| Hungary (0.24%) | ||||||||||||
| 282,741 | Wizz Air Holdings Plc, 144A1,3 | 8,645,375 | 11,682,024 | |||||||||
|
|
|
| |||||||||
| India (19.85%) | ||||||||||||
| 1,364,678 | Asian Paints Ltd.3 | 32,819,729 | 30,510,348 | |||||||||
| 1,556,866 | Bajaj Finance Limited3 | 55,265,167 | 58,597,527 | |||||||||
| 5,861,801 | Bharti Airtel Ltd.1,3 | 43,070,195 | 43,535,432 | |||||||||
| 887,689 | Britannia Industries Limited3 | 26,373,134 | 42,452,807 | |||||||||
| 1,751,111 | Divi’s Laboratories Ltd.3 | 20,605,977 | 52,889,986 | |||||||||
| 947,159 | Dr. Reddy’s Laboratories Ltd.3 | 38,778,577 | 49,611,952 | |||||||||
| 341,773 | Dr. Reddy’s Laboratories Ltd., ADR | 14,238,191 | 18,117,387 | |||||||||
| 17,435,371 | Edelweiss Financial Services Ltd.3 | 32,889,996 | 14,450,433 | |||||||||
| 3,418,086 | HDFC Bank Ltd.3 | 52,166,299 | 48,042,976 | |||||||||
| 1,426,782 | Hindustan Unilever Ltd.3 | 40,248,262 | 41,249,357 | |||||||||
| 1,992,541 | Housing Development Finance Corp., Ltd.3 | 50,804,084 | 46,330,798 | |||||||||
| 2,119,165 | ICICI Lombard General Insurance Co. Ltd., 144A3 | 37,799,722 | 35,598,031 | |||||||||
| 35,313,978 | JM Financial Limited3 | 52,389,351 | 32,570,284 | |||||||||
| 2,541,323 | Kotak Mahindra Bank Ltd.3 | 31,015,317 | 45,870,892 | |||||||||
| 8,929,261 | Max Financial Services Ltd.1,3 | 75,537,674 | 64,259,794 | |||||||||
| 1,944,933 | Muthoot Finance Ltd.3 | 28,066,039 | 28,005,619 | |||||||||
| 9,697,405 | Nippon Life India Asset Management Limited, 144A3 | 33,075,154 | 40,428,828 | |||||||||
| 5,422,402 | Reliance Industries Limited3 | 105,297,342 | 123,340,211 | |||||||||
| 370,459 | Reliance Industries Limited PP | 1,670,322 | 3,913,423 | |||||||||
| 4,520,090 | SBI Life Insurance Company Limited, 144A1,3 | 47,495,005 | 48,260,982 | |||||||||
| 4,083,287 | Tata Communications Ltd.3 | 24,669,294 | 33,252,889 | |||||||||
| 7,324,597 | Tata Consumer Products Ltd.3 | 26,885,268 | 37,616,219 | |||||||||
| 1,543,122 | �� | Titan Co. Ltd.3 | 22,254,416 | 19,429,723 | ||||||||
|
|
|
| |||||||||
Total India | 893,414,515 | 958,335,898 | ||||||||||
|
|
|
| |||||||||
| Indonesia (0.87%) | ||||||||||||
| 108,304,409 | PT Telekomunikasi Indonesia (Persero) Tbk3 | 32,050,808 | 23,200,134 | |||||||||
| 238,795,425 | PT Tower Bersama Infrastructure, Tbk.3 | 22,799,233 | 18,593,072 | |||||||||
|
|
|
| |||||||||
Total Indonesia | 54,850,041 | 41,793,206 | ||||||||||
|
|
|
| |||||||||
| Japan (0.96%) | ||||||||||||
| 110,280 | Keyence Corp.3 | 38,755,581 | 46,214,107 | |||||||||
|
|
|
| |||||||||
| Korea, Republic of (4.56%) | ||||||||||||
| 248,923 | KB Financial Group, Inc.3 | 8,908,864 | 7,046,908 | |||||||||
| 174,737 | KIA Motors Corp.3 | 4,970,949 | 4,721,841 | |||||||||
| 572,073 | Korea Shipbuilding & Offshore Engineering Co. Ltd.1,3 | 56,666,761 | 42,111,834 | |||||||||
| 3,756,303 | Samsung Electronics Co., Ltd.3 | 118,857,007 | 166,282,640 | |||||||||
|
|
|
| |||||||||
Total Korea, Republic of | 189,403,581 | 220,163,223 | ||||||||||
|
|
|
| |||||||||
| See Notes to Financial Statements. | 27 |
| Baron Emerging Markets Fund | June 30, 2020 |
STATEMENT OF NET ASSETS (Unaudited) (Continued)
JUNE 30, 2020
|
| Shares | Cost | Value | ||||||||||
| Common Stocks (continued) | ||||||||||||
| Mexico (3.19%) | ||||||||||||
| 513,802 | Fomento Económico Mexicano, S.A.B. de C.V., ADR | $ | 46,409,151 | $ | 31,860,862 | |||||||
| 3,904,317 | GRUMA, S.A.B. de C.V., Cl B | 50,247,039 | 42,320,761 | |||||||||
| 17,065,802 | Grupo México | 44,762,257 | 39,649,060 | |||||||||
| 16,844,236 | Wal-Mart de Mexico, | 38,763,471 | 40,284,873 | |||||||||
|
|
|
| |||||||||
Total Mexico | 180,181,918 | 154,115,556 | ||||||||||
|
|
|
| |||||||||
| Norway (0.38%) | ||||||||||||
| 2,508,463 | Golar LNG Ltd.1 | 27,525,242 | 18,161,272 | |||||||||
|
|
|
| |||||||||
| Philippines (1.53%) | ||||||||||||
| 56,721,965 | Ayala Land, Inc.3 | 42,607,898 | 38,686,855 | |||||||||
| 17,935,596 | BDO Unibank, Inc.3 | 38,641,622 | 35,391,854 | |||||||||
|
|
|
| |||||||||
Total Philippines | 81,249,520 | 74,078,709 | ||||||||||
|
|
|
| |||||||||
| Russia (3.47%) | ||||||||||||
| 348,781 | Novatek PJSC, GDR | 46,113,614 | 49,596,658 | |||||||||
| 6,255,596 | Sberbank of Russia PJSC, ADR1,3 | 61,216,657 | 71,112,008 | |||||||||
| 939,327 | Yandex N.V., Cl A1 | 19,873,291 | 46,985,136 | |||||||||
|
|
|
| |||||||||
Total Russia | 127,203,562 | 167,693,802 | ||||||||||
|
|
|
| |||||||||
| South Africa (1.27%) | ||||||||||||
| 2,197,876 | Bid Corp. Ltd.3 | 42,555,810 | 36,090,912 | |||||||||
| 3,060,664 | Bidvest Group Ltd.3 | 29,222,198 | 25,112,161 | |||||||||
|
|
|
| |||||||||
Total South Africa | 71,778,008 | 61,203,073 | ||||||||||
|
|
|
| |||||||||
| Taiwan (4.64%) | ||||||||||||
| 11,342,879 | Delta Electronics, Inc.3 | 47,430,631 | 64,726,936 | |||||||||
| 112,147 | Eclat Textile Co., Ltd.3 | 1,116,882 | 1,306,411 | |||||||||
| 2,368,921 | Ginko International Co., Ltd.3 | 25,196,149 | 11,859,385 | |||||||||
| 2,571,695 | Taiwan Semiconductor Manufacturing Co., Ltd., ADR | 74,329,328 | 145,995,125 | |||||||||
|
|
|
| |||||||||
Total Taiwan | 148,072,990 | 223,887,857 | ||||||||||
|
|
|
| |||||||||
| Thailand (0.66%) | ||||||||||||
| 14,384,634 | CP All Plc., Cl F3 | 31,460,642 | 31,699,376 | |||||||||
|
|
|
| |||||||||
| United Arab Emirates (0.59%) | ||||||||||||
| 5,231,503 | Network International | 33,479,000 | 28,638,884 | |||||||||
|
|
|
| |||||||||
Total Common Stocks | 3,574,918,282 | 4,634,419,162 | ||||||||||
|
|
|
| |||||||||
| Private Common Stocks (0.17%) | ||||||||||||
| India (0.17%) | ||||||||||||
| 3,846,048 | Hemisphere Properties India Limited1,2,4 | 14,647,473 | 8,218,520 | |||||||||
|
|
|
| |||||||||
| Principal Amount | Cost | Value | ||||||||||
| Short Term Investments (2.74%) | ||||||||||||
| $132,430,449 | Repurchase Agreement with Fixed Income Clearing Corp., dated 6/30/2020, 0.00% due 7/1/2020; Proceeds at maturity - $132,430,449; (Fully collateralized by $10,623,500, U.S. Treasury Note, 2.125% due 11/30/2024; Market value - $11,518,443) and $116,934,400 U.S. Treasury Note, 1.50% due 10/31/2024; Market value - $123,560,653)3 | $ | 132,430,449 | $ | 132,430,449 | |||||||
|
|
|
| |||||||||
Total Investments (98.91%) | $ | 3,721,996,204 | 4,775,068,131 | |||||||||
|
| |||||||||||
Cash and Other Assets Less Liabilities (1.09%) | 52,466,090 | |||||||||||
|
| |||||||||||
Net Assets | $ | 4,827,534,221 | ||||||||||
|
| |||||||||||
| | Retail Shares (Equivalent to $13.96 per share | $ | 454,634,868 | |||||||||
|
| |||||||||||
| | Institutional Shares (Equivalent to $14.01 per share | $ | 4,362,788,961 | |||||||||
|
| |||||||||||
| | R6 Shares (Equivalent to $14.01 per share | $ | 10,110,392 | |||||||||
|
| |||||||||||
| % | Represents percentage of net assets. |
| 1 | Non-income producing securities. |
| 2 | At June 30, 2020, the market value of restricted and fair valued securities amounted to $8,218,520 or 0.17% of net assets. This security is not deemed liquid. See Note 6 regarding Restricted Securities. |
| 3 | Level 2 security. See Note 7 regarding Fair Value Measurements. |
| 4 | Level 3 security. See Note 7 regarding Fair Value Measurements. |
| ADR | American Depositary Receipt. |
| GDR | Global Depositary Receipt. |
| 144A | Security is exempt from registration pursuant to Rule 144A under the Securities Act of 1933. This security may be resold in transactions that are exempt from registration, normally to qualified institutional buyers. At June 30, 2020, the market value of Rule 144A securities amounted to $347,697,981 or 7.20% of net assets. |
All securities are Level 1, unless otherwise noted.
| Summary of Investments by Sector as of June 30, 2020 | Percentage of Net Assets | |||
Information Technology | 21.9 | % | ||
Financials | 15.9 | |||
Consumer Discretionary | 13.8 | |||
Health Care | 11.9 | |||
Communication Services | 9.4 | |||
Consumer Staples | 8.2 | |||
Industrials | 8.1 | |||
Energy | 4.0 | |||
Materials | 2.0 | |||
Real Estate | 1.0 | |||
Cash and Cash Equivalents* | 3.8 | |||
| 100.0 | % | |||
| * | Includes short term investments. |
| 28 | See Notes to Financial Statements. |
| June 30, 2020 | Baron Global Advantage Fund |
STATEMENT OF NET ASSETS (Unaudited)
JUNE 30, 2020
|
| Shares | Cost | Value | ||||||||||
| Common Stocks (90.51%) | ||||||||||||
| Argentina (3.93%) | ||||||||||||
| 76,873 | Globant S.A.1 | $ | 5,591,434 | $ | 11,519,419 | |||||||
| 37,139 | MercadoLibre, Inc.1 | 20,777,507 | 36,610,512 | |||||||||
|
|
|
| |||||||||
Total Argentina | 26,368,941 | 48,129,931 | ||||||||||
|
|
|
| |||||||||
| Brazil (5.41%) | ||||||||||||
| 1,063,703 | Afya Ltd., Cl A1 | 23,638,835 | 24,933,198 | |||||||||
| 282,185 | Arco Platform Limited, Cl A1 | 11,848,049 | 12,269,404 | |||||||||
| 333,161 | PagSeguro Digital Ltd., Cl A1 | 10,375,526 | 11,773,910 | |||||||||
| 448,483 | StoneCo Ltd., Cl A1 | 14,134,314 | 17,383,201 | |||||||||
|
|
|
| |||||||||
Total Brazil | 59,996,724 | 66,359,713 | ||||||||||
|
|
|
| |||||||||
| Canada (2.62%) | ||||||||||||
| 8,416 | Constellation Software, Inc. | 6,018,735 | 9,502,654 | |||||||||
| 23,860 | Shopify, Inc., Cl A1 | 10,512,982 | 22,647,912 | |||||||||
|
|
|
| |||||||||
Total Canada | 16,531,717 | 32,150,566 | ||||||||||
|
|
|
| |||||||||
| China (16.57%) | ||||||||||||
| 1,959 | Agora, Inc., ADR1 | 39,180 | 86,529 | |||||||||
| 358,453 | Alibaba Group Holding Limited, ADR1 | 69,750,832 | 77,318,312 | |||||||||
| 429,102 | GDS Holdings Limited, ADR1 | 24,936,105 | 34,182,265 | |||||||||
| 1,023,313 | Meituan Dianping, Cl B1,2 | 13,512,366 | 22,867,318 | |||||||||
| 147,108 | Pinduoduo, Inc., ADR1 | 4,525,724 | 12,627,751 | |||||||||
| 519,900 | TAL Education Group, ADR1 | 23,919,987 | 35,550,762 | |||||||||
| 250,810 | Zai Lab Limited, ADR1 | 14,067,368 | 20,599,025 | |||||||||
|
|
|
| |||||||||
Total China | 150,751,562 | 203,231,962 | ||||||||||
|
|
|
| |||||||||
| Israel (5.16%) | ||||||||||||
| 326,882 | Fiverr International Ltd.1 | 7,503,852 | 24,130,429 | |||||||||
| 152,776 | Wix.com Ltd.1 | 19,711,359 | 39,144,267 | |||||||||
|
|
|
| |||||||||
Total Israel | 27,215,211 | 63,274,696 | ||||||||||
|
|
|
| |||||||||
| Netherlands (4.95%) | ||||||||||||
| 12,691 | Adyen N.V., 144A1 | 10,772,023 | 18,471,670 | |||||||||
| 125,237 | argenx SE, ADR1 | 13,884,456 | 28,207,130 | |||||||||
| 38,227 | ASML Holding N.V.2 | 8,394,703 | 13,983,927 | |||||||||
|
|
|
| |||||||||
Total Netherlands | 33,051,182 | 60,662,727 | ||||||||||
|
|
|
| |||||||||
| United Arab Emirates (0.79%) | ||||||||||||
| 1,777,372 | Network International | 11,726,099 | 9,729,890 | |||||||||
|
|
|
| |||||||||
| United Kingdom (2.00%) | ||||||||||||
| 507,254 | Endava plc, ADR1 | 19,180,920 | 24,500,368 | |||||||||
|
|
|
| |||||||||
| United States (49.08%) | ||||||||||||
| 210,070 | 10X Genomics, Inc., Cl A1 | 15,874,682 | 18,761,352 | |||||||||
| 306,315 | Acceleron Pharma, Inc.1 | 18,883,931 | 29,182,630 | |||||||||
| 18,612 | Alphabet, Inc., Cl C1 | 22,319,874 | 26,310,109 | |||||||||
| 26,695 | Amazon.com, Inc.1 | 53,833,208 | 73,646,700 | |||||||||
| 137,887 | Bill.Com Holdings, Inc.1 | 5,238,091 | 12,438,786 | |||||||||
| 331,981 | Cloudflare, Inc., Cl A1 | 6,669,399 | 11,934,717 | |||||||||
| 185,591 | Crowdstrike Holdings, Inc., Cl A1 | 10,822,568 | 18,612,921 | |||||||||
| 151,018 | Datadog, Inc., Cl A1 | 4,186,995 | 13,131,015 | |||||||||
| 276,793 | Dynatrace, Inc.1 | 7,100,539 | 11,237,796 | |||||||||
| 112,074 | EPAM Systems, Inc.1 | 20,790,150 | 28,243,769 | |||||||||
| 213,191 | Facebook, Inc., Cl A1 | 42,542,211 | 48,409,280 | |||||||||
| 95,734 | Fidelity National Information Services, Inc. | 11,571,802 | 12,836,972 | |||||||||
| 271,282 | Guardant Health, Inc.1 | 20,200,062 | 22,009,109 | |||||||||
| 79,450 | Illumina, Inc.1 | 25,399,320 | 29,424,308 | |||||||||
| 111,277 | Neurocrine Biosciences, Inc.1 | 11,792,881 | 13,575,794 | |||||||||
| Shares | Cost | Value | ||||||||||
| Common Stocks (continued) | ||||||||||||
| United States (continued) | ||||||||||||
| 49,765 | Okta, Inc.1 | $ | 4,378,487 | $ | 9,964,446 | |||||||
| 440,053 | PTC Therapeutics, Inc.1 | 21,839,713 | 22,328,289 | |||||||||
| 96,271 | RingCentral, Inc., Cl A1 | 17,075,146 | 27,438,198 | |||||||||
| 214,212 | Schrödinger, Inc.1 | 3,641,604 | 19,615,393 | |||||||||
| 524,709 | Slack Technologies, Inc., Cl A1 | 15,034,734 | 16,313,203 | |||||||||
| 168,432 | Splunk, Inc.1 | 24,123,194 | 33,467,438 | |||||||||
| 144,196 | Twilio Inc., Cl A1 | 18,279,353 | 31,639,486 | |||||||||
| 134,219 | Veeva Systems, Inc., Cl A1 | 19,244,051 | 31,463,618 | |||||||||
| 557,859 | ZoomInfo Technologies Inc., Cl A1 | 16,579,482 | 28,467,545 | |||||||||
| 103,062 | Zscaler, Inc.1 | 5,551,755 | 11,285,289 | |||||||||
|
|
|
| |||||||||
Total United States | 422,973,232 | 601,738,163 | ||||||||||
|
|
|
| |||||||||
Total Common Stocks | 767,795,588 | 1,109,778,016 | ||||||||||
|
|
|
| |||||||||
| Principal Amount | ||||||||||||
| Short Term Investments (11.99%) | ||||||||||||
| $147,012,383 | Repurchase Agreement with Fixed Income Clearing Corp., dated 6/30/2020, 0.00% due 7/1/2020; Proceeds at maturity - $147,012,383; (Fully collateralized by $138,301,900 U.S. Treasury Note, 2.125% due 11/30/2024; Market value - $149,952,701) 2 | 147,012,383 | 147,012,383 | |||||||||
|
|
|
| |||||||||
Total Investments (102.50%) | $ | 914,807,971 | 1,256,790,399 | |||||||||
|
| |||||||||||
Liabilities Less Cash and Other Assets (-2.50%) | (30,695,119 | ) | ||||||||||
|
| |||||||||||
Net Assets | $ | 1,226,095,280 | ||||||||||
|
| |||||||||||
| | Retail Shares (Equivalent to $38.74 per share | $ | 494,201,953 | |||||||||
|
| |||||||||||
| | Institutional Shares (Equivalent to $39.38 per share | $ | 721,671,806 | |||||||||
|
| |||||||||||
| | R6 Shares (Equivalent to $39.40 per share | $ | 10,221,521 | |||||||||
|
| |||||||||||
| % | Represents percentage of net assets. |
| 1 | Non-income producing securities. |
| 2 | Level 2 security. See Note 7 regarding Fair Value Measurements. |
| ADR | American Depositary Receipt. |
| 144A | Security is exempt from registration pursuant to Rule 144A under the Securities Act of 1933. This security may be resold in transactions that are exempt from registration, normally to qualified institutional buyers. At June 30, 2020, the market value of Rule 144A securities amounted to $28,201,560 or 2.30% of net assets. |
All securities are Level 1, unless otherwise noted.
| Summary of Investments by Sector as of June 30, 2020 | Percentage of Net Assets | |||
Information Technology | 36.8 | % | ||
Consumer Discretionary | 26.1 | |||
Health Care | 19.2 | |||
Communication Services | 8.4 | |||
Cash and Cash Equivalents* | 9.5 | |||
| 100.0 | % | |||
| * | Includes short term investments. |
| See Notes to Financial Statements. | 29 |
| Baron Real Estate Income Fund | June 30, 2020 |
STATEMENT OF NET ASSETS (Unaudited)
JUNE 30, 2020
|
| Shares | Cost | Value | ||||||||||
| Common Stocks (96.71%) | ||||||||||||
| Consumer Discretionary (12.68%) | ||||||||||||
Casinos & Gaming (11.36%) |
| |||||||||||
| 3,317 | Las Vegas Sands Corp. | $ | 139,230 | $ | 151,056 | |||||||
| 737 | MGM Resorts International | 8,749 | 12,382 | |||||||||
| 6,205 | Penn National Gaming, Inc.1 | 46,150 | 189,501 | |||||||||
| 9,278 | Red Rock Resorts, Inc., Cl A | 97,527 | 101,223 | |||||||||
| 1,745 | Wynn Resorts Ltd. | 146,280 | 129,985 | |||||||||
|
|
|
| |||||||||
| 437,936 | 584,147 | |||||||||||
Hotels, Resorts & Cruise Lines (1.32%) |
| |||||||||||
| 6,071 | Extended Stay America, Inc. | 66,538 | 67,934 | |||||||||
|
|
|
| |||||||||
Total Consumer Discretionary | 504,474 | 652,081 | ||||||||||
|
|
|
| |||||||||
| Information Technology (7.22%) | ||||||||||||
Internet Services & |
| |||||||||||
| 4,661 | GDS Holdings Limited, ADR1,2 | 140,834 | 371,295 | |||||||||
|
|
|
| |||||||||
| Real Estate (74.27%) | ||||||||||||
Diversified REITs (1.71%) |
| |||||||||||
| 3,688 | STORE Capital Corp. | 85,916 | 87,811 | |||||||||
Hotel & Resort REITs (5.49%) |
| |||||||||||
| 5,356 | Host Hotels & Resorts, Inc. | 58,099 | 57,791 | |||||||||
| 5,852 | MGM Growth Properties LLC, Cl A | 165,409 | 159,233 | |||||||||
| 2,600 | Park Hotels & Resorts, Inc. | 21,092 | 25,714 | |||||||||
| 2,892 | Pebblebrook Hotel Trust | 31,087 | 39,505 | |||||||||
|
|
|
| |||||||||
| 275,687 | 282,243 | |||||||||||
Industrial REITs (13.36%) |
| |||||||||||
| 2,397 | Duke Realty Corp. | 63,862 | 84,830 | |||||||||
| 3,700 | Prologis, Inc. | 274,305 | 345,321 | |||||||||
| 4,856 | Rexford Industrial Realty, Inc. | 179,838 | 201,184 | |||||||||
| 1,060 | Terreno Realty Corp. | 53,516 | 55,798 | |||||||||
|
|
|
| |||||||||
| 571,521 | 687,133 | |||||||||||
Office REITs (2.22%) |
| |||||||||||
| 407 | Douglas Emmett, Inc. | 14,008 | 12,479 | |||||||||
| 788 | Kilroy Realty Corporation | 48,095 | 46,256 | |||||||||
| 1,131 | SL Green Realty Corp. | 57,043 | 55,747 | |||||||||
|
|
|
| |||||||||
| 119,146 | 114,482 | |||||||||||
Real Estate Operating |
| |||||||||||
| 4,485 | Brookfield Property Partners LP2 | 60,276 | 44,357 | |||||||||
Residential REITs (16.24%) |
| |||||||||||
| 5,668 | American Homes 4 Rent, Cl A | 154,245 | 152,469 | |||||||||
| 349 | AvalonBay Communities, Inc. | 56,334 | 53,970 | |||||||||
| 2,099 | Equity LifeStyle Properties, Inc. | 103,546 | 131,146 | |||||||||
| 876 | Equity Residential | 52,485 | 51,526 | |||||||||
| 205 | Essex Property Trust, Inc. | 50,442 | 46,980 | |||||||||
| 9,730 | Invitation Homes, Inc. | 235,374 | 267,867 | |||||||||
| 968 | Sun Communities, Inc. | 99,340 | 131,338 | |||||||||
|
|
|
| |||||||||
| 751,766 | 835,296 | |||||||||||
| Shares | Cost | Value | ||||||||||
| Common Stocks (continued) | ||||||||||||
| Real Estate (continued) | ||||||||||||
Specialized REITs (34.39%) |
| |||||||||||
| 1,089 | Alexandria Real Estate Equities, Inc.3 | $ | 142,107 | $ | 176,690 | |||||||
| 1,336 | American Tower Corp. | 257,200 | 345,410 | |||||||||
| 5,612 | Americold Realty Trust 3 | 114,199 | 203,716 | |||||||||
| 520 | CoreSite Realty Corp. | 55,287 | 62,951 | |||||||||
| 524 | Crown Castle International Corp. | 57,637 | 87,691 | |||||||||
| 866 | Digital Realty Trust, Inc. | 114,031 | 123,067 | |||||||||
| 415 | Equinix, Inc. | 181,789 | 291,455 | |||||||||
| 3,329 | Gaming and Leisure Properties, Inc. | 114,698 | 115,183 | |||||||||
| 9,663 | Jernigan Capital, Inc. | 151,085 | 132,190 | |||||||||
| 1,802 | QTS Realty Trust, Inc., Cl A | 76,160 | 115,490 | |||||||||
| 387 | SBA Communications Corp. | 101,982 | 115,295 | |||||||||
|
|
|
| |||||||||
| 1,366,175 | 1,769,138 | |||||||||||
|
|
|
| |||||||||
Total Real Estate | 3,230,487 | 3,820,460 | ||||||||||
|
|
|
| |||||||||
| Utilities (2.54%) | ||||||||||||
Multi-Utilities (2.54%) |
| |||||||||||
| 3,179 | Brookfield Infrastructure Partners L.P.2,3 | 116,789 | 130,688 | |||||||||
|
|
|
| |||||||||
Total Common Stocks | 3,992,584 | 4,974,524 | ||||||||||
|
|
|
| |||||||||
| Principal Amount | ||||||||||||
| Short Term Investments (3.24%) | ||||||||||||
| $166,726 | Repurchase Agreement with Fixed Income Clearing Corp., dated 6/30/2020, 0.00% due 7/1/2020; Proceeds at maturity - $166,726; (Fully collateralized by $158,000 U.S. Treasury Note, 1.625% due 2/15/2026; Market value - $170,075)4 | 166,726 | 166,726 | |||||||||
|
|
|
| |||||||||
Total Investments (99.95%) | $ | 4,159,310 | 5,141,250 | |||||||||
|
| |||||||||||
Cash and Other Assets Less Liabilities (0.05%) | 2,496 | |||||||||||
|
| |||||||||||
Net Assets | $ | 5,143,746 | ||||||||||
|
| |||||||||||
| | Retail Shares (Equivalent to $11.41 per share | $ | 1,542,527 | |||||||||
|
| |||||||||||
| | Institutional Shares (Equivalent to $11.45 per share | $ | 3,129,665 | |||||||||
|
| |||||||||||
| | R6 Shares (Equivalent to $11.44 per share | $ | 471,554 | |||||||||
|
| |||||||||||
| % | Represents percentage of net assets. |
| 1 | Non-income producing securities. |
| 2 | Foreign corporation. |
| 3 | The Adviser has reclassified/classified certain securities in or out of this sub-industry. Such reclassifications/classifications are not supported by S&P or MSCI (unaudited). |
| 4 | Level 2 security. See Note 7 regarding Fair Value Measurements. |
| ADR | American Depositary Receipt. |
All securities are Level 1, unless otherwise noted.
| 30 | See Notes to Financial Statements. |
| June 30, 2020 | Baron Health Care Fund |
STATEMENT OF NET ASSETS (Unaudited)
JUNE 30, 2020
|
| Shares | Cost | Value | ||||||||||
| Common Stocks (95.18%) | ||||||||||||
| Health Care (93.15%) | ||||||||||||
Biotechnology (22.17%) | ||||||||||||
| 5,801 | Acceleron Pharma, Inc.1 | $ | 299,004 | $ | 552,661 | |||||||
| 9,482 | Alector, Inc.1 | 197,310 | 231,740 | |||||||||
| 13,091 | Applied Therapeutics, Inc.1 | 543,934 | 473,240 | |||||||||
| 3,647 | argenx SE, ADR1,2 | 330,855 | 821,414 | |||||||||
| 9,553 | Arrowhead Pharmaceuticals, Inc.1 | 290,157 | 412,594 | |||||||||
| 5,375 | Biohaven Pharmaceutical Holding Co. Ltd.1,2 | 253,237 | 392,966 | |||||||||
| 6,405 | Dicerna Pharmaceuticals, Inc.1 | 146,618 | 162,687 | |||||||||
| 6,815 | Immunomedics, Inc.1 | 228,797 | 241,524 | |||||||||
| 1,000 | Moderna, Inc.1 | 52,676 | 64,210 | |||||||||
| 2,503 | Neurocrine Biosciences, Inc.1 | 228,639 | 305,366 | |||||||||
| 9,797 | PTC Therapeutics, Inc.1 | 481,719 | 497,100 | |||||||||
| 6,471 | Trillium Therapeutics, Inc.1,2 | 46,527 | 52,350 | |||||||||
| 3,045 | Vertex Pharmaceuticals Incorporated1 | 528,927 | 883,994 | |||||||||
| 5,975 | Zai Lab Limited, ADR1,2 | 177,482 | 490,727 | |||||||||
|
|
|
| |||||||||
| 3,805,882 | 5,582,573 | |||||||||||
Health Care Equipment (22.41%) | ||||||||||||
| 12,431 | Abbott Laboratories | 976,909 | 1,136,566 | |||||||||
| 8,391 | CryoPort, Inc.1 | 202,149 | 253,828 | |||||||||
| 1,232 | DexCom, Inc.1 | 169,322 | 499,453 | |||||||||
| 7,251 | Edwards Lifesciences Corp.1 | 445,177 | 501,117 | |||||||||
| 1,145 | IDEXX Laboratories, Inc.1 | 276,772 | 378,033 | |||||||||
| 2,164 | Inari Medical, Inc.1 | 41,116 | 104,824 | |||||||||
| 3,935 | Inspire Medical Systems, Inc.1,3 | 218,891 | 342,424 | |||||||||
| 1,685 | Insulet Corp.1 | 164,658 | 327,328 | |||||||||
| 1,111 | Intuitive Surgical, Inc.1 | 572,569 | 633,081 | |||||||||
| 900 | Masimo Corporation1 | 134,241 | 205,191 | |||||||||
| 5,500 | Shockwave Medical, Inc.1 | 251,625 | 260,535 | |||||||||
| 10,662 | Silk Road Medical, Inc.1,3 | 332,294 | 446,631 | |||||||||
| 1,525 | Teleflex, Inc. | 441,628 | 555,069 | |||||||||
|
|
|
| |||||||||
| 4,227,351 | 5,644,080 | |||||||||||
Health Care Supplies (2.98%) | ||||||||||||
| 1,216 | The Cooper Companies, Inc. | 336,835 | 344,906 | |||||||||
| 1,784 | West Pharmaceutical Services, Inc. | 286,973 | 405,272 | |||||||||
|
|
|
| |||||||||
| 623,808 | 750,178 | |||||||||||
Health Care Technology (5.01%) | ||||||||||||
| 10,819 | Schrödinger, Inc.1 | 183,923 | 990,696 | |||||||||
| 1,154 | Veeva Systems, Inc., Cl A1 | 169,480 | 270,520 | |||||||||
|
|
|
| |||||||||
| 353,403 | 1,261,216 | |||||||||||
Life Sciences Tools & | ||||||||||||
| 2,940 | 10X Genomics, Inc., Cl A1 | 174,156 | 262,571 | |||||||||
| 1,833 | Adaptive Biotechnologies Corporation1 | 45,881 | 88,681 | |||||||||
| 1,430 | Bio-Techne Corporation | 250,336 | 377,620 | |||||||||
| 4,554 | Guardant Health, Inc.1,3 | 311,307 | 369,466 | |||||||||
| 1,623 | ICON plc1,2 | 239,045 | 273,411 | |||||||||
| 837 | Illumina, Inc.1 | 233,233 | 309,983 | |||||||||
| 2,702 | IQVIA Holdings, Inc.1 | 384,015 | 383,360 | |||||||||
| 590 | Mettler-Toledo International, Inc.1 | 412,278 | 475,274 | |||||||||
| 2,312 | Thermo Fisher Scientific, Inc. | 688,262 | 837,730 | |||||||||
|
|
|
| |||||||||
| 2,738,513 | 3,378,096 | |||||||||||
Managed Health Care (10.45%) | ||||||||||||
| 4,065 | HealthEquity, Inc.1 | 265,538 | 238,494 | |||||||||
| 2,085 | Humana, Inc. | 631,705 | 808,459 | |||||||||
| 5,370 | UnitedHealth Group, Incorporated | 1,397,780 | 1,583,881 | |||||||||
|
|
|
| |||||||||
| 2,295,023 | 2,630,834 | |||||||||||
| Shares | Cost | Value | ||||||||||
| Common Stocks (continued) | ||||||||||||
| Health Care (continued) | ||||||||||||
Pharmaceuticals (16.72%) | ||||||||||||
| 21,588 | AstraZeneca PLC, ADR2 | $ | 910,929 | $ | 1,141,789 | |||||||
| 8,522 | Dechra Pharmaceuticals PLC (United Kingdom)2,4 | 271,963 | 300,168 | |||||||||
| 28,570 | Roche Holding AG, ADR2 | 1,133,549 | 1,239,367 | |||||||||
| 24,644 | Sanofi, ADR2 | 1,144,838 | 1,258,076 | |||||||||
| 1,978 | Zoetis, Inc. | 234,058 | 271,065 | |||||||||
|
|
|
| |||||||||
| 3,695,337 | 4,210,465 | |||||||||||
|
|
|
| |||||||||
Total Health Care | 17,739,317 | 23,457,442 | ||||||||||
|
|
|
| |||||||||
| Real Estate (2.03%) | ||||||||||||
Specialized REITs (2.03%) | ||||||||||||
| 3,149 | Alexandria Real Estate Equities, Inc.3 | 430,941 | 510,925 | |||||||||
|
|
|
| |||||||||
Total Common Stocks | 18,170,258 | 23,968,367 | ||||||||||
|
|
|
| |||||||||
| Principal Amount | ||||||||||||
| Short Term Investments (4.69%) | ||||||||||||
| $1,181,051 | Repurchase Agreement with Fixed Income Clearing Corp., dated 6/30/2020, 0.00% due 7/1/2020; Proceeds at maturity - $1,181,051; (Fully collateralized by $1,076,200 U.S. Treasury Note, 2.375% due 4/30/2026; Market value - $1,204,705)4 | 1,181,051 | 1,181,051 | |||||||||
|
|
|
| |||||||||
Total Investments (99.87%) | $ | 19,351,309 | 25,149,418 | |||||||||
|
| |||||||||||
Cash and Other Assets Less Liabilities (0.13%) | 31,879 | |||||||||||
|
| |||||||||||
Net Assets | $ | 25,181,297 | ||||||||||
|
| |||||||||||
| | Retail Shares (Equivalent to $14.52 per share | $ | 10,379,726 | |||||||||
|
| |||||||||||
| | Institutional Shares (Equivalent to $14.60 per share | $ | 11,210,404 | |||||||||
|
| |||||||||||
| | R6 Shares (Equivalent to $14.60 per share | $ | 3,591,167 | |||||||||
|
| |||||||||||
| % | Represents percentage of net assets. |
| 1 | Non-income producing securities. |
| 2 | Foreign corporation. |
| 3 | The Adviser has reclassified/classified certain securities in or out of this sub-industry. Such reclassifications/classifications are not supported by S&P or MSCI (unaudited). |
| 4 | Level 2 security. See Note 7 regarding Fair Value Measurements. |
| ADR | American Depositary Receipt. |
All securities are Level 1, unless otherwise noted.
| See Notes to Financial Statements. | 31 |
| Baron FinTech Fund | June 30, 2020 |
STATEMENT OF NET ASSETS (Unaudited)
JUNE 30, 2020
|
| Shares | Cost | Value | ||||||||||
| Common Stocks (95.14%) | ||||||||||||
| Communication Services (2.51%) | ||||||||||||
Interactive Media & Services (2.51%) | ||||||||||||
| 5,300 | ZoomInfo Technologies Inc., Cl A1 | $ | 157,406 | $ | 270,459 | |||||||
|
|
|
| |||||||||
| Consumer Discretionary (3.01%) | ||||||||||||
Internet & Direct Marketing Retail (3.01%) | ||||||||||||
| 1,500 | Alibaba Group Holding Limited, ADR 1,2 | 314,606 | 323,550 | |||||||||
|
|
|
| |||||||||
| Financials (20.06%) | ||||||||||||
Financial Exchanges & Data (16.89%) | ||||||||||||
| 830 | CME Group, Inc. | 162,116 | 134,908 | |||||||||
| 1,100 | London Stock Exchange Group plc | 110,985 | 114,395 | |||||||||
| 430 | MarketAxess Holdings, Inc. | 148,880 | 215,396 | |||||||||
| 1,500 | Moody’s Corp. | 373,602 | 412,095 | |||||||||
| 1,300 | MSCI, Inc. | 384,380 | 433,966 | |||||||||
| 1,480 | S&P Global, Inc. | 419,738 | 487,630 | |||||||||
| 300 | Tradeweb Markets, Inc., Cl A | 16,416 | 17,442 | |||||||||
|
|
|
| |||||||||
| 1,616,117 | 1,815,832 | |||||||||||
Investment Banking & Brokerage (0.83%) | ||||||||||||
| 1,600 | Houlihan Lokey, Inc. | 81,698 | 89,024 | |||||||||
Property & Casualty Insurance (2.34%) | ||||||||||||
| 1,620 | Kinsale Capital Group, Inc. | 166,008 | 251,440 | |||||||||
|
|
|
| |||||||||
Total Financials | 1,863,823 | 2,156,296 | ||||||||||
|
|
|
| |||||||||
| Industrials (10.21%) | ||||||||||||
Research & Consulting Services (10.21%) | ||||||||||||
| 260 | CoStar Group, Inc.1 | 170,124 | 184,775 | |||||||||
| 4,700 | IHS Markit Ltd.2 | 347,660 | 354,850 | |||||||||
| 3,400 | TransUnion | 305,263 | 295,936 | |||||||||
| 1,540 | Verisk Analytics, Inc. | 242,016 | 262,108 | |||||||||
|
|
|
| |||||||||
Total Industrials | 1,065,063 | 1,097,669 | ||||||||||
|
|
|
| |||||||||
| Information Technology (59.35%) | ||||||||||||
Application Software (10.38%) | ||||||||||||
| 800 | Bill.Com Holdings, Inc.1 | 40,354 | 72,168 | |||||||||
| 1,300 | Ceridian HCM Holding, Inc.1 | 91,826 | 103,051 | |||||||||
| 900 | Fair Isaac Corp.1 | 354,674 | 376,236 | |||||||||
| 1,700 | Guidewire Software, Inc.1 | 187,166 | 188,445 | |||||||||
| 1,270 | Intuit, Inc. | 346,044 | 376,161 | |||||||||
|
|
|
| |||||||||
| 1,020,064 | 1,116,061 | |||||||||||
Data Processing & Outsourced Services (37.21%) | ||||||||||||
| 400 | Adyen N.V., 144A (Netherlands)1,2 | 342,059 | 582,197 | |||||||||
| 3,900 | Fidelity National Information Services, Inc. | 555,176 | 522,951 | |||||||||
| 220 | FleetCor Technologies, Inc.1 | 63,477 | 55,337 | |||||||||
| 1,800 | Global Payments, Inc. | 340,235 | 305,316 | |||||||||
| 700 | I3 Verticals, Inc., Cl A1 | 23,131 | 21,175 | |||||||||
| 1,200 | Jack Henry & Associates, Inc. | 191,852 | 220,836 | |||||||||
| Shares | Cost | Value | ||||||||||
| Common Stocks (continued) | ||||||||||||
| Information Technology (continued) | ||||||||||||
Data Processing & Outsourced | ||||||||||||
| 1,870 | MasterCard Incorporated, Cl A | $ | 567,614 | $ | 552,959 | |||||||
| 15,000 | Network International Holdings plc, | 125,567 | 82,115 | |||||||||
| 3,550 | PayPal Holdings, Inc.1 | 402,907 | 618,516 | |||||||||
| 14,500 | Repay Holdings Corporation, Cl A1 | 225,698 | 357,135 | |||||||||
| 3,600 | Shift4 Payments, Inc., Cl A1 | 87,163 | 127,800 | |||||||||
| 2,870 | Visa, Inc., Cl A | 550,801 | 554,398 | |||||||||
|
|
|
| |||||||||
| 3,475,680 | 4,000,735 | |||||||||||
IT Consulting & Other Services (11.76%) | ||||||||||||
| 1,430 | Accenture plc, Cl A2 | 284,258 | 307,050 | |||||||||
| 9,900 | Endava plc, ADR1,2 | 460,890 | 478,170 | |||||||||
| 1,900 | EPAM Systems, Inc.1 | 412,600 | 478,819 | |||||||||
| 1,157,748 | 1,264,039 | |||||||||||
|
|
|
| |||||||||
Total Information Technology | 5,653,492 | 6,380,835 | ||||||||||
|
|
|
| |||||||||
Total Common Stocks | 9,054,390 | 10,228,809 | ||||||||||
|
|
|
| |||||||||
| Principal Amount | ||||||||||||
| Short Term Investments (4.76%) | ||||||||||||
| $511,623 | Repurchase Agreement with Fixed Income Clearing Corp., dated 6/30/2020, 0.00% due 7/1/2020; Proceeds at maturity - $511,623; (Fully collateralized by $466,200 U.S. Treasury Note, 2.375% due 4/30/2026; Market value - $521,867)3 | 511,623 | 511,623 | |||||||||
|
|
|
| |||||||||
Total Investments (99.90%) | $ | 9,566,013 | 10,740,432 | |||||||||
|
| |||||||||||
Cash and Other Assets Less Liabilities (0.10%) | 10,973 | |||||||||||
|
| |||||||||||
Net Assets | $ | 10,751,405 | ||||||||||
|
| |||||||||||
| | Retail Shares (Equivalent to $11.54 per share | $ | 3,057,324 | |||||||||
|
| |||||||||||
| | Institutional Shares (Equivalent to $11.55 per share | $ | 5,440,773 | |||||||||
|
| |||||||||||
| | R6 Shares (Equivalent to $11.55 per share | $ | 2,253,308 | |||||||||
|
| |||||||||||
| % | Represents percentage of net assets. |
| 1 | Non-income producing securities. |
| 2 | Foreign corporation. |
| 3 | Level 2 security. See Note 7 regarding Fair Value Measurements. |
| ADR | American Depositary Receipt. |
| 144A | Security is exempt from registration pursuant to Rule 144A under the Securities Act of 1933. This security may be resold in transactions that are exempt from registration, normally to qualified institutional buyers. At June 30, 2020, the market value of Rule 144A securities amounted to $664,312 or 6.18% of net assets. |
All securities are Level 1, unless otherwise noted.
| 32 | See Notes to Financial Statements. |
| June 30, 2020 | Baron Select Funds |
STATEMENTS OF ASSETS AND LIABILITIES (Unaudited)
JUNE 30, 2020
|
| Baron Partners Fund | Baron Focused Growth Fund | Baron International Growth Fund | Baron Real Estate Fund | |||||||||||||
Assets: | ||||||||||||||||
Investments in securities, at value* | $ | 4,037,027,696 | $ | 318,238,400 | $ | 314,404,061 | $ | 597,846,622 | ||||||||
Repurchase agreements, at value** | 188,737 | 8,480,477 | 12,644,314 | 30,841,713 | ||||||||||||
|
|
|
|
|
|
|
| |||||||||
Total investments, at value | 4,037,216,433 | 326,718,877 | 327,048,375 | 628,688,335 | ||||||||||||
Foreign currency, at value† | — | — | 6 | — | ||||||||||||
Cash | 142,780 | — | 4,507 | 73,687 | ||||||||||||
Receivable for shares sold | 6,150,965 | 62,584 | 294,120 | 1,234,924 | ||||||||||||
Receivable for securities sold | — | — | 3,115,344 | — | ||||||||||||
Dividends and interest receivable | 295,200 | 24,150 | 279,499 | 643,747 | ||||||||||||
Prepaid expenses | 157,749 | 1,774 | 1,921 | 3,758 | ||||||||||||
Due from investment adviser | — | — | — | — | ||||||||||||
Other assets | — | — | — | — | ||||||||||||
|
|
|
|
|
|
|
| |||||||||
| 4,043,963,127 | 326,807,385 | 330,743,772 | 630,644,451 | |||||||||||||
|
|
|
|
|
|
|
| |||||||||
Liabilities: | ||||||||||||||||
Payable for borrowings against line of credit | 737,000,000 | — | — | — | ||||||||||||
Payable for shares redeemed | 2,545,936 | 8,112 | 976,425 | 672,032 | ||||||||||||
Payable for securities purchased | — | — | 1,365,814 | 3,993,196 | ||||||||||||
Investment advisory fees payable (Note 4) | 201 | 63 | 820 | 872 | ||||||||||||
Distribution fees payable (Note 4) | 125 | 79 | 205 | 71 | ||||||||||||
Due to custodian bank | — | — | — | — | ||||||||||||
Accrued expenses and other payables | 879,006 | 75,224 | 188,833 | 141,553 | ||||||||||||
|
|
|
|
|
|
|
| |||||||||
| 740,425,268 | 83,478 | 2,532,097 | 4,807,724 | |||||||||||||
|
|
|
|
|
|
|
| |||||||||
Net Assets | $ | 3,303,537,859 | $ | 326,723,907 | $ | 328,211,675 | $ | 625,836,727 | ||||||||
|
|
|
|
|
|
|
| |||||||||
Net Assets consist of: | ||||||||||||||||
Paid-in capital | $ | 852,961,377 | $ | 132,920,989 | $ | 269,715,933 | $ | 374,955,871 | ||||||||
Distributable earnings/(losses) | 2,450,576,482 | 193,802,918 | 58,495,742 | 250,880,856 | ||||||||||||
|
|
|
|
|
|
|
| |||||||||
Net Assets | $ | 3,303,537,859 | $ | 326,723,907 | $ | 328,211,675 | $ | 625,836,727 | ||||||||
|
|
|
|
|
|
|
| |||||||||
Retail Shares: | ||||||||||||||||
Net Assets | $ | 1,582,769,538 | $ | 66,683,382 | $ | 57,778,522 | $ | 225,916,902 | ||||||||
Shares Outstanding ($0.01 par value; indefinite shares authorized) | 19,365,062 | 2,824,639 | 2,342,830 | 8,301,860 | ||||||||||||
|
|
|
|
|
|
|
| |||||||||
Net Asset Value and Offering Price Per Share | $ | 81.73 | $ | 23.61 | $ | 24.66 | $ | 27.21 | ||||||||
|
|
|
|
|
|
|
| |||||||||
Institutional Shares: | ||||||||||||||||
Net Assets | $ | 1,499,338,867 | $ | 117,142,377 | $ | 253,280,508 | $ | 386,375,324 | ||||||||
Shares Outstanding ($0.01 par value; indefinite shares authorized) | 17,861,804 | 4,838,779 | 10,102,182 | 13,910,758 | ||||||||||||
|
|
|
|
|
|
|
| |||||||||
Net Asset Value and Offering Price Per Share | $ | 83.94 | $ | 24.21 | $ | 25.07 | $ | 27.78 | ||||||||
|
|
|
|
|
|
|
| |||||||||
R6 Shares: | ||||||||||||||||
Net Assets | $ | 221,429,454 | $ | 142,898,148 | $ | 17,152,645 | $ | 13,544,501 | ||||||||
Shares Outstanding ($0.01 par value; indefinite shares authorized) | 2,637,980 | 5,899,519 | 684,112 | 487,620 | ||||||||||||
|
|
|
|
|
|
|
| |||||||||
Net Asset Value and Offering Price Per Share | $ | 83.94 | $ | 24.22 | $ | 25.07 | $ | 27.78 | ||||||||
|
|
|
|
|
|
|
| |||||||||
*Investments in securities, at cost | $ | 1,610,813,353 | $ | 121,332,537 | $ | 237,675,582 | $ | 385,539,979 | ||||||||
**Repurchase agreements, at cost | 188,737 | 8,480,477 | 12,644,314 | 30,841,713 | ||||||||||||
|
|
|
|
|
|
|
| |||||||||
Total investments, at cost | $ | 1,611,002,090 | $ | 129,813,014 | $ | 250,319,896 | $ | 416,381,692 | ||||||||
|
|
|
|
|
|
|
| |||||||||
†Foreign currency, at cost: | $ | — | $ | — | $ | 6 | $ | — | ||||||||
|
|
|
|
|
|
|
| |||||||||
| See Notes to Financial Statements. | 33 |
| Baron Select Funds | June 30, 2020 |
STATEMENTS OF ASSETS AND LIABILITIES (Unaudited) (Continued)
JUNE 30, 2020
|
| Baron Emerging Markets Fund | Baron Global Advantage Fund | Baron Real Estate Income Fund | Baron Health Care Fund | Baron FinTech Fund | ||||||||||||||||
Assets: | ||||||||||||||||||||
Investments in securities, at value* | $ | 4,642,637,682 | $ | 1,109,778,016 | $ | 4,974,524 | $ | 23,968,367 | $ | 10,228,809 | ||||||||||
Repurchase agreements, at value** | 132,430,449 | 147,012,383 | 166,726 | 1,181,051 | 511,623 | |||||||||||||||
|
|
|
|
|
|
|
|
|
| |||||||||||
Total investments, at value | 4,775,068,131 | 1,256,790,399 | 5,141,250 | 25,149,418 | 10,740,432 | |||||||||||||||
Foreign currency, at value† | 438,153 | — | — | — | 680 | |||||||||||||||
Cash | — | — | 12,315 | — | 13,384 | |||||||||||||||
Receivable for shares sold | 40,670,021 | 9,483,101 | 62,810 | 156,259 | 37,163 | |||||||||||||||
Receivable for securities sold | 16,804,953 | — | 9,799 | — | — | |||||||||||||||
Dividends and interest receivable | 5,187,075 | 24,118 | 16,899 | 5,215 | — | |||||||||||||||
Prepaid expenses | 31,604 | 3,140 | 29 | 98 | 26,785 | |||||||||||||||
Due from investment adviser | — | — | 2 | 10 | — | |||||||||||||||
Other assets | 399,246 | — | — | — | — | |||||||||||||||
|
|
|
|
|
|
|
|
|
| |||||||||||
| 4,838,599,183 | 1,266,300,758 | 5,243,104 | 25,311,000 | 10,818,444 | ||||||||||||||||
|
|
|
|
|
|
|
|
|
| |||||||||||
Liabilities: | ||||||||||||||||||||
Payable for borrowings against line of credit | — | — | — | — | — | |||||||||||||||
Payable for shares redeemed | 7,639,562 | 1,058,808 | 3,442 | 4,135 | — | |||||||||||||||
Payable for securities purchased | 1,759,246 | 39,022,081 | 23,891 | 53,461 | — | |||||||||||||||
Investment advisory fees payable (Note 4) | 936 | 555 | — | — | — | |||||||||||||||
Distribution fees payable (Note 4) | 904 | 514 | 54 | 944 | 827 | |||||||||||||||
Due to custodian bank | — | — | — | 1,915 | — | |||||||||||||||
Accrued expenses and other payables | 1,664,314 | 123,520 | 71,971 | 69,248 | 66,212 | |||||||||||||||
|
|
|
|
|
|
|
|
|
| |||||||||||
| 11,064,962 | 40,205,478 | 99,358 | 129,703 | 67,039 | ||||||||||||||||
|
|
|
|
|
|
|
|
|
| |||||||||||
Net Assets | $ | 4,827,534,221 | $ | 1,226,095,280 | $ | 5,143,746 | $ | 25,181,297 | $ | 10,751,405 | ||||||||||
|
|
|
|
|
|
|
|
|
| |||||||||||
Net Assets consist of: | ||||||||||||||||||||
Paid-in capital | $ | 4,494,965,143 | $ | 912,139,853 | $ | 4,559,617 | $ | 19,409,493 | $ | 9,741,375 | ||||||||||
Distributable earnings/(losses) | 332,569,078 | 313,955,427 | 584,129 | 5,771,804 | 1,010,030 | |||||||||||||||
|
|
|
|
|
|
|
|
|
| |||||||||||
Net Assets | $ | 4,827,534,221 | $ | 1,226,095,280 | $ | 5,143,746 | $ | 25,181,297 | $ | 10,751,405 | ||||||||||
|
|
|
|
|
|
|
|
|
| |||||||||||
Retail Shares: | ||||||||||||||||||||
Net Assets | $ | 454,634,868 | $ | 494,201,953 | $ | 1,542,527 | $ | 10,379,726 | $ | 3,057,324 | ||||||||||
Shares Outstanding ($0.01 par value; indefinite shares authorized) | 32,560,091 | 12,756,201 | 135,224 | 714,616 | 265,041 | |||||||||||||||
|
|
|
|
|
|
|
|
|
| |||||||||||
Net Asset Value and Offering Price Per Share | $ | 13.96 | $ | 38.74 | $ | 11.41 | $ | 14.52 | $ | 11.54 | ||||||||||
|
|
|
|
|
|
|
|
|
| |||||||||||
Institutional Shares: | ||||||||||||||||||||
Net Assets | $ | 4,362,788,961 | $ | 721,671,806 | $ | 3,129,665 | $ | 11,210,404 | $ | 5,440,773 | ||||||||||
Shares Outstanding ($0.01 par value; indefinite shares authorized) | 311,512,519 | 18,324,849 | 273,309 | 767,626 | 471,178 | |||||||||||||||
|
|
|
|
|
|
|
|
|
| |||||||||||
Net Asset Value and Offering Price Per Share | $ | 14.01 | $ | 39.38 | $ | 11.45 | $ | 14.60 | $ | 11.55 | ||||||||||
|
|
|
|
|
|
|
|
|
| |||||||||||
R6 Shares: | ||||||||||||||||||||
Net Assets | $ | 10,110,392 | $ | 10,221,521 | $ | 471,554 | $ | 3,591,167 | $ | 2,253,308 | ||||||||||
Shares Outstanding ($0.01 par value; indefinite shares authorized) | 721,471 | 259,398 | 41,208 | 245,959 | 195,121 | |||||||||||||||
|
|
|
|
|
|
|
|
|
| |||||||||||
Net Asset Value and Offering Price Per Share | $ | 14.01 | $ | 39.40 | $ | 11.44 | $ | 14.60 | $ | 11.55 | ||||||||||
|
|
|
|
|
|
|
|
|
| |||||||||||
*Investments in securities, at cost | $ | 3,589,565,755 | $ | 767,795,588 | $ | 3,992,584 | $ | 18,170,258 | $ | 9,054,390 | ||||||||||
**Repurchase agreements, at cost | 132,430,449 | 147,012,383 | 166,726 | 1,181,051 | 511,623 | |||||||||||||||
|
|
|
|
|
|
|
|
|
| |||||||||||
Total investments, at cost | $ | 3,721,996,204 | $ | 914,807,971 | $ | 4,159,310 | $ | 19,351,309 | $ | 9,566,013 | ||||||||||
|
|
|
|
|
|
|
|
|
| |||||||||||
†Foreign currency, at cost: | $ | 438,314 | $ | — | $ | — | $ | — | $ | 677 | ||||||||||
|
|
|
|
|
|
|
|
|
| |||||||||||
| 34 | See Notes to Financial Statements. |
| June 30, 2020 | Baron Select Funds |
STATEMENTS OF OPERATIONS (Unaudited)
FOR THE SIX MONTHS ENDED JUNE 30, 2020
|
| Baron Partners Fund | Baron Focused Growth Fund | Baron International Growth Fund | Baron Real Estate Fund | |||||||||||||
Investment income: | ||||||||||||||||
Income: | ||||||||||||||||
Dividends — Unaffiliated investments | $ | 9,159,397 | $ | 574,609 | $ | 1,627,276 | $ | 3,522,309 | ||||||||
Interest | 337 | 13,216 | 9,832 | 32,713 | ||||||||||||
Securities lending income, net | 208,363 | — | — | — | ||||||||||||
Foreign taxes withheld on dividends | (52,196 | ) | — | (130,572 | ) | (25,629 | ) | |||||||||
|
|
|
|
|
|
|
| |||||||||
Total income | 9,315,901 | 587,825 | 1,506,536 | 3,529,393 | ||||||||||||
|
|
|
|
|
|
|
| |||||||||
Expenses: | ||||||||||||||||
Investment advisory fees (Note 4) | 14,155,559 | 1,392,148 | 1,321,954 | 2,848,547 | ||||||||||||
Distribution fees — Retail Shares (Note 4) | 1,742,143 | 67,147 | 79,556 | 275,664 | ||||||||||||
Shareholder servicing agent fees and expenses — Retail Shares | 79,760 | 11,494 | 10,878 | 21,883 | ||||||||||||
Shareholder servicing agent fees and expenses — Institutional Shares | 34,740 | 6,921 | 10,232 | 14,749 | ||||||||||||
Shareholder servicing agent fees and expenses — R6 Shares | 4,281 | 2,796 | 358 | 278 | ||||||||||||
Line of credit fees | 247,950 | 1,006 | 1,134 | 2,053 | ||||||||||||
Reports to shareholders | 179,647 | 6,174 | 36,364 | 72,192 | ||||||||||||
Trustee fees and expenses (Note 4) | 100,983 | 9,890 | 11,044 | 20,948 | ||||||||||||
Registration and filing fees | 85,310 | 42,840 | 42,600 | 30,030 | ||||||||||||
Professional fees | 57,960 | 28,015 | 25,509 | 26,694 | ||||||||||||
Custodian and fund accounting fees | 46,597 | 8,228 | 103,962 | 32,112 | ||||||||||||
Administration fees | 26,871 | 22,664 | 22,761 | 23,298 | ||||||||||||
Insurance expense | 14,167 | 1,435 | 1,588 | 3,192 | ||||||||||||
Miscellaneous expenses | 2,157 | 2,157 | 2,157 | 2,157 | ||||||||||||
|
|
|
|
|
|
|
| |||||||||
Total operating expenses | 16,778,125 | 1,602,915 | 1,670,097 | 3,373,797 | ||||||||||||
|
|
|
|
|
|
|
| |||||||||
Interest expense on borrowings | 6,217,531 | — | — | — | ||||||||||||
|
|
|
|
|
|
|
| |||||||||
Total expenses | 22,995,656 | 1,602,915 | 1,670,097 | 3,373,797 | ||||||||||||
Reimbursement of expenses by Adviser — Retail Shares (Note 4) | — | (8,582 | ) | (38,160 | ) | — | ||||||||||
Reimbursement of expenses by Adviser — Institutional Shares (Note 4) | — | (849 | ) | (117,321 | ) | — | ||||||||||
Reimbursement of expenses by Adviser — R6 Shares (Note 4) | — | — | (7,827 | ) | — | |||||||||||
|
|
|
|
|
|
|
| |||||||||
Net expenses | 22,995,656 | 1,593,484 | 1,506,789 | 3,373,797 | ||||||||||||
|
|
|
|
|
|
|
| |||||||||
Net investment income (loss) | (13,679,755 | ) | (1,005,659 | ) | (253 | ) | 155,596 | |||||||||
|
|
|
|
|
|
|
| |||||||||
Realized and unrealized gain (loss) on investments: | ||||||||||||||||
Net realized gain (loss) on investments sold — Unaffiliated investments | 27,342,953 | (5,608,696 | ) | (7,193,100 | ) | 26,418,581 | ||||||||||
Net realized gain (loss) on investments sold — “Affiliated” investments | — | — | — | — | ||||||||||||
Net realized gain (loss) on foreign currency transactions | (47,591 | ) | (880 | ) | (28,409 | ) | (27,375 | ) | ||||||||
Change in net unrealized appreciation (depreciation) of: | ||||||||||||||||
Investments — Unaffiliated investments | 499,834,000 | 52,125,439 | 5,576,471 | 1 | (11,442,980 | ) | ||||||||||
Investments — “Affiliated” investments | — | — | — | — | ||||||||||||
Foreign currency translations | — | — | 130 | — | ||||||||||||
|
|
|
|
|
|
|
| |||||||||
Net gain (loss) on investments | 527,129,362 | 46,515,863 | (1,644,908 | ) | 14,948,226 | |||||||||||
|
|
|
|
|
|
|
| |||||||||
Net increase (decrease) in net assets resulting from operations | $ | 513,449,607 | $ | 45,510,204 | $ | (1,645,161 | ) | $ | 15,103,822 | |||||||
|
|
|
|
|
|
|
| |||||||||
| 1 | Decrease in accrued foreign capital gains tax payable of $40,323. |
| See Notes to Financial Statements. | 35 |
| Baron Select Funds | June 30, 2020 |
STATEMENTS OF OPERATIONS (Unaudited) (Continued)
FOR THE SIX MONTHS ENDED JUNE 30, 2020
|
| Baron Emerging Markets Fund | Baron Global Advantage Fund | Baron Real Estate Income Fund | Baron Health Care Fund | Baron FinTech Fund | ||||||||||||||||
Investment income: | ||||||||||||||||||||
Income: | ||||||||||||||||||||
Dividends — Unaffiliated investments | $ | 26,074,458 | $ | 168,323 | $ | 55,272 | $ | 97,079 | $ | 18,252 | ||||||||||
Interest | 109,296 | 37,444 | 218 | 905 | 591 | |||||||||||||||
Securities lending income, net | — | 340,935 | — | — | — | |||||||||||||||
Foreign taxes withheld on dividends | (2,994,490 | ) | (10,891 | ) | — | (12,034 | ) | — | ||||||||||||
|
|
|
|
|
|
|
|
|
| |||||||||||
Total income | 23,189,264 | 535,811 | 55,490 | 85,950 | 18,843 | |||||||||||||||
|
|
|
|
|
|
|
|
|
| |||||||||||
Expenses: | ||||||||||||||||||||
Investment advisory fees (Note 4) | 22,632,510 | 2,739,751 | 17,871 | 68,800 | 29,751 | |||||||||||||||
Distribution fees — Retail Shares (Note 4) | 672,710 | 335,777 | 1,926 | 8,513 | 2,827 | |||||||||||||||
Shareholder servicing agent fees and expenses — Retail Shares | 32,492 | 18,031 | 6,535 | 7,310 | 6,617 | |||||||||||||||
Shareholder servicing agent fees and expenses — Institutional Shares | 83,300 | 25,128 | 5,020 | 5,209 | 5,057 | |||||||||||||||
Shareholder servicing agent fees and expenses — R6 Shares | 208 | 178 | 10 | 56 | 29 | |||||||||||||||
Line of credit fees | 17,000 | 2,224 | 19 | 71 | 40 | |||||||||||||||
Reports to shareholders | 443,013 | 62,813 | 669 | 939 | 1,822 | |||||||||||||||
Trustee fees and expenses (Note 4) | 172,117 | 19,245 | 171 | 616 | 247 | |||||||||||||||
Registration and filing fees | 128,150 | 110,530 | 24,138 | 47,996 | 44,320 | |||||||||||||||
Professional fees | 101,175 | 28,211 | 24,012 | 24,400 | 22,177 | |||||||||||||||
Custodian and fund accounting fees | 1,306,709 | 31,866 | 8,416 | 2,800 | 10,891 | |||||||||||||||
Administration fees | 30,720 | 22,976 | 22,259 | 22,256 | 22,291 | |||||||||||||||
Insurance expense | 26,573 | 1,730 | 25 | 69 | 70 | |||||||||||||||
Miscellaneous expenses | 2,157 | 2,778 | 2,156 | 2,157 | 2,274 | |||||||||||||||
|
|
|
|
|
|
|
|
|
| |||||||||||
Total operating expenses | 25,648,834 | 3,401,238 | 113,227 | 191,192 | 148,413 | |||||||||||||||
|
|
|
|
|
|
|
|
|
| |||||||||||
Interest expense on borrowings | — | — | — | — | — | |||||||||||||||
|
|
|
|
|
|
|
|
|
| |||||||||||
Total expenses | 25,648,834 | 3,401,238 | 113,227 | 191,192 | 148,413 | |||||||||||||||
Reimbursement of expenses by Adviser — Retail Shares (Note 4) | — | (67,164 | ) | (32,754 | ) | (41,384 | ) | (36,995 | ) | |||||||||||
Reimbursement of expenses by Adviser — Institutional Shares (Note 4) | — | (95,656 | ) | (51,971 | ) | (49,810 | ) | (57,452 | ) | |||||||||||
Reimbursement of expenses by Adviser — R6 Shares (Note 4) | — | (1,437 | ) | (7,514 | ) | (13,511 | ) | (15,810 | ) | |||||||||||
|
|
|
|
|
|
|
|
|
| |||||||||||
Net expenses | 25,648,834 | 3,236,981 | 20,988 | 86,487 | 38,156 | |||||||||||||||
|
|
|
|
|
|
|
|
|
| |||||||||||
Net investment income (loss) | (2,459,570 | ) | (2,701,170 | ) | 34,502 | (537 | ) | (19,313 | ) | |||||||||||
|
|
|
|
|
|
|
|
|
| |||||||||||
Realized and unrealized gain (loss) on investments: | ||||||||||||||||||||
Net realized gain (loss) on investments sold — Unaffiliated investments | (305,864,032 | )1 | (12,129,883 | ) | (179,587 | ) | 48,646 | (146,032 | ) | |||||||||||
Net realized gain (loss) on investments sold — “Affiliated” investments | (9,605,275 | ) | — | — | — | — | ||||||||||||||
Net realized gain (loss) on foreign currency transactions | (2,490,748 | ) | (37,952 | ) | (26 | ) | (239 | ) | 953 | |||||||||||
Change in net unrealized appreciation (depreciation) of: | ||||||||||||||||||||
Investments — Unaffiliated investments | (60,927,157 | ) | 264,735,300 | 2 | 78,962 | 3,014,490 | 1,174,419 | |||||||||||||
Investments — “Affiliated” investments | 9,105,404 | — | — | — | — | |||||||||||||||
Foreign currency translations | (26,662 | ) | 4,592 | — | — | 3 | ||||||||||||||
|
|
|
|
|
|
|
|
|
| |||||||||||
Net gain (loss) on investments | (369,808,470 | ) | 252,572,057 | (100,651 | ) | 3,062,897 | 1,029,343 | |||||||||||||
|
|
|
|
|
|
|
|
|
| |||||||||||
Net increase (decrease) in net assets resulting from operations | $ | (372,268,040 | ) | $ | 249,870,887 | $ | (66,149 | ) | $ | 3,062,360 | $ | 1,010,030 | ||||||||
|
|
|
|
|
|
|
|
|
| |||||||||||
| 1 | Net of realized foreign capital gains tax of $(367,009). |
| 2 | Decrease in accrued foreign capital gains tax payable of $149,209. |
| 36 | See Notes to Financial Statements. |
| June 30, 2020 | Baron Select Funds |
STATEMENTS OF CHANGES IN NET ASSETS (Unaudited)
| Baron Partners Fund | Baron Focused Growth Fund | Baron International Growth Fund | ||||||||||||||||||||||
| For the Six Months Ended June 30, 2020 | For the Year Ended December 31, 2019 | For the Six Months Ended June 30, 2020 | For the Year Ended December 31, 2019 | For the Six Months Ended June 30, 2020 | For the Year Ended December 31, 2019 | |||||||||||||||||||
Increase (Decrease) in Net Assets: | ||||||||||||||||||||||||
Operations: | ||||||||||||||||||||||||
Net investment income (loss) | $ | (13,679,755 | ) | $ | (27,282,389 | ) | $ | (1,005,659 | ) | $ | (1,056,594 | ) | $ | (253 | ) | $ | 613,714 | |||||||
Net realized gain (loss) | 27,295,362 | 42,371,737 | (5,609,576 | ) | 9,264,307 | (7,221,509 | ) | (7,867,660 | ) | |||||||||||||||
Change in net unrealized appreciation (depreciation) | 499,834,000 | 851,397,373 | 52,125,439 | 53,073,399 | 5,576,601 | 75,945,986 | ||||||||||||||||||
|
|
|
|
|
|
|
|
|
|
|
| |||||||||||||
Increase (decrease) in net assets resulting from operations | 513,449,607 | 866,486,721 | 45,510,204 | 61,281,112 | (1,645,161 | ) | 68,692,040 | |||||||||||||||||
|
|
|
|
|
|
|
|
|
|
|
| |||||||||||||
Distributions to shareholders from: | ||||||||||||||||||||||||
Distributable earnings — Retail Shares | — | (3,617,885 | ) | — | (856,916 | ) | — | (66,199 | ) | |||||||||||||||
Distributable earnings — Institutional Shares | — | (3,010,801 | ) | — | (1,561,032 | ) | — | (660,211 | ) | |||||||||||||||
Distributable earnings — R6 Shares | — | (475,654 | ) | — | (2,082,253 | ) | — | (53,273 | ) | |||||||||||||||
Return of capital — Retail Shares | — | — | — | — | — | — | ||||||||||||||||||
Return of capital — Institutional Shares | — | — | — | — | — | — | ||||||||||||||||||
Return of capital — R6 Shares | — | — | — | — | — | — | ||||||||||||||||||
|
|
|
|
|
|
|
|
|
|
|
| |||||||||||||
Decrease in net assets from distributions to shareholders | — | (7,104,340 | ) | — | (4,500,201 | ) | — | (779,683 | ) | |||||||||||||||
|
|
|
|
|
|
|
|
|
|
|
| |||||||||||||
Capital share transactions: | ||||||||||||||||||||||||
Proceeds from the sale of shares — Retail Shares | 222,714,509 | 90,037,627 | 17,238,843 | 1,825,164 | 10,220,191 | 27,933,618 | ||||||||||||||||||
Proceeds from the sale of shares — Institutional Shares | 278,360,303 | 169,666,596 | 18,238,634 | 8,892,431 | 75,335,732 | 83,222,467 | ||||||||||||||||||
Proceeds from the sale of shares — R6 Shares | 1,647,729 | 7,484,712 | 45,000 | 1,702,046 | 288,924 | 2,096,562 | ||||||||||||||||||
Net asset value of shares issued in reinvestment of distributions — Retail Shares | — | 3,525,745 | — | 835,103 | — | 65,385 | ||||||||||||||||||
Net asset value of shares issued in reinvestment of distributions — Institutional Shares | — | 2,734,753 | — | 1,545,091 | — | 628,802 | ||||||||||||||||||
Net asset value of shares issues in reinvestment of distributions — R6 Shares | — | 475,654 | — | 2,082,253 | — | 53,273 | ||||||||||||||||||
Cost of shares redeemed — Retail Shares | (240,898,083 | ) | (192,661,119 | ) | (8,393,959 | ) | (5,363,028 | ) | (28,589,971 | ) | (23,715,267 | ) | ||||||||||||
Cost of shares redeemed — Institutional Shares | (197,557,700 | ) | (167,386,058 | ) | (8,298,571 | ) | (9,547,252 | ) | (49,777,753 | ) | (60,613,362 | ) | ||||||||||||
Cost of shares redeemed — R6 Shares | (1,700,155 | ) | (896,215 | ) | (10,216 | ) | (164,500 | ) | (876,391 | ) | (775,985 | ) | ||||||||||||
|
|
|
|
|
|
|
|
|
|
|
| |||||||||||||
Increase (decrease) in net assets derived from capital share transactions | 62,566,603 | (87,018,305 | ) | 18,819,731 | 1,807,308 | 6,600,732 | 28,895,493 | |||||||||||||||||
|
|
|
|
|
|
|
|
|
|
|
| |||||||||||||
Net increase (decrease) in net assets | 576,016,210 | 772,364,076 | 64,329,935 | 58,588,219 | 4,955,571 | 96,807,850 | ||||||||||||||||||
|
|
|
|
|
|
|
|
|
|
|
| |||||||||||||
Net Assets: | ||||||||||||||||||||||||
Beginning of period | 2,727,521,649 | 1,955,157,573 | 262,393,972 | 203,805,753 | 323,256,104 | 226,448,254 | ||||||||||||||||||
|
|
|
|
|
|
|
|
|
|
|
| |||||||||||||
End of period | $ | 3,303,537,859 | $ | 2,727,521,649 | $ | 326,723,907 | $ | 262,393,972 | $ | 328,211,675 | $ | 323,256,104 | ||||||||||||
|
|
|
|
|
|
|
|
|
|
|
| |||||||||||||
Capital share transactions — Retail Shares | ||||||||||||||||||||||||
Shares sold | 3,260,671 | 1,548,458 | 804,694 | 100,539 | 454,707 | 1,265,303 | ||||||||||||||||||
Shares issued in reinvestment of distributions | — | 60,455 | — | 43,586 | — | 2,810 | ||||||||||||||||||
Shares redeemed | (3,500,184 | ) | (3,279,145 | ) | (412,594 | ) | (296,123 | ) | (1,460,115 | ) | (1,067,849 | ) | ||||||||||||
|
|
|
|
|
|
|
|
|
|
|
| |||||||||||||
Net increase (decrease) | (239,513 | ) | (1,670,232 | ) | 392,100 | (151,998 | ) | (1,005,408 | ) | 200,264 | ||||||||||||||
|
|
|
|
|
|
|
|
|
|
|
| |||||||||||||
Capital share transactions — Institutional Shares | ||||||||||||||||||||||||
Shares sold | 3,985,768 | 2,827,777 | 817,364 | 487,896 | 3,426,076 | 3,678,242 | ||||||||||||||||||
Shares issued in reinvestment of distributions | — | 45,762 | — | 78,751 | — | 26,538 | ||||||||||||||||||
Shares redeemed | (2,883,939 | ) | (2,807,163 | ) | (397,124 | ) | (530,047 | ) | (2,308,530 | ) | (2,713,113 | ) | ||||||||||||
|
|
|
|
|
|
|
|
|
|
|
| |||||||||||||
Net increase (decrease) | 1,101,829 | 66,376 | 420,240 | 36,600 | 1,117,546 | 991,667 | ||||||||||||||||||
|
|
|
|
|
|
|
|
|
|
|
| |||||||||||||
Capital share transactions — R6 Shares | ||||||||||||||||||||||||
Shares sold | 22,124 | 121,486 | 1,915 | 94,945 | 13,733 | 97,848 | ||||||||||||||||||
Shares issued in reinvestment of dividends | — | 7,958 | — | 106,075 | — | 2,249 | ||||||||||||||||||
Shares redeemed | (24,165 | ) | (13,736 | ) | (469 | ) | (8,493 | ) | (40,351 | ) | (34,481 | ) | ||||||||||||
|
|
|
|
|
|
|
|
|
|
|
| |||||||||||||
Net increase (decrease) | (2,041 | ) | 115,708 | 1,446 | 192,527 | (26,618 | ) | 65,616 | ||||||||||||||||
|
|
|
|
|
|
|
|
|
|
|
| |||||||||||||
| See Notes to Financial Statements. | 37 |
| Baron Select Funds | June 30, 2020 |
STATEMENTS OF CHANGES IN NET ASSETS (Unaudited) (Continued)
| Baron Real Estate Fund | Baron Emerging Markets Fund | Baron Global Advantage Fund | ||||||||||||||||||||||
| For the Six Months Ended June 30, 2020 | For the Year Ended December 31, 2019 | For the Six Months Ended June 30, 2020 | For the Year Ended December 31, 2019 | For the Six Months Ended June 30, 2020 | For the Year Ended December 31, 2019 | |||||||||||||||||||
Increase (Decrease) in Net Assets: | ||||||||||||||||||||||||
Operations: | ||||||||||||||||||||||||
Net investment income (loss) | $ | 155,596 | $ | 303,296 | $ | (2,459,570 | ) | $ | 23,588,977 | $ | (2,701,170 | ) | $ | (120,517 | ) | |||||||||
Net realized gain (loss) | 26,391,206 | 92,465,371 | (317,960,055 | ) | (336,710,970 | ) | (12,167,835 | ) | (9,227,493 | ) | ||||||||||||||
Change in net unrealized appreciation (depreciation) | (11,442,980 | ) | 125,806,629 | (51,848,415 | ) | 1,166,198,553 | 264,739,892 | 71,003,713 | ||||||||||||||||
|
|
|
| �� |
|
|
|
|
|
|
| |||||||||||||
Increase (decrease) in net assets resulting from operations | 15,103,822 | 218,575,296 | (372,268,040 | ) | 853,076,560 | 249,870,887 | 61,655,703 | |||||||||||||||||
|
|
|
|
|
|
|
|
|
|
|
| |||||||||||||
Distributions to shareholders from: | ||||||||||||||||||||||||
Distributable earnings — Retail Shares | — | (31,005,947 | ) | — | (1,268,843 | ) | — | — | ||||||||||||||||
Distributable earnings — Institutional Shares | — | (46,250,153 | ) | — | (19,857,592 | ) | — | — | ||||||||||||||||
Distributable earnings R6 Shares | — | (1,593,775 | ) | — | (45,104 | ) | — | — | ||||||||||||||||
Return of capital — Retail Shares | — | — | — | (95,058 | ) | — | — | |||||||||||||||||
Return of capital — Institutional Shares | — | — | — | (1,568,242 | ) | — | — | |||||||||||||||||
Return of capital — R6 Shares | — | — | — | (3,565 | ) | — | — | |||||||||||||||||
|
|
|
|
|
|
|
|
|
|
|
| |||||||||||||
Decrease in net assets from distributions to shareholders | — | (78,849,875 | ) | — | (22,838,404 | ) | — | — | ||||||||||||||||
|
|
|
|
|
|
|
|
|
|
|
| |||||||||||||
Capital share transactions: | ||||||||||||||||||||||||
Proceeds from the sale of shares — Retail Shares | 20,711,579 | 16,452,757 | 61,442,153 | 147,502,488 | 324,471,858 | 193,694,207 | ||||||||||||||||||
Proceeds from the sale of shares — Institutional Shares | 93,161,486 | 76,701,256 | 1,258,209,213 | 1,256,433,713 | 404,164,385 | 147,870,498 | ||||||||||||||||||
Proceeds from the sale of shares — R6 Shares | 332,229 | 1,015,966 | 2,455,278 | 3,111,650 | 1,091,506 | 656,639 | ||||||||||||||||||
Net asset value of shares issued in reinvestment of distributions — Retail Shares | — | 30,102,414 | — | 1,344,532 | — | — | ||||||||||||||||||
Net asset value of shares issued in reinvestment of distributions — Institutional Shares | — | 40,793,666 | — | 16,453,973 | — | — | ||||||||||||||||||
Net asset value of shares issues in reinvestment of distributions — R6 Shares | — | 1,593,775 | — | 48,668 | — | — | ||||||||||||||||||
Cost of shares redeemed — Retail Shares | (45,110,826 | ) | (66,992,253 | ) | (224,522,683 | ) | (353,218,303 | ) | (99,762,238 | ) | (77,443,109 | ) | ||||||||||||
Cost of shares redeemed — Institutional Shares | (78,236,145 | ) | (160,998,576 | ) | (1,217,855,775 | ) | (1,188,889,020 | ) | (47,658,257 | ) | (21,353,408 | ) | ||||||||||||
Cost of shares redeemed — R6 Shares | (431,105 | ) | (1,283,998 | ) | (1,958,391 | ) | (1,778,915 | ) | (248,725 | ) | (75,080 | ) | ||||||||||||
|
|
|
|
|
|
|
|
|
|
|
| |||||||||||||
Increase (decrease) in net assets derived from capital share transactions | (9,572,782 | ) | (62,614,993 | ) | (122,230,205 | ) | (118,991,214 | ) | 582,058,529 | 243,349,747 | ||||||||||||||
|
|
|
|
|
|
|
|
|
|
|
| |||||||||||||
Net increase (decrease) in net assets | 5,531,040 | 77,110,428 | (494,498,245 | ) | 711,246,942 | 831,929,416 | 305,005,450 | |||||||||||||||||
|
|
|
|
|
|
|
|
|
|
|
| |||||||||||||
Net Assets: | ||||||||||||||||||||||||
Beginning of period | 620,305,687 | 543,195,259 | 5,322,032,466 | 4,610,785,524 | 394,165,864 | 89,160,414 | ||||||||||||||||||
|
|
|
|
|
|
|
|
|
|
|
| |||||||||||||
End of period | $ | 625,836,727 | $ | 620,305,687 | $ | 4,827,534,221 | $ | 5,322,032,466 | $ | 1,226,095,280 | $ | 394,165,864 | ||||||||||||
|
|
|
|
|
|
|
|
|
|
|
| |||||||||||||
Capital share transactions — Retail Shares | ||||||||||||||||||||||||
Shares sold | 819,148 | 649,290 | 4,804,615 | 10,793,349 | 9,943,597 | 7,240,017 | ||||||||||||||||||
Shares issued in reinvestment of distributions | — | 1,177,159 | — | 96,094 | — | — | ||||||||||||||||||
Shares redeemed | (1,949,451 | ) | (2,651,592 | ) | (17,562,733 | ) | (26,095,893 | ) | (3,275,892 | ) | (2,958,414 | ) | ||||||||||||
|
|
|
|
|
|
|
|
|
|
|
| |||||||||||||
Net increase (decrease) | (1,130,303 | ) | (825,143 | ) | (12,758,118 | ) | (15,206,450 | ) | 6,667,705 | 4,281,603 | ||||||||||||||
|
|
|
|
|
|
|
|
|
|
|
| |||||||||||||
Capital share transactions — Institutional Shares | ||||||||||||||||||||||||
Shares sold | 3,680,188 | 3,031,136 | 95,874,354 | 91,670,499 | 12,600,360 | 5,662,392 | ||||||||||||||||||
Shares issued in reinvestment of distributions | — | 1,565,437 | — | 1,171,870 | — | — | ||||||||||||||||||
Shares redeemed | (3,268,600 | ) | (6,306,297 | ) | (99,345,640 | ) | (86,550,571 | ) | (1,582,669 | ) | (813,999 | ) | ||||||||||||
|
|
|
|
|
|
|
|
|
|
|
| |||||||||||||
Net increase (decrease) | 411,588 | (1,709,724 | ) | (3,471,286 | ) | 6,291,798 | 11,017,691 | 4,848,393 | ||||||||||||||||
| �� |
|
|
|
|
|
|
|
|
|
| |||||||||||||
Capital share transactions — R6 Shares | ||||||||||||||||||||||||
Shares sold | 12,267 | 41,273 | 194,566 | 223,760 | 35,792 | 24,195 | ||||||||||||||||||
Shares issued in reinvestment of dividends | — | 61,161 | — | 3,464 | — | — | ||||||||||||||||||
Shares redeemed | (18,379 | ) | (50,968 | ) | (157,122 | ) | (126,488 | ) | (8,705 | ) | (2,727 | ) | ||||||||||||
|
|
|
|
|
|
|
|
|
|
|
| |||||||||||||
Net increase (decrease) | (6,112 | ) | 51,466 | 37,444 | 100,736 | 27,087 | 21,468 | |||||||||||||||||
|
|
|
|
|
|
|
|
|
|
|
| |||||||||||||
| 38 | See Notes to Financial Statements. |
| June 30, 2020 | Baron Select Funds |
STATEMENTS OF CHANGES IN NET ASSETS (Unaudited) (Continued)
| Baron Real Estate Income Fund | Baron Health Care Fund | Baron FinTech Fund | ||||||||||||||||||
| For the Six Months Ended June 30, 2020 | For the Year Ended December 31, 2019 | For the Six Months Ended June 30, 2020 | For the Year Ended December 31, 2019 | For the Six Months Ended June 30, 20201 | ||||||||||||||||
Increase (Decrease) in Net Assets: | ||||||||||||||||||||
Operations: | ||||||||||||||||||||
Net investment income (loss) | $ | 34,502 | $ | 49,900 | $ | (537 | ) | $ | (42,533 | ) | $ | (19,313 | ) | |||||||
Net realized gain (loss) | (179,613 | ) | (36,830 | ) | 48,407 | 248,949 | (145,079 | ) | ||||||||||||
Change in net unrealized appreciation (depreciation) | 78,962 | 1,076,340 | 3,014,490 | 3,217,623 | 1,174,422 | |||||||||||||||
|
|
|
|
|
|
|
|
|
| |||||||||||
Increase (decrease) in net assets resulting from operations | (66,149 | ) | 1,089,410 | 3,062,360 | 3,424,039 | 1,010,030 | ||||||||||||||
|
|
|
|
|
|
|
|
|
| |||||||||||
Distributions to shareholders from: | ||||||||||||||||||||
Distributable earnings — Retail Shares | (8,176 | ) | (11,507 | ) | — | — | — | |||||||||||||
Distributable earnings — Institutional Shares | (15,501 | ) | (30,787 | ) | — | — | — | |||||||||||||
Distributable earnings — R6 Shares | (2,452 | ) | (4,958 | ) | — | — | — | |||||||||||||
Return of capital — Retail Shares | — | — | — | — | — | |||||||||||||||
Return of capital — Institutional Shares | — | — | — | — | — | |||||||||||||||
Return of capital — R6 Shares | — | — | — | — | — | |||||||||||||||
|
|
|
|
|
|
|
|
|
| |||||||||||
Decrease in net assets from distributions to shareholders | (26,129 | ) | (47,252 | ) | — | — | — | |||||||||||||
|
|
|
|
|
|
|
|
|
| |||||||||||
Capital share transactions: | ||||||||||||||||||||
Proceeds from the sale of shares — Retail Shares | 801,595 | 876,061 | 6,040,371 | 2,623,253 | 3,724,447 | |||||||||||||||
Proceeds from the sale of shares — Institutional Shares | 733,059 | 94,211 | 2,062,523 | 2,908,440 | 4,952,085 | |||||||||||||||
Proceeds from the sale of shares — R6 Shares | 39,480 | — | 1,807,517 | 314,189 | 2,000,000 | |||||||||||||||
Net asset value of shares issued in reinvestment of distributions — Retail Shares | 8,063 | 11,122 | — | — | — | |||||||||||||||
Net asset value of shares issued in reinvestment of distributions — Institutional Shares | 15,226 | 30,786 | — | — | — | |||||||||||||||
Net asset value of shares issues in reinvestment of distributions — R6 Shares | 2,452 | 4,958 | — | — | — | |||||||||||||||
Cost of shares redeemed — Retail Shares | (649,503 | ) | (179,430 | ) | (1,931,118 | ) | (1,669,658 | ) | (795,448 | ) | ||||||||||
Cost of shares redeemed — Institutional Shares | (227,786 | ) | (100,049 | ) | (1,171,648 | ) | (233,050 | ) | (139,709 | ) | ||||||||||
Cost of shares redeemed — R6 Shares | (2,370 | ) | (40,459 | ) | (71,335 | ) | (6,234 | ) | — | |||||||||||
|
|
|
|
|
|
|
|
|
| |||||||||||
Increase (decrease) in net assets derived from capital share transactions | 720,216 | 697,200 | 6,736,310 | 3,936,940 | 9,741,375 | |||||||||||||||
|
|
|
|
|
|
|
|
|
| |||||||||||
Net increase (decrease) in net assets | 627,938 | 1,739,358 | 9,798,670 | 7,360,979 | 10,751,405 | |||||||||||||||
|
|
|
|
|
|
|
|
|
| |||||||||||
Net Assets: | ||||||||||||||||||||
Beginning of period | 4,515,808 | 2,776,450 | 15,382,627 | 8,021,648 | — | |||||||||||||||
|
|
|
|
|
|
|
|
|
| |||||||||||
End of period | $ | 5,143,746 | $ | 4,515,808 | $ | 25,181,297 | $ | 15,382,627 | $ | 10,751,405 | ||||||||||
|
|
|
|
|
|
|
|
|
| |||||||||||
Capital share transactions — Retail Shares | ||||||||||||||||||||
Shares sold | 74,607 | 81,529 | 486,169 | 238,252 | 358,915 | |||||||||||||||
Shares issued in reinvestment of distributions | 775 | 1,030 | — | — | — | |||||||||||||||
Shares redeemed | (58,752 | ) | (16,316 | ) | (160,963 | ) | (143,689 | ) | (93,874 | ) | ||||||||||
|
|
|
|
|
|
|
|
|
| |||||||||||
Net increase (decrease) | 16,630 | 66,243 | 325,206 | 94,563 | 265,041 | |||||||||||||||
|
|
|
|
|
|
|
|
|
| |||||||||||
Capital share transactions — Institutional Shares | ||||||||||||||||||||
Shares sold | 62,623 | 9,722 | 153,521 | 250,393 | 486,270 | |||||||||||||||
Shares issued in reinvestment of distributions | 1,457 | 2,879 | — | — | — | |||||||||||||||
Shares redeemed | (21,390 | ) | (8,933 | ) | (86,653 | ) | (21,618 | ) | (15,092 | ) | ||||||||||
|
|
|
|
|
|
|
|
|
| |||||||||||
Net increase (decrease) | 42,690 | 3,668 | 66,868 | 228,775 | 471,178 | |||||||||||||||
|
|
|
|
|
|
|
|
|
| |||||||||||
Capital share transactions — R6 Shares | ||||||||||||||||||||
Shares sold | 3,411 | — | 149,195 | 27,069 | 195,121 | |||||||||||||||
Shares issued in reinvestment of dividends | 235 | 463 | — | — | — | |||||||||||||||
Shares redeemed | (222 | ) | (4,167 | ) | (5,697 | ) | (500 | ) | — | |||||||||||
|
|
|
|
|
|
|
|
|
| |||||||||||
Net increase (decrease) | 3,424 | (3,704 | ) | 143,498 | 26,569 | 195,121 | ||||||||||||||
|
|
|
|
|
|
|
|
|
| |||||||||||
| 1 | For the period December 31, 2019 (commencement of operations) to June 30, 2020. |
| See Notes to Financial Statements. | 39 |
| Baron Select Funds | June 30, 2020 |
FORTHE SIX MONTHS ENDED JUNE 30, 2020
|
| Baron Partners Fund | ||||
Increase (Decrease) in Cash: | ||||
Cash Provided (Used) from Operating Activities | ||||
Net increase (decrease) in net assets resulting from operations | $ | 513,449,607 | ||
Adjustments to reconcile net increase (decease) in net assets resulting from operations to net cash provided (used) by operating activities: | ||||
Purchases of portfolio securities | (288,405,550 | ) | ||
Proceeds from sales of portfolio securities | 243,972,869 | |||
Net purchases, sales and maturities of short term investments | 217,585 | |||
Decrease in dividends and interest receivable | 2,779,173 | |||
Decrease in prepaid expenses | 187,964 | |||
Decrease in accrued expenses | (1,053,212 | ) | ||
Net realized gain on investments | (27,342,953 | ) | ||
Change in net unrealized appreciation of investments | (499,834,000 | ) | ||
|
| |||
Net cash provided (used) by operating activities | $ | (56,028,517 | ) | |
|
| |||
Cash Provided in Financing Activities | ||||
Proceeds from shares sold | 499,416,371 | |||
Payment for shares redeemed | (439,745,074 | ) | ||
Decrease in payable for borrowings against line of credit | (3,500,000 | ) | ||
|
| |||
Net cash provided (used) in financing activities | 56,171,297 | |||
|
| |||
Net increase in cash | 142,780 | |||
Cash at beginning of period | — | |||
|
| |||
Cash at end of period | 142,780 | |||
|
| |||
Supplemental cash flow information: | ||||
Interest paid | $ | 7,279,336 | ||
|
| |||
| 40 | See Notes to Financial Statements. |
| June 30, 2020 | Baron Select Funds |
NOTES TO FINANCIAL STATEMENTS (Unaudited)
1. ORGANIZATION
Baron Select Funds (the “Trust”) is registered under the Investment Company Act of 1940, as amended (the “1940 Act”), as an open-end management investment company established as a Delaware statutory trust on April 30, 2003, and accordingly, follows the investment company accounting and reporting guidance of the Financial Accounting Standards Board (“FASB”) Accounting Standard Codification Topic 946 Financial Services — Investment Companies. The Trust currently offers 10 series (individually, a “Fund” and collectively, the “Funds”): Baron Partners Fund, Baron Focused Growth Fund, Baron Real Estate Income Fund, Baron Health Care Fund, Baron FinTech Fund, and Baron WealthBuilder Fund, which are non-diversified; and Baron International Growth Fund, Baron Real Estate Fund, Baron Emerging Markets Fund, and Baron Global Advantage Fund, which are diversified. Baron WealthBuilder Fund is presented in a separate report. Each Fund’s investment objective is to seek capital appreciation and, for Baron Real Estate Income Fund only, current income. Baron Partners Fund may employ “leverage” by borrowing money and using it to purchase additional securities. Borrowing for investment increases both investment opportunity and investment risk. Baron International Growth Fund, Baron Emerging Markets Fund, and Baron Global Advantage Fund invest their assets primarily in non-U.S. companies. Baron Real Estate Fund invests its assets primarily in U.S. and non-U.S. real estate and real estate-related companies. Baron Real Estate Income Fund invests its assets in U.S. and non-U.S. real estate income-producing securities and other real estate securities. Baron Health Care Fund invests its assets primarily in equity securities engaged in the research, development, production, sale, delivery or distribution of products and services related to the health care industry. Baron FinTech Fund invests its assets primarily in securities of companies that develop, use, or rely on innovative technologies or services, for banking, lending, capital markets, financial data analytics, insurance, payments, asset management, or wealth management. Baron FinTech Fund commenced investment operations on January 2, 2020.
Each Fund offers Retail Shares, Institutional Shares, and R6 Shares. Each class of shares differs only in its ongoing fees, expenses and eligibility requirements. Retail Shares are offered to all investors. Institutional Shares are for investments in the amount of $1 million or more per Fund. Institutional Shares are intended for certain financial intermediaries that offer shares of Baron Funds through fee-based platforms, retirement platforms, or other platforms. R6 Shares are for investments in the amount of $5 million or more per Fund. R6 Shares are available only to qualified 401(a) plans (including 401(k) plans, Keogh plans, profit sharing plans, money purchase pension plans, target benefit plans, defined benefit pension plans, and Taft-Hartley multi-employer pension plans), endowment funds and foundations, any state, county or city, or its instrumentality, department, authority, or agency, 457 plans, including 457(a) governmental entity plans and tax-exempt plans, accounts registered to insurance companies, trust companies and bank trust departments, investment companies, both affiliated and not affiliated with BAMCO, Inc. (the “Adviser”), and any entity that is considered a corporation for tax purposes, including corporate non-qualified deferred compensation plans of such corporations. Each class of shares has equal rights to earnings and assets, except that each class bears different expenses for distribution and shareholder servicing. Each Fund’s investment income, realized and unrealized gains or losses on investments and foreign currency, and expenses other than those attributable to a specific class are allocated to each class based on its relative net assets. Each class of shares has exclusive voting rights with respect to matters that affect just that class.
Baron Partners Fund was organized originally as a limited partnership in January 1992 under the laws of the State of Delaware. Effective as of the close of business on April 30, 2003, the predecessor partnership was reorganized into a series of the Trust. Baron Partners Fund commenced operations on April 30, 2003 with a contribution of assets and liabilities, including securities-in-kind, from the predecessor partnership.
Baron Focused Growth Fund was organized originally as a limited partnership in May 1996 under the laws of the State of Delaware. Effective as of the close of business on June 30, 2008, the predecessor partnership was reorganized into a series of the Trust. Baron Focused Growth Fund commenced operations on June 30, 2008 with a contribution of assets and liabilities, including securities-in-kind, from the predecessor partnership.
2. SIGNIFICANT ACCOUNTING POLICIES
The following is a summary of significant accounting policies followed by the Funds. The policies are in conformity with accounting principles generally accepted in the United States of America (“GAAP”). The preparation of financial statements in accordance with GAAP requires management to make estimates and assumptions that affect the reported amounts of assets and liabilities at the date of the financial statements and the amounts of income and expenses during the period. Actual results could differ from those estimates. Events occurring subsequent to the date of the Statements of Assets and Liabilities and through the date of issuance of the financial statements have been evaluated for adjustment to or disclosure in the financial statements.
a) Security Valuation. The Funds’ share prices or net asset values (“NAV”) are calculated as of the scheduled close of the regular trading session (usually 4 p.m. E.T. or such other time as of which the Funds’ NAVs are calculated (the “NAV Calculation Time”)) on the New York Stock Exchange (the “Exchange”) on any day the Exchange is scheduled to be open. Portfolio securities traded on any national stock exchange are valued based on the last sale price on the exchange where such shares are principally traded. For securities traded on NASDAQ, the Funds use the NASDAQ Official Closing Price. If there are no sales on a given day, the value of the security may be the average of the most recent bid and asked quotations on such exchange or the last sale price from a prior day. Where market quotations are not readily available, or, if in the Adviser’s judgment, they do not accurately reflect the fair value of a security, or an event occurs after the market close but before the Funds are priced that materially affects the value of a security, the security will be valued by the Adviser using policies and procedures approved by the Board of Trustees (the “Board”). Some of the more common reasons that may necessitate that a security be valued using “fair value” pricing may include, but are not limited to: trading of the security has been halted or suspended; or the security has not been traded for an extended period of time. The Adviser has a Fair Valuation Committee (the “Committee”) comprised of senior management representatives and the Committee reports to the Board every quarter. Factors the Committee may consider when valuing a security include whether a current price is stale, there is recent news, the security is thinly traded, transactions are infrequent or quotations are genuine. There can be no guarantee, however, that a fair valuation used by the Funds on any given day will more accurately reflect the market value of an investment than the closing price of such investment in its market. U.S. Government obligations, money market instruments, and other debt instruments held by the Funds with a remaining maturity of 60 days or less are generally valued at amortized cost, which approximates fair value. Debt instruments having a greater remaining maturity will be valued on the basis of prices obtained from a pricing service approved by the Board or at the mean of the bid and ask prices from the dealer maintaining an active market in that security. The value of the Funds’ investments in convertible bonds/convertible preferred stocks is determined primarily by obtaining valuations from independent pricing services based on readily available bid quotations or, if quotations are not available, by methods which include various considerations such as yields or prices of securities of comparable quality, coupon, maturity and type; indications as to values from dealers; and general market conditions. Other inputs used by an independent pricing service to value convertible bonds/convertible preferred
41
| Baron Select Funds | June 30, 2020 |
NOTES TO FINANCIAL STATEMENTS (Unaudited) (Continued)
2. SIGNIFICANT ACCOUNTING POLICIES (Continued)
stocks generally include underlying stock data, conversion premiums, listed bond and preferred stock prices and other market information which may include benchmark curves, trade execution data, sensitivity analysis, when available, or an estimated value calculated based on the price of the underlying common share on the valuation date adjusted for accrued and unpaid dividends. Open-end investment companies, including securities lending collateral invested in registered investment company money market funds, are valued at their NAV each day.
Non-U.S. equity securities traded on foreign securities exchanges are generally valued using an independent pricing vendor that provides daily fair value adjustment factors based on information such as local closing price, relevant general and sector indexes, currency fluctuations, and depositary receipts, as applicable. Securities valued using such adjustment factors are classified as Level 2 in the fair value hierarchy. The models of the independent pricing vendor generate an adjustment factor for each security, which is applied to the local closing price to adjust it for post-closing market movements up to the time the Funds are valued and translated into U.S. dollars. If the vendor does not provide an adjustment factor for a security, the security is valued based on its most recent local closing price and translated into U. S. dollars. The Adviser may also fair value securities in other situations, for example, when a particular foreign market is closed but the Funds are open. Other mutual funds may adjust the prices of their securities by different amounts.
b) Securities Transactions, Investment Income and Expense Allocation. Securities transactions are recorded on a trade date basis. Realized gain and loss from securities transactions are recorded on an identified cost basis for financial reporting and federal income tax purposes. Dividend income is recognized on the ex-dividend date and interest income is recognized on an accrual basis, which includes the accretion of discounts and amortization of premiums. Non-cash dividends received in the form of stock, if any, are recognized on the ex-dividend date and recorded as non-cash dividend income at fair value. Certain dividends from foreign securities will be recorded as soon as the Funds are informed of the dividend if such information is obtained subsequent to the ex-dividend date. Distributions received from certain investments held by the Funds may be comprised of dividends, realized gains and returns of capital. The Funds originally estimate the expected classification of such payments. The amounts may subsequently be reclassified upon receipt of information from the issuer. The Funds are charged for those expenses of the Trust that are directly attributable to each Fund, such as advisory and custodian fees. Expenses that are not directly attributable to a Fund are typically allocated among the Funds in proportion to their respective net assets.
c) Foreign Currency Translations. Values of assets and liabilities denominated in foreign currencies are translated into U.S. dollars using the price of such currencies at the NAV Calculation Time. Purchases and sales of investments and dividend income are converted at the prevailing rate of exchange on the respective dates of such transactions. Net realized gain (loss) on foreign currency transactions includes gain (loss) arising from the fluctuation in the exchange rates between trade and settlement dates on security transactions and currency gain (loss) between the accrual and payment dates on dividends and foreign withholding taxes. The Funds do not isolate that portion of the results of operations resulting from changes in foreign exchange rates on investments from the fluctuations arising from changes in market prices of securities held. Such fluctuations are included with the net realized and unrealized gain or loss from investments and foreign currency transactions on the Statements of Operations. The Funds may invest in foreign securities and foreign currency transactions that may involve risks not associated with domestic investments as a result of the level of governmental supervision and regulation of foreign securities markets and the possibility of political or economic instability, among others.
Pursuant to U.S. federal income tax regulations, gains and losses from certain foreign currency transactions and the foreign currency portion of gains and losses realized on sales and maturities of foreign denominated debt securities are generally treated as ordinary income for U.S. federal income tax purposes.
d) Securities Lending. The Funds may lend securities to certain brokers under the terms of a master netting agreement. Upon such loans, the Funds receive collateral which is maintained by the custodian. The Funds may pay fees to the custodian for administering the securities lending program. The Funds earn interest on such collateral and earn income in the form of negotiated lenders’ fees, both of which are included in securities lending income in the Statements of Operations. Securities loaned are required to be secured at all times by collateral equal to at least 102% of the market value of the securities loaned. Risks may arise upon entering into securities lending to the extent that the value of the collateral is less than the value of the securities loaned due to the changes in the value of collateral or the loaned securities. The collateral is marked-to-market daily and settled on the next business day. The Funds may receive collateral in the form of cash or other eligible securities, such as a letter of credit issued by a U.S. bank or securities issued or guaranteed by the U.S. government. Securities purchased with cash collateral are subject to the risks inherent in investing in these securities.
Baron Partners Fund and Baron Global Advantage Fund participated in securities lending activities during the six months ended June 30, 2020. There were no securities on loan at June 30, 2020.
e) Repurchase Agreements. The Funds may invest in repurchase agreements, which are short term investments whereby the Funds acquire ownership of a debt security and the seller agrees to repurchase the security at a future date at a specified price. When entering into repurchase agreements, it is the Funds’ policy that their custodian take possession of the underlying collateral securities, the market value of which, at all times, equals at least 102% of the principal amount of the repurchase transaction. To the extent that any repurchase transaction exceeds one business day, the value of the collateral is marked-to-market to ensure the adequacy of the collateral. If the seller defaults and the market value of the collateral declines or if bankruptcy proceedings are commenced with respect to the seller of the security, realization of the collateral by the Funds may be delayed or limited. The information required to be disclosed by FASB Accounting Standards Update No. 2011-11 for the Funds’ investments in repurchase agreements at June 30, 2020, including the fair value of the repurchase agreement and the amount of collateral, can be found in each respective Fund’s Statement of Net Assets.
f) Master Limited Partnerships. The Funds may invest in master limited partnerships (“MLPs”). MLPs are limited partnerships or limited liability companies, whose partnership units or limited liability interests are listed and traded on a U.S. securities exchange, and are treated as publicly traded partnerships for federal income tax purposes. To qualify to be treated as a partnership for tax purposes, an MLP must receive at least 90% of its income from qualifying sources as set forth in Section 7704(d) of the Internal Revenue Code of 1986, as amended. These qualifying sources include interest, dividend, real property rent, gain from sale or other disposition of real property and income from activities such as the exploration, development, mining, production, processing, refining, transportation, storage and marketing of mineral or natural resources.
42
| June 30, 2020 | Baron Select Funds |
NOTES TO FINANCIAL STATEMENTS (Unaudited) (Continued)
2. SIGNIFICANT ACCOUNTING POLICIES (Continued)
g) Federal and Foreign Income Taxes. The Trust treats each Fund as a separate entity for federal income tax purposes. Each Fund intends to meet the requirements of the Internal Revenue Code of 1986, as amended, applicable to regulated investment companies, and to distribute to its shareholders substantially all of its net investment income and any net realized capital gains at least annually. None of the Funds will be subject to federal or state income taxes to the extent that they qualify as regulated investment companies and substantially all of their income is distributed.
The Funds may be subject to foreign taxes on income and gains on investments that are accrued based upon the Funds’ understanding of the tax rules and regulations that exist in the countries in which the Funds invest. Foreign governments may also impose taxes or other payments on investments with respect to foreign securities. Such taxes are accrued as applicable.
h) Restricted Securities. The Funds may invest in securities that are restricted as to public sale in accordance with the Securities Act of 1933. Such assets are valued by the Adviser pursuant to policies and procedures approved by the Board.
i) Distributions to Shareholders. Income and capital gain distributions to shareholders are determined in accordance with income tax regulations which may differ from GAAP. These differences are primarily due to differing treatments for net investment loss, foreign currency gains and losses, non-deductible interest expense, reclassification of distributions, partnership basis adjustments, income from passive foreign investment companies, late-year loss deferral, post-October loss deferral, and wash sale loss deferral.
j) Commitments and Contingencies. In the normal course of business, the Funds may enter into contracts and agreements that contain a variety of representations and warranties, which provide general indemnification. The maximum exposure to the Funds under these agreements is unknown, as this would involve future claims that may be made against the Funds that have not yet occurred. However, based on experience, the Funds expect the risk of loss to be remote.
k) Cash and Cash Equivalents. The Funds consider all short term liquid investments with a maturity of three months or less when purchased to be cash equivalents.
l) Fund Diversification and Concentration. Certain of the Funds hold non-diversified or concentrated portfolios that may contain fewer securities or invest in fewer industries than the portfolios of other mutual funds. This may increase the risk that the value of a Fund could decrease because of the poor performance of one or a few investments or of a particular industry. Additionally, non-diversified funds may encounter difficulty liquidating securities.
3. PURCHASES AND SALES OF SECURITIES
Purchases and sales of securities, other than short term securities, for the six months ended June 30, 2020 were as follows:
| Fund | Purchases | Sales | ||||||
Baron Partners Fund | $ | 285,814,722 | $ | 240,756,661 | ||||
Baron Focused Growth Fund | 19,094,918 | 7,302,372 | ||||||
Baron International Growth Fund | 98,494,844 | 99,594,395 | ||||||
Baron Real Estate Fund | 287,619,944 | 316,565,757 | ||||||
Baron Emerging Markets Fund | 1,441,116,372 | 1,662,176,721 | ||||||
Baron Global Advantage Fund | 529,907,974 | 47,071,649 | ||||||
Baron Real Estate Income Fund | 3,298,699 | 2,628,603 | ||||||
Baron Health Care Fund | 9,159,912 | 3,069,112 | ||||||
Baron FinTech Fund | 9,635,145 | 434,723 | ||||||
4. INVESTMENT ADVISORY FEES AND OTHER TRANSACTIONS WITH AFFILIATES
a) Investment Advisory Fees. The Adviser, a wholly owned subsidiary of Baron Capital Group, Inc. (“BCG”), serves as investment adviser to the Funds. As compensation for services rendered, the Adviser receives a fee payable monthly from Baron Partners Fund, Baron Focused Growth Fund, Baron Real Estate Fund, and Baron Emerging Markets Fund equal to 1% per annum of the average daily net assets of the respective Fund. The Adviser receives a fee payable monthly from Baron International Growth Fund, Baron Global Advantage Fund, Baron Real Estate Income Fund, Baron Health Care Fund, and Baron FinTech Fund equal to 0.88%, 0.85%, 0.75%, 0.75%, and 0.80%, respectively, per annum of the average daily net assets of the respective Fund. The Adviser has contractually agreed to reduce its fee, to the extent required to limit the net annual operating expense ratio (excluding portfolio transaction costs, interest, dividend and extraordinary expenses), as follows:
| Annual Operating Expense Ratio Cap | ||||||||||||
| Fund | Retail Shares | Institutional Shares | R6 Shares | |||||||||
Baron Partners Fund | 1.45 | % | 1.20 | % | 1.20 | % | ||||||
Baron Focused Growth Fund | 1.35 | % | 1.10 | % | 1.10 | % | ||||||
Baron International Growth Fund | 1.20 | % | 0.95 | % | 0.95 | % | ||||||
Baron Real Estate Fund | 1.35 | % | 1.10 | % | 1.10 | % | ||||||
Baron Emerging Markets Fund | 1.50 | % | 1.25 | % | 1.25 | % | ||||||
Baron Global Advantage Fund | 1.15 | % | 0.90 | % | 0.90 | % | ||||||
Baron Real Estate Income Fund | 1.05 | % | 0.80 | % | 0.80 | % | ||||||
Baron Health Care Fund | 1.10 | % | 0.85 | % | 0.85 | % | ||||||
Baron FinTech Fund | 1.20 | % | 0.95 | % | 0.95 | % | ||||||
43
| Baron Select Funds | June 30, 2020 |
NOTES TO FINANCIAL STATEMENTS (Unaudited) (Continued)
4. INVESTMENT ADVISORY FEES AND OTHER TRANSACTIONS WITH AFFILIATES (Continued)
b) Distribution Fees. Baron Capital, Inc. (“BCI”), a wholly owned subsidiary of BCG, is a registered limited purpose broker-dealer and the distributor of the Funds’ shares. The Funds are authorized to pay BCI a distribution fee payable monthly pursuant to a distribution plan under Rule 12b-1 of the 1940 Act equal to 0.25% per annum of the Retail Shares’ average daily net assets of the respective Funds.
c) Trustee Fees. Certain Trustees of the Trust are interested persons (as defined by the 1940 Act) of the Trust. None of these Trustees received compensation for his or her services as a Trustee of the Trust. None of the Funds’ officers received compensation from the Funds for their services as an officer.
d) Fund Accounting and Administration Fees. The Funds have entered into an agreement with State Street Bank and Trust Company (“State Street”) to perform accounting and certain administrative services. State Street is compensated for fund accounting services based on a percentage of the Funds’ net assets, plus fixed annual fees for the administrative services.
e) Cross Trades. The Funds are permitted to purchase securities from, or sell securities to, other Funds within the Trust, the funds in Baron Investment Funds Trust and other entities advised or subadvised by the Adviser, pursuant to “Cross-Trading Procedures” adopted by the Board. These procedures have been designed to ensure that any cross-trade of securities by the respective Baron Fund from or to another fund/other entity that is or could be considered an affiliate of a Fund under certain limited circumstances by virtue of having a common investment adviser, common officers, or common trustees complies with Rule 17a-7 under the 1940 Act. Further, as defined under these procedures, each cross-trade is effected at the current market price and with no commissions. Pursuant to these procedures, for the six months ended June 30, 2020, the Funds engaged in the following cross-trades:
| Purchases | Sales | Net Realized Gains (Losses) | ||||||||||
Baron International Growth Fund | $ | — | $ | 337,227 | $ | 58,327 | ||||||
Baron Emerging Markets Fund | — | 3,718,755 | 960,411 | |||||||||
Baron Global Advantage Fund | 4,055,982 | — | — | |||||||||
5. LINE OF CREDIT
Baron Partners Fund participates in a committed syndicated line of credit agreement with State Street in the amount of $750 million. Depending on the outstanding loan amount, a commitment fee of 0.15% or 0.25% per annum is incurred on the unused portion of the line of credit. The line of credit is used for investment purposes and expires on October 30, 2020. Baron Partners Fund may borrow up to the lesser of $750 million or the maximum amount Baron Partners Fund may borrow under the 1940 Act, the limitations included in Baron Partners Fund’s prospectus, or any limit or restriction under any law or regulation to which Baron Partners Fund is subject or any agreement to which Baron Partners Fund is a party. Interest is charged to Baron Partners Fund, based on its borrowings, at a rate per annum equal to the higher of the effective federal funds rate or the one month LIBOR rate plus a margin of 0.85%. An upfront fee of 0.05% is incurred on the commitment amount. For the six months ended June 30, 2020, interest expense incurred on these loans amounted to $6,217,531. During the six months ended June 30, 2020, Baron Partners Fund had an average daily balance on the line of credit of $691.7 million at a weighted average interest rate of 1.81%. At June 30, 2020, Baron Partners Fund had an outstanding balance in the amount of $737,000,000.
The Funds, (except Baron Partners Fund), together with the funds in Baron Investment Funds Trust, participate in a committed line of credit agreement with State Street to be used for temporary purposes, primarily for financing redemptions. Each fund may borrow up to the lesser of $100 million or the maximum amount each fund may borrow under the 1940 Act, the limitations included in each fund’s prospectus, or any limit or restriction under any law or regulation to which each fund is subject or any agreement to which each fund is a party; provided that the aggregate outstanding principal amount of all loans to any of the funds may not exceed $100 million. Interest is charged to each fund, based on its borrowings, at a rate per annum equal to the higher of the effective federal funds rate or the one month LIBOR rate plus a margin of 1.00%. An upfront fee of 0.05% is incurred on the commitment amount and a commitment fee of 0.20% per annum is incurred on the unused portion of the line of credit. Both fees are allocated to the participating funds based on their relative net assets.
44
| June 30, 2020 | Baron Select Funds |
NOTES TO FINANCIAL STATEMENTS (Unaudited) (Continued)
6. RESTRICTED SECURITIES
At June 30, 2020, investments in securities included securities that are restricted and/or illiquid. Restricted securities are often purchased in private placement transactions, are not registered under the Securities Act of 1933, may have contractual restrictions on resale and are valued pursuant to the policies and procedures for fair value pricing approved by the Board. A security may be considered illiquid if it lacks a readily available market or if its valuation has not changed for a certain period of time. The Funds may receive more or less than this valuation in an actual sale and that difference could be material. At June 30, 2020, the Funds held investments in restricted and/or illiquid securities that were valued pursuant to policies and procedures for fair value pricing as follows:
| Baron Partners Fund | ||||||||
| Name of Issuer | Acquisition Date(s) | Value | ||||||
Private Common Stocks | ||||||||
Space Exploration Technologies Corp. | 9/13/2017 | $ | 57,674,108 | |||||
Private Preferred Stocks | ||||||||
Space Exploration Technologies Corp. | 11/15/2017, 4/5/2018 | 101,393,872 | ||||||
Private Partnerships | ||||||||
Windy City Investments Holdings, L.L.C. | 11/13/2007-1/27/2011 | 195,542 | ||||||
|
| |||||||
Total Restricted Securities: | $ | 159,263,522 | ||||||
|
| |||||||
(Cost $98,250,037)† (4.82% of Net Assets) | ||||||||
| Baron Focused Growth Fund | ||||||||
| Name of Issuer | Acquisition Date(s) | Value | ||||||
Private Common Stocks | ||||||||
Space Exploration Technologies Corp. | 9/13/2017 | $ | 5,427,987 | |||||
Private Preferred Stocks | ||||||||
Space Exploration Technologies Corp. | 11/15/2017, 4/5/2018 | 7,123,961 | ||||||
|
| |||||||
Total Restricted Securities: | $ | 12,551,948 | ||||||
|
| |||||||
(Cost $7,449,906)† (3.84% of Net Assets) | ||||||||
| Baron Emerging Markets Fund | ||||||||
| Name of Issuer | Acquisition Date(s) | Value | ||||||
Private Common Stocks | ||||||||
Hemisphere Properties India Limited | 9/17/2019 | $ | 8,218,520 | |||||
|
| |||||||
(Cost $14,647,473) (0.17% of Net Assets) | ||||||||
| † | See Statements of Net Assets for cost of individual securities. |
7. FAIR VALUE MEASUREMENTS
Fair value is defined by GAAP as the price that the Funds would receive upon selling an investment in a timely transaction to an independent buyer in the principal or most advantageous market for the investment. GAAP provides a three-tier hierarchy to maximize the use of observable market data and minimize the use of unobservable inputs and to establish classification of fair value measurements for disclosure purposes. Inputs refer broadly to the assumptions that market participants would use in pricing the asset or liability. Inputs may be observable or unobservable. Observable inputs are based on market data obtained from sources independent of the Funds. Unobservable inputs are inputs that reflect the Funds’ own assumptions based on the best information available in the circumstances. The three-tier hierarchy of inputs is summarized in the three broad Levels listed below.
| • | Level 1 — quoted prices in active markets for identical assets or liabilities; |
| • | Level 2 — prices determined using other inputs that are observable either directly, or indirectly through corroboration with observable market data (which could include quoted prices for similar assets or liabilities, interest rates, credit risk, etc.); |
| • | Level 3 — prices determined using unobservable inputs when quoted prices or observable inputs are unavailable, such as when there is little or no market activity for an asset or liability (unobservable inputs reflect each Fund’s own assumptions in determining the fair value of assets or liabilities and would be based on the best information available). |
The inputs or methodology used for valuing securities are not necessarily an indication of the risk or liquidity associated with investing in those securities. For example, non-U.S. securities, with markets that close hours before the Funds value their holdings, may require revised valuations to more accurately reflect their fair value. Since these values obtained from quoted prices in an active market are adjusted, such securities are reflected as Level 2.
The Funds have procedures to determine the fair value of securities and other financial instruments for which market prices are not readily available or which may not be reliably priced. Under these procedures, the Funds primarily employ a market-based approach that may use related or comparable assets or liabilities, recent transactions, market multiples, book values, and other relevant information for the investment to determine its fair value. The Funds may also use an income-based valuation approach in
45
| Baron Select Funds | June 30, 2020 |
NOTES TO FINANCIAL STATEMENTS (Unaudited) (Continued)
7. FAIR VALUE MEASUREMENTS (Continued)
which the anticipated future cash flows of the investment are discounted to calculate fair value. Discounts may also be applied due to the nature or duration of any restrictions on the disposition of the investments. Due to the inherent uncertainty of valuations of such investments, the fair values may differ significantly from the values that would have been used had an active market existed.
The following is a summary of the inputs used as of June 30, 2020 in valuing the Funds’ investments carried at fair value:
| Baron Partners Fund | ||||||||||||||||
| Description | Quoted Prices in Active Markets for Identical Assets (Level 1) | Other Observable Inputs (Level 2) | Unobservable Inputs (Level 3) | Total | ||||||||||||
Common Stocks† | $ | 3,877,764,174 | $ | — | $ | — | $ | 3,877,764,174 | ||||||||
Private Common Stocks | — | — | 57,674,108 | 57,674,108 | ||||||||||||
Private Preferred Stocks | — | — | 101,393,872 | 101,393,872 | ||||||||||||
Private Partnerships | — | — | 195,542 | 195,542 | ||||||||||||
Short Term Investments | — | 188,737 | — | 188,737 | ||||||||||||
|
|
|
|
|
|
|
| |||||||||
Total Investments | $ | 3,877,764,174 | $ | 188,737 | $ | 159,263,522 | $ | 4,037,216,433 | ||||||||
|
|
|
|
|
|
|
| |||||||||
| Baron Focused Growth Fund | ||||||||||||||||
| Description | Quoted Prices in Active Markets for Identical Assets (Level 1) | Other Observable Inputs (Level 2) | Unobservable Inputs (Level 3) | Total | ||||||||||||
Common Stocks† | $ | 305,686,452 | $ | — | $ | — | $ | 305,686,452 | ||||||||
Private Common Stocks | — | — | 5,427,987 | 5,427,987 | ||||||||||||
Private Preferred Stocks | — | — | 7,123,961 | 7,123,961 | ||||||||||||
Short Term Investments | — | 8,480,477 | — | 8,480,477 | ||||||||||||
|
|
|
|
|
|
|
| |||||||||
Total Investments | $ | 305,686,452 | $ | 8,480,477 | $ | 12,551,948 | $ | 326,718,877 | ||||||||
|
|
|
|
|
|
|
| |||||||||
| Baron International Growth Fund | ||||||||||||||||
| Description | Quoted Prices in Active Markets for Identical Assets (Level 1) | Other Observable Inputs (Level 2) | Unobservable Inputs (Level 3) | Total | ||||||||||||
Common Stocks† | $ | 115,450,343 | $ | 198,953,718 | $ | — | $ | 314,404,061 | ||||||||
Short Term Investments | — | 12,644,314 | — | 12,644,314 | ||||||||||||
|
|
|
|
|
|
|
| |||||||||
Total Investments | $ | 115,450,343 | $ | 211,598,032 | $ | — | $ | 327,048,375 | ||||||||
|
|
|
|
|
|
|
| |||||||||
| Baron Real Estate Fund | ||||||||||||||||
| Description | Quoted Prices in Active Markets for Identical Assets (Level 1) | Other Observable Inputs (Level 2) | Unobservable Inputs (Level 3) | Total | ||||||||||||
Common Stocks† | $ | 584,736,371 | $ | 13,110,251 | $ | — | $ | 597,846,622 | ||||||||
Short Term Investments | — | 30,841,713 | — | 30,841,713 | ||||||||||||
|
|
|
|
|
|
|
| |||||||||
Total Investments | $ | 584,736,371 | $ | 43,951,964 | $ | — | $ | 628,688,335 | ||||||||
|
|
|
|
|
|
|
| |||||||||
| † | See Statements of Net Assets for additional detailed categorizations. |
46
| June 30, 2020 | Baron Select Funds |
NOTES TO FINANCIAL STATEMENTS (Unaudited) (Continued)
7. FAIR VALUE MEASUREMENTS (Continued)
| Baron Emerging Markets Fund | ||||||||||||||||
| Description | Quoted Prices in Active Markets for Identical Assets (Level 1) | Other Observable Inputs (Level 2) | Unobservable Inputs (Level 3) | Total | ||||||||||||
Common Stocks† | $ | 1,481,261,218 | $ | 3,153,157,944 | $ | — | $ | 4,634,419,162 | ||||||||
Private Common Stocks | — | — | 8,218,520 | 8,218,520 | ||||||||||||
Short Term Investments | — | 132,430,449 | — | 132,430,449 | ||||||||||||
|
|
|
|
|
|
|
| |||||||||
Total Investments | $ | 1,481,261,218 | $ | 3,285,588,393 | $ | 8,218,520 | $ | 4,775,068,131 | ||||||||
|
|
|
|
|
|
|
| |||||||||
| Baron Global Advantage Fund | ||||||||||||||||
| Description | Quoted Prices in Active Markets for Identical Assets (Level 1) | Other Observable Inputs (Level 2) | Unobservable Inputs (Level 3) | Total | ||||||||||||
Common Stocks† | $ | 1,063,196,881 | $ | 46,581,135 | $ | — | $ | 1,109,778,016 | ||||||||
Short Term Investments | — | 147,012,383 | — | 147,012,383 | ||||||||||||
|
|
|
|
|
|
|
| |||||||||
Total Investments | $ | 1,063,196,881 | $ | 193,593,518 | $ | — | $ | 1,256,790,399 | ||||||||
|
|
|
|
|
|
|
| |||||||||
| Baron Real Estate Income Fund | ||||||||||||||||
| Description | Quoted Prices in Active Markets for Identical Assets (Level 1) | Other Observable Inputs (Level 2) | Unobservable Inputs (Level 3) | Total | ||||||||||||
Common Stocks† | $ | 4,974,524 | $ | — | $ | — | $ | 4,974,524 | ||||||||
Short Term Investments | — | 166,726 | — | 166,726 | ||||||||||||
|
|
|
|
|
|
|
| |||||||||
Total Investments | $ | 4,974,524 | $ | 166,726 | $ | — | $ | 5,141,250 | ||||||||
|
|
|
|
|
|
|
| |||||||||
| Baron Health Care Fund | ||||||||||||||||
| Description | Quoted Prices in Active Markets for Identical Assets (Level 1) | Other Observable Inputs (Level 2) | Unobservable Inputs (Level 3) | Total | ||||||||||||
Common Stocks† | $ | 23,668,199 | $ | 300,168 | $ | — | $ | 23,968,367 | ||||||||
Short Term Investments | — | 1,181,051 | — | 1,181,051 | ||||||||||||
|
|
|
|
|
|
|
| |||||||||
Total Investments | $ | 23,668,199 | $ | 1,481,219 | $ | — | $ | 25,149,418 | ||||||||
|
|
|
|
|
|
|
| |||||||||
| Baron FinTech Fund | ||||||||||||||||
| Description | Quoted Prices in Active Markets for Identical Assets (Level 1) | Other Observable Inputs (Level 2) | Unobservable Inputs (Level 3) | Total | ||||||||||||
Common Stocks† | $ | 10,032,299 | $ | 196,510 | $ | — | $ | 10,228,809 | ||||||||
Short Term Investments | — | 511,623 | — | 511,623 | ||||||||||||
|
|
|
|
|
|
|
| |||||||||
Total Investments | $ | 10,032,299 | $ | 708,133 | $ | — | $ | 10,740,432 | ||||||||
|
|
|
|
|
|
|
| |||||||||
| † | See Statements of Net Assets for additional detailed categorizations. |
47
| Baron Select Funds | June 30, 2020 |
NOTES TO FINANCIAL STATEMENTS (Unaudited) (Continued)
7. FAIR VALUE MEASUREMENTS (Continued)
The following is a reconciliation of investments in which unobservable inputs (Level 3) were used in determining fair value:
| Baron Partners Fund | ||||||||||||||||||||||||||||||||||||||||
| Investments in Securities | Balance as of December 31, 2019 | Accrued Premiums/ Discounts | Net Realized Gain (Loss) | Change in Net Unrealized Appreciation (Depreciation) | Purchases | Sales/ Distributions | Transfers Into Level 3 | Transfers Out of Level 3 | Balance as of 2020 | Change in Net 2020 | ||||||||||||||||||||||||||||||
Private Common Stocks |
| |||||||||||||||||||||||||||||||||||||||
Industrials | $ | 50,954,697 | $ | — | $ | — | $ | 6,719,411 | $ | — | $ | — | $ | — | $ | — | $ | 57,674,108 | $ | 6,719,411 | ||||||||||||||||||||
Private Preferred Stocks |
| |||||||||||||||||||||||||||||||||||||||
Industrials | 89,580,822 | — | — | 11,813,050 | — | — | — | — | 101,393,872 | 11,813,050 | ||||||||||||||||||||||||||||||
Private Partnerships |
| |||||||||||||||||||||||||||||||||||||||
Financials | 193,268 | — | — | 2,274 | — | — | — | — | 195,542 | 2,274 | ||||||||||||||||||||||||||||||
|
|
|
|
|
|
|
|
|
|
|
|
|
|
|
|
|
|
|
| |||||||||||||||||||||
Total | $ | 140,728,787 | $ | — | $ | — | $ | 18,534,735 | $ | — | $ | — | $ | — | $ | — | $ | 159,263,522 | $ | 18,534,735 | ||||||||||||||||||||
|
|
|
|
|
|
|
|
|
|
|
|
|
|
|
|
|
|
|
| |||||||||||||||||||||
| Baron Focused Growth Fund | ||||||||||||||||||||||||||||||||||||||||
| Investments in Securities | Balance as of December 31, 2019 | Accrued Premiums/ Discounts | Net Realized Gain (Loss) | Change in Net Unrealized Appreciation (Depreciation) | Purchases | Sales/ Distributions | Transfers Into Level 3 | Transfers Out of Level 3 | Balance as of 2020 | Change in Net 2020 | ||||||||||||||||||||||||||||||
Private Common Stocks |
| |||||||||||||||||||||||||||||||||||||||
Industrials | $ | 4,795,591 | $ | — | $ | — | $ | 632,396 | $ | — | $ | — | $ | — | $ | — | $ | 5,427,987 | $ | 632,396 | ||||||||||||||||||||
Private Preferred Stocks |
| |||||||||||||||||||||||||||||||||||||||
Industrials | 6,293,973 | — | — | 829,988 | — | — | — | — | 7,123,961 | 829,988 | ||||||||||||||||||||||||||||||
|
|
|
|
|
|
|
|
|
|
|
|
|
|
|
|
|
|
|
| |||||||||||||||||||||
Total | $ | 11,089,564 | $ | — | $ | — | $ | 1,462,384 | $ | — | $ | — | $ | — | $ | — | $ | 12,551,948 | $ | 1,462,384 | ||||||||||||||||||||
|
|
|
|
|
|
|
|
|
|
|
|
|
|
|
|
|
|
|
| |||||||||||||||||||||
| Baron Emerging Markets Fund | ||||||||||||||||||||||||||||||||||||||||
| Investments in Securities | Balance as of December 31, 2019 | Accrued Premiums/ Discounts | Net Realized Gain (Loss) | Change in Net Unrealized Appreciation (Depreciation) | Purchases | Sales/ Distributions | Transfers Into Level 3 | Transfers Out of Level 3 | Balance as of 2020 | Change in Net 2020 | ||||||||||||||||||||||||||||||
Private Common Stocks |
| |||||||||||||||||||||||||||||||||||||||
Real Estate | $ | 8,693,544 | $ | — | $ | — | $ | (475,024 | ) | $ | — | $ | — | $ | — | $ | — | $ | 8,218,520 | $ | (475,024 | ) | ||||||||||||||||||
|
|
|
|
|
|
|
|
|
|
|
|
|
|
|
|
|
|
|
| |||||||||||||||||||||
48
| June 30, 2020 | Baron Select Funds |
NOTES TO FINANCIAL STATEMENTS (Unaudited) (Continued)
7. FAIR VALUE MEASUREMENTS (Continued)
Unobservable valuation inputs developed by the Adviser for significant (greater than 1% of net assets) Level 3 investments as of June 30, 2020 were as follows:
Baron Partners Fund | ||||||||||||
| Sector | Company | Fair Value as of June 30, 2020 | Valuation Technique | Unobservable Input | Weighted Average used on June 30, 2020 | Range used on June 30, 2020 | ||||||
Private Common Stocks and Private Preferred Stocks: Industrials | Space Exploration Technologies Corp. | $159,067,980* | Combination of discounted cash flow analysis, current value via comparable companies, option- pricing, and arms- length transaction methods | Change in the composite equity index of comparable companies | (0.59)% | (2.80)% - 2.42% | ||||||
| Discount for lack of marketability | 5.36% | 5.36% | ||||||||||
| Estimated volatility of the returns of equity1 | 46.83% | 38.07% - 65.88% | ||||||||||
Baron Focused Growth Fund | ||||||||||||
| Sector | Company | Fair Value as of June 30, 2020 | Valuation Technique | Unobservable Input | Weighted Average used on June 30, 2020 | Range used on June 30, 2020 | ||||||
Private Common Stocks and Private Preferred Stocks: Industrials | Space Exploration Technologies Corp. | $12,551,948* | Combination of discounted cash flow analysis, current value via comparable companies, option- pricing, and arms- length transaction methods. | Change in the composite equity index of comparable companies | (0.59)% | (2.80)% - 2.42% | ||||||
| Discount for lack of marketability | 5.36% | 5.36% | ||||||||||
| Estimated volatility of the returns of equity1 | 46.83% | 38.07% - 65.88% | ||||||||||
| 1 | The volatility was calculated as a weighted-average of the volatilities used for the two business segments of the company. Each business segment’s volatility was calculated as the simple average volatilities of comparable companies relevant to that business segment. |
| * | The fair value as of June 30, 2020 includes a third party transaction price. |
A significant change in the EV/EBITDA multiple ratio may result in a directionally similar significant change in the fair value measurement, while a significant change in the discount for lack of marketability and equity index of comparable companies may not result in a materially higher or lower fair value measurement.
8. INCOME TAXES AND DISTRIBUTIONS TO SHAREHOLDERS
Federal income tax regulations differ from GAAP. Therefore, distributions determined in accordance with tax regulations may differ in amount or character from net investment income and net realized gain for financial reporting purposes. Net investment income (loss) and net realized and unrealized gain (loss) differ for financial statement and tax purposes due to differing treatments of net investment loss, foreign currency gains and losses, non-deductible interest expense, reclassification of distributions, partnership basis adjustments, income from passive foreign investment companies, late year loss deferral, post-October loss deferral, and wash sale loss deferral. Financial reporting records are adjusted for permanent book/tax differences to reflect tax character. Financial records are not adjusted for temporary differences.
As of June 30, 2020, the components of net assets on a tax basis were as follows:
| Baron Partners Fund | Baron Focused Growth Fund | Baron International Growth Fund | Baron Real Estate Fund | Baron Emerging | ||||||||||||||||
Cost of investments | $ | 1,611,002,090 | $ | 129,813,014 | $ | 250,319,896 | $ | 416,381,692 | $ | 3,721,996,204 | ||||||||||
|
|
|
|
|
|
|
|
|
| |||||||||||
Gross tax unrealized appreciation | 2,469,711,299 | 196,918,869 | 89,978,235 | 214,575,852 | 1,252,953,787 | |||||||||||||||
Gross tax unrealized depreciation | (43,496,956 | ) | (13,006 | ) | (13,249,756 | ) | (2,269,209 | ) | (199,881,860 | ) | ||||||||||
|
|
|
|
|
|
|
|
|
| |||||||||||
Net tax unrealized appreciation (depreciation) | 2,426,214,343 | 196,905,863 | 76,728,479 | 212,306,643 | 1,053,071,927 | |||||||||||||||
Net tax unrealized currency appreciation (depreciation) | — | — | (470 | ) | — | (24,103 | ) | |||||||||||||
Accumulated net investment income (loss) | (40,503,554 | ) | (1,005,659 | ) | 88,144 | 452,770 | (2,615,253 | ) | ||||||||||||
Accumulated net realized gain (loss) | 64,865,693 | (2,097,286 | ) | (18,320,411 | ) | 38,121,443 | (717,863,493 | ) | ||||||||||||
Paid-in capital | 852,961,377 | 132,920,989 | 269,715,933 | 374,955,871 | 4,494,965,143 | |||||||||||||||
|
|
|
|
|
|
|
|
|
| |||||||||||
Net Assets | $ | 3,303,537,859 | $ | 326,723,907 | $ | 328,211,675 | $ | 625,836,727 | $ | 4,827,534,221 | ||||||||||
|
|
|
|
|
|
|
|
|
| |||||||||||
49
| Baron Select Funds | June 30, 2020 |
NOTES TO FINANCIAL STATEMENTS (Unaudited) (Continued)
8. INCOME TAXES AND DISTRIBUTIONS TO SHAREHOLDERS (Continued)
| Baron Global Advantage Fund | Baron Real Estate Income Fund | Baron Health Care Fund | Baron FinTech Fund | |||||||||||||
Cost of investments | $ | 914,807,971 | $ | 4,159,310 | $ | 19,351,309 | $ | 9,566,013 | ||||||||
|
|
|
|
|
|
|
| |||||||||
Gross tax unrealized appreciation | 343,978,637 | 1,052,758 | 5,896,502 | 1,346,302 | ||||||||||||
Gross tax unrealized depreciation | (1,996,209 | ) | (70,818 | ) | (98,393 | ) | (171,883 | ) | ||||||||
|
|
|
|
|
|
|
| |||||||||
Net tax unrealized appreciation (depreciation) | 341,982,428 | 981,940 | 5,798,109 | 1,174,419 | ||||||||||||
Net tax unrealized currency appreciation (depreciation) | (446 | ) | — | — | 3 | |||||||||||
Accumulated net investment income (loss) | (2,701,170 | ) | 11,439 | (537 | ) | (19,313 | ) | |||||||||
Accumulated net realized gain (loss) | (25,325,385 | ) | (409,250 | ) | (25,768 | ) | (145,079 | ) | ||||||||
Paid-in capital | 912,139,853 | 4,559,617 | 19,409,493 | 9,741,375 | ||||||||||||
|
|
|
|
|
|
|
| |||||||||
Net Assets | $ | 1,226,095,280 | $ | 5,143,746 | $ | 25,181,297 | $ | 10,751,405 | ||||||||
|
|
|
|
|
|
|
| |||||||||
As of December 31, 2019, the Funds had capital loss carryforwards expiring as follows:
| Baron Partners Fund | Baron Focused Growth Fund | Baron International | Baron Real Estate Fund | |||||||||||||
Short term: | ||||||||||||||||
No expiration date | $ | — | $ | — | $ | 9,535,379 | $ | — | ||||||||
|
|
|
|
|
|
|
| |||||||||
Long term: |
| |||||||||||||||
No expiration date | $ | — | $ | — | $ | — | $ | — | ||||||||
|
|
|
|
|
|
|
| |||||||||
| Baron Emerging Markets Fund | Baron Global Advantage Fund | Baron Real Estate Income Fund | Baron Health Care Fund | |||||||||||||
Short term: | ||||||||||||||||
No expiration date | $ | 152,084,569 | $ | 9,423,721 | $ | 193,936 | $ | 31,608 | ||||||||
|
|
|
|
|
|
|
| |||||||||
Long term: |
| |||||||||||||||
No expiration date | $ | 147,297,703 | $ | 3,704,952 | $ | — | $ | — | ||||||||
|
|
|
|
|
|
|
| |||||||||
The tax character of distributions paid during the six months ended June 30, 2020 and for the year ended December 31, 2019 was as follows:
| Six Months Ended June 30, 2020 | Year Ended December 31, 2019 | |||||||||||||||||||||||
| Fund | Ordinary1 | Long Term Capital Gain | Return of Capital | Ordinary1 | Long Term Capital Gain | Return of Capital | ||||||||||||||||||
Baron Partners Fund | $ | — | $ | — | $ | — | $ | — | $ | 7,104,340 | $ | — | ||||||||||||
Baron Focused Growth Fund | — | — | — | — | 4,500,201 | — | ||||||||||||||||||
Baron International Growth Fund | — | — | — | 694,884 | 84,799 | — | ||||||||||||||||||
Baron Real Estate Fund | — | — | — | 524,560 | 78,325,315 | — | ||||||||||||||||||
Baron Emerging Markets Fund | — | — | — | 21,171,539 | — | 1,666,865 | ||||||||||||||||||
Baron Global Advantage Fund | — | — | — | — | — | — | ||||||||||||||||||
Baron Real Estate Income Fund | 26,129 | — | — | 47,252 | — | — | ||||||||||||||||||
Baron Health Care Fund | — | — | — | — | — | — | ||||||||||||||||||
Baron FinTech Fund | — | — | — | — | — | — | ||||||||||||||||||
| 1 | For tax purposes, short-term capital gains are considered ordinary income distributions. |
The Funds follow the provisions of FASB Codification Section 740 (“ASC Section 740”) “Accounting for Uncertainty in Income Taxes” which clarifies the accounting for uncertainty in tax positions taken or expected to be taken on a tax return. ASC Section 740 sets forth a threshold for financial statement recognition, measurement and disclosure of tax positions taken or expected to be taken on a tax return. The Funds are required to recognize the tax effects of certain tax positions under a “more likely than not” standard, that based on their technical merits, have more than 50 percent likelihood of being sustained upon examination. Management has analyzed the tax positions taken on the Funds’ federal income tax returns for all open years (current and prior three years), and has concluded that no provision for federal income tax is required in the Funds’ financial statements. At June 30, 2020, the Funds did not have any uncertain tax benefits that require recognition, de-recognition or disclosure. The Funds’ federal, state and local income and federal excise tax returns for which the applicable statutes of limitations have not expired (current and prior three years) are subject to examination by the Internal Revenue Service and state departments of revenue.
50
| June 30, 2020 | Baron Select Funds |
NOTES TO FINANCIAL STATEMENTS (Unaudited) (Continued)
9. OWNERSHIP CONCENTRATION
As of June 30, 2020, the officers, trustees and portfolio managers owned, directly or indirectly, 52.09% of Baron Focused Growth Fund, 54.67% of Baron Real Estate Income Fund, 37.13% of Baron Health Care Fund, and 61.53% of Baron FinTech Fund. As a result of their ownership, these investors may be able to materially affect the outcome of matters presented to Baron Focused Growth Fund, Baron Real Estate Income Fund, Baron Health Care Fund, and Baron FinTech Fund shareholders.
10. TRANSACTIONS IN “AFFILIATED” COMPANIES1
Baron Emerging Markets Fund
| Name of Issuer | Value at December 31, 2019 | Purchase Cost | Sales Proceeds | Change in Net Unrealized Appreciation (Depreciation) | Realized Gains/ (Losses) | Dividend Income | Shares Held at June 30, 2020 | Value at June 30, 2020 | % of Net Assets at June 30, 2020 | |||||||||||||||||||||||||||
No Longer an “Affiliated” Company as of June 30, 2020: |
| |||||||||||||||||||||||||||||||||||
Lekoil Ltd. | $ | 1,802,801 | $ | — | $ | 1,302,930 | $ | 9,105,404 | $ | (9,605,275 | ) | $ | — | — | $ | — | 0.00 | % | ||||||||||||||||||
|
|
|
|
|
|
|
|
|
|
|
|
|
|
|
|
|
| |||||||||||||||||||
| 1 | An “Affiliated” company (“affiliated person” as defined in the 1940 Act) is a company in which a Fund held 5% or more of the company’s outstanding voting securities at any time during the six months ended June 30, 2020. |
11. SUBSEQUENT EVENT
The coronavirus disease 2019 (COVID-19) global pandemic and the aggressive responses taken by many governments or voluntarily imposed by private parties, including closing borders, restricting travel and imposing prolonged quarantines or similar restrictions, as well as the closure of, or operational changes to, many retail and other businesses, have had negative impacts, and general uncertainty on markets worldwide. It is not known how long such impacts, or any future impacts of other significant events described above, will or would last, but there could be a prolonged period of global economic slowdown, which may impact your Fund investment.
12. STATEMENT REGARDING LIQUIDITY RISK MANAGEMENT PROGRAM
The Trust has adopted a liquidity risk management program (the “LRMP”) pursuant to the requirements of Rule 22e-4 under the 1940 Act, which requires registered open-end funds (other than money market funds) to adopt and implement a written liquidity risk management program that is reasonably designed to assess and manage fund liquidity risk. The rule is designed to promote effective liquidity risk management throughout the open-end fund industry, thereby reducing liquidity risk — i.e., the risk that a fund could not meet requests to redeem shares issued by the fund without significant dilution of remaining investors’ interests in the fund.
Pursuant to the requirements of Rule 22e-4, the LRMP is required to include policies and procedures reasonably designed to incorporate the following elements, and the LRMP complies with these requirements: (1) assessment, management and periodic review of liquidity risk; (2) classification of each Fund’s investments into one of the four liquidity categories in Rule 22e-4; (3) if the Fund does not primarily hold assets that are considered highly liquid investments (cash and other investments reasonably expected to be convertible into cash in current market conditions in three business days or less without the conversion into cash significantly changing the market value of the investment), determination of a “highly liquid investment minimum” (as defined in Rule 22e-4 and in the LRMP, the “HLIM”) and compliance with additional related requirements; (4) prohibition on the acquisition of any “illiquid investment” (as defined in Rule 22e-4) if immediately after the acquisition the Fund would have invested more than 15% of its net assets in illiquid investments; and (5) if the Funds reserve the right to engage in redemptions in-kind, establishment of policies and procedures regarding how and when the Funds will engage in such redemptions in-kind. There have been no material changes to the LRMP since it was initially approved by the Board.
The Board has approved the Adviser to administer the LRMP (the “Program Administrator”). The Program Administrator has delegated its responsibilities to a Liquidity Risk Management Committee (the “LRM Committee”), comprised of a cross-functional group of key representatives from various departments of the Program Administrator, including Operations; Accounting; Legal and Compliance; Trading; and Portfolio and Risk Analytics. In addition, the Trust has contracted with a third party liquidity assessment vendor to support the classification of Fund investments.
Pursuant to the requirements of Rule 22e-4, the Board must review, no less frequently than annually, a written report prepared by the Program Administrator that addresses the operation of the program and assesses its adequacy and effectiveness of implementation, including, if applicable, the operation of the HLIM, and any material changes to the program. The Board received a written report in May 2020 (the “Annual Report”).
The Annual Report states that the Adviser, as the Program Administrator, acting primarily through the LRM Committee, has assessed the operation of the LRMP and believes that the LRMP is adequate and effective in its implementation. The Program Administrator and the LRM Committee initially determined that each Fund primarily holds assets that are highly liquid investments, and the Annual Report states that this determination continues to be maintained so that no Fund needs to maintain a HLIM. In addition, the Annual Report states that, since the LRMP was implemented, no Fund has breached its limit on illiquid investments.
51
| Baron Select Funds | June 30, 2020 |
BARON PARTNERS FUND
Selected data for a share outstanding throughout each period:
| Income (loss) from investment operations: | Less distributions to shareholders from: | Ratios to Average Net Assets: | Supplemental Data: | |||||||||||||||||||||||||||||||||||||||||||||||||||||||||
Net asset | Net investment income (loss) ($) | Net realized and (loss) on | Total from | Net investment income ($) | Net realized | Total distributions ($) | Net asset value, end of period ($) | Total return (%) | Total expenses (%) | Less: interest expense (%) | Net Operating expenses (%) | Net investment income (loss) (%) | Net assets (in millions), end of period ($) | Portfolio turnover rate (%) | ||||||||||||||||||||||||||||||||||||||||||||||
RETAIL SHARES |
| |||||||||||||||||||||||||||||||||||||||||||||||||||||||||||
Six Months Ended June 30, |
| |||||||||||||||||||||||||||||||||||||||||||||||||||||||||||
2020 | 69.04 | (0.38 | )1 | 13.07 | 12.69 | 0.00 | 0.00 | 0.00 | 81.73 | 18.38 | 2 | 1.76 | 3 | (0.44 | )3 | 1.32 | 3 | (1.10 | )3 | 1,582.8 | 6.77 | 2 | ||||||||||||||||||||||||||||||||||||||
Year Ended December 31, |
| |||||||||||||||||||||||||||||||||||||||||||||||||||||||||||
2019 | 47.77 | (0.75 | )1 | 22.20 | 21.45 | 0.00 | (0.18 | ) | (0.18 | ) | 69.04 | 44.97 | 2.22 | (0.90 | ) | 1.32 | (1.29 | ) | 1,353.6 | 7.97 | ||||||||||||||||||||||||||||||||||||||||
2018 | 48.75 | (0.61 | )1 | (0.37 | ) | (0.98 | ) | 0.00 | 0.00 | 0.00 | 47.77 | (2.01 | ) | 2.03 | (0.71 | ) | 1.32 | (1.13 | ) | 1,016.2 | 8.09 | |||||||||||||||||||||||||||||||||||||||
2017 | 37.06 | (0.38 | )1 | 12.07 | 11.69 | 0.00 | 0.00 | 0.00 | 48.75 | 31.54 | 1.79 | (0.45 | ) | 1.34 | (0.84 | ) | 1,101.7 | 26.19 | ||||||||||||||||||||||||||||||||||||||||||
2016 | 35.62 | (0.11 | )1 | 1.55 | 1.44 | 0.00 | 0.00 | 0.00 | 37.06 | 4.04 | 1.78 | (0.43 | ) | 1.35 | (0.31 | ) | 913.9 | 15.59 | ||||||||||||||||||||||||||||||||||||||||||
2015 | 36.74 | (0.05 | )1 | (0.95 | ) | (1.00 | ) | (0.12 | ) | 0.00 | (0.12 | ) | 35.62 | (2.71 | ) | 1.52 | (0.20 | ) | 1.32 | (0.13 | ) | 1,107.5 | 17.08 | |||||||||||||||||||||||||||||||||||||
2014 | 33.32 | 0.23 | 1 | 3.19 | 3.42 | 0.00 | 0.00 | 0.00 | 36.74 | 10.26 | 1.51 | (0.19 | ) | 1.32 | 0.66 | 1,256.3 | 30.82 | |||||||||||||||||||||||||||||||||||||||||||
2013 | 22.56 | (0.19 | )1 | 10.95 | 10.76 | 0.00 | 0.00 | 0.00 | 33.32 | 47.69 | 1.67 | (0.29 | ) | 1.38 | (0.66 | ) | 1,125.6 | 18.57 | ||||||||||||||||||||||||||||||||||||||||||
2012 | 19.39 | (0.04 | )1 | 3.21 | 3.17 | 0.00 | 0.00 | 0.00 | 22.56 | 16.35 | 1.74 | (0.34 | ) | 1.40 | (0.18 | ) | 653.7 | 13.04 | ||||||||||||||||||||||||||||||||||||||||||
2011 | 20.57 | (0.14 | )1 | (1.04 | ) | (1.18 | ) | 0.00 | 0.00 | 0.00 | 19.39 | (5.74 | ) | 1.71 | (0.36 | ) | 1.35 | (0.69 | ) | 970.4 | 16.96 | |||||||||||||||||||||||||||||||||||||||
INSITUTIONAL SHARES |
| |||||||||||||||||||||||||||||||||||||||||||||||||||||||||||
Six Months Ended June 30, |
| |||||||||||||||||||||||||||||||||||||||||||||||||||||||||||
2020 | 70.82 | (0.30 | )1 | 13.42 | 13.12 | 0.00 | 0.00 | 0.00 | 83.94 | 18.53 | 2 | 1.50 | 3 | (0.44 | )3 | 1.06 | 3 | (0.84 | )3 | 1,499.3 | 6.77 | 2 | ||||||||||||||||||||||||||||||||||||||
Year Ended December 31, |
| |||||||||||||||||||||||||||||||||||||||||||||||||||||||||||
2019 | 48.86 | (0.62 | )1 | 22.76 | 22.14 | 0.00 | (0.18 | ) | (0.18 | ) | 70.82 | 45.38 | 1.96 | (0.90 | ) | 1.06 | (1.03 | ) | 1,187.0 | 7.97 | ||||||||||||||||||||||||||||||||||||||||
2018 | 49.73 | (0.49 | )1 | (0.38 | ) | (0.87 | ) | 0.00 | 0.00 | 0.00 | 48.86 | (1.75 | ) | 1.77 | (0.71 | ) | 1.06 | (0.88 | ) | 815.6 | 8.09 | |||||||||||||||||||||||||||||||||||||||
2017 | 37.70 | (0.27 | )1 | 12.30 | 12.03 | 0.00 | 0.00 | 0.00 | 49.73 | 31.91 | 1.53 | (0.45 | ) | 1.08 | (0.58 | ) | 854.9 | 26.19 | ||||||||||||||||||||||||||||||||||||||||||
2016 | 36.15 | (0.02 | )1 | 1.57 | 1.55 | 0.00 | 0.00 | 0.00 | 37.70 | 4.29 | 1.52 | (0.43 | ) | 1.09 | (0.05 | ) | 645.3 | 15.59 | ||||||||||||||||||||||||||||||||||||||||||
2015 | 37.28 | 0.04 | 1 | (0.95 | ) | (0.91 | ) | (0.22 | ) | 0.00 | (0.22 | ) | 36.15 | (2.43 | ) | 1.26 | (0.20 | ) | 1.06 | 0.11 | 793.3 | 17.08 | ||||||||||||||||||||||||||||||||||||||
2014 | 33.72 | 0.25 | 1 | 3.31 | 3.56 | 0.00 | 0.00 | 0.00 | 37.28 | 10.56 | 1.26 | (0.20 | ) | 1.06 | 0.69 | 681.5 | 30.82 | |||||||||||||||||||||||||||||||||||||||||||
2013 | 22.78 | (0.12 | )1 | 11.06 | 10.94 | 0.00 | 0.00 | 0.00 | 33.72 | 48.02 | 1.41 | (0.30 | ) | 1.11 | (0.41 | ) | 349.0 | 18.57 | ||||||||||||||||||||||||||||||||||||||||||
2012 | 19.52 | 0.04 | 1 | 3.22 | 3.26 | 0.00 | 0.00 | 0.00 | 22.78 | 16.70 | 1.48 | (0.35 | ) | 1.13 | 0.18 | 146.5 | 13.04 | |||||||||||||||||||||||||||||||||||||||||||
2011 | 20.66 | (0.08 | )1 | (1.06 | ) | (1.14 | ) | 0.00 | 0.00 | 0.00 | 19.52 | (5.52 | ) | 1.45 | (0.36 | ) | 1.09 | (0.41 | ) | 123.7 | 16.96 | |||||||||||||||||||||||||||||||||||||||
R6 SHARES |
| |||||||||||||||||||||||||||||||||||||||||||||||||||||||||||
Six Months Ended June 30, |
| |||||||||||||||||||||||||||||||||||||||||||||||||||||||||||
2020 | 70.82 | (0.30 | )1 | 13.42 | 13.12 | 0.00 | 0.00 | 0.00 | 83.94 | 18.53 | 2 | 1.50 | 3 | (0.44 | )3 | 1.06 | 3 | (0.84 | )3 | 221.4 | 6.77 | 2 | ||||||||||||||||||||||||||||||||||||||
Year Ended December 31, |
| |||||||||||||||||||||||||||||||||||||||||||||||||||||||||||
2019 | 48.86 | (0.62 | )1 | 22.76 | 22.14 | 0.00 | (0.18 | ) | (0.18 | ) | 70.82 | 45.38 | 1.96 | (0.90 | ) | 1.06 | (1.03 | ) | 186.9 | 7.97 | ||||||||||||||||||||||||||||||||||||||||
2018 | 49.73 | (0.46 | )1 | (0.41 | ) | (0.87 | ) | 0.00 | 0.00 | 0.00 | 48.86 | (1.75 | ) | 1.79 | (0.73 | ) | 1.06 | (0.82 | ) | 123.4 | 8.09 | |||||||||||||||||||||||||||||||||||||||
2017 | 37.71 | (0.26 | )1 | 12.28 | 12.02 | 0.00 | 0.00 | 0.00 | 49.73 | 31.88 | 1.52 | (0.45 | ) | 1.07 | (0.55 | ) | 15.5 | 26.19 | ||||||||||||||||||||||||||||||||||||||||||
20164 | 38.61 | (0.01 | )1 | (0.89 | ) | (0.90 | ) | 0.00 | 0.00 | 0.00 | 37.71 | (2.33 | )2 | 1.62 | 3 | (0.53 | )3 | 1.09 | 3 | (0.04 | )3 | 8.3 | 15.59 | |||||||||||||||||||||||||||||||||||||
| 1 | Based on average shares outstanding. |
| 2 | Not Annualized. |
| 3 | Annualized. |
| 4 | For the period August 31, 2016 (initial offering of R6 Shares) to December 31, 2016. |
| 52 | See Notes to Financial Statements. |
| June 30, 2020 | Baron Select Funds |
FINANCIAL HIGHLIGHTS (Continued)
BARON FOCUSED GROWTH FUND
Selected data for a share outstanding throughout each period:
| Income (loss) from investment operations: | Less distributions to shareholders from: | Ratios to Average Net Assets: | Supplemental Data: | |||||||||||||||||||||||||||||||||||||||||||||||||||||||||
| Net asset value, beginning of period ($) | Net investment income (loss) ($) | Net (loss) | Total from investment operations ($) | Net investment income ($) | Net realized gain on investments ($) | Total distributions ($) | Net asset value, end of period ($) | Total return (%) | Operating expenses (%) | Less: Reimbursement of expenses by Adviser (%) | Net operating expenses (%) | Net investment income (loss) (%) | Net assets (in millions), end of period ($) | Portfolio turnover rate (%) | ||||||||||||||||||||||||||||||||||||||||||||||
RETAIL SHARES |
| |||||||||||||||||||||||||||||||||||||||||||||||||||||||||||
Six Months Ended June 30, |
| |||||||||||||||||||||||||||||||||||||||||||||||||||||||||||
2020 | 20.18 | (0.10 | )1 | 3.53 | 3.43 | 0.00 | 0.00 | 0.00 | 23.61 | 17.00 | 3,4 | 1.38 | 5 | (0.03 | )5 | 1.35 | 5 | (0.93 | )5 | 66.7 | 2.66 | 4 | ||||||||||||||||||||||||||||||||||||||
Year Ended December 31, |
| |||||||||||||||||||||||||||||||||||||||||||||||||||||||||||
2019 | 15.81 | (0.12 | )1 | 4.85 | 4.73 | 0.00 | (0.36 | ) | (0.36 | ) | 20.18 | 30.03 | 3 | 1.39 | 8 | (0.04 | ) | 1.35 | (0.67 | ) | 49.1 | 4.53 | ||||||||||||||||||||||||||||||||||||||
2018 | 15.38 | (0.08 | )1 | 0.68 | 0.60 | 0.00 | (0.17 | ) | (0.17 | ) | 15.81 | 3.75 | 3 | 1.39 | 8 | (0.04 | ) | 1.35 | (0.49 | ) | 40.9 | 1.85 | ||||||||||||||||||||||||||||||||||||||
2017 | 12.43 | (0.09 | )1 | 3.36 | 3.27 | (0.00 | )2 | (0.32 | ) | (0.32 | ) | 15.38 | 26.36 | 3 | 1.40 | (0.05 | ) | 1.35 | (0.64 | ) | 42.4 | 11.48 | ||||||||||||||||||||||||||||||||||||||
2016 | 13.09 | 0.01 | 1 | 0.08 | 0.09 | 0.00 | (0.75 | ) | (0.75 | ) | 12.43 | 0.67 | 3 | 1.43 | (0.08 | ) | 1.35 | 0.11 | 37.7 | 14.31 | ||||||||||||||||||||||||||||||||||||||||
2015 | 14.21 | (0.01 | )1 | (0.35 | ) | (0.36 | ) | (0.02 | ) | (0.74 | ) | (0.76 | ) | 13.09 | (2.42 | )3 | 1.39 | (0.04 | ) | 1.35 | (0.10 | ) | 43.7 | 12.18 | ||||||||||||||||||||||||||||||||||||
2014 | 13.97 | 0.04 | 1 | 0.29 | 0.33 | 0.00 | (0.09 | ) | (0.09 | ) | 14.21 | 2.35 | 3 | 1.39 | (0.04 | ) | 1.35 | 0.31 | 46.1 | 36.92 | ||||||||||||||||||||||||||||||||||||||||
2013 | 11.26 | (0.07 | )1 | 2.95 | 2.88 | (0.17 | ) | 0.00 | (0.17 | ) | 13.97 | 25.69 | 3 | 1.42 | (0.07 | ) | 1.35 | (0.53 | ) | 47.6 | 33.67 | |||||||||||||||||||||||||||||||||||||||
2012 | 9.71 | 0.24 | 1 | 1.31 | 1.55 | 0.00 | 0.00 | 0.00 | 11.26 | 15.96 | 3 | 1.48 | (0.13 | ) | 1.35 | 2.30 | 31.4 | 38.38 | ||||||||||||||||||||||||||||||||||||||||||
2011 | 9.85 | (0.07 | )1 | (0.07 | ) | (0.14 | ) | 0.00 | 0.00 | 0.00 | 9.71 | (1.42 | )3 | 1.48 | (0.13 | ) | 1.35 | (0.69 | ) | 28.3 | 44.58 | |||||||||||||||||||||||||||||||||||||||
INSTITUTIONAL SHARES |
| |||||||||||||||||||||||||||||||||||||||||||||||||||||||||||
Six Months Ended June 30, |
| |||||||||||||||||||||||||||||||||||||||||||||||||||||||||||
2020 | 20.67 | (0.07 | )1 | 3.61 | 3.54 | 0.00 | 0.00 | 0.00 | 24.21 | 17.13 | 3,4 | 1.10 | 5 | (0.00 | )5,7 | 1.10 | 5 | (0.68 | )5 | 117.1 | 2.66 | 4 | ||||||||||||||||||||||||||||||||||||||
Year Ended December 31, |
| |||||||||||||||||||||||||||||||||||||||||||||||||||||||||||
2019 | 16.15 | (0.08 | )1 | 4.96 | 4.88 | 0.00 | (0.36 | ) | (0.36 | ) | 20.67 | 30.33 | 3 | 1.11 | 8 | (0.01 | ) | 1.10 | (0.42 | ) | 91.3 | 4.53 | ||||||||||||||||||||||||||||||||||||||
2018 | 15.66 | (0.05 | )1 | 0.71 | 0.66 | 0.00 | (0.17 | ) | (0.17 | ) | 16.15 | 4.07 | 1.09 | 8 | 0.00 | 1.09 | (0.30 | ) | 70.7 | 1.85 | ||||||||||||||||||||||||||||||||||||||||
2017 | 12.63 | (0.06 | )1 | 3.41 | 3.35 | (0.00 | )2 | (0.32 | ) | (0.32 | ) | 15.66 | 26.59 | 3 | 1.12 | (0.02 | ) | 1.10 | (0.39 | ) | 127.8 | 11.48 | ||||||||||||||||||||||||||||||||||||||
2016 | 13.25 | 0.05 | 1 | 0.08 | 0.13 | 0.00 | (0.75 | ) | (0.75 | ) | 12.63 | 0.97 | 3 | 1.13 | (0.03 | ) | 1.10 | 0.37 | 128.9 | 14.31 | ||||||||||||||||||||||||||||||||||||||||
2015 | 14.37 | 0.02 | 1 | (0.34 | ) | (0.32 | ) | (0.06 | ) | (0.74 | ) | (0.80 | ) | 13.25 | (2.12 | ) | 1.09 | 0.00 | 1.09 | 0.16 | 140.5 | 12.18 | ||||||||||||||||||||||||||||||||||||||
2014 | 14.10 | 0.08 | 1 | 0.28 | 0.36 | 0.00 | (0.09 | ) | (0.09 | ) | 14.37 | 2.54 | 1.09 | 0.00 | 1.09 | 0.56 | 149.2 | 36.92 | ||||||||||||||||||||||||||||||||||||||||||
2013 | 11.35 | (0.04 | )1 | 2.99 | 2.95 | (0.20 | ) | 0.00 | (0.20 | ) | 14.10 | 26.09 | 3 | 1.12 | (0.02 | ) | 1.10 | (0.28 | ) | 148.4 | 33.67 | |||||||||||||||||||||||||||||||||||||||
2012 | 9.77 | 0.26 | 1 | 1.32 | 1.58 | 0.00 | 0.00 | 0.00 | 11.35 | 16.17 | 3 | 1.16 | (0.06 | ) | 1.10 | 2.53 | 87.9 | 38.38 | ||||||||||||||||||||||||||||||||||||||||||
2011 | 9.88 | (0.04 | )1 | (0.07 | ) | (0.11 | ) | 0.00 | 0.00 | 0.00 | 9.77 | (1.11 | )3 | 1.18 | (0.08 | ) | 1.10 | (0.40 | ) | 63.6 | 44.58 | |||||||||||||||||||||||||||||||||||||||
R6 SHARES |
| |||||||||||||||||||||||||||||||||||||||||||||||||||||||||||
Six Months Ended June 30, |
| |||||||||||||||||||||||||||||||||||||||||||||||||||||||||||
2020 | 20.68 | (0.07 | )1 | 3.61 | 3.54 | 0.00 | 0.00 | 0.00 | 24.22 | 17.12 | 4 | 1.09 | 5 | 0.00 | 1.09 | 5 | (0.67 | )5 | 142.9 | 2.66 | 4 | |||||||||||||||||||||||||||||||||||||||
Year Ended December 31, |
| |||||||||||||||||||||||||||||||||||||||||||||||||||||||||||
2019 | 16.16 | (0.07 | )1 | 4.95 | 4.88 | 0.00 | (0.36 | ) | (0.36 | ) | 20.68 | 30.31 | 1.10 | 8 | 0.00 | 1.10 | (0.40 | ) | 122.0 | 4.53 | ||||||||||||||||||||||||||||||||||||||||
2018 | 15.67 | (0.03 | )1 | 0.69 | 0.66 | 0.00 | (0.17 | ) | (0.17 | ) | 16.16 | 4.07 | 3 | 1.10 | 8 | (0.00 | )7 | 1.10 | (0.18 | ) | 92.2 | 1.85 | ||||||||||||||||||||||||||||||||||||||
2017 | 12.63 | (0.06 | )1 | 3.42 | 3.36 | (0.00 | )2 | (0.32 | ) | (0.32 | ) | 15.67 | 26.67 | 3 | 1.10 | (0.00 | )7 | 1.10 | (0.38 | ) | 22.6 | 11.48 | ||||||||||||||||||||||||||||||||||||||
20166 | 13.87 | 0.02 | 1 | (0.51 | ) | (0.49 | ) | 0.00 | (0.75 | ) | (0.75 | ) | 12.63 | (3.55 | )3,4 | 1.14 | 5 | (0.04 | )5 | 1.10 | 5 | 0.53 | 5 | 8.6 | 14.31 | |||||||||||||||||||||||||||||||||||
| 1 | Based on average shares outstanding. |
| 2 | Less than $0.01 per share. |
| 3 | The total returns would have been lower had certain expenses not been reduced during the period shown. |
| 4 | Not Annualized. |
| 5 | Annualized. |
| 6 | For the period August 31, 2016 (initial offering of R6 Shares) to December 31, 2016. |
| 7 | Less than 0.01%. |
| 8 | Interest expense rounds to less than 0.01%. |
| See Notes to Financial Statements. | 53 |
| Baron Select Funds | June 30, 2020 |
FINANCIAL HIGHLIGHTS (Continued)
BARON INTERNATIONAL GROWTH FUND
Selected data for a share outstanding throughout each period:
| Income (loss) from investment operations: | Less distributions to shareholders from: | Ratios to Average Net Assets: | Supplemental Data: | |||||||||||||||||||||||||||||||||||||||||||||||||||||||||
| Net asset value, beginning of period ($) | Net investment income (loss) ($) | Net (loss) | Total from investment operations ($) | Net investment income ($) | Net realized gain on investments ($) | Total distributions ($) | Net asset value, end of period ($) | Total return (%) | Operating expenses (%) | Less: Reimbursement of expenses by Adviser (%) | Net operating expenses (%) | Net investment income (loss) (%) | Net assets (in millions), end of period ($) | Portfolio turnover rate (%) | ||||||||||||||||||||||||||||||||||||||||||||||
RETAIL SHARES |
| |||||||||||||||||||||||||||||||||||||||||||||||||||||||||||
Six Months Ended June 30, |
| |||||||||||||||||||||||||||||||||||||||||||||||||||||||||||
2020 | 24.50 | (0.03 | )1 | 0.19 | 2 | 0.16 | 0.00 | 0.00 | 0.00 | 24.66 | 0.65 | 4,5 | 1.32 | 6 | (0.12 | )6 | 1.20 | 6 | (0.25 | )6 | 57.8 | 33.38 | 5 | |||||||||||||||||||||||||||||||||||||
Year Ended December 31, |
| |||||||||||||||||||||||||||||||||||||||||||||||||||||||||||
2019 | 19.00 | 0.01 | 1 | 5.51 | 5.52 | (0.01 | ) | (0.01 | ) | (0.02 | ) | 24.50 | 29.06 | 4 | 1.31 | (0.11 | ) | 1.20 | 0.06 | 82.0 | 56.52 | |||||||||||||||||||||||||||||||||||||||
2018 | 23.90 | (0.01 | )1 | (4.21 | ) | (4.22 | ) | 0.00 | (0.68 | ) | (0.68 | ) | 19.00 | (17.90 | )4 | 1.34 | 8 | (0.14 | ) | 1.20 | (0.03 | ) | 59.8 | 50.83 | ||||||||||||||||||||||||||||||||||||
2017 | 18.09 | (0.06 | )1 | 6.72 | 6.66 | 0.00 | (0.85 | ) | (0.85 | ) | 23.90 | 36.94 | 4 | 1.51 | (0.14 | ) | 1.37 | (0.28 | ) | 56.5 | 31.44 | |||||||||||||||||||||||||||||||||||||||
2016 | 18.05 | (0.03 | )1 | 0.24 | 0.21 | (0.01 | ) | (0.16 | ) | (0.17 | ) | 18.09 | 1.14 | 4 | 1.65 | (0.15 | ) | 1.50 | (0.16 | ) | 41.8 | 38.90 | ||||||||||||||||||||||||||||||||||||||
2015 | 17.94 | 0.03 | 1 | 0.19 | 0.22 | (0.08 | ) | (0.03 | ) | (0.11 | ) | 18.05 | 1.23 | 4 | 1.59 | (0.09 | ) | 1.50 | 0.15 | 44.9 | 42.85 | |||||||||||||||||||||||||||||||||||||||
2014 | 18.91 | 0.03 | 1 | (0.46 | ) | (0.43 | ) | (0.00 | )3 | (0.54 | ) | (0.54 | ) | 17.94 | (2.33 | )4 | 1.63 | (0.13 | ) | 1.50 | 0.14 | 53.0 | 34.67 | |||||||||||||||||||||||||||||||||||||
2013 | 15.55 | (0.01 | )1 | 3.37 | 3.36 | 0.00 | 0.00 | 0.00 | 18.91 | 21.61 | 4 | 1.74 | (0.24 | ) | 1.50 | (0.05 | ) | 17.0 | 40.60 | |||||||||||||||||||||||||||||||||||||||||
2012 | 13.20 | (0.02 | )1 | 2.37 | 2.35 | 0.00 | 0.00 | 0.00 | 15.55 | 17.80 | 4 | 1.78 | (0.28 | ) | 1.50 | (0.16 | ) | 15.6 | 39.02 | |||||||||||||||||||||||||||||||||||||||||
2011 | 17.29 | (0.01 | )1 | (2.78 | ) | (2.79 | ) | (0.04 | ) | (1.26 | ) | (1.30 | ) | 13.20 | (16.35 | )4 | 1.73 | (0.23 | ) | 1.50 | (0.05 | ) | 11.7 | 53.20 | ||||||||||||||||||||||||||||||||||||
INSTITUTIONAL SHARES |
| |||||||||||||||||||||||||||||||||||||||||||||||||||||||||||
Six Months Ended June 30, |
| |||||||||||||||||||||||||||||||||||||||||||||||||||||||||||
2020 | 24.88 | 0.01 | 1 | 0.18 | 2 | 0.19 | 0.00 | 0.00 | 0.00 | 25.07 | 0.76 | 4,5 | 1.06 | 6 | (0.11 | )6 | 0.95 | 6 | 0.07 | 6 | 253.3 | 33.38 | 5 | |||||||||||||||||||||||||||||||||||||
Year Ended December 31, |
| |||||||||||||||||||||||||||||||||||||||||||||||||||||||||||
2019 | 19.29 | 0.06 | 1 | 5.61 | 5.67 | (0.07 | ) | (0.01 | ) | (0.08 | ) | 24.88 | 29.39 | 4 | 1.04 | (0.09 | ) | 0.95 | 0.27 | 223.6 | 56.52 | |||||||||||||||||||||||||||||||||||||||
2018 | 24.19 | 0.06 | 1 | (4.28 | ) | (4.22 | ) | 0.00 | (0.68 | ) | (0.68 | ) | 19.29 | (17.68 | )4 | 1.07 | 8 | (0.12 | ) | 0.95 | 0.26 | 154.2 | 50.83 | |||||||||||||||||||||||||||||||||||||
2017 | 18.25 | (0.01 | )1 | 6.80 | 6.79 | 0.00 | (0.85 | ) | (0.85 | ) | 24.19 | 37.33 | 4 | 1.23 | (0.12 | ) | 1.11 | (0.06 | ) | 110.8 | 31.44 | |||||||||||||||||||||||||||||||||||||||
2016 | 18.17 | 0.01 | 1 | 0.24 | 0.25 | (0.01 | ) | (0.16 | ) | (0.17 | ) | 18.25 | 1.35 | 4 | 1.36 | (0.11 | ) | 1.25 | 0.07 | 45.4 | 38.90 | |||||||||||||||||||||||||||||||||||||||
2015 | 18.09 | 0.08 | 1 | 0.19 | 0.27 | (0.16 | ) | (0.03 | ) | (0.19 | ) | 18.17 | 1.48 | 4 | 1.31 | (0.06 | ) | 1.25 | 0.41 | 53.7 | 42.85 | |||||||||||||||||||||||||||||||||||||||
2014 | 19.05 | 0.12 | 1 | (0.50 | ) | (0.38 | ) | (0.04 | ) | (0.54 | ) | (0.58 | ) | 18.09 | (2.07 | )4 | 1.34 | (0.09 | ) | 1.25 | 0.64 | 52.3 | 34.67 | |||||||||||||||||||||||||||||||||||||
2013 | 15.63 | 0.03 | 1 | 3.39 | 3.42 | (0.00 | )3 | 0.00 | (0.00 | )3 | 19.05 | 21.89 | 4 | 1.37 | (0.12 | ) | 1.25 | 0.20 | 45.4 | 40.60 | ||||||||||||||||||||||||||||||||||||||||
2012 | 13.25 | 0.01 | 1 | 2.40 | 2.41 | (0.03 | ) | 0.00 | (0.03 | ) | 15.63 | 18.17 | 4 | 1.40 | (0.15 | ) | 1.25 | 0.09 | 39.0 | 39.02 | ||||||||||||||||||||||||||||||||||||||||
2011 | 17.36 | 0.03 | 1 | (2.79 | ) | (2.76 | ) | (0.09 | ) | (1.26 | ) | (1.35 | ) | 13.25 | (16.13 | )4 | 1.38 | (0.13 | ) | 1.25 | 0.19 | 30.5 | 53.20 | |||||||||||||||||||||||||||||||||||||
R6 SHARES |
| |||||||||||||||||||||||||||||||||||||||||||||||||||||||||||
Six Months Ended June 30, |
| |||||||||||||||||||||||||||||||||||||||||||||||||||||||||||
2020 | 24.88 | 0.01 | 1 | 0.18 | 2 | 0.19 | 0.00 | 0.00 | 0.00 | 25.07 | 0.76 | 4,5 | 1.05 | 6 | (0.10 | )6 | 0.95 | 6 | 0.04 | 6 | 17.1 | 33.38 | 5 | |||||||||||||||||||||||||||||||||||||
Year Ended December 31, |
| |||||||||||||||||||||||||||||||||||||||||||||||||||||||||||
2019 | 19.29 | 0.06 | 1 | 5.61 | 5.67 | (0.07 | ) | (0.01 | ) | (0.08 | ) | 24.88 | 29.39 | 4 | 1.03 | (0.08 | ) | 0.95 | 0.28 | 17.7 | 56.52 | |||||||||||||||||||||||||||||||||||||||
2018 | 24.19 | 0.07 | 1 | (4.29 | ) | (4.22 | ) | 0.00 | (0.68 | ) | (0.68 | ) | 19.29 | (17.68 | )4 | 1.06 | 8 | (0.11 | ) | 0.95 | 0.31 | 12.4 | 50.83 | |||||||||||||||||||||||||||||||||||||
2017 | 18.25 | (0.02 | )1 | 6.81 | 6.79 | 0.00 | (0.85 | ) | (0.85 | ) | 24.19 | 37.33 | 4 | 1.22 | (0.12 | ) | 1.10 | (0.10 | ) | 0.8 | 31.44 | |||||||||||||||||||||||||||||||||||||||
20167 | 19.15 | (0.02 | )1 | (0.71 | ) | (0.73 | ) | (0.01 | ) | (0.16 | ) | (0.17 | ) | 18.25 | (3.83 | )4,5 | 1.38 | 6 | (0.14 | )6 | 1.24 | 6 | (0.31 | )6 | 0.4 | 38.90 | ||||||||||||||||||||||||||||||||||
| 1 | Based on average shares outstanding. |
| 2 | The amount shown for a share outstanding does not correspond with the aggregate realized and unrealized gain (loss) on investments for the period due to the timing of sales and redemptions of Fund shares in relation to fluctuating market values of investments of the Fund. |
| 3 | Less than $0.01 per share. |
| 4 | The total returns would have been lower had certain expenses not been reduced during the period shown. |
| 5 | Not Annualized. |
| 6 | Annualized. |
| 7 | For the period August 31, 2016 (initial offering of R6 Shares) to December 31, 2016. |
| 8 | Interest expense rounds to less than 0.01%. |
| 54 | See Notes to Financial Statements. |
| June 30, 2020 | Baron Select Funds |
FINANCIAL HIGHLIGHTS (Continued)
BARON REAL ESTATE FUND
Selected data for a share outstanding throughout each period:
| Income (loss) from investment operations: | Less distributions to shareholders from: | Ratios to Average Net Assets: | Supplemental Data: | |||||||||||||||||||||||||||||||||||||||||||||||||||||||||||||
Net asset | Net investment income (loss) ($) | Net (loss) | Total from investment operations ($) | Net investment income ($) | Net realized gain on investments ($) | Return of capital ($) | Total distributions ($) | Net asset | Total return (%) | Operating expenses (%) | Less: Reimbursement of expenses by Adviser (%) | Net operating expenses (%) | Net investment income (loss) (%) | Net assets (in millions), end of period ($) | Portfolio turnover rate (%) | |||||||||||||||||||||||||||||||||||||||||||||||||
RETAIL SHARES |
| |||||||||||||||||||||||||||||||||||||||||||||||||||||||||||||||
Six Months Ended June 30, |
| |||||||||||||||||||||||||||||||||||||||||||||||||||||||||||||||
2020 | 26.18 | (0.01 | )1 | 1.04 | 1.03 | 0.00 | 0.00 | 0.00 | 0.00 | 27.21 | 3.93 | 5 | 1.34 | 6 | 0.00 | 1.34 | 6 | (0.11 | )6 | 225.9 | 51.96 | 5 | ||||||||||||||||||||||||||||||||||||||||||
Year Ended December 31, |
| |||||||||||||||||||||||||||||||||||||||||||||||||||||||||||||||
2019 | 20.77 | (0.03 | )1 | 9.08 | 9.05 | 0.00 | (3.64 | ) | 0.00 | (3.64 | ) | 26.18 | 44.11 | 1.33 | 8 | 0.00 | 1.33 | (0.10 | ) | 246.9 | 53.44 | |||||||||||||||||||||||||||||||||||||||||||
2018 | 29.58 | (0.03 | )1 | (6.28 | ) | (6.31 | ) | 0.00 | (2.50 | ) | 0.00 | (2.50 | ) | 20.77 | (22.22 | ) | 1.32 | 8 | 0.00 | 1.32 | (0.10 | ) | 213.0 | 56.47 | ||||||||||||||||||||||||||||||||||||||||
2017 | 23.67 | 0.00 | 1,3 | 7.32 | 7.32 | 0.00 | (1.41 | ) | 0.00 | (1.41 | ) | 29.58 | 31.04 | 1.32 | 0.00 | 1.32 | 0.01 | 426.7 | 44.56 | |||||||||||||||||||||||||||||||||||||||||||||
2016 | 24.24 | (0.02 | )1 | (0.47 | ) | (0.49 | ) | 0.00 | (0.08 | ) | 0.00 | (0.08 | ) | 23.67 | (2.01 | ) | 1.33 | 0.00 | 1.33 | (0.07 | ) | 434.0 | 55.50 | |||||||||||||||||||||||||||||||||||||||||
2015 | 25.92 | (0.06 | )1 | (1.14 | ) | (1.20 | ) | (0.01 | ) | (0.47 | ) | 0.00 | (0.48 | ) | 24.24 | (4.65 | ) | 1.31 | 0.00 | 1.31 | (0.23 | ) | 788.9 | 50.50 | ||||||||||||||||||||||||||||||||||||||||
2014 | 22.25 | 0.04 | 1 | 3.66 | 3.70 | (0.03 | ) | 0.00 | 0.00 | (0.03 | ) | 25.92 | 16.61 | 1.32 | 0.00 | 1.32 | 0.17 | 782.8 | 24.40 | |||||||||||||||||||||||||||||||||||||||||||||
2013 | 17.52 | (0.05 | )1 | 4.80 | 4.75 | 0.00 | (0.02 | ) | 0.00 | (0.02 | ) | 22.25 | 27.12 | 1.35 | 0.00 | 1.35 | (0.23 | ) | 539.5 | 19.36 | ||||||||||||||||||||||||||||||||||||||||||||
2012 | 12.51 | 0.01 | 1 | 5.31 | 5.32 | 0.00 | (0.31 | ) | 0.00 | (0.31 | ) | 17.52 | 42.60 | 4 | 1.76 | (0.41 | ) | 1.35 | 0.07 | 53.6 | 30.14 | |||||||||||||||||||||||||||||||||||||||||||
2011 | 12.66 | (0.01 | )1 | 0.07 | 2 | 0.06 | (0.00 | )3 | (0.21 | ) | 0.00 | (0.21 | ) | 12.51 | 0.63 | 4 | 2.33 | (0.98 | ) | 1.35 | (0.08 | ) | 10.9 | 70.99 | ||||||||||||||||||||||||||||||||||||||||
INSITUTIONAL SHARES |
| |||||||||||||||||||||||||||||||||||||||||||||||||||||||||||||||
Six Months Ended June 30, |
| |||||||||||||||||||||||||||||||||||||||||||||||||||||||||||||||
2020 | 26.68 | 0.02 | 1 | 1.08 | 1.10 | 0.00 | 0.00 | 0.00 | 0.00 | 27.78 | 4.12 | 5 | 1.08 | 6 | 0.00 | 1.08 | 6 | 0.16 | 6 | 386.4 | 51.96 | 5 | ||||||||||||||||||||||||||||||||||||||||||
Year Ended December 31, |
| |||||||||||||||||||||||||||||||||||||||||||||||||||||||||||||||
2019 | 21.10 | 0.04 | 1 | 9.22 | 9.26 | (0.04 | ) | (3.64 | ) | 0.00 | (3.68 | ) | 26.68 | 44.44 | 1.08 | 8 | 0.00 | 1.08 | 0.15 | 360.2 | 53.44 | |||||||||||||||||||||||||||||||||||||||||||
2018 | 30.01 | 0.05 | 1 | (6.39 | ) | (6.34 | ) | (0.07 | ) | (2.50 | ) | 0.00 | (2.57 | ) | 21.10 | (22.04 | ) | 1.06 | 8 | 0.00 | 1.06 | 0.17 | 320.9 | 56.47 | ||||||||||||||||||||||||||||||||||||||||
2017 | 23.93 | 0.07 | 1 | 7.42 | 7.49 | 0.00 | (1.41 | ) | 0.00 | (1.41 | ) | 30.01 | 31.42 | 1.06 | 0.00 | 1.06 | 0.26 | 657.6 | 44.56 | |||||||||||||||||||||||||||||||||||||||||||||
2016 | 24.51 | 0.04 | 1 | (0.47 | ) | (0.43 | ) | 0.00 | (0.08 | ) | (0.07 | ) | (0.15 | ) | 23.93 | (1.75 | ) | 1.07 | 0.00 | 1.07 | 0.19 | 514.6 | 55.50 | |||||||||||||||||||||||||||||||||||||||||
2015 | 26.14 | 0.01 | 1 | (1.16 | ) | (1.15 | ) | (0.01 | ) | (0.47 | ) | 0.00 | (0.48 | ) | 24.51 | (4.42 | ) | 1.06 | 0.00 | 1.06 | 0.04 | 992.8 | 50.50 | |||||||||||||||||||||||||||||||||||||||||
2014 | 22.43 | 0.11 | 1 | 3.68 | 3.79 | (0.08 | ) | 0.00 | 0.00 | (0.08 | ) | 26.14 | 16.93 | 1.06 | 0.00 | 1.06 | 0.44 | 919.7 | 24.40 | |||||||||||||||||||||||||||||||||||||||||||||
2013 | 17.64 | 0.03 | 1 | 4.81 | 4.84 | (0.00 | )3 | (0.02 | ) | (0.03 | ) | (0.05 | ) | 22.43 | 27.48 | 1.09 | 0.00 | 1.09 | 0.15 | 486.1 | 19.36 | |||||||||||||||||||||||||||||||||||||||||||
2012 | 12.56 | 0.06 | 1 | 5.33 | 5.39 | 0.00 | (0.31 | ) | 0.00 | (0.31 | ) | 17.64 | 42.99 | 4 | 1.44 | (0.34 | ) | 1.10 | 0.36 | 35.5 | 30.14 | |||||||||||||||||||||||||||||||||||||||||||
2011 | 12.69 | 0.02 | 1 | 0.07 | 2 | 0.09 | (0.01 | ) | (0.21 | ) | 0.00 | (0.22 | ) | 12.56 | 0.80 | 4 | 2.14 | (1.04 | ) | 1.10 | 0.17 | 4.9 | 70.99 | |||||||||||||||||||||||||||||||||||||||||
R6 SHARES |
| |||||||||||||||||||||||||||||||||||||||||||||||||||||||||||||||
Six Months Ended June 30, |
| |||||||||||||||||||||||||||||||||||||||||||||||||||||||||||||||
2020 | 26.69 | 0.02 | 1 | 1.07 | 1.09 | 0.00 | 0.00 | 0.00 | 0.00 | 27.78 | 4.08 | 5 | 1.08 | 6 | 0.00 | 1.08 | 6 | 0.16 | 6 | 13.5 | 51.96 | 5 | ||||||||||||||||||||||||||||||||||||||||||
Year Ended December 31, |
| |||||||||||||||||||||||||||||||||||||||||||||||||||||||||||||||
2019 | 21.10 | 0.04 | 1 | 9.23 | 9.27 | (0.04 | ) | (3.64 | ) | 0.00 | (3.68 | ) | 26.69 | 44.51 | 1.07 | 8 | 0.00 | 1.07 | 0.17 | 13.2 | 53.44 | |||||||||||||||||||||||||||||||||||||||||||
2018 | 30.01 | 0.09 | 1 | (6.43 | ) | (6.34 | ) | (0.07 | ) | (2.50 | ) | 0.00 | (2.57 | ) | 21.10 | (22.03 | ) | 1.07 | 8 | 0.00 | 1.07 | 0.31 | 9.3 | 56.47 | ||||||||||||||||||||||||||||||||||||||||
2017 | 23.93 | 0.07 | 1 | 7.42 | 7.49 | 0.00 | (1.41 | ) | 0.00 | (1.41 | ) | 30.01 | 31.42 | 1.06 | 0.00 | 1.06 | 0.26 | 3.3 | 44.56 | |||||||||||||||||||||||||||||||||||||||||||||
20167 | 21.80 | 0.02 | 1 | 2.26 | 2.28 | 0.00 | (0.08 | ) | (0.07 | ) | (0.15 | ) | 23.93 | 10.47 | 5 | 1.07 | 6 | 0.00 | 1.07 | 6 | 0.08 | 6 | 2.0 | 55.50 | ||||||||||||||||||||||||||||||||||||||||
| 1 | Based on average shares outstanding. |
| 2 | The amount shown for a share outstanding does not correspond with the aggregate realized and unrealized gain (loss) on investments for the period due to the timing of sales and redemptions of Fund shares in relation to fluctuating market values of investments of the Fund. |
| 3 | Less than $0.01 per share. |
| 4 | The total returns would have been lower had certain expenses not been reduced during the period shown. |
| 5 | Not Annualized. |
| 6 | Annualized. |
| 7 | For the period January 29, 2016 (initial offering of R6 Shares) to December 31, 2016. |
| 8 | Interest expense rounds to less than 0.01%. |
| See Notes to Financial Statements. | 55 |
| Baron Select Funds | June 30, 2020 |
FINANCIAL HIGHLIGHTS (Continued)
BARON EMERGING MARKETS FUND
Selected data for a share outstanding throughout each period:
| Income (loss) from investment operations: | Less distributions to shareholders from: | Ratios to Average Net Assets | Supplemental Data: | |||||||||||||||||||||||||||||||||||||||||||||||||||||||||||||
| Net asset value, beginning of period ($) | Net investment income (loss) ($) | Net realized and unrealized gain (loss) ($) | Total from investment operations ($) | Net investment income ($) | Net realized gain on investments ($) | Return of capital ($) | Total distributions ($) | Net asset value, end of period ($) | Total return (%) | Operating expenses (%) | Less: Reimbursement of expenses by Adviser (%) | Net operating expenses (%) | Net investment income (loss) (%) | Net assets (in millions), end of period ($) | Portfolio turnover rate (%) | |||||||||||||||||||||||||||||||||||||||||||||||||
RETAIL SHARES |
| |||||||||||||||||||||||||||||||||||||||||||||||||||||||||||||||
Six Months Ended June 30, |
| |||||||||||||||||||||||||||||||||||||||||||||||||||||||||||||||
2020 | 14.72 | (0.02 | )1 | (0.74 | ) | (0.76 | ) | 0.00 | 0.00 | 0.00 | 0.00 | 13.96 | (5.16 | )3 | 1.36 | 4 | 0.00 | 1.36 | 4 | (0.35 | )4 | 454.6 | 32.17 | 3 | ||||||||||||||||||||||||||||||||||||||||
Year Ended December 31, |
| |||||||||||||||||||||||||||||||||||||||||||||||||||||||||||||||
2019 | 12.45 | 0.03 | 1 | 2.27 | 2.30 | (0.03 | ) | 0.00 | (0.00 | )6 | (0.03 | ) | 14.72 | 18.48 | 1.35 | 0.00 | 1.35 | 0.23 | 667.1 | 59.00 | ||||||||||||||||||||||||||||||||||||||||||||
2018 | 15.33 | 0.05 | 1 | (2.91 | ) | (2.86 | ) | (0.02 | ) | 0.00 | 0.00 | (0.02 | ) | 12.45 | (18.67 | ) | 1.36 | 0.00 | 1.36 | 0.36 | 753.5 | 43.27 | ||||||||||||||||||||||||||||||||||||||||||
2017 | 10.95 | 0.03 | 1 | 4.39 | 4.42 | (0.04 | ) | 0.00 | (0.00 | )6 | (0.04 | ) | 15.33 | 40.34 | 1.36 | 0.00 | 1.36 | 0.23 | 1,121.4 | 30.75 | ||||||||||||||||||||||||||||||||||||||||||||
2016 | 10.57 | 0.04 | 1 | 0.36 | 0.40 | (0.02 | ) | 0.00 | 0.00 | (0.02 | ) | 10.95 | 3.75 | 1.38 | 0.00 | 1.38 | 0.33 | 768.5 | 25.31 | |||||||||||||||||||||||||||||||||||||||||||||
2015 | 11.91 | 0.03 | 1 | (1.36 | ) | (1.33 | ) | (0.01 | ) | 0.00 | 0.00 | (0.01 | ) | 10.57 | (11.16 | ) | 1.45 | 0.00 | 1.45 | 0.25 | 665.5 | 26.34 | ||||||||||||||||||||||||||||||||||||||||||
2014 | 11.54 | 0.07 | 1 | 0.33 | 0.40 | (0.03 | ) | 0.00 | 0.00 | (0.03 | ) | 11.91 | 3.47 | 2 | 1.52 | (0.02 | ) | 1.50 | 0.56 | 649.7 | 23.38 | |||||||||||||||||||||||||||||||||||||||||||
2013 | 10.06 | (0.06 | )1 | 1.54 | 1.48 | 0.00 | 0.00 | 0.00 | 0.00 | 11.54 | 14.71 | 2 | 1.90 | (0.40 | ) | 1.50 | (0.53 | ) | 259.6 | 14.68 | ||||||||||||||||||||||||||||||||||||||||||||
2012 | 8.28 | (0.04 | )1 | 1.94 | 1.90 | (0.12 | ) | 0.00 | 0.00 | (0.12 | ) | 10.06 | 22.98 | 2 | 4.01 | (2.51 | ) | 1.50 | (0.39 | ) | 2.9 | 42.68 | ||||||||||||||||||||||||||||||||||||||||||
2011 | 10.00 | (0.03 | )1 | (1.69 | ) | (1.72 | ) | 0.00 | 0.00 | 0.00 | 0.00 | 8.28 | (17.20 | )2 | 4.49 | (2.99 | ) | 1.50 | (0.32 | ) | 2.0 | 45.86 | ||||||||||||||||||||||||||||||||||||||||||
INSTITUTIONAL SHARES |
| |||||||||||||||||||||||||||||||||||||||||||||||||||||||||||||||
Six Months Ended June 30, |
| |||||||||||||||||||||||||||||||||||||||||||||||||||||||||||||||
2020 | 14.75 | (0.00 | )1,6 | (0.74 | ) | (0.74 | ) | 0.00 | 0.00 | 0.00 | 0.00 | 14.01 | (5.02 | )3 | 1.10 | 4 | 0.00 | 1.10 | 4 | (0.08 | )4 | 4,362.8 | 32.17 | 3 | ||||||||||||||||||||||||||||||||||||||||
Year Ended December 31, |
| |||||||||||||||||||||||||||||||||||||||||||||||||||||||||||||||
2019 | 12.47 | 0.07 | 1 | 2.28 | 2.35 | (0.06 | ) | 0.00 | (0.01 | ) | (0.07 | ) | 14.75 | 18.86 | 1.09 | 0.00 | 1.09 | 0.50 | 4,644.8 | 59.00 | ||||||||||||||||||||||||||||||||||||||||||||
2018 | 15.37 | 0.09 | 1 | (2.93 | ) | (2.84 | ) | (0.06 | ) | 0.00 | 0.00 | (0.06 | ) | 12.47 | (18.49 | ) | 1.10 | 0.00 | 1.10 | 0.62 | 3,850.0 | 43.27 | ||||||||||||||||||||||||||||||||||||||||||
2017 | 10.98 | 0.06 | 1 | 4.40 | 4.46 | (0.07 | ) | 0.00 | (0.00 | )6 | (0.07 | ) | 15.37 | 40.63 | 1.10 | 0.00 | 1.10 | 0.47 | 3,842.5 | 30.75 | ||||||||||||||||||||||||||||||||||||||||||||
2016 | 10.59 | 0.06 | 1 | 0.37 | 0.43 | (0.04 | ) | 0.00 | 0.00 | (0.04 | ) | 10.98 | 4.08 | 1.13 | 0.00 | 1.13 | 0.57 | 1,832.8 | 25.31 | |||||||||||||||||||||||||||||||||||||||||||||
2015 | 11.94 | 0.06 | 1 | (1.37 | ) | (1.31 | ) | (0.04 | ) | 0.00 | 0.00 | (0.04 | ) | 10.59 | (10.97 | ) | 1.20 | 0.00 | 1.20 | 0.49 | 1,040.9 | 26.34 | ||||||||||||||||||||||||||||||||||||||||||
2014 | 11.56 | 0.09 | 1 | 0.34 | 0.43 | (0.05 | ) | 0.00 | 0.00 | (0.05 | ) | 11.94 | 3.75 | 2 | 1.27 | (0.02 | ) | 1.25 | 0.76 | 697.8 | 23.38 | |||||||||||||||||||||||||||||||||||||||||||
2013 | 10.05 | 0.01 | 1 | 1.50 | 1.51 | 0.00 | 0.00 | 0.00 | 0.00 | 11.56 | 15.02 | 2 | 1.80 | (0.55 | ) | 1.25 | 0.05 | 116.0 | 14.68 | |||||||||||||||||||||||||||||||||||||||||||||
2012 | 8.30 | (0.01 | )1 | 1.93 | 1.92 | (0.17 | ) | 0.00 | 0.00 | (0.17 | ) | 10.05 | 23.22 | 2 | 3.37 | (2.12 | ) | 1.25 | (0.14 | ) | 6.0 | 42.68 | ||||||||||||||||||||||||||||||||||||||||||
2011 | 10.00 | (0.01 | )1 | (1.69 | ) | (1.70 | ) | 0.00 | 0.00 | 0.00 | 0.00 | 8.30 | (17.00 | )2 | 3.83 | (2.58 | ) | 1.25 | (0.07 | ) | 4.3 | 45.86 | ||||||||||||||||||||||||||||||||||||||||||
R6 SHARES |
| |||||||||||||||||||||||||||||||||||||||||||||||||||||||||||||||
Six Months Ended June 30, |
| |||||||||||||||||||||||||||||||||||||||||||||||||||||||||||||||
2020 | 14.75 | (0.00 | )1,6 | (0.74 | ) | (0.74 | ) | 0.00 | 0.00 | 0.00 | 0.00 | 14.01 | (5.02 | )3 | 1.11 | 4 | 0.00 | 1.11 | 4 | (0.03 | )4 | 10.1 | 32.17 | 3 | ||||||||||||||||||||||||||||||||||||||||
Year Ended December 31, |
| |||||||||||||||||||||||||||||||||||||||||||||||||||||||||||||||
2019 | 12.48 | 0.07 | 1 | 2.27 | 2.34 | (0.06 | ) | 0.00 | (0.01 | ) | (0.07 | ) | 14.75 | 18.77 | 1.09 | 0.00 | 1.09 | 0.49 | 10.1 | 59.00 | ||||||||||||||||||||||||||||||||||||||||||||
2018 | 15.38 | 0.10 | 1 | (2.94 | ) | (2.84 | ) | (0.06 | ) | 0.00 | 0.00 | (0.06 | ) | 12.48 | (18.47 | ) | 1.11 | 0.00 | 1.11 | 0.69 | 7.3 | 43.27 | ||||||||||||||||||||||||||||||||||||||||||
2017 | 10.99 | 0.07 | 1 | 4.39 | 4.46 | (0.07 | ) | 0.00 | (0.00 | )6 | (0.07 | ) | 15.38 | 40.59 | 1.11 | 0.00 | 1.11 | 0.49 | 4.9 | 30.75 | ||||||||||||||||||||||||||||||||||||||||||||
20165 | 9.94 | 0.05 | 1 | 1.04 | 1.09 | (0.04 | ) | 0.00 | 0.00 | (0.04 | ) | 10.99 | 10.99 | 3 | 1.13 | 4 | 0.00 | 1.13 | 4 | 0.48 | 4 | 0.7 | 25.31 | |||||||||||||||||||||||||||||||||||||||||
| 1 | Based on average shares outstanding. |
| 2 | The total returns would have been lower had certain expenses not been reduced during the period shown. |
| 3 | Not Annualized. |
| 4 | Annualized. |
| 5 | For the period January 29, 2016 (initial offering of R6 Shares) to December 31, 2016. |
| 6 | Less than $0.01 per share. |
| 56 | See Notes to Financial Statements. |
| June 30, 2020 | Baron Select Funds |
FINANCIAL HIGHLIGHTS (Continued)
BARON GLOBAL ADVANTAGE FUND
Selected data for a share outstanding throughout each period:
| Income (loss) from investment operations: | Less distributions to shareholders from: | Ratios to Average Net Assets: | Supplemental Data: | |||||||||||||||||||||||||||||||||||||||||||||||||||||||||||||||||
Net asset | Net ($) | Net (loss) ($) | Total from | Net ($) | Net realized gain on investments ($) | Total distributions ($) | Net asset value, end of period ($) | Total return (%) | Total expenses (%) | Less: Interest expense (%) | Operating expenses (%) | Less: by Adviser (%) | Net operating expenses (%) | Net (%) | Net assets (in | Portfolio (%) | ||||||||||||||||||||||||||||||||||||||||||||||||||||
RETAIL SHARES |
| |||||||||||||||||||||||||||||||||||||||||||||||||||||||||||||||||||
Six Months Ended June 30, |
| |||||||||||||||||||||||||||||||||||||||||||||||||||||||||||||||||||
2020 | 28.68 | (0.15 | )2 | 10.21 | 10.06 | 0.00 | 0.00 | 0.00 | 38.74 | 35.08 | 4,6 | 1.20 | 8 | 0.00 | 1.20 | 8 | (0.05 | )8 | 1.15 | 8 | (0.99 | )8 | 494.2 | 7.63 | 6 | |||||||||||||||||||||||||||||||||||||||||||
| Year Ended December 31, |
| |||||||||||||||||||||||||||||||||||||||||||||||||||||||||||||||||||
2019 | 19.77 | (0.02 | )2 | 8.93 | 8.91 | 0.00 | 0.00 | 0.00 | 28.68 | 45.07 | 4 | 1.25 | 0.00 | 11 | 1.25 | (0.10 | ) | 1.15 | (0.08 | ) | 174.6 | 19.44 | ||||||||||||||||||||||||||||||||||||||||||||||
2018 | 20.56 | (0.21 | )2 | (0.58 | ) | (0.79 | ) | 0.00 | 0.00 | 0.00 | 19.77 | (3.84 | )4 | 1.45 | 0.00 | 11 | 1.45 | (0.30 | ) | 1.15 | (0.94 | ) | 35.7 | 19.77 | ||||||||||||||||||||||||||||||||||||||||||||
2017 | 13.75 | (0.18 | )2 | 6.99 | 6.81 | 0.00 | 0.00 | 0.00 | 20.56 | 49.53 | 4 | 2.07 | (0.01 | ) | 2.06 | (0.70 | ) | 1.36 | (1.01 | ) | 18.4 | 27.98 | ||||||||||||||||||||||||||||||||||||||||||||||
2016 | 13.91 | (0.18 | )2 | 0.02 | 10 | (0.16 | ) | 0.00 | 0.00 | 0.00 | 13.75 | (1.15 | )4 | 3.86 | 0.00 | 3.86 | (2.36 | ) | 1.50 | (1.30 | ) | 5.0 | 21.48 | |||||||||||||||||||||||||||||||||||||||||||||
2015 | 14.20 | (0.11 | )2 | (0.14 | ) | (0.25 | ) | (0.02 | ) | (0.02 | ) | (0.04 | ) | 13.91 | (1.72 | )4 | 3.19 | 0.00 | 3.19 | (1.69 | ) | 1.50 | (0.75 | ) | 6.2 | 25.88 | ||||||||||||||||||||||||||||||||||||||||||
2014 | 13.51 | 0.02 | 2 | 0.67 | 0.69 | 0.00 | (0.00 | )3 | 0.00 | 14.20 | 5.11 | 4,5 | 3.61 | 0.00 | 3.61 | (2.11 | ) | 1.50 | 0.18 | 3.9 | 123.51 | |||||||||||||||||||||||||||||||||||||||||||||||
2013 | 10.41 | (0.02 | )2 | 3.12 | 3.10 | 0.00 | 0.00 | 0.00 | 13.51 | 29.78 | 4 | 5.51 | 0.00 | 5.51 | (4.01 | ) | 1.50 | (0.20 | ) | 2.3 | 32.78 | |||||||||||||||||||||||||||||||||||||||||||||||
20121 | 10.00 | (0.02 | )2 | 0.43 | 0.41 | 0.00 | 0.00 | 0.00 | 10.41 | 4.10 | 4,6 | 8.35 | 7,8 | 0.00 | 8.35 | 7,8 | (6.85 | )7,8 | 1.50 | 7,8 | (0.38 | )7,8 | 1.5 | 24.64 | 6 | |||||||||||||||||||||||||||||||||||||||||||
INSTITUTIONAL SHARES |
| |||||||||||||||||||||||||||||||||||||||||||||||||||||||||||||||||||
Six Months Ended June 30, |
| |||||||||||||||||||||||||||||||||||||||||||||||||||||||||||||||||||
2020 | 29.12 | (0.12 | )2 | 10.38 | 10.26 | 0.00 | 0.00 | 0.00 | 39.38 | 35.23 | 4,6 | 0.95 | 8 | 0.00 | 0.95 | 8 | (0.05 | )8 | 0.90 | 8 | (0.73 | )8 | 721.7 | 7.63 | 6 | |||||||||||||||||||||||||||||||||||||||||||
| Year Ended December 31, |
| |||||||||||||||||||||||||||||||||||||||||||||||||||||||||||||||||||
2019 | 20.02 | (0.01 | )2 | 9.11 | 9.10 | 0.00 | 0.00 | 0.00 | 29.12 | 45.45 | 4 | 1.00 | 0.00 | 11 | 1.00 | (0.10 | ) | 0.90 | (0.03 | ) | 212.8 | 19.44 | ||||||||||||||||||||||||||||||||||||||||||||||
2018 | 20.77 | (0.16 | )2 | (0.59 | ) | (0.75 | ) | 0.00 | 0.00 | 0.00 | 20.02 | (3.61 | )4 | 1.18 | 0.00 | 11 | 1.18 | (0.28 | ) | 0.90 | (0.71 | ) | 49.2 | 19.77 | ||||||||||||||||||||||||||||||||||||||||||||
2017 | 13.87 | (0.14 | )2 | 7.04 | 6.90 | 0.00 | 0.00 | 0.00 | 20.77 | 49.75 | 4 | 1.70 | (0.01 | ) | 1.69 | (0.61 | ) | 1.08 | (0.77 | ) | 24.8 | 27.98 | ||||||||||||||||||||||||||||||||||||||||||||||
2016 | 14.00 | (0.14 | )2 | 0.01 | 10 | (0.13 | ) | 0.00 | 0.00 | 0.00 | 13.87 | (0.93 | )4 | 3.55 | 0.00 | 3.55 | (2.30 | ) | 1.25 | (1.06 | ) | 4.6 | 21.48 | |||||||||||||||||||||||||||||||||||||||||||||
2015 | 14.28 | (0.07 | )2 | (0.15 | ) | (0.22 | ) | (0.04 | ) | (0.02 | ) | (0.06 | ) | 14.00 | (1.51 | )4 | 2.89 | 0.00 | 2.89 | (1.64 | ) | 1.25 | (0.47 | ) | 5.3 | 25.88 | ||||||||||||||||||||||||||||||||||||||||||
2014 | 13.56 | 0.07 | 2 | 0.65 | 0.72 | 0.00 | (0.00 | )3 | 0.00 | 14.28 | 5.32 | 4,5 | 2.92 | 0.00 | 2.92 | (1.67 | ) | 1.25 | 0.48 | 4.1 | 123.51 | |||||||||||||||||||||||||||||||||||||||||||||||
2013 | 10.42 | 0.00 | 2,3 | 3.14 | 3.14 | 0.00 | 0.00 | 0.00 | 13.56 | 30.13 | 4 | 4.91 | 0.00 | 4.91 | (3.66 | ) | 1.25 | 0.02 | 3.3 | 32.78 | ||||||||||||||||||||||||||||||||||||||||||||||||
20121 | 10.00 | (0.02 | )2 | 0.44 | 0.42 | 0.00 | 0.00 | 0.00 | 10.42 | 4.20 | 4,6 | 7.33 | 7,8 | 0.00 | 7.33 | 7,8 | (6.08 | )7,8 | 1.25 | 7,8 | (0.30 | )7,8 | 1.6 | 24.64 | 6 | |||||||||||||||||||||||||||||||||||||||||||
R6 SAHRES |
| |||||||||||||||||||||||||||||||||||||||||||||||||||||||||||||||||||
Six Months Ended June 30, |
| |||||||||||||||||||||||||||||||||||||||||||||||||||||||||||||||||||
2020 | 29.14 | (0.12 | )2 | 10.38 | 10.26 | 0.00 | 0.00 | 0.00 | 39.40 | 35.21 | 4,6 | 0.94 | 8 | 0.00 | 0.94 | 8 | (0.04 | )8 | 0.90 | 8 | (0.74 | )8 | 10.2 | 7.63 | 6 | |||||||||||||||||||||||||||||||||||||||||||
| Year Ended December 31, |
| |||||||||||||||||||||||||||||||||||||||||||||||||||||||||||||||||||
2019 | 20.03 | (0.03 | )2 | 9.14 | 9.11 | 0.00 | 0.00 | 0.00 | 29.14 | 45.48 | 4 | 1.00 | 0.00 | 11 | 1.00 | (0.10 | ) | 0.90 | (0.10 | ) | 6.8 | 19.44 | ||||||||||||||||||||||||||||||||||||||||||||||
2018 | 20.79 | (0.15 | )2 | (0.61 | ) | (0.76 | ) | 0.00 | 0.00 | 0.00 | 20.03 | (3.66 | )4 | 1.16 | 0.00 | 11 | 1.16 | (0.26 | ) | 0.90 | (0.69 | ) | 4.3 | 19.77 | ||||||||||||||||||||||||||||||||||||||||||||
2017 | 13.87 | (0.14 | )2 | 7.06 | 6.92 | 0.00 | 0.00 | 0.00 | 20.79 | 49.89 | 4 | 1.69 | (0.01 | ) | 1.68 | (0.59 | ) | 1.09 | (0.75 | ) | 0.4 | 27.98 | ||||||||||||||||||||||||||||||||||||||||||||||
20169 | 14.37 | (0.07 | )2 | (0.43 | ) | (0.50 | ) | 0.00 | 0.00 | 0.00 | 13.87 | (3.48 | )4,6 | 4.11 | 8 | 0.00 | 4.11 | 8 | (2.87 | )8 | 1.24 | 8 | (1.52 | )8 | 0.1 | 21.48 | ||||||||||||||||||||||||||||||||||||||||||
| 1 | For the period April 30, 2012 (commencement of operations) to December 31, 2012. |
| 2�� | Based on average shares outstanding. |
| 3 | Less than $0.01 per share. |
| 4 | The total returns would have been lower had certain expenses not been reduced during the period shown. |
| 5 | The Adviser made a voluntary payment to the Fund in the amount of $47,291 to compensate the Fund for a loss incurred due to a shareholder activity processing error. The impact of this payment increased the Fund’s total return by 0.54%. |
| 6 | Not Annualized. |
| 7 | Certain fixed expenses incurred by the Fund were not annualized for the period ended December 31, 2012. |
| 8 | Annualized. |
| 9 | For the period August 31, 2016 (initial offering of R6 Shares) to December 31, 2016. |
| 10 | The amount shown for a share outstanding does not correspond with the aggregate realized and unrealized gain (loss) on investments for the period due to the timing of sales and redemptions of Fund shares in relation to fluctuating market values of investments of the Fund. |
| 11 | Interest expense rounds to less than 0.01%. |
| See Notes to Financial Statements. | 57 |
| Baron Select Funds | June 30, 2020 |
FINANCIAL HIGHLIGHTS (Continued)
BARON REAL ESTATE INCOME FUND
Selected data for a share outstanding throughout each period:
| Income (loss) from investment operations: | Less distributions to shareholders from: | Ratio to Average Net Assets: | Supplemental Data: | |||||||||||||||||||||||||||||||||||||||||||||||||||||||||
| Net asset value, beginning of period ($) | Net investment income ($) | Net and (loss) | Total from investment operations ($) | Net investment income ($) | Net realized gain on investments ($) | Total distributions ($) | Net asset value, end of period ($) | Total return (%) | Operating expenses (%) | Less: Reimbursement of expenses by Adviser (%) | Net operating expenses (%) | Net investment income (%) | Net assets (in millions), end of period ($) | Portfolio turnover rate (%) | ||||||||||||||||||||||||||||||||||||||||||||||
RETAIL SHARES |
| |||||||||||||||||||||||||||||||||||||||||||||||||||||||||||
Six Months Ended June 30, |
| |||||||||||||||||||||||||||||||||||||||||||||||||||||||||||
2020 | 11.65 | 0.07 | 2 | (0.25 | ) | (0.18 | ) | (0.06 | ) | 0.00 | (0.06 | ) | 11.41 | (1.50 | )3,4 | 5.30 | 5 | (4.25 | )5 | 1.05 | 5 | 1.26 | 5 | 1.5 | 56.41 | 4 | ||||||||||||||||||||||||||||||||||
Year Ended December 31, |
| |||||||||||||||||||||||||||||||||||||||||||||||||||||||||||
2019 | 8.63 | 0.13 | 2 | 3.02 | 3.15 | (0.13 | ) | 0.00 | (0.13 | ) | 11.65 | 36.67 | 3 | 6.87 | (5.82 | ) | 1.05 | 1.20 | 1.4 | 52.50 | ||||||||||||||||||||||||||||||||||||||||
20181 | 10.00 | 0.14 | 2 | (1.25 | ) | (1.11 | ) | (0.26 | ) | 0.00 | (0.26 | ) | 8.63 | (11.33 | )3 | 10.47 | (9.42 | ) | 1.05 | 1.43 | 0.4 | 67.39 | ||||||||||||||||||||||||||||||||||||||
INSTITUTIONAL SHARES |
| |||||||||||||||||||||||||||||||||||||||||||||||||||||||||||
Six Months Ended June 30, |
| |||||||||||||||||||||||||||||||||||||||||||||||||||||||||||
2020 | 11.68 | 0.08 | 2 | (0.25 | ) | (0.17 | ) | (0.06 | ) | 0.00 | (0.06 | ) | 11.45 | (1.41 | )3,4 | 4.54 | 5 | (3.74 | )5 | 0.80 | 5 | 1.54 | 5 | 3.1 | 56.41 | 4 | ||||||||||||||||||||||||||||||||||
Year Ended December 31, |
| |||||||||||||||||||||||||||||||||||||||||||||||||||||||||||
2019 | 8.66 | 0.14 | 2 | 3.01 | 3.15 | (0.13 | ) | 0.00 | (0.13 | ) | 11.68 | 36.54 | 3 | 5.63 | (4.83 | ) | 0.80 | 1.37 | 2.7 | 52.50 | ||||||||||||||||||||||||||||||||||||||||
20181 | 10.00 | 0.16 | 2 | (1.24 | ) | (1.08 | ) | (0.26 | ) | 0.00 | (0.26 | ) | 8.66 | (11.03 | )3 | 7.18 | (6.38 | ) | 0.80 | 1.71 | 2.0 | 67.39 | ||||||||||||||||||||||||||||||||||||||
R6 SHARES |
| |||||||||||||||||||||||||||||||||||||||||||||||||||||||||||
Six Months Ended June 30, |
| |||||||||||||||||||||||||||||||||||||||||||||||||||||||||||
2020 | 11.67 | 0.08 | 2 | (0.25 | ) | (0.17 | ) | (0.06 | ) | 0.00 | (0.06 | ) | 11.44 | (1.41 | )3,4 | 4.19 | 5 | (3.39 | )5 | 0.80 | 5 | 1.51 | 5 | 0.5 | 56.41 | 4 | ||||||||||||||||||||||||||||||||||
Year Ended December 31, |
| |||||||||||||||||||||||||||||||||||||||||||||||||||||||||||
2019 | 8.66 | 0.14 | 2 | 3.00 | 3.14 | (0.13 | ) | 0.00 | (0.13 | ) | 11.67 | 36.42 | 3 | 5.27 | (4.47 | ) | 0.80 | 1.36 | 0.4 | 52.50 | ||||||||||||||||||||||||||||||||||||||||
20181 | 10.00 | 0.20 | 2 | (1.28 | ) | (1.08 | ) | (0.26 | ) | 0.00 | (0.26 | ) | 8.66 | (11.03 | )3 | 7.05 | (6.25 | ) | 0.80 | 2.07 | 0.4 | 67.39 | ||||||||||||||||||||||||||||||||||||||
| 1 | For the period January 2, 2018 (commencement of operations) to December 31, 2018. |
| 2 | Based on average shares outstanding. |
| 3 | The total returns would have been lower had certain expenses not been reduced during the period shown. |
| 4 | Not Annualized. |
| 5 | Annualized. |
| 58 | See Notes to Financial Statements. |
| June 30, 2020 | Baron Select Funds |
FINANCIAL HIGHLIGHTS (Continued)
BARON HEALTH CARE FUND
Selected data for a share outstanding throughout the period:
| Income (loss) from investment operations: | Less distributions to shareholders from: | Ratios to Average Net Assets: | Supplemental Data: | |||||||||||||||||||||||||||||||||||||||||||||||||||||||||
| Net asset value, beginning of period ($) | Net investment income (loss) ($) | Net (loss) ($) | Total from investment operations ($) | Net investment income ($) | Net realized gain on investments ($) | Total distributions ($) | Net asset value, end of period ($) | Total return (%) | Operating (%) | Less: Reimbursement (%) | Net (%) | Net investment income (loss) (%) | Net assets (in millions), end of period ($) | Portfolio turnover rate (%) | ||||||||||||||||||||||||||||||||||||||||||||||
RETIAL SHARES |
| |||||||||||||||||||||||||||||||||||||||||||||||||||||||||||
Six Months Ended June 30, |
| |||||||||||||||||||||||||||||||||||||||||||||||||||||||||||
2020 | 12.86 | (0.01 | )2 | 1.67 | 1.66 | 0.00 | 0.00 | 0.00 | 14.52 | 12.91 | 3,4 | 2.32 | 5 | (1.22 | )5 | 1.10 | 5 | (0.19 | )5 | 10.4 | 17.50 | 4 | ||||||||||||||||||||||||||||||||||||||
Year Ended December 31, |
| |||||||||||||||||||||||||||||||||||||||||||||||||||||||||||
2019 | 9.51 | (0.06 | )2 | 3.41 | 3.35 | 0.00 | 0.00 | 0.00 | 12.86 | 35.23 | 3 | 2.80 | (1.70 | ) | 1.10 | (0.54 | ) | 5.0 | 68.10 | |||||||||||||||||||||||||||||||||||||||||
20181 | 10.00 | (0.04 | )2 | (0.45 | ) | (0.49 | ) | 0.00 | 0.00 | 0.00 | 9.51 | (4.90 | )3,4 | 4.94 | 5 | (3.84 | )5 | 1.10 | 5 | (0.60 | )5 | 2.8 | 27.30 | 4 | ||||||||||||||||||||||||||||||||||||
INSITUTIONAL SHARES |
| |||||||||||||||||||||||||||||||||||||||||||||||||||||||||||
Six Months Ended June 30, |
| |||||||||||||||||||||||||||||||||||||||||||||||||||||||||||
2020 | 12.92 | 0.01 | 2 | 1.67 | 1.68 | 0.00 | 0.00 | 0.00 | 14.60 | 13.00 | 3,4 | 1.95 | 5 | (1.10 | )5 | 0.85 | 5 | 0.08 | 5 | 11.2 | 17.50 | 4 | ||||||||||||||||||||||||||||||||||||||
Year Ended December 31, |
| |||||||||||||||||||||||||||||||||||||||||||||||||||||||||||
2019 | 9.53 | (0.03 | )2 | 3.42 | 3.39 | 0.00 | 0.00 | 0.00 | 12.92 | 35.57 | 3 | 2.39 | (1.54 | ) | 0.85 | (0.28 | ) | 9.1 | 68.10 | |||||||||||||||||||||||||||||||||||||||||
20181 | 10.00 | (0.02 | )2 | (0.45 | ) | (0.47 | ) | 0.00 | 0.00 | 0.00 | 9.53 | (4.70 | )3,4 | 4.06 | 5 | (3.21 | )5 | 0.85 | 5 | (0.33 | )5 | 4.5 | 27.30 | 4 | ||||||||||||||||||||||||||||||||||||
R6 SHARES |
| |||||||||||||||||||||||||||||||||||||||||||||||||||||||||||
Six Months Ended June 30, |
| |||||||||||||||||||||||||||||||||||||||||||||||||||||||||||
2020 | 12.91 | 0.01 | 2 | 1.68 | 1.69 | 0.00 | 0.00 | 0.00 | 14.60 | 13.09 | 3,4 | 1.93 | 5 | (1.08 | )5 | 0.85 | 5 | 0.18 | 5 | 3.6 | 17.50 | 4 | ||||||||||||||||||||||||||||||||||||||
Year Ended December 31, |
| |||||||||||||||||||||||||||||||||||||||||||||||||||||||||||
2019 | 9.52 | (0.03 | )2 | 3.42 | 3.39 | 0.00 | 0.00 | 0.00 | 12.91 | 35.61 | 3 | 2.22 | (1.37 | ) | 0.85 | (0.28 | ) | 1.3 | 68.10 | |||||||||||||||||||||||||||||||||||||||||
20181 | 10.00 | (0.02 | )2 | (0.46 | ) | (0.48 | ) | 0.00 | 0.00 | 0.00 | 9.52 | (4.80 | )3,4 | 3.14 | 5 | (2.29 | )5 | 0.85 | 5 | (0.32 | )5 | 0.7 | 27.30 | 4 | ||||||||||||||||||||||||||||||||||||
| 1 | For the period April 30, 2018 (commencement of operations) to December 31, 2018. |
| 2 | Based on average shares outstanding. |
| 3 | The total returns would have been lower had certain expenses not been reduced during the period shown. |
| 4 | Not Annualized. |
| 5 | Annualized. |
| See Notes to Financial Statements. | 59 |
| Baron Select Funds | June 30, 2020 |
FINANCIAL HIGHLIGHTS (Continued)
BARON FINTECH FUND
Selected data for a share outstanding throughout each period:
| Income (loss) from investment operations: | Less distributions to shareholders from: | Ratios to Average Net Assets: | Supplemental Data: | |||||||||||||||||||||||||||||||||||||||||||||||||||||||||
| Net asset value, beginning of period ($) | Net investment loss ($) | Net realized and unrealized gain ($) | Total from investment operations ($) | Net investment income ($) | Net realized gain on investments ($) | Total distributions ($) | Net asset value, end of period ($) | Total return (%) | Operating (%) | Less: Reimbursement (%) | Net (%) | Net investment loss (%) | Net assets (in millions), end of period ($) | Portfolio turnover rate (%) | ||||||||||||||||||||||||||||||||||||||||||||||
RETAIL SHARES |
| |||||||||||||||||||||||||||||||||||||||||||||||||||||||||||
Six Months Ended June 30, |
| |||||||||||||||||||||||||||||||||||||||||||||||||||||||||||
20201 | 10.00 | (0.03 | )2 | 1.57 | 1.54 | 0.00 | 0.00 | 0.00 | 11.54 | 15.40 | 3,4 | 4.47 | 5 | (3.27 | )5 | 1.20 | 5 | (0.68 | )5 | 3.1 | 5.79 | 4 | ||||||||||||||||||||||||||||||||||||||
INSTITUTIONAL SHARES |
| |||||||||||||||||||||||||||||||||||||||||||||||||||||||||||
Six Months Ended June 30, |
| |||||||||||||||||||||||||||||||||||||||||||||||||||||||||||
20201 | 10.00 | (0.02 | )2 | 1.57 | 1.55 | 0.00 | 0.00 | 0.00 | 11.55 | 15.50 | 3,4 | 3.90 | 5 | (2.95 | )5 | 0.95 | 5 | (045 | )5 | 5.4 | 5.79 | 4 | ||||||||||||||||||||||||||||||||||||||
R6 SHARES |
| |||||||||||||||||||||||||||||||||||||||||||||||||||||||||||
Six Months Ended June 30, |
| |||||||||||||||||||||||||||||||||||||||||||||||||||||||||||
20201 | 10.00 | (0.02 | )2 | 1.57 | 1.55 | 0.00 | 0.00 | 0.00 | 11.55 | 15.50 | 3,4 | 3.41 | 5 | (2.46 | )5 | 0.95 | 5 | (045 | )5 | 2.3 | 5.79 | 4 | ||||||||||||||||||||||||||||||||||||||
| 1 | For the period January 2, 2020 (commencement of operations) to June 30, 2020. |
| 2 | Based on average shares outstanding. |
| 3 | The total returns would have been lower had certain expenses not been reduced during the period shown. |
| 4 | Not Annualized. |
| 5 | Annualized. |
| 60 | See Notes to Financial Statements. |
| June 30, 2020 | Baron Select Funds |
As a shareholder of the Funds, you may incur two types of costs: ongoing expenses and transaction costs. Ongoing expenses include advisory fees, distribution and service (12b-1) fees and other Fund expenses. Due to the payment of Rule 12b-1 fees, long-term shareholders may indirectly pay more than the maximum permitted front-end sales charge. The information on this page is intended to help you understand your ongoing costs of investing in the Funds and to compare these costs with the ongoing costs of investing in other mutual funds.
The information in the following table is based on an investment of $1,000 invested on January 1, 2019 and held for the six months ended June 30, 2020.
ACTUAL EXPENSES
The table below titled “Based on Actual Total Return” provides information about actual account values and actual expenses. You may use the information provided in this table, together with the amount you invested, to estimate the expenses that you paid over the period. To estimate the expenses you paid on your account, divide your ending account value by $1,000 (for example, an $8,600 ending account value divided by $1,000 = 8.6), then multiply the result by the number under the heading titled “Expenses Paid During the Period.”
BASED ON ACTUAL TOTAL RETURN FOR THE SIX MONTHS ENDED JUNE 30, 20201
Actual Total Return | Beginning Account Value January 1, 2020 | Ending Account Value June 30, 2020 | Annualized Expense Ratio | Expenses Paid During the Period3 | ||||||||||||||||
Baron Partners Fund — Retail Shares | 18.38 | % | $ | 1,000.00 | $ | 1,183.80 | 1.76 | %2 | $ | 9.56 | ||||||||||
Baron Partners Fund — Institutional Shares | 18.53 | % | $ | 1,000.00 | $ | 1,185.30 | 1.50 | %2 | $ | 8.15 | ||||||||||
Baron Partners Fund — R6 Shares | 18.53 | % | $ | 1,000.00 | $ | 1,185.30 | 1.50 | %2 | $ | 8.15 | ||||||||||
Baron Focused Growth Fund — Retail Shares | 17.00 | % | $ | 1,000.00 | $ | 1,170.00 | 4 | 1.35 | %5 | $ | 7.28 | |||||||||
Baron Focused Growth Fund — Institutional Shares | 17.13 | % | $ | 1,000.00 | $ | 1,171.30 | 4 | 1.10 | %5 | $ | 5.94 | |||||||||
Baron Focused Growth Fund — R6 Shares | 17.12 | % | $ | 1,000.00 | $ | 1,171.20 | 1.09 | % | $ | 5.88 | ||||||||||
Baron International Growth Fund — Retail Shares | 0.65 | % | $ | 1,000.00 | $ | 1,006.50 | 4 | 1.20 | %5 | $ | 5.99 | |||||||||
Baron International Growth Fund — Institutional Shares | 0.76 | % | $ | 1,000.00 | $ | 1,007.60 | 4 | 0.95 | %5 | $ | 4.74 | |||||||||
Baron International Growth Fund — R6 Shares | 0.76 | % | $ | 1,000.00 | $ | 1,007.60 | 4 | 0.95 | %5 | $ | 4.74 | |||||||||
Baron Real Estate Fund — Retail Shares | 3.93 | % | $ | 1,000.00 | $ | 1,039.30 | 1.34 | % | $ | 6.79 | ||||||||||
Baron Real Estate Fund — Institutional Shares | 4.12 | % | $ | 1,000.00 | $ | 1,041.20 | 1.08 | % | $ | 5.48 | ||||||||||
Baron Real Estate Fund — R6 Shares | 4.08 | % | $ | 1.000.00 | $ | 1,040.80 | 1.08 | % | $ | 5.48 | ||||||||||
Baron Emerging Markets Fund — Retail Shares | (5.16 | )% | $ | 1,000.00 | $ | 948.40 | 1.36 | % | $ | 6.59 | ||||||||||
Baron Emerging Markets Fund — Institutional Shares | (5.02 | )% | $ | 1,000.00 | $ | 949.80 | 1.10 | % | $ | 5.33 | ||||||||||
Baron Emerging Markets Fund — R6 Shares | (5.02 | )% | $ | 1,000.00 | $ | 949.80 | 1.11 | % | $ | 5.38 | ||||||||||
Baron Global Advantage Fund — Retail Shares | 35.08 | % | $ | 1,000.00 | $ | 1,350.80 | 4 | 1.15 | %5 | $ | 6.72 | |||||||||
Baron Global Advantage Fund — Institutional Shares | 35.23 | % | $ | 1,000.00 | $ | 1,352.30 | 4 | 0.90 | %5 | $ | 5.26 | |||||||||
Baron Global Advantage Fund — R6 Shares | 35.21 | % | $ | 1,000.00 | $ | 1,352.10 | 4 | 0.90 | %5 | $ | 5.26 | |||||||||
Baron Real Estate Income Fund — Retail Shares | (1.50 | )% | $ | 1,000.00 | $ | 985.00 | 4 | 1.05 | %5 | $ | 5.18 | |||||||||
Baron Real Estate Income Fund — Institutional Shares | (1.41 | )% | $ | 1,000.00 | $ | 985.90 | 4 | 0.80 | %5 | $ | 3.95 | |||||||||
Baron Real Estate Income Fund — R6 Shares | (1.41 | )% | $ | 1,000.00 | $ | 985.90 | 4 | 0.80 | %5 | $ | 3.95 | |||||||||
Baron Health Care Fund — Retail Shares | 12.91 | % | $ | 1,000.00 | $ | 1,129.10 | 4 | 1.10 | %5 | $ | 5.82 | |||||||||
Baron Health Care Fund — Institutional Shares | 13.00 | % | $ | 1,000.00 | $ | 1,130.00 | 4 | 0.85 | %5 | $ | 4.50 | |||||||||
Baron Health Care Fund — R6 Shares | 13.09 | % | $ | 1,000.00 | $ | 1,130.90 | 4 | 0.85 | %5 | $ | 4.50 | |||||||||
Baron FinTech Fund — Retail Shares | 15.40 | % | $ | 1,000.00 | $ | 1,154.00 | 4 | 1.20 | %5 | $ | 6.43 | |||||||||
Baron FinTech Fund — Institutional Shares | 15.50 | % | $ | 1,000.00 | $ | 1,155.00 | 4 | 0.95 | %5 | $ | 5.09 | |||||||||
Baron FinTech Fund — R6 Shares | 15.50 | % | $ | 1,000.00 | $ | 1,155.00 | 4 | 0.95 | %5 | $ | 5.09 | |||||||||
| 1 | Assumes reinvestment of all dividends and capital gain distributions, if any. |
| 2 | Annualized expense ratio for Baron Partners Fund for the six months ended June 30, 2020, includes 1.32%, 1.06% and 1.06% for net operating expenses and 0.44%, 0.44% and 0.44% for interest expense for the Retail, Institutional and R6 Shares, respectively. |
| 3 | Expenses are equal to each share class’ respective annualized expense ratio multiplied by the average account value over the period, multiplied by the number of days in the most recent fiscal half-year, then divided by 366. |
| 4 | Ending account value assumes the return earned after waiver and would have been lower if a portion of the expenses had not been waived. |
| 5 | Annualized expense ratios are adjusted to reflect fee waiver. |
61
| Baron Select Funds | June 30, 2020 |
FUND EXPENSES (Unaudited) (Continued)
HYPOTHETICAL EXAMPLE FOR COMPARISON PURPOSES
The table below titled “Based on Hypothetical Total Return” provides information about hypothetical account values and hypothetical expenses based on the actual expense ratio and an assumed rate of return of 5% per year before expenses, which is not the Funds’ actual return. The hypothetical account values and expenses may not be used to estimate the actual ending account values and expenses you paid for the period. You may use the information provided in this table to compare the ongoing costs of investing in the Funds and other funds. To do so, compare the 5% hypothetical example relating to the Funds with the 5% hypothetical examples that appear in the shareholder reports of other funds.
Please note that expenses shown in the table below are meant to highlight your ongoing costs and do not reflect any transactional costs, such as redemption fees, if any. Therefore, the table is useful in comparing ongoing costs only and will not help you determine your relative total costs of owning different mutual funds. In addition, if these transactional costs were included, your costs would have been higher.
BASED ON HYPOTHETICAL TOTAL RETURN FOR THE SIX MONTHS ENDED JUNE 30, 2020
Hypothetical Annualized Total Return | Beginning Account Value January 1, 2020 | Ending Account Value June 30, 2020 | Annualized Expense Ratio | Expenses Paid During the Period3 | ||||||||||||||||
Baron Partners Fund — Retail Shares | 5.00 | % | $ | 1,000.00 | $ | 1,016.11 | 1.76 | %2 | $ | 8.82 | ||||||||||
Baron Partners Fund — Institutional Shares | 5.00 | % | $ | 1,000.00 | $ | 1,017.40 | 1.50 | %2 | $ | 7.52 | ||||||||||
Baron Partners Fund — R6 Shares | 5.00 | % | $ | 1,000.00 | $ | 1,017.40 | 1.50 | %2 | $ | 7.52 | ||||||||||
Baron Focused Growth Fund — Retail Shares | 5.00 | % | $ | 1,000.00 | $ | 1,018.15 | 4 | 1.35 | %5 | $ | 6.77 | |||||||||
Baron Focused Growth Fund — Institutional Shares | 5.00 | % | $ | 1,000.00 | $ | 1,019.39 | 4 | 1.10 | %5 | $ | 5.52 | |||||||||
Baron Focused Growth Fund — R6 Shares | 5.00 | % | $ | 1,000.00 | $ | 1,019.44 | 1.09 | % | $ | 5.47 | ||||||||||
Baron International Growth Fund — Retail Shares | 5.00 | % | $ | 1,000.00 | $ | 1,018.90 | 4 | 1.20 | %5 | $ | 6.02 | |||||||||
Baron International Growth Fund — Institutional Shares | 5.00 | % | $ | 1,000.00 | $ | 1,020.14 | 4 | 0.95 | %5 | $ | 4.77 | |||||||||
Baron International Growth Fund — R6 Shares | 5.00 | % | $ | 1,000.00 | $ | 1,020.14 | 4 | 0.95 | %5 | $ | 4.77 | |||||||||
Baron Real Estate Fund — Retail Shares | 5.00 | % | $ | 1,000.00 | $ | 1,018.20 | 1.34 | % | $ | 6.72 | ||||||||||
Baron Real Estate Fund — Institutional Shares | 5.00 | % | $ | 1,000.00 | $ | 1,019.49 | 1.08 | % | $ | 5.42 | ||||||||||
Baron Real Estate Fund — R6 Shares | 5.00 | % | $ | 1,000.00 | $ | 1,019.49 | 1.08 | % | $ | 5.42 | ||||||||||
Baron Emerging Markets Fund — Retail Shares | 5.00 | % | $ | 1,000.00 | $ | 1,018.10 | 1.36 | % | $ | 6.82 | ||||||||||
Baron Emerging Markets Fund — Institutional Shares | 5.00 | % | $ | 1,000.00 | $ | 1,019.39 | 1.10 | % | $ | 5.52 | ||||||||||
Baron Emerging Markets Fund — R6 Shares | 5.00 | % | $ | 1,000.00 | $ | 1,019.34 | 1.11 | % | $ | 5.57 | ||||||||||
Baron Global Advantage Fund — Retail Shares | 5.00 | % | $ | 1,000.00 | $ | 1,019.14 | 4 | 1.15 | %5 | $ | 5.77 | |||||||||
Baron Global Advantage Fund — Institutional Shares | 5.00 | % | $ | 1,000.00 | $ | 1,020.39 | 4 | 0.90 | %5 | $ | 4.52 | |||||||||
Baron Global Advantage Fund — R6 Shares | 5.00 | % | $ | 1,000.00 | $ | 1,020.39 | 4 | 0.90 | %5 | $ | 4.52 | |||||||||
Baron Real Estate Income Fund — Retail Shares | 5.00 | % | $ | 1,000.00 | $ | 1,019.64 | 4 | 1.05 | %5 | $ | 5.27 | |||||||||
Baron Real Estate Income Fund — Institutional Shares | 5.00 | % | $ | 1,000.00 | $ | 1,020.89 | 4 | 0.80 | %5 | $ | 4.02 | |||||||||
Baron Real Estate Income Fund — R6 Shares | 5.00 | % | $ | 1,000.00 | $ | 1,020.89 | 4 | 0.80 | %5 | $ | 4.02 | |||||||||
Baron Health Care Fund — Retail Shares | 5.00 | % | $ | 1,000.00 | $ | 1,019.39 | 4 | 1.10 | %5 | $ | 5.52 | |||||||||
Baron Health Care Fund — Institutional Shares | 5.00 | % | $ | 1,000.00 | $ | 1,020.64 | 4 | 0.85 | %5 | $ | 4.27 | |||||||||
Baron Health Care Fund — R6 Shares | 5.00 | % | $ | 1,000.00 | $ | 1,020.64 | 4 | 0.85 | %5 | $ | 4.27 | |||||||||
Baron FinTech Fund — Retail Shares | 5.00 | % | $ | 1,000.00 | $ | 1,018.90 | 4 | 1.20 | %5 | $ | 6.02 | |||||||||
Baron FinTech Fund — Institutional Shares | 5.00 | % | $ | 1,000.00 | $ | 1,020.14 | 4 | 0.95 | %5 | $ | 4.77 | |||||||||
Baron FinTech Fund — R6 Shares | 5.00 | % | $ | 1,000.00 | $ | 1,020.14 | 4 | 0.95 | %5 | $ | 4.77 | |||||||||
| 1 | Assumes reinvestment of all dividends and capital gain distributions, if any. |
| 2 | Annualized expense ratio for Baron Partners Fund for the six months ended June 30, 2020, includes 1.32%, 1.06% and 1.06% for net operating expenses and 0.44%, 0.44% and 0.44% for interest expense for the Retail, Institutional and R6 Shares, respectively. |
| 3 | Expenses are equal to each share class’ respective annualized expense ratio multiplied by the average account value over the period, multiplied by the number of days in the most recent fiscal half-year, then divided by 366. |
| 4 | Ending account value assumes the return earned after waiver and would have been lower if a portion of the expenses had not been waived. |
| 5 | Annualized expense ratios are adjusted to reflect fee waiver. |
62
| June 30, 2020 | Baron Select Funds |
DISCLOSURE REGARDING THE APPROVAL OF THE INVESTMENT ADVISORY AGREEMENTS BY THE BOARD OF TRUSTEES (Unaudited)
The Board of Trustees (the “Board”) of Baron Select Funds (the “Trust”) met on May 4, 2020 to discuss the selection of BAMCO, Inc. (the “Adviser”) as the investment adviser and the approval of the investment advisory agreements for Baron Partners Fund, Baron Focused Growth Fund, Baron International Growth Fund, Baron Real Estate Fund, Baron Emerging Markets Fund, Baron Global Advantage Fund, Baron Real Estate Income Fund and Baron Health Care Fund (each, a “Fund” and collectively, the “Funds”). The members of the Board who are not “interested persons” (as defined in the Investment Company Act of 1940, as amended) of the Trust (the “Independent Trustees”) met in a separate session to discuss and consider the renewal of the investment advisory agreements for the Funds. Representatives of Broadridge Financial Solutions, Inc. (“Broadridge”), an independent provider of investment company data, provided reports to the Board and attended the Board meeting. The Trustees received a substantial amount of information from the Adviser and from Broadridge, and were advised by independent legal counsel. Based on its evaluation of this and other information, the Board, including a majority of the Independent Trustees, approved the continuation of the investment advisory agreements for the Funds for an additional one-year period.
In reaching its determination, the Board considered various factors that it deemed relevant, including the factors listed below.
1. NATURE, EXTENT AND QUALITY OF SERVICES
The Trustees considered the information provided, including their experience and knowledge gained from their service as Trustees and their experience generally, including the following, which they had considered in past years and remained, in their thinking, material to their consideration:
| • | Their confidence in the senior personnel, portfolio management, the financial condition of the Adviser and its affiliates and the Adviser’s available resources; |
| • | The nature, extent and quality of the services provided by the Adviser, including: intensive devotion to research, selection of broker/dealers for Fund portfolio transactions, relationships with and supervision of third party service providers, such as the Funds’ custodian and transfer agent, the quality of shareholder reports, the ability to monitor adherence to investment guidelines and restrictions, the legal, accounting and compliance services provided to the Funds and the support services provided to the Board; |
| • | The Adviser’s investment principles and processes and the historical performance of the Funds as compared to similar funds managed by other advisers and other funds managed by the Adviser over comparable periods; |
| • | The advisory fees, total expense ratios of the Funds and comparisons to similar funds managed by other advisers over comparable periods. They observed that, for most of the Funds, while the advisory fee was comparatively higher, the net operating expenses paid by the Funds (total expense ratio) were within the range of those of the funds in their respective peer groups; and |
| • | Additional services provided by the Adviser. |
The Board concluded that the nature, extent and quality of the services the Adviser provides to each Fund, including performance consistent with its investing principles, supported approval of the investment advisory agreement for each Fund.
2. INVESTMENT PERFORMANCE OF THE FUNDS AND THE ADVISER
As part of its consideration of the investment performance of the Funds and the Adviser, the Board took into account the analyses performed by and discussed with representatives of Broadridge. The Board considered for each Fund, among other information, Broadridge’s comparisons of the expense ratio and contractual advisory fee with those of peer group funds selected by Broadridge and Morningstar category medians. The Board also considered, among other performance information, Broadridge’s comparisons of each Fund’s annualized total return and related risk metrics over one-, three-, five- and ten-year periods, where applicable, against peer group funds and Morningstar category medians. After considering all the information, the Board concluded that the Adviser continued to invest in accordance with its long-standing principles and that each Fund’s performance remained consistent with expectations for the Adviser’s investment style, in light of recent market conditions.
3. COSTS OF SERVICES PROVIDED AND PROFITS TO BE REALIZED BY THE ADVISER
The Board considered comparisons of the advisory fees charged and services provided by the Adviser and its investment adviser affiliate to sub-advised accounts and separately managed accounts. The Board considered that, while the advisory fees for the other clients are the same as, or lower than, the fees for the Funds, the Adviser or its affiliate performs significantly fewer services for those clients compared with those provided by the Adviser to the Funds. The Board also considered a profitability analysis prepared by the Adviser and discussed with the representatives of the Adviser that the Adviser has continued to invest in quality personnel, systems and facilities, and otherwise continued to invest in its business, irrespective of fund flows.
The Board also considered benefits that accrue to the Adviser and its affiliates from their relationship with the Funds. The Board considered the costs of portfolio management, including the types of investments made for the Funds, the personnel and systems necessary for implementation of investment strategies, and the pre-tax profits realized by the Adviser and its affiliates from their relationship with the Funds.
4. ECONOMIES OF SCALE AND BENEFITS TO INVESTORS
The Board considered the extent to which each Fund’s advisory fee reflected economies of scale for the benefit of Fund shareholders, appreciating that the economies of scale analysis is predicated on generally predictable increasing assets and noting the small size of certain Funds and the significant fluctuation in assets in recent years, including since the beginning of the year. The Board considered that small- and mid-cap investment strategies require more attention by the Adviser than a strategy that involves other types of investing, particularly as asset size increases. The Board considered that the Adviser was continuing to grow and upgrade its staff and invest in its business. The Board members reiterated their intention to continue to consider the extent of economies of scale, asset growth and the Adviser’s plans to invest further to support the Funds.
The Board concluded that the advisory fee for each Fund was supported by the entirety of the presentation and particularly in light of the services provided as discussed at this meeting.
After due consideration of the above-enumerated factors and other factors it deemed relevant, the Board, including a majority of the Independent Trustees, approved the continuance of each Fund’s investment advisory agreement.
63
Privacy Notice
The Funds collect nonpublic personal information about you from the following sources:
| ∎ | Information we receive from you on applications or other forms; |
| ∎ | Information about your transactions with us, our Adviser or others; and |
| ∎ | Information we receive from third parties, such as credit reporting agencies. |
“Nonpublic personal information” is private information about you that we obtain in connection with providing a financial product or service to you.
We may share your name and address with other Baron Funds and the Adviser and its affiliates for the purpose of sending you information about our products that we believe may be of interest to you and informing you of our upcoming Baron Investment Conference and for sending required information.
We do not disclose any nonpublic personal information about our customers to anyone, except as permitted or required by law. Examples of permitted disclosures under the law include sharing with companies that work for us to provide you services, such as the Transfer Agent or mailing house. All such companies that act on our behalf are contractually obligated to keep the information that we provide to them confidential and to use the information only to provide the services that we have asked them to perform for you and us.
We restrict access to nonpublic information about you to those employees who need to know that information to provide products or services to you. We maintain physical, electronic and procedural safeguards to guard your nonpublic personal information.
This privacy notice is also available at all times on the Baron Funds® website, www.BaronFunds.com or by calling 1-800-99BARON.
Go Paperless!
It’s fast, simple and a smart way to help the environment.
Enjoy the speed and convenience of receiving Fund documents electronically.
For more information, and to enroll today, go to www.baronfunds.com/edelivery.
767 Fifth Avenue, 49th Fl.
New York, NY 10153
1.800.99.BARON
212-583-2000
www.BaronFunds.com

JUNE 20
June 30, 2020
Baron Funds
Baron WealthBuilder Fund
Semi-Annual Financial Report
| Ticker Symbols: | ||||
Retail Shares: BWBFX | ||||
TA Shares: BWBTX | ||||
Institutional Shares: BWBIX | ||||
| Performance | 3 | |||
| Country Exposures | 4 | |||
| Sector Exposures | 4 | |||
| Management’s Discussion of Fund Performance | 4 | |||
| Financial Statements | ||||
| Statement of Net Assets | 5 | |||
| Statement of Assets and Liabilities | 6 | |||
| Statement of Operations | 7 | |||
| Statements of Changes in Net Assets | 8 | |||
| Notes to Financial Statements | 9 | |||
| Financial Highlights | 14 | |||
| Fund Expenses | 15 | |||
| Disclosure Regarding the Approval of the Investment Advisory Agreement for Baron WealthBuilder Fund by the Board of Trustees | 16 | |||
DEAR BARON WEALTHBUILDER FUND SHAREHOLDER:
In this report, you will find unaudited financial statements for Baron WealthBuilder Fund® (the “Fund”) for the six months ended June 30, 2020. The U.S. Securities and Exchange Commission (the “SEC”) requires mutual funds to furnish these statements semi-annually to their shareholders. We hope you find these statements informative and useful.
We thank you for choosing to join us as fellow shareholders in Baron Funds. We will continue to work hard to justify your confidence.
Sincerely,
 |  |  | ||
Ronald Baron Chief Executive Officer August 25, 2020 | Linda S. Martinson Chairman, President and Chief Operating Officer August 25, 2020 | Peggy Wong Treasurer and Chief Financial Officer August 25, 2020 |
This Semi-Annual Financial Report is for the Baron WealthBuilder Fund. If you are interested in the other series of Baron Select Funds, which contains the Baron Partners Fund, Baron Focused Growth Fund, Baron International Growth Fund, Baron Real Estate Fund, Baron Emerging Markets Fund, Baron Global Advantage Fund, Baron Real Estate Income Fund, Baron Health Care Fund, and Baron FinTech Fund, or Baron Investment Funds Trust, which contains the Baron Asset Fund, Baron Growth Fund, Baron Small Cap Fund, Baron Opportunity Fund, Baron Fifth Avenue Growth Fund, Baron Discovery Fund, and Baron Durable Advantage Fund, please visit the Funds’ website at www.BaronFunds.com or contact us at 1-800-99BARON.
Beginning on January 1, 2021, as permitted by regulations adopted by the U.S. Securities and Exchange Commission, paper copies of the Funds’ shareholder reports like this one will no longer be sent by mail, unless you specifically request paper copies of the reports from Baron Funds (“Baron”) or from your financial intermediary, such as a broker-dealer or bank. Instead, the reports will be made available on the Baron website, and you will be notified by mail each time a report is posted and provided with a website link to access the report.
If you already elected to receive shareholder reports electronically, you will not be affected by this change and you need not take any action. You may elect to receive shareholder reports and other communications from Baron or your financial intermediary electronically by contacting your financial intermediary or going to icsdelivery.com/baronfunds.
You may elect to receive all future reports in paper free of charge. You can inform Baron or your financial intermediary that you wish to continue receiving paper copies of your shareholder reports by following the instructions included on the envelope or slip inserted with this disclosure. Your election to receive reports in paper will apply to all funds held with Baron or your financial intermediary.
The Funds’ Proxy Voting Policy is available without charge and can be found on the Funds’ website at www.BaronFunds.com, by clicking on the “Legal Notices” link at the bottom left corner of the homepage or by calling 1-800-99BARON and on the SEC’s website at www.sec.gov. The Funds’ most current proxy voting record, Form N-PX, is also available on the Funds’ website and on the SEC’s website.
The Funds file their complete schedules of portfolio holdings with the SEC for the first and third quarters of each fiscal year as an exhibit to their reports on Form N-PORT. The Funds’ Form N-PORT reports are available on the SEC’s website at www.sec.gov. Schedules of portfolio holdings current to the most recent quarter are also available on the Funds’ website.
Some of the comments contained in this report are based on current management expectations and are considered “forward-looking statements.” Actual future results, however, may prove to be different from our expectations. You can identify forward-looking statements by words such as “estimate,” “may,” “expect,” “should,” “could,” “believe,” “plan”, and other similar terms. We cannot promise future returns and our opinions are a reflection of our best judgment at the time this report is compiled.
The views expressed in this report reflect those of BAMCO, Inc. (“BAMCO” or the “Adviser”) only through the end of the period stated in this report. The views are not intended as recommendations or investment advice to any person reading this report and are subject to change at any time without notice based on market and other conditions.
Past performance is no guarantee of future results. The investment return and principal value of an investment will fluctuate; an investor’s shares, when redeemed, may be worth more or less than their original cost. For more complete information about Baron Funds, including charges and expenses, call, write or go to www.BaronFunds.com for a prospectus or summary prospectus. Read them carefully before you invest or send money. This report is not authorized for use as an offer of sale or a solicitation of an offer to buy shares of the Fund, unless accompanied or preceded by the Fund’s current prospectus or summary prospectus.

| Baron WealthBuilder Fund | June 30, 2020 |
Baron WealthBuilder Fund is an open end, no-load mutual fund that invests only in Baron Funds. Long-term capital appreciation is its objective. It is not a target date fund.
| 1. | Baron WealthBuilder Fund’s objective is to provide investors with a diversified portfolio of Baron mutual funds that will outperform its benchmark index over the long term, although we cannot guarantee it will meet its objective. |
| 2. | Baron WealthBuilder Fund’s minimum initial investment is $2,000, making it suitable for periodic purchases. |
| 3. | Baron WealthBuilder Fund has no management fee, but it will indirectly bear its pro-rata share of the expenses of the Baron Funds in which it invests (acquired funds). |
| 4. | Baron WealthBuilder Fund’s annual operating expenses are capped at 5 bps per year for Institutional Shares and TA Shares (available directly through Baron Funds). Retail Shares operating expenses are capped at 30 bps per year. Portfolio transaction costs, interest, dividend, acquired fund fees and expenses are not subject to the operating expense limitation. |
Several criteria, including our qualitative assessments, are used to continually determine Baron WealthBuilder Fund allocations among Baron Funds.
Among the criteria are: (a) absolute performance; (b) excess performance vs. benchmark; (c) performance standard deviation (a measure of risk); (d) Sharpe ratio (a measure of performance per unit of risk); (e) beta (a measure of a fund’s sensitivity to market movements); (f) alpha (a measure of excess return given level of risk as measured by beta); (g) portfolio turnover; (h) growth rates of portfolio investments; (i) fund size; and (j) manager tenure.
As of June 30, 2020, the five largest Baron mutual funds represented 64.55% of Baron WealthBuilder Fund’s net assets.
Ronald Baron, CEO of Baron Capital is the portfolio manager of Baron WealthBuilder Fund. Michael Baron, Vice President, is the assistant portfolio manager.
2
| June 30, 2020 (Unaudited) | Baron WealthBuilder Fund |
COMPARISONOFTHECHANGEIN VALUEOF $10,000INVESTMENTIN BARON WEALTHBUILDER FUND (RETAIL SHARES)
INRELATIONTOTHE S&P 500 INDEXANDTHE MSCI ACWI INDEX
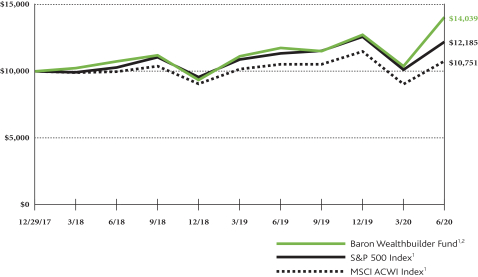
| AVERAGE ANNUAL TOTAL RETURNSFORTHEPERIODSENDED JUNE, 30, 2020 | ||||||||||
| Six Months* | One Year | Since Inception (December 29, 2017) | ||||||||
Baron WealthBuilder Fund — Retail Shares1,2 | 10.30% | 19.53% | 14.53% | |||||||
Baron WealthBuilder Fund — TA Shares1,2 | 10.50% | 19.91% | 14.80% | |||||||
Baron WealthBuilder Fund — Institutional Shares1,2 | 10.42% | 19.83% | 14.77% | |||||||
S&P 500 Index1 | (3.08)% | 7.51% | 8.23% | |||||||
MSCI ACWI Index Net1 | (6.25)% | 2.11% | 2.94% | |||||||
| * | Not Annualized. |
| 1 | The indexes are unmanaged. The index performance is not Fund performance; one cannot invest directly into an index. The S&P 500 Index measures the performance of 500 widely held large cap U.S. companies. The MSCI ACWI Index is an unmanaged, free float-adjusted market capitalization weighted index reflected in U.S. dollars that measures the equity market performance of large- and mid-cap securities across developed and emerging markets, including the United States. The Indexes and Baron WealthBuilder Fund are with dividends, which positively impact the performance results. The MSCI ACWI Index is net of foreign withholding taxes. |
| 2 | Past performance is not predictive of future performance. The performance data does not reflect the deduction of taxes that a shareholder would pay on Fund distributions or redemption of Fund shares. BAMCO, Inc. (“BAMCO” or the “Adviser”) has agreed that, pursuant to a contract expiring on August 29, 2030, unless renewed for another 11-year term, it will reimburse certain expenses of the Fund, limiting net annual operating expenses (portfolio transaction costs, interest, dividend, acquired fund fees and expenses and extraordinary expense are not subject to the operating expense limitation) to 0.30% of average daily net assets of Retail Shares, 0.05% of average daily net assets of Institutional shares and 0.05% of average daily net assets of TA shares, without which performance would have been lower. |
3
| Baron WealthBuilder Fund (Unaudited) | June 30, 2020 |
COUNTRY EXPOSURESOF UNDERLYING BARON FUNDSAS OF JUNE 30, 2020
| Percent of Total Investments | ||||
United States | 84.2% | |||
China | 4.4% | |||
United Kingdom | 2.1% | |||
Israel | 1.7% | |||
Netherlands | 1.7% | |||
Canada | 1.0% | |||
India | 0.9% | |||
Brazil | 0.8% | |||
Argentina | 0.5% | |||
Japan | 0.4% | |||
Other | 2.3% | |||
| 100.0% | ||||
SECTOR EXPOSURESOF UNDERLYING BARON FUNDSAS OF JUNE 30, 2020†
(as a percent of total investments)
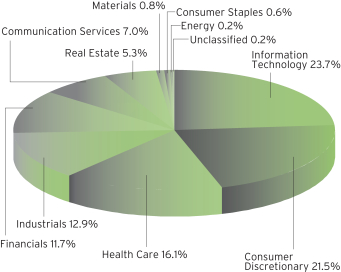
MANAGEMENT’S DISCUSSIONOF FUND PERFORMANCE
For the six-month period ended June 30, 2020, Baron WealthBuilder Fund1 appreciated 10.30%, outperforming the S&P 500 Index, which declined 3.08%.
Baron WealthBuilder Fund is a non-diversified fund that invests exclusively in other Baron mutual funds. At any given time, it invests in the securities of a select number of Baron mutual funds representing specific investment strategies. The Fund can invest in funds holding U.S. and international stocks; small-cap, small- to mid-cap, mid-cap, large-cap, all-cap stocks; and sector stocks. Baron WealthBuilder Fund normally invests in a variety of domestic and international equity funds. It seeks to invest in businesses it believes have significant opportunities for growth, sustainable competitive advantages, exceptional management, and an attractive valuation. Of course, there can be no assurance that we will be successful in achieving the Fund’s investment goals.
The past six months have been dominated by the COVID-19 pandemic, the resulting economic shutdown, and the impact of both on U.S. equity markets. The COVID-19 chapter of the 2020 book certainly is not finished, but the trajectory of U.S. equity markets has been a sharp “V” thus far and they are well on their way back to pre-COVID-19 levels. Several factors contributed to the dramatic recovery, including unprecedented fiscal and monetary stimulus, stepped up efforts to reopen the economy, optimism about potential COVID-19 therapeutics and vaccine, and various economic data (such as unemployment figures) that were more positive than investors expected.
On a sector basis, Information Technology, Health Care, and Consumer Discretionary contributed the most. Financials, Real Estate, and Materials detracted the most.
On a country basis, the U.S., Israel, and China contributed the most. Brazil, India, and the U.K. detracted the most.
Baron Opportunity Fund contributed the most to performance.
Baron Emerging Markets Fund detracted the most.
We believe that the unprecedented social, political, and economic effects stemming from the COVID-19 pandemic, coupled with unrelenting advances in technology, will result in long-lasting benefits for certain businesses and challenges for others. We continue to adhere to our traditional investment methodology while working hard to identify these long-term corporate beneficiaries. We are optimistic that this approach will continue to lead to strong performance for our portfolio, no matter the economic climate.
| † | Sector levels are provided from the Global Industry Classification Standard (“GICS”), developed and exclusively owned by MSCI, Inc. and Standard & Poor’s Financial Services LLC, unless otherwise stated that they have been reclassified or classified by the Adviser. All GICS data is provided “as is” with no warranties. |
| 1 | Performance information reflects results of the Retail Shares. |
4
| June 30, 2020 | Baron WealthBuilder Fund |
STATEMENT OF NET ASSETS (Unaudited)
JUNE 30, 2020
|
| Shares | Cost | Value | ||||||||||
| Affiliated Mutual Funds (100.05%) | ||||||||||||
| Small Cap Funds (29.59%) | ||||||||||||
| 249,922 | Baron Discovery Fund — Institutional Shares | $ | 5,107,493 | $ | 6,025,615 | |||||||
| 214,898 | Baron Growth Fund — Institutional Shares | 16,245,140 | 18,236,264 | |||||||||
| 587,075 | Baron Small Cap Fund — Institutional Shares | 17,887,483 | 18,827,498 | |||||||||
|
|
|
| |||||||||
Total Small Cap Funds | 39,240,116 | 43,089,377 | ||||||||||
|
|
|
| |||||||||
| Small to Mid Cap Funds (4.10%) | ||||||||||||
| 246,761 | Baron Focused Growth Fund — Institutional Shares | 4,349,794 | 5,974,090 | |||||||||
|
|
|
| |||||||||
| Mid Cap Funds (15.05%) | ||||||||||||
| 228,287 | Baron Asset Fund — Institutional Shares | 17,807,172 | 21,913,227 | |||||||||
|
|
|
| |||||||||
| Large Cap Funds (8.41%) | ||||||||||||
| 170,578 | Baron Durable Advantage Fund — Institutional Shares | 1,914,247 | 2,284,037 | |||||||||
| 232,891 | Baron Fifth Avenue Growth Fund — Institutional Shares | 6,962,867 | 9,963,059 | |||||||||
|
|
|
| |||||||||
Total Large Cap Funds | 8,877,114 | 12,247,096 | ||||||||||
|
|
|
| |||||||||
| All Cap Funds (24.05%) | ||||||||||||
| 349,087 | Baron Opportunity Fund — Institutional Shares | 7,467,896 | 10,891,504 | |||||||||
| 287,363 | Baron Partners Fund — Institutional Shares | 16,072,349 | 24,121,229 | |||||||||
|
|
|
| |||||||||
Total All Cap Funds | 23,540,245 | 35,012,733 | ||||||||||
|
|
|
| |||||||||
| International Funds (11.99%) | ||||||||||||
| 405,010 | Baron Emerging Markets Fund — Institutional Shares | 5,313,627 | 5,674,194 | |||||||||
| 204,945 | Baron Global Advantage Fund — Institutional Shares | 4,907,731 | 8,070,742 | |||||||||
| 148,240 | Baron International Growth Fund — Institutional Shares | 3,341,907 | 3,716,367 | |||||||||
|
|
|
| |||||||||
Total International Funds | 13,563,265 | 17,461,303 | ||||||||||
|
|
|
| |||||||||
| Sector Funds (6.86%) | ||||||||||||
| 156,774 | Baron FinTech Fund — Institutional Shares | 1,622,332 | 1,810,740 | |||||||||
| 134,675 | Baron Health Care Fund — Institutional Shares | 1,563,959 | 1,966,253 | |||||||||
| 223,463 | Baron Real Estate Fund — Institutional Shares | 5,875,769 | 6,207,804 | |||||||||
|
|
|
| |||||||||
Total Sector Funds | 9,062,060 | 9,984,797 | ||||||||||
|
|
|
| |||||||||
Total Affiliated Investments (100.05%) | $ | 116,439,766 | 145,682,623 | |||||||||
|
| |||||||||||
Liabilities Less Cash and Other Assets (-0.05%) | (77,497 | ) | ||||||||||
|
| |||||||||||
Net Assets | $ | 145,605,126 | ||||||||||
|
| |||||||||||
Retail Shares (Equivalent to $13.49 per share based on 1,091,157 shares outstanding) | $ | 14,720,276 | ||||||||||
|
| |||||||||||
TA Shares (Equivalent to $13.57 per share based on 1,951,036 shares outstanding) | $ | 26,466,893 | ||||||||||
|
| |||||||||||
Institutional Shares (Equivalent to $13.56 per share based on 7,699,229 shares outstanding) | $ | 104,417,957 | ||||||||||
|
| |||||||||||
| % | Represents percentage of net assets. |
All Affiliated Mutual Funds are Level 1.
| See Notes to Financial Statements. | 5 |
| Baron WealthBuilder Fund | June 30, 2020 |
STATEMENT OF ASSETS AND LIABILITIES (Unaudited)
JUNE 30, 2020
|
Assets: | ||||
Investments in Affiliated Mutual Funds, at value* | $ | 145,682,623 | ||
Receivable for shares sold | 27,100 | |||
Prepaid expenses | 774 | |||
|
| |||
| 145,710,497 | ||||
|
| |||
Liabilities: | ||||
Due to custodian bank | 50 | |||
Payable for securities purchased | 18,131 | |||
Payable for shares redeemed | 8,919 | |||
Distribution fees payable (Note 4) | 194 | |||
Accrued expenses and other payables | 78,077 | |||
|
| |||
| 105,371 | ||||
|
| |||
Net Assets | $ | 145,605,126 | ||
|
| |||
Net Assets consist of: | ||||
Paid-in capital | $ | 115,089,950 | ||
Distributable earnings/(losses) | 30,515,176 | |||
|
| |||
Net Assets | $ | 145,605,126 | ||
|
| |||
Retail Shares: | ||||
Net Assets | $ | 14,720,276 | ||
Shares Outstanding ($0.01 par value; indefinite shares authorized) | 1,091,157 | |||
|
| |||
Net Asset Value and Offering Price Per Share | $ | 13.49 | ||
|
| |||
TA Shares: | ||||
Net Assets | $ | 26,466,893 | ||
Shares Outstanding ($0.01 par value; indefinite shares authorized) | 1,951,036 | |||
|
| |||
Net Asset Value and Offering Price Per Share | $ | 13.57 | ||
|
| |||
Institutional Shares: | ||||
Net Assets | $ | 104,417,957 | ||
Shares Outstanding ($0.01 par value; indefinite shares authorized) | 7,699,229 | |||
|
| |||
Net Asset Value and Offering Price Per Share | $ | 13.56 | ||
|
| |||
*Investments in Affiliated Mutual Funds, at cost | $ | 116,439,766 | ||
|
| |||
| 6 | See Notes to Financial Statements. |
| June 30, 2020 | Baron WealthBuilder Fund |
STATEMENT OF OPERATIONS (Unaudited)
JUNE 30, 2020
|
| For the Six Months Ended June 30, 2020 | ||||
Investment income: | ||||
Expenses: | ||||
Distribution fees — Retail Shares (Note 4) | $ | 11,984 | ||
Shareholder servicing agent fees and expenses — Retail Shares | 240 | |||
Shareholder servicing agent fees and expenses — TA Shares | 570 | |||
Shareholder servicing agent fees and expenses — Institutional Shares | 2,362 | |||
Registration and filing fees | 28,940 | |||
Administration fees | 22,233 | |||
Reports to shareholders | 19,738 | |||
Professional fees | 19,084 | |||
Custodian and fund accounting fees | 13,704 | |||
Trustee fees and expenses (Note 4) | 4,505 | |||
Insurance expense | 699 | |||
Line of credit fees | 446 | |||
Miscellaneous expenses | 4,216 | |||
|
| |||
Total operating expenses | 128,721 | |||
|
| |||
Interest expense on borrowings | 5,368 | |||
|
| |||
Total expenses | 134,089 | |||
Reimbursement of expenses by Adviser — Retail Shares (Note 4) | (6,569 | ) | ||
Reimbursement of expenses by Adviser — TA Shares (Note 4) | (14,918 | ) | ||
Reimbursement of expenses by Adviser — Institutional Shares (Note 4) | (61,471 | ) | ||
|
| |||
Net expenses | 51,131 | |||
|
| |||
Net investment income (loss) | (51,131 | ) | ||
|
| |||
Realized and unrealized gain (loss) on investments: | ||||
Net realized gain (loss) on Affiliated Mutual Funds sold | (183,597 | ) | ||
Change in net unrealized appreciation (depreciation) of Affiliated Mutual Funds | 14,614,878 | |||
|
| |||
Net gain (loss) on investments | 14,431,281 | |||
|
| |||
Net increase (decrease) in net assets resulting from operations | $ | 14,380,150 | ||
|
| |||
| See Notes to Financial Statements. | 7 |
| Baron WealthBuilder Fund | June 30, 2020 |
STATEMENTS OF CHANGES IN NET ASSETS (Unaudited)
JUNE 30, 2020
|
| For the Six Months Ended June 30, 2020 | For the Year Ended December 31, 2019 | |||||||
Increase (Decrease) in Net Assets: | ||||||||
Operations: | ||||||||
Net investment income (loss) | $ | (51,131 | ) | $ | (36,716 | ) | ||
Net realized gain (loss) on Affiliated Mutual Funds sold | (183,597 | ) | 1,567,428 | |||||
Change in net unrealized appreciation (depreciation) of Affiliated Mutual Funds | 14,614,878 | 31,123,060 | ||||||
|
|
|
| |||||
Increase (decrease) in net assets resulting from operations | 14,380,150 | 32,653,772 | ||||||
|
|
|
| |||||
Distributions to shareholders from: | ||||||||
Distributable earnings — Retail Shares | — | (181,386 | ) | |||||
Distributable earnings — TA Shares | — | (651,102 | ) | |||||
Distributable earnings — Institutional Shares | — | (3,094,919 | ) | |||||
|
|
|
| |||||
Decrease in net assets from distributions to shareholders | — | (3,927,407 | ) | |||||
|
|
|
| |||||
Capital share transactions: | ||||||||
Proceeds from the sale of shares — Retail Shares | 13,248,539 | 4,399,604 | ||||||
Proceeds from the sale of shares — TA Shares | 4,123,426 | 7,979,048 | ||||||
Proceeds from the sale of shares — Institutional Shares | 17,137,666 | 13,978,568 | ||||||
Net asset value of shares issued in reinvestment of distributions — Retail Shares | — | 181,370 | ||||||
Net asset value of shares issues in reinvestment of distributions — TA Shares | — | 648,793 | ||||||
Net asset value of shares issued in reinvestment of distributions — Institutional Shares | — | 3,091,525 | ||||||
Cost of shares redeemed — Retail Shares | (4,922,856 | ) | (1,594,635 | ) | ||||
Cost of shares redeemed — TA Shares | (1,269,841 | ) | (615,394 | ) | ||||
Cost of shares redeemed — Institutional Shares | (18,142,499 | ) | (30,593,360 | ) | ||||
|
|
|
| |||||
Increase (decrease) in net assets derived from capital share transactions | 10,174,435 | (2,524,481 | ) | |||||
|
|
|
| |||||
Net increase (decrease) in net assets | 24,554,585 | 26,201,884 | ||||||
|
|
|
| |||||
Net Assets: | ||||||||
Beginning of period | 121,050,541 | 94,848,657 | ||||||
|
|
|
| |||||
End of period | $ | 145,605,126 | $ | 121,050,541 | ||||
|
|
|
| |||||
Capital share transactions — Retail Shares | ||||||||
Shares sold | 1,064,489 | 385,132 | ||||||
Shares issued in reinvestment of distributions | — | 16,533 | ||||||
Shares redeemed | (457,842 | ) | (139,469 | ) | ||||
|
|
|
| |||||
Net increase (decrease) | 606,647 | 262,196 | ||||||
|
|
|
| |||||
Capital share transactions — TA Shares | ||||||||
Shares sold | 315,956 | 695,656 | ||||||
Shares issued in reinvestment of distributions | — | 58,928 | ||||||
Shares redeemed | (104,962 | ) | (55,461 | ) | ||||
|
|
|
| |||||
Net increase (decrease) | 210,994 | 699,123 | ||||||
|
|
|
| |||||
Capital share transactions — Institutional Shares | ||||||||
Shares sold | 1,399,018 | 1,228,967 | ||||||
Shares issued in reinvestment of distributions | — | 281,048 | ||||||
Shares redeemed | (1,334,587 | ) | (2,759,428 | ) | ||||
|
|
|
| |||||
Net increase (decrease) | 64,431 | (1,249,413 | ) | |||||
|
|
|
| |||||
| 8 | See Notes to Financial Statements. |
| June 30, 2020 | Baron WealthBuilder Fund |
NOTES TO FINANCIAL STATEMENT (Unaudited)
1. ORGANIZATION
Baron Select Funds (the “Trust”) is registered under the Investment Company Act of 1940, as amended (the “1940 Act”), as an open-end management investment company established as a Delaware statutory trust on April 30, 2003, and accordingly, follows the investment company accounting and reporting guidance of the Financial Accounting Standards Board (“FASB”) Accounting Standard Codification Topic 946 Financial Services — Investment Companies. The Trust currently offers ten series. This report covers only the Baron WealthBuilder Fund (the “Fund”). The Fund’s investment objective is capital appreciation. The Fund is a non-diversified fund because it invests, at any given time, in the securities of a select number of Baron mutual funds (the “Underlying Funds”), representing specific investment strategies. However, included in the Underlying Funds are diversified funds (with the exception of Baron Partners Fund, Baron Focused Growth Fund, Baron Health Care Fund, and Baron FinTech Fund). The Fund normally invests in a variety of Baron domestic and international equity funds managed by BAMCO, Inc. (“BAMCO” or the “Adviser”). The Fund can invest in Underlying Funds holding U.S. and international stocks; small-cap, small- to mid-cap, large-cap, all-cap stocks; and specialty stocks. The Adviser decides how much of the Fund’s assets to allocate to Underlying Funds based on the outlook for, and on the relative valuations of, the Underlying Funds and the various markets in which they invest. For information on the Underlying Funds, please refer to the Prospectuses and Statements of Additional Information of the Underlying Funds. Also, information on the Underlying Funds is available at www.baronfunds.com.
The Fund offers Retail Shares, TA Shares and Institutional Shares. Each class of shares differs only in its ongoing fees, expenses and eligibility requirements. Retail Shares are offered to all investors but are not available through the Fund’s transfer agent. TA Shares are available only to investors who purchase shares directly through the Fund’s transfer agent. TA Shares do not charge a 12b-1 fee or make revenue sharing payments, to include payments to sub-transfer agency or record-keeping services. Institutional Shares are for investments in the amount of $1 million or more. Institutional Shares are intended for certain financial intermediaries that offer shares of the Fund through fee-based platforms, retirement platforms or other platforms. Each class of shares has equal rights to earnings and assets, except that each class bears different expenses for distribution and shareholder servicing. The Fund’s investment income, realized and unrealized gains or losses on investments, and expenses other than those attributable to a specific class are allocated to each class based on its relative net assets. Each class of shares has exclusive voting rights with respect to matters that affect just that class.
2. SIGNIFICANT ACCOUNTING POLICIES
The following is a summary of significant accounting policies followed by the Fund. The policies are in conformity with accounting principles generally accepted in the United States of America (“GAAP”). The preparation of financial statements in accordance with GAAP requires management to make estimates and assumptions that affect the reported amounts of assets and liabilities at the date of the financial statements and the amounts of income and expenses during the period. Actual results could differ from those estimates. Events occurring subsequent to the date of the Statement of Assets and Liabilities and through the date of issuance of the financial statements have been evaluated for adjustment to or disclosure in the financial statements.
a) Security Valuation. The Fund’s share price or net asset value (“NAV”) is calculated as of the scheduled close of the regular trading session (usually 4 p.m. E.T. or such other time as of which the Fund’s NAV is calculated (the “NAV Calculation Time”) on the New York Stock Exchange (the “Exchange”) on any day the Exchange is scheduled to be open. Investments in the Underlying Funds are valued at their closing NAV per share on the day of valuation.
Portfolio securities held by the Underlying Funds traded on any national stock exchange are valued based on the last sale price on the exchange where such shares are principally traded. For securities traded on NASDAQ, the Underlying Funds use the NASDAQ Official Closing Price. If there are no sales on a given day, the value of the security may be the average of the most recent bid and asked quotations on such exchange or the last sale price from a prior day. Where market quotations are not readily available, or, if in the Adviser’s judgment, they do not accurately reflect the fair value of a security held by one of the Underlying Funds, or an event occurs after the market close but before the Underlying Funds are priced that materially affects the value of a security, the security will be valued by the Adviser using policies and procedures approved by the Board of Trustees (the “Board”). Some of the more common reasons that may necessitate that a security held by one of the Underlying Funds be valued using “fair value” pricing may include, but are not limited to: trading of the security has been halted or suspended; or the security has not been traded for an extended period of time. The Adviser has a Fair Valuation Committee (the “Committee”) comprised of senior management representatives and the Committee reports to the Board every quarter. Factors the Committee may consider when valuing a security include whether a current price is stale, there is recent news, the security is thinly traded, transactions are infrequent, or quotations are genuine. There can be no guarantee, however, that a fair valuation used by the Underlying Funds on any given day will more accurately reflect the market value of an investment than the closing price of such investment in its market. U.S. Government obligations, money market instruments, and other debt instruments held by the Underlying Funds with a remaining maturity of 60 days or less are generally valued at amortized cost, which approximates fair value. Debt instruments having a greater remaining maturity will be valued on the basis of prices obtained from a pricing service approved by the Board or at the mean of the bid and ask prices from the dealer maintaining an active market in that security. The value of the Underlying Funds’ investments in convertible bonds/convertible preferred stocks is determined primarily by obtaining valuations from independent pricing services based on readily available bid quotations or, if quotations are not available, by methods which include various considerations such as yields or prices of securities of comparable quality, coupon, maturity and type; indications as to values from dealers; and general market conditions. Other inputs used by an independent pricing service to value convertible bonds/convertible preferred stocks generally include underlying stock data, conversion premiums, listed bond and preferred stock prices and other market information which may include benchmark curves, trade execution data, sensitivity analysis, when available, or an estimated value calculated based on the price of the underlying common share on the valuation date adjusted for accrued and unpaid dividends. Open-end investment companies, including securities lending collateral invested in registered investment company money market funds, are valued at their NAV each day.
Non-U.S. equity securities held by the Underlying Funds traded on foreign securities exchanges are generally valued using an independent pricing vendor that provides daily fair value adjustment factors based on information such as local closing price, relevant general and sector indexes, currency fluctuations, and depositary receipts, as applicable. Securities valued using such adjustment factors are classified as Level 2 in the fair value hierarchy. The models of the independent pricing vendor generate an adjustment factor for each security, which is applied to the local closing price to adjust it for post-closing market movements up to the time the Underlying Funds are valued and translated into U.S. dollars. If the vendor does not provide an adjustment factor for a security, the security is valued based on its most recent local closing price and translated into U.S. dollars. The Adviser may also fair value securities in other situations, for example, when a particular foreign market is closed but the Underlying Funds are open. Other mutual funds may adjust the prices of their securities by different amounts.
9
| Baron WealthBuilder Fund | June 30, 2020 |
NOTES TO FINANCIAL STATEMENT (Unaudited) (Continued)
2. SIGNIFICANT ACCOUNTING POLICIES (Continued)
b) Securities Transactions, Investment Income and Expenses. Securities transactions are recorded on a trade date basis. Realized gain and loss from securities transactions are recorded on an identified cost basis for financial reporting and federal income tax purposes. Dividend income and capital gain distributions from the Underlying Funds are recognized on the ex-dividend date and interest income is recognized on an accrual basis. Dividends received from Underlying Funds are reflected as dividend income; capital gain distributions as realized gains. The Fund is charged for those expenses directly attributable to the Fund, such as distribution and transfer agency fees.
Expenses included in the accompanying financial statements reflect the expenses of the Fund and do not include any expenses associated with the Underlying Funds. Because Underlying Funds have varied expenses and fee levels and the Fund may own different proportion of Underlying Funds at different times, the amount of fees and expenses incurred indirectly by the Fund will vary.
c) Repurchase Agreements. The Fund may invest in repurchase agreements, which are short term investments whereby the Fund acquires ownership of a debt security and the seller agrees to repurchase the security at a future date at a specified price. When entering into repurchase agreements, it is the Fund’s policy that its custodian takes possession of the underlying collateral securities, the market value of which, at all times, equals at least 102% of the principal amount of the repurchase transaction. To the extent that any repurchase transaction exceeds one business day, the value of the collateral is marked-to-market to ensure the adequacy of the collateral. If the seller defaults and the market value of the collateral declines or if bankruptcy proceedings are commenced with respect to the seller of the security, realization of the collateral by the Fund may be delayed or limited. The Fund did not own any repurchase agreements at June 30, 2020.
d) Federal Income Taxes. The Fund intends to meet the requirements of the Internal Revenue Code of 1986, as amended, applicable to regulated investment companies, and to distribute to its shareholders substantially all of its net investment income and any net realized capital gains at least annually. The Fund will not be subject to federal or state income taxes to the extent that it qualifies as regulated investment companies and substantially all of its income is distributed.
e) Distributions to Shareholders. Income and capital gain distributions to shareholders are determined in accordance with income tax regulations which may differ from GAAP. These differences are primarily due to differing treatments for net investment loss and wash sale losses deferred.
f) Commitments and Contingencies. In the normal course of business, the Fund may enter into contracts and agreements that contain a variety of representations and warranties, which provide general indemnification. The maximum exposure to the Fund under these agreements is unknown, as this would involve future claims that may be made against the Fund that have not yet occurred.
g) Cash and Cash Equivalents. The Fund considers all short-term liquid investments with a maturity of three months or less when purchased to be cash equivalents.
h) Diversification and Concentration of Underlying Funds. Certain of the Underlying Funds hold non-diversified or concentrated portfolios that may contain fewer securities or invest in fewer industries than the portfolios of other mutual funds. This may increase the risk that the value of an Underlying Fund could decrease because of the poor performance of one or a few investments or of a particular industry. Additionally, non-diversified funds may encounter difficulty liquidating securities.
3. PURCHASES AND SALES OF SECURITIES
Purchases and sales of securities, other than short term securities, for the six months ended June 30, 2020 were $17,510,571 and $7,369,059, respectively.
4. INVESTMENT ADVISORY FEES AND OTHER TRANSACTIONS WITH AFFILIATES
a) Investment Advisory Fees. The Adviser, a wholly owned subsidiary of Baron Capital Group, Inc. (“BCG”), serves as investment adviser to the Fund and the Underlying Funds. The Adviser will not be paid a management fee for performing investment management services for the Fund. However, the Adviser receives management fees for managing the Underlying Funds. See the Underlying Funds’ Prospectuses or Statements of Additional Information for specific fees. The Adviser is contractually obligated to reimburse certain expenses of the Fund so that its net annual operating expenses (excluding acquired fund fees and expenses, portfolio transaction costs, interest, dividend and extraordinary expenses) are limited to 0.30% of average daily net assets of Retail Shares, 0.05% of average daily net assets of TA Shares and 0.05% of average daily net assets of Institutional Shares.
b) Distribution Fees. Baron Capital, Inc. (“BCI”), a wholly owned subsidiary of BCG, is a registered limited purpose broker-dealer and the distributor of the Fund’s shares. The Fund is authorized to pay BCI a distribution fee payable monthly pursuant to a distribution plan under Rule 12b-1 of the 1940 Act equal to 0.25% per annum of the Retail Shares’ average daily net assets.
c) Trustee Fees. Certain Trustees of the Fund are interested persons (as defined by the 1940 Act) of the Trust. None of these Trustees received compensation for his or her services as a Trustee of the Fund. None of the Fund’s officers received compensation from the Fund for their services as an officer.
d) Fund Accounting and Administration Fees. The Fund has entered into an agreement with State Street Bank and Trust Company (“State Street”) to perform accounting and certain administrative services. State Street is compensated for fund accounting services based on a percentage of the Fund’s net assets, subject to certain minimums plus fixed annual fees for the administrative services.
10
| June 30, 2020 | Baron WealthBuilder Fund |
NOTES TO FINANCIAL STATEMENT (Unaudited) (Continued)
5. LINE OF CREDIT
Baron WealthBuilder Fund, together with other funds in Baron Select Funds (except Baron Partners Fund) and Baron Investment Funds Trust, participate in a committed line of credit agreement with State Street to be used for temporary purposes, primarily for financing redemptions. Each fund may borrow up to the lesser of $100 million or the maximum amount each fund may borrow under the 1940 Act, the limitations included in each fund’s prospectus, or any limit or restriction under any law or regulation to which each fund is subject or any agreement to which each fund is a party; provided that the aggregate outstanding principal amount of all loans to any of the funds may not exceed $100 million. Interest is charged to each fund, based on its borrowings, at a rate per annum equal to the higher of the effective federal funds rate or the one month LIBOR rate plus a margin of 1.00%. An upfront fee of 0.05% is incurred on the commitment amount and a commitment fee of 0.20% per annum is incurred on the unused portion of the line of credit. Both fees are allocated to the participating funds based on their relative net assets.
During the six months ended June 30, 2020, Baron WealthBuilder Fund had borrowings under the line of credit and incurred interest expense of $5,368. For the 24 days during which there were borrowings, Baron WealthBuilder Fund had an average daily balance on the line of credit of $4.9 million at a weighted average interest rate of 1.66%.
6. ASSET ALLOCATION AND RISKS OF INVESTING IN THE UNDERLYING FUNDS
The Fund’s ability to meet its investment objective depends largely upon selecting the best mix of Underlying Funds. The selection of the Underlying Funds and the allocation of the Fund’s assets among the various market sectors could cause the Fund to underperform in comparison to other funds with a similar investment objective. In addition, each of the Underlying Funds has its own investment risks, and those risks can affect the value of the Fund’s investments. To the extent that the Fund invests more of its assets in one Underlying Fund than in another, it will have greater exposure to the risks of that Underlying Fund.
7. FAIR VALUE MEASUREMENTS
Fair value is defined by GAAP as the price that the Fund would receive upon selling an investment in a timely transaction to an independent buyer in the principal or most advantageous market for the investment. GAAP provides a three-tier hierarchy to maximize the use of observable market data and minimize the use of unobservable inputs and to establish classification of fair value measurements for disclosure purposes. Inputs refer broadly to the assumptions that market participants would use in pricing the asset or liability. Inputs may be observable or unobservable. Observable inputs are based on market data obtained from sources independent of the Fund. Unobservable inputs are inputs that reflect the Fund’s own assumptions based on the best information available in the circumstances. The three-tier hierarchy of inputs is summarized in the three broad Levels listed below.
| • | Level 1 — quoted prices in active markets for identical assets or liabilities; |
| • | Level 2 — prices determined using other inputs that are observable either directly, or indirectly through corroboration with observable market data (which could include quoted prices for similar assets or liabilities, interest rates, credit risk, etc.); |
| • | Level 3 — prices determined using unobservable inputs when quoted prices or observable inputs are unavailable, such as when there is little or no market activity for an asset or liability (unobservable inputs reflect each Fund’s own assumptions in determining the fair value of assets or liabilities and would be based on the best information available). |
Investments in open-end registered investment companies are valued at NAV and are classified in the fair value hierarchy as Level 1.
8. INCOME TAXES AND DISTRIBUTIONS TO SHAREHOLDERS
Federal income tax regulations differ from GAAP. Therefore, distributions determined in accordance with tax regulations may differ in amount or character from net investment income and net realized gain for financial reporting purposes. Net investment income (loss) and net realized and unrealized gain (loss) differ for financial statement and tax purposes due to differing treatments of net investment loss, and wash sale losses deferred. Financial reporting records are adjusted for permanent book/tax differences to reflect tax character. Financial records are not adjusted for temporary differences.
As of June 30, 2020, the components of net assets on a tax basis were as follows:
Cost of investments | $ | 116,439,766 | ||
|
| |||
Gross tax unrealized appreciation | 29,242,857 | |||
Gross tax unrealized depreciation | — | |||
|
| |||
Net tax unrealized appreciation (depreciation) | 29,242,857 | |||
Accumulated net investment income (loss) | (51,131 | ) | ||
Accumulated net realized gain (loss) | 1,323,450 | |||
Paid-in capital | 115,089,950 | |||
|
| |||
Net Assets | $ | 145,605,126 | ||
|
|
The tax character of distributions paid during the six months ended June 30, 2020 and for the year ended December 31, 2019 was as follows:
| Six Months Ended June 30, 2020 | Year Ended December 31, 2019 | |||||||||||||||||||||||
| Ordinary1 | Long Term Capital Gain | Return of Capital | Ordinary1 | Long Term Capital Gain | Return of Capital | |||||||||||||||||||
| $ | $ | $ | — | $ | 47,533 | $ | 3,879,874 | $ | — | |||||||||||||||
| 1 | For tax purposes, short-term capital gains are considered ordinary income distributions. |
11
| Baron WealthBuilder Fund | June 30, 2020 |
NOTES TO FINANCIAL STATEMENT (Unaudited) (Continued)
8. INCOME TAXES AND DISTRIBUTIONS TO SHAREHOLDERS (Continued)
The Fund follows the provisions of FASB Codification Section 740 (“ASC Section 740”) “Accounting for Uncertainty in Income Taxes” which clarifies the accounting for uncertainty in tax positions taken or expected to be taken on a tax return. ASC Section 740 sets forth a threshold for financial statement recognition, measurement and disclosure of tax positions taken or expected to be taken on a tax return. The Fund is required to recognize the tax effects of certain tax positions under a “more likely than not” standard, that based on their technical merits, have more than 50 percent likelihood of being sustained upon examination. Management has analyzed the tax positions taken on the Fund’s federal income tax returns for the current year and prior two years, and has concluded that no provision for federal income tax is required in the Fund’s financial statements. At June 30, 2020, the Fund did not have any uncertain tax benefits that require recognition, de-recognition or disclosure. The Fund’s federal, state and local income and federal excise tax returns for which the applicable statutes of limitations have not expired (current year and prior two years) are subject to examination by the Internal Revenue Service and state departments of revenue.
9. OWNERSHIP CONCENTRATION
As of June 30, 2020, the officers, trustees and portfolio managers owned, directly or indirectly, 18.83% of the Fund. As a result of their ownership, these investors may be able to materially affect the outcome of matters presented to the Fund’s shareholders.
10. TRANSACTIONS IN “AFFILIATED” COMPANIES
The Fund invests in the Institutional Shares of the Underlying Funds which are considered to be affiliated with the Fund.
| Name of Issuer | Value at December 31, 2019 | Purchase Cost | Sales Return of | Change in Net Unrealized Appreciation (Depreciation) | Realized (Losses) | Dividend Income | Other Distributions | Shares Held at June 30, 2020 | Value at June 30, 2020 | % of Net Assets at June 30, 2020 | ||||||||||||||||||||||||||||||
“Affiliated” Company as of June 30, 2020: |
| |||||||||||||||||||||||||||||||||||||||
Baron Asset Fund, Institutional Shares | $ | 18,932,703 | $ | 2,604,960 | $ | 1,050,989 | $ | 1,453,034 | $ | (26,481 | ) | $ | — | $ | — | 228,287 | $ | 21,913,227 | 15.05 | % | ||||||||||||||||||||
Baron Discovery Fund, Institutional Shares | 5,172,226 | 547,926 | 329,346 | 653,939 | (19,130 | ) | — | — | 249,922 | 6,025,615 | 4.14 | % | ||||||||||||||||||||||||||||
Baron Durable Advantage Fund, Institutional Shares | 2,356,622 | 158,335 | 297,809 | 52,951 | 13,938 | — | — | 170,578 | 2,284,037 | 1.57 | % | |||||||||||||||||||||||||||||
Baron Emerging Markets Fund, Institutional Shares | 6,188,818 | 672,577 | 769,823 | (277,322 | ) | (140,056 | ) | — | — | 405,010 | 5,674,194 | 3.90 | % | |||||||||||||||||||||||||||
Baron Fifth Avenue Growth Fund, Institutional Shares | 7,503,384 | 1,033,147 | 609,531 | 1,967,652 | 68,407 | — | — | 232,891 | 9,963,059 | 6.84 | % | |||||||||||||||||||||||||||||
Baron FinTech Fund, Institutional Shares | — | 1,682,714 | 58,470 | 188,408 | (1,912 | ) | — | — | 156,774 | 1,810,740 | 1.25 | % | ||||||||||||||||||||||||||||
Baron Focused Growth Fund, Institutional Shares | 4,899,174 | 524,838 | 328,889 | 885,846 | (6,879 | ) | — | — | 246,761 | 5,974,090 | 4.10 | % | ||||||||||||||||||||||||||||
Baron Global Advantage Fund, Institutional Shares | 5,330,129 | 860,216 | 181,338 | 2,064,208 | (2,473 | ) | — | — | 204,945 | 8,070,742 | 5.54 | % | ||||||||||||||||||||||||||||
Baron Growth Fund, Institutional Shares | 16,636,484 | 2,184,460 | 426,392 | (82,239 | ) | (76,049 | ) | — | — | 214,898 | 18,236,264 | 12.52 | % | |||||||||||||||||||||||||||
Baron Health Care Fund, Institutional Shares | 1,261,465 | 556,593 | 59,996 | 210,278 | (2,087 | ) | — | — | 134,675 | 1,966,253 | 1.35 | % | ||||||||||||||||||||||||||||
Baron International Growth Fund, Institutional Shares | 3,587,259 | 366,503 | 281,319 | 55,312 | (11,388 | ) | — | — | 148,240 | 3,716,367 | 2.55 | % | ||||||||||||||||||||||||||||
Baron Opportunity Fund, Institutional Shares | 8,105,880 | 1,010,943 | 884,596 | 2,506,355 | 152,922 | — | — | 349,087 | 10,891,504 | 7.48 | % | |||||||||||||||||||||||||||||
Baron Partners Fund, Institutional Shares | 19,248,736 | 2,378,271 | 1,269,387 | 3,820,964 | (57,355 | ) | — | — | 287,363 | 24,121,229 | 16.57 | % | ||||||||||||||||||||||||||||
Baron Real Estate Fund, Institutional Shares | 5,325,135 | 778,794 | 155,837 | 277,174 | (17,462 | ) | — | — | 223,463 | 6,207,804 | 4.26 | % | ||||||||||||||||||||||||||||
Baron Small Cap Fund, Institutional Shares | 16,561,815 | 2,150,294 | 665,337 | 838,318 | (57,592 | ) | — | — | 587,075 | 18,827,498 | 12.93 | % | ||||||||||||||||||||||||||||
|
|
|
|
|
|
|
|
|
|
|
|
|
|
|
| |||||||||||||||||||||||||
| $ | 121,109,830 | $ | 17,510,571 | $ | 7,369,059 | $ | 14,614,878 | $ | (183,597 | ) | $ | — | $ | — | $ | 145,682,623 | ||||||||||||||||||||||||
|
|
|
|
|
|
|
|
|
|
|
|
|
|
|
| |||||||||||||||||||||||||
12
| June 30, 2020 | Baron WealthBuilder Fund |
NOTES TO FINANCIAL STATEMENTS (Unaudited) (Continued)
11. SUBSEQUENT EVENT
The coronavirus disease 2019 (COVID-19) global pandemic and the aggressive responses taken by many governments or voluntarily imposed by private parties, including closing borders, restricting travel and imposing prolonged quarantines or similar restrictions, as well as the closure of, or operational changes to, many retail and other businesses, have had negative impacts, and general uncertainty on markets worldwide. It is not known how long such impacts, or any future impacts of other significant events described above, will or would last, but there could be a prolonged period of global economic slowdown, which may impact your Fund investment.
12. STATEMENT REGARDING LIQUIDITY RISK MANAGEMENT PROGRAM
The Trust has adopted a liquidity risk management program (the “LRMP”) pursuant to the requirements of Rule 22e-4 under the 1940 Act, which requires registered open-end funds (other than money market funds) to adopt and implement a written liquidity risk management program that is reasonably designed to assess and manage fund liquidity risk. The rule is designed to promote effective liquidity risk management throughout the open-end fund industry, thereby reducing liquidity risk — i.e., the risk that a fund could not meet requests to redeem shares issued by the fund without significant dilution of remaining investors’ interests in the fund.
Pursuant to the requirements of Rule 22e-4, the LRMP is required to include policies and procedures reasonably designed to incorporate the following elements, and the LRMP complies with these requirements: (1) assessment, management and periodic review of liquidity risk; (2) classification of each Fund’s investments into one of the four liquidity categories in Rule 22e-4; (3) if the Fund does not primarily hold assets that are considered highly liquid investments (cash and other investments reasonably expected to be convertible into cash in current market conditions in three business days or less without the conversion into cash significantly changing the market value of the investment), determination of a “highly liquid investment minimum” (as defined in Rule 22e-4 and in the LRMP, the “HLIM”) and compliance with additional related requirements; (4) prohibition on the acquisition of any “illiquid investment” (as defined in Rule 22e-4) if immediately after the acquisition the Fund would have invested more than 15% of its net assets in illiquid investments; and (5) if the Funds reserve the right to engage in redemptions in-kind, establishment of policies and procedures regarding how and when the Funds will engage in such redemptions in-kind. There have been no material changes to the LRMP since it was initially approved by the Board.
The Board has approved the Adviser to administer the LRMP (the “Program Administrator”). The Program Administrator has delegated its responsibilities to a Liquidity Risk Management Committee (the “LRM Committee”), comprised of a cross-functional group of key representatives from various departments of the Program Administrator, including Operations; Accounting; Legal and Compliance; Trading; and Portfolio and Risk Analytics. In addition, the Trust has contracted with a third party liquidity assessment vendor to support the classification of Fund investments.
Pursuant to the requirements of Rule 22e-4, the Board must review, no less frequently than annually, a written report prepared by the Program Administrator that addresses the operation of the program and assesses its adequacy and effectiveness of implementation, including, if applicable, the operation of the HLIM, and any material changes to the program. The Board received a written report in May 2020 (the “Annual Report”).
The Annual Report states that the Adviser, as the Program Administrator, acting primarily through the LRM Committee, has assessed the operation of the LRMP and believes that the LRMP is adequate and effective in its implementation. The Program Administrator and the LRM Committee initially determined that each Fund primarily holds assets that are highly liquid investments, and the Annual Report states that this determination continues to be maintained so that no Fund needs to maintain a HLIM. In addition, the Annual Report states that, since the LRMP was implemented, no Fund has breached its limit on illiquid investments.
13
| Baron WealthBuilder Fund | June 30, 2020 |
BARON WEALTHBUILDER FUND
Selected data for a share outstanding throughout each period:
| Income (loss) from investment operations: | Less distributions to shareholders from: | Ratios to Average Net Assets: | Supplemental Data: | |||||||||||||||||||||||||||||||||||||||||||||||||||||||||||||||||
| �� | Net asset value, beginning of period ($) | Net investment income (loss) ($) | Net realized and unrealized gain (loss) ($) | Total from investment operations ($) | Net investment income ($) | Net realized gain on investments ($) | Total distributions ($) | Net asset value, end of period ($) | Total return (%) | Total expenses (%) | Less: Interest expense (%) | Operating expenses (%) | Less: Reimbursement of expenses by Adviser (%) | Net operating expenses (%) | Net investment income (loss) (%) | Net assets (in millions), end of period ($) | Portfolio turnover rate (%) | |||||||||||||||||||||||||||||||||||||||||||||||||||
RETAIL SHARES |
| |||||||||||||||||||||||||||||||||||||||||||||||||||||||||||||||||||
Six Months Ended June 30, |
| |||||||||||||||||||||||||||||||||||||||||||||||||||||||||||||||||||
2020 | 12.23 | (0.02 | )2 | 1.28 | 1.26 | 0.00 | 0.00 | 0.00 | 13.49 | 10.30 | 4,7 | 0.45 | 6 | (0.01 | )6 | 0.44 | 6 | (0.14 | )6 | 0.30 | 6 | (0.31 | )6 | 14.7 | 5.73 | 7 | ||||||||||||||||||||||||||||||||||||||||||
Year Ended December 31, |
| |||||||||||||||||||||||||||||||||||||||||||||||||||||||||||||||||||
2019 | 9.33 | (0.03 | )2 | 3.37 | 3.34 | (0.01 | ) | (0.43 | ) | (0.44 | ) | 12.23 | 36.24 | 4 | 0.41 | (0.02 | ) | 0.39 | (0.09 | ) | 0.30 | (0.26 | ) | 5.9 | 22.48 | |||||||||||||||||||||||||||||||||||||||||||
2018 | 10.00 | (0.01 | )2 | (0.65 | ) | (0.66 | ) | 0.00 | (0.01 | ) | (0.01 | ) | 9.33 | (6.58 | )4 | 0.90 | 0.00 | 0.90 | (0.60 | ) | 0.30 | (0.13 | ) | 2.1 | 1.24 | |||||||||||||||||||||||||||||||||||||||||||
2017 1 | 10.00 | (0.00 | )2,3 | 0.00 | (0.00 | )3 | 0.00 | 0.00 | 0.00 | 10.00 | 0.00 | 4,7 | 0.59 | 5,6 | 0.00 | 0.59 | 5,6 | (0.29 | )5,6 | 0.30 | 5,6 | (0.30 | )5,6 | 0.0 | 0.00 | 7 | ||||||||||||||||||||||||||||||||||||||||||
TA Shares |
| |||||||||||||||||||||||||||||||||||||||||||||||||||||||||||||||||||
Six Months Ended June 30, |
| |||||||||||||||||||||||||||||||||||||||||||||||||||||||||||||||||||
2020 | 12.28 | (0.00 | )2,3 | 1.29 | 1.29 | 0.00 | 0.00 | 0.00 | 13.57 | 10.50 | 4,7 | 0.19 | 6 | (0.01 | )6 | 0.18 | 6 | (0.13 | )6 | 0.05 | 6 | (0.06 | )6 | 26.5 | 5.73 | 7 | ||||||||||||||||||||||||||||||||||||||||||
Year Ended December 31, |
| |||||||||||||||||||||||||||||||||||||||||||||||||||||||||||||||||||
2019 | 9.35 | (0.00 | )2,3 | 3.37 | 3.37 | (0.01 | ) | (0.43 | ) | (0.44 | ) | 12.28 | 36.49 | 4 | 0.17 | (0.02 | ) | 0.15 | (0.10 | ) | 0.05 | (0.03 | ) | 21.4 | 22.48 | |||||||||||||||||||||||||||||||||||||||||||
2018 | 10.00 | 0.01 | 2 | (0.65 | ) | (0.64 | ) | 0.00 | (0.01 | ) | (0.01 | ) | 9.35 | (6.38 | )4 | 0.59 | 0.00 | 0.59 | (0.54 | ) | 0.05 | 0.05 | 9.7 | 1.24 | ||||||||||||||||||||||||||||||||||||||||||||
2017 1 | 10.00 | (0.00 | )2,3 | 0.00 | (0.00 | )3 | 0.00 | 0.00 | 0.00 | 10.00 | 0.00 | 4,7 | 0.34 | 5,6 | 0.00 | 0.34 | 5,6 | (0.29 | )5,6 | 0.05 | 5,6 | (0.05 | )5,6 | 3.4 | 0.00 | 7 | ||||||||||||||||||||||||||||||||||||||||||
Institutional Shares |
| |||||||||||||||||||||||||||||||||||||||||||||||||||||||||||||||||||
Six Months Ended June 30, |
| |||||||||||||||||||||||||||||||||||||||||||||||||||||||||||||||||||
2020 | 12.28 | (0.00 | )2,3 | 1.28 | 1.28 | 0.00 | 0.00 | 0.00 | 13.56 | 10.42 | 4,7 | 0.19 | 6 | (0.01 | )6 | 0.18 | 6 | (0.13 | )6 | 0.05 | 6 | (0.06 | )6 | 104.4 | 5.73 | 7 | ||||||||||||||||||||||||||||||||||||||||||
Year Ended December 31, |
| |||||||||||||||||||||||||||||||||||||||||||||||||||||||||||||||||||
2019 | 9.35 | (0.00 | )2,3 | 3.37 | 3.37 | (0.01 | ) | (0.43 | ) | (0.44 | ) | 12.28 | 36.49 | 4 | 0.17 | (0.02 | ) | 0.15 | (0.10 | ) | 0.05 | (0.02 | ) | 93.8 | 22.48 | |||||||||||||||||||||||||||||||||||||||||||
2018 | 10.00 | 0.01 | 2 | (0.65 | ) | (0.64 | ) | 0.00 | (0.01 | ) | (0.01 | ) | 9.35 | (6.38 | )4 | 0.49 | 0.00 | 0.49 | (0.44 | ) | 0.05 | 0.12 | 83.0 | 1.24 | ||||||||||||||||||||||||||||||||||||||||||||
2017 1 | 10.00 | (0.00 | )2,3 | 0.00 | (0.00 | )3 | 0.00 | 0.00 | 0.00 | 10.00 | 0.00 | 4,7 | 0.34 | 5,6 | 0.00 | 0.34 | 5,6 | (0.29 | )5,6 | 0.05 | 5,6 | (0.05 | )5,6 | 1.0 | 0.00 | 7 | ||||||||||||||||||||||||||||||||||||||||||
| 1 | For the period December 29, 2017 (commencement of operations) to December 31, 2017. |
| 2 | Based on average shares outstanding. |
| 3 | Less than $0.01 per share. |
| 4 | The total returns would have been lower had certain expenses not been reduced during the period shown. |
| 5 | Certain fixed expenses incurred by the Fund were not annualized for the period ended December 31, 2017. |
| 6 | Annualized. |
| 7 | Not Annualized. |
| 14 |
| June 30, 2020 | Baron WealthBuilder Fund |
As a shareholder of the Fund, you may incur two types of costs: ongoing expenses and transaction costs. Ongoing expenses include distribution and service (12b-1) fees and other Fund expenses. Due to the payment of Rule 12b-1 fees, long-term shareholders may indirectly pay more than the maximum permitted front-end sales charge. The information on this page is intended to help you understand your ongoing costs of investing in the Fund and to compare these costs with the ongoing costs of investing in other mutual funds.
The information in the following table is based on an investment of $1,000 invested on January 1, 2020 and held for the six months ended June 30, 2020.
ACTUAL EXPENSES
The table below titled “Based on Actual Total Return” provides information about actual account values and actual expenses. You may use the information provided in this table, together with the amount you invested, to estimate the expenses that you paid over the period. To estimate the expenses you paid on your account, divide your ending account value by $1,000 (for example, an $8,600 ending account value divided by $1,000 = 8.6), then multiply the result by the number under the heading titled “Expenses Paid During the Period.”
BASED ON ACTUAL TOTAL RETURN FOR THE SIX MONTHS ENDED JUNE 30, 20201
Actual Total Return | Beginning Account Value January 1, 2020 | Ending Account Value June 30, 2020 | Annualized Expense Ratio | Expenses Paid During the Period3 | ||||||||||||||||
Baron WealthBuilder Fund — Retail Shares | 10.30 | % | $ | 1,000.00 | $ | 1,103.00 | 4 | 0.31 | %2,5 | $ | 1.62 | |||||||||
Baron WealthBuilder Fund — TA Shares | 10.50 | % | $ | 1,000.00 | $ | 1,105.00 | 4 | 0.06 | %2,5 | $ | 0.31 | |||||||||
Baron WealthBuilder Fund — Institutional Shares | 10.42 | % | $ | 1,000.00 | $ | 1,104.20 | 4 | 0.06 | %2,5 | $ | 0.31 | |||||||||
HYPOTHETICAL EXAMPLE FOR COMPARISON PURPOSES
The table below titled “Based on Hypothetical Total Return” provides information about hypothetical account values and hypothetical expenses based on the actual expense ratio and an assumed rate of return of 5% per year before expenses, which is not the Fund’s actual return. The hypothetical account values and expenses may not be used to estimate the actual ending account values and expenses you paid for the period. You may use the information provided in this table to compare the ongoing costs of investing in the Fund and other funds. To do so, compare the 5% hypothetical example relating to the Fund with the 5% hypothetical examples that appear in the shareholder reports of other funds.
Please note that expenses shown in the table below are meant to highlight your ongoing costs and do not reflect any transactional costs, such as redemption fees, if any. Therefore, the table is useful in comparing ongoing costs only and will not help you determine your relative total costs of owning different mutual funds. In addition, if these transactional costs were included, your costs would have been higher.
BASED ON HYPOTHETICAL TOTAL RETURN FOR THE SIX MONTHS ENDED JUNE 30, 20201
Hypothetical Annualized Total Return | Beginning Account Value January 1, 2020 | Ending Account Value June 30, 2020 | Annualized Expense Ratio | Expenses Paid During the Period3 | ||||||||||||||||
Baron WealthBuilder Fund — Retail Shares | 5.00 | % | $ | 1,000.00 | $ | 1,023.32 | 4 | 0.31 | %2,5 | $ | 1.56 | |||||||||
Baron WealthBuilder Fund — TA Shares | 5.00 | % | $ | 1,000.00 | $ | 1,024.57 | 4 | 0.06 | %2,5 | $ | 0.30 | |||||||||
Baron WealthBuilder Fund — Institutional Shares | 5.00 | % | $ | 1,000.00 | $ | 1,024.57 | 4 | 0.06 | %2,5 | $ | 0.30 | |||||||||
| 1 | Assumes reinvestment of all dividends and capital gain distributions, if any. |
| 2 | Annualized expense ratio for Baron WealthBuilder Fund for the six months ended June 30, 2020, includes 0.30%, 0.05% and 0.05% for net operating expenses and 0.01%, 0.01% and 0.01% for interest expense for the Retail, TA and Institutional Shares, respectively. |
| 3 | Expenses are equal to each share class’ respective annualized expense ratio multiplied by the average account value over the period, multiplied by the number of days in the most recent fiscal half-year, then divided by 366. |
| 4 | Ending account value assumes the return earned after waiver and would have been lower if a portion of the expenses had not been waived. |
| 5 | Annualized expense ratios are adjusted to reflect fee waiver. |
15
| Baron WealthBuilder Fund | June 30, 2020 |
DISCLOSURE REGARDING THE APPROVAL OF THE INVESTMENT ADVISORY AGREEMENT FOR BARON WEALTHBUILDER FUND BY THE BOARD OF TRUSTEES (Unaudited)
The Board of Trustees (the “Board”) of Baron Select Funds (the “Trust”) met on May 4, 2020 to discuss the selection of BAMCO, Inc. (the “Adviser”) as the investment adviser and the approval of the investment advisory agreement for Baron WealthBuilder Fund (the “Fund”). The members of the Board who are not “interested persons” (as defined in the Investment Company Act of 1940, as amended) of the Trust (the “Independent Trustees”) met in a separate session to discuss and consider the renewal of the investment advisory agreement for the Fund. Representatives of Broadridge Financial Solutions, Inc. (“Broadridge”), an independent provider of investment company data, provided reports to the Board and attended the Board meeting. The Trustees received a substantial amount of information from the Adviser and from Broadridge, and were advised by independent legal counsel. Based on its evaluation of this and other information, the Board, including a majority of the Independent Trustees, approved the continuation of the investment advisory agreement for the Fund for an additional one-year period.
In reaching its determination, the Board considered various factors that it deemed relevant, including the factors listed below.
1. NATURE, EXTENT AND QUALITY OF SERVICES
The Trustees considered the information provided, including their experience and knowledge gained from their service as Trustees and their experience generally, including the following, which they had previously considered in connection with approving the investment advisory agreement for the Fund and those of the underlying Baron funds in which it invests and remained, in their thinking, material to their consideration:
| • | Their confidence in the senior personnel, portfolio management, the financial condition of the Adviser and its affiliates and the Adviser’s available resources; |
| • | The nature, extent and quality of the services provided by the Adviser, including: relationships with and supervision of third party service providers, such as the Fund’s custodian and transfer agent, the quality of shareholder reports, the ability to monitor adherence to investment guidelines and restrictions, the legal, accounting and compliance services provided to the Fund and the support services provided to the Board; |
| • | The Adviser’s investment principles and processes and the historical performance of the Fund as compared to similar funds managed by other advisers over comparable periods; |
| • | The total expense ratio of the Fund and comparisons to similar funds managed by other advisers over comparable periods. They observed that the net operating expenses paid by the Fund (total expense ratio) were within the range of those of the funds in its peer group; and |
| • | Additional services provided by the Adviser. |
No advisory fee is payable by the Fund to the Adviser, although the Fund bears indirectly its pro rata share of the expenses of the underlying Baron funds in which it invests, including advisory fees payable by such underlying Baron funds to the Adviser.
The Board concluded that the nature, extent and quality of the services the Adviser provides to the Fund supported approval of the investment advisory agreement for the Fund.
2. INVESTMENT PERFORMANCE OF THE FUND AND THE ADVISER
As part of its consideration of the investment performance of the Fund and the Adviser, the Board took into account the analyses performed by and discussed with representatives of Broadridge. The Board considered, among other information, Broadridge’s comparison of the expense ratio with those of peer group funds selected by Broadridge and Morningstar category medians. The Board also considered, among other performance information, Broadridge’s comparisons of the Fund’s annualized total return and related risk metrics over one-year and since inception periods against peer group funds and Morningstar category medians. After considering all the information, the Board concluded that the Adviser continued to invest in accordance with its long-standing principles and that the Fund’s performance remained consistent with expectations for the Adviser’s investment style, in light of recent market conditions.
3. COSTS OF SERVICES PROVIDED AND PROFITS TO BE REALIZED BY THE ADVISER
Since the Fund does not pay advisory fees, the Board did not consider any comparisons to the advisory fees charged and services provided by the Adviser and its investment adviser affiliate to any other funds or separately managed accounts. The Board was provided with a profitability analysis prepared by the Adviser and discussed with the representatives of the Adviser that the Adviser has continued to invest in quality personnel, systems and facilities, and otherwise continued to invest in its business, irrespective of fund flows. However, since the Fund does not pay an advisory fee the Board did not consider the profitability analysis material to its considerations.
The Board also considered benefits that accrue to the Adviser and its affiliates from their relationship with the Fund.
4. ECONOMIES OF SCALE AND BENEFITS TO INVESTORS
Since the Fund does not pay an advisory fee, the Board did not consider potential economies of scale. The Board did consider that the Adviser was continuing to grow and upgrade its staff and invest in its business.
After due consideration of the above-enumerated factors and other factors it deemed relevant, the Board, including a majority of the Independent Trustees, approved the continuance of the Fund’s investment advisory agreement.
16
Privacy Notice
The Fund collects nonpublic personal information about you from the following sources:
| ∎ | Information we receive from you on applications or other forms; |
| ∎ | Information about your transactions with us, our Adviser or others; and |
| ∎ | Information we receive from third parties, such as credit reporting agencies. |
“Nonpublic personal information” is private information about you that we obtain in connection with providing a financial product or service to you.
We may share your name and address with other Baron Funds and the Adviser and its affiliates for the purpose of sending you information about our products that we believe may be of interest to you and informing you of our upcoming Baron Investment Conference and for sending required information.
We do not disclose any nonpublic personal information about our customers to anyone, except as permitted or required by law. Examples of permitted disclosures under the law include sharing with companies that work for us to provide you services, such as the Transfer Agent or mailing house. All such companies that act on our behalf are contractually obligated to keep the information that we provide to them confidential and to use the information only to provide the services that we have asked them to perform for you and us.
We restrict access to nonpublic information about you to those employees who need to know that information to provide products or services to you. We maintain physical, electronic and procedural safeguards to guard your nonpublic personal information.
This privacy notice is also available at all times on the Baron Funds® website, www.BaronFunds.com or by calling 1-800-99BARON.
Go Paperless!
It’s fast, simple and a smart way to help the environment.
Enjoy the speed and convenience of receiving Fund documents electronically.
For more information, and to enroll today, go to www.baronfunds.com/edelivery.
767 Fifth Avenue, 49th Fl.
New York, NY 10153
1.800.99.BARON
212-583-2000
www.BaronFunds.com
JUNE 20
Item 2. Code of Ethics.
Not applicable.
Item 3. Audit Committee Financial Expert.
Not applicable.
Item 4. Principal Accountant Fees and Services.
Not applicable.
Item 5. Audit Committee of Listed Registrants.
Not applicable.
Item 6. Schedule of Investments.
Included herein under Item 1.
Item 7. Disclosure of Proxy Voting Policies and Procedures for Closed-End Management Investment Companies.
Not applicable.
Item 8. Portfolio Managers of Closed-End Management Investment Companies.
Not applicable.
Item 9. Purchases of Equity Securities by Closed-End Management Investment Company and Affiliated Purchasers.
Not applicable.
Item 10. Submission of Matters to a Vote of Security Holders.
Not applicable.
Item 11. Controls and Procedures.
(a) The Registrant’s principal executive officer and principal financial officer have concluded that the Registrant’s disclosure controls and procedures (as defined in Rule 30a-3(c) under the Investment Company Act of 1940 (the “1940 Act”)) are effective based on their evaluation of these controls and procedures as of a date within 90 days of the filing date of this report.
(b) There were no changes in the Registrant’s internal control over financial reporting (as defined in Rule 30a-3(d) under the 1940 Act) that occurred during the period covered by this report that have materially affected, or are reasonably likely to materially affect, the Registrant’s internal control over financial reporting.
Item 12. Disclosure of Securities Lending Activities for Closed-End Management Investment Companies.
Not applicable.
Item 13. Exhibits.
(a)(1) Not applicable.
SIGNATURES
Pursuant to the requirements of the Securities Exchange Act of 1934 and the Investment Company Act of 1940, the registrant has duly caused this report to be signed on its behalf by the undersigned, thereunto duly authorized.
| BARON SELECT FUNDS | ||
| By: | /s/ Ronald Baron | |
| Ronald Baron | ||
| Chief Executive Officer | ||
| Date: September 2, 2020 | ||
Pursuant to the requirements of the Securities Exchange Act of 1934 and the Investment Company Act of 1940, this report has been signed below by the following persons on behalf of the registrant and in the capacities and on the dates indicated.
| By: | /s/ Ronald Baron | |
| Ronald Baron | ||
| Chief Executive Officer | ||
| Date: September 2, 2020 | ||
| By: | /s/ Peggy Wong | |
| Peggy Wong | ||
| Treasurer and Chief Financial Officer | ||
| Date: September 2, 2020 | ||