UNITED STATES
SECURITIES AND EXCHANGE COMMISSION
Washington, DC 20549
FORM N-CSR
CERTIFIED SHAREHOLDER REPORT OF REGISTERED
MANAGEMENT INVESTMENT COMPANIES
Investment Company Act file number: 811-21296
BARON SELECT FUNDS
(Exact Name of Registrant as Specified in Charter)
767 Fifth Avenue, 49th Floor
New York, NY 10153
(Address of Principal Executive Offices) (Zip Code)
Patrick M. Patalino, General Counsel
c/o Baron Select Funds
767 Fifth Avenue, 49th Floor
New York, NY 10153
(Name and Address of Agent for Service)
(Registrant’s Telephone Number, including Area Code): 212-583-2000
Date of fiscal year end: December 31
Date of reporting period: June 30, 2022
Item 1. Reports to Stockholders.
(Insert Baron Select Funds Semi-Annual report here)
Baron Partners Fund
Baron Focused Growth Fund
Baron International Growth Fund
Baron Real Estate Fund
Baron Emerging Markets Fund
Baron Global Advantage Fund
Baron Real Estate Income Fund
Baron Health Care Fund
Baron FinTech Fund
Baron New Asia Fund
Baron Technology Fund
June 30, 2022
Baron Funds®
Baron Select Funds
Semi-Annual Financial Report
DEAR BARON SELECT FUNDS SHAREHOLDER:
In this report, you will find unaudited financial statements for Baron Partners Fund, Baron Focused Growth Fund, Baron International Growth Fund, Baron Real Estate Fund, Baron Emerging Markets Fund, Baron Global Advantage Fund, Baron Real Estate Income Fund, Baron Health Care Fund, Baron FinTech Fund, Baron New Asia Fund, and Baron Technology Fund (the “Funds”) for the six months ended June 30, 2022. The U.S. Securities and Exchange Commission (the “SEC”) requires mutual funds to furnish these statements semi-annually to their shareholders. We hope you find these statements informative and useful.
We thank you for choosing to join us as fellow shareholders in Baron Funds. We will continue to work hard to justify your confidence.
Sincerely,
|
|
| ||
Ronald Baron Chief Executive Officer August 25, 2022 | Linda S. Martinson Chairman, President and Chief Operating Officer August 25, 2022 | Peggy Wong Treasurer and Chief Financial Officer August 25, 2022 |


This Semi-Annual Financial Report is for the Baron Select Funds, which currently has 12 series: Baron Partners Fund, Baron Focused Growth Fund, Baron International Growth Fund, Baron Real Estate Fund, Baron Emerging Markets Fund, Baron Global Advantage Fund, Baron Real Estate Income Fund, Baron Health Care Fund, Baron FinTech Fund, Baron WealthBuilder Fund, Baron New Asia Fund, and Baron Technology Fund. Baron WealthBuilder Fund is included in a separate Financial Report. If you are interested in Baron WealthBuilder Fund or Baron Investment Funds Trust, which contains the Baron Asset Fund, Baron Growth Fund, Baron Small Cap Fund, Baron Opportunity Fund, Baron Fifth Avenue Growth Fund, Baron Discovery Fund, and Baron Durable Advantage Fund, please visit the Funds’ website at www.BaronFunds.com or contact us at 1-800-99BARON.
The Funds’ Proxy Voting Policy is available without charge and can be found on the Funds’ website at www.BaronFunds.com, by clicking on the “Regulatory Documents” link at the bottom left corner of the homepage or by calling 1-800-99BARON and on the SEC’s website at www.sec.gov. The Funds’ most current proxy voting record, Form N-PX, is also available on the Funds’ website and on the SEC’s website.
The Funds file their complete schedules of portfolio holdings with the SEC for the first and third quarters of each fiscal year as an exhibit to their reports on Form N-PORT. The Funds’ Form N-PORT reports are available on the SEC’s website at www.sec.gov. Schedules of portfolio holdings current to the most recent quarter are also available on the Funds’ website.
Some of the comments contained in this report are based on current management expectations and are considered “forward-looking statements.” Actual future results, however, may prove to be different from our expectations. You can identify forward-looking statements by words such as “estimate,” “may,” “expect,” “should,” “could,” “believe,” “plan”, and other similar terms. We cannot promise future returns and our opinions are a reflection of our best judgment at the time this report is compiled.
The views expressed in this report reflect those of BAMCO, Inc. (“BAMCO” or the “Adviser”) only through the end of the period stated in this report. The views are not intended as recommendations or investment advice to any person reading this report and are subject to change at any time without notice based on market and other conditions.
Past performance is no guarantee of future results. The investment return and principal value of an investment will fluctuate; an investor’s shares, when redeemed, may be worth more or less than their original cost. For more complete information about Baron Funds, including charges and expenses, call, write or go to www.BaronFunds.com for a prospectus or summary prospectus. Read them carefully before you invest or send money. This report is not authorized for use as an offer of sale or a solicitation of an offer to buy shares of the Funds, unless accompanied or preceded by the Funds’ current prospectus or summary prospectus.
| Baron Partners Fund (Unaudited) | June 30, 2022 |
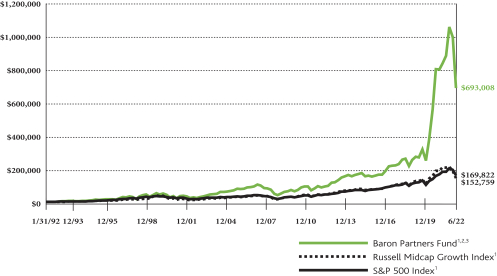
COMPARISONOFTHECHANGEIN VALUEOF $10,000INVESTMENTIN BARON PARTNERS FUND (RETAIL SHARES)
IN RELATIONTOTHE RUSSELL MIDCAP GROWTH INDEXANDTHE S&P 500 INDEX
| AVERAGE ANNUAL TOTAL RETURNSFORTHEPERIODSENDED JUNE 30, 2022 |
| |||||||||||||||||||||||
| Six Months* | One Year | Three Years | Five Years | Ten Years | Since Inception (January 31, 1992) | |||||||||||||||||||
Baron Partners Fund — Retail Shares1,2,3 | (34.68)% | (17.71)% | 35.10% | 25.43% | 21.79% | 14.95% | ||||||||||||||||||
Baron Partners Fund — Institutional Shares1,2,3,4 | (34.60)% | (17.51)% | 35.46% | 25.75% | 22.11% | 15.08% | ||||||||||||||||||
Baron Partners Fund — R6 Shares1,2,3,4 | (34.60)% | (17.50)% | 35.45% | 25.75% | 22.11% | 15.08% | ||||||||||||||||||
Russell Midcap Growth Index1 | (31.00)% | (29.57)% | 4.25% | 8.88% | 11.50% | 9.38% | ||||||||||||||||||
S&P 500 Index1 | (19.96)% | (10.62)% | 10.60% | 11.31% | 12.96% | 9.76% | ||||||||||||||||||
| * | Not Annualized. |
| 1 | The Russell Midcap® Growth Index measures the performance of medium-sized U.S. companies that are classified as growth and the S&P 500 Index of 500 widely held large-cap U.S. companies. The indexes and Baron Partners Fund are with dividends, which positively impact the performance results. The indexes are unmanaged. The index performance is not fund performance; one cannot invest directly into an index. |
| 2 | Reflects the actual fees and expenses that were charged when the Fund was a partnership. The predecessor partnership charged a 20% performance fee after reaching a certain performance benchmark. If the annual returns for the Fund did not reflect the performance fees for the years the predecessor partnership charged a performance fee, returns would be higher. The Fund’s shareholders will not be charged a performance fee. The predecessor partnership’s performance is only for periods before the Fund’s registration statement was effective, which was April 30, 2003. During those periods, the predecessor partnership was not registered under the Investment Company Act of 1940 and was not subject to its requirements or the requirements of the Internal Revenue Code relating to regulated investment companies, which, if it were, might have adversely affected its performance. |
| 3 | Past performance is not predictive of future performance. The performance data does not reflect the deduction of taxes that a shareholder would pay on Fund distributions or redemption of Fund shares. The Adviser reimburses certain Fund expenses pursuant to a contract expiring on August 29, 2032, unless renewed for another 11-year term and the Fund’s transfer agency expenses may be reduced by expense offsets from an unaffiliated transfer agent, without which performance would have been lower. |
| 4 | Performance for the Institutional Shares prior to May 29, 2009 is based on the performance of the Retail Shares. Performance for the R6 Shares prior to August 31, 2016 is based on the performance of the Institutional Shares, and prior to May 29, 2009 is based on the Retail Shares. The Retail Shares have a distribution fee, but Institutional Shares and R6 Shares do not. If the annual returns for the Institutional Shares and R6 Shares prior to May 29, 2009 did not reflect this fee, the returns would be higher. |
2
| June 30, 2022 (Unaudited) | Baron Partners Fund |
TOP TEN HOLDINGSASOF JUNE 30, 2022
| Percent of Total Investments | ||||
Tesla, Inc. | 42.2% | |||
Space Exploration Technologies Corp. | 8.4% | |||
CoStar Group, Inc. | 6.9% | |||
Arch Capital Group Ltd. | 4.6% | |||
IDEXX Laboratories, Inc. | 4.3% | |||
FactSet Research Systems, Inc. | 4.3% | |||
The Charles Schwab Corp. | 4.0% | |||
Hyatt Hotels Corp. | 3.8% | |||
Vail Resorts, Inc. | 3.5% | |||
Gartner, Inc. | 2.6% | |||
| 84.6% | ||||
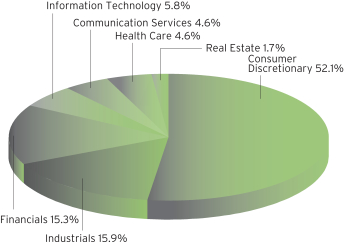
SECTOR BREAKDOWNASOF JUNE 30, 2022†
(as a percentage of total investments)
MANAGEMENT’S DISCUSSIONOF FUND PERFORMANCE
For the six months ended June 30, 2022, Baron Partners Fund1 declined 34.68%, underperforming the Russell Midcap Growth Index, which retreated 31.00%.
Baron Partners Fund invests primarily in U.S. companies of any size with, in our view, significant long-term growth potential. We believe our process can identify investment opportunities that are attractively priced relative to future prospects. The Fund is non-diversified, so its top 10 holdings are expected to comprise a significant percentage of the portfolio, and the Fund uses
leverage, both of which increase risk. In addition, the Fund may be subject to risks associated with potentially being concentrated in the securities of a single issuer or a small number of issuers, including in a particular industry. Of course, there can be no assurance that we will be successful in achieving the Fund’s investment goals.
As of June 30, 2022, 49.3% of the Fund’s net assets are invested in Tesla stock. Therefore, the Fund is exposed to the risk that were Tesla stock to lose significant value, which could happen rapidly, the Fund’s performance would be adversely affected. Before investing in the Fund, investors should carefully consider publicly available information about Tesla. There can be no assurances that the Fund will maintain its investment in Tesla, as the Adviser maintains discretion to actively manage the Fund’s portfolio, including by decreasing or liquidating the Fund’s investment in Tesla at any time. However, for so long as the Fund maintains a substantial investment in Tesla, the Fund’s performance will be significantly affected by the performance of Tesla stock and any decline in the price of Tesla stock would materially and adversely affect your investment in the Fund.
After robust performance over the prior two years, stocks declined meaningfully to start 2022. All asset classes were adversely impacted by higher interest rates, elevated core inflation, persistently high fuel prices, and a stronger dollar. Efforts at forecasting were complicated by still-stretched supply chains, lingering COVID impacts in China and other geographies, and the war in Ukraine.
Industrials was the only contributing sector. Consumer Discretionary, Information Technology, and Health Care were the top detractors.
Space Exploration Technologies Corp. (SpaceX) was the top contributor. SpaceX is a high-profile private company founded by Elon Musk that designs, manufactures, and launches rockets, satellites, and spacecrafts. Its long-term goal is to enable human beings to inhabit Mars. We believe SpaceX is creating substantial value through the expansion of its Starlink broadband service. It also reliably provides reusable launch capabilities, including crewed space flights, and is making progress on its largest rocket, Starship. We value SpaceX using prices of recent financing transactions and a proprietary valuation model.
Electric vehicle company Tesla, Inc. was the top detractor due to the three-week shutdown of its factory in China, supply-chain disruption, and slowed manufacturing volume in its recently launched production facilities. We believe these issues will be resolved, and Tesla will execute its long-term goals across electrification and software initiatives.
We invest for the long term in businesses that we believe will benefit from secular growth trends, durable competitive advantages, and best-in-class management. We remain optimistic that this approach will generate strong long-term performance regardless of the economic climate.
| † | Sector levels are provided from the Global Industry Classification Standard (“GICS”), developed and exclusively owned by MSCI, Inc. and Standard & Poor’s Financial Services LLC, unless otherwise stated that they have been reclassified or classified by the Adviser. All GICS data is provided “as is” with no warranties. Individual weights may not sum to 100% due to rounding. |
| 1 | Performance information reflects results of the Retail Shares. |
3
| Baron Focused Growth Fund (Unaudited) | June 30, 2022 |
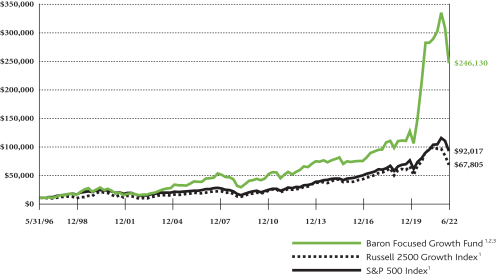
COMPARISONOFTHECHANGEIN VALUEOF $10,000INVESTMENTIN BARON FOCUSED GROWTH FUND (RETAIL SHARES)
INRELATIONTOTHE RUSSELL 2500 GROWTH INDEXANDTHE S&P 500 INDEX
| AVERAGE ANNUAL TOTAL RETURNSFORTHEPERIODSENDED JUNE 30, 2022 |
| |||||||||||||||||||||||
| Six Months* | One Year | Three Years | Five Years | Ten Years | Since Inception (May 31, 1996) | |||||||||||||||||||
Baron Focused Growth Fund — Retail Shares1,2,3 | (26.44)% | (14.63)% | 30.67% | 22.63% | 16.97% | 13.07% | ||||||||||||||||||
Baron Focused Growth Fund — Institutional Shares1,2,3,4 | (26.34)% | (14.40)% | 30.99% | 22.95% | 17.26% | 13.21% | ||||||||||||||||||
Baron Focused Growth Fund — R6 Shares1,2,3,4 | (26.34)% | (14.41)% | 31.01% | 22.96% | 17.26% | 13.21% | ||||||||||||||||||
Russell 2500 Growth Index1 | (29.45)% | (31.81)% | 3.68% | 7.53% | 10.88% | 7.61% | ||||||||||||||||||
S&P 500 Index1 | (19.96)% | (10.62)% | 10.60% | 11.31% | 12.96% | 8.88% | ||||||||||||||||||
| * | Not Annualized. |
| 1 | The Russell 2500™ Growth Index measures the performance of small- to medium-sized U.S. companies that are classified as growth and the S&P 500 Index of 500 widely held large-cap U.S. companies. The indexes and Baron Focused Growth Fund are with dividends, which positively impact the performance results. The indexes are unmanaged. The index performance is not fund performance; one cannot invest directly into an index. |
| 2 | Reflects the actual fees and expenses that were charged when the Fund was a partnership. The predecessor partnership charged a 15% performance fee through 2003 after reaching a certain performance benchmark. If the annual returns for the Fund did not reflect the performance fees for the years the predecessor partnership charged a performance fee, the returns would be higher. The Fund’s shareholders will not be charged a performance fee. The predecessor partnership’s performance is only for periods before the Fund’s registration statement was effective, which was June 30, 2008. During those periods, the predecessor partnership was not registered under the Investment Company Act of 1940 and was not subject to its requirements or the requirements of the Internal Revenue Code relating to regulated investment companies, which, if it were, might have adversely affected its performance. |
| 3 | Past performance is not predictive of future performance. The performance data does not reflect the deduction of taxes that a shareholder would pay on Fund distributions or redemption of Fund shares. The Adviser reimburses certain Fund expenses pursuant to a contract expiring on August 29, 2032, unless renewed for another 11-year term and the Fund’s transfer agency expenses may be reduced by expense offsets from an unaffiliated transfer agent, without which performance would have been lower. |
| 4 | Performance for the Institutional Shares prior to May 29, 2009 is based on the performance of the Retail Shares. Performance for the R6 Shares prior to August 31, 2016 is based on the performance of the Institutional Shares, and prior to May 29, 2009 is based on the Retail Shares. The Retail Shares have a distribution fee, but Institutional Shares and R6 Shares do not. If the annual returns for the Institutional Shares and R6 Shares prior to May 29, 2009 did not reflect this fee, the returns would be higher. |
4
| June 30, 2022 (Unaudited) | Baron Focused Growth Fund |
TOP TEN HOLDINGSASOF JUNE 30, 2022
| Percent of Net Assets | ||||
Tesla, Inc. | 20.5% | |||
Space Exploration Technologies Corp. | 11.7% | |||
Arch Capital Group Ltd. | 6.1% | |||
Hyatt Hotels Corp. | 5.5% | |||
CoStar Group, Inc. | 5.2% | |||
FactSet Research Systems, Inc. | 4.7% | |||
MSCI, Inc. | 4.6% | |||
Vail Resorts, Inc. | 4.4% | |||
Spotify Technology S.A. | 3.8% | |||
Guidewire Software, Inc. | 3.7% | |||
| 70.2% | ||||
SECTOR BREAKDOWNASOF JUNE 30, 2022†
(as a percentage of net assets)
MANAGEMENT’S DISCUSSIONOF FUND PERFORMANCE
For the six months ended June 30, 2022, Baron Focused Growth Fund1 declined 26.44%, outperforming the Russell 2500 Growth Index, which retreated 29.45%.
Baron Focused Growth Fund invests in a non-diversified portfolio of companies that we believe are well capitalized and have exceptional management, significant growth potential, and durable barriers to competition. We believe our process can identify investment opportunities that are attractively priced
relative to future prospects. In addition, the Fund may be subject to risks associated with potentially being concentrated in the securities of a single issuer or a small number of issuers, including in a particular industry. Of course, there can be no assurance that we will be successful in achieving the Fund’s investment goals.
As of June 30, 2022, 20.5% of the Fund’s net assets are invested in Tesla stock. Therefore, the Fund is exposed to the risk that were Tesla stock to lose significant value, which could happen rapidly, the Fund’s performance would be adversely affected. Before investing in the Fund, investors should carefully consider publicly available information about Tesla. There can be no assurances that the Fund will maintain its investment in Tesla, as the Adviser maintains discretion to actively manage the Fund’s portfolio, including by decreasing or liquidating the Fund’s investment in Tesla at any time. However, for so long as the Fund maintains a substantial investment in Tesla, the Fund’s performance will be significantly affected by the performance of Tesla stock and any decline in the price of Tesla stock would materially and adversely affect your investment in the Fund.
After robust performance over the prior two years, stocks declined meaningfully to start 2022. All asset classes were adversely impacted by higher interest rates, elevated core inflation, persistently high fuel prices, and a stronger dollar. Efforts at forecasting were complicated by still-stretched supply chains, lingering COVID impacts in China and other geographies, and the war in Ukraine.
Industrials was the only contributing sector. Consumer Discretionary, Communication Services, and Information Technology were the top detractors.
Space Exploration Technologies Corp. (SpaceX) was the top contributor. SpaceX is a high-profile private company founded by Elon Musk that designs, manufactures, and launches rockets, satellites, and spacecrafts. Its long-term goal is to enable human beings to inhabit Mars. We believe SpaceX is creating substantial value through the expansion of its Starlink broadband service. It also reliably provides reusable launch capabilities, including crewed space flights, and is making progress on its largest rocket, Starship. We value SpaceX using prices of recent financing transactions and a proprietary valuation model.
Electric vehicle company Tesla, Inc. was the top detractor due to the three-week shutdown of its factory in China, supply-chain disruption, and slowed manufacturing volume in its recently launched production facilities. We believe these issues will be resolved, and Tesla will execute its long-term goals across electrification and software initiatives.
We invest for the long term in businesses that we believe will benefit from secular growth trends, durable competitive advantages, and best-in-class management. We remain optimistic that this approach will generate strong long-term performance regardless of the economic climate.
| † | Sector levels are provided from the Global Industry Classification Standard (“GICS”), developed and exclusively owned by MSCI, Inc. and Standard & Poor’s Financial Services LLC, unless otherwise stated that they have been reclassified or classified by the Adviser. All GICS data is provided “as is” with no warranties. Individual weights may not sum to 100% due to rounding. |
| 1 | Performance information reflects results of the Retail Shares. |
5
| Baron International Growth Fund (Unaudited) | June 30, 2022 |
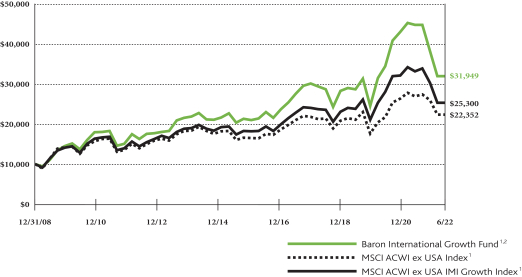
COMPARISONOFTHECHANGEIN VALUEOF $10,000INVESTMENTIN BARON INTERNATIONAL GROWTH FUND† (RETAIL SHARES)
INRELATIONTOTHE MSCI ACWIEX USA INDEXANDTHE MSCI ACWIEX USA IMI GROWTH INDEX
| AVERAGE ANNUAL TOTAL RETURNSFORTHEPERIODSENDED JUNE 30, 2022 |
| |||||||||||||||||||||||
| Six Months* | One Year | Three Years | Five Years | Ten Years | Since Inception (December 31, 2008)^ | |||||||||||||||||||
Baron International Growth Fund — Retail Shares1,2 | (28.57)% | (29.39)% | 3.30% | 4.74% | 6.98% | 8.99% | ||||||||||||||||||
Baron International Growth Fund — Institutional Shares1,2,3 | (28.45)% | (29.20)% | 3.55% | 4.99% | 7.26% | 9.26% | ||||||||||||||||||
Baron International Growth Fund — R6 Shares1,2,3 | (28.44)% | (29.19)% | 3.54% | 4.99% | 7.26% | 9.25% | ||||||||||||||||||
MSCI ACWI ex USA Index1 | (18.42)% | (19.42)% | 1.35% | 2.50% | 4.83% | 6.14% | ||||||||||||||||||
MSCI ACWI ex USA IMI Growth Index1 | (25.27)% | (26.02)% | 1.78% | 3.37% | 5.78% | 7.12% | ||||||||||||||||||
| * | Not Annualized. |
| † | The Fund’s 3- and 5-year historical performance was impacted by gains from IPOs, and there is no guarantee that these results can be repeated or that the Fund’s level of participation in IPOs will be the same in the future. |
| ^ | Commencement of investment operations was January 2, 2009. |
| 1 | The MSCI ACWI ex USA Index Net USD is a free float-adjusted market capitalization weighted index that is designed to measure the equity market performance of large- and mid-cap securities across developed and emerging markets, excluding the United States. The MSCI ACWI ex USA IMI Growth Index Net USD is a free float-adjusted market capitalization weighted index that is designed to measure the performance of large-, mid-, and small-cap growth securities across developed and emerging markets, excluding the United States. MSCI is the source and owner of the trademarks, service marks and copyrights related to the MSCI Indexes. The indexes and Baron International Growth Fund include reinvestment of dividends, net of foreign withholding taxes, which positively impact the performance results. The indexes are unmanaged. The index performance is not fund performance; one cannot invest directly into an index. |
| 2 | Past performance is not predictive of future performance. The performance data does not reflect the deduction of taxes that a shareholder would pay on Fund distributions or redemption of Fund shares. The Adviser reimburses certain Fund expenses pursuant to a contract expiring on August 29, 2032, unless renewed for another 11-year term and the Fund’s transfer agency expenses may be reduced by expense offsets from an unaffiliated transfer agent, without which performance would have been lower. |
| 3 | Performance for the Institutional Shares prior to May 29, 2009 is based on the performance of the Retail Shares. Performance for the R6 Shares prior to August 31, 2016 is based on the performance of the Institutional Shares, and prior to May 29, 2009 is based on the Retail Shares. The Retail Shares have a distribution fee, but Institutional Shares and R6 Shares do not. If the annual returns for the Institutional Shares and R6 Shares prior to May 29, 2009 did not reflect this fee, the returns would be higher. |
6
| June 30, 2022 (Unaudited) | Baron International Growth Fund |
TOP TEN HOLDINGSASOF JUNE 30, 2022
| Percent of Net Assets | ||||
AstraZeneca PLC | 2.7% | |||
argenx SE | 2.3% | |||
Arch Capital Group Ltd. | 2.2% | |||
Nestle S.A. | 2.0% | |||
Linde plc | 2.0% | |||
Constellation Software, Inc. | 1.7% | |||
Korea Shipbuilding & Offshore | 1.7% | |||
Reliance Industries Limited | 1.6% | |||
Koninklijke DSM N.V. | 1.6% | |||
BNP Paribas S.A. | 1.6% | |||
| 19.4% | ||||
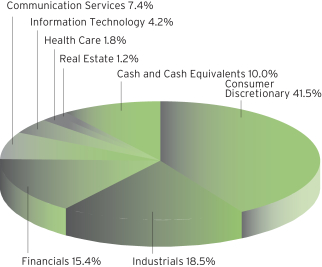
SECTOR BREAKDOWNASOF JUNE 30, 2022†
(as a percentage of net assets)
MANAGEMENT’S DISCUSSIONOF FUND PERFORMANCE
For the six months ended June 30, 2022, Baron International Growth Fund1 declined 28.57%, underperforming the MSCI ACWI ex USA Index, which declined 18.42%.
Baron International Growth Fund is a diversified fund that invests for the long term primarily in securities of non-U.S. growth companies. The Fund expects to diversify among developed and developing countries throughout the world, although total exposure to developing countries will not exceed 35%. The Fund may purchase securities of companies of any size. Of course, there can be no guarantee that we will be successful in achieving the Fund’s investment goals.
The first half of 2022 was an exceptionally challenging time for global equities, and international markets were no exception. Stubbornly high inflation, a much more hawkish U.S. Federal Reserve, global supply-chain disruptions, Russia’s invasion of Ukraine, and China’s COVID-related shutdown combined to spur a precipitous sell-off. While there were few bright spots in the period, we do believe that peak inflation panic has likely passed. Should this prove to be the case, we would expect growth equity relative performance also to have bottomed, with material headroom for recovery in the coming months.
No country meaningfully contributed. The top detractors were the U.K., Japan, and China.
No sector contributed. The top detractors were Communication Services, Industrials, and Information Technology.
The top contributor was argenx, Inc., a biotechnology company focused on autoimmune disorders. Shares increased with the strong launch of Vyvgart, a treatment for generalized myasthenia gravis, a chronic autoimmune disease that causes muscle weakness. Early sales tripled consensus expectations, and global approvals are coming in earlier than guided. We expect the next two years to have many catalysts, and, assuming a well-received commercial launch, 2022 should be another year of solid performance.
The top detractor was global marketing services business S4 Capital plc. Shares of S4 declined due to a delay in financial reporting that caused investor concern. The company ultimately was able to file its audit on a delayed basis. We retain conviction as we believe S4 is well positioned to support long-term growth in digital advertising.
International equities, defined as the MSCI ACWI ex USA Index, notably outperformed the S&P 500 Index later in the period, notwithstanding Europe’s more direct exposed to the fallout from the Russia/Ukraine war. International outperformance in a weak or global bear market is unusual and, in our view, likely signals a major long-term inflection point in relative performance. We are encouraged by recent developments and, as always, are confident we have invested in well-positioned and well-managed companies with substantial long-term investment return potential.
| † | Sector levels are provided from the Global Industry Classification Standard (“GICS”), developed and exclusively owned by MSCI, Inc. and Standard & Poor’s Financial Services LLC, unless otherwise stated that they have been reclassified or classified by the Adviser. All GICS data is provided “as is” with no warranties. Individual weights may not sum to 100% due to rounding. |
| 1 | Performance information reflects results of the Retail Shares. |
7
| Baron Real Estate Fund (Unaudited) | June 30, 2022 |
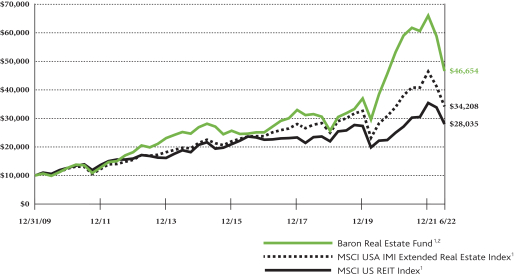
COMPARISONOFTHECHANGEIN VALUEOF $10,000INVESTMENTIN BARON REAL ESTATE FUND (RETAIL SHARES)
INRELATIONTOTHE MSCI USA IMI EXTENDED REAL ESTATE INDEXAND MSCI US REIT INDEX
| AVERAGE ANNUAL TOTAL RETURNSFORTHEPERIODSENDED JUNE 30, 2022 |
| |||||||||||||||||||||||
| Six Months* | One Year | Three Years | Five Years | Ten Years | Since Inception (December 31, 2009)^ | |||||||||||||||||||
Baron Real Estate Fund — Retail Shares1,2 | (29.25)% | (24.42)% | 13.63% | 9.90% | 12.01% | 13.11% | ||||||||||||||||||
Baron Real Estate Fund — Institutional Shares1,2 | (29.18)% | (24.24)% | 13.94% | 10.20% | 12.29% | 13.40% | ||||||||||||||||||
Baron Real Estate Fund — R6 Shares1,2,3 | (29.18)% | (24.24)% | 13.94% | 10.20% | 12.30% | 13.40% | ||||||||||||||||||
MSCI USA IMI Extended Real Estate Index1 | (26.26)% | (16.12)% | 4.45% | 5.71% | 9.36% | 10.34% | ||||||||||||||||||
MSCI US REIT Index1 | (20.71)% | (7.32)% | 2.90% | 4.08% | 6.04% | 8.60% | ||||||||||||||||||
| * | Not Annualized. |
| ^ | Commencement of investment operations was January 4, 2010. |
| 1 | The MSCI USA IMI Extended Real Estate Index is a custom index calculated by MSCI for, and as requested by, BAMCO, Inc. The index includes real estate and real estate-related GICS classification securities. MSCI makes no express or implied warranties or representation and shall have no liability whatsoever with respect to any MSCI data contained herein. The MSCI data may not be further redistributed or used as a basis for other indexes or any securities or financial products. This report is not approved, reviewed or produced by MSCI. The MSCI US REIT Index is a free float-adjusted market capitalization index that measures the performance of all equity REITs in the U.S. equity market, except for specialty equity REITs that do not generate a majority of their revenue and income from real estate rental and leasing operations. MSCI is the source and owner of the trademarks, service marks and copyrights related to the MSCI Indexes. The indexes and Baron Real Estate Fund are with dividends, which positively impact the performance results. The indexes are unmanaged. The index performance is not fund performance; one cannot invest directly into an index. |
| 2 | Past performance is not predictive of future performance. The performance data does not reflect the deduction of taxes that a shareholder would pay on Fund distributions or redemption of Fund shares. The Adviser reimburses certain Fund expenses pursuant to a contract expiring on August 29, 2032, unless renewed for another 11-year term and the Fund’s transfer agency expenses may be reduced by expense offsets from an unaffiliated transfer agent, without which performance would have been lower. |
| 3 | Performance for the R6 Shares prior to January 29, 2016 is based on the performance of the Institutional Shares. |
8
| June 30, 2022 (Unaudited) | Baron Real Estate Fund |
TOP TEN HOLDINGSASOF JUNE 30, 2022
| Percent of Net Assets | ||||
Brookfield Asset Management Inc. | 5.4% | |||
Las Vegas Sands Corporation | 4.2% | |||
CBRE Group, Inc. | 4.2% | |||
Jones Lang LaSalle Incorporated | 4.0% | |||
American Tower Corp. | 4.0% | |||
CoStar Group, Inc. | 3.7% | |||
Blackstone Inc. | 3.4% | |||
SiteOne Landscape Supply, Inc. | 2.9% | |||
Invitation Homes, Inc. | 2.9% | |||
Public Storage Incorporated | 2.7% | |||
| 37.4% | ||||
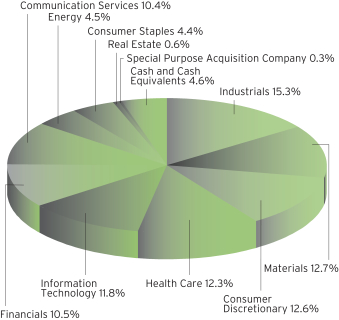
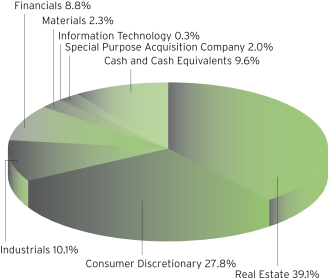
SECTOR BREAKDOWNASOF JUNE 30, 2022†
(as a percentage of net assets)
MANAGEMENT’S DISCUSSIONOF FUND PERFORMANCE
For the six months ended June 30, 2022, Baron Real Estate Fund1 declined 29.25%, underperforming the MSCI USA IMI Extended Real Estate Index, which declined 26.26%.
Baron Real Estate Fund is a diversified fund that under normal circumstances, invests 80% of its net assets in real estate and real estate-related companies of all sizes, and in companies which, in
the opinion of the Adviser, own significant real estate assets at the time of investment. The Fund seeks to invest in well-managed companies that we believe have significant long-term growth opportunities. The Fund’s investment universe extends beyond real estate investment trusts (“REITs”) to include hotels, senior housing operators, casino and gaming operators, tower operators, infrastructure-related companies and master limited partnerships, data centers, building products companies, real estate service companies, and real estate operating companies. Of course, there can be no guarantee that we will be successful in achieving the Fund’s investment goals.
The first half of 2022 was challenging to navigate. A more hawkish Federal Reserve, higher interest rates, and the possibility of moderating growth and valuation multiple compression converged to pressure real estate stocks. The Russia/Ukraine war and the spillover effects of even higher inflation (food, wheat, crude oil, natural gas), further COVID-19-related lockdowns in China, ongoing supply-chain bottlenecks, and multi-decade high inflation — a portion of which may remain elevated for an extended period — added to the uncertainty. These factors led to an unusually difficult investment environment, resulting in simultaneous and sharp declines in stocks, bonds, and most investable assets.
No real estate category contributed. Building products/services, REITs, and casinos & gaming operators were the top detractors.
Gaming and Leisure Properties, Inc., a REIT that owns the real estate of many casino operators, was the top contributor on the strength of its well-covered dividend yield and prospects for growth even in a recessionary economy. Its tenants remain solvent and flush with cash, which suggests that rent payments should remain steady regardless of the economic environment. A strong balance sheet allows for additional acquisitions, which should be accretive to the dividend and enhance shareholder returns.
Six Flags Entertainment Corporation was the top detractor, driven by investor concerns about consumer leisure spend as the company shifts to a premiumization strategy. We exited our position due to our uncertainty regarding management’s strategic pivot given the high inflation backdrop and potentially weakening consumer demand.
Looking ahead, we are incrementally positive, in part because of the sharp correction in share prices. Most business fundamentals remain strong. Commercial and residential real estate is not overbuilt. Expectations for construction activity are modest. Corporate balance sheets are liquid. Certain segments of real estate can raise prices to provide partial inflation protection. Dividend yields continue to grow and are supported by strong cash flows. While the recent spike in interest rates and widening credit spreads are a headwind, we believe real estate, for the most part, is in a good place relative to prior economic slowdowns and recessions.
| † | Sector levels are provided from the Global Industry Classification Standard (“GICS”), developed and exclusively owned by MSCI, Inc. and Standard & Poor’s Financial Services LLC, unless otherwise stated that they have been reclassified or classified by the Adviser. All GICS data is provided “as is” with no warranties. Individual weights may not sum to 100% due to rounding. |
| 1 | Performance information reflects results of the Retail Shares. |
9
| Baron Emerging Markets Fund (Unaudited) | June 30, 2022 |
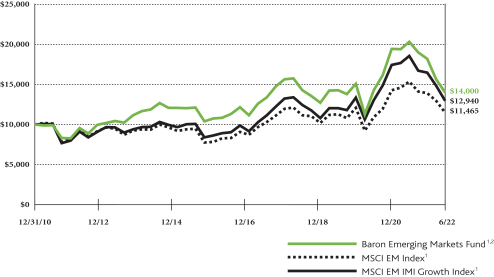
COMPARISONOFTHECHANGEIN VALUEOF $10,000INVESTMENTIN BARON EMERGING MARKETS FUND† (RETAIL SHARES)
INRELATIONTOTHE MSCI EM INDEXANDTHE MSCI EM IMI GROWTH INDEX
| AVERAGE ANNUAL TOTAL RETURNSFORTHEPERIODSENDED JUNE 30, 2022 |
| |||||||||||||||||||||||
| Six Months* | One Year | Three Years | Five Years | Ten Years | Since Inception (December 31, 2010)^ | |||||||||||||||||||
Baron Emerging Markets Fund — Retail Shares1,2 | (23.07)% | (31.05)% | (0.60)% | 0.90% | 4.69% | 2.97% | ||||||||||||||||||
Baron Emerging Markets Fund — Institutional Shares1,2 | (22.98)% | (30.88)% | (0.34)% | 1.15% | 4.96% | 3.22% | ||||||||||||||||||
Baron Emerging Markets Fund — R6 Shares1,2,3 | (22.97)% | (30.90)% | (0.34)% | 1.16% | 4.96% | 3.23% | ||||||||||||||||||
MSCI EM Index1 | (17.63)% | (25.28)% | 0.57% | 2.18% | 3.06% | 1.20% | ||||||||||||||||||
MSCI EM IMI Growth Index1 | (21.43)% | (30.30)% | 2.45% | 3.00% | 4.44% | 2.27% | ||||||||||||||||||
| * | Not Annualized. |
| † | The Fund’s 3- and 5-year historical performance was impacted by gains from IPOs, and there is no guarantee that these results can be repeated or that the Fund’s level of participation in IPOs will be the same in the future. |
| ^ | Commencement of investment operations was January 3, 2011. |
| 1 | The MSCI EM (Emerging Markets) Index and the MSCI EM (Emerging Markets) IMI Growth Index are free float-adjusted market capitalization weighted indexes. The MSCI EM (Emerging Markets) Index Net USD and the MSCI EM (Emerging Markets) IMI Growth Index Net USD are designed to measure the equity market performance of large-, mid-, and small-cap securities in the emerging markets. The MSCI EM (Emerging Markets) IMI Growth Index Net USD screens for growth-style securities. MSCI is the source and owner of the trademarks, service marks and copyrights related to the MSCI Indexes. The indexes and Baron Emerging Markets Fund include reinvestment of dividends, net of foreign withholding taxes, which positively impact the performance results. The indexes are unmanaged. The index performance is not fund performance; one cannot invest directly into an index. |
| 2 | Past performance is not predictive of future performance. The performance data does not reflect the deduction of taxes that a shareholder would pay on Fund distributions or redemption of Fund shares. The Adviser reimburses certain Fund expenses pursuant to a contract expiring on August 29, 2032 unless renewed for another 11-year term and the Fund’s transfer agency expenses may be reduced by expense offsets from an unaffiliated transfer agent without which performance would have been lower. |
| 3 | Performance for the R6 Shares prior to January 29, 2016 is based on the performance of the Institutional Shares. |
10
| June 30, 2022 (Unaudited) | Baron Emerging Markets Fund |
TOP TEN HOLDINGSASOF JUNE 30, 2022
| Percent of Net Assets | ||||
Taiwan Semiconductor Manufacturing Company Ltd. | 4.4% | |||
Tencent Holdings Limited | 3.6% | |||
Alibaba Group Holding Limited | 3.3% | |||
Samsung Electronics Co., Ltd. | 3.2% | |||
Reliance Industries Limited | 2.7% | |||
Korea Shipbuilding & Offshore | 2.1% | |||
Baidu, Inc. | 2.1% | |||
Suzano S.A. | 1.8% | |||
Bajaj Finance Limited | 1.7% | |||
Yum China Holdings Inc. | 1.6% | |||
| 26.5% | ||||
SECTOR BREAKDOWNASOF JUNE 30, 2022†
(as a percentage of net assets)
MANAGEMENT’S DISCUSSIONOF FUND PERFORMANCE
For the six months ended June 30, 2022, Baron Emerging Markets Fund1 declined 23.07%, underperforming the MSCI EM Index, which retreated 17.63%.
Baron Emerging Markets Fund is a diversified fund that invests for the long term primarily in companies of any size with their principal business activities or trading markets in developing countries. The Fund may invest up to 20% of its net assets in developed and frontier countries. The Fund seeks to invest in companies with significant long-term growth prospects and purchase them at prices we believe to be favorable. Of course, there can be no guarantee that we will be successful in achieving the Fund’s investment goals.
The first half of 2022 was an exceptionally challenging time for global equities, and emerging markets were no exception. Stubbornly high inflation, a much more hawkish U.S. Federal Reserve, global supply-chain disruptions, Russia’s invasion of Ukraine, and China’s COVID-related shutdown combined to spur a precipitous sell-off. While there were few bright spots in the period, we do believe that peak inflation panic has likely passed. Should this prove to be the case, we would expect growth equity relative performance also to have bottomed, with material headroom for recovery in the coming months.
No country contributed meaningfully. China, India, and Russia were the biggest detractors.
No sector contributed. Information Technology, Financials, and Industrials detracted the most.
Hyundai Heavy Industries Co., Ltd. was the top contributor. Shares of the world’s largest shipbuilder and global leader of eco-friendly LNG powered ships rose on increased demand for LNG carriers given the rise in natural gas prices. We remain investors as we believe Hyundai Heavy Industries will be the leading beneficiary of the trend in decarbonization of shipping given its technological leadership and dominant market position.
Semiconductor giant Taiwan Semiconductor Manufacturing Company Ltd. (Taiwan Semi) was the top detractor. Shares fell due to rising geopolitical tensions, macroeconomic uncertainties, and concerns over softening demand for consumer electronics. We retain conviction that Taiwan Semi’s technological leadership, pricing power, and exposure to secular growth markets, including high-performance computing, automotive, and IoT, will allow it to deliver above its 15% to 20% revenue growth target over the next several years.
Year-to-date, emerging market equities materially outperformed the S&P 500 Index and global indexes. This encompasses a time where Russian equities were written down to near zero and China-related equities battled geopolitical, sanction and COVID concerns. EM outperformance in a weak or global bear market is unusual and, in our view, likely signals a major long-term inflection point in relative performance. We are encouraged by the recent performance of EM equities and, as always, are confident we have invested in well-positioned and well-managed companies with substantial long-term investment return potential.
| † | Sector levels are provided from the Global Industry Classification Standard (“GICS”), developed and exclusively owned by MSCI, Inc. and Standard & Poor’s Financial Services LLC, unless otherwise stated that they have been reclassified or classified by the Adviser. All GICS data is provided “as is” with no warranties. Individual weights may not sum to 100% due to rounding. |
| 1 | Performance information reflects results of the Retail Shares. |
11
| Baron Global Advantage Fund (Unaudited) | June 30, 2022 |
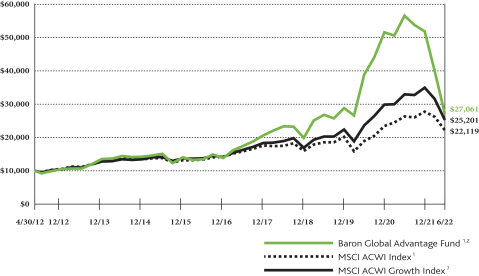
COMPARISONOFTHECHANGEIN VALUEOF $10,000INVESTMENTIN BARON GLOBAL ADVANTAGE FUND† (RETAIL SHARES)
INRELATIONTOTHE MSCI ACWI INDEXANDTHE MSCI ACWI GROWTH INDEX
| AVERAGE ANNUAL TOTAL RETURNSFORTHEPERIODSENDED JUNE 30, 2022 |
| |||||||||||||||||||||||
| Six Months* | One Year | Three Years | Five Years | Ten Years | Since Inception (April 30, 2012) | |||||||||||||||||||
Baron Global Advantage Fund — Retail Shares1,2 | (47.78)% | (52.12)% | 0.44% | 9.21% | 11.43% | 10.29% | ||||||||||||||||||
Baron Global Advantage Fund — Institutional Shares1,2 | (47.72)% | (52.01)% | 0.69% | 9.49% | 11.68% | 10.53% | ||||||||||||||||||
Baron Global Advantage Fund — R6 Shares1,2,3 | (47.71)% | (52.00)% | 0.69% | 9.49% | 11.69% | 10.54% | ||||||||||||||||||
MSCI ACWI Index1 | (20.18)% | (15.75)% | 6.21% | 7.00% | 8.76% | 8.12% | ||||||||||||||||||
MSCI ACWI Growth Index1 | (27.92)% | (23.46)% | 7.62% | 9.16% | 10.29% | 9.52% | ||||||||||||||||||
| * | Not Annualized. |
| † | The Fund’s, 3-, 5-, and 10-year historical performance was impacted by gains from IPOs, and there is no guarantee that these results can be repeated or that the Fund’s level of participation in IPOs will be the same in the future. |
| 1 | The MSCI ACWI Index and the MSCI ACWI Growth Index are free float-adjusted market capitalization weighted indexes. The MSCI ACWI Index Net USD and the MSCI ACWI Growth Index Net USD are designed to measure the equity market performance of large- and mid-cap securities across developed and emerging markets, including the United States. The MSCI ACWI Growth Index Net USD screens for growth-style securities. MSCI is the source and owner of the trademarks, service marks and copyrights related to the MSCI Indexes. The indexes and Baron Global Advantage Fund include reinvestment of dividends, net of foreign withholding taxes, which positively impact the performance results. The indexes are unmanaged. The index performance is not fund performance; one cannot invest directly into an index. |
| 2 | Past performance is not predictive of future performance. The performance data does not reflect the deduction of taxes that a shareholder would pay on Fund distributions or redemption of Fund shares. The Adviser reimburses certain Fund expenses pursuant to a contract expiring on August 29, 2032, unless renewed for another 11-year term and the Fund’s transfer agency expenses may be reduced by expense offsets from an unaffiliated transfer agent, without which performance would have been lower. |
| 3 | Performance for the R6 Shares prior to August 31, 2016 is based on the performance of the Institutional Shares. |
12
| June 30, 2022 (Unaudited) | Baron Global Advantage Fund |
TOP TEN HOLDINGSASOF JUNE 30, 2022
| Percent of Net Assets | ||||
Endava plc | 6.2% | |||
Amazon.com, Inc. | 5.3% | |||
Alphabet Inc. | 5.2% | |||
CrowdStrike, Inc. | 4.7% | |||
argenx SE | 4.7% | |||
Think & Learn Private Limited | 3.7% | |||
Rivian Automotive, Inc. | 3.6% | |||
Veeva Systems Inc. | 3.4% | |||
MercadoLibre, Inc. | 3.4% | |||
Snowflake Inc. | 3.3% | |||
| 43.5% | ||||
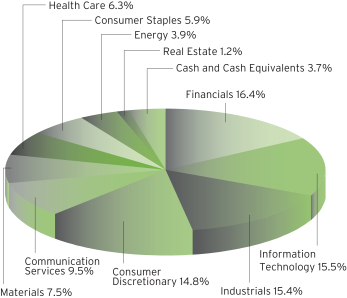
SECTOR BREAKDOWNASOF JUNE 30, 2022†
(as a percentage of net assets)
MANAGEMENT’S DISCUSSIONOF FUND PERFORMANCE
For the six months ended June 30, 2022, Baron Global Advantage Fund1 declined 47.78%, underperforming the MSCI ACWI Index, which declined 20.18%.
The Fund is a diversified fund that, under normal circumstances, invests primarily in equity securities in of companies throughout the world, with capitalizations within the range of companies included in the MSCI ACWI Index. At all times, the Fund will have
investments in equity securities of companies in at least three countries outside the U.S. Under normal conditions, at least 40% of net assets will be invested in stocks of companies outside the U.S. (at least 30% if foreign market conditions are not favorable). The Adviser seeks to invest in businesses it believes have significant opportunities for growth, durable competitive advantages, exceptional management, and an attractive valuation. Of course, there can be no guarantee that we will be successful in achieving the Fund’s investment goals.
The first half of 2022 was an exceptionally challenging time for global equities. Stubbornly high inflation, a much more hawkish U.S. Federal Reserve, global supply-chain disruptions, Russia’s invasion of Ukraine, and China’s COVID-related shutdown combined to spur a precipitous sell-off. Very recently, although the headline numbers remain alarming, inflation does appear to be moderating, and the conversation (i.e., sentiment) has shifted towards the increasingly likely recession and ostensibly broad economic slowdown.
No country contributed. The U.S., Israel, and Canada detracted the most.
No sector meaningfully contributed. Information Technology, Consumer Discretionary, and Communication Services detracted the most.
The top contributor was argenx, Inc., a biotechnology company focused on autoimmune disorders. Shares increased following the strong launch of Vyvgart, a treatment for generalized myasthenia gravis, a chronic autoimmune disease that causes muscle weakness. Early sales tripled consensus expectations, and global approvals are coming in earlier than guided. We expect the next two years to have many catalysts, and, assuming a well-received commercial launch, 2022 should be another year of solid performance.
The top detractor was electric vehicle company Rivian Automotive, Inc. Shares declined as industry-wide supply chain complexities negatively impacted the company’s production rate. In addition, management noted it would trim growth investments to reduce liquidity risk in an uncertain macroeconomic environment. We expect Rivian to overcome current challenges and benefit from the market transition to electric, connected vehicles while innovation and ramp of already installed capacity should offer ample growth opportunities.
Every day we live and invest in an uncertain world. The constant challenges we face are real and serious, with clearly uncertain outcomes. History would suggest that most will prove passing or manageable. The business of capital allocation (or investing) is the business of taking risk, managing the uncertainty, and taking advantage of the long-term opportunities that those risks and uncertainties create. We are confident our process is the right one, and we believe it will enable us to make good investment decisions over time.
| † | Sector levels are provided from the Global Industry Classification Standard (“GICS”), developed and exclusively owned by MSCI, Inc. and Standard & Poor’s Financial Services LLC, unless otherwise stated that they have been reclassified or classified by the Adviser. All GICS data is provided “as is” with no warranties. Individual weights may not sum to 100% due to rounding. |
| 1 | Performance information reflects results of the Retail Shares. |
13
| Baron Real Estate Income Fund (Unaudited) | June 30, 2022 |
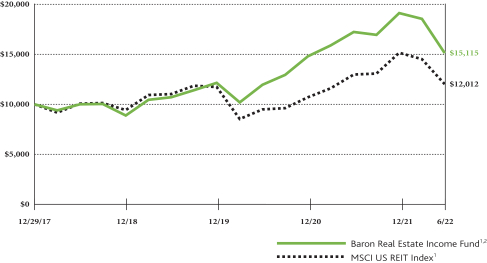
COMPARISONOFTHECHANGEIN VALUEOF $10,000INVESTMENTIN BARON REAL ESTATE INCOME FUND (RETAIL SHARES)
INRELATIONTOTHE MSCI US REIT INDEX
| AVERAGE ANNUAL TOTAL RETURNSFORTHEPERIODSENDED JUNE 30, 2022 |
| |||||||||||||||
| Six Months* | One Year | Three Years | Since Inception (December 29, 2017)^ | |||||||||||||
Baron Real Estate Income Fund — Retail Shares1,2 | (20.86)% | (12.27)% | 12.22% | 9.62% | ||||||||||||
Baron Real Estate Income Fund — Institutional Shares1,2 | (20.75)% | (12.00)% | 12.42% | 9.83% | ||||||||||||
Baron Real Estate Income Fund — R6 Shares1,2 | (20.85)% | (12.01)% | 12.35% | 9.81% | ||||||||||||
MSCI US REIT Index1 | (20.71)% | (7.32)% | 2.90% | 4.16% | ||||||||||||
| * | Not Annualized. |
| ^ | Commencement of investment operations was January 2, 2018. |
| 1 | The MSCI US REIT Index is a free float-adjusted market capitalization index that measures the performance of all equity REITs in the US equity market, except for specialty equity REITs that do not generate a majority of their revenue and income from real estate rental and leasing operations. MSCI is the source and owner of the trademarks, service marks and copyrights related to the MSCI Indexes. The index and Baron Real Estate Income Fund include reinvestment of interest, capital gains and dividends, which positively impact the performance results. The index is unmanaged. The index performance is not fund performance; one cannot invest directly into an index. |
| 2 | Past performance is not predictive of future performance. The performance data does not reflect the deduction of taxes that a shareholder would pay on Fund distributions or redemption of Fund shares. The Adviser reimburses certain Fund expenses pursuant to a contract expiring on August 29, 2032, unless renewed for another 11-year term and the Fund’s transfer agency expenses may be reduced by expense offsets from an unaffiliated transfer agent, without which performance would have been lower. |
14
| June 30, 2022 (Unaudited) | Baron Real Estate Income Fund |
TOP TEN HOLDINGSASOF JUNE 30, 2022
| Percent of Net Assets | ||||
American Tower Corp. | 6.8% | |||
Equinix, Inc. | 6.1% | |||
Public Storage Incorporated | 5.9% | |||
Digital Realty Trust, Inc. | 5.2% | |||
Ventas, Inc. | 4.7% | |||
Equity Residential | 4.3% | |||
Duke Realty Corporation | 4.3% | |||
Invitation Homes, Inc. | 4.2% | |||
Brookfield Infrastructure Partners L.P. | 4.2% | |||
Extra Space Storage Inc. | 4.1% | |||
| 49.8% | ||||
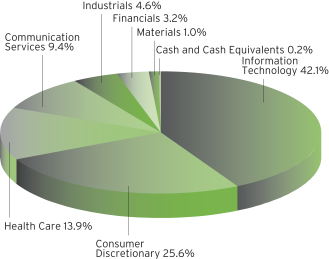
SECTOR BREAKDOWNASOF JUNE 30, 2022†
(as a percentage of net assets)
MANAGEMENT’S DISCUSSIONOF FUND PERFORMANCE
For the six months ended June 30, 2022, Baron Real Estate Income Fund1 declined 20.86%, performing in line with the MSCI US REIT Index, which declined 20.71%.
Baron Real Estate Income Fund is a non-diversified fund that under normal circumstances, invests at least 80% of its net assets in real estate income-producing securities and other real estate securities of any market capitalization, including common stocks
and equity securities, debt and preferred securities, non-U.S. real estate income-producing securities, and any other real estate-related yield securities. The Fund is likely to maintain a significant portion of its assets in real estate investment trusts (“REITs”). REITs pool money to invest in properties (“equity REITs”) or mortgages (“mortgage REITs”), and their revenue primarily consists of rent derived from owned, income producing real estate properties, and capital gains from the sale of such properties. The Fund generally invests in equity REITs. Of course, there can be no guarantee that we will be successful in achieving the Fund’s investment goals.
The first half of 2022 was challenging to navigate. A more hawkish Federal Reserve, higher interest rates, and the possibility of moderating growth and valuation multiple compression converged to pressure REITs. The Russia/Ukraine war and the spillover effects of even higher inflation (food, wheat, crude oil, natural gas), further COVID-19-related lockdowns in China, supply-chain bottlenecks and multi-decade high inflation added to the uncertainty. These factors resulted in simultaneous and sharp declines in stocks, bonds, and most investable assets.
Among REIT categories, student housing REITs contributed slightly. Non-REIT real estate companies, industrial REITs, and multi-family REITs were the top detractors.
Student housing REIT American Campus Communities, Inc. was the top contributor. The stock price remained steady ahead of the company’s pending privatization scheduled to close during the third quarter. We remain shareholders in the interim. Student housing real estate cash flow has proven relatively resilient during the pandemic, and college enrollments are expected to grow while the development of new student housing is expected to slow.
Industrial warehouse REIT Prologis, Inc. was the top detractor. Shares fell following Amazon’s announcement that it would curtail warehouse leasing and potentially shrink its existing warehouse footprint, leading to investor concerns that industrial warehouse demand more generally would soon slow. We believe these concerns are unfounded and the prospects for Prologis remain favorable over the next several years.
Looking ahead, we are incrementally positive, in part because of the sharp correction in share prices. Most business fundamentals remain strong. Commercial and residential real estate is not overbuilt. Expectations for construction activity are modest. Corporate balance sheets are liquid. Certain segments of real estate can raise prices to provide partial inflation protection. Dividend yields continue to grow and are supported by strong cash flows. While the recent spike in interest rates and widening credit spreads are a headwind, we believe real estate, for the most, is in a good place relative to prior economic slowdowns and recessions.
| † | Sector levels are provided from the Global Industry Classification Standard (“GICS”), developed and exclusively owned by MSCI, Inc. and Standard & Poor’s Financial Services LLC, unless otherwise stated that they have been reclassified or classified by the Adviser. All GICS data is provided “as is” with no warranties. Individual weights may not sum to 100% due to rounding. |
| 1 | Performance information reflects the results of Retail Shares. |
15
| Baron Health Care Fund (Unaudited) | June 30, 2022 |
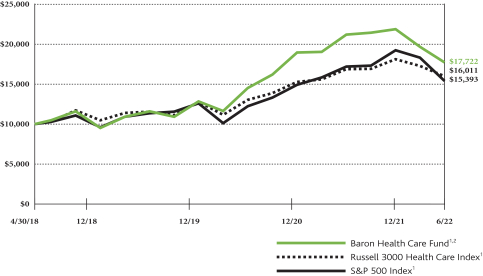
COMPARISONOFTHECHANGEIN VALUEOF $10,000INVESTMENTIN BARON HEALTH CARE FUND (RETAIL SHARES)
INRELATIONTOTHE RUSSELL 3000 HEALTH CARE INDEXANDTHE S&P 500 INDEX
| AVERAGE ANNUAL TOTAL RETURNSFORTHEPERIODSENDED JUNE 30, 2022 |
| |||||||||||||||
| Six Months* | One Year | Three Years | Since Inception (April 30, 2018) | |||||||||||||
Baron Health Care Fund — Retail Shares1,2 | (19.03)% | (16.48)% | 15.11% | 14.72% | ||||||||||||
Baron Health Care Fund — Institutional Shares1,2 | (18.94)% | (16.30)% | 15.40% | 15.00% | ||||||||||||
Baron Health Care Fund — R6 Shares1,2 | (18.94)% | (16.26)% | 15.40% | 15.00% | ||||||||||||
Russell 3000 Health Care Index1 | (11.64)% | (5.14)% | 11.48% | 11.96% | ||||||||||||
S&P 500 Index1 | (19.96)% | (10.62)% | 10.60% | 10.91% | ||||||||||||
| * | Not Annualized. |
| 1 | The Russell 3000 Health Care Index is a free float-adjusted market capitalization index that measures the performance of all equity in the US equity market. The S&P 500 Index measures the performance of 500 widely held large-cap U.S. companies. The indexes and Baron Health Care Fund are with dividends, which positively impact the performance results. The indexes are unmanaged. The index performance is not fund performance; one cannot invest directly into an index. |
| 2 | Past performance is not predictive of future performance. The performance data does not reflect the deduction of taxes that a shareholder would pay on Fund distributions or redemption of Fund shares. The Adviser reimburses certain Fund expenses pursuant to a contract expiring on August 29, 2032, unless renewed for another 11-year term and the Fund’s transfer agency expenses may be reduced by expense offsets from an unaffiliated transfer agent, without which performance would have been lower. |
16
| June 30, 2022 (Unaudited) | Baron Health Care Fund |
TOP TEN HOLDINGSASOF JUNE 30, 2022
| Percent of Net Assets | ||||
UnitedHealth Group Incorporated | 9.4% | |||
Eli Lilly and Company | 5.3% | |||
Thermo Fisher Scientific Inc. | 5.2% | |||
Bio-Techne Corporation | 4.9% | |||
AstraZeneca PLC | 4.2% | |||
argenx SE | 3.6% | |||
AbbVie Inc. | 3.5% | |||
McKesson Corporation | 3.3% | |||
Novo Nordisk A/S | 3.0% | |||
Dechra Pharmaceuticals PLC | 2.9% | |||
| 45.3% | ||||
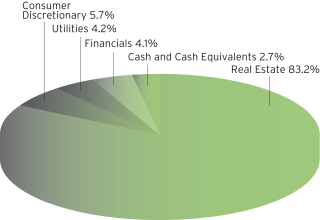
SECTOR BREAKDOWNASOF JUNE 30, 2022†
(as a percentage of net assets)
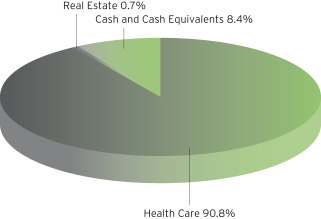
MANAGEMENT’S DISCUSSIONOF FUND PERFORMANCE
For the six months ended June 30, 2022, Baron Health Care Fund1 declined 19.03%, underperforming the Russell 3000 Health Care Index, which fell 11.64%.
Baron Health Care Fund is a non-diversified fund that under normal circumstances, invests at least 80% of its net assets in equity securities of companies engaged in the research, development, production, sale, delivery, or distribution of products and services related to the health care industry. The
Fund’s allocation among the different subsectors of the health care industry will vary depending upon the relative potential the Fund sees within each area. The Adviser seeks to invest in businesses it believes have significant growth opportunities, durable competitive advantages, exceptional management, and attractive valuations. The Fund may purchase securities of companies of any market capitalization and may invest in foreign stocks. Of course, there can be no guarantee that we will be successful in achieving the Fund’s investment goals.
The first half of 2022 was a difficult period for equities, and Health Care was no exception. Within the sector, however, different sub-industries were impacted differently by overall macroeconomic conditions. For instance, while still-subdued medical procedural volumes were a headwind for medical device companies, they were a tailwind for managed care companies. The valuation of many biotechnology stocks — a high-growth, high-risk group — were cut in half or more. Life sciences tools companies were pressured by concerns around peaking COVID-related revenues and a weak funding environment for biotechnology.
From a sub-industry perspective, health care distributors and managed health care contributed. Life sciences tools & services, health care equipment, and other health care-related companies detracted the most.
Eli Lilly and Company was the top contributor. Shares of this global pharmaceutical company rose on positive study results for its drug Tirzepatide (branded Mounjaro), which delivered up to 22.5% weight loss in adults with obesity. We think Tirzepatide is in the early innings of adoption in a large market with low penetration. We think Eli Lilly has a healthy base business with limited near-term patent expirations, a strong pipeline, and potential for significant margin expansion.
Bio-Techne Corporation was the top detractor. Shares of this seller of life science reagents, instruments, and services for the research, diagnostics, and bioprocessing markets worldwide fell along with other high-valuation and life sciences tools stocks due to concerns around inflation, interest rates, peaking COVID-related revenues, and a possible decline in biotechnology funding. We believe Bio-Techne is a stable business with multiple drivers that will enable it to grow revenue in the double digits over the next five years.
The Health Care sector has many favorable long-term attributes. Valuations are attractive, balance sheets are generally in good shape, and we believe we are at the start of a transformational period with major advances in science, medicine, and technology. We focus on identifying high-quality, competitively advantaged companies with great management teams that we believe will benefit from the secular trends we have identified.
| † | Sector levels are provided from the Global Industry Classification Standard (“GICS”), developed and exclusively owned by MSCI, Inc. and Standard & Poor’s Financial Services LLC, unless otherwise stated that they have been reclassified or classified by the Adviser. All GICS data is provided “as is” with no warranties. Individual weights may not sum to 100% due to rounding. |
| 1 | Performance information reflects results of the Retail Shares. |
17
| Baron FinTech Fund (Unaudited) | June 30, 2022 |
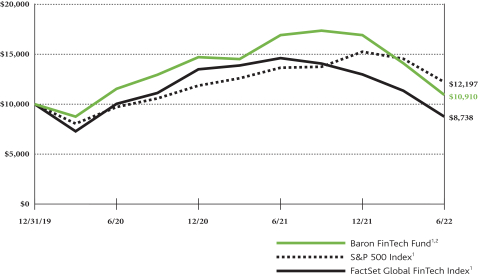
COMPARISONOFTHECHANGEIN VALUEOF $10,000INVESTMENTIN BARON FINTECH FUND (RETAIL SHARES)
INRELATIONTOTHE S&P 500 INDEXANDTHE FACTSET GLOBAL FINTECH INDEX
| AVERAGE ANNUAL TOTAL RETURNSFORTHEPERIODSENDED JUNE 30, 2022 |
| |||||||||||
| Six Months* | One Year | Since Inception (December 31, 2019)^ | ||||||||||
Baron FinTech Fund — Retail Shares1,2 | (35.44)% | (35.48)% | 3.55% | |||||||||
Baron FinTech Fund — Institutional Shares1,2 | (35.39)% | (35.36)% | 3.81% | |||||||||
Baron FinTech Fund — R6 Shares1,2 | (35.34)% | (35.30)% | 3.81% | |||||||||
S&P 500 Index1 | (19.96)% | (10.62)% | 8.27% | |||||||||
FactSet Global FinTech Index1 | (32.66)% | (40.15)% | (5.25)% | |||||||||
| * | Not Annualized. |
| ^ | Commencement of investment operations was January 2, 2020. |
| 1 | The S&P 500 Index measures the performance of 500 widely held large-cap U.S. companies. The FactSet Global FinTech Index is an unmanaged and equal-weighted index that measures the equity market performance of companies engaged in Financial Technologies, primarily in the areas of software and consulting, data and analytics, digital payment processing, money transfer, and payment transaction-related hardware, across 30 developed and emerging markets. The indexes and Baron FinTech Fund are with dividends, which positively impact the performance results. The indexes are unmanaged. The index performance is not fund performance; one cannot invest directly into an index. |
| 2 | Past performance is not predictive of future performance. The performance data does not reflect the deduction of taxes that a shareholder would pay on Fund distributions or redemption of Fund shares. The Adviser reimburses certain Fund expenses pursuant to a contract expiring on August 29, 2032, unless renewed for another 11-year term and the Fund’s transfer agency expenses may be reduced by expense offsets from an unaffiliated transfer agent, without which performance would have been lower. |
18
| June 30, 2022 (Unaudited) | Baron FinTech Fund |
TOP TEN HOLDINGSASOF JUNE 30, 2022
| Percent of Net Assets | ||||
Visa, Inc. | 5.6% | |||
LPL Financial Holdings Inc. | 5.3% | |||
Mastercard Incorporated | 5.0% | |||
Intuit Inc. | 4.7% | |||
S&P Global Inc. | 4.6% | |||
Accenture plc | 4.1% | |||
Endava plc | 3.9% | |||
MSCI, Inc. | 3.2% | |||
BlackRock Inc. | 3.2% | |||
Equifax Inc. | 2.9% | |||
| 42.5% | ||||
SECTOR BREAKDOWNASOF JUNE 30, 2022†
(as a percentage of net assets)
MANAGEMENT’S DISCUSSIONOF FUND PERFORMANCE
For the six months ended June 30, 2022, Baron FinTech Fund1 declined 35.44%, underperforming the S&P 500 Index, which declined 19.96%.
Baron FinTech Fund is a non-diversified fund that invests in companies of any market capitalization that develop or use innovative technologies related in a significant way to financial services. The Fund invests principally in U.S. securities but may invest up to 25% in non-U.S. securities. Of course, there can be no guarantee that we will be successful in achieving the Fund’s investment goals.
The first half of the year was exceptionally challenging for the markets, and FinTech was no exception. Investors grappled with persistently high inflation, rising interest rates, worsening geopolitical tensions, and COVID-related lockdowns in China. Most of the major U.S. market indexes entered bear market territory. Growth underperformed value by a wide margin, which tends to weigh on relative performance for higher growth FinTech stocks.
No sector contributed. Information Technology, Financials, and Industrials detracted the most.
LPL Financial Holdings Inc., the largest independent broker-dealer in the U.S., was the top contributor driven by positive revisions to earnings estimates. 2021 results showed continued growth in the business as LPL increased its assets 13%, up from 7% in 2020. LPL is also benefiting from rising interest rates as it earns a spread on cash held in client accounts. Increased market expectations of interest rate hikes suggest that LPL could earn an even larger yield, which is highly incremental to EBITDA and EPS.
The top detractor was Shopify Inc., a cloud-based software provider offering an operating system for multi-channel commerce. Shares fell due to post-pandemic e-commerce normalization, investor concerns around competition following Amazon’s announcement of Buy with Prime, and the broader sell-off in growth stocks. We believe Shopify has a strong competitive positioning, an innovative culture, and a long runway for growth as it currently addresses less than 1% of global commerce spend.
Despite the recent pullback, we feel positive about the growth prospects for our holdings. We believe FinTech investors are becoming more discerning about the durability of business models, expected profitability, the duration of growth, and the cost of capital. We believe greater investor discipline is healthy and should be a boon for the Fund and the types of businesses we favor. Longer term, we expect FinTech companies to benefit from secular growth trends such as the shift to electronic payments, the rise of e-commerce, the need for data and analytics to inform decision-making, the electronification of the capital markets, and the need for more modern technology and digital transformation in all areas of commerce.
| † | Sector levels are provided from the Global Industry Classification Standard (“GICS”), developed and exclusively owned by MSCI, Inc. and Standard & Poor’s Financial Services LLC, unless otherwise stated that they have been reclassified or classified by the Adviser. All GICS data is provided “as is” with no warranties. Individual weights may not sum to 100% due to rounding. |
| 1 | Performance information reflects results of the Retail Shares. |
19
| Baron New Asia Fund (Unaudited) | June 30, 2022 |
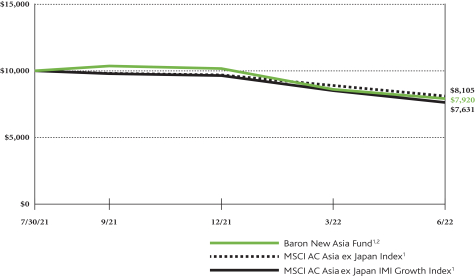
COMPARISONOFTHECHANGEIN VALUEOF $10,000INVESTMENTIN BARON NEW ASIA FUND (RETAIL SHARES)
INRELATIONTOTHE MSCI AC ASIAEX JAPAN INDEXAND MSCI AC ASIAEX JAPAN IMI GROWTH INDEX
| TOTAL RETURNSFORTHEPERIODSENDED JUNE 30, 2022 |
| |||||||
| Six Months* | Since Inception (July 30, 2021)* | |||||||
Baron New Asia Fund — Retail Shares1,2 | (22.12)% | (20.80)% | ||||||
Baron New Asia Fund — Institutional Shares1,2 | (21.93)% | (20.60)% | ||||||
Baron New Asia Fund — R6 Shares1,2 | (21.83)% | (20.50)% | ||||||
MSCI AC Asia ex Japan Index1 | (16.28)% | (18.95)% | ||||||
MSCI AC Asia ex Japan IMI Growth Index1 | (20.79)% | (23.69)% | ||||||
| * | Not Annualized. |
| 1 | The MSCI AC Asia ex Japan Index measures the performance of large and mid cap equity securities representation across 2 of 3 developed markets countries (excluding Japan) and 8 emerging markets countries in Asia. The MSCI AC Asia ex Japan IMI Growth Index measures the performance of large, mid, and small cap securities exhibiting overall growth style characteristics across 2 of 3 developed markets countries (excluding Japan) and 8 emerging market countries in Asia. MSCI is the source and owner of the trademarks, service marks and copyrights related to the MSCI Indexes. The indexes and Baron New Asia Fund include reinvestment of dividends, net of withholding taxes, which positively impact the performance results. The indexes are unmanaged. The index performance is not fund performance; one cannot invest directly into an index. |
| 2 | Past performance is not predictive of future performance. The performance data does not reflect the deduction of taxes that a shareholder would pay on Fund distributions or redemption of Fund shares. The Adviser reimburses certain Fund expenses pursuant to a contract expiring on August 29, 2032, unless renewed for another 11-year term and the Fund’s transfer agency expenses may be reduced by expense offsets from an unaffiliated transfer agent, without which performance would have been lower. |
20
| June 30, 2022 (Unaudited) | Baron New Asia Fund |
TOP TEN HOLDINGSASOF JUNE 30, 2022
| Percent of Net Assets | ||||
Taiwan Semiconductor Manufacturing Company Ltd. | 4.6% | |||
Tencent Holdings Limited | 3.7% | |||
Alibaba Group Holding Limited | 3.3% | |||
Samsung Electronics Co., Ltd. | 3.1% | |||
Reliance Industries Limited | 3.1% | |||
Kweichow Moutai Co., Ltd. | 2.5% | |||
Yum China Holdings Inc. | 2.5% | |||
ICICI Bank Limited | 2.4% | |||
Bharti Airtel Limited | 2.4% | |||
Hong Kong Exchanges and Clearing Limited | 2.1% | |||
| 29.7% | ||||
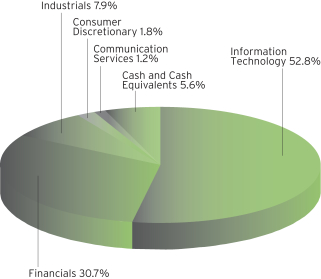
SECTOR BREAKDOWNASOF JUNE 30, 2022†
(as a percentage of net assets)
MANAGEMENT’S DISCUSSIONOF FUND PERFORMANCE
For the six months ended June 30, 2022, Baron New Asia Fund1 declined 22.12%, underperforming the MSCI AC Asia ex Japan Index, which fell 16.28%.
Baron New Asia Fund is a diversified fund that invests primarily in companies of all sizes with significant growth potential located in Asia. The Fund emphasizes securities in developing Asian markets, including frontier markets. Under normal circumstances, the Fund invests 80% of its net assets in companies located in Asia. The Fund seeks to invest in companies with significant long-term growth prospects and purchase them at prices we believe to be favorable. Of course, there can be no guarantee that we will be successful in achieving the Fund’s investment goals.
The first half of 2022 was an exceptionally challenging time for global equities, and Asian markets were no exception. Stubbornly high inflation, a much more hawkish U.S. Federal Reserve, global supply-chain disruptions, Russia’s invasion of Ukraine, and China’s COVID-related shutdown combined to spur a precipitous sell-off. While there were few bright spots, we do believe peak inflation panic has likely passed. Should this prove to be the case, we would expect growth equity relative performance also to have bottomed, with material headroom for recovery in the coming months.
No country contributed. India, China, and Taiwan were the top detractors.
No sector contributed. Information Technology, Health Care, and Industrials were the top detractors.
Hyundai Heavy Industries Co., Ltd. was the top contributor. Shares of the world’s largest shipbuilder and global leader of eco-friendly LNG powered ships rose on increased demand for LNG carriers given the rise in natural gas prices. We believe the company will be the leading beneficiary of the trend in decarbonization of shipping given its technological leadership and dominant market position.
Semiconductor giant Taiwan Semiconductor Manufacturing Company Ltd. (Taiwan Semi) was the top detractor. Shares fell due to rising geopolitical tensions, macroeconomic uncertainties, and concerns over softening demand for consumer electronics. We believe Taiwan Semi’s technological leadership, pricing power, and exposure to secular growth markets, including high-performance computing, automotive, and IoT, will allow it to deliver above its 15% to 20% revenue growth target over the next several years.
We believe Asian equities are poised for a sustained period of outperformance. After a 30-year period of globalization that led to subdued capital investment, the changing nature of U.S./China relations and Russia’s aggression necessitate a global capital investment cycle, in our view. Such a cycle has nearly always correlated with Asian outperformance as these markets are more sensitive to the beneficiaries of such an environment. We believe commodity prices will likely remain elevated, which should incentivize investment in secure energy, commodity, and agricultural supply and help fund de-globalization. We view this scenario as a transfer of wealth toward the owners of real assets and producers of industrial goods, which are more concentrated in Asia. We are confident we have invested in well-positioned and well-managed companies with substantial long-term investment return potential.
| † | Sector levels are provided from the Global Industry Classification Standard (“GICS”), developed and exclusively owned by MSCI, Inc. and Standard & Poor’s Financial Services LLC, unless otherwise stated that they have been reclassified or classified by the Adviser. All GICS data is provided “as is” with no warranties. Individual weights may not sum to 100% due to rounding. |
| 1 | Performance information reflects results of the Retail Shares. |
21
| Baron Technology Fund (Unaudited) | June 30, 2022 |
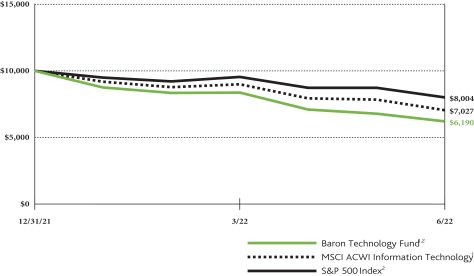
COMPARISONOFTHECHANGEIN VALUEOF $10,000INVESTMENTIN BARON TECHNOLOGY FUND (RETAIL SHARES)
INRELATIONTOTHE MSCI ACWI INFORMATION TECHNOLOGY INDEXANDTHE S&P 500 INDEX
| TOTAL RETURNSFORTHEPERIODENDED JUNE 30, 2022 | ||||
| Six Months and Since Inception (December 31, 2021)*^ | ||||
Baron Technology Fund — Retail Shares1,2 | (38.10)% | |||
Baron Technology Fund — Institutional Shares1,2 | (38.10)% | |||
Baron Technology Fund — R6 Shares1,2 | (38.10)% | |||
MSCI ACWI Information Technology Index1 | (29.73)% | |||
S&P 500 Index1 | (19.96)% | |||
| * | Not Annualized. |
| ^ | Commencement of investment operations was January 3, 2022. |
| 1 | The MSCI ACWI Information Technology Index includes large and mid cap securities across 23 developed markets countries and 24 emerging markets countries. All securities in the index are classified in the Information Technology as per the Global Industry Classification Standard. The S&P 500 Index measures the performance of 500 widely held large-cap U.S. companies. The indexes and Baron Technology Fund are with dividends, which positively impact the performance results. The indexes are unmanaged. The index performance is not fund performance; one cannot invest directly into an index. |
| 2 | Past performance is not predictive of future performance. The performance data does not reflect the deduction of taxes that a shareholder would pay on Fund distributions or redemption of Fund shares. The Adviser reimburses certain Fund expenses pursuant to a contract expiring on August 29, 2032, unless renewed for another 11-year term and the Fund’s transfer agency expenses may be reduced by expense offsets from an unaffiliated transfer agent, without which performance would have been lower. |
22
| June 30, 2022 (Unaudited) | Baron Technology Fund |
TOP TEN HOLDINGSASOF JUNE 30, 2022
| Percent of Net Assets | ||||
Microsoft Corporation | 10.3% | |||
Amazon.com, Inc. | 9.3% | |||
ServiceNow, Inc. | 3.8% | |||
CoStar Group, Inc. | 3.7% | |||
Gartner, Inc. | 3.3% | |||
Alphabet Inc. | 3.2% | |||
Visa, Inc. | 3.0% | |||
Endava plc | 3.0% | |||
Mastercard Incorporated | 2.9% | |||
NVIDIA Corporation | 2.8% | |||
| 45.3% | ||||
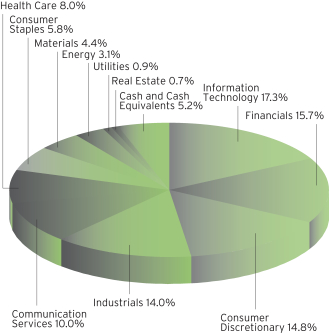
SECTOR BREAKDOWNASOF JUNE 30, 2022
(as a percentage of net assets)
MANAGEMENT’S DISCUSSIONOF FUND PERFORMANCE
For the six months ended June 30, 2022, Baron Technology Fund1 declined 38.10%, underperforming the MSCI ACWI Information Technology Index, which retreated 29.73%.
Baron Technology Fund is a non-diversified fund that invests primarily in companies of any market capitalization that we believe have durable growth potential from the development, advancement, and/or use of technology. The Fund invests principally in U.S. securities but may invest up to 35% in non-U.S. securities. The Fund seeks to invest in companies with significant long-term growth prospects and purchase them at prices we believe to be favorable. Of course, there can be no guarantee that we will be successful in achieving the Fund’s investment goals.
The first half of the year was exceptionally challenging for the markets, and Information Technology stocks were hit especially hard, with the MSCI ACWI Information Technology Index underperforming the S&P 500 Index by 977 basis points. Investors grappled with persistently high inflation, rising interest rates, worsening geopolitical tensions, and COVID-related lockdowns in China. Most of the major U.S. market indexes entered bear market territory.
No industry contributed. Software, semiconductors & semiconductor equipment, and IT services detracted the most.
Alibaba Group Holding Limited was the top contributor. Alibaba is the largest retailer and e-commerce company in China. It operates shopping platforms Taobao and Tmall and owns 33% of Ant Group, which operates Alipay, China’s largest third-party online payment provider. Shares of Alibaba rose during the period, driven by an increasing focus on improving capital allocation, an improving regulatory environment, and government stimulus targeting Chinese consumers. We retain conviction that Alibaba will benefit from rapid growth in cloud services, logistics, and retail.
Amazon.com, Inc. was the top detractor. Shares of the world’s largest retailer and cloud services provider declined due to disappointing profit results resulting from an overcapacity of resources coming out of COVID. We expect Amazon to grow into its retail capacity in the quarters to come and improve profitability accordingly. While Amazon retains roughly 40% of e-commerce market share in the U.S., the more material revenue driver is Amazon Web Services, which remains a leader in the vast and growing cloud infrastructure market.
We invest for the long term in Information Technology businesses that we believe will benefit from secular growth trends, durable competitive advantages, and best-in-class management. We remain optimistic that this approach will generate strong long-term performance regardless of the economic climate.
| † | Sector levels are provided from the Global Industry Classification Standard (“GICS”), developed and exclusively owned by MSCI, Inc. and Standard & Poor’s Financial Services LLC, unless otherwise stated that they have been reclassified or classified by the Adviser. All GICS data is provided “as is” with no warranties. Individual weights may not sum to 100% due to rounding. |
| 1 | Performance information reflects results of the Retail Shares. |
23
| Baron Partners Fund | June 30, 2022 |
STATEMENT OF NET ASSETS (Unaudited)
JUNE 30, 2022
|
| Shares | Cost | Value | ||||||||||
| Common Stocks (106.41%) | ||||||||||||
| Communication Services (5.40%) | ||||||||||||
Alternative Carriers (2.72%) | ||||||||||||
| 4,000,000 | Iridium Communications, Inc.1 | $ | 130,869,959 | $ | 150,240,000 | |||||||
Movies & Entertainment (2.68%) | ||||||||||||
| 912,357 | Manchester United plc, Cl A2 | 16,472,199 | 10,145,410 | |||||||||
| 1,473,902 | Spotify Technology SA1,2 | 304,800,247 | 138,296,225 | |||||||||
|
|
|
| |||||||||
| 321,272,446 | 148,441,635 | |||||||||||
|
|
|
| |||||||||
Total Communication Services | 452,142,405 | 298,681,635 | ||||||||||
|
|
|
| |||||||||
| Consumer Discretionary (60.45%) | ||||||||||||
Automobile Manufacturers (49.31%) |
| |||||||||||
| 4,050,000 | Tesla, Inc.1,5 | 183,531,738 | 2,727,351,000 | |||||||||
Casinos & Gaming (0.67%) |
| |||||||||||
| 1,100,000 | Red Rock Resorts, Inc., Cl A | 34,033,621 | 36,696,000 | |||||||||
Footwear (0.11%) |
| |||||||||||
| 350,000 | On Holding AG, Cl A1,2 | 9,489,013 | 6,191,500 | |||||||||
Hotels, Resorts & Cruise Lines (6.01%) |
| |||||||||||
| 60,000 | Airbnb, Inc., Cl A1 | 5,837,033 | 5,344,800 | |||||||||
| 3,325,000 | Hyatt Hotels Corp., Cl A1 | 115,871,182 | 245,750,750 | |||||||||
| 700,000 | Marriott Vacations Worldwide Corp. | 81,762,309 | 81,340,000 | |||||||||
|
|
|
| |||||||||
| 203,470,524 | 332,435,550 | |||||||||||
Leisure Facilities (4.14%) |
| |||||||||||
| 1,050,000 | Vail Resorts, Inc. | 64,124,520 | 228,952,500 | |||||||||
Restaurants (0.21%) |
| |||||||||||
| 845,000 | Krispy Kreme, Inc. | 14,332,961 | 11,492,000 | |||||||||
|
|
|
| |||||||||
Total Consumer Discretionary | 508,982,377 | 3,343,118,550 | ||||||||||
|
|
|
| |||||||||
| Financials (17.90%) | ||||||||||||
Asset Management & Custody Banks (1.45%) | ||||||||||||
| 1,000,000 | Brookfield Asset Management, Inc., Cl A2 | 35,923,845 | 44,470,000 | |||||||||
| 560,000 | Cohen & Steers, Inc. | 43,971,399 | 35,610,400 | |||||||||
|
|
|
| |||||||||
| 79,895,244 | 80,080,400 | |||||||||||
Financial Exchanges & Data (6.38%) |
| |||||||||||
| 720,000 | FactSet Research Systems, Inc. | 55,503,768 | 276,890,400 | |||||||||
| 185,000 | MSCI, Inc. | 56,540,114 | 76,247,750 | |||||||||
|
|
|
| |||||||||
| 112,043,882 | 353,138,150 | |||||||||||
Investment Banking & Brokerage (4.68%) | ||||||||||||
| 4,100,000 | The Charles Schwab Corp. | 100,494,277 | 259,038,000 | |||||||||
Property & Casualty Insurance (5.39%) |
| |||||||||||
| 6,550,000 | Arch Capital Group Ltd.1,2 | 30,153,582 | 297,959,500 | |||||||||
|
|
|
| |||||||||
Total Financials | 322,586,985 | 990,216,050 | ||||||||||
|
|
|
| |||||||||
| Health Care (5.34%) | ||||||||||||
Health Care Equipment (5.07%) | ||||||||||||
| 800,000 | IDEXX Laboratories, Inc.1 | 35,048,047 | 280,584,000 | |||||||||
Life Sciences Tools & Services (0.27%) |
| |||||||||||
| 80,000 | Illumina, Inc.1 | 18,975,807 | 14,748,800 | |||||||||
|
|
|
| |||||||||
Total Health Care | 54,023,854 | 295,332,800 | ||||||||||
|
|
|
| |||||||||
| Shares | Cost | Value | ||||||||||
| Common Stocks (continued) | ||||||||||||
| Industrials (8.62%) | ||||||||||||
Aerospace & Defense (0.52%) | ||||||||||||
| 125,625 | HEICO Corp. | $ | 9,632,520 | $ | 16,471,950 | |||||||
| 116,875 | HEICO Corp., Cl A | 7,586,429 | 12,316,287 | |||||||||
|
|
|
| |||||||||
| 17,218,949 | 28,788,237 | |||||||||||
Industrial Machinery (0.07%) |
| |||||||||||
| 2,750,000 | Velo3D, Inc.1 | 9,800,825 | 3,795,000 | |||||||||
Research & Consulting Services (8.03%) | ||||||||||||
| 7,350,000 | CoStar Group, Inc.1 | 98,974,400 | 444,013,500 | |||||||||
|
|
|
| |||||||||
Total Industrials | 125,994,174 | 476,596,737 | ||||||||||
|
|
|
| |||||||||
| Information Technology (6.75%) | ||||||||||||
Application Software (1.15%) |
| |||||||||||
| 900,000 | Guidewire Software, Inc.1 | 73,150,321 | 63,891,000 | |||||||||
Data Processing & Outsourced Services (1.55%) | ||||||||||||
| 59,246 | Adyen N.V., 144A (Netherlands)1,2,7 | 53,544,383 | 85,499,797 | |||||||||
Internet Services & Infrastructure (0.99%) | ||||||||||||
| 1,750,000 | Shopify, Inc., Cl A1,2 | 161,196,632 | 54,670,000 | |||||||||
IT Consulting & Other Services (3.06%) | ||||||||||||
| 700,000 | Gartner, Inc.1 | 83,980,674 | 169,281,000 | |||||||||
|
|
|
| |||||||||
Total Information Technology | 371,872,010 | 373,341,797 | ||||||||||
|
|
|
| |||||||||
| Real Estate (1.95%) | ||||||||||||
Office REITs (0.44%) |
| |||||||||||
| 1,085,000 | Douglas Emmett, Inc. | 29,698,261 | 24,282,300 | |||||||||
Specialized REITs (1.51%) |
| |||||||||||
| 1,819,296 | Gaming and Leisure Properties, Inc. | 57,529,251 | 83,432,915 | |||||||||
|
|
|
| |||||||||
Total Real Estate | 87,227,512 | 107,715,215 | ||||||||||
|
|
|
| |||||||||
Total Common Stocks | 1,922,829,317 | 5,885,002,784 | ||||||||||
|
|
|
| |||||||||
| Private Common Stocks (3.49%) | ||||||||||||
| Consumer Discretionary (0.43%) | ||||||||||||
Internet & Direct Marketing Retail (0.43%) | ||||||||||||
| 197,613 | StubHub Holdings, Inc., Cl A1,3,4,8 | 50,000,041 | 23,707,632 | |||||||||
|
|
|
| |||||||||
| Industrials (3.06%) | ||||||||||||
Aerospace & Defense (3.06%) | ||||||||||||
| 2,216,310 | Space Exploration Technologies Corp., Cl A1,3,4,8 | 29,920,185 | 149,006,688 | |||||||||
| 302,210 | Space Exploration Technologies Corp., Cl C1,3,4,8 | 4,079,835 | 20,318,146 | |||||||||
|
|
|
| |||||||||
Total Industrials | 34,000,020 | 169,324,834 | ||||||||||
|
|
|
| |||||||||
Total Private Common Stocks | 84,000,061 | 193,032,466 | ||||||||||
|
|
|
| |||||||||
| 24 | See Notes to Financial Statements. |
| June 30, 2022 | Baron Partners Fund |
STATEMENT OF NET ASSETS (Unaudited) (Continued)
JUNE 30, 2022
|
| Shares | Cost | Value | ||||||||||
| Private Convertible Preferred Stocks (0.14%) | ||||||||||||
| Industrials (0.14%) | ||||||||||||
Electrical Components & Equipment (0.14%) | ||||||||||||
| 21,213,656 | Northvolt AB, Series E2 (Sweden)1,2,3,4,8 | $ | 7,843,621 | $ | 7,939,847 | |||||||
|
|
|
| |||||||||
| Private Preferred Stocks (6.73%) | ||||||||||||
| Industrials (6.73%) | ||||||||||||
Aerospace & Defense (6.73%) |
| |||||||||||
| 311,111 | Space Exploration Technologies Corp., Cl H1,3,4,8 | 41,999,985 | 209,165,762 | |||||||||
| 131,657 | Space Exploration Technologies Corp., Cl I1,3,4,8 | 22,250,032 | 88,515,471 | |||||||||
| 111,111 | Space Exploration Technologies Corp., Cl N1,3,4,8 | 29,999,970 | 74,702,010 | |||||||||
|
|
|
| |||||||||
Total Private Preferred Stocks | 94,249,987 | 372,383,243 | ||||||||||
|
|
|
| |||||||||
Total Investments (116.77%) | $ | 2,108,922,986 | 6,458,358,340 | |||||||||
|
| |||||||||||
Liabilities Less Cash and Other Assets (-16.77%)6 | (927,686,421 | ) | ||||||||||
|
| |||||||||||
Net Assets | $ | 5,530,671,919 | ||||||||||
|
| |||||||||||
| | Retail Shares (Equivalent to $129.98 per share | | $ | 2,474,874,241 | ||||||||
|
| |||||||||||
| | Institutional Shares (Equivalent to $134.69 per share | | $ | 2,648,196,404 | ||||||||
|
| |||||||||||
| | R6 Shares (Equivalent to $134.69 per share | | $ | 407,601,274 | ||||||||
|
| |||||||||||
| % | Represents percentage of net assets. |
| 1 | Non-income producing securities. |
| 2 | Foreign corporation. |
| 3 | At June 30, 2022, the market value of restricted and fair valued securities amounted to $573,355,556 or 10.37% of net assets. These securities are not deemed liquid. See Note 6 regarding Restricted Securities. |
| 4 | The Adviser has reclassified/classified certain securities in or out of this sub-industry. Such reclassifications/classifications are not supported by S&P or MSCI (unaudited). |
| 5 | Investors in the Fund may view Tesla, Inc.’s financial statements on the EDGAR website of the U.S. Securities and Exchange Commission by going to https://www.sec.gov/cgi-bin/browse-edgar?CIK=1318605&owner=exclude. Please note that the Fund is not responsible for Tesla’s financial statements and can provide no assurances as to their accuracy or completeness. |
| 6 | Includes net unrealized depreciation of $502,786 on an unfunded commitment to purchase a when-issued private investment in a public entity. |
| 7 | Level 2 security. See Note 7 regarding Fair Value Measurements. |
| 8 | Level 3 security. See Note 7 regarding Fair Value Measurements. |
| 144A | Security is exempt from registration pursuant to Rule 144A under the Securities Act of 1933. This security may be resold in transactions that are exempt from registration, normally to qualified institutional buyers. At June 30, 2022, the market value of Rule 144A securities amounted to $85,499,797 or 1.55% of net assets. |
All securities are Level 1, unless otherwise noted.
| See Notes to Financial Statements. | 25 |
| Baron Focused Growth Fund | June 30, 2022 |
STATEMENT OF NET ASSETS (Unaudited)
JUNE 30, 2022
|
| Shares | Cost | Value | ||||||||||
| Common Stocks (78.26%) | ||||||||||||
| Communication Services (7.39%) | ||||||||||||
Alternative Carriers (3.56%) |
| |||||||||||
| 637,064 | Iridium Communications, Inc.1 | $ | 12,123,685 | $ | 23,928,124 | |||||||
Movies & Entertainment (3.83%) |
| |||||||||||
| 275,000 | Spotify Technology SA1,2 | 50,894,626 | 25,803,250 | |||||||||
|
|
|
| |||||||||
Total Communication Services | 63,018,311 | 49,731,374 | ||||||||||
|
|
|
| |||||||||
| Consumer Discretionary (41.50%) | ||||||||||||
Automobile Manufacturers (20.50%) |
| |||||||||||
| 205,000 | Tesla, Inc.1,5 | 8,168,271 | 138,051,100 | |||||||||
Casinos & Gaming (7.16%) |
| |||||||||||
| 150,000 | Boyd Gaming Corporation | 9,824,271 | 7,462,500 | |||||||||
| 275,000 | MGM Resorts International | 12,316,040 | 7,961,250 | |||||||||
| 470,000 | Penn National Gaming, Inc.1 | 8,830,397 | 14,297,400 | |||||||||
| 553,860 | Red Rock Resorts, Inc., Cl A | 14,851,804 | 18,476,769 | |||||||||
|
|
|
| |||||||||
| 45,822,512 | 48,197,919 | |||||||||||
Hotels, Resorts & Cruise Lines (8.06%) |
| |||||||||||
| 155,000 | Choice Hotels International, Inc. | 5,375,923 | 17,302,650 | |||||||||
| 500,000 | Hyatt Hotels Corp., Cl A1 | 24,424,809 | 36,955,000 | |||||||||
|
|
|
| |||||||||
| 29,800,732 | 54,257,650 | |||||||||||
Leisure Facilities (4.37%) |
| |||||||||||
| 135,000 | Vail Resorts, Inc. | 14,955,931 | 29,436,750 | |||||||||
Restaurants (1.41%) |
| |||||||||||
| 698,888 | Krispy Kreme, Inc. | 9,790,899 | 9,504,877 | |||||||||
|
|
|
| |||||||||
Total Consumer Discretionary | 108,538,345 | 279,448,296 | ||||||||||
|
|
|
| |||||||||
| Financials (15.38%) | ||||||||||||
Financial Exchanges & Data (9.30%) | ||||||||||||
| 82,500 | FactSet Research Systems, Inc. | 9,125,394 | 31,727,025 | |||||||||
| 75,000 | MSCI, Inc. | 36,079,367 | 30,911,250 | |||||||||
|
|
|
| |||||||||
| 45,204,761 | 62,638,275 | |||||||||||
Property & Casualty Insurance (6.08%) |
| |||||||||||
| 900,000 | Arch Capital Group Ltd.1,2 | 25,104,585 | 40,941,000 | |||||||||
|
|
|
| |||||||||
Total Financials | 70,309,346 | 103,579,275 | ||||||||||
|
|
|
| |||||||||
| Health Care (1.83%) | ||||||||||||
Health Care Supplies (1.83%) |
| |||||||||||
| 1,350,000 | Figs, Inc., Cl A1 | 11,234,017 | 12,298,500 | |||||||||
|
|
|
| |||||||||
| Industrials (6.75%) | ||||||||||||
Research & Consulting Services (6.75%) |
| |||||||||||
| 580,000 | CoStar Group, Inc.1 | 10,184,660 | 35,037,800 | |||||||||
| 60,000 | Verisk Analytics, Inc. | 10,438,106 | 10,385,400 | |||||||||
|
|
|
| |||||||||
Total Industrials | 20,622,766 | 45,423,200 | ||||||||||
|
|
|
| |||||||||
| Information Technology (4.23%) | ||||||||||||
Application Software (3.69%) |
| |||||||||||
| 350,000 | Guidewire Software, Inc.1 | 34,820,618 | 24,846,500 | |||||||||
Electronic Equipment & Instruments (0.54%) | ||||||||||||
| 635,600 | Mirion Technologies, Inc.1 | 6,356,000 | 3,661,056 | |||||||||
|
|
|
| |||||||||
Total Information Technology | 41,176,618 | 28,507,556 | ||||||||||
|
|
|
| |||||||||
| Real Estate (1.18%) | ||||||||||||
Residential REITs (1.18%) |
| |||||||||||
| 225,000 | American Homes 4 Rent, Cl A | 4,700,804 | 7,974,000 | |||||||||
|
|
|
| |||||||||
Total Common Stocks | 319,600,207 | 526,962,201 | ||||||||||
|
|
|
| |||||||||
| Shares | Cost | Value | ||||||||||
| Private Common Stocks (7.71%) | ||||||||||||
| Industrials (7.71%) | ||||||||||||
Aerospace & Defense (7.71%) |
| |||||||||||
| 629,570 | Space Exploration Technologies Corp., Cl A1,3,4,7 | $ | 26,390,845 | $ | 42,327,175 | |||||||
| 143,170 | Space Exploration Technologies Corp., Cl C1,3,4,7 | 6,808,820 | 9,625,588 | |||||||||
|
|
|
| |||||||||
Total Private Common Stocks | 33,199,665 | 51,952,763 | ||||||||||
|
|
|
| |||||||||
| Private Preferred Stocks (4.03%) | ||||||||||||
| Industrials (4.03%) | ||||||||||||
Aerospace & Defense (4.03%) |
| |||||||||||
| 29,630 | Space Exploration Technologies Corp., Cl H1,3,4,7 | 4,000,050 | 19,920,805 | |||||||||
| 1,479 | Space Exploration Technologies Corp., Cl I1,3,4,7 | 249,951 | 994,360 | |||||||||
| 9,259 | Space Exploration Technologies Corp., Cl N1,3,4,7 | 2,499,930 | 6,224,999 | |||||||||
|
|
|
| |||||||||
Total Private Preferred Stocks | 6,749,931 | 27,140,164 | ||||||||||
|
|
|
| |||||||||
| Principal Amount | ||||||||||||
| Short Term Investments (10.50%) | ||||||||||||
| $70,683,247 | Repurchase Agreement with | 70,683,247 | 70,683,247 | |||||||||
|
|
|
| |||||||||
Total Investments (100.50%) | $ | 430,233,050 | 676,738,375 | |||||||||
|
| |||||||||||
Liabilities Less Cash and Other Assets (-0.50%) | (3,356,395 | ) | ||||||||||
|
| |||||||||||
Net Assets | $ | 673,381,980 | ||||||||||
|
| |||||||||||
| | Retail Shares (Equivalent to $32.75 per share | | $ | 167,913,820 | ||||||||
|
| |||||||||||
| | Institutional Shares (Equivalent to $33.95 per share | | $ | 249,286,790 | ||||||||
|
| |||||||||||
| | R6 Shares (Equivalent to $33.97 per share | | $ | 256,181,370 | ||||||||
|
| |||||||||||
| % | Represents percentage of net assets. |
| 1 | Non-income producing securities. |
| 2 | Foreign corporation. |
| 3 | At June 30, 2022, the market value of restricted and fair valued securities amounted to $79,092,927 or 11.75% of net assets. These securities are not deemed liquid. See Note 6 regarding Restricted Securities. |
| 4 | The Adviser has reclassified/classified certain securities in or out of this sub-industry. Such reclassifications/classifications are not supported by S&P or MSCI (unaudited). |
| 5 | Investors in the Fund may view Tesla, Inc.’s financial statements on the EDGAR website of the U.S. Securities and Exchange Commission by going to https://www.sec.gov/cgi-bin/browse-edgar?CIK=1318605&owner=exclude. Please note that the Fund is not responsible for Tesla’s financial statements and can provide no assurances as to their accuracy or completeness. |
| 6 | Level 2 security. See Note 7 regarding Fair Value Measurements. |
| 7 | Level 3 security. See Note 7 regarding Fair Value Measurements. |
All securities are Level 1, unless otherwise noted.
| 26 | See Notes to Financial Statements. |
| June 30, 2022 | Baron International Growth Fund |
STATEMENT OF NET ASSETS (Unaudited)
JUNE 30, 2022
|
| Shares | Cost | Value | ||||||||||
| Common Stocks (95.41%) | ||||||||||||
| Australia (0.86%) | ||||||||||||
| 304,862 | Newcrest Mining Limited3 | $ | 6,243,197 | $ | 4,343,132 | |||||||
|
|
|
| |||||||||
| Brazil (3.46%) | ||||||||||||
| 327,118 | Afya Ltd., Cl A1 | 5,716,713 | 3,254,824 | |||||||||
| 1,032,568 | B3 S.A. - Brasil, Bolsa, Balcao | 2,545,923 | 2,162,425 | |||||||||
| 1,736,400 | Hapvida Participacoes e Investimentos SA, 144A | 3,293,879 | 1,814,885 | |||||||||
| 211,398 | StoneCo Ltd., Cl A1 | 2,189,141 | 1,627,765 | |||||||||
| 737,768 | Suzano SA | 7,221,286 | 7,004,880 | |||||||||
| 89,045 | XP, Inc., Cl A1 | 2,708,835 | 1,599,248 | |||||||||
|
|
|
| |||||||||
Total Brazil | 23,675,777 | 17,464,027 | ||||||||||
|
|
|
| |||||||||
| Canada (3.21%) | ||||||||||||
| 98,668 | Agnico Eagle Mines Ltd. | 4,813,754 | 4,515,048 | |||||||||
| 123,974 | CAE, Inc.1 | 1,428,375 | 3,055,046 | |||||||||
| 5,816 | Constellation Software, Inc. | 1,319,055 | 8,633,949 | |||||||||
|
|
|
| |||||||||
Total Canada | 7,561,184 | 16,204,043 | ||||||||||
|
|
|
| |||||||||
| China (13.63%) | ||||||||||||
| 53,684 | Alibaba Group Holding Limited, ADR1 | 6,203,523 | 6,102,797 | |||||||||
| 42,330 | Baidu, Inc., ADR1 | 6,099,768 | 6,295,741 | |||||||||
| 3,808,855 | China Conch Environment Protection Holdings Ltd.1 | 3,273,062 | 2,650,297 | |||||||||
| 597,802 | China Conch Venture Holdings Ltd.3 | 2,229,898 | 1,303,908 | |||||||||
| 81,836 | China Tourism Group Duty Free Corporation Ltd., Cl A3 | 1,336,562 | 2,853,024 | |||||||||
| 1,245,775 | Estun Automation Co. Ltd., Cl A3 | 5,019,302 | 4,574,238 | |||||||||
| 554,294 | Full Truck Alliance Co. Ltd., ADR1 | 4,188,490 | 5,021,904 | |||||||||
| 57,439 | GDS Holdings Limited, ADR1 | 2,952,949 | 1,917,888 | |||||||||
| 524,210 | Han’s Laser Technology Industry Group Co., Ltd., Cl A3 | 2,982,523 | 2,602,413 | |||||||||
| 682,396 | Hua Hong Semiconductor Limited, 144A1,3 | 1,692,898 | 2,477,002 | |||||||||
| 28,394 | JD.com, Inc., ADR1 | 2,002,983 | 1,823,463 | |||||||||
| 7,320 | JD.com, Inc., Cl A1,3 | 266,534 | 235,872 | |||||||||
| 1,405,269 | Kingdee International Software Group Co. Ltd.1,3 | 1,180,264 | 3,310,828 | |||||||||
| 1,111,728 | Kingsoft Corp. Ltd.3 | 4,429,707 | 4,343,945 | |||||||||
| 446,308 | Midea Group Co., Ltd., Cl A3 | 3,749,417 | 4,039,559 | |||||||||
| 48,764 | Shenzhen Mindray Bio-Medical Electronics Co. Ltd., Cl A3 | 1,267,527 | 2,286,559 | |||||||||
| 75,889 | Tencent Holdings Limited3 | 2,595,715 | 3,435,125 | |||||||||
| 33,213 | Tencent Holdings Limited, ADR | 2,081,142 | 1,507,538 | |||||||||
| 71,951 | Will Semiconductor Co. Ltd. Shanghai, Cl A1,3 | 2,342,147 | 1,867,300 | |||||||||
| 348,184 | Wuxi Biologics Cayman, Inc., 144A1,3 | 2,606,123 | 3,226,071 | |||||||||
| 79,115 | Yum China Holdings, Inc. | 3,854,353 | 3,837,077 | |||||||||
| 89,268 | Zai Lab Limited, ADR1 | 2,498,240 | 3,095,814 | |||||||||
|
|
|
| |||||||||
Total China | 64,853,127 | 68,808,363 | ||||||||||
|
|
|
| |||||||||
| Denmark (1.00%) | ||||||||||||
| 154,879 | Genmab A/S, ADR1 | 6,150,648 | 5,032,019 | |||||||||
|
|
|
| |||||||||
| France (8.11%) | ||||||||||||
| 168,492 | BNP Paribas S.A.3 | 6,452,423 | 8,059,302 | |||||||||
| 92,330 | Eurofins Scientific SE3 | 2,429,163 | 7,292,050 | |||||||||
| 8,907 | LVMH Moët Hennessy Louis Vuitton SE3 | 2,802,671 | 5,458,901 | |||||||||
| 42,700 | Pernod Ricard SA3 | 8,253,649 | 7,894,151 | |||||||||
| 418,139 | Vivendi SA3 | 3,847,828 | 4,267,062 | |||||||||
| 242,654 | Waga Energy SA1 | 6,991,693 | 7,984,683 | |||||||||
|
|
|
| |||||||||
Total France | 30,777,427 | 40,956,149 | ||||||||||
|
|
|
| |||||||||
| Shares | Cost | Value | ||||||||||
| Common Stocks (continued) | ||||||||||||
| Germany (2.74%) | ||||||||||||
| 119,007 | Befesa SA, 144A3 | $ | 5,251,012 | $ | 5,800,774 | |||||||
| 235,944 | Mister Spex SE1 | 6,633,159 | 1,384,642 | |||||||||
| 60,859 | Symrise AG3 | 5,295,422 | 6,637,601 | |||||||||
|
|
|
| |||||||||
Total Germany | 17,179,593 | 13,823,017 | ||||||||||
|
|
|
| |||||||||
| Hong Kong (1.29%) | ||||||||||||
| 82,050 | Hong Kong Exchanges & Clearing Ltd.3 | 3,441,560 | 4,057,884 | |||||||||
| 233,058 | Techtronic Industries Co. Ltd.3 | 1,968,623 | 2,433,625 | |||||||||
|
|
|
| |||||||||
Total Hong Kong | 5,410,183 | 6,491,509 | ||||||||||
|
|
|
| |||||||||
| India (6.04%) | ||||||||||||
| 70,645 | Bajaj Finance Limited3 | 2,927,306 | 4,860,878 | |||||||||
| 670,497 | Bharti Airtel Ltd. PP1,3 | 3,462,101 | 2,577,871 | |||||||||
| 2,601,627 | Edelweiss Financial Services Ltd.3 | 2,183,118 | 1,704,243 | |||||||||
| 192,887 | Godrej Properties Ltd.1,3 | 2,367,567 | 2,900,152 | |||||||||
| 154,305 | HDFC Bank Ltd.3 | 2,321,396 | 2,643,108 | |||||||||
| 2,195,498 | JM Financial Limited3 | 2,636,593 | 1,705,884 | |||||||||
| 343,286 | Max Financial Services Limited1,3 | 2,274,921 | 3,409,899 | |||||||||
| 688,913 | Nippon Life India Asset Management Ltd., 144A3 | 2,429,190 | 2,373,180 | |||||||||
| 251,616 | Reliance Industries Limited1,3 | 5,490,484 | 8,308,198 | |||||||||
|
|
|
| |||||||||
Total India | 26,092,676 | 30,483,413 | ||||||||||
|
|
|
| |||||||||
| Israel (1.49%) | ||||||||||||
| 361,350 | Innovid Corp.1 | 3,586,055 | 599,841 | |||||||||
| 151,660 | ION Acquisition Corp. 3 Ltd., Cl A1 | 1,516,227 | 1,478,685 | |||||||||
| 112,763 | SimilarWeb Ltd.1 | 2,294,393 | 930,295 | |||||||||
| 398,398 | Taboola.com Ltd.1 | 3,771,018 | 1,007,947 | |||||||||
| 53,784 | Wix.com Ltd.1 | 4,281,260 | 3,525,541 | |||||||||
|
|
|
| |||||||||
Total Israel | 15,448,953 | 7,542,309 | ||||||||||
|
|
|
| |||||||||
| Italy (2.19%) | ||||||||||||
| 304,151 | Stevanato Group SpA | 6,373,893 | 4,808,627 | |||||||||
| 243,205 | Tenaris SA3 | 3,125,147 | 3,123,756 | |||||||||
| 121,255 | Tenaris SA, ADR | 3,269,089 | 3,115,041 | |||||||||
|
|
|
| |||||||||
Total Italy | 12,768,129 | 11,047,424 | ||||||||||
|
|
|
| |||||||||
| Japan (7.46%) | ||||||||||||
| 22,724 | Keyence Corporation3 | 8,191,936 | 7,792,927 | |||||||||
| 163,900 | MonotaRO Co, Ltd.3 | 917,367 | 2,444,354 | |||||||||
| 105,520 | Okamoto Industries, Inc.3 | 4,831,807 | 2,962,293 | |||||||||
| 153,600 | Recruit Holdings Co, Ltd.3 | 3,788,290 | 4,523,587 | |||||||||
| 565,360 | Renesas Electronics Corp.1,3 | 6,943,128 | 5,116,143 | |||||||||
| 285,300 | SMS Co. Ltd.3 | 8,001,167 | 5,659,454 | |||||||||
| 10,831 | Tokyo Electron Limited3 | 2,498,988 | 3,535,165 | |||||||||
| 1,922,790 | Z Holdings Corporation3 | 11,109,619 | 5,591,615 | |||||||||
|
|
|
| |||||||||
Total Japan | 46,282,302 | 37,625,538 | ||||||||||
|
|
|
| |||||||||
| Korea, Republic of (3.72%) | ||||||||||||
| 266,220 | Coupang, Inc., Cl A1 | 3,245,291 | 3,394,305 | |||||||||
| 61,657 | Hyundai Heavy Industries Co. Ltd.1,3 | 5,701,992 | 6,805,010 | |||||||||
| 118,056 | Korea Shipbuilding & Offshore Engineering Co. Ltd.1,3 | 11,088,774 | 8,569,451 | |||||||||
|
|
|
| |||||||||
Total Korea, Republic of | 20,036,057 | 18,768,766 | ||||||||||
|
|
|
| |||||||||
| See Notes to Financial Statements. | 27 |
| Baron International Growth Fund | June 30, 2022 |
STATEMENT OF NET ASSETS (Unaudited) (Continued)
JUNE 30, 2022
|
| Shares | Cost | Value | ||||||||||
| Common Stocks (continued) | ||||||||||||
| Mexico (0.81%) | ||||||||||||
| 982,287 | Grupo Mexico S.A.B. de C.V., Series B | $ | 2,636,647 | $ | 4,093,860 | |||||||
|
|
|
| |||||||||
| Netherlands (5.54%) | ||||||||||||
| 154,126 | AMG Advanced Metallurgical Group NV3 | 4,024,197 | 3,960,981 | |||||||||
| 30,224 | argenx SE, ADR1 | 857,888 | 11,451,269 | |||||||||
| 56,691 | Koninklijke DSM NV3 | 8,276,192 | 8,121,016 | |||||||||
| 221,130 | Universal Music Group NV3 | 4,625,676 | 4,430,564 | |||||||||
|
|
|
| |||||||||
Total Netherlands | 17,783,953 | 27,963,830 | ||||||||||
|
|
|
| |||||||||
| Norway (0.73%) | ||||||||||||
| 2,144,373 | Aker Carbon Capture ASA1,3 | 4,327,385 | 3,697,833 | |||||||||
|
|
|
| |||||||||
| Peru (0.67%) | ||||||||||||
| 28,082 | Credicorp, Ltd. | 4,039,348 | 3,367,313 | |||||||||
|
|
|
| |||||||||
| Poland (1.63%) | ||||||||||||
| 55,785 | Dino Polska SA, 144A1,3 | 4,025,150 | 3,978,963 | |||||||||
| 732,637 | InPost SA1,3 | 10,196,922 | 4,244,942 | |||||||||
|
|
|
| |||||||||
Total Poland | 14,222,072 | 8,223,905 | ||||||||||
|
|
|
| |||||||||
| Russia (0.00%) | ||||||||||||
| 487,800 | Sberbank of Russia PJSC1,2,4 | 1,644,868 | 514 | |||||||||
|
|
|
| |||||||||
| South Africa (0.21%) | ||||||||||||
| 7,147 | Naspers Limited, Cl N3 | 1,029,346 | 1,044,080 | |||||||||
|
|
|
| |||||||||
| Spain (3.64%) | ||||||||||||
| 123,611 | Cellnex Telecom S.A., 144A3 | 6,968,974 | 4,810,713 | |||||||||
| 1,196,994 | eDreams ODIGEO SA1,3 | 9,915,740 | 6,518,453 | |||||||||
| 310,534 | Industria de Diseno Textil, S.A.3 | 9,881,964 | 7,057,031 | |||||||||
|
|
|
| |||||||||
Total Spain | 26,766,678 | 18,386,197 | ||||||||||
|
|
|
| |||||||||
| Sweden (1.45%) | ||||||||||||
| 345,344 | Epiroc AB, Cl A3 | 5,416,152 | 5,354,580 | |||||||||
| 20,978 | Spotify Technology SA1 | 2,916,562 | 1,968,366 | |||||||||
|
|
|
| |||||||||
Total Sweden | 8,332,714 | 7,322,946 | ||||||||||
|
|
|
| |||||||||
| Shares | Cost | Value | ||||||||||
| Common Stocks (continued) | ||||||||||||
| Switzerland (5.21%) | ||||||||||||
| 360,168 | Clariant AG3 | $ | 7,368,151 | $ | 6,867,781 | |||||||
| 35,072 | Compagnie Financiere Richemont SA3 | 4,105,527 | 3,772,453 | |||||||||
| 12,705,654 | Meyer Burger Technology AG1,3 | 5,831,753 | 5,395,920 | |||||||||
| 87,956 | Nestle S.A.3 | 9,712,165 | 10,279,653 | |||||||||
|
|
|
| |||||||||
Total Switzerland | 27,017,596 | 26,315,807 | ||||||||||
|
|
|
| |||||||||
| Taiwan (1.27%) | ||||||||||||
| 78,465 | Taiwan Semiconductor Manufacturing Co., Ltd., ADR | 8,792,819 | 6,414,514 | |||||||||
|
|
|
| |||||||||
| United Kingdom (15.25%) | ||||||||||||
| 202,571 | AstraZeneca PLC, ADR | 8,867,929 | 13,383,866 | |||||||||
| 1,048,884 | B&M European Value Retail S.A.3 | 4,881,189 | 4,694,045 | |||||||||
| 533,221 | Ceres Power Holdings PLC1,3 | 5,154,085 | 3,569,125 | |||||||||
| 99,898 | Dechra Pharmaceuticals PLC3 | 3,390,396 | 4,212,229 | |||||||||
| 36,791 | Endava plc, ADR1 | 735,820 | 3,247,541 | |||||||||
| 170,217 | Experian plc3 | 3,928,940 | 4,997,706 | |||||||||
| 338,320 | Future PLC3 | 5,548,821 | 7,159,382 | |||||||||
| 1,028,655 | Glencore PLC3 | 4,426,462 | 5,571,644 | |||||||||
| 460,207 | J D Wetherspoon PLC1,3 | 5,513,363 | 3,500,664 | |||||||||
| 34,980 | Linde Public Limited Company3 | 6,288,750 | 10,063,755 | |||||||||
| 11,281,079 | Lloyds Banking Group3 | 3,975,830 | 5,804,189 | |||||||||
| 1,664,858 | S4 Capital PLC1,3 | 4,481,683 | 4,671,140 | �� | ||||||||
| 440,020 | WANdisco plc1 | 3,792,714 | 1,510,495 | |||||||||
| 483,570 | Watches of Switzerland Group PLC, 144A1,3 | 4,290,360 | 4,582,523 | |||||||||
|
|
|
| |||||||||
Total United Kingdom | 65,276,342 | 76,968,304 | ||||||||||
|
|
|
| |||||||||
| United States (3.33%) | ||||||||||||
| 46,611 | Agilent Technologies, Inc. | 2,015,891 | 5,535,989 | |||||||||
| 247,670 | Arch Capital Group Ltd.1 | 6,317,413 | 11,266,508 | |||||||||
|
|
|
| |||||||||
Total United States | 8,333,304 | 16,802,497 | ||||||||||
|
|
|
| |||||||||
| Uruguay (0.47%) | ||||||||||||
| 89,722 | Dlocal Ltd.1 | 2,236,966 | 2,355,202 | |||||||||
|
|
|
| |||||||||
Total Common Stocks | 474,919,291 | 481,546,511 | ||||||||||
|
|
|
| |||||||||
| Warrants (0.00%) | ||||||||||||
| Israel (0.00%) | ||||||||||||
| 16,052 | Innovid Corp. Exp 11/30/20261 | 27,444 | 3,533 | |||||||||
| 56,745 | Taboola.com Ltd. Exp 6/29/20261 | 104,540 | 19,867 | |||||||||
|
|
|
| |||||||||
Total Warrants | 131,984 | 23,400 | ||||||||||
|
|
|
| |||||||||
| 28 | See Notes to Financial Statements. |
| June 30, 2022 | Baron International Growth Fund |
STATEMENT OF NET ASSETS (Unaudited) (Continued)
JUNE 30, 2022
|
| Principal Amount | Cost | Value | ||||||||||
| Short Term Investments (4.22%) | ||||||||||||
| $21,297,427 | Repurchase Agreement with | $ | 21,297,427 | $ | 21,297,427 | |||||||
|
|
|
| |||||||||
Total Investments (99.63%) | $ | 496,348,702 | 502,867,338 | |||||||||
|
| |||||||||||
Cash and Other Assets Less Liabilities (0.37%) | 1,863,696 | |||||||||||
|
| |||||||||||
Net Assets | $ | 504,731,034 | ||||||||||
|
| |||||||||||
| | Retail Shares (Equivalent to $23.78 per share | | $ | 73,167,911 | ||||||||
|
| |||||||||||
| | Institutional Shares (Equivalent to $24.24 per share | | $ | 320,542,032 | ||||||||
|
| |||||||||||
| | R6 Shares (Equivalent to $24.23 per share | | $ | 111,021,091 | ||||||||
|
| |||||||||||
| % | Represents percentage of net assets. |
| 1 | Non-income producing securities. |
| 2 | At June 30, 2022, the market value of restricted and/or fair valued securities amounted to $514 or 0.00% of net assets. This security is not deemed liquid. See Note 6 regarding Restricted Securities. |
| 3 | Level 2 security. See Note 7 regarding Fair Value Measurements. |
| 4 | Level 3 security. See Note 7 regarding Fair Value Measurements. |
| ADR | American Depositary Receipt. |
| 144A | Security is exempt from registration pursuant to Rule 144A under the Securities Act of 1933. This security may be resold in transactions that are exempt from registration, normally to qualified institutional buyers. At June 30, 2022, the market value of Rule 144A securities amounted to $29,064,111 or 5.76% of net assets. |
All securities are Level 1, unless otherwise noted.
| Summary of Investments by Sector as of June 30, 2022 | Percentage of Net Assets | |||
Industrials | 15.3 | % | ||
Materials | 12.7 | |||
Consumer Discretionary | 12.6 | |||
Health Care | 12.3 | |||
Information Technology | 11.8 | |||
Financials | 10.5 | |||
Communication Services | 10.4 | |||
Energy | 4.5 | |||
Consumer Staples | 4.4 | |||
Real Estate | 0.6 | |||
Special Purpose Acquisition Company | 0.3 | |||
Cash and Cash Equivalents* | 4.6 | |||
| 100.0 | %** | |||
| * | Includes short term investments. |
| ** | Individual weights may not sum to total due to rounding. |
| See Notes to Financial Statements. | 29 |
| Baron Real Estate Fund | June 30, 2022 |
STATEMENT OF NET ASSETS (Unaudited)
JUNE 30, 2022
|
| Shares | Cost | Value | ||||||||||
| Common Stocks (90.39%) | ||||||||||||
| Consumer Discretionary (27.80%) | ||||||||||||
Casinos & Gaming (10.51%) |
| |||||||||||
| 555,650 | Boyd Gaming Corporation | $ | 9,466,974 | $ | 27,643,588 | |||||||
| 1,754,076 | Las Vegas Sands Corp.1 | 64,475,073 | 58,919,413 | |||||||||
| 1,131,250 | MGM Resorts International | 44,363,957 | 32,749,687 | |||||||||
| 836,340 | Red Rock Resorts, Inc., Cl A | 7,012,780 | 27,900,302 | |||||||||
|
|
|
| |||||||||
| 125,318,784 | 147,212,990 | |||||||||||
Distributors (1.60%) |
| |||||||||||
| 63,800 | Pool Corp. | 23,692,426 | 22,408,474 | |||||||||
Home Improvement Retail (5.39%) |
| |||||||||||
| 414,700 | Floor & Decor Holdings, Inc., Cl A1 | 35,080,046 | 26,109,512 | |||||||||
| 51,300 | The Home Depot, Inc. | 11,692,709 | 14,070,051 | |||||||||
| 201,800 | Lowe’s Companies, Inc. | 28,420,851 | 35,248,406 | |||||||||
|
|
|
| |||||||||
| 75,193,606 | 75,427,969 | |||||||||||
Homebuilding (4.40%) |
| |||||||||||
| 222,297 | D.R. Horton, Inc. | 13,092,011 | 14,713,838 | |||||||||
| 357,849 | Lennar Corp., Cl A | 23,306,729 | 25,253,404 | |||||||||
| 483,900 | Toll Brothers, Inc. | 22,412,062 | 21,581,940 | |||||||||
|
|
|
| |||||||||
| 58,810,802 | 61,549,182 | |||||||||||
Hotels, Resorts & Cruise Lines (3.36%) |
| |||||||||||
| 323,873 | Hilton Grand Vacations, Inc.1 | 7,154,306 | 11,571,983 | |||||||||
| 283,800 | Hyatt Hotels Corp., Cl A1 | 21,143,100 | 20,975,658 | |||||||||
| 125,336 | Marriott Vacations Worldwide Corp. | 6,103,035 | 14,564,043 | |||||||||
|
|
|
| |||||||||
| 34,400,441 | 47,111,684 | |||||||||||
Leisure Facilities (2.54%) |
| |||||||||||
| 163,050 | Vail Resorts, Inc. | 44,699,056 | 35,553,053 | |||||||||
|
|
|
| |||||||||
Total Consumer Discretionary | 362,115,115 | 389,263,352 | ||||||||||
|
|
|
| |||||||||
| Financials (8.78%) | ||||||||||||
Asset Management & Custody | ||||||||||||
| 522,100 | Blackstone, Inc. | 56,115,311 | 47,631,183 | |||||||||
| 1,694,025 | Brookfield Asset Management, Inc., Cl A2 | 66,270,436 | 75,333,292 | |||||||||
|
|
|
| |||||||||
Total Financials | 122,385,747 | 122,964,475 | ||||||||||
|
|
|
| |||||||||
| Industrials (10.07%) | ||||||||||||
Building Products (3.40%) |
| |||||||||||
| 501,700 | Fortune Brands Home & Security, Inc. | 34,450,070 | 30,041,796 | |||||||||
| 323,950 | Trex Co., Inc.1 | 20,216,756 | 17,629,359 | |||||||||
|
|
|
| |||||||||
| 54,666,826 | 47,671,155 | |||||||||||
Research & Consulting | ||||||||||||
| 868,800 | CoStar Group, Inc.1 | 47,343,670 | 52,484,208 | |||||||||
Trading Companies & Distributors (2.92%) | ||||||||||||
| 344,085 | SiteOne Landscape Supply, Inc.1 | 44,967,045 | 40,901,384 | |||||||||
|
|
|
| |||||||||
Total Industrials | 146,977,541 | 141,056,747 | ||||||||||
|
|
|
| |||||||||
| Shares | Cost | Value | ||||||||||
| Common Stocks (continued) | ||||||||||||
| Information Technology (0.33%) | ||||||||||||
Application Software (0.33%) |
| |||||||||||
| 1,032,126 | SmartRent, Inc.1,3 | $ | 8,495,528 | $ | 4,665,209 | |||||||
|
|
|
| |||||||||
| Materials (2.26%) | ||||||||||||
Construction Materials (2.26%) |
| |||||||||||
| 223,050 | Vulcan Materials Co. | 33,191,268 | 31,695,405 | |||||||||
|
|
|
| |||||||||
| Real Estate (39.11%) | ||||||||||||
Health Care REITs (1.59%) |
| |||||||||||
| 432,650 | Ventas, Inc. | 25,531,319 | 22,251,189 | |||||||||
Industrial REITs (4.32%) |
| |||||||||||
| 319,750 | Prologis, Inc. | 28,911,130 | 37,618,587 | |||||||||
| 395,859 | Rexford Industrial Realty, Inc. | 18,684,399 | 22,797,520 | |||||||||
|
|
|
| |||||||||
| 47,595,529 | 60,416,107 | |||||||||||
Real Estate Services (8.22%) |
| |||||||||||
| 799,900 | CBRE Group, Inc., Cl A1 | 49,889,239 | 58,880,639 | |||||||||
| 321,857 | Jones Lang LaSalle, Inc.1 | 48,744,703 | 56,279,915 | |||||||||
|
|
|
| |||||||||
| 98,633,942 | 115,160,554 | |||||||||||
Residential REITs (9.38%) |
| |||||||||||
| 154,061 | AvalonBay Communities, Inc. | 37,516,698 | 29,926,349 | |||||||||
| 350,750 | Equity LifeStyle Properties, Inc. | 20,328,579 | 24,717,353 | |||||||||
| 504,195 | Equity Residential | 36,653,947 | 36,412,963 | |||||||||
| 1,133,250 | Invitation Homes, Inc. | 34,055,766 | 40,321,035 | |||||||||
|
|
|
| |||||||||
| 128,554,990 | 131,377,700 | |||||||||||
Retail REITs (0.86%) |
| |||||||||||
| 693,513 | Kite Realty Group Trust | 15,029,398 | 11,990,840 | |||||||||
Specialized REITs (14.74%) |
| |||||||||||
| 86,300 | Alexandria Real Estate Equities, Inc.3 | 7,384,376 | 12,516,089 | |||||||||
| 216,700 | American Tower Corp. | 39,069,829 | 55,386,353 | |||||||||
| 203,650 | Digital Realty Trust, Inc. | 27,363,634 | 26,439,879 | |||||||||
| 56,640 | Equinix, Inc. | 24,673,792 | 37,213,613 | |||||||||
| 493,198 | Gaming and Leisure Properties, Inc. | 17,674,987 | 22,618,060 | |||||||||
| 122,604 | Public Storage | 46,290,030 | 38,334,593 | |||||||||
| 43,550 | SBA Communications Corp. | 13,935,087 | 13,938,178 | |||||||||
|
|
|
| |||||||||
| 176,391,735 | 206,446,765 | |||||||||||
|
|
|
| |||||||||
Total Real Estate | 491,736,913 | 547,643,155 | ||||||||||
|
|
|
| |||||||||
| Special Purpose Acquisition Company (2.04%) | ||||||||||||
| 1,250,000 | Fifth Wall Acquisition Corp. III, Cl A1,2 | 12,500,000 | 12,162,500 | |||||||||
| 1,290,554 | RXR Acquisition Corp.1 | 12,905,540 | 12,647,429 | |||||||||
| 375,000 | Tishman Speyer Innovation Corp. II1 | 3,750,000 | 3,686,250 | |||||||||
|
|
|
| |||||||||
Total Special Purpose Acquisition Company | 29,155,540 | 28,496,179 | ||||||||||
|
|
|
| |||||||||
Total Common Stocks | 1,194,057,652 | 1,265,784,522 | ||||||||||
|
|
|
| |||||||||
| 30 | See Notes to Financial Statements. |
| June 30, 2022 | Baron Real Estate Fund |
STATEMENT OF NET ASSETS (Unaudited) (Continued)
JUNE 30, 2022
|
| Principal Amount | Cost | Value | ||||||||||
| Short Term Investments (6.98%) | ||||||||||||
| $97,707,622 | Repurchase Agreement with Fixed Income Clearing Corp., dated 6/30/2022, 0.24% due 7/1/2022; Proceeds at maturity - $97,708,274; (Fully collateralized by $104,213,000 U.S. Treasury Note, 2.25% due 11/15/2027 Market value - $99,661,862)4 | $ | 97,707,622 | $ | 97,707,622 | |||||||
|
|
|
| |||||||||
Total Investments (97.37%) | $ | 1,291,765,274 | 1,363,492,144 | |||||||||
|
| |||||||||||
Cash and Other Assets Less Liabilities (2.63%) | 36,885,380 | |||||||||||
|
| |||||||||||
Net Assets | $ | 1,400,377,524 | ||||||||||
|
| |||||||||||
| | Retail Shares (Equivalent to $28.47 per share | $ | 343,719,723 | |||||||||
|
| |||||||||||
| | Institutional Shares (Equivalent to $29.29 per share | $ | 1,031,948,230 | |||||||||
|
| |||||||||||
| | R6 Shares (Equivalent to $29.29 per share | $ | 24,709,571 | |||||||||
|
| |||||||||||
| % | Represents percentage of net assets. |
| 1 | Non-income producing securities. |
| 2 | Foreign corporation. |
| 3 | The Adviser has reclassified/classified certain securities in or out of this sub-industry. Such reclassifications/classifications are not supported by S&P or MSCI (unaudited). |
| 4 | Level 2 security. See Note 7 regarding Fair Value Measurements. |
All securities are Level 1, unless otherwise noted.
| See Notes to Financial Statements. | 31 |
| Baron Emerging Markets Fund | June 30, 2022 |
STATEMENT OF NET ASSETS (Unaudited)
JUNE 30, 2022
|
| Shares | Cost | Value | ||||||||||
| Common Stocks (93.56%) | ||||||||||||
| Brazil (5.89%) | ||||||||||||
| 21,322,440 | Aeris Indústria E Comércio De Equipamentos Para Geracão De Energia SA | $ | 23,491,764 | $ | 11,407,930 | |||||||
| 2,287,834 | Afya Ltd., Cl A1 | 55,401,434 | 22,763,948 | |||||||||
| 3,069,727 | Azul SA1 | 15,037,701 | 7,261,600 | |||||||||
| 566,839 | Azul SA, ADR1 | 8,247,575 | 4,024,557 | |||||||||
| 17,943,847 | B3 S.A. - Brasil, Bolsa, Balcao | 43,416,377 | 37,578,378 | |||||||||
| 34,436,298 | Hapvida Participacoes e Investimentos SA, 144A | 52,381,629 | 35,992,806 | |||||||||
| 2,541,348 | Inter & Co., Inc. BDR | 10,192,437 | 6,774,078 | |||||||||
| 6,356,728 | Localiza Rent a Car SA | 43,622,163 | 63,658,985 | |||||||||
| 4,025,340 | StoneCo Ltd., Cl A1 | 59,667,586 | 30,995,118 | |||||||||
| 11,883,911 | Suzano SA | 115,651,528 | 112,834,084 | |||||||||
| 1,495,307 | XP, Inc., Cl A1 | 46,012,670 | 26,855,714 | |||||||||
|
|
|
| |||||||||
Total Brazil | 473,122,864 | 360,147,198 | ||||||||||
|
|
|
| |||||||||
| China (38.48%) | ||||||||||||
| 1,763,044 | Alibaba Group Holding Limited, ADR1 | 170,878,202 | 200,422,842 | |||||||||
| 844,482 | Baidu, Inc., ADR1 | 121,622,910 | 125,599,808 | |||||||||
| 8,907,686 | Beijing Oriental Yuhong Waterproof Technology Co. Ltd., Cl A3 | 42,223,885 | 68,623,445 | |||||||||
| 49,656,877 | China Conch Environment Protection Holdings Ltd.1 | 31,425,134 | 34,552,499 | |||||||||
| 22,782,601 | China Conch Venture Holdings Ltd.3 | 80,539,149 | 49,692,715 | |||||||||
| 17,106,542 | China Mengniu Dairy Co. Ltd.3 | 45,437,903 | 85,757,726 | |||||||||
| 2,080,354 | China Tourism Group Duty Free Corporation Ltd., Cl A3 | 27,566,178 | 72,526,771 | |||||||||
| 24,766,577 | Estun Automation Co. Ltd., Cl A3 | 97,709,922 | 90,937,948 | |||||||||
| 9,993,164 | Full Truck Alliance Co. Ltd., ADR1 | 87,502,222 | 90,538,066 | |||||||||
| 9,785,468 | Galaxy Entertainment Group Ltd.1,3 | 72,544,300 | 58,620,536 | |||||||||
| 920,106 | GDS Holdings Limited, ADR1 | 35,166,931 | 30,722,339 | |||||||||
| 3,460,858 | GDS Holdings Limited, Cl A1,3 | 31,279,900 | 14,553,566 | |||||||||
| 3,111,198 | Glodon Co. Ltd., Cl A3 | 14,084,690 | 25,331,480 | |||||||||
| 15,011,468 | Han’s Laser Technology Industry Group Co., Ltd., Cl A3 | 87,156,076 | 74,523,639 | |||||||||
| 3,419,513 | Hangzhou Tigermed Consulting Co. Ltd., Cl A3 | 45,246,602 | 58,603,116 | |||||||||
| 12,581,772 | Hua Hong Semiconductor Limited, 144A1,3 | 28,934,775 | 45,670,072 | |||||||||
| 816,233 | JD.com, Inc., ADR1 | 56,344,995 | 52,418,483 | |||||||||
| 254,930 | JD.com, Inc., Cl A1,3 | 9,299,891 | 8,214,612 | |||||||||
| 4,395,241 | Jiangsu Hengli Hydraulic Co. Ltd., Cl A3 | 35,774,888 | 40,575,163 | |||||||||
| 24,109,644 | Kingdee International Software Group Co. Ltd.1,3 | 14,571,352 | 56,802,571 | |||||||||
| 22,379,088 | Kingsoft Corp. Ltd.3 | 88,120,793 | 87,443,617 | |||||||||
| 154,960 | Kweichow Moutai Co. Ltd., Cl A3 | 43,315,136 | 47,394,854 | |||||||||
| 4,872,629 | Lufax Holding Ltd., ADR | 31,314,554 | 29,235,774 | |||||||||
| 10,364,909 | Midea Group Co., Ltd., Cl A3 | 79,158,724 | 93,813,387 | |||||||||
| 15,762,455 | NARI Technology Co. Ltd., Cl A3 | 65,371,125 | 63,781,870 | |||||||||
| 4,129,350 | Shanghai Henlius Biotech, Inc., Cl H, 144A1,3 | 25,510,797 | 9,328,751 | |||||||||
| 1,074,040 | Shenzhen Mindray Bio-Medical Electronics Co. Ltd., Cl A3 | 28,193,528 | 50,362,069 | |||||||||
| 4,607,761 | Shenzhou International Group Holdings Ltd.3 | 30,212,672 | 56,240,513 | |||||||||
| 4,327,501 | Tencent Holdings Limited3 | 141,694,128 | 195,884,890 | |||||||||
| 472,284 | Tencent Holdings Limited, ADR | 25,659,662 | 21,436,971 | |||||||||
| 13,735,613 | Venustech Group, Inc., Cl A1,3 | 68,116,144 | 40,969,460 | |||||||||
| Shares | Cost | Value | ||||||||||
| Common Stocks (continued) | ||||||||||||
| China (continued) | ||||||||||||
| 1,447,773 | Will Semiconductor Co. Ltd. Shanghai, Cl A3 | $ | 47,451,487 | $ | 37,573,155 | |||||||
| 7,380,533 | Wuxi Biologics Cayman, Inc., 144A1,3 | 64,449,976 | 68,383,731 | |||||||||
| 1,287,871 | Yum China Holdings, Inc. | 68,908,564 | 62,461,744 | |||||||||
| 683,327 | Yum China Holdings, Inc. (Hong Kong)3 | 36,949,843 | 33,524,853 | |||||||||
| 7,078,094 | Yunnan Baiyao Group Co. Ltd., Cl A3 | 73,662,391 | 63,925,038 | |||||||||
| 1,381,620 | Zai Lab Limited, ADR1 | 33,659,287 | 47,914,582 | |||||||||
| 7,630,773 | Zhejiang Dingli Machinery Co. Ltd., Cl A3 | 69,046,231 | 57,899,452 | |||||||||
|
|
|
| |||||||||
Total China | 2,156,104,947 | 2,352,262,108 | ||||||||||
|
|
|
| |||||||||
| Hong Kong (4.55%) | ||||||||||||
| 5,924,136 | AIA Group Ltd.3 | 64,515,560 | 64,730,452 | |||||||||
| 24,633,200 | Budweiser Brewing Co. APAC Ltd., 144A3 | 77,487,554 | 73,916,778 | |||||||||
| 1,816,359 | Hong Kong Exchanges & Clearing Ltd.3 | 79,185,993 | 89,830,282 | |||||||||
| 4,759,682 | Techtronic Industries Co. Ltd.3 | 26,543,723 | 49,701,285 | |||||||||
|
|
|
| |||||||||
Total Hong Kong | 247,732,830 | 278,178,797 | ||||||||||
|
|
|
| |||||||||
| India (18.42%) | ||||||||||||
| 4,219,176 | AARTI Industries Ltd.3 | 48,974,674 | 37,473,205 | |||||||||
| 627,723 | Asian Paints Ltd.3 | 14,086,883 | 21,490,581 | |||||||||
| 1,544,001 | Bajaj Finance Limited3 | 53,510,109 | 106,238,250 | |||||||||
| 10,024,473 | Bharti Airtel Ltd.1,3 | 75,904,919 | 87,194,343 | |||||||||
| 975,478 | Bharti Airtel Ltd. PP1,3 | 1,742,579 | 3,750,436 | |||||||||
| 1,055,881 | Divi’s Laboratories Ltd.3 | 10,387,099 | 48,669,343 | |||||||||
| 36,906,768 | Edelweiss Financial Services Ltd.3 | 52,563,211 | 24,176,455 | |||||||||
| 3,648,019 | Godrej Consumer Products Ltd.1,3 | 47,010,643 | 35,109,148 | |||||||||
| 2,443,132 | Godrej Properties Ltd.1,3 | 47,310,628 | 36,733,704 | |||||||||
| 3,399,154 | HDFC Bank Ltd.3 | 51,104,386 | 58,224,489 | |||||||||
| 7,339,650 | ICICI Bank Ltd.3 | 74,504,612 | 65,938,849 | |||||||||
| 1,663,109 | ICICI Lombard General Insurance Co. Ltd., 144A3 | 28,788,331 | 23,680,477 | |||||||||
| 44,683,230 | JM Financial Limited3 | 64,708,041 | 34,718,503 | |||||||||
| 4,742,844 | Jubilant Foodworks Ltd.3 | 39,356,465 | 30,924,401 | |||||||||
| 7,014,317 | Max Financial Services Ltd.1,3 | 56,063,378 | 69,674,005 | |||||||||
| 3,495,025 | Muthoot Finance Ltd.3 | 53,719,414 | 43,308,202 | |||||||||
| 12,512,861 | Nippon Life India Asset Management Ltd., 144A3 | 46,059,468 | 43,104,522 | |||||||||
| 4,983,159 | Reliance Industries Limited1,3 | 98,785,589 | 164,540,704 | |||||||||
| 5,075,465 | SBI Life Insurance Company Limited, 144A3 | 54,201,630 | 69,702,241 | |||||||||
| 4,873,310 | Tata Communications Ltd.3 | 35,731,433 | 56,613,288 | |||||||||
| 3,914,178 | Tata Consumer Products Ltd.3 | 13,686,463 | 35,120,692 | |||||||||
| 1,216,909 | Titan Co. Ltd.3 | 18,054,769 | 29,995,009 | |||||||||
|
|
|
| |||||||||
Total India | 986,254,724 | 1,126,380,847 | ||||||||||
|
|
|
| |||||||||
| Indonesia (2.08%) | ||||||||||||
| 294,876,200 | Bank Rakyat Indonesia (Persero) Tbk PT3 | 86,787,369 | 82,348,762 | |||||||||
| 112,177,478 | Merdeka Copper Gold Tbk PT1,3 | 34,165,406 | 30,043,972 | |||||||||
| 27,420,900 | PT Bank Negara Indonesia (Persero) Tbk PT3 | 16,437,613 | 14,484,796 | |||||||||
|
|
|
| |||||||||
Total Indonesia | 137,390,388 | 126,877,530 | ||||||||||
|
|
|
| |||||||||
| 32 | See Notes to Financial Statements. |
| June 30, 2022 | Baron Emerging Markets Fund |
STATEMENT OF NET ASSETS (Unaudited) (Continued)
JUNE 30, 2022
|
| Shares | Cost | Value | ||||||||||
| Common Stocks (continued) | ||||||||||||
| Italy (1.22%) | ||||||||||||
| 2,915,453 | Tenaris SA3 | $ | 37,204,055 | $ | 37,446,442 | |||||||
| 1,444,778 | Tenaris SA, ADR | 38,611,439 | 37,116,347 | |||||||||
|
|
|
| |||||||||
Total Italy | 75,815,494 | 74,562,789 | ||||||||||
|
|
|
| |||||||||
| Japan (0.89%) | ||||||||||||
| 158,614 | Keyence Corporation3 | 62,703,163 | 54,394,798 | |||||||||
|
|
|
| |||||||||
| Korea, Republic of (8.22%) | ||||||||||||
| 3,739,966 | Coupang, Inc., Cl A1 | 45,203,588 | 47,684,566 | |||||||||
| 757,011 | Hyundai Heavy Industries Co. Ltd.1,3 | 45,297,849 | 83,550,410 | |||||||||
| 1,098,346 | Korea Aerospace Industries Ltd.3 | 36,394,032 | 45,420,620 | |||||||||
| 1,754,557 | Korea Shipbuilding & Offshore Engineering Co. Ltd.1,3 | 175,935,921 | 127,359,805 | |||||||||
| 4,499,643 | Samsung Electronics Co., Ltd.3 | 163,878,215 | 198,467,328 | |||||||||
|
|
|
| |||||||||
Total Korea, Republic of | 466,709,605 | 502,482,729 | ||||||||||
|
|
|
| |||||||||
| Mexico (2.26%) | ||||||||||||
| 12,633,048 | Grupo Mexico S.A.B. de C.V., Series B | 32,218,110 | 52,650,526 | |||||||||
| 24,850,015 | Wal-Mart de Mexico, S.A.B de C.V. | 61,269,661 | 85,512,869 | |||||||||
|
|
|
| |||||||||
Total Mexico | 93,487,771 | 138,163,395 | ||||||||||
|
|
|
| |||||||||
| Peru (0.90%) | ||||||||||||
| 459,515 | Credicorp, Ltd. | 58,839,094 | 55,100,444 | |||||||||
|
|
|
| |||||||||
| Philippines (1.49%) | ||||||||||||
| 76,362,165 | Ayala Land, Inc.3 | 56,564,741 | 35,494,430 | |||||||||
| 27,766,136 | BDO Unibank, Inc.3 | 59,655,181 | 55,862,071 | |||||||||
|
|
|
| |||||||||
Total Philippines | 116,219,922 | 91,356,501 | ||||||||||
|
|
|
| |||||||||
| Poland (0.76%) | ||||||||||||
| 8,043,132 | InPost SA1,3 | 128,794,623 | 46,602,381 | |||||||||
|
|
|
| |||||||||
| Russia (0.02%) | ||||||||||||
| 2,384,838 | Fix Price Group Ltd., GDR2,4 | 20,761,023 | 95,394 | |||||||||
| 4,746,202 | Fix Price Group Ltd., GDR, 144A2,4 | 46,272,864 | 189,848 | |||||||||
| 1,873,612 | Ozon Holdings PLC, ADR1,2,4 | 76,824,628 | 374,722 | |||||||||
| 227,252 | Polyus PJSC2,4 | 46,221,802 | 86,810 | |||||||||
| 130,700 | Polyus PJSC, GDR2,4 | 12,971,666 | 19,605 | |||||||||
| 17,949,100 | Sberbank of Russia PJSC1,2,4 | 64,206,206 | 18,896 | |||||||||
| 809,897 | Yandex N.V., Cl A1,2,4 | 16,974,482 | 299,662 | |||||||||
|
|
|
| |||||||||
Total Russia | 284,232,671 | 1,084,937 | ||||||||||
|
|
|
| |||||||||
| South Africa (1.12%) | ||||||||||||
| 1,622,060 | Gold Fields Ltd.3 | 17,775,216 | 14,960,561 | |||||||||
| 4,125,468 | Gold Fields Ltd., ADR | 44,891,212 | 37,624,268 | |||||||||
| 108,193 | Naspers Limited, Cl N3 | 15,582,493 | 15,805,531 | |||||||||
|
|
|
| |||||||||
Total South Africa | 78,248,921 | 68,390,360 | ||||||||||
|
|
|
| |||||||||
| Shares | Cost | Value | ||||||||||
| Common Stocks (continued) | ||||||||||||
| Spain (0.10%) | ||||||||||||
| 1,791,760 | Codere Online Luxembourg, S.A. Forward Shares1 | $ | 17,917,600 | $ | 5,034,846 | |||||||
| 358,352 | Codere Online Luxembourg, S.A. Founders Share1,2,4 | 3,116 | 877,962 | |||||||||
| 26,518 | Codere Online Luxembourg, S.A. Private Shares1 | 265,181 | 74,515 | |||||||||
|
|
|
| |||||||||
Total Spain | 18,185,897 | 5,987,323 | ||||||||||
|
|
|
| |||||||||
| Taiwan (5.34%) | ||||||||||||
| 8,051,818 | Delta Electronics, Inc.3 | 30,846,722 | 60,036,381 | |||||||||
| 3,262,329 | Taiwan Semiconductor Manufacturing Co., Ltd., ADR | 164,553,757 | 266,695,396 | |||||||||
|
|
|
| |||||||||
Total Taiwan | 195,400,479 | 326,731,777 | ||||||||||
|
|
|
| |||||||||
| United Arab Emirates (0.19%) | ||||||||||||
| 5,046,845 | Network International Holdings plc, 144A1 | 30,443,349 | 11,598,977 | |||||||||
|
|
|
| |||||||||
| United Kingdom (1.34%) | ||||||||||||
| 15,163,225 | Glencore PLC3 | 45,134,766 | 82,130,637 | |||||||||
|
|
|
| |||||||||
| United States (0.29%) | ||||||||||||
| 1,049,219 | ACM Research, Inc., Cl A1 | 31,540,528 | 17,658,356 | |||||||||
|
|
|
| |||||||||
Total Common Stocks | 5,686,362,036 | 5,720,091,884 | ||||||||||
|
|
|
| |||||||||
| Private Common Stocks (0.92%) | ||||||||||||
| India (0.92%) | ||||||||||||
| 27,027 | Pine Labs PTE. Ltd., Series 11,2,4 | 10,077,362 | 14,170,526 | |||||||||
| 6,833 | Pine Labs PTE. Ltd., Series A1,2,4 | 2,547,771 | 3,582,610 | |||||||||
| 7,600 | Pine Labs PTE. Ltd., Series B1,2,4 | 2,833,757 | 3,984,756 | |||||||||
| 6,174 | Pine Labs PTE. Ltd., Series B21,2,4 | 2,302,055 | 3,237,090 | |||||||||
| 9,573 | Pine Labs PTE. Ltd., Series C1,2,4 | 3,569,416 | 5,019,220 | |||||||||
| 1,932 | Pine Labs PTE. Ltd., Series C11,2,4 | 720,371 | 1,012,967 | |||||||||
| 2,459 | Pine Labs PTE. Ltd., Series D1,2,4 | 916,870 | 1,289,278 | |||||||||
| 45,680 | Pine Labs PTE. Ltd., Series J1,2,4 | 17,032,398 | 23,950,481 | |||||||||
|
|
|
| |||||||||
Total Private Common Stocks | 40,000,000 | 56,246,928 | ||||||||||
|
|
|
| |||||||||
| Private Convertible Preferred Stocks (1.85%) | ||||||||||||
| India (1.85%) | ||||||||||||
| 11,578 | Bundl Technologies Private Ltd. Series K1,2,4 | 76,776,872 | 48,491,617 | |||||||||
| 15,334 | Think & Learn Private Limited, Series F1,2,4 | 49,776,072 | 64,672,180 | |||||||||
|
|
|
| |||||||||
Total Private Convertible Preferred Stocks | 126,552,944 | 113,163,797 | ||||||||||
|
|
|
| |||||||||
| Warrants (0.00%) | ||||||||||||
| Spain (0.00%) | ||||||||||||
| 13,259 | Codere Online Luxembourg S.A. Private Shares Exp. 11/30/20261 | 0 | 3,977 | |||||||||
|
|
|
| |||||||||
| See Notes to Financial Statements. | 33 |
| Baron Emerging Markets Fund | June 30, 2022 |
STATEMENT OF NET ASSETS (Unaudited) (Continued)
JUNE 30, 2022
|
| Principal Amount | Cost | Value | ||||||||||
| Short Term Investments (2.48%) | ||||||||||||
| $151,564,518 | Repurchase Agreement with Fixed Income Clearing Corp., dated 6/30/2022, 0.24% due 7/1/2022; Proceeds at maturity - $151,565,528; (Fully collateralized by $161,655,600 U.S. Treasury Note, 2.25% due 11/15/2027 Market value -$154,595,857)3 | $ | 151,564,518 | $ | 151,564,518 | |||||||
|
|
|
| |||||||||
Total Investments (98.81%) | $ | 6,004,479,498 | 6,041,071,104 | |||||||||
|
| |||||||||||
Cash and Other Assets Less Liabilities (1.19%) | 72,590,879 | |||||||||||
|
| |||||||||||
Net Assets | $ | 6,113,661,983 | ||||||||||
|
| |||||||||||
| | Retail Shares (Equivalent to $13.47 per share | | $ | 324,085,255 | ||||||||
|
| |||||||||||
| | Institutional Shares (Equivalent to $13.54 per share | | $ | 5,774,386,689 | ||||||||
|
| |||||||||||
| | R6 Shares (Equivalent to $13.55 per share | | $ | 15,190,039 | ||||||||
|
| |||||||||||
| % | Represents percentage of net assets. |
| 1 | Non-income producing securities. |
| 2 | At June 30, 2022, the market value of restricted and/or fair valued securities amounted to $171,373,624 or 2.80% of net assets. These securities are not deemed liquid. See Note 6 regarding Restricted Securities. |
| 3 | Level 2 security. See Note 7 regarding Fair Value Measurements. |
| 4 | Level 3 security. See Note 7 regarding Fair Value Measurements. |
| ADR | American Depositary Receipt. |
| GDR | Global Depositary Receipt. |
| 144A | Security is exempt from registration pursuant to Rule 144A under the Securities Act of 1933. This security may be resold in transactions that are exempt from registration, normally to qualified institutional buyers. At June 30, 2022, the market value of Rule 144A securities amounted to $381,568,203 or 6.24% of net assets. |
All securities are Level 1, unless otherwise noted.
| Summary of Investments by Sector as of June 30, 2022 | Percentage of Net Assets | |||
Financials | 16.4 | % | ||
Information Technology | 15.5 | |||
Industrials | 15.4 | |||
Consumer Discretionary | 14.8 | |||
Communication Services | 9.5 | |||
Materials | 7.5 | |||
Health Care | 6.3 | |||
Consumer Staples | 5.9 | |||
Energy | 3.9 | |||
Real Estate | 1.2 | |||
Cash and Cash Equivalents* | 3.7 | |||
| 100.0 | %** | |||
| * | Includes short term investments. |
| ** | Individual weights may not sum to total due to rounding. |
| 34 | See Notes to Financial Statements. |
| June 30, 2022 | Baron Global Advantage Fund |
STATEMENT OF NET ASSETS (Unaudited)
JUNE 30, 2022
|
| Shares | Cost | Value | ||||||||||
| Common Stocks (91.45%) | ||||||||||||
| Argentina (4.77%) | ||||||||||||
| 83,710 | Globant S.A.1 | $ | 7,081,800 | $ | 14,565,540 | |||||||
| 54,822 | MercadoLibre, Inc.1 | 42,859,814 | 34,914,487 | |||||||||
|
|
|
| |||||||||
Total Argentina | 49,941,614 | 49,480,027 | ||||||||||
|
|
|
| |||||||||
| Brazil (1.38%) | ||||||||||||
| 1,433,148 | Afya Ltd., Cl A1 | 31,965,930 | 14,259,823 | |||||||||
|
|
|
| |||||||||
| Canada (2.74%) | ||||||||||||
| 417,196 | Nuvei Corp., 144A1 | 14,962,578 | 15,089,980 | |||||||||
| 426,943 | Shopify, Inc., Cl A1 | 15,084,398 | 13,337,699 | |||||||||
|
|
|
| |||||||||
Total Canada | 30,046,976 | 28,427,679 | ||||||||||
|
|
|
| |||||||||
| China (2.31%) | ||||||||||||
| 959,865 | Meituan Inc., Cl B, 144A1,3 | 12,096,383 | 23,952,744 | |||||||||
|
|
|
| |||||||||
| India (3.64%) | ||||||||||||
| 475,005 | Bajaj Finance Limited3 | 29,538,367 | 32,683,723 | |||||||||
| 7,379,067 | Zomato Ltd.1,3 | 12,454,605 | 5,062,816 | |||||||||
|
|
|
| |||||||||
Total India | 41,992,972 | 37,746,539 | ||||||||||
|
|
|
| |||||||||
| Israel (3.57%) | ||||||||||||
| 326,882 | Fiverr International Ltd.1 | 7,503,852 | 11,241,472 | |||||||||
| 3,375,264 | Innovid Corp.1 | 32,939,278 | 5,602,938 | |||||||||
| 2,753,705 | Taboola.com Ltd.1 | 26,501,176 | 6,966,874 | |||||||||
| 200,585 | Wix.com Ltd.1 | 31,818,685 | 13,148,347 | |||||||||
|
|
|
| |||||||||
Total Israel | 98,762,991 | 36,959,631 | ||||||||||
|
|
|
| |||||||||
| Korea, Republic of (2.03%) | ||||||||||||
| 1,653,802 | Coupang, Inc., Cl A1 | 37,788,957 | 21,085,975 | |||||||||
|
|
|
| |||||||||
| Netherlands (8.72%) | ||||||||||||
| 16,186 | Adyen N.V., 144A1,3 | 16,437,273 | 23,358,534 | |||||||||
| 129,213 | argenx SE, ADR1 | 14,746,038 | 48,956,222 | |||||||||
| 38,227 | ASML Holding N.V.3 | 8,394,703 | 18,059,885 | |||||||||
|
|
|
| |||||||||
Total Netherlands | 39,578,014 | 90,374,641 | ||||||||||
|
|
|
| |||||||||
| Poland (1.18%) | ||||||||||||
| 2,105,278 | InPost SA1,3 | 33,641,809 | 12,198,105 | |||||||||
|
|
|
| |||||||||
| Spain (0.46%) | ||||||||||||
| 996,069 | Codere Online Luxembourg, S.A.1 | 9,115,057 | 2,798,954 | |||||||||
| 584,567 | Codere Online Luxembourg, S.A. Forward Shares1 | 5,845,670 | 1,642,633 | |||||||||
| 116,913 | Codere Online Luxembourg, S.A. Founders Share1,2,4 | 1,017 | 286,437 | |||||||||
| 8,652 | Codere Online Luxembourg, S.A. Private Shares1 | 86,516 | 24,312 | |||||||||
|
|
|
| |||||||||
Total Spain | 15,048,260 | 4,752,336 | ||||||||||
|
|
|
| |||||||||
| Shares | Cost | Value | ||||||||||
| Common Stocks (continued) | ||||||||||||
| United Kingdom (6.19%) | ||||||||||||
| 726,800 | Endava plc, ADR1 | $ | 31,977,783 | $ | 64,154,636 | |||||||
|
|
|
| |||||||||
| United States (52.65%) | ||||||||||||
| 236,872 | 10X Genomics, Inc., Cl A1 | 18,461,130 | 10,718,458 | |||||||||
| 24,805 | Alphabet, Inc., Cl C1 | 31,606,969 | 54,259,697 | |||||||||
| 517,680 | Amazon.com, Inc.1 | 51,599,591 | 54,982,793 | |||||||||
| 141,583 | Bill.Com Holdings, Inc.1 | 6,149,064 | 15,565,635 | |||||||||
| 170,992 | Block, Inc., Cl A1 | 13,704,466 | 10,509,168 | |||||||||
| 371,841 | Cloudflare, Inc., Cl A1 | 9,123,087 | 16,268,044 | |||||||||
| 290,494 | Crowdstrike Holdings, Inc., Cl A1 | 33,053,591 | 48,965,669 | |||||||||
| 326,143 | Datadog, Inc., Cl A1 | 24,464,933 | 31,061,859 | |||||||||
| 102,330 | EPAM Systems, Inc.1 | 18,440,708 | 30,164,837 | |||||||||
| 241,832 | Guardant Health, Inc.1 | 17,514,518 | 9,755,503 | |||||||||
| 101,704 | Illumina, Inc.1 | 31,551,398 | 18,750,149 | |||||||||
| 1,807,894 | MaxCyte, Inc.1 | 22,208,432 | 8,551,339 | |||||||||
| 146,664 | NVIDIA Corp. | 31,174,401 | 22,232,796 | |||||||||
| 107,518 | Okta, Inc.1 | 18,324,029 | 9,719,627 | |||||||||
| 770,709 | Rivian Automotive, Inc., Cl A1 | 60,115,302 | 19,838,050 | |||||||||
| 660,574 | Rivian Automotive, Inc., Cl A1 | 14,000,003 | 17,003,174 | |||||||||
| 459,455 | Schrödinger, Inc.1 | 16,988,489 | 12,134,207 | |||||||||
| 243,176 | Snowflake, Inc., Cl A1 | 39,428,659 | 33,816,055 | |||||||||
| 26,720 | Tesla, Inc.1 | 22,840,526 | 17,993,782 | |||||||||
| 225,446 | Twilio, Inc., Cl A1 | 43,877,154 | 18,894,629 | |||||||||
| 177,200 | Veeva Systems, Inc., Cl A1 | 30,347,505 | 35,092,688 | |||||||||
| 930,540 | ZoomInfo Technologies, Inc., Cl A1 | 29,973,797 | 30,931,150 | |||||||||
| 123,983 | Zscaler, Inc.1 | 8,588,946 | 18,536,698 | |||||||||
|
|
|
| |||||||||
Total United States | 593,536,698 | 545,746,007 | ||||||||||
|
|
|
| |||||||||
| Uruguay (1.81%) | ||||||||||||
| 712,921 | Dlocal Ltd.1 | 14,971,341 | 18,714,176 | |||||||||
|
|
|
| |||||||||
Total Common Stocks | 1,031,349,728 | 947,852,319 | ||||||||||
|
|
|
| |||||||||
| Private Common Stocks (2.12%) | ||||||||||||
| United States (2.12%) | ||||||||||||
| 252,130 | Space Exploration Technologies Corp., Cl A1,2,4 | 11,571,518 | 16,951,174 | |||||||||
| 75,250 | Space Exploration Technologies Corp., Cl C1,2,4 | 3,428,124 | 5,059,199 | |||||||||
|
|
|
| |||||||||
Total Private Common Stocks | 14,999,642 | 22,010,373 | ||||||||||
|
|
|
| |||||||||
| Private Convertible Preferred Stocks (4.88%) | ||||||||||||
| India (3.75%) | ||||||||||||
| 9,201 | Think & Learn Private Limited, | 29,867,591 | 38,805,839 | |||||||||
|
|
|
| |||||||||
| United States (1.13%) | ||||||||||||
| 219,321 | Farmers Business Network, Inc., Series F1,2,4 | 7,250,006 | 7,608,245 | |||||||||
| 80,440 | Farmers Business Network, Inc., Series G1,2,4 | 5,000,000 | 2,927,211 | |||||||||
| 69,926 | Resident Home, Inc., Series B11,2,4 | 4,999,968 | 1,204,825 | |||||||||
|
|
|
| |||||||||
Total United States | 17,249,974 | 11,740,281 | ||||||||||
|
|
|
| |||||||||
Total Private Convertible Preferred Stocks | 47,117,565 | 50,546,120 | ||||||||||
|
|
|
| |||||||||
| See Notes to Financial Statements. | 35 |
| Baron Global Advantage Fund | June 30, 2022 |
STATEMENT OF NET ASSETS (Unaudited) (Continued)
JUNE 30, 2022
|
| Shares | Cost | Value | ||||||||||
| Private Preferred Stocks (1.28%) | ||||||||||||
| United States (1.28%) | ||||||||||||
| 461,004 | GM Cruise Holdings, Cl G1,2,4 | $ | 12,147,455 | $ | 13,295,356 | |||||||
|
|
|
| |||||||||
| Warrants (0.02%) | ||||||||||||
| Israel (0.01%) | ||||||||||||
| 68,986 | Innovid Corp.1 | 117,942 | 15,184 | |||||||||
| 228,748 | Taboola.com Ltd., Exp 6/29/20261 | 417,100 | 80,084 | |||||||||
|
|
|
| |||||||||
Total Israel | 535,042 | 95,268 | ||||||||||
|
|
|
| |||||||||
| Spain (0.01%) | ||||||||||||
| 502,360 | Codere Online Luxembourg S.A., Exp 11/30/20261 | 845,632 | 150,708 | |||||||||
|
|
|
| |||||||||
Total Warrants | 1,380,674 | 245,976 | ||||||||||
|
|
|
| |||||||||
Total Investments (99.75%) | $ | 1,106,995,064 | 1,033,950,144 | |||||||||
|
| |||||||||||
Cash and Other Assets Less Liabilities (0.25%) | 2,580,061 | |||||||||||
|
| |||||||||||
Net Assets | $ | 1,036,530,205 | ||||||||||
|
| |||||||||||
| | Retail Shares (Equivalent to $26.97 per share | | $ | 292,103,983 | ||||||||
|
| |||||||||||
| | Institutional Shares (Equivalent to $27.55 per share | | $ | 734,459,837 | ||||||||
|
| |||||||||||
| | R6 Shares (Equivalent to $27.57 per share | $ | 9,966,385 | |||||||||
|
| |||||||||||
| % | Represents percentage of net assets. |
| 1 | Non-income producing securities. |
| 2 | At June 30, 2022, the market value of restricted and fair valued securities amounted to $86,138,286 or 8.31% of net assets. These securities are not deemed liquid. See Note 6 regarding Restricted Securities. |
| 3 | Level 2 security. See Note 7 regarding Fair Value Measurements. |
| 4 | Level 3 security. See Note 7 regarding Fair Value Measurements. |
| ADR | American Depositary Receipt. |
| 144A | Security is exempt from registration pursuant to Rule 144A under the Securities Act of 1933. This security may be resold in transactions that are exempt from registration, normally to qualified institutional buyers. At June 30, 2022, the market value of Rule 144A securities amounted to $62,401,258 or 6.02% of net assets. |
All securities are Level 1, unless otherwise noted.
| Summary of Investments by Sector as of June 30, 2022 | Percentage of Net Assets | |||
Information Technology | 42.1 | % | ||
Consumer Discretionary | 25.6 | |||
Health Care | 13.9 | |||
Communication Services | 9.4 | |||
Industrials | 4.6 | |||
Financials | 3.2 | |||
Materials | 1.0 | |||
Cash and Cash Equivalents | 0.2 | |||
| 100.0 | %* | |||
| * | Individual weights may not sum to total due to rounding. |
| 36 | See Notes to Financial Statements. |
| June 30, 2022 | Baron Real Estate Income Fund |
STATEMENT OF NET ASSETS (Unaudited)
JUNE 30, 2022
|
| Shares | Cost | Value | ||||||||||
| Common Stocks (97.27%) | ||||||||||||
| Consumer Discretionary (5.68%) | ||||||||||||
Casinos & Gaming (4.71%) | ||||||||||||
| 123,666 | Las Vegas Sands Corp.1 | $ | 4,654,905 | $ | 4,153,941 | |||||||
| 42,150 | MGM Resorts International | 1,751,140 | 1,220,242 | |||||||||
| 18,869 | Red Rock Resorts, Inc., Cl A | 413,246 | 629,470 | |||||||||
|
|
|
| |||||||||
| 6,819,291 | 6,003,653 | |||||||||||
Leisure Facilities (0.97%) | ||||||||||||
| 5,625 | Vail Resorts, Inc. | 1,512,054 | 1,226,531 | |||||||||
|
|
|
| |||||||||
Total Consumer Discretionary | 8,331,345 | 7,230,184 | ||||||||||
|
|
|
| |||||||||
| Financials (4.15%) | ||||||||||||
Asset Management & Custody Banks (4.15%) | ||||||||||||
| 77,969 | Brookfield Asset Management, Inc., Cl A2 | 4,148,403 | 3,467,282 | |||||||||
| 19,919 | Blackstone, Inc. | 2,251,718 | 1,817,210 | |||||||||
|
|
|
| |||||||||
Total Financials | 6,400,121 | 5,284,492 | ||||||||||
|
|
|
| |||||||||
| Real Estate (83.25%) | ||||||||||||
Health Care REITs (6.41%) | ||||||||||||
| 116,549 | Ventas, Inc. | 6,031,804 | 5,994,115 | |||||||||
| 26,498 | Welltower, Inc. | 2,201,442 | 2,182,110 | |||||||||
|
|
|
| |||||||||
| 8,233,246 | 8,176,225 | |||||||||||
Hotel & Resort REITs (3.55%) | ||||||||||||
| 144,245 | Pebblebrook Hotel Trust | 3,036,679 | 2,390,140 | |||||||||
| 214,443 | Sunstone Hotel Investors, Inc.1 | 2,461,122 | 2,127,274 | |||||||||
|
|
|
| |||||||||
| 5,497,801 | 4,517,414 | |||||||||||
Industrial REITs (9.56%) | ||||||||||||
| 100,305 | Duke Realty Corp. | 5,322,731 | 5,511,760 | |||||||||
| 40,680 | Prologis, Inc. | 5,261,027 | 4,786,002 | |||||||||
| 32,636 | Rexford Industrial Realty, Inc. | 1,690,060 | 1,879,507 | |||||||||
|
|
|
| |||||||||
| 12,273,818 | 12,177,269 | |||||||||||
Residential REITs (25.95%) | ||||||||||||
| 18,177 | American Campus Communities, Inc. | 953,850 | 1,171,871 | |||||||||
| 127,400 | American Homes 4 Rent, Cl A | 4,571,949 | 4,515,056 | |||||||||
| 25,008 | AvalonBay Communities, Inc. | 5,654,100 | 4,857,804 | |||||||||
| 18,334 | Camden Property Trust | 2,727,270 | 2,465,556 | |||||||||
| 36,367 | Equity LifeStyle Properties, Inc. | 2,404,624 | 2,562,783 | |||||||||
| 76,665 | Equity Residential | 5,924,848 | 5,536,746 | |||||||||
| 151,778 | Invitation Homes, Inc. | 5,201,128 | 5,400,261 | |||||||||
Residential REITs (continued) |
| |||||||||||
| 41,059 | NexPoint Residential Trust, Inc. | 2,918,887 | 2,566,598 | |||||||||
| 25,049 | Sun Communities, Inc. | 3,901,051 | 3,991,809 | |||||||||
|
|
|
| |||||||||
| 34,257,707 | 33,068,484 | |||||||||||
Retail REITs (2.31%) | ||||||||||||
| 72,958 | Kite Realty Group Trust | 1,499,807 | 1,261,444 | |||||||||
| 64,938 | NETSTREIT Corp. | 1,251,367 | 1,225,380 | |||||||||
| 46,525 | RPT Realty | 589,804 | 457,341 | |||||||||
|
|
|
| |||||||||
| 3,340,978 | 2,944,165 | |||||||||||
| Shares | Cost | Value | ||||||||||
| Common Stocks (continued) | ||||||||||||
| Real Estate (continued) | ||||||||||||
Specialized REITs (35.47%) | ||||||||||||
| 13,162 | Alexandria Real Estate Equities, Inc.3 | $ | 1,888,438 | $ | 1,908,885 | |||||||
| 34,136 | American Tower Corp. | 8,149,120 | 8,724,820 | |||||||||
| 11,385 | Crown Castle International Corp. | 1,846,838 | 1,917,006 | |||||||||
| 51,189 | Digital Realty Trust, Inc. | 7,223,284 | 6,645,868 | |||||||||
| 11,903 | Equinix, Inc. | 7,871,684 | 7,820,509 | |||||||||
| 30,406 | Extra Space Storage, Inc. | 5,219,996 | 5,172,669 | |||||||||
| 75,323 | Gaming and Leisure Properties, Inc. | 3,393,408 | 3,454,313 | |||||||||
| 23,998 | Public Storage | 7,409,219 | 7,503,455 | |||||||||
| 6,400 | SBA Communications Corp. | 2,069,290 | 2,048,320 | |||||||||
|
|
|
| |||||||||
| 45,071,277 | 45,195,845 | |||||||||||
|
|
|
| |||||||||
Total Real Estate | 108,674,827 | 106,079,402 | ||||||||||
|
|
|
| |||||||||
| Utilities (4.19%) | ||||||||||||
Multi-Utilities (4.19%) | ||||||||||||
| 139,780 | Brookfield Infrastructure Partners L.P.2 | 5,150,910 | 5,342,392 | |||||||||
|
|
|
| |||||||||
Total Common Stocks | 128,557,203 | 123,936,470 | ||||||||||
|
|
|
| |||||||||
| Principal Amount | ||||||||||||
| Short Term Investments (1.12%) | ||||||||||||
| $1,429,182 | Repurchase Agreement with Fixed Income Clearing Corp., dated 6/30/2022, 0.24% due 7/1/2022; Proceeds at maturity - $1,429,192; (Fully collateralized by $1,524,400 U.S. Treasury Note, 2.25% due 11/15/2027 Market value -$1,457,827)4 | 1,429,182 | 1,429,182 | |||||||||
|
|
|
| |||||||||
Total Investments (98.39%) | $ | 129,986,385 | 125,365,652 | |||||||||
|
| |||||||||||
Cash and Other Assets Less Liabilities (1.61%) | 2,057,419 | |||||||||||
|
| |||||||||||
Net Assets | $ | 127,423,071 | ||||||||||
|
| |||||||||||
| | Retail Shares (Equivalent to $14.10 per share | $ | 15,644,945 | |||||||||
|
| |||||||||||
| | Institutional Shares (Equivalent to $14.24 per share | | $ | 111,136,557 | ||||||||
|
| |||||||||||
| | R6 Shares (Equivalent to $14.23 per share | $ | 641,569 | |||||||||
|
| |||||||||||
| % | Represents percentage of net assets. |
| 1 | Non-income producing securities. |
| 2 | Foreign corporation. |
| 3 | The Adviser has reclassified/classified certain securities in or out of this sub-industry. Such reclassifications/classifications are not supported by S&P or MSCI (unaudited). |
| 4 | Level 2 security. See Note 7 regarding Fair Value Measurements. |
All securities are Level 1, unless otherwise noted.
| See Notes to Financial Statements. | 37 |
| Baron Health Care Fund | June 30, 2022 |
STATEMENT OF NET ASSETS (Unaudited)
JUNE 30, 2022
|
| Shares | Cost | Value | ||||||||||
| Common Stocks (91.56%) | ||||||||||||
| Health Care (90.82%) | ||||||||||||
Biotechnology (12.64%) |
| |||||||||||
| 44,600 | AbbVie, Inc. | $ | 6,393,559 | $ | 6,830,936 | |||||||
| 18,878 | argenx SE, ADR1,2 | 4,611,455 | 7,152,496 | |||||||||
| 10,000 | Arrowhead Pharmaceuticals, Inc.1 | 301,388 | 352,100 | |||||||||
| 28,000 | Cytokinetics, Incorporated1 | 1,028,909 | 1,100,120 | |||||||||
| 52,614 | Genmab A/S, ADR1,2 | 1,944,994 | 1,709,429 | |||||||||
| 11,700 | Moderna, Inc.1 | 1,609,290 | 1,671,345 | |||||||||
| 16,600 | Vertex Pharmaceuticals Incorporated1 | 4,047,722 | 4,677,714 | |||||||||
| 22,000 | Xenon Pharmaceuticals, Inc.1,2 | 638,245 | 669,240 | |||||||||
| 20,000 | Zai Lab Limited, ADR1,2 | 664,358 | 693,600 | |||||||||
|
|
|
| |||||||||
| 21,239,920 | 24,856,980 | |||||||||||
Health Care Distributors (3.25%) |
| |||||||||||
| 19,600 | McKesson Corp. | 4,478,355 | 6,393,716 | |||||||||
Health Care Equipment (16.06%) |
| |||||||||||
| 36,662 | Abbott Laboratories | 3,793,720 | 3,983,326 | |||||||||
| 16,588 | DexCom, Inc.1 | 1,251,833 | 1,236,304 | |||||||||
| 47,351 | Edwards Lifesciences Corp.1 | 3,909,417 | 4,502,607 | |||||||||
| 6,395 | IDEXX Laboratories, Inc.1 | 2,774,392 | 2,242,918 | |||||||||
| 62,928 | Inari Medical, Inc.1 | 4,822,513 | 4,278,475 | |||||||||
| 14,236 | Inspire Medical Systems, Inc.1,3 | 2,058,454 | 2,600,490 | |||||||||
| 7,715 | Insulet Corp.1 | 1,601,902 | 1,681,407 | |||||||||
| 17,433 | Intuitive Surgical, Inc.1 | 4,104,234 | 3,498,978 | |||||||||
| 1,387,480 | Opsens, Inc. (Canada)1,2 | 2,019,084 | 2,382,171 | |||||||||
| 8,000 | Shockwave Medical, Inc.1 | 430,320 | 1,529,360 | |||||||||
| 19,000 | Tandem Diabetes Care, Inc.1 | 1,315,402 | 1,124,610 | |||||||||
| 10,173 | Teleflex, Inc. | 3,787,045 | 2,501,032 | |||||||||
|
|
|
| |||||||||
| 31,868,316 | 31,561,678 | |||||||||||
Health Care Supplies (1.82%) |
| |||||||||||
| 11,400 | The Cooper Companies, Inc. | 4,594,529 | 3,569,568 | |||||||||
Health Care Technology (2.80%) |
| |||||||||||
| 97,763 | Definitive Healthcare Corp.1 | 2,701,490 | 2,241,706 | |||||||||
| 55,819 | Schrödinger, Inc.1 | 2,436,665 | 1,474,180 | |||||||||
| 9,060 | Veeva Systems, Inc., Cl A1 | 1,898,347 | 1,794,242 | |||||||||
|
|
|
| |||||||||
| 7,036,502 | 5,510,128 | |||||||||||
Life Sciences Tools & Services (16.63%) |
| |||||||||||
| 27,730 | Bio-Techne Corporation | 10,844,423 | 9,612,327 | |||||||||
| 15,000 | ICON plc1,2 | 2,643,134 | 3,250,500 | |||||||||
| 10,337 | Illumina, Inc.1 | 2,385,633 | 1,905,729 | |||||||||
| 267,072 | MaxCyte, Inc.1 | 3,052,067 | 1,263,250 | |||||||||
| 3,110 | Mettler-Toledo International, Inc.1 | 3,304,432 | 3,572,675 | |||||||||
| 40,000 | Stevanato Group SpA2 | 708,260 | 632,400 | |||||||||
| 18,899 | Thermo Fisher Scientific, Inc. | 9,381,056 | 10,267,449 | |||||||||
| 7,234 | West Pharmaceutical Services, Inc. | 2,030,553 | 2,187,345 | |||||||||
|
|
|
| |||||||||
| 34,349,558 | 32,691,675 | |||||||||||
Managed Health Care (13.87%) |
| |||||||||||
| 10,100 | Elevance Health, Inc. (formerly, Anthem, Inc.) | 4,529,806 | 4,874,058 | |||||||||
| 8,350 | Humana, Inc. | 3,551,941 | 3,908,385 | |||||||||
| 35,972 | UnitedHealth Group, Incorporated | 13,092,572 | 18,476,298 | |||||||||
|
|
|
| |||||||||
| 21,174,319 | 27,258,741 | |||||||||||
| Shares | Cost | Value | ||||||||||
| Common Stocks (continued) | ||||||||||||
| Health Care (continued) | ||||||||||||
Pharmaceuticals (23.75%) |
| |||||||||||
| 126,000 | AstraZeneca PLC, ADR2 | $ | 7,582,100 | $ | 8,324,820 | |||||||
| 61,000 | Bristol-Myers Squibb Co. | 4,617,575 | 4,697,000 | |||||||||
| 134,322 | Dechra Pharmaceuticals PLC (United Kingdom)2,4 | 7,314,321 | 5,663,727 | |||||||||
| 31,992 | Eli Lilly & Co. | 7,311,445 | 10,372,766 | |||||||||
| 47,300 | Merck & Co., Inc. | 3,988,262 | 4,312,341 | |||||||||
| 53,100 | Novo Nordisk A/S, ADR2 | 5,871,239 | 5,916,933 | |||||||||
| 58,400 | Roche Holding AG, ADR2 | 2,861,534 | 2,435,864 | |||||||||
| 28,828 | Zoetis, Inc. | 4,820,081 | 4,955,245 | |||||||||
|
|
|
| |||||||||
| 44,366,557 | 46,678,696 | |||||||||||
|
|
|
| |||||||||
Total Health Care | 169,108,056 | 178,521,182 | ||||||||||
|
|
|
| |||||||||
| Real Estate (0.74%) | ||||||||||||
Specialized REITs (0.74%) |
| |||||||||||
| 10,000 | Alexandria Real Estate Equities, Inc.3 | 1,565,750 | 1,450,300 | |||||||||
|
|
|
| |||||||||
Total Common Stocks | 170,673,806 | 179,971,482 | ||||||||||
|
|
|
| |||||||||
| Principal Amount | ||||||||||||
| Short Term Investments (7.38%) | ||||||||||||
| $14,518,139 | Repurchase Agreement with | 14,518,139 | 14,518,139 | |||||||||
|
|
|
| |||||||||
Total Investments (98.94%) | $ | 185,191,945 | 194,489,621 | |||||||||
|
| |||||||||||
Cash and Other Assets Less Liabilities (1.06%) | 2,074,999 | |||||||||||
|
| |||||||||||
Net Assets | $ | 196,564,620 | ||||||||||
|
| |||||||||||
| | Retail Shares (Equivalent to $17.28 per share | $ | 54,057,425 | |||||||||
|
| |||||||||||
| | Institutional Shares (Equivalent to $17.46 per share | $ | 137,011,991 | |||||||||
|
| |||||||||||
| | R6 Shares (Equivalent to $17.46 per share | $ | 5,495,204 | |||||||||
|
| |||||||||||
| % | Represents percentage of net assets. |
| 1 | Non-income producing securities. |
| 2 | Foreign corporation. |
| 3 | The Adviser has reclassified/classified certain securities in or out of this sub-industry. Such reclassifications/classifications are not supported by S&P or MSCI (unaudited). |
| 4 | Level 2 security. See Note 7 regarding Fair Value Measurements. |
| ADR | American Depositary Receipt. |
All securities are Level 1, unless otherwise noted.
| 38 | See Notes to Financial Statements. |
| June 30, 2022 | Baron FinTech Fund |
STATEMENT OF NET ASSETS (Unaudited)
JUNE 30, 2022
|
| Shares | Cost | Value | ||||||||||
| Common Stocks (94.37%) | ||||||||||||
| Communication Services (1.15%) | ||||||||||||
Interactive Media & Services (1.15%) | ||||||||||||
| 14,600 | ZoomInfo Technologies, Inc., Cl A1 | $ | 820,726 | $ | 485,304 | |||||||
|
|
|
| |||||||||
| Consumer Discretionary (1.81%) | ||||||||||||
Internet & Direct Marketing Retail (1.81%) | ||||||||||||
| 1,200 | MercadoLibre, Inc.1 | 1,841,556 | 764,244 | |||||||||
|
|
|
| |||||||||
| Financials (30.69%) | ||||||||||||
Asset Management & Custody Banks (3.17%) | ||||||||||||
| 2,200 | BlackRock, Inc. | 1,851,755 | 1,339,888 | |||||||||
Financial Exchanges & Data (16.29%) |
| |||||||||||
| 4,600 | CME Group, Inc. | 983,175 | 941,620 | |||||||||
| 1,600 | MarketAxess Holdings, Inc. | 690,718 | 409,616 | |||||||||
| 4,100 | Moody’s Corp. | 1,435,717 | 1,115,077 | |||||||||
| 3,300 | MSCI, Inc. | 1,495,792 | 1,360,095 | |||||||||
| 5,800 | S&P Global, Inc. | 2,297,968 | 1,954,948 | |||||||||
| 16,000 | Tradeweb Markets, Inc., Cl A | 1,359,703 | 1,092,000 | |||||||||
|
|
|
| |||||||||
| 8,263,073 | 6,873,356 | |||||||||||
Insurance Brokers (1.03%) |
| |||||||||||
| 18,000 | BRP Group, Inc., Cl A1 | 537,395 | 434,700 | |||||||||
Investment Banking & Brokerage (7.13%) | ||||||||||||
| 9,600 | Houlihan Lokey, Inc. | 712,661 | 757,728 | |||||||||
| 12,200 | LPL Financial Holdings, Inc. | 2,015,771 | 2,250,656 | |||||||||
|
|
|
| |||||||||
| 2,728,432 | 3,008,384 | |||||||||||
Property & Casualty Insurance (3.07%) | ||||||||||||
| 2,600 | Kinsale Capital Group, Inc. | 458,703 | 597,064 | |||||||||
| 6,000 | The Progressive Corp. | 687,273 | 697,620 | |||||||||
|
|
|
| |||||||||
| 1,145,976 | 1,294,684 | |||||||||||
|
|
|
| |||||||||
Total Financials | 14,526,631 | 12,951,012 | ||||||||||
|
|
|
| |||||||||
| Industrials (7.91%) | ||||||||||||
Research & Consulting Services (7.91%) | ||||||||||||
| 10,000 | CoStar Group, Inc.1 | 863,804 | 604,100 | |||||||||
| 6,800 | Equifax, Inc. | 1,544,638 | 1,242,904 | |||||||||
| 10,000 | TransUnion | 1,034,936 | 799,900 | |||||||||
| 4,000 | Verisk Analytics, Inc. | 754,922 | 692,360 | |||||||||
|
|
|
| |||||||||
Total Industrials | 4,198,300 | 3,339,264 | ||||||||||
|
|
|
| |||||||||
| Information Technology (52.81%) | ||||||||||||
Application Software (14.02%) |
| |||||||||||
| 10,000 | Alkami Technology, Inc.1 | 273,107 | 138,900 | |||||||||
| 4,000 | Bill.Com Holdings, Inc.1 | 482,722 | 439,760 | |||||||||
| 7,400 | Ceridian HCM Holding, Inc.1 | 828,502 | 348,392 | |||||||||
| 27,000 | Clearwater Analytics Holdings, Inc., Cl A1 | 635,932 | 325,080 | |||||||||
| 14,000 | Expensify, Inc., Cl A1 | 405,659 | 249,060 | |||||||||
| 2,900 | Fair Isaac Corp.1 | 1,351,873 | 1,162,610 | |||||||||
| 12,000 | Guidewire Software, Inc.1 | 1,367,684 | 851,880 | |||||||||
| 5,100 | Intuit, Inc. | 1,893,149 | 1,965,744 | |||||||||
| 14,000 | nCino, Inc.1 | 1,008,516 | 432,880 | |||||||||
|
|
|
| |||||||||
| 8,247,144 | 5,914,306 | |||||||||||
Data Processing & Outsourced Services (26.05%) | ||||||||||||
| 700 | Adyen N.V., 144A (Netherlands)1,2,3 | 1,398,390 | 1,010,192 | |||||||||
| 12,000 | Block, Inc., Cl A1 | 2,404,198 | 737,520 | |||||||||
| 22,000 | Dlocal Ltd.1,2 | 570,023 | 577,500 | |||||||||
| 11,500 | Fidelity National Information Services, Inc. | 1,538,693 | 1,054,205 | |||||||||
| Shares | Cost | Value | ||||||||||
| Common Stocks (continued) | ||||||||||||
| Information Technology (continued) | ||||||||||||
| 6,000 | Global Payments, Inc. | $ | 829,178 | $ | 663,840 | |||||||
| 3,700 | Jack Henry & Associates, Inc. | 617,174 | 666,074 | |||||||||
| 25,000 | Marqeta, Inc.1 | 657,358 | 202,750 | |||||||||
| 6,700 | MasterCard Incorporated, Cl A | 2,325,005 | 2,113,716 | |||||||||
| 90,000 | Network International | 421,085 | 206,844 | |||||||||
| 15,000 | Nuvei Corp., 144A1,2 | 660,043 | 542,550 | |||||||||
| 18,000 | Paymentus Holdings, Inc., Cl A1 | 409,901 | 240,660 | |||||||||
| 15,000 | Repay Holdings Corporation1 | 290,606 | 192,750 | |||||||||
| 12,100 | Visa, Inc., Cl A | 2,604,565 | 2,382,369 | |||||||||
| 110,000 | Wise PLC, Cl A (United Kingdom)1,2,3 | 1,367,749 | 399,477 | |||||||||
|
|
|
| |||||||||
| 16,093,968 | 10,990,447 | |||||||||||
Internet Services & Infrastructure (1.11%) | ||||||||||||
| 15,000 | Shopify, Inc., Cl A1,2 | 2,048,592 | 468,600 | |||||||||
IT Consulting & Other Services (11.63%) | ||||||||||||
| 6,200 | Accenture plc, Cl A2 | 1,784,551 | 1,721,430 | |||||||||
| 35,000 | CI&T, Inc., Cl A1,2 | 517,710 | 353,150 | |||||||||
| 18,700 | Endava plc, ADR1,2 | 1,339,729 | 1,650,649 | |||||||||
| 6,800 | Globant S.A.1,2 | 1,704,456 | 1,183,200 | |||||||||
|
|
|
| |||||||||
| 5,346,446 | 4,908,429 | |||||||||||
|
|
|
| |||||||||
Total Information Technology | 31,736,150 | 22,281,782 | ||||||||||
|
|
|
| |||||||||
Total Common Stocks | 53,123,363 | 39,821,606 | ||||||||||
|
|
|
| |||||||||
| Principal Amount | ||||||||||||
| Short Term Investments (6.82%) | ||||||||||||
| $2,878,942 | Repurchase Agreement with Fixed Income Clearing Corp., dated 6/30/2022, 0.24% due 7/1/2022; Proceeds at maturity - $2,878,961; (Fully collateralized by $3,070,700 U.S. Treasury Note, 2.25% due 11/15/2027 Market value - $2,936,598)3 | 2,878,942 | 2,878,942 | |||||||||
|
|
|
| |||||||||
Total Investments (101.19%) | $ | 56,002,305 | 42,700,548 | |||||||||
|
| |||||||||||
Liabilities Less Cash and Other Assets (-1.19%) | (504,014 | ) | ||||||||||
|
| |||||||||||
Net Assets | $ | 42,196,534 | ||||||||||
|
| |||||||||||
| | Retail Shares (Equivalent to $10.91 per share | $ | 7,518,280 | |||||||||
|
| |||||||||||
| | Institutional Shares (Equivalent to $10.97 per share | $ | 30,377,687 | |||||||||
|
| |||||||||||
| | R6 Shares (Equivalent to $10.98 per share | $ | 4,300,567 | |||||||||
|
| |||||||||||
| % | Represents percentage of net assets. |
| 1 | Non-income producing securities. |
| 2 | Foreign corporation. |
| 3 | Level 2 security. See Note 7 regarding Fair Value Measurements. |
| ADR | American Depositary Receipt. |
| 144A | Security is exempt from registration pursuant to Rule 144A under the Securities Act of 1933. This security may be resold in transactions that are exempt from registration, normally to qualified institutional buyers. At June 30, 2022, the market value of Rule 144A securities amounted to $1,759,586 or 4.17% of net assets. |
All securities are Level 1, unless otherwise noted.
| See Notes to Financial Statements. | 39 |
| Baron New Asia Fund | June 30, 2022 |
STATEMENT OF NET ASSETS (Unaudited)
JUNE 30, 2022
|
| Shares | Cost | Value | ||||||||||
| Common Stocks (94.77%) | ||||||||||||
| China (41.39%) | ||||||||||||
| 1,149 | Alibaba Group Holding Limited, ADR1 | $ | 153,442 | $ | 130,618 | |||||||
| 532 | Baidu, Inc., ADR1 | 78,787 | 79,124 | |||||||||
| 5,409 | Beijing Oriental Yuhong Waterproof Technology Co. Ltd., Cl A2 | 37,780 | 41,670 | |||||||||
| 43,318 | China Conch Environment Protection Holdings Ltd.1 | 28,465 | 30,142 | |||||||||
| 13,768 | China Conch Venture Holdings Ltd.2 | 52,697 | 30,030 | |||||||||
| 1,368 | China Tourism Group Duty Free Corporation Ltd., Cl A1,2 | 48,202 | 47,692 | |||||||||
| 16,425 | Estun Automation Co. Ltd., Cl A2 | 64,989 | 60,309 | |||||||||
| 6,210 | Full Truck Alliance Co. Ltd., ADR1 | 42,088 | 56,263 | |||||||||
| 7,769 | Galaxy Entertainment Group Ltd.2 | 48,587 | 46,541 | |||||||||
| 43 | GDS Holdings Limited, ADR1 | 1,857 | 1,436 | |||||||||
| 8,050 | GDS Holdings Limited, Cl A1,2 | 51,594 | 33,852 | |||||||||
| 9,689 | Han’s Laser Technology Industry Group Co., Ltd., Cl A2 | 67,306 | 48,100 | |||||||||
| 2,232 | Hangzhou Tigermed Consulting Co. Ltd., Cl A2 | 41,746 | 38,252 | |||||||||
| 9,043 | Hua Hong Semiconductor Limited, 144A2 | 50,973 | 32,825 | |||||||||
| 623 | JD.com, Inc., ADR | 45,999 | 40,009 | |||||||||
| 2,660 | Jiangsu Hengli Hydraulic Co. Ltd., Cl A2 | 21,568 | 24,556 | |||||||||
| 14,800 | Kingdee International Software Group Co. Ltd.1,2 | 37,906 | 34,869 | |||||||||
| 14,297 | Kingsoft Corp. Ltd.2 | 64,852 | 55,864 | |||||||||
| 321 | Kweichow Moutai Co. Ltd., Cl A2 | 86,103 | 98,179 | |||||||||
| 3,103 | Lufax Holding Ltd., ADR | 19,937 | 18,618 | |||||||||
| 6,362 | Midea Group Co., Ltd., Cl A2 | 69,854 | 57,583 | |||||||||
| 10,496 | NARI Technology Co. Ltd., Cl A2 | 45,567 | 42,471 | |||||||||
| 800 | NAURA Technology Group Co. Ltd., Cl A2 | 44,689 | 33,254 | |||||||||
| 727 | Shenzhen Mindray Bio-Medical Electronics Co. Ltd., Cl A2 | 39,019 | 34,089 | |||||||||
| 3,153 | Tencent Holdings Limited, ADR | 185,883 | 143,115 | |||||||||
| 8,536 | Venustech Group, Inc., Cl A2 | 35,643 | 25,460 | |||||||||
| 908 | Will Semiconductor Co. Ltd. Shanghai, Cl A1,2 | 33,198 | 23,565 | |||||||||
| 2,143 | WuXi AppTec Co. Ltd., Cl H, 144A2 | 41,762 | 28,669 | |||||||||
| 4,645 | Wuxi Biologics Cayman, Inc., 144A1,2 | 56,350 | 43,038 | |||||||||
| 19,336 | Xiaomi Corporation, Cl B, 144A1,2 | 56,034 | 33,832 | |||||||||
| 1,958 | Yum China Holdings, Inc.2 | 108,663 | 96,062 | |||||||||
| 4,044 | Yunnan Baiyao Group Co. Ltd., Cl A2 | 42,240 | 36,523 | |||||||||
| 1,212 | Zai Lab Limited, ADR1 | 76,780 | 42,032 | |||||||||
| 4,592 | Zhejiang Dingli Machinery Co. Ltd., Cl A2 | 45,807 | 34,842 | |||||||||
|
|
|
| |||||||||
Total China | 1,926,367 | 1,623,484 | ||||||||||
|
|
|
| |||||||||
| Hong Kong (6.57%) | ||||||||||||
| 7,327 | AIA Group Ltd.2 | 78,762 | 80,059 | |||||||||
| 18,945 | Budweiser Brewing Co. APAC Ltd., 144A2 | 51,368 | 56,848 | |||||||||
| 1,647 | Hong Kong Exchanges & Clearing Ltd.2 | 80,274 | 81,455 | |||||||||
| 3,748 | Techtronic Industries Co. Ltd.2 | 58,664 | 39,137 | |||||||||
|
|
|
| |||||||||
Total Hong Kong | 269,068 | 257,499 | ||||||||||
|
|
|
| |||||||||
| India (25.67%) | ||||||||||||
| 6,732 | AARTI Industries Ltd.2 | 85,756 | 59,791 | |||||||||
| 702 | Amber Enterprises India Ltd.1,2 | 29,431 | 20,050 | |||||||||
| 625 | Apollo Hospitals Enterprise Ltd.2 | 39,578 | 29,242 | |||||||||
| 556 | Asian Paints Ltd.2 | 24,656 | 19,035 | |||||||||
| 1,069 | Bajaj Finance Limited2 | 94,674 | 73,555 | |||||||||
| 10,356 | Bharti Airtel Ltd.1,2 | 91,490 | 90,078 | |||||||||
| 582 | Bharti Airtel Ltd. PP1,2 | 1,202 | 2,238 | |||||||||
| 655 | Divi’s Laboratories Ltd.2 | 44,287 | 30,191 | |||||||||
| 527 | Dixon Technologies India Ltd.2 | 31,911 | 23,956 | |||||||||
| 3,060 | Godrej Consumer Products Ltd.1,2 | 41,400 | 29,450 | |||||||||
| Shares | Cost | Value | ||||||||||
| Common Stocks (continued) | ||||||||||||
| India (continued) | ||||||||||||
| 1,902 | Godrej Properties Ltd.1,2 | $ | 44,035 | $ | 28,597 | |||||||
| 3,075 | HDFC Bank Ltd.2 | 64,253 | 52,672 | |||||||||
| 10,371 | ICICI Bank Ltd.2 | 99,285 | 93,172 | |||||||||
| 1,363 | ICICI Lombard General | 28,375 | 19,407 | |||||||||
| 4,434 | Jubilant FoodWorks Ltd.2 | 46,255 | 28,911 | |||||||||
| 4,623 | Max Financial Services Ltd.1,2 | 69,485 | 45,921 | |||||||||
| 1,708 | Neogen Chemicals Ltd.1,2 | 26,137 | 28,307 | |||||||||
| 698 | PI Industries Ltd.2 | 29,745 | 22,691 | |||||||||
| 3,642 | Reliance Industries Limited1,2 | 111,352 | 120,256 | |||||||||
| 4,702 | SBI Life Insurance Company Limited, 144A2 | 74,573 | 64,573 | |||||||||
| 1,940 | Tata Communications Ltd.2 | 37,972 | 22,537 | |||||||||
| 4,975 | Tata Consumer Products Ltd.2 | 51,998 | 44,639 | |||||||||
| 1,697 | Titan Co. Ltd.2 | 46,088 | 41,829 | |||||||||
| 22,865 | Zomato Ltd.1,2 | 37,390 | 15,688 | |||||||||
|
|
|
| |||||||||
Total India | 1,251,328 | 1,006,786 | ||||||||||
|
|
|
| |||||||||
| Indonesia (2.22%) | ||||||||||||
| 214,500 | Bank Rakyat Indonesia (Persero) Tbk PT2 | 63,131 | 59,902 | |||||||||
| 51,300 | PT Bank Negara Indonesia (Persero) Tbk PT2 | 30,681 | 27,099 | |||||||||
|
|
|
| |||||||||
Total Indonesia | 93,812 | 87,001 | ||||||||||
|
|
|
| |||||||||
| Japan (2.94%) | ||||||||||||
| 372 | Hoya Corp.2 | 54,036 | 31,837 | |||||||||
| 160 | Keyence Corporation2 | 91,935 | 54,870 | |||||||||
| 88 | Tokyo Electron Limited2 | 40,111 | 28,723 | |||||||||
|
|
|
| |||||||||
Total Japan | 186,082 | 115,430 | ||||||||||
|
|
|
| |||||||||
| Korea, Republic of (8.01%) | ||||||||||||
| 2,508 | Coupang, Inc., Cl A1 | 30,343 | 31,977 | |||||||||
| 684 | Hyundai Heavy Industries Co. Ltd.1,2 | 52,318 | 75,492 | |||||||||
| 832 | Korea Aerospace Industries Ltd.2 | 28,168 | 34,406 | |||||||||
| 681 | Korea Shipbuilding & Offshore Engineering Co. Ltd.1,2 | 61,061 | 49,433 | |||||||||
| 2,780 | Samsung Electronics Co., Ltd.2 | 163,249 | 122,618 | |||||||||
|
|
|
| |||||||||
Total Korea, Republic of | 335,139 | 313,926 | ||||||||||
|
|
|
| |||||||||
| Taiwan (6.26%) | ||||||||||||
| 746 | Airtac International Group1,2 | 25,873 | 24,900 | |||||||||
| 979 | MediaTek, Inc.2 | 29,756 | 21,490 | |||||||||
| 215 | Silergy Corp.2 | 29,819 | 17,385 | |||||||||
| 2,224 | Taiwan Semiconductor Manufacturing Co., Ltd., ADR | 258,750 | 181,812 | |||||||||
|
|
|
| |||||||||
Total Taiwan | 344,198 | 245,587 | ||||||||||
|
|
|
| |||||||||
| Thailand (0.91%) | ||||||||||||
| 15,400 | Energy Absolute PCL Foreign2 | 37,594 | 35,694 | |||||||||
|
|
|
| |||||||||
| United States (0.80%) | ||||||||||||
| 1,871 | ACM Research, Inc., Cl A1 | 28,309 | 31,489 | |||||||||
|
|
|
| |||||||||
Total Common Stocks | 4,471,897 | 3,716,896 | ||||||||||
|
|
|
| |||||||||
| 40 | See Notes to Financial Statements. |
| June 30, 2022 | Baron New Asia Fund |
STATEMENT OF NET ASSETS (Unaudited) (Continued)
JUNE 30, 2022
|
| Principal Amount | Cost | Value | ||||||||||
| Short Term Investments (5.30%) | ||||||||||||
| $207,633 | Repurchase Agreement with | $ | 207,633 | $ | 207,633 | |||||||
|
|
|
| |||||||||
Total Investments (100.07%) | $ | 4,679,530 | 3,924,529 | |||||||||
|
| |||||||||||
Liabilities Less Cash and Other Assets (-0.07%) | (2,582 | ) | ||||||||||
|
| |||||||||||
Net Assets | $ | 3,921,947 | ||||||||||
|
| |||||||||||
| | Retail Shares (Equivalent to $7.92 per share | $ | 1,049,138 | |||||||||
|
| |||||||||||
| | Institutional Shares (Equivalent to $7.94 per share | $ | 2,791,697 | |||||||||
|
| |||||||||||
| | R6 Shares (Equivalent to $7.95 per share | $ | 81,112 | |||||||||
|
| |||||||||||
| % | Represents percentage of net assets. |
| 1 | Non-income producing securities. |
| 2 | Level 2 security. See Note 7 regarding Fair Value Measurements. |
| ADR | American Depositary Receipt. |
| 144A | Security is exempt from registration pursuant to Rule 144A under the Securities Act of 1933. This security may be resold in transactions that are exempt from registration, normally to qualified institutional buyers. At June 30, 2022, the market value of Rule 144A securities amounted to $279,192 or 7.12% of net assets. |
All securities are Level 1, unless otherwise noted.
Summary of Investments by Sector as of June 30, 2022 | Percent of Net Assets | |||
Information Technology | 17.3 | % | ||
Financials | 15.7 | |||
Consumer Discretionary | 14.8 | |||
Industrials | 14.0 | |||
Communication Services | 10.0 | |||
Health Care | 8.0 | |||
Consumer Staples | 5.8 | |||
Materials | 4.4 | |||
Energy | 3.1 | |||
Utilities | 0.9 | |||
Real Estate | 0.7 | |||
Cash & Cash Equivalents* | 5.2 | |||
| 100.0 | %** | |||
| * | Includes short term investments. |
| ** | Individual weights may not sum to total due to rounding. |
| See Notes to Financial Statements. | 41 |
| Baron Technology Fund | June 30, 2022 |
STATEMENT OF NET ASSETS (Unaudited)
JUNE 30, 2022
|
| Shares | Cost | Value | ||||||||||
| Common Stocks (89.67%) | ||||||||||||
| Communication Services (9.30%) | ||||||||||||
Advertising (1.02%) | ||||||||||||
| 12,360 | S4 Capital PLC (United Kingdom)1,2,4 | $ | 88,799 | $ | 34,679 | |||||||
Interactive Home Entertainment (0.38%) | ||||||||||||
| 192 | Sea Ltd. (Singapore), ADR1,2 | 27,472 | 12,837 | |||||||||
Interactive Media & Services (5.80%) | ||||||||||||
| 50 | Alphabet, Inc., Cl C1 | 142,533 | 109,372 | |||||||||
| 2,665 | ZoomInfo Technologies, Inc., Cl A1 | 150,607 | 88,585 | |||||||||
|
|
|
| |||||||||
| 293,140 | 197,957 | |||||||||||
Movies & Entertainment (1.06%) | ||||||||||||
| 384 | Spotify Technology SA1,2 | 79,582 | 36,031 | |||||||||
Publishing (1.04%) |
| |||||||||||
| 1,683 | Future PLC (United Kingdom)2,4 | 86,374 | 35,615 | |||||||||
|
|
|
| |||||||||
Total Communication Services | 575,367 | 317,119 | ||||||||||
|
|
|
| |||||||||
| Consumer Discretionary (15.16%) | ||||||||||||
Automobile Manufacturers (2.63%) |
| |||||||||||
| 576 | Rivian Automotive, Inc., Cl A1 | 55,659 | 14,826 | |||||||||
| 111 | Tesla, Inc.1 | 112,417 | 74,750 | |||||||||
|
|
|
| |||||||||
| 168,076 | 89,576 | |||||||||||
Hotels, Resorts & Cruise Lines (0.80%) |
| |||||||||||
| 5,037 | eDreams ODIGEO SA (Spain)1,2,4 | 51,402 | 27,430 | |||||||||
Internet & Direct Marketing Retail (11.73%) | ||||||||||||
| 732 | Alibaba Group Holding Limited, ADR1,2 | 81,341 | 83,214 | |||||||||
| 2,982 | Amazon.com, Inc.1 | 464,673 | 316,718 | |||||||||
|
|
|
| |||||||||
| 546,014 | 399,932 | |||||||||||
|
|
|
| |||||||||
Total Consumer Discretionary | 765,492 | 516,938 | ||||||||||
|
|
|
| |||||||||
| Health Care (0.34%) | ||||||||||||
Health Care Supplies (0.34%) |
| |||||||||||
| 1,285 | Figs, Inc., Cl A1 | 29,393 | 11,706 | |||||||||
|
|
|
| |||||||||
| Industrials (3.67%) | ||||||||||||
Research & Consulting Services (3.67%) |
| |||||||||||
| 2,074 | CoStar Group, Inc.1 | 145,960 | 125,290 | |||||||||
|
|
|
| |||||||||
| Information Technology (61.20%) | ||||||||||||
Application Software (14.20%) |
| |||||||||||
| 102 | Adobe, Inc.1 | 56,605 | 37,338 | |||||||||
| 191 | Atlassian Corp. PLC, Cl A1,2 | 58,808 | 35,793 | |||||||||
| 1,069 | Braze, Inc., Cl A1 | 42,005 | 38,730 | |||||||||
| 981 | Ceridian HCM Holding, Inc.1 | 99,979 | 46,186 | |||||||||
| 173 | HubSpot, Inc.1 | 96,535 | 52,012 | |||||||||
| 176 | Intuit, Inc. | 104,058 | 67,837 | |||||||||
| 275 | ServiceNow, Inc.1,3 | 154,411 | 130,768 | |||||||||
| 1,048 | The Trade Desk, Inc., Cl A1 | 78,395 | 43,901 | |||||||||
| 229 | Workday, Inc., Cl A1 | 60,420 | 31,964 | |||||||||
|
|
|
| |||||||||
| 751,216 | 484,529 | |||||||||||
Data Processing & Outsourced Services (6.80%) |
| |||||||||||
| 11 | Adyen N.V. (Netherlands), 144A1,2,4 | 29,311 | 15,875 | |||||||||
| 553 | Dlocal Ltd.1,2 | 19,033 | 14,516 | |||||||||
| 312 | MasterCard Incorporated, Cl A | 115,627 | 98,430 | |||||||||
| 524 | Visa, Inc., Cl A | 115,692 | 103,170 | |||||||||
|
|
|
| |||||||||
| 279,663 | 231,991 | |||||||||||
Electronic Equipment & Instruments (1.92%) |
| |||||||||||
| 1,751 | PAR Technology Corp.1 | 84,519 | 65,645 | |||||||||
Internet Services & Infrastructure (0.90%) |
| |||||||||||
| 980 | Shopify, Inc., Cl A1,2 | 108,222 | 30,615 | |||||||||
IT Consulting & Other Services (6.28%) |
| |||||||||||
| 1,144 | Endava plc, ADR1,2 | 154,797 | 100,981 | |||||||||
| 468 | Gartner, Inc.1 | 142,596 | 113,176 | |||||||||
|
|
|
| |||||||||
| 297,393 | 214,157 | |||||||||||
| Shares | Cost | Value | ||||||||||
| Common Stocks (continued) | ||||||||||||
| Information Technology (continued) | ||||||||||||
Semiconductor Equipment (3.26%) |
| |||||||||||
| 134 | ASML Holding N.V.2 | $ | 96,986 | $ | 63,768 | |||||||
| 111 | Lam Research Corp. | 79,723 | 47,303 | |||||||||
|
|
|
| |||||||||
| 176,709 | 111,071 | |||||||||||
Semiconductors (10.47%) |
| |||||||||||
| 983 | Advanced Micro Devices, Inc.1 | 128,500 | 75,170 | |||||||||
| 121 | Broadcom, Inc. | 79,246 | 58,783 | |||||||||
| 3,322 | indie Semiconductor, Inc., Cl A1 | 25,139 | 18,936 | |||||||||
| 449 | Marvell Technology, Inc. | 38,915 | 19,545 | |||||||||
| 81 | Monolithic Power Systems, Inc. | 39,157 | 31,107 | |||||||||
| 641 | NVIDIA Corp. | 181,841 | 97,169 | |||||||||
| 3,524 | Taiwan Semiconductor Manufacturing Co. Ltd. (Taiwan)2,4 | 80,790 | 56,477 | |||||||||
|
|
|
| |||||||||
| 573,588 | 357,187 | |||||||||||
Systems Software (17.37%) |
| |||||||||||
| 382 | Cloudflare, Inc., Cl A1,3 | 21,940 | 16,713 | |||||||||
| 455 | Crowdstrike Holdings, Inc., Cl A1 | 82,908 | 76,695 | |||||||||
| 416 | Datadog, Inc., Cl A1,3 | 58,237 | 39,620 | |||||||||
| 1,368 | Microsoft Corporation | 444,328 | 351,343 | |||||||||
| 213 | MongoDB, Inc.1,3 | 88,700 | 55,273 | |||||||||
| 380 | Snowflake, Inc., Cl A1,3 | 95,982 | 52,843 | |||||||||
|
|
|
| |||||||||
| 792,095 | 592,487 | |||||||||||
|
|
|
| |||||||||
Total Information Technology | 3,063,405 | 2,087,682 | ||||||||||
|
|
|
| |||||||||
Total Common Stocks | 4,579,617 | 3,058,735 | ||||||||||
|
|
|
| |||||||||
| Principal Amount | ||||||||||||
| Short Term Investments (13.37%) | ||||||||||||
| $456,025 | Repurchase Agreement with Fixed Income Clearing Corp., dated 6/30/2022, 0.24% due 7/1/2022; Proceeds at maturity - $456,028; (Fully collateralized by $534,100 U.S. Treasury Note, 0.625% due 12/31/2027 Market value - $465,210)4 | 456,025 | 456,025 | |||||||||
|
|
|
| |||||||||
Total Investments (103.04%) | $ | 5,035,642 | 3,514,760 | |||||||||
|
| |||||||||||
Liabilities Less Cash and Other Assets (-3.04%) | (103,633 | ) | ||||||||||
|
| |||||||||||
Net Assets | $ | 3,411,127 | ||||||||||
|
| |||||||||||
| | Retail Shares (Equivalent to $6.19 per share | $ | 1,699,666 | |||||||||
|
| |||||||||||
| | Institutional Shares (Equivalent to $6.19 per share | $ | 1,695,976 | |||||||||
|
| |||||||||||
| | R6 Shares (Equivalent to $6.19 per share | $ | 15,485 | |||||||||
|
| |||||||||||
| % | Represents percentage of net assets. |
| 1 | Non-income producing securities. |
| 2 | Foreign corporation. |
| 3 | The Adviser has reclassified/classified certain securities in or out of this sub-industry. Such reclassifications/classifications are not supported by S&P or MSCI (unaudited). |
| 4 | Level 2 security. See Note 7 regarding Fair Value Measurements. |
| ADR | American Depositary Receipt. |
| 144A | Security is exempt from registration pursuant to Rule 144A under the Securities Act of 1933. This security may be resold in transactions that are exempt from registration, normally to qualified institutional buyers. At June 30, 2022, the market value of Rule 144A securities amounted to $15,875 or 0.47% of net assets. |
All securities are Level 1, unless otherwise noted.
| 42 | See Notes to Financial Statements. |
| June 30, 2022 | Baron Select Funds |
STATEMENTS OF ASSETS AND LIABILITIES (Unaudited)
JUNE 30, 2022
|
| Baron Partners Fund | Baron Focused Growth Fund | Baron International Growth Fund | Baron Real Estate Fund | |||||||||||||
Assets: | ||||||||||||||||
Investments in securities, at value* | ||||||||||||||||
Unaffiliated investments | $ | 6,458,358,340 | $ | 606,055,128 | $ | 481,569,911 | $ | 1,265,784,522 | ||||||||
Repurchase agreements, at value** | — | 70,683,247 | 21,297,427 | 97,707,622 | ||||||||||||
|
|
|
|
|
|
|
| |||||||||
Total investments, at value | 6,458,358,340 | 676,738,375 | 502,867,338 | 1,363,492,144 | ||||||||||||
Foreign currency, at value† | — | — | 116,869 | — | ||||||||||||
Cash | 19,844 | — | — | 201,589 | ||||||||||||
Receivable for shares sold | 4,449,212 | 833,439 | 1,777,540 | 1,491,084 | ||||||||||||
Dividends and interest receivable | 2,331,125 | 317,634 | 933,619 | 1,794,692 | ||||||||||||
Receivable for securities sold | 338,652 | 9,364,173 | 2,910,446 | 39,544,673 | ||||||||||||
Prepaid expenses | 228,996 | 5,279 | 4,789 | 12,938 | ||||||||||||
Other assets | — | — | — | — | ||||||||||||
|
|
|
|
|
|
|
| |||||||||
| 6,465,726,169 | 687,258,900 | 508,610,601 | 1,406,537,120 | |||||||||||||
|
|
|
|
|
|
|
| |||||||||
Liabilities: | ||||||||||||||||
Payable for borrowings against line of credit | 929,000,000 | — | — | — | ||||||||||||
Payable for shares redeemed | 2,149,702 | 145,349 | 412,962 | 990,762 | ||||||||||||
Payable for securities purchased | 1,342,664 | 13,662,775 | 2,973,356 | 4,988,612 | ||||||||||||
Distribution fees payable (Note 4) | 401 | 51 | 642 | 183 | ||||||||||||
Investment advisory fees payable (Note 4) | 144 | 50 | 543 | 129 | ||||||||||||
Net unrealized depreciation on unfunded commitments | 502,786 | — | — | — | ||||||||||||
Accrued capital gains taxes | — | — | 371,862 | — | ||||||||||||
Accrued expenses and other payables | 2,058,553 | 68,695 | 120,202 | 179,910 | ||||||||||||
|
|
|
|
|
|
|
| |||||||||
| 935,054,250 | 13,876,920 | 3,879,567 | 6,159,596 | |||||||||||||
|
|
|
|
|
|
|
| |||||||||
Net Assets | $ | 5,530,671,919 | $ | 673,381,980 | $ | 504,731,034 | $ | 1,400,377,524 | ||||||||
|
|
|
|
|
|
|
| |||||||||
Net Assets consist of: | ||||||||||||||||
Paid-in capital | $ | 1,128,819,942 | $ | 400,036,153 | $ | 514,226,037 | $ | 1,374,429,952 | ||||||||
Distributable earnings/(losses) | 4,401,851,977 | 273,345,827 | (9,495,003 | ) | 25,947,572 | |||||||||||
|
|
|
|
|
|
|
| |||||||||
Net Assets | $ | 5,530,671,919 | $ | 673,381,980 | $ | 504,731,034 | $ | 1,400,377,524 | ||||||||
|
|
|
|
|
|
|
| |||||||||
Retail Shares: | ||||||||||||||||
Net Assets | $ | 2,474,874,241 | $ | 167,913,820 | $ | 73,167,911 | $ | 343,719,723 | ||||||||
Shares Outstanding ($0.01 par value; indefinite shares authorized) | 19,040,242 | 5,127,514 | 3,076,222 | 12,074,245 | ||||||||||||
|
|
|
|
|
|
|
| |||||||||
Net Asset Value and Offering Price Per Share | $ | 129.98 | $ | 32.75 | $ | 23.78 | $ | 28.47 | ||||||||
|
|
|
|
|
|
|
| |||||||||
Institutional Shares: | ||||||||||||||||
Net Assets | $ | 2,648,196,404 | $ | 249,286,790 | $ | 320,542,032 | $ | 1,031,948,230 | ||||||||
Shares Outstanding ($0.01 par value; indefinite shares authorized) | 19,660,732 | 7,343,726 | 13,223,197 | 35,229,487 | ||||||||||||
|
|
|
|
|
|
|
| |||||||||
Net Asset Value and Offering Price Per Share | $ | 134.69 | $ | 33.95 | $ | 24.24 | $ | 29.29 | ||||||||
|
|
|
|
|
|
|
| |||||||||
R6 Shares: | ||||||||||||||||
Net Assets | $ | 407,601,274 | $ | 256,181,370 | $ | 111,021,091 | $ | 24,709,571 | ||||||||
Shares Outstanding ($0.01 par value; indefinite shares authorized) | 3,026,286 | 7,541,086 | 4,582,478 | 843,582 | ||||||||||||
|
|
|
|
|
|
|
| |||||||||
Net Asset Value and Offering Price Per Share | $ | 134.69 | $ | 33.97 | $ | 24.23 | $ | 29.29 | ||||||||
|
|
|
|
|
|
|
| |||||||||
*Investments in securities, at cost | $ | 2,108,922,986 | $ | 359,549,803 | $ | 475,051,275 | $ | 1,194,057,652 | ||||||||
**Repurchase agreements, at cost | — | 70,683,247 | 21,297,427 | 97,707,622 | ||||||||||||
|
|
|
|
|
|
|
| |||||||||
Total investments, at cost | $ | 2,108,922,986 | $ | 430,233,050 | $ | 496,348,702 | $ | 1,291,765,274 | ||||||||
|
|
|
|
|
|
|
| |||||||||
†Foreign currency, at cost: | $ | — | $ | — | $ | 92,681 | $ | — | ||||||||
|
|
|
|
|
|
|
| |||||||||
| See Notes to Financial Statements. | 43 |
| Baron Select Funds | June 30, 2022 |
STATEMENTS OF ASSETS AND LIABILITIES (Unaudited) (Continued)
JUNE 30, 2022
|
| Baron Emerging Markets Fund | Baron Global Advantage Fund | Baron Real Estate Income Fund | Baron Health Care Fund | |||||||||||||
Assets: | ||||||||||||||||
Investments in securities, at value* | ||||||||||||||||
Unaffiliated investments | $ | 5,889,506,586 | $ | 1,033,950,144 | $ | 123,936,470 | $ | 179,971,482 | ||||||||
Repurchase agreements, at value** | 151,564,518 | — | 1,429,182 | 14,518,139 | ||||||||||||
|
|
|
|
|
|
|
| |||||||||
Total investments, at value | 6,041,071,104 | 1,033,950,144 | 125,365,652 | 194,489,621 | ||||||||||||
Foreign currency, at value† | 19,976,269 | — | — | 19,621 | ||||||||||||
Cash | 60,126 | 10,950 | 76,376 | — | ||||||||||||
Receivable for shares sold | 9,294,005 | 1,564,838 | 174,094 | 1,945,218 | ||||||||||||
Dividends and interest receivable | 9,539,882 | 119,861 | 302,539 | 129,333 | ||||||||||||
Receivable for securities sold | 153,338,536 | 21,267,918 | 2,428,516 | 1,309,873 | ||||||||||||
Prepaid expenses | 60,527 | 13,873 | 902 | 1,681 | ||||||||||||
Other assets | 399,246 | — | — | — | ||||||||||||
|
|
|
|
|
|
|
| |||||||||
| 6,233,739,695 | 1,056,927,584 | 128,348,079 | 197,895,347 | |||||||||||||
|
|
|
|
|
|
|
| |||||||||
Liabilities: | ||||||||||||||||
Payable for borrowings against line of credit | — | 4,300,000 | — | — | ||||||||||||
Payable for shares redeemed | 9,782,844 | 3,476,398 | 92,677 | 348,204 | ||||||||||||
Payable for securities purchased | 106,319,165 | 11,423,649 | 754,115 | 917,330 | ||||||||||||
Distribution fees payable (Note 4) | 145 | 433 | 625 | 667 | ||||||||||||
Investment advisory fees payable (Note 4) | 580 | 2 | 679 | 861 | ||||||||||||
Net unrealized depreciation on unfunded commitments | — | — | — | — | ||||||||||||
Accrued capital gains taxes | 2,672,977 | 908,248 | — | — | ||||||||||||
Accrued expenses and other payables | 1,302,001 | 288,649 | 76,912 | 63,665 | ||||||||||||
|
|
|
|
|
|
|
| |||||||||
| 120,077,712 | 20,397,379 | 925,008 | 1,330,727 | |||||||||||||
|
|
|
|
|
|
|
| |||||||||
Net Assets | $ | 6,113,661,983 | $ | 1,036,530,205 | $ | 127,423,071 | $ | 196,564,620 | ||||||||
|
|
|
|
|
|
|
| |||||||||
Net Assets consist of: | ||||||||||||||||
Paid-in capital | $ | 6,888,469,341 | $ | 1,334,007,834 | $ | 139,943,051 | $ | 210,267,674 | ||||||||
Distributable earnings/(losses) | (774,807,358 | ) | (297,477,629 | ) | (12,519,980 | ) | (13,703,054 | ) | ||||||||
|
|
|
|
|
|
|
| |||||||||
Net Assets | $ | 6,113,661,983 | $ | 1,036,530,205 | $ | 127,423,071 | $ | 196,564,620 | ||||||||
|
|
|
|
|
|
|
| |||||||||
Retail Shares: | ||||||||||||||||
Net Assets | $ | 324,085,255 | $ | 292,103,983 | $ | 15,644,945 | $ | 54,057,425 | ||||||||
Shares Outstanding ($0.01 par value; indefinite shares authorized) | 24,062,460 | 10,830,799 | 1,109,180 | 3,129,075 | ||||||||||||
|
|
|
|
|
|
|
| |||||||||
Net Asset Value and Offering Price Per Share | $ | 13.47 | $ | 26.97 | $ | 14.10 | $ | 17.28 | ||||||||
|
|
|
|
|
|
|
| |||||||||
Institutional Shares: | ||||||||||||||||
Net Assets | $ | 5,774,386,689 | $ | 734,459,837 | $ | 111,136,557 | $ | 137,011,991 | ||||||||
Shares Outstanding ($0.01 par value; indefinite shares authorized) | 426,367,640 | 26,655,592 | 7,804,960 | 7,846,589 | ||||||||||||
|
|
|
|
|
|
|
| |||||||||
Net Asset Value and Offering Price Per Share | $ | 13.54 | $ | 27.55 | $ | 14.24 | $ | 17.46 | ||||||||
|
|
|
|
|
|
|
| |||||||||
R6 Shares: | ||||||||||||||||
Net Assets | $ | 15,190,039 | $ | 9,966,385 | $ | 641,569 | $ | 5,495,204 | ||||||||
Shares Outstanding ($0.01 par value; indefinite shares authorized) | 1,121,027 | 361,504 | 45,096 | 314,819 | ||||||||||||
|
|
|
|
|
|
|
| |||||||||
Net Asset Value and Offering Price Per Share | $ | 13.55 | $ | 27.57 | $ | 14.23 | $ | 17.46 | ||||||||
|
|
|
|
|
|
|
| |||||||||
*Investments in securities, at cost | $ | 5,852,914,980 | $ | 1,106,995,064 | $ | 128,557,203 | $ | 170,673,806 | ||||||||
**Repurchase agreements, at cost | 151,564,518 | — | 1,429,182 | 14,518,139 | ||||||||||||
|
|
|
|
|
|
|
| |||||||||
Total investments, at cost | $ | 6,004,479,498 | $ | 1,106,995,064 | $ | 129,986,385 | $ | 185,191,945 | ||||||||
|
|
|
|
|
|
|
| |||||||||
†Foreign currency, at cost: | $ | 19,526,732 | $ | — | $ | — | $ | 21,077 | ||||||||
|
|
|
|
|
|
|
| |||||||||
| 44 | See Notes to Financial Statements. |
| June 30, 2022 | Baron Select Funds |
STATEMENTS OF ASSETS AND LIABILITIES (Unaudited) (Continued)
JUNE 30, 2022
|
| Baron FinTech Fund | Baron New Asia Fund | Baron Technology Fund | ||||||||||
Assets: | ||||||||||||
Investments in securities, at value* | ||||||||||||
Unaffiliated investments | $ | 39,821,606 | $ | 3,716,896 | $ | 3,058,735 | ||||||
Repurchase agreements, at value** | 2,878,942 | 207,633 | 456,025 | |||||||||
|
|
|
|
|
| |||||||
Total investments, at value | 42,700,548 | 3,924,529 | 3,514,760 | |||||||||
Foreign currency, at value† | — | 46,582 | 254 | |||||||||
Cash | — | 164 | — | |||||||||
Receivable for shares sold | 177,112 | 50 | 8,145 | |||||||||
Dividends and interest receivable | 19 | 5,916 | 513 | |||||||||
Receivable for securities sold | 126,119 | 17,396 | — | |||||||||
Prepaid expenses | 512 | 13 | 13 | |||||||||
Other assets | — | — | — | |||||||||
|
|
|
|
|
| |||||||
| 43,004,310 | 3,994,650 | 3,523,685 | ||||||||||
|
|
|
|
|
| |||||||
Liabilities: | ||||||||||||
Payable for borrowings against line of credit | — | — | — | |||||||||
Payable for shares redeemed | 226,367 | — | — | |||||||||
Payable for securities purchased | 498,572 | 5,491 | 10,328 | |||||||||
Distribution fees payable (Note 4) | 284 | 26 | 13 | |||||||||
Investment advisory fees payable (Note 4) | 528 | — | — | |||||||||
Net unrealized depreciation on unfunded commitments | — | — | — | |||||||||
Accrued capital gains taxes | — | — | — | |||||||||
Accrued expenses and other payables | 82,025 | 67,186 | 102,217 | |||||||||
|
|
|
|
|
| |||||||
| 807,776 | 72,703 | 112,558 | ||||||||||
|
|
|
|
|
| |||||||
Net Assets | $ | 42,196,534 | $ | 3,921,947 | $ | 3,411,127 | ||||||
|
|
|
|
|
| |||||||
Net Assets consist of: | ||||||||||||
Paid-in capital | $ | 57,436,731 | $ | 4,936,914 | $ | 5,122,889 | ||||||
Distributable earnings/(losses) | (15,240,197 | ) | (1,014,967 | ) | (1,711,762 | ) | ||||||
|
|
|
|
|
| |||||||
Net Assets | $ | 42,196,534 | $ | 3,921,947 | $ | 3,411,127 | ||||||
|
|
|
|
|
| |||||||
Retail Shares: | ||||||||||||
Net Assets | $ | 7,518,280 | $ | 1,049,138 | $ | 1,699,666 | ||||||
Shares Outstanding ($0.01 par value; indefinite shares authorized) | 689,093 | 132,388 | 274,716 | |||||||||
|
|
|
|
|
| |||||||
Net Asset Value and Offering Price Per Share | $ | 10.91 | $ | 7.92 | $ | 6.19 | ||||||
|
|
|
|
|
| |||||||
Institutional Shares: | ||||||||||||
Net Assets | $ | 30,377,687 | $ | 2,791,697 | $ | 1,695,976 | ||||||
Shares Outstanding ($0.01 par value; indefinite shares authorized) | 2,768,308 | 351,408 | 273,804 | |||||||||
|
|
|
|
|
| |||||||
Net Asset Value and Offering Price Per Share | $ | 10.97 | $ | 7.94 | $ | 6.19 | ||||||
|
|
|
|
|
| |||||||
R6 Shares: | ||||||||||||
Net Assets | $ | 4,300,567 | $ | 81,112 | $ | 15,485 | ||||||
Shares Outstanding ($0.01 par value; indefinite shares authorized) | 391,849 | 10,201 | 2,500 | |||||||||
|
|
|
|
|
| |||||||
Net Asset Value and Offering Price Per Share | $ | 10.98 | $ | 7.95 | $ | 6.19 | ||||||
|
|
|
|
|
| |||||||
*Investments in securities, at cost | $ | 53,123,363 | $ | 4,471,897 | $ | 4,579,617 | ||||||
**Repurchase agreements, at cost | 2,878,942 | 207,633 | 456,025 | |||||||||
|
|
|
|
|
| |||||||
Total investments, at cost | $ | 56,002,305 | $ | 4,679,530 | $ | 5,035,642 | ||||||
|
|
|
|
|
| |||||||
†Foreign currency, at cost: | $ | — | $ | 47,692 | $ | 260 | ||||||
|
|
|
|
|
| |||||||
| See Notes to Financial Statements. | 45 |
| Baron Select Funds | June 30, 2022 |
STATEMENTS OF OPERATIONS (Unaudited)
FOR THE SIX MONTHS ENDED JUNE 30, 2022
|
| Baron Partners Fund | Baron Focused Growth Fund | Baron International Growth Fund | Baron Real Estate Fund | |||||||||||||
Investment income: | ||||||||||||||||
Income: | ||||||||||||||||
Dividends — Unaffiliated investments | $ | 12,980,405 | $ | 1,556,075 | $ | 4,770,007 | $ | 9,975,323 | ||||||||
Interest | 37 | 11,377 | 3,692 | 23,493 | ||||||||||||
Securities lending income, net | 9,390 | 11,144 | — | — | ||||||||||||
Foreign taxes withheld on dividends | (42,000 | ) | — | (458,960 | ) | (71,149 | ) | |||||||||
|
|
|
|
|
|
|
| |||||||||
Total income | 12,947,832 | 1,578,596 | 4,314,739 | 9,927,667 | ||||||||||||
|
|
|
|
|
|
|
| |||||||||
Expenses: | ||||||||||||||||
Investment advisory fees (Note 4) | 34,643,516 | 3,660,743 | 2,683,522 | 8,698,140 | ||||||||||||
Distribution fees — Retail Shares (Note 4) | 3,899,290 | 232,178 | 108,766 | 537,528 | ||||||||||||
Shareholder servicing agent fees and expenses — Retail Shares | 141,115 | 21,915 | 11,073 | �� | 31,916 | |||||||||||
Shareholder servicing agent fees and expenses — Institutional Shares | 63,070 | 14,715 | 13,240 | 35,485 | ||||||||||||
Shareholder servicing agent fees and expenses — R6 Shares | 11,382 | 6,159 | 2,910 | 655 | ||||||||||||
Line of credit fees | 355,178 | 5,919 | 4,675 | 13,960 | ||||||||||||
Reports to shareholders | 266,830 | 27,932 | 42,899 | 180,800 | ||||||||||||
Registration and filing fees | 232,860 | 63,520 | 59,062 | 136,060 | ||||||||||||
Trustee fees and expenses (Note 4) | 164,694 | 16,837 | 14,456 | 40,672 | ||||||||||||
Custodian and fund accounting fees | 134,525 | 23,159 | 139,013 | 83,643 | ||||||||||||
Professional fees | 95,202 | 18,208 | 14,913 | 34,816 | ||||||||||||
Insurance expense | 48,249 | 4,888 | 4,290 | 10,777 | ||||||||||||
Administration fees | 30,579 | 23,217 | 23,112 | 24,207 | ||||||||||||
Miscellaneous expenses | 2,400 | 2,450 | 2,450 | 2,550 | ||||||||||||
|
|
|
|
|
|
|
| |||||||||
Total operating expenses | 40,088,890 | 4,121,840 | 3,124,381 | 9,831,209 | ||||||||||||
|
|
|
|
|
|
|
| |||||||||
Interest expense on borrowings | 6,531,832 | — | — | — | ||||||||||||
|
|
|
|
|
|
|
| |||||||||
Total expenses | 46,620,722 | 4,121,840 | 3,124,381 | 9,831,209 | ||||||||||||
Reimbursement of expenses by Adviser — Retail Shares (Note 4) | — | — | (23,900 | ) | — | |||||||||||
Reimbursement of expenses by Adviser — Institutional Shares (Note 4) | — | — | (68,189 | ) | — | |||||||||||
Reimbursement of expenses by Adviser — R6 Shares (Note 4) | — | — | (21,630 | ) | — | |||||||||||
|
|
|
|
|
|
|
| |||||||||
Net expenses | 46,620,722 | 4,121,840 | 3,010,662 | 9,831,209 | ||||||||||||
|
|
|
|
|
|
|
| |||||||||
Net investment income (loss) | (33,672,890 | ) | (2,543,244 | ) | 1,304,077 | 96,458 | ||||||||||
|
|
|
|
|
|
|
| |||||||||
Realized and unrealized gain (loss) on investments: | ||||||||||||||||
Net realized gain (loss) on investments sold — Unaffiliated investments | (63,570,130 | ) | (45,685,962 | ) | (5,990,261 | )1 | (56,511,650 | ) | ||||||||
Net realized gain (loss) on investments sold — “Affiliated” investments | — | — | — | — | ||||||||||||
Net realized gain (loss) on foreign currency transactions | — | — | (377,357 | ) | 9,674 | |||||||||||
Change in net unrealized appreciation (depreciation) of: | ||||||||||||||||
Investments — Unaffiliated investments | (2,888,411,405 | ) | (182,076,570 | ) | (206,489,931 | )2 | (542,687,946 | ) | ||||||||
Investments — “Affiliated” investments | — | — | — | — | ||||||||||||
Unfunded commitments | (502,786 | ) | — | — | — | |||||||||||
Foreign currency translations | — | — | 11,134 | — | ||||||||||||
|
|
|
|
|
|
|
| |||||||||
Net gain (loss) on investments | (2,952,484,321 | ) | (227,762,532 | ) | (212,846,415 | ) | (599,189,922 | ) | ||||||||
|
|
|
|
|
|
|
| |||||||||
Voluntary payment from Adviser (Note 4) | — | — | — | — | ||||||||||||
|
|
|
|
|
|
|
| |||||||||
Net increase (decrease) in net assets resulting from operations | $ | (2,986,157,211 | ) | $ | (230,305,776 | ) | $ | (211,542,338 | ) | $ | (599,093,464 | ) | ||||
|
|
|
|
|
|
|
| |||||||||
| 1 | Net of realized foreign capital gains tax of $626,386. |
| 2 | Decrease in accrued foreign capital gains tax payable of $1,291,786. |
| 46 | See Notes to Financial Statements. |
| June 30, 2022 | Baron Select Funds |
STATEMENTS OF OPERATIONS (Unaudited) (Continued)
FOR THE SIX MONTHS ENDED JUNE 30, 2022
|
| Baron Emerging Markets Fund | Baron Global Advantage Fund | Baron Real Estate Income Fund | Baron Health Care Fund | |||||||||||||
Investment income: | ||||||||||||||||
Income: | ||||||||||||||||
Dividends — Unaffiliated investments | $ | 65,892,459 | $ | 302,666 | $ | 1,527,360 | $ | 767,414 | ||||||||
Interest | 39,443 | 70 | 525 | 2,363 | ||||||||||||
Securities lending income, net | — | — | — | — | ||||||||||||
Foreign taxes withheld on dividends | (6,158,545 | ) | (50,899 | ) | (4,982 | ) | (19,446 | ) | ||||||||
|
|
|
|
|
|
|
| |||||||||
Total income | 59,773,357 | 251,837 | 1,522,903 | 750,331 | ||||||||||||
|
|
|
|
|
|
|
| |||||||||
Expenses: | ||||||||||||||||
Investment advisory fees (Note 4) | 37,841,124 | 6,721,764 | 500,759 | 767,562 | ||||||||||||
Distribution fees — Retail Shares (Note 4) | 477,724 | 561,463 | 21,821 | 72,500 | ||||||||||||
Shareholder servicing agent fees and expenses — Retail Shares | 22,156 | 29,740 | 8,524 | 12,310 | ||||||||||||
Shareholder servicing agent fees and expenses — Institutional Shares | 111,530 | 40,127 | 7,251 | 7,528 | ||||||||||||
Shareholder servicing agent fees and expenses — R6 Shares | 371 | 292 | 17 | 126 | ||||||||||||
Line of credit fees | 58,275 | 11,556 | 1,088 | 1,683 | ||||||||||||
Reports to shareholders | 941,250 | 196,395 | 11,657 | 21,602 | ||||||||||||
Registration and filing fees | 385,600 | 92,440 | 34,960 | 74,660 | ||||||||||||
Trustee fees and expenses (Note 4) | 179,385 | 41,045 | 2,905 | 4,764 | ||||||||||||
Custodian and fund accounting fees | 2,513,456 | 149,676 | 12,396 | 16,400 | ||||||||||||
Professional fees | 147,941 | 32,660 | 21,566 | 13,135 | ||||||||||||
Insurance expense | 53,563 | 13,771 | 698 | 973 | ||||||||||||
Administration fees | 30,549 | 23,091 | 22,509 | 22,569 | ||||||||||||
Miscellaneous expenses | 2,450 | 3,071 | 2,458 | 2,459 | ||||||||||||
|
|
|
|
|
|
|
| |||||||||
Total operating expenses | 42,765,374 | 7,917,091 | 648,609 | 1,018,271 | ||||||||||||
|
|
|
|
|
|
|
| |||||||||
Interest expense on borrowings | — | 47,837 | — | — | ||||||||||||
|
|
|
|
|
|
|
| |||||||||
Total expenses | 42,765,374 | 7,964,928 | 648,609 | 1,018,271 | ||||||||||||
Reimbursement of expenses by Adviser — Retail Shares (Note 4) | — | (76,007 | ) | (18,504 | ) | (27,810 | ) | |||||||||
Reimbursement of expenses by Adviser — Institutional Shares (Note 4) | — | (160,316 | ) | (73,700 | ) | (46,357 | ) | |||||||||
Reimbursement of expenses by Adviser — R6 Shares (Note 4) | — | (1,920 | ) | (441 | ) | (1,699 | ) | |||||||||
|
|
|
|
|
|
|
| |||||||||
Net expenses | 42,765,374 | 7,726,685 | 555,964 | 942,405 | ||||||||||||
|
|
|
|
|
|
|
| |||||||||
Net investment income (loss) | 17,007,983 | (7,474,848 | ) | 966,939 | (192,074 | ) | ||||||||||
|
|
|
|
|
|
|
| |||||||||
Realized and unrealized gain (loss) on investments: | ||||||||||||||||
Net realized gain (loss) on investments sold — Unaffiliated investments | (352,035,624 | )3 | (213,690,736 | ) | (7,812,885 | ) | (21,003,519 | ) | ||||||||
Net realized gain (loss) on investments sold — “Affiliated” investments | — | (208,869 | ) | — | — | |||||||||||
Net realized gain (loss) on foreign currency transactions | (5,637,965 | ) | (1,574 | ) | (142 | ) | (3,200 | ) | ||||||||
Change in net unrealized appreciation (depreciation) of: | ||||||||||||||||
Investments — Unaffiliated investments | (1,731,453,868 | )4 | (906,478,885 | )5 | (23,972,364 | ) | (26,449,114 | ) | ||||||||
Investments — “Affiliated” investments | — | (119,502 | ) | — | — | |||||||||||
Unfunded commitments | — | — | — | — | ||||||||||||
Foreign currency translations | (2,099,307 | ) | 2,271 | — | (1,693 | ) | ||||||||||
|
|
|
|
|
|
|
| |||||||||
Net gain (loss) on investments | (2,091,226,764 | ) | (1,120,497,295 | ) | (31,785,391 | ) | (47,457,526 | ) | ||||||||
|
|
|
|
|
|
|
| |||||||||
Voluntary payment from Adviser6 | — | 82,890 | — | — | ||||||||||||
|
|
|
|
|
|
|
| |||||||||
Net increase (decrease) in net assets resulting from operations | $ | (2,074,218,781 | ) | $ | (1,127,889,253 | ) | $ | (30,818,452 | ) | $ | (47,649,600 | ) | ||||
|
|
|
|
|
|
|
| |||||||||
| 3 | Net of realized foreign capital gains tax of $23,859,717. |
| 4 | Decrease in accrued foreign capital gains tax payable of $55,402,244. |
| 5 | Decrease in accrued foreign capital gains tax payable of $838,147. |
| 6 | See Note 4f. |
| See Notes to Financial Statements. | 47 |
| Baron Select Funds | June 30, 2022 |
STATEMENTS OF OPERATIONS (Unaudited) (Continued)
FOR THE SIX MONTHS ENDED JUNE 30, 2022
|
| Baron FinTech Fund | Baron New Asia Fund | Baron Technology Fund2 | ||||||||||
Investment income: | ||||||||||||
Income: | ||||||||||||
Dividends — Unaffiliated investments | $ | 147,639 | $ | 25,869 | $ | 7,039 | ||||||
Interest | 651 | 46 | 76 | |||||||||
Securities lending income, net | — | — | — | |||||||||
Foreign taxes withheld on dividends | — | (3,045 | ) | (204 | ) | |||||||
|
|
|
|
|
| |||||||
Total income | 148,290 | 22,870 | 6,911 | |||||||||
|
|
|
|
|
| |||||||
Expenses: | ||||||||||||
Investment advisory fees (Note 4) | 224,104 | 20,235 | 14,102 | |||||||||
Distribution fees — Retail Shares (Note 4) | 11,716 | 1,397 | 2,013 | |||||||||
Shareholder servicing agent fees and expenses — Retail Shares | 9,035 | 16,032 | 8,084 | |||||||||
Shareholder servicing agent fees and expenses — Institutional Shares | 7,804 | 1,694 | 6,600 | |||||||||
Shareholder servicing agent fees and expenses — R6 Shares | 117 | 2 | — | |||||||||
Line of credit fees | 481 | 23 | 31 | |||||||||
Reports to shareholders | 4,925 | 1,261 | 1,865 | |||||||||
Registration and filing fees | 29,660 | 20,009 | 32,580 | |||||||||
Trustee fees and expenses (Note 4) | 1,381 | 91 | 66 | |||||||||
Custodian and fund accounting fees | 10,992 | 43,690 | 30,880 | |||||||||
Professional fees | 33,864 | 10,266 | 34,310 | |||||||||
Insurance expense | 414 | 38 | 26 | |||||||||
Administration fees | 22,296 | 22,098 | 22,257 | |||||||||
Miscellaneous expenses | 2,458 | 4,032 | 2,576 | |||||||||
|
|
|
|
|
| |||||||
Total operating expenses | 359,247 | 140,868 | 155,390 | |||||||||
|
|
|
|
|
| |||||||
Interest expense on borrowings | 508 | — | — | |||||||||
|
|
|
|
|
| |||||||
Total expenses | 359,755 | 140,868 | 155,390 | |||||||||
Reimbursement of expenses by Adviser — Retail Shares (Note 4) | (20,434 | ) | (43,016 | ) | (63,282 | ) | ||||||
Reimbursement of expenses by Adviser — Institutional Shares (Note 4) | (54,463 | ) | (70,579 | ) | (72,637 | ) | ||||||
Reimbursement of expenses by Adviser — R6 Shares (Note 4) | (6,510 | ) | (1,523 | ) | (676 | ) | ||||||
|
|
|
|
|
| |||||||
Net expenses | 278,348 | 25,750 | 18,795 | |||||||||
|
|
|
|
|
| |||||||
Net investment income (loss) | (130,058 | ) | (2,880 | ) | (11,884 | ) | ||||||
|
|
|
|
|
| |||||||
Realized and unrealized gain (loss) on investments: | ||||||||||||
Net realized gain (loss) on investments sold — Unaffiliated investments | (2,081,805 | ) | (208,607 | )1 | (178,759 | ) | ||||||
Net realized gain (loss) on investments sold — “Affiliated” investments | — | — | — | |||||||||
Net realized gain (loss) on foreign currency transactions | 253 | (6,902 | ) | (231 | ) | |||||||
Change in net unrealized appreciation (depreciation) of: | ||||||||||||
Investments — Unaffiliated investments | (25,233,114 | ) | (822,671 | ) | (1,520,882 | ) | ||||||
Investments — “Affiliated” investments | — | — | — | |||||||||
Unfunded commitments | — | — | — | |||||||||
Foreign currency translations | (15 | ) | (1,719 | ) | (6 | ) | ||||||
|
|
|
|
|
| |||||||
Net gain (loss) on investments | (27,314,681 | ) | (1,039,899 | ) | (1,699,878 | ) | ||||||
|
|
|
|
|
| |||||||
Voluntary payment from Adviser (Note 4) | — | — | — | |||||||||
|
|
|
|
|
| |||||||
Net increase (decrease) in net assets resulting from operations | $ | (27,444,739 | ) | $ | (1,042,779 | ) | $ | (1,711,762 | ) | |||
|
|
|
|
|
| |||||||
| 1 | Net of realized foreign capital gains tax of $1,895. |
| 2 | For the period January 3, 2022 (commencement of operations) to June 30, 2022. |
| 48 | See Notes to Financial Statements. |
| June 30, 2022 | Baron Select Funds |
STATEMENTS OF CHANGES IN NET ASSETS (Unaudited)
JUNE 30, 2022
|
| Baron Partners Fund | Baron Focused Growth Fund | Baron International Growth Fund | ||||||||||||||||||||||
| For the Six Months Ended June 30, 2022 | For the Year Ended December 31, 2021 | For the Six Months Ended June 30, 2022 | For the Year Ended December 31, 2021 | For the Six Months Ended June 30, 2022 | For the Year Ended December 31, 2021 | |||||||||||||||||||
Increase (Decrease) in Net Assets: | ||||||||||||||||||||||||
Operations: | ||||||||||||||||||||||||
Net investment income (loss) | $ | (33,672,890 | ) | $ | (71,627,916 | ) | $ | (2,543,244 | ) | $ | (6,770,651 | ) | $ | 1,304,077 | $ | (678,032 | ) | |||||||
Net realized gain (loss) | (63,570,130 | ) | 453,084,289 | (45,685,962 | ) | 166,060,000 | (6,367,618 | ) | 42,359,984 | |||||||||||||||
Change in net unrealized appreciation (depreciation) | (2,888,914,191 | ) | 1,670,609,178 | (182,076,570 | ) | (30,438,918 | ) | (206,478,797 | ) | 19,033,061 | ||||||||||||||
Voluntary payment from Adviser | — | — | — | — | — | — | ||||||||||||||||||
|
|
|
|
|
|
|
|
|
|
|
| |||||||||||||
Increase (decrease) in net assets resulting from operations | (2,986,157,211 | ) | 2,052,065,551 | (230,305,776 | ) | 128,850,431 | (211,542,338 | ) | 60,715,013 | |||||||||||||||
|
|
|
|
|
|
|
|
|
|
|
| |||||||||||||
Distributions to shareholders from: | ||||||||||||||||||||||||
Distributable earnings — Retail Shares | — | (285,298,657 | ) | — | (29,204,820 | ) | — | (4,978,372 | ) | |||||||||||||||
Distributable earnings — Institutional Shares | — | (288,366,616 | ) | — | (40,962,362 | ) | — | (25,823,557 | ) | |||||||||||||||
Distributable earnings — R6 Shares | — | (44,229,727 | ) | — | (43,072,849 | ) | — | (8,078,444 | ) | |||||||||||||||
Return of capital — Retail Shares | — | — | — | — | — | — | ||||||||||||||||||
Return of capital — Institutional Shares | — | — | — | — | — | — | ||||||||||||||||||
Return of capital — R6 Shares | — | — | — | — | — | — | ||||||||||||||||||
|
|
|
|
|
|
|
|
|
|
|
| |||||||||||||
Decrease in net assets from distributions to shareholders | — | (617,895,000 | ) | — | (113,240,031 | ) | — | (38,880,373 | ) | |||||||||||||||
|
|
|
|
|
|
|
|
|
|
|
| |||||||||||||
Capital share transactions: | ||||||||||||||||||||||||
Proceeds from the sale of shares — Retail Shares | 237,999,524 | 760,220,414 | 42,226,238 | 107,438,521 | 14,701,161 | 26,389,114 | ||||||||||||||||||
Proceeds from the sale of shares — Institutional Shares | 357,240,079 | 856,707,561 | 63,548,220 | 101,240,629 | 74,279,174 | 171,578,819 | ||||||||||||||||||
Proceeds from the sale of shares — R6 Shares | 5,712,790 | 22,193,831 | 22,083,371 | 1,133,991 | 2,178,160 | 9,613,640 | ||||||||||||||||||
Net asset value of shares issued in reinvestment of distributions — Retail Shares | — | 274,538,982 | — | 27,975,547 | — | 4,859,989 | ||||||||||||||||||
Net asset value of shares issued in reinvestment of distributions — Institutional Shares | — | 264,241,681 | — | 39,977,395 | — | 24,384,727 | ||||||||||||||||||
Net asset value of shares issues in reinvestment of distributions — R6 Shares | — | 44,229,222 | — | 43,067,080 | — | 8,078,444 | ||||||||||||||||||
Cost of shares redeemed — Retail Shares | (319,782,716 | ) | (991,708,697 | ) | (25,609,981 | ) | (84,117,090 | ) | (11,757,299 | ) | (19,781,360 | ) | ||||||||||||
Cost of shares redeemed — Institutional Shares | (412,820,375 | ) | (872,220,298 | ) | (36,081,986 | ) | (73,129,942 | ) | (114,079,808 | ) | (72,675,963 | ) | ||||||||||||
Cost of shares redeemed — R6 Shares | (8,890,255 | ) | (10,795,083 | ) | (670,082 | ) | (3,735,292 | ) | (6,719,946 | ) | (28,513,714 | ) | ||||||||||||
|
|
|
|
|
|
|
|
|
|
|
| |||||||||||||
Increase (decrease) in net assets derived from capital share transactions | (140,540,953 | ) | 347,407,613 | 65,495,780 | 159,850,839 | (41,398,558 | ) | 123,933,696 | ||||||||||||||||
|
|
|
|
|
|
|
|
|
|
|
| |||||||||||||
Net increase (decrease) in net assets | (3,126,698,164 | ) | 1,781,578,164 | (164,809,996 | ) | 175,461,239 | (252,940,896 | ) | 145,768,336 | |||||||||||||||
|
|
|
|
|
|
|
|
|
|
|
| |||||||||||||
Net Assets: | ||||||||||||||||||||||||
Beginning of period | 8,657,370,083 | 6,875,791,919 | 838,191,976 | 662,730,737 | 757,671,930 | 611,903,594 | ||||||||||||||||||
|
|
|
|
|
|
|
|
|
|
|
| |||||||||||||
End of period | $ | 5,530,671,919 | $ | 8,657,370,083 | $ | 673,381,980 | $ | 838,191,976 | $ | 504,731,034 | $ | 757,671,930 | ||||||||||||
|
|
|
|
|
|
|
|
|
|
|
| |||||||||||||
Capital share transactions — Retail Shares | ||||||||||||||||||||||||
Shares sold | 1,412,452 | 4,153,964 | 1,100,634 | 2,315,981 | 498,284 | 765,936 | ||||||||||||||||||
Shares issued in reinvestment of distributions | — | 1,469,247 | — | 621,323 | — | 147,181 | ||||||||||||||||||
Shares redeemed | (1,986,400 | ) | (5,617,512 | ) | (685,968 | ) | (1,863,154 | ) | (430,657 | ) | (578,887 | ) | ||||||||||||
|
|
|
|
|
|
|
|
|
|
|
| |||||||||||||
Net increase (decrease) | (573,948 | ) | 5,699 | 414,666 | 1,074,150 | 67,627 | 334,230 | |||||||||||||||||
|
|
|
|
|
|
|
|
|
|
|
| |||||||||||||
Capital share transactions — Institutional Shares | ||||||||||||||||||||||||
Shares sold | 2,135,826 | 4,596,371 | 1,614,930 | 2,161,007 | 2,629,219 | 4,901,187 | ||||||||||||||||||
Shares issued in reinvestment of distributions | — | 1,366,284 | — | 858,473 | — | 725,762 | ||||||||||||||||||
Shares redeemed | (2,511,830 | ) | (4,805,393 | ) | (949,182 | ) | (1,585,524 | ) | (4,080,717 | )�� | (2,115,742 | ) | ||||||||||||
|
|
|
|
|
|
|
|
|
|
|
| |||||||||||||
Net increase (decrease) | (376,004 | ) | 1,157,262 | 665,748 | 1,433,956 | (1,451,498 | ) | 3,511,207 | ||||||||||||||||
|
|
|
|
|
|
|
|
|
|
|
| |||||||||||||
Capital share transactions — R6 Shares | ||||||||||||||||||||||||
Shares sold | 33,712 | 125,110 | 608,020 | 23,770 | 72,946 | 283,369 | ||||||||||||||||||
Shares issued in reinvestment of distributions | — | 228,916 | — | 924,242 | — | 240,565 | ||||||||||||||||||
Shares redeemed | (54,452 | ) | (58,052 | ) | (18,647 | ) | (80,086 | ) | (224,500 | ) | (822,259 | ) | ||||||||||||
|
|
|
|
|
|
|
|
|
|
|
| |||||||||||||
Net increase (decrease) | (20,740 | ) | 295,974 | 589,373 | 867,926 | (151,554 | ) | (298,325 | ) | |||||||||||||||
|
|
|
|
|
|
|
|
|
|
|
| |||||||||||||
| See Notes to Financial Statements. | 49 |
| Baron Select Funds | June 30, 2022 |
STATEMENTS OF CHANGES IN NET ASSETS (Unaudited) (Continued)
JUNE 30, 2022
|
| Baron Real Estate Fund | Baron Emerging Markets Fund | Baron Global Advantage Fund | ||||||||||||||||||||||
| For the Six Months Ended June 30, 2022 | For the Year Ended December 31, 2021 | For the Six Months Ended June 30, 2022 | For the Year Ended December 31, 2021 | For the Six Months Ended June 30, 2022 | For the Year Ended December 31, 2021 | |||||||||||||||||||
Increase (Decrease) in Net Assets: | ||||||||||||||||||||||||
Operations: | ||||||||||||||||||||||||
Net investment income (loss) | $ | 96,458 | $ | (730,779 | ) | $ | 17,007,983 | $ | (19,780,086 | ) | $ | (7,474,848 | ) | $ | (26,934,071 | ) | ||||||||
Net realized gain (loss) | (56,501,976 | ) | 123,683,094 | (357,673,589 | ) | 237,539,657 | (213,901,179 | ) | 47,749,909 | |||||||||||||||
Change in net unrealized appreciation (depreciation) | (542,687,946 | ) | 198,411,190 | (1,733,553,175 | ) | (851,364,442 | ) | (906,596,116 | ) | (33,614,877 | ) | |||||||||||||
Voluntary payment from Adviser | — | — | — | — | 82,890 | 162,538 | ||||||||||||||||||
|
|
|
|
|
|
|
|
|
|
|
| |||||||||||||
Increase (decrease) in net assets resulting from operations | (599,093,464 | ) | 321,363,505 | (2,074,218,781 | ) | (633,604,871 | ) | (1,127,889,253 | ) | (12,636,501 | ) | |||||||||||||
|
|
|
|
|
|
|
|
|
|
|
| |||||||||||||
Distributions to shareholders from: | ||||||||||||||||||||||||
Distributable earnings — Retail Shares | — | (39,207,046 | ) | — | (7,294,907 | ) | — | — | ||||||||||||||||
Distributable earnings — Institutional Shares | — | (110,082,837 | ) | — | (160,640,852 | ) | — | — | ||||||||||||||||
Distributable earnings — R6 Shares | — | (2,424,404 | ) | — | (308,031 | ) | — | — | ||||||||||||||||
Return of capital — Retail Shares | — | — | — | (11,672 | ) | — | — | |||||||||||||||||
Return of capital — Institutional Shares | — | — | — | (257,031 | ) | — | — | |||||||||||||||||
Return of capital — R6 Shares | — | — | — | (493 | ) | — | — | |||||||||||||||||
|
|
|
|
|
|
|
|
|
|
|
| |||||||||||||
Decrease in net assets from distributions to shareholders | — | (151,714,287 | ) | — | (168,512,986 | ) | — | — | ||||||||||||||||
|
|
|
|
|
|
|
|
|
|
|
| |||||||||||||
Capital share transactions: | ||||||||||||||||||||||||
Proceeds from the sale of shares — Retail Shares | 39,808,908 | 217,078,341 | 37,582,382 | 122,767,339 | 34,158,359 | 264,263,760 | ||||||||||||||||||
Proceeds from the sale of shares — Institutional Shares | 306,506,008 | 874,061,573 | 1,363,747,420 | 4,700,939,406 | 197,170,914 | 894,386,561 | ||||||||||||||||||
Proceeds from the sale of shares — R6 Shares | 4,348,711 | 9,984,087 | 3,522,635 | 10,022,205 | 1,591,804 | 6,586,797 | ||||||||||||||||||
Net asset value of shares issued in reinvestment of distributions — Retail Shares | — | 37,967,450 | — | 7,146,540 | — | — | ||||||||||||||||||
Net asset value of shares issued in reinvestment of distributions — Institutional Shares | — | 99,196,171 | — | 134,615,154 | — | — | ||||||||||||||||||
Net asset value of shares issues in reinvestment of distributions — R6 Shares | — | 2,424,402 | — | 308,523 | — | — | ||||||||||||||||||
Cost of shares redeemed — Retail Shares | (62,007,522 | ) | (110,928,775 | ) | (71,854,113 | ) | (136,854,830 | ) | (202,520,596 | ) | (402,410,382 | ) | ||||||||||||
Cost of shares redeemed — Institutional Shares | (325,246,161 | ) | (305,518,199 | ) | (2,032,566,052 | ) | (1,893,024,620 | ) | (472,790,396 | ) | (546,840,326 | ) | ||||||||||||
Cost of shares redeemed — R6 Shares | (2,839,853 | ) | (2,218,427 | ) | (1,346,432 | ) | (5,447,438 | ) | (1,152,101 | ) | (2,977,826 | ) | ||||||||||||
|
|
|
|
|
|
|
|
|
|
|
| |||||||||||||
Increase (decrease) in net assets derived from capital share transactions | (39,429,909 | ) | 822,046,623 | (700,914,160 | ) | 2,940,472,279 | (443,542,016 | ) | 213,008,584 | |||||||||||||||
|
|
|
|
|
|
|
|
|
|
|
| |||||||||||||
Net increase (decrease) in net assets | (638,523,373 | ) | 991,695,841 | (2,775,132,941 | ) | 2,138,354,422 | (1,571,431,269 | ) | 200,372,083 | |||||||||||||||
|
|
|
|
|
|
|
|
|
|
|
| |||||||||||||
Net Assets: | ||||||||||||||||||||||||
Beginning of period | 2,038,900,897 | 1,047,205,056 | 8,888,794,924 | 6,750,440,502 | 2,607,961,474 | 2,407,589,391 | ||||||||||||||||||
|
|
|
|
|
|
|
|
|
|
|
| |||||||||||||
End of period | $ | 1,400,377,524 | $ | 2,038,900,897 | $ | 6,113,661,983 | $ | 8,888,794,924 | $ | 1,036,530,205 | $ | 2,607,961,474 | ||||||||||||
|
|
|
|
|
|
|
|
|
|
|
| |||||||||||||
Capital share transactions — Retail Shares | ||||||||||||||||||||||||
Shares sold | 1,122,937 | 5,476,910 | 2,438,455 | 6,397,417 | 926,669 | 4,820,909 | ||||||||||||||||||
Shares issued in reinvestment of distributions | — | 968,256 | — | 399,471 | — | — | ||||||||||||||||||
Shares redeemed | (1,840,703 | ) | (2,790,098 | ) | (4,797,435 | ) | (7,132,190 | ) | (5,318,763 | ) | (7,550,400 | ) | ||||||||||||
|
|
|
|
|
|
|
|
|
|
|
| |||||||||||||
Net increase (decrease) | (717,766 | ) | 3,655,068 | (2,358,980 | ) | (335,302 | ) | (4,392,094 | ) | (2,729,491 | ) | |||||||||||||
|
|
|
|
|
|
|
|
|
|
|
| |||||||||||||
Capital share transactions — Institutional Shares | ||||||||||||||||||||||||
Shares sold | 8,453,842 | 21,464,101 | 88,822,782 | 244,714,600 | 5,375,655 | 16,132,364 | ||||||||||||||||||
Shares issued in reinvestment of distributions | — | 2,464,137 | — | 7,495,276 | — | — | ||||||||||||||||||
Shares redeemed | (9,270,118 | ) | (7,466,622 | ) | (140,689,875 | ) | (100,833,631 | ) | (12,935,570 | ) | (10,065,491 | ) | ||||||||||||
|
|
|
|
|
|
|
|
|
|
|
| |||||||||||||
Net increase (decrease) | (816,276 | ) | 16,461,616 | (51,867,093 | ) | 151,376,245 | (7,559,915 | ) | 6,066,873 | |||||||||||||||
|
|
|
|
|
|
|
|
|
|
|
| |||||||||||||
Capital share transactions — R6 Shares | ||||||||||||||||||||||||
Shares sold | 119,759 | 244,142 | 217,564 | 526,399 | 41,771 | 115,322 | ||||||||||||||||||
Shares issued in reinvestment of distributions | — | 60,234 | — | 17,168 | — | — | ||||||||||||||||||
Shares redeemed | (82,057 | ) | (54,984 | ) | (87,850 | ) | (283,235 | ) | (29,506 | ) | (53,114 | ) | ||||||||||||
|
|
|
|
|
|
|
|
|
|
|
| |||||||||||||
Net increase (decrease) | 37,702 | 249,392 | 129,714 | 260,332 | 12,265 | 62,208 | ||||||||||||||||||
|
|
|
|
|
|
|
|
|
|
|
| |||||||||||||
| 50 | See Notes to Financial Statements. |
| June 30, 2022 | Baron Select Funds |
STATEMENTS OF CHANGES IN NET ASSETS (Unaudited) (Continued)
JUNE 30, 2022
|
| Baron Real Estate Income Fund | Baron Health Care Fund | Baron FinTech Fund | ||||||||||||||||||||||
| For the Six Months Ended June 30, 2022 | For the Year Ended December 31, 2021 | For the Six Months Ended June 30, 2022 | For the Year Ended December 31, 2021 | For the Six Months Ended June 30, 2022 | For the Year Ended December 31, 2021 | |||||||||||||||||||
Increase (Decrease) in Net Assets: | ||||||||||||||||||||||||
Operations: | ||||||||||||||||||||||||
Net investment income (loss) | $ | 966,939 | $ | 757,786 | $ | (192,074 | ) | $ | (1,090,017 | ) | $ | (130,058 | ) | $ | (379,861 | ) | ||||||||
Net realized gain (loss) | (7,813,027 | ) | 353,826 | (21,006,719 | ) | 1,796,864 | (2,081,552 | ) | 516,732 | |||||||||||||||
Change in net unrealized appreciation (depreciation) | (23,972,364 | ) | 16,908,392 | (26,450,807 | ) | 20,019,523 | (25,233,129 | ) | 6,328,857 | |||||||||||||||
Voluntary payment from Adviser | — | — | — | — | — | — | ||||||||||||||||||
|
|
|
|
|
|
|
|
|
|
|
| |||||||||||||
Increase (decrease) in net assets resulting from operations | (30,818,452 | ) | 18,020,004 | (47,649,600 | ) | 20,726,370 | (27,444,739 | ) | 6,465,728 | |||||||||||||||
|
|
|
|
|
|
|
|
|
|
|
| |||||||||||||
Distributions to shareholders from: | ||||||||||||||||||||||||
Distributable earnings — Retail Shares | (78,145 | ) | (213,514 | ) | — | (936,377 | ) | — | — | |||||||||||||||
Distributable earnings — Institutional Shares | (538,071 | ) | (1,092,106 | ) | — | (2,204,913 | ) | — | — | |||||||||||||||
Distributable earnings — R6 Shares | (3,255 | ) | (11,394 | ) | — | (90,063 | ) | — | — | |||||||||||||||
Return of capital — Retail Shares | — | — | — | — | — | — | ||||||||||||||||||
Return of capital — Institutional Shares | — | — | — | — | — | — | ||||||||||||||||||
Return of capital — R6 Shares | — | — | — | — | — | — | ||||||||||||||||||
|
|
|
|
|
|
|
|
|
|
|
| |||||||||||||
Decrease in net assets from distributions to shareholders | (619,471 | ) | (1,317,014 | ) | — | (3,231,353 | ) | — | — | |||||||||||||||
|
|
|
|
|
|
|
|
|
|
|
| |||||||||||||
Capital share transactions: | ||||||||||||||||||||||||
Proceeds from the sale of shares — Retail Shares | 4,857,011 | 18,532,126 | 11,578,164 | 62,643,750 | 1,002,943 | 11,236,191 | ||||||||||||||||||
Proceeds from the sale of shares — Institutional Shares | 34,654,351 | 72,503,424 | 30,456,966 | 127,638,444 | 15,647,110 | 32,857,233 | ||||||||||||||||||
Proceeds from the sale of shares — R6 Shares | 1,676 | 74,626 | 256,078 | 811,359 | 122,646 | 2,425,253 | ||||||||||||||||||
Net asset value of shares issued in reinvestment of distributions — Retail Shares | 73,254 | 206,150 | — | 920,858 | — | — | ||||||||||||||||||
Net asset value of shares issued in reinvestment of distributions — Institutional Shares | 536,686 | 1,088,034 | — | 2,202,329 | — | — | ||||||||||||||||||
Net asset value of shares issues in reinvestment of distributions — R6 Shares | 3,255 | 11,393 | — | 90,063 | — | — | ||||||||||||||||||
Cost of shares redeemed — Retail Shares | (3,055,037 | ) | (6,119,041 | ) | (19,585,163 | ) | (18,710,961 | ) | (2,335,977 | ) | (5,233,598 | ) | ||||||||||||
Cost of shares redeemed — Institutional Shares | (10,662,046 | ) | (17,585,205 | ) | (33,715,607 | ) | (8,207,188 | ) | (23,028,684 | ) | (3,460,637 | ) | ||||||||||||
Cost of shares redeemed — R6 Shares | (28,155 | ) | (871 | ) | — | (296 | ) | (77,101 | ) | (72,123 | ) | |||||||||||||
|
|
|
|
|
|
|
|
|
|
|
| |||||||||||||
Increase (decrease) in net assets derived from capital share transactions | 26,380,995 | 68,710,636 | (11,009,562 | ) | 167,388,358 | (8,669,063 | ) | 37,752,319 | ||||||||||||||||
|
|
|
|
|
|
|
|
|
|
|
| |||||||||||||
Net increase (decrease) in net assets | (5,056,928 | ) | 85,413,626 | (58,659,162 | ) | 184,883,375 | (36,113,802 | ) | 44,218,047 | |||||||||||||||
|
|
|
|
|
|
|
|
|
|
|
| |||||||||||||
Net Assets: | ||||||||||||||||||||||||
Beginning of period | 132,479,999 | 47,066,373 | 255,223,782 | 70,340,407 | 78,310,336 | 34,092,289 | ||||||||||||||||||
|
|
|
|
|
|
|
|
|
|
|
| |||||||||||||
End of period | $ | 127,423,071 | $ | 132,479,999 | $ | 196,564,620 | $ | 255,223,782 | $ | 42,196,534 | $ | 78,310,336 | ||||||||||||
|
|
|
|
|
|
|
|
|
|
|
| |||||||||||||
Capital share transactions — Retail Shares | ||||||||||||||||||||||||
Shares sold | 297,463 | 1,150,039 | 625,883 | 3,005,430 | 73,012 | 653,709 | ||||||||||||||||||
Shares issued in reinvestment of distributions | 4,731 | 12,092 | — | 43,948 | — | — | ||||||||||||||||||
Shares redeemed | (194,276 | ) | (368,965 | ) | (1,072,147 | ) | (904,603 | ) | (165,771 | ) | (309,417 | ) | ||||||||||||
|
|
|
|
|
|
|
|
|
|
|
| |||||||||||||
Net increase (decrease) | 107,918 | 793,166 | (446,264 | ) | 2,144,775 | (92,759 | ) | 344,292 | ||||||||||||||||
|
|
|
|
|
|
|
|
|
|
|
| |||||||||||||
Capital share transactions — Institutional Shares | ||||||||||||||||||||||||
Shares sold | 2,151,423 | 4,326,943 | 1,670,146 | 6,240,144 | 1,106,854 | 2,022,530 | ||||||||||||||||||
Shares issued in reinvestment of distributions | 34,566 | 63,501 | — | 104,129 | — | — | ||||||||||||||||||
Shares redeemed | (681,002 | ) | (1,167,532 | ) | (1,828,047 | ) | (386,422 | ) | (1,783,396 | ) | (204,171 | ) | ||||||||||||
|
|
|
|
|
|
|
|
|
|
|
| |||||||||||||
Net increase (decrease) | 1,504,987 | 3,222,912 | (157,901 | ) | 5,957,851 | (676,542 | ) | 1,818,359 | ||||||||||||||||
|
|
|
|
|
|
|
|
|
|
|
| |||||||||||||
Capital share transactions — R6 Shares | ||||||||||||||||||||||||
Shares sold | 99 | 4,452 | 14,139 | 37,902 | 8,395 | 141,596 | ||||||||||||||||||
Shares issued in reinvestment of distributions | 209 | 672 | — | 4,253 | — | — | ||||||||||||||||||
Shares redeemed | (1,649 | ) | (52 | ) | — | (14 | ) | (6,280 | ) | (4,193 | ) | |||||||||||||
|
|
|
|
|
|
|
|
|
|
|
| |||||||||||||
Net increase (decrease) | (1,341 | ) | 5,072 | 14,139 | 42,141 | 2,115 | 137,403 | |||||||||||||||||
|
|
|
|
|
|
|
|
|
|
|
| |||||||||||||
| See Notes to Financial Statements. | 51 |
| Baron Select Funds | June 30, 2022 |
STATEMENTS OF CHANGES IN NET ASSETS (Unaudited) (Continued)
JUNE 30, 2022
|
| Baron New Asia Fund | Baron Technology Fund | |||||||||||
| For the Six Months Ended June 30, 2022 | For the Period Ended December 31, 20211 | For the Six Months Ended June 30, 20222 | ||||||||||
Increase (Decrease) in Net Assets: | ||||||||||||
Operations: | ||||||||||||
Net investment income (loss) | $ | (2,880 | ) | $ | (15,369 | ) | $ | (11,884 | ) | |||
Net realized gain (loss) | (215,509 | ) | (27,698 | ) | (178,990 | ) | ||||||
Change in net unrealized appreciation (depreciation) | (824,390 | ) | 68,243 | (1,520,888 | ) | |||||||
Voluntary payment from Adviser | — | — | — | |||||||||
|
|
|
|
|
| |||||||
Increase (decrease) in net assets resulting from operations | (1,042,779 | ) | 25,176 | (1,711,762 | ) | |||||||
|
|
|
|
|
| |||||||
Distributions to shareholders from: | ||||||||||||
Distributable earnings — Retail Shares | — | — | — | |||||||||
Distributable earnings — Institutional Shares | — | — | — | |||||||||
Distributable earnings — R6 Shares | — | — | — | |||||||||
Return of capital — Retail Shares | — | — | — | |||||||||
Return of capital — Institutional Shares | — | — | — | |||||||||
Return of capital — R6 Shares | — | — | — | |||||||||
|
|
|
|
|
| |||||||
Decrease in net assets from distributions to shareholders | — | — | — | |||||||||
|
|
|
|
|
| |||||||
Capital share transactions: | ||||||||||||
Proceeds from the sale of shares — Retail Shares | 273,750 | 1,451,489 | 2,509,269 | |||||||||
Proceeds from the sale of shares — Institutional Shares | 313,461 | 3,200,922 | 2,618,699 | |||||||||
Proceeds from the sale of shares — R6 Shares | 108,534 | 25,000 | 25,000 | |||||||||
Net asset value of shares issued in reinvestment of | — | — | — | |||||||||
Net asset value of shares issued in reinvestment of | — | — | — | |||||||||
Net asset value of shares issues in reinvestment of | — | — | — | |||||||||
Cost of shares redeemed — Retail Shares | (183,232 | ) | (204,914 | ) | (30,079 | ) | ||||||
Cost of shares redeemed — Institutional Shares | (3,764 | ) | (7,348 | ) | — | |||||||
Cost of shares redeemed — R6 Shares | (34,348 | ) | — | — | ||||||||
|
|
|
|
|
| |||||||
Increase (decrease) in net assets derived from capital | 474,401 | 4,465,149 | 5,122,889 | |||||||||
|
|
|
|
|
| |||||||
Net increase (decrease) in net assets | (568,378 | ) | 4,490,325 | 3,411,127 | ||||||||
|
|
|
|
|
| |||||||
Net Assets: | ||||||||||||
Beginning of period | 4,490,325 | — | — | |||||||||
|
|
|
|
|
| |||||||
End of period | $ | 3,921,947 | $ | 4,490,325 | $ | 3,411,127 | ||||||
|
|
|
|
|
| |||||||
Capital share transactions — Retail Shares | ||||||||||||
Shares sold | 30,349 | 142,534 | 278,920 | |||||||||
Shares issued in reinvestment of distributions | — | — | — | |||||||||
Shares redeemed | (20,953 | ) | (19,542 | ) | (4,204 | ) | ||||||
|
|
|
|
|
| |||||||
Net increase (decrease) | 9,396 | 122,992 | 274,716 | |||||||||
|
|
|
|
|
| |||||||
Capital share transactions — Institutional Shares | ||||||||||||
Shares sold | 35,951 | 316,629 | 273,804 | |||||||||
Shares issued in reinvestment of distributions | — | — | — | |||||||||
Shares redeemed | (463 | ) | (709 | ) | — | |||||||
|
|
|
|
|
| |||||||
Net increase (decrease) | 35,488 | 315,920 | 273,804 | |||||||||
|
|
|
|
|
| |||||||
Capital share transactions — R6 Shares | ||||||||||||
Shares sold | 11,681 | 2,500 | 2,500 | |||||||||
Shares issued in reinvestment of distributions | — | — | — | |||||||||
Shares redeemed | (3,980 | ) | — | — | ||||||||
|
|
|
|
|
| |||||||
Net increase (decrease) | 7,701 | 2,500 | 2,500 | |||||||||
|
|
|
|
|
| |||||||
| 1 | For the period July 30, 2021 (commencement of operations) to December 31, 2021. |
| 2 | For the period January 3, 2022 (commencement of operations) to June 30, 2022. |
| 52 | See Notes to Financial Statements. |
| June 30, 2022 | Baron Select Funds |
STATEMENT OF CASH FLOWS (Unaudited)
FOR THE SIX MONTHS ENDED JUNE 30, 2022
|
| Baron Partners Fund | ||||
Increase (Decrease) in Cash: | ||||
Cash Provided (Used) from Operating Activities | ||||
Net increase (decrease) in net assets resulting from operations | $ | (2,986,157,211 | ) | |
Adjustments to reconcile net increase (decrease) in net assets resulting from operations to net cash provided (used) by operating activities: | ||||
Purchases of portfolio securities | (498,764,321 | ) | ||
Proceeds from sales of portfolio securities | 288,144,665 | |||
Net purchases, sales and maturities of short term investments | 288,577 | |||
Decrease in dividends and interest receivable | 117,306 | |||
Decrease in prepaid expenses | 219,181 | |||
Increase in accrued expenses | 1,112,070 | |||
Change in net unrealized depreciation of unfunded commitments | 502,786 | |||
Net realized loss on investments | 63,570,130 | |||
Change in net unrealized appreciation (depreciation) of investments | 2,888,411,405 | |||
|
| |||
Net cash provided (used) by operating activities | $ | (242,555,412 | ) | |
|
| |||
Cash Provided in Financing Activities | ||||
Proceeds from shares sold | 608,831,593 | |||
Payment for shares redeemed | (743,369,537 | ) | ||
Increase in payable for borrowings against line of credit | 377,000,000 | |||
|
| |||
Net cash provided (used) in financing activities | 242,462,056 | |||
|
| |||
Net decrease in cash | (93,356 | ) | ||
Cash at beginning of period | 113,200 | |||
|
| |||
Cash at end of period | 19,844 | |||
|
| |||
Supplemental cash flow information: | ||||
Interest paid | $ | 5,190,551 | ||
|
| |||
| See Notes to Financial Statements. | 53 |
| Baron Select Funds | June 30, 2022 |
1. ORGANIZATION
Baron Select Funds (the “Trust”) is registered under the Investment Company Act of 1940, as amended (the “1940 Act”), as an open-end management investment company established as a Delaware statutory trust on April 30, 2003, and accordingly, follows the investment company accounting and reporting guidance of the Financial Accounting Standards Board (“FASB”) Accounting Standard Codification Topic 946 Financial Services — Investment Companies. The Trust currently offers 12 series (individually, a “Fund” and collectively, the “Funds”): Baron Partners Fund, Baron Focused Growth Fund, Baron International Growth Fund, Baron Real Estate Fund, Baron Emerging Markets Fund, Baron Global Advantage Fund, Baron Real Estate Income Fund, Baron WealthBuilder Fund, Baron Health Care Fund, Baron FinTech Fund, Baron New Asia Fund, and Baron Technology Fund. Baron WealthBuilder Fund is presented in a separate report. Baron Technology Fund commenced investment operations on January 3, 2022.
The investment goals of the Funds are as follows:
Baron Partners Fund is a non-diversified fund that seeks capital appreciation through long-term investments primarily in U.S. growth companies. The Fund may employ “leverage” by borrowing money and using it to purchase additional securities. Borrowing for investments increases both investment opportunity and investment risk.
Baron Focused Growth Fund is a non-diversified fund that seeks capital appreciation through long-term investments primarily in U.S. small- and mid-sized growth companies.
Baron International Growth Fund is a diversified fund that seeks capital appreciation through long-term investments primarily in non-U.S. growth companies.
Baron Real Estate Fund is a diversified fund that seeks capital appreciation through long-term investments primarily in U.S. and non-U.S. real estate and real estate-related companies.
Baron Emerging Markets Fund is a diversified fund that seeks capital appreciation through investments primarily in growth companies in developing countries.
Baron Global Advantage Fund is a diversified fund that seeks capital appreciation through investments primarily in equity securities of established and emerging markets companies located throughout the world.
Baron Real Estate Income Fund is a non-diversified fund that seeks both capital appreciation and current income through investments primarily in real estate income-producing securities and other real estate securities.
Baron Health Care Fund is a non-diversified fund that seeks capital appreciation through investments primarily in equity securities engaged in research, development, production, sale, delivery or distribution of products and services related to the health care industry.
Baron FinTech Fund is a non-diversified fund that seeks capital appreciation through investments primarily in equity securities that develop, use, or rely on innovative technologies or services, in a significant way, for banking, lending, capital markets, financial data analytics, insurance, payments, asset management, or wealth management.
Baron New Asia Fund is a diversified fund seeks capital appreciation through investments primarily in equity securities located in Asia, but including all other developed, developing, and frontier countries in the Asian region.
Baron Technology Fund is a non-diversified fund that seeks capital appreciation through investments primarily in equity securities of U.S and non-U.S. technology companies, selected for their durable growth potential from the development, advancement, and use of technology.
Each Fund offers Retail Shares, Institutional Shares, and R6 Shares. Each class of shares differs only in its ongoing fees, expenses and eligibility requirements. Retail Shares are offered to all investors. Institutional Shares are for investments in the amount of $1 million or more per Fund. Institutional Shares are intended for certain financial intermediaries that offer shares of Baron Funds through fee-based platforms, retirement platforms, or other platforms. R6 Shares are available only to qualified 401(a) plans (including 401(k) plans, Keogh plans, profit sharing plans, money purchase pension plans, target benefit plans, defined benefit pension plans, and Taft-Hartley multi-employer pension plans) (collectively, “Qualified Plans”), endowment funds and foundations, any state, county or city, or its instrumentality, department, authority, or agency, 457 plans, including 457(a) governmental entity plans and tax-exempt plans, accounts registered to insurance companies, trust companies and bank trust departments, investment companies, both affiliated and not affiliated with BAMCO, Inc. (the “Adviser”), and any entity that is considered a corporation for tax purposes, including corporate non-qualified deferred compensation plans of such corporations. There is no minimum initial investment for Qualified Plans. All other R6 eligible investors must meet a minimum initial investment of at least $5 million per Fund. Each class of shares has equal rights to earnings and assets, except that each class bears different expenses for distribution and shareholder servicing. Each Fund’s investment income, realized and unrealized gains or losses on investments and foreign currency, and expenses other than those attributable to a specific class are allocated to each class based on its relative net assets. Each class of shares has exclusive voting rights with respect to matters that affect just that class.
Baron Partners Fund was organized originally as a limited partnership in January 1992 under the laws of the State of Delaware. Effective as of the close of business on April 30, 2003, the predecessor partnership was reorganized into a series of the Trust. Baron Partners Fund commenced operations on April 30, 2003 with a contribution of assets and liabilities, including securities-in-kind, from the predecessor partnership.
Baron Focused Growth Fund was organized originally as a limited partnership in May 1996 under the laws of the State of Delaware. Effective as of the close of business on June 30, 2008, the predecessor partnership was reorganized into a series of the Trust. Baron Focused Growth Fund commenced operations on June 30, 2008 with a contribution of assets and liabilities, including securities-in-kind, from the predecessor partnership.
2. SIGNIFICANT ACCOUNTING POLICIES
The following is a summary of significant accounting policies followed by the Funds. The policies are in conformity with accounting principles generally accepted in the United States of America (“GAAP”). The preparation of financial statements in accordance with GAAP requires management to make estimates and assumptions that affect the reported amounts of assets and liabilities at the date of the financial statements and the amounts of income and expenses during the period. Actual results could differ
54
| June 30, 2022 | Baron Select Funds |
NOTES TO FINANCIAL STATEMENTS (Continued)
2. SIGNIFICANT ACCOUNTING POLICIES (Continued)
from those estimates. Events occurring subsequent to the date of the Statements of Assets and Liabilities and through the date of issuance of the financial statements have been evaluated for adjustment to or disclosure in the financial statements.
a) Security Valuation. The Funds’ share prices or net asset values (“NAV”) are calculated as of the scheduled close of the regular trading session (usually 4 p.m. E.T. or such other time as of which the Funds’ NAVs are calculated (the “NAV Calculation Time”)) on the New York Stock Exchange (the “Exchange”) on any day the Exchange is scheduled to be open. Portfolio securities traded on any national stock exchange are valued based on the last sale price on the exchange where such shares are principally traded. For securities traded on NASDAQ, the Funds use the NASDAQ Official Closing Price. If there are no sales on a given day, the value of the security may be the average of the most recent bid and asked quotations on such exchange or the last sale price from a prior day. Where market quotations are not readily available, or, if in the Adviser’s judgment, they do not accurately reflect the fair value of a security, or an event occurs after the market close but before the Funds are priced that materially affects the value of a security, the security will be valued by the Adviser using policies and procedures approved by the Board of Trustees (the “Board”). Some of the more common reasons that may necessitate that a security be valued using “fair value” pricing may include, but are not limited to: trading of the security has been halted or suspended; or the security has not been traded for an extended period of time. The Adviser has a Fair Valuation Committee (the “Committee”) comprised of senior management representatives and the Committee reports to the Board every quarter. Factors the Committee may consider when valuing a security include whether a current price is stale, there is recent news, the security is thinly traded, transactions are infrequent or quotations are genuine. There can be no guarantee, however, that a fair valuation used by the Funds on any given day will more accurately reflect the market value of an investment than the closing price of such investment in its market.
U.S. Government obligations, money market instruments, and other debt instruments held by the Funds with a remaining maturity of 60 days or less are generally valued at amortized cost, which approximates fair value, unless an independent pricing service provides a valuation for such security or in the opinion of the Board or the Committee, the amortized cost method would not represent fair value. Debt instruments having a greater remaining maturity will be valued on the basis of prices obtained from a pricing service approved by the Board or at the mean of the bid and ask prices from the dealer maintaining an active market in that security. The value of the Funds’ investments in convertible bonds/convertible preferred stocks is determined primarily by obtaining valuations from independent pricing services based on readily available bid quotations or, if quotations are not available, by methods which include various considerations such as yields or prices of securities of comparable quality, coupon, maturity and type; indications as to values from dealers; and general market conditions. Other inputs used by an independent pricing service to value convertible bonds/convertible preferred stocks generally include underlying stock data, conversion premiums, listed bond and preferred stock prices and other market information which may include benchmark curves, trade execution data, sensitivity analysis, when available, or an estimated value calculated based on the price of the underlying common share on the valuation date adjusted for accrued and unpaid dividends. Open-end investment companies, including securities lending collateral invested in registered investment company money market funds, are valued at their NAV each day.
Non-U.S. equity securities traded on foreign securities exchanges are generally valued using an independent pricing vendor that provides daily fair value adjustment factors based on information such as local closing price, relevant general and sector indexes, currency fluctuations, and depositary receipts, as applicable. Securities valued using such adjustment factors are classified as Level 2 in the fair value hierarchy. The models of the independent pricing vendor generate an adjustment factor for each security, which is applied to the local closing price to adjust it for post-closing market movements up to the time the Funds are valued and translated into U.S. dollars. If the vendor does not provide an adjustment factor for a security, the security is valued based on its most recent local closing price and translated into U. S. dollars. The Adviser may also fair value securities in other situations, for example, when a particular foreign market is closed but the Funds are open. Other mutual funds may adjust the prices of their securities by different amounts.
b) Securities Transactions, Investment Income and Expense Allocation. Securities transactions are recorded on a trade date basis. Realized gain and loss from securities transactions are recorded on an identified cost basis for financial reporting and federal income tax purposes. Dividend income is recognized on the ex-dividend date and interest income is recognized on an accrual basis, which includes the accretion of discounts and amortization of premiums. Non-cash dividends received in the form of stock, if any, are recognized on the ex-dividend date and recorded as non-cash dividend income at fair value. Certain dividends from foreign securities will be recorded as soon as the Funds are informed of the dividend if such information is obtained subsequent to the ex-dividend date. Distributions received from certain investments held by the Funds may be comprised of dividends, realized gains and returns of capital. The Funds originally estimate the expected classification of such payments. The amounts may subsequently be reclassified upon receipt of information from the issuer. The Funds are charged for those expenses of the Trust that are directly attributable to each Fund, such as advisory and custodian fees. Expenses that are not directly attributable to a Fund are typically allocated among the Funds in proportion to their respective net assets.
c) Single Issuer. Single issuer risk is the possibility that factors specific to an issuer to which a Fund is exposed will affect the market prices of the issuer’s securities and therefore the NAV of the Fund. Due to the size of Baron Partners Fund’s and Baron Focused Growth Fund’s investments in Tesla, Inc. (“Tesla”), 49% and 21%, respectively, of these Fund’s net assets as of June 30, 2022, the NAVs of the Funds will be materially impacted by the price of Tesla stock.
d) Non-Diversified Portfolio. Certain Funds are non-diversified, which means they will likely have a greater percentage of their assets in a single issuer than a diversified fund. As a result, a non-diversified Fund will likely invest a greater percentage of its assets in fewer issuers, and the performance of those issuers may have a greater effect on the Fund’s performance compared to a diversified fund. Thus, a non-diversified Fund is more likely to experience significant fluctuations in value, exposing the Fund to a greater risk of loss in any given period than a diversified fund. Additionally, non-diversified Funds may encounter difficulty liquidating securities.
e) Industry Concentration. From time to time, market fluctuations in the value of a Fund’s investments, combined with a Fund’s non-diversified portfolio, may result in a Fund being concentrated in the securities of a single issuer or a small number of issuers, including in a particular industry. As a result, this Fund will be particularly exposed to the risks of that company or industry relative to the risk exposure of investment companies holding a diversified portfolio of securities or those that seek to maintain near-index weightings in their portfolio securities. Accordingly, in those cases, a Fund will be disproportionately exposed to the market conditions, interest rates, and economic, regulatory, or financial developments that significantly affect that company or industry. For example, due to the size of Baron Partners Fund’s and Baron Focused Growth Fund’s investments in Tesla, which represent about 49% and 21%, respectively, of these Funds’ net assets as of June 30, 2022, these Funds will be more adversely impacted by negative developments affecting the automotive and energy industries, as well as governmental environmental regulations.
55
| Baron Select Funds | June 30, 2022 |
NOTES TO FINANCIAL STATEMENTS (Continued)
2. SIGNIFICANT ACCOUNTING POLICIES (Continued)
f) Foreign Currency Translations. Values of assets and liabilities denominated in foreign currencies are translated into U.S. dollars using the price of such currencies at the NAV Calculation Time. Purchases and sales of investments and dividend income are converted at the prevailing rate of exchange on the respective dates of such transactions. Net realized gain (loss) on foreign currency transactions includes gain (loss) arising from the fluctuation in the exchange rates between trade and settlement dates on security transactions and currency gain (loss) between the accrual and payment dates on dividends and foreign withholding taxes. The Funds do not isolate that portion of the results of operations resulting from changes in foreign exchange rates on investments from the fluctuations arising from changes in market prices of securities held. Such fluctuations are included with the net realized and unrealized gain or loss from investments and foreign currency transactions on the Statements of Operations. The Funds may invest in foreign securities and foreign currency transactions that may involve risks not associated with domestic investments as a result of the level of governmental supervision and regulation of foreign securities markets and the possibility of political or economic instability, among others.
Pursuant to U.S. federal income tax regulations, gains and losses from certain foreign currency transactions and the foreign currency portion of gains and losses realized on sales and maturities of foreign denominated debt securities are generally treated as ordinary income for U.S. federal income tax purposes.
g) Securities Lending. The Funds may lend securities to certain brokers under the terms of a master netting agreement. Upon such loans, the Funds receive collateral which is maintained by the custodian. The Funds may pay fees to the custodian for administering the securities lending program. The Funds earn interest on such collateral and earn income in the form of negotiated lenders’ fees, both of which are included in securities lending income in the Statements of Operations. Securities loaned are required to be secured at all times by collateral equal to at least 102% of the market value of the securities loaned. Risks may arise upon entering into securities lending to the extent that the value of the collateral is less than the value of the securities loaned due to the changes in the value of collateral or the loaned securities. The collateral is marked-to-market daily and settled on the next business day. The Funds may receive collateral in the form of cash or other eligible securities, such as a letter of credit issued by a U.S. bank or securities issued or guaranteed by the U.S. government. Securities purchased with cash collateral are subject to the risks inherent in investing in these securities.
There were no securities on loan at June 30, 2022.
h) Repurchase Agreements. The Funds may invest in repurchase agreements, which are short term investments whereby the Funds acquire ownership of a debt security and the seller agrees to repurchase the security at a future date at a specified price. When entering into repurchase agreements, it is the Funds’ policy that their custodian take possession of the underlying collateral securities, the market value of which, at all times, equals at least 102% of the principal amount of the repurchase transaction. To the extent that any repurchase transaction exceeds one business day, the value of the collateral is marked-to-market to ensure the adequacy of the collateral. If the seller defaults and the market value of the collateral declines or if bankruptcy proceedings are commenced with respect to the seller of the security, realization of the collateral by the Funds may be delayed or limited. The information required to be disclosed by FASB Accounting Standards Update No. 2011-11 for the Funds’ investments in repurchase agreements at June 30, 2022, including the fair value of the repurchase agreement and the amount of collateral, can be found in each respective Fund’s Statement of Net Assets.
i) Master Limited Partnerships. The Funds may invest in master limited partnerships (“MLPs”). MLPs are limited partnerships or limited liability companies, whose partnership units or limited liability interests are listed and traded on a U.S. securities exchange, and are treated as publicly traded partnerships for federal income tax purposes. To qualify to be treated as a partnership for tax purposes, an MLP must receive at least 90% of its income from qualifying sources as set forth in Section 7704(d) of the Internal Revenue Code of 1986, as amended. These qualifying sources include interest, dividend, real property rent, gain from sale or other disposition of real property and income from activities such as the exploration, development, mining, production, processing, refining, transportation, storage and marketing of mineral or natural resources.
j) Special Purpose Acquisition Company. The Funds may acquire an interest in a special purpose acquisition company (“SPAC”) in an initial public offering (“IPO”), via a private placement or a secondary market transaction. A SPAC is typically a publicly traded company that raises investment capital via an IPO for the purpose of acquiring the equity securities of one or more existing companies via merger, combination, acquisition, or other similar transactions. To the extent the SPAC is invested in cash or similar securities, this may negatively affect a Fund’s performance if the Fund is invested in the SPAC during such period. There is no guarantee that the SPACs will complete an acquisition or that any acquisitions that are completed will be profitable. Some SPACs may pursue acquisitions only within certain industries or regions, which may increase the volatility of their prices. These transactions will require the approval of the respective shareholders and are subject to other customary closing conditions, including the receipt of certain regulatory approvals. If these conditions are not met, the SPAC’s acquisition may not close and, to the extent a Fund had committed to participate in a private placement (i.e., PIPE transaction, defined below), the Fund will no longer be obligated to fulfill its commitment.
k) Private Investment in Public Equity. The Funds may acquire equity securities of an issuer that are issued through a private investment in public equity (“PIPE”) transaction, including through commitments to purchase securities on a when-issued basis. A Fund will generally earmark an amount of cash or high-quality securities equal to the amount of its commitment to purchase the when-issued securities. PIPE transactions typically involve the purchase of securities directly from a publicly traded company in a private placement transaction, including securities issued by a SPAC, typically at a discount to the market price of the company’s securities. There is a risk that if the market price of the securities drops below a set threshold, the company may have to issue additional stock at a significantly reduced price, which may dilute the value of a Fund’s investment. Shares in PIPEs generally are not registered with the SEC until after a certain time period from the date the private sale is completed. This restriction can last an uncertain amount of time and may be many months. Until the public registration process is completed, securities acquired via a PIPE are restricted as to resale and a Fund cannot freely trade the securities. Generally, such restrictions cause these securities to be illiquid during this time. PIPEs may contain provisions that the issuer will pay specified financial penalties to the holder if the issuer does not publicly register the restricted equity securities within a specified period of time, but there is no assurance that the restricted equity securities will be publicly registered, or that the registration will remain in effect.
56
| June 30, 2022 | Baron Select Funds |
NOTES TO FINANCIAL STATEMENTS (Continued)
2. SIGNIFICANT ACCOUNTING POLICIES (Continued)
Publicly traded securities acquired via a PIPE transaction are typically valued at a discount to the market price of an issuer’s common stock and classified as Level 2 or Level 3 in the fair value hierarchy depending on the significance of the unobservable inputs. Discounts are applied due to certain trading restrictions imposed or a lack of marketability preceding the conversion to publicly traded securities. The primary inputs used in determining the discount are the length of the lock-up time period and volatility of the underlying security.
As of June 30, 2022, Baron Partners Fund had a commitment to purchase a when-issued security through a private transaction. Unrealized appreciation (depreciation) on this commitment is separately presented in the Statements of Assets and Liabilities as unrealized appreciation (depreciation) on unfunded commitments, and in the Statements of Operations as change in unrealized appreciation (depreciation) on unfunded commitments.
l) Federal and Foreign Income Taxes. The Trust treats each Fund as a separate entity for federal income tax purposes. Each Fund intends to meet the requirements of the Internal Revenue Code of 1986, as amended, applicable to regulated investment companies, and to distribute to its shareholders substantially all of its net investment income and any net realized capital gains at least annually. None of the Funds will be subject to federal or state income taxes to the extent that they qualify as regulated investment companies and substantially all of their income is distributed.
The Funds may be subject to foreign taxes on income and gains on investments that are accrued based upon the Funds’ understanding of the tax rules and regulations that exist in the countries in which the Funds invest. Foreign governments may also impose taxes or other payments on investments with respect to foreign securities. Such taxes are accrued as applicable.
m) Restricted Securities. The Funds may invest in securities that are restricted as to public sale in accordance with the Securities Act of 1933. Such assets are valued by the Adviser pursuant to policies and procedures approved by the Board.
n) Distributions to Shareholders. Income and capital gain distributions to shareholders are determined in accordance with income tax regulations which may differ from GAAP. These differences are primarily due to differing treatments for net investment loss, foreign currency gains and losses, non-deductible interest expense, reclassification of distributions, partnership basis adjustments, income from passive foreign investment companies, late-year loss deferral, post-October loss deferral, and wash sale loss deferral.
o) Commitments and Contingencies. In the normal course of business, the Funds may enter into contracts and agreements that contain a variety of representations and warranties, which provide general indemnification. The maximum exposure to the Funds under these agreements is unknown, as this would involve future claims that may be made against the Funds that have not yet occurred. However, based on experience, the Funds expect the risk of loss to be remote.
p) Cash and Cash Equivalents. The Funds consider all short term liquid investments with a maturity of three months or less when purchased to be cash equivalents.
3. PURCHASES AND SALES OF SECURITIES
Purchases and sales of securities, other than short term securities, for the six months ended June 30, 2022 were as follows:
| Fund | Purchases | Sales | ||||||
Baron Partners Fund | $ | 479,720,013 | $ | 288,382,775 | ||||
Baron Focused Growth Fund | 113,583,025 | 115,302,277 | ||||||
Baron International Growth Fund | 184,945,328 | 193,878,591 | ||||||
Baron Real Estate Fund | 1,104,252,186 | 1,210,375,810 | ||||||
Baron Emerging Markets Fund | 2,077,575,193 | 2,614,375,337 | ||||||
Baron Global Advantage Fund | 105,171,639 | 551,169,040 | ||||||
Baron Real Estate Income Fund | 137,585,421 | 113,098,520 | ||||||
Baron Health Care Fund | 71,765,789 | 73,594,674 | ||||||
Baron FinTech Fund | 8,918,496 | 18,467,044 | ||||||
Baron New Asia Fund | 1,967,348 | 1,285,154 | ||||||
Baron Technology Fund | 5,015,165 | 256,789 | ||||||
4. INVESTMENT ADVISORY FEES AND OTHER TRANSACTIONS WITH AFFILIATES
a) Investment Advisory Fees. The Adviser, a wholly owned subsidiary of Baron Capital Group, Inc. (“BCG”), serves as investment adviser to the Funds. As compensation for services rendered, the Adviser receives a fee payable monthly from Baron Partners Fund, Baron Focused Growth Fund, Baron Real Estate Fund, Baron Emerging Markets Fund, and Baron New Asia Fund equal to 1% per annum of the average daily net assets of the respective Fund. The Adviser receives a fee payable monthly from Baron International Growth Fund, Baron Global Advantage Fund, Baron Real Estate Income Fund, Baron Health Care Fund, Baron FinTech Fund, and Baron Technology Fund equal to 0.88%, 0.85%, 0.75%, 0.75%, 0.80%, and 0.80%, respectively, per annum of the average daily net assets of the respective Fund. The Adviser has contractually agreed to
57
| Baron Select Funds | June 30, 2022 |
NOTES TO FINANCIAL STATEMENTS (Continued)
4. INVESTMENT ADVISORY FEES AND OTHER TRANSACTIONS WITH AFFILIATES (Continued)
reduce its fee or reimburse Fund expenses to the extent required to limit the net annual operating expense ratio (excluding portfolio transaction costs, interest, dividend and extraordinary expenses), as follows:
| Annual Operating Expense Ratio Cap | ||||||||||||
| Fund | Retail Shares | Institutional Shares | R6 Shares | |||||||||
Baron Partners Fund | 1.45 | % | 1.20 | % | 1.20 | % | ||||||
Baron Focused Growth Fund | 1.35 | % | 1.10 | % | 1.10 | % | ||||||
Baron International Growth Fund | 1.20 | % | 0.95 | % | 0.95 | % | ||||||
Baron Real Estate Fund | 1.35 | % | 1.10 | % | 1.10 | % | ||||||
Baron Emerging Markets Fund | 1.50 | % | 1.25 | % | 1.25 | % | ||||||
Baron Global Advantage Fund | 1.15 | % | 0.90 | % | 0.90 | % | ||||||
Baron Real Estate Income Fund | 1.05 | % | 0.80 | % | 0.80 | % | ||||||
Baron Health Care Fund | 1.10 | % | 0.85 | % | 0.85 | % | ||||||
Baron FinTech Fund | 1.20 | % | 0.95 | % | 0.95 | % | ||||||
Baron New Asia Fund | 1.45 | % | 1.20 | % | 1.20 | % | ||||||
Baron Technology Fund | 1.20 | % | 0.95 | % | 0.95 | % | ||||||
b) Distribution Fees. Baron Capital, Inc. (“BCI”), a wholly owned subsidiary of BCG, is a registered broker-dealer and the distributor of the Funds’ shares. The Funds are authorized to pay BCI a distribution fee payable monthly pursuant to a distribution plan under Rule 12b-1 of the 1940 Act equal to 0.25% per annum of the Retail Shares’ average daily net assets of the respective Funds.
c) Trustee Fees. Certain Trustees of the Trust are interested persons (as defined by the 1940 Act) of the Trust. None of these Trustees received compensation for his or her services as a Trustee of the Trust. None of the Funds’ officers received compensation from the Funds for their services as an officer.
d) Fund Accounting and Administration Fees. The Funds have entered into an agreement with State Street Bank and Trust Company (“State Street”) to perform accounting and certain administrative services. State Street is compensated for fund accounting services based on a percentage of the Funds’ net assets, plus fixed annual fees for the administrative services.
e) Cross Trades. The Funds are permitted to purchase securities from, or sell securities to, other Funds within the Trust, the funds in Baron Investment Funds Trust and other entities advised or subadvised by the Adviser, pursuant to “Cross-Trading Procedures” adopted by the Board. These procedures have been designed to ensure that any cross-trade of securities by the respective Baron Fund from or to another fund/other entity that is or could be considered an affiliate of a Fund under certain limited circumstances by virtue of having a common investment adviser, common officers, or common trustees complies with Rule 17a-7 under the 1940 Act. Further, as defined under these procedures, each cross-trade is effected at the current market price and with no commissions. Pursuant to these procedures, for the six months ended June 30, 2022, the Funds engaged in the following cross-trades:
| Purchases | Sales | Net Realized Gains (Losses) | ||||||||||
Baron International Growth Fund | $ | 305,410 | $ | — | $ | — | ||||||
Baron Global Advantage Fund | — | 305,410 | (152,224 | ) | ||||||||
f) Voluntary Payment. The Adviser made a voluntary payment to Baron Global Advantage Fund in the amount of $82,890 to compensate the Fund for a loss incurred due to a valuation error. The impact of this payment increased the Fund’s total return by less than 0.01%.
5. LINE OF CREDIT
Baron Partners Fund participates in a committed syndicated line of credit agreement with State Street in the amount of $1 billion. Depending on the outstanding loan amount, a commitment fee of 0.15% or 0.25% per annum is incurred on the unused portion of the line of credit. The line of credit is used for investment purposes and expires on October 27, 2022. Baron Partners Fund may borrow up to the lesser of $1 billion or the maximum amount Baron Partners Fund may borrow under the 1940 Act, the limitations included in Baron Partners Fund’s prospectus, or any limit or restriction under any law or regulation to which Baron Partners Fund is subject or any agreement to which Baron Partners Fund is a party. Interest is charged to Baron Partners Fund, based on its borrowings, at a rate per annum equal to the higher of the Effective Federal Funds Rate or the one month LIBOR rate plus a margin of 0.85%. An upfront fee of 0.05% is incurred on the commitment amount. For the six months ended June 30, 2022, interest expense incurred on these loans amounted to $6,531,832. During the six months ended June 30, 2022, Baron Partners Fund had an average daily balance on the line of credit of $873.4 million at a weighted average interest rate of 1.51%. At June 30, 2022, Baron Partners Fund had an outstanding balance in the amount of $929 million.
The Funds (except Baron Partners Fund), together with the funds in Baron Investment Funds Trust, participate in a committed line of credit agreement with State Street to be used for temporary purposes, primarily for financing redemptions. Each fund may borrow, on a first-come, first-served basis, up to the lesser of $200 million or the maximum amount each fund may borrow under the 1940 Act, the limitations included in each fund’s prospectus, or any limit or restriction under any law or regulation to which each fund is subject or any agreement to which each fund is a party; provided that the aggregate outstanding principal amount of all loans to any of the funds may not exceed $200 million. Interest is charged to each fund, based on its borrowings, at a rate per annum equal to the higher of the Overnight Bank Funding Rate plus 0.10% or the Overnight Federal Funds Rate plus 0.10%; plus a margin of 1.00%. An upfront fee of 0.05% is incurred on the commitment amount and a commitment fee of 0.20% per annum is incurred on the unused portion of the line of credit. Both fees are allocated to the participating funds based on their relative net assets.
During the six months ended June 30, 2022, Baron Global Advantage Fund and Baron FinTech Fund had borrowings under the line of credit and incurred interest expense of $47,837, and $508, respectively. For the 128 days during which there were borrowings, Baron Global Advantage Fund had an average daily balance on the line of credit of $9.8 million at a weighted average interest rate of 1.39%. For the 5 days during which there were borrowings, Baron FinTech Fund had an average daily balance on the line of credit of $3.1 million at a weighted average interest rate of 1.20%.
58
| June 30, 2022 | Baron Select Funds |
NOTES TO FINANCIAL STATEMENTS (Continued)
6. RESTRICTED SECURITIES
At June 30, 2022, investments in securities included securities that are restricted and/or illiquid. Restricted securities are often purchased in private placement transactions, are not registered under the Securities Act of 1933, may have contractual restrictions on resale and are valued pursuant to the policies and procedures for fair value pricing approved by the Board. An illiquid investment is any investment that the Funds reasonably expect cannot be sold or disposed of in current market conditions in seven calendar days or less without the sale or disposition significantly changing the market value of the investment, as determined pursuant to the provisions of the Liquidity Rule governing classification of portfolio securities. The Funds may receive more or less than this valuation in an actual sale and that difference could be material. At June 30, 2022, the Funds held investments in restricted and/or illiquid securities that were valued pursuant to policies and procedures for fair value pricing as follows:
| Baron Partners Fund | ||||||||
| Name of Issuer | Acquisition Date(s) | Value | ||||||
Common Stocks | ||||||||
Private Common Stocks | ||||||||
Space Exploration Technologies Corp. | 9/13/2017 | $ | 169,324,834 | |||||
StubHub Holdings, Inc. | 12/22/2021 | 23,707,632 | ||||||
Private Convertible Preferred Stocks | ||||||||
Northvolt AB | 5/19/2021 | 7,939,847 | ||||||
Private Preferred Stocks | ||||||||
Space Exploration Technologies Corp. | 11/15/2017-8/4/2020 | 372,383,243 | ||||||
|
| |||||||
Total Restricted Securities: | $ | 573,355,556 | ||||||
|
| |||||||
(Cost $186,093,669)† (10.37% of Net Assets) | ||||||||
| Baron Focused Growth Fund | ||||||||
| Name of Issuer | Acquisition Date(s) | Value | ||||||
Private Common Stocks | ||||||||
Space Exploration Technologies Corp. | 9/13/2017 | $ | 51,952,763 | |||||
Private Preferred Stocks | ||||||||
Space Exploration Technologies Corp. | 11/15/2017-12/3/2021 | 27,140,164 | ||||||
|
| |||||||
Total Restricted Securities: | $ | 79,092,927 | ||||||
|
| |||||||
(Cost $39,949,596)† (11.75% of Net Assets) | ||||||||
| Baron International Growth Fund | ||||||||
| Name of Issuer | Acquisition Date(s) | Value | ||||||
Common Stocks | ||||||||
Sberbank of Russia PJSC | 1/24/2017-10/29/2021 | $ | 514 | |||||
|
| |||||||
Total Restricted Securities: | $ | 514 | ||||||
|
| |||||||
(Cost $1,644,868) (0.00% of Net Assets) | ||||||||
| Baron Emerging Markets Fund | ||||||||
| Name of Issuer | Acquisition Date(s) | Value | ||||||
Common Stocks | ||||||||
Codere Online Luxembourg, S.A., Founders Shares | 12/10/2020 | $ | 877,962 | |||||
Fix Price Group Ltd | 3/5/2021-9/14/2021 | 285,242 | ||||||
Ozon Holdings PLC | 11/24/2020-2/7/2022 | 374,722 | ||||||
Polyus PJSC | 10/30/2020-2/9/2022 | 106,415 | ||||||
Sberbank of Russia PJSC | 2/11/2016-11/10/2021 | 18,896 | ||||||
Yandex N.V. | 2/3/2016-10/28/2021 | 299,662 | ||||||
Private Common Stocks | ||||||||
Pine Labs PTE. Ltd. | 5/17/2021 | 56,246,928 | ||||||
Private Convertible Preferred Stocks | ||||||||
Bundl Technologies Private Ltd. | 1/3/2022 | 48,491,617 | ||||||
Think & Learn Private Limited | 3/31/2021 | 64,672,180 | ||||||
|
| |||||||
Total Restricted Securities: | $ | 171,373,624 | ||||||
|
| |||||||
(Cost $450,788,731)† (2.80% of Net Assets) | ||||||||
| † | See Statements of Net Assets for cost of individual securities. |
59
| Baron Select Funds | June 30, 2022 |
NOTES TO FINANCIAL STATEMENTS (Continued)
6. RESTRICTED SECURITIES (Continued)
| Baron Global Advantage Fund | ||||||||
| Name of Issuer | Acquisition Date(s) | Value | ||||||
Common Stocks | ||||||||
Codere Online Luxembourg, S.A., Founders Shares | 12/10/2020 | $ | 286,437 | |||||
Private Common Stocks | ||||||||
Space Exploration Technologies Corp. | 3/25/2021-12/3/2021 | 22,010,373 | ||||||
Private Convertible Preferred Stocks | ||||||||
Farmers Business Network, Inc. | 7/31/2020-9/15/2021 | 10,535,456 | ||||||
Resident Home, Inc. | 12/3/2020 | 1,204,825 | ||||||
Think & Learn Private Limited | 3/31/2021 | 38,805,839 | ||||||
Private Preferred Stocks | ||||||||
GM Cruise Holdings LLC | 1/19/2021 | 13,295,356 | ||||||
|
| |||||||
Total Restricted Securities: | $ | 86,138,286 | ||||||
|
| |||||||
(Cost $74,265,679)† (8.31% of Net Assets) | ||||||||
| † | See Statements of Net Assets for cost of individual securities. |
7. FAIR VALUE MEASUREMENTS
Fair value is defined by GAAP as the price that the Funds would receive upon selling an investment in a timely transaction to an independent buyer in the principal or most advantageous market for the investment. GAAP provides a three-tier hierarchy to maximize the use of observable market data and minimize the use of unobservable inputs and to establish classification of fair value measurements for disclosure purposes. Inputs refer broadly to the assumptions that market participants would use in pricing the asset or liability. Inputs may be observable or unobservable. Observable inputs are based on market data obtained from sources independent of the Funds. Unobservable inputs are inputs that reflect the Funds’ own assumptions based on the best information available in the circumstances. The three-tier hierarchy of inputs is summarized in the three broad Levels listed below.
| • | Level 1 — quoted prices in active markets for identical assets or liabilities; |
| • | Level 2 — prices determined using other inputs that are observable either directly, or indirectly through corroboration with observable market data (which could include quoted prices for similar assets or liabilities, interest rates, credit risk, etc.); |
| • | Level 3 — prices determined using unobservable inputs when quoted prices or observable inputs are unavailable, such as when there is little or no market activity for an asset or liability (unobservable inputs reflect the Funds’ own assumptions in determining the fair value of assets or liabilities and would be based on the best information available). |
The inputs or methodology used for valuing securities are not necessarily an indication of the risk or liquidity associated with investing in those securities. For example, non-U.S. securities, with markets that close hours before the Funds value their holdings, may require revised valuations to more accurately reflect their fair value. Since these values obtained from quoted prices in an active market are adjusted, such securities are reflected as Level 2.
The Funds have procedures to determine the fair value of securities and other financial instruments for which market prices are not readily available or which may not be reliably priced. Under these procedures, the Funds primarily employ a market-based approach that may use related or comparable assets or liabilities, recent transactions, market multiples, book values, and other relevant information for the investment to determine its fair value. The Funds may also use an income-based valuation approach in which the anticipated future cash flows of the investment are discounted to calculate fair value. Discounts may also be applied due to the nature or duration of any restrictions on the disposition of the investments. Due to the inherent uncertainty of valuations of such investments, the fair values may differ significantly from the values that would have been used had an active market existed.
The following is a summary of the inputs used as of June 30, 2022 in valuing the Funds’ investments carried at fair value:
| Baron Partners Fund | ||||||||||||||||
| Description | Quoted Prices in Active Markets for Identical Assets (Level 1) | Other Observable Inputs (Level 2) | Unobservable Inputs (Level 3) | Total | ||||||||||||
Common Stocks† | $ | 5,799,502,987 | $ | 85,499,797 | $ | — | $ | 5,885,002,784 | ||||||||
Private Common Stocks† | — | — | 193,032,466 | 193,032,466 | ||||||||||||
Private Convertible Preferred Stocks | — | — | 7,939,847 | 7,939,847 | ||||||||||||
Private Preferred Stocks | — | — | 372,383,243 | 372,383,243 | ||||||||||||
|
|
|
|
|
|
|
| |||||||||
Total Investments | $ | 5,799,502,987 | $ | 85,499,797 | $ | 573,355,556 | $ | 6,458,358,340 | ||||||||
|
|
|
|
|
|
|
| |||||||||
Unrealized appreciation (depreciation) on unfunded commitments | $ | — | $ | — | $ | (502,786 | ) | $ | (502,786 | ) | ||||||
|
|
|
|
|
|
|
| |||||||||
| † | See Statements of Net Assets for additional detailed categorizations. |
60
| June 30, 2022 | Baron Select Funds |
NOTES TO FINANCIAL STATEMENTS (Continued)
7. FAIR VALUE MEASUREMENTS (Continued)
| Baron Focused Growth Fund | ||||||||||||||||
| Description | Quoted Prices in Active Markets for Identical Assets (Level 1) | Other Observable Inputs (Level 2) | Unobservable Inputs (Level 3) | Total | ||||||||||||
Common Stocks† | $ | 526,962,201 | $ | — | $ | — | $ | 526,962,201 | ||||||||
Private Common Stocks | — | — | 51,952,763 | 51,952,763 | ||||||||||||
Private Preferred Stocks | — | — | 27,140,164 | 27,140,164 | ||||||||||||
Short Term Investments | — | 70,683,247 | — | 70,683,247 | ||||||||||||
|
|
|
|
|
|
|
| |||||||||
Total Investments | $ | 526,962,201 | $ | 70,683,247 | $ | 79,092,927 | $ | 676,738,375 | ||||||||
|
|
|
|
|
|
|
| |||||||||
| Baron International Growth Fund | ||||||||||||||||
| Description | Quoted Prices in Active Markets for Identical Assets (Level 1) | Other Observable Inputs (Level 2) | Unobservable Inputs (Level 3) | Total | ||||||||||||
Common Stocks† | $ | 163,777,138 | $ | 317,768,859 | $ | 514 | $ | 481,546,511 | ||||||||
Warrants | 23,400 | — | — | 23,400 | ||||||||||||
Short Term Investments | — | 21,297,427 | — | 21,297,427 | ||||||||||||
|
|
|
|
|
|
|
| |||||||||
Total Investments | $ | 163,800,538 | $ | 339,066,286 | $ | 514 | $ | 502,867,338 | ||||||||
|
|
|
|
|
|
|
| |||||||||
| Baron Real Estate Fund | ||||||||||||||||
| Description | Quoted Prices in Active Markets for Identical Assets (Level 1) | Other Observable Inputs (Level 2) | Unobservable Inputs (Level 3) | Total | ||||||||||||
Common Stocks† | $ | 1,265,784,522 | $ | — | $ | — | $ | 1,265,784,522 | ||||||||
Short Term Investments | — | 97,707,622 | — | 97,707,622 | ||||||||||||
|
|
|
|
|
|
|
| |||||||||
Total Investments | $ | 1,265,784,522 | $ | 97,707,622 | $ | — | $ | 1,363,492,144 | ||||||||
|
|
|
|
|
|
|
| |||||||||
| Baron Emerging Markets Fund | ||||||||||||||||
| Description | Quoted Prices in Active Markets for Identical Assets (Level 1) | Other Observable Inputs (Level 2) | Unobservable Inputs (Level 3) | Total | ||||||||||||
Common Stocks† | $ | 1,672,201,416 | $ | 4,045,927,569 | $ | 1,962,899 | $ | 5,720,091,884 | ||||||||
Private Common Stocks | — | — | 56,246,928 | 56,246,928 | ||||||||||||
Private Convertible Preferred Stocks | — | — | 113,163,797 | 113,163,797 | ||||||||||||
Warrants | 3,977 | — | — | 3,977 | ||||||||||||
Short Term Investments | — | 151,564,518 | — | 151,564,518 | ||||||||||||
|
|
|
|
|
|
|
| |||||||||
Total Investments | $ | 1,672,205,393 | $ | 4,197,492,087 | $ | 171,373,624 | $ | 6,041,071,104 | ||||||||
|
|
|
|
|
|
|
| |||||||||
| Baron Global Advantage Fund | ||||||||||||||||
| Description | Quoted Prices in Active Markets for Identical Assets (Level 1) | Other Observable Inputs (Level 2) | Unobservable Inputs (Level 3) | Total | ||||||||||||
Common Stocks† | $ | 832,250,075 | $ | 115,315,807 | $ | 286,437 | $ | 947,852,319 | ||||||||
Private Common Stocks | — | — | 22,010,373 | 22,010,373 | ||||||||||||
Private Convertible Preferred Stocks† | — | — | 50,546,120 | 50,546,120 | ||||||||||||
Private Preferred Stocks | — | — | 13,295,356 | 13,295,356 | ||||||||||||
Warrants† | 245,976 | — | — | 245,976 | ||||||||||||
|
|
|
|
|
|
|
| |||||||||
Total Investments | $ | 832,496,051 | $ | 115,315,807 | $ | 86,138,286 | $ | 1,033,950,144 | ||||||||
|
|
|
|
|
|
|
| |||||||||
| † | See Statements of Net Assets for additional detailed categorizations. |
61
| Baron Select Funds | June 30, 2022 |
NOTES TO FINANCIAL STATEMENTS (Continued)
7. FAIR VALUE MEASUREMENTS (Continued)
| Baron Real Estate Income Fund | ||||||||||||||||
| Description | Quoted Prices in Active Markets for Identical Assets (Level 1) | Other Observable Inputs (Level 2) | Unobservable Inputs (Level 3) | Total | ||||||||||||
Common Stocks† | $ | 123,936,470 | $ | — | $ | — | $ | 123,936,470 | ||||||||
Short Term Investments | — | 1,429,182 | — | 1,429,182 | ||||||||||||
|
|
|
|
|
|
|
| |||||||||
Total Investments | $ | 123,936,470 | $ | 1,429,182 | $ | — | $ | 125,365,652 | ||||||||
|
|
|
|
|
|
|
| |||||||||
| Baron Health Care Fund | ||||||||||||||||
| Description | Quoted Prices in Active Markets for Identical Assets (Level 1) | Other Observable Inputs (Level 2) | Unobservable Inputs (Level 3) | Total | ||||||||||||
Common Stocks† | $ | 174,307,755 | $ | 5,663,727 | $ | — | $ | 179,971,482 | ||||||||
Short Term Investments | — | 14,518,139 | — | 14,518,139 | ||||||||||||
|
|
|
|
|
|
|
| |||||||||
Total Investments | $ | 174,307,755 | $ | 20,181,866 | $ | — | $ | 194,489,621 | ||||||||
|
|
|
|
|
|
|
| |||||||||
| Baron FinTech Fund | ||||||||||||||||
| Description | Quoted Prices in Active Markets for Identical Assets (Level 1) | Other Observable Inputs (Level 2) | Unobservable Inputs (Level 3) | Total | ||||||||||||
Common Stocks† | $ | 38,411,937 | $ | 1,409,669 | $ | — | $ | 39,821,606 | ||||||||
Short Term Investments | — | 2,878,942 | — | 2,878,942 | ||||||||||||
|
|
|
|
|
|
|
| |||||||||
Total Investments | $ | 38,411,937 | $ | 4,288,611 | $ | — | $ | 42,700,548 | ||||||||
|
|
|
|
|
|
|
| |||||||||
| Baron New Asia Fund | ||||||||||||||||
| Description | Quoted Prices in Active Markets for Identical Assets (Level 1) | Other Observable Inputs (Level 2) | Unobservable Inputs (Level 3) | Total | ||||||||||||
Common Stocks† | $ | 786,635 | $ | 2,930,261 | $ | — | $ | 3,716,896 | ||||||||
Short Term Investments | — | 207,633 | — | 207,633 | ||||||||||||
|
|
|
|
|
|
|
| |||||||||
Total Investments | $ | 786,635 | $ | 3,137,894 | $ | — | $ | 3,924,529 | ||||||||
|
|
|
|
|
|
|
| |||||||||
| Baron Technology Fund | ||||||||||||||||
| Description | Quoted Prices in Active Markets for Identical Assets (Level 1) | Other Observable Inputs (Level 2) | Unobservable Inputs (Level 3) | Total | ||||||||||||
Common Stocks† | $ | 2,888,659 | $ | 170,076 | $ | — | $ | 3,058,735 | ||||||||
Short Term Investments | — | 456,025 | — | 456,025 | ||||||||||||
|
|
|
|
|
|
|
| |||||||||
Total Investments | $ | 2,888,659 | $ | 626,101 | $ | — | $ | 3,514,760 | ||||||||
|
|
|
|
|
|
|
| |||||||||
| † | See Statements of Net Assets for additional detailed categorizations. |
62
| June 30, 2022 | Baron Select Funds |
NOTES TO FINANCIAL STATEMENTS (Continued)
7. FAIR VALUE MEASUREMENTS (Continued)
The following is a reconciliation of investments in which unobservable inputs (Level 3) were used in determining fair value:
| Baron Partners Fund | ||||||||||||||||||||||||||||||||||||||||
| Investments in Securities | Balance as of December 31, 2021 | Accrued Premiums/ Discounts | Net Realized Gain (Loss) | Change in Net Unrealized Appreciation (Depreciation) | Purchases | Sales | Transfers Into Level 3 | Transfers Out of Level 3 | Balance as of June 30, 2022 | Change in Net Investments | ||||||||||||||||||||||||||||||
Private Common Stocks |
| |||||||||||||||||||||||||||||||||||||||
Consumer Discretionary | $ | 46,367,914 | $ | — | $ | — | $ | (22,660,282 | ) | $ | — | $ | — | $ | — | $ | — | $ | 23,707,632 | $ | (22,660,282 | ) | ||||||||||||||||||
Industrials | 139,906,305 | — | — | 29,418,529 | — | — | — | — | 169,324,834 | 29,418,529 | ||||||||||||||||||||||||||||||
Private Convertible Preferred Stocks |
| |||||||||||||||||||||||||||||||||||||||
Industrials | 7,562,202 | — | — | 377,645 | — | — | — | — | 7,939,847 | 377,645 | ||||||||||||||||||||||||||||||
Private Preferred Stocks |
| |||||||||||||||||||||||||||||||||||||||
Industrials | 307,685,323 | — | — | 64,697,920 | — | — | — | — | 372,383,243 | 64,697,920 | ||||||||||||||||||||||||||||||
|
|
|
|
|
|
|
|
|
|
|
|
|
|
|
|
|
|
|
| |||||||||||||||||||||
Total | $ | 501,521,744 | $ | — | $ | — | $ | 71,833,812 | $ | — | $ | — | $ | — | $ | — | $ | 573,355,556 | $ | 71,833,812 | ||||||||||||||||||||
|
|
|
|
|
|
|
|
|
|
|
|
|
|
|
|
|
|
|
| |||||||||||||||||||||
Unfunded commitments | $ | — | $ | — | $ | — | $ | (502,786 | ) | $ | — | $ | — | $ | — | $ | — | $ | (502,786 | ) | $ | (502,786 | ) | |||||||||||||||||
|
|
|
|
|
|
|
|
|
|
|
|
|
|
|
|
|
|
|
| |||||||||||||||||||||
| Baron Focused Growth Fund | ||||||||||||||||||||||||||||||||||||||||
| Investments in Securities | Balance as of December 31, 2021 | Accrued Premiums/ Discounts | Net Realized Gain (Loss) | Change in Net Unrealized Appreciation (Depreciation) | Purchases | Sales | Transfers Into Level 3 | Transfers Out of Level 3 | Balance as of June 30, 2022 | Change in Net Unrealized Appreciation (Depreciation) from Investments still held at June 30, 2022 | ||||||||||||||||||||||||||||||
Private Common Stocks |
| |||||||||||||||||||||||||||||||||||||||
Industrials | $ | 42,926,480 | $ | — | $ | — | $ | 9,026,283 | $ | — | $ | — | $ | — | $ | — | $ | 51,952,763 | $ | 9,026,283 | ||||||||||||||||||||
Private Preferred Stocks |
| |||||||||||||||||||||||||||||||||||||||
Industrials | 22,424,828 | — | — | 4,715,336 | — | — | — | — | 27,140,164 | 4,715,336 | ||||||||||||||||||||||||||||||
|
|
|
|
|
|
|
|
|
|
|
|
|
|
|
|
|
|
|
| |||||||||||||||||||||
Total | $ | 65,351,308 | $ | — | $ | — | $ | 13,741,619 | $ | — | $ | — | $ | — | $ | — | $ | 79,092,927 | $ | 13,741,619 | ||||||||||||||||||||
|
|
|
|
|
|
|
|
|
|
|
|
|
|
|
|
|
|
|
| |||||||||||||||||||||
| Baron International Growth Fund | ||||||||||||||||||||||||||||||||||||||||
| Investments in Securities | Balance as of December 31, 2021 | Accrued Premiums/ Discounts | Net Realized Gain (Loss) | Change in Net Unrealized Appreciation (Depreciation) | Purchases | Sales | Transfers Into Level 3 | Transfers Out of Level 3 | Balance as of June 30, 2022 | Change in Net Unrealized Appreciation (Depreciation) from Investments still held at June 30, 2022 | ||||||||||||||||||||||||||||||
Common Stocks |
| |||||||||||||||||||||||||||||||||||||||
Financials1 | $ | — | $ | — | $ | — | $ | (63,674 | ) | $ | — | $ | — | $ | 64,188 | $ | — | $ | 514 | $ | (2,580,020 | ) | ||||||||||||||||||
|
|
|
|
|
|
|
|
|
|
|
|
|
|
|
|
|
|
|
| |||||||||||||||||||||
| 1 | Russian securities transferred into Level 3 on February 28, 2022 due to imposed sanctions. |
63
| Baron Select Funds | June 30, 2022 |
NOTES TO FINANCIAL STATEMENTS (Continued)
7. FAIR VALUE MEASUREMENTS (Continued)
| Baron Emerging Markets Fund | ||||||||||||||||||||||||||||||||||||||||
| Investments in Securities | Balance as of December 31, 2021 | Accrued Premiums/ Discounts | Net Realized Gain (Loss) | Change in Net Unrealized Appreciation (Depreciation) | Purchases | Sales | Transfers Into Level 3 | Transfers Out of Level 3 | Balance as of June 30, 2022 | Change in Net Unrealized Appreciation (Depreciation) from Investments still held at June 30, 2022 | ||||||||||||||||||||||||||||||
Common Stocks | ||||||||||||||||||||||||||||||||||||||||
Communication Services1 | $ | — | $ | — | $ | — | $ | (8,754,986 | ) | $ | — | $ | — | $ | 9,054,648 | $ | — | $ | 299,662 | $ | (48,066,655 | ) | ||||||||||||||||||
Consumer Discretionary1,2 | 12,456,029 | — | — | (20,937,087 | ) | — | — | 15,492,001 | (5,473,017 | ) | 1,537,926 | (105,153,623 | ) | |||||||||||||||||||||||||||
Financials1 | — | — | — | (2,338,792 | ) | — | — | 2,357,688 | — | 18,896 | (90,856,307 | ) | ||||||||||||||||||||||||||||
Materials1 | — | — | — | (13,764,981 | ) | — | (1,977,692 | ) | 15,849,088 | — | 106,415 | (49,204,176 | ) | |||||||||||||||||||||||||||
Private Common Stocks | ||||||||||||||||||||||||||||||||||||||||
Information Technology | 49,281,368 | — | — | 6,965,560 | — | — | — | — | 56,246,928 | 6,965,560 | ||||||||||||||||||||||||||||||
Private Convertible Preferred Stocks | ||||||||||||||||||||||||||||||||||||||||
Consumer Discretionary | 56,938,929 | — | — | (20,552,004 | ) | 76,776,872 | — | — | — | 113,163,797 | (20,552,004 | ) | ||||||||||||||||||||||||||||
Warrants | ||||||||||||||||||||||||||||||||||||||||
Consumer Discretionary2 | 12,331 | — | — | (7,690 | ) | — | — | — | (4,641 | ) | — | — | ||||||||||||||||||||||||||||
|
|
|
|
|
|
|
|
|
|
|
|
|
|
|
|
|
|
|
| |||||||||||||||||||||
Total | $ | 118,688,657 | $ | — | $ | — | $ | (59,389,980 | ) | $ | 76,776,872 | $ | (1,977,692 | ) | $ | 42,753,425 | $ | (5,477,658 | ) | $ | 171,373,624 | $ | (306,867,205 | ) | ||||||||||||||||
|
|
|
|
|
|
|
|
|
|
|
|
|
|
|
|
|
|
|
| |||||||||||||||||||||
| Baron Global Advantage Fund | ||||||||||||||||||||||||||||||||||||||||
| Investments in Securities | Balance as of December 31, 2021 | Accrued Premiums/ Discounts | Net Realized Gain (Loss) | Change in Net Unrealized Appreciation (Depreciation) | Purchases | Sales | Transfers Into Level 3 | Transfers Out of Level 3 | Balance as of June 30, 2022 | Change in Net Unrealized Appreciation (Depreciation) from Investments still held at June 30, 2022 | ||||||||||||||||||||||||||||||
Common Stocks | ||||||||||||||||||||||||||||||||||||||||
Consumer Discretionary2,3 | 68,813,281 | — | — | (51,693,378 | ) | — | — | — | (16,833,466 | ) | 286,437 | (336,709 | ) | |||||||||||||||||||||||||||
Private Common Stocks | ||||||||||||||||||||||||||||||||||||||||
Industrials | 18,186,286 | — | — | 3,824,087 | — | — | — | — | 22,010,373 | 3,824,087 | ||||||||||||||||||||||||||||||
Private Convertible Preferred Stocks | ||||||||||||||||||||||||||||||||||||||||
Consumer Discretionary | 37,523,432 | — | — | 2,487,232 | — | — | — | — | 40,010,664 | 2,487,232 | ||||||||||||||||||||||||||||||
Materials | 16,908,507 | — | — | (6,373,051 | ) | — | — | — | — | 10,535,456 | (6,373,051 | ) | ||||||||||||||||||||||||||||
Private Preferred Stocks | ||||||||||||||||||||||||||||||||||||||||
Industrials | 12,105,965 | — | — | 1,189,391 | — | — | — | — | 13,295,356 | 1,189,391 | ||||||||||||||||||||||||||||||
Warrants | ||||||||||||||||||||||||||||||||||||||||
Consumer Discretionary2 | 4,023 | — | — | (2,509 | ) | — | — | — | (1,514 | ) | — | — | ||||||||||||||||||||||||||||
|
|
|
|
|
|
|
|
|
|
|
|
|
|
|
|
|
|
|
| |||||||||||||||||||||
Total | $ | 153,541,494 | $ | — | $ | — | $ | (50,568,228 | ) | $ | — | $ | — | $ | — | $ | (16,834,980 | ) | $ | 86,138,286 | $ | 790,950 | ||||||||||||||||||
|
|
|
|
|
|
|
|
|
|
|
|
|
|
|
|
|
|
|
| |||||||||||||||||||||
| 1 | Russian securities transferred into Level 3 on February 28, 2022 due to imposed sanctions. |
| 2 | Codere Online Luxembourg, S.A. Forward, Private shares, and Private Warrants restriction on resale was lifted on May 31, 2022. |
| 3 | Rivian Automotive restriction on resale was lifted on May 9, 2022. |
64
| June 30, 2022 | Baron Select Funds |
NOTES TO FINANCIAL STATEMENTS (Continued)
7. FAIR VALUE MEASUREMENTS (Continued)
Unobservable valuation inputs developed by the Adviser for significant (greater than 1% of net assets) Level 3 investments as of June 30, 2022 were as follows:
| Baron Partners Fund | ||||||||||||
| Sector | Company | Fair Value as of June 30, 2022 | Valuation Technique | Unobservable Input | Weighted Average used on | Range used on June 30, 2022 | ||||||
Private Common Stocks: Consumer Discretionary | StubHub Holdings, Inc. | $23,707,632 | Combination of recent transaction, current value via comparable companies, option-pricing, and scenario analysis methods | Change in the composite equity index of comparable companies | (2.92)% | (5.16)% - (1.69)% | ||||||
| Discount for lack of marketability | 10.06% | 9.12% - 12.88% | ||||||||||
| Estimated volatility of the returns of equity1 | 55.58% | 41.11% - 71.22% | ||||||||||
| Scenario Probabilities: Scenario A / Scenario B / Scenario C7 | 90% /9% /1% | 1% - 90% | ||||||||||
Private Common Stocks and Private Preferred Stocks: Industrials | Space Exploration Technologies Corp. | $541,708,077 | Combination of recent transaction, current value via comparable companies, and option-pricing methods | Change in the composite equity index of comparable companies | (0.33)% | (4.50)% - (2.64)% | ||||||
| Discount for lack of marketability | 3.95% | 3.95% | ||||||||||
| Estimated volatility of the returns of equity3 | 34.59 | 20.73% - 49.07% | ||||||||||
Private Convertible Preferred Stocks: Industrials | Northvolt AB | $7,939,847 | Combination of recent transaction, current value via comparable companies, and option-pricing methods | Change in the composite equity index of comparable companies | 0.52% | (2.58)% - (5.23)% | ||||||
| Discount for lack of marketability | 16.97% | 16.97% | ||||||||||
| Estimated volatility of the returns of equity4 | 59.31% | 26.67% - 93.01% | ||||||||||
Baron Focused Growth Fund | ||||||||||||
| Sector | Company | Fair Value as of June 30, 2022 | Valuation Technique | Unobservable Input | Weighted Average used on June 30, 2022 | Range used on June 30, 2022 | ||||||
Private Common Stocks and Private Preferred Stocks: Industrials | Space Exploration Technologies Corp. | $79,092,927 | Combination of recent transaction, current value via comparable companies, and option- pricing methods | Change in the composite equity index of comparable companies | (0.33)% | (4.50)% - (2.64)% | ||||||
| Discount for lack of marketability | 3.95% | 3.95% | ||||||||||
| Estimated volatility of the returns of equity3 | 34.59% | 20.73% - 49.07% | ||||||||||
See footnotes on page 68.
65
| Baron Select Funds | June 30, 2022 |
NOTES TO FINANCIAL STATEMENTS (Continued)
7. FAIR VALUE MEASUREMENTS (Continued)
A significant change in the EV/EBITDA multiple ratio may result in a directionally similar significant change in the fair value measurement, while a significant change in the discount for lack of marketability and equity index of comparable companies may not result in a materially higher or lower fair value measurement.
Baron Emerging Markets Fund | ||||||||||||
| Sector | Company | Fair Value as of June 30, 2022 | Valuation Technique | Unobservable Input | Weighted Average used on June 30, 2022 | Range used on June 30, 2022 | ||||||
Common Stocks: Consumer Discretionary | Codere Online Luxembourg, S.A. Founders Shares | $877,962 | Discount for lack of marketability calculated using option pricing | Discount for lack of marketability | 12.77% | 12.77% | ||||||
| Estimated volatility of the returns of equity5 | 75.72% | 75.72% | ||||||||||
Common Stocks: Communication Services | Yandex N.V. | $299,662 | Combination of performance adjustment via market proxies and discount for lack of marketability | Discount for lack of marketability | 95.00% | 95.00% | ||||||
| Performance adjustment via market proxy (3/1/22 - 3/4/22) | (50.65)% | (50.65)% | ||||||||||
Common Stocks: Consumer Discretionary | Fix Price Group Ltd. | $285,242 | Combination of performance adjustment via market proxies and discount for lack of marketability | Discount for lack of marketability | 95.00% | 95.00% | ||||||
| Performance adjustment via market proxy (3/1/22 - 3/4/22) | (24.37)% | (24.37)% | ||||||||||
Common Stocks: Consumer Discretionary | Ozon Holdings PLC | $374,722 | Combination of performance adjustment via market proxies and discount for lack of marketability | Discount for lack of marketability | 95.00% | 95.00% | ||||||
| Performance adjustment via market proxy (3/1/22 - 3/4/22) | (65.05)% | (65.05)% | ||||||||||
Common Stocks: Financials | Sberbank of Russia PJSC | $18,896 | Combination of performance adjustment via market proxies and discount for lack of marketability | Discount for lack of marketability | 95.00% | 95.00% | ||||||
| Performance adjustment via market proxy (3/1/22 - 3/4/22) | (24.37)% | (24.37)% | ||||||||||
Common Stocks: Materials | Polyus PJSC | $106,415 | Combination of performance adjustment via market proxies and discount for lack of marketability | Discount for lack of marketability | 95.00% | 95.00% | ||||||
| Performance adjustment via market proxy (3/1/22 - 3/4/22) | (24.37)% | (24.37)% | ||||||||||
Private Common Stocks: Information Technology | Pine Labs PTE. Ltd. | $56,246,928 | Combination of recent transaction, current value via comparable companies, scenario analysis, and option-pricing methods | Change in the composite equity index of comparable companies | (0.26)% | (0.91)% - 0.00% | ||||||
| Discount for lack of marketability | 4.39% | 4.39% | ||||||||||
| Estimated volatility of the returns of equity2 | 19.11% | 16.50% - 42.62% | ||||||||||
| Scenario Probabilities: Scenario A / Scenario B6 | 100% / 0% | 0% - 100% | ||||||||||
Private Convertible Preferred Stocks: Consumer Discretionary | Bundl Technologies Private Ltd. | $48,491,617 | Combination of recent transaction, current value via comparable companies, scenario analysis, and option-pricing methods | Change in the composite equity index of comparable companies | (3.67)% | (5.93)% - (0.24)% | ||||||
| Discount for lack of marketability | 5.10% | 5.10% | ||||||||||
| Estimated volatility of the returns of equity 2 | 54.63% | 20.67% - 73.20% | ||||||||||
| Scenario Probabilities: Scenario A / Scenario B6 | 100% / 0% | 0% - 100% | ||||||||||
| See | footnotes on page 68. |
66
| June 30, 2022 | Baron Select Funds |
NOTES TO FINANCIAL STATEMENTS (Continued)
7. FAIR VALUE MEASUREMENTS (Continued)
Baron Emerging Markets Fund | ||||||||||||
| Sector | Company | Fair Value as of June 30, 2022 | Valuation Technique | Unobservable Input | Weighted Average used on June 30, 2022 | Range used on June 30, 2022 | ||||||
Private Convertible Preferred Stocks: Consumer Discretionary | Think & Learn Private Limited | $64,672,180 | Combination of recent transaction, current value via comparable companies, and option-pricing methods | Change in the composite equity index of comparable companies | (0.02)% | (3.36)% - (9.66)% | ||||||
| Discount for lack of marketability | 7.60% | 7.60% | ||||||||||
| Estimated volatility of the returns of equity2 | 23.27% | 16.50% - 115.49% | ||||||||||
Baron Global Advantage Fund | ||||||||||||
| Sector | Company | Fair Value as of June 30, 2022 | Valuation Technique | Unobservable Input | Weighted Average used on June 30, 2022 | Range used on June 30, 2022 | ||||||
Private Common Stocks: Consumer Discretionary | Codere Online Luxembourg, S.A. | $286,437 | Discount for lack of marketability calculated using option pricing. | Discount for lack of marketability | 12.77% | 12.77% | ||||||
| Estimated volatility of the returns of equity5 | 75.72% | 75.72% | ||||||||||
Private Common Stocks: Industrials | Space Exploration Technologies Corp. | $22,010,373 | Combination of recent transaction, current value via comparable companies, and option-pricing methods . | Change in the composite equity index of comparable companies | (0.33)% | (4.50)% - (2.64)% | ||||||
| Discount for lack of marketability | 3.95% | 3.95% | ||||||||||
| Estimated volatility of the returns of equity3 | 34.59% | 20.73% - 49.07% | ||||||||||
Private Convertible Preferred Stocks: Consumer Discretionary | Farmers Business Network, Inc. | $10,535,456 | Combination of recent transaction, current value via comparable companies, option-pricing, and scenario analysis methods. | Change in the composite equity index of comparable companies | (2.12)% | (9.57)% - 0.47% | ||||||
| Discount for lack of marketability | 12.24% | 12.24% | ||||||||||
| Estimated volatility of the returns of equity3 | 52.89% | 26.95% - 97.61% | ||||||||||
| Scenario Probabilities: Scenario A / Scenario B6 | 90% / 10% | 10% - 90% | ||||||||||
Private Convertible Preferred Stocks: Consumer Discretionary | Resident Home, Inc. | $1,204,825 | Combination of recent transaction, current value via comparable companies, option-pricing, and scenario analysis methods | Change in the composite equity index of comparable companies | (3.04)% | (9.57)% - (0.64)% | ||||||
| Discount for lack of marketability | 24.23% | 24.23% | ||||||||||
| Estimated volatility of the returns of equity1 | 73.94% | 45.62% - 86.01% | ||||||||||
| Scenario Probabilities: Scenario A / Scenario B6 | 90% / 10% | 10% - 90% | ||||||||||
Private Convertible Consumer | Think & Learn Private Limited | $38,805,839 | Combination of recent transaction, current value via comparable companies, and option-pricing methods | Change in the composite equity index of comparable companies | (0.02)% | (3.36)% - 9.66% | ||||||
| Discount for lack of marketability | 7.60% | 7.60% | ||||||||||
| Estimated volatility of the returns of equity2 | 23.27% | 16.50% - 115.49% | ||||||||||
| See | footnotes on page 68. |
67
| Baron Select Funds | June 30, 2022 |
NOTES TO FINANCIAL STATEMENTS (Continued)
7. FAIR VALUE MEASUREMENTS (Continued)
Baron Global Advantage Fund | ||||||||||||
| Sector | Company | Fair Value as of June 30, 2022 | Valuation Technique | Unobservable Input | Weighted Average used on June 30, 2022 | Range used on June 30, 2022 | ||||||
Private Preferred Stocks: Industrials | GM Cruise Holdings | $13,295,356 | Combination of recent transaction, current value via comparable companies, and option-pricing methods | Change in the composite equity index of comparable companies | (2.87)% | (5.35)% - 0.78% | ||||||
| Discount for lack of marketability | 12.99% | 12.99% | ||||||||||
| Estimated volatility of the returns of equity2 | 35.36% | 28.49% - 68.67% | ||||||||||
| Scenario Probabilities: Scenario A / Scenario B6 | 70% /30% | 30% - 70% | ||||||||||
| 1) | The volatility was calculated as a weighted-average of the volatilities of the individual comparable companies. Some companies have a higher weight in the calculation than others. |
| 2) | The volatility was calculated as a weighted-average of the volatilities of the individual comparable companies and an ETF. Some companies have a higher weight in the calculation than others. |
| 3) | The volatility was calculated as a weighted-average of the volatilities of two groups of comparable companies with different industry focus. Each group’s volatility was calculated as the simple average volatilities of comparable companies in the group. |
| 4) | The volatility was calculated as a simple-average of the volatilities of the individual comparable companies. |
| 5) | The volatility was calculated using the daily returns of the publicly traded stock of the company. |
| 6) | Scenario A represents an IPO Event, while Scenario B represents a Liquidation/M&A Event. |
| 7) | Scenario A represents a Direct Listing/ IPO Event, Scenario B represents an Other Sale Event, and Scenario C represents a Liquidation Event. |
A significant change in the EV/EBITDA multiple ratio may result in a directionally similar significant change in the fair value measurement, while a significant change in the discount for lack of marketability and equity index of comparable companies may not result in a materially higher or lower fair value measurement.
8. INCOME TAXES AND DISTRIBUTIONS TO SHAREHOLDERS
Federal income tax regulations differ from GAAP. Therefore, distributions determined in accordance with tax regulations may differ in amount or character from net investment income and net realized gain for financial reporting purposes. Net investment income (loss) and net realized and unrealized gain (loss) differ for financial statement and tax purposes due to differing treatments of net investment loss, foreign currency gains and losses, non-deductible interest expense, reclassification of distributions, partnership basis adjustments, income from passive foreign investment companies, late-year loss deferral, post-October loss deferral and wash sale loss deferral. Financial reporting records are adjusted for permanent book/tax differences to reflect tax character. Financial records are not adjusted for temporary differences.
As of June 30, 2022, the components of net assets on a tax basis were as follows:
| Baron Partners Fund | Baron Focused Growth Fund | Baron International Growth Fund | Baron Real Estate Fund | Baron Emerging Markets Fund | ||||||||||||||||
Cost of investments | $ | 2,108,922,986 | $ | 430,233,050 | $ | 496,348,702 | $ | 1,291,765,274 | $ | 6,004,479,498 | ||||||||||
|
|
|
|
|
|
|
|
|
| |||||||||||
Gross tax unrealized appreciation | 4,695,407,337 | 296,489,168 | 87,608,262 | 157,855,067 | 1,033,966,671 | |||||||||||||||
Gross tax unrealized depreciation | (345,971,983 | ) | (49,983,843 | ) | (81,089,626 | ) | (86,128,197 | ) | (997,375,065 | ) | ||||||||||
|
|
|
|
|
|
|
|
|
| |||||||||||
Net tax unrealized appreciation (depreciation) | 4,349,435,354 | 246,505,325 | 6,518,636 | 71,726,870 | 36,591,606 | |||||||||||||||
Net tax unrealized currency appreciation (depreciation) | — | — | (365,029 | ) | — | (1,565,757 | ) | |||||||||||||
Unrealized appreciation (depreciation) on unfunded commitments | (502,786 | ) | — | — | — | — | ||||||||||||||
Undistributed (accumulated) ordinary income (loss) | (34,419,226 | ) | (2,543,244 | ) | (12,828,304 | ) | 96,458 | (172,023,664 | ) | |||||||||||
Undistributed (accumulated) net realized gain (loss) | 87,338,635 | 29,383,746 | (2,820,306 | ) | (45,875,756 | ) | (637,809,543 | ) | ||||||||||||
Paid-in capital | 1,128,819,942 | 400,036,153 | 514,226,037 | 1,374,429,952 | 6,888,469,341 | |||||||||||||||
|
|
|
|
|
|
|
|
|
| |||||||||||
Net Assets | $ | 5,530,671,919 | $ | 673,381,980 | $ | 504,731,034 | $ | 1,400,377,524 | $ | 6,113,661,983 | ||||||||||
|
|
|
|
|
|
|
|
|
| |||||||||||
68
| June 30, 2022 | Baron Select Funds |
NOTES TO FINANCIAL STATEMENTS (Continued)
8. INCOME TAXES AND DISTRIBUTIONS TO SHAREHOLDERS (Continued)
| Baron Global Advantage Fund | Baron Real Estate Income Fund | Baron Health Care Fund | Baron FinTech Fund | Baron New Asia Fund | Baron Technology Fund | |||||||||||||||||||
Cost of investments | $ | 1,106,995,064 | $ | 129,986,385 | $ | 185,191,945 | $ | 56,002,305 | $ | 4,679,530 | $ | 5,035,642 | ||||||||||||
|
|
|
|
|
|
|
|
|
|
|
| |||||||||||||
Gross tax unrealized appreciation | 228,252,385 | 2,273,707 | 21,026,069 | 868,552 | 89,437 | 1,873 | ||||||||||||||||||
Gross tax unrealized depreciation | (301,297,305 | ) | (6,894,440 | ) | (11,728,393 | ) | (14,170,309 | ) | (844,438 | ) | (1,522,755 | ) | ||||||||||||
|
|
|
|
|
|
|
|
|
|
|
| |||||||||||||
Net tax unrealized appreciation (depreciation) | (73,044,920 | ) | (4,620,733 | ) | 9,297,676 | (13,301,757 | ) | (755,001 | ) | (1,520,882 | ) | |||||||||||||
Net tax unrealized currency appreciation (depreciation) | (908,248 | ) | — | (1,456 | ) | — | (1,146 | ) | (6 | ) | ||||||||||||||
Net unrealized appreciation (depreciation) on unfunded commitments | — | — | — | — | — | — | ||||||||||||||||||
Undistributed (accumulated) ordinary income (loss) | (27,067,024 | ) | 445,947 | (192,074 | ) | (130,058 | ) | (17,690 | ) | (11,884 | ) | |||||||||||||
Undistributed (accumulated) net realized gain (loss) | (196,457,437 | ) | (8,345,194 | ) | (22,807,200 | ) | (1,808,382 | ) | (241,130 | ) | (178,990 | ) | ||||||||||||
Paid-in capital | 1,334,007,834 | 139,943,051 | 210,267,674 | 57,436,731 | 4,936,914 | 5,122,889 | ||||||||||||||||||
|
|
|
|
|
|
|
|
|
|
|
| |||||||||||||
Net Assets | $ | 1,036,530,205 | $ | 127,423,071 | $ | 196,564,620 | $ | 42,196,534 | $ | 3,921,947 | $ | 3,411,127 | ||||||||||||
|
|
|
|
|
|
|
|
|
|
|
| |||||||||||||
As of December 31, 2021, the Funds had capital loss carryforwards expiring as follows:
| Baron Partners Fund | Baron Focused Growth Fund | Baron International | Baron Real Estate Fund | Baron Emerging Markets Fund | ||||||||||||||||
Short term: | ||||||||||||||||||||
No expiration date | $ | — | $ | — | $ | — | $ | — | $ | 160,275,935 | ||||||||||
|
|
|
|
|
|
|
|
|
| |||||||||||
Long term: |
| |||||||||||||||||||
No expiration date | — | — | — | — | — | |||||||||||||||
|
|
|
|
|
|
|
|
|
| |||||||||||
| Baron Global Advantage Fund | Baron Real Estate Income Fund | Baron Health Fund | Baron FinTech Fund | Baron New Asia Fund | ||||||||||||||||
Short term: | ||||||||||||||||||||
No expiration date | $ | — | $ | — | $ | — | $ | — | $ | 20,636 | ||||||||||
|
|
|
|
|
|
|
|
|
| |||||||||||
Long term: |
| |||||||||||||||||||
No expiration date | — | — | — | — | — | |||||||||||||||
|
|
|
|
|
|
|
|
|
| |||||||||||
The tax character of distributions paid during the six months ended June 30, 2022 and the year ended December 31, 2021 was as follows:
| Period Ended June 30, 2022 | Year Ended December 31, 2021 | |||||||||||||||||||||||
| Fund | Ordinary1 | Long Term Capital Gain | Return of Capital | Ordinary1 | Long Term Capital Gain | Return of Capital | ||||||||||||||||||
Baron Partners Fund | $ | — | $ | — | $ | — | $ | — | $ | 617,895,000 | $ | — | ||||||||||||
Baron Focused Growth Fund | — | — | — | — | 113,240,031 | — | ||||||||||||||||||
Baron International Growth Fund | — | — | — | 14,928,322 | 23,952,051 | — | ||||||||||||||||||
Baron Real Estate Fund | — | — | — | 21,144,244 | 130,570,043 | — | ||||||||||||||||||
Baron Emerging Markets Fund | — | — | — | 168,243,790 | — | 269,196 | ||||||||||||||||||
Baron Global Advantage Fund | — | — | — | — | — | — | ||||||||||||||||||
Baron Real Estate Income Fund | $ | 619,471 | — | — | 690,123 | 626,891 | — | |||||||||||||||||
Baron Health Care Fund | — | — | — | 1,026,513 | 2,204,840 | — | ||||||||||||||||||
Baron FinTech Fund | — | — | — | — | — | — | ||||||||||||||||||
Baron New Asia Fund | — | — | — | — | — | — | ||||||||||||||||||
Baron Technology Fund | — | — | — | N/A | N/A | N/A | ||||||||||||||||||
| 1 | For tax purposes, short-term capital gains are considered ordinary income distributions. |
69
| Baron Select Funds | June 30, 2022 |
NOTES TO FINANCIAL STATEMENTS (Continued)
8. INCOME TAXES AND DISTRIBUTIONS TO SHAREHOLDERS (Continued)
The Funds follow the provisions of FASB Codification Section 740 (“ASC Section 740”) “Accounting for Uncertainty in Income Taxes” which clarifies the accounting for uncertainty in tax positions taken or expected to be taken on a tax return. ASC Section 740 sets forth a threshold for financial statement recognition, measurement and disclosure of tax positions taken or expected to be taken on a tax return. The Funds are required to recognize the tax effects of certain tax positions under a “more likely than not” standard, that based on their technical merits, have more than 50 percent likelihood of being sustained upon examination. Management has analyzed the tax positions taken on the Funds’ federal income tax returns for all open years (current and prior three years), and has concluded that no provision for federal income tax is required in the Funds’ financial statements. At June 30, 2022, the Funds did not have any uncertain tax benefits that require recognition, de-recognition or disclosure. The Funds’ federal, state and local income and federal excise tax returns for which the applicable statutes of limitations have not expired (current and prior three years) are subject to examination by the Internal Revenue Service and state departments of revenue.
9. OWNERSHIP CONCENTRATION
As of June 30, 2022, the officers, trustees and portfolio managers owned, directly or indirectly, 56.71% of Baron Focused Growth Fund, 25.38% of Baron FinTech Fund, 68.65% of Baron New Asia Fund, and 63.15% of Baron Technology Fund. As a result of their ownership, these investors may be able to materially affect the outcome of matters presented to Baron Focused Growth Fund, Baron FinTech Fund, Baron New Asia Fund, and Baron Technology Fund shareholders.
10. TRANSACTIONS IN “AFFILIATED” COMPANIES1
| Baron Global Advantage Fund | ||||||||||||||||||||||||||||||||||||
| Name of issuer | Value at December 31, 2021 | Purchase Cost/ Transfer In | Sales Transfer | Change in Net Unrealized Appreciation (Depreciation) | Realized (Losses) | Dividend Income | Shares Held at June 30, 2022 | Value at June 30, 2022 | % of Net Assets at June 30, 2022 | |||||||||||||||||||||||||||
No longer “Affiliated” Company as of June 30, 2022: |
| |||||||||||||||||||||||||||||||||||
Sarissa Capital Acquisition Corp. | $ | 15,057,242 | $ | — | $ | (14,728,871 | ) | $ | (119,502 | ) | $ | (208,869 | ) | $ | — | — | $ | — | 0.00 | % | ||||||||||||||||
|
|
|
|
|
|
|
|
|
|
|
|
|
|
|
|
|
| |||||||||||||||||||
| 1 | An “Affiliated” company (“affiliated person” as defined in the 1940 Act) is a company in which a Fund held 5% or more of the company’s outstanding voting securities at any time during the six months ended June 30, 2022. |
11. RUSSIA/UKRAINE RISK
Certain Funds invested in securities and instruments that are economically tied to Russia. Due to the uncertainty of the geopolitical tension in Russia/Ukraine, investments in Russia are subject to political, economic, legal, market and currency risks, as well as the risk that further economic sanctions may be imposed by the United States and/or other countries. Such sanctions — which may impact companies in many sectors, including energy, financial services and defense, among others — may negatively impact a Fund’s performance and/or ability to achieve its investment objective. For example, certain transactions may be prohibited and/or existing investments may become illiquid (e.g., in the event that transacting in certain existing investments is prohibited), which could cause a Fund to sell other portfolio holdings at a disadvantageous time or price in order to meet shareholder redemptions.
70
| June 30, 2022 | Baron Select Funds |
FINANCIAL HIGHLIGHTS (Unaudited)
BARON PARTNERS FUND
Selected data for a share outstanding throughout each period:
| Income (loss) from investment operations: | Less distributions to shareholders from: | Ratios to Average Net Assets: | Supplemental Data: | |||||||||||||||||||||||||||||||||||||||||||||||||||||||||
| Net asset value, beginning of period ($) | Net investment income (loss) ($)1 | Net realized and unrealized gain (loss) on investments ($) | Total from investment operations ($) | Net investment income ($) | Net realized gain on investments ($) | Total distributions ($) | Net asset value, end of period ($) | Total return (%) | Total expenses (%) | Less: Interest expense % | Net operating expenses (%) | Net investment income (loss) (%) | Net assets (in millions), end of period ($) | Portfolio turnover rate (%) | ||||||||||||||||||||||||||||||||||||||||||||||
RETAIL SHARES |
| |||||||||||||||||||||||||||||||||||||||||||||||||||||||||||
Six Months Ended June 30, |
| |||||||||||||||||||||||||||||||||||||||||||||||||||||||||||
2022 | 199.00 | (0.90 | ) | (68.12 | ) | (69.02 | ) | 0.00 | 0.00 | 0.00 | 129.98 | (34.68 | )2 | 1.49 | 3 | (0.19 | )3 | 1.30 | 3 | (1.11 | )3 | 2,474.9 | 3.61 | 2 | ||||||||||||||||||||||||||||||||||||
Year Ended December 31, |
| |||||||||||||||||||||||||||||||||||||||||||||||||||||||||||
2021 | 164.18 | (1.98 | ) | 52.16 | 50.18 | 0.00 | (15.36 | ) | (15.36 | ) | 199.00 | 31.39 | 1.36 | (0.06 | ) | 1.30 | (1.11 | ) | 3,903.2 | 9.14 | ||||||||||||||||||||||||||||||||||||||||
2020 | 69.04 | (1.12 | ) | 102.29 | 101.17 | 0.00 | (6.03 | ) | (6.03 | ) | 164.18 | 148.56 | 1.56 | (0.25 | ) | 1.31 | (1.18 | ) | 3,219.4 | 10.70 | ||||||||||||||||||||||||||||||||||||||||
2019 | 47.77 | (0.75 | ) | 22.20 | 21.45 | 0.00 | (0.18 | ) | (0.18 | ) | 69.04 | 44.97 | 2.22 | (0.90 | ) | 1.32 | (1.29 | ) | 1,353.6 | 7.97 | ||||||||||||||||||||||||||||||||||||||||
2018 | 48.75 | (0.61 | ) | (0.37 | ) | (0.98 | ) | 0.00 | 0.00 | 0.00 | 47.77 | (2.01 | ) | 2.03 | (0.71 | ) | 1.32 | (1.13 | ) | 1,016.2 | 8.09 | |||||||||||||||||||||||||||||||||||||||
2017 | 37.06 | (0.38 | ) | 12.07 | 11.69 | 0.00 | 0.00 | 0.00 | 48.75 | 31.54 | 1.79 | (0.45 | ) | 1.34 | (0.84 | ) | 1,101.7 | 26.19 | ||||||||||||||||||||||||||||||||||||||||||
INSTITUTIONAL SHARES |
| |||||||||||||||||||||||||||||||||||||||||||||||||||||||||||
Six Months Ended June 30, |
| |||||||||||||||||||||||||||||||||||||||||||||||||||||||||||
2022 | 205.95 | (0.71 | ) | (70.55 | ) | (71.26 | ) | 0.00 | 0.00 | 0.00 | 134.69 | (34.60 | )2 | 1.23 | 3 | (0.19 | )3 | 1.04 | 3 | (0.86 | )3 | 2,648.2 | 3.61 | 2 | ||||||||||||||||||||||||||||||||||||
Year Ended December 31, |
| |||||||||||||||||||||||||||||||||||||||||||||||||||||||||||
2021 | 169.04 | (1.58 | ) | 53.85 | 52.27 | 0.00 | (15.36 | ) | (15.36 | ) | 205.95 | 31.73 | 1.11 | (0.06 | ) | 1.05 | (0.86 | ) | 4,126.7 | 9.14 | ||||||||||||||||||||||||||||||||||||||||
2020 | 70.82 | (0.92 | ) | 105.17 | 104.25 | 0.00 | (6.03 | ) | (6.03 | ) | 169.04 | 149.18 | 1.30 | (0.25 | ) | 1.05 | (0.93 | ) | 3,191.4 | 10.70 | ||||||||||||||||||||||||||||||||||||||||
2019 | 48.86 | (0.62 | ) | 22.76 | 22.14 | 0.00 | (0.18 | ) | (0.18 | ) | 70.82 | 45.38 | 1.96 | (0.90 | ) | 1.06 | (1.03 | ) | 1,187.0 | 7.97 | ||||||||||||||||||||||||||||||||||||||||
2018 | 49.73 | (0.49 | ) | (0.38 | ) | (0.87 | ) | 0.00 | 0.00 | 0.00 | 48.86 | (1.75 | ) | 1.77 | (0.71 | ) | 1.06 | (0.88 | ) | 815.6 | 8.09 | |||||||||||||||||||||||||||||||||||||||
2017 | 37.70 | (0.27 | ) | 12.30 | 12.03 | 0.00 | 0.00 | 0.00 | 49.73 | 31.91 | 1.53 | (0.45 | ) | 1.08 | (0.58 | ) | 854.9 | 26.19 | ||||||||||||||||||||||||||||||||||||||||||
R6 SHARES |
| |||||||||||||||||||||||||||||||||||||||||||||||||||||||||||
Six Months Ended June 30, |
| |||||||||||||||||||||||||||||||||||||||||||||||||||||||||||
2022 | 205.94 | (0.71 | ) | (70.54 | ) | (71.25 | ) | 0.00 | 0.00 | 0.00 | 134.69 | (34.60 | )2 | 1.23 | 3 | (0.19 | )3 | 1.04 | 3 | (0.86 | )3 | 407.6 | 3.61 | 2 | ||||||||||||||||||||||||||||||||||||
Year Ended December 31, |
| |||||||||||||||||||||||||||||||||||||||||||||||||||||||||||
2021 | 169.03 | (1.58 | ) | 53.85 | 52.27 | 0.00 | (15.36 | ) | (15.36 | ) | 205.94 | 31.73 | 1.11 | (0.06 | ) | 1.05 | (0.86 | ) | 627.5 | 9.14 | ||||||||||||||||||||||||||||||||||||||||
2020 | 70.82 | (0.91 | ) | 105.15 | 104.24 | 0.00 | (6.03 | ) | (6.03 | ) | 169.03 | 149.16 | 1.30 | (0.25 | ) | 1.05 | (0.93 | ) | 465.0 | 10.70 | ||||||||||||||||||||||||||||||||||||||||
2019 | 48.86 | (0.62 | ) | 22.76 | 22.14 | 0.00 | (0.18 | ) | (0.18 | ) | 70.82 | 45.38 | 1.96 | (0.90 | ) | 1.06 | (1.03 | ) | 186.9 | 7.97 | ||||||||||||||||||||||||||||||||||||||||
2018 | 49.73 | (0.46 | ) | (0.41 | ) | (0.87 | ) | 0.00 | 0.00 | 0.00 | 48.86 | (1.75 | ) | 1.79 | (0.73 | ) | 1.06 | (0.82 | ) | 123.4 | 8.09 | |||||||||||||||||||||||||||||||||||||||
2017 | 37.71 | (0.26 | ) | 12.28 | 12.02 | 0.00 | 0.00 | 0.00 | 49.73 | 31.88 | 1.52 | (0.45 | ) | 1.07 | (0.55 | ) | 15.5 | 26.19 | ||||||||||||||||||||||||||||||||||||||||||
| 1 | Based on average shares outstanding. |
| 2 | Not Annualized. |
| 3 | Annualized. |
| See Notes to Financial Statements. | 71 |
| Baron Select Funds | June 30, 2022 |
FINANCIAL HIGHLIGHTS (Unaudited) (Continued)
BARON FOCUSED GROWTH FUND
Selected data for a share outstanding throughout each period:
| Income (loss) from investment operations: | Less distributions to shareholders from: | Ratios to Average Net Assets: | Supplemental Data: | |||||||||||||||||||||||||||||||||||||||||||||||||||||||||
Net asset | Net investment income (loss) ($)1 | Net realized and unrealized gain (loss) ($) | Total from | Net investment income ($) | Net realized | Total distributions ($) | Net asset value, end of period ($) | Total return (%) | Operating expenses (%) | Less: Reimbursement of expenses by Adviser (%) | Net operating expenses (%) | Net investment income (loss) (%) | Net assets (in millions), end of period ($) | Portfolio turnover rate (%) | ||||||||||||||||||||||||||||||||||||||||||||||
RETAIL SHARES |
| |||||||||||||||||||||||||||||||||||||||||||||||||||||||||||
Six Months Ended June 30, |
| |||||||||||||||||||||||||||||||||||||||||||||||||||||||||||
2022 | 44.52 | (0.17 | ) | (11.60 | ) | (11.77 | ) | 0.00 | 0.00 | 0.00 | 32.75 | (26.44 | )4 | 1.32 | 5 | 0.00 | 1.32 | 5 | (0.89 | )5 | 167.9 | 15.98 | 4 | |||||||||||||||||||||||||||||||||||||
Year Ended December 31, |
| |||||||||||||||||||||||||||||||||||||||||||||||||||||||||||
2021 | 43.36 | (0.51 | ) | 8.59 | 8.08 | 0.00 | (6.92 | ) | (6.92 | ) | 44.52 | 18.83 | 1.32 | 7 | 0.00 | 1.32 | (1.12 | ) | 209.8 | 45.28 | ||||||||||||||||||||||||||||||||||||||||
2020 | 20.18 | (0.32 | ) | 24.74 | 24.42 | 0.00 | (1.24 | ) | (1.24 | ) | 43.36 | 122.21 | 1.35 | 0.00 | 1.35 | (1.15 | ) | 157.7 | 18.09 | |||||||||||||||||||||||||||||||||||||||||
2019 | 15.81 | (0.12 | ) | 4.85 | 4.73 | 0.00 | (0.36 | ) | (0.36 | ) | 20.18 | 30.03 | 3 | 1.39 | 7 | (0.04 | ) | 1.35 | (0.67 | ) | 49.1 | 4.53 | ||||||||||||||||||||||||||||||||||||||
2018 | 15.38 | (0.08 | ) | 0.68 | 0.60 | 0.00 | (0.17 | ) | (0.17 | ) | 15.81 | 3.75 | 3 | 1.39 | 7 | (0.04 | ) | 1.35 | (0.49 | ) | 40.9 | 1.85 | ||||||||||||||||||||||||||||||||||||||
2017 | 12.43 | (0.09 | ) | 3.36 | 3.27 | (0.00 | )2 | (0.32 | ) | (0.32 | ) | 15.38 | 26.36 | 3 | 1.40 | (0.05 | ) | 1.35 | (0.64 | ) | 42.4 | 11.48 | ||||||||||||||||||||||||||||||||||||||
INSTITUTIONAL SHARES |
| |||||||||||||||||||||||||||||||||||||||||||||||||||||||||||
Six Months Ended June 30, |
| |||||||||||||||||||||||||||||||||||||||||||||||||||||||||||
2022 | 46.09 | (0.12 | ) | (12.02 | ) | (12.14 | ) | 0.00 | 0.00 | 0.00 | 33.95 | (26.34 | )4 | 1.06 | 5 | 0.00 | 1.06 | 5 | (0.63 | )5 | 249.3 | 15.98 | 4 | |||||||||||||||||||||||||||||||||||||
Year Ended December 31, |
| |||||||||||||||||||||||||||||||||||||||||||||||||||||||||||
2021 | 44.56 | (0.40 | ) | 8.85 | 8.45 | 0.00 | (6.92 | ) | (6.92 | ) | 46.09 | 19.16 | 1.05 | 7 | 0.00 | 1.05 | (0.85 | ) | 307.8 | 45.28 | ||||||||||||||||||||||||||||||||||||||||
2020 | 20.67 | (0.24 | ) | 25.37 | 25.13 | 0.00 | (1.24 | ) | (1.24 | ) | 44.56 | 122.75 | 1.07 | 0.00 | 1.07 | (0.88 | ) | 233.7 | 18.09 | |||||||||||||||||||||||||||||||||||||||||
2019 | 16.15 | (0.08 | ) | 4.96 | 4.88 | 0.00 | (0.36 | ) | (0.36 | ) | 20.67 | 30.33 | 3 | 1.11 | 7 | (0.01 | ) | 1.10 | (0.42 | ) | 91.3 | 4.53 | ||||||||||||||||||||||||||||||||||||||
2018 | 15.66 | (0.05 | ) | 0.71 | 0.66 | 0.00 | (0.17 | ) | (0.17 | ) | 16.15 | 4.07 | 1.09 | 7 | 0.00 | 1.09 | (0.30 | ) | 70.7 | 1.85 | ||||||||||||||||||||||||||||||||||||||||
2017 | 12.63 | (0.06 | ) | 3.41 | 3.35 | (0.00 | )2 | (0.32 | ) | (0.32 | ) | 15.66 | 26.59 | 3 | 1.12 | (0.02 | ) | 1.10 | (0.39 | ) | 127.8 | 11.48 | ||||||||||||||||||||||||||||||||||||||
R6 SHARES |
| |||||||||||||||||||||||||||||||||||||||||||||||||||||||||||
Six Months Ended June 30, |
| |||||||||||||||||||||||||||||||||||||||||||||||||||||||||||
2022 | 46.12 | (0.12 | ) | (12.03 | ) | (12.15 | ) | 0.00 | 0.00 | 0.00 | 33.97 | (26.34 | )4 | 1.06 | 5 | 0.00 | 1.06 | 5 | (0.62 | )5 | 256.2 | 15.98 | 4 | |||||||||||||||||||||||||||||||||||||
Year Ended December 31, |
| |||||||||||||||||||||||||||||||||||||||||||||||||||||||||||
2021 | 44.59 | (0.40 | ) | 8.85 | 8.45 | 0.00 | (6.92 | ) | (6.92 | ) | 46.12 | 19.15 | 1.05 | 7 | 0.00 | 1.05 | (0.86 | ) | 320.6 | 45.28 | ||||||||||||||||||||||||||||||||||||||||
2020 | 20.68 | (0.24 | ) | 25.39 | 25.15 | 0.00 | (1.24 | ) | (1.24 | ) | 44.59 | 122.78 | 1.07 | 0.00 | 1.07 | (0.87 | ) | 271.3 | 18.09 | |||||||||||||||||||||||||||||||||||||||||
2019 | 16.16 | (0.07 | ) | 4.95 | 4.88 | 0.00 | (0.36 | ) | (0.36 | ) | 20.68 | 30.31 | 1.10 | 7 | 0.00 | 1.10 | (0.40 | ) | 122.0 | 4.53 | ||||||||||||||||||||||||||||||||||||||||
2018 | 15.67 | (0.03 | ) | 0.69 | 0.66 | 0.00 | (0.17 | ) | (0.17 | ) | 16.16 | 4.07 | 3 | 1.10 | 7 | (0.00 | )6 | 1.10 | (0.18 | ) | 92.2 | 1.85 | ||||||||||||||||||||||||||||||||||||||
2017 | 12.63 | (0.06 | ) | 3.42 | 3.36 | (0.00 | )2 | (0.32 | ) | (0.32 | ) | 15.67 | 26.67 | 3 | 1.10 | (0.00 | )6 | 1.10 | (0.38 | ) | 22.6 | 11.48 | ||||||||||||||||||||||||||||||||||||||
| 1 | Based on average shares outstanding. |
| 2 | Less than $0.01 per share. |
| 3 | The total returns would have been lower had certain expenses not been reduced during the period shown. |
| 4 | Not Annualized. |
| 5 | Annualized. |
| 6 | Less than 0.01%. |
| 7 | Interest expense rounds to less than 0.01%. |
| 72 | See Notes to Financial Statements. |
| June 30, 2022 | Baron Select Funds |
FINANCIAL HIGHLIGHTS (Unaudited) (Continued)
BARON INTERNATIONAL GROWTH FUND
Selected data for a share outstanding throughout each period:
| Income (loss) from investment operations: | Less distributions to shareholders from: | Ratios to Average Net Assets: | Supplemental Data: | |||||||||||||||||||||||||||||||||||||||||||||||||||||||||
Net asset | Net investment income (loss) ($)1 | Net realized and unrealized gain (loss) ($) | Total from | Net investment income ($) | Net realized | Total distributions ($) | Net asset value, end of period ($) | Total return (%) | Operating expenses (%) | Less: Reimbursement of expenses by Adviser (%) | Net operating expenses (%) | Net investment income (loss) (%) | Net assets (in millions), end of period ($) | Portfolio turnover rate (%) | ||||||||||||||||||||||||||||||||||||||||||||||
RETAIL SHARES |
| |||||||||||||||||||||||||||||||||||||||||||||||||||||||||||
Six Months Ended June 30, |
| |||||||||||||||||||||||||||||||||||||||||||||||||||||||||||
2022 | 33.29 | 0.03 | (9.54 | ) | (9.51 | ) | 0.00 | 0.00 | 0.00 | 23.78 | (28.57 | )2,3 | 1.26 | 4 | (0.06 | )4 | 1.20 | 4 | 0.23 | 4 | 73.2 | 31.73 | 3 | |||||||||||||||||||||||||||||||||||||
Year Ended December 31, |
| |||||||||||||||||||||||||||||||||||||||||||||||||||||||||||
2021 | 31.97 | (0.11 | ) | 3.18 | 3.07 | (0.63 | ) | (1.12 | ) | (1.75 | ) | 33.29 | 9.64 | 2 | 1.23 | (0.03 | ) | 1.20 | (0.33 | ) | 100.2 | 36.00 | ||||||||||||||||||||||||||||||||||||||
2020 | 24.50 | (0.01 | ) | 7.49 | 7.48 | (0.01 | ) | 0.00 | (0.01 | ) | 31.97 | 30.52 | 2 | 1.28 | (0.08 | ) | 1.20 | (0.05 | ) | 85.5 | 41.13 | |||||||||||||||||||||||||||||||||||||||
2019 | 19.00 | 0.01 | 5.51 | 5.52 | (0.01 | ) | (0.01 | ) | (0.02 | ) | 24.50 | 29.06 | 2 | 1.31 | (0.11 | ) | 1.20 | 0.06 | 82.0 | 56.52 | ||||||||||||||||||||||||||||||||||||||||
2018 | 23.90 | (0.01 | ) | (4.21 | ) | (4.22 | ) | 0.00 | (0.68 | ) | (0.68 | ) | 19.00 | (17.90 | )2 | 1.34 | 5 | (0.14 | ) | 1.20 | (0.03 | ) | 59.8 | 50.83 | ||||||||||||||||||||||||||||||||||||
2017 | 18.09 | (0.06 | ) | 6.72 | 6.66 | 0.00 | (0.85 | ) | (0.85 | ) | 23.90 | 36.94 | 2 | 1.51 | (0.14 | ) | 1.37 | (0.28 | ) | 56.5 | 31.44 | |||||||||||||||||||||||||||||||||||||||
INSTITUTIONAL SHARES |
| |||||||||||||||||||||||||||||||||||||||||||||||||||||||||||
Six Months Ended June 30, |
| |||||||||||||||||||||||||||||||||||||||||||||||||||||||||||
2022 | 33.88 | 0.06 | (9.70 | ) | (9.64 | ) | 0.00 | 0.00 | 0.00 | 24.24 | (28.45 | )2,3 | 0.99 | 4 | (0.04 | )4 | 0.95 | 4 | 0.46 | 4 | 320.5 | 31.73 | 3 | |||||||||||||||||||||||||||||||||||||
Year Ended December 31, |
| |||||||||||||||||||||||||||||||||||||||||||||||||||||||||||
2021 | 32.51 | (0.02 | ) | 3.22 | 3.20 | (0.71 | ) | (1.12 | ) | (1.83 | ) | 33.88 | 9.88 | 2 | 0.96 | (0.01 | ) | 0.95 | (0.05 | ) | 497.2 | 36.00 | ||||||||||||||||||||||||||||||||||||||
2020 | 24.88 | 0.06 | 7.61 | 7.67 | (0.04 | ) | 0.00 | (0.04 | ) | 32.51 | 30.83 | 2 | 1.01 | (0.06 | ) | 0.95 | 0.25 | 362.9 | 41.13 | |||||||||||||||||||||||||||||||||||||||||
2019 | 19.29 | 0.06 | 5.61 | 5.67 | (0.07 | ) | (0.01 | ) | (0.08 | ) | 24.88 | 29.39 | 2 | 1.04 | (0.09 | ) | 0.95 | 0.27 | 223.6 | 56.52 | ||||||||||||||||||||||||||||||||||||||||
2018 | 24.19 | 0.06 | (4.28 | ) | (4.22 | ) | 0.00 | (0.68 | ) | (0.68 | ) | 19.29 | (17.68 | )2 | 1.07 | 5 | (0.12 | ) | 0.95 | 0.26 | 154.2 | 50.83 | ||||||||||||||||||||||||||||||||||||||
2017 | 18.25 | (0.01 | ) | 6.80 | 6.79 | 0.00 | (0.85 | ) | (0.85 | ) | 24.19 | 37.33 | 2 | 1.23 | (0.12 | ) | 1.11 | (0.06 | ) | 110.8 | 31.44 | |||||||||||||||||||||||||||||||||||||||
R6 SHARES |
| |||||||||||||||||||||||||||||||||||||||||||||||||||||||||||
Six Months Ended June 30, |
| |||||||||||||||||||||||||||||||||||||||||||||||||||||||||||
2022 | 33.86 | 0.07 | (9.70 | ) | (9.63 | ) | 0.00 | 0.00 | 0.00 | 24.23 | (28.44 | )2,3 | 0.99 | 4 | (0.04 | )4 | 0.95 | 4 | 0.48 | 4 | 111.0 | 31.73 | 3 | |||||||||||||||||||||||||||||||||||||
Year Ended December 31, |
| |||||||||||||||||||||||||||||||||||||||||||||||||||||||||||
2021 | 32.49 | (0.03 | ) | 3.23 | 3.20 | (0.71 | ) | (1.12 | ) | (1.83 | ) | 33.86 | 9.89 | 2 | 0.96 | (0.01 | ) | 0.95 | (0.10 | ) | 160.3 | 36.00 | ||||||||||||||||||||||||||||||||||||||
2020 | 24.88 | 0.04 | 7.61 | 7.65 | (0.04 | ) | 0.00 | (0.04 | ) | 32.49 | 30.75 | 2 | 0.98 | (0.03 | ) | 0.95 | 0.15 | 163.5 | 41.13 | |||||||||||||||||||||||||||||||||||||||||
2019 | 19.29 | 0.06 | 5.61 | 5.67 | (0.07 | ) | (0.01 | ) | (0.08 | ) | 24.88 | 29.39 | 2 | 1.03 | (0.08 | ) | 0.95 | 0.28 | 17.7 | 56.52 | ||||||||||||||||||||||||||||||||||||||||
2018 | 24.19 | 0.07 | (4.29 | ) | (4.22 | ) | 0.00 | (0.68 | ) | (0.68 | ) | 19.29 | (17.68 | )2 | 1.06 | 5 | (0.11 | ) | 0.95 | 0.31 | 12.4 | 50.83 | ||||||||||||||||||||||||||||||||||||||
2017 | 18.25 | (0.02 | ) | 6.81 | 6.79 | 0.00 | (0.85 | ) | (0.85 | ) | 24.19 | 37.33 | 2 | 1.22 | (0.12 | ) | 1.10 | (0.10 | ) | 0.8 | 31.44 | |||||||||||||||||||||||||||||||||||||||
| 1 | Based on average shares outstanding. |
| 2 | The total returns would have been lower had certain expenses not been reduced during the period shown. |
| 3 | Not Annualized. |
| 4 | Annualized. |
| 5 | Interest expense rounds to less than 0.01%. |
| See Notes to Financial Statements. | 73 |
| Baron Select Funds | June 30, 2022 |
FINANCIAL HIGHLIGHTS (Unaudited) (Continued)
BARON REAL ESTATE FUND
Selected data for a share outstanding throughout each period:
| Income (loss) from investment operations: | Less distributions to shareholders from: | Ratios to Average Net Assets: | Supplemental Data: | |||||||||||||||||||||||||||||||||||||||||||||||||||||||||||||
| Net asset value, beginning of period ($) | Net investment income (loss) ($)1 | Net realized and unrealized gain (loss) ($) | Total from investment operations ($) | Net investment income ($) | Net realized gain on investments ($) | Return of capital ($) | Total distributions ($) | Net asset value, end of period ($) | Total return (%) | Operating expenses (%) | Less: Reimbursement of expenses by Adviser (%) | Net operating expenses (%) | Net investment income (loss) (%) | Net assets (in | Portfolio turnover rate (%) | |||||||||||||||||||||||||||||||||||||||||||||||||
RETAIL SHARES |
| |||||||||||||||||||||||||||||||||||||||||||||||||||||||||||||||
Six Months Ended June 30, |
| |||||||||||||||||||||||||||||||||||||||||||||||||||||||||||||||
2022 | 40.24 | (0.03 | ) | (11.74 | ) | (11.77 | ) | 0.00 | 0.00 | 0.00 | 0.00 | 28.47 | (29.25 | )3 | 1.33 | 4 | 0.00 | 1.33 | 4 | (0.19 | )4 | 343.7 | 67.38 | 3 | ||||||||||||||||||||||||||||||||||||||||
Year Ended December 31, |
| |||||||||||||||||||||||||||||||||||||||||||||||||||||||||||||||
2021 | 35.21 | (0.10 | ) | 8.42 | 8.32 | 0.00 | (3.29 | ) | 0.00 | (3.29 | ) | 40.24 | 24.03 | 1.31 | 0.00 | 1.31 | (0.26 | ) | 514.8 | 64.39 | ||||||||||||||||||||||||||||||||||||||||||||
2020 | 26.18 | (0.10 | ) | 11.34 | 11.24 | (0.00 | )2 | (2.21 | ) | 0.00 | (2.21 | ) | 35.21 | 43.85 | 1.34 | 0.00 | 1.34 | (0.36 | ) | 321.8 | 71.46 | |||||||||||||||||||||||||||||||||||||||||||
2019 | 20.77 | (0.03 | ) | 9.08 | 9.05 | 0.00 | (3.64 | ) | 0.00 | (3.64 | ) | 26.18 | 44.11 | 1.33 | 5 | 0.00 | 1.33 | (0.10 | ) | 246.9 | 53.44 | |||||||||||||||||||||||||||||||||||||||||||
2018 | 29.58 | (0.03 | ) | (6.28 | ) | (6.31 | ) | 0.00 | (2.50 | ) | 0.00 | (2.50 | ) | 20.77 | (22.22 | ) | 1.32 | 5 | 0.00 | 1.32 | (0.10 | ) | 213.0 | 56.47 | ||||||||||||||||||||||||||||||||||||||||
2017 | 23.67 | 0.00 | 2 | 7.32 | 7.32 | 0.00 | (1.41 | ) | 0.00 | (1.41 | ) | 29.58 | 31.04 | 1.32 | 0.00 | 1.32 | 0.01 | 426.7 | 44.56 | |||||||||||||||||||||||||||||||||||||||||||||
INSTITUTIONAL SHARES |
| |||||||||||||||||||||||||||||||||||||||||||||||||||||||||||||||
Six Months Ended June 30, |
| |||||||||||||||||||||||||||||||||||||||||||||||||||||||||||||||
2022 | 41.36 | 0.01 | (12.08 | ) | (12.07 | ) | 0.00 | 0.00 | 0.00 | 0.00 | 29.29 | (29.18 | )3 | 1.07 | 4 | 0.00 | 1.07 | 4 | 0.08 | 4 | 1,032.0 | 67.38 | 3 | |||||||||||||||||||||||||||||||||||||||||
Year Ended December 31, |
| |||||||||||||||||||||||||||||||||||||||||||||||||||||||||||||||
2021 | 36.02 | 0.01 | 8.62 | 8.63 | 0.00 | (3.29 | ) | 0.00 | (3.29 | ) | 41.36 | 24.36 | 1.05 | 0.00 | 1.05 | 0.04 | 1,490.8 | 64.39 | ||||||||||||||||||||||||||||||||||||||||||||||
2020 | 26.68 | (0.03 | ) | 11.60 | 11.57 | (0.02 | ) | (2.21 | ) | 0.00 | (2.23 | ) | 36.02 | 44.28 | 1.08 | 0.00 | 1.08 | (0.10 | ) | 705.4 | 71.46 | |||||||||||||||||||||||||||||||||||||||||||
2019 | 21.10 | 0.04 | 9.22 | 9.26 | (0.04 | ) | (3.64 | ) | 0.00 | (3.68 | ) | 26.68 | 44.44 | 1.08 | 5 | 0.00 | 1.08 | 0.15 | 360.2 | 53.44 | ||||||||||||||||||||||||||||||||||||||||||||
2018 | 30.01 | 0.05 | (6.39 | ) | (6.34 | ) | (0.07 | ) | (2.50 | ) | 0.00 | (2.57 | ) | 21.10 | (22.04 | ) | 1.06 | 5 | 0.00 | 1.06 | 0.17 | 320.9 | 56.47 | |||||||||||||||||||||||||||||||||||||||||
2017 | 23.93 | 0.07 | 7.42 | 7.49 | 0.00 | (1.41 | ) | 0.00 | (1.41 | ) | 30.01 | 31.42 | 1.06 | 0.00 | 1.06 | 0.26 | 657.6 | 44.56 | ||||||||||||||||||||||||||||||||||||||||||||||
R6 SHARES |
| |||||||||||||||||||||||||||||||||||||||||||||||||||||||||||||||
Six Months Ended June 30, |
| |||||||||||||||||||||||||||||||||||||||||||||||||||||||||||||||
2022 | 41.36 | 0.02 | (12.09 | ) | (12.07 | ) | 0.00 | 0.00 | 0.00 | 0.00 | 29.29 | (29.18 | )3 | 1.07 | 4 | 0.00 | 1.07 | 4 | 0.09 | 4 | 24.7 | 67.38 | 3 | |||||||||||||||||||||||||||||||||||||||||
Year Ended December 31, |
| |||||||||||||||||||||||||||||||||||||||||||||||||||||||||||||||
2021 | 36.02 | 0.01 | 8.62 | 8.63 | 0.00 | (3.29 | ) | 0.00 | (3.29 | ) | 41.36 | 24.36 | 1.05 | 0.00 | 1.05 | 0.02 | 33.3 | 64.39 | ||||||||||||||||||||||||||||||||||||||||||||||
2020 | 26.69 | (0.03 | ) | 11.59 | 11.56 | (0.02 | ) | (2.21 | ) | 0.00 | (2.23 | ) | 36.02 | 44.23 | 1.07 | 0.00 | 1.07 | (0.10 | ) | 20.0 | 71.46 | |||||||||||||||||||||||||||||||||||||||||||
2019 | 21.10 | 0.04 | 9.23 | 9.27 | (0.04 | ) | (3.64 | ) | 0.00 | (3.68 | ) | 26.69 | 44.51 | 1.07 | 5 | 0.00 | 1.07 | 0.17 | 13.2 | 53.44 | ||||||||||||||||||||||||||||||||||||||||||||
2018 | 30.01 | 0.09 | (6.43 | ) | (6.34 | ) | (0.07 | ) | (2.50 | ) | 0.00 | (2.57 | ) | 21.10 | (22.03 | ) | 1.07 | 5 | 0.00 | 1.07 | 0.31 | 9.3 | 56.47 | |||||||||||||||||||||||||||||||||||||||||
2017 | 23.93 | 0.07 | 7.42 | 7.49 | 0.00 | (1.41 | ) | 0.00 | (1.41 | ) | 30.01 | 31.42 | 1.06 | 0.00 | 1.06 | 0.26 | 3.3 | 44.56 | ||||||||||||||||||||||||||||||||||||||||||||||
| 1 | Based on average shares outstanding. |
| 2 | Less than $0.01 per share. |
| 3 | Not Annualized. |
| 4 | Annualized. |
| 5 | Interest expense rounds to less than 0.01%. |
| 74 | See Notes to Financial Statements. |
| June 30, 2022 | Baron Select Funds |
FINANCIAL HIGHLIGHTS (Unaudited) (Continued)
BARON EMERGING MARKETS FUND
Selected data for a share outstanding throughout each period:
| Income (loss) from investment operations: | Less distributions to shareholders from: | Ratios to Average Net Assets: | Supplemental Data: | |||||||||||||||||||||||||||||||||||||||||||||||||||||||||||||
Net asset | Net investment income (loss) ($)1 | Net realized and unrealized gain (loss) ($) | Total from | Net investment income ($) | Net realized | Return of capital ($) | Total distributions ($) | Net asset | Total return (%) | Operating expenses (%) | Less: Reimbursement of expenses by Adviser (%) | Net operating expenses (%) | Net investment income (loss) (%) | Net assets (in millions), end of period ($) | Portfolio turnover rate (%) | |||||||||||||||||||||||||||||||||||||||||||||||||
RETAIL SHARES |
| |||||||||||||||||||||||||||||||||||||||||||||||||||||||||||||||
Six Months Ended June 30, |
| |||||||||||||||||||||||||||||||||||||||||||||||||||||||||||||||
2022 | 17.51 | 0.02 | (4.06 | ) | (4.04 | ) | 0.00 | 0.00 | 0.00 | 0.00 | 13.47 | (23.07 | )2 | 1.38 | 3 | 0.00 | 1.38 | 3 | 0.21 | 3 | 324.1 | 28.78 | 2 | |||||||||||||||||||||||||||||||||||||||||
Year Ended December 31, |
| |||||||||||||||||||||||||||||||||||||||||||||||||||||||||||||||
2021 | 18.97 | (0.09 | ) | (1.09 | ) | (1.18 | ) | (0.28 | ) | 0.00 | (0.00 | )4 | (0.28 | ) | 17.51 | (6.26 | ) | 1.33 | 0.00 | 1.33 | (0.46 | ) | 462.6 | 33.10 | ||||||||||||||||||||||||||||||||||||||||
2020 | 14.72 | (0.06 | ) | 4.31 | 4.25 | 0.00 | 0.00 | 0.00 | 0.00 | 18.97 | 28.87 | 1.35 | 0.00 | 1.35 | (0.44 | ) | 507.7 | 55.65 | ||||||||||||||||||||||||||||||||||||||||||||||
2019 | 12.45 | 0.03 | 2.27 | 2.30 | (0.03 | ) | 0.00 | (0.00 | )4 | (0.03 | ) | 14.72 | 18.48 | 1.35 | 0.00 | 1.35 | 0.23 | 667.1 | 59.00 | |||||||||||||||||||||||||||||||||||||||||||||
2018 | 15.33 | 0.05 | (2.91 | ) | (2.86 | ) | (0.02 | ) | 0.00 | 0.00 | (0.02 | ) | 12.45 | (18.67 | ) | 1.36 | 0.00 | 1.36 | 0.36 | 753.5 | 43.27 | |||||||||||||||||||||||||||||||||||||||||||
2017 | 10.95 | 0.03 | 4.39 | 4.42 | (0.04 | ) | 0.00 | (0.00 | )4 | (0.04 | ) | 15.33 | 40.34 | 1.36 | 0.00 | 1.36 | 0.23 | 1,121.4 | 30.75 | |||||||||||||||||||||||||||||||||||||||||||||
INSTITUTIONAL SHARES |
| |||||||||||||||||||||||||||||||||||||||||||||||||||||||||||||||
Six Months Ended June 30, |
| |||||||||||||||||||||||||||||||||||||||||||||||||||||||||||||||
2022 | 17.58 | 0.03 | (4.07 | ) | (4.04 | ) | 0.00 | 0.00 | 0.00 | 0.00 | 13.54 | (22.98 | )2 | 1.12 | 3 | 0.00 | 1.12 | 3 | 0.46 | 3 | 5,774.4 | 28.78 | 2 | |||||||||||||||||||||||||||||||||||||||||
Year Ended December 31, |
| |||||||||||||||||||||||||||||||||||||||||||||||||||||||||||||||
2021 | 19.06 | (0.04 | ) | (1.11 | ) | (1.15 | ) | (0.33 | ) | 0.00 | (0.00 | )4 | (0.33 | ) | 17.58 | (6.07 | ) | 1.08 | 0.00 | 1.08 | (0.22 | ) | 8,408.8 | 33.10 | ||||||||||||||||||||||||||||||||||||||||
2020 | 14.75 | (0.03 | ) | 4.34 | 4.31 | 0.00 | 0.00 | 0.00 | 0.00 | 19.06 | 29.22 | 1.09 | 0.00 | 1.09 | (0.20 | ) | 6,228.8 | 55.65 | ||||||||||||||||||||||||||||||||||||||||||||||
2019 | 12.47 | 0.07 | 2.28 | 2.35 | (0.06 | ) | 0.00 | (0.01 | ) | (0.07 | ) | 14.75 | 18.86 | 1.09 | 0.00 | 1.09 | 0.50 | 4,644.8 | 59.00 | |||||||||||||||||||||||||||||||||||||||||||||
2018 | 15.37 | 0.09 | (2.93 | ) | (2.84 | ) | (0.06 | ) | 0.00 | 0.00 | (0.06 | ) | 12.47 | (18.49 | ) | 1.10 | 0.00 | 1.10 | 0.62 | 3,850.0 | 43.27 | |||||||||||||||||||||||||||||||||||||||||||
2017 | 10.98 | 0.06 | 4.40 | 4.46 | (0.07 | ) | 0.00 | (0.00 | )4 | (0.07 | ) | 15.37 | 40.63 | 1.10 | 0.00 | 1.10 | 0.47 | 3,842.5 | 30.75 | |||||||||||||||||||||||||||||||||||||||||||||
R6 SHARES |
| |||||||||||||||||||||||||||||||||||||||||||||||||||||||||||||||
Six Months Ended June 30, |
| |||||||||||||||||||||||||||||||||||||||||||||||||||||||||||||||
2022 | 17.59 | 0.04 | (4.08 | ) | (4.04 | ) | 0.00 | 0.00 | 0.00 | 0.00 | 13.55 | (22.97 | )2 | 1.12 | 3 | 0.00 | 1.12 | 3 | 0.51 | 3 | 15.2 | 28.78 | 2 | |||||||||||||||||||||||||||||||||||||||||
Year Ended December 31, |
| |||||||||||||||||||||||||||||||||||||||||||||||||||||||||||||||
2021 | 19.07 | (0.04 | ) | (1.11 | ) | (1.15 | ) | (0.33 | ) | 0.00 | (0.00 | )4 | (0.33 | ) | 17.59 | (6.07 | ) | 1.08 | 0.00 | 1.08 | (0.21 | ) | 17.4 | 33.10 | ||||||||||||||||||||||||||||||||||||||||
2020 | 14.75 | (0.03 | ) | 4.35 | 4.32 | 0.00 | 0.00 | 0.00 | 0.00 | 19.07 | 29.29 | 1.09 | 0.00 | 1.09 | (0.18 | ) | 13.9 | 55.65 | ||||||||||||||||||||||||||||||||||||||||||||||
2019 | 12.48 | 0.07 | 2.27 | 2.34 | (0.06 | ) | 0.00 | (0.01 | ) | (0.07 | ) | 14.75 | 18.77 | 1.09 | 0.00 | 1.09 | 0.49 | 10.1 | 59.00 | |||||||||||||||||||||||||||||||||||||||||||||
2018 | 15.38 | 0.10 | (2.94 | ) | (2.84 | ) | (0.06 | ) | 0.00 | 0.00 | (0.06 | ) | 12.48 | (18.47 | ) | 1.11 | 0.00 | 1.11 | 0.69 | 7.3 | 43.27 | |||||||||||||||||||||||||||||||||||||||||||
2017 | 10.99 | 0.07 | 4.39 | 4.46 | (0.07 | ) | 0.00 | (0.00 | )4 | (0.07 | ) | 15.38 | 40.59 | 1.11 | 0.00 | 1.11 | 0.49 | 4.9 | 30.75 | |||||||||||||||||||||||||||||||||||||||||||||
| 1 | Based on average shares outstanding. |
| 2 | Not Annualized. |
| 3 | Annualized. |
| 4 | Less than $0.01 per share. |
| See Notes to Financial Statements. | 75 |
| Baron Select Funds | June 30, 2022 |
FINANCIAL HIGHLIGHTS (Unaudited) (Continued)
BARON GLOBAL ADVANTAGE FUND
Selected data for a share outstanding throughout each period:
| Income (loss) from investment operations: | Less distributions to shareholders from: | Ratios to Average Net Assets: | Supplemental Data: | |||||||||||||||||||||||||||||||||||||||||||||||||||||||||||||||||
| Net asset value, beginning of period ($) | Net investment income (loss) ($)1 | Net realized and unrealized gain (loss) ($) | Total from investment operations ($) | Net investment income ($) | Net realized gain on investments ($) | Total distributions ($) | Net asset value, end of period ($) | Total return (%) | Total expenses (%) | Less: Interest expense % | Operating expenses (%) | Less: Reimbursement of expenses by Adviser (%) | Net operating expenses (%) | Net investment income (loss) (%) | Net assets (in millions), end of period ($) | Portfolio turnover rate (%) | ||||||||||||||||||||||||||||||||||||||||||||||||||||
RETAIL SHARES |
| |||||||||||||||||||||||||||||||||||||||||||||||||||||||||||||||||||
Six Months Ended June 30, |
| |||||||||||||||||||||||||||||||||||||||||||||||||||||||||||||||||||
2022 | 51.65 | (0.20 | ) | (24.48 | ) | (24.68 | ) | 0.00 | 0.00 | 0.00 | 26.97 | (47.78 | )2,3,7 | 1.19 | 4 | (0.01 | )4 | 1.18 | 4 | (0.03 | )4 | 1.15 | 4 | (1.12 | )4 | 292.1 | 6.32 | 3 | ||||||||||||||||||||||||||||||||||||||||
Year Ended December 31, |
| |||||||||||||||||||||||||||||||||||||||||||||||||||||||||||||||||||
2021 | 51.34 | (0.62 | ) | 0.93 | 0.31 | 0.00 | 0.00 | 0.00 | 51.65 | 0.60 | 2,6 | 1.15 | (0.00 | )5 | 1.15 | (0.00 | )8 | 1.15 | (1.14 | ) | 786.3 | 23.73 | ||||||||||||||||||||||||||||||||||||||||||||||
2020 | 28.68 | (0.44 | ) | 23.10 | 22.66 | 0.00 | 0.00 | 0.00 | 51.34 | 79.01 | 2 | 1.17 | 0.00 | 1.17 | (0.02 | ) | 1.15 | (1.10 | ) | 921.7 | 8.75 | |||||||||||||||||||||||||||||||||||||||||||||||
2019 | 19.77 | (0.02 | ) | 8.93 | 8.91 | 0.00 | 0.00 | 0.00 | 28.68 | 45.07 | 2 | 1.25 | (0.00 | )5 | 1.25 | (0.10 | ) | 1.15 | (0.08 | ) | 174.6 | 19.44 | ||||||||||||||||||||||||||||||||||||||||||||||
2018 | 20.56 | (0.21 | ) | (0.58 | ) | (0.79 | ) | 0.00 | 0.00 | 0.00 | 19.77 | (3.84 | )2 | 1.45 | (0.00 | )5 | 1.45 | (0.30 | ) | 1.15 | (0.94 | ) | 35.7 | 19.77 | ||||||||||||||||||||||||||||||||||||||||||||
2017 | 13.75 | (0.18 | ) | 6.99 | 6.81 | 0.00 | 0.00 | 0.00 | 20.56 | 49.53 | 2 | 2.07 | (0.01 | ) | 2.06 | (0.70 | ) | 1.36 | (1.01 | ) | 18.4 | 27.98 | ||||||||||||||||||||||||||||||||||||||||||||||
INSTITUTIONAL SHARES |
| |||||||||||||||||||||||||||||||||||||||||||||||||||||||||||||||||||
Six Months Ended June 30, |
| |||||||||||||||||||||||||||||||||||||||||||||||||||||||||||||||||||
2022 | 52.70 | (0.16 | ) | (24.99 | ) | (25.15 | ) | 0.00 | 0.00 | 0.00 | 27.55 | (47.72 | )2,3,7 | 0.94 | 4 | (0.01 | )4 | 0.93 | 4 | (0.03 | )4 | 0.90 | 4 | (0.87 | )4 | 734.4 | 6.32 | 3 | ||||||||||||||||||||||||||||||||||||||||
Year Ended December 31, |
| |||||||||||||||||||||||||||||||||||||||||||||||||||||||||||||||||||
2021 | 52.25 | (0.49 | ) | 0.94 | 0.45 | 0.00 | 0.00 | 0.00 | 52.70 | 0.86 | 2,6 | 0.90 | (0.00 | )5 | 0.90 | (0.00 | )8 | 0.90 | (0.89 | ) | 1,803.3 | 23.73 | ||||||||||||||||||||||||||||||||||||||||||||||
2020 | 29.12 | (0.35 | ) | 23.48 | 23.13 | 0.00 | 0.00 | 0.00 | 52.25 | 79.43 | 2 | 0.92 | 0.00 | 0.92 | (0.02 | ) | 0.90 | (0.85 | ) | 1,470.9 | 8.75 | |||||||||||||||||||||||||||||||||||||||||||||||
2019 | 20.02 | (0.01 | ) | 9.11 | 9.10 | 0.00 | 0.00 | 0.00 | 29.12 | 45.45 | 2 | 1.00 | (0.00 | )5 | 1.00 | (0.10 | ) | 0.90 | (0.03 | ) | 212.8 | 19.44 | ||||||||||||||||||||||||||||||||||||||||||||||
2018 | 20.77 | (0.16 | ) | (0.59 | ) | (0.75 | ) | 0.00 | 0.00 | 0.00 | 20.02 | (3.61 | )2 | 1.18 | (0.00 | )5 | 1.18 | (0.28 | ) | 0.90 | (0.71 | ) | 49.2 | 19.77 | ||||||||||||||||||||||||||||||||||||||||||||
2017 | 13.87 | (0.14 | ) | 7.04 | 6.90 | 0.00 | 0.00 | 0.00 | 20.77 | 49.75 | 2 | 1.70 | (0.01 | ) | 1.69 | (0.61 | ) | 1.08 | (0.77 | ) | 24.8 | 27.98 | ||||||||||||||||||||||||||||||||||||||||||||||
R6 SHARES |
| |||||||||||||||||||||||||||||||||||||||||||||||||||||||||||||||||||
Six Months Ended June 30, |
| |||||||||||||||||||||||||||||||||||||||||||||||||||||||||||||||||||
2022 | 52.73 | (0.16 | ) | (25.00 | ) | (25.16 | ) | 0.00 | 0.00 | 0.00 | 27.57 | (47.71 | )2,3,7 | 0.94 | 4 | (0.01 | )4 | 0.93 | 4 | (0.03 | )4 | 0.90 | 4 | (0.87 | )4 | 10.0 | 6.32 | 3 | ||||||||||||||||||||||||||||||||||||||||
Year Ended December 31, |
| |||||||||||||||||||||||||||||||||||||||||||||||||||||||||||||||||||
2021 | 52.28 | (0.50 | ) | 0.95 | 0.45 | 0.00 | 0.00 | 0.00 | 52.73 | 0.86 | 2,6 | 0.90 | (0.00 | )5 | 0.90 | (0.00 | )8 | 0.90 | (0.89 | ) | 18.4 | 23.73 | ||||||||||||||||||||||||||||||||||||||||||||||
2020 | 29.14 | (0.32 | ) | 23.46 | 23.14 | 0.00 | 0.00 | 0.00 | 52.28 | 79.41 | 2 | 0.92 | 0.00 | 0.92 | (0.02 | ) | 0.90 | (0.83 | ) | 15.0 | 8.75 | |||||||||||||||||||||||||||||||||||||||||||||||
2019 | 20.03 | (0.03 | ) | 9.14 | 9.11 | 0.00 | 0.00 | 0.00 | 29.14 | 45.48 | 2 | 1.00 | (0.00 | )5 | 1.00 | (0.10 | ) | 0.90 | (0.10 | ) | 6.8 | 19.44 | ||||||||||||||||||||||||||||||||||||||||||||||
2018 | 20.79 | (0.15 | ) | (0.61 | ) | (0.76 | ) | 0.00 | 0.00 | 0.00 | 20.03 | (3.66 | )2 | 1.16 | (0.00 | )5 | 1.16 | (0.26 | ) | 0.90 | (0.69 | ) | 4.3 | 19.77 | ||||||||||||||||||||||||||||||||||||||||||||
2017 | 13.87 | (0.14 | ) | 7.06 | 6.92 | 0.00 | 0.00 | 0.00 | 20.79 | 49.89 | 2 | 1.69 | (0.01 | ) | 1.68 | (0.59 | ) | 1.09 | (0.75 | ) | 0.4 | 27.98 | ||||||||||||||||||||||||||||||||||||||||||||||
| 1 | Based on average shares outstanding. |
| 2 | The total returns would have been lower had certain expenses not been reduced during the period shown. |
| 3 | Not Annualized. |
| 4 | Annualized. |
| 5 | Interest expense rounds to less than 0.01%. |
| 6 | The Adviser made voluntary payments to the Fund in the amount of $162,538 to compensate the Fund for losses incurred due to valuation errors. The impact of these payments increased the Fund’s total return by less than 0.01%. |
| 7 | The Adviser made a voluntary payment to the Fund in the amount of $82,890 to compensate the Fund for a loss incurred due to a valuation error. The impact of this payment increased the Fund’s total return by less than 0.01%. |
| 8 | Less than 0.01%. |
| 76 | See Notes to Financial Statements. |
| June 30, 2022 | Baron Select Funds |
FINANCIAL HIGHLIGHTS (Unaudited) (Continued)
BARON REAL ESTATE INCOME FUND
Selected data for a share outstanding throughout each period:
| Income (loss) from investment operations: | Less distributions to shareholders from: | Ratios to Average Net Assets: | Supplemental Data: | |||||||||||||||||||||||||||||||||||||||||||||||||||||||||
Net asset | Net investment income ($)2 | Net (loss) | Total from | Net investment income ($) | Net realized | Total distributions ($) | Net asset value, end of period ($) | Total return (%) | Operating expenses (%) | Less: Reimbursement of expenses by Adviser (%) | Net operating expenses (%) | Net investment income (%) | Net assets (in millions), end of period ($) | Portfolio turnover rate (%) | ||||||||||||||||||||||||||||||||||||||||||||||
RETAIL SHARES |
| |||||||||||||||||||||||||||||||||||||||||||||||||||||||||||
Six Months Ended June 30, |
| |||||||||||||||||||||||||||||||||||||||||||||||||||||||||||
2022 | 17.90 | 0.10 | (3.83 | ) | (3.73 | ) | (0.07 | ) | 0.00 | (0.07 | ) | 14.10 | (20.86 | )3,4 | 1.26 | 5 | (0.21 | )5 | 1.05 | 5 | 1.20 | 5 | 15.7 | 85.25 | 4 | |||||||||||||||||||||||||||||||||||
Year Ended December 31, |
| |||||||||||||||||||||||||||||||||||||||||||||||||||||||||||
2021 | 14.08 | 0.15 | 3.93 | 4.08 | (0.19 | ) | (0.07 | ) | (0.26 | ) | 17.90 | 29.08 | 3 | 1.42 | 6 | (0.37 | ) | 1.05 | 0.94 | 17.9 | 96.59 | |||||||||||||||||||||||||||||||||||||||
2020 | 11.65 | 0.11 | 2.43 | 2.54 | (0.11 | ) | 0.00 | (0.11 | ) | 14.08 | 22.02 | 3 | 4.40 | (3.35 | ) | 1.05 | 0.91 | 2.9 | 41.75 | |||||||||||||||||||||||||||||||||||||||||
2019 | 8.63 | 0.13 | 3.02 | 3.15 | (0.13 | ) | 0.00 | (0.13 | ) | 11.65 | 36.67 | 3 | 6.87 | (5.82 | ) | 1.05 | 1.20 | 1.4 | 52.50 | |||||||||||||||||||||||||||||||||||||||||
20181 | 10.00 | 0.14 | (1.25 | ) | (1.11 | ) | (0.26 | ) | 0.00 | (0.26 | ) | 8.63 | (11.33 | )3 | 10.47 | (9.42 | ) | 1.05 | 1.43 | 0.4 | 67.39 | |||||||||||||||||||||||||||||||||||||||
INSTITUTIONAL SHARES |
| |||||||||||||||||||||||||||||||||||||||||||||||||||||||||||
Six Months Ended June 30, |
| |||||||||||||||||||||||||||||||||||||||||||||||||||||||||||
2022 | 18.05 | 0.12 | (3.86 | ) | (3.74 | ) | (0.07 | ) | 0.00 | (0.07 | ) | 14.24 | (20.75 | )3,4 | 0.93 | 5 | (0.13 | )5 | 0.80 | 5 | 1.49 | 5 | 111.1 | 85.25 | 4 | |||||||||||||||||||||||||||||||||||
Year Ended December 31, |
| |||||||||||||||||||||||||||||||||||||||||||||||||||||||||||
2021 | 14.15 | 0.18 | 3.98 | 4.16 | (0.19 | ) | (0.07 | ) | (0.26 | ) | 18.05 | 29.51 | 3 | 1.08 | 6 | (0.28 | ) | 0.80 | 1.11 | 113.7 | 96.59 | |||||||||||||||||||||||||||||||||||||||
2020 | 11.68 | 0.37 | 2.21 | 2.58 | (0.11 | ) | 0.00 | (0.11 | ) | 14.15 | 22.30 | 3 | 3.45 | (2.65 | ) | 0.80 | 3.00 | 43.6 | 41.75 | |||||||||||||||||||||||||||||||||||||||||
2019 | 8.66 | 0.14 | 3.01 | 3.15 | (0.13 | ) | 0.00 | (0.13 | ) | 11.68 | 36.54 | 3 | 5.63 | (4.83 | ) | 0.80 | 1.37 | 2.7 | 52.50 | |||||||||||||||||||||||||||||||||||||||||
20181 | 10.00 | 0.16 | (1.24 | ) | (1.08 | ) | (0.26 | ) | 0.00 | (0.26 | ) | 8.66 | (11.03 | )3 | 7.18 | (6.38 | ) | 0.80 | 1.71 | 2.0 | 67.39 | |||||||||||||||||||||||||||||||||||||||
R6 SHARES |
| |||||||||||||||||||||||||||||||||||||||||||||||||||||||||||
Six Months Ended June 30, |
| |||||||||||||||||||||||||||||||||||||||||||||||||||||||||||
2022 | 18.03 | 0.12 | (3.85 | ) | (3.73 | ) | (0.07 | ) | 0.00 | (0.07 | ) | 14.23 | (20.85 | )3,4 | 0.92 | 5 | (0.12 | )5 | 0.80 | 5 | 1.42 | 5 | 0.6 | 85.25 | 4 | |||||||||||||||||||||||||||||||||||
Year Ended December 31, |
| |||||||||||||||||||||||||||||||||||||||||||||||||||||||||||
2021 | 14.14 | 0.16 | 3.99 | 4.15 | (0.19 | ) | (0.07 | ) | (0.26 | ) | 18.03 | 29.46 | 3 | 1.08 | 6 | (0.28 | ) | 0.80 | 1.01 | 0.9 | 96.59 | |||||||||||||||||||||||||||||||||||||||
2020 | 11.67 | 0.11 | 2.47 | 2.58 | (0.11 | ) | 0.00 | (0.11 | ) | 14.14 | 22.32 | 3 | 3.47 | (2.67 | ) | 0.80 | 1.06 | 0.6 | 41.75 | |||||||||||||||||||||||||||||||||||||||||
2019 | 8.66 | 0.14 | 3.00 | 3.14 | (0.13 | ) | 0.00 | (0.13 | ) | 11.67 | 36.42 | 3 | 5.27 | (4.47 | ) | 0.80 | 1.36 | 0.4 | 52.50 | |||||||||||||||||||||||||||||||||||||||||
20181 | 10.00 | 0.20 | (1.28 | ) | (1.08 | ) | (0.26 | ) | 0.00 | (0.26 | ) | 8.66 | (11.03 | )3 | 7.05 | (6.25 | ) | 0.80 | 2.07 | 0.4 | 67.39 | |||||||||||||||||||||||||||||||||||||||
| 1 | For the period January 2, 2018 (commencement of operations) to December 31, 2018. |
| 2 | Based on average shares outstanding. |
| 3 | The total returns would have been lower had certain expenses not been reduced during the period shown. |
| 4 | Not Annualized. |
| 5 | Annualized. |
| 6 | Interest expense rounds to less than 0.01%. |
| See Notes to Financial Statements. | 77 |
| Baron Select Funds | June 30, 2022 |
FINANCIAL HIGHLIGHTS (Unaudited) (Continued)
BARON HEALTH CARE FUND
Selected data for a share outstanding throughout each period:
| Income (loss) from investment operations: | Less distributions to shareholders from | Ratio to Average Net Assets: | Supplemental Data: | |||||||||||||||||||||||||||||||||||||||||||||||||||||||||
| Net asset value, beginning of period ($) | Net investment income (loss) ($)2 | Net realized and unrealized gain (loss) ($) | Total from investment operations ($) | Net investment income ($) | Net realized gain on investments ($) | Total distributions ($) | Net asset value, end of period ($) | Total return (%) | Operating expenses (%) | Less: Reimbursement of expenses by Adviser (%) | Net operating expenses (%) | Net investment income (loss) (%) | Net assets (in millions), end of period ($) | Portfolio turnover rate (%) | ||||||||||||||||||||||||||||||||||||||||||||||
RETAIL SHARES |
| |||||||||||||||||||||||||||||||||||||||||||||||||||||||||||
Six Months Ended June 30, |
| |||||||||||||||||||||||||||||||||||||||||||||||||||||||||||
2022 | 21.34 | (0.03 | ) | (4.03 | ) | (4.06 | ) | 0.00 | 0.00 | 0.00 | 17.28 | (19.03 | )3,4 | 1.20 | 5 | (0.10 | )5 | 1.10 | 5 | (0.37 | )5 | 54.1 | 36.89 | 4 | ||||||||||||||||||||||||||||||||||||
Year Ended December 31, |
| |||||||||||||||||||||||||||||||||||||||||||||||||||||||||||
2021 | 18.75 | (0.17 | ) | 3.06 | 2.89 | 0.00 | (0.30 | ) | (0.30 | ) | 21.34 | 15.46 | 3 | 1.17 | (0.07 | ) | 1.10 | (0.82 | ) | 76.3 | 55.38 | |||||||||||||||||||||||||||||||||||||||
2020 | 12.86 | (0.09 | ) | 6.17 | 6.08 | 0.00 | (0.19 | ) | (0.19 | ) | 18.75 | 47.40 | 3 | 1.73 | (0.63 | ) | 1.10 | (0.60 | ) | 26.8 | 35.84 | |||||||||||||||||||||||||||||||||||||||
2019 | 9.51 | (0.06 | ) | 3.41 | 3.35 | 0.00 | 0.00 | 0.00 | 12.86 | 35.23 | 3 | 2.80 | (1.70 | ) | 1.10 | (0.54 | ) | 5.0 | 68.10 | |||||||||||||||||||||||||||||||||||||||||
20181 | 10.00 | (0.04 | ) | (0.45 | ) | (0.49 | ) | 0.00 | 0.00 | 0.00 | 9.51 | (4.90 | )3,4 | 4.94 | 5 | (3.84 | )5 | 1.10 | 5 | (0.60 | )5 | 2.8 | 27.30 | 4 | ||||||||||||||||||||||||||||||||||||
INSTITUTIONAL SHARES |
| |||||||||||||||||||||||||||||||||||||||||||||||||||||||||||
Six Months Ended June 30, |
| |||||||||||||||||||||||||||||||||||||||||||||||||||||||||||
2022 | 21.54 | (0.01 | ) | (4.07 | ) | (4.08 | ) | 0.00 | 0.00 | 0.00 | 17.46 | (18.94 | )3,4 | 0.92 | 5 | (0.07 | )5 | 0.85 | 5 | (0.11 | )5 | 137.0 | 36.89 | 4 | ||||||||||||||||||||||||||||||||||||
Year Ended December 31, |
| |||||||||||||||||||||||||||||||||||||||||||||||||||||||||||
2021 | 18.88 | (0.12 | ) | 3.08 | 2.96 | 0.00 | (0.30 | ) | (0.30 | ) | 21.54 | 15.72 | 3 | 0.89 | (0.04 | ) | 0.85 | (0.57 | ) | 172.4 | 55.38 | |||||||||||||||||||||||||||||||||||||||
2020 | 12.92 | (0.05 | ) | 6.20 | 6.15 | 0.00 | (0.19 | ) | (0.19 | ) | 18.88 | 47.72 | 3 | 1.45 | (0.60 | ) | 0.85 | (0.31 | ) | 38.6 | 35.84 | |||||||||||||||||||||||||||||||||||||||
2019 | 9.53 | (0.03 | ) | 3.42 | 3.39 | 0.00 | 0.00 | 0.00 | 12.92 | 35.57 | 3 | 2.39 | (1.54 | ) | 0.85 | (0.28 | ) | 9.1 | 68.10 | |||||||||||||||||||||||||||||||||||||||||
20181 | 10.00 | (0.02 | ) | (0.45 | ) | (0.47 | ) | 0.00 | 0.00 | 0.00 | 9.53 | (4.70 | )3,4 | 4.06 | 5 | (3.21 | )5 | 0.85 | 5 | (0.33 | )5 | 4.5 | 27.30 | 4 | ||||||||||||||||||||||||||||||||||||
R6 SHARES |
| |||||||||||||||||||||||||||||||||||||||||||||||||||||||||||
Six Months Ended June 30, |
| |||||||||||||||||||||||||||||||||||||||||||||||||||||||||||
2022 | 21.54 | (0.01 | ) | (4.07 | ) | (4.08 | ) | 0.00 | 0.00 | 0.00 | 17.46 | (18.94 | )3,4 | 0.91 | 5 | (0.06 | )5 | 0.85 | 5 | (0.11 | )5 | 5.5 | 36.89 | 4 | ||||||||||||||||||||||||||||||||||||
Year Ended December 31, |
| |||||||||||||||||||||||||||||||||||||||||||||||||||||||||||
2021 | 18.87 | (0.12 | ) | 3.09 | 2.97 | 0.00 | (0.30 | ) | (0.30 | ) | 21.54 | 15.79 | 3 | 0.89 | (0.04 | ) | 0.85 | (0.57 | ) | 6.5 | 55.38 | |||||||||||||||||||||||||||||||||||||||
2020 | 12.91 | (0.04 | ) | 6.19 | 6.15 | 0.00 | (0.19 | ) | (0.19 | ) | 18.87 | 47.76 | 3 | 1.44 | (0.59 | ) | 0.85 | (0.25 | ) | 4.9 | 35.84 | |||||||||||||||||||||||||||||||||||||||
2019 | 9.52 | (0.03 | ) | 3.42 | 3.39 | 0.00 | 0.00 | 0.00 | 12.91 | 35.61 | 3 | 2.22 | (1.37 | ) | 0.85 | (0.28 | ) | 1.3 | 68.10 | |||||||||||||||||||||||||||||||||||||||||
20181 | 10.00 | (0.02 | ) | (0.46 | ) | (0.48 | ) | 0.00 | 0.00 | 0.00 | 9.52 | (4.80 | )3,4 | 3.14 | 5 | (2.29 | )5 | 0.85 | 5 | (0.32 | )5 | 0.7 | 27.30 | 4 | ||||||||||||||||||||||||||||||||||||
| 1 | For the period April 30, 2018 (commencement of operations) to December 31, 2018. |
| 2 | Based on average shares outstanding. |
| 3 | The total returns would have been lower had certain expenses not been reduced during the period shown. |
| 4 | Not Annualized. |
| 5 | Annualized. |
| 78 | See Notes to Financial Statements. |
| June 30, 2022 | Baron Select Funds |
FINANCIAL HIGHLIGHTS (Unaudited) (Continued)
BARON FINTECH FUND
Selected data for a share outstanding throughout each period:
| Income (loss) from investment operations: | Less distributions to shareholders from: | Ratios to Average Net Assets: | Supplemental Data: | |||||||||||||||||||||||||||||||||||||||||||||||||||||||||
Net asset | Net investment income (loss) ($)2 | Net realized and ($) | Total from | Net investment income ($) | Net realized | Total distributions ($) | Net asset value, end of period ($) | Total return (%) | Operating expenses (%) | Less: Reimbursement of expenses by Adviser (%) | Net operating expenses (%) | Net investment income (loss) (%) | Net assets (in millions), end of period ($) | Portfolio turnover rate (%) | ||||||||||||||||||||||||||||||||||||||||||||||
RETAIL SHARES |
| |||||||||||||||||||||||||||||||||||||||||||||||||||||||||||
Six Months Ended June 30, |
| |||||||||||||||||||||||||||||||||||||||||||||||||||||||||||
2022 | 16.90 | (0.04 | ) | (5.95 | ) | (5.99 | ) | 0.00 | 0.00 | 0.00 | 10.91 | (35.44 | )3,4 | 1.64 | 5,6 | (0.44 | )5 | 1.20 | 5 | (0.68 | )5 | 7.5 | 16.17 | 4 | ||||||||||||||||||||||||||||||||||||
Year Ended December 31, |
| |||||||||||||||||||||||||||||||||||||||||||||||||||||||||||
2021 | 14.69 | (0.14 | ) | 2.35 | 2.21 | 0.00 | 0.00 | 0.00 | 16.90 | 15.04 | 3 | 1.57 | (0.37 | ) | 1.20 | (0.85 | ) | 13.2 | 11.88 | |||||||||||||||||||||||||||||||||||||||||
20201 | 10.00 | (0.09 | ) | 4.78 | 4.69 | 0.00 | 0.00 | 0.00 | 14.69 | 46.90 | 3 | 3.09 | (1.89 | ) | 1.20 | (0.77 | ) | 6.4 | 8.12 | |||||||||||||||||||||||||||||||||||||||||
INSTITUTIONAL SHARES |
| |||||||||||||||||||||||||||||||||||||||||||||||||||||||||||
Six Months Ended June 30, |
| |||||||||||||||||||||||||||||||||||||||||||||||||||||||||||
2022 | 16.98 | (0.03 | ) | (5.98 | ) | (6.01 | ) | 0.00 | 0.00 | 0.00 | 10.97 | (35.39 | )3,4 | 1.21 | 5,6 | (0.26 | )5 | 0.95 | 5 | (0.42 | )5 | 30.4 | 16.17 | 4 | ||||||||||||||||||||||||||||||||||||
Year Ended December 31, |
| |||||||||||||||||||||||||||||||||||||||||||||||||||||||||||
2021 | 14.72 | (0.10 | ) | 2.36 | 2.26 | 0.00 | 0.00 | 0.00 | 16.98 | 15.35 | 3 | 1.18 | (0.23 | ) | 0.95 | (0.60 | ) | 58.5 | 11.88 | |||||||||||||||||||||||||||||||||||||||||
20201 | 10.00 | (0.07 | ) | 4.79 | 4.72 | 0.00 | 0.00 | 0.00 | 14.72 | 47.20 | 3 | 2.43 | (1.48 | ) | 0.95 | (0.54 | ) | 24.0 | 8.12 | |||||||||||||||||||||||||||||||||||||||||
R6 SHARES |
| |||||||||||||||||||||||||||||||||||||||||||||||||||||||||||
Six Months Ended June 30, |
| |||||||||||||||||||||||||||||||||||||||||||||||||||||||||||
2022 | 16.98 | (0.03 | ) | (5.97 | ) | (6.00 | ) | 0.00 | 0.00 | 0.00 | 10.98 | (35.34 | )3,4 | 1.20 | 5,6 | (0.25 | )5 | 0.95 | 5 | (0.43 | )5 | 4.3 | 16.17 | 4 | ||||||||||||||||||||||||||||||||||||
Year Ended December 31, |
| |||||||||||||||||||||||||||||||||||||||||||||||||||||||||||
2021 | 14.73 | (0.10 | ) | 2.35 | 2.25 | 0.00 | 0.00 | 0.00 | 16.98 | 15.28 | 3 | 1.18 | (0.23 | ) | 0.95 | (0.60 | ) | 6.6 | 11.88 | |||||||||||||||||||||||||||||||||||||||||
20201 | 10.00 | (0.06 | ) | 4.79 | 4.73 | 0.00 | 0.00 | 0.00 | 14.73 | 47.30 | 3 | 2.33 | (1.38 | ) | 0.95 | (0.53 | ) | 3.7 | 8.12 | |||||||||||||||||||||||||||||||||||||||||
| 1 | For the period January 2, 2020 (commencement of operations) to December 31, 2020. |
| 2 | Based on average shares outstanding. |
| 3 | The total returns would have been lower had certain expenses not been reduced during the period shown. |
| 4 | Not Annualized. |
| 5 | Annualized. |
| 6 | Interest expense rounds to less than 0.01%. |
| See Notes to Financial Statements. | 79 |
| Baron Select Funds | June 30, 2022 |
FINANCIAL HIGHLIGHTS (Unaudited) (Continued)
BARON NEW ASIA FUND
Selected data for a share outstanding throughout each period:
| Income (loss) from investment operations: | Less distributions to shareholders from: | Ratios to Average Net Assets: | Supplemental Data: | |||||||||||||||||||||||||||||||||||||||||||||||||||||||||
Net asset | Net investment income (loss) ($)2 | Net realized and unrealized gain (loss) ($) | Total from | Net investment income ($) | Net realized | Total distributions ($) | Net asset value, end of period ($) | Total return (%) | Operating expenses (%) | Less: Reimbursement of expenses by Adviser (%) | Net operating expenses (%) | Net investment income (loss) (%) | Net assets (in millions), end of period ($) | Portfolio turnover rate (%) | ||||||||||||||||||||||||||||||||||||||||||||||
RETAIL SHARES |
| |||||||||||||||||||||||||||||||||||||||||||||||||||||||||||
Six Months Ended June 30, |
| |||||||||||||||||||||||||||||||||||||||||||||||||||||||||||
2022 | 10.17 | (0.01 | ) | (2.24 | ) | (2.25 | ) | 0.00 | 0.00 | 0.00 | 7.92 | (22.12 | )3,4 | 9.15 | 6 | (7.70 | )6 | 1.45 | 6 | (0.33 | )6 | 1.0 | 34.09 | 4 | ||||||||||||||||||||||||||||||||||||
Period Ended December 31, |
| |||||||||||||||||||||||||||||||||||||||||||||||||||||||||||
20211 | 10.00 | (0.05 | ) | 0.22 | 0.17 | 0.00 | 0.00 | 0.00 | 10.17 | 1.70 | 3,4 | 10.06 | 5,6 | (8.61 | )5,6 | 1.45 | 5,6 | (1.25 | )6 | 1.3 | 14.32 | 4 | ||||||||||||||||||||||||||||||||||||||
INSTITUTIONAL SHARES |
| |||||||||||||||||||||||||||||||||||||||||||||||||||||||||||
Six Months Ended June 30, |
| |||||||||||||||||||||||||||||||||||||||||||||||||||||||||||
2022 | 10.17 | (0.00 | )7 | (2.23 | ) | (2.23 | ) | 0.00 | 0.00 | 0.00 | 7.94 | (21.93 | )3,4 | 6.13 | 6 | (4.93 | )6 | 1.20 | 6 | (0.06 | )6 | 2.8 | 34.09 | 4 | ||||||||||||||||||||||||||||||||||||
Period Ended December 31, |
| |||||||||||||||||||||||||||||||||||||||||||||||||||||||||||
20211 | 10.00 | (0.04 | ) | 0.21 | 0.17 | 0.00 | 0.00 | 0.00 | 10.17 | 1.70 | 3,4 | 8.59 | 5,6 | (7.39 | )5,6 | 1.20 | 5,6 | (1.00 | )6 | 3.2 | 14.32 | 4 | ||||||||||||||||||||||||||||||||||||||
R6 SHARES |
| |||||||||||||||||||||||||||||||||||||||||||||||||||||||||||
Six Months Ended June 30, |
| |||||||||||||||||||||||||||||||||||||||||||||||||||||||||||
2022 | 10.17 | (0.00 | )7 | (2.22 | ) | (2.22 | ) | 0.00 | 0.00 | 0.00 | 7.95 | (21.83 | )3,4 | 5.93 | 6 | (4.73 | )6 | 1.20 | 6 | (0.08 | )6 | 0.1 | 34.09 | 4 | ||||||||||||||||||||||||||||||||||||
Period Ended December 31, |
| |||||||||||||||||||||||||||||||||||||||||||||||||||||||||||
20211 | 10.00 | (0.04 | ) | 0.21 | 0.17 | 0.00 | 0.00 | 0.00 | 10.17 | 1.70 | 3,4 | 8.10 | 5,6 | (6.90 | )5,6 | 1.20 | 5,6 | (0.99 | )6 | 0.0 | 8 | 14.32 | 4 | |||||||||||||||||||||||||||||||||||||
| 1 | For the period July 30, 2021 (commencement of operations) to December 31, 2021. |
| 2 | Based on average shares outstanding. |
| 3 | The total returns would have been lower had certain expenses not been reduced during the period shown. |
| 4 | Not Annualized. |
| 5 | Certain fixed expenses incurred by the Fund were not annualized for the period ended December 31, 2021. |
| 6 | Annualized. |
| 7 | Less than $0.01 per share. |
| 8 | Amount represents less than $500,000. |
| 80 | See Notes to Financial Statements. |
| June 30, 2022 | Baron Select Funds |
FINANCIAL HIGHLIGHTS (Unaudited) (Continued)
BARON TECHNOLOGY FUND
Selected data for a share outstanding throughout each period:
| Income (loss) from investment operations: | Less distributions to shareholders from: | Ratios to Average Net Assets: | Supplemental Data: | |||||||||||||||||||||||||||||||||||||||||||||||||||||||||
| Net asset value, beginning of period ($) | Net investment income (loss) ($)2 | Net realized and unrealized gain (loss) ($) | Total from | Net investment income ($) | Net realized gain on investments ($) | Total distributions ($) | Net asset value, end of period ($) | Total return (%) | Operating expenses (%) | Less: Reimbursement of expenses by Adviser (%) | Net operating expenses (%) | Net investment income (loss) (%) | Net assets (in millions), end of period ($) | Portfolio turnover rate (%) | ||||||||||||||||||||||||||||||||||||||||||||||
RETAIL SHARES |
| |||||||||||||||||||||||||||||||||||||||||||||||||||||||||||
Six Months Ended June 30, |
| |||||||||||||||||||||||||||||||||||||||||||||||||||||||||||
20221 | 10.00 | (0.03 | ) | (3.78 | ) | (3.81 | ) | 0.00 | 0.00 | 0.00 | 6.19 | (38.10 | )3,4 | 9.06 | 6 | (7.86 | )5 | 1.20 | 5 | (0.82 | )5 | 1.7 | 7.80 | 4 | ||||||||||||||||||||||||||||||||||||
INSTITUTIONAL SHARES |
| |||||||||||||||||||||||||||||||||||||||||||||||||||||||||||
Six Months Ended June 30, |
| |||||||||||||||||||||||||||||||||||||||||||||||||||||||||||
20221 | 10.00 | (0.02 | ) | (3.79 | ) | (3.81 | ) | 0.00 | 0.00 | 0.00 | 6.19 | (38.10 | )3,4 | 8.61 | 6 | (7.66 | )5 | 0.95 | 5 | (0.56 | )5 | 1.7 | 7.80 | 4 | ||||||||||||||||||||||||||||||||||||
R6 SHARES |
| |||||||||||||||||||||||||||||||||||||||||||||||||||||||||||
Six Months Ended June 30, |
| |||||||||||||||||||||||||||||||||||||||||||||||||||||||||||
20221 | 10.00 | (0.02 | ) | (3.79 | ) | (3.81 | ) | 0.00 | 0.00 | 0.00 | 6.19 | (38.10 | )3,4 | 7.98 | 6 | (7.03 | )5 | 0.95 | 5 | (0.54 | )5 | 0.0 | 6 | 7.80 | 4 | |||||||||||||||||||||||||||||||||||
| 1 | For the period January 3, 2022 (commencement of operations) to June 30, 2022. |
| 2 | Based on average shares outstanding. |
| 3 | The total returns would have been lower had certain expenses not been reduced during the period shown. |
| 4 | Not Annualized. |
| 5 | Annualized. |
| 6 | Amount represents less than $500,000. |
| See Notes to Financial Statements. | 81 |
| Baron Select Funds | June 30, 2022 |
As a shareholder of the Funds, you incur ongoing expenses. Ongoing expenses include advisory fees, distribution and service (12b-1) fees and other Fund expenses. The information on this page is intended to help you understand your ongoing costs of investing in the Funds and to compare these costs with the ongoing costs of investing in other mutual funds.
The information in the following table is based on an investment of $1,000 invested on January 1, 2022 and held for the six months ended June 30, 2022.
ACTUAL EXPENSES
The table below titled “Based on Actual Total Return” provides information about actual account values and actual expenses. You may use the information provided in this table, together with the amount you invested, to estimate the expenses that you paid over the period. To estimate the expenses you paid on your account, divide your ending account value by $1,000 (for example, an $8,600 ending account value divided by $1,000 = 8.6), then multiply the result by the number under the heading titled “Expenses Paid During the Period.”
BASED ON ACTUAL TOTAL RETURN FOR THE SIX MONTHS ENDED JUNE 30, 20221
Actual Total Return | Beginning Account Value January 1, 2022 | Ending Account Value June 30, 2022 | Annualized Expense Ratio | Expenses Paid During the Period2 | ||||||||||||||||
Baron Partners Fund — Retail Shares | (34.68 | )% | $ | 1,000.00 | $ | 653.20 | 1.49 | %3 | $ | 6.11 | ||||||||||
Baron Partners Fund — Institutional Shares | (34.60 | )% | $ | 1,000.00 | $ | 654.00 | 1.23 | %3 | $ | 5.04 | ||||||||||
Baron Partners Fund — R6 Shares | (34.60 | )% | $ | 1,000.00 | $ | 654.00 | 1.23 | %3 | $ | 5.04 | ||||||||||
Baron Focused Growth Fund — Retail Shares | (26.44 | )% | $ | 1,000.00 | $ | 735.60 | 1.32 | % | $ | 5.68 | ||||||||||
Baron Focused Growth Fund — Institutional Shares | (26.34 | )% | $ | 1,000.00 | $ | 736.60 | 1.06 | % | $ | 4.56 | ||||||||||
Baron Focused Growth Fund — R6 Shares | (26.34 | )% | $ | 1,000.00 | $ | 736.60 | 1.06 | % | $ | 4.56 | ||||||||||
Baron International Growth Fund — Retail Shares | (28.57 | )% | $ | 1,000.00 | $ | 714.30 | 4 | 1.20 | %5 | $ | 5.10 | |||||||||
Baron International Growth Fund — Institutional Shares | (28.45 | )% | $ | 1,000.00 | $ | 715.50 | 4 | 0.95 | %5 | $ | 4.04 | |||||||||
Baron International Growth Fund — R6 Shares | (28.44 | )% | $ | 1,000.00 | $ | 715.60 | 4 | 0.95 | %5 | $ | 4.04 | |||||||||
Baron Real Estate Fund — Retail Shares | (29.25 | )% | $ | 1,000.00 | $ | 707.50 | 1.33 | % | $ | 5.63 | ||||||||||
Baron Real Estate Fund — Institutional Shares | (29.18 | )% | $ | 1,000.00 | $ | 708.20 | 1.07 | % | $ | 4.53 | ||||||||||
Baron Real Estate Fund — R6 Shares | (29.18 | )% | $ | 1.000.00 | $ | 708.20 | 1.07 | % | $ | 4.53 | ||||||||||
Baron Emerging Markets Fund — Retail Shares | (23.07 | )% | $ | 1,000.00 | $ | 769.30 | 1.38 | % | $ | 6.05 | ||||||||||
Baron Emerging Markets Fund — Institutional Shares | (22.98 | )% | $ | 1,000.00 | $ | 770.20 | 1.12 | % | $ | 4.92 | ||||||||||
Baron Emerging Markets Fund — R6 Shares | (22.97 | )% | $ | 1,000.00 | $ | 770.30 | 1.12 | % | $ | 4.92 | ||||||||||
Baron Global Advantage Fund — Retail Shares | (47.78 | )% | $ | 1,000.00 | $ | 522.20 | 4 | 1.15 | %5 | $ | 4.34 | |||||||||
Baron Global Advantage Fund — Institutional Shares | (47.72 | )% | $ | 1,000.00 | $ | 522.80 | 4 | 0.90 | %5 | $ | 3.40 | |||||||||
Baron Global Advantage Fund — R6 Shares | (47.71 | )% | $ | 1,000.00 | $ | 522.90 | 4 | 0.90 | %5 | $ | 3.40 | |||||||||
Baron Real Estate Income Fund — Retail Shares | (20.86 | )% | $ | 1,000.00 | $ | 791.40 | 4 | 1.05 | %5 | $ | 4.66 | |||||||||
Baron Real Estate Income Fund — Institutional Shares | (20.75 | )% | $ | 1,000.00 | $ | 792.50 | 4 | 0.80 | %5 | $ | 3.56 | |||||||||
Baron Real Estate Income Fund — R6 Shares | (20.85 | )% | $ | 1,000.00 | $ | 791.50 | 4 | 0.80 | %5 | $ | 3.55 | |||||||||
Baron Health Care Fund — Retail Shares | (19.03 | )% | $ | 1,000.00 | $ | 809.70 | 4 | 1.10 | %5 | $ | 4.94 | |||||||||
Baron Health Care Fund — Institutional Shares | (18.94 | )% | $ | 1,000.00 | $ | 810.60 | 4 | 0.85 | %5 | $ | 3.82 | |||||||||
Baron Health Care Fund — R6 Shares | (18.94 | )% | $ | 1,000.00 | $ | 810.60 | 4 | 0.85 | %5 | $ | 3.82 | |||||||||
Baron FinTech Fund — Retail Shares | (35.44 | )% | $ | 1,000.00 | $ | 645.60 | 4 | 1.20 | %5 | $ | 4.90 | |||||||||
Baron FinTech Fund — Institutional Shares | (35.39 | )% | $ | 1,000.00 | $ | 646.10 | 4 | 0.95 | %5 | $ | 3.88 | |||||||||
Baron FinTech Fund — R6 Shares | (35.34 | )% | $ | 1,000.00 | $ | 646.60 | 4 | 0.95 | %5 | $ | 3.88 | |||||||||
Baron New Asia Fund — Retail Shares | (22.12 | )% | $ | 1,000.00 | $ | 778.80 | 4 | 1.45 | %5 | $ | 6.40 | |||||||||
Baron New Asia Fund — Institutional Shares | (21.93 | )% | $ | 1,000.00 | $ | 780.70 | 4 | 1.20 | %5 | $ | 5.30 | |||||||||
Baron New Asia Fund — R6 Shares | (21.83 | )% | $ | 1,000.00 | $ | 781.70 | 4 | 1.20 | %5 | $ | 5.30 | |||||||||
Baron Technology Fund — Retail Shares | (38.10 | )% | $ | 1,000.00 | $ | 619.00 | 4 | 1.20 | %5 | $ | 4.82 | |||||||||
Baron Technology Fund — Institutional Shares | (38.10 | )% | $ | 1,000.00 | $ | 619.00 | 4 | 0.95 | %5 | $ | 3.81 | |||||||||
Baron Technology Fund — R6 Shares | (38.10 | )% | $ | 1,000.00 | $ | 619.00 | 4 | 0.95 | %5 | $ | 3.81 | |||||||||
| 1 | Assumes reinvestment of all dividends and capital gain distributions, if any. |
| 2 | Expenses are equal to each share class’ respective annualized expense ratio multiplied by the average account value over the period, multiplied by the number of days in the most recent fiscal half-year, then divided by 365. |
| 3 | Annualized expense ratio for Baron Partners Fund for the six months ended June 30, 2022, includes 1.30%, 1.04% and 1.04% for net operating expenses and 0.19%, 0.19% and 0.19% for interest expense for the Retail, Institutional and R6 Shares, respectively. |
| 4 | Ending account value assumes the return earned after waiver and would have been lower if a portion of the expenses had not been waived. |
| 5 | Annualized expense ratios are adjusted to reflect fee waiver. |
82
| June 30, 2022 | Baron Select Funds |
FUND EXPENSES (Unaudited) (Continued)
HYPOTHETICAL EXAMPLE FOR COMPARISON PURPOSES
The table below titled “Based on Hypothetical Total Return” provides information about hypothetical account values and hypothetical expenses based on the actual expense ratio and an assumed rate of return of 5% per year before expenses, which is not the Funds’ actual return. The hypothetical account values and expenses may not be used to estimate the actual ending account values and expenses you paid for the period. You may use the information provided in this table to compare the ongoing costs of investing in the Funds and other funds. To do so, compare the 5% hypothetical example relating to the Funds with the 5% hypothetical examples that appear in the shareholder reports of other funds.
BASED ON HYPOTHETICAL TOTAL RETURN FOR THE SIX MONTHS ENDED JUNE 30, 2022
Hypothetical Annualized Total Return | Beginning Account Value January 1, 2022 | Ending Account Value June 30, 2022 | Annualized Expense Ratio | Expenses Paid During the Period2 | ||||||||||||||||
Baron Partners Fund — Retail Shares | 5.00 | % | $ | 1,000.00 | $ | 1,017.41 | 1.49 | %3 | $ | 7.45 | ||||||||||
Baron Partners Fund — Institutional Shares | 5.00 | % | $ | 1,000.00 | $ | 1,018.70 | 1.23 | %3 | $ | 6.16 | ||||||||||
Baron Partners Fund — R6 Shares | 5.00 | % | $ | 1,000.00 | $ | 1,018.70 | 1.23 | %3 | $ | 6.16 | ||||||||||
Baron Focused Growth Fund — Retail Shares | 5.00 | % | $ | 1,000.00 | $ | 1,018.25 | 1.32 | % | $ | 6.61 | ||||||||||
Baron Focused Growth Fund — Institutional Shares | 5.00 | % | $ | 1,000.00 | $ | 1,019.54 | 1.06 | % | $ | 5.31 | ||||||||||
Baron Focused Growth Fund – R6 Shares | 5.00 | % | $ | 1,000.00 | $ | 1,019.54 | 1.06 | % | $ | 5.31 | ||||||||||
Baron International Growth Fund — Retail Shares | 5.00 | % | $ | 1,000.00 | $ | 1,018.84 | 4 | 1.20 | %5 | $ | 6.01 | |||||||||
Baron International Growth Fund — Institutional Shares | 5.00 | % | $ | 1,000.00 | $ | 1,020.08 | 4 | 0.95 | %5 | $ | 4.76 | |||||||||
Baron International Growth Fund — R6 Shares | 5.00 | % | $ | 1,000.00 | $ | 1,020.08 | 4 | 0.95 | %5 | $ | 4.76 | |||||||||
Baron Real Estate Fund — Retail Shares | 5.00 | % | $ | 1,000.00 | $ | 1,018.20 | 1.33 | % | $ | 6.66 | ||||||||||
Baron Real Estate Fund — Institutional Shares | 5.00 | % | $ | 1,000.00 | $ | 1,019.49 | 1.07 | % | $ | 5.36 | ||||||||||
Baron Real Estate Fund — R6 Shares | 5.00 | % | $ | 1,000.00 | $ | 1,019.49 | 1.07 | % | $ | 5.36 | ||||||||||
Baron Emerging Markets Fund — Retail Shares | 5.00 | % | $ | 1,000.00 | $ | 1,017.95 | 1.38 | % | $ | 6.90 | ||||||||||
Baron Emerging Markets Fund — Institutional Shares | 5.00 | % | $ | 1,000.00 | $ | 1,019.24 | 1.12 | % | $ | 5.61 | ||||||||||
Baron Emerging Markets Fund — R6 Shares | 5.00 | % | $ | 1,000.00 | $ | 1,019.24 | 1.12 | % | $ | 5.61 | ||||||||||
Baron Global Advantage Fund — Retail Shares | 5.00 | % | $ | 1,000.00 | $ | 1,019.09 | 4 | 1.15 | %5 | $ | 5.76 | |||||||||
Baron Global Advantage Fund — Institutional Shares | 5.00 | % | $ | 1,000.00 | $ | 1,020.33 | 4 | 0.90 | %5 | $ | 4.51 | |||||||||
Baron Global Advantage Fund — R6 Shares | 5.00 | % | $ | 1,000.00 | $ | 1,020.33 | 4 | 0.90 | %5 | $ | 4.51 | |||||||||
Baron Real Estate Income Fund — Retail Shares | 5.00 | % | $ | 1,000.00 | $ | 1,019.59 | 4 | 1.05 | %5 | $ | 5.26 | |||||||||
Baron Real Estate Income Fund — Institutional Shares | 5.00 | % | $ | 1,000.00 | $ | 1,020.83 | 4 | 0.80 | %5 | $ | 4.01 | |||||||||
Baron Real Estate Income Fund — R6 Shares | 5.00 | % | $ | 1,000.00 | $ | 1,020.83 | 4 | 0.80 | %5 | $ | 4.01 | |||||||||
Baron Health Care Fund — Retail Shares | 5.00 | % | $ | 1,000.00 | $ | 1,019.34 | 4 | 1.10 | %5 | $ | 5.51 | |||||||||
Baron Health Care Fund — Institutional Shares | 5.00 | % | $ | 1,000.00 | $ | 1,020.58 | 4 | 0.85 | %5 | $ | 4.26 | |||||||||
Baron Health Care Fund — R6 Shares | 5.00 | % | $ | 1,000.00 | $ | 1,020.58 | 4 | 0.85 | %5 | $ | 4.26 | |||||||||
Baron FinTech Fund — Retail Shares | 5.00 | % | $ | 1,000.00 | $ | 1,018.84 | 4 | 1.20 | %5 | $ | 6.01 | |||||||||
Baron FinTech Fund — Institutional Shares | 5.00 | % | $ | 1,000.00 | $ | 1,020.08 | 4 | 0.95 | %5 | $ | 4.76 | |||||||||
Baron FinTech Fund — R6 Shares | 5.00 | % | $ | 1,000.00 | $ | 1,020.08 | 4 | 0.95 | %5 | $ | 4.76 | |||||||||
Baron New Asia Fund — Retail Shares | 5.00 | % | $ | 1,000.00 | $ | 1,017.60 | 4 | 1.45 | %5 | $ | 7.25 | |||||||||
Baron New Asia Fund — Institutional Shares | 5.00 | % | $ | 1,000.00 | $ | 1,018.84 | 4 | 1.20 | %5 | $ | 6.01 | |||||||||
Baron New Asia Fund — R6 Shares | 5.00 | % | $ | 1,000.00 | $ | 1,018.84 | 4 | 1.20 | %5 | $ | 6.01 | |||||||||
Baron Technology Fund — Retail Shares | 5.00 | % | $ | 1,000.00 | $ | 1,018.84 | 4 | 1.20 | %5 | $ | 6.01 | |||||||||
Baron Technology Fund — Institutional Shares | 5.00 | % | $ | 1,000.00 | $ | 1,020.08 | 4 | 0.95 | %5 | $ | 4.76 | |||||||||
Baron Technology Fund — R6 Shares | 5.00 | % | $ | 1,000.00 | $ | 1,020.08 | 4 | 0.95 | %5 | $ | 4.76 | |||||||||
| 1 | Assumes reinvestment of all dividends and capital gain distributions, if any. |
| 2 | Expenses are equal to each share class’ respective annualized expense ratio multiplied by the average account value over the period, multiplied by the number of days in the most recent fiscal half-year, then divided by 365. |
| 3 | Annualized expense ratio for Baron Partners Fund for the six months ended June 30, 2022, includes 1.30%, 1.04% and 1.04% for net operating expenses and 0.19%, 0.19% and 0.19% for interest expense for the Retail, Institutional and R6 Shares, respectively. |
| 4 | Ending account value assumes the return earned after waiver and would have been lower if a portion of the expenses had not been waived. |
| 5 | Annualized expense ratios are adjusted to reflect fee waiver. |
83
| Baron Select Funds | June 30, 2022 |
DISCLOSURE REGARDING THE APPROVAL OF THE INVESTMENT ADVISORY AGREEMENTS BY THE BOARD OF TRUSTEES (Unaudited)
The Board of Trustees (the “Board”) of Baron Select Funds (the “Trust”) met on May 17, 2022 to discuss the selection of BAMCO, Inc. (the “Adviser”) as the investment adviser and the approval of the investment advisory agreements for Baron Partners Fund, Baron Focused Growth Fund, Baron International Growth Fund, Baron Real Estate Fund, Baron Emerging Markets Fund, Baron Global Advantage Fund, Baron Real Estate Income Fund, Baron Health Care Fund, Baron FinTech Fund, and Baron New Asia Fund (each, a “Fund” and collectively, the “Funds”). The members of the Board who are not “interested persons” (as defined in the Investment Company Act of 1940, as amended) of the Trust (the “Independent Trustees”) met in a separate session to discuss and consider the renewal of the investment advisory agreements for the Funds. Representatives of Broadridge Financial Solutions, Inc. (“Broadridge”), an independent provider of investment company data, provided reports to the Board and attended the Board meeting. The Trustees received a substantial amount of information from the Adviser and from Broadridge, and were advised by independent legal counsel. Based on its evaluation of this and other information, the Board, including a majority of the Independent Trustees, approved the continuation of the investment advisory agreements for the Funds for an additional one-year period.
In reaching its determination, the Board considered various factors that it deemed relevant, including the factors listed below.
1. NATURE, EXTENT AND QUALITY OF SERVICES
The Trustees considered the information provided, including, for many, their experience and knowledge gained from their service as Trustees and their experience generally, including the following, which they had considered in past years and remained, in their thinking, material to their consideration:
| • | Their confidence in the senior personnel, portfolio management, the financial condition of the Adviser and its affiliates and the Adviser’s available resources; |
| • | The nature, extent and quality of the services provided by the Adviser, including: intensive devotion to research, selection of broker/dealers for Fund portfolio transactions, relationships with and supervision of third party service providers, such as the Funds’ custodian and transfer agent, the quality of shareholder reports, the ability to monitor adherence to investment guidelines and restrictions, the legal, accounting and compliance services provided to the Funds and the support services provided to the Board; |
| • | The Adviser’s investment principles and processes and the historical (and recent negative) performance of the Funds as compared to similar funds managed by other advisers and other funds managed by the Adviser over comparable periods; |
| • | The advisory fees and total expense ratios of the Funds and comparisons to similar funds managed by other advisers over comparable periods. They observed that, for most of the Funds, while the advisory fee was comparatively higher, the net operating expenses paid by the Funds (total expense ratio) were within the range of those of the funds in their respective peer groups; and |
| • | Additional services provided by the Adviser. |
The Board concluded that the nature, extent and quality of the services the Adviser provides to each Fund, including performance consistent with its investing principles, supported approval of the investment advisory agreement for each Fund.
2. INVESTMENT PERFORMANCE OF THE FUNDS AND THE ADVISER
As part of its consideration of the investment performance of the Funds and the Adviser, the Board took into account the analyses performed by and discussed with representatives of Broadridge. The Board considered for each Fund, among other information, Broadridge’s comparisons of the expense ratio and contractual advisory fee with those of peer group funds selected by Broadridge and Morningstar category medians. The Board also considered, among other performance information, Broadridge’s comparisons of each Fund’s annualized total return and related risk metrics over one-, three-, five- and ten-year periods, where applicable, against peer group funds and Morningstar category medians. After considering all the information, the Board concluded that the Adviser continued to invest in accordance with its long-standing principles and that each Fund’s performance remained consistent with expectations for the Adviser’s investment style, in light of recent market conditions.
3. COSTS OF SERVICES PROVIDED AND PROFITS TO BE REALIZED BY THE ADVISER
The Board considered comparisons of the advisory fees charged and services provided by the Adviser and its investment adviser affiliate to sub-advised accounts and separately managed accounts. The Board considered that, while the advisory fees for the other clients are the same as, or lower than, the fees for the Funds, the Adviser or its affiliate performs significantly fewer services for those clients compared with those provided by the Adviser to the Funds. The Board also considered a profitability analysis prepared by the Adviser and discussed with the representatives of the Adviser that the Adviser has continued to invest in quality personnel, systems and facilities, and otherwise continued to invest in its business, irrespective of fund flows.
The Board also considered benefits that accrue to the Adviser and its affiliates from their relationship with the Funds. The Board considered the costs of portfolio management, including the types of investments made for the Funds, the personnel and systems necessary for implementation of investment strategies, and the pre-tax profits realized by the Adviser and its affiliates from their relationship with the Funds.
4. ECONOMIES OF SCALE AND BENEFITS TO INVESTORS
The Board considered the extent to which each Fund’s advisory fee reflected economies of scale for the benefit of Fund shareholders, appreciating that the economies of scale analysis is predicated on generally predictable increasing assets and noting the small size of certain Funds and the significant fluctuation in assets in recent years. The Board considered that small- and mid-cap investment strategies require more attention by the Adviser than a strategy that involves other types of investing, particularly as asset size increases. The Board considered that the Adviser was continuing to grow and upgrade its staff and invest in its business. The Board members reiterated their intention to continue to consider the extent of economies of scale, asset growth and the Adviser’s plans to invest further to support the Funds.
The Board concluded that the advisory fee for each Fund was supported by the entirety of the presentation and particularly in light of the services provided as discussed at this meeting.
After due consideration of the above-enumerated factors and other factors it deemed relevant, the Board, including a majority of the Independent Trustees, approved the continuance of each Fund’s investment advisory agreement.
84
Privacy Notice
The Fund collects nonpublic personal information about you from the following sources:
| ∎ | Information we receive from you on applications or other forms; |
| ∎ | Information about your transactions with us, our Adviser or others; and |
| ∎ | Information we receive from third parties, such as credit reporting agencies. |
“Nonpublic personal information” is private information about you that we obtain in connection with providing a financial product or service to you.
We may share your name and address with other Baron Funds and the Adviser and its affiliates for the purpose of sending you information about our products that we believe may be of interest to you and informing you of our upcoming Baron Investment Conference and for sending required information.
We do not disclose any nonpublic personal information about our customers to anyone, except as permitted or required by law. Examples of permitted disclosures under the law include sharing with companies that work for us to provide you services, such as the Transfer Agent or mailing house. All such companies that act on our behalf are contractually obligated to keep the information that we provide to them confidential and to use the information only to provide the services that we have asked them to perform for you and us.
We restrict access to nonpublic information about you to those employees who need to know that information to provide products or services to you. We maintain physical, electronic and procedural safeguards to guard your nonpublic personal information.
This privacy notice is also available at all times on the Baron Funds® website, www.BaronFunds.com or by calling 1-800-99BARON.
Go Paperless!
It’s fast, simple and a smart way to help the environment.
Enjoy the speed and convenience of receiving Fund documents electronically.
For more information, and to enroll today, go to www.baronfunds.com/edelivery.
767 Fifth Avenue, 49th Fl.
New York, NY 10153
1.800.99.BARON
212-583-2000
www.BaronFunds.com
JUNE 22
June 30, 2022
Baron Funds
Baron WealthBuilder Fund
Semi-Annual Financial Report
| Ticker Symbols: | ||||
Retail Shares: BWBFX | ||||
TA Shares: BWBTX | ||||
Institutional Shares: BWBIX | ||||
| Performance | 3 | |||
| Country Exposures | 4 | |||
| Sector Exposures | 4 | |||
| Management’s Discussion of Fund Performance | 4 | |||
| Financial Statements | ||||
| Statement of Net Assets | 5 | |||
| Statement of Assets and Liabilities | 6 | |||
| Statement of Operations | 7 | |||
| Statements of Changes in Net Assets | 8 | |||
| Notes to Financial Statements | 9 | |||
| Financial Highlights | 14 | |||
| Fund Expenses | 15 | |||
| Disclosure Regarding the Approval of the Investment Advisory Agreement for Baron WealthBuilder Fund by the Board of Trustees | 16 | |||
DEAR BARON WEALTHBUILDER FUND SHAREHOLDER:
In this report, you will find unaudited financial statements for Baron WealthBuilder Fund (the “Fund”) for the six months ended June 30, 2022. The U.S. Securities and Exchange Commission (the “SEC”) requires mutual funds to furnish these statements semi-annually to their shareholders. We hope you find these statements informative and useful.
We thank you for choosing to join us as fellow shareholders in Baron Funds. We will continue to work hard to justify your confidence.
Sincerely,
 |  |  | ||
Ronald Baron Chief Executive Officer August 25, 2022 | Linda S. Martinson Chairman, President and Chief Operating Officer August 25, 2022 | Peggy Wong Treasurer and Chief Financial Officer August 25, 2022 |
This Semi-Annual Financial Report is for the Baron WealthBuilder Fund. If you are interested in the other series of Baron Select Funds, which contains the Baron Partners Fund, Baron Focused Growth Fund, Baron International Growth Fund, Baron Real Estate Fund, Baron Emerging Markets Fund, Baron Global Advantage Fund, Baron Real Estate Income Fund, Baron Health Care Fund, Baron FinTech Fund, Baron New Asia Fund, and Baron Technology Fund or Baron Investment Funds Trust, which contains the Baron Asset Fund, Baron Growth Fund, Baron Small Cap Fund, Baron Opportunity Fund, Baron Fifth Avenue Growth Fund, Baron Discovery Fund, and Baron Durable Advantage Fund, please visit the Funds’ website at www.BaronFunds.com or contact us at 1-800-99BARON.
The Funds’ Proxy Voting Policy is available without charge and can be found on the Funds’ website at www.BaronFunds.com, by clicking on the “Regulatory Documents” link at the bottom left corner of the homepage or by calling 1-800-99BARON and on the SEC’s website at www.sec.gov. The Funds’ most current proxy voting record, Form N-PX, is also available on the Funds’ website and on the SEC’s website.
The Funds file their complete schedules of portfolio holdings with the SEC for the first and third quarters of each fiscal year as an exhibit to their reports on Form N-PORT. The Funds’ Form N-PORT reports are available on the SEC’s website at www.sec.gov. Schedules of portfolio holdings current to the most recent quarter are also available on the Funds’ website.
Some of the comments contained in this report are based on current management expectations and are considered “forward-looking statements.” Actual future results, however, may prove to be different from our expectations. You can identify forward-looking statements by words such as “estimate,” “may,” “expect,” “should,” “could,” “believe,” “plan”, and other similar terms. We cannot promise future returns and our opinions are a reflection of our best judgment at the time this report is compiled.
The views expressed in this report reflect those of BAMCO, Inc. (“BAMCO” or the “Adviser”) only through the end of the period stated in this report. The views are not intended as recommendations or investment advice to any person reading this report and are subject to change at any time without notice based on market and other conditions.
Past performance is no guarantee of future results. The investment return and principal value of an investment will fluctuate; an investor’s shares, when redeemed, may be worth more or less than their original cost. For more complete information about Baron Funds, including charges and expenses, call, write or go to www.BaronFunds.com for a prospectus or summary prospectus. Read them carefully before you invest or send money. This report is not authorized for use as an offer of sale or a solicitation of an offer to buy shares of the Fund, unless accompanied or preceded by the Fund’s current prospectus or summary prospectus.

| Baron WealthBuilder Fund | June 30, 2022 |
Baron WealthBuilder Fund is an open end, no-load mutual fund that invests only in shares of individual Baron mutual funds ("Baron Funds"). Long-term capital appreciation is its objective. It is not a target date fund.
| 1. | Baron WealthBuilder Fund’s objective is to provide investors with a diversified portfolio of Baron Funds that will outperform its benchmark index over the long term, although we cannot guarantee it will meet its objective. |
| 2. | Baron WealthBuilder Fund’s minimum initial investment is $2,000, making it suitable for periodic purchases. |
| 3. | Baron WealthBuilder Fund has no management fee, but it will indirectly bear its pro-rata share of the expenses of the Baron Funds in which it invests (acquired funds). |
| 4. | Baron WealthBuilder Fund’s annual operating expenses are capped at 5 bps per year for TA Shares (available directly through Baron Funds) and Institutional Shares. Retail Shares operating expenses are capped at 30 bps per year. Portfolio transaction costs, interest, dividend, acquired fund fees and expenses are not subject to the operating expense limitation. |
Several criteria, including our qualitative assessments, are used to continually determine Baron WealthBuilder Fund allocations among Baron Funds.
Among the criteria are: (a) absolute performance; (b) excess performance vs. benchmark; (c) performance standard deviation (a measure of risk); (d) Sharpe ratio (a measure of performance per unit of risk); (e) beta (a measure of a fund’s sensitivity to market movements); (f) alpha (a measure of excess return given level of risk as measured by beta); (g) portfolio turnover; (h) growth rates of portfolio investments; (i) fund size; and (j) manager tenure.
As of June 30, 2022, the five largest Baron Funds represented 60.4% of Baron WealthBuilder Fund’s net assets.
Ronald Baron, CEO of Baron Capital is the lead portfolio manager of Baron WealthBuilder Fund. Michael Baron, Vice President, is the co-portfolio manager.
2
| June 30, 2022 (Unaudited) | Baron WealthBuilder Fund |
COMPARISONOFTHECHANGEIN VALUEOF $10,000INVESTMENTIN BARON WEALTHBUILDER FUND (RETAIL SHARES)
INRELATIONTOTHE S&P 500 INDEXANDTHE MSCI ACWI INDEX
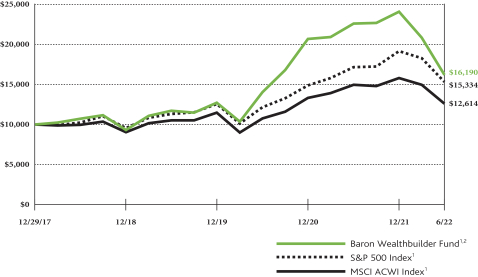
| AVERAGE ANNUAL TOTAL RETURNSFORTHEPERIODSENDED JUNE 30, 2022 |
| |||||||||||||||
| Six Months* | One Year | Three Years | Since Inception (December 29, 2017) | |||||||||||||
Baron WealthBuilder Fund — Retail Shares1, 2 | (32.75)% | (28.33)% | 11.29% | 11.30% | ||||||||||||
Baron WealthBuilder Fund — TA Shares1, 2 | (32.67)% | (28.18)% | 11.56% | 11.54% | ||||||||||||
Baron WealthBuilder Fund — Institutional Shares1, 2 | (32.63)% | (28.13)% | 11.59% | 11.56% | ||||||||||||
S&P 500 Index1 | (19.96)% | (10.62)% | 10.60% | 9.97% | ||||||||||||
MSCI ACWI Index1 | (20.18)% | (15.75)% | 6.21% | 5.30% | ||||||||||||
| * | Not Annualized. |
| 1 | The S&P 500 Index measures the performance of 500 widely held large cap U.S. companies. The MSCI ACWI Index is an unmanaged, free float-adjusted market capitalization weighted index reflected in U.S. dollars that measures the equity market performance of large- and mid-cap securities across developed and emerging markets, including the United States. MSCI is the source and owner of the trademarks, service marks and copyrights related to the MSCI Indexes. The Indexes and Baron WealthBuilder Fund are with dividends, which positively impact the performance results. The MSCI ACWI Index is net of foreign withholding taxes. The indexes are unmanaged. The index performance is not fund performance; one cannot invest directly into an index. |
| 2 | Past performance is not predictive of future performance. The performance data does not reflect the deduction of taxes that a shareholder would pay on Fund distributions or redemption of Fund shares. The Adviser has agreed that, pursuant to a contract expiring on August 29, 2032, unless renewed for another 11-year term, it will reimburse certain expenses of the Fund, limiting net annual operating expenses (portfolio transaction costs, interest, dividend, acquired fund fees and expenses and extraordinary expense are not subject to the operating expense limitation) to 0.30% of average daily net assets of Retail Shares, 0.05% of average daily net assets of Institutional shares and 0.05% of average daily net assets of TA shares, without which performance would have been lower. |
3
| Baron WealthBuilder Fund (Unaudited) | June 30, 2022 |
COUNTRY EXPOSURES THROUGH BARON UNDERLYING FUNDSASOF JUNE 30, 2022
| Percent of Net Assets | ||||
United States | 86.0% | |||
United Kingdom | 1.9% | |||
China | 1.9% | |||
Netherlands | 1.6% | |||
Canada | 1.3% | |||
India | 1.2% | |||
Sweden | 0.7% | |||
Ireland | 0.6% | |||
Korea | 0.5% | |||
Brazil | 0.4% | |||
Other | 2.9% | |||
Cash and Cash Equivalents | 1.0% | |||
| 100.0% | ||||
SECTOR EXPOSURES THROUGH BARON UNDERLYING FUNDSASOF JUNE 30, 2022†
(as a percentage of net assets)
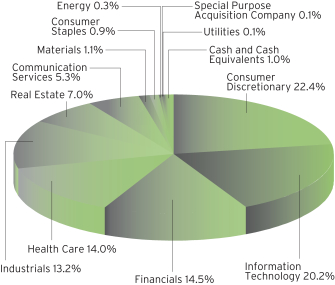
MANAGEMENT’S DISCUSSIONOF FUND PERFORMANCE
For the six months ended June 30, 2022, Baron WealthBuilder Fund1 declined 32.75%, underperforming the S&P 500 Index, which retreated 19.96%.
Baron WealthBuilder Fund is a diversified fund that invests exclusively in other Baron mutual funds. At any given time, it invests in the securities of a select number of Baron mutual funds representing specific investment strategies. The Fund can invest in funds holding U.S. and international stocks; small-cap, small- to mid-cap, mid-cap, large-cap, all-cap stocks; and sector stocks. Baron WealthBuilder Fund normally invests in a variety of domestic and international equity funds. It seeks to invest in businesses it believes have significant opportunities for growth, durable competitive advantages, exceptional management, and an attractive valuation. Of course, there can be no assurance that we will be successful in achieving the Fund’s investment goals.
After robust performance over the prior two years, stocks declined meaningfully to start 2022. All asset classes were adversely impacted by a hawkish outlook from the Federal Reserve, which is decisively raising interest rates to combat faster-than-expected inflation. Investors continued to debate how higher interest rates, elevated core inflation, persistently high fuel prices, and a stronger dollar will impact short-term GDP growth. Efforts at forecasting are further compounded by still-stretched supply chains, lingering COVID impacts in China and other geographies, and the ongoing war in the Ukraine.
No sector contributed. Consumer Discretionary, Information Technology, and Health Care detracted the most.
No country contributed. The U.S., Canada, and the U.K. detracted the most.
No Fund contributed. Baron Partners Fund detracted the most.
While we are certainly aware of current events that move the markets, we do not invest based on our insights into short-term macroeconomic, political, or public health issues. We adhere to our time-tested approach, investing for the long term in businesses that we believe will benefit from secular growth trends, durable competitive advantages, and best-in-class management. We remain optimistic that this approach will generate strong long-term performance regardless of the economic climate.
| † | Sector levels are provided from the Global Industry Classification Standard (“GICS”), developed and exclusively owned by MSCI, Inc. and Standard & Poor’s Financial Services LLC, unless otherwise stated that they have been reclassified or classified by the Adviser. All GICS data is provided “as is” with no warranties. Individual weights may not sum to 100% due to rounding. |
| 1 | Performance information reflects results of the Retail Shares. |
4
| June 30, 2022 | Baron WealthBuilder Fund |
STATEMENT OF NET ASSETS (Unaudited)
JUNE 30, 2022
|
| Shares | Cost | Value | ||||||||||
| Affiliated Mutual Funds (100.01%) | ||||||||||||
| Small Cap Funds (31.00%) | ||||||||||||
| 831,119 | Baron Discovery Fund — Institutional Shares | $ | 25,355,663 | $ | 18,949,509 | |||||||
| 688,314 | Baron Growth Fund — Institutional Shares | 69,232,392 | 59,002,305 | |||||||||
| 1,888,086 | Baron Small Cap Fund — Institutional Shares | 69,678,847 | 52,394,382 | |||||||||
|
|
|
| |||||||||
Total Small Cap Funds | 164,266,902 | 130,346,196 | ||||||||||
|
|
|
| |||||||||
| Small to Mid Cap Funds (6.38%) | ||||||||||||
| 790,296 | Baron Focused Growth Fund — Institutional Shares | 27,646,590 | 26,830,545 | |||||||||
|
|
|
| |||||||||
| Mid Cap Funds (12.97%) | ||||||||||||
| 653,734 | Baron Asset Fund — Institutional Shares | 68,022,977 | 54,547,558 | |||||||||
|
|
|
| |||||||||
| Large Cap Funds (6.49%) | ||||||||||||
| 672,280 | Baron Durable Advantage Fund — Institutional Shares | 10,651,649 | 10,494,294 | |||||||||
| 550,258 | Baron Fifth Avenue Growth Fund — Institutional Shares | 23,647,979 | 16,771,850 | |||||||||
|
|
|
| |||||||||
Total Large Cap Funds | 34,299,628 | 27,266,144 | ||||||||||
|
|
|
| |||||||||
| All Cap Funds (18.64%) | ||||||||||||
| 650,380 | Baron Opportunity Fund — Institutional Shares | 20,223,219 | 17,482,225 | |||||||||
| 452,041 | Baron Partners Fund — Institutional Shares | 42,385,686 | 60,885,381 | |||||||||
|
|
|
| |||||||||
Total All Cap Funds | 62,608,905 | 78,367,606 | ||||||||||
|
|
|
| |||||||||
| International Funds (10.51%) | ||||||||||||
| 1,100,336 | Baron Emerging Markets Fund — Institutional Shares | 18,150,509 | 14,898,547 | |||||||||
| 607,771 | Baron Global Advantage Fund — Institutional Shares | 25,689,924 | 16,744,091 | |||||||||
| 518,021 | Baron International Growth Fund — Institutional Shares | 15,265,524 | 12,556,836 | |||||||||
|
|
|
| |||||||||
Total International Funds | 59,105,957 | 44,199,474 | ||||||||||
|
|
|
| |||||||||
| Sector Funds (14.02%) | ||||||||||||
| 957,257 | Baron FinTech Fund — Institutional Shares | 13,717,884 | 10,510,677 | |||||||||
| 783,708 | Baron Health Care Fund — Institutional Shares | 14,194,087 | 13,683,534 | |||||||||
| 833,231 | Baron Real Estate Fund — Institutional Shares | 29,141,143 | 24,413,667 | |||||||||
| 726,871 | Baron Real Estate Income Fund — Institutional Shares | 11,947,091 | 10,350,639 | |||||||||
|
|
|
| |||||||||
Total Sector Funds | 69,000,205 | 58,958,517 | ||||||||||
|
|
|
| |||||||||
Total Affiliated Investments (100.01%) | $ | 484,951,164 | 420,516,040 | |||||||||
|
| |||||||||||
Liabilities Less Cash and Other Assets (-0.01%) | (40,114 | ) | ||||||||||
|
| |||||||||||
Net Assets | $ | 420,475,926 | ||||||||||
|
| |||||||||||
Retail Shares (Equivalent to $14.50 per share based on 5,247,817 shares outstanding) | $ | 76,097,119 | ||||||||||
|
| |||||||||||
TA Shares (Equivalent to $14.65 per share based on 2,437,432 shares outstanding) | $ | 35,713,985 | ||||||||||
|
| |||||||||||
Institutional Shares (Equivalent to $14.66 per share based on 21,059,883 shares outstanding) | $ | 308,664,822 | ||||||||||
|
| |||||||||||
| % | Represents percentage of net assets. |
All Affiliated Mutual Funds are Level 1.
| See Notes to Financial Statements. | 5 |
| Baron WealthBuilder Fund | June 30, 2022 |
STATEMENT OF ASSETS AND LIABILITIES (Unaudited)
JUNE 30, 2022
|
Assets: | ||||
Investments in Affiliated Mutual Funds, at value* | $ | 420,516,040 | ||
Receivable for shares sold | 548,851 | |||
Dividends and interest receivable | 30,958 | |||
Prepaid expenses | 3,565 | |||
|
| |||
| 421,099,414 | ||||
|
| |||
Liabilities: | ||||
Due to custodian bank | 208,145 | |||
Payable for securities purchased | 253,775 | |||
Payable for shares redeemed | 86,930 | |||
Distribution fees payable (Note 4) | 277 | |||
Accrued expenses and other payables | 74,361 | |||
|
| |||
| 623,488 | ||||
|
| |||
Net Assets | $ | 420,475,926 | ||
|
| |||
Net Assets consist of: | ||||
Paid-in capital | $ | 479,494,635 | ||
Distributable earnings/(losses) | (59,018,709 | ) | ||
|
| |||
Net Assets | $ | 420,475,926 | ||
|
| |||
Retail Shares: | ||||
Net Assets | $ | 76,097,119 | ||
Shares Outstanding ($0.01 par value; indefinite shares authorized) | 5,247,817 | |||
|
| |||
Net Asset Value and Offering Price Per Share | $ | 14.50 | ||
|
| |||
TA Shares: | ||||
Net Assets | $ | 35,713,985 | ||
Shares Outstanding ($0.01 par value; indefinite shares authorized) | 2,437,432 | |||
|
| |||
Net Asset Value and Offering Price Per Share | $ | 14.65 | ||
|
| |||
Institutional Shares: | ||||
Net Assets | $ | 308,664,822 | ||
Shares Outstanding ($0.01 par value; indefinite shares authorized) | 21,059,883 | |||
|
| |||
Net Asset Value and Offering Price Per Share | $ | 14.66 | ||
|
| |||
*Investments in Affiliated Mutual funds, at cost | $ | 484,951,164 | ||
|
| |||
| 6 | See Notes to Financial Statements. |
| June 30, 2022 | Baron WealthBuilder Fund |
STATEMENT OF OPERATIONS (Unaudited)
JUNE 30, 2022
|
| For The Six Months Ended June 30, 2022 | ||||
Investment income: | ||||
Income: | ||||
Dividends from Affiliated Mutual Funds | $ | 48,341 | ||
|
| |||
Total income | 48,341 | |||
|
| |||
Expenses: | ||||
Distribution fees — Retail Shares (Note 4) | 116,019 | |||
Shareholder servicing agent fees and expenses — Retail Shares | 2,320 | |||
Shareholder servicing agent fees and expenses — TA Shares | 996 | |||
Shareholder servicing agent fees and expenses — Institutional Shares | 8,738 | |||
Registration and filing fees | 61,890 | |||
Custodian and fund accounting fees | 43,487 | |||
Reports to shareholders | 27,363 | |||
Administration fees | 22,377 | |||
Professional fees | 15,835 | |||
Trustee fees and expenses (Note 4) | 11,227 | |||
Line of credit fees | 3,876 | |||
Insurance expense | 3,021 | |||
Miscellaneous expenses | 2,458 | |||
|
| |||
Total operating expenses | 319,607 | |||
Reimbursement of expenses by Adviser — Retail Shares (Note 4) | (15,936 | ) | ||
Reimbursement of expenses by Adviser — TA Shares (Note 4) | (6,854 | ) | ||
Reimbursement of expenses by Adviser — Institutional Shares (Note 4) | (60,252 | ) | ||
|
| |||
Net expenses | 236,565 | |||
|
| |||
Net investment income (loss) | (188,224 | ) | ||
|
| |||
Realized and unrealized gain (loss) on investments: | ||||
Net realized gain (loss) on Affiliated Mutual Funds | (7,023,506 | ) | ||
Change in net unrealized appreciation (depreciation) of Affiliated Mutual Funds | (189,841,096 | ) | ||
|
| |||
Net gain (loss) on investments | (196,864,602 | ) | ||
|
| |||
Net increase (decrease) in net assets resulting from operations | $ | (197,052,826 | ) | |
|
| |||
| See Notes to Financial Statements. | 7 |
| Baron WealthBuilder Fund | June 30, 2022 |
STATEMENTS OF CHANGES IN NET ASSETS (Unaudited)
|
| For the Six Months Ended June 30, 2022 | For the Year Ended December 31, 2021 | |||||||
Increase (Decrease) in Net Assets: | ||||||||
Operations: | ||||||||
Net investment income (loss) | $ | (188,224 | ) | $ | 288,319 | |||
Net realized gain (loss) | (7,023,506 | ) | 33,097,145 | |||||
Change in net unrealized appreciation (depreciation) | (189,841,096 | ) | 29,572,297 | |||||
|
|
|
| |||||
Increase (decrease) in net assets resulting from operations | (197,052,826 | ) | 62,957,761 | |||||
|
|
|
| |||||
Distributions to shareholders from: | ||||||||
Distributable earnings — Retail Shares | — | (5,644,131 | ) | |||||
Distributable earnings — TA Shares | — | (2,408,486 | ) | |||||
Distributable earnings — Institutional Shares | — | (20,327,209 | ) | |||||
|
|
|
| |||||
Decrease in net assets from distributions to shareholders | — | (28,379,826 | ) | |||||
|
|
|
| |||||
Capital share transactions: | ||||||||
Proceeds from the sale of shares — Retail Shares | 23,509,070 | 85,424,591 | ||||||
Proceeds from the sale of shares — TA Shares | 6,664,711 | 19,321,748 | ||||||
Proceeds from the sale of shares — Institutional Shares | 64,943,990 | 196,410,214 | ||||||
Net asset value of shares issued in reinvestment of distributions — Retail Shares | — | 5,604,634 | ||||||
Net asset value of shares issues in reinvestment of distributions — TA Shares | — | 2,396,842 | ||||||
Net asset value of shares issued in reinvestment of distributions — Institutional Shares | — | 19,970,891 | ||||||
Cost of shares redeemed — Retail Shares | (26,465,424 | ) | (23,711,099 | ) | ||||
Cost of shares redeemed — TA Shares | (1,779,328 | ) | (21,527,655 | ) | ||||
Cost of shares redeemed — Institutional Shares | (26,184,254 | ) | (14,246,416 | ) | ||||
|
|
|
| |||||
Increase (decrease) in net assets derived from capital share transactions | 40,688,765 | 269,643,750 | ||||||
|
|
|
| |||||
Net increase (decrease) in net assets | (156,364,061 | ) | 304,221,685 | |||||
|
|
|
| |||||
Net Assets: | ||||||||
Beginning of period | 576,839,987 | 272,618,302 | ||||||
|
|
|
| |||||
End of period | $ | 420,475,926 | $ | 576,839,987 | ||||
|
|
|
| |||||
Capital share transactions — Retail Shares | ||||||||
Shares sold | 1,323,965 | 4,031,168 | ||||||
Shares issued in reinvestment of distributions | — | 264,767 | ||||||
Shares redeemed | (1,524,084 | ) | (1,122,484 | ) | ||||
|
|
|
| |||||
Net increase (decrease) | (200,119 | ) | 3,173,451 | |||||
|
|
|
| |||||
Capital share transactions — TA Shares | ||||||||
Shares sold | 376,391 | 903,512 | ||||||
Shares issued in reinvestment of distributions | — | 112,241 | ||||||
Shares redeemed | (107,615 | ) | (1,079,573 | ) | ||||
|
|
|
| |||||
Net increase (decrease) | 268,776 | (63,820 | ) | |||||
|
|
|
| |||||
Capital share transactions — Institutional Shares | ||||||||
Shares sold | 3,603,098 | 9,332,265 | ||||||
Shares issued in reinvestment of dividends | — | 934,807 | ||||||
Shares redeemed | (1,483,556 | ) | (670,794 | ) | ||||
|
|
|
| |||||
Net increase (decrease) | 2,119,542 | 9,596,278 | ||||||
|
|
|
| |||||
| 8 | See Notes to Financial Statements. |
| June 30, 2022 | Baron WealthBuilder Fund |
NOTES TO FINANCIAL STATEMENTS (Unaudited)
1. ORGANIZATION
Baron Select Funds (the “Trust”) is registered under the Investment Company Act of 1940, as amended (the “1940 Act”), as an open-end management investment company established as a Delaware statutory trust on April 30, 2003, and accordingly, follows the investment company accounting and reporting guidance of the Financial Accounting Standards Board (“FASB”) Accounting Standard Codification Topic 946 Financial Services — Investment Companies. The Trust currently offers 12 series. This report covers only the Baron WealthBuilder Fund (the “Fund”). The Fund’s investment objective is capital appreciation. The Fund is a diversified fund that invests, at any given time, in the securities of a select number of Baron mutual funds (the “Underlying Funds”), representing specific investment strategies. The Fund normally invests in a variety of Baron domestic and international equity funds managed by BAMCO, Inc. (“BAMCO” or the “Adviser”). The Fund can invest in Underlying Funds holding U.S. and international stocks; small-cap, small- to mid-cap, large-cap, all-cap stocks; and specialty stocks. The Adviser decides how much of the Fund’s assets to allocate to Underlying Funds based on the outlook for, and on the relative valuations of, the Underlying Funds and the various markets in which they invest. For information on the Underlying Funds, please refer to the Prospectuses and Statements of Additional Information of the Underlying Funds. Also, information on the Underlying Funds is available at www.baronfunds.com.
The Fund offers Retail Shares, TA Shares and Institutional Shares. Each class of shares differs only in its ongoing fees, expenses and eligibility requirements. Retail Shares are offered to all investors but are not available through the Fund’s transfer agent. TA Shares are available only to investors who purchase shares directly through the Fund’s transfer agent. TA Shares do not charge a 12b-1 fee and no revenue sharing, sub-transfer agency or record-keeping service payments are made by or in respect of TA Shares. Institutional Shares are for investments in the amount of $1 million or more. Institutional Shares are intended for certain financial intermediaries that offer shares of the Fund through fee-based platforms, retirement platforms or other platforms. Each class of shares has equal rights to earnings and assets, except that each class bears different expenses for distribution and shareholder servicing. The Fund’s investment income, realized and unrealized gains or losses on investments, and expenses other than those attributable to a specific class are allocated to each class based on its relative net assets. Each class of shares has exclusive voting rights with respect to matters that affect just that class.
2. SIGNIFICANT ACCOUNTING POLICIES
The following is a summary of significant accounting policies followed by the Fund. The policies are in conformity with accounting principles generally accepted in the United States of America (“GAAP”). The preparation of financial statements in accordance with GAAP requires management to make estimates and assumptions that affect the reported amounts of assets and liabilities at the date of the financial statements and the amounts of income and expenses during the period. Actual results could differ from those estimates. Events occurring subsequent to the date of the Statement of Assets and Liabilities and through the date of issuance of the financial statements have been evaluated for adjustment to or disclosure in the financial statements.
a) Security Valuation. The Fund’s share price or net asset value (“NAV”) is calculated as of the scheduled close of the regular trading session (usually 4 p.m. E.T. or such other time as of which the Fund’s NAV is calculated (the “NAV Calculation Time”)) on the New York Stock Exchange (the “Exchange”) on any day the Exchange is scheduled to be open. Investments in the Underlying Funds are valued at their closing NAV per share on the day of valuation.
Portfolio securities held by the Underlying Funds traded on any national stock exchange are valued based on the last sale price on the exchange where such shares are principally traded. For securities traded on NASDAQ, the Underlying Funds use the NASDAQ Official Closing Price. If there are no sales on a given day, the value of the security may be the average of the most recent bid and asked quotations on such exchange or the last sale price from a prior day. Where market quotations are not readily available, or, if in the Adviser’s judgment, they do not accurately reflect the fair value of a security held by one of the Underlying Funds, or an event occurs after the market close but before the Underlying Funds are priced that materially affects the value of a security, the security will be valued by the Adviser using policies and procedures approved by the Board of Trustees (the “Board”). Some of the more common reasons that may necessitate that a security held by one of the Underlying Funds be valued using “fair value” pricing may include, but are not limited to: trading of the security has been halted or suspended; or the security has not been traded for an extended period of time. The Adviser has a Fair Valuation Committee (the “Committee”) comprised of senior management representatives and the Committee reports to the Board every quarter. Factors the Committee may consider when valuing a security include whether a current price is stale, there is recent news, the security is thinly traded, transactions are infrequent, or quotations are genuine. There can be no guarantee, however, that a fair valuation used by the Underlying Funds on any given day will more accurately reflect the market value of an investment than the closing price of such investment in its market.
U.S. Government obligations, money market instruments, and other debt instruments held by the Underlying Funds with a remaining maturity of 60 days or less are generally valued at amortized cost, which approximates fair value, unless an independent pricing service provides a valuation for such security or in the opinion of the Board or the Committee, the amortized cost method would not represent fair value. Debt instruments having a greater remaining maturity will be valued on the basis of prices obtained from a pricing service approved by the Board or at the mean of the bid and ask prices from the dealer maintaining an active market in that security. The value of the Underlying Funds’ investments in convertible bonds/convertible preferred stocks is determined primarily by obtaining valuations from independent pricing services based on readily available bid quotations or, if quotations are not available, by methods which include various considerations such as yields or prices of securities of comparable quality, coupon, maturity and type; indications as to values from dealers; and general market conditions. Other inputs used by an independent pricing service to value convertible bonds/convertible preferred stocks generally include underlying stock data, conversion premiums, listed bond and preferred stock prices and other market information which may include benchmark curves, trade execution data, sensitivity analysis, when available, or an estimated value, calculated based on the price of the underlying common share on the valuation date adjusted for accrued and unpaid dividends. Open-end investment companies, including securities lending collateral invested in registered investment company money market funds, are valued at their NAV each day.
Non-U.S. equity securities held by the Underlying Funds traded on foreign securities exchanges are generally valued using an independent pricing vendor that provides daily fair value adjustment factors based on information such as local closing price, relevant general and sector indexes, currency fluctuations, and depositary receipts, as applicable. Securities valued using such adjustment factors are classified as Level 2 in the fair value hierarchy. The models of the independent pricing vendor generate an adjustment factor for each security, which is applied to the local closing price to adjust it for post-closing market movements up to the time the Underlying Funds are valued and translated into U.S. dollars. If the vendor does not provide an adjustment factor for a security, the security is valued based on its most recent local closing price
9
| Baron WealthBuilder Fund | June 30, 2022 |
NOTES TO FINANCIAL STATEMENTS (Unaudited) (Continued)
2. SIGNIFICANT ACCOUNTING POLICIES (Continued)
and translated into U.S. dollars. The Adviser may also fair value securities in other situations, for example, when a particular foreign market is closed but the Underlying Funds are open. Other mutual funds may adjust the prices of their securities by different amounts.
b) Securities Transactions, Investment Income and Expenses. Securities transactions are recorded on a trade date basis. Realized gain and loss from securities transactions are recorded on an identified cost basis for financial reporting and federal income tax purposes. Dividend income and capital gain distributions from the Underlying Funds are recognized on the ex-dividend date and interest income is recognized on an accrual basis. Dividends received from Underlying Funds are reflected as dividend income; capital gain distributions as realized gains. The Fund is charged for those expenses directly attributable to the Fund, such as distribution and transfer agency fees. Expenses that are not directly attributable to the Fund are typically allocated among the Baron Funds in proportion to their respective net assets.
Expenses included in the accompanying financial statements reflect the expenses of the Fund and do not include any expenses associated with the Underlying Funds. Because Underlying Funds have varied expenses and fee levels and the Fund may own different proportion of Underlying Funds at different times, the amount of acquired fund fees and expenses incurred indirectly by the Fund will vary.
c) Single Issuer. Single issuer risk is the possibility that factors specific to an issuer to which an Underlying Fund is exposed will affect the market prices of the issuer’s securities and therefore the NAV of the Underlying Fund. Due to the size of Baron Partners Fund’s and Baron Focused Growth Fund’s investments in Tesla, Inc. (“Tesla”), 49% and 21%, respectively, of these Underlying Funds’ net assets as of June 30, 2022, the NAVs of these Underlying Funds will be materially impacted by the price of Tesla stock. The Fund’s indirect proportional ownership of Tesla is $33,592,855, which represents 8.0% of the Fund’s net assets as of June 30, 2022. The financial statements of the Underlying Funds are available at www.BaronFunds.com.
d) Non-Diversified Portfolio. Certain Underlying Funds are non-diversified, which means they will likely have a greater percentage of their assets in a single issuer than a diversified fund. As a result, a non-diversified fund will likely invest a greater percentage of its assets in fewer issuers, and the performance of those issuers may have a greater effect on the Underlying Fund’s performance (and consequently the Fund’s performance) compared to a diversified fund. Thus, a non-diversified fund is more likely to experience significant fluctuations in value, exposing the Underlying Fund (and consequently the Fund) to a greater risk of loss in any given period than a diversified fund. Additionally, non-diversified funds may encounter difficulty liquidating securities.
e) Industry Concentration. From time to time, market fluctuations in the value of an Underlying Fund’s investments, combined with an Underlying Fund’s non-diversified portfolio, may result in an Underlying Fund being concentrated in the securities of a single issuer or a small number of issuers, in a particular industry. As a result, this Underlying Fund will be particularly exposed to the risks of that company or industry relative to the risk exposure of investment companies holding a diversified portfolio of securities or those that seek to maintain near-index weightings in their portfolio securities. Accordingly, in those cases, an Underlying Fund will be disproportionately exposed to the market conditions, interest rates, and economic, regulatory, or financial developments that significantly affect that company or industry. For example, due to the size of Baron Partners Fund’s and Baron Focused Growth Fund’s investments in Tesla, which represent about 49% and 21%, respectively, of these Underlying Funds’ net assets as of June 30, 2022, these Underlying Funds will be more adversely impacted by negative developments affecting the automotive and energy industries, as well as governmental environmental regulations.
f) Federal Income Taxes. The Fund intends to meet the requirements of the Internal Revenue Code of 1986, as amended, applicable to regulated investment companies, and to distribute to its shareholders substantially all of its net investment income and any net realized capital gains at least annually. The Fund will not be subject to federal or state income taxes to the extent that it qualifies as regulated investment companies and substantially all of its income is distributed.
g) Distributions to Shareholders. Income and capital gain distributions to shareholders are determined in accordance with income tax regulations which may differ from GAAP. These differences are primarily due to differing treatments for net investment loss and wash sale losses deferred.
h) Commitments and Contingencies. In the normal course of business, the Fund may enter into contracts and agreements that contain a variety of representations and warranties, which provide general indemnification. The maximum exposure to the Fund under these agreements is unknown, as this would involve future claims that may be made against the Fund that have not yet occurred.
i) Cash and Cash Equivalents. The Fund considers all short term liquid investments with a maturity of three months or less when purchased to be cash equivalents.
3. PURCHASES AND SALES OF SECURITIES
Purchases and sales of securities, other than short term securities, for the six months ended June 30, 2022 were as follows:
| Fund | Purchases | Sales | ||||||
Baron WealthBuilder Fund | $ | 59,047,568 | $ | 18,570,472 | ||||
4. INVESTMENT ADVISORY FEES AND OTHER TRANSACTIONS WITH AFFILIATES
a) Investment Advisory Fees. The Adviser, a wholly owned subsidiary of Baron Capital Group, Inc. (“BCG”), serves as investment adviser to the Fund and the Underlying Funds. The Adviser will not be paid a management fee for performing investment management services for the Fund. However, the Adviser receives management fees for managing the Underlying Funds. See the Underlying Funds’ Prospectuses or Statements of Additional Information for specific fees. The Adviser is contractually obligated to reimburse certain expenses of the Fund so that its net annual operating expenses (excluding acquired fund fees and expenses, portfolio transaction costs, interest, dividend and extraordinary expenses) are limited to 0.30% of average daily net assets of Retail Shares, 0.05% of average daily net assets of TA Shares and 0.05% of average daily net assets of Institutional Shares.
b) Distribution Fees. Baron Capital, Inc. (“BCI”), a wholly owned subsidiary of BCG, is a registered broker-dealer and the distributor of the Fund’s shares. The Fund is authorized to pay BCI a distribution fee payable monthly pursuant to a distribution plan under Rule 12b-1 of the 1940 Act equal to 0.25% per annum of the Retail Shares’ average daily net assets.
10
| June 30, 2022 | Baron WealthBuilder Fund |
NOTES TO FINANCIAL STATEMENTS (Unaudited) (Continued)
4. INVESTMENT ADVISORY FEES AND OTHER TRANSACTIONS WITH AFFILIATES (Continued)
c) Trustee Fees. Certain Trustees of the Fund are interested persons (as defined by the 1940 Act) of the Trust. None of these Trustees received compensation for his or her services as a Trustee of the Fund. None of the Fund’s officers received compensation from the Fund for their services as an officer.
d) Fund Accounting and Administration Fees. The Fund has entered into an agreement with State Street Bank and Trust Company (“State Street”) to perform accounting and certain administrative services. State Street is compensated for fund accounting services based on a percentage of the Fund’s net assets, plus fixed annual fees for the administrative services.
5. ASSET ALLOCATION AND RISKS OF INVESTING IN THE UNDERLYING FUNDS
The Fund’s ability to meet its investment objective depends largely upon selecting the best mix of Underlying Funds. The selection of the Underlying Funds and the allocation of the Fund’s assets among the various market sectors could cause the Fund to underperform in comparison to other funds with a similar investment objective. In addition, each of the Underlying Funds has its own investment risks, and those risks can affect the value of the Fund’s investments. To the extent that the Fund invests more of its assets in one Underlying Fund than in another, it will have greater exposure to the risks of that Underlying Fund.
6. LINE OF CREDIT
Baron WealthBuilder Fund, together with other funds in Baron Select Funds (except Baron Partners Fund) and Baron Investment Funds Trust, participate in a committed line of credit agreement with State Street to be used for temporary purposes, primarily for financing redemptions. Each fund may borrow, on a first-come, first-served basis, up to the lesser of $200 million or the maximum amount each fund may borrow under the 1940 Act, the limitations included in each fund’s prospectus, or any limit or restriction under any law or regulation to which each fund is subject or any agreement to which each fund is a party; provided that the aggregate outstanding principal amount of all loans to any of the funds may not exceed $200 million. Interest is charged to each fund, based on its borrowings, at a rate per annum equal to the higher of the Overnight Bank Funding Rate plus 0.10% or the Overnight Federal Funds Rate plus 0.10%; plus a margin of 1.00%. An upfront fee of 0.05% is incurred on the commitment amount and a commitment fee of 0.20% per annum is incurred on the unused portion of the line of credit. Both fees are allocated to the participating funds based on their relative net assets.
7. FAIR VALUE MEASUREMENTS
Fair value is defined by GAAP as the price that the Fund would receive upon selling an investment in a timely transaction to an independent buyer in the principal or most advantageous market for the investment. GAAP provides a three-tier hierarchy to maximize the use of observable market data and minimize the use of unobservable inputs and to establish classification of fair value measurements for disclosure purposes. Inputs refer broadly to the assumptions that market participants would use in pricing the asset or liability. Inputs may be observable or unobservable. Observable inputs are based on market data obtained from sources independent of the Fund. Unobservable inputs are inputs that reflect the Fund’s own assumptions based on the best information available in the circumstances. The three-tier hierarchy of inputs is summarized in the three broad Levels listed below.
| • | Level 1 — quoted prices in active markets for identical assets or liabilities; |
| • | Level 2 — prices determined using other inputs that are observable either directly, or indirectly through corroboration with observable market data (which could include quoted prices for similar assets or liabilities, interest rates, credit risk, etc.); |
| • | Level 3 — prices determined using unobservable inputs when quoted prices or observable inputs are unavailable, such as when there is little or no market activity for an asset or liability (unobservable inputs reflect the Fund’s own assumptions in determining the fair value of assets or liabilities and would be based on the best information available). |
Investments in open-end registered investment companies are valued at NAV and are classified in the fair value hierarchy as Level 1.
8. INCOME TAXES AND DISTRIBUTIONS TO SHAREHOLDERS
Federal income tax regulations differ from GAAP. Therefore, distributions determined in accordance with tax regulations may differ in amount or character from net investment income and net realized gain for financial reporting purposes. Net investment income (loss) and net realized and unrealized gain (loss) differ for financial statement and tax purposes due to differing treatments of net investment loss, and wash sale losses deferred. Financial reporting records are adjusted for permanent book/tax differences to reflect tax character. Financial records are not adjusted for temporary differences.
As of June 30, 2022, the components of net assets on a tax basis were as follows:
Cost of investments | $ | 484,951,164 | ||
|
| |||
Gross tax unrealized appreciation | 18,499,695 | |||
Gross tax unrealized depreciation | (82,934,819 | ) | ||
|
| |||
Net tax unrealized appreciation (depreciation) | (64,435,124 | ) | ||
Undistributed net ordinary income | 35,239,476 | |||
Undistributed net realized gain | (29,823,061 | ) | ||
Paid-in capital | 479,494,635 | |||
|
| |||
Net Assets | $ | 420,475,926 | ||
|
|
11
| Baron WealthBuilder Fund | June 30, 2022 |
NOTES TO FINANCIAL STATEMENTS (Unaudited) (Continued)
8. INCOME TAXES AND DISTRIBUTIONS TO SHAREHOLDERS (Continued)
The tax character of distributions paid during the six months ended June 30, 2022 and for the year ended December 31, 2021 was as follows:
| Six Months Ended June 30, 2022 | Year Ended December 31, 2021 | |||||||||||||||
| Ordinary1 | Long Term Capital Gain | Ordinary1 | Long Term Capital Gain | |||||||||||||
| $ | — | $ | — | $ | 155,342 | $ | 28,224,484 | |||||||||
| 1 | For tax purposes, short-term capital gains are considered ordinary income distributions. |
The Fund follows the provisions of FASB Codification Section 740 (“ASC Section 740”) “Accounting for Uncertainty in Income Taxes” which clarifies the accounting for uncertainty in tax positions taken or expected to be taken on a tax return. ASC Section 740 sets forth a threshold for financial statement recognition, measurement and disclosure of tax positions taken or expected to be taken on a tax return. The Fund is required to recognize the tax effects of certain tax positions under a “more likely than not” standard, that based on their technical merits, have more than 50 percent likelihood of being sustained upon examination. Management has analyzed the tax positions taken on the Fund’s federal income tax returns for the current year and prior two years, and has concluded that no provision for federal income tax is required in the Fund’s financial statements. At June 30, 2022, the Fund did not have any uncertain tax benefits that require recognition, de-recognition or disclosure. The Fund’s federal, state and local income and federal excise tax returns for which the applicable statutes of limitations have not expired (current and prior three years) are subject to examination by the Internal Revenue Service and state departments of revenue.
9. OWNERSHIP CONCENTRATION
As of June 30, 2022, the officers, trustees and portfolio managers owned, directly or indirectly, 15.40% of the Fund. As a result of their ownership, these investors may be able to materially affect the outcome of matters presented to the Fund’s shareholders.
10. TRANSACTIONS IN “AFFILIATED” COMPANIES
The Fund invests in the Institutional Shares of the Underlying Funds which are considered to be affiliated with the Fund.
| Name of Issuer | Value at December 31, 2021 | Purchase Cost | Sales Return of | Change in Net Unrealized Appreciation (Depreciation) | Realized (Losses) | Dividend Income | Other Distributions | Shares Held at June 30, 2022 | Value at June 30, 2022 | % of Net Assets at June 30, 2022 | ||||||||||||||||||||||||||||||
“Affiliated” Company as of June 30, 2022: |
| |||||||||||||||||||||||||||||||||||||||
Baron Asset Fund, | $ | 73,555,131 | $ | 6,712,359 | $ | 357,238 | $ | (25,204,895 | ) | $ | (157,799 | ) | $ | — | $ | — | 653,734 | $ | 54,547,558 | 12.97 | % | |||||||||||||||||||
Baron Discovery Fund, Institutional Shares | 25,651,149 | 3,666,142 | 587,712 | (9,554,205 | ) | (225,865 | ) | — | — | 831,119 | 18,949,509 | 4.51 | % | |||||||||||||||||||||||||||
Baron Durable Advantage Fund, Institutional Shares | 9,924,047 | 3,478,960 | 4,134 | (2,903,205 | ) | (1,374 | ) | — | — | 672,280 | 10,494,294 | 2.50 | % | |||||||||||||||||||||||||||
Baron Emerging Markets Fund, Institutional Shares | 23,698,078 | 211,494 | 3,744,933 | (3,909,797 | ) | (1,356,295 | ) | — | — | 1,100,336 | 14,898,547 | 3.54 | % | |||||||||||||||||||||||||||
Baron Fifth Avenue Growth Fund, Institutional Shares | 33,337,789 | 548,754 | 2,474,953 | (13,504,060 | ) | (1,135,680 | ) | — | — | 550,258 | 16,771,850 | 3.99 | % | |||||||||||||||||||||||||||
Baron FinTech Fund, | 12,668,556 | 3,608,051 | 373,177 | (5,252,483 | ) | (140,270 | ) | — | — | 957,257 | 10,510,677 | 2.50 | % | |||||||||||||||||||||||||||
Baron Focused Growth Fund, Institutional Shares | 27,747,887 | 7,991,539 | 583,291 | (8,207,343 | ) | (118,247 | ) | — | — | 790,296 | 26,830,545 | 6.38 | % | |||||||||||||||||||||||||||
Baron Global Advantage Fund, Institutional Shares | 36,127,604 | 714,786 | 3,489,603 | (14,776,095 | ) | (1,832,601 | ) | — | — | 607,771 | 16,744,091 | 3.98 | % | |||||||||||||||||||||||||||
Baron Growth Fund, | 73,956,736 | 8,397,453 | 80,458 | (23,238,222 | ) | (33,204 | ) | — | — | 688,314 | 59,002,305 | 14.03 | % | |||||||||||||||||||||||||||
Baron Health Care Fund, Institutional Shares | 15,583,416 | 1,653,199 | 443,580 | (2,979,336 | ) | (130,165 | ) | — | — | 783,708 | 13,683,534 | 3.25 | % | |||||||||||||||||||||||||||
Baron International Growth Fund, Institutional Shares | 14,143,268 | 2,903,989 | 97,994 | (4,360,507 | ) | (31,920 | ) | — | — | 518,021 | 12,556,836 | 2.99 | % | |||||||||||||||||||||||||||
Baron Opportunity Fund, Institutional Shares | 33,577,147 | 393,175 | 4,217,508 | (10,637,326 | ) | (1,633,263 | ) | — | — | 650,380 | 17,482,225 | 4.16 | % | |||||||||||||||||||||||||||
Baron Partners Fund, | 89,688,787 | 3,893,723 | 1,992,538 | (30,534,534 | ) | (170,057 | ) | — | — | 452,041 | 60,885,381 | 14.48 | % | |||||||||||||||||||||||||||
Baron Real Estate Fund, Institutional Shares | 28,760,215 | 5,008,976 | 48,423 | (9,298,463 | ) | (8,638 | ) | — | — | 833,231 | 24,413,667 | 5.81 | % | |||||||||||||||||||||||||||
Baron Real Estate Income Fund, Institutional Shares | 8,690,011 | 4,128,144 | — | (2,467,516 | ) | — | 48,341 | — | 726,871 | 10,350,639 | 2.46 | % | ||||||||||||||||||||||||||||
12
| June 30, 2022 | Baron WealthBuilder Fund |
NOTES TO FINANCIAL STATEMENTS (Unaudited) (Continued)
10. TRANSACTIONS IN “AFFILIATED” COMPANIES (Continued)
| Name of Issuer | Value at December 31, 2021 | Purchase Cost | Sales Return of | Change in Net Unrealized Appreciation (Depreciation) | Realized (Losses) | Dividend Income | Other Distributions | Shares Held at June 30, 2022 | Value at June 30, 2022 | % of Net Assets at June 30, 2022 | ||||||||||||||||||||||||||||||
Baron Small Cap Fund, Institutional Shares | 69,793,725 | 5,736,824 | 74,930 | (23,013,109 | ) | (48,128 | ) | — | — | 1,888,086 | 52,394,382 | 12.46 | % | |||||||||||||||||||||||||||
|
|
|
|
|
|
|
|
|
|
|
|
|
|
|
| |||||||||||||||||||||||||
| $ | 576,903,546 | $ | 59,047,568 | $ | 18,570,472 | ($ | 189,841,096 | ) | $ | (7,023,506 | ) | $ | 48,341 | $ | — | $ | 420,516,040 | |||||||||||||||||||||||
|
|
|
|
|
|
|
|
|
|
|
|
|
|
|
| |||||||||||||||||||||||||
11. RUSSIA/UKRAINE RISK
Certain Underlying Funds invested in securities and instruments that are economically tied to Russia. Due to the uncertainty of the geopolitical tension in Russia/Ukraine, investments in Russia are subject to political, economic, legal, market and currency risks, as well as the risk that further economic sanctions may be imposed by the United States and/or other countries. Such sanctions — which may impact companies in many sectors, including energy, financial services and defense, among others — may negatively impact an Underlying Fund’s performance and/or ability to achieve its investment objective. For example, certain transactions may be prohibited and/or existing investments may become illiquid (e.g., in the event that transacting in certain existing investments is prohibited), which could cause an Underlying Fund to sell other portfolio holdings at a disadvantageous time or price in order to meet shareholder redemptions.
13
| Baron WealthBuilder Fund | June 30, 2022 |
FINANCIAL HIGHLIGHTS (Unaudited)
Selected data for a share outstanding throughout each period:
| Income (loss) from investment operations: | Less distributions to shareholders from: | Ratios to Average Net Assets: | Supplemental Data: | |||||||||||||||||||||||||||||||||||||||||||||||||||||||||||||||||
| Net asset value, beginning of period ($) | Net investment income (loss) ($)2 | Net realized and unrealized gain (loss) ($) | Total from investment operations ($) | Net investment income ($) | Net realized gain on investments ($) | Total distributions ($) | Net asset value, end of period ($) | Total return (%) | Total expenses9 (%) | Less: Interest expense % | Operating expenses (%) | Less: Reimbursement of expenses by Adviser (%) | Net operating expenses (%) | Net investment income (loss) (%) | Net assets (in millions), end of period ($) | Portfolio turnover rate (%) | ||||||||||||||||||||||||||||||||||||||||||||||||||||
RETAIL SHARES |
| |||||||||||||||||||||||||||||||||||||||||||||||||||||||||||||||||||
Six Months Ended June 30, |
| |||||||||||||||||||||||||||||||||||||||||||||||||||||||||||||||||||
2022 | 21.56 | (0.02 | ) | (7.04 | ) | (7.06 | ) | 0.00 | 0.00 | 0.00 | 14.50 | (32.75 | )4,7 | 0.33 | 6 | 0.00 | 0.33 | 6 | (0.03 | )6 | 0.30 | 6 | (0.28 | )6 | 76.1 | 3.75 | 7 | |||||||||||||||||||||||||||||||||||||||||
Year Ended December 31, |
| |||||||||||||||||||||||||||||||||||||||||||||||||||||||||||||||||||
2021 | 19.57 | (0.03 | ) | 3.21 | 3.18 | 0.00 | (1.19 | ) | (1.19 | ) | 21.56 | 16.42 | 4 | 0.33 | (0.00 | )8 | 0.33 | (0.03 | ) | 0.30 | (0.13 | ) | 117.4 | 0.18 | ||||||||||||||||||||||||||||||||||||||||||||
2020 | 12.23 | (0.04 | ) | 7.62 | 7.58 | 0.00 | (0.24 | ) | (0.24 | ) | 19.57 | 62.45 | 4 | 0.41 | (0.00 | )8 | 0.41 | (0.11 | ) | 0.30 | (0.29 | ) | 44.5 | 6.65 | ||||||||||||||||||||||||||||||||||||||||||||
2019 | 9.33 | (0.03 | ) | 3.37 | 3.34 | (0.01 | ) | (0.43 | ) | (0.44 | ) | 12.23 | 36.24 | 4 | 0.41 | (0.02 | ) | 0.39 | (0.09 | ) | 0.30 | (0.26 | ) | 5.9 | 22.48 | |||||||||||||||||||||||||||||||||||||||||||
2018 | 10.00 | (0.01 | ) | (0.65 | ) | (0.66 | ) | 0.00 | (0.01 | ) | (0.01 | ) | 9.33 | (6.58 | )4 | 0.90 | 0.00 | 0.90 | (0.60 | ) | 0.30 | (0.13 | ) | 2.1 | 1.24 | |||||||||||||||||||||||||||||||||||||||||||
20171 | 10.00 | (0.00 | )3 | 0.00 | (0.00 | )3 | 0.00 | 0.00 | 0.00 | 10.00 | 0.00 | 4,7 | 0.59 | 5,6 | 0.00 | 0.59 | 5,6 | (0.29 | )5,6 | 0.30 | 5,6 | (0.30 | )5,6 | 0.0 | 0.00 | 7 | ||||||||||||||||||||||||||||||||||||||||||
TA SHARES |
| |||||||||||||||||||||||||||||||||||||||||||||||||||||||||||||||||||
Six Months Ended June 30, |
| |||||||||||||||||||||||||||||||||||||||||||||||||||||||||||||||||||
2022 | 21.76 | (0.00 | )3 | (7.11 | ) | (7.11 | ) | 0.00 | 0.00 | 0.00 | 14.65 | (32.67 | )4,7 | 0.08 | 6 | 0.00 | 0.08 | 6 | (0.03 | )6 | 0.05 | 6 | (0.03 | )6 | 35.7 | 3.75 | 7 | |||||||||||||||||||||||||||||||||||||||||
Year Ended December 31, |
| |||||||||||||||||||||||||||||||||||||||||||||||||||||||||||||||||||
2021 | 19.70 | 0.03 | 3.22 | 3.25 | (0.00 | )3 | (1.19 | ) | (1.19 | ) | 21.76 | 16.70 | 4 | 0.08 | (0.00 | )8 | 0.08 | (0.03 | ) | 0.05 | 0.12 | 47.2 | 0.18 | |||||||||||||||||||||||||||||||||||||||||||||
2020 | 12.28 | (0.01 | ) | 7.67 | 7.66 | 0.00 | (0.24 | ) | (0.24 | ) | 19.70 | 62.85 | 4 | 0.16 | (0.00 | )8 | 0.16 | (0.11 | ) | 0.05 | (0.04 | ) | 44.0 | 6.65 | ||||||||||||||||||||||||||||||||||||||||||||
2019 | 9.35 | (0.00 | )3 | 3.37 | 3.37 | (0.01 | ) | (0.43 | ) | (0.44 | ) | 12.28 | 36.49 | 4 | 0.17 | (0.02 | ) | 0.15 | (0.10 | ) | 0.05 | (0.03 | ) | 21.4 | 22.48 | |||||||||||||||||||||||||||||||||||||||||||
2018 | 10.00 | 0.01 | (0.65 | ) | (0.64 | ) | 0.00 | (0.01 | ) | (0.01 | ) | 9.35 | (6.38 | )4 | 0.59 | 0.00 | 0.59 | (0.54 | ) | 0.05 | 0.05 | 9.7 | 1.24 | |||||||||||||||||||||||||||||||||||||||||||||
20171 | 10.00 | (0.00 | )3 | 0.00 | (0.00 | )3 | 0.00 | 0.00 | 0.00 | 10.00 | 0.00 | 4,7 | 0.34 | 5,6 | 0.00 | 0.34 | 5,6 | (0.29 | )5,6 | 0.05 | 5,6 | (0.05 | )5,6 | 3.4 | 0.00 | 7 | ||||||||||||||||||||||||||||||||||||||||||
INSTITUTIONAL SHARES |
| |||||||||||||||||||||||||||||||||||||||||||||||||||||||||||||||||||
Six Months Ended June 30, |
| |||||||||||||||||||||||||||||||||||||||||||||||||||||||||||||||||||
2022 | 21.76 | (0.00 | )3 | (7.10 | ) | (7.10 | ) | 0.00 | 0.00 | 0.00 | 14.66 | (32.63 | )4,7 | 0.08 | 6 | 0.00 | 0.08 | 6 | (0.03 | )6 | 0.05 | 6 | (0.03 | )6 | 308.7 | 3.75 | 7 | |||||||||||||||||||||||||||||||||||||||||
Year Ended December 31, |
| |||||||||||||||||||||||||||||||||||||||||||||||||||||||||||||||||||
2021 | 19.70 | 0.02 | 3.23 | 3.25 | (0.00 | )3 | (1.19 | ) | (1.19 | ) | 21.76 | 16.70 | 4 | 0.08 | (0.00 | )8 | 0.08 | (0.03 | ) | 0.05 | 0.09 | 412.2 | 0.18 | |||||||||||||||||||||||||||||||||||||||||||||
2020 | 12.28 | (0.01 | ) | 7.67 | 7.66 | 0.00 | (0.24 | ) | (0.24 | ) | 19.70 | 62.85 | 4 | 0.16 | (0.00 | )8 | 0.16 | (0.11 | ) | 0.05 | (0.04 | ) | 184.1 | 6.65 | ||||||||||||||||||||||||||||||||||||||||||||
2019 | 9.35 | (0.00 | )3 | 3.37 | 3.37 | (0.01 | ) | (0.43 | ) | (0.44 | ) | 12.28 | 36.49 | 4 | 0.17 | (0.02 | ) | 0.15 | (0.10 | ) | 0.05 | (0.02 | ) | 93.8 | 22.48 | |||||||||||||||||||||||||||||||||||||||||||
2018 | 10.00 | 0.01 | (0.65 | ) | (0.64 | ) | 0.00 | (0.01 | ) | (0.01 | ) | 9.35 | (6.38 | )4 | 0.49 | 0.00 | 0.49 | (0.44 | ) | 0.05 | 0.12 | 83.0 | 1.24 | |||||||||||||||||||||||||||||||||||||||||||||
20171 | 10.00 | (0.00 | )3 | 0.00 | (0.00 | )3 | 0.00 | 0.00 | 0.00 | 10.00 | 0.00 | 4,7 | 0.34 | 5,6 | 0.00 | 0.34 | 5,6 | (0.29 | )5,6 | 0.05 | 5,6 | (0.05 | )5,6 | 1.0 | 0.00 | 7 | ||||||||||||||||||||||||||||||||||||||||||
| 1 | For the period December 29, 2017 (commencement of operations) through December 31, 2017. |
| 2 | Based on average shares outstanding. |
| 3 | Less than $0.01 per share. |
| 4 | The total returns would have been lower had certain expenses not been reduced during the period shown. |
| 5 | Certain fixed expenses incurred by the Fund were not annualized for the period ended December 31, 2017. |
| 6 | Annualized. |
| 7 | Not Annualized. |
| 8 | Interest expense rounds to less than 0.01%. |
| 9 | Expenses do not include acquired fund fees and expenses of the Underlying Funds. |
| 14 | See Notes to Financial Statements. |
| June 30, 2022 | Baron WealthBuilder Fund |
As a shareholder of the Fund, you may incur two types of costs: ongoing expenses and transaction costs. Ongoing expenses include distribution and service (12b-1) fees and other Fund expenses. Due to the payment of Rule 12b-1 fees, long-term shareholders may indirectly pay more than the maximum permitted front-end sales charge. The information on this page is intended to help you understand your ongoing costs of investing in the Fund and to compare these costs with the ongoing costs of investing in other mutual funds.
The information in the following table is based on an investment of $1,000 invested on January 1, 2022 and held for the six months ended June 30, 2022.
ACTUAL EXPENSES
The table below titled “Based on Actual Total Return” provides information about actual account values and actual expenses. You may use the information provided in this table, together with the amount you invested, to estimate the expenses that you paid over the period. To estimate the expenses you paid on your account, divide your ending account value by $1,000 (for example, an $8,600 ending account value divided by $1,000 = 8.6), then multiply the result by the number under the heading titled “Expenses Paid During the Period.”
BASED ON ACTUAL TOTAL RETURN FOR THE SIX MONTHS ENDED JUNE 30, 20221
| Actual Total Return | Beginning Account Value January 1, 2022 | Ending Account Value June 30, 2022 | Annualized Expense Ratio | Expenses Paid During the Period2 | ||||||||||||||||
Baron WealthBuilder Fund — Retail Shares | (32.75 | )% | $ | 1,000.00 | $ | 672.50 | 3 | 0.30 | %4 | $ | 1.24 | |||||||||
Baron WealthBuilder Fund — TA Shares | (32.67 | )% | $ | 1,000.00 | $ | 673.30 | 3 | 0.05 | %4 | $ | 0.21 | |||||||||
Baron WealthBuilder Fund — Institutional Shares | (32.63 | )% | $ | 1,000.00 | $ | 673.70 | 3 | 0.05 | %4 | $ | 0.21 | |||||||||
HYPOTHETICAL EXAMPLE FOR COMPARISON PURPOSES
The table below titled “Based on Hypothetical Total Return” provides information about hypothetical account values and hypothetical expenses based on the actual expense ratio and an assumed rate of return of 5% per year before expenses, which is not the Fund’s actual return. The hypothetical account values and expenses may not be used to estimate the actual ending account values and expenses you paid for the period. You may use the information provided in this table to compare the ongoing costs of investing in the Fund and other funds. To do so, compare the 5% hypothetical example relating to the Fund with the 5% hypothetical examples that appear in the shareholder reports of other funds.
Please note that expenses shown in the table below are meant to highlight your ongoing costs and do not reflect any transactional costs, such as redemption fees, if any. Therefore, the table is useful in comparing ongoing costs only and will not help you determine your relative total costs of owning different mutual funds. In addition, if these transactional costs were included, your costs would have been higher.
BASED ON HYPOTHETICAL TOTAL RETURN FOR THE SIX MONTHS ENDED JUNE 30, 20221
Hypothetical Annualized Total Return | Beginning Account Value January 1, 2022 | Ending Account Value June 30, 2022 | Annualized Expense Ratio | Expenses Paid During the Period2 | ||||||||||||||||
Baron WealthBuilder Fund — Retail Shares | 5.00 | % | $ | 1,000.00 | $ | 1,023.31 | 3 | 0.30 | %4 | $ | 1.51 | |||||||||
Baron WealthBuilder Fund — TA Shares | 5.00 | % | $ | 1,000.00 | $ | 1,024.55 | 3 | 0.05 | %4 | $ | 0.25 | |||||||||
Baron WealthBuilder Fund — Institutional Shares | 5.00 | % | $ | 1,000.00 | $ | 1,024.55 | 3 | 0.05 | %4 | $ | 0.25 | |||||||||
| 1 | Assumes reinvestment of all dividends and capital gain distributions, if any. |
| 2 | Expenses are equal to each share class’ respective annualized expense ratio multiplied by the average account value over the period, multiplied by the number of days in the most recent fiscal half-year, then divided by 365. |
| 3 | Ending account value assumes the return earned after waiver and would have been lower if a portion of the expenses had not been waived. |
| 4 | Annualized expense ratios are adjusted to reflect fee waiver. |
15
| Baron WealthBuilder Fund | June 30, 2022 |
DISCLOSURE REGARDING THE APPROVAL OF THE INVESTMENT ADVISORY AGREEMENT FOR BARON WEALTHBUILDER FUND BY THE BOARD OF TRUSTEES (Unaudited)
The Board of Trustees (the “Board”) of Baron Select Funds (the “Trust”) met on May 17, 2022 to discuss the selection of BAMCO, Inc. (the “Adviser”) as the investment adviser and the approval of the investment advisory agreement for Baron WealthBuilder Fund (the “Fund”). The members of the Board who are not “interested persons” (as defined in the Investment Company Act of 1940, as amended) of the Trust (the “Independent Trustees”) met in a separate session to discuss and consider the renewal of the investment advisory agreement for the Fund. Representatives of Broadridge Financial Solutions, Inc. (“Broadridge”), an independent provider of investment company data, provided reports to the Board and attended the Board meeting. The Trustees received a substantial amount of information from the Adviser and from Broadridge, and were advised by independent legal counsel. Based on its evaluation of this and other information, the Board, including a majority of the Independent Trustees, approved the continuation of the investment advisory agreement for the Fund for an additional one-year period.
In reaching its determination, the Board considered various factors that it deemed relevant, including the factors listed below.
1. NATURE, EXTENT AND QUALITY OF SERVICES
The Trustees considered the information provided, including, for many, their experience and knowledge gained from their service as Trustees and their experience generally, including the following, which they had previously considered in connection with approving the investment advisory agreement for the Fund and those of the underlying Baron funds in which it invests and remained, in their thinking, material to their consideration:
| • | Their confidence in the senior personnel, portfolio management, the financial condition of the Adviser and its affiliates and the Adviser’s available resources; |
| • | The nature, extent and quality of the services provided by the Adviser, including: relationships with and supervision of third party service providers, such as the Fund’s custodian and transfer agent, the quality of shareholder reports, the ability to monitor adherence to investment guidelines and restrictions, the legal, accounting and compliance services provided to the Fund and the support services provided to the Board; |
| • | The Adviser’s investment principles and processes and the historical (and recent negative) performance of the Fund as compared to similar funds managed by other advisers over comparable periods; |
| • | The total expense ratio of the Fund and comparisons to similar funds managed by other advisers over comparable periods. They observed that the net operating expenses paid by the Fund (total expense ratio) were within the range of those of the funds in its peer group; and |
| • | Additional services provided by the Adviser. |
No advisory fee is payable by the Fund to the Adviser, although the Fund bears indirectly its pro rata share of the expenses of the underlying Baron funds in which it invests, including advisory fees payable by such underlying Baron funds to the Adviser.
The Board concluded that the nature, extent and quality of the services the Adviser provides to the Fund supported approval of the investment advisory agreement for the Fund.
2. INVESTMENT PERFORMANCE OF THE FUND AND THE ADVISER
As part of its consideration of the investment performance of the Fund and the Adviser, the Board took into account the analyses performed by and discussed with representatives of Broadridge. The Board considered, among other information, Broadridge’s comparison of the expense ratio with those of peer group funds selected by Broadridge and Morningstar category medians. The Board also considered, among other performance information, Broadridge’s comparisons of the Fund’s annualized total return and related risk metrics over one- and three-year periods against peer group funds and Morningstar category medians. After considering all the information, the Board concluded that the Adviser continued to invest in accordance with its long-standing principles and that the Fund’s performance remained consistent with expectations for the Adviser’s investment style, in light of recent market conditions.
3. COSTS OF SERVICES PROVIDED AND PROFITS TO BE REALIZED BY THE ADVISER
Since the Fund does not pay advisory fees, the Board did not consider any comparisons to the advisory fees charged and services provided by the Adviser and its investment adviser affiliate to any other funds or separately managed accounts. The Board was provided with a profitability analysis prepared by the Adviser and discussed with the representatives of the Adviser that the Adviser has continued to invest in quality personnel, systems and facilities, and otherwise continued to invest in its business, irrespective of fund flows. However, since the Fund does not pay an advisory fee the Board did not consider the profitability analysis material to its considerations.
The Board also considered benefits that accrue to the Adviser and its affiliates from their relationship with the Fund.
4. ECONOMIES OF SCALE AND BENEFITS TO INVESTORS
Since the Fund does not pay an advisory fee, the Board did not consider potential economies of scale. The Board did consider that the Adviser was continuing to grow and upgrade its staff and invest in its business.
After due consideration of the above-enumerated factors and other factors it deemed relevant, the Board, including a majority of the Independent Trustees, approved the continuance of the Fund’s investment advisory agreement.
16
Privacy Notice
The Fund collects nonpublic personal information about you from the following sources:
| ∎ | Information we receive from you on applications or other forms; |
| ∎ | Information about your transactions with us, our Adviser or others; and |
| ∎ | Information we receive from third parties, such as credit reporting agencies. |
“Nonpublic personal information” is private information about you that we obtain in connection with providing a financial product or service to you.
We may share your name and address with other Baron Funds and the Adviser and its affiliates for the purpose of sending you information about our products that we believe may be of interest to you and informing you of our upcoming Baron Investment Conference and for sending required information.
We do not disclose any nonpublic personal information about our customers to anyone, except as permitted or required by law. Examples of permitted disclosures under the law include sharing with companies that work for us to provide you services, such as the Transfer Agent or mailing house. All such companies that act on our behalf are contractually obligated to keep the information that we provide to them confidential and to use the information only to provide the services that we have asked them to perform for you and us.
We restrict access to nonpublic information about you to those employees who need to know that information to provide products or services to you. We maintain physical, electronic and procedural safeguards to guard your nonpublic personal information.
This privacy notice is also available at all times on the Baron Funds® website, www.BaronFunds.com or by calling 1-800-99BARON.
Go Paperless!
It’s fast, simple and a smart way to help the environment.
Enjoy the speed and convenience of receiving Fund documents electronically.
For more information, and to enroll today, go to www.baronfunds.com/edelivery.
767 Fifth Avenue, 49th Fl.
New York, NY 10153
1.800.99.BARON
212-583-2000
www.BaronFunds.com
JUNE 22
Item 2. Code of Ethics.
Not applicable.
Item 3. Audit Committee Financial Expert.
Not applicable.
Item 4. Principal Accountant Fees and Services.
Not applicable.
Item 5. Audit Committee of Listed Registrants.
Not applicable.
Item 6. Schedule of Investments.
Included herein under Item 1.
Item 7. Disclosure of Proxy Voting Policies and Procedures for Closed-End Management Investment Companies.
Not applicable.
Item 8. Portfolio Managers of Closed-End Management Investment Companies.
Not applicable.
Item 9. Purchases of Equity Securities by Closed-End Management Investment Company and Affiliated Purchasers.
Not applicable.
Item 10. Submission of Matters to a Vote of Security Holders.
Not applicable.
Item 11. Controls and Procedures.
(a) The Registrant’s principal executive officer and principal financial officer have concluded that the Registrant’s disclosure controls and procedures (as defined in Rule 30a-3(c) under the Investment Company Act of 1940 (the “1940 Act”)) are effective based on their evaluation of these controls and procedures as of a date within 90 days of the filing date of this report.
(b) There were no changes in the Registrant’s internal control over financial reporting (as defined in Rule 30a-3(d) under the 1940 Act) that occurred during the period covered by this report that have materially affected, or are reasonably likely to materially affect, the Registrant’s internal control over financial reporting.
Item 12. Disclosure of Securities Lending Activities for Closed-End Management Investment Companies.
Not applicable.
Item 13. Exhibits.
(a)(1) Not applicable.
SIGNATURES
Pursuant to the requirements of the Securities Exchange Act of 1934 and the Investment Company Act of 1940, the registrant has duly caused this report to be signed on its behalf by the undersigned, thereunto duly authorized.
| BARON SELECT FUNDS | ||
| By: | /s/ Ronald Baron | |
| Ronald Baron | ||
| Chief Executive Officer | ||
| Date: August 30, 2022 | ||
Pursuant to the requirements of the Securities Exchange Act of 1934 and the Investment Company Act of 1940, this report has been signed below by the following persons on behalf of the registrant and in the capacities and on the dates indicated.
| By: | /s/ Ronald Baron | |
| Ronald Baron | ||
| Chief Executive Officer | ||
| Date: August 30, 2022 | ||
| By: | /s/ Peggy Wong | |
| Peggy Wong | ||
| Treasurer and Chief Financial Officer | ||
| Date: August 30, 2022 | ||