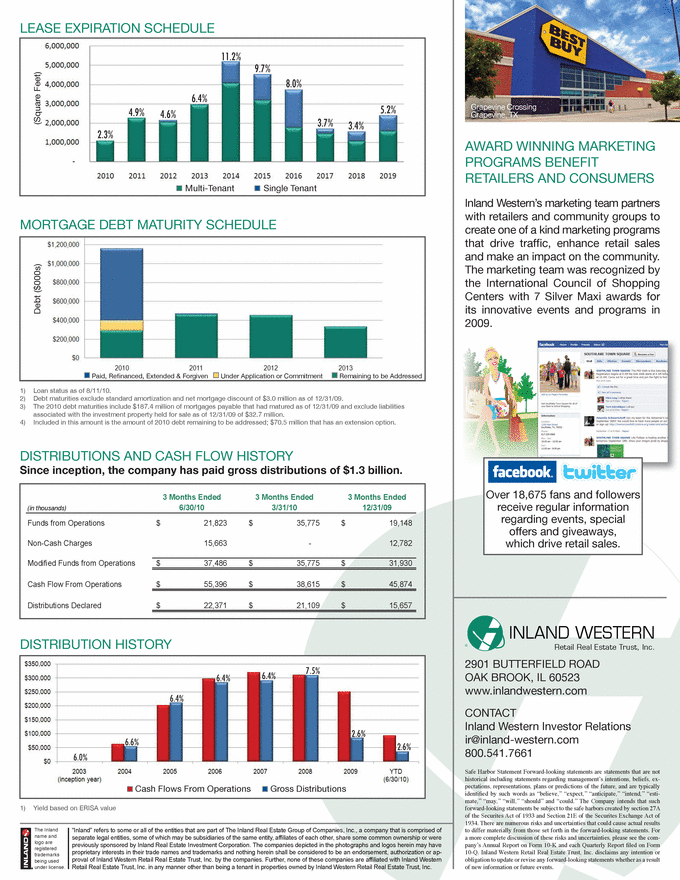
| Grapevine Crossing Grapevine, TX The Inland name and logo are registered trademarks being used under license. “Inland” refers to some or all of the entities that are part of The Inland Real Estate Group of Companies, Inc., a company that is comprised of separate legal entities, some of which may be subsidiaries of the same entity, affiliates of each other, share some common ownership or were previously sponsored by Inland Real Estate Investment Corporation. The companies depicted in the photographs and logos herein may have proprietary interests in their trade names and trademarks and nothing herein shall be considered to be an endorsement, authorization or approval of Inland Western Retail Real Estate Trust, Inc. by the companies. Further, none of these companies are affiliated with Inland Western Retail Real Estate Trust, Inc. in any manner other than being a tenant in properties owned by Inland Western Retail Real Estate Trust, Inc. 2901 BUTTERFIELD ROAD OAK BROOK, IL 60523 www.inlandwestern.com CONTACT Inland Western Investor Relations ir@inland-western.com 800.541.7661 R INLAND WESTERN Retail Real Estate Trust, Inc. LEASE EXPIRATION SCHEDULE AWARD WINNING MARKETING PROGRAMS BENEFIT RETAILERS AND CONSUMERS DISTRIBUTIONS AND CASH FLOW HISTORY Since inception, the company has paid gross distributions of $1.3 billion. MORTGAGE DEBT MATURITY SCHEDULE Inland Western’s marketing team partners with retailers and community groups to create one of a kind marketing programs that drive traffic, enhance retail sales and make an impact on the community. The marketing team was recognized by the International Council of Shopping Centers with 7 Silver Maxi awards for its innovative events and programs in 2009. 1) Loan status as of 8/11/10. 2) Debt maturities exclude standard amortization and net mortgage discount of $3.0 million as of 12/31/09. 3) The 2010 debt maturities include $187.4 million of mortgages payable that had matured as of 12/31/09 and exclude liabilities associated with the investment property held for sale as of 12/31/09 of $32.7 million. 4) Included in this amount is the amount of 2010 debt remaining to be addressed; $70.5 million that has an extension option. 1) Yield based on ERISA value 3 Months Ended 3 Months Ended 3 Months Ended (in thousands) 6/30/10 3/31/10 12/31/09 Funds from Operations 21,823 $ 35,775 $ 19,148 $ Non-Cash Charges 15,663 - 12,782 Modified Funds from Operations 37,486 $ 35,775 $ 31,930 $ Cash Flow From Operations 55,396 $ 38,615 $ 45,874 $ Distributions Declared 22,371 $ 21,109 $ 15,657 $ Safe Harbor Statement Forward-looking statements are statements that are not historical including statements regarding management’s intentions, beliefs, expectations, representations, plans or predictions of the future, and are typically identified by such words as “believe,” “expect,” “anticipate,” “intend,” “estimate,” “may,” “will,” “should” and “could.” The Company intends that such forward-looking statements be subject to the safe harbors created by section 27A of the Securites Act of 1933 and Section 21E of the Securites Exchange Act of 1934. There are numerous risks and uncertainties that could cause actual results to differ materially from those set forth in the forward-looking statements. For a more complete discussion of these risks and uncertainties, please see the company’s Annual Report on Form 10-K and each Quarterly Report filed on Form 10-Q. Inland Western Retail Real Estate Trust, Inc. disclaims any intention or obligation to update or revise any forward-looking statements whether as a result of new information or future events. Over 18,675 fans and followers receive regular information regarding events, special offers and giveaways, which drive retail sales. (Square Feet) Debt ($000s) Paid, Refinanced, Extended & Forgiven Under Application or Commitment Remaining to be Addressed Multi-Tenant Single Tenant DISTRIBUTION HISTORY 2.6% 5.2% 3.4% 3.7% 8.0% 9.7% 11.2% 6.4% 4.6% 4.9% 2.3% 2.6% 7.5% 6.4% 6.4% 6.4% 6.6% 6.0% Cash Flows From Operations Gross Distributions |

