
Exhibit 99.2 TRANSFORMATION GROWTH SHAREHOLDER VALUE I N V E S T O R D A Y 2 0 2 2 C O N N ’ S H O M E P L U S I N V E S T O R D A Y 2 0 2 2 1
TODAY’S AGENDA VISION + STRATEGY OVERVIEW Chandra Holt, President & Chief Executive Officer CUSTOMER JOURNEY + STORE EXPANSION Strengthen the Core Rodney Lastinger, President of Retail GROWTH + OPPORTUNITY Evolve the Credit Business TJ Fenton, Chief Credit Officer eCOMMERCE + DIGITAL EXPERIENCE Accelerate Growth Chandra Holt, President & Chief Executive Officer FINANCES + KPIs + SHAREHOLDER VALUE George Bchara, Chief Financial Officer CONN’S HOMEPLUS + THE FUTURE Norm Miller, Executive Chairman Q&A C O N N ’ S H O M E P L U S I N V E S T O R D A Y 2 0 2 2 2
FORWARD LOOKING STATEMENTS & OTHER DISCLOSURE MATTERS C O N N ’ S H O M E P L U S I N V E S T O R D A Y 2 0 2 2 3
VISION STRATEGY OVERVIEW Chandra Holt, President & Chief Executive Officer C C O O N N N N ’’ S S H H O O M M E E P P L L U U S S I I N N V V E E S S T T O O R R D D A A Y Y 2 2 0 0 2 2 2 2 4
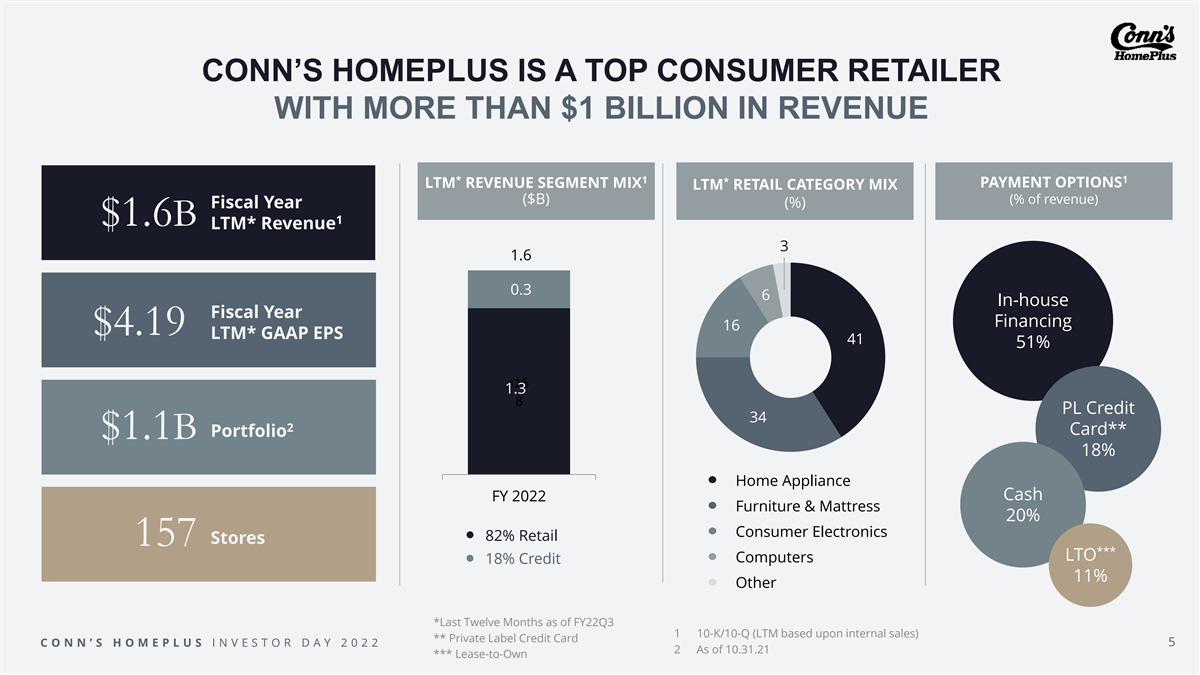
CONN’S HOMEPLUS IS A TOP CONSUMER RETAILER WITH MORE THAN $1 BILLION IN REVENUE * 1 1 * LTM REVENUE SEGMENT MIX PAYMENT OPTIONS LTM RETAIL CATEGORY MIX ($B) (% of revenue) (%) Fiscal Year 1 $1.6B LTM* Revenue 3 1.6 0.3 6 In-house Fiscal Year Financing 16 $4.19 LTM* GAAP EPS 41 51% 126 1.3 8 PL Credit 34 2 Card** Portfolio $1.1B 18% Home Appliance Cash FY 2022 Furniture & Mattress 20% Consumer Electronics 82% Retail Stores 157 *** LTO Computers 18% Credit 11% Other *Last Twelve Months as of FY22Q3 1 10-K/10-Q (LTM based upon internal sales) ** Private Label Credit Card C O N N ’ S H O M E P L U S I N V E S T O R D A Y 2 0 2 2 5 2 As of 10.31.21 *** Lease-to-Own
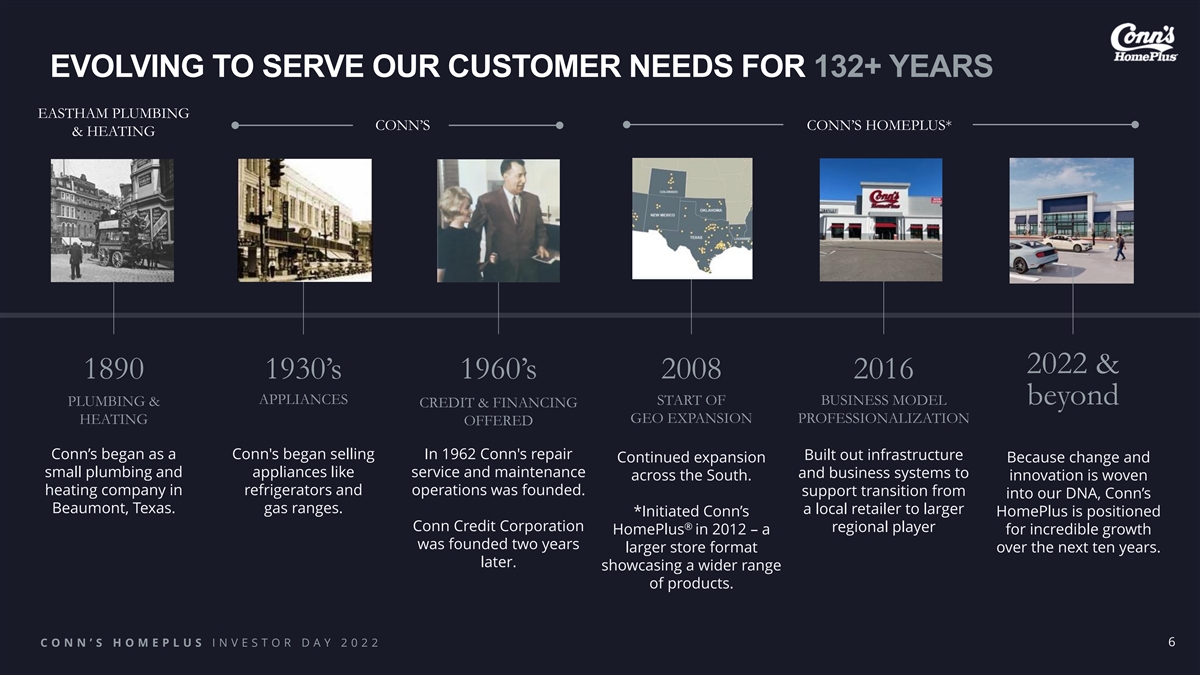
EVOLVING TO SERVE OUR CUSTOMER NEEDS FOR 132+ YEARS EASTHAM PLUMBING CONN’S CONN’S HOMEPLUS* & HEATING 2022 & 1890 1930’s 1960’s 2008 2016 APPLIANCES START OF BUSINESS MODEL beyond PLUMBING & CREDIT & FINANCING GEO EXPANSION PROFESSIONALIZATION HEATING OFFERED Conn’s began as a Conn's began selling In 1962 Conn's repair Built out infrastructure Continued expansion Because change and small plumbing and appliances like service and maintenance and business systems to across the South. innovation is woven heating company in refrigerators and operations was founded. support transition from into our DNA, Conn’s Beaumont, Texas. gas ranges. a local retailer to larger *Initiated Conn’s HomePlus is positioned ® Conn Credit Corporation regional player HomePlus in 2012 – a for incredible growth was founded two years larger store format over the next ten years. later. showcasing a wider range of products. C O N N ’ S H O M E P L U S I N V E S T O R D A Y 2 0 2 2 6

OUR CURRENT BUSINESS AND OPERATIONAL CAPABILITIES REFLECT CORE CUSTOMER NEEDS White Glove Next Day Delivery ATTRACTION Financial RETENTION Access Customers In-house Product Repair Service C C O O N N N N ’’ S S H H O O M M E E P P L L U U S S I I N N V V E E S S T T O O R R D D A A Y Y 2 2 0 0 2 2 2 2 7

WE CAN LEVERAGE THESE CAPABILITIES TO RETAIN CORE CUSTOMERS AND ATTRACT NEW CUSTOMER SEGMENTS Financial Fast & Access Reliable ~62% ~38% Customers Customers KEY CAPABILITIES KEY CAPABILITIES Financial White Glove In-house Product White Glove In-house Product Access Next-Day Delivery Repair Service Next-Day Delivery Repair Service Pricing Assortment Digital Capabilities Unified Commerce Brand C O N N ’ S H O M E P L U S I N V E S T O R D A Y 2 0 2 2 8 RE-IMAGINE IMPROVE CONTINUE
Our vision is everyone deserves a home they love. Our mission is to elevate your home life to home love. C C O O N N N N ’’ S S H H O O M M E E P P L L U U S S I I N N V V E E S S T T O O R R D D A A Y Y 2 2 0 0 2 2 2 2 9

WE WILL GROW INTO OUR NEW MISSION THROUGH THREE STRATEGIC PRIORITIES 1 2 3 Strengthen Enhance the Accelerate the Core Credit Business eCommerce Growth C O N N ’ S H O M E P L U S I N V E S T O R D A Y 2 0 2 2 10
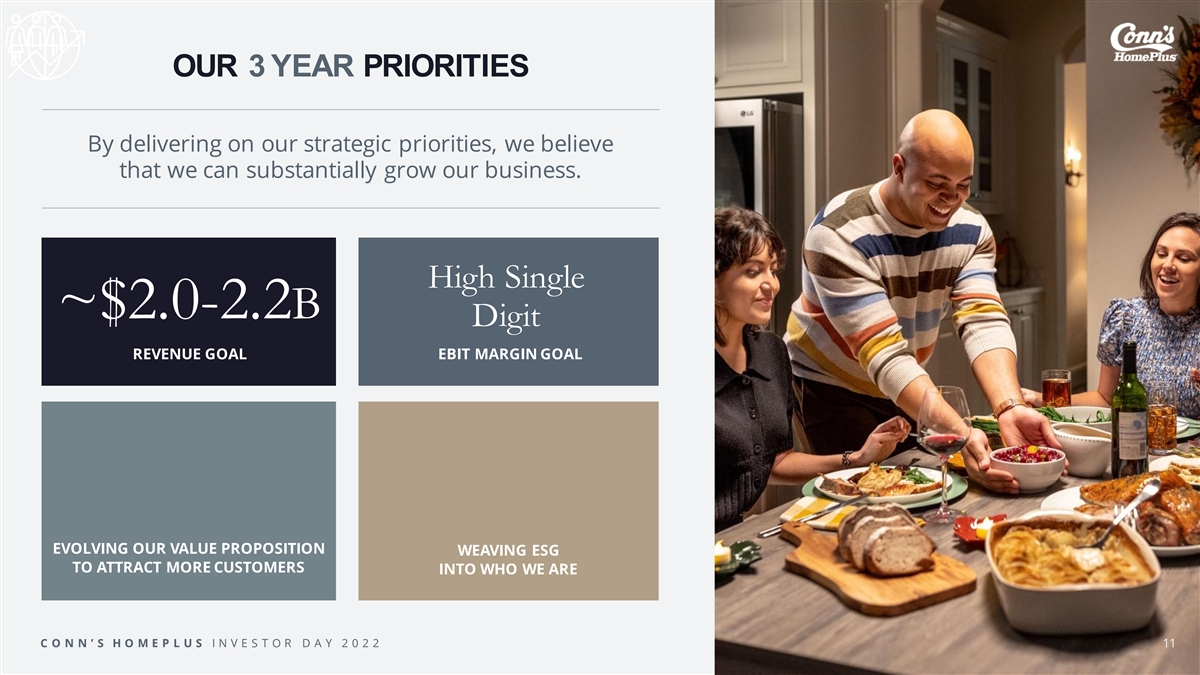
OUR 3 YEAR PRIORITIES By delivering on our strategic priorities, we believe that we can substantially grow our business. High Single ~$2.0-2.2B Digit REVENUE GOAL EBIT MARGIN GOAL EVOLVING OUR VALUE PROPOSITION WEAVING ESG TO ATTRACT MORE CUSTOMERS INTO WHO WE ARE C O N N ’ S H O M E P L U S I N V E S T O R D A Y 2 0 2 2 11

CUSTOMER JOURNEY STORE EXPANSION STRENGTHEN THE CORE Rodney Lastinger, President of Retail C C O O N N N N ’’ S S H H O O M M E E P P L L U U S S I I N N V V E E S S T T O O R R D D A A Y Y 2 2 0 0 2 2 2 2 12

THE CUSTOMER JOURNEY Product Assortment Service & Selection Delivery & Pricing Repair & Purchase C O N N ’ S H O M E P L U S I N V E S T O R D A Y 2 0 2 2 13
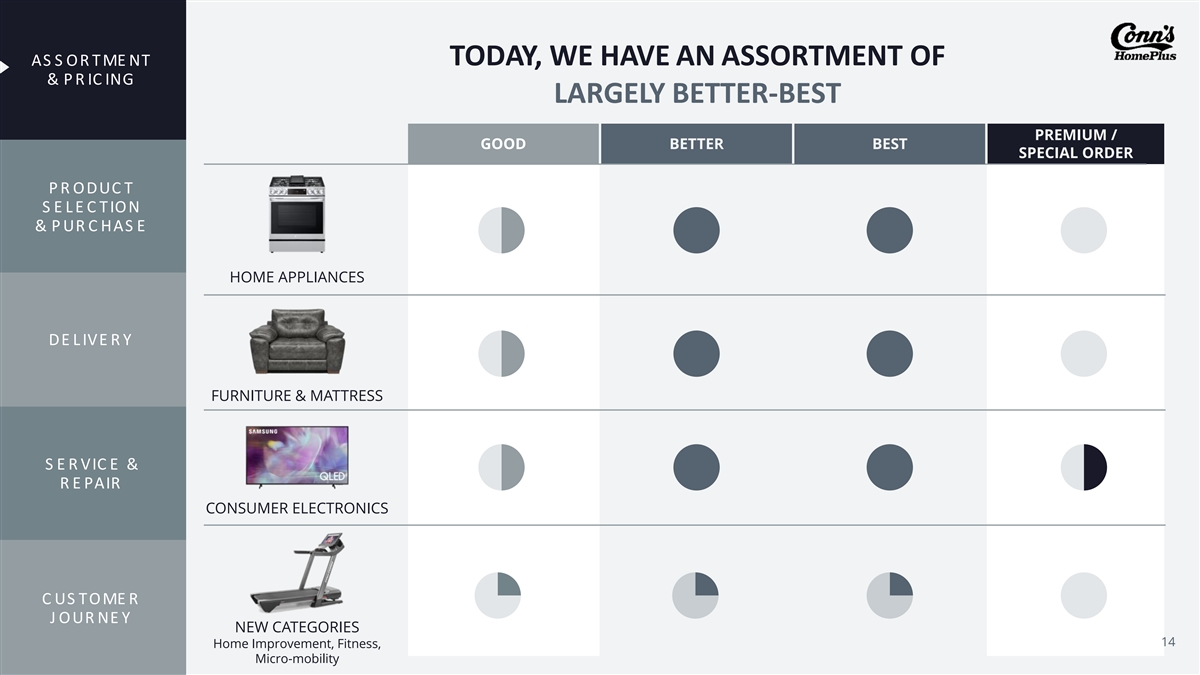
TODAY, WE HAVE AN ASSORTMENT OF AS S O R T ME NT & P R IC ING LARGELY BETTER-BEST PREMIUM / GOOD BETTER BEST SPECIAL ORDER P R O DUC T S E L E C T IO N & P UR C HAS E HOME APPLIANCES DE L IVE R Y FURNITURE & MATTRESS S E R VIC E & R E PAIR CONSUMER ELECTRONICS C US TO ME R J O UR NE Y NEW CATEGORIES C O N N ’ S H O M E P L U S I N V E S T O R D A Y 2 0 2 2 14 Home Improvement, Fitness, Micro-mobility

AS S O R T ME NT & P R IC ING TOMORROW, CONN’S HOMEPLUS WILL OFFER AN EXPANDED ASSORTMENT AND PRICING SPECTRUM P R O DUC T PREMIUM / S E L E C T IO N GOOD BETTER BEST SPECIAL ORDER & P UR C HAS E DE L IVE R Y S E R VIC E & R E PAIR <$1,000 $1,000 - $3,000 $3,000 - $5,000 $5,000+ C US TO ME R J O UR NE Y 15
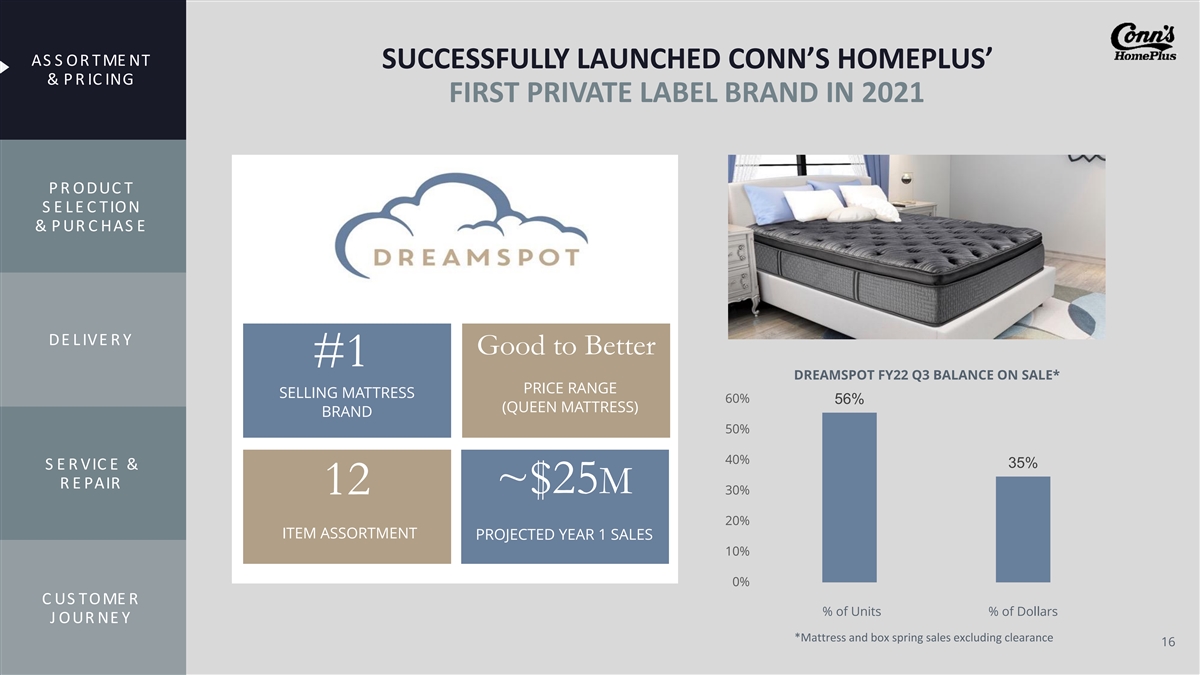
AS S O R T ME NT SUCCESSFULLY LAUNCHED CONN’S HOMEPLUS’ & P R IC ING FIRST PRIVATE LABEL BRAND IN 2021 P R O DUC T S E L E C T IO N & P UR C HAS E DE L IVE R Y Good to Better #1 DREAMSPOT FY22 Q3 BALANCE ON SALE* PRICE RANGE SELLING MATTRESS 60% 56% (QUEEN MATTRESS) BRAND 50% 40% 35% S E R VIC E & R E PAIR ~$25M 12 30% 20% ITEM ASSORTMENT PROJECTED YEAR 1 SALES 10% 0% C US TO ME R % of Units % of Dollars J O UR NE Y *Mattress and box spring sales excluding clearance 16
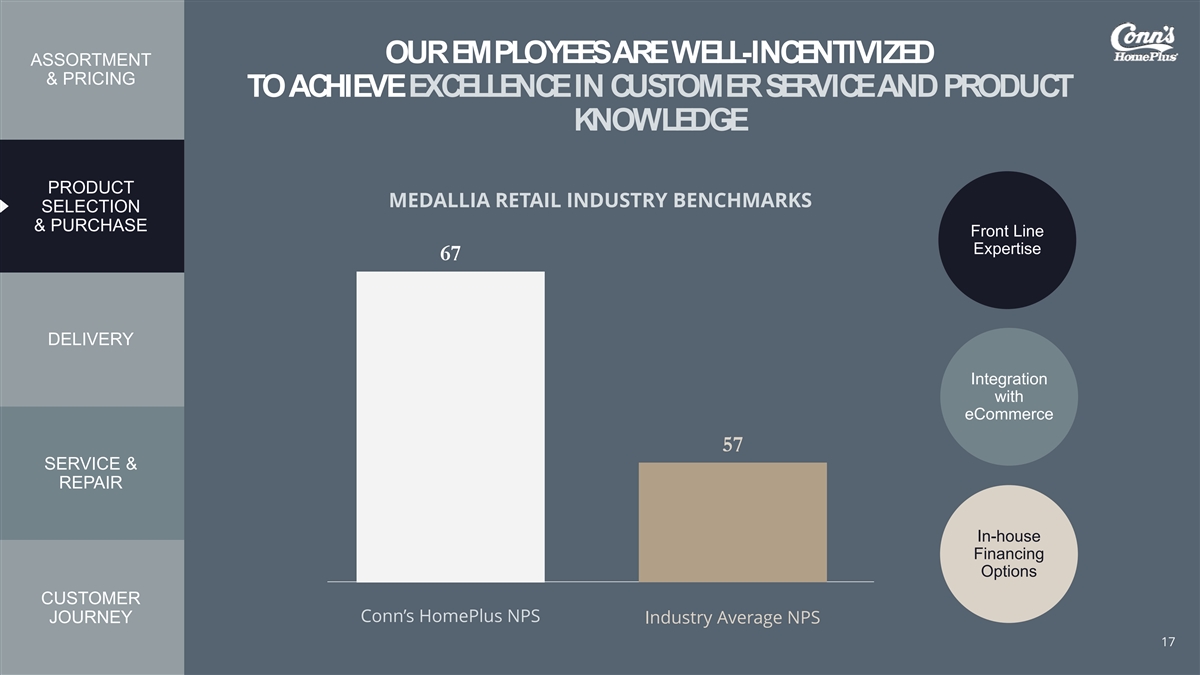
OUR EMPLOYEES ARE WELL-INCENTIVIZED ASSORTMENT & PRICING TO ACHIEVE EXCELLENCE IN CUSTOMER SERVICE AND PRODUCT KNOWLEDGE PRODUCT MEDALLIA RETAIL INDUSTRY BENCHMARKS SELECTION & PURCHASE Front Line Expertise 67 DELIVERY Integration with eCommerce 57 SERVICE & REPAIR In-house Financing Options CUSTOMER Conn’s HomePlus NPS JOURNEY Industry Average NPS C O N N ’ S H O M E P L U S I N V E S T O R D A Y 2 0 2 2 17
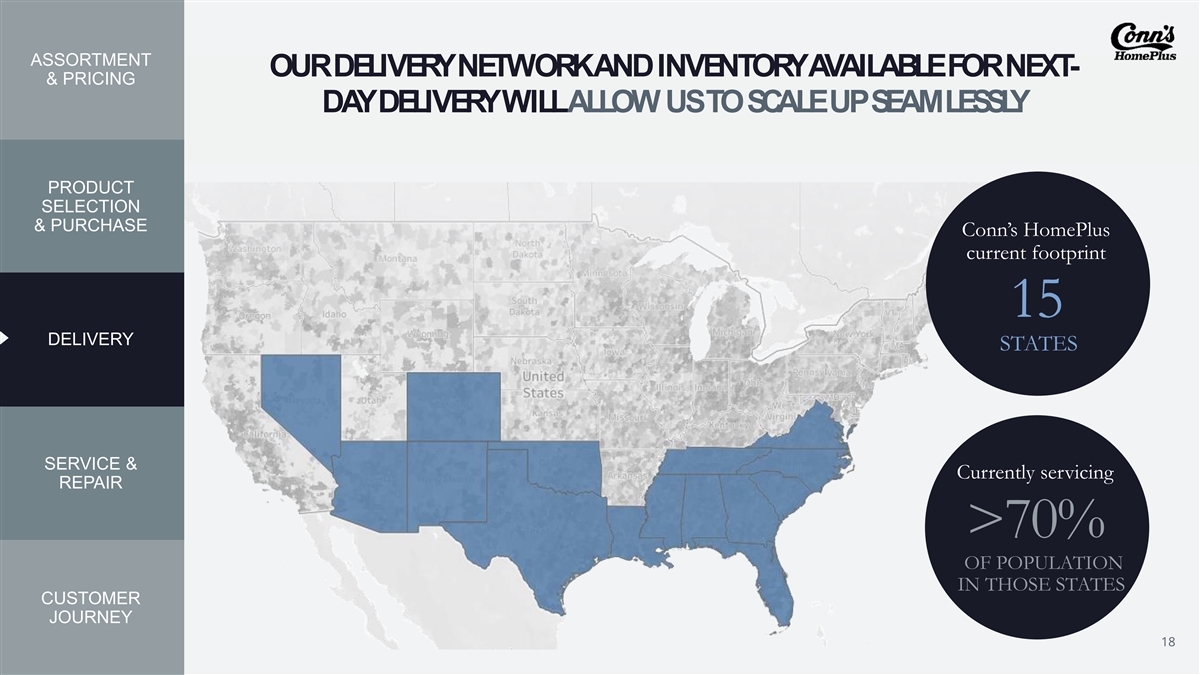
ASSORTMENT OUR DELIVERY NETWORK AND INVENTORY AVAILABLE FOR NEXT- & PRICING DAY DELIVERY WILL ALLOW US TO SCALE UP SEAMLESSL Y PRODUCT SELECTION & PURCHASE Conn’s HomePlus current footprint 15 DELIVERY STATES SERVICE & Currently servicing REPAIR >70% OF POPULATION IN THOSE STATES CUSTOMER JOURNEY 18

ASSORTMENT & PRICING OUR DISTRIBUTION CAPABILITIES ARE INDUSTRY-LEADING & DRIVE BEST-IN-CLASS DELIVERY SPEED PRODUCT DISTRIBUTION CENTER : STORE RATIO SELECTION & PURCHASE 1:14 0.08 0.07 1:17 0.06 DELIVERY 1:21 0.05 0.04 0.03 1:43 SERVICE & 1:49 1:52 REPAIR 0.02 1:84 1:93 0.01 - Conn's Pure Play Pure Play Big Box 1 Big Box 2 Big Box 3 Rent to Own 1 Pure Play CUSTOMER Furniture 1 Furniture 2 Furniture 2 JOURNEY C O N N ’ S H O M E P L U S I N V E S T O R D A Y 2 0 2 2 19 Distribution Centers per Store

ASSORTMENT OUR RELIABLE, SPEEDY INSTALLATION & SERVICE & PRICING HAS CREATED CUSTOMER LOYALTY AND BOOSTED OUR ONLINE REPUTATION PRODUCT REPAIR NPS SELECTION & PURCHASE ~70 Conn’s HomePlus In-house Service Team YTD DELIVERY REPAIR TIME 7 days 14 days SERVICE & REPAIR Conn’s HomePlus Industry In-house Service Team AVG YTD of Appliance and TV Repairs are % performed by Conn’s HomePlus employees CUSTOMER 95 JOURNEY C O N N ’ S H O M E P L U S I N V E S T O R D A Y 2 0 2 2 20
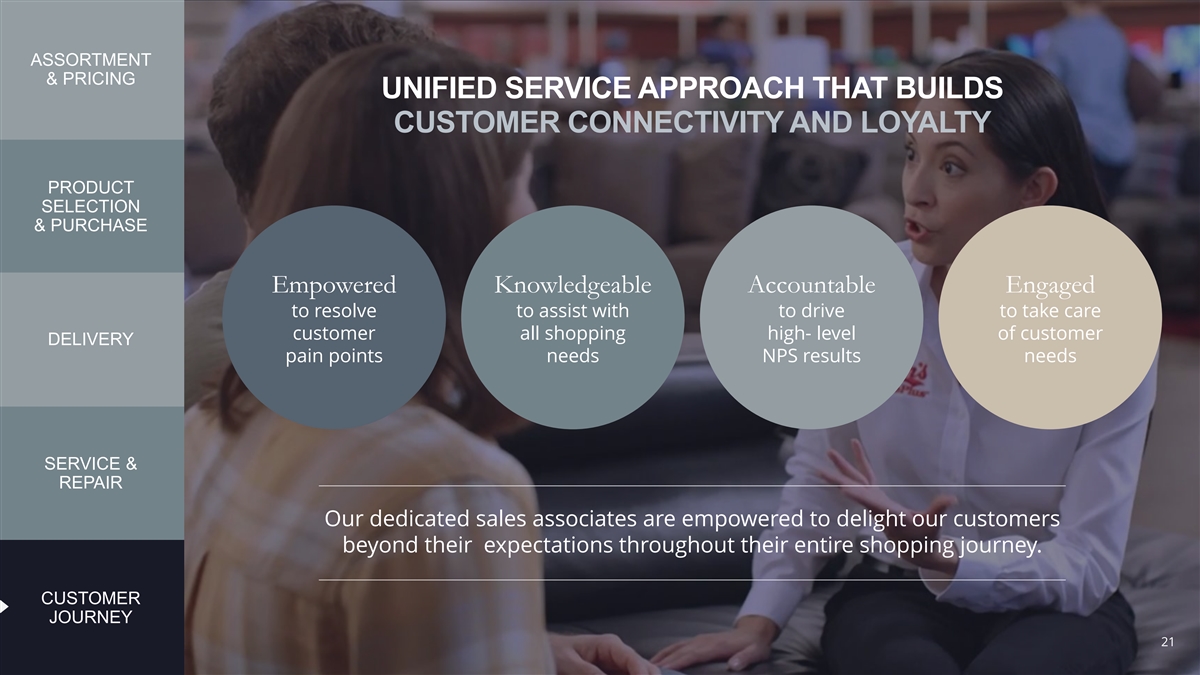
ASSORTMENT & PRICING UNIFIED SERVICE APPROACH THAT BUILDS CUSTOMER CONNECTIVITY AND LOYALTY PRODUCT SELECTION & PURCHASE Empowered Knowledgeable Accountable Engaged to resolve to assist with to drive to take care customer all shopping high- level of customer DELIVERY pain points needs NPS results needs SERVICE & REPAIR Our dedicated sales associates are empowered to delight our customers beyond their expectations throughout their entire shopping journey. CUSTOMER JOURNEY C O N N ’ S H O M E P L U S I N V E S T O R D A Y 2 0 2 2 21

VIDEO PLACEHOLDER C O N N ’ S H O M E P L U S I N V E S T O R D A Y 2 0 2 2 22

ANIMATED MAP C O N N ’ S H O M E P L U S I N V E S T O R D A Y 2 0 2 2 23

STORE GROWTH HAS BEEN HISTORICALLY STRONG 220 200 STORE COUNT 180 170-175 STORE GROWTH 158 CONSIDERATIONS 160 146 137 140 Test Small 123 116 113 120 Store Format 103 100 90 79 80 68 65 Test Layouts 60 40 New Markets 20 0 2012 2013 2014 2015 2016 2017 2018 2019 2020 2021 2022F 2023P New Stores 3 11 11 13 10 3 7 14 9 12 ~15 Store Growth 5% 16% 14% 14% 10% 3% 6% 11% 7% 8% ~10% C O N N ’ S H O M E P L U S I N V E S T O R D A Y 2 0 2 2 24

A SUCCESSFUL NEW STORE OPENING REQUIRES THREE KEY COMPONENTS Optimized Real Estate Effective Go-to-Market Strong Customer Selection and Renewals Plan and Support Value Proposition C C O O N N N N ’’ S S H H O O M M E E P P L L U U S S I I N N V V E E S S T T O O R R D D A A Y Y 2 2 0 0 2 2 2 2 25

MARKET ECONOMICS OF OPENING A NEW STORE NEW STORE NEW STORE COSTS METRICS TO BUILD $5-7M ~$4M Average annual sales New store operating 2 for new stores breakeven 3-4 yrs. ~$0.3M Expected time until 1 Pre-opening SG&A expense new store maturity ~$1M 1-3 yrs. 3 Payback period Net capital investment 1. Starts ~6 months prior to opening 2. Represents standard box size/layout C O N N ’ S H O M E P L U S I N V E S T O R D A Y 2 0 2 2 3. New store Gross Capital Expenditure is $1.7-2.5M 26
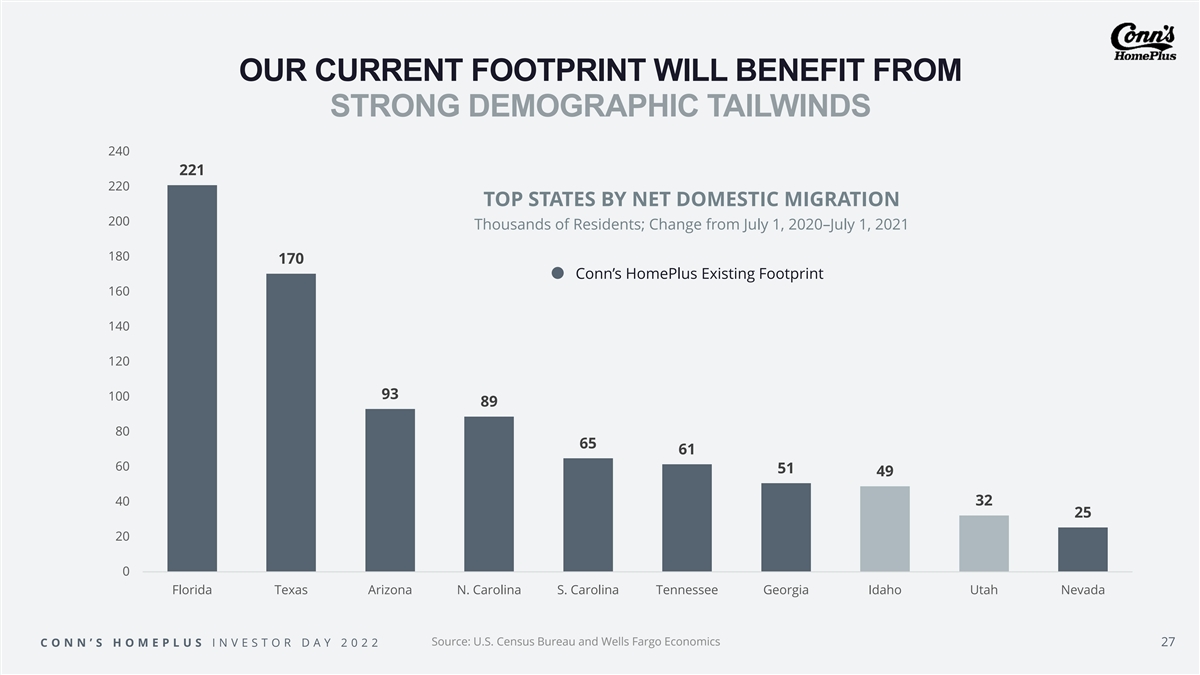
OUR CURRENT FOOTPRINT WILL BENEFIT FROM STRONG DEMOGRAPHIC TAILWINDS 240 221 220 TOP STATES BY NET DOMESTIC MIGRATION 200 Thousands of Residents; Change from July 1, 2020–July 1, 2021 180 170 Conn’s HomePlus Existing Footprint 160 140 120 93 100 89 80 65 61 60 51 49 40 32 25 20 0 Florida Texas Arizona N. Carolina S. Carolina Tennessee Georgia Idaho Utah Nevada C O N N ’ S H O M E P L U S I N V E S T O R D A Y 2 0 2 2 Source: U.S. Census Bureau and Wells Fargo Economics 27
Our strong core model is scalable across new markets. C C O O N N N N ’’ S S H H O O M M E E P P L L U U S S I I N N V V E E S S T T O O R R D D A A Y Y 2 2 0 0 2 2 2 2 28
GROWTH OPPORTUNITY ENHANCE THE CREDIT BUSINESS TJ Fenton, Chief Credit Officer C C O O N N N N ’’ S S H H O O M M E E P P L L U U S S I I N N V V E E S S T T O O R R D D A A Y Y 2 2 0 0 2 2 2 2 29

CREDIT BUSINESS HAS A SOLID FOUNDATION WITH ROOM TO GROW Payment Options Strong In-house Opportunities Digital Financing Performance Overview Ahead Experience C O N N ’ S H O M E P L U S I N V E S T O R D A Y 2 0 2 2 30
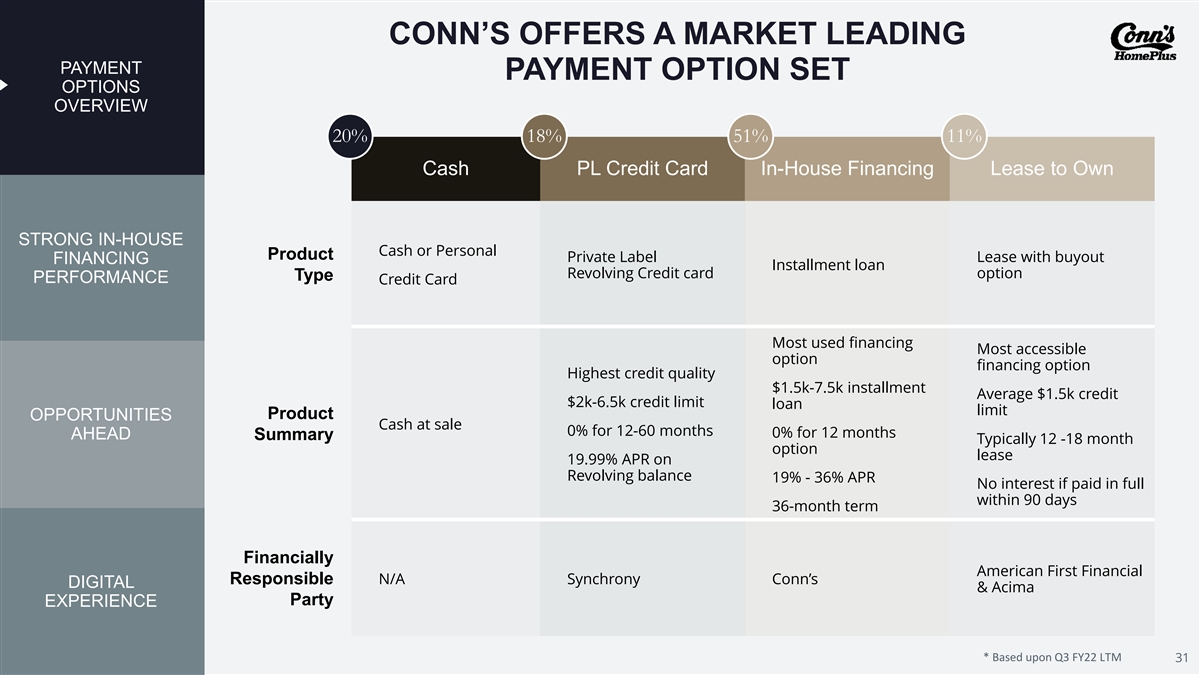
CONN’S OFFERS A MARKET LEADING PAYMENT PAYMENT OPTION SET OPTIONS OVERVIEW 20% 18% 51% 11% Cash PL Credit Card In-House Financing Lease to Own STRONG IN-HOUSE Cash or Personal Product Private Label Lease with buyout FINANCING Installment loan Revolving Credit card option Type PERFORMANCE Credit Card Most used financing Most accessible option financing option Highest credit quality $1.5k-7.5k installment Average $1.5k credit $2k-6.5k credit limit loan limit Product OPPORTUNITIES Cash at sale 0% for 12-60 months 0% for 12 months AHEAD Summary Typically 12 -18 month option lease 19.99% APR on Revolving balance 19% - 36% APR No interest if paid in full within 90 days 36-month term Financially American First Financial Responsible N/A Synchrony Conn’s DIGITAL & Acima Party EXPERIENCE C O N N ’ S H O M E P L U S I N V E S T O R D A Y 2 0 2 2 * Based upon Q3 FY22 LTM 31
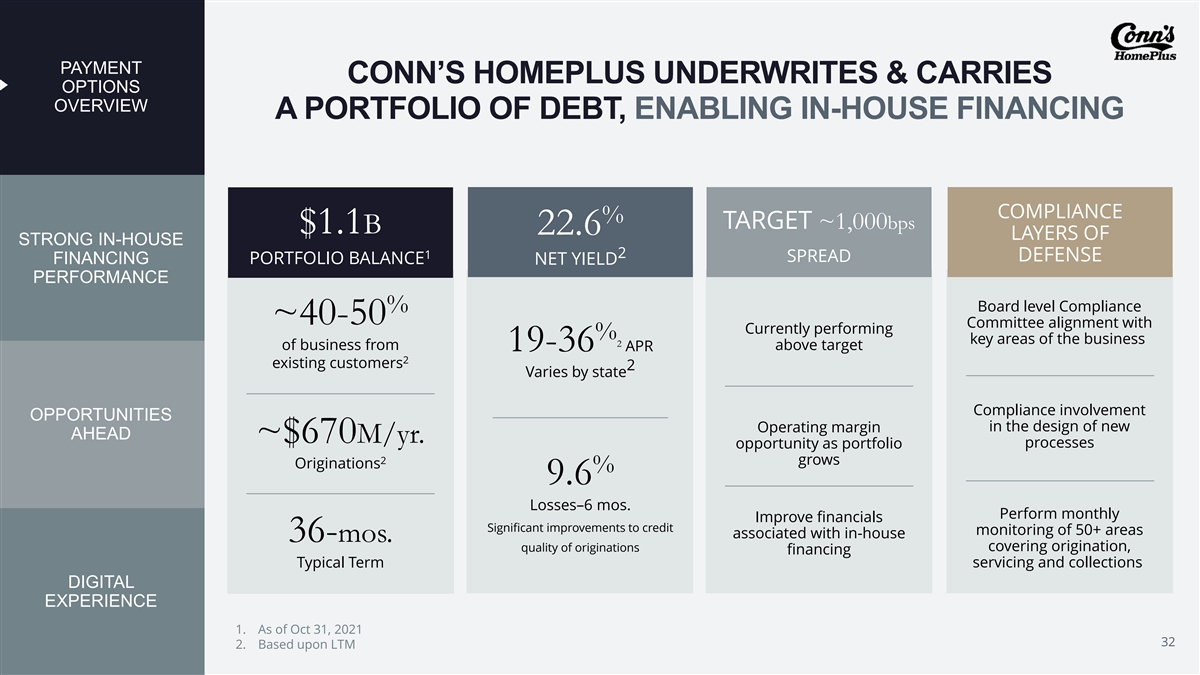
PAYMENT CONN’S HOMEPLUS UNDERWRITES & CARRIES OPTIONS OVERVIEW A PORTFOLIO OF DEBT, ENABLING IN-HOUSE FINANCING COMPLIANCE % TARGET ~1,000bps $1.1B 22.6 LAYERS OF STRONG IN-HOUSE 1 2 DEFENSE SPREAD FINANCING PORTFOLIO BALANCE NET YIELD PERFORMANCE Board level Compliance % ~40-50 Committee alignment with Currently performing % key areas of the business 2 of business from above target 19-36 APR 2 existing customers 2 Varies by state Compliance involvement OPPORTUNITIES in the design of new Operating margin AHEAD ~$670M/yr. processes opportunity as portfolio 2 grows Originations % 9.6 Losses–6 mos. Perform monthly Improve financials Significant improvements to credit monitoring of 50+ areas associated with in-house 36-mos. covering origination, quality of originations financing Typical Term servicing and collections DIGITAL EXPERIENCE 1. As of Oct 31, 2021 C O N N ’ S H O M E P L U S I N V E S T O R D A Y 2 0 2 2 32 2. Based upon LTM
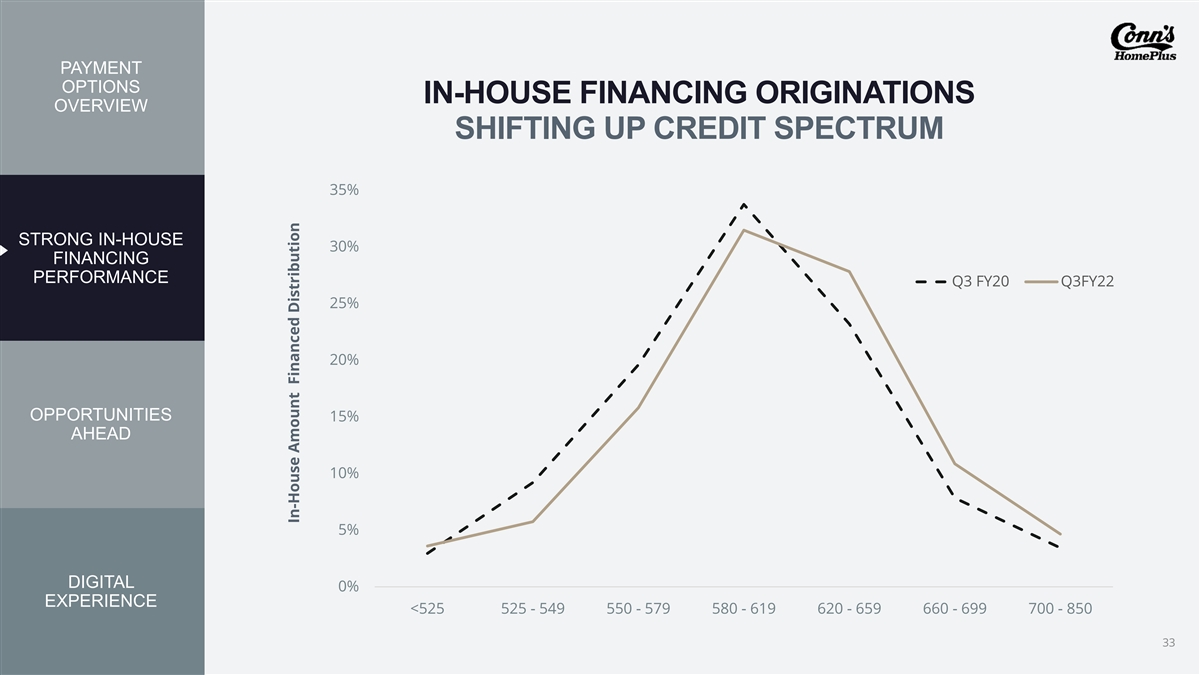
PAYMENT OPTIONS IN-HOUSE FINANCING ORIGINATIONS OVERVIEW SHIFTING UP CREDIT SPECTRUM 35% STRONG IN-HOUSE 30% FINANCING PERFORMANCE Q3 FY20 Q3FY22 25% 20% OPPORTUNITIES 15% AHEAD 10% 5% DIGITAL 0% EXPERIENCE <525 525 - 549 550 - 579 580 - 619 620 - 659 660 - 699 700 - 850 C O N N ’ S H O M E P L U S I N V E S T O R D A Y 2 0 2 2 33 In-House Amount Financed Distribution

SIGNIFICANT UNDERWRITING IMPROVEMENTS PAYMENT OPTIONS BOOSTED ORIGINATION QUALITY OVERVIEW 50% ENHANCED CREDIT strategy launched COVID-19 DRIVEN credit tightening 40% STRONG IN-HOUSE C FINANCING B PERFORMANCE 30% D A 20% OPPORTUNITIES AHEAD 10% 0% Q1 FY20 Q2 FY20 Q3 FY20 Q4 FY20 Q1 FY21 Q2 FY21 Q3 FY21 Q4 FY21 Q1 FY22 Q2 FY22 Q3 FY22 YoY Chg in Conn's -7.9% 1.0% -5.4% -10.9% -18.5% -38.8% -27.9% -28.7% -2.1% 37.2% 31.0% DIGITAL Financed Sales EXPERIENCE % A % B % C % D Low Risk High Risk C O N N ’ S H O M E P L U S I N V E S T O R D A Y 2 0 2 2 34 Percent of Originations by Risk Grade
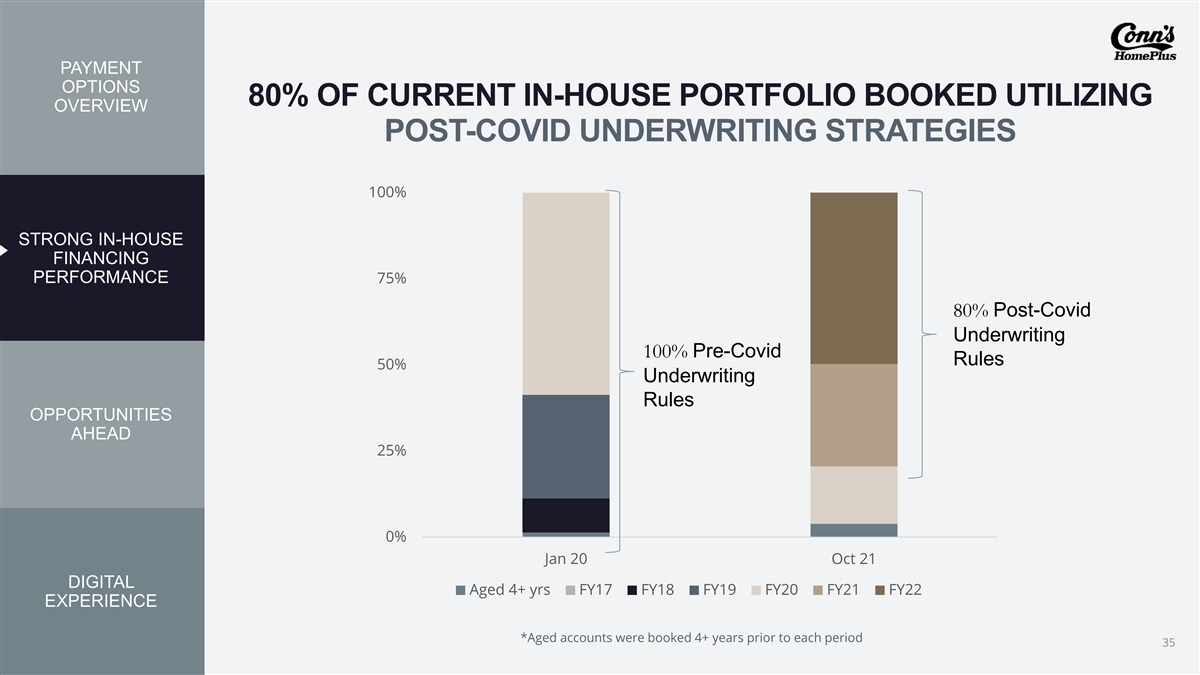
PAYMENT OPTIONS 80% OF CURRENT IN-HOUSE PORTFOLIO BOOKED UTILIZING OVERVIEW POST-COVID UNDERWRITING STRATEGIES 100% STRONG IN-HOUSE FINANCING PERFORMANCE 75% 80% Post-Covid Underwriting 100% Pre-Covid Rules 50% Underwriting Rules OPPORTUNITIES AHEAD 25% 0% Jan 20 Oct 21 DIGITAL Aged 4+ yrs FY17 FY18 FY19 FY20 FY21 FY22 EXPERIENCE *Aged accounts were booked 4+ years prior to each period C O N N ’ S H O M E P L U S I N V E S T O R D A Y 2 0 2 2 35
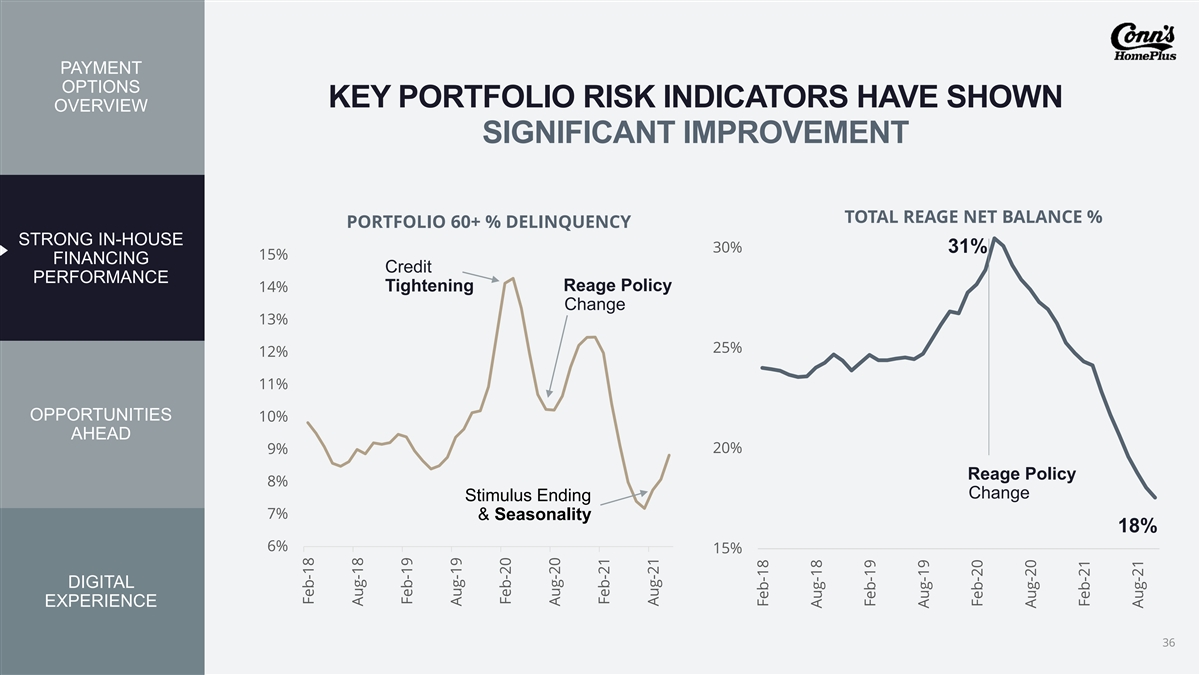
PAYMENT OPTIONS KEY PORTFOLIO RISK INDICATORS HAVE SHOWN OVERVIEW SIGNIFICANT IMPROVEMENT TOTAL REAGE NET BALANCE % PORTFOLIO 60+ % DELINQUENCY STRONG IN-HOUSE 30% 31% 15% FINANCING Credit PERFORMANCE Tightening Reage Policy 14% Change 13% 25% 12% 11% OPPORTUNITIES 10% AHEAD 9% 20% Reage Policy 8% Change Stimulus Ending 7% & Seasonality 18% 6% 15% DIGITAL EXPERIENCE C O N N ’ S H O M E P L U S I N V E S T O R D A Y 2 0 2 2 36 Feb-18 Aug-18 Feb-19 Aug-19 Feb-20 Aug-20 Feb-21 Aug-21 Feb-18 Aug-18 Feb-19 Aug-19 Feb-20 Aug-20 Feb-21 Aug-21
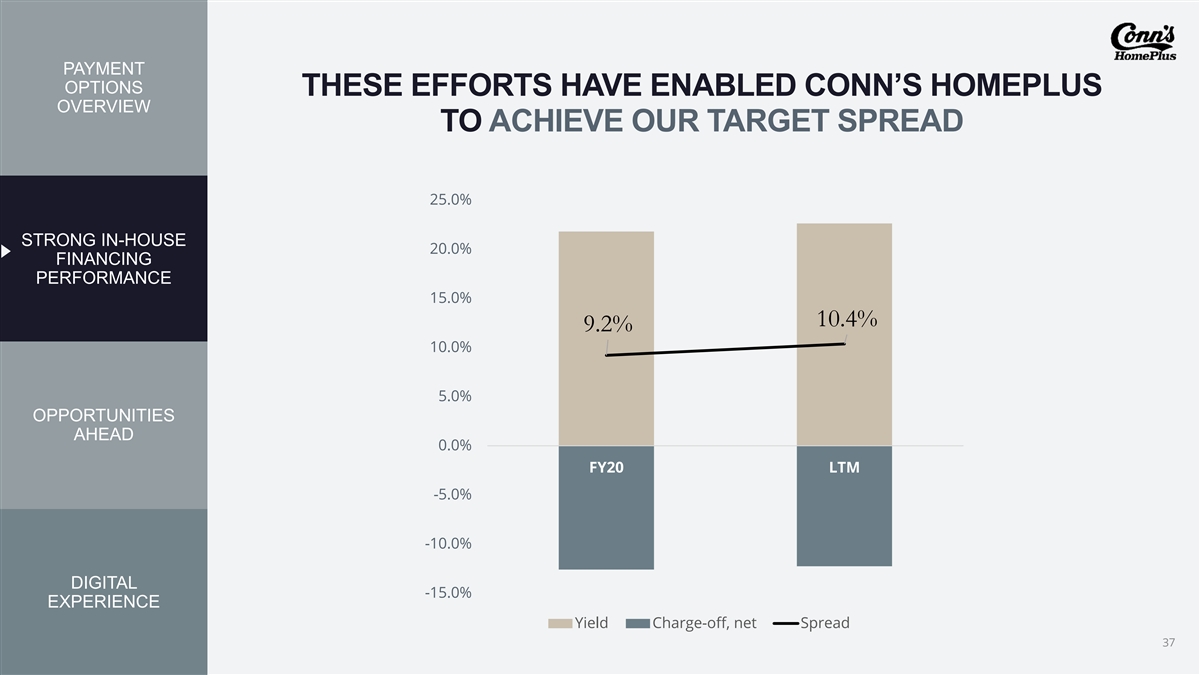
PAYMENT OPTIONS THESE EFFORTS HAVE ENABLED CONN’S HOMEPLUS OVERVIEW TO ACHIEVE OUR TARGET SPREAD 25.0% STRONG IN-HOUSE 20.0% FINANCING PERFORMANCE 15.0% 10.4% 9.2% 10.0% 5.0% OPPORTUNITIES AHEAD 0.0% FY20 LTM -5.0% -10.0% DIGITAL -15.0% EXPERIENCE Yield Charge-off, net Spread C O N N ’ S H O M E P L U S I N V E S T O R D A Y 2 0 2 2 37

PAYMENT SEVERAL GROWTH OPPORTUNITIES EMERGE ACROSS OPTIONS OVERVIEW OUR CREDIT OFFERINGS 1 OPTIMIZING CORE BUSINESS STRONG IN-HOUSE 2 PURSUING OPPORTUNITIES FINANCING 60% PERFORMANCE 3 CONTINUED FOCUS 50% 40% OPPORTUNITIES 30% AHEAD 20% 10% 0% DIGITAL <550 550-659 660-850 EXPERIENCE FICO Bands 1. PL Credit Card allocated to 660-850 C O N N ’ S H O M E P L U S I N V E S T O R D A Y 2 0 2 2 38 2. LTO allocated to <550 3. Marketplace comparison based upon unsecured installment lending Financed Sales Distribution Marketplace Conn’s
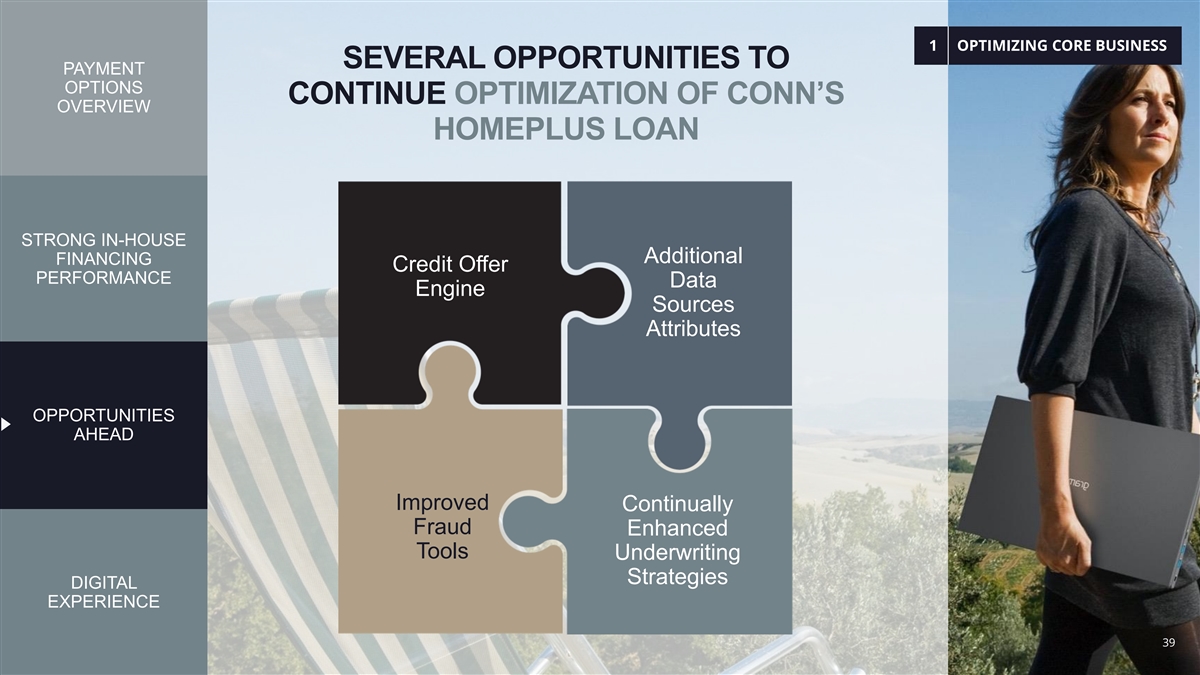
1 OPTIMIZING CORE BUSINESS SEVERAL OPPORTUNITIES TO PAYMENT OPTIONS CONTINUE OPTIMIZATION OF CONN’S OVERVIEW HOMEPLUS LOAN STRONG IN-HOUSE Additional FINANCING Credit Offer PERFORMANCE Data Engine Sources Attributes OPPORTUNITIES AHEAD Improved Continually Fraud Enhanced Tools Underwriting Strategies DIGITAL EXPERIENCE C O N N ’ S H O M E P L U S I N V E S T O R D A Y 2 0 2 2 39

2 PURSUING OPPORTUNITIES PAYMENT OPTIONS OVERVIEW WORKING TO BETTER SERVE 660+ CUSTOMER SEGMENT % 6 $400 STRONG IN-HOUSE Total FINANCING CAGR Improved offer strategy $350 PERFORMANCE including: promotional rates, $300 $116 APR, term and credit limit $102 $250 % 8 $200 In-house Financing OPPORTUNITIES Explore opportunities to $150 CAGR AHEAD better integrate with PL Credit $237 $216 $100 Card partners and optimize customer experience $50 % 5 $- PL Credit FY2020 LTM Card CAGR DIGITAL EXPERIENCE Synchrony Conn's PL Credit Card In-house Financing C O N N ’ S H O M E P L U S I N V E S T O R D A Y 2 0 2 2 40 CAGR based upon 1.75 yrs Amount Financed $MM
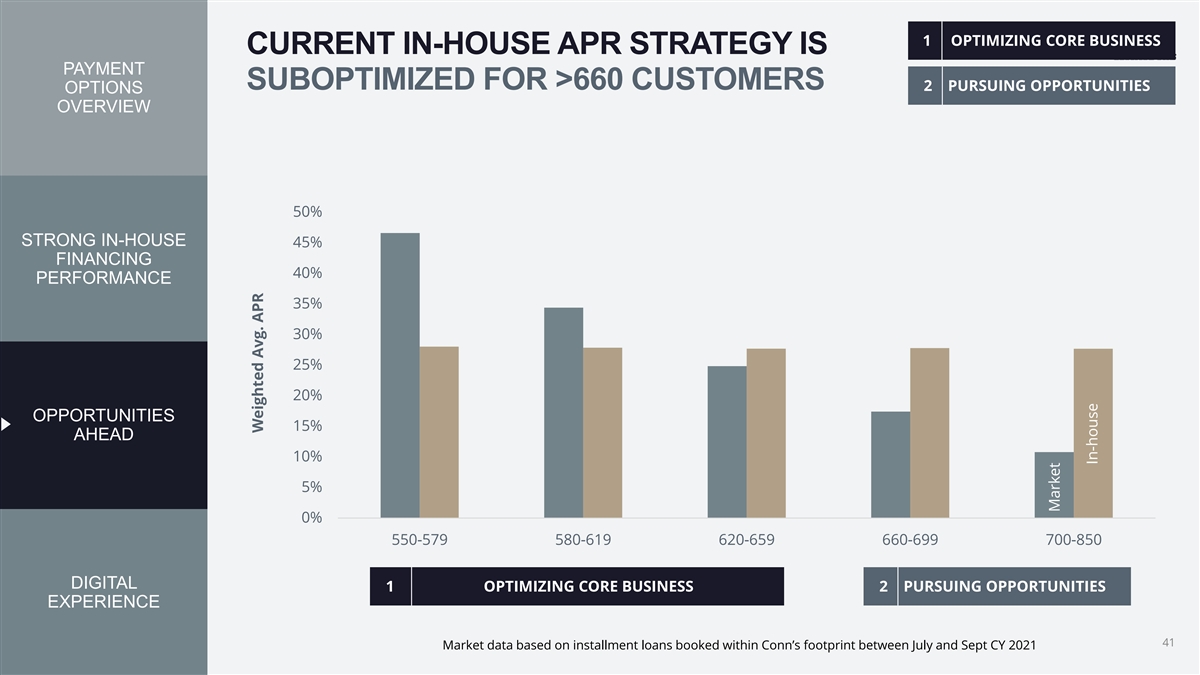
1 OPTIMIZING CORE BUSINESS CURRENT IN-HOUSE APR STRATEGY IS PAYMENT SUBOPTIMIZED FOR >660 CUSTOMERS 2 PURSUING OPPORTUNITIES OPTIONS OVERVIEW 50% STRONG IN-HOUSE 45% FINANCING 40% PERFORMANCE 35% 30% 25% 20% OPPORTUNITIES 15% AHEAD 10% 5% 0% 550-579 580-619 620-659 660-699 700-850 DIGITAL 1 OPTIMIZING CORE BUSINESS 2 PURSUING OPPORTUNITIES EXPERIENCE C O N N ’ S H O M E P L U S I N V E S T O R D A Y 2 0 2 2 41 Market data based on installment loans booked within Conn’s footprint between July and Sept CY 2021 Weighted Avg. APR Market In-house

3 CONTINUED FOCUS PAYMENT CONTINUED FOCUS ON OUR OPTIONS OVERVIEW <550 CUSTOMER SEGMENT $300 7% STRONG IN-HOUSE Total New partnerships drove FINANCING CAGR $250 PERFORMANCE significant improvement in LTO captured sales $200 % $59 -23 $150 In-house $93 Continued opportunity to Financing OPPORTUNITIES CAGR $100 AHEAD integrate customer experience $140 and optimize portfolio $50 $85 of offerings % $- 33 FY2020 LTM LTO* CAGR DIGITAL LTO Conn's LTO In-house Financing EXPERIENCE C O N N ’ S H O M E P L U S I N V E S T O R D A Y 2 0 2 2 42 42 CAGR based upon 1.75 yrs *LTO = Lease to Own Amount Financed $MM

EXCITING DIGITAL OPPORTUNITIES & PAYMENT INTERLOCKS WITH eCOMMERCE INVESTMENT OPTIONS OVERVIEW Prior State Current - Future State DIGITAL ID Manually Verified Digitally Verified VERIFICATION STRONG IN-HOUSE Longer credit application, multiple fields and FINANCING DIGITAL Streamlined application, including screens PERFORMANCE APPLICATION pre-populated fields Fields not pre-populated Not included in Credit Card or In-House Singular Application for all payment options, LTO APPLICATION Financing application including LTO OPPORTUNITIES AHEAD PREQUALIFICATION Available for In-house financing Available for all payment options Only shows 1 payment option All available payment options are displayed PAYMENT OPTIONS Best fit determined by customers credit Customer identifies which best meets their eligibility needs DIGITAL Promotional financing focused Enhanced promotional financing to include EXPERIENCE OFFER on 0% fixed rates and term variability C O N N ’ S H O M E P L U S I N V E S T O R D A Y 2 0 2 2 43 Enhanced Offers Digital ID Application

ECOMMERCE DIGITAL EXPERIENCE ACCELERATE GROWTH Chandra Holt, President & Chief Executive Officer C C O O N N N N ’’ S S H H O O M M E E P P L L U U S S I I N N V V E E S S T T O O R R D D A A Y Y 2 2 0 0 2 2 2 2 44

OUR DIGITAL LANDSCAPE Current Full Digital State Potential Experience C O N N ’ S H O M E P L U S I N V E S T O R D A Y 2 0 2 2 45
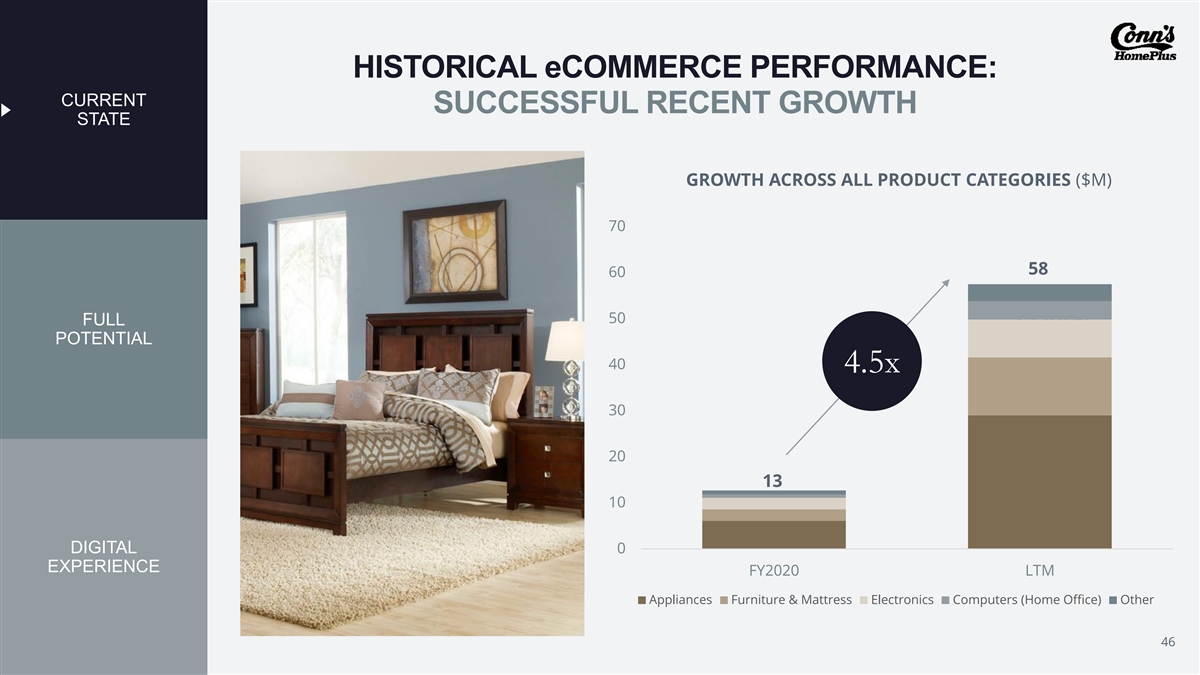
HISTORICAL eCOMMERCE PERFORMANCE: CURRENT SUCCESSFUL RECENT GROWTH STATE GROWTH ACROSS ALL PRODUCT CATEGORIES ($M) 70 58 60 50 75 Total FULL POTENTIAL 40 4.5x 30 20 13 10 DIGITAL 0 EXPERIENCE FY2020 LTM Appliances Furniture & Mattress Electronics Computers (Home Office) Other C O N N ’ S H O M E P L U S I N V E S T O R D A Y 2 0 2 2 46

GAP TO FAIR SHARE / HEAD ROOM CURRENT STATE Market Parity Opportunity Category Level Opportunity >$500M 60% Gap at category level represents significant 50% opportunity 3-Year Goal FULL 40% POTENTIAL >$300M 30% 20% 10% 0% DIGITAL Appliances Furniture Electronics EXPERIENCE Conn's Market C O N N ’ S H O M E P L U S I N V E S T O R D A Y 2 0 2 2 47 Market penetration data from Statista eComm Penetration

HOW WILL WE GROW THE BUSINESS? CURRENT STATE Traffic Conversion AOV = REVENUE LTM FULL POTENTIAL $58M 25M+ 22bps $930 3-YEAR GOAL Improving conversion will drive an increase ~150bps >$300M in revenue DIGITAL EXPERIENCE C O N N ’ S H O M E P L U S I N V E S T O R D A Y 2 0 2 2 48
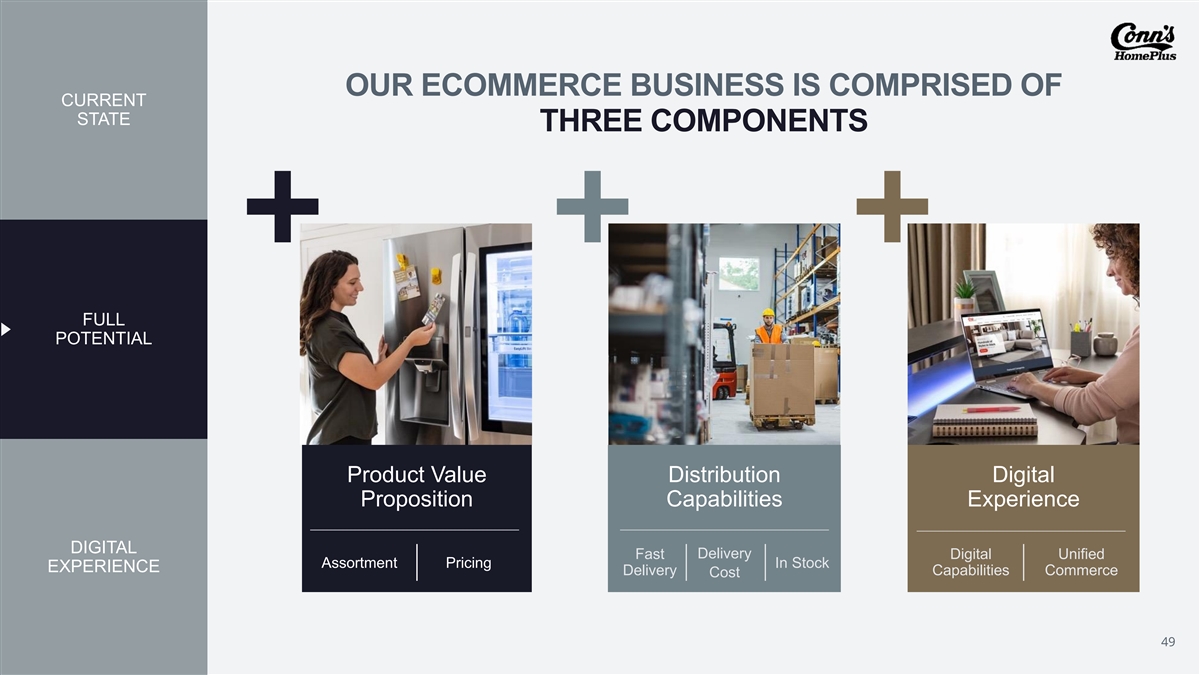
OUR ECOMMERCE BUSINESS IS COMPRISED OF CURRENT STATE THREE COMPONENTS FULL POTENTIAL Product Value Distribution Digital Proposition Capabilities Experience DIGITAL Fast Delivery Digital Unified Assortment Pricing In Stock EXPERIENCE Delivery Capabilities Commerce Cost C O N N ’ S H O M E P L U S I N V E S T O R D A Y 2 0 2 2 49
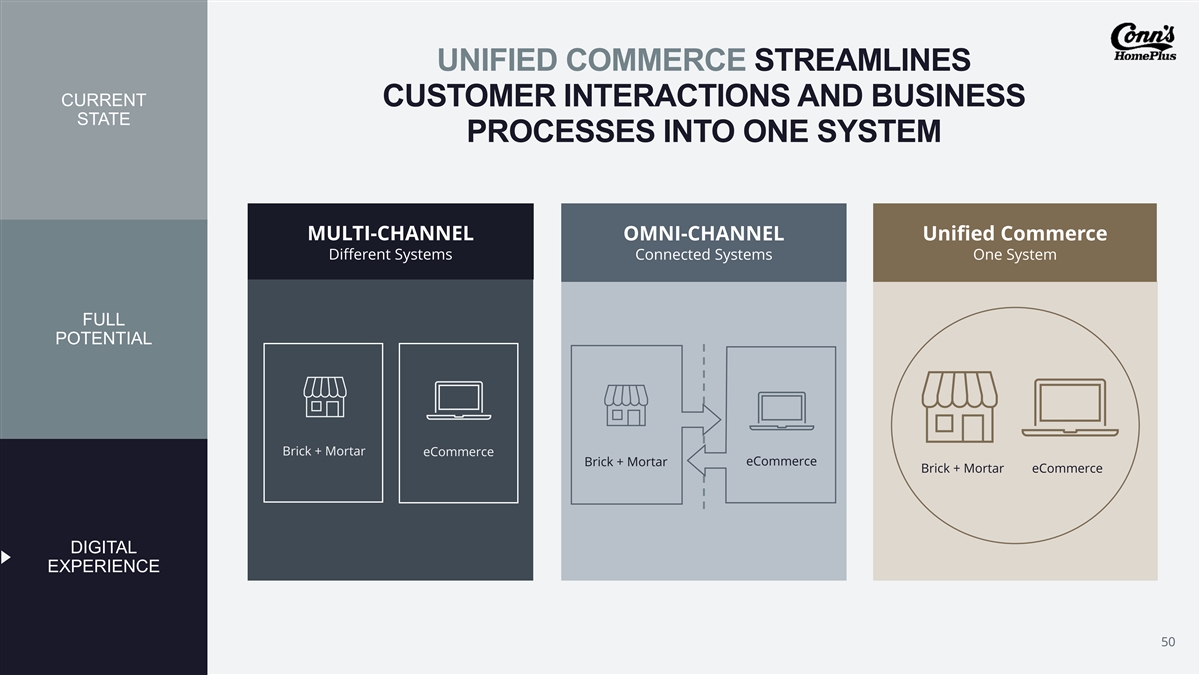
UNIFIED COMMERCE STREAMLINES CURRENT CUSTOMER INTERACTIONS AND BUSINESS STATE PROCESSES INTO ONE SYSTEM MULTI-CHANNEL OMNI-CHANNEL Unified Commerce Different Systems Connected Systems One System FULL POTENTIAL Brick + Mortar eCommerce Brick + Mortar eCommerce Brick + Mortar eCommerce DIGITAL EXPERIENCE C O N N ’ S H O M E P L U S I N V E S T O R D A Y 2 0 2 2 50

Our digital strategy is the foundation of our sales goals. C C O O N N N N ’’ S S H H O O M M E E P P L L U U S S I I N N V V E E S S T T O O R R D D A A Y Y 2 2 0 0 2 2 2 2 51
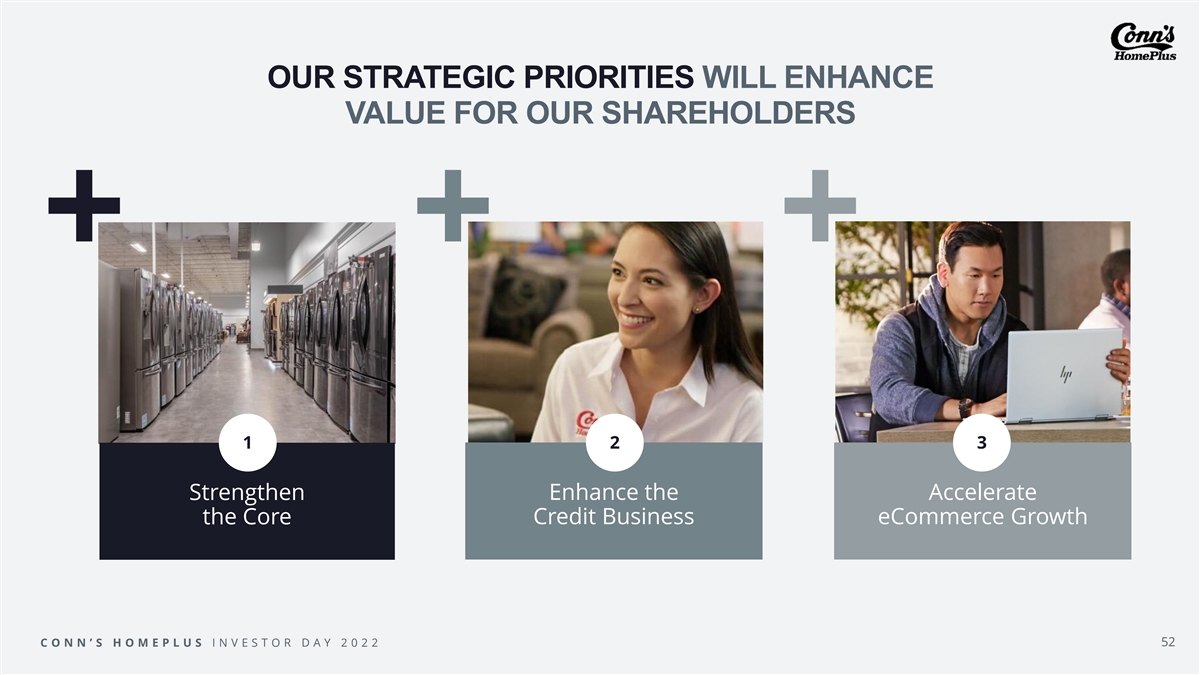
OUR STRATEGIC PRIORITIES WILL ENHANCE VALUE FOR OUR SHAREHOLDERS 1 2 3 Strengthen Enhance the Accelerate the Core Credit Business eCommerce Growth C O N N ’ S H O M E P L U S I N V E S T O R D A Y 2 0 2 2 52

WE ARE REBRANDING CONN’S HOMEPLUS Our rebrand is our strategic accelerator that will modernize our brand and better support our value proposition. C O N N ’ S H O M E P L U S I N V E S T O R D A Y 2 0 2 2 53

OUR 3 YEAR PRIORITIES By delivering on our strategic priorities, we believe that we can substantially grow our business. High Single ~$2.0-2.2B Digit REVENUE GOAL EBIT MARGIN GOAL EVOLVING OUR VALUE PROPOSITION WEAVING ESG TO ATTRACT MORE CUSTOMERS INTO WHO WE ARE C O N N ’ S H O M E P L U S I N V E S T O R D A Y 2 0 2 2 54

FINANCES KPIS SHAREHOLDER VALUE George Bchara, Chief Financial Officer C C O O N N N N ’’ S S H H O O M M E E P P L L U U S S I I N N V V E E S S T T O O R R D D A A Y Y 2 2 0 0 2 2 2 2 55

OUR CORE RETAIL BUSINESS HAS DELIVERED RECENT PERFORMANCE STRONG REVENUE GROWTH OVER THE PAST 2 YEARS 3 YEAR AMBITION % $1.2B $1.3B 5 Retail FY20 Retail LTM Retail CAGR* Revenue Revenue CAPITAL CONSIDERATIONS *CAGR is 1.75 years C O N N ’ S H O M E P L U S I N V E S T O R D A Y 2 0 2 2 56
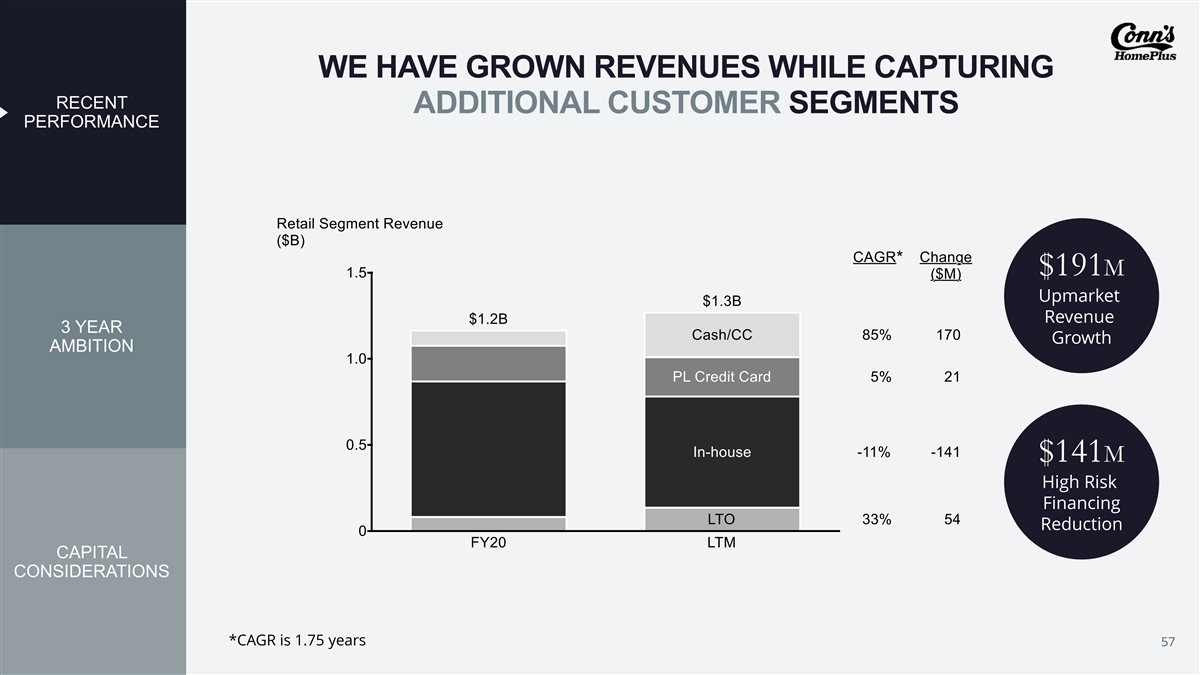
WE HAVE GROWN REVENUES WHILE CAPTURING RECENT ADDITIONAL CUSTOMER SEGMENTS PERFORMANCE * $191M Upmarket Revenue 3 YEAR Growth AMBITION $141M High Risk Financing Reduction CAPITAL CONSIDERATIONS *CAGR is 1.75 years C O N N ’ S H O M E P L U S I N V E S T O R D A Y 2 0 2 2 57

RETAIL GROSS MARGINS DECLINED AS SALES MIX RECENT SHIFTED TOWARDS CASH / THIRD-PARTY FINANCING PERFORMANCE 3 YEAR AMBITION 290 bps ~50% bps ~30% bps ~20% bps CAPITAL In-house Assortment & Supply Chain CONSIDERATIONS RSA Attach Decline in retail Promotion Impact Decline gross margin C O N N ’ S H O M E P L U S I N V E S T O R D A Y 2 0 2 2 58 Strategic Shift

OUR IN-HOUSE FINANCING UPMARKET SHIFT HAS RECENT DRIVEN HIGHER CREDIT OPERATING INCOME PERFORMANCE $45M $83M LTM Provision Credit Op. Inc. Growth 3 YEAR AMBITION $143M LTM Charge-offs ($98M) LTM Change in CAPITAL Allowance CONSIDERATIONS C O N N ’ S H O M E P L U S I N V E S T O R D A Y 2 0 2 2 59
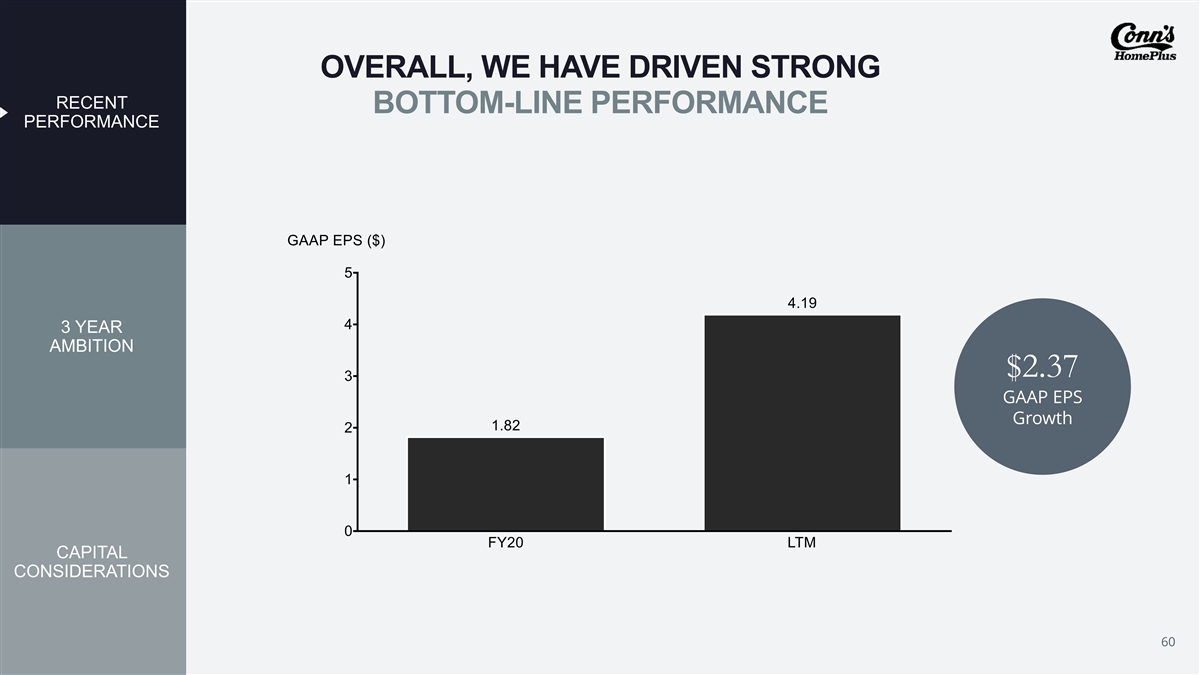
OVERALL, WE HAVE DRIVEN STRONG RECENT BOTTOM-LINE PERFORMANCE PERFORMANCE 3 YEAR AMBITION $2.37 GAAP EPS Growth CAPITAL CONSIDERATIONS C O N N ’ S H O M E P L U S I N V E S T O R D A Y 2 0 2 2 60
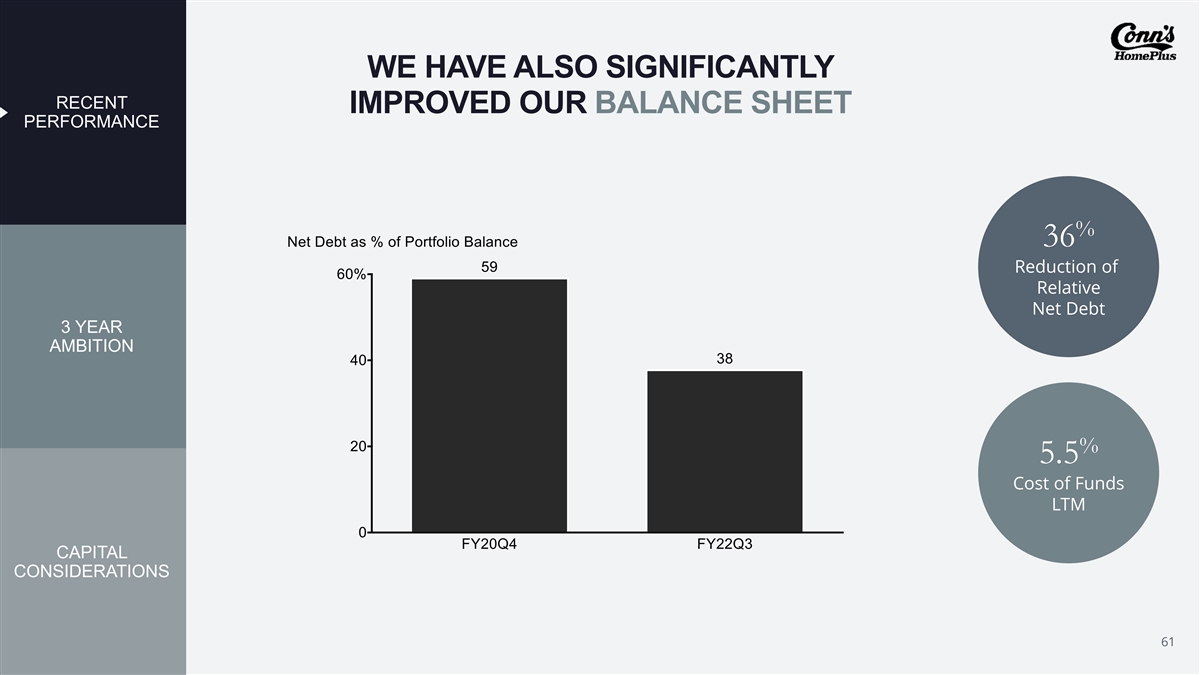
WE HAVE ALSO SIGNIFICANTLY RECENT IMPROVED OUR BALANCE SHEET PERFORMANCE % 36 Reduction of Relative Net Debt 3 YEAR AMBITION % 5.5 Cost of Funds LTM CAPITAL CONSIDERATIONS C O N N ’ S H O M E P L U S I N V E S T O R D A Y 2 0 2 2 61

OUR 3-YEAR GOAL RECENT PERFORMANCE % $1.6B ~$2-2.2B ~9-12 Revenue LTM FY25 3 YEAR CAGR AMBITION Revenue Revenue ~30-40% CAPITAL TOTAL GROWTH REVENUE CONSIDERATIONS C O N N ’ S H O M E P L U S I N V E S T O R D A Y 2 0 2 2 62

DELIVER GROWTH ACROSS RECENT THREE KEY REVENUE OPPORTUNITIES PERFORMANCE Strengthen the core and 1 expand geographically 3 YEAR AMBITION FC&O growth with retail sales 2 lift and from optimized credit offerings 20% eCommerce penetration 3 assumption of total retail revenue CAPITAL CONSIDERATIONS 1 2 3 C O N N ’ S H O M E P L U S I N V E S T O R D A Y 2 0 2 2 63

PROFIT TARGET AND PATH RECENT PERFORMANCE 11.6% EBIT MARGIN % 6.3 High IMPACT OF CHANGE IN Single Digit ALLOWANCE 3 YEAR FY25 LTM EBIT MARGIN AMBITION Increased Change in eComm Higher Continued EBIT margin assortment penetration operating credit business contribution & price range & increased leverage optimization sales volume CAPITAL CONSIDERATIONS C O N N ’ S H O M E P L U S I N V E S T O R D A Y 2 0 2 2 64

CAPEX RECENT PERFORMANCE Increase in tech spend eComm and unified with significant ROI commerce unlock growth 3 YEAR AMBITION Support next day delivery Investments in value proposition in new distribution network markets Continued investment Attractive in new stores unit economics CAPITAL CONSIDERATIONS C O N N ’ S H O M E P L U S I N V E S T O R D A Y 2 0 2 2 65
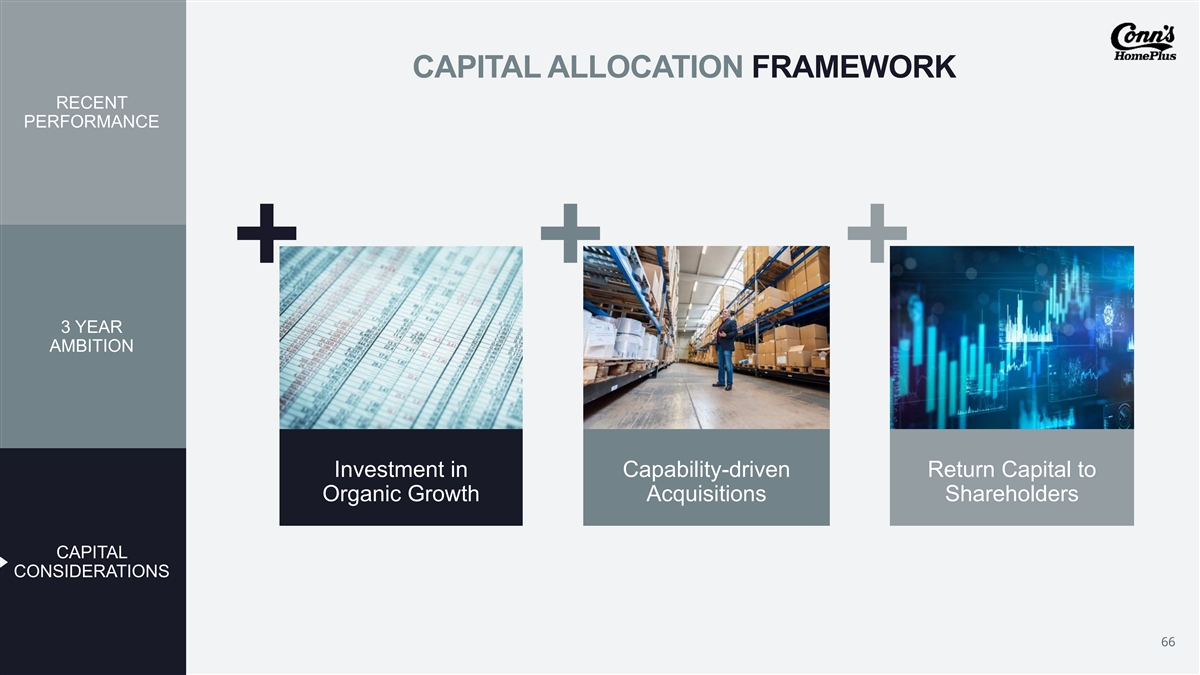
CAPITAL ALLOCATION FRAMEWORK RECENT PERFORMANCE 3 YEAR AMBITION Investment in Capability-driven Return Capital to Organic Growth Acquisitions Shareholders CAPITAL CONSIDERATIONS C O N N ’ S H O M E P L U S I N V E S T O R D A Y 2 0 2 2 66

CONN’S HOMEPLUS IS WELL-POSITIONED TO SCALE UP RETAIL 3-YEAR GOAL ~30% SHARE OF GROWTH TO GOAL ~$2B+ ~9-12% CREDIT ~15% REVENUE CAGR SHARE OF GROWTH TO GOAL High Single Digit eCOMM ~55% EBIT MARGIN SHARE OF GROWTH TO GOAL Minimize Risk, Maximize Shareholder Value C O N N ’ S H O M E P L U S I N V E S T O R D A Y 2 0 2 2 67

ALIGNMENT CONFIDENCE CULTURE C C O O N N N N ’’ S S H H O O M M E E P P L L U U S S I I N N V V E E S S T T O O R R D D A A Y Y 2 2 0 0 2 2 2 2 68

CONN’S HOMEPLUS INVESTOR DAY 2022 Q&A SESSION C O N N ’ S H O M E P L U S I N V E S T O R D A Y 2 0 2 2 69

CONN’S HOMEPLUS INVESTOR DAY 2022 APPENDIX C O N N ’ S H O M E P L U S I N V E S T O R D A Y 2 0 2 2 70

NET INCOME AND NET INCOME PER DILUTED SHARE Net Income and Net Income per Diluted Share (dollars in thousands) Year Ended Last Twelve * January 31, 2020 Months Net Income $ 56,004 $ 125,767 Weighted average common shares outstanding - Diluted 30,814,775 30,007,463 Earnings per share $ 1.82 $ 4.19 *Last Twelve Months as of October 31, 2021 C O N N ’ S H O M E P L U S I N V E S T O R D A Y 2 0 2 2 71

EARNINGS BEFORE INTEREST AND TAXES (EBIT) Earnings before Interest and Taxes (EBIT) (dollars in thousands) Year Ended January 31, Last Twelve * 2020 Months Net income (loss) $ 56,004 $ 125,767 Provision (benefit) for income taxes 18,314 23,311 Interest expense 59,107 31,101 (Gain) loss on extinguishment of debt 1,094 778 Earnings before Interest and Taxes (EBIT) $ 134,519 $ 180,957 Revenue $ 1,543,686 $ 1,555,334 EBIT Income as % of revenue 8.7% 11.6% *Last Twelve Months as of October 31, 2021 C O N N ’ S H O M E P L U S I N V E S T O R D A Y 2 0 2 2 72
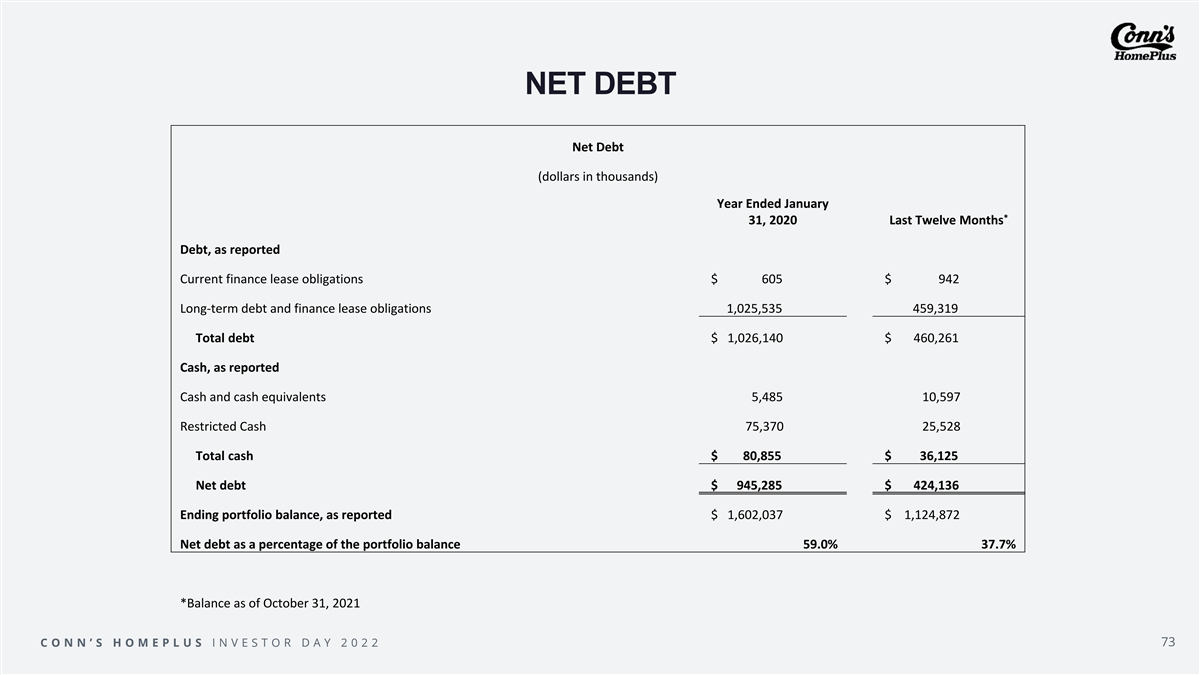
NET DEBT Net Debt (dollars in thousands) Year Ended January * 31, 2020 Last Twelve Months Debt, as reported Current finance lease obligations $ 605 $ 942 Long-term debt and finance lease obligations 1,025,535 459,319 Total debt $ 1,026,140 $ 460,261 Cash, as reported Cash and cash equivalents 5,485 10,597 Restricted Cash 75,370 25,528 Total cash $ 80,855 $ 36,125 Net debt $ 945,285 $ 424,136 Ending portfolio balance, as reported $ 1,602,037 $ 1,124,872 Net debt as a percentage of the portfolio balance 59.0% 37.7% *Balance as of October 31, 2021 C O N N ’ S H O M E P L U S I N V E S T O R D A Y 2 0 2 2 73