UNITED STATES SECURITIES AND EXCHANGE COMMISSION
Washington, D.C. 20549
FORM N-CSR
CERTIFIED SHAREHOLDER REPORT OF REGISTERED MANAGEMENT
INVESTMENT COMPANIES
Investment Company Act file number: 811-21335
Exact name of registrant as specified in charter:
Optimum Fund Trust
Address of principal executive offices:
2005 Market Street
Philadelphia, PA 19103
Name and address of agent for service:
David F. Connor, Esq.
2005 Market Street
Philadelphia, PA 19103
Registrant’s telephone number, including area code: (800) 523-1918
Date of fiscal year end: March 31
Date of reporting period: March 31, 2007
Item 1. Reports to Stockholders
| | ||
| Optimum Fund Trust | ||
| May 30, 2007 | ||
This brochure accompanies an annual report for the information of Optimum Fund Trust shareholders, but it may be used with prospective investors when preceded or accompanied by a current prospectus for Optimum Fund Trust. You should consider the investment objectives, risks, charges, and expenses of the investment company carefully before investing. The prospectus contains this and other important information about the Funds. Prospectuses for Optimum Fund Trust are available from your financial advisor, online at www.optimummutualfunds.com, or by phone at 800 914-0278. Please read the prospectus carefully before you invest or send money. The figures in the annual report for Optimum Fund Trust represent past results, which are not a guarantee of future results. The return and principal value of an investment in a Fund will fluctuate so that shares, when redeemed, may be worth more or less than their original cost. | ||
| | |||
| Optimum Fixed Income Fund* | |||
| Optimum International Fund | |||
| Optimum Large Cap Growth Fund | |||
| Optimum Large Cap Value Fund | |||
| Optimum Small Cap Growth Fund | |||
| Optimum Small Cap Value Fund | |||
| Annual Report | |||
| March 31, 2007 | |||
* | The Fund’s prospectus supplement contains important information regarding the investment manager for the Fund. A prospectus, which contains a complete copy of the supplement, may be obtained by calling 800 914-0278 or visiting our Web site at www.optimummutualfunds.com. | ||
Table of contents
| > Portfolio management review | ||
| Optimum Fixed Income Fund | 1 | |
| Optimum International Fund | 6 | |
| Optimum Large Cap Growth Fund | 10 | |
| Optimum Large Cap Value Fund | 14 | |
| Optimum Small Cap Growth Fund | 18 | |
| Optimum Small Cap Value Fund | 22 | |
| > Disclosure of Fund expenses | 28 | |
| > Sector/Country allocations, | ||
| credit quality breakdown and top 10 holdings | 30 | |
| > Financial statements | ||
| Statements of net assets | 34 | |
| Statements of assets and liabilites | 72 | |
| Statements of operations | 73 | |
| Statements of changes in net assets | 74 | |
| Financial highlights | 77 | |
| Notes to financial statements | 101 | |
| > Report of independent registered public | ||
| accounting firm | 112 | |
| > Board of trustees and officers addendum | 113 | |
| > About the organization | 115 |
Funds are not FDIC insured and are not guaranteed. It is possible to lose the principal amount invested.
Mutual fund advisory services provided by Delaware Management Company, a series of Delaware Management
Business Trust, which is a registered investment advisor.
© 2007 Delaware Distributors, L.P.
Portfolio management review
> Optimum Fixed Income Fund
April 10, 2007
Advisor
Delaware Management Company (DMC)
Sub-advisor
Aberdeen Asset Management Inc. (AAMI)
Optimum Fixed Income Fund seeks a high level of income and may also seek growth of capital. The Fund’s advisor, Delaware Management Company, manages one portion of the Fund. It also has selected a sub-advisor, AAMI, to manage another portion of the Fund’s assets.
DMC and AAMI are responsible for day-to-day investment management of a portion of the Fund’s assets. They select investments for their portion of the Fund based on their own investment style and strategy. For more information on the investment approach of the advisor and sub-advisor, please see the Fund’s prospectus.
Within its portion of the Fund, DMC allocates investments principally among the fixed income markets:
- U.S. investment grade
- U.S. high yield
- International developed markets
- International emerging markets
The strategy employed by AAMI is predicated on an investment philosophy that the best way to consistently add value is through a strictly bottom-up approach capitalizing on the inefficiencies inherent in the bond market. Therefore, the sub-advisor focuses its efforts on a disciplined process of individual security selection and avoids such techniques as interest rate forecasting.
Optimum Fixed Income Fund returned +7.58% at net asset value and +2.77% at maximum offer price for the fiscal year ended March 31, 2007 (both figures reflect performance for Class A shares with all distributions reinvested). For complete annualized performance, please see the table on page 4. By comparison, the Fund’s benchmark — the Lehman Brothers Aggregate Bond Index — gained +6.59% for the period.
During the fiscal year, the U.S. Federal Reserve ended its policy of monetary tightening. After 17 consecutive interest rate increases of 0.25 percentage points, including two last spring, the Fed paused after its June 2006 meeting. Since then the Fed funds rate has been anchored at 5.25%. In reaction to the Fed’s pause last summer, Treasuries rallied as the market priced-in interest rate cuts expected in 2007. Treasury yields have retreated, with the benchmark 10-year Treasury yielding 4.65% on March 31, 2007, versus 4.85% a year prior.
A quest for higher yields drove some investors to lower-quality assets. This increase in risk appetite, combined with the excess demand fueled by increased leverage, has pressured yields lower and, despite a deteriorating credit outlook, has compressed the difference, or spread, between yields on high- and low-quality bonds.
Against this backdrop, the Lehman Aggregate Bond Index returned 6.59% for the 12 months ended March 31, 2007. Based on total returns for Lehman Brothers sector indices, credit gained 7.08%, mortgage-backed securities (MBS) 6.94%, commercial mortgage-backed securities (CMBS) 6.85%, and asset-backed securities (ABS) 5.91%.
The sections below provide additional information about the portion of the Fund managed by the advisor and sub-advisor.
AAMI
Q: What influenced performance in your portion of the Fund?
A: We remain focused on the hard work of identifying and appropriately valuing the existing risks in individual bonds. The discipline of consistently adhering to our valuation approach has historically been a governor of our overall risk positioning, our present positioning not excepted. Given our view that valuations were full across the board at period end, we were finding more selling opportunities than buying opportunities. However, we generally believe this type of environment can be nearly as fertile as any other for generating returns.
We ended the period slightly underweight versus the Lehman Aggregate Bond Index in corporate bonds, having trimmed exposure during the year as bond prices reached our target valuations. An area of particular emphasis within our corporate positioning, as well as within headlines recently, is the broadly defined hybrid capital securities market. This market underperformed early
The views expressed are current as of the date of this report and are subject to change.
1
in the period when the regulatory treatment of these securities came under review, and appeared to cause consternation among buyers. In recent months, hybrid capital securities have regained that lost performance and then some, after it appeared that views held by market participants and regulators moved toward our own view with regard to their creditworthiness and structural integrity. Additionally, holdings in cable/media, telecommunications, and property and casualty insurance were among our better performers. Investments in gaming companies detracted from results.
Mortgage-backed securities benefited from muted volatility during much of the period. Our MBS portfolio remains largely concentrated in structured bonds (hybrid adjustable-rate mortgages and planned amortization class bonds) that are less prepayment-sensitive than the pass-throughs that comprise the MBS index. Although these securities dampened performance at times during the year when volatility eased, overall they have aided results and we believe they currently remain attractively valued in the intermediate part of the yield curve.
The other high-grade sectors of the market such as CMBS and ABS performed well during the year. Commercial real estate valuations fared better than residential mortgages, leading to positive performance during the period. Recent headlines about subprime mortgage lending notwithstanding, ABS as a market segment also posted positive results for the period. Our ABS holdings remain concentrated in high-quality (AAA-rated by Standard & Poor’s), short-duration securities. The current turmoil in subprime mortgages has negatively impacted the sector of late; however, we believe that our defensive posture has helped to minimize the effect on the portfolio.
DMC
Q: What influenced performance in your portion of the Fund?
A: The portfolio managed by Delaware Management Company uses our “core plus” fixed income investment strategy. In a core plus strategy, we invest the core of the assets under our management in domestic investment grade securities, then tactically allocate other assets to “plus” sectors of the fixed income markets. These plus sectors include domestic high yield bonds as well as both established and emerging international markets.
During the year, high yield, emerging markets, and non-dollar debt performed well, aiding performance of a core plus strategy against the Lehman Brothers Aggregate Bond Index.
Throughout the year, we focused diligently on credit selection when analyzing U.S. corporate bonds. We believed the specter of risk from highly leveraged transactions increasingly loomed over the investment-grade space during much of the year. When considering new investment grade corporate bond issues, the team tended to favor subordinated securities in capital structures of issuers that we fundamentally favor, rather than stretching for higher yields by sacrificing credit quality. Our research efforts generally have been aimed at avoiding the isolated, but now increasing situations such as leveraged buyouts (LBOs), management buyouts, leveraged recapitalizations, and mergers, which generally tend to be unfriendly to bondholders.
During the fiscal year, higher-risk securities such as emerging market bonds and U.S. high yield bonds generally outperformed lower-risk assets. Especially during the late-2006 rally, lower-rated bonds outperformed as investors continued to search for yield, with total returns among credit ratings often showing significant differences based on Lehman Brothers credit indices.
We continued to focus on security selection within our allocation to high yield bonds. Although the economic climate and other big-picture factors were influential in the high yield market, company-specific characteristics and influences generally played larger roles in overall performance. As such, we generally avoided making significant sector bets, preferring instead to focus on our in-depth research efforts to uncover attractively valued securities throughout the high yield universe. We continually paid attention to the new issue LBO market, as large deals were often priced at attractive levels.
After several years of double-digit advances, the market for emerging market bonds underwent a significant correction in the second calendar quarter of 2006, but roared back to life when fixed income assets rallied as a whole in the summer months. We believe that steady world economic growth and continued strong pricing among commodities kept demand strong for both dollar-denominated and local currency–denominated bonds. During the year, our emerging markets team attempted to add value through both the corporate emerging markets area and local currency–denominated bonds that are issued by foreign governments.
2
Performance summary
> Optimum Fixed Income Fund
The performance data quoted represent past performance; past performance does not guarantee future results. Investment return and principal value will fluctuate so your shares, when redeemed, may be worth more or less than their original cost. Current performance may be lower or higher than the performance data quoted. Please obtain the performance data for the most recent month end by calling 800 914-0278 or visiting our Web site at www.optimummutualfunds.com.
You should consider the Fund’s investment objectives, risks, charges, and expenses carefully before investing. The Optimum Fixed Income Fund prospectus contains this and other important information about the Fund. Please request a prospectus through your financial advisor or by calling 800 914-0278 or visiting our Web site at www.optimummutualfunds.com. Read the prospectus carefully before you invest or send money.
Returns reflect the reinvestment of all distributions and any applicable sales charges as noted below.
Performance for Class B and C shares, excluding sales charges, assumes either that contingent deferred sales charges did not apply or that the investment was not redeemed.
An expense limitation was in effect for all classes during the periods shown below and on the next page. Performance would have been lower had the expense limitation not been in effect.
The Fund offers Class A, B, C, and Institutional Class shares. Class A shares are sold with a maximum front-end sales charge of up to 4.50% and have an annual distribution and service fee of up to 0.35% of average daily net assets.
Class B shares are sold with a contingent deferred sales charge that declines from 4.00% to zero depending on the period of time the shares are held. Class B shares will automatically convert to Class A shares on a quarterly basis approximately eight years after purchase. They are also subject to an annual distribution and service fee of 1.00% of average daily net assets.
Effective at the close of business on July 31, 2007, no new or subsequent investments will be allowed in Class B shares of each portfolio in Optimum Fund Trust, except through a reinvestment of dividends or permitted exchanges. Please see the prospectus supplement for additional information.
Class C shares are sold with a contingent deferred sales charge of 1.00% if redeemed during the first 12 months. They are also subject to an annual distribution and service fee of 1.00% of average daily net assets.
Please see the fee table in the prospectus and your financial professional for a more complete explanation of sales charges.
Management has contracted to reimburse expenses and/or waive its management fees through Aug. 1, 2007.
The most recent Fund prospectus designates the Fund’s net expense ratios for Class A, B, C, and Institutional Class shares as 1.25%, 1.90%, 1.90%, and 0.90%, respectively, and the total operating expenses for Class A, B, C, and Institutional Class shares as 1.67%, 2.32%, 2.32%, and 1.32%, respectively. Please see the fee table in the Fund’s prospectus for more information.
The average annual total returns for the one-year and lifetime periods ended March 31, 2007, for Optimum Fixed Income Fund Institutional Class shares were +8.09% and +5.34%, respectively. Institutional Class shares were first made available on Aug. 1, 2003, for certain retirement plan products. They are sold (without a sales charge or asset-based distribution charges) only to certain eligible investors.
A rise or fall in interest rates can have a significant impact on bond prices and the NAV (net asset value) of the Fund.
Foreign investments are subject to risks not ordinarily associated with domestic investments, such as currency, economic and political risks, and different accounting standards. Investing in emerging markets can be riskier than investing in well-established foreign markets.
High yielding noninvestment grade bonds involve higher risk than investment grade bonds. Adverse conditions may affect the issuer’s ability to pay interest and principal on these securities.
Fund Performance
Average Annual Total Returns | ||
| Through March 31, 2007 | 1 Year | Lifetime |
| Class A (Est. Aug. 1, 2003) | ||
| Excluding Sales Charge | +7.58% | +4.96% |
| Including Sales Charge | +2.77% | +3.66% |
| Class B (Est. Aug. 1, 2003) | ||
| Excluding Sales Charge | +7.01% | +4.31% |
| Including Sales Charge | +3.01% | +3.95% |
| Class C (Est. Aug. 1, 2003) | ||
| Excluding Sales Charge | +6.88% | +4.31% |
| Including Sales Charge | +5.88% | +4.31% |
The performance table above and the graph on the next page do not reflect the deduction of taxes the shareholder would pay on Fund distributions or redemptions of Fund shares.
4
| Fund basics |
| As of March 31, 2007 |
| Fund objective |
| The Fund seeks a high level of income and may also seek growth of capital. |
| Total fund net assets |
| $749 million |
| Number of holdings |
| 1,039 |
| Fund start date | ||
| Aug. 1, 2003 | ||
| Nasdaq symbols | CUSIPs | |
| Class A | OAFIX | 246118681 |
| Class B | OBFIX | 246118673 |
| Class C | OCFIX | 246118665 |
| Institutional Class | OIFIX | 246118657 |
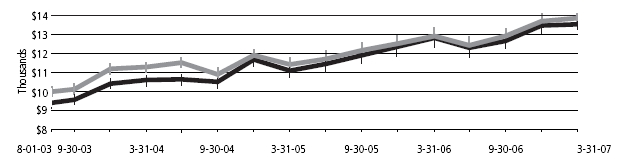
Performance of a $10,000 Investment
Aug. 1, 2003 (Fund’s inception) through March 31, 2007

| Starting value (Aug. 1, 2003) | Ending value (March 31, 2007) | ||
| Lehman Brothers Aggregate Bond Index | $10,000 | $11,732 | |
| Optimum Fixed Income Fund — Class A Shares | $9,550 | $11,408 |
Chart assumes $10,000 invested on Aug. 1, 2003 and includes the effect of a 4.50% front-end sales charge and the reinvestment of all distributions.
Performance of other Fund classes will vary due to different charges and expenses.
The chart also assumes $10,000 invested in the Lehman Brothers Aggregate Bond Index as of Aug. 1, 2003. The Lehman Brothers Aggregate Bond Index is an unmanaged composite that tracks the broad U.S. bond markets. An index does not reflect the costs of operating a mutual fund, such as the costs of buying, selling, and holding securities. You cannot invest directly in an index.
Past performance is not a guarantee of future results.
5
Portfolio management review
> Optimum International Fund
April 10, 2007
Advisor
Delaware Management Company (DMC)
Sub-advisors
AllianceBernstein L.P. (Alliance)
Mondrian Investments Partners Ltd. (Mondrian)
Optimum International Fund seeks long-term growth of capital. The Fund may also seek income. The Fund’s advisor, Delaware Management Company, selected two sub-advisors, each of whom is responsible for day-to-day investment management of a portion of the Fund’s assets. Each sub-advisor selects investments for its portion of the Fund based on its own investment style and strategy. For more information on the investment approach of the sub-advisors, please see the Fund’s prospectus.
For the fiscal year ending March 31, 2007, the Morgan Stanley Capital International Europe, Australasia, Far East Index (MSCI EAFE Index) gained +20.20%, as strong global economic growth and a falling U.S. dollar helped international equity returns outpace domestic returns in the U.S. By comparison, Optimum International Fund had a total return of +21.26% at net asset value and +14.30% at its maximum offer price. Both figures reflect performance for Class A shares with all distributions reinvested. For complete annualized returns, please see page 8.
International equity markets were again very strong, as most markets showed gains in local currency terms for the year, and currency movements added to returns in U.S. dollars for all EAFE markets except Japan and Hong Kong. For the year ended March 31, 2007, Singapore benefited from strong domestic economic growth, strong international trade, and rising property prices and returned 45.7%, making it the strongest market in the MSCI EAFE Index (all country returns based on MSCI country indices). Another strong Pacific market was Australia, up 35.0%. Conversely, the largest pacific market, Japan, had the lowest return in EAFE, up just 3.0%. Among the European markets, Spain had the highest performance at 38.3%, followed by a 37.0% rise in the Danish market. The U.K. had a reasonable 24.3% rise, but Finland’s 19.9% gain was the weakest European figure.
The utilities sector, despite its defensive reputation, had the highest performance, rising 40.0% for the year ended March 31, 2007. Merger and acquisition activity, rumored and actual, helped drive this sector. Having lagged for some time, the telecommunication sector surged in the latter half of the 12 months, making it another strong performing sector with a return of 31.0%. The weakest sector was information technology, up just 3.1%, and the former market darling, the energy sector, rose just 8.4%.
The sections below provide additional information about the portion of the Fund managed by each sub-advisor.
Alliance
Q: Please describe your approach to the Fund’s positioning during the course of the fiscal year.
A: We took advantage of the February 2007 market decline to increase some of our holdings in companies whose valuations we believed were unjustly punished during the indiscriminate sell off. We also accelerated planned purchases of shares in other companies that our research had already identified as potentially attractive value opportunities.
Financial stocks remained the single largest sector position in our portion of the Fund, but for different reasons in different markets and geographical locations.
ING Groep fell on exposure to the U.S. subprime market through bonds held by the Dutch financial service company’s life insurance subsidiary. We continued to hold significant stakes in some oil companies. We believed that strong demand from emerging economies and the commercial transportation sector, together with only gradual increases in supply, could keep oil prices higher for longer than most investors expect. We also maintained significant positions in several transport, capital equipment, and technology companies.
Q: What factors influenced performance in a positive way during the fiscal year?
A: When comparing our sector positioning and returns to the MSCI EAFE Index, both our heavier weighting and stock selection within the materials sector contributed to Fund returns. Our metal and mining stocks, including JFE Holdings, Voestalpine, and Xstrata benefited from ongoing expectations of industry consolidation.
The views expressed are current as of the date of this report and are subject to change.
6
Our consumer staples holdings also were strong performers. In the United Kingdom, the stock of food retailer J Sainsbury was buoyed by private equity interest. Meanwhile, Japan Tobacco outperformed after the company confirmed plans to purchase its smaller rival, the Gallaher Group, based in the U.K.
Q: What factors influenced performance in a negative way?
A: In our portion of the Fund, an overweight exposure to the energy sector compared to the benchmark was the main detractor from returns during the period.
Also affecting returns negatively was stock selection among healthcare companies, particularly positions in Sanofi-Aventis, a French pharmaceutical firm, and AstraZeneca. Shares of Sanofi-Aventis traded lower amid uncertainty about an ongoing U.S. patent dispute investigation regarding the firm’s blood-thinning drug, Plavix. Also detracting was our position in European aerospace and defense firm European Aeronautic Defence & Space (EADS) because of delays in the new A380 airplane. The position has since been sold.
Mondrian
Q: What global economic factors influenced your approach to the MSCI EAFE markets?
A: For the fiscal year that ended on March 31, 2007, market contribution was helped by underweight position versus the EAFE Index in the underperforming Japanese market and overweight positions in the strongest markets, Singapore and Spain. An underweight position in the Swedish and Danish markets held returns back a little. Sector weighting was also helpful because our portion of the Fund was overweight in two of the three strongest sectors. The overweight position in energy, however, was not beneficial. Also for the fiscal year stocks that did not perform well include the South African stock Sasol, which was down 8% (having risen 65.7% in the year ending on March 31, 2006) Millea Holdings, the Japanese insurer was down by more than 6% for the period ended March 31, 2007. Strongly outperforming stocks included Coles Group, Compass Group, and Bayer, the German pharmaceutical company, each up in excess of 60% for the same period. In Australia, Coles Group, one of the two main retail groups was approached in the second half of 2006 by a private equity firm with a conditional bid.
Compass Group in the U.K. gained market confidence with better-than-expected results during the year and with the appointment of a new CEO and chairman, which signaled positive change.
An underweight position in the Danish and Swedish kronor was not helpful. However, currency contribution was helped greatly by an underweight position in the underperforming Japanese yen and Swiss franc, and an overweight position in the outperforming Australian and New Zealand dollars.
Q: What transactions are noteworthy for shareholders?
A: During the fiscal year, new stocks purchased for the Fund included Astellas Pharmaceutical in Japan, France Telecom in France, and Deutsche Telekom in Germany. Astellas is one of the largest Japanese pharmaceutical companies and has recently announced a new strategy, which involves more active balance sheet management that we believe could potentially lead to a substantial improvement in shareholder returns over the long term.
The telecommunications sector has suffered from negative sentiment as a result of increasing competition and regulation and technological risks. Incumbent telecom operators such as France Telecom and Deutsche Telekom have seen their share prices hit hard. At Mondrian, we believe that these companies currently have attractive valuations, even if we assume significant market share losses and weaker pricing. These and other new positions have been funded by taking profits and selling certain positions. We liquidated our entire position in our portion of the fund of stocks including the British industrial gases company BOC, Brambles, the Anglo-Australian distribution business, and Rio Tinto, Anglo-Australian resources company.
Q: What were the main highlights of your strategy as the period ended?
A: The main highlights of the strategy adopted for Mondrian’s portion of Optimum International Fund included an underweight position in the Japanese market, an overweight position in the Australasian and smaller Asian markets, an overweight in selected European markets, and a defensive currency hedge out of sterling.
7
Performance summary
> Optimum International Fund
The performance data quoted represent past performance; past performance does not guarantee future results. Investment return and principal value will fluctuate so your shares, when redeemed, may be worth more or less than their original cost. Current performance may be lower or higher than the performance data quoted. Please obtain the performance data for the most recent month end by calling 800 914-0278 or visiting our Web site at www.optimummutualfunds.com.
You should consider the Fund’s investment objectives, risks, charges, and expenses carefully before investing. The Optimum International Fund prospectus contains this and other important information about the Fund. Please request a prospectus through your financial advisor or by calling 800 914-0278 or visiting our Web site at www.optimummutualfunds.com. Read the prospectus carefully before you invest or send money.
Returns reflect the reinvestment of all distributions and any applicable sales charges as noted below, and they are subject to change.
Performance for Class B and C shares, excluding sales charges, assumes either that contingent deferred sales charges did not apply or that the investment was not redeemed.
An expense limitation was in effect for all classes during the periods shown below and on the next page. Performance would have been lower had the expense limitation not been in effect.
The Fund offers Class A, B, C, and Institutional Class shares. Class A shares are sold with a maximum front-end sales charge of up to 5.75% and have an annual distribution and service fee of up to 0.35% of average daily net assets.
Class B shares are sold with a contingent deferred sales charge that declines from 4.00% to zero depending on the period of time the shares are held. Class B shares will automatically convert to Class A shares on a quarterly basis approximately eight years after purchase. They are also subject to an annual distribution and service fee of 1.00% of average daily net assets.
Effective at the close of business on July 31, 2007, no new or subsequent investments will be allowed in Class B shares of each portfolio in Optimum Fund Trust, except through a reinvestment of dividends or permitted exchanges. Please see the prospectus supplement for additional information.
Class C shares are sold with a contingent deferred sales charge of 1.00% if redeemed during the first 12 months. They are also subject to an annual distribution and service fee of 1.00% of average daily net assets.
Please see the fee table in the prospectus and your financial professional for a more complete explanation of sales charges.
Management has contracted to reimburse expenses and/or waive its management fees through Aug. 1, 2007.
The most recent Fund prospectus designates the Fund’s net expense ratios for Class A, B, C, and Institutional Class shares as 2.01%, 2.66%, 2.66%, and 1.66%, respectively, and the total operating expenses for Class A, B, C, and Institutional Class shares as 2.19%, 2.84%, 2.84%, and 1.84%, respectively. Please see the fee table in the Fund’s prospectus for more information.
The average annual total returns for the one-year and lifetime periods ended March 31, 2007, for Optimum International Fund Institutional Class shares were +21.68% and +22.54%, respectively. Institutional Class shares were first made available on Aug. 1, 2003, for certain retirement plan products. They are sold (without a sales charge or asset-based distribution charges) only to certain eligible investors.
Instances of high double-digit returns are unusual, cannot be sustained, and were achieved primarily during favorable market conditions.
Foreign investments are subject to risks not ordinarily associated with domestic investments, such as currency, economic and political risks, and different accounting standards.
Fund Performance
Average Annual Total Returns | ||
| Through March 31, 2007 | 1 Year | Lifetime |
| Class A (Est. Aug. 1, 2003) | ||
| Excluding sales charge | +21.26% | +22.12% |
| Including sales charge | +14.30% | +20.16% |
| Class B (Est. Aug. 1, 2003) | ||
| Excluding sales charge | +20.44% | +21.33% |
| Including sales charge | +16.44% | +20.96% |
| Class C (Est. Aug. 1, 2003) | ||
| Excluding sales charge | +20.51% | +21.35% |
| Including sales charge | +19.51% | +21.35% |
The performance table above and the graph on the next page do not reflect the deduction of taxes the shareholder would pay on Fund distributions or redemptions of Fund shares.
8
| Fund basics |
| As of March 31, 2007 |
| Fund objective |
| The Fund seeks long-term growth of capital and may also seek income. |
| Total fund net assets |
| $276 million |
| Number of holdings |
| 165 |
| Fund start date | ||
| Aug. 1, 2003 | ||
| Nasdaq symbols | CUSIPs | |
| Class A | OAIEX | 246118731 |
| Class B | OBIEX | 246118723 |
| Class C | OCIEX | 246118715 |
| Institutional Class | OIIEX | 246118699 |
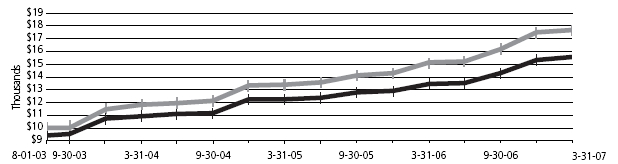
Performance of a $10,000 Investment
Aug. 1, 2003 (Fund’s inception) through March 31, 2007
![]()
| Starting value (Aug. 1, 2003) | Ending value (March 31, 2007) | ||
| MSCI EAFE Index | $10,000 | $22,485 | |
| Optimum International Fund — Class A Shares | $9,425 | $19,616 |
Chart assumes $10,000 invested on Aug. 1, 2003 and includes the effect of a 5.75% front-end sales charge and the reinvestment of all distributions.
Performance of other Fund classes will vary due to different charges and expenses.
The chart also assumes $10,000 invested in the MSCI EAFE Index as of Aug. 1, 2003. The MSCI EAFE is an unmanaged composite of stocks in established markets within Europe, Australasia, and the Far East. An index does not reflect the costs of operating a mutual fund, such as the costs of buying, selling, and holding securities. You cannot invest directly in an index.
Past performance is not a guarantee of future results.
9
Portfolio management review
> Optimum Large Cap Growth Fund
April 10, 2007
Advisor
Delaware Management Company (DMC)
Sub-advisors
Marsico Capital Management LLC (Marsico Capital) T. Rowe Price Associates Inc. (T. Rowe Price)
Optimum Large Cap Growth Fund seeks long-term growth of capital. The Fund’s advisor, Delaware Management Company, selected two sub-advisors, each of whom is responsible for day-to-day investment management of a portion of the Fund’s assets. Each sub-advisor selects investments for its portion of the Fund based on its own investment style and strategy. For more information on the investment approach of the sub-advisors, please see the Fund’s prospectus.
For the year ending March 31, 2007, the S&P 500 Index and Russell 1000 Growth Index had total returns of 11.83% and 7.06%, respectively. At an economic sector level, gains were widespread. All 10 Global Industry Classification Standard sectors of the Russell 1000 Growth Index had positive returns. Utilities, materials, telecommunication services, consumer staples, and financials were the economic sectors with the highest performance for the 12-month period with gains of more than 10%. The information technology sector was the weakest performing area with a return of 3%. In terms of investment style, large-capitalization value stocks, as represented by the Russell 1000 Value Index, solidly outperformed growth stocks, as represented by the Russell 1000 Growth Index — by more than 9% during the period.
U.S. stocks produced solid gains for the year ended March 31, 2007. Despite a housing-led economic slowdown, stocks rallied thanks to robust corporate earnings growth, declining energy prices, and significant merger and acquisition activity, particularly a marked increase in buyouts by private equity firms. A stable interest rate policy by the U.S. Federal Reserve over the last nine months of the period also contributed to the positive sentiment in the market. However, volatility increased late in the period as troubles in the subprime mortgage-lending industry worsened.
Optimum Large Cap Growth Fund underperformed its benchmark, the Russell 1000 Growth Index, for the year ended March 31, 2007. The Fund had a total return of +5.75% at net asset value and -0.30% at its maximum offer price. Both figures reflect performance for Class A shares with all distributions reinvested. For complete annualized returns, please see page 12.
The sections below provide additional information about the portion of the Fund managed by each sub-advisor.
Marsico Capital
Q: What sectors were among the largest detractors from performance?
A: Stock selection in the healthcare sector was the largest performance detractor for the Marsico portion of the Fund during the year. Pharmaceutical, biotechnology, and life sciences companies Amylin Pharmaceuticals and Genentech posted negative returns. Healthcare services provider UnitedHealth Group, one of the Fund’s largest individual holdings, declined 5% during the reporting period.
The Fund’s homebuilding and home improvement retailing positions, including KB Home, Home Depot, Lennar, and Lowe’s struggled, in part because of a softening housing market and concerns about retail spending. Of these companies, only Lowe’s was held in our portion of the Fund as of March 31, 2007.
For much of the year, the Marsico-managed portion of the Fund generally maintained a smaller allocation than the Russell 1000 Growth Index to the energy sector, an area of strong performance for the index. Stock selection in energy was weak. In particular, price declines in Peabody Energy and Halliburton hurt the Fund prior to those stocks being sold. Information technology positions Qualcomm and Texas Instruments were among the weakest performing individual positions in our portion of the Fund. Both were sold during the period.
The views expressed are current as of the date of this report and are subject to change.
10
Q: What sectors were among the largest contributors to performance?
A: Stock selection in the consumer discretionary sector was a leading positive contributor to performance. Hotel and casino operators MGM Mirage, Las Vegas Sands, and Wynn Resorts posted strong returns. Media company Comcast also performed well during the annual period and remained a holding in the Fund as of March 31, 2007.
Another significant performance contributor for the Fund was stock selection and posture in the diversified financials industry. Goldman Sachs Group was among the Fund’s strongest individual positions. A larger weighting in the strong-performing diversified financials industry versus the benchmark index also had a positive impact. Certain capital goods positions performed well, including Lockheed Martin and General Dynamics. The Fund had less exposure than the index to information technology companies, a position that aided our relative performance because information technology was the weakest sector of the index.
As of March 31, 2007, our economic sector allocations emphasized consumer discretionary, industrials, financials, and healthcare. The Fund had little exposure in areas such as utilities.
T. Rowe Price
Q: What were the positive aspects of performance for your portion of the Fund during the fiscal year?
A: Optimum Large Cap Growth Fund as a whole underperformed the benchmark, but in seven of the ten sectors in the Fund, our holdings contributed to performance compared to the Russell 1000 Growth Index during the fiscal year.
Our stock selection added the most value in the consumer discretionary sector, where choices among gaming companies and retailers contributed favorably to relative results. Stock selection also paid off among telecommunication services stocks, as did an overweight versus the index in the sector. Other sectors where stock picks enhanced results included healthcare — particularly healthcare services providers — and energy.
Liberty Media Capital, which owns interests in private and publicly held media and telecommunications companies, was among our holdings with the highest performance. Liberty benefited from an agreement to trade its shares in News Corp. for a large stake in satellite television provider DirecTV. Other strong contributors in this sector included casino operator MGM Mirage and retailer Kohl’s.
Q: What were the negative aspects of performance in your portion of the Fund?
A: Three sectors detracted from our performance relative to the benchmark index — utilities, consumer staples, and materials. Our underweight in each of these sectors was the reason for their underperformance. We tend to be underweight in this sector because long-term growth prospects are generally below our target.
Stock selection detracted from our results compared to our peers in the information technology and financial sectors, especially among semiconductor manufacturers and capital markets firms. The stocks of Marvell Technology and Maxim Integrated both suffered from options back-dating concerns and inventory growth in a moderating economy.
Financials sector stocks SLM and E-Trade also hurt relative performance. But our favorable underweight in technology and overweight in financials more than offset the negative impact of stock selection.
11
Performance summary
> Optimum Large Cap Growth Fund
The performance data quoted represent past performance; past performance does not guarantee future results. Investment return and principal value will fluctuate so your shares, when redeemed, may be worth more or less than their original cost. Current performance may be lower or higher than the performance data quoted. Please obtain the performance data for the most recent month end by calling 800 914-0278 or visiting our Web site at www.optimummutualfunds.com.
You should consider the Fund’s investment objectives, risks, charges, and expenses carefully before investing. The Optimum Large Cap Growth Fund prospectus contains this and other important information about the Fund. Please request a prospectus through your financial advisor or by calling 800 914-0278 or visiting our Web site at www.optimummutualfunds.com. Read the prospectus carefully before you invest or send money.
Returns reflect the reinvestment of all distributions and any applicable sales charges as noted below, and they are subject to change.
Performance for Class B and C shares, excluding sales charges, assumes either that contingent deferred sales charges did not apply or that the investment was not redeemed.
An expense limitation was in effect for all classes during the periods shown below and on the next page. Performance would have been lower had the expense limitation not been in effect.
The Fund offers Class A, B, C, and Institutional Class shares. Class A shares are sold with a maximum front-end sales charge of up to 5.75% and have an annual distribution and service fee of up to 0.35% of average daily net assets.
Class B shares are sold with a contingent deferred sales charge that declines from 4.00% to zero depending on the period of time the shares are held. Class B shares will automatically convert to Class A shares on a quarterly basis approximately eight years after purchase. They are also subject to an annual distribution and service fee of 1.00% of average daily net assets.
Effective at the close of business on July 31, 2007, no new or subsequent investments will be allowed in Class B shares of Optimum Fund Trust, except through a reinvestment of dividends or permitted exchanges. Please see the prospectus for additional information.
Class C shares are sold with a contingent deferred sales charge of 1.00% if redeemed during the first 12 months. They are also subject to an annual distribution and service fee of 1.00% of average daily net assets.
Please see the fee table in the prospectus and your financial professional for a more complete explanation of sales charges.
Management has contracted to reimburse expenses and/or waive its management fees through Aug. 1, 2007.
The most recent Fund prospectus designates the Fund’s net expense ratios for Class A, B, C, and Institutional Class shares as 1.69%, 2.34%, 2.34%, and 1.34%, respectively, and the total operating expenses for Class A, B, C, and Institutional Class shares as 1.83%, 2.48%, 2.48%, and 1.47%, respectively. Please see the fee table in the Fund’s prospectus for more information.
The average annual total returns for the one-year and lifetime periods ended March 31, 2007, for Optimum Large Cap Growth Fund Institutional Class shares were +6.13% and +10.76%, respectively. Institutional Class shares were first made available on Aug. 1, 2003, for certain retirement plan products. They are sold without a sales charge or asset-based distribution charges only to certain eligible investors.
Fund Performance
Average Annual Total Returns | ||
| Through March 31, 2007 | 1 Year | Lifetime |
| Class A (Est. Aug. 1, 2003) | ||
| Excluding sales charge | +5.75% | +10.36% |
| Including sales charge | -0.30% | +8.59% |
| Class B (Est. Aug. 1, 2003) | ||
| Excluding sales charge | +5.14% | +9.66% |
| Including sales charge | +1.14% | +9.18% |
| Class C (Est. Aug. 1, 2003) | ||
| Excluding sales charge | +5.14% | +9.66% |
| Including sales charge | +4.14% | +9.66% |
The performance table above and the graph on the next page do not reflect the deduction of taxes the shareholder would pay on Fund distributions or redemptions of Fund shares.
12
| Fund basics |
| As of March 31, 2007 |
| Fund objective |
| The Fund seeks long-term growth of capital. |
| Total fund net assets |
| $789 million |
| Number of holdings |
| 147 |
| Fund start date | ||
| Aug. 1, 2003 | ||
| Nasdaq symbols | CUSIPs | |
| Class A | OALGX | 246118707 |
| Class B | OBLGX | 246118806 |
| Class C | OCLGX | 246118889 |
| Institutional Class | OILGX | 246118871 |
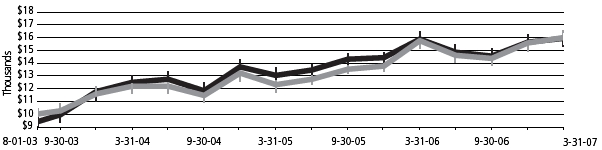
Performance of a $10,000 Investment
Aug. 1, 2003 (Fund’s inception) through March 31, 2007
| Starting value (Aug. 1, 2003) | Ending value (March 31, 2007) | ||
| Russell 1000 Growth Index | $10,000 | $13,825 | |
| Optimum Large Cap Growth Fund — Class A Shares | $9,425 | $13,531 |
Chart assumes $10,000 invested on Aug. 1, 2003 and includes the effect of a 5.75% front-end sales charge and the reinvestment of all distributions.
Performance of other Fund classes will vary due to different charges and expenses.
The chart also assumes $10,000 invested in the Russell 1000 Growth Index as of Aug. 1, 2003. The Russell 1000 Growth Index is an unmanaged composite that includes performance of those Russell 1000 companies with higher price-to-book ratios and higher forecasted growth values. An index does not reflect the costs of operating a mutual fund, such as the costs of buying, selling, and holding securities. You cannot invest directly in an index.
Past performance is not a guarantee of future results.
13
Portfolio management review
> Optimum Large Cap Value Fund
April 10, 2007
Advisor
Delaware Management Company (DMC)
Sub-advisors
Massachusetts Financial Services Company (MFS)
TCW Investment Management Company (TCW)
Optimum Large Cap Value Fund seeks long-term growth of capital and it may also seek income. The Fund’s advisor, Delaware Management Company, chose two sub-advisors to manage the Fund’s assets. Each is responsible for day-to-day investment management of a portion of the Fund’s assets and selects investments for its portion based on its own investment style and strategy.
Based on changing projections for inflation during the year, the U.S. Federal Reserve’s direction on monetary policy remained a topic of speculation and drove market volatility. As the summer of 2006 progressed, inflation concerns began to cool because of weaker housing data and a turnaround in oil prices — a steady drop. The fiscal year ended with a period of slowing economic growth overall.
Optimum Large Cap Value Fund returned +15.65% at net asset value and +9.01% at maximum offer price for the fiscal year ending March 31, 2007 (both figures reflect performance for Class A shares with all distributions reinvested). For complete annualized returns, please see page 16.
The Fund’s performance slightly trailed the Russell 1000 Value Index return of +16.84%.
The sections below provide additional information about the portion of the Fund managed by each sub-advisor.
MFS
Q: What are some of the factors important to understanding the performance of your portion of the Fund?
A: All of the investment decisions made by MFS are driven by the fundamentals of each individual opportunity. It is common for our Fund to have different currency exposure than the benchmark. During the reporting period ended March 31, 2007, the Fund’s currency exposure was a plus factor for relative performance.
Q: What were the areas of strength regarding your portion of the Fund’s holdings?
A: Stock selection in the financial services sector was the principal source of strength in our portion of the Fund. Leading contributors in this sector included investment banking firm Goldman Sachs and insurance company MetLife. Not owning American International Group (AIG) also bolstered comparative results, as this stock significantly underperformed the benchmark.
Stock selection in the industrial goods and services sector also aided relative returns. Defense contractor Lockheed Martin, which is not a benchmark constituent, and agricultural equipment manufacturer Deere & Co. were strong contributors in this sector. A lesser position compared to the Russell 1000 Value Index in industrial conglomerate General Electric, a relatively weak performer, was another positive factor in relative results. Stock selection and, to a lesser extent, an overweight position in the strong-performing consumer staples sector also helped. Tobacco company Altria Group was a leading contributor.
Q: What were areas of weakness regarding your portion of the Fund’s holdings?
A: A combination of stock selection and an underweight position in the strong-performing utilities and communications sectors held back results relative to the benchmark. Wireless services provider Sprint Nextel was among the top detractors. Underweighting telecommunications service company AT&T, and not owning BellSouth, hurt relative performance because both stocks outperformed the benchmark.
Stock selection in the energy sector also detracted from results. The Fund’s underweight positions in integrated oil and gas companies Exxon Mobil and Chevron, both of which yielded higher returns than the benchmark, dampened relative returns.
The views expressed are current as of the date of this report and are subject to change.
14
Stocks in other sectors that negatively affected relative performance included home improvement products maker Masco, healthcare products maker Johnson & Johnson, and defense contractor Northrop Grumman.
TCW
Q: What factors in the marketplace and elements of your strategy had a significant impact on the Fund?
A: During the period under review, large-cap value stocks significantly outperformed large-cap growth, with the Russell 1000 Value Index more than doubling the Russell 1000 Growth Index return of +7.06%. Although it is dividend-focused, our strategy is not deep value, and the Fund captured more than 93% of the Russell 1000 Value’s strong performance during the year ending March 31, 2007.
We believe the prospect of capital appreciation plus dividend income made the strategy an attractive investment vehicle for long-term, conservative investors. Our strategy is to select securities with outstanding performance based primarily on fundamental stock selection discipline and placing less emphasis on the impact of economic trends. In addition, we continued our search for value securities that we believe were poised for growth.
Q: What factors influenced the Fund’s performance in a negative way?
A: Relative to the Russell 1000 Value Index, the underweight in both the energy and utilities sectors in our portion of the portfolio detracted from performance for the year ending March 31, 2007. Stock selection in the healthcare sector dampened returns. Underperformers for the year in the healthcare sector include Watson Pharmaceuticals, Tenet Healthcare, and Boston Scientific, which was sold after hitting our downside sell discipline price target.
Q: What factors influenced the Fund’s performance in a positive way?
A: Relative to the Russell 1000 Value Index, stock selection within the consumer discretionary sector and the Fund’s underweight position in financials had a positive impact on performance for the year ending March 31, 2007. Top performers in the consumer discretionary sector included General Motors, Comcast, and Sears Holdings. Sears was completely sold during the year as the stock reached its target price.
15
Performance summary
> Optimum Large Cap Value Fund
The performance data quoted represent past performance; past performance does not guarantee future results. Investment return and principal value will fluctuate so your shares, when redeemed, may be worth more or less than their original cost. Current performance may be lower or higher than the performance data quoted. Please obtain the performance data for the most recent month end by calling 800 914-0278 or visiting our Web site at www.optimummutualfunds.com.
You should consider the Fund’s investment objectives, risks, charges, and expenses carefully before investing. The Optimum Large Cap Value Fund prospectus contains this and other important information about the Fund. Please request a prospectus through your financial advisor or by calling 800 914-0278 or visiting our Web site at www.optimummutualfunds.com. Read the prospectus carefully before you invest or send money.
Returns reflect the reinvestment of all distributions and any applicable sales charges as noted below and they are subject to change.
Performance for Class B and C shares, excluding sales charges, assumes either that contingent deferred sales charges did not apply or that the investment was not redeemed.
An expense limitation was in effect for all classes during the periods shown below and on the next page. Performance would have been lower had the expense limitation not been in effect.
The Fund offers Class A, B, C, and Institutional Class shares. Class A shares are sold with maximum a front-end sales charge of up to 5.75% and have an annual distribution and service fee of up to 0.35% of average daily net assets.
Class B shares are sold with a contingent deferred sales charge that declines from 4.00% to zero depending on the period of time the shares are held. Class B shares will automatically convert to Class A shares on a quarterly basis approximately eight years after purchase. They are also subject to an annual distribution and service fee of 1.00% of average daily net assets.
Effective at the close of business on July 31, 2007, no new or subsequent investments will be allowed in Class B shares of the Optimum Fund Trust, except through a reinvestment of dividends or permitted exchanges. Please see the prospectus supplement for additional information.
Class C shares are sold with a contingent deferred sales charge of 1.00% if redeemed during the first 12 months. They are also subject to an annual distribution and service fee of 1.00% of average daily net assets.
Please see the fee table in the prospectus and your financial professional for a more complete explanation of sales charges.
Management has contracted to reimburse expenses and/or waive its management fees through Aug. 1, 2007.
The most recent Fund prospectus designates the Fund’s net expense ratios for Class A, B, C, and Institutional Class shares as 1.55%, 2.20%, and 2.20%, 1.20%, respectively, and the total operating expenses for Class A, B, C, and Institutional Class shares as 1.82%, 2.47%, 2.47%, and 1.47%, respectively. Please see the fee table in the Fund’s prospectus for more information.
The average annual total returns for the one-year and lifetime periods ended March 31, 2007, for Optimum Large Cap Value Fund Institutional Class shares were +16.12% and +15.08%, respectively. Institutional Class shares were first made available on Aug. 1, 2003, for certain retirement plan products. They are sold without a sales charge or asset-based distribution charges only to certain eligible investors.
Fund Performance
Average Annual Total Returns | ||
| Through March 31, 2007 | 1 Year | Lifetime |
| Class A (Est. Aug. 1, 2003) | ||
| Excluding sales charge | +15.65% | +14.68% |
| Including sales charge | +9.01% | +12.83% |
| Class B (Est. Aug. 1, 2003) | ||
| Excluding sales charge | +14.97% | +13.94% |
| Including sales charge | +10.97% | +13.51% |
| Class C (Est. Aug. 1, 2003) | ||
| Excluding sales charge | +14.88% | +13.92% |
| Including sales charge | +13.88% | +13.92% |
The performance table above and the graph on the next page do not reflect the deduction of taxes the shareholder would pay on Fund distributions or redemptions of Fund shares.
16
| Fund basics |
| As of March 31, 2007 |
| Fund objective |
| The Fund seeks long-term growth of capital and may also seek income. |
| Total fund net assets |
| $794 million |
| Number of holdings |
| 136 |
| Fund start date | ||
| Aug. 1, 2003 | ||
| Nasdaq symbols | CUSIPs | |
| Class A | OALVX | 246118863 |
| Class B | OBLVX | 246118855 |
| Class C | OCLVX | 246118848 |
| Institutional Class | OILVX | 246118830 |
Performance of a $10,000 Investment
Aug. 1, 2003 (Fund’s inception) through March 31, 2007
| Starting value (Aug. 1, 2003) | Ending value (March 31, 2007) | ||
| Russell 1000 Value Index | $10,000 | $17,723 | |
| Optimum Large Cap Value Fund — Class A Shares | $9,425 | $15,573 |
Chart assumes $10,000 invested on Aug. 1, 2003 and includes the effect of a 5.75% front-end sales charge and the reinvestment of all distributions.
Performance of other Fund classes will vary due to different charges and expenses.
The chart also assumes $10,000 invested in the Russell 1000 Value Index as of Aug. 1, 2003. The Russell 1000 Value Index measures the performance of those Russell 1000 companies with lower price-to-book ratios and lower forecasted growth values. An index is unmanaged and does not reflect the costs of operating a mutual fund, such as the costs of buying, selling, and holding securities. You cannot invest directly in an index.
Past performance is not a guarantee of future results.
17
Portfolio management review
> Optimum Small Cap Growth Fund
April 10, 2007
Advisor
Delaware Management Company (DMC)
Sub-advisors
Columbia Wanger Asset Management L.P. (CWAM)
Oberweis Asset Management, Inc. (Oberweis)
Optimum Small Cap Growth Fund seeks long-term growth of capital. The Fund’s advisor, Delaware Management Company, selected two sub-advisors, each of whom is responsible for day-to-day investment management of a portion of the Fund’s assets. Each sub-advisor selects investments for its portion of the Fund based on its own investment style and strategy. For more information on the investment approach of the sub-advisors, please see the Fund’s prospectus.
The Fund experienced negative performance during the first half of the fiscal year ending March 31, 2007, but performed well compared to its benchmark, the Russell 2000 Growth Index. For the full year, Optimum Small Cap Growth Fund gained 0.37% at net asset value and returned -5.37% at maximum offer price (both figures are for Class A shares and include distributions reinvested during the fiscal year); by comparison, the benchmark gained 1.56%. For complete annualized performance for the Fund, please see the table on page 20.
During the first two quarters of the fiscal year, stocks of small companies pulled back after a large surge during the first quarter of calendar year 2006. Housing prices, consumer debt loads, the war in Iraq, and the threat of terrorism weighed heavily on investors’ minds. Overlooked amid the apparent pessimism, in our opinion, was the resiliency of the U.S. economy. While respected stock market watchers and the financial press warned of an economic slowdown, the market was in one of the longest stretches of double-digit profit growth in history.
The calendar year 2006 ended much the same way it began, with a large run-up in the more speculative companies of the small-cap market, including micro-caps and stocks with no earnings. As oil prices retreated and worries about the health of the consumer and the housing market abated, lesser-quality stocks surged. These trends hurt the Fund’s performance relative to its benchmark.
The sections below provide additional information about the portion of the Fund managed by each sub-advisor.
Columbia Wanger Asset Management
Q: What factors in your investment strategy influenced returns for your portion of the Fund?
A: In the final quarter of the fiscal year, U.S. markets were jolted by turbulence overseas as a steep decline in the Chinese market spread globally. In our opinion investors suddenly seemed more focused on risk. Within the small-cap market, the lower-quality and smaller-company stocks lost favor in the marketplace. This played into our strength — our attention to risk — and the Fund outpaced the benchmark during the final period of the year.
Q: Can you describe some areas that detracted from performance?
A: The largest detractors from a sector standpoint were healthcare and retail. The Fund’s healthcare stocks were down 10% more than the benchmark during the period. The largest detractor was Neurocrine Bioscience stock, which collapsed when the FDA withheld full approval for the high dosage of its sleep medication Indiplon. We sold the stock, taking a 66% loss for the year, and it later fell another 50%.
The Fund maintained a healthy overweight within the consumer discretionary sector at 4% above the benchmark. Fund performance for retail stocks was slightly better than the benchmark although retail stocks in general reported sluggish performance. A large detractor within the retail space was Chico’s FAS, a women’s specialty retailer. Chico’s lost 21% during the year because its fall lineup was off the mark, and sales came in below expectations.
The views expressed are current as of the date of this report and are subject to change.
18
| Q: | Can you describe some areas that aided performance? |
A: Information technology and telecom had the highest performance in the Fund. Good stock selection in both sectors added value. The Fund’s technology stocks were up 9% versus a slight loss for the benchmark. Fueling strong performance in this sector was bar-code scanner manufacturer Symbol Technologies, which received a buyout offer from Motorola and was up 39% before the acquisition was completed in January 2007.
The Fund’s telecommunications holdings were up 10% over the benchmark performance. Time Warner Telecom, an owner of fiber optic networks connected to more than 6,000 office buildings was up because of strong sales growth. American Tower also posted strong annual gains. As cellular minute usage grows, cellular service providers continued to turn to the company for antenna space.
Oberweis Asset Management
| Q: | What factors influenced returns for your portion of the Fund? |
A: As value-oriented investments continued to dominate the small-cap market during the year, our portfolio of high-growth companies fared poorly relative to the rest of the small-cap marketplace. Investors continued to overlook opportunities in the high earnings and high growth space. Although our style struggled during the first three quarters of 2006, returns were favorable in the calendar fourth quarter.
| Q: | What aspect of your strategy had a significant impact on the Fund during the fiscal year? |
A: Oberweis invests in small-cap companies with high earnings growth rates. However, within our small-cap universe, high-growth companies had lower performance during the year. On a valuation basis, we believe stocks within our high-growth, small-cap universe are currently inexpensive relative to their longer term averages. On a relative basis, valuations of high-growth, small-cap equities appear much more attractive than valuations of small-cap value-oriented equities. High-growth equities have underperformed value equities in recent periods. When this situation has occurred in the past, the cycle generally reversed course over time.
As a result of our strict high-growth discipline, we are generally more heavily invested in sectors such as technology, healthcare, and consumer discretionary, and we have less exposure to slower growth sectors such as financial services, utilities, and producer durables.
| Q: | What factors influenced the Fund’s performance in a negative way? |
A: On a sector basis, technology and healthcare accounted for most of the strategy’s shortfall relative to the Russell 2000 Growth Index. Our portion of the Fund tends to be consistently more invested in these two growth-oriented sectors. At the stock level, two of the leading detractors for the year were ASV and Openwave Systems. The two top-performing sectors over the fiscal year, consumer staples and utilities, were slower-growing sectors in which we maintained minimal exposure.
| Q: | What factors influenced the Fund’s performance in a positive way? |
A: The largest contributors to performance from a sector standpoint were energy and “other.” The latter sector is comprised of recent IPOs or companies that are not yet included in the Russell 2000 Growth Index. Over the past fiscal year, healthcare carried a slightly higher average weight versus the Russell 2000 Growth Index. Technology also averaged higher than the benchmark. At the stock level, two of the top contributors for the year were Vasco Data Security International and Focus Media Holding.
19
Performance summary
> Optimum Small Cap Growth Fund
The performance data quoted represent past performance; past performance does not guarantee future results. Investment return and principal value will fluctuate so your shares, when redeemed, may be worth more or less than their original cost. Current performance may be lower or higher than the performance data quoted. Please obtain the performance data for the most recent month end by calling 800 914-0278 or visiting our Web site at www.optimummutualfunds.com.
You should consider the Fund’s investment objectives, risks, charges, and expenses carefully before investing. The Optimum Small Cap Growth Fund prospectus contains this and other important information about the Fund. Please request a prospectus through your financial advisor or by calling 800 914-0278 or visiting our Web site at www.optimummutualfunds.com. Read the prospectus carefully before you invest or send money.
Returns reflect the reinvestment of all distributions and any applicable sales charges as noted below, and they are subject to change.
Performance for Class B and C shares, excluding sales charges, assumes either that contingent deferred sales charges did not apply or that the investment was not redeemed.
An expense limitation was in effect for all classes during the periods shown below and on the next page. Performance would have been lower had the expense limitation not been in effect.
The Fund offers Class A, B, C, and Institutional Class shares. Class A shares are sold with a maximum front-end sales charge of up to 5.75% and have an annual distribution and service fee of up to 0.35% of average daily net assets.
Class B shares are sold with a contingent deferred sales charge that declines from 4.00% to zero depending on the period of time the shares are held. Class B shares will automatically convert to Class A shares on a quarterly basis approximately eight years after purchase. They are also subject to an annual distribution and service fee of 1.00% of average daily net assets.
Effective at the close of business on July 31, 2007, no new or subsequent investments will be allowed in Class B shares of each portfolio in the Optimum Fund Trust, except through a reinvestment of dividends or permitted exchanges. Please see the prospectus supplement for additional information.
Class C shares are sold with a contingent deferred sales charge of 1.00% if redeemed during the first 12 months. They are also subject to an annual distribution and service fee of 1.00% of average daily net assets.
Please see the fee table in the prospectus and your financial professional for a more complete explanation of sales charges.
Management has contracted to reimburse expenses and/or waive its management fees through Aug. 1, 2007.
The most recent Fund prospectus designates the Fund’s net expense ratios for Class A, B, C, and Institutional Class shares as 1.95%, 2.60%, 2.60%, and 1.60%, respectively, and the total operating expenses for Class A, B, C, and Institutional Class shares as 2.46%, 3.11%, 3.11%, and 2.11%, respectively. Please see the fee table in the Fund’s prospectus for more information.
The average annual total returns for the one-year and lifetime periods ended March 31, 2007, for Optimum Small Cap Growth Fund Institutional Class shares were +0.72% and +15.84%, respectively. Institutional Class shares were first made available on Aug. 1, 2003, for certain retirement plan products. They are sold without a sales charge or asset-based distribution charges only to certain eligible investors.
Funds that invest in small and/or medium-sized company stocks typically involve greater risk, particularly in the short term, than those investing in larger, more established companies.
| Fund Performance | ||||
| Average Annual Total Returns | ||||
| Through March 31, 2007 | 1 Year | Lifetime | ||
| Class A (Est. Aug. 1, 2003) | ||||
| Excluding sales charge | +0.37% | +15.45% | ||
| Including sales charge | -5.37% | +13.59% | ||
| Class B (Est. Aug. 1, 2003) | ||||
| Excluding sales charge | -0.27% | +14.74% | ||
| Including sales charge | -4.17% | +14.31% | ||
| Class C (Est. Aug. 1, 2003) | ||||
| Excluding sales charge | -0.27% | +14.74% | ||
| Including sales charge | -1.25% | +14.74% |
The performance table above and the graph on the next page do not reflect the deduction of taxes the shareholder would pay on Fund distributions or redemptions of Fund shares.
20
| Fund basics |
| As of March 31, 2007 |
| Fund objective |
| The Fund seeks long-term growth of capital. |
| Total fund net assets |
| $140 million |
| Number of holdings |
| 184 |
| Fund start date | ||
| Aug. 1, 2003 | ||
| Nasdaq symbols | CUSIPs | |
| Class A | OASGX | 246118822 |
| Class B | OBSGX | 246118814 |
| Class C | OCSGX | 246118798 |
| Institutional Class | OISGX | 246118780 |
Performance of a $10,000 Investment
Aug. 1, 2003 (Fund’s inception) through March 31, 2007
| Starting value (Aug. 1, 2003) | Ending value (March 31, 2007) | ||
| Russell 2000 Growth Index | $10,000 | $16,002 | |
| Optimum Small Cap Growth Fund — Class A Shares | $9,425 | $15,960 |
Chart assumes $10,000 invested on Aug. 1, 2003 and includes the effect of a 5.75% front-end sales charge and the reinvestment of all distributions.
Performance of other Fund classes will vary due to different charges and expenses.
The chart also assumes $10,000 invested in the Russell 2000 Growth Index as of Aug. 1, 2003. The Russell 2000 Growth Index is an unmanaged index that generally tracks the performance of those stocks in the Russell 2000 Index that have higher price-to-book ratios and higher forecasted growth values. An index does not reflect the costs of operating a mutual fund, such as the costs of buying, selling, and holding securities. You cannot invest directly in an index.
Past performance is not a guarantee of future results.
21
Portfolio management review
> Optimum Small Cap Value Fund
April 10, 2007
Advisor
Delaware Management Company (DMC)
Sub-advisors
Delafield Asset Management (Delafield)
Hotchkis and Wiley Capital Management, L.L.C. (H&W)
The Killen Group, Inc. (Killen)
Optimum Small Cap Value Fund seeks long-term growth of capital. The Fund’s advisor, Delaware Management Company, selected three sub-advisors, each of whom is responsible for day-to-day investment management of a portion of the Fund’s assets. Each sub-advisor selects investments for its portion of the Fund based on its own investment style and strategy. For more information on the investment approach of the sub-advisors, please see the Fund’s prospectus.
At the beginning of the fiscal year, gross domestic product data and corporate profits remained strong, but commodity price inflation and excessive liquidity had the U.S. Federal Reserve in a tightening mode. As the year progressed, concerns arose about the growth rate of corporate earnings, as well as the higher and thus less attractive price-to-earnings ratios that come with a market rally. These concerns began to weigh on the market and produced lower but still positive returns. Interest rates remained unchanged after June 2006, and in the latter months of the fiscal period major weaknesses in the mortgage lending and homebuilding areas threatened the economic outlook.
For the fiscal year ended March 31, 2007, the overall return for Optimum Small Cap Value Fund was +5.93% at net asset value and -0.17% at maximum offer price. Both figures reflect performance for Class A shares with all distributions reinvested. For complete annualized returns for the fund, please see page 26.
For the same period, the Russell 2000 Value Index gained 10.38%.
The sections below provide additional information about the portion of the Fund managed by each sub-advisor.
Delafield
| Q: | What market factors influenced performance in your portion of the Fund? |
A: Overall, Delafield’s focus remained on finding special situations. Such investments tend to have performance that more closely parallels the underlying events of the individual company rather than the broad markets. This can cause our performance quarter-to-quarter to be out of sync with the overall market.
Following the basic Delafield discipline, we invested in appropriately priced securities that we believed to have low market risk. During the year, the significant cash position in our portion of the Fund detracted from performance.
| Q: | What contributed to positive performance in your portion of the Fund? |
A: During the fiscal year, eight of the Fund’s investments received takeover proposals, which positively impacted returns. Among our better-performing stocks were Novelis, which was up 95%; Lydall, up 70%; and Standard Motor Products, which was sold prior to year end to lock in gains, after a 57% increase. In general, holdings benefiting from cyclical growth contributed to the Fund’s overall performance.
| Q: | What elements of performance in your portion of the Fund had a negative effect? |
A: On the negative side, education curriculum materials provider ProQuest fell 30% because of concerns arising after accounting irregularities forced a restatement of financials, followed closely by Furniture Brands International, down 28%. ProQuest is no longer a holding in the portfolio. Furniture Brands remains a core holding, but has been negatively affected by the consumer slowdown in spending on big-ticket items. Combined, these stocks impaired the portfolio returns by about 2.5 percentage points.
The views expressed are current as of the date of this report and are subject to change.
22
H & W
| Q: | What market factors influenced performance in your portion of the Fund? |
A: Toward the end of 2006, the Chicago Board of Options Exchange Volatility Index, which generally reflected fears of a market downturn, hit a 12-year low. This index can be viewed as a measure of market expectations, where a low reading indicates a high level of complacency among investors. In general, we believe it is imperative to identify potential risk factors as opposed to discounting them.
We prefer to own shares that are trading at a low multiple of sustainable normal earnings rather than make a bet that good times will be everlasting. Clearly, our disciplined, value-oriented process has caused us to miss some of the lavish returns in the market. However, we remain confident due in part to the fact that many of our holdings at period end exhibited attractive valuations relative to the market.
| Q: | What were the negative factors that affected your investments during the period? |
A: Nearly all of our relative underperformance versus the Russell 2000 Value Index was concentrated in the consumer discretionary sector, and to a lesser degree industrials, energy, and financials. Within the consumer discretionary sector, homebuilders Beazer Homes USA and WCI Communities, and publisher Valassis Communications, were sources of negative performance. Within the industrials sector, equipment manufacturer Flowserve and defense manufacturer EDO posted losses. In the financials sector, mortgage REIT Fieldstone Investment and insurers Conseco, Hanover Insurance Group, and KMG America were all weak performers.
Within the energy sector, the performance of coal producers Foundation Coal Holdings and Alpha Natural Resources lagged behind other securities.
| Q: | What were the positive factors that affected your investments? |
A: Strength came primarily from positive sector allocation with regard to information technology sector and strong stock selection within the materials sector. Within materials, chemicals manufacturers CF Industries and Agrium were standouts. We sold our position in CF Industries in January 2007 when it reached its target valuation. Apparel manufacturer Warnaco, staffing company Kelly Services, shipping company Overseas Shipholding Group, and real estate company MI Developments were leading contributors to performance.
Killen
| Q: | How favorable or unfavorable was your investment approach given the year’s market backdrop? |
A: Killen Group employs a bottom-up, company-specific value approach to construct a portfolio of companies in diverse industries that in our opinion have attractive valuations. Our investment process looks to balance reward and risk. This often prevents us from investing in areas of the market that are currently in favor but have valuations that we believe do not adequately reflect the risks inherent in the businesses. Examples included raw materials and REITs in the early months of last year. We believe that this cautious, disciplined process over time leads us to undervalued areas of the market that can provide upside potential and mitigate downside risk during periods of market weakness.
| Q: | What drove positive performance in your portion of the Fund? |
A: Sectors that added to our performance during the past fiscal year included energy and consumer discretionary stocks. Within the energy sector, the Fund experienced strong returns from Input/Output, a provider of seismic products and services that was up more than 40%, and Southwestern Energy, a natural gas exploration and production company that returned in excess of 27%.
23
Portfolio management review
> Optimum Small Cap Value Fund
April 10, 2007
Consumer discretionary stocks such as Monaco Coach, IHOP, and recent addition Hooker Furniture added to performance. Two companies whose stock we held experienced takeover bids, which also helped their performance — Gold Kist, a major poultry producer in the consumer staples sector, and Duquesne Light Holdings in the utilities sector. Duquesne’s stock price ran up after an initial mid-summer 2006 takeover announcement. We decided to sell the stock in early July, as we believed it was fully priced and there was little chance that the offering price would be increased. With Gold Kist, we believed there was a chance the initial takeover price might be increased and so decided to hold the stock until the takeover was consummated in January 2007. At that time we tendered our Gold Kist shares to the acquiring entity.
| Q: | What drove negative performance in your portion of the Fund? |
A: Sectors where we did not perform as well were financials and technology. Labranche, a New York Stock Exchange specialist firm and registered broker/dealer, was the most significant underperformer within financials, which was the biggest laggard sector relative to the benchmark. Real estate investment trusts (REITs) enjoyed a strong run during the fiscal year. We have stayed away from this area with the exception of our investment in Equity Inns, a hospitality-oriented REIT.
In the technology sector, Neoware, which specializes in computer solutions that rely on servers rather than on individual computers for primary computing power, had the largest decline. Although Neoware experienced internal growth issues, we believed the company remained attractive and increased our share count. International Coal Group in the materials sector and Cooper Tire and Rubber in the industrial sector had sharp price declines following unexpected, negative news related to business fundamentals. These two positions were eliminated from the Fund.
24
Performance summary
> Optimum Small Cap Value Fund
The performance data quoted represent past performance; past performance does not guarantee future results. Investment return and principal value will fluctuate so your shares, when redeemed, may be worth more or less than their original cost. Current performance may be lower or higher than the performance data quoted. Please obtain the performance data for the most recent month end by calling 800 914-0278 or visiting our Web site at www.optimummutualfunds.com.
You should consider the Fund’s investment objectives, risks, charges, and expenses carefully before investing. The Optimum Small Cap Value Fund prospectus contains this and other important information about the Fund. Please request a prospectus through your financial advisor or by calling 800 914-0278 or visiting our Web site at www.optimummutualfunds.com. Read the prospectus carefully before you invest or send money.
Returns reflect the reinvestment of all distributions and any applicable sales charges as noted below, and they are subject to change.
Performance for Class B and C shares, excluding sales charges, assumes either that contingent deferred sales charges did not apply or that the investment was not redeemed.
An expense limitation was in effect for all classes during the periods shown below and on the next page. Performance would have been lower had the expense limitation not been in effect.
The Fund offers Class A, B, C, and Institutional Class shares. Class A shares are sold with a maximum front-end sales charge of up to 5.75% and have an annual distribution and service fee of up to 0.35% of average daily net assets.
Class B shares are sold with a contingent deferred sales charge that declines from 4.00% to zero depending on the period of time the shares are held. Class B shares will automatically convert to Class A shares on a quarterly basis approximately eight years after purchase. They are also subject to an annual distribution and service fee of 1.00% of average daily net assets.
Effective at the close of business on July 31, 2007, no new or subsequent investments will be allowed in Class B shares of Optimum Fund Trust, except through a reinvestment of dividends or permitted exchanges. Please see the prospectus supplement for additional information.
Class C shares are sold with a contingent deferred sales charge of 1.00% if redeemed during the first 12 months. They are also subject to an annual distribution and service fee of 1.00% of average daily net assets.
Please see the fee table in the prospectus and your financial professional for a more complete explanation of sales charges.
Management has contracted to reimburse expenses and/or waive its management fees through Aug. 1, 2007.
The most recent Fund prospectus designates the Fund’s net expense ratios for Class A, B, C, and Institutional Class shares as 1.76%, 2.41%, 2.41%, and 1.41%, respectively, and the total operating expenses for Class A, B, C, and Institutional Class shares as 2.57%, 3.22%, 3.22%, and 2.22%, respectively. Please see the fee table in the Fund’s prospectus for more information.
The average annual total returns for the one-year and lifetime periods ended March 31, 2007, for Optimum Small Cap Value Fund Institutional Class shares were +6.24% and +19.13%, respectively. Institutional Class shares were first made available on Aug. 1, 2003, for certain retirement plan products. They are sold without a sales charge or asset-based distribution charges only to certain eligible investors.
Funds that invest in small and/or medium-sized company stocks typically involve greater risk, particularly in the short term, than those investing in larger, more established companies.
| Fund Performance | ||||
| Average Annual Total Returns | ||||
| Through March 31, 2007 | 1 Year | Lifetime | ||
| Class A (Est. Aug. 1, 2003) | ||||
| Excluding sales charge | +5.93% | +18.75% | ||
| Including sales charge | -0.17% | +16.84% | ||
| Class B (Est. Aug. 1, 2003) | ||||
| Excluding sales charge | +5.27% | +17.98% | ||
| Including sales charge | +1.31% | +17.59% | ||
| Class C (Est. Aug. 1, 2003) | ||||
| Excluding sales charge | +5.27% | +17.99% | ||
| Including sales charge | +4.28% | +17.99% |
The performance table above and the graph on the next page do not reflect the deduction of taxes the shareholder would pay on Fund distributions or redemptions of Fund shares.
26
| Fund basics |
| As of March 31, 2007 |
| Fund objective |
| The Fund seeks long-term growth of capital. |
| Total fund net assets |
| $128 million |
| Number of holdings |
| 145 |
| Fund start date | ||
| Aug. 1, 2003 | ||
| Nasdaq symbols | CUSIPs | |
| Class A | OASVX | 246118772 |
| Class B | OBSVX | 246118764 |
| Class C | OCSVX | 246118756 |
| Institutional Class | OISVX | 246118749 |
Performance of a $10,000 Investment
Aug. 1, 2003 (Fund’s inception) through March 31, 2007
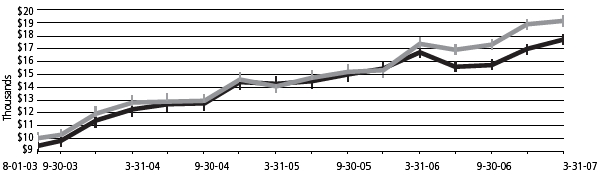
| Starting value (Aug. 1, 2003) | Ending value (March 31, 2007) | ||
| Russell 2000 Value Index | $10,000 | $19,149 | |
| Optimum Small Cap Value Fund — Class A Shares | $9,425 | $17,702 |
Chart assumes $10,000 invested on Aug. 1, 2003 and includes the effect of a 5.75% front-end sales charge and the reinvestment of all distributions.
Performance of other Fund classes will vary due to different charges and expenses.
The chart also assumes $10,000 invested in the Russell 2000 Value Index as of Aug. 1, 2003. The Russell 2000 Value Index is an unmanaged composite that measures the performance of small, value-oriented companies. An index does not reflect the costs of operating a mutual fund, such as the costs of buying, selling, and holding securities. You cannot invest directly in an index.
Past performance is not a guarantee of future results.
27
Disclosure of Fund expenses
For the period October 1, 2006 to March 31, 2007
As a shareholder of a Fund, you incur two types of costs: (1) transaction costs, including sales charges (loads) on purchase payments, reinvested dividends, or other distributions; redemption fees; and exchange fees; and (2) ongoing costs, including management fees; distribution and/or service (12b-1) fees; and other Fund expenses. These following examples are intended to help you understand your ongoing costs (in dollars) of investing in a Fund and to compare these costs with the ongoing costs of investing in other mutual funds.
The examples are based on an investment of $1,000 invested at the beginning of the period and held for the entire period from October 1, 2006 to March 31, 2007.
Actual Expenses
The first section of the tables shown, “Actual Fund Return,” provides information about actual account values and actual expenses. You may use the information in this section of the table, together with the amount you invested, to estimate the expenses that you paid over the period. Simply divide your account value by $1,000 (for example, an $8,600 account value divided by $1,000 = 8.6), then multiply the result by the number in the first section under the heading entitled “Expenses Paid During Period” to estimate the expenses you paid on your account during this period.
Hypothetical Example for Comparison Purposes
The second section of the tables shown, “Hypothetical 5% Return”, provides information about hypothetical account values and hypothetical expenses based on the Funds’ actual expense ratios and an assumed rate of return of 5% per year before expenses, which is not the Funds’ actual return. The hypothetical account values and expenses may not be used to estimate the actual ending account balance or expenses you paid for the period. You may use this information to compare the ongoing costs of investing in a Fund and other funds. To do so, compare this 5% hypothetical example with the 5% hypothetical examples that appear in the shareholder reports of the other funds.
Please note that the expenses shown in the tables are meant to highlight your ongoing costs only and do not reflect any transactional costs, such as sales charges (loads), redemption fees, or exchange fees. Therefore, the second section of each table is useful in comparing ongoing costs only, and will not help you determine the relative total costs of owning different funds. In addition, if these transactional costs were included, your costs would have been higher. Each Fund’s actual expenses shown in the tables reflect fee waivers in effect. The expenses shown in each table assume reinvestment of all dividends and distributions.
In each case, “Expenses Paid During Period” are equal to the Funds’ annualized expense ratio, multiplied by the average account value over the period, multiplied by the 182/365 (to reflect the one-half year period).
Optimum Fixed Income Fund
Expense Analysis of an Investment of $1,000
| Expenses | |||||||
| Beginning | Ending | Paid During | |||||
| Account | Account | Annualized | Period | ||||
| Value | Value | Expense | 10/1/06 to | ||||
| 10/1/06 | 3/31/07 | Ratio | 3/31/07 | ||||
| Actual Fund Return | |||||||
| Class A | $1,000.00 | $1,038.80 | 1.25% | $6.35 | |||
| Class B | 1,000.00 | 1,036.50 | 1.90% | 9.65 | |||
| Class C | 1,000.00 | 1,035.30 | 1.90% | 9.64 | |||
| Institutional Class | 1,000.00 | 1,041.80 | 0.90% | 4.58 | |||
| Hypothetical 5% Return (5% return before expenses) | |||||||
| Class A | $1,000.00 | $1,018.70 | 1.25% | $6.29 | |||
| Class B | 1,000.00 | 1,015.46 | 1.90% | 9.55 | |||
| Class C | 1,000.00 | 1,015.46 | 1.90% | 9.55 | |||
| Institutional Class | 1,000.00 | 1,020.44 | 0.90% | 4.53 | |||
Optimum International Fund
Expense Analysis of an Investment of $1,000
| Expenses | |||||||
| Beginning | Ending | Paid During | |||||
| Account | Account | Annualized | Period | ||||
| Value | Value | Expense | 10/1/06 to | ||||
| 10/1/06 | 3/31/07 | Ratio | 3/31/07 | ||||
| Actual Fund Return | |||||||
| Class A | $1,000.00 | $1,137.10 | 1.93% | $10.28 | |||
| Class B | 1,000.00 | 1,133.50 | 2.58% | 13.72 | |||
| Class C | 1,000.00 | 1,133.50 | 2.58% | 13.72 | |||
| Institutional Class | 1,000.00 | 1,138.90 | 1.58% | 8.43 | |||
| Hypothetical 5% Return (5% return before expenses) | |||||||
| Class A | $1,000.00 | $1,015.31 | 1.93% | $ 9.70 | |||
| Class B | 1,000.00 | 1,012.07 | 2.58% | 12.94 | |||
| Class C | 1,000.00 | 1,012.07 | 2.58% | 12.94 | |||
| Institutional Class | 1,000.00 | 1,017.05 | 1.58% | 7.95 | |||
28
| Optimum Large Cap Growth Fund Expense Analysis of an Investment of $1,000 | |||||||
| Expenses | |||||||
| Beginning | Ending | Paid During | |||||
| Account | Account | Annualized | Period | ||||
| Value | Value | Expense | 10/1/06 to | ||||
| 10/1/06 | 3/31/07 | Ratio | 3/31/07 | ||||
| Actual Fund Return | |||||||
| Class A | $1,000.00 | $1,070.50 | 1.69% | $ 8.72 | |||
| Class B | 1,000.00 | 1,067.40 | 2.34% | 12.06 | |||
| Class C | 1,000.00 | 1,067.40 | 2.34% | 12.06 | |||
| Institutional Class | 1,000.00 | 1,072.40 | 1.34% | 6.92 | |||
| Hypothetical 5% Return (5% return before expenses) | |||||||
| Class A | $1,000.00 | $1,016.50 | 1.69% | $ 8.50 | |||
| Class B | 1,000.00 | 1,013.26 | 2.34% | 11.75 | |||
| Class C | 1,000.00 | 1,013.26 | 2.34% | 11.75 | |||
| Institutional Class | 1,000.00 | 1,018.25 | 1.34% | 6.74 | |||
| Optimum Large Cap Value Fund Expense Analysis of an Investment of $1,000 | |||||||
| Expenses | |||||||
| Beginning | Ending | Paid During | |||||
| Account | Account | Annualized | Period | ||||
| Value | Value | Expense | 10/1/06 to | ||||
| 10/1/06 | 3/31/07 | Ratio | 3/31/07 | ||||
| Actual Fund Return | |||||||
| Class A | $1,000.00 | $1,086.30 | 1.55% | $ 8.06 | |||
| Class B | 1,000.00 | 1,083.00 | 2.20% | 11.43 | |||
| Class C | 1,000.00 | 1,083.00 | 2.20% | 11.43 | |||
| Institutional Class | 1,000.00 | 1,088.80 | 1.20% | 6.25 | |||
| Hypothetical 5% Return (5% return before expenses) | |||||||
| Class A | $1,000.00 | $1,017.20 | 1.55% | $ 7.80 | |||
| Class B | 1,000.00 | 1,013.96 | 2.20% | 11.05 | |||
| Class C | 1,000.00 | 1,013.96 | 2.20% | 11.05 | |||
| Institutional Class | 1,000.00 | 1,018.95 | 1.20% | 6.04 | |||
| Optimum Small Cap Growth Fund Expense Analysis of an Investment of $1,000 | |||||||
| Expenses | |||||||
| Beginning | Ending | Paid During | |||||
| Account | Account | Annualized | Period | ||||
| Value | Value | Expense | 10/1/06 to | ||||
| 10/1/06 | 3/31/07 | Ratio | 3/31/07 | ||||
| Actual Fund Return | |||||||
| Class A | $1,000.00 | $1,096.80 | 1.95% | $10.19 | |||
| Class B | 1,000.00 | 1,094.00 | 2.60% | 13.57 | |||
| Class C | 1,000.00 | 1,094.00 | 2.60% | 13.57 | |||
| Institutional Class | 1,000.00 | 1,098.80 | 1.60% | 8.37 | |||
| Hypothetical 5% Return (5% return before expenses) | |||||||
| Class A | $1,000.00 | $1,015.21 | 1.95% | $ 9.80 | |||
| Class B | 1,000.00 | 1,011.97 | 2.60% | 13.04 | |||
| Class C | 1,000.00 | 1,011.97 | 2.60% | 13.04 | |||
| Institutional Class | 1,000.00 | 1,016.95 | 1.60% | 8.05 | |||
| Optimum Small Cap Value Fund Expense Analysis of an Investment of $1,000 | |||||||
| Expenses | |||||||
| Beginning | Ending | Paid During | |||||
| Account | Account | Annualized | Period | ||||
| Value | Value | Expense | 10/1/06 to | ||||
| 10/1/06 | 3/31/07 | Ratio | 3/31/07 | ||||
| Actual Fund Return | |||||||
| Class A | $1,000.00 | $1,128.90 | 1.76% | $ 9.34 | |||
| Class B | 1,000.00 | 1,124.10 | 2.41% | 12.76 | |||
| Class C | 1,000.00 | 1,125.00 | 2.41% | 12.77 | |||
| Institutional Class | 1,000.00 | 1,129.70 | 1.41% | 7.49 | |||
| Hypothetical 5% Return (5% return before expenses) | |||||||
| Class A | $1,000.00 | $1,016.16 | 1.76% | $ 8.85 | |||
| Class B | 1,000.00 | 1,012.91 | 2.41% | 12.09 | |||
| Class C | 1,000.00 | 1,012.91 | 2.41% | 12.09 | |||
| Institutional Class | 1,000.00 | 1,017.90 | 1.41% | 7.09 | |||
29
Sector/Country allocations and
credit quality breakdown
> Optimum Fixed Income Fund
As of March 31, 2007
Sector designations may be different than the sector designations presented in other Fund materials.
| Percentage | ||
| Sector/Country | of Net Assets | |
| Agency Asset-Backed Securities | 0.03 | % |
| Agency Collateralized Mortgage Obligations | 5.67 | % |
| Agency Mortgage-Backed Securities | 9.34 | % |
| Agency Obligations | 2.83 | % |
| Commercial Mortgage-Backed Securities | 3.36 | % |
| Convertible Bonds | 0.02 | % |
| Corporate Bonds | 27.96 | % |
| Banking | 5.18 | % |
| Basic Industry | 2.26 | % |
| Brokerage | 0.66 | % |
| Capital Goods | 0.90 | % |
| Communications | 3.58 | % |
| Consumer Cyclical | 3.30 | % |
| Consumer Non-Cyclical | 1.30 | % |
| Electric | 2.64 | % |
| Energy | 0.89 | % |
| Finance Companies | 1.88 | % |
| Industrial - Other | 0.21 | % |
| Insurance | 2.77 | % |
| Natural Gas | 0.66 | % |
| Real Estate | 0.52 | % |
| Technology | 0.41 | % |
| Transportation | 0.80 | % |
| Foreign Agencies | 1.38 | % |
| Austria | 0.11 | % |
| France | 0.12 | % |
| Germany | 0.35 | % |
| Japan | 0.08 | % |
| Luxembourg | 0.34 | % |
| Mexico | 0.06 | % |
| Norway | 0.06 | % |
| Quatar | 0.12 | % |
| United Arab Emirates | 0.14 | % |
| Municipal Bonds | 2.74 | % |
| Non-Agency Asset-Backed Securities | 3.08 | % |
| Non-Agency Collateralized Mortgage | ||
| Obligations | 18.47 | % |
| Regional Agencies | 1.02 | % |
| Regional Authorities | 0.22 | % |
| Senior Secured Loans | 1.44 | % |
| Sovereign Debt | 6.94 | % |
| Argentina | 0.15 | % |
| Austria | 0.25 | % |
| Brazil | 0.80 | % |
| Colombia | 0.75 | % |
| Dominican Republic | 0.02 | % |
| El Salvador | 0.04 | % |
| France | 0.25 | % |
| Germany | 0.21 | % |
| Indonesia | 0.09 | % |
| Jamaica | 0.07 | % |
| Japan | 1.38 | % |
| Malaysia | 0.48 | % |
| Mexico | 0.46 | % |
| Norway | 0.30 | % |
| Panama | 0.10 | % |
| Peru | 0.07 | % |
| Philippines | 0.14 | % |
| Poland | 0.17 | % |
| Republic of Korea | 0.08 | % |
| Sweden | 0.13 | % |
| Turkey | 0.31 | % |
| United Kingdom | 0.66 | % |
| Uruguay | 0.03 | % |
| Supranational Banks | 0.57 | % |
| U.S. Treasury Obligations | 11.61 | % |
| Common Stock | 0.22 | % |
| Currency Options Purchased | 0.04 | % |
| Preferred Stock | 0.03 | % |
| Warrant | 0.08 | % |
| Repurchase Agreements | 6.76 | % |
| Total Value of Securities | 103.81 | % |
| Liabilities Net of Receivables and Other Assets | (3.81 | %) |
| Total Net Assets | 100.00 | % |
| Credit Quality Breakdown | ||
| (as a % of fixed income investments) | ||
| AAA | 44.90 | % |
| AA | 6.90 | % |
| A | 6.10 | % |
| BBB | 10.80 | % |
| BB | 12.10 | % |
| B | 13.50 | % |
| CCC | 3.60 | % |
| D | 0.10 | % |
| NR | 2.00 | % |
| Total | 100.00 | % |
30
Sector/Country allocations
> Optimum International Fund
As of March 31, 2007
Country and sector designations may be different than the country and sector designations presented in other Fund materials.
| Percentage | ||
| Country | of Net Assets | |
| Common Stock | 97.55 | % |
| Australia | 7.45 | % |
| Austria | 0.68 | % |
| Belgium | 2.13 | % |
| Brazil | 0.54 | % |
| Canada | 1.16 | % |
| China | 0.09 | % |
| Finland | 0.80 | % |
| France | 12.82 | % |
| Germany | 8.47 | % |
| Hong Kong | 2.01 | % |
| Hungary | 0.08 | % |
| India | 0.15 | % |
| Italy | 4.50 | % |
| Japan | 18.39 | % |
| Netherlands | 5.78 | % |
| New Zealand | 0.52 | % |
| Philippines | 0.08 | % |
| Republic of Korea | 0.63 | % |
| Singapore | 0.78 | % |
| South Africa | 0.64 | % |
| Spain | 4.35 | % |
| Sweden | 0.38 | % |
| Switzerland | 1.56 | % |
| Taiwan | 1.48 | % |
| Thailand | 0.06 | % |
| United Kingdom | 22.02 | % |
| Preferred Stock | 0.41 | % |
| Brazil | 0.24 | % |
| Republic of Korea | 0.17 | % |
| Repurchase Agreements | 1.82 | % |
| Total Value of Securities | 99.78 | % |
| Receivables and Other Assets Net of Liabilities | 0.22 | % |
| Total Net Assets | 100.00 | % |
| Percentage | ||
| Sector | of Net Assets | |
| Automobiles & Components | 7.42 | % |
| Banking & Finance | 21.55 | % |
| Capital Goods | 1.93 | % |
| Commercial Services | 2.16 | % |
| Consumer Durables & Apparel | 2.24 | % |
| Consumer Services | 0.23 | % |
| Energy | 9.99 | % |
| Food & Staples Retailing | 1.30 | % |
| Food, Beverage & Tobacco | 5.96 | % |
| Insurance | 7.39 | % |
| Materials | 8.68 | % |
| Media | 1.58 | % |
| Pharmaceuticals & Biotechnology | 6.19 | % |
| Real Estate | 1.08 | % |
| Semiconductors | 0.77 | % |
| Technology Hardware & Equipment | 2.01 | % |
| Telecommunication Services | 9.20 | % |
| Transportation & Shipping | 2.22 | % |
| Utilities | 6.06 | % |
| Total | 97.96 | % |
(continues) 31
Sector allocations & top 10 holdings
Sector designations may be different than the sector designations presented in other Fund materials.
> Optimum Large Cap Growth Fund | ||
| As of March 31, 2007 | ||
| Percentage | ||
| Sector | of Net Assets | |
| Common Stock | 93.81 | % |
| Basic Industry/Capital Goods | 6.59 | % |
| Business Services | 4.10 | % |
| Consumer Durables | 2.17 | % |
| Consumer Non-Durables | 13.41 | % |
| Consumer Services | 8.55 | % |
| Energy | 4.25 | % |
| Financials | 17.22 | % |
| Health Care | 14.17 | % |
| Technology | 18.63 | % |
| Transportation | 4.72 | % |
| Repurchase Agreements | 5.78 | % |
| Total Value of Securities | 99.59 | % |
| Receivables and Other Assets Net of Liabilities | 0.41 | % |
| Total Net Assets | 100.00 | % |
| Holdings are for informational purposes only and are subject to change at any time. They are not a recommendation to buy, sell, or hold any security. | ||
| Percentage | ||
| Top 10 Holdings | of Net Assets | |
| UnitedHealth Group | 4.06 | % |
| Genentech | 2.50 | % |
| Procter & Gamble | 2.22 | % |
| Goldman Sachs Group | 2.13 | % |
| General Electric | 2.03 | % |
| Target | 1.86 | % |
| Schlumberger | 1.84 | % |
| Comcast Class A | 1.70 | % |
| Cisco Systems | 1.65 | % |
| Burlington Northern Santa Fe | 1.62 | % |
| > Optimum Large Cap Value Fund | ||
| As of March 31, 2007 | ||
| Percentage | ||
| Sector | of Net Assets | |
| Common Stock² | 96.10 | % |
| Consumer Discretionary | 7.88 | % |
| Consumer Staples | 8.98 | % |
| Energy | 8.09 | % |
| Financials | 26.32 | % |
| Health Care | 8.60 | % |
| Industrials | 11.46 | % |
| Information Technology | 5.80 | % |
| Materials | 6.24 | % |
| Telecommunications | 9.19 | % |
| Utilities | 3.54 | % |
| Repurchase Agreements | 4.20 | % |
| Securities Sold Short | (0.13 | %) |
| Total Value of Securities | 100.17 | % |
| Liabilities Net of Receivables and Other Assets | (0.17 | %) |
| Total Net Assets | 100.00 | % |
| ²Narrow industries are utilized for compliance purposes for diversification whereas broad sectors are used for financial reporting. | ||
| Holdings are for informational purposes only and are subject to change at any time. They are not a recommendation to buy, sell, or hold any security. | ||
| Percentage | ||
| Top 10 Holdings | of Net Assets | |
| Citigroup | 3.06 | % |
| Fannie Mae | 2.29 | % |
| Altria Group | 2.03 | % |
| ConocoPhillips | 1.91 | % |
| Lockheed Martin | 1.90 | % |
| Bank of America | 1.89 | % |
| AT&T | 1.80 | % |
| Wyeth | 1.68 | % |
| Allstate | 1.64 | % |
| MetLife | 1.57 | % |
32
Sector designations may be different than the sector designations presented in other Fund materials.
| Optimum Small Cap Growth Fund | ||
| As of March 31, 2007 | ||
| Percentage | ||
| Sector | of Net Assets | |
| Common Stock² | 97.56 | % |
| Basic Industry/Capital Goods | 15.73 | % |
| Business Services | 10.34 | % |
| Consumer Durables | 3.42 | % |
| Consumer Non-Durables | 9.85 | % |
| Consumer Services | 5.70 | % |
| Energy | 3.40 | % |
| Financials | 2.37 | % |
| Health Care | 11.49 | % |
| Real Estate | 1.21 | % |
| Technology | 32.54 | % |
| Transportation | 0.73 | % |
| Utilities | 0.78 | % |
| Warrants | 0.00 | % |
| Repurchase Agreements | 2.56 | % |
| Total Value of Securities | 100.12 | % |
| Liabilities Net of Receivables and Other Assets | (0.12 | %) |
| Total Net Assets | 100.00 | % |
| ²Narrow industries are utilized for compliance purposes for diversification whereas broad sectors are used for financial reporting. | ||
| Holdings are for informational purposes only and are subject to change at any time. They are not a recommendation to buy, sell, or hold any security. | ||
| Percentage | ||
| Top 10 Holdings | of Net Assets | |
| Time Warner Telecommunication Class A | 1.53 | % |
| ValueClick | 1.49 | % |
| FLIR Systems | 1.41 | % |
| Focus Media Holding ADR | 1.35 | % |
| ESCO Technologies | 1.29 | % |
| Mettler-Toledo International | 1.28 | % |
| Genlyte Group | 1.26 | % |
| Avid Technology | 1.25 | % |
| Ceridian | 1.25 | % |
| Atwood Oceanics | 1.24 | % |
| Optimum Small Cap Value Fund | ||
| As of March 31, 2007 | ||
| Percentage | ||
| Sector | of Net Assets | |
| Common Stock | 91.50 | % |
| Basic Industry | 17.16 | % |
| Business Services | 8.22 | % |
| Capital Spending | 5.95 | % |
| Conglomerates | 0.65 | % |
| Consumer Cyclical | 8.04 | % |
| Consumer Services | 10.57 | % |
| Consumer Staples | 0.30 | % |
| Energy | 5.52 | % |
| Financial Services | 4.60 | % |
| Health Care | 2.12 | % |
| Real Estate | 6.01 | % |
| Technology | 17.34 | % |
| Transportation | 4.39 | % |
| Utilities | 0.63 | % |
| Repurchase Agreements | 8.51 | % |
| Total Value of Securities | 100.01 | % |
| Liabilities Net of Receivables and Other Assets | (0.01 | %) |
| Total Net Assets | 100.00 | % |
| Holdings are for informational purposes only and are subject to change at any time. They are not a recommendation to buy, sell, or hold any security. | ||
| Percentage | ||
| Top 10 Holdings | of Net Assets | |
| MI Developments Class A | 2.07 | % |
| Kennametal | 2.01 | % |
| Thermo Fisher Scientific | 1.90 | % |
| MDC Holdings | 1.83 | % |
| Albany International | 1.83 | % |
| Warnaco Group | 1.82 | % |
| Southern Union | 1.80 | % |
| Furniture Brands International | 1.73 | % |
| Kelly Services | 1.63 | % |
| YRC Worldwide | 1.59 | % |
33
Statements of net assets
> Optimum Fixed Income Fund
March 31, 2007
| Principal | Value | ||||
| Amount° | (U.S. $) | ||||
| Agency Asset-Backed Securities – 0.03% | |||||
| ¨«FHLMC Structured Pass | |||||
| Through Securities Series | |||||
| T-30 A5 8.61% 12/25/30 | USD | 226,406 | $ 226,564 | ||
| Total Agency Asset-Backed | |||||
| Securities (cost $225,840) | 226,564 | ||||
| Agency Collateralized Mortgage Obligations – 5.67% | |||||
| Fannie Mae | |||||
| Series 1996-46 ZA | |||||
| 7.50% 11/25/26 | 43,072 | 44,626 | |||
| Series 1999-19 PH | |||||
| 6.00% 5/25/29 | 1,344,450 | 1,367,932 | |||
| Series 2001-14 Z | |||||
| 6.00% 5/25/31 | 91,850 | 93,452 | |||
| Series 2002-90 A1 | |||||
| 6.50% 6/25/42 | 27,347 | 28,012 | |||
| Series 2002-90 A2 | |||||
| 6.50% 11/25/42 | 126,641 | 129,302 | |||
| Series 2003-122 AJ | |||||
| 4.50% 2/25/28 | 165,572 | 162,342 | |||
| Series 2005-14 ME | |||||
| 5.00% 10/25/33 | 1,910,000 | 1,839,738 | |||
| Series 2005-22 HE | |||||
| 5.00% 10/25/33 | 740,000 | 712,474 | |||
| Series 2005-29 QD | |||||
| 5.00% 8/25/33 | 816,000 | 785,607 | |||
| Series 2005-44 PE | |||||
| 5.00% 7/25/33 | 390,000 | 375,585 | |||
| Series 2005-54 AK | |||||
| 4.50% 9/25/32 | 1,060,630 | 1,031,751 | |||
| Series 2005-94 YD | |||||
| 4.50% 8/25/33 | 1,480,000 | 1,386,757 | |||
| Series 2005-110 MB | |||||
| 5.50% 9/25/35 | 925,000 | 932,512 | |||
| Fannie Mae Grantor Trust | |||||
| Series 1999-T2 A1 | |||||
| 7.50% 1/19/39 | 40,978 | 42,912 | |||
| Series 2001-T8 A2 | |||||
| 9.50% 7/25/41 | 21,174 | 22,814 | |||
| Series 2002-T4 A3 | |||||
| 7.50% 12/25/41 | 151,289 | 157,592 | |||
| Series 2004-T1 1A2 | |||||
| 6.50% 1/25/44 | 58,112 | 59,636 | |||
| Fannie Mae Whole Loan | |||||
| Series 2004-W9 2A1 | |||||
| 6.50% 2/25/44 | 74,118 | 76,110 | |||
| Series 2004-W10 A23 | |||||
| 5.00% 8/25/34 | 1,150,000 | 1,142,951 | |||
| Series 2004-W11 1A2 | |||||
| 6.50% 5/25/44 | 224,379 | 230,488 | |||
| Series 2004-W15 1A1 | |||||
| 6.00% 8/25/44 | 374,931 | 377,817 | |||
| Freddie Mac | |||||
| Series 1730 Z | |||||
| 7.00% 5/15/24 | 272,818 | 284,824 | |||
| Series 2113 QE | |||||
| 6.00% 11/15/27 | 16,144 | 16,153 | |||
| Series 2141 N | |||||
| 5.55% 11/15/27 | 135,686 | 135,390 | |||
| Series 2165 PE | |||||
| 6.00% 6/15/29 | 1,330,444 | 1,349,478 | |||
| Series 2326 ZQ | |||||
| 6.50% 6/15/31 | 487,746 | 507,440 | |||
| Series 2480 EH | |||||
| 6.00% 11/15/31 | 64 | 63 | |||
| Series 2497 BM | |||||
| 5.00% 2/15/22 | 419,002 | 415,983 | |||
| Series 2552 KB | |||||
| 4.25% 6/15/27 | 202,690 | 200,990 | |||
| Series 2612 LJ | |||||
| 4.00% 7/15/22 | 104,113 | 103,347 | |||
| Series 2662 DG | |||||
| 5.00% 10/15/22 | 57,000 | 55,461 | |||
| Series 2662 MA | |||||
| 4.50% 10/15/31 | 317,165 | 311,783 | |||
| Series 2721 PE | |||||
| 5.00% 1/15/23 | 100,000 | 96,958 | |||
| Series 2737 YD | |||||
| 5.00% 8/15/32 | 170,000 | 165,204 | |||
| Series 2755 LE | |||||
| 4.00% 9/15/30 | 557,000 | 519,152 | |||
| Series 2780 TE | |||||
| 5.00% 1/15/33 | 1,850,000 | 1,794,742 | |||
| Series 2783 PD | |||||
| 5.00% 1/15/33 | 1,076,000 | 1,041,915 | |||
| Series 2802 NE | |||||
| 5.00% 2/15/33 | 700,000 | 678,873 | |||
| Series 2827 TE | |||||
| 5.00% 4/15/33 | 1,335,000 | 1,292,897 | |||
| Series 2840 OE | |||||
| 5.00% 2/15/33 | 1,800,000 | 1,741,314 | |||
| Series 2841 YA | |||||
| 5.50% 7/15/27 | 1,332,577 | 1,335,147 | |||
| Series 2844 PD | |||||
| 5.00% 12/15/32 | 2,540,000 | 2,458,843 | |||
| Series 2864 PE | |||||
| 5.00% 6/15/33 | 1,095,000 | 1,060,553 | |||
| Series 2869 BG | |||||
| 5.00% 7/15/33 | 224,000 | 216,715 | |||
| Series 2872 GC | |||||
| 5.00% 11/15/29 | 405,000 | 398,965 | |||
| Series 2881 TE | |||||
| 5.00% 7/15/33 | 1,080,000 | 1,044,421 | |||
| Series 2889 OG | |||||
| 5.00% 5/15/33 | 117,000 | 113,152 | |||
| Series 2890 PC | |||||
| 5.00% 7/15/30 | 265,000 | 260,610 | |||
| Series 2890 PD | |||||
| 5.00% 3/15/33 | 1,265,000 | 1,221,524 | |||
| Series 2893 PD | |||||
| 5.00% 2/15/33 | 65,000 | 62,810 | |||
| Series 2915 KD | |||||
| 5.00% 9/15/33 | 447,000 | 431,670 | |||
| Series 2915 KP | |||||
| 5.00% 11/15/29 | 490,000 | 482,779 | |||
| Series 2921 NE | |||||
| 5.00% 9/15/33 | 1,095,000 | 1,057,407 | |||
| Series 2937 JG | |||||
| 5.00% 8/15/33 | 1,410,000 | 1,360,109 | |||
34
| Principal | Value | ||||
| Amount° | (U.S. $) | ||||
| Agency Collateralized Mortgage Obligations (continued) | |||||
| Freddie Mac (continued) | |||||
| Series 2938 ND | |||||
| 5.00% 10/15/33 | USD | 1,050,000 | $ 1,013,584 | ||
| Series 2939 PD | |||||
| 5.00% 7/15/33 | 665,000 | 641,869 | |||
| Series 2941 XD | |||||
| 5.00% 5/15/33 | 2,690,000 | 2,593,497 | |||
| Series 2987 KG | |||||
| 5.00% 12/15/34 | 1,430,000 | 1,376,366 | |||
| Series 3005 ED | |||||
| 5.00% 7/15/25 | 560,000 | 535,242 | |||
| Series 3022 MB | |||||
| 5.00% 12/15/28 | 260,000 | 257,712 | |||
| Series 3063 PC | |||||
| 5.00% 2/15/29 | 490,000 | 485,303 | |||
| Series 3145 LN | |||||
| 4.50% 10/15/34 | 1,645,000 | 1,598,225 | |||
| ¨Freddie Mac Structured Pass | |||||
| Through Securities | |||||
| Series T-54 2A | |||||
| 6.50% 2/25/43 | 48,011 | 49,097 | |||
| Series T-58 2A | |||||
| 6.50% 9/25/43 | 27,376 | 28,052 | |||
| GNMA | |||||
| Series 2004-11 QE | |||||
| 5.00% 12/16/32 | 459,000 | 439,299 | |||
| Series 2004-30 PD | |||||
| 5.00% 2/20/33 | 276,000 | 266,135 | |||
| Total Agency Collateralized | |||||
| Mortgage Obligations | |||||
| (cost $42,790,602) | 42,501,463 | ||||
| Agency Mortgage-Backed Securities – 9.34% | |||||
| Fannie Mae | |||||
| 5.50% 1/1/13 | 354,795 | 355,265 | |||
| 6.50% 8/1/17 | 148,847 | 152,175 | |||
| ŸFannie Mae ARM | |||||
| 5.063% 8/1/35 | 393,047 | 387,735 | |||
| 5.269% 10/1/33 | 457,457 | 463,586 | |||
| Fannie Mae Relocation 15 yr | |||||
| 4.00% 9/1/20 | 813,427 | 766,871 | |||
| Fannie Mae Relocation 30 yr | |||||
| 5.00% 11/1/33 | 53,167 | 51,878 | |||
| 5.00% 1/1/34 | 136,673 | 133,330 | |||
| 5.00% 2/1/34 | 70,974 | 69,253 | |||
| 5.00% 8/1/34 | 112,267 | 109,454 | |||
| 5.00% 11/1/34 | 237,762 | 231,805 | |||
| 5.00% 4/1/35 | 354,807 | 345,636 | |||
| 5.00% 10/1/35 | 278,333 | 271,139 | |||
| 5.00% 1/1/36 | 710,820 | 692,448 | |||
| Fannie Mae S.F. 15 yr | |||||
| 4.50% 6/1/19 | 2,313,840 | 2,246,206 | |||
| Fannie Mae S.F. 15 yr TBA | |||||
| 4.50% 4/1/22 | 975,000 | 943,922 | |||
| 5.50% 4/1/22 | 1,625,000 | 1,629,063 | |||
| 6.00% 4/1/22 | 1,435,000 | 1,458,766 | |||
| Fannie Mae S.F. 20 yr | |||||
| 5.50% 7/1/24 | 1,085,177 | 1,081,500 | |||
| 5.50% 10/1/24 | 350,535 | 349,347 | |||
| 5.50% 12/1/24 | 1,079,425 | 1,075,767 | |||
| Fannie Mae S.F. 30 yr | |||||
| 4.50% 8/1/33 | 558,453 | 526,265 | |||
| 4.50% 10/1/33 | 2,323,333 | 2,189,420 | |||
| 5.00% 10/1/33 | 373,712 | 362,015 | |||
| 5.00% 2/1/34 | 329,107 | 318,806 | |||
| 5.00% 5/1/34 | 277,899 | 268,976 | |||
| 5.50% 3/1/29 | 213,344 | 212,162 | |||
| 5.50% 4/1/29 | 105,186 | 104,603 | |||
| 5.50% 7/1/33 | 1,691,827 | 1,677,964 | |||
| 5.50% 12/1/33 | 244,319 | 242,317 | |||
| 5.50% 4/1/34 | 1,692,005 | 1,678,140 | |||
| 5.50% 6/1/34 | 1,317,217 | 1,305,660 | |||
| 5.50% 7/1/34 | 2,214,300 | 2,194,872 | |||
| 5.50% 12/1/34 | 1,935,410 | 1,918,428 | |||
| 6.00% 9/1/36 | 1,115,829 | 1,124,123 | |||
| 6.50% 11/1/33 | 53,657 | 55,099 | |||
| 6.50% 11/1/35 | 1,304,828 | 1,331,898 | |||
| 6.50% 2/1/36 | 1,086,002 | 1,109,155 | |||
| 6.50% 3/1/36 | 1,763,246 | 1,798,733 | |||
| 6.50% 6/1/36 | 2,849,863 | 2,907,218 | |||
| 6.50% 8/1/36 | 1,428,873 | 1,457,630 | |||
| 7.50% 3/1/32 | 2,681 | 2,799 | |||
| 7.50% 4/1/32 | 11,234 | 11,727 | |||
| 7.50% 6/1/32 | 8,151 | 8,509 | |||
| Fannie Mae S.F. 30 yr TBA | |||||
| 5.00% 4/1/37 | 2,160,000 | 2,087,100 | |||
| 5.50% 4/1/37 | 13,515,000 | 13,375,632 | |||
| 6.00% 4/1/37 | 3,380,000 | 3,404,295 | |||
| 6.50% 4/1/37 | 1,045,000 | 1,066,226 | |||
| 7.00% 4/1/37 | 1,290,000 | 1,330,715 | |||
| Freddie Mac 7.00% 1/1/08 | 30,783 | 30,860 | |||
| ŸFreddie Mac ARM | |||||
| 4.966% 12/1/33 | 526,675 | 532,451 | |||
| 5.734% 4/1/34 | 39,653 | 40,474 | |||
| Freddie Mac Relocation 30 yr | |||||
| 5.00% 9/1/33 | 6,301 | 6,166 | |||
| Freddie Mac S.F. 20 yr | |||||
| 5.50% 10/1/23 | 921,870 | 919,333 | |||
| 5.50% 8/1/24 | 232,085 | 231,286 | |||
| 6.00% 12/1/25 | 1,072,156 | 1,085,837 | |||
| Freddie Mac S.F. 30 yr | |||||
| 5.00% 4/1/35 | 805,880 | 780,883 | |||
| 6.50% 11/1/33 | 108,522 | 111,400 | |||
| 6.50% 1/1/35 | 598,423 | 615,088 | |||
| Freddie Mac S.F. 30 yr TBA | |||||
| 5.50% 4/1/37 | 4,890,000 | 4,839,574 | |||
| 6.00% 4/1/37 | 820,000 | 826,663 | |||
| GNMA I 7.00% 12/15/34 | 1,011,693 | 1,065,777 | |||
| GNMA II | |||||
| 6.00% 4/20/34 | 92,132 | 93,171 | |||
| 7.00% 8/20/34 | 8,669 | 9,033 | |||
(continues) 35
Statements of net assets
Optimum Fixed Income Fund
| Principal | Value | ||||
| Amount° | (U.S. $) | ||||
| Agency Mortgage-Backed Securities (continued) | |||||
| GNMA S.F. 30 yr TBA | |||||
| 5.50% 4/1/37 | USD | 965,000 | $ 959,874 | ||
| 6.00% 1/1/37 | 965,000 | 977,666 | |||
| Total Agency Mortgage-Backed | |||||
| Securities (cost $70,126,589) | 70,011,169 | ||||
| Agency Obligations – 2.83% | |||||
| Fannie Mae | |||||
| 3.00% 8/15/07 | 455,000 | 451,313 | |||
| 4.75% 3/12/10 | 720,000 | 719,565 | |||
| 5.00% 9/15/08 | 900,000 | 901,288 | |||
| ^8.12% 10/29/07 | NZD | 750,000 | 512,688 | ||
| Federal Farm Credit Bank | |||||
| 5.125% 8/25/16 | USD | 485,000 | 491,609 | ||
| Federal Home Loan Bank | |||||
| System | |||||
| 4.875% 11/27/13 | 3,200,000 | 3,198,015 | |||
| 5.375% 8/19/11 | 1,990,000 | 2,033,120 | |||
| ^Financing Corporation | |||||
| Interest Strip | |||||
| CPN 4.782% 4/6/12 | 465,000 | 368,721 | |||
| CPN 4.797% 5/2/12 | 85,000 | 67,340 | |||
| CPN 4.901% 10/6/12 | 385,000 | 296,395 | |||
| CPN 4.948% 10/6/14 | 465,000 | 322,747 | |||
| CPN 5.101% 10/6/11 | 113,000 | 91,400 | |||
| CPN 5.175% 3/26/12 | 120,000 | 95,180 | |||
| CPN 5.213% 10/6/15 | 160,000 | 105,295 | |||
| CPN 1 5.162% 5/11/12 | 270,000 | 213,839 | |||
| CPN 1 5.283% 5/11/15 | 330,000 | 221,978 | |||
| CPN 1 5.407% 11/11/17 | 560,000 | 327,914 | |||
| CPN 4 5.213% 10/6/15 | 160,000 | 105,295 | |||
| CPN 5 5.065% 8/8/11 | 39,000 | 31,810 | |||
| CPN 12 5.10% 12/6/11 | 500,000 | 401,084 | |||
| CPN 13 5.161% 12/27/12 | 135,000 | 102,727 | |||
| CPN 13 5.208% 6/27/13 | 320,000 | 237,472 | |||
| CPN 13 5.366% 12/27/16 | 287,000 | 176,849 | |||
| CPN 15 4.903% 9/7/13 | 610,000 | 448,438 | |||
| CPN 15 5.304% 3/7/16 | 565,000 | 363,672 | |||
| CPN A 5.098% 8/8/15 | 122,000 | 81,043 | |||
| CPN A 5.099% 2/8/15 | 122,000 | 83,062 | |||
| CPN D 5.109% 9/26/11 | 492,000 | 398,501 | |||
| CPN D 5.119% 9/26/10 | 500,000 | 424,429 | |||
| Freddie Mac | |||||
| 4.75% 1/19/16 | 100,000 | 98,516 | |||
| 5.40% 2/2/12 | 1,480,000 | 1,485,285 | |||
| 5.45% 9/2/11 | 1,480,000 | 1,482,657 | |||
| 5.50% 7/18/16 | 2,285,000 | 2,372,857 | |||
| ŸFreddie Mac ARM | |||||
| 5.87% 1/4/37 | 2,470,000 | 2,493,541 | |||
| Total Agency Obligations | |||||
| (cost $21,437,111) | 21,205,645 | ||||
| Commercial Mortgage-Backed Securities – 3.36% | |||||
| Bank of America Commercial | |||||
| Mortgage Securities | |||||
| ŸSeries 2005-5 A4 | |||||
| 5.115% 10/10/45 | 2,125,000 | 2,093,041 | |||
| ŸSeries 2006-3 A4 | |||||
| 5.889% 7/10/44 | 350,000 | 362,846 | |||
| Series 2006-4 A4 | |||||
| 5.634% 7/10/46 | 70,000 | 71,285 | |||
| Bear Stearns Commercial | |||||
| Mortgage Securities | |||||
| #Series 2004-ESA E 144A | |||||
| 5.064% 5/14/16 | 420,000 | 419,960 | |||
| Series 2007-PW15 AAB | |||||
| 5.315% 2/11/44 | 1,775,000 | 1,782,153 | |||
| ¨Commercial Mortgage Pass | |||||
| Through Certificates | |||||
| #Series 2001-J1A A2 144A | |||||
| 6.457% 2/14/34 | 274,064 | 284,000 | |||
| Series 2006-C7 A2 | |||||
| 5.69% 6/10/46 | 260,000 | 264,804 | |||
| Credit Suisse Mortgage | |||||
| Capital Certificates | |||||
| ŸSeries 2006-C1 AAB | |||||
| 5.555% 2/15/39 | 140,000 | 142,098 | |||
| Series 2006-C5 AAB | |||||
| 5.308% 12/15/39 | 1,610,000 | 1,608,618 | |||
| #Crown Castle Towers 144A | |||||
| Series 2005-1A C | |||||
| 5.074% 6/15/35 | 175,000 | 173,857 | |||
| Series 2006-1A B | |||||
| 5.362% 11/15/36 | 375,000 | 375,845 | |||
| Deutsche Mortgage & Asset | |||||
| Receiving Series 1998-C1 D | |||||
| 7.231% 6/15/31 | 1,807,000 | 1,832,876 | |||
| #DLJ Mortgage Acceptance | |||||
| Series 1997-CF2 A1B 144A | |||||
| 6.82% 10/15/30 | 740,236 | 740,939 | |||
| First Union-Lehman Brothers- | |||||
| Bank of America Series | |||||
| 1998-C2 A2 | |||||
| 6.56% 11/18/35 | 50,362 | 50,766 | |||
| #First Union National Bank | |||||
| Commercial Mortgage | |||||
| Series 2001-C2 L 144A | |||||
| 6.46% 1/12/43 | 200,000 | 202,984 | |||
| General Electric Capital | |||||
| Commercial Mortgage | |||||
| Series 2002-1A A3 | |||||
| 6.269% 12/10/35 | 325,000 | 340,056 | |||
| Greenwich Capital | |||||
| Commercial Funding | |||||
| ŸSeries 2006-GG7 AAB | |||||
| 5.914% 7/10/38 | 1,675,000 | 1,741,188 | |||
| Series 2007-GG9 A4 | |||||
| 5.444% 3/10/39 | 1,900,000 | 1,905,472 | |||
| GS Mortgage Securities II | |||||
| Series 2006-GG8 A4 | |||||
| 5.56% 11/10/39 | 1,320,000 | 1,338,335 | |||
| Ÿ#Series 2006-RR2 A1 144A | |||||
| 5.812% 6/23/46 | 350,000 | 355,807 | |||
| Ÿ#Series 2006-RR3 A1S 144A | |||||
| 5.659% 7/18/56 | 1,015,000 | 1,024,693 | |||
| JPMorgan Chase Commercial | |||||
| Mortgage Securities | |||||
| Series 2002-C1 A3 | |||||
| 5.376% 7/12/37 | 720,000 | 727,085 | |||
| Series 2002-C2 A2 | |||||
| 5.05% 12/12/34 | 665,000 | 659,925 | |||
36
| Principal | Value | ||||
| Amount° | (U.S. $) | ||||
| Commercial Mortgage-Backed Securities (continued) | |||||
| JPMorgan Chase Commercial | |||||
| Mortgage Securities | |||||
| Series 2003-C1 A2 | |||||
| 4.985% 1/12/37 | USD | 90,000 | $ 89,072 | ||
| ŸSeries 2005-LDP5 A4 | |||||
| 5.354% 12/15/44 | 1,005,000 | 1,001,985 | |||
| ŸSeries 2006-LDP7 AJ | |||||
| 5.876% 4/15/45 | 90,000 | 93,306 | |||
| Ÿ #Series 2006-RR1A A1 144A | |||||
| 5.455% 10/18/52 | 870,000 | 873,532 | |||
| Series 2007-CB18 A4 | |||||
| 5.44% 6/12/47 | 690,000 | 692,478 | |||
| LB-UBS Commercial Mortgage | |||||
| Trust Series 2002-C1 A4 | |||||
| 6.462% 3/15/31 | 245,000 | 258,406 | |||
| #Merrill Lynch Mortgage Trust 144A | |||||
| Series 2005-GGP1 E | |||||
| 4.33% 11/15/10 | 110,000 | 109,143 | |||
| Series 2005-GGP1 F | |||||
| 4.35% 11/15/10 | 105,000 | 104,182 | |||
| Merrill Lynch/Countrywide | |||||
| Commercial Mortgage | |||||
| Trust Series 2007-5 A4 | |||||
| 5.378% 8/12/48 | 670,000 | 668,261 | |||
| #Morgan Stanley Capital I | |||||
| Series 1999-FNV1 G 144A | |||||
| 6.12% 3/15/31 | 140,000 | 141,618 | |||
| Ÿ#Morgan Stanley Dean Witter | |||||
| Capital I Series 2001-TOP1 E | |||||
| 144A 7.55% 2/15/33 | 100,000 | 106,742 | |||
| Mortgage Capital Funding | |||||
| Series 1998-MC3 A2 | |||||
| 6.337% 11/18/31 | 688,522 | 692,704 | |||
| #NYC Mortgage Loan Trust | |||||
| Series 1996 A3 144A | |||||
| 6.75% 9/25/19 | 77,055 | 77,248 | |||
| Ÿ#STRIPs III Series 2003-1A AFIX | |||||
| 144A 3.308% 3/24/18 | 38,463 | 37,300 | |||
| #Tower 144A | |||||
| Series 2004-2A A | |||||
| 4.232% 12/15/14 | 195,000 | 190,746 | |||
| Series 2006-1 B | |||||
| 5.588% 2/15/36 | 160,000 | 161,302 | |||
| Series 2006-1 C | |||||
| 5.707% 2/15/36 | 250,000 | 252,203 | |||
| Wachovia Bank Commercial | |||||
| Mortgage Trust | |||||
| Series 2006-C28 A2 | |||||
| 5.50% 10/15/48 | 530,000 | 536,355 | |||
| Series 2007-C30 A3 | |||||
| 5.246% 12/15/43 | 595,000 | 595,220 | |||
| Total Commercial Mortgage-Backed | |||||
| Securities (cost $25,296,876) | 25,180,436 | ||||
| Convertible Bonds – 0.02% | |||||
| Ford Motor 4.25% 12/15/36 | |||||
| exercise price $9.20, | |||||
| expiration date 12/15/36 | 130,000 | 143,975 | |||
| †Mirant (Escrow) 2.50% | |||||
| 6/15/21 exercise price | |||||
| $67.95, expiration date | |||||
| 6/15/21 | 115,000 | 0 | |||
| Total Convertible Bonds | |||||
| (cost $136,148) | 143,975 | ||||
| Corporate Bonds – 27.96% | |||||
| Banking – 5.18% | |||||
| BAC Capital Trust XI | |||||
| 6.625% 5/23/36 | 400,000 | 424,661 | |||
| ŸBAC Capital Trust XIV | |||||
| 5.63% 12/31/49 | 370,000 | 370,555 | |||
| Ÿ#Banco Macro 144A | |||||
| 9.75% 12/18/36 | 660,000 | 669,240 | |||
| Ÿ#Banco Mercantil 144A | |||||
| 6.862% 10/13/21 | 870,000 | 891,488 | |||
| #Bank of Moscow 144A | |||||
| 7.335% 5/13/13 | 275,000 | 288,173 | |||
| Ÿ#Barclays Bank 144A | |||||
| 7.375% 6/29/49 | 330,000 | 358,051 | |||
| 10.00% 1/6/10 | BRL | 4,250,000 | 1,982,770 | ||
| #Centercredit International | |||||
| 144A 8.625% 1/30/14 | USD | 270,000 | 259,200 | ||
| Ÿ#Chinatrust Commercial Bank | |||||
| 144A 5.625% 3/29/49 | 817,000 | 799,327 | |||
| Citigroup | |||||
| 0.80% 10/30/08 | JPY | 52,000,000 | 440,917 | ||
| 6.125% 8/25/36 | USD | 370,000 | 377,097 | ||
| Credit Suisse First Boston USA | |||||
| 6.125% 11/15/11 | 140,000 | 145,390 | |||
| Depfa Bank 20.00% 11/19/07 | TRY | 5,074,000 | 3,638,188 | ||
| ^Dresdner Bank 4.66% 1/24/08 | USD | 2,953,000 | 2,809,040 | ||
| #Dresdner Funding Trust I 144A | |||||
| 8.151% 6/30/31 | 1,115,000 | 1,330,826 | |||
| First Union Institutional | |||||
| Capital II 7.85% 1/1/27 | 995,000 | 1,034,100 | |||
| ŸFortis Capital 6.25% 6/29/49 | EUR | 500,000 | 691,473 | ||
| Ÿ#HBOS 144A 5.92% 9/29/49 | USD | 300,000 | 294,439 | ||
| #HBOS Treasury Services 144A | |||||
| 5.25% 2/21/17 | 1,000,000 | 1,009,533 | |||
| #ICICI Bank 144A | |||||
| 5.75% 1/12/12 | 845,000 | 847,043 | |||
| JPMorgan Chase Capital XVIII | |||||
| 6.95% 8/17/36 | 355,000 | 371,181 | |||
| JPMorgan Chase Capital XX | |||||
| 6.55% 9/29/36 | 40,000 | 39,864 | |||
| #Kazkommerts International | |||||
| 144A 8.00% 11/3/15 | 260,000 | 265,200 | |||
| Ÿ#KBC Bank Funding Trust III | |||||
| 144A 9.86% 11/29/49 | 170,000 | 188,574 | |||
| Mizuho Financial Group | |||||
| 8.375% 12/29/49 | 1,395,000 | 1,474,935 | |||
| ŸMUFG Capital Finance 1 | |||||
| 6.346% 7/29/49 | 2,780,000 | 2,844,628 | |||
(continues) 37
Statements of net assets
Optimum Fixed Income Fund
| Principal | Value | ||||
| Amount° | (U.S. $) | ||||
| Corporate Bonds (continued) | |||||
| Banking (continued) | |||||
| Popular North America | |||||
| 4.25% 4/1/08 | USD | 320,000 | $ 315,456 | ||
| 5.20% 12/12/07 | 2,500,000 | 2,496,802 | |||
| Ÿ5.76% 4/6/09 | 320,000 | 321,739 | |||
| Popular North America Capital | |||||
| Trust I 6.564% 9/15/34 | 225,000 | 223,517 | |||
| #Privatbank 144A | |||||
| 8.00% 2/6/12 | 530,000 | 530,318 | |||
| Ÿ#Rabobank Capital Funding II | |||||
| 144A 5.26% 12/29/49 | 250,000 | 243,578 | |||
| ŸRBS Capital Trust I | |||||
| 4.709% 12/29/49 | 220,000 | 210,502 | |||
| ŸResona Bank 4.125% 9/29/49 | EUR | 300,000 | 389,101 | ||
| Ÿ#Resona Bank 144A | |||||
| 5.85% 9/29/49 | USD | 2,050,000 | 2,043,520 | ||
| Ÿ#Resona Preferred Global | |||||
| Securities 144A | |||||
| 7.191% 12/29/49 | 1,065,000 | 1,126,671 | |||
| #Russian Standard Bank 144A | |||||
| 8.625% 5/5/11 | 170,000 | 169,371 | |||
| Ÿ#Shinsei Finance II 144A | |||||
| 7.16% 7/29/49 | 185,000 | 190,897 | |||
| Ÿ#Societe Generale 144A | |||||
| 5.922% 12/31/49 | 105,000 | 105,132 | |||
| ŸStandard Chartered Capital | |||||
| Trust I 8.16% 3/29/49 | EUR | 294,000 | 431,660 | ||
| ŸSunTrust Preferred Capital I | |||||
| 5.853% 12/31/49 | USD | 464,000 | 470,971 | ||
| #TuranAlem Finance 144A | |||||
| 7.75% 4/25/13 | 313,000 | 312,218 | |||
| Vneshtorgbank 4.25% | |||||
| 2/15/16 | EUR | 325,000 | 425,763 | ||
| Ÿ#Vneshtorgbank 144A | |||||
| 5.96% 8/1/08 | USD | 100,000 | 100,175 | ||
| Wachovia Bank 5.85% 2/1/37 | 1,410,000 | 1,379,691 | |||
| ŸWachovia Capital Trust III | |||||
| 5.80% 8/29/49 | 2,465,000 | 2,496,577 | |||
| WM Covered Bond Program | |||||
| 3.875% 9/27/11 | EUR | 750,000 | 986,923 | ||
| 38,816,475 | |||||
| Basic Industry – 2.26% | |||||
| Alcoa 5.95% 2/1/37 | USD | 220,000 | 215,022 | ||
| #Aleris International 144A | |||||
| 10.00% 12/15/16 | 400,000 | 420,000 | |||
| Alrosa Finance 8.875% | |||||
| 11/17/14 | 321,000 | 370,402 | |||
| #Alrosa Finance 144A | |||||
| 8.875% 11/17/14 | 123,000 | 141,758 | |||
| Bowater | |||||
| 9.00% 8/1/09 | 725,000 | 763,062 | |||
| 9.50% 10/15/12 | 325,000 | 333,125 | |||
| Catalyst Paper | |||||
| 8.625% 6/15/11 | 590,000 | 601,800 | |||
| Celulosa Arauco | |||||
| 5.125% 7/9/13 | 585,000 | 567,764 | |||
| 5.625% 4/20/15 | 510,000 | 502,703 | |||
| #Cosan Finance 144A | |||||
| 7.00% 2/1/17 | 395,000 | 391,050 | |||
| Donohue Forest Products | |||||
| 7.625% 5/15/07 | 305,000 | 307,288 | |||
| Freeport McMoRan | |||||
| Copper & Gold | |||||
| 8.25% 4/1/15 | 725,000 | 782,093 | |||
| 8.375% 4/1/17 | 280,000 | 303,450 | |||
| Georgia-Pacific | |||||
| 8.875% 5/15/31 | 935,000 | 995,774 | |||
| 9.50% 12/1/11 | 300,000 | 334,500 | |||
| Ispat Inland 9.75% 4/1/14 | 80,000 | 88,403 | |||
| Lubrizol 4.625% 10/1/09 | 515,000 | 509,064 | |||
| Lyondell Chemical | |||||
| 8.00% 9/15/14 | 340,000 | 357,850 | |||
| 8.25% 9/15/16 | 250,000 | 268,750 | |||
| #MacDermid 144A | |||||
| 9.50% 4/15/17 | 470,000 | 484,100 | |||
| Massey Energy | |||||
| 6.625% 11/15/10 | 75,000 | 76,125 | |||
| #Momentive Performance | |||||
| Materials 144A | |||||
| 9.75% 12/1/14 | 275,000 | 284,625 | |||
| #Nell AF Sarl 144A | |||||
| 8.375% 8/15/15 | 295,000 | 309,013 | |||
| NewPage 10.00% 5/1/12 | 285,000 | 313,144 | |||
| #Norske Skogindustrier 144A | |||||
| 7.125% 10/15/33 | 585,000 | 547,427 | |||
| ‡#Port Townsend Paper 144A | |||||
| 11.00% 4/15/11 | 295,000 | 255,175 | |||
| Potlatch 13.00% 12/1/09 | 350,000 | 402,650 | |||
| #Sappi Papier Holding 144A | |||||
| 6.75% 6/15/12 | 380,000 | 383,669 | |||
| 7.50% 6/15/32 | 545,000 | 521,456 | |||
| ‡Solutia 6.72% 10/15/37 | 360,000 | 343,800 | |||
| Southern Copper | |||||
| 7.50% 7/27/35 | 100,000 | 108,288 | |||
| #Steel Dynamics 144A | |||||
| 6.75% 4/1/15 | 125,000 | 125,781 | |||
| #Stora Enso 144A | |||||
| 7.25% 4/15/36 | 435,000 | 457,018 | |||
| Tembec Industries | |||||
| 7.75% 3/15/12 | 525,000 | 321,563 | |||
| 8.625% 6/30/09 | 75,000 | 53,344 | |||
| #Tube City IMS 144A | |||||
| 9.75% 2/1/15 | 300,000 | 313,500 | |||
| Vale Overseas | |||||
| 6.25% 1/23/17 | 315,000 | 322,547 | |||
| 6.875% 11/21/36 | 1,135,000 | 1,177,774 | |||
| Witco 6.875% 2/1/26 | 200,000 | 171,500 | |||
| #Xstrata Finance Canada 144A | |||||
| 5.50% 11/16/11 | 1,430,000 | 1,439,504 | |||
| Ÿ#Xstrata Finance Dubai 144A | |||||
| 5.71% 11/13/09 | 280,000 | 280,435 | |||
| 16,946,296 | |||||
| Brokerage – 0.66% | |||||
| ŸAmeriprise Financial | |||||
| 7.518% 6/1/66 | 835,000 | 902,745 |
38
| Principal | Value | ||||
| Amount° | (U.S. $) | ||||
| Corporate Bonds (continued) | |||||
| Brokerage (continued) | |||||
| Amvescap 4.50% 12/15/09 | USD | 365,000 | $ 358,499 | ||
| E Trade Financial | |||||
| 8.00% 6/15/11 | 250,000 | 264,375 | |||
| Goldman Sachs Group | |||||
| 6.345% 2/15/34 | 235,000 | 232,883 | |||
| LaBranche & Company | |||||
| 9.50% 5/15/09 | 200,000 | 211,000 | |||
| 11.00% 5/15/12 | 500,000 | 547,500 | |||
| ŸLehman Brothers Capital | |||||
| Funding II 3.875% 2/28/49 | EUR | 250,000 | 322,341 | ||
| Merrill Lynch | |||||
| 6.11% 1/29/37 | USD | 270,000 | 262,636 | ||
| 6.22% 9/15/26 | 165,000 | 165,840 | |||
| Morgan Stanley 5.45% 1/9/17 | 1,685,000 | 1,660,384 | |||
| 4,928,203 | |||||
| Capital Goods – 0.90% | |||||
| #Ahern Rentals 144A | |||||
| 9.25% 8/15/13 | 175,000 | 183,531 | |||
| Allied Waste North America | |||||
| 9.25% 9/1/12 | 50,000 | 53,000 | |||
| Armor Holdings | |||||
| 8.25% 8/15/13 | 145,000 | 152,975 | |||
| Berry Plastics Holding | |||||
| 8.875% 9/15/14 | 260,000 | 267,150 | |||
| Casella Waste Systems | |||||
| 9.75% 2/1/13 | 625,000 | 665,624 | |||
| Caterpillar 6.05% 8/15/36 | 260,000 | 266,308 | |||
| CPG International I | |||||
| 10.50% 7/1/13 | 225,000 | 237,375 | |||
| General Electric 5.00% 2/1/13 | 345,000 | 342,815 | |||
| Geo Subordinate | |||||
| 11.00% 5/15/12 | 250,000 | 251,250 | |||
| Graham Packaging | |||||
| 9.875% 10/15/14 | 400,000 | 410,000 | |||
| #Hawker Beechcraft Acquisition | |||||
| 144A 9.75% 4/1/17 | 125,000 | 130,938 | |||
| #Hexion US Finance 144A | |||||
| 9.75% 11/15/14 | 600,000 | 632,250 | |||
| Honeywell International | |||||
| 5.70% 3/15/37 | 425,000 | 412,811 | |||
| Interface 10.375% 2/1/10 | 350,000 | 387,625 | |||
| Intertape Polymer | |||||
| 8.50% 8/1/14 | 375,000 | 335,922 | |||
| ¶NTK Holdings 10.75% 3/1/14 | 75,000 | 54,750 | |||
| #Penhall International 144A | |||||
| 12.00% 8/1/14 | 200,000 | 217,000 | |||
| #Rental Services 144A | |||||
| 9.50% 12/1/14 | 400,000 | 428,000 | |||
| #Siemens Finance 144A | |||||
| 6.125% 8/17/26 | 415,000 | 423,442 | |||
| #Vitro 144A 9.125% 2/1/17 | 595,000 | 612,850 | |||
| WCA Waste 9.25% 6/15/14 | 285,000 | 304,238 | |||
| 6,769,854 | |||||
| Communications – 3.58% | |||||
| America Movil 6.375% 3/1/35 | 270,000 | 267,316 | |||
| American Tower | |||||
| 7.125% 10/15/12 | 300,000 | 310,500 | |||
| AT&T | |||||
| 7.30% 11/15/11 | 340,000 | 369,451 | |||
| 8.00% 11/15/31 | 410,000 | 508,195 | |||
| BellSouth 4.20% 9/15/09 | 190,000 | 186,154 | |||
| British Telecommunications | |||||
| 9.125% 12/15/30 | 300,000 | 413,093 | |||
| #Broadview Networks Holdings | |||||
| 144A 11.375% 9/1/12 | 225,000 | 241,875 | |||
| #C&M Finance 144A | |||||
| 8.10% 2/1/16 | 260,000 | 273,650 | |||
| CCH I Holdings | |||||
| 13.50% 1/15/14 | 1,825,000 | 1,852,374 | |||
| Charter Communication | |||||
| Holdings 13.50% 1/15/11 | 650,000 | 679,250 | |||
| Citizens Communications | |||||
| 9.25% 5/15/11 | 10,000 | 11,200 | |||
| #CMP Susquehanna 144A | |||||
| 9.875% 5/15/14 | 175,000 | 180,250 | |||
| Comcast | |||||
| Ÿ5.66% 7/14/09 | 400,000 | 400,806 | |||
| 6.45% 3/15/37 | 225,000 | 226,002 | |||
| 6.50% 11/15/35 | 360,000 | 363,907 | |||
| Comcast Cable Holdings | |||||
| 9.875% 6/15/22 | 290,000 | 381,614 | |||
| 10.125% 4/15/22 | 329,000 | 439,779 | |||
| Cox Communications | |||||
| 4.625% 1/15/10 | 185,000 | 182,616 | |||
| #Cricket Communications 144A | |||||
| 9.375% 11/1/14 | 470,000 | 500,550 | |||
| Dex Media West | |||||
| 9.875% 8/15/13 | 300,000 | 328,875 | |||
| #Digicel 144A 9.25% 9/1/12 | 280,000 | 296,800 | |||
| #Digicel Group 144A | |||||
| 8.875% 1/15/15 | 1,360,000 | 1,322,599 | |||
| Embarq 7.995% 6/1/36 | 485,000 | 502,257 | |||
| Ÿ#Hellas Telecommunication | |||||
| Luxembourg II 144A | |||||
| 11.115% 1/15/15 | 375,000 | 387,188 | |||
| Hughes Network Systems/ | |||||
| Finance 9.50% 4/15/14 | 700,000 | 740,250 | |||
| #Idearc 144A 8.00% 11/15/16 | 190,000 | 196,413 | |||
| ¶Inmarsat Finance | |||||
| 10.375% 11/15/12 | 475,000 | 451,250 | |||
| Insight Midwest 9.75% | |||||
| 10/1/09 | 350,000 | 356,563 | |||
| #Level 3 Financing 144A | |||||
| 8.75% 2/15/17 | 300,000 | 303,750 | |||
| Mediacom Capital | |||||
| 9.50% 1/15/13 | 1,075,000 | 1,111,281 | |||
| Nextel Communications | |||||
| 6.875% 10/31/13 | 15,000 | 15,382 | |||
| #Orascom Telecommunication | |||||
| Finance 144A | |||||
| 7.875% 2/8/14 | 1,090,000 | 1,079,100 | |||
(continues) 39
Statements of net assets
Optimum Fixed Income Fund
| Principal | Value | ||||
| Amount° | (U.S. $) | ||||
| Corporate Bonds (continued) | |||||
| Communications (continued) | |||||
| #Pakistan Mobile | |||||
| Communications 144A | |||||
| 8.625% 11/13/13 | USD | 745,000 | $ 778,525 | ||
| #Quebecor World 144A | |||||
| 9.75% 1/15/15 | 300,000 | 316,500 | |||
| Qwest | |||||
| 7.50% 10/1/14 | 370,000 | 392,200 | |||
| 7.875% 9/1/11 | 20,000 | 21,350 | |||
| Ÿ8.605% 6/15/13 | 200,000 | 219,000 | |||
| Rural Cellular | |||||
| 9.875% 2/1/10 | 375,000 | 397,500 | |||
| Ÿ11.11% 11/1/12 | 75,000 | 78,375 | |||
| Sprint Capital | |||||
| 7.625% 1/30/11 | 380,000 | 408,888 | |||
| Sprint Nextel 6.00% 12/1/16 | 610,000 | 601,390 | |||
| TCI Communications | |||||
| 8.75% 8/1/15 | 432,000 | 511,020 | |||
| Telecom Italia Capital | |||||
| 4.00% 1/15/10 | 510,000 | 493,046 | |||
| 4.95% 9/30/14 | 264,000 | 249,068 | |||
| 5.25% 11/15/13 | 685,000 | 665,050 | |||
| Ÿ5.97% 7/18/11 | 485,000 | 488,014 | |||
| 7.20% 7/18/36 | 430,000 | 449,075 | |||
| Telefonica Emisones | |||||
| Ÿ5.65% 6/19/09 | 295,000 | 296,176 | |||
| 5.984% 6/20/11 | 325,000 | 333,458 | |||
| 6.421% 6/20/16 | 135,000 | 141,148 | |||
| 7.045% 6/20/36 | 115,000 | 123,201 | |||
| Telefonos de Mexico | |||||
| 4.50% 11/19/08 | 415,000 | 411,960 | |||
| TELUS 4.95% 3/15/17 | CAD | 400,000 | 341,213 | ||
| THOMSON 5.75% 2/1/08 | USD | 85,000 | 85,350 | ||
| Time Warner 7.70% 5/1/32 | 100,000 | 113,710 | |||
| Time Warner Entertainment | |||||
| 8.375% 3/15/23 | 220,000 | 260,663 | |||
| Triton PCS | |||||
| 8.50% 6/1/13 | 715,000 | 740,025 | |||
| 9.375% 2/1/11 | 970,000 | 999,100 | |||
| #True Move 144A | |||||
| 10.75% 12/16/13 | 585,000 | 598,163 | |||
| #Univision Communications PIK | |||||
| 144A 9.75% 3/15/15 | 425,000 | 425,531 | |||
| Vertis 10.875% 6/15/09 | 435,000 | 441,525 | |||
| Vimpel Communication | |||||
| 8.25% 5/23/16 | 157,000 | 168,055 | |||
| #Vimpel Communication 144A | |||||
| 8.25% 5/23/16 | 176,000 | 187,880 | |||
| Vodafone Group | |||||
| 6.15% 2/27/37 | 250,000 | 242,152 | |||
| 26,858,601 | |||||
| Consumer Cyclical – 3.30% | |||||
| Accuride 8.50% 2/1/15 | 200,000 | 202,500 | |||
| Boyd Gaming 8.75% 4/15/12 | 525,000 | 550,594 | |||
| Carrols 9.00% 1/15/13 | 445,000 | 456,125 | |||
| Corrections Corporation of | |||||
| America 7.50% 5/1/11 | 323,000 | 333,498 | |||
| Costco Wholesale | |||||
| 5.50% 3/15/17 | 520,000 | 522,109 | |||
| CVS 3.875% 11/1/07 | 240,000 | 237,930 | |||
| ŸDaimlerChrysler Holding | |||||
| 5.81% 8/3/09 | 1,020,000 | 1,024,825 | |||
| 5.89% 10/31/08 | 883,000 | 887,950 | |||
| Denny’s 10.00% 10/1/12 | 175,000 | 187,469 | |||
| Federated Retail Holdings | |||||
| 5.35% 3/15/12 | 265,000 | 264,590 | |||
| Ford Motor | |||||
| 7.45% 7/16/31 | 760,000 | 591,850 | |||
| 7.70% 5/15/97 | 220,000 | 161,700 | |||
| Ford Motor Credit | |||||
| 5.75% 1/12/09 | EUR | 520,000 | 685,535 | ||
| 7.375% 10/28/09 | USD | 355,000 | 354,551 | ||
| 8.00% 12/15/16 | 255,000 | 245,776 | |||
| Ÿ8.11% 1/13/12 | 470,000 | 459,975 | |||
| 9.875% 8/10/11 | 1,655,000 | 1,754,195 | |||
| #Ford Motor Credit 144A | |||||
| 9.75% 9/15/10 | 395,000 | 416,373 | |||
| #Galaxy Entertainment Finance | |||||
| 144A 9.875% 12/15/12 | 974,000 | 1,068,965 | |||
| Gaylord Entertainment | |||||
| 8.00% 11/15/13 | 375,000 | 385,781 | |||
| General Motors | |||||
| 8.375% 7/15/33 | 1,220,000 | 1,101,049 | |||
| Global Cash Access | |||||
| 8.75% 3/15/12 | 25,000 | 26,313 | |||
| #Goodyear Tire & Rubber 144A | |||||
| 8.625% 12/1/11 | 150,000 | 162,000 | |||
| Harrah’s Operating | |||||
| 6.50% 6/1/16 | 775,000 | 687,741 | |||
| Home Depot 5.875% 12/16/36 | 525,000 | 502,257 | |||
| Lear 8.75% 12/1/16 | 375,000 | 360,000 | |||
| Lodgenet Entertainment | |||||
| 9.50% 6/15/13 | 500,000 | 546,393 | |||
| Majestic Star Casino | |||||
| 9.50% 10/15/10 | 410,000 | 432,038 | |||
| Mandalay Resort Group | |||||
| 9.375% 2/15/10 | 100,000 | 108,250 | |||
| 9.50% 8/1/08 | 250,000 | 262,188 | |||
| #Michaels Stores 144A | |||||
| 11.375% 11/1/16 | 390,000 | 422,175 | |||
| Neiman Marcus | |||||
| 10.375% 10/15/15 | 305,000 | 341,600 | |||
| Neiman Marcus PIK | |||||
| 9.00% 10/15/15 | 300,000 | 330,000 | |||
| NPC International | |||||
| 9.50% 5/1/14 | 300,000 | 312,000 | |||
| O’Charleys 9.00% 11/1/13 | 180,000 | 192,600 | |||
| Penney (J.C.) | |||||
| 7.375% 8/15/08 | 200,000 | 205,318 | |||
| 8.125% 4/1/27 | 250,000 | 257,150 |
40
| Principal | Value | ||||
| Amount° | (U.S. $) | ||||
| Corporate Bonds (continued) | |||||
| Consumer Cyclical (continued) | |||||
| #Pokagon Gaming Authority | |||||
| 144A 10.375% 6/15/14 | USD | 400,000 | $ 443,000 | ||
| Rite Aid 9.25% 6/1/13 | 290,000 | 290,000 | |||
| Station Casinos | |||||
| 6.625% 3/15/18 | 200,000 | 179,000 | |||
| Time Warner | |||||
| 5.50% 11/15/11 | 305,000 | 307,771 | |||
| 6.50% 11/15/36 | 215,000 | 215,093 | |||
| 7.625% 4/15/31 | 828,000 | 933,241 | |||
| ¶Town Sports International | |||||
| 11.00% 2/1/14 | 175,000 | 157,500 | |||
| #TRW Automotive 144A | |||||
| 7.00% 3/15/14 | 200,000 | 197,000 | |||
| 7.25% 3/15/17 | 200,000 | 197,000 | |||
| Viacom | |||||
| Ÿ5.70% 6/16/09 | 260,000 | 260,875 | |||
| 5.75% 4/30/11 | 935,000 | 948,685 | |||
| 6.875% 4/30/36 | 605,000 | 611,752 | |||
| Visteon 8.25% 8/1/10 | 190,000 | 194,750 | |||
| Wal-Mart Stores | |||||
| 5.875% 4/5/27 | 1,072,000 | 1,077,684 | |||
| Wheeling Island Gaming | |||||
| 10.125% 12/15/09 | 1,230,000 | 1,254,599 | |||
| WMG Acquisition | |||||
| 7.375% 4/15/14 | 415,000 | 397,363 | |||
| 24,706,676 | |||||
| Consumer Non-Cyclical – 1.30% | |||||
| AmerisourceBergen | |||||
| 5.625% 9/15/12 | 15,000 | 15,106 | |||
| 5.875% 9/15/15 | 430,000 | 429,453 | |||
| #Aramark 144A | |||||
| 8.50% 2/1/15 | 405,000 | 423,225 | |||
| Ÿ8.86% 2/1/15 | 135,000 | 139,388 | |||
| Boston Scientifc | |||||
| 6.40% 6/15/16 | 355,000 | 356,547 | |||
| #Cerveceria Nacional | |||||
| Dominicana 144A | |||||
| 8.00% 3/27/14 | 325,000 | 331,500 | |||
| Constellation Brands | |||||
| 8.125% 1/15/12 | 300,000 | 312,000 | |||
| CRC Health 10.75% 2/1/16 | 355,000 | 390,500 | |||
| #Elan Finance 144A | |||||
| 8.875% 12/1/13 | 125,000 | 127,656 | |||
| HCA 6.50% 2/15/16 | 465,000 | 398,156 | |||
| #HCA 144A 9.125% 11/15/14 | 155,000 | 166,044 | |||
| #Healthsouth 144A | |||||
| 10.75% 6/15/16 | 765,000 | 835,762 | |||
| Ingles Markets | |||||
| 8.875% 12/1/11 | 300,000 | 313,500 | |||
| Kraft Foods | |||||
| 4.125% 11/12/09 | 10,000 | 9,748 | |||
| 6.50% 11/1/31 | 110,000 | 112,378 | |||
| Medco Health Solutions | |||||
| 7.25% 8/15/13 | 495,000 | 536,036 | |||
| #Miller Brewing 144A | |||||
| 4.25% 8/15/08 | 280,000 | 275,838 | |||
| National Beef Packing | |||||
| 10.50% 8/1/11 | 375,000 | 395,625 | |||
| Pilgrim’s Pride | |||||
| 8.375% 5/1/17 | 600,000 | 595,499 | |||
| 9.625% 9/15/11 | 275,000 | 287,375 | |||
| #Pinnacle Foods Finance 144A | |||||
| 10.625% 4/1/17 | 125,000 | 123,594 | |||
| Procter & Gamble | |||||
| 2.00% 6/21/10 | JPY | 48,000,000 | 418,668 | ||
| 5.55% 3/5/37 | USD | 300,000 | 292,928 | ||
| Reynolds American | |||||
| 6.50% 6/1/07 | 345,000 | 345,715 | |||
| #Sun Healthcare Group 144A | |||||
| 9.125% 4/15/15 | 75,000 | 77,250 | |||
| Swift & Company | |||||
| 12.50% 1/1/10 | 275,000 | 290,125 | |||
| True Temper Sports | |||||
| 8.375% 9/15/11 | 130,000 | 116,350 | |||
| US Oncology | |||||
| 9.00% 8/15/12 | 195,000 | 209,138 | |||
| 10.75% 8/15/14 | 200,000 | 224,000 | |||
| #US Oncology Holdings PIK | |||||
| 144A 9.797% 3/15/12 | 275,000 | 279,125 | |||
| UST 6.625% 7/15/12 | 75,000 | 79,641 | |||
| ¶Vanguard Health Holding | |||||
| 11.25% 10/1/15 | 660,000 | 539,550 | |||
| Wyeth 5.50% 2/1/14 | 315,000 | 317,366 | |||
| 9,764,786 | |||||
| Electric – 2.64% | |||||
| Arizona Public Service | |||||
| 6.50% 3/1/12 | 592,000 | 617,539 | |||
| Avista 9.75% 6/1/08 | 140,000 | 146,698 | |||
| #Baltimore Gas & Electric 144A | |||||
| 6.35% 10/1/36 | 965,000 | 985,011 | |||
| ‡#Calpine 144A | |||||
| 8.496% 7/15/07 | 146,625 | 158,355 | |||
| Commonwealth Edison | |||||
| 6.15% 3/15/12 | 810,000 | 807,785 | |||
| 6.95% 7/15/18 | 655,000 | 651,120 | |||
| Consumer Energy | |||||
| 5.00% 2/15/12 | 530,000 | 524,254 | |||
| Dominion Resources | |||||
| 5.687% 5/15/08 | 505,000 | 506,311 | |||
| Ÿ6.30% 9/30/66 | 1,200,000 | 1,223,688 | |||
| Ÿ7.50% 6/30/66 | 1,460,000 | 1,573,145 | |||
| Elwood Energy | |||||
| 8.159% 7/5/26 | 291,061 | 304,853 | |||
| Energy East 6.75% 7/15/36 | 1,035,000 | 1,097,347 | |||
| Entergy Gulf States | |||||
| 5.12% 8/1/10 | 865,000 | 852,878 | |||
| Entergy Mississippi | |||||
| 5.92% 2/1/16 | 310,000 | 311,489 | |||
| #FPL Energy National Wind | |||||
| 144A 5.608% 3/10/24 | 429,163 | 424,785 | |||
| FPL Group Capital | |||||
| 5.625% 9/1/11 | 310,000 | 315,676 |
(continues) 41
Statements of net assets
Optimum Fixed Income Fund
| Principal | Value | ||||
| Amount° | (U.S. $) | ||||
| Corporate Bonds (continued) | |||||
| Electric (continued) | |||||
| #ISA Capital do Brasil 144A | |||||
| 8.80% 1/30/17 | USD | 395,000 | $ 420,675 | ||
| #Majapahit Holding 144A | |||||
| 7.75% 10/17/16 | 365,000 | 384,163 | |||
| Midamerican Funding | |||||
| 6.75% 3/1/11 | 10,000 | 10,566 | |||
| Midwest Generation | |||||
| 8.30% 7/2/09 | 160,130 | 164,450 | |||
| 8.75% 5/1/34 | 270,000 | 294,300 | |||
| Mirant Americas Generation | |||||
| 8.30% 5/1/11 | 375,000 | 386,250 | |||
| Mirant North America | |||||
| 7.375% 12/31/13 | 400,000 | 412,000 | |||
| Oncor Electric Delivery | |||||
| 7.00% 9/1/22 | 70,000 | 75,169 | |||
| Orion Power Holdings | |||||
| 12.00% 5/1/10 | 300,000 | 348,000 | |||
| #Pedernales Electric | |||||
| Cooperative 144A | |||||
| 6.202% 11/15/32 | 620,000 | 650,203 | |||
| Pepco Holdings | |||||
| 5.50% 8/15/07 | 390,000 | 389,883 | |||
| Ÿ5.985% 6/1/10 | 335,000 | 335,339 | |||
| #Power Contract Financing | |||||
| 144A 6.256% 2/1/10 | 169,814 | 171,522 | |||
| ŸPPL Capital Funding | |||||
| 6.70% 3/30/67 | 1,555,000 | 1,531,148 | |||
| Puget Sound Energy | |||||
| 7.69% 2/1/11 | 250,000 | 271,267 | |||
| #Rede Empresas de Energia | |||||
| Electrica 144A | |||||
| 11.125% 4/2/49 | 520,000 | 535,600 | |||
| Southern Power | |||||
| 6.375% 11/15/36 | 815,000 | 802,032 | |||
| TECO Energy 7.20% 5/1/11 | 10,000 | 10,650 | |||
| #TXU Australia 144A | |||||
| 6.15% 11/15/13 | 375,000 | 387,811 | |||
| Westar Energy 5.95% 1/1/35 | 472,000 | 453,639 | |||
| ŸWPS Resources 6.11% 12/1/66 | 1,225,000 | 1,210,399 | |||
| Xcel Energy 6.50% 7/1/36 | 25,000 | 26,368 | |||
| 19,772,368 | |||||
| Energy – 0.89% | |||||
| Anadarko Petroleum | |||||
| 5.95% 9/15/16 | 140,000 | 140,546 | |||
| Bluewater Finance | |||||
| 10.25% 2/15/12 | 165,000 | 172,838 | |||
| Canadian Natural Resources | |||||
| 6.25% 3/15/38 | 280,000 | 274,876 | |||
| 6.50% 2/15/37 | 1,130,000 | 1,150,010 | |||
| #Canadian Oil Sands 144A | |||||
| 4.80% 8/10/09 | 155,000 | 153,100 | |||
| Chesapeake Energy | |||||
| 6.625% 1/15/16 | 160,000 | 162,000 | |||
| Compton Petroleum Finance | |||||
| 7.625% 12/1/13 | 585,000 | 574,763 | |||
| Geophysique-Veritas | |||||
| 7.50% 5/15/15 | 110,000 | 113,850 | |||
| 7.75% 5/15/17 | 75,000 | 78,563 | |||
| Halliburton 5.50% 10/15/10 | 5,000 | 5,058 | |||
| #Hilcorp Energy I 144A | |||||
| 7.75% 11/1/15 | 345,000 | 340,688 | |||
| 9.00% 6/1/16 | 250,000 | 266,250 | |||
| Mariner Energy 7.50% 4/15/13 | 200,000 | 197,500 | |||
| #OPTI Canada 144A | |||||
| 8.25% 12/15/14 | 250,000 | 261,250 | |||
| #Pan American Energy 144A | |||||
| 7.75% 2/9/12 | 325,000 | 331,500 | |||
| PetroHawk Energy | |||||
| 9.125% 7/15/13 | 425,000 | 454,750 | |||
| Plains Exploration & | |||||
| Production 7.00% 3/15/17 | 225,000 | 227,250 | |||
| ŸSecunda International | |||||
| 13.36% 9/1/12 | 200,000 | 208,000 | |||
| #Seitel Acquisition 144A | |||||
| 9.75% 2/15/14 | 190,000 | 193,325 | |||
| Siberian Oil 10.75% 1/15/09 | 15,000 | 16,335 | |||
| #Stallion Oilfield Services 144A | |||||
| 9.75% 2/1/15 | 300,000 | 306,750 | |||
| #TNK-BP Finance 144A | |||||
| 6.625% 3/20/17 | 785,000 | 781,075 | |||
| Tyumen Oil 11.00% 11/6/07 | 15,000 | 15,501 | |||
| Valero Energy 6.125% 4/15/07 | 35,000 | 34,998 | |||
| Weatherford International | |||||
| 4.95% 10/15/13 | 20,000 | 19,278 | |||
| Whiting Petroleum | |||||
| 7.25% 5/1/13 | 230,000 | 227,125 | |||
| 6,707,179 | |||||
| Finance Companies – 1.88% | |||||
| ŸAmerican Express | |||||
| 6.80% 9/1/66 | 225,000 | 240,031 | |||
| American General Finance | |||||
| 4.875% 5/15/10 | 650,000 | 647,858 | |||
| 4.875% 7/15/12 | 1,015,000 | 998,899 | |||
| 5.625% 8/17/11 | 900,000 | 914,290 | |||
| FTI Consulting | |||||
| 7.625% 6/15/13 | 375,000 | 390,938 | |||
| General Electric Capital | |||||
| 5.125% 1/28/14 | SEK | 3,500,000 | 522,440 | ||
| General Electric Capital UK | |||||
| Funding 4.625% 1/18/16 | GBP | 246,000 | 451,227 | ||
| Ÿw#Glen Meadow Pass Through | |||||
| Trust 144A | |||||
| 6.505% 2/12/67 | USD | 940,000 | 953,254 | ||
| GMAC | |||||
| 4.75% 9/14/09 | EUR | 517,000 | 690,880 | ||
| 5.375% 6/6/11 | EUR | 338,000 | 443,651 | ||
| 6.875% 9/15/11 | USD | 1,560,000 | 1,562,987 | ||
| 8.00% 11/1/31 | 925,000 | 994,496 | |||
42
| Principal | Value | ||||
| Amount° | (U.S. $) | ||||
| Corporate Bonds (continued) | |||||
| Finance Companies (continued) | |||||
| International Lease Finance | |||||
| 4.625% 6/2/08 | USD | 160,000 | $ 159,034 | ||
| Ÿw#Mangrove Bay Pass Through | |||||
| Trust 144A | |||||
| 6.102% 7/15/33 | 835,000 | 822,318 | |||
| Residential Capital | |||||
| Ÿ5.84% 6/9/08 | 365,000 | 361,445 | |||
| 6.00% 2/22/11 | 325,000 | 320,860 | |||
| 6.125% 11/21/08 | 580,000 | 579,925 | |||
| 6.375% 6/30/10 | 167,000 | 167,076 | |||
| 6.50% 4/17/13 | 395,000 | 391,731 | |||
| 6.875% 6/30/15 | 310,000 | 313,251 | |||
| Ÿ#Residential Capital 144A | |||||
| 7.19% 4/17/09 | 460,000 | 456,242 | |||
| Ÿ#SMFG Preferred Capital 144A | |||||
| 6.078% 12/29/49 | 1,670,000 | 1,681,590 | |||
| 14,064,423 | |||||
| Industrial - Other – 0.21% | |||||
| Adesa 7.625% 6/15/12 | 350,000 | 371,874 | |||
| Baldor Electric | |||||
| 8.625% 2/15/17 | 105,000 | 111,563 | |||
| #Mobile Services Group 144A | |||||
| 9.75% 8/1/14 | 225,000 | 239,063 | |||
| Mueller Group 10.00% 5/1/12 | 178,000 | 193,130 | |||
| RBS Global & Rexnord | |||||
| 11.75% 8/1/16 | 325,000 | 350,594 | |||
| Trimas 9.875% 6/15/12 | 350,000 | 351,312 | |||
| 1,617,536 | |||||
| Insurance – 2.77% | |||||
| 21st Century Insurance | |||||
| 5.90% 12/15/13 | 275,000 | 283,188 | |||
| ŸAMBAC Financial Group | |||||
| 6.15% 2/15/37 | 865,000 | 816,989 | |||
| ASIF III 0.95% 7/15/09 | JPY | 57,000,000 | 482,813 | ||
| Ÿ#AXA 144A 6.379% 12/14/49 | USD | 895,000 | 861,853 | ||
| Ÿ#Catlin Insurance 144A | |||||
| 7.249% 12/31/49 | 210,000 | 208,871 | |||
| ŸChubb 6.375% 3/29/67 | 912,000 | 911,340 | |||
| #Farmers Exchange Capital | |||||
| 144A 7.05% 7/15/28 | 555,000 | 570,593 | |||
| #Farmers Insurance Exchange 144A | |||||
| 6.00% 8/1/14 | 140,000 | 138,903 | |||
| 8.625% 5/1/24 | 615,000 | 733,168 | |||
| #FBL Financial Group 144A | |||||
| 5.875% 3/15/17 | 720,000 | 709,441 | |||
| Ÿ#Great West Life & Annuity | |||||
| Insurance 144A | |||||
| 7.153% 5/16/46 | 145,000 | 151,574 | |||
| #Liberty Mutual Group 144A | |||||
| Ÿ7.00% 3/15/37 | 500,000 | 493,824 | |||
| 7.80% 3/15/37 | 1,030,000 | 1,007,068 | |||
| Marsh & McLennan | |||||
| 5.15% 9/15/10 | 390,000 | 386,898 | |||
| Ÿ5.50% 7/13/07 | 425,000 | 425,121 | |||
| MetLife | |||||
| 5.00% 6/15/15 | 170,000 | 165,320 | |||
| 6.40% 12/15/36 | 790,000 | 773,872 | |||
| #Metropolitan Life Global | |||||
| Funding I 144A | |||||
| 4.25% 7/30/09 | 450,000 | 442,834 | |||
| Montpelier Re Holdings | |||||
| 6.125% 8/15/13 | 365,000 | 360,330 | |||
| #Nationwide Mutual Insurance | |||||
| 144A 7.875% 4/1/33 | 355,000 | 423,719 | |||
| #Nippon Life Insurance 144A | |||||
| 4.875% 8/9/10 | 345,000 | 339,870 | |||
| #NLV Financial 144A | |||||
| 6.50% 3/15/35 | 720,000 | 694,441 | |||
| Ÿw#North Front Pass Through Trust | |||||
| 144A 5.81% 12/15/24 | 500,000 | 494,918 | |||
| Ÿ#Oil Insurance 144A | |||||
| 7.558% 12/29/49 | 2,295,000 | 2,423,393 | |||
| ŸPartnerRe Finance II | |||||
| 6.44% 12/1/66 | 916,000 | 907,158 | |||
| Safeco Capital Trust I | |||||
| 8.072% 7/15/37 | 300,000 | 313,037 | |||
| St. Paul Travelers | |||||
| 5.01% 8/16/07 | 275,000 | 274,535 | |||
| Ÿ#Stingray Pass Through Trust | |||||
| 144A 5.902% 1/12/15 | 300,000 | 282,000 | |||
| #Sul America Participacoes | |||||
| 144A 8.625% 2/15/12 | 330,000 | 342,375 | |||
| ŸTravelers 6.25% 3/15/37 | 895,000 | 885,515 | |||
| Ÿw#Twin Reefs Pass Through Trust | |||||
| 144A 6.32% 12/31/49 | 600,000 | 602,069 | |||
| Unum Group 5.859% 5/15/09 | 250,000 | 252,281 | |||
| WellPoint | |||||
| 4.25% 12/15/09 | 150,000 | 147,028 | |||
| 5.85% 1/15/36 | 125,000 | 121,184 | |||
| #White Mountains Re Group | |||||
| 144A 6.375% 3/20/17 | 725,000 | 717,099 | |||
| Willis North America | |||||
| 5.125% 7/15/10 | 250,000 | 245,549 | |||
| ŸXL Capital 6.50% 12/31/49 | 875,000 | 850,209 | |||
| Ÿ#ZFS Finance USA Trust II 144A | |||||
| 6.45% 12/15/35 | 500,000 | 500,797 | |||
| 20,741,177 | |||||
| Natural Gas – 0.66% | |||||
| Duke Capital 5.668% 8/15/14 | 190,000 | 188,288 | |||
| El Paso Natural Gas | |||||
| 7.625% 8/1/10 | 505,000 | 529,533 | |||
| #El Paso Performance-Linked | |||||
| Trust 144A 7.75% 7/15/11 | 175,000 | 187,031 | |||
| El Paso Production Holding | |||||
| 7.75% 6/1/13 | 150,000 | 157,500 | |||
| Enterprise Products Operating | |||||
| 4.00% 10/15/07 | 125,000 | 124,105 | |||
| 4.625% 10/15/09 | 410,000 | 404,892 | |||
| 4.95% 6/1/10 | 310,000 | 307,550 | |||
(continues) 43
Statements of net assets
Optimum Fixed Income Fund
| Principal | Value | ||||
| Amount° | (U.S. $) | ||||
| Corporate Bonds (continued) | |||||
| Natural Gas (continued) | |||||
| Enterprise Products Operating | |||||
| 5.00% 3/1/15 | USD | 327,000 | $ 312,552 | ||
| 7.50% 2/1/11 | 317,000 | 340,238 | |||
| Ÿ8.375% 8/1/66 | 575,000 | 630,249 | |||
| Inergy Finance | |||||
| 6.875% 12/15/14 | 90,000 | 89,100 | |||
| 8.25% 3/1/16 | 75,000 | 79,125 | |||
| Kinder Morgan Finance | |||||
| 5.35% 1/5/11 | 460,000 | 453,611 | |||
| Oneok 5.51% 2/16/08 | 345,000 | 345,622 | |||
| #Regency Energy Partners 144A | |||||
| 8.375% 12/15/13 | 425,000 | 435,625 | |||
| Valero Logistics Operations | |||||
| 6.05% 3/15/13 | 350,000 | 357,594 | |||
| 4,942,615 | |||||
| Real Estate – 0.52% | |||||
| American Real Estate Partners | |||||
| 8.125% 6/1/12 | 175,000 | 178,938 | |||
| BF Saul REIT 7.50% 3/1/14 | 500,000 | 510,000 | |||
| Developers Diversified Realty | |||||
| 4.625% 8/1/10 | 95,000 | 93,218 | |||
| 5.25% 4/15/11 | 100,000 | 99,743 | |||
| 5.375% 10/15/12 | 440,000 | 440,290 | |||
| #Greentown China Holdings | |||||
| 144A 9.00% 11/8/13 | 545,000 | 559,988 | |||
| Health Care Property Investors | |||||
| 6.00% 1/30/17 | 745,000 | 748,824 | |||
| HRPT Properties Trust | |||||
| 5.75% 2/15/14 | 305,000 | 306,888 | |||
| Rouse 7.20% 9/15/12 | 175,000 | 183,042 | |||
| #Shimao Property Holdings | |||||
| 144A 8.00% 12/1/16 | 145,000 | 147,538 | |||
| United Dominion Realty Trust | |||||
| 3.90% 3/15/10 | 205,000 | 198,450 | |||
| Ÿ#USB Realty 144A | |||||
| 6.091% 12/22/49 | 400,000 | 402,716 | |||
| 3,869,635 | |||||
| Technology – 0.41% | |||||
| Dell 6.55% 4/15/08 | 150,000 | 152,041 | |||
| #Freescale Semiconductor 144A | |||||
| 10.125% 12/15/16 | 665,000 | 669,988 | |||
| International Business | |||||
| Machines 4.00% 11/11/11 | EUR | 400,000 | 527,530 | ||
| MagnaChip Semiconductor | |||||
| 8.00% 12/15/14 | USD | 975,000 | 611,813 | ||
| #Open Solutions 144A | |||||
| 9.75% 2/1/15 | 175,000 | 181,125 | |||
| Solectron Global Finance | |||||
| 8.00% 3/15/16 | 300,000 | 300,750 | |||
| Sungard Data Systems | |||||
| 10.25% 8/15/15 | 364,000 | 399,035 | |||
| #UGS Capital II PIK 144A | |||||
| 10.348% 6/1/11 | 200,307 | 205,815 | |||
| 3,048,097 | |||||
| Transportation – 0.80% | |||||
| American Airlines | |||||
| 6.817% 5/23/11 | 320,000 | 327,200 | |||
| 6.977% 5/23/21 | 136,414 | 136,755 | |||
| Continental Airlines | |||||
| 5.983% 4/19/22 | 255,000 | 255,000 | |||
| 6.503% 6/15/11 | 390,000 | 400,725 | |||
| 7.339% 4/19/14 | 50,000 | 50,500 | |||
| #Erac USA Finance 144A | |||||
| 5.30% 11/15/08 | 100,000 | 99,752 | |||
| 7.35% 6/15/08 | 380,000 | 386,986 | |||
| Hertz 8.875% 1/1/14 | 555,000 | 600,787 | |||
| ¶H-Lines Finance Holdings | �� | ||||
| 11.00% 4/1/13 | 400,000 | 382,000 | |||
| Horizon Lines 9.00% 11/1/12 | 205,000 | 216,275 | |||
| Kansas City Southern de | |||||
| Mexico 9.375% 5/1/12 | 450,000 | 486,000 | |||
| #Kansas City Southern de | |||||
| Mexico 144A | |||||
| 7.625% 12/1/13 | 300,000 | 304,125 | |||
| Kansas City Southern Railway | |||||
| 9.50% 10/1/08 | 175,000 | 184,188 | |||
| ‡Northwest Airlines | |||||
| 7.041% 4/1/22 | 101,919 | 102,110 | |||
| OMI 7.625% 12/1/13 | 215,000 | 219,300 | |||
| Red Arrow International | |||||
| Leasing 8.375% 3/31/12 | RUB | 44,073,316 | 1,760,564 | ||
| Seabulk International | |||||
| 9.50% 8/15/13 | USD | 90,000 | 97,650 | ||
| 6,009,917 | |||||
| Total Corporate Bonds | |||||
| (cost $206,316,657) | 209,563,838 | ||||
| Foreign Agencies – 1.38% D | |||||
| Austria – 0.11% | |||||
| Oesterreichische Kontrollbank | |||||
| 1.80% 3/22/10 | JPY | 93,000,000 | 809,522 | ||
| 809,522 | |||||
| France – 0.12% | |||||
| Caisse d’Amortissement de la | |||||
| Dette Sociale | |||||
| 3.625% 4/25/16 | EUR | 700,000 | 896,771 | ||
| 896,771 | |||||
| Germany – 0.35% | |||||
| KFW | |||||
| 1.75% 3/23/10 | JPY | 48,000,000 | 417,228 | ||
| 3.50% 7/4/21 | EUR | 688,000 | 840,403 | ||
| KFW International Finance | |||||
| 8.25% 9/20/07 | ISK | 68,100,000 | 1,005,843 | ||
| Rentenbank 1.375% 4/25/13 | JPY | 48,000,000 | 406,904 | ||
| 2,670,378 | |||||
| Japan – 0.08% | |||||
| Japan Finance Municipal | |||||
| Enterprises 2.00% 5/9/16 | JPY | 70,000,000 | 615,987 | ||
| 615,987 | |||||
44
| Principal | Value | ||||
| Amount° | (U.S. $) | ||||
| Foreign Agencies (continued) | |||||
| Luxembourg – 0.34% | |||||
| Gazprom 4.56% 12/9/12 | EUR | 530,000 | $ 694,626 | ||
| #Gazprom 144A | |||||
| 6.212% 11/22/16 | USD | 1,866,000 | 1,871,597 | ||
| 2,566,223 | |||||
| Mexico – 0.06% | |||||
| Pemex Project Funding Master | |||||
| Trust 6.625% 6/15/35 | 411,000 | 423,844 | |||
| 423,844 | |||||
| Norway – 0.06% | |||||
| Kommunalbanken | |||||
| 4.25% 10/24/11 | NOK | 2,750,000 | 442,678 | ||
| 442,678 | |||||
| Quatar – 0.12% | |||||
| #Ras Laffan Liquefied Natural | |||||
| Gas III 144A | |||||
| 5.832% 9/30/16 | USD | 400,000 | 404,194 | ||
| 5.838% 9/30/27 | 500,000 | 479,209 | |||
| 883,403 | |||||
| United Arab Emirates – 0.14% | |||||
| #Taqa 144A | |||||
| 5.875% 10/27/16 | 305,000 | 308,320 | |||
| 6.50% 10/27/36 | 745,000 | 755,188 | |||
| 1,063,508 | |||||
| Total Foreign Agencies | |||||
| (cost $9,810,427) | 10,372,314 | ||||
| Municipal Bonds – 2.74% | |||||
| Allentown, Pennsylvania | |||||
| 3.98% 10/1/11 (AMBAC) | 320,000 | 306,611 | |||
| Aruba Airport Authority Series | |||||
| A 7.70% 1/1/13 (MBIA) | 147,000 | 156,588 | |||
| Augusta, Georgia Water & | |||||
| Sewer Revenue | |||||
| 5.25% 10/1/39 (FSA) | 260,000 | 279,058 | |||
| California State | |||||
| 5.00% 2/1/33 | 5,000 | 5,193 | |||
| §5.00% 2/1/33-14 | 60,000 | 64,877 | |||
| California State University | |||||
| Systemwide Revenue | |||||
| 5.00% 11/1/30 (AMBAC) | 195,000 | 206,213 | |||
| College Park, Georgia | |||||
| Revenue Series A | |||||
| 5.557% 1/1/09 (FGIC) | 1,585,000 | 1,599,645 | |||
| Colorado Department of | |||||
| Transportation Revenue | |||||
| Series B | |||||
| 5.00% 12/15/12 (FGIC) | 85,000 | 90,838 | |||
| Delaware River Port Authority | |||||
| Series A | |||||
| 7.54% 1/1/13 (FSA) | 805,000 | 897,744 | |||
| Escondido, California Joint | |||||
| Powers Financing Authority | |||||
| Revenue Series B | |||||
| 5.53% 9/1/18 (FGIC) | 1,940,000 | 1,983,786 | |||
| Escondido, California Revenue | |||||
| (Wastewater Capital | |||||
| Projects) Series B | |||||
| 5.75% 9/1/25 (MBIA) | 565,000 | 567,848 | |||
| Gainesville, Florida Utilities | |||||
| System Revenue | |||||
| 5.31% 10/1/21 (FSA) | 1,580,000 | 1,572,574 | |||
| Hoboken, New Jersey General | |||||
| Obligation Taxable Series B | |||||
| 4.26% 2/1/10 (MBIA) | 325,000 | 318,663 | |||
| Hoboken, New Jersey | |||||
| Refunding Taxable Pension | |||||
| 6.50% 4/1/26 (MBIA) | 25,000 | 27,661 | |||
| Illinois State Taxable Pension | |||||
| 5.10% 6/1/33 | 120,000 | 114,848 | |||
| Industry Urban Development | |||||
| Agency Series 1A | |||||
| 4.50% 5/1/10 (MBIA) | 195,000 | 191,336 | |||
| La Quinta, California | |||||
| Redevelopment Agency Tax | |||||
| Allocation Project #1 | |||||
| 5.45% 9/1/13 (AMBAC) | 560,000 | 562,106 | |||
| 6.24% 9/1/23 (AMBAC) | 230,000 | 238,591 | |||
| Los Angeles, California | |||||
| Community | |||||
| Redevelopment | |||||
| Series B | |||||
| 5.83% 12/1/17 (FSA) | 635,000 | 654,520 | |||
| Series D | |||||
| 5.60% 7/1/18 (MBIA) | 80,000 | 80,394 | |||
| Series D | |||||
| 6.02% 9/1/21 (MBIA) | 950,000 | 977,797 | |||
| Massachusetts Health & | |||||
| Education Facilities | |||||
| Authority Revenue Series A | |||||
| 5.00% 7/15/36 | 355,000 | 375,583 | |||
| Metropolitan Washington, | |||||
| District of Columbia | |||||
| Airport Authority Series C | |||||
| 4.62% 10/1/10 (FGIC) | 15,000 | 14,868 | |||
| New Jersey Economic | |||||
| Development Authority | |||||
| Revenue (Cigarette Tax) | |||||
| 5.75% 6/15/29 | 100,000 | 108,177 | |||
| New York City, New York | |||||
| Transitional Finance | |||||
| Authority 5.19% 8/1/16 | 1,570,000 | 1,567,017 | |||
| New York State Urban | |||||
| Development Series A-1 | |||||
| 5.25% 3/15/34 (FGIC) | 125,000 | 133,951 | |||
| Oregon State Taxable Pension | |||||
| 5.892% 6/1/27 | 65,000 | 68,157 | |||
| Sacramento County, California | |||||
| Public Finance Authority | |||||
| Revenue (Housing Tax | |||||
| County Project) Series B | |||||
| 3.82% 12/1/08 (FGIC) | 55,000 | 53,875 | |||
| 5.18% 12/1/13 (FGIC) | 105,000 | 104,205 | |||
(continues) 45
Statements of net assets
Optimum Fixed Income Fund
| Principal | Value | ||||
| Amount° | (U.S. $) | ||||
| Municipal Bonds (continued) | |||||
| San Diego, California | |||||
| Redevelopment Tax | |||||
| Allocation Series C | |||||
| 5.81% 9/1/19 (XLCA) | USD | 645,000 | $ 657,210 | ||
| Sisters of Providence | |||||
| Obligated Group | |||||
| 7.47% 10/1/07 (MBIA) | 1,284,000 | 1,297,020 | |||
| South Texas Detention | |||||
| Complex Local | |||||
| Development Revenue | |||||
| 4.92% 2/1/14 (MBIA) | 1,150,000 | 1,134,452 | |||
| Stockton, California Pension | |||||
| Obligation Series B | |||||
| 5.675% 9/1/26 (FSA) | 1,945,000 | 1,942,627 | |||
| University Enterprises Series B | |||||
| 5.42% 10/1/37 (FGIC) | 1,455,000 | 1,405,981 | |||
| Waterbury, Connecticut Series | |||||
| B 5.43% 4/1/09 (FSA) | 189,000 | 188,752 | |||
| West Virginia Economic | |||||
| Development Authority | |||||
| 5.37% 7/1/20 (MBIA) | 590,000 | 590,283 | |||
| Total Municipal Bonds | |||||
| (cost $20,467,677) | 20,539,049 | ||||
| Non-Agency Asset-Backed Securities – 3.08% | |||||
| Capital One Auto Finance | |||||
| Trust Series 2003-A A4A | |||||
| 2.47% 1/15/10 | 8,278 | 8,267 | |||
| Centex Home Equity Series | |||||
| 2002-A AF6 | |||||
| 5.54% 1/25/32 | 51,527 | 51,336 | |||
| ŸCitigroup Mortgage Loan Trust | |||||
| Series 2006-WFH4 A1 | |||||
| 5.37% 11/25/36 | 1,242,676 | 1,242,673 | |||
| Countrywide Asset-Backed | |||||
| Certificates | |||||
| ŸSeries 2005-7 AF2 | |||||
| 4.367% 11/25/35 | 1,018,444 | 1,009,995 | |||
| ŸSeries 2006-4 2A2 | |||||
| 5.50% 7/25/36 | 935,000 | 935,494 | |||
| ŸSeries 2006-11 1AF3 | |||||
| 6.05% 9/25/46 | 770,000 | 777,703 | |||
| ŸSeries 2006-11 1AF6 | |||||
| 6.15% 9/25/46 | 1,450,000 | 1,482,705 | |||
| ŸSeries 2006-15 A3 | |||||
| 5.689% 10/25/46 | 170,000 | 170,414 | |||
| ŸSeries 2006-15 A6 | |||||
| 5.826% 10/25/46 | 525,000 | 527,810 | |||
| Series 2006-S3 A2 | |||||
| 6.085% 6/25/21 | 490,000 | 496,884 | |||
| ŸSeries 2006-S7 A3 | |||||
| 5.712% 11/25/35 | 995,000 | 994,733 | |||
| ŸSeries 2006-S9 A3 | |||||
| 5.728% 8/25/36 | 660,000 | 658,682 | |||
| #Countrywide Asset-Backed NIM | |||||
| Certificates Series 2004- | |||||
| BC1N Note 144A | |||||
| 5.50% 4/25/35 | 3,593 | 3,422 | |||
| Credit-Based Asset Servicing | |||||
| and Securitization | |||||
| Series 2005-CB8 AF1B | |||||
| 5.451% 12/25/35 | 172,834 | 172,137 | |||
| #Series 2006-SL1 A2 | |||||
| 144A 5.556% 9/25/36 | 450,000 | 451,004 | |||
| Series 2007-CB1 AF2 | |||||
| 5.721% 1/25/37 | 350,000 | 351,356 | |||
| #Drive Auto Receivables Trust | |||||
| Series 2005-2 A2 144A | |||||
| 4.12% 1/15/10 | 616,651 | 614,061 | |||
| #Dunkin Securitization Series | |||||
| 2006-1 A2 144A | |||||
| 5.779% 6/20/31 | 630,000 | 641,509 | |||
| ŸGMAC Mortgage Loan Trust | |||||
| Series 2006-HE3 A2 | |||||
| 5.75% 10/25/36 | 180,000 | 180,332 | |||
| Honda Automobile | |||||
| Receivables Owners Trust | |||||
| Series 2004-2 A4 | |||||
| 3.81% 10/15/09 | 70,000 | 69,149 | |||
| Household Automatic Trust | |||||
| Series 2006-3 A2 | |||||
| 5.38% 12/17/09 | 1,330,000 | 1,331,069 | |||
| ŸHSI Asset Securitization Trust | |||||
| Series 2006-HE1 2A1 | |||||
| 5.37% 10/25/36 | 1,390,290 | 1,388,332 | |||
| Ÿ#MASTR Specialized Loan Trust | |||||
| Series 2005-2 A2 144A | |||||
| 5.006% 7/25/35 | 310,917 | 303,342 | |||
| #MBNA Master Credit Card | |||||
| Trust Series 2000-D C | |||||
| 144A 8.40% 9/15/09 | 110,000 | 110,143 | |||
| ŸMerrill Lynch Mortgage | |||||
| Investors Series | |||||
| 2005-NCB A1A | |||||
| 5.451% 7/25/36 | 168,199 | 167,532 | |||
| Mid-State Trust | |||||
| Series 2004-1 A | |||||
| 6.005% 8/15/37 | 49,465 | 50,429 | |||
| Series 2005-1 A | |||||
| 5.745% 1/15/40 | 252,746 | 252,470 | |||
| #Series 2006-1 A 144A | |||||
| 5.787% 10/15/40 | 163,745 | 163,636 | |||
| New Century Home Equity | |||||
| Loan Trust Series 2005-A | |||||
| A2 4.461% 8/25/35 | 543,769 | 538,888 | |||
| ŸOption One Mortgage Loan | |||||
| Trust Series 2005-4 A3 | |||||
| 5.58% 11/25/35 | 235,000 | 235,311 | |||
46
| Principal | Value | ||||
| Amount° | (U.S. $) | ||||
| Non-Agency Asset-Backed Securities (continued) | |||||
| Renaissance Home Equity | |||||
| Loan Trust | |||||
| Series 2005-4 A2 | |||||
| 5.399% 2/25/36 | USD | 235,000 | $ 234,001 | ||
| Series 2005-4 A3 | |||||
| 5.565% 2/25/36 | 150,000 | 149,641 | |||
| Series 2006-3 AF1 | |||||
| 5.917% 11/25/36 | 1,776,999 | 1,773,442 | |||
| Series 2006-4 AF1 | |||||
| 5.545% 1/25/37 | 1,334,077 | 1,329,962 | |||
| ŸResidential Asset Mortgage | |||||
| Products Series 2006-RS6 | |||||
| A1 5.399% 11/25/36 | 1,138,101 | 1,138,099 | |||
| #Securitized Asset Backed NIM | |||||
| Trust Series 2005-FR4 | |||||
| 144A 6.00% 1/25/36 | 385,126 | 384,421 | |||
| Structured Asset Securities | |||||
| Series 2001-SB1 A2 | |||||
| 3.375% 8/25/31 | 124,063 | 113,315 | |||
| ŸSeries 2005-NC1 A7 | |||||
| 5.55% 2/25/35 | 12,296 | 12,300 | |||
| Terwin Mortgage Trust Series | |||||
| 2005-14HE AF2 | |||||
| 4.849% 8/25/36 | 2,022,000 | 2,002,101 | |||
| Vanderbilt Mortgage Finance | |||||
| Series 2001-A A4 | |||||
| 7.235% 6/7/28 | 175,595 | 183,551 | |||
| WFS Financial Owner Trust | |||||
| Series 2005-1 D | |||||
| 4.09% 8/17/12 | 376,315 | 372,618 | |||
| Total Non-Agency Asset-Backed | |||||
| Securities (cost $23,056,497) | 23,074,269 | ||||
| Non-Agency Collateralized Mortgage Obligations – 18.47% | |||||
| ABN Amro Mortgage Series | |||||
| 2003-4 A5 4.75% 3/25/33 | 422,528 | 418,814 | |||
| ŸAdjustable Rate Mortgage Trust | |||||
| Series 2005-10 3A31 | |||||
| 5.42% 1/25/36 | 1,145,000 | 1,141,970 | |||
| Series 2006-2 1A4 | |||||
| 5.766% 5/25/36 | 1,440,000 | 1,466,630 | |||
| Bank of America Alternative | |||||
| Loan Trust | |||||
| Series 2003-10 2A1 | |||||
| 6.00% 12/25/33 | 20,398 | 20,459 | |||
| Series 2004-2 1A1 | |||||
| 6.00% 3/25/34 | 65,940 | 66,136 | |||
| Series 2004-10 1CB1 | |||||
| 6.00% 11/25/34 | 232,855 | 234,443 | |||
| Series 2005-3 2A1 | |||||
| 5.50% 4/25/20 | 158,679 | 158,407 | |||
| Series 2005-5 2CB1 | |||||
| 6.00% 6/25/35 | 360,018 | 360,975 | |||
| Series 2005-6 7A1 | |||||
| 5.50% 7/25/20 | 478,895 | 477,773 | |||
| Series 2005-9 5A1 | |||||
| 5.50% 10/25/20 | 475,794 | 474,381 | |||
| Bank of America Funding | |||||
| Series 2005-8 1A1 | |||||
| 5.50% 1/25/36 | 1,158,251 | 1,136,715 | |||
| Bank of America Mortgage | |||||
| Securities | |||||
| Series 2003-2 1A11 | |||||
| 5.50% 4/25/33 | 1,455,000 | 1,454,688 | |||
| Series 2004-3 1A2O | |||||
| 4.25% 4/25/34 | 424,631 | 420,248 | |||
| Series 2005-9 2A1 | |||||
| 4.75% 10/25/20 | 476,922 | 470,564 | |||
| ŸSeries 2005-A 1A1 | |||||
| 4.055% 2/25/35 | 107,116 | 106,631 | |||
| Bear Stearns Adjustable Rate | |||||
| Mortgage Trust | |||||
| ŸSeries 2006-1 1A1 | |||||
| 4.625% 2/25/36 | 3,088,200 | 3,033,026 | |||
| ŸSeries 2006-4 2A1 | |||||
| 5.827% 10/25/36 | 1,268,078 | 1,276,519 | |||
| Series 2007-3 1A1 | |||||
| 5.50% 4/30/37 | 1,295,000 | 1,295,725 | |||
| ŸBear Stearns Alternative-A | |||||
| Trust | |||||
| Series 2006-3 33A1 | |||||
| 6.171% 5/25/36 | 537,345 | 545,725 | |||
| Series 2006-3 34A1 | |||||
| 6.161% 5/25/36 | 261,159 | 265,359 | |||
| Series 2006-4 23A5 | |||||
| 6.233% 8/25/36 | 451,397 | 459,417 | |||
| Bear Stearns Asset Backed | |||||
| Securities Series 2005-AC8 | |||||
| A5 5.50% 11/25/35 | 438,323 | 436,744 | |||
| Cendant Mortgage | |||||
| Series 2003-1 A6 | |||||
| 5.50% 2/25/33 | 10,468 | 10,422 | |||
| Series 2004-1 A3 | |||||
| 5.50% 2/25/34 | 556,374 | 555,907 | |||
| Chase Mortgage Finance | |||||
| Series 2003-S8 A2 | |||||
| 5.00% 9/25/18 | 808,344 | 802,799 | |||
| Series 2004-S3 2A1 | |||||
| 5.25% 3/25/34 | 497,781 | 494,067 | |||
| ŸSeries 2005-A1 3A1 | |||||
| 5.27% 12/25/35 | 887,527 | 883,734 | |||
| Citicorp Mortgage Securities | |||||
| Series 2003-3 A4 | |||||
| 5.50% 3/25/33 | 117,980 | 117,408 | |||
| Series 2004-1 1A1 | |||||
| 5.25% 1/25/34 | 1,692,554 | 1,679,025 | |||
| Series 2004-8 1A1 | |||||
| 5.50% 10/25/34 | 752,132 | 751,590 | |||
| Citigroup Mortgage Loan Trust | |||||
| Series 2004-NCM2 1CB2 | |||||
| 6.75% 8/25/34 | 240,150 | 244,953 | |||
| ŸSeries 2006-AR2 1A2 | |||||
| 5.54% 3/25/36 | 1,890,253 | 1,891,130 | |||
(continues) 47
Statements of net assets
Optimum Fixed Income Fund
| Principal | Value | ||||
| Amount° | (U.S. $) | ||||
| Non-Agency Collateralized Mortgage Obligations (continued) | |||||
| Citimortgage Alternative Loan | |||||
| Trust Series 2006-A2 A1 | |||||
| 6.00% 5/25/36 | USD | 1,428,684 | $1,445,024 | ||
| Countrywide Alternative | |||||
| Loan Trust | |||||
| Series 2002-11 A4 | |||||
| 6.25% 10/25/32 | 421,725 | 420,553 | |||
| Series 2003-21T1 A2 | |||||
| 5.25% 12/25/33 | 909,584 | 901,562 | |||
| Series 2004-1T1 A2 | |||||
| 5.50% 2/25/34 | 1,004,939 | 1,002,517 | |||
| Series 2004-14T2 A6 | |||||
| 5.50% 8/25/34 | 894,346 | 890,316 | |||
| Series 2004-28CB 6A1 | |||||
| 6.00% 1/25/35 | 665,072 | 666,631 | |||
| Series 2004-J1 1A1 | |||||
| 6.00% 2/25/34 | 28,610 | 28,506 | |||
| Series 2004-J2 7A1 | |||||
| 6.00% 12/25/33 | 47,564 | 47,675 | |||
| ŸSeries 2004-J7 1A2 | |||||
| 4.673% 8/25/34 | 65,096 | 64,386 | |||
| ŸSeries 2005-63 3A1 | |||||
| 5.894% 11/25/35 | 528,844 | 531,787 | |||
| Series 2006-2CB A3 | |||||
| 5.50% 3/25/36 | 395,982 | 395,896 | |||
| Series 2006-19CB A15 | |||||
| 6.00% 8/25/36 | 2,754,092 | 2,778,399 | |||
| Series 2006-25CB A8 | |||||
| 6.00% 10/25/36 | 1,445,241 | 1,463,535 | |||
| Series 2006-31CB A8 | |||||
| 5.75% 11/25/36 | 936,556 | 938,519 | |||
| wCountrywide Home Loan | |||||
| Mortgage Pass Through | |||||
| Trust | |||||
| ŸSeries 2003-21 A1 | |||||
| 4.078% 5/25/33 | 15,555 | 15,375 | |||
| Series 2005-23 A1 | |||||
| 5.50% 11/25/35 | 1,054,991 | 1,035,375 | |||
| Series 2005-29 A1 | |||||
| 5.75% 12/25/35 | 2,395,077 | 2,385,395 | |||
| Series 2006-1 A2 | |||||
| 6.00% 3/25/36 | 415,107 | 414,912 | |||
| Series 2006-1 A3 | |||||
| 6.00% 3/25/36 | 121,597 | 120,894 | |||
| ŸSeries 2006-HYB3 3A1A | |||||
| 6.10% 5/20/36 | 564,826 | 573,726 | |||
| ŸSeries 2007-HYB1 4A2 | |||||
| 5.974% 3/25/37 | 477,663 | 482,131 | |||
| Credit Suisse First Boston | |||||
| Mortgage Securities | |||||
| Series 2003-29 5A1 | |||||
| 7.00% 12/25/33 | 14,083 | 14,413 | |||
| Series 2004-1 3A1 | |||||
| 7.00% 2/25/34 | 8,144 | 8,335 | |||
| Credit Suisse Mortgage | |||||
| Capital Certificates | |||||
| Series 2006-9 3A1 | |||||
| 6.00% 11/25/36 | 48,370 | 49,006 | |||
| Ÿ#Deutsche Mortgage Securities | |||||
| Series 2005-WF1 1A3 | |||||
| 144A 5.051% 6/26/35 | 1,720,000 | 1,675,645 | |||
| ŸFirst Horizon Asset Securities | |||||
| Series 2004-AR5 4A1 | |||||
| 5.708% 10/25/34 | 79,713 | 79,696 | |||
| Series 2005-AR2 2A1 | |||||
| 5.124% 6/25/35 | 927,075 | 920,113 | |||
| Series 2006-AR4 1A2 | |||||
| 5.519% 1/25/37 | 2,679,051 | 2,678,650 | |||
| Series 2007-AR1 1A1 | |||||
| 5.866% 5/25/37 | 2,445,130 | 2,460,508 | |||
| GMAC Mortgage Loan Trust | |||||
| ŸSeries 2005-AR2 4A | |||||
| 5.189% 5/25/35 | 465,206 | 461,211 | |||
| Series 2006-J1 A1 | |||||
| 5.75% 4/25/36 | 2,114,254 | 2,123,199 | |||
| #GSMPS Mortgage Loan | |||||
| Trust 144A | |||||
| Series 1998-3 A | |||||
| 7.75% 9/19/27 | 30,505 | 32,088 | |||
| Series 1999-3 A | |||||
| 8.00% 8/19/29 | 49,783 | 52,661 | |||
| Series 2005-RP1 1A3 | |||||
| 8.00% 1/25/35 | 423,010 | 449,325 | |||
| Series 2005-RP1 1A4 | |||||
| 8.50% 1/25/35 | 190,296 | 203,802 | |||
| Series 2006-RP1 1A2 | |||||
| 7.50% 1/25/36 | 516,881 | 538,477 | |||
| GSR Mortgage Loan Trust | |||||
| Series 2006-1F 5A2 | |||||
| 6.00% 2/25/36 | 200,617 | 199,457 | |||
| ŸSeries 2006-AR1 2A4 | |||||
| 5.188% 1/25/36 | 2,215,000 | 2,208,556 | |||
| ŸIndymac Index Mortgage | |||||
| Loan Trust | |||||
| Series 2005-AR2 2A1 | |||||
| 5.00% 1/25/36 | 1,562,565 | 1,546,183 | |||
| Series 2005-AR25 1A21 | |||||
| 5.859% 12/25/35 | 493,252 | 496,981 | |||
| Series 2006-AR1 A1 | |||||
| 5.956% 8/25/36 | 1,352,191 | 1,364,373 | |||
| Series 2006-AR2 1A1A | |||||
| 5.54% 4/25/46 | 564,812 | 565,499 | |||
| Series 2006-AR3 1A1 | |||||
| 5.385% 12/25/36 | 2,531,316 | 2,523,207 | |||
| ŸJPMorgan Mortgage Trust | |||||
| Series 2004-A6 1A2 | |||||
| 4.860% 12/25/34 | 512,494 | 506,681 | |||
| Series 2005-A4 1A1 | |||||
| 5.405% 7/25/35 | 319,202 | 318,233 | |||
48
| Principal | Value | ||||
| Amount° | (U.S. $) | ||||
| Non-Agency Collateralized Mortgage Obligations (continued) | |||||
| ŸJPMorgan Mortgage Trust | |||||
| Series 2005-A6 1A2 | |||||
| 5.144% 9/25/35 | USD | 605,000 | $ 610,196 | ||
| Series 2006-A2 2A4 | |||||
| 5.76% 4/25/36 | 2,025,000 | 2,063,689 | |||
| Series 2006-A6 2A4L | |||||
| 5.575% 10/25/36 | 1,590,000 | 1,597,106 | |||
| Lehman Mortgage Trust | |||||
| Series 2005-2 2A3 | |||||
| 5.50% 12/25/35 | 419,391 | 420,845 | |||
| ŸMASTR Adjustable Rate | |||||
| Mortgages Trust | |||||
| Series 2003-6 1A2 | |||||
| 2.875% 12/25/33 | 20,081 | 20,387 | |||
| Series 2005-6 7A1 | |||||
| 5.358% 6/25/35 | 199,419 | 198,722 | |||
| MASTR Alternative Loans Trust | |||||
| Series 2003-6 3A1 | |||||
| 8.00% 9/25/33 | 18,246 | 18,681 | |||
| Series 2003-9 1A1 | |||||
| 5.50% 12/25/18 | 17,567 | 17,526 | |||
| Series 2004-3 8A1 | |||||
| 7.00% 4/25/34 | 25,996 | 26,245 | |||
| Series 2004-5 6A1 | |||||
| 7.00% 6/25/34 | 233,672 | 241,712 | |||
| Series 2005-3 7A1 | |||||
| 6.00% 4/25/35 | 214,865 | 216,008 | |||
| MASTR Asset Securitization | |||||
| Trust | |||||
| Series 2003-9 2A7 | |||||
| 5.50% 10/25/33 | 567,417 | 556,334 | |||
| Series 2003-11 6A12 | |||||
| 4.75% 12/25/33 | 370,000 | 365,578 | |||
| Series 2004-4 2A1 | |||||
| 5.00% 4/25/34 | 1,054,507 | 1,038,996 | |||
| #MASTR Reperforming Loan | |||||
| Trust 144A | |||||
| Series 2005-1 1A5 | |||||
| 8.00% 8/25/34 | 184,200 | 195,187 | |||
| Series 2005-2 1A4 | |||||
| 8.00% 5/25/35 | 567,271 | 604,300 | |||
| ŸMerrill Lynch Mortgage | |||||
| Investors | |||||
| Series 2005-A5 A2 | |||||
| 4.566% 6/25/35 | 460,000 | 452,281 | |||
| Series 2005-A9 2A1C | |||||
| 5.148% 12/25/35 | 2,435,000 | 2,425,684 | |||
| Morgan Stanley Mortgage | |||||
| Loan Trust Series 2006-2 | |||||
| 6A 6.50% 2/25/36 | 242,990 | 246,862 | |||
| Nomura Asset Acceptance | |||||
| Series 2005-WF1 2A2 | |||||
| 4.786% 3/25/35 | 475,000 | 469,194 | |||
| ŸSeries 2006-AF1 1A2 | |||||
| 6.159% 5/25/36 | 500,000 | 507,055 | |||
| #Novastar NIM Trust Series | |||||
| 2005-N1 Note 144A | |||||
| 4.777% 10/26/35 | 11,903 | 11,886 | |||
| Prime Mortgage Trust Series | |||||
| 2004-CL1 1A1 | |||||
| 6.00% 2/25/34 | 48,747 | 49,105 | |||
| Residential Accredit Loans | |||||
| Series 2002-QS17 CB1 | |||||
| 6.00% 11/25/32 | 825,174 | 827,444 | |||
| Series 2004-QS2 CB | |||||
| 5.75% 2/25/34 | 139,158 | 136,875 | |||
| Series 2006-QS18 3A1 | |||||
| 5.75% 12/25/21 | 2,608,252 | 2,616,726 | |||
| Residential Asset Mortgage | |||||
| Products | |||||
| Series 2004-SL1 A3 | |||||
| 7.00% 11/25/31 | 15,452 | 15,693 | |||
| Series 2004-SL4 A3 | |||||
| 6.50% 7/25/32 | 110,204 | 112,341 | |||
| Series 2005-SL1 A2 | |||||
| 6.00% 5/25/32 | 212,679 | 215,341 | |||
| ŸResidential Funding Mortgage | |||||
| Securities I | |||||
| Series 2006-SA3 3A1 | |||||
| 6.048% 9/25/36 | 508,729 | 514,925 | |||
| Series 2007-SA1 2A2 | |||||
| 5.641% 2/25/37 | 2,490,011 | 2,495,940 | |||
| ŸStructured Adjustable Rate | |||||
| Mortgage Loan Trust | |||||
| Series 2004-18 5A | |||||
| 5.50% 12/25/34 | 112,569 | 112,365 | |||
| Series 2005-18 1A1 | |||||
| 5.664% 9/25/35 | 803,502 | 807,451 | |||
| Series 2005-18 9A1 | |||||
| 5.25% 9/25/35 | 1,589,447 | 1,562,873 | |||
| Series 2005-21 6A3 | |||||
| 5.40% 11/25/35 | 1,065,000 | 1,057,149 | |||
| Series 2005-3XS A2 | |||||
| 5.57% 1/25/35 | 186,035 | 186,180 | |||
| Series 2006-1 7A4 | |||||
| 5.62% 2/25/36 | 1,305,000 | 1,300,192 | |||
| Structured Asset Securities | |||||
| ŸSeries 2002-22H 1A | |||||
| 6.953% 11/25/32 | 17,436 | 17,793 | |||
| Series 2004-5H A2 | |||||
| 4.43% 12/25/33 | 265,469 | 262,061 | |||
| Series 2004-12H 1A | |||||
| 6.00% 5/25/34 | 157,002 | 157,419 | |||
| Series 2005-6 4A1 | |||||
| 5.00% 5 /25/35 | 631,422 | 605,574 | |||
| Washington Mutual | |||||
| Series 2002-S8 2A1 | |||||
| 4.50% 1/25/18 | 56,551 | 56,232 | |||
| Series 2004-CB3 1A | |||||
| 6.00% 10/25/34 | 228,434 | 229,041 | |||
(continues) 49
Statements of net assets
Optimum Fixed Income Fund
| Principal | Value | ||||
| Amount° | (U.S. $) | ||||
| Non-Agency Collateralized Mortgage Obligations (continued) | |||||
| Washington Mutual | |||||
| Series 2004-CB3 4A | |||||
| 6.00% 10/25/19 | USD | 116,682 | $118,126 | ||
| ŸSeries 2005-AR16 1A3 | |||||
| 5.112% 12/25/35 | 1,225,000 | 1,218,395 | |||
| ŸSeries 2005-AR18 1A3A | |||||
| 5.262% 1/25/36 | 2,200,000 | 2,199,015 | |||
| ŸSeries 2006-AR2 1A1 | |||||
| 5.318% 3/25/37 | 1,759,241 | 1,751,941 | |||
| ŸSeries 2006-AR7 1A | |||||
| 5.963% 7/25/46 | 273,255 | 273,533 | |||
| ŸSeries 2006-AR10 1A1 | |||||
| 5.956% 9/25/36 | 534,505 | 541,338 | |||
| ŸSeries 2006-AR12 1A2 | |||||
| 5.829% 10/25/36 | 1,560,000 | 1,581,408 | |||
| ŸSeries 2006-AR14 2A1 | |||||
| 5.771% 11/25/36 | 3,312,827 | 3,336,995 | |||
| ŸSeries 2006-AR16 1A1 | |||||
| 5.622% 12/25/36 | 2,213,624 | 2,218,293 | |||
| ŸSeries 2006-AR18 2A2 | |||||
| 5.507% 1/25/37 | 1,670,000 | 1,666,655 | |||
| ŸSeries 2007-HY3 4A1 | |||||
| 5.357% 3/25/37 | 2,953,406 | 2,943,810 | |||
| ŸSeries 2007-HY4 1A1 | |||||
| 5.575% 4/25/37 | 2,750,001 | 2,753,338 | |||
| wWashington Mutual | |||||
| Alternative Mortgage Pass | |||||
| Through Certificates | |||||
| Series 2005-1 5A2 | |||||
| 6.00% 3/25/35 | 119,285 | 119,229 | |||
| Series 2005-1 6A2 | |||||
| 6.50% 3/25/35 | 25,093 | 25,399 | |||
| Series 2005-9 3CB | |||||
| 5.50% 10/25/20 | 499,015 | 499,881 | |||
| Series 2006-2 2CB | |||||
| 6.50% 3/25/36 | 356,808 | 362,272 | |||
| Series 2006-5 2CB3 | |||||
| 6.00% 7/25/36 | 511,369 | 517,339 | |||
| ŸSeries 2006-AR5 3A | |||||
| 5.923% 7/25/46 | 366,266 | 366,924 | |||
| Wells Fargo Mortgage Backed | |||||
| Securities Trust | |||||
| ŸSeries 2004-O A1 | |||||
| 4.895% 8/25/34 | 3,667,460 | 3,611,532 | |||
| ŸSeries 2004-T A1 | |||||
| 4.583% 9/25/34 | 211,828 | 213,249 | |||
| Series 2005-12 1A7 | |||||
| 5.50% 11/25/35 | 649,963 | 634,425 | |||
| Series 2005-14 2A1 | |||||
| 5.50% 12/25/35 | 223,660 | 219,501 | |||
| Series 2005-17 1A1 | |||||
| 5.50% 1/25/36 | 552,709 | 541,742 | |||
| Series 2005-17 1A2 | |||||
| 5.50% 1/25/36 | 510,554 | 498,348 | |||
| ŸSeries 2005-AR13 A1 | |||||
| 5.312% 5/25/35 | 1,689,000 | 1,674,169 | |||
| Series 2006-1 A3 | |||||
| 5.00% 3/25/21 | 666,490 | 653,160 | |||
| Series 2006-2 3A1 | |||||
| 5.75% 3/25/36 | 567,846 | 565,634 | |||
| Series 2006-3 A1 | |||||
| 5.50% 3/25/36 | 1,274,040 | 1,274,041 | |||
| Series 2006-4 2A3 | |||||
| 5.75% 4/25/36 | 223,684 | 221,621 | |||
| Series 2006-6 1A3 | |||||
| 5.75% 5/25/36 | 1,500,764 | 1,508,619 | |||
| ŸSeries 2006-AR4 1A1 | |||||
| 5.864% 4/25/36 | 779,078 | 785,867 | |||
| ŸSeries 2006-AR4 2A1 | |||||
| 5.779% 4/25/36 | 522,911 | 526,325 | |||
| ŸSeries 2006-AR5 2A1 | |||||
| 5.533% 4/25/36 | 324,161 | 325,520 | |||
| ŸSeries 2006-AR6 7A1 | |||||
| 5.111% 3/25/36 | 2,402,765 | 2,376,694 | |||
| ŸSeries 2006-AR10 5A1 | |||||
| 5.60% 7/25/36 | 486,729 | 487,480 | |||
| ŸSeries 2006-AR10 5A6 | |||||
| 5.60% 7/25/36 | 2,631,320 | 2,636,515 | |||
| ŸSeries 2006-AR11 A6 | |||||
| 5.526% 8/25/36 | 2,330,000 | 2,355,480 | |||
| ŸSeries 2006-AR14 2A4 | |||||
| 6.105% 10/25/36 | 368,975 | 374,139 | |||
| ŸSeries 2006-AR16 A1 | |||||
| 5.683% 10/25/36 | 1,559,156 | 1,564,846 | |||
| ŸSeries 2006-AR17 A1 | |||||
| 5.344% 10/25/36 | 3,603,531 | 3,589,145 | |||
| ŸSeries 2006-AR18 2A2 | |||||
| 5.732% 11/25/36 | 1,100,456 | 1,104,728 | |||
| ŸSeries 2006-AR19 A1 | |||||
| 5.67% 12/25/36 | 1,295,978 | 1,299,713 | |||
| Total Non-Agency Collateralized | |||||
| Mortgage Obligations | |||||
| (cost $137,704,255) | 138,411,375 | ||||
| Regional Agencies – 1.02% D | |||||
| Australia – 1.02% | |||||
| New South Wales Treasury | |||||
| 5.50% 8/1/14 | AUD | 7,157,000 | 5,543,974 | ||
| 5.50% 3/1/17 | AUD | 1,900,000 | 1,461,434 | ||
| 6.00% 5/1/12 | AUD | 780,000 | 620,764 | ||
| Total Regional Agencies | |||||
| (cost $7,300,222) | 7,626,172 | ||||
| Regional Authorities – 0.22% D | |||||
| Canada – 0.22% | |||||
| Hydro Quebec 9.40% 2/1/21 | USD | 35,000 | 48,653 | ||
| Ontario Province | |||||
| 1.875% 1/25/10 | JPY | 24,000,000 | 209,008 | ||
| 5.375% 12/2/12 | CAD | 246,000 | 225,774 | ||
| Quebec Province | |||||
| 5.75% 12/1/36 | CAD | 820,000 | 827,414 | ||
50
| Principal | Value | ||||
| Amount° | (U.S. $) | ||||
| Regional Authorities (continued) | |||||
| Canada (continued) | |||||
| Saskatchewan Province | |||||
| 4.75% 6/1/40 | CAD | 371,000 | $ 331,217 | ||
| Total Regional Authorities | |||||
| (cost $1,648,275) | 1,642,066 | ||||
| «Senior Secured Loans – 1.44% | |||||
| Aramark 7.08% 1/26/14 | USD | 200,000 | 201,250 | ||
| @Avis Car Rental | |||||
| 6.61% 4/19/12 | 159,071 | 159,071 | |||
| @AWAS Tranche B | |||||
| 11.44% 3/21/13 | 481,503 | 488,725 | |||
| Brand Energy & Infrastructure | |||||
| 11.36% 2/7/15 | 150,000 | 151,125 | |||
| Ford Motor 8.36% 11/29/13 | 1,471,313 | 1,476,830 | |||
| General Motors | |||||
| 7.745% 11/17/13 | 800,000 | 809,000 | |||
| @Georgia Pacific Loan B | |||||
| 7.345% 12/20/12 | 1,185,000 | 1,198,331 | |||
| HCA 8.086% 11/17/13 | 748,125 | 754,671 | |||
| @Healthsouth 7.86% 3/10/13 | 1,488,750 | 1,492,473 | |||
| Idearc 7.32% 11/17/14 | 299,250 | 301,120 | |||
| Lyondell Chemical | |||||
| 7.121% 8/16/13 | 298,500 | 298,873 | |||
| Talecris Biotherapeutics 2nd | |||||
| Lien Loan 13.50% 12/6/14 | 450,000 | 463,500 | |||
| Telesat Canada | |||||
| 9.00% 2/14/08 | 795,000 | 795,000 | |||
| United Airlines 7.14% 1/12/14 | 700,000 | 699,125 | |||
| Univision Communications | |||||
| 7.60% 9/28/14 | 135,000 | 135,000 | |||
| @Visteon 8.18% 6/13/13 | 300,000 | 301,875 | |||
| Wind Acquisition | |||||
| 1.26% 12/7/11 | 400,000 | 413,000 | |||
| Windstream 8.36% 7/17/13 | 615,000 | 618,075 | |||
| Total Senior Secured Loans | |||||
| (cost $10,694,582) | 10,757,044 | ||||
| Sovereign Debt – 6.94% D | |||||
| Argentina – 0.15% | |||||
| Republic of Argentina | |||||
| Ÿ5.475% 8/3/12 | USD | 347,000 | 247,055 | ||
| 7.00% 9/12/13 | USD | 880,000 | 844,996 | ||
| 1,092,051 | |||||
| Austria – 0.25% | |||||
| Republic of Austria | |||||
| 5.25% 1/4/11 | EUR | 165,000 | 229,509 | ||
| #Republic of Austria 144A | |||||
| 4.00% 9/15/16 | EUR | 1,226,000 | 1,624,360 | ||
| 1,853,869 | |||||
| Brazil – 0.80% | |||||
| Federal Republic of Brazil | |||||
| 6.00% 1/17/17 | USD | 260,000 | 263,250 | ||
| 10.25% 1/10/28 | BRL | 3,615,000 | 1,750,211 | ||
| 11.00% 8/17/40 | USD | 90,000 | 121,523 | ||
| 12.50% 1/5/22 | BRL | 4,000,000 | 2,270,542 | ||
| ŸNato do Tesouro Nacional | |||||
| (Treasury Note) | |||||
| 10.00% 1/12/12 | BRL | 3,410,000 | 1,596,095 | ||
| 6,001,621 | |||||
| Colombia – 0.75% | |||||
| Republic of Colombia | |||||
| 7.375% 9/18/37 | USD | 1,365,000 | 1,489,215 | ||
| 12.00% 10/22/15 | COP | 7,882,000,000 | 4,172,658 | ||
| 5,661,873 | |||||
| Dominican Republic – 0.02% | |||||
| #Dominican Republic 144A | |||||
| 8.625% 4/20/27 | USD | 133,000 | 154,014 | ||
| 154,014 | |||||
| El Salvador – 0.04% | |||||
| Republic of El Salvador | |||||
| 7.65% 6/15/35 | USD | 285,000 | 327,038 | ||
| 327,038 | |||||
| France – 0.25% | |||||
| France Government O.A.T. | |||||
| 4.00% 10/25/38 | EUR | 775,000 | 984,726 | ||
| 4.00% 4/25/55 | EUR | 726,000 | 919,604 | ||
| 1,904,330 | |||||
| Germany – 0.21% | |||||
| Deutschland Republic | |||||
| 6.25% 1/4/24 | EUR | 821,000 | 1,361,423 | ||
| Deutschland Republic Inflation | |||||
| Linked 1.50% 4/15/16 | EUR | 176,613 | 227,705 | ||
| 1,589,128 | |||||
| Indonesia – 0.09% | |||||
| #Republic of Indonesia 144A | |||||
| 6.625% 2/17/37 | USD | 325,000 | 320,938 | ||
| 6.875% 3/9/17 | USD | 324,000 | 342,630 | ||
| 663,568 | |||||
| Jamaica – 0.07% | |||||
| Jamaica Government | |||||
| 8.00% 3/15/39 | USD | 525,000 | 528,938 | ||
| 528,938 | |||||
| Japan – 1.38% | |||||
| Japan Government | |||||
| 2 yr Bond 0.70% 9/15/08 | JPY | 216,200,000 | 1,833,895 | ||
| 5 yr Bond 1.50% 6/20/11 | JPY | 229,400,000 | 1,979,388 | ||
| 10 yr Bond 1.90% 6/20/16 | JPY | 280,150,000 | 2,444,777 | ||
| 20 yr Bond 2.10% 12/20/26 | JPY | 162,200,000 | 1,382,358 | ||
| 20 yr Bond 2.30% 6/20/26 | JPY | 238,750,000 | 2,103,598 | ||
| Japanese Government CPI | |||||
| Linked Bond | |||||
| 0.80% 3/10/16 | JPY | 70,629,300 | 582,069 | ||
| 10,326,085 | |||||
(continues) 51
Statements of net assets
Optimum Fixed Income Fund
| Principal | Value | ||||
| Amount° | (U.S. $) | ||||
| Sovereign Debt (continued) | |||||
| Malaysia – 0.48% | |||||
| Malaysian Government | |||||
| 3.718% 6/15/12 | MYR | 8,270,000 | $ 2,419,318 | ||
| 3.756% 4/28/11 | MYR | 2,394,000 | 699,943 | ||
| 7.00% 3/15/09 | MYR | 1,613,000 | 497,416 | ||
| 3,616,677 | |||||
| Mexico – 0.46% | |||||
| Mexican Bonos | |||||
| 8.00% 12/17/15 | MXN | 22,308,000 | 2,075,324 | ||
| 9.00% 12/20/12 | MXN | 10,614,000 | 1,030,174 | ||
| Mexican Government | |||||
| 5.625% 1/15/17 | USD | 330,000 | 333,465 | ||
| 3,438,963 | |||||
| Norway – 0.30% | |||||
| Norwegian Government | |||||
| 5.00% 5/15/15 | NOK | 8,012,000 | 1,352,355 | ||
| 6.50% 5/15/13 | NOK | 4,904,000 | 886,333 | ||
| 2,238,688 | |||||
| Panama – 0.10% | |||||
| Republic of Panama | |||||
| 6.70% 1/26/36 | USD | 450,000 | 469,350 | ||
| 7.25% 3/15/15 | USD | 235,000 | 255,680 | ||
| 725,030 | |||||
| Peru – 0.07% | |||||
| Republic of Peru | |||||
| 6.55% 3/14/37 | USD | 515,000 | 535,858 | ||
| 535,858 | |||||
| Philippines – 0.14% | |||||
| Republic of Philippines | |||||
| 8.25% 1/15/14 | USD | 440,000 | 495,550 | ||
| #Republic of Philippines 144A | |||||
| 8.75% 10/7/16 | USD | 500,000 | 592,500 | ||
| 1,088,050 | |||||
| Poland – 0.17% | |||||
| Poland Government | |||||
| 6.00% 11/24/10 | PLN | 2,431,000 | 870,174 | ||
| 6.25% 10/24/15 | PLN | 1,194,000 | 442,765 | ||
| 1,312,939 | |||||
| Republic of Korea – 0.08% | |||||
| Government of South Korea | |||||
| 4.25% 12/7/21 | EUR | 450,000 | 578,728 | ||
| 578,728 | |||||
| Sweden – 0.13% | |||||
| Sweden Government | |||||
| 5.50% 10/8/12 | SEK | 6,205,000 | 956,030 | ||
| 956,030 | |||||
| Turkey – 0.31% | |||||
| Republic of Turkey | |||||
| 6.875% 3/17/36 | USD | 1,205,000 | 1,158,306 | ||
| 7.00% 9/26/16 | USD | 515,000 | 526,588 | ||
| 7.375% 2/5/25 | USD | 590,000 | 609,175 | ||
| 2,294,069 | |||||
| United Kingdom – 0.66% | |||||
| U.K. Treasury | |||||
| 4.25% 3/7/11 | GBP | 1,530,000 | 2,902,012 | ||
| 4.75% 9/7/15 | GBP | 238,000 | 459,772 | ||
| 5.00% 3/7/12 | GBP | 284,000 | 553,871 | ||
| 5.00% 9/7/14 | GBP | 271,000 | 530,787 | ||
| 9.00% 7/12/11 | GBP | 208,000 | 466,980 | ||
| 4,913,422 | |||||
| Uruguay – 0.03% | |||||
| Republic of Uruguay | |||||
| 7.625% 3/21/36 | USD | 198,000 | 219,285 | ||
| 219,285 | |||||
| Total Sovereign Debt | |||||
| (cost $50,621,738) | 52,020,254 | ||||
| Supranational Banks – 0.57% | |||||
| Asia Development Bank | |||||
| 0.50% 10/9/12 | AUD | 497,000 | 293,669 | ||
| Corp Andina de Fomento | |||||
| 5.75% 1/12/17 | USD | 960,000 | 966,322 | ||
| European Investment Bank | |||||
| 1.40% 6/20/17 | JPY | 112,100,000 | 932,355 | ||
| 4.25% 12/7/10 | GBP | 425,000 | 800,107 | ||
| Inter-American Development | |||||
| Bank 1.90% 7/8/09 | JPY | 144,000,000 | 1,250,896 | ||
| Total Supranational Banks | |||||
| (cost $4,189,159) | 4,243,349 | ||||
| U.S. Treasury Obligations – 11.61% | |||||
| U.S. Treasury Bonds | |||||
| 4.50% 2/15/36 | USD | 660,000 | 622,463 | ||
| 6.00% 2/15/26 | 12,485,000 | 14,114,879 | |||
| 8.125% 8/15/19 | 5,600,000 | 7,315,000 | |||
| U.S. Treasury Inflation | |||||
| Index Notes | |||||
| 2.00% 1/15/26 | 1,055,431 | 1,003,402 | |||
| 2.375% 4/15/11 | 285,516 | 289,319 | |||
| 2.375% 1/15/17 | 687,487 | 697,880 | |||
| 2.375% 1/15/27 | 346,252 | 349,215 | |||
| ¥3.00% 7/15/12 | 624,747 | 655,057 | |||
| 3.625% 1/15/08 | 2,493,072 | 2,531,929 | |||
| U.S. Treasury Notes | |||||
| 4.00% 2/15/15 | 5,411,000 | 5,189,068 | |||
| 4.625% 12/31/11 | 35,840,000 | 35,970,207 | |||
| 4.625% 2/29/12 | 12,287,000 | 12,336,443 | |||
| 4.625% 2/15/17 | 3,748,000 | 3,741,561 | |||
| 4.75% 3/31/11 | 2,147,000 | 2,163,942 | |||
| Total U.S. Treasury Obligations | |||||
| (cost $87,101,677) | 86,980,365 | ||||
52
| Number of | Value | ||||||
| Shares | (U.S. $) | ||||||
| Common Stock – 0.22% | |||||||
| †Adelphia | 205,000 | $ 71,750 | |||||
| †Adelphia Recovery Trust | |||||||
| Series ACC-1 | 201,191 | 19,717 | |||||
| †Adelphia Recovery Trust | |||||||
| Series Arahova | 859,019 | 455,280 | |||||
| †Century Communications | 1,975,000 | 88,875 | |||||
| †Charter Communications Class A | 5,800 | 16,182 | |||||
| †Foster Wheeler | 1,044 | 60,959 | |||||
| †Mirant | 5,054 | 204,485 | |||||
| †Time Warner Cable Class A | 19,084 | 715,077 | |||||
| Total Common Stock | |||||||
| (cost $1,407,561) | 1,632,325 | ||||||
| Currency Options Purchased – 0.04% | |||||||
| Put USD 8,271,000, | |||||||
| Call JPY 936,690,750, | |||||||
| expiration date 8/17/07 | 101,320 | ||||||
| Put USD 12,860,000, | |||||||
| Call JPY 1,427,460,000, | |||||||
| expiration date 6/5/07 | 35,044 | ||||||
| Put USD 12,900,000, | |||||||
| Call JPY 1,515,145,313, | |||||||
| expiration date 5/10/07 | 168,989 | ||||||
| Total Currency Options | |||||||
| Purchased (cost $238,629) | 305,353 | ||||||
| Preferred Stock – 0.03% | |||||||
| Arch Capital Group 8.00% | 5,809 | 155,855 | |||||
| Nexen 7.35% | 3,225 | 82,689 | |||||
| Total Preferred Stock | |||||||
| (cost $231,880) | 238,544 | ||||||
| Warrant – 0.08% | |||||||
| †Argentina GDP Linked | |||||||
| Security, expiration date | |||||||
| 12/15/35 | 4,194,000 | 580,869 | |||||
| Total Warrant (cost $552,215) | 580,869 | ||||||
| Principal | |||||||
| Amount° | |||||||
| Repurchase Agreements – 6.76% | |||||||
| With BNP Paribas | |||||||
| 5.10% 4/2/07 (dated | |||||||
| 3/30/07, to be repurchased | |||||||
| at $20,758,819, collateralized | |||||||
| by $11,528,000 U.S. | |||||||
| Treasury Notes 2.625% | |||||||
| due 5/15/08, market value | |||||||
| $11,362,566, $6,775,000 | |||||||
| U.S. Treasury Notes | |||||||
| 3.375% due 12/15/08, | |||||||
| market value $6,699,829 | |||||||
| and $3,187,000 U.S. | |||||||
| Treasury Notes 3.50% | |||||||
| due 8/15/09, market value | |||||||
| $3,124,045) | USD | 20,750,000 | 20,750,000 | ||||
| With Cantor Fitzgerald | |||||||
| 5.11% 4/2/07 (dated | |||||||
| 3/30/07, to be repurchased | |||||||
| at $14,971,373, | |||||||
| collateralized by | |||||||
| $12,244,000 U.S. Treasury | |||||||
| Bills due 6/28/07, market | |||||||
| value $12,098,207 and | |||||||
| $3,166,000 U.S. Treasury | |||||||
| Notes 4.50% due 2/28/11, | |||||||
| market value $3,176,000) | 14,965,000 | 14,965,000 | |||||
| With UBS Warburg 5.11% | |||||||
| 4/2/07 (dated 3/30/07, | |||||||
| to be repurchased at | |||||||
| $14,970,372, collateralized | |||||||
| by $15,310,000 U.S. | |||||||
| Treasury Bills due 4/19/07, | |||||||
| market value $15,273,897) | 14,964,000 | 14,964,000 | |||||
| Total Repurchase Agreements | |||||||
| (cost $50,679,000) | 50,679,000 | ||||||
| Total Value of Securities – 103.81% | |||||||
| (cost $772,033,617) | 777,935,438 | ||||||
| Liabilities Net of Receivables | |||||||
| and Other Assets – (3.81%) | (28,486,301 | ) | |||||
| Net Assets Applicable | |||||||
| to 82,773,699 Shares | |||||||
| Outstanding – 100.00% | $749,449,137 | ||||||
| Net Asset Value – Optimum Fixed Income Fund Class A | |||||||
| ($58,691,249 / 6,481,791 Shares) | �� | $9.05 | |||||
| Net Asset Value – Optimum Fixed Income Fund Class B | |||||||
| ($9,567,557 / 1,055,875 Shares) | $9.06 | ||||||
| Net Asset Value – Optimum Fixed Income Fund Class C | |||||||
| ($227,036,177 / 25,046,247 Shares) | $9.06 | ||||||
| Net Asset Value – Optimum Fixed Income Fund | |||||||
| Institutional Class | |||||||
| ($454,154,154 / 50,189,786 Shares) | $9.05 | ||||||
| Components of Net Assets at March 31, 2007: | |||||||
| Shares of beneficial interest | |||||||
| (unlimited authorization – no par) | $737,655,927 | ||||||
| Undistributed net investment income | 4,336,501 | ||||||
| Accumulated net realized loss on investments | (144,068 | ) | |||||
| Net unrealized appreciation of investments | |||||||
| and foreign currencies | 7,600,777 | ||||||
| Total net assets | $749,449,137 | ||||||
(continues) 53
Statements of net assets
Optimum Fixed Income Fund
| ° | Principal amount shown is stated in the currency in which each security is denominated. |
| AUD – Australian Dollar BRL – Brazilian Real CAD – Canadian Dollar COP – Colombian Peso EUR – European Monetary Unit GBP – British Pound Sterling ISK – Iceland Krona JPY – Japanese Yen MXN – Mexican Peso MYR – Malaysia Ringgit NOK – Norwegian Krone NZD – New Zealand Dollar PLN – Polish Zloty RUB – Russian Ruble SEK – Swedish Krona TRY – Turkish Lira USD – United States Dollar | |
| † | Non-income producing security for the year ended March 31, 2007. |
| ‡ | Non-income producing security. Security is currently in default. |
| Ÿ | Variable rate security. The rate shown is the rate as of March 31, 2007. |
| ^ | Zero coupon security. The rate shown is the yield at the time of purchase. |
| ¶ | IStep coupon bond. Indicates security that has a zero coupon that remains in effect until a predetermined date at which time the stated interest rate becomes effective. |
| « | Step coupon bond. Coupon increases periodically based on a predetermined schedule. Stated rate in effect at March 31, 2007. |
| # | Security exempt from registration under Rule 144A of the Securities Act of 1933, as amended. At March 31, 2007, the aggregate amount of Rule 144A securities equaled $81,306,924, which represented 10.85% of the Fund’s net assets. See Note 11 in “Notes to Financial Statements.” |
| @ | Illiquid security. At March 31, 2007, the aggregate amount of illiquid securities equaled $3,640,475, which represented 0.49% of the Fund’s net assets. See Note 11 in “Notes to Financial Statements.” |
| ¥ | Fully or partially pledged as collateral for financial futures contracts. |
| w | Pass Through Agreement. Security represents the contractual right to receive a proportionate amount of underlying payments due to the counterparty pursuant to various agreements related to the rescheduling of obligations and the exchange of certain notes. |
| « | Senior Secured Loans generally pay interest at rates which are periodically redetermined by reference to a base lending rate plus a premium. These base lending rates are generally (i) the prime rate offered by one or more United States banks, (ii) the lending rate offered by one or more European banks such as the London Inter-Bank Offered Rate (‘LIBOR’) and (iii) the certificate of deposit rate. Senior Secured Loans may be subject to restrictions on resale. |
| § | Pre-Refunded Bonds. Municipals that are generally backed or secured by U.S. Treasury bonds. For Pre-Refunded Bonds, the stated maturity is followed by the year in which the bond is pre-refunded. See Note 11 in “Notes to Financial Statements.” |
| D | Securities have been classified by country of origin. |
| Summary of Abbreviations: AMBAC – Insured by the AMBAC Assurance Corporation ARM – Adjustable Rate Mortgage CPI – Consumer Price Index CPN – Interest Coupon Only FGIC – Insured by the Financial Guaranty Insurance Company FHLMC – Insured by the Federal Home Loan Mortgage Corporation FSA – Insured by Financial Security Assurance GDP – Gross Domestic Product GNMA – Government National Mortgage Association GSMPS – Goldman Sachs Reperforming Mortgage Securities MBIA – Insured by the Municipal Bond Insurance Association NIM – Net Interest Margin O.A.T – Obligation Assimilable au Tresor (Treasury Security) PIK – Pay-in-Kind REIT – Real Estate Investment Trust S.F. – Single Family TBA – To be announced XLCA – Insured by XL Capital Assurance yr – Year | ||||||||
| The following foreign currency exchange contracts and foreign cross currency exchange contracts, futures contracts, and swap contracts were outstanding at March 31, 2007: |
| Foreign Currency Exchange Contracts1 | ||||||||||||||
| In | Unrealized | |||||||||||||
| Contracts to | Exchange | Settlement | Appreciation | |||||||||||
| Receive (Deliver) | For | Date | (Depreciation) | |||||||||||
| AUD | (10,000,000 | ) | USD | 7,940,900 | 4/27/07 | $(143,619 | ) | |||||||
| CAD | 248,751 | NZD | (304,000 | ) | 4/27/07 | (1,135 | ) | |||||||
| CAD | 511,303 | NOK | (2,659,589 | ) | 4/27/07 | 5,297 | ||||||||
| EUR | (3,427,200 | ) | USD | 4,566,435 | 4/27/07 | (16,907 | ) | |||||||
| EUR | (1,601,300 | ) | USD | 2,135,045 | 4/27/07 | (6,443 | ) | |||||||
| EUR | (741,700 | ) | USD | 975,877 | 6/8/07 | (17,712 | ) | |||||||
| EUR | (320,000 | ) | USD | 426,532 | 4/27/07 | (1,418 | ) | |||||||
| EUR | 170,859 | JPY | (26,500,000 | ) | 4/27/07 | 2,687 | ||||||||
| EUR | 207,721 | NZD | (390,330 | ) | 4/27/07 | (518 | ) | |||||||
| EUR | 455,766 | PLN | (1,767,488 | ) | 4/27/07 | (1,716 | ) | |||||||
| EUR | 1,181,183 | GBP | (803,000 | ) | 4/27/07 | (447 | ) | |||||||
| GBP | (689,000 | ) | USD | 1,350,902 | 4/27/07 | (4,870 | ) | |||||||
| GBP | 243,000 | USD | (476,635 | ) | 6/8/07 | 1,409 | ||||||||
| GBP | 709,214 | JPY | (163,519,000 | ) | 4/27/07 | 2,182 | ||||||||
| JPY | (208,014,000 | ) | USD | 1,781,888 | 4/27/07 | 9,375 | ||||||||
| JPY | 108,434,200 | EUR | (700,000 | ) | 4/27/07 | (12,159 | ) | |||||||
| PLN | 1,225,350 | USD | (421,909 | ) | 6/8/07 | 2,411 | ||||||||
| SEK | 3,238,429 | EUR | (348,000 | ) | 4/27/07 | (917 | ) | |||||||
| $(184,500 | ) | |||||||||||||
| Futures Contracts2 | |||||||||||
| Contracts to | Notional Cost | Notional | Expiration | Unrealized | |||||||
| Buy (Sell) | (Proceeds) | Value | Date | Appreciation | |||||||
| 75 U.S. Treasury | |||||||||||
| 2 year Notes | $15,332,053 | $15,366,797 | 6/30/07 | $ 34,744 | |||||||
| 513 U.S. Treasury | |||||||||||
| 5 year Notes | 54,156,351 | 54,273,797 | 6/30/07 | 117,446 | |||||||
| 81 U.S. Treasury | |||||||||||
| 10 year Notes | 8,748,067 | 8,758,125 | 6/30/07 | 10,058 | |||||||
| (16) U.S. Treasury | |||||||||||
| Long Bond | (1,794,287 | ) | (1,780,000 | ) | 6/30/07 | 14,287 | |||||
| $176,535 | |||||||||||
54
| Swap Contracts3 | ||||||
| Index Swap Contracts | ||||||
| Notional | Expiration | Unrealized | ||||
| Amount | Date | Description | Appreciation | |||
| $1,380,000 | 5/1/07 | Agreement with Goldman Sachs to receive the notional amount multiplied by the return on the Lehman Brothers Commercial MBS Index AAA and to pay the notional amount multiplied by the 1 month BBA LIBOR adjusted by a spread of plus 0.05%. | $13,263 | |||
| Credit Default Swap Contracts | |||||||||
| Swap Counterparty & | Annual | ||||||||
| Referenced | Notional | Protection | Termination | Unrealized | |||||
| Obligation | Amount | Payments | Date | Appreciation | |||||
| Protection | |||||||||
| Purchased: | |||||||||
| Goldman Sachs | |||||||||
| Beazer Homes | |||||||||
| 5 yr CDS IndexCo | $1,050,000 | 3.08% | 6/20/12 | $ 42,079 | |||||
| JPMorgan Chase | |||||||||
| Bank N.A. | |||||||||
| ABX Home | |||||||||
| Equity BBB-Index | |||||||||
| 06-1 | 2,100,000 | 2.67% | 7/25/45 | 12,275 | |||||
| Goldman Sachs | |||||||||
| CDS IndexCo | |||||||||
| ABX Home | |||||||||
| Equity BBB-Index | |||||||||
| 06-1 | 6,800,000 | 2.67% | 7/25/45 | 1,077,513 | |||||
| Goldman Sachs | |||||||||
| CDS IndexCo | |||||||||
| ABX Home | |||||||||
| Equity BBB-Index | |||||||||
| 06-2 | 2,000,000 | 2.42% | 5/25/46 | 510,474 | |||||
| $1,642,341 | |||||||||
| The use of foreign currency exchange contracts and foreign cross currency exchange contracts, futures contracts and swap contracts involves elements of market risk and risks in excess of the amount recognized in the financial statements. The notional amounts presented above represent the Fund’s total exposure in such contracts, whereas only the net unrealized appreciation (depreciation) is reflected in the Fund’s net assets. | |||||||||
1 See Note 7 in ”Notes to Financial Statements.”
2 See Note 8 in ”Notes to Financial Statements.”
3 See Note 10 in ”Notes to Financial Statements.”
| Net Asset Value and Offering Price per Share – | |
| Optimum Fixed Income Fund | |
| Net asset value Class A (A) | $9.05 |
| Sales charge (4.50% of offering price) (B) | 0.43 |
| Offering price | $9.48 |
| (A) | Net asset value per share, as illustrated, is the amount which would be paid upon redemption or repurchase of shares. | |
| (B) | See the current prospectus for purchases of $100,000 or more. | |
| See accompanying notes | ||
55
Statements of net assets
> Optimum International Fund
March 31, 2007
| Number of | Value | |||
| Shares | (U.S.$) | |||
| Common Stock – 97.55% D | ||||
| Australia – 7.45% | ||||
| Amcor | 234,104 | $ 1 ,430,072 | ||
| Coles Group | 179,077 | 2,354,482 | ||
| Foster’s Group | 591,966 | 3,280,874 | ||
| Macquarie Airports | 246,259 | 795,000 | ||
| National Australia Bank | 170,196 | 5,563,305 | ||
| QBE Insurance Group | 52,200 | 1,332,093 | ||
| Suncorp-Metway | 10,731 | 180,593 | ||
| Telstra | 1,121,499 | 4,228,507 | ||
| Wesfarmers | 46,849 | 1,430,934 | ||
| 20,595,860 | ||||
| Austria – 0.68% | ||||
| OMV | 3,100 | 195,255 | ||
| Voestalpine | 23,200 | 1,682,850 | ||
| 1,878,105 | ||||
| Belgium – 2.13% | ||||
| Fortis | 39,900 | 1,822,341 | ||
| Fortis (Amsterdam Exchange) | 72,723 | 3,320,485 | ||
| KBC Groep | 6,000 | 746,286 | ||
| 5,889,112 | ||||
| Brazil – 0.54% | ||||
| Gerdau ADR | 31,250 | 566,563 | ||
| Petroleo Brasiliero ADR | 6,917 | 688,310 | ||
| Unibanco ADR | 2,800 | 244,888 | ||
| 1,499,761 | ||||
| Canada – 1.16% | ||||
| †Celestica | 18,900 | 115,404 | ||
| EnCana | 7,100 | 359,120 | ||
| ING Canada | 7,900 | 354,221 | ||
| Nexen | 13,223 | 809,916 | ||
| Royal Bank of Canada | 5,275 | 262,699 | ||
| Teck Cominco Class B | 10,800 | 752,895 | ||
| TELUS | 10,846 | 541,267 | ||
| 3,195,522 | ||||
| China – 0.09% | ||||
| China Petroleum & Chemical | 280,000 | 236,872 | ||
| 236,872 | ||||
| Finland – 0.80% | ||||
| UPM-Kymmene | 86,627 | 2,206,793 | ||
| 2,206,793 | ||||
| France – 12.82% | ||||
| Air France-KLM | 8,800 | 401,450 | ||
| BNP Paribas | 22,840 | 2,385,641 | ||
| Carrefour | 34,094 | 2,493,560 | ||
| Cie de Saint-Gobain | 28,961 | 2,830,768 | ||
| Compagnie Generale des | ||||
| Etablissements Michelin Class B | 13,600 | 1,501,912 | ||
| Credit Agricole | 39,612 | 1,544,609 | ||
| France Telecom | 92,982 | 2,455,632 | ||
| Lagardere | 9,300 | 716,085 | ||
| Renault | 56,446 | 6,601,567 | ||
| Sanofi-Aventis | 23,498 | 2,043,476 | ||
| Societe Generale | 32,392 | 5,597,950 | ||
| †Suez-Strip | 9,260 | 124 | ||
| Total | 98,153 | 6,877,122 | ||
| 35,449,896 | ||||
| Germany – 8.47% | ||||
| Allianz | 12,200 | 2,509,795 | ||
| BASF | 19,400 | 2,179,493 | ||
| Bayer | 53,318 | 3,403,835 | ||
| Continental | 1,093 | 141,249 | ||
| Deutsche Lufthansa | 60,400 | 1,641,140 | ||
| Deutsche Telekom | 139,693 | 2,308,352 | ||
| E.ON | 15,700 | 2,122,871 | ||
| Epcos | 13,300 | 232,390 | ||
| Muenchener Rueckversicherungs | 15,100 | 2,546,631 | ||
| RWE | 53,834 | 5,695,600 | ||
| TUI | 26,200 | 647,137 | ||
| 23,428,493 | ||||
| Hong Kong – 2.01% | ||||
| China Netcom Group | 162,500 | 424,266 | ||
| Hong Kong Electric Holdings | 362,500 | 1,860,402 | ||
| Orient Overseas International | 48,000 | 445,997 | ||
| Sino Land | 650,985 | 1,401,365 | ||
| Wharf Holdings | 383,000 | 1,421,514 | ||
| 5,553,544 | ||||
| Hungary – 0.08% | ||||
| MOL Hungarian Oil & Gas ADR | 1,890 | 217,350 | ||
| 217,350 | ||||
| India – 0.15% | ||||
| State Bank of India GDR | 7,130 | 429,226 | ||
| 429,226 | ||||
| Italy – 4.50% | ||||
| Buzzi Unicem | 34,900 | 1,061,098 | ||
| ENI | 76,800 | 2,499,172 | ||
| Fondiaria-Sai | 27,300 | 1,253,429 | ||
| Intesa Sanpaolo | 615,786 | 4,676,468 | ||
| UniCredito Italiano | 310,251 | 2,952,948 | ||
| 12,443,115 | ||||
| Japan – 18.39% | ||||
| Astellas Pharma | 27,100 | 1,168,311 | ||
| Canon | 84,100 | 4,517,782 | ||
| Cosmo Oil | 28,000 | 117,384 | ||
| East Japan Railway | 86 | 669,987 | ||
| EDION | 31,600 | 441,142 | ||
| Fanuc | 99 | 9,217 | ||
| Honda Motor | 44,800 | 1,562,591 | ||
| Isuzu Motors | 241,000 | 1,208,732 | ||
| Itochu | 101,000 | 1,001,128 | ||
| Japan Tobacco | 277 | 1,361,081 | ||
| JFE Holdings | 44,800 | 2,649,942 | ||
| Kao | 70,000 | 2,049,475 | ||
| KDDI | 299 | 2,387,736 | ||
| Kyushu Electric Power | 34,500 | 980,820 | ||
| Leopalace21 | 4,995 | 165,320 | ||
| Millea Holdings | 71,000 | 2,627,062 | ||
| Mitsubishi | 39,000 | 905,206 | ||
| Mitsubishi UFJ Financial Group | 36 | 406,331 | ||
| Mitsui Chemicals | 149,000 | 1,302,414 | ||
| Mitsui OSK Lines | 132,000 | 1,465,235 | ||
| Nippon Mining Holdings | 103,000 | 888,963 |
56
| Number of | Value | |||
| Shares | (U.S.$) | |||
| Common Stock (continued) | ||||
| Japan (continued) | ||||
| Nippon Telegraph & Telephone | 311 | $ 1,644,273 | ||
| Nissan Motor | 55,400 | 593,798 | ||
| Oki Electric Industry | 139,000 | 267,773 | ||
| ©ORIX | 6,390 | 1,664,810 | ||
| Rengo | 25,000 | 141,936 | ||
| Seiko Epson | 35,100 | 1,033,623 | ||
| Sharp | 71,000 | 1,367,760 | ||
| Sumitomo Heavy Industries | 111,000 | 1,105,902 | ||
| Sumitomo Mitsui Financial Group | 198 | 1,797,937 | ||
| Takeda Pharmaceutical | 51,400 | 3,371,849 | ||
| Tokyo Electric Power | 41,200 | 1,409,055 | ||
| Toshiba | 181,000 | 1,208,868 | ||
| Toyota Motor | 93,900 | 6,016,420 | ||
| West Japan Railway | 291 | 1,343,437 | ||
| 50,853,300 | ||||
| Netherlands – 5.78% | ||||
| ABN AMRO Holding | 33,954 | 1,461,417 | ||
| Arcelor Mittal | 38,254 | 2,032,311 | ||
| Buhrmann | 37,200 | 500,912 | ||
| European Aeronautic | ||||
| Defence & Space | 43,840 | 1,359,848 | ||
| ING Groep | 156,234 | 6,605,519 | ||
| Reed Elsevier | 157,836 | 2,791,591 | ||
| Royal KPN | 22,400 | 348,903 | ||
| Wolters Kluwer | 28,900 | 867,092 | ||
| 15,967,593 | ||||
| New Zealand – 0.52% | ||||
| Telecom of New Zealand | 422,794 | 1,428,568 | ||
| 1,428,568 | ||||
| Philippines – 0.08% | ||||
| Philippine Long Distance Telephone | 4,200 | 220,364 | ||
| 220,364 | ||||
| Republic of Korea – 0.63% | ||||
| Honam Petrochemical | 2,900 | 251,209 | ||
| Hyundai Mobis | 1,730 | 148,572 | ||
| Industrial Bank of Korea | 16,180 | 324,169 | ||
| Kookmin Bank | 2,700 | 242,207 | ||
| POSCO | 700 | 293,884 | ||
| Samsung Electronics | 360 | 215,422 | ||
| Shinhan Financial Group | 4,530 | 259,999 | ||
| 1,735,462 | ||||
| Singapore – 0.78% | ||||
| †Flextronics International | 45,500 | 497,770 | ||
| Jardine Matheson Holdings | 4,400 | 92,840 | ||
| Neptune Orient Lines | 84,000 | 179,395 | ||
| Oversea-Chinese Banking | 235,800 | 1,398,853 | ||
| 2,168,858 | ||||
| South Africa – 0.64% | ||||
| Sanlam | 121,610 | 335,268 | ||
| Sasol | 37,917 | 1,265,120 | ||
| Standard Bank Group | 11,700 | 172,246 | ||
| 1,772,634 | ||||
| Spain – 4.35% | ||||
| Banco Santander Central Hispano | 150,462 | 2,685,289 | ||
| Iberdrola | 59,325 | 2,804,633 | ||
| Repsol YPF | 51,800 | 1,746,533 | ||
| Telefonica | 217,677 | 4,797,933 | ||
| 12,034,388 | ||||
| Sweden – 0.38% | ||||
| Svenska Cellulosa Class B | 19,700 | 1,055,105 | ||
| 1,055,105 | ||||
| Switzerland – 1.56% | ||||
| Credit Suisse Group | 30,400 | 2,181,435 | ||
| Novartis | 7,310 | 419,278 | ||
| Xstrata | 33,220 | 1,706,209 | ||
| 4,306,922 | ||||
| Taiwan – 1.48% | ||||
| AU Optronics | 293,000 | 418,824 | ||
| Chunghwa Telecom ADR | 86,104 | 1,715,192 | ||
| HON HAI Precision Industry | 43,200 | 289,828 | ||
| Siliconware Precision Industries | 246,000 | 460,925 | ||
| Taiwan Semiconductor | ||||
| Manufacturing | 157,588 | 323,367 | ||
| Taiwan Semiconductor | ||||
| Manufacturing ADR | 54,700 | 588,025 | ||
| United Microelectronics | 504,000 | 290,916 | ||
| 4,087,077 | ||||
| Thailand – 0.06% | ||||
| PTT PCL | 27,800 | 165,164 | ||
| 165,164 | ||||
| United Kingdom – 22.02% | ||||
| Alliance Boots | 125,402 | 2,534,352 | ||
| AstraZeneca | 39,200 | 2,109,000 | ||
| Aviva | 194,358 | 2,864,681 | ||
| BAE Systems | 133,300 | 1,207,958 | ||
| Barclays | 151,700 | 2,152,350 | ||
| BG Group | 203,994 | 2,944,486 | ||
| BHP Billiton | 28,000 | 624,281 | ||
| BP | 370,070 | 4,019,897 | ||
| British American Tobacco | 26,600 | 831,759 | ||
| †British Energy Group | 101,000 | 968,423 | ||
| Centrica | 121,300 | 922,576 | ||
| Compass Group | 195,361 | 1,307,100 | ||
| Enterprise Inns | 60,582 | 796,961 | ||
| GKN | 213,682 | 1,605,236 | ||
| GlaxoSmithKline | 198,750 | 5,463,809 | ||
| HBOS | 298,090 | 6,141,664 | ||
| J Sainsbury | 142,400 | 1,539,819 | ||
| Lloyds TSB Group | 265,481 | 2,928,202 | ||
| Marston’s | 85,600 | 743,277 | ||
| Punch Taverns | 32,300 | 792,613 | ||
| Rio Tinto | 18,500 | 1,055,387 | ||
| Royal Bank of Scotland Group | 152,143 | 5,936,995 | ||
| Royal Dutch Shell Class A | 137,925 | 4,587,753 | ||
| Unilever | 136,604 | 4,118,264 | ||
| Vodafone Group | 1,001,125 | 2,669,436 | ||
| 60,866,279 | ||||
| Total Common Stock | ||||
| (cost $208,740,012) | 269,685,363 |
(continues) 57
Statements of net assets
Optimum International Fund
| Number of | Value | |||||
| Shares | (U.S.$) | |||||
| Preferred Stock – 0.41% | ||||||
| Brazil – 0.24% | ||||||
| Usinas Siderurgicas de Minas Gerais | ||||||
| Class A 3.96% | 13,500 | $ 653,803 | ||||
| 653,803 | ||||||
| Republic of Korea – 0.17% | ||||||
| Hyundai Motor Class 2 3.43% | 6,020 | $ 236,104 | ||||
| Samsung Electronics 1.25% | 500 | 235,160 | ||||
| 471,264 | ||||||
| Total Preferred Stock | ||||||
| (cost $933,933) | 1,125,067 | |||||
| Principal | ||||||
| Amount (U.S $) | ||||||
| Repurchase Agreements – 1.82% | ||||||
| With BNP Paribas 5.10% 4/2/07 | ||||||
| (dated 3/30/07, to be repurchased | ||||||
| at $2,062,876, collateralized by | ||||||
| $1,146,000 U.S. Treasury Notes | ||||||
| 2.625% due 5/15/08, market | ||||||
| value $1,129,104, $673,000 | ||||||
| U.S. Treasury Notes 3.375% due | ||||||
| 12/15/08, market value $665,766 | ||||||
| and $317,000 U.S. Treasury Notes | ||||||
| 3.50% due 8/15/09, market value | ||||||
| $310,438) | $2,062,000 | 2,062,000 | ||||
| With Cantor Fitzgerald 5.11% 4/2/07 | ||||||
| (dated 3/30/07, to be repurchased | ||||||
| at $1,487,633, collateralized by | ||||||
| $1,217,000 U.S. Treasury Bills due | ||||||
| 6/28/07, market value $1,202,205 | ||||||
| and $315,000 U.S. Treasury Notes | ||||||
| 4.50% due 2/28/11, market value | ||||||
| $315,601) | 1,487,000 | 1,487,000 | ||||
| With UBS Warburg 5.11% 4/2/07 | ||||||
| (dated 3/30/07, to be repurchased | ||||||
| at $1,487,633, collateralized by | ||||||
| $1,521,000 U.S. Treasury Bills due | ||||||
| 4/19/07, market value $1,517,776) | 1,487,000 | 1,487,000 | ||||
| Total Repurchase Agreements | ||||||
| (cost $5,036,000) | 5,036,000 | |||||
| Total Value of Securities – 99.78% | ||||||
| (cost $214,709,945) | 275,846,430 | |||||
| Receivables and Other Assets | ||||||
| Net of Liabilities – 0.22% | 601,314 | |||||
| Net Assets Applicable to 17,880,041 | ||||||
| Shares Outstanding – 100.00% | $276,447,744 | |||||
| Net Asset Value – Optimum International Fund Class A | ||||||
| ($25,522,721 / 1,647,599 Shares) | $15.49 | |||||
| Net Asset Value – Optimum International Fund Class B | ||||||
| ($5,030,970 / 330,129 Shares) | $15.24 | |||||
| Net Asset Value – Optimum International Fund Class C | ||||||
| ($91,695,597 / 6,013,733 Shares) | $15.25 | |||||
| Net Asset Value – Optimum International Fund | ||||||
| Institutional Class | ||||||
| ($154,198,456 / 9,888,580 Shares) | $15.59 | |||||
| Components of Net Assets at March 31, 2007: | ||||||
| Shares of beneficial interest | ||||||
| (unlimited authorization – no par) | $210,504,705 | |||||
| Accumulated net investment loss | (462,272 | ) | ||||
| Accumulated net realized gain on investments | 5,306,083 | |||||
| Net unrealized appreciation of investments | ||||||
| and foreign currencies | 61,099,228 | |||||
| Total net assets | $276,447,744 | |||||
| † | Non-income producing security for the year ended March 31, 2007. |
| D | Securities have been classified by country origin. Classification by type of business has been presented on page 31 in “Sector/Country Allocations.” |
| © | Passive Foreign Investment Company |
Summary of Abbreviations:
ADR – American Depositary Receipts
AUD – Australian Dollar
EUR – European Monetary Unit
GBP – British Pounds Sterling
GDR – Global Depositary Receipts
HKD – Hong Kong Dollar
ILS – Israeli Shekel
JPY – Japanese Yen
SGD – Singapore Dollar
USD – United States Dollar
ZAR – South African Rand
58
| The following foreign currency exchange contracts were outstanding at March 31, 2007: | ||||||||||||||
| Foreign Currency Exchange Contracts1 | ||||||||||||||
| In | Unrealized | |||||||||||||
| Contracts to | Exchange | Settlement | Appreciation | |||||||||||
| Receive (Deliver) | For | Date | (Depreciation) | |||||||||||
| AUD | (100,000 | ) | USD | 80,950 | 4/3/07 | $ 45 | ||||||||
| AUD | 549,805 | USD | (444,462 | ) | 4/3/07 | 358 | ||||||||
| EUR | (395,000 | ) | USD | 527,641 | 4/3/07 | (65 | ) | |||||||
| EUR | 167,373 | USD | (223,192 | ) | 4/2/07 | 403 | ||||||||
| GBP | (4,519,500 | ) | USD | 8,848,150 | 4/26/07 | (45,060 | ) | |||||||
| GBP | 170,000 | USD | (334,492 | ) | 4/3/07 | 41 | ||||||||
| HKD | (1,700,000 | ) | USD | 217,543 | 4/2/07 | (37 | ) | |||||||
| ILS | (225,000 | ) | USD | 54,100 | 4/2/07 | (14 | ) | |||||||
| JPY | 7,612,378 | USD | (64,665 | ) | 4/3/07 | (43 | ) | |||||||
| JPY | 250,000,000 | USD | (2,128,747 | ) | 4/3/07 | (6,470 | ) | |||||||
| SGD | (40,000 | ) | USD | 26,376 | 4/3/07 | 6 | ||||||||
| ZAR | (2,460,000 | ) | USD | 337,217 | 4/3/07 | (1,806 | ) | |||||||
| $(52,642 | ) | |||||||||||||
1 See Note 7 in ”Notes to Financial Statements.”
| Net Asset Value and Offering Price per Share – | |
| Optimum International Fund | |
| Net asset value Class A (A) | $15.49 |
| Sales charge (5.75% of offering price) (B) | 0.95 |
| Offering price | $16.44 |
| (A) | Net asset value per share, as illustrated, is the amount which would be paid upon redemption or repurchase of shares. | |
| (B) | See the current prospectus for purchases of $75,000 or more. |
See accompanying notes
59
Statements of net assets
> Optimum Large Cap Growth Fund
March 31, 2007
| Number of | Value | |||
| Shares | (U.S. $) | |||
| Common Stock – 93.81% | ||||
| Basic Industry/Capital Goods – 6.59% | ||||
| BHP Billiton (Australia) | 124,200 | $ 3,003,653 | ||
| Danaher | 86,700 | 6,194,715 | ||
| Deere | 12,900 | 1,401,456 | ||
| General Electric | 452,850 | 16,012,776 | ||
| Joy Global | 30,600 | 1,312,740 | ||
| Monsanto | 208,242 | 11,444,980 | ||
| Praxair | 54,639 | 3,440,071 | ||
| Tyco International | 117,000 | 3,691,350 | ||
| United Technologies | 84,666 | 5,503,290 | ||
| 52,005,031 | ||||
| Business Services – 4.10% | ||||
| Accenture Class A | 186,900 | 7,203,126 | ||
| Automatic Data Processing | 97,000 | 4,694,800 | ||
| Clear Channel Communications | 59,600 | 2,088,384 | ||
| Expeditors International | ||||
| of Washington | 61,600 | 2,545,312 | ||
| Grupo Televisa ADR | 76,000 | 2,264,800 | ||
| MasterCard Class A | 67,027 | 7,120,948 | ||
| Rogers Communications Class B | 155,800 | 5,104,008 | ||
| Sysco | 40,300 | 1,363,349 | ||
| 32,384,727 | ||||
| Consumer Durables – 2.17% | ||||
| †Electronic Arts | 21,700 | 1,092,812 | ||
| Harman International Industries | 27,600 | 2,651,808 | ||
| Lennar Class A | 62,000 | 2,617,020 | ||
| Toyota Motor ADR | 83,759 | 10,734,553 | ||
| 17,096,193 | ||||
| Consumer Non-Durables – 13.41% | ||||
| †Amazon.com | 112,300 | 4,468,417 | ||
| †Bed Bath & Beyond | 41,400 | 1,663,038 | ||
| †Coach | 23,800 | 1,191,190 | ||
| CVS | 248,203 | 8,473,650 | ||
| Fastenal | 34,000 | 1,191,700 | ||
| Federated Department Stores | 187,514 | 8,447,506 | ||
| Heineken ADR | 205,253 | 5,349,694 | ||
| Home Depot | 33,950 | 1,247,323 | ||
| InBev (Belgium) | 26,522 | 1,914,960 | ||
| †Kohl’s | 68,500 | 5,247,785 | ||
| Lowe’s | 344,989 | 10,863,704 | ||
| NIKE Class B | 9,600 | 1,020,096 | ||
| PepsiCo | 53,950 | 3,429,062 | ||
| PETsMART | 86,500 | 2,851,040 | ||
| Procter & Gamble | 277,631 | 17,535,174 | ||
| Reckitt Benckiser (United Kingdom) | 36,500 | 1,901,248 | ||
| †Starbucks | 195,087 | 6,117,928 | ||
| Target | 247,354 | 14,658,198 | ||
| Walgreen | 40,000 | 1,835,600 | ||
| Wal-Mart de Mexico ADR | 32,200 | 1,366,890 | ||
| Wal-Mart Stores | 77,500 | 3,638,625 | ||
| Whole Foods Market | 31,000 | 1,390,350 | ||
| 105,803,178 | ||||
| Consumer Services – 8.55% | ||||
| Carnival | 19,250 | 902,055 | ||
| †Comcast Class A | 517,912 | 13,439,817 | ||
| †eBay | 115,000 | 3,812,250 | ||
| †EchoStar Communications Class A | 10,300 | 447,329 | ||
| Four Seasons Hotels | 11,815 | 948,745 | ||
| International Game Technology | 56,550 | 2,283,489 | ||
| †Las Vegas Sands | 109,888 | 9,517,400 | ||
| †Liberty Media - Capital Class A | 30,420 | 3,364,148 | ||
| †Liberty Media - Interactive Class A | 84,900 | 2,022,318 | ||
| Marriott International Class A | 49,000 | 2,399,040 | ||
| †MGM MIRAGE | 168,370 | 11,705,082 | ||
| Station Casinos | 27,928 | 2,417,727 | ||
| †Viacom Class B | 74,000 | 3,042,140 | ||
| †Wynn Resorts | 60,862 | 5,773,369 | ||
| Yum Brands | 93,148 | 5,380,228 | ||
| 67,455,137 | ||||
| Energy – 4.25% | ||||
| Baker Hughes | 59,700 | 3,947,961 | ||
| EOG Resources | 33,400 | 2,382,756 | ||
| Exxon Mobil | 48,700 | 3,674,415 | ||
| Murphy Oil | 31,000 | 1,655,400 | ||
| †NRG Energy | 30,201 | 2,175,680 | ||
| Schlumberger | 209,741 | 14,493,103 | ||
| Total (France) | 74,100 | 5,191,841 | ||
| 33,521,156 | ||||
| Financials – 17.22% | ||||
| American Express | 97,100 | 5,476,440 | ||
| American International Group | 102,200 | 6,869,884 | ||
| Anglo Irish Bank (Ireland) | ||||
| (London Exchange) | 154,234 | 3,296,536 | ||
| †CB Richard Ellis Group Class A | 30,001 | 1,025,434 | ||
| Chicago Mercantile Exchange | ||||
| Holdings Class A | 3,000 | 1,597,380 | ||
| †China Merchants Bank (China) | ||||
| (Hong Kong Exchange) | 341,500 | 688,813 | ||
| Citigroup | 211,786 | 10,873,093 | ||
| Countrywide Financial | 89,000 | 2,993,960 | ||
| †E Trade Financial | 174,000 | 3,692,280 | ||
| Erste Bank der Oesterreichischen | ||||
| Sparkassen (Austria) | 50,500 | 3,932,943 | ||
| Franklin Resources | 37,000 | 4,470,710 | ||
| Goldman Sachs Group | 81,362 | 16,811,830 | ||
| †Industrial & Commercial | ||||
| Bank of China (China) | ||||
| (Hong Kong Exchange) | 14,553,000 | 8,157,950 | ||
| Legg Mason | 29,400 | 2,769,774 | ||
| Lehman Brothers Holdings | 141,211 | 9,894,655 | ||
| Morgan Stanley | 45,500 | 3,583,580 | ||
| Northern Trust | 42,900 | 2,580,006 | ||
| Prudential Financial | 46,100 | 4,160,986 | ||
| Schwab (Charles) | 157,400 | 2,878,846 | ||
| SLM | 55,650 | 2,276,085 | ||
| St. Joe | 38,869 | 2,033,237 | ||
| State Street | 75,960 | 4,918,410 |
60
| Number of | Value | |||
| Shares | (U.S. $) | |||
| Common Stock (continued) | ||||
| Financials (continued) | ||||
| UBS | 177,016 | $ 10,520,061 | ||
| UBS (Switzerland) | 133,600 | 7,937,722 | ||
| UniCredito Italiano (Italy) | 372,200 | 3,542,574 | ||
| Wells Fargo | 258,466 | 8,898,984 | ||
| 135,882,173 | ||||
| Health Care – 14.17% | ||||
| Aetna | 66,300 | 2,903,277 | ||
| †Amgen | 88,080 | 4,921,910 | ||
| †Amylin Pharmaceuticals | 105,689 | 3,948,541 | ||
| †Celgene | 34,400 | 1,804,624 | ||
| †Genentech | 239,834 | 19,695,168 | ||
| †Genzyme | 74,873 | 4,493,877 | ||
| †Gilead Sciences | 57,360 | 4,388,040 | ||
| †Humana | 25,600 | 1,485,312 | ||
| Lilly (Eli) | 29,500 | 1,584,445 | ||
| †Medco Health Solutions | 69,800 | 5,062,594 | ||
| Medtronic | 104,550 | 5,129,223 | ||
| Novartis (Switzerland) | 87,594 | 5,024,113 | ||
| Roche Holding (Switzerland) | 20,761 | 3,673,153 | ||
| †Sepracor | 30,000 | 1,398,900 | ||
| †St. Jude Medical | 22,100 | 831,181 | ||
| Stryker | 39,800 | 2,639,536 | ||
| UnitedHealth Group | 604,211 | 32,005,057 | ||
| †WellPoint | 84,200 | 6,828,620 | ||
| Wyeth | 52,100 | 2,606,563 | ||
| †Zimmer Holdings | 16,100 | 1,375,101 | ||
| 111,799,235 | ||||
| Technology – 18.63% | ||||
| †Adobe Systems | 61,300 | 2,556,210 | ||
| †Amdocs | 106,900 | 3,899,712 | ||
| America Movil ADR | 228,331 | 10,911,938 | ||
| †American Tower Class A | 70,900 | 2,761,555 | ||
| Analog Devices | 75,900 | 2,617,791 | ||
| †Apple | 27,400 | 2,545,734 | ||
| Applied Materials | 85,200 | 1,560,864 | ||
| †ASML Holding | 108,900 | 2,695,275 | ||
| AT&T | 82,492 | 3,252,660 | ||
| †Autodesk | 71,100 | 2,673,360 | ||
| Boeing | 75,756 | 6,735,466 | ||
| China Mobil (Hong Kong) | 786,000 | 7,147,284 | ||
| †Cisco Systems | 510,862 | 13,042,306 | ||
| †Corning | 117,800 | 2,678,772 | ||
| †Crown Castle International | 112,400 | 3,611,412 | ||
| †Dell | 57,800 | 1,341,538 | ||
| †EMC | 151,900 | 2,103,815 | ||
| Ericsson (LM) Class B (Sweden) | 866,200 | 3,187,934 | ||
| General Dynamics | 160,474 | 12,260,214 | ||
| †Google Class A | 24,918 | 11,416,431 | ||
| HON HAI Precision Industry GDR | 131,200 | 1,774,874 | ||
| Intel | 415,135 | 7,941,533 | ||
| †Intuit | 56,200 | 1,537,632 | ||
| †Juniper Networks | 138,100 | 2,717,808 | ||
| Lockheed Martin | 117,550 | 11,404,701 | ||
| †Marvell Technology Group | 222,000 | 3,731,820 | ||
| Maxim Integrated Products | 99,950 | 2,938,530 | ||
| Microsoft | 272,350 | 7,590,395 | ||
| QUALCOMM | 65,800 | 2,807,028 | ||
| Samsung Electronics | ||||
| (Republic of Korea) | 1,090 | 652,251 | ||
| Xilinx | 109,500 | 2,817,435 | ||
| †Yahoo | 67,100 | 2,099,559 | ||
| 147,013,837 | ||||
| Transportation – 4.72% | ||||
| Burlington Northern Santa Fe | 159,196 | 12,804,134 | ||
| FedEx | 106,296 | 11,419,379 | ||
| Southwest Airlines | 302,800 | 4,451,160 | ||
| Union Pacific | 84,236 | 8,554,166 | ||
| 37,228,839 | ||||
| Total Common Stock | ||||
| (cost $638,903,813) | 740,189,506 | |||
| Principal | ||||
| Amount (U.S. $) | ||||
| Repurchase Agreements – 5.78% | ||||
| With BNP Paribas 5.10% 4/2/07 | ||||
| (dated 3/30/07, to be repurchased | ||||
| at $18,674,933, collateralized by | ||||
| $10,371,000 U.S. Treasury Notes | ||||
| 2.625% due 5/15/08, market | ||||
| value $10,221,803, $6,095,000 | ||||
| U.S. Treasury Notes 3.375% | ||||
| due 12/15/08, market value | ||||
| $6,027,189 and $2,867,000 | ||||
| U.S. Treasury Notes 3.50% due | ||||
| 8/15/09, market value $2,810,402) | $18,667,000 | 18,667,000 | ||
| With Cantor Fitzgerald 5.11% 4/2/07 | ||||
| (dated 3/30/07, to be repurchased | ||||
| at $13,467,733, collateralized | ||||
| by $11,015,000 U.S. Treasury | ||||
| Bills due 6/28/07, market value | ||||
| $10,883,588 and $2,848,000 | ||||
| U.S. Treasury Notes 4.50% due | ||||
| 2/28/11, market value $2,857,140) | 13,462,000 | 13,462,000 | ||
| With UBS Warburg 5.11% 4/2/07 | ||||
| (dated 3/30/07, to be repurchased | ||||
| at $13,467,733, collateralized | ||||
| by $13,773,000 U.S. Treasury | ||||
| Bills due 4/19/07, market value | ||||
| $13,740,450) | 13,462,000 | 13,462,000 | ||
| Total Repurchase Agreements | ||||
| (cost $45,591,000) | 45,591,000 | |||
| Total Value of Securities – 99.59% | ||||
| (cost $684,494,813) | 785,780,506 | |||
| Receivables and Other Assets | ||||
| Net of Liabilities – 0.41% | 3,226,172 | |||
| Net Assets Applicable to 65,729,217 | ||||
| Shares Outstanding – 100.00% | $789,006,678 | |||
(continues) 61
Statements of net assets
Optimum Large Cap Growth Fund
| Net Asset Value – Optimum Large Cap Growth Fund | |||
| Class A ($56,087,991 / 4,681,610 Shares) | $11.98 | ||
| Net Asset Value – Optimum Large Cap Growth Fund | |||
| Class B ($10,819,191 / 924,834 Shares) | $11.70 | ||
| Net Asset Value – Optimum Large Cap Growth Fund | |||
| Class C ($203,590,651 / 17,407,070 Shares) | $11.70 | ||
| Net Asset Value – Optimum Large Cap Growth Fund | |||
| Institutional Class | |||
| ($518,508,845 / 42,715,703 Shares) | $12.14 | ||
| Components of Net Assets at March 31, 2007: | |||
| Shares of beneficial interest | |||
| (unlimited authorization – no par) | $684,630,354 | ||
| Accumulated net investment loss | (14,801 | ) | |
| Accumulated net realized gain on investments | 3,103,270 | ||
| Net unrealized appreciation of investments | |||
| and foreign currencies | 101,287,855 | ||
| Total net assets | $789,006,678 | ||
| †Non-income producing security for the year ended March 31, 2007. | |||
Summary of Abbreviations:
ADR – American Depositary Receipts
EUR – European Monetary Unit
GDR – Global Depositary Receipts
USD – United States Dollar
| The following foreign currency exchange contract was outstanding at March 31, 2007: | ||||||||||
| Foreign Currency Exchange Contract1 | ||||||||||
| In | ||||||||||
| Contract to | Exchange | Settlement | Unrealized | |||||||
| Receive | For | Date | Depreciation | |||||||
| EUR | 173,803 | USD | (232,403) | 4/4/07 | $(198 | ) | ||||
| $(198 | ) | |||||||||
1 See Note 7 in “Notes to Financial Statements.”
| Net Asset Value and Offering Price per Share – | |
| Optimum Large Cap Growth Fund | |
| Net asset value Class A (A) | $11.98 |
| Sales charge (5.75% of offering price) (B) | 0.73 |
| Offering price | $12.71 |
| (A) | Net asset value per share, as illustrated, is the amount which would be paid upon redemption or repurchase of shares. | |
| (B) | See the current prospectus for purchases of $75,000 or more. |
See accompanying notes
62
> Optimum Large Cap Value Fund
March 31, 2007
| Number of | Value | |||
| Shares | (U.S. $) | |||
| Common Stock – 96.10% ² | ||||
| Consumer Discretionary – 7.88% | ||||
| Clear Channel Communications | 163,890 | $ 5,742,706 | ||
| †Comcast Class A | 193,200 | 5,013,540 | ||
| Disney (Walt) | 54,900 | 1,890,207 | ||
| Federated Department Stores | 217,910 | 9,816,845 | ||
| General Motors | 163,400 | 5,006,576 | ||
| †Hanesbrands | 76,878 | 2,259,444 | ||
| Hasbro | 7,960 | 227,815 | ||
| Idearc | 3,708 | 130,151 | ||
| Johnson Controls | 21,230 | 2,008,783 | ||
| Mattel | 145,300 | 4,005,921 | ||
| New York Times Class A | 41,320 | 971,433 | ||
| NIKE Class B | 50,900 | 5,408,634 | ||
| Regal Entertainment Group Class A | 354,900 | 7,051,863 | ||
| Royal Caribbean Cruises | 29,270 | 1,234,023 | ||
| Sherwin-Williams | 28,830 | 1,903,933 | ||
| Sony ADR | 73,700 | 3,721,113 | ||
| †Toll Brothers | 42,060 | 1,151,603 | ||
| †Viacom Class B | 75,780 | 3,115,316 | ||
| WPP Group (United Kingdom) | 128,070 | 1,940,574 | ||
| 62,600,480 | ||||
| Consumer Staples – 8.98% | ||||
| †Altria Group | 183,370 | 16,104,302 | ||
| Altria Group When Issued | 12,300 | 810,324 | ||
| Avon Products | 214,400 | 7,988,544 | ||
| CVS | 102,992 | 3,516,140 | ||
| Diageo (United Kingdom) | 220,876 | 4,472,557 | ||
| Kellogg | 81,430 | 4,187,945 | ||
| Kimberly-Clark | 112,450 | 7,701,701 | ||
| Kraft Foods Class A | 362,350 | 11,472,001 | ||
| Nestle (Switzerland) | 10,266 | 3,998,012 | ||
| PepsiCo | 48,430 | 3,078,211 | ||
| Sara Lee | 420,800 | 7,119,936 | ||
| Tyson Foods Class A | 43,720 | 848,605 | ||
| 71,298,278 | ||||
| Energy – 8.09% | ||||
| Apache | 42,050 | 2,972,935 | ||
| Chevron | 153,092 | 11,322,684 | ||
| ConocoPhillips | 221,330 | 15,127,905 | ||
| Devon Energy | 62,880 | 4,352,554 | ||
| EOG Resources | 37,390 | 2,667,403 | ||
| Exxon Mobil | 133,380 | 10,063,521 | ||
| Hess | 91,070 | 5,051,653 | ||
| Noble | 19,280 | 1,516,950 | ||
| Royal Dutch Shell ADR | 28,390 | 1,882,257 | ||
| Total ADR | 133,110 | 9,288,416 | ||
| 64,246,278 | ||||
| Financials – 26.32% | ||||
| AFLAC | 35,610 | 1,675,807 | ||
| Allstate | 216,210 | 12,985,572 | ||
| American Express | 71,970 | 4,059,108 | ||
| American International Group | 83,500 | 5,612,870 | ||
| Bank of America | 294,003 | 15,000,032 | ||
| Bank of New York | 149,610 | 6,066,686 | ||
| Capital One Financial | 58,600 | 4,421,956 | ||
| CapitalSource | 260,300 | 6,541,339 | ||
| Chubb | 157,030 | 8,113,740 | ||
| Citigroup | 472,920 | 24,279,712 | ||
| Crescent Real Estate | 192,400 | 3,859,544 | ||
| Fannie Mae | 332,670 | 18,157,128 | ||
| Franklin Resources | 22,400 | 2,706,592 | ||
| Freddie Mac | 34,400 | 2,046,456 | ||
| Genworth Financial | 122,050 | 4,264,427 | ||
| Goldman Sachs Group | 48,700 | 10,062,881 | ||
| Hartford Financial Services Group | 45,810 | 4,378,520 | ||
| JPMorgan Chase | 237,207 | 11,476,075 | ||
| Lehman Brothers Holdings | 40,900 | 2,865,863 | ||
| Mellon Financial | 85,610 | 3,693,215 | ||
| Merrill Lynch | 143,790 | 11,743,329 | ||
| MetLife | 197,830 | 12,492,965 | ||
| New York Community Bancorp | 258,300 | 4,543,497 | ||
| PNC Financial Services Group | 70,180 | 5,050,855 | ||
| SunTrust Banks | 91,940 | 7,634,698 | ||
| Travelers | 163,313 | 8,454,714 | ||
| UBS (Switzerland) | 115,238 | 6,846,761 | ||
| 209,034,342 | ||||
| Health Care – 8.60% | ||||
| Abbott Laboratories | 28,970 | 1,616,526 | ||
| Aetna | 120,800 | 5,289,832 | ||
| Johnson & Johnson | 172,550 | 10,397,863 | ||
| Lilly (Eli) | 66,400 | 3,566,344 | ||
| Merck | 98,180 | 4,336,611 | ||
| Pfizer | 369,400 | 9,331,044 | ||
| Schering-Plough | 186,600 | 4,760,166 | ||
| †Tenet Healthcare | 707,930 | 4,551,990 | ||
| UnitedHealth Group | 38,230 | 2,025,043 | ||
| †Watson Pharmaceuticals | 173,600 | 4,588,248 | ||
| †WellPoint | 54,630 | 4,430,493 | ||
| Wyeth | 267,430 | 13,379,523 | ||
| 68,273,683 | ||||
| Industrials – 11.46% | ||||
| Burlington Northern Santa Fe | 57,450 | 4,620,704 | ||
| Con-way | 52,900 | 2,636,536 | ||
| Cooper Industries Class A | 11,400 | 512,886 | ||
| CSX | 197,800 | 7,921,890 | ||
| Deere | 57,235 | 6,218,010 | ||
| Eaton | 10,390 | 868,188 | ||
| General Electric | 224,590 | 7,941,502 | ||
| Grainger (W.W.) | 40,160 | 3,101,958 | ||
| Honeywell International | 101,500 | 4,675,090 | ||
| Lockheed Martin | 155,280 | 15,065,266 | ||
| Masco | 238,760 | 6,542,024 | ||
| Nalco Holding | 24,150 | 577,185 | ||
| Norfolk Southern | 37,780 | 1,911,668 | ||
| Northrop Grumman | 118,880 | 8,823,274 | ||
| Rockwell Automation | 45,740 | 2,738,454 | ||
| Union Pacific | 56,500 | 5,737,575 | ||
| United Technologies | 94,370 | 6,134,050 | ||
| Waste Management | 143,900 | 4,951,599 | ||
| 90,977,859 |
(continues) 63
Statements of net assets
Optimum Large Cap Value Fund
| Number of | Value | |||||
| Shares | (U.S. $) | |||||
| Common Stock (continued) | ||||||
| Information Technology – 5.80% | ||||||
| Accenture Class A | 116,190 | $ 4,477,963 | ||||
| †Cisco Systems | 58,550 | 1,494,782 | ||||
| Electronic Data Systems | 164,500 | 4,553,360 | ||||
| Hewlett-Packard | 241,680 | 9,701,035 | ||||
| Intel | 609,150 | 11,653,039 | ||||
| International Business Machines | 85,400 | 8,049,804 | ||||
| †Oracle | 338,310 | 6,133,560 | ||||
| 46,063,543 | ||||||
| Materials – 6.24% | ||||||
| Air Products & Chemicals | 39,340 | 2,906,833 | ||||
| Bowater | 8,530 | 203,185 | ||||
| Dow Chemical | 55,530 | 2,546,606 | ||||
| duPont (E.I.) deNemours | 152,800 | 7,552,904 | ||||
| International Paper | 39,530 | 1,438,892 | ||||
| Lyondell Chemical | 139,200 | 4,171,824 | ||||
| MeadWestvaco | 236,400 | 7,290,576 | ||||
| Packaging Corp. of America | 384,400 | 9,379,359 | ||||
| PPG Industries | 79,560 | 5,593,864 | ||||
| Praxair | 47,490 | 2,989,970 | ||||
| †Smurfit-Stone Container | 60,140 | 677,176 | ||||
| Syngenta (Switzerland) | 24,980 | 4,779,337 | ||||
| 49,530,526 | ||||||
| Telecommunications – 9.19% | ||||||
| Alcatel-Lucent ADR | 660,432 | 7,806,306 | ||||
| ALLTEL | 90,900 | 5,635,800 | ||||
| AT&T | 362,450 | 14,291,404 | ||||
| BCE | 354,685 | 10,030,492 | ||||
| Embarq | 38,406 | 2,164,178 | ||||
| Nokia ADR | 384,600 | 8,815,032 | ||||
| †Qwest Communications | ||||||
| International | 517,000 | 4,647,830 | ||||
| Sprint Nextel | 225,360 | 4,272,826 | ||||
| TELUS (Canada) | 13,310 | 664,232 | ||||
| Verizon Communications | 120,820 | 4,581,494 | ||||
| Vodafone Group (United Kingdom) | 1,307,017 | 3,485,078 | ||||
| Windstream | 448,000 | 6,581,120 | ||||
| 72,975,792 | ||||||
| Utilities – 3.54% | ||||||
| American Electric Power | 198,930 | 9,697,838 | ||||
| Dominion Resources | 77,750 | 6,901,868 | ||||
| Entergy | 28,770 | 3,018,548 | ||||
| FPL Group | 70,670 | 4,322,884 | ||||
| PPL | 25,990 | 1,062,991 | ||||
| Public Service Enterprise Group | 11,880 | 986,515 | ||||
| TXU | 33,310 | 2,135,171 | ||||
| 28,125,815 | ||||||
| Total Common Stock | ||||||
| (cost $660,811,381) | 763,126,596 | |||||
| Principal | Value | |||||
| Amount (U.S. $) | (U.S. $) | |||||
| Repurchase Agreements – 4.20% | ||||||
| With BNP Paribas 5.10% 4/2/07 | ||||||
| (dated 3/30/07, to be repurchased | ||||||
| at $13,660,803, collateralized by | ||||||
| $7,587,000 U.S. Treasury Notes | ||||||
| 2.625% due 5/15/08, market | ||||||
| value $7,477,514, $4,458,000 | ||||||
| U.S. Treasury Notes 3.375% due | ||||||
| 12/15/08, market value | ||||||
| $4,409,045 and $2,097,000 U.S. | ||||||
| Treasury Notes 3.50% due 8/15/09, | ||||||
| market value $2,055,882) | $13,655,000 | $ 13,655,000 | ||||
| With Cantor Fitzgerald 5.11% 4/2/07 | ||||||
| (dated 3/30/07, to be repurchased | ||||||
| at $9,852,194, collateralized by | ||||||
| $8,057,000 U.S. Treasury Bills due | ||||||
| 6/28/07, market value $7,961,627 | ||||||
| and $2,083,000 U.S. Treasury | ||||||
| Notes 4.50% due 2/28/11, market | ||||||
| value $2,090,072) | 9,848,000 | 9,848,000 | ||||
| With UBS Warburg 5.11% 4/2/07 | ||||||
| (dated 3/30/07, to be repurchased | ||||||
| at $9,852,194, collateralized | ||||||
| by $10,075,000 U.S. Treasury | ||||||
| Bills due 4/19/07, market value | ||||||
| $10,051,496) | 9,848,000 | 9,848,000 | ||||
| Total Repurchase Agreements | ||||||
| (cost $33,351,000) | 33,351,000 | |||||
| Number of | ||||||
| Shares | ||||||
| Securities Sold Short – (0.13%) | ||||||
| Common Stock – (0.13%) | ||||||
| Consumer Staples – (0.13%) | ||||||
| Kraft Foods When Issued | (32,600 | ) | (1,033,746 | ) | ||
| Total Securities Sold Short | ||||||
| (proceeds $1,028,141) | (1,033,746 | ) | ||||
| Total Value of Securities – 100.17% | ||||||
| (cost $693,134,240) | 795,443,850 | |||||
| Liabilities Net of Receivables and | ||||||
| Other Assets – (0.17%) | (1,352,383 | ) | ||||
| Net Assets Applicable to 62,459,022 | ||||||
| Shares Outstanding – 100.00% | $794,091,467 | |||||
| Net Asset Value – Optimum Large Cap Value Fund | ||||||
| Class A ($58,160,896 / 4,569,231 Shares) | $12.73 | |||||
| Net Asset Value – Optimum Large Cap Value Fund | ||||||
| Class B ($11,403,136 / 902,244 Shares) | $12.64 | |||||
| Net Asset Value – Optimum Large Cap Value Fund | ||||||
| Class C ($216,527,492 / 17,138,070 Shares) | $12.63 | |||||
| Net Asset Value – Optimum Large Cap Value Fund | ||||||
| Institutional Class ($507,999,943 / 39,849,477 Shares) | $12.75 | |||||
64
| Components of Net Assets at March 31, 2007: | ||
| Shares of beneficial interest | ||
| (unlimited authorization – no par) | $677,279,837 | |
| Undistributed investment income | 2,307,931 | |
| Accumulated net realized gain on investments | 12,190,930 | |
| Net unrealized appreciation of investments | ||
| and foreign currencies | 102,312,769 | |
| Total net assets | $794,091,467 | |
| † | Non-income producing security for the year ended March 31, 2007. |
| ² | Narrow industries are utilized for compliance purposes for diversification whereas broad sectors are used for financial reporting. |
ADR – American Depositary Receipts
| Net Asset Value and Offering Price per Share – | |
| Optimum Large Cap Value Fund | |
| Net asset value Class A (A) | $12.73 |
| Sales charge (5.75% of offering price) (B) | 0.78 |
| Offering price | $13.51 |
| (A) | Net asset value per share, as illustrated, is the amount which would be paid upon redemption or repurchase of shares. | |
| (B) | See the current prospectus for purchases of $75,000 or more. |
See accompanying notes
65
Statements of net assets
> Optimum Small Cap Growth Fund
March 31, 2007
| Number of | ||||
| Shares | Value | |||
| Common Stock – 97.56%² | ||||
| Basic Industry/Capital Goods – 15.73% | ||||
| †Allis-Chalmers Energy | 18,900 | $ 297,675 | ||
| AMETEK | 37,500 | 1,295,250 | ||
| †Atwood Oceanics | 29,500 | 1,731,355 | ||
| Belden CDT | 8,000 | 428,720 | ||
| †Brush Engineered Materials | 14,500 | 702,815 | ||
| †Ceradyne | 14,191 | 776,815 | ||
| Donaldson | 29,000 | 1,046,900 | ||
| Dynamic Materials | 14,600 | 477,712 | ||
| Florida Rock Industries | 7,500 | 504,675 | ||
| †Genlyte Group | 25,000 | 1,763,750 | ||
| †Kadant | 22,300 | 565,528 | ||
| Kaydon | 10,000 | 425,600 | ||
| †Ladish | 20,400 | 767,856 | ||
| †Littelfuse | 10,000 | 406,000 | ||
| †Mettler-Toledo International | 20,000 | 1,791,400 | ||
| Mine Safety Appliances | 8,000 | 336,480 | ||
| Nordson | 31,000 | 1,440,260 | ||
| Pentair | 33,400 | 1,040,744 | ||
| †Quanta Services | 50,000 | 1,261,000 | ||
| †Rogers | 4,700 | 208,445 | ||
| Scotts Miracle-Gro | 35,800 | 1,576,274 | ||
| Toro | 16,200 | 830,088 | ||
| †TurboChef Technologies | 15,732 | 239,441 | ||
| †Waste Connections | 40,950 | 1,226,043 | ||
| †Zoltek | 23,000 | 803,390 | ||
| 21,944,216 | ||||
| Business Services – 10.34% | ||||
| Administaff | 20,000 | 704,000 | ||
| †Answerthink | 42,800 | 139,956 | ||
| †aQuantive | 38,070 | 1,062,534 | ||
| †Ceridian | 50,000 | 1,742,000 | ||
| †Concur Technologies | 87,800 | 1,532,988 | ||
| †CRA International | 9,588 | 500,302 | ||
| †Discovery Holding | 90,000 | 1,721,700 | ||
| †ExlService Holdings | 22,800 | 470,364 | ||
| †Gemstar-TV Guide International | 340,000 | 1,424,600 | ||
| †Kenexa | 24,700 | 768,911 | ||
| †Labor Ready | 20,000 | 379,800 | ||
| †Navigant Consulting | 29,500 | 582,920 | ||
| †SkillSoft ADR | 75,000 | 627,000 | ||
| †Universal Technical Institute | 30,000 | 692,400 | ||
| †ValueClick | 79,315 | 2,072,500 | ||
| 14,421,975 | ||||
| Consumer Durables – 3.42% | ||||
| †Cavco Industries | 37,000 | 1,293,150 | ||
| †Champion Enterprises | 168,400 | 1,481,920 | ||
| †Desarrolladora Homex ADR | 12,358 | 716,146 | ||
| †Jarden | 13,000 | 497,900 | ||
| Thor Industries | 20,000 | 787,800 | ||
| 4,776,916 | ||||
| Consumer Non-Durables – 9.85% | ||||
| Abercrombie & Fitch Class A | 22,200 | 1,680,095 | ||
| †Carter’s | 49,000 | 1,241,660 | ||
| †Central European Districtribution | 30,850 | 898,044 | ||
| †Chico’s FAS | 40,000 | 977,200 | ||
| Christopher & Banks | 16,000 | 311,520 | ||
| †Citi Trends | 20,100 | 859,074 | ||
| †Heelys | 28,900 | 847,926 | ||
| †Iconix Brand Group | 33,200 | 677,280 | ||
| †J. Crew Group | 29,050 | 1,166,939 | ||
| Oxford Industries | 31,000 | 1,532,640 | ||
| Pool | 25,000 | 895,000 | ||
| †SunOpta | 22,400 | 266,560 | ||
| †True Religion Apparel | 60,000 | 974,400 | ||
| †Volcom | 18,700 | 642,532 | ||
| †Zumiez | 19,400 | 778,328 | ||
| 13,749,198 | ||||
| Consumer Services – 5.70% | ||||
| Central Parking | 34,100 | 756,338 | ||
| Ctrip.com International ADR | 5,334 | 357,298 | ||
| †Entravision Communications | 120,000 | 1,120,800 | ||
| †HealthExtras | 29,500 | 849,010 | ||
| International Speedway Class A | 15,500 | 801,350 | ||
| †inVentiv Health | 13,869 | 531,044 | ||
| †ITT Educational Services | 10,000 | 814,900 | ||
| †Lions Gate Entertainment | 85,000 | 970,700 | ||
| †Salem Communications Holding | ||||
| Class A | 45,000 | 562,500 | ||
| †Sonic | 13,500 | 300,780 | ||
| †Spanish Broadcasting Systems | ||||
| Class A | 36,400 | 145,600 | ||
| Speedway Motorsports | 6,800 | 263,500 | ||
| †Travelzoo | 13,000 | 478,010 | ||
| 7,951,830 | ||||
| Energy – 3.40% | ||||
| †ATP Oil & Gas | 12,989 | 488,386 | ||
| †Canadian Solar | 5,800 | 56,550 | ||
| †Carrizo Oil & Gas | 24,287 | 849,073 | ||
| †Dril-Quip | 12,400 | 536,672 | ||
| †FMC Technologies | 21,000 | 1,464,960 | ||
| †GMX Resources | 7,800 | 239,694 | ||
| †Hercules Offshore | 17,400 | 456,924 | ||
| †Quicksilver Resources | 11,400 | 453,378 | ||
| †Tesco | 7,600 | 201,780 | ||
| 4,747,417 | ||||
| Financials – 2.37% | ||||
| †AmeriCredit | 19,500 | 445,770 | ||
| †Eastern Insurance Holdings | 20,800 | 311,584 | ||
| †eHealth | 11,000 | 259,050 | ||
| HCC Insurance Holdings | 28,050 | 863,940 | ||
| †Markel | 500 | 242,415 | ||
| †Pinnacle Financial Partners | 8,600 | 262,386 | ||
| TCF Financial | 8,400 | 221,424 | ||
| †TradeStation Group | 41,300 | 519,967 | ||
| †World Acceptance | 4,500 | 179,775 | ||
| 3,306,311 | ||||
| Health Care – 11.49% | ||||
| †Abaxis | 15,500 | 377,735 | ||
| †Accuray | 3,300 | 73,392 | ||
| †Allscripts Healthcare Solutions | 36,791 | 986,367 | ||
| †Barrier Therapeutics | 25,000 | 172,500 |
66
| Number of | |||
| Shares | Value | ||
| Common Stock (continued) | |||
| Health Care (continued) | |||
| †BioMarin Pharmaceuticals | 20,000 | $ 345,200 | |
| †deCODE genetics | 50,000 | 182,500 | |
| †Edwards Lifesciences | 6,000 | 304,200 | |
| †HealthSpring | 33,800 | 795,990 | |
| †Healthways | 10,672 | 498,916 | |
| †IsoRay | 140,000 | 553,000 | |
| †Kyphon | 22,719 | 1,025,536 | |
| †La Jolla Pharmaceutical | 25,000 | 151,250 | |
| LCA-Vision | 23,000 | 947,370 | |
| †LHC Group | 20,600 | 668,058 | |
| †LifeCell | 9,500 | 237,215 | |
| †Lincare Holdings | 16,000 | 586,400 | |
| †Medicines | 12,000 | 300,960 | |
| Medicis Pharmaceutical Class A | 15,000 | 462,300 | |
| †@#Medicure Restricted PIPE | 370,070 | 418,179 | |
| †MGI Pharma | 8,000 | 179,760 | |
| †Myriad Genetics | 6,000 | 206,760 | |
| †Natus Medical | 27,100 | 481,567 | |
| †Nektar Therapeutics | 15,000 | 195,900 | |
| †Neurogen | 3,500 | 22,750 | |
| †NightHawk Radiology Holdings | 29,300 | 532,967 | |
| †Nuvelo | 220,000 | 809,600 | |
| †Palomar Medical Technologies | 10,185 | 406,891 | |
| †PDL BioPharma | 70,000 | 1,518,999 | |
| †QLT | 35,000 | 274,050 | |
| †Salix Pharmaceuticals | 41,168 | 518,717 | |
| †Sciele Pharma | 25,445 | 602,538 | |
| †United Surgical Partners International | 25,000 | 770,250 | |
| †Vital Images | 12,900 | 429,054 | |
| 16,036,871 | |||
| Real Estate – 1.21% | |||
| DiamondRock Hospitality | 47,000 | 893,000 | |
| Kite Realty Group Trust | 40,000 | 798,000 | |
| 1,691,000 | |||
| Technology – 32.54% | |||
| †Acme Packet | 52,747 | 779,601 | |
| †Agile Software | 60,000 | 417,000 | |
| †American Tower Class A | 44,400 | 1,729,380 | |
| †AMIS Holdings | 81,000 | 886,950 | |
| Amphenol Class A | 10,000 | 645,700 | |
| †Atheros Communications | 46,000 | 1,100,780 | |
| †Avid Technology | 50,000 | 1,744,000 | |
| †BigBand Networks | 20,500 | 369,205 | |
| †CNET Networks | 90,000 | 783,900 | |
| †Crown Castle International | 18,400 | 591,192 | |
| CTS | 26,000 | 359,320 | |
| Daktronics | 23,300 | 639,352 | |
| †DealerTrack Holdings | 28,900 | 887,808 | |
| †DivX | 30,200 | 605,208 | |
| †Dobson Communications Class A | 92,000 | 790,280 | |
| †Entegris | 70,000 | 749,000 | |
| †ESCO Technologies | 40,200 | 1,801,764 | |
| †FalconStor Software | 58,700 | 611,654 | |
| †FEI | 19,300 | 695,958 | |
| †FLIR Systems | 55,000 | 1,961,850 | |
| †Focus Media Holding ADR | 23,988 | 1,882,098 | |
| †Gmarket ADR | 31,000 | 538,470 | |
| †Innerworkings | 56,000 | 660,800 | |
| †Integrated Device Technology | 92,000 | 1,418,640 | |
| †Interactive Intelligence | 14,300 | 217,932 | |
| †IPG Photonics | 19,300 | 370,560 | |
| †Knot | 22,400 | 482,272 | |
| †Kronos | 25,000 | 1,337,500 | |
| †Liquidity Services | 29,200 | 494,648 | |
| †Microsemi | 30,000 | 624,300 | |
| †Nice Systems ADR | 33,700 | 1,146,474 | |
| †Novatel Wireless | 41,900 | 672,076 | |
| †Novell | 140,400 | 1,013,688 | |
| †Occam Networks | 10,700 | 119,519 | |
| †Omrix Biopharmaceuticals | 26,728 | 1,022,881 | |
| †Oplink Communications | 45,400 | 815,838 | |
| †Opsware | 56,900 | 412,525 | |
| †Optium | 28,200 | 547,362 | |
| †Parametric Technology | 30,000 | 572,700 | |
| †Polycom | 30,000 | 999,900 | |
| †RightNow Technologies | 9,634 | 157,805 | |
| †Sierra Wireless | 55,700 | 873,933 | |
| †Sigma Designs | 25,500 | 669,630 | |
| †Smith Micro Software | 34,800 | 648,324 | |
| †Sourcefire | 18,800 | 331,444 | |
| †STEC | 59,600 | 419,584 | |
| †Supertex | 45,000 | 1,494,450 | |
| †Symmetricom | 25,000 | 207,500 | |
| †Synchronoss Technologies | 10,100 | 175,740 | |
| †Systems Xcellence | 15,325 | 288,723 | |
| †Tellabs | 120,000 | 1,188,000 | |
| †Tessera Technologies | 30,163 | 1,198,678 | |
| †Time Warner Telecommunication | |||
| Class A | 103,000 | 2,139,310 | |
| †Trident Microsystems | 55,400 | 1,111,324 | |
| †Vasco Data Security International | 55,800 | 997,146 | |
| 45,401,676 | |||
| Transportation – 0.73% | |||
| Heartland Express | 64,000 | 1,016,320 | |
| 1,016,320 | |||
| Utilities – 0.78% | |||
| Atlantic Tele-Network | 7,900 | 206,427 | |
| Northeast Utilities | 27,000 | 884,790 | |
| 1,091,217 | |||
| Total Common Stock | |||
| (cost $113,628,159) | 136,134,947 |
(continues) 67
Statements of net assets
Optimum Small Cap Growth Fund
| Number of | |||||
| Shares | Value | ||||
| Warrants – 0.00% | |||||
| †=Isoray, expiration date 3/22/11, | 28,000 | $ | 0 | ||
| strike price $5.00 | |||||
| †=@#Medicure Restricted PIPE, | |||||
| expiration date 12/1/11, | |||||
| strike price $1.70 | 74,014 | 0 | |||
| Total Warrants (cost $0) | 0 | ||||
| Principal | |||||
| Amount | |||||
| Repurchase Agreements – 2.56% | |||||
| With BNP Paribas 5.10% | |||||
| 4/2/07 (dated 3/30/07, to be | |||||
| repurchased at $1,460,620, | |||||
| collateralized by $811,000 | |||||
| U.S. Treasury Notes 2.625% | |||||
| due 5/15/08, market value | |||||
| $799,521, $477,000 U.S. | |||||
| Treasury Notes 3.375% | |||||
| due 12/15/08, market value | |||||
| $471,430 and $224,000 | |||||
| U.S. Treasury Notes 3.50% | |||||
| due 8/15/09, market value | |||||
| $219,822) | $1,460,000 | 1,460,000 | |||
| With Cantor Fitzgerald 5.11% | |||||
| 4/2/07 (dated 3/30/07, to be | |||||
| repurchased at $1,053,448, | |||||
| collateralized by $862,000 | |||||
| U.S. Treasury Bills due 6/28/07, | |||||
| market value $851,284 and | |||||
| $223,000 U.S. Treasury Notes | |||||
| 4.50% due 2/28/11, market | |||||
| value $223,478) | 1,053,000 | 1,053,000 | |||
| With UBS Warburg 5.11% | |||||
| 4/2/07 (dated 3/30/07, to be | |||||
| repurchased at $1,053,448, | |||||
| collateralized by $1,077,000 | |||||
| U.S. Treasury Bills due 4/19/07, | |||||
| market value $1,074,739) | 1,053,000 | 1,053,000 | |||
| Total Repurchase Agreements | |||||
| (cost $3,566,000) | 3,566,000 | ||||
| Total Value of Securities – 100.12% | |||||
| (cost $117,194,159) | 139,700,947 | ||||
| Liabilities Net of Receivables and | |||||
| Other Assets – (0.12%) | (168,402 | ) | |||
| Net Assets Applicable to 9,911,882 | |||||
| Shares Outstanding – 100.00% | $139,532,545 | ||||
| Net Asset Value – Optimum Small Cap Growth Fund | |||||
| Class A ($12,088,114 / 859,145 Shares) | $14.07 | ||||
| Net Asset Value – Optimum Small Cap Growth Fund | |||||
| Class B ($2,186,551 / 159,065 Shares) | $13.75 | ||||
| Net Asset Value – Optimum Small Cap Growth Fund | |||||
| Class C ($40,323,491 / 2,933,345 Shares) | $13.75 | ||||
| Net Asset Value – Optimum Small Cap Growth Fund | |||||
| Institutional Class ($84,934,389 / 5,960,327 Shares) | $14.25 | ||||
| Components of Net Assets at March 31, 2007: | ||
| Shares of beneficial interest | ||
| (unlimited authorization – no par) | $114,685,545 | |
| Accumulated net realized gain on investments | 2,340,212 | |
| Net unrealized appreciation of investments | 22,506,788 | |
| Total net assets | $139,532,545 |
| † | Non-income producing security for the year ended March 31, 2007. | ||
| = | Security is being fair valued in accordance with the Fund’s fair valuation policy. At March 31, 2007, the aggregate amount of fair valued securities equaled $0, which represented 0.00% of the Fund’s net assets. See Note 1 in “Notes to Financial Statements.” | ||
| # | Restricted Security. Investment in a security not registered under the Securities Act of 1933, as amended. This security has certain restrictions on resale which may limit its liquidity. At March 31, 2007, the aggregate amount of the restricted securities equaled $418,179 or 0.30% of the Fund’s net assets. See Note 11 in “Notes to Financial Statements.” | ||
| @ | Illiquid security. At March 31, 2007, the aggregate amount of illiquid securities equaled $418,179, which represented 0.30% of the Fund’s net assets. See Note 11 in “Notes to Financial Statements.” | ||
| ² | Narrow industries are utilized for compliance purposes for diversification whereas broad sectors are used for financial reporting. | ||
| Summary of Abbreviations: ADR – American Depositary Receipt PIPE – Private Investment in Public Equity | |||
| Net Asset Value and Offering Price per Share – | |
| Optimum Small Cap Growth Fund | |
| Net asset value Class A (A) | $14.07 |
| Sales charge (5.75% of offering price) (B) | 0.86 |
| Offering price | $14.93 |
| (A) | Net asset value per share, as illustrated, is the amount which would be paid upon redemption or repurchase of shares. | |
| (B) | See the current prospectus for purchases of $75,000 or more. |
See accompanying notes
68
> Optimum Small Cap Value Fund
March 31, 2007
| Number of | |||
| Shares | Value | ||
| Common Stock – 91.50% | |||
| Basic Industry – 17.16% | |||
| Agrium | 36,900 | $ 1,414,377 | |
| Albany International | 65,000 | 2,336,099 | |
| AMETEK | 10,500 | 362,670 | |
| Ashland | 23,000 | 1,508,800 | |
| Brady Class A | 28,000 | 873,600 | |
| Chemtura | 53,000 | 579,290 | |
| Crane | 37,000 | 1,495,540 | |
| Cytec Industries | 30,000 | 1,687,200 | |
| Eastman Chemical | 10,000 | 633,300 | |
| FMC | 18,500 | 1,395,455 | |
| †Hercules | 103,040 | 2,013,402 | |
| †Kapstone Paper and Packaging | 170,000 | 1,122,000 | |
| Lubrizol | 11,600 | 597,748 | |
| †Lydall | 43,000 | 683,270 | |
| †Material Sciences | 47,000 | 469,060 | |
| Novelis | 10,500 | 463,155 | |
| †Pioneer Companies | 27,000 | 746,280 | |
| Quanex | 17,000 | 719,950 | |
| Sensient Technologies | 19,175 | 494,332 | |
| St. Joe | 7,000 | 366,170 | |
| †Trex | 49,000 | 1,054,970 | |
| Tronox Class A | 27,900 | 401,760 | |
| Tronox Class B | 38,500 | 538,230 | |
| 21,956,658 | |||
| Business Services – 8.22% | |||
| Bowne & Company | 30,500 | 479,765 | |
| Courier | 9,683 | 378,315 | |
| Ennis | 20,190 | 540,284 | |
| IKON Office Solutions | 108,500 | 1,559,145 | |
| Kelly Services | 64,600 | 2,080,120 | |
| †Live Nation | 26,900 | 593,414 | |
| Nautilus | 25,250 | 389,608 | |
| †PHH | 36,100 | 1,103,216 | |
| †R.H. Donnelley | 8,200 | 581,298 | |
| †Spherion | 119,000 | 1,049,580 | |
| †Valassis Communications | 103,000 | 1,770,570 | |
| 10,525,315 | |||
| Capital Spending – 5.95% | |||
| Acuity Brands | 16,000 | 871,040 | |
| Commercial Metals | 20,000 | 627,000 | |
| †Flowserve | 28,200 | 1,612,758 | |
| Franklin Electric | 3,500 | 162,750 | |
| Hardinge | 3,958 | 103,541 | |
| Kennametal | 38,000 | 2,569,180 | |
| †Miller Industries | 4,100 | 89,421 | |
| †NaviStar International | 25,000 | 1,143,750 | |
| Wabash National | 28,200 | 434,844 | |
| 7,614,284 | |||
| Conglomerates – 0.65% | |||
| Honeywell International | 18,000 | 829,080 | |
| 829,080 | |||
| Consumer Cyclical – 8.04% | |||
| Beazer Homes USA | 30,100 | 873,803 | |
| †Comstock Homebuilding Class A | 18,800 | 76,140 | |
| Furniture Brands International | 140,100 | 2,210,778 | |
| Hooker Furniture | 23,952 | 480,238 | |
| La-Z-Boy | 31,185 | 386,070 | |
| MDC Holdings | 48,800 | 2,345,816 | |
| †Meritage Homes | 7,800 | 250,536 | |
| Newell Rubbermaid | 22,000 | 683,980 | |
| Stanley Works | 27,500 | 1,522,400 | |
| †WCI Communities | 68,500 | 1,461,790 | |
| 10,291,551 | |||
| Consumer Services – 10.57% | |||
| †Avis Budget Group | 29,860 | 815,775 | |
| †BJ’s Wholesale Club | 31,900 | 1,079,177 | |
| Delta Apparel | 37,000 | 643,800 | |
| †Eddie Bauer Holdings | 28,400 | 322,908 | |
| Foot Locker | 70,000 | 1,648,500 | |
| IHOP | 8,020 | 470,373 | |
| Kenneth Cole Productions Class A | 16,690 | 428,432 | |
| Monaco Coach | 30,495 | 485,785 | |
| Oakley | 8,850 | 178,239 | |
| †Pathmark Stores | 55,200 | 706,560 | |
| †Rent-A-Center | 33,400 | 934,532 | |
| †Rush Enterprises Class A | 33,000 | 633,930 | |
| †Russ Berrie & Company | 12,800 | 180,480 | |
| †Sturm Ruger | 1,000 | 13,450 | |
| †Sunterra | 50,600 | 794,420 | |
| †Warnaco Group | 81,900 | 2,325,961 | |
| Westwood One | 228,300 | 1,568,421 | |
| †Winn-Dixie Stores | 17,000 | 300,050 | |
| 13,530,793 | |||
| Consumer Staples – 0.30% | |||
| Chiquita Brands International | 27,875 | 390,808 | |
| 390,808 | |||
| Energy – 5.52% | |||
| †Callon Petroleum | 26,700 | 362,319 | |
| CARBO Ceramics | 13,700 | 637,735 | |
| †Forest Oil | 6,000 | 200,220 | |
| Foundation Coal Holdings | 35,700 | 1,225,938 | |
| Gulf Island Fabrication | 16,860 | 450,836 | |
| †Input/Output | 45,105 | 621,547 | |
| †Mariner Energy | 4,855 | 92,876 | |
| Southern Union | 75,954 | 2,308,242 | |
| †Southwestern Energy | 11,920 | 488,482 | |
| †Weatherford International | 15,000 | 676,500 | |
| 7,064,695 | |||
| Financial Services – 4.60% | |||
| American Equity Investment Life Holding | 32,820 | 430,927 | |
| CFS Bancorp | 7,095 | 106,354 | |
| †Conseco | 21,100 | 365,030 | |
| †Employers Holdings | 24,600 | 492,492 | |
| †FPIC Insurance Group | 10,960 | 489,583 | |
| Hanover Insurance Group | 36,000 | 1,660,319 | |
| †KMG America | 44,600 | 206,498 | |
| †LaBranche & Company | 44,360 | 361,978 | |
| Old National Bancorp | 21,150 | 384,507 | |
| †PMA Capital Class A | 28,700 | 269,493 | |
| †Quanta Capital Holdings | 42,900 | 89,661 | |
| †United America Indemnity Class A | 44,264 | 1,026,925 | |
| 5,883,767 |
(continues) 69
Statements of net assets
Optimum Small Cap Value Fund
| Number of | |||||
| Shares | Value | ||||
| Common Stock (continued) | |||||
| Health Care – 2.12% | |||||
| †Kinetic Concepts | 17,000 | $ 860,881 | |||
| †LifePoint Hospitals | 12,620 | 482,336 | |||
| †Microtek Medical Holdings | 113,565 | 540,569 | |||
| †RehabCare Group | 10,675 | 169,412 | |||
| STERIS | 25,000 | 664,000 | |||
| 2,717,198 | |||||
| Real Estate – 6.01% | |||||
| Brookfield Homes | 12,824 | 411,650 | |||
| †California Coastal Communities | 12,900 | 261,741 | |||
| Capital Lease Funding | 92,600 | 991,746 | |||
| Eagle Hospitality Properties Trust | 33,100 | 369,065 | |||
| Equity Inns | 19,370 | 317,281 | |||
| Fieldstone Investment | 45,600 | 139,992 | |||
| Government Properties Trust | 4,600 | 49,220 | |||
| Lexington Realty Trust | 30,000 | 633,900 | |||
| †Lodgian | 115,500 | 1,543,080 | |||
| MI Developments Class A | 71,000 | 2,654,690 | |||
| Thomas Properties Group | 20,400 | 316,608 | |||
| 7,688,973 | |||||
| Technology – 17.34% | |||||
| †Agile Software | 40,000 | 278,000 | |||
| Agilysys | 25,255 | 567,480 | |||
| †Axcelis Technologies | 97,000 | 741,080 | |||
| †BearingPoint | 65,100 | 498,666 | |||
| †Checkpoint Systems | 42,000 | 993,720 | |||
| †CIBER | 68,725 | 540,866 | |||
| Cohu | 22,910 | 430,708 | |||
| †Ducommun | 17,070 | 439,211 | |||
| EDO | 19,500 | 510,900 | |||
| †Esterline Technologies | 42,000 | 1,724,940 | |||
| †Fairchild Semiconductor | 35,000 | 585,200 | |||
| International Imation | 20,000 | 807,600 | |||
| †Intermec | 27,000 | 603,180 | |||
| †International Rectifier | 35,000 | 1,337,350 | |||
| †Keane | 50,000 | 679,000 | |||
| †LeCroy | 60,000 | 501,000 | |||
| †Neoware | 36,480 | 367,354 | |||
| †Novell | 99,400 | 717,668 | |||
| †Paxar | 42,000 | 1,205,400 | |||
| †Plexus | 36,000 | 617,400 | |||
| †Radyne | 62,000 | 565,440 | |||
| †Solectron | 185,000 | 582,750 | |||
| †Thermo Fisher Scientific | 52,000 | 2,430,999 | |||
| †Tollgrade Communications | 45,865 | 576,064 | |||
| †Unisys | 70,700 | 596,001 | |||
| United Online | 21,135 | 296,524 | |||
| †Vishay Intertechnology | 109,000 | 1,523,820 | |||
| †Zebra Technologies Class A | 38,000 | 1,467,180 | |||
| 22,185,501 | |||||
| Transportation – 4.39% | |||||
| Alexander & Baldwin | 25,000 | 1,261,000 | |||
| Con-way | 28,400 | 1,415,456 | |||
| Overseas Shipholding Group | 7,000 | 438,200 | |||
| SkyWest | 17,560 | 471,135 | |||
| †YRC Worldwide | 50,500 | 2,031,110 | |||
| 5,616,901 | |||||
| Utilities – 0.63% | |||||
| Great Plains Energy | 24,700 | 801,515 | |||
| 801,515 | |||||
| Total Common Stock | |||||
| (cost $103,107,370) | 117,097,039 | ||||
| Principal | |||||
| Amount | |||||
| Repurchase Agreements – 8.51% | |||||
| With BNP Paribas 5.10% 4/2/07 | |||||
| (dated 3/30/07, to be repurchased | |||||
| at $4,460,895, collateralized by | |||||
| $2,477,000 U.S. Treasury Notes | |||||
| 2.625% due 5/15/08, market | |||||
| value $2,441,610, $1,456,000 | |||||
| U.S. Treasury Notes 3.375% | |||||
| due 12/15/08, market value | |||||
| $1,439,672 and $685,000 | |||||
| U.S. Treasury Notes 3.50% due | |||||
| 8/15/09, market value $671,301) | $4,459,000 | 4,459,000 | |||
| With Cantor Fitzgerald 5.11% 4/2/07 | |||||
| (dated 3/30/07, to be repurchased | |||||
| at $3,216,369, collateralized by | |||||
| $2,631,000 U.S. Treasury Bills due | |||||
| 6/28/07, market value $2,599,686 | |||||
| and $680,000 U.S. Treasury Notes | |||||
| 4.50% due 2/28/11, market value | |||||
| $682,465) | 3,215,000 | 3,215,000 | |||
| With UBS Warburg 5.11% 4/2/07 | |||||
| (dated 3/30/07, to be repurchased | |||||
| at $3,217,369, collateralized | |||||
| by $3,290,000 U.S. Treasury | |||||
| Bills due 4/19/07, market value | |||||
| $3,282,084) | 3,216,000 | 3,216,000 | |||
| Total Repurchase Agreements | |||||
| (cost $10,890,000) | 10,890,000 | ||||
| Total Value of Securities – 100.01% | |||||
| (cost $113,997,370) | 127,987,039 | ||||
| Liabilities Net of Receivables and | |||||
| Other Assets – (0.01%) | (18,286 | ) | |||
| Net Assets Applicable to 9,466,198 | |||||
| Shares Outstanding – 100.00% | $127,968,753 | ||||
| Net Asset Value – Optimum Small Cap Value Fund | |||||
| Class A ($12,720,462 / 939,673 Shares) | $13.54 | ||||
| Net Asset Value – Optimum Small Cap Value Fund | |||||
| Class B ($2,239,176 / 169,722 Shares) | $13.19 | ||||
| Net Asset Value – Optimum Small Cap Value Fund | |||||
| Class C ($41,621,851 / 3,155,424 Shares) | $13.19 | ||||
| Net Asset Value – Optimum Small Cap Value Fund | |||||
| Institutional Class ($71,387,264 / 5,201,379 Shares) | $13.72 | ||||
70
| Components of Net Assets at March 31, 2007: | |
| Shares of beneficial interest | |
| (unlimited authorization – no par) | $111,195,246 |
| Accumulated net realized gain on investments | 2,783,838 |
| Net unrealized appreciation of investments | 13,989,669 |
| Total net assets | $127,968,753 |
| † | Non-income producing security for the year ended March 31, 2007. | |||||
| Net Asset Value and Offering Price per Share – | �� |
| Optimum Small Cap Value Fund | |
| Net asset value Class A (A) | $13.54 |
| Sales charge (5.75% of offering price) (B) | 0.83 |
| Offering price | $14.37 |
| (A) | Net asset value per share, as illustrated, is the amount which would be paid upon redemption or repurchase of shares. | |
| (B) | See the current prospectus for purchases of $75,000 or more. | |
| See accompanying notes | ||
71
Statements of assets and liabilities
> Optimum Fund Trust
March 31, 2007
| Optimum | Optimum | Optimum | Optimum | Optimum | Optimum | ||||||||
| Fixed Income | International | Large Cap | Large Cap | Small Cap | Small Cap | ||||||||
| Fund | Fund | Growth Fund | Value Fund | Growth Fund | Value Fund | ||||||||
| Assets: | |||||||||||||
| Investments at market | $777,935,438 | $275,846,430 | $785,780,506 | $796,477,596 | $139,700,947 | $127,987,039 | |||||||
| Cash | 2,440,115 | 681,599 | 249,799 | 300,936 | 16,173 | 13,678 | |||||||
| Foreign currencies | 1,972,877 | 2,314,985 | 34 | 26 | — | — | |||||||
| Subscriptions receivable | 2,243,027 | 615,456 | 2,127,968 | 2,043,369 | 343,055 | 273,717 | |||||||
| Receivables for securities sold | 16,064,845 | 400,672 | 3,396,323 | 4,991,755 | 135,739 | 561,837 | |||||||
| Foreign currency contracts, at value | 4,589 | — | — | — | — | — | |||||||
| Dividends receivable | — | 1,292,430 | 611,085 | 1,912,324 | 25,296 | 84,896 | |||||||
| Interest receivable | 7,574,123 | 1,429 | 12,932 | 9,460 | 1,011 | 3,089 | |||||||
| Credit default swap contracts, at value1 | 2,062,357 | — | — | — | — | — | |||||||
| Total return swap contract, at value | 13,263 | — | — | — | — | — | |||||||
| Total assets | 810,310,634 | 281,153,001 | 792,178,647 | 805,735,466 | 140,222,221 | 128,924,256 | |||||||
| Liabilities: | |||||||||||||
| Payables for securities purchased | 59,089,452 | 3,904,283 | 1,549,863 | 9,055,326 | 293,620 | 607,515 | |||||||
| Securities sold short at market | — | — | — | 1,033,746 | — | — | |||||||
| Liquidations payable | 453,850 | 133,144 | 335,973 | 351,701 | 81,486 | 69,098 | |||||||
| Accrued protection payments on credit | |||||||||||||
| default swaps | 7,849 | — | — | — | — | — | |||||||
| Foreign currency contracts, at value | 189,089 | 52,642 | 198 | — | — | — | |||||||
| Distributions payable | 86,420 | — | — | — | — | — | |||||||
| Due to manager and affiliates | 767,468 | 416,238 | 1,054,517 | 987,244 | 211,634 | 180,254 | |||||||
| Variation margin payable on | |||||||||||||
| futures contracts | 40,703 | — | — | — | — | — | |||||||
| Other accrued expenses | 226,666 | 198,950 | 231,418 | 215,982 | 102,936 | 98,636 | |||||||
| Total liabilities | 60,861,497 | 4,705,257 | 3,171,969 | 11,643,999 | 689,676 | 955,503 | |||||||
| Total Net Assets | $749,449,137 | $276,447,744 | $789,006,678 | $794,091,467 | $139,532,545 | $127,968,753 | |||||||
| Investments at cost | $772,033,617 | $214,709,945 | $684,494,813 | $694,162,381 | $117,194,159 | $113,997,370 | |||||||
| Proceeds for securities sold short | $— | $— | $— | $(1,028,141 | ) | $— | $— | ||||||
| Foreign currencies at cost | $1,939,825 | $2,305,200 | $33 | $26 | $— | $— | |||||||
| 1Includes up front payments of $420,016 | |||||||||||||
| See Note 10 in “Notes to Financial Statements.” | |||||||||||||
See accompanying notes
72
Statements of operations
> Optimum Fund Trust
Year Ended March 31, 2007
| Optimum | Optimum | Optimum | Optimum | Optimum | Optimum | |||||||||||||||||||
| Fixed Income | International | Large Cap | Large Cap | Small Cap | Small Cap | |||||||||||||||||||
| Fund | Fund | Growth Fund | Value Fund | Growth Fund | Value Fund | |||||||||||||||||||
| Investment Income: | ||||||||||||||||||||||||
| Dividends | $ | 44,356 | $ | 6,662,064 | $ | 7,184,169 | $ | 16,067,589 | $ | 641,188 | $ | 1,326,940 | ||||||||||||
| Interest | 36,556,131 | 230,716 | 1,498,158 | 1,279,814 | 343,130 | 481,286 | ||||||||||||||||||
| Foreign tax withheld | (1,599 | ) | (541,675 | ) | (150,717 | ) | (121,033 | ) | — | (6,968 | ) | |||||||||||||
| 36,598,888 | 6,351,105 | 8,531,610 | 17,226,370 | 984,318 | 1,801,258 | |||||||||||||||||||
| Expenses: | ||||||||||||||||||||||||
| Management fees | 3,895,800 | 1,863,431 | 5,087,458 | 4,772,852 | 1,346,139 | 1,169,780 | ||||||||||||||||||
| Distribution expenses – Class A | 184,587 | 79,062 | 177,603 | 181,266 | 40,383 | 43,986 | ||||||||||||||||||
| Distribution expenses – Class B | 93,519 | 47,768 | 102,642 | 106,796 | 21,346 | 21,822 | ||||||||||||||||||
| Distribution expenses – Class C | 2,073,016 | 812,457 | 1,831,781 | 1,918,072 | 371,744 | 386,625 | ||||||||||||||||||
| Administration expenses | 2,236,091 | 810,353 | 2,326,273 | 2,292,486 | 425,824 | 393,034 | ||||||||||||||||||
| Dividend disbursing and transfer agent fees | ||||||||||||||||||||||||
| and expenses | 1,210,806 | 623,653 | 1,289,801 | 1,278,632 | 463,650 | 442,237 | ||||||||||||||||||
| Accounting fees | 255,657 | 93,957 | 266,063 | 263,340 | 51,806 | 51,000 | ||||||||||||||||||
| Professional fees | 106,431 | 51,301 | 91,285 | 92,236 | 35,075 | 39,250 | ||||||||||||||||||
| Trustees’ fees | 91,293 | 32,899 | 94,937 | 94,111 | 17,414 | 15,995 | ||||||||||||||||||
| Reports and statements to shareholders | 75,176 | 42,694 | 85,504 | 159,603 | 15,231 | 21,884 | ||||||||||||||||||
| Custodian fees | 65,665 | 127,488 | 49,944 | 23,498 | 3,674 | 29,869 | ||||||||||||||||||
| Registration fees | 55,686 | 41,408 | 91,213 | 56,789 | 38,207 | 37,696 | ||||||||||||||||||
| Insurance fees | 34,930 | 13,736 | 37,598 | 38,717 | 6,472 | 5,841 | ||||||||||||||||||
| Pricing fees | 33,437 | 16,864 | 2,584 | 1,740 | 1,306 | 1,007 | ||||||||||||||||||
| Other | 11,108 | 10,363 | 13,685 | 21,226 | 7,208 | 6,013 | ||||||||||||||||||
| 10,423,202 | 4,667,434 | 11,548,371 | 11,301,364 | 2,845,479 | 2,666,039 | |||||||||||||||||||
| Less expenses absorbed or waived | (2,324,931 | ) | — | (538,301 | ) | (1,209,252 | ) | (453,459 | ) | (630,080 | ) | |||||||||||||
| Less expense paid indirectly | (4,357 | ) | — | — | (2,212 | ) | (941 | ) | (802 | ) | ||||||||||||||
| Total operating expenses | 8,093,914 | 4,667,434 | 11,010,070 | 10,089,900 | 2,391,079 | 2,035,157 | ||||||||||||||||||
| Net Investment Income (Loss) | 28,504,974 | 1,683,671 | (2,478,460 | ) | 7,136,470 | (1,406,761 | ) | (233,899 | ) | |||||||||||||||
| Net Realized and Unrealized Gain (Loss) | ||||||||||||||||||||||||
| on Investments and Foreign Currencies: | ||||||||||||||||||||||||
| Net realized gain (loss) on: | ||||||||||||||||||||||||
| Investments | 2,163,675 | 12,272,862 | 10,356,815 | 19,187,927 | 3,981,078 | 7,538,279 | ||||||||||||||||||
| Futures contracts | 916,486 | — | — | — | — | — | ||||||||||||||||||
| Swap contracts | 223,456 | — | — | — | — | — | ||||||||||||||||||
| Options written | 1,872 | — | — | — | — | — | ||||||||||||||||||
| Foreign currencies | (1,350,416 | ) | (403,136 | ) | (55,870 | ) | 4,857 | — | — | |||||||||||||||
| Net realized gain | 1,955,073 | 11,869,726 | 10,300,945 | 19,192,784 | 3,981,078 | 7,538,279 | ||||||||||||||||||
| Net change in unrealized | ||||||||||||||||||||||||
| appreciation/depreciation of | ||||||||||||||||||||||||
| investments and foreign currencies | 17,524,578 | 31,831,482 | 32,819,559 | 69,803,059 | (1,417,523 | ) | (108,109 | ) | ||||||||||||||||
| Net Realized and Unrealized Gain | ||||||||||||||||||||||||
| on Investments and Foreign Currencies | 19,479,651 | 43,701,208 | 43,120,504 | 88,995,843 | 2,563,555 | 7,430,170 | ||||||||||||||||||
| Net Increase in Net Assets Resulting | ||||||||||||||||||||||||
| from Operations | $ | 47,984,625 | $ | 45,384,879 | $ | 40,642,044 | $ | 96,132,313 | $ | 1,156,794 | $ | 7,196,271 | ||||||||||||
See accompanying notes
73
Statements of changes in net assets
> Optimum Fund Trust
| Optimum Fixed Income Fund | Optimum International Fund | |||||||||||||||
| Year Ended | Year Ended | Year Ended | Year Ended | |||||||||||||
| 3/31/07 | 3/31/06 | 3/31/07 | 3/31/06 | |||||||||||||
| Increase (Decrease) in Net Assets from Operations: | ||||||||||||||||
| Net investment income | $ | 28,504,974 | $ | 15,847,356 | $ | 1,683,671 | $ | 1,971,007 | ||||||||
| Net realized gain (loss) on investments and foreign currencies | 1,955,073 | (3,892,503 | ) | 11,869,726 | 9,628,788 | |||||||||||
| Net change in unrealized appreciation/depreciation of investments | ||||||||||||||||
| and foreign currencies | 17,524,578 | (8,491,476 | ) | 31,831,482 | 21,688,222 | |||||||||||
| Net increase in net assets resulting from operations | 47,984,625 | 3,463,377 | 45,384,879 | 33,288,017 | ||||||||||||
| Dividends and Distributions to Shareholders from: | ||||||||||||||||
| Net investment income: | ||||||||||||||||
| Class A | (2,067,179 | ) | (1,274,163 | ) | (266,622 | ) | (100,399 | ) | ||||||||
| Class B | (293,462 | ) | (200,881 | ) | (35,681 | ) | (5,304 | ) | ||||||||
| Class C | (6,775,928 | ) | (3,770,221 | ) | (579,343 | ) | (76,640 | ) | ||||||||
| Institutional Class | (16,228,518 | ) | (8,427,841 | ) | (1,804,993 | ) | (665,959 | ) | ||||||||
| Net realized gain on investments: | ||||||||||||||||
| Class A | — | (58,447 | ) | (915,224 | ) | (969,277 | ) | |||||||||
| Class B | — | (13,649 | ) | (192,358 | ) | (244,303 | ) | |||||||||
| Class C | — | (226,703 | ) | (3,349,247 | ) | (3,422,034 | ) | |||||||||
| Institutional Class | — | (303,646 | ) | (4,949,128 | ) | (4,392,786 | ) | |||||||||
| (25,365,087 | ) | (14,275,551 | ) | (12,092,596 | ) | (9,876,702 | ) | |||||||||
| Capital Share Transactions: | ||||||||||||||||
| Proceeds from shares sold: | ||||||||||||||||
| Class A | 16,393,284 | 21,516,919 | 5,352,586 | 7,479,635 | ||||||||||||
| Class B | 1,355,437 | 1,902,359 | 471,521 | 706,771 | ||||||||||||
| Class C | 60,326,474 | 78,822,876 | 19,502,569 | 25,628,967 | ||||||||||||
| Institutional Class | 184,683,642 | 195,734,889 | 51,070,955 | 49,032,003 | ||||||||||||
| Net asset value of shares issued upon reinvestment of dividends | ||||||||||||||||
| and distributions: | ||||||||||||||||
| Class A | 2,016,848 | 1,300,051 | 1,165,763 | 1,055,577 | ||||||||||||
| Class B | 279,003 | 201,144 | 224,316 | 245,975 | ||||||||||||
| Class C | 6,585,148 | 3,904,936 | 3,879,118 | 3,461,735 | ||||||||||||
| Institutional Class | 15,763,509 | 8,460,551 | 6,649,588 | 4,970,506 | ||||||||||||
| 287,403,345 | 311,843,725 | 88,316,416 | 92,581,169 | |||||||||||||
| Cost of shares repurchased: | ||||||||||||||||
| Class A | (9,574,166 | ) | (7,183,605 | ) | (4,487,473 | ) | (2,104,304 | ) | ||||||||
| Class B | (1,680,895 | ) | (1,063,150 | ) | (929,646 | ) | (337,867 | ) | ||||||||
| Class C | (34,207,828 | ) | (17,617,845 | ) | (14,012,831 | ) | (5,391,571 | ) | ||||||||
| Institutional Class | (68,577,083 | ) | (41,742,586 | ) | (21,132,896 | ) | (10,108,871 | ) | ||||||||
| (114,039,972 | ) | (67,607,186 | ) | (40,562,846 | ) | (17,942,613 | ) | |||||||||
| Increase in net assets derived from capital share transactions | 173,363,373 | 244,236,539 | 47,753,570 | 74,638,556 | ||||||||||||
| Net Increase in Net Assets | 195,982,911 | 233,424,365 | 81,045,853 | 98,049,871 | ||||||||||||
| Net Assets: | ||||||||||||||||
| Beginning of year | 553,466,226 | 320,041,861 | 195,401,891 | 97,352,020 | ||||||||||||
| End of year | $749,449,137 | $553,466,226 | $276,447,744 | $195,401,891 | ||||||||||||
| Undistributed (accumulated) net investment income (loss) | $ | 4,392,925 | $ | 3,066,548 | $ | (462,272 | ) | $ | 943,832 | |||||||
See accompanying notes
74
> Optimum Fund Trust
| Optimum Large Cap Growth Fund | Optimum Large Cap Value Fund | |||||||||||||||
| Year Ended | Year Ended | Year Ended | Year Ended | |||||||||||||
| 3/31/07 | 3/31/06 | 3/31/07 | 3/31/06 | |||||||||||||
| Increase (Decrease) in Net Assets from Operations: | ||||||||||||||||
| Net investment income (loss) | $ | (2,478,460 | ) | $ | (2,269,867 | ) | $ | 7,136,470 | $ | 3,295,077 | ||||||
| Net realized gain on investments and foreign currencies | 10,300,945 | 7,642,351 | 19,192,784 | 20,384,024 | ||||||||||||
| Net change in unrealized appreciation/depreciation of investments | ||||||||||||||||
| and foreign currencies | 32,819,559 | 55,920,475 | 69,803,059 | 16,355,560 | ||||||||||||
| Net increase in net assets resulting from operations | 40,642,044 | 61,292,959 | 96,132,313 | 40,034,661 | ||||||||||||
| Dividends and Distributions to Shareholders from: | ||||||||||||||||
| Net investment income: | ||||||||||||||||
| Class A | — | — | (453,759 | ) | (232,766 | ) | ||||||||||
| Class B | — | — | (26,347 | ) | — | |||||||||||
| Class C | — | — | (493,745 | ) | — | |||||||||||
| Institutional Class | — | — | (4,974,919 | ) | (2,296,205 | ) | ||||||||||
| Net realized gain on investments: | ||||||||||||||||
| Class A | (891,813 | ) | — | (978,328 | ) | (1,726,349 | ) | |||||||||
| Class B | (184,999 | ) | — | (203,057 | ) | (417,436 | ) | |||||||||
| Class C | (3,273,834 | ) | — | (3,650,460 | ) | (6,100,367 | ) | |||||||||
| Institutional Class | (7,089,482 | ) | — | (7,445,895 | ) | (10,676,069 | ) | |||||||||
| (11,440,128 | ) | — | (18,226,510 | ) | (21,449,192 | ) | ||||||||||
| Capital Share Transactions: | ||||||||||||||||
| Proceeds from shares sold: | ||||||||||||||||
| Class A | 14,966,032 | 20,928,160 | 14,226,853 | 19,869,935 | ||||||||||||
| Class B | 1,520,526 | 1,997,102 | 1,364,512 | 1,945,951 | ||||||||||||
| Class C | 54,022,224 | 67,942,559 | 53,262,225 | 66,507,062 | ||||||||||||
| Institutional Class | 199,677,058 | 192,810,241 | 189,463,422 | 184,582,292 | ||||||||||||
| Net asset value of shares issued upon reinvestment of dividends | ||||||||||||||||
| and distributions: | ||||||||||||||||
| Class A | 880,766 | — | 1,412,586 | 1,934,288 | ||||||||||||
| Class B | 182,312 | — | 225,742 | 410,885 | ||||||||||||
| Class C | 3,229,116 | — | 4,087,297 | 6,036,661 | ||||||||||||
| Institutional Class | 6,991,211 | — | 12,233,266 | 12,773,412 | ||||||||||||
| 281,469,245 | 283,678,062 | 276,275,903 | 294,060,486 | |||||||||||||
| Cost of shares repurchased: | ||||||||||||||||
| Class A | (9,138,800 | ) | (5,206,320 | ) | (9,285,118 | ) | (5,348,169 | ) | ||||||||
| Class B | (1,380,825 | ) | (648,672 | ) | (1,559,766 | ) | (724,403 | ) | ||||||||
| Class C | (25,310,354 | ) | (11,875,323 | ) | (27,494,629 | ) | (12,376,689 | ) | ||||||||
| Institutional Class | (64,241,377 | ) | (32,322,493 | ) | (61,252,317 | ) | (28,454,697 | ) | ||||||||
| (100,071,356 | ) | (50,052,808 | ) | (99,591,830 | ) | (46,903,958 | ) | |||||||||
| Increase in net assets derived from capital share transactions | 181,397,889 | 233,625,254 | 176,684,073 | 247,156,528 | ||||||||||||
| Net Increase in Net Assets | 210,599,805 | 294,918,213 | 254,589,876 | 265,741,997 | ||||||||||||
| Net Assets: | ||||||||||||||||
| Beginning of year | 578,406,873 | 283,488,660 | 539,501,591 | 273,759,594 | ||||||||||||
| End of year | $789,006,678 | $578,406,873 | $794,091,467 | $539,501,591 | ||||||||||||
| Undistributed (accumulated) net investment income (loss) | $ | (14,801 | ) | $ | (21,931 | ) | $ | 2,307,931 | $ | 1,115,374 | ||||||
See accompanying notes
(continues) 75
Statements of changes in net assets
> Optimum Fund Trust
| Optimum Small Cap Growth Fund | Optimum Small Cap Value Fund | |||||||||||||||
| Year Ended | Year Ended | Year Ended | Year Ended | |||||||||||||
| 3/31/07 | 3/31/06 | 3/31/07 | 3/31/06 | |||||||||||||
| Increase (Decrease) in Net Assets from Operations: | ||||||||||||||||
| Net investment loss | $ | (1,406,761 | ) | $ | (1,231,056 | ) | $ | (233,899 | ) | $ | (219,797 | ) | ||||
| Net realized gain on investments | 3,981,078 | 2,433,962 | 7,538,279 | 5,880,563 | ||||||||||||
| Net change in unrealized appreciation/depreciation of investments | (1,417,523 | ) | 17,760,785 | (108,109 | ) | 9,123,924 | ||||||||||
| Net increase in net assets resulting from operations | 1,156,794 | 18,963,691 | 7,196,271 | 14,784,690 | ||||||||||||
| Dividends and Distributions to Shareholders from: | ||||||||||||||||
| Net realized gain on investments: | ||||||||||||||||
| Class A | (257,820 | ) | — | (759,512 | ) | (691,256 | ) | |||||||||
| Class B | (48,248 | ) | — | (133,312 | ) | (140,472 | ) | |||||||||
| �� Class C | (848,908 | ) | — | (2,395,294 | ) | (2,090,114 | ) | |||||||||
| Institutional Class | (1,576,684 | ) | — | (3,525,226 | ) | (2,649,173 | ) | |||||||||
| (2,731,660 | ) | — | (6,813,344 | ) | (5,571,015 | ) | ||||||||||
| Capital Share Transactions: | ||||||||||||||||
| Proceeds from shares sold: | ||||||||||||||||
| Class A | 2,889,520 | 5,208,885 | 2,681,254 | 6,124,857 | ||||||||||||
| Class B | 239,515 | 368,790 | 190,310 | 345,948 | ||||||||||||
| Class C | 9,424,265 | 13,465,739 | 7,932,996 | 13,083,206 | ||||||||||||
| Institutional Class | 30,357,388 | 31,730,182 | 23,616,562 | 26,704,023 | ||||||||||||
| Net asset value of shares issued upon reinvestment of dividends | ||||||||||||||||
| and distributions: | ||||||||||||||||
| Class A | 249,707 | — | 730,606 | 679,548 | ||||||||||||
| Class B | 47,670 | — | 131,610 | 138,269 | ||||||||||||
| Class C | 837,090 | — | 2,361,924 | 2,068,790 | ||||||||||||
| Institutional Class | 1,534,687 | — | 3,443,647 | 2,582,357 | ||||||||||||
| 45,579,842 | 50,773,596 | 41,088,909 | 51,726,998 | |||||||||||||
| Cost of shares repurchased: | ||||||||||||||||
| Class A | (2,789,434 | ) | (1,294,228 | ) | (3,886,113 | ) | (1,927,172 | ) | ||||||||
| Class B | (325,853 | ) | (141,727 | ) | (415,692 | ) | (178,922 | ) | ||||||||
| Class C | (5,687,490 | ) | (2,628,027 | ) | (7,222,205 | ) | (3,359,047 | ) | ||||||||
| Institutional Class | (13,942,070 | ) | (6,909,249 | ) | (11,222,885 | ) | (6,157,132 | ) | ||||||||
| (22,744,847 | ) | (10,973,231 | ) | (22,746,895 | ) | (11,622,273 | ) | |||||||||
| Increase in net assets derived from capital share transactions | 22,834,995 | 39,800,365 | 18,342,014 | 40,104,725 | ||||||||||||
| Net Increase in Net Assets | 21,260,129 | 58,764,056 | 18,724,941 | 49,318,400 | ||||||||||||
| Net Assets: | ||||||||||||||||
| Beginning of year | 118,272,416 | 59,508,360 | 109,243,812 | 59,925,412 | ||||||||||||
| End of year (there was no undistributed net investment income | ||||||||||||||||
| at either year end) | $ | 139,532,545 | $ | 118,272,416 | $ | 127,968,753 | $ | 109,243,812 | ||||||||
See accompanying notes
76
Financial highlights
> Optimum Fixed Income Fund
Selected data for each share of the Fund outstanding throughout each period were as follows:
| Class A | ||||||||||||
| 8/1/031 | ||||||||||||
| Year Ended | to | |||||||||||
| 3/31/07 | 3/31/06 | 3/31/05 | 3/31/04 | |||||||||
| Net asset value, beginning of period | $8.740 | $8.890 | $8.980 | $8.500 | ||||||||
| Income (loss) from investment operations: | ||||||||||||
| Net investment income2 | 0.399 | 0.316 | 0.279 | 0.171 | ||||||||
| Net realized and unrealized gain (loss) on investments | ||||||||||||
| and foreign currencies | 0.255 | (0.199 | ) | (0.061 | ) | 0.417 | ||||||
| Total from investment operations | 0.654 | 0.117 | 0.218 | 0.588 | ||||||||
| Less dividends and distributions from: | ||||||||||||
| Net investment income | (0.344 | ) | (0.253 | ) | (0.228 | ) | (0.098 | ) | ||||
| Net realized gain on investments | — | (0.014 | ) | (0.080 | ) | (0.010 | ) | |||||
| Total dividends and distributions | (0.344 | ) | (0.267 | ) | (0.308 | ) | (0.108 | ) | ||||
| Net asset value, end of period | $9.050 | $8.740 | $8.890 | $8.980 | ||||||||
| Total return3 | 7.58% | 1.31% | 2.59% | 6.82% | ||||||||
| Ratios and supplemental data: | ||||||||||||
| Net assets, end of period (000 omitted) | $58,691 | $47,956 | $33,251 | $12,049 | ||||||||
| Ratio of expenses to average net assets | 1.25% | 1.25% | 1.24% | 1.20% | ||||||||
| Ratio of expenses to average net assets | ||||||||||||
| prior to expense limitation and expense paid indirectly | 1.61% | 1.67% | 1.70% | 2.25% | ||||||||
| Ratio of net investment income to average net assets | 4.48% | 3.55% | 3.12% | 2.88% | ||||||||
| Ratio of net investment income to average net assets | ||||||||||||
| prior to expense limitation and expense paid indirectly | 4.12% | 3.13% | 2.66% | 1.83% | ||||||||
| Portfolio turnover | 238% | 298% | 352% | 383% | ||||||||
| 1 Date of commencement of operations; ratios and portfolio turnover have been annualized and total return has not been annualized. |
| 2 The average shares outstanding method has been applied for per share information. |
| 3 Total investment return is based on the change in net asset value of a share during the period and assumes reinvestment of dividends and distributions at net asset value and does not reflect the impact of a sales charge. Total investment return reflects waivers and payment of fees by the manager. Performance would have been lower had the expense limitation not been in effect. |
See accompanying notes
(continues) 77
Financial highlights
> Optimum Fixed Income Fund
Selected data for each share of the Fund outstanding throughout each period were as follows:
| Class B | ||||||||||||
| 8/1/031 | ||||||||||||
| Year Ended | to | |||||||||||
| 3/31/07 | 3/31/06 | 3/31/05 | 3/31/04 | |||||||||
| Net asset value, beginning of period | $8.740 | $8.900 | $8.990 | $8.500 | ||||||||
| Income (loss) from investment operations: | ||||||||||||
| Net investment income2 | 0.342 | 0.258 | 0.221 | 0.133 | ||||||||
| Net realized and unrealized gain (loss) on investments | ||||||||||||
| and foreign currencies | 0.264 | (0.209 | ) | (0.055 | ) | 0.420 | ||||||
| Total from investment operations | 0.606 | 0.049 | 0.166 | 0.553 | ||||||||
| Less dividends and distributions from: | ||||||||||||
| Net investment income | (0.286 | ) | (0.195 | ) | (0.176 | ) | (0.053 | ) | ||||
| Net realized gain on investments | — | (0.014 | ) | (0.080 | ) | (0.010 | ) | |||||
| Total dividends and distributions | (0.286 | ) | (0.209 | ) | (0.256 | ) | (0.063 | ) | ||||
| Net asset value, end of period | $9.060 | $8.740 | $8.900 | $8.990 | ||||||||
| Total return3 | 7.01% | 0.54% | 1.88% | 6.52% | ||||||||
| Ratios and supplemental data: | ||||||||||||
| Net assets, end of period (000 omitted) | $9,568 | $9,278 | $8,405 | $4,296 | ||||||||
| Ratio of expenses to average net assets | 1.90% | 1.90% | 1.89% | 1.85% | ||||||||
| Ratio of expenses to average net assets | ||||||||||||
| prior to expense limitation and expense paid indirectly | 2.26% | 2.32% | 2.35% | 2.90% | ||||||||
| Ratio of net investment income to average net assets | 3.83% | 2.90% | 2.47% | 2.23% | ||||||||
| Ratio of net investment income to average net assets | ||||||||||||
| prior to expense limitation and expense paid indirectly | 3.47% | 2.48% | 2.01% | 1.18% | ||||||||
| Portfolio turnover | 238% | 298% | 352% | 383% | ||||||||
| 1 Date of commencement of operations; ratios and portfolio turnover have been annualized and total return has not been annualized. |
| 2 The average shares outstanding method has been applied for per share information. |
| 3 Total investment return is based on the change in net asset value of a share during the period and assumes reinvestment of dividends and distributions at net asset value and does not reflect the impact of a sales charge. Total investment return reflects waivers and payment of fees by the manager. Performance would have been lower had the expense limitation not been in effect. |
See accompanying notes
78
> Optimum Fixed Income Fund
Selected data for each share of the Fund outstanding throughout each period were as follows:
| Class C | ||||||||||||
| 8/1/031 | ||||||||||||
| Year Ended | to | |||||||||||
| 3/31/07 | 3/31/06 | 3/31/05 | 3/31/04 | |||||||||
| Net asset value, beginning of period | $8.750 | $8.900 | $8.990 | $8.500 | ||||||||
| Income (loss) from investment operations: | ||||||||||||
| Net investment income2 | 0.341 | 0.258 | 0.221 | 0.133 | ||||||||
| Net realized and unrealized gain (loss) on investments | ||||||||||||
| and foreign currencies | 0.255 | (0.199 | ) | (0.055 | ) | 0.420 | ||||||
| Total from investment operations | 0.596 | 0.059 | 0.166 | 0.553 | ||||||||
| Less dividends and distributions from: | ||||||||||||
| Net investment income | (0.286 | ) | (0.195 | ) | (0.176 | ) | (0.053 | ) | ||||
| Net realized gain on investments | — | (0.014 | ) | (0.080 | ) | (0.010 | ) | |||||
| Total dividends and distributions | (0.286 | ) | (0.209 | ) | (0.256 | ) | (0.063 | ) | ||||
| Net asset value, end of period | $9.060 | $8.750 | $8.900 | $8.990 | ||||||||
| Total return3 | 6.88% | 0.65% | 1.88% | 6.52% | ||||||||
| Ratios and supplemental data: | ||||||||||||
| Net assets, end of period (000 omitted) | $227,036 | $186,869 | $125,301 | $52,649 | ||||||||
| Ratio of expenses to average net assets | 1.90% | 1.90% | 1.89% | 1.85% | ||||||||
| Ratio of expenses to average net assets | ||||||||||||
| prior to expense limitation and expense paid indirectly | 2.26% | 2.32% | 2.35% | 2.90% | ||||||||
| Ratio of net investment income to average net assets | 3.83% | 2.90% | 2.47% | 2.23% | ||||||||
| Ratio of net investment income to average net assets | ||||||||||||
| prior to expense limitation and expense paid indirectly | 3.47% | 2.48% | 2.01% | 1.18% | ||||||||
| Portfolio turnover | 238% | 298% | 352% | 383% | ||||||||
| 1 Date of commencement of operations; ratios and portfolio turnover have been annualized and total return has not been annualized. |
| 2 The average shares outstanding method has been applied for per share information. |
| 3 Total investment return is based on the change in net asset value of a share during the period and assumes reinvestment of dividends and distributions at net asset value and does not reflect the impact of a sales charge. Total investment return reflects waivers and payment of fees by the manager. Performance would have been lower had the expense limitation not been in effect. |
See accompanying notes
(continues) 79
Financial highlights
> Optimum Fixed Income Fund
Selected data for each share of the Fund outstanding throughout each period were as follows:
| Institutional Class | ||||||||||||
| 8/1/031 | ||||||||||||
| Year Ended | to | |||||||||||
| 3/31/07 | 3/31/06 | 3/31/05 | 3/31/04 | |||||||||
| Net asset value, beginning of period | $8.730 | $8.890 | $8.970 | $8.500 | ||||||||
| Income (loss) from investment operations: | ||||||||||||
| Net investment income2 | 0.431 | 0.348 | 0.310 | 0.192 | ||||||||
| Net realized and unrealized gain (loss) on investments | ||||||||||||
| and foreign currencies | 0.265 | (0.209 | ) | (0.050 | ) | 0.407 | ||||||
| Total from investment operations | 0.696 | 0.139 | 0.260 | 0.599 | ||||||||
| Less dividends and distributions from: | ||||||||||||
| Net investment income | (0.376 | ) | (0.285 | ) | (0.260 | ) | (0.119 | ) | ||||
| Net realized gain on investments | — | (0.014 | ) | (0.080 | ) | (0.010 | ) | |||||
| Total dividends and distributions | (0.376 | ) | (0.299 | ) | (0.340 | ) | (0.129 | ) | ||||
| Net asset value, end of period | $9.050 | $8.730 | $8.890 | $8.970 | ||||||||
| Total return3 | 8.09% | 1.56% | 2.96% | 7.07% | ||||||||
| Ratios and supplemental data: | ||||||||||||
| Net assets, end of period (000 omitted) | $454,154 | $309,363 | $153,085 | $22,276 | ||||||||
| Ratio of expenses to average net assets | 0.90% | 0.90% | 0.89% | 0.85% | ||||||||
| Ratio of expenses to average net assets | ||||||||||||
| prior to expense limitation and expense paid indirectly | 1.26% | 1.32% | 1.35% | 1.90% | ||||||||
| Ratio of net investment income to average net assets | 4.83% | 3.90% | 3.47% | 3.23% | ||||||||
| Ratio of net investment income to average net assets | ||||||||||||
| prior to expense limitation and expense paid indirectly | 4.47% | 3.48% | 3.01% | 2.18% | ||||||||
| Portfolio turnover | 238% | 298% | 352% | 383% | ||||||||
| 1 Date of commencement of operations; ratios and portfolio turnover have been annualized and total return has not been annualized. |
| 2 The average shares outstanding method has been applied for per share information. |
| 3 Total investment return is based on the change in net asset value of a share during the period and assumes reinvestment of dividends and distributions at net asset value. Total investment return reflects waivers and payment of fees by the manager. Performance would have been lower had the expense limitation not been in effect. |
See accompanying notes
80
> Optimum International Fund
Selected data for each share of the Fund outstanding throughout each period were as follows:
| Class A | ||||||||||||
| 8/1/031 | ||||||||||||
| Year Ended | to | |||||||||||
| 3/31/07 | 3/31/06 | 3/31/05 | 3/31/04 | |||||||||
| Net asset value, beginning of period | $13.470 | $11.660 | $10.670 | $8.500 | ||||||||
| Income from investment operations: | ||||||||||||
| Net investment income2 | 0.112 | 0.180 | 0.050 | 0.021 | ||||||||
| Net realized and unrealized gain on investments | ||||||||||||
| and foreign currencies | 2.661 | 2.456 | 1.069 | 2.155 | ||||||||
| Total from investment operations | 2.773 | 2.636 | 1.119 | 2.176 | ||||||||
| Less dividends and distributions from: | ||||||||||||
| Net investment income | (0.172 | ) | (0.074 | ) | — | — | ||||||
| Net realized gain on investments | (0.581 | ) | (0.752 | ) | (0.129 | ) | (0.006 | ) | ||||
| Total dividends and distributions | (0.753 | ) | (0.826 | ) | (0.129 | ) | (0.006 | ) | ||||
| Net asset value, end of period | $15.490 | $13.470 | $11.660 | $10.670 | ||||||||
| Total return3 | 21.26% | 23.54% | 10.62% | 25.61% | ||||||||
| Ratios and supplemental data: | ||||||||||||
| Net assets, end of period (000 omitted) | $25,523 | $20,247 | $11,300 | $4,083 | ||||||||
| Ratio of expenses to average net assets | 1.96% | 1.96% | 1.98% | 1.92% | ||||||||
| Ratio of expenses to average net assets | ||||||||||||
| prior to expense limitation | 1.96% | 2.20% | 2.30% | 3.82% | ||||||||
| Ratio of net investment income to average net assets | 0.78% | 1.47% | 0.45% | 0.30% | ||||||||
| Ratio of net investment income (loss) to average net assets | ||||||||||||
| prior to expense limitation | 0.78% | 1.23% | 0.13% | (1.60% | ) | |||||||
| Portfolio turnover | 18% | 68% | 82% | 49% | ||||||||
| 1 Date of commencement of operations; ratios and portfolio turnover have been annualized and total return has not been annualized. |
| 2 The average shares outstanding method has been applied for per share information. |
| 3 Total investment return is based on the change in net asset value of a share during the period and assumes reinvestment of dividends and distributions at net asset value and does not reflect the impact of a sales charge. Total investment return reflects waivers and payment of fees by the manager, as applicable. Performance would have been lower had the expense limitation not been in effect. |
See accompanying notes
(continues) 81
Financial highlights
> Optimum International Fund
Selected data for each share of the Fund outstanding throughout each period were as follows:
| Class B | ||||||||||||
| 8/1/031 | ||||||||||||
| Year Ended | to | |||||||||||
| 3/31/07 | 3/31/06 | 3/31/05 | 3/31/04 | |||||||||
| Net asset value, beginning of period | $13.290 | $11.530 | $10.620 | $8.500 | ||||||||
| Income (loss) from investment operations: | ||||||||||||
| Net investment income (loss)2 | 0.021 | 0.102 | (0.020 | ) | (0.023 | ) | ||||||
| Net realized and unrealized gain on investments | ||||||||||||
| and foreign currencies | 2.614 | 2.426 | 1.059 | 2.149 | ||||||||
| Total from investment operations | 2.635 | 2.528 | 1.039 | 2.126 | ||||||||
| Less dividends and distributions from: | ||||||||||||
| Net investment income | (0.104 | ) | (0.016 | ) | — | — | ||||||
| Net realized gain on investments | (0.581 | ) | (0.752 | ) | (0.129 | ) | (0.006 | ) | ||||
| Total dividends and distributions | (0.685 | ) | (0.768 | ) | (0.129 | ) | (0.006 | ) | ||||
| Net asset value, end of period | $15.240 | $13.290 | $11.530 | $10.620 | ||||||||
| Total return3 | 20.44% | 22.81% | 9.91% | 25.02% | ||||||||
| Ratios and supplemental data: | ||||||||||||
| Net assets, end of period (000 omitted) | $5,031 | $4,594 | $3,386 | $1,624 | ||||||||
| Ratio of expenses to average net assets | 2.61% | 2.61% | 2.63% | 2.57% | ||||||||
| Ratio of expenses to average net assets | ||||||||||||
| prior to expense limitation | 2.61% | 2.85% | 2.95% | 4.47% | ||||||||
| Ratio of net investment income (loss) to average net assets | 0.13% | 0.82% | (0.20% | ) | (0.35% | ) | ||||||
| Ratio of net investment income (loss) to average net assets | ||||||||||||
| prior to expense limitation | 0.13% | 0.58% | (0.52% | ) | (2.25% | ) | ||||||
| Portfolio turnover | 18% | 68% | 82% | 49% | ||||||||
| 1 Date of commencement of operations; ratios and portfolio turnover have been annualized and total return has not been annualized. |
| 2 The average shares outstanding method has been applied for per share information. |
| 3 Total investment return is based on the change in net asset value of a share during the period and assumes reinvestment of dividends and distributions at net asset value and does not reflect the impact of a sales charge. Total investment return reflects waivers and payment of fees by the manager, as applicable. Performance would have been lower had the expense limitation not been in effect. |
See accompanying notes
82
> Optimum International Fund
Selected data for each share of the Fund outstanding throughout each period were as follows:
| Class C | ||||||||||||
| 8/1/031 | ||||||||||||
| Year Ended | to | |||||||||||
| 3/31/07 | 3/31/06 | 3/31/05 | 3/31/04 | |||||||||
| Net asset value, beginning of period | $13.290 | $11.540 | $10.620 | $8.500 | ||||||||
| Income (loss) from investment operations: | ||||||||||||
| Net investment income (loss)2 | 0.021 | 0.102 | (0.020 | ) | (0.023 | ) | ||||||
| Net realized and unrealized gain on investments | ||||||||||||
| and foreign currencies | 2.624 | 2.416 | 1.069 | 2.149 | ||||||||
| Total from investment operations | 2.645 | 2.518 | 1.049 | 2.126 | ||||||||
| Less dividends and distributions from: | ||||||||||||
| Net investment income | (0.104 | ) | (0.016 | ) | — | — | ||||||
| Net realized gain on investments | (0.581 | ) | (0.752 | ) | (0.129 | ) | (0.006 | ) | ||||
| Total dividends and distributions | (0.685 | ) | (0.768 | ) | (0.129 | ) | (0.006 | ) | ||||
| Net asset value, end of period | $15.250 | $13.290 | $11.540 | $10.620 | ||||||||
| Total return3 | 20.51% | 22.69% | 10.01% | 25.02% | ||||||||
| Ratios and supplemental data: | ||||||||||||
| Net assets, end of period (000 omitted) | $91,696 | $70,828 | $38,517 | $14,339 | ||||||||
| Ratio of expenses to average net assets | 2.61% | 2.61% | 2.63% | 2.57% | ||||||||
| Ratio of expenses to average net assets | ||||||||||||
| prior to expense limitation | 2.61% | 2.85% | 2.95% | 4.47% | ||||||||
| Ratio of net investment income (loss) to average net assets | 0.13% | 0.82% | (0.20% | ) | (0.35% | ) | ||||||
| Ratio of net investment income (loss) to average net assets | ||||||||||||
| prior to expense limitation | 0.13% | 0.58% | (0.52% | ) | (2.25% | ) | ||||||
| Portfolio turnover | 18% | 68% | 82% | 49% | ||||||||
| 1 Date of commencement of operations; ratios and portfolio turnover have been annualized and total return has not been annualized. |
| 2 The average shares outstanding method has been applied for per share information. |
| 3 Total investment return is based on the change in net asset value of a share during the period and assumes reinvestment of dividends and distributions at net asset value and does not reflect the impact of a sales charge. Total investment return reflects waivers and payment of fees by the manager, as applicable. Performance would have been lower had the expense limitation not been in effect. |
See accompanying notes
(continues) 83
Financial highlights
> Optimum International Fund
Selected data for each share of the Fund outstanding throughout each period were as follows:
| Institutional Class | ||||||||||||
| 8/1/031 | ||||||||||||
| Year Ended | to | |||||||||||
| 3/31/07 | 3/31/06 | 3/31/05 | 3/31/04 | |||||||||
| Net asset value, beginning of period | $13.550 | $11.720 | $10.690 | $ 8.500 | ||||||||
| Income from investment operations: | ||||||||||||
| Net investment income2 | 0.162 | 0.224 | 0.089 | 0.045 | ||||||||
| Net realized and unrealized gain on investments | ||||||||||||
| and foreign currencies | 2.679 | 2.464 | 1.079 | 2.151 | ||||||||
| Total from investment operations | 2.841 | 2.688 | 1.168 | 2.196 | ||||||||
| Less dividends and distributions from: | ||||||||||||
| Net investment income | (0.220 | ) | (0.106 | ) | (0.009 | ) | — | |||||
| Net realized gain on investments | (0.581 | ) | (0.752 | ) | (0.129 | ) | (0.006 | ) | ||||
| Total dividends and distributions | (0.801 | ) | (0.858 | ) | (0.138 | ) | (0.006 | ) | ||||
| Net asset value, end of period | $15.590 | $13.550 | $11.720 | $10.690 | ||||||||
| Total return3 | 21.68% | 23.91% | 11.08% | 25.84% | ||||||||
| Ratios and supplemental data: | ||||||||||||
| Net assets, end of period (000 omitted) | $154,198 | $99,733 | $44,149 | $9,302 | ||||||||
| Ratio of expenses to average net assets | 1.61% | 1.61% | 1.63% | 1.57% | ||||||||
| Ratio of expenses to average net assets | ||||||||||||
| prior to expense limitation | 1.61% | 1.85% | 1.95% | 3.47% | ||||||||
| Ratio of net investment income to average net assets | 1.13% | 1.82% | 0.80% | 0.65% | ||||||||
| Ratio of net investment income (loss) to average net assets | ||||||||||||
| prior to expense limitation | 1.13% | 1.58% | 0.48% | (1.25% | ) | |||||||
| Portfolio turnover | 18% | 68% | 82% | 49% | ||||||||
| 1 Date of commencement of operations; ratios and portfolio turnover have been annualized and total return has not been annualized. |
| 2 The average shares outstanding method has been applied for per share information. |
| 3 Total investment return is based on the change in net asset value of a share during the period and assumes reinvestment of dividends and distributions at net asset value. Total investment return reflects waivers and payment of fees by the manager, as applicable. Performance would have been lower had the expense limitation not been in effect. |
See accompanying notes
84> Optimum Large Cap Growth Fund
Selected data for each share of the Fund outstanding throughout each period were as follows:
| Class A | ||||||||||||
| 8/1/031 | ||||||||||||
| Year Ended | to | |||||||||||
| 3/31/07 | 3/31/06 | 3/31/05 | 3/31/04 | |||||||||
| Net asset value, beginning of period | $11.540 | $10.020 | $ 9.570 | $8.500 | ||||||||
| Income (loss) from investment operations: | ||||||||||||
| Net investment loss2 | (0.047 | ) | (0.057 | ) | (0.036 | ) | (0.037 | ) | ||||
| Net realized and unrealized gain on investments | ||||||||||||
| and foreign currencies | 0.692 | 1.577 | 0.486 | 1.107 | ||||||||
| Total from investment operations | 0.645 | 1.520 | 0.450 | 1.070 | ||||||||
| Less dividends and distributions from: | ||||||||||||
| Net realized gain on investments | (0.205 | ) | — | — | — | |||||||
| Total dividends and distributions | (0.205 | ) | — | — | — | |||||||
| Net asset value, end of period | $11.980 | $11.540 | $10.020 | $9.570 | ||||||||
| Total return3 | 5.75% | 15.17% | 4.70% | 12.59% | ||||||||
| Ratios and supplemental data: | ||||||||||||
| Net assets, end of period (000 omitted) | $56,088 | $47,283 | $26,252 | $9,337 | ||||||||
| Ratio of expenses to average net assets | 1.69% | 1.69% | 1.67% | 1.61% | ||||||||
| Ratio of expenses to average net assets | ||||||||||||
| prior to expense limitation | 1.77% | 1.84% | 1.87% | 2.51% | ||||||||
| Ratio of net investment loss to average net assets | (0.41% | ) | (0.52% | ) | (0.37% | ) | (0.61% | ) | ||||
| Ratio of net investment loss to average net assets | ||||||||||||
| prior to expense limitation | (0.49% | ) | (0.67% | ) | (0.57% | ) | (1.51% | ) | ||||
| Portfolio turnover | 37% | 48% | 37% | 51% | ||||||||
| 1 Date of commencement of operations; ratios and portfolio turnover have been annualized and total return has not been annualized. |
| 2 The average shares outstanding method has been applied for per share information. |
| 3 Total investment return is based on the change in net asset value of a share during the period and assumes reinvestment of dividends and distributions at net asset value and does not reflect the impact of a sales charge. Total investment return reflects waivers and payment of fees by the manager. Performance would have been lower had the expense limitation not been in effect. |
See accompanying notes
(continues) 85
Financial highlights
> Optimum Large Cap Growth Fund
Selected data for each share of the Fund outstanding throughout each period were as follows:
| Class B | ||||||||||||
| 8/1/031 | ||||||||||||
| Year Ended | to | |||||||||||
| 3/31/07 | 3/31/06 | 3/31/05 | 3/31/04 | |||||||||
| Net asset value, beginning of period | $11.340 | $ 9.910 | $9.530 | $8.500 | ||||||||
| Income (loss) from investment operations: | ||||||||||||
| Net investment loss2 | (0.119 | ) | (0.126 | ) | (0.099 | ) | (0.077 | ) | ||||
| Net realized and unrealized gain on investments | ||||||||||||
| and foreign currencies | 0.684 | 1.556 | 0.479 | 1.107 | ||||||||
| Total from investment operations | 0.565 | 1.430 | 0.380 | 1.030 | ||||||||
| Less dividends and distributions from: | ||||||||||||
| Net realized gain on investments | (0.205 | ) | — | — | — | |||||||
| Total dividends and distributions | (0.205 | ) | — | — | — | |||||||
| Net asset value, end of period | $11.700 | $11.340 | $9.910 | $9.530 | ||||||||
| Total return3 | 5.14% | 14.43% | 3.99% | 12.12% | ||||||||
| Ratios and supplemental data: | ||||||||||||
| Net assets, end of period (000 omitted) | $10,819 | $10,168 | $7,603 | $3,568 | ||||||||
| Ratio of expenses to average net assets | 2.34% | 2.34% | 2.32% | 2.26% | ||||||||
| Ratio of expenses to average net assets | ||||||||||||
| prior to expense limitation | 2.42% | 2.49% | 2.52% | 3.16% | ||||||||
| Ratio of net investment loss to average net assets | (1.06% | ) | (1.17% | ) | (1.02% | ) | (1.26% | ) | ||||
| Ratio of net investment loss to average net assets | ||||||||||||
| prior to expense limitation | (1.14% | ) | (1.32% | ) | (1.22% | ) | (2.16% | ) | ||||
| Portfolio turnover | 37% | 48% | 37% | 51% | ||||||||
| 1 Date of commencement of operations; ratios and portfolio turnover have been annualized and total return has not been annualized. |
| 2 The average shares outstanding method has been applied for per share information. |
| 3 Total investment return is based on the change in net asset value of a share during the period and assumes reinvestment of dividends and distributions at net asset value and does not reflect the impact of a sales charge. Total investment return reflects waivers and payment of fees by the manager. Performance would have been lower had the expense limitation not been in effect. |
See accompanying notes
86
> Optimum Large Cap Growth Fund
Selected data for each share of the Fund outstanding throughout each period were as follows:
| Class C | ||||||||||||
| 8/1/031 | ||||||||||||
| Year Ended | to | |||||||||||
| 3/31/07 | 3/31/06 | 3/31/05 | 3/31/04 | |||||||||
| Net asset value, beginning of period | $11.340 | $ 9.910 | $9.530 | $8.500 | ||||||||
| Income (loss) from investment operations: | ||||||||||||
| Net investment loss2 | (0.119 | ) | (0.126 | ) | (0.099 | ) | (0.077 | ) | ||||
| Net realized and unrealized gain on investments | ||||||||||||
| and foreign currencies | 0.684 | 1.556 | 0.479 | 1.107 | ||||||||
| Total from investment operations | 0.565 | 1.430 | 0.380 | 1.030 | ||||||||
| Less dividends and distributions from: | ||||||||||||
| Net realized gain on investments | (0.205 | ) | — | — | — | |||||||
| Total dividends and distributions | (0.205 | ) | — | — | — | |||||||
| Net asset value, end of period | $11.700 | $11.340 | $9.910 | $9.530 | ||||||||
| Total return3 | 5.14% | 14.43% | 3.99% | 12.12% | ||||||||
| Ratios and supplemental data: | ||||||||||||
| Net assets, end of period (000 omitted) | $203,591 | $164,995 | $91,434 | $35,143 | ||||||||
| Ratio of expenses to average net assets | 2.34% | 2.34% | 2.32% | 2.26% | ||||||||
| Ratio of expenses to average net assets | ||||||||||||
| prior to expense limitation | 2.42% | 2.49% | 2.52% | 3.16% | ||||||||
| Ratio of net investment loss to average net assets | (1.06% | ) | (1.17% | ) | (1.02% | ) | (1.26% | ) | ||||
| Ratio of net investment loss to average net assets | ||||||||||||
| prior to expense limitation | (1.14% | ) | (1.32% | ) | (1.22% | ) | (2.16% | ) | ||||
| Portfolio turnover | 37% | 48% | 37% | 51% | ||||||||
| 1 Date of commencement of operations; ratios and portfolio turnover have been annualized and total return has not been annualized. |
| 2 The average shares outstanding method has been applied for per share information. |
| 3 Total investment return is based on the change in net asset value of a share during the period and assumes reinvestment of dividends and distributions at net asset value and does not reflect the impact of a sales charge. Total investment return reflects waivers and payment of fees by the manager. Performance would have been lower had the expense limitation not been in effect. |
See accompanying notes
(continues) 87
Financial highlights
> Optimum Large Cap Growth Fund
Selected data for each share of the Fund outstanding throughout each period were as follows:
| Institutional Class | ||||||||||||
| 8/1/031 | ||||||||||||
| Year Ended | to | |||||||||||
| 3/31/07 | 3/31/06 | 3/31/05 | 3/31/04 | |||||||||
| Net asset value, beginning of period | $11.650 | $10.080 | $ 9.590 | $8.500 | ||||||||
| Income (loss) from investment operations: | ||||||||||||
| Net investment loss2 | (0.006 | ) | (0.019 | ) | (0.002 | ) | (0.015 | ) | ||||
| Net realized and unrealized gain on investments | ||||||||||||
| and foreign currencies | 0.701 | 1.589 | 0.492 | 1.105 | ||||||||
| Total from investment operations | 0.695 | 1.570 | 0.490 | 1.090 | ||||||||
| Less dividends and distributions from: | ||||||||||||
| Net realized gain on investments | (0.205 | ) | — | — | — | |||||||
| Total dividends and distributions | (0.205 | ) | — | — | — | |||||||
| Net asset value, end of period | $12.140 | $11.650 | $10.080 | $9.590 | ||||||||
| Total return3 | 6.13% | 15.57% | 5.11% | 12.82% | ||||||||
| Ratios and supplemental data: | ||||||||||||
| Net assets, end of period (000 omitted) | $518,509 | $355,961 | $158,200 | $21,557 | ||||||||
| Ratio of expenses to average net assets | 1.34% | 1.34% | 1.32% | 1.26% | ||||||||
| Ratio of expenses to average net assets | ||||||||||||
| prior to expense limitation | 1.42% | 1.49% | 1.52% | 2.16% | ||||||||
| Ratio of net investment loss to average net assets | (0.06% | ) | (0.17% | ) | (0.02% | ) | (0.26% | ) | ||||
| Ratio of net investment loss to average net assets | ||||||||||||
| prior to expense limitation | (0.14% | ) | (0.32% | ) | (0.22% | ) | (1.16% | ) | ||||
| Portfolio turnover | 37% | 48% | 37% | 51% | ||||||||
| 1 Date of commencement of operations; ratios and portfolio turnover have been annualized and total return has not been annualized. |
| 2 The average shares outstanding method has been applied for per share information. |
| 3 Total investment return is based on the change in net asset value of a share during the period and assumes reinvestment of dividends and distributions at net asset value. Total investment return reflects waivers and payment of fees by the manager. Performance would have been lower had the expense limitation not been in effect. |
See accompanying notes
88> Optimum Large Cap Value Fund
Selected data for each share of the Fund outstanding throughout each period were as follows:
| Class A | ||||||||||||
| 8/1/031 | ||||||||||||
| Year Ended | to | |||||||||||
| 3/31/07 | 3/31/06 | 3/31/05 | 3/31/04 | |||||||||
| Net asset value, beginning of period | $11.320 | $10.840 | $ 9.830 | $8.500 | ||||||||
| Income from investment operations: | ||||||||||||
| Net investment income2 | 0.128 | 0.092 | 0.074 | 0.038 | ||||||||
| Net realized and unrealized gain on investments | ||||||||||||
| and foreign currencies | 1.614 | 0.947 | 1.100 | 1.331 | ||||||||
| Total from investment operations | 1.742 | 1.039 | 1.174 | 1.369 | ||||||||
| Less dividends and distributions from: | ||||||||||||
| Net investment income | (0.104 | ) | (0.065 | ) | (0.028 | ) | (0.023 | ) | ||||
| Net realized gain on investments | (0.228 | ) | (0.494 | ) | (0.136 | ) | (0.016 | ) | ||||
| Total dividends and distributions | (0.332 | ) | (0.559 | ) | (0.164 | ) | (0.039 | ) | ||||
| Net asset value, end of period | $12.730 | $ 11.320 | $10.840 | $9.830 | ||||||||
| Total return3 | 15.65% | 9.82% | 12.04% | 16.12% | ||||||||
| Ratios and supplemental data: | ||||||||||||
| Net assets, end of period (000 omitted) | $58,161 | $45,666 | $27,524 | $9,115 | ||||||||
| Ratio of expenses to average net assets | 1.55% | 1.55% | 1.53% | 1.50% | ||||||||
| Ratio of expenses to average net assets | ||||||||||||
| prior to expense limitation and expense paid indirectly | 1.73% | 1.83% | 1.84% | 2.52% | ||||||||
| Ratio of net investment income to average net assets | 1.07% | 0.83% | 0.72% | 0.59% | ||||||||
| Ratio of net investment income (loss) to average net assets | ||||||||||||
| prior to expense limitation and expense paid indirectly | 0.89% | 0.55% | 0.41% | (0.43% | ) | |||||||
| Portfolio turnover | 22% | 52% | 38% | 38% | ||||||||
| 1 Date of commencement of operations; ratios and portfolio turnover have been annualized and total return has not been annualized. |
| 2 The average shares outstanding method has been applied for per share information. |
| 3 Total investment return is based on the change in net asset value of a share during the period and assumes reinvestment of dividends and distributions at net asset value and does not reflect the impact of a sales charge. Total investment return reflects waivers and payment of fees by the manager. Performance would have been lower had the expense limitation not been in effect. |
See accompanying notes
(continues) 89
Financial highlights
> Optimum Large Cap Value Fund
Selected data for each share of the Fund outstanding throughout each period were as follows:
| Class B | ||||||||||||
| 8/1/031 | ||||||||||||
| Year Ended | to | |||||||||||
| 3/31/07 | 3/31/06 | 3/31/05 | 3/31/04 | |||||||||
| Net asset value, beginning of period | $11.240 | $10.780 | $ 9.810 | $8.500 | ||||||||
| Income (loss) from investment operations: | ||||||||||||
| Net investment income (loss)2 | 0.052 | 0.021 | 0.008 | (0.003 | ) | |||||||
| Net realized and unrealized gain on investments | ||||||||||||
| and foreign currencies | 1.606 | 0.933 | 1.098 | 1.329 | ||||||||
| Total from investment operations | 1.658 | 0.954 | 1.106 | 1.326 | ||||||||
| Less dividends and distributions from: | ||||||||||||
| Net investment income | (0.030 | ) | — | — | — | |||||||
| Net realized gain on investments | (0.228 | ) | (0.494 | ) | (0.136 | ) | (0.016 | ) | ||||
| Total dividends and distributions | (0.258 | ) | (0.494 | ) | (0.136 | ) | (0.016 | ) | ||||
| Net asset value, end of period | $12.640 | $11.240 | $10.780 | $9.810 | ||||||||
| Total return3 | 14.97% | 9.05% | 11.36% | 15.61% | ||||||||
| Ratios and supplemental data: | ||||||||||||
| Net assets, end of period (000 omitted) | $11,403 | $10,103 | $8,072 | $3,609 | ||||||||
| Ratio of expenses to average net assets | 2.20% | 2.20% | 2.18% | 2.15% | ||||||||
| Ratio of expenses to average net assets | ||||||||||||
| prior to expense limitation and expense paid indirectly | 2.38% | 2.48% | 2.49% | 3.17% | ||||||||
| Ratio of net investment income (loss) to average net assets | 0.42% | 0.18% | 0.07% | (0.06% | ) | |||||||
| Ratio of net investment income (loss) to average net assets | ||||||||||||
| prior to expense limitation and expense paid indirectly | 0.24% | (0.10% | ) | (0.24% | ) | (1.08% | ) | |||||
| Portfolio turnover | 22% | 52% | 38% | 38% | ||||||||
| 1 Date of commencement of operations; ratios and portfolio turnover have been annualized and total return has not been annualized. |
| 2 The average shares outstanding method has been applied for per share information. |
| 3 Total investment return is based on the change in net asset value of a share during the period and assumes reinvestment of dividends and distributions at net asset value and does not reflect the impact of a sales charge. Total investment return reflects waivers and payment of fees by the manager. Performance would have been lower had the expense limitation not been in effect. |
See accompanying notes
90
> Optimum Large Cap Value Fund
Selected data for each share of the Fund outstanding throughout each period were as follows:
| Class C | ||||||||||||
| 8/1/031 | ||||||||||||
| Year Ended | to | |||||||||||
| 3/31/07 | 3/31/06 | 3/31/05 | 3/31/04 | |||||||||
| Net asset value, beginning of period | $11.240 | $10.780 | $ 9.810 | $8.500 | ||||||||
| Income (loss) from investment operations: | ||||||||||||
| Net investment income (loss)2 | 0.051 | 0.021 | 0.008 | (0.003 | ) | |||||||
| Net realized and unrealized gain on investments | ||||||||||||
| and foreign currencies | 1.597 | 0.933 | 1.098 | 1.329 | ||||||||
| Total from investment operations | 1.648 | 0.954 | 1.106 | 1.326 | ||||||||
| Less dividends and distributions from: | ||||||||||||
| Net investment income | (0.030 | ) | — | — | — | |||||||
| Net realized gain on investments | (0.228 | ) | (0.494 | ) | (0.136 | ) | (0.016 | ) | ||||
| Total dividends and distributions | (0.258 | ) | (0.494 | ) | (0.136 | ) | (0.016 | ) | ||||
| Net asset value, end of period | $12.630 | $11.240 | $10.780 | $9.810 | ||||||||
| Total return3 | 14.88% | 9.16% | 11.36% | 15.61% | ||||||||
| Ratios and supplemental data: | ||||||||||||
| Net assets, end of period (000 omitted) | $216,527 | $163,876 | $97,823 | $35,732 | ||||||||
| Ratio of expenses to average net assets | 2.20% | 2.20% | 2.18% | 2.15% | ||||||||
| Ratio of expenses to average net assets | ||||||||||||
| prior to expense limitation and expense paid indirectly | 2.38% | 2.48% | 2.49% | 3.17% | ||||||||
| Ratio of net investment income (loss) to average net assets | 0.42% | 0.18% | 0.07% | (0.06% | ) | |||||||
| Ratio of net investment income (loss) to average net assets | ||||||||||||
| prior to expense limitation and expense paid indirectly | 0.24% | (0.10% | ) | (0.24% | ) | (1.08% | ) | |||||
| Portfolio turnover | 22% | 52% | 38% | 38% | ||||||||
| 1 Date of commencement of operations; ratios and portfolio turnover have been annualized and total return has not been annualized. |
| 2 The average shares outstanding method has been applied for per share information. |
| 3 Total investment return is based on the change in net asset value of a share during the period and assumes reinvestment of dividends and distributions at net asset value and does not reflect the impact of a sales charge. Total investment return reflects waivers and payment of fees by the manager. Performance would have been lower had the expense limitation not been in effect. |
See accompanying notes
(continues) 91
Financial highlights
> Optimum Large Cap Value Fund
Selected data for each share of the Fund outstanding throughout each period were as follows:
| Institutional Class | ||||||||||||
| 8/1/031 | ||||||||||||
| Year Ended | to | |||||||||||
| 3/31/07 | 3/31/06 | 3/31/05 | 3/31/04 | |||||||||
| Net asset value, beginning of period | $11.330 | $10.860 | $ 9.840 | $8.500 | ||||||||
| Income from investment operations: | ||||||||||||
| Net investment income2 | 0.170 | 0.131 | 0.110 | 0.060 | ||||||||
| Net realized and unrealized gain on investments | ||||||||||||
| and foreign currencies | 1.623 | 0.936 | 1.110 | 1.330 | ||||||||
| Total from investment operations | 1.793 | 1.067 | 1.220 | 1.390 | ||||||||
| Less dividends and distributions from: | ||||||||||||
| Net investment income | (0.145 | ) | (0.103 | ) | (0.064 | ) | (0.034 | ) | ||||
| Net realized gain on investments | (0.228 | ) | (0.494 | ) | (0.136 | ) | (0.016 | ) | ||||
| Total dividends and distributions | (0.373 | ) | (0.597 | ) | (0.200 | ) | (0.050 | ) | ||||
| Net asset value, end of period | $12.750 | $11.330 | $10.860 | $9.840 | ||||||||
| Total return3 | 16.12% | 10.19% | 12.41% | 16.38% | ||||||||
| Ratios and supplemental data: | ||||||||||||
| Net assets, end of period (000 omitted) | $508,000 | $319,857 | $140,341 | $17,962 | ||||||||
| Ratio of expenses to average net assets | 1.20% | 1.20% | 1.18% | 1.15% | ||||||||
| Ratio of expenses to average net assets | ||||||||||||
| prior to expense limitation and expense paid indirectly | 1.38% | 1.48% | 1.49% | 2.17% | ||||||||
| Ratio of net investment income to average net assets | 1.42% | 1.18% | 1.07% | 0.94% | ||||||||
| Ratio of net investment income (loss) to average net assets | ||||||||||||
| prior to expense limitation and expense paid indirectly | 1.24% | 0.90% | 0.76% | (0.08% | ) | |||||||
| Portfolio turnover | 22% | 52% | 38% | 38% | ||||||||
| 1 Date of commencement of operations; ratios and portfolio turnover have been annualized and total return has not been annualized. |
| 2 The average shares outstanding method has been applied for per share information. |
| 3 Total investment return is based on the change in net asset value of a share during the period and assumes reinvestment of dividends and distributions at net asset value. Total investment return reflects waivers and payment of fees by the manager. Performance would have been lower had the expense limitation not been in effect. |
See accompanying notes
92
> Optimum Small Cap Growth Fund
Selected data for each share of the Fund outstanding throughout each period were as follows:
| Class A | ||||||||||||
| 8/1/031 | ||||||||||||
| Year Ended | to | |||||||||||
| 3/31/07 | 3/31/06 | 3/31/05 | 3/31/04 | |||||||||
| Net asset value, beginning of period | $14.340 | $11.750 | $11.260 | $ 8.500 | ||||||||
| Income (loss) from investment operations: | ||||||||||||
| Net investment loss2 | (0.155 | ) | (0.176 | ) | (0.161 | ) | (0.100 | ) | ||||
| Net realized and unrealized gain on investments | 0.188 | 2.766 | 0.653 | 2.860 | ||||||||
| Total from investment operations | 0.033 | 2.590 | 0.492 | 2.760 | ||||||||
| Less dividends and distributions from: | ||||||||||||
| Net realized gain on investments | (0.303 | ) | — | (0.002 | ) | — | ||||||
| Total dividends and distributions | (0.303 | ) | — | (0.002 | ) | — | ||||||
| Net asset value, end of period | $14.070 | $14.340 | $11.750 | $11.260 | ||||||||
| Total return3 | 0.37% | 22.04% | 4.37% | 32.47% | ||||||||
| Ratios and supplemental data: | ||||||||||||
| Net assets, end of period (000 omitted) | $12,088 | $11,984 | $6,133 | $2,115 | ||||||||
| Ratio of expenses to average net assets | 1.95% | 1.95% | 1.80% | 1.81% | ||||||||
| Ratio of expenses to average net assets | ||||||||||||
| prior to expense limitation and expense paid indirectly | 2.32% | 2.46% | 2.69% | 4.11% | ||||||||
| Ratio of net investment loss to average net assets | (1.15% | ) | (1.38% | ) | (1.42% | ) | (1.41% | ) | ||||
| Ratio of net investment loss to average net assets | ||||||||||||
| prior to expense limitation and expense paid indirectly | (1.52% | ) | (1.89% | ) | (2.31% | ) | (3.71% | ) | ||||
| Portfolio turnover | 46% | 47% | 44% | 16% | ||||||||
| 1 Date of commencement of operations; ratios and portfolio turnover have been annualized and total return has not been annualized. |
| 2 The average shares outstanding method has been applied for per share information. |
| 3 Total investment return is based on the change in net asset value of a share during the period and assumes reinvestment of dividends and distributions at net asset value and does not reflect the impact of a sales charge. Total investment return reflects waivers and payment of fees by the manager. Performance would have been lower had the expense limitation not been in effect. |
See accompanying notes
(continues) 93
Financial highlights
> Optimum Small Cap Growth Fund
Selected data for each share of the Fund outstanding throughout each period were as follows:
| Class B | ||||||||||||
| 8/1/031 | ||||||||||||
| Year Ended | to | |||||||||||
| 3/31/07 | 3/31/06 | 3/31/05 | 3/31/04 | |||||||||
| Net asset value, beginning of period | $14.110 | $11.640 | $11.230 | $ 8.500 | ||||||||
| Income (loss) from investment operations: | ||||||||||||
| Net investment loss2 | (0.240 | ) | (0.257 | ) | (0.233 | ) | (0.146 | ) | ||||
| Net realized and unrealized gain on investments | 0.183 | 2.727 | 0.645 | 2.876 | ||||||||
| Total from investment operations | (0.057 | ) | 2.470 | 0.412 | 2.730 | |||||||
| Less dividends and distributions from: | ||||||||||||
| Net realized gain on investments | (0.303 | ) | — | (0.002 | ) | — | ||||||
| Total dividends and distributions | (0.303 | ) | — | (0.002 | ) | — | ||||||
| Net asset value, end of period | $13.750 | $14.110 | $11.640 | $11.230 | ||||||||
| Total return3 | (0.27% | ) | 21.22% | 3.67% | 32.12% | |||||||
| Ratios and supplemental data: | ||||||||||||
| Net assets, end of period (000 omitted) | $2,187 | $2,285 | $1,665 | $792 | ||||||||
| Ratio of expenses to average net assets | 2.60% | 2.60% | 2.45% | 2.46% | ||||||||
| Ratio of expenses to average net assets | ||||||||||||
| prior to expense limitation and expense paid indirectly | 2.97% | 3.11% | 3.34% | 4.76% | ||||||||
| Ratio of net investment loss to average net assets | (1.80% | ) | (2.03% | ) | (2.07% | ) | (2.06% | ) | ||||
| Ratio of net investment loss to average net assets | ||||||||||||
| prior to expense limitation and expense paid indirectly | (2.17% | ) | (2.54% | ) | (2.96% | ) | (4.36% | ) | ||||
| Portfolio turnover | 46% | 47% | 44% | 16% | ||||||||
| 1 Date of commencement of operations; ratios and portfolio turnover have been annualized and total return has not been annualized. |
| 2 The average shares outstanding method has been applied for per share information. |
| 3 Total investment return is based on the change in net asset value of a share during the period and assumes reinvestment of dividends and distributions at net asset value and does not reflect the impact of a sales charge. Total investment return reflects waivers and payment of fees by the manager. Performance would have been lower had the expense limitation not been in effect. |
See accompanying notes
94
> Optimum Small Cap Growth Fund
Selected data for each share of the Fund outstanding throughout each period were as follows:
| Class C | ||||||||||||
| 8/1/031 | ||||||||||||
| Year Ended | to | |||||||||||
| 3/31/07 | 3/31/06 | 3/31/05 | 3/31/04 | |||||||||
| Net asset value, beginning of period | $14.110 | $11.640 | $11.230 | $ 8.500 | ||||||||
| Income (loss) from investment operations: | ||||||||||||
| Net investment loss2 | (0.240 | ) | (0.257 | ) | (0.233 | ) | (0.146 | ) | ||||
| Net realized and unrealized gain on investments | 0.183 | 2.727 | 0.645 | 2.876 | ||||||||
| Total from investment operations | (0.057 | ) | 2.470 | 0.412 | 2.730 | |||||||
| Less dividends and distributions from: | ||||||||||||
| Net realized gain on investments | (0.303 | ) | — | (0.002 | ) | — | ||||||
| Total dividends and distributions | (0.303 | ) | — | (0.002 | ) | — | ||||||
| Net asset value, end of period | $13.750 | $14.110 | $11.640 | $11.230 | ||||||||
| Total return3 | (0.27% | ) | 21.22% | 3.67% | 32.12% | |||||||
| Ratios and supplemental data: | ||||||||||||
| Net assets, end of period (000 omitted) | $40,324 | $36,537 | $19,883 | $7,521 | ||||||||
| Ratio of expenses to average net assets | 2.60% | 2.60% | 2.45% | 2.46% | ||||||||
| Ratio of expenses to average net assets | ||||||||||||
| prior to expense limitation and expense paid indirectly | 2.97% | 3.11% | 3.34% | 4.76% | ||||||||
| Ratio of net investment loss to average net assets | (1.80% | ) | (2.03% | ) | (2.07% | ) | (2.06% | ) | ||||
| Ratio of net investment loss to average net assets | ||||||||||||
| prior to expense limitation and expense paid indirectly | (2.17% | ) | (2.54% | ) | (2.96% | ) | (4.36% | ) | ||||
| Portfolio turnover | 46% | 47% | 44% | 16% | ||||||||
| 1 Date of commencement of operations; ratios and portfolio turnover have been annualized and total return has not been annualized. | ||||||||||||
| 2 The average shares outstanding method has been applied for per share information. | ||||||||||||
| 3 Total investment return is based on the change in net asset value of a share during the period and assumes reinvestment of dividends and distributions at net asset value and does not reflect the impact of a sales charge. Total investment return reflects waivers and payment of fees by the manager. Performance would have been lower had the expense limitation not been in effect. | ||||||||||||
See accompanying notes
(continues) 95
Financial highlights
> Optimum Small Cap Growth Fund
Selected data for each share of the Fund outstanding throughout each period were as follows:
| Institutional Class | ||||||||||||
| 8/1/031 | ||||||||||||
| Year Ended | to | |||||||||||
| 3/31/07 | 3/31/06 | 3/31/05 | 3/31/04 | |||||||||
| Net asset value, beginning of period | $14.470 | $11.820 | $11.280 | $ 8.500 | ||||||||
| Income (loss) from investment operations: | ||||||||||||
| Net investment loss2 | (0.108 | ) | (0.131 | ) | (0.121 | ) | (0.075 | ) | ||||
| Net realized and unrealized gain on investments | 0.191 | 2.781 | 0.663 | 2.855 | ||||||||
| Total from investment operations | (0.083 | ) | 2.650 | 0.542 | 2.780 | |||||||
| Less dividends and distributions from: | ||||||||||||
| Net realized gain on investments | (0.303 | ) | — | (0.002 | ) | — | ||||||
| Total dividends and distributions | (0.303 | ) | — | (0.002 | ) | — | ||||||
| Net asset value, end of period | $14.250 | $14.470 | $11.820 | $11.280 | ||||||||
| Total return3 | 0.72% | 22.42% | 4.81% | 32.71% | ||||||||
| Ratios and supplemental data: | ||||||||||||
| Net assets, end of period (000 omitted) | $84,934 | $67,466 | $31,827 | $10,212 | ||||||||
| Ratio of expenses to average net assets | 1.60% | 1.60% | 1.45% | 1.46% | ||||||||
| Ratio of expenses to average net assets | ||||||||||||
| prior to expense limitation and expense paid indirectly | 1.97% | 2.11% | 2.34% | 3.76% | ||||||||
| Ratio of net investment loss to average net assets | (0.80% | ) | (1.03% | ) | (1.07% | ) | (1.06% | ) | ||||
| Ratio of net investment loss to average net assets | ||||||||||||
| prior to expense limitation and expense paid indirectly | (1.17% | ) | (1.54% | ) | (1.96% | ) | (3.36% | ) | ||||
| Portfolio turnover | 46% | 47% | 44% | 16% | ||||||||
| 1 Date of commencement of operations; ratios and portfolio turnover have been annualized and total return has not been annualized. | ||||||||||||
| 2 The average shares outstanding method has been applied for per share information. | ||||||||||||
| 3 Total investment return is based on the change in net asset value of a share during the period and assumes reinvestment of dividends and distributions at net asset value. Total investment return reflects waivers and payment of fees by the manager. Performance would have been lower had the expense limitation not been in effect. | ||||||||||||
See accompanying notes
96
> Optimum Small Cap Value Fund
Selected data for each share of the Fund outstanding throughout each period were as follows:
| Class A | ||||||||||||
| 8/1/031 | ||||||||||||
| Year Ended | to | |||||||||||
| 3/31/07 | 3/31/06 | 3/31/05 | 3/31/04 | |||||||||
| Net asset value, beginning of period | $13.590 | $12.410 | $11.010 | $ 8.500 | ||||||||
| Income (loss) from investment operations: | ||||||||||||
| Net investment loss2 | (0.020 | ) | (0.022 | ) | (0.055 | ) | (0.046 | ) | ||||
| Net realized and unrealized gain on investments | 0.759 | 2.043 | 1.801 | 2.616 | ||||||||
| Total from investment operations | (0.739 | ) | 2.021 | 1.746 | 2.570 | |||||||
| Less dividends and distributions from: | ||||||||||||
| Net realized gain on investments | (0.789 | ) | (0.841 | ) | (0.346 | ) | (0.060 | ) | ||||
| Total dividends and distributions | (0.789 | ) | (0.841 | ) | (0.346 | ) | (0.060 | ) | ||||
| Net asset value, end of period | $13.540 | $13.590 | $12.410 | $11.010 | ||||||||
| Total return3 | 5.93% | 17.17% | 16.12% | 30.30% | ||||||||
| Ratios and supplemental data: | ||||||||||||
| Net assets, end of period (000 omitted) | $12,721 | $13,300 | $7,297 | $2,126 | ||||||||
| Ratio of expenses to average net assets | 1.76% | 1.76% | 1.73% | 1.67% | ||||||||
| Ratio of expenses to average net assets | ||||||||||||
| prior to expense limitation and expense paid indirectly | 2.32% | 2.58% | 2.61% | 4.08% | ||||||||
| Ratio of net investment loss to average net assets | (0.16% | ) | (0.17% | ) | (0.47% | ) | (0.69% | ) | ||||
| Ratio of net investment loss to average net assets | ||||||||||||
| prior to expense limitation and expense paid indirectly | (0.72% | ) | (0.99% | ) | (1.35% | ) | (3.10% | ) | ||||
| Portfolio turnover | 49% | 42% | 46% | 40% | ||||||||
| 1 Date of commencement of operations; ratios and portfolio turnover have been annualized and total return has not been annualized. | ||||||||||||
| 2 The average shares outstanding method has been applied for per share information. | ||||||||||||
| 3 Total investment return is based on the change in net asset value of a share during the period and assumes reinvestment of dividends and distributions at net asset value and does not reflect the impact of a sales charge. Total investment return reflects waivers and payment of fees by the manager. Performance would have been lower had the expense limitation not been in effect. | ||||||||||||
See accompanying notes
(continues) 97
Financial highlights
> Optimum Small Cap Value Fund
Selected data for each share of the Fund outstanding throughout each period were as follows:
| Class B | ||||||||||||
| 8/1/031 | ||||||||||||
| Year Ended | to | |||||||||||
| 3/31/07 | 3/31/06 | 3/31/05 | 3/31/04 | |||||||||
| Net asset value, beginning of period | $13.350 | $12.280 | $10.970 | $ 8.500 | ||||||||
| Income (loss) from investment operations: | ||||||||||||
| Net investment loss2 | (0.101 | ) | (0.102 | ) | (0.129 | ) | (0.090 | ) | ||||
| Net realized and unrealized gain on investments | 0.730 | 2.013 | 1.785 | 2.620 | ||||||||
| Total from investment operations | (0.629 | ) | 1.911 | 1.656 | 2.530 | |||||||
| Less dividends and distributions from: | ||||||||||||
| Net realized gain on investments | (0.789 | ) | (0.841 | ) | (0.346 | ) | (0.060 | ) | ||||
| Total dividends and distributions | (0.789 | ) | (0.841 | ) | (0.346 | ) | (0.060 | ) | ||||
| Net asset value, end of period | $13.190 | $13.350 | $12.280 | $10.970 | ||||||||
| Total return3 | 5.27% | 16.35% | 15.35% | 29.83% | ||||||||
| Ratios and supplemental data: | ||||||||||||
| Net assets, end of period (000 omitted) | $2,239 | $2,359 | $1,859 | $819 | ||||||||
| Ratio of expenses to average net assets | 2.41% | 2.41% | 2.38% | 2.32% | ||||||||
| Ratio of expenses to average net assets | ||||||||||||
| prior to expense limitation and expense paid indirectly | 2.97% | 3.23% | 3.26% | 4.73% | ||||||||
| Ratio of net investment loss to average net assets | (0.81% | ) | (0.82% | ) | (1.12% | ) | (1.34% | ) | ||||
| Ratio of net investment loss to average net assets | ||||||||||||
| prior to expense limitation and expense paid indirectly | (1.37% | ) | (1.64% | ) | (2.00% | ) | (3.75% | ) | ||||
| Portfolio turnover | 49% | 42% | 46% | 40% | ||||||||
| 1 Date of commencement of operations; ratios and portfolio turnover have been annualized and total return has not been annualized. | ||||||||||||
| 2 The average shares outstanding method has been applied for per share information. | ||||||||||||
| 3 Total investment return is based on the change in net asset value of a share during the period and assumes reinvestment of dividends and distributions at net asset value and does not reflect the impact of a sales charge. Total investment return reflects waivers and payment of fees by the manager. Performance would have been lower had the expense limitation not been in effect. | ||||||||||||
See accompanying notes
98
> Optimum Small Cap Value Fund
Selected data for each share of the Fund outstanding throughout each period were as follows:
| Class C | ||||||||||||
| 8/1/031 | ||||||||||||
| Year Ended | to | |||||||||||
| 3/31/07 | 3/31/06 | 3/31/05 | 3/31/04 | |||||||||
| Net asset value, beginning of period | $13.350 | $12.280 | $10.970 | $ 8.500 | ||||||||
| Income (loss) from investment operations: | ||||||||||||
| Net investment loss2 | (0.101 | ) | (0.102 | ) | (0.129 | ) | (0.090 | ) | ||||
| Net realized and unrealized gain on investments | 0.730 | 2.013 | 1.785 | 2.620 | ||||||||
| Total from investment operations | (0.629 | ) | 1.911 | 1.656 | 2.530 | |||||||
| Less dividends and distributions from: | ||||||||||||
| Net realized gain on investments | (0.789 | ) | (0.841 | ) | (0.346 | ) | (0.060 | ) | ||||
| Total dividends and distributions | (0.789 | ) | (0.841 | ) | (0.346 | ) | (0.060 | ) | ||||
| Net asset value, end of period | $13.190 | $13.350 | $12.280 | $10.970 | ||||||||
| Total return3 | 5.27% | 16.35% | 15.35% | 29.83% | ||||||||
| Ratios and supplemental data: | ||||||||||||
| Net assets, end of period (000 omitted) | $41,622 | $38,782 | $23,869 | $9,018 | ||||||||
| Ratio of expenses to average net assets | 2.41% | 2.41% | 2.38% | 2.32% | ||||||||
| Ratio of expenses to average net assets | ||||||||||||
| prior to expense limitation and expense paid indirectly | 2.97% | 3.23% | 3.26% | 4.73% | ||||||||
| Ratio of net investment loss to average net assets | (0.81% | ) | (0.82% | ) | (1.12% | ) | (1.34% | ) | ||||
| Ratio of net investment loss to average net assets | ||||||||||||
| prior to expense limitation and expense paid indirectly | (1.37% | ) | (1.64% | ) | (2.00% | ) | (3.75% | ) | ||||
| Portfolio turnover | 49% | 42% | 46% | 40% | ||||||||
| 1 Date of commencement of operations; ratios and portfolio turnover have been annualized and total return has not been annualized. | ||||||||||||
| 2 The average shares outstanding method has been applied for per share information. | ||||||||||||
| 3 Total investment return is based on the change in net asset value of a share during the period and assumes reinvestment of dividends and distributions at net asset value and does not reflect the impact of a sales charge. Total investment return reflects waivers and payment of fees by the manager. Performance would have been lower had the expense limitation not been in effect. | ||||||||||||
See accompanying notes
(continues) 99
Financial highlights
> Optimum Small Cap Value Fund
Selected data for each share of the Fund outstanding throughout each period were as follows:
| Institutional Class | ||||||||||||
| 8/1/031 | ||||||||||||
| Year Ended | to | |||||||||||
| 3/31/07 | 3/31/06 | 3/31/05 | 3/31/04 | |||||||||
| Net asset value, beginning of period | $13.720 | $12.470 | $11.040 | $ 8.500 | ||||||||
| Income (loss) from investment operations: | ||||||||||||
| Net investment income (loss)2 | 0.025 | 0.023 | (0.014 | ) | (0.022 | ) | ||||||
| Net realized and unrealized gain on investments | 0.764 | 2.068 | 1.790 | 2.622 | ||||||||
| Total from investment operations | 0.789 | 2.091 | 1.776 | 2.600 | ||||||||
| Less dividends and distributions from: | ||||||||||||
| Net realized gain on investments | (0.789 | ) | (0.841 | ) | (0.346 | ) | (0.060 | ) | ||||
| Total dividends and distributions | (0.789 | ) | (0.841 | ) | (0.346 | ) | (0.060 | ) | ||||
| Net asset value, end of period | $13.720 | $13.720 | $12.470 | $11.040 | ||||||||
| Total return3 | 6.24% | 17.66% | 16.35% | 30.66% | ||||||||
| Ratios and supplemental data: | ||||||||||||
| Net assets, end of period (000 omitted) | $71,387 | $54,803 | $26,900 | $9,262 | ||||||||
| Ratio of expenses to average net assets | 1.41% | 1.41% | 1.38% | 1.32% | ||||||||
| Ratio of expenses to average net assets | ||||||||||||
| prior to expense limitation and expense paid indirectly | 1.97% | 2.23% | 2.26% | 3.73% | ||||||||
| Ratio of net investment income (loss) to average net assets | 0.19% | 0.18% | (0.12% | ) | (0.34% | ) | ||||||
| Ratio of net investment loss to average net assets | ||||||||||||
| prior to expense limitation and expense paid indirectly | (0.37% | ) | (0.64% | ) | (1.00% | ) | (2.75% | ) | ||||
| Portfolio turnover | 49% | 42% | 46% | 40% | ||||||||
| 1 Date of commencement of operations; ratios and portfolio turnover have been annualized and total return has not been annualized. | ||||||||||||
| 2 The average shares outstanding method has been applied for per share information. | ||||||||||||
| 3 Total investment return is based on the change in net asset value of a share during the period and assumes reinvestment of dividends and distributions at net asset value. Total investment return reflects waivers and payment of fees by the manager. Performance would have been lower had the expense limitation not been in effect. | ||||||||||||
See accompanying notes
100
Notes to financial statements
> Optimum Fund Trust
March 31, 2007
Optimum Fund Trust (the “Trust”) is organized as a Delaware statutory trust and offers six series: Optimum Fixed Income Fund, Optimum International Fund, Optimum Large Cap Growth Fund, Optimum Large Cap Value Fund, Optimum Small Cap Growth Fund, and Optimum Small Cap Value Fund (each a “Fund” and collectively, the “Funds”). The Trust is an open-end investment company. The Funds are considered diversified under the Investment Company Act of 1940, as amended, and offer Class A, Class B, Class C and Institutional Class shares. Class A Shares are sold with a front-end sales charge of 5.75% for Optimum International Fund, Optimum Large Cap Growth Fund, Optimum Large Cap Value Fund, Optimum Small Cap Growth Fund and Optimum Small Cap Value Fund and 4.50% for Optimum Fixed Income Fund. Class B shares are sold with a contingent deferred sales charge that declines from 4% to zero depending upon the period of time the shares are held. Class B shares will automatically convert to Class A shares on a quarterly basis approximately eight years after purchase. Class C shares are sold with a contingent deferred sales charge of 1%, if redeemed during the first 12 months. Institutional Class shares are not subject to a sales charge and are offered for sale only to certain eligible investors.
The investment objective of Optimum Fixed Income Fund is to seek a high level of income. The Fund may also seek growth of capital.
The investment objective of Optimum International Fund is to seek long-term growth of capital. The Fund may also seek income.
The investment objective of Optimum Large Cap Growth Fund is to seek long-term growth of capital.
The investment objective of Optimum Large Cap Value Fund is to seek long-term growth of capital. The Fund may also seek income.
The investment objective of Optimum Small Cap Growth Fund is to seek long-term growth of capital.
The investment objective of Optimum Small Cap Value Fund is to seek long-term growth of capital.
1. Significant Accounting Policies
The following accounting policies are in accordance with U.S. generally accepted accounting principles and are consistently followed by the Trust.
Security Valuation – Equity securities, except those traded on the Nasdaq Stock Market, Inc. (Nasdaq), are valued at the last quoted sales price as of the time of the regular close of the New York Stock Exchange (NYSE) on the valuation date. Securities traded on the Nasdaq are valued in accordance with the Nasdaq Official Closing Price, which may not be the last sales price. If on a particular day an equity security does not trade, then the mean between the bid and asked prices will be used. Securities listed on a foreign exchange are valued at the last quoted sales price before each Fund is valued. U.S. government and agency securities are valued at the mean between the bid and asked prices. Other long-term debt securities are valued by an independent pricing service and such prices are believed to reflect the fair value of such securities. Short-term debt securities having less than 60 days to maturity are valued at amortized cost, which approximates market value. Foreign currency exchange contracts and foreign cross currency exchange contracts are valued at the mean between the bid and asked prices of the contracts and are marked-to-market daily. Interpolated values are derived when the settlement date of the contract is an interim date for which quotations are not available. Futures contracts are valued at the daily quoted settlement prices. Exchange-traded options are valued at the last reported sale price or, if no sales are reported, at the mean between the last reported bid and asked prices. Swap contracts and other securities and assets for which market quotations are not readily available are valued at fair value as determined in good faith under the direction of the Trust’s Board of Trustees. In determining whether market quotations are readily available or fair valuation will be used, various factors will be taken into consideration, such as market closures, or with respect to foreign securities, aftermarket trading or significant events after local market trading (e.g., government actions or pronouncements, trading volume or volatility on markets, exchanges among dealers, or news events).
In September 2006, the Financial Accounting Standards Board (FASB) issued FASB Statement No. 157 “Fair Value Measurements” (Statement 157). Statement 157 establishes a framework for measuring fair value in generally accepted accounting principles, clarifies the definition of fair value within that framework, and expands disclosures about the use of fair value measurements. Statement 157 is intended to increase consistency and comparability among fair value estimates used in financial reporting. Statement 157 is effective for fiscal years beginning after November 15, 2007. Management does not expect the adoption of Statement 157 to have an impact on the amounts reported in the financial statements.
Federal Income Taxes – Each Fund intends to continue to qualify for federal income tax purposes as a regulated investment company and make the requisite distributions to shareholders. Accordingly, no provision for federal income taxes has been made in the financial statements.
On July 13, 2006, the FASB released FASB Interpretation No. 48 “Accounting for Uncertainty in Income Taxes” (FIN 48). FIN 48 provides guidance for how uncertain tax positions should be recognized, measured, presented, and disclosed in the financial statements. FIN 48 requires the evaluation of tax positions taken or expected to be taken in the course of preparing the Funds’ tax returns to determine whether the tax positions are “more-likely-than-not” of being sustained by the applicable tax authority. Tax positions not deemed to meet the more-likely-than-not threshold would be recorded as a tax benefit or expense in the current year. Adoption of FIN 48 is required for fiscal years beginning after December 15, 2006 and is to be applied to all open tax years as of the effective date. Recent SEC guidance allows implementing FIN 48 in funds net asset value calculations as late as the funds’ last net asset value calculations in the first required financial statement reporting period. As a result, the Funds will incorporate FIN 48 in their semiannual report on September 30, 2007. Although the Funds’ tax positions are currently being evaluated, management does not expect the adoption of FIN 48 to have a material impact on the Funds’ financial statements.
Class Accounting – Investment income, common expenses and realized and unrealized gain (loss) on investments are allocated to the various classes of each Fund on the basis of daily net assets of each class. Distribution expenses relating to a specific class are charged directly to that class.
Repurchase Agreements – Each Fund may invest in a pooled cash account along with members of the Delaware Investments® Family of Funds pursuant to an exemptive order issued by the Securities and Exchange Commission. The aggregate daily balance of the pooled cash account is invested
(continues) 101
Notes to financial statements
Optimum Fund Trust
1. Significant Accounting Policies (continued)
Repurchase Agreements (continued)
in repurchase agreements secured by obligations of the U.S. government. The respective collateral is held by each Fund’s custodian bank until the maturity of the respective repurchase agreements. Each repurchase agreement is at least 102% collateralized. However, in the event of default or bankruptcy by the counterparty to the agreement, realization of the collateral may be subject to legal proceedings.
Foreign Currency Transactions – Transactions denominated in foreign currencies are recorded at the prevailing exchange rates on the valuation date. The value of all assets and liabilities denominated in foreign currencies is translated into U.S. dollars at the exchange rate of such currencies against the U.S. dollar daily. Transaction gains or losses resulting from changes in exchange rates during the reporting period or upon settlement of the foreign currency transaction are reported in operations for the current period. The Funds isolate that portion of realized gains and losses on investments in debt securities, which are due to changes in foreign exchange rates from that which are due to changes in market prices of debt securities. For foreign equity securities, these changes are included in realized gains (losses) on investments. The Funds report certain foreign currency related transactions as components of realized gains (losses) for financial reporting purposes, where such components are treated as ordinary income (loss) for federal income tax purposes.
Use of Estimates – The preparation of financial statements in conformity with U.S. generally accepted accounting principles requires management to make estimates and assumptions that affect the reported amounts of assets and liabilities at the date of the financial statements and the reported amounts of revenues and expenses during the reporting period. Actual results could differ from those estimates.
Other – Expenses directly attributable to a Fund are charged directly to that Fund. Other expenses common to various funds within the Optimum Fund Trust are generally allocated amongst such funds on the basis of average net assets. Management fees and some other expenses are paid monthly. Security transactions are recorded on the date the securities are purchased or sold (trade date) for financial reporting purposes. Costs used in calculating realized gains and losses on the sale of investment securities are those of the specific securities sold. Dividend income is recorded on the ex-dividend date and interest income is recorded on the accrual basis. Discounts and premiums on non-convertible bonds are amortized to interest income over the lives of the respective securities. Realized gains (losses) on paydowns of mortgage- and asset-backed securities are classified as interest income. Distributions received from investments in Real Estate Investment Trusts are recorded as dividend income on ex-dividend date, subject to reclassification upon notice of the character of such distributions by the issuer. Foreign dividends are also recorded on the ex-dividend date or as soon after the ex-dividend date that the Funds are aware of such dividends, net of all non-rebatable tax withholdings. Withholding taxes on foreign dividends have been recorded in accordance with each Fund’s understanding of the applicable country’s tax rules and rates.
Optimum International Fund, Optimum Large Cap Growth Fund, Optimum Large Cap Value Fund, Optimum Small Cap Growth Fund and Optimum Small Cap Value Fund expect to declare and pay dividends from net investment income, if any, annually. Optimum Fixed Income Fund expects to declare and pay dividends from net investment income quarterly. Each Fund will declare and pay distributions from net realized gain on investments, if any, at least annually, and may distribute net capital gains twice a year. In addition, in order to satisfy certain distribution requirements of the Tax Reform Act of 1986, each Fund may declare special year-end dividend and capital gains distributions during November or December to shareholders of record on a date in such month. Such distributions, if received by shareholders by January, are deemed to have been paid by a Fund and received by shareholders on the earlier of the date paid or December 31 of the prior year.
The Funds may receive earnings credits from their custodian when positive cash balances are maintained, which are used to offset custody fees. The expense paid under the above arrangement is included in custodian fees on the Statements of Operations with the corresponding expense offset shown as “expense paid indirectly”.
2. Investment Management, Administration Agreements and Other Transactions with Affiliates
Delaware Management Company (DMC), a series of Delaware Management Business Trust, furnishes investment management services to each Fund and has full discretion and responsibility, subject to the overall supervision of the Trust’s Board of Trustees, to select and contract with one or more investment sub-advisers to manage the investment operations and composition of each Fund, and to render investment advice for each Fund, including the purchase, retention, and dispositions of investments, securities and cash contained in each Fund. The investment management agreement obligates DMC to implement decisions with respect to the allocation or reallocation of each Fund’s assets among one or more current or additional sub-advisers, and to monitor the sub-advisers’ compliance with the relevant Fund’s investment objective, policies and restrictions. DMC pays the sub-advisers out of its fees.
In accordance with the terms of the investment management agreement, DMC is entitled to receive an annual fee equal to the following percentage rates of the average daily net assets of a Fund:
| Optimum Fixed Income Fund1 | 0.7000% of assets up to $25 million | |
| 0.6500% of assets from $25 million to $100 million | ||
| 0.6000% of assets over $100 million | ||
| Optimum International Fund | 0.8750% of assets up to $50 million | |
| 0.8000% of assets from $50 to $100 million | ||
| 0.7800% of assets from $100 to $300 million | ||
| 0.7650% of assets from $300 to $400 million | ||
| 0.7300% of assets over $400 million | ||
102
2. Investment Management, Administration Agreements and Other Transactions with Affiliates (continued)
| Optimum Large Cap Growth Fund | 0.8000% of assets up to $250 million | |
| 0.7875% of assets from $250 million to $300 million | ||
| 0.7625% of assets from $300 million to $400 million | ||
| 0.7375% of assets from $400 million to $500 million | ||
| 0.7250% of assets over $500 million | ||
| Optimum Large Cap Value Fund | 0.8000% of assets up to $100 million | |
| 0.7375% of assets from $100 million to $250 million | ||
| 0.7125% of assets from $250 million to $500 million | ||
| 0.6875% of assets over $500 million | ||
| Optimum Small Cap Growth Fund | 1.1000% of assets | |
| Optimum Small Cap Value Fund | 1.0500% of assets up to $75 million | |
| 1.0250% of assets from $75 million to $150 million | ||
| 1.0000% of assets over $150 million | ||
| 1 Effective April 1, 2007, the management fee is 0.70% of assets up to $25 million, 0.65% of assets from $25 million to $100 million, 0.60% of assets from $100 million to $500 million, 0.55% of assets from $500 million to $1 billion, and 0.50% of assets over $1 billion. See Note 15 for more information. |
DMC has entered into sub-advisory agreements for the Trust as follows: Optimum Fixed Income Fund – Aberdeen Asset Management Inc. (“AAMI”); Optimum International Fund – Mondrian Investment Partners Limited and AllianceBernstein L.P.; Optimum Large Cap Growth Fund – Marsico Capital Management, LLC (“Marsico”) and T. Rowe Price Associates, Inc.; Optimum Large Cap Value Fund – Massachusetts Financial Services Company and TCW Investment Management Company (“TCW”); Optimum Small Cap Growth Fund – Columbia Wanger Asset Management, L.P. and Oberweis Asset Management, Inc.; and Optimum Small Cap Value Fund – Hotchkis and Wiley Capital Management, LLC, Delafield Asset Management (a division of Reich & Tang Asset Management, LLC), and The Killen Group, Inc. (“Killen”).
For the year ended March 31, 2007, DMC paid the following subadvisory fees:
| Optimum | Optimum | Optimum | Optimum | Optimum | Optimum | |||||
| Fixed Income | International | Large Cap | Large Cap | Small Cap | Small Cap | |||||
| Fund | Fund | Growth Fund | Value Fund | Growth Fund | Value Fund | |||||
| $749,044 | $974,954 | $2,951,709 | $2,562,924 | $894,843 | $808,375 |
DMC has contractually agreed to waive that portion, if any, of its management fee and/or reimburse each Fund to the extent necessary to ensure that total annual operating expenses, exclusive of taxes, interest, brokerage commissions, distribution fees, certain insurance costs and extraordinary expenses, do not exceed specified percentages of average daily net assets through August 1, 2007 as shown below:
| Optimum | Optimum | Optimum | Optimum | Optimum | Optimum | |||||
| Fixed Income | International | Large Cap | Large Cap | Small Cap | Small Cap | |||||
| Fund | Fund | Growth Fund | Value Fund | Growth Fund | Value Fund | |||||
| 0.90% | 1.66% | 1.34% | 1.20% | 1.60% | 1.41% |
Delaware Service Company, Inc. (DSC), an affiliate of DMC, provides the Trust with fund accounting, administrative, and transfer agency services pursuant to a Mutual Fund Services Agreement. For fund accounting services, the Trust pays DSC a fee at an annual rate of 0.04% of the Trust’s total average daily net assets, plus out-of-pocket expenses, subject to certain minimums. DSC also provides the Trust with administrative services including financial and tax reporting, corporate governance, and preparation of materials and reports for the Board of Trustees. For administrative services, the Trust pays DSC a fee at an annual rate of 0.35% of the Trust’s total average daily net assets, plus out-of-pocket expenses. Effective April 1, 2007, DSC will be paid at an annual rate (plus out-of pocket expenses) of 0.165% of assets up to $500 million, 0.140% of assets from $500 million to $1 billion, and 0.115% of assets over $1 billion. DSC also serves as the shareholder servicing, dividend disbursing, and transfer agent for each Fund. For such services, the Trust pays DSC a fee at an annual rate of 0.15% of the Trust’s total average daily net assets, subject to certain minimums, plus out-of-pocket expenses. Effective April 1, 2007, the rate will change to 0.235%.
(continues) 103
Notes to financial statements
Optimum Fund Trust
2. Investment Management, Administration Agreements and Other Transactions with Affiliates (continued)
Delaware Distributors, L.P. (DDLP), an affiliate of DMC, serves as the national distributor of each Fund’s shares pursuant to a Distribution Agreement. Pursuant to the Distribution Agreement and Rule 12b-1 plans, each Fund pays DDLP an annual fee of 0.35% of the average daily net assets of the Class A shares and 1.00% of the average daily net assets of the Class B and C shares. Institutional Class shares pay no distribution expenses.
At March 31, 2007, each Fund had liabilities payable to affiliates as follows:
| Optimum | Optimum | Optimum | Optimum | Optimum | Optimum | ||||||||||||||||||
| Fixed Income | International | Large Cap | Large Cap | Small Cap | Small Cap | ||||||||||||||||||
| Fund | Fund | Growth Fund | Value Fund | Growth Fund | Value Fund | ||||||||||||||||||
| Investment management | |||||||||||||||||||||||
| fee payable to DMC | $ | 155,228 | $ | 182,162 | $ | 441,070 | $ | 363,680 | $ | 95,018 | $ | 67,428 | |||||||||||
| Dividend disbursing, | |||||||||||||||||||||||
| transfer agent fees, | |||||||||||||||||||||||
| accounting and other | |||||||||||||||||||||||
| expenses payable to DSC | 344,027 | 127,819 | 362,124 | 361,832 | 68,103 | 63,447 | |||||||||||||||||
| Distribution fees payable to DDLP | 217,753 | 87,398 | 197,128 | 207,757 | 38,956 | 40,629 | |||||||||||||||||
| Other expenses payable | |||||||||||||||||||||||
| to DMC and affiliates* | 50,460 | 18,859 | 54,195 | 53,975 | 9,557 | 8,750 | |||||||||||||||||
| *DMC, as part of its administrative services, pays operating expenses on behalf of each Fund and is reimbursed on a periodic basis. Such expenses include items such as printing of shareholder reports, professional fees, registration fees and trustees’ fees. |
For the year ended March 31, 2007, DDLP earned commissions on sales of Class A shares for each Fund as follows:
| Optimum | Optimum | Optimum | Optimum | Optimum | Optimum | |||||||||||||||||
| Fixed Income | International | Large Cap | Large Cap | Small Cap | Small Cap | |||||||||||||||||
| Fund | Fund | Growth Fund | Value Fund | Growth Fund | Value Fund | |||||||||||||||||
| $ | 62,039 | $ | 28,987 | $ | 81,115 | $ | 78,065 | $ | 14,476 | $ | 11,361 | |||||||||||
For the year ended March 31, 2007, DDLP received gross contingent deferred sales charge commissions on redemptions of each Fund’s Class B and Class C shares, and these commissions were entirely used to offset up-front commissions previously paid by DDLP to broker-dealers on sales of those shares. The amounts received were as follows:
| Optimum | Optimum | Optimum | Optimum | Optimum | Optimum | |||||||||||||||||||
| Fixed Income | International | Large Cap | Large Cap | Small Cap | Small Cap | |||||||||||||||||||
| Fund | Fund | Growth Fund | Value Fund | Growth Fund | Value Fund | |||||||||||||||||||
| Class B | $ | 32,978 | $ | 11,700 | $ | 32,520 | $ | 32,489 | $ | 5,662 | $ | 4,647 | ||||||||||||
| Class C | 39,042 | 10,451 | 32,037 | 31,143 | 6,410 | 5,530 | ||||||||||||||||||
DMC, DSC and DDLP are indirect, subsidiaries of Delaware Management Holdings, Inc., which is an indirect wholly owned subsidiary of Lincoln National Corporation.
Certain officers of DMC, DSC, and DDLP are officers and/or trustees of the Trust. These officers and trustees are paid no compensation by the Funds.
3. Investments
For the year ended March 31 2007, each Fund made purchases and sales of investment securities other than short-term investments as follows:
| Optimum | Optimum | Optimum | Optimum | Optimum | Optimum | |||||||||||||||||||
| Fixed Income | International | Large Cap | Large Cap | Small Cap | Small Cap | |||||||||||||||||||
| Fund | Fund | Growth Fund | Value Fund | Growth Fund | Value Fund | |||||||||||||||||||
| Purchases other than U.S. government securities | $ | 968,622,054 | $ | 77,190,976 | $ | 385,178,402 | $ | 293,670,094 | $ | 77,410,677 | $ | 59,597,354 | ||||||||||||
| Purchases of U.S. government securities | 651,591,116 | — | — | — | — | — | ||||||||||||||||||
| Sales other than U.S. government securities | 841,397,463 | 41,367,460 | 238,230,187 | 137,223,378 | 53,928,992 | 51,269,455 | ||||||||||||||||||
| Sales of U.S. government securities | 617,324,714 | — | — | — | — | — | ||||||||||||||||||
104
3. Investments (continued)
At March 31, 2007, the cost of investments, including securities sold short, and unrealized appreciation (depreciation) for federal income tax purposes for each Fund were as follows:
| Optimum | Optimum | Optimum | Optimum | Optimum | Optimum | |||||||||||||||||||
| Fixed Income | International | Large Cap | Large Cap | Small Cap | Small Cap | |||||||||||||||||||
| Fund | Fund | Growth Fund | Value Fund | Growth Fund | Value Fund | |||||||||||||||||||
| Cost of investments | $ | 773,212,172 | $ | 215,261,457 | $ | 685,650,514 | $ | 694,890,589 | $ | 117,244,732 | $ | 114,066,130 | ||||||||||||
| Aggregate unrealized appreciation | $ | 8,502,110 | $ | 61,694,585 | $ | 109,727,348 | $ | 109,060,967 | $ | 26,734,267 | $ | 18,811,927 | ||||||||||||
| Aggregate unrealized depreciation | (3,778,844 | ) | (1,109,612 | ) | (9,597,356 | ) | (8,507,706 | ) | (4,278,052 | ) | (4,891,018 | ) | ||||||||||||
| Net unrealized appreciation | $ | 4,723,266 | $ | 60,584,973 | $ | 100,129,992 | $ | 100,553,261 | $ | 22,456,215 | $ | 13,920,909 | ||||||||||||
4. Dividend and Distribution Information
Income and long-term capital gain distributions are determined in accordance with federal income tax regulations, which may differ from U.S. generally accepted accounting principles. Additionally, gains (losses) on foreign currency transactions and net short-term gains on sales of investment securities are treated as ordinary income for federal income tax purposes. The tax character of dividends and distributions paid during the years ended March 31, 2007 and 2006 was as follows:
Year Ended March 31, 2007
| Optimum | Optimum | Optimum | Optimum | Optimum | Optimum | |||||||||||||||||||
| Fixed Income | International | Large Cap | Large Cap | Small Cap | Small Cap | |||||||||||||||||||
| Fund | Fund | Growth Fund | Value Fund | Growth Fund | Value Fund | |||||||||||||||||||
| Ordinary Income | $ | 25,365,087 | $ | 7,131,730 | $ | 1,263,583 | $ | 8,816,723 | $ | — | $ | 1,226,671 | ||||||||||||
| Long-Term Capital Gain | — | 4,960,866 | 10,176,545 | 9,409,787 | 2,731,660 | 5,586,673 | ||||||||||||||||||
| Total | $ | 25,365,087 | $ | 12,092,596 | $ | 11,440,128 | $ | 18,226,510 | $ | 2,731,660 | $ | 6,813,344 | ||||||||||||
Year Ended March 31, 2006
| Optimum | Optimum | Optimum | Optimum | |||||||||
| Fixed Income | International | Large Cap | Small Cap | |||||||||
| Fund | Fund | Value Fund | Value Fund | |||||||||
| Ordinary Income | $ | 14,192,009 | $ | 7,486,399 | $ | 12,984,026 | $ | 1,969,351 | ||||
| Long-Term Capital Gain | 83,542 | 2,390,303 | 8,465,166 | 3,601,664 | ||||||||
| Total | $ | 14,275,551 | $ | 9,876,702 | $ | 21,449,192 | $ | 5,571,015 | ||||
Optimum Large Cap Growth Fund and Optimum Small Cap Growth Fund did not make any distributions during the year ended March 31, 2006.
(continues) 105
Notes to financial statements
Optimum Fund Trust
5. Components of Net Assets on a Tax Basis
At of March 31, 2007, the components of net assets on a tax basis were as follows:
| Optimum | Optimum | Optimum | |||||||
| Fixed Income | International | Large Cap | |||||||
| Fund | Fund | Growth Fund | |||||||
| Share of beneficial interest | $ | 737,655,927 | $ | 210,504,705 | $ | 684,630,354 | |||
| Undistributed ordinary income | 7,599,414 | 373,468 | — | ||||||
| Undistributed long-term capital gain | — | 5,139,405 | 4,258,971 | ||||||
| Post-October currency losses | (347,234 | ) | (170,161 | ) | (14,999 | ) | |||
| Deferred losses on straddles | (260,274 | ) | — | — | |||||
| Unrealized appreciation of investments and foreign currencies | 4,801,304 | 60,600,327 | 100,132,352 | ||||||
| Net assets | $ | 749,449,137 | $ | 276,447,744 | $ | 789,006,678 | |||
| Optimum | Optimum | Optimum | |||||||
| Large Cap | Small Cap | Small Cap | |||||||
| Value Fund | Growth Fund | Value Fund | |||||||
| Share of beneficial interest | $ | 677,279,837 | $ | 114,685,545 | $ | 111,195,246 | |||
| Undistributed ordinary income | 3,923,371 | — | 1,485,909 | ||||||
| Undistributed long-term capital gain | 12,333,186 | 2,390,785 | 1,366,689 | ||||||
| Post-October currency losses | (1,347 | ) | — | — | |||||
| Unrealized appreciation of investments and foreign currencies | 100,556,420 | 22,456,215 | 13,920,909 | ||||||
| Net assets | $ | 794,091,467 | $ | 139,532,545 | $ | 127,968,753 | |||
The differences between book basis and tax basis components of net assets are primarily attributable to tax deferral of losses on wash sales, interest accrual on defaulted bonds, contingent payment debt instruments, realization of unrealized gain on investments in passive foreign investment companies, straddle deferrals, and mark-to-market of foreign currency contracts, passive foreign investment companies, futures contracts, and credit default swap contracts.
Post-October currency losses represent losses realized on foreign currency transactions from November 1, 2006 through March 31, 2007 that, in accordance with federal income tax regulations, each Fund has elected to defer and treat as having arisen in the following fiscal year.
For financial reporting purposes, capital accounts are adjusted to reflect the tax character of permanent book/tax differences. Reclassifications are primarily due to tax treatment of net operating losses, dividends and distributions, paydowns of mortgage- and asset-backed securities, contingent payment debt instruments, credit default swap contracts and gain (loss) on foreign currency transactions. Results of operations and net assets were not affected by these reclassifications. For the year ended March 31, 2007, the Funds recorded the following reclassifications:
| Optimum | Optimum | Optimum | Optimum | Optimum | Optimum | ||||||||||||||||||
| Fixed Income | International | Large Cap | Large Cap | Small Cap | Small Cap | ||||||||||||||||||
| Fund | Fund | Growth Fund | Value Fund | Growth Fund | Value Fund | ||||||||||||||||||
| Undistributed (accumulated) net | |||||||||||||||||||||||
| investment income (loss) | $ | (1,869,934 | ) | $(403,136 | ) | $ | 2,485,590 | $ | 4,857 | $ | 1,406,761 | $ | 233,899 | ||||||||||
| Accumulated net realized gain (loss) | 1,869,934 | 403,136 | (2,532,014 | ) | (4,857 | ) | — | (233,899 | ) | ||||||||||||||
| Paid-in capital | — | — | 46,424 | — | (1,406,761 | ) | — | ||||||||||||||||
For federal income tax purposes, $611,531 of capital loss carryforwards from prior years for Optimum Fixed Income Fund was utilized in 2007.
106
6. Capital Shares
Transactions in capital shares were as follows:
| Optimum | Optimum | Optimum | |||||||||||||||
| Fixed Income | International | Large Cap Growth | |||||||||||||||
| Fund | Fund | Fund | |||||||||||||||
| Year | Year | Year | Year | Year | Year | ||||||||||||
| Ended | Ended | Ended | Ended | Ended | Ended | ||||||||||||
| 3/31/07 | 3/31/06 | 3/31/07 | 3/31/06 | 3/31/07 | 3/31/06 | ||||||||||||
| Shares sold: | |||||||||||||||||
| Class A | 1,841,350 | 2,411,550 | 375,989 | 616,189 | 1,304,218 | 1,952,410 | |||||||||||
| Class B | 152,560 | 213,339 | 33,816 | 59,206 | 135,373 | 189,679 | |||||||||||
| Class C | 6,778,612 | 8,832,658 | 1,391,456 | 2,141,181 | 4,803,075 | 6,426,511 | |||||||||||
| Institutional Class | 20,691,760 | 21,953,576 | 3,528,374 | 4,000,058 | 17,071,479 | 17,796,833 | |||||||||||
| 29,464,282 | 33,411,123 | 5,329,635 | 6,816,634 | 23,314,145 | 26,365,433 | ||||||||||||
| Shares issued upon reinvestment of dividends | |||||||||||||||||
| and distributions: | |||||||||||||||||
| Class A | 226,229 | 147,102 | 83,106 | 87,398 | 79,694 | — | |||||||||||
| Class B | 31,261 | 22,744 | 16,300 | 20,671 | 16,844 | — | |||||||||||
| Class C | 737,005 | 441,733 | 280,642 | 290,252 | 297,903 | — | |||||||||||
| Institutional Class | 1,767,917 | 958,739 | 469,204 | 408,920 | 624,104 | — | |||||||||||
| 2,762,412 | 1,570,318 | 849,252 | 807,241 | 1,018,545 | — | ||||||||||||
| Shares repurchased: | |||||||||||||||||
| Class A | (1,075,275 | ) | (808,521 | ) | (314,632 | ) | (169,365 | ) | (800,040 | ) | (475,458 | ) | |||||
| Class B | (189,221 | ) | (119,376 | ) | (65,771 | ) | (27,724 | ) | (123,686 | ) | (60,469 | ) | |||||
| Class C | (3,837,333 | ) | (1,982,783 | ) | (986,974 | ) | (440,893 | ) | (2,241,294 | ) | (1,106,014 | ) | |||||
| Institutional Class | (7,703,310 | ) | (4,702,334 | ) | (1,468,287 | ) | (817,720 | ) | (5,541,024 | ) | (2,937,531 | ) | |||||
| (12,805,139 | ) | (7,613,014 | ) | (2,835,664 | ) | (1,455,702 | ) | (8,706,044 | ) | (4,579,472 | ) | ||||||
| Net increase | 19,421,555 | 27,368,427 | 3,343,223 | 6,168,173 | 15,626,646 | 21,785,961 | |||||||||||
| Optimum | Optimum | Optimum | |||||||||||||||
| Large Cap Value | Small Cap Growth | Small Cap Value | |||||||||||||||
| Fund | Fund | Fund | |||||||||||||||
| Year | Year | Year | Year | Year | Year | ||||||||||||
| Ended | Ended | Ended | Ended | Ended | Ended | ||||||||||||
| 3/31/07 | 3/31/06 | 3/31/07 | 3/31/06 | 3/31/07 | 3/31/06 | ||||||||||||
| Shares sold: | |||||||||||||||||
| Class A | 1,191,590 | 1,801,005 | 213,329 | 412,930 | 207,100 | 485,960 | |||||||||||
| Class B | 115,682 | 177,930 | 18,163 | 29,986 | 15,227 | 28,191 | |||||||||||
| Class C | 4,508,067 | 6,073,885 | 708,196 | 1,087,467 | 627,120 | 1,059,341 | |||||||||||
| Institutional Class | 15,707,485 | 16,691,580 | 2,209,166 | 2,503,167 | 1,801,580 | 2,111,147 | |||||||||||
| 21,522,824 | 24,744,400 | 3,148,854 | 4,033,550 | 2,651,027 | 3,684,639 | ||||||||||||
| Shares issued upon reinvestment of dividends and | |||||||||||||||||
| distributions: | |||||||||||||||||
| Class A | 119,889 | 177,086 | 18,811 | — | 58,450 | 54,964 | |||||||||||
| Class B | 19,480 | 37,795 | 3,663 | — | 10,762 | 11,351 | |||||||||||
| Class C | 351,857 | 555,895 | 64,248 | — | 192,954 | 169,791 | |||||||||||
| Institutional Class | 1,031,198 | 1,169,476 | 114,103 | — | 271,409 | 207,166 | |||||||||||
| 1,522,424 | 1,940,252 | 200,825 | — | 533,575 | 443,272 | ||||||||||||
| Shares repurchased: | |||||||||||||||||
| Class A | (777,180 | ) | (481,502 | ) | (208,617 | ) | (99,159 | ) | (304,352 | ) | (150,684 | ) | |||||
| Class B | (131,451 | ) | (65,846 | ) | (24,715 | ) | (11,149 | ) | (32,920 | ) | (14,263 | ) | |||||
| Class C | (2,301,312 | ) | (1,125,476 | ) | (428,630 | ) | (206,396 | ) | (569,521 | ) | (268,751 | ) | |||||
| Institutional Class | (5,114,065 | ) | (2,564,455 | ) | (1,025,312 | ) | (534,279 | ) | (865,025 | ) | (481,357 | ) | |||||
| (8,324,008 | ) | (4,237,279 | ) | (1,687,274 | ) | (850,983 | ) | (1,771,818 | ) | (915,055 | ) | ||||||
| Net increase | 14,721,240 | 22,447,373 | 1,662,405 | 3,182,567 | 1,412,784 | 3,212,856 | |||||||||||
(continues) 107
Notes to financial statements
Optimum Fund Trust
7. Foreign Currency Exchange Contracts
The Optimum Fixed Income Fund, Optimum International Fund, Optimum Large Cap Growth Fund and Optimum Large Cap Value Fund may enter into foreign currency exchange contracts and forward foreign cross currency exchange contracts as a way of managing foreign exchange rate risk. The Funds may enter into these contracts to fix the U.S. dollar value of a security that it has agreed to buy or sell for the period between the date the trade was entered into and the date the security is delivered and paid for. The Funds may also use these contracts to hedge the U.S. dollar value of securities they already own that are denominated in foreign currencies. The change in value is recorded as an unrealized gain or loss. When the contract is closed, a realized gain or loss is recorded equal to the difference between the value of the contract at the time it was opened and the value at the time it was closed.
The use of foreign currency exchange contracts and foreign cross currency exchange contracts does not eliminate fluctuations in the underlying prices of the securities, but does establish a rate of exchange that can be achieved in the future. Although foreign currency exchange contracts limit the risk of loss due to a decline in the value of the hedged currency, they also limit any potential gain that might result should the value of the currency increase. In addition, the Funds could be exposed to risks if the counterparties to the contracts are unable to meet the terms of their contracts. The unrealized gain (loss) is included in liabilities net of receivables and other net assets or receivables and other assets net of liabilities on the Statements of Net Assets.
8. Futures Contracts
The Optimum Fixed Income Fund may invest in financial futures contracts to hedge its existing portfolio securities against fluctuations in fair value caused by changes in prevailing market interest rates. Upon entering into a futures contract, the Fund deposits cash or pledges U.S. government securities to a broker, equal to the minimum “initial margin” requirements of the exchange on which the contract is traded. Subsequent payments are received from the broker or paid to the broker each day, based on the daily fluctuation in the value of the contract. These receipts or payments are known as “variation margin” and are recorded daily by the Fund as unrealized gains or losses until the contracts are closed. When the contracts are closed, the Fund records a realized gain or loss equal to the difference between the value of the contract at the time it was opened and the value at the time it was closed. Risks of entering into futures contracts include potential imperfect correlation between the futures contracts and the underlying securities and the possibility of an illiquid secondary market for these instruments. The unrealized gain (loss) is included in liabilities net of receivables and other net assets on the Statements of Net Assets.
9. Options Written
During the year ended March 31, 2007, Optimum Fixed Income Fund entered into options contracts in accordance with its investment objectives. When the Fund writes an option, a premium is received and a liability is recorded and adjusted on a daily basis to reflect the current market value of the options written. Premiums received from writing options that expire unexercised are treated by the Fund on the expiration date as realized gains. The difference between the premium received and the amount paid on effecting a closing purchase transaction, including brokerage commissions, is treated as realized gain or loss. If a call option is exercised, the premium is added to the proceeds from the sale of the underlying security in determining whether the Fund has a realized gain or loss. If a put option is exercised, the premium reduces the cost basis of the securities purchased by the Fund. The Fund, as writer of an option, bears the market risk of an unfavorable change in the price of the security underlying the written option.
Transactions in options written during the year ended March 31, 2007 for Optimum Fixed Income Fund were as follows:
Number of contracts | Premiums | |||||
| Options outstanding at March 31, 2006 | — | $ | — | |||
| Options written | 870,000 | 1,872 | ||||
| Options expired | (870,000 | ) | — | |||
| Options outstanding at March 31, 2007 | — | $ | — | |||
10. Swap Contracts
The Optimum Fixed Income Fund may enter into interest rate swap contracts, index swap contracts and credit default swap (“CDS”) contracts in accordance with its investment objectives. The Fund may use interest rate swaps to adjust the Fund’s sensitivity to interest rates or to hedge against changes in interest rates. Index swaps may be used to gain exposure to markets that the Fund invests in, such as the corporate bond market. The Fund may also use index swaps as a substitute for futures or options contracts if such contracts are not directly available to the Fund on favorable terms. The Fund may enter into CDS contracts in order to hedge against a credit event, to enhance total return or to gain exposure to certain securities or markets.
An interest rate swap involves payments received by the Fund from another party based on a variable or floating interest rate, in return for making payments based on a fixed interest rate. An interest rate swap can also work in reverse with the Fund receiving payments based on a fixed interest rate and making payments based on a variable or floating interest rate. Interest rate swaps may be used to adjust the Fund’s sensitivity to interest rates or to hedge against changes in interest rates. Periodic payments on such contracts are accrued daily and recorded as unrealized appreciation/depreciation on swap contracts. Upon periodic payment/receipt or termination of the contract, such amounts are recorded as realized gains or losses on swap contracts.
Index swaps involve commitments to pay interest in exchange for a market linked return based on a notional amount. To the extent the total return of the security, instrument or basket of instruments underlying the transaction exceeds the offsetting interest obligation, the Fund will receive a payment from the counterparty. To the extent the total return of the security, instrument or basket of instruments underlying the transaction falls short of the offsetting interest obligation, the Fund will make a payment to the counterparty. The change in value of swap contracts outstanding, if any, is recorded as unrealized appreciation or depreciation daily. A realized gain or loss is recorded on maturity or termination of the swap contract.
108
10. Swap Contracts (continued)
A CDS contract is a risk-transfer instrument through which one party (the “purchaser of protection”) transfers to another party (the “seller of protection”) the financial risk of a Credit Event (as defined in the CDS agreement), as it relates to a particular reference security or basket of securities (such as an index). In exchange for the protection offered by the seller of protection, the purchaser of protection agrees to pay the seller of protection a periodic amount at a stated rate that is applied to the notional amount of the CDS contract. In addition, an upfront payment may be made or received by the Fund in connection with an unwinding or assignment of a CDS contract. Upon the occurrence of a Credit Event, the seller of protection would pay the par (or other agreed-upon) value of the referenced security (or basket of securities) to the counterparty.
During the year ended March 31, 2007, the Optimum Fixed Income Fund entered into CDS contracts as a purchaser of protection. Periodic payments on such contracts are accrued daily and recorded as unrealized losses on swap contracts. Upon payment, such amounts are recorded as realized losses on swap contracts. Upfront payments made or received in connection with CDS contracts are amortized over the expected life of the CDS contracts as realized losses (gains) on swap contracts. The change in value of CDS contracts is recorded as unrealized appreciation or depreciation daily. A realized gain or loss is recorded upon a Credit Event or the maturity or termination of the agreement. For the year ended March 31, 2007, the Fund did not enter into any CDS contracts as a seller of protection.
Credit default swaps may involve greater risks than if the Fund had invested in the referenced obligation directly. Credit default swaps are subject to general market risk, liquidity risk, counterparty risk and credit risk. If the Fund enters into a CDS contract as a purchaser of protection and no credit event occurs, its exposure is limited to the periodic payments previously made to the counterparty.
Because there is no organized market for swap contracts, the value of open swaps may differ from that which would be realized in the event the Fund terminated its position in the agreement. Risks of entering into these contracts include the potential inability of the counterparty to meet the terms of the contracts. This type of risk is generally limited to the amount of favorable movement in the value of the underlying security, instrument or basket of instruments, if any, at the day of default. Risks also arise from potential losses from adverse market movements and such losses could exceed the unrealized amounts shown on the Statements of Net Assets.
11. Credit and Market Risk
Some countries in which the Optimum Fixed Income Fund, Optimum International Fund, Optimum Large Cap Growth Fund and Optimum Large Cap Value Fund may invest require governmental approval for the repatriation of investment income, capital or the proceeds of sales of securities by foreign investors. In addition, if there is deterioration in a country’s balance of payments or for other reasons, a country may impose temporary restrictions on foreign capital remittances abroad.
The securities exchanges of certain foreign markets are substantially smaller, less liquid and more volatile than the major securities markets in the United States. Consequently, acquisition and disposition of securities by such Fund may be inhibited. In addition, a significant portion of the aggregate value of securities listed on the major securities exchanges in emerging markets are held by a smaller number of investors. This may limit the number of shares available for acquisition or disposition by the Funds.
The Optimum Fixed Income Fund may invest a portion of its assets in high yield fixed income securities, which carry ratings of BB or lower by Standard & Poor’s Ratings Group and/or Ba or lower by Moody’s Investors Service, Inc. Investments in these higher yielding securities are generally accompanied by a greater degree of credit risk than higher rated securities. Additionally, lower rated securities may be more susceptible to adverse economic and competitive industry conditions than investment grade securities.
The Optimum Fixed Income Fund invests in fixed income securities whose value is derived from underlying mortgages or consumer loans. Investors receive principal and interest payments as the underlying mortgages or consumer loans are paid back. Some of these securities are collateralized mortgage obligations (CMOs). CMOs are debt securities issued by U.S. government agencies or by financial institutions and other mortgage lenders, which are collateralized by a pool of mortgages held under an indenture. Prepayment of mortgages may shorten the stated maturity of the obligations and can result in a loss of premium, if any has been paid. Certain of these securities may be stripped (securities which provide only the principal or interest feature of the underlying security). The yield to maturity on an interest-only CMO is extremely sensitive not only to changes in prevailing interest rates, but also to the rate of principal payments (including prepayments) on the related underlying mortgage assets. A rapid rate of principal payments may have a material adverse affect on the Fund’s yield to maturity. If the underlying mortgage assets experience greater than anticipated prepayments of principal, the Fund may fail to fully recoup its initial investment in these securities even if the securities are rated in the highest rating categories. The Optimum Fixed Income Fund also invests in taxable municipal bonds.
The Optimum Small Cap Growth Fund and Optimum Small Cap Value Fund invest a significant portion of their assets in small companies and may be subject to certain risks associated with ownership of securities of such companies. Investments in small-sized companies may be more volatile than investments in larger companies for a number of reasons, which include limited financial resources or a dependence on narrow product lines.
Each Fund may invest up to 15% of its total assets in illiquid securities, which may include securities with contractual restrictions on resale, securities exempt from registration under Rule 144A of the Securities Act of 1933, as amended, and other securities which may not be readily marketable. The relative illiquidity of these securities may impair each Fund from disposing of them in a timely manner and at a fair price when it is necessary or desirable to do so. While maintaining oversight, the Board of Trustees has delegated to DMC the day-to-day functions of determining whether individual securities are liquid for purposes of each Fund’s limitation on investments in illiquid assets. Rule 144A and illiquid securities have been identified on the Statements of Net Assets.
(continues) 109
Notes to financial statements
Optimum Fund Trust
12. Contractual Obligations
The Funds enter into contracts in the normal course of business that contain a variety of indemnifications. The Funds’ maximum exposure under these arrangements is unknown. However, the Funds have not had prior claims or losses pursuant to these contracts. Management has reviewed the Funds’ existing contracts and expects the risk of loss to be remote.
13. Tax Information (Unaudited)
The information set forth below is for each Fund’s fiscal year as required by federal laws. Shareholders, however, must report distributions on a calendar year basis for income tax purposes, which may include distributions for portions of two fiscal years of a fund. Accordingly, the information needed by shareholders for income tax purposes will be sent to them in January of each year. Please consult your tax advisor for proper treatment of this information.
For the fiscal year ended March 31, 2007, each Fund designates distributions paid during the year as follows:
| (A) | (B) | |||||||||
| Long-Term | Ordinary | (C) | ||||||||
| Capital Gains | Income | Total | Qualifying | |||||||
| Distributions | Distributions* | Distributions | Dividends1 | |||||||
| (Tax Basis) | (Tax Basis) | (Tax Basis) | ||||||||
| Optimum Fixed Income Fund | — | 100% | 100% | — | ||||||
| Optimum International Fund | 41% | 59% | 100% | — | ||||||
| Optimum Large Cap Growth Fund | 89% | 11% | 100% | 100% | ||||||
| Optimum Large Cap Value Fund | 52% | 48% | 100% | 83% | ||||||
| Optimum Small Cap Growth Fund | 100% | — | 100% | — | ||||||
| Optimum Small Cap Value Fund | 82% | 18% | 100% | 58% | ||||||
(A) and (B) are based on a percentage of each Fund’s total distributions.
(C) is based on a percentage of each Fund’s ordinary income distributions.
| 1 Qualifying dividends represent dividends which qualify for the corporate dividends received deduction. |
| *For the fiscal year ended March 31, 2007, certain dividends paid by the Funds may be subject to a maximum tax rate of 15%, as provided for by the Jobs and Growth Tax Relief Reconciliation Act of 2003. The Funds intend to designate the following amounts to be taxed at a maximum rate of 15%. Complete information will be computed and reported in conjunction with your 2006 or 2007 Form 1099-DIV. |
| Maximum amount to be | |||
| taxed at a maximum rate of 15% | |||
| Optimum Fixed Income Fund | $ | 40,779 | |
| Optimum International Fund | 7,131,730 | ||
| Optimum Large Cap Growth Fund | 1,263,583 | ||
| Optimum Large Cap Value Fund | 8,816,723 | ||
| Optimum Small Cap Value Fund | 1,226,671 | ||
The Optimum International Fund intends to pass through foreign taxes credits in the maximum amount of $383,616. The gross foreign source income earned during the fiscal year 2007 by the Optimum International Fund was $6,588,176. Complete information will be computed and reported in conjunction with your 2007 Form 1099-DIV.
14. Investment Management Personnel (Unaudited)
Delaware Investment Advisers (“DIA”) has announced that is has entered into discussions with Logan Circle Partners about a possible transaction involving certain members of the taxable fixed income team. This team is also part of DMC, the investment manager to the Funds. Regardless of whether this transaction is consummated, DIA and DMC anticipate that they will continue to have substantial fixed income teams in place to support their commitment to managing fixed income strategies.
Although the precise scope of the expected transaction is still under consideration, the desire of the involved parties is to structure this transaction in a manner that minimizes any potential disruption to clients. It is anticipated that there would be an appropriate transition period which would allow for continued and consistent management of the fixed income products.
15. Subsequent Events
Termination of New Purchases of Class B Shares
On March 29, 2007, the Board of Trustees of Optimum Fund Trust approved the termination of new purchases of the Funds’ Class B shares. Effective at the close of business on July 31, 2007, no new or subsequent investments, including investments through automatic investment plans and by qualified retirement plans (such as 401(k) plans, 403(b) plans, or 457 plans), will be allowed in Class B shares in any of the Funds, except through a reinvestment of dividends or capital gains or permitted exchanges. Existing shareholders of Class B shares may continue to hold their Class B shares, reinvest
110
dividends into Class B shares, and exchange their Class B shares of one Fund for Class B shares of another Fund, as permitted by existing exchange privileges. Existing Class B shareholders wishing to make subsequent purchases in a Funds’ shares will be permitted to invest in other classes of the Funds, subject to that class’ pricing structure and eligibility requirements, if any.
For Class B shares outstanding as of July 31, 2007 and Class B shares acquired upon reinvestment of dividends or capital gains, all Class B share attributes, including the contingent deferred sales charge (“CDSC”) schedules, conversion to Class A schedule, and distribution and service (12b-1) fees, will continue in their current form. However, effective at the close of business on July 31, 2007, reinvestment of redeemed shares with respect to Class B shares (which, as described in the Class B shares prospectus, permits you to reinvest within 35 days of selling your shares and have any CDSC you paid on such shares credited back to your account) will be discontinued. In addition, because a Fund’s or its distributor’s ability to assess certain sales charges and fees is dependent on the sale of new shares, the termination of new purchases of Class B shares could ultimately lead to the elimination and/or reduction of such sales charges and fees. A Fund may not be able to provide shareholders with advance notice of the reduction in these sales charges and fees. You will be notified via a Prospectus Supplement if there are any changes to any attributes, sales charges, or fees.
Amendment to Investment Management Fee for Optimum Fixed Income Fund
On March 29, 2007, the Board of Trustees of the Optimum Fixed Income Fund approved a revised fee schedule to the existing investment management agreement between the Fund and DMC. As of April 1, 2007, the investment management fee is 0.70% of assets up to $25 million, 0.65% of assets from $25 million to $100 million, 0.60% of assets from $100 million to $500 million, 0.55% of assets from $500 million to $1 billion, and 0.50% of assets over $1 billion. The revised fee schedule will result in a reduction of investment management fees paid by the Fund (before current fee waivers) as compared to the Fees paid under the prior investment management fee schedule of: 0.70% of assets up to $25 million, 0.65% of assets from $25 million to $100 million, and 0.60% of assets over $100 million. In approving the revised fee schedule with DMC, the Board received, and took into consideration, a written representation that there will be no change in the nature, quality, and quantity of the services provided by DMC to the Fund.
111
Report of independent
registered public accounting firm
To the Shareholders and Board of Trustees
Optimum Fund Trust
We have audited the accompanying statements of net assets and statements of assets and liabilities of Optimum Fund Trust (comprising, respectively, the Optimum Fixed Income Fund, Optimum International Fund, Optimum Large Cap Growth Fund, Optimum Large Cap Value Fund, Optimum Small Cap Growth Fund, and Optimum Small Cap Value Fund (the “Funds”)) as of March 31, 2007, and the related statements of operations for the year then ended, the statements of changes in net assets for each of the two years in the period then ended, and the financial highlights for each of the three years in the period then ended and the period August 1, 2003 (commencement of operations) through March 31, 2004. These financial statements and financial highlights are the responsibility of the Funds’ management. Our responsibility is to express an opinion on these financial statements and financial highlights based on our audits.
We conducted our audits in accordance with the standards of the Public Company Accounting Oversight Board (United States). Those standards require that we plan and perform the audit to obtain reasonable assurance about whether the financial statements and financial highlights are free of material misstatement. We were not engaged to perform an audit of the Funds’ internal control over financial reporting. Our audits included consideration of internal control over financial reporting as a basis for designing audit procedures that are appropriate in the circumstances, but not for the purpose of expressing an opinion on the effectiveness of the Funds’ internal control over financial reporting. Accordingly, we express no such opinion. An audit also includes examining, on a test basis, evidence supporting the amounts and disclosures in the financial statements and financial highlights, assessing the accounting principles used and significant estimates made by management, and evaluating the overall financial statement presentation. Our procedures included confirmation of securities owned as of March 31, 2007, by correspondence with the Funds’ custodian and brokers or by other appropriate auditing procedures where replies from brokers were not received. We believe that our audits provide a reasonable basis for our opinion.
In our opinion, the financial statements and financial highlights referred to above present fairly, in all material respects, the financial position of each of the respective Funds constituting Optimum Fund Trust at March 31, 2007, the results of their operations for the year then ended, the changes in their net assets for each of the two years in the period then ended, and their financial highlights for each of the three years in the period then ended and the period August 1, 2003 (commencement of operations) through March 31, 2004, in conformity with U.S. generally accepted accounting principles.

Philadelphia, Pennsylvania
May 15, 2007
112
Board of trustees and officers addendum
Optimum Fund Trust
A mutual fund is governed by a Board of Trustees which has oversight responsibility for the management of a fund’s business affairs. Trustees establish procedures and oversee and review the performance of the investment manager, the distributor and others that perform services for the fund. The independent fund trustees, in particular, are advocates for shareholder interests. The following is a list of the Trustees and Officers of the Trust with certain background and related information.
| Number of | |||||
| Portfolios in Fund | Other | ||||
| Name, | Complex1 Overseen | Directorships | |||
| Address | Position(s) | Length of | Principal Occupation(s) | by Trustee | Held by |
| and Age | Held with Fund(s) | Time Served | During Past 5 Years | or Officer | Trustee or Officer |
| Interested Trustees | |||||
| Mark S. Casady2 | Trustee | April 21, | Chairman and | 6 | None |
| 2005 Market Street | 2003 to | Chief Executive Officer – | |||
| Philadelphia, PA | present | LPL Financial Services | |||
| 19103 | (2005 – Present) | ||||
| Age 46 | President and Chief Executive | ||||
| Officer – LPL Financial Services | |||||
| (2004 – 2005) | |||||
| President and Chief Operating | |||||
| Officer – LPL Financial Services | |||||
| (2002 – 2004) | |||||
| Managing Director | |||||
| Scudder Investments | |||||
| (1994 – 2002) | |||||
| John C. E. Campbell2 | Trustee, President | June 17, 2004 | President, Global – | 6 | None |
| 2005 Market Street | and Chief | to present | Institutional Services, | ||
| Philadelphia, PA | Executive Officer | Delaware Investment Advisers | |||
| 19103 | (2003 – Present) | ||||
| Age 61 | Executive Vice President | ||||
| Global Marketing & Client Services | |||||
| Delaware Management Company | |||||
| (1992 – Present) | |||||
| Independent Trustees | |||||
| Nicholas D. Constan | Trustee | July 17, 2003 | Adjunct Professor – | 6 | None |
| 2005 Market Street | to present | University of Pennsylvania | |||
| Philadelphia, PA | (1972 – Present) | ||||
| 19103 | |||||
| Age 68 | |||||
| William W. Hennig | Trustee | July 17, 2003 | Private Investor | 6 | None |
| 2005 Market Street | to present | ||||
| Philadelphia, PA | |||||
| 19103 | |||||
| Age 76 | |||||
| Durant Adams Hunter | Trustee | July 17, 2003 | Principal-Ridgeway Partners | 6 | None |
| 2005 Market Street | to present | (Executive Recruiting) | |||
| Philadelphia, PA | (2004 – Present) | ||||
| 19103 | |||||
| Age 58 | Chief Executive Officer | ||||
| Whitehead Mann Inc. | |||||
| (Executive Recruiting) | |||||
| 2000 – 2003) | |||||
(continues) 113
| Number of | |||||
| Portfolios in Fund | Other | ||||
| Name, | Complex1 Overseen | Directorships | |||
| Address | Position(s) | Length of | Principal Occupation(s) | by Trustee | Held by |
| and Age | Held with Fund(s) | Time Served | During Past 5 Years | or Officer | Trustee or Officer |
| Independent Trustees (continued) | |||||
| Stephen Paul Mullin | Trustee and | July 17, 2003 | Senior Vice President – | 6 | None |
| 2005 Market Street | Chairman | to present | Econsult Corporation | ||
| Philadelphia, PA | (Economic Consulting) | ||||
| 19103 | (2000 – Present) | ||||
| Age 51 | |||||
| Robert A. Rudell | Trustee | July 17, 2003 | Private Investor | 6 | Director – |
| 2005 Market Street | to present | (2002 – Present) | Medtox Scientific, Inc. | ||
| Philadelphia, PA | (Clinic Lab) | ||||
| 19103 | (2002 – Present) | ||||
| Age 58 | Chief Operating Officer – ZSI | Director – | |||
| (Asset Management) | Heartland Group, Inc. | ||||
| (1998 – 2002) | Family of Funds | ||||
| (3 mutual funds) | |||||
| (2005 – Present) | |||||
| Director – | |||||
| The Vantage Point Funds | |||||
| Family of Funds | |||||
| (27 mutual funds) | |||||
| (2007 – Present) | |||||
| Jon Edward Socolofsky | Trustee | July 17, 2003 | Private Investor | 6 | None |
| 2005 Market Street | to present | (2002 – Present) | |||
| Philadelphia, PA | |||||
| 19103 | |||||
| Age 61 | Senior Vice President – | ||||
| The Northern Trust Company | |||||
| (Trust Bank) | |||||
| (1970 – 2001) | |||||
Officers | |||||
| David F. Connor | Vice President, | Vice President since | Mr. Connor has served as | 6 | None4 |
| 2005 Market Street | Deputy General | July 17, 2003 | Vice President and Deputy | ||
| Philadelphia, PA | Counsel, and Secretary | and Secretary | General Counsel of | ||
| 19103 | since | Delaware Investments3 since 2000. | |||
| December 6, 2005 | |||||
| Age 42 | |||||
| David P. O’Connor | Senior Vice President, | October 25, 2005 | Mr. O’Connor has served in | 6 | None4 |
| 2005 Market Street | General Counsel, | to present | various executive and legal | ||
| Philadelphia, PA | and Chief | capacities at different times at | |||
| 19103 | Legal Officer | Delaware Investments. | |||
| Age 40 | |||||
| John J. O’Connor | Senior Vice President | March 29, 2007 | Mr. O’Connor has served in | 6 | None4 |
| 2005 Market Street | and Treasurer | to present | various executive capacities | ||
| Philadelphia, PA | at different times at | ||||
| 19103 | Delaware Investments. | ||||
| Age 49 | |||||
| Richard Salus | Senior | January 1, 2006 | Mr. Salus has served in | 6 | None4 |
| 2005 Market Street | Vice President | to present | various executive capacities | ||
| Philadelphia, PA | and | at different times at | |||
| 19103 | Chief Financial | Delaware Investments. | |||
| Officer | |||||
| Age 42 | |||||
| 1 The term “Fund Complex” refers to the Funds in the Optimum Fund Trust. |
| 2 “Interested persons” of the Funds by virtue of their executive and management positions or relationships with the Fund’s service providers or sub-service providers. |
| 3 Delaware Investments is the marketing name for Delaware Management Holdings, Inc. and its subsidiaries, including the Trust’s manager, principal underwriter and service agent. |
| 4 Messrs Connor, David P. O’Connor, John J. O’Connor and Salus also serve in similar capacities for the Delaware Investments Family of Funds, a fund complex also managed and distributed by Delaware Investments with 87 funds. |
| The Statement of Additional Information for the Fund(s) includes additional information about the Trustees and Officers and is available, without charge, upon request by calling your financial advisor or 800 914-0278. |
114
About the organization
This annual report is for the information of Optimum Fund Trust shareholders, but it may be used with prospective investors when preceded or accompanied by a current prospectus for Optimum Fund Trust and the Performance Update for the most recently completed calendar quarter. The prospectus sets forth details about charges, expenses, investment objectives, and operating policies of the Fund. You should read the prospectus carefully before you invest. The figures in this report represent past results that are not a guarantee of future results. The return and principal value of an investment in the Fund will fluctuate so that shares, when redeemed, may be worth more or less than their original cost.
| Board of trustees Mark S. Casady John C.E. Campbell Nicholas D. Constan William W. Hennig Durant Adams Hunter Stephen Paul Mullin Robert A. Rudell Jon Edward Socolofsky | Affiliated officers David P. O’Connor John J. O’Connor Richard Salus | Contact information Investment manager National distributor Shareholder servicing, dividend For Shareholders For securities dealers Web site |
Each Fund files its complete schedule of portfolio holdings with the Securities and Exchange Commission for the first and third quarters of each fiscal year on Forms N-Q. Each Fund’s Forms N-Q, as well as a description of the policies and procedures that each Fund uses to determine how to vote proxies (if any) relating to portfolio securities is available without charge (i) upon request, by calling 800 914-0278; (ii) on the Fund’s Web site at http://www.optimummutualfunds.com ; and (iii) on the Commission’s Web site at http://www.sec.gov. Each Fund’s Forms N-Q may be reviewed and copied at the Commission’s Public Reference Room in Washington, DC; information on the operation of the Public Reference Room may be obtained by calling 800 SEC-0330.
Information (if any) regarding how each Fund voted proxies relating to portfolio securities during the most recently disclosed 12-month period ended June 30 is available without charge (i) through the Fund’s Web site at http://www.optimummutualfunds.com; and (ii) on the Commission’s Web site at http://www.sec.gov.
115
![]()
| (1804) | Printed in the USA |
| AR-901 [3/07] CGI 5/07 | PO11858 |
Item 2. Code of Ethics
The registrant has adopted a code of ethics that applies to the registrant’s principal executive officer, principal financial officer, principal accounting officer or controller, or persons performing similar functions, regardless of whether these individuals are employed by the registrant or a third party. A copy of the registrant’s Code of Business Ethics has been posted on Delaware Investments’ internet website at www.delawareinvestments.com. Any amendments to the Code of Business Ethics, and information on any waiver from its provisions granted by the registrant, will also be posted on this website within five business days of such amendment or waiver and will remain on the website for at least 12 months.
Item 3. Audit Committee Financial Expert
The registrant’s Board of Trustees/Directors has determined that each member of the registrant’s Audit Committee is an audit committee financial expert, as defined below. For purposes of this item, an “audit committee financial expert” is a person who has the following attributes:
a. An understanding of generally accepted accounting principles and financial statements;
b. The ability to assess the general application of such principles in connection with the accounting for estimates, accruals, and reserves;
c. Experience preparing, auditing, analyzing, or evaluating financial statements that present a breadth and level of complexity of accounting issues that are generally comparable to the breadth and complexity of issues that can reasonably be expected to be raised by the registrant’s financial statements, or experience actively supervising one or more persons engaged in such activities;
d. An understanding of internal controls and procedures for financial reporting; and
e. An understanding of audit committee functions.
An “audit committee financial expert” shall have acquired such attributes through:
a. Education and experience as a principal financial officer, principal accounting officer, controller, public accountant, or auditor or experience in one or more positions that involve the performance of similar functions;
b. Experience actively supervising a principal financial officer, principal accounting officer, controller, public accountant, auditor, or person performing similar functions;
c. Experience overseeing or assessing the performance of companies or public accountants with respect to the preparation, auditing, or evaluation of financial statements; or
d. Other relevant experience.
The registrant’s Board of Trustees/Directors has also determined that each member of the registrant’s Audit Committee is independent. In order to be “independent” for purposes of this item, the Audit Committee member may not: (i) other than in his or her capacity as a member of the Board of Trustees/Directors or any committee thereof, accept directly or indirectly any consulting, advisory or other compensatory fee from the issuer; or (ii) be an “interested person” of the registrant as defined in Section 2(a)(19) of the Investment Company Act of 1940.
The names of the audit committee financial experts on the registrant’s Audit Committee are set forth below:
Robert A. Rudell
Jon. E. Socolofsky
Item 4. Principal Accountant Fees and Services
(a) Audit fees.
The aggregate fees billed for services provided to the registrant by its independent auditors for the audit of the registrant’s annual financial statements and for services normally provided by the independent auditors in connection with statutory and regulatory filings or engagements were $124,110 for the fiscal year ended March 31, 2007.
The aggregate fees billed for services provided to the registrant by its independent auditors for the audit of the registrant’s annual financial statements and for services normally provided by the independent auditors in connection with statutory and regulatory filings or engagements were $125,700 for the fiscal year ended March 31, 2006.
(b) Audit-related fees.
The aggregate fees billed by the registrant’s independent auditors for services relating to the performance of the audit of the registrant’s financial statements and not reported under paragraph (a) of this Item were $0 for the fiscal year ended March 31, 2007.
The aggregate fees billed by the registrant’s independent auditors for services relating to the performance of the audit of the financial statements of the registrant’s investment adviser and other service providers under common control with the adviser and that relate directly to the operations or financial reporting of the registrant were $13,400 for the registrant’s fiscal year ended March 31, 2007. The percentage of these fees relating to services approved by the registrant’s Audit Committee pursuant to the de minimis exception from the pre-approval requirement in Rule 2-01(c)(7)(i)(C) of Regulation S-X was 0%. These audit-related services were as follows: issuance of report concerning transfer agent’s system of internal accounting control pursuant to Rule 17Ad-13 of the Securities Exchange Act.
The aggregate fees billed by the registrant’s independent auditors for services relating to the performance of the audit of the registrant’s financial statements and not reported under paragraph (a) of this Item were $0 for the fiscal year ended March 31, 2006.
The aggregate fees billed by the registrant’s independent auditors for services relating to the performance of the audit of the financial statements of the registrant’s investment adviser and other service providers under common control with the adviser and that relate directly to the operations or financial reporting of the registrant were $13,300 for the registrant’s fiscal year ended March 31, 2006. The percentage of these fees relating to services approved by the registrant’s Audit Committee pursuant to the de minimis exception from the pre-approval requirement in Rule 2-01(c)(7)(i)(C) of Regulation S-X was 0%. These audit-related services were as follows: issuance of report concerning transfer agent’s system of internal accounting control pursuant to Rule 17Ad-13 of the Securities Exchange Act.
(c) Tax fees.
The aggregate fees billed by the registrant’s independent auditors for tax-related services provided to the registrant were $23,000 for the fiscal year ended March 31, 2007. The percentage of these fees relating to services approved by the registrant’s Audit Committee pursuant to the de minimis exception from the pre-approval requirement in Rule 2-01(c)(7)(i)(C) of Regulation S-X was 0%. These tax-related services were as follows: review of income tax return and review of annual excise distribution calculation.
The aggregate fees billed by the registrant’s independent auditors for tax-related services provided to the registrant’s investment adviser and other service providers under common control with the adviser and that relate directly to the operations or financial reporting of the registrant were $0 for the registrant’s fiscal year ended March 31, 2007.
The aggregate fees billed by the registrant’s independent auditors for tax-related services provided to the registrant were $21,900 for the fiscal year ended March 31, 2006. The percentage of these fees relating to services approved by the registrant’s Audit Committee pursuant to the de minimis exception from the pre-approval requirement in Rule 2-01(c)(7)(i)(C) of Regulation S-X was 0%. These tax-related services were as follows: review of income tax return and review of annual excise distribution calculation.
The aggregate fees billed by the registrant’s independent auditors for tax-related services provided to the registrant’s adviser and other service providers under common control with the adviser and that relate directly to the operations or financial reporting of the registrant were $0 for the registrant’s fiscal year ended March 31, 2006.
(d) All other fees.
The aggregate fees billed for all services provided by the independent auditors to the registrant other than those set forth in paragraphs (a), (b) and (c) of this Item were $0 for the fiscal year ended March 31, 2007.
The aggregate fees billed for all services other than those set forth in paragraphs (b) and (c) of this Item provided by the registrant’s independent auditors to the registrant’s adviser and other service providers under common control with the adviser and that relate directly to the operations or financial reporting of the registrant were $0 for the registrant’s fiscal year ended March 31, 2007.
The aggregate fees billed for all services provided by the independent auditors to the registrant other than those set forth in paragraphs (a), (b) and (c) of this Item were $0 for the fiscal year ended March 31, 2006.
The aggregate fees billed for all services other than those set forth in paragraphs (b) and (c) of this Item provided by the registrant’s independent auditors to the registrant’s adviser and other service providers under common control with the adviser and that relate directly to the operations or financial reporting of the registrant were $0 for the registrant’s fiscal year ended March 31, 2006.
(e) The registrant’s Audit Committee has established pre-approval policies and procedures as permitted by Rule 2-01(c)(7)(i)(B) of Regulation S-X (the “Pre-Approval Policy”) with respect to services provided by the registrant’s independent auditors. Pursuant to the Pre-Approval Policy, the Audit Committee has pre-approved the services set forth in the table below with respect to the registrant up to the specified fee limits. Certain fee limits are based on aggregate fees to the registrant and other registrants within the Delaware Investments Family of Funds.
| Service | Range of Fees |
| Audit Services | |
| Statutory audits or financial audits for new Funds | up to $25,000 per Fund |
| Services associated with SEC registration statements (e.g., Form N-1A, Form N-14, etc.), periodic reports and other documents filed with the SEC or other documents issued in connection with securities offerings (e.g., comfort letters for closed-end Fund offerings, consents), and assistance in responding to SEC comment letters | up to $10,000 per Fund |
| Consultations by Fund management as to the accounting or disclosure treatment of transactions or events and/or the actual or potential impact of final or proposed rules, standards or interpretations by the SEC, FASB, or other regulatory or standard-setting bodies (Note: Under SEC rules, some consultations may be considered “audit-related services” rather than “audit services”) | up to $25,000 in the aggregate |
| Audit-Related Services | |
| Consultations by Fund management as to the accounting or disclosure treatment of transactions or events and /or the actual or potential impact of final or proposed rules, standards or interpretations by the SEC, FASB, or other regulatory or standard-setting bodies (Note: Under SEC rules, some consultations may be considered “audit services” rather than “audit-related services”) | up to $25,000 in the aggregate |
| Tax Services | |
| U.S. federal, state and local and international tax planning and advice (e.g., consulting on statutory, regulatory or administrative developments, evaluation of Funds’ tax compliance function, etc.) | up to $25,000 in the aggregate |
| U.S. federal, state and local tax compliance (e.g., excise distribution reviews, etc.) | up to $5,000 per Fund |
| Review of federal, state, local and international income, franchise and other tax returns | up to $5,000 per Fund |
Under the Pre-Approval Policy, the Audit Committee has also pre-approved the services set forth in the table below with respect to the registrant’s investment adviser and other entities controlling, controlled by or under common control with the investment adviser that provide ongoing services to the registrant (the “Control Affiliates”) up to the specified fee limit. This fee limit is based on aggregate fees to the investment adviser and its Control Affiliates.
| Service | Range of Fees |
| Non-Audit Services | |
Services associated with periodic reports and other documents filed with the SEC and assistance in responding to SEC comment letters | up to $10,000 in the aggregate |
The Pre-Approval Policy requires the registrant’s independent auditors to report to the Audit Committee at each of its regular meetings regarding all services initiated since the last such report was rendered, including those services authorized by the Pre-Approval Policy.
(f) Not applicable.
(g) The aggregate non-audit fees billed by the registrant’s independent auditors for services rendered to the registrant and to its investment adviser and other service providers under common control with the adviser were $262,408 and $212, 460 for the registrant’s fiscal years ended March 31, 2007 and March 31, 2006, respectively.
(h) In connection with its selection of the independent auditors, the registrant’s Audit Committee has considered the independent auditors’ provision of non-audit services to the registrant’s investment adviser and other service providers under common control with the adviser that were not required to be pre-approved pursuant to Rule 2-01(c)(7)(ii) of Regulation S-X. The Audit Committee has determined that the independent auditors’ provision of these services is compatible with maintaining the auditors’ independence.
Item 5. Audit Committee of Listed Registrants
Not applicable.
Item 6. Schedule of Investments
Included as part of report to shareholders filed under Item 1 of this Form N-CSR.
Item 7. Disclosure of Proxy Voting Policies and Procedures for Closed-End Management Investment Companies
Not applicable.
Item 8. Portfolio Managers of Closed-End Management Investment Companies
Not applicable.
Item 9. Purchases of Equity Securities by Closed-End Management Investment Company and Affiliated Purchasers
Not applicable.
Item 10. Submission of Matters to a Vote of Security Holders
Not applicable.
Item 11. Controls and Procedures
The registrant’s principal executive officer and principal financial officer have evaluated the registrant’s disclosure controls and procedures within 90 days of the filing of this report and have concluded that they are effective in providing reasonable assurance that the information required to be disclosed by the registrant in its reports or statements filed under the Securities Exchange Act of 1934 is recorded, processed, summarized and reported within the time periods specified in the rules and forms of the Securities and Exchange Commission.
There were no significant changes in the registrant’s internal control over financial reporting that occurred during the second fiscal quarter of the period covered by the report to stockholders included herein (i.e., the registrant’s fourth fiscal quarter) that have materially affected, or are reasonably likely to materially affect, the registrant’s internal control over financial reporting.
Item 12. Exhibits
(a) (1) Code of Ethics
Not applicable.
(2) Certifications of Principal Executive Officer and Principal Financial Officer pursuant to Rule 30a-2 under the Investment Company Act of 1940 are attached hereto as Exhibit 99.CERT.
(3) Written solicitations to purchase securities pursuant to Rule 23c-1 under the Securities Exchange Act of 1934.
Not applicable.
(b) Certifications pursuant to Section 906 of the Sarbanes-Oxley Act of 2002 are furnished herewith as Exhibit 99.906CERT.
SIGNATURES
Pursuant to the requirements of the Securities Exchange Act of 1934 and the Investment Company Act of 1940, the registrant has duly caused this report to be signed on its behalf, by the undersigned, thereunto duly authorized.
Name of Registrant: Optimum Fund Trust
| JOHN C.E. CAMPBELL | ||
| By: | John C.E. Campbell | |
| Title: | Chief Executive Officer | |
| Date: | June 7, 2007 | |
Pursuant to the requirements of the Securities Exchange Act of 1934 and the Investment Company Act of 1940, this report has been signed below by the following persons on behalf of the registrant and in the capacities and on the dates indicated.
| JOHN C.E. CAMPBELL | ||
| By: | John C.E. Campbell | |
| Title: | Chief Executive Officer | |
| Date: | June 7, 2007 | |
| RICHARD SALUS | ||
| By: | Richard Salus | |
| Title: | Chief Financial Officer | |
| Date: | June 7, 2007 | |