UNITED STATES SECURITIES AND EXCHANGE COMMISSION
Washington, D.C. 20549
FORM N-CSR
CERTIFIED SHAREHOLDER REPORT OF REGISTERED MANAGEMENT INVESTMENT
COMPANIES
| Investment Company Act file number: | 811-21335 |
| Exact name of registrant as specified in charter: | Optimum Fund Trust |
| Address of principal executive offices: | 2005 Market Street |
| Philadelphia, PA 19103 | |
| Name and address of agent for service: | David F. Connor, Esq. |
| 2005 Market Street | |
| Philadelphia, PA 19103 | |
| Registrant’s telephone number, including area code: | (800) 523-1918 |
| Date of fiscal year end: | March 31 |
| Date of reporting period: | March 31, 2012 |
Item 1. Reports to Stockholders
| | |||
Optimum Fixed Income Fund | |||
Optimum International Fund | |||
| Optimum Large Cap Growth Fund | |||
| Optimum Large Cap Value Fund | |||
| Optimum Small-Mid Cap Growth Fund | |||
| Optimum Small-Mid Cap Value Fund | |||
| Annual Report | |||
| March 31, 2012 | |||
Carefully consider the Funds’ investment objectives, risk factors, charges, and expenses before investing. This and other information can be found in the Funds’ prospectus and, if available, their summary prospectus, which may be obtained by visiting www.optimummutualfunds.com or calling 800 914-0278. Investors should read the prospectus and, if available, the summary prospectus carefully before investing.
Table of contents
| Portfolio management review | |
| Optimum Fixed Income Fund | 1 |
| Optimum International Fund | 3 |
| Optimum Large Cap Growth Fund | 6 |
| Optimum Large Cap Value Fund | 9 |
| Optimum Small-Mid Cap Growth Fund | 12 |
| Optimum Small-Mid Cap Value Fund | 14 |
| Performance summary | |
| Optimum Fixed Income Fund | 18 |
| Optimum International Fund | 22 |
| Optimum Large Cap Growth Fund | 24 |
| Optimum Large Cap Value Fund | 26 |
| Optimum Small-Mid Cap Growth Fund | 28 |
| Optimum Small-Mid Cap Value Fund | 30 |
| Disclosure of Fund expenses | 32 |
| Security type/sector/country allocations | |
| and top 10 equity holdings | 34 |
| Financial statements | |
| Statements of net assets | 38 |
| Statements of assets and liabilities | 83 |
| Statements of operations | 84 |
| Statements of changes in net assets | 85 |
| Financial highlights | 88 |
| Notes to financial statements | 112 |
| Report of independent | |
| registered public accounting firm | 129 |
| Other Fund information | 130 |
| Board of trustees and officers addendum | 131 |
| About the organization | 133 |
Investments in Optimum Fixed Income Fund, Optimum International Fund, Optimum Large Cap Growth Fund, Optimum Large Cap Value Fund, Optimum Small-Mid Cap Growth Fund, and Optimum Small-Mid Cap Value Fund are not and will not be deposits with or liabilities of Macquarie Bank Limited ABN 46 008 583 542 and its holding companies, including their subsidiaries or related companies, and are subject to investment risk, including possible delays in repayment and loss of income and capital invested. No Macquarie Group company guarantees or will guarantee the performance of the Funds, the repayment of capital from the Funds, or any particular rate of return.
Unless otherwise noted, views expressed herein are current as of March 31, 2012, and subject to change. Holdings are as of the date indicated and subject to change.
Funds are not FDIC insured and are not guaranteed. It is possible to lose the principal amount invested.
Mutual fund advisory services provided by Delaware Management Company, a series of Delaware Management Business Trust, which is a registered investment advisor. Delaware Investments, a member of Macquarie Group, refers to Delaware Management Holdings, Inc. and its subsidiaries, including the Funds’ distributor, Delaware Distributors, L.P. Macquarie Group refers to Macquarie Group Limited and its subsidiaries and affiliates worldwide.
All third-party marks cited are the property of their respective owners.
© 2012 Delaware Management Holdings, Inc.
Portfolio management review
Optimum Fixed Income Fund
April 10, 2012
| Performance review (for the year ended March 31, 2012) | ||||
| Optimum Fixed Income Fund (Class A shares) | 1-year return | +6.71% | ||
| Optimum Fixed Income Fund (Institutional Class shares) | 1-year return | +7.20% | ||
| Barclays U.S. Aggregate Bond Index (benchmark) | 1-year return | +7.71% |
For complete, annualized performance for Optimum Fixed Income Fund, please see the table on page 18.
The performance of Class A shares excludes the applicable sales charge and reflects the reinvestment of all distributions.
Institutional Class shares are available without sales or asset-based distribution charges only to certain eligible institutional accounts.
Index performance returns do not reflect any management fees, transaction costs, or expenses. Indices are unmanaged and one cannot invest directly in an index.
Advisor
Delaware Management Company (DMC)
Sub-advisor
Delaware Management Company (DMC)
Pacific Investment Management Company LLC (PIMCO)
Market overview
Throughout the Fund’s fiscal year, political and economic policy makers around the world continued to have a significant effect on global financial markets, which were characterized by growing uncertainty.
Volatility was amplified during the first half of the Fund’s fiscal year on concerns surrounding the sovereign debt crisis in Europe, news of Standard & Poor’s downgrade of the long-term U.S. credit rating, and disappointing global growth expectations. During this period, the markets experienced a massive selloff in risky assets and a flight to U.S. Treasurys. The move caused interest rates across the yield curve to fall sharply. In response, the U.S. Federal Reserve signaled its intent to buy $400 billion of long-dated U.S. Treasurys through “Operation Twist,” which further fueled the rally in U.S. Treasurys.
Risk appetite cautiously returned in the second half of the Fund’s fiscal year amid improving U.S. economic data and short-term prevention of a disorderly default by a European sovereign. The European Central Bank instituted long-term refinancing operations in December 2011, which had an immediate stabilizing effect on markets. To further support the nascent recovery, the Fed indicated that economic conditions were likely to warrant exceptionally low rates at least through late 2014. Markets reflected optimism over these policy measures, and risk assets rallied during this period.
Fund performance
Although Optimum Fixed Income Fund lagged its benchmark index for the fiscal year, the Fund posted a positive return for the period. In general, returns for the Fund were aided by exposures to corporate bonds, both investment grade and high yield, while allocations to Treasurys detracted from returns.
DMC
DMC’s portion of Optimum Fixed Income Fund employs a diversified “core plus” investment strategy. This means that DMC seeks to invest the core of its assets under management in U.S. investment grade securities, and then strategically allocates other assets to additional fixed income markets. These additional sectors include U.S. high yield bonds as well as established and emerging international markets.
Within the investment grade market, emphasis on lower-medium and medium-grade (BBB- and A-rated) issues, as well as the generally positive effects of security selection, contributed to performance within DMC’s portion of the Fund.
The high yield bond market was a tale of two halves throughout the Fund’s fiscal year. As the period began, it underperformed other fixed income sectors as lower-quality issues did not directly participate in the interest-rate-driven rally in bond prices. However,
(continues) 1
Portfolio management review
Optimum Fixed Income Fund
exposure to the sector aided the performance of the DMC portion of the Fund during the second half of the fiscal year, as lower-quality issues produced both income and price appreciation benefits.
DMC’s focus continued to be about quality ratings, liquidity, potential downside protection, and seeking exceptional value for taking risk. For instance, it generally remained underweight in government-backed or agency mortgage-backed securities (MBS) as the team believed that such securities remained expensive for much of the Fund’s fiscal year. Though these areas of the market underperformed during much of the period, they did improve toward the end as rates rose slightly. Overall, however, the Fund’s portfolio holdings in agency mortgage-backed securities had a neutral effect for the Fund’s fiscal year.
Despite DMC’s bias toward higher-quality commercial mortgage-backed securities (CMBS), its overweight position in this category detracted from Fund performance early in its fiscal year, but became a positive as conditions improved. An overweight allocation to asset-backed securities (ABS) had a similar effect.
Finally, bonds issued within developed markets (denominated in local currencies) contributed to the Fund’s total returns during its fiscal year, despite lagging U.S. markets. Security selection, for example, was positive with benefits from the portfolio’s currency exposures in Australia and Canada.
PIMCO
In this environment, the PIMCO portion of Optimum Fixed Income Fund posted positive returns over the Fund’s fiscal year, both on an absolute basis and relative to its benchmark. It maintained an underweight allocation to U.S. duration, which detracted from returns as rates fell, especially in the third calendar quarter of 2011.
Tactical curve positioning, including an underweight position to the long end of the yield curve, also hurt returns. The negative effects of U.S. duration positioning were partially offset by duration exposure in other developed markets, particularly the United Kingdom and Australia, where interest rates also fell over concerns of a muted global economic recovery.
Corporate bond exposure near the benchmark was neutral for returns in PIMCO’s sleeve of the Fund, but an emphasis on the bonds of banks and other financial institutions hurt performance. These securities lagged the broader corporate sector amid fears of contagion related to European sovereign risk, although they recouped a portion of their losses in late 2011 as risk appetite returned and investors appreciated their relatively robust fundamentals. Within the mortgage-backed securities sector, an underweight to Ginnie Mae MBS hurt returns as Ginnie Mae MBS outperformed conventional MBS due to regulation-driven demand from banks and international investors. Modest holdings of nonagency MBS generally benefited performance amid strong demand for higher yielding assets in the second half of the fiscal year, although they hurt returns in periods of risk aversion earlier in the fiscal year.
Beyond core sectors, holdings of taxable Build America Bonds contributed to returns in PIMCO’s sleeve of the Fund as the sector outpaced like-duration Treasurys on limited supply and reduced negative headlines for municipal bonds. A modest allocation to local debt in Brazil also added to performance amid a sharp fall in Brazilian interest rates. Exposure to a select basket of emerging market currencies, which depreciated against the U.S. dollar, detracted from performance. This was mitigated by exposure to the Chinese renminbi, which was permitted to cautiously appreciate as economic imbalances persisted.
2
Optimum International Fund
April 10, 2012
| Performance review (for the year ended March 31, 2012) | ||||
| Optimum International Fund (Class A shares) | 1-year return | -5.30% | ||
| Optimum International Fund (Institutional Class shares) | 1-year return | -4.93% | ||
| MSCI EAFE Index (gross) (benchmark) | 1-year return | -5.31% | ||
| MSCI EAFE Index (net) (benchmark) | 1-year return | -5.77% | ||
| Past performance does not guarantee future results. For complete, annualized performance for Optimum International Fund, please see the table on page 22. The performance of Class A shares excludes the applicable sales charge and reflects the reinvestment of all distributions. Institutional Class shares are available without sales or asset-based distribution charges only to certain eligible institutional accounts. Index performance returns do not reflect any management fees, transaction costs, or expenses. Indices are unmanaged and one cannot invest directly in an index. | ||||
Advisor
Delaware Management Company (DMC)
Sub-advisors
BlackRock Advisors, LLC (BlackRock)
Mondrian Investment Partners Ltd. (Mondrian)
Market overview
Unless otherwise noted, regional performance cited below is based on each region’s respective MSCI index.
The Fund’s fiscal year was dominated by two distinct periods: the broad equity market selloff during the third calendar quarter of 2011, and the recovery that began during the subsequent quarter and continued into the first calendar quarter of 2012. The extent of the perceived flight from risk during the third calendar quarter, primarily driven by the sovereign debt crisis in Europe and political squabbling in the United States, was reflected in the MSCI EAFE Index, as it slid nearly 20% during the quarter.
Fortunately, the final quarter of the Fund’s fiscal year brought some relief for financial markets, as investors were somewhat appeased by the coordinated efforts of central banks and European politicians. The European Central Bank’s injection of liquidity into the European banking system, together with political initiatives to lay the groundwork for fiscal unity, were probably the most noteworthy events. Moving into the first three months of 2012, economic data out of the euro zone were less negative than expected, lending further support to investors’ appetite for risk.
Additional notes on regional developments during the fiscal year:
- In Europe, countries outside the euro zone tended to perform well on a relative basis. The U.K. equity market was among the strongest-performing markets, up by 1.1%, as the U.K. coalition government pressed ahead with tough austerity measures.
- The energy-intensive Norwegian equity market delivered one of the best relative returns, although it still fell 3.1%.
- In contrast, euro zone equity markets tended to underperform the broader index as sovereign debt tensions lingered. For example, Greece had by far the weakest-performing equity market, down 63.3%; Portugal, Italy, and Spain each fell more than 25%; and the French and German equity markets decreased 15.6% and 7.8%, respectively.
- In the Asia-Pacific region, the equity market in New Zealand generated the best relative return, up 17.9%. The Japanese equity market recovered well after the natural disasters and ended the period marginally positive.
Fund performance
Optimum International Fund generally performed in line with its benchmark index for the fiscal year, as Class A and Institutional Class shares posted slightly better returns than the MSCI EAFE Index (both gross and net figures).
(continues) 3
Portfolio management review
Optimum International Fund
The positive bias toward the Fund’s relative performance was due primarily to the performance of Mondrian’s portion of the Fund.
BlackRock
For the fiscal year ended March 31, 2012, BlackRock’s portion of the Fund underperformed its benchmark index. The majority of underperformance occurred during the dramatic selloff during the third calendar quarter of 2011. It was BlackRock’s intention to avoid making a macroeconomic directional bet on the economy, and to maintain sector weights similar to the benchmark. BlackRock generally kept its portion of the Fund’s portfolio at a low level of tracking error (measured as the tendency of portfolio returns to follow along those of the benchmark index). This approach, combined with minimal sector bets and a modest overweight allocation to cyclical categories, was a strategy framework that BlackRock believed should have served investors well.
The BlackRock portfolio sleeve began to suffer, however, and it lagged the benchmark notably during the third calendar quarter of 2011. There were three reasons for this result.
First, BlackRock’s holdings in the consumer discretionary and information technology (IT) sectors had greater exposure to China and other faster-growing end markets. More specifically within IT, internet software holdings included Tencent Holdings. The company is part of the social media industry in China and was negatively affected by speculations of a hard landing for China’s economy. The negative effects of stock selection in the consumer discretionary sector detracted from performance, as positions in the casinos-and-gaming and education services sectors had direct exposure to economic growth in China.
The second reason for BlackRock’s underperformance can be attributed to its positioning in the energy sector, where its holdings in the coal and oil-and-gas industries detracted from relative returns.
Lastly, an underweight allocation to healthcare industries, which was predicated on threats of austerity programs in Europe and the pressures they would put on drug reimbursement systems across the region, hurt relative performance. Looking across all major sectors in the benchmark index, healthcare proved to be the most resilient sector during the equity market downturn.
Despite the underperformance during the third calendar quarter of 2011, the BlackRock portion of the Fund rebounded strongly during the final six months of the fiscal year. Stock selection in sectors such as financials, IT, and utilities proved to be areas of relative strength. Within financials, emerging-market banks such as China Merchants Bank and Banco Bradesco benefited from easing fiscal and monetary conditions in their local markets. Positioning in IT was another contributor to the BlackRock portfolio — specifically after the market selloff during the third quarter of 2011 — as an overweight to semiconductors positively influenced returns. BlackRock favors so-called mission-critical software providers like Check Point Software Technologies, because it believes corporate IT departments will continue to purchase products in areas like security and business analytics to protect their businesses.
Mondrian
The Mondrian portion of the Fund led the benchmark index for the fiscal year.
The overall country allocations across the Mondrian portion of the Fund held back performance relative to the benchmark. In Europe, returns were hampered by the negative effects of an overweight exposure to the relatively weak Spanish and Italian markets, more than offsetting the positive effects of avoiding any exposure in Greece and Portugal. The Mondrian portion of the Fund benefited from an underweight position in Australia, as well as an overweight exposure to the Singaporean market and an out-of-benchmark position in Taiwan.
4
At the sector level, Mondrian’s overweight allocation to the healthcare and consumer staples sectors, as well as an underweight position in the materials sector, all resulted in positive returns versus the benchmark. The healthcare and consumer staples sectors were among the strongest performers within the index for the year. This positive performance was slightly offset by the negative effects of Mondrian’s overweight positioning in the weaker-performing telecommunications sector and an underweight position in the consumer discretionary sector.
Across Mondrian’s portfolio, the effect of stock selection was the dominant factor for outperformance during the fiscal year. At the country level, stock selection was notably strong in Japan, the United Kingdom, and Australia. Stock selection was also generally strong at the sector level, particularly within IT, energy, and industrials.
Both the aforementioned consumer staples and healthcare sectors demonstrated defensive qualities in what was generally a weak market for equities. Notable gains were recorded by names that included the consumer staples companies operated by Japanese food retailer Seven & i Holdings, and Unilever, the Anglo-Dutch food producer. Other notable performers included the pharmaceutical companies GlaxoSmithKline in the U.K., Sanofi in France, and Astellas Pharma in Japan; shares for these firms advanced 23.3%, 15.2%, and 15.3%, respectively during the fiscal year. In addition, Australian telecommunications company Telstra saw its shares gain 26.8% during the Fund’s fiscal year as a network transaction with the government progressed toward resolution.
Conversely, weak performance was recorded by companies that included the French food retailer Carrefour, which fell 32.2% during the fiscal year following several profit warnings that were triggered by strategic indecision and competitive pressures in the French market. Amid ongoing euro-zone sovereign debt tensions, Intesa Sanpaolo, the Italian retail bank, fell 31.6% during the fiscal year. In the telecommunication services sector, certain companies reacted to competition and a weak economy by reducing their guidance for shareholder distributions. Such companies included France Telecom and Telefonica, both of which lagged the broader market, declining by 25.8% and 28.2%, respectively.
(continues) 5
Portfolio management review
Optimum Large Cap Growth Fund
April 10, 2012
| Performance review (for the year ended March 31, 2012) | ||||
| Optimum Large Cap Growth Fund (Class A shares) | 1-year return | +8.45% | ||
| Optimum Large Cap Growth Fund (Institutional Class shares) | 1-year return | +8.78% | ||
| Russell 1000® Growth Index (benchmark) | 1-year return | +11.02% | ||
| Past performance does not guarantee future results. For complete, annualized performance for Optimum Large Cap Growth Fund, please see the table on page 24. The performance of Class A shares excludes the applicable sales charge and reflects the reinvestment of all distributions. Institutional Class shares are available without sales or asset-based distribution charges only to certain eligible institutional accounts. Index performance returns do not reflect any management fees, transaction costs, or expenses. Indices are unmanaged and one cannot invest directly in an index. | ||||
Advisor
Delaware Management Company (DMC)
Sub-advisors
Fred Alger Management, Inc. (Alger)
T. Rowe Price Associates, Inc. (T. Rowe Price)
Marsico Capital Management, LLC (Marsico)
Market overview
Most major U.S. stock market indices rose in the one-year period ended March 31, 2012. Driven by economic uncertainty and geopolitical concerns, however, market volatility was high during the Fund’s fiscal year.
At the beginning of the period, equities climbed despite turmoil in various Middle Eastern and North African countries, and sharp increases in oil and other commodity prices. Stocks started falling in May 2011, however, as U.S. and European economies weakened and the European sovereign debt crisis intensified. Shares bottomed in early October 2011, and staged a significant rally through the end of the Fund’s fiscal year. Investors were generally reacting to more sustainable signs of strengthening within the U.S. economy as well as central banks’ commitment across the developed world to continue implementing measures to suppress interest rates and stimulate economic growth.
Over the course of the entire fiscal year, the Russell 1000 Growth Index generated a solid, double-digit return.
Fund performance
Optimum Large Cap Growth Fund lagged its benchmark index for the fiscal year, due in part to underperformance within the financials sector by each of the Fund’s three sub-advisors. Returns within the energy and consumer staples sectors also detracted from the Fund’s performance.
Fred Alger Management, Inc.
Alger attempts to invest in companies that it believes are undergoing positive dynamic change, meaning that these companies are typically high-quality generating strong organic revenue, earnings, and free cash-flow growth. They also tend to be market-dominant companies with high barriers to competitive entry. During the latter months of 2011, the shares of these types of companies underperformed the benchmark. Fortunes changed during the first quarter of 2012, as investors generally rewarded the shares of companies that reported strong earnings growth.
As the equity markets started to decline during the summer of 2011, Alger became somewhat more defensive within its portion of the Fund by reducing cyclically sensitive exposure in the technology, energy, and industrials sectors, and increasing exposure to the more defensive consumer staples sector. Several months later as market conditions began to improve, it again increased holdings of companies in those cyclically sensitive sectors.
6
Within Alger’s portion of the Fund, relative outperformance within the industrials and information technology sectors were the most important contributors to performance. Alger’s large exposure to the information technology sector is based on its positive view of increased usage of the internet, as well as the continued global penetration of smartphone devices.
Alternatively, Alger’s positions within the energy and financials sectors detracted from performance within its portion of the Fund during the fiscal year. Its generally lower exposure to the energy sector was based on a reduced view of global oil demand combined with continued low natural gas prices.
Apple was the most important contributor to Alger’s portion of the Fund. As of the end of the fiscal year, shares of Apple stock continued to be reasonably priced in Alger’s opinion, despite the stock’s already strong positive price movement. Lowe’s was also a strong contributor to Alger’s portion of the Fund.
Several of the companies that detracted from Alger’s portion of the Fund were in the energy sector, primarily natural gas and coal related. Alger believes that the ongoing earnings pressure on many companies in these sectors may continue. As a result, Alger lessened its exposure in the portfolio and sold notable detractors Baker Hughes and Newfield Exploration during the fiscal year.
T. Rowe Price
Overall, stock selection and sector weighting decisions both contributed to the portion of the Fund managed by T. Rowe Price. The information technology, telecommunication services, and consumer discretionary sectors were leading outperformers, while healthcare, consumer staples, and financials were its principal detractors.
Information technology was by far T. Rowe Price’s primary contributor to relative performance, mostly due to stock selection, but its significant weighting also aided results. Shares of Apple were up sharply, largely due to robust demand for its products. The company released an upgraded version of the popular iPad tablet and announced a stock buyback and dividend payment plan.
The telecommunication services sector outperformed primarily due to stock selection decisions, with holdings concentrated in the wireless telecommunication services industry. Tower companies Crown Castle International and American Tower, which recently converted to a real estate investment trust, were among the top overall contributors to portfolio performance.
Stock selection in the healthcare sector was the primary detractor from T. Rowe Price’s portion of the Fund. Shares of biotechnology firm Human Genome Sciences tumbled after the company reported missing sales targets of its promising lupus drug, Benlysta. Although investors had expected a quick adoption of the drug, the time frame for its widespread use has lengthened.
T. Rowe Price remained underweight consumer staples stocks within its portion of the Fund — it does not typically place an emphasis on this sector as the manager believes it does not generally offer an opportunity for sustained double-digit growth. In this case, the underweighting hurt performance, as investors apparently favored defensive sectors during much of the fiscal year.
Marsico
The Marsico investment approach emphasizes owning stocks of high-quality companies with, in its view, compelling potential for long-term capital appreciation. Marsico’s investment process combines top-down macroeconomic and industry analysis with individual stock selection.
Marsico came into 2011 with optimism about the U.S. economy. However, as exogenous events occurred, such as the Japanese earthquake and tsunami, the Arab Spring, Congressional debt-ceiling discussions, and increasing concerns surrounding European sovereign debt, confidence among consumers and corporations declined. Marsico lowered its expectations for growth and positioned its sleeve of the Fund into more defensive growth names.
During the Fund’s fiscal year, positions in consumer-oriented companies generated strong returns. Within the sector, Marsico favored companies with durable
Portfolio management review
Optimum Large Cap Growth Fund
franchises and dependable revenue streams over time that could grow earnings in a “slow growth” environment. Companies that offered a cost savings to consumers such as TJX, priceline.com, Yum! Brands, and McDonald’s were material contributors to Marsico’s portion of the Fund. In addition, its overweight to consumer discretionary, among the best-performing sectors in the benchmark index, helped performance.
While Marsico’s holdings in the information technology sector posted positive returns in aggregate, led by its largest holding, Apple, the collective return of its technology holdings lagged that of the benchmark index, which hampered performance. In addition, the Marsico sleeve maintained an underweighted posture to information technology, the strongest-performing sector in the benchmark index, which also weighed on relative performance.
Stock selection in the financials sector also dampened returns as positions in Goldman Sachs Group, Citigroup, and PNC Financial Services Group were material detractors, and were sold from the Fund during the fiscal year. Marsico’s holdings in the financials sector were reduced significantly early in the reporting period as it became more concerned that the regulatory environment for financial companies had become considerably more complex and could ultimately result in regulations that could impact future profitability of some companies. Additionally, a particular holding in the energy sector, Halliburton, was a significant individual detractor as the market appeared to discount its earnings potential due to lower natural gas prices in the United States.
8
Optimum Large Cap Value Fund
April 10, 2012
| Performance review (for the year ended March 31, 2012) | |||||
| Optimum Large Cap Value Fund (Class A shares) | 1-year return | +7.01 | % | ||
| Optimum Large Cap Value Fund (Institutional Class shares) | 1-year return | +7.32 | % | ||
| Russell 1000® Value Index (benchmark) | 1-year return | +4.79 | % |
For complete, annualized performance for Optimum Large Cap Value Fund, please see the table on page 26.
The performance of Class A shares excludes the applicable sales charge and reflects the reinvestment of all distributions.
Institutional Class shares are available without sales or asset-based distribution charges only to certain eligible institutional accounts.
Index performance returns do not reflect any management fees, transaction costs, or expenses. Indices are unmanaged and one cannot invest directly in an index.
Advisor
Delaware Management Company (DMC)
Sub-advisors
Herndon Capital Management, LLC (Herndon)
Massachusetts Financial Services Company (MFS)
Market overview
Back in early 2011, prior to the beginning of the Fund’s fiscal year, looser U.S. monetary and fiscal policy fostered a sharp rebound in market risk sentiment. By the beginning of the fiscal year, however, global macroeconomic conditions had begun to weaken and renewed concerns surrounding euro-zone sovereign debt arose, causing the recovery in asset valuations to level off.
As the period progressed, worries about U.S. sovereign debt default and the long-term sustainability of the trend in U.S. fiscal policy resulted in Standard & Poor’s downgrading U.S. credit quality. Amid this turmoil, global equity markets declined sharply and credit spreads widened. At the same time, global consumer and producer sentiment indicators fell precipitously and highly-rated sovereign bond yields hit multi-decade lows.
In the latter part of the fiscal year, however, improved global macroeconomic conditions coupled with additional liquidity from the U.S. Federal Reserve in the form of “Operation Twist” (in which it sold approximately $400 billion of its short-term security holdings while simultaneously purchasing an equivalent amount of longer-dated government securities) and from the European Central Bank in the form of 3-year, longer-term refinancing operations (LTROs), ushered in improved market dynamics.
In addition, multiple metrics used to define the health of consumers, corporations, and the broader U.S. economy — including employment data, consumer sentiment readings, and manufacturing and productivity measures — trended positively throughout the Fund’s fiscal year. As a result, U.S. stocks rose in three of the last four quarters and were boosted by encouraging data on both consumer spending and corporate profitability. The numbers in the first quarter of 2012 were particularly strong: both the Dow Jones Industrial Average and S&P 500® Index recorded historic first-quarter gains. These encouraging results, coupled with what appeared to be at least an interim solution to the Greek debt crisis, buoyed risk assets and seemed to provide optimism and comfort to many U.S. equity investors. (Source: Bloomberg.)
Fund performance
Optimum Large Cap Value Fund’s outperformance versus the benchmark index was due primarily to strong returns by several high-profile holdings in the Fund. The names, which represented a number of sectors and were held by different sub-advisors for the Fund, included Accenture, International Business Machines (IBM), Lockheed Martin, and MasterCard.
Herndon
Herndon’s approach in this market environment has been to seek out value-creating opportunities at the individual stock level and aggregate the individual stock information to determine the sector’s weighting. This approach led to outperformance during the Fund’s fiscal year.
(continues) 9
Portfolio management review
Optimum Large Cap Value Fund
Two sectors that outperformed and contributed the most to Herndon’s portion of the Fund were the consumer discretionary and information technology sectors. Gains in the consumer discretionary sector resulted from a diversified set of holdings leveraged to positive trends and growth in discount retailing (including Ross Stores and TJX) as well as international market growth and upscale retailing (Yum! Brands and Coach). Holdings within the technology sector, including Apple, IBM, Microsoft, and Accenture, were notable for their robust business models as well as being leveraged to major technological innovation and positive industry shifts, including smartphone and mobile computing growth, a rollout of cloud-based IT solutions, and continued demand for high-margin IT service, to name a few.
Two sectors detracted from Herndon’s portion of the Fund: financial services and energy. The financial services sector was one of three sectors in the benchmark index to post negative returns during the fiscal year. Strong performance in the financial services sector during the first quarter of 2012 was not enough to overcome the weakness of the first three quarters of the fiscal year. An overweight position in the energy sector, coupled with poor performance from several names that are more leveraged to natural gas production, detracted from performance for Herndon’s portion of the Fund.
TJX, advancing more than 60% during the fiscal year, was a key contributor to performance in Herndon’s portion of the Fund. TJX Companies is the leading off-price retailer of apparel and home fashions in the United States and worldwide. The company’s recent strong performance was driven, in part, by robust monthly sales numbers. TJX continues to take market share from department stores with similar-quality merchandise at better prices. Additionally, the company’s European business is beginning to report strong sales numbers. Management recently expressed optimism regarding this division’s early-stage turnaround after a challenging couple of years.
In terms of laggards for Herndon’s portion of the Fund, Lazard (declining approximately 40%), hurt performance as the company saw multiple macroeconomic trends pressure its stock. Lazard is a global financial advisory and asset management firm, focused on providing money-management and investment-banking services to corporations, partnerships, institutions, governments, and high net worth individuals. Like many financial institutions, particularly those leveraged to Europe, Lazard’s stock felt pressure from the global and European declines in investment banking, mergers and acquisitions, and initial public offerings. Herndon no longer holds this stock in the Fund.
MFS
MFS’s investment philosophy and approach remains consistent in all market environments because the management team believes focusing on investing in high-quality, undervalued stocks gives it the best potential for delivering long-term, strong risk-adjusted returns. Therefore, MFS did not make any changes to its approach during the course of the Fund’s fiscal year.
The combination of stock selection and an overweight position in the consumer staples sector contributed to Fund performance. An overweight allocation to tobacco company Philip Morris International aided returns within MFS’s portion of the Fund. Holdings of alcoholic-drink producer Diageo also contributed positively to performance.
Stock selection in the special products and services sector also contributed positively to performance within MFS’s portion of the Fund. Global consulting and outsourcing company Accenture was among the top relative contributors for its portion of the Fund during the fiscal year.
Stock selection in the industrial goods and services sector strengthened relative performance for MFS’s portion of the Fund. An overweight position in defense contractor Lockheed Martin had a positive effect on relative returns as the stock outperformed the benchmark.
10
Elsewhere, holdings of diversified technology products and services company IBM and debit and credit transaction processing company MasterCard aided relative returns. An overweight position in pharmaceutical and medical products maker Abbott Laboratories, and MFS’s avoidance of poor-performing financial services firm Citigroup, also contributed to performance relative to the benchmark.
Security selection in the healthcare sector detracted from the Fund’s relative performance. Not holding shares of strong-performing health insurance and Medicare/Medicaid provider UnitedHealth Group negatively affected relative results.
Stock selection in the financial services sector also weakened relative performance. Overweight positions in investment banking firm Goldman Sachs Group, financial firm Bank of New York Mellon, and insurance company MetLife hurt relative performance over the Fund’s fiscal year.
Elsewhere, the Fund’s holdings in enterprise software products maker Oracle, oil and gas exploration and production company Apache, and offshore drilling company Transocean were among the worst performers for MFS’s portion of the Fund. Not holding shares of global payments technology company Visa also detracted from performance. Additionally, strong-performing network equipment company Cisco Systems had a negative effect on relative performance — in the second quarter of 2011, the security underperformed and wasn’t in the benchmark. However, for the rest of the fiscal year, where performance was better, it was a large benchmark constituent and the Fund was underweight.
(continues) 11
Portfolio management review
Optimum Small-Mid Cap Growth Fund
April 10, 2012
| Performance review (for the year ended March 31, 2012) | |||||
| Optimum Small-Mid Cap Growth Fund (Class A shares) | 1-year return | +0.33 | % | ||
| Optimum Small-Mid Cap Growth Fund (Institutional Class shares) | 1-year return | +0.68 | % | ||
| Russell 2500™ Growth Index (benchmark) | 1-year return | +2.70 | % |
For complete, annualized performance for Optimum Small-Mid Cap Growth Fund, please see the table on page 28.
Institutional Class shares are available without sales or asset-based distribution charges only to certain eligible institutional accounts.
Index performance returns do not reflect any management fees, transaction costs, or expenses. Indices are unmanaged and one cannot invest directly in an index.
Advisor
Delaware Management Company (DMC)
Sub-advisors
Wellington Management Company, LLP (Wellington)
Columbia Wanger Asset Management, LLC (Columbia WAM)
Market overview
The Fund’s fiscal year was a volatile one for equity markets around the globe. Fueled by growing concerns regarding economic problems in Europe and the United States, markets came under significant pressure during the first half of the fiscal year as investors reacted to greater uncertainty and the prospect of slower growth.
Beginning in the latter half of the fiscal year, equity markets reversed course, gaining back much of the losses from earlier in the period. Generally, better-than-feared global economic data, interest rate cuts by the European Central Bank, and speculation that China may ease its monetary policy, outweighed continued uncertainty over the outcome of the euro-zone debt crisis.
Fund performance
Optimum Small-Mid Cap Growth Fund lagged its benchmark index for the fiscal year, due in part to poor returns by well-known holdings in the portfolios of both sub-advisors, including Shutterfly and James River Coal.
Wellington
During the Fund’s fiscal year, the investment team at Wellington continued to adhere to its disciplined and focused investment approach in managing its portion of the Fund, even as company fundamentals seemingly took a back seat to macroeconomic concerns during much of the period. The investment team’s research continued to focus on identifying companies that it believes are able to sustain superior revenue and earnings growth by virtue of their advantaged market positions. The team also remained conservative in the assumptions it used to estimate companies’ potential future earnings and cash flows, as well as in the valuation metrics it employed to set target prices.
Due to strong security selection, holdings in the healthcare and materials sectors contributed to relative results for Wellington’s portion of the Fund for the fiscal year. Conversely, weak security selection within the information technology, consumer staples, and industrials sectors was the main driver of underperformance.
At the individual security level, top relative contributors for the Fund’s fiscal year included mattress maker Tempur-Pedic International and contract research organization (CRO) Pharmaceutical Product Development. Share prices of Tempur-Pedic, a leading global manufacturer and distributor of premium mattresses and pillows with operations in approximately 80 countries, moved higher based on strong earnings results and better-than-expected earnings guidance. The investment team maintained its position in this name as it continues to believe the company has an impressive growth outlook. Alternately, the team sold its position in the stock of Pharmaceutical Product Development. The company, a CRO providing discovery, development, and
12
lifecycle management services, agreed to be acquired by private equity investors The Carlyle Group and Hellman & Friedman in an all-cash transaction.
Top relative detractors from Wellington’s portion of the Fund included technology hardware company Acme Packet, and energy company James River Coal. Acme Packet is a leading provider of session border control solutions that enable the delivery of voice over internet protocol (VoIP) and data communications across network borders. The stock underperformed after the company posted disappointing quarterly earnings due to higher-than-expected operating expenditures. The investment team maintains a positive view of Acme Packet based on the firm’s leading position in a fast growing market. James River Coal is a thermal and metallurgical coal producer. Lower production levels, increased costs, and concerns about slowing macroeconomic growth during the fiscal year negatively pressured share prices. James River Coal was ultimately eliminated from Wellington’s portion of the Fund.
Columbia WAM
Columbia WAM’s portion of the Fund employs a low-turnover, bottom-up, fundamental strategy. The investment team focuses on the merits of individual companies rather than macroeconomic headlines.
At the sector level, this portion of the Fund benefited from overweight allocations in the healthcare sector and an underweight position in the materials sector. Healthcare performed well given investors’ generally defensive stance during the period. Though its individual stock selection within healthcare was not positive for the period, Columbia WAM’s decision to overweight allocations in the sector was beneficial. Stocks owned in the materials sector (one of the poorest performing sectors within the Fund’s benchmark), outperformed the benchmark, and a relative underweight allocation there also helped returns.
The utilities and financials sectors were the largest detractors from performance. An underweight allocation in utilities is fairly standard for Columbia WAM’s growth strategy. The sector performed well during 2011 as investors looked for positive yield opportunities. As a result, the underweight allocation hurt returns, though this was beginning to reverse at the start of 2012. Columbia WAM’s portion of the Fund maintains a large underweight allocation to financials, though its holdings in the financials sector performed well relative to the benchmark. Ultimately, an underweight position in this sector detracted from returns within its portion of the Fund.
At the individual stock level, top contributors to performance for the Fund’s fiscal year included Alexion Pharmaceuticals and Lululemon Athletica. Alexion is a biotech company that focuses on orphan diseases; it performed well as its primary drug, Soliris, was approved for treating a severe neurological condition. Performance of Lululemon Athletica, a yoga-inspired athletic apparel company, was volatile during the Fund’s fiscal year, but was positive for the fiscal year as increased awareness of its brand name and product contributed to strong sales growth.
Detractors for the period included Shutterfly and InterMune. Internet photo-centric retailer Shutterfly fell victim to a fierce price war waged by all the internet photo book and photo card companies during the 2011 holiday season, resulting in a steep drop in stock prices for the year. InterMune is a biotechnology company focused on the research, development, and commercialization of innovative therapies in pulmonology and fibrotic diseases. The stock price suffered after the company received a negative ruling from a drug reimbursement board in Germany.
(continues) 13
Portfolio management review
Optimum Small-Mid Cap Value Fund
April 10, 2012
| Performance review (for the year ended March 31, 2012) | |||||
| Optimum Small-Mid Cap Value Fund (Class A shares) | 1-year return | +1.01 | % | ||
| Optimum Small-Mid Cap Value Fund (Institutional Class shares) | 1-year return | +1.37 | % | ||
| Russell 2500™ Value Index (benchmark) | 1-year return | +0.09 | % |
For complete, annualized performance for Optimum Small-Mid Cap Value Fund please see the table on page 30.
The performance of Class A shares excludes the applicable sales charge and reflects the reinvestment of all distributions.
Institutional Class shares are available without sales or asset-based distribution charges only to certain eligible institutional accounts.
Index performance returns do not reflect any management fees, transaction costs, or expenses. Indices are unmanaged and one cannot invest directly in an index.
Advisor
Delaware Management Company (DMC)
Sub-advisors
The Delafield Group, a division of Tocqueville Asset Management L.P. (Tocqueville)
The Killen Group, Inc. (Killen)
Westwood Management Corp. (Westwood)
Market overview
The Fund’s fiscal year was a volatile one for equity markets around the globe. Fueled by growing concerns regarding economic problems in Europe and the United States, markets came under significant pressure during the first half of the fiscal year as investors reacted to increasing uncertainty and the prospect of slower economic growth.
Beginning in the latter half of the Fund’s fiscal year, equity markets reversed course, gaining back much of the losses from earlier in the period. Generally, better-than-feared global economic data, interest rate cuts by the European Central Bank, and speculation that China may ease its monetary policy, outweighed continued uncertainty over the outcome of the debt crisis in the euro zone. Amid this volatility, the benchmark Russell 2500 Value Index finished the fiscal year slightly above where it began, notching a small gain.
Fund performance
Security selection in the energy sector by two of Optimum Small-Mid Cap Value Fund’s three sub-advisors contributed to its outperformance versus the Fund’s benchmark.
Tocqueville
Despite the volatility, Tocqueville remained steadfast in its approach to investing. This company’s analytical, bottom-up (stock by stock) approach to investing generated a number of attractively priced investment prospects during the market’s downturn, which it opportunistically acted upon. Tocqueville also used cash reserves to add to its favorite holdings at what it believed to be reasonable valuations.
Tocqueville’s portion of the Fund had limited exposure to the energy sector. This limited position benefited performance relative to the benchmark, as energy was the weakest-performing sector for the fiscal year. Tocqueville also had virtually no exposure to financials, but this negatively affected relative performance within its portion of the Fund, as financials performed well for the Fund’s fiscal year. An overweight position in materials was also a negative for performance, as the sector underperformed during this period.
Stock selection was an overall positive for Tocqueville’s portion of the Fund, as it outperformed the corresponding benchmark returns in six of eight sectors. Investments in the industrials sector were the most beneficial to performance relative to the benchmark. Foot Locker, Solutia, and El Paso were the top contributors to performance. Foot Locker reported improving sales trends during the second half of the Fund’s fiscal year, and its earnings showed improved operational performance. Both Solutia and El Paso received takeover proposals at substantial premiums, which benefited Fund performance. In contrast, Ferro and Checkpoint
14
Systems detracted from performance for its portion of the Fund. Investors penalized Ferro for its exposure to the solar industry and European end markets. Checkpoint Systems experienced a sluggish business environment and disappointing topline results throughout the fiscal year.
Killen
Killen’s portion of the Fund generally performed well during the Fund’s fiscal year. It entered the Fund’s fiscal year with a larger-than-normal cash position, a result of strong performance late in the previous fiscal year that led Killen to take gains. This cash was beneficial to performance during the weak first half of the period and enabled Killen to buy stocks that were viewed as attractively priced as the year progressed. By the fall of 2011, it was essentially fully invested.
Killen uses a company-by-company approach, looking at the long-term potential for each business, and then judges its valuation based on that analysis. With this in mind, the company’s value-based, bottom-up approach led it to invest in situations that many investors seemed to view negatively, at least from a macroeconomic perspective. By focusing on individual companies and taking a long-term viewpoint, the company was able to look past the headlines surrounding Greece and other European debt problems, and invest in what were believed to be strong businesses with solid prospects.
The best-performing sectors for Killen’s portion of the Fund were consumer discretionary, energy, and materials. Its consumer discretionary stocks had broad strength with several holdings showing sizable gains. In energy, stock selection resulted in strong absolute gains for the sector despite energy stocks, in general, performing poorly during this period. In materials, both of its holdings turned in solid absolute gains for the fiscal year even though the sector as a whole struggled.
The only significantly underperforming sector was healthcare. The one healthcare holding produced negative returns while the sector as a whole was up (Killen sold its healthcare holding during the fiscal year). The underperformance in this area was not of a significant enough magnitude, however, to seriously hurt overall returns.
The two biggest positive contributors to its portion of the Fund were in the consumer discretionary sector: Sturm Ruger, a manufacturer of firearms, and Genesco, a shoe and hat retailer, each generated strong absolute returns. Both companies had significant revenue growth during the fiscal year, expanded profit margins, and gained market share in their respective specialty fields. The solid fundamental results, combined with low market expectations, caused their stocks to be revalued significantly higher.
SkyWest and Ducommun detracted from its portion of the Fund. SkyWest operates regional airlines that act as feeders to the hubs of the major airlines. The company experienced reduced profitability due to increased training costs and a less-than-smooth integration of an acquired rival. The poor results led Killen to re-evaluate the company’s long-term potential; it decided to begin selling its SkyWest position just prior to the end of the Fund’s fiscal year.
Ducommun also struggled with the integration of a large acquisition, and experienced a decline in profit margins. Killen believes that the acquisition could negatively affect Ducommun over the long term — therefore its position in the stock was reduced during the period.
Westwood
Westwood continued to use the consistent and disciplined investment approach that it employs through all market environments; that is, focusing on high-quality companies with strong fundamental characteristics and visible earnings prospects.
Security selection in the energy and technology sectors was the primary contributor to performance for this portion of the Fund. A number of the energy companies it held are beneficiaries of new exploration techniques, such as hydraulic fracturing, and persistently high crude-oil prices buoyed the earnings of exploration
(continues) 15
Portfolio management review
Optimum Small-Mid Cap Value Fund
and production firms. Within technology, its holdings generally performed well due to the strong earnings results of companies in that sector, as investor sentiment surrounding global economic growth generally improved toward the end of the Fund’s fiscal year.
Security selection within the financial services and producer durables sectors hindered relative performance. Holdings within financial services lagged because of concerns about bank capital levels and lack of loan growth, though the sector bounced back toward the end of the fiscal year after receiving mostly positive results from government “stress tests.” Despite the continued solid operating results of many companies in producer durables, this economically sensitive sector performed poorly due to extreme macroeconomic fears that were pervasive throughout much of this period. Like the financial services sector, however, these stocks, particularly those with global exposure, rebounded nicely late in the Fund’s fiscal year due to the renewed optimism about the global economy.
The top-performing security in this portion of the Fund was Motorola Mobility Holdings, which provides technologies, products, and services for mobile and wireline digital communication. The company’s August 2011 announcement that it was being acquired by Google at a significant premium to its market value drove its strong performance. Electronics manufacturer Hubbell was another strong performer. Its shares climbed after the company reported that its order growth remains strong despite still-poor commercial construction activity.
The poorest-performing stocks in Westwood’s portion of the Fund included Veeco Instruments, a provider of solutions and services within the LED lighting industry, and trucking parts manufacturer Navistar International. Veeco’s stock was weak as many investors grew concerned about overcapacity in the growing LED industry, while Navistar sold off after reporting disappointing second quarter 2011 earnings and on concerns of lower truck and transport demand as the economy weakened.
16
Performance summary
Optimum Fixed Income Fund
The performance quoted represents past performance and does not guarantee future results. Investment return and principal value of an investment will fluctuate so that shares, when redeemed, may be worth more or less than their original cost. Current performance may be lower or higher than the performance data quoted. Please obtain the performance data for the most recent month end by calling 800 914-0278 or visiting our website at www.optimummutualfunds.com.
| Fund performance1, 2 | ||||||||
| Average annual total returns | ||||||||
| Through March 31, 2012 | 1 year | 3 years | 5 years | Lifetime | ||||
| Class A (Est. Aug. 1, 2003) | ||||||||
| Excluding sales charge | +6.71% | +13.56% | +6.98% | +6.12% | ||||
| Including sales charge | +1.91% | +11.81% | +5.99% | +5.56% | ||||
| Class B (Est. Aug. 1, 2003) | ||||||||
| Excluding sales charge | +6.15% | +12.90% | +6.30% | +5.45% | ||||
| Including sales charge | +2.15% | +12.31% | +6.06% | +5.45% | ||||
| Class C (Est. Aug. 1, 2003) | ||||||||
| Excluding sales charge | +6.15% | +12.85% | +6.30% | +5.45% | ||||
| Including sales charge | +5.15% | +12.85% | +6.30% | +5.45% | ||||
| Institutional Class (Est. Aug. 1, 2003) | ||||||||
| Excluding sales charge | +7.20% | +14.01% | +7.35% | +6.50% | ||||
| Including sales charge | +7.20% | +14.01% | +7.35% | +6.50% |
1Returns reflect the reinvestment of all distributions and are presented both with and without the applicable sales charges described below. Returns do not reflect the deduction of taxes the shareholder would pay on Fund distributions or redemptions of Fund shares.
Expense limitations were in effect for certain classes during some or all of the periods shown in the “Fund performance” chart. The current expenses for each class are listed on the “Fund expense ratios” table on page 19. Performance would have been lower had expense limitations not been in effect.
Class A shares are sold with a maximum front-end sales charge of up to 4.50%, and have an annual distribution and service fee of up to 0.35% of average daily net assets. Performance for Class A shares, excluding sales charges, assumes that no front-end sales charge applied.
Class B shares may be purchased only through dividend reinvestment and certain permitted exchanges as described in the prospectus. Please see the prospectus for additional information on Class B shares. Class B shares have a contingent deferred sales charge that declines from 4.00% to zero depending on the period of time the shares are held. They are also subject to an annual distribution and service fee of up to 1.00% of average daily net assets. Class B shares will automatically convert to Class A shares on a quarterly basis approximately eight years after purchase. Lifetime performance figures for Class B shares reflect conversion to Class A shares after approximately eight years.
Class C shares are sold with a contingent deferred sales charge of 1.00% if redeemed during the first 12 months. They are also subject to an annual distribution and service fee of up to 1.00% of average daily net assets.
Performance for Class B and C shares, excluding sales charges, assumes either that contingent deferred sales charges did not apply or that the investment was not redeemed.
Institutional Class shares are available without sales or asset-based distribution charges only to certain eligible institutional accounts.
The “Fund performance” table and the “Performance of a $10,000 investment” graph do not reflect the deduction of taxes the shareholder would pay on Fund distributions or redemptions of Fund shares.
2The Fund’s expense ratios, as described in the most recent prospectus, are disclosed in the following “Fund expense ratios” table. Delaware Management Company has agreed to reimburse certain expenses and/or waive certain fees in order to prevent total fund operating expenses (excluding any 12b-1 fees and certain other expenses) from exceeding 1.00% of the Fund’s average daily net assets from July 29, 2011, through July 29, 2012. Please see the most recent prospectus and any applicable supplement(s) for additional information on these fee waivers and/or reimbursements.
18
| Fund expense ratios | Class A | Class B | Class C | Institutional Class | |||
| Total annual operating expenses | |||||||
| (without fee waivers) | 1.46% | 2.11% | 2.11% | 1.11% | |||
| Net expenses | |||||||
| (including fee waivers, if any) | 1.35% | 2.00% | 2.00% | 1.00% | |||
| Type of waiver | Contractual | Contractual | Contractual | Contractual |
Fixed income securities and bond funds can lose value, and investors can lose principal, as interest rates rise. They also may be affected by economic conditions that hinder an issuer’s ability to make interest and principal payments on its debt.
The Fund may also be subject to prepayment risk, the risk that the principal of a fixed income security that is held by the Fund may be prepaid prior to maturity, potentially forcing the Fund to reinvest that money at a lower interest rate.
High yielding, noninvestment grade bonds (junk bonds) involve higher risk than investment grade bonds. The high yield secondary market is particularly susceptible to liquidity problems when institutional investors, such as mutual funds and certain other financial institutions, temporarily stop buying bonds for regulatory, financial, or other reasons. In addition, a less liquid secondary market makes it more difficult for the Fund to obtain precise valuations of the high yield securities in its portfolio.
If and when the Fund invests in forward foreign currency contracts or uses other investments to hedge against currency risks, the Fund will be subject to special risks, including counterparty risk.
The Fund may invest in derivatives, which may involve additional expenses and are subject to risk, including the risk that an underlying security or securities index moves in the opposite direction from what the portfolio manager anticipated. A derivative transaction depends upon the counterparties’ ability to fulfill their contractual obligations.
The Fund may experience portfolio turnover in excess of 100%, which could result in higher transaction costs and tax liability.
Performance of a $10,000 Investment1
Aug. 1, 2003 (Fund’s inception) through March 31, 2012
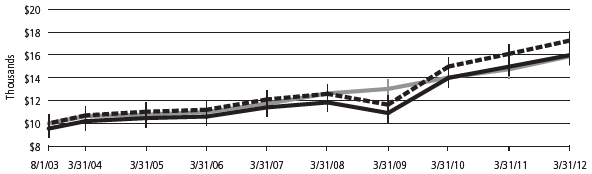
| Starting value (Aug. 1, 2003) | Ending value (March 31, 2012) | ||||
| Optimum Fixed Income Fund — | |||||
| Institutional Class shares | $10,000 | $17,257 | |||
| Optimum Fixed Income Fund — Class A shares | $9,550 | $15,982 | |||
| Barclays U.S. Aggregate Bond Index | $10,000 | $15,882 | |||
1The “Performance of a $10,000 investment” graph assumes $10,000 invested in Class A and Institutional Class shares of the Fund on Aug. 1, 2003, and includes the effect of a 4.50% front-end sales charge (for Class A shares) and the reinvestment of all distributions. The graph does not reflect the deduction of taxes shareholders would pay on Fund distributions or redemptions of Fund shares. Expense limitations were in effect for some or all of the periods shown. Performance would have been lower had expense limitations not been in effect. Current expenses are listed in the “Fund expense ratios” table above. Please note additional details on pages 18 through 20.
(continues) 19
Performance summary
Optimum Fixed Income Fund
The chart also assumes $10,000 invested in the Barclays U.S. Aggregate Bond Index as of Aug. 1, 2003. The Barclays U.S. Aggregate Bond Index is a broad composite of more than 8,000 securities that tracks the investment grade domestic bond market.
Index performance returns do not reflect any management fees, transaction costs or expenses. Indices are unmanaged and one cannot invest directly in an index. Past performance does not guarantee future results.
Performance of other Fund classes will vary due to different charges and expenses.
| Stock symbols and CUSIP numbers | ||||
| Nasdaq symbols | CUSIPs | |||
| Class A | OAFIX | 246118681 | ||
| Class B | OBFIX | 246118673 | ||
| Class C | OCFIX | 246118665 | ||
| Institutional Class | OIFIX | 246118657 |
20
Performance summary
Optimum International Fund
The performance quoted represents past performance and does not guarantee future results. Investment return and principal value of an investment will fluctuate so that shares, when redeemed, may be worth more or less than their original cost. Current performance may be lower or higher than the performance data quoted. Please obtain the performance data for the most recent month end by calling 800 914-0278 or visiting our website at www.optimummutualfunds.com.
| Fund performance | ||||||||
| Average annual total returns | ||||||||
| Through March 31, 2012 | 1 year | 3 years | 5 years | Lifetime | ||||
| Class A (Est. Aug. 1, 2003) | ||||||||
| Excluding sales charge | -5.30% | +16.18% | -4.28% | +6.12% | ||||
| Including sales charge | -10.72% | +13.90% | -5.41% | +5.39% | ||||
| Class B (Est. Aug. 1, 2003) | ||||||||
| Excluding sales charge | -5.94% | +15.45% | -4.90% | +5.43% | ||||
| Including sales charge | -9.68% | +14.76% | -5.27% | +5.43% | ||||
| Class C (Est. Aug. 1, 2003) | ||||||||
| Excluding sales charge | -5.94% | +15.43% | -4.90% | +5.44% | ||||
| Including sales charge | -6.87% | +15.43% | -4.90% | +5.44% | ||||
| Institutional Class (Est. Aug. 1, 2003) | ||||||||
| Excluding sales charge | -4.93% | +16.61% | -3.94% | +6.49% | ||||
| Including sales charge | -4.93% | +16.61% | -3.94% | +6.49% |
1Returns reflect the reinvestment of all distributions and are presented both with and without the applicable sales charges described below. Returns do not reflect the deduction of taxes the shareholder would pay on Fund distributions or redemptions of Fund shares.
Expense limitations were in effect for certain classes during some or all of the periods shown in the “Fund performance” chart. The current expenses for each class are listed on the “Fund expense ratios” table on page 23. Performance would have been lower had expense limitations not been in effect.
Class A shares are sold with a maximum front-end sales charge of up to 5.75%, and have an annual distribution and service fee of up to 0.35% of average daily net assets. Performance for Class A shares, excluding sales charges, assumes that no front-end sales charge applied.
Class B shares may be purchased only through dividend reinvestment and certain permitted exchanges as described in the prospectus. Please see the prospectus for additional information on Class B shares. Class B shares have a contingent deferred sales charge that declines from 4.00% to zero depending on the period of time the shares are held. They are also subject to an annual distribution and service fee of up to 1.00% of average daily net assets. Class B shares will automatically convert to Class A shares on a quarterly basis approximately eight years after purchase. Lifetime performance figures for Class B shares reflect conversion to Class A shares after approximately eight years.
Class C shares are sold with a contingent deferred sales charge of 1.00% if redeemed during the first 12 months. They are also subject to an annual distribution and service fee of up to 1.00% of average daily net assets.
Performance for Class B and C shares, excluding sales charges, assumes either that contingent deferred sales charges did not apply or that the investment was not redeemed.
Institutional Class shares are available without sales or asset-based distribution charges only to certain eligible institutional accounts.
The “Fund performance” table and the “Performance of a $10,000 investment” graph do not reflect the deduction of taxes the shareholder would pay on Fund distributions or redemptions of Fund shares.
2The Fund’s expense ratios, as described in the most recent prospectus, are disclosed in the following “Fund expense ratios” table. Delaware Management Company has agreed to reimburse certain expenses and/or waive certain fees in order to prevent total fund operating expenses, (excluding any 12b-1 fees and certain other expenses) from exceeding 1.40% of the Fund’s average daily net assets from July 29, 2011, through July 29, 2012. Please see the most recent prospectus and any applicable supplement(s) for additional information on these fee waivers and/or reimbursements.
22
| Fund expense ratios | Class A | Class B | Class C | Institutional Class | |||
| Total annual operating expenses | |||||||
| (without fee waivers) | 1.88% | 2.53% | 2.53% | 1.53% | |||
| Net expenses | |||||||
| (including fee waivers, if any) | 1.75% | 2.40% | 2.40% | 1.40% | |||
| Type of waiver | Contractual | Contractual | Contractual | Contractual |
International investments entail risks not ordinarily associated with U.S. investments including fluctuation in currency values, differences in accounting principles, or economic or political instability in other nations. Investing in emerging markets can be riskier than investing in established foreign markets due to increased volatility and lower trading volume.
Performance of a $10,000 Investment
Aug. 1, 2003 (Fund’s inception) through March 31, 2012
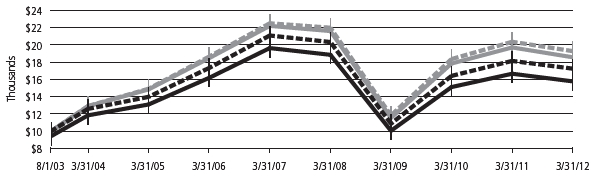
| Starting value (Aug. 1, 2003) | Ending value (March 31, 2012) | ||||
| MSCI EAFE Index (gross) | $10,000 | $19,266 | |||
| MSCI EAFE Index (net) | $10,000 | $18,557 | |||
| Optimum International Fund — Institutional Class shares | $10,000 | $17,240 | |||
| Optimum International Fund — Class A shares | $9,425 | $15,768 | |||
1The “Performance of a $10,000 investment” graph assumes $10,000 invested in Class A and Institutional Class shares of the Fund on Aug. 1, 2003, and includes the effect of a 5.75% front-end sales charge (for Class A shares) and the reinvestment of all distributions. The graph does not reflect the deduction of taxes shareholders would pay on Fund distributions or redemptions of Fund shares. Expense limitations were in effect for some or all of the periods shown. Performance would have been lower had expense limitations not been in effect. Current expenses are listed in the “Fund expense ratios” table above. Please note additional details on pages 22 through 23.
The chart also assumes $10,000 invested in the MSCI EAFE Index as of Aug. 1, 2003. The MSCI EAFE Index measures equity market performance across developed market countries in Europe, Australasia, and the Far East. Index “gross” return approximates the maximum possible dividend reinvestment. Index “net” return approximates the minimum possible dividend reinvestment, after deduction of withholding tax at the highest possible rate.
Index performance returns do not reflect any management fees, transaction costs or expenses. Indices are unmanaged and one cannot invest directly in an index. Past performance does not guarantee future results.
Performance of other Fund classes will vary due to different charges and expenses.
| Stock symbols and CUSIP numbers | ||||
| Nasdaq symbols | CUSIPs | |||
| Class A | OAIEX | 246118731 | ||
| Class B | OBIEX | 246118723 | ||
| Class C | OCIEX | 246118715 | ||
| Institutional Class | OIIEX | 246118699 |
(continues) 23
Performance summary
Optimum Large Cap Growth Fund
The performance quoted represents past performance and does not guarantee future results. Investment return and principal value of an investment will fluctuate so that shares, when redeemed, may be worth more or less than their original cost. Current performance may be lower or higher than the performance data quoted. Please obtain the performance data for the most recent month end by calling 800 914-0278 or visiting our website at www.optimummutualfunds.com.
| Fund performance1, 2 | ||||||||
| Average annual total returns | ||||||||
| Through March 31, 2012 | 1 year | 3 years | 5 years | Lifetime | ||||
| Class A (Est. Aug. 1, 2003) | ||||||||
| Excluding sales charge | +8.45% | +24.47% | +2.92% | +6.01% | ||||
| Including sales charge | +2.20% | +22.02% | +1.71% | +5.28% | ||||
| Class B (Est. Aug. 1, 2003) | ||||||||
| Excluding sales charge | +7.70% | +23.67% | +2.25% | +5.32% | ||||
| Including sales charge | +3.70% | +23.07% | +1.84% | +5.32% | ||||
| Class C (Est. Aug. 1, 2003) | ||||||||
| Excluding sales charge | +7.61% | +23.64% | +2.23% | +5.31% | ||||
| Including sales charge | +6.61% | +23.64% | +2.23% | +5.31% | ||||
| Institutional Class (Est. Aug. 1, 2003) | ||||||||
| Excluding sales charge | +8.78% | +24.91% | +3.27% | +6.37% | ||||
| Including sales charge | +8.78% | +24.91% | +3.27% | +6.37% |
1Returns reflect the reinvestment of all distributions and are presented both with and without the applicable sales charges described below. Returns do not reflect the deduction of taxes the shareholder would pay on Fund distributions or redemptions of Fund shares.
Expense limitations were in effect for certain classes during some or all of the periods shown in the “Fund performance” chart. The current expenses for each class are listed on the “Fund expense ratios” table on page 25. Performance would have been lower had expense limitations not been in effect.
Class A shares are sold with a maximum front-end sales charge of up to 5.75%, and have an annual distribution and service fee of up to 0.35% of average daily net assets. Performance for Class A shares, excluding sales charges, assumes that no front-end sales charge applied.
Class B shares may be purchased only through dividend reinvestment and certain permitted exchanges as described in the prospectus. Please see the prospectus for additional information on Class B shares. Class B shares have a contingent deferred sales charge that declines from 4.00% to zero depending on the period of time the shares are held. They are also subject to an annual distribution and service fee of up to 1.00% of average daily net assets. Class B shares will automatically convert to Class A shares on a quarterly basis approximately eight years after purchase. Lifetime performance figures for Class B shares reflect conversion to Class A shares after approximately eight years.
Class C shares are sold with a contingent deferred sales charge of 1.00% if redeemed during the first 12 months. They are also subject to an annual distribution and service fee of up to 1.00% of average daily net assets.
Performance for Class B and C shares, excluding sales charges, assumes either that contingent deferred sales charges did not apply or that the investment was not redeemed.
Institutional Class shares are available without sales or asset-based distribution charges only to certain eligible institutional accounts.
The “Fund performance” table and the “Performance of a $10,000 investment” graph do not reflect the deduction of taxes the shareholder would pay on Fund distributions or redemptions of Fund shares.
2The Fund’s expense ratios, as described in the most recent prospectus, are disclosed in the following “Fund expense ratios” table. Delaware Management Company has agreed to reimburse certain expenses and/or waive certain fees in order to prevent total fund operating expenses, (excluding any 12b-1 fees and certain other expenses) from exceeding 1.25% of the Fund’s average daily net assets from July 29, 2011, through July 29, 2012. Please see the most recent prospectus and any applicable supplement(s) for additional information on these fee waivers and/or reimbursements.
24
| Fund expense ratios | Class A | Class B | Class C | Institutional Class | |||
| Total annual operating expenses | |||||||
| (without fee waivers) | 1.64% | 2.29% | 2.29% | 1.29% | |||
| Net expenses | |||||||
| (including fee waivers, if any) | 1.60% | 2.25% | 2.25% | 1.25% | |||
| Type of waiver | Contractual | Contractual | Contractual | Contractual |
Performance of a $10,000 Investment1
Aug. 1, 2003 (Fund’s inception) through March 31, 2012
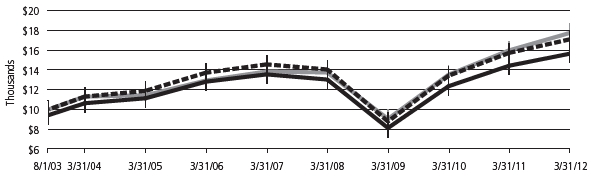
| Starting value (Aug. 1, 2003) | Ending value (March 31, 2012) | ||||
| Russell 1000 Growth Index | $10,000 | $17,731 | |||
| Optimum Large Cap Growth Fund — Institutional Class shares | $10,000 | $17,083 | |||
| Optimum Large Cap Growth Fund — Class A shares | $9,425 | $15,629 | |||
1The “Performance of a $10,000 investment” graph assumes $10,000 invested in Class A and Institutional Class shares of the Fund on Aug. 1, 2003, and includes the effect of a 5.75% front-end sales charge (for Class A shares) and the reinvestment of all distributions. The graph does not reflect the deduction of taxes shareholders would pay on Fund distributions or redemptions of Fund shares. Expense limitations were in effect for some or all of the periods shown. Performance would have been lower had expense limitations not been in effect. Current expenses are listed in the “Fund expense ratios” table above. Please note additional details on pages 24 through 25.
The chart also assumes $10,000 invested in the Russell 1000 Growth Index as of Aug. 1, 2003. The Russell 1000 Growth Index measures the performance of the large-cap growth segment of the U.S. equity universe. It includes those Russell 1000 companies with higher price-to-book ratios and higher forecasted growth values.
Index performance returns do not reflect any management fees, transaction costs or expenses. Indices are unmanaged and one cannot invest directly in an index. Past performance does not guarantee future results.
Performance of other Fund classes will vary due to different charges and expenses.
| Stock symbols and CUSIP numbers | ||||
| Nasdaq symbols | CUSIPs | |||
| Class A | OALGX | 246118707 | ||
| Class B | OBLGX | 246118806 | ||
| Class C | OCLGX | 246118889 | ||
| Institutional Class | OILGX | 246118871 |
(continues) 25
Performance summary
Optimum Large Cap Value Fund
The performance quoted represents past performance and does not guarantee future results. Investment return and principal value of an investment will fluctuate so that shares, when redeemed, may be worth more or less than their original cost. Current performance may be lower or higher than the performance data quoted. Please obtain the performance data for the most recent month end by calling 800 914-0278 or visiting our website at www.optimummutualfunds.com.
| Fund performance1, 2 | ||||||||
| Average annual total returns | ||||||||
| Through March 31, 2012 | 1 year | 3 years | 5 years | Lifetime | ||||
| Class A (Est. Aug. 1, 2003) | ||||||||
| Excluding sales charge | +7.01% | +22.29% | +0.79% | +6.45% | ||||
| Including sales charge | +0.90% | +19.90% | -0.40% | +5.72% | ||||
| Class B (Est. Aug. 1, 2003) | ||||||||
| Excluding sales charge | +6.28% | +21.47% | +0.13% | +5.76% | ||||
| Including sales charge | +2.28% | +20.85% | -0.28% | +5.76% | ||||
| Class C (Est. Aug. 1, 2003) | ||||||||
| Excluding sales charge | +6.19% | +21.44% | +0.13% | +5.75% | ||||
| Including sales charge | +5.19% | +21.44% | +0.13% | +5.75% | ||||
| Institutional Class (Est. Aug. 1, 2003) | ||||||||
| Excluding sales charge | +7.32% | +22.71% | +1.14% | +6.82% | ||||
| Including sales charge | +7.32% | +22.71% | +1.14% | +6.82% |
1Returns reflect the reinvestment of all distributions and are presented both with and without the applicable sales charges described below. Returns do not reflect the deduction of taxes the shareholder would pay on Fund distributions or redemptions of Fund shares.
Expense limitations were in effect for certain classes during some or all of the periods shown in the “Fund performance” chart. The current expenses for each class are listed on the “Fund expense ratios” table on page 27. Performance would have been lower had expense limitations not been in effect.
Class A shares are sold with a maximum front-end sales charge of up to 5.75%, and have an annual distribution and service fee of up to 0.35% of average daily net assets. Performance for Class A shares, excluding sales charges, assumes that no front-end sales charge applied.
Class B shares may be purchased only through dividend reinvestment and certain permitted exchanges as described in the prospectus. Please see the prospectus for additional information on Class B shares. Class B shares have a contingent deferred sales charge that declines from 4.00% to zero depending on the period of time the shares are held. They are also subject to an annual distribution and service fee of up to 1.00% of average daily net assets. Class B shares will automatically convert to Class A shares on a quarterly basis approximately eight years after purchase. Lifetime performance figures for Class B shares reflect conversion to Class A shares after approximately eight years.
Class C shares are sold with a contingent deferred sales charge of 1.00% if redeemed during the first 12 months. They are also subject to an annual distribution and service fee of up to 1.00% of average daily net assets.
Performance for Class B and C shares, excluding sales charges, assumes either that contingent deferred sales charges did not apply or that the investment was not redeemed.
Institutional Class shares are available without sales or asset-based distribution charges only to certain eligible institutional accounts.
The “Fund performance” table and the “Performance of a $10,000 investment” graph do not reflect the deduction of taxes the shareholder would pay on Fund distributions or redemptions of Fund shares.
2The Fund’s expense ratios, as described in the most recent prospectus, are disclosed in the following “Fund expense ratios” table. Delaware Management Company has agreed to reimburse certain expenses and/or waive certain fees in order to prevent total fund operating expenses (excluding any 12b-1 fees and certain other expenses) from exceeding 1.22% of the Fund’s average daily net assets from July 29, 2011, through July 29, 2012. Please see the most recent prospectus and any applicable supplement(s) for additional information on these fee waivers and/or reimbursements.
26
| Fund expense ratios | Class A | Class B | Class C | Institutional Class | |||
| Total annual operating expenses | |||||||
| (without fee waivers) | 1.61% | 2.26% | 2.26% | 1.26% | |||
| Net expenses | |||||||
| (including fee waivers, if any) | 1.57% | 2.22% | 2.22% | 1.22% | |||
| Type of waiver | Contractual | Contractual | Contractual | Contractual |
Performance of a $10,000 Investment1
Aug. 1, 2003 (Fund’s inception) through March 31, 2012
![]()
| Starting value (Aug. 1, 2003) | Ending value (March 31, 2012) | |||||
| Optimum Large Cap Value Fund — Institutional Class shares | $10,000 | $17,716 | ||||
| Russell 1000 Value Index | $10,000 | $17,021 | ||||
| Optimum Large Cap Value Fund — Class A shares | $9,425 | $16,200 |
1The “Performance of a $10,000 investment” graph assumes $10,000 invested in Class A and Institutional Class shares of the Fund on Aug. 1, 2003, and includes the effect of a 5.75% front-end sales charge (for Class A shares) and the reinvestment of all distributions. The graph does not reflect the deduction of taxes shareholders would pay on Fund distributions or redemptions of Fund shares. Expense limitations were in effect for some or all of the periods shown. Performance would have been lower had expense limitations not been in effect. Current expenses are listed in the “Fund expense ratios” table above. Please note additional details on pages 26 through 27.
The chart also assumes $10,000 invested in the Russell 1000 Value Index as of Aug. 1, 2003. The Russell 1000 Value Index measures the performance of the large-cap value segment of the U.S. equity universe. It includes those Russell 1000 companies with lower price-to-book ratios and lower forecasted growth values.
Index performance returns do not reflect any management fees, transaction costs or expenses. Indices are unmanaged and one cannot invest directly in an index. Past performance does not guarantee future results.
Performance of other Fund classes will vary due to different charges and expenses.
| Stock symbols and CUSIP numbers | ||||
| Nasdaq symbols | CUSIPs | |||
| Class A | OALVX | 246118863 | ||
| Class B | OBLVX | 246118855 | ||
| Class C | OCLVX | 246118848 | ||
| Institutional Class | OILVX | 246118830 |
(continues) 27
Performance summary
Optimum Small-Mid Cap Growth Fund
The performance quoted represents past performance and does not guarantee future results. Investment return and principal value of an investment will fluctuate so that shares, when redeemed, may be worth more or less than their original cost. Current performance may be lower or higher than the performance data quoted. Please obtain the performance data for the most recent month end by calling 800 914-0278 or visiting our website at www.optimummutualfunds.com.
Average annual total returns
| Through March 31, 2012 | 1 year | 3 years | 5 years | Lifetime | |||||
| Class A (Est. Aug. 1, 2003) | |||||||||
| Excluding sales charge | +0.33% | +27.30% | +0.77% | +6.74% | |||||
| Including sales charge | -5.45% | +24.83% | -0.42% | +6.01% | |||||
| Class B (Est. Aug. 1, 2003) | |||||||||
| Excluding sales charge | -0.28% | +26.45% | +0.10% | +6.05% | |||||
| Including sales charge | -3.98% | +25.88% | -0.30% | +6.05% | |||||
| Class C (Est. Aug. 1, 2003) | |||||||||
| Excluding sales charge | -0.27% | +26.46% | +0.10% | +6.05% | |||||
| Including sales charge | -1.19% | +26.46% | +0.10% | +6.05% | |||||
| Institutional Class (Est. Aug. 1, 2003) | |||||||||
| Excluding sales charge | +0.68% | +27.69% | +1.10% | +7.09% | |||||
| Including sales charge | +0.68% | +27.69% | +1.10% | +7.09% |
1Returns reflect the reinvestment of all distributions and are presented both with and without the applicable sales charges described below. Returns do not reflect the deduction of taxes the shareholder would pay on Fund distributions or redemptions of Fund shares.
Expense limitations were in effect for certain classes during some or all of the periods shown in the “Fund performance” chart. The current expenses for each class are listed on the “Fund expense ratios” table on page 29. Performance would have been lower had expense limitations not been in effect.
Class A shares are sold with a maximum front-end sales charge of up to 5.75%, and have an annual distribution and service fee of up to 0.35% of average daily net assets. Performance for Class A shares, excluding sales charges, assumes that no front-end sales charge applied.
Class B shares may be purchased only through dividend reinvestment and certain permitted exchanges as described in the prospectus. Please see the prospectus for additional information on Class B shares. Class B shares have a contingent deferred sales charge that declines from 4.00% to zero depending on the period of time the shares are held. They are also subject to an annual distribution and service fee of up to 1.00% of average daily net assets. Class B shares will automatically convert to Class A shares on a quarterly basis approximately eight years after purchase. Lifetime performance figures for Class B shares reflect conversion to Class A shares after approximately eight years.
Class C shares are sold with a contingent deferred sales charge of 1.00% if redeemed during the first 12 months. They are also subject to an annual distribution and service fee of up to 1.00% of average daily net assets.
Performance for Class B and C shares, excluding sales charges, assumes either that contingent deferred sales charges did not apply or that the investment was not redeemed.
Institutional Class shares are available without sales or asset-based distribution charges only to certain eligible institutional accounts.
The “Fund performance” table and the “Performance of a $10,000 investment” graph do not reflect the deduction of taxes the shareholder would pay on Fund distributions or redemptions of Fund shares.
2The Fund’s expense ratios, as described in the most recent prospectus, are disclosed in the following “Fund expense ratios” table. Delaware Management Company has agreed to reimburse certain expenses and/or waive certain fees in order to prevent total fund operating expenses, (excluding any 12b-1 fees and certain other expenses) from exceeding 1.55% of the Fund’s average daily net assets from July 29, 2011, through July 29, 2012. Please see the most recent prospectus and any applicable supplement(s) for additional information on these fee waivers and/or reimbursements.
28
| Fund expense ratios | Class A | Class B | Class C | Institutional Class | |||
| Total annual operating expenses | |||||||
| (without fee waivers) | 2.07% | 2.72% | 2.72% | 1.72% | |||
| Net expenses | |||||||
| (including fee waivers, if any) | 1.90% | 2.55% | 2.55% | 1.55% | |||
| Type of waiver | Contractual | Contractual | Contractual | Contractual |
Investments in small and/or medium-sized companies typically exhibit greater risk and higher volatility than larger, more established companies.
Performance of a $10,000 Investment1
Aug. 1, 2003 (Fund’s inception) through March 31, 2012
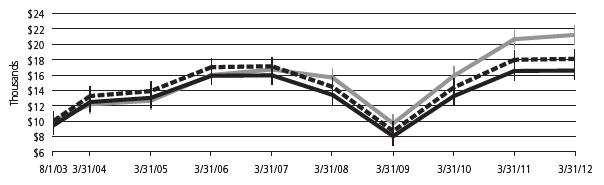
| Starting value (Aug. 1, 2003) | Ending value (March 31, 2012) | |||||
| Russell 2500 Growth Index | $10,000 | $21,230 | ||||
| Optimum Small-Mid Cap Growth Fund — Institutional Class shares | $10,000 | $18,111 | ||||
| Optimum Small-Mid Cap Growth Fund — Class A shares | $9,425 | $16,585 |
1The “Performance of a $10,000 investment” graph assumes $10,000 invested in Class A and Institutional Class shares of the Fund on Aug. 1, 2003, and includes the effect of a 5.75% front-end sales charge (for Class A shares) and the reinvestment of all distributions. The graph does not reflect the deduction of taxes shareholders would pay on Fund distributions or redemptions of Fund shares. Expense limitations were in effect for some or all of the periods shown. Performance would have been lower had expense limitations not been in effect. Current expenses are listed in the “Fund expense ratios” table above. Please note additional details on pages 28 through 29.
The chart also assumes $10,000 invested in the Russell 2500 Growth Index as of Aug. 1, 2003. The Russell 2500 Growth Index measures the performance of the small- to mid-cap growth segment of the U.S. equity universe. It includes those Russell 2500 companies with higher price-to-book ratios and higher forecasted growth values.
Index performance returns do not reflect any management fees, transaction costs or expenses. Indices are unmanaged and one cannot invest directly in an index. Past performance does not guarantee future results.
Performance of other Fund classes will vary due to different charges and expenses.
| Stock symbols and CUSIP numbers | ||||
| Nasdaq symbols | CUSIPs | |||
| Class A | OASGX | 246118822 | ||
| Class B | OBSGX | 246118814 | ||
| Class C | OCSGX | 246118798 | ||
| Institutional Class | OISGX | 246118780 |
(continues) 29
Performance summary
Optimum Small-Mid Cap Value Fund
The performance quoted represents past performance and does not guarantee future results. Investment return and principal value of an investment will fluctuate so that shares, when redeemed, may be worth more or less than their original cost. Current performance may be lower or higher than the performance data quoted. Please obtain the performance data for the most recent month end by calling 800 914-0278 or visiting our website at www.optimummutualfunds.com.
Average annual total returns
| Through March 31, 2012 | 1 year | 3 years | 5 years | Lifetime | |||||
| Class A (Est. Aug. 1, 2003) | |||||||||
| Excluding sales charge | +1.01% | +30.81% | +0.56% | +7.89% | |||||
| Including sales charge | -4.81% | +28.24% | -0.63% | +7.15% | |||||
| Class B (Est. Aug. 1, 2003) | |||||||||
| Excluding sales charge | +0.39% | +29.97% | -0.08% | +7.20% | |||||
| Including sales charge | -3.57% | +29.42% | -0.48% | +7.20% | |||||
| Class C (Est. Aug. 1, 2003) | |||||||||
| Excluding sales charge | +0.39% | +29.93% | -0.09% | +7.19% | |||||
| Including sales charge | -0.60% | +29.93% | -0.09% | +7.19% | |||||
| Institutional Class (Est. Aug. 1, 2003) | |||||||||
| Excluding sales charge | +1.37% | +31.28% | +0.93% | +8.27% | |||||
| Including sales charge | +1.37% | +31.28% | +0.93% | +8.27% |
1Returns reflect the reinvestment of all distributions and are presented both with and without the applicable sales charges described below. Returns do not reflect the deduction of taxes the shareholder would pay on Fund distributions or redemptions of Fund shares.
Expense limitations were in effect for certain classes during some or all of the periods shown in the “Fund performance” chart. The current expenses for each class are listed on the “Fund expense ratios” table on page 31. Performance would have been lower had expense limitations not been in effect.
Class A shares are sold with a maximum front-end sales charge of up to 5.75%, and have an annual distribution and service fee of up to 0.35% of average daily net assets. Performance for Class A shares, excluding sales charges, assumes that no front-end sales charge applied.
Class B shares may be purchased only through dividend reinvestment and certain permitted exchanges as described in the prospectus. Please see the prospectus for additional information on Class B shares. Class B shares have a contingent deferred sales charge that declines from 4.00% to zero depending on the period of time the shares are held. They are also subject to an annual distribution and service fee of up to 1.00% of average daily net assets. Class B shares will automatically convert to Class A shares on a quarterly basis approximately eight years after purchase. Lifetime performance figures for Class B shares reflect conversion to Class A shares after approximately eight years.
Class C shares are sold with a contingent deferred sales charge of 1.00% if redeemed during the first 12 months. They are also subject to an annual distribution and service fee of up to 1.00% of average daily net assets.
Performance for Class B and C shares, excluding sales charges, assumes either that contingent deferred sales charges did not apply or that the investment was not redeemed.
Institutional Class shares are available without sales or asset-based distribution charges only to certain eligible institutional accounts.
The “Fund performance” table and the “Performance of a $10,000 investment” graph do not reflect the deduction of taxes the shareholder would pay on Fund distributions or redemptions of Fund shares.
2The Fund’s expense ratios, as described in the most recent prospectus, are disclosed in the following “Fund expense ratios” table. Delaware Management Company has agreed to reimburse certain expenses and/or waive certain fees in order to prevent total fund operating expenses (excluding any 12b-1 fees and certain other expenses) from exceeding 1.43% of the Fund’s average daily net assets from July 29, 2011, through July 29, 2012. Please see the most recent prospectus and any applicable supplement(s) for additional information on these fee waivers and/or reimbursements.
30
| Fund expense ratios | Class A | Class B | Class C | Institutional Class | |||
| Total annual operating expenses | |||||||
| (without fee waivers) | 2.00% | 2.65% | 2.65% | 1.65% | |||
| Net expenses | |||||||
| (including fee waivers, if any) | 1.78% | 2.43% | 2.43% | 1.43% | |||
| Type of waiver | Contractual | Contractual | Contractual | Contractual |
Investments in small and/or medium-sized companies typically exhibit greater risk and higher volatility than larger, more established companies.
Performance of a $10,000 Investment1
Aug. 1, 2003 (Fund’s inception) through March 31, 2012

| Starting value (Aug. 1, 2003) | Ending value (March 31, 2012) | |||||
| Russell 2500 Value Index | $10,000 | $20,506 | ||||
| Optimum Small-Mid Cap Value Fund — Institutional Class shares | $10,000 | $19,909 | ||||
| Optimum Small-Mid Cap Value Fund — Class A shares | $9,425 | $18,201 |
1The “Performance of $10,000 investment” graph assumes $10,000 invested in Class A and Institutional Class shares of the Fund on Aug. 1, 2003, and includes the effect of a 5.75% front-end sales charge (for Class A shares) and the reinvestment of all distributions. The graph does not reflect the deduction of taxes shareholders would pay on Fund distributions or redemptions of Fund shares. Expense limitations were in effect for some or all of the periods shown. Performance would have been lower had expense limitations not been in effect. Current expenses are listed in the “Fund expense ratios” table above. Please note additional details on pages 30 through 31.
The chart also assumes $10,000 invested in the Russell 2500 Value Index as of Aug. 1, 2003. The Russell 2500 Value Index measures the performance of the small- to mid-cap value segment of the U.S. equity universe. It includes those Russell 2500 companies with lower price-to-book ratios and lower forecasted growth values.
Index performance returns do not reflect any management fees, transaction costs or expenses. Indices are unmanaged and one cannot invest directly in an index. Past performance does not guarantee future results.
Performance of other Fund classes will vary due to different charges and expenses.
| Stock symbols and CUSIP numbers | ||||
| Nasdaq symbols | CUSIPs | |||
| Class A | OASVX | 246118772 | ||
| Class B | OBSVX | 246118764 | ||
| Class C | OCSVX | 246118756 | ||
| Institutional Class | OISVX | 246118749 |
31
Disclosure of Fund expenses
For the six-month period from October 1, 2011 to March 31, 2012
As a shareholder of a Fund, you incur two types of costs: (1) transaction costs, including sales charges (loads) on purchase payments, reinvested dividends, or other distributions; redemption fees; and exchange fees; and (2) ongoing costs, including management fees; distribution and/or service (12b-1) fees; and other Fund expenses. These following examples are intended to help you understand your ongoing costs (in dollars) of investing in a Fund and to compare these costs with the ongoing costs of investing in other mutual funds.
The examples are based on an investment of $1,000 invested at the beginning of the period and held for the entire six-month period from October 1, 2011 to March 31, 2012.
Actual Expenses
The first section of the tables shown, “Actual Fund Return,” provides information about actual account values and actual expenses. You may use the information in this section of the table, together with the amount you invested, to estimate the expenses that you paid over the period. Simply divide your account value by $1,000 (for example, an $8,600 account value divided by $1,000 = 8.6), then multiply the result by the number in the first section under the heading entitled “Expenses Paid During Period” to estimate the expenses you paid on your account during this period.
Hypothetical Example for Comparison Purposes
The second section of the tables shown, “Hypothetical 5% Return,” provides information about hypothetical account values and hypothetical expenses based on the Funds’ actual expense ratios and an assumed rate of return of 5% per year before expenses, which is not the Funds’ actual return. The hypothetical account values and expenses may not be used to estimate the actual ending account balance or expenses you paid for the period. You may use this information to compare the ongoing costs of investing in a Fund and other funds. To do so, compare this 5% hypothetical example with the 5% hypothetical examples that appear in the shareholder reports of the other funds.
Please note that the expenses shown in the tables are meant to highlight your ongoing costs only and do not reflect any transactional costs, such as sales charges (loads), redemption fees, or exchange fees. Therefore, the second section of each table is useful in comparing ongoing costs only, and will not help you determine the relative total costs of owning different funds. In addition, if these transactional costs were included, your costs would have been higher. Each Fund’s expenses shown in the tables reflect fee waivers in effect. The expenses shown in each table assume reinvestment of all dividends and distributions.
| Optimum Fixed Income Fund | ||||||||||
| Expense Analysis of an Investment of $1,000 | ||||||||||
| Expenses | ||||||||||
| Beginning | Ending | Paid During | ||||||||
| Account | Account | Annualized | Period | |||||||
| Value | Value | Expense | 10/1/11 to | |||||||
| 10/1/11 | 3/31/12 | Ratio | 3/31/12* | |||||||
| Actual Fund Return | ||||||||||
| Class A | $1,000.00 | $1,029.50 | 1.35% | $ | 6.85 | |||||
| Class B | 1,000.00 | 1,026.70 | 2.00% | 10.13 | ||||||
| Class C | 1,000.00 | 1,026.70 | 2.00% | 10.13 | ||||||
| Institutional Class | 1,000.00 | 1,032.20 | 1.00% | 5.08 | ||||||
| Hypothetical 5% Return (5% return before expenses) | ||||||||||
| Class A | $1,000.00 | $1,018.25 | 1.35% | $ | 6.81 | |||||
| Class B | 1,000.00 | 1,015.00 | 2.00% | 10.08 | ||||||
| Class C | 1,000.00 | 1,015.00 | 2.00% | 10.08 | ||||||
| Institutional Class | 1,000.00 | 1,020.00 | 1.00% | 5.05 | ||||||
| Optimum International Fund | ||||||||||
| Expense Analysis of an Investment of $1,000 | ||||||||||
| Expenses | ||||||||||
| Beginning | Ending | Paid During | ||||||||
| Account | Account | Annualized | Period | |||||||
| Value | Value | Expense | 10/1/11 to | |||||||
| 10/1/11 | 3/31/12 | Ratio | 3/31/12* | |||||||
| Actual Fund Return | ||||||||||
| Class A | $1,000.00 | $1,131.80 | 1.75% | $ | 9.33 | |||||
| Class B | 1,000.00 | 1,128.60 | 2.40% | 12.77 | ||||||
| Class C | 1,000.00 | 1,128.50 | 2.40% | 12.77 | ||||||
| Institutional Class | 1,000.00 | 1,134.10 | 1.40% | 7.47 | ||||||
| Hypothetical 5% Return (5% return before expenses) | ||||||||||
| Class A | $1,000.00 | $1,016.25 | 1.75% | $ | 8.82 | |||||
| Class B | 1,000.00 | 1,013.00 | 2.40% | 12.08 | ||||||
| Class C | 1,000.00 | 1,013.00 | 2.40% | 12.08 | ||||||
| Institutional Class | 1,000.00 | 1,018.00 | 1.40% | 7.06 | ||||||
*“Expenses Paid During Period” are equal to the relevant Fund’s annualized expense ratio, multiplied by the average account value over the period, multiplied by 183/366 (to reflect the one-half year period).
32
| Optimum Large Cap Growth Fund | ||||||||||
| Expense Analysis of an Investment of $1,000 | ||||||||||
| Expenses | ||||||||||
| Beginning | Ending | Paid During | ||||||||
| Account | Account | Annualized | Period | |||||||
| Value | Value | Expense | 10/1/11 to | |||||||
| 10/1/11 | 3/31/12 | Ratio | 3/31/12* | |||||||
| Actual Fund Return | ||||||||||
| Class A | $1,000.00 | $1,285.00 | 1.60% | $ | 9.14 | |||||
| Class B | 1,000.00 | 1,280.70 | 2.25% | 12.83 | ||||||
| Class C | 1,000.00 | 1,281.00 | 2.25% | 12.83 | ||||||
| Institutional Class | 1,000.00 | 1,286.60 | 1.25% | 7.15 | ||||||
| Hypothetical 5% Return (5% return before expenses) | ||||||||||
| Class A | $1,000.00 | $1,017.00 | 1.60% | $ | 8.07 | |||||
| Class B | 1,000.00 | 1,013.75 | 2.25% | 11.33 | ||||||
| Class C | 1,000.00 | 1,013.75 | 2.25% | 11.33 | ||||||
| Institutional Class | 1,000.00 | 1,018.75 | 1.25% | 6.31 | ||||||
| Optimum Large Cap Value Fund | ||||||||||
| Expense Analysis of an Investment of $1,000 | ||||||||||
| Expenses | ||||||||||
| Beginning | Ending | Paid During | ||||||||
| Account | Account | Annualized | Period | |||||||
| Value | Value | Expense | 10/1/11 to | |||||||
| 10/1/11 | 3/31/12 | Ratio | 3/31/12* | |||||||
| Actual Fund Return | ||||||||||
| Class A | $1,000.00 | $1,255.30 | 1.57% | $ | 8.85 | |||||
| Class B | 1,000.00 | 1,251.40 | 2.22% | 12.50 | ||||||
| Class C | 1,000.00 | 1,250.30 | 2.22% | 12.49 | ||||||
| Institutional Class | 1,000.00 | 1,258.00 | 1.22% | 6.89 | ||||||
| Hypothetical 5% Return (5% return before expenses) | ||||||||||
| Class A | $1,000.00 | $1,017.15 | 1.57% | $ | 7.92 | |||||
| Class B | 1,000.00 | 1,013.90 | 2.22% | 11.18 | ||||||
| Class C | 1,000.00 | 1,013.90 | 2.22% | 11.18 | ||||||
| Institutional Class | 1,000.00 | 1,018.90 | 1.22% | 6.16 | ||||||
| Optimum Small-Mid Cap Growth Fund | ||||||||||
| Expense Analysis of an Investment of $1,000 | ||||||||||
| Expenses | ||||||||||
| Beginning | Ending | Paid During | ||||||||
| Account | Account | Annualized | Period | |||||||
| Value | Value | Expense | 10/1/11 to | |||||||
| 10/1/11 | 3/31/12 | Ratio | 3/31/12* | |||||||
| Actual Fund Return | ||||||||||
| Class A | $1,000.00 | $1,272.30 | 1.90% | $ | 10.79 | |||||
| Class B | 1,000.00 | 1,268.00 | 2.55% | 14.46 | ||||||
| Class C | 1,000.00 | 1,269.40 | 2.55% | 14.47 | ||||||
| Institutional Class | 1,000.00 | 1,274.70 | 1.55% | 8.81 | ||||||
| Hypothetical 5% Return (5% return before expenses) | ||||||||||
| Class A | $1,000.00 | $1,015.50 | 1.90% | $ | 9.57 | |||||
| Class B | 1,000.00 | 1,012.25 | 2.55% | 12.83 | ||||||
| Class C | 1,000.00 | 1,012.25 | 2.55% | 12.83 | ||||||
| Institutional Class | 1,000.00 | 1,017.25 | 1.55% | 7.82 | ||||||
| Optimum Small-Mid Cap Value Fund | ||||||||||
| Expense Analysis of an Investment of $1,000 | ||||||||||
| Expenses | ||||||||||
| Beginning | Ending | Paid During | ||||||||
| Account | Account | Annualized | Period | |||||||
| Value | Value | Expense | 10/1/11 to | |||||||
| 10/1/11 | 3/31/12 | Ratio | 3/31/12* | |||||||
| Actual Fund Return | ||||||||||
| Class A | $1,000.00 | $1,335.10 | 1.78% | $ | 10.39 | |||||
| Class B | 1,000.00 | 1,331.90 | 2.43% | 14.17 | ||||||
| Class C | 1,000.00 | 1,330.80 | 2.43% | 14.16 | ||||||
| Institutional Class | 1,000.00 | 1,337.80 | 1.43% | 8.36 | ||||||
| Hypothetical 5% Return (5% return before expenses) | ||||||||||
| Class A | $1,000.00 | $1,016.10 | 1.78% | $ | 8.97 | |||||
| Class B | 1,000.00 | 1,012.85 | 2.43% | 12.23 | ||||||
| Class C | 1,000.00 | 1,012.85 | 2.43% | 12.23 | ||||||
| Institutional Class | 1,000.00 | 1,017.85 | 1.43% | 7.21 | ||||||
*“Expenses Paid During Period” are equal to the relevant Fund’s annualized expense ratio, multiplied by the average account value over the period, multiplied by 183/366 (to reflect the one-half year period).
33
Security type/sector allocations
Optimum Fixed Income Fund
As of March 31, 2012
Sector designations may be different than the sector designations presented in other Fund materials. The sector designations may represent the investment manager or sub-adviser’s internal sector classifications, which may result in the sector designations for one fund being different than another fund’s sector designations.
| Percentage | ||
| Security type/sector | of Net Assets | |
| Agency Collateralized Mortgage Obligations | 8.73 | % |
| Agency Mortgage-Backed Securities | 6.60 | % |
| Collateralized Debt Obligation | 0.09 | % |
| Commercial Mortgage-Backed Securities | 2.70 | % |
| Convertible Bonds | 1.00 | % |
| Corporate Bonds | 38.45 | % |
| Banking | 7.37 | % |
| Basic Industry | 3.71 | % |
| Brokerage | 0.82 | % |
| Capital Goods | 1.16 | % |
| Communications | 3.80 | % |
| Consumer Cyclical | 2.02 | % |
| Consumer Non-Cyclical | 3.92 | % |
| Electric | 3.59 | % |
| Energy | 3.29 | % |
| Finance Companies | 2.40 | % |
| Insurance | 0.90 | % |
| Natural Gas | 2.13 | % |
| Real Estate | 1.50 | % |
| Technology | 1.01 | % |
| Transportation | 0.83 | % |
| Municipal Bonds | 0.68 | % |
| Non-Agency Asset-Backed Securities | 0.88 | % |
| Non-Agency Collateralized Mortgage Obligations | 4.31 | % |
| Regional Bonds | 1.71 | % |
| Securities Sold Short | (0.81 | %) |
| Senior Secured Loans | 1.84 | % |
| Sovereign Bonds | 6.97 | % |
| Supranational Banks | 0.27 | % |
| U.S. Treasury Obligations | 12.76 | % |
| Common Stock | 0.00 | % |
| Convertible Preferred Stock | 0.11 | % |
| Preferred Stock | 0.19 | % |
| Warrant | 0.00 | % |
| Short-Term Investments | 16.42 | % |
| Securities Lending Collateral | 2.57 | % |
| Total Value of Securities | 105.47 | % |
| Options Written | (0.03 | %) |
| Obligation to Return Securities Lending Collateral | (2.67 | %) |
| Other Liabilities Net of Receivables and Other Assets | (2.77 | %) |
| Total Net Assets | 100.00 | % |
34
Security type/country and sector allocations
Optimum International Fund
As of March 31, 2012
Sector designations may be different than the sector designations presented in other Fund materials. The sector designations may represent the investment manager or sub-adviser’s internal sector classifications, which may result in the sector designations for one fund being different than another fund’s sector designations.
| Percentage | ||
| Security type/country | of Net Assets | |
| Common Stock by Country | 97.14 | % |
| Argentina | 0.45 | % |
| Australia | 4.91 | % |
| Belgium | 0.37 | % |
| Bermuda | 0.26 | % |
| Brazil | 1.02 | % |
| Canada | 1.93 | % |
| China/Hong Kong | 2.48 | % |
| France | 11.02 | % |
| Germany | 6.57 | % |
| Gibraltar | 0.05 | % |
| India | 0.24 | % |
| Indonesia | 0.44 | % |
| Ireland | 1.62 | % |
| Israel | 1.87 | % |
| Italy | 2.92 | % |
| Japan | 17.57 | % |
| Luxembourg | 0.34 | % |
| Malaysia | 0.18 | % |
| Mexico | 0.53 | % |
| Netherlands | 4.15 | % |
| Norway | 0.52 | % |
| Republic of Korea | 0.92 | % |
| Singapore | 3.46 | % |
| South Africa | 0.41 | % |
| Spain | 4.06 | % |
| Sweden | 0.60 | % |
| Switzerland | 6.58 | % |
| Taiwan | 2.04 | % |
| United Kingdom | 19.53 | % |
| United States | 0.10 | % |
| Preferred Stock | 0.74 | % |
| Short-Term Investments | 1.53 | % |
| Securities Lending Collateral | 9.44 | % |
| Total Value of Securities | 108.85 | % |
| Obligation to Return Securities Lending Collateral | (9.65 | %) |
| Receivables and Other Assets Net of Other Liabilities | 0.80 | % |
| Total Net Assets | 100.00 | % |
| Percentage | ||
| Common Stock and Preferred Stock by Sector | of Net Assets | |
| Automobiles & Components | 3.19 | % |
| Banking & Finance | 10.30 | % |
| Capital Goods | 4.49 | % |
| Consumer Durables & Apparel | 2.30 | % |
| Consumer Services | 0.96 | % |
| Energy | 11.54 | % |
| Food & Staples Retailing | 11.66 | % |
| Food, Beverage & Tobacco | 3.92 | % |
| Insurance | 8.39 | % |
| Materials | 5.15 | % |
| Media | 1.19 | % |
| Pharmaceuticals & Biotechnology | 11.84 | % |
| Real Estate | 0.76 | % |
| Semiconductors | 2.93 | % |
| Technology & Equipment | 3.48 | % |
| Telecommunication Services | 10.28 | % |
| Transportation & Shipping | 0.53 | % |
| Utilities | 4.97 | % |
| Total | 97.88 | % |
(continues) 35
Security type/sector allocations and
top 10 equity holdings
Sector designations may be different than the sector designations presented in other Fund materials. The sector designations may represent the investment manager or sub-adviser’s internal sector classifications, which may result in the sector designations for one fund being different than another fund’s sector designations.
Optimum Large Cap Growth Fund
As of March 31, 2012
| Percentage | |||||
| Security type/sector | of Net Assets | ||||
| ²Common Stock | 96.39 | % | |||
| Consumer Discretionary | 22.99 | % | |||
| Consumer Staples | 4.72 | % | |||
| Energy | 7.86 | % | |||
| Financials | 5.91 | % | |||
| Healthcare | 7.90 | % | |||
| Industrials | 13.29 | % | |||
| Information Technology | 28.15 | % | |||
| Materials | 4.58 | % | |||
| Telecommunication Services | 0.99 | % | |||
| Convertible Preferred Stock | 0.05 | % | |||
| Preferred Stock | 0.14 | % | |||
| Short-Term Investments | 3.35 | % | |||
| Securities Lending Collateral | 2.38 | % | |||
| Total Value of Securities | 102.31 | % | |||
| Obligation to Return Securities Lending Collateral | (2.50 | %) | |||
| Receivables and Other Assets Net of Other Liabilities | 0.19 | % | |||
| Total Net Assets | 100.00 | % | |||
²Narrow industries are utilized for compliance purposes for diversification whereas broad sectors are used for financial reporting.
Holdings are for informational purposes only and are subject to change at any time. They are not a recommendation to buy, sell, or hold any security.
| Percentage | |||||
| Top 10 equity holdings | of Net Assets | ||||
| Apple | 7.95 | % | |||
| Google Class A | 2.50 | % | |||
| QUALCOMM | 2.50 | % | |||
| priceline.com | 1.85 | % | |||
| Amazon.com | 1.71 | % | |||
| Wells Fargo | 1.62 | % | |||
| Starbucks | 1.61 | % | |||
| Baidu ADR | 1.52 | % | |||
| NIKE Class B | 1.51 | % | |||
| TJX | 1.48 | % | |||
Optimum Large Cap Value Fund
As of March 31, 2012
| Percentage | |||||
| Security type/sector | of Net Assets | ||||
| Common Stock | 98.14 | % | |||
| Consumer Discretionary | 10.22 | % | |||
| Consumer Staples | 13.09 | % | |||
| Energy | 13.84 | % | |||
| Financials | 19.64 | % | |||
| Healthcare | 11.12 | % | |||
| Industrials | 12.51 | % | |||
| Information Technology | 11.16 | % | |||
| Materials | 4.00 | % | |||
| Telecommunication Services | 1.83 | % | |||
| Utilities | 0.73 | % | |||
| Convertible Preferred Stock | 0.07 | % | |||
| Short-Term Investments | 1.71 | % | |||
| Securities Lending Collateral | 0.87 | % | |||
| Total Value of Securities | 100.79 | % | |||
| Obligation to Return Securities Lending Collateral | (1.00 | %) | |||
| Receivables and Other Assets Net of Other Liabilities | 0.21 | % | |||
| Total Net Assets | 100.00 | % | |||
Holdings are for informational purposes only and are subject to change at any time. They are not a recommendation to buy, sell, or hold any security.
| Percentage | |||||
| Top 10 equity holdings | of Net Assets | ||||
| Philip Morris International | 3.28 | % | |||
| Lockheed Martin | 2.80 | % | |||
| Exxon Mobil | 2.61 | % | |||
| International Business Machines | 2.25 | % | |||
| Chevron | 2.06 | % | |||
| Copa Holdings Class A | 1.89 | % | |||
| TJX | 1.88 | % | |||
| Apple | 1.77 | % | |||
| Coach | 1.73 | % | |||
| Herbalife | 1.67 | % | |||
36
Sector designations may be different than the sector designations presented in other Fund materials. The sector designations may represent the investment manager or sub-adviser’s internal sector classifications, which may result in the sector designations for one fund being different than another fund’s sector designations.
Optimum Small-Mid Cap Growth Fund
As of March 31, 2012
| Percentage | |||||
| Security type/sector | of Net Assets | ||||
| Common Stock | 97.77 | % | |||
| Consumer Discretionary | 20.06 | % | |||
| Consumer Staples | 0.89 | % | |||
| Energy | 7.41 | % | |||
| Financials | 9.75 | % | |||
| Healthcare | 14.36 | % | |||
| Industrials | 18.09 | % | |||
| Information Technology | 23.07 | % | |||
| Materials | 1.25 | % | |||
| Telecommunication Services | 2.89 | % | |||
| Exchange-Traded Fund | 1.44 | % | |||
| Short-Term Investments | 1.56 | % | |||
| Securities Lending Collateral | 11.00 | % | |||
| Total Value of Securities | 111.77 | % | |||
| Obligation to Return Securities Lending Collateral | (11.14 | %) | |||
| Other Liabilities Net of Receivables and Other Assets | (0.63 | %) | |||
| Total Net Assets | 100.00 | % | |||
Holdings are for informational purposes only and are subject to change at any time. They are not a recommendation to buy, sell, or hold any security.
| Percentage | |||||
| Top 10 equity holdings | of Net Assets | ||||
| iShares Russell 2000 Growth Index Fund | 1.44 | % | |||
| Mettler-Toledo International | 1.35 | % | |||
| Atwood Oceanics | 1.28 | % | |||
| Nordson | 1.19 | % | |||
| Cadence Design Systems | 1.11 | % | |||
| Concur Technologies | 1.08 | % | |||
| AMETEK | 1.08 | % | |||
| Gaylord Entertainment | 1.06 | % | |||
| Rosetta Resources | 1.03 | % | |||
| Donaldson | 1.00 | % | |||
Optimum Small-Mid Cap Value Fund
As of March 31, 2012
| Percentage | |||||
| Security type/sector | of Net Assets | ||||
| ◊Common Stock | 91.55 | % | |||
| Consumer Discretionary | 11.10 | % | |||
| Consumer Staples | 2.87 | % | |||
| Energy | 5.32 | % | |||
| Financials | 11.50 | % | |||
| Healthcare | 2.94 | % | |||
| Industrials | 27.96 | % | |||
| Information Technology | 16.42 | % | |||
| Materials | 11.61 | % | |||
| Utilities | 1.83 | % | |||
| Short-Term Investments | 9.05 | % | |||
| Securities Lending Collateral | 4.41 | % | |||
| Total Value of Securities | 105.01 | % | |||
| Obligation to Return Securities Lending Collateral | (4.48 | %) | |||
| Other Liabilities Net of Receivables and Other Assets | (0.53 | %) | |||
| Total Net Assets | 100.00 | % | |||
◊Narrow industries are utilized for compliance purposes for diversification whereas broad sectors are used for financial reporting.
Holdings are for informational purposes only and are subject to change at any time. They are not a recommendation to buy, sell, or hold any security.
| Percentage | |||||
| Top 10 equity holdings | of Net Assets | ||||
| Hubbell Class B | 1.48 | % | |||
| Plexus | 1.43 | % | |||
| Eastman Chemical | 1.32 | % | |||
| Timken | 1.30 | % | |||
| Kennametal | 1.18 | % | |||
| Harsco | 1.11 | % | |||
| VASCO Data Security International | 1.09 | % | |||
| Vaalco Energy | 1.08 | % | |||
| Fair Isaac | 1.08 | % | |||
| Flextronics International | 1.07 | % | |||
37
Statements of net assets
Optimum Fixed Income Fund
March 31, 2012
| Principal | Value | |||||||
| Amount° | (U.S. $) | |||||||
| Agency Collateralized Mortgage Obligations – 8.73% | ||||||||
| Fannie Mae Grantor Trust | ||||||||
| •Series 1999-T2 A1 | ||||||||
| 7.50% 1/19/39 | USD | 20,663 | $ | 23,433 | ||||
| Series 2001-T8 A2 | ||||||||
| 9.50% 7/25/41 | 10,259 | 12,350 | ||||||
| Series 2002-T4 A3 | ||||||||
| 7.50% 12/25/41 | 75,182 | 86,557 | ||||||
| Series 2004-T1 1A2 | ||||||||
| 6.50% 1/25/44 | 21,717 | 24,398 | ||||||
| Fannie Mae REMICs | ||||||||
| Series 1996-46 ZA | ||||||||
| 7.50% 11/25/26 | 17,427 | 19,694 | ||||||
| Series 1999-19 PH | ||||||||
| 6.00% 5/25/29 | 392,178 | 436,395 | ||||||
| Series 2001-14 Z | ||||||||
| 6.00% 5/25/31 | 28,714 | 32,347 | ||||||
| Series 2002-90 A1 | ||||||||
| 6.50% 6/25/42 | 15,526 | 17,966 | ||||||
| Series 2002-90 A2 | ||||||||
| 6.50% 11/25/42 | 56,533 | 65,437 | ||||||
| Series 2003-26 AT | ||||||||
| 5.00% 11/25/32 | 917,693 | 975,202 | ||||||
| Series 2003-122 AJ | ||||||||
| 4.50% 2/25/28 | 38,006 | 38,904 | ||||||
| Series 2005-22 HE | ||||||||
| 5.00% 10/25/33 | 740,000 | 789,461 | ||||||
| Series 2005-29 QD | ||||||||
| 5.00% 8/25/33 | 816,000 | 870,144 | ||||||
| Series 2005-54 AK | ||||||||
| 4.50% 9/25/32 | 146,120 | 149,290 | ||||||
| Series 2005-94 YD | ||||||||
| 4.50% 8/25/33 | 1,480,000 | 1,556,357 | ||||||
| Series 2005-110 MB | ||||||||
| 5.50% 9/25/35 | 369,670 | 406,742 | ||||||
| @^•Series 2007-30 OE | ||||||||
| 2.58% 4/25/37 | 8,369,767 | 7,675,152 | ||||||
| Series 2008-24 ZA | ||||||||
| 5.00% 4/25/38 | 18,313,430 | 20,998,518 | ||||||
| @•ûSeries 2009-2 AS | ||||||||
| 5.458% 2/25/39 | 12,920,797 | 1,420,853 | ||||||
| @•ûSeries 2009-68 SA | ||||||||
| 6.51% 9/25/39 | 1,715,958 | 255,493 | ||||||
| Series 2009-94 AC | ||||||||
| 5.00% 11/25/39 | 400,000 | 448,875 | ||||||
| Series 2010-41 PN | ||||||||
| 4.50% 4/25/40 | 475,000 | 512,366 | ||||||
| Series 2010-96 DC | ||||||||
| 4.00% 9/25/25 | 900,000 | 967,435 | ||||||
| •Series 2010-123 FE | ||||||||
| 0.722% 11/25/40 | 9,572,963 | 9,556,759 | ||||||
| Fannie Mae Whole Loan | ||||||||
| Series 2004-W4 A5 | ||||||||
| 5.50% 6/25/34 | 3,000,000 | 3,358,594 | ||||||
| Series 2004-W9 2A1 | ||||||||
| 6.50% 2/25/44 | 33,770 | 38,322 | ||||||
| Series 2004-W11 1A2 | ||||||||
| 6.50% 5/25/44 | 102,566 | 116,275 | ||||||
| Series 2004-W15 1A1 | ||||||||
| 6.00% 8/25/44 | 157,283 | 175,641 | ||||||
| Freddie Mac REMICs | ||||||||
| Series 1730 Z | ||||||||
| 7.00% 5/15/24 | 104,544 | 121,678 | ||||||
| Series 2165 PE | ||||||||
| 6.00% 6/15/29 | 408,801 | 460,779 | ||||||
| Series 2326 ZQ | ||||||||
| 6.50% 6/15/31 | 187,525 | 214,483 | ||||||
| Series 2557 WE | ||||||||
| 5.00% 1/15/18 | 732,415 | 792,901 | ||||||
| Series 2662 MA | ||||||||
| 4.50% 10/15/31 | 4,221 | 4,225 | ||||||
| Series 2755 LE | ||||||||
| 4.00% 9/15/30 | 557,000 | 563,604 | ||||||
| Series 2762 LG | ||||||||
| 5.00% 9/15/32 | 2,000,000 | 2,104,592 | ||||||
| Series 2802 NE | ||||||||
| 5.00% 2/15/33 | 700,000 | 737,940 | ||||||
| Series 2827 TE | ||||||||
| 5.00% 4/15/33 | 1,335,000 | 1,419,961 | ||||||
| Series 2840 OE | ||||||||
| 5.00% 2/15/33 | 1,800,000 | 1,897,118 | ||||||
| Series 2864 PE | ||||||||
| 5.00% 6/15/33 | 1,070,620 | 1,127,450 | ||||||
| Series 2869 BG | ||||||||
| 5.00% 7/15/33 | 196,494 | 207,043 | ||||||
| Series 2881 TE | ||||||||
| 5.00% 7/15/33 | 1,080,000 | 1,138,723 | ||||||
| Series 2889 OG | ||||||||
| 5.00% 5/15/33 | 117,000 | 123,129 | ||||||
| Series 2890 PC | ||||||||
| 5.00% 7/15/30 | 126,251 | 127,584 | ||||||
| Series 2890 PD | ||||||||
| 5.00% 3/15/33 | 1,265,000 | 1,337,961 | ||||||
| Series 2893 PD | ||||||||
| 5.00% 2/15/33 | 65,000 | 68,903 | ||||||
| Series 2915 KD | ||||||||
| 5.00% 9/15/33 | 447,000 | 474,274 | ||||||
| Series 2938 ND | ||||||||
| 5.00% 10/15/33 | 1,050,000 | 1,109,665 | ||||||
| Series 2939 PD | ||||||||
| 5.00% 7/15/33 | 665,000 | 702,815 | ||||||
| Series 2941 XD | ||||||||
| 5.00% 5/15/33 | 2,690,000 | 2,835,274 | ||||||
| Series 2987 KG | ||||||||
| 5.00% 12/15/34 | 1,430,000 | 1,526,908 | ||||||
| Series 3022 MB | ||||||||
| 5.00% 12/15/28 | 20,753 | 20,773 | ||||||
| Series 3131 MC | ||||||||
| 5.50% 4/15/33 | 445,000 | 473,269 | ||||||
| Series 3143 BC | ||||||||
| 5.50% 2/15/36 | 8,000,000 | 9,059,784 | ||||||
38
| Principal | Value | |||||||
| Amount° | (U.S. $) | |||||||
| Agency Collateralized Mortgage Obligations (continued) | ||||||||
| Freddie Mac REMICs (continued) | ||||||||
| Series 3145 LN | ||||||||
| 4.50% 10/15/34 | USD | 657,401 | $ | 692,574 | ||||
| @•ûSeries 3289 SA | ||||||||
| 6.51% 3/15/37 | 4,785,351 | 751,370 | ||||||
| Series 3337 PB | ||||||||
| 5.50% 7/15/30 | 36,952 | 36,945 | ||||||
| Series 3476 Z | ||||||||
| 5.50% 7/15/38 | 12,228,766 | 13,806,541 | ||||||
| Series 3626 MA | ||||||||
| 5.00% 2/15/30 | 2,561,662 | 2,673,122 | ||||||
| Series 3656 PM | ||||||||
| 5.00% 4/15/40 | 770,000 | 865,347 | ||||||
| w | Freddie Mac Structured Pass | |||||||
| Through Securities | ||||||||
| Series T-54 2A | ||||||||
| 6.50% 2/25/43 | 26,765 | 29,997 | ||||||
| Series T-58 2A | ||||||||
| 6.50% 9/25/43 | 14,425 | 16,591 | ||||||
| GNMA | ||||||||
| @•ûSeries 2007-64 AI | ||||||||
| 6.31% 10/20/37 | 16,269,172 | 2,560,193 | ||||||
| @•ûSeries 2008-65 SB | ||||||||
| 5.758% 8/20/38 | 5,682,875 | 874,208 | ||||||
| @•Series 2009-2 SE | ||||||||
| 5.578% 1/20/39 | 15,013,775 | 2,234,784 | ||||||
| Series 2010-113 KE | ||||||||
| 4.50% 9/20/40 | 1,170,000 | 1,286,336 | ||||||
| NCUA Guaranteed Notes | ||||||||
| Series 2010-C1 A2 | ||||||||
| 2.90% 10/29/20 | 390,000 | 409,211 | ||||||
| Total Agency Collateralized | ||||||||
| Mortgage Obligations | ||||||||
| (cost $93,653,090) | 105,917,015 | |||||||
| Agency Mortgage-Backed Securities – 6.60% | ||||||||
| Fannie Mae | ||||||||
| 5.50% 1/1/13 | 14,801 | 15,035 | ||||||
| 5.50% 3/1/37 | 213,552 | 229,978 | ||||||
| 5.50% 7/1/37 | 911,492 | 981,742 | ||||||
| 6.50% 8/1/17 | 36,711 | 40,459 | ||||||
| • | Fannie Mae ARM | |||||||
| 2.277% 10/1/33 | 32,562 | 34,278 | ||||||
| 5.061% 8/1/35 | 47,669 | 50,999 | ||||||
| 5.131% 11/1/35 | 215,855 | 229,883 | ||||||
| 5.724% 7/1/37 | 272,630 | 291,998 | ||||||
| 5.939% 8/1/37 | 293,927 | 318,486 | ||||||
| Fannie Mae Relocation 30 yr | ||||||||
| 5.00% 11/1/33 | 10,211 | 10,933 | ||||||
| 5.00% 1/1/34 | 33,293 | 35,646 | ||||||
| 5.00% 2/1/34 | 25,781 | 27,604 | ||||||
| 5.00% 8/1/34 | 14,727 | 15,768 | ||||||
| 5.00% 11/1/34 | 72,243 | 77,351 | ||||||
| 5.00% 4/1/35 | 78,464 | 84,012 | ||||||
| 5.00% 10/1/35 | 63,215 | 67,685 | ||||||
| 5.00% 1/1/36 | 174,762 | 187,120 | ||||||
| Fannie Mae S.F. 15 yr | ||||||||
| 4.00% 11/1/25 | 2,358,794 | 2,527,919 | ||||||
| 4.50% 8/1/18 | 311,369 | 334,813 | ||||||
| 4.50% 7/1/20 | 760,648 | 817,445 | ||||||
| 5.00% 5/1/21 | 88,061 | 95,600 | ||||||
| Fannie Mae S.F. 15 yr TBA | ||||||||
| 3.00% 4/1/27 | 3,570,000 | 3,695,508 | ||||||
| 3.00% 5/1/27 | 1,140,000 | 1,177,050 | ||||||
| 3.50% 4/1/27 | 7,131,000 | 7,478,637 | ||||||
| Fannie Mae S.F. 20 yr | ||||||||
| 5.50% 7/1/24 | 355,001 | 390,349 | ||||||
| 5.50% 10/1/24 | 106,022 | 116,578 | ||||||
| 5.50% 12/1/24 | 352,031 | 387,084 | ||||||
| 5.50% 8/1/28 | 1,529,817 | 1,669,235 | ||||||
| Fannie Mae S.F. 30 yr | ||||||||
| 4.00% 10/1/40 | 100,478 | 105,417 | ||||||
| 5.00% 12/1/36 | 229,622 | 248,299 | ||||||
| 5.00% 12/1/37 | 155,914 | 168,547 | ||||||
| 5.00% 2/1/38 | 129,790 | 140,306 | ||||||
| 5.50% 12/1/32 | 136,312 | 149,800 | ||||||
| 5.50% 7/1/33 | 525,262 | 577,234 | ||||||
| 5.50% 12/1/33 | 98,164 | 108,644 | ||||||
| 5.50% 4/1/34 | 1,273,941 | 1,399,407 | ||||||
| 5.50% 5/1/34 | 393,866 | 432,838 | ||||||
| 5.50% 6/1/34 | 510,698 | 560,352 | ||||||
| 5.50% 7/1/34 | 816,924 | 896,352 | ||||||
| 5.50% 2/1/35 | 2,496,044 | 2,753,065 | ||||||
| 5.50% 9/1/36 | 930,083 | 1,020,513 | ||||||
| 6.00% 9/1/36 | 203,966 | 226,397 | ||||||
| 6.00% 7/1/38 | 1,140,771 | 1,258,028 | ||||||
| 6.00% 8/1/38 | 716,068 | 789,670 | ||||||
| 6.00% 12/1/38 | 91,643 | 101,063 | ||||||
| 6.00% 2/1/41 | 1,299,055 | 1,439,483 | ||||||
| 6.50% 11/1/33 | 16,578 | 18,882 | ||||||
| 6.50% 2/1/36 | 379,720 | 428,406 | ||||||
| 6.50% 3/1/36 | 589,935 | 665,466 | ||||||
| 6.50% 6/1/36 | 703,598 | 793,765 | ||||||
| 6.50% 2/1/38 | 182,895 | 206,311 | ||||||
| 6.50% 11/1/38 | 86,085 | 96,703 | ||||||
| 7.50% 3/1/32 | 1,121 | 1,342 | ||||||
| 7.50% 4/1/32 | 4,674 | 5,607 | ||||||
| 7.50% 6/1/32 | 2,049 | 2,458 | ||||||
| Fannie Mae S.F. 30 yr TBA | ||||||||
| 3.50% 4/1/42 | 7,450,000 | 7,650,220 | ||||||
| 3.50% 5/1/42 | 5,340,000 | 5,467,661 | ||||||
| 4.00% 4/1/42 | 500,000 | 524,219 | ||||||
| 4.00% 5/1/42 | 4,940,000 | 5,168,475 | ||||||
| 5.50% 5/1/42 | 2,430,000 | 2,643,384 | ||||||
| 6.00% 4/1/42 | 2,245,000 | 2,473,359 | ||||||
| 6.00% 5/1/42 | 3,718,000 | 4,090,381 | ||||||
| 6.00% 6/1/42 | 3,000,000 | 3,296,250 | ||||||
(continues) 39
Statements of net assets
Optimum Fixed Income Fund
| Principal | Value | |||||||
| Amount° | (U.S. $) | |||||||
| Agency Mortgage-Backed Securities (continued) | ||||||||
| • | Freddie Mac ARM | |||||||
| 2.342% 12/1/33 | USD | 92,918 | $ | 97,889 | ||||
| 2.495% 7/1/36 | 126,990 | 135,605 | ||||||
| 2.56% 4/1/34 | 5,903 | 6,297 | ||||||
| 5.481% 2/1/38 | 719,896 | 779,252 | ||||||
| 5.675% 5/1/37 | 478,870 | 502,524 | ||||||
| Freddie Mac Relocation 30 yr | ||||||||
| 5.00% 9/1/33 | 1,340 | 1,433 | ||||||
| Freddie Mac S.F. 15 yr | ||||||||
| 4.50% 5/1/20 | 405,486 | 435,003 | ||||||
| 5.00% 6/1/18 | 140,330 | 150,457 | ||||||
| Freddie Mac S.F. 20 yr | ||||||||
| 5.50% 10/1/23 | 271,796 | 298,464 | ||||||
| 5.50% 8/1/24 | 61,826 | 67,970 | ||||||
| Freddie Mac S.F. 30 yr | ||||||||
| 5.00% 7/1/38 | 267,160 | 287,961 | ||||||
| 5.50% 3/1/42 | 5,705,000 | 6,216,666 | ||||||
| 6.00% 8/1/38 | 981,057 | 1,090,240 | ||||||
| 6.00% 10/1/38 | 1,375,013 | 1,528,039 | ||||||
| 6.50% 11/1/33 | 49,842 | 56,779 | ||||||
| 6.50% 1/1/35 | 242,543 | 276,228 | ||||||
| 6.50% 8/1/38 | 142,049 | 159,113 | ||||||
| 7.00% 1/1/38 | 170,082 | 194,478 | ||||||
| GNMA I S.F. 30 yr | ||||||||
| 7.00% 12/15/34 | 421,930 | 487,692 | ||||||
| GNMA II | ||||||||
| 6.00% 4/20/34 | 22,645 | 25,635 | ||||||
| Total Agency Mortgage- | ||||||||
| Backed Securities | ||||||||
| (cost $78,042,913) | 80,095,224 | |||||||
| Collateralized Debt Obligation – 0.09% | ||||||||
| @•# | Landmark CDO | |||||||
| Series 2005-1A A1L 144A | ||||||||
| 0.788% 6/1/17 | 1,126,181 | 1,093,882 | ||||||
| Total Collateralized | ||||||||
| Debt Obligation | ||||||||
| (cost $1,087,058) | 1,093,882 | |||||||
| Commercial Mortgage-Backed Securities – 2.70% | ||||||||
| # | American Tower Trust | |||||||
| Series 2007-1A AFX 144A | ||||||||
| 5.42% 4/15/37 | 420,000 | 447,130 | ||||||
| BAML Commercial Mortgage | ||||||||
| •Series 2005-1 A5 | ||||||||
| 5.337% 11/10/42 | 1,620,000 | 1,781,645 | ||||||
| •Series 2005-6 A4 | ||||||||
| 5.366% 9/10/47 | 1,615,000 | 1,803,427 | ||||||
| Series 2006-4 A4 | ||||||||
| 5.634% 7/10/46 | 1,070,000 | 1,207,476 | ||||||
| •# | Bank of America Large Loan | |||||||
| Series 2009-UB2 A4AA | ||||||||
| 144A 5.673% 2/24/51 | 2,200,000 | 2,436,937 | ||||||
| • | Bear Stearns Commercial Mortgage Securities | |||||||
| Series 2005-PW10 A4 | ||||||||
| 5.405% 12/11/40 | 540,000 | 603,181 | ||||||
| Series 2005-T20 A4A | ||||||||
| 5.145% 10/12/42 | 990,000 | 1,101,570 | ||||||
| Series 2006-PW12 A4 | ||||||||
| 5.719% 9/11/38 | 895,000 | 1,015,945 | ||||||
| # | CFCRE Commercial Mortgage | |||||||
| Trust Series 2011-C1 A2 | ||||||||
| 144A 3.759% 4/15/44 | 120,000 | 126,219 | ||||||
| • | Citigroup/Deutsche Bank | |||||||
| Commercial Mortgage | ||||||||
| Trust Series 2005-CD1 | ||||||||
| A4 5.225% 7/15/44 | 400,000 | 429,538 | ||||||
| w | Commercial Mortgage Pass | |||||||
| Through Certificates | ||||||||
| •Series 2005-C6 A5A | ||||||||
| 5.116% 6/10/44 | 550,000 | 606,095 | ||||||
| Series 2006-C7 A2 | ||||||||
| 5.69% 6/10/46 | 20,483 | 20,478 | ||||||
| #Series 2010-C1 A1 144A | ||||||||
| 3.156% 12/18/49 | 505,078 | 525,738 | ||||||
| • | Credit Suisse Mortgage | |||||||
| Capital Certificates | ||||||||
| Series 2006-C1 AAB | ||||||||
| 5.419% 2/15/39 | 106,809 | 112,784 | ||||||
| #Series 2010-UD1 A 144A | ||||||||
| 5.786% 6/18/17 | 2,200,000 | 2,435,961 | ||||||
| # | DB-UBS Mortgage Trust 144A | |||||||
| •Series 2011-LC1A A3 | ||||||||
| 5.002% 11/10/46 | 1,070,000 | 1,204,049 | ||||||
| Series 2011-LC1A C | ||||||||
| 5.557% 1/1/21 | 120,000 | 124,912 | ||||||
| Goldman Sachs Mortgage | ||||||||
| Securities II | ||||||||
| •*Series 2004-GG2 A6 | ||||||||
| 5.396% 8/10/38 | 570,000 | 614,964 | ||||||
| Series 2005-GG4 A4 | ||||||||
| 4.761% 7/10/39 | 822,500 | 876,992 | ||||||
| Series 2005-GG4 A4A | ||||||||
| 4.751% 7/10/39 | 1,215,000 | 1,317,619 | ||||||
| •Series 2006-GG6 A4 | ||||||||
| 5.553% 4/10/38 | 595,000 | 659,318 | ||||||
| #Series 2007-GG10 J 144A | ||||||||
| 5.993% 8/10/45 | 1,956,000 | 978 | ||||||
| #Series 2010-C1 A2 144A | ||||||||
| 4.592% 9/1/40 | 915,000 | 1,007,475 | ||||||
| •#Series 2010-C1 C 144A | ||||||||
| 5.635% 8/10/43 | 375,000 | 396,356 | ||||||
| •#Series 2011-GC3 B 144A | ||||||||
| 5.361% 3/10/44 | 500,000 | 537,020 | ||||||
| • | Greenwich Capital | |||||||
| Commercial Funding | ||||||||
| Series 2005-GG5 A5 | ||||||||
| 5.224% 4/10/37 | 1,155,000 | 1,258,579 | ||||||
40
| Principal | Value | |||||||
| Amount° | (U.S. $) | |||||||
| Commercial Mortgage-Backed Securities (continued) | ||||||||
| • | Greenwich Capital Commercial Funding (continued) | |||||||
| Series 2006-GG7 A4 | ||||||||
| 5.883% 7/10/38 | USD | 1,140,000 | $ | 1,291,359 | ||||
| JPMorgan Chase Commercial | ||||||||
| Mortgage Securities | ||||||||
| •Series 2005-LDP3 A4A | ||||||||
| 4.936% 8/15/42 | 450,000 | 494,091 | ||||||
| •Series 2005-LDP5 A4 | ||||||||
| 5.205% 12/15/44 | 2,063,000 | 2,301,087 | ||||||
| Series 2007-LDPX A3 | ||||||||
| 5.42% 1/15/49 | 1,140,000 | 1,263,337 | ||||||
| LB-UBS Commercial Mortgage | ||||||||
| Trust Series 2004-C1 A4 | ||||||||
| 4.568% 1/15/31 | 360,000 | 378,581 | ||||||
| Morgan Stanley Capital I | ||||||||
| Series 2005-HQ6 A4A | ||||||||
| 4.989% 8/13/42 | 240,000 | 263,526 | ||||||
| •Series 2007-T27 A4 | ||||||||
| 5.64% 6/11/42 | 1,740,000 | 2,000,330 | ||||||
| •# | Morgan Stanley Dean Witter | |||||||
| Capital I Series 2001- | ||||||||
| TOP1 E 144A | ||||||||
| 7.390% 2/15/33 | 100,000 | 98,240 | ||||||
| # | OBP Depositor Trust Series | |||||||
| 2010-OBP A 144A | ||||||||
| 4.646% 7/15/45 | 585,000 | 654,047 | ||||||
| # | Timberstar Trust Series | |||||||
| 2006-1A A 144A | ||||||||
| 5.668% 10/15/36 | 515,000 | 576,993 | ||||||
| # | WF-RBS Commercial | |||||||
| Mortgage Trust Series | ||||||||
| 2011-C3 A4 144A | ||||||||
| 4.375% 3/15/44 | 730,000 | 782,386 | ||||||
| Total Commercial Mortgage- | ||||||||
| Backed Securities | ||||||||
| (cost $31,854,480) | 32,756,363 | |||||||
| Convertible Bonds – 1.00% | ||||||||
| AAR 1.75% | ||||||||
| exercise price $29.04, | ||||||||
| expiration date 1/1/26 | 275,000 | 272,938 | ||||||
| Advanced Micro | ||||||||
| Devices 6.00% | ||||||||
| exercise price $28.08, | ||||||||
| expiration date 4/30/15 | 348,000 | 363,660 | ||||||
| # | Alaska Communications | |||||||
| Systems Group | ||||||||
| 144A 6.25% | ||||||||
| exercise price $10.28, | ||||||||
| expiration date 4/27/18 | 288,000 | 223,200 | ||||||
| * | Alcatel-Lucent USA 2.875% | |||||||
| exercise price $15.35, | ||||||||
| expiration date 6/15/25 | 415,000 | 409,813 | ||||||
| Alere 3.00% | ||||||||
| exercise price $43.98, | ||||||||
| expiration date 5/15/16 | 233,000 | 235,039 | ||||||
| # | Ares Capital 144A 5.75% | |||||||
| exercise price $19.13, | ||||||||
| expiration date 2/1/16 | 205,000 | 214,994 | ||||||
| ϕ | ArvinMeritor 4.00% | |||||||
| exercise price $26.73, | ||||||||
| expiration date 2/15/27 | 412,000 | 345,565 | ||||||
| # | BGC Partners 144A 4.50% | |||||||
| exercise price $9.84, | ||||||||
| expiration date 7/13/16 | 147,000 | 148,286 | ||||||
| Chesapeake Energy 2.25% | ||||||||
| exercise price $85.81, | ||||||||
| expiration date 12/15/38 | 264,000 | 214,830 | ||||||
| *# | Clearwire Communications | |||||||
| 144A 8.25% | ||||||||
| exercise price $7.08, | ||||||||
| expiration date 11/30/40 | 258,000 | 202,208 | ||||||
| # | Corporate Office Properties | |||||||
| 144A 4.25% | ||||||||
| exercise price $48.00, | ||||||||
| expiration date 4/12/30 | 146,000 | 142,898 | ||||||
| Dendreon 2.875% | ||||||||
| exercise price $51.24, | ||||||||
| expiration date 1/13/16 | 129,000 | 103,845 | ||||||
| Equinix 4.75% | ||||||||
| exercise price $84.32, | ||||||||
| expiration date 6/15/16 | 146,000 | 292,730 | ||||||
| Euronet Worldwide 3.50% | ||||||||
| exercise price $40.48, | ||||||||
| expiration date 10/15/25 | 219,000 | 220,916 | ||||||
| *# | Gaylord Entertainment | |||||||
| 144A 3.75% | ||||||||
| exercise price $27.25, | ||||||||
| expiration date 9/29/14 | 269,000 | 346,338 | ||||||
| ϕ | General Cable 4.50% | |||||||
| exercise price $36.75, | ||||||||
| expiration date 11/15/29 | 179,000 | 189,516 | ||||||
| Health Care REIT 3.00% | ||||||||
| exercise price $51.08, | ||||||||
| expiration date 11/30/29 | 343,000 | 393,593 | ||||||
| Helix Energy Solutions | ||||||||
| Group 3.25% | ||||||||
| exercise price $25.01, | ||||||||
| expiration date 3/12/32 | 298,000 | 315,880 | ||||||
| ϕ | Hologic 2.00% | |||||||
| exercise price $31.17, | ||||||||
| expiration date 2/27/42 | 60,000 | 59,925 | ||||||
| # | Illumina 144A 3.00% | |||||||
| exercise price $83.55, | ||||||||
| expiration date 3/11/16 | 110,000 | 106,013 | ||||||
| Intel 2.95% | ||||||||
| exercise price $29.96, | ||||||||
| expiration date 12/15/35 | 300,000 | 346,500 | ||||||
(continues) 41
Statements of net assets
Optimum Fixed Income Fund
| Principal | Value | |||||||
| Amount° | (U.S. $) | |||||||
| Convertible Bonds (continued) | ||||||||
| James River Coal 4.50% | ||||||||
| exercise price $25.78, | ||||||||
| expiration date 12/1/15 | USD | 145,000 | $ | 81,925 | ||||
| Jefferies Group 3.875% | ||||||||
| exercise price $37.94, | ||||||||
| expiration date 11/1/29 | 367,000 | 350,485 | ||||||
| L-3 Communications | ||||||||
| Holdings 3.00% | ||||||||
| exercise price $96.48, | ||||||||
| expiration date 8/1/35 | 431,000 | 421,840 | ||||||
| * | Leap Wireless | |||||||
| International 4.50% | ||||||||
| exercise price $93.21, | ||||||||
| expiration date 7/15/14 | 404,000 | 387,335 | ||||||
| # | Lexington Realty Trust | |||||||
| 144A 6.00% | ||||||||
| exercise price $7.01, | ||||||||
| expiration date 1/11/30 | 198,000 | 273,488 | ||||||
| Linear Technology 3.00% | ||||||||
| exercise price $43.39, | ||||||||
| expiration date 5/1/27 | 508,000 | 542,924 | ||||||
| Live Nation | ||||||||
| Entertainment 2.875% | ||||||||
| exercise price $27.14, | ||||||||
| expiration date 7/14/27 | 496,000 | 476,779 | ||||||
| MGM Resorts | ||||||||
| international 4.25% | ||||||||
| exercise price $18.58, | ||||||||
| expiration date 4/10/15 | 196,000 | 208,005 | ||||||
| Mylan 3.75% | ||||||||
| exercise price $13.32, | ||||||||
| expiration date 9/10/15 | 276,000 | 518,189 | ||||||
| National Retail | ||||||||
| Properties 5.125% | ||||||||
| exercise price $25.37, | ||||||||
| expiration date 6/15/28 | 415,000 | 474,137 | ||||||
| # | Nuance Communications | |||||||
| 144A 2.75% | ||||||||
| exercise price $32.30, | ||||||||
| expiration date 11/1/31 | 83,000 | 94,205 | ||||||
| NuVasive | ||||||||
| 2.25% | ||||||||
| exercise price $42.13, | ||||||||
| expiration date 6/30/17 | 236,000 | 202,370 | ||||||
| 2.75% | ||||||||
| exercise price $44.74, | ||||||||
| expiration date 3/15/13 | 126,000 | 125,055 | ||||||
| # | Owens-Brockway Glass | |||||||
| Container 144A 3.00% | ||||||||
| exercise price $47.47, | ||||||||
| expiration date 5/28/15 | 550,000 | 541,062 | ||||||
| Pantry 3.00% | ||||||||
| exercise price $50.09, | ||||||||
| expiration date 11/15/12 | 403,000 | 405,519 | ||||||
| * | Peabody Energy 4.75% | |||||||
| exercise price $58.19, | ||||||||
| expiration date 12/15/41 | 52,000 | 49,660 | ||||||
| PHH 4.00% | ||||||||
| exercise price $25.80, | ||||||||
| expiration date 9/1/14 | 431,000 | 415,915 | ||||||
| Rovi 2.625% | ||||||||
| exercise price $47.36, | ||||||||
| expiration date 2/10/40 | 257,000 | 270,814 | ||||||
| SanDisk 1.50% | ||||||||
| exercise price $52.37, | ||||||||
| expiration date 8/11/17 | 245,000 | 291,244 | ||||||
| SBA Communications 4.00% | ||||||||
| exercise price $30.38, | ||||||||
| expiration date 10/1/14 | 132,000 | 232,650 | ||||||
| Transocean 1.50% | ||||||||
| exercise price $158.97, | ||||||||
| expiration date 12/15/37 | 205,000 | 203,975 | ||||||
| VeriSign 3.25% | ||||||||
| exercise price $34.37, | ||||||||
| expiration date 8/15/37 | 313,000 | 401,423 | ||||||
| Total Convertible Bonds | ||||||||
| (cost $11,428,867) | 12,117,686 | |||||||
| Corporate Bonds – 38.45% | ||||||||
| Banking – 7.37% | ||||||||
| Abbey National Treasury | ||||||||
| Services 4.00% 4/27/16 | 670,000 | 665,347 | ||||||
| AgriBank 9.125% 7/15/19 | 845,000 | 1,073,608 | ||||||
| •# | Banco Bradesco 144A | |||||||
| 2.598% 5/16/14 | 1,300,000 | 1,320,705 | ||||||
| # | Banco do Brasil 144A | |||||||
| 6.00% 1/22/20 | 3,000,000 | 3,382,499 | ||||||
| # | Banco Mercantil del | |||||||
| Norte 144A | ||||||||
| 4.375% 7/19/15 | 400,000 | 418,000 | ||||||
| @•6.862% 10/13/21 | 520,000 | 542,100 | ||||||
| # | Banco Santander Chile 144A | |||||||
| 3.75% 9/22/15 | 2,200,000 | 2,255,607 | ||||||
| # | Banco Votorantim 144A | |||||||
| •3.473% 3/28/14 | 2,000,000 | 2,032,040 | ||||||
| @5.25% 2/11/16 | 2,300,000 | 2,395,450 | ||||||
| Bank of America | ||||||||
| 3.75% 7/12/16 | 1,045,000 | 1,051,237 | ||||||
| 3.875% 3/22/17 | 675,000 | 679,484 | ||||||
| 5.65% 5/1/18 | 1,000,000 | 1,068,877 | ||||||
| 5.70% 1/24/22 | 520,000 | 551,501 | ||||||
| 6.00% 9/1/17 | 1,200,000 | 1,308,509 | ||||||
| BB&T | ||||||||
| 3.95% 3/22/22 | 755,000 | 758,508 | ||||||
| 5.25% 11/1/19 | 1,146,000 | 1,259,757 | ||||||
| BB&T Capital Trust II | ||||||||
| 6.75% 6/7/36 | 1,310,000 | 1,338,297 | ||||||
| Capital One Capital V | ||||||||
| 10.25% 8/15/39 | 500,000 | 516,250 | ||||||
42
| Principal | Value | |||||||
| Amount° | (U.S. $) | |||||||
| Corporate Bonds (continued) | ||||||||
| Banking (continued) | ||||||||
| Citigroup | ||||||||
| •0.811% 11/5/14 | USD | 700,000 | $ | 671,378 | ||||
| •2.027% 1/13/14 | 500,000 | 497,289 | ||||||
| •2.51% 8/13/13 | 1,000,000 | 1,003,377 | ||||||
| 4.587% 12/15/15 | 200,000 | 210,799 | ||||||
| 5.50% 4/11/13 | 1,700,000 | 1,764,614 | ||||||
| 6.125% 5/15/18 | 1,900,000 | 2,132,619 | ||||||
| 8.50% 5/22/19 | 1,800,000 | 2,222,264 | ||||||
| * | City National | |||||||
| 5.25% 9/15/20 | 755,000 | 760,456 | ||||||
| @# | CoBank 144A | |||||||
| 7.875% 4/16/18 | 570,000 | 682,391 | ||||||
| # | DNB Bank 144A | |||||||
| 3.20% 4/3/17 | 3,300,000 | 3,316,806 | ||||||
| Eksportfinans | ||||||||
| 1.60% 3/20/14 | JPY | 2,000,000 | 22,488 | |||||
| 1.875% 4/2/13 | USD | 100,000 | 97,523 | |||||
| 2.00% 9/15/15 | 200,000 | 177,592 | ||||||
| 5.50% 5/25/16 | 100,000 | 97,979 | ||||||
| *5.50% 6/26/17 | 200,000 | 194,848 | ||||||
| Export-Import Bank of Korea | ||||||||
| 5.00% 4/11/22 | 705,000 | 747,299 | ||||||
| 5.125% 3/16/15 | 200,000 | 215,128 | ||||||
| 5.125% 6/29/20 | 1,500,000 | 1,615,254 | ||||||
| *5.50% 10/17/12 | 300,000 | 306,923 | ||||||
| Fifth Third Bancorp | ||||||||
| 3.50% 3/15/22 | 460,000 | 450,400 | ||||||
| • | Fifth Third Capital Trust IV | |||||||
| 6.50% 4/15/37 | 1,275,000 | 1,275,000 | ||||||
| Goldman Sachs Group | ||||||||
| •0.924% 3/22/16 | 300,000 | 274,100 | ||||||
| •*0.961% 7/22/15 | 200,000 | 187,156 | ||||||
| •1.08% 1/12/15 | 700,000 | 665,679 | ||||||
| •1.408% 2/4/13 | EUR | 800,000 | 1,061,245 | |||||
| 3.70% 8/1/15 | USD | 900,000 | 916,593 | |||||
| 5.15% 1/15/14 | 2,000,000 | 2,103,370 | ||||||
| 6.25% 9/1/17 | 1,100,000 | 1,207,091 | ||||||
| •# | HBOS Capital Funding 144A | |||||||
| 6.071% 6/29/49 | 300,000 | 215,250 | ||||||
| # | HSBC Bank 144A | |||||||
| 1.625% 8/12/13 | 2,300,000 | 2,295,750 | ||||||
| 4.75% 1/19/21 | 890,000 | 942,671 | ||||||
| HSBC Holdings | ||||||||
| 4.00% 3/30/22 | 1,575,000 | 1,564,358 | ||||||
| ICICI Bank | ||||||||
| *5.50% 3/25/15 | 2,100,000 | 2,183,255 | ||||||
| #144A 5.50% 3/25/15 | 2,000,000 | 2,079,290 | ||||||
| JPMorgan Chase | ||||||||
| 3.15% 7/5/16 | 100,000 | 103,189 | ||||||
| 4.40% 7/22/20 | 400,000 | 415,686 | ||||||
| 4.50% 1/24/22 | 750,000 | 781,801 | ||||||
| 6.30% 4/23/19 | 300,000 | 347,157 | ||||||
| JPMorgan Chase | ||||||||
| Capital XXV | ||||||||
| 6.80% 10/1/37 | 1,373,000 | 1,387,554 | ||||||
| KeyBank 6.95% 2/1/28 | 1,220,000 | 1,354,740 | ||||||
| KeyCorp 5.10% 3/24/21 | 620,000 | 684,606 | ||||||
| KFW 6.25% 5/19/21 | AUD | 2,300,000 | 2,569,439 | |||||
| Korea Development Bank | ||||||||
| 8.00% 1/23/14 | USD | 1,200,000 | 1,325,770 | |||||
| Lloyds TSB Bank | ||||||||
| •2.911% 1/24/14 | 2,300,000 | 2,292,058 | ||||||
| 4.20% 3/28/17 | 900,000 | 907,771 | ||||||
| Morgan Stanley | ||||||||
| 7.30% 5/13/19 | 2,700,000 | 2,909,681 | ||||||
| • | National City Bank | |||||||
| 0.845% 6/7/17 | 325,000 | 296,694 | ||||||
| •# | Nordea Bank 144A | |||||||
| 1.467% 1/14/14 | 3,000,000 | 2,993,555 | ||||||
| PNC Bank 6.875% 4/1/18 | 1,415,000 | 1,682,303 | ||||||
| PNC Funding | ||||||||
| 3.30% 3/8/22 | 430,000 | 426,288 | ||||||
| 5.625% 2/1/17 | 195,000 | 217,853 | ||||||
| •# | PNC Preferred Funding | |||||||
| Trust II 144A | ||||||||
| 1.696% 3/31/49 | 1,600,000 | 1,229,232 | ||||||
| Rabobank Utrecht | ||||||||
| 3.875% 2/8/22 | 895,000 | 867,278 | ||||||
| SunTrust Bank | ||||||||
| •0.782% 8/24/15 | 505,000 | 461,291 | ||||||
| 3.50% 1/20/17 | 340,000 | 347,181 | ||||||
| *SVB Financial Group | ||||||||
| 5.375% 9/15/20 | 190,000 | 205,832 | ||||||
| UBS | ||||||||
| 2.25% 1/28/14 | 1,900,000 | 1,908,645 | ||||||
| 5.875% 12/20/17 | 2,000,000 | 2,220,122 | ||||||
| US Bank 4.95% 10/30/14 | 1,000,000 | 1,095,952 | ||||||
| • | USB Capital IX | |||||||
| 3.50% 10/29/49 | 1,955,000 | 1,509,514 | ||||||
| • | Wachovia 0.937% 10/15/16 | 255,000 | 237,277 | |||||
| Wachovia Bank | ||||||||
| 5.60% 3/15/16 | 595,000 | 662,797 | ||||||
| Wells Fargo | ||||||||
| 3.50% 3/8/22 | 640,000 | 631,370 | ||||||
| 4.75% 2/9/15 | 250,000 | 268,347 | ||||||
| Zions Bancorporation | ||||||||
| 7.75% 9/23/14 | 280,000 | 306,774 | ||||||
| 89,423,768 | ||||||||
| Basic Industry – 3.71% | ||||||||
| * | AK Steel 7.625% 5/15/20 | 270,000 | 261,900 | |||||
| Alcoa | ||||||||
| 5.40% 4/15/21 | 785,000 | 812,599 | ||||||
| 6.75% 7/15/18 | 1,600,000 | 1,826,184 | ||||||
| # | Algoma Acquisition 144A | |||||||
| 9.875% 6/15/15 | 249,000 | 227,835 | ||||||
(continues) 43
Statements of net assets
Optimum Fixed Income Fund
| Principal | Value | |||||||
| Amount° | (U.S. $) | |||||||
| Corporate Bonds (continued) | ||||||||
| Basic Industry (continued) | ||||||||
| # | Anglo American Capital | |||||||
| 144A 2.625% 4/3/17 | USD | 1,425,000 | $ | 1,428,186 | ||||
| ArcelorMittal | ||||||||
| 6.25% 2/25/22 | 665,000 | 673,612 | ||||||
| 9.85% 6/1/19 | 1,060,000 | 1,277,174 | ||||||
| # | Barrick Gold 144A | |||||||
| 3.85% 4/1/22 | 2,055,000 | 2,067,402 | ||||||
| 5.25% 4/1/42 | 170,000 | 171,569 | ||||||
| Barrick North America Finance | ||||||||
| 4.40% 5/30/21 | 1,125,000 | 1,188,056 | ||||||
| •# | Cemex 144A 5.47% 9/30/15 | 1,031,000 | 935,633 | |||||
| # | Cemex Espana | |||||||
| Luxembourg 144A | ||||||||
| 9.25% 5/12/20 | 100,000 | 92,750 | ||||||
| Century Aluminum | ||||||||
| 8.00% 5/15/14 | 279,000 | 286,673 | ||||||
| CF Industries | ||||||||
| 7.125% 5/1/20 | 260,000 | 310,375 | ||||||
| # | CODELCO 144A | |||||||
| 3.75% 11/4/20 | 332,000 | 341,792 | ||||||
| Compass Minerals | ||||||||
| International | ||||||||
| 8.00% 6/1/19 | 268,000 | 292,120 | ||||||
| CSN Resources | ||||||||
| 6.50% 7/21/20 | 600,000 | 675,000 | ||||||
| #144A 6.50% 7/21/20 | 3,400,000 | 3,825,000 | ||||||
| Domtar 4.40% 4/1/22 | 545,000 | 539,635 | ||||||
| Dow Chemical | ||||||||
| 8.55% 5/15/19 | 2,322,000 | 3,015,002 | ||||||
| # | FMG Resources August | |||||||
| 2006 144A | ||||||||
| *6.875% 4/1/22 | 65,000 | 63,538 | ||||||
| 7.00% 11/1/15 | 275,000 | 281,875 | ||||||
| Georgia-Pacific | ||||||||
| #144A 5.40% 11/1/20 | 230,000 | 257,191 | ||||||
| 8.00% 1/15/24 | 1,757,000 | 2,241,198 | ||||||
| #144A 8.25% 5/1/16 | 108,000 | 119,149 | ||||||
| # | Gerdau Trade 144A | |||||||
| 5.75% 1/30/21 | 4,300,000 | 4,576,489 | ||||||
| Headwaters | ||||||||
| 7.625% 4/1/19 | 375,000 | 366,563 | ||||||
| Hexion US Finance | ||||||||
| 8.875% 2/1/18 | 260,000 | 270,400 | ||||||
| International Paper | ||||||||
| 4.75% 2/15/22 | 1,670,000 | 1,763,271 | ||||||
| 9.375% 5/15/19 | 165,000 | 218,307 | ||||||
| JSG Funding | ||||||||
| 7.75% 4/1/15 | 217,000 | 219,170 | ||||||
| # | Kinross Gold 144A | |||||||
| 5.125% 9/1/21 | 755,000 | 768,047 | ||||||
| # | LyondellBasell Industries | |||||||
| 144A 5.75% 4/15/24 | 425,000 | 425,000 | ||||||
| # | MacDermid 144A | |||||||
| 9.50% 4/15/17 | 251,000 | 261,668 | ||||||
| Momentive Performance | ||||||||
| Materials | ||||||||
| 11.50% 12/1/16 | 165,000 | 137,775 | ||||||
| # | Murray Energy 144A | |||||||
| 10.25% 10/15/15 | 237,000 | 231,668 | ||||||
| Nortek 8.50% 4/15/21 | 325,000 | 323,375 | ||||||
| Novelis 8.75% 12/15/20 | 375,000 | 412,500 | ||||||
| Ply Gem Industries | ||||||||
| 13.125% 7/15/14 | 157,000 | 159,355 | ||||||
| =@ | Port Townsend | |||||||
| 12.431% 8/27/12 | 92,303 | 41,998 | ||||||
| Rio Tinto Finance USA | ||||||||
| 3.50% 3/22/22 | 1,625,000 | 1,631,380 | ||||||
| Ryerson | ||||||||
| •7.922% 11/1/14 | 127,000 | 120,015 | ||||||
| 12.00% 11/1/15 | 237,000 | 244,110 | ||||||
| Steel Dynamics | ||||||||
| 7.375% 11/1/12 | 1,400,000 | 1,442,000 | ||||||
| 7.75% 4/15/16 | 404,000 | 421,170 | ||||||
| Syngenta Finance | ||||||||
| 3.125% 3/28/22 | 720,000 | 726,286 | ||||||
| Teck Resources | ||||||||
| 3.00% 3/1/19 | 380,000 | 375,594 | ||||||
| 5.20% 3/1/42 | 950,000 | 904,607 | ||||||
| Vale Overseas | ||||||||
| 4.375% 1/11/22 | 2,601,000 | 2,625,569 | ||||||
| 6.875% 11/10/39 | 2,700,000 | 3,167,424 | ||||||
| 45,045,189 | ||||||||
| Brokerage – 0.82% | ||||||||
| Bear Stearns | ||||||||
| •4.923% 12/7/12 | AUD | 2,130,000 | 2,194,754 | |||||
| 7.25% 2/1/18 | USD | 2,000,000 | 2,414,589 | |||||
| E Trade Financial | ||||||||
| 12.50% 11/30/17 | 370,000 | 432,438 | ||||||
| Jefferies Group | ||||||||
| 6.25% 1/15/36 | 335,000 | 305,688 | ||||||
| 6.45% 6/8/27 | 296,000 | 294,520 | ||||||
| Lazard Group | ||||||||
| 6.85% 6/15/17 | 1,087,000 | 1,196,345 | ||||||
| Merrill Lynch | ||||||||
| 5.45% 2/5/13 | 500,000 | 514,239 | ||||||
| 6.875% 4/25/18 | 2,325,000 | 2,587,933 | ||||||
| 9,940,506 | ||||||||
| Capital Goods – 1.16% | ||||||||
| Anixter 10.00% 3/15/14 | 101,000 | 110,595 | ||||||
| Berry Plastics 9.75% 1/15/21 | 265,000 | 290,838 | ||||||
| Case New Holland | ||||||||
| 7.75% 9/1/13 | 163,000 | 174,410 | ||||||
| Casella Waste Systems | ||||||||
| 11.00% 7/15/14 | 6,000 | 6,450 | ||||||
44
| Principal | Value | |||||||
| Amount° | (U.S. $) | |||||||
| Corporate Bonds (continued) | ||||||||
| Capital Goods (continued) | ||||||||
| Koninklijke Philips | ||||||||
| Electronics | ||||||||
| 3.75% 3/15/22 | USD | 730,000 | $ | 735,842 | ||||
| 5.00% 3/15/42 | 1,280,000 | 1,282,314 | ||||||
| Kratos Defense & | ||||||||
| Security Solutions | ||||||||
| 10.00% 6/1/17 | 145,000 | 157,688 | ||||||
| # | Meccanica Holdings USA | |||||||
| 144A 6.25% 7/15/19 | 245,000 | 219,242 | ||||||
| # | Plastipak Holdings 144A | |||||||
| 10.625% 8/15/19 | 201,000 | 230,145 | ||||||
| Pregis 12.375% 10/15/13 | 277,000 | 278,724 | ||||||
| * | RBS Global 11.75% 8/1/16 | 212,000 | 224,985 | |||||
| Stanley Black & Decker | ||||||||
| 3.40% 12/1/21 | 615,000 | 624,269 | ||||||
| TriMas 9.75% 12/15/17 | 173,000 | 192,030 | ||||||
| Tyco Electronics Group | ||||||||
| 3.50% 2/3/22 | 735,000 | 718,029 | ||||||
| 6.00% 10/1/12 | 4,500,000 | 4,618,943 | ||||||
| Tyco International Finance | ||||||||
| 3.75% 1/15/18 | 2,200,000 | 2,363,415 | ||||||
| # | URS 144A 5.00% 4/1/22 | 610,000 | 604,153 | |||||
| # | Votorantim Cimentos 144A | |||||||
| 7.25% 4/5/41 | 1,180,000 | 1,209,500 | ||||||
| 14,041,572 | ||||||||
| Communications – 3.80% | ||||||||
| Affinion Group | ||||||||
| 7.875% 12/15/18 | 315,000 | 288,225 | ||||||
| America Movil | ||||||||
| 5.00% 3/30/20 | 720,000 | 804,237 | ||||||
| American Tower | ||||||||
| 4.70% 3/15/22 | 300,000 | 303,008 | ||||||
| # | Brasil Telecom 144A | |||||||
| 5.75% 2/10/22 | 838,000 | 864,188 | ||||||
| 9.75% 9/15/16 | BRL | 2,398,000 | 1,366,045 | |||||
| CBS 3.375% 3/1/22 | USD | 1,810,000 | 1,750,864 | |||||
| CCO Holdings | ||||||||
| 7.375% 6/1/20 | 105,000 | 114,450 | ||||||
| CenturyLink 5.80% 3/15/22 | 750,000 | 733,746 | ||||||
| Citizens Communications | ||||||||
| 6.25% 1/15/13 | 78,000 | 80,340 | ||||||
| Clear Channel Communications | ||||||||
| 9.00% 3/1/21 | 150,000 | 135,750 | ||||||
| # | Clear Channel Worldwide | |||||||
| Holdings 144A | ||||||||
| 7.625% 3/15/20 | 220,000 | 216,325 | ||||||
| # | Clearwire Communications | |||||||
| 144A | ||||||||
| 12.00% 12/1/15 | 188,000 | 186,120 | ||||||
| *12.00% 12/1/15 | 361,000 | 357,390 | ||||||
| # | Columbus International 144A | |||||||
| 11.50% 11/20/14 | 460,000 | 514,970 | ||||||
| Comcast 5.70% 5/15/18 | 1,000,000 | 1,181,784 | ||||||
| Cricket Communications | ||||||||
| 7.75% 10/15/20 | 485,000 | 478,331 | ||||||
| Crown Castle International | ||||||||
| 9.00% 1/15/15 | 80,000 | 88,400 | ||||||
| # | Crown Castle Towers 144A | |||||||
| 4.883% 8/15/20 | 1,920,000 | 1,978,922 | ||||||
| Deutsche Telekom | ||||||||
| International Finance | ||||||||
| #144A 2.25% 3/6/17 | 1,785,000 | 1,768,771 | ||||||
| 4.25% 7/13/22 | EUR | 850,000 | 1,251,172 | |||||
| # | Digicel 144A | |||||||
| 8.25% 9/1/17 | USD | 100,000 | 106,750 | |||||
| # | Digicel Group 144A | |||||||
| 8.875% 1/15/15 | 170,000 | 173,825 | ||||||
| # | DIRECTV Holdings 144A | |||||||
| 3.80% 3/15/22 | 1,655,000 | 1,635,632 | ||||||
| 5.15% 3/15/42 | 405,000 | 396,027 | ||||||
| DISH DBS | ||||||||
| 6.75% 6/1/21 | 153,000 | 165,623 | ||||||
| 7.875% 9/1/19 | 268,000 | 309,540 | ||||||
| Entravision Communications | ||||||||
| 8.75% 8/1/17 | 120,000 | 127,650 | ||||||
| Historic TW | ||||||||
| 6.875% 6/15/18 | 1,660,000 | 2,037,332 | ||||||
| Intelsat Bermuda | ||||||||
| 11.25% 2/4/17 | 420,000 | 437,850 | ||||||
| 11.50% 2/4/17 | 410 | 427 | ||||||
| #PIK 144A | ||||||||
| 11.50% 2/4/17 | 105,000 | 108,413 | ||||||
| Intelsat Jackson Holdings | ||||||||
| 7.25% 10/15/20 | 195,000 | 205,481 | ||||||
| Interpublic Group | ||||||||
| 4.00% 3/15/22 | 1,065,000 | 1,044,975 | ||||||
| Level 3 Financing | ||||||||
| 10.00% 2/1/18 | 213,000 | 234,300 | ||||||
| MetroPCS Wireless | ||||||||
| 6.625% 11/15/20 | 150,000 | 149,438 | ||||||
| # | Nara Cable Funding 144A | |||||||
| 8.875% 12/1/18 | 420,000 | 401,100 | ||||||
| Nielsen Finance | ||||||||
| 11.50% 5/1/16 | 130,000 | 150,475 | ||||||
| 11.625% 2/1/14 | 82,000 | 95,120 | ||||||
| NII Capital 10.00% 8/15/16 | 316,000 | 359,450 | ||||||
| PAETEC Holding | ||||||||
| 8.875% 6/30/17 | 157,000 | 171,130 | ||||||
| Qwest | ||||||||
| 6.75% 12/1/21 | 565,000 | 632,094 | ||||||
| 8.375% 5/1/16 | 1,920,000 | 2,303,849 | ||||||
| # | Sinclair Television Group | |||||||
| 144A 9.25% 11/1/17 | 216,000 | 241,380 | ||||||
| # | Sirius XM Radio 144A | |||||||
| 8.75% 4/1/15 | 250,000 | 285,000 | ||||||
Statements of net assets
Optimum Fixed Income Fund
| Principal | Value | |||||||
| Amount° | (U.S. $) | |||||||
| Corporate Bonds (continued) | ||||||||
| Communications (continued) | ||||||||
| Sprint Capital | ||||||||
| 8.75% 3/15/32 | USD | 162,000 | $ | 139,725 | ||||
| Sprint Nextel | ||||||||
| 6.00% 12/1/16 | 145,000 | 130,138 | ||||||
| 8.375% 8/15/17 | 155,000 | 150,350 | ||||||
| #144A 9.125% 3/1/17 | 250,000 | 249,375 | ||||||
| Telecom Italia Capital | ||||||||
| 5.25% 10/1/15 | 885,000 | 915,975 | ||||||
| Telefonica Emisiones | ||||||||
| 5.462% 2/16/21 | 340,000 | 331,108 | ||||||
| 6.421% 6/20/16 | 815,000 | 869,651 | ||||||
| Telesat Canada | ||||||||
| 11.00% 11/1/15 | 547,000 | 586,658 | ||||||
| 12.50% 11/1/17 | 85,000 | 95,413 | ||||||
| Time Warner Cable | ||||||||
| 5.50% 9/1/41 | 750,000 | 788,567 | ||||||
| 6.75% 7/1/18 | 1,500,000 | 1,832,544 | ||||||
| 8.25% 4/1/19 | 1,080,000 | 1,383,132 | ||||||
| # | Univision Communications | |||||||
| 144A 6.875% 5/15/19 | 265,000 | 269,969 | ||||||
| # | UPC Holding 144A | |||||||
| 9.875% 4/15/18 | 170,000 | 188,700 | ||||||
| # | UPCB Finance III 144A | |||||||
| 6.625% 7/1/20 | 520,000 | 533,000 | ||||||
| Verizon Communications | ||||||||
| 8.75% 11/1/18 | 3,600,000 | 4,891,765 | ||||||
| Videotron 6.375% 12/15/15 | 90,000 | 92,363 | ||||||
| # | VimpelCom Holdings 144A | |||||||
| •4.471% 6/29/14 | 840,000 | 817,942 | ||||||
| 7.504% 3/1/22 | 410,000 | 399,750 | ||||||
| Virgin Media Finance | ||||||||
| 8.375% 10/15/19 | 200,000 | 225,000 | ||||||
| Virgin Media | ||||||||
| Secured Finance | ||||||||
| 6.50% 1/15/18 | 2,470,000 | 2,695,387 | ||||||
| # | Vivendi 144A | |||||||
| 6.625% 4/4/18 | 1,275,000 | 1,434,110 | ||||||
| West 7.875% 1/15/19 | 100,000 | 107,000 | ||||||
| # | Wind Acquisition Finance | |||||||
| 144A 11.75% 7/15/17 | 410,000 | 405,900 | ||||||
| Windstream | ||||||||
| 7.875% 11/1/17 | 3,000 | 3,323 | ||||||
| 8.125% 8/1/13 | 103,000 | 110,210 | ||||||
| # | XM Escrow Satellite Radio | |||||||
| 144A 13.00% 8/1/13 | 220,000 | 249,975 | ||||||
| 46,132,929 | ||||||||
| Consumer Cyclical – 2.02% | ||||||||
| Albertson’s 7.25% 5/1/13 | 66,000 | 69,300 | ||||||
| # | Allison Transmission 144A | |||||||
| 11.00% 11/1/15 | 112,000 | 118,440 | ||||||
| American Axle & | ||||||||
| Manufacturing | ||||||||
| 7.875% 3/1/17 | 344,000 | 356,040 | ||||||
| Ameristar Casinos | ||||||||
| 7.50% 4/15/21 | 285,000 | 300,319 | ||||||
| ArvinMeritor | ||||||||
| 8.125% 9/15/15 | 443,000 | 469,580 | ||||||
| Beazer Homes USA | ||||||||
| 9.125% 5/15/19 | 160,000 | 138,400 | ||||||
| Chrysler Group | ||||||||
| 8.25% 6/15/21 | 305,000 | 309,575 | ||||||
| CKE Restaurants | ||||||||
| 11.375% 7/15/18 | 260,000 | 298,350 | ||||||
| Dave & Buster’s | ||||||||
| 11.00% 6/1/18 | 75,000 | 80,625 | ||||||
| #Delphi 144A | ||||||||
| 6.125% 5/15/21 | 545,000 | 583,150 | ||||||
| # | Equinox Holdings 144A | |||||||
| 9.50% 2/1/16 | 40,000 | 42,975 | ||||||
| * | Ford Motor 7.45% 7/16/31 | 655,000 | 804,013 | |||||
| Ford Motor Credit | ||||||||
| 5.00% 5/15/18 | 925,000 | 960,479 | ||||||
| 8.00% 6/1/14 | 300,000 | 330,422 | ||||||
| 8.70% 10/1/14 | 3,800,000 | 4,307,379 | ||||||
| 12.00% 5/15/15 | 480,000 | 596,400 | ||||||
| # | FUEL Trust 144A | |||||||
| 3.984% 6/15/16 | 485,000 | 492,527 | ||||||
| * | Hanesbrands | |||||||
| 6.375% 12/15/20 | 255,000 | 263,288 | ||||||
| Host Hotels & Resorts | ||||||||
| #144A 5.25% 3/15/22 | 280,000 | 280,000 | ||||||
| 5.875% 6/15/19 | 295,000 | 312,331 | ||||||
| #144A 6.00% 10/1/21 | 432,000 | 462,240 | ||||||
| 6.00% 11/1/20 | 375,000 | 399,375 | ||||||
| *# | Hyundai Capital Services | |||||||
| 144A 3.50% 9/13/17 | 460,000 | 461,647 | ||||||
| Ingles Markets | ||||||||
| 8.875% 5/15/17 | 196,000 | 213,150 | ||||||
| * | Levi Strauss | |||||||
| 7.625% 5/15/20 | 100,000 | 106,250 | ||||||
| M/I Homes | ||||||||
| 8.625% 11/15/18 | 225,000 | 226,125 | ||||||
| Macy’s Retail Holdings | ||||||||
| 3.875% 1/15/22 | 150,000 | 150,735 | ||||||
| 5.90% 12/1/16 | 763,000 | 876,486 | ||||||
| Marina District Finance | ||||||||
| 9.875% 8/15/18 | 110,000 | 99,275 | ||||||
| MGM Resorts International | ||||||||
| 7.75% 3/15/22 | 65,000 | 66,300 | ||||||
| 11.375% 3/1/18 | 579,000 | 691,181 | ||||||
| Mobile Mini 6.875% 5/1/15 | 161,000 | 163,415 | ||||||
| Mohawk Industries | ||||||||
| 6.375% 1/15/16 | 146,000 | 162,060 | ||||||
| Norcraft 10.50% 12/15/15 | 169,000 | 149,143 | ||||||
| OSI Restaurant Partners | ||||||||
| 10.00% 6/15/15 | 199,000 | 206,960 | ||||||
46
| Principal | Value | |||||||
| Amount° | (U.S. $) | |||||||
| Corporate Bonds (continued) | ||||||||
| Consumer Cyclical (continued) | ||||||||
| * | Pinnacle Entertainment | |||||||
| 8.75% 5/15/20 | USD | 325,000 | $ | 356,688 | ||||
| * | Quiksilver 6.875% 4/15/15 | 225,000 | 227,250 | |||||
| # | Rite Aid 144A | |||||||
| 9.25% 3/15/20 | 75,000 | 75,938 | ||||||
| Royal Caribbean Cruises | ||||||||
| 7.00% 6/15/13 | 250,000 | 262,500 | ||||||
| Ryland Group | ||||||||
| 8.40% 5/15/17 | 172,000 | 190,920 | ||||||
| # | Sealy Mattress 144A | |||||||
| 10.875% 4/15/16 | 57,000 | 61,988 | ||||||
| Standard Pacific | ||||||||
| 10.75% 9/15/16 | 248,000 | 286,440 | ||||||
| Target 2.90% 1/15/22 | 810,000 | 802,273 | ||||||
| Tomkins 9.00% 10/1/18 | 275,000 | 305,938 | ||||||
| # | Volkswagen International | |||||||
| Finance 144A | ||||||||
| 1.625% 8/12/13 | 2,800,000 | 2,824,513 | ||||||
| Western Union | ||||||||
| 3.65% 8/22/18 | 555,000 | 594,225 | ||||||
| Wyndham Worldwide | ||||||||
| 4.25% 3/1/22 | 1,725,000 | 1,694,441 | ||||||
| 5.625% 3/1/21 | 450,000 | 485,325 | ||||||
| 5.75% 2/1/18 | 620,000 | 691,277 | ||||||
| Wynn Las Vegas | ||||||||
| 7.75% 8/15/20 | 60,000 | 66,225 | ||||||
| 24,473,876 | ||||||||
| Consumer Non-Cyclical – 3.92% | ||||||||
| Accellent 8.375% 2/1/17 | 150,000 | 151,500 | ||||||
| Altria Group | ||||||||
| 9.70% 11/10/18 | 1,000,000 | 1,360,589 | ||||||
| # | AMGH Merger Sub 144A | |||||||
| 9.25% 11/1/18 | 225,000 | 235,125 | ||||||
| Anheuser-Busch InBev | ||||||||
| Worldwide | ||||||||
| •1.107% 1/27/14 | 3,800,000 | 3,821,427 | ||||||
| 5.375% 1/15/20 | 1,000,000 | 1,177,104 | ||||||
| # | Aristotle Holding 144A | |||||||
| 2.65% 2/15/17 | 565,000 | 572,035 | ||||||
| 3.50% 11/15/16 | 295,000 | 308,470 | ||||||
| 3.90% 2/15/22 | 310,000 | 313,970 | ||||||
| 4.75% 11/15/21 | 335,000 | 359,218 | ||||||
| # | Ashtead Capital 144A | |||||||
| 9.00% 8/15/16 | 200,000 | 209,750 | ||||||
| Bio-Rad Laboratories | ||||||||
| 4.875% 12/15/20 | 155,000 | 159,372 | ||||||
| 8.00% 9/15/16 | 146,000 | 162,790 | ||||||
| Boston Scientific | ||||||||
| 6.00% 1/15/20 | 835,000 | 959,924 | ||||||
| CareFusion 6.375% 8/1/19 | 2,085,000 | 2,426,356 | ||||||
| Celgene | ||||||||
| 2.45% 10/15/15 | 330,000 | 337,521 | ||||||
| 3.95% 10/15/20 | 1,045,000 | 1,066,024 | ||||||
| Coca-Cola Enterprises | ||||||||
| 1.125% 11/12/13 | 2,000,000 | 2,008,652 | ||||||
| Community Health Systems | ||||||||
| *#144A 8.00% 11/15/19 | 110,000 | 114,400 | ||||||
| 8.875% 7/15/15 | 54,000 | 56,025 | ||||||
| Corrections Corp. of | ||||||||
| America 7.75% 6/1/17 | 344,000 | 376,680 | ||||||
| Coventry Health Care | ||||||||
| 5.45% 6/15/21 | 1,400,000 | 1,535,303 | ||||||
| Del Monte | ||||||||
| 7.625% 2/15/19 | 445,000 | 445,000 | ||||||
| # | Dole Food 144A | |||||||
| 8.00% 10/1/16 | 123,000 | 129,765 | ||||||
| General Mills | ||||||||
| 3.15% 12/15/21 | 390,000 | 391,167 | ||||||
| * | Geo Group | |||||||
| 6.625% 2/15/21 | 145,000 | 152,431 | ||||||
| HCA 7.50% 2/15/22 | 315,000 | 336,263 | ||||||
| HCA Holdings | ||||||||
| 7.75% 5/15/21 | 355,000 | 368,756 | ||||||
| # | Heineken 144A | |||||||
| 3.40% 4/1/22 | 1,140,000 | 1,133,979 | ||||||
| # | Highmark 144A | |||||||
| 4.75% 5/15/21 | 405,000 | 406,378 | ||||||
| 6.125% 5/15/41 | 150,000 | 156,413 | ||||||
| Iron Mountain | ||||||||
| 7.75% 10/1/19 | 75,000 | 82,313 | ||||||
| Jarden | ||||||||
| 6.125% 11/15/22 | 215,000 | 226,288 | ||||||
| 7.50% 1/15/20 | 30,000 | 32,700 | ||||||
| # | Kinetic Concepts 144A | |||||||
| 12.50% 11/1/19 | 260,000 | 247,000 | ||||||
| • | Kraft Foods | |||||||
| 1.457% 7/10/13 | 1,195,000 | 1,203,071 | ||||||
| LVB Acquisition | ||||||||
| 11.625% 10/15/17 | 204,000 | 221,595 | ||||||
| PIK 10.375% 10/15/17 | 158,000 | 171,035 | ||||||
| Medtronic 3.125% 3/15/22 | 705,000 | 709,834 | ||||||
| # | Multiplan 144A | |||||||
| 9.875% 9/1/18 | 280,000 | 303,800 | ||||||
| # | Mylan 144A | |||||||
| 6.00% 11/15/18 | 315,000 | 330,750 | ||||||
| NBTY 9.00% 10/1/18 | 385,000 | 425,906 | ||||||
| PepsiCo 2.75% 3/5/22 | 1,295,000 | 1,262,704 | ||||||
| # | Pernod-Ricard 144A | |||||||
| 2.95% 1/15/17 | 405,000 | 409,556 | ||||||
| 4.45% 1/15/22 | 1,125,000 | 1,143,420 | ||||||
| 5.50% 1/15/42 | 475,000 | 479,274 | ||||||
| Pfizer 5.35% 3/15/15 | 4,100,000 | 4,638,300 | ||||||
| PHH 9.25% 3/1/16 | 860,000 | 878,275 | ||||||
| Quest Diagnostics | ||||||||
| 4.70% 4/1/21 | 1,480,000 | 1,604,934 | ||||||
| 4.75% 1/30/20 | 135,000 | 147,488 | ||||||
(continues) 47
Statements of net assets
Optimum Fixed Income Fund
| Principal | Value | |||||||
| Amount° | (U.S. $) | |||||||
| Corporate Bonds (continued) | ||||||||
| Consumer Non-Cyclical (continued) | ||||||||
| RadNet Management | ||||||||
| 10.375% 4/1/18 | USD | 125,000 | $ | 125,000 | ||||
| # | Reynolds Group 144A | |||||||
| 9.00% 4/15/19 | 730,000 | 722,700 | ||||||
| RSC Equipment Rental | ||||||||
| 10.25% 11/15/19 | 278,000 | 312,750 | ||||||
| # | SABMiller Holdings 144A | |||||||
| 2.45% 1/15/17 | 595,000 | 603,141 | ||||||
| 3.75% 1/15/22 | 1,940,000 | 1,977,706 | ||||||
| 4.95% 1/15/42 | 305,000 | 317,236 | ||||||
| Safeway 4.75% 12/1/21 | 825,000 | 854,511 | ||||||
| Sara Lee 4.10% 9/15/20 | 498,000 | 505,351 | ||||||
| Scotts Miracle-Gro | ||||||||
| 6.625% 12/15/20 | 125,000 | 132,188 | ||||||
| Teva Pharmaceutical Finance | ||||||||
| IV 3.65% 11/10/21 | 355,000 | 360,084 | ||||||
| Tops Markets | ||||||||
| 10.125% 10/15/15 | 117,000 | 125,483 | ||||||
| Tyson Foods 10.50% 3/1/14 | 213,000 | 248,145 | ||||||
| # | Woolworths 144A | |||||||
| 3.15% 4/12/16 | 305,000 | 316,369 | ||||||
| 4.55% 4/12/21 | 1,340,000 | 1,443,417 | ||||||
| Yale University | ||||||||
| 2.90% 10/15/14 | 1,115,000 | 1,179,457 | ||||||
| Zimmer Holdings | ||||||||
| 3.375% 11/30/21 | 1,200,000 | 1,205,953 | ||||||
| 4.625% 11/30/19 | 1,205,000 | 1,331,670 | ||||||
| 47,511,791 | ||||||||
| Electric – 3.59% | ||||||||
| AES 8.00% 6/1/20 | 133,000 | 153,283 | ||||||
| Ameren Illinois | ||||||||
| 9.75% 11/15/18 | 1,930,000 | 2,617,889 | ||||||
| # | American Transmission | |||||||
| Systems 144A | ||||||||
| 5.25% 1/15/22 | 1,225,000 | 1,385,686 | ||||||
| * | Appalachian Power | |||||||
| 7.95% 1/15/20 | 1,000,000 | 1,310,851 | ||||||
| Baltimore Gas & Electric | ||||||||
| 3.50% 11/15/21 | 1,285,000 | 1,301,439 | ||||||
| # | Calpine 144A | |||||||
| 7.875% 7/31/20 | 225,000 | 245,813 | ||||||
| # | Centrais Eletricas | |||||||
| Brasileiras 144A | ||||||||
| 5.75% 10/27/21 | 2,116,000 | 2,326,542 | ||||||
| CMS Energy | ||||||||
| 4.25% 9/30/15 | 1,465,000 | 1,527,331 | ||||||
| 6.25% 2/1/20 | 575,000 | 630,980 | ||||||
| ComEd Financing III | ||||||||
| 6.35% 3/15/33 | 605,000 | 583,719 | ||||||
| Commonwealth Edison | ||||||||
| 3.40% 9/1/21 | 1,375,000 | 1,420,568 | ||||||
| Dominion Resources | ||||||||
| 5.70% 9/17/12 | 3,000,000 | 3,068,438 | ||||||
| Duquense Light Holdings | ||||||||
| 5.50% 8/15/15 | 756,000 | 785,746 | ||||||
| Elwood Energy | ||||||||
| 8.159% 7/5/26 | 240,062 | 245,463 | ||||||
| Entergy | ||||||||
| 3.625% 9/15/15 | 215,000 | 218,795 | ||||||
| 5.125% 9/15/20 | 4,400,000 | 4,439,502 | ||||||
| Florida Power | ||||||||
| 5.65% 6/15/18 | 205,000 | 245,140 | ||||||
| • | FPL Group Capital | |||||||
| 6.35% 10/1/66 | 730,000 | 745,321 | ||||||
| GenOn Energy | ||||||||
| 9.875% 10/15/20 | 160,000 | 146,400 | ||||||
| Great Plains Energy | ||||||||
| 5.292% 6/15/22 | 1,070,000 | 1,143,902 | ||||||
| Ipalco Enterprises | ||||||||
| 5.00% 5/1/18 | 405,000 | 405,000 | ||||||
| Jersey Central | ||||||||
| Power & Light | ||||||||
| 5.625% 5/1/16 | 80,000 | 89,967 | ||||||
| *7.35% 2/1/19 | 1,000,000 | 1,253,060 | ||||||
| LG&E & KU Energy | ||||||||
| 3.75% 11/15/20 | 965,000 | 962,647 | ||||||
| #144A 4.375% 10/1/21 | 1,230,000 | 1,266,814 | ||||||
| * | Mirant Americas | |||||||
| 8.50% 10/1/21 | 310,000 | 274,350 | ||||||
| NiSource Finance | ||||||||
| 4.45% 12/1/21 | 235,000 | 245,603 | ||||||
| 5.80% 2/1/42 | 705,000 | 755,127 | ||||||
| NRG Energy | ||||||||
| 7.875% 5/15/21 | 190,000 | 183,350 | ||||||
| PacifiCorp 2.95% 2/1/22 | 760,000 | 750,818 | ||||||
| @# | Pedernales Electric | |||||||
| Cooperative 144A | ||||||||
| 6.202% 11/15/32 | 620,000 | 659,160 | ||||||
| Pennsylvania Electric | ||||||||
| 5.20% 4/1/20 | 1,105,000 | 1,199,421 | ||||||
| • | PPL Capital Funding | |||||||
| 6.70% 3/30/67 | 110,000 | 110,115 | ||||||
| Public Service Oklahoma | ||||||||
| 5.15% 12/1/19 | 1,170,000 | 1,315,961 | ||||||
| Puget Energy | ||||||||
| 6.00% 9/1/21 | 340,000 | 362,492 | ||||||
| 6.50% 12/15/20 | 3,800,000 | 4,173,809 | ||||||
| • | Puget Sound Energy | |||||||
| 6.974% 6/1/67 | 1,295,000 | 1,329,100 | ||||||
| SCANA 4.125% 2/1/22 | 740,000 | 741,858 | ||||||
| Tokyo Electric Power | ||||||||
| 4.50% 3/24/14 | EUR | 1,100,000 | 1,403,933 | |||||
| • | Wisconsin Energy | |||||||
| 6.25% 5/15/67 | USD | 1,480,000 | 1,526,058 | |||||
| 43,551,451 | ||||||||
48
| Principal | Value | |||||||
| Amount° | (U.S. $) | |||||||
| Corporate Bonds (continued) | ||||||||
| Energy – 3.29% | ||||||||
| Antero Resources Finance | ||||||||
| 9.375% 12/1/17 | USD | 122,000 | $ | 132,675 | ||||
| Berry Petroleum | ||||||||
| 10.25% 6/1/14 | 227,000 | 263,320 | ||||||
| # | BG Energy Capital 144A | |||||||
| 4.00% 10/15/21 | 1,100,000 | 1,149,411 | ||||||
| BP Capital Markets | ||||||||
| 3.625% 5/8/14 | 500,000 | 525,946 | ||||||
| 4.75% 3/10/19 | 160,000 | 181,444 | ||||||
| # | Canadian Oil Sands 144A | |||||||
| 4.50% 4/1/22 | 735,000 | 741,891 | ||||||
| Chesapeake Energy | ||||||||
| 6.125% 2/15/21 | 220,000 | 218,900 | ||||||
| 6.625% 8/15/20 | 92,000 | 94,070 | ||||||
| 6.875% 11/15/20 | 8,000 | 8,300 | ||||||
| 9.50% 2/15/15 | 45,000 | 51,750 | ||||||
| Comstock Resources | ||||||||
| 7.75% 4/1/19 | 110,000 | 102,850 | ||||||
| # | Continental Resources 144A | |||||||
| 5.00% 9/15/22 | 190,000 | 191,188 | ||||||
| Ecopetrol 7.625% 7/23/19 | 892,000 | 1,108,310 | ||||||
| Encana 3.90% 11/15/21 | 1,595,000 | 1,555,809 | ||||||
| # | ENI 144A 4.15% 10/1/20 | 1,085,000 | 1,077,864 | |||||
| Forest Oil 7.25% 6/15/19 | 207,000 | 203,378 | ||||||
| * | Gazprom 10.50% 3/25/14 | 500,000 | 571,725 | |||||
| # | Helix Energy Solutions | |||||||
| Group 144A | ||||||||
| 9.50% 1/15/16 | 165,000 | 173,044 | ||||||
| # | Hercules Offshore 144A | |||||||
| 10.50% 10/15/17 | 314,000 | 330,485 | ||||||
| # | Hilcorp Energy I 144A | |||||||
| 7.625% 4/15/21 | 135,000 | 146,475 | ||||||
| Holly 9.875% 6/15/17 | 217,000 | 243,040 | ||||||
| Husky Energy | ||||||||
| 3.95% 4/15/22 | 1,420,000 | 1,432,493 | ||||||
| Linn Energy | ||||||||
| #144A 6.25% 11/1/19 | 60,000 | 58,275 | ||||||
| #144A 6.50% 5/15/19 | 70,000 | 68,950 | ||||||
| 8.625% 4/15/20 | 125,000 | 135,313 | ||||||
| Lukoil International Finance | ||||||||
| 6.125% 11/9/20 | 1,410,000 | 1,501,650 | ||||||
| # | NFR Energy Finance 144A | |||||||
| 9.75% 2/15/17 | 205,000 | 177,325 | ||||||
| Noble Holding International | ||||||||
| 3.95% 3/15/22 | 875,000 | 876,141 | ||||||
| 5.25% 3/15/42 | 2,235,000 | 2,228,639 | ||||||
| Pemex Project Funding | ||||||||
| Master Trust | ||||||||
| 6.625% 6/15/35 | 440,000 | 506,000 | ||||||
| Petrobras International Finance | ||||||||
| 3.50% 2/6/17 | 775,000 | 796,288 | ||||||
| 5.375% 1/27/21 | 2,494,000 | 2,697,856 | ||||||
| 5.875% 3/1/18 | 45,000 | 50,700 | ||||||
| Petrohawk Energy | ||||||||
| 7.25% 8/15/18 | 855,000 | 982,181 | ||||||
| Petroleos de Venezuela | ||||||||
| 9.00% 11/17/21 | 4,004,000 | 3,263,259 | ||||||
| 12.75% 2/17/22 | 499,000 | 500,248 | ||||||
| Petroleum Development | ||||||||
| 12.00% 2/15/18 | 212,000 | 231,080 | ||||||
| Pride International | ||||||||
| 6.875% 8/15/20 | 2,575,000 | 3,145,289 | ||||||
| Quicksilver Resources | ||||||||
| 9.125% 8/15/19 | 175,000 | 171,500 | ||||||
| Range Resources | ||||||||
| 5.75% 6/1/21 | 95,000 | 100,225 | ||||||
| 8.00% 5/15/19 | 282,000 | 310,905 | ||||||
| # | Samson Investment 144A | |||||||
| 9.75% 2/15/20 | 70,000 | 70,963 | ||||||
| SandRidge Energy | ||||||||
| 7.50% 3/15/21 | 90,000 | 89,100 | ||||||
| Southwestern Energy | ||||||||
| #144A 4.10% 3/15/22 | 705,000 | 700,250 | ||||||
| 7.50% 2/1/18 | 2,300,000 | 2,782,663 | ||||||
| * | TNK-BP Finance | |||||||
| 7.50% 3/13/13 | 3,000,000 | 3,161,249 | ||||||
| Transocean | ||||||||
| 5.05% 12/15/16 | 295,000 | 316,254 | ||||||
| 6.375% 12/15/21 | 1,425,000 | 1,606,317 | ||||||
| Weatherford Bermuda | ||||||||
| 4.50% 4/15/22 | 320,000 | 319,536 | ||||||
| 9.625% 3/1/19 | 775,000 | 1,028,475 | ||||||
| # | Woodside Finance 144A | |||||||
| 8.125% 3/1/14 | 320,000 | 354,883 | ||||||
| 8.75% 3/1/19 | 890,000 | 1,131,022 | ||||||
| 39,866,904 | ||||||||
| Finance Companies – 2.40% | ||||||||
| American Express | ||||||||
| 7.00% 3/19/18 | 6,100,000 | 7,498,034 | ||||||
| # | BM&FBovespa 144A | |||||||
| 5.50% 7/16/20 | 200,000 | 214,500 | ||||||
| # | CDP Financial 144A | |||||||
| 4.40% 11/25/19 | 1,260,000 | 1,362,360 | ||||||
| 5.60% 11/25/39 | 880,000 | 1,034,051 | ||||||
| • | Credit Suisse USA | |||||||
| 0.83% 4/12/13 | 4,000,000 | 3,985,211 | ||||||
| FTI Consulting | ||||||||
| 6.75% 10/1/20 | 230,000 | 247,538 | ||||||
| 7.75% 10/1/16 | 5,000 | 5,169 | ||||||
| General Electric Capital | ||||||||
| 4.65% 10/17/21 | 1,130,000 | 1,205,007 | ||||||
| 5.50% 2/1/17 | NZD | 720,000 | 602,335 | |||||
| 6.00% 8/7/19 | USD | 2,245,000 | 2,625,593 | |||||
(continues) 49
Statements of net assets
Optimum Fixed Income Fund
| Principal | Value | |||||||
| Amount° | (U.S. $) | |||||||
| Corporate Bonds (continued) | ||||||||
| Finance Companies (continued) | ||||||||
| International Lease Finance | ||||||||
| 5.875% 4/1/19 | USD | 265,000 | $ | 256,471 | ||||
| 6.25% 5/15/19 | 565,000 | 557,841 | ||||||
| 8.25% 12/15/20 | 180,000 | 198,488 | ||||||
| 8.75% 3/15/17 | 495,000 | 551,925 | ||||||
| *# | IPIC GMTN 144A | |||||||
| 5.50% 3/1/22 | 546,000 | 564,428 | ||||||
| Nuveen Investments | ||||||||
| 10.50% 11/15/15 | 164,000 | 170,765 | ||||||
| #144A 10.50% 11/15/15 | 185,000 | 191,706 | ||||||
| SLM | ||||||||
| 5.375% 5/15/14 | 1,400,000 | 1,446,365 | ||||||
| 6.25% 1/25/16 | 1,300,000 | 1,353,140 | ||||||
| •# | SSIF Nevada 144A | |||||||
| 1.267% 4/14/14 | 900,000 | 893,672 | ||||||
| @# | Stone Street Trust 144A | |||||||
| 5.902% 12/15/15 | 2,300,000 | 2,312,409 | ||||||
| Waha Aerospace | ||||||||
| 3.925% 7/28/20 | 1,785,000 | 1,853,366 | ||||||
| 29,130,374 | ||||||||
| Insurance – 0.90% | ||||||||
| American International Group | ||||||||
| #144A 3.75% 11/30/13 | 600,000 | 607,168 | ||||||
| 5.85% 1/16/18 | 95,000 | 103,568 | ||||||
| 8.25% 8/15/18 | 2,360,000 | 2,840,193 | ||||||
| • | Chubb 6.375% 3/29/67 | 820,000 | 850,750 | |||||
| •# | ILFC E-Capital Trust I 144A | |||||||
| 5.03% 12/21/65 | 100,000 | 67,016 | ||||||
| •# | ILFC E-Capital Trust II 144A | |||||||
| 6.25% 12/21/65 | 405,000 | 298,688 | ||||||
| • | ING Groep 5.775% 12/29/49 | 425,000 | 367,625 | |||||
| •# | Liberty Mutual Group | |||||||
| 144A 7.00% 3/15/37 | 180,000 | 162,900 | ||||||
| MetLife 6.817% 8/15/18 | 500,000 | 613,467 | ||||||
| # | Metlife Capital Trust IV 144A | |||||||
| 7.875% 12/15/37 | 300,000 | 331,500 | ||||||
| # | MetLife Capital Trust X | |||||||
| 144A 9.25% 4/8/38 | 1,100,000 | 1,331,000 | ||||||
| @# | NLV Financial 144A | |||||||
| 6.50% 3/15/35 | 385,000 | 320,600 | ||||||
| Prudential Financial | ||||||||
| 3.875% 1/14/15 | 290,000 | 305,573 | ||||||
| 4.50% 11/15/20 | 265,000 | 281,652 | ||||||
| 4.50% 11/16/21 | 80,000 | 85,116 | ||||||
| 6.00% 12/1/17 | 540,000 | 629,913 | ||||||
| •# | Symetra Financial 144A | |||||||
| 8.30% 10/15/37 | 515,000 | 512,425 | ||||||
| =w@‡# | Twin Reefs Pass | |||||||
| Through Trust 144A | ||||||||
| 0.00% 12/29/49 | 300,000 | 0 | ||||||
| • | XL Group 6.50% 12/31/49 | 275,000 | 234,438 | |||||
| •# | ZFS Finance USA Trust II 144A | |||||||
| 6.45% 12/15/65 | 500,000 | 500,000 | ||||||
| •# | ZFS Finance USA Trust IV | |||||||
| 144A 5.875% 5/9/32 | 500,000 | 504,375 | ||||||
| 10,947,967 | ||||||||
| Natural Gas – 2.13% | ||||||||
| AmeriGas Finance | ||||||||
| 6.75% 5/20/20 | 60,000 | 61,050 | ||||||
| 7.00% 5/20/22 | 70,000 | 71,575 | ||||||
| AmeriGas Partners | ||||||||
| 6.50% 5/20/21 | 82,000 | 83,640 | ||||||
| CenterPoint Energy | ||||||||
| 5.95% 2/1/17 | 830,000 | 943,301 | ||||||
| # | China Resources Gas | |||||||
| Group 144A | ||||||||
| 4.50% 4/5/22 | 520,000 | 512,063 | ||||||
| Copano Energy | ||||||||
| 7.75% 6/1/18 | 218,000 | 229,445 | ||||||
| El Paso Pipeline | ||||||||
| 6.50% 4/1/20 | 830,000 | 931,674 | ||||||
| • | Enbridge Energy | |||||||
| 8.05% 10/1/37 | 1,365,000 | 1,484,528 | ||||||
| Energy Transfer Partners | ||||||||
| 4.65% 6/1/21 | 375,000 | 382,750 | ||||||
| 6.05% 6/1/41 | 190,000 | 192,386 | ||||||
| 9.70% 3/15/19 | 916,000 | 1,172,655 | ||||||
| Enterprise Products Operating | ||||||||
| •7.034% 1/15/68 | 1,360,000 | 1,463,741 | ||||||
| 9.75% 1/31/14 | 1,005,000 | 1,153,784 | ||||||
| Inergy 6.875% 8/1/21 | 125,000 | 120,938 | ||||||
| Kinder Morgan | ||||||||
| Energy Partners | ||||||||
| 3.95% 9/1/22 | 715,000 | 709,392 | ||||||
| 5.95% 2/15/18 | 1,000,000 | 1,169,394 | ||||||
| 9.00% 2/1/19 | 1,170,000 | 1,500,703 | ||||||
| # | NGPL PipeCo 144A | |||||||
| 6.514% 12/15/12 | 2,000,000 | 1,930,292 | ||||||
| Plains All American Pipeline | ||||||||
| 3.65% 6/1/22 | 645,000 | 634,546 | ||||||
| 8.75% 5/1/19 | 1,045,000 | 1,362,995 | ||||||
| @ | Ras Laffan Liquefied | |||||||
| Natural Gas II | ||||||||
| 5.298% 9/30/20 | 2,519,400 | 2,708,355 | ||||||
| # | Ras Laffan Liquefied | |||||||
| Natural Gas III 144A | ||||||||
| 5.832% 9/30/16 | 310,320 | 333,594 | ||||||
| # | Rockies Express | |||||||
| Pipeline 144A | ||||||||
| 6.25% 7/15/13 | 1,000,000 | 1,020,000 | ||||||
| 6.85% 7/15/18 | 500,000 | 470,000 | ||||||
| Southwest Gas | ||||||||
| 3.875% 4/1/22 | 945,000 | 965,972 | ||||||
| • | TransCanada PipeLines | |||||||
| 6.35% 5/15/67 | 1,920,000 | 1,986,682 | ||||||
50
| Principal | Value | |||||||
| Amount° | (U.S. $) | |||||||
| Corporate Bonds (continued) | ||||||||
| Natural Gas (continued) | ||||||||
| Williams | ||||||||
| 7.75% 6/15/31 | USD | 195,000 | $ | 238,194 | ||||
| 8.75% 3/15/32 | 198,000 | 261,727 | ||||||
| Williams Partners | ||||||||
| 4.00% 11/15/21 | 645,000 | 653,055 | ||||||
| 7.25% 2/1/17 | 915,000 | 1,102,249 | ||||||
| 25,850,680 | ||||||||
| Real Estate – 1.50% | ||||||||
| Alexandria Real Estate | ||||||||
| Equities 4.60% 4/1/22 | 980,000 | 961,214 | ||||||
| American Tower | ||||||||
| 5.90% 11/1/21 | 2,230,000 | 2,462,727 | ||||||
| Brandywine Operating | ||||||||
| Partnership | ||||||||
| 4.95% 4/15/18 | 755,000 | 770,880 | ||||||
| Developers Diversified Realty | ||||||||
| 4.75% 4/15/18 | 310,000 | 321,554 | ||||||
| 7.50% 4/1/17 | 625,000 | 709,874 | ||||||
| 7.875% 9/1/20 | 631,000 | 747,438 | ||||||
| 9.625% 3/15/16 | 145,000 | 175,702 | ||||||
| Digital Realty Trust | ||||||||
| 5.25% 3/15/21 | 1,280,000 | 1,322,121 | ||||||
| 5.875% 2/1/20 | 425,000 | 463,652 | ||||||
| HCP 5.375% 2/1/21 | 2,300,000 | 2,482,819 | ||||||
| Health Care REIT | ||||||||
| 4.125% 4/1/19 | 355,000 | 352,701 | ||||||
| 5.25% 1/15/22 | 1,085,000 | 1,137,093 | ||||||
| Qatari Diar Finance | ||||||||
| 3.50% 7/21/15 | 2,100,000 | 2,184,000 | ||||||
| #144A 5.00% 7/21/20 | 486,000 | 523,058 | ||||||
| Rayonier 3.75% 4/1/22 | 680,000 | 668,659 | ||||||
| Regency Centers | ||||||||
| 4.80% 4/15/21 | 420,000 | 434,207 | ||||||
| 5.875% 6/15/17 | 285,000 | 319,092 | ||||||
| UDR 4.625% 1/10/22 | 870,000 | 892,354 | ||||||
| •# | USB Realty 144A | |||||||
| 1.719% 12/29/49 | 300,000 | 227,568 | ||||||
| # | WEA Finance 144A | |||||||
| 4.625% 5/10/21 | 1,040,000 | 1,053,999 | ||||||
| 18,210,712 | ||||||||
| Technology – 1.01% | ||||||||
| Amkor Technology | ||||||||
| 7.375% 5/1/18 | 125,000 | 134,531 | ||||||
| Avaya | ||||||||
| #144A 7.00% 4/1/19 | 320,000 | 322,400 | ||||||
| 9.75% 11/1/15 | 300,000 | 297,000 | ||||||
| PIK 10.125% 11/1/15 | 120,000 | 119,400 | ||||||
| Broadcom 2.70% 11/1/18 | 665,000 | 677,183 | ||||||
| CDW 12.535% 10/12/17 | 180,000 | 196,425 | ||||||
| Fidelity National | ||||||||
| Information Services | ||||||||
| 7.875% 7/15/20 | 75,000 | 83,625 | ||||||
| First Data | ||||||||
| 9.875% 9/24/15 | 320,000 | 323,200 | ||||||
| 10.55% 9/24/15 | 185,000 | 188,700 | ||||||
| 11.25% 3/31/16 | 160,000 | 145,600 | ||||||
| GXS Worldwide | ||||||||
| 9.75% 6/15/15 | 514,000 | 502,435 | ||||||
| Hewlett-Packard | ||||||||
| 4.05% 9/15/22 | 1,835,000 | 1,831,393 | ||||||
| Jabil Circuit 7.75% 7/15/16 | 82,000 | 93,890 | ||||||
| National Semiconductor | ||||||||
| 6.60% 6/15/17 | 1,395,000 | 1,722,869 | ||||||
| # | Seagate Technology | |||||||
| International 144A | ||||||||
| 10.00% 5/1/14 | 735,000 | 834,225 | ||||||
| Symantec 4.20% 9/15/20 | 2,585,000 | 2,641,616 | ||||||
| # | Unisys 144A 12.75% 10/15/14 | 110,000 | 123,200 | |||||
| Xerox | ||||||||
| 4.50% 5/15/21 | 1,330,000 | 1,370,780 | ||||||
| 6.35% 5/15/18 | 525,000 | 609,918 | ||||||
| 12,218,390 | ||||||||
| Transportation – 0.83% | ||||||||
| w | American Airlines 2011-1 | |||||||
| Class A Pass Through | ||||||||
| Trust 5.25% 1/31/21 | 582,490 | 594,140 | ||||||
| # | Brambles USA 144A | |||||||
| 3.95% 4/1/15 | 1,660,000 | 1,715,333 | ||||||
| 5.35% 4/1/20 | 320,000 | 340,451 | ||||||
| Burlington Northern Santa Fe | ||||||||
| 4.40% 3/15/42 | 1,415,000 | 1,343,147 | ||||||
| 5.65% 5/1/17 | 380,000 | 442,681 | ||||||
| w | Continental Airlines 2009-2 | |||||||
| Class A Pass Through | ||||||||
| Trust 7.25% 5/10/21 | 834,173 | 934,274 | ||||||
| CSX 4.75% 5/30/42 | 210,000 | 204,465 | ||||||
| w | Delta Air Lines 2007-1 | |||||||
| Class A Pass Through | ||||||||
| Trust 6.821% 8/10/22 | 366,467 | 401,281 | ||||||
| w | Delta Air Lines 2010-1 | |||||||
| Class A Pass Through | ||||||||
| Trust 6.20% 7/2/18 | 449,642 | 486,738 | ||||||
| # | ERAC USA Finance 144A | |||||||
| 5.25% 10/1/20 | 1,365,000 | 1,482,419 | ||||||
| Russian Railways | ||||||||
| 5.739% 4/3/17 | 1,000,000 | 1,063,750 | ||||||
| w | UAL 2009-1 Pass Through | |||||||
| Trust 10.40% 11/1/16 | 383,928 | 437,678 | ||||||
| w | UAL 2009-2A Pass Through | |||||||
| Trust 9.75% 1/15/17 | 250,466 | 286,783 | ||||||
| # | United Air Lines 144A | |||||||
| 12.00% 11/1/13 | 282,000 | 300,330 | ||||||
| 10,033,470 | ||||||||
| Total Corporate Bonds | ||||||||
| (cost $449,646,528) | 466,379,579 | |||||||
(continues) 51
Statements of net assets
Optimum Fixed Income Fund
| Principal | Value | |||||||
| Amount° | (U.S. $) | |||||||
| Municipal Bonds – 0.68% | ||||||||
| Bay Area California | ||||||||
| Toll Authority | ||||||||
| 6.918% 4/1/40 | USD | 800,000 | $ | 1,050,624 | ||||
| 7.043% 4/1/50 | 3,000,000 | 4,016,280 | ||||||
| California State | ||||||||
| 7.30% 10/1/39 | 200,000 | 251,406 | ||||||
| Los Angeles, California | ||||||||
| Community College | ||||||||
| District Revenue | ||||||||
| Build America Bonds | ||||||||
| 6.60% 8/1/42 | 800,000 | 1,038,064 | ||||||
| New York City Transitional | ||||||||
| Finance Authority | ||||||||
| 5.508% 8/1/37 | 700,000 | 822,472 | ||||||
| New York State Urban | ||||||||
| Development | ||||||||
| 5.77% 3/15/39 | 800,000 | 942,088 | ||||||
| Oregon State | ||||||||
| Taxable Pension | ||||||||
| 5.892% 6/1/27 | 65,000 | 78,964 | ||||||
| Sacramento County, | ||||||||
| California Public | ||||||||
| Finance Authority | ||||||||
| Revenue (Housing | ||||||||
| Tax County | ||||||||
| Project) Series B | ||||||||
| 5.18% 12/1/13 | ||||||||
| (NATL-RE) (FGIC) | 45,000 | 45,561 | ||||||
| Total Municipal Bonds | ||||||||
| (cost $6,482,104) | 8,245,459 | |||||||
| Non-Agency Asset-Backed Securities – 0.88% | ||||||||
| • | Ally Master Owner Trust | |||||||
| Series 2011-1 A1 | ||||||||
| 1.112% 1/15/16 | 730,000 | 736,214 | ||||||
| • | American Express Credit | |||||||
| Account Master | ||||||||
| Trust Series 2010-1 B | ||||||||
| 0.842% 11/16/15 | 405,000 | 405,640 | ||||||
| # | Avis Budget Rental Car | |||||||
| Funding AESOP 144A | ||||||||
| Series 2011-2A A | ||||||||
| 2.37% 11/20/14 | 465,000 | 471,809 | ||||||
| # | Cabela’s Master Credit | |||||||
| Card Trust 144A | ||||||||
| Series 2012-1A A1 | ||||||||
| 1.63% 2/18/20 | 635,000 | 630,985 | ||||||
| Capital One Multi-Asset | ||||||||
| Execution Trust | ||||||||
| Series 2007-A7 A7 | ||||||||
| 5.75% 7/15/20 | 685,000 | 814,616 | ||||||
| CenterPoint Energy | ||||||||
| Transition Bond | ||||||||
| Series 2012-1 A2 | ||||||||
| 2.161% 10/15/21 | 405,000 | 406,595 | ||||||
| Centex Home Equity | ||||||||
| Series 2002-A AF6 | ||||||||
| 5.54% 1/25/32 | 21,546 | 21,714 | ||||||
| # | CIT Equipment Collateral | |||||||
| Series 2010-VT1A A3 | ||||||||
| 144A 2.41% 5/15/13 | 127,281 | 127,718 | ||||||
| • | Citicorp Residential | |||||||
| Mortgage Securities | ||||||||
| Series 2006-3 A4 | ||||||||
| 5.703% 11/25/36 | 808,861 | 781,362 | ||||||
| Series 2006-3 A5 | ||||||||
| 5.948% 11/25/36 | 900,000 | 698,218 | ||||||
| • | Countrywide Asset-Backed | |||||||
| Certificates Series | ||||||||
| 2006-11 1AF6 | ||||||||
| 5.695% 9/25/46 | 1,272,863 | 803,876 | ||||||
| Discover Card Master Trust | ||||||||
| Series 2007-A1 A1 | ||||||||
| 5.65% 3/16/20 | 310,000 | 369,806 | ||||||
| Series 2012-A1 A1 | ||||||||
| 0.81% 8/15/17 | 685,000 | 683,304 | ||||||
| # | Ford Auto Securitization | |||||||
| Trust Series | ||||||||
| 2011-R1A A3 144A | ||||||||
| 3.02% 2/15/16 | CAD | 340,000 | 347,993 | |||||
| • | Ford Credit Floorplan | |||||||
| Master Owner Trust | ||||||||
| Series 2009-2 A | ||||||||
| 1.792% 9/15/14 | USD | 385,000 | 387,649 | |||||
| GE Capital Credit Card | ||||||||
| Master Note Trust | ||||||||
| Series 2012-2A | ||||||||
| 2.22% 1/18/22 | 555,000 | 551,032 | ||||||
| # | Golden Credit Card Trust | |||||||
| 144A Series 2012-2A | ||||||||
| A1 1.77% 1/15/19 | 575,000 | 573,765 | ||||||
| Harley-Davidson | ||||||||
| Motorcycle Trust | ||||||||
| Series 2008-1 A4 | ||||||||
| 4.90% 12/15/13 | 163,929 | 165,300 | ||||||
| Series 2009-4 A3 | ||||||||
| 1.87% 2/17/14 | 37,640 | 37,690 | ||||||
| • | HSI Asset Securitization | |||||||
| Trust Series | ||||||||
| 2006-HE1 2A1 | ||||||||
| 0.292% 10/25/36 | 55,505 | 19,208 | ||||||
| • | MBNA Credit Card | |||||||
| Master Note Trust | ||||||||
| Series 2002-C3 C3 | ||||||||
| 1.592% 10/15/14 | 520,000 | 520,564 | ||||||
| • | Merrill Auto Trust | |||||||
| Securitization | ||||||||
| Series 2007-1 A4 | ||||||||
| 0.302% 12/15/13 | 12,005 | 12,003 | ||||||
| • | Residential Asset Securities | |||||||
| Series 2006-EMX1 A2 | ||||||||
| 0.472% 1/25/36 | 225,949 | 202,120 | ||||||
52
| Principal | Value | |||||||
| Amount° | (U.S. $) | |||||||
| Non-Agency Asset-Backed Securities (continued) | ||||||||
| • | SLM Student Loan Trust | |||||||
| Series 2005-4 A2 | ||||||||
| 0.640% 4/26/21 | USD | 555,452 | $ | 553,194 | ||||
| # | Sonic Capital Series | |||||||
| 2011-1A A2 144A | ||||||||
| 5.438% 5/20/41 | 326,625 | 340,321 | ||||||
| • | Vanderbilt Mortgage | |||||||
| Finance Series 2001-A | ||||||||
| A4 7.235% 6/7/28 | 59,236 | 61,935 | ||||||
| Total Non-Agency | ||||||||
| Asset-Backed Securities | ||||||||
| (cost $11,090,171) | 10,724,631 | |||||||
| Non-Agency Collateralized Mortgage Obligations – 4.31% | ||||||||
| • | ARM Trust | |||||||
| Series 2004-5 3A1 | ||||||||
| 2.737% 4/25/35 | 2,697,503 | 2,462,052 | ||||||
| Series 2005-10 3A31 | ||||||||
| 5.15% 1/25/36 | 1,145,000 | 987,221 | ||||||
| Series 2006-2 1A4 | ||||||||
| 5.407% 5/25/36 | 1,440,000 | 951,337 | ||||||
| Bank of America Alternative | ||||||||
| Loan Trust | ||||||||
| Series 2004-11 1CB1 | ||||||||
| 6.00% 12/25/34 | 1,382 | 1,348 | ||||||
| Series 2005-3 2A1 | ||||||||
| 5.50% 4/25/20 | 67,368 | 69,179 | ||||||
| Series 2005-6 7A1 | ||||||||
| 5.50% 7/25/20 | 218,368 | 208,542 | ||||||
| Series 2005-9 5A1 | ||||||||
| 5.50% 10/25/20 | 213,096 | 205,969 | ||||||
| Bank of America Funding | ||||||||
| Securities Series | ||||||||
| 2006-5 2A10 | ||||||||
| 5.75% 9/25/36 | 420,272 | 419,595 | ||||||
| • | Bear Stearns ARM Trust | |||||||
| Series 2005-5 A1 | ||||||||
| 2.22% 8/25/35 | 3,989,224 | 3,849,465 | ||||||
| Chase Mortgage Finance | ||||||||
| Series 2003-S8 A2 | ||||||||
| 5.00% 9/25/18 | 84,086 | 87,255 | ||||||
| •Series 2005-A1 3A1 | ||||||||
| 5.097% 12/25/35 | 401,471 | 353,910 | ||||||
| • | Chaseflex Trust Series | |||||||
| 2006-1 A4 | ||||||||
| 6.23% 6/25/36 | 420,000 | 312,134 | ||||||
| Citicorp Mortgage | ||||||||
| Securities Series | ||||||||
| 2006-4 3A1 | ||||||||
| 5.50% 8/25/21 | 75,405 | 73,944 | ||||||
| • | Citigroup Mortgage Loan | |||||||
| Trust Series 2004-UST1 | ||||||||
| A6 5.069% 8/25/34 | 71,773 | 73,352 | ||||||
| Countrywide Alternative | ||||||||
| Loan Trust | ||||||||
| •Series 2003-21T1 A2 | ||||||||
| 2.803% 5/25/33 | 89,626 | 89,980 | ||||||
| Series 2004-14T2 A6 | ||||||||
| 5.50% 8/25/34 | 106,794 | 106,775 | ||||||
| Series 2004-J1 1A1 | ||||||||
| 6.00% 2/25/34 | 4,962 | 5,069 | ||||||
| Series 2004-J2 7A1 | ||||||||
| 6.00% 12/25/33 | 7,244 | 7,249 | ||||||
| Series 2008-2R 3A1 | ||||||||
| 6.00% 8/25/37 | 3,049,011 | 2,435,632 | ||||||
| w | Countrywide Home Loan | |||||||
| Mortgage Pass | ||||||||
| Through Trust | ||||||||
| •Series 2003-21 A1 | ||||||||
| 2.803% 5/25/33 | 4,758 | 4,702 | ||||||
| Series 2007-4 1A1 | ||||||||
| 6.00% 5/25/37 | 3,953,871 | 3,190,647 | ||||||
| Credit Suisse First Boston | ||||||||
| Mortgage Securities | ||||||||
| Series 2004-1 3A1 | ||||||||
| 7.00% 2/25/34 | 3,502 | 3,639 | ||||||
| Credit Suisse Mortgage | ||||||||
| Capital Certificates | ||||||||
| #Series 2005-1R 2A5 | ||||||||
| 144A 5.75% 12/26/35 | 5,408,496 | 4,317,733 | ||||||
| Series 2007-1 5A14 | ||||||||
| 6.00% 2/25/37 | 873,199 | 676,367 | ||||||
| •Series 2007-3 4A6 | ||||||||
| 0.492% 4/25/37 | 1,513,440 | 1,179,594 | ||||||
| @•ûSeries 2007-3 4A12 | ||||||||
| 6.508% 4/25/37 | 1,513,440 | 165,120 | ||||||
| Series 2007-3 4A15 | ||||||||
| 5.50% 4/25/37 | 632,062 | 568,544 | ||||||
| Series 2007-5 3A19 | ||||||||
| 6.00% 8/25/37 | 1,479,124 | 1,354,554 | ||||||
| Series 2007-5 10A2 | ||||||||
| 6.00% 4/25/29 | 600,265 | 618,499 | ||||||
| •# | Deutsche Mortgage | |||||||
| Securities Series | ||||||||
| 2005-WF1 1A3 144A | ||||||||
| 5.248% 6/26/35 | 1,720,000 | 1,671,721 | ||||||
| • | First Horizon Asset | |||||||
| Securities Series | ||||||||
| 2005-AR2 2A1 | ||||||||
| 2.701% 6/25/35 | 374,832 | 306,641 | ||||||
| GMAC Mortgage Loan | ||||||||
| Trust Series 2006-J1 | ||||||||
| A1 5.75% 4/25/36 | 424,048 | 402,418 | ||||||
| •# | GSMPS Mortgage Loan | |||||||
| Trust 144A | ||||||||
| Series 1998-3 A | ||||||||
| 7.75% 9/19/27 | 13,996 | 14,859 | ||||||
| Series 1999-3 A | ||||||||
| 8.00% 8/19/29 | 23,594 | 23,295 | ||||||
(continues) 53
Statements of net assets
Optimum Fixed Income Fund
| Principal | Value | |||||||
| Amount° | (U.S. $) | |||||||
| Non-Agency Collateralized Mortgage Obligations (continued) | ||||||||
| • | GSR Mortgage Loan Trust | |||||||
| Series 2006-AR1 3A1 | ||||||||
| 5.018% 1/25/36 | USD | 196,890 | $ | 175,141 | ||||
| • | Indymac INDA Mortgage | |||||||
| Loan Trust Series | ||||||||
| 2006-AR1 A1 | ||||||||
| 5.519% 8/25/36 | 467,228 | 455,290 | ||||||
| • | JPMorgan Mortgage Trust | |||||||
| Series 2006-A6 2A4L | ||||||||
| 5.141% 10/25/36 | 1,569,768 | 1,226,469 | ||||||
| Series 2006-A7 2A2 | ||||||||
| 2.721% 1/25/37 | 315,412 | 222,025 | ||||||
| Series 2007-A1 6A1 | ||||||||
| 3.845% 7/25/35 | 942,063 | 881,709 | ||||||
| Lehman Mortgage Trust | ||||||||
| Series 2007-10 2A2 | ||||||||
| 6.50% 1/25/38 | 4,553,207 | 4,172,163 | ||||||
| MASTR Alternative | ||||||||
| Loans Trust | ||||||||
| Series 2004-3 8A1 | ||||||||
| 7.00% 4/25/34 | 5,660 | 5,683 | ||||||
| Series 2004-5 6A1 | ||||||||
| 7.00% 6/25/34 | 95,666 | 101,342 | ||||||
| • | MASTR ARM Trust | |||||||
| Series 2003-6 1A2 | ||||||||
| 6.808% 12/25/33 | 4,049 | 3,900 | ||||||
| Series 2005-6 7A1 | ||||||||
| 5.206% 6/25/35 | 124,459 | 124,999 | ||||||
| Series 2006-2 4A1 | ||||||||
| 4.854% 2/25/36 | 31,679 | 30,511 | ||||||
| MASTR Asset | ||||||||
| Securitization Trust | ||||||||
| Series 2003-9 2A7 | ||||||||
| 5.50% 10/25/33 | 188,481 | 195,777 | ||||||
| •# | MASTR Specialized | |||||||
| Loan Trust Series | ||||||||
| 2005-2 A2 144A | ||||||||
| 5.006% 7/25/35 | 90,629 | 91,154 | ||||||
| • | Merrill Lynch Mortgage | |||||||
| Investors Series | ||||||||
| 2005-A5 A2 | ||||||||
| 2.644% 6/25/35 | 460,000 | 422,384 | ||||||
| • | Opteum Mortgage | |||||||
| Acceptance Series | ||||||||
| 2006-1 2A1 | ||||||||
| 5.75% 4/25/36 | 3,918,905 | 3,723,705 | ||||||
| Residential Accredit Loans | ||||||||
| Series 2004-QS2 CB | ||||||||
| 5.75% 2/25/34 | 75,534 | 75,688 | ||||||
| Residential Funding | ||||||||
| Mortgage Securities | ||||||||
| I Series 2004-S9 2A1 | ||||||||
| 4.75% 12/25/19 | 574,789 | 586,999 | ||||||
| • | Sequoia Mortgage Trust | |||||||
| Series 2007-1 4A1 | ||||||||
| 5.339% 9/20/46 | 1,823,052 | 1,422,815 | ||||||
| • | Structured ARM Loan Trust | |||||||
| Series 2005-22 1A4 | ||||||||
| 2.50% 12/25/35 | 2,025,414 | 846,291 | ||||||
| Series 2006-1 7A4 | ||||||||
| 5.439% 2/25/36 | 1,305,000 | 754,712 | ||||||
| Series 2006-5 5A4 | ||||||||
| 5.231% 6/25/36 | 5,818 | 461 | ||||||
| Structured Asset Securities | ||||||||
| Series 2005-6 4A1 | ||||||||
| 5.00% 5/25/35 | 186,527 | 183,810 | ||||||
| w | Washington Mutual | |||||||
| Alternative | ||||||||
| Mortgage Pass | ||||||||
| Through Certificates | ||||||||
| Series 2005-1 5A2 | ||||||||
| 6.00% 3/25/35 | 82,866 | 53,710 | ||||||
| w | Washington Mutual | |||||||
| Mortgage Pass | ||||||||
| Through Certificates | ||||||||
| Series 2004-CB3 1A | ||||||||
| 6.00% 10/25/34 | 130,907 | 136,987 | ||||||
| • | Series 2005-AR16 1A3 | |||||||
| 2.457% 12/25/35 | 1,225,000 | 985,814 | ||||||
| • | Series 2007-HY1 3A3 | |||||||
| 5.442% 2/25/37 | 850,000 | 708,901 | ||||||
| • | Series 2007-HY7 4A1 | |||||||
| 5.349% 7/25/37 | 1,755,078 | 1,470,634 | ||||||
| Wells Fargo Mortgage- | ||||||||
| Backed Securities Trust | ||||||||
| Series 2005-18 1A1 | ||||||||
| 5.50% 1/25/36 | 50,147 | 46,497 | ||||||
| • | Series 2005-AR13 A1 | |||||||
| 5.248% 5/25/35 | 574,680 | 574,414 | ||||||
| Series 2006-2 3A1 | ||||||||
| 5.75% 3/25/36 | 323,978 | 320,400 | ||||||
| Series 2006-3 A1 | ||||||||
| 5.50% 3/25/36 | 261,860 | 259,952 | ||||||
| Series 2006-3 A11 | ||||||||
| 5.50% 3/25/36 | 283,805 | 283,438 | ||||||
| Series 2006-6 1A3 | ||||||||
| 5.75% 5/25/36 | 330,111 | 318,194 | ||||||
| • | Series 2006-AR5 2A1 | |||||||
| 2.638% 4/25/36 | 144,770 | 114,429 | ||||||
| • | Series 2006-AR11 A6 | |||||||
| 5.133% 8/25/36 | 2,170,468 | 1,909,608 | ||||||
| • | Series 2006-AR17 A1 | |||||||
| 2.611% 10/25/36 | 1,307,104 | 993,412 | ||||||
| Series 2007-10 1A36 | ||||||||
| 6.00% 7/25/37 | 1,246,209 | 1,130,168 | ||||||
| Series 2007-13 A9 | ||||||||
| 6.00% 9/25/37 | 351,342 | 41,584 | ||||||
| Total Non-Agency Collateralized | ||||||||
| Mortgage Obligations | ||||||||
| (cost $54,982,778) | 52,249,511 | |||||||
54
| Principal | Value | ||||||||||
| Amount° | (U.S. $) | ||||||||||
| ΔRegional Bonds – 1.71% | |||||||||||
| Australia – 1.20% | |||||||||||
| New South Wales Treasury | |||||||||||
| 6.00% 4/1/19 | AUD | 3,538,000 | $ | 4,000,835 | |||||||
| Queensland Treasury | |||||||||||
| 6.00% 9/14/17 | AUD | 1,558,000 | 1,739,310 | ||||||||
| 6.25% 6/14/19 | AUD | 7,727,000 | 8,795,895 | ||||||||
| 14,536,040 | |||||||||||
| Canada – 0.51% | |||||||||||
| Ontario Province | |||||||||||
| 3.15% 6/2/22 | CAD | 2,987,000 | 3,000,863 | ||||||||
| 4.00% 6/2/21 | CAD | 2,752,000 | 2,976,591 | ||||||||
| Quebec Province | |||||||||||
| 4.25% 12/1/21 | CAD | 214,000 | 234,833 | ||||||||
| 6,212,287 | |||||||||||
| Total Regional Bonds | |||||||||||
| (cost $20,377,454) | 20,748,327 | ||||||||||
| Securities Sold Short – (0.81%) | |||||||||||
| Fannie Mae S.F. 30 yr TBA | |||||||||||
| 5.50% 5/1/42 | USD | (7,000,000 | ) | (7,614,687 | ) | ||||||
| 6.00% 5/1/42 | (1,000,000 | ) | (1,100,156 | ) | |||||||
| 6.50% 5/1/42 | (1,000,000 | ) | (1,119,375 | ) | |||||||
| Total Securities Sold Short | |||||||||||
| (proceeds $9,810,781) | (9,834,218 | ) | |||||||||
| «Senior Secured Loans – 1.84% | |||||||||||
| 99 Cents Only Stores | |||||||||||
| Tranche B | |||||||||||
| 7.00% 10/4/18 | 279,663 | 284,757 | |||||||||
| Alliance HealthCare | |||||||||||
| Services 7.25% 6/1/16 | 246,487 | 229,233 | |||||||||
| Allied Security Holdings | |||||||||||
| Tranche Loan 2L | |||||||||||
| 8.50% 1/21/18 | 150,000 | 150,500 | |||||||||
| Anchor Glass Container | |||||||||||
| 6.00% 2/3/16 | 278,500 | 278,936 | |||||||||
| Aspect Software Tranche B | |||||||||||
| 6.25% 5/7/16 | 137,200 | 137,643 | |||||||||
| Attachmate | |||||||||||
| 6.50% 11/21/16 | 358,528 | 356,962 | |||||||||
| Avis Budget Car | |||||||||||
| Rental Tranche B | |||||||||||
| 6.25% 6/13/18 | 166,493 | 168,089 | |||||||||
| BNY ConvergEx Group | |||||||||||
| 8.75% 11/29/17 | 100,497 | 99,994 | |||||||||
| 8.75% 12/16/17 | 239,503 | 238,306 | |||||||||
| Brickman Group | |||||||||||
| Holdings Tranche B | |||||||||||
| 7.25% 10/14/16 | 227,398 | 230,051 | |||||||||
| Brock Holdings III | |||||||||||
| 10.00% 2/15/18 | 385,000 | 376,819 | |||||||||
| Tranche B | |||||||||||
| 6.00% 2/15/17 | 105,665 | 105,401 | |||||||||
| Burlington Coat Factory | |||||||||||
| Warehouse Tranche B | |||||||||||
| 6.25% 2/10/17 | 440,628 | 444,285 | |||||||||
| Caesars Entertainment | |||||||||||
| Operating Tranche B6 | |||||||||||
| 5.494% 1/28/18 | 595,000 | 538,897 | |||||||||
| Cengage Learning | |||||||||||
| Acquisitions | |||||||||||
| 2.49% 7/3/14 | 90,000 | 83,182 | |||||||||
| 7.50% 7/7/14 | 243,167 | 236,025 | |||||||||
| Charter Communications | |||||||||||
| Operating Tranche B | |||||||||||
| 7.25% 3/6/14 | 31,783 | 31,843 | |||||||||
| Chrysler Group | |||||||||||
| 6.00% 4/28/17 | 491,986 | 500,653 | |||||||||
| Clear Channel | |||||||||||
| Communications | |||||||||||
| Tranche A | |||||||||||
| 3.639% 7/30/14 | 691,789 | 638,539 | |||||||||
| Tranche B | |||||||||||
| 3.889% 1/29/16 | 669,333 | 543,760 | |||||||||
| Consolidated Container | |||||||||||
| 5.75% 9/28/14 | 365,000 | 348,575 | |||||||||
| Covanta Energy Tranche B | |||||||||||
| 4.00% 3/1/19 | 55,000 | 54,817 | |||||||||
| Delos Aircraft Tranche 2 | |||||||||||
| 7.00% 3/17/16 | 344,231 | 345,874 | |||||||||
| Delta Air Lines Tranche B | |||||||||||
| 5.50% 3/29/17 | 482,210 | 482,285 | |||||||||
| Dynegy Power Tranche 1st | |||||||||||
| Lien 9.25% 7/11/16 | 134,001 | 140,533 | |||||||||
| Emdeon Tranche B | |||||||||||
| 6.75% 8/3/18 | 299,250 | 304,083 | |||||||||
| First Data Tranche B2 | |||||||||||
| 5.00% 3/24/17 | 436,681 | 418,806 | |||||||||
| Frac Tech International | |||||||||||
| Tranche B | |||||||||||
| 6.25% 4/19/16 | 449,334 | 448,368 | |||||||||
| Fram Group Holdings 1st | |||||||||||
| Lien 6.50% 7/5/17 | 114,425 | 115,379 | |||||||||
| Fresenius Medical | |||||||||||
| Care Tranche B | |||||||||||
| 1.744% 3/31/13 | 1,973,753 | 1,974,808 | |||||||||
| GenOn Energy Tranche B | |||||||||||
| 6.00% 6/20/17 | 157,197 | 155,953 | |||||||||
| Goodman Global Tranche B | |||||||||||
| 5.75% 10/28/16 | 12,896 | 12,997 | |||||||||
| HCA Tranche B | |||||||||||
| 2.619% 11/18/13 | 1,000,000 | 997,029 | |||||||||
| Houghton International | |||||||||||
| Tranche B | |||||||||||
| 6.75% 1/11/16 | 231,642 | 232,656 | |||||||||
| IASIS Healthcare Tranche B | |||||||||||
| 5.00% 4/18/18 | 248,120 | 248,586 | |||||||||
| Immucor Tranche B | |||||||||||
| 7.25% 7/2/18 | 268,650 | 272,093 | |||||||||
(continues) 55
Statements of net assets
Optimum Fixed Income Fund
| Principal | Value | |||||||
| Amount° | (U.S. $) | |||||||
| «Senior Secured Loans (continued) | ||||||||
| Kinetic Concepts Tranche B | ||||||||
| 7.00% 1/12/18 | USD | 473,813 | $ | 484,007 | ||||
| Kronos 1st Lien | ||||||||
| 6.25% 12/11/17 | 109,725 | 109,793 | ||||||
| Level 3 Financing | ||||||||
| Tranche B | ||||||||
| 5.75% 9/1/18 | 200,000 | 202,250 | ||||||
| Tranche B2 | ||||||||
| 5.75% 4/11/18 | 235,000 | 237,644 | ||||||
| Lord & Taylor | ||||||||
| 5.75% 12/2/18 | 150,000 | 151,266 | ||||||
| MTL Publishing Tranche B | ||||||||
| 5.50% 11/14/17 | 170,000 | 171,084 | ||||||
| Multiplan 4.75% 8/26/17 | 355,731 | 353,287 | ||||||
| Nuveen Investments | ||||||||
| 5.863% 5/13/17 | 260,074 | 260,454 | ||||||
| 8.25% 3/1/19 | 853,000 | 866,502 | ||||||
| Tranche B | ||||||||
| 3.26% 11/13/14 | 80,000 | 79,890 | ||||||
| 7.25% 5/13/17 | 185,000 | 186,696 | ||||||
| NXP 5.25% 2/13/19 | 510,000 | 506,494 | ||||||
| OSI Restaurant Partners | ||||||||
| 2.562% 6/13/14 | 529,437 | 521,350 | ||||||
| 2.59% 6/14/13 | 20,190 | 19,938 | ||||||
| 2.592% 6/14/13 | 32,233 | 31,740 | ||||||
| Pharmaceutical Product | ||||||||
| Development | ||||||||
| 6.25% 11/10/18 | 204,488 | 207,284 | ||||||
| Pinnacle Entertainment | ||||||||
| Tranche B | ||||||||
| 4.50% 3/5/19 | 125,000 | 125,755 | ||||||
| Pinnacle Foods | ||||||||
| Tranche B | ||||||||
| 4.75% 10/31/16 | 115,000 | 115,048 | ||||||
| Tranche D | ||||||||
| 6.00% 4/2/14 | 81,432 | 81,709 | ||||||
| PQ 6.79% 7/30/15 | 937,000 | 903,703 | ||||||
| Prestige Brands | ||||||||
| 5.25% 12/20/18 | 105,833 | 106,664 | ||||||
| @ | Prime Healthcare | |||||||
| Services Tranche B | ||||||||
| 7.25% 4/28/15 | 396,120 | 388,693 | ||||||
| Protection One | ||||||||
| 5.75% 3/31/19 | 230,000 | 228,563 | ||||||
| Remy International | ||||||||
| Tranche B | ||||||||
| 6.25% 12/16/16 | 86,769 | 87,202 | ||||||
| Reynolds Group Holdings | ||||||||
| 6.50% 7/7/18 | 666,902 | 676,407 | ||||||
| Roundy’s Supermarkets | ||||||||
| Tranche B | ||||||||
| 5.75% 1/24/19 | 95,000 | 95,802 | ||||||
| @ | SandRidge Energy | |||||||
| 5.00% 2/2/17 | 275,000 | 275,000 | ||||||
| Sensus USA 2nd Lien | ||||||||
| 8.50% 4/13/18 | 465,000 | 465,000 | ||||||
| Sophia Tranche B | ||||||||
| 6.25% 6/5/18 | 100,000 | 101,667 | ||||||
| Swift Transportation | ||||||||
| Tranche B2 | ||||||||
| 1.25% 12/15/17 | 275,000 | 277,200 | ||||||
| Taminco Global Chemical | ||||||||
| 6.25% 12/16/18 | 260,000 | 262,132 | ||||||
| Texas Competitive | ||||||||
| Electric Holdings | ||||||||
| 3.690% 10/10/14 | 105,648 | 64,721 | ||||||
| Toys R Us Delaware | ||||||||
| Tranche B | ||||||||
| 6.00% 9/1/16 | 459,708 | 461,278 | ||||||
| Univision Communications | ||||||||
| 4.489% 3/29/17 | 598,257 | 555,796 | ||||||
| US TelePacific | ||||||||
| 5.75% 2/10/17 | 208,446 | 199,848 | ||||||
| Visant 5.25% 12/31/16 | 116,814 | 114,271 | ||||||
| Yankee Candle | ||||||||
| 5.25% 3/2/19 | 85,000 | 85,381 | ||||||
| Total Senior Secured Loans | ||||||||
| (cost $21,930,811) | 22,288,236 | |||||||
| ΔSovereign Bonds – 6.97% | ||||||||
| Australia – 0.04% | ||||||||
| Australia Government | ||||||||
| Bond 5.75% 5/15/21 | AUD | 372,000 | 436,963 | |||||
| 436,963 | ||||||||
| Brazil – 1.34% | ||||||||
| # | Banco Nacional de | |||||||
| Desenvolvimento | ||||||||
| Economico e | ||||||||
| Social 144A | ||||||||
| 6.369% 6/16/18 | USD | 1,500,000 | 1,751,250 | |||||
| 6.50% 6/10/19 | 2,500,000 | 2,953,125 | ||||||
| Brazil Notas do Tesouro | ||||||||
| Nacional Serie F | ||||||||
| 10.00% 1/1/13 | BRL | 401,000 | 221,290 | |||||
| 10.00% 1/1/14 | BRL | 1,218,000 | 671,272 | |||||
| 10.00% 1/1/17 | BRL | 15,800,000 | 8,444,841 | |||||
| Brazilian Government | ||||||||
| International Bond | ||||||||
| 5.625% 1/7/41 | USD | 927,000 | 1,073,003 | |||||
| 8.875% 10/14/19 | 820,000 | 1,163,170 | ||||||
| 16,277,951 | ||||||||
| Canada – 0.24% | ||||||||
| Canadian Government | ||||||||
| Bond 2.75% 9/1/16 | CAD | 400,000 | 421,661 | |||||
| 3.75% 6/1/19 | CAD | 1,137,000 | 1,282,666 | |||||
| 4.00% 6/1/17 | CAD | 1,045,000 | 1,170,446 | |||||
| 2,874,773 | ||||||||
56
| Principal | Value | |||||||
| Amount° | (U.S. $) | |||||||
| ΔSovereign Bonds (continued) | ||||||||
| Chile – 0.24% | ||||||||
| Chile Government | ||||||||
| International Bond | ||||||||
| 5.50% 8/5/20 | CLP | 1,354,000,000 | $ | 2,910,019 | ||||
| 2,910,019 | ||||||||
| Colombia – 0.09% | ||||||||
| Colombia Government | ||||||||
| International Bond | ||||||||
| 6.125% 1/18/41 | USD | 918,000 | 1,129,140 | |||||
| 1,129,140 | ||||||||
| Finland – 0.08% | ||||||||
| Finland Government | ||||||||
| Bond | ||||||||
| 4.00% 7/4/25 | EUR | 626,000 | 956,194 | |||||
| 956,194 | ||||||||
| Germany – 0.30% | ||||||||
| Deutschland Republic | ||||||||
| 2.00% 1/4/22 | EUR | 1,351,000 | 1,834,117 | |||||
| 2.50% 1/4/21 | EUR | 705,375 | 1,007,629 | |||||
| 3.50% 7/4/19 | EUR | 562,000 | 861,694 | |||||
| 3,703,440 | ||||||||
| Indonesia – 0.24% | ||||||||
| Indonesia Government | ||||||||
| International Bond | ||||||||
| 4.875% 5/5/21 | USD | 380,000 | 413,725 | |||||
| 7.25% 4/20/15 | 415,000 | 474,656 | ||||||
| Indonesia Treasury Bond | ||||||||
| 11.00% 11/15/20 | IDR | 7,060,000,000 | 1,034,426 | |||||
| # | Republic of | |||||||
| Indonesia 144A | ||||||||
| 5.25% 1/17/42 | USD | 914,000 | 963,128 | |||||
| 2,885,935 | ||||||||
| Malaysia – 0.04% | ||||||||
| Malaysia Government | ||||||||
| Bond | ||||||||
| 4.262% 9/15/16 | MYR | 1,380,000 | 467,867 | |||||
| 467,867 | ||||||||
| Mexico – 0.70% | ||||||||
| Mexican Bonos | ||||||||
| 6.50% 6/10/21 | MXN | 5,990,900 | 479,961 | |||||
| 7.50% 6/3/27 | MXN | 6,827,000 | 565,988 | |||||
| 8.50% 5/31/29 | MXN | 51,498,500 | 4,619,242 | |||||
| 8.50% 11/18/38 | MXN | 5,625,000 | 492,728 | |||||
| 10.00% 12/5/24 | MXN | 16,700,000 | 1,709,414 | |||||
| Mexico Government | ||||||||
| International Bond | ||||||||
| 4.75% 3/8/44 | USD | 690,000 | 677,925 | |||||
| 8,545,258 | ||||||||
| Norway – 1.11% | ||||||||
| Norway Government Bond | ||||||||
| 3.75% 5/25/21 | NOK | 2,484,000 | 482,894 | |||||
| 4.25% 5/19/17 | NOK | 4,293,000 | 837,960 | |||||
| * | 4.50% 5/22/19 | NOK | 24,123,000 | 4,852,858 | ||||
| 5.00% 5/15/15 | NOK | 37,790,000 | 7,305,488 | |||||
| 13,479,200 | ||||||||
| Panama – 0.15% | ||||||||
| Panama Government | ||||||||
| International Bond | ||||||||
| 6.70% 1/26/36 | USD | 302,000 | 398,640 | |||||
| 7.125% 1/29/26 | 340,000 | 455,600 | ||||||
| 7.25% 3/15/15 | 234,000 | 271,557 | ||||||
| 8.875% 9/30/27 | 451,000 | 693,413 | ||||||
| 1,819,210 | ||||||||
| Peru – 0.16% | ||||||||
| Peruvian Government | ||||||||
| International Bond | ||||||||
| 5.625% 11/18/50 | 300,000 | 337,500 | ||||||
| 7.125% 3/30/19 | 1,218,000 | 1,559,040 | ||||||
| 1,896,540 | ||||||||
| Philippines – 0.18% | ||||||||
| Philippine Government | ||||||||
| International Bond | ||||||||
| 5.00% 1/13/37 | 710,000 | 743,725 | ||||||
| 6.50% 1/20/20 | 520,000 | 631,150 | ||||||
| 9.50% 10/21/24 | 507,000 | 759,233 | ||||||
| 2,134,108 | ||||||||
| Poland – 0.19% | ||||||||
| Poland Government | ||||||||
| Bond | ||||||||
| 5.25% 10/25/17 | PLN | 2,351,000 | 765,844 | |||||
| 5.25% 10/25/20 | PLN | 2,076,000 | 660,414 | |||||
| Poland Government | ||||||||
| International Bond | ||||||||
| 5.00% 3/23/22 | USD | 822,000 | 870,514 | |||||
| 2,296,772 | ||||||||
| Qatar – 0.24% | ||||||||
| Qatar Government | ||||||||
| International Bond | ||||||||
| 4.00% 1/20/15 | 2,800,000 | 2,954,000 | ||||||
| 2,954,000 | ||||||||
| Republic of Korea – 0.21% | ||||||||
| Korea Treasury Inflation- | ||||||||
| Linked Bond | ||||||||
| 2.75% 6/10/20 | KRW | 710,192,003 | 721,678 | |||||
| Republic of Korea | ||||||||
| 5.75% 4/16/14 | USD | 900,000 | 971,259 | |||||
| 7.125% 4/16/19 | 700,000 | 869,436 | ||||||
| 2,562,373 | ||||||||
Statements of net assets
Optimum Fixed Income Fund
| Principal | Value | |||||||
| Amount° | (U.S. $) | |||||||
| ΔSovereign Bonds (continued) | ||||||||
| Russia – 0.23% | ||||||||
| Russia-Eurobond | ||||||||
| # | 144A 3.25% 4/4/17 | USD | 600,000 | $ | 605,523 | |||
| 7.50% 3/31/30 | 1,558,870 | 1,872,593 | ||||||
| # | 144A 7.50% 3/31/30 | 276,385 | 332,007 | |||||
| 2,810,123 | ||||||||
| South Africa – 0.49% | ||||||||
| #Eskom Holdings 144A | ||||||||
| 5.75% 1/26/21 | 995,000 | 1,049,725 | ||||||
| South Africa | ||||||||
| Government Bond | ||||||||
| 7.25% 1/15/20 | ZAR | 9,294,000 | 1,175,653 | |||||
| 8.00% 12/21/18 | ZAR | 28,543,000 | 3,785,628 | |||||
| 6,011,006 | ||||||||
| Sweden – 0.24% | ||||||||
| Sweden Government Bond | ||||||||
| * | 3.00% 7/12/16 | SEK | 11,100,000 | 1,782,213 | ||||
| 5.00% 12/1/20 | SEK | 5,830,000 | 1,098,399 | |||||
| 2,880,612 | ||||||||
| Turkey – 0.03% | ||||||||
| Turkey Government | ||||||||
| International Bond | ||||||||
| 5.625% 3/30/21 | USD | 360,000 | 377,460 | |||||
| 377,460 | ||||||||
| United Kingdom – 0.35% | ||||||||
| United Kingdom Gilt | ||||||||
| 3.75% 9/7/21 | GBP | 300,000 | 547,376 | |||||
| 4.25% 12/7/27 | GBP | 478,000 | 901,057 | |||||
| 4.50% 3/7/19 | GBP | 515,000 | 986,322 | |||||
| 4.75% 3/7/20 | GBP | 910,500 | 1,778,619 | |||||
| 4,213,374 | ||||||||
| Uruguay – 0.08% | ||||||||
| Uruguay Government | ||||||||
| International Bond | ||||||||
| 8.00% 11/18/22 | USD | 711,750 | 983,994 | |||||
| 983,994 | ||||||||
| Total Sovereign Bonds | ||||||||
| (cost $81,664,101) | 84,606,312 | |||||||
| Supranational Banks – 0.27% | ||||||||
| International Bank for | ||||||||
| Reconstruction & | ||||||||
| Development | ||||||||
| 3.25% 12/15/17 | SEK | 4,340,000 | 689,897 | |||||
| 3.375% 4/30/15 | NOK | 6,860,000 | 1,244,173 | |||||
| 3.625% 6/22/20 | NOK | 4,020,000 | 719,510 | |||||
| 6.00% 2/15/17 | AUD | 530,000 | 583,459 | |||||
| Total Supranational Banks | ||||||||
| (cost $3,023,951) | 3,237,039 | |||||||
| U.S. Treasury Obligations – 12.76% | ||||||||
| U.S. Treasury Bonds | ||||||||
| * | 2.00% 2/15/22 | USD | 79,095,000 | 77,587,290 | ||||
| ∞ | 3.125% 11/15/41 | 13,235,000 | 12,697,328 | |||||
| 3.125% 2/15/42 | 285,000 | 273,244 | ||||||
| 3.75% 8/15/41 | 15,000 | 16,219 | ||||||
| U.S. Treasury Inflation | ||||||||
| Indexed Bonds | ||||||||
| * | 0.125% 1/15/22 | 20,129,346 | 20,626,299 | |||||
| 0.625% 7/15/21 | 603,408 | 653,425 | ||||||
| 1.125% 1/15/21 | 828,936 | 933,849 | ||||||
| 1.25% 7/15/20 | 1,766,878 | 2,019,349 | ||||||
| 2.375% 1/15/25 | 1,683,486 | 2,144,603 | ||||||
| U.S. Treasury Notes | ||||||||
| * | 0.875% 2/28/17 | 15,200,000 | 15,095,500 | |||||
| 1.00% 3/31/17 | 17,205,000 | 17,167,373 | ||||||
| * | 2.00% 11/15/21 | 5,600,000 | 5,513,816 | |||||
| Total U.S. Treasury Obligations | ||||||||
| (cost $155,494,015) | 154,728,295 | |||||||
| Number of | ||||||||
| Shares | ||||||||
| Common Stock – 0.00% | ||||||||
| =† | Century Communications | 1,975,000 | 0 | |||||
| Delta Air Lines | 29 | 287 | ||||||
| † | GenOn Energy | 343 | 714 | |||||
| =†∏ | PT Holdings | 295 | 3 | |||||
| Total Common Stock | ||||||||
| (cost $244,598) | 1,004 | |||||||
| Convertible Preferred Stock – 0.11% | ||||||||
| * | Apache 6.00% | |||||||
| exercise price $109.12, | ||||||||
| expiration date 8/1/13 | 4,000 | 222,160 | ||||||
| Aspen Insurance | ||||||||
| Holding 5.625% | ||||||||
| exercise price $29.28, | ||||||||
| expiration date 12/31/49 | 2,829 | 157,010 | ||||||
| Bank of America 7.25% | ||||||||
| exercise price $50.00, | ||||||||
| expiration date 12/31/49 | 71 | 69,509 | ||||||
| # | Chesapeake Energy | |||||||
| 144A 5.75% | ||||||||
| exercise price $27.94, | ||||||||
| expiration date 12/31/49 | 204 | 208,080 | ||||||
| HealthSouth 6.00% | ||||||||
| exercise price $30.50, | ||||||||
| expiration date 12/31/49 | 329 | 324,146 | ||||||
| PPL 9.50% | ||||||||
| exercise price $28.80, | ||||||||
| expiration date 7/1/13 | 3,300 | 179,322 | ||||||
| SandRidge Energy 8.50% | ||||||||
| exercise price $8.01, | ||||||||
| expiration date 12/31/49 | 1,560 | 186,128 | ||||||
| Total Convertible Preferred | ||||||||
| Stock (cost $1,518,812) | 1,346,355 | |||||||
58
| Number of | Value | |||||||
| Shares | (U.S. $) | |||||||
| Preferred Stock – 0.19% | ||||||||
| Alabama Power 5.625% | 19,190 | $ | 492,224 | |||||
| # | Ally Financial 144A 7.00% | 500 | 416,578 | |||||
| PNC Financial | ||||||||
| Services 8.25% | 875,000 | 901,100 | ||||||
| † | PT Holdings | 59 | 0 | |||||
| US Bancorp 6.50% | 19,200 | 522,048 | ||||||
| Total Preferred Stock | ||||||||
| (cost $2,302,907) | 2,331,950 | |||||||
| Warrant – 0.00% | ||||||||
| =@∏†Port Townsend | 59 | 1 | ||||||
| Total Warrant (cost $1,416) | 1 | |||||||
| Principal | ||||||||
| Amount° | ||||||||
| Short-Term Investments – 16.42% | ||||||||
| ≠Discount Notes – 2.52% | ||||||||
| Federal Home Loan Bank | ||||||||
| 0.04% 4/27/12 | USD | 10,930,423 | 10,930,347 | |||||
| 0.65% 4/25/12 | 19,634,305 | 19,634,187 | ||||||
| 30,564,534 | ||||||||
| Repurchase Agreements – 3.02% | ||||||||
| Bank of America 0.03%, | ||||||||
| dated 3/30/12, to | ||||||||
| be repurchased on | ||||||||
| 4/2/12, repurchase | ||||||||
| price $10,930,451 | ||||||||
| (collateralized by | ||||||||
| U.S. government | ||||||||
| obligations 0.125%- | ||||||||
| 4.125% 12/31/13– | ||||||||
| 5/15/15; market value | ||||||||
| $11,149,033) | 10,930,424 | 10,930,424 | ||||||
| BNP Paribas 0.04%, | ||||||||
| dated 3/30/12, to | ||||||||
| be repurchased on | ||||||||
| 4/2/12, repurchase | ||||||||
| price $25,749,594 | ||||||||
| (collateralized by | ||||||||
| U.S. government | ||||||||
| obligations 1.375%- | ||||||||
| 7.50% 6/15/12– | ||||||||
| 2/15/37; market value | ||||||||
| $26,264,498) | 25,749,508 | 25,749,508 | ||||||
| 36,679,932 | ||||||||
| ≠U.S. Treasury Obligations – 10.88% | ||||||||
| U.S. Treasury Bills | ||||||||
| 0.008% 4/19/12 | USD | 18,900,509 | $ | 18,900,169 | ||||
| 0.04% 6/21/12 | 9,600,000 | 9,598,733 | ||||||
| 0.06% 7/5/12 | 2,600,000 | 2,599,524 | ||||||
| 0.07% 7/26/12 | 16,700,000 | 16,695,742 | ||||||
| 0.08% 8/2/12 | 700,000 | 699,781 | ||||||
| 0.08% 9/20/12 | 800,000 | 799,497 | ||||||
| 0.09% 8/23/12 | 9,000,000 | 8,995,797 | ||||||
| 0.10% 1/10/13 | 5,000,000 | 4,993,815 | ||||||
| 0.11% 10/18/12 | 2,500,000 | 2,498,240 | ||||||
| 0.12% 9/13/12 | 32,800,000 | 32,781,336 | ||||||
| 0.121% 8/16/12 | 12,100,000 | 12,095,087 | ||||||
| 0.133% 8/9/12 | 500,000 | 499,817 | ||||||
| 0.135% 9/6/12 | 3,000,000 | 2,998,223 | ||||||
| 0.14% 9/27/12 | 400,000 | 399,738 | ||||||
| 0.14% 2/7/13 | 6,400,000 | 6,390,893 | ||||||
| 0.15% 8/30/12 | 2,200,000 | 2,198,924 | ||||||
| 0.17% 3/7/13 | 5,600,000 | 5,591,180 | ||||||
| 0.18% 6/28/12 | 3,200,000 | 3,199,478 | ||||||
| 131,935,974 | ||||||||
| Total Short-Term Investments | ||||||||
| (cost $199,178,971) | 199,180,440 | |||||||
| Total Value of Securities | ||||||||
| Before Securities | ||||||||
| Lending Collateral – 102.90% | ||||||||
| (cost $1,214,194,244) | 1,248,213,091 | |||||||
| Number of | |||||||
| Shares | |||||||
| **Securities Lending Collateral – 2.57% | |||||||
| Investment Companies | |||||||
| BNY Mellon SL DBT II | |||||||
| Liquidating Fund | 374,161 | 364,171 | |||||
| Delaware Investments | |||||||
| Collateral Fund No. 1 | 30,800,339 | 30,800,339 | |||||
| @† | Mellon GSL | ||||||
| Reinvestment Trust II | 1,198,247 | 0 | |||||
| Total Securities Lending | |||||||
| Collateral (cost $32,372,747) | 31,164,510 | ||||||
| Total Value of Securities – 105.47% | |||||||
| (cost $1,246,566,991) | 1,279,377,601 | © | |||||
(continues) 59
Statements of net assets
Optimum Fixed Income Fund
| Number of | Value | |||||||||
| Contracts | (U.S. $) | |||||||||
| Options Written – (0.03%) | ||||||||||
| Put Options – (0.02%) | ||||||||||
| U.S. Long Bond Future, | ||||||||||
| strike price $139, | ||||||||||
| Expires 4/30/12 (JPMC) | (97 | ) | $ | (197,031 | ) | |||||
| (197,031 | ) | |||||||||
| Call Swaption – (0.01%) | ||||||||||
| 10-Yr IRO, | ||||||||||
| strike rate 2.50%, | ||||||||||
| expires 6/18/12 (CITI) | (4,100,000 | ) | (112,906 | ) | ||||||
| (112,906 | ) | |||||||||
| Put Swaption – (0.00%) | ||||||||||
| 10-Yr IRO, strike rate | ||||||||||
| 2.50%, expires | ||||||||||
| 6/18/12 (CITI) | (4,100,000 | ) | (37,113 | ) | ||||||
| (37,113 | ) | |||||||||
| Total Options Written | ||||||||||
| (premium received ($286,829)) | (347,050 | ) | ||||||||
| **Obligation to Return Securities | ||||||||||
| Lending Collateral – (2.67%) | (32,372,747 | ) | ||||||||
| Other Liabilities Net of | ||||||||||
| Receivables and Other | ||||||||||
| Assets – (2.77%) | (33,608,326 | )« | ||||||||
| Net Assets Applicable to | ||||||||||
| 124,891,406 Shares | ||||||||||
| Outstanding – 100.00% | $ | 1,213,049,478 | ||||||||
| Net Asset Value – Optimum Fixed Income Fund | ||||||||||
| Class A ($40,620,429 / 4,181,781 Shares) | $9.71 | |||||||||
| Net Asset Value – Optimum Fixed Income Fund | ||||||||||
| Class B ($3,056,004 / 314,899 Shares) | $9.70 | |||||||||
| Net Asset Value – Optimum Fixed Income Fund | ||||||||||
| Class C ($154,777,524 / 15,947,151 Shares) | $9.71 | |||||||||
| Net Asset Value – Optimum Fixed Income Fund | ||||||||||
| Institutional Class ($1,014,595,521 / 104,447,575 Shares) | $9.71 | |||||||||
| Components of Net Assets at March 31, 2012: | ||||||||||
| Shares of beneficial interest | ||||||||||
| (unlimited authorization – no par) | $ | 1,170,469,829 | ||||||||
| Undistributed net investment income | 1,107,367 | |||||||||
| Accumulated net realized gain | 9,465,941 | |||||||||
| Net unrealized appreciation of investments | ||||||||||
| and derivatives | 32,006,341 | |||||||||
| Total net assets | $ | 1,213,049,478 | ||||||||
| ° | Principal amount shown is stated in the currency in which each security is denominated. |
| • | Variable rate security. The rate shown is the rate as of March 31, 2012. Interest rates reset periodically. |
| @ | Illiquid security. At March 31, 2012, the aggregate value of illiquid securities was $27,478,280, which represented 2.27% of the Fund’s net assets. See Note 9 in “Notes to financial statements.” |
| ^ | Zero coupon security. The rate shown is the yield at the time of purchase. |
| û | Interest only security. An interest only security is the interest only portion of a fixed income security which is separated and sold individually from the principal portion of the security. |
| w | Pass Through Agreement. Security represents the contractual right to receive a proportionate amount of underlying payments due to the counterparty pursuant to various agreements related to the rescheduling of obligations and the exchange of certain notes. |
| # | Security exempt from registration under Rule 144A of the Securities Act of 1933, as amended. At March 31, 2012, the aggregate value of Rule 144A securities was $143,511,602, which represented 11.83% of the Fund’s net assets. See Note 9 in “Notes to financial statements.“ |
| * | Fully or partially on loan. |
| Φ | Step coupon bond. Coupon increases or decreases periodically based on a predetermined schedule. Stated rate in effect at March 31, 2012. |
| = | Security is being fair valued in accordance with the Fund’s fair valuation policy. At March 31, 2012, the aggregate value of fair valued securities was $42,002, which represented 0.00% of the Fund’s net assets. See Note 1 in “Notes to financial statements.“ |
| ‡ | Non income producing security. Security is currently in default. |
| Δ | Securities have been classified by country of origin. |
| « | Senior Secured Loans generally pay interest at rates which are periodically redetermined by reference to a base lending rate plus a premium. These base lending rates are generally: (i) the prime rate offered by one or more United States banks, (ii) the lending rate offered by one or more European banks such as the London Inter-Bank Offered Rate (LIBOR), and (iii) the certificate of deposit rate. Senior Secured Loans may be subject to restrictions on resale. Stated rate in effect at March 31, 2012. |
| ∞ | Fully or partially pledged as collateral for futures contracts. |
| † | Non income producing security. |
| ∏ | Restricted Security. These investments are in securities not registered under the Securities Act of 1933, as amended, and have certain restrictions on resale which may limit their liquidity. At March 31, 2012, the aggregate value of restricted securities was $4, which represented 0.00% of the Fund’s net assets. |
| ≠ | The rate shown is the effective yield at the time of purchase. |
| ** | See Note 8 in “Notes to financial statements“ for additional information on securities lending collateral and non-cash collateral. |
| © | Includes $129,883,573 of securities loaned. |
| « | Includes foreign currency valued at $2,561,413 with a cost of $2,572,275 and $1,090,000 restricted cash for open swap contracts. |
| Net Asset Value and Offering Price Per Share – | ||
| Optimum Fixed Income Fund | ||
| Net asset value Class A (A) | $ | 9.71 |
| Sales charge (4.50% of offering price) (B) | 0.46 | |
| Offering price | $ | 10.17 |
| (A) | Net asset value per share, as illustrated, is the amount which would be paid upon redemption or repurchase of shares. |
| (B) | See the current prospectus for purchases of $100,000 or more. |
60
| The following foreign currency exchange contracts, foreign cross currency exchange contracts, futures contracts and swap contracts were outstanding at March 31, 2012:1 |
| Foreign Currency Exchange Contracts | |||||||||||||||||
| Unrealized | |||||||||||||||||
| Contracts to | Settlement | Appreciation | |||||||||||||||
| Counterparty | Receive (Deliver) | In Exchange For | Date | (Depreciation) | |||||||||||||
| BAML | AUD | (2,009,806 | ) | USD | 2,092,249 | 5/2/12 | $ | 18,371 | |||||||||
| BAML | BRL | 5,328,985 | USD | (2,892,258 | ) | 5/2/12 | 4,993 | ||||||||||
| BAML | CLP | (769,348,000 | ) | USD | 1,575,855 | 5/2/12 | (1,988 | ) | |||||||||
| BAML | EUR | (559,000 | ) | JPY | 61,803,599 | 5/2/12 | 1,160 | ||||||||||
| BAML | EUR | (8,149,432 | ) | USD | 10,750,730 | 5/2/12 | (119,405 | ) | |||||||||
| BAML | HUF | (1,664,661,200 | ) | USD | 7,480,000 | 5/2/12 | (25,523 | ) | |||||||||
| BAML | JPY | (124,735,190 | ) | USD | 1,490,648 | 5/2/12 | (16,549 | ) | |||||||||
| BAML | MXN | 56,878,169 | USD | (4,468,427 | ) | 5/2/12 | (36,780 | ) | |||||||||
| BAML | NOK | (7,986,997 | ) | USD | 1,385,378 | 5/2/12 | (15,536 | ) | |||||||||
| BAML | NZD | (410,350 | ) | USD | 332,846 | 5/2/12 | (2,374 | ) | |||||||||
| BAML | RUB | 108,541,510 | USD | (3,687,686 | ) | 5/2/12 | (4,671 | ) | |||||||||
| BAML | ZAR | (31,243,810 | ) | USD | 4,063,884 | 5/2/12 | 10,384 | ||||||||||
| BCLY | EUR | (884,601 | ) | USD | 1,171,636 | 5/2/12 | (8,290 | ) | |||||||||
| BCLY | JPY | 77,686,984 | USD | (926,732 | ) | 5/2/12 | 11,974 | ||||||||||
| CITI | BRL | 5,349,200 | USD | (2,909,546 | ) | 5/2/12 | (1,305 | ) | |||||||||
| CITI | CNY | 49,500 | USD | (7,776 | ) | 6/1/12 | 73 | ||||||||||
| CITI | CNY | 7,820,211 | USD | (1,213,000 | ) | 2/1/13 | 25,544 | ||||||||||
| CITI | EUR | (20,722,000 | ) | USD | 26,942,903 | 4/16/12 | (695,094 | ) | |||||||||
| CITI | EUR | (2,146,052 | ) | USD | 2,831,791 | 5/2/12 | (30,725 | ) | |||||||||
| CITI | EUR | 3,242,000 | USD | (4,275,206 | ) | 6/14/12 | 50,233 | ||||||||||
| CITI | GBP | 11,892,000 | USD | (18,797,673 | ) | 6/12/12 | 213,138 | ||||||||||
| CITI | JPY | 77,620,704 | USD | (925,853 | ) | 5/2/12 | 12,052 | ||||||||||
| CITI | JPY | (432,732,000 | ) | USD | 5,266,570 | 6/7/12 | 36,093 | ||||||||||
| CITI | KRW | 6,376,334,319 | USD | (5,648,522 | ) | 7/12/12 | (55,879 | ) | |||||||||
| CITI | MYR | (13,544,706 | ) | USD | 4,242,000 | 4/23/12 | (174,286 | ) | |||||||||
| CITI | PHP | (164,340 | ) | USD | 3,812 | 6/8/12 | 4 | ||||||||||
| CITI | SGD | 14,067,769 | USD | (11,201,345 | ) | 5/15/12 | (8,265 | ) | |||||||||
| GSC | BRL | 6,563,952 | USD | (3,560,592 | ) | 5/2/12 | 8,082 | ||||||||||
| GSC | GBP | 74,616 | USD | (118,094 | ) | 5/2/12 | 1,224 | ||||||||||
| GSC | NOK | (2,380,480 | ) | USD | 411,279 | 5/2/12 | (6,256 | ) | |||||||||
| GSC | RUB | 55,892,400 | USD | (1,896,908 | ) | 5/2/12 | (375 | ) | |||||||||
| HSBC | AUD | (3,826,342 | ) | USD | 3,982,839 | 5/2/12 | 34,517 | ||||||||||
| HSBC | CLP | (785,545,814 | ) | USD | 1,612,037 | 5/2/12 | 975 | ||||||||||
| HSBC | EUR | (1,774,842 | ) | USD | 2,342,277 | 5/2/12 | (25,100 | ) | |||||||||
| HSBC | NOK | (19,482,027 | ) | USD | 3,384,000 | 5/2/12 | (33,136 | ) | |||||||||
| HSBC | PLN | (5,441,904 | ) | USD | 1,710,000 | 5/2/12 | (34,027 | ) | |||||||||
| JPMC | AUD | (14,529,000 | ) | USD | 15,414,107 | 4/23/12 | 406,500 | ||||||||||
| JPMC | BRL | 3,354,750 | USD | (1,822,243 | ) | 5/2/12 | 1,659 | ||||||||||
| JPMC | BRL | (17,071,054 | ) | USD | 9,518,821 | 6/4/12 | 298,551 | ||||||||||
| JPMC | CAD | (442,000 | ) | USD | 446,925 | 6/21/12 | 4,627 | ||||||||||
| JPMC | CNY | 1,410,528 | USD | (224,000 | ) | 6/1/12 | (341 | ) | |||||||||
| JPMC | CNY | 10,338,900 | USD | (1,740,000 | ) | 4/7/16 | (133,966 | ) | |||||||||
| JPMC | EUR | (4,233,000 | ) | USD | 5,512,672 | 4/16/12 | (133,098 | ) | |||||||||
| JPMC | EUR | (310,921 | ) | USD | 410,105 | 5/2/12 | (4,618 | ) | |||||||||
| JPMC | GBP | (12,524,000 | ) | USD | 19,669,192 | 6/12/12 | (351,947 | ) | |||||||||
| JPMC | IDR | (460,768,000 | ) | USD | 48,966 | 7/2/12 | (925 | ) | |||||||||
| JPMC | INR | 534,380 | USD | (11,497 | ) | 7/12/12 | (1,211 | ) | |||||||||
| JPMC | MXN | (22,520,545 | ) | USD | 1,739,173 | 6/15/12 | (8,254 | ) | |||||||||
| JPMC | MYR | 13,499,260 | USD | (4,450,795 | ) | 4/23/12 | (49,326 | ) | |||||||||
| JPMC | NOK | (18,192,515 | ) | USD | 3,151,583 | 5/2/12 | (39,374 | ) | |||||||||
| JPMC | TWD | (115,930 | ) | USD | 3,844 | 4/9/12 | (85 | ) | |||||||||
| MSC | AUD | (1,222,280 | ) | USD | 1,269,656 | 5/2/12 | 8,410 | ||||||||||
| MSC | CNY | 55,270,000 | USD | (8,600,000 | ) | 9/8/15 | 13,040 | ||||||||||
| MSC | EUR | (4,023,012 | ) | USD | 5,306,824 | 5/2/12 | (59,279 | ) | |||||||||
| MSC | GBP | (581,463 | ) | USD | 920,330 | 5/2/12 | (9,489 | ) | |||||||||
| MSC | JPY | 34,518,576 | USD | (422,035 | ) | 5/2/12 | (4,941 | ) | |||||||||
| MSC | NOK | (16,608,300 | ) | USD | 2,876,764 | 5/2/12 | (36,322 | ) | |||||||||
| MSC | RUB | 57,282,775 | USD | (1,944,756 | ) | 5/2/12 | (1,045 | ) | |||||||||
| $ | (968,181 | ) | |||||||||||||||
| Futures Contracts | |||||||||||||||||||
| Unrealized | |||||||||||||||||||
| Contracts to | Notional Cost | Notional | Expiration | Appreciation | |||||||||||||||
| Buy (Sell) | (Proceeds) | Value | Date | (Depreciation) | |||||||||||||||
| 11 | Euro-Bund | $ | 2,000,656 | $ | 2,031,669 | 6/12/12 | $ | 31,013 | |||||||||||
| 8 | Long Gilt | 1,447,818 | 1,465,224 | 6/30/12 | 17,406 | ||||||||||||||
| (91) | U.S. Treasury | ||||||||||||||||||
| 10 yr Notes | (11,827,598 | ) | (11,783,078 | ) | 6/29/12 | 44,520 | |||||||||||||
| (54) | U.S. Treasury | ||||||||||||||||||
| Long Notes | (7,371,134 | ) | (7,440,187 | ) | 6/21/12 | (69,053 | ) | ||||||||||||
| $ | (15,750,258 | ) | $ | 23,886 | |||||||||||||||
(continues) 61
Statements of net assets
Optimum Fixed Income Fund
| Swap Contracts | |||||||||||||||||||
| CDS Contracts | |||||||||||||||||||
| Annual | Unrealized | ||||||||||||||||||
| Swap | Notional | Protection | Termination | Appreciation | |||||||||||||||
| Counterparty | Referenced Obligation | Value | Payments | Date | (Depreciation) | ||||||||||||||
| Protection Purchased: | |||||||||||||||||||
| BAML | ITRAXX Europe | ||||||||||||||||||
| Subordinate | |||||||||||||||||||
| Financials | |||||||||||||||||||
| 17.15 yr CDS | EUR | 7,090,000 | 5.00 | % | 6/20/17 | $ | 176,527 | ||||||||||||
| BAML | Kingdom of Spain | ||||||||||||||||||
| 5 yr CDS | USD | 1,951,000 | 1.00 | % | 12/20/15 | 46,943 | |||||||||||||
| BCLY | ITRAXX Europe | ||||||||||||||||||
| Subordinate | |||||||||||||||||||
| Financials | |||||||||||||||||||
| 17.1 5 yr CDS | EUR | 6,840,000 | 5.00 | % | 6/20/17 | 168,105 | |||||||||||||
| Kingdom of Spain | |||||||||||||||||||
| BCLY | 5 yr CDS | USD | 1,462,000 | 1.00 | % | 3/20/15 | 54,338 | ||||||||||||
| BCLY | 5 yr CDS | 730,000 | 1.00 | % | 3/21/16 | 21,286 | |||||||||||||
| BCLY | Republic of France | ||||||||||||||||||
| 5 yr CDS | 2,504,000 | 0.25 | % | 9/20/16 | (40,832 | ) | |||||||||||||
| CITI | Credit Agricole | ||||||||||||||||||
| 5 yr CDS | EUR | 2,600,000 | 1.00 | % | 12/20/16 | (8,999 | ) | ||||||||||||
| GSC | Republic of France | ||||||||||||||||||
| 5 yr CDS | USD | 890,000 | 0.25 | % | 9/20/16 | (12,944 | ) | ||||||||||||
| JPMC | Finmeccanica | 140,000 | 5.00 | % | 3/20/17 | (8,475 | ) | ||||||||||||
| JPMC | ITRAXX Europe | ||||||||||||||||||
| Crossover | |||||||||||||||||||
| 16.1 5 yr CDS | EUR | 7,685,000 | 5.00 | % | 12/20/16 | (433,220 | ) | ||||||||||||
| JPMC | Kingdom of Belgium | ||||||||||||||||||
| 5 yr CDS | USD | 907,000 | 1.00 | % | 3/20/17 | (40,059 | ) | ||||||||||||
| Kingdom of Spain | |||||||||||||||||||
| JPMC | 5 yr CDS | 1,648,000 | 1.00 | % | 3/20/17 | 40,636 | |||||||||||||
| JPMC | 5 yr CDs | 1,788,000 | 1.00 | % | 9/20/16 | 41,869 | |||||||||||||
| JPMC | MeadWestvaco | ||||||||||||||||||
| 5 yr CDS | 725,000 | 1.00 | % | 12/20/16 | (28,608 | ) | |||||||||||||
| JPMC | Republic of France | ||||||||||||||||||
| 5 yr CDS | 1,126,000 | 0.25 | % | 12/20/16 | (20,812 | ) | |||||||||||||
| JPMC | Republic of Italy | ||||||||||||||||||
| 5 yr CDS | 907,000 | 1.00 | % | 3/20/17 | (44,419 | ) | |||||||||||||
| MSC | Dow Jones ITRAXX | ||||||||||||||||||
| Europe | |||||||||||||||||||
| Subordinate | |||||||||||||||||||
| 16.2 5 yr CDS | EUR | 11,200,000 | 5.00 | % | 12/20/16 | (310,723 | ) | ||||||||||||
| Japan | |||||||||||||||||||
| MSC | 5 yr CDS | USD | 2,250,000 | 1.00 | % | 3/20/17 | (46,752 | ) | |||||||||||
| MSC | 5 yr CDS | 1,420,000 | 1.00 | % | 9/20/16 | (16,909 | ) | ||||||||||||
| MSC | Kingdom of Belgium | ||||||||||||||||||
| 5 yr CDS | 2,932,000 | 1.00 | % | 12/20/16 | (113,888 | ) | |||||||||||||
| Kingdom of Spain | |||||||||||||||||||
| MSC | 5 yr CDS | 1,631,000 | 1.00 | % | 6/20/16 | 86,480 | |||||||||||||
| MSC | 5 yr CDS | 1,880,000 | 1.00 | % | 3/20/17 | 24,503 | |||||||||||||
| MSC | Republic of France | ||||||||||||||||||
| 5 yr CDS | 1,990,000 | 0.25 | % | 9/20/16 | (28,306 | ) | |||||||||||||
| MSC | Republic of Italy | ||||||||||||||||||
| 5 yr CDS | 1,460,000 | 1.00 | % | 9/20/16 | 22,122 | ||||||||||||||
| $ | (472,137 | ) | |||||||||||||||||
| Protection Sold / Moody’s Rating: | |||||||||||||||||||
| CITI | Republic of Brazil | ||||||||||||||||||
| 5 yr CDS / Baa | 2,000,000 | 1.00 | % | 3/20/17 | 4,182 | ||||||||||||||
| JPMC | Georgia Pacific | ||||||||||||||||||
| 5 yr CDS / Baa | 725,000 | 1.00 | % | 12/20/16 | 24,260 | ||||||||||||||
| JPMC | Tyson Foods CDS / Ba | 735,000 | 1.00 | % | 3/20/16 | 23,908 | |||||||||||||
| MSC | People’s Republic | ||||||||||||||||||
| of China | |||||||||||||||||||
| 5 yr CDS/Aa | 2,700,000 | 1.00 | % | 9/20/16 | 12,920 | ||||||||||||||
| $ | 65,270 | ||||||||||||||||||
| Total | $ | (406,867 | ) | ||||||||||||||||
Interest Rate Swap Contracts
| Fixed | |||||||||||||||||||
| Deal | Unrealized | ||||||||||||||||||
| Receive | Maturity | Appreciation | |||||||||||||||||
| Counterparty | Swap Referenced | Notional Amount | Rate | Date | (Depreciation) | ||||||||||||||
| CITI | 3-Month LIBOR | USD | 38,700,000 | 4.00 | % | 9/21/21 | $ | (232,012 | ) | ||||||||||
| CITI | 6-Month LIBOR | AUD | 9,400,000 | 4.75 | % | 6/15/22 | 45,256 | ||||||||||||
| CITI | 6-Month LIBOR | AUD | 6,600,000 | 6.00 | % | 12/15/20 | 641,416 | ||||||||||||
| CITI | 6-Month LIBOR | AUD | 3,200,000 | 5.75 | % | 12/15/21 | 293,368 | ||||||||||||
| JPMC | 6-Month LIBOR | AUD | 10,900,000 | 4.75 | % | 6/15/22 | 39,618 | ||||||||||||
| JPMC | 3-Month LIBOR | USD | 4,000,000 | 4.00 | % | 9/21/21 | (18,662 | ) | |||||||||||
| JPMC | Brazil CETIP | ||||||||||||||||||
| Interbank Deposit | BRL | 21,100,000 | 9.98 | % | 1/2/15 | 10,757 | |||||||||||||
| MSC | 3-Month Libor | USD | 18,800,000 | 4.00 | % | 9/21/21 | (112,407 | ) | |||||||||||
| MSC | Brazil CETIP | ||||||||||||||||||
| Interbank Deposit | BRL | 48,700,000 | 10.605 | % | 1/2/15 | 48,255 | |||||||||||||
| Total | $ | 715,589 | |||||||||||||||||
The use of foreign currency exchange contracts, foreign cross currency exchange contracts, futures contracts and swap contracts involves elements of market risk and risks in excess of the amounts recognized in the financial statements. The notional values presented above represent the Fund’s total exposure in such contracts, whereas only the net unrealized appreciation (depreciation) is reflected in the Fund’s net assets.
1See Note 7 in “Notes to financial statements.”
62
| Summary of Abbreviations: ARM — Adjustable Rate Mortgage AUD — Australian Dollar BAML — Bank of America Merrill Lynch BCLY — Barclays Bank BRL — Brazilian Real CAD — Canadian Dollar CDO — Collateralized Debt Obligation CDS — Credit Default Swap CITI — Citigroup Global Markets CLP — Chilean Peso CNY — Chinese Renminbi EUR — European Monetary Unit FGIC — Insured by Financial Guaranty Insurance Company GBP — British Pound Sterling GNMA — Government National Mortgage Association GSC — Goldman Sachs Capital GSMPS — Goldman Sachs Reperforming Mortgage Securities HSBC — Hong Kong Shanghai Bank HUF — Hungarian Forint IDR — Indonesian Rupiah INR — Indian Rupee IRO — Interest Rate Swaption JPMC — JPMorgan Chase Bank JPY — Japanese Yen KRW — South Korean Won MASTR — Mortgage Asset Securitization Transactions, Inc. MSC — Morgan Stanley Capital MXN — Mexican Peso MYR — Malaysian Ringgit NATL-RE — Insured by National Public Finance Guarantee Corporation NCUA — National Credit Union Administration NOK — Norwegian Krone NZD — New Zealand Dollar PHP — Philippine Peso PIK — Pay-in-kind PLN — Polish Zloty REIT — Real Estate Investment Trust REMIC — Real Estate Mortgage Investment Conduit RUB — Russian Ruble S.F. — Single Family SEK — Swedish Krona SGD — Singapore Dollar TBA — To be announced TWD — Taiwanese Dollar USD — United States Dollar yr — Year ZAR — South African Rand |
See accompanying notes, which are an integral part of the financial statements.
(continues) 63
Statements of net assets
Optimum International Fund
March 31, 2012
| Number of | Value | |||||
| Shares | (U.S. $) | |||||
| ΔCommon Stock – 97.14% | ||||||
| Argentina – 0.45% | ||||||
| Arcos Dorados Holdings Class A | 37,600 | $ | 680,184 | |||
| * | MercadoLibre | 6,798 | 664,776 | |||
| 1,344,960 | ||||||
| Australia – 4.91% | ||||||
| Amcor | 359,034 | 2,766,708 | ||||
| AMP | 796,674 | 3,564,669 | ||||
| Australia & New Zealand | ||||||
| Banking Group | 68,900 | 1,659,907 | ||||
| BHP Billiton | 27,900 | 1,000,140 | ||||
| CSL | 8,700 | 323,406 | ||||
| Newcrest Mining | 32,900 | 1,011,381 | ||||
| QBE Insurance Group | 210,952 | 3,096,053 | ||||
| Telstra | 326,250 | 1,111,735 | ||||
| 14,533,999 | ||||||
| Belgium – 0.37% | ||||||
| w† | Ageas VVPR Strip | 48,482 | 65 | |||
| Anheuser-Busch InBev | 14,900 | 1,088,554 | ||||
| 1,088,619 | ||||||
| Bermuda – 0.26% | ||||||
| * | Seadrill | 20,700 | 775,796 | |||
| 775,796 | ||||||
| Brazil – 1.02% | ||||||
| BM&FBovespa | 113,700 | 696,904 | ||||
| Brasil Foods | 29,700 | 586,468 | ||||
| Cia Energetica de Minas | ||||||
| Gerais ADR | 31,055 | 738,488 | ||||
| PDG Realty | 95,000 | 327,308 | ||||
| Tractebel Energia | 36,800 | 655,109 | ||||
| 3,004,277 | ||||||
| Canada – 1.93% | ||||||
| First Quantum Minerals | 31,500 | 600,601 | ||||
| Gildan Activewear | 15,000 | 412,761 | ||||
| * | Manulife Financial | 47,300 | 640,592 | |||
| * | Royal Bank of Canada | 15,900 | 921,437 | |||
| Suncor Energy | 27,000 | 882,091 | ||||
| * | Toronto-Dominion Bank | 8,600 | 729,864 | |||
| * | TransCanada | 12,600 | 540,983 | |||
| * | Yamana Gold | 63,000 | 982,689 | |||
| 5,711,018 | ||||||
| China/Hong Kong – 2.48% | ||||||
| AIA Group | 303,500 | 1,111,901 | ||||
| † | Baidu ADR | 4,500 | 655,965 | |||
| China Construction Bank | 1,500,300 | 1,159,188 | ||||
| China Merchants | ||||||
| Holdings International | 168,700 | 564,824 | ||||
| China Mobile | 55,600 | 611,803 | ||||
| Hong Kong Exchanges | ||||||
| & Clearing | 32,700 | 549,520 | ||||
| *† | Lentuo International ADR | 19,800 | 74,844 | |||
| *† | Melco Crown Entertainment ADR | 41,800 | 568,898 | |||
| REXLot Holdings | 3,195,100 | 283,896 | ||||
| Tencent Holdings | 26,100 | 727,988 | ||||
| Wharf Holdings | 93,400 | 507,556 | ||||
| * | Zoomlion Heavy Industry | |||||
| Science & Technology | 403,600 | 537,399 | ||||
| 7,353,782 | ||||||
| France – 11.02% | ||||||
| AXA | 57,800 | 958,166 | ||||
| BNP Paribas | 10,100 | 479,190 | ||||
| Carrefour | 163,985 | 3,931,107 | ||||
| Cie de Saint-Gobain | 62,268 | 2,780,719 | ||||
| Danone | 12,000 | 836,999 | ||||
| France Telecom | 338,784 | 5,017,454 | ||||
| GDF Suez | 24,100 | 622,570 | ||||
| w† | GDF Suez VVPR Strip | 8,820 | 12 | |||
| LVMH Moet Hennessy | ||||||
| Louis Vuitton | 4,100 | 704,547 | ||||
| Sanofi | 88,360 | 6,861,901 | ||||
| Societe Generale | 59,193 | 1,733,977 | ||||
| * | Total | 93,721 | 4,779,656 | |||
| Vallourec | 13,860 | 878,008 | ||||
| Vinci | 58,392 | 3,044,893 | ||||
| 32,629,199 | ||||||
| Germany – 6.57% | ||||||
| Adidas | 10,800 | 843,176 | ||||
| Allianz | 10,400 | 1,240,945 | ||||
| † | Continental | 6,500 | 613,486 | |||
| Daimler | 11,200 | 675,296 | ||||
| Deutsche Bank | 21,400 | 1,064,689 | ||||
| Deutsche Lufthansa | 45,600 | 638,248 | ||||
| Deutsche Telekom | 393,794 | 4,740,830 | ||||
| Gerry Weber International | 23,308 | 894,307 | ||||
| Infineon Technologies | 71,366 | 729,629 | ||||
| K+S | 16,600 | 868,386 | ||||
| Merck | 8,300 | 918,530 | ||||
| RWE | 130,470 | 6,230,118 | ||||
| 19,457,640 | ||||||
| Gilbraltar – 0.05% | ||||||
| Bwin.Party Digital Entertainment | 53,100 | 131,643 | ||||
| 131,643 | ||||||
| India – 0.24% | ||||||
| ICICI Bank | 17,100 | 299,389 | ||||
| † | Jubilant Foodworks | 17,290 | 399,953 | |||
| 699,342 | ||||||
| Indonesia – 0.44% | ||||||
| Adaro Energy | 2,340,500 | 494,003 | ||||
| Indofood Sukses Makmur | 1,086,000 | 576,017 | ||||
| Tower Bersama Infrastructure | 725,100 | 233,929 | ||||
| 1,303,949 | ||||||
64
| Number of | Value | |||||
| Shares | (U.S. $) | |||||
| ΔCommon Stock (continued) | ||||||
| Ireland – 1.62% | ||||||
| Accenture Class A | 11,400 | $ | 735,300 | |||
| Covidien | 12,600 | 688,968 | ||||
| Experian | 194,812 | 3,036,465 | ||||
| Shire ADR | 3,400 | 322,150 | ||||
| 4,782,883 | ||||||
| Israel – 1.87% | ||||||
| † | Check Point Software Technologies | 10,500 | 670,320 | |||
| Teva Pharmaceutical Industries ADR | 107,800 | 4,857,468 | ||||
| 5,527,788 | ||||||
| Italy – 2.92% | ||||||
| ENI | 236,501 | 5,548,054 | ||||
| Intesa Sanpaolo | 1,722,930 | 3,088,224 | ||||
| 8,636,278 | ||||||
| Japan – 17.57% | ||||||
| * | Astellas Pharma | 118,400 | 4,862,717 | |||
| Bridgestone | 46,100 | 1,117,070 | ||||
| Canon | 118,300 | 5,587,401 | ||||
| Chiba Bank | 124,200 | 792,144 | ||||
| Daiwa Office Investment | 90 | 240,261 | ||||
| * | Honda Motor | 19,800 | 752,201 | |||
| * | HOYA | 80,300 | 1,803,197 | |||
| IHI | 523,000 | 1,320,372 | ||||
| * | Japan Prime Realty Investment | 110 | 316,108 | |||
| JGC | 32,000 | 991,484 | ||||
| Kao | 145,300 | 3,812,183 | ||||
| * | Kubota | 103,900 | 997,771 | |||
| Mitsui Fudosan | 38,800 | 741,927 | ||||
| * | Nintendo | 11,000 | 1,654,285 | |||
| * | ORIX | 7,800 | 744,338 | |||
| Seven & I Holdings | 182,400 | 5,415,706 | ||||
| Shin-Etsu Chemical | 26,000 | 1,501,238 | ||||
| SMC | 5,200 | 826,623 | ||||
| * | Softbank | 27,900 | 824,682 | |||
| * | Sumitomo Mitsui Financial Group | 34,800 | 1,144,657 | |||
| * | Takeda Pharmaceutical | 101,000 | 4,447,001 | |||
| Tokio Marine Holdings | 148,600 | 4,076,470 | ||||
| Tokyo Electron | 2,200 | 125,832 | ||||
| * | Toray Industries | 142,500 | 1,056,894 | |||
| * | Toyota Motor | 101,500 | 4,377,061 | |||
| Trend Micro | 29,600 | 909,257 | ||||
| Yamato Holdings | 30,500 | 471,215 | ||||
| Zeon | 118,700 | 1,099,751 | ||||
| 52,009,846 | ||||||
| Luxembourg – 0.34% | ||||||
| ArcelorMittal | 52,000 | 993,783 | ||||
| 993,783 | ||||||
| Malaysia – 0.18% | ||||||
| Genting Malaysia | 425,500 | 544,773 | ||||
| 544,773 | ||||||
| Mexico – 0.53% | ||||||
| Fomento Economico Mexicano ADR | 12,500 | 1,028,375 | ||||
| Grupo Modelo Series C | 78,400 | 549,692 | ||||
| 1,578,067 | ||||||
| Netherlands – 4.15% | ||||||
| Akzo Nobel | 13,900 | 820,666 | ||||
| ASML Holding | 2,600 | 129,962 | ||||
| Corio | 2,400 | 126,590 | ||||
| † | ING Groep CVA | 260,379 | 2,169,299 | |||
| Koninklijke Ahold | 318,449 | 4,412,627 | ||||
| Koninklijke DSM | 16,500 | 954,697 | ||||
| Reed Elsevier | 227,995 | 2,911,731 | ||||
| † | Unilever CVA | 17,900 | 609,103 | |||
| † | Ziggo | 4,700 | 146,612 | |||
| 12,281,287 | ||||||
| Norway – 0.52% | ||||||
| Statoil | 41,500 | 1,126,783 | ||||
| Storebrand | 82,600 | 417,787 | ||||
| 1,544,570 | ||||||
| Republic of Korea – 0.92% | ||||||
| † | Hynix Semiconductor | 8,900 | 229,989 | |||
| Hyundai Marine & Fire Insurance | 27,500 | 792,031 | ||||
| † | Samsung Electronics | 900 | 1,013,783 | |||
| Samsung Life Insurance | 8,000 | 699,708 | ||||
| 2,735,511 | ||||||
| Singapore – 3.46% | ||||||
| Avago Technologies | 19,600 | 763,812 | ||||
| DBS Group Holdings | 71,000 | 801,002 | ||||
| Jardine Matheson Holdings | 29,200 | 1,460,000 | ||||
| Sakari Resources | 362,300 | 671,620 | ||||
| Singapore Telecommunications | 1,555,500 | 3,898,341 | ||||
| United Overseas Bank | 181,047 | 2,643,180 | ||||
| 10,237,955 | ||||||
| South Africa – 0.41% | ||||||
| MTN Group | 34,300 | 603,750 | ||||
| Naspers Class N | 10,700 | 601,210 | ||||
| 1,204,960 | ||||||
| Spain – 4.06% | ||||||
| Banco Santander | 257,071 | 1,978,203 | ||||
| † | Distribuidora Internacional | |||||
| de Alimentacion | 80,119 | 397,164 | ||||
| Iberdrola | 705,626 | 4,006,084 | ||||
| Repsol YPF | 17,762 | 445,577 | ||||
| Telefonica | 316,306 | 5,182,323 | ||||
| 12,009,351 | ||||||
| Sweden – 0.60% | ||||||
| * | Svenska Cellulosa Class B | 33,300 | 576,819 | |||
| * | Volvo Class B | 82,400 | 1,200,647 | |||
| 1,777,466 | ||||||
(continues) 65
Statements of net assets
Optimum International Fund
| Number of | Value | ||||||
| Shares | (U.S. $) | ||||||
| ΔCommon Stock (continued) | |||||||
| Switzerland – 6.58% | |||||||
| † | Julius Baer Group | 18,100 | $ | 730,657 | |||
| Nestle | 40,500 | 2,548,355 | |||||
| Novartis | 96,107 | 5,319,049 | |||||
| Roche Holding | 5,000 | 870,167 | |||||
| SGS | 885 | 1,721,569 | |||||
| † | Swiss Re | 18,200 | 1,162,324 | ||||
| † | Syngenta | 2,200 | 760,629 | ||||
| TE Connectivity | 16,000 | 588,000 | |||||
| Xstrata | 51,800 | 884,854 | |||||
| Zurich Insurance Group | 18,218 | 4,896,075 | |||||
| 19,481,679 | |||||||
| Taiwan – 2.04% | |||||||
| Chunghwa Telecom ADR | 14,770 | 454,325 | |||||
| Mega Financial Holding | 1,032,664 | 729,693 | |||||
| Taiwan Semiconductor | |||||||
| Manufacturing | 1,456,269 | 4,190,099 | |||||
| United Microelectronics | 1,350,000 | 661,114 | |||||
| 6,035,231 | |||||||
| United Kingdom – 19.53% | |||||||
| Barclays | 257,300 | 968,144 | |||||
| † | Barratt Developments | 29,800 | 67,206 | ||||
| Bellway | 12,500 | 163,544 | |||||
| BG Group | 208,803 | 4,835,885 | |||||
| BP | 790,155 | 5,845,769 | |||||
| British American Tobacco | 37,000 | 1,864,455 | |||||
| Britvic | 113,600 | 698,990 | |||||
| Compass Group | 409,928 | 4,297,847 | |||||
| Diageo | 23,900 | 574,358 | |||||
| GlaxoSmithKline | 249,443 | 5,571,638 | |||||
| HSBC Holdings | 179,207 | 1,590,238 | |||||
| Imperial Tobacco Group | 34,500 | 1,398,839 | |||||
| Inchcape | 76,720 | 461,634 | |||||
| Invensys | 210,000 | 668,410 | |||||
| Kazakhmys | 29,600 | 429,881 | |||||
| Meggitt | 93,300 | 602,735 | |||||
| National Grid | 144,000 | 1,452,173 | |||||
| Persimmon | 14,200 | 145,358 | |||||
| Rexam | 134,900 | 923,693 | |||||
| Royal Dutch Shell Class A | 202,179 | 7,077,945 | |||||
| SSE | 47,900 | 1,018,195 | |||||
| † | Subea 7 | 42,300 | 1,120,274 | ||||
| † | Taylor Wimpey | 214,400 | 176,605 | ||||
| TESCO | 1,033,410 | 5,454,529 | |||||
| Unilever | 155,740 | 5,141,390 | |||||
| Vodafone Group | 1,429,514 | 3,937,243 | |||||
| Vodafone Group ADR | 47,300 | 1,308,791 | |||||
| 57,795,769 | |||||||
| United States – 0.10% | |||||||
| † | NII Holdings | 16,800 | 307,608 | ||||
| 307,608 | |||||||
| Total Common Stock | |||||||
| (cost $287,235,296) | 287,519,029 | ||||||
| ΔPreferred Stock – 0.74% | |||||||
| Brazil – 0.50% | |||||||
| Banco Bradesco 3.40% | 84,900 | 1,478,827 | |||||
| 1,478,827 | |||||||
| Germany – 0.24% | |||||||
| Volkswagen 1.76% | 4,042 | 710,752 | |||||
| 710,752 | |||||||
| Total Preferred Stock | |||||||
| (cost $2,075,769) | 2,189,579 | ||||||
| Principal | |||||||
| Amount (U.S. $) | |||||||
| Short-Term Investments – 1.53% | |||||||
| ≠Discount Notes – 0.59% | |||||||
| Federal Home Loan Bank | |||||||
| 0.04% 4/27/12 | $ | 551,687 | 551,683 | ||||
| 0.65% 4/25/12 | 1,196,527 | 1,196,519 | |||||
| 1,748,202 | |||||||
| Repurchase Agreements – 0.62% | |||||||
| Bank of America 0.03%, | |||||||
| dated 3/30/12, to be | |||||||
| repurchased on 4/2/12, | |||||||
| repurchase price $551,688 | |||||||
| (collateralized by U.S. | |||||||
| government obligations | |||||||
| 0.125%-4.125% | |||||||
| 12/31/13-5/15/15; | |||||||
| market value $562,721) | 551,687 | 551,687 | |||||
| BNP Paribas 0.04%, | |||||||
| dated 3/30/12, to be | |||||||
| repurchased on 4/2/12, | |||||||
| repurchase price $1,299,648 | |||||||
| (collateralized by U.S. | |||||||
| government obligations | |||||||
| 1.375%-7.50% | |||||||
| 6/15/12–2/15/37; | |||||||
| market value $1,325,637) | 1,299,644 | 1,299,644 | |||||
| 1,851,331 | |||||||
| ≠U.S. Treasury Obligation – 0.32% | |||||||
| U.S. Treasury Bill 0.008% 4/19/12 | 934,076 | 934,060 | |||||
| 934,060 | |||||||
| Total Short-Term Investments | |||||||
| (cost $4,533,518) | 4,533,593 | ||||||
| Total Value of Securities Before Securities | |||||||
| Lending Collateral – 99.41% | |||||||
| (cost $293,844,583) | 294,242,201 | ||||||
66
| Number of | Value | ||||||
| Shares | (U.S. $) | ||||||
| **Securities Lending Collateral – 9.44% | |||||||
| Investment Companies | |||||||
| BNY Mellon SL DBT II | |||||||
| Liquidating Fund | 182,132 | $ | 177,269 | ||||
| Delaware Investments | |||||||
| Collateral Fund No. 1 | 27,776,435 | 27,776,435 | |||||
| †@Mellon GSL Reinvestment Trust II | 620,609 | 0 | |||||
| Total Securities Lending Collateral | |||||||
| (cost $28,579,176) | 27,953,704 | ||||||
| Total Value of Securities – 108.85% | |||||||
| (cost $322,423,759) | 322,195,905 | © | |||||
| **Obligation to Return Securities | |||||||
| Lending Collateral – (9.65%) | (28,579,176 | ) | |||||
| Receivables and Other Assets | |||||||
| Net of Other Liabilities – 0.80% | 2,373,992 | « | |||||
| Net Assets Applicable to 28,301,854 | |||||||
| Shares Outstanding – 100.00% | $ | 295,990,721 | |||||
| Net Asset Value – Optimum International Fund | |||||||
| Class A ($9,317,961 / 894,059 Shares) | $10.42 | ||||||
| Net Asset Value – Optimum International Fund | |||||||
| Class B ($1,139,387 / 111,445 Shares) | $10.22 | ||||||
| Net Asset Value – Optimum International Fund | |||||||
| Class C ($32,994,849 / 3,225,332 Shares) | $10.23 | ||||||
| Net Asset Value – Optimum International Fund | |||||||
| Institutional Class ($252,538,524 / 24,071,018 Shares) | $10.49 | ||||||
| Components of Net Assets at March 31, 2012: | |||||||
| Shares of beneficial interest | |||||||
| (unlimited authorization – no par) | $ | 349,265,835 | |||||
| Undistributed net investment income | 3,163,379 | ||||||
| Accumulated net realized loss | (56,170,889 | ) | |||||
| Net unrealized depreciation of investments | |||||||
| and derivatives | (267,604 | ) | |||||
| Total net assets | $ | 295,990,721 | |||||
| Δ | Securities have been classified by country of origin. Classification by type of business has been presented on page 35 in “Security type/country and sector allocations.” |
| * | Fully or partially on loan. |
| w | Dividend coupon which when presented with the corresponding coupon of the share benefits from a reduced withholding tax of 15% (rather than 25%) on dividends paid. |
| † | Non income producing security. |
| ≠ | The rate shown is the effective yield at the time of purchase. |
| ** | See Note 8 in “Notes to financial statements” for additional information on securities lending collateral and non-cash collateral. |
| @ | Illiquid security. At March 31, 2012, the aggregate value of illiquid securities was $0, which represented 0.00% of the Fund’s net assets. See Note 9 in “Notes to financial statements.” |
| © | Includes $27,225,461 of securities loaned. |
| « | Includes foreign currency valued at $2,468,163 with a cost of $2,465,982. |
| Net Asset Value and Offering Price Per Share – | ||
| Optimum International Fund | ||
| Net asset value Class A (A) | $10.42 | |
| Sales charge (5.75% of offering price) (B) | 0.64 | |
| Offering price | $11.06 |
| (A) | Net asset value per share, as illustrated, is the amount which would be paid upon redemption or repurchase of shares. |
| (B) | See the current prospectus for purchases of $75,000 or more. |
The following foreign currency exchange contracts were outstanding at March 31, 2012:1
Foreign Currency Exchange Contracts
| Unrealized | ||||||||||||||||||
| Contracts to | Settlement | Appreciation | ||||||||||||||||
| Counterparty | Receive (Deliver) | In Exchange For | Date | (Depreciation) | ||||||||||||||
| CITI | AUD | 2,708,000 | USD | (2,770,509 | ) | 4/11/12 | $ | 30,494 | ||||||||||
| CITI | CAD | 3,906,000 | USD | (3,839,698 | ) | 4/11/12 | 74,965 | |||||||||||
| CITI | CHF | 483,000 | USD | (530,045 | ) | 4/11/12 | 5,088 | |||||||||||
| CITI | DKK | 3,282,000 | USD | (591,625 | ) | 4/11/12 | (3,309 | ) | ||||||||||
| CITI | EUR | (6,571,000 | ) | USD | 8,505,792 | 4/11/12 | (258,092 | ) | ||||||||||
| CITI | GBP | 1,165,000 | USD | (1,841,188 | ) | 4/11/12 | 22,027 | |||||||||||
| CITI | HKD | (782,000 | ) | USD | 100,739 | 4/11/12 | 33 | |||||||||||
| CITI | JPY | 143,905,000 | USD | (1,801,648 | ) | 4/11/12 | (63,156 | ) | ||||||||||
| CITI | MXN | 11,625,000 | USD | (849,140 | ) | 4/11/12 | 58,468 | |||||||||||
| CITI | NOK | (13,151,000 | ) | USD | 2,236,883 | 4/11/12 | (71,675 | ) | ||||||||||
| CITI | SEK | 7,401,000 | USD | (1,049,221 | ) | 4/11/12 | 68,896 | |||||||||||
| CITI | SGD | (978,000 | ) | USD | 764,277 | 4/11/12 | (13,835 | ) | ||||||||||
| MNB | AUD | 42,157 | USD | (43,892 | ) | 4/2/12 | (242 | ) | ||||||||||
| MNB | AUD | (211,514 | ) | USD | 220,053 | 4/4/12 | 1,102 | |||||||||||
| MNB | AUD | (7,313,000 | ) | USD | 7,711,705 | 4/27/12 | 161,216 | |||||||||||
| MNB | EUR | 176,431 | USD | (234,505 | ) | 4/2/12 | 795 | |||||||||||
| MNB | EUR | 105,452 | USD | (140,725 | ) | 4/3/12 | (87 | ) | ||||||||||
| MNB | JPY | 38,517,732 | USD | (464,080 | ) | 4/2/12 | 1,207 | |||||||||||
| MNB | JPY | 73,836,000 | USD | (963,437 | ) | 4/11/12 | (71,437 | ) | ||||||||||
| MNB | SGD | 226,966 | USD | (180,734 | ) | 4/2/12 | (158 | ) | ||||||||||
| MNB | SGD | (380,000 | ) | USD | 302,694 | 4/11/12 | 360 | |||||||||||
| $ | (57,340 | ) | ||||||||||||||||
The use of foreign currency exchange contracts involves elements of market risk and risks in excess of the amounts recognized in the financial statements. The notional values presented above represent the Fund’s total exposure in such contracts, whereas only the net unrealized appreciation (depreciation) is reflected in the Fund’s net assets.
1See Note 7 in “Notes to financial statements.”
(continues) 67
Statements of net assets
Optimum International Fund
Summary of Abbreviations: |
See accompanying notes, which are an integral part of the financial statements.
68
Optimum Large Cap Growth Fund
March 31, 2012
| Number of | Value | |||||
| Shares | (U.S. $) | |||||
| ²Common Stock – 96.39% | ||||||
| Consumer Discretionary – 22.99% | ||||||
| † | Amazon.com | 68,447 | $ | 13,861,201 | ||
| † | AutoZone | 5,631 | 2,093,606 | |||
| British Sky Broadcasting Group | ||||||
| (United Kingdom) | 126,462 | 1,367,343 | ||||
| † | CarMax | 37,800 | 1,309,770 | |||
| Carnival (United Kingdom) | 25,400 | 811,708 | ||||
| CBS Class B | 123,650 | 4,192,972 | ||||
| † | Chipotle Mexican Grill | 4,400 | 1,839,200 | |||
| Cie Financiere Richemont ADR | 837,126 | 5,242,167 | ||||
| Coach | 69,948 | 5,405,581 | ||||
| *† | Ctrip.com International ADR | 22,200 | 480,408 | |||
| D.R.Horton | 25,300 | 383,801 | ||||
| *† | Deckers Outdoor | 18,800 | 1,185,340 | |||
| † | Delphi Automotive | |||||
| (United Kingdom) | 30,100 | 951,160 | ||||
| Dick’s Sporting Goods | 41,900 | 2,014,552 | ||||
| † | Discovery Communications Class A | 8,900 | 450,340 | |||
| Disney (Walt) | 38,200 | 1,672,396 | ||||
| † | Dollar General | 43,250 | 1,998,150 | |||
| † | Dollar Tree | 13,026 | 1,230,827 | |||
| * | Expedia | 70,650 | 2,362,536 | |||
| * | Focus Media Holding ADR | 134,825 | 3,386,804 | |||
| † | Fossil | 8,700 | 1,148,226 | |||
| *† | Groupon | 49,000 | 900,620 | |||
| † | Hanesbrands | 41,400 | 1,222,956 | |||
| Harley-Davidson | 17,200 | 844,176 | ||||
| Home Depot | 94,571 | 4,757,867 | ||||
| † | Hyatt Hotels Class A | 13,000 | 555,360 | |||
| Johnson Controls | 22,000 | 714,560 | ||||
| Las Vegas Sands | 106,400 | 6,125,448 | ||||
| Lear | 49,600 | 2,305,904 | ||||
| * | Lennar Class A | 16,700 | 453,906 | |||
| Li & Fung (China) | ||||||
| (Hong Kong Exchange) | 714,000 | 1,638,441 | ||||
| † | Liberty Interactive Class A | 38,600 | 736,874 | |||
| Limited Brands | 52,667 | 2,528,016 | ||||
| Lowe’s | 227,950 | 7,153,071 | ||||
| † | Lululemon Athletica (Canada) | 13,713 | 1,024,087 | |||
| Marriott International Class A | 48,880 | 1,850,108 | ||||
| McDonald’s | 109,731 | 10,764,611 | ||||
| † | MGM Resorts International | 22,800 | 310,536 | |||
| † | Michael Kors Holdings (China) | |||||
| (Hong Kong Exchange) | 33,050 | 1,539,800 | ||||
| News Class A | 270,150 | 5,319,254 | ||||
| NIKE Class B | 112,893 | 12,242,116 | ||||
| † | NVR | 500 | 363,165 | |||
| † | O’Reilly Automotive | 35,554 | 3,247,858 | |||
| † | Prada (Italy) | 134,400 | 874,008 | |||
| † | priceline.com | 20,884 | 14,984,269 | |||
| PVH | 25,100 | 2,242,183 | ||||
| Ralph Lauren | 16,700 | 2,911,311 | ||||
| Ross Stores | 18,800 | 1,092,280 | ||||
| Starbucks | 232,356 | 12,986,376 | ||||
| Starwood Hotel & | ||||||
| Resorts Worldwide | 23,800 | 1,342,558 | ||||
| Target | 36,400 | 2,121,028 | ||||
| TJX | 300,950 | 11,950,725 | ||||
| Vail Resorts | 14,550 | 629,288 | ||||
| Wyndham Worldwide | 41,200 | 1,916,212 | ||||
| Wynn Resorts | 53,944 | 6,736,527 | ||||
| Yum Brands | 86,544 | 6,160,202 | ||||
| 185,933,789 | ||||||
| Consumer Staples – 4.72% | ||||||
| Coca-Cola | 55,700 | 4,122,357 | ||||
| Costco Wholesale | 17,100 | 1,552,680 | ||||
| CVS Caremark | 176,200 | 7,893,760 | ||||
| Estee Lauder Class A | 50,024 | 3,098,487 | ||||
| Mead Johnson Nutrition | 72,291 | 5,962,562 | ||||
| † | Monster Beverage | 13,000 | 807,170 | |||
| PepsiCo | 35,500 | 2,355,425 | ||||
| Philip Morris International | 74,200 | 6,574,862 | ||||
| Procter & Gamble | 75,400 | 5,067,634 | ||||
| Whole Foods Market | 9,100 | 757,120 | ||||
| 38,192,057 | ||||||
| Energy – 7.86% | ||||||
| Anadarko Petroleum | 83,369 | 6,531,127 | ||||
| Cabot Oil & Gas | 15,700 | 489,369 | ||||
| † | Cameron International | 23,700 | 1,252,071 | |||
| Cimarex Energy | 6,300 | 475,461 | ||||
| ConocoPhillips | 96,100 | 7,304,561 | ||||
| *† | Continental Resources | 24,026 | 2,061,911 | |||
| EOG Resources | 18,300 | 2,033,130 | ||||
| † | FMC Technologies | 38,900 | 1,961,338 | |||
| Halliburton | 260,396 | 8,642,542 | ||||
| † | Kodiak Oil & Gas | 104,250 | 1,038,330 | |||
| † | McDermott International | 39,900 | 511,119 | |||
| † | Nabors Industries (Bermuda) | 139,950 | 2,447,726 | |||
| National Oilwell Varco | 105,663 | 8,397,039 | ||||
| Occidental Petroleum | 86,873 | 8,272,916 | ||||
| Pioneer Natural Resources | 32,950 | 3,676,891 | ||||
| Plains All American Pipeline | 20,500 | 1,608,225 | ||||
| Royal Dutch Shell ADR | 41,800 | 2,931,434 | ||||
| Schlumberger | 31,000 | 2,167,830 | ||||
| † | Weatherford International | |||||
| (Switzerland) | 50,200 | 757,518 | ||||
| Williams | 33,000 | 1,016,730 | ||||
| 63,577,268 | ||||||
| Financials – 5.91% | ||||||
| † | Affiliated Managers Group | 7,900 | 883,299 | |||
| American Express | 48,000 | 2,777,280 | ||||
| American Tower | 94,400 | 5,949,088 | ||||
| Annaly Capital Management | 71,800 | 1,135,876 | ||||
| Blackstone Group | 168,300 | 2,682,702 | ||||
| Franklin Resources | 15,700 | 1,947,271 | ||||
(continues) 69
Statements of net assets
Optimum Large Cap Growth Fund
| Number of | Value | |||||
| Shares | (U.S. $) | |||||
| ²Common Stock (continued) | ||||||
| Financials (continued) | ||||||
| Home Properties | 25,600 | $ | 1,561,856 | |||
| † | IntercontinentalExchange | 32,300 | 4,438,666 | |||
| Invesco | 61,000 | 1,626,870 | ||||
| JPMorgan Chase | 14,100 | 648,318 | ||||
| MetLife | 62,750 | 2,343,713 | ||||
| Regions Financial | 274,400 | 1,808,296 | ||||
| U.S. Bancorp | 218,602 | 6,925,311 | ||||
| Wells Fargo | 383,046 | 13,077,190 | ||||
| 47,805,736 | ||||||
| Healthcare – 7.90% | ||||||
| Aetna | 65,350 | 3,277,956 | ||||
| Agilent Technologies | 26,600 | 1,183,966 | ||||
| † | Alexion Pharmaceuticals | 12,600 | 1,170,036 | |||
| Allergan | 46,080 | 4,397,414 | ||||
| Baxter International | 10,800 | 645,624 | ||||
| † | Biogen Idec | 59,487 | 7,493,576 | |||
| Bristol-Myers Squibb | 99,630 | 3,362,513 | ||||
| † | Celgene | 12,500 | 969,000 | |||
| CIGNA | 41,850 | 2,061,113 | ||||
| Covidien (Ireland) | 90,350 | 4,940,338 | ||||
| † | Edwards Lifesciences | 10,700 | 778,211 | |||
| † | Express Scripts Holding | 135,200 | 7,325,136 | |||
| † | Gilead Sciences | 63,050 | 3,079,993 | |||
| *† | Human Genome Sciences | 100,600 | 828,944 | |||
| † | Insulet | 58,150 | 1,112,991 | |||
| Johnson & Johnson | 36,700 | 2,420,732 | ||||
| † | Life Technologies | 46,200 | 2,255,484 | |||
| McKesson | 24,500 | 2,150,365 | ||||
| Pfizer | 196,934 | 4,462,524 | ||||
| † | Regeneron Pharmaceuticals | 3,300 | 384,846 | |||
| Stryker | 18,100 | 1,004,188 | ||||
| Thermo Fisher Scientific | 45,000 | 2,537,100 | ||||
| † | United Therapeutics | 3,500 | 164,955 | |||
| UnitedHealth Group | 51,650 | 3,044,251 | ||||
| Universal Health Services Class B | 45,750 | 1,917,383 | ||||
| † | Valeant Pharmaceuticals | |||||
| International (Canada) | 17,800 | 955,682 | ||||
| 63,924,321 | ||||||
| Industrials – 13.29% | ||||||
| † | Babcock & Wilcox | 19,700 | 507,275 | |||
| Boeing | 19,200 | 1,427,904 | ||||
| Caterpillar | 44,950 | 4,788,074 | ||||
| Chicago Bridge & | ||||||
| Iron (Netherlands) | 250 | 10,798 | ||||
| Cooper Industries | 61,450 | 3,929,728 | ||||
| CSX | 198,200 | 4,265,264 | ||||
| Cummins | 54,775 | 6,575,191 | ||||
| Danaher | 187,857 | 10,519,991 | ||||
| Deere | 23,100 | 1,868,790 | ||||
| Expeditors International | ||||||
| of Washington | 15,300 | 711,603 | ||||
| Fastenal | 59,400 | 3,213,540 | ||||
| FedEx | 34,700 | 3,191,012 | ||||
| Fluor | 5,762 | 345,950 | ||||
| General Dynamics | 26,350 | 1,933,563 | ||||
| Grainger (W.W.) | 3,900 | 837,759 | ||||
| † | Hertz Global Holdings | 151,750 | 2,282,320 | |||
| Honeywell International | 75,450 | 4,606,223 | ||||
| Hunt (J.B.) Transport | 16,700 | 907,979 | ||||
| Hutchison Port Holdings | ||||||
| Trust (Singapore) | 2,758,000 | 2,109,870 | ||||
| Joy Global | 4,700 | 345,450 | ||||
| † | Kansas City Southern | 15,300 | 1,096,857 | |||
| KBR | 49,350 | 1,754,393 | ||||
| Precision Castparts | 51,271 | 8,864,755 | ||||
| Rockwell Automation | 30,524 | 2,432,763 | ||||
| Roper Industries | 9,800 | 971,768 | ||||
| Stanley Black & Decker | 50,650 | 3,898,024 | ||||
| Timken | 17,200 | 872,728 | ||||
| Towers Watson Class A | 23,400 | 1,546,038 | ||||
| Tyco International (Switzerland) | 73,500 | 4,129,230 | ||||
| Union Pacific | 79,465 | 8,540,898 | ||||
| † | United Continental Holdings | 63,800 | 1,371,700 | |||
| United Parcel Service Class B | 84,700 | 6,836,984 | ||||
| *† | United Rentals | 57,650 | 2,472,609 | |||
| United Technologies | 41,850 | 3,471,039 | ||||
| † | Verisk Analytics Class A | 37,400 | 1,756,678 | |||
| † | WABCO Holdings | 35,000 | 2,116,800 | |||
| † | WESCO International | 15,450 | 1,009,040 | |||
| 107,520,588 | ||||||
| Information Technology – 28.15% | ||||||
| Accenture Class A (Ireland) | 127,081 | 8,196,725 | ||||
| † | Akamai Technologies | 31,500 | 1,156,050 | |||
| † | Apple | 107,221 | 64,275,772 | |||
| ASML Holding (Netherlands) | 14,500 | 727,030 | ||||
| † | Autodesk | 22,500 | 952,200 | |||
| Avago Technologies (Singapore) | 76,150 | 2,967,566 | ||||
| † | Baidu ADR | 84,320 | 12,291,326 | |||
| † | Broadcom Class A | 108,400 | 4,260,120 | |||
| † | Check Point Software | |||||
| Technologies (Israel) | 64,336 | 4,107,210 | ||||
| Cisco Systems | 92,750 | 1,961,663 | ||||
| † | Cognizant Technology Solutions | |||||
| Class A | 24,800 | 1,908,360 | ||||
| † | eBay | 231,450 | 8,538,191 | |||
| † | EMC | 205,200 | 6,131,376 | |||
| =@† | Facebook Class A | 17,038 | 530,684 | |||
| =@† | Facebook Class B | 30,629 | 954,005 | |||
| † | Gartner | 26,100 | 1,112,904 | |||
| † | Google Class A | 31,557 | 20,235,610 | |||
| IAC/InterActiveCorp | 31,770 | 1,559,589 | ||||
| † | Informatica | 19,000 | 1,005,100 | |||
| International Business Machines | 34,850 | 7,271,453 | ||||
| † | Juniper Networks | 95,000 | 2,173,600 | |||
70
| Number of | Value | ||||||
| Shares | (U.S. $) | ||||||
| ²Common Stock (continued) | |||||||
| Information Technology (continued) | |||||||
| *† | Lam Research | 59,850 | $ | 2,670,507 | |||
| *† | LinkedIn Class A | 27,432 | 2,797,790 | ||||
| MasterCard Class A | 22,000 | 9,251,880 | |||||
| † | NetApp | 121,900 | 5,457,463 | ||||
| † | Nuance Communications | 37,700 | 964,366 | ||||
| Oracle | 110,150 | 3,211,974 | |||||
| QUALCOMM | 296,825 | 20,190,036 | |||||
| † | Red Hat | 21,600 | 1,293,624 | ||||
| † | salesforce.com | 20,450 | 3,159,730 | ||||
| † | SanDisk | 14,700 | 728,973 | ||||
| Seagate Technology (Ireland) | 112,200 | 3,023,790 | |||||
| † | Skyworks Solutions | 47,450 | 1,311,993 | ||||
| Tencent Holdings (China) | |||||||
| (Hong Kong Exchange) | 63,400 | 1,768,368 | |||||
| † | Teradata | 18,200 | 1,240,330 | ||||
| † | Trimble Navigation | 18,800 | 1,023,096 | ||||
| =@† | 7,812 | 124,992 | |||||
| Visa Class A | 95,874 | 11,313,132 | |||||
| *† | VistaPrint (Netherlands) | 97,350 | 3,762,578 | ||||
| † | VMware Class A | 8,629 | 969,641 | ||||
| *† | Youku ADR | 49,871 | 1,096,663 | ||||
| 227,677,460 | |||||||
| Materials – 4.58% | |||||||
| Air Products & Chemicals | 3,400 | 312,120 | |||||
| Celanese Class A | 51,470 | 2,376,885 | |||||
| Cytec Industries | 28,550 | 1,735,555 | |||||
| Dow Chemical | 85,995 | 2,978,867 | |||||
| Eastman Chemical | 43,550 | 2,251,100 | |||||
| Freeport-McMoRan Copper & Gold | 65,000 | 2,472,600 | |||||
| International Paper | 29,300 | 1,028,430 | |||||
| LyondellBasell Industries | |||||||
| Class A (Netherlands) | 39,700 | 1,732,905 | |||||
| Monsanto | 101,650 | 8,107,604 | |||||
| Potash Corp. of | |||||||
| Saskatchewan (Canada) | 7,700 | 351,813 | |||||
| Praxair | 91,758 | 10,519,136 | |||||
| † | Rockwood Holdings | 34,900 | 1,820,035 | ||||
| Sherwin-Williams | 12,200 | 1,325,774 | |||||
| 37,012,824 | |||||||
| Telecommunication Services – 0.99% | |||||||
| † | Crown Castle International | 88,000 | 4,693,920 | ||||
| Vodafone Group ADR | 119,900 | 3,317,633 | |||||
| 8,011,553 | |||||||
| Total Common Stock | |||||||
| (cost $604,223,378) | 779,655,596 | ||||||
| Convertible Preferred Stock – 0.05% | |||||||
| =@† | LivingSocial Series F | 14,824 | 78,982 | ||||
| =@† | Twitter Series A | 20 | 320 | ||||
| =@† | Twitter Series B | 5,988 | 95,808 | ||||
| =@† | Twitter Series C | 1,619 | 25,904 | ||||
| =@† | Twitter Series D | 2,999 | 47,984 | ||||
| =@† | Twitter Series F | 1,022 | 16,352 | ||||
| =@† | Twitter Series G-2 | 12,309 | 196,944 | ||||
| Total Convertible Preferred Stock | |||||||
| (cost $498,781) | 462,294 | ||||||
| Preferred Stock– 0.14% | |||||||
| Wells Fargo 8.00% | 38,550 | 1,120,263 | |||||
| Total Preferred Stock | |||||||
| (cost $741,030) | 1,120,263 | ||||||
| Principal | |||||||
| Amount (U.S. $) | |||||||
| Short-Term Investments – 3.35% | |||||||
| ≠Discount Notes – 1.21% | |||||||
| Federal Home Loan Bank | |||||||
| 0.04% 4/27/12 | $ | 4,036,979 | 4,036,951 | ||||
| 0.65% 4/25/12 | 5,749,380 | 5,749,346 | |||||
| 9,786,297 | |||||||
| Repurchase Agreements – 1.68% | |||||||
| Bank of America 0.03%, dated | |||||||
| 3/30/12, to be repurchased | |||||||
| on 4/2/12, repurchase price | |||||||
| $4,036,989 (collateralized by | |||||||
| U.S. government obligations | |||||||
| 0.125%-4.125% | |||||||
| 12/31/13–5/15/15; | |||||||
| market value $4,117,719) | 4,036,979 | 4,036,979 | |||||
| BNP Paribas 0.04%, dated | |||||||
| 3/30/12, to be repurchased | |||||||
| on 4/2/12, repurchase price | |||||||
| $9,510,205 (collateralized by | |||||||
| U.S. government obligations | |||||||
| 1.375%-7.50% | |||||||
| 6/15/12–2/15/37; | |||||||
| market value $9,700,376) | 9,510,173 | 9,510,173 | |||||
| 13,547,152 | |||||||
| ≠U.S. Treasury Obligation – 0.46% | |||||||
| U.S. Treasury Bill 0.008% 4/19/12 | 3,750,705 | 3,750,637 | |||||
| 3,750,637 | |||||||
| Total Short-Term Investments | |||||||
| (cost $27,083,710) | 27,084,086 | ||||||
| Total Value of Securities Before Securities | |||||||
| Lending Collateral – 99.93% | |||||||
| (cost $632,546,899) | 808,322,239 | ||||||
(continues) 71
Statements of net assets
Optimum Large Cap Growth Fund
| Number of | Value | ||||||
| Shares | (U.S. $) | ||||||
| **Securities Lending Collateral – 2.38% | |||||||
| Investment Companies | |||||||
| BNY Mellon SL DBT II | |||||||
| Liquidating Fund | 502,050 | $ | 488,645 | ||||
| Delaware Investments | |||||||
| Collateral Fund No.1 | 18,755,004 | 18,755,004 | |||||
| †@Mellon GSL Reinvestment | |||||||
| Trust II | 999,997 | 0 | |||||
| Total Securities Lending Collateral | |||||||
| (cost $20,257,051) | 19,243,649 | ||||||
| Total Value of Securities – 102.31% | |||||||
| (cost $652,803,950) | 827,565,888 | © | |||||
| **Obligation to Return Securities | |||||||
| Lending Collateral – (2.50%) | (20,257,051 | ) | |||||
| Receivables and Other Assets Net of | |||||||
| Other Liabilities – 0.19% | 1,540,997 | ||||||
| Net Assets Applicable to 59,174,766 | |||||||
| Shares Outstanding – 100.00% | $ | 808,849,834 | |||||
| Net Asset Value – Optimum Large Cap Growth Fund | |||||||
| Class A ($34,170,233 / 2,535,753 Shares) | $13.48 | ||||||
| Net Asset Value – Optimum Large Cap Growth Fund | |||||||
| Class B ($3,627,653 / 285,043 Shares) | $12.73 | ||||||
| Net Asset Value – Optimum Large Cap Growth Fund | |||||||
| Class C ($120,182,897 / 9,445,166 Shares) | $12.72 | ||||||
| Net Asset Value – Optimum Large Cap Growth Fund | |||||||
| Institutional Class ($650,869,051 / 46,908,804 Shares) | $13.88 | ||||||
| Components of Net Assets at March 31, 2012: | |||||||
| Shares of beneficial interest | |||||||
| (unlimited authorization – no par) | $ | 707,087,297 | |||||
| Accumulated net investment loss | (217,029 | ) | |||||
| Accumulated net realized loss | (72,832,712 | ) | |||||
| Net unrealized appreciation of investments | |||||||
| and derivatives | 174,812,278 | ||||||
| Total net assets | $ | 808,849,834 | |||||
| ² | Narrow industries are utilized for compliance purposes for diversification whereas broad sectors are used for financial reporting. |
| † | Non income producing security. |
| * | Fully or partially on loan. |
| = | Security is being fair valued in accordance with the Fund’s fair valuation policy. At March 31, 2012, the aggregate value of fair valued securities was $2,071,975, which represented 0.26% of the Fund’s net assets. See Note 1 in “Notes to financial statements.” |
| @ | Illiquid security. At March 31, 2012, the aggregate value of illiquid securities was $2,071,975, which represented 0.26% of the Fund’s net assets. See Note 9 in “Notes to financial statements.” |
| ≠ | The rate shown is the effective yield at the time of purchase. |
| ** | See Note 8 in “Notes to financial statements” for additional information on securities lending collateral and non-cash collateral. |
| © | Includes $21,635,534 of securities loaned. |
| Net Asset Value and Offering Price Per Share – | ||
| Optimum Large Cap Growth Fund | ||
| Net asset value Class A (A) | $13.48 | |
| Sales charge (5.75% of offering price) (B) | 0.82 | |
| Offering price | $14.30 |
| (A) | Net asset value per share, as illustrated, is the amount which would be paid upon redemption or repurchase of shares. |
| (B) | See the current prospectus for purchases of $75,000 or more. |
The following foreign currency exchange contracts were outstanding at March 31, 2012:1
Foreign Currency Exchange Contracts
| Unrealized | |||||||||||||||
| Contracts to | Settlement | Appreciation | |||||||||||||
| Counterparty | Receive (Deliver) | In Exchange For | Date | (Depreciation) | |||||||||||
| MNB | GBP | (283,504 | ) | USD | 449,722 | 4/2/12 | $ | (3,719 | ) | ||||||
| MNB | GBP | (27,178 | ) | USD | 43,241 | 4/3/12 | (229 | ) | |||||||
| $ | (3,948 | ) | |||||||||||||
The use of foreign currency exchange contracts involves elements of market risk and risks in excess of the amounts recognized in the financial statements. The notional values presented above represent the Fund’s total exposure in such contracts, whereas only the net unrealized appreciation (depreciation) is reflected in the Fund’s net assets.
1See Note 7 in “Notes to financial statements.”
Summary of Abbreviations:
ADR — American Depositary Receipt
GBP — British Pound Sterling
MNB — Mellon National Bank
USD — United States Dollar
See accompanying notes, which are an integral part of the financial statements.
72
Optimum Large Cap Value Fund
March 31, 2012
| Number of | Value | ||||
| Shares | (U.S. $) | ||||
| Common Stock – 98.14% | |||||
| Consumer Discretionary – 10.22% | |||||
| Advance Auto Parts | 18,660 | $ | 1,652,716 | ||
| Coach | 171,265 | 13,235,359 | |||
| Comcast Special Class A | 103,000 | 3,039,530 | |||
| † | Delphi Automotive | 23,310 | 736,596 | ||
| Disney (Walt) | 132,220 | 5,788,592 | |||
| † | General Motors | 28,920 | 741,798 | ||
| Hasbro | 85,790 | 3,150,209 | |||
| Johnson Controls | 112,830 | 3,664,718 | |||
| Kohl’s | 23,360 | 1,168,701 | |||
| Omnicom Group | 84,130 | 4,261,185 | |||
| Ross Stores | 164,729 | 9,570,755 | |||
| Staples | 111,440 | 1,803,099 | |||
| Target | 92,240 | 5,374,825 | |||
| TJX | 361,144 | 14,341,028 | |||
| Viacom Class B | 82,400 | 3,910,704 | |||
| Yum Brands | 79,656 | 5,669,914 | |||
| 78,109,729 | |||||
| Consumer Staples – 13.09% | |||||
| Altria Group | 400,977 | 12,378,160 | |||
| Colgate-Palmolive | 67,998 | 6,648,844 | |||
| CVS Caremark | 70,831 | 3,173,229 | |||
| Danone (France) | 31,068 | 2,166,990 | |||
| Diageo (United Kingdom) | 253,146 | 6,083,538 | |||
| General Mills | 140,460 | 5,541,147 | |||
| Herbalife (Cayman Islands) | 185,650 | 12,776,432 | |||
| Kellogg | 214,547 | 11,506,156 | |||
| Lorillard | 7,000 | 906,360 | |||
| Nestle (Switzerland) | 70,180 | 4,415,890 | |||
| PepsiCo | 48,010 | 3,185,464 | |||
| Philip Morris International | 282,588 | 25,040,123 | |||
| Procter & Gamble | 32,626 | 2,192,793 | |||
| Reynolds American | 17,150 | 710,696 | |||
| Smucker (J.M.) | 16,450 | 1,338,372 | |||
| Walgreen | 57,660 | 1,931,033 | |||
| 99,995,227 | |||||
| Energy – 13.84% | |||||
| Apache | 102,927 | 10,337,988 | |||
| Chevron | 146,443 | 15,704,547 | |||
| Core Laboratories (Netherlands) | 76,565 | 10,073,657 | |||
| * | Diamond Offshore Drilling | 112,355 | 7,499,696 | ||
| EOG Resources | 17,860 | 1,984,246 | |||
| Exxon Mobil | 229,474 | 19,902,280 | |||
| Halliburton | 186,424 | 6,187,413 | |||
| Hess | 5,450 | 321,278 | |||
| HollyFrontier | 235,382 | 7,567,531 | |||
| Marathon Oil | 282,630 | 8,959,371 | |||
| Occidental Petroleum | 62,130 | 5,916,640 | |||
| * | RPC | 234,194 | 2,484,793 | ||
| Transocean (Switzerland) | 19,940 | 1,090,718 | |||
| Valero Energy | 298,429 | 7,690,515 | |||
| 105,720,673 | |||||
| Financials – 19.64% | |||||
| ACE (Switzerland) | 39,820 | 2,914,824 | |||
| AFLAC | 141,371 | 6,501,652 | |||
| American Capital Agency | 306,333 | 9,049,077 | |||
| Annaly Capital Management | 398,684 | 6,307,181 | |||
| Aon (United Kingdom) | 71,270 | 3,496,506 | |||
| Apartment Investment | |||||
| & Management | 290,817 | 7,680,477 | |||
| Bank of America | 111,870 | 1,070,596 | |||
| Bank of New York Mellon | 262,476 | 6,333,546 | |||
| BlackRock | 20,953 | 4,293,270 | |||
| CBOE Holdings | 142,118 | 4,038,994 | |||
| Chimera Investment | 3,084,903 | 8,730,275 | |||
| Chubb | 37,880 | 2,617,887 | |||
| Discover Financial Services | 124,248 | 4,142,428 | |||
| Eaton Vance | 260,166 | 7,435,544 | |||
| Federated Investors Class B | 542,036 | 12,147,026 | |||
| Franklin Resources | 19,700 | 2,443,391 | |||
| Goldman Sachs Group | 75,080 | 9,337,700 | |||
| JPMorgan Chase | 242,590 | 11,154,287 | |||
| MetLife | 188,490 | 7,040,102 | |||
| Moody’s | 42,170 | 1,775,357 | |||
| PNC Financial Services Group | 44,680 | 2,881,413 | |||
| Prudential Financial | 82,920 | 5,256,299 | |||
| State Street | 73,240 | 3,332,420 | |||
| SunTrust Banks | 22,580 | 545,759 | |||
| Travelers | 70,290 | 4,161,168 | |||
| Waddell & Reed Financial Class A | 235,411 | 7,629,671 | |||
| Wells Fargo | 227,340 | 7,761,388 | |||
| 150,078,238 | |||||
| Healthcare – 11.12% | |||||
| Abbott Laboratories | 110,690 | 6,784,190 | |||
| Becton, Dickinson | 28,370 | 2,202,931 | |||
| † | Endo Pharmaceuticals Holdings | 250,980 | 9,720,455 | ||
| † | Express Scripts Holding | 169,510 | 9,184,052 | ||
| † | Gilead Sciences | 180,684 | 8,826,413 | ||
| Johnson & Johnson | 141,020 | 9,301,679 | |||
| Medtronic | 119,150 | 4,669,489 | |||
| Merck | 64,610 | 2,481,024 | |||
| Pfizer | 483,015 | 10,945,120 | |||
| Quest Diagnostics | 32,930 | 2,013,670 | |||
| Roche Holding (Switzerland) | 10,504 | 1,828,047 | |||
| St. Jude Medical | 67,690 | 2,999,344 | |||
| Thermo Fisher Scientific | 56,550 | 3,188,289 | |||
| † | Waters | 116,460 | 10,791,184 | ||
| 84,935,887 | |||||
| Industrials – 12.51% | |||||
| 3M | 67,280 | 6,002,049 | |||
| Canadian National Railway (Canada) | 27,020 | 2,146,199 | |||
| Caterpillar | 35,060 | 3,734,591 | |||
| Copa Holdings Class A (Panama) | 181,852 | 14,402,678 | |||
| Cummins | 75,034 | 9,007,081 | |||
| Danaher | 78,390 | 4,389,840 | |||
(continues) 73
Statements of net assets
Optimum Large Cap Value Fund
| Number of | Value | ||||
| Shares | (U.S. $) | ||||
| Common Stock (continued) | |||||
| Industrials (continued) | |||||
| Dun & Bradstreet | 24,070 | $ | 2,039,451 | ||
| Eaton | 48,400 | 2,411,772 | |||
| Fluor | 10,070 | 604,603 | |||
| Honeywell International | 98,140 | 5,991,447 | |||
| † | Huntington Ingalls Industries | 10,783 | 433,908 | ||
| Lockheed Martin | 238,155 | 21,400,608 | |||
| Northrop Grumman | 64,560 | 3,943,325 | |||
| Stanley Black & Decker | 58,417 | 4,495,772 | |||
| Tyco International (Switzerland) | 85,220 | 4,787,660 | |||
| United Parcel Service Class B | 22,970 | 1,854,138 | |||
| United Technologies | 95,440 | 7,915,794 | |||
| 95,560,916 | |||||
| Information Technology – 11.16% | |||||
| Accenture Class A (Ireland) | 187,659 | 12,104,006 | |||
| † | Apple | 22,567 | 13,528,239 | ||
| ASML Holding (Netherlands) | 25,620 | 1,284,587 | |||
| Cisco Systems | 120,740 | 2,553,651 | |||
| † | Fiserv | 18,960 | 1,315,634 | ||
| Hewlett-Packard | 38,080 | 907,446 | |||
| Intel | 128,470 | 3,611,292 | |||
| International Business Machines | 82,366 | 17,185,666 | |||
| MasterCard Class A | 5,310 | 2,233,067 | |||
| Microsoft | 342,462 | 11,044,400 | |||
| Oracle | 230,790 | 6,729,836 | |||
| † | Western Digital | 226,069 | 9,356,996 | ||
| Western Union | 192,750 | 3,392,400 | |||
| 85,247,220 | |||||
| Materials – 4.00% | |||||
| Air Products & Chemicals | 39,400 | 3,616,920 | |||
| CF Industries Holdings | 42,505 | 7,763,538 | |||
| Cliffs Natural Resources | 134,610 | 9,323,088 | |||
| Freeport-McMoRan Copper & Gold | 92,366 | 3,513,603 | |||
| PPG Industries | 47,310 | 4,532,298 | |||
| Sherwin-Williams | 16,840 | 1,830,003 | |||
| 30,579,450 | |||||
| Telecommunication Services – 1.83% | |||||
| AT&T | 284,010 | 8,869,633 | |||
| Vodafone Group (United Kingdom) | 1,850,930 | 5,097,929 | |||
| 13,967,562 | |||||
| Utilities – 0.73% | |||||
| PG&E | 80,260 | 3,484,086 | |||
| PPL | 40,810 | 1,153,291 | |||
| Public Service Enterprise Group | 30,610 | 936,972 | |||
| 5,574,349 | |||||
| Total Common Stock | |||||
| (cost $614,968,588) | 749,769,251 | ||||
| Convertible Preferred Stock – 0.07% | |||||
| PPL 9.50% exercise price $28.80, | |||||
| expiration date 7/1/13 | 9,830 | 534,162 | |||
| Total Convertible Preferred Stock | |||||
| (cost $491,500) | 534,162 | ||||
| Principal | |||||
| Amount (U.S. $) | |||||
| Short-Term Investments – 1.71% | |||||
| ≠Discount Notes – 0.59% | |||||
| Federal Home Loan Bank | |||||
| 0.04% 4/27/12 | $2,101,369 | 2,101,354 | |||
| 0.65% 4/25/12 | 2,402,649 | 2,402,635 | |||
| 4,503,989 | |||||
| Repurchase Agreements – 0.92% | |||||
| Bank of America 0.03%, dated | |||||
| 3/30/12, to be repurchased | |||||
| on 4/2/12, repurchase price | |||||
| $2,101,374 (collateralized by | |||||
| U.S. government obligations | |||||
| 0.125%-4.125% 12/31/13– | |||||
| 5/15/15; market value | |||||
| $2,143,396) | 2,101,369 | 2,101,369 | |||
| BNP Paribas 0.04%, dated | |||||
| 3/30/12, to be repurchased | |||||
| on 4/2/12, repurchase price | |||||
| $4,950,347 (collateralized by | |||||
| U.S. government obligations | |||||
| 1.375%-7.50% 6/15/12– | |||||
| 2/15/37; market value | |||||
| $5,049,338) | 4,950,331 | 4,950,331 | |||
| 7,051,700 | |||||
| ≠U.S. Treasury Obligation – 0.20% | |||||
| U.S. Treasury Bill 0.008% 4/19/12 | 1,542,956 | 1,542,928 | |||
| 1,542,928 | |||||
| Total Short-Term Investments | |||||
| (cost $13,098,451) | 13,098,617 | ||||
| Total Value of Securities Before | |||||
| Securities Lending Collateral – | |||||
| 99.92% (cost $628,558,539) | 763,402,030 | ||||
| Number of | |||||
| Shares | |||||
| **Securities Lending Collateral – 0.87% | |||||
| Investment Companies | |||||
| BNY Mellon SL DBT II | |||||
| Liquidating Fund | 353,804 | 344,358 | |||
| Delaware Investments | |||||
| Collateral Fund No. 1 | 6,255,754 | 6,255,754 | |||
| †@ | Mellon GSL | ||||
| Reinvestment Trust II | 996,642 | 0 | |||
| Total Securities Lending Collateral | |||||
| (cost $7,606,200) | 6,600,112 | ||||
74
| Value | ||||
| (U.S. $) | ||||
| Total Value of Securities – 100.79% | ||||
| (cost $636,164,739) | $ | 770,002,142 | © | |
| **Obligation to Return Securities | ||||
| Lending Collateral – (1.00%) | (7,606,200 | ) | ||
| Receivables and Other Assets Net | ||||
| of Other Liabilities – 0.21% | 1,602,448 | « | ||
| Net Assets Applicable to 64,948,708 | ||||
| Shares Outstanding – 100.00% | $ | 763,998,390 | ||
| Net Asset Value – Optimum Large Cap Value Fund | ||||
| Class A ($31,478,208 / 2,679,897 Shares) | $11.75 | |||
| Net Asset Value – Optimum Large Cap Value Fund | ||||
| Class B ($3,478,122 / 299,833 Shares) | $11.60 | |||
| Net Asset Value – Optimum Large Cap Value Fund | ||||
| Class C ($111,556,947 / 9,621,764 Shares) | $11.59 | |||
| Net Asset Value – Optimum Large Cap Value Fund | ||||
| Institutional Class ($617,485,113 / 52,347,214 Shares) | $11.80 | |||
| Components of Net Assets at March 31, 2012: | ||||
| Shares of beneficial interest | ||||
| (unlimited authorization – no par) | $ | 788,249,300 | ||
| Undistributed net investment income | 9,816,408 | |||
| Accumulated net realized loss | (167,936,840 | ) | ||
| Net unrealized appreciation of investments and | ||||
| foreign currencies | 133,869,522 | |||
| Total net assets | $ | 763,998,390 | ||
| † | Non income producing security. |
| * | Fully or partially on loan. |
| ≠ | The rate shown is the effective yield at the time of purchase. |
| ** | See Note 8 in “Notes to financial statements” for additional information on securities lending collateral. |
| @ | Illiquid security. At March 31, 2012, the aggregate value of illiquid securities was $0, which represented 0.00% of the Fund’s net assets. See Note 9 in “Notes to financial statements.” |
| © | Includes $7,328,168 of securities loaned. |
| « | Includes foreign currency valued at $8,652 with a cost of $8,657. |
| Net Asset Value and Offering Price Per Share – | |
| Optimum Large Cap Value Fund | |
| Net asset value Class A (A) | $11.75 |
| Sales charge (5.75% of offering price) (B) | 0.72 |
| Offering price | $12.47 |
| (A) | Net asset value per share, as illustrated, is the amount which would be paid upon redemption or repurchase of shares. |
| (B) | See the current prospectus for purchases of $75,000 or more. |
See accompanying notes, which are an integral part of the financial statements.
(continues) 75
Statements of net assets
Optimum Small-Mid Cap Growth Fund
March 31, 2012
| Number of | Value | ||||
| Shares | (U.S. $) | ||||
| Common Stock – 97.77% | |||||
| Consumer Discretionary – 20.06% | |||||
| Abercrombie & Fitch Class A | 42,900 | $ | 2,128,269 | ||
| *† | American Public Education | 29,320 | 1,114,160 | ||
| † | Bally Technologies | 67,000 | 3,132,250 | ||
| Brunswick | 39,400 | 1,014,550 | |||
| † | Buffalo Wild Wings | 14,870 | 1,348,560 | ||
| † | Cheesecake Factory | 49,620 | 1,458,332 | ||
| Dana Holding | 115,640 | 1,792,420 | |||
| *† | Deckers Outdoor | 24,852 | 1,566,919 | ||
| DSW Class A | 37,380 | 2,047,303 | |||
| † | Express | 85,580 | 2,137,788 | ||
| *† | Gaylord Entertainment | 120,000 | 3,695,999 | ||
| GNC Holdings | 89,240 | 3,113,584 | |||
| † | Hanesbrands | 70,330 | 2,077,548 | ||
| † | Helen of Troy (Bermuda) | 45,000 | 1,530,450 | ||
| † | Hibbett Sports | 13,300 | 725,515 | ||
| Jarden | 55,000 | 2,212,650 | |||
| * | Lennar Class A | 50,230 | 1,365,251 | ||
| *† | Life Time Fitness | 38,000 | 1,921,660 | ||
| † | LKQ | 60,000 | 1,870,200 | ||
| Localiza Rent a Car (Brazil) | 65,400 | 1,203,648 | |||
| *† | Lululemon Athletica (Canada) | 32,000 | 2,389,760 | ||
| † | Madden (Steven) | 28,625 | 1,223,719 | ||
| † | Meritage Homes | 32,120 | 869,167 | ||
| † | Pier 1 Imports | 103,000 | 1,872,540 | ||
| † | Pinnacle Entertainment | 135,000 | 1,553,850 | ||
| Pool | 45,000 | 1,683,900 | |||
| † | PulteGroup | 187,630 | 1,660,526 | ||
| PVH | 10,000 | 893,300 | |||
| † | Red Robin Gourmet Burgers | 19,360 | 719,998 | ||
| Rent-A-Center | 53,510 | 2,020,003 | |||
| *† | rue21 | 58,310 | 1,710,815 | ||
| *† | Saks | 67,500 | 783,675 | ||
| † | Shutterfly | 86,600 | 2,713,178 | ||
| *† | Skullcandy | 30,000 | 474,900 | ||
| Sotheby’s | 24,840 | 977,206 | |||
| † | Tempur-Pedic International | 27,550 | 2,326,047 | ||
| † | Tenneco | 44,510 | 1,653,547 | ||
| *† | TripAdvisor | 48,500 | 1,729,995 | ||
| † | True Religion Apparel | 20,800 | 569,920 | ||
| † | Urban Outfitters | 46,620 | 1,357,108 | ||
| *† | Vera Bradley | 25,500 | 769,845 | ||
| † | Warnaco Group | 23,000 | 1,343,200 | ||
| † | WMS Industries | 55,000 | 1,305,150 | ||
| 70,058,405 | |||||
| Consumer Staples – 0.89% | |||||
| † | Chefs’ Warehouse | 65,000 | 1,504,100 | ||
| † | Elizabeth Arden | 45,514 | 1,592,080 | ||
| 3,096,180 | |||||
| Energy – 7.41% | |||||
| *† | Approach Resources | 10,000 | 369,500 | ||
| † | Atwood Oceanics | 99,800 | 4,480,021 | ||
| † | Bonanza Creek Energy | 58,910 | 1,287,184 | ||
| Cabot Oil & Gas | 6,000 | 187,020 | |||
| † | Carrizo Oil & Gas | 50,430 | 1,425,152 | ||
| Core Laboratories (Netherlands) | 11,000 | 1,447,270 | |||
| † | FMC Technologies | 41,000 | 2,067,220 | ||
| † | Gulfmark Offshore | 41,888 | 1,925,172 | ||
| † | Hornbeck Offshore Services | 26,000 | 1,092,780 | ||
| *† | Houston America Energy | 15,000 | 78,300 | ||
| † | ION Geophysical | 137,558 | 887,249 | ||
| † | Petroleum Development | 19,000 | 704,710 | ||
| † | Rex Energy | 134,410 | 1,435,499 | ||
| † | Rosetta Resources | 73,750 | 3,596,050 | ||
| SM Energy | 19,000 | 1,344,630 | |||
| † | Swift Energy | 15,000 | 435,450 | ||
| Tidewater | 23,880 | 1,289,998 | |||
| World Fuel Services | 44,500 | 1,824,500 | |||
| 25,877,705 | |||||
| Financials – 9.75% | |||||
| Associated Banc-Corp | 68,100 | 950,676 | |||
| Associated Estates Realty | 136,000 | 2,222,240 | |||
| Berkshire Hills Bancorp | 25,500 | 584,460 | |||
| BioMed Realty Trust | 87,000 | 1,651,260 | |||
| City National | 30,000 | 1,574,100 | |||
| Coresite Realty | 71,600 | 1,689,044 | |||
| * | DuPont Fabros Technology | 70,000 | 1,711,500 | ||
| East West Bancorp | 10,220 | 235,980 | |||
| Eaton Vance | 50,000 | 1,429,000 | |||
| † | Enstar Group (Bermuda) | 6,700 | 663,233 | ||
| Extra Space Storage | 63,600 | 1,831,044 | |||
| First Busey | 177,800 | 878,332 | |||
| First Commonwealth Financial | 72,000 | 440,640 | |||
| Hancock Holding | 27,318 | 970,062 | |||
| Kaiser Federal Financial Group | 54,674 | 764,889 | |||
| Kilroy Realty | 15,000 | 699,150 | |||
| Kite Realty Group Trust | 245,000 | 1,291,150 | |||
| † | Knight Capital Group Class A | 82,350 | 1,059,845 | ||
| Lakeland Financial | 19,300 | 502,379 | |||
| Manning & Napier | 28,800 | 423,360 | |||
| MB Financial | 72,000 | 1,511,280 | |||
| *† | NetSpend Holdings | 39,400 | 305,744 | ||
| Pacific Continental Bancorp | 111,000 | 1,045,620 | |||
| Pebblebrook Hotel Trust | 45,770 | 1,033,487 | |||
| Provident New York | 60,000 | 507,600 | |||
| Sandy Spring Bancorp | 32,400 | 588,708 | |||
| SEI Investments | 35,000 | 724,150 | |||
| † | Strategic Hotel & Resorts | 164,480 | 1,082,278 | ||
| † | SVB Financial Group | 15,000 | 965,100 | ||
76
| Number of | Value | ||||
| Shares | (U.S. $) | ||||
| Common Stock (continued) | |||||
| Financials (continued) | |||||
| Tower Group | 38,000 | $ | 852,340 | ||
| Trico Bancshares | 27,350 | 476,437 | |||
| Valley National Bancorp | 121,917 | 1,578,825 | |||
| † | Western Alliance Bancorp | 89,603 | 758,937 | ||
| *† | World Acceptance | 17,000 | 1,041,250 | ||
| 34,044,100 | |||||
| Healthcare – 14.36% | |||||
| † | ABIOMED | 33,110 | 734,711 | ||
| † | Akorn | 46,000 | 538,200 | ||
| † | Alexion Pharmaceuticals | 20,000 | 1,857,200 | ||
| *† | Algeta (Norway) | 18,147 | 457,978 | ||
| *† | Alimera Sciences | 26,100 | 88,218 | ||
| † | Amylin Pharmaceuticals | 31,830 | 794,477 | ||
| *† | Anthera Pharmaceuticals | 48,500 | 107,185 | ||
| † | Ardea Biosciences | 41,760 | 908,698 | ||
| *† | Auxilium Pharmaceuticals | 38,000 | 705,660 | ||
| † | BioMarin Pharmaceutical | 51,000 | 1,746,750 | ||
| † | Catalyst Health Solutions | 20,470 | 1,304,553 | ||
| † | Cepheid | 37,900 | 1,585,357 | ||
| *† | Chelsea Therapeutics International | 93,000 | 238,080 | ||
| † | eResearch Technology | 31,300 | 244,766 | ||
| *† | Exelixis | 132,740 | 687,593 | ||
| † | Gen-Probe | 41,900 | 2,782,578 | ||
| † | Health Net | 26,600 | 1,056,552 | ||
| *† | HeartWare International | 22,780 | 1,496,418 | ||
| Hill-Rom Holdings | 42,000 | 1,403,220 | |||
| *† | Horizon Pharma | 15,000 | 62,100 | ||
| *��� | Immunogen | 63,310 | 911,031 | ||
| *† | Incyte | 63,980 | 1,234,814 | ||
| † | Insulet | 69,590 | 1,331,953 | ||
| *† | InterMune | 32,000 | 469,440 | ||
| *† | Ironwood Pharmaceuticals | 77,400 | 1,030,194 | ||
| † | Isis Pharmaceuticals | 61,000 | 534,970 | ||
| † | Mednax | 15,000 | 1,115,550 | ||
| † | Mettler-Toledo International | 25,500 | 4,711,125 | ||
| † | NPS Pharmaceuticals | 243,150 | 1,663,146 | ||
| † | ONYX Pharmaceuticals | 45,970 | 1,732,150 | ||
| *† | Pacific Biosciences | 39,000 | 133,380 | ||
| *† | PAREXEL International | 55,980 | 1,509,781 | ||
| Patterson | 51,000 | 1,703,400 | |||
| *† | Raptor Pharmaceutical | 47,000 | 317,720 | ||
| † | Salix Pharmaceuticals | 37,610 | 1,974,525 | ||
| *† | Seattle Genetics | 140,050 | 2,854,218 | ||
| † | Sirona Dental Systems | 37,000 | 1,906,980 | ||
| † | SXC Health Solutions | 35,990 | 2,697,810 | ||
| † | Synageva BioPharma | 3,000 | 107,610 | ||
| Techne | 11,000 | 771,100 | |||
| † | Vocera Communications | 2,400 | 56,160 | ||
| † | Volcano | 38,059 | 1,078,973 | ||
| † | WellCare Health Plans | 21,270 | 1,528,888 | ||
| 50,175,212 | |||||
| Industrials – 18.09% | |||||
| * | Acorn Energy | 100,000 | 1,087,000 | ||
| Acuity Brands | 26,000 | 1,633,580 | |||
| † | Advisory Board | 19,500 | 1,728,090 | ||
| AMETEK | 77,500 | 3,759,525 | |||
| † | Avis Budget Group | 60,170 | 851,406 | ||
| † | CAI International | 38,300 | 696,294 | ||
| Chicago Bridge & Iron (Netherlands) | 35,000 | 1,511,650 | |||
| † | Colfax | 48,100 | 1,695,044 | ||
| † | Corrections Corp. of America | 45,310 | 1,237,416 | ||
| † | DigitalGlobe | 90,800 | 1,211,272 | ||
| Donaldson | 97,800 | 3,494,394 | |||
| ESCO Technologies | 64,200 | 2,360,634 | |||
| † | Esterline Technologies | 14,000 | 1,000,440 | ||
| † | GrafTech International | 70,500 | 841,770 | ||
| HEICO Class A | 33,125 | 1,329,969 | |||
| Herman Miller | 27,000 | 619,920 | |||
| † | Hertz Global Holdings | 56,500 | 849,760 | ||
| † | II-VI | 62,000 | 1,466,300 | ||
| Interface Class A | 90,000 | 1,255,500 | |||
| Kennametal | 41,000 | 1,825,730 | |||
| Knoll | 75,000 | 1,248,000 | |||
| Landstar System | 30,860 | 1,781,239 | |||
| † | Meritor | 135,720 | 1,095,260 | ||
| † | Middleby | 11,900 | 1,204,042 | ||
| † | Moog Class A | 57,800 | 2,479,042 | ||
| Nordson | 76,000 | 4,142,760 | |||
| † | Old Dominion Freight Line | 40,774 | 1,943,697 | ||
| † | Oshkosh | 27,000 | 625,590 | ||
| Pentair | 49,000 | 2,332,890 | |||
| *† | Polypore International | 35,890 | 1,261,892 | ||
| † | Real Goods Solar Class A | 150,000 | 217,500 | ||
| † | Rush Enterprises Class A | 65,000 | 1,379,300 | ||
| Sauer-Danfoss | 14,200 | 667,400 | |||
| † | Spirit Airlines | 116,670 | 2,341,567 | ||
| † | SYKES Enterprises | 77,516 | 1,224,753 | ||
| † | Teledyne Technologies | 22,010 | 1,387,731 | ||
| Toro | 23,000 | 1,635,530 | |||
| *† | Trex | 49,960 | 1,602,717 | ||
| *† | United Rentals | 38,560 | 1,653,838 | ||
| *† | US Airways Group | 139,080 | 1,055,617 | ||
| † | WABCO Holdings | 13,000 | 786,240 | ||
| *† | Westport Innovations (Canada) | 16,633 | 680,622 | ||
| 63,202,921 | |||||
| Information Technology – 23.07% | |||||
| † | Acme Packet | 27,050 | 744,416 | ||
| Adtran | 11,540 | 359,933 | |||
| † | Advent Software | 20,000 | 512,000 | ||
| Amphenol Class A | 28,400 | 1,697,468 | |||
| † | ANSYS | 35,000 | 2,275,700 | ||
| † | Ariba | 27,000 | 883,170 | ||
| *† | Aruba Networks | 63,670 | 1,418,568 | ||
| † | Atmel | 155,000 | 1,528,300 | ||
| † | Bottomline Technologies | 41,190 | 1,150,849 | ||
(continues) 77
Statements of net assets
Optimum Small-Mid Cap Growth Fund
| Number of | Value | ||||
| Shares | (U.S. $) | ||||
| Common Stock (continued) | |||||
| Information Technology (continued) | |||||
| *† | BroadSoft | 58,080 | $ | 2,221,560 | |
| † | Cadence Design Systems | 326,740 | 3,868,601 | ||
| † | Ciena | 63,280 | 1,024,503 | ||
| † | Coherent | 26,120 | 1,523,580 | ||
| *† | Concur Technologies | 65,950 | 3,784,210 | ||
| *† | Constant Contact | 15,000 | 446,850 | ||
| † | Cypress Semiconductor | 91,430 | 1,429,051 | ||
| † | DealerTrack Holdings | 37,550 | 1,136,263 | ||
| † | Entegris | 110,000 | 1,027,400 | ||
| † | ExlService Holdings | 60,000 | 1,646,400 | ||
| † | Fabrinet (Cayman Islands) | 71,330 | 1,263,254 | ||
| † | Finisar | 148,220 | 2,986,633 | ||
| † | Hackett Group | 26,225 | 156,563 | ||
| † | Hittite Microwave | 10,000 | 543,100 | ||
| * | IAC/InterActiveCorp | 42,490 | 2,085,834 | ||
| † | Imperva | 20,400 | 798,660 | ||
| *† | Infinera | 60,000 | 487,200 | ||
| † | Informatica | 55,000 | 2,909,500 | ||
| † | IPG Photonics | 58,000 | 3,018,900 | ||
| † | Ixia | 75,400 | 941,746 | ||
| Jabil Circuit | 86,030 | 2,161,074 | |||
| *† | Jive Software | 43,560 | 1,183,090 | ||
| † | Lattice Semiconductor | 219,267 | 1,409,887 | ||
| † | LivePerson | 87,290 | 1,463,853 | ||
| † | MICROS Systems | 28,000 | 1,548,120 | ||
| † | Microsemi | 60,000 | 1,286,400 | ||
| † | Microstrategy | 12,890 | 1,804,600 | ||
| † | NETGEAR | 19,000 | 725,800 | ||
| † | ON Semiconductor | 130,000 | 1,171,300 | ||
| † | Parametric Technology | 59,080 | 1,650,695 | ||
| * | Pegasystems | 23,170 | 884,167 | ||
| † | Riverbed Technology | 52,910 | 1,485,713 | ||
| † | Sapient | 198,500 | 2,471,325 | ||
| † | Skyworks Solutions | 52,160 | 1,442,224 | ||
| Solera Holdings | 21,070 | 966,902 | |||
| † | SPS Commerce | 80,000 | 2,150,400 | ||
| † | Stratasys | 18,000 | 657,360 | ||
| Syntel | 28,170 | 1,577,520 | |||
| † | TIBCO Software | 27,000 | 823,500 | ||
| † | TriQuint Semiconductor | 95,000 | 655,025 | ||
| *† | Ubiquiti Networks | 25,900 | 819,217 | ||
| † | Ultratech | 21,600 | 625,968 | ||
| *† | Universal Display | 25,680 | 938,090 | ||
| *† | VeriFone Systems | 46,400 | 2,406,768 | ||
| † | Virtusa | 85,411 | 1,475,048 | ||
| † | WNS Holdings ADR | 36,500 | 439,825 | ||
| † | Wright Express | 23,300 | 1,508,209 | ||
| † | Zebra Technologies | 24,000 | 988,320 | ||
| 80,590,612 | |||||
| Materials – 1.25% | |||||
| Albemarle | 28,000 | 1,789,760 | |||
| Methanex (Canada) | 79,310 | 2,572,024 | |||
| 4,361,784 | |||||
| Telecommunication Services – 2.89% | |||||
| † | AboveNet | 27,000 | 2,235,600 | ||
| *† | Boingo Wireless | 75,000 | 907,500 | ||
| † | Cogent Communications Group | 18,290 | 348,973 | ||
| † | MetroPCS Communications | 109,900 | 991,298 | ||
| *† | SBA Communications Class A | 65,000 | 3,302,650 | ||
| † | tw telecom Class A | 104,000 | 2,304,640 | ||
| 10,090,661 | |||||
| Total Common Stock | |||||
| (cost $275,574,329) | 341,497,580 | ||||
| Exchange-Traded Fund – 1.44% | |||||
| * | iShares Russell 2000 Growth | ||||
| Index Fund | 52,800 | 5,036,064 | |||
| Total Exchange-Traded Fund | |||||
| (cost $5,062,034) | 5,036,064 | ||||
| Principal | |||||
| Amount (U.S. $) | |||||
| Short-Term Investments – 1.56% | |||||
| ≠Discount Notes – 0.54% | |||||
| Federal Home Loan Bank | |||||
| 0.04% 4/27/12 | $ 727,777 | 727,771 | |||
| 0.65% 4/25/12 | 1,147,071 | 1,147,065 | |||
| 1,874,836 | |||||
| Repurchase Agreements – 0.70% | |||||
| Bank of America 0.03%, dated | |||||
| 3/30/12, to be repurchased | |||||
| on 4/2/12, repurchase price | |||||
| $727,779 (collateralized by U.S. | |||||
| government obligations 0.125%- | |||||
| 4.125% 12/31/13–5/15/15; | |||||
| market value $742,332) | 727,777 | 727,777 | |||
| BNP Paribas 0.04%, dated 3/30/12, | |||||
| to be repurchased on 4/2/12, | |||||
| repurchase price $1,714,476 | |||||
| (collateralized by U.S. | |||||
| government obligations | |||||
| 1.375%-7.50% 6/15/12–2/15/37; | |||||
| market value $1,748,760) | 1,714,470 | 1,714,470 | |||
| 2,442,247 | |||||
| ≠U.S. Treasury Obligation – 0.32% | |||||
| U.S. Treasury Bill 0.008% 4/19/12 | 1,135,665 | 1,135,644 | |||
| 1,135,644 | |||||
| Total Short-Term Investments | |||||
| (cost $5,452,646) | 5,452,727 | ||||
| Total Value of Securities Before Securities | |||||
| Lending Collateral – 100.77% | |||||
| (cost $286,089,009) | 351,986,371 | ||||
78
| Number of | Value | |||||
| Shares | (U.S. $) | |||||
| **Securities Lending Collateral – 11.00% | ||||||
| Investment Companies | ||||||
| BNY Mellon SL DBT II | ||||||
| Liquidating Fund | 205,071 | $ | 199,596 | |||
| Delaware Investments | ||||||
| Collateral Fund No. 1 | 38,201,799 | 38,201,799 | ||||
| †@Mellon GSL Reinvestment Trust II | 484,445 | 0 | ||||
| Total Securities Lending Collateral | ||||||
| (cost $38,891,315) | 38,401,395 | |||||
| Total Value of Securities – 111.77% | ||||||
| (cost $324,980,324) | 390,387,766 | © | ||||
| **Obligation to Return Securities | ||||||
| Lending Collateral – (11.14%) | (38,891,315 | ) | ||||
| Other Liabilities Net of Receivables and | ||||||
| Other Assets – (0.63%) | (2,213,384 | ) | ||||
| Net Assets Applicable to 26,191,966 | ||||||
| Shares Outstanding – 100.00% | $ | 349,283,067 | ||||
| Net Asset Value – Optimum Small-Mid Cap Growth Fund | |||
| Class A ($5,989,293 / 460,580 Shares) | $13.00 | ||
| Net Asset Value – Optimum Small-Mid Cap Growth Fund | |||
| Class B ($660,516 / 54,061 Shares) | $12.22 | ||
| Net Asset Value – Optimum Small-Mid Cap Growth Fund | |||
| Class C ($20,991,774 / 1,718,391 Shares) | $12.22 | ||
| Net Asset Value – Optimum Small-Mid Cap Growth Fund | |||
| Institutional Class ($321,641,484 / 23,958,934 Shares) | $13.42 | ||
| Components of Net Assets at March 31, 2012: | |||||
| Shares of beneficial interest | |||||
| (unlimited authorization – no par) | $ | 283,962,411 | |||
| Accumulated net investment loss | (1,079,817 | ) | |||
| Accumulated net realized gain | 993,062 | ||||
| Net unrealized appreciation of investments | 65,407,411 | ||||
| Total net assets | $ | 349,283,067 | |||
| * | Fully or partially on loan. |
| † | Non income producing security. |
| ≠ | The rate shown is the effective yield at the time of purchase. |
| ** | See Note 8 in “Notes to financial statements” for additional information on securities lending collateral and non-cash collateral. |
| @ | Illiquid security. At March 31, 2012, the aggregate value of illiquid securities was $0, which represented 0.00% of the Fund’s net assets. See Note 9 in “Notes to financial statements.” |
| © | Includes $41,585,564 of securities loaned. |
| Net Asset Value and Offering Price Per Share – | |
| Optimum Small-Mid Cap Growth Fund | |
| Net asset value Class A (A) | $13.00 |
| Sales charge (5.75% of offering price) (B) | 0.79 |
| Offering price | $13.79 |
| (A) | Net asset value per share, as illustrated, is the amount which would be paid upon redemption or repurchase of shares. |
| (B) | See the current prospectus for purchases of $75,000 or more. |
Summary of Abbreviations:
ADR — American Depositary Receipt
See accompanying notes, which are an integral part of the financial statements.
(continues) 79
Statements of net assets
Optimum Small-Mid Cap Value Fund
March 31, 2012
| Number of | Value | ||||
| Shares | (U.S. $) | ||||
| ²Common Stock – 91.55% | |||||
| Consumer Discretionary – 11.10% | |||||
| *† | BorgWarner | 26,500 | $ | 2,235,010 | |
| Brinker International | 42,500 | 1,170,875 | |||
| † | Children’s Place Retail Stores | 21,700 | 1,121,239 | ||
| † | Collective Brands | 160,300 | 3,151,498 | ||
| Family Dollar Stores | 3,800 |
| 240,464 | ||
| Foot Locker | 65,600 | 2,036,880 | |||
| † | Genesco | 14,000 | 1,003,100 | ||
| * | Hooker Furniture | 202,374 | 2,762,405 | ||
| *† | Jos.A. Bank Clothiers | 40,102 | 2,021,542 | ||
| † | Kirkland’s | 33,000 | 533,940 | ||
| Lear | 47,600 | 2,212,924 | |||
| † | MaidenForm Brands | 60,000 | 1,350,600 | ||
| PETsMART | 22,000 | 1,258,840 | |||
| Signet Jewelers (Bermuda) | 46,500 | 2,198,520 | |||
| Spartan Motors | 509,273 | 2,694,054 | |||
| * | Sturm Ruger | 5,503 | 270,197 | ||
| Tupperware Brands | 36,100 | 2,292,350 | |||
| Universal Technical Institute | 55,800 | 736,002 | |||
| † | Visteon | 50,000 | 2,650,000 | ||
| *† | Winnebago Industries | 288,900 | 2,831,220 | ||
| † | WMS Industries | 110,000 | 2,610,300 | ||
| 37,381,960 | |||||
| Consumer Staples – 2.87% | |||||
| † | Chiquita Brands International | 224,373 | 1,972,239 | ||
| Dr Pepper Snapple Group | 27,500 | 1,105,775 | |||
| Molson Coors Brewing Class B | 25,000 | 1,131,250 | |||
| * | Sanderson Farms | 53,000 | 2,810,590 | ||
| Smucker (J.M.) | 32,400 | 2,636,064 | |||
| 9,655,918 | |||||
| Energy – 5.32% | |||||
| *† | Approach Resources | 15,500 | 572,725 | ||
| Cabot Oil & Gas | 34,700 | 1,081,599 | |||
| † | Cloud Peak Energy | 66,400 | 1,057,752 | ||
| CONSOL Energy | 67,800 | 2,311,980 | |||
| Gulf Island Fabrication | 80,629 | 2,360,011 | |||
| † | Newpark Resources | 243,350 | 1,993,037 | ||
| † | Plains Exploration & Production | 62,200 | 2,652,830 | ||
| † | Swift Energy | 76,300 | 2,214,989 | ||
| † | Vaalco Energy | 386,503 | 3,652,453 | ||
| 17,897,376 | |||||
| Financials – 11.50% | |||||
| American Equity Investment | |||||
| Life Holding | 103,265 | 1,318,694 | |||
| Aspen Insurance Holdings (Bermuda) | 80,500 | 2,249,170 | |||
| AXIS Capital Holdings (Bermuda) | 65,700 | 2,179,269 | |||
| BankUnited | 79,300 | 1,982,500 | |||
| † | BBCN Bancorp | 70,900 | 789,117 | ||
| City Holding | 67,979 | 2,360,231 | |||
| DiamondRock Hospitality | 127,700 | 1,314,033 | |||
| * | Digital Realty Trust | 16,300 | 1,205,711 | ||
| Dime Community Bancshares | 190,022 | 2,776,221 | |||
| East West Bancorp | 114,600 | 2,646,114 | |||
| First Financial Bancorp | 125,100 | 2,164,230 | |||
| † | Hallmark Financial Services | 299,798 | 2,365,406 | ||
| HCC Insurance Holdings | 65,200 | 2,032,284 | |||
| Horace Mann Educators | 143,376 | 2,526,285 | |||
| Lazard Class A (Bermuda) | 78,600 | 2,244,816 | |||
| Safety Insurance Group | 21,400 | 891,096 | |||
| Stewart Information Services | 197,658 | 2,808,721 | |||
| † | SVB Financial Group | 18,200 | 1,170,988 | ||
| Willis Group Holdings (United Kingdom) | 24,600 | 860,508 | |||
| Wintrust Financial | 43,200 | 1,546,128 | |||
| XL Group (Ireland) | 60,000 | 1,301,400 | |||
| 38,732,922 | |||||
| Healthcare – 2.94% | |||||
| † | CareFusion | 100,000 | 2,593,000 | ||
| DENTSPLY International | 27,400 | 1,099,562 | |||
| † | Hologic | 109,200 | 2,353,260 | ||
| † | Orthofix International (Curacao) | 14,500 | 544,910 | ||
| Teleflex | 27,800 | 1,699,970 | |||
| Thermo Fisher Scientific | 28,800 | 1,623,744 | |||
| 9,914,446 | |||||
| Industrials – 27.96% | |||||
| * | AAON | 103,843 | 2,096,590 | ||
| † | ACCO Brands | 120,000 | 1,489,200 | ||
| Acuity Brands | 42,800 | 2,689,124 | |||
| † | Aegion | 93,000 | 1,658,190 | ||
| † | AGCO | 23,200 | 1,095,272 | ||
| Albany International | 120,400 | 2,763,180 | |||
| *† | Allegiant Travel | 14,700 | 801,150 | ||
| AMETEK | 35,250 | 1,709,978 | |||
| Avery Dennison | 86,000 | 2,591,180 | |||
| † | BE Aerospace | 28,200 | 1,310,454 | ||
| Brady Class A | 61,300 | 1,983,055 | |||
| Carlisle | 61,300 | 3,060,096 | |||
| † | Colfax | 32,800 | 1,155,872 | ||
| Cooper Industries | 11,000 | 703,450 | |||
| Crane | 33,300 | 1,615,050 | |||
| * | Donnelley (R.R.) & Sons | 64,800 | 802,872 | ||
| Dover | 50,700 | 3,191,058 | |||
| † | Ducommun | 5,158 | 61,380 | ||
| Encore Wire | 104,510 | 3,107,082 | |||
| Ennis | 148,790 | 2,353,858 | |||
| † | Federal Signal | 265,000 | 1,473,400 | ||
| † | Foster Wheeler (Switzerland) | 125,400 | 2,854,104 | ||
| Gardner Denver | 13,200 | 831,864 | |||
| Graham | 134,757 | 2,949,831 | |||
| * | Granite Construction | 86,200 | 2,477,388 | ||
| Griffon | 100,300 | 1,073,210 | |||
| Harsco | 158,800 | 3,725,448 | |||
80
| Number of | Value | ||||||
| Shares | (U.S. $) | ||||||
| ²Common Stock (continued) | |||||||
| Industrials (continued) | |||||||
| Hubbell Class B | 63,600 | $ | 4,997,688 | ||||
| IDEX | 32,700 | 1,377,651 | |||||
| Ingersoll-Rand (Ireland) | 69,000 | 2,853,150 | |||||
| Kennametal | 89,600 | 3,989,888 | |||||
| Knoll | 156,848 | 2,609,951 | |||||
| † | Navistar International | 56,400 | 2,281,380 | ||||
| Quanex Building Products | 37,500 | 661,125 | |||||
| † | Rush Enterprises Class A | 47,300 | 1,003,706 | ||||
| SkyWest | 90,160 | 996,268 | |||||
| Stanley Black & Decker | 38,000 | 2,924,480 | |||||
| Tennant | 44,988 | 1,979,472 | |||||
| Timken | 86,300 | 4,378,862 | |||||
| † | TMS International Class A | 32,380 | 391,798 | ||||
| *† | Trex | 41,800 | 1,340,944 | ||||
| † | TrueBlue | 130,000 | 2,324,400 | ||||
| Tyco International (Switzerland) | 48,400 | 2,719,112 | |||||
| * | US Ecology | 136,753 | 2,973,010 | ||||
| † | WESCO International | 41,800 | 2,729,958 | ||||
| 94,156,179 | |||||||
| Information Technology – 16.42% | |||||||
| † | Advanced Energy Industries | 194,325 | 2,549,544 | ||||
| Brooks Automation | 80,500 | 992,565 | |||||
| † | Cabot Microelectronics | 20,900 | 812,592 | ||||
| † | Checkpoint Systems | 165,600 | 1,867,968 | ||||
| † | Diodes | 22,000 | 509,960 | ||||
| Fair Isaac | 83,050 | 3,645,895 | |||||
| † | Fairchild Semiconductor International | 114,100 | 1,677,270 | ||||
| † | Flextronics International (Singapore) | 497,700 | 3,598,371 | ||||
| = | Global Payments | 52,100 | 2,474,750 | ||||
| Harris | 57,100 | 2,574,068 | |||||
| Henry (Jack) & Associates | 62,000 | 2,115,440 | |||||
| † | Ingram Micro Class A | 68,000 | 1,262,080 | ||||
| * | InterDigital | 44,935 | 1,566,434 | ||||
| * | j2 Global | 76,100 | 2,182,548 | ||||
| KLA-Tencor | 22,400 | 1,219,008 | |||||
| † | LTX-Credence | 180,300 | 1,296,357 | ||||
| Methode Electronics | 235,752 | 2,187,779 | |||||
| † | Plexus | 137,800 | 4,821,621 | ||||
| † | Rudolph Technologies | 268,982 | 2,988,390 | ||||
| *† | Stratasys | 56,078 | 2,047,969 | ||||
| *† | Synaptics | 72,425 | 2,644,237 | ||||
| Tellabs | 678,000 | 2,745,900 | |||||
| † | Teradyne | 99,600 | 1,682,244 | ||||
| † | VASCO Data Security International | 339,663 | 3,664,964 | ||||
| † | Western Digital | 40,800 | 1,688,712 | ||||
| † | XO Group | 50,200 | 471,378 | ||||
| 55,288,044 | |||||||
| Materials – 11.61% | |||||||
| Albemarle | 18,400 | 1,176,128 | |||||
| AptarGroup | 41,400 | 2,267,478 | |||||
| Ashland | 29,700 | 1,813,482 | |||||
| Celanese Class A | 45,000 | 2,078,100 | |||||
| Cytec Industries | 34,800 | 2,115,492 | |||||
| Eastman Chemical | 86,200 | 4,455,677 | |||||
| † | Ferro | 209,600 | 1,245,024 | ||||
| FMC | 24,500 | 2,593,570 | |||||
| Fuller (H.B.) | 45,000 | 1,477,350 | |||||
| KMG Chemicals | 150,335 | 2,713,547 | |||||
| † | Kraton Performance Polymers | 79,500 | 2,112,315 | ||||
| † | Landec | 375,553 | 2,452,361 | ||||
| Minerals Technologies | 36,900 | 2,413,629 | |||||
| † | Owens-Illinois | 72,000 | 1,680,480 | ||||
| Packaging Corp. of America | 73,000 | 2,160,070 | |||||
| PolyOne | 139,000 | 2,001,600 | |||||
| Sealed Air | 48,000 | 926,880 | |||||
| Solutia | 30,000 | 838,200 | |||||
| Sonoco Products | 77,600 | 2,576,320 | |||||
| 39,097,703 | |||||||
| Utilities – 1.83% | |||||||
| CMS Energy | 91,100 | 2,004,200 | |||||
| Laclede Group | 47,198 | 1,841,666 | |||||
| Wisconsin Energy | 65,600 | 2,307,808 | |||||
| 6,153,674 | |||||||
| Total Common Stock | |||||||
| (cost $252,179,764) | 308,278,222 | ||||||
| Principal | |||||||
| Amount (U.S. $) | |||||||
| Short-Term Investments – 9.05% | |||||||
| ≠Discount Notes – 3.03% | |||||||
| Federal Home Loan Bank | |||||||
| 0.04% 4/27/12 | $ | 4,509,460 | 4,509,428 | ||||
| 0.65% 4/25/12 | 5,694,512 | 5,694,478 | |||||
| 10,203,906 | |||||||
| Repurchase Agreements – 4.49% | |||||||
| Bank of America 0.03%, dated | |||||||
| 3/30/12, to be repurchased | |||||||
| on 4/2/12, repurchase price | |||||||
| $4,509,471 (collateralized by | |||||||
| U.S. government obligations | |||||||
| 0.125%-4.125% | |||||||
| 12/31/13–5/15/15; | |||||||
| market value $4,599,649) | 4,509,460 | 4,509,460 | |||||
| BNP Paribas 0.04%, dated 3/30/12, | |||||||
| to be repurchased on 4/2/12, | |||||||
| repurchase price $10,623,262 | |||||||
| (collateralized by U.S. | |||||||
| government obligations | |||||||
| 1.375%-7.50% 6/15/12–2/15/37; | |||||||
| market value $10,835,691) | 10,623,227 | 10,623,227 | |||||
| 15,132,687 | |||||||
(continues) 81
Statements of net assets
Optimum Small-Mid Cap Value Fund
| Principal | Value | |||||||
| Amount (U.S. $) | (U.S. $) | |||||||
| Short-Term Investments (continued) | ||||||||
| ≠U.S. Treasury Obligation – 1.53% | ||||||||
| U.S. Treasury Bill 0.008% 4/19/12 | $ | 5,153,222 | $ | 5,153,129 | ||||
| 5,153,129 | ||||||||
| Total Short-Term Investments | ||||||||
| (cost $30,489,311) | 30,489,722 | |||||||
| Total Value of Securities Before Securities | ||||||||
| Lending Collateral – 100.60% | ||||||||
| (cost $282,669,075) | 338,767,944 | |||||||
| Number of | ||||||||
| Shares | ||||||||
| **Securities Lending Collateral – 4.41% | ||||||||
| Investment Companies | ||||||||
| BNY Mellon SL DBT II | ||||||||
| Liquidating Fund | 123,899 | 120,591 | ||||||
| Delaware Investments Collateral | ||||||||
| Fund No.1 | 14,715,997 | 14,715,997 | ||||||
| †@Mellon GSL Reinvestment Trust II | 250,193 | 0 | ||||||
| Total Securities Lending Collateral | ||||||||
| (cost $15,090,089) | 14,836,588 | |||||||
| Total Value of Securities – 105.01% | ||||||||
| (cost $297,759,164) | 353,604,532 | © | ||||||
| **Obligation to Return Securities | ||||||||
| Lending Collateral – (4.48%) | (15,090,089 | ) | ||||||
| Other Liabilities Net of Receivables and | ||||||||
| Other Assets – (0.53%) | (1,766,133 | ) | ||||||
| Net Assets Applicable to 26,097,346 | ||||||||
| Shares Outstanding – 100.00% | $ | 336,748,310 | ||||||
| Net Asset Value – Optimum Small-Mid Cap Value Fund | ||||||||
| Class A ($5,371,630 / 426,581 Shares) | $12.59 | |||||||
| Net Asset Value – Optimum Small-Mid Cap Value Fund | ||||||||
| Class B ($653,054 / 55,162 Shares) | $11.84 | |||||||
| Net Asset Value – Optimum Small-Mid Cap Value Fund | ||||||||
| Class C ($19,986,510 / 1,689,087 Shares) | $11.83 | |||||||
| Net Asset Value – Optimum Small-Mid Cap Value Fund | ||||||||
| Institutional Class ($310,737,116 / 23,926,516 Shares) | $12.99 | |||||||
| Components of Net Assets at March 31, 2012: | ||||
| Shares of beneficial interest | ||||
| (unlimited authorization – no par) | $ | 276,787,279 | ||
| Distributions in excess of net investment income | 13,456 | |||
| Accumulated net realized gain on investments | 4,102,207 | |||
| Net unrealized appreciation of investments | 55,845,368 | |||
| Total net assets | $ | 336,748,310 |
| ² | Narrow industries are utilized for compliance purposes for diversification whereas broad sectors are used for financial reporting. |
| * | Fully or partially on loan. |
| † | Non income producing security. |
| = | Security is being fair valued in accordance with the Fund’s fair valuation policy. At March 31, 2012, the aggregate value of fair valued securities was $2,474,750, which represented 0.73% of the Fund’s net assets. See Note 1 in “Notes to financial statements.” |
| ≠ | The rate shown is the effective yield at the time of purchase. |
| ** | See Note 8 in “Notes to financial statements” for additional information on securities lending collateral. |
| @ | Illiquid security. At March 31, 2012, the aggregate value of illiquid securities was $0, which represented 0.00% of the Fund’s net assets. See Note 9 in “Notes to financial statements.” |
| © | Includes $14,644,191 of securities loaned. |
| Net Asset Value and Offering Price Per Share – | |||
| Optimum Small-Mid Cap Value Fund | |||
| Net asset value Class A (A) | $ | 12.59 | |
| Sales charge (5.75% of offering price) (B) | 0.77 | ||
| Offering price | $ | 13.36 |
| (A) | Net asset value per share, as illustrated, is the amount which would be paid upon redemption or repurchase of shares. | |
| (B) | See the current prospectus for purchases of $75,000 or more. |
See accompanying notes, which are an integral part of the financial statements.
82
Statements of assets and liabilities
Optimum Fund Trust
March 31, 2012
| Optimum | Optimum | Optimum | Optimum | Optimum | Optimum | ||||||||||||||||||
| Fixed Income | International | Large Cap | Large Cap | Small-Mid Cap | Small-Mid Cap | ||||||||||||||||||
| Fund | Fund | Growth Fund | Value Fund | Growth Fund | Value Fund | ||||||||||||||||||
| Assets: | |||||||||||||||||||||||
| Investments, at value1 | $ | 1,058,866,869 | $ | 289,708,608 | $ | 781,238,153 | $ | 750,303,413 | $ | 346,533,644 | $ | 308,278,222 | |||||||||||
| Short-term investments, at value | 199,180,440 | 4,533,593 | 27,084,086 | 13,098,617 | 5,452,727 | 30,489,722 | |||||||||||||||||
| Short-term investments held as collateral | |||||||||||||||||||||||
| for loaned securities, at value | 31,164,510 | 27,953,704 | 19,243,649 | 6,600,112 | 38,401,395 | 14,836,588 | |||||||||||||||||
| Cash | 1,166,051 | 138,620 | 168,978 | 123,719 | 53,940 | 129,138 | |||||||||||||||||
| Cash collateral | 1,090,000 | — | — | — | — | — | |||||||||||||||||
| Foreign currencies, at value | 2,561,413 | 2,468,163 | — | 8,652 | — | — | |||||||||||||||||
| Receivables for fund shares sold | 2,193,554 | 436,021 | 898,536 | 945,916 | 460,996 | 440,015 | |||||||||||||||||
| Receivable for securities sold | 86,304,275 | 361,855 | 11,929,725 | 55,678 | 2,123,029 | 245,784 | |||||||||||||||||
| Unrealized gain on foreign currency | |||||||||||||||||||||||
| exchange contracts | 6,359 | 92,756 | — | — | — | — | |||||||||||||||||
| Dividends and interest receivable | 10,204,016 | 1,060,157 | 749,479 | 1,941,084 | 109,896 | 264,877 | |||||||||||||||||
| Securities lending income receivable | 10,163 | 9,629 | 55,263 | 8,225 | 19,198 | 4,323 | |||||||||||||||||
| Variation margin receivable on futures contracts | 101,245 | — | — | — | — | — | |||||||||||||||||
| Unrealized gain on credit default swap contracts | |||||||||||||||||||||||
| (including up front payments received $2,148,385) | 1,315,152 | — | — | — | — | — | |||||||||||||||||
| Unrealized gain on interest rate swap contracts | |||||||||||||||||||||||
| (including up front payments received $2,388,899) | 3,104,488 | — | — | — | — | — | |||||||||||||||||
| Annual protection payments on swap contracts | 97,088 | — | — | — | — | — | |||||||||||||||||
| Other assets | — | 134 | — | — | 79 | 17 | |||||||||||||||||
| Total assets | 1,397,365,623 | 326,763,240 | 841,367,869 | 773,085,416 | 393,154,904 | 354,688,686 | |||||||||||||||||
| Liabilities: | |||||||||||||||||||||||
| Securities sold short, at value | 9,834,218 | — | — | — | — | — | |||||||||||||||||
| Payable for securities purchased | 138,034,296 | 1,386,669 | 10,629,201 | — | 4,233,816 | 2,178,695 | |||||||||||||||||
| Payables for fund shares redeemed | 834,729 | 214,280 | 626,511 | 557,898 | 251,683 | 228,436 | |||||||||||||||||
| Options written, at value | 347,050 | — | — | — | — | — | |||||||||||||||||
| Unrealized loss on foreign currency | |||||||||||||||||||||||
| exchange contracts | 974,540 | 150,096 | 3,948 | — | — | — | |||||||||||||||||
| Unrealized gain on credit default swap contracts | |||||||||||||||||||||||
| (including up front payments paid $1,081,303) | 654,937 | — | — | — | — | — | |||||||||||||||||
| Obligation to return securities lending collateral | 32,372,747 | 28,579,176 | 20,257,051 | 7,606,200 | 38,891,315 | 15,090,089 | |||||||||||||||||
| Due to manager and affiliates | 997,711 | 350,365 | 867,812 | 795,013 | 409,008 | 358,529 | |||||||||||||||||
| Other accrued expenses | 233,097 | 91,933 | 133,512 | 127,915 | 86,015 | 84,627 | |||||||||||||||||
| Other liabilities | 32,820 | — | — | — | — | — | |||||||||||||||||
| Total liabilities | 184,316,145 | 30,772,519 | 32,518,035 | 9,087,026 | 43,871,837 | 17,940,376 | |||||||||||||||||
| Total Net Assets | $ | 1,213,049,478 | $ | 295,990,721 | $ | 808,849,834 | $ | 763,998,390 | $ | 349,283,067 | $ | 336,748,310 | |||||||||||
| Investments, at cost | $ | 1,024,826,054 | $ | 289,311,065 | $ | 605,463,189 | $ | 615,460,088 | $ | 280,636,363 | $ | 252,179,764 | |||||||||||
| Securities sold short, at cost | (9,810,781 | ) | — | — | — | — | — | ||||||||||||||||
| Short-term investments, at cost | 199,178,971 | 4,533,518 | 27,083,710 | 13,098,451 | 5,452,646 | 30,489,311 | |||||||||||||||||
| Short-term investments held as collateral | |||||||||||||||||||||||
| for loaned securities, at cost | 32,372,747 | 28,579,176 | 20,257,051 | 7,606,200 | 38,891,315 | 15,090,089 | |||||||||||||||||
| Foreign currencies, at cost | 2,572,275 | 2,465,982 | — | 8,657 | — | — | |||||||||||||||||
| Options written, at cost | (286,829 | ) | — | — | — | — | — | ||||||||||||||||
| 1Including securities on loan | 129,883,573 | 27,225,461 | 21,635,534 | 7,328,168 | 41,585,564 | 14,644,191 | |||||||||||||||||
See accompanying notes, which are an integral part of the financial statements.
83
Statements of operations
Optimum Fund Trust
Year Ended March 31, 2012
| Optimum | Optimum | Optimum | Optimum | Optimum | Optimum | |||||||||||||||||||||||||||
| Fixed Income | International | Large Cap | Large Cap | Small-Mid Cap | Small-Mid Cap | |||||||||||||||||||||||||||
| Fund | Fund | Growth Fund | Value Fund | Growth Fund | Value Fund | |||||||||||||||||||||||||||
| Investment Income: | ||||||||||||||||||||||||||||||||
| Interest | $ | 48,477,454 | $ | 10,917 | $ | 3,031 | $ | 5,118 | $ | 3,124 | $ | 10,637 | ||||||||||||||||||||
| Dividends | 264,854 | 10,610,973 | 8,978,006 | 19,440,589 | 1,539,720 | 4,087,011 | ||||||||||||||||||||||||||
| Securities lending income | 16,807 | 376,903 | 315,322 | 112,911 | 254,854 | 82,534 | ||||||||||||||||||||||||||
| Foreign tax withheld | (8,882 | ) | (901,035 | ) | (65,730 | ) | (48,359 | ) | (10,866 | ) | — | |||||||||||||||||||||
| 48,750,233 | 10,097,758 | 9,230,629 | 19,510,259 | 1,786,832 | 4,180,182 | |||||||||||||||||||||||||||
| Expenses: | ||||||||||||||||||||||||||||||||
| Management fees | 6,407,321 | 2,239,119 | 5,529,721 | 5,003,853 | 3,510,050 | 3,036,632 | ||||||||||||||||||||||||||
| Dividend disbursing and transfer | ||||||||||||||||||||||||||||||||
| agent fees and expenses | 2,885,437 | 937,660 | 1,985,845 | 1,905,557 | 1,032,982 | 988,174 | ||||||||||||||||||||||||||
| Distribution expenses – Class A | 140,796 | 34,451 | 112,444 | 107,818 | 20,712 | 18,297 | ||||||||||||||||||||||||||
| Distribution expenses – Class B | 41,809 | 15,115 | 44,426 | 42,618 | 8,479 | 8,132 | ||||||||||||||||||||||||||
| Distribution expenses – Class C | 1,578,547 | 348,590 | 1,149,205 | 1,081,787 | 208,812 | 195,149 | ||||||||||||||||||||||||||
| Administration expenses | 1,661,809 | 464,603 | 1,140,912 | 1,093,057 | 526,508 | 491,763 | ||||||||||||||||||||||||||
| Accounting fees | 440,065 | 110,737 | 285,361 | 271,921 | 125,482 | 117,195 | ||||||||||||||||||||||||||
| Trustees’ fees | 157,709 | 37,394 | 94,693 | 92,786 | 43,857 | 41,629 | ||||||||||||||||||||||||||
| Reports and statements to shareholders | 150,826 | 31,698 | 68,694 | 108,368 | 37,964 | 34,368 | ||||||||||||||||||||||||||
| Registration fees | 119,982 | 76,064 | 85,248 | 83,944 | 75,438 | 75,676 | ||||||||||||||||||||||||||
| Professional fees | 119,179 | 53,074 | 78,137 | 64,490 | 42,069 | 42,650 | ||||||||||||||||||||||||||
| Custodian fees | 101,452 | 202,010 | 30,935 | 19,159 | 24,665 | 5,876 | ||||||||||||||||||||||||||
| Pricing fees | 47,089 | 6,291 | 2,733 | 1,393 | 2,339 | 1,511 | ||||||||||||||||||||||||||
| Insurance fees | 41,024 | 9,075 | 26,344 | 24,670 | 10,080 | 8,736 | ||||||||||||||||||||||||||
| Other | 15,718 | 17,884 | 13,600 | 12,273 | 7,914 | 9,244 | ||||||||||||||||||||||||||
| 13,908,763 | 4,583,765 | 10,648,298 | 9,913,694 | 5,677,351 | 5,075,032 | |||||||||||||||||||||||||||
| Less fees waived | (967,078 | ) | (254,951 | ) | (221,782 | ) | (222,626 | ) | (494,366 | ) | (573,027 | ) | ||||||||||||||||||||
| Less expense paid indirectly | (315 | ) | (331 | ) | (344 | ) | (344 | ) | (338 | ) | (344 | ) | ||||||||||||||||||||
| Total operating expenses | 12,941,370 | 4,328,483 | 10,426,172 | 9,690,724 | 5,182,647 | 4,501,661 | ||||||||||||||||||||||||||
| Net Investment Income (Loss) | 35,808,863 | 5,769,275 | (1,195,543 | ) | 9,819,535 | (3,395,815 | ) | (321,479 | ) | |||||||||||||||||||||||
| Net Realized and Unrealized Gain (Loss): | ||||||||||||||||||||||||||||||||
| Net realized gain (loss) on: | ||||||||||||||||||||||||||||||||
| Investments | 21,434,533 | (2,805,393 | ) | 34,122,267 | 884,378 | 19,579,425 | 18,668,872 | |||||||||||||||||||||||||
| Foreign currencies | 1,960,211 | (14,243 | ) | (23,409 | ) | (13,744 | ) | 13,676 | — | |||||||||||||||||||||||
| Foreign currency exchange contracts | (5,778,099 | ) | 513,656 | (28,593 | ) | 24,403 | (31,915 | ) | — | |||||||||||||||||||||||
| Futures contracts | 10,757,678 | — | — | — | — | — | ||||||||||||||||||||||||||
| Swap contracts | (2,119,102 | ) | — | — | — | — | — | |||||||||||||||||||||||||
| Options written | 368,241 | — | — | — | — | — | ||||||||||||||||||||||||||
| Net realized gain (loss) | 26,623,462 | (2,305,980 | ) | 34,070,265 | 895,037 | 19,561,186 | 18,668,872 | |||||||||||||||||||||||||
| Net change in unrealized appreciation | ||||||||||||||||||||||||||||||||
| (depreciation) on: | ||||||||||||||||||||||||||||||||
| Investments | 10,809,912 | (18,264,595 | ) | 29,547,677 | 39,177,837 | (13,534,110 | ) | (12,454,173 | ) | |||||||||||||||||||||||
| Foreign currencies | (101,407 | ) | (4,277 | ) | 6,462 | (1,537 | ) | (241 | ) | — | ||||||||||||||||||||||
| Foreign currency exchange contracts | 331,792 | (134,697 | ) | (4,275 | ) | — | (6 | ) | — | |||||||||||||||||||||||
| Futures contracts | (9,789 | ) | — | — | — | — | — | |||||||||||||||||||||||||
| Swap contracts | 254,609 | — | — | — | — | — | ||||||||||||||||||||||||||
| Options written | (60,221 | ) | — | — | — | — | — | |||||||||||||||||||||||||
| Net change in unrealized appreciation (depreciation) | 11,224,896 | (18,403,569 | ) | 29,549,864 | 39,176,300 | (13,534,357 | ) | (12,454,173 | ) | |||||||||||||||||||||||
| Net Realized and Unrealized Gain (Loss) | 37,848,358 | (20,709,549 | ) | 63,620,129 | 40,071,337 | 6,026,829 | 6,214,699 | |||||||||||||||||||||||||
| Net Increase (Decrease) in Net Assets | ||||||||||||||||||||||||||||||||
| Resulting from Operations | $ | 73,657,221 | $ | (14,940,274 | ) | $ | 62,424,586 | $ | 49,890,872 | $ | 2,631,014 | $ | 5,893,220 | |||||||||||||||||||
See accompanying notes, which are an integral part of the financial statements.
84
Statements of changes in net assets
Optimum Fund Trust
| Optimum Fixed Income Fund | Optimum International Fund | |||||||||||||||
| Year Ended | Year Ended | |||||||||||||||
| 3/31/12 | 3/31/11 | 3/31/12 | 3/31/11 | |||||||||||||
| Increase (Decrease) in Net Assets from Operations: | ||||||||||||||||
| Net investment income | $ | 35,808,863 | $ | 38,096,816 | $ | 5,769,275 | $ | 3,075,635 | ||||||||
| Net realized gain (loss) | 26,623,462 | 4,314,546 | (2,305,980 | ) | 8,099,778 | |||||||||||
| Net change in unrealized appreciation (depreciation) | 11,224,896 | 17,773,249 | (18,403,569 | ) | 11,446,234 | |||||||||||
| Net increase (decrease) in net assets resulting from operations | 73,657,221 | 60,184,611 | (14,940,274 | ) | 22,621,647 | |||||||||||
| Dividends and Distributions to Shareholders from: | ||||||||||||||||
| Net investment income: | ||||||||||||||||
| Class A | (1,400,452 | ) | (1,580,182 | ) | (173,139 | ) | (174,283 | ) | ||||||||
| Class B | (124,278 | ) | (176,801 | ) | (10,683 | ) | (20,118 | ) | ||||||||
| Class C | (4,493,484 | ) | (5,530,649 | ) | (237,826 | ) | (399,968 | ) | ||||||||
| Institutional Class | (34,952,120 | ) | (28,959,780 | ) | (5,393,090 | ) | (2,614,834 | ) | ||||||||
| Net realized gain: | ||||||||||||||||
| Class A | (526,487 | ) | — | — | — | |||||||||||
| Class B | (55,074 | ) | — | — | — | |||||||||||
| Class C | (2,032,246 | ) | — | — | — | |||||||||||
| Institutional Class | (12,395,715 | ) | — | — | — | |||||||||||
| (55,979,856 | ) | (36,247,412 | ) | (5,814,738 | ) | (3,209,203 | ) | |||||||||
| Capital Share Transactions: | ||||||||||||||||
| Proceeds from shares sold: | ||||||||||||||||
| Class A | 7,125,739 | 6,361,932 | 979,426 | 1,004,512 | ||||||||||||
| Class B | 102,779 | 140,931 | 1,982 | 13,384 | ||||||||||||
| Class C | 18,405,803 | 20,924,263 | 2,541,744 | 2,593,727 | ||||||||||||
| Institutional Class | 344,737,019 | 311,193,996 | 84,407,565 | 98,523,741 | ||||||||||||
| Net asset value of shares issued upon reinvestment of dividends | ||||||||||||||||
| and distributions: | ||||||||||||||||
| Class A | 1,825,346 | 1,536,790 | 169,731 | 171,047 | ||||||||||||
| Class B | 167,562 | 167,095 | 10,278 | 19,701 | ||||||||||||
| Class C | 6,391,577 | 5,405,852 | 233,901 | 395,170 | ||||||||||||
| Institutional Class | 46,132,876 | 28,157,880 | 5,310,361 | 2,580,351 | ||||||||||||
| 424,888,701 | 373,888,739 | 93,654,988 | 105,301,633 | |||||||||||||
| Cost of shares repurchased: | ||||||||||||||||
| Class A | (8,794,831 | ) | (10,149,128 | ) | (2,234,243 | ) | (2,906,788 | ) | ||||||||
| Class B | (2,001,651 | ) | (1,337,919 | ) | (610,159 | ) | (554,797 | ) | ||||||||
| Class C | (32,581,127 | ) | (41,735,014 | ) | (6,954,080 | ) | (9,569,069 | ) | ||||||||
| Institutional Class | (182,353,558 | ) | (144,692,404 | ) | (46,442,258 | ) | (36,092,756 | ) | ||||||||
| (225,731,167 | ) | (197,914,465 | ) | (56,240,740 | ) | (49,123,410 | ) | |||||||||
| Increase in net assets derived from capital share transactions | 199,157,534 | 175,974,274 | 37,414,248 | 56,178,223 | ||||||||||||
| Net Increase in Net Assets | 216,834,899 | 199,911,473 | 16,659,236 | 75,590,667 | ||||||||||||
| Net Assets: | ||||||||||||||||
| Beginning of year | 996,214,579 | 796,303,106 | 279,331,485 | 203,740,818 | ||||||||||||
| End of year | $ | 1,213,049,478 | $ | 996,214,579 | $ | 295,990,721 | $ | 279,331,485 | ||||||||
| Undistributed net investment income | $ | 1,107,367 | $ | 12,498,004 | $ | 3,163,379 | $ | 2,625,593 | ||||||||
See accompanying notes, which are an integral part of the financial statements.
(continues) 85
Statements of changes in net assets
Optimum Fund Trust
| Optimum Large Cap Growth Fund | Optimum Large Cap Value Fund | |||||||||||||||
| Year Ended | Year Ended | |||||||||||||||
| 3/31/12 | 3/31/11 | 3/31/12 | 3/31/11 | |||||||||||||
| Increase (Decrease) in Net Assets from Operations: | ||||||||||||||||
| Net investment income (loss) | $ | (1,195,543 | ) | $ | (3,025,733 | ) | $ | 9,819,535 | $ | 6,069,421 | ||||||
| Net realized gain | 34,070,265 | 74,395,811 | 895,037 | 23,316,446 | ||||||||||||
| Net change in unrealized appreciation | 29,549,864 | 45,782,341 | 39,176,300 | 62,928,731 | ||||||||||||
| Net increase in net assets resulting from operations | 62,424,586 | 117,152,419 | 49,890,872 | 92,314,598 | ||||||||||||
| Dividends and Distributions to Shareholders from: | ||||||||||||||||
| Net investment income: | ||||||||||||||||
| Class A | — | — | (236,093 | ) | (397,086 | ) | ||||||||||
| Class B | — | — | (6,668 | ) | (36,673 | ) | ||||||||||
| Class C | — | — | (159,907 | ) | (808,084 | ) | ||||||||||
| Institutional Class | — | — | (5,647,235 | ) | (7,461,811 | ) | ||||||||||
| — | — | (6,049,903 | ) | (8,703,654 | ) | |||||||||||
| Capital Share Transactions: | ||||||||||||||||
| Proceeds from shares sold: | ||||||||||||||||
| Class A | 3,365,959 | 2,880,833 | 3,175,476 | 3,699,946 | ||||||||||||
| Class B | 3,199 | 27,050 | 4,198 | 19,398 | ||||||||||||
| Class C | 7,470,184 | 7,733,548 | 7,374,125 | 7,643,883 | ||||||||||||
| Institutional Class | 147,609,090 | 157,827,455 | 147,534,944 | 152,059,465 | ||||||||||||
| Net asset value of shares issued upon reinvestment of dividends | ||||||||||||||||
| and distributions: | ||||||||||||||||
| Class A | — | — | 232,490 | 391,381 | ||||||||||||
| Class B | — | — | 6,437 | 36,248 | ||||||||||||
| Class C | — | — | 157,221 | 797,769 | ||||||||||||
| Institutional Class | — | — | 5,557,758 | 7,362,691 | ||||||||||||
| 158,448,432 | 168,468,886 | 164,042,649 | 172,010,781 | |||||||||||||
| Cost of shares repurchased: | ||||||||||||||||
| Class A | (7,033,325 | ) | (8,883,133 | ) | (7,405,494 | ) | (8,008,532 | ) | ||||||||
| Class B | (1,959,532 | ) | (1,581,843 | ) | (1,813,412 | ) | (1,454,201 | ) | ||||||||
| Class C | (23,442,450 | ) | (29,884,245 | ) | (21,690,877 | ) | (27,843,973 | ) | ||||||||
| Institutional Class | (135,724,594 | ) | (196,082,815 | ) | (122,214,398 | ) | (155,909,561 | ) | ||||||||
| (168,159,901 | ) | (236,432,036 | ) | (153,124,181 | ) | (193,216,267 | ) | |||||||||
| Increase (decrease) in net assets derived from capital share transactions | (9,711,469 | ) | (67,963,150 | ) | 10,918,468 | (21,205,486 | ) | |||||||||
| Net Increase in Net Assets | 52,713,117 | 49,189,269 | 54,759,437 | 62,405,458 | ||||||||||||
| Net Assets: | ||||||||||||||||
| Beginning of year | 756,136,717 | 706,947,448 | 709,238,953 | 646,833,495 | ||||||||||||
| End of year | $ | 808,849,834 | $ | 756,136,717 | $ | 763,998,390 | $ | 709,238,953 | ||||||||
| Undistributed (accumulated) net investment income (loss) | $ | (217,029 | ) | $ | (19,646 | ) | $ | 9,816,408 | $ | 6,037,066 | ||||||
See accompanying notes, which are an integral part of the financial statements.
86
| Optimum Small-Mid Cap Growth Fund | Optimum Small-Mid Cap Value Fund | |||||||||||||||||||||
| Year Ended | Year Ended | |||||||||||||||||||||
| 3/31/12 | 3/31/11 | 3/31/12 | 3/31/11 | |||||||||||||||||||
| Increase (Decrease) in Net Assets from Operations: | ||||||||||||||||||||||
| Net investment loss | $ | (3,395,815 | ) | $ | (2,635,441 | ) | $ | (321,479 | ) | $ | (746,540 | ) | ||||||||||
| Net realized gain | 19,561,186 | 23,081,567 | 18,668,872 | 22,987,790 | ||||||||||||||||||
| Net change in unrealized appreciation (depreciation) | (13,534,357 | ) | 40,739,949 | (12,454,173 | ) | 31,873,059 | ||||||||||||||||
| Net increase in net assets resulting from operations | 2,631,014 | 61,186,075 | 5,893,220 | 54,114,309 | ||||||||||||||||||
| Dividends and Distributions to Shareholders from: | ||||||||||||||||||||||
| Net realized gain: | ||||||||||||||||||||||
| Class A | (357,682 | ) | — | (53,670 | ) | — | ||||||||||||||||
| Class B | (55,125 | ) | — | (8,906 | ) | — | ||||||||||||||||
| Class C | (1,337,094 | ) | — | (213,540 | ) | — | ||||||||||||||||
| Institutional Class | (17,659,856 | ) | — | (2,878,962 | ) | — | ||||||||||||||||
| (19,409,757 | ) | — | (3,155,078 | ) | — | |||||||||||||||||
| Capital Share Transactions: | ||||||||||||||||||||||
| Proceeds from shares sold: | ||||||||||||||||||||||
| Class A | 563,709 | 514,239 | 470,396 | 430,872 | ||||||||||||||||||
| Class B | 1,508 | 5,887 | 1,881 | 293 | ||||||||||||||||||
| Class C | 1,292,696 | 1,358,229 | 1,377,784 | 1,363,672 | ||||||||||||||||||
| Institutional Class | 83,984,281 | 104,724,111 | 85,683,785 | 104,115,451 | ||||||||||||||||||
| Net asset value of shares issued upon reinvestment of dividends | ||||||||||||||||||||||
| and distributions: | ||||||||||||||||||||||
| Class A | 352,435 | — | 52,637 | — | ||||||||||||||||||
| Class B | 53,832 | — | 8,646 | — | ||||||||||||||||||
| Class C | 1,325,055 | — | 211,440 | — | ||||||||||||||||||
| Institutional Class | 17,401,090 | — | 2,838,393 | — | ||||||||||||||||||
| 104,974,606 | 106,602,466 | 90,644,962 | 105,910,288 | |||||||||||||||||||
| Cost of shares repurchased: | ||||||||||||||||||||||
| Class A | (1,383,482 | ) | (1,760,162 | ) | (1,183,911 | ) | (1,518,111 | ) | ||||||||||||||
| Class B | (370,439 | ) | (305,695 | ) | (361,555 | ) | (297,186 | ) | ||||||||||||||
| Class C | (4,323,168 | ) | (5,679,529 | ) | (4,031,151 | ) | (5,411,146 | ) | ||||||||||||||
| Institutional Class | (69,507,535 | ) | (59,916,934 | ) | (55,490,093 | ) | (39,423,619 | ) | ||||||||||||||
| (75,584,624 | ) | (67,662,320 | ) | (61,066,710 | ) | (46,650,062 | ) | |||||||||||||||
| Increase in net assets derived from capital share transactions | 29,389,982 | 38,940,146 | 29,578,252 | 59,260,226 | ||||||||||||||||||
| Net Increase in Net Assets | 12,611,239 | 100,126,221 | 32,316,394 | 113,374,535 | ||||||||||||||||||
| Net Assets: | ||||||||||||||||||||||
| Beginning of year | 336,671,828 | 236,545,607 | 304,431,916 | 191,057,381 | ||||||||||||||||||
| End of year | $ | 349,283,067 | $ | 336,671,828 | $ | 336,748,310 | $ | 304,431,916 | ||||||||||||||
| Undistributed net investment income (loss) | $ | (1,079,817 | ) | $ | (89,705 | ) | $ | 13,456 | $ | — | ||||||||||||
See accompanying notes, which are an integral part of the financial statements.
87
Financial highlights
Optimum Fixed Income Fund Class A
Selected data for each share of the Fund outstanding throughout each period were as follows:
| Year Ended | |||||||||||||||||
| 3/31/12 | 3/31/11 | 3/31/10 | 3/31/09 | 3/31/08 | |||||||||||||
| Net asset value, beginning of period | $9.550 | $9.290 | $7.750 | $8.930 | $9.050 | ||||||||||||
| Income (loss) from investment operations: | |||||||||||||||||
| Net investment income1 | 0.293 | 0.391 | 0.661 | 0.449 | 0.402 | ||||||||||||
| Net realized and unrealized gain (loss) | 0.338 | 0.247 | 1.482 | (1.140 | ) | (0.066 | ) | ||||||||||
| Total from investment operations | 0.631 | 0.638 | 2.143 | (0.691 | ) | 0.336 | |||||||||||
| Less dividends and distributions from: | |||||||||||||||||
| Net investment income | (0.342 | ) | (0.378 | ) | (0.603 | ) | (0.462 | ) | (0.380 | ) | |||||||
| Net realized gain | (0.129 | ) | — | — | (0.027 | ) | (0.076 | ) | |||||||||
| Total dividends and distributions | (0.471 | ) | (0.378 | ) | (0.603 | ) | (0.489 | ) | (0.456 | ) | |||||||
| Net asset value, end of period | $9.710 | $9.550 | $9.290 | $7.750 | $8.930 | ||||||||||||
| Total return2 | 6.71% | 7.01% | 28.24% | (7.82% | ) | 3.78% | |||||||||||
| Ratios and supplemental data: | |||||||||||||||||
| Net assets, end of period (000 omitted) | $40,620 | $39,758 | $40,808 | $39,299 | $63,262 | ||||||||||||
| Ratio of expenses to average net assets | 1.35% | 1.35% | 1.31% | 1.24% | 1.24% | ||||||||||||
| Ratio of expenses to average net assets | |||||||||||||||||
| prior to fees waived and expense paid indirectly | 1.44% | 1.46% | 1.48% | 1.47% | 1.43% | ||||||||||||
| Ratio of net investment income to average net assets | 3.01% | 4.10% | 7.49% | 5.38% | 4.44% | ||||||||||||
| Ratio of net investment income to average net assets | |||||||||||||||||
| prior to fees waived and expense paid indirectly | 2.92% | 3.99% | 7.32% | 5.15% | 4.25% | ||||||||||||
| Portfolio turnover | 211% | 273% | 134% | 158% | 256% | ||||||||||||
1 The average shares outstanding method has been applied for per share information. |
2 Total investment return is based on the change in net asset value of a share during the period and assumes reinvestment of dividends and distributions at net asset value and does not reflect the impact of a sales charge. Total investment return during all of the periods shown reflects a waiver by the manager. Performance would have been lower had the waiver not been in effect. |
See accompanying notes, which are an integral part of the financial statements.
88
Optimum Fixed Income Fund Class B
Selected data for each share of the Fund outstanding throughout each period were as follows:
| Year Ended | |||||||||||||||||
| 3/31/12 | 3/31/11 | 3/31/10 | 3/31/09 | 3/31/08 | |||||||||||||
| Net asset value, beginning of period | $9.540 | $9.280 | $7.750 | $8.930 | $9.060 | ||||||||||||
| Income (loss) from investment operations: | |||||||||||||||||
| Net investment income1 | 0.229 | 0.328 | 0.604 | 0.395 | 0.343 | ||||||||||||
| Net realized and unrealized gain (loss) | 0.340 | 0.248 | 1.486 | (1.140 | ) | (0.076 | ) | ||||||||||
| Total from investment operations | 0.569 | 0.576 | 2.090 | (0.745 | ) | 0.267 | |||||||||||
| Less dividends and distributions from: | |||||||||||||||||
| Net investment income | (0.280 | ) | (0.316 | ) | (0.560 | ) | (0.408 | ) | (0.321 | ) | |||||||
| Net realized gain | (0.129 | ) | — | — | (0.027 | ) | (0.076 | ) | |||||||||
| Total dividends and distributions | (0.409 | ) | (0.316 | ) | (0.560 | ) | (0.435 | ) | (0.397 | ) | |||||||
| Net asset value, end of period | $9.700 | $9.540 | $9.280 | $7.750 | $8.930 | ||||||||||||
| Total return2 | 6.15% | 6.32% | 27.51% | (8.42% | ) | 2.99% | |||||||||||
| Ratios and supplemental data: | |||||||||||||||||
| Net assets, end of period (000 omitted) | $3,056 | $4,714 | $5,587 | $5,483 | $8,788 | ||||||||||||
| Ratio of expenses to average net assets | 2.00% | 2.00% | 1.96% | 1.89% | 1.89% | ||||||||||||
| Ratio of expenses to average net assets | |||||||||||||||||
| prior to fees waived and expense paid indirectly | 2.09% | 2.11% | 2.13% | 2.12% | 2.08% | ||||||||||||
| Ratio of net investment income to average net assets | 2.36% | 3.45% | 6.84% | 4.73% | 3.79% | ||||||||||||
| Ratio of net investment income to average net assets | |||||||||||||||||
| prior to fees waived and expense paid indirectly | 2.27% | 3.34% | 6.67% | 4.50% | 3.60% | ||||||||||||
| Portfolio turnover | 211% | 273% | 134% | 158% | 256% | ||||||||||||
1 The average shares outstanding method has been applied for per share information. |
2 Total investment return is based on the change in net asset value of a share during the period and assumes reinvestment of dividends and distributions at net asset value and does not reflect the impact of a sales charge. Total investment return during all of the periods shown reflects a waiver by the manager. Performance would have been lower had the waiver not been in effect. |
See accompanying notes, which are an integral part of the financial statements.
(continues) 89
Financial highlights
Optimum Fixed Income Fund Class C
Selected data for each share of the Fund outstanding throughout each period were as follows:
| Year Ended | |||||||||||||||||||||
| 3/31/12 | 3/31/11 | 3/31/10 | 3/31/09 | 3/31/08 | |||||||||||||||||
| Net asset value, beginning of period | $9.540 | $9.280 | $7.760 | $8.940 | $9.060 | ||||||||||||||||
| Income (loss) from investment operations: | |||||||||||||||||||||
| Net investment income1 | 0.229 | 0.329 | 0.604 | 0.395 | 0.343 | ||||||||||||||||
| Net realized and unrealized gain (loss) | 0.350 | 0.247 | 1.476 | (1.140 | ) | (0.066 | ) | ||||||||||||||
| Total from investment operations | 0.579 | 0.576 | 2.080 | (0.745 | ) | 0.277 | |||||||||||||||
| Less dividends and distributions from: | |||||||||||||||||||||
| Net investment income | (0.280 | ) | (0.316 | ) | (0.560 | ) | (0.408 | ) | (0.321 | ) | |||||||||||
| Net realized gain | (0.129 | ) | — | — | (0.027 | ) | (0.076 | ) | |||||||||||||
| Total dividends and distributions | (0.409 | ) | (0.316 | ) | (0.560 | ) | (0.435 | ) | (0.397 | ) | |||||||||||
| Net asset value, end of period | $9.710 | $9.540 | $9.280 | $7.760 | $8.940 | ||||||||||||||||
| Total return2 | 6.15% | 6.32% | 27.34% | (8.41% | ) | 3.11% | |||||||||||||||
| Ratios and supplemental data: | |||||||||||||||||||||
| Net assets, end of period (000 omitted) | $154,778 | $159,759 | $170,214 | $157,185 | $257,340 | ||||||||||||||||
| Ratio of expenses to average net assets | 2.00% | 2.00% | 1.96% | 1.89% | 1.89% | ||||||||||||||||
| Ratio of expenses to average net assets | |||||||||||||||||||||
| prior to fees waived and expense paid indirectly | 2.09% | 2.11% | 2.13% | 2.12% | 2.08% | ||||||||||||||||
| Ratio of net investment income to average net assets | 2.36% | 3.45% | 6.84% | 4.73% | 3.79% | ||||||||||||||||
| Ratio of net investment income to average net assets | |||||||||||||||||||||
| prior to fees waived and expense paid indirectly | 2.27% | 3.34% | 6.67% | 4.50% | 3.60% | ||||||||||||||||
| Portfolio turnover | 211% | 273% | 134% | 158% | 256% | ||||||||||||||||
1 The average shares outstanding method has been applied for per share information. |
| 2 Total investment return is based on the change in net asset value of a share during the period and assumes reinvestment of dividends and distributions at net asset value and does not reflect the impact of a sales charge. Total investment return during all of the periods shown reflects a waiver by the manager. Performance would have been lower had the waiver not been in effect. |
See accompanying notes, which are an integral part of the financial statements.
90
Optimum Fixed Income Fund Institutional Class
Selected data for each share of the Fund outstanding throughout each period were as follows:
| Year Ended | |||||||||||||||||||||
| 3/31/12 | 3/31/11 | 3/31/10 | 3/31/09 | 3/31/08 | |||||||||||||||||
| Net asset value, beginning of period | $9.550 | $9.290 | $7.740 | $8.920 | $9.050 | ||||||||||||||||
| Income (loss) from investment operations: | |||||||||||||||||||||
| Net investment income1 | 0.327 | 0.424 | 0.692 | 0.479 | 0.434 | ||||||||||||||||
| Net realized and unrealized gain (loss) | 0.338 | 0.247 | 1.484 | (1.141 | ) | (0.076 | ) | ||||||||||||||
| Total from investment operations | 0.665 | 0.671 | 2.176 | (0.662 | ) | 0.358 | |||||||||||||||
| Less dividends and distributions from: | |||||||||||||||||||||
| Net investment income | (0.376 | ) | (0.411 | ) | (0.626 | ) | (0.491 | ) | (0.412 | ) | |||||||||||
| Net realized gain | (0.129 | ) | — | — | (0.027 | ) | (0.076 | ) | |||||||||||||
| Total dividends and distributions | (0.505 | ) | (0.411 | ) | (0.626 | ) | (0.518 | ) | (0.488 | ) | |||||||||||
| Net asset value, end of period | $9.710 | $9.550 | $9.290 | $7.740 | $8.920 | ||||||||||||||||
| Total return2 | 7.20% | 7.39% | 28.73% | (7.51% | ) | 4.04% | |||||||||||||||
| Ratios and supplemental data: | |||||||||||||||||||||
| Net assets, end of period (000 omitted) | $ | 1,014,595 | $791,984 | $579,694 | $434,285 | $597,388 | |||||||||||||||
| Ratio of expenses to average net assets | 1.00% | 1.00% | 0.96% | 0.89% | 0.89% | ||||||||||||||||
| Ratio of expenses to average net assets | |||||||||||||||||||||
| prior to fees waived and expense paid indirectly | 1.09% | 1.11% | 1.13% | 1.12% | 1.08% | ||||||||||||||||
| Ratio of net investment income to average net assets | 3.36% | 4.45% | 7.84% | 5.73% | 4.79% | ||||||||||||||||
| Ratio of net investment income to average net assets | |||||||||||||||||||||
| prior to fees waived and expense paid indirectly | 3.27% | 4.34% | 7.67% | 5.50% | 4.60% | ||||||||||||||||
| Portfolio turnover | 211% | 273% | 134% | 158% | 256% | ||||||||||||||||
1 The average shares outstanding method has been applied for per share information. |
| 2 Total investment return is based on the change in net asset value of a share during the period and assumes reinvestment of dividends and distributions at net asset value. Total investment return during all of the periods shown reflects a waiver by the manager. Performance would have been lower had the waiver not been in effect. |
See accompanying notes, which are an integral part of the financial statements.
Financial highlights
Optimum International Fund Class A
Selected data for each share of the Fund outstanding throughout each period were as follows:
| Year Ended | |||||||||||||||||||||
| 3/31/12 | 3/31/11 | 3/31/10 | 3/31/09 | 3/31/08 | |||||||||||||||||
| Net asset value, beginning of period | $11.200 | $10.340 | $7.010 | $13.840 | $15.490 | ||||||||||||||||
| Income (loss) from investment operations: | |||||||||||||||||||||
| Net investment income1 | 0.192 | 0.129 | 0.124 | 0.280 | 0.262 | ||||||||||||||||
| Net realized and unrealized gain (loss) | (0.790 | ) | 0.887 | 3.366 | (6.557 | ) | (0.798 | ) | |||||||||||||
| Total from investment operations | (0.598 | ) | 1.016 | 3.490 | (6.277 | ) | (0.536 | ) | |||||||||||||
| Less dividends and distributions from: | |||||||||||||||||||||
| Net investment income | (0.182 | ) | (0.156 | ) | (0.160 | ) | (0.326 | ) | (0.116 | ) | |||||||||||
| Net realized gain | — | — | — | (0.227 | ) | (0.998 | ) | ||||||||||||||
| Total dividends and distributions | (0.182 | ) | (0.156 | ) | (0.160 | ) | (0.553 | ) | (1.114 | ) | |||||||||||
| Net asset value, end of period | $10.420 | $11.200 | $10.340 | $7.010 | $13.840 | ||||||||||||||||
| Total return2 | (5.30% | ) | 10.19% | 50.29% | (46.64% | ) | (3.96% | ) | |||||||||||||
| Ratios and supplemental data: | |||||||||||||||||||||
| Net assets, end of period (000 omitted) | $9,318 | $11,189 | $12,082 | $9,578 | $22,971 | ||||||||||||||||
| Ratio of expenses to average net assets | 1.75% | 1.75% | 1.75% | 1.77% | 1.75% | ||||||||||||||||
| Ratio of expenses to average net assets | |||||||||||||||||||||
| prior to fees waived and expense paid indirectly | 1.84% | 1.88% | 1.94% | 1.86% | 1.75% | ||||||||||||||||
| Ratio of net investment income to average net assets | 1.84% | 1.26% | 1.30% | 2.66% | 1.69% | ||||||||||||||||
| Ratio of net investment income to average net assets | |||||||||||||||||||||
| prior to fees waived and expense paid indirectly | 1.75% | 1.13% | 1.11% | 2.57% | 1.69% | ||||||||||||||||
| Portfolio turnover | 50% | 95% | 91% | 58% | 19% | ||||||||||||||||
1 The average shares outstanding method has been applied for per share information. |
| 2 Total investment return is based on the change in net asset value of a share during the period and assumes reinvestment of dividends and distributions at net asset value and does not reflect the impact of a sales charge. Total investment return during some of the periods shown reflects a waiver by the manager. Performance would have been lower had the waiver not been in effect. |
See accompanying notes, which are an integral part of the financial statements.
92
Optimum International Fund Class B
Selected data for each share of the Fund outstanding throughout each period were as follows:
| Year Ended | |||||||||||||||||||||
| 3/31/12 | 3/31/11 | 3/31/10 | 3/31/09 | 3/31/08 | |||||||||||||||||
| Net asset value, beginning of period | $10.940 | $10.100 | $6.880 | $13.580 | $15.240 | ||||||||||||||||
| Income (loss) from investment operations: | |||||||||||||||||||||
| Net investment income1 | 0.122 | 0.061 | 0.064 | 0.213 | 0.163 | ||||||||||||||||
| Net realized and unrealized gain (loss) | (0.773 | ) | 0.875 | 3.304 | (6.436 | ) | (0.787 | ) | |||||||||||||
| Total from investment operations | (0.651 | ) | 0.936 | 3.368 | (6.223 | ) | (0.624 | ) | |||||||||||||
| Less dividends and distributions from: | |||||||||||||||||||||
| Net investment income | (0.069 | ) | (0.096 | ) | (0.148 | ) | (0.250 | ) | (0.038 | ) | |||||||||||
| Net realized gain | — | — | — | (0.227 | ) | (0.998 | ) | ||||||||||||||
| Total dividends and distributions | (0.069 | ) | (0.096 | ) | (0.148 | ) | (0.477 | ) | (1.036 | ) | |||||||||||
| Net asset value, end of period | $10.220 | $10.940 | $10.100 | $6.880 | $13.580 | ||||||||||||||||
| Total return2 | (5.94% | ) | 9.49% | 49.42% | (47.02% | ) | (4.59% | ) | |||||||||||||
| Ratios and supplemental data: | |||||||||||||||||||||
| Net assets, end of period (000 omitted) | $1,139 | $1,868 | $2,243 | $1,764 | $4,203 | ||||||||||||||||
| Ratio of expenses to average net assets | 2.40% | 2.40% | 2.40% | 2.42% | 2.40% | ||||||||||||||||
| Ratio of expenses to average net assets | |||||||||||||||||||||
| prior to fees waived and expense paid indirectly | 2.49% | 2.53% | 2.59% | 2.51% | 2.40% | ||||||||||||||||
| Ratio of net investment income to average net assets | 1.19% | 0.61% | 0.65% | 2.01% | 1.04% | ||||||||||||||||
| Ratio of net investment income to average net assets | |||||||||||||||||||||
| prior to fees waived and expense paid indirectly | 1.10% | 0.48% | 0.46% | 1.92% | 1.04% | ||||||||||||||||
| Portfolio turnover | 50% | 95% | 91% | 58% | 19% | ||||||||||||||||
1 The average shares outstanding method has been applied for per share information. |
| 2 Total investment return is based on the change in net asset value of a share during the period and assumes reinvestment of dividends and distributions at net asset value and does not reflect the impact of a sales charge. Total investment return during some of the periods shown reflects a waiver by the manager. Performance would have been lower had the waiver not been in effect. |
See accompanying notes, which are an integral part of the financial statements.
(continues) 93
Financial highlights
Optimum International Fund Class C
Selected data for each share of the Fund outstanding throughout each period were as follows:
| Year Ended | |||||||||||||||||||||
| 3/31/12 | 3/31/11 | 3/31/10 | 3/31/09 | 3/31/08 | |||||||||||||||||
| Net asset value, beginning of period | $10.950 | $10.100 | $6.890 | $13.590 | $15.250 | ||||||||||||||||
| Income (loss) from investment operations: | |||||||||||||||||||||
| Net investment income1 | 0.122 | 0.061 | 0.064 | 0.213 | 0.163 | ||||||||||||||||
| Net realized and unrealized gain (loss) | (0.773 | ) | 0.885 | 3.294 | (6.436 | ) | (0.787 | ) | |||||||||||||
| Total from investment operations | (0.651 | ) | 0.946 | 3.358 | (6.223 | ) | (0.624 | ) | |||||||||||||
| Less dividends and distributions from: | |||||||||||||||||||||
| Net investment income | (0.069 | ) | (0.096 | ) | (0.148 | ) | (0.250 | ) | (0.038 | ) | |||||||||||
| Net realized gain | — | — | — | (0.227 | ) | (0.998 | ) | ||||||||||||||
| Total dividends and distributions | (0.069 | ) | (0.096 | ) | (0.148 | ) | (0.477 | ) | (1.036 | ) | |||||||||||
| Net asset value, end of period | $10.230 | $10.950 | $10.100 | $6.890 | $13.590 | ||||||||||||||||
| Total return2 | (5.94% | ) | 9.59% | 49.20% | (46.98% | ) | (4.59% | ) | |||||||||||||
| Ratios and supplemental data: | |||||||||||||||||||||
| Net assets, end of period (000 omitted) | $32,995 | $39,762 | $43,260 | $34,520 | $84,431 | ||||||||||||||||
| Ratio of expenses to average net assets | 2.40% | 2.40% | 2.40% | 2.42% | 2.40% | ||||||||||||||||
| Ratio of expenses to average net assets | |||||||||||||||||||||
| prior to fees waived and expense paid indirectly | 2.49% | 2.53% | 2.59% | 2.51% | 2.40% | ||||||||||||||||
| Ratio of net investment income to average net assets | 1.19% | 0.61% | 0.65% | 2.01% | 1.04% | ||||||||||||||||
| Ratio of net investment income to average net assets | |||||||||||||||||||||
| prior to fees waived and expense paid indirectly | 1.10% | 0.48% | 0.46% | 1.92% | 1.04% | ||||||||||||||||
| Portfolio turnover | 50% | 95% | 91% | 58% | 19% | ||||||||||||||||
1 The average shares outstanding method has been applied for per share information. |
| 2 Total investment return is based on the change in net asset value of a share during the period and assumes reinvestment of dividends and distributions at net asset value and does not reflect the impact of a sales charge. Total investment return during some of the periods shown reflects a waiver by the manager. Performance would have been lower had the waiver not been in effect. |
See accompanying notes, which are an integral part of the financial statements.
94
Optimum International Fund Institutional Class
Selected data for each share of the Fund outstanding throughout each period were as follows:
| Year Ended | |||||||||||||||||||||
| 3/31/12 | 3/31/11 | 3/31/10 | 3/31/09 | 3/31/08 | |||||||||||||||||
| Net asset value, beginning of period | $11.300 | $10.430 | $7.050 | $13.940 | $15.590 | ||||||||||||||||
| Income (loss) from investment operations: | |||||||||||||||||||||
| Net investment income1 | 0.229 | 0.168 | 0.157 | 0.317 | 0.317 | ||||||||||||||||
| Net realized and unrealized gain (loss) | (0.793 | ) | 0.887 | 3.393 | (6.611 | ) | (0.797 | ) | |||||||||||||
| Total from investment operations | (0.564 | ) | 1.055 | 3.550 | (6.294 | ) | (0.480 | ) | |||||||||||||
| Less dividends and distributions from: | |||||||||||||||||||||
| Net investment income | (0.246 | ) | (0.185 | ) | (0.170 | ) | (0.369 | ) | (0.172 | ) | |||||||||||
| Net realized gain | — | — | — | (0.227 | ) | (0.998 | ) | ||||||||||||||
| Total dividends and distributions | (0.246 | ) | (0.185 | ) | (0.170 | ) | (0.596 | ) | (1.170 | ) | |||||||||||
| Net asset value, end of period | $10.490 | $11.300 | $10.430 | $7.050 | $13.940 | ||||||||||||||||
| Total return2 | (4.93% | ) | 10.55% | 50.88% | (46.49% | ) | (3.59% | ) | |||||||||||||
| Ratios and supplemental data: | |||||||||||||||||||||
| Net assets, end of period (000 omitted) | $252,539 | $226,512 | $146,156 | $79,430 | $174,954 | ||||||||||||||||
| Ratio of expenses to average net assets | 1.40% | 1.40% | 1.40% | 1.42% | 1.40% | ||||||||||||||||
| Ratio of expenses to average net assets | |||||||||||||||||||||
| prior to fees waived and expense paid indirectly | 1.49% | 1.53% | 1.59% | 1.51% | 1.40% | ||||||||||||||||
| Ratio of net investment income to average net assets | 2.19% | 1.61% | 1.65% | 3.01% | 2.04% | ||||||||||||||||
| Ratio of net investment income to average net assets | |||||||||||||||||||||
| prior to fees waived and expense paid indirectly | 2.10% | 1.48% | 1.46% | 2.92% | 2.04% | ||||||||||||||||
| Portfolio turnover | 50% | 95% | 91% | 58% | 19% | ||||||||||||||||
1 The average shares outstanding method has been applied for per share information. |
| 2 Total investment return is based on the change in net asset value of a share during the period and assumes reinvestment of dividends and distributions at net asset value. Total investment return during some of the periods shown reflects a waiver by the manager. Performance would have been lower had the waiver not been in effect. |
See accompanying notes, which are an integral part of the financial statements.
(continues) 95
Financial highlights
Optimum Large Cap Growth Fund Class A
Selected data for each share of the Fund outstanding throughout each period were as follows:
| Year Ended | |||||||||||||||||||||
| 3/31/12 | 3/31/11 | 3/31/10 | 3/31/09 | 3/31/08 | |||||||||||||||||
| Net asset value, beginning of period | $12.430 | $10.640 | $6.990 | $11.220 | $11.980 | ||||||||||||||||
| Income (loss) from investment operations: | |||||||||||||||||||||
| Net investment loss1 | (0.040 | ) | (0.062 | ) | (0.025 | ) | (0.001 | ) | (0.021 | ) | |||||||||||
| Net realized and unrealized gain (loss) | 1.090 | 1.852 | 3.675 | (4.229 | ) | (0.406 | ) | ||||||||||||||
| Total from investment operations | 1.050 | 1.790 | 3.650 | (4.230 | ) | (0.427 | ) | ||||||||||||||
| Less dividends and distributions from: | |||||||||||||||||||||
| Net investment income | — | — | — | — | (0.296 | ) | |||||||||||||||
| Return of capital | — | — | — | — | (0.037 | ) | |||||||||||||||
| Total dividends and distributions | — | — | — | — | (0.333 | ) | |||||||||||||||
| Net asset value, end of period | $13.480 | $12.430 | $10.640 | $6.990 | $11.220 | ||||||||||||||||
| Total return2 | 8.45% | 16.82% | 52.22% | (37.70% | ) | (3.86% | ) | ||||||||||||||
| Ratios and supplemental data: | |||||||||||||||||||||
| Net assets, end of period (000 omitted) | $34,170 | $35,359 | $36,288 | $28,347 | $54,022 | ||||||||||||||||
| Ratio of expenses to average net assets | 1.61% | 1.61% | 1.61% | 1.61% | 1.60% | ||||||||||||||||
| Ratio of expenses to average net assets | |||||||||||||||||||||
| prior to fees waived and expense paid indirectly | 1.64% | 1.64% | 1.66% | 1.64% | 1.60% | ||||||||||||||||
| Ratio of net investment loss to average net assets | (0.34% | ) | (0.57% | ) | (0.28% | ) | (0.01% | ) | (0.17% | ) | |||||||||||
| Ratio of net investment loss to average net assets | |||||||||||||||||||||
| prior to fees waived and expense paid indirectly | (0.37% | ) | (0.60% | ) | (0.33% | ) | (0.04% | ) | (0.17% | ) | |||||||||||
| Portfolio turnover | 89% | 117% | 145% | 164% | 59% | ||||||||||||||||
1 The average shares outstanding method has been applied for per share information. |
| 2 Total investment return is based on the change in net asset value of a share during the period and assumes reinvestment of dividends and distributions at net asset value and does not reflect the impact of a sales charge. Total investment return during some of the periods shown reflects a waiver by the manager. Performance would have been lower had the waiver not been in effect. |
See accompanying notes, which are an integral part of the financial statements.
96
Optimum Large Cap Growth Fund Class B
Selected data for each share of the Fund outstanding throughout each period were as follows:
| Year Ended | |||||||||||||||||||||
| 3/31/12 | 3/31/11 | 3/31/10 | 3/31/09 | 3/31/08 | |||||||||||||||||
| Net asset value, beginning of period | $11.820 | $10.180 | $6.730 | $10.870 | $11.700 | ||||||||||||||||
| Income (loss) from investment operations: | |||||||||||||||||||||
| Net investment loss1 | (0.112 | ) | (0.127 | ) | (0.081 | ) | (0.059 | ) | (0.100 | ) | |||||||||||
| Net realized and unrealized gain (loss) | 1.022 | 1.767 | 3.531 | (4.081 | ) | (0.397 | ) | ||||||||||||||
| Total from investment operations | 0.910 | 1.640 | 3.450 | (4.140 | ) | (0.497 | ) | ||||||||||||||
| Less dividends and distributions from: | |||||||||||||||||||||
| Net investment income | — | — | — | — | (0.296 | ) | |||||||||||||||
| Return of capital | — | — | — | — | (0.037 | ) | |||||||||||||||
| Total dividends and distributions | — | — | — | — | (0.333 | ) | |||||||||||||||
| Net asset value, end of period | $12.730 | $11.820 | $10.180 | $6.730 | $10.870 | ||||||||||||||||
| Total return2 | 7.70% | 16.11% | 51.26% | (38.09% | ) | (4.56% | ) | ||||||||||||||
| Ratios and supplemental data: | |||||||||||||||||||||
| Net assets, end of period (000 omitted) | $3,628 | $5,381 | $6,135 | $4,780 | $9,345 | ||||||||||||||||
| Ratio of expenses to average net assets | 2.26% | 2.26% | 2.26% | 2.26% | 2.25% | ||||||||||||||||
| Ratio of expenses to average net assets | |||||||||||||||||||||
| prior to fees waived and expense paid indirectly | 2.29% | 2.29% | 2.31% | 2.29% | 2.25% | ||||||||||||||||
| Ratio of net investment loss to average net assets | (0.99% | ) | (1.22% | ) | (0.93% | ) | (0.66% | ) | (0.82% | ) | |||||||||||
| Ratio of net investment loss to average net assets | |||||||||||||||||||||
| prior to fees waived and expense paid indirectly | (1.02% | ) | (1.25% | ) | (0.98% | ) | (0.69% | ) | (0.82% | ) | |||||||||||
| Portfolio turnover | 89% | 117% | 145% | 164% | 59% | ||||||||||||||||
1 The average shares outstanding method has been applied for per share information. |
| 2 Total investment return is based on the change in net asset value of a share during the period and assumes reinvestment of dividends and distributions at net asset value and does not reflect the impact of a sales charge. Total investment return during some of the periods shown reflects a waiver by the manager. Performance would have been lower had the waiver not been in effect. |
See accompanying notes, which are an integral part of the financial statements.
(continues) 97
Financial highlights
Optimum Large Cap Growth Fund Class C
Selected data for each share of the Fund outstanding throughout each period were as follows:
| Year Ended | |||||||||||||||||||||
| 3/31/12 | 3/31/11 | 3/31/10 | 3/31/09 | 3/31/08 | |||||||||||||||||
| Net asset value, beginning of period | $11.820 | $10.180 | $6.730 | $10.870 | $11.700 | ||||||||||||||||
| Income (loss) from investment operations: | |||||||||||||||||||||
| Net investment loss1 | (0.112 | ) | (0.127 | ) | (0.081 | ) | (0.059 | ) | (0.100 | ) | |||||||||||
| Net realized and unrealized gain (loss) | 1.012 | 1.767 | 3.531 | (4.081 | ) | (0.397 | ) | ||||||||||||||
| Total from investment operations | 0.900 | 1.640 | 3.450 | (4.140 | ) | (0.497 | ) | ||||||||||||||
| Less dividends and distributions from: | |||||||||||||||||||||
| Net investment income | — | — | — | — | (0.296 | ) | |||||||||||||||
| Return of capital | — | — | — | — | (0.037 | ) | |||||||||||||||
| Total dividends and distributions | — | — | — | — | (0.333 | ) | |||||||||||||||
| Net asset value, end of period | $12.720 | $11.820 | $10.180 | $6.730 | $10.870 | ||||||||||||||||
| Total return2 | 7.61% | 16.11% | 51.26% | (38.09% | ) | (4.56% | ) | ||||||||||||||
| Ratios and supplemental data: | |||||||||||||||||||||
| Net assets, end of period (000 omitted) | $120,183 | $128,256 | $132,242 | $102,233 | $203,394 | ||||||||||||||||
| Ratio of expenses to average net assets | 2.26% | 2.26% | 2.26% | 2.26% | 2.25% | ||||||||||||||||
| Ratio of expenses to average net assets | |||||||||||||||||||||
| prior to fees waived and expense paid indirectly | 2.29% | 2.29% | 2.31% | 2.29% | 2.25% | ||||||||||||||||
| Ratio of net investment loss to average net assets | (0.99% | ) | (1.22% | ) | (0.93% | ) | (0.66% | ) | (0.82% | ) | |||||||||||
| Ratio of net investment loss to average net assets | |||||||||||||||||||||
| prior to fees waived and expense paid indirectly | (1.02% | ) | (1.25% | ) | (0.98% | ) | (0.69% | ) | (0.82% | ) | |||||||||||
| Portfolio turnover | 89% | 117% | 145% | 164% | 59% | ||||||||||||||||
1 The average shares outstanding method has been applied for per share information. |
| 2 Total investment return is based on the change in net asset value of a share during the period and assumes reinvestment of dividends and distributions at net asset value and does not reflect the impact of a sales charge. Total investment return during some of the periods shown reflects a waiver by the manager. Performance would have been lower had the waiver not been in effect. |
See accompanying notes, which are an integral part of the financial statements.
98
Optimum Large Cap Growth Fund Institutional Class
Selected data for each share of the Fund outstanding throughout each period were as follows:
| Year Ended | |||||||||||||||||
| 3/31/12 | 3/31/11 | 3/31/10 | 3/31/09 | 3/31/08 | |||||||||||||
| Net asset value, beginning of period | $12.760 | $10.880 | $7.130 | $11.410 | $12.140 | ||||||||||||
| Income (loss) from investment operations: | |||||||||||||||||
| Net investment income (loss)1 | 0.002 | (0.025 | ) | 0.007 | 0.032 | 0.023 | |||||||||||
| Net realized and unrealized gain (loss) | 1.118 | 1.905 | 3.758 | (4.312 | ) | (0.420 | ) | ||||||||||
| Total from investment operations | 1.120 | 1.880 | 3.765 | (4.280 | ) | (0.397 | ) | ||||||||||
| Less dividends and distributions from: | |||||||||||||||||
| Net investment income | — | — | (0.015 | ) | — | (0.296 | ) | ||||||||||
| Return of capital | — | — | — | — | (0.037 | ) | |||||||||||
| Total dividends and distributions | — | — | (0.015 | ) | — | (0.333 | ) | ||||||||||
| Net asset value, end of period | $13.880 | $12.760 | $10.880 | $7.130 | $11.410 | ||||||||||||
| Total return2 | 8.78% | 17.28% | 52.87% | (37.51% | ) | (3.56% | ) | ||||||||||
| Ratios and supplemental data: | |||||||||||||||||
| Net assets, end of period (000 omitted) | $650,869 | $587,141 | $532,282 | $402,574 | $723,347 | ||||||||||||
| Ratio of expenses to average net assets | 1.26% | 1.26% | 1.26% | 1.26% | 1.25% | ||||||||||||
| Ratio of expenses to average net assets | |||||||||||||||||
| prior to fees waived and expense paid indirectly | 1.29% | 1.29% | 1.31% | 1.29% | 1.25% | ||||||||||||
| Ratio of net investment income (loss) to average net assets | 0.01% | (0.22% | ) | 0.07% | 0.34% | 0.18% | |||||||||||
| Ratio of net investment income (loss) to average net assets | |||||||||||||||||
| prior to fees waived and expense paid indirectly | (0.02% | ) | (0.25% | ) | 0.02% | 0.31% | 0.18% | ||||||||||
| Portfolio turnover | 89% | 117% | 145% | 164% | 59% | ||||||||||||
| 1 The average shares outstanding method has been applied for per share information. |
| 2 Total investment return is based on the change in net asset value of a share during the period and assumes reinvestment of dividends and distributions at net asset value. Total investment return during some of the periods shown reflects a waiver by the manager. Performance would have been lower had the waiver not been in effect. |
See accompanying notes, which are an integral part of the financial statements.
(continues) 99
Financial highlights
Optimum Large Cap Value Fund Class A
Selected data for each share of the Fund outstanding throughout each period were as follows:
| Year Ended | |||||||||||||||||
| 3/31/12 | 3/31/11 | 3/31/10 | 3/31/09 | 3/31/08 | |||||||||||||
| Net asset value, beginning of period | $11.060 | $9.830 | $6.710 | $11.170 | $12.730 | ||||||||||||
| Income (loss) from investment operations: | |||||||||||||||||
| Net investment income1 | 0.133 | 0.075 | 0.118 | 0.165 | 0.138 | ||||||||||||
| Net realized and unrealized gain (loss) | 0.635 | 1.274 | 3.181 | (4.453 | ) | (0.931 | ) | ||||||||||
| Total from investment operations | 0.768 | 1.349 | 3.299 | (4.288 | ) | (0.793 | ) | ||||||||||
| Less dividends and distributions from: | |||||||||||||||||
| Net investment income | (0.078 | ) | (0.119 | ) | (0.179 | ) | (0.029 | ) | (0.134 | ) | |||||||
| Net realized gain | — | — | — | (0.143 | ) | (0.633 | ) | ||||||||||
| Total dividends and distributions | (0.078 | ) | (0.119 | ) | (0.179 | ) | (0.172 | ) | (0.767 | ) | |||||||
| Net asset value, end of period | $11.750 | $11.060 | $9.830 | $6.710 | $11.170 | ||||||||||||
| Total return2 | 7.01% | 14.00% | 49.92% | (38.97% | ) | (6.80% | ) | ||||||||||
| Ratios and supplemental data: | |||||||||||||||||
| Net assets, end of period (000 omitted) | $31,478 | $33,892 | $34,167 | $26,901 | $53,097 | ||||||||||||
| Ratio of expenses to average net assets | 1.57% | 1.59% | 1.58% | 1.54% | 1.54% | ||||||||||||
| Ratio of expenses to average net assets | |||||||||||||||||
| prior to fees waived and expense paid indirectly | 1.60% | 1.61% | 1.62% | 1.60% | 1.56% | ||||||||||||
| Ratio of net investment income to average net assets | 1.25% | 0.77% | 1.38% | 1.82% | 1.09% | ||||||||||||
| Ratio of net investment income to average net assets | |||||||||||||||||
| prior to fees waived and expense paid indirectly | 1.22% | 0.75% | 1.34% | 1.76% | 1.07% | ||||||||||||
| Portfolio turnover | 57% | 82% | 28% | 37% | 30% | ||||||||||||
| 1 The average shares outstanding method has been applied for per share information. |
| 2 Total investment return is based on the change in net asset value of a share during the period and assumes reinvestment of dividends and distributions at net asset value and does not reflect the impact of a sales charge. Total investment return during all of the periods shown reflects a waiver by the manager. Performance would have been lower had the waiver not been in effect. |
100
Optimum Large Cap Value Fund Class B
Selected data for each share of the Fund outstanding throughout each period were as follows:
| Year Ended | |||||||||||||||||
| 3/31/12 | 3/31/11 | 3/31/10 | 3/31/09 | 3/31/08 | |||||||||||||
| Net asset value, beginning of period | $10.930 | $9.720 | $6.630 | $11.090 | $12.640 | ||||||||||||
| Income (loss) from investment operations: | |||||||||||||||||
| Net investment income1 | 0.063 | 0.012 | 0.063 | 0.106 | 0.056 | ||||||||||||
| Net realized and unrealized gain (loss) | 0.622 | 1.262 | 3.147 | (4.413 | ) | (0.923 | ) | ||||||||||
| Total from investment operations | 0.685 | 1.274 | 3.210 | (4.307 | ) | (0.867 | ) | ||||||||||
| Less dividends and distributions from: | |||||||||||||||||
| Net investment income | (0.015 | ) | (0.064 | ) | (0.120 | ) | (0.010 | ) | (0.050 | ) | |||||||
| Net realized gain | — | — | — | (0.143 | ) | (0.633 | ) | ||||||||||
| Total dividends and distributions | (0.015 | ) | (0.064 | ) | (0.120 | ) | (0.153 | ) | (0.683 | ) | |||||||
| Net asset value, end of period | $11.600 | $10.930 | $9.720 | $6.630 | $11.090 | ||||||||||||
| Total return2 | 6.28% | 13.25% | 48.92% | (39.37% | ) | (7.38% | ) | ||||||||||
| Ratios and supplemental data: | |||||||||||||||||
| Net assets, end of period (000 omitted) | $3,478 | $5,135 | $5,943 | $4,664 | $9,454 | ||||||||||||
| Ratio of expenses to average net assets | 2.22% | 2.24% | 2.23% | 2.19% | 2.19% | ||||||||||||
| Ratio of expenses to average net assets | |||||||||||||||||
| prior to fees waived and expense paid indirectly | 2.25% | 2.26% | 2.27% | 2.25% | 2.21% | ||||||||||||
| Ratio of net investment income to average net assets | 0.60% | 0.12% | 0.73% | 1.17% | 0.44% | ||||||||||||
| Ratio of net investment income to average net assets | |||||||||||||||||
| prior to fees waived and expense paid indirectly | 0.57% | 0.10% | 0.69% | 1.11% | 0.42% | ||||||||||||
| Portfolio turnover | 57% | 82% | 28% | 37% | 30% | ||||||||||||
| 1 The average shares outstanding method has been applied for per share information. |
| 2 Total investment return is based on the change in net asset value of a share during the period and assumes reinvestment of dividends and distributions at net asset value and does not reflect the impact of a sales charge. Total investment return during all of the periods shown reflects a waiver by the manager. Performance would have been lower had the waiver not been in effect. |
See accompanying notes, which are an integral part of the financial statements.
(continues) 101
Financial highlights
Optimum Large Cap Value Fund Class C
Selected data for each share of the Fund outstanding throughout each period were as follows:
| Year Ended | |||||||||||||||||
| 3/31/12 | 3/31/11 | 3/31/10 | 3/31/09 | 3/31/08 | |||||||||||||
| Net asset value, beginning of period | $10.930 | $9.710 | $6.630 | $11.080 | $12.630 | ||||||||||||
| Income (loss) from investment operations: | |||||||||||||||||
| Net investment income1 | 0.063 | 0.012 | 0.063 | 0.106 | 0.057 | ||||||||||||
| Net realized and unrealized gain (loss) | 0.612 | 1.272 | 3.137 | (4.403 | ) | (0.924 | ) | ||||||||||
| Total from investment operations | 0.675 | 1.284 | 3.200 | (4.297 | ) | (0.867 | ) | ||||||||||
| Less dividends and distributions from: | |||||||||||||||||
| Net investment income | (0.015 | ) | (0.064 | ) | (0.120 | ) | (0.010 | ) | (0.050 | ) | |||||||
| Net realized gain | — | — | — | (0.143 | ) | (0.633 | ) | ||||||||||
| Total dividends and distributions | (0.015 | ) | (0.064 | ) | (0.120 | ) | (0.153 | ) | (0.683 | ) | |||||||
| Net asset value, end of period | $11.590 | $10.930 | $9.710 | $6.630 | $11.080 | ||||||||||||
| Total return2 | 6.19% | 13.37% | 48.76% | (39.31% | ) | (7.39% | ) | ||||||||||
| Ratios and supplemental data: | |||||||||||||||||
| Net assets, end of period (000 omitted) | $111,557 | $119,899 | $125,961 | $98,881 | $205,501 | ||||||||||||
| Ratio of expenses to average net assets | 2.22% | 2.24% | 2.23% | 2.19% | 2.19% | ||||||||||||
| Ratio of expenses to average net assets | |||||||||||||||||
| prior to fees waived and expense paid indirectly | 2.25% | 2.26% | 2.27% | 2.25% | 2.21% | ||||||||||||
| Ratio of net investment income to average net assets | 0.60% | 0.12% | 0.73% | 1.17% | 0.44% | ||||||||||||
| Ratio of net investment income to average net assets | |||||||||||||||||
| prior to fees waived and expense paid indirectly | 0.57% | 0.10% | 0.69% | 1.11% | 0.42% | ||||||||||||
| Portfolio turnover | 57% | 82% | 28% | 37% | 30% | ||||||||||||
| 1 The average shares outstanding method has been applied for per share information. |
| 2 Total investment return is based on the change in net asset value of a share during the period and assumes reinvestment of dividends and distributions at net asset value and does not reflect the impact of a sales charge. Total investment return during all of the periods shown reflects a waiver by the manager. Performance would have been lower had the waiver not been in effect. |
102
Optimum Large Cap Value Fund Institutional Class
Selected data for each share of the Fund outstanding throughout each period were as follows:
| Year Ended | |||||||||||||||||
| 3/31/12 | 3/31/11 | 3/31/10 | 3/31/09 | 3/31/08 | |||||||||||||
| Net asset value, beginning of period | $11.110 | $9.870 | $6.740 | $11.190 | $12.750 | ||||||||||||
| Income (loss) from investment operations: | |||||||||||||||||
| Net investment income1 | 0.171 | 0.110 | 0.148 | 0.197 | 0.183 | ||||||||||||
| Net realized and unrealized gain (loss) | 0.631 | 1.279 | 3.193 | (4.465 | ) | (0.931 | ) | ||||||||||
| Total from investment operations | 0.802 | 1.389 | 3.341 | (4.268 | ) | (0.748 | ) | ||||||||||
| Less dividends and distributions from: | |||||||||||||||||
| Net investment income | (0.112 | ) | (0.149 | ) | (0.211 | ) | (0.039 | ) | (0.179 | ) | |||||||
| Net realized gain | — | — | — | (0.143 | ) | (0.633 | ) | ||||||||||
| Total dividends and distributions | (0.112 | ) | (0.149 | ) | (0.211 | ) | (0.182 | ) | (0.812 | ) | |||||||
| Net asset value, end of period | $11.800 | $11.110 | $9.870 | $6.740 | $11.190 | ||||||||||||
| Total return2 | 7.32% | 14.42% | 50.47% | (38.76% | ) | (6.46% | ) | ||||||||||
| Ratios and supplemental data: | |||||||||||||||||
| Net assets, end of period (000 omitted) | $617,485 | $550,313 | $480,762 | $358,559 | $607,637 | ||||||||||||
| Ratio of expenses to average net assets | 1.22% | 1.24% | 1.23% | 1.19% | 1.19% | ||||||||||||
| Ratio of expenses to average net assets | |||||||||||||||||
| prior to fees waived and expense paid indirectly | 1.25% | 1.26% | 1.27% | 1.25% | 1.21% | ||||||||||||
| Ratio of net investment income to average net assets | 1.60% | 1.12% | 1.73% | 2.17% | 1.44% | ||||||||||||
| Ratio of net investment income to average net assets | |||||||||||||||||
| prior to fees waived and expense paid indirectly | 1.57% | 1.10% | 1.69% | 2.11% | 1.42% | ||||||||||||
| Portfolio turnover | 57% | 82% | 28% | 37% | 30% | ||||||||||||
| 1 The average shares outstanding method has been applied for per share information. |
| 2 Total investment return is based on the change in net asset value of a share during the period and assumes reinvestment of dividends and distributions at net asset value. Total investment return during all of the periods shown reflects a waiver by the manager. Performance would have been lower had the waiver not been in effect. |
(continues) 103
Financial highlights
Optimum Small-Mid Cap Growth Fund Class A
Selected data for each share of the Fund outstanding throughout each period were as follows:
| Year Ended | |||||||||||||||||
| 3/31/12 | 3/31/11 | 3/31/10 | 3/31/09 | 3/31/08 | |||||||||||||
| Net asset value, beginning of period | $13.900 | $11.150 | $6.760 | $11.280 | $14.070 | ||||||||||||
| Income (loss) from investment operations: | |||||||||||||||||
| Net investment loss1 | (0.169 | ) | (0.149 | ) | (0.123 | ) | (0.092 | ) | (0.177 | ) | |||||||
| Net realized and unrealized gain (loss) | 0.064 | 2.899 | 4.513 | (4.428 | ) | (1.952 | ) | ||||||||||
| Total from investment operations | (0.105 | ) | 2.750 | 4.390 | (4.520 | ) | (2.129 | ) | |||||||||
| Less dividends and distributions from: | |||||||||||||||||
| Net realized gain | (0.795 | ) | — | — | — | (0.651 | ) | ||||||||||
| Return of capital | — | — | — | — | (0.010 | ) | |||||||||||
| Total dividends and distributions | (0.795 | ) | — | — | — | (0.661 | ) | ||||||||||
| Net asset value, end of period | $13.000 | $13.900 | $11.150 | $6.760 | $11.280 | ||||||||||||
| Total return2 | 0.33% | 24.66% | 64.94% | (40.07% | ) | (15.96% | ) | ||||||||||
| Ratios and supplemental data: | |||||||||||||||||
| Net assets, end of period (000 omitted) | $5,989 | $6,866 | $6,736 | $4,814 | $9,282 | ||||||||||||
| Ratio of expenses to average net assets | 1.90% | 1.90% | 1.90% | 1.90% | 1.92% | ||||||||||||
| Ratio of expenses to average net assets | |||||||||||||||||
| prior to fees waived and expense paid indirectly | 2.06% | 2.07% | 2.10% | 2.26% | 2.11% | ||||||||||||
| Ratio of net investment loss to average net assets | (1.34% | ) | (1.29% | ) | (1.30% | ) | (0.96% | ) | (1.27% | ) | |||||||
| Ratio of net investment loss to average net assets | |||||||||||||||||
| prior to fees waived and expense paid indirectly | (1.50% | ) | (1.46% | ) | (1.50% | ) | (1.32% | ) | (1.46% | ) | |||||||
| Portfolio turnover | 82% | 86% | 100% | 119% | 46% | ||||||||||||
| 1 The average shares outstanding method has been applied for per share information. |
| 2 Total investment return is based on the change in net asset value of a share during the period and assumes reinvestment of dividends and distributions at net asset value and does not reflect the impact of a sales charge. Total investment return during all of the periods shown reflects a waiver by the manager. Performance would have been lower had the waiver not been in effect. |
See accompanying notes, which are an integral part of the financial statements.
104
Optimum Small-Mid Cap Growth Fund Class B
Selected data for each share of the Fund outstanding throughout each period were as follows:
| Year Ended | |||||||||||||||||
| 3/31/12 | 3/31/11 | 3/31/10 | 3/31/09 | 3/31/08 | |||||||||||||
| Net asset value, beginning of period | $13.200 | $10.660 | $6.510 | $10.930 | $13.750 | ||||||||||||
| Income (loss) from investment operations: | |||||||||||||||||
| Net investment loss1 | (0.238 | ) | (0.213 | ) | (0.179 | ) | (0.152 | ) | (0.265 | ) | |||||||
| Net realized and unrealized gain (loss) | 0.053 | 2.753 | 4.329 | (4.268 | ) | (1.894 | ) | ||||||||||
| Total from investment operations | (0.185 | ) | 2.540 | 4.150 | (4.420 | ) | (2.159 | ) | |||||||||
| Less dividends and distributions from: | |||||||||||||||||
| Net realized gain | (0.795 | ) | — | — | — | (0.651 | ) | ||||||||||
| Return of capital | — | — | — | — | (0.010 | ) | |||||||||||
| Total dividends and distributions | (0.795 | ) | — | — | — | (0.661 | ) | ||||||||||
| Net asset value, end of period | $12.220 | $13.200 | $10.660 | $6.510 | $10.930 | ||||||||||||
| Total return2 | (0.28% | ) | 23.83% | 63.75% | (40.44% | ) | (16.56% | ) | |||||||||
| Ratios and supplemental data: | |||||||||||||||||
| Net assets, end of period (000 omitted) | $661 | $1,063 | $1,143 | $807 | $1,620 | ||||||||||||
| Ratio of expenses to average net assets | 2.55% | 2.55% | 2.55% | 2.55% | 2.57% | ||||||||||||
| Ratio of expenses to average net assets | |||||||||||||||||
| prior to fees waived and expense paid indirectly | 2.71% | 2.72% | 2.75% | 2.91% | 2.76% | ||||||||||||
| Ratio of net investment loss to average net assets | (1.99% | ) | (1.94% | ) | (1.95% | ) | (1.61% | ) | (1.92% | ) | |||||||
| Ratio of net investment loss to average net assets | |||||||||||||||||
| prior to fees waived and expense paid indirectly | (2.15% | ) | (2.11% | ) | (2.15% | ) | (1.97% | ) | (2.11% | ) | |||||||
| Portfolio turnover | 82% | 86% | 100% | 119% | 46% | ||||||||||||
| 1 The average shares outstanding method has been applied for per share information. |
| 2 Total investment return is based on the change in net asset value of a share during the period and assumes reinvestment of dividends and distributions at net asset value and does not reflect the impact of a sales charge. Total investment return during all of the periods shown reflects a waiver by the manager. Performance would have been lower had the waiver not been in effect. |
See accompanying notes, which are an integral part of the financial statements.
(continues) 105
Financial highlights
Optimum Small-Mid Cap Growth Fund Class C
Selected data for each share of the Fund outstanding throughout each period were as follows:
| Year Ended | |||||||||||||||||
| 3/31/12 | 3/31/11 | 3/31/10 | 3/31/09 | 3/31/08 | |||||||||||||
| Net asset value, beginning of period | $13.200 | $10.660 | $6.510 | $10.930 | $13.750 | ||||||||||||
| Income (loss) from investment operations: | |||||||||||||||||
| Net investment loss1 | (0.237 | ) | (0.213 | ) | (0.179 | ) | (0.152 | ) | (0.264 | ) | |||||||
| Net realized and unrealized gain (loss) | 0.052 | 2.753 | 4.329 | (4.268 | ) | (1.895 | ) | ||||||||||
| Total from investment operations | (0.185 | ) | 2.540 | 4.150 | (4.420 | ) | (2.159 | ) | |||||||||
| Less dividends and distributions from: | |||||||||||||||||
| Net realized gain | (0.795 | ) | — | — | — | (0.651 | ) | ||||||||||
| Return of capital | — | — | — | — | (0.010 | ) | |||||||||||
| Total dividends and distributions | (0.795 | ) | — | — | — | (0.661 | ) | ||||||||||
| Net asset value, end of period | $12.220 | $13.200 | $10.660 | $6.510 | $10.930 | ||||||||||||
| Total return2 | (0.27% | ) | 23.83% | 63.75% | (40.44% | ) | (16.56% | ) | |||||||||
| Ratios and supplemental data: | |||||||||||||||||
| Net assets, end of period (000 omitted) | $20,992 | $24,337 | $23,824 | $16,863 | $34,086 | ||||||||||||
| Ratio of expenses to average net assets | 2.55% | 2.55% | 2.55% | 2.55% | 2.57% | ||||||||||||
| Ratio of expenses to average net assets | |||||||||||||||||
| prior to fees waived and expense paid indirectly | 2.71% | 2.72% | 2.75% | 2.91% | 2.76% | ||||||||||||
| Ratio of net investment loss to average net assets | (1.99% | ) | (1.94% | ) | (1.95% | ) | (1.61% | ) | (1.92% | ) | |||||||
| Ratio of net investment loss to average net assets | |||||||||||||||||
| prior to fees waived and expense paid indirectly | (2.15% | ) | (2.11% | ) | (2.15% | ) | (1.97% | ) | (2.11% | ) | |||||||
| Portfolio turnover | 82% | 86% | 100% | 119% | 46% | ||||||||||||
| 1 The average shares outstanding method has been applied for per share information. |
| 2 Total investment return is based on the change in net asset value of a share during the period and assumes reinvestment of dividends and distributions at net asset value and does not reflect the impact of a sales charge. Total investment return during all of the periods shown reflects a waiver by the manager. Performance would have been lower had the waiver not been in effect. |
See accompanying notes, which are an integral part of the financial statements.
106
Optimum Small-Mid Cap Growth Fund Institutional Class
Selected data for each share of the Fund outstanding throughout each period were as follows:
| Year Ended | |||||||||||||||||
| 3/31/12 | 3/31/11 | 3/31/10 | 3/31/09 | 3/31/08 | |||||||||||||
| Net asset value, beginning of period | $14.270 | $11.410 | $6.900 | $11.470 | $14.250 | ||||||||||||
| Income (loss) from investment operations: | |||||||||||||||||
| Net investment loss1 | (0.128 | ) | (0.112 | ) | (0.091 | ) | (0.059 | ) | (0.128 | ) | |||||||
| Net realized and unrealized gain (loss) | 0.073 | 2.972 | 4.601 | (4.511 | ) | (1.991 | ) | ||||||||||
| Total from investment operations | (0.055 | ) | 2.860 | 4.510 | (4.570 | ) | (2.119 | ) | |||||||||
| Less dividends and distributions from: | |||||||||||||||||
| Net realized gain | (0.795 | ) | — | — | — | (0.651 | ) | ||||||||||
| Return of capital | — | — | — | — | (0.010 | ) | |||||||||||
| Total dividends and distributions | (0.795 | ) | — | — | — | (0.661 | ) | ||||||||||
| Net asset value, end of period | $13.420 | $14.270 | $11.410 | $6.900 | $11.470 | ||||||||||||
| Total return2 | 0.68% | 25.07% | 65.36% | (39.84% | ) | (15.68% | ) | ||||||||||
| Ratios and supplemental data: | |||||||||||||||||
| Net assets, end of period (000 omitted) | $321,641 | $304,406 | $204,843 | $53,244 | $90,614 | ||||||||||||
| Ratio of expenses to average net assets | 1.55% | 1.55% | 1.55% | 1.55% | 1.57% | ||||||||||||
| Ratio of expenses to average net assets | |||||||||||||||||
| prior to fees waived and expense paid indirectly | 1.71% | 1.72% | 1.75% | 1.91% | 1.76% | ||||||||||||
| Ratio of net investment loss to average net assets | (0.99% | ) | (0.94% | ) | (0.95% | ) | (0.61% | ) | (0.92% | ) | |||||||
| Ratio of net investment loss to average net assets | |||||||||||||||||
| prior to fees waived and expense paid indirectly | (1.15% | ) | (1.11% | ) | (1.15% | ) | (0.97% | ) | (1.11% | ) | |||||||
| Portfolio turnover | 82% | 86% | 100% | 119% | 46% | ||||||||||||
| 1 The average shares outstanding method has been applied for per share information. |
| 2 Total investment return is based on the change in net asset value of a share during the period and assumes reinvestment of dividends and distributions at net asset value. Total investment return during all of the periods shown reflects a waiver by the manager. Performance would have been lower had the waiver not been in effect. |
(continues) 107
Financial highlights
Optimum Small-Mid Cap Value Fund Class A
Selected data for each share of the Fund outstanding throughout each period were as follows:
| Year Ended | |||||||||||||||||
| 3/31/12 | 3/31/11 | 3/31/10 | 3/31/09 | 3/31/08 | |||||||||||||
| Net asset value, beginning of period | $12.610 | $10.070 | $5.690 | $10.380 | $13.540 | ||||||||||||
| Income (loss) from investment operations: | |||||||||||||||||
| Net investment income (loss)1 | (0.044 | ) | (0.062 | ) | (0.027 | ) | 0.011 | (0.025 | ) | ||||||||
| Net realized and unrealized gain (loss) | 0.148 | 2.602 | 4.407 | (4.683 | ) | (2.102 | ) | ||||||||||
| Total from investment operations | 0.104 | 2.540 | 4.380 | (4.672 | ) | (2.127 | ) | ||||||||||
| Less dividends and distributions from: | |||||||||||||||||
| Net realized gain | (0.124 | ) | — | — | (0.018 | ) | (1.033 | ) | |||||||||
| Total dividends and distributions | (0.124 | ) | — | — | (0.018 | ) | (1.033 | ) | |||||||||
| Net asset value, end of period | $12.590 | $12.610 | $10.070 | $5.690 | $10.380 | ||||||||||||
| Total return2 | 1.01% | 25.22% | 76.98% | (45.09% | ) | (16.34% | ) | ||||||||||
| Ratios and supplemental data: | |||||||||||||||||
| Net assets, end of period (000 omitted) | $5,372 | $6,102 | $5,918 | $4,045 | $9,145 | ||||||||||||
| Ratio of expenses to average net assets | 1.79% | 1.81% | 1.82% | 1.75% | 1.76% | ||||||||||||
| Ratio of expenses to average net assets | |||||||||||||||||
| prior to fees waived and expense paid indirectly | 1.98% | 2.00% | 2.13% | 2.22% | 2.09% | ||||||||||||
| Ratio of net investment income (loss) to average net assets | (0.38% | ) | (0.59% | ) | (0.32% | ) | 0.15% | (0.20% | ) | ||||||||
| Ratio of net investment loss to average net assets | |||||||||||||||||
| prior to fees waived and expense paid indirectly | (0.57% | ) | (0.78% | ) | (0.63% | ) | (0.32% | ) | (0.53% | ) | |||||||
| Portfolio turnover | 30% | 43% | 40% | 86% | 53% | ||||||||||||
See accompanying notes, which are an integral part of the financial statements.
108
Optimum Small-Mid Cap Value Fund Class B
Selected data for each share of the Fund outstanding throughout each period were as follows:
| Year Ended | |||||||||||||||||
| 3/31/12 | 3/31/11 | 3/31/10 | 3/31/09 | 3/31/08 | |||||||||||||
| Net asset value, beginning of period | $11.940 | $9.590 | $5.460 | $10.030 | $13.190 | ||||||||||||
| Income (loss) from investment operations: | |||||||||||||||||
| Net investment loss1 | (0.113 | ) | (0.123 | ) | (0.077 | ) | (0.042 | ) | (0.102 | ) | |||||||
| Net realized and unrealized gain (loss) | 0.137 | 2.473 | 4.207 | (4.510 | ) | (2.025 | ) | ||||||||||
| Total from investment operations | 0.024 | 2.350 | 4.130 | (4.552 | ) | (2.127 | ) | ||||||||||
| Less dividends and distributions from: | |||||||||||||||||
| Net realized gain | (0.124 | ) | — | — | (0.018 | ) | (1.033 | ) | |||||||||
| Total dividends and distributions | (0.124 | ) | — | — | (0.018 | ) | (1.033 | ) | |||||||||
| Net asset value, end of period | $11.840 | $11.940 | $9.590 | $5.460 | $10.030 | ||||||||||||
| Total return2 | 0.39% | 24.50% | 75.64% | (45.47% | ) | (16.79% | ) | ||||||||||
| Ratios and supplemental data: | |||||||||||||||||
| Net assets, end of period (000 omitted) | $653 | $1,038 | $1,114 | $731 | $1,636 | ||||||||||||
| Ratio of expenses to average net assets | 2.44% | 2.46% | 2.47% | 2.40% | 2.41% | ||||||||||||
| Ratio of expenses to average net assets | |||||||||||||||||
| prior to fees waived and expense paid indirectly | 2.63% | 2.65% | 2.78% | 2.87% | 2.74% | ||||||||||||
| Ratio of net investment loss to average net assets | (1.03% | ) | (1.24% | ) | (0.97% | ) | (0.50% | ) | (0.85% | ) | |||||||
| Ratio of net investment loss to average net assets | |||||||||||||||||
| prior to fees waived and expense paid indirectly | (1.22% | ) | (1.43% | ) | (1.28% | ) | (0.97% | ) | (1.18% | ) | |||||||
| Portfolio turnover | 30% | 43% | 40% | 86% | 53% | ||||||||||||
See accompanying notes, which are an integral part of the financial statements.
(continues) 109
Financial highlights
Optimum Small-Mid Cap Value Fund Class C
Selected data for each share of the Fund outstanding throughout each period were as follows:
| Year Ended | |||||||||||||||||
| 3/31/12 | 3/31/11 | 3/31/10 | 3/31/09 | 3/31/08 | |||||||||||||
| Net asset value, beginning of period | $11.930 | $9.590 | $5.460 | $10.020 | $13.190 | ||||||||||||
| Income (loss) from investment operations: | |||||||||||||||||
| Net investment loss1 | (0.113 | ) | (0.124 | ) | (0.076 | ) | (0.042 | ) | (0.102 | ) | |||||||
| Net realized and unrealized gain (loss) | 0.137 | 2.464 | 4.206 | (4.500 | ) | (2.035 | ) | ||||||||||
| Total from investment operations | 0.024 | 2.340 | 4.130 | (4.542 | ) | (2.137 | ) | ||||||||||
| Less dividends and distributions from: | |||||||||||||||||
| Net realized gain | (0.124 | ) | — | — | (0.018 | ) | (1.033 | ) | |||||||||
| Total dividends and distributions | (0.124 | ) | — | — | (0.018 | ) | (1.033 | ) | |||||||||
| Net asset value, end of period | $11.830 | $11.930 | $9.590 | $5.460 | $10.020 | ||||||||||||
| Total return2 | 0.39% | 24.40% | 75.64% | (45.42% | ) | (16.79% | ) | ||||||||||
| Ratios and supplemental data: | |||||||||||||||||
| Net assets, end of period (000 omitted) | $19,986 | $22,797 | $22,163 | $14,811 | $32,891 | ||||||||||||
| Ratio of expenses to average net assets | 2.44% | 2.46% | 2.47% | 2.40% | 2.41% | ||||||||||||
| Ratio of expenses to average net assets | |||||||||||||||||
| prior to fees waived and expense paid indirectly | 2.63% | 2.65% | 2.78% | 2.87% | 2.74% | ||||||||||||
| Ratio of net investment loss to average net assets | (1.03% | ) | (1.24% | ) | (0.97% | ) | (0.50% | ) | (0.85% | ) | |||||||
| Ratio of net investment loss to average net assets | |||||||||||||||||
| prior to fees waived and expense paid indirectly | (1.22% | ) | (1.43% | ) | (1.28% | ) | (0.97% | ) | (1.18% | ) | |||||||
| Portfolio turnover | 30% | 43% | 40% | 86% | 53% | ||||||||||||
See accompanying notes, which are an integral part of the financial statements.
110
Optimum Small-Mid Cap Value Fund Institutional Class
Selected data for each share of the Fund outstanding throughout each period were as follows:
| Year Ended | |||||||||||||||||
| 3/31/12 | 3/31/11 | 3/31/10 | 3/31/09 | 3/31/08 | |||||||||||||
| Net asset value, beginning of period | $12.960 | $10.310 | $5.820 | $10.580 | $13.720 | ||||||||||||
| Income (loss) from investment operations: | |||||||||||||||||
| Net investment income (loss)1 | (0.004 | ) | (0.026 | ) | 0.002 | 0.041 | 0.018 | ||||||||||
| Net realized and unrealized gain (loss) | 0.158 | 2.676 | 4.505 | (4.783 | ) | (2.125 | ) | ||||||||||
| Total from investment operations | 0.154 | 2.650 | 4.507 | (4.742 | ) | (2.107 | ) | ||||||||||
| Less dividends and distributions from: | |||||||||||||||||
| Net investment income | — | — | (0.008 | ) | — | — | |||||||||||
| Net realized gain | (0.124 | ) | — | — | (0.018 | ) | (1.033 | ) | |||||||||
| Return of capital | — | — | (0.009 | ) | — | — | |||||||||||
| Total dividends and distributions | (0.124 | ) | — | (0.017 | ) | (0.018 | ) | (1.033 | ) | ||||||||
| Net asset value, end of period | $12.990 | $12.960 | $10.310 | $5.820 | $10.580 | ||||||||||||
| Total return2 | 1.37% | 25.70% | 77.56% | (44.90% | ) | (15.97% | ) | ||||||||||
| Ratios and supplemental data: | |||||||||||||||||
| Net assets, end of period (000 omitted) | $310,737 | $274,495 | $161,862 | $58,173 | $66,657 | ||||||||||||
| Ratio of expenses to average net assets | 1.44% | 1.46% | 1.47% | 1.40% | 1.41% | ||||||||||||
| Ratio of expenses to average net assets | |||||||||||||||||
| prior to fees waived and expense paid indirectly | 1.63% | 1.65% | 1.78% | 1.87% | 1.74% | ||||||||||||
| Ratio of net investment income (loss) to average net assets | (0.03% | ) | (0.24% | ) | 0.03% | 0.50% | 0.15% | ||||||||||
| Ratio of net investment income (loss) to average net assets | |||||||||||||||||
| prior to fees waived and expense paid indirectly | (0.22% | ) | (0.43% | ) | (0.28% | ) | 0.03% | (0.18% | ) | ||||||||
| Portfolio turnover | 30% | 43% | 40% | 86% | 53% | ||||||||||||
See accompanying notes, which are an integral part of the financial statements.
111
Notes to financial statements
Optimum Fund Trust
March 31, 2012
Optimum Fund Trust (Trust) is organized as a Delaware statutory trust and offers six series: Optimum Fixed Income Fund, Optimum International Fund, Optimum Large Cap Growth Fund, Optimum Large Cap Value Fund, Optimum Small-Mid Cap Growth Fund, and Optimum Small-Mid Cap Value Fund, (each, a Fund, or collectively, the Funds). The Trust is an open-end investment company. The Funds are considered diversified under the Investment Company Act of 1940, as amended, and offer Class A, Class B, Class C and Institutional Class shares. Class A shares are sold with a maximum front-end sales charge of 4.50% for Optimum Fixed Income Fund and 5.75% for Optimum International Fund, Optimum Large Cap Growth Fund, Optimum Large Cap Value Fund, Optimum Small-Mid Cap Growth Fund and Optimum Small-Mid Cap Value Fund. Class A share purchases of $1,000,000 or more will incur a contingent deferred sales charge (CDSC) of 1% if redeemed during the first year and 0.50% during the second year, provided that Delaware Distributors L.P. (DDLP) paid a financial advisor a commission on the purchase of those shares. Class B shares may be purchased only through dividend reinvestment and certain permitted exchanges. Prior to August 1, 2007, Class B shares were sold with a CDSC that declined from 4% to zero depending upon the period of time the shares were held. Class B shares will automatically convert to Class A shares on a quarterly basis approximately eight years after purchase. Class C shares are sold with a CDSC of 1%, if redeemed during the first twelve months. Institutional Class shares are not subject to a sales charge and are offered for sale exclusively to certain eligible investors.
The investment objective of Optimum Fixed Income Fund is to seek a high level of income. The Fund may also seek growth of capital.
The investment objective of Optimum International Fund is to seek long-term growth of capital. The Fund may also seek income.
The investment objective of Optimum Large Cap Growth Fund is to seek long-term growth of capital.
The investment objective of Optimum Large Cap Value Fund is to seek long-term growth of capital. The Fund may also seek income.
The investment objective of Optimum Small-Mid Cap Growth Fund is to seek long-term growth of capital.
The investment objective of Optimum Small-Mid Cap Value Fund is to seek long-term growth of capital.
1. Significant Accounting Policies
The following accounting policies are in accordance with U.S. generally accepted accounting principles (U.S. GAAP) and are consistently followed by the Funds.
Security Valuation — Equity securities, except those traded on the Nasdaq Stock Market, Inc. (Nasdaq), are valued at the last quoted sales price as of the time of the regular close of the New York Stock Exchange (NYSE) on the valuation date. Securities traded on the Nasdaq are valued in accordance with the Nasdaq Official Closing Price, which may not be the last sales price. If on a particular day an equity security does not trade, then the mean between the bid and ask prices will be used, which approximates fair value. Securities listed on a foreign exchange are normally valued at the last quoted sales price on the valuation date. Short-term debt securities are valued at market value. U.S. government and agency securities are valued at the mean between the bid and ask prices, which approximates fair value. Other debt securities, credit default swap (CDS) contracts and interest rate swap contracts are valued based upon valuations provided by an independent pricing service or broker and reviewed by management. To the extent current market prices are not available, the pricing service may take into account developments related to the specific security, as well as transactions in comparable securities. Valuations for fixed income securities utilize matrix systems, which reflect such factors as security prices, yields, maturities, and ratings, and are supplemented by dealer and exchange quotations. Investment company securities are valued at net asset value per share. Open-end investment companies are valued at their published net asset value. Foreign currency exchange contracts and foreign cross currency exchange contracts are valued at the mean between the bid and ask prices, which approximates fair value. Interpolated values are derived when the settlement date of the contract is an interim date for which quotations are not available. Futures contracts and options on futures contracts are valued at the daily quoted settlement prices. Exchange-traded options are valued at the last reported sale price or, if no sales are reported, at the mean between the last reported bid and ask prices, which approximates fair value. Generally, other securities and assets for which market quotations are not readily available are valued at fair value as determined in good faith under the direction of the Funds’ Board of Trustees (Board). In determining whether market quotations are readily available or fair valuation will be used, various factors will be taken into consideration, such as market closures or suspension of trading in a security. Each Fund may use fair value pricing more frequently for securities traded primarily in non-U.S. markets because, among other things, most foreign markets close well before each Fund values its securities, generally as of 4:00 p.m. Eastern time. The earlier close of these foreign markets gives rise to the possibility that significant events, including broad market moves, government actions or pronouncements, aftermarket trading, or news events may have occurred in the interim. To account for this, the Funds may frequently value foreign securities using fair value prices based on third-party vendor modeling tools (international fair value pricing).
Federal Income Taxes — No provision for federal income taxes has been made as each Fund intends to continue to qualify for federal income tax purposes as a regulated investment company under Subchapter M of the Internal Revenue Code of 1986, as amended, and make the requisite distributions to shareholders. The Funds evaluate tax positions taken or expected to be taken in the course of preparing the Funds’ tax returns to determine whether the tax positions are “more-likely-than-not” of being sustained by the applicable tax authority. Tax positions not deemed to meet the more-likely-than-not threshold are recorded as a tax benefit or expense in the current year. Management has analyzed the Funds’ tax positions taken on federal income tax returns for all open tax years (March 31, 2009–March 31, 2012), and has concluded that no provision for federal income tax is required in the Funds’ financial statements.
112
Class Accounting — Investment income, common expenses and realized and unrealized gain (loss) on investments are allocated to the various classes of the Funds on the basis of daily net assets of each class. Distribution expenses relating to a specific class are charged directly to that class.
Repurchase Agreements — Each Fund may purchase certain U.S. government securities subject to the counterparty’s agreement to repurchase them at an agreed upon date and price. The counterparty will be required on a daily basis to maintain the value of the collateral subject to the agreement at not less than the repurchase price (including accrued interest). The agreements are conditioned upon the collateral being deposited under the Federal Reserve book-entry system with the Funds’ custodian or a third-party sub-custodian. In the event of default or bankruptcy by the other party to the agreement, retention of the collateral may be subject to legal proceedings. All open repurchase agreements as of the date of this report were entered into on March 30, 2012.
To Be Announced Trades — Optimum Fixed Income Fund may contract to purchase securities for a fixed price at a transaction date beyond the customary settlement period (e.g., “when issued,” “delayed delivery,” “forward commitment,” or “TBA transactions”) consistent with the Fund’s ability to manage its investment portfolio and meet redemption requests. These transactions involve a commitment by the Fund to purchase securities for a predetermined price or yield with payment and delivery taking place more than three days in the future, or after a period longer than the customary settlement period for that type of security. No interest will be earned by the Fund on such purchases until the securities are delivered; however, the market value may change prior to delivery.
Foreign Currency Transactions — Transactions denominated in foreign currencies are recorded at the prevailing exchange rates on the valuation date in accordance with the Funds’ prospectus. The value of all assets and liabilities denominated in foreign currencies is translated into U.S. dollars at the exchange rate of such currencies against the U.S. dollar daily. Transaction gains or losses resulting from changes in exchange rates during the reporting period or upon settlement of the foreign currency transaction are reported in operations for the current period. The Funds generally isolate that portion of realized gains and losses on investments in debt securities, which is due to changes in foreign exchange rates from that which is due to changes in market prices of debt securities. For foreign equity securities, these changes are included in net realized and unrealized gain or loss on investments. The Funds report certain foreign currency related transactions as components of realized gains (losses) for financial reporting purposes, whereas such components are treated as ordinary income (loss) for federal income tax purposes.
Use of Estimates — The preparation of financial statements in conformity with U.S. GAAP requires management to make estimates and assumptions that affect the fair value of investments, the reported amounts of assets and liabilities and disclosure of contingent assets and liabilities at the date of the financial statements and the reported amounts of revenues and expenses during the reporting period. Actual results could differ from those estimates and the differences could be material.
Other — Expenses directly attributable to a Fund are charged directly to that Fund. Other expenses common to various funds within the Trust are generally allocated amongst such funds on the basis of average net assets. Management fees and some other expenses are paid monthly. Security transactions are recorded on the date the securities are purchased or sold (trade date) for financial reporting purposes. Costs used in calculating realized gains and losses on the sale of investment securities are those of the specific securities sold. Dividend income is recorded on the ex-dividend date and interest income is recorded on the accrual basis. Discounts and premiums on non-convertible debt securities are amortized to interest income over the lives of the respective securities using the effective interest method. Realized gains (losses) on paydowns of asset- and mortgage-backed securities are classified as interest income. Distributions received from investments in Real Estate Investment Trusts (REITs) are recorded as dividend income on the ex-dividend date, subject to reclassification upon notice of the character of such distributions by the issuer. Foreign dividends are also recorded on the ex-dividend date or as soon after the ex-dividend date that the Funds are aware of such dividends, net of all non-rebatable tax withholdings. Withholding taxes on foreign dividends and interest have been recorded in accordance with the Funds’ understanding of the applicable country’s tax rules and rates. Each Fund declares and pays dividends from net investment income, if any, annually. Each Fund declares and pays distributions from net realized gain on investments, if any, at least annually, and may distribute net investment income and net capital gains more frequently, if necessary for tax purposes. Dividends and distributions, if any, are recorded on the ex-dividend date.
The Funds may receive earnings credits from their custodian when positive cash balances are maintained, which are used to offset custody fees. There were no earnings credits for the year ended March 31, 2012.
The Funds receive earnings credits from their transfer agent when positive cash balances are maintained, which are used to offset transfer agent fees. The expense paid under this arrangement is included in dividend disbursing and transfer agent fees and expenses on the statements of operations with the corresponding expense offset shown as “expense paid indirectly.” For the year ended March 31, 2012, the Funds earned the following amounts under this agreement:
| Optimum | Optimum | Optimum | Optimum | Optimum | Optimum | |||||||
| Fixed Income | International | Large Cap | Large Cap | Small-Mid Cap | Small-Mid Cap | |||||||
| Fund | Fund | Growth Fund | Value Fund | Growth Fund | Value Fund | |||||||
| $315 | $331 | $344 | $344 | $338 | $344 |
(continues) 113
Notes to financial statements
Optimum Fund Trust
2. Investment Management, Administration Agreements and Other Transactions with Affiliates
Delaware Management Company (DMC), a series of Delaware Management Business Trust, furnishes investment management services to each Fund and has full discretion and responsibility, subject to the overall supervision of the Trust’s Board, to select and contract with one or more investment sub-advisers to manage the investment operations and composition of each Fund, and to render investment advice for each Fund, including the purchase, retention, and dispositions of investments, securities and cash contained in each Fund. The investment management agreement obligates DMC to implement decisions with respect to the allocation or reallocation of each Fund’s assets among one or more current or additional sub-advisers, and to monitor the sub-advisers’ compliance with the relevant Fund’s investment objective, policies and restrictions. DMC pays the sub-advisers out of its fees.
In accordance with the terms of its respective investment management agreement, DMC is entitled to receive an annual fee equal to the following percentage rates of the average daily net assets of each Fund:
| Optimum Fixed Income Fund | 0.7000% of net assets up to $25 million | |
| 0.6500% of net assets from $25 million to $100 million | ||
| 0.6000% of net assets from $100 million to $500 million | ||
| 0.5500% of net assets from $500 million to $1 billion | ||
| 0.5000% of net assets over $1 billion | ||
| Optimum International Fund | 0.8750% of net assets up to $50 million | |
| 0.8000% of net assets from $50 million to $100 million | ||
| 0.7800% of net assets from $100 million to $300 million | ||
| 0.7650% of net assets from $300 million to $400 million | ||
| 0.7300% of net assets over $400 million | ||
| Optimum Large Cap Growth Fund | 0.8000% of net assets up to $250 million | |
| 0.7875% of net assets from $250 million to $300 million | ||
| 0.7625% of net assets from $300 million to $400 million | ||
| 0.7375% of net assets from $400 million to $500 million | ||
| 0.7250% of net assets from $500 million to $1 billion | ||
| 0.7100% of net assets from $1 billion to $1.5 billion | ||
| 0.7000% of net assets over $1.5 billion | ||
| Optimum Large Cap Value Fund | 0.8000% of net assets up to $100 million | |
| 0.7375% of net assets from $100 million to $250 million | ||
| 0.7125% of net assets from $250 million to $500 million | ||
| 0.6875% of net assets from $500 million to $1 billion | ||
| 0.6675% of net assets from $1 billion to $1.5 billion | ||
| 0.6475% of net assets over $1.5 billion | ||
| Optimum Small-Mid Cap Growth Fund | 1.1000% of net assets | |
| Optimum Small-Mid Cap Value Fund | 1.0500% of net assets up to $75 million | |
| 1.0250% of net assets from $75 million to $150 million | ||
| 1.0000% of net assets over $150 million | ||
DMC has entered into sub-advisory agreements for the Trust as follows: Optimum Fixed Income Fund – Pacific Investment Management Company LLC (PIMCO); Optimum International Fund – Mondrian Investment Partners Limited (Mondrian) and BlackRock Advisors, LLC (BlackRock); Optimum Large Cap Growth Fund – Marsico Capital Management, LLC (Marsico), T. Rowe Price Associates, Inc. (T. Rowe Price), and Fred Alger Management, Inc. (Alger); Optimum Large Cap Value Fund – Massachusetts Financial Services Company (MFS) and Herndon Capital Management, LLC (Herndon); Optimum Small-Mid Cap Growth Fund – Columbia Wanger Asset Management, LLC (Columbia WAM) and Wellington Management Company, LLP (Wellington Management); Optimum Small-Mid Cap Value Fund – The Killen Group, Inc. (Killen), Westwood Management Corp. (Westwood) and The Delafield Group, a division of Tocqueville Asset Management L.P. (Tocqueville).
114
For the year ended March 31, 2012, DMC paid the following sub-advisory fees:
| Optimum | Optimum | Optimum | Optimum | Optimum | Optimum | |||||||
| Fixed Income | International | Large Cap | Large Cap | Small-Mid Cap | Small-Mid Cap | |||||||
| Fund | Fund | Growth Fund | Value Fund | Growth Fund | Value Fund | |||||||
| $1,335,863 | $1,111,670 | $3,053,929 | $2,249,360 | $2,393,216 | $1,754,117 |
Effective July 29, 2011, DMC has contractually agreed to waive all or a portion of its investment advisory fees and/or reimburse expenses for each Fund to the extent necessary to prevent total annual operating expenses (excluding any 12b-1 plan and certain other expenses) from exceeding the specified percentages of average daily net assets through July 29, 2012 as shown below. These waivers and reimbursements may be terminated only by agreement of the manager and each Fund.
| Optimum | Optimum | Optimum | Optimum | Optimum | Optimum | |||||||
| Fixed Income | International | Large Cap | Large Cap | Small-Mid Cap | Small-Mid Cap | |||||||
| Fund | Fund | Growth Fund | Value Fund | Growth Fund | Value Fund | |||||||
| Effective July 29, 2011, | ||||||||||||
| operating expense limitation as | ||||||||||||
| a percentage of average | ||||||||||||
| daily net assets (per annum) | 1.00% | 1.40% | 1.25% | 1.22% | 1.55% | 1.43% | ||||||
| Effective July 29, 2010 | ||||||||||||
| through July 28, 2011, | ||||||||||||
| operating expense limitation as | ||||||||||||
| a percentage of average | ||||||||||||
| daily net assets (per annum) | 1.00% | 1.40% | 1.27% | 1.23% | 1.55% | 1.45% |
Delaware Service Company, Inc. (DSC), an affiliate of DMC, provides fund accounting oversight services to the Trust. For these services, the Trust pays DSC fees based on the aggregate daily net assets of the Trust at the following annual rate: 0.0050% of the first $3 billion; 0.0045% of the next $2 billion; 0.0040% of the next $2.5 billion; 0.0030% of the next $2.5 billion; and 0.0025% of aggregate average daily net assets in excess of $10 billion. The fees payable to DSC under the service agreement described above are allocated among all Funds in the Trust on a relative net asset value basis. For the year ended March 31, 2012, each Fund was charged for these services as follows:
| Optimum | Optimum | Optimum | Optimum | Optimum | Optimum | |||||||
| Fixed Income | International | Large Cap | Large Cap | Small-Mid Cap | Small-Mid Cap | |||||||
| Fund | Fund | Growth Fund | Value Fund | Growth Fund | Value Fund | |||||||
| $55,245 | $13,901 | $35,822 | $34,135 | $15,752 | $14,712 |
DSC also provides the Trust with administrative services including financial and tax reporting, corporate governance, and preparation of materials and reports for the Board. For administrative services, each Fund pays DSC a fee at an annual rate (plus out-of-pocket expenses) of 0.165% of assets up to $500 million of the Funds’ average daily net assets; 0.140% of assets from $500 million to $1 billion; and 0.115% of assets over $1 billion. DSC also serves as the shareholder servicing, dividend disbursing and transfer agent for each Fund. Effective July 18, 2011, for these services, the Trust pays DSC a fee at an annual rate of 0.225% of the Trust’s total average daily net assets, subject to certain minimums, plus out-of-pocket expenses. Prior to July 18, 2011, for these services, the Trust paid DSC a fee at an annual rate of 0.235% of the Trust’s total average daily net assets, subject to certain minimums, plus out-of-pocket expenses.
DDLP, an affiliate of DMC, serves as the national distributor of each Fund’s shares pursuant to a Distribution Agreement. Pursuant to the Distribution Agreement and Rule 12b-1 plan, each Fund pays DDLP an annual fee of 0.35% of the average daily net assets of the Class A shares and 1.00% of the average daily net assets of the Class B and Class C shares. Institutional Class shares pay no distribution expenses.
(continues) 115
Notes to financial statements
Optimum Fund Trust
2. Investment Management, Administration Agreements and Other Transactions with Affiliates (continued)
At March 31, 2012, each Fund had liabilities payable to affiliates as follows:
| Optimum | Optimum | Optimum | Optimum | Optimum | Optimum | |||||||||||||||||||
| Fixed Income | International | Large Cap | Large Cap | Small-Mid Cap | Small-Mid Cap | |||||||||||||||||||
| Fund | Fund | Growth Funds | Value Fund | Growth Fund | Value Fund | |||||||||||||||||||
| Investment management | ||||||||||||||||||||||||
| fees payable to DMC | $467,370 | $219,871 | $494,072 | $442,029 | $273,530 | $228,152 | ||||||||||||||||||
| Dividend disbursing, transfer agent and fund | ||||||||||||||||||||||||
| accounting oversight fees, administration | ||||||||||||||||||||||||
| fees and other expenses payable to DSC | 384,085 | 98,676 | 260,056 | 247,040 | 115,479 | 111,360 | ||||||||||||||||||
| Distribution fees payable to DDLP | 146,232 | 31,812 | 113,668 | 105,929 | 19,992 | 19,010 | ||||||||||||||||||
| Other expenses payable | ||||||||||||||||||||||||
| to DMC and affiliates* | 24 | 6 | 16 | 15 | 7 | 7 | ||||||||||||||||||
*DMC, as part of its administrative services, pays operating expenses on behalf of each Fund and is reimbursed on a periodic basis. Expenses include items such as printing of shareholder reports, fees for audit, legal and tax services, registration fees and trustees’ fees.
For the year ended March 31, 2012, DDLP earned commissions on sales of Class A shares for each Fund as follows:
| Optimum | Optimum | Optimum | Optimum | Optimum | Optimum | |||||||
| Fixed Income | International | Large Cap | Large Cap | Small-Mid Cap | Small-Mid Cap | |||||||
| Fund | Fund | Growth Fund | Value Fund | Growth Fund | Value Fund | |||||||
| $18,983 | $3,989 | $12,674 | $11,743 | $2,021 | $1,812 |
For the year ended March 31, 2012, DDLP received gross CDSC commissions on redemptions of each Fund’s Class A, Class B and Class C shares, and these commissions were entirely used to offset up-front commissions previously paid by DDLP to broker/dealers on sales of those shares. The amounts received were as follows:
| Optimum | Optimum | Optimum | Optimum | Optimum | Optimum | ||||||||||||||||||
| Fixed Income | International | Large Cap | Large Cap | Small-Mid Cap | Small-Mid Cap | ||||||||||||||||||
| Fund | Fund | Growth Fund | Value Fund | Growth Fund | Value Fund | ||||||||||||||||||
| Class A | $ | 0 | $ | 0 | $ | 0 | $ | 0 | $ | 0 | $ | 0 | |||||||||||
| Class B | 1,910 | 1,096 | 3,414 | 2,951 | 547 | 522 | |||||||||||||||||
| Class C | 16,914 | 2,922 | 8,668 | 8,542 | 1,443 | 1,388 | |||||||||||||||||
DMC, DSC and DDLP are indirect, wholly owned subsidiaries of Delaware Management Holdings, Inc.
Certain officers of DMC, DSC and DDLP are officers and/or Trustees of the Trust. These officers and Trustees are paid no compensation by the Funds.
3. Investments
For the year ended March 31, 2012, the Funds made purchases and sales of investment securities other than short-term investments as follows:
| Optimum | Optimum | Optimum | Optimum | Optimum | Optimum | |||||||||||||||
| Fixed Income | International | Large Cap | Large Cap | Small-Mid Cap | Small-Mid Cap | |||||||||||||||
| Fund | Fund | Growth Fund | Value Fund | Growth Fund | Value Fund | |||||||||||||||
| Purchases other than U.S. government securities | $ | 1,477,457,015 | $ | 181,413,787 | $ | 640,011,351 | $ | 406,871,435 | $ | 273,041,693 | $ | 112,413,718 | ||||||||
| Purchases of U.S. government securities | 738,456,823 | — | — | — | — | — | ||||||||||||||
| Sales other than U.S. government securities | 1,480,309,410 | 138,927,175 | 666,374,963 | 392,877,701 | 260,158,515 | 84,266,322 | ||||||||||||||
| Sales of U.S. government securities | 654,788,341 | — | — | — | — | — | ||||||||||||||
At March 31, 2012, the cost of investments and unrealized appreciation (depreciation) for federal income tax purposes for each Fund were as follows:
| Optimum | Optimum | Optimum | Optimum | Optimum | Optimum | ||||||||||||||||||||
| Fixed Income | International | Large Cap | Large Cap | Small-Mid Cap | Small-Mid Cap | ||||||||||||||||||||
| Fund | Fund | Growth Fund | Value Fund | Growth Fund | Value Fund | ||||||||||||||||||||
| Cost of Investments | $ | 1,247,800,626 | $ | 326,593,382 | $ | 662,814,567 | $ | 650,345,975 | $ | 326,743,104 | $ | 298,849,820 | |||||||||||||
| Aggregate unrealized appreciation | $ | 50,226,714 | $ | 25,759,348 | $ | 186,451,437 | $ | 149,815,992 | $ | 76,081,756 | $ | 63,574,221 | |||||||||||||
| Aggregate unrealized depreciation | (18,649,739 | ) | (30,156,825 | ) | (21,700,116 | ) | (30,159,825 | ) | (12,437,094 | ) | (8,819,509 | ) | |||||||||||||
| Net unrealized appreciation (depreciation) | $ | 31,576,975 | $ | (4,397,477 | ) | $ | 164,751,321 | $ | 119,656,167 | $ | 63,644,662 | $ | 54,754,712 | ||||||||||||
116
U.S. GAAP defines fair value as the price that the Funds would receive to sell an asset or pay to transfer a liability in an orderly transaction between market participants at the measurement date under current market conditions. A three level hierarchy for fair value measurements has been established based upon the transparency of inputs to the valuation of an asset or liability. Inputs may be observable or unobservable and refer broadly to the assumptions that market participants would use in pricing the asset or liability. Observable inputs reflect the assumptions market participants would use in pricing the asset or liability based on market data obtained from sources independent of the reporting entity. Unobservable inputs reflect the reporting entity’s own assumptions about the assumptions that market participants would use in pricing the asset or liability developed based on the best information available under the circumstances. Each Fund’s investments in its entirety is assigned a level based upon the observability of the inputs which are significant to the overall valuation. The three level hierarchy of inputs is summarized below.
| Level 1 – | inputs are quoted prices in active markets for identical investments (e.g., equity securities, open-end investment companies, futures contracts, options contracts) |
| Level 2 – | other observable inputs (including, but not limited to: quoted prices for similar assets or liabilities in markets that are active, quoted prices for identical or similar assets or liabilities in markets that are not active, inputs other than quoted prices that are observable for the assets or liabilities (such as interest rates, yield curves, volatilities, prepayment speeds, loss severities, credit risks and default rates) or other market-corroborated inputs) (e.g., debt securities, government securities, swap contracts, foreign currency exchange contracts, foreign securities utilizing international fair value pricing broker-quoted securities, fair valued securities) |
| Level 3 – | inputs are significant unobservable inputs (including each Fund’s own assumptions used to determine the fair value of investments) (e.g., broker-quoted securities, fair valued securities) |
Level 3 investments are valued using significant unobservable inputs, including related or comparable assets or liabilities, recent transactions, market multiples, book values, and other relevant information for the investment to determine the fair value of the investment. Each Fund may also use an income-based valuation approach in which the anticipated future cash flows of the investment are discounted to calculate fair value. Discounts may also be applied due to the nature or duration of any restrictions on the disposition of the investments. Valuations may also be based upon current market prices of securities that are comparable in coupon, rating, maturity and industry. The derived value of a Level 3 investment may not represent the value which is received upon disposition and this could impact the results of operations.
The following table summarizes the valuation of Optimum Fixed Income Fund’s investments by fair value hierarchy levels as of March 31, 2012:
| Level 1 | Level 2 | Level 3 | Total | ||||||||||||
| Agency, Asset- & Mortgage-Backed Securities | $ | — | $ | 275,178,084 | $ | 6,564,660 | $ | 281,742,744 | |||||||
| Common Stock | 1,001 | — | — | 1,001 | |||||||||||
| Corporate Debt | 222,160 | 502,961,580 | 41,998 | 503,225,738 | |||||||||||
| Foreign Debt | — | 108,591,678 | — | 108,591,678 | |||||||||||
| Municipal Bonds | — | 8,245,459 | — | 8,245,459 | |||||||||||
| Securities sold short | — | (9,834,218 | ) | — | (9,834,218 | ) | |||||||||
| U.S. Treasury Obligations | — | 154,728,295 | — | 154,728,295 | |||||||||||
| Other | 1,014,272 | 1,317,678 | 4 | 2,331,954 | |||||||||||
| Short-Term Investments | — | 199,180,440 | — | 199,180,440 | |||||||||||
| Securities Lending | |||||||||||||||
| Collateral | — | 31,164,510 | — | 31,164,510 | |||||||||||
| Options Written | (197,031 | ) | (150,019 | ) | — | (347,050 | ) | ||||||||
| Total | $ | 1,040,402 | $ | 1,271,383,487 | $ | 6,606,662 | $ | 1,279,030,551 | |||||||
| Foreign Currency Exchange Contracts | $ | — | $ | (968,181 | ) | $ | — | $ | (968,181 | ) | |||||
| Futures Contracts | $ | 23,886 | $ | — | $ | — | $ | 23,886 | |||||||
| Swap Contracts | $ | — | $ | 249,711 | $ | 59,011 | $ | 308,722 | |||||||
(continues) 117
Notes to financial statements
Optimum Fund Trust
3. Investments (continued)
The following is a reconciliation of investments in which significant unobservable inputs (Level 3) were used in determining fair value:
| Optimum Fixed Income Fund | ||||||||||||||||||||||
| Agency, Asset- & | ||||||||||||||||||||||
| Mortgage-Backed | Corporate | Foreign | ||||||||||||||||||||
| Securities | Debt | Debt | Other | Total | ||||||||||||||||||
| Balance as of 3/31/11 | $ | 4,530,991 | $ | 39,344 | $ | 9,310,911 | $ | 4 | $ | 13,881,250 | ||||||||||||
| Purchases | 6,216,667 | 4,327 | — | — | 6,220,994 | |||||||||||||||||
| Sales | — | — | — | (9,335 | ) | (9,335 | ) | |||||||||||||||
| Transfers out of Level 3 | (4,180,752 | ) | — | (9,310,911 | ) | — | (13,491,663 | ) | ||||||||||||||
| Net unrealized appreciation (depreciation) | (2,246 | ) | (1,673 | ) | — | 9,335 | 5,416 | |||||||||||||||
| Balance as of 3/31/12 | $ | 6,564,660 | $ | 41,998 | $ | — | $ | 4 | $ | 6,606,662 | ||||||||||||
| Net change in unrealized appreciation | ||||||||||||||||||||||
| (depreciation) from Level 3 investments still held as of 3/31/12 | $ | (2,246 | ) | $ | (1,673 | ) | $ | — | $ | — | $ | (3,919 | ) | |||||||||
The following table summarizes the valuation of Optimum International Fund’s investments by fair value hierarchy levels as of March 31, 2012:
| Level 1 | Level 2 | Level 3 | Total | |||||||||||||
| Common Stock | $ | 287,519,029 | $ | — | $ | — | $ | 287,519,029 | ||||||||
| Preferred Stock | 2,189,579 | — | — | 2,189,579 | ||||||||||||
| Short-Term Investments | — | 4,533,593 | — | 4,533,593 | ||||||||||||
| Securities Lending Collateral | — | 27,953,704 | — | 27,953,704 | ||||||||||||
| Total | $ | 289,708,608 | $ | 32,487,297 | $ | — | $ | 322,195,905 | ||||||||
| Foreign Currency Exchange Contracts | $ | — | $ | (57,340 | ) | $ | — | $ | (57,340 | ) | ||||||
The following is a reconciliation of investments in which significant unobservable inputs (Level 3) were used in determining fair value:
| Optimum International Fund | ||||||
| Common | ||||||
| Stock | ||||||
| Balance as of 3/31/11 | $ | 86,855 | ||||
| Sales | (104,038 | ) | ||||
| Net realized gain | 23,708 | |||||
| Net change in unrealized | ||||||
| appreciation (depreciation) | (6,525 | ) | ||||
| Balance as of 3/31/12 | $ | — | ||||
| Net change in unrealized appreciation | ||||||
| (depreciation) from Level 3 investments still held as of 3/31/12 | $ | — | ||||
The following table summarizes the valuation of Optimum Large Cap Growth Fund’s investments by fair value hierarchy levels as of March 31, 2012:
| Level 1 | Level 2 | Level 3 | Total | |||||||||||
| Common Stock | $ | 772,803,748 | $ | 5,242,167 | $ | 1,609,681 | $ | 779,655,596 | ||||||
| Convertible Preferred Stock | — | — | 462,294 | 462,294 | ||||||||||
| Preferred Stock | 1,120,263 | — | — | 1,120,263 | ||||||||||
| Short-Term Investments | — | 27,084,086 | — | 27,084,086 | ||||||||||
| Securities Lending Collateral | — | 19,243,649 | — | 19,243,649 | ||||||||||
| $ | 773,924,011 | $ | 51,569,902 | $ | 2,071,975 | $ | 827,565,888 | |||||||
| Foreign Currency Exchange Contracts | $ | — | $ | (3,948 | ) | $ | — | $ | (3,948 | ) | ||||
118
The following is a reconciliation of investments in which significant unobservable inputs (Level 3) were used in determining fair value:
| Optimum Large Cap Growth Fund | ||||||||||||||
| Convertible | ||||||||||||||
| Common | Preferred | |||||||||||||
| Stock | Stock | Total | ||||||||||||
| Balance as of 3/31/11 | $ | 867,695 | $ | — | $ | 867,695 | ||||||||
| Purchases | 1,236,501 | 498,781 | 1,735,282 | |||||||||||
| Sales | (664,037 | ) | — | (664,037 | ) | |||||||||
| Net realized gain | (78,839 | ) | — | (78,839 | ) | |||||||||
| Net change in unrealized | ||||||||||||||
| appreciation (depreciation) | 248,361 | (36,487 | ) | 211,874 | ||||||||||
| Balance as of 3/31/12 | $ | 1,609,681 | $ | 462,294 | $ | 2,071,975 | ||||||||
| Net change in unrealized appreciation | ||||||||||||||
| (depreciation) from Level 3 investments still held as of 3/31/12 | $ | 202,957 | $ | (36,487 | ) | $ | 166,470 | |||||||
The following table summarizes the valuation of Optimum Large Cap Value Fund’s investments by fair value hierarchy levels as of March 31, 2012:
| Level 1 | Level 2 | Level 3 | Total | |||||||||||
| Common Stock | $ | 749,769,251 | $ | — | $ | — | $ | 749,769,251 | ||||||
| Convertible Preferred | — | 534,162 | — | 534,162 | ||||||||||
| Short-Term Investments | — | 13,098,617 | — | 13,098,617 | ||||||||||
| Securities Lending Collateral | — | 6,600,112 | — | 6,600,112 | ||||||||||
| Total | $ | 749,769,251 | $ | 20,232,891 | $ | — | $ | 770,002,142 | ||||||
| The following table summarizes the valuation of Optimum Small-Mid Cap Growth Fund’s investments by fair value hierarchy levels as of March 31, 2012: | ||||||||||||||
| Level 1 | Level 2 | Level 3 | Total | |||||||||||
| Common Stock | $ | 341,497,580 | $ | — | $ | — | $ | 341,497,580 | ||||||
| Exchange-Traded Fund | 5,036,064 | — | — | 5,036,064 | ||||||||||
| Short-Term Investments | — | 5,452,727 | — | 5,452,727 | ||||||||||
| Securities Lending Collateral | — | 38,401,395 | — | 38,401,395 | ||||||||||
| Total | $ | 346,533,644 | $ | 43,854,122 | $ | — | $ | 390,387,766 | ||||||
| The following table summarizes the valuation of Optimum Small-Mid Cap Value Fund’s investments by fair value hierarchy levels as of March 31, 2012: | ||||||||||||||
| Level 1 | Level 2 | Level 3 | Total | |||||||||||
| Common Stock | $ | 308,278,222 | $ | — | $ | — | $ | 308,278,222 | ||||||
| Short-Term Investments | — | 30,489,722 | — | 30,489,722 | ||||||||||
| Securities Lending Collateral | — | 14,836,588 | — | 14,836,588 | ||||||||||
| Total | $ | 308,278,222 | $ | 45,326,310 | $ | — | $ | 353,604,532 | ||||||
The values of Level 3 investments for Optimum Large Cap Value Fund, Optimum Small-Mid Cap Growth Fund and Optimum Small-Mid Cap Value Fund were zero at the beginning and end of the year and there was no change in unrealized appreciation (depreciation).
During the year ended March 31, 2012, transfers out of Level 3 investments into Level 2 investments were made in the amount of $13,491,663 for Optimum Fixed Income Fund. These were due to the Fund’s pricing vendor being able to supply a matrix price for investments that had been utilizing broker quoted prices.
During the year ended March 31, 2012, there were no transfers between Level 1 investments and Level 2 investments that had a material impact to the Funds. This does not include transfers between Level 1 investments and Level 2 investments due to the Funds utilizing international fair value pricing during the year. International fair value pricing uses other observable market-based inputs in place of the closing exchange price due to the events occurring after the close of the exchange or market on which the investment is principally traded in accordance with the fair valuation procedures described in Note 1, causing a change in classification between levels.
During the year ended March 31, 2012, there were no transfers between Level 1 investments and Level 3 investments that had a material impact to Optimum International Fund, Optimum Large Cap Growth Fund, Optimum Large Cap Value Fund, Optimum Small-Mid Cap Growth Fund and Optimum Small-Mid Cap Value Fund. Each Fund’s policy is to recognize transfers between levels at the beginning of the reporting period.
In May 2011, the Financial Accounting Standards Board (FASB) issued ASU No. 2011-04 modifying Topic 820, Fair Value Measurements and Disclosures. ASU No. 2011-04 requires reporting entities to disclose i) the amounts of any transfers between Level 1 and Level 2, and the reasons for the transfers, ii) for Level 3 fair value measurements, iii) quantitative information about significant unobservable inputs used, iv) a description of the valuation
(continues) 119
Notes to financial statements
Optimum Fund Trust
3. Investments (continued)
processes used by the reporting entity and v) a narrative description of the sensitivity of the fair value measurement to changes in unobservable inputs if a change in those inputs might result in a significantly higher or lower fair value measurement. The effective date of ASU No. 2011-04 is for interim and annual periods beginning after December 15, 2011. Management is currently evaluating the implications of this guidance and the impact it will have on the financial statement amounts and footnote disclosures, if any.
4. Dividend and Distribution Information
Income and long-term capital gain distributions are determined in accordance with federal income tax regulations, which may differ from U.S. GAAP. Additionally, distributions from net gains on foreign currency transactions and net short-term gains on sales of investment securities are treated as ordinary income for federal income tax purposes. Optimum Large Cap Growth Fund did not make any distributions during the year ended March 31, 2012. The tax character of dividends and distributions paid during the years ended March 31, 2012 and 2011 was as follows:
Year Ended March 31, 2012
| Optimum | Optimum | Optimum | Optimum | Optimum | |||||||||||||||||||||
| Fixed Income | International | Large Cap | Small-Mid Cap | Small-Mid Cap | |||||||||||||||||||||
| Fund | Fund | Value Fund | Growth Fund | Value Fund | |||||||||||||||||||||
| Ordinary income | $ | 46,904,331 | $ | 5,814,738 | $ | 6,049,903 | $ | — | $ | — | |||||||||||||||
| Long-term capital gains | 9,075,525 | — | — | 19,409,757 | 3,155,078 | ||||||||||||||||||||
| Total | $ | 55,979,856 | $ | 5,814,738 | $ | 6,049,903 | $ | 19,409,757 | $ | 3,155,078 | |||||||||||||||
| Year Ended March 31, 2011 | |||||||||||||||||||||||||
| Optimum | Optimum | Optimum | |||||||||||||||||||||||
| Fixed Income | International | Large Cap | |||||||||||||||||||||||
| Fund | Fund | Value Fund | |||||||||||||||||||||||
| Ordinary income | $ | 36,247,412 | $ | 3,209,203 | $ | 8,703,654 | |||||||||||||||||||
Optimum Large Cap Growth Fund, Optimum Small-Mid Cap Growth and Optimum Small-Mid Cap Value did not make any distributions during the year ended March 31, 2011.
5. Components of Net Assets on a Tax Basis
As of March 31, 2012, the components of net assets on a tax basis were as follows:
| Optimum | Optimum | Optimum | ||||||||||||||
| Fixed Income | International | Large Cap | ||||||||||||||
| Fund | Fund | Growth Fund | ||||||||||||||
| Shares of beneficial interest | $ | 1,170,469,829 | $ | 349,265,835 | $ | 707,087,297 | ||||||||||
| Undistributed ordinary income | 9,996,714 | 3,180,992 | — | |||||||||||||
| Undistributed long-term capital gains | 3,547,459 | — | — | |||||||||||||
| Capital loss carryforwards | — | (50,992,198 | ) | (60,435,247 | ) | |||||||||||
| Other temporary differences | (1,430,601 | ) | 41,139 | 3,948 | ||||||||||||
| Qualified late year long-term capital losses deferral | (306,629 | ) | — | — | ||||||||||||
| Qualified late year ordinary losses deferral | — | (1,067,820 | ) | (2,607,825 | ) | |||||||||||
| Unrealized appreciation (depreciation) | 30,772,706 | (4,437,227 | ) | 164,801,661 | ||||||||||||
| Net assets | $ | 1,213,049,478 | $ | 295,990,721 | $ | 808,849,834 | ||||||||||
| Optimum | Optimum | Optimum | ||||||||||||||
| Large Cap | Small-Mid Cap | Small-Mid Cap | ||||||||||||||
| Value Fund | Growth Fund | Value Fund | ||||||||||||||
| Shares of beneficial interest | $ | 788,249,300 | $ | 283,962,411 | $ | 276,787,279 | ||||||||||
| Undistributed ordinary income | 9,816,408 | — | — | |||||||||||||
| Undistributed long-term capital gains | — | 4,841,523 | 5,606,120 | |||||||||||||
| Capital loss carryforwards | (149,287,237 | ) | — | — | ||||||||||||
| Qualified late year long-term capital losses deferral | (376,144 | ) | — | — | ||||||||||||
| Qualified late year ordinary losses deferral | (4,092,223 | ) | (3,165,498 | ) | (399,801 | ) | ||||||||||
| Unrealized appreciation | 119,688,286 | 63,644,631 | 54,754,712 | |||||||||||||
| Net assets | $ | 763,998,390 | $ | 349,283,067 | $ | 336,748,310 | ||||||||||
120
The differences between book basis and tax basis components of net assets are primarily attributable to tax deferral of losses on wash sales, tax deferral of losses on straddles, mark-to-market of foreign currency exchange contracts, mark-to-market of futures contracts, tax recognition of unrealized gain on passive foreign investment companies, tax treatment of contingent payment on debt instruments, amortization of premium on convertible securities, return of capital on investments, partnership interest and CDS contracts.
Qualified late year losses represent losses realized on investments and foreign currency transactions from November 1, 2011 through March 31, 2012 that, in accordance with federal income tax regulations, the Funds have elected to defer and treat as having arisen in the following fiscal year.
For financial reporting purposes, capital accounts are adjusted to reflect the tax character of permanent book/tax differences. Reclassifications are primarily due to tax treatment of net operating losses, dividends and distributions, tax treatment of CDS contracts, contingent payment on debt instruments, gain (loss) on foreign currency transactions, foreign capital gain taxes, amortization of premium on convertible securities, passive foreign investment companies, paydown gains (losses) of asset- and mortgage-backed securities and partnership interest. Results of operations and net assets were not affected by these reclassifications. For the year ended March 31, 2012, the Funds recorded the following reclassifications:
| Optimum | Optimum | Optimum | Optimum | Optimum | Optimum | |||||||||||||||||||||||||
| Fixed Income | International | Large Cap | Large Cap | Small-Mid Cap | Small-Mid Cap | |||||||||||||||||||||||||
| Fund | Fund | Growth Fund | Value Fund | Growth Fund | Value Fund | |||||||||||||||||||||||||
| Undistributed (accumulated) net | ||||||||||||||||||||||||||||||
| investment income (loss) | $ | (6,229,166 | ) | $ | 583,249 | $ | 998,160 | $ | 9,710 | $ | 2,405,703 | $ | 334,935 | |||||||||||||||||
| Accumulated net realized gain (loss) | 5,572,182 | (583,249 | ) | 52,361 | (9,710 | ) | (1,523,851 | ) | — | |||||||||||||||||||||
| Paid-in capital | 656,984 | — | (1,050,521 | ) | — | (881,852 | ) | (334,935 | ) | |||||||||||||||||||||
For federal income tax purposes, capital loss carryforwards may be carried forward and applied against future capital gains. In 2012, the Funds utilized capital loss carryforwards as follows:
| Capital loss | |||
| carryforwards | |||
| utilized | |||
| Optimum Fixed Income Fund | $ | 6,818,431 | |
| Optimum Large Cap Growth Fund | 34,267,222 | ||
| Optimum Large Cap Value Fund | 7,845,800 | ||
| Optimum Small-Mid Cap Value Fund | 9,947,941 | ||
Capital loss carryforwards remaining at March 31, 2012, if not utilized in future years, for each Fund will expire as follows:
| Optimum | Optimum | Optimum | |||||||||||||
| Year of | International | Large Cap | Large Cap | ||||||||||||
| Expiration | Fund | Growth Fund | Value Fund | ||||||||||||
| 3/31/17 | $ | — | $ | — | $ | 30,259,101 | |||||||||
| 3/31/18 | 49,949,013 | 60,435,247 | 119,028,136 | ||||||||||||
| Total | $ | 49,949,013 | $ | 60,435,247 | $ | 149,287,237 | |||||||||
On December 22, 2010, the Regulated Investment Company Modernization Act of 2010 (the Act) was enacted, which changed various technical rules governing the tax treatment of regulated investment companies. The changes are generally effective for taxable years beginning after the date of enactment. Under the Act, the Funds will be permitted to carry forward capital losses incurred in taxable years beginning after the date of enactment for an unlimited period. However, any losses incurred during those future taxable years will be required to be utilized prior to the losses incurred in pre-enactment taxable years, which carry an expiration date. As a result of this ordering rule, pre-enactment capital loss carryforwards may be more likely to expire unused. Additionally, post-enactment capital loss carryforwards will retain their character as either short-term or long-term capital losses rather than being considered all short-term as permitted under previous regulation.
Losses incurred that will be carried forward under the Act are as follows:
| Loss carryforward character | |||||
| Short term | Long term | ||||
| Optimum International Fund | $1,043,185 | $ | — | ||
(continues) 121
Notes to financial statements
Optimum Fund Trust
6. Capital Shares
Transactions in capital shares were as follows:
| Optimum | Optimum | Optimum | ||||||||||||||||
| Fixed Income | International | Large Cap | ||||||||||||||||
| Fund | Fund | Growth Fund | ||||||||||||||||
| Year Ended | Year Ended | Year Ended | ||||||||||||||||
| 3/31/12 | 3/31/11 | 3/31/12 | 3/31/11 | 3/31/12 | 3/31/11 | |||||||||||||
| Shares sold: | ||||||||||||||||||
| Class A | 731,647 | 668,845 | 94,500 | 98,203 | 279,314 | 263,299 | ||||||||||||
| Class B | 10,542 | 14,845 | 193 | 1,265 | 293 | 2,753 | ||||||||||||
| Class C | 1,893,449 | 2,198,457 | 246,063 | 257,286 | 646,825 | 747,705 | ||||||||||||
| Institutional Class | 35,411,000 | 32,665,979 | 7,961,220 | 9,197,950 | 11,897,997 | 14,150,435 | ||||||||||||
| 38,046,638 | 35,548,126 | 8,301,976 | 9,554,704 | 12,824,429 | 15,164,192 | |||||||||||||
| Shares issued upon reinvestment of dividends | ||||||||||||||||||
| and distributions: | ||||||||||||||||||
| Class A | 190,195 | 165,039 | 16,553 | 19,005 | — | — | ||||||||||||
| Class B | 17,448 | 17,942 | 1,012 | 2,229 | — | — | ||||||||||||
| Class C | 665,608 | 580,410 | 23,075 | 44,652 | — | — | ||||||||||||
| Institutional Class | 4,811,837 | 3,024,744 | 518,666 | 284,807 | — | — | ||||||||||||
| 5,685,088 | 3,788,135 | 559,306 | 350,693 | — | — | |||||||||||||
| Shares repurchased: | ||||||||||||||||||
| Class A | (903,863 | ) | (1,064,216 | ) | (216,075 | ) | (287,128 | ) | (587,288 | ) | (828,938 | ) | ||||||
| Class B | (207,118 | ) | (140,744 | ) | (60,541 | ) | (54,889 | ) | (170,393 | ) | (149,964 | ) | ||||||
| Class C | (3,353,403 | ) | (4,377,419 | ) | (676,649 | ) | (951,575 | ) | (2,054,304 | ) | (2,882,603 | ) | ||||||
| Institutional Class | (18,712,858 | ) | (15,164,664 | ) | (4,447,808 | ) | (3,461,623 | ) | (11,007,911 | ) | (17,038,995 | ) | ||||||
| (23,177,242 | ) | (20,747,043 | ) | (5,401,073 | ) | (4,755,215 | ) | (13,819,896 | ) | (20,900,500 | ) | |||||||
| Net increase (decrease) | 20,554,484 | 18,589,218 | 3,460,209 | 5,150,182 | (995,467 | ) | (5,736,308 | ) | ||||||||||
| Optimum | Optimum | Optimum | ||||||||||||||||
| Large Cap | Small-Mid Cap | Small-Mid Cap | ||||||||||||||||
| Value Fund | Growth Fund | Value Fund | ||||||||||||||||
| Year Ended | Year Ended | Year Ended | ||||||||||||||||
| 3/31/12 | 3/31/11 | 3/31/12 | 3/31/11 | 3/31/12 | 3/31/11 | |||||||||||||
| Shares sold: | ||||||||||||||||||
| Class A | 295,586 | 370,267 | 45,025 | 44,155 | 40,909 | 40,638 | ||||||||||||
| Class B | 411 | 2,052 | 123 | 575 | 167 | 28 | ||||||||||||
| Class C | 690,498 | 786,822 | 106,952 | 123,804 | 125,046 | 134,424 | ||||||||||||
| Institutional Class | 13,727,120 | 15,358,661 | 6,417,276 | 8,456,356 | 7,157,709 | 9,084,213 | ||||||||||||
| 14,713,615 | 16,517,802 | 6,569,376 | 8,624,890 | 7,323,831 | 9,259,303 | |||||||||||||
| Shares issued upon reinvestment of dividends | ||||||||||||||||||
| and distributions: | ||||||||||||||||||
| Class A | 21,647 | 43,343 | 31,939 | — | 4,961 | — | ||||||||||||
| Class B | 603 | 4,041 | 5,167 | — | 865 | — | ||||||||||||
| Class C | 14,762 | 88,937 | 127,506 | — | 21,186 | — | ||||||||||||
| Institutional Class | 517,001 | 814,457 | 1,532,498 | — | 259,689 | — | ||||||||||||
| 554,013 | 950,778 | 1,697,110 | — | 286,701 | — | |||||||||||||
| Shares repurchased: | ||||||||||||||||||
| Class A | (700,734 | ) | (826,246 | ) | (110,454 | ) | (154,171 | ) | (103,180 | ) | (144,619 | ) | ||||||
| Class B | (170,823 | ) | (148,015 | ) | (31,773 | ) | (27,258 | ) | (32,765 | ) | (29,222 | ) | ||||||
| Class C | (2,055,194 | ) | (2,870,932 | ) | (360,430 | ) | (515,098 | ) | (367,305 | ) | (535,392 | ) | ||||||
| Institutional Class | (11,445,134 | ) | (15,357,080 | ) | (5,326,873 | ) | (5,077,250 | ) | (4,679,016 | ) | (3,600,939 | ) | ||||||
| (14,371,885 | ) | (19,202,273 | ) | (5,829,530 | ) | (5,773,777 | ) | (5,182,266 | ) | (4,310,172 | ) | |||||||
| Net increase (decrease) | 895,743 | (1,733,693 | ) | 2,436,956 | 2,851,113 | 2,428,266 | 4,949,131 | |||||||||||
122
For the year ended March 31, 2012, the following Class B shares were converted to Class A shares. The amounts are included in Class B redemptions and Class A subscriptions in the tables on previous page and the statements of changes in net assets.
| Year Ended | |||||||
| 3/31/12 | |||||||
| Class B | Class A | ||||||
| Shares | Shares | Value | |||||
| Optimum Fixed Income Fund | 103,352 | 103,410 | $ | 995,147 | |||
| Optimum International Fund | 25,092 | 24,635 | 245,632 | ||||
| Optimum Large Cap Growth Fund | 73,009 | 69,063 | 853,164 | ||||
| Optimum Large Cap Value Fund | 74,517 | 73,694 | 799,078 | ||||
| Optimum Small-Mid Cap Growth Fund | 13,539 | 12,737 | 153,307 | ||||
| Optimum Small-Mid Cap Value Fund | 13,498 | 12,700 | 149,142 | ||||
7. Derivatives
U.S. GAAP requires disclosures that enable investors to understand: 1) how and why an entity uses derivatives; 2) how they are accounted for; and 3) how they affect an entity’s results of operations and financial position.
Foreign Currency Exchange Contracts — Each Fund may enter into foreign currency exchange contracts and foreign cross currency exchange contracts as a way of managing foreign exchange rate risk. Each Fund may enter into these contracts to fix the U.S. dollar value of a security that it has agreed to buy or sell for the period between the date the trade was entered into and the date the security is delivered and paid for. Each Fund may also use these contracts to hedge the U.S. dollar value of securities it already owns that are denominated in foreign currencies. The change in value is recorded as an unrealized gain or loss. When the contract is closed, a realized gain or loss is recorded equal to the difference between the value of the contract at the time it was opened and the value at the time it was closed.
The use of foreign currency exchange contracts and foreign cross currency exchange contracts does not eliminate fluctuations in the underlying prices of the securities, but does establish a rate of exchange that can be achieved in the future. Although foreign currency exchange contracts and foreign cross currency exchange contracts limit the risk of loss due to an unfavorable change in the value of the hedged currency, they also limit any potential gain that might result should the value of the currency change favorably. In addition, the Funds could be exposed to risks if the counterparties to the contracts are unable to meet the terms of their contracts. The Funds’ maximum risk of loss from counterparty credit risk is the value of their currency exchanged with the counterparty. The risk is generally mitigated by having a netting arrangement between the Funds and the counterparty and by the posting of collateral by the counterparty to the Funds to cover the Funds’ exposure to the counterparty.
Futures Contracts — A futures contract is an agreement in which the writer (or seller) of the contract agrees to deliver to the buyer an amount of cash or securities equal to a specific dollar amount times the difference between the value of a specific security or index at the close of the last trading day of the contract and the price at which the agreement is made. Optimum Fixed Income Fund and Optimum International Fund may use futures in the normal course of pursuing their investment objectives. Optimum Fixed Income Fund may invest in futures contracts to hedge its existing portfolio securities against fluctuations in fair value caused by changes in prevailing market interest rates. Optimum International Fund may use futures contracts to a limited extent, with the objectives of maintaining full exposure to the stock market, enhancing returns, maintaining liquidity and minimizing costs. Upon entering into a futures contract, each Fund deposits cash or pledges U.S. government securities to a broker, equal to the minimum “initial margin” requirements of the exchange on which the contract is traded. Subsequent payments are received from the broker or paid to the broker each day, based on the daily fluctuation in the market value of the contract. These receipts or payments are known as “variation margin” and are recorded daily by each Fund as unrealized gains or losses until the contracts are closed. When the contracts are closed, each Fund records a realized gain or loss equal to the difference between the value of the contract at the time it was opened and the value at the time it was closed. Risks of entering into futures contracts include potential imperfect correlation between the futures contracts and the underlying securities and the possibility of an illiquid secondary market for these instruments. When investing in futures, there is minimal counterparty credit risk to a Fund because futures are exchange-traded and the exchange’s clearinghouse, as counterparty to all exchange-traded futures, guarantees against default.
Options Contracts — During the year ended March 31, 2012, Optimum Fixed Income Fund entered into options contracts in the normal course of pursuing its investment objective. The Fund may buy or write options contracts for any number of reasons, including without limitation: to manage the Fund’s exposure to changes in securities prices and foreign currencies; as an efficient means of adjusting the Fund’s overall exposure to certain markets; to protect the value of portfolio securities; and as a cash management tool. The Fund may buy or write call or put options on securities, futures, swaps, “swaptions”, financial indices, and foreign currencies. When the Fund buys an option, a premium is paid and an asset is recorded and adjusted on a daily basis to reflect the current market value of the options purchased. When the Fund writes an option, a premium is received and a liability is recorded and adjusted on a daily basis to reflect the current market value of the options written. Premiums received from writing options that expire unexercised are treated by the Fund on the expiration date as realized gains. The difference between the premium received and the amount paid on effecting a closing purchase transaction, including brokerage commissions, is treated as realized gain or loss. If a call option is exercised, the premium is added to the proceeds from the sale of the underlying security in determining whether the Fund has a realized gain or loss. If a put option is exercised, the premium reduces the cost basis of the securities purchased by the Fund. The Fund, as writer of an option, bears the market risk of an unfavorable change in the price of the security underlying the written option. When writing options, the Fund is subject to minimal counterparty risk because the counterparty is only obligated to pay premiums and does not bear the market risk of an unfavorable market change.
(continues) 123
Notes to financial statements
Optimum Fund Trust
7. Derivatives (continued)
Transactions in options written during the year ended March 31, 2012 for Optimum Fixed Income Fund were as follows:
| Number of contracts | Premiums | ||||||||
| Options outstanding at March 31, 2011 | — | $ | — | ||||||
| Options written | 8,200,569 | 734,298 | |||||||
| Options expired | (175 | ) | (111,212 | ) | |||||
| Options terminated in closing purchase transactions | (297 | ) | (336,257 | ) | |||||
| Options outstanding at March 31, 2012 | 8,200,097 | $ | 286,829 | ||||||
Swap Contracts — Optimum Fixed Income Fund enters into interest rate swap contracts, inflation swap contracts and CDS contracts in the normal course of pursuing its investment objective. The Fund may use interest rate swaps to adjust the Fund’s sensitivity to interest rates or to hedge against changes in interest rates. The Fund may use inflation swaps to hedge the inflation risk in nominal bonds, thereby creating synthetic inflation-indexed bonds. The Fund may enter into CDS contracts in order to hedge against a credit event, to enhance total return or to gain exposure to certain securities or markets.
Interest Rate Swaps. An interest rate swap contract is an exchange of interest rates between counterparties. In one instance, an interest rate swap involves payments received by the Fund from another party based on a variable or floating interest rate, in return for making payments based on a fixed interest rate. An interest rate swap can also work in reverse with the Fund receiving payments based on a fixed interest rate and making payments based on a variable or floating interest rate. Interest rate swaps may be used to adjust the Fund’s sensitivity to interest rates or to hedge against changes in interest rates. Periodic payments on such contracts are accrued daily and recorded as unrealized appreciation/depreciation on swap contracts. Upon periodic payment/receipt or termination of the contract, such amounts are recorded as realized gains or losses on swap contracts. The Fund’s maximum risk of loss from counterparty credit risk is the discounted net value of the cash flows to be received from/paid to the counterparty over the interest rate swap contract’s remaining life, to the extent that the amount is positive. This risk is mitigated by having a netting arrangement between the Fund and the counterparty and by the posting of collateral by the counterparty to the Fund to cover the Fund’s exposure to the counterparty.
Inflation Swaps. Inflation swap agreements involve commitments to pay a regular stream of inflation-indexed cash payments in exchange for receiving a stream of nominal interest payments (or vice versa), where both payment streams are based on notional amounts. The nominal interest payments may be based on either a fixed interest rate or variable interest rate such as London Interbank Offered Rate (LIBOR). The change in value of swap contracts outstanding, if any, is recorded as unrealized appreciation or depreciation daily. A realized gain or loss is recorded on maturity or termination of the swap contract. The Fund’s maximum risk of loss from counterparty credit risk is the discounted net value of the cash flows to be received from/paid to the counterparty over the index swap contract’s remaining life, to the extent that the amount is positive. This risk is mitigated by having a netting arrangement between the Fund and the counterparty and by the posting of collateral by the counterparty to the Fund to cover the Fund’s exposure to the counterparty. No inflation swap contracts outstanding at March 31, 2012.
Credit Default Swaps. A CDS contract is a risk-transfer instrument through which one party (purchaser of protection) transfers to another party (seller of protection) the financial risk of a credit event (as defined in the CDS agreement), as it relates to a particular reference security or basket of securities (such as an index). In exchange for the protection offered by the seller of protection, the purchaser of protection agrees to pay the seller of protection a periodic amount at a stated rate that is applied to the notional amount of the CDS contract. In addition, an upfront payment may be made or received by the Fund in connection with an unwinding or assignment of a CDS contract. Upon the occurrence of a credit event, the seller of protection would pay the par (or other agreed-upon) value of the reference security (or basket of securities) to the counterparty. Credit events generally include, among others, bankruptcy, failure to pay, and obligation default.
During the year ended March 31, 2012, the Fund entered into CDS contracts as a purchaser and seller of protection. Periodic payments (receipts) on such contracts are accrued daily and recorded as unrealized losses (gains) on swap contracts. Upon payment (receipt), such amounts are recorded as realized losses (gains) on swap contracts. Upfront payments made or received in connection with CDS contracts are amortized over the expected life of the CDS contracts as unrealized losses (gains) on swap contracts. The change in value of CDS contracts is recorded as unrealized appreciation or depreciation daily. A realized gain or loss is recorded upon a credit event (as defined in the CDS agreement) or the maturity or termination of the agreement. At March 31, 2012, the net unrealized depreciation of CDS contracts was $406,867. The Fund had posted $1,090,000 cash collateral for open swap contracts. If a credit event had occurred for all open swap transactions where collateral posting was required as of March 31, 2012, the Fund would have received EUR 35,415,000 and $ 22,181,000 less the value of the contracts’ related reference obligations. The Fund received $1,726,000 in cash collateral and $ 625,000 in securities collateral for open swap contracts.
As disclosed in the footnotes to the statements of net assets, at March 31, 2012, the notional value of the protection sold was $6,160,000, which reflects the maximum potential amount the Fund would have been required to make as a seller of credit protection if a credit event had occurred. The quoted market prices and resulting market values for CDS contracts on securities and credit indices serve as an indicator of the current status of the payment/ performance risk and represent the likelihood of an expected liability (or profit) for the credit derivative if the swap agreement has been closed/sold as of the period end. Increasing market values, in absolute terms when compared to the notional amount of the swap, represent a deterioration of the reference entity’s credit soundness and a greater likelihood of risk of default or other credit event occurring as defined under the terms of the agreement. At March, 2012, the net unrealized appreciation of the protection sold was $65,270
CDS contracts may involve greater risks than if the Fund had invested in the reference obligation directly. CDS contracts are subject to general market risk, liquidity risk, counterparty risk and credit risk. The Fund’s maximum risk of loss from counterparty credit risk, either as the seller of protection or the buyer of protection, is the fair value of the contract. This risk is mitigated by having a netting arrangement between the Fund and the counterparty and by the posting of collateral by the counterparty to the Fund to cover the Fund’s exposure to the counterparty.
124
Swaps Generally. Because there are generally no organized markets for swap contracts, the value of open swaps may differ from that which would be realized in the event the Fund terminated its position in the agreement. Risks of entering into these contracts include the potential inability of the counterparty to meet the terms of the contracts. This type of risk is generally limited to the amount of favorable movement in the value of the underlying security, instrument or basket of instruments, if any, at the day of default. Risks also arise from potential losses from adverse market movements and such losses could exceed the unrealized amounts shown on the statements of net assets.
Fair values of derivative instruments as of March 31, 2012 were as follows:
| Optimum Fixed Income Fund | ||||||||||||
| Asset Derivatives | Liability Derivatives | |||||||||||
| Statements of | Statements of | |||||||||||
| Assets and Liabilities Location | Fair Value | Assets and Liabilities Location | Fair Value | |||||||||
| Forward currency exchange contracts (Foreign currency exchange contracts) | Unrealized gain on foreign currency exchange contracts | $ | 6,359 | Unrealized loss on foreign currency exchange contracts | $ | (974,540 | ) | |||||
| Interest rate contracts (Futures contracts) | Variation margin receivable on futures contracts | 101,245 | * | Variation margin payable on futures contracts | — | |||||||
| Interest rate contracts (Options written, at value) | Options written, at value | — | Options written, at value | (347,050 | ) | |||||||
| Interest rate contracts (Interest rate swap contracts) | Unrealized gain on interest rate swap contracts | 715,589 | Unrealized loss on interest rate swap contracts | — | ||||||||
| Credit contracts (CDS contracts) | Unrealized gain on CDS contracts | 426,366 | Unrealized loss on CDS contracts | (833,233 | ) | |||||||
| Total | $ | 1,249,559 | $ | (2,154,823 | ) | |||||||
*Includes cumulative appreciation of futures contracts from the date the contracts are opened through March 31, 2012. Only current day variation margin is reported on the Optimum Fixed Income Fund’s statements of assets and liabilities.
The effect of derivative instruments on the statements of operations for the year ended March 31, 2012 was as follows:
| Optimum Fixed Income Fund | ||||||||||||||
| Change in Unrealized | ||||||||||||||
| Realized Gain (Loss) on | Appreciation | |||||||||||||
| Location of Gain (Loss) on | Derivatives Recognized in | (Depreciation) on Derivatives | ||||||||||||
| Derivatives Recognized in Income | Income | Recognized in Income | ||||||||||||
| Forward currency exchange contracts (Foreign currency exchange contracts) | Net realized loss on foreign currency exchange contracts and net change in unrealized appreciation (depreciation) of investments and foreign currencies | $ | (5,778,099 | ) | $ | 331,792 | ||||||||
| Interest rate contracts (Futures contracts) | Net realized gain on futures contracts and net change in unrealized appreciation (depreciation) of investments and foreign currencies | 10,757,678 | (9,789 | ) | ||||||||||
| Interest rate contracts (Options written) | Net realized gain on options written and net change in unrealized appreciation (depreciation) of investments and foreign currencies | 368,241 | (60,221 | ) | ||||||||||
| Credit contracts (Swap contracts) | Net realized loss on swap contracts and net change in unrealized appreciation (depreciation) of investments and foreign currencies | (2,119,102 | ) | 254,609 | ||||||||||
| $ | 3,228,718 | $ | 516,391 | |||||||||||
(continues) 125
Notes to financial statements
Optimum Fund Trust
7. Derivatives (continued)
Derivatives Generally. The tables below summarize the average balance of derivative holdings by the Funds during the year ended March 31, 2012. The average balance of derivatives held is generally similar to the volume of derivative activity for the year ended March 31, 2012.
| Asset Derivative Volume | |||||||||||
| Optimum | Optimum | Optimum | Optimum | Optimum | |||||||
| Fixed Income | International | Large Cap | Large Cap | Small-Mid Cap | |||||||
| Fund | Fund | Growth Fund | Value Fund | Growth Fund | |||||||
| Foreign currency exchange contracts (average cost) | USD | 66,106,344 | USD 16,329,294 | USD 37,742 | USD 22,370 | USD 34,218 | |||||
| Futures contracts (average notional value) | 241,043,119 | — | — | — | — | ||||||
| Options contracts (average notional value) | 7,950 | — | — | — | — | ||||||
| Swap contracts (average notional value) | AUD | 11,761,508 | — | — | — | — | |||||
| BRL | 20,282,143 | — | — | — | — | ||||||
| USD | 34,442,817 | — | — | — | — | ||||||
| Liability Derivative Volume | |||||||||||
| Optimum | Optimum | Optimum | Optimum | Optimum | |||||||
| Fixed Income | International | Large Cap | Large Cap | Small-Mid Cap | |||||||
| Fund | Fund | Growth Fund | Value Fund | Growth Fund | |||||||
| Foreign currency exchange contracts (average cost) | USD | 135,133,666 | USD 19,865,832 | USD 35,228 | USD 13,754 | USD 61,914 | |||||
| Futures contracts (average notional value) | 9,318,429 | — | — | — | — | ||||||
| Options contracts (average notional value) | 41,642 | — | — | — | — | ||||||
| Swap contracts (average notional value) | EUR | 18,531,480 | — | — | — | — | |||||
| USD | 39,445,454 | — | — | — | — | ||||||
8. Securities Lending
Each Fund may lend its securities pursuant to a security lending agreement (Lending Agreement) with The Bank of New York Mellon (BNY Mellon). At the time a security is loaned, the borrower must post collateral equal to the required percentage of the market value of the loaned security, including any accrued interest. The required percentage is: (i) 102% with respect to U.S. securities and foreign securities that are denominated and payable in U.S. dollars; and (ii) 105% with respect to foreign securities. With respect to each loan, if on any business day the aggregate market value of securities collateral plus cash collateral held is less than the aggregate market value of the securities which are the subject of such loan, the borrower will be notified to provide additional collateral by the end of the following business day which, together with the collateral already held, will be not less than the applicable initial collateral requirements for such security loan. If the aggregate market value of securities collateral and cash collateral held with respect to a security loan exceeds the applicable initial collateral requirement, upon the request of the borrower BNY Mellon must return enough collateral to the borrower by the end of the following business day to reduce the value of the remaining collateral to the applicable initial collateral requirement for such security loan. As a result of the foregoing, the value of the collateral held with respect to a loaned security may be temporarily more or less than the value of the security on loan.
Cash collateral received is generally invested in the Delaware Investments Collateral Fund No. 1 (Collective Trust) established by BNY Mellon for the purpose of investment on behalf of funds managed by DMC that participate in BNY Mellon’s securities lending program. The Collective Trust may invest in U.S. government securities and high quality corporate debt, asset-backed and other money market securities and in repurchase agreements collateralized by such securities, provided that the Collective Trust will generally have a dollar-weighted average portfolio maturity of 60 days or less. Effective April 20, 2009, BNY Mellon transferred the assets of the Funds’ previous collateral investment pool other than cash and assets with a maturity of one business day or less to the BNY Mellon SL DBT II Liquidating Fund (the Liquidating Fund), effectively bifurcating the previous collateral investment pool. The Funds’ exposure to the Liquidating Fund is expected to decrease as the Liquidating Fund’s assets mature or are sold. In October 2008, BNY Mellon transferred certain distressed securities from the previous collateral investment pool into the Mellon GSL Reinvestment Trust II. The Funds can also accept U.S. government securities and letters of credit (non-cash collateral) in connection with securities loans. In the event of default or bankruptcy by the lending agent, realization and/or retention of the collateral may be subject to legal proceedings. In the event the borrower fails to return loaned securities and the collateral received is insufficient to cover the value of the loaned securities and provided such collateral shortfall is not the result of investment losses, the lending agent has agreed to pay the amount of the shortfall to the Funds, or at the discretion of the lending agent, replace the loaned securities. The Funds continue to record dividends or interest, as applicable, on the securities loaned and are subject to the changes in value of the securities loaned that may occur during the term of the loan. The Funds have the right under the Lending Agreement to recover the securities from the borrower on demand. With respect to security loans collateralized by non-cash collateral, the Funds receive loan premiums paid by the borrower. With respect to security loans collateralized by cash collateral, the earnings from the collateral investments are shared among the Funds, the security lending agent and the borrower.
The Funds record security lending income net of allocations to the security lending agent and the borrower. The Collective Trust used for the investment of cash collateral received from borrowers of securities seeks to maintain a net asset value per unit of $1.00, but there can be no assurance that it will always be able to do so. The Funds may incur investment losses as a result of investing securities lending collateral in the Collective Trust or another collateral investment pool. This could occur if an investment in a collateral investment pool defaulted
126
or if it were necessary to liquidate assets in the collateral investment pool to meet returns on outstanding security loans at a time when the collateral investment pool’s net asset value per unit was less than $1.00. Under those circumstances, the Funds may not receive an amount from the collateral investment pool that is equal in amount to the collateral the Funds would be required to return to the borrower of the securities and the Funds would be required to make up for this shortfall.
At March 31, 2012, the values of securities on loan and the values of invested collateral for each Fund are presented below, for which the Funds received collateral, comprised of non-cash collateral and cash collateral. Investments purchased with cash collateral are presented on the statements of net assets under the caption “Securities Lending Collateral.”
| Optimum | Optimum | Optimum | Optimum | Optimum | Optimum | ||||||||
| Fixed Income | International | Large Cap | Large Cap | Small-Mid Cap | Small-Mid Cap | ||||||||
| Fund | Fund | Growth Fund | Value Fund | Growth Fund | Value Fund | ||||||||
| Values of securities on loan | $129,883,573 | $ 27,225,461 | $ 21,635,534 | $7,328,168 | $41,585,564 | $14,644,191 | |||||||
| Values of invested collateral | 31,164,510 | 27,953,704 | 19,243,649 | 6,600,112 | 38,401,395 | 14,836,588 | |||||||
| Cash collateral | 32,372,747 | 28,579,176 | 20,257,051 | 7,606,200 | 38,891,315 | 15,090,089 | |||||||
| Non-cash collateral | 101,687,870 | 83,275 | 1,646,918 | — | 3,622,655 | — | |||||||
9. Credit and Market Risk
Some countries in which the Funds may invest require governmental approval for the repatriation of investment income, capital or the proceeds of sales of securities by foreign investors. In addition, if there is deterioration in a country’s balance of payments or for other reasons, a country may impose temporary restrictions on foreign capital remittances abroad.
The securities exchanges of certain foreign markets are substantially smaller, less liquid and more volatile than the major securities markets in the United States. Consequently, acquisition and disposition of securities by the Funds may be inhibited. In addition, a significant portion of the aggregate market value of securities listed on the major securities exchanges in emerging markets is held by a smaller number of investors. This may limit the number of shares available for acquisition or disposition by the Funds.
Optimum Fixed Income Fund invests in high yield fixed income securities, which are securities rated lower than BBB- by Standard & Poor’s and Baa3 by Moody’s Investor Services, or similarly rated by another nationally recognized statistical rating organization. Investments in these higher yielding securities are generally accompanied by a greater degree of credit risk than higher rated securities. Additionally, lower rated securities may be more susceptible to adverse economic and competitive industry conditions than investment-grade securities.
Optimum Fixed Income Fund invests in fixed income securities whose value is derived from an underlying pool of mortgages or consumer loans. The value of these securities is sensitive to changes in economic conditions, including delinquencies and/or defaults, and may be adversely affected by shifts in the market’s perception of the issuers and changes in interest rates. Investors receive principal and interest payments as the underlying mortgages and consumer loans are paid back. Some of these securities are collateralized mortgage obligations (CMOs). CMOs are debt securities issued by U.S. government agencies or by financial institutions and other mortgage lenders, which are collateralized by a pool of mortgages held under an indenture. Prepayment of mortgages may shorten the stated maturity of the obligations and can result in a loss of premium, if any has been paid. Certain of these securities may be stripped (securities which provide only the principal or interest feature of the underlying security). The yield to maturity on an interest-only CMO is extremely sensitive not only to changes in prevailing interest rates, but also to the rate of principal payments (including prepayments) on the related underlying mortgage assets. A rapid rate of principal payments may have a material adverse effect on the Fund’s yield to maturity. If the underlying mortgage assets experience greater than anticipated prepayments of principal, the Fund may fail to fully recoup its initial investment in these securities even if the securities are rated in the highest rating categories.
Optimum Small-Mid Cap Growth Fund and Optimum Small-Mid Cap Value Fund invest a significant portion of their assets in small- and mid-sized companies. Investments in small- and mid-sized companies may be more volatile than investments in larger companies for a number of reasons, which include more limited financial resources or a dependence on narrow product lines.
Optimum Large Cap Growth Fund, Optimum Large Cap Value Fund, Optimum Small-Mid Cap Growth Fund and Optimum Small-Mid Cap Value Fund may invest in REITs and are subject to the risks associated with that industry. If a Fund holds real estate directly as a result of defaults or receives rental income directly from real estate holdings, its tax status as a regulated investment company may be jeopardized. There were no direct real estate holdings during the year ended March 31, 2012. The Funds’ REIT holdings are also affected by interest rate changes, particularly if the REITs they hold use floating rate debt to finance their ongoing operations.
Each Fund may invest up to 15% of its net assets in illiquid securities, which may include securities with contractual restrictions on resale, securities exempt from registration under Rule 144A of the Securities Act of 1933, as amended, and other securities which may not be readily marketable. The relative illiquidity of these securities may impair the Funds from disposing of them in a timely manner and at a fair price when it is necessary or desirable to do so. While maintaining oversight, the Funds’ Board has delegated to DMC, the day-to-day functions of determining whether individual securities are liquid for purposes of the Funds’ limitation on investments in illiquid securities. Securities eligible for resale pursuant to Rule 144A, which are determined to be liquid, are not subject to the Funds’ 15% limit on investments in illiquid securities. Rule 144A and illiquid securities have been identified on the statements of net assets.
(continues) 127
Notes to financial statements
Optimum Fund Trust
10. Contractual Obligations
The Funds enter into contracts in the normal course of business that contain a variety of indemnifications. The Funds’ maximum exposure under these arrangements is unknown. However, the Funds have not had prior claims or losses pursuant to these contracts. Management has reviewed the Funds’ existing contracts and expects the risk of loss to be remote.
11. Subsequent Events
Management has determined that no material events or transactions occurred subsequent to March 31, 2012 that would require recognition or disclosure in the Funds’ financial statements.
12. Tax Information (Unaudited)
The information set forth below is for the Funds’ fiscal year as required by federal income tax laws. Shareholders, however, must report distributions on a calendar year basis for income tax purposes, which may include distributions for portions of two fiscal years of a fund. Accordingly, the information needed by shareholders for income tax purposes will be sent to them in January of each year. Please consult your tax advisor for proper treatment of this information.
All designations are based on financial information available as of the date of this annual report and, accordingly are subject to change. For any and all items requiring designation, it is the intention of each Fund to designate the maximum amount permitted under the Internal Revenue Code and the regulations thereunder. Optimum Large Cap Growth Fund did not have any distributions during the year ended March 31, 2012.
For the fiscal year ended March 31, 2012, each Fund designates distributions paid during the year as follows:
| (A) | (B) | |||||||||
| Long-Term | Ordinary | |||||||||
| Capital Gains | Income | Total | (C) | |||||||
| Distributions | Distributions* | Distributions | Qualifying | |||||||
| (Tax Basis) | (Tax Basis) | (Tax Basis) | Dividends1 | |||||||
| Optimum Fixed Income Fund | 16.21 | % | 83.79 | % | 100.00% | 0.15 | % | |||
| Optimum International Fund | — | 100.00 | % | 100.00% | — | |||||
| Optimum Large Cap Value Fund | — | 100.00 | % | 100.00% | 100.00 | % | ||||
| Optimum Small-Mid Cap Growth Fund | 100.00 | % | — | 100.00% | — | |||||
| Optimum Small-Mid Cap Value Fund | 100.00 | % | — | 100.00% | — | |||||
(A) and (B) are based on a percentage of each Fund’s total distributions.
(C) is based on a percentage of each Fund’s ordinary income distributions.
1Qualifying dividends represent dividends which qualify for the corporate dividends received deduction.
*For the fiscal year ended March 31, 2012, certain dividends paid by the Funds may be subject to a maximum tax rate of 15%, as provided for by the Jobs and Growth Tax Relief Reconciliation Act of 2003, and as extended by Tax Relief Unemployment Insurance Reauthorization and Job Creations Act of 2010. The Funds intend to designate the following percentages to be taxed at a maximum rate of 15%. Complete information will be computed and reported in conjunction with your 2012 Form 1099-DIV, as applicable.
| Maximum percentage to be | ||
| taxed at a maximum rate of 15% | ||
| Optimum Fixed Income Fund | 0.15 | % |
| Optimum International Fund | 9.67 | % |
| Optimum Large Cap Value Fund | 100.00 | % |
Optimum International Fund intends to pass through foreign tax credits in the maximum amount of $411,923. The gross foreign source income earned during the fiscal year 2012 by Optimum International Fund was $10,610,973. Complete information will be computed and reported in conjunction with your 2012 Form 1099-DIV.
128
Report of independent
registered public accounting firm
To the Board of Trustees of Optimum Fund Trust and the Shareholders of Optimum Fixed Income Fund, Optimum International Fund, Optimum Large Cap Growth Fund, Optimum Large Cap Value Fund, Optimum Small-Mid Cap Growth Fund and Optimum Small-Mid Cap Value Fund:
In our opinion, the accompanying statements of net assets, statements of assets and liabilities, and the related statements of operations and of changes in net assets and the financial highlights present fairly, in all material respects, the financial position of Optimum Fixed Income Fund, Optimum International Fund, Optimum Large Cap Growth Fund, Optimum Large Cap Value Fund, Optimum Small-Mid Cap Growth Fund and Optimum Small-Mid Cap Value Fund (constituting Optimum Fund Trust, hereafter referred to as the “Funds”) at March 31, 2012, the results of each of their operations for the year then ended and the changes in each of their net assets and the financial highlights for each of the two years in the period then ended, in conformity with accounting principles generally accepted in the United States of America. These financial statements and financial highlights (hereafter referred to as “financial statements”) are the responsibility of the Funds’ management; our responsibility is to express an opinion on these financial statements based on our audits. We conducted our audits of these financial statements in accordance with the standards of the Public Company Accounting Oversight Board (United States). Those standards require that we plan and perform the audit to obtain reasonable assurance about whether the financial statements are free of material misstatement. An audit includes examining, on a test basis, evidence supporting the amounts and disclosures in the financial statements, assessing the accounting principles used and significant estimates made by management, and evaluating the overall financial statement presentation. We believe that our audits, which included confirmation of securities at March 31, 2012 by correspondence with the custodian and brokers, provide a reasonable basis for our opinion. The financial highlights for each of the three years in the period ended March 31, 2010 were audited by other independent accountants whose report dated May 19, 2010 expressed an unqualified opinion on those statements.
PricewaterhouseCoopers LLP
Philadelphia, Pennsylvania
May 24, 2012
129
Other Fund information
(Unaudited)
Optimum Fund Trust
Change in Independent Registered Public Accounting Firm
Due to independence matters under the Securities and Exchange Commission’s auditor independence rules relating to the January 4, 2010 acquisition of Delaware Investments (including DMC, DDLP and DSC) by Macquarie Group, Ernst & Young LLP (E&Y) has resigned as the independent registered public accounting firm for Optimum Fund Trust (the Trust) effective May 27, 2010. At a meeting held on March 17, 2010, the Board of Trustees of the Trust, upon recommendation of the Audit Committee, selected PricewaterhouseCoopers LLP (PwC) to serve as the independent registered public accounting firm for the Trust for the fiscal year ended March 31, 2011. During the fiscal years ended March 31, 2010 and 2009, E&Y’s audit reports on the financial statements of the Trust did not contain any adverse opinion or disclaimer of opinion, nor were they qualified or modified as to uncertainty, audit scope, or accounting principles. In addition, there were no disagreements between the Trust and E&Y on accounting principles, financial statements disclosures or audit scope, which, if not resolved to the satisfaction of E&Y, would have caused them to make reference to the disagreement in their reports. Neither the Trust nor anyone on its behalf has consulted with PwC at any time prior to their selection with respect to the application of accounting principles to a specified transaction, either completed or proposed, or the type of audit opinion that might be rendered on the Trust’s financial statements.
130
Board of trustees and officers addendum
Optimum Fund Trust
A mutual fund is governed by a Board of Trustees, which has oversight responsibility for the management of a fund’s business affairs. Trustees establish procedures and oversee and review the performance of the investment manager, the distributor and others that perform services for the fund. The independent fund trustees, in particular, are advocates for shareholder interests. The following is a list of the Trustees and Officers of the Trust with certain background and related information.
| Number of | |||||
| Portfolios in Fund | Other | ||||
| Name, | Complex1 Overseen | Directorships | |||
| Address | Position(s) | Length of | Principal Occupation(s) | by Trustee | Held by |
| and Age | Held with Fund(s) | Time Served | During Past 5 Years | or Officer | Trustee or Officer |
| Interested Trustees | |||||
| Robert J. Moore2 | Trustee | June 10, 2010 | President and Chief Operating Officer — | 6 | Independent Board |
| 2005 Market Street | to present | LPL Financial LLC | Member — Legal and | ||
| Philadelphia, PA | (2012–Present) | General Investment | |||
| 19103 | Management America | ||||
| Chief Financial Officer — | (Investment Adviser) | ||||
| Age 50 | LPL Financial LLC | (2008–Present) | |||
| (2008–Present) | |||||
| Chief Executive Officer and | |||||
| Chief Financial Officer — | |||||
| ABN AMRO North America | |||||
| (2006–2007) | |||||
| J. Scott Coleman2 | Trustee, President | June 16, 2011 | Executive Vice President | 6 | None |
| 2005 Market Street | and Chief | to present | Head of Distribution and Marketing — | ||
| Philadelphia, PA | Executive Officer | Delaware Investments | |||
| 19103 | (October 2008–Present) | ||||
| Age 51 | Managing Director for | ||||
| Investment Consulting Group — | |||||
| Goldman Sachs Asset Management | |||||
| (2001–2008) | |||||
| Independent Trustees | |||||
| Robert J. Christian | Trustee | November 1, 2007 | Private Investor | 6 | Trustee — Wilmington |
| 2005 Market Street | and Chairman | to present | (2006–Present) | Funds (26 mutual funds) | |
| Philadelphia, PA | (1998–Present) | ||||
| 19103 | Chief Investment Officer | ||||
| Wilmington Trust Corporation | Trustee — FundVantage | ||||
| Age 63 | (Trust Bank) | Trust (34 mutual funds) | |||
| (1996–2006) | (2007–Present) | ||||
| Nicholas D. Constan | Trustee | July 17, 2003 | Adjunct Professor — | 6 | None |
| 2005 Market Street | to present | University of Pennsylvania | |||
| Philadelphia, PA | (1972–Present) | ||||
| 19103 | |||||
| Age 73 | |||||
| Durant Adams Hunter | Trustee | July 17, 2003 | Principal—Ridgeway Partners | 6 | None |
| 2005 Market Street | to present | (Executive Recruiting) | |||
| Philadelphia, PA | (2004–Present) | ||||
| 19103 | |||||
| Age 63 | |||||
(continues) 131
Board of trustees and officers addendum
| Number of | |||||
| Portfolios in Fund | Other | ||||
| Name, | Complex1 Overseen | Directorships | |||
| Address | Position(s) | Length of | Principal Occupation(s) | by Trustee | Held by |
| and Age | Held with Fund(s) | Time Served | During Past 5 Years | or Officer | Trustee or Officer |
| Independent Trustees (continued) | |||||
| Stephen Paul Mullin | Trustee | July 17, 2003 | Senior Vice President — | 6 | None |
| 2005 Market Street | to present | Econsult Corporation | |||
| Philadelphia, PA | (Economic Consulting) | ||||
| 19103 | (2000–Present) | ||||
| Age 56 | |||||
| Robert A. Rudell | Trustee | July 17, 2003 | Private Investor | 6 | Director and Chair, |
| 2005 Market Street | to present | (2002–Present) | Compensation Committee — | ||
| Philadelphia, PA | Medtox Scientific, Inc. | ||||
| 19103 | (Medical devices/Clinical lab) | ||||
| (2002–Present) | |||||
| Age 63 | |||||
| Director and | |||||
| Independent Chairman — | |||||
| Heartland Funds | |||||
| (3 mutual funds) | |||||
| (2005–Present) | |||||
| Jon Edward Socolofsky | Trustee | July 17, 2003 | Private Investor | 6 | None |
| 2005 Market Street | to present | (2002–Present) | |||
| Philadelphia, PA | |||||
| 19103 | |||||
| Age 66 | |||||
| Officers | |||||
| David F. Connor | Vice President, | Vice President since | Mr. Connor has served as | 6 | None4 |
| 2005 Market Street | Deputy General | July 17, 2003 | Vice President and Deputy | ||
| Philadelphia, PA | Counsel, and Secretary | and Secretary | General Counsel of | ||
| 19103 | since | Delaware Investments3 since 2000. | |||
| December 6, 2005 | |||||
| Age 47 | |||||
| David P. O’Connor | Executive Vice President, | Executive Vice President | Mr. O’Connor has served in | 6 | None4 |
| 2005 Market Street | General Counsel | since February 2012; | various executive and legal | ||
| Philadelphia, PA | and Chief | Senior Vice President | capacities at different times at | ||
| 19103 | Legal Officer | October 2005– | Delaware Investments. | ||
| February 2012; | |||||
| Age 45 | General Counsel | ||||
| and Chief Legal Officer | |||||
| since October 2005 | |||||
| Daniel Geatens | Vice President | September 20, 2007 | Mr. Geatens has served in | 6 | None4 |
| 2005 Market Street | and Treasurer | to present | various capacities at | ||
| Philadelphia, PA | Delaware Investments. | ||||
| 19103 | |||||
| Age 39 | |||||
| Richard Salus | Senior | January 1, 2006 | Mr. Salus has served in | 6 | None4 |
| 2005 Market Street | Vice President | to present | various executive capacities | ||
| Philadelphia, PA | and | at different times at | |||
| 19103 | Chief Financial | Delaware Investments. | |||
| Officer | |||||
| Age 48 | |||||
1 The term “Fund Complex” refers to the Funds in the Optimum Fund Trust. |
2 “Interested persons” of the Funds by virtue of their executive and management positions or relationships with the Fund’s service providers or sub-service providers. |
3 Delaware Investments is the marketing name for Delaware Management Holdings, Inc. and its subsidiaries, including the Trust’s manager, principal underwriter and service agent. |
4 Messrs Connor, O’Connor, Geatens and Salus also serve in similar capacities for the Delaware Investments® Family of Funds, a fund complex also managed and distributed by Delaware Investments with 73 funds. |
The Statement of Additional Information for the Funds includes additional information about the Trustees and Officers and is available, without charge, upon request by calling your financial advisor or 800 914-0278. |
132
About the organization
This annual report is for the information of Optimum Fund Trust shareholders, but it may be used with prospective investors when preceded or accompanied by a current prospectus for Optimum Fund Trust and the fact sheet for the most recently completed calendar quarter. The prospectus sets forth details about charges, expenses, investment objectives, and operating policies of the investment company. You should read the prospectus carefully before you invest. The figures in this report represent past results that are not a guarantee of future results. The return and principal value of an investment in the investment company will fluctuate so that shares, when redeemed, may be worth more or less than their original cost.
| Board of trustees Robert J. Moore President, Chief Operating Officer and Chief Financial Officer LPL Financial LLC J. Scott Coleman Executive Vice President Delaware Investments Robert J. Christian Private Investor Nicholas D. Constan Adjunct Professor — University of Pennsylvania Durant Adams Hunter Principal — Ridgeway Partners Stephen Paul Mullin Senior Vice President — Econsult Corporation Robert A. Rudell Private Investor Jon Edward Socolofsky Private Investor | Affiliated officers David F. Connor Vice President, Deputy General Counsel and Secretary Optimum Fund Trust Philadelphia, PA Daniel V. Geatens Vice President and Treasurer Optimum Fund Trust Philadelphia, PA David P. O’Connor Executive Vice President, General Counsel and Chief Legal Officer Optimum Fund Trust Philadelphia, PA Richard Salus Senior Vice President and Chief Financial Officer Optimum Fund Trust Philadelphia, PA | Contact information Investment manager Delaware Management Company, a series of Delaware Management Business Trust Philadelphia, PA National distributor Delaware Distributors, L.P. Philadelphia, PA Shareholder servicing, dividend disbursing, and transfer agent Delaware Service Company, Inc. 2005 Market Street Philadelphia, PA 19103-7094 For shareholders 800 914-0278 For securities dealers and financial institutions representatives only 800 362-7500 Website www.optimummutualfunds.com |
Each Fund files its complete schedule of portfolio holdings with the Securities and Exchange Commission (SEC) for the first and third quarters of each fiscal year on Forms N-Q. Each Fund’s Forms N-Q, as well as a description of the policies and procedures that each Fund uses to determine how to vote proxies (if any) relating to portfolio securities is available without charge (i) upon request, by calling 800 914-0278; (ii) on the Fund’s website at www.optimummutualfunds.com; and (iii) on the SEC’s website at www.sec.gov. Each Fund’s Forms N-Q may be reviewed and copied at the SEC’s Public Reference Room in Washington, D.C.; information on the operation of the Public Reference Room may be obtained by calling 800 SEC-0330.
Information (if any) regarding how each Fund voted proxies relating to portfolio securities during the most recently disclosed 12-month period ended June 30 is available without charge (i) through the Fund’s website at www.optimummutualfunds.com; and (ii) on the SEC’s website at www.sec.gov.
133
Item 2. Code of Ethics
The registrant has adopted a code of ethics that applies to the registrant’s principal executive officer, principal financial officer, principal accounting officer or controller, or persons performing similar functions, regardless of whether these individuals are employed by the registrant or a third party. A copy of the registrant’s Code of Business Ethics has been posted on the Delaware Investments Internet Web site at www.delawareinvestments.com. Any amendments to the Code of Business Ethics, and information on any waiver from its provisions granted by the registrant, will also be posted on this Web site within five business days of such amendment or waiver and will remain on the Web site for at least 12 months.
Item 3. Audit Committee Financial Expert
The registrant’s Board of Trustees/Directors has determined that certain members of the registrant’s Audit Committee are audit committee financial experts, as defined below. For purposes of this item, an “audit committee financial expert” is a person who has the following attributes:
a. An understanding of generally accepted accounting principles and financial statements;
b. The ability to assess the general application of such principles in connection with the accounting for estimates, accruals, and reserves;
c. Experience preparing, auditing, analyzing, or evaluating financial statements that present a breadth and level of complexity of accounting issues that are generally comparable to the breadth and complexity of issues that can reasonably be expected to be raised by the registrant’s financial statements, or experience actively supervising one or more persons engaged in such activities;
d. An understanding of internal controls and procedures for financial reporting; and
e. An understanding of audit committee functions.
An “audit committee financial expert” shall have acquired such attributes through:
a. Education and experience as a principal financial officer, principal accounting officer, controller, public accountant, or auditor or experience in one or more positions that involve the performance of similar functions;
b. Experience actively supervising a principal financial officer, principal accounting officer, controller, public accountant, auditor, or person performing similar functions;
c. Experience overseeing or assessing the performance of companies or public accountants with respect to the preparation, auditing, or evaluation of financial statements; or
d. Other relevant experience.
The registrant’s Board of Trustees/Directors has also determined that each member of the registrant’s Audit Committee is independent. In order to be “independent” for purposes of this item, the Audit Committee member may not: (i) other than in his or her capacity as a member of the Board of Trustees/Directors or any committee thereof, accept directly or indirectly any consulting, advisory or other compensatory fee from the issuer; or (ii) be an “interested person” of the registrant as defined in Section 2(a)(19) of the Investment Company Act of 1940.
The names of the audit committee financial experts on the registrant’s Audit Committee are set forth below:
Thomas L. Bennett1
John A. Fry
Frances A. Sevilla-Sacasa
Janet L. Yeomans
Item 4. Principal Accountant Fees and Services
(a) Audit fees.
The aggregate fees billed for services provided to the registrant by its independent auditors for the audit of the registrant’s annual financial statements and for services normally provided by the independent auditors in connection with statutory and regulatory filings or engagements were $120,000 for the fiscal year ended March 31, 2012.
____________________
1 The instructions to Form N-CSR require disclosure on the relevant experience of persons who qualify as audit committee financial experts based on “other relevant experience.” The Board of Trustees/Directors has determined that Mr. Bennett qualifies as an audit committee financial expert by virtue of: his education and Chartered Financial Analyst designation; his experience as a credit analyst, portfolio manager and the manager of other credit analysts and portfolio managers; and his prior service on the audit committees of public companies.
The aggregate fees billed for services provided to the registrant by its independent auditors for the audit of the registrant’s annual financial statements and for services normally provided by the independent auditors in connection with statutory and regulatory filings or engagements were $120,000 for the fiscal year ended March 31, 2011.
(b) Audit-related fees.
The aggregate fees billed by the registrant’s independent auditors for services relating to the performance of the audit of the registrant’s financial statements and not reported under paragraph (a) of this Item were $0 for the fiscal year ended March 31, 2012.
The aggregate fees billed by the registrant’s independent auditors for services relating to the performance of the audit of the financial statements of the registrant’s investment adviser and other service providers under common control with the adviser and that relate directly to the operations or financial reporting of the registrant were $416,500 for the registrant’s fiscal year ended March 31, 2012. The percentage of these fees relating to services approved by the registrant’s Audit Committee pursuant to the de minimis exception from the pre-approval requirement in Rule 2-01(c)(7)(i)(C) of Regulation S-X was 0%. These audit-related services were as follows: year end audit procedures; reporting up and subsidiary statutory audits.
The aggregate fees billed by the registrant’s independent auditors for services relating to the performance of the audit of the registrant’s financial statements and not reported under paragraph (a) of this Item were $0 for the fiscal year ended March 31, 2011.
The aggregate fees billed by the registrant’s independent auditors for services relating to the performance of the audit of the financial statements of the registrant’s investment adviser and other service providers under common control with the adviser and that relate directly to the operations or financial reporting of the registrant were $593,000 for the registrant’s fiscal year ended March 31, 2011. The percentage of these fees relating to services approved by the registrant’s Audit Committee pursuant to the de minimis exception from the pre-approval requirement in Rule 2-01(c)(7)(i)(C) of Regulation S-X was 0%. These audit-related services were as follows: audit procedures performed for both the reporting up on Delaware Investments’ balances for its consolidation into the parent company, Macquarie. Also, included are the fees for each of the statutory audits performed on the advisor and its affiliates/subsidiaries.
(c) Tax fees.
The aggregate fees billed by the registrant’s independent auditors for tax-related services provided to the registrant were $25,000 for the fiscal year ended March 31, 2012. The percentage of these fees relating to services approved by the registrant’s Audit Committee pursuant to the de minimis exception from the pre-approval requirement in Rule 2-01(c)(7)(i)(C) of Regulation S-X was 0%. These tax-related services were as follows: review of income tax returns and review of annual excise distribution calculations.
The aggregate fees billed by the registrant’s independent auditors for tax-related services provided to the registrant’s investment adviser and other service providers under common control with the adviser and that relate directly to the operations or financial reporting of the registrant were $0 for the registrant’s fiscal year ended March 31, 2012.
The aggregate fees billed by the registrant’s independent auditors for tax-related services provided to the registrant were $25,000 for the fiscal year ended March 31, 2011. The percentage of these fees relating to services approved by the registrant’s Audit Committee pursuant to the de minimis exception from the pre-approval requirement in Rule 2-01(c)(7)(i)(C) of Regulation S-X was 0%. These tax-related services were as follows: review of income tax returns and review of annual excise distribution calculations.
The aggregate fees billed by the registrant’s independent auditors for tax-related services provided to the registrant’s investment adviser and other service providers under common control with the adviser and that relate directly to the operations or financial reporting of the registrant were $10,000 for the registrant’s fiscal year ended March 31, 2011. The percentage of these fees relating to services approved by the registrant’s Audit Committee pursuant to the de minimis exception from the pre-approval requirement in Rule 2-01(c)(7)(i)(C) of Regulation S-X was 0%. These tax-related services were as follows: state and local tax services.
(d) All other fees.
The aggregate fees billed for all services provided by the independent auditors to the registrant other than those set forth in paragraphs (a), (b) and (c) of this Item were $0 for the fiscal year ended March 31, 2012.
The aggregate fees billed for all services other than those set forth in paragraphs (b) and (c) of this Item provided by the registrant’s independent auditors to the registrant’s adviser and other service providers under common control with the adviser and that relate directly to the operations or financial reporting of the registrant were $25,000 for the registrant’s fiscal year ended March 31, 2012. The percentage of these fees relating to services approved by the registrant’s Audit Committee pursuant to the de minimis exception from the pre-approval requirement in Rule 2-01(c)(7)(i)(C) of Regulation S-X was 0%. These other services were as follows: attest examination of management's assertion to the controls in place at the transfer agent to be in compliance with Rule 17ad-13(a)(3) of the Securities Exchange Act of 1934.
The aggregate fees billed for all services provided by the independent auditors to the registrant other than those set forth in paragraphs (a), (b) and (c) of this Item were $0 for the fiscal year ended March 31, 2011.
The aggregate fees billed for all services other than those set forth in paragraphs (b) and (c) of this Item provided by the registrant’s independent auditors to the registrant’s adviser and other service providers under common control with the adviser and that relate directly to the operations or financial reporting of the registrant were $0 for the registrant’s fiscal year ended March 31, 2011.
(e) The registrant’s Audit Committee has established pre-approval policies and procedures as permitted by Rule 2-01(c)(7)(i)(B) of Regulation S-X (the “Pre-Approval Policy”) with respect to services provided by the registrant’s independent auditors. Pursuant to the Pre-Approval Policy, the Audit Committee has pre-approved the services set forth in the table below with respect to the registrant up to the specified fee limits. Certain fee limits are based on aggregate fees to the registrant and other registrants within the Delaware Investments Family of Funds.
Service | Range of Fees |
| Audit Services | |
| Statutory audits or financial audits for new Funds | up to $25,000 per Fund |
| Services associated with SEC registration statements (e.g., Form N-1A, Form N-14, etc.), periodic reports and other documents filed with the SEC or other documents issued in connection with securities offerings (e.g., comfort letters for closed-end Fund offerings, consents), and assistance in responding to SEC comment letters | up to $10,000 per Fund |
| Consultations by Fund management as to the accounting or disclosure treatment of transactions or events and/or the actual or potential impact of final or proposed rules, standards or interpretations by the SEC, FASB, or other regulatory or standard-setting bodies (Note: Under SEC rules, some consultations may be considered “audit-related services” rather than “audit services”) | up to $25,000 in the aggregate |
| Audit-Related Services | |
| Consultations by Fund management as to the accounting or disclosure treatment of transactions or events and /or the actual or potential impact of final or proposed rules, standards or interpretations by the SEC, FASB, or other regulatory or standard-setting bodies (Note: Under SEC rules, some consultations may be considered “audit services” rather than “audit-related services”) | up to $25,000 in the aggregate |
| Tax Services | |
| U.S. federal, state and local and international tax planning and advice (e.g., consulting on statutory, regulatory or administrative developments, evaluation of Funds’ tax compliance function, etc.) | up to $25,000 in the aggregate |
| U.S. federal, state and local tax compliance (e.g., excise distribution reviews, etc.) | up to $5,000 per Fund |
| Review of federal, state, local and international income, franchise and other tax returns | up to $5,000 per Fund |
Under the Pre-Approval Policy, the Audit Committee has also pre-approved the services set forth in the table below with respect to the registrant’s investment adviser and other entities controlling, controlled by or under common control with the investment adviser that provide ongoing services to the registrant (the “Control Affiliates”) up to the specified fee limit. This fee limit is based on aggregate fees to the investment adviser and its Control Affiliates.
| Service | Range of Fees |
| Non-Audit Services | |
| Services associated with periodic reports and other documents filed with the SEC and assistance in responding to SEC comment letters | up to $10,000 in the aggregate |
The Pre-Approval Policy requires the registrant’s independent auditors to report to the Audit Committee at each of its regular meetings regarding all services initiated since the last such report was rendered, including those services authorized by the Pre-Approval Policy.
(f) Not applicable.
(g) The aggregate non-audit fees billed by the registrant’s independent auditors for services rendered to the registrant and to its investment adviser and other service providers under common control with the adviser were $10,901,705 and $25,000 for the registrant’s fiscal years ended March 31, 2012 and March 31, 2011, respectively.
(h) In connection with its selection of the independent auditors, the registrant’s Audit Committee has considered the independent auditors’ provision of non-audit services to the registrant’s investment adviser and other service providers under common control with the adviser that were not required to be pre-approved pursuant to Rule 2-01(c)(7)(ii) of Regulation S-X. The Audit Committee has determined that the independent auditors’ provision of these services is compatible with maintaining the auditors’ independence.
Item 5. Audit Committee of Listed Registrants
Not applicable.
Item 6. Investments
(a) Included as part of report to shareholders filed under Item 1 of this Form N-CSR.
(b) Divestment of securities in accordance with Section 13(c) of the Investment Company Act of 1940.
Not applicable.
Item 7. Disclosure of Proxy Voting Policies and Procedures for Closed-End Management Investment Companies
Not applicable.
Item 8. Portfolio Managers of Closed-End Management Investment Companies
Not applicable.
Item 9. Purchases of Equity Securities by Closed-End Management Investment Company and Affiliated Purchasers
Not applicable.
Item 10. Submission of Matters to a Vote of Security Holders
Not applicable.
Item 11. Controls and Procedures
The registrant’s principal executive officer and principal financial officer have evaluated the registrant’s disclosure controls and procedures within 90 days of the filing of this report and have concluded that they are effective in providing reasonable assurance that the information required to be disclosed by the registrant in its reports or statements filed under the Securities Exchange Act of 1934 is recorded, processed, summarized and reported within the time periods specified in the rules and forms of the Securities and Exchange Commission.
There were no significant changes in the registrant’s internal control over financial reporting that occurred during the second fiscal quarter of the period covered by the report to stockholders included herein (i.e., the registrant’s fourth fiscal quarter) that have materially affected, or are reasonably likely to materially affect, the registrant’s internal control over financial reporting.
Item 12. Exhibits
(a) (1) Code of Ethics
Not applicable.
(2) Certifications of Principal Executive Officer and Principal Financial Officer pursuant to Rule 30a-2 under the Investment Company Act of 1940 are attached hereto as Exhibit 99.CERT.
(3) Written solicitations to purchase securities pursuant to Rule 23c-1 under the Securities Exchange Act of 1934.
Not applicable.
(b) Certifications pursuant to Section 906 of the Sarbanes-Oxley Act of 2002 are furnished herewith as Exhibit 99.906CERT.
SIGNATURES
Pursuant to the requirements of the Securities Exchange Act of 1934 and the Investment Company Act of 1940, the registrant has duly caused this report to be signed on its behalf, by the undersigned, thereunto duly authorized.
Name of Registrant: Optimum Fund Trust
| /s/ J. SCOTT COLEMAN | |
| By: | J. Scott Coleman |
| Title: | Chief Executive Officer |
| Date: | June 6, 2012 |
Pursuant to the requirements of the Securities Exchange Act of 1934 and the Investment Company Act of 1940, this report has been signed below by the following persons on behalf of the registrant and in the capacities and on the dates indicated.
| /s/ J. SCOTT COLEMAN | |
| By: | J. Scott Coleman |
| Title: | Chief Executive Officer |
| Date: | June 6, 2012 |
| /s/ RICHARD SALUS | |
| By: | Richard Salus |
| Title: | Chief Financial Officer |
| Date: | June 6, 2012 |