UNITED STATES SECURITIES AND EXCHANGE COMMISSION
Washington, D.C. 20549
FORM N-CSR
CERTIFIED SHAREHOLDER REPORT OF REGISTERED MANAGEMENT
INVESTMENT COMPANIES
| Investment Company Act file number: | 811-21335 | |
| Exact name of registrant as specified in charter: | Optimum Fund Trust | |
| Address of principal executive offices: | 2005 Market Street | |
| Philadelphia, PA 19103 | ||
| Name and address of agent for service: | David F. Connor, Esq. | |
| 2005 Market Street | ||
| Philadelphia, PA 19103 | ||
| Registrant’s telephone number, including area code: | (800) 523-1918 | |
| Date of fiscal year end: | March 31 | |
| Date of reporting period: | March 31, 2013 |
Item 1. Reports to Stockholders
| | |||
Optimum Fixed Income Fund | |||
Optimum International Fund | |||
| Optimum Large Cap Growth Fund | |||
| Optimum Large Cap Value Fund | |||
| Optimum Small-Mid Cap Growth Fund | |||
| Optimum Small-Mid Cap Value Fund | |||
| Annual Report | |||
| March 31, 2013 | |||
Carefully consider the Funds’ investment objectives, risk factors, charges, and expenses before investing. This and other information can be found in the Funds’ prospectus and, if available, their summary prospectus, which may be obtained by visiting optimummutualfunds.com or calling 800 914-0278. Investors should read the prospectus and, if available, the summary prospectus carefully before investing.
Table of contents
| Portfolio management review | |
| Optimum Fixed Income Fund | 1 |
| Optimum International Fund | 3 |
| Optimum Large Cap Growth Fund | 6 |
| Optimum Large Cap Value Fund | 9 |
| Optimum Small-Mid Cap Growth Fund | 12 |
| Optimum Small-Mid Cap Value Fund | 14 |
| Performance summary | |
| Optimum Fixed Income Fund | 18 |
| Optimum International Fund | 22 |
| Optimum Large Cap Growth Fund | 24 |
| Optimum Large Cap Value Fund | 26 |
| Optimum Small-Mid Cap Growth Fund | 28 |
| Optimum Small-Mid Cap Value Fund | 30 |
| Disclosure of Fund expenses | 32 |
| Security type/sector/country allocations | |
| and top 10 equity holdings | 34 |
| Financial statements | |
| Statements of net assets | 38 |
| Statements of assets and liabilities | 86 |
| Statements of operations | 87 |
| Statements of changes in net assets | 88 |
| Financial highlights | 91 |
| Notes to financial statements | 115 |
| Report of independent | |
| registered public accounting firm | 131 |
| Other Fund information | 132 |
| Board of trustees and officers addendum | 133 |
| About the organization | 135 |
Investments in Optimum Fixed Income Fund, Optimum International Fund, Optimum Large Cap Growth Fund, Optimum Large Cap Value Fund, Optimum Small-Mid Cap Growth Fund, and Optimum Small-Mid Cap Value Fund are not and will not be deposits with or liabilities of Macquarie Bank Limited ABN 46 008 583 542 and its holding companies, including their subsidiaries or related companies, and are subject to investment risk, including possible delays in repayment and loss of income and capital invested. No Macquarie Group company guarantees or will guarantee the performance of the Funds, the repayment of capital from the Funds, or any particular rate of return.
Unless otherwise noted, views expressed herein are current as of March 31, 2013, and subject to change. Holdings are as of the date indicated and subject to change.
Funds are not FDIC insured and are not guaranteed. It is possible to lose the principal amount invested.
Mutual fund advisory services provided by Delaware Management Company, a series of Delaware Management Business Trust, which is a registered investment advisor. Delaware Investments, a member of Macquarie Group, refers to Delaware Management Holdings, Inc. and its subsidiaries, including the Funds’ distributor, Delaware Distributors, L.P. Macquarie Group refers to Macquarie Group Limited and its subsidiaries and affiliates worldwide.
All third-party marks cited are the property of their respective owners.
© 2013 Delaware Management Holdings, Inc.
Portfolio management review
Optimum Fixed Income Fund
April 9, 2013
| Performance review (for the year ended March 31, 2013) | ||||
| Optimum Fixed Income Fund (Class A shares) | 1-year return | +5.47% | ||
| Optimum Fixed Income Fund (Institutional Class shares) | 1-year return | +5.72% | ||
| Barclays U.S. Aggregate Index (benchmark) | 1-year return | +3.77% |
Past performance does not guarantee future results. |
Advisor
Delaware Management Company (DMC)
Sub-advisor
Pacific Investment Management Company LLC (PIMCO)
Market overview
The 12 months ended March 31, 2013 were defined in part by a dynamic global political process. The year began with a focus on Europe, as the situation in Greece fueled speculation of when, not if, the European Union (EU) would see its membership shrink. In late July 2012, a few determined statements from the European Central Bank (ECB) — later reinforced by the ECB Governing Council — stabilized markets and helped result in no sovereign exits from the EU during the period. The markets spent the remainder of 2012 weighing the costs of the Greek austerity commitment, the bailout package for Cyprus, and Spanish financial system stability against the benefits of safeguarding the European monetary union.
Despite this, the U.S. political climate often relegated geopolitical instability and uprising to second-page news. Markets confronted an evolving monetary policy that produced a third quantitative easing mortgage purchase program, targeted Treasury purchases, and significantly increased the Federal Reserve balance sheet. Risk assets generally benefited from these actions, while yields on intermediate and long-term Treasurys moved temporarily higher.
The start of 2013 brought rallies in the U.S. equity markets despite news that the world’s largest economy unexpectedly shrank during the fourth quarter of 2012. U.S. economic indicators were generally solid, as employment, manufacturing, auto sales, consumer spending, and housing statistics showed strength. Volatility followed, however, as investors tried to make sense of major political events in the U.S. and Europe. In the U.S., for example, Congress failed to reach a budget, which triggered the so-called “sequester”, invoking $1.2 trillion in automatic spending cuts over the next decade. In Europe, the surprise outcome of the Italian elections, in which no party managed to secure a governing majority, heightened concerns about the country’s commitment to the reform agenda of outgoing Prime Minister Mario Monti.
Fund performance
For the fiscal year, Optimum Fixed Income Fund (Class A shares with all dividends reinvested and excluding the applicable sales charge) outperformed its benchmark index, the Barclays U.S. Aggregate Index. The following remarks describe several factors that affected performance within the two respective portions of the Fund.
DMC
Positioning that was in place during the Fund’s fiscal year included:
- an underweight position in Treasury securities
- an overweight allocation to investment grade corporate bonds
- productive positions in emerging markets
(continues) 1
Portfolio management review
Optimum Fixed Income Fund
Generally speaking, DMC spent the fiscal year transitioning its portion of the Fund from being long versus the benchmark index (in terms of duration) to being short. Its small position in U.S. Treasury notes detracted from relative performance, and investment grade positions helped performance.
The most notable positive performance factors came from the Fund’s positioning in the high grade corporate sector. DMC maintained an overweight allocation to this sector. Emerging markets investments also garnered strong returns. Notable gains were likewise registered in the high yield corporate and developed market segments.
On the other hand, significant detractors from performance within DMC’s portion of the Fund came from hedges in European credit derivative indices, high yield credit derivative indices, and hedges on the euro. These hedges were in place throughout most of the Fund’s fiscal year. DMC began reducing the hedge positions in September 2012, and removed the last of these in December 2012 (except for the euro hedge).
DMC’s portion of the Fund had an overweight exposure to the 7- and 10-year maturity groups via corporate investments. This positioning served the portfolio well, as the 5- to 10-year maturity points of the curve recorded small rallies for the full fiscal year.
DMC also used interest rate futures in its portion of the Fund to adjust interest rate sensitivity levels during the Fund’s fiscal year. These instruments had a neutral effect on performance.
PIMCO
The PIMCO portion of the Fund maintained an underweight allocation to U.S. duration, which detracted from returns as rates fell over the 12-month period. However, tactical curve positioning, including an overweight allocation to the intermediate portion of the yield curve, where rates fell the most, more than offset the negative U.S. duration positioning. Duration exposure in other developed markets, particularly Australia and Canada, contributed to returns as interest rates also fell in these countries over the fiscal year.
An underweight allocation to corporate bonds also detracted from returns, but this was more than offset by an emphasis on the bonds of banks and other financial institutions as these securities outperformed the broader corporate market on renewed risk appetite. Within the mortgage-backed securities (MBS) sector, an underweight to agency MBS hindered returns as rates dropped due to the Federal Reserve’s quantitative-easing purchases (QE3) and investor demand for these securities, which was brought on by signs of recovery in the housing market. Exposure to nonagency MBS helped performance amid strong demand for higher-yielding assets.
Beyond the core sectors, holdings of taxable Build America Bonds (BABs) contributed to returns as the sector outpaced like-duration Treasurys due to supply technicals. Positions within the high yield corporate sector designed to benefit from the widening of European credit spreads detracted from performance as European credit spreads compressed during the period due to the risk-on environment. Performance within PIMCO’s portion of the Fund also benefited from exposure to external debt in Asia and the Middle East as spreads tightened and to Brazilian local rates as yields fell. Select developed-market currency positioning, including strategies designed to benefit from a decline in the euro and exposure to a narrow basket of emerging market currencies, added to returns as the U.S. dollar appreciated relative to the euro and depreciated relative to these emerging markets.
Derivatives, including government futures and interest rate swaps as well as credit default swaps, were used to manage duration and credit risk. These positions were used in conjunction with physical securities to tactically manage credit exposure and to focus on the intermediate portion of the yield curve; this was a net contributor for performance.
2
Optimum International Fund
April 9, 2013
| Performance review (for the year ended March 31, 2013) | ||||
| Optimum International Fund (Class A shares) | 1-year return | +8.10% | ||
| Optimum International Fund (Institutional Class shares) | 1-year return | +8.41% | ||
| MSCI EAFE Index (gross) (benchmark) | 1-year return | +11.81% | ||
| MSCI EAFE Index (net) (benchmark) | 1-year return | +11.27% |
Past performance does not guarantee future results. |
Advisor
Delaware Management Company (DMC)
Sub-advisors
BlackRock Advisors, LLC (BlackRock)
Mondrian Investment Partners Ltd. (Mondrian)
Market overview
Major headwinds to growth — namely the ongoing euro crisis, concerns over a stalling Chinese economy, and moderating U.S. economic growth — collectively began to subside during the Fund’s fiscal year, leading to a more favorable market environment. While no single catalyst was responsible for turning the table, a series of positive policy-related outcomes and further central bank easing measures, most notably an announcement by the European Central Bank, fueled an updraft in risk assets.
Concurrently, key economic indicators related to U.S. housing continued to convalesce, while last-minute U.S. “fiscal cliff” negotiations proved to be more political drama than anything of substance. Japan also garnered much attention toward the end of the Fund’s fiscal year as the new prime minister, Shinzõ Abe, began to promote aggressive monetary tactics and higher inflation targets, measures intended to weaken the yen and boost overall economic output.
Additional notes on regional developments during the Fund’s fiscal year:
- Despite the euro crisis, European equity markets were generally strong. The Belgian and Swiss equity markets rose 27.7% and 21.6%, respectively, during the period, while the French, German, and U.K. markets were each up more than 8.0%.
- Italy was one of the worst-performing markets, down 6.8%, with most of the declines taking place since its inconclusive election in late February 2013.
- In March 2013, protracted and fraught negotiations over a financial support package for Cyprus eventually produced an agreement which imposed the burden of recapitalizing Cypriot banks on bank bondholders and uninsured depositors. This situation put pressure on other peripheral markets’ banking sectors.
- In the Asia-Pacific region, New Zealand and Australia were the strongest-performing equity markets, up 22.7% and 22.2%, respectively, while the Japanese equity market only amassed 8.5%.
Fund performance
Optimum International Fund posted a positive return for its fiscal year but trailed its benchmark, the MSCI EAFE (Europe, Australasia, Far East) Index (both gross and net figures).
BlackRock
When the fiscal year began, BlackRock maintained an optimistic outlook on equity markets, based on what the firm deemed to be reasonable valuations, as well as on expectations that larger policy risks — namely a potential euro-zone breakup and the worst-case scenario of the U.S. fiscal cliff — would begin to fade.
(continues) 3
Portfolio management review
Optimum International Fund
As a result, BlackRock’s risk-reward analysis by sector led to an overweight bias toward cyclical subsectors such as asset management, construction equipment, chemicals, heavy trucks, and oil and gas services. This approach, combined with a large allocation to European names (58% on average), contributed to Fund performance during the year. Conversely, stocks selection in the energy and semiconductor sector detracted from Fund performance.
At the individual stock level, BlackRock was particularly attracted to well-run European businesses where valuations still did not reflect enhanced margin potential after years of either restructuring or successful penetration into higher growth parts of the world, like China and ASEAN (Association of Southeast Asian Nations) regions. For example, Deutsche Lufthansa is a holding that BlackRock believes stands out as a prime beneficiary of massive consolidation in the European airline industry where the gains from cost cutting are only now being realized in higher stock valuations. Similarly, exposure to Svenska Cellulosa, a Swedish tissue and packaging company, contributed meaningfully to Fund performance as investors shifted their focus to the potential for its steadier, highly cash-generative household products business (following a recent divesture of its more cyclical forest products segment).
Stock selection in energy was a negative factor, due in part to holdings in select Asian coal names. As an example, Adaro Energy, an Indonesian mining company no longer held in the Fund’s portfolio, came under pressure on account of lower production levels and lackluster coal pricing tied to a slowdown in China. Elsewhere, performance volatility in semiconductors hurt relative results as Avago Technologies, a key component supplier to the Apple iPhone platform, suggested softer forward-looking demand trends in the wireless market.
Now that global equities have repriced, although not necessarily rerated upward, it seems plausible to expect a pullback in the near term. However, BlackRock’s core thesis remains that the combination of proactive policy responses, combined with an extraordinary investment replacement cycle and still-low intrinsic valuations versus long-term history, make equities the place to continue the hunt for opportunities in the foreseeable future.
Mondrian
Overall, country allocations across Mondrian’s portion of the Fund were broadly in line with the benchmark for the fiscal year. In Europe, overweight positions toward Spain, Italy, and France held back returns while exposure to the Japanese and Taiwanese markets helped offset their effects.
At the sector level, the healthcare and consumer staples sectors were among the strongest-performing sectors, up 25.5% and 20.6% respectively during the Fund’s fiscal year. The financial sector was also strong, gaining 20.3% as European banks benefited from reduced refinancing risks following two substantial liquidity injections by the European Central Bank (ECB). In the utilities sector, ongoing regulatory concerns continued to dampen returns in the sector as it fell 2.4% for the period. Energy and materials were the worst-performing sectors, falling 5.7% and 3.3%, respectively. Lower prices for many commodities affected certain large companies in the metals and mining subindex as well.
Looking back, an additional feature of the past year was investors’ intolerance for companies whose results failed to live up to expectations. Certain stocks in Mondrian’s portion of the Fund experienced this fate. They included a diverse range of companies such as BG Group, the British oil and gas company, which fell 24.9% following a profits warning due to revised production expectations for 2013. This did not change the company’s longer-term production guidance. Canon, the Japanese printer manufacturer, fell 21.0% as slowing demand growth for office equipment weighed on the company in addition to market concerns regarding Hewlett-Packard’s strategy and commitment to laser printers. Additionally, France
4
Telecom and Telefonica fell 19.5% and 12.6%, respectively, as a result of higher-than-expected sensitivity to weak economic environments and fears of dividend cuts.
On a positive note, stocks that performed well during the Fund’s fiscal year included Sanofi, a France-based pharmaceutical company. For the period, the company’s share price gained 35.7% on the back of stronger-than-expected results and as concerns surrounding its insulin drug Lantus were reduced. Unilever, the Anglo-Dutch consumer products company, appreciated 31.8% following consistent financial results and continued profitable growth in emerging markets. Finally, Toyota Motor, the Japanese automobile manufacturer, benefited from the weaker yen and better-than-expected sales in the United States, and gained 20.6% during the Fund’s fiscal year.
(continues) 5
Portfolio management review
Optimum Large Cap Growth Fund
April 9, 2013
| Performance review (for the year ended March 31, 2013) | ||||
| Optimum Large Cap Growth Fund (Class A shares) | 1-year return | +7.76% | ||
| Optimum Large Cap Growth Fund (Institutional Class shares) | 1-year return | +8.25% | ||
| Russell 1000® Growth Index (benchmark) | 1-year return | +10.08% |
Past performance does not guarantee future results. |
Advisor
Delaware Management Company (DMC)
Sub-advisors
Fred Alger Management, Inc. (Alger)
T. Rowe Price Associates, Inc. (T. Rowe Price)
Marsico Capital Management, LLC (Marsico)
Market overview
Domestic stocks generated solid gains during the Fund’s fiscal year ended March 31, 2013. Generally, American corporations’ ongoing ability to show solid earnings growth, generate strong cash flows, and maintain healthy balance sheets boosted stock prices. The Federal Reserve’s accommodative monetary policies also firmed investors’ confidence in stocks during the fiscal year.
These factors largely helped domestic markets overcome a range of macroeconomic headwinds throughout the fiscal year, including yearlong uncertainty about the direction of U.S. fiscal policy and concerns about slow economic growth in the United States and Europe, coupled with ongoing concerns surrounding the debt crisis in the euro zone.
Within the equity markets, mid- and small-cap shares generally outpaced large-caps, and value stocks strongly outperformed growth stocks.
Fund performance
Optimum Large Cap Growth Fund lagged its benchmark index for the fiscal year, due in part to underperformance within the healthcare sector across the portions of the Fund that Alger and T. Rowe Price manage. Returns within the consumer discretionary and energy sectors detracted from performance for the portion of the Fund that Marsico manages.
Alger
One of Alger’s long-standing priorities has been to achieve exposure to high-quality U.S. companies that might benefit from strong emerging market demand. Alger believes it owned these types of companies within the consumer discretionary and financial sectors during the fiscal year, both of which benefited performance within Alger’s portion of the Fund. The most significant detractors to portfolio performance within Alger’s portion of the Fund came from the consumer staples and healthcare sectors. In both instances, stock selection led to disappointing performance.
Among individual stocks, eBay was the largest individual contributor to positive performance (on a relative basis) within Alger’s portion of the Fund. The company brings together millions of buyers and sellers every day on a local, national, and international basis through an array of websites. Alger looked favorably upon the shares as the company improved its pace of innovation and leveraged its core assets into the mobile landscape, leading to accelerated growth in e-commerce. Alger believes eBay can see improved growth driving long-term margin expansion, if eBay retakes share in e-commerce and grows its online payment processing businesses.
6
News Corp. was another important contributor to Alger’s portion of the Fund. News Corp. is a diversified global media company with operations across a wide array of industry segments. Alger continued to own shares in the company as of the end of the fiscal year because it was the fastest growing network, bolstered by sports, news, and international programming, each of which was in growth mode.
Apple, whose shares posted a 27% decline during the Fund’s fiscal year, was the largest detractor from Alger’s portion of the Fund. Apple suffered some margin compression during the fiscal year as it introduced several new products, reported somewhat disappointing earnings as customers waited for the newest versions of the iPhone, and lost some market share to its strongest competitor, Samsung. With net cash of more than $140 per share, a current annual dividend of $11 per share, and free cash flow generation of more than $50 per share annually, Alger believed that Apple’s shares were attractively valued at the end of the Fund’s fiscal year. As a result, it maintained its position in the stock.
Caterpillar was another relatively large detractor from Alger’s portion of the Fund during the fiscal year, as shares of the company registered a double-digit loss. Caterpillar is the world’s largest manufacturer of construction and earthmoving equipment. A weakening environment within the mining industry, inventory buildups in China, and diminished agricultural demand in North America combined to hurt Caterpillar during the fiscal year.
Looking forward, however, Alger believes that the company can potentially achieve strong growth in the coming years, based on its forecast of 3%-plus gross domestic product growth in the U.S., a healthy Chinese economy, and a recovering European economy. As a result, Alger maintained a position in the company as of the end of the fiscal year.
T. Rowe Price
The consumer discretionary sector was the largest relative detractor within T. Rowe Price’s portion of the Fund. Within this sector, priceline.com and Chipotle Mexican Grill were the greatest individual detractors. Concerns over the health of the euro-zone economy, combined with worries that higher payroll taxes in the U.S. would reduce domestic consumer spending, weighed on share prices of online travel company priceline.com. Chipotle was hurt by slowing sales and higher food costs, a combination that also drove down the share prices of many other chain restaurants in the U.S.
T. Rowe Price’s position within the healthcare sector, and particularly its underweight position in the strong-performing pharmaceuticals industry during the fiscal year, also detracted from performance within its portion of the Fund. Its positions within the healthcare providers and services industry also hurt its relative performance, as many managed-care companies were affected by concerns that Medicare reimbursements would be cut as costs rose.
Information technology was the top performer within T. Rowe Price’s portion of the Fund. Within this sector, shares of Google moved higher as the company profited from the popularity of smartphones running on its Android operating system. Google has expanded its efforts to increase mobile-use monetization, and has attracted advertisers by offering a single package that utilizes both mobile and personal-computer endpoints.
Telecommunication services holdings also contributed to the performance of T. Rowe Price’s portion of the Fund. Specifically within this sector, holding Crown Castle International benefited, as did other wireless communication tower companies, from strong demand for higher data capacity to support smartphone technology.
Marsico
The Marsico investment approach seeks stocks of companies that have potential for long-term capital appreciation. Marsico’s investment process combines top-down macroeconomic and industry analysis with individual stock selection.
During the Fund’s fiscal year, stock selection in the consumer discretionary and energy sectors was the primary source of underperformance within Marsico’s
(continues) 7
Portfolio management review
Optimum Large Cap Growth Fund
portion of the Fund. A portion of its consumer discretionary stocks were positioned in companies with high-end brands in an attempt to benefit from growing high-net-worth populations in emerging markets. Early in the Fund’s fiscal year, however, concerns about a global economic slowdown negatively affected some of the Fund’s consumer stocks. In particular, positions in luxury goods retailers Cie Financiere Richemont and Coach, which produce significant revenues from Asia, were pressured. Marsico sold both positions from its portion of the Fund during the fiscal year.
Marsico believes that a paradigm shift is taking place in energy production as advances in horizontal drilling and hydraulic fracturing techniques have allowed for energy exploration companies to drill for previously unreachable natural gas and crude oil. One of the ways in which Marsico chose to participate in the energy theme was through positions in oilfield services companies National Oilwell Varco and Halliburton. However, both stocks were hurt by low natural gas prices, which prompted drillers to reduce their land rig count in the U.S. While Marsico believes in the long-term tailwinds of this theme, it did not see a likely recovery in rig count until the back half of 2013 at the earliest, and sold its positions in both stocks.
The information technology sector was a contributor to Marsico’s portion of the Fund. A particular benefit to performance came from Marsico’s sale of Apple during the fiscal year. It began selling the position in 2012 and was completely out of the stock prior to Apple’s announcement of quarterly earnings in January 2013, at which time the stock price fell further. Marsico exited the position because it was concerned that Apple’s product pipeline was lacking a major catalyst and a recurring revenue stream.
Another bright spot for Marsico’s portion of the Fund came from healthcare stocks. Several biotechnology and pharmaceutical companies stood out for their strong returns during the fiscal year, including Biogen Idec, Gilead Sciences, and Bristol-Myers Squibb. These companies introduced products during the fiscal year that have large markets. Marsico believes these companies have distinguished themselves as a result of the innovative science they are using to perform drug research.
8
Optimum Large Cap Value Fund
April 9, 2013
| Performance review (for the year ended March 31, 2013) | |||
| Optimum Large Cap Value Fund (Class A shares) | 1-year return | +12.48% | |
| Optimum Large Cap Value Fund (Institutional Class shares) | 1-year return | +12.92% | |
| Russell 1000® Value Index (benchmark) | 1-year return | +18.77% |
For complete, annualized performance for Optimum Large Cap Value Fund, please see the table on page 26.
The performance of Class A shares excludes the applicable sales charge and reflects the reinvestment of all distributions.
Institutional Class shares are available without sales or asset-based distribution charges only to certain eligible investors.
Index performance returns do not reflect any management fees, transaction costs, or expenses. Indices are unmanaged and one cannot invest directly in an index.
Advisor
Delaware Management Company (DMC)
Sub-advisors
Herndon Capital Management, LLC (Herndon)
Massachusetts Financial Services Company (MFS)
Market overview
The beginning of the Fund’s fiscal year was characterized by a risk-on sentiment as a result of additional liquidity measures by the U.S. Federal Reserve and the European Central Bank (ECB), as well as a commensurate improvement in macroeconomic conditions. During this time, global equity valuations rose, credit spreads contracted, and high-quality sovereign yields increased modestly.
Within a couple of months, however, conditions worsened, driven by broadly weaker global macroeconomic indicators, as well as renewed concerns over the euro zone’s capacity and determination to address its ongoing crisis. Despite this deterioration, broad market sentiment remained relatively resilient as equity markets generally maintained gains and credit spreads did not indicate deterioration.
However, this renewed weakness in the fundamentals precipitated a further round of monetary easing by both the Fed (through a third round of quantitative easing) and the ECB (through a new bond-purchase facility) in the middle of the Fund’s fiscal year, which helped instill additional confidence in risk markets. Nonetheless, toward the end of 2012, weaker equity earnings reports and declining forward guidance caused market sentiment to soften. In addition, fiscal-cliff negotiations between congressional Republicans and President Obama were a particular source of market attention, as the uncertainty surrounding the fiscal negotiations continued right up to the Dec. 31 deadline. A last-minute political agreement averted the worst-case scenario and markets gravitated toward risk assets again; however, heading into 2013, the implementation of the U.S. budget sequester, combined with the uncertainty surrounding the Italian election results, inserted a greater degree of caution as the fiscal year ended.
Fund performance
Optimum Large Cap Value Fund underperformed its benchmark primarily due to weak returns by several high-profile holdings in the Fund. The holdings, which represented a number of sectors and were held by different sub-advisors for the Fund, included Cliffs Natural Resources, Coach, Philip Morris International, and Western Union.
Herndon
Herndon’s approach in this market environment has been to identify what it views as value-creating opportunities, and this approach led to positive returns during the fiscal year, though they lagged those of the benchmark index. These results may not be surprising, given the current environment in which the market continues to be as much affected by macro events and sentiment as by company fundamentals.
The two sectors that contributed most to the performance of Herndon’s portion of the Fund were healthcare and energy. Over the course of the Fund’s fiscal year, nine of Herndon’s holdings in the healthcare sector generated returns exceeding 40% (versus just a 20% gain from the
(continues) 9
Portfolio management review
Optimum Large Cap Value Fund
benchmark’s healthcare holdings). The positive effects from stock selection offset a slight negative effect from allocation. An overweight allocation and outperformance in the energy sector proved beneficial to Herndon’s portion of the Fund as its energy names made significant gains (versus slight gains from the benchmark’s energy stocks).
The two sectors that detracted the most from the performance of Herndon’s portion of the Fund were consumer discretionary and materials. In both cases, along with negative absolute returns (due principally to two stocks in each sector), an overweight position in these sectors exacerbated the negative results. Investments in high-end retailer Coach and for-profit education company Apollo Group proved less than profitable, especially when compared to the consumer discretionary stocks within the benchmark, which gained almost 30%. And while the benchmark’s materials sector gained less than 5% for the Fund’s fiscal year (the worst of any sector), Herndon’s holdings failed to keep up as well. Underperformance coupled with an overweight allocation to the sector proved unfavorable.
Two names that performed quite well and contributed to Herndon’s portion of the Fund were Marathon Petroleum and Health Management Associates. These stocks remain in the portfolio as they continue to meet Herndon’s criteria for value-creating opportunities.
Marathon Petroleum sells refined products through a nationwide network of branded gas stations. It also holds stakes in pipelines and is one of the largest asphalt and light-oil product terminal operators in the United States. Improvements in revenue, earnings, and profit margins helped propel the stock’s performance.
Health Management Associates is an owner of more than 65 hospitals and acute healthcare facilities in suburban and rural markets primarily in the southeastern U.S. — the stock’s strong performance was primarily due to fewer concerns over corporate governance and management. Also, the stock has benefited as many investors have become enthusiastic that new healthcare regulations will likely lead to more patients.
Two stocks that significantly detracted from Herndon’s portion of the Fund during the fiscal year were Cliffs Natural Resources and Herbalife. Cliffs Natural Resources is an international mining and natural resources company that produces iron ore and metallurgical coal in the U.S., Canada, and Australia. The company’s recent disappointing earnings results, coupled with a dividend cut and new share issuance leading to dilution for current shareholders, have disappointed long-only investors in this stock. Herndon continues to hold the stock, given that Cliffs has reduced debt, lowered its dividend, disposed of noncore assets, and refinanced near-term debt maturities. Cliffs management’s actions to maintain financial flexibility — while somewhat discomforting for the short term — seem to be prudent measures to help the company execute on its long-term plans for future organic growth and expansion.
Herbalife manufactures and distributes weight-control products including meal replacements, snacks, and “enhancers.” It also offers nutritional supplements, energy drinks, and skincare products. In 2013, Herbalife found itself at the center of an ugly skirmish between two hedge-fund heavyweights. While the company’s fundamentals and growth story appear to be intact, concerns over valuation, its risk-reward profile, and weak relative performance led Herndon to exit the position at the end of the Fund’s fiscal year.
MFS
The management team at MFS continues to believe that focusing on investing in high-quality, undervalued stocks can give the best potential for delivering long-term, strong risk-adjusted returns. The market environment did, however, present headwinds for MFS’s strategy given the outperformance of companies with high betas (that is, stocks considered to have higher volatility in relation to the market) and low return on equities as compared to those with low betas and high return on equities (which is more consistent with those owned in MFS’s portion of the Fund). This continued to present some attractive investment opportunities, in the team’s opinion,
10
in a number of larger-capitalization, higher-quality companies. The team continued to add to these types of companies throughout the Fund’s fiscal year.
Security selection in the consumer staples sector detracted from the Fund’s relative performance. MFS’s holdings of tobacco companies Philip Morris International and Lorillard hurt relative performance as both stocks underperformed the benchmark during the fiscal year.
An underweight allocation and poor stock selection within the strong-performing utilities-and-communications sector also weakened relative performance. Within this sector, the Fund’s avoidance of telecommunications services provider Verizon Communications at the beginning of the period detracted from performance within MFS’s portion of the Fund.
Stock selection in both the retail and financial services sectors detracted from relative returns. Within the financial services sector, holdings of poor-performing money transfer services firm Western Union held back relative performance.
Elsewhere, MFS’s holdings of diversified technology products and services company International Business Machines (IBM) and cardiovascular medical device maker St. Jude Medical, and its lack of a position in strong-performing integrated oil company Phillips 66, had a negative effect on relative performance.
Cash and cash equivalents were another detractor from relative performance. MFS strives to be fully invested and generally holds cash to buy new holdings and to provide liquidity. In a period when equity markets rose, as measured by the Fund’s benchmark, holding cash hurt performance versus the benchmark, which does not have a cash component.
Stock selection in the basic materials sector contributed to relative performance. Holdings of protective and decorative coatings manufacturer PPG Industries boosted performance as the stock outpaced the benchmark over the course of the Fund’s fiscal year.
The Fund’s position in poorly performing integrated oil and gas company Exxon Mobil was the largest individual detractor from performance. Elsewhere, the Fund’s holdings of alcoholic beverage producer Diageo, insurance company St. Paul Travelers, media company Viacom, automotive supplier Delphi Automotive, paint retailer Sherwin Williams, and an underweight position in network equipment company Cisco Systems, had a positive impact on relative performance. Avoiding shares of weak-performing health insurance provider UnitedHealth Group and oil & gas producer Devon Energy also helped performance.
(continues) 11
Portfolio management review
Optimum Small-Mid Cap Growth Fund
April 9, 2013
| Performance review (for the year ended March 31, 2013) | |||
| Optimum Small-Mid Cap Growth Fund (Class A shares) | 1-year return | +12.50% | |
| Optimum Small-Mid Cap Growth Fund (Institutional Class shares) | 1-year return | +12.94% | |
| Russell 2500™ Growth Index (benchmark) | 1-year return | +13.69% |
For complete, annualized performance for Optimum Small-Mid Cap Growth Fund, please see the table on page 28.
The performance of Class A shares excludes the applicable sales charge and reflects the reinvestment of all distributions.
Institutional Class shares are available without sales or asset-based distribution charges only to certain eligible investors.
Index performance returns do not reflect any management fees, transaction costs, or expenses. Indices are unmanaged and one cannot invest directly in an index.
Advisor
Delaware Management Company (DMC)
Sub-advisors
Wellington Management Company, LLP (Wellington)
Columbia Wanger Asset Management, LLC (Columbia WAM)
Market overview
Global equity markets performed well over the Fund’s fiscal year ended March 31, 2013. The global slow-growth environment did not appear to diminish investor appetite for equities, particularly as several downside risks seemed to abate during the fiscal year. Concerns about the euro zone generally remained in check as policy makers seemed committed to saving the euro. Additionally, numerous central banks around the globe continued their aggressive monetary stimulus policies in an effort to jumpstart sustainable economic recovery from the financial crisis that remains fresh on many investors’ minds. China, a major engine of global growth, also showed signs that its economy would not experience a “hard landing.”
Despite concerns about the so-called fiscal cliff and sequestration cuts in the United States, domestic investors bid up risk assets amid signs of improvement in the U.S. housing market, for the first time in approximately seven years. Housing prices in the U.S. began 2013 with the largest 12-month advance since August 2006. Better-than-expected corporate earnings and generally improving economic data also provided tailwinds for stocks.
Fund performance
Optimum Small-Mid Cap Growth Fund underperformed its benchmark index for the Fund’s fiscal year, due in part to poor performance by information technology holdings in the portfolios of both sub-advisors.
Wellington
Wellington’s portion of the Fund generated strong absolute gains but underperformed the Fund’s benchmark index for the fiscal year. Weak security selection within the information technology and financial sectors drove underperformance within Wellington’s portion of the Fund, while strong performance in the energy, healthcare, and consumer discretionary sectors contributed to relative results for the fiscal year ended March 31, 2013.
At the individual security level, top relative contributors for Wellington’s portion of the Fund included companies in the industrials, consumer discretionary, and healthcare sectors. Shares of DigitalGlobe, a digital imaging products and service provider for defense, intelligence, and industrial applications, increased during the year after DigitalGlobe reached a resolution on a merger agreement with former competitor GeoEye. Wellington continued to hold its position in this stock as of the end of the Fund’s fiscal year. U.S. homebuilder PulteGroup was another contributor to Wellington’s portion of the Fund. This stock’s price rose during the Fund’s fiscal year as signs of stabilization began to turn investor sentiment positive toward housing in the first half of 2012. Following many years of decline, investors began contemplating future home-price appreciation as the combination of record home affordability, an improving jobs picture, and very low levels of new home construction provided a powerful backdrop for U.S. homebuilders. The investment team at Wellington exited its position as PulteGroup’s shares approached the team’s target price. Finally, Gen-Probe, a biotechnology firm specializing in molecular diagnostics products, also contributed to performance. Share prices rose after the company announced that it would be acquired by Hologic, a leading
12
manufacturer and supplier of diagnostic, surgical, and medical imaging equipment and products. Wellington eliminated its position in Gen-Probe after the stock passed the investment team’s target price.
VeriFone Systems, a company that designs, markets, and services electronic payment solutions worldwide, was one of the top detractors from Wellington’s portion of the Fund. Weak macroeconomic conditions in Europe, lower revenue from Brazil-based business, and delays in customer projects caused the company to lower earnings estimates, which may have contributed to a decrease in share price. Wellington eliminated its position in the stock during the Fund’s fiscal year. Riverbed Technology, a wide-area networks (WAN) optimization provider that offers cloud computing services, was another detractor from Wellington’s portion of the Fund. Wellington eliminated its position in Riverbed during the year as shares in the company declined based on soft earnings and concerns about the ongoing impact of a weak demand environment. In the healthcare sector, Abiomed also detracted from performance. Shares of Abiomed, a cardiac treatment-focused medical device manufacturer, declined because of controversy regarding the efficacy and labeling of the company’s Impella ventricular support treatment. Wellington eliminated its position in Abiomed during the year.
Columbia WAM
During the Fund’s fiscal year, Columbia WAM continued to employ its low-turnover, bottom-up, fundamental strategy to the portion of the Fund that it manages. The investment team works to identify reasonably priced growth companies that it believes are positioned to grow over the next three to five years.
At the sector level, the team lowered its allocations in the energy and telecom sectors and increased its allocation to financials during the Fund’s fiscal year. Columbia WAM lowered its energy allocation due to its perception of changing supply-demand dynamics within the sector. Specifically, energy supply has increased due to new technology, while demand has decreased due to conservation efforts.
Consumer discretionary and healthcare companies were strong contributors to performance during the Fund’s fiscal year. A variety of different companies linked to the consumer discretionary sector performed well for Columbia WAM’s portion of the Fund as U.S. consumers became more confident in the economic recovery, due in part to the housing recovery and an improving stock market. Within the healthcare sector, Columbia WAM generally stayed away from areas that could potentially be affected by healthcare reform and government reimbursement risk.
Underweight allocations to the financials and real estate sectors were the largest detractors from Columbia WAM’s portion of the Fund during the fiscal year. Financial stocks were surprisingly strong performers, while real estate also performed well as investors continued to seek yield in a low interest rate environment.
At the individual stock level, Ryman Hospitality Properties, formerly Gaylord Entertainment, was a top contributor to Columbia WAM’s portion of the Fund. The stock’s performance surged during the Fund’s fiscal year as the company converted its status as a hotel, resort, entertainment, and media company to a real estate investment trust (REIT) that specializes in group-oriented, destination hotel assets in urban and resort markets. Avis Budget Group, a leading global provider of vehicle rental services, was the second-largest contributor to performance. The stock’s performance was likely boosted by high fleet utilization as well as what Columbia WAM viewed as a positive new pricing trend within the rental car industry.
The largest detractors from Columbia WAM’s portion of the Fund during the fiscal year came from technology stocks. Share prices of Informatica, a data integration software company, declined during the fiscal year after the company reported disappointing earnings that likely came as a result of a slowdown in sales to European customers. Atmel was another notable detractor from performance during the fiscal year. The company manufactures microcontrollers that are used in the industrial, consumer, security, communications, computing, and automotive markets. Its stock was likely affected by declining revenues and a lost contract bid.
(continues) 13
Portfolio management review
Optimum Small-Mid Cap Value Fund
April 9, 2013
| Performance review (for the year ended March 31, 2013) | |||
| Optimum Small-Mid Cap Value Fund (Class A shares) | 1-year return | +13.23% | |
| Optimum Small-Mid Cap Value Fund (Institutional Class shares) | 1-year return | +13.56% | |
| Russell 2500™ Value Index (benchmark) | 1-year return | +21.17% |
For complete, annualized performance for Optimum Small-Mid Cap Value Fund please see the table on page 30.
The performance of Class A shares excludes the applicable sales charge and reflects the reinvestment of all distributions.
Institutional Class shares are available without sales or asset-based distribution charges only to certain eligible investors.
Index performance returns do not reflect any management fees, transaction costs, or expenses. Indices are unmanaged and one cannot invest directly in an index.
Advisor
Delaware Management Company (DMC)
Sub-advisors
The Delafield Group, a division of Tocqueville Asset Management L.P. (Tocqueville)
The Killen Group, Inc. (Killen)
Westwood Management Corp. (Westwood)
Market overview
Despite a mostly unchanged global economic landscape and uncertainty regarding the outcome of the U.S. presidential election, equity markets generally achieved strong gains during the Fund’s fiscal year ended March 31, 2013. In general, investors seemed buoyed by directionally favorable, albeit modest, improvements in U.S. economic data along with reasonably positive corporate earnings reports, and the Federal Reserve’s announcement in September 2012 that it would engage in new, and open-ended, quantitative easing measures.
Toward the end of 2012, however, investors’ worries were rekindled on several fronts that included the European sovereign debt crisis and the fiscal cliff standoff in the United States. Global markets had a mixed response as a result, although the Fund’s benchmark (the Russell 2500 Value Index) registered a solid gain during the last three months of 2012, compared to the broad stock market’s decline. Despite reminders of the fragile status of Europe’s economies (most recently in Cyprus), investors cheered a last-minute deal for the so-called fiscal cliff to start the new calendar year. Improved U.S. housing and jobs market data reports and relative stability in the U.S. fiscal situation drove strong market returns to close out the Fund’s fiscal year on a high note.
Fund performance
Security selection by two of Optimum Small-Mid Cap Value Fund’s sub-advisors across the consumer staples, energy, consumer discretionary, and real estate investment trusts (REITs) sectors was a leading factor in the Fund’s underperformance versus its benchmark. An underweight allocation to the strong-performing financials sector by one of the sub-advisors was another notable detractor.
Tocqueville
Despite the uncertain macroeconomic environment, Tocqueville stayed true to its investment strategy throughout the Fund’s fiscal year, as it continued to employ its bottom-up (stock-by-stock) approach. Tocqueville generally seeks to hold stocks of companies whose management teams it believes are taking action to position their businesses for the long term.
Tocqueville’s limited exposure to the financial sector detracted from relative performance, as the financial sector outperformed the overall index for the Fund’s fiscal year and also constituted the largest component of the index. Additionally, Tocqueville held no utilities stocks during this period, which also detracted from relative returns within its portion of the Fund.
Tocqueville’s stock selection was mixed during the Fund’s fiscal year. Its holdings in the materials sector strongly outperformed comparable index positions and, owing to an overweight allocation in the space, contributed to performance of Tocqueville’s portion of the Fund.
14
In contrast, investments in its other large areas of exposure, namely industrials and information technology, underperformed the index for the fiscal year.
PolyOne was the top contributor to the performance of Tocqueville’s portion of the Fund. This company reported solid earnings and continued to demonstrate a successful expansion of its product offerings to include custom-engineered structure and packaging solutions. Sealed Air, a packaging producer, was another large contributor to performance, benefiting from stabilized earnings trends and senior management appointments that the market generally viewed as favorable.
Tocqueville’s investments in ACCO Brands and Plexus were the largest detractors from performance within its portion of the Fund. ACCO, a supplier of branded office products, experienced disappointing earnings results and Plexus, a provider of electronic manufacturing services, was battered after announcing the loss of its largest customer. Despite the stocks’ recent challenges, Tocqueville continued to hold them. It continues to view ACCO’s May 2011 merger with MeadWestvaco’s office products business positively, with the belief that, over time, the combined businesses should realize improved earnings power as well as substantial free cash flow and debt reduction. With respect to the Plexus investment, Tocqueville believes the long-term financial model for the company — specifically, its targets of 10% gross margins and 5% operating margins — remains achievable. Further, with a modest net cash position and more than $100 million in estimated free cash flow in fiscal 2013, Tocqueville believes that Plexus could be well positioned to accelerate an opportunistic share repurchase program that its board has authorized.
Killen
Killen’s strategy seeks overlooked and undervalued businesses. During the Fund’s fiscal year, it found contrarian investment opportunities in a number of disparate sectors, including consumer discretionary, industrials, information technology, healthcare, and telecom services. The market’s weakness during the first few months of the fiscal year allowed Killen to opportunistically deploy cash reserves that had risen during the preceding quarters. In similar fashion, cash rose once again during the second half of the Fund’s fiscal year as valuations became somewhat extended, in Killen’s view.
As a value-based, bottom-up investment manager, Killen does not change or adapt its approach to the economic environment. While remaining cognizant of the broader economic conditions, it uses a company-by-company approach, looking at the long-term potential for each business and judging its valuation based on that analysis. Additionally, Killen believes its valuation discipline can help mitigate portfolio risk, as it is willing to maintain cash when investments are sold if it cannot find replacements at suitable valuations.
During the Fund’s fiscal year, Killen’s allocations to specific sectors were attributable to its value-oriented stock selection process, and not consciously targeted. Nevertheless, Killen derived positive contributions from the financials, information technology, materials, industrials, and consumer discretionary sectors. The solid returns from these sectors were primarily the result of one or more stocks performing well in each sector, rather than from sector positioning.
Killen underperformed the benchmark index for the Fund’s fiscal year in the consumer staples and energy sectors. Killen’s lagging performance in both sectors was mainly a result of stock-specific factors.
Winnebago Industries, a manufacturer of recreational vehicles, and Stewart Information Services, a title insurance company, were notable contributors to performance within Killen’s portion of the Fund. Winnebago benefited from a number of developing trends, such as an improving economic outlook, pent-up demand, and the return of financing availability. Stewart rallied from depressed levels on the strength of refinancing activity and the general improvement in housing.
Portfolio management review
Optimum Small-Mid Cap Value Fund
SkyWest, a regional airline carrier that serves as a feeder to hubs of major airlines, and Gulf Island Fabrication, a manufacturer of offshore drilling platforms and other structures used primarily in oil and gas exploration, were examples of detractors within Killen’s portion of the Fund. Each stock fell more than 20% for the Fund’s fiscal year.
SkyWest suffered from a decline in revenues as a result of increased training costs and a challenging integration of an acquired rival. Consequently, Killen felt the management team was not able to deliver on its margin and revenue growth targets, and projected that the company’s fundamentals would deteriorate. In keeping with its sell discipline, Killen completely exited the holding during the fiscal year. Gulf Island Fabrication suffered more as a result of company-specific issues, including the bankruptcy of a client with an existing contract and cost overruns on another contract. Killen believes that Gulf Island remains financially strong, and maintained its position within the Fund.
Westwood
Throughout the Fund’s fiscal year, Westwood continued to use the consistent and disciplined investment approach that it employs through all market environments; that is, Westwood focuses on what it views as high-quality companies with strong fundamental characteristics and visible earnings prospects.
Security selection in the technology and utilities sectors helped the relative performance of Westwood’s portion of the Fund. Utilities generally benefited from the demand for safety and yield during the first part of the Fund’s fiscal year, while technology companies gained from secular growth trends in storage, enterprise software, and cloud services.
Security selection in the consumer discretionary and REIT sectors detracted from relative performance within Westwood’s portion of the Fund. The economically-sensitive consumer discretionary sector was hurt by uncertainty in the U.S. and global economies in the earlier part of the fiscal year. In addition, Westwood’s underweight allocation to REITs, which are similarly sensitive to macroeconomic factors, was a drag on performance as the economy gained strength and investors seemed to gain confidence.
j2 Global, a provider of cloud-based communications and storage services to businesses, was the top-performing security for Westwood’s portion of the Fund for the fiscal year. The company reported strong results during its second and fourth fiscal quarters that highlighted its attractive growth opportunities and investor demand for companies with attractive dividend yields. Packaging Corporation of America, a manufacturer and seller of packaging materials for industrial and consumer use, also added to returns within Westwood’s portion of the Fund. The stock rose after the company reported a second-quarter earnings surprise, resulting from revenue growth that exceeded expectations.
Navistar International manufactures and markets medium and heavy trucks, school buses, midrange diesel engines, and service parts worldwide. This company, which fell on the announcement of a slowdown of global heavy truck orders, was the worst-performing security for Westwood’s portion of the Fund during the fiscal year. Based on the company’s declining fundamentals, Westwood ultimately sold the stock.
Swift Energy, an independent oil and gas company that explores, acquires, and operates oil and gas properties, declined as a result of falling crude oil prices and expectations for weaker commodity demand. While Westwood is optimistic about oil and gas commodity prices over the medium and longer term, it was not comfortable with Swift’s increased spending and lack of defensive hedging. Westwood felt that both could be damaging in the event of a rebound in commodity prices. As a result, Westwood exited the position during the Fund’s fiscal year, seeking a company with a better natural gas hedge and balance sheet.
16
Performance summary
Optimum Fixed Income Fund
The performance data quoted represent past performance; past performance does not guarantee future results. Investment return and principal value will fluctuate so your shares, when redeemed, may be worth more or less than their original cost. Please obtain the performance data for the most recent month end by calling 800 914-0278 or visiting our website at optimummutualfunds.com. Current performance may be lower or higher than the performance data quoted.
| Fund performance1, 2 | |||||||||
| Average annual total returns | |||||||||
| Through March 31, 2013 | 1 year | 3 years | 5 years | Lifetime | |||||
| Class A (Est. Aug. 1, 2003) | |||||||||
| Excluding sales charge | +5.47% | +6.40% | +7.32% | +6.05% | |||||
| Including sales charge | +0.70% | +4.77% | +6.34% | +5.55% | |||||
| Class B (Est. Aug. 1, 2003) | |||||||||
| Excluding sales charge | +4.69% | +5.72% | +6.65% | +5.49% | |||||
| Including sales charge | +0.69% | +5.04% | +6.42% | +5.49% | |||||
| Class C (Est. Aug. 1, 2003) | |||||||||
| Excluding sales charge | +4.69% | +5.72% | +6.62% | +5.37% | |||||
| Including sales charge | +3.69% | +5.72% | +6.62% | +5.37% | |||||
| Institutional Class (Est. Aug. 1, 2003) | |||||||||
| Excluding sales charge | +5.72% | +6.76% | +7.70% | +6.42% | |||||
| Including sales charge | +5.72% | +6.76% | +7.70% | +6.42% |
1Returns reflect the reinvestment of all distributions and are presented both with and without the applicable sales charges described below. Returns do not reflect the deduction of taxes the shareholder would pay on Fund distributions or redemptions of Fund shares.
Expense limitations were in effect for certain classes during some or all of the periods shown in the “Fund performance” chart. The current expenses for each class are listed on the “Fund expense ratios” table on page 19. Performance would have been lower had expense limitations not been in effect.
Class A shares are sold with a maximum front-end sales charge of 4.50%, and have an annual distribution and service fee of 0.35% of average daily net assets. Performance for Class A shares, excluding sales charges, assumes that no front-end sales charge applied.
Class B shares may be purchased only through dividend reinvestment and certain permitted exchanges as described in the prospectus. Please see the prospectus for additional information on Class B shares. Class B shares have a contingent deferred sales charge that declines from 4.00% to zero depending on the period of time the shares are held. They are also subject to an annual distribution and service fee of 1.00% of average daily net assets. Class B shares will automatically convert to Class A shares on a quarterly basis approximately eight years after purchase. Lifetime performance figures for Class B shares reflect conversion to Class A shares after approximately eight years.
Class C shares are sold with a contingent deferred sales charge of 1.00% if redeemed during the first 12 months. They are also subject to an annual distribution and service fee of 1.00% of average daily net assets.
Performance for Class B and C shares, excluding sales charges, assumes either that contingent deferred sales charges did not apply or that the investment was not redeemed.
Institutional Class shares are available without sales or asset-based distribution charges only to certain eligible investors.
The “Fund performance” table and the “Performance of a $10,000 investment” graph do not reflect the deduction of taxes the shareholder would pay on Fund distributions or redemptions of Fund shares.
2The Fund’s expense ratios, as described in the most recent prospectus, are disclosed in the following “Fund expense ratios” table. Delaware Management Company has agreed to reimburse certain expenses and/or waive certain fees in order to prevent total annual fund operating expenses (excluding certain other expenses) from exceeding 1.00% of the Fund’s average daily net assets from July 27, 2012, through July 29, 2013. Please see the most recent prospectus and any applicable supplement(s) for additional information on these fee waivers and/or reimbursements.
18
| Fund expense ratios | Class A | Class B | Class C | Institutional Class | ||||
| Total annual operating expenses | ||||||||
| (without fee waivers) | 1.44% | 2.09% | 2.09% | 1.09% | ||||
| Net expenses | ||||||||
| (including fee waivers, if any) | 1.35% | 2.00% | 2.00% | 1.00% | ||||
| Type of waiver | Contractual | Contractual | Contractual | Contractual |
Fixed income securities and bond funds can lose value, and investors can lose principal, as interest rates rise. They also may be affected by economic conditions that hinder an issuer’s ability to make interest and principal payments on its debt.
The Fund may also be subject to prepayment risk, the risk that the principal of a fixed income security that is held by the Fund may be prepaid prior to maturity, potentially forcing the Fund to reinvest that money at a lower interest rate.
High yielding, noninvestment grade bonds (junk bonds) involve higher risk than investment grade bonds. The high yield secondary market is particularly susceptible to liquidity problems when institutional investors, such as mutual funds and certain other financial institutions, temporarily stop buying bonds for regulatory, financial, or other reasons. In addition, a less liquid secondary market makes it more difficult for the Fund to obtain precise valuations of the high yield securities in its portfolio.
If and when we invest in forward foreign currency contracts or use other investments to hedge against currency risks, the Fund will be subject to special risks, including counterparty risk.
The Fund may invest in derivatives, which may involve additional expenses and are subject to risk, including the risk that an underlying security or securities index moves in the opposite direction from what the portfolio manager anticipated. A derivative transaction depends upon the counterparties’ ability to fulfill their contractual obligations.
The Fund may experience portfolio turnover in excess of 100%, which could result in higher transaction costs and tax liability.
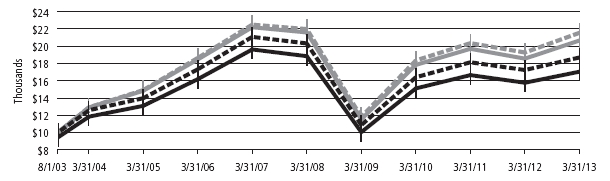
Performance of a $10,000 Investment1
Average annual total returns from Aug. 1, 2003 (Fund’s inception) through March 31, 2013

| Starting value (Aug. 1, 2003) | Ending value (March 31, 2013) | ||||
| Optimum Fixed Income Fund — Institutional Class shares | $10,000 | $18,244 | |||
| Optimum Fixed Income Fund — Class A shares | $9,550 | $16,856 | |||
| Barclays U.S. Aggregate Index | $10,000 | $16,482 |
(continues) 19
Performance summary
Optimum Fixed Income Fund
The chart also assumes $10,000 invested in the Barclays U.S. Aggregate Index as of Aug. 1, 2003. The Barclays U.S. Aggregate Index is a broad composite that tracks the investment grade domestic bond market.
Index performance returns do not reflect any management fees, transaction costs, or expenses. Indices are unmanaged and one cannot invest directly in an index. Past performance is not a guarantee of future results.
Performance of other Fund classes will vary due to different charges and expenses.
| Stock symbols and CUSIP numbers | ||||
| Nasdaq symbols | CUSIPs | |||
| Class A | OAFIX | 246118681 | ||
| Class B | OBFIX | 246118673 | ||
| Class C | OCFIX | 246118665 | ||
| Institutional Class | OIFIX | 246118657 |
20
Performance summary
Optimum International Fund
The performance data quoted represent past performance; past performance does not guarantee future results. Investment return and principal value will fluctuate so your shares, when redeemed, may be worth more or less than their original cost. Please obtain the performance data for the most recent month end by calling 800 914-0278 or visiting our website at optimummutualfunds.com. Current performance may be lower or higher than the performance data quoted.
| Fund performance1,2 | |||||||||
| Average annual total returns | |||||||||
| Through March 31, 2013 | 1 year | 3 years | 5 years | Lifetime | |||||
| Class A (Est. Aug. 1, 2003) | |||||||||
| Excluding sales charge | +8.10% | +4.10% | -1.98% | +6.32% | |||||
| Including sales charge | +1.84% | +2.07% | -3.13% | +5.67% | |||||
| Class B (Est. Aug. 1, 2003) | |||||||||
| Excluding sales charge | +7.38% | +3.41% | -2.63% | +5.74% | |||||
| Including sales charge | +3.38% | +2.55% | -3.03% | +5.74% | |||||
| Class C (Est. Aug. 1, 2003) | |||||||||
| Excluding sales charge | +7.37% | +3.44% | -2.62% | +5.63% | |||||
| Including sales charge | +6.37% | +3.44% | -2.62% | +5.63% | |||||
| Institutional Class (Est. Aug. 1, 2003) | |||||||||
| Excluding sales charge | +8.41% | +4.45% | -1.66% | +6.68% | |||||
| Including sales charge | +8.41% | +4.45% | -1.66% | +6.68% |
1Returns reflect the reinvestment of all distributions and are presented both with and without the applicable sales charges described below. Returns do not reflect the deduction of taxes the shareholder would pay on Fund distributions or redemptions of Fund shares.
Expense limitations were in effect for certain classes during some or all of the periods shown in the “Fund performance” chart. The current expenses for each class are listed on the “Fund expense ratios” table on page 23. Performance would have been lower had expense limitations not been in effect.
Class A shares are sold with a maximum front-end sales charge of 5.75%, and have an annual distribution and service fee of 0.35% of average daily net assets. Performance for Class A shares, excluding sales charges, assumes that no front-end sales charge applied.
Class B shares may be purchased only through dividend reinvestment and certain permitted exchanges as described in the prospectus. Please see the prospectus for additional information on Class B shares. Class B shares have a contingent deferred sales charge that declines from 4.00% to zero depending on the period of time the shares are held. They are also subject to an annual distribution and service fee of 1.00% of average daily net assets. Class B shares will automatically convert to Class A shares on a quarterly basis approximately eight years after purchase. Lifetime performance figures for Class B shares reflect conversion to Class A shares after approximately eight years.
Class C shares are sold with a contingent deferred sales charge of 1.00% if redeemed during the first 12 months. They are also subject to an annual distribution and service fee of 1.00% of average daily net assets.
Performance for Class B and C shares, excluding sales charges, assumes either that contingent deferred sales charges did not apply or that the investment was not redeemed.
Institutional Class shares are available without sales or asset-based distribution charges only to certain eligible investors.
The “Fund performance” table and the “Performance of a $10,000 investment” graph do not reflect the deduction of taxes the shareholder would pay on Fund distributions or redemptions of Fund shares.
2The Fund’s expense ratios, as described in the most recent prospectus, are disclosed in the following “Fund expense ratios” table. Delaware Management Company has agreed to reimburse certain expenses and/or waive certain fees in order to prevent total annual fund operating expenses, (excluding certain other expenses) from exceeding 1.40% of the Fund’s average daily net assets from July 27, 2012, through July 29, 2013. Please see the most recent prospectus and any applicable supplement(s) for additional information on these fee waivers and/or reimbursements.
22
| Fund expense ratios | Class A | Class B | Class C | Institutional Class | |||
| Total annual operating expenses | |||||||
| (without fee waivers) | 1.84% | 2.49% | 2.49% | 1.49% | |||
| Net expenses | |||||||
| (including fee waivers, if any) | 1.75% | 2.40% | 2.40% | 1.40% | |||
| Type of waiver | Contractual | Contractual | Contractual | Contractual |
International investments entail risks not ordinarily associated with U.S. investments including fluctuation in currency values, differences in accounting principles, or economic or political instability in other nations. Investing in emerging markets can be riskier than investing in established foreign markets due to increased volatility and lower trading volume.
Performance of a $10,000 Investment1
Average annual total returns from Aug. 1, 2003 (Fund’s inception) through March 31, 2013
| Starting value (Aug. 1, 2003) | Ending value (March 31, 2013) | |||||
| MSCI EAFE Index (gross) | $10,000 | $21,542 | ||||
| MSCI EAFE Index (net) | $10,000 | $20,649 | ||||
| Optimum International Fund — Institutional Class shares | $10,000 | $18,690 | ||||
| Optimum International Fund — Class A shares | $9,425 | $17,042 |
1The “Performance of a $10,000 investment” graph assumes $10,000 invested in Class A and Institutional Class shares of the Fund on Aug. 1, 2003, and includes the effect of a 5.75% front-end sales charge (for Class A shares) and the reinvestment of all distributions. The graph does not reflect the deduction of taxes the shareholders would pay on Fund distributions or redemptions of Fund shares. Expense limitations were in effect for some or all of the periods shown. Performance would have been lower had expense limitations not been in effect. Current expenses are listed in the “Fund expense ratios” table above. Please note additional details on pages 22 through 23.
The chart also assumes $10,000 invested in the MSCI EAFE Index as of Aug. 1, 2003. The MSCI EAFE Index measures equity market performance across developed market countries in Europe, Australasia, and the Far East. Index “gross” return approximates the maximum possible dividend reinvestment. Index “net” return approximates the minimum possible dividend reinvestment, after deduction of withholding tax at the highest possible rate.
Index performance returns do not reflect any management fees, transaction costs, or expenses. Indices are unmanaged and one cannot invest directly in an index. Past performance is not a guarantee of future results.
Performance of other Fund classes will vary due to different charges and expenses.
| Stock symbols and CUSIP numbers | ||||
| Nasdaq symbols | CUSIPs | |||
| Class A | OAIEX | 246118731 | ||
| Class B | OBIEX | 246118723 | ||
| Class C | OCIEX | 246118715 | ||
| Institutional Class | OIIEX | 246118699 |
(continues) 23
Performance summary
Optimum Large Cap Growth Fund
The performance data quoted represent past performance; past performance does not guarantee future results. Investment return and principal value will fluctuate so your shares, when redeemed, may be worth more or less than their original cost. Please obtain the performance data for the most recent month end by calling 800 914-0278 or visiting our website at optimummutualfunds.com. Current performance may be lower or higher than the performance data quoted.
| Fund performance1, 2 | |||||||||
| Average annual total returns | |||||||||
| Through March 31, 2013 | 1 year | 3 years | 5 years | Lifetime | |||||
| Class A (Est. Aug. 1, 2003) | |||||||||
| Excluding sales charge | +7.76% | +10.94% | +5.30% | +6.19% | |||||
| Including sales charge | +1.58% | +8.77% | +4.07% | +5.54% | |||||
| Class B (Est. Aug. 1, 2003) | |||||||||
| Excluding sales charge | +7.07% | +10.22% | +4.63% | +5.62% | |||||
| Including sales charge | +3.07% | +9.46% | +4.25% | +5.62% | |||||
| Class C (Est. Aug. 1, 2003) | |||||||||
| Excluding sales charge | +7.15% | +10.22% | +4.63% | +5.50% | |||||
| Including sales charge | +6.15% | +10.22% | +4.63% | +5.50% | |||||
| Institutional Class (Est. Aug. 1, 2003) | |||||||||
| Excluding sales charge | +8.25% | +11.33% | +5.68% | +6.57% | |||||
| Including sales charge | +8.25% | +11.33% | +5.68% | +6.57% |
1Returns reflect the reinvestment of all distributions and are presented both with and without the applicable sales charges described below. Returns do not reflect the deduction of taxes the shareholder would pay on Fund distributions or redemptions of Fund shares.
Expense limitations were in effect for certain classes during some or all of the periods shown in the “Fund performance” chart. The current expenses for each class are listed on the “Fund expense ratios” table on page 25. Performance would have been lower had expense limitations not been in effect.
Class A shares are sold with a maximum front-end sales charge of 5.75%, and have an annual distribution and service fee of 0.35% of average daily net assets. Performance for Class A shares, excluding sales charges, assumes that no front-end sales charge applied.
Class B shares may be purchased only through dividend reinvestment and certain permitted exchanges as described in the prospectus. Please see the prospectus for additional information on Class B shares. Class B shares have a contingent deferred sales charge that declines from 4.00% to zero depending on the period of time the shares are held. They are also subject to an annual distribution and service fee of 1.00% of average daily net assets. Class B shares will automatically convert to Class A shares on a quarterly basis approximately eight years after purchase. Lifetime performance figures for Class B shares reflect conversion to Class A shares after approximately eight years.
Class C shares are sold with a contingent deferred sales charge of 1.00% if redeemed during the first 12 months. They are also subject to an annual distribution and service fee of 1.00% of average daily net assets.
Performance for Class B and C shares, excluding sales charges, assumes either that contingent deferred sales charges did not apply or that the investment was not redeemed.
Institutional Class shares are available without sales or asset-based distribution charges only to certain eligible investors.
The “Fund performance” table and the “Performance of a $10,000 investment” graph do not reflect the deduction of taxes the shareholder would pay on Fund distributions or redemptions of Fund shares.
2The Fund’s expense ratios, as described in the most recent prospectus, are disclosed in the following “Fund expense ratios” table. Delaware Management Company has agreed to reimburse certain expenses and/or waive certain fees in order to prevent total annual fund operating expenses, (excluding certain other expenses) from exceeding 1.25% of the Fund’s average daily net assets from July 27, 2012, through July 29, 2013. Please see the most recent prospectus and any applicable supplement(s) for additional information on these fee waivers and/or reimbursements.
24
| Fund expense ratios | Class A | Class B | Class C | Institutional Class | ||||
| Total annual operating expenses | ||||||||
| (without fee waivers) | 1.64% | 2.29% | 2.29% | 1.29% | ||||
| Net expenses | ||||||||
| (including fee waivers, if any) | 1.60% | 2.25% | 2.25% | 1.25% | ||||
| Type of waiver | Contractual | Contractual | Contractual | Contractual |
Performance of a $10,000 Investment1
Average annual total returns from Aug. 1, 2003 (Fund’s inception) through March 31, 2013
![]()
| Starting value (Aug. 1, 2003) | Ending value (March 31, 2013) | |||||
| Russell 1000 Growth Index | $10,000 | $19,519 | ||||
| Optimum Large Cap Growth Fund — Institutional Class shares | $10,000 | $18,492 | ||||
| Optimum Large Cap Growth Fund — Class A shares | $9,425 | $16,840 | ||||
1The “Performance of a $10,000 investment” graph assumes $10,000 invested in Class A and Institutional Class shares of the Fund on Aug. 1, 2003, and includes the effect of a 5.75% front-end sales charge (for Class A shares) and the reinvestment of all distributions. The graph does not reflect the deduction of taxes the shareholders would pay on Fund distributions or redemptions of Fund shares. Expense limitations were in effect for some or all of the periods shown. Performance would have been lower had expense limitations not been in effect. Current expenses are listed in the “Fund expense ratios” table above. Please note additional details on pages 24 through 25.
The chart also assumes $10,000 invested in the Russell 1000 Growth Index as of Aug. 1, 2003. The Russell 1000 Growth Index measures the performance of the large-cap growth segment of the U.S. equity universe. It includes those Russell 1000 companies with higher price-to-book ratios and higher forecasted growth values.
Index performance returns do not reflect any management fees, transaction costs or expenses. Indices are unmanaged and one cannot invest directly in an index. Past performance is not a guarantee of future results.
Performance of other Fund classes will vary due to different charges and expenses.
| Stock symbols and CUSIP numbers | |||||
| Nasdaq symbols | CUSIPs | ||||
| Class A | OALGX | 246118707 | |||
| Class B | OBLGX | 246118806 | |||
| Class C | OCLGX | 246118889 | |||
| Institutional Class | OILGX | 246118871 |
(continues) 25
Performance summary
Optimum Large Cap Value Fund
The performance data quoted represent past performance; past performance does not guarantee future results. Investment return and principal value will fluctuate so your shares, when redeemed, may be worth more or less than their original cost. Please obtain the performance data for the most recent month end by calling 800 914-0278 or visiting our website at optimummutualfunds.com. Current performance may be lower or higher than the performance data quoted.
| Fund performance1, 2 | |||||||||||||||||
| Average annual total returns | |||||||||||||||||
| Through March 31, 2013 | 1 year | 3 years | 5 years | Lifetime | |||||||||||||
| Class A (Est. Aug. 1, 2003) | |||||||||||||||||
| Excluding sales charge | +12.48 | % | +11.12 | % | +4.65 | % | +7.06 | % | |||||||||
| Including sales charge | +5.98 | % | +8.95 | % | +3.42 | % | +6.40 | % | |||||||||
| Class B (Est. Aug. 1, 2003) | |||||||||||||||||
| Excluding sales charge | +11.84 | % | +10.42 | % | +3.98 | % | +6.48 | % | |||||||||
| Including sales charge | +7.84 | % | +9.66 | % | +3.59 | % | +6.48 | % | |||||||||
| Class C (Est. Aug. 1, 2003) | |||||||||||||||||
| Excluding sales charge | +11.85 | % | +10.43 | % | +3.98 | % | +6.36 | % | |||||||||
| Including sales charge | +10.85 | % | +10.43 | % | +3.98 | % | +6.36 | % | |||||||||
| Institutional Class (Est. Aug. 1, 2003) | |||||||||||||||||
| Excluding sales charge | +12.92 | % | +11.51 | % | +5.02 | % | +7.44 | % | |||||||||
| Including sales charge | +12.92 | % | +11.51 | % | +5.02 | % | +7.44 | % | |||||||||
1Returns reflect the reinvestment of all distributions and are presented both with and without the applicable sales charges described below. Returns do not reflect the deduction of taxes the shareholder would pay on Fund distributions or redemptions of Fund shares.
Expense limitations were in effect for certain classes during some or all of the periods shown in the “Fund performance” chart. The current expenses for each class are listed on the “Fund expense ratios” table on page 27. Performance would have been lower had expense limitations not been in effect.
Class A shares are sold with a maximum front-end sales charge of 5.75%, and have an annual distribution and service fee of 0.35% of average daily net assets. Performance for Class A shares, excluding sales charges, assumes that no front-end sales charge applied.
Class B shares may be purchased only through dividend reinvestment and certain permitted exchanges as described in the prospectus. Please see the prospectus for additional information on Class B shares. Class B shares have a contingent deferred sales charge that declines from 4.00% to zero depending on the period of time the shares are held. They are also subject to an annual distribution and service fee of 1.00% of average daily net assets. Class B shares will automatically convert to Class A shares on a quarterly basis approximately eight years after purchase. Lifetime performance figures for Class B shares reflect conversion to Class A shares after approximately eight years.
Class C shares are sold with a contingent deferred sales charge of 1.00% if redeemed during the first 12 months. They are also subject to an annual distribution and service fee of 1.00% of average daily net assets.
Performance for Class B and C shares, excluding sales charges, assumes either that contingent deferred sales charges did not apply or that the investment was not redeemed.
Institutional Class shares are available without sales or asset-based distribution charges only to certain eligible investors.
The “Fund performance” table and the “Performance of a $10,000 investment” graph do not reflect the deduction of taxes the shareholder would pay on Fund distributions or redemptions of Fund shares.
2The Fund’s expense ratios, as described in the most recent prospectus, are disclosed in the following “Fund expense ratios” table. Delaware Management Company has agreed to reimburse certain expenses and/or waive certain fees in order to prevent total annual fund operating expenses (excluding certain other expenses) from exceeding 1.22% of the Fund’s average daily net assets from July 27, 2012, through July 29, 2013. Please see the most recent prospectus and any applicable supplement(s) for additional information on these fee waivers and/or reimbursements.
26
| Fund expense ratios | Class A | Class B | Class C | Institutional Class | ||||
| Total annual operating expenses | ||||||||
| (without fee waivers) | 1.60% | 2.25% | 2.25% | 1.25% | ||||
| Net expenses | ||||||||
| (including fee waivers, if any) | 1.57% | 2.22% | 2.22% | 1.22% | ||||
| Type of waiver | Contractual | Contractual | Contractual | Contractual |
Performance of a $10,000 Investment1
Average annual total returns from Aug. 1, 2003 (Fund’s inception) through March 31, 2013
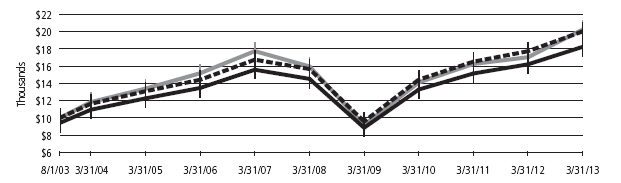
| Starting value (Aug. 1, 2003) | Ending value (March 31, 2013) | |||||
| Russell 1000 Value Index | $10,000 | $20,215 | ||||
| Optimum Large Cap Value Fund — Institutional Class shares | $10,000 | $20,005 | ||||
| Optimum Large Cap Value Fund — Class A shares | $9,425 | $18,219 | ||||
1The “Performance of a $10,000 investment” graph assumes $10,000 invested in Class A and Institutional Class shares of the Fund on Aug. 1, 2003, and includes the effect of a 5.75% front-end sales charge (for Class A shares) and the reinvestment of all distributions. The graph does not reflect the deduction of taxes the shareholders would pay on Fund distributions or redemptions of Fund shares. Expense limitations were in effect for some or all of the periods shown. Performance would have been lower had expense limitations not been in effect. Current expenses are listed in the “Fund expense ratios” table above. Please note additional details on pages 26 through 27.
The chart also assumes $10,000 invested in the Russell 1000 Value Index as of Aug. 1, 2003. The Russell 1000 Value Index measures the performance of the large-cap value segment of the U.S. equity universe. It includes those Russell 1000 companies with lower price-to-book ratios and lower forecasted growth values.
Index performance returns do not reflect any management fees, transaction costs, or expenses. Indices are unmanaged and one cannot invest directly in an index. Past performance is not a guarantee of future results.
Performance of other Fund classes will vary due to different charges and expenses.
| Stock symbols and CUSIP numbers | |||||
| Nasdaq symbols | CUSIPs | ||||
| Class A | OALVX | 246118863 | |||
| Class B | OBLVX | 246118855 | |||
| Class C | OCLVX | 246118848 | |||
| Institutional Class | OILVX | 246118830 |
(continues) 27
Performance summary
Optimum Small-Mid Cap Growth Fund
The performance data quoted represent past performance; past performance does not guarantee future results. Investment return and principal value will fluctuate so your shares, when redeemed, may be worth more or less than their original cost. Please obtain the performance data for the most recent month end by calling 800 914-0278 or visiting our website at optimummutualfunds.com. Current performance may be lower or higher than the performance data quoted.
| Fund performance1, 2 | |||||||||||||||||
| Average annual total returns | |||||||||||||||||
| Through March 31, 2013 | 1 year | 3 years | 5 years | Lifetime | |||||||||||||
| Class A (Est. Aug. 1, 2003) | |||||||||||||||||
| Excluding sales charge | +12.50 | % | +12.06 | % | +6.82 | % | +7.32 | % | |||||||||
| Including sales charge | +6.06 | % | +9.87 | % | +5.56 | % | +6.66 | % | |||||||||
| Class B (Est. Aug. 1, 2003) | |||||||||||||||||
| Excluding sales charge | +11.82 | % | +11.35 | % | +6.13 | % | +6.74 | % | |||||||||
| Including sales charge | +7.82 | % | +10.61 | % | +5.78 | % | +6.74 | % | |||||||||
| Class C (Est. Aug. 1, 2003) | |||||||||||||||||
| Excluding sales charge | +11.73 | % | +11.33 | % | +6.12 | % | +6.63 | % | |||||||||
| Including sales charge | +10.73 | % | +11.33 | % | +6.12 | % | +6.63 | % | |||||||||
| Institutional Class (Est. Aug. 1, 2003) | |||||||||||||||||
| Excluding sales charge | +12.94 | % | +12.45 | % | +7.18 | % | +7.68 | % | |||||||||
| Including sales charge | +12.94 | % | +12.45 | % | +7.18 | % | +7.68 | % | |||||||||
1Returns reflect the reinvestment of all distributions and are presented both with and without the applicable sales charges described below. Returns do not reflect the deduction of taxes the shareholder would pay on Fund distributions or redemptions of Fund shares.
Expense limitations were in effect for certain classes during some or all of the periods shown in the “Fund performance” chart. The current expenses for each class are listed on the “Fund expense ratios” table on page 29. Performance would have been lower had expense limitations not been in effect.
Class A shares are sold with a maximum front-end sales charge of 5.75%, and have an annual distribution and service fee of 0.35% of average daily net assets. Performance for Class A shares, excluding sales charges, assumes that no front-end sales charge applied.
Class B shares may be purchased only through dividend reinvestment and certain permitted exchanges as described in the prospectus. Please see the prospectus for additional information on Class B shares. Class B shares have a contingent deferred sales charge that declines from 4.00% to zero depending on the period of time the shares are held. They are also subject to an annual distribution and service fee of 1.00% of average daily net assets. Effective March 1, 2013, DDLP has contractually agreed to waive Class B shares’s 12b-1 fees to 0.25% of average daily net assets through Feb. 28, 2014. Class B shares will automatically convert to Class A shares on a quarterly basis approximately eight years after purchase. Lifetime performance figures for Class B shares reflect conversion to Class A shares after approximately eight years.
Class C shares are sold with a contingent deferred sales charge of 1.00% if redeemed during the first 12 months. They are also subject to an annual distribution and service fee of 1.00% of average daily net assets.
Performance for Class B and C shares, excluding sales charges, assumes either that contingent deferred sales charges did not apply or that the investment was not redeemed.
Institutional Class shares are available without sales or asset-based distribution charges only to certain eligible investors.
The “Fund performance” table and the “Performance of a $10,000 investment” graph do not reflect the deduction of taxes the shareholder would pay on Fund distributions or redemptions of Fund shares.
2The Fund’s expense ratios, as described in the most recent prospectus, are disclosed in the following “Fund expense ratios” table. Delaware Management Company has agreed to reimburse certain expenses and/or waive certain fees in order to prevent total annual fund operating expenses, (excluding certain other expenses) from exceeding 1.50% of the Fund’s average daily net assets from July 27, 2012, through July 29, 2013. Please see the most recent prospectus and any applicable supplement(s) for additional information on these fee waivers and/or reimbursements.
28
| Fund expense ratios | Class A | Class B | Class C | Institutional Class | ||||
| Total annual operating expenses | ||||||||
| (without fee waivers) | 2.06% | 2.71% | 2.71% | 1.71% | ||||
| Net expenses | ||||||||
| (including fee waivers, if any) | 1.85% | 2.50% | 2.50% | 1.50% | ||||
| Type of waiver | Contractual | Contractual | Contractual | Contractual |
Investments in small and/or medium-sized companies typically exhibit greater risk and higher volatility than larger, more established companies.
Performance of a $10,000 Investment1
Average annual total returns from Aug. 1, 2003 (Fund’s inception) through March 31, 2013
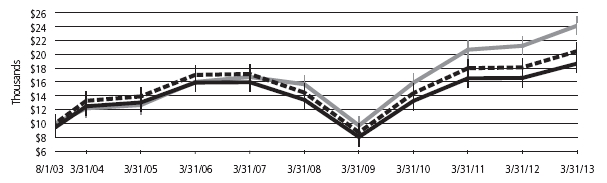
| Starting value (Aug. 1, 2003) | Ending value (March 31, 2013) | |||||
| Russell 2500 Growth Index | $10,000 | $24,137 | ||||
| Optimum Small-Mid Cap Growth Fund — Institutional Class shares | $10,000 | $20,454 | ||||
| Optimum Small-Mid Cap Growth Fund — Class A shares | $9,425 | $18,656 | ||||
1The “Performance of a $10,000 investment” graph assumes $10,000 invested in Class A and Institutional Class shares of the Fund on Aug. 1, 2003, and includes the effect of a 5.75% front-end sales charge (for Class A shares) and the reinvestment of all distributions. The graph does not reflect the deduction of taxes the shareholders would pay on Fund distributions or redemptions of Fund shares. Expense limitations were in effect for some or all of the periods shown. Performance would have been lower had expense limitations not been in effect. Current expenses are listed in the “Fund expense ratios” table above. Please note additional details on pages 28 through 29.
The chart also assumes $10,000 invested in the Russell 2500 Growth Index as of Aug. 1, 2003. The Russell 2500 Growth Index measures the performance of the small- to mid-cap growth segment of the U.S. equity universe. It includes those Russell 2500 companies with higher price-to-book ratios and higher forecasted growth values.
Index performance returns do not reflect any management fees, transaction costs or expenses. Indices are unmanaged and one cannot invest directly in an index. Past performance is not a guarantee of future results.
Performance of other Fund classes will vary due to different charges and expenses.
| Stock symbols and CUSIP numbers | |||||
| Nasdaq symbols | CUSIPs | ||||
| Class A | OASGX | 246118822 | |||
| Class B | OBSGX | 246118814 | |||
| Class C | OCSGX | 246118798 | |||
| Institutional Class | OISGX | 246118780 | |||
(continues) 29
Performance summary
Optimum Small-Mid Cap Value Fund
The performance data quoted represent past performance; past performance does not guarantee future results. Investment return and principal value will fluctuate so your shares, when redeemed, may be worth more or less than their original cost. Please obtain the performance data for the most recent month end by calling 800 914-0278 or visiting our website at optimummutualfunds.com. Current performance may be lower or higher than the performance data quoted.
Fund performance1, 2 | |||||||||||||||||
| Average annual total returns | |||||||||||||||||
| Through March 31, 2013 | 1 year | 3 years | 5 years | Lifetime | |||||||||||||
| Class A (Est. Aug. 1, 2003) | |||||||||||||||||
| Excluding sales charge | +13.23 | % | +12.72 | % | +6.83 | % | +8.43 | % | |||||||||
| Including sales charge | +6.70 | % | +10.53 | % | +5.58 | % | +7.77 | % | |||||||||
| Class B (Est. Aug. 1, 2003) | |||||||||||||||||
| Excluding sales charge | +12.53 | % | +12.04 | % | +6.14 | % | +7.86 | % | |||||||||
| Including sales charge | +8.53 | % | +11.31 | % | +5.79 | % | +7.86 | % | |||||||||
| Class C (Est. Aug. 1, 2003) | |||||||||||||||||
| Excluding sales charge | +12.45 | % | +11.99 | % | +6.11 | % | +7.72 | % | |||||||||
| Including sales charge | +11.45 | % | +11.99 | % | +6.11 | % | +7.72 | % | |||||||||
| Institutional Class (Est. Aug. 1, 2003) | |||||||||||||||||
| Excluding sales charge | +13.56 | % | +13.11 | % | +7.20 | % | +8.80 | % | |||||||||
| Including sales charge | +13.56 | % | +13.11 | % | +7.20 | % | +8.80 | % | |||||||||
1Returns reflect the reinvestment of all distributions and are presented both with and without the applicable sales charges described below. Returns do not reflect the deduction of taxes the shareholder would pay on Fund distributions or redemptions of Fund shares.
Expense limitations were in effect for certain classes during some or all of the periods shown in the “Fund performance” chart. The current expenses for each class are listed on the “Fund expense ratios” table on page 31. Performance would have been lower had expense limitations not been in effect.
Class A shares are sold with a maximum front-end sales charge of 5.75%, and have an annual distribution and service fee of 0.35% of average daily net assets. Performance for Class A shares, excluding sales charges, assumes that no front-end sales charge applied.
Class B shares may be purchased only through dividend reinvestment and certain permitted exchanges as described in the prospectus. Please see the prospectus for additional information on Class B shares. Class B shares have a contingent deferred sales charge that declines from 4.00% to zero depending on the period of time the shares are held. They are also subject to an annual distribution and service fee of 1.00% of average daily net assets. Effective March 1, 2013, DDLP has contractually agreed to waive Class B shares’s 12b-1 fees to 0.25% of average daily net assets through Feb. 28, 2014. Class B shares will automatically convert to Class A shares on a quarterly basis approximately eight years after purchase. Lifetime performance figures for Class B shares reflect conversion to Class A shares after approximately eight years.
Class C shares are sold with a contingent deferred sales charge of 1.00% if redeemed during the first 12 months. They are also subject to an annual distribution and service fee of 1.00% of average daily net assets.
Performance for Class B and C shares, excluding sales charges, assumes either that contingent deferred sales charges did not apply or that the investment was not redeemed.
Institutional Class shares are available without sales or asset-based distribution charges only to certain eligible investors.
The “Fund performance” table and the “Performance of a $10,000 investment” graph do not reflect the deduction of taxes the shareholder would pay on Fund distributions or redemptions of Fund shares.
2The Fund’s expense ratios, as described in the most recent prospectus, are disclosed in the following “Fund expense ratios” table. Delaware Management Company has agreed to reimburse certain expenses and/or waive certain fees in order to prevent total annual fund operating expenses (excluding certain other expenses) from exceeding 1.40% of the Fund’s average daily net assets from July 27, 2012, through July 29, 2013. Please see the most recent prospectus and any applicable supplement(s) for additional information on these fee waivers and/or reimbursements.
30
| Fund expense ratios | Class A | Class B | Class C | Institutional Class | ||||
| Total annual operating expenses | ||||||||
| (without fee waivers) | 1.98% | 2.63% | 2.63% | 1.63% | ||||
| Net expenses | ||||||||
| (including fee waivers, if any) | 1.75% | 2.40% | 2.40% | 1.40% | ||||
| Type of waiver | Contractual | Contractual | Contractual | Contractual |
Investments in small and/or medium-sized companies typically exhibit greater risk and higher volatility than larger, more established companies.
Performance of a $10,000 Investment1
Average annual total returns from Aug. 1, 2003 (Fund’s inception) through March 31, 2013
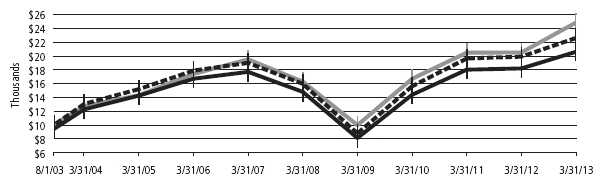
| Starting value (Aug. 1, 2003) | Ending value (March 31, 2013) | |||||
| Russell 2500 Value Index | $10,000 | $24,846 | ||||
| Optimum Small-Mid Cap Value Fund — Institutional Class shares | $10,000 | $22,610 | ||||
| Optimum Small-Mid Cap Value Fund — Class A shares | $9,425 | $20,606 | ||||
1The “Performance of $10,000 investment” graph assumes $10,000 invested in Class A and Institutional Class shares of the Fund on Aug. 1, 2003, and includes the effect of a 5.75% front-end sales charge (for Class A shares) and the reinvestment of all distributions. The graph does not reflect the deduction of taxes the shareholders would pay on Fund distributions or redemptions of Fund shares. Expense limitations were in effect for some or all of the periods shown. Performance would have been lower had expense limitations not been in effect. Current expenses are listed in the “Fund expense ratios” table above. Please note additional details on pages 30 through 31.
The chart also assumes $10,000 invested in the Russell 2500 Value Index as of Aug. 1, 2003. The Russell 2500 Value Index measures the performance of the small- to mid-cap value segment of the U.S. equity universe. It includes those Russell 2500 companies with lower price-to-book ratios and lower forecasted growth values.
Index performance returns do not reflect any management fees, transaction costs or expenses. Indices are unmanaged and one cannot invest directly in an index. Past performance is not a guarantee of future results.
Performance of other Fund classes will vary due to different charges and expenses.
| Stock symbols and CUSIP numbers | |||||
| Nasdaq symbols | CUSIPs | ||||
| Class A | OASVX | 246118772 | |||
| Class B | OBSVX | 246118764 | |||
| Class C | OCSVX | 246118756 | |||
| Institutional Class | OISVX | 246118749 |
31
Disclosure of Fund expenses
For the six-month period from October 1, 2012 to March 31, 2013 (Unaudited)
As a shareholder of a Fund, you incur two types of costs: (1) transaction costs, including sales charges (loads) on purchase payments, reinvested dividends, or other distributions; redemption fees; and exchange fees; and (2) ongoing costs, including management fees; distribution and/or service (12b-1) fees; and other Fund expenses. These following examples are intended to help you understand your ongoing costs (in dollars) of investing in a Fund and to compare these costs with the ongoing costs of investing in other mutual funds.
The examples are based on an investment of $1,000 invested at the beginning of the period and held for the entire six-month period from Oct. 1, 2012 to March 31, 2013.
Actual Expenses
The first section of the tables shown, “Actual Fund Return,” provides information about actual account values and actual expenses. You may use the information in this section of the table, together with the amount you invested, to estimate the expenses that you paid over the period. Simply divide your account value by $1,000 (for example, an $8,600 account value divided by $1,000 = 8.6), then multiply the result by the number in the first section under the heading entitled “Expenses Paid During Period” to estimate the expenses you paid on your account during this period.
Hypothetical Example for Comparison Purposes
The second section of the tables shown, “Hypothetical 5% Return,” provides information about hypothetical account values and hypothetical expenses based on the Funds’ actual expense ratios and an assumed rate of return of 5% per year before expenses, which is not the Funds’ actual return. The hypothetical account values and expenses may not be used to estimate the actual ending account balance or expenses you paid for the period. You may use this information to compare the ongoing costs of investing in a Fund and other funds. To do so, compare this 5% hypothetical example with the 5% hypothetical examples that appear in the shareholder reports of the other funds.
Please note that the expenses shown in the tables are meant to highlight your ongoing costs only and do not reflect any transactional costs, such as sales charges (loads), redemption fees, or exchange fees. Therefore, the second section of each table is useful in comparing ongoing costs only, and will not help you determine the relative total costs of owning different funds. In addition, if these transactional costs were included, your costs would have been higher. Each Fund’s expenses shown in the tables reflect fee waivers in effect. The expenses shown in each table assume reinvestment of all dividends and distributions.
Optimum Fixed Income Fund
Expense Analysis of an Investment of $1,000
| Expenses | |||||||||||||||||
| Beginning | Ending | Paid During | |||||||||||||||
| Account | Account | Annualized | Period | ||||||||||||||
| Value | Value | Expense | 10/1/12 to | ||||||||||||||
| 10/1/12 | 3/31/13 | Ratio | 3/31/13* | ||||||||||||||
| Actual Fund Return† | |||||||||||||||||
| Class A | $ | 1,000.00 | $ | 1,006.60 | 1.35% | $ | 6.75 | ||||||||||
| Class B | 1,000.00 | 1,002.80 | 2.00% | 9.99 | |||||||||||||
| Class C | 1,000.00 | 1,002.80 | 2.00% | 9.99 | |||||||||||||
| Institutional Class | 1,000.00 | 1,008.30 | 1.00% | 5.01 | |||||||||||||
| Hypothetical 5% Return (5% return before expenses) | |||||||||||||||||
| Class A | $ | 1,000.00 | $ | 1,018.20 | 1.35% | $ | 6.79 | ||||||||||
| Class B | 1,000.00 | 1,014.96 | 2.00% | 10.05 | |||||||||||||
| Class C | 1,000.00 | 1,014.96 | 2.00% | 10.05 | |||||||||||||
| Institutional Class | 1,000.00 | 1,019.95 | 1.00% | 5.04 | |||||||||||||
Optimum International Fund
Expense Analysis of an Investment of $1,000
| Expenses | |||||||||||||||||
| Beginning | Ending | Paid During | |||||||||||||||
| Account | Account | Annualized | Period | ||||||||||||||
| Value | Value | Expense | 10/1/12 to | ||||||||||||||
| 10/1/12 | 3/31/13 | Ratio | 3/31/13* | ||||||||||||||
| Actual Fund Return† | |||||||||||||||||
| Class A | $ | 1,000.00 | $ | 1,087.90 | 1.75% | $ | 9.11 | ||||||||||
| Class B | 1,000.00 | 1,084.90 | 2.40% | 12.48 | |||||||||||||
| Class C | 1,000.00 | 1,084.80 | 2.40% | 12.47 | |||||||||||||
| Institutional Class | 1,000.00 | 1,090.00 | 1.40% | 7.29 | |||||||||||||
| Hypothetical 5% Return (5% return before expenses) | |||||||||||||||||
| Class A | $ | 1,000.00 | $ | 1,016.21 | 1.75% | $ | 8.80 | ||||||||||
| Class B | 1,000.00 | 1,012.96 | 2.40% | 12.04 | |||||||||||||
| Class C | 1,000.00 | 1,012.96 | 2.40% | 12.04 | |||||||||||||
| Institutional Class | 1,000.00 | 1,017.95 | 1.40% | 7.04 | |||||||||||||
*“Expenses Paid During Period” are equal to the relevant Fund’s annualized expense ratio, multiplied by the average account value over the period, multiplied by 182/365 (to reflect the one-half year period).
†Because actual returns reflect only the most recent six-month period, the returns shown may differ significantly from fiscal year returns.
32
Optimum Large Cap Growth Fund
Expense Analysis of an Investment of $1,000
| Expenses | ||||||||||||||||||
| Beginning | Ending | Paid During | ||||||||||||||||
| Account | Account | Annualized | Period | |||||||||||||||
| Value | Value | Expense | 10/1/12 to | |||||||||||||||
| 10/1/12 | 3/31/13 | Ratio | 3/31/13* | |||||||||||||||
| Actual Fund Return† | ||||||||||||||||||
| Class A | $ | 1,000.00 | $ | 1,074.50 | 1.60 | % | $ | 8.28 | ||||||||||
| Class B | 1,000.00 | 1,071.50 | 2.25 | % | 11.62 | |||||||||||||
| Class C | 1,000.00 | 1,071.50 | 2.25 | % | 11.62 | |||||||||||||
| Institutional Class | 1,000.00 | 1,077.00 | 1.25 | % | 6.47 | |||||||||||||
| Hypothetical 5% Return (5% return before expenses) | ||||||||||||||||||
| Class A | $ | 1,000.00 | $ | 1,016.95 | 1.60 | % | $ | 8.05 | ||||||||||
| Class B | 1,000.00 | 1,013.71 | 2.25 | % | 11.30 | |||||||||||||
| Class C | 1,000.00 | 1,013.71 | 2.25 | % | 11.30 | |||||||||||||
| Institutional Class | 1,000.00 | 1,018.70 | 1.25 | % | 6.29 | |||||||||||||
Optimum Large Cap Value Fund
Expense Analysis of an Investment of $1,000
| Expenses | ||||||||||||||||||
| Beginning | Ending | Paid During | ||||||||||||||||
| Account | Account | Annualized | Period | |||||||||||||||
| Value | Value | Expense | 10/1/12 to | |||||||||||||||
| 10/1/12 | 3/31/13 | Ratio | 3/31/13* | |||||||||||||||
| Actual Fund Return† | ||||||||||||||||||
| Class A | $ | 1,000.00 | $ | 1,113.50 | 1.57 | % | $ | 8.27 | ||||||||||
| Class B | 1,000.00 | 1,111.20 | 2.22 | % | 11.69 | |||||||||||||
| Class C | 1,000.00 | 1,110.30 | 2.22 | % | 11.68 | |||||||||||||
| Institutional Class | 1,000.00 | 1,116.10 | 1.22 | % | 6.44 | |||||||||||||
| Hypothetical 5% Return (5% return before expenses) | ||||||||||||||||||
| Class A | $ | 1,000.00 | $ | 1,017.10 | 1.57 | % | $ | 7.90 | ||||||||||
| Class B | 1,000.00 | 1,013.86 | 2.22 | % | 11.15 | |||||||||||||
| Class C | 1,000.00 | 1,013.86 | 2.22 | % | 11.15 | |||||||||||||
| Institutional Class | 1,000.00 | 1,018.85 | 1.22 | % | 6.14 | |||||||||||||
Optimum Small-Mid Cap Growth Fund
Expense Analysis of an Investment of $1,000
| Expenses | ||||||||||||||||||
| Beginning | Ending | Paid During | ||||||||||||||||
| Account | Account | Annualized | Period | |||||||||||||||
| Value | Value | Expense | 10/1/12 to | |||||||||||||||
| 10/1/12 | 3/31/13 | Ratio | 3/31/13* | |||||||||||||||
| Actual Fund Return† | ||||||||||||||||||
| Class A | $ | 1,000.00 | $ | 1,140.40 | 1.85 | % | $ | 9.87 | ||||||||||
| Class B | 1,000.00 | 1,137.30 | 2.41 | % | 12.84 | |||||||||||||
| Class C | 1,000.00 | 1,136.40 | 2.50 | % | 13.32 | |||||||||||||
| Institutional Class | 1,000.00 | 1,142.60 | 1.50 | % | 8.01 | |||||||||||||
| Hypothetical 5% Return (5% return before expenses) | ||||||||||||||||||
| Class A | $ | 1,000.00 | $ | 1,015.71 | 1.85 | % | $ | 9.30 | ||||||||||
| Class B | 1,000.00 | 1,012.91 | 2.41 | % | 12.09 | |||||||||||||
| Class C | 1,000.00 | 1,012.47 | 2.50 | % | 12.54 | |||||||||||||
| Institutional Class | 1,000.00 | 1,017.45 | 1.50 | % | 7.54 | |||||||||||||
Optimum Small-Mid Cap Value Fund
Expense Analysis of an Investment of $1,000
| Expenses | ||||||||||||||||||
| Beginning | Ending | Paid During | ||||||||||||||||
| Account | Account | Annualized | Period | |||||||||||||||
| Value | Value | Expense | 10/1/12 to | |||||||||||||||
| 10/1/12 | 3/31/13 | Ratio | 3/31/13* | |||||||||||||||
| Actual Fund Return† | ||||||||||||||||||
| Class A | $ | 1,000.00 | $ | 1,162.00 | 1.75 | % | $ | 9.43 | ||||||||||
| Class B | 1,000.00 | 1,158.90 | 2.31 | % | 12.43 | |||||||||||||
| Class C | 1,000.00 | 1,158.10 | 2.40 | % | 12.91 | |||||||||||||
| Institutional Class | 1,000.00 | 1,164.50 | 1.40 | % | 7.55 | |||||||||||||
| Hypothetical 5% Return (5% return before expenses) | ||||||||||||||||||
| Class A | $ | 1,000.00 | $ | 1,016.21 | 1.75 | % | $ | 8.80 | ||||||||||
| Class B | 1,000.00 | 1,013.41 | 2.31 | % | 11.60 | |||||||||||||
| Class C | 1,000.00 | 1,012.96 | 2.40 | % | 12.04 | |||||||||||||
| Institutional Class | 1,000.00 | 1,017.95 | 1.40 | % | 7.04 | |||||||||||||
*“Expenses Paid During Period” are equal to the relevant Fund’s annualized expense ratio, multiplied by the average account value over the period, multiplied by 182/365 (to reflect the one-half year period).
†Because actual returns reflect only the most recent six-month period, the returns shown may differ significantly from fiscal year returns.
33
Security type/sector allocations
Optimum Fixed Income Fund
As of March 31, 2013 (Unaudited)
Sector designations may be different than the sector designations presented in other Fund materials. The sector designations may represent the investment manager or sub-adviser’s internal sector classifications, which may result in the sector designations for one fund being different than another fund’s sector designations.
| Percentage | ||
| Security type/sector | of net assets | |
| Agency Collateralized Mortgage Obligations | 5.85 | % |
| Agency Mortgage-Backed Securities | 13.00 | % |
| Collateralized Debt Obligations | 0.98 | % |
| Commercial Mortgage-Backed Securities | 2.51 | % |
| Convertible Bonds | 1.65 | % |
| Corporate Bonds | 36.03 | % |
| Banking | 8.05 | % |
| Basic Industry | 2.51 | % |
| Brokerage | 0.89 | % |
| Capital Goods | 0.46 | % |
| Communications | 3.46 | % |
| Consumer Cyclical | 2.49 | % |
| Consumer Non-Cyclical | 3.36 | % |
| Electric | 2.92 | % |
| Energy | 3.50 | % |
| Finance Companies | 2.12 | % |
| Insurance | 1.57 | % |
| Natural Gas | 1.66 | % |
| Real Estate | 1.25 | % |
| Technology | 1.16 | % |
| Transportation | 0.63 | % |
| Municipal Bonds | 0.59 | % |
| Non-Agency Asset-Backed Securities | 3.09 | % |
| Non-Agency Collateralized Mortgage Obligations | 3.74 | % |
| Regional Bonds | 0.72 | % |
| Securities Sold Short | (0.36 | %) |
| Senior Secured Loans | 3.44 | % |
| Sovereign Bonds | 6.84 | % |
| Supranational Banks | 0.22 | % |
| U.S. Treasury Obligations | 15.27 | % |
| Option Purchased | 0.00 | % |
| Common Stock | 0.00 | % |
| Convertible Preferred Stock | 0.41 | % |
| Preferred Stock | 0.31 | % |
| Short-Term Investments | 12.32 | % |
| Securities Lending Collateral | 0.08 | % |
| Total Value of Securities | 106.69 | % |
| Options Written | (0.02 | %) |
| Obligation to Return Securities Lending Collateral | (0.13 | %) |
| Other Liabilities Net of Receivables and Other Assets | (6.54 | %) |
| Total Net Assets | 100.00 | % |
34
Security type/country and sector allocations
Optimum International Fund
As of March 31, 2013 (Unaudited)
Sector designations may be different than the sector designations presented in other Fund materials. The sector designations may represent the investment manager or sub-adviser’s internal sector classifications, which may result in the sector designations for one fund being different than another fund’s sector designations.
| Percentage | ||
| Security type/country | of net assets | |
| Common Stock by Country | 97.03 | % |
| Australia | 2.61 | % |
| Belgium | 1.54 | % |
| Canada | 0.22 | % |
| China/Hong Kong | 3.20 | % |
| Cyprus | 0.49 | % |
| Finland | 0.48 | % |
| France | 9.38 | % |
| Germany | 6.40 | % |
| India | 0.38 | % |
| Indonesia | 1.22 | % |
| Ireland | 1.38 | % |
| Israel | 1.14 | % |
| Italy | 2.89 | % |
| Japan | 16.60 | % |
| Malaysia | 0.20 | % |
| Mexico | 0.83 | % |
| Netherlands | 3.55 | % |
| Singapore | 2.31 | % |
| Spain | 2.77 | % |
| Sweden | 1.25 | % |
| Switzerland | 14.98 | % |
| Taiwan | 0.77 | % |
| Thailand | 0.45 | % |
| United Kingdom | 21.55 | % |
| United States | 0.44 | % |
| Preferred Stock | 0.44 | % |
| Short-Term Investments | 1.09 | % |
| Securities Lending Collateral | 8.20 | % |
| Total Value of Securities | 106.76 | % |
| Obligation to Return Securities Lending Collateral | (8.30 | %) |
| Receivables and Other Assets Net of Other Liabilities | 1.54 | % |
| Total Net Assets | 100.00 | % |
| Percentage | ||
| Common Stock and Preferred Stock by Sector | of net assets | |
| Consumer Discretionary | 10.20 | % |
| Consumer Staples | 13.16 | % |
| Energy | 8.84 | % |
| Financials | 18.31 | % |
| Healthcare | 13.56 | % |
| Industrials | 9.62 | % |
| Information Technology | 6.75 | % |
| Materials | 6.96 | % |
| Telecommunication Services | 6.23 | % |
| Utilities | 3.84 | % |
| Total | 97.47 | % |
(continues) 35
Security type/sector allocations and
top 10 equity holdings
Sector designations may be different than the sector designations presented in other Fund materials. The sector designations may represent the investment manager or sub-adviser’s internal sector classifications, which may result in the sector designations for one fund being different than another fund’s sector designations.
Optimum Large Cap Growth Fund
As of March 31, 2013 (Unaudited)
| Percentage | ||
| Security type/sector | of net assets | |
| Common Stock | 96.56 | % |
| Consumer Discretionary | 22.27 | % |
| Consumer Staples | 6.50 | % |
| Energy | 5.18 | % |
| Financials | 7.94 | % |
| Healthcare | 13.74 | % |
| Industrials | 12.89 | % |
| Information Technology | 23.13 | % |
| Materials | 3.52 | % |
| Telecommunication Services | 1.39 | % |
| Convertible Preferred Stock | 0.05 | % |
| Short-Term Investments | 3.50 | % |
| Securities Lending Collateral | 0.15 | % |
| Total Value of Securities | 100.26 | % |
| Obligation to Return Securities Lending Collateral | (0.23 | %) |
| Other Liabilities Net of Receivables and Other Assets | (0.03 | %) |
| Total Net Assets | 100.00 | % |
Holdings are for informational purposes only and are subject to change at any time. They are not a recommendation to buy, sell, or hold any security.
| Percentage | ||
| Top 10 equity holdings | of net assets | |
| Google Class A | 3.60 | % |
| eBay | 3.08 | % |
| Gilead Sciences | 2.57 | % |
| Apple | 2.55 | % |
| Amazon.com | 2.16 | % |
| Bristol-Myers Squibb | 1.66 | % |
| Biogen Idec | 1.62 | % |
| Visa Class A | 1.59 | % |
| CBS Class B | 1.58 | % |
| QUALCOMM | 1.47 | % |
Optimum Large Cap Value Fund
As of March 31, 2013 (Unaudited)
| Percentage | ||
| Security type/sector | of net assets | |
| Common Stock | 96.67 | % |
| Consumer Discretionary | 10.59 | % |
| Consumer Staples | 11.56 | % |
| Energy | 15.59 | % |
| Financials | 20.11 | % |
| Healthcare | 10.03 | % |
| Industrials | 12.76 | % |
| Information Technology | 9.53 | % |
| Materials | 4.38 | % |
| Telecommunication Services | 1.94 | % |
| Utilities | 0.18 | % |
| Convertible Preferred Stock | 0.11 | % |
| Short-Term Investments | 2.94 | % |
| Securities Lending Collateral | 0.09 | % |
| Total Value of Securities | 99.81 | % |
| Obligation to Return Securities Lending Collateral | (0.17 | %) |
| Receivables and Other Assets Net of Other Liabilities | 0.36 | % |
| Total Net Assets | 100.00 | % |
Holdings are for informational purposes only and are subject to change at any time. They are not a recommendation to buy, sell, or hold any security.
| Percentage | ||
| Top 10 equity holdings | of net assets | |
| Philip Morris International | 3.03 | % |
| Lockheed Martin | 2.54 | % |
| Exxon Mobil | 2.11 | % |
| Accenture Class A (Ireland) | 2.10 | % |
| International Business Machines | 2.08 | % |
| Chevron | 1.88 | % |
| Marathon Petroleum | 1.75 | % |
| Johnson & Johnson | 1.75 | % |
| Pfizer | 1.69 | % |
| JPMorgan Chase | 1.61 | % |
36
Sector designations may be different than the sector designations presented in other Fund materials. The sector designations may represent the investment manager or sub-adviser’s internal sector classifications, which may result in the sector designations for one fund being different than another fund’s sector designations.
Optimum Small-Mid Cap Growth Fund
As of March 31, 2013 (Unaudited)
| Percentage | ||
| Security type/sector | of net assets | |
| Common Stock | 97.46 | % |
| Consumer Discretionary | 17.58 | % |
| Consumer Staples | 2.05 | % |
| Energy | 5.74 | % |
| Financials | 12.08 | % |
| Healthcare | 12.95 | % |
| Industrials | 21.78 | % |
| Information Technology | 20.83 | % |
| Materials | 3.02 | % |
| Telecommunication Services | 1.43 | % |
| Exchange-Traded Fund | 0.56 | % |
| Short-Term Investments | 1.69 | % |
| Securities Lending Collateral | 2.09 | % |
| Total Value of Securities | 101.80 | % |
| Obligation to Return Securities Lending Collateral | (2.19 | %) |
| Receivables and Other Assets Net of Other Liabilities | 0.39 | % |
| Total Net Assets | 100.00 | % |
Holdings are for informational purposes only and are subject to change at any time. They are not a recommendation to buy, sell, or hold any security.
| Percentage | ||
| Top 10 equity holdings | of net assets | |
| Nordson | 1.32 | % |
| AMETEK | 1.30 | % |
| Mettler-Toledo International | 1.22 | % |
| Ryman Hospitality Properties | 1.18 | % |
| Pier 1 Imports | 1.15 | % |
| Atwood Oceanics | 1.14 | % |
| IPG Photonics | 1.07 | % |
| Avis Budget Group | 1.03 | % |
| Donaldson | 1.01 | % |
| Bally Technologies | 1.00 | % |
Optimum Small-Mid Cap Value Fund
As of March 31, 2013 (Unaudited)
| Percentage | ||
| Security type/sector | of net assets | |
| Common Stock² | 91.21 | % |
| Consumer Discretionary | 12.64 | % |
| Consumer Staples | 1.43 | % |
| Energy | 5.00 | % |
| Financials | 11.36 | % |
| Healthcare | 2.77 | % |
| Industrials | 28.90 | % |
| Information Technology | 16.49 | % |
| Materials | 11.44 | % |
| Telecommunication Services | 0.60 | % |
| Utilities | 0.58 | % |
| Short-Term Investments | 8.31 | % |
| Securities Lending Collateral | 0.53 | % |
| Total Value of Securities | 100.05 | % |
| Obligation to Return Securities Lending Collateral | (0.58 | %) |
| Receivables and Other Assets Net of Other Liabilities | 0.53 | % |
| Total Net Assets | 100.00 | % |
²Narrow industries are utilized for compliance purposes for diversification whereas broad sectors are used for financial reporting.
Holdings are for informational purposes only and are subject to change at any time. They are not a recommendation to buy, sell, or hold any security.
| Percentage | ||
| Top 10 equity holdings | of net assets | |
| Timken | 1.38 | % |
| Hubbell Class B | 1.13 | % |
| TrueBlue | 1.05 | % |
| Dover | 1.03 | % |
| Kennametal | 1.00 | % |
| Synaptics | 1.00 | % |
| Sealed Air | 0.98 | % |
| Flextronics International | 0.98 | % |
| Staples | 0.97 | % |
| Landec | 0.97 | % |
37
Statements of net assets
Optimum Fixed Income Fund
March 31, 2013
| Principal | Value | |||||||
| Amount° | (U.S. $) | |||||||
| Agency Collateralized Mortgage Obligations – 5.85% | ||||||||
| Fannie Mae Grantor Trust | ||||||||
| • | Series 1999-T2 A1 | |||||||
| 7.50% 1/19/39 | USD | 17,871 | $ | 20,152 | ||||
| Series 2002-T4 A3 | ||||||||
| 7.50% 12/25/41 | 59,963 | 69,323 | ||||||
| Series 2004-T1 1A2 | ||||||||
| 6.50% 1/25/44 | 18,673 | 22,274 | ||||||
| Fannie Mae REMICs | ||||||||
| Series 1996-46 ZA | ||||||||
| 7.50% 11/25/26 | 15,681 | 18,241 | ||||||
| Series 1999-19 PH | ||||||||
| 6.00% 5/25/29 | 289,880 | 328,763 | ||||||
| Series 2001-14 Z | ||||||||
| 6.00% 5/25/31 | 19,430 | 21,987 | ||||||
| Series 2002-90 A1 | ||||||||
| 6.50% 6/25/42 | 14,475 | 17,007 | ||||||
| Series 2002-90 A2 | ||||||||
| 6.50% 11/25/42 | 52,694 | 61,002 | ||||||
| Series 2003-26 AT | ||||||||
| 5.00% 11/25/32 | 486,130 | 508,901 | ||||||
| Series 2003-122 AJ | ||||||||
| 4.50% 2/25/28 | 10,285 | 10,345 | ||||||
| Series 2005-22 HE | ||||||||
| 5.00% 10/25/33 | 548,466 | 567,423 | ||||||
| Series 2005-29 QD | ||||||||
| 5.00% 8/25/33 | 679,049 | 699,851 | ||||||
| Series 2005-54 AK | ||||||||
| 4.50% 9/25/32 | 150 | 150 | ||||||
| Series 2005-94 YD | ||||||||
| 4.50% 8/25/33 | 362,401 | 366,138 | ||||||
| Series 2005-110 MB | ||||||||
| 5.50% 9/25/35 | 271,099 | 297,732 | ||||||
| @^ | Series 2007-30 OE | |||||||
| 0.00% 4/25/37 | 7,236,893 | 6,866,802 | ||||||
| Series 2008-24 ZA | ||||||||
| 5.00% 4/25/38 | 19,250,380 | 21,620,217 | ||||||
| @•û | Series 2009-2 AS | |||||||
| 5.496% 2/25/39 | 7,024,117 | 593,014 | ||||||
| @•û | Series 2009-68 SA | |||||||
| 6.546% 8/25/39 | 1,228,753 | 192,679 | ||||||
| Series 2009-94 AC | ||||||||
| 5.00% 11/25/39 | 400,000 | 450,207 | ||||||
| Series 2010-41 PN | ||||||||
| 4.50% 4/25/40 | 475,000 | 536,935 | ||||||
| Series 2010-96 DC | ||||||||
| 4.00% 9/25/25 | 915,000 | 995,805 | ||||||
| • | Series 2010-123 FE | |||||||
| 0.684% 11/25/40 | 6,995,906 | 7,032,159 | ||||||
| •û | Series 2012-122 SD | |||||||
| 5.896% 11/25/42 | 961,246 | 258,755 | ||||||
| •û | Series 2012-124 SD | |||||||
| 5.946% 11/25/42 | 1,252,380 | 368,228 | ||||||
| û | Series 2013-38 AI | |||||||
| 3.00% 4/25/33 | 1,340,000 | 194,300 | ||||||
| Fannie Mae Whole Loan | ||||||||
| REMIC Trust | ||||||||
| Series 2004-W4 A5 | ||||||||
| 5.50% 6/25/34 | 3,000,000 | 3,269,112 | ||||||
| Series 2004-W11 1A2 | ||||||||
| 6.50% 5/25/44 | 88,174 | 102,937 | ||||||
| Fannie Mae Whole Loan | ||||||||
| Trust Series 2004-W15 | ||||||||
| 1A1 6.00% 8/25/44 | 127,909 | 144,196 | ||||||
| Freddie Mac REMICs | ||||||||
| Series 1730 Z | ||||||||
| 7.00% 5/15/24 | 82,726 | 95,073 | ||||||
| Series 2165 PE | ||||||||
| 6.00% 6/15/29 | 280,261 | 317,068 | ||||||
| Series 2326 ZQ | ||||||||
| 6.50% 6/15/31 | 144,674 | 165,397 | ||||||
| Series 2557 WE | ||||||||
| 5.00% 1/15/18 | 568,785 | 607,755 | ||||||
| Series 2762 LG | ||||||||
| 5.00% 9/15/32 | 831,373 | 850,558 | ||||||
| Series 2802 NE | ||||||||
| 5.00% 2/15/33 | 354,666 | 365,222 | ||||||
| Series 2827 TE | ||||||||
| 5.00% 4/15/33 | 896,434 | 930,384 | ||||||
| Series 2840 OE | ||||||||
| 5.00% 2/15/33 | 856,275 | 882,134 | ||||||
| Series 2864 PE | ||||||||
| 5.00% 6/15/33 | 412,999 | 425,214 | ||||||
| Series 2869 BG | ||||||||
| 5.00% 7/15/33 | 90,751 | 93,433 | ||||||
| Series 2881 TE | ||||||||
| 5.00% 7/15/33 | 512,263 | 528,106 | ||||||
| Series 2889 OG | ||||||||
| 5.00% 5/15/33 | 49,899 | 51,055 | ||||||
| Series 2890 PD | ||||||||
| 5.00% 3/15/33 | 690,736 | 703,552 | ||||||
| Series 2893 PD | ||||||||
| 5.00% 2/15/33 | 39,850 | 40,712 | ||||||
| Series 2915 KD | ||||||||
| 5.00% 9/15/33 | 246,892 | 254,446 | ||||||
| Series 2938 ND | ||||||||
| 5.00% 10/15/33 | 502,543 | 517,567 | ||||||
| Series 2939 PD | ||||||||
| 5.00% 7/15/33 | 345,794 | 353,826 | ||||||
| Series 2941 XD | ||||||||
| 5.00% 5/15/33 | 1,158,993 | 1,176,596 | ||||||
| Series 2987 KG | ||||||||
| 5.00% 12/15/34 | 1,031,029 | 1,066,795 | ||||||
| Series 3131 MC | ||||||||
| 5.50% 4/15/33 | 180,368 | 182,912 | ||||||
| Series 3143 BC | ||||||||
| 5.50% 2/15/36 | 8,000,000 | 8,924,656 | ||||||
| Series 3145 LN | ||||||||
| 4.50% 10/15/34 | 203,400 | 209,983 | ||||||
| @•û | Series 3289 SA | |||||||
| 6.547% 3/15/37 | 3,608,465 | 537,298 | ||||||
38
| Principal | Value | |||||||
| Amount° | (U.S. $) | |||||||
| Agency Collateralized Mortgage Obligations (continued) | ||||||||
| Freddie Mac REMICs (continued) | ||||||||
| Series 3476 Z | ||||||||
| 5.50% 7/15/38 | USD | 12,918,564 | $ | 14,644,199 | ||||
| Series 3626 MA | ||||||||
| 5.00% 2/15/30 | 1,718,676 | 1,782,156 | ||||||
| Series 3656 PM | ||||||||
| 5.00% 4/15/40 | 770,000 | 861,434 | ||||||
| Series 4065 DE | ||||||||
| 3.00% 6/15/32 | 120,000 | 128,747 | ||||||
| •û | Series 4148 SA | |||||||
| 5.897% 12/15/42 | 1,481,080 | 414,739 | ||||||
| t | Freddie Mac Structured Pass | |||||||
| Through Securities | ||||||||
| Series T-54 2A | ||||||||
| 6.50% 2/25/43 | 24,149 | 29,019 | ||||||
| Series T-58 2A | ||||||||
| 6.50% 9/25/43 | 13,091 | 15,279 | ||||||
| GNMA | ||||||||
| @•û | Series 2007-64 AI | |||||||
| 6.347% 10/20/37 | 11,719,692 | 1,767,262 | ||||||
| @•û | Series 2008-65 SB | |||||||
| 5.797% 8/20/38 | 3,567,370 | 420,139 | ||||||
| @•û | Series 2009-2 SE | |||||||
| 5.617% 1/20/39 | 9,898,319 | 1,220,257 | ||||||
| Series 2010-113 KE | ||||||||
| 4.50% 9/20/40 | 1,170,000 | 1,337,178 | ||||||
| Total Agency Collateralized | ||||||||
| Mortgage Obligations | ||||||||
| (cost $80,278,636) | 87,534,786 | |||||||
| Agency Mortgage-Backed Securities – 13.00% | ||||||||
| Fannie Mae | ||||||||
| 5.50% 3/1/37 | 82,488 | 88,890 | ||||||
| 5.50% 7/1/37 | 632,789 | 681,902 | ||||||
| 6.50% 8/1/17 | 25,373 | 28,079 | ||||||
| • | Fannie Mae ARM | |||||||
| 2.402% 10/1/33 | 23,792 | 24,683 | ||||||
| 2.495% 7/1/37 | 142,800 | 151,812 | ||||||
| 2.811% 11/1/35 | 124,038 | 132,455 | ||||||
| 5.204% 8/1/35 | 23,785 | 25,655 | ||||||
| 5.844% 8/1/37 | 142,615 | 154,368 | ||||||
| Fannie Mae Relocation 30 yr | ||||||||
| 5.00% 11/1/33 | 4,461 | 4,789 | ||||||
| 5.00% 1/1/34 | 10,465 | 11,234 | ||||||
| 5.00% 11/1/34 | 27,556 | 29,578 | ||||||
| 5.00% 4/1/35 | 32,816 | 35,225 | ||||||
| 5.00% 10/1/35 | 25,751 | 27,641 | ||||||
| 5.00% 1/1/36 | 80,559 | 86,471 | ||||||
| Fannie Mae S.F. 15 yr | ||||||||
| 2.50% 2/1/28 | 1,453,105 | 1,510,947 | ||||||
| 3.00% 11/1/27 | 233,620 | 247,014 | ||||||
| 3.50% 7/1/26 | 500,872 | 536,317 | ||||||
| 3.50% 10/1/26 | 2,860,165 | 3,033,970 | ||||||
| 4.00% 11/1/25 | 1,830,633 | 1,988,428 | ||||||
| 4.50% 8/1/18 | 182,214 | 196,499 | ||||||
| 4.50% 7/1/20 | 509,272 | 548,878 | ||||||
| 5.00% 5/1/21 | 61,029 | 65,937 | ||||||
| Fannie Mae S.F. 15 yr TBA | ||||||||
| 2.50% 4/1/28 | 15,545,000 | 16,125,508 | ||||||
| 3.00% 4/1/28 | 18,295,000 | 19,234,762 | ||||||
| Fannie Mae S.F. 20 yr | ||||||||
| 4.50% 10/1/23 | 238,307 | 260,815 | ||||||
| 5.00% 11/1/23 | 46,719 | 51,345 | ||||||
| 5.00% 6/1/25 | 167,485 | 183,651 | ||||||
| 5.00% 11/1/25 | 245,167 | 268,831 | ||||||
| 5.00% 7/1/27 | 229,930 | 248,870 | ||||||
| 5.00% 3/1/28 | 707,143 | 766,558 | ||||||
| 5.00% 4/1/28 | 1,190,538 | 1,290,568 | ||||||
| 5.00% 7/1/28 | 93,863 | 101,749 | ||||||
| 5.00% 4/1/29 | 939,995 | 1,019,304 | ||||||
| 5.50% 7/1/24 | 256,171 | 281,977 | ||||||
| 5.50% 10/1/24 | 78,326 | 86,217 | ||||||
| 5.50% 12/1/24 | 267,709 | 294,678 | ||||||
| 5.50% 8/1/28 | 929,599 | 1,015,113 | ||||||
| 5.50% 12/1/29 | 74,152 | 80,973 | ||||||
| Fannie Mae S.F. 30 yr | ||||||||
| 4.00% 10/1/40 | 67,392 | 71,879 | ||||||
| 4.00% 11/1/40 | 600,247 | 640,219 | ||||||
| 4.00% 1/1/41 | 991,151 | 1,057,155 | ||||||
| 4.00% 9/1/41 | 147,392 | 157,254 | ||||||
| 4.00% 3/1/42 | 838,162 | 903,277 | ||||||
| 4.00% 1/1/43 | 2,793,255 | 2,980,141 | ||||||
| 4.50% 5/1/35 | 298,470 | 322,556 | ||||||
| 4.50% 8/1/35 | 686,491 | 740,173 | ||||||
| 4.50% 9/1/35 | 477,679 | 515,033 | ||||||
| 4.50% 7/1/36 | 150,396 | 162,109 | ||||||
| 4.50% 2/1/39 | 611,175 | 658,586 | ||||||
| 4.50% 3/1/39 | 1,470,668 | 1,584,752 | ||||||
| 4.50% 5/1/39 | 650,413 | 712,758 | ||||||
| 4.50% 6/1/39 | 8,074,466 | 8,700,828 | ||||||
| 4.50% 7/1/39 | 933,503 | 1,005,918 | ||||||
| 4.50% 4/1/40 | 223,642 | 241,270 | ||||||
| 4.50% 5/1/40 | 726,026 | 783,253 | ||||||
| 4.50% 6/1/40 | 335,849 | 362,322 | ||||||
| 4.50% 7/1/40 | 288,293 | 311,018 | ||||||
| 4.50% 8/1/40 | 4,196,850 | 4,522,192 | ||||||
| 4.50% 9/1/40 | 512,453 | 552,846 | ||||||
| 4.50% 12/1/40 | 274,310 | 299,430 | ||||||
| 4.50% 2/1/41 | 1,171,331 | 1,263,817 | ||||||
| 4.50% 3/1/41 | 671,257 | 724,587 | ||||||
| 4.50% 4/1/41 | 533,290 | 578,327 | ||||||
| 4.50% 5/1/41 | 361,677 | 390,412 | ||||||
| 4.50% 7/1/41 | 171,241 | 184,846 | ||||||
| 4.50% 8/1/41 | 1,146,607 | 1,237,703 | ||||||
| 4.50% 9/1/41 | 1,506,081 | 1,625,736 | ||||||
| 4.50% 10/1/41 | 639,515 | 690,323 | ||||||
| 4.50% 11/1/41 | 507,928 | 548,282 | ||||||
(continues) 39
Statements of net assets
Optimum Fixed Income Fund
| Principal | Value | |||||||
| Amount° | (U.S. $) | |||||||
| Agency Mortgage-Backed Securities (continued) | ||||||||
| Fannie Mae S.F. 30 yr (continued) | ||||||||
| 4.50% 1/1/42 | USD | 518,352 | $ | 565,041 | ||||
| 4.50% 11/1/42 | 633,179 | 682,297 | ||||||
| 5.00% 5/1/33 | 598,590 | 659,259 | ||||||
| 5.00% 3/1/34 | 8,979 | 9,765 | ||||||
| 5.00% 4/1/34 | 46,838 | 50,900 | ||||||
| 5.00% 8/1/34 | 89,127 | 96,868 | ||||||
| 5.00% 4/1/35 | 16,758 | 18,402 | ||||||
| 5.00% 7/1/35 | 64,006 | 69,504 | ||||||
| 5.00% 9/1/35 | 93,775 | 101,830 | ||||||
| 5.00% 10/1/35 | 5,327,821 | 5,785,313 | ||||||
| 5.00% 11/1/35 | 934,822 | 1,015,119 | ||||||
| 5.00% 5/1/36 | 63,667 | 68,977 | ||||||
| 5.00% 6/1/36 | 699,188 | 757,505 | ||||||
| 5.00% 11/1/36 | 939,053 | 1,019,714 | ||||||
| 5.00% 1/1/37 | 31,594 | 34,229 | ||||||
| 5.00% 5/1/37 | 895,893 | 970,606 | ||||||
| 5.00% 7/1/37 | 10,116 | 10,960 | ||||||
| 5.00% 10/1/37 | 20,073 | 21,747 | ||||||
| 5.00% 12/1/37 | 15,665 | 16,971 | ||||||
| 5.00% 2/1/38 | 77,818 | 84,307 | ||||||
| 5.00% 3/1/38 | 747,083 | 809,386 | ||||||
| 5.00% 4/1/38 | 84,990 | 92,078 | ||||||
| 5.00% 6/1/38 | 30,581 | 33,132 | ||||||
| 5.00% 2/1/39 | 615,727 | 667,087 | ||||||
| 5.00% 4/1/39 | 373,571 | 405,425 | ||||||
| 5.00% 5/1/40 | 544,284 | 593,026 | ||||||
| 5.00% 8/1/40 | 14,208 | 15,606 | ||||||
| 5.50% 12/1/32 | 70,232 | 77,417 | ||||||
| 5.50% 7/1/33 | 336,761 | 370,791 | ||||||
| 5.50% 12/1/33 | 76,891 | 86,559 | ||||||
| 5.50% 4/1/34 | 815,970 | 899,659 | ||||||
| 5.50% 5/1/34 | 261,839 | 288,298 | ||||||
| 5.50% 6/1/34 | 349,254 | 385,311 | ||||||
| 5.50% 7/1/34 | 541,008 | 596,861 | ||||||
| 5.50% 2/1/35 | 1,771,110 | 1,977,377 | ||||||
| 5.50% 9/1/36 | 715,428 | 783,332 | ||||||
| 6.00% 9/1/36 | 103,658 | 115,824 | ||||||
| 6.00% 3/1/37 | 37,689 | 41,463 | ||||||
| 6.00% 4/1/38 | 1,126,829 | 1,235,768 | ||||||
| 6.00% 8/1/38 | 434,831 | 476,869 | ||||||
| 6.00% 12/1/38 | 49,763 | 54,574 | ||||||
| 6.00% 2/1/41 | 825,431 | 913,254 | ||||||
| 6.50% 11/1/33 | 10,355 | 11,689 | ||||||
| 6.50% 2/1/36 | 262,672 | 296,768 | ||||||
| 6.50% 3/1/36 | 357,060 | 400,785 | ||||||
| 6.50% 6/1/36 | 499,770 | 562,847 | ||||||
| 6.50% 2/1/38 | 127,684 | 143,168 | ||||||
| 6.50% 11/1/38 | 45,671 | 50,931 | ||||||
| 7.50% 3/1/32 | 984 | 1,203 | ||||||
| 7.50% 4/1/32 | 4,277 | 5,132 | ||||||
| 7.50% 6/1/32 | 2,008 | 2,348 | ||||||
| Fannie Mae S.F. 30 yr TBA | ||||||||
| 3.00% 4/1/43 | 9,794,000 | 10,101,592 | ||||||
| 3.00% 5/1/43 | 4,445,000 | 4,572,099 | ||||||
| 3.50% 4/1/43 | 12,934,000 | 13,657,496 | ||||||
| 3.50% 5/1/43 | 13,539,000 | 14,262,490 | ||||||
| 4.50% 4/1/43 | 13,000,000 | 14,005,469 | ||||||
| 4.50% 5/1/43 | 2,125,000 | 2,292,012 | ||||||
| 5.00% 4/1/43 | 12,000,000 | 12,999,374 | ||||||
| Freddie Mac 4.50% 1/1/41 | 972,214 | 1,018,810 | ||||||
| • | Freddie Mac ARM | |||||||
| 2.342% 12/1/33 | 89,203 | 95,126 | ||||||
| 2.763% 7/1/36 | 87,375 | 93,474 | ||||||
| 2.865% 4/1/34 | 4,602 | 4,909 | ||||||
| 3.303% 5/1/37 | 434,453 | 457,248 | ||||||
| 5.475% 2/1/38 | 428,062 | 464,163 | ||||||
| Freddie Mac Relocation 30 yr | ||||||||
| 5.00% 9/1/33 | 706 | 754 | ||||||
| Freddie Mac S.F. 15 yr | ||||||||
| 4.50% 5/1/20 | 284,387 | 303,438 | ||||||
| 5.00% 6/1/18 | 94,461 | 101,185 | ||||||
| Freddie Mac S.F. 20 yr | ||||||||
| 5.50% 10/1/23 | 155,745 | 170,041 | ||||||
| 5.50% 8/1/24 | 42,992 | 47,060 | ||||||
| Freddie Mac S.F. 30 yr | ||||||||
| 3.00% 11/1/42 | 480,826 | 495,561 | ||||||
| 4.00% 10/1/40 | 570,907 | 606,832 | ||||||
| 4.00% 11/1/40 | 326,577 | 347,128 | ||||||
| 5.50% 7/1/40 | 3,351,036 | 3,638,745 | ||||||
| 6.00% 8/1/38 | 648,579 | 715,594 | ||||||
| 6.00% 10/1/38 | 970,520 | 1,072,043 | ||||||
| 6.00% 5/1/40 | 1,944,586 | 2,126,126 | ||||||
| 6.50% 11/1/33 | 37,670 | 43,438 | ||||||
| 6.50% 1/1/35 | 200,898 | 227,854 | ||||||
| 6.50% 8/1/38 | 104,168 | 116,322 | ||||||
| 7.00% 1/1/38 | 116,537 | 134,445 | ||||||
| GNMA I S.F. 30 yr | ||||||||
| 7.00% 12/15/34 | 348,540 | 410,057 | ||||||
| GNMA II 30 yr | ||||||||
| 6.00% 4/20/34 | 14,995 | 16,842 | ||||||
| Total Agency Mortgage- | ||||||||
| Backed Securities | ||||||||
| (cost $192,724,842) | 194,481,702 | |||||||
| Collateralized Debt Obligations – 0.98% | ||||||||
| #• | Black Diamond CLO | |||||||
| Series 2005-1A A1A | ||||||||
| 144A 0.53% 6/20/17 | 12,165 | 12,125 | ||||||
| #• | BlueMountain CLO | |||||||
| Series 2005- | ||||||||
| 1A A1F 144A | ||||||||
| 0.528% 11/15/17 | 383,439 | 379,532 | ||||||
| • | Euro-Galaxy CLO | |||||||
| Series 2006-1X A2 | ||||||||
| 0.449% 10/23/21 | EUR | 3,598,024 | 4,427,550 | |||||
| #• | Franklin CLO Series 5A A2 | |||||||
| 144A 0.54% 6/15/18 | USD | 4,874,153 | 4,811,763 | |||||
40
| Principal | Value | |||||||
| Amount° | (U.S. $) | |||||||
| Collateralized Debt Obligations (continued) | ||||||||
| #• | Halcyon Structured | |||||||
| Asset Management | ||||||||
| Long Secured/ | ||||||||
| Short Unsecured | ||||||||
| Series 2006-1A A 144A | ||||||||
| 0.495% 10/12/18 | 2,580,161 | $ | 2,552,192 | |||||
| #• | Kingsland I | |||||||
| Series 2005-1A A1A | ||||||||
| 144A 0.53% 6/13/19 | 1,997,258 | 1,986,933 | ||||||
| #@• | Landmark V CDO | |||||||
| Series 2005-1A A1L | ||||||||
| 144A 0.587% 6/1/17 | 437,609 | 432,817 | ||||||
| Total Collateralized Debt | ||||||||
| Obligations (cost $14,648,228) | 14,602,912 | |||||||
| Commercial Mortgage-Backed Securities – 2.51% | ||||||||
| BAML Commercial Mortgage | ||||||||
| • | Series 2005-6 A4 | |||||||
| 5.188% 9/10/47 | 1,615,000 | 1,773,126 | ||||||
| Series 2006-4 A4 | ||||||||
| 5.634% 7/10/46 | 1,070,000 | 1,202,493 | ||||||
| #• | Bank of America Re-REMIC | |||||||
| Trust Series 2009- | ||||||||
| UB2 A4AA 144A | ||||||||
| 5.675% 2/24/51 | 2,200,000 | 2,548,239 | ||||||
| • | Bear Stearns | |||||||
| Commercial Mortgage | ||||||||
| Securities Trust | ||||||||
| Series 2005-PW10 A4 | ||||||||
| 5.405% 12/11/40 | 540,000 | 594,566 | ||||||
| Series 2005-T20 A4A | ||||||||
| 5.147% 10/12/42 | 990,000 | 1,084,709 | ||||||
| Series 2006-PW12 A4 | ||||||||
| 5.718% 9/11/38 | 895,000 | 1,009,603 | ||||||
| • | Citicorp Residential | |||||||
| Mortgage Securities | ||||||||
| Series 2006-3 A4 | ||||||||
| 5.703% 11/25/36 | 645,633 | 644,124 | ||||||
| Series 2006-3 A5 | ||||||||
| 5.948% 11/25/36 | 900,000 | 869,788 | ||||||
| Citigroup Commercial | ||||||||
| Mortgage Trust | ||||||||
| Series 2012-GC8 A4 | ||||||||
| 3.024% 9/10/45 | 675,000 | 690,875 | ||||||
| • | COMM Mortgage | |||||||
| Trust Series 2005-C6 | ||||||||
| A5A 5.116% 6/10/44 | 480,000 | 521,462 | ||||||
| •t | Commercial Mortgage Pass | |||||||
| Through Certificates | ||||||||
| Series 2006-C1 AAB | ||||||||
| 5.407% 2/15/39 | 72,422 | 75,054 | ||||||
| # | Series 2010-UD1 A | |||||||
| 144A 5.766% 6/18/17 | 2,200,000 | 2,473,351 | ||||||
| Series 2013-CR6 A2 | ||||||||
| 2.122% 3/10/46 | 1,005,000 | 1,034,186 | ||||||
| # | DB-UBS Mortgage | |||||||
| Trust 144A | ||||||||
| Series 2011-LC1A A3 | ||||||||
| 5.002% 11/10/46 | 1,070,000 | 1,259,478 | ||||||
| • | Series 2011-LC1A C | |||||||
| 5.557% 11/10/46 | 380,000 | 439,251 | ||||||
| #• | FREMF Mortgage Trust | |||||||
| Series 2012-K21 B | ||||||||
| 144A 3.939% 7/25/45 | 395,000 | 407,209 | ||||||
| Goldman Sachs Mortgage | ||||||||
| Securities II | ||||||||
| • | Series 2004-GG2 A6 | |||||||
| 5.396% 8/10/38 | 570,000 | 595,322 | ||||||
| Series 2005-GG4 A4A | ||||||||
| 4.751% 7/10/39 | 1,215,000 | 1,293,547 | ||||||
| • | Series 2006-GG6 A4 | |||||||
| 5.553% 4/10/38 | 595,000 | 657,841 | ||||||
| #• | Series 2007-EOP A1 | |||||||
| 144A 1.103% 3/6/20 | 632,766 | 632,950 | ||||||
| #• | Series 2007-GG10 J | |||||||
| 144A 5.787% 8/10/45 | 1,956,000 | 391 | ||||||
| # | Series 2010-C1 A2 | |||||||
| 144A 4.592% 8/10/43 | 915,000 | 1,052,691 | ||||||
| #• | Series 2010-C1 C 144A | |||||||
| 5.635% 8/10/43 | 375,000 | 428,178 | ||||||
| • | Greenwich Capital | |||||||
| Commercial Funding | ||||||||
| Series 2005-GG5 A5 | ||||||||
| 5.224% 4/1/37 | 1,155,000 | 1,260,538 | ||||||
| Series 2006-GG7 A4 | ||||||||
| 5.866% 7/10/38 | 1,140,000 | 1,287,025 | ||||||
| # | GS Mortgage Securities Trust | |||||||
| Series 2012-ALOH B | ||||||||
| 144A 4.049% 4/10/34 | 385,000 | 412,166 | ||||||
| JPMorgan Chase Commercial | ||||||||
| Mortgage Securities | ||||||||
| • | Series 2005-LDP3 A4A | |||||||
| 4.936% 8/15/42 | 450,000 | 486,278 | ||||||
| • | Series 2005-LDP5 A4 | |||||||
| 5.201% 12/15/44 | 2,063,000 | 2,261,225 | ||||||
| Series 2007-LDPX A3 | ||||||||
| 5.42% 1/15/49 | 1,140,000 | 1,296,228 | ||||||
| Series 2011-C5 A3 | ||||||||
| 4.171% 8/15/46 | 1,055,000 | 1,179,527 | ||||||
| LB-UBS Commercial | ||||||||
| Mortgage Trust | ||||||||
| Series 2004-C1 A4 | ||||||||
| 4.568% 1/15/31 | 319,352 | 327,387 | ||||||
| Morgan Stanley-BAML Trust | ||||||||
| Series 2013-C8 AS | ||||||||
| 3.376% 12/15/48 | 600,000 | 614,849 | ||||||
| • | Series 2013-C8 B | |||||||
| 3.676% 12/15/48 | 325,000 | 335,220 | ||||||
(continues) 41
Statements of net assets
Optimum Fixed Income Fund
| Principal | Value | |||||||
| Amount° | (U.S. $) | |||||||
| Commercial Mortgage-Backed Securities (continued) | ||||||||
| Morgan Stanley Capital I | ||||||||
| Series 2005-HQ6 A4A | ||||||||
| 4.989% 8/13/42 | USD | 240,000 | $ | 258,345 | ||||
| • | Series 2007-T27 A4 | |||||||
| 5.651% 6/11/42 | 1,740,000 | 2,035,541 | ||||||
| NCUA Guaranteed Notes | ||||||||
| Trust Series 2010-C1 | ||||||||
| A2 2.90% 10/29/20 | 390,000 | 415,627 | ||||||
| # | OBP Depositor Trust | |||||||
| Series 2010-OBP A | ||||||||
| 144A 4.646% 7/15/45 | 585,000 | 673,219 | ||||||
| # | Timberstar Trust | |||||||
| Series 2006-1A A 144A | ||||||||
| 5.668% 10/15/36 | 515,000 | 587,979 | ||||||
| # | VNO Mortgage Trust | |||||||
| Series 2012-6AVE A | ||||||||
| 144A 2.996% 11/15/30 | 1,330,000 | 1,338,938 | ||||||
| WF-RBS Commercial | ||||||||
| Mortgage Trust | ||||||||
| Series 2012-C9 A3 | ||||||||
| 2.87% 11/15/45 | 540,000 | 544,750 | ||||||
| Series 2012-C9 B | ||||||||
| 3.84% 11/15/45 | 195,000 | 202,158 | ||||||
| Series 2013-C11 A5 | ||||||||
| 3.071% 3/15/45 | 455,000 | 466,089 | ||||||
| Series 2013-C11 AS | ||||||||
| 3.311% 3/15/45 | 280,000 | 285,398 | ||||||
| Total Commercial Mortgage- | ||||||||
| Backed Securities | ||||||||
| (cost $36,684,923) | 37,556,921 | |||||||
| Convertible Bonds – 1.65% | ||||||||
| Advanced Micro Devices | ||||||||
| 6.00% exercise price | ||||||||
| $28.08, expiration | ||||||||
| date 4/30/15 | 541,000 | 540,324 | ||||||
| # | Alaska Communications | |||||||
| Systems Group 144A | ||||||||
| 6.25% exercise price | ||||||||
| $10.28, expiration | ||||||||
| date 4/27/18 | 490,000 | 354,944 | ||||||
| Alcatel-Lucent USA 2.875% | ||||||||
| exercise price $15.35, | ||||||||
| expiration date 6/13/25 | 415,000 | 416,816 | ||||||
| Alere 3.00% exercise price | ||||||||
| $43.98, expiration | ||||||||
| date 5/15/16 | 577,000 | 569,788 | ||||||
| Ares Capital 5.75% | ||||||||
| exercise price $19.13, | ||||||||
| expiration date 2/1/16 | 508,000 | 553,085 | ||||||
| *ϕ | ArvinMeritor 4.00% | |||||||
| exercise price $26.73, | ||||||||
| expiration date 2/12/27 | 945,000 | 756,591 | ||||||
| BGC Partners 4.50% | ||||||||
| exercise price $9.84, | ||||||||
| expiration date 7/13/16 | 485,000 | 482,272 | ||||||
| # | Blucora 144A 4.25% | |||||||
| exercise price $21.66, | ||||||||
| expiration date 9/28/18 | 315,000 | 327,797 | ||||||
| Chesapeake Energy | ||||||||
| 2.25% exercise price | ||||||||
| $85.61, expiration | ||||||||
| date 12/14/38 | 193,000 | 172,253 | ||||||
| 2.50% exercise price | ||||||||
| $51.14, expiration | ||||||||
| date 5/15/37 | 205,000 | 197,441 | ||||||
| # | Ciena 144A 3.75% exercise | |||||||
| price $20.17, expiration | ||||||||
| date 10/15/18 | 584,000 | 665,030 | ||||||
| # | Clearwire Communications | |||||||
| 144A 8.25% exercise | ||||||||
| price $7.08, expiration | ||||||||
| date 11/30/40 | 377,000 | 421,769 | ||||||
| # | Corporate Office Properties | |||||||
| 144A 4.25% exercise | ||||||||
| price $47.96 expiration | ||||||||
| date 4/12/30 | 454,000 | 473,863 | ||||||
| Dendreon 2.875% | ||||||||
| exercise price $51.24, | ||||||||
| expiration date 1/13/16 | 575,000 | 461,438 | ||||||
| ϕ | General Cable 4.50% | |||||||
| exercise price | ||||||||
| $36.75, expiration | ||||||||
| date 11/15/29 | 660,000 | 825,825 | ||||||
| Gilead Sciences 1.625% | ||||||||
| exercise price $22.71, | ||||||||
| expiration date 5/1/16 | 221,000 | 480,124 | ||||||
| Helix Energy Solutions | ||||||||
| Group 3.25% | ||||||||
| exercise price $25.02, | ||||||||
| expiration date 3/12/32 | 618,000 | 760,526 | ||||||
| ϕ | Hologic 2.00% exercise | |||||||
| price $31.17, | ||||||||
| expiration date 2/27/42 | 606,000 | 636,300 | ||||||
| # | Iconix Brand Group 144A | |||||||
| 2.50% exercise price | ||||||||
| $30.75, expiration | ||||||||
| date 5/31/16 | 433,000 | 483,066 | ||||||
| # | Illumina 144A 0.25% | |||||||
| exercise price $83.55, | ||||||||
| expiration date 3/11/16 | 289,000 | 278,885 | ||||||
| Intel 3.25% exercise price | ||||||||
| $22.20, expiration | ||||||||
| date 8/1/39 | 607,000 | 731,817 | ||||||
| International Game | ||||||||
| Technology 3.25% | ||||||||
| exercise price $19.93, | ||||||||
| expiration date 5/1/14 | 231,000 | 249,624 | ||||||
42
| Principal | Value | ||||||
| Amount° | (U.S. $) | ||||||
| Convertible Bonds (continued) | |||||||
| Jefferies Group 3.875% | |||||||
| exercise price | |||||||
| $45.82, expiration | |||||||
| date 10/31/29 | USD | 609,000 | $ | 628,412 | |||
| L-3 Communications | |||||||
| Holdings 3.00% | |||||||
| exercise price $91.21, | |||||||
| expiration date 8/1/35 | 391,000 | 397,354 | |||||
| Leap Wireless International | |||||||
| 4.50% exercise price | |||||||
| $93.21, expiration | |||||||
| date 7/10/14 | 599,000 | 613,226 | |||||
| # | Lexington Realty Trust 144A | ||||||
| 6.00% exercise price | |||||||
| $6.93, expiration | |||||||
| date 1/11/30 | 257,000 | 448,626 | |||||
| Linear Technology 3.00% | |||||||
| exercise price $42.07, | |||||||
| expiration date 4/30/27 | 508,000 | 544,195 | |||||
| Live Nation Entertainment | |||||||
| 2.875% exercise price | |||||||
| $27.14, expiration | |||||||
| date 7/14/27 | 628,000 | 632,710 | |||||
| MGM Resorts International | |||||||
| 4.25% exercise price | |||||||
| $18.58, expiration | |||||||
| date 4/10/15 | 741,000 | 806,301 | |||||
| # | Molina Healthcare 144A | ||||||
| 1.125% exercise price | |||||||
| $40.77, expiration | |||||||
| date 1/13/20 | 89,000 | 89,445 | |||||
| Mylan 3.75% exercise price | |||||||
| $13.32, expiration | |||||||
| date 9/15/15 | 254,000 | 564,039 | |||||
| Nuance Communications | |||||||
| 2.75% exercise | |||||||
| price $32.30, | |||||||
| expiration date 11/1/31 | 857,000 | 889,672 | |||||
| NuVasive 2.75% exercise | |||||||
| price $42.13, | |||||||
| expiration date 6/30/17 | 1,226,000 | 1,198,414 | |||||
| # | Opko Health 144A 3.00% | ||||||
| exercise price $7.07, | |||||||
| expiration date 1/28/33 | 140,000 | 155,400 | |||||
| # | Owens-Brockway Glass | ||||||
| Container 144A 3.00% | |||||||
| exercise price $47.47, | |||||||
| expiration date 5/28/15 | 633,000 | 639,726 | |||||
| * | Peabody Energy 4.75% | ||||||
| exercise price | |||||||
| $57.95, expiration | |||||||
| date 12/15/41 | 341,000 | 279,620 | |||||
| PHH 4.00% exercise price | |||||||
| $25.80, expiration | |||||||
| date 8/27/14 | 888,000 | 980,684 | |||||
| * | Rovi 2.625% exercise price | ||||||
| $47.36, expiration | |||||||
| date 2/10/40 | 292,000 | 298,388 | |||||
| # | Ryman Hospitality Properties | ||||||
| 144A 3.75% exercise | |||||||
| price $22.23, | |||||||
| expiration date 9/29/14 | 301,000 | 621,753 | |||||
| SanDisk 1.50% exercise | |||||||
| price $52.37, | |||||||
| expiration date 8/11/17 | 644,000 | 833,174 | |||||
| SBA Communications | |||||||
| 4.00% exercise price | |||||||
| $30.38, expiration | |||||||
| date 9/29/14 | 168,000 | 401,415 | |||||
| Steel Dynamics 5.125% | |||||||
| exercise price $17.25, | |||||||
| expiration date 6/15/14 | 187,000 | 210,843 | |||||
| # | TIBCO Software 144A | ||||||
| 2.25% exercise price | |||||||
| $50.57, expiration | |||||||
| date 4/30/32 | 1,051,000 | 1,022,753 | |||||
| # | Titan Machinery 144A | ||||||
| 3.75% exercise price | |||||||
| $43.17, expiration | |||||||
| date 4/30/19 | 306,000 | 309,251 | |||||
| • | Vector Group 2.50% | ||||||
| exercise price $18.50, | |||||||
| expiration date 1/14/19 | 167,000 | 195,130 | |||||
| VeriSign 3.25% exercise | |||||||
| price $34.37, | |||||||
| expiration date 8/15/37 | 463,000 | 688,423 | |||||
| # | WellPoint 144A 2.75% | ||||||
| exercise price | |||||||
| $75.57, expiration | |||||||
| date 10/15/42 | 411,000 | 451,073 | |||||
| Total Convertible Bonds | |||||||
| (cost $23,141,665) | 24,739,605 | ||||||
| Corporate Bonds – 36.03% | |||||||
| Banking – 8.05% | |||||||
| Abbey National | |||||||
| Treasury Services | |||||||
| 4.00% 4/27/16 | 670,000 | 712,974 | |||||
| AgriBank 9.125% 7/15/19 | 845,000 | 1,140,472 | |||||
| #• | Banco Bradesco 144A | ||||||
| 2.39% 5/16/14 | 1,300,000 | 1,316,379 | |||||
| # | Banco BTG Pactual 144A | ||||||
| 4.00% 1/16/20 | 760,000 | 735,300 | |||||
| Banco do Brasil | |||||||
| 3.875% 10/10/22 | 3,650,000 | 3,540,499 | |||||
| #144A 6.00% 1/22/20 | 3,000,000 | 3,472,500 | |||||
| # | Banco Mercantil | ||||||
| del Norte 144A | |||||||
| 4.375% 7/19/15 | 400,000 | 423,000 | |||||
| @•6.862% 10/13/21 | 520,000 | 556,400 | |||||
| #• | Banco Santander Brazil 144A | ||||||
| 2.38% 3/18/14 | 2,000,000 | 2,005,490 | |||||
| # | Banco Santander Chile 144A | ||||||
| 3.75% 9/22/15 | 2,200,000 | 2,317,641 | |||||
(continues) 43
Statements of net assets
Optimum Fixed Income Fund
| Principal | Value | |||||||
| Amount° | (U.S. $) | |||||||
| Corporate Bonds (continued) | ||||||||
| Banking (continued) | ||||||||
| # | Banco Santander | |||||||
| Mexico 144A | ||||||||
| 4.125% 11/9/22 | USD | 1,270,000 | $ | 1,279,525 | ||||
| # | Banco Votorantim 144A | |||||||
| • | 3.284% 3/28/14 | 2,000,000 | 2,057,760 | |||||
| *@ | 5.25% 2/11/16 | 2,300,000 | 2,455,250 | |||||
| Bancolombia | ||||||||
| 5.125% 9/11/22 | 677,000 | 683,770 | ||||||
| # | Bank Nederlandse | |||||||
| Gemeenten 144A | ||||||||
| 2.50% 1/23/23 | 1,772,000 | 1,771,968 | ||||||
| Bank of America | ||||||||
| 2.00% 1/11/18 | 1,410,000 | 1,404,883 | ||||||
| 3.30% 1/11/23 | 525,000 | 518,754 | ||||||
| 3.875% 3/22/17 | 635,000 | 683,739 | ||||||
| 5.65% 5/1/18 | 1,000,000 | 1,158,104 | ||||||
| 6.00% 9/1/17 | 1,200,000 | 1,394,509 | ||||||
| 7.375% 5/15/14 | 100,000 | 107,047 | ||||||
| 7.625% 6/1/19 | 800,000 | 1,017,521 | ||||||
| * | Barclays Bank | |||||||
| 7.625% 11/21/22 | 825,000 | 815,719 | ||||||
| BB&T 5.25% 11/1/19 | 1,146,000 | 1,322,509 | ||||||
| BBVA US Senior | ||||||||
| 4.664% 10/9/15 | 550,000 | 564,343 | ||||||
| # | Caixa Economica | |||||||
| Federal 144A | ||||||||
| 2.375% 11/6/17 | 1,030,000 | 1,003,220 | ||||||
| # | CIT Group 144A | |||||||
| 5.25% 4/1/14 | 1,350,000 | 1,405,688 | ||||||
| Citigroup | ||||||||
| • | 0.576% 11/5/14 | 4,600,000 | 4,582,979 | |||||
| • | 1.755% 1/13/14 | 500,000 | 504,654 | |||||
| 4.587% 12/15/15 | 200,000 | 216,932 | ||||||
| 5.50% 10/15/14 | 600,000 | 640,495 | ||||||
| 6.125% 5/15/18 | 1,900,000 | 2,266,067 | ||||||
| 8.50% 5/22/19 | 1,400,000 | 1,867,495 | ||||||
| City National 5.25% 9/15/20 | 755,000 | 851,047 | ||||||
| # | DnB Bank 144A | |||||||
| 3.20% 4/3/17 | 3,300,000 | 3,498,525 | ||||||
| Eksportfinans | ||||||||
| • | 0.505% 4/5/13 | 500,000 | 499,902 | |||||
| 1.60% 3/20/14 | JPY | 2,000,000 | 20,793 | |||||
| 1.875% 4/2/13 | USD | 500,000 | 500,000 | |||||
| 2.00% 9/15/15 | 1,300,000 | 1,248,850 | ||||||
| 2.375% 5/25/16 | 500,000 | 475,980 | ||||||
| 3.00% 11/17/14 | 300,000 | 298,617 | ||||||
| 4.75% 6/11/13 | EUR | 100,000 | 129,257 | |||||
| 5.50% 5/25/16 | USD | 200,000 | 207,903 | |||||
| 5.50% 6/26/17 | 300,000 | 311,393 | ||||||
| Export-Import Bank of Korea | ||||||||
| 1.25% 11/20/15 | 400,000 | 401,246 | ||||||
| 4.375% 9/15/21 | 600,000 | 666,101 | ||||||
| 5.00% 4/11/22 | 2,000,000 | 2,322,570 | ||||||
| 5.125% 3/16/15 | 200,000 | 216,073 | ||||||
| 5.125% 6/29/20 | 1,500,000 | 1,731,446 | ||||||
| 5.875% 1/14/15 | 950,000 | 1,032,148 | ||||||
| • | Fifth Third Capital Trust IV | |||||||
| 6.50% 4/15/37 | 1,210,000 | 1,217,563 | ||||||
| Goldman Sachs Group | ||||||||
| • | 0.575% 5/18/15 | EUR | 100,000 | 126,966 | ||||
| • | 0.702% 7/22/15 | USD | 200,000 | 198,067 | ||||
| • | 0.734% 3/22/16 | 300,000 | 296,803 | |||||
| • | 0.805% 1/12/15 | 700,000 | 697,264 | |||||
| 3.375% 2/1/18 | CAD | 468,000 | 468,182 | |||||
| 3.70% 8/1/15 | USD | 900,000 | 951,679 | |||||
| 5.15% 1/15/14 | 2,000,000 | 2,070,438 | ||||||
| 6.25% 9/1/17 | 1,100,000 | 1,293,369 | ||||||
| # | Halkbank 144A | |||||||
| 3.875% 2/5/20 | 570,000 | 562,875 | ||||||
| #• | HBOS Capital Funding 144A | |||||||
| 6.071% 6/29/49 | 300,000 | 269,625 | ||||||
| # | HSBC Bank 144A | |||||||
| 1.625% 8/12/13 | 2,300,000 | 2,311,035 | ||||||
| 4.75% 1/19/21 | 1,095,000 | 1,253,944 | ||||||
| HSBC Holdings | ||||||||
| 4.00% 3/30/22 | 615,000 | 662,952 | ||||||
| ICICI Bank | ||||||||
| 5.50% 3/25/15 | 2,100,000 | 2,231,664 | ||||||
| # | 144A 5.50% 3/25/15 | 3,300,000 | 3,506,900 | |||||
| JPMorgan Chase | ||||||||
| • | 0.879% 5/31/17 | EUR | 2,400,000 | 3,022,602 | ||||
| 2.92% 9/19/17 | CAD | 720,000 | 720,475 | |||||
| 3.15% 7/5/16 | USD | 100,000 | 106,111 | |||||
| 3.20% 1/25/23 | 950,000 | 950,448 | ||||||
| • | 4.375% 11/30/21 | EUR | 2,600,000 | 3,468,925 | ||||
| 4.40% 7/22/20 | USD | 400,000 | 444,110 | |||||
| # | 144A 6.00% 6/19/13 | BRL | 141,500 | 1,831,708 | ||||
| 6.30% 4/23/19 | USD | 300,000 | 366,897 | |||||
| KeyBank 6.95% 2/1/28 | 1,220,000 | 1,520,502 | ||||||
| KFW 6.25% 5/19/21 | AUD | 2,300,000 | 2,704,386 | |||||
| Morgan Stanley | ||||||||
| • | 0.605% 1/9/14 | USD | 500,000 | 498,947 | ||||
| • | 1.902% 1/24/14 | 700,000 | 705,916 | |||||
| 3.45% 11/2/15 | 1,000,000 | 1,048,625 | ||||||
| 3.75% 2/25/23 | 545,000 | 552,011 | ||||||
| 7.30% 5/13/19 | 2,700,000 | 3,345,449 | ||||||
| 7.375% 2/22/18 | AUD | 1,836,000 | 2,080,956 | |||||
| 7.60% 8/8/17 | NZD | 574,000 | 513,456 | |||||
| • | National City Bank | |||||||
| 0.651% 6/7/17 | USD | 325,000 | 321,614 | |||||
| #• | Nordea Bank 144A | |||||||
| 1.205% 1/14/14 | 3,000,000 | 3,019,770 | ||||||
| PNC Bank 6.875% 4/1/18 | 1,415,000 | 1,758,070 | ||||||
| PNC Funding 5.625% 2/1/17 | 195,000 | 222,931 | ||||||
| #• | PNC Preferred Funding | |||||||
| Trust II 144A | ||||||||
| 1.503% 3/31/49 | 1,600,000 | 1,408,000 | ||||||
44
| Principal | Value | |||||||
| Amount° | (U.S. $) | |||||||
| Corporate Bonds (continued) | ||||||||
| Banking (continued) | ||||||||
| • | Royal Bank of Scotland | |||||||
| 9.50% 3/16/22 | USD | 300,000 | $ | 346,610 | ||||
| # | Sberbank 144A | |||||||
| 6.125% 2/7/22 | 765,000 | 856,800 | ||||||
| # | Standard Chartered 144A | |||||||
| 3.95% 1/11/23 | 1,125,000 | 1,122,686 | ||||||
| • | SunTrust Bank | |||||||
| 0.578% 8/24/15 | 505,000 | 497,522 | ||||||
| SVB Financial Group | ||||||||
| 5.375% 9/15/20 | 190,000 | 215,728 | ||||||
| UBS | ||||||||
| 2.25% 1/28/14 | 1,104,000 | 1,118,946 | ||||||
| 5.875% 12/20/17 | 1,163,000 | 1,380,864 | ||||||
| U.S. Bank | ||||||||
| 4.95% 10/30/14 | 1,000,000 | 1,065,779 | ||||||
| • | USB Capital IX | |||||||
| 3.50% 10/29/49 | 1,820,000 | 1,692,782 | ||||||
| #• | USB Realty 144A | |||||||
| 1.451% 12/22/49 | 100,000 | 87,125 | ||||||
| • | Wachovia | |||||||
| 0.674% 10/15/16 | 255,000 | 252,301 | ||||||
| Wells Fargo | ||||||||
| 3.45% 2/13/23 | 1,735,000 | 1,750,291 | ||||||
| Zions Bancorp | ||||||||
| 4.50% 3/27/17 | 520,000 | 555,934 | ||||||
| 7.75% 9/23/14 | 280,000 | 304,520 | ||||||
| 120,334,560 | ||||||||
| Basic Industry – 2.51% | ||||||||
| Airgas | ||||||||
| 1.65% 2/15/18 | 715,000 | 716,967 | ||||||
| 2.375% 2/15/20 | 1,590,000 | 1,589,076 | ||||||
| AK Steel 7.625% 5/15/20 | 170,000 | 149,600 | ||||||
| ArcelorMittal | ||||||||
| 10.35% 6/1/19 | 830,000 | 1,049,370 | ||||||
| Barrick Gold 3.85% 4/1/22 | 665,000 | 681,070 | ||||||
| Barrick North America | ||||||||
| Finance 4.40% 5/30/21 | 375,000 | 401,121 | ||||||
| Cabot | ||||||||
| 2.55% 1/15/18 | 1,565,000 | 1,610,556 | ||||||
| 3.70% 7/15/22 | 495,000 | 503,399 | ||||||
| Century Aluminum | ||||||||
| 8.00% 5/15/14 | 279,000 | 280,744 | ||||||
| CF Industries | ||||||||
| 6.875% 5/1/18 | 1,570,000 | 1,883,162 | ||||||
| 7.125% 5/1/20 | 260,000 | 322,604 | ||||||
| Compass Minerals | ||||||||
| International | ||||||||
| 8.00% 6/1/19 | 268,000 | 292,120 | ||||||
| # | CSN Resources 144A | |||||||
| 6.50% 7/21/20 | 2,600,000 | 2,793,699 | ||||||
| Dow Chemical | ||||||||
| 8.55% 5/15/19 | 2,322,000 | 3,125,079 | ||||||
| DuPont (E.I.) de Nemours | ||||||||
| 2.80% 2/15/23 | 3,590,000 | 3,653,951 | ||||||
| # | FMG Resources August | |||||||
| 2006 144A | ||||||||
| * | 6.875% 4/1/22 | 65,000 | 68,331 | |||||
| 7.00% 11/1/15 | 250,000 | 263,125 | ||||||
| # | Freeport-McMoRan | |||||||
| Copper & Gold 144A | ||||||||
| 3.875% 3/15/23 | 2,035,000 | 2,044,988 | ||||||
| # | Georgia Gulf 144A | |||||||
| 4.875% 5/15/23 | 115,000 | 117,444 | ||||||
| Georgia-Pacific | ||||||||
| 8.00% 1/15/24 | 1,757,000 | 2,436,188 | ||||||
| # | Gerdau Trade 144A | |||||||
| 5.75% 1/30/21 | 4,300,000 | 4,611,749 | ||||||
| HD Supply | ||||||||
| *# | 144A 7.50% 7/15/20 | 151,000 | 159,305 | |||||
| 11.00% 4/15/20 | 150,000 | 182,625 | ||||||
| Headwaters | ||||||||
| 7.625% 4/1/19 | 375,000 | 403,125 | ||||||
| International Paper | ||||||||
| 6.00% 11/15/41 | 315,000 | 367,832 | ||||||
| 9.375% 5/15/19 | 165,000 | 227,044 | ||||||
| LyondellBasell Industries | ||||||||
| 5.75% 4/15/24 | 425,000 | 500,438 | ||||||
| 6.00% 11/15/21 | 240,000 | 285,600 | ||||||
| # | MacDermid 144A | |||||||
| 9.50% 4/15/17 | 251,000 | 260,726 | ||||||
| # | Mexichem 144A | |||||||
| 4.875% 9/19/22 | 850,000 | 903,125 | ||||||
| Mohawk Industries | ||||||||
| 6.375% 1/15/16 | 146,000 | 163,520 | ||||||
| # | Murray Energy 144A | |||||||
| 10.25% 10/15/15 | 237,000 | 239,074 | ||||||
| Norcraft 10.50% 12/15/15 | 169,000 | 177,239 | ||||||
| Nortek 8.50% 4/15/21 | 325,000 | 362,375 | ||||||
| Novelis 8.75% 12/15/20 | 375,000 | 424,688 | ||||||
| # | Phosagro 144A | |||||||
| 4.204% 2/13/18 | 1,228,000 | 1,226,465 | ||||||
| # | Polyone 144A | |||||||
| 5.25% 3/15/23 | 190,000 | 192,375 | ||||||
| Rockwood Specialties Group | ||||||||
| 4.625% 10/15/20 | 170,000 | 174,888 | ||||||
| # | Ryerson 144A | |||||||
| 9.00% 10/15/17 | 200,000 | 219,250 | ||||||
| 11.25% 10/15/18 | 85,000 | 88,613 | ||||||
| # | Samarco Mineracao 144A | |||||||
| 4.125% 11/1/22 | 894,000 | 872,097 | ||||||
| Southern Copper | ||||||||
| 3.50% 11/8/22 | 275,000 | 275,059 | ||||||
| 5.25% 11/8/42 | 1,020,000 | 970,909 | ||||||
| # | TPC Group 144A | |||||||
| 8.75% 12/15/20 | 155,000 | 162,169 | ||||||
| # | U.S. Coatings Acquisition | |||||||
| 144A 7.375% 5/1/21 | 150,000 | 158,438 | ||||||
| 37,591,322 | ||||||||
(continues) 45
Statements of net assets
Optimum Fixed Income Fund
| Principal | Value | ||||||
| Amount° | (U.S. $) | ||||||
| Corporate Bonds (continued) | |||||||
| Brokerage – 0.89% | |||||||
| Bear Stearns 7.25% 2/1/18 | USD | 2,000,000 | $ | 2,488,148 | |||
| #t | Citicorp Lease Pass Through | ||||||
| Trust Series 1999-1 | |||||||
| 144A 8.04% 12/15/19 | 400,000 | 509,376 | |||||
| Jefferies Group | |||||||
| 5.125% 1/20/23 | 555,000 | 588,756 | |||||
| 6.45% 6/8/27 | 296,000 | 328,560 | |||||
| 6.50% 1/20/43 | 205,000 | 219,273 | |||||
| Lazard Group | |||||||
| 6.85% 6/15/17 | 1,087,000 | 1,250,927 | |||||
| Merrill Lynch | |||||||
| 6.875% 4/25/18 | 2,325,000 | 2,809,395 | |||||
| 6.875% 11/15/18 | 4,200,000 | 5,162,103 | |||||
| 13,356,538 | |||||||
| Capital Goods – 0.46% | |||||||
| Anixter 10.00% 3/15/14 | 101,000 | 108,575 | |||||
| # | Ardagh Packaging Finance | ||||||
| 144A 7.00% 11/15/20 | 200,000 | 206,000 | |||||
| Berry Plastics | |||||||
| 9.75% 1/15/21 | 265,000 | 311,044 | |||||
| Case New Holland | |||||||
| 7.75% 9/1/13 | 163,000 | 167,320 | |||||
| # | Cemex 144A | ||||||
| •5.283% 9/30/15 | 471,000 | 490,429 | |||||
| 5.875% 3/25/19 | 235,000 | 237,938 | |||||
| *9.50% 6/15/18 | 650,000 | 758,875 | |||||
| *# | Cemex Espana Luxembourg | ||||||
| 144A 9.25% 5/12/20 | 250,000 | 278,750 | |||||
| # | Consolidated Container | ||||||
| 144A 10.125% 7/15/20 | 155,000 | 170,500 | |||||
| # | Crown Americas 144A | ||||||
| 4.50% 1/15/23 | 115,000 | 112,125 | |||||
| Kratos Defense & | |||||||
| Security Solutions | |||||||
| 10.00% 6/1/17 | 145,000 | 160,225 | |||||
| # | Plastipak Holdings 144A | ||||||
| 10.625% 8/15/19 | 201,000 | 231,150 | |||||
| Reynolds Group Issuer | |||||||
| 9.00% 4/15/19 | 730,000 | 775,625 | |||||
| Rock Tenn 4.00% 3/1/23 | 160,000 | 162,128 | |||||
| # | Sealed Air 144A | ||||||
| 6.50% 12/1/20 | 230,000 | 253,000 | |||||
| # | Silver II Borrower 144A | ||||||
| 7.75% 12/15/20 | 150,000 | 160,500 | |||||
| # | URS 144A | ||||||
| 4.10% 4/1/17 | 450,000 | 468,085 | |||||
| 5.25% 4/1/22 | 480,000 | 504,867 | |||||
| # | Votorantim Cimentos 144A | ||||||
| 7.25% 4/5/41 | 1,180,000 | 1,289,149 | |||||
| 6,846,285 | |||||||
| Communications – 3.46% | |||||||
| AMC Networks | |||||||
| 4.75% 12/15/22 | 260,000 | 260,000 | |||||
| America Movil | |||||||
| 3.125% 7/16/22 | 665,000 | 653,795 | |||||
| 5.00% 3/30/20 | 720,000 | 813,379 | |||||
| American Tower | |||||||
| 5.90% 11/1/21 | 1,030,000 | 1,208,943 | |||||
| AT&T 2.625% 12/1/22 | 965,000 | 933,721 | |||||
| Bell Canada 3.35% 3/22/23 | CAD | 1,051,000 | 1,041,978 | ||||
| # | Brasil Telecom 144A | ||||||
| 5.75% 2/10/22 | USD | 1,358,000 | 1,422,504 | ||||
| # | CC Holdings 144A | ||||||
| 3.849% 4/15/23 | 450,000 | 454,297 | |||||
| CCO Holdings | |||||||
| 5.25% 9/30/22 | 230,000 | 227,125 | |||||
| 7.375% 6/1/20 | 105,000 | 116,944 | |||||
| CenturyLink 5.80% 3/15/22 | 1,160,000 | 1,176,536 | |||||
| Clear Channel Communications | |||||||
| 9.00% 3/1/21 | 150,000 | 140,813 | |||||
| Clear Channel | |||||||
| Worldwide Holdings | |||||||
| 7.625% 3/15/20 | 320,000 | 335,350 | |||||
| # | Clearwire Communications | ||||||
| 144A 12.00% 12/1/15 | 219,000 | 236,657 | |||||
| # | Columbus International | ||||||
| 144A 11.50% 11/20/14 | 460,000 | 517,500 | |||||
| Comcast 5.70% 5/15/18 | 1,000,000 | 1,203,910 | |||||
| # | Cox Communications 144A | ||||||
| 3.25% 12/15/22 | 1,260,000 | 1,282,673 | |||||
| # | Crown Castle Towers 144A | ||||||
| 4.883% 8/15/20 | 1,805,000 | 2,080,861 | |||||
| CSC Holdings | |||||||
| 6.75% 11/15/21 | 115,000 | 129,519 | |||||
| Deutsche Telekom | |||||||
| International Finance | |||||||
| #144A 2.25% 3/6/17 | 510,000 | 522,952 | |||||
| 4.25% 7/13/22 | EUR | 850,000 | 1,267,466 | ||||
| # | Digicel 144A | ||||||
| 6.00% 4/15/21 | USD | 595,000 | 593,513 | ||||
| 8.25% 9/1/17 | 100,000 | 106,750 | |||||
| # | Digicel Group 144A | ||||||
| 8.25% 9/30/20 | 240,000 | 255,600 | |||||
| 10.50% 4/15/18 | 400,000 | 449,000 | |||||
| # | DigitalGlobe 144A | ||||||
| 5.25% 2/1/21 | 85,000 | 84,788 | |||||
| DIRECTV Holdings | |||||||
| 5.15% 3/15/42 | 630,000 | 611,086 | |||||
| Discovery Communications | |||||||
| 3.25% 4/1/23 | 1,030,000 | 1,047,258 | |||||
| DISH DBS | |||||||
| 5.875% 7/15/22 | 145,000 | 152,794 | |||||
| 7.875% 9/1/19 | 268,000 | 318,920 | |||||
| Entravision Communications | |||||||
| 8.75% 8/1/17 | 102,000 | 110,925 | |||||
46
| Principal | Value | ||||||
| Amount° | (U.S. $) | ||||||
| Corporate Bonds (continued) | |||||||
| Communications (continued) | |||||||
| Intelsat Bermuda | |||||||
| 11.25% 2/4/17 | USD | 420,000 | $ | 447,825 | |||
| Intelsat Jackson Holdings | |||||||
| 7.25% 10/15/20 | 195,000 | 214,988 | |||||
| Intelsat Luxembourg | |||||||
| #144A 7.75% 6/1/21 | 265,000 | 270,300 | |||||
| #144A 8.125% 6/1/23 | 70,000 | 71,400 | |||||
| 11.50% 2/4/17 | 410 | 436 | |||||
| #144A 11.50% 2/4/17 | 105,000 | 111,563 | |||||
| Interpublic Group | |||||||
| 2.25% 11/15/17 | 15,000 | 15,013 | |||||
| 3.75% 2/15/23 | 670,000 | 651,320 | |||||
| 4.00% 3/15/22 | 1,065,000 | 1,074,246 | |||||
| Lamar Media 5.00% 5/1/23 | 275,000 | 276,375 | |||||
| Level 3 Communications | |||||||
| 11.875% 2/1/19 | 150,000 | 176,625 | |||||
| Level 3 Financing | |||||||
| 10.00% 2/1/18 | 213,000 | 236,430 | |||||
| # | MDC Partners 144A | ||||||
| 6.75% 4/1/20 | 160,000 | 162,400 | |||||
| MetroPCS Wireless | |||||||
| #144A 6.25% 4/1/21 | 25,000 | 25,531 | |||||
| 6.625% 11/15/20 | 150,000 | 157,313 | |||||
| # | Myriad International | ||||||
| Holdings 144A | |||||||
| 6.375% 7/28/17 | 965,000 | 1,091,705 | |||||
| # | Nara Cable Funding 144A | ||||||
| 8.875% 12/1/18 | 420,000 | 442,050 | |||||
| # | NBCUniversal | ||||||
| Enterprise 144A | |||||||
| 1.662% 4/15/18 | 475,000 | 476,415 | |||||
| 1.974% 4/15/19 | 360,000 | 361,508 | |||||
| Nielsen Finance | |||||||
| 11.625% 2/1/14 | 82,000 | 88,765 | |||||
| # | Qtel International | ||||||
| Finance 144A | |||||||
| 3.25% 2/21/23 | 420,000 | 413,175 | |||||
| 4.50% 1/31/43 | 300,000 | 289,500 | |||||
| 4.75% 2/16/21 | 2,000,000 | 2,234,999 | |||||
| Qwest 6.75% 12/1/21 | 565,000 | 651,628 | |||||
| # | SES 144A 3.60% 4/4/23 | 870,000 | 878,230 | ||||
| # | Sinclair Television | ||||||
| Group 144A | |||||||
| 5.375% 4/1/21 | 200,000 | 199,500 | |||||
| 6.125% 10/1/22 | 115,000 | 121,038 | |||||
| # | Sirius XM Radio 144A | ||||||
| 8.75% 4/1/15 | 250,000 | 279,375 | |||||
| Sprint Capital | |||||||
| 8.75% 3/15/32 | 162,000 | 193,995 | |||||
| Sprint Nextel | |||||||
| 6.00% 12/1/16 | 145,000 | 157,688 | |||||
| 8.375% 8/15/17 | 155,000 | 181,156 | |||||
| 9.125% 3/1/17 | 250,000 | 296,875 | |||||
| # | TBG Global PTE 144A | ||||||
| 4.625% 4/3/18 | 400,000 | 403,000 | |||||
| # | Telefonica Chile 144A | ||||||
| 3.875% 10/12/22 | 1,180,000 | 1,164,305 | |||||
| Telefonica Emisiones | |||||||
| 5.462% 2/16/21 | 340,000 | 366,761 | |||||
| 6.421% 6/20/16 | 815,000 | 905,929 | |||||
| Telesat Canada | |||||||
| #144A 6.00% 5/15/17 | 190,000 | 199,500 | |||||
| 12.50% 11/1/17 | 85,000 | 91,163 | |||||
| Time Warner Cable | |||||||
| 5.85% 5/1/17 | 375,000 | 435,894 | |||||
| 6.75% 7/1/18 | 1,500,000 | 1,847,956 | |||||
| 8.25% 4/1/19 | 1,080,000 | 1,407,598 | |||||
| # | Univision | ||||||
| Communications 144A | |||||||
| 6.75% 9/15/22 | 110,000 | 119,350 | |||||
| 6.875% 5/15/19 | 265,000 | 284,875 | |||||
| # | UPC Holding 144A | ||||||
| 9.875% 4/15/18 | 170,000 | 190,613 | |||||
| # | UPCB Finance III 144A | ||||||
| 6.625% 7/1/20 | 520,000 | 561,600 | |||||
| Verizon Communications | |||||||
| 8.75% 11/1/18 | 2,340,000 | 3,150,559 | |||||
| Viacom 3.25% 3/15/23 | 850,000 | 855,464 | |||||
| # | VimpelCom 144A | ||||||
| 7.748% 2/2/21 | 1,020,000 | 1,144,950 | |||||
| Virgin Media Finance | |||||||
| 8.375% 10/15/19 | 134,000 | 150,415 | |||||
| Virgin Media Secured | |||||||
| Finance 6.50% 1/15/18 | 2,470,000 | 2,642,899 | |||||
| # | Vivendi 144A | ||||||
| 3.45% 1/12/18 | 830,000 | 860,244 | |||||
| 6.625% 4/4/18 | 1,155,000 | 1,352,121 | |||||
| Vodafone Group | |||||||
| 2.95% 2/19/23 | 930,000 | 928,874 | |||||
| West 7.875% 1/15/19 | 355,000 | 379,850 | |||||
| # | Wind Acquisition Finance | ||||||
| 144A 11.75% 7/15/17 | 175,000 | 186,375 | |||||
| Windstream 7.50% 4/1/23 | 80,000 | 85,200 | |||||
| 51,722,419 | |||||||
| Consumer Cyclical – 2.49% | |||||||
| # | ADT 144A 4.125% 6/15/23 | 575,000 | 597,876 | ||||
| # | Algeco Scotsman Global | ||||||
| Finance 144A | |||||||
| 8.50% 10/15/18 | 280,000 | 301,700 | |||||
| 10.75% 10/15/19 | 335,000 | 348,400 | |||||
| Amazon.com | |||||||
| 2.50% 11/29/22 | 1,190,000 | 1,160,549 | |||||
| American Axle & | |||||||
| Manufacturing | |||||||
| 6.25% 3/15/21 | 275,000 | 283,250 | |||||
| Ameristar Casinos | |||||||
| 7.50% 4/15/21 | 285,000 | 313,856 | |||||
| ArvinMeritor | |||||||
| 8.125% 9/15/15 | 238,000 | 252,875 | |||||
(continues) 47
Statements of net assets
Optimum Fixed Income Fund
| Principal | Value | ||||||
| Amount° | (U.S. $) | ||||||
| Corporate Bonds (continued) | |||||||
| Consumer Cyclical (continued) | |||||||
| * | Chrysler Group | ||||||
| 8.25% 6/15/21 | USD | 305,000 | $ | 341,981 | |||
| CKE Restaurants | |||||||
| 11.375% 7/15/18 | 232,000 | 270,280 | |||||
| # | Daimler Finance North | ||||||
| America 144A | |||||||
| 2.25% 7/31/19 | 895,000 | 900,255 | |||||
| Darden Restaurants | |||||||
| 3.35% 11/1/22 | 695,000 | 662,314 | |||||
| Dave & Buster’s | |||||||
| 11.00% 6/1/18 | 75,000 | 85,219 | |||||
| Delphi 6.125% 5/15/21 | 545,000 | 602,225 | |||||
| Dollar General | |||||||
| 4.125% 7/15/17 | 175,000 | 188,781 | |||||
| eBay 4.00% 7/15/42 | 955,000 | 879,853 | |||||
| Ford Motor | |||||||
| 7.45% 7/16/31 | 655,000 | 831,664 | |||||
| Ford Motor Credit | |||||||
| 3.875% 1/15/15 | 2,200,000 | 2,288,033 | |||||
| 3.984% 6/15/16 | 485,000 | 514,223 | |||||
| 5.00% 5/15/18 | 725,000 | 800,335 | |||||
| 5.875% 8/2/21 | 200,000 | 229,170 | |||||
| 7.00% 4/15/15 | 1,100,000 | 1,216,535 | |||||
| 8.00% 6/1/14 | 300,000 | 322,822 | |||||
| 8.70% 10/1/14 | 4,100,000 | 4,549,576 | |||||
| 12.00% 5/15/15 | 480,000 | 583,511 | |||||
| Hanesbrands | |||||||
| 6.375% 12/15/20 | 255,000 | 278,906 | |||||
| Historic TW | |||||||
| 6.875% 6/15/18 | 2,015,000 | 2,516,980 | |||||
| Host Hotels & Resorts | |||||||
| 3.75% 10/15/23 | 520,000 | 523,333 | |||||
| 4.75% 3/1/23 | 845,000 | 912,600 | |||||
| 5.25% 3/15/22 | 280,000 | 312,200 | |||||
| 5.875% 6/15/19 | 295,000 | 325,606 | |||||
| Hughes Satellite Systems | |||||||
| 7.625% 6/15/21 | 125,000 | 143,594 | |||||
| # | Hyundai Capital | ||||||
| America 144A | |||||||
| 2.125% 10/2/17 | 705,000 | 711,502 | |||||
| Levi Strauss | |||||||
| 6.875% 5/1/22 | 130,000 | 143,000 | |||||
| #144A 6.875% 5/1/22 | 75,000 | 82,500 | |||||
| 7.625% 5/15/20 | 100,000 | 110,500 | |||||
| M/I Homes | |||||||
| 8.625% 11/15/18 | 225,000 | 250,875 | |||||
| Macy’s Retail Holdings | |||||||
| 5.90% 12/1/16 | 325,000 | 377,908 | |||||
| MGM Resorts International | |||||||
| 7.75% 3/15/22 | 65,000 | 72,475 | |||||
| 11.375% 3/1/18 | 579,000 | 739,673 | |||||
| Pinnacle Entertainment | |||||||
| 8.75% 5/15/20 | 140,000 | 154,525 | |||||
| * | Quiksilver 6.875% 4/15/15 | 355,000 | 355,000 | ||||
| # | QVC 144A 4.375% 3/15/23 | 1,015,000 | 1,028,156 | ||||
| Rite Aid 9.25% 3/15/20 | 225,000 | 255,094 | |||||
| Royal Caribbean Cruises | |||||||
| 5.25% 11/15/22 | 5,000 | 5,088 | |||||
| 7.00% 6/15/13 | 250,000 | 252,813 | |||||
| Ryland Group | |||||||
| 8.40% 5/15/17 | 172,000 | 205,325 | |||||
| Sally Holdings 5.75% 6/1/22 | 230,000 | 241,213 | |||||
| # | Sealy Mattress 144A | ||||||
| 10.875% 4/15/16 | 45,000 | 47,644 | |||||
| Standard Pacific | |||||||
| 10.75% 9/15/16 | 248,000 | 308,760 | |||||
| *# | Tenedora Nemak 144A | ||||||
| 5.50% 2/28/23 | 640,000 | 649,600 | |||||
| Tomkins 9.00% 10/1/18 | 99,000 | 110,756 | |||||
| # | TRW Automotive 144A | ||||||
| 4.50% 3/1/21 | 255,000 | 260,100 | |||||
| # | Volkswagen International | ||||||
| Finance 144A | |||||||
| 1.625% 8/12/13 | 2,800,000 | 2,812,180 | |||||
| Walgreen 3.10% 9/15/22 | 1,420,000 | 1,408,025 | |||||
| # | Wesfarmers 144A | ||||||
| 1.874% 3/20/18 | 625,000 | 631,120 | |||||
| Western Union | |||||||
| 2.875% 12/10/17 | 400,000 | 406,408 | |||||
| 3.65% 8/22/18 | 460,000 | 475,221 | |||||
| Wyndham Worldwide | |||||||
| 2.50% 3/1/18 | 480,000 | 483,264 | |||||
| 4.25% 3/1/22 | 350,000 | 367,227 | |||||
| 5.625% 3/1/21 | 450,000 | 506,168 | |||||
| Wynn Las Vegas | |||||||
| 7.75% 8/15/20 | 170,000 | 191,463 | |||||
| 37,182,085 | |||||||
| Consumer Non-Cyclical – 3.36% | |||||||
| Accellent 8.375% 2/1/17 | 150,000 | 160,125 | |||||
| Air Medical Group Holdings | |||||||
| 9.25% 11/1/18 | 203,000 | 225,838 | |||||
| # | Alere 144A 7.25% 7/1/18 | 60,000 | 64,050 | ||||
| Altria Group | |||||||
| 9.70% 11/10/18 | 338,000 | 470,925 | |||||
| Amgen 3.875% 11/15/21 | 405,000 | 442,839 | |||||
| *# | Anadolu Efes Biracilik Ve | ||||||
| Malt Sanayii 144A | |||||||
| 3.375% 11/1/22 | 755,000 | 722,913 | |||||
| Anheuser-Busch InBev | |||||||
| Worldwide | |||||||
| •0.851% 1/27/14 | 3,800,000 | 3,812,368 | |||||
| 5.375% 1/15/20 | 1,000,000 | 1,207,844 | |||||
| # | ARAMARK 144A | ||||||
| 5.75% 3/15/20 | 80,000 | 82,200 | |||||
| # | Avis Budget Car Rental | ||||||
| 144A 5.50% 4/1/23 | 260,000 | 260,650 | |||||
| *# | BFF International 144A | ||||||
| 7.25% 1/28/20 | 380,000 | 452,200 | |||||
48
| Principal | Value | ||||||
| Amount° | (U.S. $) | ||||||
| Corporate Bonds (continued) | |||||||
| Consumer Non-Cyclical (continued) | |||||||
| # | Biomet 144A | ||||||
| 6.50% 8/1/20 | USD | 180,000 | $ | 191,700 | |||
| 6.50% 10/1/20 | 55,000 | 56,822 | |||||
| Bio-Rad Laboratories | |||||||
| 8.00% 9/15/16 | 146,000 | 156,320 | |||||
| Boston Scientific | |||||||
| 6.00% 1/15/20 | 550,000 | 643,790 | |||||
| # | Brasil Foods 144A | ||||||
| 5.875% 6/6/22 | 685,000 | 763,775 | |||||
| Cardinal Health | |||||||
| 3.20% 3/15/23 | 600,000 | 598,252 | |||||
| CareFusion | |||||||
| #144A 3.30% 3/1/23 | 735,000 | 742,055 | |||||
| 6.375% 8/1/19 | 2,085,000 | 2,523,814 | |||||
| Celgene | |||||||
| 3.25% 8/15/22 | 330,000 | 334,419 | |||||
| 3.95% 10/15/20 | 835,000 | 904,882 | |||||
| Coca-Cola Enterprises | |||||||
| 1.125% 11/12/13 | 2,000,000 | 2,009,154 | |||||
| Community Health Systems | |||||||
| 8.00% 11/15/19 | 110,000 | 122,375 | |||||
| ConAgra Foods | |||||||
| 3.20% 1/25/23 | 690,000 | 689,172 | |||||
| Constellation Brands | |||||||
| 6.00% 5/1/22 | 265,000 | 290,838 | |||||
| # | Cosan Luxembourg 144A | ||||||
| 5.00% 3/14/23 | 330,000 | 332,805 | |||||
| 9.50% 3/14/18 | BRL | 1,035,000 | 530,756 | ||||
| Del Monte 7.625% 2/15/19 | USD | 445,000 | 463,913 | ||||
| # | Dole Food 144A | ||||||
| 8.00% 10/1/16 | 123,000 | 128,535 | |||||
| Energizer Holdings | |||||||
| 4.70% 5/24/22 | 1,500,000 | 1,599,311 | |||||
| # | ESAL 144A 6.25% 2/5/23 | 745,000 | 752,450 | ||||
| # | Fresenius Medical Care | ||||||
| 144A 5.875% 1/31/22 | 245,000 | 274,706 | |||||
| Geo Group | |||||||
| #144A 5.125% 4/1/23 | 50,000 | 50,625 | |||||
| 6.625% 2/15/21 | 145,000 | 160,044 | |||||
| GlaxoSmithkline Capital | |||||||
| 2.80% 3/18/23 | 760,000 | 766,327 | |||||
| # | H&E Equipment Services | ||||||
| 144A 7.00% 9/1/22 | 290,000 | 320,450 | |||||
| HCA 7.50% 2/15/22 | 315,000 | 363,038 | |||||
| HCA Holdings | |||||||
| 7.75% 5/15/21 | 355,000 | 396,491 | |||||
| # | Heineken 144A | ||||||
| 3.40% 4/1/22 | 1,310,000 | 1,363,216 | |||||
| # | Imperial Tobacco Finance | ||||||
| 144A 3.50% 2/11/23 | 1,080,000 | 1,091,808 | |||||
| Ingles Markets | |||||||
| 8.875% 5/15/17 | 196,000 | 205,800 | |||||
| Iron Mountain | |||||||
| 7.75% 10/1/19 | 75,000 | 83,719 | |||||
| Jarden | |||||||
| 6.125% 11/15/22 | 215,000 | 231,394 | |||||
| 7.50% 1/15/20 | 30,000 | 32,813 | |||||
| * | Kinetic Concepts | ||||||
| 12.50% 11/1/19 | 260,000 | 258,700 | |||||
| # | Korea Expressway 144A | ||||||
| 1.875% 10/22/17 | 720,000 | 720,547 | |||||
| Laboratory Corp. of | |||||||
| America Holdings | |||||||
| 2.20% 8/23/17 | 765,000 | 774,290 | |||||
| Medtronic | |||||||
| 2.75% 4/1/23 | 1,295,000 | 1,293,419 | |||||
| 4.00% 4/1/43 | 185,000 | 180,727 | |||||
| # | Mylan 144A | ||||||
| 3.125% 1/15/23 | 260,000 | 256,552 | |||||
| 6.00% 11/15/18 | 160,000 | 175,763 | |||||
| NBTY 9.00% 10/1/18 | 385,000 | 432,163 | |||||
| Newell Rubbermaid | |||||||
| 2.05% 12/1/17 | 450,000 | 452,993 | |||||
| # | Pernod-Ricard 144A | ||||||
| 5.75% 4/7/21 | 1,820,000 | 2,166,352 | |||||
| Pfizer 5.35% 3/15/15 | 4,100,000 | 4,479,409 | |||||
| Quest Diagnostics | |||||||
| 4.70% 4/1/21 | 990,000 | 1,084,218 | |||||
| * | RadNet Management | ||||||
| 10.375% 4/1/18 | 125,000 | 130,938 | |||||
| # | SABMiller Holdings 144A | ||||||
| 2.45% 1/15/17 | 200,000 | 208,387 | |||||
| 3.75% 1/15/22 | 1,025,000 | 1,099,169 | |||||
| Scotts Miracle-Gro | |||||||
| 6.625% 12/15/20 | 125,000 | 136,875 | |||||
| # | Spectrum Brands | ||||||
| Escrow 144A | |||||||
| 6.375% 11/15/20 | 245,000 | 263,681 | |||||
| St. Jude Medical | |||||||
| 3.25% 4/15/23 | 1,655,000 | 1,665,529 | |||||
| Tenet Healthcare | |||||||
| 8.00% 8/1/20 | 95,000 | 105,094 | |||||
| United Rentals | |||||||
| North America | |||||||
| 10.25% 11/15/19 | 278,000 | 324,565 | |||||
| # | Woolworths 144A | ||||||
| 4.55% 4/12/21 | 320,000 | 360,389 | |||||
| Yale University | |||||||
| 2.90% 10/15/14 | 836,000 | 866,987 | |||||
| Zimmer Holdings | |||||||
| 3.375% 11/30/21 | 1,200,000 | 1,241,896 | |||||
| 4.625% 11/30/19 | 1,205,000 | 1,374,616 | |||||
| # | Zoetis 144A 3.25% 2/1/23 | 3,130,000 | 3,180,589 | ||||
| 50,311,369 | |||||||
| Electric – 2.92% | |||||||
| AES | |||||||
| 7.375% 7/1/21 | 84,000 | 97,860 | |||||
| 8.00% 6/1/20 | 133,000 | 158,270 | |||||
(continues) 49
Statements of net assets
Optimum Fixed Income Fund
| Principal | Value | ||||||
| Amount° | (U.S. $) | ||||||
| Corporate Bonds (continued) | |||||||
| Electric (continued) | |||||||
| Ameren Illinois | |||||||
| 9.75% 11/15/18 | USD | 1,930,000 | $ | 2,661,333 | |||
| American Electric Power | |||||||
| 1.65% 12/15/17 | 2,025,000 | 2,034,127 | |||||
| # | American Transmission | ||||||
| Systems 144A | |||||||
| 5.25% 1/15/22 | 1,225,000 | 1,422,622 | |||||
| Appalachian Power | |||||||
| 7.95% 1/15/20 | 1,000,000 | 1,342,937 | |||||
| # | APT Pipelines 144A | ||||||
| 3.875% 10/11/22 | 555,000 | 552,713 | |||||
| # | Calpine 144A | ||||||
| 7.875% 7/31/20 | 203,000 | 223,300 | |||||
| CenterPoint Energy | |||||||
| 5.95% 2/1/17 | 830,000 | 965,195 | |||||
| CMS Energy | |||||||
| 4.25% 9/30/15 | 1,465,000 | 1,579,964 | |||||
| 6.25% 2/1/20 | 575,000 | 703,991 | |||||
| ComEd Financing III | |||||||
| 6.35% 3/15/33 | 680,000 | 714,000 | |||||
| Duquense Light Holdings | |||||||
| 5.50% 8/15/15 | 756,000 | 821,041 | |||||
| #• | Electricite de France 144A | ||||||
| 5.25% 12/29/49 | 1,025,000 | 1,020,210 | |||||
| Elwood Energy | |||||||
| 8.159% 7/5/26 | 205,404 | 214,647 | |||||
| Entergy | |||||||
| 3.625% 9/15/15 | 215,000 | 224,778 | |||||
| 5.125% 9/15/20 | 3,000,000 | 3,299,868 | |||||
| Exelon Generation | |||||||
| 4.00% 10/1/20 | 250,000 | 264,361 | |||||
| 4.25% 6/15/22 | 1,140,000 | 1,201,749 | |||||
| • | FPL Group Capital | ||||||
| 6.35% 10/1/66 | 1,205,000 | 1,278,300 | |||||
| 6.65% 6/15/67 | 135,000 | 144,920 | |||||
| Great Plains Energy | |||||||
| 5.292% 6/15/22 | 1,095,000 | 1,245,013 | |||||
| • | Integrys Energy Group | ||||||
| 6.11% 12/1/66 | 1,110,000 | 1,177,565 | |||||
| Ipalco Enterprises | |||||||
| 5.00% 5/1/18 | 405,000 | 439,425 | |||||
| Jersey Central | |||||||
| Power & Light | |||||||
| 7.35% 2/1/19 | 1,000,000 | 1,275,169 | |||||
| Kansas City Power & Light | |||||||
| 3.15% 3/15/23 | 470,000 | 477,480 | |||||
| LG&E & KU Energy | |||||||
| 3.75% 11/15/20 | 965,000 | 1,026,514 | |||||
| 4.375% 10/1/21 | 1,230,000 | 1,347,870 | |||||
| Mirant Americas | |||||||
| 8.50% 10/1/21 | 110,000 | 129,525 | |||||
| # | Narragansett Electric 144A | ||||||
| 4.17% 12/10/42 | 510,000 | 502,704 | |||||
| NRG Energy | |||||||
| 7.875% 5/15/21 | 190,000 | 212,325 | |||||
| # | Pedernales Electric | ||||||
| Cooperative 144A | |||||||
| 6.202% 11/15/32 | 620,000 | 651,873 | |||||
| Pennsylvania Electric | |||||||
| 5.20% 4/1/20 | 1,105,000 | 1,262,295 | |||||
| • | PPL Capital Funding | ||||||
| 6.70% 3/30/67 | 440,000 | 467,909 | |||||
| Public Service of Oklahoma | |||||||
| 5.15% 12/1/19 | 1,170,000 | 1,368,510 | |||||
| Puget Energy | |||||||
| 6.00% 9/1/21 | 340,000 | 387,066 | |||||
| 6.50% 12/15/20 | 3,800,000 | 4,422,873 | |||||
| • | Puget Sound Energy | ||||||
| 6.974% 6/1/67 | 1,295,000 | 1,385,958 | |||||
| # | Saudi Electricity Global | ||||||
| Sukuk 144A | |||||||
| 3.473% 4/8/23 | 500,000 | 502,935 | |||||
| 5.06% 4/8/43 | 355,000 | 356,244 | |||||
| SCANA 4.125% 2/1/22 | 740,000 | 778,627 | |||||
| # | TAQA Abu Dhabi National | ||||||
| Energy 144A | |||||||
| 2.50% 1/12/18 | 285,000 | 287,280 | |||||
| Tokyo Electric Power | |||||||
| 4.50% 3/24/14 | EUR | 1,100,000 | 1,441,761 | ||||
| • | Wisconsin Energy | ||||||
| 6.25% 5/15/67 | USD | 1,480,000 | 1,608,004 | ||||
| 43,681,111 | |||||||
| Energy – 3.50% | |||||||
| Antero Resources Finance | |||||||
| 9.375% 12/1/17 | 122,000 | 132,980 | |||||
| Apache 2.625% 1/15/23 | 235,000 | 229,048 | |||||
| BP Capital Markets | |||||||
| 3.625% 5/8/14 | 500,000 | 516,677 | |||||
| 4.75% 3/10/19 | 160,000 | 185,579 | |||||
| Chesapeake Energy | |||||||
| 5.375% 6/15/21 | 35,000 | 35,219 | |||||
| 5.75% 3/15/23 | 90,000 | 91,463 | |||||
| # | CNOOC Finance 2012 144A | ||||||
| 3.875% 5/2/22 | 6,675,000 | 7,046,903 | |||||
| Comstock Resources | |||||||
| 7.75% 4/1/19 | 110,000 | 116,600 | |||||
| Continental Resources | |||||||
| 5.00% 9/15/22 | 190,000 | 202,825 | |||||
| Ecopetrol 7.625% 7/23/19 | 1,207,000 | 1,517,803 | |||||
| # | ENI 144A 4.15% 10/1/20 | 1,085,000 | 1,141,077 | ||||
| Forest Oil 7.25% 6/15/19 | 207,000 | 208,035 | |||||
| Gazprom | |||||||
| #144A 3.85% 2/6/20 | 570,000 | 572,850 | |||||
| 10.50% 3/25/14 | 500,000 | 542,475 | |||||
| # | Gazprom Neft 144A | ||||||
| 4.375% 9/19/22 | 940,000 | 931,775 | |||||
| #Helix Energy Solutions | |||||||
| Group 144A | |||||||
| 9.50% 1/15/16 | 165,000 | 169,847 | |||||
50
| Principal | Value | ||||||
| Amount° | (U.S. $) | ||||||
| Corporate Bonds (continued) | |||||||
| Energy (continued) | |||||||
| # | Hercules Offshore 144A | ||||||
| 10.50% 10/15/17 | USD | 314,000 | $ | 342,260 | |||
| # | Hilcorp Energy I 144A | ||||||
| 7.625% 4/15/21 | 135,000 | 149,175 | |||||
| Holly 9.875% 6/15/17 | 217,000 | 231,919 | |||||
| Kodiak Oil & Gas | |||||||
| 8.125% 12/1/19 | 120,000 | 136,200 | |||||
| Linn Energy | |||||||
| #144A 6.25% 11/1/19 | 60,000 | 61,650 | |||||
| 6.50% 5/15/19 | 70,000 | 73,588 | |||||
| 8.625% 4/15/20 | 125,000 | 138,438 | |||||
| Lukoil International Finance | |||||||
| 6.125% 11/9/20 | 1,225,000 | 1,396,500 | |||||
| Murphy Oil | |||||||
| 2.50% 12/1/17 | 365,000 | 366,916 | |||||
| 3.70% 12/1/22 | 2,435,000 | 2,370,359 | |||||
| Newfield Exploration | |||||||
| 5.625% 7/1/24 | 695,000 | 719,325 | |||||
| Pemex Project Funding | |||||||
| Master Trust | |||||||
| 6.625% 6/15/35 | 340,000 | 408,850 | |||||
| # | Pertamina Persero 144A | ||||||
| 4.875% 5/3/22 | 1,045,000 | 1,089,413 | |||||
| 6.00% 5/3/42 | 455,000 | 465,238 | |||||
| Petrobras | |||||||
| International Finance | |||||||
| 3.875% 1/27/16 | 770,000 | 809,644 | |||||
| 5.375% 1/27/21 | 1,186,000 | 1,285,616 | |||||
| Petrohawk Energy | |||||||
| 7.25% 8/15/18 | 1,085,000 | 1,215,418 | |||||
| Petroleos de Venezuela | |||||||
| 9.00% 11/17/21 | 3,856,000 | 3,672,839 | |||||
| Petroleos Mexicanos | |||||||
| #144A 3.50% 1/30/23 | 845,000 | 845,000 | |||||
| 5.50% 6/27/44 | 525,000 | 542,850 | |||||
| Pride International | |||||||
| 6.875% 8/15/20 | 2,575,000 | 3,233,089 | |||||
| # | PTT PCL 144A | ||||||
| 3.375% 10/25/22 | 900,000 | 896,851 | |||||
| Range Resources | |||||||
| 5.75% 6/1/21 | 95,000 | 102,363 | |||||
| 8.00% 5/15/19 | 282,000 | 310,200 | |||||
| # | Rosneft Oil 144A | ||||||
| 3.149% 3/6/17 | 345,000 | 347,588 | |||||
| 4.199% 3/6/22 | 537,000 | 533,644 | |||||
| # | Samson Investment 144A | ||||||
| 9.75% 2/15/20 | 265,000 | 282,888 | |||||
| SandRidge Energy | |||||||
| 7.50% 3/15/21 | 90,000 | 94,050 | |||||
| 8.125% 10/15/22 | 140,000 | 150,150 | |||||
| # | Sinopec Group Overseas | ||||||
| Development 2012 | |||||||
| 144A 2.75% 5/17/17 | 700,000 | 731,595 | |||||
| Southwestern Energy | |||||||
| 7.50% 2/1/18 | 2,300,000 | 2,828,063 | |||||
| Statoil 2.45% 1/17/23 | 575,000 | 566,874 | |||||
| Suburban Propane Partners | |||||||
| 7.375% 8/1/21 | 105,000 | 116,288 | |||||
| Talisman Energy | |||||||
| 5.50% 5/15/42 | 1,865,000 | 1,946,907 | |||||
| TNK-BP Finance | |||||||
| 6.25% 2/2/15 | 2,100,000 | 2,248,889 | |||||
| Total Capital Canada | |||||||
| 2.75% 7/15/23 | 3,295,000 | 3,311,405 | |||||
| Transocean 3.80% 10/15/22 | 1,535,000 | 1,515,151 | |||||
| Weatherford Bermuda | |||||||
| 4.50% 4/15/22 | 550,000 | 567,580 | |||||
| 9.625% 3/1/19 | 775,000 | 1,013,388 | |||||
| # | Woodside Finance 144A | ||||||
| 8.125% 3/1/14 | 320,000 | 340,559 | |||||
| 8.75% 3/1/19 | 890,000 | 1,189,238 | |||||
| 52,289,114 | |||||||
| Finance Companies – 2.12% | |||||||
| American Express | |||||||
| 7.00% 3/19/18 | 6,100,000 | 7,625,263 | |||||
| # | BM&FBovespa 144A | ||||||
| 5.50% 7/16/20 | 200,000 | 223,100 | |||||
| # | CDP Financial 144A | ||||||
| 4.40% 11/25/19 | 1,260,000 | 1,444,713 | |||||
| 5.60% 11/25/39 | 880,000 | 1,068,319 | |||||
| • | Credit Suisse USA | ||||||
| 0.555% 4/12/13 | 4,000,000 | 4,000,444 | |||||
| E Trade Financial | |||||||
| 6.375% 11/15/19 | 320,000 | 340,000 | |||||
| FTI Consulting | |||||||
| 6.75% 10/1/20 | 230,000 | 250,125 | |||||
| General Electric Capital | |||||||
| 4.25% 1/17/18 | NZD | 765,000 | 635,474 | ||||
| 5.55% 5/4/20 | USD | 610,000 | 728,633 | ||||
| 6.00% 8/7/19 | 2,280,000 | 2,771,817 | |||||
| •6.25% 12/15/49 | 1,200,000 | 1,319,465 | |||||
| •7.125% 12/15/49 | 500,000 | 582,541 | |||||
| #• | ILFC E-Capital Trust II 144A | ||||||
| 6.25% 12/21/65 | 305,000 | 288,988 | |||||
| International Lease Finance | |||||||
| 5.875% 4/1/19 | 265,000 | 287,566 | |||||
| 6.25% 5/15/19 | 565,000 | 621,500 | |||||
| 8.25% 12/15/20 | 180,000 | 220,950 | |||||
| 8.75% 3/15/17 | 495,000 | 584,719 | |||||
| # | IPIC GMTN 144A | ||||||
| 5.50% 3/1/22 | 746,000 | 869,090 | |||||
| # | LJ VP Holdings 144A | ||||||
| 3.80% 6/18/19 | 345,000 | 371,869 | |||||
| # | Nuveen Investments 144A | ||||||
| 9.50% 10/15/20 | 500,000 | 525,000 | |||||
| PHH | |||||||
| 7.375% 9/1/19 | 170,000 | 192,950 | |||||
| 9.25% 3/1/16 | 405,000 | 474,863 | |||||
(continues) 51
Statements of net assets
Optimum Fixed Income Fund
| Principal | Value | ||||||
| Amount° | (U.S. $) | ||||||
| Corporate Bonds (continued) | |||||||
| Finance Companies (continued) | |||||||
| SLM | |||||||
| 5.375% 5/15/14 | USD | 1,400,000 | $ | 1,465,122 | |||
| 6.25% 1/25/16 | 1,300,000 | 1,426,721 | |||||
| #• | SSIF Nevada 144A | ||||||
| 1.005% 4/14/14 | 900,000 | 905,610 | |||||
| # | Temasek Financial I 144A | ||||||
| 2.375% 1/23/23 | 810,000 | 784,086 | |||||
| Waha Aerospace | |||||||
| 3.925% 7/28/20 | 1,575,000 | 1,683,281 | |||||
| 31,692,209 | |||||||
| Insurance – 1.57% | |||||||
| American International Group | |||||||
| #144A 3.75% 11/30/13 | 600,000 | 612,344 | |||||
| 6.40% 12/15/20 | 310,000 | 384,522 | |||||
| 8.25% 8/15/18 | 2,820,000 | 3,661,615 | |||||
| • | Chubb 6.375% 3/29/67 | 820,000 | 905,075 | ||||
| # | Highmark 144A | ||||||
| 4.75% 5/15/21 | 405,000 | 404,872 | |||||
| 6.125% 5/15/41 | 150,000 | 143,044 | |||||
| *• | ING Groep | ||||||
| 5.775% 12/29/49 | 425,000 | 405,875 | |||||
| # | ING US 144A | ||||||
| 2.90% 2/15/18 | 555,000 | 563,571 | |||||
| 5.50% 7/15/22 | 830,000 | 919,996 | |||||
| # | Liberty Mutual Group 144A | ||||||
| 4.95% 5/1/22 | 760,000 | 834,877 | |||||
| 6.50% 5/1/42 | 1,555,000 | 1,778,024 | |||||
| •7.00% 3/15/37 | 180,000 | 186,300 | |||||
| MetLife | |||||||
| 6.817% 8/15/18 | 500,000 | 623,989 | |||||
| # | MetLife Capital | ||||||
| Trust IV 144A | |||||||
| 7.875% 12/15/37 | 300,000 | 378,750 | |||||
| # | MetLife Capital | ||||||
| Trust X 144A | |||||||
| 9.25% 4/8/38 | 1,100,000 | 1,540,000 | |||||
| # | Metropolitan Life Global | ||||||
| Funding I 144A | |||||||
| 3.00% 1/10/23 | 2,295,000 | 2,303,840 | |||||
| 3.875% 4/11/22 | 200,000 | 216,472 | |||||
| # | MultiPlan 144A | ||||||
| 9.875% 9/1/18 | 330,000 | 368,363 | |||||
| Prudential Financial | |||||||
| 3.875% 1/14/15 | 290,000 | 305,250 | |||||
| 4.50% 11/15/20 | 265,000 | 298,334 | |||||
| 4.50% 11/16/21 | 80,000 | 89,155 | |||||
| •5.625% 6/15/43 | 440,000 | 457,600 | |||||
| •5.875% 9/15/42 | 555,000 | 593,156 | |||||
| 6.00% 12/1/17 | 540,000 | 644,954 | |||||
| #@ | Stone Street Trust 144A | ||||||
| 5.902% 12/15/15 | 2,300,000 | 2,501,197 | |||||
| =@#t‡ | Twin Reefs Pass Through | ||||||
| Trust 144A | |||||||
| 0.00% 12/29/49 | 300,000 | 0 | |||||
| WellPoint 3.30% 1/15/23 | 1,490,000 | 1,513,023 | |||||
| • | XL Group 6.50% 12/29/49 | 275,000 | 270,188 | ||||
| #• | ZFS Finance USA Trust II | ||||||
| 144A 6.45% 12/15/65 | 500,000 | 541,250 | |||||
| 23,445,636 | |||||||
| Natural Gas – 1.66% | |||||||
| AmeriGas Finance | |||||||
| 6.50% 5/20/21 | 82,000 | 87,740 | |||||
| 6.75% 5/20/20 | 60,000 | 65,550 | |||||
| 7.00% 5/20/22 | 95,000 | 103,788 | |||||
| # | Atlas Pipeline Partners 144A | ||||||
| 5.875% 8/1/23 | 85,000 | 85,000 | |||||
| Copano Energy | |||||||
| 7.75% 6/1/18 | 218,000 | 229,173 | |||||
| El Paso Pipeline | |||||||
| 6.50% 4/1/20 | 930,000 | 1,131,524 | |||||
| • | Enbridge Energy | ||||||
| 8.05% 10/1/37 | 1,365,000 | 1,571,253 | |||||
| Energy Transfer Partners | |||||||
| 3.60% 2/1/23 | 755,000 | 752,859 | |||||
| 9.70% 3/15/19 | 916,000 | 1,236,228 | |||||
| Enterprise Products Operating | |||||||
| •7.034% 1/15/68 | 1,645,000 | 1,910,170 | |||||
| 9.75% 1/31/14 | 1,005,000 | 1,080,012 | |||||
| # | GDF Suez 144A | ||||||
| 2.875% 10/10/22 | 780,000 | 778,121 | |||||
| GenOn Energy | |||||||
| 9.875% 10/15/20 | 200,000 | 230,000 | |||||
| Kinder Morgan Energy Partners | |||||||
| 3.50% 9/1/23 | 1,355,000 | 1,376,595 | |||||
| 5.95% 2/15/18 | 1,000,000 | 1,193,549 | |||||
| 9.00% 2/1/19 | 1,170,000 | 1,567,183 | |||||
| NiSource Finance | |||||||
| 5.25% 2/15/43 | 405,000 | 425,946 | |||||
| 5.80% 2/1/42 | 705,000 | 792,794 | |||||
| Plains All American Pipeline | |||||||
| 8.75% 5/1/19 | 1,045,000 | 1,417,454 | |||||
| @ | Ras Laffan Liquefied Natural | ||||||
| Gas II 5.298% 9/30/20 | 2,392,500 | 2,673,618 | |||||
| # | Ras Laffan Liquefied | ||||||
| Natural Gas III 144A | |||||||
| 5.832% 9/30/16 | 591,456 | 638,181 | |||||
| # | Rockies Express Pipeline | ||||||
| 144A 6.85% 7/15/18 | 500,000 | 513,750 | |||||
| Spectra Energy Capital | |||||||
| 3.30% 3/15/23 | 515,000 | 517,806 | |||||
| Sunoco Logistics | |||||||
| Partners Operations | |||||||
| 3.45% 1/15/23 | 1,320,000 | 1,308,684 | |||||
| • | TransCanada PipeLines | ||||||
| 6.35% 5/15/67 | 1,920,000 | 2,049,971 | |||||
| Williams Partners Finance | |||||||
| 7.25% 2/1/17 | 915,000 | 1,101,638 | |||||
| 24,838,587 | |||||||
52
| Principal | Value | ||||||
| Amount° | (U.S. $) | ||||||
| Corporate Bonds (continued) | |||||||
| Real Estate – 1.25% | |||||||
| Alexandria Real Estate | |||||||
| Equities 4.60% 4/1/22 | USD | 980,000 | $ | 1,058,033 | |||
| # | American Tower Trust I 144A | ||||||
| 1.551% 3/15/18 | 350,000 | 352,659 | |||||
| 3.07% 3/15/23 | 880,000 | 891,381 | |||||
| BRE Properties | |||||||
| 3.375% 1/15/23 | 770,000 | 766,225 | |||||
| Developers Diversified Realty | |||||||
| 4.625% 7/15/22 | 265,000 | 287,189 | |||||
| 4.75% 4/15/18 | 310,000 | 343,103 | |||||
| 7.50% 4/1/17 | 625,000 | 743,618 | |||||
| 7.875% 9/1/20 | 631,000 | 803,470 | |||||
| 9.625% 3/15/16 | 145,000 | 176,849 | |||||
| Digital Realty Trust | |||||||
| 5.25% 3/15/21 | 1,280,000 | 1,421,687 | |||||
| 5.875% 2/1/20 | 425,000 | 484,866 | |||||
| Duke Realty | |||||||
| 3.625% 4/15/23 | 625,000 | 627,116 | |||||
| HCP 5.375% 2/1/21 | 2,300,000 | 2,676,038 | |||||
| Mack-Cali Realty | |||||||
| 4.50% 4/18/22 | 635,000 | 677,809 | |||||
| National Retail Properties | |||||||
| 3.80% 10/15/22 | 150,000 | 153,734 | |||||
| Qatari Diar Finance | |||||||
| 3.50% 7/21/15 | 2,100,000 | 2,207,624 | |||||
| 5.00% 7/21/20 | 500,000 | 572,500 | |||||
| #144A 5.00% 7/21/20 | 486,000 | 556,470 | |||||
| Regency Centers | |||||||
| 4.80% 4/15/21 | 420,000 | 467,771 | |||||
| 5.875% 6/15/17 | 285,000 | 327,654 | |||||
| UDR 4.625% 1/10/22 | 870,000 | 957,438 | |||||
| Ventas Realty | |||||||
| 2.70% 4/1/20 | 580,000 | 582,819 | |||||
| # | WEA Finance 144A | ||||||
| 4.625% 5/10/21 | 785,000 | 877,091 | |||||
| Weingarten Realty Investors | |||||||
| 3.50% 4/15/23 | 685,000 | 683,026 | |||||
| 18,696,170 | |||||||
| Technology – 1.16% | |||||||
| * | Amkor Technology | ||||||
| 7.375% 5/1/18 | 125,000 | 131,563 | |||||
| # | Avaya 144A | ||||||
| 7.00% 4/1/19 | 160,000 | 157,200 | |||||
| 10.50% 3/1/21 | 300,000 | 287,250 | |||||
| Baidu 3.50% 11/28/22 | 1,385,000 | 1,407,868 | |||||
| CDW 12.535% 10/12/17 | 142,000 | 153,183 | |||||
| Equinix | |||||||
| 4.875% 4/1/20 | 142,000 | 143,775 | |||||
| 5.375% 4/1/23 | 98,000 | 99,715 | |||||
| First Data | |||||||
| 9.875% 9/24/15 | 320,000 | 331,200 | |||||
| 11.25% 3/31/16 | 160,000 | 161,600 | |||||
| #144A 11.25% 1/15/21 | 230,000 | 240,350 | |||||
| GXS Worldwide | |||||||
| 9.75% 6/15/15 | 514,000 | 535,203 | |||||
| Infor US | |||||||
| 9.375% 4/1/19 | 60,000 | 68,325 | |||||
| Intel 2.70% 12/15/22 | 3,410,000 | 3,385,713 | |||||
| Jabil Circuit | |||||||
| 7.75% 7/15/16 | 82,000 | 94,813 | |||||
| Maxim Integrated Products | |||||||
| 3.375% 3/15/23 | 510,000 | 514,683 | |||||
| Microsoft | |||||||
| 2.125% 11/15/22 | 745,000 | 729,754 | |||||
| National Semiconductor | |||||||
| 6.60% 6/15/17 | 1,395,000 | 1,694,300 | |||||
| NetApp | |||||||
| 2.00% 12/15/17 | 475,000 | 478,188 | |||||
| 3.25% 12/15/22 | 590,000 | 582,047 | |||||
| Oracle 5.75% 4/15/18 | 70,000 | 84,559 | |||||
| # | Samsung Electronics | ||||||
| America 144A | |||||||
| 1.75% 4/10/17 | 745,000 | 756,386 | |||||
| Symantec | |||||||
| 4.20% 9/15/20 | 2,585,000 | 2,765,014 | |||||
| # | Tencent Holdings 144A | ||||||
| 3.375% 3/5/18 | 1,105,000 | 1,154,611 | |||||
| Xerox 6.35% 5/15/18 | 1,220,000 | 1,431,432 | |||||
| 17,388,732 | |||||||
| Transportation – 0.63% | |||||||
| t | American Airlines 2011-1 | ||||||
| Class A Pass Through | |||||||
| Trust 5.25% 1/31/21 | 541,030 | 589,722 | |||||
| # | Brambles USA 144A | ||||||
| 3.95% 4/1/15 | 1,660,000 | 1,733,905 | |||||
| 5.35% 4/1/20 | 320,000 | 359,952 | |||||
| Burlington Northern Santa Fe | |||||||
| 4.45% 3/15/43 | 310,000 | 314,852 | |||||
| t | Continental Airlines 2009-2 | ||||||
| Class A Pass Through | |||||||
| Trust 7.25% 11/10/19 | 788,922 | 921,066 | |||||
| t | Delta Air Lines 2007-1 | ||||||
| Class A Pass Through | |||||||
| Trust 6.821% 8/10/22 | 344,036 | 389,621 | |||||
| t | Delta Air Lines 2010-1 | ||||||
| Class A Pass Through | |||||||
| Trust 6.20% 7/2/18 | 402,278 | 458,597 | |||||
| t# | Doric Nimrod Air Finance | ||||||
| Alpha 2012-1 | |||||||
| Class A Pass | |||||||
| Through Trust 144A | |||||||
| 5.125% 11/30/24 | 400,000 | 430,000 | |||||
| # | ERAC USA Finance 144A | ||||||
| 3.30% 10/15/22 | 620,000 | 625,868 | |||||
| 5.25% 10/1/20 | 1,365,000 | 1,587,266 | |||||
| # | Penske Truck Leasing 144A | ||||||
| 4.875% 7/11/22 | 290,000 | 306,394 | |||||
(continues) 53
Statements of net assets
Optimum Fixed Income Fund
| Principal | Value | ||||||
| Amount° | (U.S. $) | ||||||
| Corporate Bonds (continued) | |||||||
| Transportation (continued) | |||||||
| Russian Railways | |||||||
| 5.739% 4/3/17 | USD | 1,000,000 | $ | 1,102,500 | |||
| t | UAL 2009-1 Pass | ||||||
| Through Trust | |||||||
| 10.40% 11/1/16 | 317,882 | 365,564 | |||||
| t | UAL 2009-2A Pass | ||||||
| Through Trust | |||||||
| 9.75% 1/15/17 | 222,741 | 258,380 | |||||
| 9,443,687 | |||||||
| Total Corporate Bonds | |||||||
| (cost $509,568,561) | 538,819,824 | ||||||
| Municipal Bonds – 0.59% | |||||||
| Bay Area, California | |||||||
| Toll Authority | |||||||
| 6.918% 4/1/40 | 800,000 | 1,092,360 | |||||
| 7.043% 4/1/50 | 3,000,000 | 4,325,609 | |||||
| California State | |||||||
| 7.30% 10/1/39 | 200,000 | 279,890 | |||||
| Los Angeles, California | |||||||
| Community College | |||||||
| District Revenue | |||||||
| Build America Bond | |||||||
| 6.60% 8/1/42 | 800,000 | 1,107,744 | |||||
| New York City Transitional | |||||||
| Finance Authority | |||||||
| 5.508% 8/1/37 | 700,000 | 861,973 | |||||
| New York State | |||||||
| Urban Development | |||||||
| 5.77% 3/15/39 | 800,000 | 984,440 | |||||
| Oregon State Taxable | |||||||
| Pension 5.892% 6/1/27 | 65,000 | 82,961 | |||||
| Sacramento County, | |||||||
| California Public | |||||||
| Finance Authority | |||||||
| Revenue (Housing Tax | |||||||
| County Project) Series B | |||||||
| 5.18% 12/1/13 | |||||||
| (NATL-RE) (FGIC) | 20,000 | 20,143 | |||||
| Total Municipal Bonds | |||||||
| (cost $6,455,539) | 8,755,120 | ||||||
| Non-Agency Asset-Backed Securities – 3.09% | |||||||
| • | Accredited Mortgage | ||||||
| Loan Trust | |||||||
| Series 2006-2 A4 | |||||||
| 0.464% 9/25/36 | 2,000,000 | 1,178,972 | |||||
| Series 2007-1 A3 | |||||||
| 0.334% 2/25/37 | 4,474,031 | 4,031,648 | |||||
| • | Ally Master | ||||||
| Owner Trust | |||||||
| Series 2011-1 A1 | |||||||
| 1.073% 1/15/16 | 730,000 | 733,914 | |||||
| •t | Ameriquest Mortgage | ||||||
| Securities Asset-Backed | |||||||
| Pass Through Certificates | |||||||
| Series 2005-R5 M2 | |||||||
| 0.664% 7/25/35 | 1,400,000 | 1,295,830 | |||||
| Series 2005-R7 M2 | |||||||
| 0.704% 9/25/35 | 2,000,000 | 1,682,998 | |||||
| •t | Argent Securities | ||||||
| Asset-Backed Pass | |||||||
| Through Certificates | |||||||
| Series 2003-W9 M1 | |||||||
| 1.239% 1/25/34 | 474,647 | 448,846 | |||||
| • | Argent Securities Trust | ||||||
| Series 2006-M1 A2C | |||||||
| 0.354% 7/25/36 | 1,602,352 | 631,525 | |||||
| Series 2006-M1 A2D | |||||||
| 0.444% 7/25/36 | 1,602,352 | 642,633 | |||||
| Series 2006-W4 A2C | |||||||
| 0.364% 5/25/36 | 816,224 | 289,346 | |||||
| # | Avis Budget Rental Car | ||||||
| Funding AESOP | |||||||
| Series 2011-2A A 144A | |||||||
| 2.37% 11/20/14 | 465,000 | 474,914 | |||||
| • | Bear Stearns Asset-Backed | ||||||
| Securities I Trust | |||||||
| Series 2005-FR1 M2 | |||||||
| 0.874% 6/25/35 | 2,000,000 | 1,381,746 | |||||
| Series 2007-HE5 1A1 | |||||||
| 0.294% 6/25/47 | 91,525 | 90,675 | |||||
| Capital One Multi-Asset | |||||||
| Execution Trust | |||||||
| Series 2007-A7 A7 | |||||||
| 5.75% 7/15/20 | 685,000 | 822,614 | |||||
| • | Carrington Mortgage Loan | ||||||
| Trust Series 2006-RFC1 | |||||||
| A2 0.304% 5/25/36 | 1,156 | 1,153 | |||||
| CenterPoint Energy | |||||||
| Transition Bond | |||||||
| Series 2012-1 A2 | |||||||
| 2.161% 10/15/21 | 890,000 | 921,940 | |||||
| Centex Home Equity | |||||||
| Series 2002-A AF6 | |||||||
| 5.54% 1/25/32 | 14,506 | 14,597 | |||||
| #• | Citibank Omni Master Trust | ||||||
| Series 2009-A14A A14 | |||||||
| 144A 2.953% 8/15/18 | 400,000 | 414,062 | |||||
| • | Countrywide Asset-Backed | ||||||
| Certificates | |||||||
| Series 2004-3 2A | |||||||
| 0.604% 8/25/34 | 60,609 | 57,344 | |||||
| Series 2005-AB2 2A3 | |||||||
| 0.589% 11/25/35 | 1,577,786 | 1,404,424 | |||||
| Series 2006-1 AF6 | |||||||
| 5.526% 7/25/36 | 2,321,450 | 2,208,337 | |||||
| Series 2006-11 1AF6 | |||||||
| 5.361% 9/25/46 | 1,055,107 | 898,426 | |||||
54
| Principal | Value | ||||||
| Amount° | (U.S. $) | ||||||
| Non-Agency Asset-Backed Securities (continued) | |||||||
| • | Countrywide Asset-Backed Certificates (continued) | ||||||
| Series 2006-26 2A4 | |||||||
| 0.424% 6/25/37 | USD | 2,000,000 | $ | 827,140 | |||
| Series 2007-26 2A4 | |||||||
| 0.514% 9/25/37 | 1,000,000 | 332,106 | |||||
| Discover Card Master Trust | |||||||
| Series 2012-A1 A1 | |||||||
| 0.81% 8/15/17 | 685,000 | 689,160 | |||||
| # | Enterprise Fleet Financing | ||||||
| Series 2012-1 A2 144A | |||||||
| 1.14% 11/20/17 | 275,798 | 276,939 | |||||
| GE Capital Credit Card | |||||||
| Master Note Trust | |||||||
| Series 2012-2 A | |||||||
| 2.22% 1/15/22 | 365,000 | 377,890 | |||||
| Series 2012-6 A | |||||||
| 1.36% 8/17/20 | 625,000 | 630,273 | |||||
| # | Golden Credit Card | ||||||
| Trust 144A | |||||||
| Series 2012-1A A1 | |||||||
| 1.77% 1/15/19 | 345,000 | 354,290 | |||||
| Series 2012-5A A | |||||||
| 0.79% 9/15/17 | 360,000 | 360,672 | |||||
| # | Great America | ||||||
| Leasing Receivables | |||||||
| Series 2013-1 B 144A | |||||||
| 1.44% 5/15/18 | 100,000 | 100,270 | |||||
| • | GSAMP Trust | ||||||
| Series 2006-HE6 A3 | |||||||
| 0.354% 8/25/36 | 1,900,000 | 1,182,110 | |||||
| • | Home Equity Mortgage Loan | ||||||
| Asset-Backed Trust | |||||||
| Series 2007-A 2A3 | |||||||
| 0.444% 4/25/47 | 2,000,000 | 1,078,400 | |||||
| • | HSI Asset Securitization Trust | ||||||
| Series 2006-HE1 2A1 | |||||||
| 0.254% 10/25/36 | 49,513 | 24,328 | |||||
| #• | MASTR Specialized Loan | ||||||
| Trust Series 2005-2 A2 | |||||||
| 144A 5.006% 7/25/35 | 54,174 | 54,867 | |||||
| • | Merrill Lynch Mortgage | ||||||
| Investors Trust | |||||||
| Series 2006-FF1 M2 | |||||||
| 0.494% 8/25/36 | 2,000,000 | 1,758,488 | |||||
| Series 2007-MLN1 A2A | |||||||
| 0.314% 3/25/37 | 1,839,393 | 1,269,183 | |||||
| • | Morgan Stanley ABS Capital I | ||||||
| Trust Series 2007-HE1 | |||||||
| A2C 0.354% 11/25/36 | 7,600,000 | 3,976,130 | |||||
| • | New Century Home Equity | ||||||
| Loan Trust Series 2005-1 | |||||||
| M2 0.684% 3/25/35 | 1,400,000 | 1,154,328 | |||||
| • | RAMP Trust Series 2006-RZ5 | ||||||
| A2 0.384% 8/25/46 | 1,133,346 | 1,045,619 | |||||
| • | RASC Trust | ||||||
| Series 2006-EMX1 A2 | |||||||
| 0.434% 1/25/36 | 155,033 | 149,169 | |||||
| Series 2007-KS3 AI2 | |||||||
| 0.384% 4/25/37 | 2,813,415 | 2,750,499 | |||||
| • | SLM Student Loan Trust | ||||||
| Series 2005-4 A2 | |||||||
| 0.381% 4/26/21 | 365,151 | 364,979 | |||||
| Series 2008-9 A | |||||||
| 1.801% 4/25/23 | 3,980,388 | 4,140,876 | |||||
| • | Soundview Home Loan Trust | ||||||
| Series 2006-WF2 A1 | |||||||
| 0.334% 12/25/36 | 1,659,822 | 1,587,171 | |||||
| • | Structured Asset | ||||||
| Investment Loan Trust | |||||||
| Series 2003-BC2 M1 | |||||||
| 1.584% 4/25/33 | 385,932 | 332,202 | |||||
| # | TAL Advantage V | ||||||
| Series 2013-1A A 144A | |||||||
| 2.83% 2/22/38 | 441,292 | 442,703 | |||||
| #• | Trafigura Securitisation | ||||||
| Finance Series | |||||||
| 2012-1A A 144A | |||||||
| 2.603% 10/15/15 | 500,000 | 510,156 | |||||
| # | Trinity Rail Leasing | ||||||
| Series 2012-1A A1 | |||||||
| 144A 2.266% 1/15/43 | 392,463 | 409,817 | |||||
| • | Vanderbilt Mortgage | ||||||
| Finance Series 2001-A | |||||||
| A4 7.235% 6/7/28 | 41,485 | 42,567 | |||||
| World Financial Network | |||||||
| Credit Card Master | |||||||
| Trust Series 2012-B A | |||||||
| 1.76% 5/17/21 | 360,000 | 366,294 | |||||
| Total Non-Agency | |||||||
| Asset-Backed Securities | |||||||
| (cost $46,182,024) | 46,214,570 | ||||||
| Non-Agency Collateralized Mortgage Obligations – 3.74% | |||||||
| • | ARM Trust | ||||||
| Series 2004-5 3A1 | |||||||
| 2.769% 4/25/35 | 2,195,956 | 2,213,910 | |||||
| Series 2005-10 3A31 | |||||||
| 5.046% 1/25/36 | 1,015,385 | 947,303 | |||||
| Series 2006-2 1A4 | |||||||
| 3.224% 5/25/36 | 1,422,140 | 1,191,055 | |||||
| • | Banc of America Funding | ||||||
| Trust Series 2006-I 1A1 | |||||||
| 2.658% 12/20/36 | 979,048 | 982,965 | |||||
| • | Banc of America Mortgage | ||||||
| Series 2003-D 2A1 | |||||||
| 3.119% 5/25/33 | 968,523 | 957,508 | |||||
(continues) 55
Statements of net assets
Optimum Fixed Income Fund
| Principal | Value | ||||||
| Amount° | (U.S. $) | ||||||
| Non-Agency Collateralized Mortgage Obligations (continued) | |||||||
| Bank of America Alternative | |||||||
| Loan Trust | |||||||
| Series 2005-3 2A1 | |||||||
| 5.50% 4/25/20 | USD | 53,610 | $ | 56,154 | |||
| Series 2005-6 7A1 | |||||||
| 5.50% 7/25/20 | 176,296 | 183,411 | |||||
| • | Bear Stearns ARM Trust | ||||||
| Series 2003-5 2A1 | |||||||
| 2.736% 8/25/33 | 172,102 | 171,957 | |||||
| Series 2005-2 A2 | |||||||
| 2.793% 3/25/35 | 363,133 | 365,516 | |||||
| Series 2005-5 | |||||||
| 2.24% 8/25/35 | 3,171,974 | 3,186,004 | |||||
| • | Chase Mortgage Finance | ||||||
| Series 2005-A1 3A1 | |||||||
| 2.912% 12/25/35 | 334,872 | 314,289 | |||||
| • | ChaseFlex Trust Series 2006-1 | ||||||
| A4 5.564% 6/25/36 | 420,000 | 371,811 | |||||
| • | Citigroup Mortgage Loan | ||||||
| Trust Series 2004-UST1 | |||||||
| A6 4.804% 8/25/34 | 45,451 | 45,828 | |||||
| Countrywide Alternative | |||||||
| Loan Trust | |||||||
| Series 2003-21T1 A2 | |||||||
| 5.25% 12/25/33 | 13,316 | 13,316 | |||||
| Series 2004-J1 1A1 | |||||||
| 6.00% 2/25/34 | 3,974 | 4,057 | |||||
| Series 2004-J2 7A1 | |||||||
| 6.00% 12/25/33 | 5,130 | 5,127 | |||||
| Series 2008-2R 3A1 | |||||||
| 6.00% 8/25/37 | 2,607,776 | 2,090,221 | |||||
| t | Countrywide Home Loan | ||||||
| Mortgage Pass | |||||||
| Through Trust | |||||||
| •Series 2003-21 A1 | |||||||
| 3.105% 5/25/33 | 3,739 | 3,746 | |||||
| Series 2007-4 1A1 | |||||||
| 6.00% 5/25/37 | 3,223,545 | 2,842,022 | |||||
| CSMC Mortgage-Backed Trust | |||||||
| #Series 2005-1R 2A5 | |||||||
| 144A 5.75% 12/26/35 | 4,504,930 | 3,852,905 | |||||
| Series 2007-1 5A14 | |||||||
| 6.00% 2/25/37 | 752,042 | 688,232 | |||||
| •Series 2007-3 4A6 | |||||||
| 0.454% 4/25/37 | 1,030,799 | 867,007 | |||||
| @•ûSeries 2007-3 4A12 | |||||||
| 6.546% 4/25/37 | 1,030,799 | 163,094 | |||||
| Series 2007-3 4A15 | |||||||
| 5.50% 4/25/37 | 457,707 | 442,517 | |||||
| Series 2007-5 3A19 | |||||||
| 6.00% 8/25/37 | 1,331,917 | 1,350,193 | |||||
| Series 2007-5 10A2 | |||||||
| 6.00% 4/25/29 | 516,937 | 550,826 | |||||
| #• | Deutsche Mortgage | ||||||
| Securities Re-Remic | |||||||
| Trust Certificate | |||||||
| Series 2005-WF1 1A3 | |||||||
| 144A 5.228% 6/26/35 | 1,720,000 | 1,747,687 | |||||
| •t | First Horizon Mortgage | ||||||
| Pass Through Trust | |||||||
| Series 2005-AR2 2A1 | |||||||
| 2.575% 6/25/35 | 332,769 | 320,479 | |||||
| GMAC Mortgage Loan Trust | |||||||
| Series 2006-J1 A1 | |||||||
| 5.75% 4/25/36 | 187,936 | 188,977 | |||||
| #• | GSMPS Mortgage Loan Trust | ||||||
| Series 1998-3 A 144A | |||||||
| 7.75% 9/19/27 | 11,628 | 12,295 | |||||
| • | GSR Mortgage Loan Trust | ||||||
| Series 2006-AR1 3A1 | |||||||
| 3.149% 1/25/36 | 174,281 | 158,212 | |||||
| • | Indymac INDA Loan Trust | ||||||
| Series 2006-AR1 A1 | |||||||
| 5.363% 8/25/36 | 413,595 | 412,803 | |||||
| • | JPMorgan Mortgage Trust | ||||||
| Series 2006-A6 2A4L | |||||||
| 4.788% 10/25/36 | 1,354,900 | 1,145,649 | |||||
| Series 2006-A7 2A2 | |||||||
| 2.914% 1/25/37 | 253,167 | 208,844 | |||||
| Series 2007-A1 6A1 | |||||||
| 3.003% 7/25/35 | 709,322 | 700,117 | |||||
| Lehman Mortgage Trust | |||||||
| Series 2007-10 2A2 | |||||||
| 6.50% 1/25/38 | 3,962,726 | 3,856,227 | |||||
| MASTR Alternative | |||||||
| Loans Trust | |||||||
| Series 2004-3 8A1 | |||||||
| 7.00% 4/25/34 | 5,279 | 5,327 | |||||
| Series 2004-5 6A1 | |||||||
| 7.00% 6/25/34 | 91,449 | 96,246 | |||||
| • | MASTR ARM Trust | ||||||
| Series 2003-6 1A2 | |||||||
| 2.825% 12/25/33 | 5,518 | 5,497 | |||||
| Series 2004-4 4A1 | |||||||
| 2.682% 5/25/34 | 171,192 | 168,212 | |||||
| Series 2005-6 7A1 | |||||||
| 5.304% 6/25/35 | 104,583 | 102,357 | |||||
| Series 2006-2 4A1 | |||||||
| 2.648% 2/25/36 | 23,871 | 22,143 | |||||
| MASTR Asset Securitization | |||||||
| Trust Series 2003-9 | |||||||
| 2A7 5.50% 10/25/33 | 118,546 | 120,826 | |||||
| • | Merrill Lynch Mortgage | ||||||
| Investors Trust | |||||||
| Series MLCC 2005-2 | |||||||
| 1A 1.76% 10/25/35 | 269,307 | 264,872 | |||||
| Series MLMI 2004-A1 | |||||||
| 2A2 2.636% 2/25/34 | 14,004 | 14,061 | |||||
| Series MLMI 2005-A5 | |||||||
| A2 2.579% 6/25/35 | 404,318 | 400,569 | |||||
| • | Opteum Mortgage | ||||||
| Acceptance | |||||||
| Series 2006-1 2A1 | |||||||
| 5.75% 4/25/36 | 3,198,120 | 3,248,260 | |||||
56
| Principal | Value | |||||||
| Amount° | (U.S. $) | |||||||
| Non-Agency Collateralized Mortgage Obligations (continued) | ||||||||
| RALI Trust Series 2004-QS2 | ||||||||
| CB 5.75% 2/25/34 | USD | 67,069 | $ | 70,082 | ||||
| RFMI Trust I Series 2004-S9 | ||||||||
| 2A1 4.75% 12/25/19 | 371,594 | 379,968 | ||||||
| RFMSI Trust Series 2004-S9 | ||||||||
| 1A23 5.50% 12/25/34 | 4,500,000 | 4,622,138 | ||||||
| • | Sequoia Mortgage Trust | |||||||
| Series 2004-5 A3 | ||||||||
| 1.086% 6/20/34 | 493,329 | 471,708 | ||||||
| Series 2007-1 4A1 | ||||||||
| 4.725% 9/20/46 | 1,586,245 | 1,364,642 | ||||||
| • | Structured ARM Loan Trust | |||||||
| Series 2005-22 1A4 | ||||||||
| 2.60% 12/25/35 | 1,926,986 | 1,239,871 | ||||||
| Series 2006-1 7A4 | ||||||||
| 5.33% 2/25/36 | 1,231,083 | 1,015,864 | ||||||
| • | Structured Asset Mortgage | |||||||
| Investments Trust II | ||||||||
| Series 2005-AR5 A2 | ||||||||
| 0.453% 7/19/35 | 1,430,371 | 1,342,981 | ||||||
| •t | WAMU Alternative | |||||||
| Mortgage Pass | ||||||||
| Through Certificates | ||||||||
| Series 2005-1 5A2 | ||||||||
| 6.00% 3/25/35 | 74,796 | 27,575 | ||||||
| Series 2005-AR16 1A3 | ||||||||
| 2.49% 12/25/35 | 1,225,000 | 1,137,616 | ||||||
| Series 2007-HY1 3A3 | ||||||||
| 5.091% 2/25/37 | 742,678 | 709,186 | ||||||
| Series 2007-HY7 4A1 | ||||||||
| 5.05% 7/25/37 | 1,511,669 | 1,395,760 | ||||||
| WAMU Structured | ||||||||
| Asset-Trust Securities | ||||||||
| Series 2005-6 4A1 | ||||||||
| 5.00% 5/25/35 | 128,407 | 130,220 | ||||||
| Wells Fargo | ||||||||
| Mortgage-Backed | ||||||||
| Securities Trust | ||||||||
| Series 2005-18 1A1 | ||||||||
| 5.50% 1/25/36 | 41,320 | 41,025 | ||||||
| • | Series 2005-AR13 A1 | |||||||
| 5.23% 5/25/35 | 19,217 | 19,214 | ||||||
| • | Series 2005-AR16 2A1 | |||||||
| 2.71% 2/25/34 | 340,995 | 339,791 | ||||||
| Series 2006-2 3A1 | ||||||||
| 5.75% 3/25/36 | 260,346 | 260,444 | ||||||
| Series 2006-3 A1 | ||||||||
| 5.50% 3/25/36 | 108,756 | 109,364 | ||||||
| Series 2006-3 A11 | ||||||||
| 5.50% 3/25/36 | 250,965 | 265,597 | ||||||
| Series 2006-6 1A3 | ||||||||
| 5.75% 5/25/36 | 179,786 | 179,125 | ||||||
| • | Series 2006-AR5 2A1 | |||||||
| 2.639% 4/25/36 | 128,093 | 117,742 | ||||||
| • | Series 2006-AR11 A6 | |||||||
| 5.165% 8/25/36 | 1,835,699 | 1,695,325 | ||||||
| • | Series 2006-AR17 A1 | |||||||
| 2.63% 10/25/36 | 1,046,218 | 960,158 | ||||||
| Series 2007-10 1A36 | ||||||||
| 6.00% 7/25/37 | 990,047 | 970,553 | ||||||
| Total Non-Agency Collateralized | ||||||||
| Mortgage Obligations | ||||||||
| (cost $54,597,334) | 55,926,583 | |||||||
| ΔRegional Bonds – 0.72% | ||||||||
| Australia – 0.52% | ||||||||
| New South Wales Treasury | ||||||||
| 3.75% 11/20/20 | AUD | 668,000 | 899,237 | |||||
| 6.00% 3/1/22 | AUD | 2,779,000 | 3,285,748 | |||||
| Queensland Treasury | ||||||||
| 4.25% 7/21/23 | AUD | 600,000 | 607,267 | |||||
| Victoria Treasury | ||||||||
| 6.00% 10/17/22 | AUD | 2,536,000 | 3,018,286 | |||||
| 7,810,538 | ||||||||
| Canada – 0.20% | ||||||||
| Manitoba Province | ||||||||
| 2.10% 9/6/22 | USD | 1,575,000 | 1,555,870 | |||||
| Quebec Province | ||||||||
| 2.625% 2/13/23 | 1,395,000 | 1,404,310 | ||||||
| 2,960,180 | ||||||||
| Total Regional Bonds | ||||||||
| (cost $10,880,081) | 10,770,718 | |||||||
| «Senior Secured Loans – 3.44% | ||||||||
| Air Medical Group | ||||||||
| Holdings Tranche B1 | ||||||||
| 6.50% 5/26/18 | 169,575 | 173,814 | ||||||
| AI Chem & CY Tranche B 1st | ||||||||
| Lien 4.50% 9/12/19 | 165,000 | 165,451 | ||||||
| Albertsons 1st Lien | ||||||||
| 6.25% 2/14/16 | 555,000 | 565,159 | ||||||
| Alcatel-Lucent USA | ||||||||
| Tranche B 1st Lien | ||||||||
| 6.25% 6/4/16 | 55,000 | 55,877 | ||||||
| Tranche C 1st Lien | ||||||||
| 7.25% 12/4/18 | 279,300 | 284,159 | ||||||
| Allied Security Holdings | ||||||||
| Tranche 2L | ||||||||
| 9.75% 1/21/18 | 150,000 | 150,938 | ||||||
| ARAMARK Tranche D | ||||||||
| 4.00% 9/30/19 | 180,000 | 182,169 | ||||||
| ATI Holdings Tranche B | ||||||||
| 5.75% 1/31/20 | 239,400 | 243,440 | ||||||
| Avaya | ||||||||
| Tranche B-3 | ||||||||
| 4.79% 10/27/17 | 275,960 | 260,878 | ||||||
| Tranche B5 | ||||||||
| 8.00% 3/31/18 | 262,637 | 264,831 | ||||||
(continues) 57
Statements of net assets
Optimum Fixed Income Fund
| Principal | Value | |||||||
| Amount° | (U.S. $) | |||||||
| «Senior Secured Loans (continued) | ||||||||
| Avis Budget Car Rental | ||||||||
| Tranche B 1st Lien | ||||||||
| 3.75% 3/15/19 | USD | 115,000 | $ | 116,437 | ||||
| Bausch & Lomb | ||||||||
| 4.75% 6/27/15 | 399,000 | 402,990 | ||||||
| Tranche B | ||||||||
| 5.25% 4/17/19 | 795,920 | 804,516 | ||||||
| Biomet Tranche B | ||||||||
| 3.7% 7/25/17 | 218,900 | 221,413 | ||||||
| BJ’s Wholesale | ||||||||
| Club 2nd Lien | ||||||||
| 9.75% 3/29/19 | 555,000 | 577,547 | ||||||
| Blackboard Tranche B2 | ||||||||
| 6.25% 10/4/18 | 566,867 | 574,662 | ||||||
| BNY ConvergEx Group | ||||||||
| 8.75% 11/29/17 | 100,497 | 99,429 | ||||||
| 8.75% 12/16/17 | 239,503 | 236,959 | ||||||
| Bombardier Recreational | ||||||||
| Products 1st Lien | ||||||||
| 5.00% 1/17/19 | 555,000 | 561,186 | ||||||
| Bresnan Broadband Holdings | ||||||||
| 4.50% 12/14/17 | 455,000 | 458,356 | ||||||
| Brickman Group | ||||||||
| Holdings Tranche B1 | ||||||||
| 5.50% 10/14/16 | 250,506 | 255,516 | ||||||
| Brock Holdings III | ||||||||
| 10.00% 2/15/18 | 74,000 | 75,018 | ||||||
| Tranche B | ||||||||
| 6.01% 2/15/17 | 63,527 | 64,400 | ||||||
| Burlington Coat | ||||||||
| Factory Warehouse | ||||||||
| 5.50% 5/1/17 | 400,840 | 406,665 | ||||||
| Caesars Entertainment | ||||||||
| Operating Tranche B6 | ||||||||
| 5.45% 1/28/18 | 574,705 | 533,901 | ||||||
| 9.50% 10/31/16 | 857,941 | 877,245 | ||||||
| Chrysler Group | ||||||||
| 6.00% 5/24/17 | 1,317,475 | 1,345,118 | ||||||
| Clear Channel | ||||||||
| Communications | ||||||||
| Tranche B | ||||||||
| 3.85% 1/29/16 | 934,333 | 830,389 | ||||||
| Community Health Systems | ||||||||
| 3.79% 1/25/17 | 1,050,000 | 1,062,633 | ||||||
| Compass Investors Tranche B | ||||||||
| 5.25% 12/14/19 | 568,575 | 574,498 | ||||||
| @ | Constellation Brands | |||||||
| Tranche A | ||||||||
| 6.00% 6/29/20 | 250,000 | 250,000 | ||||||
| Crown Castle Tranche B | ||||||||
| 4.00% 1/31/19 | 348,237 | 352,764 | ||||||
| David’s Bridal Operating | ||||||||
| Tranche B | ||||||||
| 5.00% 9/25/19 | 129,675 | 131,518 | ||||||
| DaVita Tranche B | ||||||||
| 4.00% 8/1/19 | 448,875 | 454,100 | ||||||
| 4.50% 10/20/16 | 1,173,000 | 1,180,076 | ||||||
| Delos Aircraft | ||||||||
| 4.75% 3/17/16 | 1,150,000 | 1,158,624 | ||||||
| Delta Air Lines | ||||||||
| Tranche B 1st Lien | ||||||||
| 4.25% 4/15/17 | 1,153,566 | 1,169,427 | ||||||
| Deltek | ||||||||
| 10.00% 8/28/17 | 20,000 | 20,356 | ||||||
| Tranche 1st Lien | ||||||||
| 5.00% 10/10/18 | 129,675 | 131,296 | ||||||
| Dynegy Power 1st Lien | ||||||||
| 9.25% 8/5/16 | 182,274 | 190,362 | ||||||
| Edward Cayman | ||||||||
| Islands II 1st Lien | ||||||||
| 4.75% 3/5/20 | 68,000 | 68,255 | ||||||
| Emdeon Tranche B | ||||||||
| 5.00% 11/2/18 | 296,542 | 300,898 | ||||||
| Energy Transfer Equity | ||||||||
| 3.75% 3/26/17 | 155,000 | 156,033 | ||||||
| Equipower Resources | ||||||||
| Holdings | ||||||||
| 1st Lien | ||||||||
| 5.50% 12/21/18 | 102,811 | 104,674 | ||||||
| 2nd Lien | ||||||||
| 10.00% 5/23/19 | 220,000 | 226,600 | ||||||
| Essar Steel Algoma | ||||||||
| 8.75% 9/12/14 | 278,725 | 285,693 | ||||||
| First Data Tranche B2 | ||||||||
| 5.20% 3/24/17 | 1,001,681 | 1,010,368 | ||||||
| Flying Fortress 1st Lien | ||||||||
| 5.00% 6/30/17 | 120,000 | 120,750 | ||||||
| Generac Power | ||||||||
| Systems Tranche B | ||||||||
| 6.25% 5/30/18 | 176,692 | 181,330 | ||||||
| Getty Images Tranche B | ||||||||
| 3.78% 9/19/19 | 473,813 | 481,554 | ||||||
| Gray Television | ||||||||
| 4.75% 10/11/19 | 954,820 | 970,336 | ||||||
| Harrah’s Las Vegas | ||||||||
| Propco | ||||||||
| 3.70% 2/13/15 | 230,000 | 217,120 | ||||||
| HCA Tranche B | ||||||||
| 3.45% 5/1/18 | 1,735,000 | 1,751,619 | ||||||
| HD Supply Tranche B | ||||||||
| 4.50% 10/12/17 | 468,261 | 473,295 | ||||||
| Hologic Tranche B | ||||||||
| 4.50% 4/29/19 | 412,925 | 419,162 | ||||||
| Hostess Brands 1st Lien | ||||||||
| 6.75% 3/12/20 | 455,000 | 465,238 | ||||||
| Houghton International | ||||||||
| 1st Lien | ||||||||
| 5.05% 11/20/19 | 114,713 | 116,600 | ||||||
| 2nd Lien | ||||||||
| 9.50% 11/20/20 | 205,000 | 208,844 | ||||||
| IASIS Healthcare Tranche B | ||||||||
| 1st Lien 4.50% 5/3/18 | 666,954 | 677,167 | ||||||
| Immucor Tranche B2 | ||||||||
| 5.00% 8/19/18 | 894,910 | 903,160 | ||||||
58
| Principal | Value | |||||||
| Amount° | (U.S. $) | |||||||
| «Senior Secured Loans (continued) | ||||||||
| Ineos US Finance | ||||||||
| 6.50% 5/4/18 | USD | 252,078 | $ | 256,411 | ||||
| Infor US Tranche B | ||||||||
| 5.25% 4/5/18 | 297,754 | 303,275 | ||||||
| Intelsat Jackson | ||||||||
| Holdings Tranche B | ||||||||
| 4.50% 4/2/18 | 761,161 | 774,005 | ||||||
| Landry’s Tranche B | ||||||||
| 4.75% 4/24/18 | 628,744 | 634,508 | ||||||
| Level 3 Financing Tranche B | ||||||||
| 1st Lien 4.75% 8/1/19 | 485,000 | 491,113 | ||||||
| MGM Resorts International | ||||||||
| 4.25% 12/13/19 | 1,451,363 | 1,477,538 | ||||||
| Michael Stores Tranche B 1st | ||||||||
| Lien 3.75% 1/16/20 | 265,000 | 268,201 | ||||||
| Mission Broadcasting | ||||||||
| Tranche B 1st Lien | ||||||||
| 4.50% 12/3/19 | 26,743 | 27,244 | ||||||
| MultiPlan Tranche B | ||||||||
| 4.00% 8/18/17 | 302,372 | 306,189 | ||||||
| National CineMedia | ||||||||
| 3.46% 11/26/19 | 88,000 | 88,843 | ||||||
| NEP Broadcasting 2nd Lien | ||||||||
| 9.50% 7/3/20 | 555,000 | 575,813 | ||||||
| Nexstar Broadcasting | ||||||||
| Tranche B | ||||||||
| 4.50% 7/19/19 | 63,257 | 64,443 | ||||||
| Novelis Tranche B | ||||||||
| 3.75% 3/10/17 | 107,725 | 109,324 | ||||||
| NRG Energy 3.25% 7/1/18 | 992,475 | 1,007,238 | ||||||
| Nuveen Investments | ||||||||
| 8.25% 3/1/19 | 1,493,000 | 1,541,522 | ||||||
| Tranche B | ||||||||
| 5.20% 5/15/17 | 525,074 | 535,247 | ||||||
| NXP 4.75% 12/4/20 | 89,775 | 91,945 | ||||||
| Offshore Group | ||||||||
| Investment Tranche B | ||||||||
| 6.25% 10/17/17 | 311,063 | 314,117 | ||||||
| OSI Restaurant Partners | ||||||||
| 4.75% 10/5/19 | 355,875 | 361,360 | ||||||
| Par Pharmaceutical | ||||||||
| Tranche B 1st Lien | ||||||||
| 4.25% 9/28/19 | 129,675 | 131,282 | ||||||
| Peninsula Gaming Tranche B | ||||||||
| 5.75% 5/16/17 | 338,900 | 345,466 | ||||||
| Pharmaceutical Product | ||||||||
| Development | ||||||||
| 4.25% 12/5/18 | 324,188 | 328,747 | ||||||
| PQ Tranche B 4.50% 8/7/17 | 443,888 | 449,159 | ||||||
| PVH Tranche B | ||||||||
| 3.25% 12/19/19 | 770,000 | 779,324 | ||||||
| Remy International | ||||||||
| Tranche B 1st Lien | ||||||||
| 4.25% 3/5/20 | 85,878 | 86,200 | ||||||
| Reynolds Group | ||||||||
| Holdings 1st Lien | ||||||||
| 4.75% 9/21/18 | 532,325 | 540,690 | ||||||
| RGIS Services | ||||||||
| 5.50% 5/3/17 | 312,160 | 317,038 | ||||||
| Rite Aid 2nd Lien | ||||||||
| 5.75% 8/3/20 | 555,000 | 576,275 | ||||||
| Samson Investment 2nd Lien | ||||||||
| 6.00% 9/10/18 | 390,000 | 395,655 | ||||||
| Sensus USA 2nd Lien | ||||||||
| 8.50% 4/13/18 | 465,000 | 469,650 | ||||||
| Seven Seas Cruises 1st Lien | ||||||||
| 4.75% 12/21/18 | 301,188 | 305,706 | ||||||
| Smart & Final | ||||||||
| 1st Lien 5.75% 11/8/19 | 399,998 | 405,747 | ||||||
| 2nd Lien | ||||||||
| 10.50% 11/8/20 | 610,000 | 631,350 | ||||||
| Sophia Tranche B 1st Lien | ||||||||
| 4.50% 1/29/18 | 96,682 | 98,268 | ||||||
| Station Casinos Tranche B | ||||||||
| 5.00% 2/13/20 | 320,000 | 324,000 | ||||||
| Supervalu 1st Lien | ||||||||
| 6.25% 1/10/19 | 580,000 | 590,927 | ||||||
| Swift Transportation | ||||||||
| Tranche B2 1st Lien | ||||||||
| 2.95% 12/21/17 | 167,285 | 169,899 | ||||||
| Taminco Global | ||||||||
| Chemical Tranche B | ||||||||
| 4.25% 2/15/19 | 217,531 | 220,114 | ||||||
| Tempur-Pedic International | ||||||||
| Tranche B | ||||||||
| 5.00% 9/27/19 | 309,225 | 313,946 | ||||||
| TI Group Automotive | ||||||||
| Systems Tranche B | ||||||||
| 5.25% 3/14/19 | 220,000 | 217,800 | ||||||
| Topaz Power Holdings | ||||||||
| 5.25% 2/4/20 | 433,913 | 442,591 | ||||||
| Toys R Us Delaware Tranche | ||||||||
| B 6.00% 9/1/16 | 484,207 | 475,249 | ||||||
| Truven Health Analytics | ||||||||
| Tranche B | ||||||||
| 5.75% 5/23/19 | 546,049 | 555,605 | ||||||
| United Airlines Tranche B 1st | ||||||||
| Lien 4.00% 3/12/19 | 255,000 | 258,108 | ||||||
| Univision Communications | ||||||||
| Tranche C1 1st Lien | ||||||||
| 4.75% 2/22/20 | 700,435 | 705,426 | ||||||
| Tranche C2 | ||||||||
| 4.75% 2/6/20 | 1,015,000 | 1,022,232 | ||||||
| US Coatings Acquisition | ||||||||
| Tranche B | ||||||||
| 4.75% 2/1/20 | 750,000 | 760,824 | ||||||
| US TelePacific | ||||||||
| 5.75% 2/10/17 | 72,173 | 72,196 | ||||||
| Visant 5.25% 12/22/16 | 286,610 | 278,668 | ||||||
| Warner Chilcott | ||||||||
| Tranche B1 | ||||||||
| 4.25% 3/15/18 | 126,926 | 128,830 | ||||||
| Tranche B2 | ||||||||
| 4.25% 3/15/18 | 151,336 | 153,606 | ||||||
(continues) 59
Statements of net assets
Optimum Fixed Income Fund
| Principal | Value | |||||||
| Amount° | (U.S. $) | |||||||
| «Senior Secured Loans (continued) | ||||||||
| WC Luxco Tranche B3 | ||||||||
| 4.25% 3/15/18 | USD | 69,685 | $ | 70,730 | ||||
| Wide Open | ||||||||
| West Finance | ||||||||
| 4.75% 3/27/19 | 1,070,000 | 1,081,369 | ||||||
| 1st Lien | ||||||||
| 6.25% 7/17/18 | 1,041,826 | 1,056,411 | ||||||
| Yankee Cable Acquisition | ||||||||
| 5.25% 2/13/20 | 245,000 | 247,603 | ||||||
| Yankee Candle | ||||||||
| 5.25% 3/2/19 | 76,720 | 77,607 | ||||||
| Zayo Group | ||||||||
| Tranche B 1st Lien | ||||||||
| 4.50% 7/2/19 | 532,318 | 538,773 | ||||||
| Total Senior Secured Loans | ||||||||
| (cost $50,774,984) | 51,454,220 | |||||||
| ΔSovereign Bonds – 6.84% | ||||||||
| Australia – 0.29% | ||||||||
| Australian Government | ||||||||
| Inflation-Linked Bond | ||||||||
| 4.00% 8/20/20 | AUD | 451,000 | 901,215 | |||||
| 5.50% 4/21/23 | AUD | 2,800,000 | 3,428,398 | |||||
| 4,329,613 | ||||||||
| Brazil – 1.11% | ||||||||
| # | Banco Nacional de | |||||||
| Desenvolvimento | ||||||||
| Economico e | ||||||||
| Social 144A | ||||||||
| 6.369% 6/16/18 | USD | 1,500,000 | 1,740,000 | |||||
| 6.50% 6/10/19 | 2,500,000 | 2,943,750 | ||||||
| Brazil Notas do Tesouro | ||||||||
| Nacional Serie F | ||||||||
| 10.00% 1/1/14 | BRL | 2,039,000 | 1,023,911 | |||||
| 10.00% 1/1/17 | BRL | 19,681,000 | 9,964,410 | |||||
| 10.00% 1/1/21 | BRL | 304,000 | 152,524 | |||||
| 10.00% 1/1/23 | BRL | 304,000 | 152,354 | |||||
| Republic of Brazil | ||||||||
| 5.625% 1/7/41 | USD | 500,000 | 587,500 | |||||
| 16,564,449 | ||||||||
| Colombia – 0.19% | ||||||||
| Republic of Colombia | ||||||||
| * | 4.375% 3/21/23 | COP | 3,068,000,000 | 1,743,491 | ||||
| 6.125% 1/18/41 | USD | 918,000 | 1,159,434 | |||||
| 2,902,925 | ||||||||
| Finland – 0.07% | ||||||||
| Finnish Government | ||||||||
| 4.00% 7/4/25 | EUR | 626,000 | 989,320 | |||||
| 989,320 | ||||||||
| Indonesia – 0.55% | ||||||||
| Indonesia Government | ||||||||
| 5.625% 5/15/23 | IDR | 23,710,000,000 | 2,433,294 | |||||
| 7.00% 5/15/22 | IDR | 21,551,000,000 | 2,451,990 | |||||
| 7.00% 5/15/27 | IDR | 12,468,000,000 | 1,377,410 | |||||
| 11.00% 11/15/20 | IDR | 7,060,000,000 | 979,701 | |||||
| # | Republic of | |||||||
| Indonesia 144A | ||||||||
| 5.25% 1/17/42 | USD | 914,000 | 977,980 | |||||
| 8,220,375 | ||||||||
| Ireland – 0.09% | ||||||||
| # | VEB Finance 144A | |||||||
| 6.025% 7/5/22 | 1,175,000 | 1,305,719 | ||||||
| 1,305,719 | ||||||||
| Malaysia – 0.03% | ||||||||
| Malaysia Government | ||||||||
| 4.262% 9/15/16 | MYR | 1,380,000 | 462,780 | |||||
| 462,780 | ||||||||
| Mexico – 0.58% | ||||||||
| Mexican Bonos | ||||||||
| 6.00% 6/18/15 | MXN | 3,646,000 | 306,712 | |||||
| 6.50% 6/10/21 | MXN | 5,990,900 | 539,976 | |||||
| 6.50% 6/9/22 | MXN | 6,425,000 | 581,714 | |||||
| 7.50% 6/3/27 | MXN | 24,334,000 | 2,392,044 | |||||
| 7.75% 5/29/31 | MXN | 15,022,000 | 1,508,366 | |||||
| 8.00% 12/17/15 | MXN | 6,827,000 | 603,544 | |||||
| 10.00% 12/5/24 | MXN | 16,700,000 | 1,947,785 | |||||
| United Mexican | ||||||||
| 4.75% 3/8/44 | USD | 690,000 | 717,600 | |||||
| 8,597,741 | ||||||||
| Nigeria – 0.03% | ||||||||
| Nigerian Treasury Bond | ||||||||
| 15.10% 4/27/17 | NGN | 60,345,000 | 434,575 | |||||
| 434,575 | ||||||||
| Norway – 0.06% | ||||||||
| # | Kommunalbanken 144A | |||||||
| 1.00% 3/15/18 | USD | 952,000 | 945,502 | |||||
| 945,502 | ||||||||
| Panama – 0.10% | ||||||||
| Panama Government | ||||||||
| International Bond | ||||||||
| 6.70% 1/26/36 | 302,000 | 403,925 | ||||||
| 7.125% 1/29/26 | 340,000 | 459,680 | ||||||
| 8.875% 9/30/27 | 451,000 | 699,501 | ||||||
| 1,563,106 | ||||||||
| Paraguay – 0.03% | ||||||||
| # | Republic of Paraguay | |||||||
| 144A 4.625% 1/25/23 | 430,000 | 433,870 | ||||||
| 433,870 | ||||||||
60
| Principal | Value | |||||||
| Amount° | (U.S. $) | |||||||
| ΔSovereign Bonds (continued) | ||||||||
| Peru – 0.13% | ||||||||
| Republic of Peru | ||||||||
| 5.625% 11/18/50 | USD | 300,000 | $ | 360,300 | ||||
| 7.125% 3/30/19 | 1,218,000 | 1,569,393 | ||||||
| 1,929,693 | ||||||||
| Philippines – 0.11% | ||||||||
| Philippines Republic | ||||||||
| 5.00% 1/13/37 | 710,000 | 819,162 | ||||||
| 9.50% 10/21/24 | 507,000 | 794,723 | ||||||
| 1,613,885 | ||||||||
| Poland – 0.38% | ||||||||
| Poland Government Bond | ||||||||
| 4.00% 10/25/23 | PLN | 4,003,000 | 1,237,442 | |||||
| 5.75% 10/25/21 | PLN | 12,776,000 | 4,483,564 | |||||
| 5,721,006 | ||||||||
| Qatar – 0.41% | ||||||||
| Qatar Government | ||||||||
| International Bond | ||||||||
| 4.00% 1/20/15 | USD | 5,800,000 | 6,127,700 | |||||
| 6,127,700 | ||||||||
| Republic of Korea – 0.17% | ||||||||
| Korea Treasury Inflation- | ||||||||
| Linked Bond | ||||||||
| 2.75% 6/10/20 | KRW | 720,942,559 | 759,376 | |||||
| Republic of Korea | ||||||||
| 5.75% 4/16/14 | USD | 900,000 | 946,364 | |||||
| 7.125% 4/16/19 | 700,000 | 906,849 | ||||||
| 2,612,589 | ||||||||
| Russia – 0.05% | ||||||||
| Russia Eurobond | ||||||||
| 7.50% 3/31/30 | 623,875 | 774,073 | ||||||
| 774,073 | ||||||||
| South Africa – 0.32% | ||||||||
| Republic of South Africa | ||||||||
| 7.25% 1/15/20 | ZAR | 9,725,000 | 1,106,647 | |||||
| 8.00% 12/21/18 | ZAR | 7,821,000 | 924,608 | |||||
| 13.50% 9/15/15 | ZAR | 8,587,000 | 1,103,567 | |||||
| South Africa Government | ||||||||
| Inflation-Linked Bond | ||||||||
| 2.75% 1/31/22 | 13,241,014 | 1,706,287 | ||||||
| 4,841,109 | ||||||||
| Sri Lanka – 0.06% | ||||||||
| # | Republic of Sri Lanka 144A | |||||||
| 5.875% 7/25/22 | USD | 861,000 | 897,593 | |||||
| 897,593 | ||||||||
| Turkey – 0.25% | ||||||||
| Turkey Government Bond | ||||||||
| 4.50% 2/11/15 | TRY | 915,135 | 546,866 | |||||
| 9.00% 3/5/14 | TRY | 2,655,000 | 1,511,023 | |||||
| 10.50% 1/15/20 | TRY | 2,523,000 | 1,681,397 | |||||
| 3,739,286 | ||||||||
| United Kingdom – 1.76% | ||||||||
| United Kingdom Gilt | ||||||||
| 1.75% 9/7/22 | GBP | 3,800,000 | 5,770,908 | |||||
| 3.75% 9/7/21 | GBP | 300,000 | 536,616 | |||||
| 4.00% 3/7/22 | GBP | 9,484,757 | 17,292,453 | |||||
| 4.50% 3/7/19 | GBP | 515,000 | 944,154 | |||||
| 4.75% 3/7/20 | GBP | 910,500 | 1,714,966 | |||||
| 26,259,097 | ||||||||
| Uruguay – 0.07% | ||||||||
| Uruguay Government | ||||||||
| International Bond | ||||||||
| 8.00% 11/18/22 | USD | 711,750 | 995,738 | |||||
| 995,738 | ||||||||
| Total Sovereign Bonds | ||||||||
| (cost $101,596,813) | 102,261,744 | |||||||
| Supranational Banks – 0.22% | ||||||||
| Andina de Fomento | ||||||||
| 4.375% 6/15/22 | 670,000 | 730,681 | ||||||
| International Bank | ||||||||
| for Reconstruction | ||||||||
| & Development | ||||||||
| 3.375% 4/30/15 | NOK | 6,860,000 | 1,212,230 | |||||
| 3.625% 6/22/20 | NOK | 4,020,000 | 729,769 | |||||
| 6.00% 2/15/17 | AUD | 530,000 | 597,041 | |||||
| Total Supranational Banks | ||||||||
| (cost $3,058,619) | 3,269,721 | |||||||
| U.S. Treasury Obligations – 15.27% | ||||||||
| U.S. Treasury Bill | ||||||||
| 0.125% 12/31/13 | USD | 15,000,000 | 15,000,000 | |||||
| U.S. Treasury Bonds | ||||||||
| ∞ | 2.75% 8/15/42 | 4,980,000 | 4,621,286 | |||||
| 2.75% 11/15/42 | 1,975,000 | 1,830,886 | ||||||
| U.S. Treasury Inflation | ||||||||
| Indexed Bonds | ||||||||
| 0.125% 1/15/23 | 4,190,130 | 4,525,014 | ||||||
| 1.75% 1/15/28 | 10,574,400 | 13,464,183 | ||||||
| 2.00% 1/15/26 | 1,624,322 | 2,117,456 | ||||||
| 2.375% 1/15/25 | 2,785,408 | 3,744,198 | ||||||
| 2.375% 1/15/27 | 4,190,773 | 5,712,221 | ||||||
| 2.50% 1/15/29 | 4,215,200 | 5,898,646 | ||||||
| 3.875% 4/15/29 | 266,150 | 433,304 | ||||||
| U.S. Treasury Notes | ||||||||
| 0.75% 2/28/18 | 5,965,000 | 5,964,535 | ||||||
| ∞ | 1.625% 11/15/22 | 41,100,000 | 40,377,543 | |||||
| 2.00% 11/15/21 | 5,600,000 | 5,775,874 | ||||||
| 2.00% 2/15/22 | 27,100,000 | 27,864,301 | ||||||
| 2.00% 2/15/23 | 89,810,000 | 90,960,735 | ||||||
| Total U.S. Treasury Obligations | ||||||||
| (cost $225,755,619) | 228,290,182 | |||||||
(continues) 61
Statements of net assets
Optimum Fixed Income Fund
| Number of | Value | ||||||||
| Contracts | (U.S. $) | ||||||||
| Option Purchased – 0.00% | |||||||||
| Put Option – 0.00% | |||||||||
| U.S. 10 yr future, strike price | |||||||||
| $128.50, expiration | |||||||||
| date 4/26/13 (JPMC) | 177 | $ | 2,766 | ||||||
| Total Option Purchased | |||||||||
| (cost $42,281) | 2,766 | ||||||||
| Number of | |||||||||
| Shares | |||||||||
| Common Stock – 0.00% | |||||||||
| = | Century Communications | 1,975,000 | 0 | ||||||
| † | Delta Air Lines | 29 | 479 | ||||||
| NRG Energy | 41 | 1,086 | |||||||
| Total Common Stock | |||||||||
| (cost $60,518) | 1,565 | ||||||||
| Convertible Preferred Stock – 0.41% | |||||||||
| Apache 6.00% exercise | |||||||||
| price $109.12, | |||||||||
| expiration date 8/1/13 | 12,400 | 552,296 | |||||||
| ArcelorMittal 6.00% | |||||||||
| exercise price | |||||||||
| $20.94, expiration | |||||||||
| date 12/21/15 | 8,925 | 189,656 | |||||||
| Aspen Insurance Holdings | |||||||||
| 5.625% exercise price | |||||||||
| $29.28, expiration | |||||||||
| date 12/31/49 | 10,329 | 685,587 | |||||||
| Bank of America 7.25% | |||||||||
| exercise price | |||||||||
| $50.00, expiration | |||||||||
| date 12/31/49 | 123 | 150,321 | |||||||
| # | Chesapeake Energy 144A | ||||||||
| 5.75% exercise price | |||||||||
| $27.90, expiration | |||||||||
| date 12/31/49 | 276 | 282,728 | |||||||
| Cliffs Natural Resources | |||||||||
| 7.00% exercise price | |||||||||
| $35.53, expiration | |||||||||
| date 2/1/16 | 14,625 | 273,049 | |||||||
| * | Goodyear Tire & Rubber | ||||||||
| 5.875% exercise price | |||||||||
| $18.21, expiration | |||||||||
| date 3/31/14 | 11,650 | 514,784 | |||||||
| HealthSouth 6.50% | |||||||||
| exercise price | |||||||||
| $30.50, expiration | |||||||||
| date 12/31/49 | 695 | 816,799 | |||||||
| Huntington Bancshares | |||||||||
| 8.50% exercise price | |||||||||
| $11.95, expiration | |||||||||
| date 4/15/13 | 281 | 361,647 | |||||||
| MetLife 5.00% exercise | |||||||||
| price $44.28, | |||||||||
| expiration date 9/4/13 | 13,600 | 671,840 | |||||||
| PPL 9.50% exercise price | |||||||||
| $28.80, expiration | |||||||||
| date 7/1/13 | 12,200 | 672,464 | |||||||
| SandRidge Energy 8.50% | |||||||||
| exercise price | |||||||||
| $8.01, expiration | |||||||||
| date 12/31/49 | 4,073 | 374,879 | |||||||
| Wells Fargo 7.50% | |||||||||
| exercise price | |||||||||
| $156.71, expiration | |||||||||
| date 12/31/49 | 485 | 625,044 | |||||||
| Total Convertible Preferred Stock | |||||||||
| (cost $6,359,325) | 6,171,094 | ||||||||
| Preferred Stock – 0.31% | |||||||||
| Alabama Power 5.625% | 19,190 | 491,264 | |||||||
| # | Ally Financial 144A 7.00% | 500 | 494,500 | ||||||
| * | BB&T 5.85% | 15,975 | 418,865 | ||||||
| * | JPMorgan Chase 5.50% | 10,000 | 253,000 | ||||||
| • | PNC Financial Services Group | ||||||||
| • | 6.125% | 15,000 | 415,050 | ||||||
| 8.25% | 875,000 | 884,709 | |||||||
| Public Storage 5.20% | 17,200 | 430,344 | |||||||
| *• | U.S. Bancorp 6.50% | 19,200 | 573,312 | ||||||
| Wells Fargo 5.20% | 25,600 | 652,544 | |||||||
| Total Preferred Stock | |||||||||
| (cost $4,338,873) | 4,613,588 | ||||||||
| Security Sold Short – (0.36%) | |||||||||
| Fannie Mae S.F. 30 yr TBA | |||||||||
| 5.50% 5/1/43 | (5,000,000 | ) | (5,453,125 | ) | |||||
| Total Security Sold Short | |||||||||
| (proceeds $5,444,531) | (5,453,125 | ) | |||||||
| Principal | |||||||||
| Amount° | |||||||||
| Short-Term Investments – 12.32% | |||||||||
| ≠Discounted Commercial Paper – 0.26% | |||||||||
| ≥ | Daimler Finance | ||||||||
| 1.082% 10/15/13 | USD | 3,900,000 | $ | 3,888,720 | |||||
| 3,888,720 | |||||||||
| ≠Discount Notes – 1.12% | |||||||||
| Federal Home Loan Bank | |||||||||
| 0.085% 5/24/13 | 9,511,895 | 9,511,333 | |||||||
| 0.12% 4/2/13 | 7,234,964 | 7,234,964 | |||||||
| 16,746,297 | |||||||||
62
| Principal | Value | |||||||||
| Amount° | (U.S. $) | |||||||||
| Short-Term Investments (continued) | ||||||||||
| Repurchase Agreements – 1.67% | ||||||||||
| Bank of America 0.07%, | ||||||||||
| dated 3/28/13, to | ||||||||||
| be repurchased on | ||||||||||
| 4/1/13, repurchase | ||||||||||
| price $12,821,327 | ||||||||||
| (collateralized by | ||||||||||
| U.S. government | ||||||||||
| obligations 0.125%- | ||||||||||
| 1.50% 8/31/18- | ||||||||||
| 1/15/22; market value | ||||||||||
| $13,077,653) | USD | 12,821,227 | $ | 12,821,227 | ||||||
| BNP Paribas 0.15%, | ||||||||||
| dated 3/28/13, to | ||||||||||
| be repurchased on | ||||||||||
| 4/1/13, repurchase | ||||||||||
| price $12,106,518 | ||||||||||
| (collateralized by | ||||||||||
| U.S. government | ||||||||||
| obligations 0.25%- | ||||||||||
| 0.875% 2/28/14- | ||||||||||
| 7/31/19; market value | ||||||||||
| $12,360,560) | 12,106,316 | 12,106,316 | ||||||||
| 24,927,543 | ||||||||||
| ≠U.S. Treasury Obligations – 9.27% | ||||||||||
| U.S. Treasury Bills | ||||||||||
| 0.029% 4/4/13 | 3,700,000 | 3,699,996 | ||||||||
| 0.04% 4/11/13 | 12,955,637 | 12,955,534 | ||||||||
| 0.0575% 4/18/13 | 28,263,545 | 28,263,121 | ||||||||
| 0.065% 4/25/13 | 7,325,936 | 7,325,775 | ||||||||
| 0.065% 5/9/13 | 13,964,593 | 13,963,922 | ||||||||
| 0.101% 4/15/13 | 39,464,434 | 39,464,118 | ||||||||
| 0.103% 5/30/13 | 8,525,000 | 8,524,165 | ||||||||
| 0.108% 5/23/13 | 8,125,000 | 8,124,326 | ||||||||
| 0.118% 6/6/13 | 8,125,000 | 8,124,253 | ||||||||
| 0.125% 6/13/13 | 8,125,000 | 8,124,090 | ||||||||
| 138,569,300 | ||||||||||
| Total Short-Term Investments | ||||||||||
| (cost $184,114,315) | 184,131,860 | |||||||||
| Total Value of Securities | ||||||||||
| Before Securities Lending | ||||||||||
| Collateral – 106.61% | ||||||||||
| (cost $1,545,818,649) | 1,594,146,356 | |||||||||
| Number of | ||||||||||
| Shares | ||||||||||
| **Securities Lending Collateral – 0.08% | ||||||||||
| Investment Companies | ||||||||||
| Delaware Investments | ||||||||||
| Collateral Fund No. 1 | 1,137,484 | 1,137,484 | ||||||||
| †@ | Mellon GSL | |||||||||
| Reinvestment Trust II | 862,515 | 0 | ||||||||
| Total Securities Lending Collateral | ||||||||||
| (cost $1,999,999) | 1,137,484 | |||||||||
| Total Value of Securities – 106.69% | ||||||||||
| (cost $1,547,818,648) | 1,595,283,840 | © | ||||||||
| Number of | ||||||||||
| Contracts | ||||||||||
| Options Written – (0.02%) | ||||||||||
| Call Swaptions – (0.01%) | ||||||||||
| 10 yr IRO, strike rate 1.80%, | ||||||||||
| expiration date | ||||||||||
| 7/31/13 (JPMC) | (15,000,000 | ) | (55,380 | ) | ||||||
| 10 yr IRO, strike rate 1.80%, | ||||||||||
| expiration date | ||||||||||
| 7/31/13 (MSC) | (16,400,000 | ) | (60,549 | ) | ||||||
| (115,929 | ) | |||||||||
| Put Swaptions – (0.01%) | ||||||||||
| 10 yr IRO, strike rate 2.65%, | ||||||||||
| expiration date | ||||||||||
| 7/31/13 (JPMC) | (15,000,000 | ) | (79,455 | ) | ||||||
| 10 yr IRO, strike rate 2.65%, | ||||||||||
| expiration date | ||||||||||
| 7/31/13 (MSC) | (16,400,000 | ) | (86,871 | ) | ||||||
| (166,326 | ) | |||||||||
| Total Options Written | ||||||||||
| (premium received ($336,325)) | (282,255 | ) | ||||||||
| **Obligation to Return Securities | ||||||||||
| Lending Collateral – (0.13%) | (1,999,999 | ) | ||||||||
| «Other Liabilities Net of | ||||||||||
| Receivables and Other | ||||||||||
| Assets – (6.54%) | (97,706,425 | ) | ||||||||
| Net Assets Applicable to | ||||||||||
| 151,830,737 Shares | ||||||||||
| Outstanding – 100.00% | $ | 1,495,295,161 | ||||||||
| Net Asset Value – Optimum Fixed Income Fund | ||||||||||
| Class A ($41,210,013 / 4,184,211 Shares) | $9.85 | |||||||||
| Net Asset Value – Optimum Fixed Income Fund | ||||||||||
| Class B ($1,203,044 / 122,287 Shares) | $9.84 | |||||||||
| Net Asset Value – Optimum Fixed Income Fund | ||||||||||
| Class C ($155,727,640 / 15,826,940 Shares) | $9.84 | |||||||||
| Net Asset Value – Optimum Fixed Income Fund | ||||||||||
| Institutional Class ($1,297,154,464 / 131,697,299 Shares) | $9.85 | |||||||||
(continues) 63
Statements of net assets
Optimum Fixed Income Fund
| Components of Net Assets at March 31, 2013: | ||
| Shares of beneficial interest | ||
| (unlimited authorization – no par) | $ | 1,437,080,818 |
| Undistributed net investment income | 8,689,178 | |
| Accumulated net realized gain on investments | 1,752,058 | |
| Net unrealized appreciation of investments | ||
| and derivatives | 47,773,107 | |
| Total net assets | $ | 1,495,295,161 |
| ° | Principal amount shown is stated in the currency in which each security is denominated. |
| • | Variable rate security. The rate shown is the rate as of March 31, 2013. Interest rates reset periodically. |
| @ | Illiquid security. At March 31, 2013, the aggregate value of illiquid securities was $20,629,827, which represented 1.38% of the Fund’s net assets. See Note 9 in “Notes to financial statements.” |
| ^ | Zero coupon security. The rate shown is the yield at the time of purchase. |
| û | Interest only security. An interest only security is the interest only portion of a fixed income security which is separated and sold individually from the principal portion of the security. |
| t | Pass Through Agreement. Security represents the contractual right to receive a proportionate amount of underlying payments due to the counterparty pursuant to various agreements related to the rescheduling of obligations and the exchange of certain notes. |
| # | Security exempt from registration under Rule 144A of the Securities Act of 1933, as amended. At March 31, 2013, the aggregate value of Rule 144A securities was $210,436,670, which represented 14.07% of the Fund’s net assets. See Note 9 in “Notes to financial statements.” |
| * | Fully or partially on loan. |
| ϕ | Step coupon bond. Coupon increases or decreases periodically based on a predetermined schedule. Stated rate in effect at March 31, 2013. |
| = | Security is being fair valued in accordance with the Fund’s fair valuation policy. At March 31, 2013, the aggregate value of fair valued securities was $0, which represented 0.00% of the Fund’s net assets. See Note 1 in “Notes to financial statements.” |
| ‡ | Non income producing security. Security is currently in default. |
| Δ | Securities have been classified by country of origin. |
| « | Senior Secured Loans generally pay interest at rates that are periodically redetermined by reference to a base lending rate plus a premium. These base lending rates are generally: (i) the prime rate offered by one or more United States banks, (ii) the lending rate offered by one or more European banks such as the London Inter-Bank Offered Rate (LIBOR), and (iii) the certificate of deposit rate. Senior secured loans may be subject to restrictions on resale. Stated rate in effect at March 31, 2013. |
| ∞ | Fully or partially pledged as collateral for futures contracts. |
| † | Non income producing security. |
| ≠ | The rate shown is the effective yield at the time of purchase. |
| ≥ | Commercial paper exempt from registration under Section 4(2) and/or Rule 144A of the Securities Act of 1933, as amended, and may be resold in transactions exempt from registration only to dealers in that program or other “accredited investors”. At March 31, 2013, the aggregate amount of these securities equaled $3,888,720, which represented 0.26% of the Fund’s net assets. See Note 9 in “Notes to financial statements.” |
| ** | See Note 8 in “Notes to financial statements” for additional information on securities lending collateral. |
| © | Includes $1,923,783 of securities loaned. |
| « | Includes $830,000 cash collateral for derivatives and foreign currency valued at $581,128 with a cost of $602,385. |
| Net Asset Value and Offering Price Per Share – | |||
| Optimum Fixed Income Fund | |||
| Net asset value Class A (A) | $ | 9.85 | |
| Sales charge (4.50% of offering price) (B) | 0.46 | ||
| Offering price | $ | 10.31 |
| (A) | Net asset value per share, as illustrated, is the amount that would be paid upon redemption or repurchase of shares. | |
| (B) | See the current prospectus for purchases of $100,000 or more. |
The following foreign currency exchange contracts, futures contracts and swap contracts were outstanding at March 31, 2013:1
Foreign Currency Exchange Contracts
| Unrealized | |||||||||||||||
| Contracts to | Settlement | Appreciation | |||||||||||||
| Counterparty | Receive (Deliver) | In Exchange For | Date | (Depreciation) | |||||||||||
| BAML | AUD | (4,346,925 | ) | USD | 4,402,827 | 4/12/13 | $ | (117,697 | ) | ||||||
| BAML | BRL | 3,400,624 | USD | (1,691,432 | ) | 4/12/13 | (11,012 | ) | |||||||
| BAML | CLP | 1,683,024,000 | USD | (3,527,021 | ) | 4/12/13 | 34,595 | ||||||||
| BAML | COP | 3,406,383,000 | USD | (1,873,035 | ) | 4/12/13 | (9,587 | ) | |||||||
| BAML | EUR | (8,462,146 | ) | USD | 11,019,660 | 4/12/13 | 171,397 | ||||||||
| BAML | INR | 40,351,543 | USD | (729,025 | ) | 4/12/13 | 11,914 | ||||||||
| BAML | JPY | (301,245,813 | ) | USD | 3,219,057 | 4/12/13 | 18,429 | ||||||||
| BAML | KRW | (263,618,550 | ) | USD | 240,990 | 4/12/13 | 4,431 | ||||||||
| BAML | MXN | 28,404,800 | USD | (2,290,377 | ) | 4/12/13 | 6,273 | ||||||||
| BAML | MYR | 6,957,232 | USD | (2,233,533 | ) | 4/12/13 | 9,379 | ||||||||
| BAML | NZD | (753,390 | ) | USD | 618,895 | 4/12/13 | (10,763 | ) | |||||||
| BCLY | MXN | (22,731,875 | ) | USD | 1,827,615 | 4/12/13 | (10,355 | ) | |||||||
| BP | AUD | (757,779 | ) | USD | 789,844 | 4/12/13 | 1,802 | ||||||||
| BP | RUB | 70,226,440 | USD | (2,275,683 | ) | 4/12/13 | (24,565 | ) | |||||||
| CITI | AUD | (2,366,404 | ) | USD | 2,466,905 | 4/12/13 | 5,997 | ||||||||
| CITI | CNY | (9,280,239 | ) | USD | 1,472,353 | 8/5/13 | (10,311 | ) | |||||||
| CITI | CNY | (13,893,253 | ) | USD | 2,199,169 | 11/25/13 | (9,137 | ) | |||||||
| CITI | CNY | (55,270,000 | ) | USD | 8,633,240 | 2/15/14 | (121,710 | ) | |||||||
| CITI | JPY | 77,620,704 | USD | (830,150 | ) | 4/12/13 | (5,458 | ) | |||||||
| CITI | JPY | (202,802,000 | ) | USD | 2,190,922 | 4/17/13 | 36,153 | ||||||||
| CITI | PLN | (5,060,027 | ) | USD | 1,586,041 | 4/12/13 | 34,347 | ||||||||
| CITI | TRY | 3,101,202 | USD | (1,713,371 | ) | 4/12/13 | (2,972 | ) | |||||||
| CS | COP | 2,102,179,775 | USD | (1,147,948 | ) | 4/12/13 | 2,041 | ||||||||
| CS | IDR | 16,148,691,920 | USD | (1,657,466 | ) | 4/12/13 | 724 | ||||||||
| CS | MXN | 28,779,936 | USD | (2,313,834 | ) | 4/12/13 | 13,147 | ||||||||
| GSC | BRL | 6,617,252 | USD | (3,325,085 | ) | 4/12/13 | (55,167 | ) | |||||||
| GSC | GBP | (1,714,299 | ) | USD | 2,580,364 | 4/12/13 | (24,214 | ) | |||||||
| GSC | NOK | 3,040,474 | USD | (522,176 | ) | 4/12/13 | (1,943 | ) | |||||||
| HSBC | CAD | 417,090 | USD | (405,445 | ) | 4/12/13 | 5,004 | ||||||||
| HSBC | EUR | (3,002,226 | ) | USD | 3,909,559 | 4/12/13 | 60,779 | ||||||||
| HSBC | GBP | (500,063 | ) | USD | 752,955 | 4/12/13 | (6,803 | ) | |||||||
| HSBC | JPY | 221,619,545 | USD | (2,368,426 | ) | 4/12/13 | (13,798 | ) | |||||||
| JPMC | AUD | (7,688,000 | ) | USD | 7,940,074 | 4/4/13 | (59,723 | ) | |||||||
| JPMC | BRL | 3,354,750 | USD | (1,684,534 | ) | 4/12/13 | (26,783 | ) | |||||||
| JPMC | BRL | (19,177,896 | ) | USD | 9,582,241 | 6/4/13 | 164,445 | ||||||||
| JPMC | CNY | 9,280,239 | USD | (1,477,674 | ) | 8/5/13 | 4,989 | ||||||||
| JPMC | CNY | 13,893,252 | USD | (2,195,000 | ) | 11/25/13 | 13,306 | ||||||||
64
| Foreign Currency Exchange Contracts (continued) | ||||||||||||||||||
| Unrealized | ||||||||||||||||||
| Contracts to | Settlement | Appreciation | ||||||||||||||||
| Counterparty | Receive (Deliver) | In Exchange For | Date | (Depreciation) | ||||||||||||||
| JPMC | EUR | (1,249,305 | ) | USD | 1,625,595 | 4/12/13 | $ | 24,017 | ||||||||||
| JPMC | EUR | (21,600,000 | ) | USD | 28,012,461 | 6/17/13 | 308,099 | |||||||||||
| JPMC | GBP | (1,955,975 | ) | USD | 2,943,156 | 4/12/13 | (28,606 | ) | ||||||||||
| JPMC | GBP | (13,304,000 | ) | USD | 19,866,797 | 6/12/13 | (339,892 | ) | ||||||||||
| JPMC | JPY | 176,471,546 | USD | (1,888,002 | ) | 4/12/13 | (13,055 | ) | ||||||||||
| JPMC | JPY | (427,616,000 | ) | USD | 4,804,588 | 4/17/13 | 261,174 | |||||||||||
| JPMC | MXN | (20,241,545 | ) | USD | 1,599,806 | 6/27/13 | (25,245 | ) | ||||||||||
| MNB | IDR | 4,616,171,756 | USD | (474,672 | ) | 4/1/13 | 88 | |||||||||||
| MSC | AUD | (3,677,915 | ) | USD | 3,830,622 | 4/12/13 | 5,826 | |||||||||||
| MSC | CNY | 55,270,000 | USD | (8,600,000 | ) | 2/15/14 | 155,148 | |||||||||||
| MSC | GBP | (581,463 | ) | USD | 874,956 | 4/12/13 | (8,475 | ) | ||||||||||
| MSC | JPY | 297,910,314 | USD | (3,186,138 | ) | 4/12/13 | (20,948 | ) | ||||||||||
| MSC | PLN | (3,527,720 | ) | USD | 1,105,879 | 4/12/13 | 24,077 | |||||||||||
| MSC | ZAR | (26,714,536 | ) | USD | 2,925,472 | 4/12/13 | 24,312 | |||||||||||
| TD | CLP | 644,844,000 | USD | (1,353,222 | ) | 4/12/13 | 11,397 | |||||||||||
| TD | GBP | (1,512,828 | ) | USD | 2,286,405 | 4/12/13 | (12,072 | ) | ||||||||||
| TD | JPY | (549,059,972 | ) | USD | 5,799,826 | 4/12/13 | (33,739 | ) | ||||||||||
| TD | MXN | 28,946,749 | USD | (2,329,285 | ) | 4/12/13 | 11,184 | |||||||||||
| $ | 420,444 | |||||||||||||||||
Futures Contracts
| Unrealized | ||||||||||||||||||||||
| Contracts to | Notional Cost | Notional | Expiration | Appreciation | ||||||||||||||||||
| Buy (Sell) | (Proceeds) | Value | Date | (Depreciation) | ||||||||||||||||||
| 47 | Euro-Bund | $ | 8,788,821 | $ | 8,765,329 | 6/11/13 | $ | (23,492 | ) | |||||||||||||
| (62) | Euro-O.A.T. | (10,860,142 | ) | (10,810,149 | ) | 6/11/13 | 49,993 | |||||||||||||||
| 25 | Long Gilt | 4,373,666 | 4,512,007 | 6/29/13 | 138,341 | |||||||||||||||||
| (324) | U.S. Treasury | |||||||||||||||||||||
| 5 yr Notes | (39,972,859 | ) | (40,193,719 | ) | 7/4/13 | (220,860 | ) | |||||||||||||||
| 177 | U.S. Treasury | |||||||||||||||||||||
| 10 yr Notes | 23,285,667 | 23,361,234 | 6/29/13 | 75,567 | ||||||||||||||||||
| $ | (14,384,847 | ) | $ | 19,549 | ||||||||||||||||||
| Swap Contracts | ||||||||||||||||||
| CDS Contracts | ||||||||||||||||||
| Swap | Annual | Unrealized | ||||||||||||||||
| Referenced | Notional | Protection | Termination | Appreciation | ||||||||||||||
| Counterparty | Obligation | Value | Payments | Date | (Depreciation) | |||||||||||||
| Protection Purchased: | ||||||||||||||||||
| CITI | Credit Agricole | |||||||||||||||||
| SA-London Senior | ||||||||||||||||||
| 5 yr CDS | EUR | 2,600,000 | 1.00% | 12/20/16 | $ | (106,678 | ) | |||||||||||
| CITI | ITRAXX Europe | |||||||||||||||||
| Crossover 17.1 | ||||||||||||||||||
| 5 yr CDS | EUR | 9,300,000 | 5.00% | 6/20/17 | (1,342,964 | ) | ||||||||||||
| JPMC | ITRAXX Europe | |||||||||||||||||
| Crossover S19 V1 | EUR | 2,960,000 | 5.00% | 6/20/18 | 11,751 | |||||||||||||
| JPMC | ITRAXX Europe | |||||||||||||||||
| Subordinate | ||||||||||||||||||
| Financials 18.1 | ||||||||||||||||||
| 5 yr CDS | EUR | 1,225,000 | 5.00% | 12/20/17 | 34,513 | |||||||||||||
| $ | (1,403,378 | ) | ||||||||||||||||
| Protection Sold / Moody’s Rating: | ||||||||||||||||||
| CITI | Dell Senior/ Baa | USD | 1,200,000 | 1.00% | 12/20/17 | $ | (28,223 | ) | ||||||||||
| CITI | NRG Energy | |||||||||||||||||
| Senior /Baa | 1,200,000 | 5.00% | 6/20/17 | 158,843 | ||||||||||||||
| CITI | Republic of Brazil | |||||||||||||||||
| 5 yr CDS / Baa | 2,000,000 | 1.00% | 3/20/17 | 4,567 | ||||||||||||||
| CITI | Republic of Italy | |||||||||||||||||
| 5 yr CDS / Baa | EUR | 1,000,000 | 1.00% | 6/20/17 | 91,375 | |||||||||||||
| MSC | Lloyds TSB Bank / A | EUR | 5,500,000 | 3.00% | 9/20/17 | 383,601 | ||||||||||||
| MSC | People’s Republic | |||||||||||||||||
| of China | ||||||||||||||||||
| 5 yr CDS/ Aa | USD | 2,700,000 | 1.00% | 9/20/16 | 60,117 | |||||||||||||
| $ | 670,280 | |||||||||||||||||
| Total | $ | (733,098 | ) | |||||||||||||||
(continues) 65
Statements of net assets
Optimum Fixed Income Fund
Swap Contracts (continued) | ||||||||||||||||||||||
| Fixed | Variable | |||||||||||||||||||||
| Interest | Interest | |||||||||||||||||||||
| Swap | Rate | Rate | Unrealized | |||||||||||||||||||
| Referenced | Received | Received | Termination | Appreciation | ||||||||||||||||||
| Counterparty | Obligations | Notional Value | (Paid) | (Paid) | Date | (Depreciation) | ||||||||||||||||
| CITI | 3-Month | |||||||||||||||||||||
| LIBOR | USD | 21,700,000 | 3.00% | (0.302% | ) | 3/21/23 | $ | (80,577 | ) | |||||||||||||
| CITI | 6-Month | |||||||||||||||||||||
| LIBOR | AUD | 6,100,000 | 4.00% | (3.41% | ) | 3/15/23 | 9,491 | |||||||||||||||
| CITI | 6-Month | |||||||||||||||||||||
| LIBOR | AUD | 9,400,000 | 4.75% | (3.10% | ) | 6/15/22 | 635,872 | |||||||||||||||
| JPMC | 6-Month | |||||||||||||||||||||
| LIBOR | AUD | 10,900,000 | 4.75% | (3.10% | ) | 6/15/22 | 726,509 | |||||||||||||||
| JPMC | Brazil CETIP | |||||||||||||||||||||
| Interbank | ||||||||||||||||||||||
| Deposit | BRL | 23,800,000 | 8.21% | 0.00% | 1/4/17 | (324,511 | ) | |||||||||||||||
| JPMC | Brazil CETIP | |||||||||||||||||||||
| Interbank | ||||||||||||||||||||||
| Deposit | BRL | 7,800,000 | 9.01% | 0.00% | 1/4/17 | (100,842 | ) | |||||||||||||||
| MSC | 3-Month | |||||||||||||||||||||
| LIBOR | USD | 1,800,000 | (2.75% | ) | 0.282% | 6/19/43 | 49,684 | |||||||||||||||
| MSC | Brazil CETIP | |||||||||||||||||||||
| Interbank | ||||||||||||||||||||||
| Deposit | BRL | 27,400,000 | 8.22% | 0.00% | 1/2/17 | (371,745 | ) | |||||||||||||||
| $ | 543,881 | |||||||||||||||||||||
The use of foreign currency exchange contracts, futures contracts and swap contracts involves elements of market risk and risks in excess of the amounts disclosed in the financial statements. The foreign currency exchange contracts and notional values presented above represent the Fund’s total exposure in such contracts, whereas only the net unrealized appreciation (depreciation) is reflected in the Fund’s net assets.
1See Note 7 in “Notes to financial statements.”
Summary of Abbreviations:
ARM — Adjustable Rate Mortgage
AUD — Australian Dollar
BAML — Bank of America Merrill Lynch
BCLY — Barclays Bank
BP — Banque Paribas
BRL — Brazilian Real
CAD — Canadian Dollar
CDO — Collateralized Debt Obligation
CDS — Credit Default Swap
CITI — Citigroup Global Markets
CLO — Collateralized Loan Obligation
CLP — Chilean Peso
CNY — China Renminbi
COP — Colombian Peso
CS — Credit Suisse
EUR — European Monetary Unit
FGIC — Insured by Financial Guaranty Insurance Company
GBP — British Pound Sterling
GNMA — Government National Mortgage Association
GSC — Goldman Sachs Capital
GSMPS — Goldman Sachs Reperforming Mortgage Securities
HSBC — Hong Kong Shanghai Bank
IDR — Indonesia Rupiah
INR — Indian Rupee
IRO — Interest Rate Swaptions
IRS — Interest Rate Swap
JPMC — JPMorgan Chase Bank
JPY — Japanese Yen
KRW — South Korean Won
MASTR — Mortgage Asset Securitization Transactions, Inc.
MNB — Mellon National Bank
MSC — Morgan Stanley Capital
MXN — Mexican Peso
MYR — Malaysian Ringgit
NATL-RE — Insured by National Public Finance Guarantee Corporation
NCUA — National Credit Union Administration
NGN — Nigerian Naira
NOK — Norwegian Krone
NZD — New Zealand Dollar
O.A.T. — Obligations Assimilables du Tresor
PLN — Polish Zloty
REMIC — Real Estate Mortgage Investment Conduit
RUB — Russian Ruble
S.F. — Single Family
TBA — To be announced
TD — Toronto Dominion Securities
TRY— Turkish Lira
USD — United States Dollar
yr — Year
ZAR — South African Rand
See accompanying notes, which are an integral part of the financial statements.
66
Optimum International Fund
March 31, 2013
| Number of | Value | |||||
| Shares | (U.S. $) | |||||
| ΔCommon Stock – 97.03% | ||||||
| Australia – 2.61% | ||||||
| Amcor | 366,882 | $ | 3,544,596 | |||
| AMP | 702,432 | 3,810,083 | ||||
| CSL | 26,818 | 1,653,714 | ||||
| QBE Insurance Group | 227,210 | 3,195,767 | ||||
| 12,204,160 | ||||||
| Belgium – 1.54% | ||||||
| * | Ageas | 43,200 | 1,461,094 | |||
| †= | Ageas VVPR Strip | 2,424 | 0 | |||
| * | Anheuser-Busch InBev | 28,178 | 2,790,268 | |||
| KBC Groep | 85,868 | 2,957,577 | ||||
| 7,208,939 | ||||||
| Canada – 0.22% | ||||||
| Gildan Activewear | 26,300 | 1,049,307 | ||||
| 1,049,307 | ||||||
| China/Hong Kong – 3.20% | ||||||
| AIA Group | 1,037,200 | 4,542,940 | ||||
| Cheung Kong Holdings | 146,000 | 2,155,426 | ||||
| China Mobile | 99,000 | 1,048,341 | ||||
| † | Melco Crown Entertainment ADR | 95,600 | 2,231,304 | |||
| Tencent Holdings | 67,900 | 2,158,791 | ||||
| Wharf Holdings | 318,600 | 2,840,190 | ||||
| 14,976,992 | ||||||
| Cyprus – 0.49% | ||||||
| * | Eurasia Drilling GDR | 65,100 | 2,311,050 | |||
| 2,311,050 | ||||||
| Finland – 0.48% | ||||||
| * | Konecranes | 68,600 | 2,264,324 | |||
| 2,264,324 | ||||||
| France – 9.38% | ||||||
| * | Carrefour | 109,064 | 2,985,508 | |||
| Cie de Saint-Gobain | 111,817 | 4,145,179 | ||||
| France Telecom | 430,919 | 4,358,227 | ||||
| =† | GDF Suez VVPR Strip | 8,820 | 0 | |||
| Publicis Groupe | 25,800 | 1,729,982 | ||||
| Rexel | 123,125 | 2,687,018 | ||||
| Safran | 29,100 | 1,297,917 | ||||
| Sanofi | 121,739 | 12,370,174 | ||||
| † | Societe Generale | 44,600 | 1,465,280 | |||
| * | Technip | 12,000 | 1,230,268 | |||
| Total | 111,709 | 5,349,019 | ||||
| Valeo | 23,300 | 1,260,840 | ||||
| Vallourec | 41,267 | 1,983,679 | ||||
| * | Vinci | 68,464 | 3,084,346 | |||
| 43,947,437 | ||||||
| Germany – 6.40% | ||||||
| BASF | 22,200 | 1,944,187 | ||||
| Bayer | 25,800 | 2,661,282 | ||||
| Brenntag | 4,400 | 686,969 | ||||
| Daimler | 40,125 | 2,183,126 | ||||
| Deutsche Lufthansa | 126,600 | 2,472,369 | ||||
| Deutsche Telekom | 476,699 | 5,038,773 | ||||
| Deutsche Wohnen | 141,100 | 2,564,723 | ||||
| Gerry Weber International | 40,208 | 1,754,958 | ||||
| † | LEG Immobilien | 25,200 | 1,350,250 | |||
| Linde | 7,200 | 1,338,713 | ||||
| RWE | 111,346 | 4,149,842 | ||||
| SAP | 15,900 | 1,273,838 | ||||
| SAP ADR | 31,400 | 2,528,956 | ||||
| 29,947,986 | ||||||
| India – 0.38% | ||||||
| † | Jubilant Foodworks | 77,211 | 1,773,570 | |||
| 1,773,570 | ||||||
| Indonesia – 1.22% | ||||||
| Global Mediacom | 4,185,500 | 1,001,419 | ||||
| Indofood Sukses Makmur | 1,894,900 | 1,452,740 | ||||
| † | Matahari Department Store | 2,182,300 | 2,470,317 | |||
| † | Tower Bersama Infrastructure | 1,265,200 | 787,698 | |||
| 5,712,174 | ||||||
| Ireland – 1.38% | ||||||
| Accenture Class A | 22,900 | 1,739,713 | ||||
| DCC | 113,570 | 3,917,201 | ||||
| Kingspan Group | 68,001 | 826,170 | ||||
| 6,483,084 | ||||||
| Israel – 1.14% | ||||||
| Teva Pharmaceutical Industries ADR | 134,100 | 5,321,088 | ||||
| 5,321,088 | ||||||
| Italy – 2.89% | ||||||
| Banca Generali | 66,500 | 1,261,597 | ||||
| ENI | 401,738 | 9,027,386 | ||||
| Intesa Sanpaolo | 873,272 | 1,278,359 | ||||
| Saipem | 64,400 | 1,980,402 | ||||
| 13,547,744 | ||||||
| Japan – 16.60% | ||||||
| Astellas Pharma | 93,400 | 5,020,759 | ||||
| Canon | 182,700 | 6,599,171 | ||||
| * | Honda Motor | 117,800 | 4,448,943 | |||
| Hoya | 111,700 | 2,079,023 | ||||
| Hulic | 241,800 | 1,985,673 | ||||
| ITOCHU | 147,500 | 1,772,256 | ||||
| JGC | 59,000 | 1,491,140 | ||||
| Kao | 150,500 | 4,924,466 | ||||
| Kubota | 88,900 | 1,263,659 | ||||
| * | Nabtesco | 68,100 | 1,399,910 | |||
| * | Nintendo | 12,300 | 1,321,077 | |||
| *=† | Nippon Paper Industries | 79,700 | 1,215,863 | |||
| † | ORIX | 411,000 | 5,200,266 | |||
| Seven & I Holdings | 154,700 | 5,119,415 | ||||
| Shin-Etsu Chemical | 24,800 | 1,646,659 | ||||
(continues) 67
Statements of net assets
Optimum International Fund
| Number of | Value | |||||
| Shares | (U.S. $) | |||||
| ΔCommon Stock (continued) | ||||||
| Japan (continued) | ||||||
| Softbank | 83,300 | $ | 3,840,667 | |||
| * | Sumitomo Mitsui Financial Group | 62,800 | 2,518,538 | |||
| * | Takeda Pharmaceutical | 104,400 | 5,578,795 | |||
| Tokio Marine Holdings | 204,300 | 5,751,567 | ||||
| Tokyo Electron | 46,400 | 2,053,076 | ||||
| Toyota Motor | 154,700 | 7,987,273 | ||||
| Trend Micro | 25,900 | 736,580 | ||||
| * | Unipres | 57,500 | 1,315,787 | |||
| * | Yahoo Japan | 5,331 | 2,452,271 | |||
| 77,722,834 | ||||||
| Malaysia – 0.20% | ||||||
| Astro Malaysia Holdings | 1,009,600 | 918,855 | ||||
| 918,855 | ||||||
| Mexico – 0.83% | ||||||
| Fomento Economico Mexicano ADR | 21,900 | 2,485,650 | ||||
| Grupo Mexico Series B | 350,500 | 1,415,872 | ||||
| 3,901,522 | ||||||
| Netherlands – 3.55% | ||||||
| Aalberts Industries | 35,936 | 803,596 | ||||
| ASML Holding | 39,086 | 2,628,872 | ||||
| Koninklijke Ahold | 372,863 | 5,713,945 | ||||
| † | NXP Semiconductor | 41,300 | 1,249,738 | |||
| Reed Elsevier | 202,332 | 3,466,337 | ||||
| Ziggo | 78,300 | 2,753,620 | ||||
| 16,616,108 | ||||||
| Singapore – 2.31% | ||||||
| Jardine Matheson Holdings | 70,400 | 4,583,039 | ||||
| Singapore Telecommunications | 1,073,000 | 3,105,131 | ||||
| United Overseas Bank | 190,047 | 3,122,130 | ||||
| 10,810,300 | ||||||
| Spain – 2.77% | ||||||
| Banco Santander | 228,310 | 1,534,119 | ||||
| Duro Felguera | 161,000 | 1,099,994 | ||||
| Iberdrola | 1,207,037 | 5,621,125 | ||||
| Telefonica | 350,401 | 4,711,704 | ||||
| 12,966,942 | ||||||
| Sweden – 1.25% | ||||||
| * | Electrolux Class B | 56,506 | 1,437,688 | |||
| Svenska Cellulosa Class B | 162,684 | 4,194,109 | ||||
| Volvo Class B | 16,222 | 235,868 | ||||
| 5,867,665 | ||||||
| Switzerland – 14.98% | ||||||
| † | ABB | 199,437 | 4,497,047 | |||
| * | Cie Financiere Richemont Class A | 30,000 | 2,353,870 | |||
| *† | GAM Holding | 202,300 | 3,419,605 | |||
| *† | Glencore International | 892,300 | 4,828,022 | |||
| † | Holcim | 33,489 | 2,668,186 | |||
| Nestle | 81,100 | 5,863,628 | ||||
| Novartis | 172,402 | 12,246,989 | ||||
| * | Partners Group Holding | 9,200 | 2,270,205 | |||
| Roche Holding | 45,500 | 10,590,311 | ||||
| † | Swiss Re | 67,982 | 5,527,341 | |||
| Syngenta | 13,400 | 5,588,626 | ||||
| † | Transocean | 45,300 | 2,353,788 | |||
| † | UBS | 179,900 | 2,756,761 | |||
| † | Zurich Insurance Group | 18,584 | 5,171,030 | |||
| 70,135,409 | ||||||
| Taiwan – 0.77% | ||||||
| MediaTek | 156,700 | 1,794,095 | ||||
| Taiwan Semiconductor Manufacturing | 539,269 | 1,814,353 | ||||
| 3,608,448 | ||||||
| Thailand – 0.45% | ||||||
| Bangkok Bank NVDR | 169,700 | 1,314,068 | ||||
| Charoen Pokphand Foods | 712,600 | 796,099 | ||||
| 2,110,167 | ||||||
| United Kingdom – 21.55% | ||||||
| Aberdeen Asset Management | 439,856 | 2,868,512 | ||||
| AMEC | 125,215 | 2,009,124 | ||||
| * | APR Energy | 214,131 | 2,749,303 | |||
| Aveva Group | 34,909 | 1,200,882 | ||||
| Babcock International Group | 161,900 | 2,676,469 | ||||
| Barclays ADR | 305,100 | 5,418,576 | ||||
| BG Group | 376,331 | 6,455,804 | ||||
| BP | 639,819 | 4,471,023 | ||||
| British American Tobacco | 67,600 | 3,622,752 | ||||
| Compass Group | 340,178 | 4,344,405 | ||||
| † | Crest Nicholson Holdings | 808,900 | 3,622,722 | |||
| Diageo | 124,200 | 3,915,851 | ||||
| DS Smith | 369,200 | 1,227,426 | ||||
| † | esure Group | 808,580 | 3,685,791 | |||
| GlaxoSmithKline | 256,600 | 5,998,471 | ||||
| Hargreaves Lansdown | 104,269 | 1,375,186 | ||||
| HSBC Holdings | 162,607 | 1,735,689 | ||||
| Inchcape | 133,820 | 1,021,747 | ||||
| Intertek Group | 62,100 | 3,201,562 | ||||
| Jardine Lloyd Thompson Group | 92,800 | 1,199,952 | ||||
| National Grid | 471,625 | 5,482,071 | ||||
| Rexam | 443,810 | 3,557,181 | ||||
| Rotork | 58,640 | 2,587,480 | ||||
| * | Royal Dutch Shell Class A | 125,273 | 4,045,040 | |||
| SABMiller | 38,600 | 2,031,663 | ||||
| Tesco | 1,098,440 | 6,368,164 | ||||
| Tullow Oil | 116,100 | 2,171,584 | ||||
| Unilever | 178,854 | 7,565,791 | ||||
| Vodafone Group | 1,516,956 | 4,301,016 | ||||
| 100,911,237 | ||||||
| United States – 0.44% | ||||||
| † | Sirona Dental Systems | 27,900 | 2,057,068 | |||
| 2,057,068 | ||||||
| Total Common Stock | ||||||
| (cost $430,251,234) | 454,374,410 | |||||
68
| Number of | Value | ||||||||
| Shares | (U.S. $) | ||||||||
| ΔPreferred Stock – 0.44% | |||||||||
| Germany – 0.44% | |||||||||
| † | Volkswagen | 10,400 | $ | 2,066,342 | |||||
| Total Preferred Stock | |||||||||
| (cost $2,214,082) | 2,066,342 | ||||||||
| Principal | |||||||||
| Amount (U.S. $) | |||||||||
| Short-Term Investments – 1.09% | |||||||||
| ≠Discount Notes – 0.18% | |||||||||
| Federal Home Loan Bank | |||||||||
| 0.085% 5/24/13 | $ | 678,877 | 678,837 | ||||||
| 0.12% 4/2/13 | 168,207 | 168,207 | |||||||
| 847,044 | |||||||||
| Repurchase Agreements – 0.13% | |||||||||
| Bank of America 0.07%, | |||||||||
| dated 3/28/13, to be | |||||||||
| repurchased on 4/1/13, | |||||||||
| repurchase price $313,958 | |||||||||
| (collateralized by U.S. | |||||||||
| government obligations | |||||||||
| 0.125%-1.50% | |||||||||
| 8/31/18-1/15/22; | |||||||||
| market value $320,235) | 313,956 | 313,956 | |||||||
| BNP Paribas 0.15%, | |||||||||
| dated 3/28/13, to be | |||||||||
| repurchased on 4/1/13, | |||||||||
| repurchase price $296,454 | |||||||||
| (collateralized by U.S. | |||||||||
| government obligations | |||||||||
| 0.25%-0.875% | |||||||||
| 2/28/14-7/31/19; | |||||||||
| market value $302,675) | 296,449 | 296,449 | |||||||
| 610,405 | |||||||||
| ≠U.S. Treasury Obligations – 0.78% | |||||||||
| U.S. Treasury Bills | |||||||||
| 0.04% 4/11/13 | 261,630 | 261,628 | |||||||
| 0.058% 4/18/13 | 1,324,638 | 1,324,618 | |||||||
| 0.065% 4/25/13 | 156,978 | 156,974 | |||||||
| 0.065% 5/9/13 | 509,092 | 509,068 | |||||||
| 0.101% 4/15/13 | 1,385,377 | 1,385,366 | |||||||
| 3,637,654 | |||||||||
| Total Short-Term Investments | |||||||||
| (cost $5,094,984) | 5,095,103 | ||||||||
| Total Value of Securities Before Securities | |||||||||
| Lending Collateral – 98.56% | |||||||||
| (cost $437,560,300) | 461,535,855 | ||||||||
| **Securities Lending Collateral – 8.20% | |||||||||
| Investment Companies | |||||||||
| Delaware Investments | |||||||||
| Collateral Fund No. 1 | 38,430,216 | 38,430,216 | |||||||
| †@Mellon GSL Reinvestment Trust II | 446,723 | 0 | |||||||
| Total Securities Lending Collateral | |||||||||
| (cost $38,876,939) | 38,430,216 | ||||||||
| Total Value of Securities – 106.76% | |||||||||
| (cost $476,437,239) | 499,966,071 | © | |||||||
| **Obligation to Return Securities | |||||||||
| Lending Collateral – (8.30%) | (38,876,939 | ) | |||||||
| «Receivables and Other Assets | |||||||||
| Net of Other Liabilities – 1.54% | 7,198,345 | ||||||||
| Net Assets Applicable to 42,461,747 | |||||||||
| Shares Outstanding – 100.00% | $ | 468,287,477 | |||||||
| Net Asset Value – Optimum International Fund | |||||||||
| Class A ($9,552,749 / 870,495 Shares) | $10.97 | ||||||||
| Net Asset Value – Optimum International Fund | |||||||||
| Class B ($412,321 / 38,329 Shares) | $10.76 | ||||||||
| Net Asset Value – Optimum International Fund | |||||||||
| Class C ($32,063,847 / 2,978,610 Shares) | $10.76 | ||||||||
| Net Asset Value – Optimum International Fund | |||||||||
| Institutional Class ($426,258,560 / 38,574,313 Shares) | $11.05 | ||||||||
| Components of Net Assets at March 31, 2013: | |||||||||
| Shares of beneficial interest | |||||||||
| (unlimited authorization – no par) | $ | 501,625,268 | |||||||
| Undistributed net investment income | 931,692 | ||||||||
| Accumulated net realized loss on investments | (58,946,301 | ) | |||||||
| Net unrealized appreciation of investments | |||||||||
| and derivatives | 24,676,818 | ||||||||
| Total net assets | $ | 468,287,477 | |||||||
(continues) 69
Statements of net assets
Optimum International Fund
| Δ | Securities have been classified by country of origin. Classification by type of business has been presented in page 35 in “Security type/country and sector allocations.” |
| * | Fully or partially on loan. |
| † | Non income producing security. |
| = | Security is being fair valued in accordance with the Fund’s fair valuation policy. At March 31, 2013, the aggregate value of fair valued securities was $1,215,863, which represented 0.26% of the Fund’s net assets. See Note 1 in “Notes to financial statements.” |
| ≠ | The rate shown is the effective yield at the time of purchase. |
| ** | See Note 8 in “Notes to financial statements” for additional information on securities lending collateral and non-cash collateral. |
| @ | Illiquid security. At March 31, 2013, the aggregate value of illiquid securities was $0, which represented 0.00% of the Fund’s net assets. See Note 9 in “Notes to financial statements.” |
| © | Includes $36,853,828 of securities loaned. |
| « | Includes foreign currency valued at $3,205,200 with a cost of $3,188,936. |
| Net Asset Value and Offering Price Per Share – | ||
| Optimum International Fund | ||
| Net asset value Class A (A) | $10.97 | |
| Sales charge (5.75% of offering price) (B) | 0.67 | |
| Offering price | $11.64 |
| (A) | Net asset value per share, as illustrated, is the amount that would be paid upon redemption or repurchase of shares. |
| (B) | See the current prospectus for purchases of $75,000 or more. |
The following foreign currency exchange contracts were outstanding at March 31, 2013:1
| Foreign Currency Exchange Contracts | |||||||||||||||||
| Unrealized | |||||||||||||||||
| Contracts to | Settlement | Appreciation | |||||||||||||||
| Counterparty | Receive (Deliver) | In Exchange For | Date | (Depreciation) | |||||||||||||
| CITI | AUD | 11,217,141 | USD | (11,669,626 | ) | 4/17/13 | $ | (8,864 | ) | ||||||||
| CITI | CAD | 17,733,974 | USD | (17,834,259 | ) | 4/17/13 | (384,479 | ) | |||||||||
| CITI | CHF | 3,121,943 | USD | (3,278,319 | ) | 4/2/13 | 9,870 | ||||||||||
| CITI | CHF | (29,045,150 | ) | USD | 31,295,898 | 4/17/13 | 698,406 | ||||||||||
| CITI | DKK | 3,988,910 | USD | (721,809 | ) | 4/17/13 | (35,818 | ) | |||||||||
| CITI | EUR | 1,882,548 | USD | (2,414,556 | ) | 4/3/13 | (1,317 | ) | |||||||||
| CITI | EUR | (898,121 | ) | USD | 1,152,018 | 4/17/13 | 611 | ||||||||||
| CITI | GBP | 70,479 | USD | (106,931 | ) | 4/3/13 | 155 | ||||||||||
| CITI | GBP | (3,947,771 | ) | USD | 5,978,131 | 4/17/13 | (19,650 | ) | |||||||||
| CITI | HKD | 10,086,265 | USD | (1,300,790 | ) | 4/17/13 | (1,302 | ) | |||||||||
| CITI | JPY | (362,825,476 | ) | USD | 3,815,818 | 4/17/13 | (39,199 | ) | |||||||||
| CITI | MXN | 23,793,073 | USD | (1,852,608 | ) | 4/17/13 | 70,251 | ||||||||||
| CITI | NOK | 13,079,191 | USD | (2,350,470 | ) | 4/17/13 | (113,028 | ) | |||||||||
| CITI | SEK | (18,140,866 | ) | USD | 2,779,911 | 4/2/13 | (3,619 | ) | |||||||||
| CITI | SEK | 19,080,491 | USD | (2,923,119 | ) | 4/17/13 | 3,622 | ||||||||||
| CITI | SGD | 3,220,199 | USD | (2,618,771 | ) | 4/17/13 | (22,869 | ) | |||||||||
| CITI | ZAR | 38,148,667 | USD | (4,292,535 | ) | 4/17/13 | (152,444 | ) | |||||||||
| DB | GBP | 4,000 | USD | (6,057 | ) | 4/2/13 | 21 | ||||||||||
| JPMC | CHF | 83,000 | USD | (87,523 | ) | 4/17/13 | (87 | ) | |||||||||
| MNB | AUD | (203,464 | ) | USD | 211,668 | 4/4/13 | (48 | ) | |||||||||
| MNB | AUD | (8,425,000 | ) | USD | 8,738,615 | 4/30/13 | (11,017 | ) | |||||||||
| MNB | CHF | (193,630 | ) | USD | 203,244 | 4/3/13 | (700 | ) | |||||||||
| MNB | EUR | (194,316 | ) | USD | 248,666 | 4/2/13 | (426 | ) | |||||||||
| MNB | EUR | (154,893 | ) | USD | 198,216 | 4/3/13 | (341 | ) | |||||||||
| MNB | GBP | 49,669 | USD | (75,050 | ) | 4/2/13 | 418 | ||||||||||
| MNB | GBP | (131,345 | ) | USD | 198,895 | 4/3/13 | (670 | ) | |||||||||
| MNB | JPY | (56,182,966 | ) | USD | 595,413 | 4/2/13 | (1,472 | ) | |||||||||
| MSC | AUD | 1,536,000 | USD | (1,611,350 | ) | 4/17/13 | (14,603 | ) | |||||||||
| MSC | CHF | (448,944 | ) | USD | 472,861 | 4/3/13 | 10 | ||||||||||
| MSC | CHF | 448,944 | USD | (472,941 | ) | 4/17/13 | (5 | ) | |||||||||
| MSC | DKK | 3,282,000 | USD | (575,249 | ) | 4/17/13 | (10,829 | ) | |||||||||
| MSC | EUR | 1,254,000 | USD | (1,607,595 | ) | 4/2/13 | (103 | ) | |||||||||
| MSC | EUR | (9,302,000 | ) | USD | 12,243,480 | 4/17/13 | 318,153 | ||||||||||
| MSC | GBP | (7,759,000 | ) | USD | 12,303,871 | 4/17/13 | 515,756 | ||||||||||
| MSC | HKD | 22,090,000 | USD | (2,846,231 | ) | 4/17/13 | (211 | ) | |||||||||
| MSC | JPY | (357,410,000 | ) | USD | 4,056,743 | 4/17/13 | 259,266 | ||||||||||
| MSC | NOK | (4,434,000 | ) | USD | 798,157 | 4/17/13 | 39,638 | ||||||||||
| MSC | SEK | (28,338,000 | ) | USD | 4,350,019 | 4/17/13 | 3,278 | ||||||||||
| UBS | CHF | (1,421,713 | ) | USD | 1,531,738 | 4/17/13 | 34,040 | ||||||||||
| $ | 1,130,394 | ||||||||||||||||
The use of foreign currency exchange contracts involves elements of market risk and risks in excess of the amounts disclosed in the financial statements. The foreign currency exchange contracts presented above represent the Fund’s total exposure in such contracts, whereas only the net unrealized appreciation (depreciation) is reflected in the Fund’s net assets.
1See Note 7 in “Notes to financial statements.”
70
Summary of Abbreviations: |
See accompanying notes, which are an integral part of the financial statements.
(continues) 71
Statements of net assets
Optimum Large Cap Growth Fund
March 31, 2013
| Number of | Value | |||||
| Shares | (U.S. $) | |||||
| Common Stock – 96.56% | ||||||
| Consumer Discretionary – 22.27% | ||||||
| † | Amazon.com | 71,100 | $ | 18,947,438 | ||
| † | AutoZone | 23,202 | 9,205,858 | |||
| † | CarMax | 35,900 | 1,497,030 | |||
| Carnival (United Kingdom) | 28,774 | 1,007,324 | ||||
| CBS Class B | 297,525 | 13,891,441 | ||||
| † | Charter Communications Class A | 5,300 | 552,154 | |||
| † | Chipotle Mexican Grill | 13,509 | 4,402,178 | |||
| Comcast Class A | 247,588 | 10,401,172 | ||||
| D.R.Horton | 45,300 | 1,100,790 | ||||
| Delphi Automotive | ||||||
| (United Kingdom) | 84,200 | 3,738,480 | ||||
| Dick’s Sporting Goods | 23,450 | 1,109,185 | ||||
| † | Discovery Communications | |||||
| Class A | 2,900 | 228,346 | ||||
| † | Discovery Communications | |||||
| Class C | 10,900 | 757,986 | ||||
| DISH Network Class A | 58,800 | 2,228,520 | ||||
| Disney (Walt) | 69,150 | 3,927,720 | ||||
| † | Dollar General | 39,250 | 1,985,265 | |||
| † | Dollar Tree | 13,600 | 658,648 | |||
| *† | Focus Media Holding ADR | 41,675 | 1,117,307 | |||
| † | Fossil | 28,000 | 2,704,800 | |||
| Harley-Davidson | 14,000 | 746,200 | ||||
| Home Depot | 151,171 | 10,548,712 | ||||
| L Brands | 14,900 | 665,434 | ||||
| Las Vegas Sands | 117,650 | 6,629,578 | ||||
| * | Lennar Class A | 27,000 | 1,119,960 | |||
| † | Liberty Global Class A | 50,085 | 3,676,239 | |||
| Lowe’s | 338,317 | 12,828,981 | ||||
| *† | Lululemon Athletica (Canada) | 64,037 | 3,992,707 | |||
| Marriott International Class A | 23,380 | 987,337 | ||||
| McDonald’s | 107,813 | 10,747,878 | ||||
| † | MGM Resorts International | 17,200 | 226,180 | |||
| † | Michael Kors Holdings | |||||
| (China) (Hong Kong) | 44,850 | 2,547,032 | ||||
| † | Netflix | 7,100 | 1,344,811 | |||
| News Class A | 82,150 | 2,507,218 | ||||
| NIKE Class B | 135,001 | 7,966,409 | ||||
| Prada (Italy) | 94,600 | 962,751 | ||||
| † | priceline.com | 12,194 | 8,388,618 | |||
| PVH | 29,600 | 3,161,576 | ||||
| Ralph Lauren | 4,400 | 744,964 | ||||
| Ross Stores | 17,900 | 1,085,098 | ||||
| Starbucks | 172,925 | 9,849,808 | ||||
| Starwood Hotels & | ||||||
| Resorts Worldwide | 120,991 | 7,710,756 | ||||
| TJX | 114,016 | 5,330,248 | ||||
| Tractor Supply | 8,500 | 885,105 | ||||
| † | TripAdvisor | 18,900 | 992,628 | |||
| † | TRW Automotive Holdings | 13,750 | 756,250 | |||
| VF | 4,050 | 679,388 | ||||
| Viacom Class B | 39,700 | 2,444,329 | ||||
| Wynn Resorts | 51,116 | 6,397,679 | ||||
| Yum Brands | 5,100 | 366,894 | ||||
| 195,752,410 | ||||||
| Consumer Staples – 6.50% | ||||||
| Anheuser-Busch InBev (Belgium) | 9,256 | 916,556 | ||||
| Anheuser-Busch InBev ADR | 32,714 | 3,256,679 | ||||
| Beam | 39,300 | 2,497,122 | ||||
| Coca-Cola | 129,200 | 5,224,848 | ||||
| Colgate-Palmolive | 9,300 | 1,097,679 | ||||
| Costco Wholesale | 38,900 | 4,127,679 | ||||
| CVS Caremark | 194,600 | 10,701,053 | ||||
| *† | Green Mountain Coffee Roasters | 4,800 | 272,448 | |||
| † | Monster Beverage | 14,800 | 706,552 | |||
| Nestle (Switzerland) | 13,807 | 998,263 | ||||
| PepsiCo | 75,350 | 5,960,939 | ||||
| Pernod-Ricard (France) | 5,841 | 727,839 | ||||
| Philip Morris International | 89,200 | 8,269,732 | ||||
| Procter & Gamble | 70,550 | 5,436,583 | ||||
| Wal-Mart Stores | 70,208 | 5,253,665 | ||||
| Whole Foods Market | 19,100 | 1,656,925 | ||||
| 57,104,562 | ||||||
| Energy – 5.18% | ||||||
| Anadarko Petroleum | 77,550 | 6,781,748 | ||||
| Cabot Oil & Gas | 6,900 | 466,509 | ||||
| † | Cameron International | 44,200 | 2,881,840 | |||
| Cimarex Energy | 8,300 | 626,152 | ||||
| EOG Resources | 12,700 | 1,626,489 | ||||
| EQT | 15,800 | 1,070,450 | ||||
| † | FMC Technologies | 27,700 | 1,506,603 | |||
| Halliburton | 67,500 | 2,727,675 | ||||
| Kinder Morgan | 101,549 | 3,927,915 | ||||
| National Oilwell Varco | 30,050 | 2,126,038 | ||||
| Phillips 66 | 20,900 | 1,462,373 | ||||
| Pioneer Natural Resources | 27,150 | 3,373,388 | ||||
| Range Resources | 25,600 | 2,074,624 | ||||
| Schlumberger | 122,262 | 9,156,200 | ||||
| Valero Energy | 68,300 | 3,106,967 | ||||
| † | Whiting Petroleum | 23,050 | 1,171,862 | |||
| Williams | 38,000 | 1,423,480 | ||||
| 45,510,313 | ||||||
| Financials – 7.94% | ||||||
| American Express | 162,898 | 10,989,098 | ||||
| † | American International Group | 38,160 | 1,481,371 | |||
| American Tower | 121,935 | 9,379,240 | ||||
| Bank of America | 73,400 | 894,012 | ||||
| Blackstone Group | 113,850 | 2,251,953 | ||||
| Capital One Financial | 67,550 | 3,711,873 | ||||
| * | Carlyle Group | 13,300 | 402,325 | |||
| Citigroup | 280,686 | 12,417,548 | ||||
| Franklin Resources | 14,300 | 2,156,583 | ||||
72
| Number of | Value | ||||
| Shares | (U.S. $) | ||||
| Common Stock (continued) | |||||
| Financials (continued) | |||||
| †IntercontinentalExchange | 4,900 | $ | 799,043 | ||
| Invesco | 62,200 | 1,801,312 | |||
| JPMorgan Chase | 13,500 | 640,710 | |||
| Morgan Stanley | 258,350 | 5,678,533 | |||
| * | Ryman Hospitality Properties | 47,130 | 2,156,198 | ||
| Silver Bay Realty Trust | 11,473 | 237,498 | |||
| Two Harbors Investment | 234,150 | 2,952,632 | |||
| U.S. Bancorp | 23,900 | 810,927 | |||
| Wells Fargo | 241,782 | 8,943,516 | |||
| Zions Bancorp | 83,750 | 2,092,913 | |||
| 69,797,285 | |||||
| Healthcare – 13.74% | |||||
| † | Actavis | 25,400 | 2,339,594 | ||
| † | Alexion Pharmaceuticals | 14,500 | 1,336,030 | ||
| Allergan | 11,300 | 1,261,419 | |||
| Amgen | 20,850 | 2,137,334 | |||
| Baxter International | 11,200 | 813,568 | |||
| † | Biogen Idec | 73,948 | 14,265,308 | ||
| Bristol-Myers Squibb | 355,016 | 14,623,108 | |||
| † | Catamaran | 18,934 | 1,004,070 | ||
| † | Celgene | 52,300 | 6,062,093 | ||
| Covidien (Ireland) | 64,700 | 4,389,248 | |||
| † | Edwards Lifesciences | 11,800 | 969,488 | ||
| † | Express Scripts Holding | 119,950 | 6,915,118 | ||
| † | Gilead Sciences | 461,276 | 22,570,234 | ||
| HCA Holdings | 149,550 | 6,076,217 | |||
| † | IDEXX Laboratories | 8,800 | 813,032 | ||
| † | Insulet | 48,250 | 1,247,745 | ||
| † | Intuitive Surgical | 5,872 | 2,884,268 | ||
| Lilly (Eli) | 56,200 | 3,191,598 | |||
| McKesson | 25,600 | 2,763,776 | |||
| * | Novo Nordisk Class B (Denmark) | 6,985 | 1,134,855 | ||
| † | ONYX Pharmaceuticals | 6,300 | 559,818 | ||
| Pfizer | 242,734 | 7,005,302 | |||
| † | Pharmacyclics | 7,900 | 635,239 | ||
| † | Regeneron Pharmaceuticals | 4,500 | 793,800 | ||
| Sanofi ADR | 34,400 | 1,757,152 | |||
| Stryker | 15,700 | 1,024,268 | |||
| Thermo Fisher Scientific | 17,250 | 1,319,453 | |||
| UnitedHealth Group | 102,650 | 5,872,607 | |||
| Universal Health Services Class B | 22,250 | 1,421,108 | |||
| † | Valeant Pharmaceuticals | ||||
| International (Canada) | 21,500 | 1,612,930 | |||
| † | Vertex Pharmaceuticals | 33,500 | 1,841,830 | ||
| † | Zoetis | 4,900 | 163,660 | ||
| 120,805,270 | |||||
| Industrials – 12.89% | |||||
| ADT | 44,075 | 2,157,031 | |||
| Babcock & Wilcox | 10,100 | 286,941 | |||
| Boeing | 38,250 | 3,283,763 | |||
| Caterpillar | 27,800 | 2,417,766 | |||
| Chicago Bridge & Iron (Netherlands) | 64,850 | 4,027,185 | |||
| Copa Holdings Class A (Panama) | 5,000 | 598,050 | |||
| CSX | 108,926 | 2,682,847 | |||
| Cummins | 22,880 | 2,649,733 | |||
| Danaher | 130,984 | 8,140,655 | |||
| † | Delta Air Lines | 84,750 | 1,399,223 | ||
| Eaton (Ireland) | 51,602 | 3,160,623 | |||
| Fastenal | 60,500 | 3,106,675 | |||
| FedEx | 35,900 | 3,525,380 | |||
| General Dynamics | 28,050 | 1,977,806 | |||
| Grainger (W.W.) | 26,439 | 5,948,246 | |||
| Honeywell International | 99,250 | 7,478,487 | |||
| Hunt (J.B.) Transport Services | 16,200 | 1,206,576 | |||
| † | IHS Class A | 7,000 | 733,040 | ||
| Joy Global | 9,850 | 586,272 | |||
| Kansas City Southern | 25,100 | 2,783,590 | |||
| † | MRC Global | 53,700 | 1,768,341 | ||
| Pentair (Switzerland) | 121,184 | 6,392,456 | |||
| Precision Castparts | 59,346 | 11,253,188 | |||
| † | Quanta Services | 118,150 | 3,376,727 | ||
| Robert Half International | 66,800 | 2,507,004 | |||
| Rolls-Royce Holdings | |||||
| (United Kingdom) | 174,032 | 2,988,092 | |||
| Roper Industries | 18,700 | 2,380,697 | |||
| † | Terex | 66,400 | 2,285,488 | ||
| Tyco International (Switzerland) | 85,750 | 2,744,000 | |||
| Union Pacific | 51,812 | 7,378,546 | |||
| † | United Continental Holdings | 27,000 | 864,270 | ||
| United Parcel Service Class B | 47,300 | 4,063,070 | |||
| *† | United Rentals | 49,908 | 2,743,443 | ||
| † | WABCO Holdings | 36,400 | 2,569,476 | ||
| *† | WESCO International | 25,300 | 1,837,033 | ||
| 113,301,720 | |||||
| Information Technology – 23.13% | |||||
| Accenture Class A (Ireland) | 64,782 | 4,921,489 | |||
| † | Akamai Technologies | 24,300 | 857,547 | ||
| † | Alliance Data Systems | 5,000 | 809,450 | ||
| Apple | 50,600 | 22,397,078 | |||
| ASML Holding (Netherlands) | 26,357 | 1,792,540 | |||
| † | Autodesk | 18,300 | 754,692 | ||
| † | Baidu ADR | 11,600 | 1,017,320 | ||
| Broadcom Class A | 117,000 | 4,056,390 | |||
| † | Cadence Design Systems | 295,300 | 4,113,529 | ||
| Cisco Systems | 36,550 | 764,261 | |||
| † | Citrix Systems | 36,500 | 2,633,840 | ||
| † | Cognizant Technology Solutions | ||||
| Class A | 36,450 | 2,792,435 | |||
| † | eBay | 499,265 | 27,070,148 | ||
| † | Equinix | 31,862 | 6,892,069 | ||
| † | F5 Networks | 31,150 | 2,774,842 | ||
| † | Facebook Class A | 165,767 | 4,240,320 | ||
| † | Fiserv | 10,100 | 887,083 | ||
(continues) 73
Statements of net assets
Optimum Large Cap Growth Fund
| Number of | Value | |||||
| Shares | (U.S. $) | |||||
| Common Stock (continued) | ||||||
| Information Technology (continued) | ||||||
| † | Google Class A | 39,811 | $ | 31,611,127 | ||
| International Business Machines | 53,650 | 11,443,545 | ||||
| Intuit | 39,416 | 2,587,660 | ||||
| † | Juniper Networks | 73,400 | 1,360,836 | |||
| † | Lam Research | 79,800 | 3,308,508 | |||
| † | LinkedIn Class A | 11,800 | 2,077,508 | |||
| MasterCard Class A | 19,250 | 10,416,753 | ||||
| † | Microsemi | 8,850 | 205,055 | |||
| Motorola Solutions | 31,538 | 2,019,378 | ||||
| † | NetSuite | 4,100 | 328,246 | |||
| *† | Nuance Communications | 26,000 | 524,680 | |||
| QUALCOMM | 193,634 | 12,963,796 | ||||
| † | Red Hat | 80,450 | 4,067,552 | |||
| † | salesforce.com | 36,500 | 6,527,295 | |||
| Samsung Electronics | ||||||
| (Republic of Korea) | 1,196 | 1,621,964 | ||||
| † | SanDisk | 58,700 | 3,228,500 | |||
| † | Sina (China) | |||||
| (Hong Kong Exchange) | 58,500 | 2,842,515 | ||||
| † | Skyworks Solutions | 14,050 | 309,522 | |||
| Tencent Holdings (China) | ||||||
| (Hong Kong Exchange) | 15,100 | 480,085 | ||||
| † | Trimble Navigation | 18,000 | 539,280 | |||
| @=† | 7,812 | 127,961 | ||||
| Visa Class A | 82,386 | 13,992,438 | ||||
| † | Yahoo | 81,100 | 1,908,283 | |||
| 203,267,520 | ||||||
| Materials – 3.52% | ||||||
| Celanese Class A | 58,370 | 2,571,199 | ||||
| Eastman Chemical | 23,500 | 1,641,945 | ||||
| Ecolab | 19,400 | 1,555,492 | ||||
| International Paper | 38,500 | 1,793,330 | ||||
| LyondellBasell Industries | ||||||
| Class A (Netherlands) | 37,526 | 2,375,021 | ||||
| Monsanto | 79,680 | 8,416,597 | ||||
| Mosaic | 43,000 | 2,563,230 | ||||
| PPG Industries | 8,600 | 1,151,884 | ||||
| Praxair | 31,900 | 3,558,126 | ||||
| Rockwood Holdings | 43,500 | 2,846,640 | ||||
| Sherwin-Williams | 14,400 | 2,432,016 | ||||
| 30,905,480 | ||||||
| Telecommunication Services – 1.39% | ||||||
| † | Crown Castle International | 84,300 | 5,870,652 | |||
| † | SBA Communications Class A | 7,600 | 547,352 | |||
| Verizon Communications | 80,000 | 3,932,000 | ||||
| Vodafone Group ADR | 67,400 | 1,914,834 | ||||
| 12,264,838 | ||||||
| Total Common Stock | ||||||
| (cost $691,326,419) | 848,709,398 | |||||
| Convertible Preferred Stock – 0.05% | ||||||
| @=† | LivingSocial Series F | 14,824 | 16,603 | |||
| @=† | Twitter Series A | 20 | 328 | |||
| @=† | Twitter Series B | 5,988 | 98,083 | |||
| @=† | Twitter Series C | 1,619 | 26,519 | |||
| @=† | Twitter Series D | 2,999 | 49,124 | |||
| @=† | Twitter Series F | 1,022 | 16,740 | |||
| @=† | Twitter Series G-2 | 12,309 | 201,622 | |||
| Total Convertible Preferred Stock | ||||||
| (cost $498,781) | 409,019 | |||||
| Principal | ||||||
| Amount (U.S. $) | ||||||
| Short-Term Investments – 3.50% | ||||||
| ≠Discount Notes – 0.46% | ||||||
| Federal Home Loan Bank | ||||||
| 0.085% 5/24/13 | $ | 2,997,587 | 2,997,410 | |||
| 0.12% 4/2/13 | 1,067,208 | 1,067,209 | ||||
| 4,064,619 | ||||||
| Repurchase Agreements – 0.99% | ||||||
| Bank of America 0.07%, | ||||||
| dated 3/28/13, to be | ||||||
| repurchased on 4/1/13, | ||||||
| repurchase price $4,492,438 | ||||||
| (collateralized by U.S. | ||||||
| government obligations | ||||||
| 0.125%-1.50% | ||||||
| 8/31/18-1/15/22; | ||||||
| market value $4,582,251) | 4,492,403 | 4,492,403 | ||||
| BNP Paribas 0.15%, | ||||||
| dated 3/28/13, to be | ||||||
| repurchased on 4/1/13, | ||||||
| repurchase price $4,241,977 | ||||||
| (collateralized by U.S. | ||||||
| government obligations | ||||||
| 0.25%-0.875% | ||||||
| 2/28/14-7/31/19; | ||||||
| market value $4,330,990) | 4,241,906 | 4,241,906 | ||||
| 8,734,309 | ||||||
| ≠U.S. Treasury Obligations – 2.05% | ||||||
| U.S. Treasury Bills | ||||||
| 0.04% 4/11/13 | 3,743,669 | 3,743,639 | ||||
| 0.058% 4/18/13 | 5,848,951 | 5,848,863 | ||||
| 0.065% 4/25/13 | 2,246,201 | 2,246,152 | ||||
| 0.065% 5/9/13 | 1,738,394 | 1,738,311 | ||||
| 0.101% 4/15/13 | 4,439,879 | 4,439,843 | ||||
| 18,016,808 | ||||||
| Total Short-Term Investments | ||||||
| (cost $30,815,230) | 30,815,736 | |||||
| Total Value of Securities Before Securities | ||||||
| Lending Collateral – 100.11% | ||||||
| (cost $722,640,430) | 879,934,153 | |||||
74
| Number of | Value | |||||
| Shares | (U.S. $) | |||||
| **Securities Lending Collateral – 0.15% | ||||||
| Investment Companies | ||||||
| Delaware Investments | ||||||
| Collateral Fund No. 1 | 1,280,182 | $ | 1,280,182 | |||
| †@Mellon GSL Reinvestment | ||||||
| Trust II | 719,812 | 0 | ||||
| Total Securities Lending Collateral | ||||||
| (cost $1,999,994) | 1,280,182 | |||||
| Total Value of Securities – 100.26% | ||||||
| (cost $724,640,424) | 881,214,335 | © | ||||
| **Obligation to Return Securities | ||||||
| Lending Collateral – (0.23%) | (1,999,994 | ) | ||||
| Other Liabilities Net of Receivables | ||||||
| and other Assets – (0.03%) | (239,258 | ) | ||||
| Net Assets Applicable to 59,545,154 | ||||||
| Shares Outstanding – 100.00% | $ | 878,975,083 | ||||
| Net Asset Value – Optimum Large Cap Growth Fund | ||||||
| Class A ($34,182,270 / 2,353,310 Shares) | $14.53 | |||||
| Net Asset Value – Optimum Large Cap Growth Fund | ||||||
| Class B ($1,447,170 / 106,137 Shares) | $13.63 | |||||
| Net Asset Value – Optimum Large Cap Growth Fund | ||||||
| Class C ($115,241,913 / 8,452,970 Shares) | $13.63 | |||||
| Net Asset Value – Optimum Large Cap Growth Fund | ||||||
| Institutional Class ($728,103,730 / 48,632,737 Shares) | $14.97 | |||||
| Components of Net Assets at March 31, 2013: | ||||||
| Shares of beneficial interest | ||||||
| (unlimited authorization – no par) | $ | 713,262,769 | ||||
| Undistributed net investment income | 249,945 | |||||
| Accumulated net realized gain on investments | 8,884,646 | |||||
| Net unrealized appreciation of investments and | ||||||
| foreign currencies | 156,577,723 | |||||
| Total net assets | $ | 878,975,083 | ||||
| † | Non income producing security. |
| * | Fully or partially on loan. |
| @ | Illiquid security. At March 31, 2013, the aggregate value of illiquid securities was $536,980, which represented 0.06% of the Fund’s net assets. See Note 9 in “Notes to financial statements.” |
| = | Security is being fair valued in accordance with the Fund’s fair valuation policy. At March 31, 2013, the aggregate value of fair valued securities was $536,980, which represented 0.06% of the Fund’s net assets. See Note 1 in “Notes to financial statements.” |
| ≠ | The rate shown is the effective yield at the time of purchase. |
| ** | See Note 8 in “Notes to financial statements” for additional information on securities lending collateral. |
| © | Includes $1,949,712 of securities loaned. |
| Net Asset Value and Offering Price Per Share – | |||
| Optimum Large Cap Growth Fund | |||
| Net asset value Class A (A) | $ | 14.53 | |
| Sales charge (5.75% of offering price) (B) | 0.89 | ||
| Offering price | $ | 15.42 |
| (A) | Net asset value per share, as illustrated, is the amount that would be paid upon redemption or repurchase of shares. |
| (B) | See the current prospectus for purchases of $75,000 or more. |
ADR — American Depositary Receipt
See accompanying notes, which are an integral part of the financial statements.
(continues) 75
Statements of net assets
Optimum Large Cap Value Fund
March 31, 2013
| Number of | Value | ||||
| Shares | (U.S. $) | ||||
| Common Stock – 96.67% | |||||
| Consumer Discretionary – 10.59% | |||||
| Advance Auto Parts | 30,350 | $ | 2,508,428 | ||
| Coach | 169,982 | 8,497,400 | |||
| Comcast Special Class A | 103,650 | 4,106,613 | |||
| Delphi Automotive (United Kingdom) | 60,650 | 2,692,860 | |||
| Disney (Walt) | 133,040 | 7,556,672 | |||
| † | General Motors | 29,090 | 809,284 | ||
| Hasbro | 86,320 | 3,792,901 | |||
| Johnson Controls | 111,270 | 3,902,239 | |||
| Kohl’s | 23,380 | 1,078,519 | |||
| McDonald’s | 26,010 | 2,592,937 | |||
| Nordstrom | 82,676 | 4,566,195 | |||
| Omnicom Group | 84,640 | 4,985,296 | |||
| Ross Stores | 182,800 | 11,081,336 | |||
| Staples | 85,550 | 1,148,937 | |||
| Target | 93,930 | 6,429,509 | |||
| TJX | 264,168 | 12,349,853 | |||
| Viacom Class B | 82,900 | 5,104,153 | |||
| Yum Brands | 134,313 | 9,662,477 | |||
| 92,865,609 | |||||
| Consumer Staples – 11.56% | |||||
| Altria Group | 379,149 | 13,038,934 | |||
| Campbell Soup | 114,807 | 5,207,646 | |||
| Coca-Cola Enterprises | 32,600 | 1,203,592 | |||
| Colgate-Palmolive | 58,333 | 6,885,044 | |||
| CVS Caremark | 120,021 | 6,599,955 | |||
| Danone (France) | 57,879 | 4,027,152 | |||
| Diageo (United Kingdom) | 247,147 | 7,792,196 | |||
| Dr. Pepper Snapple Group | 41,780 | 1,961,571 | |||
| General Mills | 141,330 | 6,968,982 | |||
| Hershey | 55,546 | 4,861,941 | |||
| Kellogg | 24,660 | 1,588,844 | |||
| Lorillard | 101,140 | 4,080,999 | |||
| Nestle (Switzerland) | 73,440 | 5,309,801 | |||
| PepsiCo | 24,290 | 1,921,582 | |||
| Philip Morris International | 286,959 | 26,603,969 | |||
| Procter & Gamble | 27,046 | 2,084,165 | |||
| Smucker (J.M.) | 12,150 | 1,204,794 | |||
| 101,341,167 | |||||
| Energy – 15.59% | |||||
| Apache | 146,517 | 11,305,252 | |||
| Chevron | 139,043 | 16,521,089 | |||
| ConocoPhillips | 141,930 | 8,529,993 | |||
| EOG Resources | 21,880 | 2,802,172 | |||
| Exxon Mobil | 205,290 | 18,498,682 | |||
| HollyFrontier | 233,887 | 12,033,486 | |||
| Marathon Petroleum | 171,654 | 15,380,198 | |||
| † | Newfield Exploration | 274,943 | 6,164,222 | ||
| Occidental Petroleum | 74,900 | 5,869,913 | |||
| Patterson-UTI Energy | 479,850 | 11,439,624 | |||
| * | RPC | 697,575 | 10,582,213 | ||
| † | Superior Energy Services | 161,324 | 4,189,584 | ||
| † | Ultra Petroleum | 666,139 | 13,389,394 | ||
| 136,705,822 | |||||
| Financials – 20.11% | |||||
| ACE (Switzerland) | 55,200 | 4,911,144 | |||
| AFLAC | 234,073 | 12,176,476 | |||
| American Capital Agency | 304,109 | 9,968,693 | |||
| Aon (United Kingdom) | 64,790 | 3,984,585 | |||
| Apartment Investment & Management | 339,229 | 10,400,761 | |||
| Bank of New York Mellon | 236,146 | 6,609,727 | |||
| BlackRock | 20,569 | 5,283,765 | |||
| CBOE Holdings | 285,532 | 10,547,552 | |||
| Chubb | 35,210 | 3,081,931 | |||
| Discover Financial Services | 237,603 | 10,654,119 | |||
| Eaton Vance | 258,595 | 10,817,028 | |||
| Franklin Resources | 24,100 | 3,634,521 | |||
| Goldman Sachs Group | 61,010 | 8,977,622 | |||
| JPMorgan Chase | 297,260 | 14,107,959 | |||
| McGraw-Hill | 263,114 | 13,702,976 | |||
| MetLife | 189,650 | 7,210,493 | |||
| Moody’s | 58,880 | 3,139,482 | |||
| PNC Financial Services Group | 44,950 | 2,989,175 | |||
| Prudential Financial | 83,430 | 4,921,536 | |||
| State Street | 80,020 | 4,728,382 | |||
| Travelers | 70,720 | 5,953,917 | |||
| Waddell & Reed Financial Class A | 224,288 | 9,819,329 | |||
| Wells Fargo | 235,810 | 8,722,612 | |||
| 176,343,785 | |||||
| Healthcare – 10.03% | |||||
| Abbott Laboratories | 95,130 | 3,359,992 | |||
| AbbVie | 71,970 | 2,934,937 | |||
| Becton, Dickinson | 24,800 | 2,371,128 | |||
| † | Endo Health Solutions | 155,092 | 4,770,630 | ||
| † | Express Scripts Holding | 18,480 | 1,065,372 | ||
| † | Gilead Sciences | 188,025 | 9,200,063 | ||
| † | Health Management Associates Class A | 1,051,100 | 13,527,657 | ||
| Johnson & Johnson | 188,470 | 15,365,959 | |||
| Medtronic | 100,920 | 4,739,203 | |||
| Merck | 85,000 | 3,759,550 | |||
| Pfizer | 513,205 | 14,811,096 | |||
| Quest Diagnostics | 33,130 | 1,870,189 | |||
| Roche Holding (Switzerland) | 10,568 | 2,459,745 | |||
| St. Jude Medical | 80,470 | 3,254,207 | |||
| Thermo Fisher Scientific | 56,890 | 4,351,516 | |||
| † | Zoetis | 4,550 | 151,970 | ||
| 87,993,214 | |||||
| Industrials – 12.76% | |||||
| 3M | 70,160 | 7,458,710 | |||
| Canadian National Railway (Canada) | 20,160 | 2,022,048 | |||
| Caterpillar | 74,680 | 6,494,920 | |||
| Copa Holdings Class A (Panama) | 93,441 | 11,176,477 | |||
| Danaher | 84,790 | 5,269,699 | |||
| * | Dun & Bradstreet | 22,630 | 1,893,000 | ||
| Eaton (Ireland) | 62,420 | 3,823,225 | |||
76
| Number of | Value | |||||
| Shares | (U.S. $) | |||||
| Common Stock (continued) | ||||||
| Industrials (continued) | ||||||
| Fluor | 10,120 | $ | 671,260 | |||
| Honeywell International | 106,050 | 7,990,868 | ||||
| Illinois Tool Works | 1,040 | 63,378 | ||||
| Joy Global | 137,657 | 8,193,344 | ||||
| Lockheed Martin | 231,237 | 22,318,994 | ||||
| Northrop Grumman | 58,750 | 4,121,313 | ||||
| Pentair (Switzerland) | 31,134 | 1,642,319 | ||||
| Stanley Black & Decker | 53,107 | 4,300,074 | ||||
| Tyco International (Switzerland) | 138,640 | 4,436,480 | ||||
| United Parcel Service Class B | 133,561 | 11,472,889 | ||||
| United Technologies | 91,700 | 8,567,530 | ||||
| 111,916,528 | ||||||
| Information Technology – 9.53% | ||||||
| Accenture Class A (Ireland) | 242,107 | 18,392,868 | ||||
| Apple | 16,162 | 7,153,786 | ||||
| Fidelity National Information Services | 16,390 | 649,372 | ||||
| † | Fiserv | 24,790 | 2,177,306 | |||
| Harris | 63,935 | 2,962,748 | ||||
| Hewlett-Packard | 38,090 | 908,066 | ||||
| Intel | 125,360 | 2,739,116 | ||||
| International Business Machines | 85,581 | 18,254,427 | ||||
| MasterCard Class A | 3,108 | 1,681,832 | ||||
| Microsoft | 313,040 | 8,956,074 | ||||
| Oracle | 171,870 | 5,558,276 | ||||
| Western Digital | 224,413 | 11,283,486 | ||||
| Western Union | 192,340 | 2,892,794 | ||||
| 83,610,151 | ||||||
| Materials – 4.38% | ||||||
| Air Products & Chemicals | 45,750 | 3,985,740 | ||||
| CF Industries Holdings | 42,170 | 8,027,902 | ||||
| Cliffs Natural Resources | 293,529 | 5,579,986 | ||||
| NewMarket | 30,652 | 7,980,555 | ||||
| PPG Industries | 43,790 | 5,865,233 | ||||
| Southern Copper | 185,631 | 6,974,157 | ||||
| 38,413,573 | ||||||
| Telecommunication Services – 1.94% | ||||||
| AT&T | 186,640 | 6,847,821 | ||||
| Verizon Communications | 73,690 | 3,621,864 | ||||
| Vodafone Group (United Kingdom) | 2,291,959 | 6,498,377 | ||||
| 16,968,062 | ||||||
| Utilities – 0.18% | ||||||
| PPL | 24,880 | 778,993 | ||||
| Public Service Enterprise Group | 24,130 | 828,624 | ||||
| 1,607,617 | ||||||
| Total Common Stock | ||||||
| (cost $657,968,763) | 847,765,528 | |||||
| Convertible Preferred Stock – 0.11% | ||||||
| PPL 9.50% exercise price $28.80, | ||||||
| expiration date 7/1/13 | 9,830 | 541,830 | ||||
| United Technologies 7.50% | ||||||
| exercise price $98.52, | ||||||
| expiration date 8/1/15 | 7,480 | 447,678 | ||||
| Total Convertible Preferred Stock | ||||||
| (cost $867,563) | 989,508 | |||||
| Principal | ||||||
| Amount (U.S. $) | ||||||
| Short-Term Investments – 2.94% | ||||||
| ≠Discount Note – 0.32% | ||||||
| Federal Home Loan Bank | ||||||
| 0.085% 5/24/13 | $ | 2,768,016 | 2,767,853 | |||
| 2,767,853 | ||||||
| Repurchase Agreements – 0.96% | ||||||
| Bank of America 0.07%, dated | ||||||
| 3/28/13, to be repurchased | ||||||
| on 4/1/13, repurchase price | ||||||
| $4,338,662 (collateralized by | ||||||
| U.S. government obligations | ||||||
| 0.125%-1.50% | ||||||
| 8/31/18-1/15/22; | ||||||
| market value $4,425,401) | 4,338,628 | 4,338,628 | ||||
| BNP Paribas 0.15%, dated | ||||||
| 3/28/13, to be repurchased | ||||||
| on 4/1/13, repurchase price | ||||||
| $4,096,775 (collateralized by | ||||||
| U.S. government obligations | ||||||
| 0.25%-0.875% | ||||||
| 2/28/14-7/31/19; | ||||||
| market value $4,182,741) | 4,096,707 | 4,096,707 | ||||
| 8,435,335 | ||||||
| ≠U.S. Treasury Obligations – 1.66% | ||||||
| U.S. Treasury Bills | ||||||
| 0.04% 4/11/13 | 3,615,524 | 3,615,495 | ||||
| 0.058% 4/18/13 | 5,401,007 | 5,400,927 | ||||
| 0.065% 4/25/13 | 3,204,392 | 3,204,321 | ||||
| 0.065% 5/9/13 | 791,376 | 791,338 | ||||
| 0.101% 4/15/13 | 1,542,191 | 1,542,178 | ||||
| 14,554,259 | ||||||
| Total Short-Term Investments | ||||||
| (cost $25,757,054) | 25,757,447 | |||||
| Total Value of Securities Before Securities | ||||||
| Lending Collateral – 99.72% | ||||||
| (cost $684,593,380) | 874,512,483 | |||||
(continues) 77
Statements of net assets
Optimum Large Cap Value Fund
| Number of | Value | |||||
| Shares | (U.S. $) | |||||
| **Securities Lending Collateral – 0.09% | ||||||
| Investment Companies | ||||||
| Delaware Investments | ||||||
| Collateral Fund No.1 | 762,187 | $ | 762,187 | |||
| †@Mellon GSL Reinvestment Trust II | 717,397 | 0 | ||||
| Total Securities Lending Collateral | ||||||
| (cost $1,479,584) | 762,187 | |||||
| Total Value of Securities – 99.81% | ||||||
| (cost $686,072,964) | 875,274,670 | © | ||||
| **Obligation to Return Securities | ||||||
| Lending Collateral – (0.17%) | (1,479,584 | ) | ||||
| «Receivables and Other Assets Net | ||||||
| of Other Liabilities – 0.36% | 3,216,289 | |||||
| Net Assets Applicable to 67,975,353 | ||||||
| Shares Outstanding – 100.00% | $ | 877,011,375 | ||||
| Net Asset Value – Optimum Large Cap Value Fund | ||||||
| Class A ($32,994,856 / 2,558,433 Shares) | $12.90 | |||||
| Net Asset Value – Optimum Large Cap Value Fund | ||||||
| Class B ($1,424,534 / 111,379 Shares) | $12.79 | |||||
| Net Asset Value – Optimum Large Cap Value Fund | ||||||
| Class C ($111,806,488 / 8,745,882 Shares) | $12.78 | |||||
| Net Asset Value – Optimum Large Cap Value Fund | ||||||
| Institutional Class ($730,785,497 / 56,559,659 Shares) | $12.92 | |||||
| Components of Net Assets at March 31, 2013: | ||||||
| Shares of beneficial interest | ||||||
| (unlimited authorization – no par) | $ | 822,482,491 | ||||
| Undistributed net investment income | 1,658,748 | |||||
| Accumulated net realized loss on investments | (136,355,431 | ) | ||||
| Net unrealized appreciation of investments and | ||||||
| foreign currencies | 189,225,567 | |||||
| Total net assets | $ | 877,011,375 | ||||
| † | Non income producing security. |
| * | Fully or partially on loan. |
| ≠ | The rate shown is the effective yield at the time of purchase. |
| ** | See Note 8 in “Notes to financial statements” for additional information on securities lending collateral. |
| @ | Illiquid security. At March 31, 2013, the aggregate value of illiquid securities was $0, which represented 0.00% of the Fund’s net assets. See Note 9 in “Notes to financial statements.” |
| © | Includes $1,416,398 of securities loaned. |
| « | Includes foreign currency valued at $7,271 with a cost of $7,267. |
| Net Asset Value and Offering Price Per Share – | |||
| Optimum Large Cap Value Fund | |||
| Net asset value Class A (A) | $ | 12.90 | |
| Sales charge (5.75% of offering price) (B) | 0.79 | ||
| Offering price | $ | 13.69 |
| (A) | Net asset value per share, as illustrated, is the amount that would be paid upon redemption or repurchase of shares. |
| (B) | See the current prospectus for purchases of $75,000 or more. |
See accompanying notes, which are an integral part of the financial statements.
78
Optimum Small-Mid Cap Growth Fund
March 31, 2013
| Number of | Value | ||||
| Shares | (U.S. $) | ||||
| Common Stock – 97.46% | |||||
| Consumer Discretionary – 17.58% | |||||
| Abercrombie & Fitch Class A | 13,000 | $ | 600,600 | ||
| Allison Transmission Holdings | 63,630 | 1,527,756 | |||
| † | Bally Technologies | 67,000 | 3,481,990 | ||
| † | Bloomin’ Brands | 76,570 | 1,368,306 | ||
| † | Buffalo Wild Wings | 15,140 | 1,325,204 | ||
| Burger King Worldwide | 83,510 | 1,595,041 | |||
| Cheesecake Factory | 38,690 | 1,493,821 | |||
| Choice Hotels International | 49,000 | 2,073,190 | |||
| † | Deckers Outdoor | 14,000 | 779,660 | ||
| Domino’s Pizza | 27,000 | 1,388,880 | |||
| DSW Class A | 23,880 | 1,523,544 | |||
| † | Five Below | 22,960 | 869,954 | ||
| † | Francesca’s Holdings | 48,790 | 1,398,321 | ||
| GNC Holdings | 43,000 | 1,689,040 | |||
| † | Hanesbrands | 34,350 | 1,564,986 | ||
| † | Helen of Troy (Bermuda) | 37,000 | 1,419,320 | ||
| † | Hibbett Sports | 22,570 | 1,270,014 | ||
| *† | HomeAway | 34,710 | 1,128,075 | ||
| HSN | 26,640 | 1,461,470 | |||
| † | iRobot | 26,700 | 685,122 | ||
| † | Jarden | 34,500 | 1,478,325 | ||
| † | Life Time Fitness | 43,000 | 1,839,540 | ||
| † | LKQ | 90,000 | 1,958,400 | ||
| † | Lululemon Athletica | 7,000 | 436,450 | ||
| † | Madden (Steven) | 40,185 | 1,733,581 | ||
| *† | Pandora Media | 133,930 | 1,896,449 | ||
| Pier 1 Imports | 174,730 | 4,018,791 | |||
| † | Pinnacle Entertainment | 134,000 | 1,959,080 | ||
| Pool | 36,000 | 1,728,000 | |||
| PVH | 16,200 | 1,730,322 | |||
| † | Quiksilver | 164,090 | 996,026 | ||
| † | rue21 | 42,680 | 1,254,365 | ||
| Samsonite International | 907,610 | 2,268,280 | |||
| † | Shutterfly | 27,000 | 1,192,590 | ||
| † | Shutterstock | 28,700 | 1,290,926 | ||
| † | Standard Pacific | 134,140 | 1,158,970 | ||
| † | Tenneco | 52,930 | 2,080,678 | ||
| † | Urban Outfitters | 22,390 | 867,389 | ||
| Vail Resorts | 27,000 | 1,682,640 | |||
| Williams-Sonoma | 22,000 | 1,133,440 | |||
| 61,348,536 | |||||
| Consumer Staples – 2.05% | |||||
| Casey’s General Stores | 43,680 | 2,546,544 | |||
| † | Chefs’ Warehouse | 65,000 | 1,200,550 | ||
| † | Elizabeth Arden | 37,874 | 1,524,429 | ||
| Spectrum Brands Holdings | 33,490 | 1,895,199 | |||
| 7,166,722 | |||||
| Energy – 5.74% | |||||
| † | Approach Resources | 20,000 | 492,200 | ||
| † | Atwood Oceanics | 75,710 | 3,977,804 | ||
| † | Dresser-Rand Group | 11,000 | 678,260 | ||
| † | FMC Technologies | 22,000 | 1,196,580 | ||
| † | Gulfport Energy | 21,340 | 978,012 | ||
| † | Hornbeck Offshore Services | 9,000 | 418,140 | ||
| † | Laredo Petroleum Holdings | 20,000 | 365,800 | ||
| † | Painted Pony Petroleum (Canada) | 113,980 | 1,143,334 | ||
| Patterson-UTI Energy | 48,070 | 1,145,989 | |||
| † | PDC Energy | 19,000 | 941,830 | ||
| † | Rex Energy | 60,230 | 992,590 | ||
| † | Rosetta Resources | 44,460 | 2,115,407 | ||
| † | SemGroup Class A | 38,640 | 1,998,461 | ||
| SM Energy | 30,000 | 1,776,600 | |||
| Trican Well Service (Canada) | 123,200 | 1,807,038 | |||
| 20,028,045 | |||||
| Financials – 12.08% | |||||
| Allied World Assurance Company Holdings (Switzerland) | 10,000 | 927,200 | |||
| Associated Banc-Corp | 110,000 | 1,670,900 | |||
| Berkshire Hills Bancorp | 17,500 | 446,950 | |||
| BioMed Realty Trust | 61,000 | 1,317,600 | |||
| City National | 30,000 | 1,767,300 | |||
| Coresite Realty | 7,178 | 251,086 | |||
| † | Countrywide (United Kingdom) | 18,900 | 111,999 | ||
| DuPont Fabros Technology | 50,879 | 1,234,833 | |||
| East West Bancorp | 15,180 | 389,671 | |||
| Education Realty Trust | 165,000 | 1,737,450 | |||
| † | Enstar Group (Bermuda) | 6,700 | 832,743 | ||
| Extra Space Storage | 44,000 | 1,727,880 | |||
| Financial Engines | 30,540 | 1,106,159 | |||
| First Busey | 177,800 | 812,546 | |||
| First Commonwealth Financial | 110,000 | 820,600 | |||
| Kennedy-Wilson Holdings | 24,000 | 372,240 | |||
| Kite Realty Group Trust | 245,000 | 1,651,300 | |||
| Lakeland Financial | 40,000 | 1,067,600 | |||
| MB Financial | 72,000 | 1,740,240 | |||
| † | Ocwen Financial | 25,657 | 972,913 | ||
| Pebblebrook Hotel Trust | 71,320 | 1,839,343 | |||
| Potlatch | 45,020 | 2,064,617 | |||
| Provident New York Bancorp | 60,000 | 544,200 | |||
| Ryman Hospitality Properties | 90,000 | 4,117,501 | |||
| Sandy Spring Bancorp | 43,000 | 864,300 | |||
| SEI Investments | 70,000 | 2,019,500 | |||
| Simplicity Bancorp | 54,674 | 821,750 | |||
| Summit Hotel Properties | 144,000 | 1,507,680 | |||
| † | SVB Financial Group | 20,000 | 1,418,800 | ||
| Tower Group International (Bermuda) | 41,921 | 773,442 | |||
| † | Virtus Investment Partners | 2,680 | 499,230 | ||
| † | WageWorks | 82,830 | 2,073,235 | ||
| † | WisdomTree Investments | 57,070 | 593,528 | ||
| † | World Acceptance | 24,000 | 2,060,880 | ||
| 42,157,216 | |||||
(continues) 79
Statements of net assets
Optimum Small-Mid Cap Growth Fund
| Number of | Value | ||||
| Shares | (U.S. $) | ||||
| Common Stock (continued) | |||||
| Healthcare – 12.95% | |||||
| Air Methods | 29,110 | $ | 1,404,266 | ||
| † | Akorn | 46,000 | 636,180 | ||
| *† | Algeta (Norway) | 21,664 | 728,809 | ||
| † | Alnylam Pharmaceuticals | 18,000 | 438,660 | ||
| † | Arena Pharmaceuticals | 81,380 | 668,130 | ||
| † | Ariad Pharmaceuticals | 48,000 | 868,320 | ||
| † | AVEO Pharmaceuticals | 56,100 | 412,335 | ||
| † | BioMarin Pharmaceutical | 23,000 | 1,431,980 | ||
| † | Cepheid | 58,900 | 2,259,993 | ||
| † | Chelsea Therapeutics International | 113,086 | 230,695 | ||
| † | Coronado Biosciences | 7,878 | 76,574 | ||
| † | Covance | 23,370 | 1,736,858 | ||
| † | Cubist Pharmaceuticals | 23,690 | 1,109,166 | ||
| DENTSPLY International | 30,000 | 1,272,600 | |||
| *† | Exelixis | 127,680 | 589,882 | ||
| † | HeartWare International | 10,550 | 932,937 | ||
| *† | ImmunoGen | 51,660 | 829,660 | ||
| *† | Incyte | 40,260 | 942,487 | ||
| † | Insulet | 46,020 | 1,190,077 | ||
| † | InterMune | 22,000 | 199,100 | ||
| † | Ironwood Pharmaceuticals | 68,860 | 1,259,449 | ||
| † | Medicines | 49,030 | 1,638,583 | ||
| † | Mednax | 18,000 | 1,613,340 | ||
| † | Mettler-Toledo International | 20,000 | 4,264,399 | ||
| † | NPS Pharmaceuticals | 147,100 | 1,498,949 | ||
| † | Onyx Pharmaceuticals | 23,310 | 2,071,327 | ||
| Patterson | 51,000 | 1,940,040 | |||
| † | Rigel Pharmaceuticals | 61,700 | 418,943 | ||
| † | Salix Pharmaceuticals | 23,870 | 1,221,667 | ||
| † | Sarepta Therapeutics | 22,000 | 812,900 | ||
| *† | Seattle Genetics | 97,510 | 3,462,580 | ||
| † | Sirona Dental Systems | 34,000 | 2,506,820 | ||
| † | Synageva BioPharma | 23,593 | 1,295,728 | ||
| † | Team Health Holdings | 26,160 | 951,701 | ||
| Techne | 15,000 | 1,017,750 | |||
| † | WellCare Health Plans | 21,840 | 1,265,846 | ||
| 45,198,731 | |||||
| Industrials – 21.78% | |||||
| Acorn Energy | 81,362 | 598,011 | |||
| Acuity Brands | 39,680 | 2,751,808 | |||
| @ | Altra Holdings | 13,230 | 360,121 | ||
| AMETEK | 105,000 | 4,552,800 | |||
| Apogee Enterprises | 30,170 | 873,422 | |||
| Applied Industrial Technologies | 26,880 | 1,209,600 | |||
| † | Armstrong World Industries | 17,360 | 970,250 | ||
| † | Avis Budget Group | 129,580 | 3,606,211 | ||
| Briggs & Stratton | 69,170 | 1,715,416 | |||
| † | CAI International | 53,000 | 1,527,460 | ||
| † | Chart Industries | 4,000 | 320,040 | ||
| Chicago Bridge & Iron (Netherlands) | 31,000 | 1,925,100 | |||
| † | DigitalGlobe | 87,480 | 2,529,047 | ||
| Donaldson | 97,800 | 3,539,382 | |||
| † | DXP Enterprises | 7,891 | 589,458 | ||
| ESCO Technologies | 64,200 | 2,623,212 | |||
| Forward Air | 35,000 | 1,305,150 | |||
| Generac Holdings | 31,000 | 1,095,540 | |||
| HEICO Class A | 50,000 | 1,715,500 | |||
| † | Hertz Global Holdings | 56,500 | 1,257,690 | ||
| † | II-VI | 90,000 | 1,533,600 | ||
| Interface | 90,000 | 1,729,800 | |||
| Kennametal | 41,000 | 1,600,640 | |||
| † | Kirby | 16,000 | 1,228,800 | ||
| Knoll | 65,781 | 1,192,610 | |||
| Landstar System | 26,434 | 1,509,117 | |||
| McGrath RentCorp | 31,000 | 964,100 | |||
| † | Middleby | 12,290 | 1,869,924 | ||
| † | Moog Class A | 73,920 | 3,387,754 | ||
| Nordson | 70,000 | 4,616,499 | |||
| † | Old Dominion Freight Line | 48,856 | 1,866,299 | ||
| † | On Assignment | 45,370 | 1,148,315 | ||
| † | Oshkosh | 22,000 | 934,780 | ||
| † | Owens Corning | 19,038 | 750,668 | ||
| † | Performant Financial | 77,000 | 945,560 | ||
| † | Polypore International | 71,190 | 2,860,414 | ||
| † | RPX | 23,059 | 325,362 | ||
| † | Rush Enterprises Class A | 57,000 | 1,374,840 | ||
| † | Spirit Airlines | 109,910 | 2,787,318 | ||
| † | Teledyne Technologies | 17,860 | 1,400,938 | ||
| Textainer Group Holdings (Bermuda) | 36,000 | 1,423,800 | |||
| † | Thermon Group Holdings | 20,000 | 444,200 | ||
| Toro | 35,000 | 1,611,400 | |||
| † | TrueBlue | 35,160 | 743,282 | ||
| † | WESCO International | 37,340 | 2,711,257 | ||
| 76,026,495 | |||||
| Information Technology – 20.83% | |||||
| Amphenol Class A | 28,400 | 2,120,060 | |||
| † | ANSYS | 36,000 | 2,931,120 | ||
| † | Aruba Networks | 40,630 | 1,005,186 | ||
| † | Atmel | 155,000 | 1,078,800 | ||
| † | Cadence Design Systems | 138,650 | 1,931,395 | ||
| Coherent | 3,560 | 201,994 | |||
| † | Concur Technologies | 35,180 | 2,415,459 | ||
| † | Cornerstone OnDemand | 26,370 | 899,217 | ||
| † | CoStar Group | 8,620 | 943,545 | ||
| † | DealerTrack Technologies | 48,570 | 1,426,987 | ||
| † | Demandware | 15,000 | 380,250 | ||
| † | Exa | 55,000 | 523,600 | ||
| † | ExlService Holdings | 88,000 | 2,893,440 | ||
| Fair Isaac | 40,180 | 1,835,824 | |||
| † | FleetMatics Group (Ireland) | 57,450 | 1,393,163 | ||
| Heartland Payment Systems | 31,740 | 1,046,468 | |||
| † | Hittite Microwave | 10,000 | 605,600 | ||
| IAC/InterActiveCorp | 30,710 | 1,372,123 | |||
| † | Imperva | 57,210 | 2,202,585 | ||
80
| Number of | Value | |||||
| Shares | (U.S. $) | |||||
| Common Stock (continued) | ||||||
| Information Technology (continued) | ||||||
| *† | Infinera | 60,000 | $ | 420,000 | ||
| † | Informatica | 42,000 | 1,447,740 | |||
| * | IPG Photonics | 56,430 | 3,747,515 | |||
| † | Ixia | 75,180 | 1,626,895 | |||
| † | JDS Uniphase | 123,070 | 1,645,446 | |||
| † | Lattice Semiconductor | 273,387 | 1,489,959 | |||
| † | Liquidity Services | 20,000 | 596,200 | |||
| † | LivePerson | 76,100 | 1,033,438 | |||
| † | MICROS Systems | 62,150 | 2,828,447 | |||
| † | Microsemi | 40,000 | 926,800 | |||
| † | NETGEAR | 19,000 | 636,690 | |||
| † | ON Semiconductor | 130,000 | 1,076,400 | |||
| † | Palo Alto Networks | 20,110 | 1,138,226 | |||
| † | PTC | 51,840 | 1,321,402 | |||
| † | RealPage | 28,632 | 592,969 | |||
| † | Rogers | 29,203 | 1,390,647 | |||
| † | ServiceNow | 49,179 | 1,780,280 | |||
| Solera Holdings | 33,430 | 1,949,972 | ||||
| † | Splunk | 30,540 | 1,222,516 | |||
| † | SPS Commerce | 59,000 | 2,517,530 | |||
| † | Stratasys | 10,000 | 742,200 | |||
| † | TIBCO Software | 40,260 | 814,057 | |||
| † | Trulia | 49,070 | 1,539,817 | |||
| † | Ultratech | 55,810 | 2,206,169 | |||
| † | Verint Systems | 47,620 | 1,740,511 | |||
| † | Virtusa | 106,211 | 2,523,573 | |||
| † | Web.com Group | 118,780 | 2,028,762 | |||
| † | WEX | 17,320 | 1,359,620 | |||
| † | WNS Holdings ADR | 214,490 | 3,161,583 | |||
| 72,712,180 | ||||||
| Materials – 3.02% | ||||||
| Albemarle | 19,000 | 1,187,880 | ||||
| † | CaesarStone Sdot Yam (Israel) | 7,184 | 189,658 | |||
| † | Headwaters | 159,270 | 1,736,043 | |||
| KapStone Paper & Packaging | 85,560 | 2,378,567 | ||||
| † | Louisiana-Pacific | 70,490 | 1,522,584 | |||
| Methanex (Canada) | 55,290 | 2,246,433 | ||||
| Packaging Corp. of America | 28,730 | 1,289,115 | ||||
| 10,550,280 | ||||||
| Telecommunication Services – 1.43% | ||||||
| *† | Boingo Wireless | 75,000 | 414,000 | |||
| † | SBA Communications Class A | 27,000 | 1,944,540 | |||
| † | tw telecom | 104,000 | 2,619,760 | |||
| 4,978,300 | ||||||
| Total Common Stock | ||||||
| (cost $256,080,920) | 340,166,505 | |||||
| Exchange-Traded Fund – 0.56% | ||||||
| iShares Russell 2000 Growth | ||||||
| Index Fund | 18,200 | 1,961,050 | ||||
| Total Exchange-Traded Fund | ||||||
| (cost $1,901,820) | 1,961,050 | |||||
| Principal | ||||||
| Amount (U.S. $) | ||||||
| Short-Term Investments – 1.69% | ||||||
| ≠Discount Notes – 0.25% | ||||||
| Federal Home Loan Bank | ||||||
| 0.085% 5/24/13 | $ | 575,383 | 575,349 | |||
| 0.12% 4/2/13 | 304,701 | 304,701 | ||||
| 880,050 | ||||||
| Repurchase Agreements – 0.57% | ||||||
| Bank of America 0.07%, dated | ||||||
| 3/28/13, to be repurchased | ||||||
| on 4/1/13, repurchase price | ||||||
| $1,012,965 (collateralized by | ||||||
| U.S. government obligations | ||||||
| 0.125%-1.50% | ||||||
| 8/31/18-1/15/22; | ||||||
| market value $1,033,216) | 1,012,957 | 1,012,957 | ||||
| BNP Paribas 0.15%, dated | ||||||
| 3/28/13, to be repurchased | ||||||
| on 4/1/13, repurchase price | ||||||
| $956,490 (collateralized by U.S. | ||||||
| government obligations | ||||||
| 0.25%-0.875% | ||||||
| 2/28/14-7/31/19; | ||||||
| market value $976,561) | 956,474 | 956,474 | ||||
| 1,969,431 | ||||||
| ≠U.S. Treasury Obligations – 0.87% | ||||||
| U.S. Treasury Bills | ||||||
| 0.04% 4/11/13 | 844,131 | 844,124 | ||||
| 0.058% 4/18/13 | 1,122,698 | 1,122,682 | ||||
| 0.065% 4/25/13 | 506,478 | 506,467 | ||||
| 0.065% 5/9/13 | 146,255 | 146,248 | ||||
| 0.101% 4/15/13 | 427,125 | 427,122 | ||||
| 3,046,643 | ||||||
| Total Short-Term Investments | ||||||
| (cost $5,896,041) | 5,896,124 | |||||
| Total Value of Securities Before Securities | ||||||
| Lending Collateral – 99.71% | ||||||
| (cost $263,878,781) | 348,023,679 | |||||
(continues) 81
Statements of net assets
Optimum Small-Mid Cap Growth Fund
| Number of | Value | ||||||
| Shares | (U.S. $) | ||||||
| **Securities Lending Collateral – 2.09% | |||||||
| Investment Companies | |||||||
| Delaware Investments | |||||||
| Collateral Fund No. 1 | 7,278,964 | $ | 7,278,964 | ||||
| †@Mellon GSL Reinvestment Trust II | 348,710 | 0 | |||||
| Total Securities Lending Collateral | |||||||
| (cost $7,627,674) | 7,278,964 | ||||||
| Total Value of Securities – 101.80% | |||||||
| (cost $271,506,455) | 355,302,643 | © | |||||
| **Obligation to Return Securities | |||||||
| Lending Collateral – (2.19%) | (7,627,674 | ) | |||||
| Receivables and Other Assets Net of Other | |||||||
| Liabilities – 0.39% | 1,362,842 | ||||||
| Net Assets Applicable to 23,789,763 Shares | |||||||
| Outstanding – 100.00% | $ | 349,037,811 | |||||
| Net Asset Value – Optimum Small-Mid Cap Growth Fund | |||||||
| Class A ($6,414,464 / 449,925 Shares) | $14.26 | ||||||
| Net Asset Value – Optimum Small-Mid Cap Growth Fund | |||||||
| Class B ($260,949 / 19,629 Shares) | $13.29 | ||||||
| Net Asset Value – Optimum Small-Mid Cap Growth Fund | |||||||
| Class C ($20,921,246 / 1,575,001 Shares) | $13.28 | ||||||
| Net Asset Value – Optimum Small-Mid Cap Growth Fund | |||||||
| Institutional Class ($321,441,152 / 21,745,208 Shares) | $14.78 | ||||||
| Components of Net Assets at March 31 2013: | |||||||
| Shares of beneficial interest | |||||||
| (unlimited authorization – no par) | $ | 246,997,482 | |||||
| Distributions in excess of net investment income | (992,046 | ) | |||||
| Accumulated net realized gain on investments | 19,236,178 | ||||||
| Net unrealized appreciation of investments and derivatives | 83,796,197 | ||||||
| Total net assets | $ | 349,037,811 | |||||
† | Non income producing security. |
* | Fully or partially on loan. |
@ | Illiquid security. At March 31, 2013, the aggregate value of illiquid securities was $360,121, which represented 0.10% of the Fund’s net assets. See Note 9 in “Notes to financial statements.” |
| ≠ | The rate shown is the effective yield at the time of purchase. |
** | See Note 8 in “Notes to financial statements” for additional information on securities lending collateral. |
| © | Includes $7,436,986 of securities loaned. |
The following foreign currency exchange contract was outstanding at March 31, 2013:1
Foreign Currency Exchange Contract
| Unrealized | ||||||||||
| Contract to | Settlement | Appreciation | ||||||||
| Counterparty | Receive (Deliver) | In Exchange For | Date | (Depreciation) | ||||||
| DB | CAD 27,112 | USD | (26,676) | 4/3/13 | $9 | |||||
The use of foreign currency exchange contract involves elements of market risk and risks in excess of the amount disclosed in the financial statements. The foreign currency exchange contract presented above represents the Fund’s total exposure in such contracts, whereas only the net unrealized appreciation (depreciation) is reflected in the Fund’s net assets.
1See Note 7 in “Notes to financial statements.”
| Net Asset Value and Offering Price Per Share – | ||
| Optimum Small-Mid Cap Growth Fund | ||
| Net asset value Class A (A) | $ | 14.26 |
| Sales charge (5.75% of offering price) (B) | 0.87 | |
| Offering price | $ | 15.13 |
| (A) | Net asset value per share, as illustrated, is the amount that would be paid upon redemption or repurchase of shares. |
| (B) | See the current prospectus for purchases of $75,000 or more. |
Summary of Abbreviations:
ADR — American Depositary Receipt
CAD — Canadian Dollar
DB — Deutsche Bank
USD — United States Dollar
See accompanying notes, which are an integral part of the financial statements.
82
Optimum Small-Mid Cap Value Fund
March 31, 2013
| Number of | Value | ||||
| Shares | (U.S. $) | ||||
| ²Common Stock – 91.21% | |||||
| Consumer Discretionary – 12.64% | |||||
| Advance Auto Parts | 21,400 | $ | 1,768,710 | ||
| † | Ascena Retail Group | 80,000 | 1,484,000 | ||
| * | bebe Stores | 58,404 | 243,545 | ||
| † | Borg Warner | 26,500 | 2,049,510 | ||
| † | Children’s Place Retail Stores | 11,800 | 528,876 | ||
| † | Crocs | 149,300 | 2,212,626 | ||
| Family Dollar Stores | 20,100 | 1,186,905 | |||
| Finish Line Class A | 78,000 | 1,528,020 | |||
| Foot Locker | 37,600 | 1,287,424 | |||
| Garmin (Switzerland) | 70,700 | 2,335,928 | |||
| †Genesco | 12,000 | 721,080 | |||
| Hooker Furniture | 155,694 | 2,481,762 | |||
| *† | Jos.A. Bank Clothiers | 45,602 | 1,819,520 | ||
| Lear | 41,600 | 2,282,592 | |||
| † | Life Time Fitness | 26,700 | 1,142,226 | ||
| † | MaidenForm Brands | 60,000 | 1,051,800 | ||
| PETsMART | 17,100 | 1,061,910 | |||
| † | Ruth’s Hospitality Group | 189,053 | 1,803,566 | ||
| Signet Jewelers (Bermuda) | 37,500 | 2,512,500 | |||
| Spartan Motors | 473,516 | 2,514,370 | |||
| * | Staples | 249,000 | 3,344,069 | ||
| Tupperware Brands | 36,200 | 2,958,988 | |||
| † | Winnebago Industries | 131,001 | 2,703,861 | ||
| † | WMS Industries | 101,600 | 2,561,336 | ||
| 43,585,124 | |||||
| Consumer Staples – 1.43% | |||||
| Dr. Pepper Snapple Group | 26,500 | 1,244,175 | |||
| Molson Coors Brewing Class B | 25,000 | 1,223,250 | |||
| * | Sanderson Farms | 45,000 | 2,457,900 | ||
| 4,925,325 | |||||
| Energy – 5.00% | |||||
| *† | Approach Resources | 46,700 | 1,149,287 | ||
| † | Cloud Peak Energy | 66,500 | 1,248,870 | ||
| CONSOL Energy | 68,000 | 2,288,200 | |||
| Gulf Island Fabrication | 78,416 | 1,651,441 | |||
| *† | Newpark Resources | 287,350 | 2,666,608 | ||
| † | PDC Energy | 23,700 | 1,174,809 | ||
| † | Rex Energy | 137,800 | 2,270,944 | ||
| *† | Ultra Petroleum | 115,300 | 2,317,530 | ||
| † | Vaalco Energy | 326,503 | 2,478,158 | ||
| 17,245,847 | |||||
| Financials – 11.36% | |||||
| Alexandria Real Estate Equities | 32,092 | 2,277,890 | |||
| Aspen Insurance Holdings (Bermuda) | 61,100 | 2,357,238 | |||
| AXIS Capital Holdings (Bermuda) | 56,200 | 2,339,044 | |||
| BankUnited | 79,300 | 2,031,666 | |||
| City Holding | 65,979 | 2,625,304 | |||
| DiamondRock Hospitality | 127,700 | 1,188,887 | |||
| * | Digital Realty Trust | 16,500 | 1,104,015 | ||
| Dime Community Bancshares | 178,626 | 2,565,069 | |||
| East West Bancorp | 100,700 | 2,584,969 | |||
| First Financial Bancorp | 125,100 | 2,007,855 | |||
| † | Hallmark Financial Services | 262,778 | 2,365,002 | ||
| HCC Insurance Holdings | 56,900 | 2,391,507 | |||
| Horace Mann Educators | 125,376 | 2,614,090 | |||
| Lazard Class A (Bermuda) | 59,400 | 2,027,322 | |||
| Potlatch | 30,103 | 1,380,524 | |||
| PrivateBancorp | 72,300 | 1,367,193 | |||
| Safety Insurance Group | 12,500 | 614,375 | |||
| Stewart Information Services | 29,945 | 762,699 | |||
| † | SVB Financial Group | 18,200 | 1,291,108 | ||
| Wintrust Financial | 38,800 | 1,437,152 | |||
| XL Group (Ireland) | 60,000 | 1,818,000 | |||
| 39,150,909 | |||||
| Healthcare – 2.77% | |||||
| † | Cambrex | 14,701 | 188,026 | ||
| † | CareFusion | 86,400 | 3,023,136 | ||
| DENTSPLY International | 27,400 | 1,162,308 | |||
| † | Hologic | 91,500 | 2,067,900 | ||
| † | Mednax | 26,900 | 2,411,047 | ||
| † | Orthofix International (Curacao) | 20,000 | 717,400 | ||
| 9,569,817 | |||||
| Industrials – 28.90% | |||||
| AAON | 93,556 | 2,581,210 | |||
| † | ACCO Brands | 302,200 | 2,018,696 | ||
| Acuity Brands | 38,000 | 2,635,300 | |||
| † | Aegion | 63,000 | 1,458,450 | ||
| AGCO | 22,500 | 1,172,700 | |||
| Albany International | 52,600 | 1,520,140 | |||
| AMETEK | 52,875 | 2,292,660 | |||
| Avery Dennison | 70,000 | 3,014,900 | |||
| † | BE Aerospace | 38,600 | 2,327,194 | ||
| Brady Class A | 53,300 | 1,787,149 | |||
| Carlisle | 43,300 | 2,935,307 | |||
| *† | Colfax | 58,500 | 2,722,590 | ||
| Crane | 33,300 | 1,860,138 | |||
| † | Diana Shipping (Greece) | 19,000 | 202,540 | ||
| Dover | 48,700 | 3,549,256 | |||
| Encore Wire | 82,507 | 2,889,395 | |||
| Ennis | 144,790 | 2,181,985 | |||
| Equifax | 40,097 | 2,309,186 | |||
| † | Federal Signal | 268,000 | 2,181,520 | ||
| † | Foster Wheeler (Switzerland) | 103,000 | 2,353,550 | ||
| Graham | 123,157 | 3,046,904 | |||
| Granite Construction | 69,200 | 2,203,328 | |||
| Griffon | 53,300 | 635,336 | |||
| Harsco | 55,000 | 1,362,350 | |||
| Houston Wire & Cable | 1,000 | 12,950 | |||
| Hubbell Class B | 40,100 | 3,894,111 | |||
| IDEX | 27,700 | 1,479,734 | |||
| Ingersoll-Rand (Ireland) | 51,500 | 2,833,015 | |||
(continues) 83
Statements of net assets
Optimum Small-Mid Cap Value Fund
| Number of | Value | ||||
| Shares | (U.S. $) | ||||
| ²Common Stock (continued) | |||||
| Industrials (continued) | |||||
| Kennametal | 88,600 | $ | 3,458,944 | ||
| Knoll | 149,824 | 2,716,309 | |||
| Manpower | 37,100 | 2,104,312 | |||
| McGrath RentCorp | 84,476 | 2,627,204 | |||
| Primoris Services | 11,800 | 260,898 | |||
| Robert Half International | 30,800 | 1,155,924 | |||
| † | Rush Enterprises Class A | 57,300 | 1,382,076 | ||
| Stanley Black & Decker | 41,000 | 3,319,770 | |||
| TAL International Group | 25,900 | 1,173,529 | |||
| Tennant | 38,988 | 1,893,257 | |||
| Timken | 84,200 | 4,764,037 | |||
| † | Trex | 28,200 | 1,386,876 | ||
| Trinity Industries | 29,800 | 1,350,834 | |||
| † | TrueBlue | 171,300 | 3,621,282 | ||
| Tyco International (Switzerland) | 28,400 | 908,800 | |||
| US Ecology | 101,481 | 2,694,321 | |||
| Watts Water Technologies Class A | 48,801 | 2,341,960 | |||
| *† | WESCO International | 41,800 | 3,035,098 | ||
| 99,657,025 | |||||
| Information Technology – 16.49% | |||||
| * | Adtran | 8,000 | 157,200 | ||
| † | Advanced Energy Industries | 137,925 | 2,524,028 | ||
| Broadridge Financial Solutions | 101,700 | 2,526,228 | |||
| Brooks Automation | 175,500 | 1,786,590 | |||
| † | Cabot Microelectronics | 32,900 | 1,143,275 | ||
| † | Checkpoint Systems | 140,600 | 1,836,236 | ||
| † | Digi International | 85,000 | 759,050 | ||
| † | Diodes | 64,000 | 1,342,720 | ||
| † | Fairchild Semiconductor International | 164,100 | 2,320,374 | ||
| † | Flextronics International (Singapore) | 497,700 | 3,364,452 | ||
| Global Payments | 58,800 | 2,920,008 | |||
| Harris | 31,100 | 1,441,174 | |||
| Henry (Jack) & Associates | 28,000 | 1,293,880 | |||
| Infineon Technologies (Germany) | 100,000 | 789,620 | |||
| † | Ingram Micro Class A | 98,000 | 1,928,640 | ||
| * | j2 Global | 75,600 | 2,964,276 | ||
| † | KEMET | 200,000 | 1,250,000 | ||
| KLA-Tencor | 22,400 | 1,181,376 | |||
| † | Lam Research | 31,900 | 1,322,574 | ||
| † | LTX-Credence | 205,300 | 1,240,012 | ||
| Methode Electronics | 221,252 | 2,849,726 | |||
| Micrel | 239,111 | 2,513,057 | |||
| † | Plexus | 136,661 | 3,322,229 | ||
| † | Rudolph Technologies | 228,342 | 2,689,869 | ||
| † | ScanSource | 83,581 | 2,358,656 | ||
| † | Synaptics | 84,625 | 3,443,390 | ||
| *† | Teradyne | 99,600 | 1,615,512 | ||
| † | Unisys | 60,287 | 1,371,529 | ||
| † | VASCO Data Security International | 257,534 | 2,173,587 | ||
| † | VeriFone Holdings | 20,000 | 413,600 | ||
| 56,842,868 | |||||
| Materials – 11.44% | |||||
| Ashland | 29,700 | 2,206,710 | |||
| Carpenter Technology | 54,000 | 2,661,660 | |||
| Celanese Class A | 45,000 | 1,982,250 | |||
| † | Chemtura | 85,000 | 1,836,850 | ||
| Eastman Chemical | 46,600 | 3,255,942 | |||
| Fuller (H.B.) | 38,000 | 1,485,040 | |||
| KMG Chemicals | 129,335 | 2,514,272 | |||
| † | Landec | 230,153 | 3,330,314 | ||
| Minerals Technologies | 67,800 | 2,814,378 | |||
| *† | Molycorp | 110,000 | 572,000 | ||
| † | Owens-Illinois | 97,000 | 2,585,050 | ||
| Packaging Corp. of America | 59,400 | 2,665,278 | |||
| PolyOne | 119,000 | 2,904,790 | |||
| Rock-Tenn Class A | 27,100 | 2,514,609 | |||
| Sealed Air | 140,500 | 3,387,455 | |||
| Sonoco Products | 77,600 | 2,715,224 | |||
| 39,431,822 | |||||
| Telecommunication Services – 0.60% | |||||
| † | Vonage Holdings | 713,600 | 2,062,304 | ||
| 2,062,304 | |||||
| Utilities – 0.58% | |||||
| CMS Energy | 71,900 | 2,008,886 | |||
| 2,008,886 | |||||
| Total Common Stock | |||||
| (cost $243,578,507) | 314,479,927 | ||||
| Principal | |||||
| Amount (U.S. $) | |||||
| Short-Term Investments – 8.31% | |||||
| ≠Discount Notes – 1.36% | |||||
| Federal Home Loan Bank | |||||
| 0.085% 5/24/13 | $2,666,185 | 2,666,027 | |||
| 0.12% 4/2/13 | 2,005,009 | 2,005,009 | |||
| 4,671,036 | |||||
| Repurchase Agreements – 2.50% | |||||
| Bank of America 0.07%, dated | |||||
| 3/28/13, to be repurchased | |||||
| on 4/1/13, repurchase price | |||||
| $4,440,570 (collateralized by | |||||
| U.S. government obligations | |||||
| 0.125%-1.50% | |||||
| 8/31/18-1/15/22; | |||||
| market value $4,529,345) | 4,440,535 | 4,440,535 | |||
| BNP Paribas 0.15%, dated 3/28/13, | |||||
| to be repurchased on 4/1/13, | |||||
| repurchase price $4,193,000 | |||||
| (collateralized by U.S. | |||||
| government obligations | |||||
| 0.25%-0.875% 2/28/14-7/31/19; | |||||
| market value $4,280,986) | 4,192,930 | 4,192,930 | |||
| 8,633,465 | |||||
84
| Principal | Value | |||||||
| Amount (U.S. $) | (U.S. $) | |||||||
| Short-Term Investments (continued) | ||||||||
| ≠U.S. Treasury Obligations – 4.45% | ||||||||
| U.S. Treasury Bills | ||||||||
| 0.04% 4/11/13 | $ | 3,700,445 | $ | 3,700,416 | ||||
| 0.058% 4/18/13 | 5,202,311 | 5,202,233 | ||||||
| 0.065% 4/25/13 | 2,220,267 | 2,220,218 | ||||||
| 0.065% 5/9/13 | 787,874 | 787,836 | ||||||
| 0.101% 4/15/13 | 3,422,561 | 3,422,534 | ||||||
| 15,333,237 | ||||||||
| Total Short-Term Investments | ||||||||
| (cost $28,637,311) | 28,637,738 | |||||||
| Total Value of Securities Before Securities | ||||||||
| Lending Collateral – 99.52% | ||||||||
| (cost $272,215,818) | 343,117,665 | |||||||
| Number of | ||||||||
| Shares | ||||||||
| **Securities Lending Collateral – 0.53% | ||||||||
| Investment Companies | ||||||||
| Delaware Investments Collateral | ||||||||
| Fund No. 1 | 1,819,878 | 1,819,878 | ||||||
| †@Mellon GSL Reinvestment Trust II | 180,092 | 0 | ||||||
| Total Securities Lending Collateral | ||||||||
| (cost $1,999,970) | 1,819,878 | |||||||
| Total Value of Securities – 100.05% | ||||||||
| (cost $274,215,788) | 344,937,543 | © | ||||||
| **Obligation to Return Securities | ||||||||
| Lending Collateral – (0.58%) | (1,999,970 | ) | ||||||
| «Receivables and Other Assets Net | ||||||||
| of Other Liabilities – 0.53% | 1,825,330 | |||||||
| Net Assets Applicable to 24,395,977 | ||||||||
| Shares Outstanding – 100.00% | $ | 344,762,903 | ||||||
| Net Asset Value – Optimum Small-Mid Cap Value Fund | ||||||||
| Class A ($5,711,315 / 415,622 Shares) | $13.74 | |||||||
| Net Asset Value – Optimum Small-Mid Cap Value Fund | ||||||||
| Class B ($235,957 / 18,415 Shares) | $12.81 | |||||||
| Net Asset Value – Optimum Small-Mid Cap Value Fund | ||||||||
| Class C ($20,057,513 / 1,567,427 Shares) | $12.80 | |||||||
| Net Asset Value – Optimum Small-Mid Cap Value Fund | ||||||||
| Institutional Class ($318,758,118 / 22,394,513 Shares) | $14.23 | |||||||
| Components of Net Assets at March 31, 2013: | ||||||||
| Shares of beneficial interest | ||||||||
| (unlimited authorization – no par) | $ | 250,566,743 | ||||||
| Undistributed net investment income | 97,355 | |||||||
| Accumulated net realized gain on investments | 23,377,336 | |||||||
| Net unrealized appreciation of investments | ||||||||
| and foreign currencies | 70,721,469 | |||||||
| Total net assets | $ | 344,762,903 | ||||||
| ² | Narrow industries are utilized for compliance purposes for diversification whereas broad sectors are used for financial reporting. |
† | Non income producing security. |
* | Fully or partially on loan. |
| ≠ | The rate shown is the effective yield at the time of purchase. |
** | See Note 8 in “Notes to financial statements” for additional information on securities lending collateral and non-cash collateral. |
@ | Illiquid security. At March 31, 2013, the aggregate value of illiquid securities was $0, which represented 0.00% of the Fund’s net assets. See Note 9 in “Notes to financial statements.” |
| © | Includes $1,903,314 of securities loaned. |
| « | Includes foreign currency valued at $15,382 with a cost of $15,668. |
| Net Asset Value and Offering Price Per Share – | ||
| Optimum Small-Mid Cap Value Fund | ||
| Net asset value Class A (A) | $ | 13.74 |
| Sales charge (5.75% of offering price) (B) | 0.84 | |
| Offering price | $ | 14.58 |
| (A) | Net asset value per share, as illustrated, is the amount that would be paid upon redemption or repurchase of shares. |
| (B) | See the current prospectus for purchases of $75,000 or more. |
See accompanying notes, which are an integral part of the financial statements.
85
Statements of assets and liabilities
Optimum Fund Trust
March 31, 2013
| Optimum | Optimum | Optimum | Optimum | Optimum | Optimum | ||||||||||||||||||
| Fixed Income | International | Large Cap | Large Cap | Small-Mid Cap | Small-Mid Cap | ||||||||||||||||||
| Fund | Fund | Growth Fund | Value Fund | Growth Fund | Value Fund | ||||||||||||||||||
| Assets: | |||||||||||||||||||||||
| Investments, at value1 | $ | 1,415,464,855 | $ | 456,440,752 | $ | 849,118,417 | $ | 848,755,036 | $ | 342,127,555 | $ | 314,479,927 | |||||||||||
| Option purchased, at value | 2,766 | — | — | — | — | — | |||||||||||||||||
| Short-term investments, at value | 184,131,860 | 5,095,103 | 30,815,736 | 25,757,447 | 5,896,124 | 28,637,738 | |||||||||||||||||
| Short-term investments held as collateral | |||||||||||||||||||||||
| for loaned securities, at value | 1,137,484 | 38,430,216 | 1,280,182 | 762,187 | 7,278,964 | 1,819,878 | |||||||||||||||||
| Cash | 716,515 | 3,993,046 | 125,370 | — | 18,702 | 50,107 | |||||||||||||||||
| Cash collateral | 830,000 | — | — | — | — | — | |||||||||||||||||
| Foreign currencies, at value | 581,128 | 3,205,200 | — | 7,271 | — | 15,382 | |||||||||||||||||
| Receivables for fund shares sold | 37,511,788 | 935,336 | 1,544,257 | 1,507,831 | 652,966 | 646,651 | |||||||||||||||||
| Receivables for securities sold | 3,551,919 | 11,510,440 | 9,307,040 | 16,544,882 | 3,472,859 | 2,816,619 | |||||||||||||||||
| Variation margin receivable on futures contracts | 1,340 | — | — | — | — | — | |||||||||||||||||
| Unrealized gain of foreign currency | |||||||||||||||||||||||
| exchange contracts | 1,424,474 | 1,953,495 | — | — | 9 | — | |||||||||||||||||
| Dividends and interest receivable | 10,770,274 | 1,345,164 | 602,370 | 2,224,089 | 171,417 | 367,923 | |||||||||||||||||
| Securities lending income receivable | 2,741 | 27,582 | 854 | 8,921 | 8,092 | 1,118 | |||||||||||||||||
| Annual protection payments on credit default | |||||||||||||||||||||||
| swap contracts | 83,992 | — | — | — | — | — | |||||||||||||||||
| Unrealized gain on credit default swap contracts | |||||||||||||||||||||||
| (including upfront payments paid $406,620) | 338,146 | — | — | — | — | — | |||||||||||||||||
| Unrealized gain on interest rate swap contracts | |||||||||||||||||||||||
| (including upfront payments paid $88,415) | 1,333,140 | — | — | — | — | — | |||||||||||||||||
| Other assets | 825 | 106 | — | — | — | — | |||||||||||||||||
| Total assets | 1,657,883,247 | 522,936,440 | 892,794,226 | 895,567,664 | 359,626,688 | 348,835,343 | |||||||||||||||||
| Liabilities: | |||||||||||||||||||||||
| Cash overdraft | — | — | — | 1,475,762 | — | — | |||||||||||||||||
| Securities sold short, at value | 5,453,125 | — | — | — | — | — | |||||||||||||||||
| Options written, at value | 282,255 | — | — | — | — | — | |||||||||||||||||
| Payables for securities purchased | 149,955,054 | 14,193,682 | 10,380,604 | 14,184,518 | 2,339,833 | 1,462,205 | |||||||||||||||||
| Payables for fund shares redeemed | 722,976 | 188,890 | 359,578 | 360,837 | 131,277 | 148,128 | |||||||||||||||||
| Unrealized loss of foreign currency | |||||||||||||||||||||||
| exchange contracts | 1,004,030 | 823,101 | — | — | — | — | |||||||||||||||||
| Unrealized loss on credit default swap contracts | |||||||||||||||||||||||
| (including upfront payments received $813,577) | 664,287 | — | — | — | — | — | |||||||||||||||||
| Unrealized loss on interest rate swap contracts | |||||||||||||||||||||||
| (including upfront payments paid $77,183) | 954,857 | — | — | — | — | — | |||||||||||||||||
| Obligation to return securities lending collateral | 1,999,999 | 38,876,939 | 1,999,994 | 1,479,584 | 7,627,674 | 1,999,970 | |||||||||||||||||
| Due to manager and affiliates | 1,266,352 | 451,955 | 943,964 | 920,800 | 397,168 | 369,817 | |||||||||||||||||
| Other accrued expenses | 233,087 | 114,396 | 134,403 | 134,788 | 92,925 | 92,320 | |||||||||||||||||
| Other liabilities | 52,064 | — | 600 | — | — | — | |||||||||||||||||
| Total liabilities | 162,588,086 | 54,648,963 | 13,819,143 | 18,556,289 | 10,588,877 | 4,072,440 | |||||||||||||||||
| Total Net Assets | $ | 1,495,295,161 | $ | 468,287,477 | $ | 878,975,083 | $ | 877,011,375 | $ | 349,037,811 | $ | 344,762,903 | |||||||||||
| Investments, at cost | $ | 1,367,106,584 | $ | 432,465,316 | $ | 691,825,200 | $ | 658,836,326 | $ | 257,982,740 | $ | 243,578,507 | |||||||||||
| Securities sold short, at proceeds | (5,444,531 | ) | — | — | — | — | — | ||||||||||||||||
| Option purchased, at cost | 42,281 | — | — | — | — | — | |||||||||||||||||
| Short-term investments, at cost | 184,114,315 | 5,094,984 | 30,815,230 | 25,757,054 | 5,896,041 | 28,637,311 | |||||||||||||||||
| Short-term investments held as collateral | |||||||||||||||||||||||
| for loaned securities, at cost | 1,999,999 | 38,876,939 | 1,999,994 | 1,479,584 | 7,627,674 | 1,999,970 | |||||||||||||||||
| Foreign currencies, at cost | 602,385 | 3,188,936 | — | 7,267 | — | 15,668 | |||||||||||||||||
| Options written, at cost | (336,325 | ) | — | — | — | — | — | ||||||||||||||||
| 1Including securities on loan | 1,923,783 | 36,853,828 | 1,949,712 | 1,416,398 | 7,436,986 | 1,903,314 | |||||||||||||||||
See accompanying notes, which are an integral part of the financial statements.
86
Statements of operations
Optimum Fund Trust
Year Ended March 31, 2013
| Optimum | Optimum | Optimum | Optimum | Optimum | Optimum | ||||||||||||||||||||||
| Fixed Income | International | Large Cap | Large Cap | Small-Mid Cap | Small-Mid Cap | ||||||||||||||||||||||
| Fund | Fund | Growth Fund | Value Fund | Growth Fund | Value Fund | ||||||||||||||||||||||
| Investment Income: | |||||||||||||||||||||||||||
| Interest | $ | 48,981,910 | $ | 8,506 | $ | 40,419 | $ | 22,137 | $ | 10,613 | $ | 34,373 | |||||||||||||||
| Dividends | 416,385 | 12,354,833 | 13,530,232 | 23,458,101 | 3,667,613 | 5,026,378 | |||||||||||||||||||||
| Securities lending income | 168,052 | 376,614 | 286,297 | 476,992 | 611,584 | 96,179 | |||||||||||||||||||||
| Foreign tax withheld | (54,863 | ) | (970,021 | ) | (102,587 | ) | (57,761 | ) | (13,160 | ) | — | ||||||||||||||||
| 49,511,484 | 11,769,932 | 13,754,361 | 23,899,469 | 4,276,650 | 5,156,930 | ||||||||||||||||||||||
| Expenses: | |||||||||||||||||||||||||||
| Management fees | 7,649,618 | 2,627,764 | 6,131,426 | 5,632,349 | 3,797,114 | 3,414,966 | |||||||||||||||||||||
| Dividend disbursing and transfer | |||||||||||||||||||||||||||
| agent fees and expenses | 3,476,352 | 1,083,513 | 2,209,056 | 2,149,211 | 1,134,481 | 1,116,526 | |||||||||||||||||||||
| Administration expenses | 1,947,537 | 545,603 | 1,257,103 | 1,221,042 | 569,567 | 554,188 | |||||||||||||||||||||
| Distribution expenses – Class A | 145,185 | 31,489 | 113,978 | 106,913 | 20,319 | 18,075 | |||||||||||||||||||||
| Distribution expenses – Class B | 21,008 | 6,992 | 23,240 | 22,180 | 4,154 | 3,919 | |||||||||||||||||||||
| Distribution expenses – Class C | 1,583,665 | 313,495 | 1,134,317 | 1,069,927 | 197,557 | 187,698 | |||||||||||||||||||||
| Accounting fees | 531,698 | 126,947 | 314,439 | 304,413 | 134,230 | 130,601 | |||||||||||||||||||||
| Trustees’ fees | 169,365 | 39,185 | 101,834 | 96,889 | 43,108 | 41,829 | |||||||||||||||||||||
| Professional fees | 144,748 | 96,746 | 82,159 | 82,321 | 51,236 | 49,164 | |||||||||||||||||||||
| Reports and statements to shareholders | 135,730 | 84,119 | 77,640 | 74,316 | 61,494 | 63,195 | |||||||||||||||||||||
| Registration fees | 117,323 | 74,109 | 66,436 | 70,279 | 58,329 | 56,668 | |||||||||||||||||||||
| Custodian fees | 108,979 | 227,774 | 30,301 | 20,701 | 20,908 | 8,882 | |||||||||||||||||||||
| Pricing fees | 47,704 | 5,761 | 2,560 | 1,391 | 2,218 | 1,484 | |||||||||||||||||||||
| Insurance fees | 41,297 | 9,344 | 24,095 | 23,133 | 10,201 | 9,585 | |||||||||||||||||||||
| Other | 13,082 | 6,157 | 11,912 | 11,379 | 6,824 | 7,931 | |||||||||||||||||||||
| 16,133,291 | 5,278,998 | 11,580,496 | 10,886,444 | 6,111,740 | 5,664,711 | ||||||||||||||||||||||
| Less fees waived | (721,408 | ) | (307,422 | ) | (205,993 | ) | (142,469 | ) | (659,614 | ) | (723,602 | ) | |||||||||||||||
| Less waived distribution expenses – Class B | — | — | — | — | (184 | ) | (172 | ) | |||||||||||||||||||
| Less expense paid indirectly | (592 | ) | (607 | ) | (638 | ) | (638 | ) | (629 | ) | (636 | ) | |||||||||||||||
| Total operating expenses | 15,411,291 | 4,970,969 | 11,373,865 | 10,743,337 | 5,451,313 | 4,940,301 | |||||||||||||||||||||
| Net Investment Income (Loss) | 34,100,193 | 6,798,963 | 2,380,496 | 13,156,132 | (1,174,663 | ) | 216,629 | ||||||||||||||||||||
| Net Realized and Unrealized Gain (Loss): | |||||||||||||||||||||||||||
| Net realized gain (loss) on: | |||||||||||||||||||||||||||
| Investments | 21,904,150 | (2,664,564 | ) | 81,717,358 | 31,581,409 | 26,731,323 | 31,061,601 | ||||||||||||||||||||
| Foreign currencies | (893,363 | ) | (119,684 | ) | 39,115 | 1,077 | (13,820 | ) | (2,111 | ) | |||||||||||||||||
| Foreign currency exchange contracts | 1,473,308 | (656,822 | ) | (2,478 | ) | (8,380 | ) | 7,069 | (1,515 | ) | |||||||||||||||||
| Futures contracts | (1,889,375 | ) | 19,197 | — | — | — | — | ||||||||||||||||||||
| Options written | 688,340 | — | — | — | — | — | |||||||||||||||||||||
| Swap contracts | 713,508 | — | — | — | — | — | |||||||||||||||||||||
| Net realized gain (loss) | 21,996,568 | (3,421,873 | ) | 81,753,995 | 31,574,106 | 26,724,572 | 31,057,975 | ||||||||||||||||||||
| Net change in unrealized appreciation | |||||||||||||||||||||||||||
| (depreciation) of: | |||||||||||||||||||||||||||
| Investments | 14,654,582 | 23,756,685 | (18,188,027 | ) | 55,364,303 | 18,388,746 | 14,876,387 | ||||||||||||||||||||
| Foreign currencies | (26,873 | ) | 3 | (50,476 | ) | (8,258 | ) | 31 | (286 | ) | |||||||||||||||||
| Foreign currency exchange contracts | 1,388,338 | 1,187,734 | 3,948 | — | 9 | — | |||||||||||||||||||||
| Futures contracts | (4,337 | ) | — | — | — | — | — | ||||||||||||||||||||
| Options written | 114,291 | — | — | — | — | — | |||||||||||||||||||||
| Swap contracts | (359,235 | ) | — | — | — | — | — | ||||||||||||||||||||
| Net change in unrealized appreciation (depreciation) | 15,766,766 | 24,944,422 | (18,234,555 | ) | 55,356,045 | 18,388,786 | 14,876,101 | ||||||||||||||||||||
| Net Realized and Unrealized Gain | 37,763,334 | 21,522,549 | 63,519,440 | 86,930,151 | 45,113,358 | 45,934,076 | |||||||||||||||||||||
| Net Increase in Net Assets | |||||||||||||||||||||||||||
| Resulting from Operations | $ | 71,863,527 | $ | 28,321,512 | $ | 65,899,936 | $ | 100,086,283 | $ | 43,938,695 | $ | 46,150,705 | |||||||||||||||
See accompanying notes, which are an integral part of the financial statements.
87
Statements of changes in net assets
Optimum Fund Trust
| Optimum Fixed Income Fund | Optimum International Fund | ||||||||||||||
| Year Ended | Year Ended | ||||||||||||||
| 3/31/13 | 3/31/12 | 3/31/13 | 3/31/12 | ||||||||||||
| Increase (Decrease) in Net Assets from Operations: | |||||||||||||||
| Net investment income | $ | 34,100,193 | $ | 35,808,863 | $ | 6,798,963 | $ | 5,769,275 | |||||||
| Net realized gain (loss) | 21,996,568 | 26,623,462 | (3,421,873 | ) | (2,305,980 | ) | |||||||||
| Net change in unrealized appreciation (depreciation) | 15,766,766 | 11,224,896 | 24,944,422 | (18,403,569 | ) | ||||||||||
| Net increase (decrease) in net assets resulting from operations | 71,863,527 | 73,657,221 | 28,321,512 | (14,940,274 | ) | ||||||||||
| Dividends and Distributions to Shareholders from: | |||||||||||||||
| Net investment income: | |||||||||||||||
| Class A | (705,869 | ) | (1,400,452 | ) | (221,995 | ) | (173,139 | ) | |||||||
| Class B | (18,326 | ) | (124,278 | ) | (14,640 | ) | (10,683 | ) | |||||||
| Class C | (1,734,659 | ) | (4,493,484 | ) | (604,569 | ) | (237,826 | ) | |||||||
| Institutional Class | (24,459,033 | ) | (34,952,120 | ) | (7,542,985 | ) | (5,393,090 | ) | |||||||
| Net realized gain: | |||||||||||||||
| Class A | (885,521 | ) | (526,487 | ) | — | — | |||||||||
| Class B | (47,372 | ) | (55,074 | ) | — | — | |||||||||
| Class C | (3,438,394 | ) | (2,032,246 | ) | — | — | |||||||||
| Institutional Class | (24,939,659 | ) | (12,395,715 | ) | — | — | |||||||||
| (56,228,833 | ) | (55,979,856 | ) | (8,384,189 | ) | (5,814,738 | ) | ||||||||
| Capital Share Transactions: | |||||||||||||||
| Proceeds from shares sold: | |||||||||||||||
| Class A | 6,614,929 | 7,125,739 | 1,218,380 | 979,426 | |||||||||||
| Class B | 296,046 | 102,779 | 848 | 1,982 | |||||||||||
| Class C | 21,603,340 | 18,405,803 | 2,704,519 | 2,541,744 | |||||||||||
| Institutional Class | 409,166,594 | 344,737,019 | 196,255,415 | 84,407,565 | |||||||||||
| Net asset value of shares issued upon reinvestment of dividends | |||||||||||||||
| and distributions: | |||||||||||||||
| Class A | 1,505,154 | 1,825,346 | 216,582 | 169,731 | |||||||||||
| Class B | 60,765 | 167,562 | 13,932 | 10,278 | |||||||||||
| Class C | 5,073,086 | 6,391,577 | 593,528 | 233,901 | |||||||||||
| Institutional Class | 48,185,066 | 46,132,876 | 7,407,070 | 5,310,361 | |||||||||||
| 492,504,980 | 424,888,701 | 208,410,274 | 93,654,988 | ||||||||||||
| Cost of shares redeemed: | |||||||||||||||
| Class A | (8,123,561 | ) | (8,794,831 | ) | (1,675,759 | ) | (2,234,243 | ) | |||||||
| Class B | (2,263,772 | ) | (2,001,651 | ) | (743,674 | ) | (610,159 | ) | |||||||
| Class C | (27,829,130 | ) | (32,581,127 | ) | (5,840,722 | ) | (6,954,080 | ) | |||||||
| Institutional Class | (187,677,528 | ) | (182,353,558 | ) | (47,790,686 | ) | (46,442,258 | ) | |||||||
| (225,893,991 | ) | (225,731,167 | ) | (56,050,841 | ) | (56,240,740 | ) | ||||||||
| Increase in net assets derived from capital share transactions | 266,610,989 | 199,157,534 | 152,359,433 | 37,414,248 | |||||||||||
| Net Increase in Net Assets | 282,245,683 | 216,834,899 | 172,296,756 | 16,659,236 | |||||||||||
| Net Assets: | |||||||||||||||
| Beginning of year | 1,213,049,478 | 996,214,579 | 295,990,721 | 279,331,485 | |||||||||||
| End of year | $ | 1,495,295,161 | $ | 1,213,049,478 | $ | 468,287,477 | $ | 295,990,721 | |||||||
| Undistributed net investment income | $ | 8,689,178 | $ | 1,107,367 | $ | 931,692 | $ | 3,163,379 | |||||||
See accompanying notes, which are an integral part of the financial statements.
88
| Optimum Large Cap Growth Fund | Optimum Large Cap Value Fund | ||||||||||||||
| Year Ended | Year Ended | ||||||||||||||
| 3/31/13 | 3/31/12 | 3/31/13 | 3/31/12 | ||||||||||||
| Increase (Decrease) in Net Assets from Operations: | |||||||||||||||
| Net investment income (loss) | $ | 2,380,496 | $ | (1,195,543 | ) | $ | 13,156,132 | $ | 9,819,535 | ||||||
| Net realized gain | 81,753,995 | 34,070,265 | 31,574,106 | 895,037 | |||||||||||
| Net change in unrealized appreciation (depreciation) | (18,234,555 | ) | 29,549,864 | 55,356,045 | 39,176,300 | ||||||||||
| Net increase in net assets resulting from operations | 65,899,936 | 62,424,586 | 100,086,283 | 49,890,872 | |||||||||||
| Dividends and Distributions to Shareholders from: | |||||||||||||||
| Net investment income: | |||||||||||||||
| Class A | (14,343 | ) | — | (732,104 | ) | (236,093 | ) | ||||||||
| Class B | — | — | (32,069 | ) | (6,668 | ) | |||||||||
| Class C | — | — | (1,492,048 | ) | (159,907 | ) | |||||||||
| Institutional Class | (1,935,816 | ) | — | (19,050,268 | ) | (5,647,235 | ) | ||||||||
| (1,950,159 | ) | — | (21,306,489 | ) | (6,049,903 | ) | |||||||||
| Capital Share Transactions: | |||||||||||||||
| Proceeds from shares sold: | |||||||||||||||
| Class A | 3,617,845 | 3,365,959 | 3,489,269 | 3,175,476 | |||||||||||
| Class B | — | 3,199 | 8,398 | 4,198 | |||||||||||
| Class C | 8,431,034 | 7,470,184 | 8,322,880 | 7,374,125 | |||||||||||
| Institutional Class | 153,435,556 | 147,609,090 | 153,379,757 | 147,534,944 | |||||||||||
| Net asset value of shares issued upon reinvestment of dividends | |||||||||||||||
| and distributions: | |||||||||||||||
| Class A | 13,990 | — | 715,995 | 232,490 | |||||||||||
| Class B | — | — | 30,412 | 6,437 | |||||||||||
| Class C | — | — | 1,465,095 | 157,221 | |||||||||||
| Institutional Class | 1,902,244 | — | 18,733,067 | 5,557,758 | |||||||||||
| 167,400,669 | 158,448,432 | 186,144,873 | 164,042,649 | ||||||||||||
| Cost of shares redeemed: | |||||||||||||||
| Class A | (6,020,536 | ) | (7,033,325 | ) | (5,615,546 | ) | (7,405,494 | ) | |||||||
| Class B | (2,257,306 | ) | (1,959,532 | ) | (2,218,584 | ) | (1,813,412 | ) | |||||||
| Class C | (20,960,355 | ) | (23,442,450 | ) | (20,042,010 | ) | (21,690,877 | ) | |||||||
| Institutional Class | (131,987,000 | ) | (135,724,594 | ) | (124,035,542 | ) | (122,214,398 | ) | |||||||
| (161,225,197 | ) | (168,159,901 | ) | (151,911,682 | ) | (153,124,181 | ) | ||||||||
| Increase (decrease) in net assets derived from capital share transactions | 6,175,472 | (9,711,469 | ) | 34,233,191 | 10,918,468 | ||||||||||
| Net Increase in Net Assets | 70,125,249 | 52,713,117 | 113,012,985 | 54,759,437 | |||||||||||
| Net Assets: | |||||||||||||||
| Beginning of year | 808,849,834 | 756,136,717 | 763,998,390 | 709,238,953 | |||||||||||
| End of year | $ | 878,975,083 | $ | 808,849,834 | $ | 877,011,375 | $ | 763,998,390 | |||||||
| Undistributed (accumulated) net investment income (loss) | $ | 249,945 | $ | (217,029 | ) | $ | 1,658,748 | $ | 9,816,408 | ||||||
See accompanying notes, which are an integral part of the financial statements.
(continues) 89
Statements of changes in net assets
Optimum Fund Trust
| Optimum Small-Mid Cap Growth Fund | Optimum Small-Mid Cap Value Fund | |||||||||||||||
| Year Ended | Year Ended | |||||||||||||||
| 3/31/13 | 3/31/12 | 3/31/13 | 3/31/12 | |||||||||||||
| Increase (Decrease) in Net Assets from Operations: | ||||||||||||||||
| Net investment income (loss) | $ | (1,174,663 | ) | $ | (3,395,815 | ) | $ | 216,629 | $ | (321,479 | ) | |||||
| Net realized gain | 26,724,572 | 19,561,186 | 31,057,975 | 18,668,872 | ||||||||||||
| Net change in unrealized appreciation (depreciation) | 18,388,786 | (13,534,357 | ) | 14,876,101 | (12,454,173 | ) | ||||||||||
| Net increase in net assets resulting from operations | 43,938,695 | 2,631,014 | 46,150,705 | 5,893,220 | ||||||||||||
| Dividends and Distributions to Shareholders from: | ||||||||||||||||
| Net investment income: | ||||||||||||||||
| Institutional Class | — | — | (129,104 | ) | — | |||||||||||
| Net realized gain: | ||||||||||||||||
| Class A | (142,744 | ) | (357,682 | ) | (180,540 | ) | (53,670 | ) | ||||||||
| Class B | (12,682 | ) | (55,125 | ) | (16,448 | ) | (8,906 | ) | ||||||||
| Class C | (527,248 | ) | (1,337,094 | ) | (711,537 | ) | (213,540 | ) | ||||||||
| Institutional Class | (7,805,533 | ) | (17,659,856 | ) | (10,877,947 | ) | (2,878,962 | ) | ||||||||
| (8,488,207 | ) | (19,409,757 | ) | (11,915,576 | ) | (3,155,078 | ) | |||||||||
| Capital Share Transactions: | ||||||||||||||||
| Proceeds from shares sold: | ||||||||||||||||
| Class A | 733,570 | 563,709 | 621,539 | 470,396 | ||||||||||||
| Class B | — | 1,508 | — | 1,881 | ||||||||||||
| Class C | 1,452,841 | 1,292,696 | 1,369,455 | 1,377,784 | ||||||||||||
| Institutional Class | 77,287,163 | 83,984,281 | 77,146,866 | 85,683,785 | ||||||||||||
| Net asset value of shares issued upon reinvestment of dividends | ||||||||||||||||
| and distributions: | ||||||||||||||||
| Class A | 140,773 | 352,435 | 176,797 | 52,637 | ||||||||||||
| Class B | 12,323 | 53,832 | 15,664 | 8,646 | ||||||||||||
| Class C | 522,531 | 1,325,055 | 702,460 | 211,440 | ||||||||||||
| Institutional Class | 7,690,684 | 17,401,090 | 10,840,542 | 2,838,393 | ||||||||||||
| 87,839,885 | 104,974,606 | 90,873,323 | 90,644,962 | |||||||||||||
| Cost of shares redeemed: | ||||||||||||||||
| Class A | (1,009,965 | ) | (1,383,482 | ) | (940,201 | ) | (1,183,911 | ) | ||||||||
| Class B | (422,410 | ) | (370,439 | ) | (436,293 | ) | (361,555 | ) | ||||||||
| Class C | (3,717,995 | ) | (4,323,168 | ) | (3,525,201 | ) | (4,031,151 | ) | ||||||||
| Institutional Class | (118,385,259 | ) | (69,507,535 | ) | (112,192,164 | ) | (55,490,093 | ) | ||||||||
| (123,535,629 | ) | (75,584,624 | ) | (117,093,859 | ) | (61,066,710 | ) | |||||||||
| Increase (decrease) in net assets derived from capital share transactions | (35,695,744 | ) | 29,389,982 | (26,220,536 | ) | 29,578,252 | ||||||||||
| Net Increase (decrease) in Net Assets | (245,256 | ) | 12,611,239 | 8,014,593 | 32,316,394 | |||||||||||
| Net Assets: | ||||||||||||||||
| Beginning of year | 349,283,067 | 336,671,828 | 336,748,310 | 304,431,916 | ||||||||||||
| End of year | $ | 349,037,811 | $ | 349,283,067 | $ | 344,762,903 | $ | 336,748,310 | ||||||||
| Undistributed (distributions in excess of) net investment income | $ | (992,046 | ) | $ | (1,079,817 | ) | $ | 97,355 | $ | 13,456 | ||||||
See accompanying notes, which are an integral part of the financial statements.
90
Financial highlights
Optimum Fixed Income Fund Class A
Selected data for each share of the Fund outstanding throughout each period were as follows:
| Year Ended | |||||||||||||||||
| 3/31/13 | 3/31/12 | 3/31/11 | 3/31/10 | 3/31/09 | |||||||||||||
| Net asset value, beginning of period | $9.710 | $9.550 | $9.290 | $7.750 | $8.930 | ||||||||||||
| Income (loss) from investment operations: | |||||||||||||||||
| Net investment income1 | 0.225 | 0.293 | 0.391 | 0.661 | 0.449 | ||||||||||||
| Net realized and unrealized gain (loss) | 0.302 | 0.338 | 0.247 | 1.482 | (1.140 | ) | |||||||||||
| Total from investment operations | 0.527 | 0.631 | 0.638 | 2.143 | (0.691 | ) | |||||||||||
| Less dividends and distributions from: | |||||||||||||||||
| Net investment income | (0.172 | ) | (0.342 | ) | (0.378 | ) | (0.603 | ) | (0.462 | ) | |||||||
| Net realized gain | (0.215 | ) | (0.129 | ) | — | — | (0.027 | ) | |||||||||
| Total dividends and distributions | (0.387 | ) | (0.471 | ) | (0.378 | ) | (0.603 | ) | (0.489 | ) | |||||||
| Net asset value, end of period | $9.850 | $9.710 | $9.550 | $9.290 | $7.750 | ||||||||||||
| Total return2 | 5.47% | 6.71% | 7.01% | 28.24% | (7.82% | ) | |||||||||||
| Ratios and supplemental data: | |||||||||||||||||
| Net assets, end of period (000 omitted) | $41,210 | $40,620 | $39,758 | $40,808 | $39,299 | ||||||||||||
| Ratio of expenses to average net assets | 1.35% | 1.35% | 1.35% | 1.31% | 1.24% | ||||||||||||
| Ratio of expenses to average net assets | |||||||||||||||||
| prior to fees waived | 1.40% | 1.44% | 1.46% | 1.48% | 1.47% | ||||||||||||
| Ratio of net investment income to average net assets | 2.27% | 3.01% | 4.10% | 7.49% | 5.38% | ||||||||||||
| Ratio of net investment income to average net assets | |||||||||||||||||
| prior to fees waived | 2.22% | 2.92% | 3.99% | 7.32% | 5.15% | ||||||||||||
| Portfolio turnover | 208% | 211% | 273% | 134% | 158% | ||||||||||||
| 1 The average shares outstanding method has been applied for per share information. |
| 2 Total investment return is based on the change in net asset value of a share during the period and assumes reinvestment of dividends and distributions at net asset value and does not reflect the impact of a sales charge. Total investment return during all of the periods shown reflects a waiver by the manager. Performance would have been lower had the waiver not been in effect. |
See accompanying notes, which are an integral part of the financial statements.
(continues) 91
Financial highlights
Optimum Fixed Income Fund Class B
Selected data for each share of the Fund outstanding throughout each period were as follows:
| Year Ended | |||||||||||||||||
| 3/31/13 | 3/31/12 | 3/31/11 | 3/31/10 | 3/31/09 | |||||||||||||
| Net asset value, beginning of period | $9.700 | $9.540 | $9.280 | $7.750 | $8.930 | ||||||||||||
| Income (loss) from investment operations: | |||||||||||||||||
| Net investment income1 | 0.161 | 0.229 | 0.328 | 0.604 | 0.395 | ||||||||||||
| Net realized and unrealized gain (loss) | 0.302 | 0.340 | 0.248 | 1.486 | (1.140 | ) | |||||||||||
| Total from investment operations | 0.463 | 0.569 | 0.576 | 2.090 | (0.745 | ) | |||||||||||
| Less dividends and distributions from: | |||||||||||||||||
| Net investment income | (0.108 | ) | (0.280 | ) | (0.316 | ) | (0.560 | ) | (0.408 | ) | |||||||
| Net realized gain | (0.215 | ) | (0.129 | ) | — | — | (0.027 | ) | |||||||||
| Total dividends and distributions | (0.323 | ) | (0.409 | ) | (0.316 | ) | (0.560 | ) | (0.435 | ) | |||||||
| Net asset value, end of period | $9.840 | $9.700 | $9.540 | $9.280 | $7.750 | ||||||||||||
| Total return2 | 4.69% | 6.15% | 6.32% | 27.51% | (8.42% | ) | |||||||||||
| Ratios and supplemental data: | |||||||||||||||||
| Net assets, end of period (000 omitted) | $1,203 | $3,056 | $4,714 | $5,587 | $5,483 | ||||||||||||
| Ratio of expenses to average net assets | 2.00% | 2.00% | 2.00% | 1.96% | 1.89% | ||||||||||||
| Ratio of expenses to average net assets | |||||||||||||||||
| prior to fees waived | 2.05% | 2.09% | 2.11% | 2.13% | 2.12% | ||||||||||||
| Ratio of net investment income to average net assets | 1.62% | 2.36% | 3.45% | 6.84% | 4.73% | ||||||||||||
| Ratio of net investment income to average net assets | |||||||||||||||||
| prior to fees waived | 1.57% | 2.27% | 3.34% | 6.67% | 4.50% | ||||||||||||
| Portfolio turnover | 208% | 211% | 273% | 134% | 158% | ||||||||||||
| 1 The average shares outstanding method has been applied for per share information. |
| 2 Total investment return is based on the change in net asset value of a share during the period and assumes reinvestment of dividends and distributions at net asset value and does not reflect the impact of a sales charge. Total investment return during all of the periods shown reflects a waiver by the manager. Performance would have been lower had the waiver not been in effect. |
See accompanying notes, which are an integral part of the financial statements.
92
Optimum Fixed Income Fund Class C
Selected data for each share of the Fund outstanding throughout each period were as follows:
| Year Ended | |||||||||||||||||
| 3/31/13 | 3/31/12 | 3/31/11 | 3/31/10 | 3/31/09 | |||||||||||||
| Net asset value, beginning of period | $9.710 | $9.540 | $9.280 | $7.760 | $8.940 | ||||||||||||
| Income (loss) from investment operations: | |||||||||||||||||
| Net investment income1 | 0.161 | 0.229 | 0.329 | 0.604 | 0.395 | ||||||||||||
| Net realized and unrealized gain (loss) | 0.292 | 0.350 | 0.247 | 1.476 | (1.140 | ) | |||||||||||
| Total from investment operations | 0.453 | 0.579 | 0.576 | 2.080 | (0.745 | ) | |||||||||||
| Less dividends and distributions from: | |||||||||||||||||
| Net investment income | (0.108 | ) | (0.280 | ) | (0.316 | ) | (0.560 | ) | (0.408) | ||||||||
| Net realized gain | (0.215 | ) | (0.129 | ) | — | — | (0.027 | ) | |||||||||
| Total dividends and distributions | (0.323 | ) | (0.409 | ) | (0.316 | ) | (0.560 | ) | (0.435 | ) | |||||||
| Net asset value, end of period | $9.840 | $9.710 | $9.540 | $9.280 | $7.760 | ||||||||||||
| Total return2 | 4.69% | 6.15% | 6.32% | 27.34% | (8.41% | ) | |||||||||||
| Ratios and supplemental data: | |||||||||||||||||
| Net assets, end of period (000 omitted) | $155,728 | $154,778 | $159,759 | $170,214 | $157,185 | ||||||||||||
| Ratio of expenses to average net assets | 2.00% | 2.00% | 2.00% | 1.96% | 1.89% | ||||||||||||
| Ratio of expenses to average net assets | |||||||||||||||||
| prior to fees waived | 2.05% | 2.09% | 2.11% | 2.13% | 2.12% | ||||||||||||
| Ratio of net investment income to average net assets | 1.62% | 2.36% | 3.45% | 6.84% | 4.73% | ||||||||||||
| Ratio of net investment income to average net assets | |||||||||||||||||
| prior to fees waived | 1.57% | 2.27% | 3.34% | 6.67% | 4.50% | ||||||||||||
| Portfolio turnover | 208% | 211% | 273% | 134% | 158% | ||||||||||||
| 1 The average shares outstanding method has been applied for per share information. |
| 2 Total investment return is based on the change in net asset value of a share during the period and assumes reinvestment of dividends and distributions at net asset value and does not reflect the impact of a sales charge. Total investment return during all of the periods shown reflects a waiver by the manager. Performance would have been lower had the waiver not been in effect. |
See accompanying notes, which are an integral part of the financial statements.
(continues) 93
Financial highlights
Optimum Fixed Income Fund Institutional Class
Selected data for each share of the Fund outstanding throughout each period were as follows:
| Year Ended | |||||||||||||||||
| 3/31/13 | 3/31/12 | 3/31/11 | 3/31/10 | 3/31/09 | |||||||||||||
| Net asset value, beginning of period | $9.710 | $9.550 | $9.290 | $7.740 | $8.920 | ||||||||||||
| Income (loss) from investment operations: | |||||||||||||||||
| Net investment income1 | 0.260 | 0.327 | 0.424 | 0.692 | 0.479 | ||||||||||||
| Net realized and unrealized gain (loss) | 0.301 | 0.338 | 0.247 | 1.484 | (1.141 | ) | |||||||||||
| Total from investment operations | 0.561 | 0.665 | 0.671 | 2.176 | (0.662 | ) | |||||||||||
| Less dividends and distributions from: | |||||||||||||||||
| Net investment income | (0.206 | ) | (0.376 | ) | (0.411 | ) | (0.626 | ) | (0.491) | ||||||||
| Net realized gain | (0.215 | ) | (0.129 | ) | — | — | (0.027 | ) | |||||||||
| Total dividends and distributions | (0.421 | ) | (0.505 | ) | (0.411 | ) | (0.626 | ) | (0.518 | ) | |||||||
| Net asset value, end of period | $9.850 | $9.710 | $9.550 | $9.290 | $7.740 | ||||||||||||
| Total return2 | 5.72% | 7.20% | 7.39% | 28.73% | (7.51% | ) | |||||||||||
| Ratios and supplemental data: | |||||||||||||||||
| Net assets, end of period (000 omitted) | $1,297,154 | $1,014,595 | $791,984 | $579,694 | $434,285 | ||||||||||||
| Ratio of expenses to average net assets | 1.00% | 1.00% | 1.00% | 0.96% | 0.89% | ||||||||||||
| Ratio of expenses to average net assets | |||||||||||||||||
| prior to fees waived | 1.05% | 1.09% | 1.11% | 1.13% | 1.12% | ||||||||||||
| Ratio of net investment income to average net assets | 2.62% | 3.36% | 4.45% | 7.84% | 5.73% | ||||||||||||
| Ratio of net investment income to average net assets | |||||||||||||||||
| prior to fees waived | 2.57% | 3.27% | 4.34% | 7.67% | 5.50% | ||||||||||||
| Portfolio turnover | 208% | 211% | 273% | 134% | 158% | ||||||||||||
| 1 The average shares outstanding method has been applied for per share information. |
| 2 Total investment return is based on the change in net asset value of a share during the period and assumes reinvestment of dividends and distributions at net asset value. Total investment return during all of the periods shown reflects a waiver by the manager. Performance would have been lower had the waiver not been in effect. |
See accompanying notes, which are an integral part of the financial statements.
94
Optimum International Fund Class A
Selected data for each share of the Fund outstanding throughout each period were as follows:
| Year Ended | |||||||||||||||||
| 3/31/13 | 3/31/12 | 3/31/11 | 3/31/10 | 3/31/09 | |||||||||||||
| Net asset value, beginning of period | $10.420 | $11.200 | $10.340 | $7.010 | $13.840 | ||||||||||||
| Income (loss) from investment operations: | |||||||||||||||||
| Net investment income1 | 0.185 | 0.192 | 0.129 | 0.124 | 0.280 | ||||||||||||
| Net realized and unrealized gain (loss) | 0.620 | (0.790 | ) | 0.887 | 3.366 | (6.557 | ) | ||||||||||
| Total from investment operations | 0.805 | (0.598 | ) | 1.016 | 3.490 | (6.277 | ) | ||||||||||
| Less dividends and distributions from: | |||||||||||||||||
| Net investment income | (0.255 | ) | (0.182 | ) | (0.156 | ) | (0.160 | ) | (0.326 | ) | |||||||
| Net realized gain | — | — | — | — | (0.227 | ) | |||||||||||
| Total dividends and distributions | (0.255 | ) | (0.182 | ) | (0.156 | ) | (0.160 | ) | (0.553 | ) | |||||||
| Net asset value, end of period | $10.970 | $10.420 | $11.200 | $10.340 | $7.010 | ||||||||||||
| Total return2 | 8.10% | (5.30% | ) | 10.19% | 50.29% | (46.64% | ) | ||||||||||
| Ratios and supplemental data: | |||||||||||||||||
| Net assets, end of period (000 omitted) | $9,553 | $9,318 | $11,189 | $12,082 | $9,578 | ||||||||||||
| Ratio of expenses to average net assets | 1.75% | 1.75% | 1.75% | 1.75% | 1.77% | ||||||||||||
| Ratio of expenses to average net assets prior to fees waived | 1.84% | 1.84% | 1.88% | 1.94% | 1.86% | ||||||||||||
| Ratio of net investment income to average net assets | 1.81% | 1.84% | 1.26% | 1.30% | 2.66% | ||||||||||||
| Ratio of net investment income to average net assets prior to fees waived | 1.72% | 1.75% | 1.13% | 1.11% | 2.57% | ||||||||||||
| Portfolio turnover | 70% | 50% | 95% | 91% | 58% | ||||||||||||
| 1 The average shares outstanding method has been applied for per share information. |
| 2 Total investment return is based on the change in net asset value of a share during the period and assumes reinvestment of dividends and distributions at net asset value and does not reflect the impact of a sales charge. Total investment return during all of the periods shown reflects a waiver by the manager. Performance would have been lower had the waiver not been in effect. |
See accompanying notes, which are an integral part of the financial statements.
(continues) 95
Financial highlights
Optimum International Fund Class B
Selected data for each share of the Fund outstanding throughout each period were as follows:
| Year Ended | |||||||||||||||||
| 3/31/13 | 3/31/12 | 3/31/11 | 3/31/10 | 3/31/09 | |||||||||||||
| Net asset value, beginning of period | $10.220 | $10.940 | $10.100 | $6.880 | $13.580 | ||||||||||||
| Income (loss) from investment operations: | |||||||||||||||||
| Net investment income1 | 0.115 | 0.122 | 0.061 | 0.064 | 0.213 | ||||||||||||
| Net realized and unrealized gain (loss) | 0.617 | (0.773 | ) | 0.875 | 3.304 | (6.436 | ) | ||||||||||
| Total from investment operations | 0.732 | (0.651 | ) | 0.936 | 3.368 | (6.223 | ) | ||||||||||
| Less dividends and distributions from: | |||||||||||||||||
| Net investment income | (0.192 | ) | (0.069 | ) | (0.096 | ) | (0.148 | ) | (0.250 | ) | |||||||
| Net realized gain | — | — | — | — | (0.227 | ) | |||||||||||
| Total dividends and distributions | (0.192 | ) | (0.069 | ) | (0.096 | ) | (0.148 | ) | (0.477 | ) | |||||||
| Net asset value, end of period | $10.760 | $10.220 | $10.940 | $10.100 | $6.880 | ||||||||||||
| Total return2 | 7.38% | (5.94% | ) | 9.49% | 49.42% | (47.02% | ) | ||||||||||
| Ratios and supplemental data: | |||||||||||||||||
| Net assets, end of period (000 omitted) | $412 | $1,139 | $1,868 | $2,243 | $1,764 | ||||||||||||
| Ratio of expenses to average net assets | 2.40% | 2.40% | 2.40% | 2.40% | 2.42% | ||||||||||||
| Ratio of expenses to average net assets prior to fees waived | 2.49% | 2.49% | 2.53% | 2.59% | 2.51% | ||||||||||||
| Ratio of net investment income to average net assets | 1.16% | 1.19% | 0.61% | 0.65% | 2.01% | ||||||||||||
| Ratio of net investment income to average net assets prior to fees waived | 1.07% | 1.10% | 0.48% | 0.46% | 1.92% | ||||||||||||
| Portfolio turnover | 70% | 50% | 95% | 91% | 58% | ||||||||||||
| 1 The average shares outstanding method has been applied for per share information. |
| 2 Total investment return is based on the change in net asset value of a share during the period and assumes reinvestment of dividends and distributions at net asset value and does not reflect the impact of a sales charge. Total investment return during all of the periods shown reflects a waiver by the manager. Performance would have been lower had the waiver not been in effect. |
See accompanying notes, which are an integral part of the financial statements.
96
Optimum International Fund Class C
Selected data for each share of the Fund outstanding throughout each period were as follows:
| Year Ended | |||||||||||||||||
| 3/31/13 | 3/31/12 | 3/31/11 | 3/31/10 | 3/31/09 | |||||||||||||
| Net asset value, beginning of period | $10.230 | $10.950 | $10.100 | $6.890 | $13.590 | ||||||||||||
| Income (loss) from investment operations: | |||||||||||||||||
| Net investment income1 | 0.116 | 0.122 | 0.061 | 0.064 | 0.213 | ||||||||||||
| Net realized and unrealized gain (loss) | 0.606 | (0.773 | ) | 0.885 | 3.294 | (6.436 | ) | ||||||||||
| Total from investment operations | 0.722 | (0.651 | ) | 0.946 | 3.358 | (6.223 | ) | ||||||||||
| Less dividends and distributions from: | |||||||||||||||||
| Net investment income | (0.192 | ) | (0.069 | ) | (0.096 | ) | (0.148 | ) | (0.250 | ) | |||||||
| Net realized gain | — | — | — | — | (0.227 | ) | |||||||||||
| Total dividends and distributions | (0.192 | ) | (0.069 | ) | (0.096 | ) | (0.148 | ) | (0.477 | ) | |||||||
| Net asset value, end of period | $10.760 | $10.230 | $10.950 | $10.100 | $6.890 | ||||||||||||
| Total return2 | 7.37% | (5.94% | ) | 9.59% | 49.20% | (46.98% | ) | ||||||||||
| Ratios and supplemental data: | |||||||||||||||||
| Net assets, end of period (000 omitted) | $32,064 | $32,995 | $39,762 | $43,260 | $34,520 | ||||||||||||
| Ratio of expenses to average net assets | 2.40% | 2.40% | 2.40% | 2.40% | 2.42% | ||||||||||||
| Ratio of expenses to average net assets prior to fees waived | 2.49% | 2.49% | 2.53% | 2.59% | 2.51% | ||||||||||||
| Ratio of net investment income to average net assets | 1.16% | 1.19% | 0.61% | 0.65% | 2.01% | ||||||||||||
| Ratio of net investment income to average net assets prior to fees waived | 1.07% | 1.10% | 0.48% | 0.46% | 1.92% | ||||||||||||
| Portfolio turnover | 70% | 50% | 95% | 91% | 58% | ||||||||||||
| 1 The average shares outstanding method has been applied for per share information. |
| 2 Total investment return is based on the change in net asset value of a share during the period and assumes reinvestment of dividends and distributions at net asset value and does not reflect the impact of a sales charge. Total investment return during all of the periods shown reflects a waiver by the manager. Performance would have been lower had the waiver not been in effect. |
See accompanying notes, which are an integral part of the financial statements.
(continues) 97
Financial highlights
Optimum International Fund Institutional Class
Selected data for each share of the Fund outstanding throughout each period were as follows:
| Year Ended | |||||||||||||||||
| 3/31/13 | 3/31/12 | 3/31/11 | 3/31/10 | 3/31/09 | |||||||||||||
| Net asset value, beginning of period | $10.490 | $11.300 | $10.430 | $7.050 | $13.940 | ||||||||||||
| Income (loss) from investment operations: | |||||||||||||||||
| Net investment income1 | 0.223 | 0.229 | 0.168 | 0.157 | 0.317 | ||||||||||||
| Net realized and unrealized gain (loss) | 0.627 | (0.793 | ) | 0.887 | 3.393 | (6.611 | ) | ||||||||||
| Total from investment operations | 0.850 | (0.564 | ) | 1.055 | 3.550 | (6.294 | ) | ||||||||||
| Less dividends and distributions from: | |||||||||||||||||
| Net investment income | (0.290 | ) | (0.246 | ) | (0.185 | ) | (0.170 | ) | (0.369 | ) | |||||||
| Net realized gain | — | — | — | — | (0.227 | ) | |||||||||||
| Total dividends and distributions | (0.290 | ) | (0.246 | ) | (0.185 | ) | (0.170 | ) | (0.596 | ) | |||||||
| Net asset value, end of period | $11.050 | $10.490 | $11.300 | $10.430 | $7.050 | ||||||||||||
| Total return2 | 8.41% | (4.93% | ) | 10.55% | 50.88% | (46.49% | ) | ||||||||||
| Ratios and supplemental data: | |||||||||||||||||
| Net assets, end of period (000 omitted) | $426,258 | $252,539 | $226,512 | $146,156 | $79,430 | ||||||||||||
| Ratio of expenses to average net assets | 1.40% | 1.40% | 1.40% | 1.40% | 1.42% | ||||||||||||
| Ratio of expenses to average net assets prior to fees waived | 1.49% | 1.49% | 1.53% | 1.59% | 1.51% | ||||||||||||
| Ratio of net investment income to average net assets | 2.16% | 2.19% | 1.61% | 1.65% | 3.01% | ||||||||||||
| Ratio of net investment income to average net assets prior to fees waived | 2.07% | 2.10% | 1.48% | 1.46% | 2.92% | ||||||||||||
| Portfolio turnover | 70% | 50% | 95% | 91% | 58% | ||||||||||||
| 1 The average shares outstanding method has been applied for per share information. |
| 2 Total investment return is based on the change in net asset value of a share during the period and assumes reinvestment of dividends and distributions at net asset value. Total investment return during all of the periods shown reflects a waiver by the manager. Performance would have been lower had the waiver not been in effect. |
See accompanying notes, which are an integral part of the financial statements.
98
Optimum Large Cap Growth Fund Class A
Selected data for each share of the Fund outstanding throughout each period were as follows:
| Year Ended | |||||||||||||||||
| 3/31/13 | 3/31/12 | 3/31/11 | 3/31/10 | 3/31/09 | |||||||||||||
| Net asset value, beginning of period | $13.480 | $12.430 | $10.640 | $6.990 | $11.220 | ||||||||||||
| Income (loss) from investment operations: | |||||||||||||||||
| Net investment income (loss)1 | 0.014 | (0.040 | ) | (0.062 | ) | (0.025 | ) | (0.001 | ) | ||||||||
| Net realized and unrealized gain (loss) | 1.042 | 1.090 | 1.852 | 3.675 | (4.229 | ) | |||||||||||
| Total from investment operations | 1.056 | 1.050 | 1.790 | 3.650 | (4.230 | ) | |||||||||||
| Less dividends and distributions from: | |||||||||||||||||
| Net investment income | (0.006 | ) | — | — | — | — | |||||||||||
| Total dividends and distributions | (0.006 | ) | — | — | — | — | |||||||||||
| Net asset value, end of period | $14.530 | $13.480 | $12.430 | $10.640 | $6.990 | ||||||||||||
| Total return2 | 7.76% | 8.45% | 16.82% | 52.22% | (37.70% | ) | |||||||||||
| Ratios and supplemental data: | |||||||||||||||||
| Net assets, end of period (000 omitted) | $34,182 | $34,170 | $35,359 | $36,288 | $28,347 | ||||||||||||
| Ratio of expenses to average net assets | 1.60% | 1.61% | 1.61% | 1.61% | 1.61% | ||||||||||||
| Ratio of expenses to average net assets | |||||||||||||||||
| prior to fees waived | 1.63% | 1.64% | 1.64% | 1.66% | 1.64% | ||||||||||||
| Ratio of net investment income (loss) to average net assets | 0.10% | (0.34% | ) | (0.57% | ) | (0.28% | ) | (0.01% | ) | ||||||||
| Ratio of net investment income (loss) to average net assets | |||||||||||||||||
| prior to fees waived | 0.07% | (0.37% | ) | (0.60% | ) | (0.33% | ) | (0.04% | ) | ||||||||
| Portfolio turnover | 102% | 89% | 117% | 145% | 164% | ||||||||||||
| 1 The average shares outstanding method has been applied for per share information. |
| 2 Total investment return is based on the change in net asset value of a share during the period and assumes reinvestment of dividends and distributions at net asset value and does not reflect the impact of a sales charge. Total investment return during all of the periods shown reflects a waiver by the manager. Performance would have been lower had the waiver not been in effect. |
See accompanying notes, which are an integral part of the financial statements.
(continues) 99
Financial highlights
Optimum Large Cap Growth Fund Class B
Selected data for each share of the Fund outstanding throughout each period were as follows:
| Year Ended | |||||||||||||||||
| 3/31/13 | 3/31/12 | 3/31/11 | 3/31/10 | 3/31/09 | |||||||||||||
| Net asset value, beginning of period | $12.730 | $11.820 | $10.180 | $6.730 | $10.870 | ||||||||||||
| Income (loss) from investment operations: | |||||||||||||||||
| Net investment loss1 | (0.068 | ) | (0.112 | ) | (0.127 | ) | (0.081 | ) | (0.059 | ) | |||||||
| Net realized and unrealized gain (loss) | 0.968 | 1.022 | 1.767 | 3.531 | (4.081 | ) | |||||||||||
| Total from investment operations | 0.900 | 0.910 | 1.640 | 3.450 | (4.140 | ) | |||||||||||
| Net asset value, end of period | $13.630 | $12.730 | $11.820 | $10.180 | $6.730 | ||||||||||||
| Total return2 | 7.07% | 7.70% | 16.11% | 51.26% | (38.09% | ) | |||||||||||
| Ratios and supplemental data: | |||||||||||||||||
| Net assets, end of period (000 omitted) | $1,447 | $3,628 | $5,381 | $6,135 | $4,780 | ||||||||||||
| Ratio of expenses to average net assets | 2.25% | 2.26% | 2.26% | 2.26% | 2.26% | ||||||||||||
| Ratio of expenses to average net assets | |||||||||||||||||
| prior to fees waived | 2.28% | 2.29% | 2.29% | 2.31% | 2.29% | ||||||||||||
| Ratio of net investment loss to average net assets | (0.55% | ) | (0.99% | ) | (1.22% | ) | (0.93% | ) | (0.66% | ) | |||||||
| Ratio of net investment loss to average net assets | |||||||||||||||||
| prior to fees waived | (0.58% | ) | (1.02% | ) | (1.25% | ) | (0.98% | ) | (0.69% | ) | |||||||
| Portfolio turnover | 102% | 89% | 117% | 145% | 164% | ||||||||||||
| 1 The average shares outstanding method has been applied for per share information. |
| 2 Total investment return is based on the change in net asset value of a share during the period and assumes reinvestment of dividends and distributions at net asset value and does not reflect the impact of a sales charge. Total investment return during all of the periods shown reflects a waiver by the manager. Performance would have been lower had the waiver not been in effect. |
See accompanying notes, which are an integral part of the financial statements.
100
Optimum Large Cap Growth Fund Class C
Selected data for each share of the Fund outstanding throughout each period were as follows:
| Year Ended | |||||||||||||||||
| 3/31/13 | 3/31/12 | 3/31/11 | 3/31/10 | 3/31/09 | |||||||||||||
| Net asset value, beginning of period | $12.720 | $11.820 | $10.180 | $6.730 | $10.870 | ||||||||||||
| Income (loss) from investment operations: | |||||||||||||||||
| Net investment loss1 | (0.069 | ) | (0.112 | ) | (0.127 | ) | (0.081 | ) | (0.059 | ) | |||||||
| Net realized and unrealized gain (loss) | 0.979 | 1.012 | 1.767 | 3.531 | (4.081 | ) | |||||||||||
| Total from investment operations | 0.910 | 0.900 | 1.640 | 3.450 | (4.140 | ) | |||||||||||
| Net asset value, end of period | $13.630 | $12.720 | $11.820 | $10.180 | $6.730 | ||||||||||||
| Total return2 | 7.15% | 7.61% | 16.11% | 51.26% | (38.09% | ) | |||||||||||
| Ratios and supplemental data: | |||||||||||||||||
| Net assets, end of period (000 omitted) | $115,242 | $120,183 | $128,256 | $132,242 | $102,233 | ||||||||||||
| Ratio of expenses to average net assets | 2.25% | 2.26% | 2.26% | 2.26% | 2.26% | ||||||||||||
| Ratio of expenses to average net assets | |||||||||||||||||
| prior to fees waived | 2.28% | 2.29% | 2.29% | 2.31% | 2.29% | ||||||||||||
| Ratio of net investment loss to average net assets | (0.55% | ) | (0.99% | ) | (1.22% | ) | (0.93% | ) | (0.66% | ) | |||||||
| Ratio of net investment loss to average net assets | |||||||||||||||||
| prior to fees waived | (0.58% | ) | (1.02% | ) | (1.25% | ) | (0.98% | ) | (0.69% | ) | |||||||
| Portfolio turnover | 102% | 89% | 117% | 145% | 164% | ||||||||||||
1 The average shares outstanding method has been applied for per share information. |
| 2 Total investment return is based on the change in net asset value of a share during the period and assumes reinvestment of dividends and distributions at net asset value and does not reflect the impact of a sales charge. Total investment return during all of the periods shown reflects a waiver by the manager. Performance would have been lower had the waiver not been in effect. |
See accompanying notes, which are an integral part of the financial statements.
(continues) 101
Financial highlights
Optimum Large Cap Growth Fund Institutional Class
Selected data for each share of the Fund outstanding throughout each period were as follows:
| Year Ended | |||||||||||||||||
| 3/31/13 | 3/31/12 | 3/31/11 | 3/31/10 | 3/31/09 | |||||||||||||
| Net asset value, beginning of period | $13.880 | $12.760 | $10.880 | $7.130 | $11.410 | ||||||||||||
| Income (loss) from investment operations: | |||||||||||||||||
| Net investment income (loss)1 | 0.062 | 0.002 | (0.025 | ) | 0.007 | 0.032 | |||||||||||
| Net realized and unrealized gain (loss) | 1.068 | 1.118 | 1.905 | 3.758 | (4.312 | ) | |||||||||||
| Total from investment operations | 1.130 | 1.120 | 1.880 | 3.765 | (4.280 | ) | |||||||||||
| Less dividends and distributions from: | |||||||||||||||||
| Net investment income | (0.040 | ) | — | — | (0.015 | ) | — | ||||||||||
| Total dividends and distributions | (0.040 | ) | — | — | (0.015 | ) | — | ||||||||||
| Net asset value, end of period | $14.970 | $13.880 | $12.760 | $10.880 | $7.130 | ||||||||||||
| Total return2 | 8.25% | 8.78% | 17.28% | 52.87% | (37.51% | ) | |||||||||||
| Ratios and supplemental data: | |||||||||||||||||
| Net assets, end of period (000 omitted) | $728,104 | $650,869 | $587,141 | $532,282 | $402,574 | ||||||||||||
| Ratio of expenses to average net assets | 1.25% | 1.26% | 1.26% | 1.26% | 1.26% | ||||||||||||
| Ratio of expenses to average net assets | |||||||||||||||||
| prior to fees waived | 1.28% | 1.29% | 1.29% | 1.31% | 1.29% | ||||||||||||
| Ratio of net investment income (loss) to average net assets | 0.45% | 0.01% | (0.22% | ) | 0.07% | 0.34% | |||||||||||
| Ratio of net investment income (loss) to average net assets | |||||||||||||||||
| prior to fees waived | 0.42% | (0.02% | ) | (0.25% | ) | 0.02% | 0.31% | ||||||||||
| Portfolio turnover | 102% | 89% | 117% | 145% | 164% | ||||||||||||
1 The average shares outstanding method has been applied for per share information. |
| 2 Total investment return is based on the change in net asset value of a share during the period and assumes reinvestment of dividends and distributions at net asset value. Total investment return during all of the periods shown reflects a waiver by the manager. Performance would have been lower had the waiver not been in effect. |
See accompanying notes, which are an integral part of the financial statements.
102
Optimum Large Cap Value Fund Class A
Selected data for each share of the Fund outstanding throughout each period were as follows:
| Year Ended | |||||||||||||||||
| 3/31/13 | 3/31/12 | 3/31/11 | 3/31/10 | 3/31/09 | |||||||||||||
| Net asset value, beginning of period | $11.750 | $11.060 | $9.830 | $6.710 | $11.170 | ||||||||||||
| Income (loss) from investment operations: | |||||||||||||||||
| Net investment income1 | 0.173 | 0.133 | 0.075 | 0.118 | 0.165 | ||||||||||||
| Net realized and unrealized gain (loss) | 1.259 | 0.635 | 1.274 | 3.181 | (4.453 | ) | |||||||||||
| Total from investment operations | 1.432 | 0.768 | 1.349 | 3.299 | (4.288 | ) | |||||||||||
| Less dividends and distributions from: | |||||||||||||||||
| Net investment income | (0.282 | ) | (0.078 | ) | (0.119 | ) | (0.179 | ) | (0.029 | ) | |||||||
| Net realized gain | — | — | — | — | (0.143 | ) | |||||||||||
| Total dividends and distributions | (0.282 | ) | (0.078 | ) | (0.119 | ) | (0.179 | ) | (0.172 | ) | |||||||
| Net asset value, end of period | $12.900 | $11.750 | $11.060 | $9.830 | $6.710 | ||||||||||||
| Total return2 | 12.48% | 7.01% | 14.00% | 49.92% | (38.97% | ) | |||||||||||
| Ratios and supplemental data: | |||||||||||||||||
| Net assets, end of period (000 omitted) | $32,995 | $31,478 | $33,892 | $34,167 | $26,901 | ||||||||||||
| Ratio of expenses to average net assets | 1.57% | 1.57% | 1.59% | 1.58% | 1.54% | ||||||||||||
| Ratio of expenses to average net assets | |||||||||||||||||
| prior to fees waived | 1.59% | 1.60% | 1.61% | 1.62% | 1.60% | ||||||||||||
| Ratio of net investment income to average net assets | 1.48% | 1.25% | 0.77% | 1.38% | 1.82% | ||||||||||||
| Ratio of net investment income to average net assets | |||||||||||||||||
| prior to fees waived | 1.46% | 1.22% | 0.75% | 1.34% | 1.76% | ||||||||||||
| Portfolio turnover | 49% | 57% | 82% | 28% | 37% | ||||||||||||
1 The average shares outstanding method has been applied for per share information. |
| 2 Total investment return is based on the change in net asset value of a share during the period and assumes reinvestment of dividends and distributions at net asset value and does not reflect the impact of a sales charge. Total investment return during all of the periods shown reflects a waiver by the manager. Performance would have been lower had the waiver not been in effect. |
See accompanying notes, which are an integral part of the financial statements.
(continues) 103
Optimum Large Cap Value Fund Class B
Selected data for each share of the Fund outstanding throughout each period were as follows:
| Year Ended | |||||||||||||||||
| 3/31/13 | 3/31/12 | 3/31/11 | 3/31/10 | 3/31/09 | |||||||||||||
| Net asset value, beginning of period | $11.600 | $10.930 | $9.720 | $6.630 | $11.090 | ||||||||||||
| Income (loss) from investment operations: | |||||||||||||||||
| Net investment income1 | 0.095 | 0.063 | 0.012 | 0.063 | 0.106 | ||||||||||||
| Net realized and unrealized gain (loss) | 1.255 | 0.622 | 1.262 | 3.147 | (4.413 | ) | |||||||||||
| Total from investment operations | 1.350 | 0.685 | 1.274 | 3.210 | (4.307 | ) | |||||||||||
| Less dividends and distributions from: | |||||||||||||||||
| Net investment income | (0.160 | ) | (0.015 | ) | (0.064 | ) | (0.120 | ) | (0.010 | ) | |||||||
| Net realized gain | — | — | — | — | (0.143 | ) | |||||||||||
| Total dividends and distributions | (0.160 | ) | (0.015 | ) | (0.064 | ) | (0.120 | ) | (0.153 | ) | |||||||
| Net asset value, end of period | $12.790 | $11.600 | $10.930 | $9.720 | $6.630 | ||||||||||||
| Total return2 | 11.84% | 6.28% | 13.25% | 48.92% | (39.37% | ) | |||||||||||
| Ratios and supplemental data: | |||||||||||||||||
| Net assets, end of period (000 omitted) | $1,425 | $3,478 | $5,135 | $5,943 | $4,664 | ||||||||||||
| Ratio of expenses to average net assets | 2.22% | 2.22% | 2.24% | 2.23% | 2.19% | ||||||||||||
| Ratio of expenses to average net assets | |||||||||||||||||
| prior to fees waived | 2.24% | 2.25% | 2.26% | 2.27% | 2.25% | ||||||||||||
| Ratio of net investment income to average net assets | 0.83% | 0.60% | 0.12% | 0.73% | 1.17% | ||||||||||||
| Ratio of net investment income to average net assets | |||||||||||||||||
| prior to fees waived | 0.81% | 0.57% | 0.10% | 0.69% | 1.11% | ||||||||||||
| Portfolio turnover | 49% | 57% | 82% | 28% | 37% | ||||||||||||
1 The average shares outstanding method has been applied for per share information. |
| 2 Total investment return is based on the change in net asset value of a share during the period and assumes reinvestment of dividends and distributions at net asset value and does not reflect the impact of a sales charge. Total investment return during all of the periods shown reflects a waiver by the manager. Performance would have been lower had the waiver not been in effect. |
See accompanying notes, which are an integral part of the financial statements.
104
Optimum Large Cap Value Fund Class C
Selected data for each share of the Fund outstanding throughout each period were as follows:
| Year Ended | |||||||||||||||||
| 3/31/13 | 3/31/12 | 3/31/11 | 3/31/10 | 3/31/09 | |||||||||||||
| Net asset value, beginning of period | $11.590 | $10.930 | $9.710 | $6.630 | $11.080 | ||||||||||||
| Income (loss) from investment operations: | |||||||||||||||||
| Net investment income1 | 0.096 | 0.063 | 0.012 | 0.063 | 0.106 | ||||||||||||
| Net realized and unrealized gain (loss) | 1.254 | 0.612 | 1.272 | 3.137 | (4.403 | ) | |||||||||||
| Total from investment operations | 1.350 | 0.675 | 1.284 | 3.200 | (4.297 | ) | |||||||||||
| Less dividends and distributions from: | |||||||||||||||||
| Net investment income | (0.160 | ) | (0.015 | ) | (0.064 | ) | (0.120 | ) | (0.010 | ) | |||||||
| Net realized gain | — | — | — | — | (0.143 | ) | |||||||||||
| Total dividends and distributions | (0.160 | ) | (0.015 | ) | (0.064 | ) | (0.120 | ) | (0.153 | ) | |||||||
| Net asset value, end of period | $12.780 | $11.590 | $10.930 | $9.710 | $6.630 | ||||||||||||
| Total return2 | 11.85% | 6.19% | 13.37% | 48.76% | (39.31% | ) | |||||||||||
| Ratios and supplemental data: | |||||||||||||||||
| Net assets, end of period (000 omitted) | $111,806 | $111,557 | $119,899 | $125,961 | $98,881 | ||||||||||||
| Ratio of expenses to average net assets | 2.22% | 2.22% | 2.24% | 2.23% | 2.19% | ||||||||||||
| Ratio of expenses to average net assets | |||||||||||||||||
| prior to fees waived | 2.24% | 2.25% | 2.26% | 2.27% | 2.25% | ||||||||||||
| Ratio of net investment income to average net assets | 0.83% | 0.60% | 0.12% | 0.73% | 1.17% | ||||||||||||
| Ratio of net investment income to average net assets | |||||||||||||||||
| prior to fees waived | 0.81% | 0.57% | 0.10% | 0.69% | 1.11% | ||||||||||||
| Portfolio turnover | 49% | 57% | 82% | 28% | 37% | ||||||||||||
1 The average shares outstanding method has been applied for per share information. |
| 2 Total investment return is based on the change in net asset value of a share during the period and assumes reinvestment of dividends and distributions at net asset value and does not reflect the impact of a sales charge. Total investment return during all of the periods shown reflects a waiver by the manager. Performance would have been lower had the waiver not been in effect. |
See accompanying notes, which are an integral part of the financial statements.
(continues) 105
Financial highlights
Optimum Large Cap Value Fund Institutional Class
Selected data for each share of the Fund outstanding throughout each period were as follows:
| Year Ended | |||||||||||||||||
| 3/31/13 | 3/31/12 | 3/31/11 | 3/31/10 | 3/31/09 | |||||||||||||
| Net asset value, beginning of period | $11.800 | $11.110 | $9.870 | $6.740 | $11.190 | ||||||||||||
| Income (loss) from investment operations: | |||||||||||||||||
| Net investment income1 | 0.214 | 0.171 | 0.110 | 0.148 | 0.197 | ||||||||||||
| Net realized and unrealized gain (loss) | 1.255 | 0.631 | 1.279 | 3.193 | (4.465 | ) | |||||||||||
| Total from investment operations | 1.469 | 0.802 | 1.389 | 3.341 | (4.268 | ) | |||||||||||
| Less dividends and distributions from: | |||||||||||||||||
| Net investment income | (0.349 | ) | (0.112 | ) | (0.149 | ) | (0.211 | ) | (0.039 | ) | |||||||
| Net realized gain | — | — | — | — | (0.143 | ) | |||||||||||
| Total dividends and distributions | (0.349 | ) | (0.112 | ) | (0.149 | ) | (0.211 | ) | (0.182 | ) | |||||||
| Net asset value, end of period | $12.920 | $11.800 | $11.110 | $9.870 | $6.740 | ||||||||||||
| Total return2 | 12.92% | 7.32% | 14.42% | 50.47% | (38.76% | ) | |||||||||||
| Ratios and supplemental data: | |||||||||||||||||
| Net assets, end of period (000 omitted) | $730,785 | $617,485 | $550,313 | $480,762 | $358,559 | ||||||||||||
| Ratio of expenses to average net assets | 1.22% | 1.22% | 1.24% | 1.23% | 1.19% | ||||||||||||
| Ratio of expenses to average net assets | |||||||||||||||||
| prior to fees waived | 1.24% | 1.25% | 1.26% | 1.27% | 1.25% | ||||||||||||
| Ratio of net investment income to average net assets | 1.83% | 1.60% | 1.12% | 1.73% | 2.17% | ||||||||||||
| Ratio of net investment income to average net assets | |||||||||||||||||
| prior to fees waived | 1.81% | 1.57% | 1.10% | 1.69% | 2.11% | ||||||||||||
| Portfolio turnover | 49% | 57% | 82% | 28% | 37% | ||||||||||||
1 The average shares outstanding method has been applied for per share information. |
| 2 Total investment return is based on the change in net asset value of a share during the period and assumes reinvestment of dividends and distributions at net asset value. Total investment return during all of the periods shown reflects a waiver by the manager. Performance would have been lower had the waiver not been in effect. |
See accompanying notes, which are an integral part of the financial statements.
106
Optimum Small-Mid Cap Growth Fund Class A
Selected data for each share of the Fund outstanding throughout each period were as follows:
| Year Ended | |||||||||||||||||
| 3/31/13 | 3/31/12 | 3/31/11 | 3/31/10 | 3/31/09 | |||||||||||||
| Net asset value, beginning of period | $13.000 | $13.900 | $11.150 | $6.760 | $11.280 | ||||||||||||
| Income (loss) from investment operations: | |||||||||||||||||
| Net investment loss1 | (0.079 | ) | (0.169 | ) | (0.149 | ) | (0.123 | ) | (0.092 | ) | |||||||
| Net realized and unrealized gain (loss) | 1.653 | 0.064 | 2.899 | 4.513 | (4.428 | ) | |||||||||||
| Total from investment operations | 1.574 | (0.105 | ) | 2.750 | 4.390 | (4.520 | ) | ||||||||||
| Less dividends and distributions from: | |||||||||||||||||
| Net realized gain | (0.314 | ) | (0.795 | ) | — | — | — | ||||||||||
| Total dividends and distributions | (0.314 | ) | (0.795 | ) | — | — | — | ||||||||||
| Net asset value, end of period | $14.260 | $13.000 | $13.900 | $11.150 | $6.760 | ||||||||||||
| Total return2 | 12.50% | 0.33% | 24.66% | 64.94% | (40.07% | ) | |||||||||||
| Ratios and supplemental data: | |||||||||||||||||
| Net assets, end of period (000 omitted) | $6,415 | $5,989 | $6,866 | $6,736 | $4,814 | ||||||||||||
| Ratio of expenses to average net assets | 1.86% | 1.90% | 1.90% | 1.90% | 1.90% | ||||||||||||
| Ratio of expenses to average net assets | |||||||||||||||||
| prior to fees waived | 2.05% | 2.06% | 2.07% | 2.10% | 2.26% | ||||||||||||
| Ratio of net investment loss to average net assets | (0.62% | ) | (1.34% | ) | (1.29% | ) | (1.30% | ) | (0.96% | ) | |||||||
| Ratio of net investment loss to average net assets | |||||||||||||||||
| prior to fees waived | (0.81% | ) | (1.50% | ) | (1.46% | ) | (1.50% | ) | (1.32% | ) | |||||||
| Portfolio turnover | 78% | 82% | 86% | 100% | 119% | ||||||||||||
1 The average shares outstanding method has been applied for per share information. |
| 2 Total investment return is based on the change in net asset value of a share during the period and assumes reinvestment of dividends and distributions at net asset value and does not reflect the impact of a sales charge. Total investment return during all of the periods shown reflects a waiver by the manager. Performance would have been lower had the waiver not been in effect. |
See accompanying notes, which are an integral part of the financial statements.
(continues) 107
Optimum Small-Mid Cap Growth Fund Class B
Selected data for each share of the Fund outstanding throughout each period were as follows:
| Year Ended | |||||||||||||||||
| 3/31/13 | 3/31/12 | 3/31/11 | 3/31/10 | 3/31/09 | |||||||||||||
| Net asset value, beginning of period | $12.220 | $13.200 | $10.660 | $6.510 | $10.930 | ||||||||||||
| Income (loss) from investment operations: | |||||||||||||||||
| Net investment loss1 | (0.145 | ) | (0.238 | ) | (0.213 | ) | (0.179 | ) | (0.152 | ) | |||||||
| Net realized and unrealized gain (loss) | 1.529 | 0.053 | 2.753 | 4.329 | (4.268 | ) | |||||||||||
| Total from investment operations | 1.384 | (0.185 | ) | 2.540 | 4.150 | (4.420 | ) | ||||||||||
| Less dividends and distributions from: | |||||||||||||||||
| Net realized gain | (0.314 | ) | (0.795 | ) | — | — | — | ||||||||||
| Total dividends and distributions | (0.314 | ) | (0.795 | ) | — | — | — | ||||||||||
| Net asset value, end of period | $13.290 | $12.220 | $13.200 | $10.660 | $6.510 | ||||||||||||
| Total return2 | 11.82% | (0.28% | ) | 23.83% | 63.75% | (40.44% | ) | ||||||||||
| Ratios and supplemental data: | |||||||||||||||||
| Net assets, end of period (000 omitted) | $261 | $661 | $1,063 | $1,143 | $807 | ||||||||||||
| Ratio of expenses to average net assets | 2.47% | 2.55% | 2.55% | 2.55% | 2.55% | ||||||||||||
| Ratio of expenses to average net assets | |||||||||||||||||
| prior to fees waived | 2.70% | 2.71% | 2.72% | 2.75% | 2.91% | ||||||||||||
| Ratio of net investment loss to average net assets | (1.23% | ) | (1.99% | ) | (1.94% | ) | (1.95% | ) | (1.61% | ) | |||||||
| Ratio of net investment loss to average net assets | |||||||||||||||||
| prior to fees waived | (1.46% | ) | (2.15% | ) | (2.11% | ) | (2.15% | ) | (1.97% | ) | |||||||
| Portfolio turnover | 78% | 82% | 86% | 100% | 119% | ||||||||||||
1 The average shares outstanding method has been applied for per share information. |
| 2 Total investment return is based on the change in net asset value of a share during the period and assumes reinvestment of dividends and distributions at net asset value and does not reflect the impact of a sales charge. Total investment return during all of the periods shown reflects a waiver by the manager and/or distributor. Performance would have been lower had the waiver not been in effect. |
See accompanying notes, which are an integral part of the financial statements.
108
Optimum Small-Mid Cap Growth Fund Class C
Selected data for each share of the Fund outstanding throughout each period were as follows:
| Year Ended | ||||||||||||||||
| 3/31/13 | 3/31/12 | 3/31/11 | 3/31/10 | 3/31/09 | ||||||||||||
| Net asset value, beginning of period | $12.220 | $13.200 | $10.660 | $6.510 | $10.930 | |||||||||||
| Income (loss) from investment operations: | ||||||||||||||||
| Net investment loss1 | (0.151 | ) | (0.237 | ) | (0.213 | ) | (0.179 | ) | (0.152 | ) | ||||||
| Net realized and unrealized gain (loss) | 1.525 | 0.052 | 2.753 | 4.329 | (4.268 | ) | ||||||||||
| Total from investment operations | 1.374 | (0.185 | ) | 2.540 | 4.150 | (4.420 | ) | |||||||||
| Less dividends and distributions from: | ||||||||||||||||
| Net realized gain | (0.314 | ) | (0.795 | ) | — | — | — | |||||||||
| Total dividends and distributions | (0.314 | ) | (0.795 | ) | — | — | — | |||||||||
| Net asset value, end of period | $13.280 | $12.220 | $13.200 | $10.660 | $6.510 | |||||||||||
| Total return2 | 11.73% | (0.27% | ) | 23.83% | 63.75% | (40.44% | ) | |||||||||
| Ratios and supplemental data: | ||||||||||||||||
| Net assets, end of period (000 omitted) | $20,921 | $20,992 | $24,337 | $23,824 | $16,863 | |||||||||||
| Ratio of expenses to average net assets | 2.51% | 2.55% | 2.55% | 2.55% | 2.55% | |||||||||||
| Ratio of expenses to average net assets | ||||||||||||||||
| prior to fees waived | 2.70% | 2.71% | 2.72% | 2.75% | 2.91% | |||||||||||
| Ratio of net investment loss to average net assets | (1.27% | ) | (1.99% | ) | (1.94% | ) | (1.95% | ) | (1.61% | ) | ||||||
| Ratio of net investment loss to average net assets | ||||||||||||||||
| prior to fees waived | (1.46% | ) | (2.15% | ) | (2.11% | ) | (2.15% | ) | (1.97% | ) | ||||||
| Portfolio turnover | 78% | 82% | 86% | 100% | 119% | |||||||||||
1 The average shares outstanding method has been applied for per share information. |
2 Total investment return is based on the change in net asset value of a share during the period and assumes reinvestment of dividends and distributions at net asset value and does not reflect the impact of a sales charge. Total investment return during all of the periods shown reflects a waiver by the manager. Performance would have been lower had the waiver not been in effect. |
See accompanying notes, which are an integral part of the financial statements.
(continues) 109
Financial highlights
Optimum Small-Mid Cap Growth Fund Institutional Class
Selected data for each share of the Fund outstanding throughout each period were as follows:
| Year Ended | ||||||||||||||||
| 3/31/13 | 3/31/12 | 3/31/11 | 3/31/10 | 3/31/09 | ||||||||||||
| Net asset value, beginning of period | $13.420 | $14.270 | $11.410 | $6.900 | $11.470 | |||||||||||
| Income (loss) from investment operations: | ||||||||||||||||
| Net investment loss1 | (0.036 | ) | (0.128 | ) | (0.112 | ) | (0.091 | ) | (0.059 | ) | ||||||
| Net realized and unrealized gain (loss) | 1.710 | 0.073 | 2.972 | 4.601 | (4.511 | ) | ||||||||||
| Total from investment operations | 1.674 | (0.055 | ) | 2.860 | 4.510 | (4.570 | ) | |||||||||
| Less dividends and distributions from: | ||||||||||||||||
| Net realized gain | (0.314 | ) | (0.795 | ) | — | — | — | |||||||||
| Total dividends and distributions | (0.314 | ) | (0.795 | ) | — | — | — | |||||||||
| Net asset value, end of period | $14.780 | $13.420 | $14.270 | $11.410 | $6.900 | |||||||||||
| Total return2 | 12.94% | 0.68% | 25.07% | 65.36% | (39.84% | ) | ||||||||||
| Ratios and supplemental data: | ||||||||||||||||
| Net assets, end of period (000 omitted) | $321,441 | $321,641 | $304,406 | $204,843 | $53,244 | |||||||||||
| Ratio of expenses to average net assets | 1.51% | 1.55% | 1.55% | 1.55% | 1.55% | |||||||||||
| Ratio of expenses to average net assets | ||||||||||||||||
| prior to fees waived | 1.70% | 1.71% | 1.72% | 1.75% | 1.91% | |||||||||||
| Ratio of net investment loss to average net assets | (0.27% | ) | (0.99% | ) | (0.94% | ) | (0.95% | ) | (0.61% | ) | ||||||
| Ratio of net investment loss to average net assets | ||||||||||||||||
| prior to fees waived | (0.46% | ) | (1.15% | ) | (1.11% | ) | (1.15% | ) | (0.97% | ) | ||||||
| Portfolio turnover | 78% | 82% | 86% | 100% | 119% | |||||||||||
1 The average shares outstanding method has been applied for per share information. |
2 Total investment return is based on the change in net asset value of a share during the period and assumes reinvestment of dividends and distributions at net asset value. Total investment return during all of the periods shown reflects a waiver by the manager. Performance would have been lower had the waiver not been in effect. |
See accompanying notes, which are an integral part of the financial statements.
110
Optimum Small-Mid Cap Value Fund Class A
Selected data for each share of the Fund outstanding throughout each period were as follows:
| Year Ended | ||||||||||||||||
| 3/31/13 | 3/31/12 | 3/31/11 | 3/31/10 | 3/31/09 | ||||||||||||
| Net asset value, beginning of period | $12.590 | $12.610 | $10.070 | $5.690 | $10.380 | |||||||||||
| Income (loss) from investment operations: | ||||||||||||||||
| Net investment income (loss)1 | (0.027 | ) | (0.044 | ) | (0.062 | ) | (0.027 | ) | 0.011 | |||||||
| Net realized and unrealized gain (loss) | 1.609 | 0.148 | 2.602 | 4.407 | (4.683 | ) | ||||||||||
| Total from investment operations | 1.582 | 0.104 | 2.540 | 4.380 | (4.672 | ) | ||||||||||
| Less dividends and distributions from: | ||||||||||||||||
| Net realized gain | (0.432 | ) | (0.124 | ) | — | — | (0.018 | ) | ||||||||
| Total dividends and distributions | (0.432 | ) | (0.124 | ) | — | — | (0.018 | ) | ||||||||
| Net asset value, end of period | $13.740 | $12.590 | $12.610 | $10.070 | $5.690 | |||||||||||
| Total return2 | 13.23% | 1.01% | 25.22% | 76.98% | (45.09% | ) | ||||||||||
| Ratios and supplemental data: | ||||||||||||||||
| Net assets, end of period (000 omitted) | $5,711 | $5,372 | $6,102 | $5,918 | $4,045 | |||||||||||
| Ratio of expenses to average net assets | 1.76% | 1.79% | 1.81% | 1.82% | 1.75% | |||||||||||
| Ratio of expenses to average net assets | ||||||||||||||||
| prior to fees waived | 1.98% | 1.98% | 2.00% | 2.13% | 2.22% | |||||||||||
| Ratio of net investment income (loss) to average net assets | (0.22% | ) | (0.38% | ) | (0.59% | ) | (0.32% | ) | 0.15% | |||||||
| Ratio of net investment loss to average net assets | ||||||||||||||||
| prior to fees waived | (0.44% | ) | (0.57% | ) | (0.78% | ) | (0.63% | ) | (0.32% | ) | ||||||
| Portfolio turnover | 36% | 30% | 43% | 40% | 86% | |||||||||||
1 The average shares outstanding method has been applied for per share information. |
2 Total investment return is based on the change in net asset value of a share during the period and assumes reinvestment of dividends and distributions at net asset value and does not reflect the impact of a sales charge. Total investment return during all of the periods shown reflects a waiver by the manager. Performance would have been lower had the waiver not been in effect. |
See accompanying notes, which are an integral part of the financial statements.
(continues) 111
Financial highlights
Optimum Small-Mid Cap Value Fund Class B
Selected data for each share of the Fund outstanding throughout each period were as follows:
| Year Ended | ||||||||||||||||
| 3/31/13 | 3/31/12 | 3/31/11 | 3/31/10 | 3/31/09 | ||||||||||||
| Net asset value, beginning of period | $11.840 | $11.940 | $9.590 | $5.460 | $10.030 | |||||||||||
| Income (loss) from investment operations: | ||||||||||||||||
| Net investment loss1 | (0.094 | ) | (0.113 | ) | (0.123 | ) | (0.077 | ) | (0.042 | ) | ||||||
| Net realized and unrealized gain (loss) | 1.496 | 0.137 | 2.473 | 4.207 | (4.510 | ) | ||||||||||
| Total from investment operations | 1.402 | 0.024 | 2.350 | 4.130 | (4.552 | ) | ||||||||||
| Less dividends and distributions from: | ||||||||||||||||
| Net realized gain | (0.432 | ) | (0.124 | ) | — | — | (0.018 | ) | ||||||||
| Total dividends and distributions | (0.432 | ) | (0.124 | ) | — | — | (0.018 | ) | ||||||||
| Net asset value, end of period | $12.810 | $11.840 | $11.940 | $9.590 | $5.460 | |||||||||||
| Total return2 | 12.53% | 0.39% | 24.50% | 75.64% | (45.47% | ) | ||||||||||
| Ratios and supplemental data: | ||||||||||||||||
| Net assets, end of period (000 omitted) | $236 | $653 | $1,038 | $1,114 | $731 | |||||||||||
| Ratio of expenses to average net assets | 2.37% | 2.44% | 2.46% | 2.47% | 2.40% | |||||||||||
| Ratio of expenses to average net assets | ||||||||||||||||
| prior to fees waived | 2.63% | 2.63% | 2.65% | 2.78% | 2.87% | |||||||||||
| Ratio of net investment loss to average net assets | (0.83% | ) | (1.03% | ) | (1.24% | ) | (0.97% | ) | (0.50% | ) | ||||||
| Ratio of net investment loss to average net assets | ||||||||||||||||
| prior to fees waived | (1.09% | ) | (1.22% | ) | (1.43% | ) | (1.28% | ) | (0.97% | ) | ||||||
| Portfolio turnover | 36% | 30% | 43% | 40% | 86% | |||||||||||
1 The average shares outstanding method has been applied for per share information. |
2 Total investment return is based on the change in net asset value of a share during the period and assumes reinvestment of dividends and distributions at net asset value and does not reflect the impact of a sales charge. Total investment return during all of the periods shown reflects a waiver by the manager and/or distributor. Performance would have been lower had the waiver not been in effect. |
See accompanying notes, which are an integral part of the financial statements.
112
Optimum Small-Mid Cap Value Fund Class C
Selected data for each share of the Fund outstanding throughout each period were as follows:
| Year Ended | ||||||||||||||||
| 3/31/13 | 3/31/12 | 3/31/11 | 3/31/10 | 3/31/09 | ||||||||||||
| Net asset value, beginning of period | $11.830 | $11.930 | $9.590 | $ 5.460 | $10.020 | |||||||||||
| Income (loss) from investment operations: | ||||||||||||||||
| Net investment loss1 | (0.100 | ) | (0.113 | ) | (0.124 | ) | (0.076 | ) | (0.042 | ) | ||||||
| Net realized and unrealized gain (loss) | 1.502 | 0.137 | 2.464 | 4.206 | (4.500 | ) | ||||||||||
| Total from investment operations | 1.402 | 0.024 | 2.340 | 4.130 | (4.542 | ) | ||||||||||
| Less dividends and distributions from: | ||||||||||||||||
| Net realized gain | (0.432 | ) | (0.124 | ) | — | — | (0.018 | ) | ||||||||
| Total dividends and distributions | (0.432 | ) | (0.124 | ) | — | — | (0.018 | ) | ||||||||
| Net asset value, end of period | $12.800 | $11.830 | $11.930 | $9.590 | $5.460 | |||||||||||
| Total return2 | 12.45% | 0.39% | 24.40% | 75.64% | (45.42% | ) | ||||||||||
| Ratios and supplemental data: | ||||||||||||||||
| Net assets, end of period (000 omitted) | $20,058 | $19,986 | $22,797 | $22,163 | $14,811 | |||||||||||
| Ratio of expenses to average net assets | 2.41% | 2.44% | 2.46% | 2.47% | 2.40% | |||||||||||
| Ratio of expenses to average net assets | ||||||||||||||||
| prior to fees waived | 2.63% | 2.63% | 2.65% | 2.78% | 2.87% | |||||||||||
| Ratio of net investment loss to average net assets | (0.87% | ) | (1.03% | ) | (1.24% | ) | (0.97% | ) | (0.50% | ) | ||||||
| Ratio of net investment loss to average net assets | ||||||||||||||||
| prior to fees waived | (1.09% | ) | (1.22% | ) | (1.43% | ) | (1.28% | ) | (0.97% | ) | ||||||
| Portfolio turnover | 36% | 30% | 43% | 40% | 86% | |||||||||||
1 The average shares outstanding method has been applied for per share information. |
2 Total investment return is based on the change in net asset value of a share during the period and assumes reinvestment of dividends and distributions at net asset value and does not reflect the impact of a sales charge. Total investment return during all of the periods shown reflects a waiver by the manager. Performance would have been lower had the waiver not been in effect. |
See accompanying notes, which are an integral part of the financial statements.
(continues) 113
Financial highlights
Optimum Small-Mid Cap Value Fund Institutional Class
Selected data for each share of the Fund outstanding throughout each period were as follows:
| Year Ended | ||||||||||||||||
| 3/31/13 | 3/31/12 | 3/31/11 | 3/31/10 | 3/31/09 | ||||||||||||
| Net asset value, beginning of period | $12.990 | $12.960 | $10.310 | $5.820 | $10.580 | |||||||||||
| Income (loss) from investment operations: | ||||||||||||||||
| Net investment income (loss)1 | 0.016 | (0.004 | ) | (0.026 | ) | 0.002 | 0.041 | |||||||||
| Net realized and unrealized gain (loss) | 1.661 | 0.158 | 2.676 | 4.505 | (4.783 | ) | ||||||||||
| Total from investment operations | 1.677 | 0.154 | 2.650 | 4.507 | (4.742 | ) | ||||||||||
| Less dividends and distributions from: | ||||||||||||||||
| Net investment income | (0.005 | ) | — | — | (0.008 | ) | — | |||||||||
| Net realized gain | (0.432 | ) | (0.124 | ) | — | — | (0.018 | ) | ||||||||
| Return of capital | — | — | — | (0.009 | ) | — | ||||||||||
| Total dividends and distributions | (0.437 | ) | (0.124 | ) | — | (0.017 | ) | (0.018 | ) | |||||||
| Net asset value, end of period | $14.230 | $12.990 | $12.960 | $10.310 | $5.820 | |||||||||||
| Total return2 | 13.56% | 1.37% | 25.70% | 77.56% | (44.90% | ) | ||||||||||
| Ratios and supplemental data: | ||||||||||||||||
| Net assets, end of period (000 omitted) | $318,758 | $310,737 | $274,495 | $161,862 | $58,173 | |||||||||||
| Ratio of expenses to average net assets | 1.41% | 1.44% | 1.46% | 1.47% | 1.40% | |||||||||||
| Ratio of expenses to average net assets | ||||||||||||||||
| prior to fees waived | 1.63% | 1.63% | 1.65% | 1.78% | 1.87% | |||||||||||
| Ratio of net investment income (loss) to average net assets | 0.13% | (0.03% | ) | (0.24% | ) | 0.03% | 0.50% | |||||||||
| Ratio of net investment income (loss) to average net assets | ||||||||||||||||
| prior to fees waived | (0.09% | ) | (0.22% | ) | (0.43% | ) | (0.28% | ) | 0.03% | |||||||
| Portfolio turnover | 36% | 30% | 43% | 40% | 86% | |||||||||||
1 The average shares outstanding method has been applied for per share information. |
2 Total investment return is based on the change in net asset value of a share during the period and assumes reinvestment of dividends and distributions at net asset value. Total investment return during all of the periods shown reflects a waiver by the manager. Performance would have been lower had the waiver not been in effect. |
See accompanying notes, which are an integral part of the financial statements.
114
Notes to financial statements
Optimum Fund Trust
March 31, 2013
Optimum Fund Trust (Trust) is organized as a Delaware statutory trust and offers six series: Optimum Fixed Income Fund, Optimum International Fund, Optimum Large Cap Growth Fund, Optimum Large Cap Value Fund, Optimum Small-Mid Cap Growth Fund, and Optimum Small-Mid Cap Value Fund, (each, a Fund, or collectively, the Funds). The Trust is an open-end investment company. The Funds are considered diversified under the Investment Company Act of 1940, as amended, and offer Class A, Class B, Class C and Institutional Class shares. Class A shares are sold with a maximum front-end sales charge of 4.50% for Optimum Fixed Income Fund and 5.75% for Optimum International Fund, Optimum Large Cap Growth Fund, Optimum Large Cap Value Fund, Optimum Small-Mid Cap Growth Fund and Optimum Small-Mid Cap Value Fund. Class A share purchases of $1,000,000 or more will incur a contingent deferred sales charge (CDSC) of 1% if redeemed during the first year and 0.50% during the second year, provided that Delaware Distributors, L.P. (DDLP) paid a financial advisor a commission on the purchase of those shares. Class B shares may be purchased only through dividend reinvestment and certain permitted exchanges. Prior to Aug. 1, 2007, Class B shares were sold with a CDSC that declined from 4% to zero depending upon the period of time the shares were held. Class B shares will automatically convert to Class A shares on a quarterly basis approximately eight years after purchase. Class C shares are sold with a CDSC of 1%, if redeemed during the first twelve months. Institutional Class shares are not subject to a sales charge and are offered for sale exclusively to certain eligible investors.
The investment objective of Optimum Fixed Income Fund is to seek a high level of income. The Fund may also seek growth of capital.
The investment objective of Optimum International Fund is to seek long-term growth of capital. The Fund may also seek income.
The investment objective of Optimum Large Cap Growth Fund is to seek long-term growth of capital.
The investment objective of Optimum Large Cap Value Fund is to seek long-term growth of capital. The Fund may also seek income.
The investment objective of Optimum Small-Mid Cap Growth Fund is to seek long-term growth of capital.
The investment objective of Optimum Small-Mid Cap Value Fund is to seek long-term growth of capital.
1. Significant Accounting Policies
The following accounting policies are in accordance with U.S. generally accepted accounting principles (U.S. GAAP) and are consistently followed by the Funds.
Security Valuation — Equity securities and Exchange-Traded Funds (ETFs), except those traded on the Nasdaq Stock Market, Inc. (Nasdaq), are valued at the last quoted sales price as of the time of the regular close of the New York Stock Exchange (NYSE) on the valuation date. Securities traded on the Nasdaq are valued in accordance with the Nasdaq Official Closing Price, which may not be the last sales price. If on a particular day an equity security or an ETF does not trade, then the mean between the bid and ask prices will be used, which approximates fair value. Securities listed on a foreign exchange are normally valued at the last quoted sales price on the valuation date. Debt securities, credit default swap (CDS) contracts, interest rate swap options (IRO) contracts (swaptions) and interest rate swap (IRS) contracts are valued based upon valuations provided by an independent pricing service or broker/counterparty and reviewed by management. To the extent current market prices are not available, the pricing service may take into account developments related to the specific security, as well as transactions in comparable securities. U.S. government and agency securities are valued at the mean between the bid and ask prices, which approximates fair value. Valuations for fixed income securities utilize matrix systems, which reflect such factors as security prices, yields, maturities, and ratings, and are supplemented by dealer and exchange quotations. Swap prices are derived using daily swap curves and models that incorporate a number of market data factors, such as discounted cash flows, trades and values of the underlying reference instruments. Open-end investment companies are valued at their published net asset value. Investment company securities are valued at net asset value per share, as reported by the underlying investment company. Foreign currency exchange contracts and foreign cross currency exchange contracts are valued at the mean between the bid and ask prices, which approximates fair value. Interpolated values are derived when the settlement date of the contract is an interim date for which quotations are not available. Futures contracts and options on futures contracts are valued at the daily quoted settlement prices. Exchange-traded options are valued at the last reported sale price or, if no sales are reported, at the mean between the last reported bid and ask prices, which approximates fair value. Generally, other securities and assets for which market quotations are not readily available are valued at fair value as determined in good faith under the direction of each Fund’s Board of Trustees (Board). In determining whether market quotations are readily available or fair valuation will be used, various factors will be taken into consideration, such as market closures or suspension of trading in a security. Each Fund may use fair value pricing more frequently for securities traded primarily in non-U.S. markets because, among other things, most foreign markets close well before the each Fund values its securities, generally as of 4:00 p.m. Eastern time. The earlier close of these foreign markets gives rise to the possibility that significant events, including broad market moves, government actions or pronouncements, aftermarket trading, or news events may have occurred in the interim. To account for this, the Funds may frequently value foreign securities using fair value prices based on third-party vendor modeling tools (international fair value pricing).
Federal & Foreign Income Taxes — No provision for federal income taxes has been made as each Fund intends to continue to qualify for federal income tax purposes as a regulated investment company under Subchapter M of the Internal Revenue Code of 1986, as amended, and make the requisite distributions to shareholders. The Funds evaluate tax positions taken or expected to be taken in the course of preparing the Funds’ tax returns to determine whether the tax positions are “more-likely-than-not” of being sustained by the applicable tax authority. Tax positions not deemed to meet the more-likely-than-not threshold are recorded as a tax benefit or expense in the current year. Management has analyzed each Fund’s tax positions taken for all open federal income tax years (March 31, 2010–March 31, 2013) and has concluded that no provision for federal income tax is required in the Funds’ financial statements. In regards to foreign taxes only, each Fund has open tax years in certain foreign countries it invests in that may date back to the inception of each Fund.
(continues) 115
Notes to financial statements
Optimum Fund Trust
1. Significant Accounting Policies (continued)
Class Accounting — Investment income, common expenses and realized and unrealized gain (loss) on investments are allocated to the various classes of the Funds on the basis of daily net assets of each class. Distribution expenses relating to a specific class are charged directly to that class.
Repurchase Agreements — The Funds may purchase certain U.S. government securities subject to the counterparty’s agreement to repurchase them at an agreed upon date and price. The counterparty will be required on a daily basis to maintain the value of the collateral subject to the agreement at not less than the repurchase price (including accrued interest). The agreements are conditioned upon the collateral being deposited under the Federal Reserve book-entry system with the Funds’ custodian or a third-party sub-custodian. In the event of default or bankruptcy by the other party to the agreement, retention of the collateral may be subject to legal proceedings. All open repurchase agreements as of the date of this report were entered into on March 28, 2013.
To Be Announced Trades — Optimum Fixed Income Fund may contract to purchase securities for a fixed price at a transaction date beyond the customary settlement period (e.g., “when issued,” “delayed delivery,” “forward commitment,” or “TBA transactions”) consistent with the Fund’s ability to manage its investment portfolio and meet redemption requests. These transactions involve a commitment by the Fund to purchase securities for a predetermined price or yield with payment and delivery taking place more than three days in the future, or after a period longer than the customary settlement period for that type of security. No interest will be earned by the Fund on such purchases until the securities are delivered; however, the market value may change prior to delivery.
Foreign Currency Transactions — Transactions denominated in foreign currencies are recorded at the prevailing exchange rates on the valuation date in accordance with the Funds’ prospectus. The value of all assets and liabilities denominated in foreign currencies is translated daily into U.S. dollars at the exchange rate of such currencies against the U.S. dollar. Transaction gains or losses resulting from changes in exchange rates during the reporting period or upon settlement of the foreign currency transaction are reported in operations for the current period. The Funds generally bifurcate that portion of realized gains and losses on investments in debt securities which is due to changes in foreign exchange rates from that which is due to changes in market prices of debt securities. That portion of gains (losses) is included in the statements of operations under the caption net realized gain (loss) on foreign currencies. For foreign equity securities, these changes are included in net realized and unrealized gain or loss on investments. The Funds report certain foreign currency related transactions as components of realized gains (losses) for financial reporting purposes, whereas such components are treated as ordinary income (loss) for federal income tax purposes.
Use of Estimates — The preparation of financial statements in conformity with U.S. GAAP requires management to make estimates and assumptions that affect the fair value of investments, the reported amounts of assets and liabilities and disclosure of contingent assets and liabilities at the date of the financial statements and the reported amounts of revenues and expenses during the reporting period. Actual results could differ from those estimates and the differences could be material.
Other — Expenses directly attributable to a Fund are charged directly to that Fund. Other expenses common to various funds within the Trust are generally allocated among such funds on the basis of average net assets. Management fees and some other expenses are paid monthly. Security transactions are recorded on the date the securities are purchased or sold (trade date) for financial reporting purposes. Costs used in calculating realized gains and losses on the sale of investment securities are those of the specific securities sold. Dividend income is recorded on the ex-dividend date and interest income is recorded on the accrual basis. Discounts and premiums on debt securities are amortized to interest income over the lives of the respective securities using the effective interest method. Realized gains (losses) on paydowns of asset- and mortgage-backed securities are classified as interest income. Distributions received from investments in Real Estate Investment Trusts (REITs) are recorded as dividend income on the ex-dividend date, subject to reclassification upon notice of the character of such distributions by the issuer. Foreign dividends are also recorded on the ex-dividend date or as soon after the ex-dividend date that the Funds are aware of such dividends, net of all tax withholdings, a portion of which may be reclaimable. Withholding taxes and reclaims on foreign dividends and interest have been recorded in accordance with the Funds’ understanding of the applicable country’s tax rules and rates. Each Fund declares and pays distributions from net investment income, and net realized gain on investments, if any, at least annually, and may distribute more frequently, if necessary for tax purposes. Dividends and distributions, if any, are recorded on the ex-dividend date.
Each Fund may receive earnings credits from its custodian when positive cash balances are maintained, which are used to offset custody fees. There were no earnings credits for the year ended March 31, 2013.
Each Fund receives earnings credits from its transfer agent when positive cash balances are maintained, which are used to offset transfer agent fees. The expense paid under this arrangement is included in dividend disbursing and transfer agent fees and expenses on the statements of operations with the corresponding expense offset shown as “expense paid indirectly.” For the year ended March 31, 2013, each Fund earned the following amounts under this agreement:
| Optimum | Optimum | Optimum | Optimum | Optimum | Optimum | ||||||
| Fixed Income | International | Large Cap | Large Cap | Small-Mid Cap | Small-Mid Cap | ||||||
| Fund | Fund | Growth Fund | Value Fund | Growth Fund | Value Fund | ||||||
| $592 | $607 | $638 | $638 | $629 | $636 |
116
2. Investment Management, Administration Agreements and Other Transactions with Affiliates
Delaware Management Company (DMC), a series of Delaware Management Business Trust, furnishes investment management services to each Fund and has full discretion and responsibility, subject to the overall supervision of the Trust’s Board, to select and contract with one or more investment sub-advisers to manage the investment operations and composition of each Fund, and to render investment advice for each Fund, including the purchase, retention, and dispositions of investments, securities and cash contained in each Fund. The investment management agreement obligates DMC to implement decisions with respect to the allocation or reallocation of each Fund’s assets among one or more current or additional sub-advisers, and to monitor the sub-advisers’ compliance with the relevant Fund’s investment objective, policies and restrictions. DMC pays the sub-advisers out of its fees.
In accordance with the terms of its respective investment management agreement, DMC is entitled to receive an annual fee equal to the following percentage rates of the average daily net assets of each Fund:
| Optimum Fixed Income Fund1 | 0.7000% of net assets up to $25 million | |
| 0.6500% of net assets from $25 million to $100 million | ||
| 0.6000% of net assets from $100 million to $500 million | ||
| 0.5500% of net assets from $500 million to $1 billion | ||
| 0.5000% of net assets from $1 billion to $2.5 billion | ||
| 0.4750% of net assets over $2.5 billion | ||
| Optimum International Fund | 0.8750% of net assets up to $50 million | |
| 0.8000% of net assets from $50 million to $100 million | ||
| 0.7800% of net assets from $100 million to $300 million | ||
| 0.7650% of net assets from $300 million to $400 million | ||
| 0.7300% of net assets over $400 million | ||
| Optimum Large Cap Growth Fund | 0.8000% of net assets up to $250 million | |
| 0.7875% of net assets from $250 million to $300 million | ||
| 0.7625% of net assets from $300 million to $400 million | ||
| 0.7375% of net assets from $400 million to $500 million | ||
| 0.7250% of net assets from $500 million to $1 billion | ||
| 0.7100% of net assets from $1 billion to $1.5 billion | ||
| 0.7000% of net assets over $1.5 billion | ||
| Optimum Large Cap Value Fund | 0.8000% of net assets up to $100 million | |
| 0.7375% of net assets from $100 million to $250 million | ||
| 0.7125% of net assets from $250 million to $500 million | ||
| 0.6875% of net assets from $500 million to $1 billion | ||
| 0.6675% of net assets from $1 billion to $1.5 billion | ||
| 0.6475% of net assets over $1.5 billion | ||
| Optimum Small-Mid Cap Growth Fund | 1.1000% of net assets | |
| Optimum Small-Mid Cap Value Fund | 1.0500% of net assets up to $75 million | |
| 1.0250% of net assets from $75 million to $150 million | ||
| 1.0000% of net assets over $150 million | ||
| 1Prior to Oct. 1, 2012, DMC was entitled to receive an annual fee equal to the following percentage rates of the average daily net assets of Optimum Fixed Income Fund: | ||
| 0.7000% of net assets up to $25 million | ||
| 0.6500% of net assets from $25 million to $100 million | ||
| 0.6000% of net assets from $100 million to $500 million | ||
| 0.5500% of net assets from $500 million to $1 billion | ||
| 0.5000% of net assets over $1 billion | ||
(continues) 117
Notes to financial statements
Optimum Fund Trust
2. Investment Management, Administration Agreements and Other Transactions with Affiliates (continued)
DMC has entered into sub-advisory agreements for the Trust as follows: Optimum Fixed Income Fund – Pacific Investment Management Company, LLC (PIMCO); Optimum International Fund – Mondrian Investment Partners Limited (Mondrian) and BlackRock Advisors, LLC (BlackRock); Optimum Large Cap Growth Fund – Marsico Capital Management, LLC (Marsico), T. Rowe Price Associates, Inc. (T. Rowe Price), and Fred Alger Management, Inc. (Alger); Optimum Large Cap Value Fund – Massachusetts Financial Services Company (MFS) and Herndon Capital Management, LLC (Herndon); Optimum Small-Mid Cap Growth Fund – Columbia Wanger Asset Management, LLC (Columbia WAM) and Wellington Management Company, LLP (Wellington Management); Optimum Small-Mid Cap Value Fund – The Killen Group, Inc. (Killen), Westwood Management Corp. (Westwood) and The Delafield Group, a division of Tocqueville Asset Management L.P. (Tocqueville).
For the year ended March 31, 2013, DMC paid the following sub-advisory fees:
| Optimum | Optimum | Optimum | Optimum | Optimum | Optimum | ||||||
| Fixed Income | International | Large Cap | Large Cap | Small-Mid Cap | Small-Mid Cap | ||||||
| Fund | Fund | Growth Fund | Value Fund | Growth Fund | Value Fund | ||||||
| $1,654,249 | $1,322,542 | $3,396,793 | $2,504,697 | $2,588,941 | $1,960,501 |
Effective July 27, 2012, DMC has contractually agreed to waive all or a portion of its investment advisory fees and/or reimburse expenses for each Fund to the extent necessary to prevent total annual operating expenses (excluding any 12b-1 plan fees and certain other expenses) do not exceed the specified percentages of average daily net assets through July 29, 2013 as shown below. These waivers and reimbursements may only be terminated by agreement of DMC and the Funds’ Board.
| Optimum | Optimum | Optimum | Optimum | Optimum | Optimum | |||||||
| Fixed Income | International | Large Cap | Large Cap | Small-Mid Cap | Small-Mid Cap | |||||||
| Fund | Fund | Growth Fund | Value Fund | Growth Fund | Value Fund | |||||||
| Effective July 27, 2012, | ||||||||||||
| operating expense limitation as | ||||||||||||
| a percentage of average | ||||||||||||
| daily net assets (per annum) | 1.00% | 1.40% | 1.25% | 1.22% | 1.50% | 1.40% | ||||||
| Effective July 29, 2011 | ||||||||||||
| through July 26, 2012, | ||||||||||||
| operating expense limitation as | ||||||||||||
| a percentage of average | ||||||||||||
| daily net assets (per annum) | 1.00% | 1.40% | 1.25% | 1.22% | 1.55% | 1.43% |
Delaware Service Company, Inc. (DSC), an affiliate of DMC, provides fund accounting oversight services to the Trust. For these services, the Trust pays DSC fees based on the aggregate daily net assets of the Trust at the following annual rate: 0.0050% of the first $3 billion; 0.0045% of the next $2 billion; 0.0040% of the next $2.5 billion; 0.0030% of the next $2.5 billion; and 0.0025% of aggregate average daily net assets in excess of $10 billion. The fees payable to DSC under the service agreement described above are allocated among all Funds in the Trust on a relative net asset value basis. For the year ended March 31, 2013, each Fund was charged for these services as follows:
| Optimum | Optimum | Optimum | Optimum | Optimum | Optimum | ||||||
| Fixed Income | International | Large Cap | Large Cap | Small-Mid Cap | Small-Mid Cap | ||||||
| Fund | Fund | Growth Fund | Value Fund | Growth Fund | Value Fund | ||||||
| $66,700 | $16,122 | $39,447 | $38,188 | $16,840 | $16,384 |
DSC also provides the Trust with administrative services including financial and tax reporting, corporate governance, and preparation of materials and reports for the Board. For administrative services, each Fund pays DSC a fee at an annual rate (plus out-of-pocket expenses) of 0.165% of assets up to $500 million of the Funds’ average daily net assets; 0.140% of assets from $500 million to $1 billion; and 0.115% of assets over $1 billion.
DSC also serves as the shareholder servicing, dividend disbursing and transfer agent for each Fund. For these services, the Trust pays DSC a fee at an annual rate of 0.225% of the Trust’s total average daily net assets, subject to certain minimums, plus out-of-pocket expenses. Pursuant to a sub-transfer agency agreement between DSC and BNY Mellon Investment Servicing (US) Inc. (BNYMIS), BNYMIS provides certain sub-transfer agency services to the Funds. Sub-transfer agency fees are passed on to and paid directly by the Funds.
DDLP, an affiliate of DMC, serves as the national distributor of each Fund’s shares pursuant to a Distribution Agreement. Pursuant to the Distribution Agreement and Rule 12b-1 plan, each Fund pays DDLP an annual fee of 0.35% of the average daily net assets of the Class A shares and 1.00% of the average daily net assets of the Class B and Class C shares. Institutional Class shares pay no distribution expenses. Effective March 1, 2013, DDLP has contractually agreed to waive Class B shares’ 12b-1 fees to 0.25% of average daily net assets through Feb. 28, 2014 for the Optimum Small-Mid Cap Growth Fund and Optimum Small-Mid Cap Value Fund.
118
At March 31, 2013, each Fund had liabilities payable to affiliates as follows:
| Optimum | Optimum | Optimum | Optimum | Optimum | Optimum | |||||||||||||||||||||||||
| Fixed Income | International | Large Cap | Large Cap | Small-Mid Cap | Small-Mid Cap | |||||||||||||||||||||||||
| Fund | Fund | Growth Fund | Value Fund | Growth Fund | Value Fund | |||||||||||||||||||||||||
| Investment management | ||||||||||||||||||||||||||||||
| fees payable to DMC | $ | 618,155 | $ | 253,233 | $ | 531,205 | $ | 512,361 | $ | 254,061 | $ | 228,043 | ||||||||||||||||||
| Dividend disbursing, transfer agent and fund | ||||||||||||||||||||||||||||||
| accounting oversight fees, administration | ||||||||||||||||||||||||||||||
| fees and other expenses payable to DSC | 465,659 | 156,385 | 282,544 | 281,632 | 114,946 | 114,446 | ||||||||||||||||||||||||
| Distribution fees payable to DDLP | 145,448 | 30,626 | 108,570 | 105,169 | 19,545 | 18,778 | ||||||||||||||||||||||||
| Other expenses payable | ||||||||||||||||||||||||||||||
| to DMC and affiliates* | 37,090 | 11,711 | 21,645 | 21,638 | 8,616 | 8,550 | ||||||||||||||||||||||||
*DMC, as part of its administrative services, pays operating expenses on behalf of each Fund and is reimbursed on a periodic basis. Expenses include items such as printing of shareholder reports, legal and tax services, registration fees and trustees’ fees.
For the year ended March 31, 2013, DDLP earned commissions on sales of Class A shares for each Fund as follows:
| Optimum | Optimum | Optimum | Optimum | Optimum | Optimum | |||||||||||||||||||
| Fixed Income | International | Large Cap | Large Cap | Small-Mid Cap | Small-Mid Cap | |||||||||||||||||||
| Fund | Fund | Growth Fund | Value Fund | Growth Fund | Value Fund | |||||||||||||||||||
| $21,539 | $4,082 | $12,574 | $12,615 | $2,646 | $1,938 | |||||||||||||||||||
For the year ended March 31, 2013, DDLP received gross CDSC commissions on redemptions of each Fund’s Class A, Class B, and Class C shares, and these commissions were entirely used to offset up-front commissions previously paid by DDLP to broker/dealers on sales of those shares. The amounts received were as follows:
| Optimum | Optimum | Optimum | Optimum | Optimum | Optimum | |||||||||||||||||||||||||
| Fixed Income | International | Large Cap | Large Cap | Small-Mid Cap | Small-Mid Cap | |||||||||||||||||||||||||
| Fund | Fund | Growth Fund | Value Fund | Growth Fund | Value Fund | |||||||||||||||||||||||||
| Class A | $ | 0 | $ | 0 | $ | 0 | $ | 0 | $ | 0 | $ | 0 | ||||||||||||||||||
| Class B | 756 | 221 | 830 | 776 | 129 | 110 | ||||||||||||||||||||||||
| Class C | 14,318 | 2,295 | 7,320 | 6,843 | 1,191 | 1,167 | ||||||||||||||||||||||||
DMC, DSC and DDLP are indirect, wholly owned subsidiaries of Delaware Management Holdings, Inc.
Certain officers of DMC, DSC and DDLP are officers and/or Trustees of the Trust. These officers and Trustees are paid no compensation by the Funds.
3. Investments
For the year ended March 31, 2013, the Funds made purchases and sales of investments securities other than short-term investments as follows:
| Optimum | Optimum | Optimum | Optimum | Optimum | Optimum | |||||||||||||||||||||||||
| Fixed Income | International | Large Cap | Large Cap | Small-Mid Cap | Small-Mid Cap | |||||||||||||||||||||||||
| Fund | Fund | Growth Fund | Value Fund | Growth Fund | Value Fund | |||||||||||||||||||||||||
| Purchases other than U.S. government securities | $ | 2,036,814,060 | $ | 377,578,271 | $ | 797,481,946 | $ | 385,410,128 | $ | 263,157,550 | $ | 110,763,622 | ||||||||||||||||||
| Purchases of U.S. government securities | 872,483,217 | — | — | — | — | — | ||||||||||||||||||||||||
| Sales other than U.S. government securities | 1,772,616,129 | 231,688,754 | 793,332,550 | 373,013,853 | 313,108,579 | 150,343,116 | ||||||||||||||||||||||||
| Sales of U.S. government securities | 808,505,792 | — | — | — | — | — | ||||||||||||||||||||||||
At March 31, 2013, the cost of investments and unrealized appreciation (depreciation) for federal income tax purposes for each Fund were as follows:
| Optimum | Optimum | Optimum | Optimum | Optimum | Optimum | ||||||||||||||||||||
| Fixed Income | International | Large Cap | Large Cap | Small-Mid Cap | Small-Mid Cap | ||||||||||||||||||||
| Fund | Fund | Growth Fund | Value Fund | Growth Fund | Value Fund | ||||||||||||||||||||
| Cost of Investments | $ | 1,549,618,775 | $ | 481,836,978 | $ | 731,091,823 | $ | 701,341,833 | $ | 272,401,498 | $ | 274,712,327 | |||||||||||||
| Aggregate unrealized appreciation | $ | 64,607,741 | $ | 53,816,587 | $ | 160,709,218 | $ | 200,701,001 | $ | 86,630,997 | $ | 75,271,322 | |||||||||||||
| Aggregate unrealized depreciation | (18,942,676 | ) | (35,687,494 | ) | (10,586,706 | ) | (26,768,164 | ) | (3,729,852 | ) | (5,046,106 | ) | |||||||||||||
| Net unrealized appreciation (depreciation) | $ | 45,665,065 | $ | 18,129,093 | $ | 150,122,512 | $ | 173,932,837 | $ | 82,901,145 | $ | 70,225,216 | |||||||||||||
(continues) 119
Notes to financial statements
Optimum Fund Trust
3. Investments (continued)
U.S. GAAP defines fair value as the price that each Fund would receive to sell an asset or pay to transfer a liability in an orderly transaction between market participants at the measurement date under current market conditions. A three level hierarchy for fair value measurements has been established based upon the transparency of inputs to the valuation of an asset or liability. Inputs may be observable or unobservable and refer broadly to the assumptions that market participants would use in pricing the asset or liability. Observable inputs reflect the assumptions market participants would use in pricing the asset or liability based on market data obtained from sources independent of the reporting entity. Unobservable inputs reflect the reporting entity’s own assumptions about the assumptions that market participants would use in pricing the asset or liability developed based on the best information available under the circumstances. Each Fund’s investment in its entirety is assigned a level based upon the observability of the inputs which are significant to the overall valuation. The three level hierarchy of inputs is summarized below.
| Level 1 – | inputs are quoted prices in active markets for identical investments (e.g., equity securities, open-end investment companies, futures contracts, exchange-traded options contracts) |
| Level 2 – | other observable inputs (including, but not limited to: quoted prices for similar assets or liabilities in markets that are active, quoted prices for identical or similar assets or liabilities in markets that are not active, inputs other than quoted prices that are observable for the assets or liabilities (such as interest rates, yield curves, volatilities, prepayment speeds, loss severities, credit risks and default rates) or other market-corroborated inputs) (e.g., debt securities, government securities, swap contracts, foreign currency exchange contracts, foreign securities utilizing international fair value pricing, broker-quoted securities, fair valued securities) |
| Level 3 – | inputs are significant unobservable inputs (including each Fund’s own assumptions used to determine the fair value of investments) (e.g., broker-quoted securities, fair valued securities) |
Level 3 investments are valued using significant unobservable inputs. Each Fund may also use an income-based valuation approach in which the anticipated future cash flows of the investment are discounted to calculate fair value. Discounts may also be applied due to the nature or duration of any restrictions on the disposition of the investments. Valuations may also be based upon current market prices of securities that are comparable in coupon, rating, maturity and industry. The derived value of a Level 3 investment may not represent the value which is received upon disposition and this could impact the results of operations.
The following tables summarize the valuation of each Fund’s investments by fair value hierarchy levels as of March 31, 2013:
| Optimum Fixed Income Fund | |||||||||||||
| Level 1 | Level 2 | Level 3 | Total | ||||||||||
| Agency, Asset- & Mortgage-Backed Securities | $ | — | $ | 421,520,262 | $ | 194,300 | $ | 421,714,562 | |||||
| Common Stock | 1,565 | — | — | 1,565 | |||||||||
| Municipal Bonds | — | 8,755,120 | — | 8,755,120 | |||||||||
| Convertible Preferred Stock | 2,483,876 | 3,687,218 | — | 6,171,094 | |||||||||
| Corporate Debt | — | 629,616,561 | — | 629,616,561 | |||||||||
| Foreign Debt | — | 116,302,183 | — | 116,302,183 | |||||||||
| U.S. Treasury Obligations | — | 228,290,182 | — | 228,290,182 | |||||||||
| Other | 2,981,379 | 1,632,209 | — | 4,613,588 | |||||||||
| Option Purchased | — | 2,766 | — | 2,766 | |||||||||
| Securities Sold Short | — | (5,453,125 | ) | — | (5,453,125 | ) | |||||||
| Short-Term Investments | — | 184,131,860 | — | 184,131,860 | |||||||||
| Securities Lending Collateral | — | 1,137,484 | — | 1,137,484 | |||||||||
| Options Written | — | (282,255 | ) | — | (282,255 | ) | |||||||
| Total | $ | 5,466,820 | $ | 1,589,340,465 | $ | 194,300 | $ | 1,595,001,585 | |||||
| Foreign Currency Exchange Contracts | $ | — | $ | 420,444 | $ | — | $ | 420,444 | |||||
| Futures Contracts | 19,549 | — | — | 19,549 | |||||||||
| Swap Contracts | — | (189,217 | ) | — | (189,217 | ) | |||||||
| Optimum International Fund | |||||||||||||
| Level 1 | Level 2 | Level 3 | Total | ||||||||||
| Common Stock | $ | 453,158,547 | $ | 1,215,863 | $ | — | $ | 454,374,410 | |||||
| Preferred Stock | 2,066,342 | — | — | 2,066,342 | |||||||||
| Short-Term Investments | — | 5,095,103 | — | 5,095,103 | |||||||||
| Securities Lending Collateral | — | 38,430,216 | — | 38,430,216 | |||||||||
| Total | $ | 455,224,889 | $ | 43,741,182 | $ | — | $ | 499,966,071 | |||||
| Foreign Currency Exchange Contracts | $ | — | $ | 1,130,394 | $ | — | $ | 1,130,394 | |||||
120
| Optimum Large Cap Growth Fund | ||||||||||||||
| Level 1 | Level 2 | Level 3 | Total | |||||||||||
| Common Stock | $ | 848,581,437 | $ | — | $ | 127,961 | $ | 848,709,398 | ||||||
| Convertible Preferred Stock | — | — | 409,019 | 409,019 | ||||||||||
| Short-Term Investments | — | 30,815,736 | — | 30,815,736 | ||||||||||
| Securities Lending Collateral | — | 1,280,182 | — | 1,280,182 | ||||||||||
| Total | $ | 848,581,437 | $ | 32,095,918 | $ | 536,980 | $ | 881,214,335 | ||||||
| Optimum Large Cap Value Fund | ||||||||||||||
| Level 1 | Level 2 | Level 3 | Total | |||||||||||
| Common Stock | $ | 847,765,528 | $ | — | $ | — | $ | 847,765,528 | ||||||
| Convertible Preferred Stock | — | 989,508 | — | 989,508 | ||||||||||
| Short-Term Investments | — | 25,757,447 | — | 25,757,447 | ||||||||||
| Securities Lending Collateral | — | 762,187 | — | 762,187 | ||||||||||
| Total | $ | 847,765,528 | $ | 27,509,142 | $ | — | $ | 875,274,670 | ||||||
| Optimum Small-Mid Cap Growth Fund | ||||||||||||||
| Level 1 | Level 2 | Level 3 | Total | |||||||||||
| Common Stock | $ | 340,166,505 | $ | — | $ | — | $ | 340,166,505 | ||||||
| Exchange-Traded Fund | 1,961,050 | — | — | 1,961,050 | ||||||||||
| Short-Term Investments | — | 5,896,124 | — | 5,896,124 | ||||||||||
| Securities Lending Collateral | — | 7,278,964 | — | 7,278,964 | ||||||||||
| Total | $ | 342,127,555 | $ | 13,175,088 | $ | — | $ | 355,302,643 | ||||||
| Foreign Currency Exchange Contract | $ | — | $ | 9 | $ | — | $ | 9 | ||||||
| Optimum Small-Mid Cap Value Fund | ||||||||||||||
| Level 1 | Level 2 | Level 3 | Total | |||||||||||
| Common Stock | $ | 314,479,927 | $ | — | $ | — | $ | 314,479,927 | ||||||
| Short-Term Investments | — | 28,637,738 | — | 28,637,738 | ||||||||||
| Securities Lending Collateral | — | 1,819,878 | — | 1,819,878 | ||||||||||
| Total | $ | 314,479,927 | $ | 30,457,616 | $ | — | $ | 344,937,543 | ||||||
The securities that have been deemed worthless on the statements of net assets are considered to be Level 3 securities in these tables.
A reconciliation of Level 3 investments is presented when each Fund has a significant amount of Level 3 investments at the beginning, interim or end of the period in relation to each Fund’s net assets. Management has determined not to provide additional disclosure on Level 3 inputs under ASU No. 2011-04 since the Level 3 investments are not considered significant to each Fund’s net assets at the end of the year.
During the year ended March 31, 2013, there were no transfers between Level 1 investments, Level 2 investments or Level 3 investments that had a significant impact to the Funds. This does not include transfers between Level 1 investments and Level 2 investments due to the Funds utilizing international fair value pricing during the year. In accordance with the fair valuation procedures described in Note 1, international fair value pricing uses other observable market-based inputs in place of the closing exchange price due to the events occurring after the close of the exchange or market on which the investment is principally traded causing a change in classification between levels. Each Fund’s policy is to recognize transfers between levels at the beginning of the reporting period.
(continues) 121
Notes to financial statements
Optimum Fund Trust
4. Dividend and Distribution Information
Income and long-term capital gain distributions are determined in accordance with federal income tax regulations, which may differ from U.S. GAAP. Additionally, distributions from net gains on foreign currency transactions and net short-term gains on sales of investment securities are treated as ordinary income for federal income tax purposes. The tax character of dividends and distributions paid during the years ended March 31, 2013 and 2012 was as follows:
Year Ended March 31, 2013
| Optimum | Optimum | Optimum | Optimum | Optimum | Optimum | |||||||||||||||||||||||||
| Fixed Income | International | Large Cap | Large Cap | Small-Mid Cap | Small-Mid Cap | |||||||||||||||||||||||||
| Fund | Fund | Growth Fund | Value Fund | Growth Fund | Value Fund | |||||||||||||||||||||||||
| Ordinary income | $ | 49,368,932 | $ | 8,384,189 | $ | 1,950,159 | $ | 21,306,489 | $ | — | $ | 1,660,618 | ||||||||||||||||||
| Long-term capital gains | 6,859,901 | — | — | — | 8,488,207 | 10,254,958 | ||||||||||||||||||||||||
| Total | $ | 56,228,833 | $ | 8,384,189 | $ | 1,950,159 | $ | 21,306,489 | $ | 8,488,207 | $ | 11,915,576 | ||||||||||||||||||
Year Ended March 31, 2012
| Optimum | Optimum | Optimum | Optimum | Optimum | |||||||||||||||||||||
| Fixed Income | International | Large Cap | Small-Mid Cap | Small-Mid Cap | |||||||||||||||||||||
| Fund | Fund | Value Fund | Growth Fund | Value Fund | |||||||||||||||||||||
| Ordinary income | $ | 46,904,331 | $ | 5,814,738 | $ | 6,049,903 | $ | — | $ | — | |||||||||||||||
| Long-term capital gains | 9,075,525 | — | — | 19,409,757 | 3,155,078 | ||||||||||||||||||||
| Total | $ | 55,979,856 | $ | 5,814,738 | $ | 6,049,903 | $ | 19,409,757 | $ | 3,155,078 | |||||||||||||||
Optimum Large Cap Growth Fund did not make any distributions during the year ended March 31, 2012.
5. Components of Net Assets on a Tax Basis
As of March 31, 2013, the components of net assets on a tax basis were as follows:
| Optimum | Optimum | Optimum | ||||||||||||
| Fixed Income | International | Large Cap | ||||||||||||
| Fund | Fund | Growth Fund | ||||||||||||
| Shares of beneficial interest | $ | 1,437,080,818 | $ | 501,625,268 | $ | 713,262,769 | ||||||||
| Undistributed ordinary income | 10,111,027 | 2,909,246 | 118,484 | |||||||||||
| Undistributed long-term capital gains | 3,988,584 | — | 15,467,506 | |||||||||||
| Capital loss carryforwards | — | (54,326,974 | ) | — | ||||||||||
| Unrealized appreciation (depreciation) | 44,114,732 | 18,079,937 | 150,126,324 | |||||||||||
| Net assets | $ | 1,495,295,161 | $ | 468,287,477 | $ | 878,975,083 | ||||||||
| Optimum | Optimum | Optimum | ||||||||||||
| Large Cap | Small-Mid Cap | Small-Mid Cap | ||||||||||||
| Value Fund | Growth Fund | Value Fund | ||||||||||||
| Share of beneficial interest | $ | 822,482,491 | $ | 246,997,482 | $ | 250,566,743 | ||||||||
| Undistributed ordinary income | 1,658,748 | — | 2,505,618 | |||||||||||
| Undistributed long-term capital gains | — | 20,131,221 | 21,465,612 | |||||||||||
| Capital loss carryforwards | (121,086,562 | ) | — | — | ||||||||||
| Qualified late year loss deferrals | — | (992,037 | ) | — | ||||||||||
| Unrealized appreciation | 173,956,698 | 82,901,145 | 70,224,930 | |||||||||||
| Net assets | $ | 877,011,375 | $ | 349,037,811 | $ | 344,762,903 | ||||||||
The differences between book basis and tax basis components of net assets are primarily attributable to tax deferral of losses on wash sales, tax deferral of losses on straddles, mark-to-market of foreign currency exchange contracts, mark-to-market of futures contracts, tax recognition of unrealized gain on passive foreign investment companies, tax treatment of contingent payment on debt instruments, amortization of premium on convertible securities, return of capital on investments, partnership interest and CDS contracts.
Qualified late year losses represent losses realized on investment transactions from November 1, 2012 through March 31, 2013 that, in accordance with federal income tax regulations, each Fund has elected to defer and treat as having arisen in the following fiscal year.
122
For financial reporting purposes, capital accounts are adjusted to reflect the tax character of permanent book/tax differences. Reclassifications are primarily due to tax treatment of net operating losses, gain (loss) on foreign currency transactions, CDS contracts, foreign tax capital gain, contingent payment on debt instruments, sale of passive foreign investment companies, and paydown gains (losses) of asset- and mortgage-backed securities. Results of operations and net assets were not affected by these reclassifications. For the year ended March 31, 2013, the Funds recorded the following reclassifications:
| Optimum | Optimum | Optimum | Optimum | Optimum | Optimum | |||||||||||||||||||||||||
| Fixed Income | International | Large Cap | Large Cap | Small-Mid Cap | Small-Mid Cap | |||||||||||||||||||||||||
| Fund | Fund | Growth Fund | Value Fund | Growth Fund | Value Fund | |||||||||||||||||||||||||
| Undistributed (accumulated) net | ||||||||||||||||||||||||||||||
| investment income (loss) | $ | 399,505 | $ | (646,461 | ) | $ | 36,637 | $ | (7,303 | ) | $ | 1,262,434 | $ | (3,626 | ) | |||||||||||||||
| Accumulated net realized gain (loss) | (399,505 | ) | 646,461 | (36,637 | ) | 7,303 | 6,751 | 3,626 | ||||||||||||||||||||||
| Paid-in capital | — | — | — | — | (1,269,185 | ) | — | |||||||||||||||||||||||
For federal income tax purposes, capital loss carryforwards may be carried forward and applied against future capital gains. At March 31, 2013, the Funds utilized capital loss carryforwards as follows:
| Optimum | Optimum | Optimum | |||
| International | Large Cap | Large Cap | |||
| Fund | Growth Fund | Value Fund | |||
| $1,024,451 | $60,435,247 | $28,200,675 |
At March 31, 2013, Optimum Fixed Income Fund, Optimum Large Cap Growth, Optimum Small-Mid Cap Growth Fund and Optimum Small-Mid Cap Value Fund did not have any capital loss carryforwards outstanding. Capital loss carryforwards remaining at March 31, 2013 will expire as follows:
| Optimum | Optimum | ||||||||
| Years of | International | Large Cap | |||||||
| Expiration | Fund | Value Fund | |||||||
| 3/31/17 | $ | — | $ | 2,058,426 | |||||
| 3/31/18 | 49,949,013 | 119,028,136 | |||||||
| Total | $ | 49,949,013 | $ | 121,086,562 | |||||
On December 22, 2010, the Regulated Investment Company Modernization Act of 2010 (Act) was enacted, which changed various technical rules governing the tax treatment of regulated investment companies. The changes were generally effective for taxable years beginning after the date of enactment. Under the Act, each Fund is permitted to carry forward capital losses incurred in taxable years beginning after the date of enactment for an unlimited period. However, any losses incurred during those future taxable years will be required to be utilized prior to the losses incurred in pre-enactment taxable years, which carry an expiration date. As a result of this ordering rule, pre-enactment capital loss carryforwards may be more likely to expire unused. Additionally, post-enactment capital loss carryforwards will retain their character as either short-term or long-term capital losses rather than being considered all short-term as permitted under previous regulation.
Losses incurred that will be carried forward under the Act are as follows:
| Loss carryforward character | ||||
| Short-term | Long-term | |||
| Optimum International Fund | $18,734 | $4,359,227 | ||
(continues) 123
Notes to financial statements
Optimum Fund Trust
6. Capital Shares
Transactions in capital shares were as follows:
| Optimum | Optimum | Optimum | ||||||||||||||||
| Fixed Income | International | Large Cap | ||||||||||||||||
| Fund | Fund | Growth Fund | ||||||||||||||||
| Year Ended | Year Ended | Year Ended | ||||||||||||||||
| 3/31/13 | 3/31/12 | 3/31/13 | 3/31/12 | 3/31/13 | 3/31/12 | |||||||||||||
| Shares sold: | ||||||||||||||||||
| Class A | 667,703 | 731,647 | 118,996 | 94,500 | 269,213 | 279,314 | ||||||||||||
| Class B | 30,084 | 10,542 | 84 | 193 | — | 293 | ||||||||||||
| Class C | 2,178,257 | 1,893,449 | 270,564 | 246,063 | 672,086 | 646,825 | ||||||||||||
| Institutional Class | 41,250,317 | 35,411,000 | 18,394,158 | 7,961,220 | 11,150,649 | 11,897,997 | ||||||||||||
| 44,126,361 | 38,046,638 | 18,783,802 | 8,301,976 | 12,091,948 | 12,824,429 | |||||||||||||
| Shares issued upon reinvestment of dividends | ||||||||||||||||||
| and distributions: | ||||||||||||||||||
| Class A | 153,152 | 190,195 | 21,816 | 16,553 | 1,062 | — | ||||||||||||
| Class B | 6,179 | 17,448 | 1,457 | 1,012 | — | — | ||||||||||||
| Class C | 515,944 | 665,608 | 61,190 | 23,075 | — | — | ||||||||||||
| Institutional Class | 4,907,021 | 4,811,837 | 738,511 | 518,666 | 140,180 | — | ||||||||||||
| 5,582,296 | 5,685,088 | 822,974 | 559,306 | 141,242 | — | |||||||||||||
| Shares redeemed: | ||||||||||||||||||
| Class A | (818,425 | ) | (903,863 | ) | (164,376 | ) | (216,075 | ) | (452,718 | ) | (587,288 | ) | ||||||
| Class B | (228,875 | ) | (207,118 | ) | (74,657 | ) | (60,541 | ) | (178,906 | ) | (170,393 | ) | ||||||
| Class C | (2,814,412 | ) | (3,353,403 | ) | (578,476 | ) | (676,649 | ) | (1,664,282 | ) | (2,054,304 | ) | ||||||
| Institutional Class | (18,907,614 | ) | (18,712,858 | ) | (4,629,374 | ) | (4,447,808 | ) | (9,566,896 | ) | (11,007,911 | ) | ||||||
| (22,769,326 | ) | (23,177,242 | ) | (5,446,883 | ) | (5,401,073 | ) | (11,862,802 | ) | (13,819,896 | ) | |||||||
| Net increase (decrease) | 26,939,331 | 20,554,484 | 14,159,893 | 3,460,209 | 370,388 | (995,467 | ) | |||||||||||
| Optimum | Optimum | Optimum | ||||||||||||||||
| Large Cap | Small-Mid Cap | Small-Mid Cap | ||||||||||||||||
| Value Fund | Growth Fund | Value Fund | ||||||||||||||||
| Year Ended | Year Ended | Year Ended | ||||||||||||||||
| 3/31/13 | 3/31/12 | 3/31/13 | 3/31/12 | 3/31/13 | 3/31/12 | |||||||||||||
| Shares sold: | ||||||||||||||||||
| Class A | 298,117 | 295,586 | 57,488 | 45,025 | 50,905 | 40,909 | ||||||||||||
| Class B | 716 | 411 | — | 123 | — | 167 | ||||||||||||
| Class C | 722,182 | 690,498 | 122,324 | 106,952 | 120,056 | 125,046 | ||||||||||||
| Institutional Class | 13,102,181 | 13,727,120 | 5,899,681 | 6,417,276 | 6,121,705 | 7,157,709 | ||||||||||||
| 14,123,196 | 14,713,615 | 6,079,493 | 6,569,376 | 6,292,666 | 7,323,831 | |||||||||||||
| Shares issued upon reinvestment of dividends | ||||||||||||||||||
| and distributions: | ||||||||||||||||||
| Class A | 63,822 | 21,647 | 11,735 | 31,939 | 15,217 | 4,961 | ||||||||||||
| Class B | 2,737 | 603 | 1,102 | 5,167 | 1,454 | 865 | ||||||||||||
| Class C | 131,014 | 14,762 | 46,545 | 127,506 | 64,652 | 21,186 | ||||||||||||
| Institutional Class | 1,667,880 | 517,001 | 619,318 | 1,532,498 | 900,872 | 259,689 | ||||||||||||
| 1,865,453 | 554,013 | 678,700 | 1,697,110 | 982,195 | 286,701 | |||||||||||||
| Shares redeemed: | ||||||||||||||||||
| Class A | (483,403 | ) | (700,734 | ) | (79,878 | ) | (110,454 | ) | (77,081 | ) | (103,180 | ) | ||||||
| Class B | (191,907 | ) | (170,823 | ) | (35,534 | ) | (31,773 | ) | (38,201 | ) | (32,765 | ) | ||||||
| Class C | (1,729,078 | ) | (2,055,194 | ) | (312,259 | ) | (360,430 | ) | (306,368 | ) | (367,305 | ) | ||||||
| Institutional Class | (10,557,616 | ) | (11,445,134 | ) | (8,732,725 | ) | (5,326,873 | ) | (8,554,580 | ) | (4,679,016 | ) | ||||||
| (12,962,004 | ) | (14,371,885 | ) | (9,160,396 | ) | (5,829,530 | ) | (8,976,230 | ) | (5,182,266 | ) | |||||||
| Net increase (decrease) | 3,026,645 | 895,743 | (2,402,203 | ) | 2,436,956 | (1,701,369 | ) | 2,428,266 | ||||||||||
124
For the years ended March 31, 2013 and 2012, the following shares and values were converted from Class B to Class A. The amounts are included in Class B redemptions and Class A subscriptions in the tables on the previous page and the statements of changes in net assets.
| Year Ended | Year Ended | |||||||||||||
| 3/31/13 | 3/31/12 | |||||||||||||
| Class B | Class A | Class B | Class A | |||||||||||
| Shares | Shares | Value | Shares | Shares | Value | |||||||||
| Optimum Fixed Income Fund | 157,446 | 157,610 | $ | 1,557,933 | 103,352 | 103,410 | $ | 995,147 | ||||||
| Optimum International Fund | 51,846 | 52,868 | 527,495 | 25,092 | 24,635 | 245,632 | ||||||||
| Optimum Large Cap Growth Fund | 118,588 | 125,938 | 1,593,093 | 73,009 | 69,063 | 853,164 | ||||||||
| Optimum Large Cap Value Fund | 130,198 | 131,274 | 1,522,989 | 74,517 | 73,694 | 799,078 | ||||||||
| Optimum Small-Mid Cap Growth Fund | 24,219 | 25,895 | 307,513 | 13,539 | 12,737 | 153,307 | ||||||||
| Optimum Small-Mid Cap Value Fund | 25,297 | 27,050 | 308,649 | 13,498 | 12,700 | 149,142 | ||||||||
7. Derivatives
U.S. GAAP requires disclosures that enable investors to understand: 1) how and why an entity uses derivatives; 2) how they are accounted for; and 3) how they affect an entity’s results of operations and financial position.
Foreign Currency Exchange Contracts — Each Fund may enter into foreign currency exchange contracts and foreign cross currency exchange contracts as a way of managing foreign exchange rate risk. Each Fund may enter into these contracts to fix the U.S. dollar value of a security that it has agreed to buy or sell for the period between the date the trade was entered into and the date the security is delivered and paid for. Each Fund may also use these contracts to hedge the U.S. dollar value of securities it already owns that are denominated in foreign currencies. The change in value is recorded as an unrealized gain or loss. When the contract is closed, a realized gain or loss is recorded equal to the difference between the value of the contract at the time it was opened and the value at the time it was closed.
The use of foreign currency exchange contracts and foreign cross currency exchange contracts does not eliminate fluctuations in the underlying prices of the securities, but does establish a rate of exchange that can be achieved in the future. Although foreign currency exchange contracts and foreign cross currency exchange contracts limit the risk of loss due to an unfavorable change in the value of the hedged currency, they also limit any potential gain that might result should the value of the currency change favorably. In addition, each Fund could be exposed to risks if the counterparties to the contracts are unable to meet the terms of their contracts. Each Fund’s maximum risk of loss from counterparty credit risk is the value of its currency exchanged with the counterparty. The risk is generally mitigated by having a netting arrangement between the Funds and the counterparty and by the posting of collateral by the counterparty to the Funds to cover the Funds’ exposure to the counterparty.
Futures Contracts — A futures contract is an agreement in which the writer (or seller) of the contract agrees to deliver to the buyer an amount of cash or securities equal to a specific dollar amount times the difference between the value of a specific security or index at the close of the last trading day of the contract and the price at which the agreement is made. Optimum Fixed Income Fund and Optimum International Fund may use futures in the normal course of pursuing their investment objectives. Optimum Fixed Income Fund invests in futures contracts to hedge its existing portfolio securities against fluctuations in fair value caused by changes in prevailing market interest rates. Optimum International Fund may use futures contracts to a limited extent, with the objectives of maintaining full exposure to the stock market, enhancing returns, maintaining liquidity and minimizing costs. Upon entering into a futures contract, each Fund deposits cash or pledges U.S. government securities to a broker, equal to the minimum “initial margin” requirements of the exchange on which the contract is traded. Subsequent payments are received from the broker or paid to the broker each day, based on the daily fluctuation in the market value of the contract. These receipts or payments are known as “variation margin” and are recorded daily by the Funds as unrealized gains or losses until the contracts are closed. When the contracts are closed, the Funds record a realized gain or loss equal to the difference between the value of the contract at the time it was opened and the value at the time it was closed. Risks of entering into futures contracts include potential imperfect correlation between the futures contracts and the underlying securities and the possibility of an illiquid secondary market for these instruments. When investing in futures, there is reduced counterparty credit risk to a Fund because futures are exchange-traded and the exchange’s clearinghouse, as counterparty to all exchange-traded futures, guarantees against default.
Options Contracts — During the year ended March 31, 2013, Optimum Fixed Income Fund entered into options contracts in the normal course of pursuing its investment objective. The Fund may buy or write options contracts for any number of reasons, including without limitation: to manage the Funds’ exposure to changes in securities prices and foreign currencies; as an efficient means of adjusting the Fund’s overall exposure to certain markets; to protect the value of portfolio securities; and as a cash management tool. The Fund may buy or write call or put options on securities, futures, swaps, swaptions, financial indices, and foreign currencies. When the Fund buys an option, a premium is paid and an asset is recorded and adjusted on a daily basis to reflect the current market value of the options purchased. When the Fund writes an option, a premium is received and a liability is recorded and adjusted on a daily basis to reflect the current market value of the options written. Premiums received from writing options that expire unexercised are treated by the Fund on the expiration date as realized gains. The difference between the premium received and the amount paid on effecting a closing purchase transaction, including brokerage commissions, is treated as realized gain or loss. If a call option is exercised, the premium is added to the
(continues) 125
Notes to financial statements
Optimum Fund Trust
7. Derivatives (continued)
proceeds from the sale of the underlying security in determining whether the Fund has a realized gain or loss. If a put option is exercised, the premium reduces the cost basis of the securities purchased by the Fund. The Fund, as writer of an option, bears the market risk of an unfavorable change in the price of the security underlying the written option. When writing options, the Fund is subject to minimal counterparty risk because the counterparty is only obligated to pay premiums and does not bear the market risk of an unfavorable market change.
Transactions in options written during the year ended March 31, 2013 for Optimum Fixed Income Fund were as follows:
| Number of contracts | Premiums | ||||||
| Options outstanding at March 31, 2012 | 8,200,097 | $ | 286,829 | ||||
| Options written | 289,600,260 | 919,319 | |||||
| Options expired | (235,000,097 | ) | (778,024 | ) | |||
| Options terminated in closing purchase transactions | (260 | ) | (91,799 | ) | |||
| Options outstanding at March 31, 2013 | 62,800,000 | $ | 336,325 | ||||
Swap Contracts — Optimum Fixed Income Fund enters into interest rate swap contracts and CDS contracts in the normal course of pursuing its investment objective. The Fund may use interest rate swaps to adjust the Fund’s sensitivity to interest rates or to hedge against changes in interest rates. The Fund enters into CDS contracts in order to hedge against a credit event, to enhance total return or to gain exposure to certain securities or markets.
Interest Rate Swaps. An interest rate swap contract is an exchange of interest rates between counterparties. In one instance, an interest rate swap involves payments received by the Fund from another party based on a variable or floating interest rate, in return for making payments based on a fixed interest rate. An interest rate swap can also work in reverse with the Fund receiving payments based on a fixed interest rate and making payments based on a variable or floating interest rate. Interest rate swaps may be used to adjust the Fund’s sensitivity to interest rates or to hedge against changes in interest rates. Periodic payments on such contracts are accrued daily and recorded as unrealized appreciation/depreciation on swap contracts. Upon periodic payment/receipt or termination of the contract, such amounts are recorded as realized gains or losses on swap contracts. The Fund’s maximum risk of loss from counterparty credit risk is the discounted net value of the cash flows to be received from/paid to the counterparty over the interest rate swap contract’s remaining life, to the extent that the amount is positive. This risk is mitigated by having a netting arrangement between the Fund and the counterparty and by the posting of collateral by the counterparty to the Fund to cover the Fund’s exposure to the counterparty.
Credit Default Swaps. A CDS contract is a risk-transfer instrument through which one party (purchaser of protection) transfers to another party (seller of protection) the financial risk of a credit event (as defined in the CDS agreement), as it relates to a particular reference security or basket of securities (such as an index). In exchange for the protection offered by the seller of protection, the purchaser of protection agrees to pay the seller of protection a periodic amount at a stated rate that is applied to the notional amount of the CDS contract. In addition, an upfront payment may be made or received by the Fund in connection with an unwinding or assignment of a CDS contract. Upon the occurrence of a credit event, the seller of protection would pay the par (or other agreed-upon) value of the reference security (or basket of securities) to the counterparty. Credit events generally include, among others, bankruptcy, failure to pay, and obligation default.
During the year ended March 31, 2013, the Fund entered into CDS contracts as a purchaser and seller of protection. Periodic payments (receipts) on such contracts are accrued daily and recorded as unrealized losses (gains) on swap contracts. Upon payment (receipt), such amounts are recorded as realized losses (gains) on swap contracts. Upfront payments made or received in connection with CDS contracts are amortized over the expected life of the CDS contracts as unrealized losses (gains) on swap contracts. The change in value of CDS contracts is recorded as unrealized appreciation or depreciation daily. A realized gain or loss is recorded upon a credit event (as defined in the CDS agreement) or the maturity or termination of the agreement. The Fund had posted $830,000 as cash collateral for certain open derivatives. The Fund received $308,000 as securities collateral for certain open derivatives. This cash amount is presented as restricted cash on the statements of assets and liabilities.
As disclosed in the footnotes to the statements of net assets, at March 31, 2013, the notional value of the protection sold was EUR 6,500,000 and USD 7,100,000, which reflects the maximum potential amount the Fund would have been required to make as a seller of credit protection if a credit event had occurred. In addition to serving as the source of the current value of the securities, the quoted market prices and resulting market values for credit default swap agreements on securities and credit indices serve as an indicator of the current status of the payment/performance risk and represent the likelihood of an expected liability (or profit) for the credit derivative if the swap agreement has been closed/sold as of the period end. Increasing market values, in absolute terms when compared to the notional amount of the swap, represent a deterioration of the reference entity’s credit soundness and a greater likelihood of risk of default or other credit event occurring as defined under the terms of the agreement. At March 31, 2013, the net unrealized appreciation of the protection sold was $670,280.
CDS contracts may involve greater risks than if the Fund had invested in the reference obligation directly. CDS contracts are subject to general market risk, liquidity risk, counterparty risk and credit risk. The Fund’s maximum risk of loss from counterparty credit risk, either as the seller of protection or the buyer of protection, is the fair value of the contract. This risk is mitigated by having a netting arrangement between the Fund and the counterparty and by the posting of collateral by the counterparty to the Fund to cover the Fund’s exposure to the counterparty.
Swaps Generally. The value of open swaps may differ from that which would be realized in the event the Fund terminated its position in the agreement. Risks of entering into these contracts include the potential inability of the counterparty to meet the terms of the contracts. This type of risk is generally limited to the amount of favorable movement in the value of the underlying security, instrument or basket of instruments, if any, at the day of default. Risks also arise from potential losses from adverse market movements and such losses could exceed the unrealized amounts shown on the statements of net assets.
126
Fair values of derivative instruments as of March 31, 2013 were as follows:
| Optimum Fixed Income Fund | ||||||||||||
| Asset Derivatives | Liability Derivatives | |||||||||||
| Statements of | Statements of | |||||||||||
| Assets and Liabilities Location | Fair Value | Assets and Liabilities Location | Fair Value | |||||||||
| Forward currency exchange contracts (Foreign currency exchange contracts) | Unrealized gain on foreign currency exchange contracts | $ | 1,424,474 | Unrealized loss on foreign currency exchange contracts | $ | (1,004,030 | ) | |||||
| Interest rate contracts (Futures contracts) | Variation margin receivable on futures contracts | 263,901 | * | Variation margin payable on futures contracts | (244,352 | ) | ||||||
| Interest and credit contracts (Swap contracts) | Options written, at value | — | Options written, at value | (282,255 | ) | |||||||
| Interest rate contracts (Options written, at value) | Unrealized gain on credit default swap contracts and interest rate swap contracts | 2,166,323 | Unrealized loss on credit default swap contracts and interest rate swap contracts | (2,355,540 | ) | |||||||
| Total | $ | 3,854,698 | $ | (3,886,177 | ) | |||||||
| * | Includes cumulative appreciation of futures contracts from the date the contracts are opened through March 31, 2013. Only current day variation margin is reported on the Optimum Fixed Income Fund’s statements of assets and liabilities. |
The effect of derivative instruments on the statements of operations for the year ended March 31, 2013 was as follows:
| Optimum Fixed Income Fund | ||||||||||||||||||||||||||||||||||
| Change in Unrealized | ||||||||||||||||||||||||||||||||||
| Realized Gain (Loss) on | Appreciation | |||||||||||||||||||||||||||||||||
| Location of Gain (Loss) on | Derivatives Recognized in | (Depreciation) on Derivatives | ||||||||||||||||||||||||||||||||
| Derivatives Recognized in Income | Income | Recognized in Income | ||||||||||||||||||||||||||||||||
| Forward currency exchange contracts (Foreign currency exchange contracts) | Net realized gain on foreign currency exchange contracts and net change in unrealized appreciation (depreciation) of foreign currency exchange contracts | $ | 1,473,308 | $ | 1,388,625 | |||||||||||||||||||||||||||||
| Interest rate contracts (Futures contracts) | Net realized loss on futures contracts and net change in unrealized appreciation (depreciation) of futures contacts | (1,889,375 | ) | (4,337 | ) | |||||||||||||||||||||||||||||
| Interest rate contracts (Options written) | Net realized gain on options written and net change in unrealized appreciation (depreciation) of options written | 688,340 | 114,291 | |||||||||||||||||||||||||||||||
| Interest and credit contracts (Swap contracts) | Net realized gain on swap contracts and net change in unrealized appreciation (depreciation) of swap contracts | 713,508 | (359,235 | ) | ||||||||||||||||||||||||||||||
| $ | 985,781 | $ | 1,139,344 | |||||||||||||||||||||||||||||||
(continues) 127
Notes to financial statements
Optimum Fund Trust
7. Derivatives (continued)
Derivatives Generally. The tables below summarize the average balance of derivative holdings by each Fund during the year ended March 31, 2013.
| Long Derivative Volume | |||||||||||
| Optimum | Optimum | Optimum | Optimum | Optimum | |||||||
| Fixed Income | International | Large Cap | Large Cap | Small-Mid Cap | |||||||
| Fund | Fund | Growth Fund | Value Fund | Growth Fund | |||||||
| Foreign currency exchange contracts (average cost) | USD | 81,110,776 | USD 23,024,831 | USD 56,518 | USD 40,294 | USD 47,889 | |||||
| Futures contracts (average notional value) | 25,845,117 | 71,296 | — | — | — | ||||||
| Options contracts (average notional value) | 29,608 | — | — | — | — | ||||||
| Swap contracts (average notional value)* | AUD | 28,420,000 | — | — | — | — | |||||
| BRL | 77,331,600 | — | — | — | — | ||||||
| CAD | 10,046,400 | — | — | — | — | ||||||
| EUR | 24,945,560 | — | — | — | — | ||||||
| USD | 63,435,104 | — | — | — | — | ||||||
| Short Derivative Volume | |||||||||||
| Optimum | Optimum | Optimum | Optimum | Optimum | |||||||
| Fixed Income | International | Large Cap | Large Cap | Small-Mid Cap | |||||||
| Fund | Fund | Growth Fund | Value Fund | Growth Fund | |||||||
| Foreign currency exchange contracts (average cost) | USD | 160,654,752 | USD 39,424,124 | USD 30,123 | USD 12,386 | USD 19,308 | |||||
| Futures contracts (average notional value) | 31,181,838 | — | — | — | — | ||||||
| Options contracts (average notional value) | 147,858 | — | — | — | — | ||||||
| Swap contracts (average notional value)* | EUR | 4,622,000 | — | — | — | — | |||||
| USD | 6,652,200 | — | — | — | — | ||||||
*Long represents buying protection and short represents selling protection.
8. Securities Lending
Each Fund, may lend its securities pursuant to a security lending agreement (Lending Agreement) with The Bank of New York Mellon (BNY Mellon). At the time a security is loaned, the borrower must post collateral equal to the required percentage of the market value of the loaned security, including any accrued interest. The required percentage is: (i) 102% with respect to U.S. securities and foreign securities that are denominated and payable in U.S. dollars; and (ii) 105% with respect to foreign securities. With respect to each loan, if on any business day the aggregate market value of securities collateral plus cash collateral held is less than the aggregate market value of the securities which are the subject of such loan, the borrower will be notified to provide additional collateral by the end of the following business day which, together with the collateral already held, will be not less than the applicable initial collateral requirements for such security loan. If the aggregate market value of securities collateral and cash collateral held with respect to a security loan exceeds the applicable initial collateral requirement, upon request of the borrower BNY Mellon must return enough collateral to the borrower by the end of the following business day to reduce the value of the remaining collateral to the applicable initial collateral requirement for such security loan. As a result of the foregoing, the value of the collateral held with respect to a loaned security may be temporarily more or less than the value of the security on loan.
Cash collateral received is generally invested in the Delaware Investments Collateral Fund No. 1 (Collective Trust) established by BNY Mellon for the purpose of investment on behalf of funds managed by DMC that participate in BNY Mellon’s securities lending program. The Collective Trust may invest in U.S. government securities and high quality corporate debt, asset-backed and other money market securities and in repurchase agreements collateralized by such securities, provided that the Collective Trust will generally have a dollar-weighted average portfolio maturity of 60 days or less. In October 2008, BNY Mellon transferred certain distressed securities from the Funds’ previous collateral investment pool into the Mellon GSL Reinvestment Trust II. The Funds can also accept U.S. government securities and letters of credit (non-cash collateral) in connection with securities loans. In the event of default or bankruptcy by the lending agent, realization and/or retention of the collateral may be subject to legal proceedings. In the event the borrower fails to return loaned securities and the collateral received is insufficient to cover the value of the loaned securities and provided such collateral shortfall is not the result of investment losses, the lending agent has agreed to pay the amount of the shortfall to the Funds or, at the discretion of the lending agent, replace the loaned securities. The Funds continue to record dividends or interest, as applicable, on the securities loaned and are subject to changes in value of the securities loaned that may occur during the term of the loan. The Funds have the right under the Lending Agreement to recover the securities from the borrower on demand. With respect to security loans collateralized by non-cash collateral, the Funds receive loan premiums paid by the borrower. With respect to security loans collateralized by cash collateral, the earnings from the collateral investments are shared among the Funds, the security lending agent and the borrower. The Funds record security lending income net of allocations to the security lending agent and the borrower.
128
The Collective Trust used for the investment of cash collateral received from borrowers of securities seeks to maintain a net asset value per unit of $1.00, but there can be no assurance that it will always be able to do so. The Funds may incur investment losses as a result of investing securities lending collateral in the Collective Trust or another collateral investment pool. This could occur if an investment in a collateral investment pool defaulted or if it were necessary to liquidate assets in the collateral investment pool to meet returns on outstanding security loans at a time when the collateral investment pool’s net asset value per unit was less than $1.00. Under those circumstances, the Funds may not receive an amount from the collateral investment pool that is equal in amount to the collateral the Funds would be required to return to the borrower of the securities and the Funds would be required to make up for this shortfall.
At March 31, 2013, the values of securities on loan and the values of invested collateral for each Fund is presented below, for which cash collateral was received and invested in accordance with the Lending Agreement. These investments are presented on the statements of net assets under the caption “Securities Lending Collateral“.
| Optimum | Optimum | Optimum | Optimum | Optimum | Optimum | |||||||||||||||||||||||
| Fixed Income | International | Large Cap | Large Cap | Small-Mid Cap | Small-Mid Cap | |||||||||||||||||||||||
| Fund | Fund | Growth Fund | Value Fund | Growth Fund | Value Fund | |||||||||||||||||||||||
| Values of securities on loan | $ | 1,923,783 | $ | 36,853,828 | $ | 1,949,712 | $ | 1,416,398 | $ | 7,436,986 | $ | 1,903,314 | ||||||||||||||||
| Values of invested Collateral | 1,137,484 | 38,430,216 | 1,280,182 | 762,187 | 7,278,964 | 1,819,878 | ||||||||||||||||||||||
| Cash collateral | 1,999,999 | 38,876,939 | 1,999,994 | 1,479,584 | 7,627,674 | 1,999,970 | ||||||||||||||||||||||
| Non-cash collateral | — | 62,065 | — | — | — | 27 | ||||||||||||||||||||||
9. Credit and Market Risk
Some countries in which the Funds may invest require governmental approval for the repatriation of investment income, capital or the proceeds of sales of securities by foreign investors. In addition, if there is deterioration in a country’s balance of payments or for other reasons, a country may impose temporary restrictions on foreign capital remittances abroad.
The securities exchanges of certain foreign markets are substantially smaller, less liquid and more volatile than the major securities markets in the United States. Consequently, acquisition and disposition of securities by the Funds may be inhibited. In addition, a significant portion of the aggregate market value of securities listed on the major securities exchanges in emerging markets is held by a smaller number of investors. This may limit the number of shares available for acquisition or disposition by the Funds.
Optimum Fixed Income Fund invests in high yield fixed income securities, which are securities rated lower than BBB- by Standard & Poor’s and Baa3 by Moody’s Investors Service, or similarly rated by another nationally recognized statistical rating organization. Investments in these higher yielding securities are generally accompanied by a greater degree of credit risk than higher rated securities. Additionally, lower rated securities may be more susceptible to adverse economic and competitive industry conditions than investment-grade securities.
Optimum Fixed Income Fund invests in certain obligations held by the Fund that may have liquidity protection to ensure that the receipt of payments due on the underlying security is timely. Such protection may be provided through guarantees, insurance policies or letter of credit obtained by the issuer or sponsor through third parties, through various means of structuring the transaction or through a combination of such approaches. The Fund will not pay any additional fees for such credit support, although the existence of credit support may increase the price of a security.
Optimum Fixed Income Fund invests in fixed income securities whose value is derived from an underlying pool of mortgages or consumer loans. The value of these securities is sensitive to changes in economic conditions, including delinquencies and/or defaults, and may be adversely affected by shifts in the market’s perception of the issuers and changes in interest rates. Investors receive principal and interest payments as the underlying mortgages and consumer loans are paid back. Some of these securities are collateralized mortgage obligations (CMOs). CMOs are debt securities issued by U.S. government agencies or by financial institutions and other mortgage lenders, which are collateralized by a pool of mortgages held under an indenture. Prepayment of mortgages may shorten the stated maturity of the obligations and can result in a loss of premium, if any has been paid. Certain of these securities may be stripped (securities which provide only the principal or interest feature of the underlying security). The yield to maturity on an interest-only CMO is extremely sensitive not only to changes in prevailing interest rates, but also to the rate of principal payments (including prepayments) on the related underlying mortgage assets. A rapid rate of principal payments may have a material adverse effect on the Fund’s yield to maturity. If the underlying mortgage assets experience greater than anticipated prepayments of principal, the Fund may fail to fully recoup its initial investment in these securities even if the securities are rated in the highest rating categories.
Optimum Small-Mid Cap Growth Fund and Optimum Small-Mid Cap Value Fund invest a significant portion of their assets in small- and mid-sized companies. Investments in small- and mid-sized companies may be more volatile than investments in larger companies for a number of reasons, which include more limited financial resources or a dependence on narrow product lines.
(continues) 129
Notes to financial statements
Optimum Fund Trust
9. Credit and Market Risk (continued)
Optimum Large Cap Growth Fund, Optimum Large Cap Value Fund, Optimum Small-Mid Cap Growth Fund and Optimum Small-Mid Cap Value Fund may invest in REITs and are subject to the risks associated with that industry. If a Fund holds real estate directly as a result of defaults or receives rental income directly from real estate holdings, its tax status as a regulated investment company may be jeopardized. There were no direct real estate holdings during the year ended March 31, 2013. The Funds’ REIT holdings are also affected by interest rate changes, particularly if the REITs they hold use floating rate debt to finance their ongoing operations.
Each Fund may invest up to 15% of its net assets in illiquid securities, which may include securities with contractual restrictions on resale, securities exempt from registration under Rule 144A of the Securities Act of 1933, as amended (Act), and other securities which may not be readily marketable. The relative illiquidity of these securities may impair the Funds from disposing of them in a timely manner and at a fair price when it is necessary or desirable to do so. While maintaining oversight, the Funds’ Board has delegated to DMC, the day-to-day functions of determining whether individual securities are liquid for purposes of the Funds’ limitation on investments in illiquid securities. The Funds’ may also invest in securities exempt from registration under Section 4(2) of the Act, which exempts from registration transactions by an issuer not involving any public offering. Securities eligible for resale pursuant to Rule 144A, which are determined to be liquid, are not subject to the Funds’ 15% limit on investments in illiquid securities. Section 4(2) and/or Rule 144A and illiquid securities have been identified on the statements of net assets.
10. Contractual Obligations
Each Fund enters into contracts in the normal course of business that contain a variety of indemnifications. The Funds’ maximum exposure under these arrangements is unknown. However, each Fund has not had prior claims or losses pursuant to these contracts. Management has reviewed the Funds’ existing contracts and expects the risk of loss to be remote.
11. Subsequent Events
Management has determined that no material events or transactions occurred subsequent to March 31, 2013 that would require recognition or disclosure in the Funds’ financial statements.
130
Report of independent
registered public accounting firm
To the Board of Trustees of Optimum Fund Trust, as defined, and the Shareholders:
In our opinion, the accompanying statements of net assets, statements of assets and liabilities, and the related statements of operations and of changes in net assets and the financial highlights present fairly, in all material respects, the financial position of Optimum Fixed Income Fund, Optimum International Fund, Optimum Large Cap Growth Fund, Optimum Large Cap Value Fund, Optimum Small-Mid Cap Growth Fund and Optimum Small-Mid Cap Value Fund (constituting Optimum Fund Trust, hereafter referred to as the “Funds”) at March 31, 2013, the results of each of their operations for the year then ended, the changes in each of their net assets for each of the two years in the period then ended and the financial highlights for each of the three years in the period then ended, in conformity with accounting principles generally accepted in the United States of America. These financial statements and financial highlights (hereafter referred to as “financial statements”) are the responsibility of the Funds’ management; our responsibility is to express an opinion on these financial statements based on our audits. We conducted our audits of these financial statements in accordance with the standards of the Public Company Accounting Oversight Board (United States). Those standards require that we plan and perform the audit to obtain reasonable assurance about whether the financial statements are free of material misstatement. An audit includes examining, on a test basis, evidence supporting the amounts and disclosures in the financial statements, assessing the accounting principles used and significant estimates made by management, and evaluating the overall financial statement presentation. We believe that our audits, which included confirmation of securities at March 31, 2013 by correspondence with the custodian and brokers, provide a reasonable basis for our opinion. The financial highlights for each of the two years in the period ended March 31, 2010 were audited by other independent accountants whose report dated May 19, 2010 expressed an unqualified opinion on those statements.
PricewaterhouseCoopers LLP
Philadelphia, Pennsylvania
May 21, 2013
131
Other Fund information
(Unaudited)
Optimum Fund Trust
Tax Information
The information set forth below is for each Fund’s fiscal year as required by federal income tax laws. Shareholders, however, must report distributions on a calendar year basis for income tax purposes, which may include distributions for portions of two fiscal years of the Funds. Accordingly, the information needed by shareholders for income tax purposes will be sent to them in January of each year. Please consult your tax advisor for proper treatment of this information.
All designations are based on financial information available as of the date of this annual report and, accordingly are subject to change. For any and all items requiring designation, it is the intention of the Funds to designate the maximum amount permitted under the Internal Revenue Code and the regulations thereunder.
For the fiscal year ended March 31, 2013, each Fund designates distributions paid during the year as follows:
| (A) | (B) | ||||||||||||||||
| Long-Term | Ordinary | ||||||||||||||||
| Capital Gains | Income | Total | (C) | ||||||||||||||
| Distributions | Distributions* | Distributions | Qualifying | ||||||||||||||
| (Tax Basis) | (Tax Basis) | (Tax Basis) | Dividends1 | ||||||||||||||
| Optimum Fixed Income Fund | 12.20 | % | 87.80 | % | 100.00% | 0.14 | % | ||||||||||
| Optimum International Fund | — | 100.00 | % | 100.00% | — | ||||||||||||
| Optimum Large Cap Growth Fund | — | 100.00 | % | 100.00% | 100.00 | % | |||||||||||
| Optimum Large Cap Value Fund | — | 100.00 | % | 100.00% | 100.00 | % | |||||||||||
| Optimum Small-Mid Cap Growth Fund | 100.00 | % | — | 100.00% | — | ||||||||||||
| Optimum Small-Mid Cap Value Fund | 86.06 | % | 13.94 | % | 100.00% | 90.03 | % | ||||||||||
(A) and (B) are based on a percentage of each Fund’s total distributions.
(C) is based on a percentage of each Fund’s ordinary income distributions.
1Qualifying dividends represent dividends which qualify for the corporate dividends received deduction.
| * | For the fiscal year ended March 31, 2013, certain dividends paid by the Funds may be subject to a maximum tax rate of 15%, as provided for by the Jobs and Growth Tax Relief Reconciliation Act of 2003, as extended by the Tax Relief, Unemployment Insurance Reauthorization and Jobs Creation Act of 2010, and made permanent by the American Taxpayer Relief Act of 2012. The Funds intend to designate the following percentages to be taxed at a maximum rate of 15%. Complete information will be computed and reported in conjunction with your 2013 Form 1099-DIV. |
| Optimum | Optimum | Optimum | Optimum | Optimum | Optimum | |||||
| Fixed Income | International | Large Cap | Large Cap | Small-Mid Cap | Small-Mid Cap | |||||
| Fund | Fund | Growth Fund | Value Fund | Growth Fund | Value Fund | |||||
| 0.14% | 65.38% | 100.00% | 100.00% | — | 100.00% |
Optimum International Fund intends to pass through foreign tax credits in the maximum amount of $372,088. The gross foreign source income earned during the fiscal year 2013 by the Fund was $12,354,833.
132
Board of trustees and officers addendum
Optimum Fund Trust
A mutual fund is governed by a Board of Trustees, which has oversight responsibility for the management of a fund’s business affairs. Trustees establish procedures and oversee and review the performance of the investment manager, the distributor and others that perform services for the fund. The independent fund trustees, in particular, are advocates for shareholder interests. The following is a list of the Trustees and Officers of the Trust with certain background and related information.
| Number of | |||||
| Portfolios in Fund | Other | ||||
| Name, | Complex1 Overseen | Directorships | |||
| Address | Position(s) | Length of | Principal Occupation(s) | by Trustee | Held by |
| and Age | Held with Fund(s) | Time Served | During Past 5 Years | or Officer | Trustee or Officer |
| Interested Trustees | |||||
| Daniel H. Arnold2 | Trustee | September 19, 2012 | Chief Financial Officer — | 6 | None |
| 2005 Market Street | to present | LPL Financial LLC | |||
| Philadelphia, PA | (2012–Present) | ||||
| 19103 | |||||
| Managing Director — | |||||
| Age 48 | LPL Financial LLC | ||||
| (2007–Present) | |||||
| J. Scott Coleman2 | Trustee, President | June 16, 2011 | Executive Vice President | 6 | None |
| 2005 Market Street | and Chief | to present | Head of Distribution and Marketing — | ||
| Philadelphia, PA | Executive Officer | Delaware Investments | |||
| 19103 | (October 2008–Present) | ||||
| Age 52 | Managing Director for | ||||
| Investment Consulting Group — | |||||
| Goldman Sachs Asset Management | |||||
| (2001–2008) | |||||
| Independent Trustees | |||||
| Robert J. Christian | Trustee | November 1, 2007 | Private Investor | 6 | Trustee — FundVantage |
| 2005 Market Street | and Chairman | to present | (2006–Present) | Trust (34 mutual funds) | |
| Philadelphia, PA | (2007–Present) | ||||
| 19103 | Chief Investment Officer | ||||
| Wilmington Trust Corporation | |||||
| Age 64 | (Trust Bank) | ||||
| (1996–2006) | |||||
| Nicholas D. Constan | Trustee | July 17, 2003 | Adjunct Professor — | 6 | None |
| 2005 Market Street | to present | University of Pennsylvania | |||
| Philadelphia, PA | (1972–Present) | ||||
| 19103 | |||||
| Age 74 | |||||
| Durant Adams Hunter | Trustee | July 17, 2003 | Principal—Ridgeway Partners | 6 | None |
| 2005 Market Street | to present | (Executive Recruiting) | |||
| Philadelphia, PA | (2004–Present) | ||||
| 19103 | |||||
| Age 64 | |||||
(continues) 133
Board of trustees and officers addendum
| Number of | |||||
| Portfolios in Fund | Other | ||||
| Name, | Complex1 Overseen | Directorships | |||
| Address | Position(s) | Length of | Principal Occupation(s) | by Trustee | Held by |
| and Age | Held with Fund(s) | Time Served | During Past 5 Years | or Officer | Trustee or Officer |
| Independent Trustees (continued) | |||||
| Stephen Paul Mullin | Trustee | July 17, 2003 | President — | 6 | None |
| 2005 Market Street | to present | Econsult Solutions, Inc. | |||
| Philadelphia, PA | (Economic Consulting) | ||||
| 19103 | (2000–Present) | ||||
| Age 57 | |||||
| Robert A. Rudell | Trustee | July 17, 2003 | Private Investor | 6 | Director and Chair, |
| 2005 Market Street | to present | (2002–Present) | Compensation Committee — | ||
| Philadelphia, PA | Medtox Scientific, Inc. | ||||
| 19103 | (Medical devices/Clinical lab) | ||||
| (2002–Present) | |||||
| Age 64 | |||||
| Director and | |||||
| Independent Chairman — | |||||
| Heartland Funds | |||||
| (3 mutual funds) | |||||
| (2005–Present) | |||||
| Jon Edward Socolofsky Trustee | July 17, 2003 | Private Investor | 6 | None | |
| 2005 Market Street | to present | (2002–Present) | |||
| Philadelphia, PA | |||||
| 19103 | |||||
| Age 67 | |||||
| Officers | |||||
| David F. Connor | Vice President, | Vice President since | Mr. Connor has served as | 6 | None4 |
| 2005 Market Street | Deputy General | July 17, 2003 | Vice President and Deputy | ||
| Philadelphia, PA | Counsel, and Secretary | and Secretary | General Counsel of | ||
| 19103 | since | Delaware Investments3 since 2000. | |||
| December 6, 2005 | |||||
| Age 48 | |||||
| David P. O’Connor | Executive Vice President, | Executive Vice President | Mr. O’Connor has served in | 6 | None4 |
| 2005 Market Street | General Counsel | since February 2012; | various executive and legal | ||
| Philadelphia, PA | and Chief | Senior Vice President | capacities at different times at | ||
| 19103 | Legal Officer | October 2005– | Delaware Investments. | ||
| February 2012; | |||||
| Age 46 | General Counsel | ||||
| and Chief Legal Officer | |||||
| since October 2005 | |||||
| Daniel Geatens | Vice President | September 20, 2007 | Mr. Geatens has served in | 6 | None4 |
| 2005 Market Street | and Treasurer | to present | various capacities at | ||
| Philadelphia, PA | Delaware Investments. | ||||
| 19103 | |||||
| Age 40 | |||||
| Richard Salus | Senior | January 1, 2006 | Mr. Salus has served in | 6 | None4 |
| 2005 Market Street | Vice President | to present | various executive capacities | ||
| Philadelphia, PA | and | at different times at | |||
| 19103 | Chief Financial | Delaware Investments. | |||
| Officer | |||||
| Age 49 | |||||
1 The term “Fund Complex” refers to the Funds in the Optimum Fund Trust. |
2 “Interested persons” of the Funds by virtue of their executive and management positions or relationships with the Fund’s service providers or sub-service providers. |
3 Delaware Investments is the marketing name for Delaware Management Holdings, Inc. and its subsidiaries, including the Trust’s manager, principal underwriter and service agent. |
4 Messrs Connor, O’Connor, Geatens and Salus also serve in similar capacities for the Delaware Investments® Family of Funds, a fund complex also managed and distributed by Delaware Investments with 70 funds. |
The Statement of Additional Information for the Funds includes additional information about the Trustees and Officers and is available, without charge, upon request by calling your financial advisor or 800 914-0278. |
134
About the organization
This annual report is for the information of Optimum Fund Trust shareholders, but it may be used with prospective investors when preceded or accompanied by a current prospectus for Optimum Fund Trust and the fact sheet for the most recently completed calendar quarter. The prospectus sets forth details about charges, expenses, investment objectives, and operating policies of the investment company. You should read the prospectus carefully before you invest. The figures in this report represent past results that are not a guarantee of future results. The return and principal value of an investment in the investment company will fluctuate so that shares, when redeemed, may be worth more or less than their original cost.
| Board of trustees | Affiliated officers | Contact information |
| Daniel H. Arnold Chief Financial Officer LPL Financial LLC J. Scott Coleman Robert J. Christian Nicholas D. Constan Durant Adams Hunter Stephen Paul Mullin Robert A. Rudell Jon Edward Socolofsky | David F. Connor Vice President, Deputy General Counsel and Secretary Optimum Fund Trust Philadelphia, PA Daniel V. Geatens David P. O’Connor Richard Salus | Investment manager Delaware Management Company, a series of Delaware Management Business Trust Philadelphia, PA National distributor Shareholder servicing, dividend For shareholders For securities dealers Website |
| | ||
Each Fund files its complete schedule of portfolio holdings with the Securities and Exchange Commission (SEC) for the first and third quarters of each fiscal year on Forms N-Q. Each Fund’s Forms N-Q, as well as a description of the policies and procedures that each Fund uses to determine how to vote proxies (if any) relating to portfolio securities is available without charge (i) upon request, by calling 800 914-0278; (ii) on the Fund’s website at optimummutualfunds.com; and (iii) on the SEC’s website at sec.gov. Each Fund’s Forms N-Q may be reviewed and copied at the SEC’s Public Reference Room in Washington, D.C.; information on the operation of the Public Reference Room may be obtained by calling 800 SEC-0330. Information (if any) regarding how each Fund voted proxies relating to portfolio securities during the most recently disclosed 12-month period ended June 30 is available without charge (i) through the Fund’s website at optimummutualfunds.com; and (ii) on the SEC’s website at sec.gov. | ||
135
Item 2. Code of Ethics
The registrant has adopted a code of ethics that applies to the registrant’s principal executive officer, principal financial officer, principal accounting officer or controller, or persons performing similar functions, regardless of whether these individuals are employed by the registrant or a third party. A copy of the registrant’s Code of Business Ethics has been posted on the Delaware Investments Internet Web site at www.delawareinvestments.com. Any amendments to the Code of Business Ethics, and information on any waiver from its provisions granted by the registrant, will also be posted on this Web site within five business days of such amendment or waiver and will remain on the Web site for at least 12 months.
Item 3. Audit Committee Financial Expert
The registrant’s Board of Trustees/Directors has determined that certain members of the registrant’s Audit Committee are audit committee financial experts, as defined below. For purposes of this item, an “audit committee financial expert” is a person who has the following attributes:
a. An understanding of generally accepted accounting principles and financial statements;
b. The ability to assess the general application of such principles in connection with the accounting for estimates, accruals, and reserves;
c. Experience preparing, auditing, analyzing, or evaluating financial statements that present a breadth and level of complexity of accounting issues that are generally comparable to the breadth and complexity of issues that can reasonably be expected to be raised by the registrant’s financial statements, or experience actively supervising one or more persons engaged in such activities;
d. An understanding of internal controls and procedures for financial reporting; and
e. An understanding of audit committee functions.
An “audit committee financial expert” shall have acquired such attributes through:
a. Education and experience as a principal financial officer, principal accounting officer, controller, public accountant, or auditor or experience in one or more positions that involve the performance of similar functions;
b. Experience actively supervising a principal financial officer, principal accounting officer, controller, public accountant, auditor, or person performing similar functions;
c. Experience overseeing or assessing the performance of companies or public accountants with respect to the preparation, auditing, or evaluation of financial statements; or
d. Other relevant experience.
The registrant’s Board of Trustees/Directors has also determined that each member of the registrant’s Audit Committee is independent. In order to be “independent” for purposes of this item, the Audit Committee member may not: (i) other than in his or her capacity as a member of the Board of Trustees/Directors or any committee thereof, accept directly or indirectly any consulting, advisory or other compensatory fee from the issuer; or (ii) be an “interested person” of the registrant as defined in Section 2(a)(19) of the Investment Company Act of 1940.
The names of the audit committee financial experts on the registrant’s Audit Committee are set forth below:
Thomas L. Bennett1
John A. Fry
Frances A. Sevilla-Sacasa
Janet L. Yeomans
Item 4. Principal Accountant Fees and Services
(a) Audit fees.
The aggregate fees billed for services provided to the registrant by its independent auditors for the audit of the registrant’s annual financial statements and for services normally provided by the independent auditors in connection with statutory and regulatory filings or engagements were $131,500 for the fiscal year ended March 31, 2013.
The aggregate fees billed for services provided to the registrant by its independent auditors for the audit of the registrant’s annual financial statements and for services normally provided by the independent auditors in connection with statutory and regulatory filings or engagements were $120,000 for the fiscal year ended March 31, 2012.
____________________
1 The instructions to Form N-CSR require disclosure on the relevant experience of persons who qualify as audit committee financial experts based on “other relevant experience.” The Board of Trustees/Directors has determined that Mr. Bennett qualifies as an audit committee financial expert by virtue of: his education and Chartered Financial Analyst designation; his experience as a credit analyst, portfolio manager and the manager of other credit analysts and portfolio managers; and his prior service on the audit committees of public companies.
(b) Audit-related fees.
The aggregate fees billed by the registrant’s independent auditors for services relating to the performance of the audit of the registrant’s financial statements and not reported under paragraph (a) of this Item were $0 for the fiscal year ended March 31, 2013.
The aggregate fees billed by the registrant’s independent auditors for services relating to the performance of the audit of the financial statements of the registrant’s investment adviser and other service providers under common control with the adviser and that relate directly to the operations or financial reporting of the registrant were $565,000 for the registrant’s fiscal year ended March 31, 2013. The percentage of these fees relating to services approved by the registrant’s Audit Committee pursuant to the de minimis exception from the pre-approval requirement in Rule 2-01(c)(7)(i)(C) of Regulation S-X was 0%. These audit-related services were as follows: year end audit procedures; group reporting and subsidiary statutory audits.
The aggregate fees billed by the registrant’s independent auditors for services relating to the performance of the audit of the registrant’s financial statements and not reported under paragraph (a) of this Item were $0 for the fiscal year ended March 31, 2012.
The aggregate fees billed by the registrant’s independent auditors for services relating to the performance of the audit of the financial statements of the registrant’s investment adviser and other service providers under common control with the adviser and that relate directly to the operations or financial reporting of the registrant were $416,500 for the registrant’s fiscal year ended March 31, 2012. The percentage of these fees relating to services approved by the registrant’s Audit Committee pursuant to the de minimis exception from the pre-approval requirement in Rule 2-01(c)(7)(i)(C) of Regulation S-X was 0%. These audit-related services were as follows: year end audit procedures; reporting up and subsidiary statutory audits.
(c) Tax fees.
The aggregate fees billed by the registrant’s independent auditors for tax-related services provided to the registrant were $25,000 for the fiscal year ended March 31, 2013. The percentage of these fees relating to services approved by the registrant’s Audit Committee pursuant to the de minimis exception from the pre-approval requirement in Rule 2-01(c)(7)(i)(C) of Regulation S-X was 0%. These tax-related services were as follows: review of income tax returns and review of annual excise distribution calculations.
The aggregate fees billed by the registrant’s independent auditors for tax-related services provided to the registrant’s investment adviser and other service providers under common control with the adviser and that relate directly to the operations or financial reporting of the registrant were $0 for the registrant’s fiscal year ended March 31, 2013.
The aggregate fees billed by the registrant’s independent auditors for tax-related services provided to the registrant were $25,000 for the fiscal year ended March 31, 2012. The percentage of these fees relating to services approved by the registrant’s Audit Committee pursuant to the de minimis exception from the pre-approval requirement in Rule 2-01(c)(7)(i)(C) of Regulation S-X was 0%. These tax-related services were as follows: review of income tax returns and review of annual excise distribution calculations.
The aggregate fees billed by the registrant’s independent auditors for tax-related services provided to the registrant’s investment adviser and other service providers under common control with the adviser and that relate directly to the operations or financial reporting of the registrant were $0 for the registrant’s fiscal year ended March 31, 2012.
(d) All other fees.
The aggregate fees billed for all services provided by the independent auditors to the registrant other than those set forth in paragraphs (a), (b) and (c) of this Item were $0 for the fiscal year ended March 31, 2013.
The aggregate fees billed for all services other than those set forth in paragraphs (b) and (c) of this Item provided by the registrant’s independent auditors to the registrant’s adviser and other service providers under common control with the adviser and that relate directly to the operations or financial reporting of the registrant were $0 for the registrant’s fiscal year ended March 31, 2013.
The aggregate fees billed for all services provided by the independent auditors to the registrant other than those set forth in paragraphs (a), (b) and (c) of this Item were $0 for the fiscal year ended March 31, 2012.
The aggregate fees billed for all services other than those set forth in paragraphs (b) and (c) of this Item provided by the registrant’s independent auditors to the registrant’s adviser and other service providers under common control with the adviser and that relate directly to the operations or financial reporting of the registrant were $25,000 for the registrant’s fiscal year ended March 31, 2012. The percentage of these fees relating to services approved by the registrant’s Audit Committee pursuant to the de minimis exception from the pre-approval requirement in Rule 2-01(c)(7)(i)(C) of Regulation S-X was 0%. These other services were as follows: attest examination of management's assertion to the controls in place at the transfer agent to be in compliance with Rule 17ad-13(a)(3) of the Securities Exchange Act of 1934.
(e) The registrant’s Audit Committee has established pre-approval policies and procedures as permitted by Rule 2-01(c)(7)(i)(B) of Regulation S-X (the “Pre-Approval Policy”) with respect to services provided by the registrant’s independent auditors. Pursuant to the Pre-Approval Policy, the Audit Committee has pre-approved the services set forth in the table below with respect to the registrant up to the specified fee limits. Certain fee limits are based on aggregate fees to the registrant and other registrants within the Delaware Investments Family of Funds.
Service | Range of Fees |
| Audit Services | |
| Statutory audits or financial audits for new Funds | up to $40,000 per Fund |
| Services associated with SEC registration statements (e.g., Form N-1A, Form N-14, etc.), periodic reports and other documents filed with the SEC or other documents issued in connection with securities offerings (e.g., comfort letters for closed-end Fund offerings, consents), and assistance in responding to SEC comment letters | up to $10,000 per Fund |
| Consultations by Fund management as to the accounting or disclosure treatment of transactions or events and/or the actual or potential impact of final or proposed rules, standards or interpretations by the SEC, FASB, or other regulatory or standard-setting bodies (Note: Under SEC rules, some consultations may be considered “audit-related services” rather than “audit services”) | up to $25,000 in the aggregate |
| Audit-Related Services | |
| Consultations by Fund management as to the accounting or disclosure treatment of transactions or events and /or the actual or potential impact of final or proposed rules, standards or interpretations by the SEC, FASB, or other regulatory or standard-setting bodies (Note: Under SEC rules, some consultations may be considered “audit services” rather than “audit-related services”) | up to $25,000 in the aggregate |
| Tax Services | |
| U.S. federal, state and local and international tax planning and advice (e.g., consulting on statutory, regulatory or administrative developments, evaluation of Funds’ tax compliance function, etc.) | up to $25,000 in the aggregate |
| U.S. federal, state and local tax compliance (e.g., excise distribution reviews, etc.) | up to $5,000 per Fund |
| Review of federal, state, local and international income, franchise and other tax returns | up to $5,000 per Fund |
Under the Pre-Approval Policy, the Audit Committee has also pre-approved the services set forth in the table below with respect to the registrant’s investment adviser and other entities controlling, controlled by or under common control with the investment adviser that provide ongoing services to the registrant (the “Control Affiliates”) up to the specified fee limit. This fee limit is based on aggregate fees to the investment adviser and its Control Affiliates.
| Service | Range of Fees |
| Non-Audit Services | |
| Services associated with periodic reports and other documents filed with the SEC and assistance in responding to SEC comment letters | up to $10,000 in the aggregate |
The Pre-Approval Policy requires the registrant’s independent auditors to report to the Audit Committee at each of its regular meetings regarding all services initiated since the last such report was rendered, including those services authorized by the Pre-Approval Policy.
(f) Not applicable.
(g) The aggregate non-audit fees billed by the registrant’s independent auditors for services rendered to the registrant and to its investment adviser and other service providers under common control with the adviser were $10,584,953 and $10,901,705 for the registrant’s fiscal years ended March 31, 2013 and March 31, 2012, respectively.
(h) In connection with its selection of the independent auditors, the registrant’s Audit Committee has considered the independent auditors’ provision of non-audit services to the registrant’s investment adviser and other service providers under common control with the adviser that were not required to be pre-approved pursuant to Rule 2-01(c)(7)(ii) of Regulation S-X. The Audit Committee has determined that the independent auditors’ provision of these services is compatible with maintaining the auditors’ independence.
Item 5. Audit Committee of Listed Registrants
Not applicable.
Item 6. Investments
(a) Included as part of report to shareholders filed under Item 1 of this Form N-CSR.
(b) Divestment of securities in accordance with Section 13(c) of the Investment Company Act of 1940.
Not applicable.
Item 7. Disclosure of Proxy Voting Policies and Procedures for Closed-End Management Investment Companies
Not applicable.
Item 8. Portfolio Managers of Closed-End Management Investment Companies
Not applicable.
Item 9. Purchases of Equity Securities by Closed-End Management Investment Company and Affiliated Purchasers
Not applicable.
Item 10. Submission of Matters to a Vote of Security Holders
Not applicable.
Item 11. Controls and Procedures
The registrant’s principal executive officer and principal financial officer have evaluated the registrant’s disclosure controls and procedures within 90 days of the filing of this report and have concluded that they are effective in providing reasonable assurance that the information required to be disclosed by the registrant in its reports or statements filed under the Securities Exchange Act of 1934 is recorded, processed, summarized and reported within the time periods specified in the rules and forms of the Securities and Exchange Commission.
There were no significant changes in the registrant’s internal control over financial reporting that occurred during the second fiscal quarter of the period covered by the report to stockholders included herein (i.e., the registrant’s fourth fiscal quarter) that have materially affected, or are reasonably likely to materially affect, the registrant’s internal control over financial reporting.
Item 12. Exhibits
| (a) | (1) Code of Ethics | |
Not applicable. | ||
(2) Certifications of Principal Executive Officer and Principal Financial Officer pursuant to Rule 30a-2 under the Investment Company Act of 1940 are attached hereto as Exhibit 99.CERT. | ||
(3) Written solicitations to purchase securities pursuant to Rule 23c-1 under the Securities Exchange Act of 1934. | ||
Not applicable. | ||
| (b) | Certifications pursuant to Section 906 of the Sarbanes-Oxley Act of 2002 are furnished herewith as Exhibit 99.906CERT. |
SIGNATURES
Pursuant to the requirements of the Securities Exchange Act of 1934 and the Investment Company Act of 1940, the registrant has duly caused this report to be signed on its behalf, by the undersigned, thereunto duly authorized.
Name of Registrant: OPTIMUM FUND TRUST
| /s/ J. SCOTT COLEMAN | |
| By: | J. Scott Coleman |
| Title: | Chief Executive Officer |
| Date: | June 5, 2013 |
Pursuant to the requirements of the Securities Exchange Act of 1934 and the Investment Company Act of 1940, this report has been signed below by the following persons on behalf of the registrant and in the capacities and on the dates indicated.
| /s/ J. SCOTT COLEMAN | |
| By: | J. Scott Coleman |
| Title: | Chief Executive Officer |
| Date: | June 5, 2013 |
| /s/ RICHARD SALUS | |
| By: | Richard Salus |
| Title: | Chief Financial Officer |
| Date: | June 5, 2013 |