UNITED STATES SECURITIES AND EXCHANGE COMMISSION
Washington, D.C. 20549
FORM N-CSR
CERTIFIED SHAREHOLDER REPORT OF REGISTERED MANAGEMENT
INVESTMENT COMPANIES
| Investment Company Act file number: | 811-21335 | |
| Exact name of registrant as specified in charter: | Optimum Fund Trust | |
| Address of principal executive offices: | 2005 Market Street | |
| Philadelphia, PA 19103 | ||
| Name and address of agent for service: | David F. Connor, Esq. | |
| 2005 Market Street | ||
| Philadelphia, PA 19103 | ||
| Registrant’s telephone number, including area code: | (800) 523-1918 | |
| Date of fiscal year end: | March 31 | |
| Date of reporting period: | March 31, 2015 |
Item 1. Reports to Stockholders
Table of Contents
Optimum Fixed Income Fund
Optimum International Fund
Optimum Large Cap Growth Fund
Optimum Large Cap Value Fund
Optimum Small-Mid Cap Growth Fund
Optimum Small-Mid Cap Value Fund
Annual report
March 31, 2015
|
Carefully consider the Funds’ investment objectives, risk factors, charges, and expenses before investing. This and other information can be found in the Funds’ prospectus and, if available, their summary prospectus, which may be obtained by visiting optimummutualfunds.com or calling 800 914-0278. Investors should read the prospectus and, if available, the summary prospectus carefully before investing.
Table of Contents
| 1 | ||||
| 4 | ||||
| 7 | ||||
| 9 | ||||
| 11 | ||||
| 13 | ||||
| 16 | ||||
| 19 | ||||
| 22 | ||||
| 25 | ||||
| 28 | ||||
| 31 | ||||
| 34 | ||||
Security type / sector / country allocations and top 10 equity holdings | 36 | |||
Financial statements | ||||
| 41 | ||||
| 97 | ||||
| 99 | ||||
| 101 | ||||
| 104 | ||||
| 122 | ||||
| 148 | ||||
| 149 | ||||
| 152 | ||||
| 154 | ||||
Investments in Optimum Fixed Income Fund, Optimum International Fund, Optimum Large Cap Growth Fund, Optimum Large Cap Value Fund, Optimum Small-Mid Cap Growth Fund, and Optimum Small-Mid Cap Value Fund are not and will not be deposits with or liabilities of Macquarie Bank Limited ABN 46 008 583 542 and its holding companies, including their subsidiaries or related companies, and are subject to investment risk, including possible delays in repayment and loss of income and capital invested. No Macquarie Group company guarantees or will guarantee the performance of the Funds, the repayment of capital from the Funds, or any particular rate of return.
Unless otherwise noted, views expressed herein are current as of March 31, 2015, and subject to change for events occurring after such a date. Holdings are as of the date indicated and subject to change.
Funds are not FDIC insured and are not guaranteed. It is possible to lose the principal amount invested.
Mutual fund advisory services provided by Delaware Management Company, a series of Delaware Management Business Trust, which is a registered investment advisor. Delaware Investments, a member of Macquarie Group, refers to Delaware Management Holdings, Inc. and its subsidiaries, including the Funds’ distributor, Delaware Distributors, L. P. Macquarie Group refers to Macquarie Group Limited and its subsidiaries and affiliates worldwide.
All third-party marks cited are the property of their respective owners.
© 2015 Delaware Management Holdings, Inc.
Table of Contents
April 7, 2015
Performance review (for the year ended March 31, 2015) | ||||||
Optimum Fixed Income Fund (Class A shares) | 1-year return | +4.21% | ||||
Optimum Fixed Income Fund (Institutional Class shares) | 1-year return | +4.47% | ||||
Barclays U.S. Aggregate Index (benchmark) | 1-year return | +5.72% |
Past performance does not guarantee future results.
For complete, annualized performance for Optimum Fixed Income Fund, please see the table on page 16.
The performance of Class A shares excludes the applicable sales charge and reflects the reinvestment of all distributions. Institutional Class shares are available without sales or asset-based distribution charges only to certain eligible institutional accounts. Index performance returns do not reflect any management fees, transaction costs, or expenses. Indices are unmanaged and one cannot invest directly in an index.
Advisor
Delaware Management Company (DMC)
Sub-advisor
Pacific Investment Management Company LLC (PIMCO)
Market overview
Risk appetite returned through much of the Fund’s fiscal year. Generally, global equity markets posted gains and bonds rallied as central banks remained accommodative.
The U.S. job gains stabilized, economic growth was robust, and consumer confidence rose. With inflation low, the U.S. Federal Reserve continued its dovish bias, reaffirming that the fed funds rate would remain near zero for a “considerable time” after the end of its quantitative easing (QE) program. As QE came to an end in October 2014, the U.S. dollar quickly strengthened and oil prices fell sharply, causing speculation that Fed rate hikes would be delayed further. By the first quarter of 2015, however, improving economic conditions signaled that the Fed seemed to remain on track to raise rates in the summer or fall of 2015.
The European Central Bank (ECB) rolled out a series of easing measures, including a negative rate on deposits, a policy rate cut, and targeted long-term refinancing to spur business lending. Euro-zone growth weakened, German business confidence fell, and geopolitical tensions created uncertainty. Inflationary expectations fell, feeding expectations for a full-scale QE. In January 2015, 14 central banks eased policies, but the ECB took center stage as it unveiled its plan to deploy quantitative easing. While markets largely expected the move, the program exceeded expectations in terms of its size, pace, and open-ended design.
Emerging markets experienced episodes of heightened volatility and weakness. Geopolitical headlines and country-specific events drove markets. Sanctions against Russia and a sharp decline in oil prices caused the ruble to tumble, forcing the Russian central bank to raise rates to 17% as of December 2014.
Source: Bloomberg
Fund performance
For the fiscal year, Optimum Fixed Income Fund underperformed its benchmark index, the Barclays U.S. Aggregate Index. In particular, DMC’s diversified floating-rate component and PIMCO’s low duration component both detracted from the Fund’s overall performance versus the Fund’s benchmark index. The following remarks describe factors that affected performance within the Fund’s respective portions.
DMC
Note: The portfolio-level discussion presented below appears in two sections. The first section covers DMC’s portion of the Fund that focused on a multisector strategy, while the second section covers its portion of the Fund that focused on a short duration strategy.
Intermediate-term component
For the year ended March 31, 2015, DMC’s fixed-rate, intermediate-term portion of Optimum Fixed Income Fund underperformed the Fund’s benchmark, the Barclays U.S. Aggregate Index.
The U.S. Treasury sector had strong gains, and longer-maturity instruments performed better than short maturities as the yield curve flattened. The Fed’s tapering of bond purchases tightened monetary conditions, and inflation remained benign. DMC’s portion of the Fund had low allocations to this sector in an attempt to capture extra income in the credit sectors. The fixed-rate portfolio had an average exposure of 8% to U.S. Treasury investments in the first quarter of 2015. The portfolio’s significant underweight to Treasurys detracted from relative performance for the year. This was offset partially by the use of U.S. Treasury futures to balance yield curve exposure and add some duration.
DMC’s most successful strategies were in its investment grade corporate bond exposure, which returned 8.15%, outpacing the 6.74% return of corporate bonds in the Barclays benchmark index. High-quality corporate bonds represented DMC’s largest exposure within this component of the Fund, at 35%. The financial services sector contained some of the leading performers, as bank credits outperformed index returns.
| (continues | ) | 1 |
Table of Contents
Portfolio management reviews
Optimum Fixed Income Fund
DMC’s mortgage position (19% of this component of the Fund) produced mixed results. Although its security selection outperformed the index, its underweight allocation (10 percentage points less than the index) slightly detracted from performance. DMC’s investments in commercial mortgage-backed securities (CMBS), although only a 3% exposure, added to relative returns.
High yield bond investments were a drag on results, as this segment had a return of 0.52% for the period — below that of the benchmark sector’s 1.98% return.
Energy sector bonds also detracted 43 basis points from the Fund’s relative performance for the period as oil prices declined significantly in the second half of 2014. (One basis point is a hundredth of a percentage point.) DMC held several shale-drilling names and water-drilling service names that were adversely affected.
Emerging market investments accounted for 8% of DMC’s intermediate-term portion of the Fund and returned 2.35%. Significant moves in both currencies and commodities prices challenged emerging markets. DMC’s U.S. dollar–denominated (USD) sovereign investments did well, but results in USD corporate investments, and in local currency exposures disappointed. Additionally, investments in developed-market international bonds took 3 basis points away from index returns, as surprisingly good payroll numbers continued to boost the U.S. dollar versus many developed-market currencies.
DMC employed derivatives in the intermediate-term strategy. In addition to the U.S. Treasury futures mentioned earlier, it hedged currency losses with strict stop-loss mitigation tactics. Total currency hedging in the intermediate-term portfolio clawed back 17 basis points from the index deficit.
Diversified floating-rate component
In managing its diversified floating-rate portion of the Fund’s assets, DMC principally invests in a diversified group of floating-rate securities. During the fiscal year, those assets made up about 5% of the total DMC-managed assets within the Fund.
The diversified floating-rate component of DMC’s portion of the Fund outperformed the London interbank offered rate (Libor) — DMC’s internal benchmark for this component — and returned 0.80%. During the 12-month period, DMC’s primary objective was to maintain a duration of about three months within its diversified floating-rate segment.
Investment grade credit represented the largest segment (averaging more than half) of this portion of the Fund. An 18% exposure to financials returned 0.86%, contributing 26 basis points to performance. Industrials were the largest sector exposure within high-grade credit but underperformed the benchmark. Utilities and noncorporate positions contributed little to overall performance.
Emerging markets, with a 3% weighting within this component, detracted from performance, due largely to security selection.
Performance was mixed for assets rated below investment grade. The Fund benefited from having 30% exposure to bank loans, which returned 1.41%. However, exposure to the energy sector broadly detracted from results.
On average, DMC maintained a 5% exposure to AAA-rated asset-backed securities within this component, which help provide liquidity and risk management flexibility. This holding outperformed Libor with a 0.41% total return.
DMC used interest rate swaps in the diversified floating-rate strategy to hedge its allocation to fixed-rate bonds. These positions declined in value as rates fell.
Overall, the use of derivatives in DMC’s portion of the Fund had a slight negative effect on overall performance but was not material. It is worth noting that the use of derivatives in the diversified floating-rate component was used to hedge fixed-rate bonds.
PIMCO
Note: The portfolio-level discussion presented below appears in two sections. The first section covers PIMCO’s portion of the Fund that focused on an intermediate-term strategy, while the second section covers its portion of the Fund that focused on a low duration strategy.
Intermediate-term component
The intermediate-term component of PIMCO’s portion of the Fund returned 6.28% (before fees), outperforming its benchmark, the Barclays U.S. Aggregate Index by 56 basis points for the Fund’s fiscal year. An underweight to U.S. duration detracted from performance, as yields on U.S. Treasurys generally fell. Additionally, yield curve positioning with an underweight to longer-dated Treasurys hurt performance, as intermediate and long rates fell the most.
Overall spread sector strategies added to returns during the 12-month period. An average underweight to agency mortgage-backed securities (MBS) modestly detracted from returns. However, positive security selection within agency collateralized mortgage obligations (CMOs) more than offset this. An allocation to nonagency MBS was positive for returns, as the sector benefited from strong demand and limited supply. An underweight to investment grade credit and security selection within high yield financials and industrials was positive for performance. Holdings of Treasury inflation-protected securities (TIPS) detracted from performance, as break-even levels tightened. Lastly, a long U.S. dollar bias versus the euro and Japanese yen helped performance, as these currencies depreciated relative to the U.S. dollar.
2
Table of Contents
Low duration component
The low duration component of PIMCO’s portion of the Fund returned 2.08% (before fees), outperforming PIMCO’s internal benchmark, the BofA Merrill Lynch
1–3 Year U.S. Treasury Index by 1.08% for the Fund’s fiscal year. An underweight to U.S. duration detracted from performance, as yields on U.S. Treasurys generally fell. However, yield curve positioning more than offset the underweight position. In this portion of the Fund, PIMCO concentrated its underweight on the short end of the yield curve, where rates rose, and had an allocation to intermediate rates, where yields fell. Short exposure to core European rates detracted from returns, as yields fell in this region.
Overall spread sector strategies contributed to returns during the fiscal year. An allocation to nonagency MBS helped, as the sector benefited from strong demand and limited supply. Exposure to investment grade credit was negative, as the sector underperformed, but this was more than offset by positive security selection within financials and industrials. Exposure to U.S. dollar–denominated Brazilian debt within the energy sector detracted from performance since declining oil prices hurt this sector. Lastly, a long dollar bias versus the euro and yen boosted performance, as these currencies depreciated relative to the dollar.
Currency forwards held within PIMCO’s intermediate-term and low duration portions of the Fund had a positive material effect on performance. PIMCO used currency forwards to short the euro and yen, which depreciated against the U.S. dollar during the fiscal year. Its use of money market and government futures, interest rate swaps, and credit default swaps did not have a material impact on performance, nor did the use of options and interest rate swaps.
| (continues | ) | 3 |
Table of Contents
Portfolio management reviews
April 7, 2015
Performance review (for the year ended March 31, 2015) | ||||||
Optimum International Fund (Class A shares) | 1-year return | – 6.25% | ||||
Optimum International Fund (Institutional Class shares) | 1-year return | – 6.04% | ||||
MSCI EAFE Index (gross) (benchmark) | 1-year return | – 0.48% | ||||
MSCI EAFE Index (net) (benchmark) | 1-year return | – 0.92% |
Past performance does not guarantee future results.
For complete, annualized performance for Optimum International Fund, please see the table on page 19.
The performance of Class A shares excludes the applicable sales charge and reflects the reinvestment of all distributions. Institutional Class shares are available without sales or asset-based distribution charges only to certain eligible institutional accounts. Index performance returns do not reflect any management fees, transaction costs, or expenses. Indices are unmanaged and one cannot invest directly in an index.
Advisor
Delaware Management Company (DMC)
Sub-advisors
Acadian Asset Management LLC (Acadian)
EARNEST Partners LLC (EARNEST)
The Board of Trustees of the Fund approved the appointment of Acadian Asset Management LLC (“Acadian”) as a sub-advisor to the Fund during the fiscal year. Acadian replaced BlackRock Advisors, LLC (“BlackRock”) as a sub-advisor to Optimum International Fund. Please see the supplement to the Fund’s prospectus, dated Dec. 22, 2014, for more information.
Market overview
The fiscal year ended March 31, 2015, was a tough one for international markets and investors. Economies worldwide were buffeted by cross currents that were difficult to navigate. The fiscal year began with a profound rotation from growth into value and also featured a major strengthening of the U.S. dollar, a historic drop in oil prices, increased geopolitical tensions in Ukraine and the Middle East, and the continued focus on the divergent central bank policies in different markets as a key driver of results.
Through the end of 2014, weak European economic data, more dovish commentary from the European Central Bank and the Bank of Japan, and continued expectations for monetary tightening by the U.S. Federal Reserve drove the U.S. dollar higher. At the same time, the drop in oil prices exacerbated the already-tenuous deflationary environments in both Europe and Japan.
However, by the beginning of 2015, a nascent recovery emerged in Europe, particularly in Germany, as the effects of lower oil prices, the euro’s drop, and quantitative easing combined to provide an inflection point.
A similar phenomenon occurred in Japan where the yen weakened 15% over the fiscal year relative to the dollar. Exports ranging from semiconductors to pick-up trucks increased. Strong corporate earnings from the nation’s exporters and fourth-quarter gross domestic product recovery (following two quarters of contraction) benefited Japanese equities.
Emerging markets remained mixed. Chinese equities continued to rise even as signs of slowing mounted. There were signs of trouble in Brazil, Russia, India, China, and South Africa (BRICS) and, in general, emerging markets underperformed their developed — market counterparts.
Source: Bloomberg
Fund performance
Optimum International Fund declined in a tough year for international equities, and trailed its benchmark, the MSCI EAFE (Europe, Australia, Far East) Index, which also declined. In Acadian’s case, an underweight in financial services was a detractor. EARNEST underperformed in the energy sector; its underweight to Japan was also a detractor. For BlackRock, stock selection in industrials and financials detracted from performance within its portion of the Fund.
Acadian
Acadian managed its portion of the Fund from Jan. 26, 2015 to March 31, 2015. During this period, Acadian outperformed the MSCI EAFE Index.
On a sector level, Acadian added value via its overweight position in information technology. During the fiscal period, many technology companies reported earnings that exceeded consensus estimates and returned money to investors in the form of dividends and share repurchases. Acadian’s underweight position in energy was also a contributor, as slumping oil prices and a stronger U.S. dollar hurt the sector.
4
Table of Contents
Financial services was the only notable performance detractor from Acadian’s portion of the Fund during the fiscal period. Acadian maintained an underweight position in this sector and, subsequently, underperformed when several financial institutions received approval from the Fed in March 2015 to initiate stock buy-back programs and raise dividends — developments that seemed to provide a boost to overall sector performance.
In security selection, two holdings that contributed to Acadian’s portion of the Fund were Delhaize Group and Alps Electric. Shares of Delhaize Group advanced after the Belgian supermarket operator reported solid fourth-quarter results, including double-digit sales growth at its Hannaford and Food Lion chains. Meanwhile, shares of Alps Electric rallied after Morgan Stanley upgraded its rating for the Japanese electronics manufacturer to “overweight” from “equal weight.”
In contrast, two holdings that detracted from performance within Acadian’s portion of the Fund were Deutsche Lufthansa and Hindustan Unilever. Shares of Deutsche Lufthansa dropped after the German air carrier suspended its 2014 dividend. The company cited several factors, including poor full-year earnings brought on by the sale of the company’s information technology unit, an increase in pension liabilities, and fuel-hedging provisions. In India, shares of Hindustan Unilever retreated after this leading provider of consumer goods reported a fiscal third quarter net loss.
BlackRock
During the period that BlackRock was a sub-advisor to the Fund, its portion of the Fund posted a negative return and underperformed the benchmark. Stock selection in the financials and industrials sectors was the main detractor. An overweight allocation and good stock selection in the healthcare sector helped dampen losses. Holdings in the information technology sector also outperformed.
Within the financials sector, BlackRock’s holdings in the real estate services sub-industry led detractors due to its position in U. K.-based Foxtons Group. A steep decline in prices and volumes in the London property market negatively affected this residential real estate company.
BlackRock’s security selection in the industrials sector also detracted from relative returns, led by a position in Osram Licht. Based in Germany, Osram is one of the world’s two leading lighting product manufacturers. The stock sold off over the fiscal period, ignited by poor operational execution, decreased capital expenditures, and excessive cost cutting.
On the plus side, BlackRock’s overweight allocation and stock selection in the healthcare sector contributed to its portion of the Fund. BlackRock consistently focuses on companies that have positioned themselves to benefit from innovation, mergers-and-acquisitions activity, and healthcare reform. More specifically,
positioning in the pharmaceuticals subindustry led to gains for the sector, driven by a holding in Novartis. Based in Basel, Switzerland, Novartis is one of the elite innovators in the pharmaceutical industry, and BlackRock’s portion of the Fund benefited from Novartis’ strong pipeline of drugs for the treatment of psoriasis, heart failure, and respiratory-related illnesses. BlackRock’s security selection in information technology also contributed to gains, led by holdings in the internet software and services subindustry. Baidu, a Chinese developer of search engines and related products, was a strong performer. Baidu traded significantly higher after reporting exponential growth above expectations, resulting from widening profit margins and continued demand for internet search engines in China.
The use of derivatives in BlackRock’s portion of the Fund was small during the period, but deliberate in risk management decisions. Derivatives were used in the form of forward currency transactions to hedge currency exposure of its holdings back to the exposure of the benchmark but they had little effect on performance.
EARNEST
During the period, EARNEST’s portion of the Fund posted a negative return, trailing the MSCI EAFE Index.
EARNEST’s underperformance stemmed largely from its overweight to the energy sector. The spot price of oil fell more than 50% over the last nine months of the period (from approximately $100 to $50 a barrel). EARNEST’s allocation was a headwind as its portion of the Fund had twice the weighting to energy than the benchmark (13% versus 6.5%). Additionally, EARNEST’s Japanese holdings trailed, and its underweight to Japan also detracted as the Nikkei Index was up more than 10% for the period.
The industrials and healthcare sectors were the largest contributors to EARNEST’s portion of the Fund during the fiscal year, primarily due to stock selection. That said, one of EARNEST’s strongest performers was a financial services company. ICICI Bank is India’s largest private-sector bank by assets. The company reported strong net profits, driven by strength in its retail franchise, which saw loan growth of 25% at the end of 2014. ICICI has also been able to maintain its asset quality. This was an area of concern for the market in 2013 as investors had expected loan quality to deteriorate in light of India’s macroeconomic problems. ICICI’s notable customer service, however, fostered continued growth, and shares were up more than 20% for the period.
ICON is a global contract research organization, with headquarters in Ireland. The company provides outsourced phase I-IV clinical trial management and laboratory services for pharmaceutical and biotech companies. Outsourcing is a growing trend, and pharmaceutical companies are consolidating their relationships with fewer strategic partners. As such, ICON has seen steady earnings growth in excess of expectations. Shares rose close to 50% during the fiscal year.
| (continues | ) | 5 |
Table of Contents
Portfolio management reviews
Optimum International Fund
As noted earlier, investments in Japan and in the energy sector were the largest detractors during the fiscal year. Hitachi is the well-known Japanese conglomerate with a diversified revenue stream ranging from thermal power systems, water recycling systems, and electronic materials, to automotive components, telecom services, and home appliances. During the most recent quarter, management reported revenues in excess of expectations; however, operating profits disappointed, despite being above management’s guidance. The stock was down more than 5% for the fiscal year. Statoil is one of the world’s largest oil and gas companies and is the largest oil producer in its home country of Norway. The stock fell more than 30% during the fiscal year, driven by an approximately 50% decline in Brent oil prices. However, Statoil withstood the fall in oil price due to investor appreciation of Statoil’s focus on generating free cash flow and improving its return on invested capital.
Overall, Optimum International Fund used derivatives, including foreign currency exchange contracts, during the fiscal year. However, these had a minimal effect on performance.
6
Table of Contents
April 7, 2015
Performance review (for the year ended March 31, 2015) | ||||||
Optimum Large Cap Growth Fund (Class A shares) | 1-year return | +17.27% | ||||
Optimum Large Cap Growth Fund (Institutional Class shares) | 1-year return | +17.55% | ||||
Russell 1000® Growth Index (benchmark) | 1-year return | +16.09% |
Past performance does not guarantee future results.
For complete, annualized performance for Optimum Large Cap Growth Fund, please see the table on page 22.
The performance of Class A shares excludes the applicable sales charge and reflects the reinvestment of all distributions. Institutional Class shares are available without sales or asset-based distribution charges only to certain eligible institutional accounts. Index performance returns do not reflect any management fees, transaction costs, or expenses. Indices are unmanaged and one cannot invest directly in an index.
Advisor
Delaware Management Company (DMC)
Sub-advisors
Fred Alger Management, Inc. (Alger)
T. Rowe Price Associates, Inc. (T. Rowe Price)
Market overview
U.S. stock market indices posted strong gains during the fiscal year ended March 31, 2015, as the global economy continued to gradually improve. Major market indices climbed to record highs during the period with large- and mid-cap stocks outperforming small-caps. As measured by Russell indices, growth stocks outperformed value across all market capitalizations. In the United States, an accommodative U.S. Federal Reserve kept interest rates at historically low levels even as continued employment gains, lower energy prices, and steady economic growth raised investor expectations for an interest rate increase.
Europe continued to show signs of stabilization, and as the fiscal year progressed, increasing economic strength in Germany and the United Kingdom spread to other European countries. Lower interest rates, a weakening euro that helped European export markets, and the European Central Bank’s aggressive quantitative-easing program supported this stabilization. Japan, China, and many Southeast Asian emerging markets continued to experience reasonably positive gross domestic product growth due in part to lower energy prices, Japan’s own quantitative-easing program, and China’s steady bank effort to restore liquidity. Amid this slow-but-steady progression of global economic growth, corporate profits generally continued to strengthen.
The strong market environment was also supported by an increase in global merger and acquisition activity, shareholder activism, attractive equity valuations, and a strengthening U.S. dollar that helped drive down commodity costs and shore up consumer income.
Source: Bloomberg
Fund performance
Optimum Large Cap Growth Fund delivered positive double-digit returns for the fiscal year, outperforming its benchmark. Sector allocation was the primary contributor to performance within the portions of the Fund managed by Alger and T. Rowe Price. Stock selection was a secondary but still significant factor during the fiscal year. The healthcare sector was the most significant contributor in both Alger’s and T. Rowe Price’s portions of the Fund. Also within Alger’s portion of the Fund, the information technology sector was a leading contributor while industrials and financials detracted. T. Rowe Price’s portion of the Fund saw a significant contribution from industrials; its detractors included information technology and consumer discretionary sectors.
Alger
With its strategy of investing in companies undergoing “positive dynamic change, “ Alger seeks what it views as high-quality, domestic growth stocks that can potentially generate strong earnings growth and free cash flow.
An overweight in the healthcare sector was a strong contributor to performance in Alger’s portion of the Fund, as its holdings in the sector outperformed the healthcare companies in the benchmark index. Many of Alger’s favored companies in this sector posted strong earnings increases, raised dividends to shareholders, generated strong levels of free cash flow, and authorized substantial share repurchase programs. Additionally, several of the healthcare companies in Alger’s portion of the Fund achieved advancements in drug trials and regulatory approvals. Another significant contributor to performance was Alger’s overweight in information technology, as these companies within its portion of the Fund on average gained more than 25% for the fiscal year.
In the industrials sector, Alger’s underweight allocation was largely responsible for its underperformance in the sector. In financials, an overweight versus the benchmark, combined with weak stock selection, detracted from performance in Alger’s portion of the Fund.
| (continues | ) | 7 |
Table of Contents
Portfolio management reviews
Optimum Large Cap Growth Fund
At the individual security level, Actavis was a leading contributor to overall results in Alger’s portion of the Fund. Actavis manufactures and distributes generic pharmaceuticals and branded pharmaceutical products focused on urology, nephrology, and women’s health globally. The shares gained more than 45% during the Fund’s fiscal year. The company is a leading global generic pharmaceutical company with one of the industry’s most profitable and sustainable generic pipelines that includes many first-to-file and difficult-to-manufacture drugs. Actavis also is aggressive with patent challenges, has what Alger believes is a leading management team, and appears positioned to cut costs across the company, allowing for greater merger-and-acquisition and pipeline investment.
NXP Semiconductors was another notable contributor to Alger’s portion of the Fund, which gained more than 65% during the fiscal year. NXP Semiconductors is one of the leading suppliers of motion co-processors and the near field communication (NFC) controller chip used in mobile payment systems. The company has benefited from the growth in mobile adoption and usage. A key driver has been its proprietary hardware and customized software capabilities, in addition to its product innovation.
The largest relative detractor in Alger’s portion of the Fund was industrials company Precision Castparts. The company manufactures and sells metal components and products used for aircraft engines, industrial gas turbine engines, medical implants, aerial vehicles, and other industrial applications. Although the company did not execute effectively over the last 12 months, Alger remains positive given the company’s growth prospects and management team. Alger’s average allocation to the stock was overweight the benchmark index, which seemed to magnify the effect of the company’s underperformance.
Within the financials sector, Carlyle Group detracted from performance in Alger’s portion of the Fund as the shares declined sharply in the fourth quarter of 2014. Slowed earnings growth and consequently, significant outflows in assets under management, were to blame. Overall, Alger remains positive on the company and the sector and believes that relative valuations are attractive.
T. Rowe Price
T. Rowe Price’s portion of the Fund contributed to Fund performance relative to the benchmark. Overall, sector allocations were the principal reason for this relative performance, though stock selection was also notably positive.
Healthcare, driven mainly by stock selection, was by far the leading relative outperformer in T. Rowe Price’s portion of the Fund. A significant overweight allocation to this strongest-performing sector also helped. Shares of Pharmacyclics surged after the biotechnology company announced better-than-expected revenue forecasts for its leukemia drug Imbruvica, which the U.S. Food and Drug Administration also approved for the additional treatment of a rare type of lymphoma. Shares surged later after AbbVie agreed to acquire the company in a $21 billion deal.
Industrials and business services outperformed on stock selection. Shares of American Airlines Group experienced a difficult third quarter in 2014 but rebounded sharply, helped by solid fundamental results, progress on its merger integration with US Airways, and falling crude oil prices. The company does not hedge fuel, which allowed it to take full advantage of the decline in oil prices.
Furthermore, American Airlines has more transatlantic traffic than its peers, allowing the airline to benefit from its competitive position.
Consumer discretionary was the largest relative detractor in T. Rowe Price’s portion of the Fund, largely due to stock selection. Wynn Resorts detracted from relative performance as its Macau revenues continued to decline. Though its VIP and high-end mass-gaming business in Macau continued to slide, the casino operator’s share of the mass-business market experienced an increase relative to last year.
Stock selection in information technology, including a limited allocation to Apple, hurt relative performance in T. Rowe Price’s portion of the Fund. Apple’s shares were up during the fiscal year as investors anticipated the iPhone 6 upgrade cycle, and the company subsequently reported strong quarterly results driven by iPhone sales that exceeded expectations. However, the company is slowly losing share in the tablet market, and T. Rowe Price believes that the law of large numbers and a decelerating product cycle could eventually hamper iPhone growth. The tech firm is generating solid gross margins, remains financially sound, and has become more committed to returning value to shareholders via buybacks. T. Rowe Price is also encouraged by the potential market effect to two new products, Apple Watch and Apple Pay, a mobile payment option for iPhone and Watch users.
Overall, Optimum Large Cap Growth Fund used derivatives, including foreign currency exchange contracts, during the fiscal year. However, these had a minimal effect on performance.
8
Table of Contents
April 7, 2015
Performance review (for the year ended March 31, 2015) | ||||||
Optimum Large Cap Value Fund (Class A shares) | 1-year return | +5.34% | ||||
Optimum Large Cap Value Fund (Institutional Class shares) | 1-year return | +5.60% | ||||
Russell 1000® Value Index (benchmark) | 1-year return | +9.33% |
Past performance does not guarantee future results.
For complete, annualized performance for Optimum Large Cap Value Fund, please see the table on page 25.
The performance of Class A shares excludes the applicable sales charge and reflects the reinvestment of all distributions. Institutional Class shares are available without sales or asset-based distribution charges only to certain eligible institutional accounts. Index performance returns do not reflect any management fees, transaction costs, or expenses. Indices are unmanaged and one cannot invest directly in an index.
Advisor
Delaware Management Company (DMC)
Sub-advisors
Herndon Capital Management, LLC (Herndon)
Massachusetts Financial Services Company (MFS)
Market overview
A generally risk-friendly environment persisted from early in the Fund’s fiscal year until mid-2014. While geopolitical tensions flared in the Middle East and Ukraine, any market setbacks were short-lived. Improving economic growth within the United States and the potential for a looser monetary policy in regions with slowing growth such as Japan, Europe, and China, supported price-sensitive investments, or risk assets. The European Central Bank (ECB), for example, cut policy interest rates below zero. Expectations were subsequently high for additional rate cuts and additional nonconventional easing measures. Similarly, toward the middle of the fiscal year, and on the heels of lackluster growth trends, the Bank of Japan surprised markets with fresh stimulus measures. The related decline in government bond yields and credit spreads within developed markets also supported equity markets during this period.
A dominant trend during the second half of the Fund’s fiscal year was the ongoing rise in U.S. equities alongside a decline in U.S. bond yields. The uptrend in U.S. corporate margins and profits continued throughout the second half of 2014, but a rising dollar and a sharp decline in commodity prices, particularly crude oil prices, negatively affected credit markets. This was particularly true among U.S. high yield and emerging market debt. The higher weightings of oil and gas credits in these asset classes resulted in widening spreads and increased volatility. Toward the end of this period, declining inflation and inflation expectations caused a mini-wave of global quantitative easing (QE). In particular, the ECB initiated a potentially open-ended phase of QE, a move that appeared to support both risk assets and government bond prices. Meanwhile, the U.S. dollar continued to
benefit from the perception that the U.S. Federal Reserve could tighten its monetary policy in mid to late 2015.
Source: Bloomberg
Fund performance
Optimum Large Cap Value Fund generated solid absolute gains but underperformed its benchmark, the Russell 1000 Value Index, for the fiscal year. A dramatic decline in oil prices, combined with weak-performing stocks within financials, were significant detractors for Herndon’s portion of the Fund. Holdings in healthcare and an underweight position in technology detracted from performance within MFS’s portion of the Fund.
Herndon
Herndon’s approach to managing its portion of the Fund remained consistent throughout the fiscal year. The management team seeks value-creating opportunities at the individual stock level and subsequently aggregates individual stock information to determine sector weightings. Each market sector presents both risks and opportunities; the team seeks adequate compensation for risks taken. The team seeks stocks that it believes offer value-creating opportunities, which it defines as those exhibiting both attractive fundamental and valuation characteristics.
From a sector perspective, the strongest performance relative to the benchmark came from the materials and telecommunications sectors. Telecommunications companies in general suffered during the Fund’s fiscal year, and Herndon’s portion of the Fund held just one stock from the sector, global broadband and cell phone leader Verizon Communications, which had positive returns. Positive stock selection within the materials sector also helped bolster returns, particularly from NewMarket Corporation, parent company for several petroleum additives businesses, and CF Industries, agricultural fertilizer producer and distributor.
| (continues | ) | 9 |
Table of Contents
Portfolio management reviews
Optimum Large Cap Value Fund
The primary performance detractors within Herndon’s portion of the Fund came from the energy and financial sectors. Unexpected dramatic declines in oil prices, particularly during the fourth quarter of 2014, substantially affected returns, and blindsided many investors. Within the financial sector, increased investor pessimism dragged down performance of residential mortgage provider Nationstar Mortgage Holdings and asset manager and financial planning firm Waddell & Reed. Despite negative performance during the fiscal year, Herndon believes both holdings maintain solid long-term fundamentals and therefore it continues to hold each.
From an individual stock perspective, consumer electronics leader Apple advanced by more than 65% during the Fund’s fiscal year, due primarily to its consumer-needs driven focus. The company has surprised the market by maintaining a culture of innovation, even several years after it transitioned leadership from its late founder Steve Jobs to former COO and current CEO Tim Cook. Another key contributor to Herndon’s portion of the Fund was off-price department store chain Ross Stores. The company reclaimed investor attention as it continued to deliver quality goods at fair value, particularly as consumers remained cost conscious. Herndon views each of these as a value creating opportunity and therefore continues to hold them in the Fund.
In terms of laggards, U.S. shale producer Oasis Petroleum suffered a 70% loss during the Fund’s fiscal year. More than 50% of that drop was attributable to factors outside the dramatic decrease in oil prices. Herndon eliminated its position in this stock in early 2015 as part of an overarching adjustment to sector weightings. Another performance detractor, Waddell & Reed, was plagued by negative investor sentiment during the fiscal year amid turnover within its portfolio management. Even so, Herndon believes the market’s reaction was overstated and therefore it continues to hold the stock in its portion of the Fund.
MFS
MFS’s investment philosophy and approach for its portion of the Fund remain consistent during all market environments. The management team seeks to identify high-quality, undervalued stocks that offer the best potential for healthy long-term, risk-adjusted returns.
From a sector perspective, performance for MFS’s portion of the Fund relative to the benchmark was enhanced by an underweight allocation to energy stocks, which suffered dramatic losses during the fiscal year. Most notably, MFS held an underweight position in integrated oil and gas company ExxonMobil, a strategy that benefited performance relative to the benchmark. Stock selection within the industrial goods and services and basic materials sectors also contributed to performance.
An underweight position in the technology industry, which posted strong results during the fiscal year, detracted from performance within MFS’s portion of the Fund, as did weak stock selection within the sector. MFS’s portion of the Fund did not hold several strong benchmark performers, including network equipment company Cisco Systems and computer and personal electronics maker Apple. Further, MFS’s position in diversified technology products and services company IBM, which is not held within the benchmark, also detracted from performance.
At the individual stock level, a position in defense contractor Lockheed Martin (which was not represented within the benchmark) contributed to relative performance within MFS’s portion of the Fund. Conversely, MFS did not hold positions in industrial conglomerate General Electric or financial services firm Bank of America — lack of exposure to these names enhanced performance relative to the benchmark. Overweight positions in diversified technology company 3M, retail giant Target, insurance company St. Paul Travelers, and drugstore retailer CVS Health also contributed to relative performance. Other stock holdings that aided performance within MFS’s portion of the Fund included management consulting firm Accenture and semiconductor company Texas Instruments, neither of which was represented within the benchmark index.
At the individual stock level, an overweight position in tobacco company Philip Morris International detracted from performance. Other performance detractors included positions in Diageo, an international manufacturer and distributer of premium drinks, and media giant Viacom. Overweight positions in insurance provider MetLife, investment management firm Franklin Resources, oil and gas exploration and production company Occidental Petroleum, also hurt performance relative to the benchmark.
MFS’s portion of the Fund also benefited from its currency exposure during the fiscal year, which resulted primarily from differences between the Fund’s and benchmark’s exposures to holdings of securities dominated in foreign currencies. All of MFS’s investment decisions are driven by the fundamentals of each individual opportunity and, as such, it is common for the mutual funds that MFS advises to have different currency exposure than that of the benchmark.
Overall, Optimum Large Cap Value Fund used derivatives, including foreign currency exchange contracts, during the fiscal year. However, these had a minimal effect on performance.
10
Table of Contents
Optimum Small-Mid Cap Growth Fund
April 7, 2015
Performance review (for the year ended March 31, 2015) | ||||||
Optimum Small-Mid Cap Growth Fund (Class A shares) | 1-year return | +8.93% | ||||
Optimum Small-Mid Cap Growth Fund (Institutional Class shares) | 1-year return | +9.18% | ||||
Russell 2500™ Growth Index (benchmark) | 1-year return | +13.83% |
Past performance does not guarantee future results.
For complete, annualized performance for Optimum Small-Mid Cap Growth Fund, please see the table on page 28.
The performance of Class A shares excludes the applicable sales charge and reflects the reinvestment of all distributions. Institutional Class shares are available without sales or asset-based distribution charges only to certain eligible institutional accounts. Index performance returns do not reflect any management fees, transaction costs, or expenses. Indices are unmanaged and one cannot invest directly in an index.
Advisor
Delaware Management Company (DMC)
Sub-advisors
Columbia Wanger Asset Management, LLC (Columbia WAM)
Wellington Management Company, LLP (Wellington)
Market overview
During the Fund’s fiscal year ended March 31, 2015, domestic equity markets continued to gain, although at a slower pace than the previous year. Larger company stocks generally outperformed those of small companies, with growth stocks outperforming core and value stocks.
Though the overall market trend throughout the year was upward, with the S&P 500® Index passing through the 2,000 level for the first time and the NASDAQ making a brief return to 5,000, the pattern of volatility that began in 2013 continued. However, it was the specter of rising interest rates rather than the end of quantitative easing that repeatedly roiled the markets during the fiscal year. International concerns also arose throughout year, including heightened tension in Ukraine and the Middle East, the plunging price of oil, continued economic weakness in Europe and Japan, and a rapid strengthening of the U.S. dollar. On the positive side, the economy in the United States continued to grow as new-job creation picked up, unemployment declined, and interest rates remained low.
Interest rate sensitive areas such as utilities and real estate investment trusts (REITs) beat the overall market as investors clamored for the yield these stocks offered. In addition, biotech stocks performed well during the 12-month period. Energy stocks declined the most as oil prices were down nearly 50% in the last six months of 2014. Industrial company stocks also lagged the market. Because smaller-cap industrial companies tend to have a higher amount of revenues outside the U.S., the stronger U.S. dollar and
lower growth in emerging markets negatively affected many of these stocks.
Source: Bloomberg
Fund performance
Optimum Small-Mid Cap Growth Fund underperformed its benchmark index for the Fund’s fiscal year due, in part, to poor stock selection in the healthcare sector by both sub-advisors. Additionally, within one sub-advised portion of the Fund, an overweight and weak relative performance of companies in the industrials sector was a notable detractor.
Wellington
Wellington’s portion of the Fund generated strong gains on an absolute basis but underperformed the benchmark for the fiscal year. Generally, weak security selection within information technology weighed on relative performance, as did selection within healthcare. Stronger selection within energy, consumer discretionary, and materials helped to partially offset this weakness.
Among the strongest contributors to Wellington’s portion of the Fund were companies in energy, pharmaceuticals, and information technology (the problem with otherwise poor stock selection in that last sector notwithstanding). Shares of Mobileye — the leading designer of driver-assistance systems that seek to increase driver safety and comfort — were purchased prior to the company’s initial public offering and subsequently climbed. Later in the fiscal year, Wellington exited the position. Shares of Athlon, an exploration and production company focused on the Permian Basin, gained after it was acquired by natural gas producer Encana. Wellington also exited that position during the fiscal year. Shares of Anacor Pharmaceuticals, a biopharmaceutical company focused on discovering, developing, and commercializing novel small-molecule therapeutics, rose as the market responded favorably when the company highlighted its two lead compounds in development during a presentation to analysts. Wellington initiated its position during the 12-month period and continued to hold it as of the end of the Fund’s fiscal year. Wellington’s investment in several privately held companies also contributed to relative performance in aggregate.
| (continues | ) | 11 |
Table of Contents
Portfolio management reviews
Optimum Small-Mid Cap Growth Fund
Web.com Group, an internet service provider focused primarily on small- and medium-sized businesses, was one of the largest detractors from Wellington’s portion of the Fund. Its shares declined following weak results brought about by increased competition in the company’s “do-it-for-me” web design and service business. Wellington exited the position during the fiscal year. Shares of zulily, an e-commerce company focused on children’s and women’s apparel, and other product categories, also declined. The company faced significant challenges related to marketing promotions, specifically flash sales driving customer traffic. The lack of a position in healthcare company Intermune, a strong-performing constituent of the Russell 2500 Growth Index, also detracted from relative results in Wellington’s portion of the Fund.
As of the end of the fiscal year, Wellington’s portion of the Fund had significant exposure to the information technology, industrials, and healthcare sectors, and no exposure to utilities and telecommunication services.
Columbia WAM
Columbia WAM’s portion of the Fund gained on an absolute basis, but underperformed the benchmark, reflecting the stronger performance of growth-oriented investments during the fiscal year. Columbia WAM employs a low-turnover, bottom-up (stock-by-stock), fundamental investment strategy and made no significant adjustments to its portion of the Fund during the 12-month period. The company seeks to identify reasonably priced growth companies that it believes are positioned to grow over the next three to five years. During much of the fiscal year, more reasonably priced companies underperformed both high-priced momentum stocks and value stocks, resulting in significant relative underperformance for Columbia WAM’s portion of the Fund.
The consumer discretionary and telecommunication sectors were the two most significant contributors to Columbia WAM’s portion of the Fund. During the fiscal year, it maintained an underweight in consumer discretionary and an overweight in telecommunications. These weighting decisions had little effect on performance. Instead, positive results were largely attributable to strong stock selection in both sectors.
Consumer discretionary stocks generally outperformed the overall benchmark index return while Columbia WAM’s selections in this sector outperformed the benchmark index by nearly 5% during the period. Columbia WAM’s allocation to telecommunications, roughly 2% as of the end of the Fund’s fiscal year, was greater than that of the benchmark. While telecommunications overall was a laggard for
the Fund’s fiscal year, Columbia’s telecommunications stocks gained more than 50% during the fiscal year versus just more than 5% for the benchmark.
The two sectors that detracted most from performance in Columbia WAM’s portion of the Fund were healthcare and industrials. Industrials accounted for the largest absolute and relative weight. With industrials lagging for the fiscal year, the weighting decision resulted in below-benchmark performance. Additionally, several of these industrial stocks derive a fair amount of revenue from outside the U.S. With the U.S. dollar strengthening throughout the 12-month period, prices rose for industrial goods outside the U.S. while demand from end users slowed.
Columbia WAM’s portion of the Fund was underweight the healthcare sector on average during the fiscal year. At the same time, healthcare stocks (in particular pharmaceuticals and biotechnology) were among the strongest performers within the benchmark. The combination of the underweight and Columbia WAM’s stock selection — which failed to keep pace with the torrid 36% return of the benchmark healthcare stocks during the period — was the culprit in Columbia WAM’s underperformance in this sector.
At the individual stock level, Akorn and Infinera were the two strongest contributors to performance in Columbia WAM’s portion of the Fund. Both stocks more than doubled during the Fund’s fiscal year.
Akorn is a developer of specialty generic drugs and has experienced strong revenue growth from new products. Infinera is an optical networking equipment company. Internet service providers deploy its networks as users increase data transmission. Infinera’s Cloud Xpress product appears to have strong potential.
During the fiscal year, the two largest detractors were Rosetta Resources and Chicago Bridge & Iron. Rosetta Resources, an energy exploration company, fell more than 64% during the fiscal year, reflecting the hefty decline in oil prices and the anticipated lower level of production that lower prices will induce.
Chicago Bridge & Iron is a multinational engineering and construction company that specializes in natural gas and petrochemical projects. Falling energy prices were partly responsible for the stock’s decline, as well as potential cost overruns at two nuclear power plant projects. For these reasons, Columbia WAM exited that position during the fiscal year.
Overall, Optimum Small-Mid Cap Growth Fund used derivatives, including foreign currency exchange contracts, during the fiscal year. However, these had a minimal effect on performance.
12
Table of Contents
Optimum Small-Mid Cap Value Fund
April 7, 2015
Performance review (for the year ended March 31, 2015) | ||||||
Optimum Small-Mid Cap Value Fund (Class A shares) | 1-year return | – 0.69% | ||||
Optimum Small-Mid Cap Value Fund (Institutional Class shares) | 1-year return | – 0.53% | ||||
Russell 2500™ Value Index (benchmark) | 1-year return | +6.59% |
Past performance does not guarantee future results.
For complete, annualized performance for Optimum Small-Mid Cap Value Fund please see the table on page 31. The performance of Class A shares excludes the applicable sales charge and reflects the reinvestment of all distributions.
Institutional Class shares are available without sales or asset-based distribution charges only to certain eligible institutional accounts. Index performance returns do not reflect any management fees, transaction costs, or expenses. Indices are unmanaged and one cannot invest directly in an index.
Advisor
Delaware Management Company (DMC)
Sub-advisors
The Delafield Group, a division of Tocqueville Asset
Management L.P. (Tocqueville)
The Killen Group, Inc. (Killen)
Westwood Management Corp. (Westwood)
Market overview
The Fund’s fiscal year ended March 31, 2015 was marked by rising volatility, with investors keenly sensitive to the actions of global central banks. A significant decline in crude oil prices, which began in the third quarter of 2014, also contributed to the volatile environment. The fiscal year began with many investors pulling back from equities on the release of weaker-than-expected first-quarter 2014 domestic economic data that was due, in part, to severe weather. Improved consumer confidence, job numbers, and housing reports then seemed to be the tonic for a jittery market, despite renewed geopolitical flare-ups in the Middle East and Ukraine.
Challenges remained, however, as investors anticipated a near-term rise in interest rates. Despite the U.S. Federal Reserve’s October 2014 decision to complete its quantitative easing (QE) program, investors seemed encouraged by continued signs of strength in the U.S. economy and solid earnings reports.
In early 2015, the markets experienced persistent volatility as oil prices continued to drop, the U.S. dollar surged, and worries about international economic activity, particularly in China, resurfaced. In late January, the European Central Bank embarked on its own version of QE, which resulted in an equity rally, particularly for European stocks. For the balance of the Fund’s fiscal year, investors’ optimism won out, with fundamental economic and corporate data supporting indices just shy of record highs.
Source: Bloomberg
Fund performance
Optimum Small-Mid Cap Value Fund underperformed the Fund’s benchmark for the fiscal year. In Killen’s case, weak-performing stocks in the consumer discretionary sector were a significant factor. For Tocqueville, the two weakest detractors were holdings in the industrials and materials sectors. The third sub-advisor, Westwood, underperformed in the energy and producer durables sectors, while its holdings in materials & processing and increased exposure to healthcare stocks helped performance.
Tocqueville
Tocqueville’s investment approach remained consistent throughout the fiscal year, which resulted in performance that was out of step with the market. During this period, the Russell 2500 Value Index favored larger-tier companies, and financials and healthcare over basic industry. Tocqueville’s bottom-up (stock-by-stock), value-driven investment approach did not uncover attractive opportunities in the financial and healthcare sectors. While these two sectors comprised nearly 44% of the benchmark’s holdings — and contributed more than six percentage points of total return to the index during the fiscal year — Tocqueville’s portion of the Fund had virtually no exposure to these stocks during the fiscal year.
Tocqueville’s holdings in the industrials sector, followed by materials, were the most detrimental to its performance. In industrials, its portion of the Fund underperformed the benchmark’s sector holdings, while Tocqueville’s large weighting compounded the weak performance. In materials, Tocqueville’s absolute returns were essentially in-line with those of the benchmark, but an overweight there hurt relative performance. Within the industrials segment, two of the poorest performers were Aegion and Civeo. Both declined on weaker outlooks, largely due to the rapid decline in energy prices. Tocqueville ultimately sold Civeo after the company decided against the real estate investment trust (REIT) conversion that Tocqueville had anticipated. A number of Tocqueville’s holdings in the industrials and materials sectors experienced tangential energy price-related
| (continues | ) | 13 |
Table of Contents
Portfolio management reviews
Optimum Small-Mid Cap Value Fund
declines. Some, like Dover and Wesco International were the result of end-market exposure; others, like Eastman Chemical, were a function of energy-related input cost variations.
In contrast, Tocqueville’s overweight in the information technology (IT) sector was a bright spot. Its stock selection outperformed the benchmark’s IT holdings for the fiscal year. Tocqueville’s electronic manufacturing service stocks contributed favorably on the strength of solid earnings reports and improved outlooks.
Flextronics International was the strongest contributor to the performance of Tocqueville’s portion of the Fund. The company reported solid earnings throughout the fiscal year, exhibited robust free-cash-flow generation, and strategically created shareholder value through substantial share repurchase activity. Staples was Tocqueville’s second-strongest contributor to performance. The stock showed modest improvement midway through the fiscal year on stabilized earnings trends, and then jumped following confirmed reports that the company was in advanced merger talks with Office Depot.
Energy XXI was the largest individual detractor from performance. Tocqueville invested in the company believing that its anticipated acquisition of EPL Oil & Gas would consolidate its position in the Gulf Coast shelf and lead to efficiencies of operation and substantial free cash flow. However, due to unexpected operating inefficiencies, the sharp decline in the price of oil, and tax-loss selling late in 2014, shares declined radically. Tocqueville sold the stock during the fiscal year. Carpenter Technology was Tocqueville’s next-biggest detractor from performance. Shares declined on missed earnings, a lowered outlook on a slower-than-expected ramp-up of its Athens, Ga., facility, and lower specialty steel prices.
Killen
The Killen Group’s value style strategy seeks to invest in what it views as overlooked and undervalued businesses. During the Fund’s fiscal year, Killen found contrarian investment opportunities in a number of sectors, including consumer discretionary, materials, and industrials. Killen’s allocations to specific sectors result from its bottom-up stock selection process rather than from a sector-weighting strategy.
The fiscal year was particularly challenging for the Fund’s asset class, as small-cap stocks underperformed the S&P 500 Index. In addition, the strong dollar darkened the outlook for many manufacturing companies, and the severe drop in oil and other commodity prices affected the near-term earnings potential of a number of holdings in Killen’s portion of the Fund. Despite these challenges, Killen’s portion of the Fund experienced strong performance within information technology, financials, and telecommunications. Double-digit returns from these sectors were primarily the result of large gains in one or more stocks.
For the 12-month period, Killen’s portion of the Fund posted negative returns within the energy, consumer discretionary, and industrials sectors. In aggregate, Killen underperformed the Fund’s benchmark, the Russell 2500 Value Index, for the same period.
KMG Chemicals, a manufacturer of specialty chemicals, and Methode Electronics, a manufacturer of electronic components used in automobiles and other industrial equipment, were strong performers within Killen’s portion of the Fund. KMG benefited from cost-savings initiatives and its divestment of a noncore business. In Methode’s case, improved manufacturing efficiencies and continued strong automotive segment sales for its center consoles played a large role in the stock’s strong showing.
Two of Killen’s holdings fell more than 50% for the Fund’s fiscal year. Vaalco Energy, an oil and gas exploration and development company, was hit by both rapidly declining oil prices and an unsuccessful exploration-drilling program. Even with a new CEO who Killen believes is focused on the correct strategy, the company faces structural issues that are likely to persist; therefore, Killen is in the process of exiting this position. LeapFrog Enterprises, a manufacturer of children’s electronic toys, has been tested by sales and operating margin pressure as its educational products have fallen out of favor with the marketplace. Killen believes that although LeapFrog is attractively priced and carries a strong balance sheet, the competitive pressures are too great for the company’s management team to overcome. Therefore, Killen plans to exit this position over the coming fiscal year.
Westwood
Westwood employs a consistent and disciplined approach throughout all market environments that seeks to protect capital in unfavorable market periods and provide attractive risk-adjusted returns over the long term. Stock selection priority is driven by extensive research to attempt to identify companies that have limited downside risk from strong fundamental underpinnings but that are also attractively valued.
Westwood’s security selection in the materials & processing and healthcare sectors aided both absolute and relative performance in Westwood’s portion of the Fund during the Fund’s fiscal year. Westwood’s materials & processing holdings benefited from improvements in the demand for housing-related materials and from moves to unlock value by several companies. Over the past two years, Westwood has increased exposure in the healthcare sector through the acquisition of companies with good earnings visibility that Westwood believes are unlikely to be affected by legislation-associated healthcare pricing pressures. This approach proved favorable for performance in its portion of the Fund during the fiscal year.
| 14 |
Table of Contents
Security selection in the energy and producer durables sectors hurt performance in Westwood’s portion of the Fund. Holdings in both sectors were hampered by the unexpected and dramatic decline in crude oil prices in the second half of 2014. Energy producers and industrial companies connected to energy production performed poorly in this environment. During the fiscal year, a number of companies held in Westwood’s portion of the Fund underwent corporate actions — including mergers and breakups — that unlocked a great deal of value and contributed strong returns. Westwood views this trend as a confirmation of the unrealized value it seeks to identify through its fundamental research process. Healthcare firms Hospira, acquired by Pfizer, and CareFusion, acquired by Becton, Dickinson & Co., both benefited from such corporate actions.
Energy exploration and production holdings were the worst performers in Westwood’s portion of the Fund during the 12-month period. Investors were forced to price the impact of a 50% decline in West Texas Intermediate crude during the last six months of 2014 into their valuations of these companies, and the result was a material drop in the stock prices of many companies. Two such holdings affected by this repricing were Rex Energy and Oasis Petroleum. Westwood exited both positions during the fiscal year.
Overall, Optimum Small-Mid Cap Value Fund used derivatives, including foreign currency exchange contracts, during the fiscal year. However, these had a minimal effect on performance.
| (continues | ) | 15 |
Table of Contents
The performance data quoted represent past performance; past performance does not guarantee future results. Investment return and principal value will fluctuate so your shares, when redeemed, may be worth more or less than their original cost. Please obtain the performance data for the most recent month end by calling 800 914-0278 or visiting our website at optimummutualfunds.com. Current performance may be lower or higher than the performance data quoted.
| Fund and benchmark performance1,2 | ||||||||||||
| Average annual total returns through March 31, 2015 | 1 year | 5 years | 10 years | |||||||||
| ||||||||||||
Class A (Est. Aug. 1, 2003) | ||||||||||||
Excluding sales charge | +4.21% | +4.35% | +5.17% | |||||||||
Including sales charge | – 0.49% | +3.39% | +4.68% | |||||||||
| ||||||||||||
Class C (Est. Aug. 1, 2003) | ||||||||||||
Excluding sales charge | +3.44% | +3.66% | +4.47% | |||||||||
Including sales charge | +2.44% | +3.66% | +4.47% | |||||||||
| ||||||||||||
Institutional Class (Est. Aug. 1, 2003) | ||||||||||||
Excluding sales charge | +4.47% | +4.70% | +5.52% | |||||||||
Including sales charge | +4.47% | +4.70% | +5.52% | |||||||||
| ||||||||||||
Barclays U.S. Aggregate Index | +5.72% | +4.41% | +4.93% | |||||||||
1Returns reflect the reinvestment of all distributions and are presented both with and without the applicable sales charges described below. Returns do not reflect the deduction of taxes the shareholder would pay on Fund distributions or redemptions of Fund shares.
Expense limitations were in effect for certain classes during some or all of the periods shown in the “Fund and benchmark performance” graph. The current expenses for each class are listed on the “Fund expense ratios” table on the next page. Performance would have been lower had expense limitations not been in effect.
Class A shares are sold with a maximum front-end sales charge of 4.50%, and have an annual distribution and service fee of 0.25% of average daily net assets. Performance for Class A shares, excluding sales charges, assumes that no front-end sales charge applied.
Class C shares are sold with a contingent deferred sales charge of 1.00% if redeemed during the first 12 months. They are also subject to an annual distribution and service fee of 1.00% of average daily net assets.
Performance for Class C shares, excluding sales charges, assumes either that contingent deferred sales charges did not apply or that the investment was not redeemed.
Institutional Class shares are available without sales or asset-based distribution charges only to certain eligible institutional accounts.
The “Fund and benchmark performance” table and the “Performance of a $10,000 investment” graph do not reflect the deduction of taxes the shareholder would pay on Fund distributions or redemptions of Fund shares.
2 The Fund’s expense ratios, as described in the most recent prospectus, are disclosed in the “Fund expense ratios” table on the next page. Delaware Management Company has agreed to reimburse certain expenses and/or waive certain fees in order to prevent total fund operating expenses (excluding any 12b-1 fees and certain other expenses) from exceeding 0.95% of the Fund’s average daily net assets from July 29, 2014, through July 29, 2015.* Please see the most recent prospectus and any applicable supplement(s) for additional information on these fee waivers and/or reimbursements.
16
Table of Contents
| Fund expense ratios | Class A | Class C | Institutional Class | |||
| Total annual operating expenses | 1.27% | 2.02% | 1.02% | |||
| (without fee waivers) | ||||||
| Net expenses (including fee | 1.20% | 1.95% | 0.95% | |||
| waivers, if any) | ||||||
| Type of waiver | Contractual | Contractual | Contractual |
* The contractual waiver period is from July 29, 2014 to July 29, 2015. Prior to July 29, 2014, the contractual waiver was 1.00%.
Fixed income securities and bond funds can lose value, and investors can lose principal, as interest rates rise. They also may be affected by economic conditions that hinder an issuer’s ability to make interest and principal payments on its debt.
The Fund may also be subject to prepayment risk, the risk that the principal of a fixed income security that is held by the Fund may be prepaid prior to maturity, potentially forcing the Fund to reinvest that money at a lower interest rate.
High yielding, noninvestment grade bonds (junk bonds) involve higher risk than investment grade bonds. The high yield secondary market is particularly susceptible to liquidity problems when institutional investors, such as mutual funds and certain other financial institutions, temporarily stop buying bonds for regulatory, financial, or other reasons. In addition, a less liquid secondary market makes it more difficult for the Fund to obtain precise valuations of the high yield securities in its portfolio.
If and when we invest in forward foreign currency contracts or use other investments to hedge against currency risks, the Fund will be subject to special risks, including counterparty risk.
The Fund may invest in derivatives, which may involve additional expenses and are subject to risk, including the risk that an underlying security or securities index moves in the opposite direction from what the portfolio manager anticipated. A derivative transaction depends upon the counterparties’ ability to fulfill their contractual obligations.
The Fund may experience portfolio turnover in excess of 100%, which could result in higher transaction costs and tax liability.
Performance of a $10,000 Investment1
Average annual total returns from March 31, 2005 through March 31, 2015
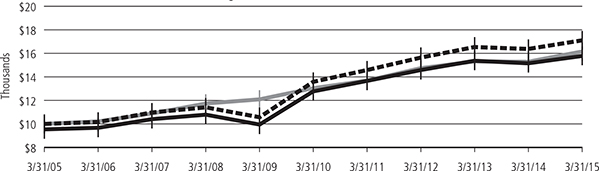
| Starting value (March 31, 2005) Ending value (March 31, 2015) | ||||||
| $10,000 | $17,107 | ||||
| $10,000 | $16,174 | ||||
| $9,550 | $15,801 | ||||
 Optimum Fixed Income Fund — Institutional Class shares
 Barclays U.S. Aggregate Index
 Optimum Fixed Income Fund — Class A shares
1The “Performance of $10,000 investment” graph assumes $10,000 invested in Class A and Institutional Class shares of the Fund on March 31, 2005, and includes the effect of a 4.50% front-end sales charge (for Class A shares) and the reinvestment of all distributions. The graph does not reflect the deduction of taxes the shareholders would pay on Fund distributions or redemptions of Fund shares. Expense
| (continues | ) | 17 |
Table of Contents
Performance summaries
Optimum Fixed Income Fund
Performance of a $10,000 Investment1 (continued)
limitations were in effect for some or all of the periods shown. Performance would have been lower had expense limitations not been in effect. Current expenses are listed in the “Fund expense ratios” table on page 17. Please note additional details on pages 16 through 18.
The graph also assumes $10,000 invested in the Barclays U.S. Aggregate Index as of March 31, 2005. The Barclays U.S. Aggregate Index measures the performance of publicly issued investment grade (Baa3/BBB- or better) corporate, U.S. government, mortgage- and asset-backed securities with at least one year to maturity and at least $250 million par amount outstanding.
The BofA Merrill Lynch 1–3 Year U.S. Treasury Index, mentioned on page 3, generally tracks the market for U.S. Treasury securities with maturities of one to three years.
Index performance returns do not reflect any management fees, transaction costs, or expenses. Indices are unmanaged and one cannot invest directly in an index. Past performance is not a guarantee of future results.
Performance of other Fund classes will vary due to different charges and expenses.
Stock symbols and CUSIP numbers | ||||||
| Nasdaq symbols | CUSIPs | |||||
Class A | OAFIX | 246118681 | ||||
Class C | OCFIX | 246118665 | ||||
Institutional Class | OIFIX | 246118657 |
18
Table of Contents
The performance data quoted represent past performance; past performance does not guarantee future results. Investment return and principal value will fluctuate so your shares, when redeemed, may be worth more or less than their original cost. Please obtain the performance data for the most recent month end by calling 800 914-0278 or visiting our website at optimummutualfunds.com. Current performance may be lower or higher than the performance data quoted.
| Fund and benchmark performance1,2 | ||||||||||||||
| Average annual total returns through March 31, 2015 | 1 year | 5 years | 10 years | |||||||||||
Class A (Est. Aug. 1, 2003) | ||||||||||||||
Excluding sales charge | –6.25% | +4.05% | +3.47% | |||||||||||
Including sales charge | –11.66% | +2.82% | +2.86% | |||||||||||
Class C (Est. Aug. 1, 2003) | ||||||||||||||
Excluding sales charge | –7.00% | +3.35% | +2.78% | |||||||||||
Including sales charge | –7.92% | +3.35% | +2.78% | |||||||||||
Institutional Class (Est. Aug. 1, 2003) | ||||||||||||||
Excluding sales charge | –6.04% | +4.39% | +3.82% | |||||||||||
Including sales charge | –6.04% | +4.39% | +3.82% | |||||||||||
MSCI EAFE Index (gross) | –0.48% | +6.64% | +5.43% | |||||||||||
MSCI EAFE Index (net) | –0.92% | +6.16% | +4.95% | |||||||||||
1Returns reflect the reinvestment of all distributions and are presented both with and without the applicable sales charges described below. Returns do not reflect the deduction of taxes the shareholder would pay on Fund distributions or redemptions of Fund shares.
Expense limitations were in effect for certain classes during some or all of the periods shown in the “Fund and benchmark performance” graph. The current expenses for each class are listed on the “Fund expense ratios” table on the next page. Performance would have been lower had expense limitations not been in effect.
Class A shares are sold with a maximum front-end sales charge of 5.75%, and have an annual distribution and service fee of 0.25% of average daily net assets. Performance for Class A shares, excluding sales charges, assumes that no front-end sales charge applied.
Class C shares are sold with a contingent deferred sales charge of 1.00% if redeemed during the first 12 months. They are also subject to an annual distribution and service fee of 1.00% of average daily net assets.
Performance for Class C shares, excluding sales charges, assumes either that contingent deferred sales charges did not apply or that the investment was not redeemed.
Institutional Class shares are available without sales or asset-based distribution charges only to certain eligible institutional accounts.
The “Fund and benchmark performance” table and the “Performance of a $10,000 investment” graph do not reflect the deduction of taxes the shareholder would pay on Fund distributions or redemptions of Fund shares.
2 The Fund’s expense ratios, as described in the most recent prospectus, are disclosed in the “Fund expense ratios” table on the next page. Delaware Management Company has agreed to reimburse certain expenses and/or waive certain fees in order to prevent total fund operating expenses (excluding any 12b-1 fees and certain other expenses) from exceeding 1.25% of the Fund’s average daily net assets from July 29, 2014, through July 29, 2015.* Please see the most recent prospectus and any applicable supplement(s) for additional information on these fee waivers and/or reimbursements.
| (continues | ) | 19 |
Table of Contents
Performance summaries
Optimum International Fund
Fund expense ratios | Class A | Class C | Institutional Class | |||
Total annual operating expenses | ||||||
(without fee waivers) | 1.61% | 2.36% | 1.36% | |||
Net expenses | ||||||
(including fee waivers, if any) | 1.50% | 2.25% | 1.25% | |||
Type of waiver | Contractual | Contractual | Contractual |
* The contractual waiver period is from July 29, 2014 to July 29, 2015. Prior to July 29, 2014, the contractual waiver was 1.40%.
International investments entail risks not ordinarily associated with U.S. investments including fluctuation in currency values, differences in accounting principles, or economic or political instability in other nations. Investing in emerging markets can be riskier than investing in established foreign markets due to increased volatility and lower trading volume.
The Fund may invest in derivatives, which may involve additional expenses and are subject to risk, including the risk that an underlying security or securities index moves in the opposite direction from what the portfolio manager anticipated. A derivative transaction depends upon the counterparties’ ability to fulfill their contractual obligations.
Performance of a $10,000 Investment1
Average annual total returns from March 31, 2005 through March 31, 2015
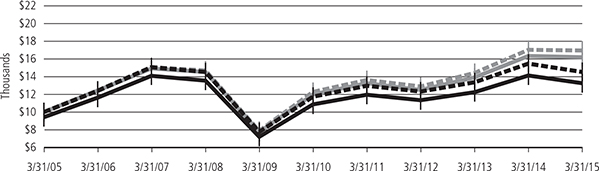
| Starting value (March 31, 2005) Ending value (March 31, 2015) | ||||||||
| $10,000 | $16,971 | ||||||
| $10,000 | $16,206 | ||||||
| $10,000 | $14,548 | ||||||
| $9,425 | $13,263 | ||||||
 MSCI EAFE Index (gross)
 MSCI EAFE Index (net)
 Optimum International Fund — Institutional Class shares
 Optimum International Fund — Class A shares
1The “Performance of $10,000 investment” graph assumes $10,000 invested in Class A and Institutional Class shares of the Fund on March 31, 2005, and includes the effect of a 5.75% front-end sales charge (for Class A shares) and the reinvestment of all distributions. The graph does not reflect the deduction of taxes the shareholders would pay on Fund distributions or redemptions of Fund shares. Expense limitations were in effect for some or all of the periods shown. Performance would have been lower had expense limitations not been in effect. Current expenses are listed in the “Fund expense ratios” table above. Please note additional details on pages 19 through 21.
The chart also assumes $10,000 invested in the MSCI EAFE Index as of March 31, 2005. The MSCI EAFE Index measures equity market performance across developed market countries in Europe, Australasia, and the Far East. Index “ gross” return approximates the maximum possible dividend reinvestment. Index “net” return approximates the minimum possible dividend reinvestment, after deduction of withholding tax at the highest possible rate.
Index performance returns do not reflect any management fees, transaction costs, or expenses. Indices are unmanaged and one cannot invest directly in an index. Past performance is not a guarantee of future results.
20
Table of Contents
Performance of other Fund classes will vary due to different charges and expenses.
Stock symbols and CUSIP numbers | ||||||
| Nasdaq symbols | CUSIPs | |||||
Class A | OAIEX | 246118731 | ||||
Class C | OCIEX | 246118715 | ||||
Institutional Class | OIIEX | 246118699 |
| (continues | ) | 21 |
Table of Contents
Performance summaries
The performance data quoted represent past performance; past performance does not guarantee future results. Investment return and principal value will fluctuate so your shares, when redeemed, may be worth more or less than their original cost. Please obtain the performance data for the most recent month end by calling 800 914-0278 or visiting our website at optimummutualfunds.com. Current performance may be lower or higher than the performance data quoted.
Fund and benchmark performance1, 2 | ||||||||||||||
| Average annual total returns through March 31, 2015 | 1 year | 5 years | 10 years | |||||||||||
| ||||||||||||||
Class A (Est. Aug. 1, 2003) | ||||||||||||||
Excluding sales charge | +17.27% | +14.92% | +8.33% | |||||||||||
Including sales charge | +10.53% | +13.56% | +7.69% | |||||||||||
| ||||||||||||||
Class C (Est. Aug. 1, 2003) | ||||||||||||||
Excluding sales charge | +16.44% | +14.14% | +7.62% | |||||||||||
Including sales charge | +15.44% | +14.14% | +7.62% | |||||||||||
| ||||||||||||||
Institutional Class (Est. Aug. 1, 2003) | ||||||||||||||
Excluding sales charge | +17.55% | +15.28% | +8.69% | |||||||||||
Including sales charge | +17.55% | +15.28% | +8.69% | |||||||||||
| ||||||||||||||
Russell 1000 Growth Index | +16.09% | +15.63% | +9.36% | |||||||||||
1Returns reflect the reinvestment of all distributions and are presented both with and without the applicable sales charges described below. Returns do not reflect the deduction of taxes the shareholder would pay on Fund distributions or redemptions of Fund shares.
Expense limitations were in effect for certain classes during some or all of the periods shown in the “Fund and benchmark performance” graph. The current expenses for each class are listed on the “Fund expense ratios” table on the next page. Performance would have been lower had expense limitations not been in effect.
Class A shares are sold with a maximum front-end sales charge of 5.75%, and have an annual distribution and service fee of 0.25% of average daily net assets. Performance for Class A shares, excluding sales charges, assumes that no front-end sales charge applied.
Class C shares are sold with a contingent deferred sales charge of 1.00% if redeemed during the first 12 months. They are also subject to an annual distribution and service fee of 1.00% of average daily net assets.
Performance for Class C shares, excluding sales charges, assumes either that contingent deferred sales charges did not apply or that the investment was not redeemed.
Institutional Class shares are available without sales or asset-based distribution charges only to certain eligible institutional accounts.
The “Fund and benchmark performance” table and the “Performance of a $10,000 investment” graph do not reflect the deduction of taxes the shareholder would pay on Fund distributions or redemptions of Fund shares.
2 The Fund’s expense ratios, as described in the most recent prospectus, are disclosed in the “Fund expense ratios” table on the next page. Delaware Management Company has agreed to reimburse certain expenses and/or waive certain fees in order to prevent total fund operating expenses (excluding any 12b-1 fees and certain other expenses) from exceeding 1.12% of the Fund’s average daily net assets from July 29, 2014, through July 29, 2015.* Please see the most recent prospectus and any applicable supplement(s) for additional information on these fee waivers and/or reimbursements.
22
Table of Contents
Fund expense ratios | Class A | Class C | Institutional Class | |||
Total annual operating expenses | ||||||
(without fee waivers) | 1.48% | 2.23% | 1.23% | |||
Net expenses | ||||||
(including fee waivers, if any) | 1.37% | 2.12% | 1.12% | |||
Type of waiver | Contractual | Contractual | Contractual |
* The contractual waiver period is from July 29, 2014 to July 29, 2015. Prior to July 29, 2014, the contractual waiver was 1.25%.
Performance of a $10,000 Investment1
Average annual total returns from March 31, 2005 through March 31, 2015
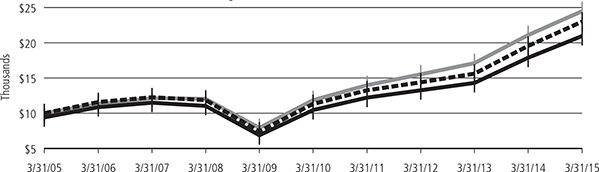
| Starting value (March 31, 2005) Ending value (March 31, 2015) | ||||||||
| $10,000 | $24,462 | ||||||
| $10,000 | $23,006 | ||||||
| $9,425 | $20,974 | ||||||
 Russell 1000 Growth Index
 Optimum Large Cap Growth Fund — Institutional Class shares
 Optimum Large Cap Growth Fund — Class A shares
1The “Performance of $10,000 investment” graph assumes $10,000 invested in Class A and Institutional Class shares of the Fund on March 31, 2005, and includes the effect of a 5.75% front-end sales charge (for Class A shares) and the reinvestment of all distributions. The graph does not reflect the deduction of taxes the shareholders would pay on Fund distributions or redemptions of Fund shares. Expense limitations were in effect for some or all of the periods shown. Performance would have been lower had expense limitations not been in effect. Current expenses are listed in the “Fund expense ratios” table above. Please note additional details on pages 22 through 24.
The chart also assumes $10,000 invested in the Russell 1000 Growth Index as of March 31, 2005. The Russell 1000 Growth Index measures the performance of the large-cap growth segment of the U.S. equity universe. It includes those Russell 1000 companies with higher price-to-book ratios and higher forecasted growth values.
Russell Investment Group is the source and owner of the trademarks, service marks, and copyrights related to the Russell Indexes. Russell® is a trademark of Russell Investment Group.
Index performance returns do not reflect any management fees, transaction costs, or expenses. Indices are unmanaged and one cannot invest directly in an index. Past performance is not a guarantee of future results.
Performance of other Fund classes will vary due to different charges and expenses.
| (continues | ) | 23 |
Table of Contents
Performance summaries
Optimum Large Cap Growth Fund
| Stock symbols and CUSIP numbers | ||||||||
| Nasdaq symbols | CUSIPs | |||||||
Class A | OALGX | 246118707 | ||||||
Class C | OCLGX | 246118889 | ||||||
Institutional Class | OILGX | 246118871 | ||||||
24
Table of Contents
The performance data quoted represent past performance; past performance does not guarantee future results. Investment return and principal value will fluctuate so your shares, when redeemed, may be worth more or less than their original cost. Please obtain the performance data for the most recent month end by calling 800 914-0278 or visiting our website at optimummutualfunds.com. Current performance may be lower or higher than the performance data quoted.
| Fund and benchmark performance1,2 | ||||||||||||||
| Average annual total returns through March 31, 2015 | 1 year | 5 years | 10 years | |||||||||||
| ||||||||||||||
Class A (Est. Aug. 1, 2003) | ||||||||||||||
Excluding sales charge | +5.34% | +11.64% | +6.50% | |||||||||||
Including sales charge | –0.73% | +10.32% | +5.88% | |||||||||||
| ||||||||||||||
Class C (Est. Aug. 1, 2003) | ||||||||||||||
Excluding sales charge | +4.48% | +10.89% | +5.80% | |||||||||||
Including sales charge | +3.48% | +10.89% | +5.80% | |||||||||||
| ||||||||||||||
Institutional Class (Est. Aug. 1, 2003) | ||||||||||||||
Excluding sales charge | +5.60% | +11.99% | +6.87% | |||||||||||
Including sales charge | +5.60% | +11.99% | +6.87% | |||||||||||
| ||||||||||||||
Russell 1000 Value Index | +9.33% | +13.75% | +7.21% | |||||||||||
1Returns reflect the reinvestment of all distributions and are presented both with and without the applicable sales charges described below. Returns do not reflect the deduction of taxes the shareholder would pay on Fund distributions or redemptions of Fund shares.
Expense limitations were in effect for certain classes during some or all of the periods shown in the “Fund and benchmark performance” graph. The current expenses for each class are listed on the “Fund expense ratios” table on the next page. Performance would have been lower had expense limitations not been in effect.
Class A shares are sold with a maximum front-end sales charge of 5.75%, and have an annual distribution and service fee of 0.25% of average daily net assets. Performance for Class A shares, excluding sales charges, assumes that no front-end sales charge applied.
Class C shares are sold with a contingent deferred sales charge of 1.00% if redeemed during the first 12 months. They are also subject to an annual distribution and service fee of 1.00% of average daily net assets.
Performance for C shares, excluding sales charges, assumes either that contingent deferred sales charges did not apply or that the investment was not redeemed.
Institutional Class shares are available without sales or asset-based distribution charges only to certain eligible institutional accounts.
The “Fund and benchmark performance” table and the “Performance of a $10,000 investment” graph do not reflect the deduction of taxes the shareholder would pay on Fund distributions or redemptions of Fund shares.
2 The Fund’s expense ratios, as described in the most recent prospectus, are disclosed in the “Fund expense ratios” table on the next page. Delaware Management Company has agreed to reimburse certain expenses and/or waive certain fees in order to prevent total fund operating expenses (excluding any 12b-1 fees and certain other expenses) from exceeding 1.08% of the Fund’s average daily net assets from July 29, 2014, through July 29, 2015.* Please see the most recent prospectus and any applicable supplement(s) for additional information on these fee waivers and/or reimbursements.
| (continues | ) | 25 |
Table of Contents
Performance summaries
Optimum Large Cap Value Fund
| Fund expense ratios | Class A | Class C | Institutional Class | |||
| Total annual operating expenses | ||||||
| (without fee waivers) | 1.44% | 2.19% | 1.19% | |||
| Net expenses | ||||||
| (including fee waivers, if any) | 1.33% | 2.08% | 1.08% | |||
| Type of waiver | Contractual | Contractual | Contractual |
*The contractual waiver period is from July 29, 2014 to July 29, 2015. Prior to July 29, 2014, the contractual waiver was 1.20%.
Performance of a $10,000 Investment1
Average annual total returns from March 31, 2005 through March 31, 2015
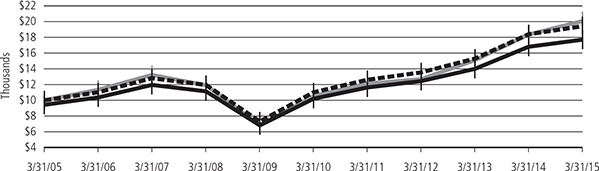
| Starting value (March 31, 2005) Ending value (March 31, 2015) | ||||||||
| $10,000 | $20,066 | ||||||
| $10,000 | $19,428 | ||||||
| $9,425 | $17,702 | ||||||
 Russell 1000 Value Index
 Optimum Large Cap Value Fund — Institutional Class shares
 Optimum Large Cap Value Fund — Class A shares
1The “Performance of $10,000 investment” graph assumes $10,000 invested in Class A and Institutional Class shares of the Fund on March 31, 2005, and includes the effect of a 5.75% front-end sales charge (for Class A shares) and the reinvestment of all distributions. The graph does not reflect the deduction of taxes the shareholders would pay on Fund distributions or redemptions of Fund shares. Expense limitations were in effect for some or all of the periods shown. Performance would have been lower had expense limitations not been in effect. Current expenses are listed in the “Fund expense ratios” table above. Please note additional details on pages 25 through 27.
The graph also assumes $10,000 invested in the Russell 1000 Value Index as of March 31, 2005. The Russell 1000 Value Index measures the performance of the large-cap value segment of the U.S. equity universe. It includes those Russell 1000 companies with lower price-to-book ratios and lower forecasted growth values.
Russell Investment Group is the source and owner of the trademarks, service marks, and copyrights related to the Russell Indexes. Russell® is a trademark of Russell Investment Group.
Index performance returns do not reflect any management fees, transaction costs, or expenses. Indices are unmanaged and one cannot invest directly in an index. Past performance is not a guarantee of future results.
Performance of other Fund classes will vary due to different charges and expenses.
26
Table of Contents
| Stock symbols and CUSIP numbers | ||||||||
| Nasdaq symbols | CUSIPs | |||||||
Class A | OALVX | 2461118863 | ||||||
Class C | OCLVX | 2461118848 | ||||||
Institutional Class | OILVX | 2461118830 | ||||||
| (continues | ) | 27 |
Table of Contents
Performance summaries
Optimum Small-Mid Cap Growth Fund
The performance data quoted represent past performance; past performance does not guarantee future results. Investment return and principal value will fluctuate so your shares, when redeemed, may be worth more or less than their original cost. Please obtain the performance data for the most recent month end by calling 800 914-0278 or visiting our website at optimummutualfunds.com. Current performance may be lower or higher than the performance data quoted.
| Fund and benchmark performance1,2 | ||||||||||||||
| Average annual total returns through March 31, 2015 | 1 year | 5 years | 10 years | |||||||||||
| ||||||||||||||
Class A (Est. Aug. 1, 2003) | ||||||||||||||
Excluding sales charge | +8.93% | +13.27% | +6.61% | |||||||||||
Including sales charge | +2.67% | +11.93% | +5.98% | |||||||||||
| ||||||||||||||
Class C (Est. Aug. 1, 2003) | ||||||||||||||
Excluding sales charge | +8.08% | +12.50% | �� | +5.89% | ||||||||||
Including sales charge | +7.11% | +12.50% | +5.89% | |||||||||||
| ||||||||||||||
Institutional Class (Est. Aug. 1, 2003) | ||||||||||||||
Excluding sales charge | +9.18% | +13.63% | +6.96% | |||||||||||
Including sales charge | +9.18% | +13.63% | +6.96% | |||||||||||
| ||||||||||||||
Russell 2500 Growth Index | +13.83% | +16.97% | +10.64% | |||||||||||
1Returns reflect the reinvestment of all distributions and are presented both with and without the applicable sales charges described below. Returns do not reflect the deduction of taxes the shareholder would pay on Fund distributions or redemptions of Fund shares.
Expense limitations were in effect for certain classes during some or all of the periods shown in the “Fund and benchmark performance” graph. The current expenses for each class are listed on the “Fund expense ratios” table on the next page. Performance would have been lower had expense limitations not been in effect.
Class A shares are sold with a maximum front-end sales charge of 5.75%, and have an annual distribution and service fee of 0.25% of average daily net assets. Performance for Class A shares, excluding sales charges, assumes that no front-end sales charge applied.
Class C shares are sold with a contingent deferred sales charge of 1.00% if redeemed during the first 12 months. They are also subject to an annual distribution and service fee of 1.00% of average daily net assets.
Performance for Class C shares, excluding sales charges, assumes either that contingent deferred sales charges did not apply or that the investment was not redeemed.
Institutional Class shares are available without sales or asset-based distribution charges only to certain eligible institutional accounts.
The “Fund and benchmark performance” table and the “Performance of a $10,000 investment” graph do not reflect the deduction of taxes the shareholder would pay on Fund distributions or redemptions of Fund shares.
2 The Fund’s expense ratios, as described in the most recent prospectus, are disclosed in the “Fund expense ratios” table on the next page. Delaware Management Company has agreed to reimburse certain expenses and/or waive certain fees in order to prevent total fund operating expenses (excluding any 12b-1 fees and certain other expenses) from exceeding 1.36% of the Fund’s average daily net assets from July 29, 2014, through July 29, 2015.* Please see the most recent prospectus and any applicable supplement(s) for additional information on these fee waivers and/or reimbursements.
28
Table of Contents
| Fund expense ratios | Class A | Class C | Institutional Class | |||
| Total annual operating expenses | ||||||
| (without fee waivers) | 1.90% | 2.65% | 1.65% | |||
| Net expenses | ||||||
| (including fee waivers, if any) | 1.61% | 2.36% | 1.36% | |||
| Type of waiver | Contractual | Contractual | Contractual |
* The contractual waiver period is from July 29, 2014 to July 29, 2015. Prior to July 29, 2014, the contractual waiver was 1.43%.
Investments in small and/or medium-sized companies typically exhibit greater risk and higher volatility than larger, more established companies.
Performance of a $10,000 Investment1
Average annual total returns from March 31, 2005 through March 31, 2015
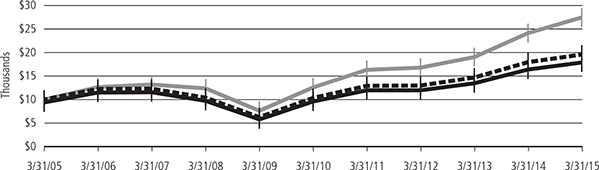
| Starting value (March 31, 2005) Ending value (March 31, 2015) | ||||||||
| $10,000 | $27,489 | ||||||
| $10,000 | $19,593 | ||||||
| $9,425 | $17,876 | ||||||
 Russell 2500 Growth Index
 Optimum Small-Mid Cap Growth Fund — Institutional Class shares
 Optimum Small-Mid Cap Growth Fund — Class A shares
1The “Performance of $10,000 investment” graph assumes $10,000 invested in Class A and Institutional Class shares of the Fund on March 31, 2005, and includes the effect of a 5.75% front-end sales charge (for Class A shares) and the reinvestment of all distributions. The graph does not reflect the deduction of taxes the shareholders would pay on Fund distributions or redemptions of Fund shares. Expense limitations were in effect for some or all of the periods shown. Performance would have been lower had expense limitations not been in effect. Current expenses are listed in the “Fund expense ratios” table above. Please note additional details on pages 28 through 30.
The graph also assumes $10,000 invested in the Russell 2500 Growth Index as of March 31, 2005. The Russell 2500 Growth Index measures the performance of the small- to mid-cap growth segment of the U.S. equity universe. It includes those Russell 2500 companies with higher price-to-book ratios and higher forecasted growth values.
Russell Investment Group is the source and owner of the trademarks, service marks, and copyrights related to the Russell Indexes. Russell® Investment Group.
The S&P 500 Index, mentioned on page 11, measures the performance of 500 mostly large-cap stocks weighted by market value, and is often used to represent performance of the U.S. stock market.
Index performance returns do not reflect any management fees, transaction costs, or expenses. Indices are unmanaged and one cannot invest directly in an index. Past performance is not a guarantee of future results.
Performance of other Fund classes will vary due to different charges and expenses.
| (continues | ) | 29 |
Table of Contents
Performance summaries
Optimum Small-Mid Cap Growth Fund
Stock symbols and CUSIP numbers | ||||||||
| Nasdaq symbols | CUSIPs | |||||||
Class A | OASGX | 246118822 | ||||||
Class C | OCSGX | 246118798 | ||||||
Institutional Class | OISGX | 246118780 | ||||||
30
Table of Contents
Optimum Small-Mid Cap Value Fund
The performance data quoted represent past performance; past performance does not guarantee future results. Investment return and principal value will fluctuate so your shares, when redeemed, may be worth more or less than their original cost. Please obtain the performance data for the most recent month end by calling 800 914-0278 or visiting our website at optimummutualfunds.com. Current performance may be lower or higher than the performance data quoted.
| Fund and benchmark performance1,2 | ||||||||||||||
| Average annual total returns through March 31, 2015 | 1 year | 5 years | 10 years | |||||||||||
| ||||||||||||||
Class A (Est. Aug. 1, 2003) | ||||||||||||||
Excluding sales charge | – 0.69% | +11.63% | +5.75% | |||||||||||
Including sales charge | – 6.42% | +10.32% | +5.12% | |||||||||||
| ||||||||||||||
Class C (Est. Aug. 1, 2003) | ||||||||||||||
Excluding sales charge | – 1.45% | +10.88% | +5.04% | |||||||||||
Including sales charge | – 2.36% | +10.88% | +5.04% | |||||||||||
| ||||||||||||||
Institutional Class (Est. Aug. 1, 2003) | ||||||||||||||
Excluding sales charge | – 0.53% | +11.97% | +6.11% | |||||||||||
Including sales charge | – 0.53% | +11.97% | +6.11% | |||||||||||
| ||||||||||||||
Russell 2500 Value Index | +6.59% | +14.06% | +8.46% | |||||||||||
1Returns reflect the reinvestment of all distributions and are presented both with and without the applicable sales charges described below. Returns do not reflect the deduction of taxes the shareholder would pay on Fund distributions or redemptions of Fund shares.
Expense limitations were in effect for certain classes during some or all of the periods shown in the “Fund and benchmark performance” graph. The current expenses for each class are listed on the “Fund expense ratios” table on the next page. Performance would have been lower had expense limitations not been in effect.
Class A shares are sold with a maximum front-end sales charge of 5.75%, and have an annual distribution and service fee of 0.25% of average daily net assets. Performance for Class A shares, excluding sales charges, assumes that no front-end sales charge applied.
Class C shares are sold with a contingent deferred sales charge of 1.00% if redeemed during the first 12 months. They are also subject to an annual distribution and service fee of 1.00% of average daily net assets.
Performance for Class C shares, excluding sales charges, assumes either that contingent deferred sales charges did not apply or that the investment was not redeemed.
Institutional Class shares are available without sales or asset-based distribution charges only to certain eligible institutional accounts.
The “Fund and benchmark performance” table and the “Performance of a $10,000 investment” graph do not reflect the deduction of taxes the shareholder would pay on Fund distributions or redemptions of Fund shares.
2 The Fund’s expense ratios, as described in the most recent prospectus, are disclosed in the “Fund expense ratios” table on the next page. Delaware Management Company has agreed to reimburse certain expenses and/or waive certain fees in order to prevent total fund operating expenses (excluding any 12b-1 fees and certain other expenses) from exceeding 1.35% of the Fund’s average daily net assets from July 29, 2014, through July 29, 2015.* Please see the most recent prospectus and any applicable supplement(s) for additional information on these fee waivers and/or reimbursements.
| (continues | ) | 31 |
Table of Contents
Performance summaries
Optimum Small-Mid Cap Value Fund
| Fund expense ratios | Class A | Class C | Institutional Class | |||
| Total annual operating expenses | ||||||
| (without fee waivers) | 1.81% | 2.56% | 1.56% | |||
| Net expenses | ||||||
| (including fee waivers, if any) | 1.60% | 2.35% | 1.35% | |||
| Type of waiver | Contractual | Contractual | Contractual |
* The contractual waiver period is from July 29, 2014 to July 29, 2015. Prior to July 29, 2014, the contractual waiver was 1.40%.
Investing involves risk, including the possible loss of principal.
Investments in small and/or medium-sized companies typically exhibit greater risk and higher volatility than larger, more established companies.
Performance of a $10,000 Investment1
Average annual total returns from March 31, 2005 through March 31, 2015
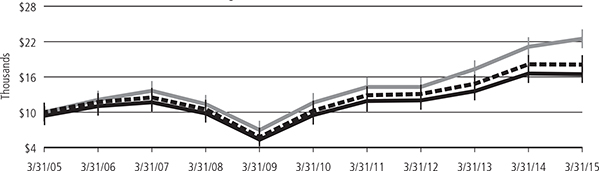
| Starting value (March 31, 2005) Ending value (March 31, 2015) | ||||||||
| $10,000 | $22,533 | ||||||
| $10,000 | $18,092 | ||||||
| $9,425 | $16,478 | ||||||
 Russell 2500 Value Index
 Optimum Small-Mid Cap Value Fund — Institutional Class shares
 Optimum Small-Mid Cap Value Fund — Class A shares
1The “Performance of $10,000 investment” graph assumes $10,000 invested in Class A and Institutional Class shares of the Fund on March 31, 2005, and includes the effect of a 5.75% front-end sales charge (for Class A shares) and the reinvestment of all distributions. The graph does not reflect the deduction of taxes the shareholders would pay on Fund distributions or redemptions of Fund shares. Expense limitations were in effect for some or all of the periods shown. Performance would have been lower had expense limitations not been in effect. Current expenses are listed in the “Fund expense ratios” table above. Please note additional details on pages 31 through 33.
The chart also assumes $10,000 invested in the Russell 2500 Value Index as of March 31, 2005. The Russell 2500 Value Index measures the performance of the small- to mid-cap value segment of the U.S. equity universe. It includes those Russell 2500 companies with lower price-to-book ratios and lower forecasted growth values.
The S&P 500 Index, mentioned on page 14, measures the performance of 500 mostly large-cap stocks weighted by market value, and is often used to represent performance of the U.S. stock market.
Russell Investment Group is the source and owner of the trademarks, service marks, and copyrights related to the Russell Index. Russell® is a trademark of Russell Investment Group.
Index performance returns do not reflect any management fees, transaction costs, or expenses. Indices are unmanaged and one cannot invest directly in an index. Past performance is not a guarantee of future results.
Performance of other Fund classes will vary due to different charges and expenses.
32
Table of Contents
| Stock symbols and CUSIP numbers | ||||||
| Nasdaq symbols | CUSIPs | |||||
Class A | OASVX | 246118772 | ||||
Class C | OCSVX | 246118756 | ||||
Institutional Class | OISVX | 246118749 |
| (continues | ) | 33 |
Table of Contents
For the six-month period from October 1, 2014 to March 31, 2015 (Unaudited)
As a shareholder of a Fund, you incur two types of costs: (1) transaction costs, including sales charges (loads) on purchase payments, reinvested dividends, or other distributions; redemption fees; and exchange fees; and (2) ongoing costs, including management fees; distribution and/or service (12b-1) fees; and other Fund expenses. These following examples are intended to help you understand your ongoing costs (in dollars) of investing in a Fund and to compare these costs with the ongoing costs of investing in other mutual funds.
The examples are based on an investment of $1,000 invested at the beginning of the period and held for the entire six-month period from Oct. 1, 2014 to March 31, 2015.
Actual Expenses
The first section of the tables shown, “Actual Fund Return,” provides information about actual account values and actual expenses. You may use the information in this section of the table, together with the amount you invested, to estimate the expenses that you paid over the period. Simply divide your account value by $1,000 (for example, an $8,600 account value divided by $1,000 = 8.6), then multiply the result by the number in the first section under the heading entitled “Expenses Paid During Period” to estimate the expenses you paid on your account during this period.
Hypothetical Example for Comparison Purposes
The second section of the tables shown, “Hypothetical 5% Return,” provides information about hypothetical account values and hypothetical expenses based on the Funds’ actual expense ratios and an assumed rate of return of 5% per year before expenses, which is not the Funds’ actual return. The hypothetical account values and expenses may not be used to estimate the actual ending account balance or expenses you paid for the period. You may use this information to compare the ongoing costs of investing in a Fund and other funds. To do so, compare this 5% hypothetical example with the 5% hypothetical examples that appear in the shareholder reports of the other funds.
Please note that the expenses shown in the tables are meant to highlight your ongoing costs only and do not reflect any transactional costs, such as sales charges (loads), redemption fees, or exchange fees. Therefore, the second section of each table is useful in comparing ongoing costs only, and will not help you determine the relative total costs of owning different funds. In addition, if these transactional costs were included, your costs would have been higher. Each Fund’s expenses shown in the tables reflect fee waivers in effect. The expenses shown in each table assume reinvestment of all dividends and distributions.
| Optimum Fixed Income Fund | ||||||||||||||||
| Expense analysis of an investment of $1,000 | ||||||||||||||||
| Expenses | ||||||||||||||||
| Paid | ||||||||||||||||
| Beginning | Ending | During | ||||||||||||||
| Account | Account | Annualized | Period | |||||||||||||
| Value | Value | Expense | 10/1/14 to | |||||||||||||
| 10/1/14 | 3/31/15 | Ratio | 3/31/15* | |||||||||||||
Actual Fund return† |
| |||||||||||||||
Class A | $1,000.00 | $1,025.30 | 1.17% | $5.91 | ||||||||||||
Class C | 1,000.00 | 1,021.60 | 1.92% | 9.68 | ||||||||||||
Institutional Class | 1,000.00 | 1,027.30 | 0.92% | 4.65 | ||||||||||||
Hypothetical 5% return (5% return before expenses) |
| |||||||||||||||
Class A | $1,000.00 | $1,019.10 | 1.17% | $5.89 | ||||||||||||
Class C | 1,000.00 | 1,015.36 | 1.92% | 9.65 | ||||||||||||
Institutional Class | 1,000.00 | 1,020.34 | 0.92% | 4.63 | ||||||||||||
Optimum International Fund |
| |||||||||||||||
Expense analysis of an investment of $1,000 |
| |||||||||||||||
| Expenses | ||||||||||||||||
| Paid | ||||||||||||||||
| Beginning | Ending | During | ||||||||||||||
| Account | Account | Annualized | Period | |||||||||||||
| Value | Value | Expense | 10/1/14 to | |||||||||||||
| 10/1/14 | 3/31/15 | Ratio | 3/31/15* | |||||||||||||
Actual Fund return† |
| |||||||||||||||
Class A | $1,000.00 | $975.00 | 1.49% | $ 7.34 | ||||||||||||
Class C | 1,000.00 | 971.10 | 2.24% | 11.01 | ||||||||||||
Institutional Class | 1,000.00 | 976.30 | 1.24% | 6.11 | ||||||||||||
Hypothetical 5% return (5% return before expenses) |
| |||||||||||||||
Class A | $1,000.00 | $1,017.50 | 1.49% | $ 7.49 | ||||||||||||
Class C | 1,000.00 | 1,013.76 | 2.24% | 11.25 | ||||||||||||
Institutional Class | 1,000.00 | 1,018.75 | 1.24% | 6.24 | ||||||||||||
34
Table of Contents
Optimum Large Cap Growth Fund
Expense analysis of an investment of $1,000
| Expenses | ||||||||||||||
| Paid | ||||||||||||||
| Beginning | Ending | During | ||||||||||||
| Account | Account | Annualized | Period | |||||||||||
| Value | Value | Expense | 10/1/14 to | |||||||||||
| 10/1/14 | 3/31/15 | Ratio | 3/31/15* | |||||||||||
Actual Fund return† |
| |||||||||||||
Class A | $1,000.00 | $1,099.70 | 1.36% | $ 7.12 | ||||||||||
Class C | 1,000.00 | 1,095.30 | 2.11% | 11.02 | ||||||||||
Institutional Class | 1,000.00 | 1,100.50 | 1.11% | 5.81 | ||||||||||
Hypothetical 5% return (5% return before expenses) |
| |||||||||||||
Class A | $1,000.00 | $1,018.15 | 1.36% | $ 6.84 | ||||||||||
Class C | 1,000.00 | 1,014.41 | 2.11% | 10.60 | ||||||||||
Institutional Class | 1,000.00 | 1,019.40 | 1.11% | 5.59 | ||||||||||
Optimum Large Cap Value Fund Expense analysis of an investment of $1,000 |
| |||||||||||||
| Expenses | ||||||||||||||
| Paid | ||||||||||||||
| Beginning | Ending | During | ||||||||||||
| Account | Account | Annualized | Period | |||||||||||
| Value | Value | Expense | 10/1/14 to | |||||||||||
| 10/1/14 | 3/31/15 | Ratio | 3/31/15* | |||||||||||
| Actual Fund return† | ||||||||||||||
Class A | $1,000.00 | $1,027.40 | 1.33% | $ 6.72 | ||||||||||
Class C | 1,000.00 | 1,023.20 | 2.08% | 10.49 | ||||||||||
Institutional Class | 1,000.00 | 1,028.60 | 1.08% | 5.46 | ||||||||||
Hypothetical 5% return (5% return before expenses) |
| |||||||||||||
Class A | $1,000.00 | $1,018.30 | 1.33% | $ 6.69 | ||||||||||
Class C | 1,000.00 | 1,014.56 | 2.08% | 10.45 | ||||||||||
Institutional Class | 1,000.00 | 1,019.55 | 1.08% | 5.44 | ||||||||||
Optimum Small-Mid Cap Growth Fund
Expense analysis of an investment of $1,000
| Expenses | ||||||||||||||
| Paid | ||||||||||||||
| Beginning | Ending | During | ||||||||||||
| Account | Account | Annualized | Period | |||||||||||
| Value | Value | Expense | 10/1/14 to | |||||||||||
| 10/1/14 | 3/31/15 | Ratio | 3/31/15* | |||||||||||
Actual Fund return† |
| |||||||||||||
Class A | $1,000.00 | $1,108.60 | 1.61% | $ 8.46 | ||||||||||
Class C | 1,000.00 | 1,105.00 | 2.36% | 12.39 | ||||||||||
Institutional Class | 1,000.00 | 1,110.20 | 1.36% | 7.16 | ||||||||||
Hypothetical 5% return (5% return before expenses) |
| |||||||||||||
Class A | $1,000.00 | $1,016.90 | 1.61% | $ 8.10 | ||||||||||
Class C | 1,000.00 | 1,013.16 | 2.36% | 11.85 | ||||||||||
Institutional Class | 1,000.00 | 1,018.15 | 1.36% | 6.84 | ||||||||||
Optimum Small-Mid Cap Value Fund Expense analysis of an investment of $1,000 |
| |||||||||||||
| Expenses | ||||||||||||||
| Paid | ||||||||||||||
| Beginning | Ending | During | ||||||||||||
| Account | Account | Annualized | Period | |||||||||||
| Value | Value | Expense | 10/1/14 to | |||||||||||
| 10/1/14 | 3/31/15 | Ratio | 3/31/15* | |||||||||||
| Actual Fund return† | ||||||||||||||
Class A | $1,000.00 | $1,041.30 | 1.61% | $ 8.19 | ||||||||||
Class C | 1,000.00 | 1,037.30 | 2.36% | 11.99 | ||||||||||
Institutional Class | 1,000.00 | 1,042.30 | 1.36% | 6.92 | ||||||||||
Hypothetical 5% return (5% return before expenses) |
| |||||||||||||
Class A | $1,000.00 | $1,016.90 | 1.61% | $ 8.10 | ||||||||||
Class C | 1,000.00 | 1,013.16 | 2.36% | 11.85 | ||||||||||
Institutional Class | 1,000.00 | 1,018.15 | 1.36% | 6.84 | ||||||||||
*“Expenses Paid During Period” are equal to the relevant Fund’s annualized expense ratio, multiplied by the average account value over the period, multiplied by 182/365 (to reflect the one-half year period).
†Because actual returns reflect only the most recent six-month period, the returns shown may differ significantly from fiscal year returns.
| (continues | ) | 35 |
Table of Contents
Security type / sector allocations
Optimum Fixed Income Fund
As of March 31, 2015 (Unaudited)
Sector designations may be different than the sector designations presented in other fund materials. The sector designations may represent the investment manager or sub-advisor’s internal sector classifications, which may result in the sector designations for one fund being different than another fund’s sector designations.
| . | Percentage | |||||
| Security type / sector | of net assets | |||||
Agency Collateralized Mortgage Obligations | 4.41% | |||||
Agency Mortgage-Backed Securities | 11.17% | |||||
Collateralized Debt Obligations | 0.69% | |||||
Commercial Mortgage-Backed Securities | 2.78% | |||||
Convertible Bonds | 0.77% | |||||
Corporate Bonds | 40.32% | |||||
Banking | 9.61% | |||||
Basic Industry | 1.78% | |||||
Brokerage | 0.40% | |||||
Capital Goods | 0.64% | |||||
Communications | 5.47% | |||||
Consumer Cyclical | 3.22% | |||||
Consumer Non-Cyclical | 4.10% | |||||
Energy | 3.58% | |||||
Finance Companies | 1.74% | |||||
Insurance | 1.28% | |||||
Natural Gas | 1.53% | |||||
Real Estate | 1.46% | |||||
Technology | 1.28% | |||||
Transportation | 0.89% | |||||
Utilities | 3.34% | |||||
Municipal Bonds | 2.26% | |||||
| Percentage | ||||||
| Security type / sector | of net assets | |||||
Non-Agency Asset-Backed Securities | 3.51% | |||||
Non-Agency Collateralized Mortgage Obligations | 2.56% | |||||
Regional Bonds | 0.13% | |||||
Senior Secured Loans | 7.35% | |||||
Sovereign Bonds | 3.40% | |||||
Supranational Banks | 0.31% | |||||
U.S. Treasury Obligations | 19.11% | |||||
Common Stock | 0.00% | |||||
Convertible Preferred Stock | 0.24% | |||||
Preferred Stock | 0.47% | |||||
Securities Sold Short | (0.11%) | |||||
Short-Term Investments | 4.84% | |||||
Total Value of Securities | 104.21% | |||||
Options Written | (0.01%) | |||||
Liabilities Net of Receivables and Other Assets | (4.20%) | |||||
Total Net Assets | 100.00% | |||||
36
Table of Contents
Security type / country and sector allocations
Optimum International Fund
As of March 31, 2015 (Unaudited)
Sector designations may be different than the sector designations presented in other fund materials. The sector designations may represent the investment manager or sub-advisor’s internal sector classifications, which may result in the sector designations for one fund being different than another fund’s sector designations.
| . | Percentage | |||||
| Security type / country | of net assets | |||||
Common Stock by Country | 97.75% | |||||
Australia | 4.91% | |||||
Austria | 2.49% | |||||
Belgium | 1.30% | |||||
Bermuda | 1.44% | |||||
Brazil | 1.66% | |||||
Canada | 1.94% | |||||
China/Hong Kong | 7.86% | |||||
Colombia | 0.46% | |||||
Czech Republic | 0.52% | |||||
Denmark | 0.27% | |||||
Finland | 0.91% | |||||
France | 3.67% | |||||
Germany | 2.12% | |||||
India | 3.02% | |||||
Indonesia | 0.45% | |||||
Ireland | 4.64% | |||||
Israel | 1.92% | |||||
Italy | 0.13% | |||||
Japan | 17.70% | |||||
Malaysia | 0.28% | |||||
Netherlands | 1.99% | |||||
New Zealand | 0.58% | |||||
Norway | 3.14% | |||||
Republic of Korea | 4.38% | |||||
Singapore | 2.69% | |||||
Spain | 1.45% | |||||
Sweden | 1.03% | |||||
| Percentage | ||||||
| Security type / country | of net assets | |||||
Switzerland | 5.67% | |||||
Taiwan | 3.43% | |||||
Turkey | 1.20% | |||||
United Kingdom | 11.62% | |||||
United States | 2.88% | |||||
Short-Term Investments | 1.46% | |||||
Total Value of Securities | 99.21% | |||||
Receivables and Other Assets Net of Liabilities | 0.79% | |||||
Total Net Assets | 100.00% | |||||
| Percentage | ||||||
| Common stock by sector | of net assets | |||||
Consumer Discretionary | 15.08% | |||||
Consumer Staples | 4.79% | |||||
Energy | 8.61% | |||||
Financials | 21.93% | |||||
Healthcare | 15.64% | |||||
Industrials | 11.52% | |||||
Information Technology | 7.66% | |||||
Materials | 8.41% | |||||
Telecommunication Services | 2.10% | |||||
Utilities | 2.01% | |||||
Total | 97.75% | |||||
| (continues | ) | 37 |
Table of Contents
Security type /sector allocations and top 10 equity holdings
Sector designations may be different than the sector designations presented in other fund materials. The sector designations may represent the investment manager or sub-advisor’s internal sector classifications, which may result in the sector designations for one fund being different than another fund’s sector designations.
Optimum Large Cap Growth Fund
As of March 31, 2015 (Unaudited)
| Percentage | ||||||
| Security type / sector | of net assets | |||||
Common Stock² | 95.71% | |||||
Consumer Discretionary | 20.99% | |||||
Consumer Staples | 4.01% | |||||
Energy | 3.63% | |||||
Financials | 5.32% | |||||
Healthcare | 19.88% | |||||
Industrials | 11.89% | |||||
Information Technology1 | 28.05% | |||||
Materials | 1.53% | |||||
Telecommunication Services | 0.26% | |||||
Utilities | 0.15% | |||||
Convertible Preferred Stock | 0.06% | |||||
U.S. Master Limited Partnerships | 1.22% | |||||
Short-Term Investments | 3.21% | |||||
Total Value of Securities | 100.20% | |||||
Liabilities Net of Receivables and Other Assets | (0.20%) | |||||
Total Net Assets | 100.00% | |||||
| ² | Narrow industries are utilized for compliance purposes for diversification whereas broad sectors are used for financial reporting. |
Holdings are for informational purposes only and are subject to change at any time. They are not a recommendation to buy, sell, or hold any security.
| . | Percentage | |||
| Top 10 equity holdings | of net assets | |||
Apple | 4.63% | |||
Actavis | 3.56% | |||
Facebook Class A | 3.46% | |||
Google Class C | 2.68% | |||
Amazon.com | 2.60% | |||
Visa Class A | 2.56% | |||
Gilead Sciences | 1.92% | |||
Biogen | 1.91% | |||
Priceline Group | 1.73% | |||
Danaher | 1.49% |
Optimum Large Cap Value Fund
As of March 31, 2015 (Unaudited)
| Percentage | ||||||
| Security type / sector | of net assets | |||||
Common Stock | 97.26 | % | ||||
Consumer Discretionary | 10.18 | % | ||||
Consumer Staples | 11.86 | % | ||||
Energy | 12.35 | % | ||||
Financials | 23.70 | % | ||||
Healthcare | 10.27 | % | ||||
Industrials | 12.19 | % | ||||
Information Technology | 9.60 | % | ||||
Materials | 4.49 | % | ||||
Telecommunication Services | 2.28 | % | ||||
Utilities | 0.34 | % | ||||
Convertible Preferred Stock | 0.04 | % | ||||
Short-Term Investments | 2.62 | % | ||||
Total Value of Securities | 99.92 | % | ||||
Receivables and Other Assets Net of Liabilities | 0.08 | % | ||||
Total Net Assets | 100.00 | % | ||||
Holdings are for informational purposes only and are subject to change at any time. They are not a recommendation to buy, sell, or hold any security.
| . | Percentage | |||
| Top 10 equity holdings | of net assets | |||
Lockheed Martin | 2.82% | |||
Philip Morris International | 2.77% | |||
Exxon Mobil | 2.24% | |||
JPMorgan Chase | 2.18% | |||
Apple | 2.05% | |||
Verizon Communications | 1.88% | |||
Johnson & Johnson | 1.74% | |||
Wells Fargo | 1.69% | |||
Altria Group | 1.65% | |||
TJX | 1.63% |
38
Table of Contents
Sector designations may be different than the sector designations presented in other fund materials. The sector designations may represent the investment manager or sub-advisor’s internal sector classifications, which may result in the sector designations for one fund being different than another fund’s sector designations.
Optimum Small-Mid Cap Growth Fund
As of March 31, 2015 (Unaudited)
| Percentage | ||||||
| Security type / sector | of net assets | |||||
Common Stock | 95.54 | % | ||||
Consumer Discretionary | 12.76 | % | ||||
Consumer Staples | 1.68 | % | ||||
Energy | 3.08 | % | ||||
Financials | 12.02 | % | ||||
Healthcare | 16.05 | % | ||||
Industrials | 22.87 | % | ||||
Information Technology | 21.15 | % | ||||
Materials | 4.01 | % | ||||
Telecommunication Services | 1.92 | % | ||||
Convertible Preferred Stock | 0.58 | % | ||||
Exchange-Traded Fund | 0.50 | % | ||||
Preferred Stock | 0.54 | % | ||||
Short-Term Investments | 2.45 | % | ||||
Total Value of Securities | 99.61 | % | ||||
Receivables and Other Assets Net of Liabilities | 0.39 | % | ||||
Total Net Assets | 100.00 | % | ||||
Holdings are for informational purposes only and are subject to change at any time. They are not a recommendation to buy, sell, or hold any security.
| . | Percentage | |||
| Top 10 equity holdings | of net assets | |||
AMETEK | 1.31% | |||
WNS Holdings ADR | 1.31% | |||
Donaldson | 1.30% | |||
Generac Holdings | 1.29% | |||
LKQ | 1.27% | |||
Acuity Brands | 1.25% | |||
Virtusa | 1.18% | |||
Nordson | 1.12% | |||
Synageva BioPharma | 1.06% | |||
Diamond Resorts International | 1.01% |
Optimum Small-Mid Cap Value Fund
As of March 31, 2015 (Unaudited)
| Percentage | ||||||
| Security type / sector | of net assets | |||||
Common Stock | 88.36 | % | ||||
Consumer Discretionary | 9.56 | % | ||||
Consumer Staples | 1.20 | % | ||||
Energy | 4.84 | % | ||||
Financials | 7.77 | % | ||||
Healthcare | 4.57 | % | ||||
Industrials | 24.93 | % | ||||
Information Technology | 19.68 | % | ||||
Materials | 13.49 | % | ||||
Telecommunication Services | 1.67 | % | ||||
Utilities | 0.65 | % | ||||
U.S. Master Limited Partnership | 0.31 | % | ||||
Short-Term Investments | 11.54 | % | ||||
Total Value of Securities | 100.21 | % | ||||
Liabilities Net of Receivables and Other Assets | (0.21 | %) | ||||
Total Net Assets | 100.00 | % | ||||
Holdings are for informational purposes only and are subject to change at any time. They are not a recommendation to buy, sell, or hold any security.
| . | Percentage | |||
| Top 10 equity holdings | of net assets | |||
Flextronics International | 1.36% | |||
KMG Chemicals | 1.13% | |||
Fairchild Semiconductor International | 1.13% | |||
FreightCar America | 1.00% | |||
Avery Dennison | 0.98% | |||
Dover | 0.97% | |||
Stanley Black & Decker | 0.95% | |||
AMC Networks Class A | 0.95% | |||
TrueBlue | 0.95% | |||
Cardtronics | 0.93% |
| (continues | ) | 39 |
Table of Contents
Security type/sector allocations and top 10 equity holdings
1To monitor compliance with the Optimum Large Cap Growth Fund’s concentration guidelines as described in the Fund’s Prospectus and Statement of Additional Information, the Information Technology sector (as disclosed herein for financial reporting purposes) is subdivided into a variety of “industries” (in accordance with the requirements of the 1940 Act). The “Information Technology sector” consisted of diversified financial services, commercial services, computers, internet and communications, semiconductors and software. As of March 31, 2015, such amounts, as percentage of total net assets, were 2.56%, 1.77%, 5.34%, 12.01%, 1.89% and 4.48%, respectively. The percentage in any such single industry will comply with the Fund’s concentration policy even if the percentages in the “Information Technology sector” for financial reporting purposes may exceed 25%.
40
Table of Contents
Optimum Fixed Income Fund
March 31, 2015
Principal amount° | Value (U.S. $) | |||||||
| ||||||||
Agency Collateralized Mortgage Obligations – 4.41% |
| |||||||
| ||||||||
Fannie Mae Grantor Trust | ||||||||
Series 1999-T2 A1 7.50% 1/19/39 • | 13,448 | $ | 14,879 | |||||
Series 2002-T4 A3 7.50% 12/25/41 | 47,151 | 53,612 | ||||||
Series 2004-T1 1A2 6.50% 1/25/44 | 13,954 | 16,122 | ||||||
Fannie Mae REMIC Trust | ||||||||
Series 2004-W4 A5 5.50% 6/25/34 | 2,025,340 | 2,142,538 | ||||||
Series 2004-W11 1A2 6.50% 5/25/44 | 68,418 | 81,379 | ||||||
Fannie Mae REMICs | ||||||||
Series 1996-46 ZA 7.50% 11/25/26 | 9,948 | 11,360 | ||||||
Series 1999-19 PH 6.00% 5/25/29 | 185,857 | 211,885 | ||||||
Series 2001-14 Z 6.00% 5/25/31 | 11,233 | 12,874 | ||||||
Series 2002-90 A1 6.50% 6/25/42 | 11,968 | 13,717 | ||||||
Series 2002-90 A2 6.50% 11/25/42 | 40,554 | 46,078 | ||||||
Series 2003-26 AT 5.00% 11/25/32 | 138,891 | 143,340 | ||||||
Series 2005-22 HE 5.00% 10/25/33 | 82,305 | 83,128 | ||||||
Series 2005-29 QD 5.00% 8/25/33 | 23,969 | 23,975 | ||||||
Series 2005-110 MB 5.50% 9/25/35 | 137,941 | 148,828 | ||||||
Series 2007-30 OE 2.579% 4/25/37 @W^ | 4,575,266 | 4,313,110 | ||||||
Series 2007-114 A6 0.374% 10/27/37 • | 7,557,417 | 7,461,045 | ||||||
Series 2008-24 ZA 5.00% 4/25/38 | 21,270,541 | 23,423,715 | ||||||
Series 2009-2 AS 5.526% 2/25/39 @•S | 2,479,113 | 297,424 | ||||||
Series 2009-68 SA 6.576% 9/25/39 @•S | 542,522 | 88,007 | ||||||
Series 2009-94 AC 5.00% 11/25/39 | 326,851 | 364,854 | ||||||
Series 2010-41 PN 4.50% 4/25/40 | 475,000 | 520,253 | ||||||
Series 2010-96 DC 4.00% 9/25/25 | 880,210 | 930,915 | ||||||
Series 2010-123 FE 0.654% 11/25/40 • | 3,864,014 | 3,898,411 | ||||||
Series 2012-122 SD 5.926% 11/25/42 •S | 841,204 | 204,418 | ||||||
Principal amount° | Value (U.S. $) | |||||||
| ||||||||
Agency Collateralized Mortgage Obligations (continued) |
| |||||||
| ||||||||
Fannie Mae REMICs | ||||||||
Series 2013-38 AI 3.00% 4/25/33 S | 2,249,788 | $ | 328,688 | |||||
Series 2013-44 DI 3.00% 5/25/33 S | 3,422,050 | 506,044 | ||||||
Series 2014-36 ZE 3.00% 6/25/44 | 622,347 | 575,653 | ||||||
Fannie Mae Trust | ||||||||
Series 2004-W15 1A1 6.00% 8/25/44 | 79,567 | 88,802 | ||||||
Freddie Mac REMICs | ||||||||
Series 1730 Z 7.00% 5/15/24 | 52,244 | 59,609 | ||||||
Series 2165 PE 6.00% 6/15/29 | 146,197 | 167,089 | ||||||
Series 2326 ZQ 6.50% 6/15/31 | 89,400 | 103,098 | ||||||
Series 2557 WE 5.00% 1/15/18 | 206,800 | 215,606 | ||||||
Series 2802 NE 5.00% 2/15/33 | 59,843 | 60,076 | ||||||
Series 2827 TE 5.00% 4/15/33 | 229,829 | 233,384 | ||||||
Series 2869 BG 5.00% 7/15/33 | 56,276 | 56,507 | ||||||
Series 2915 KD 5.00% 9/15/33 | 33,937 | 34,268 | ||||||
Series 2938 ND 5.00% 10/15/33 | 5,598 | 5,599 | ||||||
Series 2987 KG 5.00% 12/15/34 | 157,713 | 159,976 | ||||||
Series 3143 BC 5.50% 2/15/36 | 3,904,114 | 4,367,119 | ||||||
Series 3289 SA 6.576% 3/15/37 @•S | 1,777,340 | 297,353 | ||||||
Series 3626 MA 5.00% 2/15/30 | 34,390 | 34,396 | ||||||
Series 3656 PM 5.00% 4/15/40 | 682,093 | 756,493 | ||||||
Series 4065 DE 3.00% 6/15/32 | 120,000 | 123,316 | ||||||
Series 4185 LI 3.00% 3/15/33 S | 844,215 | 129,856 | ||||||
Series 4191 CI 3.00% 4/15/33 S | 348,039 | 47,360 | ||||||
Freddie Mac Structured | ||||||||
Agency Credit Risk Debt Notes Series 2014-DN2 M1 1.024% 4/25/24 • | 245,381 | 245,134 | ||||||
| (continues | ) | 41 |
Table of Contents
Schedules of investments
Optimum Fixed Income Fund
| Principal amount° | Value (U.S. $) | |||||||
| ||||||||
Agency Collateralized Mortgage Obligations (continued) |
| |||||||
| ||||||||
Freddie Mac Structured | ||||||||
Agency Credit Risk Debt Notes | ||||||||
Series 2014-DN2 M2 1.824% 4/25/24 • | 524,600 | $ | 521,396 | |||||
Series 2015-DN1 M1 1.424% 1/25/25 • | 558,104 | 559,241 | ||||||
Freddie Mac Structured Pass Through Securities | ||||||||
Series T-54 2A 6.50% 2/25/43 ¿ | 19,463 | 23,250 | ||||||
Series T-58 2A 6.50% 9/25/43 ¿ | 10,099 | 11,702 | ||||||
GNMA | ||||||||
Series 2007-64 AI 6.374% 10/20/37 @•S | 6,300,907 | 1,091,793 | ||||||
Series 2008-65 SB 5.824% 8/20/38 @•S | 1,662,085 | 228,707 | ||||||
Series 2009-2 SE 5.644% 1/20/39 @•S | 4,699,290 | 645,777 | ||||||
Series 2010-113 KE 4.50% 9/20/40 | 1,170,000 | 1,308,902 | ||||||
Series 2011-H21 FT 0.87% 10/20/61 • | 14,090,254 | 14,157,521 | ||||||
Series 2011-H23 FA 0.871% 10/20/61 • | 9,350,496 | 9,409,217 | ||||||
Series 2012-H08 FB 0.771% 3/20/62 • | 1,343,144 | 1,350,910 | ||||||
Series 2012-H18 NA 0.691% 8/20/62 • | 809,471 | 812,684 | ||||||
Series 2012-H29 SA 0.686% 10/20/62 • | 6,581,659 | 6,588,004 | ||||||
|
| |||||||
Total Agency Collateralized Mortgage Obligations | 89,810,397 | |||||||
|
| |||||||
| ||||||||
Agency Mortgage-Backed Securities – 11.17% |
| |||||||
| ||||||||
Fannie Mae | ||||||||
5.50% 3/1/37 | 32,707 | 35,785 | ||||||
5.50% 7/1/37 | 236,274 | 258,413 | ||||||
6.50% 8/1/17 | 8,315 | 8,592 | ||||||
Fannie Mae ARM | ||||||||
1.861% 7/1/37 • | 74,842 | 78,901 | ||||||
2.277% 10/1/33 • | 21,175 | 22,089 | ||||||
2.315% 11/1/35 • | 58,470 | 62,603 | ||||||
2.42% 5/1/43 • | 474,103 | 484,788 | ||||||
2.546% 6/1/43 • | 168,370 | 172,829 | ||||||
3.196% 4/1/44 • | 699,621 | 729,952 | ||||||
3.266% 3/1/44 • | 668,800 | 700,078 | ||||||
3.31% 9/1/43 • | 496,078 | 520,315 | ||||||
| Principal amount° | Value (U.S. $) | |||||||
| ||||||||
Agency Mortgage-Backed Securities (continued) |
| |||||||
| ||||||||
Fannie Mae ARM | ||||||||
5.141% 8/1/35 • | 18,025 | $ | 19,221 | |||||
5.646% 8/1/37 • | 70,836 | 74,432 | ||||||
Fannie Mae Relocation 30 yr | ||||||||
5.00% 11/1/33 | 1,615 | 1,778 | ||||||
5.00% 1/1/34 | 3,398 | 3,741 | ||||||
5.00% 11/1/34 | 10,254 | 11,289 | ||||||
5.00% 4/1/35 | 12,461 | 13,714 | ||||||
5.00% 10/1/35 | 11,162 | 12,293 | ||||||
5.00% 1/1/36 | 30,452 | 33,512 | ||||||
Fannie Mae S.F. 15 yr | ||||||||
2.50% 2/1/28 | 1,189,695 | 1,225,066 | ||||||
2.50% 5/1/28 | 170,548 | 175,556 | ||||||
3.00% 5/1/28 | 112,901 | 118,489 | ||||||
3.50% 7/1/26 | 350,524 | 373,924 | ||||||
3.50% 12/1/28 | 140,403 | 150,459 | ||||||
4.00% 5/1/24 | 42,567 | 45,095 | ||||||
4.00% 7/1/24 | 11,822 | 12,528 | ||||||
4.00% 5/1/25 | 238,234 | 253,314 | ||||||
4.00% 6/1/25 | 805,692 | 856,589 | ||||||
4.00% 9/1/25 | 28,479 | 30,174 | ||||||
4.00% 11/1/25 | 1,151,167 | 1,241,914 | ||||||
4.00% 1/1/26 | 33,738 | 36,310 | ||||||
4.00% 12/1/26 | 394,905 | 418,474 | ||||||
4.00% 1/1/27 | 29,129 | 31,048 | ||||||
4.00% 5/1/27 | 848,612 | 904,524 | ||||||
4.00% 8/1/27 | 507,951 | 539,847 | ||||||
4.50% 8/1/18 | 72,449 | 75,968 | ||||||
4.50% 7/1/20 | 229,212 | 240,873 | ||||||
5.00% 12/1/20 | 47,346 | 51,221 | ||||||
5.00% 5/1/21 | 29,359 | 31,222 | ||||||
5.00% 6/1/23 | 84,061 | 91,237 | ||||||
Fannie Mae S.F. 15 yr TBA | ||||||||
2.50% 5/1/30 | 5,081,000 | 5,207,826 | ||||||
Fannie Mae S.F. 20 yr | ||||||||
3.00% 2/1/33 | 60,706 | 62,931 | ||||||
3.00% 8/1/33 | 217,317 | 225,278 | ||||||
3.50% 4/1/33 | 62,568 | 66,178 | ||||||
3.50% 9/1/33 | 313,553 | 334,937 | ||||||
4.00% 1/1/31 | 113,917 | 122,692 | ||||||
4.00% 2/1/31 | 316,028 | 340,341 | ||||||
5.00% 11/1/23 | 25,227 | 28,019 | ||||||
5.50% 11/1/25 | 38,852 | 43,719 | ||||||
5.50% 8/1/28 | 403,455 | 453,997 | ||||||
5.50% 12/1/29 | 33,494 | 37,690 | ||||||
6.00% 9/1/29 | 255,299 | 290,756 | ||||||
Fannie Mae S.F. 30 yr | ||||||||
3.00% 7/1/42 | 418,034 | 428,419 | ||||||
3.00% 10/1/42 | 6,696,707 | 6,863,985 | ||||||
42
Table of Contents
| Principal amount° | Value (U.S. $) | |||||||
| ||||||||
Agency Mortgage-Backed Securities (continued) |
| |||||||
| ||||||||
Fannie Mae S.F. 30 yr | ||||||||
3.00% 12/1/42 | 1,070,055 | $ | 1,096,774 | |||||
3.00% 1/1/43 | 2,464,461 | 2,525,438 | ||||||
3.00% 2/1/43 | 259,839 | 266,305 | ||||||
3.00% 4/1/43 | 42,495,793 | 43,536,996 | ||||||
3.00% 5/1/43 | 379,041 | 388,110 | ||||||
4.00% 10/1/40 | 44,290 | 47,470 | ||||||
4.00% 11/1/40 | 257,868 | 276,428 | ||||||
4.00% 7/1/41 | 856,016 | 923,125 | ||||||
4.00% 8/1/43 | 191,133 | 206,130 | ||||||
4.00% 7/1/44 | 776,789 | 840,469 | ||||||
4.50% 5/1/35 | 168,933 | 185,791 | ||||||
4.50% 8/1/35 | 343,300 | 376,034 | ||||||
4.50% 9/1/35 | 308,645 | 337,984 | ||||||
4.50% 7/1/36 | 131,341 | 143,785 | ||||||
4.50% 5/1/39 | 1,155,213 | 1,264,944 | ||||||
4.50% 11/1/40 | 361,058 | 395,419 | ||||||
4.50% 3/1/41 | 709,820 | 777,983 | ||||||
4.50% 4/1/41 | 1,131,789 | 1,240,746 | ||||||
4.50% 10/1/41 | 404,098 | 442,966 | ||||||
4.50% 1/1/42 | 11,336,856 | 12,407,097 | ||||||
4.50% 12/1/43 | 60,106 | 65,522 | ||||||
4.50% 5/1/44 | 288,622 | 315,362 | ||||||
5.00% 3/1/34 | 4,817 | 5,380 | ||||||
5.00% 4/1/34 | 27,753 | 31,012 | ||||||
5.00% 8/1/34 | 46,907 | 52,422 | ||||||
5.00% 4/1/35 | 8,672 | 9,706 | ||||||
5.00% 7/1/35 | 169,072 | 188,104 | ||||||
5.00% 10/1/35 | 418,489 | 465,615 | ||||||
5.00% 11/1/35 | 125,938 | 140,147 | ||||||
5.00% 2/1/36 | 176,951 | 196,886 | ||||||
5.00% 2/1/37 | 370,278 | 413,700 | ||||||
5.00% 4/1/37 | 107,189 | 119,319 | ||||||
5.00% 8/1/37 | 313,588 | 349,226 | ||||||
5.00% 12/1/37 | 5,683 | 6,312 | ||||||
5.00% 2/1/38 | 111,613 | 124,166 | ||||||
5.00% 3/1/38 | 270,492 | 300,424 | ||||||
5.00% 6/1/38 | 17,045 | 18,931 | ||||||
5.00% 2/1/39 | 6,656 | 7,392 | ||||||
5.00% 5/1/40 | 142,923 | 159,973 | ||||||
5.50% 12/1/32 | 23,655 | 26,801 | ||||||
5.50% 2/1/33 | 75,368 | 85,389 | ||||||
5.50% 12/1/33 | 41,326 | 47,322 | ||||||
5.50% 11/1/34 | 121,419 | 137,518 | ||||||
5.50% 2/1/35 | 1,712,893 | 1,947,667 | ||||||
5.50% 3/1/35 | 56,610 | 63,702 | ||||||
5.50% 6/1/35 | 89,670 | 100,947 | ||||||
5.50% 1/1/36 | 197,889 | 225,257 | ||||||
5.50% 4/1/36 | 1,739,813 | 1,958,253 | ||||||
| Principal amount° | Value (U.S. $) | |||||||
| ||||||||
Agency Mortgage-Backed Securities (continued) |
| |||||||
| ||||||||
Fannie Mae S.F. 30 yr | ||||||||
5.50% 7/1/36 | 35,538 | $ | 40,189 | |||||
5.50% 1/1/37 | 518,399 | 583,847 | ||||||
5.50% 2/1/37 | 628,470 | 707,457 | ||||||
5.50% 8/1/37 | 29,580 | 33,452 | ||||||
5.50% 1/1/38 | 524,526 | 590,234 | ||||||
5.50% 2/1/38 | 216,064 | 244,201 | ||||||
5.50% 3/1/38 | 257,710 | 292,777 | ||||||
5.50% 4/1/38 | 1,287,519 | 1,448,808 | ||||||
5.50% 6/1/38 | 22,312 | 25,107 | ||||||
5.50% 11/1/38 | 1,864,135 | 2,097,658 | ||||||
5.50% 2/1/39 | 8,784,631 | 9,927,106 | ||||||
5.50% 10/1/39 | 1,056,036 | 1,188,327 | ||||||
5.50% 7/1/40 | 319,045 | 359,151 | ||||||
5.50% 9/1/41 | 133,563 | 150,356 | ||||||
6.00% 4/1/35 | 362,014 | 415,844 | ||||||
6.00% 5/1/36 | 87,949 | 100,519 | ||||||
6.00% 6/1/36 | 41,806 | 47,802 | ||||||
6.00% 9/1/36 | 43,149 | 49,575 | ||||||
6.00% 12/1/36 | 49,797 | 57,242 | ||||||
6.00% 2/1/37 | 133,354 | 152,319 | ||||||
6.00% 5/1/37 | 388,224 | 442,991 | ||||||
6.00% 6/1/37 | 25,557 | 29,455 | ||||||
6.00% 7/1/37 | 316,048 | 360,716 | ||||||
6.00% 8/1/37 | 268,504 | 306,994 | ||||||
6.00% 9/1/37 | 1,008,818 | 1,149,174 | ||||||
6.00% 11/1/37 | 60,999 | 70,173 | ||||||
6.00% 5/1/38 | 1,252,995 | 1,429,702 | ||||||
6.00% 7/1/38 | 17,213 | 19,637 | ||||||
6.00% 8/1/38 | 245,671 | 279,791 | ||||||
6.00% 9/1/38 | 1,079,428 | 1,235,236 | ||||||
6.00% 10/1/38 | 506,750 | 578,977 | ||||||
6.00% 11/1/38 | 112,160 | 128,310 | ||||||
6.00% 12/1/38 | 347,423 | 398,911 | ||||||
6.00% 1/1/39 | 213,585 | 244,190 | ||||||
6.00% 2/1/39 | 363,877 | 416,071 | ||||||
6.00% 9/1/39 | 653,064 | 745,066 | ||||||
6.00% 10/1/39 | 120,058 | 137,121 | ||||||
6.00% 3/1/40 | 186,562 | 212,897 | ||||||
6.00% 7/1/40 | 792,892 | 904,606 | ||||||
6.00% 9/1/40 | 165,191 | 188,567 | ||||||
6.00% 11/1/40 | 72,606 | 83,673 | ||||||
6.00% 5/1/41 | 1,125,894 | 1,285,917 | ||||||
6.50% 11/1/33 | 5,993 | 6,881 | ||||||
6.50% 2/1/36 | 121,944 | 147,108 | ||||||
6.50% 3/1/36 | 114,855 | 131,864 | ||||||
6.50% 6/1/36 | 266,575 | 326,068 | ||||||
6.50% 2/1/38 | 50,120 | 57,543 | ||||||
6.50% 11/1/38 | 15,020 | 17,244 | ||||||
| (continues | ) | 43 |
Table of Contents
Schedules of investments
Optimum Fixed Income Fund
Principal amount° | Value (U.S. $) | |||||||
| ||||||||
Agency Mortgage-Backed Securities (continued) |
| |||||||
| ||||||||
Fannie Mae S.F. 30 yr | ||||||||
6.50% 3/1/40 | 2,443,682 | $ | 2,845,736 | |||||
7.50% 3/1/32 | 681 | 800 | ||||||
7.50% 4/1/32 | 1,935 | 2,294 | ||||||
7.50% 6/1/32 | 1,553 | 1,704 | ||||||
Fannie Mae S.F. 30 yr TBA |
| |||||||
3.00% 5/1/45 | 40,588,000 | 41,395,795 | ||||||
3.50% 5/1/45 | 15,476,000 | 16,215,341 | ||||||
4.50% 5/1/45 | 23,046,000 | 25,078,738 | ||||||
Freddie Mac ARM | ||||||||
2.249% 7/1/36 • | 51,615 | 55,037 | ||||||
2.307% 4/1/34 • | 2,579 | 2,741 | ||||||
2.342% 12/1/33 • | 58,781 | 62,875 | ||||||
2.532% 1/1/44 • | 1,348,460 | 1,390,993 | ||||||
2.68% 5/1/37 • | 405,671 | 439,495 | ||||||
5.387% 2/1/38 • | 166,745 | 179,059 | ||||||
Freddie Mac Relocation 30 yr |
| |||||||
5.00% 9/1/33 | 300 | 330 | ||||||
Freddie Mac S.F. 15 yr |
| |||||||
2.50% 3/1/28 | 256,115 | 263,362 | ||||||
3.50% 10/1/26 | 119,682 | 128,241 | ||||||
4.00% 4/1/25 | 54,806 | 58,376 | ||||||
4.00% 5/1/25 | 74,182 | 78,999 | ||||||
4.00% 8/1/25 | 244,778 | 260,749 | ||||||
4.00% 11/1/26 | 318,675 | 339,073 | ||||||
4.50% 5/1/20 | 148,714 | 156,993 | ||||||
4.50% 7/1/25 | 75,873 | 81,809 | ||||||
4.50% 6/1/26 | 177,764 | 191,741 | ||||||
4.50% 9/1/26 | 341,720 | 369,019 | ||||||
5.00% 6/1/18 | 38,088 | 40,021 | ||||||
Freddie Mac S.F. 20 yr |
| |||||||
3.50% 1/1/34 | 566,295 | 597,352 | ||||||
4.00% 11/1/32 | 158,149 | 170,616 | ||||||
5.50% 10/1/23 | 83,975 | 94,071 | ||||||
5.50% 8/1/24 | 23,021 | 25,908 | ||||||
Freddie Mac S.F. 30 yr |
| |||||||
3.00% 10/1/42 | 484,957 | 495,998 | ||||||
3.00% 11/1/42 | 404,950 | 415,285 | ||||||
4.50% 10/1/39 | 194,666 | 212,396 | ||||||
5.50% 3/1/34 | 50,827 | 57,358 | ||||||
5.50% 12/1/34 | 47,979 | 54,244 | ||||||
5.50% 6/1/36 | 29,994 | 33,747 | ||||||
5.50% 11/1/36 | 68,136 | 76,279 | ||||||
5.50% 12/1/36 | 14,945 | 16,779 | ||||||
5.50% 4/1/38 | 287,971 | 323,209 | ||||||
5.50% 6/1/38 | 40,517 | 45,483 | ||||||
5.50% 6/1/39 | 314,787 | 353,106 | ||||||
5.50% 3/1/40 | 166,067 | 186,414 | ||||||
5.50% 8/1/40 | 666,269 | 747,356 | ||||||
Principal amount° | Value (U.S. $) | |||||||
| ||||||||
Agency Mortgage-Backed Securities (continued) |
| |||||||
| ||||||||
Freddie Mac S.F. 30 yr |
| |||||||
5.50% 1/1/41 | 187,460 | $ | 210,037 | |||||
5.50% 6/1/41 | 788,094 | 883,760 | ||||||
6.00% 2/1/36 | 385,954 | 443,534 | ||||||
6.00% 3/1/36 | 172,279 | 197,412 | ||||||
6.00% 1/1/38 | 66,681 | 75,684 | ||||||
6.00% 6/1/38 | 188,159 | 214,034 | ||||||
6.00% 8/1/38 | 287,925 | 328,687 | ||||||
6.00% 5/1/40 | 78,133 | 88,857 | ||||||
6.00% 7/1/40 | 528,197 | 603,528 | ||||||
6.50% 11/1/33 | 29,022 | 33,247 | ||||||
6.50% 1/1/35 | 146,395 | 175,908 | ||||||
6.50% 8/1/38 | 50,492 | 57,842 | ||||||
6.50% 4/1/39 | 288,312 | 330,285 | ||||||
7.00% 1/1/38 | 46,784 | 53,069 | ||||||
GNMA I S.F. 30 yr | ||||||||
5.00% 6/15/40 | 96,090 | 107,167 | ||||||
7.00% 12/15/34 | 238,888 | 289,181 | ||||||
GNMA II S.F. 30 yr | ||||||||
6.00% 4/20/34 | 8,548 | 9,615 | ||||||
|
| |||||||
Total Agency Mortgage-Backed Securities | 227,390,997 | |||||||
|
| |||||||
| ||||||||
Collateralized Debt Obligations – 0.69% |
| |||||||
| ||||||||
ACAS CLO | ||||||||
Series 2007-1A 0.467% | 605,877 | 601,454 | ||||||
ALM VII | ||||||||
Series 2012-7A A1 144A 1.677% | 250,000 | 249,405 | ||||||
Cavalry CLO V | ||||||||
Series 2014-5A A 144A 1.528% | 400,000 | 397,480 | ||||||
Cordatus CLO I | ||||||||
Series 2006-1X A1 0.37% 1/30/24 • | EUR 6,787,718 | 7,235,612 | ||||||
Elm CLO | ||||||||
Series 2014-1A A 144A 1.676% | 600,000 | 599,700 | ||||||
Euro-Galaxy CLO | ||||||||
Series 2006-1X A2 0.295% 10/23/21 • | EUR 1,029,669 | 1,100,603 | ||||||
Franklin CLO V | ||||||||
Series 5A A2 144A 0.531% | 1,125,370 | 1,120,868 | ||||||
Lockwood Grove CLO | ||||||||
Series 2014-1A A1 144A 1.622% | 400,000 | 398,520 | ||||||
44
Table of Contents
| Principal amount° | Value (U.S. $) | |||||||
| ||||||||
Collateralized Debt Obligations (continued) |
| |||||||
| ||||||||
Queen Street CLO II | ||||||||
Series 2007-1X A1 0.328% 8/15/24 • | EUR | 534,391 | $ | 572,124 | ||||
Stoney Lane Funding I | ||||||||
Series 2007-1A A1 144A 0.497% 4/18/22 #• | 843,647 | 835,042 | ||||||
Symphony CLO VII | ||||||||
Series 2011-7A A 144A 1.506% 7/28/21 #• | 835,279 | 834,610 | ||||||
Voya CLO | ||||||||
Series 2012-2AR AR 144A 1.57% 10/15/22 #• | 200,000 | 199,900 | ||||||
|
| |||||||
Total Collateralized Debt Obligations | 14,145,318 | |||||||
|
| |||||||
| ||||||||
Commercial Mortgage-Backed Securities – 2.78% |
| |||||||
| ||||||||
BAMLL Commercial Mortgage Securities Trust | ||||||||
Series 2015-ASHF A 144A 1.394% 1/15/28 #• | 900,000 | 900,000 | ||||||
Banc of America Commercial Mortgage Trust | ||||||||
Series 2006-1 AM 5.421% 9/10/45 • | 210,000 | 215,757 | ||||||
Series 2007-4 AM 5.821% 2/10/51 • | 505,000 | 548,691 | ||||||
Bank of America Re-REMIC |
| |||||||
Series 2009-UBER2 144A 5.678% 2/24/51 #• | 2,102,986 | 2,197,515 | ||||||
CD Commercial Mortgage Trust | ||||||||
Series 2005-CD1 AM 5.225% 7/15/44 • | 665,000 | 675,250 | ||||||
Series 2005-CD1 C 5.225% 7/15/44 • | 250,000 | 253,577 | ||||||
Citigroup Commercial Mortgage Trust | ||||||||
Series 2014-GC25 A4 3.635% 10/10/47 | 1,100,000 | 1,173,359 | ||||||
COMM Mortgage Trust | ||||||||
Series 2014-CR19 A5 3.796% 8/10/47 | 470,000 | 507,867 | ||||||
Series 2014-CR20 A4 3.59% 11/10/47 | 910,000 | 968,083 | ||||||
Series 2014-CR20 AM 3.938% 11/10/47 | 575,000 | 614,103 | ||||||
Commercial Mortgage Trust | ||||||||
Series 2005-GG5 A5 5.224% 4/10/37 • | 983,693 | 990,952 | ||||||
| Principal amount° | Value (U.S. $) | |||||||
| ||||||||
Commercial Mortgage-Backed Securities (continued) |
| |||||||
| ||||||||
Commercial Mortgage Trust |
| |||||||
Series 2006-GG7 A4 5.816% 7/10/38 • | 1,092,788 | $ | 1,132,610 | |||||
CSMC | ||||||||
Series 2010-UD1 A 144A 5.771% 12/16/49 #• | 1,753,052 | 1,851,731 | ||||||
DBUBS Mortgage Trust | ||||||||
Series 2011-LC1A A3 144A 5.002% 11/10/46 # | 2,050,000 | 2,340,610 | ||||||
Series 2011-LC1A C 144A 5.558% 11/10/46 #• | 815,000 | 924,849 | ||||||
FREMF Mortgage Trust | ||||||||
Series 2011-K10 B 144A 4.618% 11/25/49 #• | 485,000 | 532,100 | ||||||
Series 2011-K15 B 144A 4.932% 8/25/44 #• | 75,000 | 83,406 | ||||||
Series 2011-K702 B 144A 4.771% 4/25/44 #• | 210,000 | 225,586 | ||||||
Series 2011-K703 B 144A 4.884% 7/25/44 #• | 660,000 | 712,786 | ||||||
Series 2012-K19 B 144A 4.037% 5/25/45 #• | 145,000 | 154,919 | ||||||
Series 2012-K22 B 144A 3.687% 8/25/45 #• | 665,000 | 690,782 | ||||||
Series 2012-K708 B 144A 3.761% 2/25/45 #• | 1,705,000 | 1,779,783 | ||||||
Series 2012-K708 C 144A 3.761% 2/25/45 #• | 230,000 | 235,556 | ||||||
Series 2012-K711 B 144A 3.562% 8/25/45 #• | 820,000 | 855,574 | ||||||
Series 2013-K33 B 144A 3.504% 8/25/46 #• | 505,000 | 516,883 | ||||||
Series 2013-K712 B 144A 3.369% 5/25/45 #• | 2,215,000 | 2,279,062 | ||||||
Series 2013-K713 B 144A 3.165% 4/25/46 #• | 1,215,000 | 1,238,476 | ||||||
GRACE Mortgage Trust | ||||||||
Series 2014-GRCE A 144A 3.369% 6/10/28 # | 2,200,000 | 2,324,760 | ||||||
GS Mortgage Securities Trust | ||||||||
Series 2006-GG6 A4 5.553% 4/10/38 • | 595,000 | 604,643 | ||||||
Series 2010-C1 A2 144A 4.592% 8/10/43 # | 915,000 | 1,021,744 | ||||||
Series 2010-C1 C 144A 5.635% 8/10/43 #• | 375,000 | 420,279 | ||||||
Hilton USA Trust | ||||||||
Series 2013-HLT AFX 144A 2.662% 11/5/30 # | 3,540,000 | 3,548,050 | ||||||
Series 2013-HLT BFX 144A 3.367% 11/5/30 # | 1,620,000 | 1,640,589 | ||||||
| (continues | ) | 45 |
Table of Contents
Schedules of investments
Optimum Fixed Income Fund
| Principal amount° | Value (U.S. $) | |||||||
| ||||||||
Commercial Mortgage-Backed Securities (continued) |
| |||||||
| ||||||||
Hyatt Hotel Portfolio Trust | ||||||||
Series 2015-HYT A 144A 1.425% 11/15/29 #• | 900,000 | $ | 901,109 | |||||
JPMBB Commercial Mortgage Securities Trust | ||||||||
Series 2014-C18 A1 1.254% 2/15/47 | 975,459 | 974,932 | ||||||
Series 2014-C22 B 4.562% 9/15/47 • | 470,000 | 513,454 | ||||||
JPMorgan Chase Commercial Mortgage Securities Trust | ||||||||
Series 2005-CB11 E 5.724% 8/12/37 • | 230,000 | 249,797 | ||||||
Series 2005-LDP5 D 5.382% 12/15/44 • | 420,000 | 428,873 | ||||||
Series 2006-LDP8 AM 5.44% 5/15/45 | 1,558,000 | 1,636,375 | ||||||
Series 2007-LDPX A3 5.42% 1/15/49 | 1,068,218 | 1,132,554 | ||||||
Series 2011-C5 C 144A 5.323% 8/15/46 #• | 410,000 | 460,138 | ||||||
LB-UBS Commercial Mortgage Trust | ||||||||
Series 2004-C1 A4 4.568% 1/15/31 | 38,660 | 39,330 | ||||||
Series 2006-C6 AJ 5.452% 9/15/39 • | 920,000 | 964,822 | ||||||
Series 2006-C6 AM 5.413% 9/15/39 | 2,445,000 | 2,580,245 | ||||||
Morgan Stanley Bank of America Merrill Lynch Trust | ||||||||
Series 2014-C18 A4 3.923% 10/15/47 | 625,000 | 681,601 | ||||||
Morgan Stanley Capital I Trust | ||||||||
Series 2005-HQ7 AJ 5.204% 11/14/42 • | 615,000 | 622,817 | ||||||
Series 2005-HQ7 C 5.204% 11/14/42 • | 870,000 | 875,463 | ||||||
Series 2006-T21 AM 5.204% 10/12/52 • | 600,000 | 615,239 | ||||||
Series 2015-XLF1 A 144A 1.30% 8/13/16 #• | 1,900,000 | 1,899,392 | ||||||
Morgan Stanley Re-REMIC Trust | ||||||||
Series 2009-GG10 A4A 144A 5.796% 8/12/45 #• | 4,033,966 | 4,318,647 | ||||||
Silenus European Loan | ||||||||
Conduit No. 25X A 0.198% 5/15/19 • | EUR | 824,766 | 886,107 | |||||
| Principal amount° | Value (U.S. $) | |||||||
| ||||||||
Commercial Mortgage-Backed Securities (continued) |
| |||||||
| ||||||||
TimberStar Trust I | ||||||||
Series 2006-1A A 144A 5.668% 10/15/36 # | 415,000 | $ | 439,210 | |||||
Wachovia Bank Commercial Mortgage Trust | ||||||||
Series 2006-C28 A4FL 144A 0.327% 10/15/48 #• | 873,356 | 866,164 | ||||||
Series 2007-C32 A4FL 144A 0.352% 6/15/49 #• | 700,000 | 686,403 | ||||||
WFRBS Commercial Mortgage Trust | ||||||||
Series 2014-C23 A5 3.917% 10/15/57 | 545,000 | 595,624 | ||||||
|
| |||||||
Total Commercial Mortgage-Backed Securities | 56,528,228 | |||||||
|
| |||||||
| ||||||||
Convertible Bonds – 0.77% |
| |||||||
| ||||||||
Abengoa 144A 5.125% exercise price $38.74, expiration date 2/23/17 # | 400,000 | 402,500 | ||||||
Alaska Communications Systems Group 6.25% exercise price $10.28, expiration date 4/27/18 | 608,000 | 599,260 | ||||||
Ares Capital 5.75% exercise price $19.13, expiration date 2/1/16 | 206,000 | 213,339 | ||||||
BGC Partners 4.50% exercise price $9.84, expiration date 7/13/16 | 421,000 | 458,890 | ||||||
BioMarin Pharmaceutical 1.50% exercise price $94.15, expiration date 10/13/20 | 291,000 | 442,138 | ||||||
Blackstone Mortgage Trust 5.25% exercise price $28.66, expiration date 12/1/18 | 576,000 | 600,840 | ||||||
Blucora 4.25% exercise price $21.66, expiration date 3/29/19 | 275,000 | 256,953 | ||||||
Campus Crest Communities Operating Partnership 144A 4.75% exercise price $12.56, expiration date 10/11/18 # | 604,000 | 584,747 | ||||||
Cardtronics 1.00% exercise price $52.35, expiration date 11/27/20 | 536,000 | 532,985 | ||||||
46
Table of Contents
| Principal amount° | Value (U.S. $) | |||||||
| ||||||||
Convertible Bonds (continued) |
| |||||||
| ||||||||
Cemex 3.25% exercise price $9.65, expiration date 3/9/16 | 367,000 | $ | 412,646 | |||||
Chart Industries 2.00% exercise price $69.03, expiration date 7/30/18 | 177,000 | 171,137 | ||||||
Chesapeake Energy 2.25%exercise price $80.28, expiration date 12/14/38 | 200,000 | 182,500 | ||||||
Ciena 144A 3.75% exercise price $20.17, expiration date 10/15/18 # | 283,000 | 348,267 | ||||||
Gain Capital Holdings 4.125% exercise price $12.00, expiration date 11/30/18 | 158,000 | 170,344 | ||||||
General Cable 4.50% exercise price $34.47, expiration date 11/15/29 f | 580,000 | 462,187 | ||||||
Gilead Sciences 1.625% exercise price $22.71, expiration date 4/29/16 | 131,000 | 564,611 | ||||||
Hologic 2.00% exercise price $31.17, expiration date 2/27/42 f | 259,000 | 321,322 | ||||||
Illumina 0.25% exercise price $83.55, expiration date 3/11/16 | 113,000 | 250,084 | ||||||
Intel 3.25% exercise price $21.47, expiration date 8/1/39 | 200,000 | 316,126 | ||||||
j2 Global 3.25% exercise price $69.37, expiration date 6/14/29 | 483,000 | 558,469 | ||||||
Jefferies Group 3.875% exercise price $44.94, expiration date 10/31/29 | 355,000 | 360,103 | ||||||
Lexington Realty Trust 144A 6.00% exercise price $6.60, expiration date 1/11/30 # | 147,000 | 213,426 | ||||||
Liberty Interactive | ||||||||
0.75% exercise price $1,000.00, expiration date 3/30/43 | 462,000 | 647,089 | ||||||
144A 1.00% exercise price $64.31, expiration date 9/28/43 # | 369,000 | 362,543 | ||||||
Meritor 4.00% exercise price $26.73, expiration date 2/12/27 f | 598,000 | 621,546 | ||||||
| Principal amount° | Value (U.S. $) | |||||||
| ||||||||
Convertible Bonds (continued) |
| |||||||
| ||||||||
Microchip Technology 144A 1.625% exercise price $68.17, expiration date 2/13/25 # | 66,000 | $ | 68,846 | |||||
Mylan 3.75% exercise price $13.32, expiration date 9/10/15 | 130,000 | 578,581 | ||||||
Novellus Systems 2.625% exercise price $34.78, expiration date 5/14/41 | 268,000 | 548,563 | ||||||
Nuance Communications 2.75% exercise price $32.30, expiration date 11/1/31 | 35,000 | 34,913 | ||||||
NuVasive 2.75% exercise price $42.13,expiration date 6/30/17 | 576,000 | 722,160 | ||||||
NXP Semiconductors 144A 1.00% exercise price $102.84, expiration date 11/27/19 # | 262,000 | 313,417 | ||||||
Oclaro 144A 6.00% exercise price $1.95, expiration date 2/14/20 # | 101,000 | 123,536 | ||||||
Peabody Energy 4.75% exercise price $57.15, expiration date 12/15/41 | 668,000 | 239,227 | ||||||
PROS Holdings 144A 2.00% exercise price $33.79, expiration date 11/27/19 # | 262,000 | 270,515 | ||||||
SanDisk 1.50% exercise price $51.16, expiration date 8/11/17 | 262,000 | 358,121 | ||||||
Spectrum Pharmaceuticals 2.75% exercise price $10.53, expiration date 12/13/18 | 176,000 | 161,810 | ||||||
Spirit Realty Capital 3.75% exercise price $13.10, expiration date 5/13/21 | 348,000 | 348,437 | ||||||
Titan Machinery 3.75% exercise price $43.17, expiration date 4/30/19 | 219,000 | 152,205 | ||||||
TPG Specialty Lending 144A 4.50% exercise price $25.83, expiration date 12/15/19 # | 372,000 | 371,535 | ||||||
Vantage Drilling 144A 5.50% exercise price $2.39, expiration date 7/15/43 # | 487,000 | 297,070 | ||||||
| (continues | ) | 47 |
Table of Contents
Schedules of investments
Optimum Fixed Income Fund
| Principal amount° | Value (U.S. $) | |||||||
| ||||||||
Convertible Bonds (continued) |
| |||||||
| ||||||||
Vector Group | ||||||||
1.75% exercise price $25.87, expiration date 4/15/20 | 424,000 | $ | 456,330 | |||||
2.50% exercise price $16.78, expiration date 1/14/19 • | 147,000 | 207,958 | ||||||
VeriSign 4.136% exercise price $34.37, expiration date 8/15/37 | 175,000 | 347,922 | ||||||
|
| |||||||
Total Convertible Bonds | 15,655,198 | |||||||
|
| |||||||
| ||||||||
Corporate Bonds – 40.32% |
| |||||||
| ||||||||
Banking – 9.61% | ||||||||
Abbey National Treasury Services 0.78% 3/13/17 • | 225,000 | 225,176 | ||||||
Akbank 144A | ||||||||
4.00% 1/24/20 # | 1,135,000 | 1,110,030 | ||||||
Ally Financial | ||||||||
2.75% 1/30/17 | 200,000 | 199,762 | ||||||
3.125% 1/15/16 | 100,000 | 100,500 | ||||||
3.50% 7/18/16 | 400,000 | 406,000 | ||||||
4.125% 2/13/22 | 135,000 | 131,963 | ||||||
4.625% 6/26/15 | 1,200,000 | 1,207,500 | ||||||
4.75% 9/10/18 | 200,000 | 206,250 | ||||||
5.50% 2/15/17 | 1,800,000 | 1,876,500 | ||||||
ANZ New Zealand International 144A 2.60% 9/23/19 # | 200,000 | 204,448 | ||||||
Australia & New Zealand Banking Group 2.625% 12/10/18 | CAD | 151,000 | 124,612 | |||||
Banco do Brasil 144A 6.00% 1/22/20 # | 3,200,000 | 3,424,000 | ||||||
Banco Mercantil del Norte 144A 4.375% 7/19/15 # | 400,000 | 403,040 | ||||||
Banco Santander Chile 144A 3.75% | 2,200,000 | 2,225,771 | ||||||
Banco Votorantim 144A 5.25% | 2,300,000 | 2,323,000 | ||||||
Bank of America | ||||||||
0.571% 6/15/17 • | 3,800,000 | 3,769,938 | ||||||
1.293% 1/15/19 • | 1,130,000 | 1,146,525 | ||||||
2.60% 1/15/19 | 1,200,000 | 1,222,008 | ||||||
3.30% 1/11/23 | 716,000 | 726,078 | ||||||
4.25% 10/22/26 | 2,125,000 | 2,196,727 | ||||||
5.65% 5/1/18 | 900,000 | 999,051 | ||||||
5.75% 12/1/17 | 700,000 | 770,724 | ||||||
Principal amount° | Value (U.S. $) | |||||||
| ||||||||
Corporate Bonds (continued) |
| |||||||
| ||||||||
Banking (continued) | ||||||||
Bank of America | ||||||||
6.00% 9/1/17 | 1,700,000 | $ | 1,871,185 | |||||
6.875% 4/25/18 | 3,825,000 | 4,378,317 | ||||||
7.625% 6/1/19 | 800,000 | 966,470 | ||||||
Bank of Montreal | ||||||||
0.773% 7/15/16 • | 565,000 | 567,620 | ||||||
Bank of New York Mellon | ||||||||
0.747% 9/11/19 • | 830,000 | 826,509 | ||||||
2.15% 2/24/20 | 1,960,000 | 1,977,346 | ||||||
Bank of Nova Scotia | ||||||||
0.773% 7/15/16 • | 835,000 | 839,085 | ||||||
Barclays Bank | ||||||||
7.625% 11/21/22 | 2,025,000 | 2,374,313 | ||||||
BB&T | ||||||||
0.915% 2/1/19 • | 750,000 | 752,938 | ||||||
1.131% 6/15/18 • | 65,000 | 65,664 | ||||||
2.45% 1/15/20 | 1,435,000 | 1,460,730 | ||||||
5.25% 11/1/19 | 1,241,000 | 1,404,706 | ||||||
BBVA Banco Continental | ||||||||
144A 2.25% 7/29/16 # | 900,000 | 907,200 | ||||||
144A 5.00% 8/26/22 # | 540,000 | 576,720 | ||||||
BBVA Bancomer | ||||||||
144A 6.50% 3/10/21 # | 1,365,000 | 1,517,716 | ||||||
144A 7.25% 4/22/20 # | 100,000 | 111,000 | ||||||
Branch Banking & Trust | ||||||||
3.80% 10/30/26 | 1,270,000 | 1,339,079 | ||||||
BRFkredit 2.00% 4/1/15 | DKK | 15,000,000 | 2,158,677 | |||||
CIT Group 5.25% 3/15/18 | 2,500,000 | 2,593,750 | ||||||
Citigroup | ||||||||
0.805% 3/10/17 • | 900,000 | 899,688 | ||||||
4.05% 7/30/22 | 150,000 | 157,611 | ||||||
6.125% 5/15/18 | 2,300,000 | 2,590,511 | ||||||
8.50% 5/22/19 | 1,400,000 | 1,745,099 | ||||||
City National 5.25% 9/15/20 | 770,000 | 884,926 | ||||||
Cooperatieve Centrale | ||||||||
Raiffeisen-Boerenleenbank |
| |||||||
2.50% 9/4/20 | NOK | 1,740,000 | 225,553 | |||||
4.25% 1/13/22 | AUD | 353,000 | 283,640 | |||||
4.625% 12/1/23 | 1,665,000 | 1,803,183 | ||||||
6.875% 3/19/20 | EUR | 2,400,000 | 3,162,783 | |||||
Credit Suisse 144A | ||||||||
6.50% 8/8/23 # | 1,215,000 | 1,390,309 | ||||||
Credit Suisse Group | ||||||||
144A 6.25% 12/29/49 #• | 270,000 | 266,085 | ||||||
144A 7.50% 12/29/49 #• | 200,000 | 215,250 | ||||||
Credit Suisse Group Funding Guernsey 144A 3.75% 3/26/25 # | 1,155,000 | 1,170,926 | ||||||
48
Table of Contents
Principal amount° | Value (U.S. $) | |||||||
| ||||||||
Corporate Bonds (continued) |
| |||||||
| ||||||||
Banking (continued) | ||||||||
Depfa ACS Bank 4.875% 5/21/19 | EUR | 2,500,000 | $ | 3,207,785 | ||||
DNB Bank 144A 3.20% 4/3/17 # | 3,300,000 | 3,420,826 | ||||||
Eksportfinans | ||||||||
2.00% 9/15/15 | 1,300,000 | 1,303,783 | ||||||
2.375% 5/25/16 | 500,000 | 503,035 | ||||||
5.50% 5/25/16 | 800,000 | 832,320 | ||||||
5.50% 6/26/17 | 300,000 | 320,250 | ||||||
Export-Import Bank of China 144A 2.50% 7/31/19 # | 1,025,000 | 1,039,836 | ||||||
Export-Import Bank of Korea |
| |||||||
1.121% 9/17/16 • | 900,000 | 904,017 | ||||||
1.25% 11/20/15 | 400,000 | 401,298 | ||||||
4.375% 9/15/21 | 700,000 | 781,797 | ||||||
5.00% 4/11/22 | 2,000,000 | 2,321,340 | ||||||
5.125% 6/29/20 | 1,500,000 | 1,719,111 | ||||||
Goldman Sachs Group | ||||||||
0.398% 5/18/15 • | EUR | 100,000 | 107,588 | |||||
0.657% 7/22/15 • | 200,000 | 200,062 | ||||||
0.715% 3/22/16 • | 300,000 | 299,992 | ||||||
1.357% 11/15/18 • | 420,000 | 424,961 | ||||||
1.417% 4/23/20 • | 1,800,000 | 1,825,099 | ||||||
2.60% 4/23/20 | 1,940,000 | 1,962,913 | ||||||
3.55% 2/12/21 | CAD | 200,000 | 169,156 | |||||
3.617% 8/21/19 • | AUD | 140,000 | 107,716 | |||||
3.70% 8/1/15 | 1,900,000 | 1,918,793 | ||||||
5.20% 12/17/19 | NZD | 932,000 | 713,988 | |||||
5.35% 1/15/16 | 1,400,000 | 1,448,247 | ||||||
5.95% 1/18/18 | 700,000 | 779,937 | ||||||
6.25% 9/1/17 | 1,100,000 | 1,220,516 | ||||||
Hana Bank 1.375% 2/5/16 | 1,800,000 | 1,803,953 | ||||||
HBOS 0.964% 9/6/17 • | 500,000 | 500,250 | ||||||
HSBC Bank 144A 0.897% 5/15/18 #• | 620,000 | 623,328 | ||||||
HSBC Holdings 6.375% 3/29/49 • | 3,290,000 | 3,372,250 | ||||||
HSBC New Zealand 4.54% 12/10/18 • | NZD | 500,000 | 377,131 | |||||
ICICI Bank 4.75% 11/25/16 | 2,600,000 | 2,718,823 | ||||||
JPMorgan Chase | ||||||||
0.886% 1/28/19 • | 574,000 | 575,601 | ||||||
1.50% 1/27/25 | EUR | 903,000 | 1,003,223 | |||||
2.25% 1/23/20 | 5,775,000 | 5,791,234 | ||||||
3.15% 7/5/16 | 100,000 | 102,614 | ||||||
4.125% 12/15/26 | 2,670,000 | 2,774,408 | ||||||
4.25% 11/2/18 | NZD | 570,000 | 428,234 | |||||
4.40% 7/22/20 | 400,000 | 439,608 | ||||||
Principal amount° | Value (U.S. $) | |||||||
| ||||||||
Corporate Bonds (continued) |
| |||||||
| ||||||||
Banking (continued) | ||||||||
JPMorgan Chase | ||||||||
6.30% 4/23/19 | 300,000 | $ | 348,681 | |||||
6.75% 1/29/49 • | 590,000 | 643,100 | ||||||
JPMorgan Chase Bank |
| |||||||
0.60% 6/13/16 • | 500,000 | 498,797 | ||||||
0.748% 5/31/17 • | EUR | 2,400,000 | 2,583,403 | |||||
4.375% 11/30/21 • | EUR | 2,600,000 | 2,957,391 | |||||
6.00% 10/1/17 | 600,000 | 664,495 | ||||||
KBC Bank 8.00% 1/25/23 • | 2,200,000 | 2,477,750 | ||||||
KeyBank 6.95% 2/1/28 | 1,220,000 | 1,627,933 | ||||||
Korea Development Bank | 900,000 | 896,862 | ||||||
Lloyds Banking Group | ||||||||
4.50% 11/4/24 | 1,150,000 | 1,196,812 | ||||||
7.50% 4/30/49 • | 1,205,000 | 1,283,325 | ||||||
Morgan Stanley | ||||||||
1.106% 1/24/19 • | 369,000 | 370,573 | ||||||
1.396% 1/27/20 • | 845,000 | 858,633 | ||||||
3.125% 8/5/21 | CAD | 387,000 | 319,774 | |||||
3.45% 11/2/15 | 1,000,000 | 1,015,596 | ||||||
4.35% 9/8/26 | 1,135,000 | 1,191,389 | ||||||
5.00% 9/30/21 | AUD | 359,000 | 293,112 | |||||
5.45% 1/9/17 | 700,000 | 749,129 | ||||||
MUFG Americas Holdings | ||||||||
2.25% 2/10/20 | 685,000 | 687,100 | ||||||
3.00% 2/10/25 | 1,595,000 | 1,580,285 | ||||||
National City Bank 0.634% 6/7/17 • | 325,000 | 323,584 | ||||||
Nordea Kredit Realkreditak-tieselskab 2.00% 10/1/15 | DKK | 14,000,000 | 2,040,439 | |||||
Northern Trust | 550,000 | 591,624 | ||||||
Novo Banco | ||||||||
5.00% 4/4/19 | EUR | 50,000 | 55,655 | |||||
5.00% 5/21/19 | EUR | 50,000 | 55,613 | |||||
5.875% 11/9/15 | EUR | 200,000 | 217,080 | |||||
NRW Bank | 3,800,000 | 3,808,345 | ||||||
Nykredit Realkredit 2.00% 10/1/15 | DKK | 15,000,000 | 2,186,185 | |||||
Oversea-Chinese Banking 144A 4.00% 10/15/24 #• | 220,000 | 229,572 | ||||||
PNC Bank | ||||||||
3.30% 10/30/24 | 995,000 | 1,034,985 | ||||||
6.875% 4/1/18 | 1,415,000 | 1,623,806 | ||||||
PNC Funding 5.625% 2/1/17 | 225,000 | 241,982 | ||||||
PNC Preferred Funding Trust II 144A 1.493% 3/29/49 #• | 2,000,000 | 1,840,000 | ||||||
| (continues | ) | 49 |
Table of Contents
Schedules of investments
Optimum Fixed Income Fund
Principal amount° | Value (U.S. $) | |||||||
| ||||||||
Corporate Bonds (continued) |
| |||||||
| ||||||||
Banking (continued) | ||||||||
Realkredit Danmark 2.00% 1/1/16 | DKK | 43,300,000 | $ | 6,337,689 | ||||
Royal Bank of Canada | 530,000 | 531,271 | ||||||
Royal Bank of Scotland Group | ||||||||
144A 6.99% 10/29/49 #• | 200,000 | 237,000 | ||||||
9.50% 3/16/22 • | 1,400,000 | 1,581,903 | ||||||
Santander Bank 1.182% 1/12/18 • | 1,400,000 | 1,401,326 | ||||||
Santander Holdings USA | 1,335,000 | 1,390,317 | ||||||
Santander UK 144A 5.00% 11/7/23 # | 2,760,000 | 2,977,369 | ||||||
State Bank of India 144A | 200,000 | 202,097 | ||||||
State Street | 525,000 | 531,989 | ||||||
Sumitomo Mitsui Banking | 1,000,000 | 996,965 | ||||||
SunTrust Bank 0.553% | 505,000 | 504,855 | ||||||
SunTrust Banks 2.35% 11/1/18 | 535,000 | 543,778 | ||||||
SVB Financial Group | 2,205,000 | 2,195,089 | ||||||
Toronto-Dominion Bank 0.805% 4/30/18 • | 835,000 | 839,182 | ||||||
Turkiye Garanti Bankasi 144A 4.75% 10/17/19 # | 1,083,000 | 1,096,018 | ||||||
U.S. Bancorp | 1,275,000 | 1,331,740 | ||||||
UBS | ||||||||
4.75% 5/22/23 • | 400,000 | 414,658 | ||||||
5.875% 12/20/17 | 1,163,000 | 1,291,823 | ||||||
7.625% 8/17/22 | 500,000 | 607,321 | ||||||
US Bank | ||||||||
0.485% 1/30/17 • | 850,000 | 850,635 | ||||||
2.80% 1/27/25 | 1,285,000 | 1,285,604 | ||||||
USB Capital IX 3.50% 10/29/49 • | 1,820,000 | 1,515,150 | ||||||
USB Realty 144A 1.40% 12/29/49 #• | 500,000 | 457,500 | ||||||
Wells Fargo | ||||||||
0.935% 1/30/20 • | 1,180,000 | 1,187,495 | ||||||
1.25% 7/20/16 | 10,300,000 | 10,360,133 | ||||||
3.50% 9/12/29 | GBP | 196,000 | 311,787 | |||||
4.75% 8/27/24 | AUD | 260,000 | 214,916 | |||||
5.875% 12/29/49 • | 425,000 | 450,585 | ||||||
Woori Bank | ||||||||
144A 2.875% 10/2/18 # | 565,000 | 581,139 | ||||||
144A 4.75% 4/30/24 # | 1,000,000 | 1,070,868 | ||||||
| Principal amount° | Value (U.S. $) | |||||||
| ||||||||
Corporate Bonds (continued) |
| |||||||
| ||||||||
Banking (continued) | ||||||||
Zions Bancorp | 830,000 | $ | 879,243 | |||||
|
| |||||||
| 195,599,670 | ||||||||
|
| |||||||
Basic Industry – 1.78% |
| |||||||
AECOM | ||||||||
144A 5.75% 10/15/22 # | 190,000 | 197,125 | ||||||
144A 5.875% 10/15/24 # | 785,000 | 826,213 | ||||||
AK Steel 7.625% 5/15/20 | 280,000 | 242,200 | ||||||
ArcelorMittal | ||||||||
6.125% 6/1/18 | 322,000 | 346,794 | ||||||
10.60% 6/1/19 | 830,000 | 1,018,306 | ||||||
Axalta Coating Systems U.S. Holdings 144A 7.375% 5/1/21 # | . 400,000 | . 432,000 | ||||||
BHP Billiton Finance 3.25% 9/25/24 | GBP | 223,000 | 350,436 | |||||
BHP Billiton Finance USA 0.523% 9/30/16 • | 500,000 | 500,231 | ||||||
Braskem Finance 6.45% 2/3/24 | 285,000 | 275,737 | ||||||
Builders FirstSource 144A 7.625% | 175,000 | 176,750 | ||||||
CF Industries | ||||||||
6.875% 5/1/18 | 1,690,000 | 1,927,991 | ||||||
7.125% 5/1/20 | 300,000 | 361,877 | ||||||
Consolidated Energy Finance 144A 6.75% 10/15/19 # | 690,000 | 698,625 | ||||||
Domtar 9.50% 8/1/16 | 800,000 | 875,410 | ||||||
Dow Chemical | ||||||||
3.50% 10/1/24 | 395,000 | 401,910 | ||||||
8.55% 5/15/19 | 2,322,000 | 2,909,789 | ||||||
Fibria Overseas Finance 5.25% 5/12/24 | 525,000 | 522,375 | ||||||
FMG Resources August 2006 | ||||||||
144A 6.875% | 1,362,000 | 1,011,285 | ||||||
144A 8.25% | 285,000 | 246,169 | ||||||
Georgia-Pacific | ||||||||
144A 2.539% 11/15/19 # | 1,050,000 | 1,065,664 | ||||||
144A 3.60% | 635,000 | 652,271 | ||||||
8.00% 1/15/24 | 1,927,000 | 2,560,943 | ||||||
Gerdau Holdings 144A | 710,000 | 761,475 | ||||||
Gerdau Trade 144A 5.75% 1/30/21 # | 255,000 | 255,956 | ||||||
Grace (W.R.) 144A 5.125% 10/1/21 # | 635,000 | 660,400 | ||||||
HD Supply | 211,000 | 226,825 | ||||||
| 50 |
Table of Contents
Principal amount° | Value (U.S. $) | |||||||
| ||||||||
Corporate Bonds (continued) |
| |||||||
| ||||||||
Basic Industry (continued) | ||||||||
HD Supply 11.50% 7/15/20 | 530,000 | $ | 615,463 | |||||
Inversiones 144A | 490,000 | 545,370 | ||||||
LSB Industries | 100,000 | 104,750 | ||||||
Lundin Mining 144A | 460,000 | 478,400 | ||||||
LYB International Finance 4.875% 3/15/44 | 70,000 | 75,491 | ||||||
LyondellBasell Industries | ||||||||
4.625% 2/26/55 | 1,650,000 | 1,650,457 | ||||||
5.00% 4/15/19 | 500,000 | 551,861 | ||||||
Methanex 4.25% 12/1/24 | 1,270,000 | 1,289,257 | ||||||
MMC Norilsk Nickel 144A 5.55% 10/28/20 # | 258,000 | 248,359 | ||||||
Nortek 8.50% 4/15/21 | 545,000 | 585,875 | ||||||
NOVA Chemicals 144A 5.00% 5/1/25 # | 1,242,000 | 1,300,995 | ||||||
Novelis 8.75% 12/15/20 | 490,000 | 527,363 | ||||||
OCP | ||||||||
144A 5.625% 4/25/24 # | 1,185,000 | 1,293,131 | ||||||
144A 6.875% 4/25/44 # | 535,000 | 599,869 | ||||||
Phosagro 144A | 628,000 | 594,716 | ||||||
PolyOne 5.25% 3/15/23 | 290,000 | 302,325 | ||||||
Potash of Saskatchewan 3.00% 4/1/25 | 745,000 | 747,563 | ||||||
PPG Industries | 685,000 | 693,499 | ||||||
Rio Tinto Finance USA 1.111% 6/17/16 • | 420,000 | 421,071 | ||||||
Rockwood Specialties Group 4.625% 10/15/20 | 690,000 | 720,187 | ||||||
Ryerson | ||||||||
9.00% 10/15/17 | 320,000 | 324,000 | ||||||
11.25% 10/15/18 | 89,000 | 90,780 | ||||||
TPC Group 144A | 305,000 | 280,600 | ||||||
USG 6.30% 11/15/16 | 800,000 | 842,000 | ||||||
Weyerhaeuser | 1,140,000 | 1,255,403 | ||||||
Yamana Gold | 625,000 | 615,637 | ||||||
|
| |||||||
| 36,259,179 | ||||||||
|
| |||||||
Brokerage – 0.40% | ||||||||
Affiliated Managers Group 3.50% 8/1/25 | 930,000 | 930,843 | ||||||
Bear Stearns | 700,000 | 781,405 | ||||||
Principal amount° | Value (U.S. $) | |||||||
| ||||||||
Corporate Bonds (continued) |
| |||||||
| ||||||||
Brokerage (continued) | ||||||||
Bear Stearns | 2,000,000 | $ | 2,304,020 | |||||
E*TRADE Financial 4.625% 9/15/23 | 601,000 | 613,020 | ||||||
Jefferies Group | ||||||||
5.125% 1/20/23 | 585,000 | 608,205 | ||||||
6.45% 6/8/27 | 331,000 | 359,135 | ||||||
6.50% 1/20/43 | 220,000 | 219,598 | ||||||
Lazard Group | ||||||||
3.75% 2/13/25 | 2,100,000 | 2,075,317 | ||||||
6.85% 6/15/17 | 215,000 | 238,980 | ||||||
|
| |||||||
| 8,130,523 | ||||||||
|
| |||||||
Capital Goods – 0.64% | ||||||||
Accudyne Industries 144A 7.75% | 315,000 | 282,713 | ||||||
Algeco Scotsman Global Finance | ||||||||
144A 8.50% | 700,000 | 697,375 | ||||||
144A 10.75% | 170,000 | 140,250 | ||||||
Berry Plastics 5.50% 5/15/22 | 240,000 | 246,900 | ||||||
BWAY Holding 144A 9.125% 8/15/21 # | 730,000 | 762,850 | ||||||
Cemex | ||||||||
144A 4.375% 3/5/23 # | EUR | 605,000 | 653,087 | |||||
144A 5.003% | 200,000 | 209,400 | ||||||
144A 7.25% 1/15/21 # | 305,000 | 326,350 | ||||||
Cemex Finance 144A 9.375% 10/12/22 # | 870,000 | 991,800 | ||||||
Consolidated Container 144A | 285,000 | 249,375 | ||||||
Crane | ||||||||
2.75% 12/15/18 | 225,000 | 230,866 | ||||||
4.45% 12/15/23 | 1,180,000 | 1,265,004 | ||||||
Gates Global 144A 6.00% 7/15/22 # | 425,000 | 403,219 | ||||||
Ingersoll-Rand Global Holding | 1,410,000 | 1,508,099 | ||||||
Lockheed Martin | 380,000 | 379,420 | ||||||
Masco 4.45% 4/1/25 | 610,000 | 631,350 | ||||||
Milacron 144A 7.75% 2/15/21 # | 345,000 | 358,800 | ||||||
Parker-Hannifin 3.30% 11/21/24 | 65,000 | 68,324 | ||||||
Plastipak Holdings 144A 6.50% 10/1/21 # | 370,000 | 378,325 | ||||||
Reynolds Group Issuer 8.25% 2/15/21 | 370,000 | 397,750 | ||||||
| (continues | ) | 51 |
Table of Contents
Schedules of investments
Optimum Fixed Income Fund
Principal amount° | Value (U.S. $) | |||||||
| ||||||||
Corporate Bonds (continued) |
| |||||||
| ||||||||
Capital Goods (continued) |
| |||||||
TransDigm | ||||||||
6.00% 7/15/22 | 240,000 | $ | 241,200 | |||||
6.50% 7/15/24 | 65,000 | 65,650 | ||||||
7.50% 7/15/21 | 345,000 | 372,600 | ||||||
Trinity Industries 4.55% 10/1/24 | 1,010,000 | 1,017,295 | ||||||
Tyco Electronics Group 0.453% | 515,000 | 515,060 | ||||||
Votorantim Cimentos 144A 7.25% 4/5/41 # | 540,000 | 531,924 | ||||||
|
| |||||||
| 12,924,986 | ||||||||
|
| |||||||
Communications – 5.47% |
| |||||||
Alibaba Group Holding | ||||||||
144A 0.782% 11/28/17 #• | 345,000 | 344,122 | ||||||
144A 2.50% 11/28/19 # | 7,500,000 | 7,510,763 | ||||||
144A 3.125% 11/28/21 # | 1,685,000 | 1,699,412 | ||||||
Altice | ||||||||
144A 7.625% 2/15/25 # | 200,000 | 201,375 | ||||||
144A 7.75% 5/15/22 # | 480,000 | 489,300 | ||||||
Altice Financing 144A 6.625% 2/15/23 # | 1,835,000 | 1,899,225 | ||||||
America Movil | ||||||||
5.00% 3/30/20 | 720,000 | 819,518 | ||||||
6.00% 6/9/19 | MXN | 31,600,000 | 2,082,223 | |||||
American Tower Trust I |
| |||||||
144A 1.551% 3/15/43 # | 425,000 | 424,477 | ||||||
144A 3.07% 3/15/23 # | 970,000 | 977,472 | ||||||
AT&T | ||||||||
0.693% 3/30/17 • | 1,000,000 | 998,722 | ||||||
1.171% 11/27/18 • | 830,000 | 841,705 | ||||||
4.35% 6/15/45 | 690,000 | 662,684 | ||||||
5.35% 9/1/40 | 1,155,000 | 1,264,995 | ||||||
Bell Canada 3.35% 3/22/23 | CAD | 219,000 | 182,150 | |||||
Bharti Airtel International | ||||||||
Netherlands 144A 5.35% 5/20/24 # | 1,245,000 | 1,377,281 | ||||||
CC Holdings GS V 3.849% 4/15/23 | 450,000 | 456,359 | ||||||
CCO Holdings 5.25% 9/30/22 | 380,000 | 389,975 | ||||||
CCOH Safari 5.75% 12/1/24 | 2,740,000 | 2,829,050 | ||||||
CenturyLink | ||||||||
5.80% 3/15/22 | 2,155,000 | 2,254,669 | ||||||
6.75% 12/1/23 | 340,000 | 375,700 | ||||||
Cequel Communications Holdings I 144A | 435,000 | 460,556 | ||||||
| Principal amount° | Value (U.S. $) | |||||||
| ||||||||
Corporate Bonds (continued) |
| |||||||
| ||||||||
Communications (continued) | ||||||||
Columbus International 144A 7.375% 3/30/21 # | 1,300,000 | $ | 1,371,500 | |||||
Comcast | ||||||||
3.375% 2/15/25 | 2,810,000 | 2,942,303 | ||||||
5.70% 5/15/18 | 1,000,000 | 1,129,227 | ||||||
Cox Communications 144A 3.85% 2/1/25 # | 1,485,000 | 1,532,443 | ||||||
Crown Castle Towers 144A 4.883% 8/15/20 # | 2,090,000 | 2,301,193 | ||||||
CSC Holdings 144A 5.25% 6/1/24 # | 2,145,000 | 2,193,263 | ||||||
Deutsche Telekom International Finance 6.50% 4/8/22 | GBP | 36,000 | 67,949 | |||||
Digicel Group 144A 8.25% 9/30/20 # | 1,580,000 | 1,590,270 | ||||||
DISH DBS 5.00% 3/15/23 | 640,000 | 623,872 | ||||||
Gray Television 7.50% 10/1/20 | 695,000 | 734,963 | ||||||
Grupo Televisa 5.00% 5/13/45 | 645,000 | 674,574 | ||||||
Hughes Satellite Systems 7.625% 6/15/21 | 280,000 | 309,050 | ||||||
Intelsat Luxembourg | ||||||||
7.75% 6/1/21 | 315,000 | 291,769 | ||||||
8.125% 6/1/23 | 4,290,000 | 3,968,250 | ||||||
Interpublic Group 2.25% 11/15/17 | 15,000 | 15,130 | ||||||
KT 144A 1.75% 4/22/17 # | 900,000 | 902,041 | ||||||
Lamar Media 5.00% 5/1/23 | 795,000 | 816,863 | ||||||
Level 3 Financing 5.375% 8/15/22 | 465,000 | 480,839 | ||||||
MDC Partners 144A 6.75% 4/1/20 # | 270,000 | 285,525 | ||||||
Millicom International Cellular | ||||||||
144A 6.00% 3/15/25 # | 645,000 | 645,806 | ||||||
144A 6.625% | 685,000 | 726,956 | ||||||
Motorola Solutions | 1,290,000 | 1,335,589 | ||||||
MTN Mauritius Investments 144A 4.755% 11/11/24 # | 500,000 | 504,750 | ||||||
MTS International Funding 144A 8.625% 6/22/20 # | 670,000 | 705,229 | ||||||
NBCUniversal Enterprise 144A 0.938% 4/15/18 #• | 840,000 | 846,802 | ||||||
Netflix 144A 5.875% 2/15/25 # | 2,755,000 | 2,841,094 | ||||||
Nielsen Finance 144A 5.00% 4/15/22 # | 685,000 | 691,850 | ||||||
52
Table of Contents
| Principal amount° | Value (U.S. $) | |||||||
| ||||||||
Corporate Bonds (continued) |
| |||||||
| ||||||||
Communications (continued) |
| |||||||
Numericable-SFR 144A | 900,000 | $ | 912,375 | |||||
Oi 144A 5.75% 2/10/22 # | 520,000 | 429,260 | ||||||
Orange | ||||||||
2.75% 9/14/16 | 100,000 | 102,290 | ||||||
5.50% 2/6/44 | 870,000 | 1,036,935 | ||||||
Priceline Group | 1,880,000 | 1,917,111 | ||||||
SBA Tower Trust | ||||||||
144A 2.24% 4/16/18 # | 735,000 | 735,560 | ||||||
144A 2.898% 10/15/19 # | 600,000 | 607,292 | ||||||
SES 144A 3.60% 4/4/23 # | 1,555,000 | 1,631,745 | ||||||
SES GLOBAL Americas | 1,495,000 | 1,684,034 | ||||||
Sinclair Television Group | 1,405,000 | 1,447,150 | ||||||
Sirius XM Radio | ||||||||
144A 5.375% 4/15/25 # | 465,000 | 468,487 | ||||||
144A 6.00% 7/15/24 # | 1,310,000 | 1,378,775 | ||||||
Sky 144A 3.75% 9/16/24 # | 1,905,000 | 1,973,386 | ||||||
Sprint | ||||||||
7.125% 6/15/24 | 2,890,000 | 2,832,200 | ||||||
7.25% 9/15/21 | 620,000 | 625,425 | ||||||
7.625% 2/15/25 | 65,000 | 65,000 | ||||||
7.875% 9/15/23 | 1,160,000 | 1,189,000 | ||||||
Sprint Communications | 100,000 | 109,500 | ||||||
Telefonica Emisiones | ||||||||
4.57% 4/27/23 | 1,010,000 | 1,113,301 | ||||||
6.421% 6/20/16 | 1,750,000 | 1,859,995 | ||||||
Telemar Norte Leste 144A | 878,000 | 775,713 | ||||||
Time Warner Cable | ||||||||
6.75% 7/1/18 | 1,500,000 | 1,724,742 | ||||||
8.25% 4/1/19 | 2,195,000 | 2,687,137 | ||||||
T-Mobile USA | ||||||||
6.125% 1/15/22 | 970,000 | 1,003,950 | ||||||
6.836% 4/28/23 | 690,000 | 728,813 | ||||||
Unitymedia KabelBW 144A | 515,000 | 545,900 | ||||||
Univision Communications | 210,000 | 214,200 | ||||||
UPCB Finance IV 144A | 745,000 | 745,000 | ||||||
Verizon Communications | ||||||||
1.801% 9/15/16 • | 1,900,000 | 1,931,308 | ||||||
2.021% 9/14/18 • | 2,895,000 | 3,022,079 | ||||||
2.50% 9/15/16 | 138,000 | 140,987 | ||||||
| Principal amount° | Value (U.S. $) | |||||||||||
| ||||||||||||
Corporate Bonds (continued) |
| |||||||||||
| ||||||||||||
Communications (continued) |
| |||||||||||
Verizon Communications | ||||||||||||
3.00% 11/1/21 | 5,000 | $ | 5,107 | |||||||||
3.25% 2/17/26 | EUR | 323,000 | 415,660 | |||||||||
3.65% 9/14/18 | 2,200,000 | 2,340,507 | ||||||||||
4.40% 11/1/34 | 1,380,000 | 1,410,357 | ||||||||||
4.50% 9/15/20 | 2,000,000 | 2,210,156 | ||||||||||
4.862% 8/21/46 | 1,985,000 | 2,083,275 | ||||||||||
5.15% 9/15/23 | 750,000 | 860,461 | ||||||||||
Viacom | 2,280,000 | 2,362,816 | ||||||||||
Vimpel Communications | 620,000 | 616,094 | ||||||||||
Virgin Media Finance 144A | 450,000 | 481,500 | ||||||||||
Virgin Media Secured Finance | 200,000 | 204,500 | ||||||||||
VTR Finance 144A | 1,485,000 | 1,544,400 | ||||||||||
Wind Acquisition Finance | 395,000 | 410,800 | ||||||||||
Windstream | ||||||||||||
7.50% 4/1/23 | 110,000 | 105,600 | ||||||||||
7.75% 10/1/21 | 205,000 | 205,513 | ||||||||||
WPP Finance 2010 | 1,085,000 | 1,283,521 | ||||||||||
|
| |||||||||||
| 111,249,750 | ||||||||||||
|
| |||||||||||
Consumer Cyclical – 3.22% |
| |||||||||||
American Axle & | 415,000 | 438,863 | ||||||||||
American Honda Finance | 435,000 | 436,728 | ||||||||||
AutoZone 6.95% 6/15/16 | 300,000 | 320,402 | ||||||||||
Bed Bath & Beyond | 935,000 | 1,004,438 | ||||||||||
BorgWarner 3.375% 3/15/25 | 285,000 | 293,953 | ||||||||||
Caesars Growth Properties | 305,000 | 235,613 | ||||||||||
Chinos Intermediate Holdings | ||||||||||||
A 144A PIK 7.75% | ||||||||||||
5/1/19 #T | 340,000 | 299,200 | ||||||||||
CVS Pass Through Trust 144A | 89,366 | 105,313 | ||||||||||
Daimler 2.75% 12/10/18 | NOK | 1,870,000 | 244,144 | |||||||||
Daimler Finance North America | ||||||||||||
144A 0.595% 8/1/17 #• | 540,000 | 539,300 | ||||||||||
144A 0.615% 3/10/17 #• | 650,000 | 650,883 | ||||||||||
144A 1.25% 1/11/16 # | 1,300,000 | 1,305,058 | ||||||||||
| (continues | ) | 53 |
Table of Contents
Schedules of investments
Optimum Fixed Income Fund
| Principal amount° | Value (U.S. $) | |||||||
| ||||||||
Corporate Bonds (continued) |
| |||||||
| ||||||||
Consumer Cyclical (continued) |
| |||||||
Daimler Finance North America | 280,000 | $ | 285,998 | |||||
Dana Holding | 240,000 | 248,400 | ||||||
Delphi | ||||||||
4.15% 3/15/24 | 795,000 | 846,689 | ||||||
5.00% 2/15/23 | 195,000 | 209,625 | ||||||
Ford Motor 7.45% 7/16/31 | 745,000 | 1,031,245 | ||||||
Ford Motor Credit | ||||||||
0.784% 9/8/17 • | 500,000 | 497,422 | ||||||
2.75% 5/15/15 | 500,000 | 501,118 | ||||||
4.207% 4/15/16 | 1,300,000 | 1,337,496 | ||||||
5.875% 8/2/21 | 1,000,000 | 1,178,788 | ||||||
7.00% 4/15/15 | 1,100,000 | 1,102,034 | ||||||
General Motors | ||||||||
3.50% 10/2/18 | 1,690,000 | 1,739,956 | ||||||
5.00% 4/1/35 | 710,000 | 760,034 | ||||||
General Motors Financial | ||||||||
3.00% 9/25/17 | 900,000 | 918,000 | ||||||
3.15% 1/15/20 | 295,000 | 298,834 | ||||||
4.00% 1/15/25 | 345,000 | 352,565 | ||||||
4.375% 9/25/21 | 695,000 | 739,021 | ||||||
Historic TW 6.875% 6/15/18 | 2,200,000 | 2,560,461 | ||||||
Host Hotels & Resorts | ||||||||
3.75% 10/15/23 | 2,100,000 | 2,132,315 | ||||||
4.75% 3/1/23 | 910,000 | 982,359 | ||||||
5.875% 6/15/19 | 325,000 | 337,299 | ||||||
Hyundai Capital America | ||||||||
144A 2.125% 10/2/17 # | 615,000 | 621,448 | ||||||
144A 2.55% 2/6/19 # | 715,000 | 727,822 | ||||||
Hyundai Capital Services | ||||||||
144A 1.07% 3/18/17 #• | 205,000 | 205,358 | ||||||
International Game Technology | 1,460,000 | 1,483,541 | ||||||
INVISTA Finance 144A | 1,060,000 | 1,058,675 | ||||||
Kia Motors 3.625% 6/14/16 | 900,000 | 924,071 | ||||||
Landry’s 144A | 515,000 | 554,913 | ||||||
Lear 5.25% 1/15/25 | 1,710,000 | 1,752,750 | ||||||
Lowe’s 0.685% 9/10/19 • | 520,000 | 522,571 | ||||||
Magna International | 1,740,000 | 1,776,126 | ||||||
Marriott International | 650,000 | 681,548 | ||||||
Meritor 6.75% 6/15/21 | 210,000 | 218,400 | ||||||
| Principal amount° | Value (U.S. $) | |||||||||||
| ||||||||||||
Corporate Bonds (continued) |
| |||||||||||
| ||||||||||||
Consumer Cyclical (continued) |
| |||||||||||
MGM Resorts International | ||||||||||||
6.00% 3/15/23 | 1,710,000 | $ | 1,765,575 | |||||||||
7.50% 6/1/16 | 100,000 | 105,320 | ||||||||||
10.00% 11/1/16 | 300,000 | 333,750 | ||||||||||
PACCAR Financial | 835,000 | 840,238 | ||||||||||
PF Chang’s China Bistro 144A | 140,000 | 145,600 | ||||||||||
Pinnacle Entertainment | 425,000 | 450,500 | ||||||||||
QVC | ||||||||||||
4.375% 3/15/23 | 1,515,000 | 1,546,136 | ||||||||||
5.45% 8/15/34 | 1,080,000 | 1,074,384 | ||||||||||
RCI Banque 144A | 900,000 | 930,742 | ||||||||||
Sally Holdings 5.75% 6/1/22 | 340,000 | 363,375 | ||||||||||
Schaeffler Finance | ||||||||||||
144A 4.75% 5/15/23 # | 200,000 | 202,500 | ||||||||||
7.75% 2/15/17 | EUR | 1,400,000 | 1,712,654 | |||||||||
Schaeffler Holding Finance | EUR | 1,300,000 | 1,468,420 | |||||||||
Signet UK Finance | 1,290,000 | 1,326,578 | ||||||||||
Starwood Hotels & Resorts Worldwide | ||||||||||||
3.75% 3/15/25 | 2,280,000 | 2,344,647 | ||||||||||
4.50% 10/1/34 | 230,000 | 240,091 | ||||||||||
Target 2.30% 6/26/19 | 390,000 | 399,863 | ||||||||||
Tenedora Nemak 144A | 1,105,000 | 1,148,647 | ||||||||||
Toyota Finance Australia | ||||||||||||
2.25% 8/31/16 | NOK | 110,000 | 13,813 | |||||||||
3.04% 12/20/16 | NZD | 760,000 | 560,975 | |||||||||
TRW Automotive | ||||||||||||
144A 4.45% 12/1/23 # | 1,585,000 | 1,600,850 | ||||||||||
144A 4.50% 3/1/21 # | 405,000 | 409,050 | ||||||||||
Tupy Overseas 144A | 700,000 | 675,500 | ||||||||||
Volkswagen International | 620,000 | 621,420 | ||||||||||
Volvo Treasury | SEK | 1,100,000 | 129,629 | |||||||||
Wyndham Worldwide | ||||||||||||
3.90% 3/1/23 | 435,000 | 444,125 | ||||||||||
4.25% 3/1/22 | 725,000 | 757,721 | ||||||||||
5.625% 3/1/21 | 495,000 | 559,652 | ||||||||||
Wynn Las Vegas | 125,000 | 130,000 | ||||||||||
54
Table of Contents
| Principal amount° | Value (U.S. $) | |||||||||||
| ||||||||||||
Corporate Bonds (continued) |
| |||||||||||
| ||||||||||||
Consumer Cyclical (continued) |
| |||||||||||
Wynn Las Vegas | 8,695,000 | $ | 8,847,163 | |||||||||
|
| |||||||||||
| 65,609,695 | ||||||||||||
|
| |||||||||||
Consumer Non-Cyclical – 4.10% |
| |||||||||||
Actavis Funding | ||||||||||||
1.30% 6/15/17 | 900,000 | 892,781 | ||||||||||
1.348% 3/12/18 • | 300,000 | 302,111 | ||||||||||
2.35% 3/12/18 | 500,000 | 507,121 | ||||||||||
3.00% 3/12/20 | 1,300,000 | 1,331,507 | ||||||||||
3.45% 3/15/22 | 1,925,000 | 1,974,702 | ||||||||||
3.80% 3/15/25 | 1,305,000 | 1,349,525 | ||||||||||
4.55% 3/15/35 | 130,000 | 135,942 | ||||||||||
Air Medical Group Holdings | 301,000 | 317,555 | ||||||||||
AmerisourceBergen | 2,675,000 | 2,716,235 | ||||||||||
Amgen | ||||||||||||
0.862% 5/22/19 • | 1,000,000 | 1,001,768 | ||||||||||
2.30% 6/15/16 | 125,000 | 126,913 | ||||||||||
3.875% 11/15/21 | 470,000 | 506,436 | ||||||||||
4.00% 9/13/29 | GBP | 216,000 | 351,577 | |||||||||
Anheuser-Busch InBev Finance 0.655% 2/1/19 • | 840,000 | 840,774 | ||||||||||
Anheuser-Busch InBev Worldwide | 1,000,000 | 1,153,100 | ||||||||||
Bayer U.S. Finance 144A | 495,000 | 495,552 | ||||||||||
Becton Dickinson | ||||||||||||
0.721% 6/15/16 • | 1,000,000 | 1,001,517 | ||||||||||
3.734% 12/15/24 | 890,000 | 933,330 | ||||||||||
Boston Scientific | ||||||||||||
2.65% 10/1/18 | 205,000 | 207,428 | ||||||||||
6.00% 1/15/20 | 1,665,000 | 1,918,453 | ||||||||||
BRF | ||||||||||||
144A 3.95% 5/22/23 # | 465,000 | 432,892 | ||||||||||
144A 4.75% 5/22/24 # | 600,000 | 585,000 | ||||||||||
Campbell Soup | 1,275,000 | 1,299,010 | ||||||||||
CareFusion | 1,330,000 | 1,556,442 | ||||||||||
CDK Global 144A | 700,000 | 722,850 | ||||||||||
Celgene | ||||||||||||
3.25% 8/15/22 | 925,000 | 947,267 | ||||||||||
3.95% 10/15/20 | 925,000 | 999,428 | ||||||||||
Cencosud 144A | 1,420,000 | 1,405,409 | ||||||||||
| Principal amount° | Value (U.S. $) | |||||||
| ||||||||
Corporate Bonds (continued) |
| |||||||
| ||||||||
Consumer Non-Cyclical (continued) |
| |||||||
Community Health Systems | 2,590,000 | $ | 2,781,013 | |||||
ConAgra Foods | 260,000 | 259,077 | ||||||
DaVita HealthCare Partners | 705,000 | 720,422 | ||||||
EMD Finance | ||||||||
144A 2.95% 3/19/22 # | 570,000 | 577,567 | ||||||
144A 3.25% 3/19/25 # | 1,240,000 | 1,257,140 | ||||||
ENA Norte Trust 144A | 533,783 | 551,131 | ||||||
Express Scripts Holding | ||||||||
2.25% 6/15/19 | 765,000 | 769,211 | ||||||
3.50% 6/15/24 | 1,045,000 | 1,077,914 | ||||||
Fresenius Medical Care U.S. Finance II 144A | 355,000 | . 392,275 | ||||||
Gilead Sciences | 920,000 | 971,356 | ||||||
HCA | ||||||||
3.75% 3/15/19 | 1,200,000 | 1,219,128 | ||||||
5.375% 2/1/25 | 1,330,000 | 1,401,487 | ||||||
HealthSouth | ||||||||
5.125% 3/15/23 | 235,000 | 240,287 | ||||||
5.75% 11/1/24 | 165,000 | 172,425 | ||||||
Heinz (H.J.) 144A | 300,000 | 325,875 | ||||||
HPHT Finance 15 144A | 835,000 | 844,491 | ||||||
Immucor 11.125% 8/15/19 | 470,000 | 507,013 | ||||||
JBS Investments 144A | 1,540,000 | 1,636,250 | ||||||
Kimberly-Clark | 900,000 | 900,941 | ||||||
Kinetic Concepts | 290,000 | 314,650 | ||||||
Kroger 0.787% 10/17/16 • | 420,000 | 420,960 | ||||||
Lilly (Eli) 2.75% 6/1/25 | 680,000 | 683,886 | ||||||
Medtronic | ||||||||
0.351% 2/27/17 • | 1,430,000 | 1,426,278 | ||||||
144A 3.15% 3/15/22 # | 1,360,000 | 1,413,494 | ||||||
144A 3.50% 3/15/25 # | 1,210,000 | 1,266,518 | ||||||
Merck | ||||||||
0.616% 5/18/18 • | 835,000 | 838,221 | ||||||
0.631% 2/10/20 • | 900,000 | 904,706 | ||||||
2.35% 2/10/22 | 840,000 | 841,535 | ||||||
2.75% 2/10/25 | 1,985,000 | 1,985,945 | ||||||
Minerva Luxembourg 144A | 260,000 | 256,750 | ||||||
| (continues | ) | 55 |
Table of Contents
Schedules of investments
Optimum Fixed Income Fund
| Principal amount° | Value (U.S. $) | |||||||||||
| ||||||||||||
Corporate Bonds (continued) |
| |||||||||||
| ||||||||||||
Consumer Non-Cyclical (continued) |
| |||||||||||
Mondelez International | 750,000 | $ | 770,376 | |||||||||
Omnicare 5.00% 12/1/24 | 235,000 | 246,750 | ||||||||||
Par Pharmaceutical | 510,000 | 540,600 | ||||||||||
Pernod-Ricard 144A | 1,850,000 | 2,149,643 | ||||||||||
Perrigo | ||||||||||||
4.00% 11/15/23 | 1,125,000 | 1,177,577 | ||||||||||
5.30% 11/15/43 | 320,000 | 363,896 | ||||||||||
Perrigo Finance | 1,975,000 | 2,045,509 | ||||||||||
Pfizer 0.571% 6/15/18 • | 754,000 | 754,841 | ||||||||||
Prestige Brands 144A | 475,000 | 483,313 | ||||||||||
Red de Carreteras de Occidente 144A | MXN | 8,440,000 | 535,077 | |||||||||
Service International | 275,000 | 288,750 | ||||||||||
Smithfield Foods | 225,000 | 241,594 | ||||||||||
Smucker (J.M.) | ||||||||||||
144A 3.00% 3/15/22 # | 325,000 | 330,395 | ||||||||||
144A 3.50% 3/15/25 # | 1,475,000 | 1,519,496 | ||||||||||
144A 4.25% 3/15/35 # | 395,000 | 410,503 | ||||||||||
Spectrum Brands | ||||||||||||
6.375% 11/15/20 | 405,000 | 431,325 | ||||||||||
6.625% 11/15/22 | 860,000 | 924,500 | ||||||||||
Tenet Healthcare | 728,000 | 773,500 | ||||||||||
Thermo Fisher Scientific | ||||||||||||
2.40% 2/1/19 | 1,430,000 | 1,451,403 | ||||||||||
3.30% 2/15/22 | 640,000 | 657,240 | ||||||||||
United Rentals North America | ||||||||||||
4.625% 7/15/23 | 700,000 | 709,625 | ||||||||||
5.50% 7/15/25 | 560,000 | 571,900 | ||||||||||
5.75% 11/15/24 | 535,000 | 555,063 | ||||||||||
VRX Escrow | ||||||||||||
144A 4.50% 5/15/23 # | EUR | 4,200,000 | 4,551,896 | |||||||||
144A 5.375% 3/15/20 # | 400,000 | 404,500 | ||||||||||
144A 5.875% 5/15/23 # | 880,000 | 904,200 | ||||||||||
Zimmer Holdings | ||||||||||||
3.15% 4/1/22 | 365,000 | 369,756 | ||||||||||
3.375% 11/30/21 | 1,290,000 | 1,327,567 | ||||||||||
3.55% 4/1/25 | 1,275,000 | 1,303,049 | ||||||||||
4.625% 11/30/19 | 1,270,000 | 1,400,080 | ||||||||||
| Principal amount° | Value (U.S. $) | |||||||
| ||||||||
Corporate Bonds (continued) |
| |||||||
| ||||||||
Consumer Non-Cyclical (continued) |
| |||||||
Zoetis 3.25% 2/1/23 | 2,335,000 | $ | 2,331,056 | |||||
|
| |||||||
| 83,495,551 | ||||||||
|
| |||||||
Energy – 3.58% | ||||||||
Anadarko Petroleum | 1,825,000 | 1,874,640 | ||||||
BP Capital Markets | 160,000 | 177,247 | ||||||
Bristow Group | 420,000 | 401,100 | ||||||
California Resources | ||||||||
144A 5.00% 1/15/20 # | 535,000 | 485,513 | ||||||
144A 5.50% 9/15/21 # | 240,000 | 214,128 | ||||||
144A 6.00% 11/15/24 # | 750,000 | 661,875 | ||||||
Canadian Natural Resources | 680,000 | 679,201 | ||||||
Chaparral Energy | 580,000 | 394,400 | ||||||
Chesapeake Energy | ||||||||
3.503% 4/15/19 • | 300,000 | 289,500 | ||||||
5.75% 3/15/23 | 1,885,000 | 1,847,300 | ||||||
Chevron | ||||||||
0.792% 3/3/22 • | 1,575,000 | 1,580,791 | ||||||
1.961% 3/3/20 | 1,005,000 | 1,012,131 | ||||||
2.411% 3/3/22 | 570,000 | 571,601 | ||||||
Cimarex Energy | 565,000 | 563,587 | ||||||
CNOOC Finance 2012 144A | 8,955,000 | 9,341,668 | ||||||
ConocoPhillips | 435,000 | 462,877 | ||||||
Continental Resources | 2,190,000 | 2,128,993 | ||||||
Devon Energy | 500,000 | 494,421 | ||||||
EOG Resources | 870,000 | 888,403 | ||||||
Exterran Partners | 130,000 | 120,250 | ||||||
Exxon Mobil | ||||||||
0.634% 3/6/22 • | 1,125,000 | 1,129,164 | ||||||
2.397% 3/6/22 | 605,000 | 610,325 | ||||||
2.709% 3/6/25 | 2,325,000 | 2,351,679 | ||||||
Freeport-McMoRan Oil & Gas | 514,000 | 546,767 | ||||||
Harvest Operations | 500,000 | 503,589 | ||||||
KazMunayGas National 144A | 405,000 | 405,810 | ||||||
| 56 |
Table of Contents
| Principal amount° | Value (U.S. $) | |||||||
| ||||||||
Corporate Bonds (continued) |
| |||||||
| ||||||||
Energy (continued) | ||||||||
Laredo Petroleum | 405,000 | $ | 419,681 | |||||
Lukoil International Finance | 515,000 | 475,474 | ||||||
MarkWest Energy Partners | 790,000 | 811,646 | ||||||
Murphy Oil USA | 550,000 | 592,625 | ||||||
Newfield Exploration | ||||||||
5.375% 1/1/26 | 1,110,000 | 1,123,320 | ||||||
5.625% 7/1/24 | 855,000 | 893,475 | ||||||
Noble Energy | ||||||||
3.90% 11/15/24 | 360,000 | 366,959 | ||||||
5.05% 11/15/44 | 705,000 | 742,641 | ||||||
Noble Holding International | 250,000 | 251,557 | ||||||
Northern Oil & Gas | 175,000 | 156,187 | ||||||
Oasis Petroleum | 520,000 | 509,600 | ||||||
ONGC Videsh | 400,000 | 407,138 | ||||||
PDC Energy 7.75% 10/15/22 | 125,000 | 131,875 | ||||||
Petrobras Global Finance | ||||||||
1.881% 5/20/16 • | 2,300,000 | 2,179,480 | ||||||
2.00% 5/20/16 | 200,000 | 191,800 | ||||||
2.393% 1/15/19 • | 500,000 | 434,375 | ||||||
2.631% 3/17/17 • | 600,000 | 553,440 | ||||||
3.00% 1/15/19 | 786,000 | 680,534 | ||||||
3.151% 3/17/20 • | 425,000 | 367,625 | ||||||
3.50% 2/6/17 | 600,000 | 563,010 | ||||||
4.875% 3/17/20 | 1,028,000 | 925,714 | ||||||
5.375% 1/27/21 | 600,000 | 547,290 | ||||||
5.875% 3/1/18 | 1,130,000 | 1,084,800 | ||||||
6.125% 10/6/16 | 100,000 | 99,974 | ||||||
7.875% 3/15/19 | 700,000 | 716,072 | ||||||
Petroleos Mexicanos | 400,000 | 406,420 | ||||||
6.50% 6/2/41 | 390,000 | 443,625 | ||||||
Petronas Capital 144A | 215,000 | 216,824 | ||||||
Petronas Global Sukuk 144A | 1,240,000 | 1,247,601 | ||||||
Pride International | 2,785,000 | 3,175,229 | ||||||
PTT Exploration & Production 144A | 900,000 | 904,500 | ||||||
| Principal amount° | Value (U.S. $) | |||||||
| ||||||||
Corporate Bonds (continued) |
| |||||||
| ||||||||
Energy (continued) | ||||||||
Regency Energy Partners | ||||||||
5.50% 4/15/23 | 220,000 | $ | 228,250 | |||||
5.875% 3/1/22 | 140,000 | 152,600 | ||||||
Reliance Industries 144A | 415,000 | 397,101 | ||||||
Shell International Finance | 340,000 | 340,778 | ||||||
Sinopec Group Overseas Development 2012 144A | 3,200,000 | 3,366,570 | ||||||
Sinopec Group Overseas Development 2014 | 4,600,000 | 5,009,225 | ||||||
Southwestern Energy | ||||||||
4.05% 1/23/20 | 200,000 | 206,896 | ||||||
7.50% 2/1/18 | 2,500,000 | 2,825,805 | ||||||
Statoil 0.716% 11/8/18 • | 835,000 | 835,714 | ||||||
Talisman Energy | 1,325,000 | 1,316,910 | ||||||
Total Capital International | 840,000 | 845,132 | ||||||
Valero Energy | ||||||||
3.65% 3/15/25 | 880,000 | 901,835 | ||||||
4.90% 3/15/45 | 460,000 | 477,457 | ||||||
Williams 4.55% 6/24/24 | 685,000 | 664,663 | ||||||
Woodside Finance | ||||||||
144A 3.65% | 1,025,000 | 1,017,877 | ||||||
144A 8.75% | 1,125,000 | 1,383,103 | ||||||
YPF | ||||||||
7.758% 8/15/18 • | 411,765 | 420,000 | ||||||
144A 8.75% | 510,000 | 523,056 | ||||||
144A 8.875% | 510,000 | 525,785 | ||||||
|
| |||||||
| 72,796,208 | ||||||||
|
| |||||||
Finance Companies – 1.74% |
| |||||||
American Express | 6,600,000 | 7,630,293 | ||||||
American Express Credit | 1,500,000 | 1,500,741 | ||||||
BM&FBovespa | 1,000,000 | 1,075,000 | ||||||
BOC Aviation 144A | 500,000 | 499,667 | ||||||
Citicorp Lease Pass Through Trust Series 1999-1 144A 8.04% 12/15/19 # ¿ | 200,000 | 246,006 | ||||||
CME Group 3.00% 3/15/25 | 865,000 | 874,881 | ||||||
Corp Financiera de Desarrollo | 315,000 | 328,340 | ||||||
| (continues | ) | 57 |
Table of Contents
Schedules of investments
Optimum Fixed Income Fund
| Principal amount° | Value (U.S. $) | |||||||||||
| ||||||||||||
Corporate Bonds (continued) |
| |||||||||||
| ||||||||||||
Finance Companies (continued) |
| |||||||||||
General Electric Capital |
| |||||||||||
0.635% 5/5/26 • | 920,000 | $ | 865,272 | |||||||||
2.20% 1/9/20 | 875,000 | 885,243 | ||||||||||
144A 3.80% 6/18/19 # | 345,000 | 369,603 | ||||||||||
4.208% 12/6/21 | SEK | 1,000,000 | 138,026 | |||||||||
4.25% 1/17/18 | NZD | 140,000 | 105,484 | |||||||||
4.65% 10/17/21 | 310,000 | 351,351 | ||||||||||
5.55% 5/4/20 | 470,000 | 547,842 | ||||||||||
6.00% 8/7/19 | 1,025,000 | 1,198,549 | ||||||||||
7.125% 12/29/49 • | 2,100,000 | 2,472,750 | ||||||||||
GMAC International Finance | EUR | 100,000 | 107,946 | |||||||||
HSBC Finance | 1,500,000 | 1,498,224 | ||||||||||
Hutchison Whampoa | ||||||||||||
International 14 144A | 765,000 | 785,291 | ||||||||||
International Lease Finance | ||||||||||||
4.875% 4/1/15 | 200,000 | 200,000 | ||||||||||
5.75% 5/15/16 | 900,000 | 936,675 | ||||||||||
144A 6.75% 9/1/16 # | 1,640,000 | 1,746,600 | ||||||||||
144A 7.125% 9/1/18 # | 100,000 | 112,500 | ||||||||||
8.625% 9/15/15 | 1,200,000 | 1,236,000 | ||||||||||
Murray Street Investment | ||||||||||||
Trust I 4.647% 3/9/17 | 4,700,000 | 4,982,935 | ||||||||||
Navient | ||||||||||||
6.25% 1/25/16 | 665,000 | 685,781 | ||||||||||
7.25% 1/25/22 | 550,000 | 581,625 | ||||||||||
Springleaf Finance | 700,000 | 713,195 | ||||||||||
SUAM Finance 144A | 985,000 | 1,021,937 | ||||||||||
Synchrony Financial | 500,000 | 502,903 | ||||||||||
Waha Aerospace | 1,155,000 | 1,214,194 | ||||||||||
|
| |||||||||||
| 35,414,854 | ||||||||||||
|
| |||||||||||
Insurance – 1.28% |
| |||||||||||
American International Group | ||||||||||||
3.875% 1/15/35 | 3,405,000 | 3,433,820 | ||||||||||
8.175% 5/15/58 • | 795,000 | 1,131,325 | ||||||||||
Berkshire Hathaway Finance | ||||||||||||
0.402% 1/10/17 • | 120,000 | 120,073 | ||||||||||
2.90% 10/15/20 | 885,000 | 935,894 | ||||||||||
Chubb 6.375% 3/29/67 • | 820,000 | 873,300 | ||||||||||
Five Corners Funding Trust | ||||||||||||
144A 4.419% 11/15/23 # | 3,265,000 | 3,509,069 | ||||||||||
| Principal amount° | Value (U.S. $) | |||||||
| ||||||||
Corporate Bonds (continued) |
| |||||||
| ||||||||
Insurance (continued) | ||||||||
Highmark | ||||||||
144A 4.75% 5/15/21 # | 445,000 | $ | 468,673 | |||||
144A 6.125% 5/15/41 # | 160,000 | 171,825 | ||||||
HUB International 144A | 380,000 | 390,450 | ||||||
Jackson National Life Global Funding 144A | 200,000 | 200,561 | ||||||
Liberty Mutual Group | ||||||||
144A 4.25% 6/15/23 # | 925,000 | 986,957 | ||||||
144A 4.95% | 320,000 | 354,016 | ||||||
MetLife 3.60% 4/10/24 | 950,000 | 1,005,167 | ||||||
MetLife Capital Trust IV 144A 7.875% | 300,000 | 399,000 | ||||||
MetLife Capital Trust X 144A | 1,100,000 | 1,643,125 | ||||||
Metropolitan Life Global Funding I 144A | 835,000 | 839,404 | ||||||
Peachtree Corners Funding Trust 144A | 705,000 | 716,627 | ||||||
Prudential Financial | ||||||||
4.50% 11/15/20 | 275,000 | 306,400 | ||||||
5.625% 6/15/43 • | 440,000 | 468,600 | ||||||
5.875% 9/15/42 • | 555,000 | 605,644 | ||||||
Stone Street Trust 144A | 2,300,000 | 2,371,114 | ||||||
TIAA Asset Management Finance | ||||||||
144A 2.95% 11/1/19 # | 1,420,000 | 1,456,897 | ||||||
144A 4.125% 11/1/24 # | 1,460,000 | 1,544,078 | ||||||
USI 144A 7.75% 1/15/21 # | 65,000 | 66,950 | ||||||
Voya Financial | ||||||||
5.65% 5/15/53 • | 920,000 | 966,000 | ||||||
XLIT | ||||||||
4.45% 3/31/25 | 490,000 | 494,159 | ||||||
6.50% 10/29/49 • | 655,000 | 581,313 | ||||||
|
| |||||||
| 26,040,441 | ||||||||
|
| |||||||
Natural Gas – 1.53% | ||||||||
AmeriGas Finance | 435,000 | 468,713 | ||||||
Enbridge Energy Partners | 1,210,000 | 1,303,775 | ||||||
Energy Transfer Partners | ||||||||
4.05% 3/15/25 | 1,435,000 | 1,450,024 | ||||||
4.90% 3/15/35 | 440,000 | 438,411 | ||||||
5.15% 3/15/45 | 570,000 | 575,746 | ||||||
9.70% 3/15/19 | 694,000 | 873,087 | ||||||
| 58 |
Table of Contents
| Principal amount° | Value (U.S. $) | |||||||
| ||||||||
Corporate Bonds (continued) |
| |||||||
| ||||||||
Natural Gas (continued) |
| |||||||
EnLink Midstream Partners | 870,000 | $ | 888,408 | |||||
Enterprise Products Operating | 1,645,000 | 1,779,574 | ||||||
Florida Gas Transmission 144A | 320,000 | 382,682 | ||||||
Kinder Morgan | ||||||||
144A 5.00% | 550,000 | 588,581 | ||||||
7.00% 6/15/17 | 800,000 | 882,885 | ||||||
Kinder Morgan | ||||||||
5.95% 2/15/18 | 1,000,000 | 1,106,272 | ||||||
6.85% 2/15/20 | 700,000 | 817,886 | ||||||
9.00% 2/1/19 | 1,280,000 | 1,560,454 | ||||||
Kinder Morgan Energy Partners | 620,000 | 665,957 | ||||||
ONEOK Partners | 515,000 | 525,688 | ||||||
Plains All American Pipeline |
| |||||||
6.50% 5/1/18 | 800,000 | 908,469 | ||||||
8.75% 5/1/19 | 1,160,000 | 1,447,128 | ||||||
Ras Laffan Liquefied Natural Gas II 5.298% 9/30/20 @ | 1,718,100 | 1,855,118 | ||||||
Rockies Express Pipeline | 500,000 | 542,500 | ||||||
Sabine Pass Liquefaction | 5,500,000 | 5,555,000 | ||||||
Suburban Propane Partners | 115,000 | 124,200 | ||||||
Sunoco Logistics Partners Operations | 1,235,000 | 1,217,194 | ||||||
Texas Eastern Transmission 144A | 800,000 | 883,567 | ||||||
TransCanada PipeLines | 1,790,000 | 1,740,775 | ||||||
Williams Partners | ||||||||
4.00% 9/15/25 | 1,465,000 | 1,439,858 | ||||||
7.25% 2/1/17 | 1,010,000 | 1,110,057 | ||||||
|
| |||||||
| 31,132,009 | ||||||||
|
| |||||||
Real Estate – 1.46% | ||||||||
Alexandria Real | ||||||||
4.50% 7/30/29 | 450,000 | 476,296 | ||||||
4.60% 4/1/22 | 1,080,000 | 1,142,902 | ||||||
AvalonBay Communities | ||||||||
3.50% 11/15/24 | 625,000 | 643,421 | ||||||
Carey (W.P.) 4.60% 4/1/24 | 695,000 | 720,108 | ||||||
| Principal amount° | Value (U.S. $) | |||||||
| ||||||||
Corporate Bonds (continued) |
| |||||||
| ||||||||
Real Estate (continued) | ||||||||
CBL & Associates | ||||||||
4.60% 10/15/24 | 1,105,000 | $ | 1,125,575 | |||||
5.25% 12/1/23 | 185,000 | 198,372 | ||||||
Corporate Office Properties |
| |||||||
3.60% 5/15/23 | 690,000 | 670,830 | ||||||
5.25% 2/15/24 | 800,000 | 871,962 | ||||||
Corrections of America | 388,000 | 389,940 | ||||||
DDR | ||||||||
3.625% 2/1/25 | 350,000 | 350,006 | ||||||
7.50% 4/1/17 | 940,000 | 1,045,518 | ||||||
7.875% 9/1/20 | 731,000 | 912,085 | ||||||
Education Realty Operating Partnership | 950,000 | 989,435 | ||||||
Excel Trust | 460,000 | 483,574 | ||||||
GEO Group | ||||||||
5.125% 4/1/23 | 285,000 | 292,125 | ||||||
5.875% 10/15/24 | 285,000 | 297,825 | ||||||
Goodman Funding 144A | 5,300,000 | 6,211,224 | ||||||
HCP | 2,300,000 | 2,592,484 | ||||||
Hospitality Properties Trust | 870,000 | 891,910 | ||||||
Omega Healthcare Investors 144A | 955,000 | 942,871 | ||||||
Prologis | 300,000 | 317,222 | ||||||
Qatari Diar Finance | ||||||||
3.50% 7/21/15 | 2,100,000 | 2,119,383 | ||||||
5.00% 7/21/20 | 500,000 | 563,630 | ||||||
Regency Centers | 285,000 | 311,722 | ||||||
Trust F/1401 144A | 1,150,000 | 1,239,125 | ||||||
WEA Finance 144A | 3,855,000 | 3,995,044 | ||||||
|
| |||||||
| 29,794,589 | ||||||||
|
| |||||||
Technology – 1.28% | ||||||||
Activision Blizzard 144A | 470,000 | 513,475 | ||||||
Apple | ||||||||
0.555% 5/6/19 • | 840,000 | 844,556 | ||||||
3.45% 2/9/45 | 2,235,000 | 2,127,353 | ||||||
Baidu 2.75% 6/9/19 | 1,116,000 | 1,129,768 | ||||||
CDW 5.00% 9/1/23 | 190,000 | 193,325 | ||||||
Cisco Systems | 650,000 | 655,628 | ||||||
eBay 0.735% 8/1/19 • | 765,000 | 752,263 | ||||||
| (continues | ) | 59 |
Table of Contents
Schedules of investments
Optimum Fixed Income Fund
| Principal amount° | Value (U.S. $) | |||||||
| ||||||||
Corporate Bonds (continued) |
| |||||||
| ||||||||
Technology (continued) |
| |||||||
Equinix | ||||||||
4.875% 4/1/20 | 255,000 | $ | 264,563 | |||||
5.375% 4/1/23 | 493,000 | 514,199 | ||||||
First Data | ||||||||
11.25% 1/15/21 | 907,000 | 1,033,980 | ||||||
11.75% 8/15/21 | 281,000 | 326,311 | ||||||
Hewlett-Packard | ||||||||
1.193% 1/14/19 · | 420,000 | 416,227 | ||||||
2.65% 6/1/16 | 130,000 | 132,468 | ||||||
International Business Machines | ||||||||
0.835% 11/6/21 · | 690,000 | 695,069 | ||||||
1.625% 5/15/20 | 440,000 | 434,625 | ||||||
Jabil Circuit 7.75% 7/15/16 | 92,000 | 99,130 | ||||||
Micron Technology 144A | 1,730,000 | 1,764,600 | ||||||
Microsoft | ||||||||
2.70% 2/12/25 | 540,000 | 542,767 | ||||||
3.50% 2/12/35 | 500,000 | 499,747 | ||||||
3.75% 2/12/45 | 1,045,000 | 1,051,776 | ||||||
National Semiconductor | 1,530,000 | 1,712,688 | ||||||
NetApp 3.25% 12/15/22 | 745,000 | 738,021 | ||||||
NXP 144A 5.75% 3/15/23 # | 270,000 | 287,550 | ||||||
Oracle | ||||||||
0.784% 10/8/19 · | 940,000 | 945,209 | ||||||
4.30% 7/8/34 | 370,000 | 402,262 | ||||||
Samsung Electronics America | 745,000 | 751,596 | ||||||
Seagate HDD Cayman | ||||||||
144A 4.75% 1/1/25 # | 945,000 | 980,445 | ||||||
144A 5.75% 12/1/34 # | 1,050,000 | 1,125,613 | ||||||
Symantec 4.20% 9/15/20 | 2,000,000 | 2,110,332 | ||||||
Tencent Holdings | ||||||||
144A 2.875% 2/11/20 # | 710,000 | 715,969 | ||||||
144A 3.375% 5/2/19 # | 555,000 | 575,598 | ||||||
144A 3.80% 2/11/25 # | 305,000 | 312,320 | ||||||
Xerox 6.35% 5/15/18 | 1,220,000 | 1,378,788 | ||||||
|
| |||||||
| 26,028,221 | ||||||||
|
| |||||||
Transportation – 0.89% | ||||||||
Air Canada 2015-1 Class A | 580,000 | 580,000 | ||||||
American Airlines 2011-1 | 433,673 | 470,535 | ||||||
| Principal amount° | Value (U.S. $) | |||||||
| ||||||||
Corporate Bonds (continued) |
| |||||||
| ||||||||
Transportation (continued) | ||||||||
American Airlines 2014-1 | 470,000 | $ | 486,450 | |||||
American Airlines 2015-1 | 375,000 | 377,813 | ||||||
AP Moeller – Maersk 144A | 500,000 | 508,745 | ||||||
Aviation Capital Group 144A | 790,000 | 900,177 | ||||||
Brambles USA | ||||||||
144A 3.95% 4/1/15 # | 395,000 | 395,000 | ||||||
144A 5.35% 4/1/20 # | 320,000 | 359,713 | ||||||
Burlington Northern Santa Fe | 495,000 | 517,645 | ||||||
Continental Airlines 2009-2 | 697,186 | 806,993 | ||||||
Delta Air Lines Class A Pass | 302,562 | 355,147 | ||||||
Doric Nimrod Air Finance | 1,660,762 | 1,765,059 | ||||||
ERAC USA Finance | ||||||||
144A 4.50% 2/15/45 # | 165,000 | 167,606 | ||||||
144A 5.25% 10/1/20 # | 1,470,000 | 1,679,293 | ||||||
Kansas City Southern de Mexico | 900,000 | 898,378 | ||||||
Norfolk Southern | 1,085,000 | 1,173,067 | ||||||
Penske Truck Leasing | ||||||||
144A 2.50% 3/15/16 # | 1,400,000 | 1,420,604 | ||||||
144A 3.75% 5/11/17 # | 200,000 | 208,701 | ||||||
UAL 2009-1 Pass Through Trust | 159,514 | 174,078 | ||||||
UAL 2009-2A Pass Through | 617,341 | 685,248 | ||||||
United Airlines 2014-1 Class | 350,000 | 369,250 | ||||||
United Airlines 2014-2 Class | 650,000 | 677,625 | ||||||
United Parcel Service | 2,210,000 | 2,515,287 | ||||||
60
Table of Contents
| Principal amount° | Value (U.S. $) | |||||||
| ||||||||
Corporate Bonds (continued) |
| |||||||
| ||||||||
Transportation (continued) |
| |||||||
US Airways 2012-2 Class A Pass Through Trust 4.625% 6/3/25 ¿ | 633,978 | $ | 678,357 | |||||
|
| |||||||
| 18,170,771 | ||||||||
|
| |||||||
Utilities – 3.34% | ||||||||
AES | ||||||||
5.50% 3/15/24 | 515,000 | 516,287 | ||||||
5.50% 4/15/25 | 440,000 | 435,600 | ||||||
7.375% 7/1/21 | 419,000 | 467,185 | ||||||
AES Gener | ||||||||
144A 5.25% 8/15/21 # 144A | 420,000 | 452,820 | ||||||
8.375% 12/18/73 #· | 676,000 | 743,668 | ||||||
Ameren Illinois | ||||||||
3.25% 3/1/25 | 810,000 | 845,938 | ||||||
9.75% 11/15/18 | 2,110,000 | 2,681,082 | ||||||
American Transmission Systems 144A | 3,135,000 | 3,607,037 | ||||||
Appalachian Power | 1,000,000 | 1,246,961 | ||||||
Berkshire Hathaway Energy | ||||||||
3.75% 11/15/23 | 1,235,000 | 1,318,881 | ||||||
4.50% 2/1/45 | 555,000 | 606,756 | ||||||
Calpine 5.375% 1/15/23 | 415,000 | 417,075 | ||||||
CenterPoint Energy | 35,000 | 37,979 | ||||||
Cleveland Electric Illuminating | 515,000 | 621,259 | ||||||
CMS Energy 6.25% 2/1/20 | 635,000 | 751,040 | ||||||
ComEd Financing III | 680,000 | 702,343 | ||||||
Comision Federal de Electricidad 144A | 575,000 | 613,813 | ||||||
Dominion Gas Holdings 3.60% 12/15/24 | 1,210,000 | 1,271,224 | ||||||
DTE Energy | 1,505,000 | 1,531,145 | ||||||
Duke Energy | 1,000,000 | 1,011,388 | ||||||
Duke Energy Indiana | 835,000 | 836,103 | ||||||
Duquesne Light Holdings | 756,000 | 768,654 | ||||||
Dynegy 5.875% 6/1/23 | 515,000 | 503,413 | ||||||
Dynegy Finance I/II | ||||||||
144A 6.75% 11/1/19 # | 110,000 | 113,987 | ||||||
144A 7.375% 11/1/22 # | 165,000 | 174,075 | ||||||
144A 7.625% 11/1/24 # | 1,695,000 | 1,781,869 | ||||||
| Principal amount° | Value (U.S. $) | |||||||
| ||||||||
Corporate Bonds (continued) |
| |||||||
| ||||||||
Utilities (continued) |
| |||||||
E.CL 144A 5.625% | 260,000 | $ | 289,053 | |||||
Electricite de France | ||||||||
144A 0.717% 1/20/17 #· | 840,000 | 841,719 | ||||||
144A 4.60% 1/27/20 # | 525,000 | 586,004 | ||||||
144A 5.25% 1/29/49 #· | 1,785,000 | 1,867,110 | ||||||
Enel 144A | ||||||||
8.75% 9/24/73 #· | 1,405,000 | 1,697,906 | ||||||
Entergy 3.625% 9/15/15 | 215,000 | 217,516 | ||||||
Entergy Arkansas | ||||||||
3.70% 6/1/24 | 115,000 | 123,358 | ||||||
3.75% 2/15/21 | 200,000 | 215,160 | ||||||
Entergy Louisiana | ||||||||
4.05% 9/1/23 | 1,555,000 | 1,710,097 | ||||||
Eskom Holdings 144A | ||||||||
7.125% 2/11/25 # | 470,000 | 474,465 | ||||||
FirstEnergy 2.75% 3/15/18 | 1,000,000 | 1,024,813 | ||||||
Great Plains Energy | 910,000 | 1,019,094 | ||||||
Integrys Energy Group | 1,200,000 | 1,176,454 | ||||||
IPALCO Enterprises | 405,000 | 431,325 | ||||||
ITC Holdings 3.65% 6/15/24 | 4,300,000 | 4,465,331 | ||||||
Jersey Central Power & Light | 1,000,000 | 1,182,877 | ||||||
Laclede Group | 700,000 | 699,555 | ||||||
LG&E & KU Energy | ||||||||
3.75% 11/15/20 | 1,175,000 | 1,245,039 | ||||||
4.375% 10/1/21 | 1,555,000 | 1,718,732 | ||||||
Majapahit Holding | 400,000 | 473,600 | ||||||
Metropolitan Edison 144A | 600,000 | 628,056 | ||||||
National Rural Utilities Cooperative Finance | ||||||||
2.85% 1/27/25 | 715,000 | 721,449 | ||||||
4.75% 4/30/43 · | 1,640,000 | 1,649,020 | ||||||
NextEra Energy Capital Holdings | ||||||||
2.40% 9/15/19 | 1,455,000 | 1,473,611 | ||||||
2.70% 9/15/19 | 450,000 | 461,570 | ||||||
3.625% 6/15/23 | 490,000 | 513,744 | ||||||
NV Energy 6.25% 11/15/20 | 1,135,000 | 1,348,681 | ||||||
Pedernales Electric Cooperative 144A | ||||||||
6.202% 11/15/32 # | 620,000 | 759,120 | ||||||
Pennsylvania Electric | 1,180,000 | 1,307,757 | ||||||
| (continues | ) | 61 |
Table of Contents
Schedules of investments
Optimum Fixed Income Fund
| Principal amount° | Value (U.S. $) | |||||||
| ||||||||
Corporate Bonds (continued) |
| |||||||
| ||||||||
Utilities (continued) | ||||||||
Perusahaan Listrik Negara 144A | 900,000 | $ | 986,625 | |||||
Public Service of New Hampshire | 635,000 | 676,919 | ||||||
Public Service of Oklahoma | 1,300,000 | 1,469,335 | ||||||
Puget Energy | ||||||||
6.00% 9/1/21 | 340,000 | 401,999 | ||||||
6.50% 12/15/20 | 3,800,000 | 4,573,733 | ||||||
Saudi Electricity Global Sukuk 3 144A | 252,000 | 274,630 | ||||||
SCANA 4.125% 2/1/22 | 810,000 | 852,836 | ||||||
Southwestern Electric Power | 690,000 | 805,120 | ||||||
State Grid Overseas Investment 2014 | ||||||||
144A 2.75% 5/7/19 # | 490,000 | 499,756 | ||||||
144A 4.125% 5/7/24 # | 315,000 | 341,840 | ||||||
Trans-Allegheny Interstate Line 144A | 960,000 | 1,004,854 | ||||||
Transelec 144A | 700,000 | 716,872 | ||||||
Wisconsin Energy | 1,015,000 | 1,017,506 | ||||||
|
| |||||||
| 68,001,823 | ||||||||
|
| |||||||
Total Corporate Bonds |
| 820,648,270 | ||||||
|
| |||||||
| ||||||||
Municipal Bonds – 2.26% |
| |||||||
| ||||||||
American Municipal Power, | 1,500,000 | 2,432,520 | ||||||
Atlanta,Georgia Water & | 510,000 | 588,096 | ||||||
Bay Area,California Toll | ||||||||
6.918% 4/1/40 | 800,000 | 1,127,848 | ||||||
7.043% 4/1/50 | 3,000,000 | 4,506,930 | ||||||
| Principal amount° | Value (U.S. $) | |||||||
| ||||||||
Municipal Bonds (continued) |
| |||||||
| ||||||||
California State | ||||||||
7.35% 11/1/39 | 2,000,000 | $ | 3,002,640 | |||||
7.60% 11/1/40 | 1,900,000 | 3,057,252 | ||||||
California State Various Purpose | 885,000 | 1,025,954 | ||||||
(Taxable Build America Bonds) | ||||||||
7.30% 10/1/39 | 200,000 | 298,808 | ||||||
7.55% 4/1/39 | 1,900,000 | 2,974,488 | ||||||
Chicago, Illinois Transit | 1,800,000 | 2,325,294 | ||||||
(Retiree Health Care | 1,800,000 | 2,325,294 | ||||||
Clark County, Nevada Airport | 1,500,000 | 2,212,050 | ||||||
Golden State, California | ||||||||
Series A-1 5.125% 6/1/47 | 370,000 | 287,464 | ||||||
Series A-1 5.75% 6/1/47 | 405,000 | 343,250 | ||||||
Golden State, California | ||||||||
5.00% 6/1/40 | 1,530,000 | 1,747,352 | ||||||
5.00% 6/1/45 | 485,000 | 551,207 | ||||||
Los Angeles,California | 800,000 | 1,160,256 | ||||||
Maryland State Local Facilities | 405,000 | 490,629 | ||||||
Mississippi State | 385,000 | 485,269 | ||||||
Missouri State Highway & | 215,000 | 275,796 | ||||||
62
Table of Contents
| Principal amount° | Value (U.S. $) | |||||||
| ||||||||
Municipal Bonds (continued) |
| |||||||
| ||||||||
Municipal Electric Authority of Georgia (Plant Vogtle Units 3 & 4 Project) | 1,800,000 | $ | 2,358,828 | |||||
New Jersey Transportation | 450,000 | 478,273 | ||||||
New York City,New York | 295,000 | 353,097 | ||||||
New York City,New York | 700,000 | 887,306 | ||||||
New York City,New York Water & Sewer System Series EE 5.00% 6/15/45 |
| 755,000 |
|
| 866,800 |
| ||
New York State Thruway Authority Revenue Series A 5.00% 5/1/19 |
| 415,000 |
|
| 475,071 |
| ||
New York State Urban Development (Build America Bonds) 5.77% 3/15/39 |
| 800,000 |
|
| 997,376 |
| ||
Oregon State Taxable Pension 5.892% 6/1/27 |
| 65,000 |
|
| 80,859 |
| ||
Pennsylvania Turnpike Commission Series B-1 1.00% 12/1/21 · |
| 750,000 |
|
| 757,365 |
| ||
Port Authority of New York & New Jersey Consolidated Bonds (One Hundred Sixty-Fifth Series) 5.647% 11/1/40 |
| 3,300,000 |
|
| 4,234,626 |
| ||
Texas Private Activity Bond Surface Transportation Revenue (Senior Lien Note Mobility) 6.75% 6/30/43 (AMT) |
| 310,000 |
|
| 380,606 |
| ||
Texas State Transportation Commission (Senior Lien Mobility Fund) Series A 5.00% 10/1/44 |
| 1,285,000 |
|
| 1,501,869 |
| ||
University of California | ||||||||
Series AO 5.00% 5/15/25 |
| 175,000 |
|
| 221,183 |
| ||
Series Y-1 0.679% |
| 500,000 |
|
| 500,010 |
| ||
| Principal amount° | Value (U.S. $) | |||||||
| ||||||||
Municipal Bonds (continued) |
| |||||||
| ||||||||
Utah Transit Authority Series A 5.00% 6/15/25 |
| 200,000 |
| $ | 253,216 |
| ||
Washington State Motor Vehicle Fuel Series C 5.00% 2/1/25 |
| 430,000 |
|
| 536,894 |
| ||
|
| |||||||
Total Municipal Bonds |
| 46,101,776 | ||||||
|
| |||||||
| ||||||||
Non-Agency Asset-Backed Securities – 3.51% |
| |||||||
| ||||||||
ABFC Trust Series 2006-HE1 A2D 0.394% 1/25/37 · |
| 495,456 |
|
| 307,717 |
| ||
Accredited Mortgage Loan Trust | ||||||||
Series 2006-2 A4 0.434% 9/25/36 · | 3,500,000 | 2,920,333 | ||||||
Series 2007-1 A3 0.304% 2/25/37 · |
| 2,918,806 |
|
| 2,772,778 |
| ||
AEP Texas Central Transition Funding II Series 2006-A A4 5.17% 1/1/18 |
| 485,000 |
|
| 515,425 |
| ||
Ally Master Owner Trust Series 2013-2 A 0.625% 4/15/18 · |
| 855,000 |
|
| 855,631 |
| ||
American Express Credit Account Master Trust Series 2013-2 A 0.595% 5/17/21 · |
| 530,000 |
|
| 531,763 |
| ||
AmeriCredit Automobile Receivables Trust Series 2013-5 A2B 0.555% 3/8/17 · |
| 318,584 |
|
| 318,584 |
| ||
Ameriquest Mortgage Securities Asset-Backed Pass Through Certificates | ||||||||
Series 2005-R5 M2 0.634% 7/25/35 ¿· | 1,400,000 | 1,334,882 | ||||||
Series 2005-R7 M2 0.674% 9/25/35 ¿· |
| 2,000,000 |
|
| 1,775,130 |
| ||
Argent Securities Asset-Backed Pass Through Certificates Series 2003-W9 M1 1.206% 1/25/34 ¿· |
| 385,681 |
|
| 370,862 |
| ||
Argent Securities Trust | ||||||||
Series 2006-M1 A2C 0.324% 7/25/36 · | 1,479,621 | 668,548 | ||||||
Series 2006-M1 A2D 0.414% 7/25/36 · | 1,479,621 | 678,545 | ||||||
| (continues | ) | 63 |
Table of Contents
Schedules of investments
Optimum Fixed Income Fund
Principal amount° | Value (U.S. $) | |||||||
| ||||||||
Non-Agency Asset-Backed Securities (continued) |
| |||||||
| ||||||||
Argent Securities Trust | 755,676 | $ | 279,686 | |||||
Avis Budget Rental Car Funding AESOP | ||||||||
Series 2011-3A A 144A 3.41% 11/20/17 # |
| 565,000 |
|
| 583,161 |
| ||
Series 2013-1A A 144A 1.92% 9/20/19 # |
| 700,000 |
|
| 699,927 |
| ||
Series 2014-1A A 144A 2.46% 7/20/20 # |
| 665,000 |
|
| 673,195 |
| ||
BA Credit Card Trust |
| 2,000,000 |
|
| 2,000,474 |
| ||
Bank of America Credit Card Trust | ||||||||
Series 2014-A2 A 0.445% 9/16/19 · |
| 3,300,000 |
|
| 3,300,683 |
| ||
Series 2014-A3 A 0.462% 1/15/20 · |
| 670,000 |
|
| 669,717 |
| ||
Bear Stearns Asset-Backed Securities Trust | 248,499 | 185,133 | ||||||
Bear Stearns Asset-Backed Securities I Trust | ||||||||
Series 2005-FR1 M2 0.841% 6/25/35 · |
| 2,000,000 |
|
| 1,764,482 |
| ||
Series 2007-HE2 1A2 0.344% 3/25/37 · |
| 625,832 |
|
| 593,310 |
| ||
California Republic Auto | 202,028 | 202,871 | ||||||
Centex Home Equity Loan Trust | 5,594 | 5,585 | ||||||
Chase Issuance Trust | ||||||||
Series 2007-A2 A2 0.225% 4/15/19 · |
| 550,000 |
|
| 547,334 |
| ||
Series 2013-A9 A 0.595% 11/16/20 · |
| 1,000,000 |
|
| 1,002,595 |
| ||
Series 2014-A4 A4 0.383% 4/16/18 · | 1,500,000 | 1,499,231 | ||||||
Series 2014-A8 A 0.425% 11/15/18 · |
| 770,000 |
|
| 770,193 |
| ||
Citibank Credit Card Issuance Trust | ||||||||
Series 2006-A8 A8 0.293% 12/17/18 · |
| 500,000 |
|
| 498,711 |
| ||
Principal amount° | Value (U.S. $) | |||||||
| ||||||||
Non-Agency Asset-Backed Securities (continued) |
| |||||||
| ||||||||
Citibank Credit Card Issuance Trust |
| |||||||
Series 2013-A2 A2 0.454% 5/26/20 · |
| 1,450,000 |
| $ | 1,447,428 |
| ||
Series 2014-A7 A7 0.374% 8/24/18 · |
| 1,800,000 |
|
| 1,800,000 |
| ||
Citicorp Residential Mortgage Trust | 900,000 | 897,605 | ||||||
Countrywide Asset-Backed Certificates | ||||||||
Series 2004-3 2A 0.574% 8/25/34 · |
| 59,986 |
|
| 55,448 |
| ||
Series 2005-7 MV3 0.754% 11/25/35 · |
| 400,000 |
|
| 356,052 |
| ||
Series 2005-AB2 2A3 0.559% 11/25/35 · |
| 905,142 |
|
| 860,553 |
| ||
Series 2006-1 AF6 5.099% 7/25/36 · |
| 1,521,915 |
|
| 1,524,623 |
| ||
Series 2006-11 1AF6 4.915% 9/25/46 · |
| 659,256 |
|
| 851,445 |
| ||
Series 2006-26 2A4 0.394% 6/25/37 · |
| 2,000,000 |
|
| 1,151,494 |
| ||
Series 2007-6 2A4 0.484% 9/25/37 · |
| 1,000,000 |
|
| 487,569 |
| ||
Discover Card Execution Note Trust |
| 2,000,000 |
|
| 2,005,522 |
| ||
Ford Credit Floorplan Master | 750,000 | 750,299 | ||||||
GE Dealer Floorplan | 1,000,000 | 999,511 | ||||||
Golden Credit Card Trust | ||||||||
Series 2012-5A A 144A 0.79% 9/15/17 # |
| 360,000 |
|
| 360,274 |
| ||
Series 2014-2A A 144A 0.625% 3/15/21 #· |
| 420,000 |
|
| 420,143 |
| ||
GreatAmerica Leasing Receivables | ||||||||
Series 2013-1 B 144A 1.44% 5/15/18 # |
| 100,000 |
|
| 99,650 |
| ||
GSAMP Trust | ||||||||
Series 2006-FM3 A2D 0.404% 11/25/36 · |
| 1,341,845 |
|
| 782,184 |
| ||
64
Table of Contents
Principal amount° | Value (U.S. $) | |||||||
| ||||||||
Non-Agency Asset-Backed Securities (continued) |
| |||||||
| ||||||||
GSAMP Trust | 1,663,767 | $ | 1,263,400 | |||||
HOA Funding | 1,069,200 | 1,071,873 | ||||||
Home Equity Mortgage Loan | 2,000,000 | 1,213,548 | ||||||
HSI Asset Securitization Trust | 41,605 | 24,472 | ||||||
JPMorgan Mortgage | 500,000 | 404,685 | ||||||
MASTR Specialized Loan Trust | 5,175 | 5,160 | ||||||
Merrill Lynch Mortgage | 2,000,000 | 1,887,236 | ||||||
MMAF Equipment Finance | 810,000 | 806,768 | ||||||
Morgan Stanley ABS | ||||||||
Series 2007-HE1 A2C 0.324% 11/25/36 · |
| 6,830,315 |
|
| 4,331,424 |
| ||
Series 2007-HE5 A2D 0.514% 3/25/37 · |
| 4,423,768 |
|
| 2,513,908 |
| ||
New Century Home Equity | 868,466 | 754,724 | ||||||
RAAC Trust | 806,968 | 693,588 | ||||||
RAMP Trust | ||||||||
Series 2006-RZ5 A2 0.354% 8/25/46 · |
| 667,391 |
|
| 643,665 |
| ||
Series 2007-RZ1 A2 0.334% 2/25/37 · |
| 1,063,897 |
|
| 963,877 |
| ||
RASC Trust | 748,547 | 745,331 | ||||||
Rise | 2,804,432 | 2,825,465 | ||||||
Principal amount° | Value (U.S. $) | |||||||
| ||||||||
Non-Agency Asset-Backed Securities (continued) |
| |||||||
| ||||||||
Santander Drive Auto | 900,000 | $ | 899,597 | |||||
SLM Student Loan Trust | ||||||||
Series 2005-4 A2 0.336% 4/26/21 · |
| 48,535 |
|
| 48,527 |
| ||
Series 2008-9 A 1.756% 4/25/23 · |
| 3,100,119 |
|
| 3,178,806 |
| ||
Series 2012-5 A2 0.474% 6/25/19 · |
| 946,433 |
|
| 946,326 |
| ||
Soundview Home Loan Trust | 1,064,207 | 1,019,836 | ||||||
Structured Asset Investment | 131,172 | 114,048 | ||||||
Synchrony Credit Card Master | 820,000 | 822,384 | ||||||
Trade MAPS 1 | 500,000 | 499,717 | ||||||
Trafigura Securitisation | 500,000 | 500,180 | ||||||
|
| |||||||
Total Non-Agency | 71,354,831 | |||||||
|
| |||||||
| ||||||||
Non-Agency Collateralized Mortgage |
| |||||||
| ||||||||
Alternative Loan Trust |
| |||||||
Series 2004-J1 1A1 6.00% 2/25/34 |
| 2,589 |
|
| 2,634 |
| ||
Series 2004-J2 7A1 6.00% 12/25/33 |
| 3,821 |
|
| 3,885 |
| ||
Alternative Loan Trust Resecuritization | ||||||||
Series 2008-2R 3A1 6.00% 8/25/37 |
| 1,983,116 |
|
| 1,564,841 |
| ||
ARM Trust | ||||||||
Series 2004-5 3A1 2.47% 4/25/35 · |
| 1,461,438 |
|
| 1,456,320 |
| ||
Series 2005-10 3A31 4.858% 1/25/36 · |
| 602,804 |
|
| 532,686 |
| ||
Series 2006-2 1A4 2.793% 5/25/36 · |
| 1,389,754 |
|
| 1,218,220 |
| ||
| (continues | ) | 65 |
Table of Contents
Schedules of investments
Optimum Fixed Income Fund
Principal amount° | Value (U.S. $) | |||||||
| ||||||||
| Non-Agency Collateralized Mortgage Obligations (continued) | ||||||||
| ||||||||
Bank of America Alternative Loan Trust |
| |||||||
Series 2005-3 2A1 5.50% 4/25/20 |
| 27,654 |
| $ | 28,492 |
| ||
Series 2005-6 7A1 5.50% 7/25/20 |
| 98,316 |
|
| 98,927 |
| ||
Bank of America | 675,387 | 679,085 | ||||||
Bank of America | 670,933 | 670,467 | ||||||
Bear Stearns ARM Trust | ||||||||
Series 2003-5 2A1 2.449% 8/25/33 · |
| 106,906 |
|
| 106,597 |
| ||
Series 2005-2 A2 2.515% 3/25/35 · |
| 201,820 |
|
| 202,200 |
| ||
Series 2005-5 A1 2.16% 8/25/35 · |
| 2,113,342 |
|
| 2,132,239 |
| ||
Chase Mortgage | 249,526 | 226,279 | ||||||
ChaseFlex Trust | 420,000 | 363,616 | ||||||
CHL Mortgage Pass Through Trust | ||||||||
Series 2003-21 A1 2.63% 5/25/33 ¿· |
| 2,261 |
|
| 2,271 |
| ||
Series 2007-4 1A1 6.00% 5/25/37 ¿ |
| 2,173,371 |
|
| 1,951,313 |
| ||
Claris ABS | EUR | 5,413,166 | 5,790,921 | |||||
CSMC Mortgage-Backed Trust | ||||||||
Series 2005-1R 2A5 144A 5.75% 12/26/35 # |
| 2,865,891 |
|
| 2,463,208 |
| ||
Series 2007-1 5A14 6.00% 2/25/37 |
| 485,303 |
|
| 433,508 |
| ||
Series 2007-3 4A6 0.424% 4/25/37 · |
| 599,763 |
|
| 497,145 |
| ||
Series 2007-3 4A12 6.576% 4/25/37 @·S |
| 599,763 |
|
| 98,390 |
| ||
Series 2007-3 4A15 5.50% 4/25/37 |
| 266,314 |
|
| 252,414 |
| ||
Deutsche Mortgage Securities | ||||||||
Series 2005-WF1 |
| 449,429 |
|
| 448,218 |
| ||
Principal amount° | Value (U.S. $) | |||||||
| ||||||||
| Non-Agency Collateralized Mortgage Obligations (continued) | ||||||||
| ||||||||
Eurosail-UK | GBP | 194,345 | $ | 287,343 | ||||
Fannie Mae Connecticut Avenue Securities | ||||||||
Series 2014-C01 M1 1.774% 1/25/24 · |
| 177,568 |
|
| 178,564 |
| ||
Series 2015-C01 1M1 1.674% 2/25/25 · |
| 246,478 |
|
| 248,167 |
| ||
First Horizon Mortgage Pass | 231,209 | 212,946 | ||||||
GMACM Mortgage Loan Trust | 99,201 | 93,418 | ||||||
GSMPS Mortgage Loan Trust | 7,610 | 7,966 | ||||||
GSR Mortgage Loan Trust | 136,998 | 123,686 | ||||||
JPMorgan Mortgage Trust | ||||||||
Series 2006-A6 2A4L 2.56% 10/25/36 · |
| 1,031,055 |
|
| 938,598 |
| ||
Series 2006-A7 2A2 2.539% 1/25/37 · |
| 197,062 |
|
| 179,054 |
| ||
Series 2007-A1 6A1 2.504% 7/25/35 · |
| 424,542 |
|
| 419,773 |
| ||
Lehman Mortgage Trust | 2,946,658 | 2,543,556 | ||||||
MASTR Alternative Loan Trust | ||||||||
Series 2004-3 8A1 7.00% 4/25/34 |
| 4,546 |
|
| 4,687 |
| ||
Series 2004-5 6A1 7.00% 6/25/34 |
| 68,869 |
|
| 73,577 |
| ||
MASTR ARM Trust | ||||||||
Series 2003-6 1A2 2.45% 12/25/33 · |
| 3,989 |
|
| 3,970 |
| ||
Series 2004-4 4A1 2.421% 5/25/34 · |
| 158,577 |
|
| 154,436 |
| ||
MASTR Asset Securitization Trust | ||||||||
Series 2003-9 2A7 5.50% 10/25/33 |
| 66,963 |
|
| 66,979 |
| ||
Merrill Lynch Mortgage Investors Trust | ||||||||
Series 2004-A1 2A2 2.379% 2/25/34 · |
| 9,994 |
|
| 10,037 |
| ||
66
Table of Contents
| Principal | Value | |||||||
| amount° | (U.S. $) | |||||||
| ||||||||
Non-Agency Collateralized Mortgage Obligations (continued) |
| |||||||
| ||||||||
Merrill Lynch Mortgage Investors Trust Series 2005-A5 A2 2.471% 6/25/35 • | 81,124 | $ | 80,516 | |||||
Opteum Mortgage Acceptance Trust Series 2006-1 2A1 5.75% 4/25/36 • | 1,895,609 | 1,951,579 | ||||||
RALI Trust Series 2004-QS2 CB 5.75% 2/25/34 | 47,412 | 49,576 | ||||||
RFMSI Trust | ||||||||
Series 2004-S9 1A23 | 4,292,362 | 4,292,044 | ||||||
Series 2004-S9 2A1 | 173,039 | 175,250 | ||||||
Sequoia Mortgage Trust | ||||||||
Series 2004-5 A3 | 376,643 | 371,898 | ||||||
Series 2007-1 4A1 | 1,086,483 | 850,375 | ||||||
Series 2013-11 B1 144A | 410,873 | 400,125 | ||||||
Structured ARM Loan Trust | ||||||||
Series 2005-22 1A4 | 1,845,754 | 1,416,483 | ||||||
Series 2006-1 7A4 | 1,165,375 | 958,387 | ||||||
Structured Asset Mortgage | ||||||||
Investments II Trust | 944,740 | 911,686 | ||||||
Structured Asset Securities Trust | ||||||||
Series 2005-6 4A1 | 61,294 | 62,167 | ||||||
Thrones | GBP | 2,262,300 | 3,392,831 | |||||
WaMu Mortgage Pass | 5,232,760 | 4,797,588 | ||||||
Series 2005-AR16 1A3 | 923,203 | 875,297 | ||||||
Series 2007-HY1 3A3 | 499,634 | 464,472 | ||||||
Series 2007-HY7 4A1 | 998,146 | 924,152 | ||||||
| Principal | Value | |||||||
| amount° | (U.S. $) | |||||||
| ||||||||
Non-Agency Collateralized Mortgage Obligations (continued) |
| |||||||
| ||||||||
Washington Mutual | ||||||||
Alternative Mortgage Pass Through Certificates | ||||||||
Series 2005-1 5A2 | ||||||||
6.00% 3/25/35 w | 53,355 | $ | 26,455 | |||||
Wells Fargo Mortgage-Backed Securities Trust | ||||||||
Series 2005-AR16 2A1 | 243,932 | 247,116 | ||||||
Series 2006-2 3A1 | 156,047 | 160,262 | ||||||
Series 2006-3 A11 | 171,644 | 177,701 | ||||||
Series 2006-6 1A3 | 95,345 | 93,313 | ||||||
Series 2006-AR5 2A1 | 91,936 | 86,281 | ||||||
Series 2006-AR11 A6 | 1,290,019 | 1,225,459 | ||||||
Series 2006-AR17 A1 | 754,010 | 692,313 | ||||||
Series 2007-10 1A36 | 569,339 | 559,862 | ||||||
|
| |||||||
Total Non-Agency Collateralized Mortgage Obligations | 52,013,821 | |||||||
|
| |||||||
| ||||||||
Regional Bonds – 0.13%D |
| |||||||
| ||||||||
Australia – 0.04% | ||||||||
New South Wales Treasury | AUD | 716,900 | 612,320 | |||||
Queensland Treasury 144A | AUD | 207,000 | 184,092 | |||||
|
| |||||||
| 796,412 | ||||||||
|
| |||||||
Canada – 0.03% | ||||||||
Province of Ontario Canada | CAD | 281,000 | 250,481 | |||||
Province of Quebec Canada | CAD | 302,000 | 339,895 | |||||
|
| |||||||
| 590,376 | ||||||||
|
| |||||||
Spain – 0.06% | ||||||||
Autonomous Community of Catalonia | EUR | 1,100,000 | 1,358,465 | |||||
|
| |||||||
| 1,358,465 | ||||||||
|
| |||||||
Total Regional Bonds | 2,745,253 | |||||||
|
| |||||||
| (continues | ) | 67 |
Table of Contents
Schedules of investments
Optimum Fixed Income Fund
| Principal | Value | |||||||
| amount° | (U.S. $) | |||||||
| ||||||||
Senior Secured Loans – 7.35%« |
| |||||||
| ||||||||
Accudyne Industries | ||||||||
(Hamilton Sundstrand | ||||||||
Industrial) 1st Lien | ||||||||
4.00% 12/13/19 | 685,000 | $ | 651,606 | |||||
Air Medical Group Holdings | 1,752,147 | 1,755,433 | ||||||
Albertson’s Holdings Tranche B4 1st Lien 5.50% 8/25/21 |
| 1,740,000 |
|
| 1,756,433 |
| ||
Albertsons Tranche B 1st Lien | ||||||||
5.375% 3/21/19 | 215,824 | 217,409 | ||||||
Altice Financing Tranche B 1st | ||||||||
Lien 5.25% 1/29/22 | 1,180,000 | 1,193,570 | ||||||
Amaya Gaming 1st Lien | ||||||||
5.00% 8/1/21 | 1,084,550 | 1,075,964 | ||||||
Amaya Gaming 2nd Lien | ||||||||
8.00% 8/1/22 | 295,000 | 295,369 | ||||||
American Tire Distributors 1st Lien | ||||||||
5.25% 9/30/21 | 635,000 | 638,572 | ||||||
5.75% 6/1/18 | 635,000 | 636,587 | ||||||
Applied Systems 1st Lien | 296,250 | 296,731 | ||||||
Applied Systems 2nd Lien | 1,241,000 | 1,240,690 | ||||||
Ashland Water 1st Lien | 402,975 | 402,597 | ||||||
Ashland Water 2nd Lien | 325,000 | 316,063 | ||||||
Atkore International 2nd Lien | 460,000 | 446,200 | ||||||
Avast Software 1st Lien | 489,250 | 492,206 | ||||||
Avaya Tranche B-3 | 1,533,084 | 1,512,676 | ||||||
Axalta Coating Systems U.S. | 704,266 | 701,065 | ||||||
Azure Midstream Tranche B | 123,796 | 117,761 | ||||||
BJ’s Wholesale Club 2nd Lien | 1,475,000 | 1,476,844 | ||||||
BJ’s Wholesale Club Tranche B | 2,085,762 | 2,089,835 | ||||||
Borgata Tranche B 1st Lien | 788,557 | 794,274 | ||||||
Burlington Coat Factory | 615,000 | 620,574 | ||||||
| Principal | Value | |||||||
| amount° | (U.S. $) | |||||||
| ||||||||
Senior Secured Loans« (continued) |
| |||||||
| ||||||||
BWAY Holding Tranche B 1st Lien 5.50% 8/14/20 | 724,525 | $ | 731,317 | |||||
Cable & Wireless Communications 5.50% 12/31/16 | 821,630 | 823,675 | ||||||
Cable & Wireless Communications (Unsecured) | 415,000 | 416,037 | ||||||
Caesars Growth Partners | 2,227,566 | 1,981,977 | ||||||
Calpine Construction Finance Tranche B | 327,872 | 324,030 | ||||||
Charter Communications Tranche B 1st Lien | 3,185,000 | 3,214,611 | ||||||
Chemstralia (Orica Chemicals) Tranche B 1st Lien | 620,000 | 613,800 | ||||||
Citgo Holding Tranche B 1st | 209,475 | 208,515 | ||||||
Citycenter Holdings Tranche B | 574,950 | 577,945 | ||||||
Clear Channel | 184,983 | 178,833 | ||||||
Community Health Systems | 2,828,080 | 2,845,167 | ||||||
Community Health Systems | 422,704 | 423,270 | ||||||
Crown Castles Operating | 341,306 | 340,965 | ||||||
DaVita Healthcare Partners | 749,338 | 752,081 | ||||||
Dell Tranche C | 6,400,000 | 6,423,002 | ||||||
Dollar Tree Tranche B 1st Lien | 1,065,000 | 1,077,481 | ||||||
Drillships Financing Holding Tranche B1 | 3,714,625 | 2,845,403 | ||||||
Dynegy Tranche B2 | 528,258 | 529,814 | ||||||
Emdeon 1st Lien | 762,191 | 764,573 | ||||||
Energy Transfer Equity 1st Lien | ||||||||
3.25% 12/2/19 | 539,750 | 533,453 | ||||||
4.00% 12/2/19 | 445,000 | 444,166 | ||||||
FCA US Tranche B 1st Lien | 2,529,450 | 2,528,924 | ||||||
68
Table of Contents
| Principal | Value | |||||||
| amount° | (U.S. $) | |||||||
| ||||||||
Senior Secured Loans« (continued) |
| |||||||
| ||||||||
FCA US Tranche B 1st Lien | 1,285,419 | $ | 1,286,220 | |||||
First Data Tranche B 1st Lien | ||||||||
3.674% 3/24/17 | 1,470,000 | 1,471,072 | ||||||
4.174% 3/24/21 | 1,106,681 | 1,113,104 | ||||||
First Data Tranche C1 1st Lien | 1,185,000 | 1,185,864 | ||||||
Flint Group 1st Lien | 448,271 | 448,551 | ||||||
Flint Group 2nd Lien | 235,000 | 229,713 | ||||||
Flint Group Tranche C 1st Lien | 74,104 | 74,151 | ||||||
Flying Fortress 1st Lien | 1,151,000 | 1,153,638 | ||||||
Fortescue Resources 1st Lien | 2,170,881 | 1,968,525 | ||||||
Gardner Denver 1st Lien | 1,505,510 | 1,431,835 | ||||||
Gates Global 1st Lien | 472,625 | 471,407 | ||||||
Global Cash Access Tranche B | 1,795,975 | 1,787,744 | ||||||
Goodpack 1st Lien 4.75% 9/15/21 | 720,000 | 721,462 | ||||||
Hanson Building Tranche B | 1,070,000 | 1,070,000 | ||||||
HCA 2.928% 3/31/17 | 5,386,329 | 5,394,748 | ||||||
HCA Tranche B4 | 197,985 | 198,325 | ||||||
HD Supply Tranche B | 1,997,570 | 2,003,563 | ||||||
Headwaters Tranche B 1st | 210,000 | 211,181 | ||||||
Heinz (H.J.) Tranche B2 1st | 1,249,195 | 1,251,612 | ||||||
Hilton Worldwide Finance | 3,436,423 | 3,444,708 | ||||||
Hostess Brands 1st Lien | 1,803,560 | 1,841,885 | ||||||
Houghton International 1st | 112,413 | 112,319 | ||||||
Houghton International 2nd | 205,000 | 204,744 | ||||||
Huntsman International | 967,575 | 974,227 | ||||||
Hyperion Insurance Group | 845,000 | 850,281 | ||||||
| Principal | Value | |||||||
| amount° | (U.S. $) | |||||||
| ||||||||
Senior Secured Loans« (continued) |
| |||||||
| ||||||||
IASIS Healthcare Tranche B | 653,581 | $ | 655,787 | |||||
iHeartCommunications | 2,615,000 | 2,493,403 | ||||||
Immucor Tranche B2 | 1,864,648 | 1,874,555 | ||||||
Ineos U.S. Finance Tranche B | 1,954,257 | 1,946,405 | ||||||
Ineos U.S. Finance Tranche B | 265,000 | 265,497 | ||||||
Infor U.S. Tranche B5 1st | 519,449 | 515,599 | ||||||
Intelsat Jackson Holdings | 2,246,616 | 2,240,718 | ||||||
J. Crew Group Tranche B 1st | 1,397,324 | 1,300,210 | ||||||
JLL/Delta Dutch Newco 1st | 1,796,425 | 1,790,811 | ||||||
KIK Custom Products 1st Lien | 781,352 | 781,840 | ||||||
KIK Custom Products 2nd Lien | 200,000 | 200,563 | ||||||
Kinetic Concepts Tranche E1 | 674,785 | 677,421 | ||||||
Landry’s Tranche B | 543,394 | 545,092 | ||||||
Level 3 Financing Tranche B | 985,000 | 988,489 | ||||||
Lightower Fiber Networks 1st | 113,012 | 112,776 | ||||||
LTS Buyer 2nd Lien | 627,238 | 626,192 | ||||||
Mauser Holdings 2nd Lien | 530,000 | 519,400 | ||||||
MGM Resorts International | 1,624,445 | 1,621,568 | ||||||
Michael Stores Tranche B 1st | 260,363 | 260,595 | ||||||
Moxie Patriot (Panda Power | 720,000 | 723,600 | ||||||
MPH Acquisition Tranche B | 1,535,166 | 1,532,972 | ||||||
Neiman Marcus Tranche 1st | 280,000 | 279,380 | ||||||
NEP Broadcasting 2nd Lien | 628,571 | 617,571 | ||||||
NEP/NCP Tranche B 1st Lien | 861,316 | 840,860 | ||||||
| (continues | ) | 69 |
Table of Contents
Schedules of investments
Optimum Fixed Income Fund
| Principal | Value | |||||||
| amount° | (U.S. $) | |||||||
| ||||||||
Senior Secured Loans« (continued) |
| |||||||
| ||||||||
New Albertsons 1st Lien | 383,075 | $ | 384,512 | |||||
NRG Energy Tranche B | 972,625 | 969,450 | ||||||
Numericable 4.50% 5/21/20 | 1,264,834 | 1,272,936 | ||||||
Numericable U.S. Tranche | 1,094,254 | 1,098,904 | ||||||
Ocean Rig (Drillship) | 881,872 | 734,599 | ||||||
OSI Restaurants Tranche B 1st | 78,475 | 78,344 | ||||||
Pabst Blue Ribbon 1st Lien | 763,228 | 767,998 | ||||||
Pabst Blue Ribbon 2nd Lien | 290,000 | 292,900 | ||||||
Pacific Drilling Tranche B | 600,742 | 500,568 | ||||||
Panda Liberty Tranche B | 1,507,000 | 1,518,303 | ||||||
Panda Stonewall Tranche B | 890,000 | 903,350 | ||||||
Par Pharmaceutical Tranche | 428,925 | 430,802 | ||||||
PetSmart Tranche B 1st Lien | 1,662,000 | 1,676,165 | ||||||
Polymer Group Tranche B | 1,711,460 | 1,719,303 | ||||||
PVH Tranche B 1st Lien | 370,379 | 372,719 | ||||||
Quickrete 2nd Lien | 322,737 | 324,956 | ||||||
Republic of Angola | 1,850,000 | 1,831,500 | ||||||
Reynolds Group 1st Lien | 1,508,883 | 1,516,562 | ||||||
Rite Aid 2nd Lien | ||||||||
4.875% 6/21/21 | 445,000 | 446,738 | ||||||
5.75% 8/21/20 | 1,535,000 | 1,549,710 | ||||||
Royalty Pharma | 309,225 | 311,544 | ||||||
Salix Pharmaceuticals Tranche | 1,480,263 | 1,481,837 | ||||||
Santander Asset Management | 731,987 | 734,732 | ||||||
Scientific Games International | 1,599,750 | 1,605,749 | ||||||
| Principal | Value | |||||||
| amount° | (U.S. $) | |||||||
| ||||||||
Senior Secured Loans« (continued) |
| |||||||
| ||||||||
Scientific Games International | 1,745,625 | $ | 1,751,928 | |||||
Sensus 4.50% 5/9/17 | 886,356 | 887,464 | ||||||
Sensus 2nd Lien | 295,000 | 290,575 | ||||||
SIG Combibloc Group 1st Lien | 1,100,000 | 1,112,203 | ||||||
Signode Industrial Group | 818,519 | 813,914 | ||||||
Smart & Final Tranche B 1st | 1,023,824 | 1,029,796 | ||||||
Sprouts Farmers | 1,449,138 | 1,455,177 | ||||||
Stena 1st Lien 4.00% 3/3/21 | 183,150 | 165,751 | ||||||
Styrolution Group Tranche B | 384,067 | 385,987 | ||||||
Supervalu 1st Lien | 470,189 | 472,246 | ||||||
Surgical Care Affiliates | 760,000 | 760,475 | ||||||
Targa Resources 1st Lien | 256,070 | 257,350 | ||||||
TLFC Delos Finance Tranche | 400,000 | 401,100 | ||||||
TransDigm Tranche C | 604,629 | 604,582 | ||||||
United Continental Tranche | 249,900 | 249,275 | ||||||
Univision Communications | 926,577 | 925,902 | ||||||
Univision Communications Tranche C4 | 2,860,575 | 2,859,233 | ||||||
US Airways Tranche B1 | 257,150 | 256,875 | ||||||
US Airways Tranche B2 | 88,110 | 88,037 | ||||||
USI Insurance Services | 557,239 | 554,453 | ||||||
Valeant Pharmaceuticals | 780,273 | 781,005 | ||||||
Valeant Pharmaceuticals | 1,715,000 | 1,724,914 | ||||||
Vantage Drilling Tranche B | 880,220 | 557,997 | ||||||
70
Table of Contents
Principal amount° | Value (U.S. $) | |||||||
| ||||||||
Senior Secured Loans« (continued) |
| |||||||
| ||||||||
Vantage Drilling Tranche B 1st Lien | 680,594 | $ | 389,640 | |||||
Varsity Brands Tranche B 1st Lien | 728,175 | 735,457 | ||||||
Weight Watchers International | 270,000 | 236,925 | ||||||
Wide Open West Finance | 2,038,499 | 2,044,323 | ||||||
Zayo Group Tranche B 1st Lien | 1,150,144 | 1,153,288 | ||||||
Ziggo Tranche B 2nd Lien | 616,000 | 612,728 | ||||||
Ziggo Tranche B 3rd Lien | 1,013,100 | 1,007,718 | ||||||
Ziggo Tranche B1 1st Lien | 955,900 | 950,822 | ||||||
|
| |||||||
Total Senior Secured Loans |
| 149,661,002 | ||||||
|
| |||||||
| ||||||||
Sovereign Bonds – 3.40%D |
| |||||||
| ||||||||
Armenia – 0.03% | ||||||||
Republic of Armenia 144A | 600,000 | 588,000 | ||||||
|
| |||||||
| 588,000 | ||||||||
|
| |||||||
Australia – 0.01% | ||||||||
Australia Government Bond 3.75% 4/21/37 | AUD | 352,000 | 309,518 | |||||
|
| |||||||
| 309,518 | ||||||||
|
| |||||||
Brazil – 0.32% | ||||||||
Banco Nacional de Desenvolvimento Economico e Social 144A | ||||||||
6.369% 6/16/18 # | 1,500,000 | 1,593,300 | ||||||
144A 6.50% 6/10/19 # | 2,500,000 | 2,687,500 | ||||||
Brazil Letras do Tesouro Nacional | ||||||||
1.135% 1/1/18 ^ | BRL | 900,000 | 200,379 | |||||
1.528% 1/1/16 ^ | BRL | 6,000,000 | 1,708,872 | |||||
Brazil Notas do Tesouro Nacional Series F | BRL | 1,211,000 | 360,643 | |||||
|
| |||||||
| 6,550,694 | ||||||||
|
| |||||||
Canada – 0.02% | ||||||||
Canadian Government Bonds | ||||||||
2.75% 12/1/48 | CAD | 171,000 | 160,609 | |||||
Principal amount° | Value (U.S. $) | |||||||
| ||||||||
Sovereign BondsD (continued) |
| |||||||
| ||||||||
Canada (continued) |
| |||||||
Canadian Government Bonds | CAD | 270,000 | $ | 287,895 | ||||
|
| |||||||
| 448,504 | ||||||||
|
| |||||||
Chile – 0.05% | ||||||||
Chile Government International Bond | CLP | 637,000,000 | 1,089,418 | |||||
|
| |||||||
| 1,089,418 | ||||||||
|
| |||||||
Colombia – 0.13% |
| |||||||
Colombia Government International Bonds | ||||||||
4.375% 3/21/23 | COP | 1,816,000,000 | 638,785 | |||||
5.00% 6/15/45 | 1,650,000 | 1,703,625 | ||||||
9.85% 6/28/27 | COP | 719,000,000 | 359,158 | |||||
|
| |||||||
| 2,701,568 | ||||||||
|
| |||||||
Costa Rica – 0.04% |
| |||||||
Costa Rica Government International Bond | ||||||||
5.625% 4/30/43 | 841,000 | 739,029 | ||||||
|
| |||||||
| 739,029 | ||||||||
|
| |||||||
Dominican Republic – 0.08% |
| |||||||
Dominican Republic International Bonds | ||||||||
144A 5.50% 1/27/25 # 800,000 |
| 830,000 | ||||||
144A 6.85% 1/27/45 # 800,000 |
| 844,000 | ||||||
|
| |||||||
| 1,674,000 | ||||||||
|
| |||||||
France – 0.08% |
| |||||||
France Government Bond O.A.T. | ||||||||
0.50% 5/25/25 | EUR | 1,100,000 | 1,186,065 | |||||
3.25% 5/25/45 | EUR | 300,000 | 500,426 | |||||
|
| |||||||
| 1,686,491 | ||||||||
|
| |||||||
Germany – 0.54% |
| |||||||
Bundesrepublik Deutschland | ||||||||
2.50% 7/4/44 | EUR | 500,000 | 814,901 | |||||
4.25% 7/4/39 | EUR | 4,700,000 | 9,291,241 | |||||
4.75% 7/4/40 | EUR | 400,000 | 854,075 | |||||
|
| |||||||
| 10,960,217 | ||||||||
|
| |||||||
Indonesia – 0.13% |
| |||||||
Indonesia Government International Bond 144A | 1,110,000 | 1,089,187 | ||||||
| (continues | ) | 71 |
Table of Contents
Schedules of investments
Optimum Fixed Income Fund
| Principal | Value | |||||||
| amount° | (U.S. $) | |||||||
| ||||||||
Sovereign BondsD (continued) |
| |||||||
| ||||||||
Indonesia (continued) |
| |||||||
Indonesia Treasury Bond | IDR | 18,939,000,000 | $ | 1,543,003 | ||||
|
| |||||||
| 2,632,190 | ||||||||
|
| |||||||
Italy – 0.43% | ||||||||
Italy Buoni Poliennali Del Tesoro | ||||||||
1.35% 4/15/22 | EUR | 1,945,000 | 2,151,637 | |||||
2.50% 12/1/24 | EUR | 4,495,000 | 5,388,199 | |||||
144A 3.25% 9/1/46 # | EUR | 903,000 | 1,231,699 | |||||
|
| |||||||
| 8,771,535 | ||||||||
|
| |||||||
Ivory Coast – 0.05% | ||||||||
Ivory Coast Government International Bond 144A | 966,000 | 970,830 | ||||||
|
| |||||||
| 970,830 | ||||||||
|
| |||||||
Kazakhstan – 0.06% |
| |||||||
Kazakhstan Government International Bond 144A | 1,311,000 | 1,217,788 | ||||||
|
| |||||||
| 1,217,788 | ||||||||
|
| |||||||
Mexico – 0.10% | ||||||||
Mexican Bonos | MXN | 25,246,000 | 1,841,301 | |||||
Mexican Government | 200,000 | 206,250 | ||||||
|
| |||||||
| 2,047,551 | ||||||||
|
| |||||||
Norway – 0.02% |
| |||||||
Kommunalbanken 5.00% | NZD | 72,000 | 56,071 | |||||
Norway Government Bonds | ||||||||
2.00% 5/24/23 | NOK | 126,000 | 16,421 | |||||
3.00% 3/14/24 | NOK | 1,956,000 | 275,580 | |||||
|
| |||||||
| 348,072 | ||||||||
|
| |||||||
Pakistan – 0.07% | ||||||||
Pakistan Government | 1,286,000 | 1,328,303 | ||||||
|
| |||||||
| 1,328,303 | ||||||||
|
| |||||||
Peru – 0.06% | ||||||||
Peruvian Government International Bond 144A 6.95% 8/12/31 # | PEN | 3,500,000 | 1,164,687 | |||||
|
| |||||||
| 1,164,687 | ||||||||
|
| |||||||
| Principal | Value | |||||||
| amount° | (U.S. $) | |||||||
| ||||||||
Sovereign BondsD (continued) |
| |||||||
| ||||||||
Poland – 0.01% | ||||||||
Poland Government Bond | PLN | 632,000 | $ | 181,364 | ||||
|
| |||||||
| 181,364 | ||||||||
|
| |||||||
Portugal – 0.01% | ||||||||
Portugal Government International Bond 144A | 131,000 | 145,054 | ||||||
|
| |||||||
| 145,054 | ||||||||
|
| |||||||
Republic of Korea – 0.09% |
| |||||||
Inflation Linked Korea Treasury Bond | KRW | 1,080,165,360 | 940,622 | |||||
Republic of Korea | 700,000 | 846,370 | ||||||
|
| |||||||
| 1,786,992 | ||||||||
|
| |||||||
Senegal – 0.02% | ||||||||
Senegal Government International Bond 144A | 500,000 | 489,733 | ||||||
|
| |||||||
| 489,733 | ||||||||
|
| |||||||
Singapore – 0.03% |
| |||||||
Temasek Financial I 144A | 560,000 | 558,636 | ||||||
|
| |||||||
| 558,636 | ||||||||
|
| |||||||
Slovenia – 0.81% | ||||||||
Slovenia Government Bond | EUR | 8,000,000 | 11,300,828 | |||||
Slovenia Government International Bonds | ||||||||
4.125% 2/18/19 | 200,000 | 211,948 | ||||||
5.50% 10/26/22 | 4,300,000 | 4,972,047 | ||||||
|
| |||||||
| 16,484,823 | ||||||||
|
| |||||||
South Africa – 0.12% |
| |||||||
South Africa Government Bond | ZAR | 24,572,000 | 2,000,169 | |||||
South Africa Government International Bond | 444,000 | 478,232 | ||||||
|
| |||||||
| 2,478,401 | ||||||||
|
| |||||||
United Kingdom – 0.06% |
| |||||||
United Kingdom Gilt | ||||||||
1.75% 9/7/22 | GBP | 100,000 | 151,858 | |||||
3.25% 1/22/44 | GBP | 200,000 | 355,061 | |||||
3.50% 1/22/45 | GBP | 138,800 | 257,940 | |||||
72
Table of Contents
| Principal | Value | |||||||
| amount° | (U.S. $) | |||||||
| ||||||||
Sovereign BondsD (continued) |
| |||||||
| ||||||||
United Kingdom (continued) |
| |||||||
United Kingdom Gilt Inflation Linked | GBP | 274,977 | $ | 452,897 | ||||
|
| |||||||
| 1,217,756 | ||||||||
|
| |||||||
Uruguay – 0.03% |
| |||||||
Uruguay Government International Bond | 524,000 | 546,270 | ||||||
|
| |||||||
| 546,270 | ||||||||
|
| |||||||
Total Sovereign Bonds |
| 69,117,424 | ||||||
|
| |||||||
| ||||||||
Supranational Banks – 0.31% |
| |||||||
| ||||||||
Corp Andina de Fomento | 1,800,000 | 1,809,754 | ||||||
European Bank for Reconstruction & Development | ||||||||
6.00% 3/3/16 | INR | 45,500,000 | 726,829 | |||||
7.375% 4/15/19 | IDR | 6,240,000,000 | 474,741 | |||||
Inter-American Development Bank | ||||||||
6.00% 9/5/17 | INR | 67,600,000 | 1,080,294 | |||||
7.25% 7/17/17 | IDR | 7,830,000,000 | 589,720 | |||||
International Bank for Reconstruction & Development | ||||||||
0.247% 4/17/19 • | 440,000 | 440,480 | ||||||
2.465% 9/24/18 • | AUD | 149,000 | 113,593 | |||||
2.50% 11/25/24 | 440,000 | 456,121 | ||||||
4.625% 10/6/21 | NZD | 862,000 | 673,977 | |||||
|
| |||||||
Total Supranational Banks |
| 6,365,509 | ||||||
|
| |||||||
| ||||||||
U.S. Treasury Obligations – 19.11% |
| |||||||
| ||||||||
U.S. Treasury Bonds | ||||||||
2.50% 2/15/45 | 53,905,000 | 53,416,513 | ||||||
2.75% 11/15/42 | 600,000 | 623,672 | ||||||
3.00% 11/15/44 | 1,400,000 | 1,534,203 | ||||||
3.125% 8/15/44 | 11,000,000 | 12,326,017 | ||||||
6.25% 5/15/30 ¥ | 600,000 | 912,187 | ||||||
U.S. Treasury Inflation Indexed Bonds | ||||||||
0.125% 4/15/19 ¥ | 7,580,164 | 7,729,994 | ||||||
0.125% 7/15/22 | 2,032,560 | 2,056,060 | ||||||
0.125% 7/15/24 | 35,039,300 | 35,080,366 | ||||||
| Principal | Value | |||||||
| amount° | (U.S. $) | |||||||
| ||||||||
U.S. Treasury Obligations (continued) |
| |||||||
| ||||||||
U.S. Treasury Inflation Indexed Bonds | ||||||||
0.75% 2/15/45 | 8,535,156 | $ | 8,699,193 | |||||
1.75% 1/15/28 | 29,250,245 | 34,279,913 | ||||||
2.00% 1/15/26 | 1,648,500 | 1,956,178 | ||||||
2.375% 1/15/25 | 1,710,993 | 2,076,451 | ||||||
2.375% 1/15/27 | 4,253,126 | 5,253,938 | ||||||
2.50% 1/15/29 | 4,277,923 | 5,474,407 | ||||||
3.875% 4/15/29 | 270,110 | 397,336 | ||||||
U.S. Treasury Notes | ||||||||
0.50% 2/28/17 | 600,000 | 599,672 | ||||||
0.50% 3/31/17 | 11,500,000 | 11,487,419 | ||||||
1.375% 2/29/20 | 1,190,000 | 1,190,371 | ||||||
1.375% 3/31/20 | 580,000 | 580,136 | ||||||
2.00% 10/31/21 | 1,600,000 | 1,633,125 | ||||||
2.00% 2/15/25 ¥ | 32,730,000 | 32,939,668 | ||||||
2.125% 9/30/21 ¥ | 33,000,000 | 33,951,324 | ||||||
2.25% 11/15/24 | 955,000 | 981,859 | ||||||
2.375% 8/15/24 | 57,800,000 | 60,089,400 | ||||||
2.50% 5/15/24 | 14,800,000 | 15,548,096 | ||||||
2.75% 2/15/24 | 54,300,000 | 58,198,577 | ||||||
|
| |||||||
Total U.S. Treasury Obligations | 389,016,075 | |||||||
|
| |||||||
| Number of | ||||||||
| shares | ||||||||
| ||||||||
Common Stock – 0.00% |
| |||||||
| ||||||||
Century | 1,975,000 | 0 | ||||||
|
| |||||||
Total Common Stock | 0 | |||||||
|
| |||||||
| ||||||||
Convertible Preferred Stock – 0.24% |
| |||||||
| ||||||||
Alcoa 5.375% exercise price $19.39, expiration date 10/1/17 | 5,800 | 254,272 | ||||||
ArcelorMittal 6.00% exercise price $20.36, expiration date 12/21/15 | 9,300 | 141,970 | ||||||
Bank of America 7.25% exercise price $50.00, expiration date 12/31/49 | 203 | 232,866 | ||||||
Chesapeake Energy 144A 5.75% exercise price $26.14, expiration date 12/31/49 # | 292 | 252,945 | ||||||
| (continues | ) | 73 |
Table of Contents
Schedules of investments
Optimum Fixed Income Fund
| Number of | Value | |||||||
| shares | (U.S. $) | |||||||
| ||||||||
Convertible Preferred Stock (continued) |
| |||||||
| ||||||||
Crown Castle International 4.50% exercise price $90.25, expiration date 11/1/16 | 300 | $ | 31,449 | |||||
Dominion Resources 6.125% exercise price $65.06, expiration date 4/1/16 | 5,082 | 285,405 | ||||||
Dynegy 5.375% exercise price $38.75, expiration date 11/1/17 @ | 2,990 | 326,359 | ||||||
Exelon 6.50% exercise price $43.75, expiration date 6/1/17 | 6,250 | 304,063 | ||||||
Halcon Resources 5.75% exercise price $6.16, expiration date 12/31/49 | 337 | 99,499 | ||||||
HealthSouth 6.50% exercise price $29.70, expiration date 12/31/49 | 439 | 653,945 | ||||||
Huntington Bancshares 8.50% exercise price $11.95, expiration date 12/31/49 | 305 | 406,565 | ||||||
Intelsat 5.75% exercise price $22.05, expiration date 5/1/16 | 13,632 | 474,394 | ||||||
Maiden Holdings 7.25% exercise price $15.35, expiration date 9/15/16 | 10,743 | 562,289 | ||||||
SandRidge Energy 8.50% exercise price $8.01, expiration date 12/31/49 | 4,195 | 159,934 | ||||||
T-Mobile US 5.50% exercise price $31.02, expiration date 12/15/17 | 3,927 | 230,358 | ||||||
Wells Fargo 7.50% exercise price $156.71, expiration date 12/31/49 | 321 | 392,583 | ||||||
|
| |||||||
Total Convertible Preferred Stock |
| 4,808,896 | ||||||
|
| |||||||
| ||||||||
Preferred Stock – 0.47% |
| |||||||
| ||||||||
Alabama Power 5.625% | 21,075 | 541,627 | ||||||
Ally Financial 144A 7.00% # | 5,600 | 5,747,875 | ||||||
Bank of America 6.10% • | 635,000 | 645,716 | ||||||
Integrys Energy Group 6.00% • | 35,650 | 1,002,121 | ||||||
Morgan Stanley 5.55% • | 350,000 | 354,375 | ||||||
National Retail Properties 5.70% | 9,340 | 233,033 | ||||||
Public Storage 5.20% | 18,720 | 453,398 | ||||||
| Number of | Value | |||||||
| shares | (U.S. $) | |||||||
| ||||||||
Preferred Stock (continued) |
| |||||||
| ||||||||
Standard Chartered 144A 6.50% #• | 595,000 | $ | 600,856 | |||||
|
| |||||||
Total Preferred Stock | 9,579,001 | |||||||
|
| |||||||
| Principal | ||||||||
| amount° | ||||||||
| ||||||||
Security Sold Short – (0.11%) |
| |||||||
| ||||||||
Fannie Mae S.F. 30 yr TBA 4.50% 4/1/45 | (2,000,000 | ) | (2,181,875 | ) | ||||
|
| |||||||
Total Security Sold Short | (2,181,875 | ) | ||||||
|
| |||||||
| ||||||||
Short-Term Investments – 4.84% |
| |||||||
| ||||||||
Commercial Paper – 0.05%≠ | ||||||||
Entergy 0.932% 4/21/15 > | 1,000,000 | 999,761 | ||||||
|
| |||||||
| 999,761 | ||||||||
|
| |||||||
Discount Notes – 2.79%≠ | ||||||||
Federal Home Loan Bank | ||||||||
0.057% 4/8/15 | 11,977,079 | 11,977,019 | ||||||
0.065% 4/20/15 | 7,516,451 | 7,516,346 | ||||||
0.07% 4/6/15 | 25,897,096 | 25,896,992 | ||||||
0.075% 6/4/15 | 2,890,080 | 2,889,817 | ||||||
0.075% 6/29/15 | 2,890,080 | 2,889,716 | ||||||
0.095% 7/14/15 | 5,491,152 | 5,490,202 | ||||||
|
| |||||||
| 56,660,092 | ||||||||
|
| |||||||
Repurchase Agreements – 1.99% |
| |||||||
Bank of America Merrill Lynch 0.05%, dated 3/31/15, to be repurchased on 4/1/15, repurchase price $16,622,306 (collateralized by U.S. government obligations 2.125%–3.125% 6/30/21–2/15/43; market value $16,954,731) | 16,622,282 | 16,622,282 | ||||||
Bank of Montreal 0.10%, dated 3/31/15, to be repurchased on 4/1/15, repurchase price $13,851,941 (collateralized by U.S. government obligations 0.00%–9.125% 10/15/16–2/15/23; market value $14,128,941) | 13,851,902 | 13,851,902 | ||||||
74
Table of Contents
Principal amount° | Value (U.S. $) | |||||||
| ||||||||
Short-Term Investments (continued) |
| |||||||
| ||||||||
Repurchase Agreements (continued) |
| |||||||
BNP Paribas 0.10%, dated 3/31/15, to be repurchased on 4/1/15, repurchase price $10,076,843 (collateralized by U.S. government obligations 0.00%–2.250% 1/31/19–2/15/26; market value $10,278,357) | 10,076,816 | 10,076,816 | ||||||
|
| |||||||
| 40,551,000 | ||||||||
|
| |||||||
U.S. Treasury Obligation – 0.01%≠ |
| |||||||
U.S. Treasury Bill | ||||||||
0.011% 5/7/15 | 250,000 | 249,995 | ||||||
|
| |||||||
| 249,995 | ||||||||
|
| |||||||
Total Short-Term Investments |
| 98,460,848 | ||||||
|
| |||||||
Total Value of Securities – 104.21% |
| 2,121,220,969 | ||||||
|
| |||||||
Number of contracts | ||||||||
| ||||||||
Options Written – (0.01%) |
| |||||||
| ||||||||
Currency Call Options – 0.00% |
| |||||||
USD vs INR strike price $65, expiration date 6/8/15 (JPMC) | (1,100,000 | ) | (3,816 | ) | ||||
USD vs INR strike price $65, expiration date 7/16/15 (JPMC) | (1,100,000 | ) | (8,885 | ) | ||||
|
| |||||||
| (12,701 | ) | |||||||
|
| |||||||
Currency Put Options – 0.00% |
| |||||||
USD vs INR strike price $61.50, expiration date 7/15/15 (JPMC) | (1,100,000 | ) | (4,478 | ) | ||||
USD vs INR strike price $62, expiration date 6/8/15 (JPMC) | (1,100,000 | ) | (5,328 | ) | ||||
|
| |||||||
| (9,806 | ) | |||||||
|
| |||||||
Futures Call Options – (0.01%) |
| |||||||
IMM Eurodollar Future exercise price $99.13, expiration date 12/14/15 (BAML) | (94 | ) | (67,562 | ) | ||||
Number of contracts | Value (U.S. $) | |||||||
| ||||||||
Options Written (continued) |
| |||||||
| ||||||||
Futures Call Options (continued) |
| |||||||
IMM Eurodollar Future exercise price $99.25, expiration date 6/14/16 (HSBC) | (65 | ) | $ | (23,969 | ) | |||
|
| |||||||
| (91,531 | ) | |||||||
|
| |||||||
Futures Put Options – 0.00% |
| |||||||
IMM Eurodollar Future exercise price $99.13, expiration date 12/14/15 (BAML) | (94 | ) | (15,863 | ) | ||||
IMM Eurodollar Future exercise price $99.25, expiration date 6/14/16 (HSBC) | (65 | ) | (69,062 | ) | ||||
|
| |||||||
| (84,925 | ) | |||||||
|
| |||||||
Put Swaptions – 0.00% | ||||||||
2 yr IRS pay a fixed rate 1.25% and receive a floating rate based on 3-month USD-ICE LIBOR expiration date 5/26/15 (MSC) | (24,000,000 | ) | (6,024 | ) | ||||
CDX.O IG23 V1 5 yr strike price $1.00, expiration date 4/15/15 (JPMC) | (15,500,000 | ) | (481 | ) | ||||
|
| |||||||
| (6,505 | ) | |||||||
|
| |||||||
Total Options Written |
| $ (205,468 | ) | |||||
|
| |||||||
| # | Security exempt from registration under Rule 144A of the Securities Act of 1933, as amended. At March 31, 2015, the aggregate value of Rule 144A securities was $306,334,950, which represents 15.05% of the Fund’s net assets. See Note 10 in “Notes to financial statements.” |
| @ | Illiquid security. At March 31, 2015, the aggregate value of illiquid securities was $13,936,152, which represents 0.68% of the Fund’s net assets. See Note 10 in “Notes to financial statements.” |
| ¿ | Pass Through Agreement. Security represents the contractual right to receive a proportionate amount of underlying payments due to the counter party pursuant to various agreements related to the rescheduling of obligations and the exchange of certain notes. |
| T | 100% of the income received was in the form of additional cash. |
| = | Security is being fair valued in accordance with the Fund’s fair valuation policy. At March 31, 2015, the aggregate value of fair valued securities was $0, which represents 0.00% of the Fund’s net assets. See Note 1 in “Notes to financial statements.” |
| ≠ | The rate shown is the effective yield at the time of purchase. |
| (continues | ) | 75 |
Table of Contents
Schedules of investments
Optimum Fixed Income Fund
| > | Commercial paper exempt from registration under Section 4(2) and/or Rule 144A of the Securities Act of 1933, as amended, and may be resold in transactions exempt from registration only to dealers in that program or other “accredited investors”. At March 31, 2015, the aggregate value of these securities was $999,761, which represented 0.05% of the Fund’s net assets. See Note 10 in “Notes to financial statements.” |
| ° | Principal amount shown is stated in U.S. dollars unless noted that the security is denominated in another currency. |
| † | Non-income-producing security. |
| • | Variable rate security. The rate shown is the rate as of March 31, 2015. Interest rates reset periodically. |
| ¥ | Fully or partially pledged as collateral for futures contracts and reverse repurchase agreements. |
| D | Securities have been classified by country of origin. |
| S | Interest only security. An interest only security is the interest only portion of a fixed income security which is separated and sold individually from the principal portion of the security. |
| W | Principal only security. A principal only security is the principal only portion of a fixed income security which is separated and sold individually from the interest portion of the security. |
| ^ | Zero coupon security. The rate shown is the yield at the time of purchase. |
| « | Senior secured loans generally pay interest at rates which are periodically redetermined by reference to a base lending rate plus a premium. These base lending rates are generally: (i) the prime rate offered by one or more U.S. banks, (ii) the lending rate offered by one or more European banks such as the London Interbank Offered Rate (LIBOR), and (iii) the certificate of deposit rate. Senior secured loans may be subject to restrictions on resale. Stated rate in effect at March 31, 2015. |
| f | Step coupon bond. Coupon increases or decreases periodically based on a predetermined schedule. Stated rate in effect at March 31, 2015. |
The following foreign currency exchange contracts, futures contracts, reverse repurchase agreements, and swap contracts were outstanding at March 31, 2015:1
Foreign Currency Exchange Contracts
Counterparty | Contracts to Receive (Deliver) | In Exchange For | Settlement Date | Unrealized Appreciation (Depreciation) | ||||||||||||
BAML | AUD | (1,518,626 | ) | USD | 1,188,741 | 4/30/15 | $ | 34,272 | ||||||||
BAML | CAD | (1,723,446 | ) | USD | 1,376,257 | 4/30/15 | 16,118 | |||||||||
BAML | EUR | 8,657 | USD | (14,471 | ) | 4/30/15 | (5,158 | ) | ||||||||
BAML | JPY | 156,341,254 | USD | (1,304,000 | ) | 4/1/15 | (647 | ) | ||||||||
BAML | JPY | (79,216,047 | ) | USD | 660,875 | 4/30/15 | 177 | |||||||||
BAML | NZD | (2,494,403 | ) | USD | 1,899,188 | 4/30/15 | 39,897 | |||||||||
BNP | AUD | (1,563,562 | ) | USD | 1,224,374 | 4/30/15 | 35,745 | |||||||||
BNP | NOK | (6,415,880 | ) | USD | 811,573 | 4/30/15 | 15,754 | |||||||||
CITI | CNY | (55,270,000 | ) | USD | 8,633,240 | 9/8/15 | (139,010 | ) | ||||||||
CITI | DKK | (15,303,800 | ) | USD | 2,343,422 | 4/1/15 | 140,948 | |||||||||
CITI | DKK | (15,305,000 | ) | USD | 2,325,903 | 10/1/15 | 110,084 | |||||||||
CITI | DKK | (44,344,000 | ) | USD | 6,836,778 | 1/4/16 | 393,750 | |||||||||
CITI | EUR | 906,000 | USD | (974,131 | ) | 4/1/15 | 240 | |||||||||
CITI | EUR | (109,445,000 | ) | USD | 122,930,244 | 5/19/15 | 5,149,430 | |||||||||
CITI | GBP | (232,000 | ) | USD | 342,222 | 4/2/15 | (1,910 | ) | ||||||||
CITI | ILS | (4,846,225 | ) | USD | 1,218,988 | 6/11/15 | 1,453 | |||||||||
CITI | INR | 36,930,000 | USD | (585,030 | ) | 6/26/15 | (3,114 | ) | ||||||||
CITI | JPY | (217,100,000 | ) | USD | 1,811,431 | 4/1/15 | 1,557 | |||||||||
CITI | JPY | (71,700,000 | ) | USD | 605,590 | 4/2/15 | 7,847 | |||||||||
CITI | JPY | (4,508,300,000 | ) | USD | 37,794,795 | 5/8/15 | 190,188 | |||||||||
CITI | KRW | 284,542,200 | USD | (260,474 | ) | 5/18/15 | (4,294 | ) | ||||||||
CITI | MXN | (23,937,415 | ) | USD | 1,578,389 | 5/5/15 | 12,524 | |||||||||
CSFB | EUR | 2,388,000 | USD | (2,566,501 | ) | 4/2/15 | 1,744 | |||||||||
CSFB | JPY | 60,833,916 | USD | (507,000 | ) | 4/1/15 | 148 | |||||||||
DB | EUR | (906,000 | ) | USD | 980,212 | 4/1/15 | 5,841 | |||||||||
HSBC | GBP | (470,553 | ) | USD | 700,066 | 4/30/15 | 2,218 | |||||||||
JPMC | BRL | 10,309 | USD | (3,591 | ) | 4/2/15 | (363 | ) | ||||||||
JPMC | BRL | (10,309 | ) | USD | 3,213 | 4/2/15 | (14 | ) | ||||||||
JPMC | BRL | 14,778,265 | USD | (4,558,379 | ) | 5/5/15 | 27,536 | |||||||||
JPMC | BRL | (15,910,280 | ) | USD | 5,853,672 | 7/2/15 | 1,007,582 | |||||||||
JPMC | BRL | (6,000,000 | ) | USD | 2,085,143 | 1/5/16 | 252,498 | |||||||||
JPMC | COP | (2,340,144,329 | ) | USD | 905,541 | 4/30/15 | 8,908 | |||||||||
JPMC | DKK | (14,000,000 | ) | USD | 2,192,811 | 10/1/15 | 165,926 | |||||||||
JPMC | EUR | (2,937,000 | ) | USD | 3,090,208 | 5/19/15 | (70,488 | ) | ||||||||
JPMC | GBP | (2,945,000 | ) | USD | 4,533,585 | 4/2/15 | 165,181 | |||||||||
JPMC | INR | 92,361,420 | USD | (1,457,035 | ) | 6/26/15 | (1,671 | ) | ||||||||
JPMC | JPY | 71,700,000 | USD | (592,065 | ) | 4/2/15 | 5,678 | |||||||||
JPMC | KRW | (1,037,881,750 | ) | USD | 937,309 | 4/30/15 | 2,347 | |||||||||
JPMC | MXN | (29,156,000 | ) | USD | 1,981,238 | 4/22/15 | 72,271 | |||||||||
JPMC | MXN | (7,814,000 | ) | USD | 522,920 | 5/5/15 | 11,768 | |||||||||
JPMC | PLN | (864,314 | ) | USD | 229,990 | 4/30/15 | 2,206 | |||||||||
MSC | CNY | 55,270,000 | USD | (8,600,000 | ) | 9/8/15 | 172,250 | |||||||||
TD | EUR | (4,529,115 | ) | USD | 4,913,585 | 4/30/15 | 40,743 | |||||||||
TD | JPY | 59,735,463 | USD | (499,384 | ) | 4/30/15 | (1,162 | ) | ||||||||
|
| |||||||||||||||
| $ | 7,866,998 | |||||||||||||||
|
| |||||||||||||||
76
Table of Contents
Futures Contracts
Contracts to Buy (Sell) | Notional Cost (Proceeds) | Notional Value | Expiration Date | Unrealized Appreciation (Depreciation) | ||||||||||||||
(3) | 90 Day Euro | $ | (740,429 | ) | $ | (740,812 | ) | 9/20/16 | $ | (383 | ) | |||||||
(6) | 90 Day Euro | (1,483,880 | ) | (1,484,550 | ) | 6/14/16 | (670 | ) | ||||||||||
(410) | 90 Day Euro | (102,149,606 | ) | (102,161,750 | ) | 6/16/15 | (12,144 | ) | ||||||||||
(164) | 90 Day Euro | (40,604,469 | ) | (40,655,600 | ) | 3/15/16 | (51,131 | ) | ||||||||||
(624) | 90 Day Euro | (155,187,433 | ) | (155,251,200 | ) | 9/15/15 | (63,767 | ) | ||||||||||
(692) | 90 Day Euro | (171,761,947 | ) | (171,866,850 | ) | 12/15/15 | (104,903 | ) | ||||||||||
(353) | 90 Day Euro | (86,788,640 | ) | (87,010,088 | ) | 12/20/16 | (221,448 | ) | ||||||||||
(114) | 90 Day Sterling | (20,894,259 | ) | (20,951,725 | ) | 6/16/16 | (57,466 | ) | ||||||||||
(149) | 90 Day Sterling | (27,140,636 | ) | (27,215,745 | ) | 12/21/17 | (75,109 | ) | ||||||||||
(711) | 90 Day Sterling | (130,498,760 | ) | (130,830,799 | ) | 3/17/16 | (332,039 | ) | ||||||||||
100 | Euro-Bund | 16,889,493 | 17,073,843 | 6/9/15 | 184,350 | |||||||||||||
78 | U.S. Treasury 2 yr Notes | 17,035,777 | 17,094,188 | 7/1/15 | 58,411 | |||||||||||||
527 | U.S. Treasury 5 yr Notes | 63,284,466 | 63,351,164 | 7/1/15 | 66,698 | |||||||||||||
| U.S. Treasury 10 yr | ||||||||||||||||||
(422) | Notes | (54,106,333 | ) | (54,398,437 | ) | 6/22/15 | (292,104 | ) | ||||||||||
65 | U.S. Treasury Ultra Bond | 10,905,724 | 11,041,875 | 6/22/15 | 136,151 | |||||||||||||
|
|
|
| |||||||||||||||
| $ | (683,240,932 | ) | $ | (765,554 | ) | |||||||||||||
|
|
|
| |||||||||||||||
Swap Contracts
CDS Contracts2
Counterparty | Swap Referenced Obligation | Notional Value3 | Annual Protection Payments (Receipts) | Termination Date | Unrealized Appreciation (Depreciation) | |||||||||||||
Protection Sold (Moody’s Rating): | ||||||||||||||||||
Finmeccanica Finance (Ba) | ||||||||||||||||||
CITI | 5 yr CDS | EUR 300,000 | 5.00 | % | 3/20/19 | $ | 13,485 | |||||||||||
Mexico LA SP (A) | ||||||||||||||||||
JPMC | 5 yr CDS | 14,300,000 | 1.00 | % | 12/20/19 | (238,988 | ) | |||||||||||
Republic of Brazil (Baa) | ||||||||||||||||||
JPMC | 5 yr CDS | 2,000,000 | 1.00 | % | 9/20/19 | (102,372 | ) | |||||||||||
|
| |||||||||||||||||
Total | $ | (327,875 | ) | |||||||||||||||
|
| |||||||||||||||||
Interest Rate Swap Contracts4
Counter- party | Swap Referenced Obligations | Notional Value3 | Fixed Interest Rate Recei- ved (Paid) | Vari- able Interest Rate Recei- ved (Paid) | Termi- nation Date | Unreali- zed Appreci- ation (Depreci- ation) | ||||||||||||||||
| CME - 1 yr | ||||||||||||||||||||||
USD-BBA- LIBOR | ||||||||||||||||||||||
CSFB | 3M | 6,800,000 | 0.75 | % | 0.266 | % | 6/17/16 | $ | (4,180 | ) | ||||||||||||
| CME - 2 yr | ||||||||||||||||||||||
| TIEE-Banxico | ||||||||||||||||||||||
CSFB | 28D | MXN | 139,300,000 | 4.04 | % | 3.287 | % | 2/3/17 | (5,570 | ) | ||||||||||||
Counter- party | Swap Referenced Obligations | Notional Value3 | Fixed Interest Rate Recei- ved (Paid) | Vari- able Interest Rate Recei- ved (Paid) | Termi- nation Date | Unreali- zed Appreci- ation (Depreci- ation) | ||||||||||||||||
| CME - 5 yr | ||||||||||||||||||||||
| TIEE-Banxico | ||||||||||||||||||||||
CSFB | 28D | MXN | 209,200,000 | 5.27 | % | 3.307 | % | 2/5/20 | $ | 4,704 | ||||||||||||
| CME - 5 yr | ||||||||||||||||||||||
| USD-BBA-LIBOR | ||||||||||||||||||||||
CSFB | 3M | 65,300,000 | 2.25 | % | 0.270 | % | 12/17/19 | (1,053,821 | ) | |||||||||||||
| CME - 7 yr | ||||||||||||||||||||||
| USD-BBA | ||||||||||||||||||||||
CSFB | LIBOR 3M | 17,300,000 | 2.50 | % | 0.270 | % | 12/17/21 | (647,356 | ) | |||||||||||||
| CME - 10 yr | ||||||||||||||||||||||
| TIEE-Banxico | ||||||||||||||||||||||
CSFB | 28D | MXN | 13,700,000 | 5.98 | % | 3.303 | % | 8/26/24 | 15,714 | |||||||||||||
| CME - 15 yr | ||||||||||||||||||||||
| TIEE-Banxico | ||||||||||||||||||||||
CSFB | 28D | MXN | 84,300,000 | 6.71 | % | 3.307 | % | 9/20/29 | 123,675 | |||||||||||||
| CME - 15 yr | ||||||||||||||||||||||
| TIEE-Banxico | ||||||||||||||||||||||
CSFB | 28D | MXN | 312,900,000 | 5.99 | % | 3.305 | % | 1/8/30 | (104,079 | ) | ||||||||||||
| CME - 2 yr | ||||||||||||||||||||||
| GBP-BBA-LIBOR | ||||||||||||||||||||||
CSFB | 6M | GBP | 3,200,000 | 1.50 | % | 0.684 | % | 12/16/17 | (27,152 | ) | ||||||||||||
| CME - 5 yr | ||||||||||||||||||||||
| USD-BBA-LIBOR | ||||||||||||||||||||||
JPMC | 3M | 6,900,000 | 1.65 | % | 0.261 | % | 2/26/19 | (84,342 | ) | |||||||||||||
| CME - 5 yr | ||||||||||||||||||||||
| USD-BBA-LIBOR | ||||||||||||||||||||||
JPMC | 3M | 2,300,000 | 1.67 | % | 0.258 | % | 2/17/20 | (16,952 | ) | |||||||||||||
| CME - 7 yr | ||||||||||||||||||||||
| USD-BBA-LIBOR | ||||||||||||||||||||||
JPMC | 3M | 2,240,000 | 2.27 | % | 0.261 | % | 2/26/21 | (76,640 | ) | |||||||||||||
| CME - 10 yr | ||||||||||||||||||||||
| USD-BBA-LIBOR | ||||||||||||||||||||||
JPMC | 3M | 8,680,000 | 2.84 | % | 0.261 | % | 2/26/24 | (635,233 | ) | |||||||||||||
| CME - 3 yr | ||||||||||||||||||||||
| USD-BBA-LIBOR | ||||||||||||||||||||||
JPMC | 3M | 3,700,000 | 1.28 | % | 0.270 | % | 9/16/17 | (28,471 | ) | |||||||||||||
| CME - 7 yr | ||||||||||||||||||||||
| USD-BBA | ||||||||||||||||||||||
JPMC | LIBOR 3M | 2,800,000 | 2.22 | % | 0.258 | % | 5/12/21 | (86,232 | ) | |||||||||||||
| CME - 7 yr | ||||||||||||||||||||||
| USD-BBA-LIBOR | ||||||||||||||||||||||
JPMC | 3M | 1,750,000 | 2.24 | % | 0.256 | % | 7/28/21 | (55,984 | ) | |||||||||||||
| CME - 1 yr | ||||||||||||||||||||||
| USD-BBA-LIBOR | ||||||||||||||||||||||
MSC | 3M | 22,000,000 | 0.75 | % | 0.266 | % | 6/17/16 | (13,123 | ) | |||||||||||||
| CME - 7 yr | ||||||||||||||||||||||
| USD-BBA-LIBOR | ||||||||||||||||||||||
MSC | 3M | 6,500,000 | 2.00 | % | 0.268 | % | 6/15/22 | (15,270 | ) | |||||||||||||
| CME - 10 yr | ||||||||||||||||||||||
| USD-BBA-LIBOR | ||||||||||||||||||||||
MSC | 3M | 1,000,000 | 2.42 | % | 0.261 | % | 12/3/24 | (36,729 | ) | |||||||||||||
| CME - 30 yr | ||||||||||||||||||||||
| USD-BBA-LIBOR | ||||||||||||||||||||||
MSC | 3M | 39,300,000 | 2.50 | % | 0.266 | % | 6/15/45 | 637,670 | ||||||||||||||
|
| |||||||||||||||||||||
| $ | (2,109,371 | ) | ||||||||||||||||||||
|
| |||||||||||||||||||||
| (continues | ) | 77 |
Table of Contents
Schedules of investments
Optimum Fixed Income Fund
Reverse Repurchase Agreements5
Counterparty | Interest Rate | Trade Date | Maturity Date | Face Value | Repurchase Price | |||||||||||||||
BCLY - U.S. Treasury | ||||||||||||||||||||
Inflation Protected Bond | 0.33 | % | 3/18/15 | 4/9/15 | $ | (1,804,500 | ) | $ | (1,804,864 | ) | ||||||||||
TD - U.S. Treasury Bond | 0.30 | % | 3/30/15 | 4/6/15 | (926,250 | ) | (926,304 | ) | ||||||||||||
|
|
|
| |||||||||||||||||
| $ | (2,730,750 | ) | $ | (2,731,168 | ) | |||||||||||||||
|
|
|
| |||||||||||||||||
The use of foreign currency exchange contracts, futures contracts, reverse repurchase agreements, and swap contracts involves elements of market risk and risks in excess of the amounts disclosed in the financial statements. The foreign currency exchange contracts, notional values, and reverse repurchase agreements presented above represent the Fund’s total exposure in such contracts, whereas only the net unrealized appreciation (depreciation) is reflected in the Fund’s net assets.
1See Note 7 in “Notes to financial statements.”
2A CDS contract is a risk-transfer instrument through which one party (purchaser of protection) transfers to another party (seller of protection) the financial risk of a credit event (as defined in the CDS agreement), as it relates to a particular reference security or basket of securities (such as an index). Periodic payments (receipts) on such contracts are accrued daily and recorded as unrealized losses (gains) on swap contracts. Upon payment (receipt), such amounts are recorded as realized losses (gains) on swap contracts. Upfront payments made or received in connection with CDS contracts are amortized over the expected life of the CDS contracts as unrealized losses (gains) on swap contracts. The change in value of CDS contracts is recorded daily as unrealized appreciation or depreciation. A realized gain or loss is recorded upon a credit event (as defined in the CDS agreement) or the maturity or termination of the agreement.
3Notional value shown is stated in U.S. dollars unless noted that the swap is denominated in another currency.
4An interest rate swap agreement is an exchange of interest rates between counterparties. Periodic payments (receipt) on such contracts are accrued daily and recorded as unrealized appreciation (depreciation) on swap contracts. Upon periodic payment (receipt) or termination of the contract, such amounts are recorded as realized gains (losses) on swap contracts.
5See Note 1 in “Notes to financial statements.”
Summary of abbreviations:
AMT – Subject to Alternative Minimum Tax
ARM – Adjustable Rate Mortgage
AUD – Australian Dollar
BAML – Bank of America Merrill Lynch
BBA – LIBOR – British Bankers Association Rate
BCLY – Barclays Bank
BNP – BNP Paribas
BRL – Brazilian Real
CAD – Canadian Dollar
CDS – Credit Default Swap
CITI – Citigroup Global Markets
CLO – Collateralized Loan Obligation
CLP – Chilean Peso
CME – Chicago Mercantile Exchange Inc.
CNY – China Renminbi
COP – Colombian Peso
CSFB – Credit Suisse First Boston
DB – Deutsche Bank
DKK – Danish Krone
EUR – European Monetary Unit
GBP – British Pound Sterling
GNMA – Government National Mortgage Association
GSMPS – Goldman Sachs Reperforming Mortgage
Securities
HSBC – Hong Kong Shanghai Bank
ICE LIBOR – IntercontinentalExchange London Interbank
Offered Rate
IDR – Indonesian Rupiah
IG – Investment Grade
ILS – Israeli Shekel
IMM – International Monetary Market
INR – Indian Rupee
IRS – Interest Rate Swaptions
JPMC – JPMorgan Chase Bank
JPY – Japanese Yen
KRW – South Korean Won
LB – Lehman Brothers
M – Month
MASTR – Mortgage Asset Securitization Transactions, Inc.
MSC – Morgan Stanley Capital
MXN – Mexican Peso
NOK – Norwegian Krone
NZD – New Zealand Dollar
O.A.T. – Obligations Assimilables du Tresor
PEN – Peruvian Nuevo Sol
PIK – Payment-in-kind
PLN – Polish Zloty
REMIC – Real Estate Mortgage Investment Conduit
SEK – Swedish Krona
S.F. – Single Family
TBA – To be announced
TD – Toronto Dominion Bank
TIEE – Banxico – Interbank Equilibrium Interest Rate
Banco de Mexico
UBS – Union Bank of Switzerland
USD – U.S. Dollar
yr – Year
ZAR – South African Rand
See accompanying notes, which are an integral part of the financial statements.
| 78 |
Table of Contents
Optimum International Fund
March 31, 2015
| Number of shares | Value (U.S. $) | |||||||
| ||||||||
Common Stock – 97.75%D |
| |||||||
| ||||||||
Australia – 4.91% | ||||||||
Amcor | 610,218 | $ | 6,501,419 | |||||
Australia & New Zealand Banking Group | 278,631 | 7,751,058 | ||||||
BHP Billiton ADR | 68,110 | 3,165,072 | ||||||
Commonwealth Bank of Australia | 23,418 | 1,660,945 | ||||||
Orora | 1,005,896 | 1,733,313 | ||||||
Qantas Airways † | 1,098,540 | 2,605,461 | ||||||
Telstra | 379,811 | 1,823,147 | ||||||
Transfield Services † | 461,311 | 478,411 | ||||||
|
| |||||||
| 25,718,826 | ||||||||
|
| |||||||
Austria – 2.49% | ||||||||
Conwert Immobilien Invest † | 193,095 | 2,419,969 | ||||||
Erste Group Bank | 130,301 | 3,203,948 | ||||||
Schoeller-Bleckmann Oilfield Equipment | 53,912 | 3,450,019 | ||||||
voestalpine | 108,323 | 3,963,199 | ||||||
|
| |||||||
| 13,037,135 | ||||||||
|
| |||||||
Belgium – 1.30% | ||||||||
Ageas VVPR Strip «=† | 2,424 | 0 | ||||||
Delhaize Group | 75,872 | 6,817,615 | ||||||
|
| |||||||
| 6,817,615 | ||||||||
|
| |||||||
Bermuda – 1.44% | ||||||||
Everest Re Group | 43,534 | 7,574,916 | ||||||
|
| |||||||
| 7,574,916 | ||||||||
|
| |||||||
Brazil – 1.66% | ||||||||
Banco Bradesco ADR | 252,332 | 2,341,645 | ||||||
Banco do Brasil | 301,900 | 2,176,290 | ||||||
JBS | 281,000 | 1,249,182 | ||||||
Qualicorp † | 407,267 | 2,932,016 | ||||||
|
| |||||||
| 8,699,133 | ||||||||
|
| |||||||
Canada – 1.94% | ||||||||
Dominion Diamond † | 143,800 | 2,456,742 | ||||||
Interfor † | 38,300 | 579,043 | ||||||
Magna International Class A | 92,600 | 4,950,024 | ||||||
Rogers Communications Class B | 60,386 | 2,021,723 | ||||||
Tourmaline Oil † | 6,200 | 187,618 | ||||||
|
| |||||||
| 10,195,150 | ||||||||
|
| |||||||
China/Hong Kong – 7.86% | ||||||||
Anhui Conch Cement | 1,120,000 | 4,229,397 | ||||||
Cathay Pacific Airways | 223,000 | 516,033 | ||||||
China Mobile | 75,000 | 977,430 | ||||||
China Oilfield Services | 2,444,000 | 4,069,595 | ||||||
China Shipping Container Lines † | 3,968,000 | 1,259,785 | ||||||
| Number of shares | Value (U.S. $) | |||||||
| ||||||||
Common StockD (continued) |
| |||||||
| ||||||||
China/Hong Kong (continued) | ||||||||
CLP Holdings | 631,000 | $ | 5,515,018 | |||||
Industrial & Commercial Bank of China | 4,353,000 | 3,219,837 | ||||||
Mindray Medical International ADR | 133,187 | 3,642,664 | ||||||
New China Life Insurance Class H | 184,900 | 1,029,470 | ||||||
New World Development | 460,000 | 533,297 | ||||||
Orient Overseas International | 878,500 | 5,362,519 | ||||||
Power Assets Holdings | 119,000 | 1,214,733 | ||||||
Swire Pacific Class A | 209,000 | 2,845,007 | ||||||
Weichai Power | 1,112,000 | 4,287,341 | ||||||
Yangzijiang Shipbuilding Holdings | 1,431,000 | 1,315,594 | ||||||
Yue Yuen Industrial Holdings | 341,000 | 1,206,608 | ||||||
|
| |||||||
| 41,224,328 | ||||||||
|
| |||||||
Colombia – 0.46% | ||||||||
Bancolombia ADR | 61,088 | 2,402,591 | ||||||
|
| |||||||
| 2,402,591 | ||||||||
|
| |||||||
Czech Republic – 0.52% | ||||||||
Komercni banka | 12,639 | 2,726,203 | ||||||
|
| |||||||
| 2,726,203 | ||||||||
|
| |||||||
Denmark – 0.27% | ||||||||
H. Lundbeck † | 24,666 | 519,590 | ||||||
Pandora | 9,641 | 877,759 | ||||||
|
| |||||||
| 1,397,349 | ||||||||
|
| |||||||
Finland – 0.91% | ||||||||
Neste Oil | 181,169 | 4,754,749 | ||||||
|
| |||||||
| 4,754,749 | ||||||||
|
| |||||||
France – 3.67% | ||||||||
Derichebourg † | 184,871 | 566,625 | ||||||
Etablissements Maurel | 59,064 | 431,485 | ||||||
Faurecia | 54,538 | 2,378,632 | ||||||
GDF Suez VVPR Strip =† | 8,820 | 0 | ||||||
IPSOS | 31,419 | 879,388 | ||||||
Metropole Television | 27,031 | 542,193 | ||||||
Peugeot † | 79,144 | 1,323,186 | ||||||
Sanofi | 10,204 | 1,007,925 | ||||||
Societe Generale | 77,210 | 3,728,550 | ||||||
Sodexo | 37,004 | 3,609,794 | ||||||
Thales | 27,031 | 1,500,024 | ||||||
Vivendi | 131,972 | 3,277,183 | ||||||
|
| |||||||
| 19,244,985 | ||||||||
|
| |||||||
Germany – 2.12% | ||||||||
Aurubis | 45,957 | 2,596,057 | ||||||
| (continues | ) | 79 |
Table of Contents
Schedules of investments
Optimum International Fund
| Number of shares | Value (U.S. $) | |||||||
| ||||||||
Common StockD (continued) |
| |||||||
| ||||||||
Germany (continued) | ||||||||
Deutsche Lufthansa | 344,743 | $ | 4,828,223 | |||||
Hella KGaA Hueck † | 19,988 | 963,929 | ||||||
K+S | 21,098 | 687,544 | ||||||
Krones | 5,273 | 547,515 | ||||||
TUI | 84,474 | 1,479,824 | ||||||
|
| |||||||
| 11,103,092 | ||||||||
|
| |||||||
India – 3.02% | ||||||||
Britannia Industries | 23,968 | 830,660 | ||||||
Hindustan Unilever | 232,962 | 3,269,761 | ||||||
ICICI Bank ADR | 561,212 | 5,814,156 | ||||||
Yes Bank | 449,470 | 5,895,225 | ||||||
|
| |||||||
| 15,809,802 | ||||||||
|
| |||||||
Indonesia – 0.45% | ||||||||
Indofood Sukses Makmur | 4,146,300 | 2,361,163 | ||||||
|
| |||||||
| 2,361,163 | ||||||||
|
| |||||||
Ireland – 4.64% | ||||||||
ICON † | 192,511 | 13,577,801 | ||||||
Shire | 134,879 | 10,752,612 | ||||||
|
| |||||||
| 24,330,413 | ||||||||
|
| |||||||
Israel – 1.92% | ||||||||
Plus500 | 91,064 | 921,920 | ||||||
Taro Pharmaceutical Industries † | 6,562 | 925,439 | ||||||
Teva Pharmaceutical Industries ADR | 131,786 | 8,210,268 | ||||||
|
| |||||||
| 10,057,627 | ||||||||
|
| |||||||
Italy – 0.13% | ||||||||
La Doria | 45,778 | 689,415 | ||||||
|
| |||||||
| 689,415 | ||||||||
|
| |||||||
Japan – 17.70% | ||||||||
Aderans | 55,100 | 570,040 | ||||||
Alpine Electronics | 48,700 | 809,787 | ||||||
Alps Electric | 200,000 | 4,815,062 | ||||||
Asahi Kasei | 405,000 | 3,866,954 | ||||||
Bic Camera | 131,600 | 1,366,798 | ||||||
CyberAgent | 26,400 | 1,511,868 | ||||||
Daiwa Securities Group | 324,000 | 2,550,067 | ||||||
Denso | 172,700 | 7,871,273 | ||||||
Fuji Heavy Industries | 22,100 | 733,514 | ||||||
Fujitsu | 271,000 | 1,847,814 | ||||||
Hazama Ando | 77,600 | 443,264 | ||||||
Heiwado | 25,900 | 592,803 | ||||||
Hitachi | 618,000 | 4,220,146 | ||||||
Japan Airlines | 45,800 | 1,424,475 | ||||||
JVC Kenwood † | 166,600 | 512,317 | ||||||
| Number of shares | Value (U.S. $) | |||||||
| ||||||||
Common StockD (continued) |
| |||||||
| ||||||||
Japan (continued) | ||||||||
Kaken Pharmaceutical | 56,000 | $ | 1,618,672 | |||||
Kawasaki Heavy Industries | 105,000 | 529,639 | ||||||
Kissei Pharmaceutical | 21,300 | 664,939 | ||||||
Konica Minolta | 56,600 | 573,508 | ||||||
Kose | 9,800 | 540,397 | ||||||
KYORIN Holdings | 27,400 | 654,928 | ||||||
MEIJI Holdings | 13,900 | 1,692,874 | ||||||
Minebea | 33,000 | 518,952 | ||||||
Mizuho Financial Group | 1,244,500 | 2,186,816 | ||||||
MS&AD Insurance Group Holdings | 51,100 | 1,430,359 | ||||||
Nexon | 62,100 | 661,197 | ||||||
NH Foods | 58,000 | 1,336,308 | ||||||
Nichi-iko Pharmaceutical | 52,200 | 1,201,885 | ||||||
Nichirei | 113,000 | 632,951 | ||||||
Nippon Paper Industries | 52,400 | 787,295 | ||||||
Nippon Steel & Sumitomo Metal | 1,383,000 | 3,476,843 | ||||||
Nissha Printing | 79,700 | 1,452,715 | ||||||
Oracle Japan | 11,800 | 507,713 | ||||||
Otsuka | 14,800 | 630,599 | ||||||
Otsuka Holdings | 179,200 | 5,605,098 | ||||||
Panasonic | 90,000 | 1,181,687 | ||||||
Resona Holdings | 211,000 | 1,046,969 | ||||||
Round One | 126,000 | 714,351 | ||||||
SBI Holdings | 102,500 | 1,240,594 | ||||||
Secom | 96,200 | 6,415,502 | ||||||
Shionogi | 55,800 | 1,857,302 | ||||||
Sumitomo Dainippon Pharma | 94,400 | 1,117,908 | ||||||
Sumitomo Heavy Industries | 594,000 | 3,886,668 | ||||||
Sumitomo Mitsui Financial Group | 165,500 | 6,338,352 | ||||||
T-Gaia | 70,900 | 937,681 | ||||||
Tokyo Electric Power † | 202,700 | 767,081 | ||||||
Toridoll.corporation | 33,600 | 466,203 | ||||||
Towa Pharmaceutical | 21,100 | 1,206,039 | ||||||
Toyota Motor | 49,000 | 3,419,812 | ||||||
Ulvac † | 46,600 | 715,971 | ||||||
Yamazaki Baking | 90,000 | 1,621,380 | ||||||
|
| |||||||
| 92,773,370 | ||||||||
|
| |||||||
Malaysia – 0.28% | ||||||||
British American Tobacco Malaysia | 25,400 | 470,833 | ||||||
Tenaga Nasional | 253,300 | 980,708 | ||||||
|
| |||||||
| 1,451,541 | ||||||||
|
| |||||||
Netherlands – 1.99% | ||||||||
Boskalis Westminster | 27,435 | 1,352,485 | ||||||
80
Table of Contents
| Number of shares | Value (U.S. $) | |||||||
| ||||||||
Common StockD (continued) |
| |||||||
| ||||||||
Netherlands (continued) | ||||||||
Core Laboratories | 60,913 | $ | 6,364,799 | |||||
Royal Dutch Shell Class A | 91,036 | 2,716,899 | ||||||
|
| |||||||
| 10,434,183 | ||||||||
|
| |||||||
New Zealand – 0.58% | ||||||||
Meridian Energy | 406,214 | 614,172 | ||||||
Spark New Zealand | 233,915 | 520,286 | ||||||
Xero Private | 104,850 | 1,889,351 | ||||||
|
| |||||||
| 3,023,809 | ||||||||
|
| |||||||
Norway – 3.14% | ||||||||
DNB | 423,405 | 6,796,373 | ||||||
Norsk Hydro | 733,327 | 3,855,090 | ||||||
Statoil ADR | 194,156 | 3,415,204 | ||||||
Subsea 7 | 276,814 | 2,377,355 | ||||||
|
| |||||||
| 16,444,022 | ||||||||
|
| |||||||
Republic of Korea – 4.38% |
| |||||||
Hyundai Mobis | 17,709 | 3,924,482 | ||||||
Korea Electric Power | 34,449 | 1,420,299 | ||||||
LG Display ADR † | 36,618 | 524,004 | ||||||
POSCO | 12,941 | 2,829,815 | ||||||
Samsung Electronics | 7,657 | 9,933,897 | ||||||
SK Hynix | 106,030 | 4,332,999 | ||||||
|
| |||||||
| 22,965,496 | ||||||||
|
| |||||||
Singapore – 2.69% | ||||||||
DBS Group Holdings | 461,000 | 6,835,393 | ||||||
Singapore Airlines | 461,000 | 4,013,570 | ||||||
United Industrial | 1,117,000 | 2,790,831 | ||||||
Wilmar International | 207,000 | 491,396 | ||||||
|
| |||||||
| 14,131,190 | ||||||||
|
| |||||||
Spain – 1.45% | ||||||||
Amadeus IT Holding | 177,865 | 7,624,192 | ||||||
|
| |||||||
| 7,624,192 | ||||||||
|
| |||||||
Sweden – 1.03% | ||||||||
Getinge Class B | 218,373 | 5,395,766 | ||||||
|
| |||||||
| 5,395,766 | ||||||||
|
| |||||||
Switzerland – 5.67% | ||||||||
Credit Suisse Group ADR | 126,025 | 3,393,853 | ||||||
Galenica | 5,823 | 5,076,005 | ||||||
Lonza Group † | 51,962 | 6,469,167 | ||||||
Novartis ADR | 73,334 | 7,231,466 | ||||||
Roche Holding | 25,573 | 7,027,258 | ||||||
Zehnder Group | 11,237 | 523,807 | ||||||
|
| |||||||
| 29,721,556 | ||||||||
|
| |||||||
Taiwan – 3.43% | ||||||||
Advanced Semiconductor Engineering | 4,425,000 | 5,999,135 | ||||||
| Number of shares | Value (U.S. $) | |||||||
| ||||||||
Common StockD (continued) |
| |||||||
| ||||||||
Taiwan (continued) | ||||||||
AU Optronics | 6,392,000 | $ | 3,211,074 | |||||
Taiwan Semiconductor | ||||||||
Manufacturing | 1,881,000 | 8,752,413 | ||||||
|
| |||||||
| 17,962,622 | ||||||||
|
| |||||||
Turkey – 1.20% | ||||||||
Akbank | 1,111,349 | 3,260,736 | ||||||
Turkiye Garanti Bankasi | 934,609 | 3,048,369 | ||||||
|
| |||||||
| 6,309,105 | ||||||||
|
| |||||||
United Kingdom – 11.62% | ||||||||
Abcam | 102,032 | 732,865 | ||||||
ARM Holdings ADR | 230,928 | 11,384,750 | ||||||
Debenhams | 1,781,156 | 1,982,105 | ||||||
Diageo | 214,160 | 5,917,970 | ||||||
DS Smith | 203,956 | 1,041,378 | ||||||
Great Portland Estates | 244,650 | 2,939,349 | ||||||
Hikma Pharmaceuticals | 32,673 | 1,028,308 | ||||||
HSBC Holdings | 301,889 | 2,572,437 | ||||||
Inchcape | 208,795 | 2,454,532 | ||||||
International Consolidated | ||||||||
Airlines Group † | 742,686 | 6,619,497 | ||||||
Investec | 415,991 | 3,449,921 | ||||||
Land Securities Group | 74,437 | 1,381,897 | ||||||
Legal & General Group | 1,012,155 | 4,168,265 | ||||||
Man Group | 1,013,210 | 3,056,097 | ||||||
Mondi | 136,622 | 2,625,378 | ||||||
Persimmon † | 164,019 | 4,041,857 | ||||||
Project White =† | 83,072 | 1,443,949 | ||||||
Rio Tinto ADR | 98,303 | 4,069,744 | ||||||
|
| |||||||
| 60,910,299 | ||||||||
|
| |||||||
United States – 2.88% | ||||||||
Carnival | 140,552 | 6,724,008 | ||||||
Carnival – London Stock Exchange | 141,653 | 6,926,670 | ||||||
Project Star =† | 142 | 1,063,796 | ||||||
Project Star Series G =† | 47 | 373,872 | ||||||
|
| |||||||
| 15,088,346 | ||||||||
|
| |||||||
Total Common Stock | 512,379,989 | |||||||
|
| |||||||
| (continues | ) | 81 |
Table of Contents
Schedules of investments
Optimum International Fund
| Principal amount° | Value (U.S. $) | |||||||
| ||||||||
Short-Term Investments – 1.46% |
| |||||||
| ||||||||
Discount Notes – 0.67%≠ | ||||||||
Federal Home Loan Bank | ||||||||
0.07% 4/6/15 | 2,585,582 | $ | 2,585,572 | |||||
0.075% 6/4/15 | 235,155 | 235,134 | ||||||
0.075% 6/29/15 | 235,155 | 235,126 | ||||||
0.095% 7/14/15 | 446,795 | 446,718 | ||||||
|
| |||||||
| 3,502,550 | ||||||||
|
| |||||||
Repurchase Agreements – 0.79% |
| |||||||
Bank of America Merrill Lynch 0.05%, dated 3/31/15, to be repurchased on 4/1/15, repurchase price $1,697,852 (collateralized by U.S. government obligations 2.125%–3.125% 6/30/21–2/15/43; market value $1,731,807) | 1,697,849 | 1,697,849 | ||||||
Bank of Montreal 0.10%, dated 3/31/15, to be repurchased on 4/1/15, repurchase price $1,414,878 (collateralized by U.S. government obligations 0.00%–9.125% 10/15/16–2/15/23; market value $1,443,172) | 1,414,875 | 1,414,875 | ||||||
BNP Paribas 0.10%, dated 3/31/15, to be repurchased on 4/1/15, repurchase price $1,029,279 (collateralized by U. S. government obligations 0.00%–2.250% 1/31/19–2/15/26; market value $1,049,862) | 1,029,276 | 1,029,276 | ||||||
|
| |||||||
| 4,142,000 | ||||||||
|
| |||||||
Total Short-Term Investments | 7,644,550 | |||||||
|
| |||||||
Total Value of Securities – 99.21% | $ | 520,024,539 |
| « | Dividend coupon which when presented with the corresponding coupon of the share benefits from a reduced withholding tax of 15% (rather than 25%) on dividends paid. |
| = | Security is being fair valued in accordance with the Fund’s fair valuation policy. At March 31, 2015, the aggregate value of fair valued securities was $2,881,617, which represents 0.55% of the Fund’s net assets. See Note 1 in “Notes to financial statements.” |
| ≠ | The rate shown is the effective yield at the time of purchase. |
| ° | Principal amount shown is stated in U. S. dollars unless noted that the security is denominated in another currency. |
| † | Non-income-producing security. |
| D | Securities have been classified by country of origin. Aggregate classification by business sectors has been presented on page 37 in “Security type / country and sector allocations.” |
The following foreign currency exchange contract were outstanding at March 31, 2015:1
Foreign Currency Exchange Contract
Counterparty | Contract to Receive (Deliver) | In Exchange For | Settlement | Unrealized | ||||||||||
BBH | HKD | (1,321,180) | USD | 170,391 | 4/2/15 | $ | (24 | ) | ||||||
The use of foreign currency exchange contracts involves elements of market risk and risks in excess of the amounts disclosed in the financial statements. The foreign currency exchange contract presented above represents the Fund’s total exposure in such contracts, whereas only the net unrealized appreciation (depreciation) is reflected in the Fund’s net assets.
1See Note 7 in “Notes to financial statements.”
Summary of abbreviations:
ADR – American Depositary Receipt
BBH – Brown Brothers Harriman
HKD – Hong Kong Dollar
USD – U. S. Dollar
VVPR Strip – Dividend Coupon
See accompanying notes, which are an integral part of the
financial statements.
82
Table of Contents
Optimum Large Cap Growth Fund
March 31, 2015
Number of shares | Value (U.S. $) | |||||||
| ||||||||
Common Stock – 95.71%² |
| |||||||
| ||||||||
Consumer Discretionary – 20.99% |
| |||||||
Amazon.com † | 111,300 | $ | 41,414,730 | |||||
AutoZone † | 13,600 | 9,277,376 | ||||||
BorgWarner | 55,700 | 3,368,736 | ||||||
CarMax † | 102,100 | 7,045,921 | ||||||
Chipotle Mexican Grill † | 3,650 | 2,374,471 | ||||||
Comcast Class A | 169,950 | 9,597,077 | ||||||
Darden Restaurants | 34,700 | 2,406,098 | ||||||
Delphi Automotive (United Kingdom) | 155,400 | 12,391,596 | ||||||
DISH Network Class A † | 15,000 | 1,050,900 | ||||||
Disney (Walt) | 216,900 | 22,750,641 | ||||||
Dollar General | 54,150 | 4,081,827 | ||||||
Dollar Tree † | 104,650 | 8,491,824 | ||||||
Flipkart Limited @=† | 1,530 | 165,368 | ||||||
Flipkart Limited Series A @=† | 522 | 56,420 | ||||||
Flipkart Limited Series C @=† | 921 | 99,545 | ||||||
Flipkart Limited Series E @=† | 1,712 | 185,039 | ||||||
Flipkart Limited Series G @=† | 7,188 | 817,793 | ||||||
Hanesbrands | 232,900 | 7,804,479 | ||||||
Hilton Worldwide Holdings † | 340,200 | 10,076,724 | ||||||
Home Depot | 106,523 | 12,102,078 | ||||||
Las Vegas Sands | 72,600 | 3,995,904 | ||||||
Lear | 23,650 | 2,620,893 | ||||||
Lowe’s | 253,400 | 18,850,426 | ||||||
McDonald’s | 54,000 | 5,261,760 | ||||||
MGM Resorts International † | 357,770 | 7,523,903 | ||||||
Netflix † | 14,600 | 6,083,674 | ||||||
NIKE Class B | 128,550 | 12,897,421 | ||||||
Pandora Media † | 72,300 | 1,171,983 | ||||||
Priceline Group † | 23,600 | 27,473,940 | ||||||
PVH | 7,650 | 815,184 | ||||||
Ralph Lauren | 4,450 | 585,175 | ||||||
Ross Stores | 42,700 | 4,498,872 | ||||||
Royal Caribbean Cruises | 80,550 | 6,593,018 | ||||||
Signet Jewelers (Bermuda) | 37,800 | 5,246,262 | ||||||
Starbucks | 139,650 | 13,224,855 | ||||||
Tesla Motors † | 40,800 | 7,701,816 | ||||||
Time Warner Cable | 13,200 | 1,978,416 | ||||||
Toll Brothers † | 94,450 | 3,715,663 | ||||||
Tractor Supply | 93,700 | 7,970,122 | ||||||
TripAdvisor † | 34,350 | 2,856,890 | ||||||
Twitter † | 112,500 | 5,634,000 | ||||||
Under Armour Class A † | 92,550 | 7,473,413 | ||||||
Walgreens Boots Alliance | 174,100 | 14,742,788 | ||||||
Wynn Macau (Macau) | 1,355,600 | 2,929,618 | ||||||
Wynn Resorts | 53,130 | 6,688,004 | ||||||
|
| |||||||
| 334,092,643 | ||||||||
|
| |||||||
| Number of shares | Value (U.S. $) | |||||||
| ||||||||
Common Stock² (continued) |
| |||||||
| ||||||||
Consumer Staples – 4.01% |
| |||||||
Altria Group | 112,100 | $ | 5,607,242 | |||||
Anheuser-Busch InBev ADR (Belgium) | 17,850 | 2,176,093 | ||||||
Costco Wholesale | 25,300 | 3,832,823 | ||||||
CVS Health | 210,750 | 21,751,507 | ||||||
Estee Lauder | 38,300 | 3,185,028 | ||||||
Jarden † | 56,800 | 3,004,720 | ||||||
Kroger | 57,750 | 4,427,115 | ||||||
Mead Johnson Nutrition | 46,500 | 4,674,645 | ||||||
Molson Coors Brewing Class B | 49,300 | 3,670,385 | ||||||
PepsiCo | 88,750 | 8,486,275 | ||||||
Whole Foods Market | 59,200 | 3,083,136 | ||||||
|
| |||||||
| 63,898,969 | ||||||||
|
| |||||||
Energy – 3.63% | ||||||||
Anadarko Petroleum | 92,500 | 7,659,925 | ||||||
Baker Hughes | 93,600 | 5,951,088 | ||||||
Cheniere Energy † | 50,150 | 3,881,610 | ||||||
Concho Resources † | 9,500 | 1,101,240 | ||||||
Continental Resources † | 56,000 | 2,445,520 | ||||||
Devon Energy | 112,050 | 6,757,735 | ||||||
EOG Resources | 15,000 | 1,375,350 | ||||||
EQT | 57,100 | 4,731,877 | ||||||
Pioneer Natural Resources | 30,300 | 4,954,353 | ||||||
Range Resources | 69,231 | 3,602,781 | ||||||
Schlumberger | 22,250 | 1,856,540 | ||||||
SunEdison † | 336,500 | 8,076,000 | ||||||
TerraForm Power Class A † | 87,750 | 3,203,753 | ||||||
Weatherford International (Switzerland) † | 181,900 | 2,237,370 | ||||||
|
| |||||||
| 57,835,142 | ||||||||
|
| |||||||
Financials – 5.32% | ||||||||
American Express | 24,650 | 1,925,658 | ||||||
American International Group | 46,700 | 2,558,693 | ||||||
American Tower | 123,000 | 11,580,450 | ||||||
Bank of America | 369,900 | 5,692,761 | ||||||
BlackRock | 10,100 | 3,694,984 | ||||||
Charles Schwab | 140,850 | 4,287,474 | ||||||
Citigroup | 158,300 | 8,155,616 | ||||||
Crown Castle International | 110,300 | 9,104,162 | ||||||
Discover Financial Services | 50,800 | 2,862,580 | ||||||
Hartford Financial Services Group | 209,300 | 8,752,926 | ||||||
Intercontinental Exchange | 24,400 | 5,691,788 | ||||||
Morgan Stanley | 300,550 | 10,726,629 | ||||||
State Street | 71,800 | 5,279,454 | ||||||
| (continues | ) | 83 |
Table of Contents
Schedules of investments
Optimum Large Cap Growth Fund
| Number of shares | Value (U.S. $) | |||||||
| ||||||||
Common Stock² (continued) |
| |||||||
| ||||||||
Financials (continued) |
| |||||||
TD Ameritrade Holding | 118,100 | $ | 4,400,406 | |||||
|
| |||||||
| 84,713,581 | ||||||||
|
| |||||||
Healthcare – 19.88% | ||||||||
Actavis † | 190,218 | 56,612,779 | ||||||
Alexion Pharmaceuticals † | 70,000 | 12,131,000 | ||||||
Amgen | 13,100 | 2,094,035 | ||||||
Anthem | 28,400 | 4,385,244 | ||||||
Becton, Dickinson | 57,500 | 8,256,425 | ||||||
Biogen † | 72,050 | 30,422,392 | ||||||
BioMarin Pharmaceutical † | 61,000 | 7,601,820 | ||||||
Bristol-Myers Squibb | 92,900 | 5,992,050 | ||||||
Celgene † | 151,800 | 17,499,504 | ||||||
Cigna | 10,745 | 1,390,833 | ||||||
Gilead Sciences † | 310,700 | 30,488,991 | ||||||
HCA Holdings † | 113,259 | 8,520,475 | ||||||
Humana | 91,300 | 16,253,226 | ||||||
Incyte † | 88,050 | 8,070,663 | ||||||
Intercept Pharmaceuticals † | 15,250 | 4,300,805 | ||||||
Intuitive Surgical † | 22,000 | 11,110,660 | ||||||
McKesson | 78,200 | 17,688,840 | ||||||
Pharmacyclics † | 38,200 | 9,777,290 | ||||||
Puma Biotechnology † | 4,250 | 1,003,467 | ||||||
Regeneron Pharmaceuticals † | 13,700 | 6,185,276 | ||||||
Shire ADR (Ireland) | 32,950 | 7,884,605 | ||||||
St.Jude Medical | 24,500 | 1,602,300 | ||||||
Teva Pharmaceutical Industries ADR (Israel) | 20,200 | 1,258,460 | ||||||
Thermo Fisher Scientific | 72,600 | 9,753,084 | ||||||
United Therapeutics † | 19,450 | 3,353,861 | ||||||
UnitedHealth Group | 76,400 | 9,037,356 | ||||||
Valeant Pharmaceuticals | 86,700 | 17,220,354 | ||||||
Vertex Pharmaceuticals † | 55,450 | 6,541,437 | ||||||
|
| |||||||
| 316,437,232 | ||||||||
|
| |||||||
Industrials – 11.89% |
| |||||||
American Airlines Group | 285,900 | 15,089,802 | ||||||
Boeing | 123,250 | 18,497,360 | ||||||
Danaher | 279,100 | 23,695,590 | ||||||
FedEx | 34,900 | 5,774,205 | ||||||
Flowserve | 76,700 | 4,332,783 | ||||||
HD Supply Holdings † | 280,200 | 8,729,631 | ||||||
Honeywell International | 141,650 | 14,775,511 | ||||||
Hunt (J.B.) Transport Services | 39,000 | 3,330,405 | ||||||
Ingersoll-Rand (Ireland) | 89,100 | 6,065,928 | ||||||
Lockheed Martin | 17,150 | 3,480,764 | ||||||
Martin Marietta Materials | 29,400 | 4,110,120 | ||||||
McGraw Hill Financial | 43,250 | 4,472,050 | ||||||
Number of shares | Value (U.S. $) | |||||||
| ||||||||
Common Stock² (continued) |
| |||||||
| ||||||||
Industrials (continued) |
| |||||||
Mobileye (Israel) † | 72,300 | $ | 3,038,769 | |||||
Precision Castparts | 69,250 | 14,542,500 | ||||||
Roper Industries | 50,900 | 8,754,800 | ||||||
Tyco International (Switzerland) | 190,850 | 8,218,001 | ||||||
Union Pacific | 64,900 | 7,029,319 | ||||||
United Continental Holdings † | 186,750 | 12,558,938 | ||||||
United Parcel Service Class B | 63,650 | 6,170,231 | ||||||
United Technologies | 35,900 | 4,207,480 | ||||||
Vulcan Materials | 47,300 | 3,987,390 | ||||||
WABCO Holdings † | 16,700 | 2,052,096 | ||||||
Wabtec | 66,400 | 6,308,664 | ||||||
|
| |||||||
| 189,222,337 | ||||||||
|
| |||||||
Information Technology – 28.05% |
| |||||||
Activision Blizzard | 165,800 | 3,767,805 | ||||||
Adobe Systems † | 111,400 | 8,236,916 | ||||||
Alibaba Group Holding ADR † | 139,405 | 11,604,072 | ||||||
Alliance Data Systems † | 25,185 | 7,461,056 | ||||||
Apple | 592,050 | 73,668,781 | ||||||
Arista Networks † | 63,250 | 4,461,023 | ||||||
ASML Holding (Netherlands) | 30,800 | 3,111,724 | ||||||
Avago Technologies | 54,750 | 6,952,155 | ||||||
Baidu ADR † | 61,300 | 12,774,920 | ||||||
Broadcom Class A | 87,450 | 3,786,148 | ||||||
Cognizant Technology | ||||||||
Solutions Class A † | 85,800 | 5,353,062 | ||||||
Ctrip.com International ADR † | 35,550 | 2,083,941 | ||||||
Dropbox Class A @=† | 61,727 | 1,180,946 | ||||||
Facebook Class A † | 669,479 | 55,041,216 | ||||||
Fiserv † | 113,950 | 9,047,630 | ||||||
Google Class A † | 42,100 | 23,352,870 | ||||||
Google Class C † | 77,750 | 42,607,000 | ||||||
GrubHub † | 62,200 | 2,823,258 | ||||||
LinkedIn Class A † | 40,900 | 10,219,274 | ||||||
MasterCard Class A | 195,000 | 16,846,050 | ||||||
Micron Technology † | 212,385 | 5,762,005 | ||||||
Microsoft | 216,750 | 8,811,971 | ||||||
NAVER (South Korea) | 3,042 | 1,836,109 | ||||||
NetSuite † | 39,000 | 3,617,640 | ||||||
NXP Semiconductor (Netherlands) † | 76,450 | 7,672,522 | ||||||
Palo Alto Networks † | 14,400 | 2,103,552 | ||||||
QUALCOMM | 39,950 | 2,770,133 | ||||||
Red Hat † | 71,900 | 5,446,425 | ||||||
salesforce.com † | 330,700 | 22,094,067 | ||||||
SanDisk | 69,750 | 4,437,495 | ||||||
SAP ADR (Germany) | 21,000 | 1,515,570 | ||||||
84
Table of Contents
| Number of shares | Value (U.S. $) | |||||||
| ||||||||
Common Stock² (continued) |
| |||||||
| ||||||||
Information Technology (continued) |
| |||||||
SBA Communications Class A † | 33,100 | $ | 3,876,010 | |||||
ServiceNow † | 52,800 | 4,159,584 | ||||||
Tencent Holdings (China) (Hong Kong Exchange) | 340,300 | 6,462,269 | ||||||
Vipshop Holdings ADR † | 293,900 | 8,652,416 | ||||||
Visa Class A | 623,250 | 40,766,783 | ||||||
Western Digital | 16,150 | 1,469,812 | ||||||
Workday Class A † | 40,100 | 3,384,841 | ||||||
Yahoo † | 162,300 | 7,211,801 | ||||||
|
| |||||||
| 446,430,852 | ||||||||
|
| |||||||
Materials – 1.53% |
| |||||||
Air Products & Chemicals | 30,100 | 4,553,528 | ||||||
Ashland | 29,700 | 3,781,107 | ||||||
duPont (E. I.) deNemours | 61,800 | 4,416,846 | ||||||
PPG Industries | 20,100 | 4,533,354 | ||||||
Sherwin-Williams | 24,700 | 7,027,150 | ||||||
|
| |||||||
| 24,311,985 | ||||||||
|
| |||||||
Telecommunication Services – 0.26% |
| |||||||
Level 3 Communications † | 78,000 | 4,199,520 | ||||||
|
| |||||||
| 4,199,520 | ||||||||
|
| |||||||
Utilities �� 0.15% |
| |||||||
Sempra Energy | 22,100 | 2,409,342 | ||||||
|
| |||||||
| 2,409,342 | ||||||||
|
| |||||||
Total Common Stock | 1,523,551,603 | |||||||
|
| |||||||
| ||||||||
Convertible Preferred Stock – 0.06% |
| |||||||
| ||||||||
Airbnb Private Placement @=† | 23,130 | 894,608 | ||||||
LivingSocial Private Placement Series F @=† | 14,824 | 3,854 | ||||||
|
| |||||||
Total Convertible Preferred Stock | 898,462 | |||||||
|
| |||||||
| ||||||||
U. S. Master Limited Partnerships – 1.22% |
| |||||||
| ||||||||
Blackstone Group | 425,600 | 16,551,584 | ||||||
Carlyle Group | 103,650 | 2,808,915 | ||||||
|
| |||||||
Total U. S. Master Limited Partnerships | 19,360,499 | |||||||
|
| |||||||
| Principal amount° | Value (U.S. $) | |||||||
| ||||||||
Short-Term Investments – 3.21% |
| |||||||
| ||||||||
Discount Notes – 0.59%≠ |
| |||||||
Federal Home Loan Bank | ||||||||
0.075% 6/4/15 | 2,431,783 | $ | 2,431,562 | |||||
0.075% 6/29/15 | 2,431,783 | 2,431,477 | ||||||
0.095% 7/14/15 | 4,620,388 | 4,619,588 | ||||||
|
| |||||||
| 9,482,627 | ||||||||
|
| |||||||
Repurchase Agreements – 2.62% |
| |||||||
Bank of America Merrill Lynch 0.05%, dated 3/31/15, to be repurchased on 4/1/15, repurchase price $17,067,059 (collateralized by U.S. government obligations 2.125%–3.125% 6/30/21–2/15/43; market value $17,408,379) | 17,067,035 | 17,067,035 | ||||||
Bank of Montreal 0.10%, dated 3/31/15, to be repurchased on 4/1/15, repurchase price $14,222,569 (collateralized by U.S. government obligations 0.00%–9.125% 10/15/16–2/15/23; market value $14,506,981) | 14,222,530 | 14,222,530 | ||||||
BNP Paribas 0.10%, dated 3/31/15, to be repurchased on 4/1/15, repurchase price $10,346,464 (collateralized by U.S. government obligations 0.00%–2.250% 1/31/19–2/15/26; market value $10,553,369) | 10,346,435 | 10,346,435 | ||||||
|
| |||||||
| 41,636,000 | ||||||||
|
| |||||||
Total Short-Term Investments | 51,118,627 | |||||||
|
| |||||||
Total Value of Securities – 100.20% | $ | 1,594,929,191 | ||||||
|
| |||||||
| @ | Illiquid security. At March 31, 2015, the aggregate value of illiquid securities was $3,403,573,which represents 0.21% of the Fund’s net assets. See Note 10 in “Notes to financial statements.” |
| ² | Narrow industries are utilized for compliance purposes for diversification whereas broad sectors are used for financial reporting. |
| (continues | ) | 85 |
Table of Contents
Schedules of investments
Optimum Large Cap Growth Fund
| = | Security is being fair valued in accordance with the Fund’s fair valuation policy. At March 31, 2015, the aggregate value of fair valued securities was $3,403,573, which represents 0.21% of the Fund’s net assets. See Note 1 in “Notes to financial statements.” |
| ≠ | The rate shown is the effective yield at the time of purchase. |
| ° | Principal amount shown is stated in U.S. dollars unless noted that the security is denominated in another currency. |
| † | Non-income-producing security. |
ADR – American Depositary Receipt
See accompanying notes, which are an integral part of the financial statements.
86
Table of Contents
Optimum Large Cap Value Fund
March 31, 2015
| Number of shares | Value (U.S. $) | |||||||
| ||||||||
Common Stock – 97.26% |
| |||||||
| ||||||||
Consumer Discretionary – 10.18% |
| |||||||
Advance Auto Parts | 22,280 | $ | 3,335,093 | |||||
Bed Bath & Beyond † | 23,638 | 1,814,807 | ||||||
Comcast Class A | 136,323 | 7,642,949 | ||||||
Copa Holdings Class A (Panama) | 33,236 | 3,355,839 | ||||||
Delphi Automotive (United Kingdom) | 66,153 | 5,275,040 | ||||||
Disney (Walt) | 45,717 | 4,795,256 | ||||||
Hasbro | 50,907 | 3,219,359 | ||||||
Johnson Controls | 132,879 | 6,702,417 | ||||||
Kohl’s | 23,879 | 1,868,532 | ||||||
Mattel | 25,426 | 580,984 | ||||||
McDonald’s | 54,936 | 5,352,964 | ||||||
Newell Rubbermaid | 29,927 | 1,169,248 | ||||||
Omnicom Group | 101,079 | 7,882,140 | ||||||
Ross Stores | 159,728 | 16,828,942 | ||||||
Target | 145,407 | 11,933,552 | ||||||
Time | 7,084 | 158,965 | ||||||
Time Warner | 67,818 | 5,726,552 | ||||||
TJX | 303,337 | 21,248,757 | ||||||
Verisk Analytics | 198,113 | 14,145,268 | ||||||
Viacom Class B | 56,439 | 3,854,784 | ||||||
Yum Brands | 74,654 | 5,876,763 | ||||||
|
| |||||||
| 132,768,211 | ||||||||
|
| |||||||
Consumer Staples – 11.86% |
| |||||||
Altria Group | 430,629 | 21,540,063 | ||||||
Archer-Daniels-Midland | 9,471 | 448,925 | ||||||
Campbell Soup | 385,269 | 17,934,272 | ||||||
Colgate-Palmolive | 230,067 | 15,952,846 | ||||||
CVS Health | 127,954 | 13,206,132 | ||||||
Danone (France) | 70,452 | 4,749,900 | ||||||
Diageo (United Kingdom) | 311,524 | 8,608,469 | ||||||
Dr Pepper Snapple Group | 16,596 | 1,302,454 | ||||||
General Mills | 185,329 | 10,489,621 | ||||||
Imperial Tobacco Group (United Kingdom) | 30,879 | 1,354,501 | ||||||
Kellogg | 26,229 | 1,729,803 | ||||||
Lorillard | 109,718 | 7,170,071 | ||||||
Nestle (Switzerland) | 143,025 | 10,770,132 | ||||||
Philip Morris International | 480,400 | 36,188,532 | ||||||
Procter & Gamble | 40,360 | 3,307,098 | ||||||
|
| |||||||
| 154,752,819 | ||||||||
|
| |||||||
Energy — 12.35% | ||||||||
Apache | 219,219 | 13,225,482 | ||||||
Atwood Oceanics | 262,025 | 7,365,523 | ||||||
Baker Hughes | 20,737 | 1,318,458 | ||||||
| Number of shares | Value (U.S. $) | |||||||
| ||||||||
Common Stock (continued) |
| |||||||
| ||||||||
Energy (continued) |
| |||||||
Chevron | 87,667 | $ | 9,203,282 | |||||
ConocoPhillips | 263,538 | 16,407,876 | ||||||
Continental Resources † | 212,443 | 9,277,386 | ||||||
EOG Resources | 41,826 | 3,835,026 | ||||||
Exxon Mobil | 344,013 | 29,241,105 | ||||||
Marathon Petroleum | 197,828 | 20,255,609 | ||||||
Occidental Petroleum | 89,453 | 6,530,069 | ||||||
Oil States International † | 330,123 | 13,128,992 | ||||||
Schlumberger | 50,593 | 4,221,480 | ||||||
SM Energy | 196,147 | 10,136,877 | ||||||
Valero Energy | 266,727 | 16,969,172 | ||||||
|
| |||||||
| 161,116,337 | ||||||||
|
| |||||||
Financials – 23.70% |
| |||||||
ACE (Switzerland) | 65,910 | 7,348,306 | ||||||
Aflac | 165,592 | 10,599,544 | ||||||
American Express | 47,980 | 3,748,198 | ||||||
Aon (United Kingdom) | 82,392 | 7,919,519 | ||||||
Apartment Investment & Management | 411,776 | 16,207,503 | ||||||
Bank of New York Mellon | 206,190 | 8,297,086 | ||||||
BlackRock | 18,442 | 6,746,821 | ||||||
CBOE Holdings | 328,248 | 18,843,076 | ||||||
Chubb | 50,235 | 5,078,760 | ||||||
Citigroup | 44,488 | 2,292,022 | ||||||
Discover Financial Services | 272,563 | 15,358,925 | ||||||
Eaton Vance | 297,475 | 12,386,859 | ||||||
Franklin Resources | 152,441 | 7,823,272 | ||||||
Goldman Sachs Group | 67,274 | 12,645,494 | ||||||
JPMorgan Chase | 469,319 | 28,431,345 | ||||||
McGraw Hill Financial | 197,111 | 20,381,277 | ||||||
MetLife | 226,487 | 11,448,918 | ||||||
Moody’s | 145,074 | 15,058,681 | ||||||
NASDAQ OMX Group | 104,262 | 5,311,106 | ||||||
Nationstar Mortgage Holdings † | 628,338 | 15,563,932 | ||||||
PNC Financial Services Group | 59,638 | 5,560,647 | ||||||
Prudential Financial | 72,590 | 5,829,703 | ||||||
State Street | 82,256 | 6,048,284 | ||||||
Travelers | 118,619 | 12,826,272 | ||||||
U. S. Bancorp | 291,352 | 12,723,342 | ||||||
Waddell & Reed Financial Class A | 257,909 | 12,776,812 | ||||||
Wells Fargo | 405,321 | 22,049,462 | ||||||
|
| |||||||
| 309,305,166 | ||||||||
|
| |||||||
Healthcare – 10.27% |
| |||||||
Abbott Laboratories | 181,666 | 8,416,586 | ||||||
| (continues | ) | 87 |
Table of Contents
Schedules of investments
Optimum Large Cap Value Fund
| Number of shares | Value (U.S. $) | |||||||
| ||||||||
Common Stock (continued) |
| |||||||
| ||||||||
Healthcare (continued) |
| |||||||
Baxter International | 86,724 | $ | 5,940,594 | |||||
Express Scripts Holding † | 84,416 | 7,324,776 | ||||||
Gilead Sciences † | 121,197 | 11,893,062 | ||||||
Johnson & Johnson | 225,089 | 22,643,953 | ||||||
Medtronic (Ireland) | 172,286 | 13,436,585 | ||||||
Merck | 157,197 | 9,035,684 | ||||||
Mylan † | 319,456 | 18,959,714 | ||||||
Novartis (Switzerland) | 23,061 | 2,276,132 | ||||||
Pfizer | 571,961 | 19,898,523 | ||||||
Roche Holding (Switzerland) | 6,561 | 1,802,911 | ||||||
St. Jude Medical | 70,737 | 4,626,200 | ||||||
Thermo Fisher Scientific | 57,691 | 7,750,209 | ||||||
|
| |||||||
| 134,004,929 | ||||||||
|
| |||||||
Industrials – 12.19% |
| |||||||
3M | 84,652 | 13,963,347 | ||||||
Canadian National Railway (Canada) | 59,584 | 3,984,382 | ||||||
Danaher | 101,267 | 8,597,568 | ||||||
Eaton (Ireland) | 83,909 | 5,700,777 | ||||||
Equifax | 16,819 | 1,564,167 | ||||||
Honeywell International | 143,258 | 14,943,242 | ||||||
Illinois Tool Works | 49,077 | 4,767,340 | ||||||
Lockheed Martin | 181,585 | 36,854,492 | ||||||
Northrop Grumman | 36,525 | 5,879,064 | ||||||
Pentair (United Kingdom) | 39,409 | 2,478,432 | ||||||
Rockwell Collins | 148,005 | 14,289,883 | ||||||
Stanley Black & Decker | 32,111 | 3,062,105 | ||||||
Tyco International | 193,472 | 8,330,904 | ||||||
United Parcel Service | 211,461 | 20,499,029 | ||||||
United Technologies | 120,343 | 14,104,200 | ||||||
|
| |||||||
| 159,018,932 | ||||||||
|
| |||||||
Information Technology – 9.60% |
| |||||||
Accenture Class A (Ireland) | 180,229 | 16,885,655 | ||||||
Apple | 215,413 | 26,803,840 | ||||||
Fidelity National Information Services | 53,681 | 3,653,529 | ||||||
Fiserv † | 65,452 | 5,196,889 | ||||||
International Business Machines | 57,468 | 9,223,614 | ||||||
Microsoft | 361,953 | 14,715,199 | ||||||
Oracle | 155,576 | 6,713,104 | ||||||
Texas Instruments | 148,048 | 8,466,125 | ||||||
Western Digital | 189,036 | 17,204,166 | ||||||
Western Union | 786,918 | 16,375,764 | ||||||
|
| |||||||
| 125,237,885 | ||||||||
|
| |||||||
Materials – 4.49% |
| |||||||
CF Industries Holdings | 48,358 | 13,718,197 | ||||||
| Number of shares | Value (U.S. $) | |||||||
| ||||||||
Common Stock (continued) |
| |||||||
| ||||||||
Materials (continued) |
| |||||||
Crown Holdings † | 66,423 | $ | 3,588,170 | |||||
duPont (E. I.) deNemours | 22,308 | 1,594,353 | ||||||
LyondellBasell Industries Class A | 150,456 | 13,210,037 | ||||||
NewMarket | 35,169 | 16,803,748 | ||||||
PPG Industries | 43,111 | 9,723,255 | ||||||
|
| |||||||
| 58,637,760 | ||||||||
|
| |||||||
Telecommunication Services – 2.28% |
| |||||||
AT&T | 54,596 | 1,782,559 | ||||||
Verizon Communications | 503,142 | 24,467,795 | ||||||
Vodafone Group (United Kingdom) | 1,079,332 | 3,531,806 | ||||||
|
| |||||||
| 29,782,160 | ||||||||
|
| |||||||
Utilities – 0.34% |
| |||||||
Duke Energy | 58,175 | 4,466,678 | ||||||
|
| |||||||
| 4,466,678 | ||||||||
|
| |||||||
Total Common Stock | 1,269,090,877 | |||||||
|
| |||||||
| ||||||||
Convertible Preferred Stock – 0.04% |
| |||||||
| ||||||||
United Technologies 7.50% exercise price $98.52, expiration date 8/1/15 | 7,480 | 460,319 | ||||||
|
| |||||||
Total Convertible Preferred Stock | 460,319 | |||||||
|
| |||||||
| Principal amount° | ||||||||
| ||||||||
Short-Term Investments – 2.62% |
| |||||||
| ||||||||
Discount Notes – 0.27%≠ |
| |||||||
Federal Home Loan Bank | ||||||||
0.054% 4/6/15 | 1,505,699 | 1,505,693 | ||||||
0.057% 4/8/15 | 578,664 | 578,662 | ||||||
0.065% 4/20/15 | 362,330 | 362,325 | ||||||
0.075% 6/4/15 | 265,879 | 265,855 | ||||||
0.075% 6/29/15 | 265,879 | 265,845 | ||||||
0.095% 7/14/15 | 505,170 | 505,082 | ||||||
|
| |||||||
| 3,483,462 | ||||||||
|
| |||||||
88
Table of Contents
| Principal amount° | Value (U.S. $) | |||||||
| ||||||||
Short-Term Investments (continued) |
| |||||||
| ||||||||
Repurchase Agreements – 2.35% |
| |||||||
Bank of America Merrill Lynch 0.05%, dated 3/31/15, to be repurchased on 4/1/15, repurchase price $12,599,848 (collateralized by U.S. government obligations 2.125%–3.125% 6/30/21–2/15/43; market value $12,851,829) | 12,599,830 | $ | 12,599,830 | |||||
Bank of Montreal | 10,499,859 | 10,499,859 | ||||||
BNP Paribas | 7,638,311 | 7,638,311 | ||||||
|
| |||||||
| 30,738,000 | ||||||||
|
| |||||||
Total Short-Term Investments | 34,221,462 | |||||||
|
| |||||||
Total Value of Securities –99.92% | $ | 1,303,772,658 | ||||||
|
| |||||||
| ≠ | The rate shown is the effective yield at the time of purchase. |
| ° | Principal amount shown is stated in U.S. dollars unless noted that the security is denominated in another currency. |
| † | Non-income-producing security. |
See accompanying notes, which are an integral part of the financial statements.
.
| 89 |
Table of Contents
Schedules of investments
Optimum Small-Mid Cap Growth Fund
March 31, 2015
| Number of shares | Value (U.S. $) | |||||||
| ||||||||
Common Stock – 95.54% |
| |||||||
| ||||||||
Consumer Discretionary – 12.76% |
| |||||||
Buffalo Wild Wings † | 5,536 | $ | 1,003,345 | |||||
Casey’s General Stores | 24,000 | 2,162,400 | ||||||
Choice Hotels International | 40,000 | 2,562,800 | ||||||
CST Brands | 56,176 | 2,462,194 | ||||||
Diamond Resorts International † | 168,193 | 5,622,692 | ||||||
Domino’s Pizza | 20,000 | 2,011,000 | ||||||
Dorman Products † | 80,000 | 3,980,000 | ||||||
Fiesta Restaurant Group † | 40,000 | 2,440,000 | ||||||
Fossil Group † | 26,000 | 2,143,700 | ||||||
Gentex | 123,623 | 2,262,301 | ||||||
Gentherm † | 24,644 | 1,244,768 | ||||||
GoPro Class A † | 71,526 | 3,104,944 | ||||||
IMAX (Canada) † | 128,506 | 4,331,937 | ||||||
Jack in the Box | 11,679 | 1,120,250 | ||||||
Kate Spade † | 91,425 | 3,052,681 | ||||||
LKQ † | 277,000 | 7,080,120 | ||||||
Michaels † | 30,410 | 822,895 | ||||||
Panera Bread Class A † | 13,703 | 2,192,411 | ||||||
Papa John’s International | 45,000 | 2,781,450 | ||||||
Performance Sports | 48,952 | 954,564 | ||||||
Pool | 45,000 | 3,139,200 | ||||||
Red Robin Gourmet Burgers † | 8,366 | 727,842 | ||||||
Samsonite International | 516,730 | 1,798,066 | ||||||
Select Comfort † | 48,984 | 1,688,478 | ||||||
Skechers U.S.A. Class A † | 25,857 | 1,859,377 | ||||||
Tuesday Morning † | 101,043 | 1,626,792 | ||||||
Vail Resorts | 36,520 | 3,776,898 | ||||||
Vince Holding † | 45,379 | 841,780 | ||||||
Williams-Sonoma | 30,000 | 2,391,300 | ||||||
|
| |||||||
| 71,186,185 | ||||||||
|
| |||||||
Consumer Staples – 1.68% |
| |||||||
Fresh Market † | 115,223 | 4,682,663 | ||||||
SunOpta (Canada) † | 142,560 | 1,513,987 | ||||||
United Natural Foods † | 41,000 | 3,158,640 | ||||||
|
| |||||||
| 9,355,290 | ||||||||
|
| |||||||
Energy – 3.08% | ||||||||
Carrizo Oil & Gas † | 32,000 | 1,588,800 | ||||||
Clayton Williams Energy † | 17,000 | 860,710 | ||||||
Diamondback Energy † | 42,363 | 3,255,173 | ||||||
Energen | 12,000 | 792,000 | ||||||
Gulfport Energy † | 37,000 | 1,698,670 | ||||||
Hornbeck Offshore Services † | 27,000 | 507,870 | ||||||
PDC Energy † | 13,000 | 702,520 | ||||||
Rosetta Resources † | 30,000 | 510,600 | ||||||
RSP Permian † | 98,062 | 2,470,182 | ||||||
| Number of shares | Value (U.S. $) | |||||||
| ||||||||
Common Stock (continued) |
| |||||||
| ||||||||
Energy (continued) | ||||||||
SM Energy | 27,000 | $ | 1,395,360 | |||||
SunEdison † | 141,291 | 3,390,984 | ||||||
|
| |||||||
| 17,172,869 | ||||||||
|
| |||||||
Financials – 12.02% | ||||||||
Allied World Assurance Holdings (Switzerland) | 30,000 | 1,212,000 | ||||||
Associated Banc-Corp | 245,000 | 4,557,000 | ||||||
Assured Guaranty (Bermuda) | 87,677 | 2,313,796 | ||||||
Blackhawk Network Holdings † | 79,000 | 2,808,450 | ||||||
Eaton Vance | 104,000 | 4,330,560 | ||||||
Education Realty Trust | 93,000 | 3,290,340 | ||||||
Extra Space Storage | 43,000 | 2,905,510 | ||||||
Financial Engines | 25,289 | 1,057,839 | ||||||
First Busey | 177,800 | 1,189,482 | ||||||
First Commonwealth Financial | 83,000 | 747,000 | ||||||
HFF Class A | 94,516 | 3,548,131 | ||||||
Kennedy-Wilson Holdings | 118,511 | 3,097,878 | ||||||
Lakeland Financial | 80,000 | 3,246,400 | ||||||
MB Financial | 53,000 | 1,659,430 | ||||||
PacWest Bancorp | 76,534 | 3,588,679 | ||||||
Paramount Group | 183,966 | 3,550,544 | ||||||
Patriot National † | 101,764 | 1,292,403 | ||||||
Pebblebrook Hotel Trust | 58,653 | 2,731,470 | ||||||
Post Properties | 35,000 | 1,992,550 | ||||||
Sandy Spring Bancorp | 85,000 | 2,229,550 | ||||||
SEI Investments | 79,000 | 3,483,110 | ||||||
SVB Financial Group † | 20,000 | 2,540,800 | ||||||
TriNet Group † | 118,323 | 4,168,519 | ||||||
TrustCo Bank New York | 400,000 | 2,752,000 | ||||||
WisdomTree Investments | 85,222 | 1,828,864 | ||||||
WL Ross Holding † | 4,100 | 43,091 | ||||||
World Acceptance † | 12,437 | 906,906 | ||||||
|
| |||||||
| 67,072,302 | ||||||||
|
| |||||||
Healthcare – 16.05% |
| |||||||
Abaxis | 11,000 | 705,210 | ||||||
Acadia Healthcare † | 64,387 | 4,610,109 | ||||||
Achillion Pharmaceuticals † | 83,379 | 822,117 | ||||||
Aerie Pharmaceuticals † | 40,733 | 1,276,572 | ||||||
Agios Pharmaceuticals † | 22,095 | 2,083,559 | ||||||
Akorn † | 55,000 | 2,613,050 | ||||||
Align Technology † | 14,000 | 752,990 | ||||||
Allscripts Healthcare Solutions † | 95,300 | 1,139,788 | ||||||
Alnylam Pharmaceuticals † | 19,871 | 2,074,930 | ||||||
90
Table of Contents
| Number of shares | Value (U.S. $) | |||||||
| ||||||||
Common Stock (continued) |
| |||||||
| ||||||||
Healthcare (continued) | ||||||||
Anacor | 42,157 | $ | 2,438,782 | |||||
BioCryst | 110,392 | 996,840 | ||||||
Bio-Techne | 27,500 | 2,757,975 | ||||||
Cardiovascular | 22,585 | 881,718 | ||||||
Celldex Therapeutics † | 44,700 | 1,245,789 | ||||||
Cepheid † | 88,933 | 5,060,288 | ||||||
DexCom † | 62,691 | 3,908,157 | ||||||
Endologix † | 95,961 | 1,638,054 | ||||||
Envision Healthcare Holdings † | 117,946 | 4,523,229 | ||||||
ExamWorks Group † | 5,485 | 228,286 | ||||||
HealthSouth | 31,000 | 1,375,160 | ||||||
HeartWare | 39,202 | 3,440,760 | ||||||
Insulet † | 124,091 | 4,138,435 | ||||||
Intercept | 4,000 | 1,128,080 | ||||||
Intersect ENT † | 35,036 | 904,980 | ||||||
Ironwood Pharmaceuticals † | 60,499 | 967,984 | ||||||
Isis Pharmaceuticals † | 26,673 | 1,698,270 | ||||||
LDR Holding † | 42,308 | 1,550,165 | ||||||
Mettler-Toledo International † | 17,000 | 5,587,050 | ||||||
Novavax † | 154,555 | 1,278,170 | ||||||
Otonomy † | 30,495 | 1,078,303 | ||||||
Portola | 67,776 | 2,572,777 | ||||||
PTC Therapeutics † | 36,376 | 2,213,480 | ||||||
Puma Biotechnology † | 4,664 | 1,101,217 | ||||||
Regulus Therapeutics † | 58,689 | 994,192 | ||||||
Relypsa † | 35,053 | 1,264,362 | ||||||
Sarepta Therapeutics † | 48,000 | 637,440 | ||||||
Seattle Genetics † | 32,000 | 1,131,200 | ||||||
Sirona Dental | 21,000 | 1,889,790 | ||||||
Synageva BioPharma † | 60,556 | 5,906,027 | ||||||
TESARO † | 51,100 | 2,933,140 | ||||||
Tetraphase Pharmaceuticals † | 32,034 | 1,173,726 | ||||||
Ultragenyx Pharmaceutical † | 29,000 | 1,800,610 | ||||||
VWR † | 70,000 | 1,819,300 | ||||||
Wright Medical Group † | 47,000 | 1,212,600 | ||||||
|
| |||||||
| 89,554,661 | ||||||||
|
| |||||||
Industrials – 22.87% | ||||||||
Acuity Brands | 41,611 | 6,997,306 | ||||||
Advanced Drainage Systems | 39,655 | 1,187,271 | ||||||
AECOM † | 69,853 | 2,152,869 | ||||||
Altra Industrial | 83,621 | 2,311,284 | ||||||
AMETEK | 139,000 | 7,303,060 | ||||||
Applied Industrial Technologies | 47,664 | 2,161,086 | ||||||
Astronics † | 29,633 | 2,183,952 | ||||||
| Number of shares | Value (U.S. $) | |||||||
| ||||||||
Common Stock (continued) |
| |||||||
| ||||||||
Industrials (continued) | ||||||||
Avis Budget Group † | 70,000 | $ | 4,131,050 | |||||
Belden | 21,000 | 1,964,760 | ||||||
CAI International † | 53,000 | 1,302,210 | ||||||
Cognex † | 39,092 | 1,938,572 | ||||||
DigitalGlobe † | 96,057 | 3,272,662 | ||||||
Donaldson | 192,000 | 7,240,320 | ||||||
ESCO Technologies | 47,000 | 1,832,060 | ||||||
Forward Air | 24,000 | 1,303,200 | ||||||
Generac Holdings † | 147,965 | 7,204,416 | ||||||
Graphic Packaging Holding | 330,213 | 4,801,297 | ||||||
HD Supply Holdings † | 106,376 | 3,314,144 | ||||||
Heartland Express | 86,000 | 2,043,360 | ||||||
HEICO Class A | 75,000 | 3,715,500 | ||||||
Kennametal | 41,000 | 1,381,290 | ||||||
Kirby † | 12,000 | 900,600 | ||||||
Knoll @ | 65,000 | 1,522,950 | ||||||
Landstar System | 64,663 | 4,287,157 | ||||||
Masonite International † | 64,374 | 4,329,795 | ||||||
Middleby † | 26,000 | 2,668,900 | ||||||
Moog Class A † | 57,312 | 4,301,266 | ||||||
Nordson | 80,000 | 6,267,200 | ||||||
Old Dominion Freight Line † | 43,761 | 3,382,725 | ||||||
Oshkosh | 55,000 | 2,683,450 | ||||||
Owens Corning | 66,798 | 2,899,033 | ||||||
PGT † | 85,000 | 949,875 | ||||||
RPX † | 34,000 | 489,260 | ||||||
Rush Enterprises Class A † | 57,000 | 1,559,520 | ||||||
Spirit Airlines † | 28,547 | 2,208,396 | ||||||
SunPower † | 67,429 | 2,111,202 | ||||||
Swift Transportation † | 141,445 | 3,680,399 | ||||||
Teledyne Technologies † | 15,629 | 1,668,083 | ||||||
Thermon Group Holdings @† | 86,904 | 2,091,779 | ||||||
Toro | 35,000 | 2,454,200 | ||||||
WageWorks † | 37,389 | 1,993,955 | ||||||
Watts Water Technologies | ||||||||
Class A | 38,020 | 2,092,241 | ||||||
WESCO International † | 27,000 | 1,887,030 | ||||||
XPO Logistics † | 31,369 | 1,426,348 | ||||||
|
| |||||||
| 127,597,033 | ||||||||
|
| |||||||
Information Technology – 21.15% |
| |||||||
Ambarella † | 27,166 | 2,056,738 | ||||||
Amber Road † | 158,533 | 1,466,430 | ||||||
Amphenol Class A | 56,800 | 3,347,224 | ||||||
ANSYS † | 45,000 | 3,968,550 | ||||||
Atmel | 173,000 | 1,423,790 | ||||||
Bankrate † | 200,000 | 2,268,000 | ||||||
Castlight Health Class B † | 6,780 | 52,613 | ||||||
| (continues | ) | 91 |
Table of Contents
Schedules of investments
Optimum Small-Mid Cap Growth Fund
| Number of shares | Value (U.S. $) | |||||||
| ||||||||
Common Stock (continued) |
| |||||||
| ||||||||
Information Technology (continued) |
| |||||||
Cogent Communications Holdings | 20,000 | $ | 706,600 | |||||
Constant Contact † | 73,559 | 2,810,689 | ||||||
CoStar Group † | 24,597 | 4,866,025 | ||||||
Demandware † | 54,551 | 3,322,156 | ||||||
Envestnet † | 34,108 | 1,912,777 | ||||||
ExlService Holdings † | 80,000 | 2,976,000 | ||||||
F5 Networks † | 21,000 | 2,413,740 | ||||||
Fleetmatics Group (Ireland) † | 91,019 | 4,082,202 | ||||||
FLIR Systems | 75,000 | 2,346,000 | ||||||
Heartland Payment Systems @ | 32,952 | 1,543,801 | ||||||
HubSpot † | 62,811 | 2,506,159 | ||||||
Infinera † | 152,000 | 2,989,840 | ||||||
Informatica † | 35,000 | 1,534,925 | ||||||
IPG Photonics † | 41,000 | 3,800,700 | ||||||
Marketo † | 82,297 | 2,108,449 | ||||||
Markit (United Kingdom) † | 71,086 | 1,912,213 | ||||||
MAXIMUS | 38,045 | 2,539,884 | ||||||
Medidata Solutions † | 25,000 | 1,226,000 | ||||||
Mellanox Technologies (Israel) † | 54,005 | 2,448,587 | ||||||
Nimble Storage † | 48,588 | 1,083,998 | ||||||
Power Integrations | 41,430 | 2,157,674 | ||||||
Rogers † | 25,000 | 2,055,250 | ||||||
Shutterstock † | 45,003 | 3,090,356 | ||||||
Solera Holdings | 93,000 | 4,804,380 | ||||||
SPS Commerce † | 48,455 | 3,251,331 | ||||||
Stratasys † | 10,000 | 527,800 | ||||||
SunEdison Semiconductor † | 21,876 | 564,838 | ||||||
Telogis @=† | 185,242 | 133,374 | ||||||
Textura † | 30,233 | 821,733 | ||||||
TrueCar † | 108,785 | 1,941,812 | ||||||
Tyler Technologies † | 35,373 | 4,263,508 | ||||||
Ultimate Software | 12,000 | 2,039,460 | ||||||
Veeva Systems | 139,540 | 3,562,456 | ||||||
Verint Systems † | 80,083 | 4,959,540 | ||||||
Virtusa † | 159,552 | 6,602,262 | ||||||
Wayfair Class A † | 5,100 | 163,812 | ||||||
WEX † | 20,344 | 2,184,132 | ||||||
WNS Holdings ADR † | 300,087 | 7,298,116 | ||||||
Zendesk † | 18,600 | 422,034 | ||||||
Zillow Group † | 34,194 | 3,429,658 | ||||||
|
| |||||||
| 117,987,616 | ||||||||
|
| |||||||
Materials – 4.01% |
| |||||||
Airgas | 36,000 | 3,819,960 | ||||||
| Number of shares | Value (U.S. $) | |||||||
| ||||||||
Common Stock (continued) |
| |||||||
| ||||||||
Materials (continued) |
| |||||||
Caesarstone Sdot-Yam (Israel) | 36,443 | $ | 2,212,455 | |||||
Drew Industries | 67,000 | 4,123,180 | ||||||
Headwaters † | 272,285 | 4,993,707 | ||||||
KapStone Paper & Packaging | 74,864 | 2,458,534 | ||||||
Platform Specialty Products † | 186,491 | 4,785,359 | ||||||
|
| |||||||
| 22,393,195 | ||||||||
|
| |||||||
Telecommunication |
| |||||||
Arista Networks † | 36,071 | 2,544,088 | ||||||
Boingo Wireless † | 135,000 | 1,017,900 | ||||||
CalAmp † | 49,000 | 793,310 | ||||||
Gogo † | 104,030 | 1,982,812 | ||||||
SBA Communications Class A † | 14,000 | 1,639,400 | ||||||
Vonage Holdings † | 555,000 | 2,725,050 | ||||||
|
| |||||||
| 10,702,560 | ||||||||
|
| |||||||
Total Common Stock | 533,021,711 | |||||||
|
| |||||||
| ||||||||
Convertible Preferred Stock – 0.58% |
| |||||||
| ||||||||
Cloudera@= | 30,243 | 998,019 | ||||||
DocuSign | ||||||||
Series B @= | 1,166 | 22,492 | ||||||
Series B-1 @= | 349 | 6,732 | ||||||
Series D @= | 838 | 16,165 | ||||||
Series E @= | 21,664 | 417,899 | ||||||
Telogis@=† | 252,269 | 1,074,666 | ||||||
Zuora= | 209,844 | 717,534 | ||||||
|
| |||||||
Total Convertible Preferred Stock | 3,253,507 | |||||||
|
| |||||||
| ||||||||
Exchange -Traded Fund – 0.50% |
| |||||||
| ||||||||
iShares Russell 2000 Growth | 18,330 | 2,777,912 | ||||||
|
| |||||||
Total Exchange-Traded Fund | 2,777,912 | |||||||
|
| |||||||
| ||||||||
Preferred Stock – 0.54% |
| |||||||
| ||||||||
Apigee Series H = | 256,001 | 893,443 | ||||||
Nutanix @= | 40,185 | 695,602 | ||||||
Pure Storage = | 36,123 | 578,329 | ||||||
Veracode Series 8 @= | 30,584 | 840,754 | ||||||
|
| |||||||
Total Preferred Stock | 3,008,128 | |||||||
|
| |||||||
92
Table of Contents
| Principal amount° | Value (U.S. $) | |||||||
| ||||||||
Short-Term Investments – 2.45% |
| |||||||
| ||||||||
Discount Notes – 1.25%≠ |
| |||||||
Federal Home Loan Bank |
| |||||||
0.047% 4/6/15 | 5,190,677 | $ | 5,190,656 | |||||
0.058% 4/8/15 | 580,051 | 580,048 | ||||||
0.065% 4/20/15 | 589,749 | 589,740 | ||||||
0.075% 6/4/15 | 160,923 | 160,909 | ||||||
0.075% 6/29/15 | 160,923 | 160,903 | ||||||
0.095% 7/14/15 | 305,755 | 305,702 | ||||||
|
| |||||||
| 6,987,958 | ||||||||
|
| |||||||
Repurchase Agreements – 1.20% |
| |||||||
Bank of America Merrill Lynch 0.05%, dated 3/31/15, to be repurchased on 4/1/15, repurchase price $2,728,778 (collateralized by U.S. government obligations 2.125%–3.125% 6/30/21–2/15/43; market value $2,783,350) | 2,728,774 | 2,728,774 | ||||||
Bank of Montreal 0.10%, dated 3/31/15, to be repurchased on 4/1/15, repurchase price $2,273,985 (collateralized by U.S. government obligations 0.00%–9.125% 10/15/16–2/15/23; market value $2,319,458) | 2,273,979 | 2,273,979 | ||||||
BNP Paribas 0.10%, dated 3/31/15, to be repurchased on 4/1/15, repurchase price $1,654,251 (collateralized by U.S. government obligations 0.00%–2.250% 1/31/19–2/15/26; market value $1,687,333) | 1,654,247 | 1,654,247 | ||||||
|
| |||||||
| 6,657,000 | ||||||||
|
| |||||||
Total Short-Term Investments | 13,644,958 | |||||||
|
| |||||||
Total Value of Securities – 99.61% | $ | 555,706,216 | ||||
|
|
| @ | Illiquid security. At March 31, 2015, the aggregate value of illiquid securities was $11,675,517, which represents 2.09% of the Fund’s net assets. See Note 10 in “Notes to financial statements.” |
| = | Security is being fair valued in accordance with the Fund’s fair valuation policy. At March 31, 2015, the aggregate value of fair valued securities was $6,395,009, which represents 1.15% of the Fund’s net assets. See Note 1 in “Notes to financial statements.” |
| ≠ | The rate shown is the effective yield at the time of purchase. |
| ° | Principal amount shown is stated in U. S. dollars unless noted that the security is denominated in an other currency. |
| † | Non-income-producing security. |
The following foreign currency exchange contract was outstanding at March 31, 2015:1
Foreign Currency Exchange Contract
Counterparty | Contract to Receive (Deliver) | In Exchange For | Settlement Date | Unrealized Appreciation (Depreciation) | ||||||||||||
JPMC | HKD | (567,475) | USD | 73,192 | 4/2/15 | $ | (5) | |||||||||
The use of foreign currency exchange contracts involves elements of market risk and risks in excess of the amounts disclosed in the financial statements. The foreign currency exchange contract presented above represents the Fund’s total exposure in such contracts, whereas only the net unrealized appreciation (depreciation) is reflected in the Fund’s net assets.
1See Note 7 in “Notes to financial statements.”
Summary of abbreviations:
ADR – American Depositary Receipt
HKD – Hong Kong Dollar
JPMC – JPMorgan Chase Bank
USD – U.S. Dollar
See accompanying notes, which are an integral part of the financial statements.
| (continues | ) | 93 |
Table of Contents
Schedules of investments
Optimum Small-Mid Cap Value Fund
March 31, 2015
| Number of shares | Value (U.S. $) | |||||||
| ||||||||
Common Stock – 88.36% |
| |||||||
| ||||||||
Consumer Discretionary – 9.56% |
| |||||||
AMC Networks | 65,200 | $ | 4,996,928 | |||||
Ascena Retail | 244,000 | 3,540,440 | ||||||
bebe stores | 917,855 | 3,331,814 | ||||||
Callaway Golf | 446,910 | 4,259,052 | ||||||
China Automotive Systems (China) † | 48,278 | 351,464 | ||||||
Christopher & | 427,291 | 2,375,738 | ||||||
Crocs † | 269,800 | 3,186,338 | ||||||
Dick’s Sporting Goods | 54,500 | 3,105,955 | ||||||
Express † | 163,400 | 2,701,002 | ||||||
Finish Line Class A | 59,000 | 1,446,680 | ||||||
Hooker Furniture | 143,694 | 2,737,371 | ||||||
LeapFrog Enterprises † | 474,500 | 1,034,410 | ||||||
Life Time Fitness † | 27,900 | 1,979,784 | ||||||
Meredith | 45,300 | 2,526,381 | ||||||
Pier 1 Imports | 228,000 | 3,187,440 | ||||||
Rent-A-Center | 132,500 | 3,635,800 | ||||||
Spartan Motors | 510,538 | 2,476,109 | ||||||
Staples | 106,000 | 1,726,210 | ||||||
Winnebago Industries | 71,143 | 1,512,500 | ||||||
|
| |||||||
| 50,111,416 | ||||||||
|
| |||||||
Consumer Staples – 1.20% |
| |||||||
Darling Ingredients † | 115,100 | 1,612,551 | ||||||
Dean Foods | 283,600 | 4,687,908 | ||||||
|
| |||||||
| 6,300,459 | ||||||||
|
| |||||||
Energy – 4.84% |
| |||||||
Bonanza Creek Energy † | 57,600 | 1,420,416 | ||||||
CONSOL Energy | 109,500 | 3,053,955 | ||||||
Frank’s International (Netherlands) | 113,000 | 2,113,100 | ||||||
Gulf Island Fabrication | 110,875 | 1,647,603 | ||||||
Hallador Energy | 270,626 | 3,163,618 | ||||||
McDermott International † | 60,500 | 232,320 | ||||||
Memorial Resource Development † | 95,300 | 1,690,622 | ||||||
Newpark Resources † | 293,403 | 2,672,901 | ||||||
Oil States International † | 47,000 | 1,869,190 | ||||||
PDC Energy † | 35,900 | 1,940,036 | ||||||
RSP Permian † | 89,600 | 2,257,024 | ||||||
VAALCO Energy † | 403,356 | 988,222 | ||||||
Warren Resources † | 403,457 | 359,077 | ||||||
Weatherford International (Switzerland) † | 158,000 | 1,943,400 | ||||||
|
| |||||||
| 25,351,484 | ||||||||
|
| |||||||
Financials – 7.77% |
| |||||||
Alexandria Real Estate Equities | 43,192 | 4,234,544 | ||||||
| Number of shares | Value (U.S. $) | |||||||
| ||||||||
Common Stock (continued) |
| |||||||
| ||||||||
Financials (continued) |
| |||||||
BankUnited | 108,200 | $ | 3,542,468 | |||||
Cedar Realty Trust | 546,776 | 4,095,352 | ||||||
Comerica | 30,100 | 1,358,413 | ||||||
Dime Community Bancshares | 239,303 | 3,852,778 | ||||||
East West Bancorp | 42,900 | 1,735,734 | ||||||
First Financial Bancorp @ | 125,100 | 2,228,031 | ||||||
Hallmark Financial Services † | 342,326 | 3,628,656 | ||||||
Inland Real Estate | 143,200 | 1,530,808 | ||||||
Potlatch | 48,903 | 1,958,076 | ||||||
PrivateBancorp | 105,700 | 3,717,469 | ||||||
SVB Financial | 30,500 | 3,874,720 | ||||||
Wintrust Financial | 64,900 | 3,094,432 | ||||||
XL Group (Ireland) | 51,000 | 1,876,800 | ||||||
|
| |||||||
| 40,728,281 | ||||||||
|
| |||||||
Healthcare – 4.57% | ||||||||
CONMED | 61,600 | 3,110,184 | ||||||
Haemonetics † | 93,600 | 4,204,512 | ||||||
Integra Lifesciences Holdings † | 35,200 | 2,170,080 | ||||||
MEDNAX † | 50,800 | 3,683,508 | ||||||
Myriad Genetics † | 115,400 | 4,085,160 | ||||||
Premier Class A † | 80,800 | 3,036,464 | ||||||
Teleflex | 30,600 | 3,697,398 | ||||||
|
| |||||||
| 23,987,306 | ||||||||
|
| |||||||
Industrials – 24.93% | ||||||||
ACCO Brands † | 343,825 | 2,857,186 | ||||||
Advanced Energy Industries † | 186,925 | 4,796,495 | ||||||
Aegion † | 101,900 | 1,839,295 | ||||||
AMETEK | 52,875 | 2,778,053 | ||||||
Apogee Enterprises | 57,800 | 2,496,960 | ||||||
Avery Dennison | 97,000 | 5,132,270 | ||||||
B/E Aerospace | 33,400 | 2,124,908 | ||||||
Beacon Roofing Supply † | 115,079 | 3,601,973 | ||||||
Boise Cascade † | 93,700 | 3,510,002 | ||||||
Brady Class A | 89,500 | 2,531,955 | ||||||
Carlisle | 30,800 | 2,853,004 | ||||||
Colfax † | 10,000 | 477,300 | ||||||
Crane | 42,800 | 2,671,148 | ||||||
Diana Shipping (Greece) † | 501,100 | 3,066,732 | ||||||
Dover | 73,700 | 5,094,144 | ||||||
Encore Wire | 82,497 | 3,124,986 | ||||||
Energizer Holdings | 26,800 | 3,699,740 | ||||||
Ennis | 179,949 | 2,540,880 | ||||||
FreightCar America | 167,172 | 5,254,216 | ||||||
Graham | 130,142 | 3,119,504 | ||||||
Granite Construction | 127,171 | 4,468,789 | ||||||
94
Table of Contents
| Number of shares | Value (U.S. $) | |||||||
| ||||||||
Common Stock (continued) |
| |||||||
| ||||||||
Industrials (continued) |
| |||||||
Harsco | 136,000 | $ | 2,347,360 | |||||
Herman Miller | 87,100 | 2,417,896 | ||||||
Hubbell Class B | 10,900 | 1,194,858 | ||||||
IDEX | 20,200 | 1,531,766 | ||||||
Joy Global | 78,600 | 3,079,548 | ||||||
Kennametal | 99,000 | 3,335,310 | ||||||
KLX † | 72,500 | 2,794,150 | ||||||
Knoll @ | 205,824 | 4,822,456 | ||||||
Landstar System | 22,400 | 1,485,120 | ||||||
ManpowerGroup | 25,600 | 2,205,440 | ||||||
McGrath RentCorp | 103,549 | 3,407,798 | ||||||
MRC Global † | 110,000 | 1,303,500 | ||||||
PerkinElmer | 55,500 | 2,838,270 | ||||||
Rush Enterprises Class A † | 70,600 | 1,931,616 | ||||||
STAG Industrial | 69,700 | 1,639,344 | ||||||
Stanley Black & Decker | 52,500 | 5,006,400 | ||||||
Timken | 52,000 | 2,191,280 | ||||||
Trex † | 36,200 | 1,973,986 | ||||||
TrueBlue † | 204,100 | 4,969,835 | ||||||
Tyco International | 15,400 | 663,124 | ||||||
Watts Water Technologies Class A | 67,901 | 3,736,592 | ||||||
WESCO International † | 59,800 | 4,179,422 | ||||||
Woodward | 70,500 | 3,596,205 | ||||||
|
| |||||||
| 130,690,816 | ||||||||
|
| |||||||
Information Technology – 19.68% |
| |||||||
Amdocs | 86,000 | 4,678,400 | ||||||
AVG Technologies (Netherlands) † | 209,200 | 4,529,180 | ||||||
Broadridge Financial Solutions | 60,700 | 3,339,107 | ||||||
Brooks Automation | 145,500 | 1,692,165 | ||||||
Cardtronics † | 130,000 | 4,888,000 | ||||||
Checkpoint Systems | 106,600 | 1,153,412 | ||||||
Diebold | 23,500 | 833,310 | ||||||
Equifax | 45,297 | 4,212,621 | ||||||
Fairchild Semiconductor International † | 324,500 | 5,899,410 | ||||||
Flextronics International † | 562,000 | 7,123,350 | ||||||
IAC/InterActiveCorp | 63,500 | 4,284,345 | ||||||
Infineon Technologies (Germany) | 100,000 | 1,189,914 | ||||||
Ingram Micro Class A † | 184,500 | 4,634,640 | ||||||
j2 Global @ | 61,200 | 4,019,616 | ||||||
Jabil Circuit | 191,000 | 4,465,580 | ||||||
KEMET † | 270,000 | 1,117,800 | ||||||
Mercury Systems † | 224,629 | 3,492,981 | ||||||
| Number of shares | Value (U.S. $) | |||||||
| ||||||||
Common Stock (continued) |
| |||||||
| ||||||||
Information Technology (continued) |
| |||||||
Methode Electronics | 78,279 | $ | 3,682,244 | |||||
Micrel | 262,111 | 3,952,634 | ||||||
ON Semiconductor † | 388,600 | 4,705,946 | ||||||
Pitney Bowes | 156,000 | 3,637,920 | ||||||
Plexus † | 118,302 | 4,823,173 | ||||||
Rudolph Technologies † | 276,342 | 3,045,289 | ||||||
ScanSource † | 99,836 | 4,058,333 | ||||||
Synaptics † | 35,975 | 2,924,947 | ||||||
Teradyne | 192,100 | 3,621,085 | ||||||
Trimble Navigation † | 133,000 | 3,351,600 | ||||||
Unisys † | 138,287 | 3,209,641 | ||||||
Xcerra † | 70,300 | 624,967 | ||||||
|
| |||||||
| 103,191,610 | ||||||||
|
| |||||||
Materials – 13.49% |
| |||||||
Albemarle | 45,462 | 2,402,212 | ||||||
Allegheny Technologies | 115,000 | 3,451,150 | ||||||
Ashland | 20,100 | 2,558,931 | ||||||
Cabot | 44,000 | 1,980,000 | ||||||
Carpenter Technology | 72,000 | 2,799,360 | ||||||
Celanese Class A | 14,500 | 809,970 | ||||||
Chemtura † | 98,000 | 2,674,420 | ||||||
Deltic Timber | 56,516 | 3,744,185 | ||||||
Eastman Chemical | 61,600 | 4,266,416 | ||||||
Fuller (H. B.) | 59,000 | 2,529,330 | ||||||
Intrepid Potash † | 258,400 | 2,984,520 | ||||||
KMG Chemicals | 220,801 | 5,902,011 | ||||||
Landec † | 318,757 | 4,446,660 | ||||||
MeadWestvaco | 41,000 | 2,044,670 | ||||||
Minerals Technologies | 65,800 | 4,809,980 | ||||||
Olympic Steel | 159,667 | 2,149,118 | ||||||
Owens-Illinois † | 97,000 | 2,262,040 | ||||||
PolyOne | 119,000 | 4,444,650 | ||||||
Rock-Tenn Class A | 27,200 | 1,754,400 | ||||||
Ryerson Holding @† | 117,000 | 745,290 | ||||||
Sealed Air | 79,000 | 3,599,240 | ||||||
Sonoco Products | 77,600 | 3,527,696 | ||||||
Stillwater Mining † | 278,056 | 3,592,484 | ||||||
Xerium Technologies † | 77,500 | 1,257,050 | ||||||
|
| |||||||
| 70,735,783 | ||||||||
|
| |||||||
Telecommunication Services – 1.67% | ||||||||
ARRIS Group † | 137,500 | 3,973,063 | ||||||
Vonage Holdings † | 972,600 | 4,775,466 | ||||||
|
| |||||||
| 8,748,529 | ||||||||
|
| |||||||
| (continues | ) | 95 |
Table of Contents
Schedules of investments
Optimum Small-Mid Cap Value Fund
| Number of shares | Value (U.S. $) | |||||||
| ||||||||
Common Stock (continued) |
| |||||||
| ||||||||
Utilities – 0.65% | ||||||||
Questar | 142,900 | $ | 3,409,594 | |||||
|
| |||||||
| 3,409,594 | ||||||||
|
| |||||||
Total Common Stock | 463,255,278 | |||||||
|
| |||||||
| ||||||||
U.S. Master Limited Partnership – 0.31% |
| |||||||
| ||||||||
Boardwalk Pipeline Partners | 100,000 | 1,610,000 | ||||||
|
| |||||||
Total U.S. Master Limited Partnership | 1,610,000 | |||||||
|
| |||||||
| Principal amount° | ||||||||
| ||||||||
Short-Term Investments – 11.54% |
| |||||||
| ||||||||
Discount Notes – 5.25%≠ |
| |||||||
Federal Home Loan Bank |
| |||||||
0.053% 4/6/15 | 14,991,503 | 14,991,443 | ||||||
0.056% 4/8/15 | 4,475,385 | 4,475,363 | ||||||
0.065% 4/20/15 | 2,492,136 | 2,492,101 | ||||||
0.075% 6/4/15 | 1,429,195 | 1,429,065 | ||||||
0.075% 6/29/15 | 1,429,195 | 1,429,015 | ||||||
0.095% 7/14/15 | 2,715,471 | 2,715,001 | ||||||
|
| |||||||
| 27,531,988 | ||||||||
|
| |||||||
Repurchase Agreements – 6.29% |
| |||||||
Bank of America Merrill Lynch 0.05%, dated 3/31/15, to be repurchased on 4/1/15, repurchase price $13,513,130 (collateralized by U.S. government obligations 2.125%–3.125% 6/30/21–2/15/43; market value $13,783,376) | 13,513,111 | 13,513,111 | ||||||
Bank of Montreal 0.10%, dated 3/31/15, to be repurchased on 4/1/15, repurchase price $11,260,957 (collateralized by U.S. government obligations 0.00%–9.125% 10/15/16–2/15/23; market value $11,486,145) | 11,260,926 | 11,260,926 | ||||||
| Principal amount° | Value (U.S. $) | |||||||
| ||||||||
Short-Term Investments (continued) |
| |||||||
| ||||||||
Repurchase Agreements (continued) |
| |||||||
BNP Paribas 0.10%, dated 3/31/15, to be repurchased on 4/1/15, repurchase price $8,191,986 (collateralized by U.S. government obligations 0.00%–2.250% 1/31/19–2/15/26; market value $8,355,806) | 8,191,963 | $ | 8,191,963 | |||||
|
| |||||||
| 32,966,000 | ||||||||
|
| |||||||
Total Short-Term Investments | 60,497,988 | |||||||
|
| |||||||
Total Value of Securities – 100.21% | $ | 525,363,266 | ||||||
|
| |||||||
| @ | Illiquid security. At March 31, 2015, the aggregate value of illiquid securities was $11,815,393, which represents 2.25% of the Fund’s net assets. See Note 10 in “Notes to financial statements.” |
| ≠ | The rate shown is the effective yield at the time of purchase. |
| ° | Principal amount shown is stated in U.S. dollars unless noted that the security is denominated in another currency. |
| † | Non-income-producing security. |
See accompanying notes, which are an integral part of the financial statements.
96
Table of Contents
Statements of assets and liabilities
Optimum Fund Trust
March 31, 2015
| Optimum Fixed Income Fund | Optimum International Fund | Optimum Large Cap Growth Fund | Optimum Large Cap Value Fund | Optimum Small-Mid Cap Growth Fund | Optimum Small-Mid Cap Value Fund | |||||||||||||||||||
Assets: | ||||||||||||||||||||||||
Investments, at value1 | $ | 2,024,941,996 | $ | 512,379,989 | $ | 1,543,810,564 | $ | 1,269,551,196 | $ | 542,061,258 | $ | 464,865,278 | ||||||||||||
Short-term investments, at value2 | 98,460,848 | 7,644,550 | 51,118,627 | 34,221,462 | 13,644,958 | 60,497,988 | �� | |||||||||||||||||
Cash | 12,908,945 | — | — | 254,544 | 80,601 | 72,186 | ||||||||||||||||||
Cash collateral due from brokers | 3,920,348 | — | — | — | — | — | ||||||||||||||||||
Foreign currencies, at value3 | 3,237,332 | 1,652,161 | — | — | — | 45,169 | ||||||||||||||||||
Receivable for securities sold | 130,430,943 | 954,026 | 9,229,779 | 868,305 | 4,878,580 | 468,678 | ||||||||||||||||||
Dividends and interest receivable | 13,684,512 | 2,482,359 | 481,601 | 1,889,406 | 312,138 | 340,317 | ||||||||||||||||||
Receivable for fund shares sold | 4,083,103 | 785,899 | 1,937,160 | 1,842,842 | 761,774 | 808,598 | ||||||||||||||||||
Swap interest receivable | 126,436 | — | — | — | — | — | ||||||||||||||||||
Securities lending income receivable | — | 7,630 | — | — | — | — | ||||||||||||||||||
Unrealized appreciation on foreign currency exchange contracts | 8,094,829 | — | — | — | — | — | ||||||||||||||||||
Unrealized appreciation on interest rate swap contracts | 781,763 | — | — | — | — | — | ||||||||||||||||||
Unrealized appreciation on credit default swap contracts | 13,485 | — | — | — | — | — | ||||||||||||||||||
Upfront payments on credit default swap contracts | 166,799 | — | — | — | — | — | ||||||||||||||||||
Upfront payments on interest rate swap contracts | 119,202 | — | — | — | — | — | ||||||||||||||||||
Other assets | 772 | — | — | — | — | — | ||||||||||||||||||
|
|
|
|
|
|
|
|
|
|
|
| |||||||||||||
Total assets | 2,300,971,313 | 525,906,614 | 1,606,577,731 | 1,308,627,755 | 561,739,309 | 527,098,214 | ||||||||||||||||||
|
|
|
|
|
|
|
|
|
|
|
| |||||||||||||
Liabilities: | ||||||||||||||||||||||||
Reverse repurchase agreement payable | 2,730,750 | — | — | — | — | — | ||||||||||||||||||
Securities sold short, at value4 | 2,181,875 | — | — | — | — | — | ||||||||||||||||||
Options written, at value5 | 205,468 | — | — | — | — | — | ||||||||||||||||||
Cash overdraft | — | 508,151 | 89,280 | — | — | — | ||||||||||||||||||
Payable for securities purchased | 244,978,219 | — | 11,607,796 | 1,214,288 | 2,640,732 | 1,735,642 | ||||||||||||||||||
Cash collateral due to brokers | 4,290,000 | — | — | — | — | — | ||||||||||||||||||
Payable for fund shares redeemed | 1,360,571 | 411,214 | 1,352,195 | 1,124,175 | 467,783 | 406,276 | ||||||||||||||||||
Swap interest payable | 703,182 | — | — | — | — | — | ||||||||||||||||||
Variation margin due to broker on futures contracts | 80,249 | — | — | — | — | — | ||||||||||||||||||
Interest payable for reverse repurchase agreements and securities sold short | 3,497 | — | — | — | — | — | ||||||||||||||||||
Investment management fees payable | 925,753 | 367,883 | 999,978 | 780,607 | 440,529 | 427,977 | ||||||||||||||||||
Other affiliates payable | 663,077 | 178,762 | 535,417 | 452,630 | 174,284 | 161,501 | ||||||||||||||||||
Other accrued expenses | 326,744 | 159,958 | 221,181 | 183,774 | 102,706 | 94,096 | ||||||||||||||||||
Trustees’ fees and expenses payable | 38,876 | 10,137 | 30,413 | 24,855 | 10,496 | 9,974 | ||||||||||||||||||
Upfront receipts on interest rate swap contracts | 3,528,254 | — | — | — | — | — | ||||||||||||||||||
Unrealized depreciation on interest rate swap contracts | 2,891,134 | — | — | — | — | — | ||||||||||||||||||
Unrealized depreciation on credit default swap contracts | 341,360 | — | — | — | — | — | ||||||||||||||||||
Unrealized depreciation on foreign currency exchange contracts | 227,831 | 24 | — | — | 5 | — | ||||||||||||||||||
Upfront receipts on credit default swap contracts | 30,938 | — | — | — | — | — | ||||||||||||||||||
Accrued capital gain taxes payable | 9,146 | 99,000 | — | — | — | — | ||||||||||||||||||
|
|
|
|
|
|
|
|
|
|
|
| |||||||||||||
Total liabilities | 265,516,924 | 1,735,129 | 14,836,260 | 3,780,329 | 3,836,535 | 2,835,466 | ||||||||||||||||||
|
|
|
|
|
|
|
|
|
|
|
| |||||||||||||
Total Net Assets | $ | 2,035,454,389 | $ | 524,171,485 | $ | 1,591,741,471 | $ | 1,304,847,426 | $ | 557,902,774 | $ | 524,262,748 | ||||||||||||
|
|
|
|
|
|
|
|
|
|
|
| |||||||||||||
| (continues | ) | 97 |
Table of Contents
Statements of assets and liabilities
Optimum Fund Trust
| Optimum Fixed Income Fund | Optimum International Fund | Optimum Large Cap Growth Fund | Optimum Large Cap Value Fund | Optimum Small-Mid Cap Growth Fund | Optimum Small-Mid Cap Value Fund | |||||||||||||||||||
Net Assets Consist of: | ||||||||||||||||||||||||
Paid-in capital | $ | 1,990,244,943 | $ | 538,003,071 | $ | 1,232,523,224 | $ | 1,022,996,840 | $ | 416,173,939 | $ | 429,975,636 | ||||||||||||
Undistributed (accumulated) net investment income (loss) | 16,614,976 | 735,684 | — | 2,591,084 | (1,040,171 | ) | (742,120 | ) | ||||||||||||||||
Accumulated net realized gain (loss) | (349,909 | ) | (17,262,914 | ) | 60,866,852 | (39,888,922 | ) | 25,935,244 | 7,224,160 | |||||||||||||||
Net unrealized appreciation of investments, foreign currencies, and derivatives | 28,944,379 | 2,695,644 | 298,351,395 | 319,148,424 | 116,833,762 | 87,805,072 | ||||||||||||||||||
|
|
|
|
|
|
|
|
|
|
|
| |||||||||||||
Total Net Assets | $ | 2,035,454,389 | $ | 524,171,485 | $ | 1,591,741,471 | $ | 1,304,847,426 | $ | 557,902,774 | $ | 524,262,748 | ||||||||||||
|
|
|
|
|
|
|
|
|
|
|
| |||||||||||||
Net Asset Value | ||||||||||||||||||||||||
Class A: | ||||||||||||||||||||||||
Net assets | $ | 43,144,268 | $ | 10,290,841 | $ | 40,789,895 | $ | 35,951,739 | $ | 7,050,172 | $ | 5,440,190 | ||||||||||||
Shares of beneficial interest outstanding, unlimited authorization, no par | 4,439,014 | 882,615 | 2,399,753 | 2,246,169 | 458,589 | 398,920 | ||||||||||||||||||
Net asset value per share | $ | 9.72 | $ | 11.66 | $ | 17.00 | $ | 16.01 | $ | 15.37 | $ | 13.64 | ||||||||||||
Sales charge | 4.50 | % | 5.75 | % | 5.75 | % | 5.75 | % | 5.75 | % | 5.75 | % | ||||||||||||
Offering price per share, equal to net asset value per share / (1 – sales charge) | $ | 10.18 | $ | 12.37 | $ | 18.04 | $ | 16.99 | $ | 16.31 | $ | 14.47 | ||||||||||||
Class C: | ||||||||||||||||||||||||
Net assets | $ | 166,154,365 | $ | 35,996,632 | $ | 137,891,897 | $ | 122,772,726 | $ | 23,205,691 | $ | 19,245,161 | ||||||||||||
Shares of beneficial interest outstanding, unlimited authorization, no par | 17,115,342 | 3,154,169 | 8,932,697 | 7,744,964 | 1,674,155 | 1,564,966 | ||||||||||||||||||
Net asset value per share | $ | 9.71 | $ | 11.41 | $ | 15.44 | $ | 15.85 | $ | 13.86 | $ | 12.30 | ||||||||||||
Institutional Class: | ||||||||||||||||||||||||
Net assets | $ | 1,826,155,756 | $ | 477,884,012 | $ | 1,413,059,679 | $ | 1,146,122,961 | $ | 527,646,911 | $ | 499,577,397 | ||||||||||||
Shares of beneficial interest outstanding, unlimited authorization, no par | 187,954,780 | 40,715,826 | 79,544,540 | 71,471,654 | 32,630,553 | 34,902,562 | ||||||||||||||||||
Net asset value per share | $ | 9.72 | $ | 11.74 | $ | 17.76 | $ | 16.04 | $ | 16.17 | $ | 14.31 | ||||||||||||
| ||||||||||||||||||||||||
1 Investments, at cost | $ | 1,999,437,541 | $ | 509,508,814 | $ | 1,245,458,174 | $ | 950,384,706 | $ | 425,227,567 | $ | 377,053,302 | ||||||||||||
2 Short-term investments, at cost | 98,459,399 | 7,644,474 | 51,117,911 | 34,221,367 | 13,644,882 | 60,497,442 | ||||||||||||||||||
3 Foreign currencies, at cost | 3,260,130 | 1,675,131 | — | — | — | 52,619 | ||||||||||||||||||
4 Securities sold short, proceeds | (2,168,750 | ) | — | — | — | — | — | |||||||||||||||||
5 Premium received | (273,531 | ) | — | — | — | — | — | |||||||||||||||||
See accompanying notes, which are an integral part of the financial statements.
98
Table of Contents
Optimum Fund Trust
Year ended March 31, 2015
| Optimum Fixed Income Fund | Optimum International Fund | Optimum Large Cap Growth Fund | Optimum Large Cap Value Fund | Optimum Small-Mid Cap Growth Fund | Optimum Small-Mid Cap Value Fund | |||||||||||||||||||
Investment Income: | ||||||||||||||||||||||||
Interest | $ | 61,374,924 | $ | 6,499 | $ | 17,772 | $ | 16,361 | $ | 7,762 | $ | 28,933 | ||||||||||||
Dividends | 786,134 | 13,258,993 | 11,790,768 | 26,861,563 | 2,746,328 | 4,726,700 | ||||||||||||||||||
Distributions from U.S. master limited partnerships | — | — | 819,724 | — | — | (40,000 | ) | |||||||||||||||||
Less return of capital distributions1 | — | — | (819,724 | ) | — | — | 40,000 | |||||||||||||||||
Securities lending income | — | 654,232 | — | — | — | — | ||||||||||||||||||
Foreign tax withheld | (1,290 | ) | (1,175,841 | ) | (36,060 | ) | (96,468 | ) | (4,694 | ) | (6,098 | ) | ||||||||||||
|
|
|
|
|
|
|
|
|
|
|
| |||||||||||||
| 62,159,768 | 12,743,883 | 11,772,480 | 26,781,456 | 2,749,396 | 4,749,535 | |||||||||||||||||||
|
|
|
|
|
|
|
|
|
|
|
| |||||||||||||
Expenses: | ||||||||||||||||||||||||
Management fees | 10,308,427 | 4,911,540 | 10,067,722 | 8,859,590 | 5,559,678 | 4,977,672 | ||||||||||||||||||
Distribution expenses — Class A | 108,907 | 26,854 | 99,722 | 92,505 | 17,165 | 14,177 | ||||||||||||||||||
Distribution expenses — Class B | 2,504 | 915 | 3,264 | 3,049 | 564 | 514 | ||||||||||||||||||
Distribution expenses — Class C | 1,653,040 | 367,935 | 1,317,490 | 1,237,476 | 222,738 | 197,423 | ||||||||||||||||||
Dividend disbursing and transfer agent fees and expenses | 3,830,160 | 1,297,579 | 2,749,871 | 2,549,843 | 1,029,332 | 1,003,943 | ||||||||||||||||||
Administration expenses | 1,704,430 | 732,615 | 1,326,440 | 1,256,905 | 602,746 | 589,808 | ||||||||||||||||||
Accounting fees | 692,773 | 233,226 | 495,747 | 457,880 | 184,359 | 179,527 | ||||||||||||||||||
Reports and statements to shareholders | 192,764 | 142,261 | 148,826 | 113,500 | 46,666 | 45,914 | ||||||||||||||||||
Custodian fees | 180,087 | 247,428 | 80,313 | 68,559 | 43,256 | 22,542 | ||||||||||||||||||
Professional fees | 175,540 | 69,456 | 107,397 | 103,639 | 55,974 | 54,820 | ||||||||||||||||||
Trustees’ fees and expenses | 170,530 | 56,263 | 123,036 | 112,686 | 45,726 | 44,180 | ||||||||||||||||||
Registration fees | 124,414 | 73,002 | 117,240 | 88,881 | 77,712 | 79,086 | ||||||||||||||||||
Pricing fees | 82,124 | 7,302 | 1,248 | 1,010 | 1,114 | 935 | ||||||||||||||||||
Insurance | 38,597 | 15,668 | 26,732 | 25,331 | 10,117 | 9,791 | ||||||||||||||||||
Interest expense | 2,130 | — | — | — | — | — | ||||||||||||||||||
Tax services | 1,689 | 30,453 | 1,528 | 187 | 1,025 | 448 | ||||||||||||||||||
Other | 16,663 | 8,932 | 12,061 | 12,444 | 7,621 | 7,939 | ||||||||||||||||||
|
|
|
|
|
|
|
|
|
|
|
| |||||||||||||
| 19,284,779 | 8,221,429 | 16,678,637 | 14,983,485 | 7,905,793 | 7,228,719 | |||||||||||||||||||
Less expenses waived | — | — | (18,021 | ) | (15,128 | ) | (689,292 | ) | (298,419 | ) | ||||||||||||||
Less waived distribution expenses — Class B | (1,878 | ) | (686 | ) | (2,448 | ) | (2,286 | ) | (423 | ) | (385 | ) | ||||||||||||
Less expense paid indirectly | (343 | ) | (339 | ) | (363 | ) | (363 | ) | (359 | ) | (362 | ) | ||||||||||||
|
|
|
|
|
|
|
|
|
|
|
| |||||||||||||
Total operating expenses | 19,282,558 | 8,220,404 | 16,657,805 | 14,965,708 | 7,215,719 | 6,929,553 | ||||||||||||||||||
|
|
|
|
|
|
|
|
|
|
|
| |||||||||||||
Net Investment Income (Loss) | 42,877,210 | 4,523,479 | (4,885,325 | ) | 11,815,748 | (4,466,323 | ) | (2,180,018 | ) | |||||||||||||||
|
|
|
|
|
|
|
|
|
|
|
| |||||||||||||
| (continues | ) | 99 |
Table of Contents
Statements of operations
Optimum Fund Trust
| Optimum Fixed Income Fund | Optimum International Fund | Optimum Large Cap Growth Fund | Optimum Large Cap Value Fund | Optimum Small-Mid Cap Growth Fund | Optimum Small-Mid Cap Value Fund | |||||||||||||||||||
Net Realized and Unrealized Gain (Loss): |
| |||||||||||||||||||||||
Net realized gain (loss) on: | ||||||||||||||||||||||||
Investments2 | $ | 33,761,368 | $ | (1,152,740 | ) | $ | 157,437,843 | $ | 29,433,784 | $ | 60,176,510 | $ | 28,637,953 | |||||||||||
Foreign currencies | (19,515,870 | ) | 733,578 | (15,795 | ) | 231 | 2,645 | — | ||||||||||||||||
Foreign currency exchange contracts | 25,392,414 | 661,006 | 16,451 | (31,863 | ) | (2,750 | ) | — | ||||||||||||||||
Futures contracts | (5,466,644 | ) | — | — | — | — | — | |||||||||||||||||
Options written | 26,472 | — | — | — | — | — | ||||||||||||||||||
Swap contracts | (8,786,751 | ) | — | — | — | — | — | |||||||||||||||||
|
|
|
|
|
|
|
|
|
|
|
| |||||||||||||
Net realized gain | 25,410,989 | 241,844 | 157,438,499 | 29,402,152 | 60,176,405 | 28,637,953 | ||||||||||||||||||
|
|
|
|
|
|
|
|
|
|
|
| |||||||||||||
Net change in unrealized appreciation (depreciation) of: |
| |||||||||||||||||||||||
Investments3 | (562,522 | ) | (50,956,110 | ) | 70,632,977 | 24,731,035 | (8,698,393 | ) | (28,251,138 | ) | ||||||||||||||
Foreign currencies | (590,708 | ) | (34,805 | ) | (2,227 | ) | (22,574 | ) | — | (8,431 | ) | |||||||||||||
Foreign currency exchange contracts | 10,926,479 | 954,041 | 283 | — | (5 | ) | — | |||||||||||||||||
Futures contracts | 249,640 | — | — | — | — | — | ||||||||||||||||||
Options written | (318,721 | ) | — | — | — | — | — | |||||||||||||||||
Swap contracts | 2,337,215 | — | — | — | — | — | ||||||||||||||||||
|
|
|
|
|
|
|
|
|
|
|
| |||||||||||||
Net change in unrealized appreciation (depreciation) | 12,041,383 | (50,036,874 | ) | 70,631,033 | 24,708,461 | (8,698,398 | ) | (28,259,569 | ) | |||||||||||||||
|
|
|
|
|
|
|
|
|
|
|
| |||||||||||||
Net Realized and Unrealized Gain (Loss) | 37,452,372 | (49,795,030 | ) | 228,069,532 | 54,110,613 | 51,478,007 | 378,384 | |||||||||||||||||
|
|
|
|
|
|
|
|
|
|
|
| |||||||||||||
Net Increase (Decrease) in Net Assets Resulting from Operations | $ | 80,329,582 | $ | (45,271,551 | ) | $ | 223,184,207 | $ | 65,926,361 | $ | 47,011,684 | $ | (1,801,634 | ) | ||||||||||
|
|
|
|
|
|
|
|
|
|
|
| |||||||||||||
1See Note 1 in “Notes to financial statements.”
2Includes $6,987 and $43,590 capital gain taxes paid for Optimum Fixed Income Fund and Optimum International Fund, respectively.
3Includes $9,146 and $99,000 capital gain taxes accrued for Optimum Fixed Income Fund and Optimum International Fund, respectively.
See accompanying notes, which are an integral part of the financial statements.
100
Table of Contents
Statements of changes in net assets
Optimum Fund Trust
| Optimum Fixed Income Fund | Optimum International Fund | |||||||||||||||
| Year ended | Year ended | |||||||||||||||
| 3/31/15 | 3/31/14 | 3/31/15 | 3/31/14 | |||||||||||||
Increase (Decrease) in Net Assets from Operations: | ||||||||||||||||
Net investment income | $ | 42,877,210 | $ | 38,401,260 | $ | 4,523,479 | $ | 8,022,731 | ||||||||
Net realized gain (loss) | 25,410,989 | (23,489,916 | ) | 241,844 | 42,282,307 | |||||||||||
Net change in unrealized appreciation (depreciation) | 12,041,383 | (30,870,111 | ) | (50,036,874 | ) | 28,055,700 | ||||||||||
|
|
|
|
|
|
|
| |||||||||
Net increase (decrease) in net assets resulting from operations | 80,329,582 | (15,958,767 | ) | (45,271,551 | ) | 78,360,738 | ||||||||||
|
|
|
|
|
|
|
| |||||||||
Dividends and Distributions to Shareholders from: | ||||||||||||||||
Net investment income: | ||||||||||||||||
Class A | (972,785 | ) | (607,560 | ) | (112,096 | ) | (71,136 | ) | ||||||||
Class B | (3,454 | ) | (10,243 | ) | (616 | ) | (2,198 | ) | ||||||||
Class C | (2,477,203 | ) | (1,279,141 | ) | (62,325 | ) | (128,217 | ) | ||||||||
Institutional Class | (42,437,451 | ) | (25,186,612 | ) | (8,097,595 | ) | (5,108,799 | ) | ||||||||
Net realized gain: | ||||||||||||||||
Class A | — | (117,055 | ) | — | — | |||||||||||
Class B | — | (3,398 | ) | — | — | |||||||||||
Class C | — | (446,725 | ) | — | — | |||||||||||
Institutional Class | — | (3,834,085 | ) | — | — | |||||||||||
|
|
|
|
|
|
|
| |||||||||
| (45,890,893 | ) | (31,484,819 | ) | (8,272,632 | ) | (5,310,350 | ) | |||||||||
|
|
|
|
|
|
|
| |||||||||
Capital Share Transactions: | ||||||||||||||||
Proceeds from shares sold: | ||||||||||||||||
Class A | 6,766,684 | 9,525,104 | 1,745,456 | 1,958,772 | ||||||||||||
Class B | 20,913 | 113,873 | 7,604 | 19,764 | ||||||||||||
Class C | 23,437,353 | 34,709,090 | 5,301,094 | 6,035,603 | ||||||||||||
Institutional Class | 556,695,575 | 500,376,862 | 179,026,388 | 166,107,011 | ||||||||||||
Net asset value of shares issued upon reinvestment of dividends and distributions: | ||||||||||||||||
Class A | 971,831 | 703,966 | 111,087 | 70,139 | ||||||||||||
Class B | 3,454 | 12,872 | 616 | 2,114 | ||||||||||||
Class C | 2,477,203 | 1,701,326 | 62,286 | 125,977 | ||||||||||||
Institutional Class | 42,420,198 | 28,740,751 | 8,094,257 | 5,073,768 | ||||||||||||
|
|
|
|
|
|
|
| |||||||||
| 632,793,211 | 575,883,844 | 194,348,788 | 179,393,148 | |||||||||||||
|
|
|
|
|
|
|
| |||||||||
Cost of shares redeemed: | ||||||||||||||||
Class A | (8,655,227 | ) | (6,935,320 | ) | (2,032,127 | ) | (1,707,398 | ) | ||||||||
Class B | (539,075 | ) | (779,341 | ) | (202,237 | ) | (283,253 | ) | ||||||||
Class C | (24,148,962 | ) | (25,916,378 | ) | (4,538,818 | ) | (4,922,840 | ) | ||||||||
Institutional Class | (312,691,990 | ) | (275,846,637 | ) | (248,326,505 | ) | (75,350,955 | ) | ||||||||
|
|
|
|
|
|
|
| |||||||||
| (346,035,254 | ) | (309,477,676 | ) | (255,099,687 | ) | (82,264,446 | ) | |||||||||
|
|
|
|
|
|
|
| |||||||||
Increase (decrease) in net assets derived from capital share transactions | 286,757,957 | 266,406,168 | (60,750,899 | ) | 97,128,702 | |||||||||||
|
|
|
|
|
|
|
| |||||||||
Net Increase (Decrease) in Net Assets | 321,196,646 | 218,962,582 | (114,295,082 | ) | 170,179,090 | |||||||||||
Net Assets: | ||||||||||||||||
Beginning of year | 1,714,257,743 | 1,495,295,161 | 638,466,567 | 468,287,477 | ||||||||||||
|
|
|
|
|
|
|
| |||||||||
End of year | $ | 2,035,454,389 | $ | 1,714,257,743 | $ | 524,171,485 | $ | 638,466,567 | ||||||||
|
|
|
|
|
|
|
| |||||||||
Undistributed net investment income | $ | 16,614,976 | $ | 15,403,925 | $ | 735,684 | $ | 2,497,578 | ||||||||
|
|
|
|
|
|
|
| |||||||||
See accompanying notes, which are an integral part of the financial statements.
| (continues | ) | 101 |
Table of Contents
Statements of changes in net assets
Optimum Fund Trust
| Optimum Large Cap Growth Fund | Optimum Large Cap Value Fund | |||||||||||||||
| Year ended | Year ended | |||||||||||||||
| 3/31/15 | 3/31/14 | 3/31/15 | 3/31/14 | |||||||||||||
Increase (Decrease) in Net Assets from Operations: | ||||||||||||||||
Net investment income (loss) | $ | (4,885,325 | ) | $ | (4,499,020 | ) | $ | 11,815,748 | $ | 13,154,681 | ||||||
Net realized gain | 157,438,499 | 163,571,786 | 29,402,152 | 67,075,662 | ||||||||||||
Net change in unrealized appreciation (depreciation) | 70,631,033 | 71,142,639 | 24,708,461 | 105,214,396 | ||||||||||||
|
|
|
|
|
|
|
| |||||||||
Net increase in net assets resulting from operations | 223,184,207 | 230,215,405 | 65,926,361 | 185,444,739 | ||||||||||||
|
|
|
|
|
|
|
| |||||||||
Dividends and Distributions to Shareholders from: | ||||||||||||||||
Net investment income: | ||||||||||||||||
Class A | — | — | (389,161 | ) | (236,189 | ) | ||||||||||
Class B | — | — | (2,891 | ) | (1,805 | ) | ||||||||||
Class C | — | — | (410,056 | ) | (82,417 | ) | ||||||||||
Institutional Class | — | (149,730 | ) | (14,234,137 | ) | (8,692,742 | ) | |||||||||
Net realized gain: | ||||||||||||||||
Class A | (4,725,705 | ) | (3,780,983 | ) | — | — | ||||||||||
Class B | (39,437 | ) | (124,078 | ) | — | — | ||||||||||
Class C | (17,001,096 | ) | (13,379,555 | ) | — | — | ||||||||||
Institutional Class | (132,344,945 | ) | (88,348,179 | ) | — | — | ||||||||||
|
|
|
|
|
|
|
| |||||||||
| (154,111,183 | ) | (105,782,525 | ) | (15,036,245 | ) | (9,013,153 | ) | |||||||||
|
|
|
|
|
|
|
| |||||||||
Capital Share Transactions: | ||||||||||||||||
Proceeds from shares sold: | ||||||||||||||||
Class A | 3,915,387 | 4,278,699 | 3,834,210 | 4,044,375 | ||||||||||||
Class B | — | — | — | 1,935 | ||||||||||||
Class C | 11,171,034 | 12,295,792 | 11,105,595 | 12,080,730 | ||||||||||||
Institutional Class | 428,853,799 | 260,083,733 | 304,551,900 | 257,308,753 | ||||||||||||
Net asset value of shares issued upon reinvestment of dividends and distributions: | ||||||||||||||||
Class A | 4,683,628 | 3,742,628 | 385,440 | 233,521 | ||||||||||||
Class B | 39,437 | 122,957 | 2,891 | 1,804 | ||||||||||||
Class C | 16,990,698 | 13,354,876 | 409,674 | 82,351 | ||||||||||||
Institutional Class | 132,270,741 | 88,289,266 | 14,226,052 | 8,665,410 | ||||||||||||
|
|
|
|
|
|
|
| |||||||||
| 597,924,724 | 382,167,951 | 334,515,762 | 282,418,879 | |||||||||||||
|
|
|
|
|
|
|
| |||||||||
Cost of shares redeemed: | ||||||||||||||||
Class A | (8,493,939 | ) | (7,683,829 | ) | (7,080,917 | ) | (6,111,227 | ) | ||||||||
Class B | (736,843 | ) | (1,035,685 | ) | (674,306 | ) | (977,280 | ) | ||||||||
Class C | (20,959,718 | ) | (26,676,702 | ) | (17,325,453 | ) | (20,860,221 | ) | ||||||||
Institutional Class | (238,712,891 | ) | (156,532,584 | ) | (219,519,999 | ) | (143,870,889 | ) | ||||||||
|
|
|
|
|
|
|
| |||||||||
| (268,903,391 | ) | (191,928,800 | ) | (244,600,675 | ) | (171,819,617 | ) | |||||||||
|
|
|
|
|
|
|
| |||||||||
Increase in net assets derived from capital share transactions | 329,021,333 | 190,239,151 | 89,915,087 | 110,599,262 | ||||||||||||
|
|
|
|
|
|
|
| |||||||||
Net Increase in Net Assets | 398,094,357 | 314,672,031 | 140,805,203 | 287,030,848 | ||||||||||||
Net Assets: | ||||||||||||||||
Beginning of year | 1,193,647,114 | 878,975,083 | 1,164,042,223 | 877,011,375 | ||||||||||||
|
|
|
|
|
|
|
| |||||||||
End of year | $ | 1,591,741,471 | $ | 1,193,647,114 | $ | 1,304,847,426 | $ | 1,164,042,223 | ||||||||
|
|
|
|
|
|
|
| |||||||||
Undistributed net investment income | $ | — | $ | 136,365 | $ | 2,591,084 | $ | 5,843,213 | ||||||||
|
|
|
|
|
|
|
| |||||||||
See accompanying notes, which are an integral part of the financial statements.
102
Table of Contents
| Optimum Small-Mid Cap Growth Fund | Optimum Small-Mid Cap Value Fund | |||||||||||||||
| Year ended | Year ended | |||||||||||||||
| 3/31/15 | 3/31/14 | 3/31/15 | 3/31/14 | |||||||||||||
Increase (Decrease) in Net Assets from Operations: | ||||||||||||||||
Net investment loss | $ | (4,466,323 | ) | $ | (4,227,467 | ) | $ | (2,180,018 | ) | $ | (1,594,905 | ) | ||||
Net realized gain | 60,176,405 | 41,798,567 | 28,637,953 | 36,556,718 | ||||||||||||
Net change in unrealized appreciation (depreciation) | (8,698,398 | ) | 41,735,963 | (28,259,569 | ) | 45,343,172 | ||||||||||
|
|
|
|
|
|
|
| |||||||||
Net increase (decrease) in net assets resulting from operations | 47,011,684 | 79,307,063 | (1,801,634 | ) | 80,304,985 | |||||||||||
|
|
|
|
|
|
|
| |||||||||
Dividends and Distributions to Shareholders from: | ||||||||||||||||
Net investment income: | ||||||||||||||||
Institutional Class | — | — | — | (92,035 | ) | |||||||||||
Net realized gain: | ||||||||||||||||
Class A | (654,511 | ) | (705,607 | ) | (441,863 | ) | (661,267 | ) | ||||||||
Class B | (4,518 | ) | (25,053 | ) | (3,938 | ) | (24,770 | ) | ||||||||
Class C | (2,336,871 | ) | (2,430,254 | ) | (1,690,812 | ) | (2,497,276 | ) | ||||||||
Institutional Class | (43,752,716 | ) | (36,720,711 | ) | (34,758,367 | ) | (39,680,287 | ) | ||||||||
|
|
|
|
|
|
|
| |||||||||
| (46,748,616 | ) | (39,881,625 | ) | (36,894,980 | ) | (42,955,635 | ) | |||||||||
|
|
|
|
|
|
|
| |||||||||
Capital Share Transactions: | ||||||||||||||||
Proceeds from shares sold: | ||||||||||||||||
Class A | 740,727 | 863,138 | 571,508 | 566,977 | ||||||||||||
Class C | 1,992,629 | 2,312,977 | 1,621,958 | 1,599,572 | ||||||||||||
Institutional Class | 136,228,092 | 114,271,501 | 139,212,657 | 113,886,038 | ||||||||||||
Net asset value of shares issued upon reinvestment of dividends and distributions: | ||||||||||||||||
Class A | 647,712 | 698,439 | 439,827 | 651,876 | ||||||||||||
Class B | 4,518 | 24,611 | 3,938 | 23,763 | ||||||||||||
Class C | 2,335,600 | 2,419,840 | 1,689,461 | 2,480,011 | ||||||||||||
Institutional Class | 43,731,065 | 36,468,070 | 34,741,502 | 39,475,438 | ||||||||||||
|
|
|
|
|
|
|
| |||||||||
| 185,680,343 | 157,058,576 | 178,280,851 | 158,683,675 | |||||||||||||
|
|
|
|
|
|
|
| |||||||||
Cost of shares redeemed: | ||||||||||||||||
Class A | (1,418,846 | ) | (1,464,584 | ) | (1,130,853 | ) | (1,379,142 | ) | ||||||||
Class B | (125,696 | ) | (181,096 | ) | (108,596 | ) | (162,113 | ) | ||||||||
Class C | (3,128,298 | ) | (4,796,730 | ) | (2,902,357 | ) | (4,715,105 | ) | ||||||||
Institutional Class | (90,053,069 | ) | (72,394,143 | ) | (77,610,272 | ) | (68,108,979 | ) | ||||||||
|
|
|
|
|
|
|
| |||||||||
| (94,725,909 | ) | (78,836,553 | ) | (81,752,078 | ) | (74,365,339 | ) | |||||||||
|
|
|
|
|
|
|
| |||||||||
Increase in net assets derived from capital share transactions | 90,954,434 | 78,222,023 | 96,528,773 | 84,318,336 | ||||||||||||
|
|
|
|
|
|
|
| |||||||||
Net Increase in Net Assets | 91,217,502 | 117,647,461 | 57,832,159 | 121,667,686 | ||||||||||||
Net Assets: | ||||||||||||||||
Beginning of year | 466,685,272 | 349,037,811 | 466,430,589 | 344,762,903 | ||||||||||||
|
|
|
|
|
|
|
| |||||||||
End of year | $ | 557,902,774 | $ | 466,685,272 | $ | 524,262,748 | $ | 466,430,589 | ||||||||
|
|
|
|
|
|
|
| |||||||||
Accumulated net investment loss | $ | (1,040,171 | ) | $ | — | $ | (742,120 | ) | $ | — | ||||||
|
|
|
|
|
|
|
| |||||||||
See accompanying notes, which are an integral part of the financial statements.
| (continues | ) | 103 |
Table of Contents
Optimum Fixed Income Fund Class A
Selected data for each share of the Fund outstanding throughout each period were as follows:
| Year ended | ||||||||||||||||||||
| 3/31/15 | 3/31/14 | 3/31/13 | 3/31/12 | 3/31/11 | ||||||||||||||||
Net asset value, beginning of period | $ | 9.540 | $ | 9.850 | $ | 9.710 | $ | 9.550 | $ | 9.290 | ||||||||||
Income (loss) from investment operations: | ||||||||||||||||||||
Net investment income1 | 0.203 | 0.213 | 0.225 | 0.293 | 0.391 | |||||||||||||||
Net realized and unrealized gain (loss) | 0.194 | (0.353 | ) | 0.302 | 0.338 | 0.247 | ||||||||||||||
|
|
|
|
|
|
|
|
|
| |||||||||||
Total from investment operations | 0.397 | (0.140 | ) | 0.527 | 0.631 | 0.638 | ||||||||||||||
|
|
|
|
|
|
|
|
|
| |||||||||||
Less dividends and distributions from: | ||||||||||||||||||||
Net investment income | (0.217 | ) | (0.142 | ) | (0.172 | ) | (0.342 | ) | (0.378 | ) | ||||||||||
Net realized gain | — | (0.028 | ) | (0.215 | ) | (0.129 | ) | — | ||||||||||||
|
|
|
|
|
|
|
|
|
| |||||||||||
Total dividends and distributions | (0.217 | ) | (0.170 | ) | (0.387 | ) | (0.471 | ) | (0.378 | ) | ||||||||||
|
|
|
|
|
|
|
|
|
| |||||||||||
Net asset value, end of period | $ | 9.720 | $ | 9.540 | $ | 9.850 | $ | 9.710 | $ | 9.550 | ||||||||||
|
|
|
|
|
|
|
|
|
| |||||||||||
Total return2 | 4.21% | (1.40% | ) | 5.47% | 6.71% | 7.01% | ||||||||||||||
Ratios and supplemental data: | ||||||||||||||||||||
Net assets, end of period (000 omitted) | $ | 43,144 | $ | 43,241 | $ | 41,210 | $ | 40,620 | $ | 39,758 | ||||||||||
Ratio of expenses to average net assets | 1.17% | 1.31% | 1.35% | 1.35% | 1.35% | |||||||||||||||
Ratio of expenses to average net assets prior to fees waived | 1.17% | 1.34% | 1.40% | 1.44% | 1.46% | |||||||||||||||
Ratio of net investment income to average net assets | 2.11% | 2.24% | 2.27% | 3.01% | 4.10% | |||||||||||||||
Ratio of net investment income to average net assets prior to fees waived | 2.11% | 2.21% | 2.22% | 2.92% | 3.99% | |||||||||||||||
Portfolio turnover3 | 482% | 323% | 208% | 211% | 273% | |||||||||||||||
| 1 | The average shares outstanding method has been applied for per share information. |
| 2 | Total investment return is based on the change in net asset value of a share during the period and assumes reinvestment of dividends and distributions at net asset value and does not reflect the impact of a sales charge. Total investment return during some of the periods shown reflects a waiver by the manager. Performance would have been lower had the waiver not been in effect. |
| 3 | As a result of the addition of Delaware Management Company’s diversified floating rate investment strategy and Pacific Investment Management Company, LLC’s low-duration investment strategy on Feb. 1, 2014, to the Fund’s principal investment strategy, the Fund’s portfolio turnover rate increased substantially during the years ended March 31, 2015 and 2014. |
See accompanying notes, which are an integral part of the financial statements.
104
Table of Contents
Optimum Fixed Income Fund Class C
Selected data for each share of the Fund outstanding throughout each period were as follows:
| Year ended | ||||||||||||||||||||
| 3/31/15 | 3/31/14 | 3/31/13 | 3/31/12 | 3/31/11 | ||||||||||||||||
Net asset value, beginning of period | $ | 9.530 | $ | 9.840 | $ | 9.710 | $ | 9.540 | $ | 9.280 | ||||||||||
Income (loss) from investment operations: | ||||||||||||||||||||
Net investment income1 | 0.131 | 0.148 | 0.161 | 0.229 | 0.329 | |||||||||||||||
Net realized and unrealized gain (loss) | 0.194 | (0.351 | ) | 0.292 | 0.350 | 0.247 | ||||||||||||||
|
|
|
|
|
|
|
|
|
| |||||||||||
Total from investment operations | 0.325 | (0.203 | ) | 0.453 | 0.579 | 0.576 | ||||||||||||||
|
|
|
|
|
|
|
|
|
| |||||||||||
Less dividends and distributions from: | ||||||||||||||||||||
Net investment income | (0.145 | ) | (0.079 | ) | (0.108 | ) | (0.280 | ) | (0.316 | ) | ||||||||||
Net realized gain | — | (0.028 | ) | (0.215 | ) | (0.129 | ) | — | ||||||||||||
|
|
|
|
|
|
|
|
|
| |||||||||||
Total dividends and distributions | (0.145 | ) | (0.107 | ) | (0.323 | ) | (0.409 | ) | (0.316 | ) | ||||||||||
|
|
|
|
|
|
|
|
|
| |||||||||||
Net asset value, end of period | $ | 9.710 | $ | 9.530 | $ | 9.840 | $ | 9.710 | $ | 9.540 | ||||||||||
|
|
|
|
|
|
|
|
|
| |||||||||||
Total return2 | 3.44% | (2.06% | ) | 4.69% | 6.15% | 6.32% | ||||||||||||||
Ratios and supplemental data: | ||||||||||||||||||||
Net assets, end of period (000 omitted) | $ | 166,154 | $ | 161,353 | $ | 155,728 | $ | 154,778 | $ | 159,759 | ||||||||||
Ratio of expenses to average net assets | 1.92% | 1.99% | 2.00% | 2.00% | 2.00% | |||||||||||||||
Ratio of expenses to average net assets prior to fees waived | 1.92% | 2.02% | 2.05% | 2.09% | 2.11% | |||||||||||||||
Ratio of net investment income to average net assets | 1.36% | 1.56% | 1.62% | 2.36% | 3.45% | |||||||||||||||
Ratio of net investment income to average net assets prior to fees waived | 1.36% | 1.53% | 1.57% | 2.27% | 3.34% | |||||||||||||||
Portfolio turnover3 | 482% | 323% | 208% | 211% | 273% | |||||||||||||||
| 1 | The average shares outstanding method has been applied for per share information. |
| 2 | Total investment return is based on the change in net asset value of a share during the period and assumes reinvestment of dividends and distributions at net asset value and does not reflect the impact of a sales charge. Total investment return during some of the periods shown reflects a waiver by the manager. Performance would have been lower had the waiver not been in effect. |
| 3 | As a result of the addition of Delaware Management Company’s diversified floating rate investment strategy and Pacific Investment Management Company, LLC‘s low-duration investment strategy on Feb. 1, 2014, to the Fund’s principal investment strategy, the Fund’s portfolio turnover rate increased substantially during the years ended March 31, 2015 and 2014. |
See accompanying notes, which are an integral part of the financial statements.
| (continues | ) | 105 |
Table of Contents
Financial highlights
Optimum Fixed Income Fund Institutional Class
Selected data for each share of the Fund outstanding throughout each period were as follows:
| Year ended | ||||||||||||||||||||
| 3/31/15 | 3/31/14 | 3/31/13 | 3/31/12 | 3/31/11 | ||||||||||||||||
Net asset value, beginning of period | $ | 9.540 | $ | 9.850 | $ | 9.710 | $ | 9.550 | $ | 9.290 | ||||||||||
Income (loss) from investment operations: | ||||||||||||||||||||
Net investment income1 | 0.227 | 0.244 | 0.260 | 0.327 | 0.424 | |||||||||||||||
Net realized and unrealized gain (loss) | 0.194 | (0.350 | ) | 0.301 | 0.338 | 0.247 | ||||||||||||||
|
|
|
|
|
|
|
|
|
| |||||||||||
Total from investment operations | 0.421 | (0.106 | ) | 0.561 | 0.665 | 0.671 | ||||||||||||||
|
|
|
|
|
|
|
|
|
| |||||||||||
Less dividends and distributions from: | ||||||||||||||||||||
Net investment income | (0.241 | ) | (0.176 | ) | (0.206 | ) | (0.376 | ) | (0.411 | ) | ||||||||||
Net realized gain | — | (0.028 | ) | (0.215 | ) | (0.129 | ) | — | ||||||||||||
|
|
|
|
|
|
|
|
|
| |||||||||||
Total dividends and distributions | (0.241 | ) | (0.204 | ) | (0.421 | ) | (0.505 | ) | (0.411 | ) | ||||||||||
|
|
|
|
|
|
|
|
|
| |||||||||||
Net asset value, end of period | $ | 9.720 | $ | 9.540 | $ | 9.850 | $ | 9.710 | $ | 9.550 | ||||||||||
|
|
|
|
|
|
|
|
|
| |||||||||||
Total return2 | 4.47% | (1.05% | ) | 5.72% | 7.20% | 7.39% | ||||||||||||||
Ratios and supplemental data: | ||||||||||||||||||||
Net assets, end of period (000 omitted) | $ | 1,826,156 | $ | 1,509,156 | $ | 1,297,154 | $ | 1,014,595 | $ | 791,984 | ||||||||||
Ratio of expenses to average net assets | 0.92% | 0.99% | 1.00% | 1.00% | 1.00% | |||||||||||||||
Ratio of expenses to average net assets prior to fees waived | 0.92% | 1.02% | 1.05% | 1.09% | 1.11% | |||||||||||||||
Ratio of net investment income to average net assets | 2.36% | 2.56% | 2.62% | 3.36% | 4.45% | |||||||||||||||
Ratio of net investment income to average net assets prior to fees waived | 2.36% | 2.53% | 2.57% | 3.27% | 4.34% | |||||||||||||||
Portfolio turnover3 | 482% | 323% | 208% | 211% | 273% | |||||||||||||||
| 1 | The average shares outstanding method has been applied for per share information. |
| 2 | Total investment return is based on the change in net asset value of a share during the period and assumes reinvestment of dividends and distributions at net asset value. Total investment return during some of the periods shown reflects a waiver by the manager. Performance would have been lower had the waiver not been in effect. |
| 3 | As a result of the addition of Delaware Management Company’s diversified floating rate investment strategy and Pacific Investment Management Company, LLC‘s low-duration investment strategy on Feb. 1, 2014, to the Fund’s principal investment strategy, the Fund’s portfolio turnover rate increased substantially during the years ended March 31, 2015 and 2014. |
See accompanying notes, which are an integral part of the financial statements.
106
Table of Contents
Optimum International Fund Class A
Selected data for each share of the Fund outstanding throughout each period were as follows:
| Year ended | ||||||||||||||||||||
| 3/31/15 | 3/31/14 | 3/31/13 | 3/31/12 | 3/31/11 | ||||||||||||||||
Net asset value, beginning of period | $ | 12.570 | $ | 10.970 | $ | 10.420 | $ | 11.200 | $ | 10.340 | ||||||||||
Income (loss) from investment operations: | ||||||||||||||||||||
Net investment income1 | 0.062 | 0.142 | 0.185 | 0.192 | 0.129 | |||||||||||||||
Net realized and unrealized gain (loss) | (0.846 | ) | 1.540 | 0.620 | (0.790 | ) | 0.887 | |||||||||||||
|
|
|
|
|
|
|
|
|
| |||||||||||
Total from investment operations | (0.784 | ) | 1.682 | 0.805 | (0.598 | ) | 1.016 | |||||||||||||
|
|
|
|
|
|
|
|
|
| |||||||||||
Less dividends and distributions from: | ||||||||||||||||||||
Net investment income | (0.126 | ) | (0.082 | ) | (0.255 | ) | (0.182 | ) | (0.156 | ) | ||||||||||
|
|
|
|
|
|
|
|
|
| |||||||||||
Total dividends and distributions | (0.126 | ) | (0.082 | ) | (0.255 | ) | (0.182 | ) | (0.156 | ) | ||||||||||
|
|
|
|
|
|
|
|
|
| |||||||||||
Net asset value, end of period | $ | 11.660 | $ | 12.570 | $ | 10.970 | $ | 10.420 | $ | 11.200 | ||||||||||
|
|
|
|
|
|
|
|
|
| |||||||||||
Total return2 | (6.25% | ) | 15.31% | 8.10% | (5.30% | ) | 10.19% | |||||||||||||
Ratios and supplemental data: | ||||||||||||||||||||
Net assets, end of period (000 omitted) | $ | 10,291 | $ | 11,277 | $ | 9,553 | $ | 9,318 | $ | 11,189 | ||||||||||
Ratio of expenses to average net assets | 1.47% | 1.68% | 1.75% | 1.75% | 1.75% | |||||||||||||||
Ratio of expenses to average net assets prior to fees waived | 1.47% | 1.68% | 1.84% | 1.84% | 1.88% | |||||||||||||||
Ratio of net investment income to average net assets | 0.51% | 1.20% | 1.81% | 1.84% | 1.26% | |||||||||||||||
Ratio of net investment income to average net assets prior to fees waived | 0.51% | 1.20% | 1.72% | 1.75% | 1.13% | |||||||||||||||
Portfolio turnover | 117% | 126% | 70% | 50% | 95% | |||||||||||||||
| 1 | The average shares outstanding method has been applied for per share information. |
| 2 | Total investment return is based on the change in net asset value of a share during the period and assumes reinvestment of dividends and distributions at net asset value and does not reflect the impact of a sales charge. Total investment return during some of the periods shown reflects a waiver by the manager. Performance would have been lower had the waiver not been in effect. |
See accompanying notes, which are an integral part of the financial statements.
| (continues | ) | 107 |
Table of Contents
Financial highlights
Optimum International Fund Class C
Selected data for each share of the Fund outstanding throughout each period were as follows:
| Year ended | ||||||||||||||||||||
| 3/31/15 | 3/31/14 | 3/31/13 | 3/31/12 | 3/31/11 | ||||||||||||||||
Net asset value, beginning of period | $ | 12.290 | $ | 10.760 | $ | 10.230 | $ | 10.950 | $ | 10.100 | ||||||||||
Income (loss) from investment operations: | ||||||||||||||||||||
Net investment income (loss)1 | (0.028 | ) | 0.061 | 0.116 | 0.122 | 0.061 | ||||||||||||||
Net realized and unrealized gain (loss) | (0.832 | ) | 1.512 | 0.606 | (0.773 | ) | 0.885 | |||||||||||||
|
|
|
|
|
|
|
|
|
| |||||||||||
Total from investment operations | (0.860 | ) | 1.573 | 0.722 | (0.651 | ) | 0.946 | |||||||||||||
|
|
|
|
|
|
|
|
|
| |||||||||||
Less dividends and distributions from: | ||||||||||||||||||||
Net investment income | (0.020 | ) | (0.043 | ) | (0.192 | ) | (0.069 | ) | (0.096 | ) | ||||||||||
|
|
|
|
|
|
|
|
|
| |||||||||||
Total dividends and distributions | (0.020 | ) | (0.043 | ) | (0.192 | ) | (0.069 | ) | (0.096 | ) | ||||||||||
|
|
|
|
|
|
|
|
|
| |||||||||||
Net asset value, end of period | $ | 11.410 | $ | 12.290 | $ | 10.760 | $ | 10.230 | $ | 10.950 | ||||||||||
|
|
|
|
|
|
|
|
|
| |||||||||||
Total return2 | (7.00% | ) | 14.56% | 7.37% | (5.94% | ) | 9.59% | |||||||||||||
Ratios and supplemental data: | ||||||||||||||||||||
Net assets, end of period (000 omitted) | $ | 35,996 | $ | 37,893 | $ | 32,064 | $ | 32,995 | $ | 39,762 | ||||||||||
Ratio of expenses to average net assets | 2.22% | 2.36% | 2.40% | 2.40% | 2.40% | |||||||||||||||
Ratio of expenses to average net assets prior to fees waived | 2.22% | 2.36% | 2.49% | 2.49% | 2.53% | |||||||||||||||
Ratio of net investment income (loss) to average net assets | (0.24% | ) | 0.52% | 1.16% | 1.19% | 0.61% | ||||||||||||||
Ratio of net investment income (loss) to average net assets prior to fees waived | (0.24% | ) | 0.52% | 1.07% | 1.10% | 0.48% | ||||||||||||||
Portfolio turnover | 117% | 126% | 70% | 50% | 95% | |||||||||||||||
| 1 | The average shares outstanding method has been applied for per share information. |
| 2 | Total investment return is based on the change in net asset value of a share during the period and assumes reinvestment of dividends and distributions at net asset value and does not reflect the impact of a sales charge. Total investment return during some of the periods shown reflects a waiver by the manager. Performance would have been lower had the waiver not been in effect. |
See accompanying notes, which are an integral part of the financial statements.
108
Table of Contents
Optimum International Fund Institutional Class
Selected data for each share of the Fund outstanding throughout each period were as follows:
| Year ended | ||||||||||||||||||||
| 3/31/15 | 3/31/14 | 3/31/13 | 3/31/12 | 3/31/11 | ||||||||||||||||
Net asset value, beginning of period | $ | 12.660 | $ | 11.050 | $ | 10.490 | $ | 11.300 | $ | 10.430 | ||||||||||
Income (loss) from investment operations: | ||||||||||||||||||||
Net investment income1 | 0.093 | 0.182 | 0.223 | 0.229 | 0.168 | |||||||||||||||
Net realized and unrealized gain (loss) | (0.856 | ) | 1.551 | 0.627 | (0.793 | ) | 0.887 | |||||||||||||
|
|
|
|
|
|
|
|
|
| |||||||||||
Total from investment operations | (0.763 | ) | 1.733 | 0.850 | (0.564 | ) | 1.055 | |||||||||||||
|
|
|
|
|
|
|
|
|
| |||||||||||
Less dividends and distributions from: | ||||||||||||||||||||
Net investment income | (0.157 | ) | (0.123 | ) | (0.290 | ) | (0.246 | ) | (0.185 | ) | ||||||||||
|
|
|
|
|
|
|
|
|
| |||||||||||
Total dividends and distributions | (0.157 | ) | (0.123 | ) | (0.290 | ) | (0.246 | ) | (0.185 | ) | ||||||||||
|
|
|
|
|
|
|
|
|
| |||||||||||
Net asset value, end of period | $ | 11.740 | $ | 12.660 | $ | 11.050 | $ | 10.490 | $ | 11.300 | ||||||||||
|
|
|
|
|
|
|
|
|
| |||||||||||
Total return2 | (6.04% | ) | 15.79% | 8.41% | (4.93% | ) | 10.55% | |||||||||||||
Ratios and supplemental data: | ||||||||||||||||||||
Net assets, end of period (000 omitted) | $ | 477,884 | $ | 589,098 | $ | 426,258 | $ | 252,539 | $ | 226,512 | ||||||||||
Ratio of expenses to average net assets | 1.22% | 1.36% | 1.40% | 1.40% | 1.40% | |||||||||||||||
Ratio of expenses to average net assets prior to fees waived | 1.22% | 1.36% | 1.49% | 1.49% | 1.53% | |||||||||||||||
Ratio of net investment income to average net assets | 0.76% | 1.52% | 2.16% | 2.19% | 1.61% | |||||||||||||||
Ratio of net investment income to average net assets prior to fees waived | 0.76% | 1.52% | 2.07% | 2.10% | 1.48% | |||||||||||||||
Portfolio turnover | 117% | 126% | 70% | 50% | 95% | |||||||||||||||
| 1 | The average shares outstanding method has been applied for per share information. |
| 2 | Total investment return is based on the change in net asset value of a share during the period and assumes reinvestment of dividends and distributions at net asset value. Total investment return during some of the periods shown reflects a waiver by the manager. Performance would have been lower had the waiver not been in effect. |
See accompanying notes, which are an integral part of the financial statements.
| (continues | ) | 109 |
Table of Contents
Financial highlights
Optimum Large Cap Growth Fund Class A
Selected data for each share of the Fund outstanding throughout each period were as follows:
| Year ended | ||||||||||||||||||||
| 3/31/15 | 3/31/14 | 3/31/13 | 3/31/12 | 3/31/11 | ||||||||||||||||
Net asset value, beginning of period | $ | 16.390 | $ | 14.530 | $ | 13.480 | $ | 12.430 | $ | 10.640 | ||||||||||
Income (loss) from investment operations: | ||||||||||||||||||||
Net investment income (loss)1 | (0.083 | ) | (0.099 | ) | 0.014 | (0.040 | ) | (0.062 | ) | |||||||||||
Net realized and unrealized gain | 2.711 | 3.631 | 1.042 | 1.090 | 1.852 | |||||||||||||||
|
|
|
|
|
|
|
|
|
| |||||||||||
Total from investment operations | 2.628 | 3.532 | 1.056 | 1.050 | 1.790 | |||||||||||||||
|
|
|
|
|
|
|
|
|
| |||||||||||
Less dividends and distributions from: | ||||||||||||||||||||
Net investment income | — | — | (0.006 | ) | — | — | ||||||||||||||
Net realized gain | (2.018 | ) | (1.672 | ) | — | — | — | |||||||||||||
|
|
|
|
|
|
|
|
|
| |||||||||||
Total dividends and distributions | (2.018 | ) | (1.672 | ) | (0.006 | ) | — | — | ||||||||||||
|
|
|
|
|
|
|
|
|
| |||||||||||
Net asset value, end of period | $ | 17.000 | $ | 16.390 | $ | 14.530 | $ | 13.480 | $ | 12.430 | ||||||||||
|
|
|
|
|
|
|
|
|
| |||||||||||
Total return2 | 17.27% | 25.17% | 7.76% | 8.45% | 16.82% | |||||||||||||||
Ratios and supplemental data: | ||||||||||||||||||||
Net assets, end of period (000 omitted) | $ | 40,790 | $ | 39,044 | $ | 34,182 | $ | 34,170 | $ | 35,359 | ||||||||||
Ratio of expenses to average net assets | 1.37% | 1.54% | 1.60% | 1.61% | 1.61% | |||||||||||||||
Ratio of expenses to average net assets prior to fees waived | 1.37% | 1.55% | 1.63% | 1.64% | 1.64% | |||||||||||||||
Ratio of net investment income (loss) to average net assets | (0.50% | ) | (0.62% | ) | 0.10% | (0.34% | ) | (0.57% | ) | |||||||||||
Ratio of net investment income (loss) to average net assets prior to fees waived | (0.50% | ) | (0.63% | ) | 0.07% | (0.37% | ) | (0.60% | ) | |||||||||||
Portfolio turnover | 86% | 98% | 102% | 89% | 117% | |||||||||||||||
| 1 | The average shares outstanding method has been applied for per share information. |
| 2 | Total investment return is based on the change in net asset value of a share during the period and assumes reinvestment of dividends and distributions at net asset value and does not reflect the impact of a sales charge. Total investment return during all of the periods shown reflects a waiver by the manager. Performance would have been lower had the waiver not been in effect. |
See accompanying notes, which are an integral part of the financial statements.
110
Table of Contents
Optimum Large Cap Growth Fund Class C
Selected data for each share of the Fund outstanding throughout each period were as follows:
| Year ended | ||||||||||||||||||||
| 3/31/15 | 3/31/14 | 3/31/13 | 3/31/12 | 3/31/11 | ||||||||||||||||
Net asset value, beginning of period | $ | 15.160 | $ | 13.630 | $ | 12.720 | $ | 11.820 | $ | 10.180 | ||||||||||
Income (loss) from investment operations: | ||||||||||||||||||||
Net investment loss1 | (0.189 | ) | (0.192 | ) | (0.069 | ) | (0.112 | ) | (0.127 | ) | ||||||||||
Net realized and unrealized gain | 2.487 | 3.394 | 0.979 | 1.012 | 1.767 | |||||||||||||||
|
|
|
|
|
|
|
|
|
| |||||||||||
Total from investment operations | 2.298 | 3.202 | 0.910 | 0.900 | 1.640 | |||||||||||||||
|
|
|
|
|
|
|
|
|
| |||||||||||
Less dividends and distributions from: | ||||||||||||||||||||
Net realized gain | (2.018 | ) | (1.672 | ) | — | — | — | |||||||||||||
|
|
|
|
|
|
|
|
|
| |||||||||||
Total dividends and distributions | (2.018 | ) | (1.672 | ) | — | — | — | |||||||||||||
|
|
|
|
|
|
|
|
|
| |||||||||||
Net asset value, end of period | $ | 15.440 | $ | 15.160 | $ | 13.630 | $ | 12.720 | $ | 11.820 | ||||||||||
|
|
|
|
|
|
|
|
|
| |||||||||||
Total return2 | 16.44% | 24.27% | 7.15% | 7.61% | 16.11% | |||||||||||||||
Ratios and supplemental data: | ||||||||||||||||||||
Net assets, end of period (000 omitted) | $ | 137,892 | $ | 127,540 | $ | 115,242 | $ | 120,183 | $ | 128,256 | ||||||||||
Ratio of expenses to average net assets | 2.12% | 2.22% | 2.25% | 2.26% | 2.26% | |||||||||||||||
Ratio of expenses to average net assets prior to fees waived | 2.12% | 2.23% | 2.28% | 2.29% | 2.29% | |||||||||||||||
Ratio of net investment loss to average net assets | (1.25% | ) | (1.30% | ) | (0.55% | ) | (0.99% | ) | (1.22% | ) | ||||||||||
Ratio of net investment loss to average net assets prior to fees waived | (1.25% | ) | (1.31% | ) | (0.58% | ) | (1.02% | ) | (1.25% | ) | ||||||||||
Portfolio turnover | 86% | 98% | 102% | 89% | 117% | |||||||||||||||
| 1 | The average shares outstanding method has been applied for per share information. |
| 2 | Total investment return is based on the change in net asset value of a share during the period and assumes reinvestment of dividends and distributions at net asset value and does not reflect the impact of a sales charge. Total investment return during all of the periods shown reflects a waiver by the manager. Performance would have been lower had the waiver not been in effect. |
See accompanying notes, which are an integral part of the financial statements.
| (continues | ) | 111 |
Table of Contents
Financial highlights
Optimum Large Cap Growth Fund Institutional Class
Selected data for each share of the Fund outstanding throughout each period were as follows:
| Year ended | ||||||||||||||||||||
| 3/31/15 | 3/31/14 | 3/31/13 | 3/31/12 | 3/31/11 | ||||||||||||||||
Net asset value, beginning of period | $ | 17.000 | $ | 14.970 | $ | 13.880 | $ | 12.760 | $ | 10.880 | ||||||||||
Income (loss) from investment operations: | ||||||||||||||||||||
Net investment income (loss)1 | (0.044 | ) | (0.049 | ) | 0.062 | 0.002 | (0.025 | ) | ||||||||||||
Net realized and unrealized gain | 2.822 | 3.754 | 1.068 | 1.118 | 1.905 | |||||||||||||||
|
|
|
|
|
|
|
|
|
| |||||||||||
Total from investment operations | 2.778 | 3.705 | 1.130 | 1.120 | 1.880 | |||||||||||||||
|
|
|
|
|
|
|
|
|
| |||||||||||
Less dividends and distributions from: | ||||||||||||||||||||
Net investment income | — | (0.003 | ) | (0.040 | ) | — | — | |||||||||||||
Net realized gain | (2.018 | ) | (1.672 | ) | — | — | — | |||||||||||||
|
|
|
|
|
|
|
|
|
| |||||||||||
Total dividends and distributions | (2.018 | ) | (1.675 | ) | (0.040 | ) | — | — | ||||||||||||
|
|
|
|
|
|
|
|
|
| |||||||||||
Net asset value, end of period | $ | 17.760 | $ | 17.000 | $ | 14.970 | $ | 13.880 | $ | 12.760 | ||||||||||
|
|
|
|
|
|
|
|
|
| |||||||||||
Total return2 | 17.55% | 25.51% | 8.25% | 8.78% | 17.28% | |||||||||||||||
Ratios and supplemental data: | ||||||||||||||||||||
Net assets, end of period (000 omitted) | $ | 1,413,059 | $ | 1,026,377 | $ | 728,104 | $ | 650,869 | $ | 587,141 | ||||||||||
Ratio of expenses to average net assets | 1.12% | 1.22% | 1.25% | 1.26% | 1.26% | |||||||||||||||
Ratio of expenses to average net assets prior to fees waived | 1.12% | 1.23% | 1.28% | 1.29% | 1.29% | |||||||||||||||
Ratio of net investment income (loss) to average net assets | (0.25% | ) | (0.30% | ) | 0.45% | 0.01% | (0.22% | ) | ||||||||||||
Ratio of net investment income (loss) to average net assets prior to fees waived | (0.25% | ) | (0.31% | ) | 0.42% | (0.02% | ) | (0.25% | ) | |||||||||||
Portfolio turnover | 86% | 98% | 102% | 89% | 117% | |||||||||||||||
| 1 | The average shares outstanding method has been applied for per share information. |
| 2 | Total investment return is based on the change in net asset value of a share during the period and assumes reinvestment of dividends and distributions at net asset value. Total investment return during all of the periods shown reflects a waiver by the manager. Performance would have been lower had the waiver not been in effect. |
See accompanying notes, which are an integral part of the financial statements.
112
Table of Contents
Optimum Large Cap Value Fund Class A
Selected data for each share of the Fund outstanding throughout each period were as follows:
| Year ended | ||||||||||||||||||||
| 3/31/15 | 3/31/14 | 3/31/13 | 3/31/12 | 3/31/11 | ||||||||||||||||
Net asset value, beginning of period | $ | 15.360 | $ | 12.900 | $ | 11.750 | $ | 11.060 | $ | 9.830 | ||||||||||
Income from investment operations: | ||||||||||||||||||||
Net investment income1 | 0.124 | 0.157 | 0.173 | 0.133 | 0.075 | |||||||||||||||
Net realized and unrealized gain | 0.692 | 2.399 | 1.259 | 0.635 | 1.274 | |||||||||||||||
|
|
|
|
|
|
|
|
|
| |||||||||||
Total from investment operations | 0.816 | 2.556 | 1.432 | 0.768 | 1.349 | |||||||||||||||
|
|
|
|
|
|
|
|
|
| |||||||||||
Less dividends and distributions from: | ||||||||||||||||||||
Net investment income | (0.166 | ) | (0.096 | ) | (0.282 | ) | (0.078 | ) | (0.119 | ) | ||||||||||
|
|
|
|
|
|
|
|
|
| |||||||||||
Total dividends and distributions | (0.166 | ) | (0.096 | ) | (0.282 | ) | (0.078 | ) | (0.119 | ) | ||||||||||
|
|
|
|
|
|
|
|
|
| |||||||||||
Net asset value, end of period | $ | 16.010 | $ | 15.360 | $ | 12.900 | $ | 11.750 | $ | 11.060 | ||||||||||
|
|
|
|
|
|
|
|
|
| |||||||||||
Total return2 | 5.34% | 19.96% | 12.48% | 7.01% | 14.00% | |||||||||||||||
Ratios and supplemental data: | ||||||||||||||||||||
Net assets, end of period (000 omitted) | $ | 35,952 | $ | 37,299 | $ | 32,995 | $ | 31,478 | $ | 33,892 | ||||||||||
Ratio of expenses to average net assets | 1.33% | 1.50% | 1.57% | 1.57% | 1.59% | |||||||||||||||
Ratio of expenses to average net assets prior to fees waived | 1.33% | 1.51% | 1.59% | 1.60% | 1.61% | |||||||||||||||
Ratio of net investment income to average net assets | 0.79% | 1.12% | 1.48% | 1.25% | 0.77% | |||||||||||||||
Ratio of net investment income to average net assets prior to fees waived | 0.79% | 1.11% | 1.46% | 1.22% | 0.75% | |||||||||||||||
Portfolio turnover | 35% | 37% | 49% | 57% | 82% | |||||||||||||||
| 1 | The average shares outstanding method has been applied for per share information. |
| 2 | Total investment return is based on the change in net asset value of a share during the period and assumes reinvestment of dividends and distributions at net asset value and does not reflect the impact of a sales charge. Total investment return during all of the periods shown reflects a waiver by the manager. Performance would have been lower had the waiver not been in effect. |
See accompanying notes, which are an integral part of the financial statements.
| (continues | ) | 113 |
Table of Contents
Financial highlights
Optimum Large Cap Value Fund Class C
Selected data for each share of the Fund outstanding throughout each period were as follows:
| Year ended | ||||||||||||||||||||
| 3/31/15 | 3/31/14 | 3/31/13 | 3/31/12 | 3/31/11 | ||||||||||||||||
Net asset value, beginning of period | $ | 15.220 | $ | 12.780 | $ | 11.590 | $ | 10.930 | $ | 9.710 | ||||||||||
Income from investment operations: | ||||||||||||||||||||
Net investment income1 | 0.007 | 0.061 | 0.096 | 0.063 | 0.012 | |||||||||||||||
Net realized and unrealized gain | 0.674 | 2.389 | 1.254 | 0.612 | 1.272 | |||||||||||||||
|
|
|
|
|
|
|
|
|
| |||||||||||
Total from investment operations | 0.681 | 2.450 | 1.350 | 0.675 | 1.284 | |||||||||||||||
|
|
|
|
|
|
|
|
|
| |||||||||||
Less dividends and distributions from: | ||||||||||||||||||||
Net investment income | (0.051 | ) | (0.010 | ) | (0.160 | ) | (0.015 | ) | (0.064 | ) | ||||||||||
|
|
|
|
|
|
|
|
|
| |||||||||||
Total dividends and distributions | (0.051 | ) | (0.010 | ) | (0.160 | ) | (0.015 | ) | (0.064 | ) | ||||||||||
|
|
|
|
|
|
|
|
|
| |||||||||||
Net asset value, end of period | $ | 15.850 | $ | 15.220 | $ | 12.780 | $ | 11.590 | $ | 10.930 | ||||||||||
|
|
|
|
|
|
|
|
|
| |||||||||||
Total return2 | 4.48% | 19.17% | 11.85% | 6.19% | 13.37% | |||||||||||||||
Ratios and supplemental data: | ||||||||||||||||||||
Net assets, end of period (000 omitted) | $ | 122,772 | $ | 123,541 | $ | 111,806 | $ | 111,557 | $ | 119,899 | ||||||||||
Ratio of expenses to average net assets | 2.08% | 2.18% | 2.22% | 2.22% | 2.24% | |||||||||||||||
Ratio of expenses to average net assets prior to fees waived | 2.08% | 2.19% | 2.24% | 2.25% | 2.26% | |||||||||||||||
Ratio of net investment income to average net assets | 0.04% | 0.44% | 0.83% | 0.60% | 0.12% | |||||||||||||||
Ratio of net investment income to average net assets prior to fees waived | 0.04% | 0.43% | 0.81% | 0.57% | 0.10% | |||||||||||||||
Portfolio turnover | 35% | 37% | 49% | 57% | 82% | |||||||||||||||
| 1 | The average shares outstanding method has been applied for per share information. |
| 2 | Total investment return is based on the change in net asset value of a share during the period and assumes reinvestment of dividends and distributions at net asset value and does not reflect the impact of a sales charge. Total investment return during all of the periods shown reflects a waiver by the manager. Performance would have been lower had the waiver not been in effect. |
See accompanying notes, which are an integral part of the financial statements.
114
Table of Contents
Optimum Large Cap Value Fund Institutional Class
Selected data for each share of the Fund outstanding throughout each period were as follows:
| Year ended | ||||||||||||||||||||
| 3/31/15 | 3/31/14 | 3/31/13 | 3/31/12 | 3/31/11 | ||||||||||||||||
Net asset value, beginning of period | $ | 15.390 | $ | 12.920 | $ | 11.800 | $ | 11.110 | $ | 9.870 | ||||||||||
Income from investment operations: | ||||||||||||||||||||
Net investment income1 | 0.165 | 0.203 | 0.214 | 0.171 | 0.110 | |||||||||||||||
Net realized and unrealized gain | 0.690 | 2.410 | 1.255 | 0.631 | 1.279 | |||||||||||||||
|
|
|
|
|
|
|
|
|
| |||||||||||
Total from investment operations | 0.855 | 2.613 | 1.469 | 0.802 | 1.389 | |||||||||||||||
|
|
|
|
|
|
|
|
|
| |||||||||||
Less dividends and distributions from: | ||||||||||||||||||||
Net investment income | (0.205 | ) | (0.143 | ) | (0.349 | ) | (0.112 | ) | (0.149 | ) | ||||||||||
|
|
|
|
|
|
|
|
|
| |||||||||||
Total dividends and distributions | (0.205 | ) | (0.143 | ) | (0.349 | ) | (0.112 | ) | (0.149 | ) | ||||||||||
|
|
|
|
|
|
|
|
|
| |||||||||||
Net asset value, end of period | $ | 16.040 | $ | 15.390 | $ | 12.920 | $ | 11.800 | $ | 11.110 | ||||||||||
|
|
|
|
|
|
|
|
|
| |||||||||||
Total return2 | 5.60% | 20.31% | 12.92% | 7.32% | 14.42% | |||||||||||||||
Ratios and supplemental data: | ||||||||||||||||||||
Net assets, end of period (000 omitted) | $ | 1,146,123 | $ | 1,002,553 | $ | 730,785 | $ | 617,485 | $ | 550,313 | ||||||||||
Ratio of expenses to average net assets | 1.08% | 1.18% | 1.22% | 1.22% | 1.24% | |||||||||||||||
Ratio of expenses to average net assets prior to fees waived | 1.08% | 1.19% | 1.24% | 1.25% | 1.26% | |||||||||||||||
Ratio of net investment income to average net assets | 1.04% | 1.44% | 1.83% | 1.60% | 1.12% | |||||||||||||||
Ratio of net investment income to average net assets prior to fees waived | 1.04% | 1.43% | 1.81% | 1.57% | 1.10% | |||||||||||||||
Portfolio turnover | 35% | 37% | 49% | 57% | 82% | |||||||||||||||
| ||||||||||||||||||||
| 1 | The average shares outstanding method has been applied for per share information. |
| 2 | Total investment return is based on the change in net asset value of a share during the period and assumes reinvestment of dividends and distributions at net asset value. Total investment return during all of the periods shown reflects a waiver by the manager. Performance would have been lower had the waiver not been in effect. |
See accompanying notes, which are an integral part of the financial statements.
| (continues | ) | 115 |
Table of Contents
Financial highlights
Optimum Small-Mid Cap Growth Fund Class A
Selected data for each share of the Fund outstanding throughout each period were as follows:
| Year ended | ||||||||||||||||||||
| 3/31/15 | 3/31/14 | 3/31/13 | 3/31/12 | 3/31/11 | ||||||||||||||||
Net asset value, beginning of period | $ | 15.570 | $ | 14.260 | $ | 13.000 | $ | 13.900 | $ | 11.150 | ||||||||||
Income (loss) from investment operations: | ||||||||||||||||||||
Net investment loss1 | (0.164 | ) | (0.193 | ) | (0.079 | ) | (0.169 | ) | (0.149 | ) | ||||||||||
Net realized and unrealized gain | 1.442 | 3.073 | 1.653 | 0.064 | 2.899 | |||||||||||||||
|
|
|
|
|
|
|
|
|
| |||||||||||
Total from investment operations | 1.278 | 2.880 | 1.574 | (0.105 | ) | 2.750 | ||||||||||||||
|
|
|
|
|
|
|
|
|
| |||||||||||
Less dividends and distributions from: | ||||||||||||||||||||
Net realized gain | (1.478 | ) | (1.570 | ) | (0.314 | ) | (0.795 | ) | — | |||||||||||
|
|
|
|
|
|
|
|
|
| |||||||||||
Total dividends and distributions | (1.478 | ) | (1.570 | ) | (0.314 | ) | (0.795 | ) | — | |||||||||||
|
|
|
|
|
|
|
|
|
| |||||||||||
Net asset value, end of period | $ | 15.370 | $ | 15.570 | $ | 14.260 | $ | 13.000 | $ | 13.900 | ||||||||||
|
|
|
|
|
|
|
|
|
| |||||||||||
Total return2 | 8.93% | 21.63% | 12.50% | 0.33% | 24.66% | |||||||||||||||
Ratios and supplemental data: | ||||||||||||||||||||
Net assets, end of period (000 omitted) | $ | 7,050 | $ | 7,158 | $ | 6,415 | $ | 5,989 | $ | 6,866 | ||||||||||
Ratio of expenses to average net assets | 1.63% | 1.76% | 1.86% | 1.90% | 1.90% | |||||||||||||||
Ratio of expenses to average net assets prior to fees waived | 1.77% | 1.96% | 2.05% | 2.06% | 2.07% | |||||||||||||||
Ratio of net investment loss to average net assets | (1.09% | ) | (1.28% | ) | (0.62% | ) | (1.34% | ) | (1.29% | ) | ||||||||||
Ratio of net investment loss to average net assets prior to fees waived | (1.23% | ) | (1.48% | ) | (0.81% | ) | (1.50% | ) | (1.46% | ) | ||||||||||
Portfolio turnover | 72% | 58% | 78% | 82% | 86% | |||||||||||||||
| ||||||||||||||||||||
| 1 | The average shares outstanding method has been applied for per share information. |
| 2 | Total investment return is based on the change in net asset value of a share during the period and assumes reinvestment of dividends and distributions at net asset value and does not reflect the impact of a sales charge. Total investment return during all of the periods shown reflects a waiver by the manager. Performance would have been lower had the waiver not been in effect. |
See accompanying notes, which are an integral part of the financial statements.
116
Table of Contents
Optimum Small-Mid Cap Growth Fund Class C
Selected data for each share of the Fund outstanding throughout each period were as follows:
| Year ended | ||||||||||||||||||||
| 3/31/15 | 3/31/14 | 3/31/13 | 3/31/12 | 3/31/11 | ||||||||||||||||
Net asset value, beginning of period | $ | 14.290 | $ | 13.280 | $ | 12.220 | $ | 13.200 | $ | 10.660 | ||||||||||
Income (loss) from investment operations: | ||||||||||||||||||||
Net investment loss1 | (0.252 | ) | (0.274 | ) | (0.151 | ) | (0.237 | ) | (0.213 | ) | ||||||||||
Net realized and unrealized gain | 1.300 | 2.854 | 1.525 | 0.052 | 2.753 | |||||||||||||||
|
|
|
|
|
|
|
|
|
| |||||||||||
Total from investment operations | 1.048 | 2.580 | 1.374 | (0.185 | ) | 2.540 | ||||||||||||||
|
|
|
|
|
|
|
|
|
| |||||||||||
Less dividends and distributions from: | ||||||||||||||||||||
Net realized gain | (1.478 | ) | (1.570 | ) | (0.314 | ) | (0.795 | ) | — | |||||||||||
|
|
|
|
|
|
|
|
|
| |||||||||||
Total dividends and distributions | (1.478 | ) | (1.570 | ) | (0.314 | ) | (0.795 | ) | — | |||||||||||
|
|
|
|
|
|
|
|
|
| |||||||||||
Net asset value, end of period | $ | 13.860 | $ | 14.290 | $ | 13.280 | $ | 12.220 | $ | 13.200 | ||||||||||
|
|
|
|
|
|
|
|
|
| |||||||||||
Total return2 | 8.08% | 20.82% | 11.73% | (0.27% | ) | 23.83% | ||||||||||||||
Ratios and supplemental data: | ||||||||||||||||||||
Net assets, end of period (000 omitted) | $ | 23,206 | $ | 22,581 | $ | 20,921 | $ | 20,992 | $ | 24,337 | ||||||||||
Ratio of expenses to average net assets | 2.38% | 2.45% | 2.51% | 2.55% | 2.55% | |||||||||||||||
Ratio of expenses to average net assets prior to fees waived | 2.52% | 2.65% | 2.70% | 2.71% | 2.72% | |||||||||||||||
Ratio of net investment loss to average net assets | (1.84% | ) | (1.97% | ) | (1.27% | ) | (1.99% | ) | (1.94% | ) | ||||||||||
Ratio of net investment loss to average net assets prior to fees waived | (1.98% | ) | (2.17% | ) | (1.46% | ) | (2.15% | ) | (2.11% | ) | ||||||||||
Portfolio turnover | 72% | 58% | 78% | 82% | 86% | |||||||||||||||
| ||||||||||||||||||||
| 1 | The average shares outstanding method has been applied for per share information. |
| 2 | Total investment return is based on the change in net asset value of a share during the period and assumes reinvestment of dividends and distributions at net asset value and does not reflect the impact of a sales charge. Total investment return during all of the periods shown reflects a waiver by the manager. Performance would have been lower had the waiver not been in effect. |
See accompanying notes, which are an integral part of the financial statements.
| (continues | ) | 117 |
Table of Contents
Financial highlights
Optimum Small-Mid Cap Growth Fund Institutional Class
Selected data for each share of the Fund outstanding throughout each period were as follows:
| Year ended | ||||||||||||||||||||
| 3/31/15 | 3/31/14 | 3/31/13 | 3/31/12 | 3/31/11 | ||||||||||||||||
Net asset value, beginning of period | $ | 16.270 | $ | 14.780 | $ | 13.420 | $ | 14.270 | $ | 11.410 | ||||||||||
Income (loss) from investment operations: | ||||||||||||||||||||
Net investment loss1 | (0.132 | ) | (0.152 | ) | (0.036 | ) | (0.128 | ) | (0.112 | ) | ||||||||||
Net realized and unrealized gain | 1.510 | 3.212 | 1.710 | 0.073 | 2.972 | |||||||||||||||
|
|
|
|
|
|
|
|
|
| |||||||||||
Total from investment operations | 1.378 | 3.060 | 1.674 | (0.055 | ) | 2.860 | ||||||||||||||
|
|
|
|
|
|
|
|
|
| |||||||||||
Less dividends and distributions from: | ||||||||||||||||||||
Net realized gain | (1.478 | ) | (1.570 | ) | (0.314 | ) | (0.795 | ) | — | |||||||||||
|
|
|
|
|
|
|
|
|
| |||||||||||
Total dividends and distributions | (1.478 | ) | (1.570 | ) | (0.314 | ) | (0.795 | ) | — | |||||||||||
|
|
|
|
|
|
|
|
|
| |||||||||||
Net asset value, end of period | $ | 16.170 | $ | 16.270 | $ | 14.780 | $ | 13.420 | $ | 14.270 | ||||||||||
|
|
|
|
|
|
|
|
|
| |||||||||||
Total return2 | 9.18% | 22.03% | 12.94% | 0.68% | 25.07% | |||||||||||||||
Ratios and supplemental data: | ||||||||||||||||||||
Net assets, end of period (000 omitted) | $ | 527,647 | $ | 436,823 | $ | 321,441 | $ | 321,641 | $ | 304,406 | ||||||||||
Ratio of expenses to average net assets | 1.38% | 1.45% | 1.51% | 1.55% | 1.55% | |||||||||||||||
Ratio of expenses to average net assets prior to fees waived | 1.52% | 1.65% | 1.70% | 1.71% | 1.72% | |||||||||||||||
Ratio of net investment loss to average net assets | (0.84% | ) | (0.97% | ) | (0.27% | ) | (0.99% | ) | (0.94% | ) | ||||||||||
Ratio of net investment loss to average net assets prior to fees waived | (0.98% | ) | (1.17% | ) | (0.46% | ) | (1.15% | ) | (1.11% | ) | ||||||||||
Portfolio turnover | 72% | 58% | 78% | 82% | 86% | |||||||||||||||
| ||||||||||||||||||||
| 1 | The average shares outstanding method has been applied for per share information. |
| 2 | Total investment return is based on the change in net asset value of a share during the period and assumes reinvestment of dividends and distributions at net asset value. Total investment return during all of the periods shown reflects a waiver by the manager. Performance would have been lower had the waiver not been in effect. |
See accompanying notes, which are an integral part of the financial statements.
118
Table of Contents
Optimum Small-Mid Cap Value Fund Class A
Selected data for each share of the Fund outstanding throughout each period were as follows:
| Year ended | ||||||||||||||||||||
| 3/31/15 | 3/31/14 | 3/31/13 | 3/31/12 | 3/31/11 | ||||||||||||||||
Net asset value, beginning of period | $ | 14.880 | $ | 13.740 | $ | 12.590 | $ | 12.610 | $ | 10.070 | ||||||||||
Income (loss) from investment operations: | ||||||||||||||||||||
Net investment loss1 | (0.092 | ) | (0.092 | ) | (0.027 | ) | (0.044 | ) | (0.062 | ) | ||||||||||
Net realized and unrealized gain (loss) | (0.032 | ) | 2.873 | 1.609 | 0.148 | 2.602 | ||||||||||||||
|
|
|
|
|
|
|
|
|
| |||||||||||
Total from investment operations | (0.124 | ) | 2.781 | 1.582 | 0.104 | 2.540 | ||||||||||||||
|
|
|
|
|
|
|
|
|
| |||||||||||
Less dividends and distributions from: | ||||||||||||||||||||
Net realized gain | (1.116 | ) | (1.641 | ) | (0.432 | ) | (0.124 | ) | — | |||||||||||
|
|
|
|
|
|
|
|
|
| |||||||||||
Total dividends and distributions | (1.116 | ) | (1.641 | ) | (0.432 | ) | (0.124 | ) | — | |||||||||||
|
|
|
|
|
|
|
|
|
| |||||||||||
Net asset value, end of period | $ | 13.640 | $ | 14.880 | $ | 13.740 | $ | 12.590 | $ | 12.610 | ||||||||||
|
|
|
|
|
|
|
|
|
| |||||||||||
Total return2 | (0.69% | ) | 21.85% | 13.23% | 1.01% | 25.22% | ||||||||||||||
Ratios and supplemental data: | ||||||||||||||||||||
Net assets, end of period (000 omitted) | $ | 5,440 | $ | 6,058 | $ | 5,711 | $ | 5,372 | $ | 6,102 | ||||||||||
Ratio of expenses to average net assets | 1.62% | 1.70% | 1.76% | 1.79% | 1.81% | |||||||||||||||
Ratio of expenses to average net assets prior to fees waived | 1.68% | 1.86% | 1.98% | 1.98% | 2.00% | |||||||||||||||
Ratio of net investment loss to average net assets | (0.65% | ) | (0.64% | ) | (0.22% | ) | (0.38% | ) | (0.59% | ) | ||||||||||
Ratio of net investment loss to average net assets prior to fees waived | (0.71% | ) | (0.80% | ) | (0.44% | ) | (0.57% | ) | (0.78% | ) | ||||||||||
Portfolio turnover | 31% | 33% | 36% | 30% | 43% | |||||||||||||||
| ||||||||||||||||||||
| 1 | The average shares outstanding method has been applied for per share information. |
| 2 | Total investment return is based on the change in net asset value of a share during the period and assumes reinvestment of dividends and distributions at net asset value and does not reflect the impact of a sales charge. Total investment return during all of the periods shown reflects a waiver by the manager. Performance would have been lower had the waiver not been in effect. |
See accompanying notes, which are an integral part of the financial statements.
| (continues | ) | 119 |
Table of Contents
Financial highlights
Optimum Small-Mid Cap Value Fund Class C
Selected data for each share of the Fund outstanding throughout each period were as follows:
| Year ended | ||||||||||||||||||||
| 3/31/15 | 3/31/14 | 3/31/13 | 3/31/12 | 3/31/11 | ||||||||||||||||
Net asset value, beginning of period | $ | 13.630 | $ | 12.800 | $ | 11.830 | $ | 11.930 | $ | 9.590 | ||||||||||
Income (loss) from investment operations: | ||||||||||||||||||||
Net investment loss1 | (0.179 | ) | (0.175 | ) | (0.100 | ) | (0.113 | ) | (0.124 | ) | ||||||||||
Net realized and unrealized gain (loss) | (0.035 | ) | 2.646 | 1.502 | 0.137 | 2.464 | ||||||||||||||
|
|
|
|
|
|
|
|
|
| |||||||||||
Total from investment operations | (0.214 | ) | 2.471 | 1.402 | 0.024 | 2.340 | ||||||||||||||
|
|
|
|
|
|
|
|
|
| |||||||||||
Less dividends and distributions from: | ||||||||||||||||||||
Net realized gain | (1.116 | ) | (1.641 | ) | (0.432 | ) | (0.124 | ) | — | |||||||||||
|
|
|
|
|
|
|
|
|
| |||||||||||
Total dividends and distributions | (1.116 | ) | (1.641 | ) | (0.432 | ) | (0.124 | ) | — | |||||||||||
|
|
|
|
|
|
|
|
|
| |||||||||||
Net asset value, end of period | $ | 12.300 | $ | 13.630 | $ | 12.800 | $ | 11.830 | $ | 11.930 | ||||||||||
|
|
|
|
|
|
|
|
|
| |||||||||||
Total return2 | (1.45% | ) | 21.08% | 12.45% | 0.39% | 24.40% | ||||||||||||||
Ratios and supplemental data: | ||||||||||||||||||||
Net assets, end of period (000 omitted) | $ | 19,245 | $ | 20,846 | $ | 20,058 | $ | 19,986 | $ | 22,797 | ||||||||||
Ratio of expenses to average net assets | 2.37% | 2.40% | 2.41% | 2.44% | 2.46% | |||||||||||||||
Ratio of expenses to average net assets prior to fees waived | 2.43% | 2.56% | 2.63% | 2.63% | 2.65% | |||||||||||||||
Ratio of net investment loss to average net assets | (1.40% | ) | (1.34% | ) | (0.87% | ) | (1.03% | ) | (1.24% | ) | ||||||||||
Ratio of net investment loss to average net assets prior to fees waived | (1.46% | ) | (1.50% | ) | (1.09% | ) | (1.22% | ) | (1.43% | ) | ||||||||||
Portfolio turnover | 31% | 33% | 36% | 30% | 43% | |||||||||||||||
| ||||||||||||||||||||
| 1 | The average shares outstanding method has been applied for per share information. |
| 2 | Total investment return is based on the change in net asset value of a share during the period and assumes reinvestment of dividends and distributions at net asset value and does not reflect the impact of a sales charge. Total investment return during all of the periods shown reflects a waiver by the manager. Performance would have been lower had the waiver not been in effect. |
See accompanying notes, which are an integral part of the financial statements.
120
Table of Contents
Optimum Small-Mid Cap Value Fund Institutional Class
Selected data for each share of the Fund outstanding throughout each period were as follows:
| Year ended | ||||||||||||||||||||
| 3/31/15 | 3/31/14 | 3/31/13 | 3/31/12 | 3/31/11 | ||||||||||||||||
Net asset value, beginning of period | $ | 15.530 | $ | 14.230 | $ | 12.990 | $ | 12.960 | $ | 10.310 | ||||||||||
Income (loss) from investment operations: | ||||||||||||||||||||
Net investment income (loss)1 | (0.059 | ) | (0.050 | ) | 0.016 | (0.004 | ) | (0.026 | ) | |||||||||||
Net realized and unrealized gain (loss) | (0.045 | ) | 2.995 | 1.661 | 0.158 | 2.676 | ||||||||||||||
|
|
|
|
|
|
|
|
|
| |||||||||||
Total from investment operations | (0.104 | ) | 2.945 | 1.677 | 0.154 | 2.650 | ||||||||||||||
|
|
|
|
|
|
|
|
|
| |||||||||||
Less dividends and distributions from: | ||||||||||||||||||||
Net investment income | — | (0.004 | ) | (0.005 | ) | — | — | |||||||||||||
Net realized gain | (1.116 | ) | (1.641 | ) | (0.432 | ) | (0.124 | ) | — | |||||||||||
|
|
|
|
|
|
|
|
|
| |||||||||||
Total dividends and distributions | (1.116 | ) | (1.645 | ) | (0.437 | ) | (0.124 | ) | — | |||||||||||
|
|
|
|
|
|
|
|
|
| |||||||||||
Net asset value, end of period | $ | 14.310 | $ | 15.530 | $ | 14.230 | $ | 12.990 | $ | 12.960 | ||||||||||
|
|
|
|
|
|
|
|
|
| |||||||||||
Total return2 | (0.53% | ) | 22.29% | 13.56% | 1.37% | 25.70% | ||||||||||||||
Ratios and supplemental data: | ||||||||||||||||||||
Net assets, end of period (000 omitted) | $ | 499,578 | $ | 439,417 | $ | 318,758 | $ | 310,737 | $ | 274,495 | ||||||||||
Ratio of expenses to average net assets | 1.37% | 1.40% | 1.41% | 1.44% | 1.46% | |||||||||||||||
Ratio of expenses to average net assets prior to fees waived | 1.43% | 1.56% | 1.63% | 1.63% | 1.65% | |||||||||||||||
Ratio of net investment income (loss) to average net assets | (0.40% | ) | (0.34% | ) | 0.13% | (0.03% | ) | (0.24% | ) | |||||||||||
Ratio of net investment loss to average net assets prior to fees waived | (0.46% | ) | (0.50% | ) | (0.09% | ) | (0.22% | ) | (0.43% | ) | ||||||||||
Portfolio turnover | 31% | 33% | 36% | 30% | 43% | |||||||||||||||
| ||||||||||||||||||||
| 1 | The average shares outstanding method has been applied for per share information. |
| 2 | Total investment return is based on the change in net asset value of a share during the period and assumes reinvestment of dividends and distributions at net asset value. Total investment return during all of the periods shown reflects a waiver by the manager. Performance would have been lower had the waiver not been in effect. |
See accompanying notes, which are an integral part of the financial statements.
| (continues | ) | 121 |
Table of Contents
Optimum Fund Trust
March 31, 2015
Optimum Fund Trust (Trust) is organized as a Delaware statutory trust and offers six series: Optimum Fixed Income Fund, Optimum International Fund, Optimum Large Cap Growth Fund, Optimum Large Cap Value Fund, Optimum Small-Mid Cap Growth Fund, and Optimum Small-Mid Cap Value Fund, (each, a Fund, or collectively, the Funds). The Trust is an open-end investment company. The Funds are considered diversified under the Investment Company Act of 1940, as amended, and offer Class A, Class C, and Institutional Class shares. Class A shares are sold with a maximum front-end sales charge of 4.50% for Optimum Fixed Income Fund and 5.75% for Optimum International Fund, Optimum Large Cap Growth Fund, Optimum Large Cap Value Fund, Optimum Small-Mid Cap Growth Fund, and Optimum Small-Mid Cap Value Fund. Class A share purchases of $1,000,000 or more will incur a contingent deferred sales charge (CDSC) of 1.00% if redeemed during the first year and 0.50% during the second year, provided that Delaware Distributors, L.P. (DDLP) paid a financial advisor a commission on the purchase of those shares. Effective Nov. 4, 2014, all remaining shares of Class B were converted to Class A shares. Between June 1, 2007 and Nov. 4, 2014, Class B shares could be purchased only through dividend reinvestment and certain permitted exchanges. Class B shares automatically converted to Class A shares on a quarterly basis approximately eight years after purchase. Class C shares are sold with a CDSC of 1.00%, if redeemed during the first 12 months. Institutional Class shares are not subject to a sales charge and are offered for sale exclusively to certain eligible investors.
The investment objective of Optimum Fixed Income Fund is to seek a high level of income. The Fund may also seek growth of capital.
The investment objective of Optimum International Fund is to seek long-term growth of capital. The Fund may also seek income.
The investment objective of Optimum Large Cap Growth Fund is to seek long-term growth of capital.
The investment objective of Optimum Large Cap Value Fund is to seek long-term growth of capital. The Fund may also seek income.
The investment objective of Optimum Small-Mid Cap Growth Fund is to seek long-term growth of capital.
The investment objective of Optimum Small-Mid Cap Value Fund is to seek long-term growth of capital.
1. Significant Accounting Policies
The following accounting policies are in accordance with U.S. generally accepted accounting principles (U.S. GAAP) and are consistently followed by the Funds.
Security Valuation — Equity securities and exchange-traded funds (ETFs), except those traded on the Nasdaq Stock Market, Inc. (Nasdaq), are valued at the last quoted sales price as of the time of the regular close of the New York Stock Exchange on the valuation date. Securities and ETFs traded on the Nasdaq are valued in accordance with the Nasdaq Official Closing Price, which may not be the last sales price. If, on a particular day, an equity security or ETF does not trade, the mean between the bid and ask prices will be used, which approximates fair value. Securities listed on a foreign exchange are normally valued at the last quoted sales price on the valuation date. Open-end investment company securities are valued at net asset value per share, as reported by the underlying investment company. U.S. government and agency securities are valued at the mean between the bid and ask prices, which approximates fair value. Other debt securities, credit default swap (CDS) contracts, interest rate swap options contracts (swaptions) and interest rate swap contracts are valued based upon valuations provided by an independent pricing service or broker/counterparty and reviewed by management. To the extent current market prices are not available, the pricing service may take into account developments related to the specific security, as well as transactions in comparable securities. Valuations for fixed income securities utilize matrix systems, which reflect such factors as security prices, yields, maturities, and ratings, and are supplemented by dealer and exchange quotations. For asset-backed securities, collateralized mortgage obligations, commercial mortgage securities, and U.S. government agency mortgage securities, pricing vendors utilize matrix pricing which considers prepayment speed, attributes of the collateral, yield or price of bonds of comparable quality, coupon, maturity, and type as well as broker/dealer-supplied prices. Swap prices are derived using daily swap curves and models that incorporate a number of market data factors, such as discounted cash flows, trades, and values of the underlying reference instruments. Foreign currency exchange contracts and foreign cross currency exchange contracts are valued at the mean between the bid and the ask prices, which approximates fair value. Interpolated values are derived when the settlement date of the contract is an interim date for which quotations are not available. Futures contracts and options on futures contracts are valued at the daily quoted settlement prices. Exchange-traded options are valued at the last reported sale price or, if no sales are reported, at the mean between the last reported bid and ask prices, which approximates fair value. Generally, other securities and assets for which market quotations are not readily available are valued at fair value as determined in good faith under the direction of the Funds’ Board of Trustees (Board). In determining whether market quotations are readily available or fair valuation will be used, various factors will be taken into consideration, such as market closures or suspension of trading in a security. Each Fund may use fair value pricing more frequently for securities traded primarily in non-U.S. markets because, among other things, most foreign markets close well before each Fund values its securities, generally as of 4:00 p.m. Eastern time. The earlier close of
122
Table of Contents
these foreign markets gives rise to the possibility that significant events, including broad market moves, government actions or pronouncements, aftermarket trading, or news events may have occurred in the interim. Whenever such a significant event occurs, each Fund may value foreign securities using fair value prices based on third-party vendor modeling tools (international fair value pricing).
Federal and Foreign Income Taxes — No provision for federal income taxes has been made as each Fund intends to continue to qualify for federal income tax purposes as a regulated investment company under Subchapter M of the Internal Revenue Code of 1986, as amended, and make the requisite distributions to shareholders. The Funds evaluate tax positions taken or expected to be taken in the course of preparing each Fund’s tax returns to determine whether the tax positions are “more-likely-than-not” of being sustained by the applicable tax authority. Tax positions not deemed to meet the “more-likely-than-not” threshold are recorded as a tax benefit or expense in the current year. Management has analyzed each Fund’s tax positions taken for all open federal income tax years (March 31, 2012–March 31, 2015) and has concluded that no provision for federal income tax is required in any Fund’s financial statements. In regard to foreign taxes only, each Fund has open tax years in certain foreign countries in which it invests that may date back to the inception of each Fund.
Class Accounting — Investment income, common expenses, and realized and unrealized gain (loss) on investments are allocated to the various classes of the Funds on the basis of daily net assets of each class. Distribution expenses relating to a specific class are charged directly to that class.
Repurchase Agreements — Each Fund may purchase certain U.S. government securities subject to the counterparty’s agreement to repurchase them at an agreed upon date and price. The counterparty will be required on a daily basis to maintain the value of the collateral subject to the agreement at not less than the repurchase price (including accrued interest). The agreements are conditioned upon the collateral being deposited under the Federal Reserve book-entry system with each Fund’s custodian or a third-party sub-custodian. In the event of default or bankruptcy by the other party to the agreement, retention of the collateral may be subject to legal proceedings. All open repurchase agreements as of the date of this report were entered into on March 31, 2015.
Reverse Repurchase Agreements — Optimum Fixed Income Fund may enter into reverse repurchase agreements. In a reverse repurchase agreement, the Fund sells securities to a bank or broker/dealer and agrees to repurchase the securities at an agreed upon date and price. The Fund will maintain in a segregated account, cash, cash equivalents, or U.S. government securities in an amount sufficient to cover its obligations under reverse repurchase agreements with broker/dealers (but no collateral is required on reverse repurchase agreements with banks). The Fund will subject its investments in reverse repurchase agreements to the borrowing provisions set forth in the 1940 Act. The use of reverse repurchase agreements by the Fund creates leverage, which increases the Fund’s investment risk. If the income and gains on securities purchased with the proceeds of reverse repurchase agreements exceed the costs of the agreements, the Fund’s earnings or NAV will increase faster than otherwise would be the case; conversely, if the income and gains fail to exceed the costs, earnings or NAV would decline faster than otherwise would be the case. For the year ended March 31, 2015, the Fund had average reverse repurchase agreements of $352,768, for which it paid interest at an average rate of 0.60%. At March 31, 2015, the Fund posted $2,747,766 in securities as collateral for reverse repurchase agreements.
To Be Announced Trades (TBA) — Optimum Fixed Income Fund may contract to purchase or sell securities for a fixed price at a transaction date beyond the customary settlement period (examples: when issued, delayed delivery, forward commitment, or TBA transactions) consistent with the Fund’s ability to manage its investment portfolio and meet redemption requests. These transactions involve a commitment by the Fund to purchase or sell securities for a predetermined price or yield with payment and delivery taking place more than three days in the future, or after a period longer than the customary settlement period for that type of security. No interest will be earned by the Fund on such purchases until the securities are delivered or the transaction is completed; however, the market value may change prior to delivery.
Foreign Currency Transactions — Transactions denominated in foreign currencies are recorded at the prevailing exchange rates on the valuation date in accordance with the Funds’ prospectus. The value of all assets and liabilities denominated in foreign currencies is translated daily into U.S. dollars at the exchange rate of such currencies against the U.S. dollar. Transaction gains or losses resulting from changes in exchange rates during the reporting period or upon settlement of the foreign currency transaction are reported in operations for the current period. The Funds generally bifurcate that portion of realized gains and losses on investments in debt securities which is due to changes in foreign exchange rates from that which is due to changes in market prices of debt securities. That portion of gains (losses) is included on the “Statements of operations” under “Net realized gain (loss) on foreign currencies.” For foreign equity securities, these changes are included on the “Statements of operations” under “Net realized and unrealized gain (loss) on investments. The Funds report certain foreign currency related transactions as components of realized gains (losses) for financial reporting purposes, whereas such components are treated as ordinary income (loss) for federal income tax purposes.
| (continues | ) | 123 |
Table of Contents
Notes to financial statements
Optimum Fund Trust
1. Significant Accounting Policies (continued)
Use of Estimates — Each Fund is an investment company in conformity with U.S. GAAP. Therefore, each Fund follows the accounting and reporting guidelines for investment companies. The preparation of financial statements in conformity with U.S. GAAP requires management to make estimates and assumptions that affect the fair value of investments, the reported amounts of assets and liabilities and disclosure of contingent assets and liabilities at the date of the financial statements, and the reported amounts of revenues and expenses during the reporting period. Actual results could differ from those estimates and the differences could be material.
Other — Expenses directly attributable to a Fund are charged directly to that Fund. Other expenses common to various funds within the Trust are generally allocated among such funds on the basis of average net assets. Management fees and some other expenses are paid monthly. Security transactions are recorded on the date the securities are purchased or sold (trade date) for financial reporting purposes. Costs used in calculating realized gains and losses on the sale of investment securities are those of the specific securities sold. Dividend income is recorded on the ex-dividend date and interest income is recorded on the accrual basis. Discounts and premiums on debt securities are accreted or amortized to interest income, respectively, over the lives of the respective securities using the effective interest method. Realized gains (losses) on paydowns of asset- and mortgage-backed securities are classified as interest income. Distributions received from investments in real estate investment trusts (REITs) are recorded as dividend income on the ex-dividend date, subject to reclassification upon notice of the character of such distributions by the issuer. Foreign dividends are also recorded on the ex-dividend date or as soon after the ex-dividend date that the Funds are aware of such dividends, net of all tax withholdings, a portion of which may be reclaimable. Withholding taxes and reclaims on foreign dividends and interest have been recorded in accordance with the Funds’ understanding of the applicable country’s tax rules and rates. Each Fund may pay foreign capital gains taxes on certain foreign securities held, which are reported as components of realized losses for financial reporting purposes, whereas such components are treated as ordinary loss for federal income tax purposes. Each Fund declares and pays distributions from net investment income and net realized gain on investments, if any, at least annually. The Funds may distribute more frequently, if necessary for tax purposes. Dividends and distributions, if any, are recorded on the ex-dividend date.
Optimum Large Cap Growth Fund and Optimum Small-Mid Cap Value Fund invest in master limited partnerships (MLPs) which make distributions that are primarily attributable to return of capital. The Funds record investment income and return of capital on the “Statements of operations” using management’s estimate of the percentage of income included in the distributions received from each MLP based on historical information from the MLPs and other industry sources. These estimates may be adjusted based on information received from the MLPs after the tax and fiscal year ends.
The return of capital portion of the MLP distributions is a reduction to investment income and a reduction in the cost basis of each investment which increases net realized gain (loss) and net change in unrealized appreciation (depreciation). If the return of capital distributions exceed its cost basis, the distributions are treated as realized gains. The actual amounts of income and return of capital are only determined by each MLP after its fiscal year-end and may differ from the estimated amounts. For the fiscal year ended March 31, 2015, the Funds estimated that 100% of the MLP distributions received would be treated as a return of capital.
Each Fund may receive earnings credits from its custodian when positive cash balances are maintained, which may be used to offset custody fees. There were no such earnings credits for the year ended March 31, 2015.
Each Fund receives earnings credits from its transfer agent when positive cash balances are maintained, which may be used to offset transfer agent fees. If the amount earned is greater than one dollar, the expense paid under this arrangement is included on the “Statements of operations” under “Dividend disbursing and transfer agent fees and expenses” with the corresponding expense offset shown under “Less expense paid indirectly.” For the year ended March 31, 2015, each Fund earned the following amounts under this agreement:
| Optimum | Optimum | Optimum | Optimum | Optimum | Optimum | |||||
| Fixed Income | International | Large Cap | Large Cap | Small-Mid Cap | Small-Mid Cap | |||||
| Fund | Fund | Growth Fund | Value Fund | Growth Fund | Value Fund | |||||
| $343 | $339 | $363 | $363 | $359 | $362 |
2. Investment Management, Administration Agreements, and Other Transactions with Affiliates
Delaware Management Company (DMC), a series of Delaware Management Business Trust, furnishes investment management services to each Fund and has full discretion and responsibility, subject to the overall supervision of the Trust’s Board, to select and contract with one or more investment sub-advisors to manage the investment operations and composition of each Fund, and to render investment advice for each Fund, including the purchase, retention, and dispositions of investments, securities, and cash contained in each Fund. The investment management
124
Table of Contents
agreement obligates DMC to implement decisions with respect to the allocation or reallocation of each Fund’s assets among one or more current or additional sub-advisors, and to monitor the sub-advisors’ compliance with the relevant Fund’s investment objective, policies and restrictions. DMC pays the sub-advisors out of its fees.
In accordance with the terms of its respective investment management agreement, DMC is entitled to receive an annual fee equal to the following percentage rates of the average daily net assets of each Fund:
| Optimum Fixed Income Fund | 0.7000% of net assets up to $25 million | |
| 0.6500% of net assets from $25 million to $100 million | ||
| 0.6000% of net assets from $100 million to $500 million | ||
| 0.5500% of net assets from $500 million to $1 billion | ||
| 0.5000% of net assets from $1 billion to $2.5 billion | ||
| 0.4750% of net assets over $2.5 billion | ||
| Optimum International Fund | 0.8750% of net assets up to $50 million | |
| 0.8000% of net assets from $50 million to $100 million | ||
| 0.7800% of net assets from $100 million to $300 million | ||
| 0.7650% of net assets from $300 million to $400 million | ||
| 0.7300% of net assets over $400 million | ||
| Optimum Large Cap Growth Fund | 0.8000% of net assets up to $250 million | |
| 0.7875% of net assets from $250 million to $300 million | ||
| 0.7625% of net assets from $300 million to $400 million | ||
| 0.7375% of net assets from $400 million to $500 million | ||
| 0.7250% of net assets from $500 million to $1 billion | ||
| 0.7100% of net assets from $1 billion to $1.5 billion | ||
| 0.7000% of net assets over $1.5 billion | ||
| Optimum Large Cap Value Fund | 0.8000% of net assets up to $100 million | |
| 0.7375% of net assets from $100 million to $250 million | ||
| 0.7125% of net assets from $250 million to $500 million | ||
| 0.6875% of net assets from $500 million to $1 billion | ||
| 0.6675% of net assets from $1 billion to $1.5 billion | ||
| 0.6475% of net assets over $1.5 billion | ||
Optimum Small-Mid Cap Growth Fund | 1.1000% of net assets | |
| Optimum Small-Mid Cap Value Fund | 1.0500% of net assets up to $75 million | |
| 1.0250% of net assets from $75 million to $150 million | ||
| 1.0000% of net assets over $150 million | ||
DMC has entered into sub-advisory agreements for the Trust as follows: Optimum Fixed Income Fund – Pacific Investment Management Company, LLC (PIMCO); Optimum International Fund – Acadian Asset Management LLC (Acadian), and EARNEST Partners, LLC (EARNEST); Optimum Large Cap Growth Fund – T. Rowe Price Associates, Inc. (T. Rowe Price), and Fred Alger Management, Inc. (Alger); Optimum Large Cap Value Fund – Massachusetts Financial Services Company (MFS) and Herndon Capital Management, LLC (Herndon); Optimum Small-Mid Cap Growth Fund – Columbia Wanger Asset Management, LLC (CWAM) and Wellington Management Company, LLP (Wellington Management); Optimum Small-Mid Cap Value Fund – The Killen Group, Inc. (Killen), Westwood Management Corp. (Westwood) and The Delafield Group, a division of Tocqueville Asset Management L.P. (Tocqueville). Prior to Jan. 13, 2015, BlackRock Advisors, LLC (BlackRock) was a sub-advisor for the Optimum International Fund.
| (continues | ) | 125 |
Table of Contents
Notes to financial statements
Optimum Fund Trust
2. Investment Management, Administration Agreements, and Other Transactions with Affiliates (continued)
For the year ended March 31, 2015, DMC paid the following sub-advisory fees:
Optimum | Optimum International Fund | Optimum Large Cap Growth Fund | Optimum Large Cap Value Fund | Optimum Small-Mid Cap Growth Fund | Optimum Small-Mid Cap Value Fund | |||||
| $2,295,037 | $2,460,419 | $4,906,790 | $3,674,423 | $3,668,153 | $2,832,484 |
DMC has contractually agreed to waive that portion, if any, of its management fee and reimburse each Fund to the extent necessary to ensure that total annual fund operating expenses (excluding any 12b-1 fees, acquired fund fees and expenses, taxes, interest, short sale and dividend interest expenses, brokerage fees, certain insurance costs, and nonroutine expenses or costs, including, but not limited to, those relating to reorganizations, litigation, conducting shareholder meetings, and liquidations (collectively, nonroutine expenses)) do not exceed the following percentages of each Fund’s average daily net assets. For purposes of these waivers and reimbursements, nonroutine expenses may also include such additional costs and expenses as may be agreed upon from time to time by the Funds’ Board and DMC. These waivers and reimbursements may be terminated only by agreement of DMC and the Funds.
| Optimum | Optimum | Optimum | Optimum | Optimum | Optimum | |||||||
| Fixed Income | International | Large Cap | Large Cap | Small-Mid Cap | Small-Mid Cap | |||||||
| Fund | Fund | Growth Fund | Value Fund | Growth Fund | Value Fund | |||||||
Operating expense limitation as a percentage of average daily net assets (per annum) for the period | ||||||||||||
July 29, 2014 - | ||||||||||||
July 29, 2015 | 0.95% | 1.25% | 1.12% | 1.08% | 1.36% | 1.35% | ||||||
Operating expense limitation as a percentage of average daily net assets (per annum) for the period | ||||||||||||
July 29, 2013 - | ||||||||||||
July 28, 2014 | 1.00% | 1.40% | 1.25% | 1.20% | 1.43% | 1.40% |
Effective Nov. 1, 2014, Delaware Investments Fund Services Company (DIFSC), an affiliate of DMC, provides fund accounting and financial administration oversight services to the Trust. Prior to this time, Delaware Service Company, Inc. (DSC), an affiliate of DMC, provided fund accounting and financial administration oversight services to the Trust. Those services include overseeing the Funds’ pricing process, the calculation and payment of fund expenses, and financial reporting in shareholder reports, registration statements and other regulatory filings. DIFSC also manages the process for the payment of dividends and distributions and the dissemination of Fund NAVs and performance data. For these services, the Funds pay DIFSC an asset-based fee, plus certain out-of-pocket expenses and transactional charges. DIFSC fees are calculated based on the aggregate daily net assets of the Trust at the following annual rate: 0.0075% of the first $3 billion; 0.0070% of the next $2 billion; 0.0065% of the next $2.5 billion; 0.0055% of the next $2.5 billion; and 0.0050% of aggregate average daily net assets in excess of $10 billion. The fees payable to DIFSC under the service agreement described above are allocated among all funds in the Trust on a relative net asset value basis. These amounts are included on the “Statements of operations” under “Accounting fees.” For the year ended March 31, 2015, each Fund was charged for these services as follows:
Optimum | Optimum International Fund | Optimum Large Cap Growth Fund | Optimum Large Cap Value Fund | Optimum Small-Mid Cap Growth Fund | Optimum Small-Mid Cap Value Fund | |||||
| $135,787 | $45,744 | $97,166 | $90,081 | $36,135 | $35,189 |
Effective Nov. 1, 2014, DIFSC provides the Trust with administrative services including: preparation, filing and maintaining governing documents; preparation of materials and reports for the Board; and preparation and filing of registration statements and other regulatory filings. Prior to Nov. 1, 2014, DSC provided the Trust with these administrative services. For these administrative services, each Fund pays DIFSC a fee at an annual rate (plus out-of-pocket expenses) of 0.120% of assets up to $500 million of the Funds’ average daily net assets; 0.095% of assets from $500 million to $1 billion; and 0.070% of assets over $1 billion.
126
Table of Contents
Effective Nov. 1, 2014, DIFSC, is the shareholder servicing, dividend disbursing, and transfer agent for each Fund. Prior to Nov. 1, 2014, DSC was the shareholder servicing, dividend disbursing and transfer agent for each Fund. For these services, the Trust pays DIFSC a fee at an annual rate of 0.200% of the Trust’s total average daily net assets, subject to certain minimums, plus out-of-pocket expenses. Pursuant to a sub-transfer agency agreement between DIFSC and BNY Mellon Investment Servicing (US) Inc. (BNYMIS), BNYMIS provides certain sub-transfer agency services to the Funds. Sub-transfer agency fees are passed on to and paid by the Funds.
DDLP, an affiliate of DMC, serves as the national distributor of each Fund’s shares pursuant to a Distribution Agreement. Pursuant to the Distribution Agreement and Rule 12b-1 plan, each Fund pays DDLP an annual distribution and service fee of 0.25% of the average daily net assets of the Class A shares and 1.00% of the average daily net assets of the Class C shares. Each Fund’s Class B shares were subject to a 12b-1 fee of 1.00% of the average daily net assets , which was contractually waived to 0.25% of average daily net assets from April 1, 2014 through Nov. 4, 2014.
For the year ended March 31, 2015, DDLP earned commissions on sales of Class A shares for each Fund as follows:
Optimum | Optimum International Fund | Optimum Large Cap Growth Fund | Optimum Large Cap Value Fund | Optimum Small-Mid Cap Growth Fund | Optimum Small-Mid Cap Value Fund | |||||
| $33,035 | $5,779 | $19,463 | $19,200 | $3,754 | $2,762 |
For the year ended March 31, 2015, DDLP received gross CDSC commissions on redemptions of each Fund’s Class C shares, and these commissions were entirely used to offset upfront commissions previously paid by DDLP to broker/dealers on sales of those shares. The amounts received were as follows:
| Optimum | Optimum | Optimum | Optimum | Optimum | Optimum | |||||||
| Fixed Income | International | Large Cap | Large Cap | Small-Mid Cap | Small-Mid Cap | |||||||
| Fund | Fund | Growth Fund | Value Fund | Growth Fund | Value Fund | |||||||
Class C | $141 | $114 | $99 | $100 | $17 | $14 |
DMC, DIFSC and DDLP are indirect, wholly owned subsidiaries of Delaware Management Holdings, Inc. Certain officers of DMC, DIFSC and DDLP are officers and/or Trustees of the Trust. These officers and Trustees are paid no compensation by the Funds.
3. Investments
For the year ended March 31, 2015, each Fund made purchases and sales of investments securities other than short-term investments as follows:
| Optimum | Optimum | Optimum | Optimum | Optimum | Optimum | |||||||||||||||||||
| Fixed Income | International | Large Cap | Large Cap | Small-Mid Cap | Small-Mid Cap | |||||||||||||||||||
| Fund | Fund | Growth Fund | Value Fund | Growth Fund | Value Fund | |||||||||||||||||||
Purchases other than U.S. government securities | $ | 2,745,805,288 | $ | 722,245,255 | $ | 1,303,218,082 | $ | 522,489,183 | $ | 391,323,220 | $ | 175,443,590 | ||||||||||||
Purchases of U.S. government securities | 6,556,908,176 | — | — | — | — | — | ||||||||||||||||||
Sales other than U.S. government securities | 2,510,138,993 | 789,651,319 | 1,149,916,993 | 428,971,902 | 354,016,096 | 136,672,143 | ||||||||||||||||||
Sales of U.S. government securities | 6,460,918,033 | — | — | — | — | — | ||||||||||||||||||
| (continues | ) | 127 |
Table of Contents
Notes to financial statements
Optimum Fund Trust
3. Investments (continued)
At March 31, 2015, the cost of investments and unrealized appreciation (depreciation) for federal income tax purposes for each Fund were as follows:
| Optimum | Optimum | Optimum | Optimum | Optimum | Optimum | |||||||||||||||||||
| Fixed Income | International | Large Cap | Large Cap | Small-Mid Cap | Small-Mid Cap | |||||||||||||||||||
| Fund | Fund | Growth Fund | Value Fund | Growth Fund | Value Fund | |||||||||||||||||||
Cost of investments | $ | 2,099,944,429 | $ | 518,629,302 | $ | 1,304,619,645 | $ | 995,391,518 | $ | 440,095,403 | $ | 437,914,220 | ||||||||||||
|
|
|
|
|
|
|
|
|
|
|
| |||||||||||||
Aggregate unrealized appreciation | $ | 151,730,770 | $ | 52,786,789 | $ | 318,817,882 | $ | 353,962,672 | $ | 128,083,554 | $ | 110,880,537 | ||||||||||||
Aggregate unrealized depreciation | (130,454,230 | ) | (51,391,552 | ) | (28,508,336 | ) | (45,581,532 | ) | (12,472,741 | ) | (23,431,491 | ) | ||||||||||||
|
|
|
|
|
|
|
|
|
|
|
| |||||||||||||
Net unrealized appreciation | $ | 21,276,540 | $ | 1,395,237 | $ | 290,309,546 | $ | 308,381,140 | $ | 115,610,813 | $ | 87,449,046 | ||||||||||||
|
|
|
|
|
|
|
|
|
|
|
| |||||||||||||
U.S. GAAP defines fair value as the price that each Fund would receive to sell an asset or pay to transfer a liability in an orderly transaction between market participants at the measurement date under current market conditions. A three-level hierarchy for fair value measurements has been established based upon the transparency of inputs to the valuation of an asset or liability. Inputs may be observable or unobservable and refer broadly to the assumptions that market participants would use in pricing the asset or liability. Observable inputs reflect the assumptions market participants would use in pricing the asset or liability based on market data obtained from sources independent of the reporting entity. Unobservable inputs reflect the reporting entity’s own assumptions about the assumptions that market participants would use in pricing the asset or liability based on the best information available under the circumstances. Each Fund’s investment in its entirety is assigned a level based upon the observability of the inputs which are significant to the overall valuation. The three-level hierarchy of inputs is summarized below.
| Level 1 | – | Inputs are quoted prices in active markets for identical investments. (Examples: equity securities, open-end investment companies, futures contracts, exchange-traded options contracts) | ||
| Level 2 | – | Other observable inputs, including, but not limited to: quoted prices for similar assets or liabilities in markets that are active, quoted prices for identical or similar assets or liabilities in markets that are not active, inputs other than quoted prices that are observable for the assets or liabilities (such as interest rates, yield curves, volatilities, prepayment speeds, loss severities, credit risks, and default rates) or other market-corroborated inputs. (Examples: debt securities, government securities, swap contracts, foreign currency exchange contracts, foreign securities utilizing international fair value pricing, broker-quoted securities, fair valued securities) | ||
| Level 3 | – | Significant unobservable inputs, including each Fund’s own assumptions used to determine the fair value of investments. (Examples: broker-quoted securities, fair valued securities) | ||
Level 3 investments are valued using significant unobservable inputs. Each Fund may also use an income-based valuation approach in which the anticipated future cash flows of the investment are discounted to calculate fair value. Discounts may also be applied due to the nature or duration of any restrictions on the disposition of the investments. Valuations may also be based upon current market prices of securities that are comparable in coupon, rating, maturity, and industry. The derived value of a Level 3 investment may not represent the value which is received upon disposition and this could impact the results of operations.
128
Table of Contents
The following tables summarize the valuation of each Fund’s investments by fair value hierarchy levels as of March 31, 2015:
| Optimum Fixed Income Fund | ||||||||||||||||
| Level 1 | Level 2 | Level 3 | Total | |||||||||||||
Assets: | ||||||||||||||||
Agency, Asset- & | $ | — | $ | 494,272,809 | $ | 2,825,465 | $ | 497,098,274 | ||||||||
Corporate Debt | — | 850,448,786 | — | 850,448,786 | ||||||||||||
Foreign Debt | — | 78,228,186 | — | 78,228,186 | ||||||||||||
Municipal Bonds | — | 46,101,776 | — | 46,101,776 | ||||||||||||
Senior Secured Loans1 | — | 144,973,799 | 4,687,203 | 149,661,002 | ||||||||||||
Convertible Preferred Stock1 | 3,267,737 | 1,541,159 | — | 4,808,896 | ||||||||||||
Preferred Stock1 | 2,230,179 | 7,348,822 | — | 9,579,001 | ||||||||||||
U.S. Treasury Obligations | — | 389,016,075 | — | 389,016,075 | ||||||||||||
Short-Term Investments | — | 98,460,848 | — | 98,460,848 | ||||||||||||
Liabilities: | ||||||||||||||||
Security Sold Short | — | (2,181,875 | ) | — | (2,181,875 | ) | ||||||||||
|
|
|
|
|
|
|
| |||||||||
Total | $ | 5,497,916 | $ | 2,108,210,385 | $ | 7,512,668 | $ | 2,121,220,969 | ||||||||
|
|
|
|
|
|
|
| |||||||||
Foreign Currency Exchange | $ | — | $ | 7,866,998 | $ | — | $ | 7,866,998 | ||||||||
Futures Contracts | (765,554 | ) | — | — | (765,554 | ) | ||||||||||
Swap Contracts | — | (2,437,246 | ) | — | (2,437,246 | ) | ||||||||||
Reverse Repurchase Agreements | — | (2,730,750 | ) | — | (2,730,750 | ) | ||||||||||
Options Written | (176,456 | ) | (29,012 | ) | — | (205,468 | ) | |||||||||
1Security type is valued across multiple levels. Level 1 investments represent exchange-traded investments, Level 2 investments represent investments with observable inputs or matrix-priced investments, and Level 3 investments represent investments without observable inputs. The amounts attributed to Level 1 investments, Level 2 investments, and Level 3 investments represent the following percentages of the total market value of these security types:
| Level 1 | Level 2 | Level 3 | Total | |||||||||||||
Agency, Asset & | — | 99.43 | % | 0.57 | % | 100.00 | % | |||||||||
Senior Secured Loans | — | 96.87 | % | 3.13 | % | 100.00 | % | |||||||||
Convertible Preferred Stock | 67.95 | % | 32.05 | % | — | 100.00 | % | |||||||||
Preferred Stock | 23.28 | % | 76.72 | % | — | 100.00 | % | |||||||||
| (continues | ) | 129 |
Table of Contents
Notes to financial statements
Optimum Fund Trust
3. Investments (continued)
Optimum International Fund | ||||||||||||||||
| Level 1 | Level 2 | Level 3 | Total | |||||||||||||
Common Stock | ||||||||||||||||
Australia | $ | 3,165,072 | $ | 22,553,754 | $ | — | $ | 25,718,826 | ||||||||
Austria | — | 13,037,135 | — | 13,037,135 | ||||||||||||
Belgium | — | 6,817,615 | — | 6,817,615 | ||||||||||||
Bermuda | 7,574,916 | — | — | 7,574,916 | ||||||||||||
Brazil | 8,699,133 | — | — | 8,699,133 | ||||||||||||
Canada | 10,195,150 | — | — | 10,195,150 | ||||||||||||
China/Hong Kong | 4,158,697 | 37,065,631 | — | 41,224,328 | ||||||||||||
Colombia | 2,402,591 | — | — | 2,402,591 | ||||||||||||
Czech Republic | — | 2,726,203 | — | 2,726,203 | ||||||||||||
Denmark | — | 1,397,349 | — | 1,397,349 | ||||||||||||
Finland | — | 4,754,749 | — | 4,754,749 | ||||||||||||
France | — | 19,244,985 | — | 19,244,985 | ||||||||||||
Germany | — | 11,103,092 | — | 11,103,092 | ||||||||||||
India | 5,814,156 | 9,995,646 | — | 15,809,802 | ||||||||||||
Indonesia | — | 2,361,163 | — | 2,361,163 | ||||||||||||
Ireland | 13,577,801 | 10,752,612 | — | 24,330,413 | ||||||||||||
Israel | 10,057,627 | — | — | 10,057,627 | ||||||||||||
Italy | — | 689,415 | — | 689,415 | ||||||||||||
Japan | — | 92,773,370 | — | 92,773,370 | ||||||||||||
Malaysia | — | 1,451,541 | — | 1,451,541 | ||||||||||||
Netherlands | 6,364,799 | 4,069,384 | — | 10,434,183 | ||||||||||||
New Zealand | 1,889,351 | 1,134,458 | — | 3,023,809 | ||||||||||||
Norway | 3,415,204 | 13,028,818 | — | 16,444,022 | ||||||||||||
Republic of Korea | 524,004 | 22,441,492 | — | 22,965,496 | ||||||||||||
Singapore | — | 14,131,190 | — | 14,131,190 | ||||||||||||
Spain | — | 7,624,192 | — | 7,624,192 | ||||||||||||
Sweden | — | 5,395,766 | — | 5,395,766 | ||||||||||||
Switzerland | 11,149,126 | 18,572,430 | — | 29,721,556 | ||||||||||||
Taiwan | — | 17,962,622 | — | 17,962,622 | ||||||||||||
Turkey | — | 6,309,105 | — | 6,309,105 | ||||||||||||
United Kingdom | 15,454,494 | 44,011,856 | 1,443,949 | 60,910,299 | ||||||||||||
United States | 6,724,008 | 6,926,670 | 1,437,668 | 15,088,346 | ||||||||||||
Short-Term Investments | — | 7,644,550 | — | 7,644,550 | ||||||||||||
|
|
|
|
|
|
|
| |||||||||
Total | $ | 111,166,129 | $ | 405,976,793 | $ | 2,881,617 | $ | 520,024,539 | ||||||||
|
|
|
|
|
|
|
| |||||||||
Foreign Currency Exchange | $ | — | $ | (24 | ) | $ | — | $ | (24 | ) | ||||||
130
Table of Contents
Optimum Large Cap Growth Fund | ||||||||||||||||||||
| Level 1 | Level 2 | Level 3 | Total | |||||||||||||||||
Common Stock | ||||||||||||||||||||
Consumer Discretionary | $ | 329,838,860 | $ | 2,929,618 | $ | 1,324,165 | $ | 334,092,643 | ||||||||||||
Consumer Staples | 63,898,969 | — | — | 63,898,969 | ||||||||||||||||
Energy | 57,835,142 | — | — | 57,835,142 | ||||||||||||||||
Financials | 84,713,581 | — | — | 84,713,581 | ||||||||||||||||
Healthcare | 316,437,232 | — | — | 316,437,232 | ||||||||||||||||
Industrials | 189,222,337 | — | — | 189,222,337 | ||||||||||||||||
Information Technology | 436,951,528 | 8,298,378 | 1,180,946 | 446,430,852 | ||||||||||||||||
Materials | 24,311,985 | — | — | 24,311,985 | ||||||||||||||||
Telecommunication Services | 4,199,520 | — | — | 4,199,520 | ||||||||||||||||
Utilities | 2,409,342 | — | — | 2,409,342 | ||||||||||||||||
Convertible Preferred Stock | — | — | 898,462 | 898,462 | ||||||||||||||||
U.S. Master Limited Partnerships | 19,360,499 | — | — | 19,360,499 | ||||||||||||||||
Short-Term Investments | — | 51,118,627 | — | 51,118,627 | ||||||||||||||||
|
|
|
|
|
|
|
| |||||||||||||
Total | $ | 1,529,178,995 | $ | 62,346,623 | $ | 3,403,573 | $ | 1,594,929,191 | ||||||||||||
|
|
|
|
|
|
|
| |||||||||||||
Optimum Large Cap Value Fund | ||||||||||||||||||||
| Level 1 | Level 2 | Total | ||||||||||||||||||
Common Stock | ||||||||||||||||||||
Consumer Discretionary | $ | 132,768,211 | $ | — | $ | 132,768,211 | ||||||||||||||
Consumer Staples | 129,269,817 | 25,483,002 | 154,752,819 | |||||||||||||||||
Energy | 161,116,337 | — | 161,116,337 | |||||||||||||||||
Financials | 309,305,166 | — | 309,305,166 | |||||||||||||||||
Healthcare | 129,925,886 | 4,079,043 | 134,004,929 | |||||||||||||||||
Industrials | 159,018,932 | — | 159,018,932 | |||||||||||||||||
Information Technology | 125,237,885 | — | 125,237,885 | |||||||||||||||||
Materials | 58,637,760 | — | 58,637,760 | |||||||||||||||||
Telecommunication Services | 26,250,354 | 3,531,806 | 29,782,160 | |||||||||||||||||
Utilities | 4,466,678 | — | 4,466,678 | |||||||||||||||||
Convertible Preferred Stock | 460,319 | — | 460,319 | |||||||||||||||||
Short-Term Investments | — | 34,221,462 | 34,221,462 | |||||||||||||||||
|
|
|
|
|
| |||||||||||||||
Total | $ | 1,236,457,345 | $ | 67,315,313 | $ | 1,303,772,658 | ||||||||||||||
|
|
|
|
|
| |||||||||||||||
| (continues | ) | 131 |
Table of Contents
Notes to financial statements
Optimum Fund Trust
3. Investments (continued)
Optimum Small-Mid Cap Growth Fund | ||||||||||||||||||||
| Level 1 | Level 2 | Level 3 | Total | |||||||||||||||||
Common Stock | ||||||||||||||||||||
Consumer Discretionary | $ | 69,388,119 | $ | 1,798,066 | $ | — | $ | 71,186,185 | ||||||||||||
Consumer Staples | 9,355,290 | — | — | 9,355,290 | ||||||||||||||||
Energy | 17,172,869 | — | — | 17,172,869 | ||||||||||||||||
Financials | 67,072,302 | — | — | 67,072,302 | ||||||||||||||||
Healthcare | 89,554,661 | — | — | 89,554,661 | ||||||||||||||||
Industrials | 127,597,033 | — | — | 127,597,033 | ||||||||||||||||
Information Technology | 117,854,242 | — | 133,374 | 117,987,616 | ||||||||||||||||
Materials | 22,393,195 | — | — | 22,393,195 | ||||||||||||||||
Telecommunication Services | 10,702,560 | — | — | 10,702,560 | ||||||||||||||||
Convertible Preferred Stock | — | — | 3,253,507 | 3,253,507 | ||||||||||||||||
Exchange-Traded Funds | 2,777,912 | — | — | 2,777,912 | ||||||||||||||||
Preferred Stock | — | — | 3,008,128 | 3,008,128 | ||||||||||||||||
Short-Term Investments | — | 13,644,958 | — | 13,644,958 | ||||||||||||||||
|
|
|
|
|
|
|
| |||||||||||||
Total | $ | 533,868,183 | $ | 15,443,024 | $ | 6,395,009 | $ | 555,706,216 | ||||||||||||
|
|
|
|
|
|
|
| |||||||||||||
Foreign Currency Exchange | $ | — | $ | (5 | ) | $ | — | $ | (5 | ) | ||||||||||
Optimum Small-Mid Cap Value Fund | ||||||||||||||||||||
| Level 1 | Level 2 | Total | ||||||||||||||||||
Common Stock | ||||||||||||||||||||
Consumer Discretionary | $ | 50,111,416 | $ | — | $ | 50,111,416 | ||||||||||||||
Consumer Staples | 6,300,459 | — | 6,300,459 | |||||||||||||||||
Energy | 25,351,484 | — | 25,351,484 | |||||||||||||||||
Financials | 40,728,281 | — | 40,728,281 | |||||||||||||||||
Healthcare | 23,987,306 | — | 23,987,306 | |||||||||||||||||
Industrials | 130,690,816 | — | 130,690,816 | |||||||||||||||||
Information Technology | 102,001,696 | 1,189,914 | 103,191,610 | |||||||||||||||||
Materials | 70,735,783 | — | 70,735,783 | |||||||||||||||||
Telecommunication Services | 8,748,529 | — | 8,748,529 | |||||||||||||||||
Utilities | 3,409,594 | — | 3,409,594 | |||||||||||||||||
U.S. Master Limited Partnership | 1,610,000 | — | 1,610,000 | |||||||||||||||||
Short-Term Investments | — | 60,497,988 | 60,497,988 | |||||||||||||||||
|
|
|
|
|
| |||||||||||||||
Total | $ | 463,675,364 | $ | 61,687,902 | $ | 525,363,266 | ||||||||||||||
|
|
|
|
|
| |||||||||||||||
The securities deemed worthless on the “Schedules of investments” are considered to be Level 3 investments in these tables.
As a result of utilizing international fair value pricing at March 31, 2015, the majority of Optimum International Fund and a portion of Optimum Large Cap Growth Fund, Optimum Large Cap Value Fund, Optimum Small-Mid Cap Growth Fund, and Optimum Small-Mid Cap Value Fund’s common stock investments were categorized as Level 2.
During the year ended March 31, 2015, there were no transfers between Level 1 investments, Level 2 investments, or Level 3 investments that had a significant impact to the Funds. This does not include transfers between Level 1 investments and Level 2 investments due to the Funds utilizing international fair value pricing during the year. In accordance with the fair valuation procedures described in Note 1, international fair value pricing of securities in each Fund occurs when market volatility exceeds an established rolling threshold. If the threshold is exceeded on a given date, then prices of international securities (those that traded on exchanges that close at a different time than the time that the Funds’ net asset value is determined) are established using a separate pricing feed from a third-party vendor designed to establish a price for each
132
Table of Contents
such security as of the time that the Fund’s net asset value is determined. Further, international fair value pricing uses other observable market-based inputs in place of the closing exchange price due to the events occurring after the close of the exchange or market on which the investment is principally traded, causing a change in classification between levels. Each Fund’s policy is to recognize transfers between levels at the beginning of the period.
A reconciliation of Level 3 investments is presented when each Fund has a significant amount of Level 3 investments at the beginning, interim, or end of the period in relation to each Fund’s (except Optimum Small-Mid Cap Growth Fund) net assets. Management has determined not to provide additional disclosure on Level 3 inputs since the Level 3 investments are not considered significant to each Fund’s net assets at the end of the year.
The following is a reconciliation of investments in which significant unobservable inputs (Level 3) were used in determining fair value for Optimum Small-Mid Cap Growth Fund:
| Convertible | ||||||||||||||||||||
| Common | Preferred | Preferred | ||||||||||||||||||
| Stock | Stock | Stock | Total | |||||||||||||||||
Beginning balance March 31, 2014 | $ | 194,504 | $ | 2,926,996 | $ | — | $ | 3,121,500 | ||||||||||||
Purchases | — | 797,260 | 2,416,128 | 3,213,388 | ||||||||||||||||
Sales | — | (904,922 | ) | — | (904,922 | ) | ||||||||||||||
Net change in unrealized appreciation (depreciation) | (61,130 | ) | 434,173 | 592,000 | 965,043 | |||||||||||||||
|
|
|
|
|
|
|
| |||||||||||||
Ending balance March 31, 2015 | $ | 133,374 | $ | 3,253,507 | $ | 3,008,128 | $ | 6,395,009 | ||||||||||||
|
|
|
|
|
|
|
| |||||||||||||
Net change in unrealized appreciation (depreciation) from investments still held at the end of the year | $ | (61,130 | ) | $ | 590,525 | $ | 592,000 | $ | 1,121,395 | |||||||||||
Sensitivity Analysis for Optimum Small-Mid Cap Growth Fund
Valuation: U.S. GAAP defines fair value as the price that each Fund would receive to sell an asset or pay to transfer a liability in an orderly transaction between market participants at the measurement date. Each Fund fair values its financial instruments at fair value using independent pricing sources under the policies approved by the Board. The Pricing Committee is the committee formed by the advisor to develop pricing policies and procedures and to provide oversight of the pricing function for the Funds.
When market quotations are not readily available for one or more portfolio securities, the Funds’ NAV shall be calculated by using the “fair value” of the securities as determined by the Pricing Committee. Such “fair value” is the amount that a Fund might reasonably expect to receive for the security (or asset) upon its current sale. Each such determination should be based on a consideration of all relevant factors, which are likely to vary from one pricing context to another. Examples of such factors may include, but are not limited to: (i) the type of security, (ii) the size of the holding, (iii) the initial cost of the security, (iv) the existence of any contractual restrictions of the security’s disposition, (v) the price and extent of public trading in similar securities of the issuer or of comparable companies, (vi) quotations or evaluated prices from broker-dealers and/or pricing services, (vii) information obtained from the issuer, analysts, and/or appropriate stock exchange (for exchange-traded securities), (viii) an analysis of the company’s financial statements, and (ix) an evaluation of the forces that influence the issuer and the market(s) in which the security is purchased and sold.
The Pricing Committee, or its delegate, employs various methods for calibrating these valuation approaches, including due diligence of the Funds’ pricing vendors and periodic back-testing of the prices that are fair valued under these procedures and reviews of any market related activity. The pricing of all securities fair valued by the Pricing Committee is subsequently reported to and approved by the Board on a quarterly basis.
Quantitative information about Level 3 fair value measurements for Optimum Small-Mid Cap Growth Fund:
| Fair Value at March 31, 2015 | Valuation Techniques | Unobservable Input | Range (Weighted Average) | |||
|
|
| ||||
Common stock $133,374 | Broker quote | Market pricing of securities | N/A | |||
Convertible Preferred stock $3,253,507 | Broker quote | Market pricing of securities | N/A | |||
Preferred stock $3,008,129 | Broker quote | Unlisted | N/A |
| (continues | ) | 133 |
Table of Contents
Notes to financial statements
Optimum Fund Trust
4. Dividend and Distribution Information
Income and long-term capital gain distributions are determined in accordance with federal income tax regulations, which may differ from U.S. GAAP. Additionally, distributions from net gains on foreign currency transactions and net short-term gains on sales of investment securities are treated as ordinary income for federal income tax purposes. The tax character of dividends and distributions paid during the years ended March 31, 2015 and 2014 were as follows:
Year ended March 31, 2015
| Optimum | Optimum | Optimum | Optimum | Optimum | Optimum | |||||||||||||||||||||||||
| Fixed Income | International | Large Cap | Large Cap | Small-Mid Cap | Small-Mid Cap | |||||||||||||||||||||||||
| Fund | Fund | Growth Fund | Value Fund | Growth Fund | Value Fund | |||||||||||||||||||||||||
Ordinary income | $ | 45,890,893 | $ | 8,272,632 | $ | 46,602,612 | $ | 15,036,245 | $ | 5,821,786 | $ | 128,414 | ||||||||||||||||||
Long-term capital gains | — | — | 107,508,571 | — | 40,926,830 | 36,766,566 | ||||||||||||||||||||||||
|
|
|
|
|
|
|
|
|
|
|
| |||||||||||||||||||
Total | $ | 45,890,893 | $ | 8,272,632 | $ | 154,111,183 | $ | 15,036,245 | $ | 46,748,616 | $ | 36,894,980 | ||||||||||||||||||
|
|
|
|
|
|
|
|
|
|
|
| |||||||||||||||||||
| Year ended March 31, 2014 | ||||||||||||||||||||||||||||||
| Optimum | Optimum | Optimum | Optimum | Optimum | Optimum | |||||||||||||||||||||||||
| Fixed Income | International | Large Cap | Large Cap | Small-Mid Cap | Small-Mid Cap | |||||||||||||||||||||||||
| Fund | Fund | Growth Fund | Value Fund | Growth Fund | Value Fund | |||||||||||||||||||||||||
Ordinary income | $ | 27,496,235 | $ | 5,310,350 | $ | 35,275,226 | $ | 9,013,153 | $ | 5,318,544 | $ | 2,621,910 | ||||||||||||||||||
Long-term capital gains | 3,988,584 | — | 70,507,299 | — | 34,563,081 | 40,333,725 | ||||||||||||||||||||||||
|
|
|
|
|
|
|
|
|
|
|
| |||||||||||||||||||
Total | $ | 31,484,819 | $ | 5,310,350 | $ | 105,782,525 | $ | 9,013,153 | $ | 39,881,625 | $ | 42,955,635 | ||||||||||||||||||
|
|
|
|
|
|
|
|
|
|
|
| |||||||||||||||||||
5. Components of Net Assets on a Tax Basis
As of March 31, 2015, the components of net assets on a tax basis were as follows:
| Optimum | Optimum | Optimum | ||||||||||
| Fixed Income | International | Large Cap | ||||||||||
| Fund | Fund | Growth Fund | ||||||||||
Shares of beneficial interest | $ | 1,990,244,943 | $ | 538,003,071 | $ | 1,232,523,224 | ||||||
Undistributed ordinary income | 27,530,045 | 824,130 | 15,880,220 | |||||||||
Undistributed long-term capital gains | 1,046,441 | — | 53,030,192 | |||||||||
Capital loss carryforwards | — | (4,316,656 | ) | — | ||||||||
Qualified late year losses deferred | — | (11,558,690 | ) | — | ||||||||
Straddle losses deferred | (2,038,604 | ) | — | — | ||||||||
Unrealized appreciation | 18,671,564 | 1,219,630 | 290,307,835 | |||||||||
|
|
|
|
|
| |||||||
Net assets | $ | 2,035,454,389 | $ | 524,171,485 | $ | 1,591,741,471 | ||||||
|
|
|
|
|
| |||||||
| Optimum | Optimum | Optimum | ||||||||||
| Large Cap | Small-Mid Cap | Small-Mid Cap | ||||||||||
| Value Fund | Growth Fund | Value Fund | ||||||||||
Share of beneficial interest | $ | 1,022,996,840 | $ | 416,173,939 | $ | 429,975,636 | ||||||
Undistributed ordinary income | 2,597,001 | — | — | |||||||||
Undistributed long-term capital gains | — | 29,061,662 | 7,587,636 | |||||||||
Capital loss carryforwards | (19,145,969 | ) | — | — | ||||||||
Qualified late year losses deferred | (9,963,425 | ) | (2,943,635 | ) | (742,120 | ) | ||||||
Unrealized appreciation | 308,362,979 | 115,610,808 | 87,441,596 | |||||||||
|
|
|
|
|
| |||||||
Net assets | $ | 1,304,847,426 | $ | 557,902,774 | $ | 524,262,748 | ||||||
|
|
|
|
|
| |||||||
The differences between book basis and tax basis components of net assets are primarily attributable to tax deferral of losses on wash sales, tax deferral of losses on straddles, mark-to-market of foreign currency exchange contracts, mark-to-market of futures contracts, tax recognition of unrealized gain on passive foreign investment companies, tax treatment of contingent payment on debt instruments, amortization of premium on convertible securities, treasury inflation protected securities, partnership interest and swap contracts.
134
Table of Contents
Qualified late year ordinary and capital losses (including currency and specified gain/loss items) represent losses realized from Jan. 1, 2015 through March 31, 2015 and Nov. 1, 2014 through March 31, 2015, respectively, that in accordance with federal income tax regulations, the Funds have elected to defer and treat as having arisen in the following fiscal year.
For financial reporting purposes, capital accounts are adjusted to reflect the tax character of permanent book/tax differences. Reclassifications are primarily due to tax treatment of net operating losses, gain (loss) on foreign currency transactions, tax treatment of partnerships, amortization of premium on convertible securities, CDS contracts, foreign capital gain tax, contingent payment on debt instruments, sale of passive foreign investment companies, and paydown gains (losses) of asset- and mortgage-backed securities. Results of operations and net assets were not affected by these reclassifications. For the year ended March 31, 2015, the Funds recorded the following reclassifications:
| Optimum | Optimum | Optimum | Optimum | Optimum | Optimum | |||||||||||||||||||
| Fixed Income | International | Large Cap | Large Cap | Small-Mid Cap | Small-Mid Cap | |||||||||||||||||||
| Fund | Fund | Growth Fund | Value Fund | Growth Fund | Value Fund | |||||||||||||||||||
Undistributed (accumulated) net investment income (loss) | $ | 4,224,734 | $ | 1,987,259 | $ | 4,748,960 | $ | (31,632 | ) | $ | 3,426,152 | $ | 1,437,898 | |||||||||||
Accumulated net realized gain (loss) | (4,224,734 | ) | (1,987,259 | ) | (4,748,931 | ) | 31,632 | (3,426,152 | ) | 318 | ||||||||||||||
Paid-in capital | — | — | (29 | ) | — | — | (1,438,216 | ) | ||||||||||||||||
For federal income tax purposes, capital loss carryforwards may be carried forward and applied against future capital gains. At March 31, 2015, the Funds utilized capital loss carryforwards as follows:
| Optimum | Optimum | Optimum | ||
| Fixed Income | International | Large Cap | ||
Fund | Fund | Value Fund | ||
| $20,553,369 | $10,388,185 | $38,738,692 |
At March 31, 2015, Optimum Fixed Income Fund, Optimum Large Cap Growth, Optimum Small-Mid Cap Growth Fund, and Optimum Small-Mid Cap Value Fund did not have any capital loss carryforwards outstanding. Capital loss carryforwards remaining at March 31, 2015 will expire as follows:
| Optimum | Optimum | |||
| Year of | International | Large Cap | ||
Expiration | Fund | Value Fund | ||
| 3/31/18 | $4,316,656 | $19,145,969 |
On Dec. 22, 2010, the Regulated Investment Company Modernization Act of 2010 (Act) was enacted, which changed various technical rules governing the tax treatment of regulated investment companies. The changes were generally effective for taxable years beginning after the date of enactment. Under the Act, each Fund is permitted to carry forward capital losses incurred in taxable years beginning after the date of enactment for an unlimited period. However, any losses incurred during those future taxable years will be required to be utilized prior to the losses incurred in pre-enactment taxable years, which carry an expiration date. As a result of this ordering rule, pre-enactment capital loss carryforwards may be more likely to expire unused. Additionally, post-enactment capital loss carryforwards will retain their character as either short-term or long-term capital losses rather than being considered all short-term as permitted under previous regulation. At March 31, 2015, no capital loss carryforward was carried forward under the Act.
| (continues | ) | 135 |
Table of Contents
Notes to financial statements
Optimum Fund Trust
6. Capital Shares
Transactions in capital shares were as follows:
| Optimum | Optimum | Optimum | ||||||||||||||||||||||
| Fixed Income | International | Large Cap | ||||||||||||||||||||||
| Fund | Fund | Growth Fund | ||||||||||||||||||||||
| Year ended | Year ended | Year ended | ||||||||||||||||||||||
| 3/31/15 | 3/31/14 | 3/31/15 | 3/31/14 | 3/31/15 | 3/31/14 | |||||||||||||||||||
Shares sold: | ||||||||||||||||||||||||
Class A | 701,373 | 1,000,079 | 144,856 | 164,094 | 238,790 | 270,733 | ||||||||||||||||||
Class B | 2,158 | 11,996 | 625 | 1,696 | — | — | ||||||||||||||||||
Class C | 2,431,086 | 3,653,069 | 449,982 | 516,592 | 739,198 | 830,030 | ||||||||||||||||||
Institutional Class | 57,659,471 | 52,479,284 | 14,726,160 | 13,817,101 | 25,086,102 | 15,787,976 | ||||||||||||||||||
Shares issued upon reinvestment of dividends and distributions: | ||||||||||||||||||||||||
Class A | 101,608 | 74,238 | 9,420 | 6,158 | 293,955 | 240,221 | ||||||||||||||||||
Class B | 359 | 1,354 | 49 | 189 | 2,683 | 8,509 | ||||||||||||||||||
Class C | 258,942 | 178,787 | 5,556 | 11,515 | 1,166,611 | 922,805 | ||||||||||||||||||
Institutional Class | 4,439,558 | 3,035,957 | 683,957 | 436,578 | 7,964,010 | 5,465,216 | ||||||||||||||||||
|
|
|
|
|
|
|
|
|
|
|
| |||||||||||||
| 65,594,555 | 60,434,764 | 16,020,605 | 14,953,923 | 35,491,349 | 23,525,490 | |||||||||||||||||||
|
|
|
|
|
|
|
|
|
|
|
| |||||||||||||
Shares redeemed: | ||||||||||||||||||||||||
Class A | (896,505 | ) | (725,990 | ) | (168,763 | ) | (143,645 | ) | (515,858 | ) | (481,398 | ) | ||||||||||||
Class B | (55,793 | ) | (82,361 | ) | (16,823 | ) | (24,065 | ) | (47,783 | ) | (69,546 | ) | ||||||||||||
Class C | (2,506,285 | ) | (2,727,197 | ) | (385,205 | ) | (422,881 | ) | (1,385,681 | ) | (1,793,236 | ) | ||||||||||||
Institutional Class | (32,380,914 | ) | (28,975,875 | ) | (21,241,770 | ) | (6,280,513 | ) | (13,882,557 | ) | (9,508,944 | ) | ||||||||||||
|
|
|
|
|
|
|
|
|
|
|
| |||||||||||||
| (35,839,497 | ) | (32,511,423 | ) | (21,812,561 | ) | (6,871,104 | ) | (15,831,879 | ) | (11,853,124 | ) | |||||||||||||
|
|
|
|
|
|
|
|
|
|
|
| |||||||||||||
Net increase (decrease) | 29,755,058 | 27,923,341 | (5,791,956 | ) | 8,082,819 | 19,659,470 | 11,672,366 | |||||||||||||||||
|
|
|
|
|
|
|
|
|
|
|
| |||||||||||||
| Optimum | Optimum | Optimum | ||||||||||||||||||||||
| Large Cap | Small-Mid Cap | Small-Mid Cap | ||||||||||||||||||||||
| Value Fund | Growth Fund | Value Fund | ||||||||||||||||||||||
| Year ended | Year ended | Year ended | ||||||||||||||||||||||
| 3/31/15 | 3/31/14 | 3/31/15 | 3/31/14 | 3/31/15 | 3/31/14 | |||||||||||||||||||
Shares sold: | ||||||||||||||||||||||||
Class A | 245,216 | 288,149 | 48,945 | 57,896 | 40,325 | 40,164 | ||||||||||||||||||
Class B | — | 131 | — | — | — | — | ||||||||||||||||||
Class C | 713,968 | 864,017 | 145,303 | 166,070 | 126,685 | 122,226 | ||||||||||||||||||
Institutional Class | 19,341,523 | 18,155,553 | 8,637,127 | 7,266,342 | 9,504,226 | 7,698,944 | ||||||||||||||||||
Shares issued upon reinvestment of dividends and distributions: | ||||||||||||||||||||||||
Class A | 24,712 | 16,351 | 44,321 | 48,996 | 32,193 | 48,311 | ||||||||||||||||||
Class B | 186 | 125 | 323 | 1,872 | 295 | 1,912 | ||||||||||||||||||
Class C | 26,420 | 5,715 | 176,249 | 183,909 | 136,318 | 199,457 | ||||||||||||||||||
Institutional Class | 911,060 | 605,862 | 2,854,903 | 2,451,119 | 2,434,118 | 2,808,274 | ||||||||||||||||||
|
|
|
|
|
|
|
|
|
|
|
| |||||||||||||
| 21,263,085 | 19,935,903 | 11,907,171 | 10,176,204 | 12,274,160 | 10,919,288 | |||||||||||||||||||
|
|
|
|
|
|
|
|
|
|
|
| |||||||||||||
Shares redeemed: | ||||||||||||||||||||||||
Class A | (451,499 | ) | (435,193 | ) | (94,337 | ) | (97,157 | ) | (80,560 | ) | (97,135 | ) | ||||||||||||
Class B | (42,763 | ) | (69,058 | ) | (8,898 | ) | (12,926 | ) | (8,274 | ) | (12,348 | ) | ||||||||||||
Class C | (1,113,280 | ) | (1,497,758 | ) | (228,076 | ) | (344,301 | ) | (227,298 | ) | (359,849 | ) | ||||||||||||
Institutional Class | (13,915,081 | ) | (10,186,922 | ) | (5,717,697 | ) | (4,606,449 | ) | (5,333,870 | ) | (4,603,643 | ) | ||||||||||||
|
|
|
|
|
|
|
|
|
|
|
| |||||||||||||
| (15,522,623 | ) | (12,188,931 | ) | (6,049,008 | ) | (5,060,833 | ) | (5,650,002 | ) | (5,072,975 | ) | |||||||||||||
|
|
|
|
|
|
|
|
|
|
|
| |||||||||||||
Net increase | 5,740,462 | 7,746,972 | 5,858,163 | 5,115,371 | 6,624,158 | 5,846,313 | ||||||||||||||||||
|
|
|
|
|
|
|
|
|
|
|
| |||||||||||||
136
Table of Contents
For the years ended March 31, 2015, and 2014, the following shares and values were converted from Class B to Class A. The amounts are included in Class B redemptions and Class A subscriptions in the tables above and the “Statements of changes in net assets.”
| Year ended | Year ended | |||||||||||||||||||||||
| 3/31/15 | 3/31/14 | |||||||||||||||||||||||
| Class B | Class A | Class B | Class A | |||||||||||||||||||||
| Shares | Shares | Value | Shares | Shares | Value | |||||||||||||||||||
Optimum Fixed Income Fund | 24,014 | 24,039 | $ | 232,918 | 39,925 | 39,876 | $ | 377,824 | ||||||||||||||||
Optimum International Fund | 6,634 | 6,516 | 76,569 | 10,379 | 10,185 | 119,447 | ||||||||||||||||||
Optimum Large Cap Growth Fund | 19,395 | 17,924 | 302,553 | 25,481 | 23,838 | 372,877 | ||||||||||||||||||
Optimum Large Cap Value Fund | 17,595 | 17,473 | 276,645 | 29,211 | 28,937 | 400,667 | ||||||||||||||||||
Optimum Small-Mid Cap Growth Fund | 3,651 | 3,368 | 51,725 | 5,102 | 4,739 | 70,060 | ||||||||||||||||||
Optimum Small-Mid Cap Value Fund | 3,776 | 3,481 | 48,518 | 5,391 | 5,001 | 69,457 | ||||||||||||||||||
Certain shareholders may exchange shares of one class for another class in the same Fund. For the year ended March 31, 2015, each Fund had the following exchange transactions. These exchange transactions are included as subscriptions and redemptions in the table above and the “Statements of changes in net assets.”
| Exchange Redemptions | Exchange Subscriptions | |||||||||||||||
| Institutional | ||||||||||||||||
| Class C | Class | |||||||||||||||
| Shares | Value | Shares | Value | |||||||||||||
Optimum Fixed Income Fund | 978 | $9,437 | 973 | $9,437 | ||||||||||||
Optimum International Fund | 133 | 1,532 | 129 | 1,532 | ||||||||||||
Optimum Large Cap Growth Fund | 381 | 5,988 | 336 | 5,988 | ||||||||||||
Optimum Large Cap Value Fund | 362 | 5,700 | 357 | 5,700 | ||||||||||||
Optimum Small-Mid Cap Growth Fund | 68 | 962 | 59 | 962 | ||||||||||||
Optimum Small-Mid Cap Value Fund | 60 | 764 | 52 | 764 | ||||||||||||
7. Derivatives
U.S. GAAP requires disclosures that enable investors to understand: (1) how and why an entity uses derivatives; (2) how they are accounted for; and (3) how they affect an entity’s results of operations and financial position.
Foreign Currency Exchange Contracts — Each Fund may enter into foreign currency exchange contracts and foreign cross currency exchange contracts as a way of managing foreign exchange rate risk. Each Fund may also enter into these contracts to fix the U.S. dollar value of a security that it has agreed to buy or sell for the period between the date the trade was entered into and the date the security is delivered and paid for. Each Fund may enter into these contracts to hedge the U.S. dollar value of securities it already owns that are denominated in foreign currencies. In addition, each Fund may enter into these contracts to facilitate or expedite the settlement of portfolio transactions. The change in value is recorded as an unrealized gain or loss. When the contract is closed, a realized gain or loss is recorded equal to the difference between the value of the contract at the time it was opened and the value at the time it was closed.
The use of foreign currency exchange contracts and foreign cross currency exchange contracts does not eliminate fluctuations in the underlying prices of the securities, but does establish a rate of exchange that can be achieved in the future. Although foreign currency exchange contracts and foreign cross currency exchange contracts limit the risk of loss due to an unfavorable change in the value of the hedged currency, they also limit any potential gain that might result should the value of the currency change favorably. In addition, each Fund could be exposed to risks if the counterparties to the contracts are unable to meet the terms of their contracts. Each Fund’s maximum risk of loss from counterparty credit risk is the value of its currency exchanged with the counterparty. The risk is generally mitigated by having a netting arrangement between the Funds and the counterparty and by the posting of collateral by the counterparty to the Funds to cover the Funds’ exposure to the counterparty.
During the year ended March 31, 2015, Optimum Fixed Income Fund, Optimum International Fund, Optimum Large Cap Growth Fund, Optimum Large Cap Value Fund, and Optimum Small-Mid Cap Growth Fund, used foreign currency exchange contracts to fix the U.S. dollar value of a security between trade date and settlement date, hedge the U.S. dollar value of securities it already owns that are denominated in foreign currencies, and/or to facilitate or expedite the settlement of portfolio transactions.
Optimum Small-Mid Cap Value Fund did not hold any foreign currency exchange during the year ended March 31, 2015.
| (continues | ) | 137 |
Table of Contents
Notes to financial statements
Optimum Fund Trust
7. Derivatives (continued)
Futures Contracts — A futures contract is an agreement in which the writer (or seller) of the contract agrees to deliver to the buyer an amount of cash or securities equal to a specific dollar amount times the difference between the value of a specific security or index at the close of the last trading day of the contract and the price at which the agreement is made. Optimum Fixed Income Fund may use futures in the normal course of pursuing its investment objective. Optimum Fixed Income Fund may invest in futures contracts to hedge its existing portfolio securities against fluctuations in fair value caused by changes in interest rates or market conditions. Upon entering into a futures contract, the Fund deposits cash or pledges U.S. government securities to a broker, equal to the minimum “initial margin” requirements of the exchange on which the contract is traded. Subsequent payments are received from the broker or paid to the broker each day, based on the daily fluctuation in the market value of the contract. These receipts or payments are known as “variation margin” and are recorded daily by the Fund as unrealized gains or losses until the contracts are closed. When the contracts are closed, the Fund records a realized gain or loss equal to the difference between the value of the contract at the time it was opened and the value at the time it was closed. Risks of entering into futures contracts include potential imperfect correlation between the futures contracts and the underlying securities and the possibility of an illiquid secondary market for these instruments. When investing in futures, there is reduced counterparty credit risk to the Fund because futures are exchange-traded and the exchange’s clearinghouse, as counterparty to all exchange-traded futures, guarantees against default. The Fund posted $366,000 cash and $2,080,000 in securities collateral as margin for open futures contracts, which is presented on the “Statements of assets and liabilities” as “Cash collateral due from brokers”, and “Schedules of investments.”
During the year ended March 31, 2015, Optimum Fixed Income Fund used futures contracts to hedge the Fund’s existing portfolio securities against fluctuations in value caused by changes in interest rates or market conditions and to facilitate investments in portfolio securities.
Options Contracts — Optimum Fixed Income Fund may enter into options contracts in the normal course of pursuing its investment objective. The Fund may buy or write options contracts for any number of reasons, including without limitation: to manage the Fund’s exposure to changes in securities prices caused by interest rates or market conditions and foreign currencies; as an efficient means of adjusting the Fund’s overall exposure to certain markets; to protect the value of portfolio securities; and as a cash management tool. The Fund may buy or write call or put options on securities, futures, swaps, swaptions, financial indices, and foreign currencies. When the Fund buys an option, a premium is paid and an asset is recorded and adjusted on a daily basis to reflect the current market value of the option purchased. When the Fund writes an option, a premium is received and a liability is recorded and adjusted on a daily basis to reflect the current market value of the option written. Premiums received from writing options that expire unexercised are treated by the Fund on the expiration date as realized gains. The difference between the premium received and the amount paid on effecting a closing purchase transaction, including brokerage commissions, is treated as realized gain or loss. If a call option is exercised, the premium is added to the proceeds from the sale of the underlying security in determining whether the Fund has a realized gain or loss. If a put option is exercised, the premium reduces the cost basis of the securities purchased by the Fund. The Fund, as writer of an option, bears the market risk of an unfavorable change in the price of the security underlying the written option. When writing options, the Fund is subject to minimal counterparty risk because the counterparty is only obligated to pay premiums and does not bear the market risk of an unfavorable market change.
Transactions in options written during the year ended March 31, 2015 for Optimum Fixed Income Fund were as follows:
| Number of | ||||||||
Call options | contracts | Premiums | ||||||
Options outstanding March 31, 2014 | 50,100,037 | $ | 265,906 | |||||
Options written | 84,762,159 | 372,847 | ||||||
Options expired | (68,800,000 | ) | (129,050 | ) | ||||
Options terminated in closing purchase transactions | (63,862,037 | ) | (395,770 | ) | ||||
|
|
|
| |||||
Options outstanding March 31, 2015 | 2,200,159 | $ | 113,933 | |||||
|
|
|
| |||||
| Number of | ||||||||
Put options | contracts | Premiums | ||||||
Options outstanding March 31, 2014 | 55,800,071 | $ | 385,414 | |||||
Options written | 100,289,159 | 439,612 | ||||||
Options expired | (107,485,000 | ) | (605,372 | ) | ||||
Options terminated in closing purchase transactions | (6,904,071 | ) | (60,056 | ) | ||||
|
|
|
| |||||
Options outstanding March 31, 2015 | 41,700,159 | $ | 159,598 | |||||
|
|
|
| |||||
138
Table of Contents
During the year ended March 31, 2015, Optimum Fixed Income Fund used options contracts to manage the Fund’s exposure to changes in securities prices caused by interest rates or market conditions, to adjust the Fund’s overall exposure to certain markets, to receive premiums for writing options, to facilitate investments in portfolio securities, and to protect the value of portfolio securities.
Swap Contracts — Optimum Fixed Income Fund may enter into currency swap contracts, index swap contracts, inflation swaps, interest rate swap contracts, and CDS contracts in the normal course of pursuing its investment objective. The Fund may invest in interest rate swaps to manage the Fund’s sensitivity to interest rates or to hedge against changes in interest rates. The Fund may use currency swaps to protect against currency fluctuations. The Fund may enter into CDS contracts in order to hedge against a credit event, to enhance total return or to gain exposure to certain securities or markets. The Fund will not be permitted to enter into any swap transactions unless, at the time of entering into such transactions, the unsecured long-term debt of the actual counterparty, combined with any credit enhancements, is rated at least BBB- by Standard & Poor’s Financial Services LLC. (S&P) or Baa3 by Moody’s Investors Service Inc. (Moody’s) or is determined to be of equivalent credit quality by DMC.
Currency Swaps. A currency swap is an agreement to exchange cash flows on a notional amount of two or more currencies based on the relative value differential among them.
During the year ended March 31, 2015, Optimum Fixed Income Fund used currency swaps to protect against currency fluctuations.
Interest Rate Swaps. An interest rate swap contract is an exchange of interest rates between counterparties. In one instance, an interest rate swap involves payments received by Optimum Fixed Income Fund from another party based on a variable or floating interest rate, in return for making payments based on a fixed interest rate. An interest rate swap can also work in reverse with the Fund receiving payments based on a fixed interest rate and making payments based on a variable or floating interest rate. Interest rate swaps may be used to adjust the Fund’s sensitivity to interest rates or to hedge against changes in interest rates. Periodic payments on such contracts are accrued daily and recorded as unrealized appreciation (depreciation) on swap contracts. Upon periodic payment (receipt) or termination of the contract, such amounts are recorded as realized gains or losses on swap contracts. The Fund’s maximum risk of loss from counterparty credit risk is the discounted net value of the cash flows to be received from/paid to the counterparty over the interest rate swap contract’s remaining life, to the extent that the amount is positive. This risk is mitigated by (1) for bilateral swap contracts, having a netting arrangement between the Fund and the counterparty and by the posting of collateral by the counterparty to the Fund to cover the Fund’s exposure to the counterparty and (2) for cleared swaps, trading these instruments through a central counterparty.
During the year ended March 31, 2015, Optimum Fixed Income Fund entered into interest rate swap contracts to manage the Fund’s sensitivity to interest rates or to hedge against changes in interest rates.
Credit Default Swaps. A CDS contract is a risk-transfer instrument through which one party (purchaser of protection) transfers to another party (seller of protection) the financial risk of a credit event (as defined in the CDS agreement), as it relates to a particular reference security or basket of securities (such as an index). In exchange for the protection offered by the seller of protection, the purchaser of protection agrees to pay the seller of protection a periodic amount at a stated rate that is applied to the notional amount of the CDS contract. In addition, an upfront payment may be made or received by the Fund in connection with an unwinding or assignment of a CDS contract. Upon the occurrence of a credit event, the seller of protection would pay the par (or other agreed-upon) value of the reference security (or basket of securities) to the counterparty. Credit events generally include, among others, bankruptcy, failure to pay, and obligation default.
During the year ended March 31, 2015, Optimum Fixed Income Fund entered into CDS contracts as a purchaser and seller of protection, as a hedge against credit events. Periodic payments (receipts) on such contracts are accrued daily and recorded as unrealized losses (gains) on swap contracts. Upon payment (receipt), such amounts are recorded as realized losses (gains) on swap contracts. Upfront payments made or received in connection with CDS contracts are amortized over the expected life of the CDS contracts as unrealized losses (gains) on swap contracts. The change in value of CDS contracts is recorded daily as unrealized appreciation or depreciation. A realized gain or loss is recorded upon a credit event (as defined in the CDS agreement) or the maturity or termination of the agreement. Initial margin and variation margin are posted to central counterparties for central cleared CDS basket trades, as determined by the applicable central counterparty.
As disclosed in the footnotes to the “Schedules of investments,” at March 31, 2015, the notional value of the protection sold was EUR 300,000 and USD 16,300,000, which reflects the maximum potential amount Optimum Fixed Income Fund would have been required to make as a seller of credit protection if a credit event had occurred. In addition to serving as the source of the current value of the securities, the quoted market prices and resulting market values for credit default swap agreements on securities and credit indices serve as an indicator of the current status of the payment/performance risk and represent the likelihood of an expected liability (or profit) for the credit derivative if the swap
| (continues | ) | 139 |
Table of Contents
Notes to financial statements
Optimum Fund Trust
7. Derivatives (continued)
agreement has been closed/sold as of the period end. Increasing market values, in absolute terms when compared to the notional amount of the swap, represent a deterioration of the reference entity’s credit soundness and a greater likelihood of risk of default or other credit event occurring as defined under the terms of the agreement. At March 31, 2015, net unrealized depreciation of the protection sold was $327,875.
CDS contracts may involve greater risks than if Optimum Fixed Income Fund had invested in the reference obligation directly. CDS contracts are subject to general market risk, liquidity risk, counterparty risk and credit risk. The Fund’s maximum risk of loss from counterparty credit risk, either as the seller of protection or the buyer of protection, is the fair value of the contract. This risk is mitigated by (1) for bilateral swap contracts, having a netting arrangement between the Fund and the counterparty and by the posting of collateral by the counterparty to the Fund to cover the Fund’s exposure to the counterparty and (2) for cleared swaps, trading these instruments through a central counterparty.
During the year ended March 31, 2015, Optimum Fixed Income Fund used CDS contracts to hedge against credit events, and to gain exposure to certain securities or markets.
Swaps Generally. The value of open swaps may differ from that which would be realized in the event Optimum Fixed Income Fund terminated its position in the contract on a given day. Risks of entering into these contracts include the potential inability of the counterparty to meet the terms of the contracts. This type of risk is generally limited to the amount of favorable movement in the value of the underlying security, instrument or basket of instruments, if any, at the day of default. Risks also arise from potential losses from adverse market movements and such losses could exceed the unrealized amounts shown on the “Schedules of investments.”
At March 31, 2015, for bilateral swap contracts, Optimum Fixed Income Fund posted $10,000 in cash collateral for certain open derivatives, which is presented as “Cash collateral due from brokers” on the “Statements of assets and liabilities.” Optimum Fixed Income Fund posted $3,544,348 in cash collateral for centrally cleared swap contracts, which is presented as “Cash collateral due from brokers” on the “Statements of assets and liabilities. ” At March 31, 2015, the Fund received $4,290,000 in cash and $389,885 securities collateral for certain open derivatives. Cash collateral received is presented as “Cash collateral due to brokers” on the “Statements of assets and liabilities.”
Fair values of derivative instruments for Optimum Fixed Income Fund as of March 31, 2015 were as follows:
| Asset Derivatives | ||||||||||||||||
| Fair Value | ||||||||||||||||
| Currency | Interest rate | Credit | ||||||||||||||
| Statements of Assets and Liabilities Location | Contracts | Contracts | Contracts | Total | ||||||||||||
Unrealized appreciation on foreign currency exchange contracts | $ | 8,094,829 | $ | — | $ | — | $ | 8,094,829 | ||||||||
Variation margin due from broker on futures contracts* | — | 445,610 | — | 445,610 | ||||||||||||
Unrealized appreciation on swap contracts | — | 781,763 | 13,485 | 795,248 | ||||||||||||
|
|
|
|
|
|
|
| |||||||||
Total | $ | 8,094,829 | $ | 1,227,373 | $ | 13,485 | $ | 9,335,687 | ||||||||
|
|
|
|
|
|
|
| |||||||||
| Liability Derivatives | ||||||||||||||||
| Fair Value | ||||||||||||||||
| Currency | Interest | Credit | ||||||||||||||
| Statements of Assets and Liabilities Location | Contracts | Contracts | Contracts | Total | ||||||||||||
Unrealized depreciation on foreign currency exchange contracts | $ | 227,831 | $ | — | $ | — | $ | 227,831 | ||||||||
Variation margin due to broker on futures contracts* | 919,060 | 292,104 | — | 1,211,164 | ||||||||||||
Options written, at value | 198,963 | 6,024 | 481 | 205,468 | ||||||||||||
Unrealized depreciation on swap contracts | — | 2,891,134 | 341,360 | 3,232,494 | ||||||||||||
|
|
|
|
|
|
|
| |||||||||
Total | $ | 1,345,854 | $ | 3,189,262 | $ | 341,841 | $ | 4,876,957 | ||||||||
|
|
|
|
|
|
|
| |||||||||
*Includes cumulative appreciation (depreciation) of futures contracts from the date the contracts are opened through March 31, 2015. Only current day variation margin is reported on Optimum Fixed Income Fund’s “Statements of assets and liabilities.”
140
Table of Contents
The effect of derivative instruments on the Optimum Fixed Income Fund’s “Statements of operations” for the year ended March 31, 2015 was as follows:
| Net Realized Gain (Loss) on: | ||||||||||||||||||||
| Foreign | ||||||||||||||||||||
| Currency | ||||||||||||||||||||
| Exchange | Futures | Options | Swap | |||||||||||||||||
| Contracts | Contracts | Written | Contracts | Total | ||||||||||||||||
Currency contracts | $ | 25,392,414 | $ | 113,807 | $ | (625,609 | ) | $ | — | $ | 24,880,612 | |||||||||
Interest rate contracts | — | (5,580,451 | ) | 619,936 | (6,607,895 | ) | (11,568,410 | ) | ||||||||||||
Credit contracts | — | — | 32,145 | (2,178,856 | ) | (2,146,711 | ) | |||||||||||||
|
|
|
|
|
|
|
|
|
| |||||||||||
Total | $ | 25,392,414 | $ | (5,466,644 | ) | $ | 26,472 | $ | (8,786,751 | ) | $ | 11,165,491 | ||||||||
|
|
|
|
|
|
|
|
|
| |||||||||||
Net Change in Unrealized Appreciation (Depreciation) of: | ||||||||||||||||||||
| Foreign | ||||||||||||||||||||
| Currency | ||||||||||||||||||||
| Exchange | Futures | Options | Swap | |||||||||||||||||
| Contracts | Contracts | Written | Contracts | Total | ||||||||||||||||
Currency contracts | $ | 10,926,479 | $ | (919,060 | ) | $ | 23,186 | $ | — | $ | 10,030,605 | |||||||||
Interest rate contracts | — | 1,168,700 | (352,340 | ) | 643,651 | 1,460,011 | ||||||||||||||
Credit contracts | — | — | 10,433 | 1,693,564 | 1,703,997 | |||||||||||||||
|
|
|
|
|
|
|
|
|
| |||||||||||
Total | $ | 10,926,479 | $ | 249,640 | $ | (318,721 | ) | $ | 2,337,215 | $ | 13,194,613 | |||||||||
|
|
|
|
|
|
|
|
|
| |||||||||||
Derivatives generally. The tables below summarize the average balance of derivative holdings by the Funds during the year ended March 31, 2015. During the year ended March 31, 2015, Optimum Small-Mid Cap Value Fund did not enter into any derivative contracts.
| Long Derivative Volume | ||||||||||||||||||||
| Optimum | ||||||||||||||||||||
| Optimum | Optimum | Optimum | Optimum | Small-Mid | ||||||||||||||||
| Fixed Income | International | Large Cap | Large Cap | Cap | ||||||||||||||||
| Fund | Fund | Growth Fund | Value Fund | Growth Fund | ||||||||||||||||
Foreign currency exchange contracts (average cost) | USD | 34,087,027 | USD | 33,835,494 | USD | 26,745 | USD | 24,052 | USD | 3,934 | ||||||||||
Futures contracts | 129,541,737 | — | — | — | — | |||||||||||||||
Options contracts | 1,223 | — | — | — | — | |||||||||||||||
CDS contracts | EUR | 3,146,798 | — | — | — | — | ||||||||||||||
| USD | 1,563,373 | — | — | — | — | |||||||||||||||
Interest rate swap contracts | AUD | 313,329,249 | — | — | — | — | ||||||||||||||
| BRL | 6,063,241 | — | — | — | — | |||||||||||||||
| EUR | 17,230,435 | — | — | — | — | |||||||||||||||
| GBP | 240,316 | |||||||||||||||||||
| JPY | 1,333,952,569 | — | — | — | — | |||||||||||||||
| MXN | 87,794,071 | |||||||||||||||||||
| USD | 87,846,403 | — | — | — | — | |||||||||||||||
| (continues | ) | 141 |
Table of Contents
Notes to financial statements
Optimum Fund Trust
7. Derivatives (continued)
| Short Derivative Volume | ||||||||||||||||||||
| Optimum | ||||||||||||||||||||
| Optimum | Optimum | Optimum | Optimum | Small-Mid | ||||||||||||||||
| Fixed Income | International | Large Cap | Large Cap | Cap | ||||||||||||||||
| Fund | Fund | Growth Fund | Value Fund | Growth Fund | ||||||||||||||||
Foreign currency exchange contracts | USD | 207,404,803 | USD | 51,324,964 | USD | 76,751 | USD | 1,662 | USD | 3,500 | ||||||||||
Futures contracts | 175,245,573 | — | — | — | — | |||||||||||||||
Options contracts | 198,052 | — | — | — | — | |||||||||||||||
CDS contracts | EUR | 1,340,316 | — | — | — | — | ||||||||||||||
| USD | 14,152,316 | — | — | — | — | |||||||||||||||
*Long represents buying protection and short represents selling protection.
**Long represents receiving fixed interest payments and short represents paying fixed interest payments.
8. Offsetting
In December 2011, the Financial Accounting Standards Board (FASB) issued guidance that expands disclosure requirements on the offsetting of certain assets and liabilities. The disclosures are required for investments and derivative financial instruments subject to master netting or similar agreements which are eligible for offset on the “Statements of assets and liabilities” and require an entity to disclose both gross and net information about such investments and transactions in the financial statements. In January 2013, the FASB issued guidance that clarifies which investments and transactions are subject to the offsetting disclosure requirements. The scope of the disclosure requirements for offsetting is limited to derivative instruments, repurchase agreements and reverse repurchase agreements, and securities borrowing. The guidance was effective for financial statements with fiscal years beginning on or after Jan. 1, 2013, and interim periods within those fiscal years.
In order to better define its contractual rights and to secure rights that will help the Funds mitigate its counterparty risk, the Funds entered into an International Swaps and Derivatives Association, Inc. Master Agreement (ISDA Master Agreement) or a similar agreement with each of their derivative contract counterparties. An ISDA Master Agreement is a bilateral agreement between the Funds and a counterparty that governs certain over-the-counter (OTC) derivatives and foreign exchange contracts and typically contains, among other things, collateral posting items and netting provisions in the event of a default and/or termination event. Under an ISDA Master Agreement, the Funds may, under certain circumstances, offset with the counterparty certain derivative financial instruments’ payables and/or receivables with collateral held and/or posted and create one single net payment. The provisions of the ISDA Master Agreement typically permit a single net payment in the event of default (close-out), including the bankruptcy or insolvency of the counterparty. However, bankruptcy, or insolvency laws of a particular jurisdiction may impose restrictions on or prohibitions against the right of offset in bankruptcy, insolvency, or other events.
For financial reporting purposes, each Fund does not offset derivative assets and derivative liabilities that are subject to netting arrangements on the “Statements of assets and liabilities.”
At March 31, 2015, each Fund had the following assets and liabilities subject to offsetting provisions:
142
Table of Contents
Offsetting of Financial Assets and Liabilities and Derivative Assets and Liabilities
| Optimum Fixed Income Fund | |||||||||||||||
| Gross Value of | Gross Value of | ||||||||||||||
Counterparty | Derivative Asset | Derivative Liability | Net Position | ||||||||||||
Bank of America Merrill Lynch | $ | 90,464 | $ | (5,805 | ) | $ | 84,659 | ||||||||
Barclays Bank | — | (1,804,500 | ) | (1,804,500 | ) | ||||||||||
BNP Paribas | 51,499 | — | 51,499 | ||||||||||||
Citigroup Global Markets | 6,021,506 | (148,328 | ) | 5,873,178 | |||||||||||
Credit Suisse First Boston | 145,985 | (1,842,158 | ) | (1,696,173 | ) | ||||||||||
Deutsche Bank | 5,841 | — | 5,841 | ||||||||||||
Hong Kong Shanghai Bank | 2,218 | — | 2,218 | ||||||||||||
JPMorgan Chase Bank | 1,746,535 | (1,397,750 | ) | 348,785 | |||||||||||
Morgan Stanley Capital | 836,171 | (65,122 | ) | 771,049 | |||||||||||
Toronto Dominion Bank | 40,743 | (927,412 | ) | (886,669 | ) | ||||||||||
|
|
|
|
|
| ||||||||||
Total | $ | 8,940,962 | $ | (6,191,075 | ) | $ | 2,749,887 | ||||||||
|
|
|
|
|
| ||||||||||
| Optimum Fixed Income Fund | ||||||||||||||||||||||||
Counterparty | Net Position | Fair Value of Non-Cash Collateral Received | Cash Collateral Received | Fair Value of Non-Cash Collateral Pledged | Cash Collateral Pledged | Net Amount(a) | ||||||||||||||||||
Bank of America Merrill Lynch | $ | 84,659 | $ | — | $ | — | $ | — | $ | — | $ | 84,659 | ||||||||||||
Barclays Bank | (1,804,500 | ) | — | — | 1,804,500 | — | — | |||||||||||||||||
BNP Paribas | 51,499 | — | — | — | — | 51,499 | ||||||||||||||||||
Citigroup Global Markets | 5,873,178 | — | (4,280,000 | ) | — | — | 1,593,178 | |||||||||||||||||
Credit Suisse First Boston | (1,696,173 | ) | — | — | — | 1,696,173 | — | |||||||||||||||||
Deutsche Bank | 5,841 | — | — | — | — | 5,841 | ||||||||||||||||||
Hong Kong Shanghai Bank | 2,218 | — | (2,218 | ) | — | — | — | |||||||||||||||||
JPMorgan Chase Bank | 348,785 | (242,816 | ) | — | — | — | 105,969 | |||||||||||||||||
Morgan Stanley Capital | 771,049 | (147,069 | ) | — | — | — | 623,980 | |||||||||||||||||
Toronto Dominion Bank | (886,669 | ) | — | — | 886,669 | — | — | |||||||||||||||||
|
|
|
|
|
|
|
|
|
|
|
| |||||||||||||
Total | $ | 2,749,887 | $ | (389,885 | ) | $ | (4,282,218 | ) | $ | 2,691,169 | $ | 1,696,173 | $ | 2,465,126 | ||||||||||
|
|
|
|
|
|
|
|
|
|
|
| |||||||||||||
| Optimum Fixed Income Fund | ||||||||||||||||||||
| Fair Value of | ||||||||||||||||||||
| Non-Cash | Cash | |||||||||||||||||||
| Master Repurchase Agreements | Repurchase | Collateral | Collateral | |||||||||||||||||
Counterparty | Agreements | Received | Received | Net Amount(a) | ||||||||||||||||
Bank of America Merrill Lynch | $ | 16,622,282 | $ | (16,622,282 | ) | $ | — | $ | — | |||||||||||
Bank of Montreal | 13,851,902 | (13,851,902 | ) | — | — | |||||||||||||||
BNP Paribas | 10,076,816 | (10,076,816 | ) | — | — | |||||||||||||||
|
|
|
|
|
|
|
| |||||||||||||
Total | $ | 40,551,000 | $ | (40,551,000 | ) | $ | — | $ | — | |||||||||||
|
|
|
|
|
|
|
| |||||||||||||
| (continues | ) | 143 |
Table of Contents
Notes to financial statements
Optimum Fund Trust
8. Offsetting (continued)
| Optimum International Fund | ||||||||||||||||||||
| Fair Value of | ||||||||||||||||||||
| Non-Cash | Cash | |||||||||||||||||||
| Master Repurchase Agreements(b) | Repurchase | Collateral | Collateral | |||||||||||||||||
Counterparty | Agreements | Received | Received | Net Amount(a) | ||||||||||||||||
Bank of America Merrill Lynch | $ | 1,697,849 | $ | (1,697,849 | ) | $ | — | $ | — | |||||||||||
Bank of Montreal | 1,414,875 | (1,414,875 | ) | — | — | |||||||||||||||
BNP Paribas | 1,029,276 | (1,029,276 | ) | — | — | |||||||||||||||
|
|
|
|
|
|
|
| |||||||||||||
Total | $ | 4,142,000 | $ | (4,142,000 | ) | $ | — | $ | — | |||||||||||
|
|
|
|
|
|
|
| |||||||||||||
| Optimum Large Cap Growth Fund | ||||||||||||||||||||
| Fair Value of | ||||||||||||||||||||
| Non-Cash | Cash | |||||||||||||||||||
| Master Repurchase Agreements | Repurchase | Collateral | Collateral | |||||||||||||||||
Counterparty | Agreements | Received | Received | Net Amount(a) | ||||||||||||||||
Bank of America Merrill Lynch | $ | 17,067,035 | $ | (17,067,035 | ) | $ | — | $ | — | |||||||||||
Bank of Montreal | 14,222,530 | (14,222,530 | ) | — | — | |||||||||||||||
BNP Paribas | 10,346,435 | (10,346,435 | ) | — | — | |||||||||||||||
|
|
|
|
|
|
|
| |||||||||||||
Total | $ | 41,636,000 | $ | (41,636,000 | ) | $ | — | $ | — | |||||||||||
|
|
|
|
|
|
|
| |||||||||||||
| Optimum Large Cap Value Fund | ||||||||||||||||||||
| Fair Value of | ||||||||||||||||||||
| Non-Cash | Cash | |||||||||||||||||||
| Master Repurchase Agreements | Repurchase | Collateral | Collateral | |||||||||||||||||
Counterparty | Agreements | Received | Received | Net Amount(a) | ||||||||||||||||
Bank of America Merrill Lynch | $ | 12,599,830 | $ | (12,599,830 | ) | $ | — | $ | — | |||||||||||
Bank of Montreal | 10,499,859 | (10,499,859 | ) | — | — | |||||||||||||||
BNP Paribas | 7,638,311 | (7,638,311 | ) | — | — | |||||||||||||||
|
|
|
|
|
|
|
| |||||||||||||
Total | $ | 30,738,000 | $ | (30,738,000 | ) | $ | — | $ | — | |||||||||||
|
|
|
|
|
|
|
| |||||||||||||
| Optimum Small-Mid Cap Growth Fund | ||||||||||||||||||||
| Fair Value of | ||||||||||||||||||||
| Non-Cash | Cash | |||||||||||||||||||
| Master Repurchase Agreements(b) | Repurchase | Collateral | Collateral | |||||||||||||||||
Counterparty | Agreements | Received | Received | Net Amount(a) | ||||||||||||||||
Bank of America Merrill Lynch | $ | 2,728,774 | $ | (2,728,774 | ) | $ | — | $ | — | |||||||||||
Bank of Montreal | 2,273,979 | (2,273,979 | ) | — | — | |||||||||||||||
BNP Paribas | 1,654,247 | (1,654,247 | ) | — | — | |||||||||||||||
|
|
|
|
|
|
|
| |||||||||||||
Total | $ | 6,657,000 | $ | (6,657,000 | ) | $ | — | $ | — | |||||||||||
|
|
|
|
|
|
|
| |||||||||||||
144
Table of Contents
| Optimum Small-Mid Cap Value Fund | ||||||||||||||||||||
| Fair Value of | ||||||||||||||||||||
| Non-Cash | Cash | |||||||||||||||||||
| Master Repurchase Agreements | Repurchase | Collateral | Collateral | |||||||||||||||||
Counterparty | Agreements | Received | Received | Net Amount(a) | ||||||||||||||||
Bank of America Merrill Lynch | $ | 13,513,111 | $ | (13,513,111 | ) | $ | — | $ | — | |||||||||||
Bank of Montreal | 11,260,926 | (11,260,926 | ) | — | — | |||||||||||||||
BNP Paribas | 8,191,963 | (8,191,963 | ) | — | — | |||||||||||||||
|
|
|
|
|
|
|
| |||||||||||||
Total | $ | 32,966,000 | $ | (32,966,000 | ) | $ | — | $ | — | |||||||||||
|
|
|
|
|
|
|
| |||||||||||||
(a)Net amount represents the receivable/(payable) that would be due from/(to) the counterparty in the event of default.
(b)Table excludes counterparties where the absolute value of the total is less than 0.05% of the net assets of the respective Fund. These holdings are deemed immaterial to the respective Fund.
9. Securities Lending
Each Fund may lend its securities pursuant to a security lending agreement (Lending Agreement) with The Bank of New York Mellon (BNY Mellon). At the time a security is loaned, the borrower must post collateral equal to the required percentage of the market value of the loaned security, including any accrued interest. The required percentage is: (1) 102% with respect to U.S. securities and foreign securities that are denominated and payable in U.S. dollars; and (2) 105% with respect to foreign securities. With respect to each loan, if on any business day the aggregate market value of securities collateral plus cash collateral held is less than the aggregate market value of the securities which are the subject of such loan, the borrower will be notified to provide additional collateral by the end of the following business day which, together with the collateral already held, will be not less than the applicable initial collateral requirements for such security loan. If the aggregate market value of securities collateral and cash collateral held with respect to a security loan exceeds the applicable initial collateral requirement, upon the request of the borrower, BNY Mellon must return enough collateral to the borrower by the end of the following business day to reduce the value of the remaining collateral to the applicable initial collateral requirement for such security loan. As a result of the foregoing, the value of the collateral held with respect to a loaned security on any particular day may be more or less than the value of the security on loan.
Cash collateral received is generally invested in the Delaware Investments® Collateral Fund No. 1 (Collective Trust) established by BNY Mellon for the purpose of investment on behalf of funds managed by DMC that participate in BNY Mellon’s securities lending program. The Collective Trust may invest in U.S. government securities and high-quality corporate debt, asset-backed and other money market securities, and in repurchase agreements collateralized by such securities, provided that the Collective Trust will generally have a dollar-weighted average portfolio maturity of 60 days or less. The Funds can also accept U.S. government securities and letters of credit (non-cash collateral) in connection with securities loans. In the event of default or bankruptcy by the lending agent, realization and/or retention of the collateral may be subject to legal proceedings. In the event the borrower fails to return the loaned securities and the collateral received is insufficient to cover the value of the loaned securities and provided such collateral shortfall is not the result of investment losses, the lending agent has agreed to pay the amount of the shortfall to the Funds or, at the discretion of the lending agent, replace the loaned securities. The Funds continue to record dividends or interest, as applicable, on the securities loaned and are subject to changes in value of the securities loaned that may occur during the term of the loan. The Funds have the right under the Lending Agreement to recover the securities from the borrower on demand. With respect to security loans collateralized by non-cash collateral, the Funds receive loan premiums paid by the borrower. With respect to security loans collateralized by cash collateral, the earnings from the collateral investments are shared among the Funds, the security lending agent, and the borrower. The Funds record security lending income net of allocations to the security lending agent, and the borrower.
The Collective Trust used for the investment of cash collateral received from borrowers of securities seeks to maintain a net asset value per unit of $1.00, but there can be no assurance that it will always be able to do so. The Funds may incur investment losses as a result of investing securities lending collateral in the Collective Trust. This could occur if an investment in the Collective Trust defaulted or if it were necessary to liquidate assets in the Collective Trust to meet returns on outstanding security loans at a time when the Collective Trust’s net asset value per unit was less than $1.00. Under those circumstances, the Funds may not receive an amount from the Collective Trust that is equal in amount to the collateral the Funds would be required to return to the borrower of the securities and the Funds would be required to make up for this shortfall.
| (continues | ) | 145 |
Table of Contents
Notes to financial statements
Optimum Fund Trust
9. Securities Lending (continued)
At the year ended March 31, 2015, the Funds had no securities on loan.
10. Credit and Market Risk
Some countries in which the Funds may invest require governmental approval for the repatriation of investment income, capital, or the proceeds of sales of securities by foreign investors. In addition, if there is deterioration in a country’s balance of payments or for other reasons, a country may impose temporary restrictions on foreign capital remittances abroad.
The securities exchanges of certain foreign markets are substantially smaller, less liquid and more volatile than the major securities markets in the United States. Consequently, acquisition and disposition of securities by the Funds may be inhibited. In addition, a significant portion of the aggregate market value of securities listed on the major securities exchanges in emerging markets is held by a smaller number of investors. This may limit the number of shares available for acquisition or disposition by the Funds.
Optimum Fixed Income Fund invests in high yield fixed income securities, which are securities rated lower than BBB by S&P and lower than Baa3 by Moody’s, or similarly rated by another nationally recognized statistical rating organization. Investments in these higher yielding securities are generally accompanied by a greater degree of credit risk than higher rated securities. Additionally, lower rated securities may be more susceptible to adverse economic and competitive industry conditions than investment grade securities.
Optimum Fixed Income Fund invests in bank loans and other securities that may subject it to direct indebtedness risk, the risk that the Fund will not receive payment of principal, interest and other amounts due in connection with these investments and will depend primarily on the financial condition of the borrower. Loans that are fully secured offer the Fund more protection than unsecured loans in the event of nonpayment of scheduled interest or principal, although there is no assurance that the liquidation of collateral from a secured loan would satisfy the corporate borrower’s obligation, or that the collateral can be liquidated. Some loans or claims may be in default at the time of purchase. Certain of the loans and the other direct indebtedness acquired by the Fund may involve revolving credit facilities or other standby financing commitments that obligate the Fund to pay additional cash on a certain date or on demand. These commitments may require the Fund to increase its investment in a company at a time when the Fund might not otherwise decide to do so (including at a time when the company’s financial condition makes it unlikely that such amounts will be repaid). To the extent that the Fund is committed to advance additional funds, it will at all times hold and maintain cash or other high grade debt obligations in an amount sufficient to meet such commitments. As the Fund may be required to rely upon another lending institution to collect and pass on to the Fund amounts payable with respect to the loan and to enforce the Fund’s rights under the loan and other direct indebtedness, an insolvency, bankruptcy, or reorganization of the lending institution may delay or prevent the Fund from receiving such amounts. The highly leveraged nature of many loans may make them especially vulnerable to adverse changes in economic or market conditions. Investments in such loans and other direct indebtedness may involve additional risk to the Fund.
Optimum Fixed Income Fund invests in certain obligations that may have liquidity protection designed to ensure that the receipt of payments due on the underlying security is timely. Such protection may be provided through guarantees, insurance policies, or letters of credit obtained by the issuer or sponsor through third parties, through various means of structuring the transaction or through a combination of such approaches. The Fund will not pay any additional fees for such credit support, although the existence of credit support may increase the price of a security.
Optimum Fixed Income Fund invests in fixed income securities whose value is derived from an underlying pool of mortgages or consumer loans. The value of these securities is sensitive to changes in economic conditions, including delinquencies and/or defaults, and may be adversely affected by shifts in the market’s perception of the issuers and changes in interest rates. Investors receive principal and interest payments as the underlying mortgages and consumer loans are paid back. Some of these securities are collateralized mortgage obligations (CMOs). CMOs are debt securities issued by U.S. government agencies or by financial institutions and other mortgage lenders, which are collateralized by a pool of mortgages held under an indenture. Prepayment of mortgages may shorten the stated maturity of the obligations and can result in a loss of premium, if any has been paid. Certain of these securities may be stripped (securities which provide only the principal or interest feature of the underlying security). The yield to maturity on an interest-only CMO is extremely sensitive not only to changes in prevailing interest rates, but also to the rate of principal payments (including prepayments) on the related underlying mortgage assets. A rapid rate of principal payments may have a material adverse effect on the Fund’s yield to maturity. If the underlying mortgage assets experience greater than anticipated prepayments of principal, the Fund may fail to fully recoup its initial investment in these securities even if the securities are rated in the highest rating categories.
146
Table of Contents
Optimum Small-Mid Cap Growth Fund and Optimum Small-Mid Cap Value Fund invest a significant portion of their assets in small- and mid-sized companies. Investments in small- and mid-sized companies may be more volatile than investments in larger companies for a number of reasons, which include more limited financial resources or a dependence on narrow product lines.
Optimum Large Cap Growth Fund, Optimum Large Cap Value Fund, Optimum Small-Mid Cap Growth Fund, and Optimum Small-Mid Cap Value Fund may invest in REITs and are subject to the risks associated with that industry. If a Fund holds real estate directly as a result of defaults or receives rental income directly from real estate holdings, its tax status as a regulated investment company may be jeopardized. There were no direct real estate holdings during the year ended March 31, 2015. The Funds’ REIT holdings are also affected by interest rate changes, particularly if the REITs they hold use floating rate debt to finance their ongoing operations.
Each Fund may invest up to 15% of its net assets in illiquid securities, which may include securities with contractual restrictions on resale, securities exempt from registration under Rule 144A promulgated under the Securities Act of 1933 (the Act), as amended, and other securities which may not be readily marketable. The Funds may also invest in securities exempt from registration under Section 4(a)(2) of the Act, which exempts from registration transactions by an issuer not involving any public offering. The relative illiquidity of these securities may impair the Funds from disposing of them in a timely manner and at a fair price when it is necessary or desirable to do so. While maintaining oversight, the Funds’ Board has delegated to DMC, the day-to-day functions of determining whether individual securities are liquid for purposes of the Funds’ limitation on investments in illiquid securities. Securities eligible for resale pursuant to Rule 144A, which are determined to be liquid, are not subject to the Funds’ 15% limit on investments in illiquid securities. Rule 144A, Section 4(a)(2), and illiquid securities have been identified on the “ Schedules of investments.”
11. Contractual Obligations
Each Fund enters into contracts in the normal course of business that contain a variety of indemnifications. Each Fund’s maximum exposure under these arrangements is unknown. However, each Fund has not had prior claims or losses pursuant to these contracts. Management has reviewed the Funds’ existing contracts and expects the risk of loss to be remote.
12. Recent Accounting Pronouncements
In June 2014, the FASB issued guidance to improve the financial reporting of reverse repurchase agreements and other similar transactions. The guidance includes expanded disclosure requirements for entities that enter into reverse repurchase agreements and similar transactions accounted for as secured borrowings. The guidance is effective for financial statements with fiscal years beginning on or after Dec. 15, 2014 and interim periods within those fiscal years. Management has determined that this pronouncement has no impact to each Fund’s financial statements.
13. Subsequent Events
Management has determined that no material events or transactions occurred subsequent to March 31, 2015 that would require recognition or disclosure in the Funds’ financial statements.
| (continues | ) | 147 |
Table of Contents
registered public accounting firm
To the Board of Trustees of Optimum Fund Trust, as defined, and the Shareholders:
In our opinion, the accompanying statements of assets and liabilities, including the schedules of investments, and the related statements of operations and of changes in net assets and the financial highlights present fairly, in all material respects, the financial position of the Optimum Fixed Income Fund, Optimum International Fund, Optimum Large Cap Growth Fund, Optimum Large Cap Value Fund, Optimum Small-Mid Cap Growth Fund and Optimum Small-Mid Cap Value Fund (constituting Optimum Fund Trust, hereafter referred to as the “Funds”) at March 31, 2015, the results of each of their operations for the year then ended, the changes in each of their net assets for each of the two years in the period then ended and the financial highlights for each of the five years in the period then ended, in conformity with accounting principles generally accepted in the United States of America. These financial statements and financial highlights (hereafter referred to as “financial statements”) are the responsibility of the Funds’ management. Our responsibility is to express an opinion on these financial statements based on our audits. We conducted our audits of these financial statements in accordance with the standards of the Public Company Accounting Oversight Board (United States). Those standards require that we plan and perform the audit to obtain reasonable assurance about whether the financial statements are free of material misstatement. An audit includes examining, on a test basis, evidence supporting the amounts and disclosures in the financial statements, assessing the accounting principles used and significant estimates made by management, and evaluating the overall financial statement presentation. We believe that our audits, which included confirmation of securities at March 31, 2015 by correspondence with the custodian and brokers, and the application of alternative auditing procedures where confirmations of security purchases had not been received, provide a reasonable basis for our opinion.
PricewaterhouseCoopers LLP
Philadelphia, Pennsylvania
May 19, 2015
148
Table of Contents
(Unaudited)
Optimum Fund Trust
Tax Information
The information set forth below is for each Fund’s fiscal year as required by federal income tax laws. Shareholders, however, must report distributions on a calendar year basis for income tax purposes, which may include distributions for portions of two fiscal years of the Funds. Accordingly, the information needed by shareholders for income tax purposes will be sent to them in January of each year. Please consult your tax advisor for proper treatment of this information.
All disclosures are based on financial information available as of the date of this annual report and, accordingly are subject to change. For any and all items requiring reporting, it is the intention of the Funds to report the maximum amount permitted under the Internal Revenue Code and the regulations thereunder.
For the fiscal year ended March 31, 2015, each Fund reports distributions paid during the year as follows:
| (A) | ||||||||||||||||
| Long-Term | (B) | |||||||||||||||
| Capital Gains | Ordinary Income | Total | (C) | |||||||||||||
| Distributions | Distributions* | Distributions | Qualifying | |||||||||||||
| (Tax Basis) | (Tax Basis) | (Tax Basis) | Dividends1 | |||||||||||||
Optimum Fixed Income Fund | — | 100.00% | 100.00% | — | ||||||||||||
Optimum International Fund | — | 100.00% | 100.00% | 1.01% | ||||||||||||
Optimum Large Cap Growth Fund | 69.76% | 30.24% | 100.00% | 19.98% | ||||||||||||
Optimum Large Cap Value Fund | — | 100.00% | 100.00% | 100.00% | ||||||||||||
Optimum Small-Mid Cap Growth Fund | 87.55% | 12.45% | 100.00% | 48.04% | ||||||||||||
Optimum Small-Mid Cap Value Fund | 99.65% | 0.35% | 100.00% | 100.00% | ||||||||||||
(A) and (B) are based on a percentage of each Fund’s total distributions.
(C) is based on a percentage of each Fund’s ordinary income distributions.
1Qualifying dividends represent dividends which qualify for the corporate dividends received deduction.
*For the fiscal year ended March 31, 2015, certain dividends paid by the Funds may be subject to a maximum tax rate of 20%. The percentage of dividends paid by the Funds from ordinary income reported as qualified income are as reported in the following table. Complete information will be computed and reported in conjunction with your 2015 Form 1099-DIV.
| Optimum | Optimum | Optimum | Optimum | Optimum | Optimum | |||||||
| Fixed Income | International | Large Cap | Large Cap | Small-Mid Cap | Small-Mid Cap | |||||||
Fund | Fund | Growth Fund | Value Fund | Growth Fund | Value Fund | |||||||
| — | 100.00% | 21.48% | 100.00% | 49.71% | 100.00% |
Optimum International Fund intends to pass through foreign tax credits in the maximum amount of $566,048. The gross foreign source income earned during the fiscal year 2015 by the Fund was $13,258,993.
Board Consideration of Sub-Advisory Agreement with Acadian Asset Management LLC at Meeting Held Dec. 10, 2014
At a meeting held Dec. 10, 2014, the Board of Trustees, including a majority of non-interested or independent Trustees, approved a new Sub-Advisory Agreement (the “Sub-Advisory Agreement”) between Delaware Management Company (“DMC” or “Management”) and Acadian Asset Management LLC (“Acadian”) for the Optimum International Fund (the “Fund”). Acadian replaced BlackRock Advisors, LLC (“BlackRock”) as a sub-advisor to the Fund as of Jan. 26, 2015.
In reaching the decision to approve the Sub-Advisory Agreement, the Board considered and reviewed information about Acadian, including its personnel, operations and financial condition, which had been provided by Acadian. The Board also reviewed material furnished by DMC (with the assistance of its consultant, LPL Financial LLC (“LPL”)), including: a memorandum from DMC reviewing the Sub-Advisory Agreement and the various services proposed to be rendered by Acadian; research and analysis concerning DMC’s proposal of Acadian; a description of Acadian’s proposed sub-advisory fees under the Sub-Advisory Agreement, along with fees that Acadian charges similar institutional accounts; information concerning Acadian’s organizational structure and the experience of its investment management personnel; a “due diligence” report describing various material items in relation to Acadian’s personnel, organization and policies; copies of Acadian’s Form ADV, compliance policies and procedures and its Code of Ethics; and a copy of the Sub-Advisory Agreement.
| (continues | ) | 149 |
Table of Contents
Other Fund information
(Unaudited)
Optimum Fund Trust
Board Consideration of Sub-Advisory Agreement with Acadian Asset Management LLC at Meeting Held Dec. 10, 2014 (continued)
In considering such information and materials, the Independent Trustees received assistance and advice from and met separately with independent counsel. The materials prepared by Management specifically in connection with the approval of the Sub-Advisory Agreement were sent to the Independent Trustees in advance of the Meeting. While attention was given to all information furnished, the following discusses some primary factors relevant to the Board’s decision. This discussion of the information and factors considered by the Board (as well as the discussion above) is not intended to be exhaustive, but rather summarizes certain factors considered by the Board. In view of the wide variety of factors considered, the Board did not, unless otherwise noted, find it practicable to quantify or otherwise assign relative weights to the following factors. In addition, individual Trustees may have assigned different weights to various factors.
Nature, Extent and Quality of Services. In considering the nature, extent and quality of the services to be provided by Acadian, the Board specifically considered that the Sub-Advisory Agreement contains substantially similar provisions to those in the prior BlackRock sub-advisory agreement, except for the provisions relating to the fees. The Board reviewed materials provided by Acadian regarding the experience and qualifications of personnel who will be responsible for managing Acadian’s portion of the Optimum International Fund. The Board also placed weight on the projected performance of a representative Acadian portfolio that utilized the investment process and parameters that would be employed by Acadian on behalf of its portion of the Optimum International Fund (the “Acadian Account”). The Board also considered that Acadian would co-manage the Fund with another adviser, EARNEST Partners, LLC (“EARNEST”). The Board considered the compatibility of the two advisers’ investment philosophies and methodologies. Based upon these considerations, the Board was satisfied with the nature and quality of the overall services to be provided by Acadian to the Optimum International Fund and its shareholders and was confident in the abilities of Acadian to provide quality services to the Optimum International Fund and its shareholders.
Investment Performance. The Board reviewed information on the projected performance of the Acadian Account over various time periods. The Board also reviewed a combination analysis showing various performance metrics that would have resulted from combining the performance of the Acadian Account with the performance of EARNEST in managing its portion of the Fund over various time periods measured in several different ways. In respect to such analysis, the Board noted that Acadian’s investment style seemed a good complement to that followed by EARNEST, and Acadian’s investment strategy seemed to provide a better balance to EARNEST’s investment philosophy. The Board believed such information and analysis evidenced the benefits to the Fund and high quality of portfolio management services expected to be provided by Acadian under the Sub-Advisory Agreement.
Comparative Expenses. In In considering the appropriateness of the sub-advisory fees to be charged by Acadian, the Board reviewed and considered the sub-advisory fees in light of the nature, extent and quality of the sub-advisory services to be provided by Acadian, as more fully described above. The Board noted that Acadian’s sub-advisory fees are paid by DMC and are not additional fees borne by the Fund. The Board also noted that the sub-advisory fees to be paid by DMC to Acadian were the product of arms-length negotiations between DMC and Acadian, and the Board considered the allocation of the investment management fees charged to the Fund between DMC and Acadian in light of the nature, extent and quality of the investment management services provided, and to be provided by, DMC and Acadian. In particular, the Board was provided with a description of fees to be charged by Acadian under the Sub-Advisory Agreement for the Optimum International Fund, which showed them to be slightly higher than the sub-advisory fees charged by BlackRock under its sub-advisory agreement at the Fund’s current amount of assets under management. The Board discussed the impact that the differences in fees would have on DMC’s profitability. The Board also was provided with information showing that Acadian’s fees were competitive with those charged by Acadian to other comparable investment companies or accounts, and was informed by Management that Acadian’s fees were competitive with fees of other investment managers being considered as possible sub-advisors to the Fund. The Board also noted that the management fee paid by the Fund to DMC would stay the same at current asset levels. Based upon such facts, the Board believed that the fees to be charged by Acadian under the Sub-Advisory Agreement were acceptable in relation to the services being provided.
150
Table of Contents
Profitability and Economies of Scale. The Board was informed that Acadian may receive certain fall-out benefits in connection with their relationship with the Fund, such as soft-dollar arrangements. Information about Acadian’s profitability from its relationship with the Fund was not available because it had not begun to provide services to the Fund. The Trustees also noted that economies of scale are shared with the Fund and its shareholders through investment management fee breakpoints so that as the Fund grows in size, its effective investment management fee rate declines. The Board considered that the asset size of the Optimum International Fund, as of Sep. 30, 2014, exceeded the last fee breakpoint under its respective investment management agreement. The Trustees noted, however, that the actual investment management fee charged to the Fund was also limited as a result of management expense caps, and while intending to monitor the need for additional breakpoints, believed it unlikely that meaningful economies of scale currently existed in the management of such Fund.
| (continues | ) | 151 |
Table of Contents
Board of trustees and officers addendum
Optimum Fund Trust
A mutual fund is governed by a Board of Trustees, which has oversight responsibility for the management of a fund’s business affairs. Trustees establish procedures and oversee and review the performance of the investment manager, the distributor and others that perform services for the fund. The independent fund trustees, in particular, are advocates for shareholder interests. The following is a list of the Trustees and Officers of the Trust with certain background and related information.
Name, Address, and Age | Position(s) Held with Fund(s) | Length of Time Served | Principal Occupation(s) During Past 5 Years | Number of Portfolios in Fund Complex1 Overseen by Trustee or Officer | Other Directorships Held by Trustee or Officer | |||||
INTERESTED TRUSTEES | ||||||||||
Dan H. Arnold2 2005 Market Street Philadelphia, PA 19103
Age 50 | Trustee | September 19, 2012 to present | President — LPL Financial LLC (2015-Present)
Chief Financial Officer LPL Financial LLC (2012-2015)
Managing Director, Head of Strategy — LPL Financial LLC (2011-2012)
Divisional President of Institutional Services — LPL Financial LLC (2007-2011)
| 6 | None | |||||
J. Scott Coleman2, 5 2005 Market Street Philadelphia, PA 19103
Age 54 | Trustee, President and Chief Executive Officer | June 16, 2011 to present | Executive Vice President Head of Distribution and Marketing — Delaware Investments (2008-Present) | 6 | None | |||||
INDEPENDENT TRUSTEES | ||||||||||
Robert J. Christian 2005 Market Street Philadelphia, PA 19103
Age 66 | Trustee and Chairman | November 1, 2007 to present | Private Investor (2006-Present)
Chief Investment Officer Wilmington Trust Corporation (Trust Bank) (1996-2006)
| 6 | Trustee — FundVantage Trust (34 mutual funds) (2007-present) | |||||
Durant Adams Hunter 2005 Market Street Philadelphia, PA 19103
Age 66
| Trustee | July 17, 2003 to present | Managing Partner — Ridgeway Partners (Executive Recruiting) (2004-Present) | 6 | None | |||||
Pamela J. Moret 2005 Market Street Philadelphia, PA 19103
Age 59 | Trustee | October 1, 2013 to present | Chief Executive Officer — brightpeak financial (2011-Present)
Senior Vice President — Thrivent Financial for Lutherans (2002-Present)
| 6 | Director — Brotherhood Mutual Insurance Company (2011-present)
Director — Blue Cross Blue Shield of Minnesota (2014-present)
| |||||
Stephen Paul Mullin 2005 Market Street Philadelphia, PA 19103
Age 59
| Trustee | July 17, 2003 to present | President — Econsult Solutions, Inc. (Economic Consulting) (2013-Present)
Senior Vice President — Econsult Corporation (Economic Consulting) (2000-2013)
| 6 | None | |||||
152
Table of Contents
Name, Address, and Age | Position(s) Held with Fund(s) | Length of Time Served | Principal Occupation(s) During Past 5 Years | Number of Portfolios in Fund Complex1 Overseen by Trustee or Officer | Other Directorships Held by Trustee or Officer | |||||
INDEPENDENT TRUSTEES (continued) | ||||||||||
Robert A. Rudell 2005 Market Street Philadelphia, PA 19103
Age 66
| Trustee | July 17, 2003 to present | Private Investor (2002–Present) | 6 | Director and Independent Chairman — Heartland Funds (3 mutual funds) (2005-present)
| |||||
Jon Edward Socolofsky 2005 Market Street Philadelphia, PA 19103
Age 69 | Trustee | July 17, 2003 to present | Private Investor (2002–Present)
President — H&S Enterprises of Minocqua, LLC (Commercial real estate developer) (2005-Present) | 6 | None | |||||
OFFICERS | ||||||||||
David F. Connor 2005 Market Street Philadelphia, PA 19103
51 | Senior Vice President, Deputy General Counsel, and Secretary | Senior Vice President, Deputy General Counsel since May 2013; Vice President, Deputy General Counsel September 2000- May 2013; Secretary since October 2005
| Mr. Connor has served as Deputy General Counsel of Delaware Investments3 since 2000. | 6 | None4 | |||||
David P. O’Connor5 2005 Market Street Philadelphia, PA 19103
48 | Executive Vice President, General Counsel, and Chief Legal Officer | Executive Vice President since February 2012; Senior Vice President October 2005– February 2012; General Counsel and Chief Legal Officer since October 2005
| Mr. O’Connor has served in various executive and legal capacities at different times at Delaware Investments. | 6 | None4 | |||||
Daniel V. Geatens 2005 Market Street Philadelphia, PA 19103
42
| Vice President and Treasurer | September 20, 2007 to present | Mr. Geatens has served in various capacities at Delaware Investments. | 6 | None4 | |||||
Richard Salus 2005 Market Street Philadelphia, PA 19103
51
| Senior Vice President and Chief Financial Officer | January 1, 2006 to present | Mr. Salus has served in various executive capacities at different times at Delaware Investments. | 6 | None4 | |||||
| 1 | The term “Fund Complex” refers to the Funds in the Optimum Fund Trust. |
| 2 | “Interested persons” of the Funds by virtue of their executive and management positions or relationships with the Fund’s service providers or sub-service providers. |
| 3 | Delaware Investments is the marketing name for Delaware Management Holdings, Inc. and its subsidiaries, including the Trust’s manager, principal underwriter and service agent. |
| 4 | Messrs. Connor, O’Connor, Geatens and Salus also serve in similar capacities for the Delaware Investments® Family of Funds, a fund complex also managed and distributed by Delaware Investments with 70 funds. |
| 5 | Messrs. Coleman and O’Connor have retired from their positions with the Funds effective as of the close of business on May 23, 2015. |
The Statement of Additional Information for the Funds includes additional information about the Trustees and Officers and is available, without charge, upon request by calling your financial advisor or 800 914-0278.
| (continues | ) | 153 |
Table of Contents
This annual report is for the information of Optimum Fund Trust shareholders, but it may be used with prospective investors when preceded or accompanied by a current prospectus for Optimum Fund Trust and the fact sheet for the most recently completed calendar quarter. The prospectus sets forth details about charges, expenses, investment objectives, and operating policies of the investment company. You should read the prospectus carefully before you invest. The figures in this report represent past results that are not a guarantee of future results. The return and principal value of an investment in the investment company will fluctuate so that shares, when redeemed, may be worth more or less than their original cost.
Board of trustees
Dan H. Arnold
President LPL Financial LLC
J. Scott Coleman
Executive Vice President Delaware Investments
Robert J. Christian
Private Investor
Durant Adams Hunter
Managing Partner — Ridgeway Partners
Pamela J. Moret
Chief Executive Officer — brightpeak financial
Stephen Paul Mullin
President — Econsult Solutions, Inc.
Robert A. Rudell
Private Investor
Jon Edward Socolofsky
Private Investor | Affiliated officers
David F. Connor
Senior Vice President, Deputy General Counsel and Secretary Optimum Fund Trust Philadelphia, PA
Daniel V. Geatens
Vice President and Treasurer Optimum Fund Trust Philadelphia, PA
David P. O’Connor
Executive Vice President, General Counsel and Chief Legal Officer Optimum Fund Trust Philadelphia, PA
Richard Salus
Senior Vice President and Chief Financial Officer Optimum Fund Trust Philadelphia, PA | Contact information
Investment manager
Delaware Management Company, a series of Delaware Management Business Trust Philadelphia, PA
National distributor
Delaware Distributors, L. P. Philadelphia, PA
Shareholder servicing, dividend disbursing, and transfer agent
Delaware Service Company, Inc. 2005 Market Street Philadelphia, PA 19103-7094
For shareholders
800 914-0278
For securities dealers and financial institutions representatives only
800 362-7500
Website
optimummutualfunds.com | ||
Each Fund files its complete schedule of portfolio holdings with the Securities and Exchange Commission (SEC) for the first and third quarters of each fiscal year on Forms N-Q. Each Fund’s Forms N-Q, as well as a description of the policies and procedures that the Funds use to determine how to vote proxies (if any) relating to portfolio securities and the Schedules of Investments included in the Funds’ most recent Forms N-Q are available without charge (i) upon request, by calling 800 914-0278; (ii) on the Funds’ website at optimummutualfunds.com; and (iii) on the SEC’s website at sec.gov. Each Fund’s Forms N-Q may be reviewed and copied at the SEC’s Public Reference Room in Washington, D.C.; information on the operation of the Public Reference Room may be obtained by calling 800 SEC-0330.
Information (if any) regarding how the Funds voted proxies relating to portfolio securities during the most recently disclosed 12-month period ended June 30 is available without charge (i) through the Funds’ website at optimummutualfunds. com; and (ii) on the SEC’s website at sec. gov. | ||||
154
Table of Contents
This page intentionally left blank.
Table of Contents
This page intentionally left blank.
Table of Contents
This page intentionally left blank.
Table of Contents

| (14463) | ||
| AR-901 20435 [5/15] | Printed in the USA |
Item 2. Code of Ethics
The registrant has adopted a code of ethics that applies to the registrant’s principal executive officer, principal financial officer, principal accounting officer or controller, or persons performing similar functions, regardless of whether these individuals are employed by the registrant or a third party. A copy of the registrant’s Code of Business Ethics has been posted on the Delaware Investments Internet Web site at www.delawareinvestments.com/optimum-funds. Any amendments to the Code of Business Ethics, and information on any waiver from its provisions granted by the registrant, will also be posted on this Web site within five business days of such amendment or waiver and will remain on the Web site for at least 12 months.
Item 3. Audit Committee Financial Expert
The registrant’s Board of Trustees/Directors has determined that certain members of the registrant’s Audit Committee are audit committee financial experts, as defined below. For purposes of this item, an “audit committee financial expert” is a person who has the following attributes:
a. An understanding of generally accepted accounting principles and financial statements;
b. The ability to assess the general application of such principles in connection with the accounting for estimates, accruals, and reserves;
c. Experience preparing, auditing, analyzing, or evaluating financial statements that present a breadth and level of complexity of accounting issues that are generally comparable to the breadth and complexity of issues that can reasonably be expected to be raised by the registrant’s financial statements, or experience actively supervising one or more persons engaged in such activities;
d. An understanding of internal controls and procedures for financial reporting; and
e. An understanding of audit committee functions.
An “audit committee financial expert” shall have acquired such attributes through:
a. Education and experience as a principal financial officer, principal accounting officer, controller, public accountant, or auditor or experience in one or more positions that involve the performance of similar functions;
b. Experience actively supervising a principal financial officer, principal accounting officer, controller, public accountant, auditor, or person performing similar functions;
c. Experience overseeing or assessing the performance of companies or public accountants with respect to the preparation, auditing, or evaluation of financial statements; or
d. Other relevant experience.
The registrant’s Board of Trustees/Directors has also determined that each member of the registrant’s Audit Committee is independent. In order to be “independent” for purposes of this item, the Audit Committee member may not: (i) other than in his or her capacity as a member of the Board of Trustees/Directors or any committee thereof, accept directly or indirectly any consulting, advisory or other compensatory fee from the issuer; or (ii) be an “interested person” of the registrant as defined in Section 2(a)(19) of the Investment Company Act of 1940.
The names of the audit committee financial experts on the registrant’s Audit Committee are set forth below:
Robert J. Christian
Robert A. Rudell
Jon E. Socolofsky
Item 4. Principal Accountant Fees and Services
(a) Audit fees.
The aggregate fees billed for services provided to the registrant by its independent auditors for the audit of the registrant’s annual financial statements and for services normally provided by the independent auditors in connection with statutory and regulatory filings or engagements were $144,200 for the fiscal year ended March 31, 2015.
The aggregate fees billed for services provided to the registrant by its independent auditors for the audit of the registrant’s annual financial statements and for services normally provided by the independent auditors in connection with statutory and regulatory filings or engagements were $140,000 for the fiscal year ended March 31, 2014.
(b) Audit-related fees.
The aggregate fees billed by the registrant’s independent auditors for services relating to the performance of the audit of the registrant’s financial statements and not reported under paragraph (a) of this Item were $0 for the fiscal year ended March 31, 2015.
The aggregate fees billed by the registrant’s independent auditors for services relating to the performance of the audit of the financial statements of the registrant’s investment adviser and other service providers under common control with the adviser and that relate directly to the operations or financial reporting of the registrant were $612,000 for the registrant’s fiscal year ended March 31, 2015. The percentage of these fees relating to services approved by the registrant’s Audit Committee pursuant to the de minimis exception from the pre-approval requirement in Rule 2-01(c)(7)(i)(C) of Regulation S-X was 0%. These audit-related services were as follows: year-end audit procedures; reporting up and subsidiary statutory audits.
The aggregate fees billed by the registrant’s independent auditors for services relating to the performance of the audit of the registrant’s financial statements and not reported under paragraph (a) of this Item were $0 for the fiscal year ended March 31, 2014.
The aggregate fees billed by the registrant’s independent auditors for services relating to the performance of the audit of the financial statements of the registrant’s investment adviser and other service providers under common control with the adviser and that relate directly to the operations or financial reporting of the registrant were $618,000 for the registrant’s fiscal year ended March 31, 2014. The percentage of these fees relating to services approved by the registrant’s Audit Committee pursuant to the de minimis exception from the pre-approval requirement in Rule 2-01(c)(7)(i)(C) of Regulation S-X was 0%. These audit-related services were as follows: year-end audit procedures; group reporting and subsidiary statutory audits.
(c) Tax fees.
The aggregate fees billed by the registrant’s independent auditors for tax-related services provided to the registrant were $28,325 for the fiscal year ended March 31, 2015. The percentage of these fees relating to services approved by the registrant’s Audit Committee pursuant to the de minimis exception from the pre-approval requirement in Rule 2-01(c)(7)(i)(C) of Regulation S-X was 0%. These tax-related services were as follows: review of income tax returns and review of annual excise distribution calculations.
The aggregate fees billed by the registrant’s independent auditors for tax-related services provided to the registrant’s investment adviser and other service providers under common control with the adviser and that relate directly to the operations or financial reporting of the registrant were $0 for the registrant’s fiscal year ended March 31, 2015.
The aggregate fees billed by the registrant’s independent auditors for tax-related services provided to the registrant were $27,500 for the fiscal year ended March 31, 2014. The percentage of these fees relating to services approved by the registrant’s Audit Committee pursuant to the de minimis exception from the pre-approval requirement in Rule 2-01(c)(7)(i)(C) of Regulation S-X was 0%. These tax-related services were as follows: review of income tax returns and review of annual excise distribution calculations.
The aggregate fees billed by the registrant’s independent auditors for tax-related services provided to the registrant’s investment adviser and other service providers under common control with the adviser and that relate directly to the operations or financial reporting of the registrant were $0 for the registrant’s fiscal year ended March 31, 2014.
(d) All other fees.
The aggregate fees billed for all services provided by the independent auditors to the registrant other than those set forth in paragraphs (a), (b) and (c) of this Item were $0 for the fiscal year ended March 31, 2015.
The aggregate fees billed for all services other than those set forth in paragraphs (b) and (c) of this Item provided by the registrant’s independent auditors to the registrant’s adviser and other service providers under common control with the adviser and that relate directly to the operations or financial reporting of the registrant were $0 for the registrant’s fiscal year ended March 31, 2015. The percentage of these fees relating to services approved by the registrant’s Audit Committee pursuant to the de minimis exception from the pre-approval requirement in Rule 2-01(c)(7)(i)(C) of Regulation S-X was 0%.
The aggregate fees billed for all services provided by the independent auditors to the registrant other than those set forth in paragraphs (a), (b) and (c) of this Item were $0 for the fiscal year ended March 31, 2014.
The aggregate fees billed for all services other than those set forth in paragraphs (b) and (c) of this Item provided by the registrant’s independent auditors to the registrant’s adviser and other service providers under common control with the adviser and that relate directly to the operations or financial reporting of the registrant were $0 for the registrant’s fiscal year ended March 31, 2014. The percentage of these fees relating to services approved by the registrant’s Audit Committee pursuant to the de minimis exception from the pre-approval requirement in Rule 2-01(c)(7)(i)(C) of Regulation S-X was 0%.
(e) The registrant’s Audit Committee has established pre-approval policies and procedures as permitted by Rule 2-01(c)(7)(i)(B) of Regulation S-X (the “Pre-Approval Policy”) with respect to services provided by the registrant’s independent auditors. Pursuant to the Pre-Approval Policy, the Audit Committee has pre-approved the services set forth in the table below with respect to the registrant up to the specified fee limits. Certain fee limits are based on aggregate fees to the registrant and other registrants within the Delaware Investments Family of Funds.
| Service | Range of Fees |
Audit Services | |
Statutory audits or financial audits for new Funds | up to $25,000 per Fund |
Services associated with SEC registration statements (e.g., Form N-1A, Form N-14, etc.), periodic reports and other documents filed with the SEC or other documents issued in connection with securities offerings (e.g., comfort letters for closed-end Fund offerings, consents), and assistance in responding to SEC comment letters | up to $10,000 per Fund |
Consultations by Fund management as to the accounting or disclosure treatment of transactions or events and/or the actual or potential impact of final or proposed rules, standards or interpretations by the SEC, FASB, or other regulatory or standard-setting bodies (Note: Under SEC rules, some consultations may be considered “audit-related services” rather than “audit services”) | up to $25,000 in the aggregate |
Audit-Related Services | |
Consultations by Fund management as to the accounting or disclosure treatment of transactions or events and /or the actual or potential impact of final or proposed rules, standards or interpretations by the SEC, FASB, or other regulatory or standard-setting bodies (Note: Under SEC rules, some consultations may be considered “audit services” rather than “audit-related services”) | up to $25,000 in the aggregate |
Tax Services | |
U.S. federal, state and local and international tax planning and advice (e.g., consulting on statutory, regulatory or administrative developments, evaluation of Funds’ tax compliance function, etc.) | up to $25,000 in the aggregate |
U.S. federal, state and local tax compliance (e.g., excise distribution reviews, etc.) | up to $5,000 per Fund |
Review of federal, state, local and international income, franchise and other tax returns | up to $5,000 per Fund |
Under the Pre-Approval Policy, the Audit Committee has also pre-approved the services set forth in the table below with respect to the registrant’s investment adviser and other entities controlling, controlled by or under common control with the investment adviser that provide ongoing services to the registrant (the “Control Affiliates”) up to the specified fee limit. This fee limit is based on aggregate fees to the investment adviser and its Control Affiliates.
| Service | Range of Fees |
Non-Audit Services | |
Services associated with periodic reports and other documents filed with the SEC and assistance in responding to SEC comment letters | up to $10,000 in the aggregate |
The Pre-Approval Policy requires the registrant’s independent auditors to report to the Audit Committee at each of its regular meetings regarding all services initiated since the last such report was rendered, including those services authorized by the Pre-Approval Policy.
(f) Not applicable.
(g) The aggregate non-audit fees billed by the registrant’s independent auditors for services rendered to the registrant and to its investment adviser and other service providers under common control with the adviser were $7,530,526 and $8,090,937 for the registrant’s fiscal years ended March 31, 2015 and March 31, 2014, respectively.
(h) In connection with its selection of the independent auditors, the registrant’s Audit Committee has considered the independent auditors’ provision of non-audit services to the registrant’s investment adviser and other service providers under common control with the adviser that were not required to be pre-approved pursuant to Rule 2-01(c)(7)(ii) of Regulation S-X. The Audit Committee has determined that the independent auditors’ provision of these services is compatible with maintaining the auditors’ independence.
Item 5. Audit Committee of Listed Registrants
Not applicable.
Item 6. Investments
(a) Included as part of report to shareholders filed under Item 1 of this Form N-CSR.
(b) Divestment of securities in accordance with Section 13(c) of the Investment Company Act of 1940.
Not applicable.
Item 7. Disclosure of Proxy Voting Policies and Procedures for Closed-End Management Investment Companies
Not applicable.
Item 8. Portfolio Managers of Closed-End Management Investment Companies
Not applicable.
Item 9. Purchases of Equity Securities by Closed-End Management Investment Company and Affiliated Purchasers
Not applicable.
Item 10. Submission of Matters to a Vote of Security Holders
Not applicable.
Item 11. Controls and Procedures
The registrant’s principal executive officer and principal financial officer have evaluated the registrant’s disclosure controls and procedures within 90 days of the filing of this report and have concluded that they are effective in providing reasonable assurance that the information required to be disclosed by the registrant in its reports or statements filed under the Securities Exchange Act of 1934 is recorded, processed, summarized and reported within the time periods specified in the rules and forms of the Securities and Exchange Commission.
There were no significant changes in the registrant’s internal control over financial reporting that occurred during the second fiscal quarter of the period covered by the report to stockholders included herein (i.e., the registrant’s fourth fiscal quarter) that have materially affected, or are reasonably likely to materially affect, the registrant’s internal control over financial reporting.
Item 12. Exhibits
(a) (1) Code of Ethics
Not applicable.
(2) Certifications of Principal Executive Officer and Principal Financial Officer pursuant to Rule 30a-2 under the Investment Company Act of 1940 are attached hereto as Exhibit 99.CERT.
(3) Written solicitations to purchase securities pursuant to Rule 23c-1 under the Securities Exchange Act of 1934.
Not applicable.
(b) Certifications pursuant to Section 906 of the Sarbanes-Oxley Act of 2002 are furnished herewith as Exhibit 99.906CERT.
SIGNATURES
Pursuant to the requirements of the Securities Exchange Act of 1934 and the Investment Company Act of 1940, the registrant has duly caused this report to be signed on its behalf, by the undersigned, thereunto duly authorized.
OPTIMUM FUND TRUST
| /s/ ROGER A. EARLY | ||
| By: | Roger A. Early | |
| Title: | Chief Executive Officer | |
| Date: | June 5, 2015 | |
Pursuant to the requirements of the Securities Exchange Act of 1934 and the Investment Company Act of 1940, this report has been signed below by the following persons on behalf of the registrant and in the capacities and on the dates indicated.
| /s/ ROGER A. EARLY | ||
| By: | Roger A. Early | |
| Title: | Chief Executive Officer | |
| Date: | June 5, 2015 | |
| /s/ RICHARD SALUS | ||
| By: | Richard Salus | |
| Title: | Chief Financial Officer | |
| Date: | June 5, 2015 | |