UNITED STATES SECURITIES AND EXCHANGE COMMISSION
Washington, D.C. 20549
FORM N-CSR
CERTIFIED SHAREHOLDER REPORT OF REGISTERED MANAGEMENT
INVESTMENT COMPANIES
| Investment Company Act file number: | 811-21335 | |
| Exact name of registrant as specified in charter: | Optimum Fund Trust | |
| Address of principal executive offices: | 2005 Market Street | |
| Philadelphia, PA 19103 | ||
| Name and address of agent for service: | David F. Connor, Esq. | |
| 2005 Market Street | ||
| Philadelphia, PA 19103 | ||
| Registrant’s telephone number, including area code: | (800) 523-1918 | |
| Date of fiscal year end: | March 31 | |
| Date of reporting period: | March 31, 2017 |
Item 1. Reports to Stockholders
Table of Contents
Optimum Fixed Income Fund
Optimum International Fund
Optimum Large Cap Growth Fund
Optimum Large Cap Value Fund
Optimum Small-Mid Cap Growth Fund
Optimum Small-Mid Cap Value Fund
Annual report
March 31, 2017
Carefully consider the Funds’ investment objectives, risk factors, charges, and expenses before investing. This and other information can be found in the Funds’ prospectus and, if available, their summary prospectuses, which may be obtained by visiting optimummutualfunds.com/literature or calling 800 914-0278. Investors should read the prospectus and, if available, the summary prospectus carefully before investing.
Table of Contents
| 1 | ||||
| 4 | ||||
| 7 | ||||
| 10 | ||||
| 13 | ||||
| 16 | ||||
| 19 | ||||
| 23 | ||||
| 26 | ||||
| 29 | ||||
| 32 | ||||
| 35 | ||||
| 38 | ||||
Security type / sector / country allocations | 40 | |||
Financial statements | ||||
| 45 | ||||
| 112 | ||||
| 115 | ||||
| 117 | ||||
| 120 | ||||
| 138 | ||||
| 167 | ||||
| 168 | ||||
| 171 | ||||
| 173 | ||||
Neither Delaware Investments nor its affiliates referred to in this document are authorized deposit-taking institutions for the purposes of the Banking Act 1959 (Commonwealth of Australia). The obligations of these entities do not represent deposits or other liabilities of Macquarie Bank Limited (MBL), a subsidiary of Macquarie Group Limited and an affiliate of Delaware Investments. MBL does not guarantee or otherwise provide assurance in respect of the obligations of these entities, unless noted otherwise. The Funds are governed by US laws and regulations.
Unless otherwise noted, views expressed herein are current as of March 31, 2017, and subject to change for events occurring after such a date. Holdings are as of the date indicated and subject to change.
The Funds are not FDIC insured and are not guaranteed. It is possible to lose the principal amount invested.
Mutual fund advisory services provided by Delaware Management Company, a series of Delaware Management Business Trust, which is a registered investment advisor. Delaware Investments, a member of Macquarie Group, refers to Delaware Management Holdings, Inc. and its subsidiaries, including the Funds’ distributor, Delaware Distributors, L.P. Macquarie Group refers to Macquarie Group Limited and its subsidiaries and affiliates worldwide.
All third-party marks cited are the property of their respective owners.
© 2017 Delaware Management Holdings, Inc.
Table of Contents
April 11, 2017 (Unaudited)
Performance review (for the year ended March 31, 2017) | ||||||
Optimum Fixed Income Fund (Institutional Class shares) | 1-year return | +2.40% | ||||
Optimum Fixed Income Fund (Class A shares) | 1-year return | +2.03% | ||||
Bloomberg Barclays US Aggregate Index* (benchmark) | 1-year return | +0.44% |
Past performance does not guarantee future results.
For complete, annualized performance for Optimum Fixed Income Fund, please see the table on page 19.
Institutional Class shares are available without sales or asset-based distribution charges only to certain eligible institutional accounts. The performance of Class A shares excludes the applicable sales charge. Both Institutional Class shares and Class A shares reflect the reinvestment of all distributions.
Please see page 21 for a description of the index. Index performance returns do not reflect any management fees, transaction costs, or expenses. Indices are unmanaged and one cannot invest directly in an index.
*Formerly, the Barclays US Aggregate Index.
Advisor
Delaware Management Company (DMC)
Sub-advisor
Pacific Investment Management Company LLC (PIMCO)
Market overview
After a rocky start to the Fund’s fiscal year ended March 31, 2017, markets calmed as oil prices rebounded and concerns over a slowdown in China’s growth began to subside. However, the outcome of the United Kingdom’s “Brexit” referendum led to a decline in global sovereign yields, which fell to all-time lows in July 2016, and a brief selloff of risk assets. However, markets quickly shook off the unexpected Brexit results and equity prices hit new highs while volatility eased.
Donald Trump’s surprise victory in the US presidential election dominated news at the end of 2016. Most markets focused on the pro-growth and inflationary potential for expansionary fiscal policy as domestic equities rallied, credit spreads tightened, interest rates rose as bonds sold off, and inflation expectations jumped. The potential for growth-enhancing policies –– including infrastructure spending, tax reform, and deregulation –– along with solid economic data helped seal the US Federal Reserve’s interest rate hike in December 2016. Risk assets generally performed well and emerging market assets rebounded despite geopolitical tensions. Market volatility remained low as equity prices rose and credit spreads tightened.
A rise in confidence and optimism for economic growth marked the end of the Fund’s fiscal year. Despite US policy uncertainty, surprises in the run-up to French elections and a Fed rate hike in March 2017, risk assets continued to rebound as credit spreads tightened, US equities set new highs, and emerging markets outperformed.
Data source: Bloomberg
Fund performance
For the fiscal year, Optimum Fixed Income Fund outperformed its benchmark index, the Bloomberg Barclays US Aggregate Index. Both the DMC and PIMCO intermediate-term components of the Fund outpaced their benchmark, the Bloomberg Barclays US Aggregate Index. DMC’s floating-rate component outpaced its internal benchmark, the BofA Merrill Lynch US Dollar 3-Month Deposit Offered Rate Constant Maturity Index, while PIMCO’s low duration component outperformed its internal benchmark, the BofA Merrill Lynch 1-3 Year US Treasury Index. The following remarks describe factors that affected relative performance within the Fund’s respective portions.
DMC
Note: The portfolio-level discussion presented below appears in two sections. The first covers DMC ’s portion of the Fund that focused on a multisector, intermediate-term strategy, while the second covers its portion that focused on a short duration, floating rate strategy.
Intermediate-term component
For the fiscal year ended March 31, 2017, DMC’s fixed-rate intermediate-term portion of Optimum Fixed Income Fund returned +3.27% (before expenses) and outperformed the Fund’s benchmark, the Bloomberg Barclays US Aggregate Index, which returned +0.44% for the same period.
In this portion of the Fund, DMC’s emerging market allocation, averaging roughly 9% during the fiscal year, generated strong gains (9.2%), contributing 79 basis points (one basis point is one-hundredth of a percentage point) to index-relative returns. (All return references are before expenses.) A key decision to add to quasi-sovereign, oil-sensitive names aided performance for the fiscal year. Mexican exposure hurt performance after the US election, as Mexico was often targeted in the Trump campaign’s trade promises.
Investments in the bank loan sector, with an average portfolio allocation of 8% during the fiscal year, contributed to relative returns for DMC’s intermediate-term portion of the Fund. DMC’s bank loan
| (continues) | 1 |
Table of Contents
Portfolio management reviews
Optimum Fixed Income Fund
holdings returned 8.2%, in sharp contrast to the Bloomberg Barclays US Aggregate Index return of 0.44%. Floating-rate bank loans added 61 basis points of index-relative gains. This subportfolio underperformed the S&P/LSTA Leveraged Loan Index return of 9.7%.
Investments in traditional high yield bonds, which averaged a 6% allocation in DMC’s portion of the Fund during the fiscal year, contributed to performance with an 8.7% return. This subsector trailed the BofA Merrill Lynch BB-B Rated US High Yield Index’s 13.8% return. Important sector exposures for high yield investments included media, healthcare, and technology companies, and the leisure area. This portion of the Fund had an underweight to both the energy and mining sectors, which saw significant returns.
Collateralized mortgage obligation (CMO) investments contributed to performance relative to the benchmark for DMC’s intermediate-term portion of the Fund. Specifically, the CMO basket earned 2.4%, beating both the Bloomberg Barclays US Aggregate Index and the Bloomberg Barclays US Mortgage-Backed Securities (MBS) Index (+0.17%). For its CMO investments, DMC used a barbell strategy that combines interest-only and inverse interest-only investments, coupled with longer-duration sequential and planned amortization class (PAC) tranches.
Detractors from performance included positioning within the energy sector as well as curve positioning. More specifically, DMC’s conservative posture within energy and the underweight exposure for some of 2016 led to relative underperformance in DMC’s intermediate-term portion of the Fund. Additionally, the significant yield and curve move in the fourth quarter of 2016 created performance drags. Attractive new-issue corporate and curve placement led DMC to concentrate exposure in the 5- to 10-year maturity space. This placement was very sensitive to fourth-quarter interest movements. While these factors hurt performance, the investment grade corporate investments in DMC’s intermediate-term portion play an important role in its income advantage over the Bloomberg Barclays US Aggregate Index.
Floating-rate component
In managing its short duration, floating-rate portion of the Fund, DMC focuses on a diversified group of floating-rate securities. For the fiscal year, the floating-rate portion of the Fund returned +4.75% (before expenses), outperforming DMC’s internal benchmark, the BofA Merrill Lynch US Dollar 3-Month Deposit Offered Rate Constant Maturity Index, which returned +0.74% for the same period.
Investment grade credit which made up 52% of the floating-rate portion of the Fund was its largest contributor to performance. With a total return of 4.0% (all returns are before expenses), investment grade credit contributed more than 200 basis points to performance for DMC’s floating-rate portion of the Fund, outperforming the BofA Merrill Lynch US Dollar 3-Month Deposit Offered Rate Index. All four
of the portfolio’s major investment grade sectors –– industrial, financial, utility, and noncorporate –– outperformed the BofA Merrill Lynch US Dollar 3-Month Deposit Offered Rate Constant Maturity Index.
Industrial securities (at 24% of this portion of the Fund on average during the fiscal year) returned 3.8% for the fiscal period. The strongest-performing industrials were General Electric, Exxon Mobil, and Conoco Phillips, an oil exploration and services company. Financials (18% allocation) returned 5.3%. Banks contributed significantly to performance, led by PNC, Wells Fargo, and Goldman Sachs. The utility sector (4% allocation) and noncorporate sector (6% allocation) returned 3.4% and 1.5%, respectively.
Bank loans, at 31% of this portion of the Fund on average during the fiscal year, were the second largest sector allocation in DMC’s floating-rate portion of the Fund. DMC’s bank loan holdings returned 7.0% and outperformed the BofA Merrill Lynch US Dollar 3-Month Deposit Offered Rate Constant Maturity Index, contributing more than 200 basis points to overall performance for DMC’s floating-rate component of the Fund. Leading contributors among bank loans were Russell Investments, FMG Resources, a mining company, and Gardner Denver, a machinery manufacturer. The average quality of the bank loans during the fiscal year was Ba3, relatively high quality within the sector. DMC continued to find the bank loans’ floating-rate coupons an attractive alternative to fixed-rate securities.
Over the course of the year, lower-quality assets generally outperformed higher quality assets. Sectors such as bank loans, high yield, and emerging markets posted strong returns for this portion of the Fund. High yield and emerging markets securities each made up about a 1% allocation to DMC’s floating-rate component, and returned (before expenses) 13.7% and 10.1%, respectively.
Structured credit, which averaged about a 13% allocation, outperformed 3-month London interbank offered rate (Libor) returns. Asset-backed securities (ABS), which averaged about a 10% allocation during the fiscal year, outpaced the BofA Merrill Lynch US Dollar 3-Month Deposit Offered Rate Constant Maturity Index with a return of 1.3%. The ABS exposure was primarily in nonresidential ABS, including credit cards and autos, which generally provide high-quality liquidity and income. Collateralized loan obligations (CLOs), at a 3% allocation, returned 3.3%, outperforming both the BofA Merrill Lynch US Dollar 3-Month Deposit Offered Rate Constant Maturity Index and DMC’s ABS holdings. CLO holdings continue to be senior in the capital structure and carry an AAA rating.
DMC uses derivatives such as interest rate swaps to hedge the duration of fixed-rate bonds within its floating-rate portion of the Fund. As interest rates rose and swap spreads widened, these interest rate hedges benefited the portfolio. As swap spreads
| 2 |
Table of Contents
widened, paying fixed on an interest rate swap was a more effective hedge than selling Treasury futures.
DMC used interest rate swaps to hedge its fixed-rate bonds with a duration of 2.5 years and longer, to maintain an overall DMC portfolio duration of roughly 0.25 years. DMC also initiated a credit hedge at fiscal year end to attempt to protect the Fund against potential spread volatility. This hedge did not have a significant effect on performance.
PIMCO
Note: The portfolio-level discussion presented below appears in two sections. The first covers PIMCO’s portion of the Fund that focused on an intermediate-term strategy, while the second covers its portion that focused on a low duration strategy.
Intermediate-term component
The intermediate-term component of PIMCO’s portion of the Fund returned +3.19% (before expenses) and outperformed its benchmark, the Bloomberg Barclays US Aggregate Index, which returned +0.44% for the same period.
Interest rate strategies detracted from performance for PIMCO’s intermediate-term portion of the Fund. US yield curve positioning, specifically a focus on intermediate rates, hurt performance as intermediate yields rose the most. Short exposure to UK duration also detracted from performance as UK yields fell.
Spread sector strategies were positive for returns overall. Exposure to nonagency mortgages, high yield credit, and holding US Treasury inflation-protected securities (TIPS) in lieu of nominal Treasurys added to performance as these sectors outperformed like-duration Treasurys. An underweight to strong-performing investment grade credit hurt performance. Lastly, holdings of taxable municipals and emerging market external debt added to returns.
Currency positioning contributed to performance for PIMCO’s portion of the Fund. Modest exposure to the Brazilian real added to returns as the real appreciated against the US dollar. A long-dollar bias versus the British pound also helped results as the pound depreciated.
While US fundamentals remain solid, international demand should still weigh on US interest rates. Because PIMCO believes the extent of the US interest rate move relative to other developed markets may be overdone, this portion of the Fund remains modestly overweight to US duration.
Low duration component
The low duration component of PIMCO’s portion of the Fund returned +3.69% (before expenses) and outperformed PIMCO’s internal benchmark, the BofA Merrill Lynch 1–3 Year US Treasury Index, which returned +0.25% for the same period.
Interest rate strategies were positive for PIMCO’s low duration portion of the Fund. An underweight to US duration added to performance as US Treasury yields rose. Outside of the United States, an allocation to front-end core European and Australian rates contributed to returns as short rates in these regions fell.
Non-US interest rate strategies, including short exposure to UK duration and modest exposure to Mexican local rates, modestly detracted from performance for PIMCO’s portion of the Fund, as UK yields fell while Mexican local yields rose during the fiscal period.
Spread sector strategies also added to results for PIMCO’s portion of the Fund. Exposure to investment grade credit and high yield credit added to performance as these securities outperformed like-duration Treasurys. An allocation to nonagency mortgages and emerging market external debt also contributed to returns.
Currency positioning likewise contributed. A long-dollar position against the Australian and Canadian dollars was positive for returns as these currencies depreciated. However, short exposure to the Japanese yen, which appreciated, partially offset this.
At the end of the fiscal year, PIMCO’s low duration component of the Fund remained underweight to US duration in light of potential volatility as the Fed continues its hiking cycle. However, the portfolio maintains neutral overall duration with its underweight to US duration offset by exposure to countries that benefit from supportive monetary policy, including Germany, France, and Australia.
The use of money market and government futures, currency forwards, options, and credit default swaps did not have a material effect on performance during the fiscal year within either component of PIMCO’s portion of the Fund.
PIMCO’s use of interest rate swaps to underweight the long end of the US yield curve resulted in short exposure to swap rates in its intermediate-term portion of the Fund. This aided performance as swap rates underperformed Treasury rates.
| (continues) | 3 |
Table of Contents
Portfolio management reviews
April 11, 2017 (Unaudited)
| Performance review (for the year ended March 31, 2017) | ||||||
Optimum International Fund (Institutional Class shares)* | 1-year return | +14.18% | ||||
Optimum International Fund (Class A shares)* | 1-year return | +13.91% | ||||
MSCI EAFE Index (gross) (benchmark) | 1-year return | +12.25% | ||||
MSCI EAFE Index (net) (benchmark) | 1-year return | +11.67% |
Past performance does not guarantee future results.
For complete, annualized performance for Optimum International Fund, please see the table on page 23.
Institutional Class shares are available without sales or asset-based distribution charges only to certain eligible institutional accounts. The performance of Class A shares excludes the applicable sales charge. Both Institutional Class shares and Class A shares reflect the reinvestment of all distributions.
Please see page 24 for a description of the index. Index performance returns do not reflect any management fees, transaction costs, or expenses. Indices are unmanaged and one cannot invest directly in an index.
*Total returns for the report period presented in the table differ from the returns in “Financial highlights.” The total returns presented in the above table are calculated based on the net asset value (NAV) at which shareholder transactions were processed. The total returns presented in “Financial highlights” are calculated in the same manner, but also take into account certain adjustments that are necessary under US generally accepted accounting principles (US GAAP) required in the annual report.
Advisor
Delaware Management Company (DMC)
Sub-advisors
Acadian Asset Management LLC (Acadian) EARNEST Partners LLC (EARNEST)
Market overview
International equity markets rebounded during the Fund’s fiscal year ended March 31, 2017. Emerging markets and US equity markets also posted strong absolute returns. International markets, as represented by the MSCI ACWI (All Country World Index) ex USA Index returned +13.13% (net), and developed markets, as represented by the MSCI EAFE Index, returned +11.67% (net) for the fiscal year. Emerging markets, as represented by the MSCI Emerging Markets Index, and the large-cap sector of the US market, as represented by the Russell 1000® Index, returned +17.21% (net) and +17.43%, respectively.
Three key drivers strongly influenced equity market performance during the Fund’s fiscal year: mounting political uncertainty in Europe following the United Kingdom’s vote to leave the European Union; the election of Donald Trump as US president; and ongoing divergence in major central-bank policies. Investors paid close attention to the US Federal Reserve during the fiscal year in anticipation of rate hikes, and the Fed responded in kind. Amid signs of a strengthening economy, the Federal Open Market Committee raised interest rates by 0.25 percentage points, once in December 2016 and again in March 2017, signaling the possibility of further hikes in 2017. The European Central Bank stated that it would taper
bond purchases beginning in April 2017, but that its quantitative easing measures would continue until at least the end of 2017.
Despite bouts of volatility and risks from US dollar strength and higher interest rates, indications of more stable growth in many economies underpinned emerging markets. Over the past several years, concerns about commodity price fluctuations, central bank activity, and political uncertainty drove emerging market equities to historically low valuations relative to developed markets. At the end of the Fund’s fiscal year, emerging market valuations were still near historic lows relative to their developed counterparts, but investors’ confidence in these emerging economies appeared to be growing.
Data source: Bloomberg
Fund performance
For the fiscal year, Optimum International Fund outperformed its benchmark, the MSCI EAFE Index (net). Acadian’s portion of the Fund turned in a positive performance, largely the result of country allocations. Strong stock selection across developed markets contributed to EARNEST’s relative outperformance for its portion of the Fund.
Acadian
Stock selection in France and Denmark, along with opportunistic stock positioning in Indonesia and Korea, drove relative outperformance of Acadian’s portion of the Fund during the fiscal year. Stock selection in Switzerland and Germany detracted from the Fund’s performance, as did the combined effects of stock selection and a market underweight in Australia.
Acadian’s overweight position in the information technology sector yielded strong results for its portion of the Fund. Many companies in
| 4 |
Table of Contents
this sector consistently reported earnings that exceeded market expectations. Acadian’s underweight allocation in consumer staples also contributed to outperformance for its portion of the Fund. Particularly after the US presidential election, companies in the consumer staples sector appeared to lose favor with investors, who seemed to gravitate toward more cyclical, higher-risk sectors.
Acadian’s underweight in the financial sector detracted from its portion of the Fund; many stocks within this sector rallied late in the fiscal period on prospects of looser industry regulations. Acadian’s overweight position in the healthcare sector also detracted from performance for its portion of the Fund. New US tax inversion rules, along with public outcries over substantial drug price increases, hurt many healthcare companies.
Samsung and STMicroelectronics were leading contributors for Acadian’s portion of the Fund. Shares of Samsung jumped after the Korean electronics and digital media producer reported a considerable increase in second-quarter operating profits, boosted by strong sales of its Galaxy S7 smartphone. STMicroelectronics, based in Geneva, is one of the world’s largest producers of semiconductors. The company’s shares rose after its president and CEO reaffirmed STMicroelectronics’ focus on organic growth and reported that all business units were contributing to its bottom line.
Galenica and Qantas Airways were detractors for Acadian’s portion of the Fund. Galenica, the leading fully integrated healthcare provider in Switzerland, operates the largest network of pharmacies in Switzerland and manufactures drugs and beauty products. Galenica’s shares tumbled after it agreed to purchase US biopharmaceutical producer Relypsa at a substantial premium. At the end of the Fund’s fiscal year, Acadian continued to hold Galenica in its portion of the Fund. Positive indications from Acadian’s price to intrinsic asset value, management behavior, and signals of smart investor activity contributed to Acadian’s confidence in Galenica’s stock.
Qantas, the Australian air carrier, saw its shares decline after it announced a cut in its domestic expansion plans. The company cited uncertainty ahead of Australia’s federal elections and a drop in consumer sentiment as the rationale for its decision. Qantas remained a portfolio holding in Acadian’s portion of the Fund at the close of the fiscal year, owing primarily to what Acadian views as the stock’s favorable valuation and quality characteristics.
As of the end of the Fund’s fiscal year, Acadian’s largest overweight positions compared to the benchmark at the country level were Japan and Israel. Its portion of the Fund also held significant opportunistic exposures to Canada and Indonesia. France, the United Kingdom, Germany, and Australia were Acadian’s largest underweight positions relative to the benchmark in its portion of the Fund. At the sector level, Acadian held overweights in information technology and healthcare, while underweighting financials.
EARNEST
During the Fund’s fiscal year, strong stock selection across developed markets contributed to EARNEST’s relative outperformance in its portion of the Fund. EARNEST’s stock selection in the information technology and financial sectors accounted for a material portion of its outperformance during the fiscal year. Its relative overweight to the healthcare sector and underweight to industrials posed minor headwinds during the fiscal period and detracted from relative performance in its portion of the Fund.
EARNEST’s portion of the Fund held an average weighting of 74% to developed markets and an average weighting of 26% to emerging markets during the fiscal year.
EARNEST’s two Asian emerging market holdings helped drive outperformance for its portion of the Fund: Advanced Semiconductor Engineering and Shanghai Fosun Pharmaceutical Group. Based in Taiwan, Advanced Semiconductor Engineering is the world’s largest provider of semiconductor packaging and testing services. In 2016, the company continued driving margin expansion. The company’s ability to deliver profitable services to a wide range of clients led investors to reward the stock during the fiscal year.
Shanghai Fosun Pharmaceutical Group is a leading Chinese healthcare company. Manufacturing both generic drugs and Chinese traditional medicines generates the bulk of the company’s revenues. During the fiscal period, Fosun Pharmaceutical Group seemed relatively insulated from the pessimism surrounding drug pricing by some of the largest global drug manufacturers. The local traditional medicines that the company produces lifted revenues ahead of consensus; it continued to post a strong performance against its peers.
Sweden-based Getinge and Czech Republic-based Komercní banka were two EARNEST holdings that detracted from performance for its portion of the Fund. Getinge is a medical device manufacturer that serves the global healthcare industry. Due to currency fluctuations and political uncertainty, the company experienced some pressure on sales during the year. Despite its top-line miss, Getinge continued to drive organic growth during the year on the back of higher demand for its acute care therapies. EARNEST’s view is that, as currency fluctuations level out over time, the company may be well positioned to benefit from strong demand for its products and systems. EARNEST held Getinge in its portion of the Fund at the end of the fiscal year.
Based in the Czech Republic, Komercní banka provides commercial and retail financial banking through its more than 350 branch offices servicing approximately 1.5 million customers. While the stock traded down during the fiscal year, EARNEST continued to hold the company in its portion of the Fund at the end of the fiscal year, based on what
| (continues) | 5 |
Table of Contents
Portfolio management reviews
Optimum International Fund
it views as its attractive fundamentals. Komercní banka has generally shown resilience during past economic shocks and remained profitable during the global financial crisis. The company maintains a higher-than-average net interest margin and operates in a jurisdiction that seems to be relatively underpenetrated.
As of the end of the Fund’s fiscal year, EARNEST held sector overweights in consumer discretionary, energy, financials, healthcare, and information technology and underweights in consumer staples, industrials, materials, real estate, telecommunications, and utilities. These relative overweight and underweight positions compared to the benchmark are an outgrowth of where EARNEST perceives individual opportunities.
Overall, Optimum International Fund used derivatives, including foreign currency exchange contracts, during the fiscal year. However, these had a minimal effect on performance.
| 6 |
Table of Contents
April 11, 2017 (Unaudited)
Performance review (for the year ended March 31, 2017) | ||||||
Optimum Large Cap Growth Fund (Institutional Class shares) | 1-year return | +17.14% | ||||
Optimum Large Cap Growth Fund (Class A shares) | 1-year return | +16.83% | ||||
Russell 1000® Growth Index (benchmark) | 1-year return | +15.76% |
Past performance does not guarantee future results.
For complete, annualized performance for Optimum Large Cap Growth Fund, please see the table on page 26.
Institutional Class shares are available without sales or asset-based distribution charges only to certain eligible institutional accounts. The performance of Class A shares excludes the applicable sales charge. Both Institutional Class shares and Class A shares reflect the reinvestment of all distributions.
Please see page 27 for a description of the index. Index performance returns do not reflect any management fees, transaction costs, or expenses. Indices are unmanaged and one cannot invest directly in an index.
Advisor
Delaware Management Company (DMC)
Sub-advisors
Fred Alger Management, Inc. (Alger)
T. Rowe Price Associates, Inc. (T. Rowe Price)
Market overview
The large-cap equity markets experienced several distinct phases during the fiscal year ended March 31, 2017. In the opening months, investors seeking yield in a low interest rate environment turned to the consumer staples, telecommunications, and utilities sectors in search of stocks with high dividend yields. Those purchases were largely funded by sales of high-quality growth stocks in the healthcare and technology sectors. As economic growth improved, however, interest rates rose and investors once again began focusing on operating fundamentals, innovation, and growth.
Market dynamics changed dramatically in early November 2016 with the surprising election of Donald Trump as president. Given the pro-business, pro-growth policies the incoming administration espoused — including fewer regulations, tax-code revisions, and increased infrastructure spending investors sought companies in the energy, materials, and industrials sectors that they believed stood to benefit. Again, high-growth, high-quality companies underperformed.
The post-election rally lasted into the beginning of 2017. For the first time in two years, growth companies reported two consecutive periods of growth, underlining the strength of both the economy and company fundamentals. Then in March, the Trump administration failed to secure a vote for its proposed replacement for the Affordable Care Act (ACA), calling into question the likelihood that the rest of its agenda could be implemented. Again investors reacted, rotating back into quality growth-oriented companies.
Data source: Bloomberg
Fund performance
Optimum Large Cap Growth Fund outperformed its benchmark, the Russell 1000 Growth Index, for the Fund’s fiscal year. Sector allocation was the most significant contributor to performance in Alger’s portion of the Fund, while stock selection was the main contributor to performance in T. Rowe Price’s portion of the Fund. Contributions from the consumer staples sector benefited both Alger and T. Rowe Price. Information technology factored in both portions of the Fund, contributing to Alger’s portion of the Fund and detracting from T. Rowe Price’s portion. Shares of Amazon.com contributed to performance for Alger and T. Rowe Price, while shares of Allergan was a performance detractor for both sub-advisors during the Fund’s fiscal year.
Alger
With its strategy of investing in companies undergoing what it views as “positive dynamic change,” Alger seeks what it believes are high-quality, domestic growth stocks that have the potential to generate strong earnings growth and free cash flow. Both sector allocation and stock selection were responsible for outperformance in Alger’s portion of the Fund.
The consumer staples and information technology sectors were the leading contributors to performance in Alger’s portion of the Fund. The consumer staples group outperformed the benchmark, benefiting from both a relative underweight and strong stock selection. Technology was the second strongest sector on an absolute basis in this portion of the Fund, and Alger’s overweight relative to the benchmark benefited performance.
In both the industrials and materials sectors, weak stock selection could not overcome underweight allocations. Each sector underperformed the benchmark and detracted from performance in Alger’s portion of the Fund. Alger underweighted these cyclical sectors due to its philosophy of investing in growth companies undergoing rapid growth and positive dynamic change.
| (continues) | 7 |
Table of Contents
Portfolio management reviews
Optimum Large Cap Growth Fund
Amazon.com, the world’s leading ecommerce company, was a significant contributor to performance in Alger’s portion of the Fund. The company’s ecommerce platform continues to take share from brick-and-mortar retailing. The product variety, ease of use, and consistency of quality have increased customer satisfaction and driven growth. Additionally, the company is disrupting another trillion-dollar addressable market opportunity with its web hosting business, Amazon Web Services (AWS). This solution provides cloud and information technology services for entire business enterprises to support technology infrastructure throughout their migration to the cloud. Given Amazon.com’s strength in both ecommerce and web service, Alger believes the company could be well positioned for sustained growth.
Apple, another performance contributor to Alger’s portion of the Fund, is a leading technology provider in telecommunications, computing, and services. Apple’s iOS operating system is the company’s unique intellectual property and competitive advantage. This software drives tight engagement with captive consumers and enterprises. The company has benefited from steady subscriber growth and an expanding user base in the iOS ecosystem. Additionally, Alger believes the prospect of a significant new product cycle could drive further revenue acceleration and profit potential.
Allergan, a leading performance detractor from Alger’s portion of the Fund, manufactures and distributes pharmaceuticals globally. The company has a diversified product portfolio in key therapeutic areas including aesthetics and dermatology, central nervous system, women’s health and urology, gastroenterology, cardiovascular disease, and other infectious diseases. Shares of the company sold off as investors digested management’s lowered earnings guidance in the wake of the government’s ruling against the proposed Pfizer merger. The guidance revision induced a less favorable view of management’s ability to execute efficiently and deploy capital effectively. Given the company’s product pipeline and attractive relative valuation, Alger continues to hold shares of Allergan in its portion of the Fund, although it has trimmed the position’s size.
Norwegian Cruise Lines, is the third-largest cruise operator globally and currently operates the youngest fleet in the industry. Shares detracted from performance for Alger’s portion of the Fund as terror incidents in 2016 seemed to spook investors and sparked concerns about market demand. Alger sold its shares in Norwegian Cruise Lines during the Fund’s fiscal year.
T. Rowe Price
In general, T. Rowe Price invests in stocks of large-capitalization companies with one or more of the following characteristics: strong cash flow and an above-average rate of earnings growth; the ability to sustain earnings momentum during economic downturns; and occupation of a lucrative niche in the economy with the ability to expand even during times of slow economic growth. Overall, stock
selection was the primary reason for relative outperformance in T. Rowe Price’s portion of the Fund. Sector weighting was also positive.
In the T. Rowe Price portion of the Fund, the consumer discretionary sector was the leading outperformer relative to the benchmark, driven by stock selection that more than overcame an unfavorable overweighting. Financials also outperformed, mainly on stock selection. In contrast, consumer staples outperformed due to a significant underweighting against the benchmark.
Information technology was the largest detractor in T. Rowe Price’s portion of the Fund due to poor stock selection that more than offset a favorable overweighting to the sector, which was the strongest performer in the benchmark. T. Rowe Price’s healthcare names also underperformed the benchmark due to stock selection.
Amazon.com was a leading contributor to performance in T. Rowe Price’s portion of the Fund. The company’s shares traded higher as Amazon.com continues to innovate and branch out with early-stage initiatives that include apparel, pay TV, and a highly automated physical grocery store concept. While its “Prime” service is attracting new customers to the company’s dominant ecommerce platform, it is also actively promoting higher customer retention and greater usage among active members. Strong growth in third-party fulfillment represents a positive addition to its lower-margin retail business.
Priceline Group contributed to performance in T. Rowe Price’s portion of the Fund, as the online travel agency continued to generate strong earnings. The most-recent quarterly results came in well ahead of consensus analyst expectations and previously issued guidance.
Morgan Stanley also contributed to the T. Rowe Price portion of the Fund as its shares traded higher along with the broader financials sector during the fourth quarter of 2016. In addition to tailwinds from higher interest rates, the firm saw improvement in fixed income, currencies, and commodities activity. Following the election, asset managers also got a boost based on expectations that the US Labor Department’s fiduciary rule could be rolled back under the Trump administration.
While shares of Alphabet lagged during the fiscal year and weighed on performance, the stock remains a top holding and high-conviction idea for T. Rowe Price. Recent results continue to confirm T. Rowe Price’s belief that the company remains well positioned to continue capturing share of traditional advertising dollars.
Allergan also detracted from performance in T. Rowe Price’s portion of the Fund. Its shares declined early in the year when its proposed merger with Pfizer was called off, the result of the US Treasury Department’s issuing a notice aimed at curbing the benefits of tax inversions. While T. Rowe Price maintains a constructive view, it subsequently trimmed its Allergan position and continues to monitor
| 8 |
Table of Contents
competitive pressures on the company’s dry-eye medication Restasis and sales growth of its Alzheimer’s treatment Namenda.
Shares of Bristol-Myers Squibb fell as disappointing clinical trial results for its drug treatment Opdivo were a major setback for the company. While its Opdivo and Yervoy combination could eventually succeed in the longer term as a more efficacious regimen in lung
cancer, Merck now enjoys a substantial lead with its competing immuno-oncology treatment.
Overall, Optimum Large Cap Growth Fund used derivatives, including foreign currency exchange contracts, during the fiscal year. However, these had a minimal effect on performance.
| (continues) | 9 |
Table of Contents
Portfolio management reviews
April 11, 2017 (Unaudited)
Performance review (for the year ended March 31, 2017) | ||||||
Optimum Large Cap Value Fund (Institutional Class shares) | 1-year return | +15.30% | ||||
Optimum Large Cap Value Fund (Class A shares) | 1-year return | +14.99% | ||||
Russell 1000® Value Index (benchmark) | 1-year return | +19.22% |
Past performance does not guarantee future results.
For complete, annualized performance for Optimum Large Cap Value Fund, please see the table on page 29.
Institutional Class shares are available without sales or asset-based distribution charges only to certain eligible institutional accounts. The performance of Class A shares excludes the applicable sales charge. Both Institutional Class shares and Class A shares reflect the reinvestment of all distributions.
Please see page 30 for a description of the index. Index performance returns do not reflect any management fees, transaction costs, or expenses. Indices are unmanaged and one cannot invest directly in an index.
Advisor
Delaware Management Company (DMC)
Sub-advisors
Massachusetts Financial Services Company (MFS)
Rothschild Asset Management Inc. (Rothschild)
The Board of the Trustees of the Fund approved the appointment of Rothschild Asset Management Inc. (Rothschild) as a sub-advisor to the Fund during the fiscal year. Rothschild replaced Herndon Capital Management, LLC (Herndon) as a sub-advisor to Optimum Large Cap Value Fund. Please see the supplement to the Fund’s prospectus, dated Sept. 27, 2016, for more information.
Market overview
During the Fund’s fiscal year ended March 31, 2017, market confidence rose in the United States upon completion of a historically turbulent election cycle. With the incoming Trump administration came an expectation of lower taxes, a lighter regulatory burden, and increased infrastructure spending. Global growth improved during much of the fiscal year as oil prices recovered from their earlier plunge and fiscal and monetary stimulus from China took hold.
Meanwhile, toward the end of the fiscal period, the Federal Open Market Committee (FOMC) increased the federal funds rate by 0.25 percentage points. It was the third such move since December 2015. Globally, however, central bank policy remained highly accommodative, which forced many government bond yields —and even some corporate yields — into negative territory.
Headwinds from lower energy and commodity prices abated during the Fund’s fiscal year as stabilizing oil prices helped push energy earnings higher relative to expectations. A sharp rise in the US dollar was an earnings headwind for multinationals earlier in the fiscal period, but has since subsided. US consumer spending held up well during the second half of the Fund’s fiscal year amid a modest increase in real wages and relatively low gasoline prices. Demand for
autos also reached near-record territory, while the housing market continued to recover.
Overseas, the United Kingdom voted to leave the European Union (EU) early in the fiscal year. While markets initially reacted to the vote with alarm, the spillover to European and emerging market economies was relatively short-lived. Global trade, which was sluggish early in the fiscal period, showed signs of improvement in the second half.
Data source: Bloomberg
Fund performance
For the fiscal year ended March 31, 2017, Optimum Large Cap Value Fund underperformed its benchmark, the Russell 1000 Value Index. MFS’s portion of the Fund reported a healthy absolute return for the fiscal period; however, weak stock selection within several sectors contributed to trailing relative performance. Herndon’s portion of the Fund underperformed the benchmark for the period it managed the Fund. The lion’s share of Herndon’s underperformance occurred during the beginning months of the fiscal year which favored defensive, income-oriented investing. Rothschild’s portion of the Fund slightly underperformed the benchmark for the portion of the fiscal period it managed the Fund. Financials and healthcare contributed to Rothschild’s portion of the Fund; however, real estate and telecommunication services detracted from performance.
MFS
MFS managed its portion of the Fund for the entire fiscal year. Several holdings that were not represented within the Russell 1000 Value benchmark hampered performance for its portion of the Fund. These included chemical company, PPG Industries (basic materials sector), ground delivery service company United Parcel Service (transportation sector), consulting firm Accenture (special products and services sector), branded consumer foods producer General Mills (consumer staples sector), and marketing and communications company Omnicom Group (consumer discretionary sector).
| 10 |
Table of Contents
Other performance detractors stemmed from overweight positions in drugstore retailer CVS Health and beauty products manufacturer Coty.
Within the retail area, CVS Health weighed on MFS’s performance for its portion of the Fund. Despite CVS Health reporting results throughout the fiscal year that were generally in line with or better than expectations, concerns about the prospects for its pharmacy benefits management business weighed on its share price. Several high-profile customer losses, as well as the potential for increased regulatory scrutiny and uncertainty prior to the US presidential election, seemed to add to investors’ concerns. CVS Health may stand to benefit from corporate tax reform; however, news that the company’s retail business could face more significant headwinds than expected from network losses heading into 2017 caused the company to lower its projected earnings and further pressured its share price.
Relative performance was also hindered somewhat by a lack of exposure to benchmark index holdings which included diversified financial services firms Bank of America and Morgan Stanley. The Fund’s overweight position in insurance provider Travelers Companies further crimped relative returns.
In addition, the rotation into higher-beta (higher-risk) areas of the market during the second half of 2016, particularly following the US presidential election, presented relative performance headwinds for MFS’s high-quality strategy.
Underweight allocations to the utilities and communications and energy sectors contributed to relative performance. Not owning telecommunications giant AT&T within the utilities and communications sector benefited the MFS portion of the Fund. Within the energy sector, an underweight position in integrated oil and gas company Exxon Mobil also helped boost relative returns.
Strong stock selection in the industrial goods and services sector further aided relative returns. In particular, not owning shares of diversified industrial conglomerate General Electric supported relative results.
Other relative contributors included overweight positions in financial services firms JPMorgan Chase and Goldman Sachs Group. Holdings of semiconductor company Texas Instruments, which is not represented within the benchmark, boosted relative returns as did not owning software giant Microsoft. Overweight positions in medical device maker St. Jude Medical and diversified financial services firm PNC Financial Services Group contributed to relative performance as did not owning global auto maker Ford Motor.
Herndon
Herndon managed its portion of the Fund from April 1, 2016 to Oct. 3, 2016, when the management of the sleeve was transitioned to Rothschild.
The Herndon process includes income components but not enough to maintain pace with a market that was dominated by income investing at the beginning of the Fund’s fiscal year. In July through September, the Herndon strategy outperformed as the potency of income-related factors waned.
The largest performance detractors came from the energy sector. Overweight exposure to refining and marketing, when coupled with Herndon’s lack of exposure to other companies more positively correlated to oil, hurt the portfolio’s opportunity to participate in the run-up in oil prices.
The technology and utilities sectors offered the greatest contribution to return for Herndon’s portion of the Fund. Within technology, Hewlett Packard Enterprise, Western Digital, and HP Inc. all enjoyed positive returns as sentiment improved during the third quarter. Also, Herndon’s overweight position in the technology sector benefited performance. Within utilities, Herndon found only one opportunity in AES. AES outperformed the sector return, and Herndon’s underweight position in that sector contributed to relative performance for its portion of the Fund.
The energy and healthcare sectors were the largest detractors for Herndon’s portion of the Fund. As mentioned previously, Herndon’s positioning within the energy sector was out of favor as the refiners, where the portfolio was primarily focused, struggled to generate share returns. Holdings in refiners Tesoro, Valero Energy, and Oceaneering weighed on performance. In healthcare, Mylan and Gilead Sciences detracted from performance. Mylan’s product, EpiPen, became embroiled in a public relations firestorm over whether the company sacrificed access for higher prices. Gilead Sciences shares suffered due to declining revenues in the company’s Hepatitis C franchise.
Additionally, S&P Global enjoyed positive performance as the market became more optimistic on debt issuance. As the urgency mounts for corporations and sovereignties to issue debt before interest rates move higher, the revenue opportunities for rating agencies also improve.
Meanwhile, Waddell & Reed detracted from performance. Waddell & Reed, an asset manager, suffered management turnover that caused significant client outflows.
Rothschild
Rothschild managed its portion of the Fund from Oct. 13, 2016 to March 31, 2017. During the shortened period, Rothschild slightly underperformed the benchmark Russell 1000 Value Index.
| (continues) | 11 |
Table of Contents
Portfolio management reviews
Optimum Large Cap Value Fund
From a sector perspective, financials and healthcare led Rothschild’s portion of the Fund higher. Financials benefited both from rising interest rates and hopes of deregulation. The strongest contributors for Rothschild’s portion of the Fund included Bank of America, which gained more than 50% during the period when Rothschild managed its portion of the Fund, due to perceptions of its being the prime beneficiary of higher interest rates among the money-center banks. The bank also executed well on its cost-savings initiatives, which should drive further efficiency gains.
Similarly, healthcare performed well for Rothschild’s portion of the Fund, as fears over drug pricing declined. Although animal healthcare stock VCA was a strong performer within the Fund, in January 2017, Rothschild sold the shares following a $93-a-share takeout offer from Mars.
While the real estate and telecommunication services were laggards for Rothschild’s portion of the Fund, all sectors finished in positive territory for the period that it managed the Fund. Real estate and telecommunications moderated, as investors’ prior thirst for yield seemed to abate due to rising interest rates and concerns over valuations.
Detractors in Rothschild’s portion of the Fund included Antero Resources, which suffered as natural gas prices plummeted. Rothschild trimmed the shares in late February 2017, as winter’s end lowered the chances of an upward move in natural gas pricing. Tyson Foods reported a disappointing quarter and reduced financial guidance for the rest of the year as chicken margins were pressured.
Qualcomm declined in the wake of a lawsuit filed by its largest customer, Apple, which claimed that the equipment maker charged it
too much for its wireless patents. Given the significant decline in Qualcomm’s stock following the lawsuit, Rothschild believes that a negative outcome has already been priced in and continues to hold the stock.
As of the end of the Fund’s fiscal year, Rothschild is slightly overweighting the materials sector, holding positions in steel-producer Nucor and Dow Chemical, the latter of which Rothschild believes could leverage possible synergies as part of its proposed merger with DuPont.
Rothschild’s portfolio is also slightly overweight within the consumer services sector where Rothschild is particularly impressed with Comcast’s strong execution, ongoing broadband and small business success, and ability to maintain pricing power.
While Rothschild’s portion of the Fund holds an underweight position within some financial subsectors, such as insurers, it also holds an overweight position relative to others, such as banks, which have demonstrated decent loan growth and could potentially benefit if interest rates continue to rise.
While Rothschild takes a bottom-up (stock by stock) investment approach, its team is also cognizant of market-expected macro drivers that must be considered. As a result, Rothschild believes it is important to follow a balanced investment approach that can help minimize or limit the macro-factor risks facing the market.
Overall, Optimum Large Cap Value Fund used derivatives, including foreign currency exchange contracts, during the fiscal year. However, these had a minimal effect on performance.
| 12 |
Table of Contents
Optimum Small-Mid Cap Growth Fund
April 11, 2017 (Unaudited)
Performance review (for the year ended March 31, 2017) | ||||||
Optimum Small-Mid Cap Growth Fund (Institutional Class shares) | 1-year return | +21.80% | ||||
Optimum Small-Mid Cap Growth Fund (Class A shares) | 1-year return | +21.55% | ||||
Russell 2500™ Growth Index (benchmark) | 1-year return | +19.77% |
Past performance does not guarantee future results.
For complete, annualized performance for Optimum Small-Mid Cap Growth Fund, please see the table on page 32.
Institutional Class shares are available without sales or asset-based distribution charges only to certain eligible institutional accounts. The performance of Class A shares excludes the applicable sales charge. Both Institutional Class shares and Class A shares reflect the reinvestment of all distributions.
Please see page 33 for a description of the index. Index performance returns do not reflect any management fees, transaction costs, or expenses. Indices are unmanaged and one cannot invest directly in an index.
Advisor
Delaware Management Company (DMC)
Sub-advisors
Columbia Circle Investors (CCI)
Peregrine Capital Management, LLC (Peregrine)
Market overview
The Fund’s fiscal year ended March 31, 2017 fell into pre- and post-election parts. The period from April 2016 through the first week of November was characterized by continued, mostly steady growth. A sustained rally fueled by the pro-business agenda of the incoming Trump administration marked the rest of the Fund’s fiscal year.
In the months leading up to the US presidential election, the markets sensed a political undertone that was generally unfavorable towards business, in spite of the many economic indicators that argued otherwise. Energy prices rose, manufacturing data improved, housing markets were robust, new jobs were being created, and unemployment declined. These improvements led the US Federal Reserve to raise interest rates by 0.25 percentage points twice, once in December 2016 and the again March 2017.
The markets reacted immediately to the election results, sparking a rally that was fueled by the promise of reduced regulation, lower taxes, and infrastructure projects. Where high-growth, secular companies in technology and healthcare had been strong performers in the opening months of the Fund’s fiscal year, the post-election rally favored value-oriented cyclicals in energy, industrials, and materials.
In the closing weeks of the fiscal year — as the new administration confronted challenges to its agenda, including the failure of a replacement for the Affordable Care Act (ACA) to receive a vote in Congress — the post-election rally seemed to slow down.
With interest rates rising, investors once again began investing in industries with strong secular growth rates.
Data source: Bloomberg
Fund performance
Optimum Small-Mid Cap Growth Fund outperformed its benchmark, the Russell 2500 Growth Index, during the Fund’s fiscal year, largely as a result of overweight allocations in the information technology and consumer staples sectors by both sub-advisors. The strong growth-orientation in both sub-advisors’ portions of the Fund detracted from relative performance.
CCI
CCI’s portion of the Fund outperformed the Russell 2500 Growth Index for the fiscal year. Stock selection in the technology sector contributed to relative outperformance, led by individual stocks such as Nvidia, Micron Technology, and Mobileye. Overweight allocations in the healthcare and consumer staples sectors and the absence of holdings in the real estate sector also contributed to performance in CCI’s portion of the Fund. Adverse stock selection in consumer discretionary and an underweight in industrials, especially after the election, detracted from performance.
CCI uses a growth-oriented, investment philosophy of “positive momentum and positive surprise” in which CCI strives to invest in what it views as good companies getting stronger and in companies whose fundamentals are exceeding investor expectations. While remaining consistent to its discipline, CCI sought greater exposure to industrials after the election in an effort to take advantage of the rally that was fueled by the new administration’s pro-business policies and the potential for fiscal stimulus.
Idexx Laboratories was the leading contributor to performance in CCI’s portion of the Fund. The company, which historically had used third parties to distribute consumables for its veterinary diagnostic equipment, successfully initiated its own direct distribution to
| (continues) | 13 |
Table of Contents
Portfolio management reviews
Optimum Small-Mid Cap Growth Fund
veterinary clinics, increasing its profit margin and adding to its competitive edge against new entrants. The new business model, increased support from its customers, and the development of new products resulted in stronger-than-expected financial results.
Shares of Nvidia, a designer of high speed processors used for graphics and other computationally intensive applications, rose sharply as strong demand driven by the video game cycle coincided with data centers’ demand for faster processors. Additionally, the potential for use in self-driving cars, artificial intelligence, and virtual and augmented reality applications captured investors’ attention. Nvidia’s stock reached a market capitalization of more than $40 billion, which was nearly 10 times higher than the weighted average market capitalization for the Russell 2500 Growth Index. Clearly, this made Nvidia a large capitalization stock. For this reason, CCI sold the stock in October 2016.
Pacira Pharmaceuticals was the leading detractor from performance in CCI’s portion of the Fund. The company, which makes an extended duration pain killer for use in surgical incisions, suffered as revenues grew less rapidly than expected. Although the company successfully contested an FDA attack on its marketing practices, revenues failed to resume growth with the vigor that many had anticipated. CCI exited its position during the fiscal year.
Banc of California was another disappointing stock. Purchased for the potential benefit that could accrue from interest rate increases, CCI sold the stock because of the Fed’s delay in normalizing interest rates. Questions concerning management’s integrity also contributed to the decision to sell.
At the end of the Fund’s fiscal year, CCI’s portion of the Fund was most overweight the consumer discretionary sector, led by leisure and entertainment stocks such as cruise lines and ski resorts, which have benefited from stronger economic activity and higher consumer confidence. It was also overweight the technology sector, though less so than before, as CCI sold its shares in Mobileye after its acquisition by Intel was announced. Within technology, CCI owned a variety of display and semiconductor related stocks as well as companies that help automate production. CCI was most underweight in the real estate sector (which may suffer from rising interest rates) and industrials (which include a variety of service companies that CCI has found little interest in).
Peregrine
Peregrine’s portion of the Fund outperformed the Russell 2500 Growth Index as a result of both favorable stock selection and sector allocation. In financials, strong stock selection and an overweight in the sector drove outperformance. Strength in semiconductors and software drove strong returns in technology. Consumer staples, a smaller weight in the Fund’s portfolio, was also a sector that contributed to returns. Technology and consumer staples were two
sectors in Peregrine’s portfolio that ran into significant headwinds during the post-election rally, though they seemed to show signs of recovering in the latter months of the Fund’s fiscal year. Consumer discretionary was a key detractor for Peregrine, led by shifting consumer spending patterns that have affected growth stocks in the sector.
Peregrine focuses its research on companies experiencing high growth and significant fundamental change that have the potential for dramatic stock price appreciation.
SVB Financial Group was a strong contributor to relative performance in Peregrine’s portion of the Fund. SVB Financial Group is a diversified financial holdings company based in Santa Clara, Calif. It is a preferred lender to many technology, healthcare, and other high-growth companies in the region. Demand for loans in recent years has enabled the company to profitably deploy its significantly underleveraged balance sheet. Throughout the Fund’s fiscal year, a combination of continued strong results in a rising interest rate environment drove strong relative returns for the company.
A strong contributor in the technology sector, Shopify, offers a turnkey antidote to what has ailed many retailers in recent years. Shopify’s leading cloud-based and multichannel commerce platform enables small-to-medium businesses to seamlessly and cost-effectively build and manage an online business. Managing the many disparate functions of the online shopping process, from payments to inventory and order management, Shopify has been an outsized beneficiary of businesses moving to sell online.
A detractor in Peregrine’s portion of the Fund, consumer discretionary company Houghton Mifflin Harcourt, is a leader in educational content and services to more than 50 million K-12 students worldwide. The company has undergone a significant change in its distribution model from legacy textbooks to digital content. Although adoption of digital content is inevitable within education, its rate of adoption has been difficult to predict on a quarterly basis. This dynamic, coupled with a management change in the middle of the Fund’s fiscal year, negatively affected the company’s share price. After a series of disappointments and a CEO change, Peregrine believes the company is undervalued and presents a favorable risk-reward opportunity. Peregrine continues to hold Houghton Mifflin Harcourt in its portion of the Fund.
Rubicon Project, a technology company, also detracted from performance for Peregrine’s portion of the Fund. Rubicon Project provides a real-time automated bidding platform for buyers and sellers of on-line advertising. A $9 billion market, real-time bidding eliminates many of the inefficiencies in the legacy ad-buying process. Despite strong competition, the company had demonstrated its capabilities and achieved strong growth prior to technical issues
| 14 |
Table of Contents
arising in August of 2016 that raised questions about the long-term growth prospects for Rubicon Project. Peregrine exited the position during the Fund’s fiscal year.
Overall, Optimum Small-Mid Cap Growth Fund used derivatives, including foreign currency exchange contracts, during the fiscal year. However, these had a minimal effect on performance.
| (continues) | 15 |
Table of Contents
Portfolio management reviews
Optimum Small-Mid Cap Value Fund
April 11, 2017 (Unaudited)
Performance review (for the year ended March 31, 2017) | ||||||
Optimum Small-Mid Cap Value Fund (Institutional Class shares) | 1-year return | +20.05% | ||||
Optimum Small-Mid Cap Value Fund (Class A shares) | 1-year return | +19.84% | ||||
Russell 2500™ Value Index (benchmark) | 1-year return | +23.13% |
Past performance does not guarantee future results.
For complete, annualized performance for Optimum Small-Mid Cap Value Fund please see the table on page 35.
Institutional Class shares are available without sales or asset-based distribution charges only to certain eligible institutional accounts. The performance of Class A shares excludes the applicable sales charge. Both Institutional Class shares and Class A shares reflect the reinvestment of all distributions.
Please see page 36 for a description of the index. Index performance returns do not reflect any management fees, transaction costs, or expenses. Indices are unmanaged and one cannot invest directly in an index.
Advisor
Delaware Management Company (DMC)
Sub-advisors
LSV Asset Management (LSV)
Westwood Management Corp. (Westwood)
Market overview
During the Fund’s fiscal year ended March 31, 2017, several important shifts in the economic and investing landscape began to unfold. Fiscal policy, in the form of tax and regulatory reform, replaced monetary policy as the primary source of stimulus to push gross domestic product (GDP) higher. The markets ended the Fund’s fiscal year with strong absolute gains as risk-on rallies supported this growth outlook. These rallies drove the performance of small-cap value equities well in excess of large-cap value equities, distinctly favoring lower-quality companies and those more reliant on leverage.
The US economy saw continued employment gains and upticks in wage growth. The stock performance of consumer goods firms reflected the changing nature of consumer spending patterns. The US Federal Reserve raised the federal funds rate by 0.25 percentage points, once in December 2016 and again in March 2017, indicating that a normalization of monetary policy was warranted given the healthier state of the economy. Interest rates had bottomed out during the summer of 2016 but rose toward the end of the Fund’s fiscal year.
Renewed optimism post-US presidential election arose as a result of the possibility for fiscal action, given single party control of Congress and the White House. Crude oil prices rebounded as the Organization of the Petroleum Exporting Countries (OPEC) reduced its output. Continued drilling by domestic shale producers tempered those
gains, creating additional supply. Other economic indicators — particularly sentiment-oriented ones — remained strong and supportive of economic growth.
Data source: Bloomberg
Fund performance
Optimum Small-Mid Cap Value Fund underperformed its benchmark, the Russell 2500 Value Index, for the fiscal year. Westwood’s portion of the Fund trailed the benchmark primarily as a result of stock selection in the consumer discretionary and healthcare sectors. LSV’s portion of the Fund outperformed the benchmark, aided by its deeper value and smaller size biases as value stocks and smaller-cap stocks rallied.
Westwood
Westwood employs a consistent, disciplined approach that seeks to provide attractive risk-adjusted long-term returns while protecting capital during unfavorable market periods. The Fund’s fiscal year saw a risk-on rally that proved short lived. Prospects for rising interest rates and inflation resulted in declines in the broad equity market. As a result, Westwood’s underweight in the financial sector hurt relative performance for its portion of the Fund, despite absolute gains. Its underweight allocation in real estate provided some balance, however. Westwood continues to be optimistic, as it believes that company fundamentals — specifically cash flow and earnings growth — have increased overall.
Westwood’s consumer discretionary holdings faced a challenging landscape as unsteady consumer-spending patterns offset employment gains. Healthcare also faced headwinds as companies with a more recurring nature to their business saw their performance lag. Performance in the industrial sector, while strong in absolute terms, trailed primarily due to a negative development for Pitney Bowes.
| 16 |
Table of Contents
During the fiscal year, security selection in real estate and materials contributed to relative performance in Westwood’s portion of the Fund. Westwood’s holdings in the materials sector are characterized by high-quality businesses with attractive end-market exposures, including containerboard and lithium, but with limited commodity price risk. While rising interest rates limited the gains in the real estate sector, several holdings posted strong returns due to company specifics.
Pitney Bowes, Haemonetics, and Hanesbrands detracted from performance for Westwood’s portion of the Fund. Shares of Pitney Bowes declined as the company’s efforts in ecommerce gained traction, but were more than offset by headwinds in its small-medium business mailing area. Westwood sold the position during the fiscal year. Shares of Haemonetics moved lower due to a poor outlook for the company during the fiscal period. The company saw headwinds increase from pricing pressures in its red blood segment, as well as market share losses in Japan for the company’s platelet business. Westwood sold the position during the fiscal year.
Shares of Hanesbrands declined as the retailer’s sales growth was hurt by shifting consumer spending patterns, and lower orders from an important customer in the most recent quarter. Westwood continued to hold Hanesbrands at the end of the fiscal year, believing that its shares were attractively valued. Hanesbrands has a scale advantage as it is the global low-cost leader in basic apparel. This provides opportunities for Hanesbrands to improve its margins and capture additional market share as consumers’ purchases shift online. Acquisitions are another possible growth driver as management leverages its scale and efficiencies to add value.
Two strong contributors for Westwood’s portion of the Fund were Wintrust Financial and KapStone Paper and Packaging. Wintrust Financial’s mix of strong regional bank franchises and national specialty lending continued to perform at a high level, enabling the company to gain additional market share. KapStone Paper and Packaging saw a strong rebound in its share price due to solid performance at its mills. Rising containerboard prices helped offset cost and input inflation.
Westwood continues to consider opportunities as the economic landscape seems to shift from monetary policy to fiscal policy, disinflation to inflation, and to a focus on earnings growth forecasts. US business sentiment and indicators have improved markedly from the prior fiscal period; in Westwood’s view, the differentiation in company prospects should help further create a favorable backdrop for high-quality businesses. As interest rates and inflation increase, the rising cost of capital could further benefit businesses with pricing power, helping them offset inflationary pressures as profit margins expand.
Westwood has found transparent free cash flow generation that has historically driven long-term investment outperformance of its strategy in several areas, including domestic manufacturing and building products. Westwood believes this improvement should also help regional banks that may be poised to benefit from incremental loan growth, easing regulatory burdens, and rising interest rates. Westwood relies on its well-tested process of fundamental stock picking with a long-term view.
LSV
LSV’s portion of the Fund outpaced the Russell 2500 Value Index, aided by its deeper value and smaller size orientation relative to the benchmark, as value and smaller-cap stocks did particularly well during the Fund’s fiscal year.
Because LSV’s sector weights generally don’t differ much from the benchmark weight, sector allocations tend to have little effect on LSV’s relative performance. However, during the Fund’s fiscal year, they did contribute to performance for its portion of the Fund. Although overweight positions in consumer discretionary and telecommunications detracted from performance, an underweight to the real estate sector offset this underperformance. Stock selection contributed to performance overall: Stock selection was strong in the consumer discretionary, real estate, and telecommunications sectors, while holdings in the materials, energy, and industrials sectors detracted from performance for LSV’s portion of the Fund.
LSV’s portion of the Fund is broadly diversified, with 156 stocks at fiscal year end, limiting the effect of any single holding on performance. The two largest contributors during the Fund’s fiscal year were regional bank Hancock Holding Company and information technology services company NCR. Banks and technology companies performed well overall and these two holdings benefited particularly.
Detracting from performance for LSV’s portion of the Fund were oil refiner HollyFrontier and Kindred Healthcare. Oil refiner HollyFrontier saw its profit margins mostly squeezed early in the fiscal period. Oil refiners generally struggled relative to exploration companies, and HollyFrontier is perceived as less diversified and with weaker growth prospects than some of its peers, making it more vulnerable. The short-term environment may continue to be difficult for HollyFrontier but LSV’s investment model suggests investors may be underappreciating its growth potential. Although Kindred Healthcare has missed earnings estimates, LSV’s investment model ranking suggests the potential for stronger earnings in the long term. LSV’s portion of the Fund held both stocks at the end of the Fund’s fiscal year.
At the end of the fiscal year, LSV’s portion of the Fund was underweight energy, utilities, and real estate sectors compared to the
| (continues) | 17 |
Table of Contents
Portfolio management reviews
Optimum Small-Mid Cap Value Fund
benchmark and overweight consumer discretionary, industrials, consumer staples, and technology.
Overall, Optimum Small-Mid Cap Value Fund used derivatives, including foreign currency exchange contracts, during the fiscal year. However, these had a minimal effect on performance.
| 18 |
Table of Contents
| Optimum Fixed Income Fund | March 31, 2017 | |
(Unaudited) |
The performance data quoted represent past performance; past performance does not guarantee future results. Investment return and principal value will fluctuate so your shares, when redeemed, may be worth more or less than their original cost. Please obtain the performance data for the most recent month end by calling 800 914-0278 or visiting our website at optimummutualfunds.com/performance. Current performance may be lower or higher than the performance data quoted.
| Fund and benchmark performance1,2 | ||||||
| Average annual total returns through March 31, 2017 | 1 year | 5 years | 10 years | |||
Class A (Est. Aug. 1, 2003) | ||||||
Excluding sales charge | +2.03% | +1.90% | +4.41% | |||
Including sales charge | -2.55% | +0.96% | +3.92% | |||
Class C (Est. Aug. 1, 2003) | ||||||
Excluding sales charge | +1.27% | +1.15% | +3.70% | |||
Including sales charge | +0.27% | +1.15% | +3.70% | |||
Institutional Class (Est. Aug. 1, 2003) | ||||||
Excluding sales charge | +2.40% | +2.18% | +4.73% | |||
Including sales charge | +2.40% | +2.18% | +4.73% | |||
Bloomberg Barclays US Aggregate Index | +0.44% | +2.34% | +4.27% |
1Returns reflect the reinvestment of all distributions and are presented both with and without the applicable sales charges described below. Returns do not reflect the deduction of taxes the shareholder would pay on Fund distributions or redemptions of Fund shares.
Expense limitations were in effect for certain classes during some or all of the periods shown in the “Fund and benchmark performance” graph. The current expenses for each class are listed on the “Fund expense ratios” table below. Performance would have been lower had expense limitations not been in effect.
Institutional Class shares are available without sales or asset-based distribution charges only to certain eligible institutional accounts.
Class A shares are sold with a maximum front-end sales charge of 4.50%, and have an annual distribution and service fee of 0.25% of average daily net assets. Performance for Class A shares, excluding sales charges, assumes that no front-end sales charge applied.
Class C shares are sold with a contingent deferred sales charge of 1.00% if redeemed during the first 12 months. They are also subject to an annual distribution and service fee of 1.00% of average daily net assets.
Performance for Class C shares, excluding sales charges, assumes either that contingent deferred sales charges did not apply or that the investment was not redeemed.
The “Fund and benchmark performance” table and the “Performance of a $10,000 investment” graph do not reflect the deduction of taxes the shareholder would pay on Fund distributions or redemptions of Fund shares.
2 The Fund’s expense ratios, as described in the most recent prospectus, are disclosed in the “Fund expense ratios” table on the next page. Delaware Management Company has agreed to reimburse certain expenses and/or waive certain fees in order to prevent total fund operating expenses (excluding any 12b-1 fees and certain other expenses) from exceeding 0.92% of the Fund’s average daily net assets from April 1, 2016, through March 31, 2017.* Please see the most recent prospectus and any applicable supplement(s) for additional information on these fee waivers and/or reimbursements.
| (continues) | 19 |
Table of Contents
Performance summaries
Optimum Fixed Income Fund
| Fund expense ratios | Class A | Class C | Institutional Class | |||
Total annual operating expenses (without fee waivers) | 1.17% | 1.92% | 0.92% | |||
Net expenses (including fee waivers, if any) | 1.17% | 1.92% | 0.92% | |||
Type of waiver | Contractual | Contractual | Contractual |
* The aggregate contractual waiver period covering this report is from July 29, 2015 to July 29, 2017.
Fixed income securities and bond funds can lose value, and investors can lose principal, as interest rates rise. They also may be affected by economic conditions that hinder an issuer’s ability to make interest and principal payments on its debt.
The Fund may also be subject to prepayment risk, the risk that the principal of a bond that is held by a portfolio will be prepaid prior to maturity, at the time when interest rates are lower than what the bond was paying. A portfolio may then have to reinvest that money at a lower interest rate.
Securities in the lowest of the rating categories considered to be investment grade (that is, Baa or BBB) have some speculative characteristics.
High yielding, non-investment-grade bonds (junk bonds) involve higher risk than investment grade bonds.
The high yield secondary market is particularly susceptible to liquidity problems when institutional investors, such as mutual funds and certain other financial institutions, temporarily stop buying bonds for regulatory, financial, or other reasons. In addition, a less liquid secondary market makes it more difficult for the Fund to obtain precise valuations of the high yield securities in its portfolio.
If and when we invest in forward foreign currency contracts or use other investments to hedge against currency risks, the Fund will be subject to special risks, including counterparty risk.
The Fund may invest in derivatives, which may involve additional expenses and are subject to risk, including the risk that an underlying security or securities index moves in the opposite direction from what the portfolio manager anticipated. A derivatives transaction depends upon the counterparties’ ability to fulfill their contractual obligations.
Portfolio turnover is a measure of how frequently the managers buy and sell assets within a fund over a particular period. It is usually reported for a 12-month time period.
| 20 |
Table of Contents
Performance of a $10,000 Investment1
Average annual total returns from March 31, 2007 through March 31, 2017
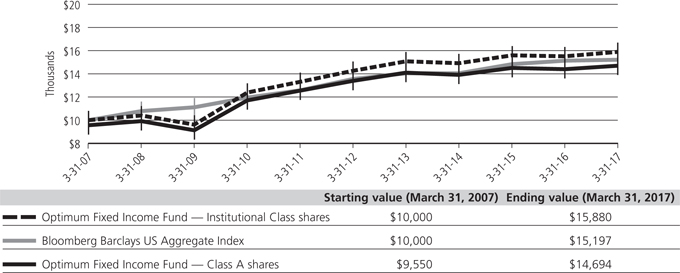
1The “Performance of $10,000 investment” graph assumes $10,000 invested in Class A and Institutional Class shares of the Fund on March 31, 2007, and includes the effect of a 4.50% front-end sales charge (for Class A shares) and the reinvestment of all distributions. The graph does not reflect the deduction of taxes the shareholders would pay on Fund distributions or redemptions of Fund shares. Expense limitations were in effect for some or all of the periods shown. Performance would have been lower had expense limitations not been in effect. Current expenses are listed in the “Fund expense ratios” table on page 20. Please note additional details on pages 19 through 22.
The graph also assumes $10,000 invested in the Bloomberg Barclays US Aggregate Index as of March 31, 2007. The Bloomberg Barclays US Aggregate Index (formerly known as the Barclays US Aggregate Index) measures the performance of publicly issued investment grade (Baa3/ BBB- or better) corporate, US government, mortgage- and asset-backed securities with at least one year to maturity and at least $250 million par amount outstanding.
The S&P/LSTA (Loan Syndications and Trading Association) Leveraged Loan Index, mentioned on page 2, is a broad index designed to reflect the market-value-weighted performance of US dollar-denominated institutional leveraged loans.
The BofA Merrill Lynch BB-B US High Yield Index, mentioned on page 2, tracks the performance of US dollar-denominated high yield corporate debt rated BB1 through B3 publicly issued in the US domestic market.
The Bloomberg Barclays US Mortgage-Backed Securities (MBS) Index, mentioned on pages 1 and 2, measures the performance of agency mortgage-backed pass-through securities (both fixed-rate and hybrid adjustable-rate mortgage) issued by the Federal National Mortgage Association (Fannie Mae), Federal Home Loan Mortgage Association (Freddie Mac), and Government National Mortgage Association (Ginnie Mae).
The BofA Merrill Lynch US Dollar 3-Month Deposit Offered Rate Constant Maturity Index, mentioned on pages 1 and 2, represents the London interbank offered rate (Libor) with a constant 3-month average maturity. Libor, published by the British Bankers’ Association, is a composite of the rates of interest at which banks borrow from one another in the London market, and it is a widely used benchmark for short-term interest rates.
The BofA Merrill Lynch 1–3 Year US Treasury Index, mentioned on pages 1 and 3, is composed of US Treasury notes and bonds with maturities of at least one year but less than three years. It does not include inflation-linked US government bonds.
Index performance returns do not reflect any management fees, transaction costs, or expenses. Indices are unmanaged and one cannot invest directly in an index. Past performance is not a guarantee of future results.
| (continues) | 21 |
Table of Contents
Performance summaries
Optimum Fixed Income Fund
Performance of other Fund classes will vary due to different charges and expenses.
| Stock symbols and CUSIP numbers | ||||
| Nasdaq symbols | CUSIPs | |||
| Class A | OAFIX | 246118681 | ||
| Class C | OCFIX | 246118665 | ||
| Institutional Class | OIFIX | 246118657 |
| 22 |
Table of Contents
| Optimum International Fund | March 31, 2017 | |
(Unaudited) |
The performance data quoted represent past performance; past performance does not guarantee future results. Investment return and principal value will fluctuate so your shares, when redeemed, may be worth more or less than their original cost. Please obtain the performance data for the most recent month end by calling 800 914-0278 or visiting our website at optimummutualfunds.com/performance. Current performance may be lower or higher than the performance data quoted.
| Fund and benchmark performance1,2 | ||||||
| Average annual total returns through March 31, 2017 | 1 year | 5 years | 10 years | |||
Class A (Est. Aug. 1, 2003) | ||||||
Excluding sales charge | +13.91%* | +4.68% | +0.10% | |||
Including sales charge | +7.34%* | +3.44% | –0.49% | |||
Class C (Est. Aug. 1, 2003) | ||||||
Excluding sales charge | +13.07%* | +3.92% | –0.59% | |||
Including sales charge | +12.07%* | +3.92% | –0.59% | |||
Institutional Class (Est. Aug. 1, 2003) | ||||||
Excluding sales charge | +14.18%* | +4.97% | +0.42% | |||
Including sales charge | +14.18%* | +4.97% | +0.42% | |||
MSCI EAFE Index (gross) | +12.25% | +6.32% | +1.53% | |||
MSCI EAFE Index (net) | +11.67% | +5.83% | +1.05% |
*Total returns for the report period presented in the table differ from the returns in “Financial highlights.” The total returns presented in the above table are calculated based on the net asset value (NAV) at which shareholder transactions were processed. The total returns presented in “Financial highlights” are calculated in the same manner, but also take into account certain adjustments that are necessary under US generally accepted accounting principles (US GAAP) required in the annual report.
1Returns reflect the reinvestment of all distributions and are presented both with and without the applicable sales charges described below. Returns do not reflect the deduction of taxes the shareholder would pay on Fund distributions or redemptions of Fund shares.
Expense limitations were in effect for certain classes during some or all of the periods shown in the “Fund and benchmark performance” graph. The current expenses for each class are listed on the “Fund expense ratios” table below. Performance would have been lower had expense limitations not been in effect.
Institutional Class shares are available without sales or asset-based distribution charges only to certain eligible institutional accounts.
Class A shares are sold with a maximum front-end sales charge of up to 5.75%, and have an annual distribution and service fee of up to 0.25% of average daily net assets. Performance for Class A shares, excluding sales charges, assumes that no front-end sales charge applied.
Class C shares are sold with a contingent deferred sales charge of 1.00% if redeemed during the first 12 months. They are also subject to an annual distribution and service fee of up to 1.00% of average daily net assets.
Performance for Class C shares, excluding sales charges, assumes either that contingent deferred sales charges did not apply or that the investment was not redeemed.
The “Fund and benchmark performance” table and the “Performance of a $10,000 investment” graph do not reflect the deduction of taxes the shareholder would pay on Fund distributions or redemptions of Fund shares.
2 The Fund’s expense ratios, as described in the most recent prospectus, are disclosed in the “Fund expense ratios” table on the next page. Delaware Management Company has agreed to reimburse certain expenses and/or waive certain fees in order to prevent total fund operating expenses (excluding any 12b-1 fees and certain other expenses) from exceeding 1.25% of the Fund’s average daily net assets from April 1, 2016, through March 31, 2017.* Please see the most recent prospectus and any applicable supplement(s) for additional information on these fee waivers and/or reimbursements.
| (continues) | 23 |
Table of Contents
Performance summaries
Optimum International Fund
| Fund expense ratios | Class A | Class C | Institutional Class | |||
Total annual operating expenses (without fee waivers) | 1.49% | 2.24% | 1.24% | |||
Net expenses (including fee waivers, if any) | 1.49% | 2.24% | 1.24% | |||
Type of waiver | Contractual | Contractual | Contractual |
* The aggregate contractual waiver period covering this report is from July 29, 2015 to July 29, 2017. Prior to July 29, 2016, the contractual waiver was 1.25%.
International investments entail risks not ordinarily associated with US investments including fluctuation in currency values, differences in accounting principles, or economic or political instability in other nations. Investing in emerging markets can be riskier than investing in established foreign markets due to increased volatility and lower trading volume.
The Funds may invest in derivatives, which may involve additional expenses and are subject to risk, including the risk that an underlying security or securities index moves in the opposite direction from what the portfolio manager anticipated. A derivative transaction depends upon the counterparties’ ability to fulfill their contractual obligations.
There is no guarantee that a dividend-paying stock will continue to pay dividends.
Performance of a $10,000 Investment1
Average annual total returns from March 31, 2007 through March 31, 2017
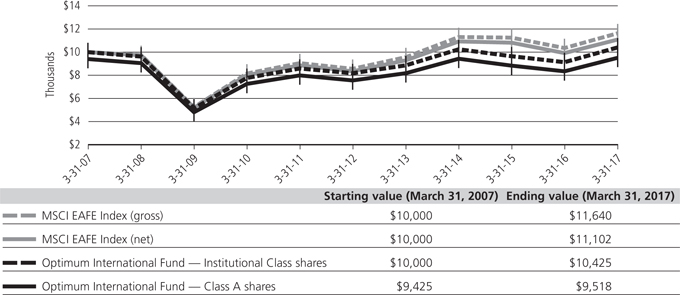
1The “Performance of $10,000 investment” graph assumes $10,000 invested in Class A and Institutional Class shares of the Fund on March 31, 2007, and includes the effect of a 5.75% front-end sales charge (for Class A shares) and the reinvestment of all distributions. The graph does not reflect the deduction of taxes the shareholders would pay on Fund distributions or redemptions of Fund shares. Expense limitations were in effect for some or all of the periods shown. Performance would have been lower had expense limitations not been in effect. Current expenses are listed in the “Fund expense ratios” table above. Please note additional details on pages 23 through 25.
The graph also assumes $10,000 invested in the MSCI EAFE Index as of March 31, 2007. The MSCI EAFE (Europe, Australasia, Far East) Index is a free float-adjusted market capitalization weighted index designed to measure equity market performance of developed markets, excluding the United States and Canada. Index “gross” return approximates the maximum possible dividend reinvestment. Index “net” return approximates the minimum possible dividend reinvestment, after deduction of withholding tax at the highest possible rate.
| 24 |
Table of Contents
The MSCI ACWI ex USA Index, mentioned on page 4, is a free float-adjusted market capitalization weighted index that is designed to measure equity market performance across developed and emerging markets worldwide, excluding the United States. Index “net” return approximates the minimum possible dividend reinvestment, after deduction of withholding tax at the highest possible rate.
The MSCI Emerging Markets Index, mentioned on page 4, is a free float-adjusted market capitalization index designed to measure equity market performance across emerging market countries worldwide. Index “net” return approximates the minimum possible dividend reinvestment, after deduction of withholding tax at the highest possible rate.
The Russell 1000 Index, mentioned on page 4, measures the performance of the large-cap segment of the US equity universe.
Russell Investment Group is the source and owner of the trademarks, service marks, and copyrights related to the Russell Indexes. Russell® is a trademark of Russell Investment Group.
Index performance returns do not reflect any management fees, transaction costs, or expenses. Indices are unmanaged and one cannot invest directly in an index. Past performance is not a guarantee of future results.
Performance of other Fund classes will vary due to different charges and expenses.
| Stock symbols and CUSIP numbers | ||||
| Nasdaq symbols | CUSIPs | |||
| Class A | OAIEX | 246118731 | ||
| Class C | OCIEX | 246118715 | ||
| Institutional Class | OIIEX | 246118699 |
| (continues) | 25 |
Table of Contents
Performance summaries
| Optimum Large Cap Growth Fund | March 31, 2017 | |
(Unaudited) |
The performance data quoted represent past performance; past performance does not guarantee future results. Investment return and principal value will fluctuate so your shares, when redeemed, may be worth more or less than their original cost. Please obtain the performance data for the most recent month end by calling 800 914-0278 or visiting our website at optimummutualfunds.com/performance. Current performance may be lower or higher than the performance data quoted.
| Fund and benchmark performance1,2 | ||||||||||||
| Average annual total returns through March 31, 2017 | 1 year | 5 years | 10 years | |||||||||
Class A (Est. Aug. 1, 2003) | ||||||||||||
Excluding sales charge | +16.83% | +12.55% | +7.63% | |||||||||
Including sales charge | +10.14% | +11.23% | +6.99% | |||||||||
Class C (Est. Aug. 1, 2003) | ||||||||||||
Excluding sales charge | +15.88% | +11.75% | +6.89% | |||||||||
Including sales charge | +14.88% | +11.75% | +6.89% | |||||||||
Institutional Class (Est. Aug. 1, 2003) | ||||||||||||
Excluding sales charge | +17.14% | +12.89% | +7.97% | |||||||||
Including sales charge | +17.14% | +12.89% | +7.97% | |||||||||
Russell 1000 Growth Index | +15.76% | +13.32% | +9.13% | |||||||||
1Returns reflect the reinvestment of all distributions and are presented both with and without the applicable sales charges described below. Returns do not reflect the deduction of taxes the shareholder would pay on Fund distributions or redemptions of Fund shares.
Expense limitations were in effect for certain classes during some or all of the periods shown in the “Fund and benchmark performance” graph. The current expenses for each class are listed on the “Fund expense ratios” table on the next page. Performance would have been lower had expense limitations not been in effect.
Institutional Class shares are available without sales or asset-based distribution charges only to certain eligible institutional accounts.
Class A shares are sold with a maximum front-end sales charge of 5.75%, and have an annual distribution and service fee of 0.25% of average daily net assets. Performance for Class A shares, excluding sales charges, assumes that no front-end sales charge applied.
Class C shares are sold with a contingent deferred sales charge of 1.00% if redeemed during the first 12 months. They are also subject to an annual distribution and service fee of 1.00% of average daily net assets.
Performance for Class C shares, excluding sales charges, assumes either that contingent deferred sales charges did not apply or that the investment was not redeemed.
The “Fund and benchmark performance” table and the “Performance of a $10,000 investment” graph do not reflect the deduction of taxes the shareholder would pay on Fund distributions or redemptions of Fund shares.
2 The Fund’s expense ratios, as described in the most recent prospectus, are disclosed in the “Fund expense ratios” table on the next page. Delaware Management Company has agreed to reimburse certain expenses and/or waive certain fees in order to prevent total fund operating expenses (excluding any 12b-1 fees and certain other expenses) from exceeding 1.10% of the Fund’s average daily net assets from April 1, 2016, through March 31, 2017.* Please see the most recent prospectus and any applicable supplement(s) for additional information on these fee waivers and/or reimbursements.
| 26 |
Table of Contents
| Fund expense ratios | Class A | Class C | Institutional Class | |||||||||
Total annual operating expenses | ||||||||||||
(without fee waivers) | 1.37% | 2.12% | 1.12% | |||||||||
Net expenses | ||||||||||||
(including fee waivers, if any) | 1.35% | 2.10% | 1.10% | |||||||||
Type of waiver | Contractual | Contractual | Contractual | |||||||||
* The aggregate contractual waiver period covering this report is from July 29, 2015 to July 29, 2017. Prior to July 29, 2016, the contractual waiver was 1.09%.
Narrowly focused investments may exhibit higher volatility than investments in multiple industry sectors.
REIT investments are subject to many of the risks associated with direct real estate ownership, including changes in economic conditions, credit risk, and interest rate fluctuations.
Performance of a $10,000 Investment1
Average annual total returns from March 31, 2007 through March 31, 2017
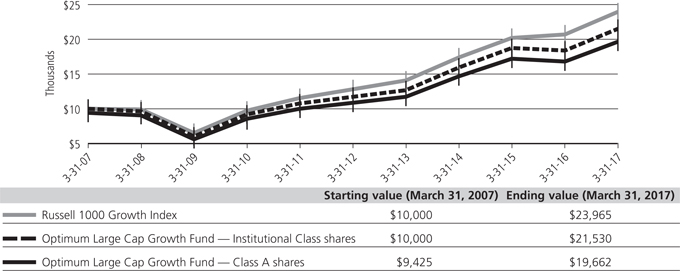
1The “Performance of $10,000 investment” graph assumes $10,000 invested in Class A and Institutional Class shares of the Fund on March 31, 2007, and includes the effect of a 5.75% front-end sales charge (for Class A shares) and the reinvestment of all distributions. The graph does not reflect the deduction of taxes the shareholders would pay on Fund distributions or redemptions of Fund shares. Expense limitations were in effect for some or all of the periods shown. Performance would have been lower had expense limitations not been in effect. Current expenses are listed in the “Fund expense ratios” table above. Please note additional details on pages 26 through 28.
The graph also assumes $10,000 invested in the Russell 1000 Growth Index as of March 31, 2007. The Russell 1000 Growth Index measures the performance of the large-cap growth segment of the US equity universe. It includes those Russell 1000 companies with higher price-to-book ratios and higher forecasted growth values.
Russell Investment Group is the source and owner of the trademarks, service marks, and copyrights related to the Russell Indexes. Russell® is a trademark of Russell Investment Group.
Index performance returns do not reflect any management fees, transaction costs, or expenses. Indices are unmanaged and one cannot invest directly in an index. Past performance is not a guarantee of future results.
Performance of other Fund classes will vary due to different charges and expenses.
| (continues) | 27 |
Table of Contents
Performance summaries
Optimum Large Cap Growth Fund
| Stock symbols and CUSIP numbers | ||||
| Nasdaq symbols | CUSIPs | |||
| Class A | OALGX | 246118707 | ||
| Class C | OCLGX | 246118889 | ||
| Institutional Class | OILGX | 246118871 |
28
Table of Contents
| Optimum Large Cap Value Fund | March 31, 2017 | |
(Unaudited) |
The performance data quoted represent past performance; past performance does not guarantee future results. Investment return and principal value will fluctuate so your shares, when redeemed, may be worth more or less than their original cost. Please obtain the performance data for the most recent month end by calling 800 914-0278 or visiting our website at optimummutualfunds.com/performance. Current performance may be lower or higher than the performance data quoted.
Fund and benchmark performance1,2 | ||||||||||||
Average annual total returns through March 31, 2017 | 1 year | 5 years | 10 years | |||||||||
Class A (Est. Aug. 1, 2003) | ||||||||||||
Excluding sales charge | +14.99% | +9.31% | +4.96% | |||||||||
Including sales charge | +8.40% | +8.01% | +4.34% | |||||||||
Class C (Est. Aug. 1, 2003) | ||||||||||||
Excluding sales charge | +14.13% | +8.55% | +4.25% | |||||||||
Including sales charge | +13.13% | +8.55% | +4.25% | |||||||||
Institutional Class (Est. Aug. 1, 2003) | ||||||||||||
Excluding sales charge | +15.30% | +9.63% | +5.30% | |||||||||
Including sales charge | +15.30% | +9.63% | +5.30% | |||||||||
Russell 1000 Value Index | +19.22% | +13.13% | +5.93% | |||||||||
1Returns reflect the reinvestment of all distributions and are presented both with and without the applicable sales charges described below. Returns do not reflect the deduction of taxes the shareholder would pay on Fund distributions or redemptions of Fund shares.
Expense limitations were in effect for certain classes during some or all of the periods shown in the “Fund and benchmark performance” graph. The current expenses for each class are listed on the “Fund expense ratios” table on the next page. Performance would have been lower had expense limitations not been in effect.
Institutional Class shares are available without sales or asset-based distribution charges only to certain eligible institutional accounts.
Class A shares are sold with a maximum front-end sales charge of up to 5.75%, and have an annual distribution and service fee of up to 0.25% of average daily net assets. Performance for Class A shares, excluding sales charges, assumes that no front-end sales charge applied.
Class C shares are sold with a contingent deferred sales charge of 1.00% if redeemed during the first 12 months. They are also subject to an annual distribution and service fee of up to 1.00% of average daily net assets.
Performance for Class C shares, excluding sales charges, assumes either that contingent deferred sales charges did not apply or that the investment was not redeemed.
The “Fund and benchmark performance” table and the “Performance of a $10,000 investment” graph do not reflect the deduction of taxes the shareholder would pay on Fund distributions or redemptions of Fund shares.
2 The Fund’s expense ratios, as described in the most recent prospectus, are disclosed in the “Fund expense ratios” table on the next page. Delaware Management Company has agreed to reimburse certain expenses and/or waive certain fees in order to prevent total fund operating expenses (excluding any 12b-1 fees and certain other expenses) from exceeding 1.08% of the Fund’s average daily net assets from April 1, 2016, through March 31, 2017.* Please see the most recent prospectus and any applicable supplement(s) for additional information on these fee waivers and/or reimbursements.
| (continues) | 29 |
Table of Contents
Performance summaries
Optimum Large Cap Value Fund
| Fund expense ratios | Class A | Class C | Institutional Class | |||||||||
Total annual operating expenses | ||||||||||||
(without fee waivers) | 1.34% | 2.09% | 1.09% | |||||||||
Net expenses | ||||||||||||
(including fee waivers, if any) | 1.33% | 2.08% | 1.08% | |||||||||
Type of waiver | Contractual | Contractual | Contractual | |||||||||
*The aggregate contractual waiver period covering this report is from July 29, 2015 to July 29, 2017. Prior to July 29, 2016, the contractual waiver was 1.08%.
Performance of a $10,000 Investment1
Average annual total returns from March 31, 2007 through March 31, 2017
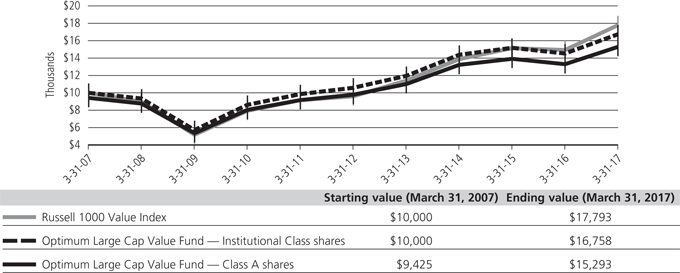
1The “Performance of $10,000 investment” graph assumes $10,000 invested in Class A and Institutional Class shares of the Fund on March 31, 2007, and includes the effect of a 5.75% front-end sales charge (for Class A shares) and the reinvestment of all distributions. The graph does not reflect the deduction of taxes the shareholders would pay on Fund distributions or redemptions of Fund shares. Expense limitations were in effect for some or all of the periods shown. Performance would have been lower had expense limitations not been in effect. Current expenses are listed in the “Fund expense ratios” table above. Please note additional details on pages 29 through 31.
The graph also assumes $10,000 invested in the Russell 1000 Value Index as of March 31, 2007. The Russell 1000 Value Index measures the performance of the large-cap value segment of the US equity universe. It includes those Russell 1000 companies with lower price-to-book ratios and lower forecasted growth values.
Russell Investment Group is the source and owner of the trademarks, service marks, and copyrights related to the Russell Indexes. Russell® is a trademark of Russell Investment Group.
Index performance returns do not reflect any management fees, transaction costs, or expenses. Indices are unmanaged and one cannot invest directly in an index. Past performance is not a guarantee of future results.
Performance of other Fund classes will vary due to different charges and expenses.
| 30 |
Table of Contents
| Stock symbols and CUSIP numbers | ||||
| Nasdaq symbols | CUSIPs | |||
| Class A | OALVX | 2461118863 | ||
| Class C | OCLVX | 2461118848 | ||
| Institutional Class | OILVX | 2461118830 |
| (continues) | 31 |
Table of Contents
Performance summaries
| Optimum Small-Mid Cap Growth Fund | March 31, 2017 | |
(Unaudited) |
The performance data quoted represent past performance; past performance does not guarantee future results. Investment return and principal value will fluctuate so your shares, when redeemed, may be worth more or less than their original cost. Please obtain the performance data for the most recent month end by calling 800 914-0278 or visiting our website at optimummutualfunds.com/performance. Current performance may be lower or higher than the performance data quoted.
| Fund and benchmark performance1,2 | ||||||||||||
| Average annual total returns through March 31, 2017 | 1 year | 5 years | 10 years | |||||||||
Class A (Est. Aug. 1, 2003) | ||||||||||||
Excluding sales charge | +21.55% | +8.56% | +4.59% | |||||||||
Including sales charge | +14.55% | +7.29% | +3.97% | |||||||||
Class C (Est. Aug. 1, 2003) | ||||||||||||
Excluding sales charge | +20.60% | +7.77% | +3.86% | |||||||||
Including sales charge | +19.60% | +7.77% | +3.86% | |||||||||
Institutional Class (Est. Aug. 1, 2003) | ||||||||||||
Excluding sales charge | +21.80% | +8.87% | +4.91% | |||||||||
Including sales charge | +21.80% | +8.87% | +4.91% | |||||||||
Russell 2500 Growth Index | +19.77% | +12.17% | +8.47% | |||||||||
1Returns reflect the reinvestment of all distributions and are presented both with and without the applicable sales charges described below. Returns do not reflect the deduction of taxes the shareholder would pay on Fund distributions or redemptions of Fund shares.
Expense limitations were in effect for certain classes during some or all of the periods shown in the “Fund and benchmark performance” graph. The current expenses for each class are listed on the “Fund expense ratios” table on the next page. Performance would have been lower had expense limitations not been in effect.
Institutional Class shares are available without sales or asset-based distribution charges only to certain eligible institutional accounts.
Class A shares are sold with a maximum front-end sales charge of 5.75%, and have an annual distribution and service fee of 0.25% of average daily net assets. Performance for Class A shares, excluding sales charges, assumes that no front-end sales charge applied.
Class C shares are sold with a contingent deferred sales charge of 1.00% if redeemed during the first 12 months. They are also subject to an annual distribution and service fee of 1.00% of average daily net assets.
Performance for Class C shares, excluding sales charges, assumes either that contingent deferred sales charges did not apply or that the investment was not redeemed.
The “Fund and benchmark performance” table and the “Performance of a $10,000 investment” graph do not reflect the deduction of taxes the shareholder would pay on Fund distributions or redemptions of Fund shares.
2 The Fund’s expense ratios, as described in the most recent prospectus, are disclosed in the “Fund expense ratios” table on the next page. Delaware Management Company has agreed to reimburse certain expenses and/or waive certain fees in order to prevent total fund operating expenses (excluding any 12b-1 fees and certain other expenses) from exceeding 1.33% of the Fund’s average daily net assets from April 1, 2016, through March 31, 2017.* Please see the most recent prospectus and any applicable supplement(s) for additional information on these fee waivers and/or reimbursements.
| 32 |
Table of Contents
| Fund expense ratios | Class A | Class C | Institutional Class | |||
Total annual operating expenses (without fee waivers) | 1.78% | 2.53% | 1.53% | |||
Net expenses (including fee waivers, if any) | 1.58% | 2.33% | 1.33% | |||
Type of waiver | Contractual | Contractual | Contractual |
*The aggregate contractual waiver period covering this report is from July 29, 2015 to July 29, 2017. Prior to July 29, 2016, the contractual waiver was 1.34%.
Investments in small and/or medium-sized companies typically exhibit greater risk and higher volatility than larger, more established companies.
Performance of a $10,000 Investment1
Average annual total returns from March 31, 2007 through March 31, 2017
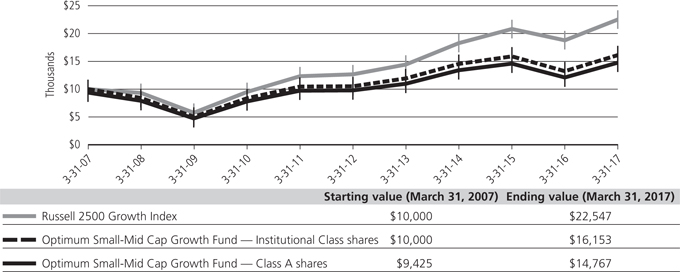
1The “Performance of $10,000 investment” graph assumes $10,000 invested in Class A and Institutional Class shares of the Fund on March 31, 2007, and includes the effect of a 5.75% front-end sales charge (for Class A shares) and the reinvestment of all distributions. The graph does not reflect the deduction of taxes the shareholders would pay on Fund distributions or redemptions of Fund shares. Expense limitations were in effect for some or all of the periods shown. Performance would have been lower had expense limitations not been in effect. Current expenses are listed in the “Fund expense ratios” table above. Please note additional details on pages 32 through 34.
The graph also assumes $10,000 invested in the Russell 2500 Growth Index as of March 31, 2007. The Russell 2500 Growth Index measures the performance of the small- to mid-cap growth segment of the US equity universe. It includes those Russell 2500 companies with higher price-to-book ratios and higher forecasted growth values.
Russell Investment Group is the source and owner of the trademarks, service marks, and copyrights related to the Russell Indexes. Russell® Investment Group.
Index performance returns do not reflect any management fees, transaction costs, or expenses. Indices are unmanaged and one cannot invest directly in an index. Past performance is not a guarantee of future results.
Performance of other Fund classes will vary due to different charges and expenses.
| (continues) | 33 |
Table of Contents
Performance summaries
Optimum Small-Mid Cap Growth Fund
| Stock symbols and CUSIP numbers | ||||
| Nasdaq symbols | CUSIPs | |||
| Class A | OASGX | 246118822 | ||
| Class C | OCSGX | 246118798 | ||
| Institutional Class | OISGX | 246118780 |
| 34 |
Table of Contents
| Optimum Small-Mid Cap Value Fund | March 31, 2017 | |
(Unaudited)
|
The performance data quoted represent past performance; past performance does not guarantee future results. Investment return and principal value will fluctuate so your shares, when redeemed, may be worth more or less than their original cost. Please obtain the performance data for the most recent month end by calling 800 914-0278 or visiting our website at optimummutualfunds.com/performance. Current performance may be lower or higher than the performance data quoted.
Fund and benchmark performance1,2
Average annual total returns through March 31, 2017 | 1 year | 5 years | 10 years | |||||||||
Class A (Est. Aug. 1, 2003) | ||||||||||||
Excluding sales charge | +19.84% | +7.65% | +4.04% | |||||||||
Including sales charge | +12.98% | +6.38% | +3.43% | |||||||||
Class C (Est. Aug. 1, 2003) | ||||||||||||
Excluding sales charge | +18.89% | +6.87% | +3.33% | |||||||||
Including sales charge | +17.89% | +6.87% | +3.33% | |||||||||
Institutional Class (Est. Aug. 1, 2003) | ||||||||||||
Excluding sales charge | +20.05% | +7.93% | +4.38% | |||||||||
Including sales charge | +20.05% | +7.93% | +4.38% | |||||||||
Russell 2500 Value Index | +23.13% | +12.92% | +6.79% | |||||||||
1Returns reflect the reinvestment of all distributions and are presented both with and without the applicable sales charges described below. Returns do not reflect the deduction of taxes the shareholder would pay on Fund distributions or redemptions of Fund shares.
Expense limitations were in effect for certain classes during some or all of the periods shown in the “Fund and benchmark performance” graph. The current expenses for each class are listed on the “Fund expense ratios” table on the next page. Performance would have been lower had expense limitations not been in effect.
Institutional Class shares are available without sales or asset-based distribution charges only to certain eligible institutional accounts.
Class A shares are sold with a maximum front-end sales charge of 5.75%, and have an annual distribution and service fee of 0.25% of average daily net assets. Performance for Class A shares, excluding sales charges, assumes that no front-end sales charge applied.
Class C shares are sold with a contingent deferred sales charge of 1.00% if redeemed during the first 12 months. They are also subject to an annual distribution and service fee of 1.00% of average daily net assets.
Performance for Class C shares, excluding sales charges, assumes either that contingent deferred sales charges did not apply or that the investment was not redeemed.
The “Fund and benchmark performance” table and the “Performance of a $10,000 investment” graph do not reflect the deduction of taxes the shareholder would pay on Fund distributions or redemptions of Fund shares.
2 The Fund’s expense ratios, as described in the most recent prospectus, are disclosed in the “Fund expense ratios” table on the next page. Delaware Management Company has agreed to reimburse certain expenses and/or waive certain fees in order to prevent total fund operating expenses (excluding any 12b-1 fees and certain other expenses) from exceeding 1.25% of the Fund’s average daily net assets from April 1, 2016, through March 31, 2017.* Please see the most recent prospectus and any applicable supplement(s) for additional information on these fee waivers and/or reimbursements.
| (continues) | 35 |
Table of Contents
Performance summaries
Optimum Small-Mid Cap Value Fund
Fund expense ratios | Class A | Class C | Institutional Class | |||
Total annual operating expenses (without fee waivers) | 1.69% | 2.44% | 1.44% | |||
Net expenses (including fee waivers, if any) | 1.50% | 2.25% | 1.25% | |||
Type of waiver | Contractual | Contractual | Contractual |
*The aggregate contractual waiver period covering this report is from July 29, 2015 to July 29, 2017. Prior to July 29, 2016, the contractual waiver was 1.27%.
Investing involves risk, including the possible loss of principal.
Investments in small and/or medium-sized companies typically exhibit greater risk and higher volatility than larger, more established companies.
Performance of a $10,000 Investment1
Average annual total returns from March 31, 2007 through March 31, 2017
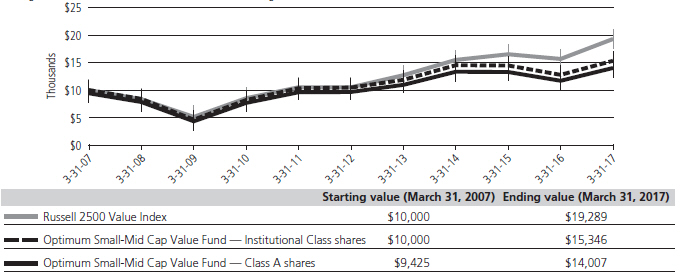
1The “Performance of $10,000 investment” graph assumes $10,000 invested in Class A and Institutional Class shares of the Fund on March 31, 2007, and includes the effect of a 5.75% front-end sales charge (for Class A shares) and the reinvestment of all distributions. The graph does not reflect the deduction of taxes the shareholders would pay on Fund distributions or redemptions of Fund shares. Expense limitations were in effect for some or all of the periods shown. Performance would have been lower had expense limitations not been in effect. Current expenses are listed in the “Fund expense ratios” table above. Please note additional details on pages 35 through 37.
The graph also assumes $10,000 invested in the Russell 2500 Value Index as of March 31, 2007. The Russell 2500 Value Index measures the performance of the small- to mid-cap value segment of the US equity universe. It includes those Russell 2500 companies with lower price-to-book ratios and lower forecasted growth values.
Russell Investment Group is the source and owner of the trademarks, service marks, and copyrights related to the Russell Index. Russell® is a trademark of Russell Investment Group.
Index performance returns do not reflect any management fees, transaction costs, or expenses. Indices are unmanaged and one cannot invest directly in an index. Past performance is not a guarantee of future results.
Performance of other Fund classes will vary due to different charges and expenses.
36
Table of Contents
| Stock symbols and CUSIP numbers | ||||
| Nasdaq symbols | CUSIPs | |||
| Class A | OASVX | 246118772 | ||
| Class C | OCSVX | 246118756 | ||
| Institutional Class | OISVX | 246118749 |
| (continues) | 37 |
Table of Contents
For the six-month period from October 1, 2016 to March 31, 2017 (Unaudited)
As a shareholder of a Fund, you incur two types of costs: (1) transaction costs, including sales charges (loads) on purchase payments, reinvested dividends, or other distributions; redemption fees; and exchange fees; and (2) ongoing costs, including management fees; distribution and/or service (12b-1) fees; and other Fund expenses. These following examples are intended to help you understand your ongoing costs (in dollars) of investing in a Fund and to compare these costs with the ongoing costs of investing in other mutual funds.
The examples are based on an investment of $1,000 invested at the beginning of the period and held for the entire six-month period from Oct. 1, 2016 to March 31, 2017.
Actual Expenses
The first section of the tables shown, “Actual Fund Return,” provides information about actual account values and actual expenses. You may use the information in this section of the table, together with the amount you invested, to estimate the expenses that you paid over the period. Simply divide your account value by $1,000 (for example, an $8,600 account value divided by $1,000 = 8.6), then multiply the result by the number in the first section under the heading entitled “Expenses Paid During Period” to estimate the expenses you paid on your account during this period.
Hypothetical Example for Comparison Purposes
The second section of the tables shown, “Hypothetical 5% Return,” provides information about hypothetical account values and hypothetical expenses based on the Funds’ actual expense ratios and an assumed rate of return of 5% per year before expenses, which is not the Funds’ actual return. The hypothetical account values and expenses may not be used to estimate the actual ending account balance or expenses you paid for the period. You may use this information to compare the ongoing costs of investing in a Fund and other funds. To do so, compare this 5% hypothetical example with the 5% hypothetical examples that appear in the shareholder reports of the other funds.
Please note that the expenses shown in the tables are meant to highlight your ongoing costs only and do not reflect any transactional costs, such as sales charges (loads), redemption fees, or exchange fees. Therefore, the second section of each table is useful in comparing ongoing costs only, and will not help you determine the relative total costs of owning different funds. In addition, if these transactional costs were included, your costs would have been higher. Each Fund’s expenses shown in the tables reflect fee waivers in effect. The expenses shown in each table assume reinvestment of all dividends and distributions.
Optimum Fixed Income Fund
Expense analysis of an investment of $1,000
| Beginning Account Value 10/1/16 | Ending Account Value 3/31/17 | Annualized Expense Ratio | Expenses Paid During Period 10/1/16 to 3/31/17* | |||||
| Actual Fund return† | ||||||||
Class A | $1,000.00 | $ 991.70 | 1.17% | $5.81 | ||||
Class C | 1,000.00 | 988.40 | 1.92% | 9.52 | ||||
Institutional Class | 1,000.00 | 993.30 | 0.92% | 4.57 | ||||
Hypothetical 5% return (5% return before expenses) | ||||||||
Class A | $1,000.00 | $1,019.10 | 1.17% | $5.89 | ||||
Class C | 1,000.00 | 1,015.36 | 1.92% | 9.65 | ||||
Institutional Class | 1,000.00 | 1,020.34 | 0.92% | 4.63 | ||||
Optimum International Fund
Expense analysis of an investment of $1,000
| Beginning Account Value 10/1/16 | Ending Account Value 3/31/17 | Annualized Expense Ratio | Expenses Paid During Period 10/1/16 to 3/31/17* | |||||
Actual Fund return† | ||||||||
Class A | $1,000.00 | $1,063.70 | 1.48% | $ 7.61 | ||||
Class C | 1,000.00 | 1,059.70 | 2.23% | 11.45 | ||||
Institutional Class | 1,000.00 | 1,064.90 | 1.23% | 6.33 | ||||
Hypothetical 5% return (5% return before expenses) | ||||||||
Class A | $1,000.00 | $1,017.55 | 1.48% | $ 7.44 | ||||
Class C | 1,000.00 | 1,013.81 | 2.23% | 11.20 | ||||
Institutional Class | 1,000.00 | 1,018.80 | 1.23% | 6.19 | ||||
38
Table of Contents
Optimum Large Cap Growth Fund
Expense analysis of an investment of $1,000
| Beginning Account Value 10/1/16 | Ending Account Value 3/31/17 | Annualized Expense Ratio | Expenses Paid During Period 10/1/16 to 3/31/17* | |||||
Actual Fund return† | ||||||||
Class A | $1,000.00 | $1,099.30 | 1.35% | $ 7.07 | ||||
Class C | 1,000.00 | 1,094.70 | 2.10% | 10.97 | ||||
Institutional Class | 1,000.00 | 1,100.80 | 1.10% | 5.76 | ||||
Hypothetical 5% return (5% return before expenses) | ||||||||
Class A | $1,000.00 | $1,018.20 | 1.35% | $ 6.79 | ||||
Class C | 1,000.00 | 1,014.46 | 2.10% | 10.55 | ||||
Institutional Class | 1,000.00 | 1,019.45 | 1.10% | 5.54 | ||||
Optimum Large Cap Value Fund
Expense analysis of an investment of $1,000
| Beginning Account Value 10/1/16 | Ending Account Value 3/31/17 | Annualized Expense Ratio | Expenses Paid During Period 10/1/16 to 3/31/17* | |||||
Actual Fund return† | ||||||||
Class A | $1,000.00 | $1,090.80 | 1.33% | $ 6.93 | ||||
Class C | 1,000.00 | 1,086.90 | 2.08% | 10.82 | ||||
Institutional Class | 1,000.00 | 1,092.50 | 1.08% | 5.63 | ||||
Hypothetical 5% return (5% return before expenses) | ||||||||
Class A | $1,000.00 | $1,018.30 | 1.33% | $ 6.69 | ||||
Class C | 1,000.00 | 1,014.56 | 2.08% | 10.45 | ||||
Institutional Class | 1,000.00 | 1,019.55 | 1.08% | 5.44 | ||||
Optimum Small-Mid Cap Growth Fund
Expense analysis of an investment of $1,000
| Beginning Account Value 10/1/16 | Ending Account Value 3/31/17 | Annualized Expense Ratio | Expenses Paid During Period 10/1/16 to 3/31/17* | |||||
Actual Fund return† | ||||||||
Class A | $1,000.00 | $1,099.10 | 1.58% | $ 8.27 | ||||
Class C | 1,000.00 | 1,094.40 | 2.33% | 12.17 | ||||
Institutional Class | 1,000.00 | 1,100.00 | 1.33% | 6.96 | ||||
Hypothetical 5% return (5% return before expenses) | ||||||||
Class A | $1,000.00 | $1,017.05 | 1.58% | $ 7.95 | ||||
Class C | 1,000.00 | 1,013.31 | 2.33% | 11.70 | ||||
Institutional Class | 1,000.00 | 1,018.30 | 1.33% | 6.69 | ||||
Optimum Small-Mid Cap Value Fund
Expense analysis of an investment of $1,000
| Beginning Account Value 10/1/16 | Ending Account Value 3/31/17 | Annualized Expense Ratio | Expenses Paid During Period 10/1/16 to 3/31/17* | |||||
Actual Fund return† | ||||||||
Class A | $1,000.00 | $1,124.30 | 1.50% | $ 7.94 | ||||
Class C | 1,000.00 | 1,120.20 | 2.25% | 11.89 | ||||
Institutional Class | 1,000.00 | 1,125.60 | 1.25% | 6.62 | ||||
Hypothetical 5% return (5% return before expenses) | ||||||||
Class A | $1,000.00 | $1,017.45 | 1.50% | $ 7.54 | ||||
Class C | 1,000.00 | 1,013.71 | 2.25% | 11.30 | ||||
Institutional Class | 1,000.00 | 1,018.70 | 1.25% | 6.29 | ||||
*“Expenses Paid During Period” are equal to the relevant Fund’s annualized expense ratio, multiplied by the average account value over the period, multiplied by 182/365 (to reflect the one-half year period).
†Because actual returns reflect only the most recent six-month period, the returns shown may differ significantly from fiscal year returns.
| (continues) | 39 |
Table of Contents
Security type / sector allocations
Optimum Fixed Income Fund
As of March 31, 2017 (Unaudited)
Sector designations may be different than the sector designations presented in other Fund materials. The sector designations may represent the investment manager or sub-advisor’s internal sector classifications, which may result in the sector designations for one fund being different than another fund’s sector designations.
| Security type / sector | Percentage of net assets | |||||||
Agency Asset-Backed Securities | 0.14% | |||||||
Agency Collateralized Mortgage Obligations | 6.61% | |||||||
Agency Commercial Mortgage-Backed Securities | 0.78% | |||||||
Agency Mortgage-Backed Securities | 17.57% | |||||||
Collateralized Debt Obligations | 3.97% | |||||||
Convertible Bonds | 0.85% | |||||||
Corporate Bonds | 45.94% | |||||||
Banking | 16.30% | |||||||
Basic Industry | 2.06% | |||||||
Brokerage | 0.44% | |||||||
Capital Goods | 1.46% | |||||||
Communications | 3.67% | |||||||
Consumer Cyclical | 3.39% | |||||||
Consumer Non-Cyclical | 3.62% | |||||||
Energy | 4.16% | |||||||
Finance Companies | 1.76% | |||||||
Insurance | 0.65% | |||||||
Natural Gas | 0.23% | |||||||
Real Estate | 1.86% | |||||||
Technology | 1.38% | |||||||
Transportation | 1.23% | |||||||
Utilities | 3.73% | |||||||
Municipal Bonds | 1.02% | |||||||
| Security type / sector | Percentage of net assets | |||||||
Non-Agency Asset-Backed Securities | 3.80% | |||||||
Non-Agency Collateralized Mortgage Obligations | 1.63% | |||||||
Non-Agency Commercial Mortgage-Backed Securities | 4.08% | |||||||
Regional Bonds | 0.53% | |||||||
Loan Agreements | 6.83% | |||||||
Sovereign Bonds | 3.83% | |||||||
Supranational Banks | 0.38% | |||||||
U.S. Treasury Obligations | 7.66% | |||||||
Common Stock | 0.00% | |||||||
Convertible Preferred Stock | 0.19% | |||||||
Preferred Stock | 0.28% | |||||||
Options Purchased | 0.03% | |||||||
Short-Term Investments | 9.22% | |||||||
Total Value of Securities Before Options Written | 115.34% | |||||||
Options Written | (0.04% | ) | ||||||
Liabilities Net of Receivables and Other Assets | (15.30% | ) | ||||||
Total Net Assets | 100.00% | |||||||
| 40 |
Table of Contents
Security type / country and sector allocations
Optimum International Fund
As of March 31, 2017 (Unaudited)
Sector designations may be different than the sector designations presented in other Fund materials. The sector designations may represent the investment manager or sub-advisor’s internal sector classifications, which may result in the sector designations for one fund being different than another fund’s sector designations.
| Security type / country | Percentage of net assets | |||||
Common Stock by Country | 98.64% | |||||
Australia | 1.86% | |||||
Austria | 2.73% | |||||
Bermuda | 1.03% | |||||
Brazil | 1.33% | |||||
Canada | 3.79% | |||||
China/Hong Kong | 6.54% | |||||
Colombia | 0.59% | |||||
Czech Republic | 0.41% | |||||
Denmark | 1.49% | |||||
Finland | 0.32% | |||||
France | 3.88% | |||||
Germany | 3.38% | |||||
India | 3.81% | |||||
Indonesia | 2.72% | |||||
Ireland | 2.07% | |||||
Israel | 3.34% | |||||
Italy | 1.84% | |||||
Japan | 17.37% | |||||
Mexico | 0.78% | |||||
Netherlands | 4.00% | |||||
New Zealand | 0.84% | |||||
Norway | 2.59% | |||||
Republic of Korea | 3.73% | |||||
Singapore | 1.14% | |||||
South Africa | 0.16% | |||||
Spain | 2.05% | |||||
Sweden | 0.66% | |||||
Switzerland | 6.60% | |||||
Taiwan | 2.56% | |||||
| Security type / country | Percentage of net assets | |||||
Thailand | 0.55% | |||||
Turkey | 0.65% | |||||
United Kingdom | 11.25% | |||||
United States | 2.58% | |||||
Short-Term Investments | 0.89% | |||||
Securities Lending Collateral | 3.39% | |||||
Total Value of Securities | 102.92% | |||||
Obligation to Return Securities Lending Collateral | (3.39% | ) | ||||
Receivables and Other Assets Net of Liabilities | 0.47% | |||||
Total Net Assets | 100.00% | |||||
| Common stock by sector |
Percentage | |||||
Consumer Discretionary | 11.72% | |||||
Consumer Staples | 5.61% | |||||
Energy | 7.09% | |||||
Financials | 22.16% | |||||
Healthcare | 15.71% | |||||
Industrials | 9.63% | |||||
Information Technology | 13.47% | |||||
Materials | 6.53% | |||||
Real Estate | 0.41% | |||||
Telecommunication Services | 3.13% | |||||
Utilities | 3.18% | |||||
Total | 98.64% | |||||
| (continues) | 41 |
Table of Contents
Security type / sector allocations and top 10 equity holdings
Sector designations may be different than the sector designations presented in other Fund materials. The sector designations may represent the investment manager or sub-advisor’s internal sector classifications, which may result in the sector designations for one fund being different than another fund’s sector designations.
Optimum Large Cap Growth Fund
As of March 31, 2017 (Unaudited)
| Security type / sector | Percentage of net assets | |||||||
Common Stock² | 96.79 | % | ||||||
Consumer Discretionary | 22.05 | % | ||||||
Consumer Staples | 3.42 | % | ||||||
Energy | 1.02 | % | ||||||
Financials | 4.69 | % | ||||||
Healthcare | 14.85 | % | ||||||
Industrials | 6.23 | % | ||||||
Information Technology1 | 39.83 | % | ||||||
Materials | 1.08 | % | ||||||
Real Estate | 2.28 | % | ||||||
Telecommunication Services | 0.93 | % | ||||||
Utilities | 0.41 | % | ||||||
Convertible Preferred Stock | 0.57 | % | ||||||
U.S. Master Limited Partnerships | 0.47 | % | ||||||
Short-Term Investments | 1.47 | % | ||||||
Total Value of Securities | 99.30 | % | ||||||
Receivables and Other Assets Net of Liabilities | 0.70 | % | ||||||
Total Net Assets | 100.00 | % | ||||||
| ² | Narrow industries are utilized for compliance purposes for diversification whereas broad sectors are used for financial reporting. |
Holdings are for informational purposes only and are subject to change at any time. They are not a recommendation to buy, sell, or hold any security.
| Top 10 equity holdings | Percentage of net assets | |||||
Amazon.com | 6.73% | |||||
Apple | 6.17% | |||||
Facebook Class A | 4.66% | |||||
Microsoft | 4.63% | |||||
Alphabet Class C | 4.45% | |||||
Visa Class A | 3.56% | |||||
Priceline Group | 2.35% | |||||
Honeywell International | 2.18% | |||||
UnitedHealth Group | 1.93% | |||||
Alphabet Class A | 1.79% | |||||
Optimum Large Cap Value Fund
As of March 31, 2017 (Unaudited)
| Security type / sector | Percentage of net assets | |||||||
Common Stock² | 98.50 | % | ||||||
Consumer Discretionary | 7.12 | % | ||||||
Consumer Staples | 9.67 | % | ||||||
Energy | 7.71 | % | ||||||
Financials2 | 26.50 | % | ||||||
Healthcare | 13.59 | % | ||||||
Industrials | 13.22 | % | ||||||
Information Technology | 7.82 | % | ||||||
Materials | 4.58 | % | ||||||
Real Estate | 1.58 | % | ||||||
Telecommunication Services | 2.72 | % | ||||||
Utilities | 3.99 | % | ||||||
Short-Term Investments | 1.29 | % | ||||||
Total Value of Securities | 99.79 | % | ||||||
Receivables and Other Assets Net of Liabilities | 0.21 | % | ||||||
Total Net Assets | 100.00 | % | ||||||
| ² | Narrow industries are utilized for compliance purposes for diversification whereas broad sectors are used for financial reporting. |
Holdings are for informational purposes only and are subject to change at any time. They are not a recommendation to buy, sell, or hold any security.
| Top 10 equity holdings | Percentage of net assets | |||||
JPMorgan Chase & Co. | 4.20% | |||||
Wells Fargo & Co. | 2.50% | |||||
Johnson & Johnson | 2.46% | |||||
Pfizer | 2.09% | |||||
Chubb (Switzerland) | 1.96% | |||||
Philip Morris International | 1.90% | |||||
Medtronic (Ireland) | 1.84% | |||||
Bank of America | 1.81% | |||||
AT&T | 1.60% | |||||
Chevron | 1.59% | |||||
42
Table of Contents
Sector designations may be different than the sector designations presented in other Fund materials. The sector designations may represent the investment manager or sub-advisor’s internal sector classifications, which may result in the sector designations for one fund being different than another fund’s sector designations.
Optimum Small-Mid Cap Growth Fund
As of March 31, 2017 (Unaudited)
| Security type / sector | Percentage of net assets | |||||||
Common Stock² | 97.06 | % | ||||||
Consumer Discretionary | 17.43 | % | ||||||
Consumer Staples | 3.24 | % | ||||||
Energy | 1.97 | % | ||||||
Financials | 7.24 | % | ||||||
Healthcare | 18.60 | % | ||||||
Industrials | 15.53 | % | ||||||
Information Technology3 | 27.90 | % | ||||||
Materials | 4.63 | % | ||||||
Real Estate | 0.52 | % | ||||||
Convertible Preferred Stock | 1.21 | % | ||||||
Short-Term Investments | 2.42 | % | ||||||
Total Value of Securities | 100.69 | % | ||||||
Liabilities Net of Receivables and Other Assets | (0.69 | %) | ||||||
Total Net Assets | 100.00 | % | ||||||
| ² | Narrow industries are utilized for compliance purposes for diversification whereas broad sectors are used for financial reporting. |
Holdings are for informational purposes only and are subject to change at any time. They are not a recommendation to buy, sell, or hold any security.
| Top 10 equity holdings | Percentage of net assets | |||||
Burlington Stores | 1.85% | |||||
Nevro | 1.54% | |||||
Universal Display | 1.51% | |||||
IDEXX Laboratories | 1.26% | |||||
Micron Technology | 1.26% | |||||
Royal Caribbean Cruises | 1.25% | |||||
Snyder’s-Lance | 1.24% | |||||
Albemarle | 1.24% | |||||
ServiceNow | 1.14% | |||||
PTC | 1.11% | |||||
Optimum Small-Mid Cap Value Fund
As of March 31, 2017 (Unaudited)
| Security type / sector | Percentage of net assets | |||||||
Common Stock | 98.83 | % | ||||||
Consumer Discretionary | 9.41 | % | ||||||
Consumer Staples | 5.36 | % | ||||||
Energy | 5.00 | % | ||||||
Financials | 21.84 | % | ||||||
Healthcare | 6.72 | % | ||||||
Industrials | 14.04 | % | ||||||
Information Technology | 13.40 | % | ||||||
Materials | 7.15 | % | ||||||
Real Estate | 10.06 | % | ||||||
Telecommunication Services | 1.10 | % | ||||||
Utilities | 4.75 | % | ||||||
Short-Term Investments | 0.22 | % | ||||||
Total Value of Securities | 99.05 | % | ||||||
Receivables and Other Assets Net of Liabilities | 0.95 | % | ||||||
Total Net Assets | 100.00 | % | ||||||
Holdings are for informational purposes only and are subject to change at any time. They are not a recommendation to buy, sell, or hold any security.
| Top 10 equity holdings | Percentage of net assets | |||||
Huntington Ingalls Industries | 1.35% | |||||
Avnet | 1.27% | |||||
Amdocs | 1.20% | |||||
Chemical Financial | 1.15% | |||||
Western Alliance Bancorp | 1.12% | |||||
Wintrust Financial | 1.08% | |||||
j2 Global | 1.06% | |||||
Great Western Bancorp | 1.05% | |||||
Teleflex | 1.04% | |||||
IDACORP | 1.00% | |||||
| (continues) | 43 |
Table of Contents
Security type / sector allocations and top 10 equity holdings
1To monitor compliance with Optimum Large Cap Growth Fund’s concentration guidelines as described in the Fund’s Prospectus and Statement of Additional Information, the Information Technology sector (as disclosed herein for financial reporting purposes) is subdivided into a variety of “industries” (in accordance with the requirements of the Investment Company Act of 1940 (1940 Act)). The Information Technology sector consisted of commercial services, computers, diversified financial services, internet, semiconductors and software. As of March 31, 2017, such amounts, as percentage of total net assets, were 1.00%, 7.01%, 4.63%, 13.71%, 3.39%, and 10.09%, respectively. The percentage in any such single industry will comply with the Fund’s concentration policy even if the percentages in the Information Technology sector for financial reporting purposes may exceed 25%.
2To monitor compliance with Optimum Large Cap Value Fund’s concentration guidelines as described in the Fund’s Prospectus and Statement of Additional Information, the Financials sector (as disclosed herein for financial reporting purposes) is subdivided into a variety of “industries” (in accordance with the requirements of the 1940 Act). The Financials sector consisted of banks, commercial services, diversified financial services, and insurance. As of March 31, 2017, such amounts, as percentage of total net assets, were 16.10%, 0.45%, 3.71%, and 6.24%, respectively. The percentage in any such single industry will comply with the Fund’s concentration policy even if the percentages in the Financials sector for financial reporting purposes may exceed 25%.
3To monitor compliance with Optimum Small-Mid Cap Growth Fund’s concentration guidelines as described in the Fund’s Prospectus and Statement of Additional Information, the Information Technology (as disclosed herein for financial reporting purposes) are subdivided into a variety of “industries” (in accordance with the requirements of the 1940 Act). The Information Technology sector consisted of commercial services, computers, electrical components and equipment, electronics, internet, machinery, semiconductors, software, and telecommunications. As of March 31, 2017, such amounts, as percentage of total net assets, were 2.24%, 0.35%, 1.51%, 1.58%, 2.97%, 0.63%, 5.96%, 10.70%, and 1.96% respectively. The percentage in any such single industry will comply with the Fund’s concentration policy even if the percentages in the Information Technology sectors for financial reporting purposes may exceed 25%.
44
Table of Contents
Optimum Fixed Income Fund
March 31, 2017
Principal amount° | Value (U.S. $) | |||||||
| ||||||||
Agency Asset-Backed Securities – 0.14% |
| |||||||
| ||||||||
Navient Student Loan Trust | ||||||||
Series 2016-5A A 144A 2.232% 6/25/65 #● | 192,694 | $ | 195,615 | |||||
SLM Student Loan Trust | ||||||||
Series 2008-9 A 2.538% 4/25/23 ● | 2,212,120 | 2,256,287 | ||||||
Series 2012-5 A2 1.282% 6/25/19 ● | 246,173 | 246,276 | ||||||
|
| |||||||
Total Agency Asset-Backed Securities (cost $2,675,327) | 2,698,178 | |||||||
|
| |||||||
| ||||||||
Agency Collateralized Mortgage Obligations – 6.61% |
| |||||||
| ||||||||
Fannie Mae Connecticut | ||||||||
Avenue Securities | ||||||||
Series 2015-C03 1M1 2.482% 7/25/25 ● | 6,780 | 6,782 | ||||||
Series 2015-C03 2M1 2.482% 7/25/25 ● | 46,276 | 46,371 | ||||||
Series 2015-C04 2M1 2.682% 4/25/28 ● | 44,631 | 44,760 | ||||||
Series 2016-C03 1M1 2.982% 10/25/28 ● | 98,642 | 100,240 | ||||||
Series 2016-C04 1M1 2.432% 1/25/29 ● | 52,883 | 53,461 | ||||||
Series 2017-C01 1M1 2.282% 7/25/29 ● | 34,637 | 34,804 | ||||||
Series 2017-C02 2M1 2.127% 9/25/29 ● | 290,000 | 290,512 | ||||||
Fannie Mae Grantor Trust | ||||||||
Series 1999-T2 A1 5.289% 1/19/39 ● | 9,691 | 10,874 | ||||||
Series 2002-T4 A3 7.50% 12/25/41 | 33,300 | 37,574 | ||||||
Series 2004-T1 1A2 6.50% 1/25/44 | 10,326 | 11,877 | ||||||
Fannie Mae REMIC Trust | ||||||||
Series 2004-W4 A5 5.50% 6/25/34 | 597,677 | 621,956 | ||||||
Series 2004-W11 1A2 6.50% 5/25/44 | 53,301 | 61,525 | ||||||
Fannie Mae REMICs | ||||||||
Series 1996-46 ZA 7.50% 11/25/26 | 6,827 | 7,919 | ||||||
Series 1999-19 PH 6.00% 5/25/29 | 119,236 | 134,684 | ||||||
Series 2001-14 Z 6.00% 5/25/31 | 7,065 | 7,742 | ||||||
Series 2002-90 A1 6.50% 6/25/42 | 9,219 | 10,709 | ||||||
| Principal amount° | Value (U.S. $) | |||||||
| ||||||||
Agency Collateralized Mortgage Obligations (continued) |
| |||||||
| ||||||||
Fannie Mae REMICs | ||||||||
Series 2002-90 A2 6.50% 11/25/42 | 30,919 | $ | 35,515 | |||||
Series 2005-70 PA 5.50% 8/25/35 | 66,847 | 74,717 | ||||||
Series 2005-110 MB 5.50% 9/25/35 | 62,983 | 66,260 | ||||||
Series 2007-30 OE 2.00% 4/25/37 W^ | 3,456,449 | 2,895,750 | ||||||
Series 2007-114 A6 1.182% 10/27/37 ● | 15,108 | 15,098 | ||||||
Series 2008-15 SB 5.618% 8/25/36 S● | 148,984 | 28,282 | ||||||
Series 2008-24 ZA 5.00% 4/25/38 | 14,377,037 | 15,705,955 | ||||||
Series 2009-2 AS 4.718% 2/25/39 S● | 1,307,454 | 167,246 | ||||||
Series 2009-68 SA 5.768% 9/25/39 S● | 327,702 | 55,074 | ||||||
Series 2009-94 AC 5.00% 11/25/39 | 190,079 | 206,149 | ||||||
Series 2010-41 PN 4.50% 4/25/40 | 475,000 | 512,533 | ||||||
Series 2010-43 HJ 5.50% 5/25/40 | 106,439 | 118,781 | ||||||
Series 2010-96 DC 4.00% 9/25/25 | 472,150 | 504,692 | ||||||
Series 2010-123 FE 1.462% 11/25/40 ● | 2,352,779 | 2,356,098 | ||||||
Series 2010-129 SM 5.018% 11/25/40 S● | 1,148,078 | 186,042 | ||||||
Series 2011-118 DC 4.00% 11/25/41 | 1,292,776 | 1,342,941 | ||||||
Series 2012-98 MI 3.00% 8/25/31 S | 1,629,478 | 184,022 | ||||||
Series 2012-99 AI 3.50% 5/25/39 S | 609,914 | 65,055 | ||||||
Series 2012-120 WI 3.00% 11/25/27 S | 1,358,563 | 137,511 | ||||||
Series 2012-122 SD 5.118% 11/25/42 S● | 1,554,761 | 319,309 | ||||||
Series 2012-139 NS 5.718% 12/25/42 S● | 593,578 | 139,549 | ||||||
Series 2013-7 EI 3.00% 10/25/40 S | 893,963 | 120,368 | ||||||
Series 2013-26 ID 3.00% 4/25/33 S | 843,058 | 118,265 | ||||||
Series 2013-38 AI 3.00% 4/25/33 S | 786,860 | 106,474 | ||||||
Series 2013-43 IX 4.00% 5/25/43 S | 4,685,642 | 1,106,932 | ||||||
| (continues) | 45 |
Table of Contents
Schedules of investments
Optimum Fixed Income Fund
Principal amount° | Value (U.S. $) | |||||||
| ||||||||
Agency Collateralized Mortgage Obligations (continued) |
| |||||||
| ||||||||
Fannie Mae REMICs | ||||||||
Series 2013-44 DI 3.00% 5/25/33 S | 2,542,234 | $ | 405,523 | |||||
Series 2013-45 PI 3.00% 5/25/33 S | 165,562 | 24,408 | ||||||
Series 2013-55 AI 3.00% 6/25/33 S | 1,972,920 | 285,466 | ||||||
Series 2013-59 PY 2.50% 6/25/43 | 110,000 | 100,457 | ||||||
Series 2013-69 IJ 3.00% 7/25/33 S | 382,846 | 55,668 | ||||||
Series 2014-36 ZE 3.00% 6/25/44 | 660,781 | 603,499 | ||||||
Series 2014-68 BS 5.168% 11/25/44 S● | 1,614,446 | 315,977 | ||||||
Series 2014-90 SA 5.168% 1/25/45 S● | 4,488,798 | 903,425 | ||||||
Series 2015-27 SA 5.468% 5/25/45 S● | 604,235 | 128,514 | ||||||
Series 2015-40 GZ 3.50% 5/25/45 | 427,534 | 406,726 | ||||||
Series 2015-43 PZ 3.50% 6/25/45 | 447,792 | 450,931 | ||||||
Series 2015-44 Z 3.00% 9/25/43 | 1,628,173 | 1,573,826 | ||||||
Series 2015-89 AZ 3.50% 12/25/45 | 152,964 | 147,779 | ||||||
Series 2015-95 SH 5.018% 1/25/46 S● | 1,477,073 | 316,345 | ||||||
Series 2016-30 CI 3.00% 5/25/36 S | 1,017,489 | 137,008 | ||||||
Series 2016-33 DI 3.50% 6/25/36 S | 2,469,127 | 386,517 | ||||||
Series 2016-50 IB 3.00% 2/25/46 S | 140,147 | 21,130 | ||||||
Series 2016-55 SK 5.018% 8/25/46 S● | 1,213,418 | 290,699 | ||||||
Series 2016-62 SA 5.018% 9/25/46 S● | 2,355,267 | 565,173 | ||||||
Series 2016-74 GS 5.018% 10/25/46 S● | 1,580,835 | 389,376 | ||||||
Series 2016-85 SA 5.018% 11/25/46 S● | 2,409,640 | 572,006 | ||||||
Series 2016-99 DI 3.50% 1/25/46 S | 674,347 | 112,565 | ||||||
Series 2016-105 SA 5.018% 1/25/47 S● | 1,625,148 | 347,043 | ||||||
Series 2017-6 NI 3.50% 3/25/46 S | 138,814 | 22,075 | ||||||
Series 2017-8 BZ 3.00% 2/25/47 | 1,080,382 | 968,729 | ||||||
Principal amount° | Value (U.S. $) | |||||||
| ||||||||
Agency Collateralized Mortgage Obligations (continued) |
| |||||||
| ||||||||
Fannie Mae REMICs | ||||||||
Series 2017-8 SG 5.018% 2/25/47 S● | 1,968,526 | $ | 439,167 | |||||
Series 2017-11 EI 3.00% 3/25/42 S | 1,957,491 | 250,392 | ||||||
Series 2017-12 JI 3.50% 5/25/40 S | 683,911 | 96,673 | ||||||
Series 2017-16 SM 5.068% 3/25/47 S● | 1,293,474 | 288,008 | ||||||
Series 2017-16 WI 3.00% 1/25/45 S | 427,149 | 58,850 | ||||||
Series 2017-16 YT 3.00% 7/25/46 | 19,000 | 18,602 | ||||||
Series 2017-25 GS 5.73% 4/25/47 S● | 176,000 | 30,800 | ||||||
Fannie Mae Whole Loan Trust | ||||||||
Series 2004-W15 1A1 6.00% 8/25/44 | 47,102 | 53,140 | ||||||
Freddie Mac REMICs | ||||||||
Series 1730 Z 7.00% 5/15/24 | 31,910 | 35,565 | ||||||
Series 2165 PE 6.00% 6/15/29 | 96,147 | 109,484 | ||||||
Series 2326 ZQ 6.50% 6/15/31 | 54,353 | 61,381 | ||||||
Series 3143 BC 5.50% 2/15/36 | 2,290,701 | 2,525,414 | ||||||
Series 3289 SA 5.838% 3/15/37 S● | 1,052,283 | 161,337 | ||||||
Series 3656 PM 5.00% 4/15/40 | 391,194 | 429,133 | ||||||
Series 4050 EI 4.00% 2/15/39 S | 283,286 | 29,045 | ||||||
Series 4065 DE 3.00% 6/15/32 | 120,000 | 120,741 | ||||||
Series 4109 AI 3.00% 7/15/31 S | 3,005,409 | 323,463 | ||||||
Series 4120 IK 3.00% 10/15/32 S | 2,420,525 | 330,505 | ||||||
Series 4146 IA 3.50% 12/15/32 S | 1,277,477 | 201,174 | ||||||
Series 4159 KS 5.238% 1/15/43 S● | 1,147,377 | 263,798 | ||||||
Series 4161 IM 3.50% 2/15/43 S | 363,621 | 82,305 | ||||||
Series 4181 DI 2.50% 3/15/33 S | 797,756 | 89,729 | ||||||
Series 4184 GS 5.208% 3/15/43 S● | 1,312,582 | 298,994 | ||||||
Series 4185 LI 3.00% 3/15/33 S | 619,669 | 86,544 | ||||||
| 46 |
Table of Contents
Principal amount° | Value (U.S. $) | |||||||
| ||||||||
Agency Collateralized Mortgage Obligations (continued) |
| |||||||
| ||||||||
Freddie Mac REMICs | ||||||||
Series 4191 CI 3.00% 4/15/33 S | 263,823 | $ | 37,100 | |||||
Series 4342 CI 3.00% 11/15/33 S | 469,344 | 60,801 | ||||||
Series 4435 DY 3.00% 2/15/35 | 1,305,000 | 1,295,286 | ||||||
Series 4453 DI 3.50% 11/15/33 S | 619,694 | 79,014 | ||||||
Series 4494 SA 5.268% 7/15/45 S● | 340,418 | 75,959 | ||||||
Series 4543 HI 3.00% 4/15/44 S | 646,153 | 98,810 | ||||||
Series 4581 LI 3.00% 5/15/36 S | 596,947 | 83,484 | ||||||
Series 4592 WT 5.50% 6/15/46 | 2,595,567 | 2,896,841 | ||||||
Series 4594 SG 5.088% 6/15/46 S● | 3,531,205 | 862,427 | ||||||
Series 4614 HB 2.50% 9/15/46 | 605,000 | 540,857 | ||||||
Series 4618 SA 5.088% 9/15/46 S● | 730,011 | 179,197 | ||||||
Series 4623 LZ 2.50% 10/15/46 | 521,397 | 444,815 | ||||||
Series 4623 MW 2.50% 10/15/46 | 610,000 | 553,913 | ||||||
Series 4625 BI 3.50% 6/15/46 S | 2,293,795 | 455,094 | ||||||
Series 4631 GS 5.088% 11/15/46 S● | 2,556,064 | 557,811 | ||||||
Series 4636 NZ 3.00% 12/15/46 | 666,977 | 614,323 | ||||||
Series 4648 SA 5.088% 1/15/47 S● | 1,732,590 | 396,030 | ||||||
Series 4657 NW 3.00% 4/15/45 | 146,000 | 144,268 | ||||||
Series 4657 PS 5.088% 2/15/47 S● | 491,855 | 104,770 | ||||||
Series 4660 GI 3.00% 8/15/43 S | 508,915 | 72,659 | ||||||
Series 4663 AI 3.00% 3/15/42 S | 1,224,000 | 158,361 | ||||||
Freddie Mac Strips | ||||||||
Series 267 S5 5.088% 8/15/42 S● | 1,650,239 | 334,429 | ||||||
Series 299 S1 5.088% 1/15/43 S● | 1,251,780 | 256,243 | ||||||
Series 319 S2 5.088% 11/15/43 S● | 508,209 | 109,255 | ||||||
Series 326 S2 5.038% 3/15/44 S● | 875,714 | 173,451 | ||||||
Principal amount° | Value (U.S. $) | |||||||
| ||||||||
Agency Collateralized Mortgage Obligations (continued) |
| |||||||
| ||||||||
Freddie Mac Structured Agency Credit Risk Debt Notes | ||||||||
Series 2016-DNA3 M1 2.082% 12/25/28 ● | 239,327 | $ | 240,222 | |||||
Series 2017-DNA1 M2 4.232% 7/25/29 ● | 750,000 | 748,623 | ||||||
Freddie Mac Structured Pass Through Certificates | ||||||||
Series T-54 2A 6.50% 2/25/43 ◆ | 15,965 | 18,750 | ||||||
Series T-58 2A 6.50% 9/25/43 ◆ | 8,185 | 9,469 | ||||||
GNMA | ||||||||
Series 2008-65 SB 5.022% 8/20/38 S● | 920,394 | 136,625 | ||||||
Series 2009-2 SE 4.842% 1/20/39 S● | 2,810,852 | 394,570 | ||||||
Series 2010-113 KE 4.50% 9/20/40 | 1,170,000 | 1,275,033 | ||||||
Series 2011-H21 FT 1.51% 10/20/61 ● | 10,795,615 | 10,888,522 | ||||||
Series 2011-H23 FA 1.48% 10/20/61 ● | 7,138,037 | 7,154,809 | ||||||
Series 2012-136 MX 2.00% 11/20/42 | 240,000 | 217,618 | ||||||
Series 2012-H08 FB 1.38% 3/20/62 ● | 1,152,644 | 1,152,033 | ||||||
Series 2012-H18 NA 1.30% 8/20/62 ● | 654,583 | 652,902 | ||||||
Series 2012-H29 SA 1.295% 10/20/62 ● | 5,166,294 | 5,146,169 | ||||||
Series 2013-113 AZ 3.00% 8/20/43 | 1,675,579 | 1,589,134 | ||||||
Series 2013-113 LY 3.00% 5/20/43 | 173,000 | 170,481 | ||||||
Series 2015-64 GZ 2.00% 5/20/45 | 634,837 | 516,262 | ||||||
Series 2015-74 CI 3.00% 10/16/39 S | 1,306,937 | 165,878 | ||||||
Series 2015-133 AL 3.00% 5/20/45 | 1,725,000 | 1,685,299 | ||||||
Series 2015-142 AI 4.00% 2/20/44 S | 461,897 | 58,420 | ||||||
Series 2015-H10 FA 1.38% 4/20/65 ● | 16,368,985 | 16,229,345 | ||||||
Series 2015-H11 FC 1.33% 5/20/65 ● | 2,031,711 | 2,009,281 | ||||||
Series 2015-H12 FB 1.38% 5/20/65 ● | 8,147,176 | 8,079,322 | ||||||
Series 2015-H20 FB 1.38% 8/20/65 ● | 2,191,846 | 2,172,504 | ||||||
| (continues) | 47 |
Table of Contents
Schedules of investments
Optimum Fixed Income Fund
| Principal amount° | Value (U.S. $) | |||||||
| ||||||||
Agency Collateralized Mortgage Obligations (continued) |
| |||||||
| ||||||||
GNMA | ||||||||
Series 2016-108 SK 5.072% 8/20/46 S● | 1,795,972 | $ | 432,322 | |||||
Series 2016-111 PB 2.50% 8/20/46 | 579,000 | 520,897 | ||||||
Series 2016-116 GI 3.50% 11/20/44 S | 2,234,427 | 385,720 | ||||||
Series 2016-118 DI 3.50% 3/20/43 S | 2,543,919 | 387,368 | ||||||
Series 2016-120 AS 5.122% 9/20/46 S● | 1,933,460 | 476,478 | ||||||
Series 2016-120 NS 5.122% 9/20/46 S● | 2,581,946 | 642,600 | ||||||
Series 2016-121 JS 5.122% 9/20/46 S● | 1,878,920 | 457,996 | ||||||
Series 2016-134 MW 3.00% 10/20/46 | 98,000 | 97,556 | ||||||
Series 2016-149 GI 4.00% 11/20/46 S | 622,167 | 136,046 | ||||||
Series 2016-156 PB 2.00% 11/20/46 | 362,000 | 291,795 | ||||||
Series 2016-160 GI 3.50% 11/20/46 S | 1,527,684 | 350,978 | ||||||
Series 2016-160 GS 5.122% 11/20/46 S● | 3,502,192 | 873,369 | ||||||
Series 2016-160 VZ 2.50% 11/20/46 | 175,455 | 142,869 | ||||||
Series 2016-163 MI 3.50% 11/20/46 S | 1,252,747 | 161,381 | ||||||
Series 2016-163 PI 3.50% 5/20/43 S | 3,191,926 | 521,272 | ||||||
Series 2016-163 XI 3.00% 10/20/46 S | 1,805,246 | 238,006 | ||||||
Series 2016-H06 FD 1.70% 7/20/65 ● | 2,112,351 | 2,126,972 | ||||||
Series 2017-4 BW 3.00% 1/20/47 | 106,000 | 99,883 | ||||||
Series 2017-25 CZ 3.50% 2/20/47 | 454,321 | 453,049 | ||||||
Series 2017-26 SA 5.122% 2/20/47 S● | 1,627,511 | 341,225 | ||||||
|
| |||||||
Total Agency Collateralized Mortgage Obligations | 124,399,768 | |||||||
|
| |||||||
| ||||||||
Agency Commercial Mortgage-Backed Securities – 0.78% |
| |||||||
| ||||||||
Freddie Mac Multifamily Structured Pass Through Certificates | ||||||||
Series K037 A2 3.49% 1/25/24 ◆ | 1,390,000 | 1,472,712 | ||||||
Principal amount° | Value (U.S. $) | |||||||
| ||||||||
Agency Commercial Mortgage-Backed Securities (continued) |
| |||||||
| ||||||||
Freddie Mac Multifamily Structured Pass Through Certificates | ||||||||
Series K719 A1 2.53% 12/25/21 ◆ | 440,586 | $ | 444,099 | |||||
Series K719 A2 2.731% 6/25/22 ◆● | 1,900,000 | 1,912,773 | ||||||
Series K724 A2 3.062% 11/25/23 ◆ | 975,000 | 1,004,813 | ||||||
Series KS03 A4 3.161% 5/25/25 ◆● | 920,000 | 927,867 | ||||||
FREMF Mortgage Trust | ||||||||
Series 2011-K10 B 144A 4.631% 11/25/49 #● | 245,000 | 260,091 | ||||||
Series 2011-K12 B 144A 4.345% 1/25/46 #● | 685,000 | 723,341 | ||||||
Series 2011-K13 B 144A 4.611% 1/25/48 #● | 650,000 | 693,396 | ||||||
Series 2011-K15 B 144A 4.949% 8/25/44 #● | 75,000 | 81,463 | ||||||
Series 2011-K704 B 144A 4.536% 10/25/30 #● | 650,000 | 668,572 | ||||||
Series 2012-K22 B 144A 3.686% 8/25/45 #● | 665,000 | 683,523 | ||||||
Series 2012-K23 B 144A 3.656% 10/25/45 #● | 1,500,000 | 1,538,633 | ||||||
Series 2012-K708 B 144A 3.752% 2/25/45 #● | 885,000 | 904,478 | ||||||
Series 2013-K32 B 144A 3.538% 10/25/46 #● | 650,000 | 649,676 | ||||||
Series 2013-K33 B 144A 3.502% 8/25/46 #● | 505,000 | 501,898 | ||||||
Series 2013-K712 B 144A 3.365% 5/25/45 #● | 470,000 | 479,369 | ||||||
Series 2013-K713 B 144A 3.166% 4/25/46 #● | 285,000 | 289,125 | ||||||
Series 2013-K713 C 144A 3.166% 4/25/46 #● | 945,000 | 947,420 | ||||||
Series 2014-K716 B 144A 3.952% 8/25/47 #● | 500,000 | 515,226 | ||||||
|
| |||||||
Total Agency Commercial Mortgage-Backed Securities | 14,698,475 | |||||||
|
| |||||||
| ||||||||
Agency Mortgage-Backed Securities – 17.57% |
| |||||||
| ||||||||
Fannie Mae | ||||||||
5.50% 3/1/37 | 16,010 | 16,997 | ||||||
5.50% 7/1/37 | 108,377 | 117,136 | ||||||
Fannie Mae ARM | ||||||||
2.669% 7/1/37 ● | 50,562 | 52,934 | ||||||
2.91% 7/1/45 ● | 251,686 | 257,094 | ||||||
| 48 |
Table of Contents
| Principal amount° | Value (U.S. $) | |||||||
| ||||||||
Agency Mortgage-Backed Securities (continued) |
| |||||||
| ||||||||
Fannie Mae ARM | ||||||||
3.046% 4/1/44 ● | 1,183,372 | $ | 1,217,574 | |||||
3.076% 8/1/35 ● | 15,259 | 16,104 | ||||||
6.098% 8/1/37 ● | 35,613 | 35,796 | ||||||
Fannie Mae S.F. 15 yr | ||||||||
4.50% 8/1/18 | 17,081 | 17,517 | ||||||
4.50% 7/1/20 | 76,144 | 78,087 | ||||||
Fannie Mae S.F. 30 yr | ||||||||
3.00% 4/1/43 | 1,462,523 | 1,458,603 | ||||||
4.00% 10/1/40 | 27,345 | 28,772 | ||||||
4.00% 11/1/40 | 155,480 | 163,594 | ||||||
4.50% 5/1/35 | 98,832 | 106,487 | ||||||
4.50% 8/1/35 | 193,793 | 208,618 | ||||||
4.50% 9/1/35 | 160,097 | 172,404 | ||||||
4.50% 5/1/39 | 669,818 | 720,777 | ||||||
4.50% 9/1/39 | 146,344 | 158,365 | ||||||
4.50% 11/1/39 | 460,119 | 499,224 | ||||||
4.50% 6/1/40 | 504,672 | 546,639 | ||||||
4.50% 7/1/40 | 572,673 | 619,199 | ||||||
4.50% 8/1/40 | 145,656 | 157,132 | ||||||
4.50% 4/1/41 | 73,562 | 79,201 | ||||||
4.50% 1/1/42 | 560,787 | 606,643 | ||||||
4.50% 10/1/44 | 404,342 | 435,814 | ||||||
4.50% 3/1/46 | 547,540 | 590,077 | ||||||
4.50% 7/1/46 | 1,394,860 | 1,501,836 | ||||||
5.00% 3/1/34 | 2,936 | 3,210 | ||||||
5.00% 4/1/34 | 19,151 | 20,973 | ||||||
5.00% 8/1/34 | 28,149 | 30,729 | ||||||
5.00% 4/1/35 | 7,445 | 8,233 | ||||||
5.00% 12/1/37 | 3,066 | 3,347 | ||||||
5.00% 3/1/38 | 146,100 | 159,469 | ||||||
5.00% 6/1/38 | 8,411 | 9,180 | ||||||
5.00% 2/1/39 | 4,268 | 4,659 | ||||||
5.00% 5/1/40 | 98,741 | 108,022 | ||||||
5.50% 12/1/33 | 21,013 | 23,584 | ||||||
5.50% 11/1/34 | 23,931 | 26,795 | ||||||
5.50% 2/1/35 | 414,211 | 463,266 | ||||||
5.50% 8/1/37 | 134,886 | 151,049 | ||||||
5.50% 3/1/38 | 123,534 | 138,180 | ||||||
5.50% 6/1/39 | 377,749 | 422,787 | ||||||
5.50% 5/1/44 | 13,948,230 | 15,608,591 | ||||||
6.00% 4/1/35 | 228,605 | 260,661 | ||||||
6.00% 3/1/36 | 255,566 | 290,092 | ||||||
6.00% 5/1/36 | 49,717 | 56,277 | ||||||
6.00% 6/1/36 | 24,255 | 27,412 | ||||||
6.00% 9/1/36 | 178,142 | 205,722 | ||||||
6.00% 12/1/36 | 27,055 | 30,805 | ||||||
6.00% 6/1/37 | 14,633 | 16,686 | ||||||
6.00% 7/1/37 | 11,454 | 12,935 | ||||||
| Principal amount° | Value (U.S. $) | |||||||
| ||||||||
Agency Mortgage-Backed Securities (continued) |
| |||||||
| ||||||||
Fannie Mae S.F. 30 yr | ||||||||
6.00% 8/1/37 | 38,632 | $ | 44,179 | |||||
6.00% 9/1/37 | 351,300 | 396,802 | ||||||
6.00% 5/1/38 | 146,079 | 164,920 | ||||||
6.00% 8/1/38 | 97,436 | 109,998 | ||||||
6.00% 9/1/38 | 667,831 | 756,459 | ||||||
6.00% 11/1/38 | 63,367 | 72,329 | ||||||
6.00% 12/1/38 | 177,484 | 200,872 | ||||||
6.00% 9/1/39 | 351,911 | 397,288 | ||||||
6.00% 10/1/39 | 1,346,769 | 1,540,757 | ||||||
6.00% 3/1/40 | 111,135 | 125,464 | ||||||
6.00% 7/1/40 | 398,458 | 449,925 | ||||||
6.00% 11/1/40 | 43,361 | 49,673 | ||||||
6.00% 5/1/41 | 301,240 | 340,079 | ||||||
6.00% 7/1/41 | 454,763 | 520,568 | ||||||
6.50% 11/1/33 | 4,733 | 5,261 | ||||||
6.50% 2/1/36 | 53,523 | 60,682 | ||||||
6.50% 3/1/36 | 61,122 | 67,932 | ||||||
6.50% 6/1/36 | 176,223 | 203,698 | ||||||
6.50% 2/1/38 | 31,292 | 35,392 | ||||||
6.50% 11/1/38 | 8,778 | 9,985 | ||||||
6.50% 3/1/40 | 1,429,823 | 1,617,811 | ||||||
6.50% 5/1/40 | 260,732 | 293,572 | ||||||
7.50% 3/1/32 | 317 | 363 | ||||||
7.50% 4/1/32 | 1,496 | 1,674 | ||||||
Fannie Mae S.F. 30 yr TBA | ||||||||
3.00% 4/1/47 | 9,600,000 | 9,520,500 | ||||||
3.00% 5/1/47 | 39,000,000 | 38,603,908 | ||||||
3.50% 5/1/47 | 83,800,000 | 85,541,473 | ||||||
4.00% 4/1/47 | 96,000,000 | 100,694,995 | ||||||
4.50% 4/1/47 | 32,000,000 | 34,313,750 | ||||||
4.50% 5/1/47 | 297,000 | 317,976 | ||||||
Freddie Mac ARM | ||||||||
2.553% 10/1/46 ● | 659,486 | 662,364 | ||||||
2.929% 10/1/45 ● | 507,683 | 519,189 | ||||||
3.307% 5/1/37 ● | 366,395 | 391,170 | ||||||
5.384% 2/1/38 ● | 75,074 | 79,206 | ||||||
Freddie Mac S.F. 20 yr | ||||||||
5.50% 10/1/23 | 39,511 | 43,762 | ||||||
5.50% 8/1/24 | 13,499 | 14,959 | ||||||
Freddie Mac S.F. 30 yr | ||||||||
4.50% 4/1/39 | 79,875 | 86,374 | ||||||
4.50% 7/1/42 | 761,655 | �� | 821,263 | |||||
4.50% 12/1/43 | 184,683 | 199,129 | ||||||
4.50% 8/1/44 | 1,187,054 | 1,280,789 | ||||||
5.00% 5/1/41 | 532,186 | 586,273 | ||||||
5.50% 3/1/34 | 32,101 | 36,089 | ||||||
5.50% 12/1/34 | 28,666 | 32,229 | ||||||
5.50% 12/1/35 | 28,207 | 31,703 | ||||||
| (continues) | 49 |
Table of Contents
Schedules of investments
Optimum Fixed Income Fund
| Principal amount° | Value (U.S. $) | |||||||
| ||||||||
Agency Mortgage-Backed Securities (continued) |
| |||||||
| ||||||||
Freddie Mac S.F. 30 yr | ||||||||
5.50% 11/1/36 | 34,192 | $ | 38,009 | |||||
5.50% 12/1/36 | 7,749 | 8,590 | ||||||
5.50% 4/1/38 | 155,752 | 172,709 | ||||||
5.50% 6/1/38 | 22,297 | 24,712 | ||||||
5.50% 1/1/39 | 154,631 | 173,282 | ||||||
5.50% 6/1/39 | 198,778 | 220,382 | ||||||
5.50% 3/1/40 | 88,547 | 98,161 | ||||||
5.50% 8/1/40 | 343,493 | 380,742 | ||||||
5.50% 1/1/41 | 98,040 | 108,751 | ||||||
5.50% 6/1/41 | 1,578,828 | 1,765,275 | ||||||
6.00% 2/1/36 | 239,155 | 271,755 | ||||||
6.00% 3/1/36 | 216,269 | 246,879 | ||||||
6.00% 9/1/37 | 102,129 | 115,515 | ||||||
6.00% 1/1/38 | 35,896 | 40,608 | ||||||
6.00% 6/1/38 | 96,633 | 109,395 | ||||||
6.00% 8/1/38 | 158,243 | 181,358 | ||||||
6.00% 5/1/40 | 253,243 | 287,885 | ||||||
6.00% 7/1/40 | 572,812 | 649,669 | ||||||
6.50% 11/1/33 | 26,934 | 30,337 | ||||||
6.50% 1/1/35 | 98,403 | 114,968 | ||||||
6.50% 8/1/38 | 15,159 | 16,866 | ||||||
6.50% 4/1/39 | 150,894 | 169,887 | ||||||
7.00% 1/1/38 | 24,972 | 28,399 | ||||||
Freddie Mac S.F. 30 yr TBA | ||||||||
3.50% 5/1/47 | 6,000,000 | 6,124,219 | ||||||
GNMA I S.F. 30 yr | ||||||||
5.50% 2/15/41 | 306,487 | 342,832 | ||||||
7.00% 12/15/34 | 168,929 | 198,741 | ||||||
GNMA II S.F. 30 yr | ||||||||
5.00% 9/20/46 | 112,122 | 120,400 | ||||||
5.50% 5/20/37 | 236,645 | 263,227 | ||||||
5.50% 4/20/40 | 214,049 | 234,010 | ||||||
6.00% 4/20/34 | 5,323 | 5,903 | ||||||
6.00% 2/20/39 | 298,173 | 338,034 | ||||||
6.00% 10/20/39 | 469,011 | 523,857 | ||||||
6.00% 2/20/40 | 1,020,877 | 1,143,533 | ||||||
6.00% 4/20/46 | 326,292 | 365,162 | ||||||
6.50% 10/20/39 | 381,497 | 430,619 | ||||||
GNMA II S.F. 30 yr TBA | ||||||||
4.00% 4/1/47 | 6,000,000 | 6,337,500 | ||||||
|
| |||||||
Total Agency Mortgage-Backed Securities (cost $329,720,569) | 330,870,243 | |||||||
|
| |||||||
| ||||||||
Collateralized Debt Obligations – 3.97% |
| |||||||
| ||||||||
AMMC CLO 16 | ||||||||
Series 2015-16A AR 144A 2.00% 4/14/29 #● | 145,000 | 144,927 | ||||||
| Principal amount° | Value (U.S. $) | |||||||
| ||||||||
Collateralized Debt Obligations (continued) |
| |||||||
| ||||||||
Anchorage Capital CLO 6 | ||||||||
Series 2015-6A A1 144A 2.563% 4/15/27 #● | 435,000 | $ | 434,820 | |||||
Ares XXV CLO | ||||||||
Series 2012-3A AR 144A 2.243% 1/17/24 #● | 700,000 | 700,342 | ||||||
Atlas Senior Loan Fund VI | ||||||||
Series 2014-6A AR 144A 2.284% 10/15/26 #● | 2,500,000 | 2,500,195 | ||||||
Avery Point III CLO | ||||||||
Series 2013-3A A 144A 2.424% 1/18/25 #● | 1,000,000 | 999,579 | ||||||
Avery Point VI CLO | ||||||||
Series 2015-6A A 144A 2.484% 8/5/27 #● | 250,000 | 250,836 | ||||||
Benefit Street Partners CLO IV | ||||||||
Series 2014-IVA A1R 144A 2.515% 1/20/29 #● | 2,400,000 | 2,406,878 | ||||||
Benefit Street Partners CLO VI | ||||||||
Series 2015-VIA A1A 144A 2.574% 4/18/27 #● | 520,000 | 519,794 | ||||||
Blue Hill CLO | ||||||||
Series 2013-1A AR 144A 2.203% 1/15/26 #● | 1,500,000 | 1,501,446 | ||||||
BlueMountain CLO | ||||||||
Series 2015-1A A1R 144A 2.352% 4/13/27 #● | 400,000 | 400,112 | ||||||
Series 2015-2A A1 144A 2.454% 7/18/27 #● | 710,000 | 711,910 | ||||||
Carlyle Global Market | ||||||||
Strategies CLO | ||||||||
Series 2014-3A A1AR 144A 2.187% 7/27/26 #● | 1,900,000 | 1,891,355 | ||||||
Series 2014-5A A1R 144A 2.298% 10/16/25 #● | 400,000 | 399,800 | ||||||
Cavalry CLO V | ||||||||
Series 2014-5A A 144A 2.393% 1/16/24 #● | 167,942 | 168,062 | ||||||
Cedar Funding V CLO | ||||||||
Series 2016-5A A1 144A 2.633% 7/17/28 #● | 530,000 | 535,724 | ||||||
Cedar Funding VI CLO | ||||||||
Series 2016-6A A1 144A 2.344% 10/20/28 #● | 1,230,000 | 1,232,577 | ||||||
Cent CLO 20 | ||||||||
Series 2013-20A A 144A 2.518% 1/25/26 #● | 654,000 | 653,742 | ||||||
CIFC Funding | ||||||||
Series 2012-3A A1R 144A 2.239% 1/29/25 #● | 2,700,000 | 2,698,380 | ||||||
| 50 |
Table of Contents
| Principal amount° | Value (U.S. $) | |||||||
| ||||||||
Collateralized Debt Obligations (continued) |
| |||||||
| ||||||||
Dryden XXV Senior Loan Fund | ||||||||
Series 2012-25A AR 144A 2.223% 1/15/25 #● | 3,600,000 | $ | 3,595,468 | |||||
Finn Square CLO | ||||||||
Series 2012-1AR 144A 2.37% 12/24/23 # | 3,422,851 | 3,419,185 | ||||||
Flagship CLO VIII | ||||||||
Series 2014-8A AR 144A 2.085% 1/16/26 #● | 2,300,000 | 2,298,960 | ||||||
Flatiron CLO 2014-1 | ||||||||
Series 2014-1A A1R 144A 2.018% 7/17/26 #● | 1,250,000 | 1,251,106 | ||||||
Fortress Credit BSL II | ||||||||
Series 2013-2A A1FR 144A 1.00% 10/19/25 #● | 2,000,000 | 1,999,000 | ||||||
Fraser Sullivan CLO VII | ||||||||
Series 2012-7A A1R 144A 2.105% 4/20/23 #● | 80,403 | 80,363 | ||||||
Galaxy XVI CLO | ||||||||
Series 2013-16A A2R 144A 2.278% 11/16/25 #● | 1,500,000 | 1,502,685 | ||||||
GoldentTree Loan Management US CLO 1 | ||||||||
Series 2017-1A A 144A 2.40% 4/20/29 #● | 1,190,000 | 1,194,310 | ||||||
Halcyon Loan Advisors Funding | ||||||||
Series 2012-1A A1 144A 2.539% 8/15/23 #● | 442,409 | 442,321 | ||||||
JFIN CLO | ||||||||
Series 2015-2A AX 144A 2.473% 10/19/26 #● | 165,000 | 165,230 | ||||||
Series 2017-1A A1 144A 2.324% 4/24/29 #● | 1,275,000 | 1,276,916 | ||||||
JMP Credit Advisors CLO III | ||||||||
Series 2014-1A AR 144A 2.263% 10/17/25 #● | 2,600,000 | 2,611,700 | ||||||
Jubilee CDO I-R | ||||||||
Series I-RA A 144A 0.10% 7/30/24 #● | EUR | 201,627 | 214,428 | |||||
Series I-RX A 0.30% 7/30/24 ● | EUR | 1,008,137 | 1,072,140 | |||||
KVK CLO 2013-2 | ||||||||
Series 2013-2A AR 144A 2.308% 1/15/26 #● | 2,000,000 | 2,002,674 | ||||||
Limerock CLO II | ||||||||
Series 2014-2A AR 144A 2.31% 4/18/26 #● | 2,000,000 | 1,999,172 | ||||||
Lockwood Grove CLO | ||||||||
Series 2014-1A A1R 144A 2.508% 4/25/25 #● | 500,000 | 499,780 | ||||||
| Principal amount° | Value (U.S. $) | |||||||
| ||||||||
Collateralized Debt Obligations (continued) |
| |||||||
| ||||||||
Madison Park Funding IX | ||||||||
Series 2012-9AR AR 144A 2.329% 8/15/22 #● | 346,151 | $ | 346,843 | |||||
Madison Park Funding XIII | ||||||||
Series 2014-13A AR 144A 1.988% 1/19/25 #● | 1,500,000 | 1,499,855 | ||||||
Magnetite IX | ||||||||
Series 2014-9A A1 144A 2.458% 7/25/26 #● | 2,405,000 | 2,407,405 | ||||||
Malin CLO | ||||||||
Series 2007-1A A1 144A 0.24% 5/7/23 #● | EUR | 190,668 | 203,159 | |||||
MP CLO V | ||||||||
Series 2014-1A AR 144A 2.215% 7/18/26 #● | 2,500,000 | 2,511,250 | ||||||
MP CLO VI | ||||||||
Series 2014-2A AR 144A 2.165% 1/15/27 #● | 2,000,000 | 1,999,000 | ||||||
Nelder Grove CLO | ||||||||
Series 2014-1A A1R 144A 2.30% 8/28/26 #● | 1,500,000 | 1,499,695 | ||||||
Neuberger Berman CLO XIX | ||||||||
Series 2015-19A A1 144A 2.443% 7/15/27 #● | 1,300,000 | 1,299,973 | ||||||
Neuberger Berman CLO XVII | ||||||||
Series 2014-17A A 144A 2.504% 8/4/25 #● | 1,350,000 | 1,349,684 | ||||||
Oak Hill Credit Partners X | ||||||||
Series 2014-10A AR 144A 2.077% 7/20/26 #● | 1,000,000 | 999,500 | ||||||
Octagon Investment Partners XIX | ||||||||
Series 2014-1A AR 144A 2.069% 4/15/26 #● | 1,000,000 | 1,004,500 | ||||||
OZLM IX | ||||||||
Series 2014-9A A1R 144A 2.052% 1/20/27 #● | 1,800,000 | 1,799,842 | ||||||
Palmer Square Loan Funding | ||||||||
Series 2016-2A A1 144A 2.391% 6/21/24 #● | 716,276 | 716,883 | ||||||
Shackleton CLO | ||||||||
Series 2014-5A A 144A 2.534% 5/7/26 #● | 1,565,000 | 1,564,476 | ||||||
Series 2015-8A A1 144A 2.54% 10/20/27 #● | 250,000 | 250,296 | ||||||
Staniford Street CLO | ||||||||
Series 2014-1A AR 144A 2.311% 6/15/25 #● | 1,500,000 | 1,499,685 | ||||||
Stoney Lane Funding I | ||||||||
Series 2007-1A A1 144A 1.263% 4/18/22 #● | 224,513 | 223,110 | ||||||
| (continues) | 51 |
Table of Contents
Schedules of investments
Optimum Fixed Income Fund
| Principal amount° | Value (U.S. $) | |||||||
| ||||||||
Collateralized Debt Obligations (continued) |
| |||||||
| ||||||||
TIAA CLO II | ||||||||
Series 2017-1A A 144A | 1,040,000 | $ | 1,039,087 | |||||
Tralee CLO III | ||||||||
Series 2014-3A A1R 144A | 250,000 | 249,905 | ||||||
Venture CDO | ||||||||
Series 2016-25A A1 144A | 490,000 | 491,597 | ||||||
Venture X CLO | ||||||||
Series 2012-10A AR 144A | 1,497,205 | 1,496,362 | ||||||
Venture XI CLO | ||||||||
Series 2012-11AR AR 144A | 665,479 | 666,477 | ||||||
Venture XXI CLO | ||||||||
Series 2015-21A A 144A 2.513% 7/15/27 #● | 285,000 | 285,026 | ||||||
Venture XXIV CLO | ||||||||
Series 2016-24A A1D 144A | 1,115,000 | 1,116,478 | ||||||
Voya CLO | ||||||||
Series 2012-2AR AR 144A | 191,582 | 191,849 | ||||||
Westwood CDO II | ||||||||
Series 2007-2A A1 144A | 54,641 | 54,602 | ||||||
WhiteHorse VI | ||||||||
Series 2012-1A A1R 144A | 4,300,000 | 4,289,044 | ||||||
|
| |||||||
Total Collateralized Debt |
| 74,831,500 | ||||||
|
| |||||||
| ||||||||
Convertible Bonds – 0.85% |
| |||||||
| ||||||||
Aerojet Rocketdyne Holdings 144A 2.25% exercise price $26.00, maturity date 12/15/23 # | 100,000 | 108,312 | ||||||
Alaska Communications Systems Group 6.25% exercise price $10.28, maturity date 5/1/18 | 707,000 | 737,047 | ||||||
Ares Capital 144A 3.75% exercise price $19.39, maturity date 2/1/22 # | 102,000 | 102,064 | ||||||
BioMarin Pharmaceutical 1.50% exercise price | 225,000 | 266,766 | ||||||
| Principal amount° | Value (U.S. $) | |||||||
| ||||||||
Convertible Bonds (continued) |
| |||||||
| ||||||||
Blackhawk Network Holdings 144A 1.50% exercise price $49.83, maturity date 1/15/22 # | 427,000 | $ | 457,691 | |||||
Blackstone Mortgage Trust | 676,000 | 776,132 | ||||||
Blucora 4.25% exercise price $21.66, maturity date 4/1/19 | 275,000 | 277,063 | ||||||
Brookdale Senior Living 2.75% exercise price $29.33, maturity date 6/15/18 | 641,000 | 632,987 | ||||||
Cardtronics 1.00% exercise price $52.35, maturity date 12/1/20 | 220,000 | 239,113 | ||||||
Cemex 3.72% exercise price $11.45, maturity date 3/15/20 | 277,000 | 314,222 | ||||||
Chart Industries 2.00% exercise price $69.03, maturity date 8/1/18 | 540,000 | 535,950 | ||||||
Ciena 144A 3.75% exercise price $20.17, maturity date 10/15/18 # | 278,000 | 364,180 | ||||||
Clearwire Communications 144A 8.25% exercise price $7.08, maturity date 12/1/40 # | 515,000 | 534,956 | ||||||
DISH Network | 96,000 | 98,460 | ||||||
144A 3.375% exercise price $65.18, expiration date 8/15/26 # | 107,000 | 129,804 | ||||||
GAIN Capital Holdings 4.125% exercise price $12.00, maturity date 12/1/18 | 359,000 | 358,103 | ||||||
General Cable 4.50% exercise price $31.67, maturity date 11/15/29 ϕ | 649,000 | 505,814 | ||||||
HealthSouth 2.00% exercise price $37.16, maturity date 12/1/43 | 422,000 | 517,477 | ||||||
Helix Energy Solutions Group 4.25% exercise price $13.89, maturity date 5/1/22 | 479,000 | 471,216 | ||||||
| 52 |
Table of Contents
| Principal amount° | Value (U.S. $) | |||||||
| ||||||||
Convertible Bonds (continued) |
| |||||||
| ||||||||
Hercules Capital 144A 4.375% exercise price $16.41, maturity date 2/1/22 # | 241,000 | $ | 247,326 | |||||
Hologic 2.00% exercise price $31.18, maturity date 3/1/42 ϕ | 239,000 | 333,405 | ||||||
Infinera 1.75% exercise price $12.58, maturity date 6/1/18 | 353,000 | 376,607 | ||||||
Insulet 144A 1.25% exercise price $58.37, maturity date 9/15/21 # | 220,000 | 221,925 | ||||||
Jefferies Group 3.875% exercise price $43.83, maturity date 11/1/29 | 501,000 | 507,889 | ||||||
Knowles 144A 3.25% exercise price $18.43, maturity date 11/1/21 # | 299,000 | 375,993 | ||||||
Liberty Interactive 144A 1.75% exercise price $341.10, maturity date 9/30/46 # | 285,000 | 321,872 | ||||||
Liberty Media 144A 2.25% exercise price $104.55, maturity date 9/30/46 # | 103,000 | 111,497 | ||||||
Medicines 144A 2.75% exercise price $48.97, maturity date 7/15/23 # | 292,000 | 353,320 | ||||||
New Mountain Finance 5.00% exercise price $15.80, maturity date 6/15/19 | 331,000 | 341,344 | ||||||
Novellus Systems 2.625% exercise price $33.72, maturity date 5/15/41 | 181,000 | 687,347 | ||||||
NuVasive 2.25% exercise price $59.82, maturity date 3/15/21 | 180,000 | 246,375 | ||||||
NXP Semiconductors 1.00% exercise price $102.84, maturity date 12/1/19 | 348,000 | 404,550 | ||||||
ON Semiconductor 1.00% exercise price $18.50, maturity date 12/1/20 | 299,000 | 327,966 | ||||||
Pacira Pharmaceuticals 144A 2.375% exercise price $66.89, maturity date 4/1/22 # | 20,000 | 20,812 | ||||||
PROS Holdings 2.00% exercise price $33.79, maturity date 12/1/19 | 510,000 | 518,606 | ||||||
| Principal amount° | Value (U.S. $) | |||||||
| ||||||||
Convertible Bonds (continued) |
| |||||||
| ||||||||
Silicon Laboratories 144A 1.375% exercise price $92.81, maturity date 3/1/22 # | 39,000 | $ | 41,559 | |||||
Spectrum Pharmaceuticals 2.75% exercise price $10.53, maturity date 12/15/18 | 540,000 | 544,725 | ||||||
Spirit Realty Capital 3.75% exercise price $13.10, maturity date 5/15/21 | 383,000 | 393,295 | ||||||
Synchronoss Technologies 0.75% exercise price $53.17, maturity date 8/15/19 | 303,000 | 287,282 | ||||||
Vector Group | 466,000 | 528,619 | ||||||
2.50% exercise price $15.22, expiration date 1/15/19 ● | 147,000 | 213,481 | ||||||
VEREIT 3.75% exercise price $14.99, maturity date 12/15/20 | 568,000 | 571,198 | ||||||
Verint Systems 1.50% exercise price $64.46, maturity date 6/1/21 | 585,000 | 579,516 | ||||||
|
| |||||||
Total Convertible Bonds |
| 15,983,866 | ||||||
|
| |||||||
| ||||||||
Corporate Bonds – 45.94% |
| |||||||
| ||||||||
Banking – 16.30% | ||||||||
Akbank TAS 144A | 840,000 | 869,486 | ||||||
Ally Financial | ||||||||
4.125% 3/30/20 | 200,000 | 204,500 | ||||||
4.75% 9/10/18 | 200,000 | 206,000 | ||||||
5.75% 11/20/25 | 730,000 | 750,075 | ||||||
ANZ New Zealand International 144A 2.60% 9/23/19 # | 200,000 | 201,633 | ||||||
Banco Bilbao Vizcaya Argentaria | EUR | 400,000 | 427,881 | |||||
Banco Nacional de Costa Rica 144A 5.875% | 1,050,000 | 1,069,687 | ||||||
Banco Nacional de Desenvol-vimento Economico e Social | 1,500,000 | 1,569,090 | ||||||
| (continues) | 53 |
Table of Contents
Schedules of investments
Optimum Fixed Income Fund
| Principal amount° | Value (U.S. $) | |||||||
| ||||||||
Corporate Bonds (continued) |
| |||||||
| ||||||||
Banking (continued) | ||||||||
Banco Nacional de Desenvol-vimento Economico e Social | 2,500,000 | $ | 2,685,000 | |||||
Bank Nederlandse Gemeenten | AUD | 292,000 | 221,558 | |||||
Bank of America | ||||||||
1.431% 6/15/17 ● | 3,800,000 | 3,800,714 | ||||||
2.221% 10/21/22 ● | 545,000 | 553,977 | ||||||
2.60% 1/15/19 | 1,200,000 | 1,212,932 | ||||||
2.625% 4/19/21 | 2,300,000 | 2,296,315 | ||||||
3.124% 1/20/23 ● | 3,465,000 | 3,482,173 | ||||||
3.30% 8/5/21 | AUD | 240,000 | 182,803 | |||||
3.30% 1/11/23 | 716,000 | 721,289 | ||||||
3.824% 1/20/28 ● | 1,100,000 | 1,104,474 | ||||||
4.183% 11/25/27 | 1,065,000 | 1,070,910 | ||||||
4.443% 1/20/48 ● | 1,275,000 | 1,281,713 | ||||||
5.65% 5/1/18 | 3,300,000 | 3,434,129 | ||||||
5.75% 12/1/17 | 700,000 | 718,587 | ||||||
6.00% 9/1/17 | 3,200,000 | 3,257,834 | ||||||
6.40% 8/28/17 | 1,000,000 | 1,019,527 | ||||||
6.875% 4/25/18 | 5,025,000 | 5,288,883 | ||||||
7.625% 6/1/19 | 800,000 | 892,206 | ||||||
Bank of New York Mellon | ||||||||
2.089% 10/30/23 ● | 840,000 | 859,893 | ||||||
2.15% 2/24/20 | 1,960,000 | 1,968,620 | ||||||
2.20% 8/16/23 | 810,000 | 778,216 | ||||||
2.50% 4/15/21 | 180,000 | 180,556 | ||||||
3.442% 2/7/28 ● | 1,165,000 | 1,175,189 | ||||||
4.625% 12/29/49 ● | 1,365,000 | 1,313,813 | ||||||
Bank of Nova Scotia | ||||||||
1.875% 4/26/21 | 4,500,000 | 4,414,140 | ||||||
Banque Federative du Credit Mutuel 144A | ||||||||
2.00% 4/12/19 # | 500,000 | 496,933 | ||||||
Barclays | ||||||||
2.00% 3/16/18 | 1,000,000 | 1,001,380 | ||||||
3.20% 8/10/21 | 760,000 | 761,094 | ||||||
4.337% 1/10/28 | 735,000 | 735,031 | ||||||
4.95% 1/10/47 | 485,000 | 486,337 | ||||||
6.50% 6/15/49 ● | EUR | 400,000 | 434,730 | |||||
8.25% 12/29/49 ● | 1,775,000 | 1,869,909 | ||||||
Barclays Bank | ||||||||
1.804% 11/6/17 ● | 3,000,000 | 3,006,249 | ||||||
144A 6.05% 12/4/17 # | 300,000 | 307,942 | ||||||
7.625% 11/21/22 | 1,800,000 | 1,972,035 | ||||||
BB&T | ||||||||
1.694% 2/1/19 ● | 750,000 | 755,017 | ||||||
| Principal amount° | Value (U.S. $) | |||||||
| ||||||||
Corporate Bonds (continued) |
| |||||||
| ||||||||
Banking (continued) | ||||||||
BB&T | ||||||||
1.991% 6/15/18 ● | 65,000 | $ | 65,496 | |||||
2.45% 1/15/20 | 670,000 | 677,032 | ||||||
BBVA Bancomer | ||||||||
144A 6.50% 3/10/21 # | 435,000 | 478,500 | ||||||
144A 7.25% 4/22/20 # | 100,000 | 110,220 | ||||||
BNP Paribas | ||||||||
144A 7.375% 8/19/25 #● | 700,000 | 720,125 | ||||||
7.375% 12/29/49 ● | 500,000 | 514,375 | ||||||
Branch Banking & Trust | 250,000 | 250,818 | ||||||
Capital One Financial | 640,000 | 637,375 | ||||||
CIT Group | ||||||||
5.25% 3/15/18 | 6,100,000 | 6,271,563 | ||||||
144A 5.50% 2/15/19 # | 2,800,000 | 2,950,500 | ||||||
Citigroup | ||||||||
1.80% 1/10/20 ● | 520,000 | 521,948 | ||||||
1.919% 7/30/18 ● | 2,300,000 | 2,316,765 | ||||||
2.032% 6/7/19 ● | 2,300,000 | 2,322,057 | ||||||
2.485% 9/1/23 ● | 830,000 | 854,136 | ||||||
3.20% 10/21/26 | 1,000,000 | 956,383 | ||||||
3.75% 10/27/23 | AUD | 498,000 | 380,515 | |||||
4.05% 7/30/22 | 150,000 | 156,376 | ||||||
Citizens Bank | 1,655,000 | 1,647,039 | ||||||
Citizens Financial Group | ||||||||
2.375% 7/28/21 | 115,000 | 113,504 | ||||||
4.30% 12/3/25 | 965,000 | 996,281 | ||||||
Compass Bank | 1,145,000 | 1,125,788 | ||||||
Cooperatieve Rabobank | ||||||||
2.50% 9/4/20 | NOK | 1,740,000 | 210,971 | |||||
3.75% 7/21/26 | 2,405,000 | 2,354,223 | ||||||
4.375% 8/4/25 | 2,000,000 | 2,054,782 | ||||||
6.875% 3/19/20 | EUR | 2,400,000 | 3,026,984 | |||||
8.40% 11/29/49 ● | 500,000 | 507,909 | ||||||
Credit Suisse | 400,000 | 400,950 | ||||||
Credit Suisse Group | ||||||||
144A 4.282% 1/9/28 # | 1,730,000 | 1,725,194 | ||||||
144A 6.25% 12/29/49 #● | 2,350,000 | 2,392,204 | ||||||
Credit Suisse Group Funding Guernsey | ||||||||
2.75% 3/26/20 | 2,449,000 | 2,453,714 | ||||||
3.125% 12/10/20 | 1,445,000 | 1,454,067 | ||||||
3.45% 4/16/21 | 400,000 | 405,635 | ||||||
3.80% 9/15/22 | 3,350,000 | 3,401,858 | ||||||
3.80% 6/9/23 | 2,300,000 | 2,311,668 | ||||||
| 54 |
Table of Contents
| Principal amount° | Value (U.S. $) | |||||||
| ||||||||
Corporate Bonds (continued) |
| |||||||
| ||||||||
Banking (continued) | ||||||||
Credit Suisse Group Funding Guernsey | 1,810,000 | $ | 1,874,003 | |||||
DBS Bank | ||||||||
144A 3.625% 9/21/22 #● | 700,000 | 705,363 | ||||||
3.625% 9/21/22 ● | 200,000 | 201,532 | ||||||
Deutsche Bank | ||||||||
2.85% 5/10/19 | 3,100,000 | 3,122,429 | ||||||
144A 4.25% 10/14/21 # | 1,200,000 | 1,230,980 | ||||||
Dexia Credit Local 144A | 560,000 | 559,879 | ||||||
DNB Bank 144A | 3,300,000 | 3,300,000 | ||||||
Eksportfinans | 600,000 | 604,082 | ||||||
Fifth Third Bancorp | 435,000 | 440,925 | ||||||
Fifth Third Bank | ||||||||
1.967% 8/20/18 ● | 905,000 | 910,578 | ||||||
2.25% 6/14/21 | 665,000 | 657,781 | ||||||
3.85% 3/15/26 | 985,000 | 994,620 | ||||||
Goldman Sachs Group | ||||||||
1.72% 5/22/17 ● | 1,800,000 | 1,801,516 | ||||||
2.331% 9/15/20 ● | 3,000,000 | 3,044,922 | ||||||
2.654% 11/29/23 ● | 875,000 | 907,231 | ||||||
3.08% 8/21/19 ● | AUD | 140,000 | 107,842 | |||||
3.55% 2/12/21 | CAD | 100,000 | 79,184 | |||||
3.85% 1/26/27 | 1,450,000 | 1,459,331 | ||||||
5.15% 5/22/45 | 1,755,000 | 1,847,366 | ||||||
5.20% 12/17/19 | NZD | 206,000 | 149,892 | |||||
5.95% 1/18/18 | 700,000 | 723,016 | ||||||
HBOS 1.80% 9/6/17 ● | 500,000 | 499,594 | ||||||
HSBC Bank 144A | 620,000 | 622,032 | ||||||
HSBC Holdings | ||||||||
2.65% 1/5/22 ● | 2,000,000 | 2,057,740 | ||||||
2.65% 1/5/22 | 545,000 | 537,907 | ||||||
2.712% 5/25/21 ● | 1,100,000 | 1,135,617 | ||||||
4.041% 3/13/28 ● | 615,000 | 622,346 | ||||||
4.375% 11/23/26 | 560,000 | 565,391 | ||||||
6.00% 12/29/49 ● | EUR | 900,000 | 1,035,845 | |||||
Huntington Bancshares | 670,000 | 653,149 | ||||||
Huntington National Bank | 275,000 | 276,124 | ||||||
ICICI Bank 144A | 1,070,000 | 1,067,400 | ||||||
ING Bank 144A | 4,500,000 | 4,524,606 | ||||||
| Principal amount° | Value (U.S. $) | |||||||
| ||||||||
Corporate Bonds (continued) |
| |||||||
| ||||||||
Banking (continued) | ||||||||
ING Groep | ||||||||
3.15% 3/29/22 | 525,000 | $ | 526,947 | |||||
3.95% 3/29/27 | 1,340,000 | 1,343,676 | ||||||
JPMorgan Chase & Co. | ||||||||
1.656% 3/9/21 ● | 895,000 | 891,722 | ||||||
1.669% 1/28/19 ● | 200,000 | 201,314 | ||||||
2.202% 6/7/21 ● | 2,900,000 | 2,949,865 | ||||||
2.25% 1/23/20 | 9,800,000 | 9,834,966 | ||||||
2.273% 10/24/23 ● | 375,000 | 383,940 | ||||||
3.782% 2/1/28 ● | 830,000 | 838,708 | ||||||
4.25% 11/2/18 | NZD | 570,000 | 405,595 | |||||
4.25% 10/1/27 | 1,130,000 | 1,162,097 | ||||||
4.26% 2/22/48 ● | 1,990,000 | 1,991,558 | ||||||
4.40% 7/22/20 | 400,000 | 426,626 | ||||||
5.30% 12/29/49 ● | 100,000 | 103,875 | ||||||
6.75% 8/29/49 ● | 865,000 | 954,744 | ||||||
7.90% 4/29/49 ● | 500,000 | 518,750 | ||||||
JPMorgan Chase Bank | 600,000 | 612,621 | ||||||
KBC Bank 8.00% | 2,200,000 | 2,308,748 | ||||||
KeyBank | ||||||||
3.18% 5/22/22 | 250,000 | 252,502 | ||||||
3.40% 5/20/26 | 2,690,000 | 2,620,794 | ||||||
6.95% 2/1/28 | 1,220,000 | 1,528,376 | ||||||
KeyCorp 5.00% 12/29/49 ● | 1,675,000 | 1,662,437 | ||||||
Korea Development Bank | 850,000 | 866,636 | ||||||
Landwirtschaftliche Rentenbank | NZD | 1,150,000 | 880,646 | |||||
Lloyds Bank 144A | 4,700,000 | 6,328,550 | ||||||
Lloyds Banking Group | ||||||||
3.00% 1/11/22 | 1,175,000 | 1,169,443 | ||||||
3.75% 1/11/27 | 565,000 | 556,500 | ||||||
7.50% 4/30/49 ● | 805,000 | 853,381 | ||||||
7.625% 12/29/49 ● | GBP | 2,500,000 | 3,422,979 | |||||
7.875% 12/29/49 ● | GBP | 1,300,000 | 1,812,210 | |||||
Mitsubishi UFJ Financial Group | ||||||||
2.18% 9/13/21 ● | 450,000 | 454,577 | ||||||
2.19% 9/13/21 | 2,050,000 | 2,006,460 | ||||||
Mitsubishi UFJ Trust & Banking | ||||||||
1.872% 9/19/17 ● | 1,900,000 | 1,905,107 | ||||||
144A 2.45% 10/16/19 # | 500,000 | 501,995 | ||||||
144A 2.65% 10/19/20 # | 500,000 | 501,960 | ||||||
Mizuho Bank 144A | 600,000 | 603,169 | ||||||
| (continues) | 55 |
Table of Contents
Schedules of investments
Optimum Fixed Income Fund
| Principal amount° | Value (U.S. $) | |||||||
| ||||||||
Corporate Bonds (continued) |
| |||||||
| ||||||||
Banking (continued) | ||||||||
Morgan Stanley | ||||||||
2.125% 4/25/18 | 3,450,000 | $ | 3,464,114 | |||||
2.443% 10/24/23 ● | 875,000 | 894,262 | ||||||
2.50% 4/21/21 | 3,500,000 | 3,484,093 | ||||||
2.625% 11/17/21 | 1,055,000 | 1,047,774 | ||||||
3.125% 8/5/21 | CAD | 387,000 | 302,811 | |||||
3.95% 4/23/27 | 675,000 | 669,728 | ||||||
4.375% 1/22/47 | 2,230,000 | 2,224,715 | ||||||
5.00% 9/30/21 | AUD | 359,000 | 293,027 | |||||
National City Bank | ||||||||
1.472% 6/7/17 ● | 325,000 | 325,014 | ||||||
Nationwide Building Society | ||||||||
144A 4.00% 9/14/26 # | 1,855,000 | 1,799,163 | ||||||
4.125% 3/20/23 ● | EUR | 300,000 | 330,953 | |||||
Natixis 1.846% 9/25/17 ● | 4,300,000 | 4,310,225 | ||||||
Norinchukin Bank | ||||||||
1.733% 10/10/17 ● | 700,000 | 701,998 | ||||||
1.733% 10/11/17 ● | 700,000 | 702,001 | ||||||
1.733% 10/12/17 ● | 1,500,000 | 1,504,293 | ||||||
PNC Bank | ||||||||
2.30% 6/1/20 | 500,000 | 501,590 | ||||||
2.45% 11/5/20 | 1,035,000 | 1,039,866 | ||||||
2.625% 2/17/22 | 570,000 | 570,677 | ||||||
6.875% 4/1/18 | 1,415,000 | 1,483,571 | ||||||
PNC Financial Services Group | 1,100,000 | 1,097,250 | ||||||
Popular 7.00% 7/1/19 | 645,000 | 676,444 | ||||||
Regions Bank | 345,000 | 346,159 | ||||||
Royal Bank of Canada | ||||||||
2.30% 3/22/21 | 2,300,000 | 2,303,510 | ||||||
2.75% 2/1/22 | 185,000 | 186,798 | ||||||
Royal Bank of Scotland Group | ||||||||
3.875% 9/12/23 | 1,745,000 | 1,721,983 | ||||||
144A 6.99% 10/29/49 #● | 300,000 | 339,000 | ||||||
8.625% 12/29/49 ● | 4,970,000 | 5,193,650 | ||||||
Santander Holdings USA | ||||||||
2.504% 11/24/17 ● | 2,500,000 | 2,516,517 | ||||||
2.70% 5/24/19 | 2,100,000 | 2,110,811 | ||||||
Santander UK | ||||||||
1.904% 8/24/18 ● | 730,000 | 733,835 | ||||||
144A 5.00% 11/7/23 # | 795,000 | 831,061 | ||||||
Santander UK Group Holdings | ||||||||
2.875% 10/16/20 | 440,000 | 441,338 | ||||||
3.125% 1/8/21 | 550,000 | 553,390 | ||||||
3.571% 1/10/23 | 945,000 | 946,078 | ||||||
7.375% 6/24/22 ● | GBP | 2,200,000 | 2,890,754 | |||||
Societe Generale 144A | 3,600,000 | 3,534,196 | ||||||
| Principal amount° | Value (U.S. $) | |||||||
| ||||||||
Corporate Bonds (continued) |
| |||||||
| ||||||||
Banking (continued) | ||||||||
Standard Chartered 144A | 3,200,000 | $ | 3,223,926 | |||||
State Street | ||||||||
2.55% 8/18/20 | 1,000,000 | 1,013,783 | ||||||
3.10% 5/15/23 | 525,000 | 529,171 | ||||||
3.55% 8/18/25 | 900,000 | 925,817 | ||||||
Sumitomo Mitsui Banking | ||||||||
1.558% 1/11/19 ● | 1,000,000 | 1,000,951 | ||||||
1.831% 9/15/17 ● | 3,800,000 | 3,809,530 | ||||||
Sumitomo Mitsui Financial | 2,300,000 | 2,375,251 | ||||||
Sumitomo Mitsui Trust Bank | 2,700,000 | 2,707,471 | ||||||
SunTrust Bank | 540,000 | 525,289 | ||||||
SunTrust Banks | 1,105,000 | 1,101,651 | ||||||
SVB Financial Group | 2,205,000 | 2,158,578 | ||||||
Swedbank 144A | 1,135,000 | 1,141,262 | ||||||
Synchrony Financial | ||||||||
1.875% 8/15/17 | 500,000 | 500,223 | ||||||
2.265% 2/3/20 ● | 500,000 | 503,527 | ||||||
2.438% 11/9/17 ● | 1,400,000 | 1,407,941 | ||||||
Toronto-Dominion Bank | ||||||||
1.589% 4/30/18 ● | 835,000 | 838,486 | ||||||
2.125% 4/7/21 | 750,000 | 743,710 | ||||||
2.50% 12/14/20 | 690,000 | 696,048 | ||||||
3.625% 9/15/31 ● | 1,075,000 | 1,054,451 | ||||||
Turkiye Garanti Bankasi | ||||||||
144A 5.25% 9/13/22 # | 355,000 | 354,104 | ||||||
144A 6.25% 4/20/21 # | 590,000 | 615,880 | ||||||
UBS | ||||||||
4.75% 5/22/23 ● | 1,300,000 | 1,331,379 | ||||||
5.125% 5/15/24 | 200,000 | 205,315 | ||||||
5.875% 12/20/17 | 1,163,000 | 1,198,380 | ||||||
7.625% 8/17/22 | 500,000 | 579,350 | ||||||
UBS Group | 555,000 | 572,404 | ||||||
UBS Group Funding Jersey | ||||||||
144A 2.65% 2/1/22 # | 785,000 | 770,300 | ||||||
144A 2.803% 4/14/21 #● | 400,000 | 413,811 | ||||||
144A 3.00% 4/15/21 # | 3,165,000 | 3,173,175 | ||||||
144A 4.125% 9/24/25 # | 870,000 | 886,209 | ||||||
144A 4.125% 4/15/26 # | 845,000 | 860,518 | ||||||
UBS Group Funding Switzerland | 1,145,000 | 1,153,600 | ||||||
| 56 |
Table of Contents
| Principal amount° | Value (U.S. $) | |||||||
| ||||||||
Corporate Bonds (continued) |
| |||||||
| ||||||||
Banking (continued) | ||||||||
UBS Group Funding Switzerland | 290,000 | $ | 293,979 | |||||
US Bancorp | ||||||||
2.375% 7/22/26 | 1,700,000 | 1,591,599 | ||||||
2.625% 1/24/22 | 935,000 | 939,046 | ||||||
3.60% 9/11/24 | 1,275,000 | 1,314,148 | ||||||
USB Capital IX | 1,820,000 | 1,549,275 | ||||||
Wells Fargo & Co. | ||||||||
2.269% 10/31/23 ● | 1,440,000 | 1,467,562 | ||||||
2.55% 12/7/20 | 3,000,000 | 3,016,362 | ||||||
3.00% 7/27/21 | AUD | 979,000 | 736,906 | |||||
3.069% 1/24/23 | 2,160,000 | 2,170,694 | ||||||
3.50% 9/12/29 | GBP | 196,000 | 272,672 | |||||
4.75% 12/7/46 | 490,000 | 502,095 | ||||||
Wells Fargo Bank | 535,000 | 537,145 | ||||||
Westpac Banking | 860,000 | 870,740 | ||||||
Woori Bank 144A | 800,000 | 827,579 | ||||||
Zions Bancorporation | 830,000 | 861,419 | ||||||
|
| |||||||
| 306,906,473 | ||||||||
|
| |||||||
Basic Industry – 2.06% | ||||||||
Air Liquide Finance 144A | 700,000 | 676,682 | ||||||
ArcelorMittal 6.125% 6/1/25 | 320,000 | 356,800 | ||||||
Barrick North America Finance | 670,000 | 780,156 | ||||||
BHP Billiton Finance | GBP | 123,000 | 171,471 | |||||
BHP Billiton Finance USA | 2,795,000 | 3,033,274 | ||||||
CF Industries |
| |||||||
144A 3.40% 12/1/21 # | 135,000 | 135,174 | ||||||
6.875% 5/1/18 | 1,750,000 | 1,828,750 | ||||||
Cia Brasileira de Aluminio | 555,000 | 602,175 | ||||||
CK Hutchison International 17 | 700,000 | 698,749 | ||||||
Cliffs Natural Resources 144A | 225,000 | 218,813 | ||||||
Dow Chemical | 3,662,000 | 4,152,979 | ||||||
Evraz Group 144A | 825,000 | 829,125 | ||||||
| Principal amount° | Value (U.S. $) | |||||||
| ||||||||
Corporate Bonds (continued) |
| |||||||
| ||||||||
Basic Industry (continued) | ||||||||
Freeport-McMoRan | ||||||||
4.55% 11/14/24 | 650,000 | $ | 607,750 | |||||
144A 6.875% 2/15/23 # | 410,000 | 425,375 | ||||||
Georgia-Pacific | ||||||||
144A 2.539% 11/15/19 # | 1,050,000 | 1,058,940 | ||||||
8.00% 1/15/24 | 2,242,000 | 2,875,917 | ||||||
Glencore Funding 144A | 505,000 | 499,178 | ||||||
Hexion 144A | 40,000 | 40,000 | ||||||
Hudbay Minerals |
| |||||||
144A 7.25% 1/15/23 # | 10,000 | 10,650 | ||||||
144A 7.625% 1/15/25 # | 325,000 | 354,250 | ||||||
International Paper | 2,555,000 | 2,421,021 | ||||||
INVISTA Finance 144A | 1,060,000 | 1,094,450 | ||||||
Joseph T Ryerson & Son 144A | 30,000 | 33,825 | ||||||
Kraton Polymers 144A | 70,000 | 80,675 | ||||||
LYB International Finance II | 1,530,000 | 1,504,431 | ||||||
MMC Norilsk Nickel |
| |||||||
144A 5.55% 10/28/20 # | 258,000 | 277,532 | ||||||
144A 6.625% 10/14/22 # | 605,000 | 682,997 | ||||||
NCI Building Systems 144A | 275,000 | 299,750 | ||||||
New Gold |
| |||||||
144A 6.25% 11/15/22 # | 30,000 | 30,225 | ||||||
144A 7.00% 4/15/20 # | 20,000 | 20,037 | ||||||
NOVA Chemicals 144A | 526,000 | 536,520 | ||||||
Novelis |
| |||||||
144A 5.875% 9/30/26 # | 515,000 | 526,587 | ||||||
144A 6.25% 8/15/24 # | 280,000 | 292,600 | ||||||
OCP |
| |||||||
144A 4.50% 10/22/25 # | 1,180,000 | 1,166,873 | ||||||
144A 6.875% 4/25/44 # | 210,000 | 226,380 | ||||||
Olin 5.125% 9/15/27 | 360,000 | 366,984 | ||||||
PolyOne 5.25% 3/15/23 | 290,000 | 293,625 | ||||||
Potash Corp. of Saskatchewan | 780,000 | 800,017 | ||||||
PQ 144A 6.75% 11/15/22 # | 70,000 | 74,725 | ||||||
Southern Copper | 775,000 | 811,370 | ||||||
Steel Dynamics 144A | 480,000 | 487,200 | ||||||
| (continues) | 57 |
Table of Contents
Schedules of investments
Optimum Fixed Income Fund
| Principal amount° | Value (U.S. $) | |||||||
| ||||||||
Corporate Bonds (continued) |
| |||||||
| ||||||||
Basic Industry (continued) | ||||||||
Summit Materials | ||||||||
6.125% 7/15/23 | 70,000 | $ | 71,750 | |||||
8.50% 4/15/22 | 30,000 | 33,263 | ||||||
Suzano Austria | ||||||||
144A 5.75% 7/14/26 # | 770,000 | 786,170 | ||||||
144A 7.00% 3/16/47 # | 485,000 | 477,725 | ||||||
US Concrete | ||||||||
144A 6.375% 6/1/24 # | 505,000 | 525,200 | ||||||
6.375% 6/1/24 | 95,000 | 98,800 | ||||||
Vale Overseas | ||||||||
5.875% 6/10/21 | 520,000 | 558,542 | ||||||
6.25% 8/10/26 | 1,220,000 | 1,328,275 | ||||||
6.875% 11/10/39 | 70,000 | 75,208 | ||||||
Vedanta Resources | ||||||||
144A 6.375% 7/30/22 # | 760,000 | 767,220 | ||||||
144A 7.125% 5/31/23 # | 355,000 | 364,763 | ||||||
Westlake Chemical 144A | 1,815,000 | 1,870,334 | ||||||
WR Grace & Co.-Conn 144A 5.625% 10/1/24 # | 508,000 | 537,210 | ||||||
|
| |||||||
| 38,878,492 | ||||||||
|
| |||||||
Brokerage – 0.44% | ||||||||
Affiliated Managers Group | ||||||||
3.50% 8/1/25 | 830,000 | 816,869 | ||||||
Bear Stearns | ||||||||
6.40% 10/2/17 | 700,000 | 716,881 | ||||||
7.25% 2/1/18 | 2,000,000 | 2,090,516 | ||||||
BlackRock 3.20% 3/15/27 | 695,000 | 696,107 | ||||||
E*TRADE Financial | 1,120,000 | 1,156,680 | ||||||
Jefferies Group | ||||||||
6.45% 6/8/27 | 331,000 | 375,102 | ||||||
6.50% 1/20/43 | 270,000 | 293,760 | ||||||
Lazard Group | 2,100,000 | 2,090,876 | ||||||
|
| |||||||
| 8,236,791 | ||||||||
|
| |||||||
Capital Goods – 1.46% | ||||||||
Advanced Disposal Services 144A 5.625% 11/15/24 # | 80,000 | 81,000 | ||||||
Ardagh Packaging Finance | ||||||||
144A 4.289% 5/15/21 #● | 435,000 | 446,419 | ||||||
144A 6.00% 2/15/25 # | 405,000 | 410,569 | ||||||
144A 7.25% 5/15/24 # | 200,000 | 214,750 | ||||||
Ball 5.25% 7/1/25 | 725,000 | 770,313 | ||||||
BMC East 144A 5.50% 10/1/24 # | 50,000 | 51,000 | ||||||
Boise Cascade 144A | 750,000 | 765,000 | ||||||
| Principal amount° | Value (U.S. $) | |||||||
| ||||||||
Corporate Bonds (continued) |
| |||||||
| ||||||||
Capital Goods (continued) |
| |||||||
Builders FirstSource | ||||||||
144A 5.625% 9/1/24 # | 715,000 | $ | 728,406 | |||||
144A 10.75% 8/15/23 # | 70,000 | 81,725 | ||||||
BWAY Holding | ||||||||
144A 5.50% 4/15/24 # | 380,000 | 383,800 | ||||||
144A 9.125% 8/15/21 # | 110,000 | 120,445 | ||||||
CCL Industries 144A | 655,000 | 628,077 | ||||||
Cemex 144A | 245,000 | 276,289 | ||||||
Cemex Finance 144A 6.00% 4/1/24 # | 785,000 | 827,390 | ||||||
Crane | ||||||||
2.75% 12/15/18 | 170,000 | 172,775 | ||||||
4.45% 12/15/23 | 1,050,000 | 1,103,141 | ||||||
Crown Americas 144A | ||||||||
4.25% 9/30/26 # | 364,000 | 351,034 | ||||||
Fortune Brands Home & Security 3.00% 6/15/20 | 515,000 | 521,577 | ||||||
Gardner Denver 144A | 130,000 | 134,875 | ||||||
General Electric | ||||||||
1.414% 5/5/26 ● | 920,000 | 903,204 | ||||||
144A 3.80% 6/18/19 # | 345,000 | 359,141 | ||||||
4.25% 1/17/18 | NZD | 140,000 | 99,349 | |||||
4.65% 10/17/21 | 89,000 | 97,743 | ||||||
5.55% 5/4/20 | 470,000 | 520,111 | ||||||
6.00% 8/7/19 | 1,025,000 | 1,126,162 | ||||||
Heathrow Funding 144A | 200,000 | 214,412 | ||||||
KLX 144A 5.875% 12/1/22 # | 500,000 | 517,500 | ||||||
Koppers 144A | 80,000 | 82,800 | ||||||
LafargeHolcim Finance US | ||||||||
144A 3.50% 9/22/26 # | 1,470,000 | 1,423,804 | ||||||
144A 4.75% 9/22/46 # | 570,000 | 572,694 | ||||||
Lennox International | 710,000 | 698,732 | ||||||
Lockheed Martin | 1,111,000 | 1,127,497 | ||||||
Masco | ||||||||
3.50% 4/1/21 | 1,265,000 | 1,293,602 | ||||||
5.95% 3/15/22 | 400,000 | 449,691 | ||||||
Owens-Brockway Glass Container 144A | ||||||||
5.875% 8/15/23 # | 600,000 | 636,000 | ||||||
Parker-Hannifin | 65,000 | 66,198 | ||||||
Rockwell Collins | 775,000 | 774,508 | ||||||
| 58 |
Table of Contents
| Principal amount° | Value (U.S. $) | |||||||
| ||||||||
Corporate Bonds (continued) |
| |||||||
| ||||||||
Capital Goods (continued) | ||||||||
Roper Technologies | ||||||||
2.80% 12/15/21 | 685,000 | $ | 686,436 | |||||
3.80% 12/15/26 | 485,000 | 488,037 | ||||||
Siemens Financierings-maatschappij | ||||||||
144A 1.332% 5/25/18 #● | 610,000 | 611,676 | ||||||
144A 1.70% 9/15/21 # | 1,235,000 | 1,191,309 | ||||||
144A 3.125% 3/16/24 # | 1,325,000 | 1,335,415 | ||||||
St. Marys Cement 144A | 920,000 | 920,276 | ||||||
Standard Industries 144A | 985,000 | 967,763 | ||||||
StandardAero Aviation Holdings 144A | ||||||||
10.00% 7/15/23 # | 30,000 | 32,325 | ||||||
Suzano Trading 144A | 350,000 | 374,605 | ||||||
TransDigm 6.375% 6/15/26 | 415,000 | 416,282 | ||||||
Union Andina de Cementos 144A 5.875% 10/30/21 # | 460,000 | 479,550 | ||||||
United Technologies | 875,000 | 823,389 | ||||||
Zekelman Industries 144A | 90,000 | 100,800 | ||||||
|
| |||||||
| 27,459,596 | ||||||||
|
| |||||||
Communications – 3.67% | ||||||||
21st Century Fox America | ||||||||
4.50% 2/15/21 | 155,000 | 165,476 | ||||||
4.95% 10/15/45 | 1,000,000 | 1,038,682 | ||||||
AT&T | ||||||||
2.082% 6/30/20 ● | 810,000 | 819,850 | ||||||
2.80% 2/17/21 | 2,200,000 | 2,208,307 | ||||||
3.20% 3/1/22 | 100,000 | 100,867 | ||||||
3.80% 3/1/24 | 100,000 | 101,220 | ||||||
5.25% 3/1/37 | 3,635,000 | 3,713,440 | ||||||
Bell Canada 3.35% | CAD | 219,000 | 172,321 | |||||
Cablevision 144A | 950,000 | 1,003,200 | ||||||
CCO Holdings | ||||||||
144A 5.125% 5/1/27 # | 215,000 | 217,016 | ||||||
144A 5.50% 5/1/26 # | 530,000 | 549,875 | ||||||
144A 5.75% 2/15/26 # | 80,000 | 84,200 | ||||||
144A 5.875% 5/1/27 # | 60,000 | 63,150 | ||||||
CenturyLink | ||||||||
5.80% 3/15/22 | 1,160,000 | 1,199,811 | ||||||
6.75% 12/1/23 | 729,000 | 762,716 | ||||||
7.50% 4/1/24 | 20,000 | 21,194 | ||||||
| Principal amount° | Value (U.S. $) | |||||||
| ||||||||
Corporate Bonds (continued) |
| |||||||
| ||||||||
Communications (continued) | ||||||||
Charter Communications Operating | ||||||||
3.579% 7/23/20 | 300,000 | $ | 308,971 | |||||
4.464% 7/23/22 | 800,000 | 843,446 | ||||||
4.908% 7/23/25 | 1,810,000 | 1,914,412 | ||||||
Cincinnati Bell 144A | 355,000 | 373,194 | ||||||
Columbus Cable Barbados 144A 7.375% 3/30/21 # | 595,000 | 639,625 | ||||||
Comcast 3.00% 2/1/24 | 1,305,000 | 1,305,339 | ||||||
Crown Castle Towers | ||||||||
144A 3.663% 5/15/25 # | 110,000 | 110,090 | ||||||
144A 4.883% 8/15/20 # | 2,090,000 | 2,226,069 | ||||||
CSC Holdings 144A | 826,000 | 841,487 | ||||||
Deutsche Telekom International Finance | ||||||||
144A 1.95% 9/19/21 # | 770,000 | 744,525 | ||||||
144A 2.485% 9/19/23 # | 3,005,000 | 2,876,374 | ||||||
144A 3.60% 1/19/27 # | 285,000 | 284,303 | ||||||
6.50% 4/8/22 | GBP | 36,000 | 56,291 | |||||
Digicel 144A | 205,000 | 187,319 | ||||||
Digicel Group | ||||||||
144A 7.125% 4/1/22 # | 420,000 | 328,650 | ||||||
144A 8.25% 9/30/20 # | 680,000 | 587,092 | ||||||
DISH DBS | ||||||||
4.25% 4/1/18 | 200,000 | 203,814 | ||||||
7.75% 7/1/26 | 300,000 | 349,500 | ||||||
Gray Television 144A 5.875% 7/15/26 # | 750,000 | 765,000 | ||||||
Grupo Televisa | 570,000 | 605,604 | ||||||
GTP Acquisition Partners I 144A 2.35% 6/15/20 # | 530,000 | 523,868 | ||||||
KT 144A 1.75% 4/22/17 # | 900,000 | 899,993 | ||||||
Lamar Media 5.75% 2/1/26 | 501,000 | 537,949 | ||||||
Level 3 Financing | 1,036,000 | 1,056,720 | ||||||
Midcontinent Communications | 355,000 | 379,406 | ||||||
Millicom International Cellular | 675,000 | 694,406 | ||||||
Myriad International Holdings | 700,000 | 728,700 | ||||||
NBCUniversal Enterprise 144A 1.707% 4/15/18 #● | 840,000 | 845,258 | ||||||
Nexstar Broadcasting 144A 5.625% 8/1/24 # | 635,000 | 646,113 | ||||||
| (continues) | 59 |
Table of Contents
Schedules of investments
Optimum Fixed Income Fund
| Principal amount° | Value (U.S. $) | |||||||
| ||||||||
Corporate Bonds (continued) |
| |||||||
| ||||||||
Communications (continued) | ||||||||
Radiate Holdco 144A 6.625% 2/15/25 # | 80,000 | $ | 79,150 | |||||
SBA Tower Trust | ||||||||
144A 2.24% 4/16/18 # | 735,000 | 735,281 | ||||||
144A 2.898% 10/15/19 # | 600,000 | 601,792 | ||||||
Scripps Networks Interactive | 300,000 | 305,944 | ||||||
SFR Group | ||||||||
144A 6.25% 5/15/24 # | 790,000 | 797,900 | ||||||
144A 7.375% 5/1/26 # | 1,000,000 | 1,033,750 | ||||||
Sinclair Television Group 144A 5.125% 2/15/27 # | 615,000 | 596,550 | ||||||
Sirius XM Radio 144A 5.375% 4/15/25 # | 1,147,000 | 1,176,822 | ||||||
Sprint | ||||||||
7.125% 6/15/24 | 110,000 | 117,700 | ||||||
7.875% 9/15/23 | 628,000 | 697,080 | ||||||
Sprint Capital 6.90% 5/1/19 | 900,000 | 963,000 | ||||||
Sprint Communications 7.00% 8/15/20 | 260,000 | 279,825 | ||||||
Telecom Italia 144A 5.303% 5/30/24 # | 200,000 | 203,000 | ||||||
Telefonica Emisiones SAU | ||||||||
5.213% 3/8/47 | 2,500,000 | 2,548,990 | ||||||
6.221% 7/3/17 | 722,000 | 729,987 | ||||||
Time Warner Cable | ||||||||
6.75% 7/1/18 | 1,500,000 | 1,586,544 | ||||||
7.30% 7/1/38 | 2,685,000 | 3,336,279 | ||||||
T-Mobile USA | ||||||||
6.00% 3/1/23 | 40,000 | 42,812 | ||||||
6.00% 4/15/24 | 20,000 | 21,375 | ||||||
6.375% 3/1/25 | 50,000 | 54,000 | ||||||
6.50% 1/15/26 | 615,000 | 674,963 | ||||||
Tribune Media | 708,000 | 741,630 | ||||||
Unitymedia 144A | 340,000 | 359,550 | ||||||
UPCB Finance IV 144A | ||||||||
5.375% 1/15/25 # | 488,000 | 493,490 | ||||||
Verizon Communications | ||||||||
2.137% 3/16/22 ● | 4,250,000 | 4,291,675 | ||||||
2.871% 9/14/18 ● | 650,000 | 663,902 | ||||||
144A 2.946% 3/15/22 # | 1,631,000 | 1,625,719 | ||||||
3.125% 3/16/22 | 1,600,000 | 1,607,144 | ||||||
3.25% 2/17/26 | EUR | 323,000 | 397,576 | |||||
3.50% 11/1/21 | 50,000 | 51,349 | ||||||
4.125% 3/16/27 | 1,500,000 | 1,528,841 | ||||||
5.15% 9/15/23 | 1,400,000 | 1,538,643 | ||||||
5.25% 3/16/37 | 225,000 | 233,121 | ||||||
| Principal amount° | Value (U.S. $) | |||||||
| ||||||||
Corporate Bonds (continued) |
| |||||||
| ||||||||
Communications (continued) | ||||||||
Vimpel Communications | 420,000 | $ | 476,424 | |||||
VimpelCom Holdings 144A | 645,000 | 688,537 | ||||||
Virgin Media Secured Finance 144A 5.25% 1/15/26 # | 790,000 | 797,900 | ||||||
VTR Finance 144A | 1,055,000 | 1,099,837 | ||||||
WideOpenWest Finance | 90,000 | 94,050 | ||||||
Wind Acquisition Finance 144A 7.375% 4/23/21 # | 350,000 | 364,875 | ||||||
WPP Finance 2010 | 340,000 | 363,552 | ||||||
Zayo Group | ||||||||
144A 5.75% 1/15/27 # | 120,000 | 126,876 | ||||||
6.00% 4/1/23 | 695,000 | 737,569 | ||||||
6.375% 5/15/25 | 110,000 | 119,143 | ||||||
|
| |||||||
| 69,068,990 | ||||||||
|
| |||||||
Consumer Cyclical – 3.39% | ||||||||
Adient Global Holdings 144A 4.875% 8/15/26 # | 370,000 | 363,987 | ||||||
Allison Transmission 144A 5.00% 10/1/24 # | 275,000 | 278,437 | ||||||
American Tire Distributors 144A 10.25% 3/1/22 # | 60,000 | 61,350 | ||||||
BMW US Capital | ||||||||
144A 1.50% 4/11/19 # | 500,000 | 496,703 | ||||||
144A 3.30% 4/6/27 # | 940,000 | 937,613 | ||||||
Boyd Gaming | ||||||||
6.375% 4/1/26 | 860,000 | 922,350 | ||||||
Cencosud | ||||||||
144A 5.15% 2/12/25 # | 600,000 | 626,317 | ||||||
144A 6.625% 2/12/45 # | 530,000 | 543,124 | ||||||
CVS Health 2.125% 6/1/21 | 450,000 | 441,788 | ||||||
CVS Pass Through Trust 144A | ||||||||
5.773% 1/10/33 # ◆ | 83,151 | 93,411 | ||||||
Daimler 2.75% 12/10/18 | NOK | 1,870,000 | 223,767 | |||||
Daimler Finance North America | ||||||||
144A 1.374% 8/1/17 #● | 540,000 | 540,531 | ||||||
144A 1.745% 8/3/17 #● | 4,500,000 | 4,510,314 | ||||||
144A 2.00% 8/3/18 # | 3,800,000 | 3,809,519 | ||||||
144A 2.00% 7/6/21 # | 300,000 | 291,929 | ||||||
144A 2.20% 10/30/21 # | 910,000 | 890,528 | ||||||
144A 3.45% 1/6/27 # | 1,215,000 | 1,219,865 | ||||||
Delphi Automotive | 900,000 | 918,804 | ||||||
| 60 |
Table of Contents
| Principal amount° | Value (U.S. $) | |||||||
| ||||||||
Corporate Bonds (continued) |
| |||||||
| ||||||||
Consumer Cyclical (continued) | ||||||||
Dollar General | 1,110,000 | $ | 1,113,013 | |||||
DR Horton | ||||||||
3.75% 3/1/19 | 200,000 | 205,032 | ||||||
4.00% 2/15/20 | 400,000 | 416,403 | ||||||
Ford Motor Credit | ||||||||
1.897% 8/12/19 | 1,000,000 | 990,942 | ||||||
2.24% 6/15/18 | 4,000,000 | 4,014,644 | ||||||
3.096% 5/4/23 | 1,340,000 | 1,307,918 | ||||||
3.20% 1/15/21 | 4,600,000 | 4,652,969 | ||||||
4.389% 1/8/26 | 455,000 | 464,546 | ||||||
5.75% 2/1/21 | 700,000 | 771,630 | ||||||
General Motors | 525,000 | 616,847 | ||||||
General Motors Financial | ||||||||
3.00% 9/25/17 | 3,400,000 | 3,420,764 | ||||||
3.70% 5/9/23 | 575,000 | 580,092 | ||||||
4.375% 9/25/21 | 800,000 | 842,024 | ||||||
4.75% 8/15/17 | 900,000 | 909,870 | ||||||
5.25% 3/1/26 | 725,000 | 780,236 | ||||||
GLP Capital | 730,000 | 755,550 | ||||||
Goodyear Tire & Rubber | ||||||||
4.875% 3/15/27 | 370,000 | 370,925 | ||||||
5.00% 5/31/26 | 530,000 | 544,575 | ||||||
Hanesbrands 144A | 630,000 | 622,125 | ||||||
HD Supply 144A | 510,000 | 537,693 | ||||||
Hilton Worldwide Finance | 365,000 | 369,563 | ||||||
Hyundai Capital America | ||||||||
144A 2.125% 10/2/17 # | 615,000 | 616,001 | ||||||
144A 2.55% 2/6/19 # | 715,000 | 718,970 | ||||||
144A 3.00% 3/18/21 # | 580,000 | 582,447 | ||||||
IHO Verwaltungs 144A PIK | ||||||||
4.75% 9/15/26 #T | 430,000 | 420,325 | ||||||
JC Penney 8.125% 10/1/19 | 325,000 | 352,625 | ||||||
JD.com 3.125% 4/29/21 | 935,000 | 932,971 | ||||||
KFC Holding | ||||||||
144A 5.00% 6/1/24 # | 340,000 | 348,075 | ||||||
144A 5.25% 6/1/26 # | 318,000 | 324,360 | ||||||
Landry’s 144A | 50,000 | 52,000 | ||||||
Lennar | ||||||||
4.75% 5/30/25 | 40,000 | 40,300 | ||||||
4.875% 12/15/23 | 380,000 | 390,450 | ||||||
Levi Strauss & Co. | 805,000 | 829,311 | ||||||
| Principal amount° | Value (U.S. $) | |||||||
| ||||||||
Corporate Bonds (continued) |
| |||||||
| ||||||||
Consumer Cyclical (continued) |
| |||||||
Lowe’s | ||||||||
1.529% 9/10/19 ● | 520,000 | $ | 523,591 | |||||
3.70% 4/15/46 | 1,475,000 | 1,372,504 | ||||||
M/I Homes 6.75% 1/15/21 | 80,000 | 84,155 | ||||||
Marriott International | ||||||||
3.75% 3/15/25 | 1,020,000 | 1,038,244 | ||||||
4.50% 10/1/34 | 160,000 | 162,579 | ||||||
MGM Resorts International 4.625% 9/1/26 | 605,000 | 589,875 | ||||||
Mohegan Tribal Gaming Authority 144A | 110,000 | 111,925 | ||||||
PACCAR Financial | 835,000 | 841,790 | ||||||
Penn National Gaming 144A | 930,000 | 925,350 | ||||||
Penske Automotive Group | 490,000 | 481,425 | ||||||
PulteGroup 5.00% 1/15/27 | 430,000 | 431,613 | ||||||
Scientific Games International | ||||||||
144A 7.00% 1/1/22 # | 610,000 | 653,463 | ||||||
10.00% 12/1/22 | 130,000 | 139,100 | ||||||
Target 3.625% 4/15/46 | 1,140,000 | 1,031,245 | ||||||
Toyota Motor Credit | 420,000 | 423,210 | ||||||
Volkswagen Financial Services | GBP | 800,000 | 1,022,767 | |||||
Walgreens Boots Alliance | ||||||||
2.60% 6/1/21 | 585,000 | 586,197 | ||||||
3.10% 6/1/23 | 1,670,000 | 1,669,781 | ||||||
3.45% 6/1/26 | 475,000 | 463,942 | ||||||
Wolverine World Wide 144A | 400,000 | 377,000 | ||||||
Wyndham Worldwide | 555,000 | 560,433 | ||||||
Wynn Las Vegas | 2,900,000 | 2,954,375 | ||||||
ZF North America Capital 144A 4.00% 4/29/20 # | 400,000 | 412,500 | ||||||
|
| |||||||
| 63,922,597 | ||||||||
|
| |||||||
Consumer Non-Cyclical – 3.62% |
| |||||||
Abbott Laboratories | ||||||||
2.90% 11/30/21 | 475,000 | 477,535 | ||||||
4.90% 11/30/46 | 1,260,000 | 1,311,535 | ||||||
AbbVie | ||||||||
2.30% 5/14/21 | 1,000,000 | 988,309 | ||||||
2.85% 5/14/23 | 1,400,000 | 1,375,164 | ||||||
ACCO Brands 144A | 450,000 | 453,375 | ||||||
| (continues) | 61 |
Table of Contents
Schedules of investments
Optimum Fixed Income Fund
| Principal amount° | Value (U.S. $) | |||||||
| ||||||||
Corporate Bonds (continued) |
| |||||||
| ||||||||
Consumer Non-Cyclical (continued) |
| |||||||
Actavis Funding SCS | ||||||||
2.35% 3/12/18 | 500,000 | $ | 502,277 | |||||
3.00% 3/12/20 | 1,200,000 | 1,220,537 | ||||||
3.45% 3/15/22 | 1,000,000 | 1,020,096 | ||||||
Air Medical Group Holdings | 110,000 | 106,975 | ||||||
Albertsons | ||||||||
144A 5.75% 3/15/25 # | 805,000 | 782,863 | ||||||
144A 6.625% 6/15/24 # | 70,000 | 71,750 | ||||||
Altria Group | 1,230,000 | 1,142,708 | ||||||
Amgen 4.00% 9/13/29 | GBP | 216,000 | 308,994 | |||||
Anheuser-Busch InBev Finance | ||||||||
1.434% 2/1/19 ● | 340,000 | 341,254 | ||||||
2.65% 2/1/21 | 900,000 | 907,490 | ||||||
3.65% 2/1/26 | 5,310,000 | 5,378,770 | ||||||
Anheuser-Busch InBev Worldwide | 1,000,000 | 1,087,080 | ||||||
Aramark Services | 895,000 | 902,831 | ||||||
BAT International Finance | ||||||||
144A 2.75% 6/15/20 # | 700,000 | 706,479 | ||||||
Bayer US Finance 144A | ||||||||
1.43% 10/6/17 #● | 295,000 | 294,782 | ||||||
Becle 144A 3.75% | 1,815,000 | 1,775,677 | ||||||
Biogen 5.20% 9/15/45 | 870,000 | 943,873 | ||||||
Boston Scientific | 800,000 | 815,966 | ||||||
BRF 144A 4.35% 9/29/26 # | 270,000 | 247,725 | ||||||
Celgene 3.25% 8/15/22 | 1,475,000 | 1,499,500 | ||||||
Change Healthcare Holdings | 80,000 | 82,300 | ||||||
DaVita | ||||||||
5.00% 5/1/25 | 831,000 | 830,485 | ||||||
5.125% 7/15/24 | 30,000 | 30,356 | ||||||
Dean Foods 144A | 525,000 | 548,625 | ||||||
ESAL 144A 6.25% 2/5/23 # | 390,000 | 391,950 | ||||||
Gilead Sciences | 580,000 | 540,282 | ||||||
HCA | ||||||||
3.75% 3/15/19 | 1,700,000 | 1,742,500 | ||||||
5.375% 2/1/25 | 715,000 | 745,387 | ||||||
7.58% 9/15/25 | 30,000 | 33,863 | ||||||
HealthSouth | 235,000 | 236,175 | ||||||
| Principal amount° | Value (U.S. $) | |||||||
| ||||||||
Corporate Bonds (continued) |
| |||||||
| ||||||||
Consumer Non-Cyclical (continued) |
| |||||||
HealthSouth | ||||||||
5.75% 11/1/24 | 643,000 | $ | 651,037 | |||||
5.75% 9/15/25 | 270,000 | 271,013 | ||||||
Heineken 144A | ||||||||
3.50% 1/29/28 # | 385,000 | 387,857 | ||||||
Hill-Rom Holdings | ||||||||
144A 5.00% 2/15/25 # | 245,000 | 245,306 | ||||||
144A 5.75% 9/1/23 # | 325,000 | 338,406 | ||||||
IASIS Healthcare | 60,000 | 57,750 | ||||||
Imperial Brands Finance | ||||||||
144A 2.05% 2/11/18 # | 270,000 | 270,350 | ||||||
144A 2.95% 7/21/20 # | 700,000 | 709,387 | ||||||
144A 3.75% 7/21/22 # | 470,000 | 483,218 | ||||||
inVentiv Group Holdings | ||||||||
144A 7.50% 10/1/24 # | 40,000 | 41,350 | ||||||
JBS Investments 144A | ||||||||
7.75% 10/28/20 # | 235,000 | 247,337 | ||||||
JBS USA | ||||||||
144A 5.75% 6/15/25 # | 155,000 | 157,325 | ||||||
144A 5.875% 7/15/24 # | 320,000 | 331,200 | ||||||
Kernel Holding 144A | ||||||||
8.75% 1/31/22 # | 890,000 | 923,838 | ||||||
Kroger 4.45% 2/1/47 | 905,000 | 890,891 | ||||||
Kronos Acquisition Holdings | ||||||||
144A 9.00% 8/15/23 # | 90,000 | 91,800 | ||||||
Lamb Weston Holdings | ||||||||
144A 4.625% 11/1/24 # | 220,000 | 224,950 | ||||||
144A 4.875% 11/1/26 # | 355,000 | 362,987 | ||||||
Live Nation Entertainment | ||||||||
144A 4.875% 11/1/24 # | 711,000 | 712,777 | ||||||
Mallinckrodt International Finance | ||||||||
144A 5.50% 4/15/25 # | 572,000 | 529,100 | ||||||
144A 5.625% 10/15/23 # | 30,000 | 28,650 | ||||||
Marfrig Holdings Europe | ||||||||
144A 8.00% 6/8/23 # | 935,000 | 979,225 | ||||||
Merck 1.412% 5/18/18 ● | 680,000 | 682,564 | ||||||
Molson Coors Brewing | ||||||||
3.00% 7/15/26 | 1,410,000 | 1,343,354 | ||||||
4.20% 7/15/46 | 830,000 | 780,166 | ||||||
MPH Acquisition Holdings | ||||||||
144A 7.125% 6/1/24 # | 110,000 | 118,539 | ||||||
Mylan 3.95% 6/15/26 | 2,370,000 | 2,323,998 | ||||||
New York and Presbyterian | ||||||||
Hospital 4.063% 8/1/56 | 690,000 | 648,683 | ||||||
Nielsen Co. Luxembourg | ||||||||
144A 5.00% 2/1/25 # | 790,000 | 789,013 | ||||||
PepsiCo 1.372% 10/13/17 ● | 950,000 | 951,679 | ||||||
| 62 |
Table of Contents
| Principal amount° | Value (U.S. $) | |||||||
| ||||||||
Corporate Bonds (continued) |
| |||||||
| ||||||||
Consumer Non-Cyclical (continued) |
| |||||||
Pernod Ricard 144A | 1,940,000 | $ | 2,067,161 | |||||
Pfizer | ||||||||
1.431% 6/15/18 ● | 754,000 | 756,944 | ||||||
3.00% 12/15/26 | 1,105,000 | 1,095,356 | ||||||
Post Holdings | ||||||||
144A 5.00% 8/15/26 # | 825,000 | 792,000 | ||||||
144A 5.75% 3/1/27 # | 105,000 | 105,263 | ||||||
Prime Security Services Borrower 144A | 745,000 | 818,569 | ||||||
Quintiles IMS 144A | 610,000 | 613,813 | ||||||
Revlon Consumer Products 6.25% 8/1/24 | 365,000 | 365,000 | ||||||
Reynolds American | 2,200,000 | 2,311,481 | ||||||
Scotts Miracle-Gro 144A | 395,000 | 400,925 | ||||||
ServiceMaster 144A | 650,000 | 667,875 | ||||||
Shire Acquisitions Investments Ireland | ||||||||
2.40% 9/23/21 | 1,470,000 | 1,441,063 | ||||||
2.875% 9/23/23 | 1,385,000 | 1,345,570 | ||||||
Sigma Alimentos 144A | 490,000 | 480,200 | ||||||
Team Health Holdings 144A | 60,000 | 58,950 | ||||||
Tempur Sealy International | 450,000 | 444,825 | ||||||
Tenet Healthcare | ||||||||
8.00% 8/1/20 | 80,000 | 81,000 | ||||||
8.125% 4/1/22 | 80,000 | 83,800 | ||||||
Thermo Fisher Scientific | 1,980,000 | 1,967,362 | ||||||
Tyson Foods 2.65% 8/15/19 | 1,500,000 | 1,517,203 | ||||||
Universal Health Services | 210,000 | 216,825 | ||||||
Valeant Pharmaceuticals International | EUR | 2,500,000 | 1,970,686 | |||||
Zimmer Biomet Holdings | ||||||||
3.375% 11/30/21 | 745,000 | 754,389 | ||||||
4.625% 11/30/19 | 1,270,000 | 1,347,385 | ||||||
|
| |||||||
| 68,122,863 | ||||||||
|
| |||||||
Energy – 4.16% |
| |||||||
Alta Mesa Holdings 144A | 80,000 | 83,600 | ||||||
| Principal amount° | Value (U.S. $) | |||||||
| ||||||||
Corporate Bonds (continued) |
| |||||||
| ||||||||
Energy (continued) | ||||||||
Anadarko Petroleum | ||||||||
5.55% 3/15/26 | 355,000 | $ | 394,623 | |||||
6.60% 3/15/46 | 1,875,000 | 2,270,644 | ||||||
Antero Resources | 90,000 | 92,475 | ||||||
BG Energy Capital 144A | 600,000 | 635,424 | ||||||
BP Capital Markets | ||||||||
3.216% 11/28/23 | 1,650,000 | 1,659,661 | ||||||
3.224% 4/14/24 | 975,000 | 976,227 | ||||||
Cheniere Corpus Christi Holdings 144A | 295,000 | 308,644 | ||||||
Chevron 1.623% 3/3/22 ● | 575,000 | 576,781 | ||||||
CNOOC Finance 2015 Australia 2.625% 5/5/20 | 460,000 | 458,762 | ||||||
CNOOC Nexen Finance 2014 1.625% 4/30/17 | 1,000,000 | 1,000,240 | ||||||
ConocoPhillips | 1,075,000 | 1,095,010 | ||||||
Crestwood Midstream Partners 144A | 50,000 | 51,187 | ||||||
Diamondback Energy 144A | 775,000 | 783,447 | ||||||
Ecopetrol | ||||||||
5.875% 9/18/23 | 410,000 | 445,363 | ||||||
7.375% 9/18/43 | 270,000 | 289,845 | ||||||
Empresa Nacional del Petroleo 144A 4.75% 12/6/21 # | 899,000 | 951,698 | ||||||
Enbridge | ||||||||
4.25% 12/1/26 | 490,000 | 501,118 | ||||||
6.00% 1/15/77 ● | 245,000 | 248,369 | ||||||
Energy Transfer Equity | ||||||||
5.50% 6/1/27 | 50,000 | 52,500 | ||||||
7.50% 10/15/20 | 475,000 | 532,000 | ||||||
Energy Transfer Partners | ||||||||
6.125% 12/15/45 | 1,640,000 | 1,753,544 | ||||||
9.70% 3/15/19 | 694,000 | 789,459 | ||||||
Enterprise Products Operating 7.034% 1/15/68 ● | 200,000 | 208,180 | ||||||
Exxon Mobil 1.47% 3/6/22 ● | 1,125,000 | 1,132,447 | ||||||
Gazprom OAO Via Gaz Capital 144A | 1,065,000 | 1,062,848 | ||||||
Genesis Energy | ||||||||
5.625% 6/15/24 | 315,000 | 309,487 | ||||||
5.75% 2/15/21 | 30,000 | 30,525 | ||||||
6.00% 5/15/23 | 30,000 | 30,300 | ||||||
| (continues) | 63 |
Table of Contents
Schedules of investments
Optimum Fixed Income Fund
| Principal amount° | Value (U.S. $) | |||||||
| ||||||||
Corporate Bonds (continued) |
| |||||||
| ||||||||
Energy (continued) | ||||||||
Genesis Energy | 375,000 | $ | 388,500 | |||||
Gulfport Energy | ||||||||
144A 6.00% 10/15/24 # | 520,000 | 507,000 | ||||||
6.625% 5/1/23 | 245,000 | 248,981 | ||||||
Hilcorp Energy I | ||||||||
144A 5.00% 12/1/24 # | 700,000 | 659,750 | ||||||
144A 5.75% 10/1/25 # | 40,000 | 38,800 | ||||||
Holly Energy Partners 144A | 40,000 | 42,100 | ||||||
Kinder Morgan | ||||||||
2.00% 12/1/17 | 600,000 | 600,542 | ||||||
7.00% 6/15/17 | 800,000 | 808,616 | ||||||
Kinder Morgan Energy Partners | ||||||||
5.00% 10/1/21 | 620,000 | 665,199 | ||||||
5.80% 3/1/21 | 975,000 | 1,072,001 | ||||||
5.95% 2/15/18 | 1,000,000 | 1,034,335 | ||||||
6.85% 2/15/20 | 2,000,000 | 2,226,988 | ||||||
9.00% 2/1/19 | 2,200,000 | 2,461,831 | ||||||
Laredo Petroleum | 285,000 | 290,700 | ||||||
MPLX | ||||||||
4.875% 12/1/24 | 1,615,000 | 1,701,375 | ||||||
4.875% 6/1/25 | 550,000 | 577,007 | ||||||
Murphy Oil 6.875% 8/15/24 | 860,000 | 913,750 | ||||||
Murphy Oil USA | 895,000 | 941,987 | ||||||
Nabors Industries 144A | 262,000 | 268,714 | ||||||
Newfield Exploration | ||||||||
5.375% 1/1/26 | 50,000 | 52,470 | ||||||
5.75% 1/30/22 | 475,000 | 506,469 | ||||||
Noble Energy | 705,000 | 721,650 | ||||||
NuStar Logistics | 70,000 | 74,550 | ||||||
Oasis Petroleum | 40,000 | 41,100 | ||||||
Pertamina Persero | ||||||||
144A 4.875% 5/3/22 # | 525,000 | 557,520 | ||||||
144A 5.25% 5/23/21 # | 440,000 | 472,955 | ||||||
144A 5.625% 5/20/43 # | 255,000 | 262,413 | ||||||
Petrobras Global Finance | ||||||||
5.375% 1/27/21 | 515,000 | 531,651 | ||||||
6.125% 1/17/22 | 500,000 | 525,500 | ||||||
6.75% 1/27/41 | 985,000 | 926,885 | ||||||
6.85% 6/5/15 | 1,700,000 | 1,523,625 | ||||||
7.25% 3/17/44 | 600,000 | 595,500 | ||||||
| Principal amount° | Value (U.S. $) | |||||||
| ||||||||
Corporate Bonds (continued) |
| |||||||
| ||||||||
Energy (continued) | ||||||||
Petrobras Global Finance | ||||||||
7.375% 1/17/27 | 670,000 | $ | 709,999 | |||||
8.375% 5/23/21 | 1,200,000 | 1,360,500 | ||||||
Petroleos Mexicanos | ||||||||
3.125% 1/23/19 | 200,000 | 201,300 | ||||||
144A 4.77% 3/11/22 #● | 160,000 | 172,200 | ||||||
144A 6.50% 3/13/27 # | 390,000 | 420,030 | ||||||
6.75% 9/21/47 | 375,000 | 381,604 | ||||||
9.25% 3/30/18 | 1,000,000 | 1,064,591 | ||||||
Plains All American Pipeline | ||||||||
6.50% 5/1/18 | 800,000 | 837,526 | ||||||
8.75% 5/1/19 | 1,160,000 | 1,308,859 | ||||||
QEP Resources | 565,000 | 556,745 | ||||||
Raizen Fuels Finance 144A | 885,000 | 899,381 | ||||||
Regency Energy Partners | ||||||||
5.00% 10/1/22 | 2,490,000 | 2,650,545 | ||||||
5.75% 9/1/20 | 400,000 | 432,331 | ||||||
Rio Oil Finance Trust | 227,290 | 231,268 | ||||||
Rockies Express Pipeline | 500,000 | 525,000 | ||||||
Sabine Pass Liquefaction | ||||||||
144A 5.00% 3/15/27 # | 270,000 | 282,528 | ||||||
5.625% 4/15/23 | 1,720,000 | 1,868,109 | ||||||
5.75% 5/15/24 | 6,050,000 | 6,603,799 | ||||||
6.25% 3/15/22 | 400,000 | 443,909 | ||||||
Shell International Finance | ||||||||
1.484% 5/11/20 ● | 595,000 | 599,045 | ||||||
4.00% 5/10/46 | 580,000 | 558,978 | ||||||
4.375% 5/11/45 | 2,050,000 | 2,085,365 | ||||||
Sinopec Group Overseas Development 2012 | 500,000 | 500,735 | ||||||
Sinopec Group Overseas Development 2014 144A | 500,000 | 500,021 | ||||||
Southwestern Energy | ||||||||
4.10% 3/15/22 | 220,000 | 206,250 | ||||||
6.70% 1/23/25 | 95,000 | 94,525 | ||||||
7.50% 2/1/18 | 1,000,000 | 1,046,250 | ||||||
Statoil 1.498% 11/8/18 ● | 835,000 | 839,835 | ||||||
Summit Midstream Holdings | 50,000 | 50,000 | ||||||
Targa Resources Partners | 680,000 | 707,200 | ||||||
| 64 |
Table of Contents
| Principal amount° | Value (U.S. $) | |||||||
| ||||||||
Corporate Bonds (continued) |
| |||||||
| ||||||||
Energy (continued) | ||||||||
Tengizchevroil Finance Co. | 1,000,000 | $ | 960,710 | |||||
Tesoro Logistics | 390,000 | 408,525 | ||||||
Transcanada Trust | ||||||||
5.30% 3/15/77 ● | 430,000 | 425,700 | ||||||
5.875% 8/15/76 ● | 560,000 | 592,200 | ||||||
Transocean 144A | 70,000 | 75,075 | ||||||
Transocean Proteus 144A | 325,000 | 337,187 | ||||||
WildHorse Resource Development 144A | 80,000 | 76,600 | ||||||
Williams Partners | 1,800,000 | 1,854,459 | ||||||
Woodside Finance | ||||||||
144A 3.65% 3/5/25 # | 485,000 | 478,348 | ||||||
144A 3.70% 9/15/26 # | 680,000 | 665,524 | ||||||
144A 4.60% 5/10/21 # | 400,000 | 419,788 | ||||||
144A 8.75% 3/1/19 # | 1,125,000 | 1,258,945 | ||||||
YPF | ||||||||
144A 8.50% 3/23/21 # | 225,000 | 247,165 | ||||||
144A 23.854% 7/7/20 #● | 1,205,000 | 1,348,997 | ||||||
|
| |||||||
| 78,252,523 | ||||||||
|
| |||||||
Finance Companies – 1.76% | ||||||||
AerCap Global Aviation Trust 144A 6.50% 6/15/45 #● | 1,785,000 | 1,872,019 | ||||||
AerCap Ireland Capital | ||||||||
3.95% 2/1/22 | 1,685,000 | 1,732,148 | ||||||
4.625% 10/30/20 | 1,150,000 | 1,216,235 | ||||||
Air Lease | ||||||||
3.00% 9/15/23 | 985,000 | 963,809 | ||||||
3.375% 6/1/21 | 1,600,000 | 1,632,450 | ||||||
3.625% 4/1/27 | 715,000 | 696,305 | ||||||
American Express | 6,600,000 | 6,931,881 | ||||||
American Express Credit | ||||||||
1.782% 5/26/20 ● | 1,000,000 | 1,009,210 | ||||||
2.20% 3/3/20 | 900,000 | 902,915 | ||||||
Aviation Capital Group | ||||||||
144A 2.875% 9/17/18 # | 445,000 | 449,587 | ||||||
144A 2.875% 1/20/22 # | 1,865,000 | 1,853,959 | ||||||
144A 4.875% 10/1/25 # | 1,090,000 | 1,174,399 | ||||||
BOC Aviation | 600,000 | 581,757 | ||||||
| Principal amount° | Value (U.S. $) | |||||||
| ||||||||
Corporate Bonds (continued) |
| |||||||
| ||||||||
Finance Companies (continued) | ||||||||
Citicorp Lease Pass Through Trust Series 1999-1 144A 8.04% 12/15/19 #◆ | 148,870 | $ | 170,277 | |||||
Equate Petrochemical 144A 3.00% 3/3/22 # | 625,000 | 611,937 | ||||||
GE Capital International Funding Unlimited | 251,000 | 252,099 | ||||||
International Lease Finance | ||||||||
6.25% 5/15/19 | 200,000 | 215,588 | ||||||
144A 7.125% 9/1/18 # | 100,000 | 106,905 | ||||||
8.625% 1/15/22 | 995,000 | 1,221,104 | ||||||
LeasePlan 144A | 1,600,000 | 1,607,406 | ||||||
Navient 5.50% 1/15/19 | 700,000 | 726,950 | ||||||
Park Aerospace Holdings 144A 5.50% 2/15/24 # | 785,000 | 818,363 | ||||||
Peachtree Corners Funding Trust 144A | 580,000 | 583,290 | ||||||
SMBC Aviation Capital Finance 144A | 895,000 | 872,067 | ||||||
Springleaf Finance | ||||||||
6.90% 12/15/17 | 300,000 | 308,910 | ||||||
8.25% 12/15/20 | 2,500,000 | 2,737,500 | ||||||
SUAM Finance 144A | 655,000 | 681,659 | ||||||
Temasek Financial I 144A 2.375% 1/23/23 # | 560,000 | 552,192 | ||||||
Waha Aerospace | 735,000 | 755,903 | ||||||
|
| |||||||
| 33,238,824 | ||||||||
|
| |||||||
Insurance – 0.65% | ||||||||
Allstate 3.28% 12/15/26 | 305,000 | 306,813 | ||||||
Berkshire Hathaway | 600,000 | 600,557 | ||||||
Berkshire Hathaway Finance | 885,000 | 914,541 | ||||||
HUB International | ||||||||
144A 7.875% 10/1/21 # | 120,000 | 125,400 | ||||||
144A 9.25% 2/15/21 # | 20,000 | 20,638 | ||||||
Liberty Mutual Group 144A | 320,000 | 348,031 | ||||||
Manulife Financial | 1,075,000 | 1,079,017 | ||||||
MetLife 144A | 1,100,000 | 1,522,125 | ||||||
MetLife Capital Trust IV 144A | 300,000 | 370,500 | ||||||
| (continues) | 65 |
Table of Contents
Schedules of investments
Optimum Fixed Income Fund
| Principal amount° | Value (U.S. $) | |||||||
| ||||||||
Corporate Bonds (continued) | ||||||||
| ||||||||
Insurance (continued) | ||||||||
Metropolitan Life Global | 765,000 | $ | 771,402 | |||||
Principal Life Global Funding | 745,000 | 726,139 | ||||||
Prudential Financial | 765,000 | 802,485 | ||||||
TIAA Asset Management | ||||||||
144A 2.95% 11/1/19 # | 1,130,000 | 1,149,189 | ||||||
144A 4.125% 11/1/24 # | 1,460,000 | 1,490,040 | ||||||
USI 144A 7.75% 1/15/21 # | 172,000 | 175,117 | ||||||
XLIT | ||||||||
4.45% 3/31/25 | 590,000 | 596,203 | ||||||
5.50% 3/31/45 | 900,000 | 902,364 | ||||||
6.50% 12/29/49 ● | 510,000 | 429,675 | ||||||
|
| |||||||
| 12,330,236 | ||||||||
|
| |||||||
Natural Gas – 0.23% | ||||||||
AmeriGas Partners | 825,000 | 825,000 | ||||||
Dominion Gas Holdings | 405,000 | 407,562 | ||||||
Florida Gas Transmission 144A | 320,000 | 355,147 | ||||||
Perusahaan Gas Negara | 615,000 | 653,853 | ||||||
Southern Co. Gas Capital | 670,000 | 653,180 | ||||||
Southern Gas Corridor 144A | 600,000 | 659,310 | ||||||
Texas Eastern Transmission 144A | 800,000 | 814,674 | ||||||
|
| |||||||
| 4,368,726 | ||||||||
|
| |||||||
Real Estate – 1.86% | ||||||||
American Tower | ||||||||
2.25% 1/15/22 | 225,000 | 217,353 | ||||||
4.00% 6/1/25 | 1,440,000 | 1,459,303 | ||||||
4.40% 2/15/26 | 525,000 | 544,018 | ||||||
5.05% 9/1/20 | 500,000 | 538,391 | ||||||
American Tower Trust I 144A | 1,285,000 | 1,282,239 | ||||||
CC Holdings GS V | 450,000 | 461,448 | ||||||
Corporate Office Properties | 690,000 | 671,493 | ||||||
5.25% 2/15/24 | 670,000 | 705,799 | ||||||
Crown Castle International | 1,190,000 | 1,300,037 | ||||||
| Principal amount° | Value (U.S. $) | |||||||
| ||||||||
Corporate Bonds (continued) | ||||||||
| ||||||||
Real Estate (continued) | ||||||||
CubeSmart 3.125% 9/1/26 | 930,000 | $ | 875,206 | |||||
CyrusOne 144A | 150,000 | 154,500 | ||||||
DDR | ||||||||
2.60% 4/1/17 | 1,640,000 | 1,640,000 | ||||||
7.875% 9/1/20 | 415,000 | 480,323 | ||||||
Digital Realty Trust | 2,100,000 | 2,155,207 | ||||||
Education Realty Operating Partnership |
| 950,000 |
|
| 958,662 |
| ||
Equinix 5.375% 5/15/27 | 350,000 | 362,250 | ||||||
ESH Hospitality 144A | 845,000 | 853,974 | ||||||
GEO Group | ||||||||
5.125% 4/1/23 | 140,000 | 139,650 | ||||||
5.875% 10/15/24 | 40,000 | 41,100 | ||||||
6.00% 4/15/26 | 85,000 | 86,506 | ||||||
Goodman Funding | ||||||||
144A 6.00% 3/22/22 # | 300,000 | 338,657 | ||||||
144A 6.375% 11/12/20 # | 5,300,000 | 5,934,447 | ||||||
HCP 5.375% 2/1/21 | 2,300,000 | 2,507,046 | ||||||
Hospitality Properties Trust | 870,000 | 874,580 | ||||||
Host Hotels & Resorts | ||||||||
3.75% 10/15/23 | 1,270,000 | 1,281,472 | ||||||
3.875% 4/1/24 | 250,000 | 252,219 | ||||||
4.50% 2/1/26 | 45,000 | 46,632 | ||||||
Iron Mountain US Holdings | 600,000 | 601,500 | ||||||
Kite Realty Group | 330,000 | 316,819 | ||||||
LifeStorage 3.50% 7/1/26 | 695,000 | 666,215 | ||||||
MGM Growth Properties |
| 265,000 |
|
| 258,375 |
| ||
Physicians Realty | 395,000 | 395,404 | ||||||
PLA Administradora Industrial | 200,000 | 202,980 | ||||||
Prologis 4.00% 1/15/18 | 300,000 | 303,604 | ||||||
Regency Centers | 460,000 | 457,287 | ||||||
SBA Communications 144A | 525,000 | 519,645 | ||||||
Trust F/1401 144A | 745,000 | 752,450 | ||||||
Uniti Group | ||||||||
144A 7.125% 12/15/24 # | 120,000 | 122,100 | ||||||
8.25% 10/15/23 | 235,000 | 249,100 | ||||||
| 66 |
Table of Contents
| Principal amount° | Value (U.S. $) | |||||||
| ||||||||
Corporate Bonds (continued) | ||||||||
| ||||||||
Real Estate (continued) | ||||||||
Ventas Realty |
| 1,000,000 |
| $ | 1,000,002 |
| ||
WEA Finance 144A | 1,800,000 | 1,835,874 | ||||||
Welltower 2.25% 3/15/18 | 400,000 | 401,825 | ||||||
WP Carey 4.60% 4/1/24 | 695,000 | 720,267 | ||||||
|
| |||||||
| 34,965,959 | ||||||||
|
| |||||||
Technology – 1.38% | ||||||||
Apple | ||||||||
1.334% 5/6/19 ● | 840,000 | 844,446 | ||||||
1.538% 2/9/22 ● | 180,000 | 181,579 | ||||||
3.45% 2/9/45 | 690,000 | 619,697 | ||||||
4.65% 2/23/46 | 330,000 | 354,715 | ||||||
Applied Materials | 900,000 | 912,595 | ||||||
Broadcom | ||||||||
144A 3.00% 1/15/22 # | 2,380,000 | 2,375,459 | ||||||
144A 3.625% 1/15/24 # | 1,550,000 | 1,563,367 | ||||||
CDK Global 5.00% 10/15/24 | 910,000 | 922,667 | ||||||
CDW Finance 5.00% 9/1/25 | 90,000 | 91,913 | ||||||
Cisco Systems | ||||||||
1.555% 3/1/19 ● | 650,000 | 655,129 | ||||||
1.85% 9/20/21 | 950,000 | 932,158 | ||||||
CommScope Technologies | ||||||||
144A 5.00% 3/15/27 # | 345,000 | 345,328 | ||||||
144A 6.00% 6/15/25 # | 40,000 | 42,100 | ||||||
Diamond 1 Finance | ||||||||
144A 3.48% 6/1/19 # | 600,000 | 615,416 | ||||||
144A 4.42% 6/15/21 # | 300,000 | 313,988 | ||||||
144A 6.02% 6/15/26 # | 600,000 | 656,479 | ||||||
144A 8.10% 7/15/36 # | 15,000 | 18,896 | ||||||
DXC Technology | ||||||||
144A 4.25% 4/15/24 # | 345,000 | 351,296 | ||||||
144A 4.75% 4/15/27 # | 645,000 | 658,946 | ||||||
EMC 2.65% 6/1/20 | 900,000 | 877,429 | ||||||
Entegris 144A | 60,000 | 62,850 | ||||||
Fidelity National Information | 655,000 | 713,541 | ||||||
First Data | ||||||||
144A 5.75% 1/15/24 # | 510,000 | 527,977 | ||||||
144A 7.00% 12/1/23 # | 513,000 | 551,475 | ||||||
Genesys Telecommunications | 20,000 | 21,800 | ||||||
Hewlett Packard Enterprise | ||||||||
2.45% 10/5/17 | 300,000 | 300,916 | ||||||
2.85% 10/5/18 | 150,000 | 151,834 | ||||||
| Principal amount° | Value (U.S. $) | |||||||
| ||||||||
Corporate Bonds (continued) | ||||||||
| ||||||||
Technology (continued) | ||||||||
Infor US 6.50% 5/15/22 | 70,000 | $ | 72,282 | |||||
Intel 2.45% 7/29/20 | 200,000 | 203,287 | ||||||
International Business | 440,000 | 436,769 | ||||||
Microsoft | ||||||||
2.40% 2/6/22 | 35,000 | 35,230 | ||||||
2.875% 2/6/24 | 30,000 | 30,212 | ||||||
4.25% 2/6/47 | 4,060,000 | 4,170,944 | ||||||
NXP | ||||||||
144A 4.125% 6/1/21 # | 200,000 | 208,000 | ||||||
144A 4.625% 6/1/23 # | 575,000 | 610,219 | ||||||
Oracle 1.519% 10/8/19 ● | 940,000 | 949,308 | ||||||
Samsung Electronics | 745,000 | 745,030 | ||||||
Solera 144A | 50,000 | 57,359 | ||||||
Symantec | ||||||||
4.20% 9/15/20 | 2,000,000 | 2,063,546 | ||||||
144A 5.00% 4/15/25 # | 530,000 | 542,964 | ||||||
Western Digital 144A | 240,000 | 263,700 | ||||||
|
| |||||||
| 26,052,846 | ||||||||
|
| |||||||
Transportation – 1.23% | ||||||||
Air Canada 2015-1 Class A | 541,381 | 544,765 | ||||||
American Airlines 2011-1 | 330,311 | 351,781 | ||||||
American Airlines 2014-1 | 416,135 | 418,216 | ||||||
American Airlines 2015-1 | 348,460 | 341,926 | ||||||
American Airlines 2015-2 | 233,402 | 234,978 | ||||||
American Airlines 2016-1 | 472,734 | 472,143 | ||||||
American Airlines 2016-3 | 1,300,000 | 1,246,375 | ||||||
AP Moller - Maersk 144A | 200,000 | 202,437 | ||||||
Autoridad del Canal de | 780,000 | 856,050 | ||||||
| (continues) | 67 |
Table of Contents
Schedules of investments
Optimum Fixed Income Fund
| Principal amount° | Value (U.S. $) | |||||||
| ||||||||
Corporate Bonds (continued) |
| |||||||
| ||||||||
Transportation (continued) | ||||||||
Avis Budget Car Rental 144A | 560,000 | $ | 563,500 | |||||
Burlington Northern Santa Fe | 1,915,000 | 2,084,897 | ||||||
Continental Airlines 2009-2 | 604,459 | 671,705 | ||||||
Delta Air Lines 2007-1 Class A | 251,406 | 290,688 | ||||||
Doric Nimrod Air Finance | 1,376,713 | 1,425,739 | ||||||
ERAC USA Finance 144A | 1,420,000 | 1,362,855 | ||||||
Herc Rentals | ||||||||
144A 7.50% 6/1/22 # | 319,000 | 340,533 | ||||||
144A 7.75% 6/1/24 # | 171,000 | 182,970 | ||||||
Latam Airlines 2015-1 Pass | 469,922 | 468,160 | ||||||
NES Rentals Holdings 144A | 345,000 | 348,039 | ||||||
Penske Truck Leasing | ||||||||
144A 3.30% 4/1/21 # | 855,000 | 867,366 | ||||||
144A 3.40% 11/15/26 # | 140,000 | 134,839 | ||||||
144A 3.75% 5/11/17 # | 200,000 | 200,460 | ||||||
144A 4.20% 4/1/27 # | 1,800,000 | 1,836,158 | ||||||
Transurban Finance 144A | 410,000 | 397,251 | ||||||
Union Pacific 3.00% 4/15/27 | 1,010,000 | 998,935 | ||||||
United Airlines 2014-1 Class A | 320,325 | 332,337 | ||||||
United Airlines 2014-2 Class A | 593,961 | 603,661 | ||||||
United Airlines 2016-1 Class | 555,000 | 546,675 | ||||||
United Parcel Service | 2,210,000 | 2,362,072 | ||||||
United Rentals North America 5.50% 5/15/27 | 1,080,000 | 1,093,500 | ||||||
US Airways 2012-2 Class A | 535,201 | 562,630 | ||||||
XPO Logistics 144A | 705,000 | 735,844 | ||||||
| Principal amount° | Value (U.S. $) | |||||||
| ||||||||
Corporate Bonds (continued) | ||||||||
| ||||||||
Transportation (continued) | ||||||||
XPO Logistics | 30,000 | $ | 31,613 | |||||
| 23,111,098 | ||||||||
Utilities – 3.73% | ||||||||
AES 5.50% 4/15/25 | 760,000 | 773,300 | ||||||
AES Andres 144A | 500,000 | 537,685 | ||||||
AES Gener | ||||||||
144A 5.25% 8/15/21 # | 40,000 | 42,329 | ||||||
144A 8.375% 12/18/73 #● | 796,000 | 840,775 | ||||||
Ameren 3.65% 2/15/26 | 410,000 | 415,003 | ||||||
Ameren Illinois | 2,110,000 | 2,370,980 | ||||||
American Transmission | 2,445,000 | 2,693,933 | ||||||
Berkshire Hathaway Energy | 1,235,000 | 1,292,346 | ||||||
Calpine | ||||||||
144A 5.25% 6/1/26 # | 495,000 | 504,900 | ||||||
5.50% 2/1/24 | 344,000 | 343,893 | ||||||
5.75% 1/15/25 | 100,000 | 99,738 | ||||||
Cleveland Electric Illuminating | 515,000 | 588,500 | ||||||
CMS Energy | ||||||||
3.45% 8/15/27 | 50,000 | 49,859 | ||||||
6.25% 2/1/20 | 1,080,000 | 1,191,754 | ||||||
ComEd Financing III | 680,000 | 727,072 | ||||||
Consumers Energy | 675,000 | 602,910 | ||||||
Dominion Resources | ||||||||
2.00% 8/15/21 | 280,000 | 271,913 | ||||||
3.90% 10/1/25 | 1,645,000 | 1,677,719 | ||||||
DTE Energy | ||||||||
2.85% 10/1/26 | 950,000 | 890,613 | ||||||
3.30% 6/15/22 | 855,000 | 869,019 | ||||||
3.80% 3/15/27 | 300,000 | 304,809 | ||||||
Duke Energy | ||||||||
1.625% 8/15/17 | 1,000,000 | 1,000,874 | ||||||
1.80% 9/1/21 | 480,000 | 464,088 | ||||||
2.65% 9/1/26 | 205,000 | 190,618 | ||||||
Dynegy | ||||||||
6.75% 11/1/19 | 290,000 | 299,425 | ||||||
144A 8.00% 1/15/25 # | 70,000 | 67,375 | ||||||
E.ON International Finance | 200,000 | 208,366 | ||||||
Emera 6.75% 6/15/76 ● | 1,515,000 | 1,660,819 | ||||||
| 68 |
Table of Contents
| Principal amount° | Value (U.S. $) | |||||||
| ||||||||
Corporate Bonds (continued) | ||||||||
| ||||||||
Utilities (continued) | ||||||||
Emera US Finance | ||||||||
3.55% 6/15/26 | 995,000 | $ | 979,911 | |||||
4.75% 6/15/46 | 995,000 | 1,007,659 | ||||||
Enel 144A | 1,605,000 | 1,849,763 | ||||||
Enel Americas | 295,000 | 292,566 | ||||||
Enel Finance International | ||||||||
144A 6.00% 10/7/39 # | 550,000 | 628,731 | ||||||
144A 6.25% 9/15/17 # | 900,000 | 918,135 | ||||||
Entergy | ||||||||
2.95% 9/1/26 | 195,000 | 185,403 | ||||||
4.00% 7/15/22 | 1,070,000 | 1,121,942 | ||||||
Entergy Arkansas | 200,000 | 209,380 | ||||||
Entergy Louisiana | ||||||||
4.05% 9/1/23 | 1,555,000 | 1,641,817 | ||||||
4.95% 1/15/45 | 235,000 | 241,213 | ||||||
Exelon | ||||||||
2.45% 4/15/21 | 200,000 | 197,775 | ||||||
3.497% 6/1/22 | 870,000 | 878,944 | ||||||
3.95% 6/15/25 | 1,070,000 | 1,101,547 | ||||||
Exelon Generation | 1,750,000 | 1,766,023 | ||||||
FirstEnergy 2.75% 3/15/18 | 1,000,000 | 1,003,873 | ||||||
Fortis | ||||||||
144A 2.10% 10/4/21 # | 325,000 | 315,206 | ||||||
144A 3.055% 10/4/26 # | 1,970,000 | 1,852,058 | ||||||
Great Plains Energy | ||||||||
3.15% 4/1/22 | 965,000 | 975,686 | ||||||
3.90% 4/1/27 | 535,000 | 540,485 | ||||||
4.85% 6/1/21 | 545,000 | 581,996 | ||||||
IPALCO Enterprises | 165,000 | 170,363 | ||||||
ITC Holdings 3.25% 6/30/26 | 885,000 | 861,331 | ||||||
Jersey Central Power & Light | 1,000,000 | 1,089,238 | ||||||
Kansas City Power & Light | 1,350,000 | 1,357,547 | ||||||
LG&E & KU Energy | ||||||||
3.75% 11/15/20 | 165,000 | 171,320 | ||||||
4.375% 10/1/21 | 1,555,000 | 1,643,170 | ||||||
Majapahit Holding | 400,000 | 452,280 | ||||||
Massachusetts Electric 144A | 805,000 | 785,191 | ||||||
Metropolitan Edison 144A | 600,000 | 605,999 | ||||||
| Principal amount° | Value (U.S. $) | |||||
| ||||||
Corporate Bonds (continued) | ||||||
| ||||||
Utilities (continued) | ||||||
National Rural Utilities | ||||||
2.70% 2/15/23 | 1,215,000 | $ | 1,204,536 | |||
4.75% 4/30/43 ● | 1,195,000 | 1,224,875 | ||||
5.25% 4/20/46 ● | 865,000 | 902,588 | ||||
New York State Electric & Gas | 1,015,000 | 1,010,837 | ||||
Newfoundland & Labrador | CAD 100,000 | 73,472 | ||||
NextEra Energy Capital Holdings | ||||||
2.40% 9/15/19 | 1,455,000 | 1,467,213 | ||||
2.70% 9/15/19 | 450,000 | 456,503 | ||||
NV Energy 6.25% 11/15/20 | 935,000 | 1,050,850 | ||||
Pampa Energia 144A | 1,155,000 | 1,171,055 | ||||
Pedernales Electric | 620,000 | 702,949 | ||||
Pennsylvania Electric | 1,380,000 | 1,468,027 | ||||
Perusahaan Listrik Negara | 900,000 | 979,920 | ||||
Public Service Co. of | 635,000 | 654,343 | ||||
Public Service Co. of Oklahoma | 645,000 | 691,523 | ||||
Puget Energy | 3,800,000 | 4,258,759 | ||||
SCANA 4.125% 2/1/22 | 810,000 | 821,683 | ||||
Southern | ||||||
2.75% 6/15/20 | 1,260,000 | 1,271,497 | ||||
2.95% 7/1/23 | 500,000 | 487,318 | ||||
3.25% 7/1/26 | 1,170,000 | 1,118,247 | ||||
4.40% 7/1/46 | 970,000 | 930,574 | ||||
Southwestern Electric Power | 690,000 | 742,277 | ||||
Trans-Allegheny Interstate Line | 525,000 | 538,624 | ||||
Wisconsin Electric Power | 555,000 | 568,958 | ||||
|
| |||||
| 70,203,795 | ||||||
|
| |||||
Total Corporate Bonds |
| 865,119,809 |
| |||
|
| |||||
| (continues) | 69 |
Table of Contents
Schedules of investments
Optimum Fixed Income Fund
| Principal amount° | Value (U.S. $) | |||||||
| ||||||||
Municipal Bonds – 1.02% |
| |||||||
| ||||||||
American Municipal Power, Ohio (Combined Hydroelectric Projects) Series B | 1,500,000 | $ | 2,305,455 | |||||
Bay Area, California Toll Authority | 905,000 | 1,298,539 | ||||||
California State Various Purposes | 715,000 | 1,050,078 | ||||||
Chicago, Illinois Transit Authority | ||||||||
(Pension Funding) Series A 6.899% 12/1/40 | 1,800,000 | 2,249,622 | ||||||
(Retiree Health Care Funding) Series B 6.899% 12/1/40 | 1,800,000 | 2,249,622 | ||||||
Commonwealth of Massachusetts | 455,000 | 553,867 | ||||||
Michigan Finance Authority | 1,125,000 | 1,171,103 | ||||||
Municipal Electric Authority of Georgia (Build America Bond Plant Vogtle Units 3 & 4 Project) | 1,800,000 | 2,030,238 | ||||||
New Jersey Transportation Trust Fund Authority | 1,590,000 | 1,646,238 | ||||||
New Jersey Turnpike Authority | ||||||||
Series A 7.102% 1/1/41 | 495,000 | 692,708 | ||||||
Series F 7.414% 1/1/40 | 240,000 | 346,229 | ||||||
New York City, New York | ||||||||
Series C 5.00% 8/1/26 | 175,000 | 210,299 | ||||||
Series C 5.00% 8/1/27 | 200,000 | 238,516 | ||||||
New York City, New York Transitional Finance Authority Future Tax Secured Revenue | 700,000 | 850,346 | ||||||
| Principal amount° | Value (U.S. $) | |||||||
| ||||||||
Municipal Bonds (continued) |
| |||||||
| ||||||||
New York State Urban Development (Build America Bond) | 800,000 | $ | 965,072 | |||||
Oregon State Taxable Pension | 65,000 | 78,240 | ||||||
South Carolina Public Service Authority Series D | 290,000 | 261,122 | ||||||
Texas Water Development Board | ||||||||
Series A 5.00% 10/15/45 | 255,000 | 289,667 | ||||||
(2016 State Water Implementation) Series B | 665,000 | 761,545 | ||||||
|
| |||||||
Total Municipal Bonds |
| 19,248,506 | ||||||
|
| |||||||
| ||||||||
Non-Agency Asset-Backed Securities – 3.80% |
| |||||||
| ||||||||
ABFC Trust | 420,273 | 280,368 | ||||||
AEP Texas Central Transition Funding II | 156,803 | 159,624 | ||||||
American Express Credit Account Master Trust | ||||||||
Series 2013-1 A 1.332% 2/16/21 ● | 500,000 | 501,574 | ||||||
Series 2013-2 A 1.332% 5/17/21 ● | 530,000 | 532,303 | ||||||
American Express Credit Account Secured Note Trust | 205,000 | 205,193 | ||||||
Argent Securities Asset-Backed Pass Through Certificates Series 2003-W9 M1 | 284,993 | 267,544 | ||||||
Argent Securities Trust | ||||||||
Series 2006-M1 A2C 1.132% 7/25/36 ● | 1,369,872 | 607,076 | ||||||
Series 2006-W4 A2C 1.142% 5/25/36 ● | 709,556 | 248,125 | ||||||
Avis Budget Rental Car Funding AESOP | 700,000 | 699,908 | ||||||
| 70 |
Table of Contents
Principal amount° | Value (U.S. $) | |||||||
| ||||||||
Non-Agency Asset-Backed Securities (continued) |
| |||||||
| ||||||||
Avis Budget Rental Car Funding AESOP | 665,000 | $ | 668,138 | |||||
Bank of America Credit Card Trust | ||||||||
Series 2014-A2 A | 1,000,000 | 1,000,000 | ||||||
Series 2014-A3 A 1.202% 1/15/20 ● | 1,120,000 | 1,121,029 | ||||||
Series 2015-A1 A | 205,000 | 205,405 | ||||||
Bear Stearns Asset-Backed Securities I Trust | ||||||||
Series 2005-FR1 M2 | 2,000,000 | 1,853,061 | ||||||
Series 2007-HE2 1A2 | 384,504 | 434,509 | ||||||
Bear Stearns Asset-Backed Securities Trust | 215,393 | 155,228 | ||||||
California Republic Auto Receivables Trust | 2,268 | 2,268 | ||||||
Capital One Multi-Asset Execution Trust | 100,000 | 99,981 | ||||||
Centex Home Equity Loan Trust | 1,381 | 1,379 | ||||||
Chase Issuance Trust | ||||||||
Series 2013-A6 A6 | 500,000 | 501,623 | ||||||
Series 2014-A5 A5 | 500,000 | 502,198 | ||||||
Series 2016-A3 A3 | 500,000 | 505,143 | ||||||
Chesapeake Funding | 394,180 | 393,763 | ||||||
Citibank Credit Card Issuance Trust | ||||||||
Series 2013-A2 A2 | 200,000 | 200,400 | ||||||
Series 2013-A7 A7 | 500,000 | 502,043 | ||||||
Principal amount° | Value (U.S. $) | |||||||
| ||||||||
Non-Agency Asset-Backed Securities (continued) |
| |||||||
| ||||||||
Citicorp Residential Mortgage Trust | 900,000 | $ | 915,050 | |||||
CNH Equipment Trust | 141,206 | 141,505 | ||||||
Countrywide Asset-Backed Certificates | ||||||||
Series 2004-3 2A | 57,403 | 53,692 | ||||||
Series 2005-AB2 2A3 | 171,763 | 170,867 | ||||||
Series 2006-1 AF6 | 529,911 | 534,081 | ||||||
Series 2006-26 2A4 | 2,000,000 | 1,666,304 | ||||||
Series 2007-6 2A4 | 1,000,000 | 499,243 | ||||||
CSMC | 300,000 | 300,167 | ||||||
CWABS Asset-Backed Certificates Trust | ||||||||
Series 2005-7 MV3 | 400,000 | 394,782 | ||||||
Series 2006-11 1AF6 | 330,915 | 637,239 | ||||||
Series 2006-17 2A2 | 2,323,611 | 2,169,055 | ||||||
Discover Card Execution Note Trust | ||||||||
Series 2013-A6 A6 | 560,000 | 562,766 | ||||||
Series 2014-A1 A1 | 690,000 | 693,671 | ||||||
Series 2017-A1 A1 | 1,000,000 | 1,006,388 | ||||||
Ford Credit Auto Owner Trust | 1,950,000 | 1,923,176 | ||||||
Ford Credit Floorplan Master Owner Trust A | 1,240,000 | 1,240,921 | ||||||
Golden Credit Card Trust | 420,000 | 421,039 | ||||||
GSAMP Trust | 1,164,175 | 696,104 | ||||||
| (continues) | 71 |
Table of Contents
Schedules of investments
Optimum Fixed Income Fund
Principal amount° | Value (U.S. $) | |||||||
| ||||||||
Non-Agency Asset-Backed Securities (continued) |
| |||||||
| ||||||||
GSAMP Trust | 1,083,602 | $ | 1,005,346 | |||||
HOA Funding | 1,026,000 | 939,276 | ||||||
Home Equity Mortgage Loan Asset-Backed Trust | 1,746,177 | 1,109,379 | ||||||
HSI Asset Securitization Trust | 33,922 | 18,927 | ||||||
JPMorgan Mortgage Acquisition Trust | 500,000 | 441,583 | ||||||
Long Beach Mortgage Loan Trust | ||||||||
Series 2006-1 2A4 | 4,054,874 | 2,777,830 | ||||||
Series 2006-7 1A | 4,200,418 | 2,514,612 | ||||||
Mercedes-Benz Master Owner Trust | ||||||||
Series 2016-AA A 144A | 915,000 | 918,611 | ||||||
Series 2016-BA A 144A | 1,021,000 | 1,027,612 | ||||||
Merrill Lynch Mortgage Investors Trust | 2,000,000 | 1,972,417 | ||||||
Morgan Stanley ABS Capital I Trust | ||||||||
Series 2007-HE1 A2C | 5,947,342 | 3,653,317 | ||||||
Series 2007-HE5 A2D | 3,904,372 | 2,093,757 | ||||||
Navistar Financial Dealer Note Master Owner Trust II | 525,000 | 526,258 | ||||||
New Century Home Equity Loan Trust | 233,599 | 197,239 | ||||||
Option One Mortgage Loan Trust | 2,155,252 | 1,768,020 | ||||||
Principal amount° | Value (U.S. $) | |||||||
| ||||||||
Non-Agency Asset-Backed Securities (continued) |
| |||||||
| ||||||||
Option One Mortgage Loan Trust | 7,345,309 | $ | 4,643,589 | |||||
Penarth Master Issuer Series 2015-2A A1 144A | 4,400,000 | 4,401,892 | ||||||
PFS Financing | 250,000 | 249,922 | ||||||
RAAC Trust | 603,357 | 500,820 | ||||||
RAMP Trust | ||||||||
Series 2006-RZ5 A2 | 214,948 | 211,603 | ||||||
Series 2007-RZ1 A2 | 651,035 | 638,094 | ||||||
Rise | 2,159,659 | 2,148,860 | ||||||
Sofi Professional Loan Program | 671,150 | 672,462 | ||||||
Soundview Home Loan Trust | 555,529 | 546,924 | ||||||
SpringCastle America Funding | 3,911,214 | 3,935,201 | ||||||
Structured Asset Investment Loan Trust | 15,778 | 13,496 | ||||||
Structured Asset Securities Corp Mortgage Loan Trust | 1,800,000 | 1,387,000 | ||||||
Towd Point Mortgage Trust | 428,652 | 428,200 | ||||||
Verizon Owner Trust | 680,000 | 677,651 | ||||||
VOLT XL | 170,552 | 172,220 | ||||||
VOLT XLI | 1,570,589 | 1,578,078 | ||||||
| 72 |
Table of Contents
Principal amount° | Value (U.S. $) | |||||||
| ||||||||
Non-Agency Asset-Backed Securities (continued) |
| |||||||
| ||||||||
VOLT XLII | 1,653,256 | $ | 1,665,687 | |||||
Wells Fargo Dealer Floorplan Master Note Trust | 1,000,000 | 1,000,673 | ||||||
|
| |||||||
Total Non-Agency Asset-Backed Securities |
| 71,510,489 | ||||||
|
| |||||||
| ||||||||
Non-Agency Collateralized Mortgage Obligations – 1.63% |
| |||||||
| ||||||||
Alternative Loan Trust | 1,897 | 1,934 | ||||||
Alternative Loan Trust Resecuritization | 1,523,130 | 1,231,402 | ||||||
ARM Trust | ||||||||
Series 2004-5 3A1 | 750,014 | 749,397 | ||||||
Series 2005-10 3A31 | 340,319 | 296,330 | ||||||
Series 2006-2 1A4 | 1,197,860 | 1,089,112 | ||||||
Banc of America Funding Trust | ||||||||
Series 2005-E 7A1 | 241,899 | 186,246 | ||||||
Series 2006-I 1A1 | 434,303 | 436,574 | ||||||
Banc of America Mortgage Trust | 380,785 | 383,034 | ||||||
Bank of America Alternative Loan Trust | 46,039 | 44,048 | ||||||
Bear Stearns ARM Trust | ||||||||
Series 2003-5 2A1 | 59,754 | 59,544 | ||||||
Series 2005-2 A2 | 127,286 | 128,269 | ||||||
Chase Mortgage Finance Trust | 153,820 | 147,154 | ||||||
CHL Mortgage Pass Through Trust | 1,401,555 | 1,164,082 | ||||||
Principal amount° | Value (U.S. $) | |||||||
| ||||||||
Non-Agency Collateralized Mortgage Obligations (continued) |
| |||||||
| ||||||||
CSMC Mortgage-Backed Trust | ||||||||
Series 2005-1R 2A5 144A | 1,742,277 | $ | 1,528,015 | |||||
Series 2007-1 5A14 | 316,025 | 267,831 | ||||||
Series 2007-3 4A6 | 294,558 | 239,599 | ||||||
Series 2007-3 4A12 | 294,558 | 35,463 | ||||||
Series 2007-3 4A15 | 130,793 | 128,151 | ||||||
Deutsche Mortgage Securities Re-REMIC Trust Certificates | 116,827 | 116,312 | ||||||
Eurosail-UK | GBP 26,213 | 32,884 | ||||||
First Horizon Mortgage Pass Through Trust | 126,118 | 120,171 | ||||||
GMACM Mortgage Loan Trust | 63,407 | 58,981 | ||||||
GSR Mortgage Loan Trust | 1,174,766 | 1,057,821 | ||||||
INTL FCStone Structured | 335,000 | 281,348 | ||||||
JPMorgan Mortgage Trust | ||||||||
Series 2006-A6 2A4L 3.238% 10/25/36 ● | 711,101 | 627,581 | ||||||
Series 2006-A7 2A2 | 134,577 | 123,622 | ||||||
Series 2007-A1 6A1 | 248,865 | 246,238 | ||||||
Series 2014-2 B1 144A | 79,285 | 78,488 | ||||||
Series 2014-2 B2 144A | 79,285 | 77,662 | ||||||
Series 2015-1 B1 144A | 653,809 | 647,957 | ||||||
Series 2015-4 B1 144A | 491,093 | 478,556 | ||||||
Series 2015-4 B2 144A | 351,468 | 336,671 | ||||||
Series 2015-5 B2 144A | 537,652 | 507,921 | ||||||
Series 2015-6 B1 144A | 356,222 | 349,552 | ||||||
| (continues) | 73 |
Table of Contents
Schedules of investments
Optimum Fixed Income Fund
| Principal amount° | Value (U.S. $) | |||||
| ||||||
Non-Agency Collateralized Mortgage Obligations (continued) | ||||||
| ||||||
JPMorgan Mortgage Trust | ||||||
Series 2015-6 B2 144A | 346,594 | $ 335,207 | ||||
Series 2016-4 B1 144A | 247,924 | 249,999 | ||||
Series 2016-4 B2 144A | 421,471 | 414,409 | ||||
Series 2017-1 B2 144A | 733,730 | 699,971 | ||||
Lehman Mortgage Trust Series 2007-10 2A2 | 2,029,197 | 1,470,327 | ||||
Ludgate Funding | ||||||
Series 2006-1X A2A | GBP | 1,841,779 | 2,178,491 | |||
Series 2008-W1X A1 | GBP | 821,493 | 1,000,380 | |||
Mansard Mortgages Parent Series 2007-1X A2 | GBP | 882,898 | 1,049,713 | |||
MASTR Alternative Loan Trust | ||||||
Series 2004-3 8A1 | 3,606 | 3,848 | ||||
Series 2004-5 6A1 | 51,510 | 53,944 | ||||
MASTR ARM Trust | 106,765 | 105,018 | ||||
Merrill Lynch Mortgage Investors Trust | 7,552 | 7,568 | ||||
Opteum Mortgage Acceptance Trust | 756,712 | 762,095 | ||||
Reperforming Loan REMIC Trust | 1,659,136 | 1,450,683 | ||||
RFMSI Trust | 62,916 | 63,096 | ||||
Sequoia Mortgage Trust | ||||||
Series 2004-5 A3 | 261,068 | 243,220 | ||||
Series 2007-1 4A1 | 797,219 | 650,776 | ||||
Series 2015-1 B2 144A | 375,378 | 369,493 | ||||
| Principal amount° | Value (U.S. $) | |||||
| ||||||
Non-Agency Collateralized Mortgage Obligations (continued) | ||||||
| ||||||
Structured ARM Loan Trust | 720,312 | $ 610,541 | ||||
Structured Asset Mortgage Investments II Trust | 505,366 | 491,112 | ||||
Thrones | GBP | 1,420,635 | 1,790,172 | |||
WaMu Mortgage Pass Through Certificates Trust | ||||||
Series 2005-AR16 1A3 | 627,124 | 602,699 | ||||
Series 2007-HY1 3A3 | 313,942 | 294,410 | ||||
Series 2007-HY7 4A1 | 670,779 | 609,867 | ||||
Washington Mutual Mortgage Pass Through Certificates Trust | 35,793 | 13,206 | ||||
Wells Fargo Mortgage-Backed Securities Trust | ||||||
Series 2005-AR16 2A1 | 158,092 | 160,603 | ||||
Series 2006-2 3A1 | 75,269 | 75,456 | ||||
Series 2006-3 A11 | 100,873 | 102,836 | ||||
Series 2006-6 1A3 | 50,849 | 50,847 | ||||
Series 2006-AR5 2A1 | 57,856 | 54,273 | ||||
Series 2006-AR11 A6 | 770,468 | 727,295 | ||||
Series 2006-AR17 A1 | 426,005 | 405,013 | ||||
Series 2007-10 1A36 | 306,404 | 301,943 | ||||
| ||||||
Total Non-Agency Collateralized |
| 30,656,461 | ||||
| ||||||
| ||||||
Non-Agency Commercial Mortgage-Backed Securities – 4.08% | ||||||
| ||||||
BAMLL Commercial Mortgage Securities Trust | 900,000 | 902,749 | ||||
| 74 |
Table of Contents
| Principal amount° | Value (U.S. $) | |||||||
| ||||||||
Non-Agency Commercial Mortgage-Backed Securities (continued) |
| |||||||
| ||||||||
Banc of America Commercial Mortgage Trust | 505,000 | $ | 509,883 | |||||
Banc of America Re-REMIC | 154,640 | 154,410 | ||||||
BBCMS Trust | ||||||||
Series 2015- RRI A 144A | 4,877,359 | 4,883,423 | ||||||
Series 2015-STP A 144A | 4,485,451 | 4,600,356 | ||||||
CD Mortgage Trust | ||||||||
Series 2016-CD2 A3 | 4,000,000 | 4,016,511 | ||||||
Series 2016-CD2 A4 | 620,000 | 633,995 | ||||||
CFCRE Commercial Mortgage Trust | 530,000 | 545,432 | ||||||
Citigroup Commercial Mortgage Trust | ||||||||
Series 2014-GC25 A4 | 1,100,000 | 1,134,695 | ||||||
Series 2015-GC27 A5 | 3,085,000 | 3,073,678 | ||||||
Series 2016-P5 A4 | 760,000 | 738,702 | ||||||
COMM Mortgage Trust | ||||||||
Series 2013-WWP A2 144A | 1,100,000 | 1,132,855 | ||||||
Series 2014-CR19 A5 | 4,470,000 | 4,675,741 | ||||||
Series 2014-CR20 AM | 2,225,000 | 2,307,050 | ||||||
Series 2015-CR23 A4 | 1,640,000 | 1,668,320 | ||||||
CSMC | 98,496 | 98,340 | ||||||
DBJPM Mortgage Trust | 1,320,000 | 1,325,175 | ||||||
DBJPM Motgage Trust | 945,000 | 917,385 | ||||||
DBUBS Mortgage Trust | 805,000 | 866,543 | ||||||
| Principal amount° | Value (U.S. $) | |||||||
| ||||||||
Non-Agency Commercial Mortgage-Backed Securities (continued) |
| |||||||
| ||||||||
DBUBS Mortgage Trust | 955,000 | $ | 1,048,063 | |||||
GRACE Mortgage Trust | ||||||||
Series 2014-GRCE A 144A | 2,200,000 | 2,278,425 | ||||||
Series 2014-GRCE B 144A | 1,455,000 | 1,497,520 | ||||||
GS Mortgage Securities Corp Trust | 2,300,000 | 2,342,299 | ||||||
GS Mortgage Securities Trust | ||||||||
Series 2010-C1 C 144A | 375,000 | 397,328 | ||||||
Series 2017-GS A4 | 1,205,000 | 1,245,553 | ||||||
Hyatt Hotel Portfolio Trust | 900,000 | 902,240 | ||||||
JPMBB Commercial Mortgage Securities Trust | ||||||||
Series 2015-C32 A5 | 1,340,000 | 1,372,298 | ||||||
Series 2015-C33 A4 | 570,000 | 590,868 | ||||||
JPMDB Commercial Mortgage Securities Trust | ||||||||
Series 2016-C2 A4 | 1,640,000 | 1,625,941 | ||||||
Series 2016-C4 A3 | 1,065,000 | 1,051,913 | ||||||
JPMorgan Chase Commercial Mortgage Securities Trust | ||||||||
Series 2005-CB11 E | 230,000 | 239,124 | ||||||
Series 2011-C5 C 144A | 410,000 | 435,826 | ||||||
Series 2016-ATRM A 144A | 2,700,000 | 2,716,343 | ||||||
Series 2016-JP2 A4 | 2,555,000 | 2,466,320 | ||||||
Series 2016-JP2 AS | 1,250,000 | 1,208,980 | ||||||
Series 2016-JP3 B | 300,000 | 292,850 | ||||||
Series 2016-WIKI A 144A | 375,000 | 377,310 | ||||||
Series 2016-WIKI B 144A | 690,000 | 697,296 | ||||||
| (continues) | 75 |
Table of Contents
Schedules of investments
Optimum Fixed Income Fund
| Principal amount° | Value (U.S. $) | |||||||
| ||||||||
Non-Agency Commercial Mortgage-Backed Securities (continued) |
| |||||||
| ||||||||
LB-UBS Commercial Mortgage Trust | 725,919 | $ | 641,524 | |||||
ML-CFC Commercial Mortgage Trust | 384,522 | 384,525 | ||||||
Morgan Stanley Bank of America Merrill Lynch Trust | ||||||||
Series 2014-C17 A5 | 795,000 | 827,671 | ||||||
Series 2015-C23 A4 | 1,275,000 | 1,320,745 | ||||||
Series 2015-C26 A5 | 820,000 | 837,519 | ||||||
Series 2015-C27 ASB | 2,200,000 | 2,288,498 | ||||||
Series 2016-C29 A4 | 795,000 | 798,860 | ||||||
Morgan Stanley Capital I Trust | ||||||||
Series 2011-C3 A4 | 855,000 | 910,547 | ||||||
Series 2014-CPT AM 144A | 2,200,000 | 2,247,372 | ||||||
Series 2015-XLF1 A 144A | 1,602,832 | 1,601,193 | ||||||
Series 2016-BNK2 A4 | 2,066,000 | 2,028,035 | ||||||
Morgan Stanley Re-REMIC Trust | 296,114 | 295,881 | ||||||
RFTI Issuer | 1,642,683 | 1,641,431 | ||||||
Wachovia Bank Commercial Mortgage Trust | 700,000 | 698,572 | ||||||
Wells Fargo Commercial Mortgage Trust | ||||||||
Series 2014-LC18 A5 | 275,000 | 278,269 | ||||||
Series 2015-C30 XA | 6,568,062 | 411,012 | ||||||
Series 2015-NXS3 A4 | 740,000 | 757,755 | ||||||
Series 2016-BNK1 A3 | 1,220,000 | 1,162,658 | ||||||
Principal amount° | Value (U.S. $) | |||||||
| ||||||||
Non-Agency Commercial Mortgage-Backed Securities (continued) |
| |||||||
| ||||||||
Wells Fargo Commercial Mortgage Trust | 8,530,000 | $ | 834,674 | |||||
|
| |||||||
Total Non-Agency Commercial |
| 76,938,481 | ||||||
|
| |||||||
| ||||||||
Regional Bonds – 0.53%D |
| |||||||
| ||||||||
Argentina – 0.11% | ||||||||
Province of Santa Fe | 330,000 | 333,128 | ||||||
Provincia de Buenos Aires | 780,000 | 791,856 | ||||||
Provincia de Cordoba | 960,000 | 975,562 | ||||||
|
| |||||||
| 2,100,546 | ||||||||
|
| |||||||
Australia – 0.06% | ||||||||
New South Wales Treasury | AUD | 404,900 | 336,762 | |||||
Queensland Treasury | ||||||||
144A 2.75% 8/20/27 # | AUD | 446,000 | 326,933 | |||||
144A 3.25% 7/21/28 # | AUD | 495,000 | 376,506 | |||||
|
| |||||||
| 1,040,201 | ||||||||
|
| |||||||
Canada – 0.03% | ||||||||
Province of Ontario | CAD | 551,000 | 432,551 | |||||
Province of Quebec | CAD | 155,000 | 156,414 | |||||
|
| |||||||
| 588,965 | ||||||||
|
| |||||||
Germany – 0.11% | ||||||||
State of North | 2,000,000 | 2,000,570 | ||||||
|
| |||||||
| 2,000,570 | ||||||||
|
| |||||||
Japan – 0.05% | ||||||||
Japan Finance Organization For Municipalities | 900,000 | 899,202 | ||||||
|
| |||||||
| 899,202 | ||||||||
|
| |||||||
Spain – 0.17% | ||||||||
Autonomous Community of Catalonia | EUR | 1,800,000 | 2,036,799 | |||||
| 76 |
Table of Contents
Principal amount° | Value (U.S. $) | |||||||
| ||||||||
Regional BondsD (continued) |
| |||||||
| ||||||||
Spain (continued) | ||||||||
Autonomous Community of Catalonia | EUR | 1,100,000 | $ | 1,258,557 | ||||
|
| |||||||
| 3,295,356 | ||||||||
|
| |||||||
Total Regional Bonds | 9,924,840 | |||||||
|
| |||||||
| ||||||||
Loan Agreements – 6.83%« |
| |||||||
| ||||||||
1011778 BC 1st Lien | 500,000 | 500,313 | ||||||
Accudyne Industries Borrower 1st Lien | 899,259 | 850,250 | ||||||
Air Medical Group Holdings Tranche B 1st Lien | 3,166,209 | 3,168,846 | ||||||
Albertsons Tranche B 1st Lien 3.982% 8/25/21 | 1,290,459 | 1,298,256 | ||||||
Allied Universal Holdco 1st | 1,349,180 | 1,360,311 | ||||||
Allied Universal Holdco Tranche DD 1st Lien | 163,899 | 165,251 | ||||||
Alpha 3 Tranche B1 1st Lien 4.147% 1/25/24 | 200,000 | 201,250 | ||||||
Amaya Holdings 1st Lien 4.647% 8/1/21 | 1,875,129 | 1,881,825 | ||||||
Amaya Holdings 2nd Lien | 165,000 | 166,212 | ||||||
American Airlines Tranche B 1st Lien 3.412% 12/14/23 | 1,836,751 | 1,843,512 | ||||||
Applied Systems 1st Lien 4.147% 1/23/21 | 243,996 | 245,470 | ||||||
Applied Systems 2nd Lien 7.647% 1/23/22 | 2,285,501 | 2,304,546 | ||||||
ATI Holdings Acquisition 1st Lien 5.505% 5/10/23 | 859,047 | 869,427 | ||||||
Avolon TLB Borrower 1 US Tranche B2 1st Lien | 485,000 | 492,342 | ||||||
BJ’s Wholesale Club 1st Lien | 645,000 | 632,100 | ||||||
BJ’s Wholesale Club 2nd Lien 8.50% 1/27/25 | 1,492,000 | 1,460,295 | ||||||
Blue Ribbon 1st Lien | 1,336,512 | 1,244,627 | ||||||
Builders FirstSource 1st Lien | 2,864,698 | 2,866,846 | ||||||
BWAY Holding Tranche B 1st Lien 4.75% 8/14/23 | 1,323,712 | 1,324,067 | ||||||
Principal amount° | Value (U.S. $) | |||||||
| ||||||||
Loan Agreements« (continued) | ||||||||
| ||||||||
BWAY Tranche B 1st Lien | 1,220,000 | $ | 1,219,237 | |||||
Caesars Growth Properties Holdings Tranche B 1st Lien 6.25% 5/8/21 | 1,539,351 | 1,548,972 | ||||||
Calpine Construction Finance 1st Lien 3.03% 5/3/20 | 263,630 | 264,702 | ||||||
Calpine Tranche B 1st Lien | 197,500 | 198,652 | ||||||
CH Hold 1st Lien 4.00% 2/1/24 | 409,091 | 412,585 | ||||||
CH Hold 2nd Lien 8.25% 2/1/25 | 385,000 | 391,497 | ||||||
Change Healthcare Holdings TrancheB 1st Lien 3.75% 3/1/24 | 1,780,000 | 1,785,192 | ||||||
Charter Communications Operating 1st Lien 3.232% 1/15/24 | 495,000 | 498,060 | ||||||
Charter Communications Operating Tranche H 1st Lien 2.99% 1/15/22 | 165,330 | 165,996 | ||||||
Chesapeake Energy 1st Lien | 490,000 | 522,922 | ||||||
CityCenter Holdings Tranche B 1st Lien 3.732% 10/16/20 | 461,876 | 467,765 | ||||||
Colorado Buyer 1st Lien | 165,000 | 166,278 | ||||||
Colorado Buyer 2nd Lien | 325,000 | 326,524 | ||||||
Community Health Systems Tranche G 1st Lien 3.804% 12/31/19 | 386,925 | 385,191 | ||||||
Community Health Systems Tranche H 1st Lien 4.054% 1/27/21 | 908,254 | 896,428 | ||||||
CSC Holdings Tranche B 1st Lien | ||||||||
2.25% 7/17/25 | 430,000 | 429,883 | ||||||
3.943% 10/11/24 | 429,844 | 429,664 | ||||||
DaVita Tranche B 1st Lien | 1,555,018 | 1,575,144 | ||||||
Dell International 1st Lien | 191,538 | 192,691 | ||||||
Dynegy Tranche C 1st Lien | 865,000 | 869,488 | ||||||
Eldorado Resorts Tranche B 1st Lien | 290,000 | 291,087 | ||||||
ESH Hospitality Tranche B 1st Lien | 333,327 | 335,291 | ||||||
ExamWorks Group Tranche B1 1st Lien 4.25% 7/27/23 | 1,253,708 | 1,263,111 | ||||||
| (continues) | 77 |
Table of Contents
Schedules of investments
Optimum Fixed Income Fund
| Principal amount° | Value (U.S. $) | |||||||
| ||||||||
Loan Agreements« (continued) |
| |||||||
| ||||||||
First Data 1st Lien | ||||||||
3.984% 3/24/21 | 2,363,992 | $ | 2,384,677 | |||||
3.984% 7/10/22 | 856,451 | 864,361 | ||||||
First Eagle Holdings | 2,054,909 | 2,068,395 | ||||||
Flex Acquisition 1st Lien 4.398% 12/29/23 | 435,000 | 438,671 | ||||||
Flying Fortress Tranche B 1st Lien 3.397% 10/30/22 | 1,356,000 | 1,368,571 | ||||||
FMG Resources August 2006 1st Lien 3.75% 6/30/19 | 616,470 | 620,555 | ||||||
Forterra Finance 1st Lien 4.50% 10/25/23 | 1,990,000 | 2,008,656 | ||||||
Gardner Denver 4.568% 7/30/20 | 1,555,618 | 1,554,403 | ||||||
Gates Global 1st Lien 4.397% 7/6/21 | 1,159,168 | 1,162,790 | ||||||
Gates Global Tranche B 1st Lien 4.25% 3/30/24 | 220,000 | 221,100 | ||||||
Genesys Telecommunications Laboratories Tranche B 1st Lien 5.025% 1/19/24 | 1,032,481 | 1,040,870 | ||||||
Genoa a QoL Healthcare 1st Lien 4.897% 10/28/23 | 960,175 | 966,416 | ||||||
HCA Tranche B8 1st Lien 3.232% 2/15/24 | 359,100 | 362,467 | ||||||
HCA Tranche B9 1st Lien 2.982% 3/18/23 | 229,268 | 230,503 | ||||||
Hilton Worldwide Finance Tranche B2 1st Lien | ||||||||
2.00% 10/25/23 | 1,020,000 | 1,029,669 | ||||||
2.982% 10/25/23 | 1,500,094 | 1,513,637 | ||||||
Houghton International 1st Lien 4.397% 12/20/19 | 11,011 | 11,108 | ||||||
HUB International Tranche B 1st Lien 4.035% 10/2/20 | 449,034 | 451,455 | ||||||
Hyperion Insurance Group Tranche B 1st Lien 5.50% 4/29/22 | 1,454,902 | 1,467,451 | ||||||
IASIS Healthcare Tranche B 1st Lien 4.50% 5/3/18 | 50,130 | 50,134 | ||||||
Ineos US Finance Tranche B 1st Lien | ||||||||
3.531% 3/31/24 | 254,363 | 255,793 | ||||||
3.732% 3/31/22 | 1,227,626 | 1,235,108 | ||||||
inVentiv Group Holdings Tranche B 1st Lien 4.804% 11/9/23 | 2,229,413 | 2,240,361 | ||||||
JBS USA Tranche B 1st Lien 3.289% 10/30/22 | 770,000 | 772,807 | ||||||
| Principal amount° | Value (U.S. $) | |||||||
| ||||||||
Loan Agreements« (continued) |
| |||||||
| ||||||||
JC Penney Tranche B 1st Lien | 1,737,914 | $ | 1,729,496 | |||||
KIK Custom Products Tranche B 1st Lien 5.653% 8/26/22 | 1,287,777 | 1,302,668 | ||||||
KRATON Polymers Tranche B 1st Lien 5.00% 1/6/22 | 1,032,973 | 1,044,477 | ||||||
Kronos 2nd Lien 9.284% 11/1/24 | 735,000 | 759,921 | ||||||
Kronos Tranche B 1st Lien 5.034% 11/1/23 | 538,650 | 542,353 | ||||||
Landry’s 1st Lien 4.039% 10/4/23 | 701,262 | 708,212 | ||||||
Las Vegas Sands Tranche B 1st Lien 3.04% 12/19/20 | 197,959 | 198,277 | ||||||
Level 3 Financing Tranche B 1st Lien 2.25% 2/22/24 | 1,030,000 | 1,032,317 | ||||||
MGM Growth Properties Operating Partnership Tranche B 1st Lien 3.482% 4/25/23 | 1,143,450 | 1,150,882 | ||||||
Micron Technology Tranche B 1st Lien 4.74% 4/26/22 | 84,363 | 85,351 | ||||||
Mohegan Tribal Gaming Authority Tranche B 1st Lien 5.50% 10/13/23 | 1,421,253 | 1,430,135 | ||||||
Moran Foods Tranche B 1st Lien 7.00% 12/5/23 | 1,350,725 | 1,349,670 | ||||||
MPH Acquisition Holdings Tranche B 1st Lien 4.897% 6/7/23 | 1,007,875 | 1,021,838 | ||||||
Nature’s Bounty Tranche B 1st Lien 4.647% 5/5/23 | 781,000 | 785,638 | ||||||
ON Semiconductor Tranche B 1st Lien 4.232% 3/31/23 | 1,033,372 | 1,040,199 | ||||||
Optiv Security 1st Lien 4.25% 2/1/24 | 400,000 | 402,667 | ||||||
Optiv Security 2nd Lien 8.25% 2/1/25 | 545,000 | 551,813 | ||||||
Panda Hummel Tranche B1 1st Lien 7.00% 10/27/22 | 315,000 | 308,700 | ||||||
Panda Stonewall Tranche B 1st Lien 6.647% 11/13/21 | 591,000 | 576,225 | ||||||
Penn National Gaming Tranche B 1st Lien 3.524% 1/19/24 | 205,000 | 206,431 | ||||||
PQ 1st Lien 5.25% 11/4/22 | 1,838,133 | 1,859,797 | ||||||
Prestige Brands Tranche B 1st Lien 3.531% 1/26/24 | 198,535 | 200,562 | ||||||
Prime Security Services Borrower 1st Lien 4.25% 5/2/22 | 1,576,865 | 1,593,197 | ||||||
| 78 |
Table of Contents
| Principal amount° | Value (U.S. $) | |||||||
| ||||||||
Loan Agreements« (continued) |
| |||||||
| ||||||||
Radiate Holdco 1st Lien | 1,380,000 | $ | 1,388,748 | |||||
Republic of Angola 7.57% 12/16/23 | 1,618,750 | 1,408,312 | ||||||
Revlon Consumer Products Tranche B 1st Lien 4.482% 9/7/23 | 1,642,500 | 1,645,921 | ||||||
Reynolds Group Holdings Trance B 1st Lien 3.982% 2/5/23 | 1,581,846 | 1,590,251 | ||||||
Rite Aid 1st Lien 5.75% 8/21/20 | 475,500 | 478,056 | ||||||
Russell Investments US Institutional Holdco Tranche B 1st Lien 6.75% 6/1/23 | 2,304,740 | 2,327,787 | ||||||
Sable International Finance Tranche B 1st Lien 5.732% 1/3/23 | 2,095,000 | 2,122,933 | ||||||
SAM Finance Tranche B Ist Lien 4.387% 12/17/20 | 852,840 | 860,835 | ||||||
Scientific Games International Tranche B3 1st lien 4.846% 10/1/21 | 1,807,353 | 1,832,017 | ||||||
SFR Group Tranche B 1st Lien | ||||||||
2.75% 6/22/25 | 1,675,000 | 1,671,231 | ||||||
5.289% 1/15/24 | 1,677,325 | 1,688,018 | ||||||
SFR Group Tranche B10 1st Lien 4.289% 1/31/25 | 1,067,325 | 1,069,993 | ||||||
Sinclair Television Group Tranche B2 1st Lien 3.24% 1/3/24 | 2,633,400 | 2,646,293 | ||||||
Spectrum Brands Tranche B 1st Lien 3.509% 6/23/22 | 679,473 | 685,206 | ||||||
Sprint Communications Tranche B 1st Lien 3.50% 2/2/24 | 2,795,000 | 2,799,075 | ||||||
StandardAero Aviation Holdings 1st Lien 5.25% 7/7/22 | 615,321 | 619,360 | ||||||
Summit Materials Tranche B1 1st Lien 3.75% 7/17/22 | 724,905 | 732,834 | ||||||
Summit Midstream Partners Holdings Tranche B 1st Lien 7.022% 5/21/22 | 345,000 | 351,900 | ||||||
Team Holdings Tranche B 1st Lien 3.75% 2/6/24 | 825,000 | 822,834 | ||||||
Telenet Financing USD Tranche B 1st Lien 3.912% 1/31/25 | 1,265,000 | 1,272,412 | ||||||
TKC Holdings 1st Lien | 545,000 | 550,535 | ||||||
| Principal amount° | Value (U.S. $) | |||||||
| ||||||||
Loan Agreements« (continued) |
| |||||||
| ||||||||
TransDigm Tranche E 1st Lien 3.982% 5/14/22 | 217,672 | $ | 217,286 | |||||
TransDigm Tranche F 1st Lien 3.982% 6/9/23 | 1,706,700 | 1,700,834 | ||||||
Travel Leaders Group Tranche B 1st Lien | 205,000 | 207,947 | ||||||
Tribune Media Tranche B 1st Lien 3.982% 12/27/20 | 471,824 | 476,247 | ||||||
Tronox Pigments Holland Tranche B | 533,614 | 537,565 | ||||||
Uniti Group 1st Lien | 1,573,274 | 1,572,283 | ||||||
Univar USA Tranche B 1st Lien 3.732% 7/1/22 | 1,679,788 | 1,683,987 | ||||||
Univision Communications Tranche C 1st Lien | 2,625,820 | 2,610,640 | ||||||
USI 4.25% 12/27/19 | 1,933,849 | 1,939,086 | ||||||
USIC Holdings 1st lien | 1,027,425 | 1,038,021 | ||||||
VC GB Holdings 1st lien 4.75% 2/23/24 | 1,460,000 | 1,470,950 | ||||||
VC GB Holdings 2nd Lien 9.00% 2/23/25 | 355,000 | 351,450 | ||||||
Virgin Media Bristol 1st Lien 3.662% 1/31/25 | 620,000 | 622,325 | ||||||
Western Digital 1st Lien 3.732% 4/29/23 | 304,000 | 306,517 | ||||||
WideOpenWest Finance Tranche B 1st Lien | 1,241,566 | 1,250,257 | ||||||
Windstream Services Tranche B6 1st Lien 4.95% 3/30/21 | 1,396,372 | 1,411,791 | ||||||
Zayo Group Tranche B2 1st Lien 3.50% 1/19/24 | 205,000 | 206,409 | ||||||
Zekelman Industries Tranche B 1st Lien 4.788% 6/14/21 | 679,871 | 690,069 | ||||||
|
| |||||||
Total Loan Agreements |
| 128,571,105 | ||||||
|
| |||||||
| ||||||||
Sovereign Bonds – 3.83%D |
| |||||||
| ||||||||
Argentina – 0.10% | ||||||||
Argentine Bonos del Tesoro 15.50% 10/17/26 | ARS | 5,155,000 | 378,564 | |||||
Argentine Republic Government International Bond | 930,000 | 953,483 | ||||||
| (continues) | 79 |
Table of Contents
Schedules of investments
Optimum Fixed Income Fund
Principal amount° | Value (U.S. $) | |||||||
| ||||||||
Sovereign BondsD (continued) |
| |||||||
| ||||||||
Argentina (continued) | ||||||||
Argentine Republic Government International Bond | 575,000 | $ | 556,887 | |||||
|
| |||||||
| 1,888,934 | ||||||||
|
| |||||||
Australia – 0.02% | ||||||||
Australia Government Bond | AUD | 352,000 | 286,349 | |||||
|
| |||||||
| 286,349 | ||||||||
|
| |||||||
Bahrain – 0.04% | ||||||||
Bahrain Government International Bond | 800,000 | 836,636 | ||||||
|
| |||||||
| 836,636 | ||||||||
|
| |||||||
Bermuda – 0.04% | ||||||||
Bermuda Government International Bond | 800,000 | 774,024 | ||||||
|
| |||||||
| 774,024 | ||||||||
|
| |||||||
Brazil – 0.08% | ||||||||
Brazil Notas do Tesouro Nacional Series F | BRL | 1,826,000 | 584,744 | |||||
Brazilian Government International Bond | 800,000 | 871,600 | ||||||
|
| |||||||
| 1,456,344 | ||||||||
|
| |||||||
Canada – 0.01% | ||||||||
Canadian Government Bond | CAD | 171,000 | 141,072 | |||||
|
| |||||||
| 141,072 | ||||||||
|
| |||||||
Colombia – 0.06% | ||||||||
Colombia Government International Bond | 1,100,000 | 1,108,800 | ||||||
|
| |||||||
| 1,108,800 | ||||||||
|
| |||||||
Costa Rica – 0.03% | ||||||||
Costa Rica Government International Bond | 500,000 | 510,625 | ||||||
|
| |||||||
| 510,625 | ||||||||
|
| |||||||
Principal amount° | Value (U.S. $) | |||||||
| ||||||||
Sovereign BondsD (continued) |
| |||||||
| ||||||||
Croatia – 0.04% | ||||||||
Croatia Government International Bond | 655,000 | $ | 706,961 | |||||
|
| |||||||
| 706,961 | ||||||||
|
| |||||||
Cyprus – 0.07% | ||||||||
Cyprus Government International Bond | EUR | 1,200,000 | 1,360,656 | |||||
|
| |||||||
| 1,360,656 | ||||||||
|
| |||||||
Ecuador – 0.04% | ||||||||
Ecuador Government International Bond | 800,000 | 830,000 | ||||||
|
| |||||||
| 830,000 | ||||||||
|
| |||||||
Egypt – 0.03% | ||||||||
Egypt Government International Bond 144A 8.50% 1/31/47 # | 600,000 | 646,500 | ||||||
|
| |||||||
| 646,500 | ||||||||
|
| |||||||
Greece – 0.21% | ||||||||
Hellenic Republic Government Bond 144A 3.375% 7/17/17 # | EUR | 3,800,000 | 3,998,347 | |||||
|
| |||||||
| 3,998,347 | ||||||||
|
| |||||||
Hungary – 0.07% | ||||||||
Hungary Government International Bond 5.75% 11/22/23 | 1,160,000 | 1,313,115 | ||||||
|
| |||||||
| 1,313,115 | ||||||||
|
| |||||||
India – 0.08% | ||||||||
Export-Import Bank of India | 1,500,000 | 1,436,652 | ||||||
|
| |||||||
| 1,436,652 | ||||||||
|
| |||||||
Indonesia – 0.29% | ||||||||
Indonesia Government International Bond 144A 5.125% 1/15/45 # | 200,000 | 212,444 | ||||||
Indonesia Treasury Bond | ||||||||
7.50% 8/15/32 | IDR | 15,069,000,000 | 1,149,602 | |||||
8.375% 9/15/26 | IDR | 15,310,000,000 | 1,250,605 | |||||
9.00% 3/15/29 | IDR | 26,764,000,000 | 2,231,809 | |||||
Perusahaan Penerbit SBSN Indonesia III 144A 4.15% | 700,000 | 703,815 | ||||||
|
| |||||||
| 5,548,275 | ||||||||
|
| |||||||
| 80 |
Table of Contents
| Principal amount° | Value (U.S. $) | |||||||
| ||||||||
Sovereign BondsD (continued) |
| |||||||
| ||||||||
Jamaica – 0.05% | ||||||||
Jamaica Government International Bond 8.00% 3/15/39 | 800,000 | $ | 920,504 | |||||
|
| |||||||
| 920,504 | ||||||||
|
| |||||||
Japan – 0.01% | ||||||||
Japan Bank For International Cooperation | 248,000 | 247,933 | ||||||
|
| |||||||
| 247,933 | ||||||||
|
| |||||||
Jordan – 0.02% | ||||||||
Jordan Government International Bond | 400,000 | 392,831 | ||||||
|
| |||||||
| 392,831 | ||||||||
|
| |||||||
Kuwait – 0.18% | ||||||||
Kuwait International Government Bond | 3,400,000 | 3,409,180 | ||||||
|
| |||||||
| 3,409,180 | ||||||||
|
| |||||||
Mexico – 0.60% | ||||||||
Mexican Bonos | MXN | 149,877,400 | 7,335,345 | |||||
Mexico Cetes | MXN | 593,000,000 | 3,088,202 | |||||
Mexico Government International Bond | ||||||||
4.15% 3/28/27 | 200,000 | 203,750 | ||||||
4.35% 1/15/47 | 800,000 | 738,000 | ||||||
|
| |||||||
| 11,365,297 | ||||||||
|
| |||||||
New Zealand – 0.06% | ||||||||
New Zealand Government Bond | ||||||||
2.75% 4/15/25 | NZD | 1,710,000 | 1,170,332 | |||||
4.50% 4/15/27 | NZD | 69,000 | 53,771 | |||||
|
| |||||||
| 1,224,103 | ||||||||
|
| |||||||
Nigeria – 0.06% | ||||||||
Nigeria Government International Bond 144A 7.875% 2/16/32 # | 1,000,000 | 1,045,600 | ||||||
|
| |||||||
| 1,045,600 | ||||||||
|
| |||||||
Principal amount° | Value (U.S. $) | |||||||
| ||||||||
Sovereign BondsD (continued) |
| |||||||
| ||||||||
Paraguay – 0.03% | ||||||||
Paraguay Government International Bond 144A 4.70% 3/27/27 # | 600,000 | $ | 609,000 | |||||
|
| |||||||
| 609,000 | ||||||||
|
| |||||||
Peru – 0.20% | ||||||||
Peruvian Government International Bond | ||||||||
144A 6.90% 8/12/37 # | PEN | 3,868,000 | 1,275,373 | |||||
6.95% 8/12/31 | PEN | 7,355,000 | 2,433,838 | |||||
|
| |||||||
| 3,709,211 | ||||||||
|
| |||||||
Poland – 0.12% | ||||||||
Republic of Poland Government Bond | ||||||||
2.50% 7/25/26 | PLN | 8,756,000 | 2,057,462 | |||||
3.25% 7/25/25 | PLN | 1,087,000 | 273,593 | |||||
|
| |||||||
| 2,331,055 | ||||||||
|
| |||||||
Portugal – 0.06% | ||||||||
Portugal Government International Bond 144A 5.125% | 1,251,000 | 1,215,181 | ||||||
|
| |||||||
| 1,215,181 | ||||||||
|
| |||||||
Republic of Korea – 0.31% | ||||||||
Export-Import Bank of Korea | ||||||||
4.00% 6/7/27 | AUD | 210,000 | 159,745 | |||||
4.375% 9/15/21 | 700,000 | 747,447 | ||||||
5.00% 4/11/22 | 2,000,000 | 2,202,214 | ||||||
5.125% 6/29/20 | 1,500,000 | 1,624,956 | ||||||
Inflation Linked Korea Treasury Bond | KRW | 1,110,340,963 | 1,020,689 | |||||
|
| |||||||
| 5,755,051 | ||||||||
|
| |||||||
Russia – 0.04% | ||||||||
Russian Foreign Bond - Eurobond 144A 5.625% 4/4/42 # | 600,000 | 661,080 | ||||||
|
| |||||||
| 661,080 | ||||||||
|
| |||||||
Saudi Arabia – 0.14% | ||||||||
Saudi Government International Bond | ||||||||
144A 2.375% 10/26/21 # | 915,000 | 899,569 | ||||||
144A 3.25% 10/26/26 # | 1,000,000 | 973,500 | ||||||
144A 4.50% 10/26/46 # | 800,000 | 790,264 | ||||||
|
| |||||||
| 2,663,333 | ||||||||
|
| |||||||
| (continues) | 81 |
Table of Contents
Schedules of investments
Optimum Fixed Income Fund
| Principal amount° | Value (U.S. $) | |||||||
| ||||||||
Sovereign BondsD (continued) |
| |||||||
| ||||||||
Serbia – 0.04% | ||||||||
Serbia International Bond 144A 4.875% 2/25/20 # | 665,000 | $ | 690,543 | |||||
|
| |||||||
| 690,543 | ||||||||
|
| |||||||
South Africa – 0.29% | ||||||||
Republic of South Africa Government Bond | ZAR | 69,499,000 | 4,705,242 | |||||
Republic of South Africa Government International Bond 5.875% 5/30/22 | 750,000 | 820,150 | ||||||
|
| |||||||
| 5,525,392 | ||||||||
|
| |||||||
Sri Lanka – 0.08% | ||||||||
Sri Lanka Government International Bond | ||||||||
144A 6.00% 1/14/19 # | 535,000 | 555,045 | ||||||
144A 6.125% 6/3/25 # | 880,000 | 882,079 | ||||||
|
| |||||||
| 1,437,124 | ||||||||
|
| |||||||
Turkey – 0.26% | ||||||||
Export Credit Bank of Turkey | ||||||||
144A 5.375% 2/8/21 # | 910,000 | 917,725 | ||||||
144A 5.375% 10/24/23 # | 260,000 | 255,989 | ||||||
Turkey Government Bond 8.00% 3/12/25 | TRY | 15,697,000 | 3,705,657 | |||||
|
| |||||||
| 4,879,371 | ||||||||
|
| |||||||
Ukraine – 0.05% | ||||||||
Ukraine Government International Bond | 900,000 | 866,363 | ||||||
|
| |||||||
| 866,363 | ||||||||
|
| |||||||
United Kingdom – 0.02% | ||||||||
United Kingdom Gilt | ||||||||
1.75% 9/7/22 | GBP | 100,000 | 133,595 | |||||
3.50% 1/22/45 | GBP | 138,800 | 240,124 | |||||
|
| |||||||
| 373,719 | ||||||||
|
| |||||||
Total Sovereign Bonds |
| 72,165,161 | ||||||
|
| |||||||
| ||||||||
Supranational Banks – 0.38% |
| |||||||
| ||||||||
Inter-American Development Bank 1.243% 10/15/20 ● | 890,000 | 895,189 | ||||||
International Bank for Reconstruction & Development | ||||||||
1.013% 4/17/19 ● | 440,000 | 439,857 | ||||||
2.50% 11/25/24 | 440,000 | 441,199 | ||||||
3.375% 1/25/22 | NZD | 500,000 | 351,463 | |||||
| Principal amount° | Value (U.S. $) | |||||||
| ||||||||
Supranational Banks (continued) |
| |||||||
| ||||||||
International Bank for Reconstruction & Development | ||||||||
3.50% 1/22/21 | NZD | 2,494,000 | $ | 1,775,267 | ||||
4.625% 10/6/21 | NZD | 380,000 | 281,845 | |||||
International Finance | ||||||||
1.21% 1/9/19 ● | 600,000 | 600,514 | ||||||
3.00% 5/6/21 | NZD | 305,000 | 212,345 | |||||
3.625% 5/20/20 | NZD | 163,000 | 116,572 | |||||
6.30% 11/25/24 | INR | 133,470,000 | 2,069,273 | |||||
|
| |||||||
Total Supranational Banks |
| 7,183,524 | ||||||
|
| |||||||
| ||||||||
U.S. Treasury Obligations – 7.66% |
| |||||||
| ||||||||
U.S. Treasury Bonds | ||||||||
2.50% 2/15/45 | 37,100,000 | 33,334,944 | ||||||
2.75% 8/15/42 | 900,000 | 858,006 | ||||||
2.75% 11/15/42 | 1,400,000 | 1,333,090 | ||||||
2.875% 5/15/43 | 2,200,000 | 2,142,034 | ||||||
2.875% 8/15/45 ¥ | 16,700,000 | 16,193,790 | ||||||
2.875% 11/15/46 | 6,140,000 | 5,956,641 | ||||||
4.375% 5/15/40 | 100,000 | 124,166 | ||||||
U.S. Treasury Inflation Indexed Bonds | ||||||||
0.125% 4/15/19 ¥ | 1,243,632 | 1,262,211 | ||||||
0.125% 4/15/20 ¥ | 6,014,426 | 6,106,068 | ||||||
0.125% 4/15/21 | 3,212,152 | 3,247,255 | ||||||
0.125% 7/15/26 | 20,262 | 19,784 | ||||||
0.375% 7/15/25 | 2,560,050 | 2,568,083 | ||||||
0.625% 1/15/26 | 30,660 | 31,242 | ||||||
1.75% 1/15/28 | 32,711,495 | 37,034,875 | ||||||
2.375% 1/15/25 | 5,256,223 | 6,066,607 | ||||||
2.50% 1/15/29 | 33,932 | 41,541 | ||||||
3.875% 4/15/29 | 280,664 | 388,687 | ||||||
U.S. Treasury Notes | ||||||||
1.125% 1/31/19 ¥ | 4,200,000 | 4,191,877 | ||||||
1.125% 8/31/21 | 13,800,000 | 13,370,641 | ||||||
2.00% 10/31/21 | 1,600,000 | 1,607,374 | ||||||
2.00% 11/15/26 | 2,035,000 | 1,965,723 | ||||||
2.25% 2/15/27 | 6,545,000 | 6,461,525 | ||||||
|
| |||||||
Total U.S. Treasury Obligations |
| 144,306,164 | ||||||
|
| |||||||
| Number of shares | ||||||||
| ||||||||
Common Stock – 0.00% |
| |||||||
| ||||||||
Century Communications =† | 1,975,000 | 0 | ||||||
|
| |||||||
Total Common Stock | 0 | |||||||
|
| |||||||
| 82 |
Table of Contents
Number of shares | Value (U.S. $) | |||||||
| ||||||||
Convertible Preferred Stock – 0.19% |
| |||||||
| ||||||||
A Schulman 6.00% exercise price $52.33, expiration date 12/31/49 | 308 | $ | 266,072 | |||||
American Tower 5.50% exercise price $116.40, expiration date 2/15/18 | 926 | 103,434 | ||||||
AMG Capital Trust II 5.15% exercise price $200.00, expiration date 10/15/37 | 5,867 | 334,786 | ||||||
Bank of America 7.25% exercise price $50.00, expiration date 12/31/49 | 229 | 273,669 | ||||||
DTE Energy 6.50% exercise price $116.31, expiration date 10/1/19 | 5,605 | 301,157 | ||||||
El Paso Energy Capital Trust I 4.75% exercise price $50.00, expiration date 3/31/28 | 7,755 | 387,750 | ||||||
Exelon 6.50% exercise price $43.75, expiration date 6/1/17 | 6,250 | 308,500 | ||||||
Huntington Bancshares 8.50% exercise price $11.95, expiration date 12/31/49 | 305 | 417,087 | ||||||
Teva Pharmaceutical Industries 7.00% exercise price $75.00, expiration date 12/15/18 | 194 | 111,938 | ||||||
T-Mobile US 5.50% exercise price $31.02, expiration date 12/15/17 | 2,180 | 230,666 | ||||||
Wells Fargo & Co. 7.50% exercise price $156.71, expiration date 12/31/49 | 366 | 453,840 | ||||||
Welltower 6.50% exercise price $57.54, expiration date 12/31/49 | 4,947 | 312,255 | ||||||
|
| |||||||
Total Convertible Preferred Stock | 3,501,154 | |||||||
|
| |||||||
| ||||||||
Preferred Stock – 0.28% | ||||||||
| ||||||||
Bank of America 6.50% ● | 1,150,000 | 1,256,375 | ||||||
General Electric 5.00% ● | 2,448,000 | 2,582,640 | ||||||
Integrys Holdings 6.00% ● | 35,650 | 930,911 | ||||||
USB Realty 144A 2.169% #● | 500,000 | 426,250 | ||||||
|
| |||||||
Total Preferred Stock | 5,196,176 | |||||||
|
| |||||||
| Number of contracts | Value (U.S. $) | |||||||
| ||||||||
Options Purchased – 0.03% | ||||||||
| ||||||||
Call Swaptions – 0.02% | ||||||||
2 yr IRS pay a fixed rate 1.65% and receive a floating rate based on 3-month USD-ICE LIBOR expiration date 11/15/18 (MSC) | 88,800,000 | $ | 235,586 | |||||
2 yr IRS pay a fixed rate 1.67% and receive a floating rate based on 3-month USD-ICE LIBOR expiration date 9/6/17 (BAML) | 9,500,000 | 13,006 | ||||||
|
| |||||||
| 248,592 | ||||||||
|
| |||||||
Currency Call Option – 0.00% | ||||||||
USD vs TWD strike price $32.50, expiration date 4/17/17 (BAML) | 2,250,000 | 3 | ||||||
|
| |||||||
| 3 | ||||||||
|
| |||||||
Fixed Income Put Options – 0.00% | ||||||||
U.S. Treasury 10 yr Notes Future strike price $110, expiration date 5/26/17 (HSBC) | 770 | 0 | ||||||
U.S. Treasury 5 yr Notes Future strike price $108, expiration date 5/26/17 (HSBC) | 1,400 | 0 | ||||||
|
| |||||||
| 0 | ||||||||
|
| |||||||
Put Swaptions – 0.01% | ||||||||
30 yr IRS pay a fixed rate 2.91% and receive a floating rate based on 3-month USD-ICE LIBOR expiration date 8/20/18 (MSC) | 4,400,000 | 243,738 | ||||||
|
| |||||||
| 243,738 | ||||||||
|
| |||||||
Total Options Purchased | 492,333 | |||||||
|
| |||||||
Principal amount° | ||||||||
| ||||||||
Short-Term Investments – 9.22% | ||||||||
| ||||||||
Discount Notes – 8.24%≠ | ||||||||
Federal Home Loan Bank | ||||||||
0.588% 4/3/17 | 12,600,000 | 12,599,588 | ||||||
0.63% 4/17/17 | 13,000,000 | 12,996,568 | ||||||
0.663% 4/26/17 | 94,500,000 | 94,458,987 | ||||||
0.71% 4/28/17 | 30,800,000 | 30,785,462 | ||||||
0.72% 4/10/17 | 2,700,000 | 2,699,644 | ||||||
| (continues) | 83 |
Table of Contents
Schedules of investments
Optimum Fixed Income Fund
Principal amount° | Value (U.S. $) | |||||||
| ||||||||
Short-Term Investments (continued) |
| |||||||
| ||||||||
Discount Notes≠ (continued) |
| |||||||
Federal Home Loan Bank | ||||||||
0.75% 4/19/17 | 1,100,000 | $ | 1,099,668 | |||||
0.75% 4/21/17 | 300,000 | 299,898 | ||||||
0.75% 4/24/17 | 300,000 | 299,881 | ||||||
|
| |||||||
| 155,239,696 | ||||||||
|
| |||||||
Repurchase Agreements – 0.93% |
| |||||||
Bank of America Merrill Lynch | 5,743,260 | 5,743,260 | ||||||
Bank of Montreal | 5,743,260 | 5,743,260 | ||||||
BNP Paribas | 6,094,480 | 6,094,480 | ||||||
|
| |||||||
| 17,581,000 | ||||||||
|
| |||||||
U.S. Treasury Obligations – 0.05%≠ |
| |||||||
U.S. Treasury Bills | ||||||||
0.53% 5/11/17 | 479,000 | 478,639 | ||||||
0.605% 4/27/17 | 419,000 | 418,801 | ||||||
|
| |||||||
| 897,440 | ||||||||
|
| |||||||
Total Short-Term Investments |
| 173,718,136 | ||||||
|
| |||||||
Total Value of Securities Before |
| $ | 2,172,014,369 | |||||
|
| |||||||
Number of contracts | Value (U.S. $) | |||||||
| ||||||||
Options Written – (0.04%) |
| |||||||
| ||||||||
Call Swaptions – (0.02%) |
| |||||||
10 yr IRS pay a fixed rate 2.00% and receive a floating rate based on 3-month USD-ICE LIBOR expiration date 11/15/18 (MSC) | (19,100,000) | $ | (256,933 | ) | ||||
|
| |||||||
| (256,933 | ) | |||||||
|
| |||||||
Fixed Income Call Option – (0.01%) |
| |||||||
U.S. Treasury 10 yr Notes Future strike price $125, expiration date 5/26/17 (HSBC) | (364) | (255,938) | ||||||
|
| |||||||
| (255,938) | ||||||||
|
| |||||||
Put Swaptions – (0.01%) |
| |||||||
5 yr IRS pay a fixed rate 2.70% and receive a floating rate based on 3-month USD-ICE LIBOR expiration date 9/6/17 (BAML) | (3,900,000) | (6,813) | ||||||
5 yr IRS pay a fixed rate 2.80% and receive a floating rate based on 3-month USD-ICE LIBOR expiration date 8/20/18 (MSC) | (19,500,000) | (181,701) | ||||||
|
| |||||||
| (188,514) | ||||||||
|
| |||||||
Total Options Written (premium |
| (701,385) | ||||||
|
| |||||||
| # | Security exempt from registration under Rule 144A of the Securities Act of 1933, as amended. At March 31, 2017, the aggregate value of Rule 144A securities was $423,232,547, which represents 22.47% of the Fund’s net assets. See Note 10 in “Notes to financial statements.” |
| ◆ | Pass Through Agreement. Security represents the contractual right to receive a proportionate amount of underlying payments due to the counterparty pursuant to various agreements related to the rescheduling of obligations and the exchange of certain notes. |
| T | PIK. 100% of the income received was in the form of cash. |
| = | Security is being fair valued in accordance with the Fund’s fair valuation policy. At March 31, 2017, the aggregate value of fair valued securities was $0, which represents 0.00% of the Fund’s net assets. See Note 1 in “Notes to financial statements.” |
| ≠ | The rate shown is the effective yield at the time of purchase. |
| « | Loan agreements generally pay interest at rates which are periodically reset by reference to a base lending rate plus a premium. These base lending rates are generally: (i) the prime rate offered by one or more |
| 84 |
Table of Contents
U.S. banks, (ii) the lending rate offered by one or more European banks such as the London Interbank Offered Rate (LIBOR), and (iii) the certificate of deposit rate. Loan agreements may be subject to restrictions on resale. Stated rate in effect at March 31, 2017.
| § | Pre-refunded bonds. Municipal bonds that are generally backed or secured by U.S. Treasury bonds. For pre-refunded bonds, the stated maturity is followed by the year in which the bond is pre-refunded. |
| ° | Principal amount shown is stated in U.S. dollars unless noted that the security is denominated in another currency. |
| D | Securities have been classified by country of origin. |
| S | Interest only security. An interest only security is the interest only portion of a fixed income security, which is separated and sold individually from the principal portion of the security. |
| W | Principal only security. A principal only security is the principal only portion of a fixed income security which is separated and sold individually from the interest portion of the security. |
| † | Non-income producing security. |
| ● | Variable rate security. Each rate shown is as of March 31, 2017. Interest rates reset periodically. |
| ϕ | Step coupon bond. Coupon increases or decreases periodically based on a predetermined schedule. Stated rate in effect at March 31,2017. |
| ¥ | Fully or partially pledged as collateral for future contracts, reverse repurchase agreements and swap contracts. |
| ^ | Zero coupon security. The rate shown is the yield at the time of purchase. |
The following foreign currency exchange contracts, futures contracts, and swap contracts were outstanding at March 31, 2017:1
Foreign Currency Exchange Contracts
Counterparty | Contracts to Receive (Deliver) | In Exchange For | Settlement Date | Unrealized Appreciation (Depreciation) | ||||||||||||||||||||||||||||
BAML | AUD | (510,000 | ) | USD | 391,130 | 4/4/17 | $ | 1,516 | ||||||||||||||||||||||||
BAML | AUD | (1,324,000 | ) | USD | 1,014,610 | 5/2/17 | 3,644 | |||||||||||||||||||||||||
BAML | AUD | (2,830,386 | ) | USD | 2,154,631 | 5/12/17 | (6,142 | ) | ||||||||||||||||||||||||
BAML | BRL | 22,254,720 | USD | (7,187,288 | ) | 5/3/17 | (132,097 | ) | ||||||||||||||||||||||||
BAML | CAD | 591,000 | USD | (437,229 | ) | 4/4/17 | 7,208 | |||||||||||||||||||||||||
BAML | CAD | (1,370,047 | ) | USD | 1,023,218 | 5/12/17 | (7,617 | ) | ||||||||||||||||||||||||
BAML | EUR | (1,098,000 | ) | USD | 1,172,318 | 4/3/17 | 821 | |||||||||||||||||||||||||
BAML | EUR | (18,510,000 | ) | USD | 19,634,223 | 4/4/17 | (115,629 | ) | ||||||||||||||||||||||||
BAML | EUR | 1,098,000 | USD | (1,173,822 | ) | 5/2/17 | (779 | ) | ||||||||||||||||||||||||
BAML | EUR | 2,301,970 | USD | (2,504,543 | ) | 5/12/17 | (44,024 | ) | ||||||||||||||||||||||||
BAML | INR | 23,338,266 | USD | (338,133 | ) | 4/20/17 | 21,463 | |||||||||||||||||||||||||
BAML | JPY | 108,000,000 | USD | (971,223 | ) | 4/4/17 | (1,010 | ) | ||||||||||||||||||||||||
BAML | JPY | (108,000,000 | ) | USD | 972,241 | 5/2/17 | 903 | |||||||||||||||||||||||||
BAML | JPY | 34,779,403 | USD | (315,645 | ) | 5/12/17 | (2,735 | ) | ||||||||||||||||||||||||
BAML | MXN | 88,622,555 | USD | (4,313,932 | ) | 4/17/17 | 407,113 | |||||||||||||||||||||||||
BAML | MXN | (14,300,000 | ) | USD | 716,038 | 8/17/17 | (31,616 | ) | ||||||||||||||||||||||||
BAML | NZD | (3,177,739 | ) | USD | 2,231,535 | 5/12/17 | 6,388 | |||||||||||||||||||||||||
BAML | SGD | (9,478,079 | ) | USD | 6,747,789 | 6/23/17 | (32,254 | ) | ||||||||||||||||||||||||
BAML | TWD | (69,157,201 | ) | USD | 2,265,666 | 6/23/17 | (21,051 | ) | ||||||||||||||||||||||||
BCLY | BRL | 8,658,540 | USD | (2,743,082 | ) | 5/12/17 | (4,208 | ) | ||||||||||||||||||||||||
BCLY | COP | 3,270,500,226 | USD | (1,113,816 | ) | 5/12/17 | 17,069 | |||||||||||||||||||||||||
BNP | AUD | 564,000 | USD | (433,611 | ) | 4/4/17 | (2,744 | ) | ||||||||||||||||||||||||
BNP | AUD | (1,381,816 | ) | USD | 1,051,275 | 5/12/17 | (3,631 | ) | ||||||||||||||||||||||||
BNP | EUR | 18,058,000 | USD | (19,475,553 | ) | 4/4/17 | (207,977 | ) | ||||||||||||||||||||||||
BNP | EUR | (18,396,000 | ) | USD | 19,865,416 | 5/2/17 | 212,127 | |||||||||||||||||||||||||
BNP | GBP | 12,176,000 | USD | (15,155,344 | ) | 4/4/17 | 101,356 | |||||||||||||||||||||||||
BNP | GBP | (12,176,000 | ) | USD | 15,165,232 | 5/2/17 | (101,523 | ) | ||||||||||||||||||||||||
BNP | JPY | (108,000,000 | ) | USD | 963,343 | 4/4/17 | (6,870 | ) | ||||||||||||||||||||||||
BNP | MXN | (45,000,000 | ) | USD | 2,252,748 | 8/17/17 | (100,009 | ) | ||||||||||||||||||||||||
BNP | NOK | 6,491,578 | USD | (762,989 | ) | 5/12/17 | (6,609 | ) | ||||||||||||||||||||||||
BNYM | CAD | (4,650 | ) | USD | 3,487 | 4/3/17 | (9 | ) | ||||||||||||||||||||||||
CITI | CAD | 625,000 | USD | (469,501 | ) | 4/4/17 | 505 | |||||||||||||||||||||||||
CITI | CAD | (2,446,000 | ) | USD | 1,838,254 | 5/2/17 | (1,900 | ) | ||||||||||||||||||||||||
| (continues) | 85 |
Table of Contents
Schedules of investments
Optimum Fixed Income Fund
Counterparty | Contracts to Receive (Deliver) | In Exchange For | Settlement Date | Unrealized Appreciation (Depreciation) | ||||||||||||||||||||||||||||||
CITI | EUR | 452,000 | USD | (477,909 | ) | 4/4/17 | $ | 4,367 | ||||||||||||||||||||||||||
HSBC | EUR | (142,638 | ) | USD | 155,240 | 5/12/17 | 2,778 | |||||||||||||||||||||||||||
HSBC | GBP | 360,383 | USD | (452,857 | ) | 5/12/17 | (887 | ) | ||||||||||||||||||||||||||
JPMC | AUD | (54,000 | ) | USD | 40,888 | 4/4/17 | (365 | ) | ||||||||||||||||||||||||||
JPMC | CAD | (1,216,000 | ) | USD | 912,716 | 4/4/17 | (1,727 | ) | ||||||||||||||||||||||||||
JPMC | DKK | 265,000 | USD | (38,343 | ) | 4/3/17 | (337 | ) | ||||||||||||||||||||||||||
JPMC | GBP | (12,176,000 | ) | USD | 15,004,364 | 4/4/17 | (252,336 | ) | ||||||||||||||||||||||||||
JPMC | KRW | (1,150,799,750 | ) | USD | 1,034,590 | 5/12/17 | 4,368 | |||||||||||||||||||||||||||
JPMC | MXN | 158,865,000 | USD | (7,905,266 | ) | 4/17/17 | 557,691 | |||||||||||||||||||||||||||
JPMC | PLN | (795,314 | ) | USD | 203,643 | 5/12/17 | 3,183 | |||||||||||||||||||||||||||
JPMC | SEK | 813,406 | USD | (92,873 | ) | 5/12/17 | (1,917 | ) | ||||||||||||||||||||||||||
JPMC | THB | (4,239,616 | ) | USD | 120,829 | 6/23/17 | (2,477 | ) | ||||||||||||||||||||||||||
TD | AUD | 1,099,731 | USD | (838,451 | ) | 5/12/17 | 1,105 | |||||||||||||||||||||||||||
TD | COP | 2,706,630,221 | USD | (921,876 | ) | 5/12/17 | 14,032 | |||||||||||||||||||||||||||
TD | EUR | 77,397 | USD | (83,175 | ) | 5/12/17 | (447 | ) | ||||||||||||||||||||||||||
TD | JPY | 129,558,430 | USD | (1,176,669 | ) | 5/12/17 | (11,031 | ) | ||||||||||||||||||||||||||
|
| |||||||||||||||||||||||||||||||||
| $ | 265,679 | |||||||||||||||||||||||||||||||||
|
| |||||||||||||||||||||||||||||||||
Futures Contracts
Contracts to Buy (Sell) | Notional Cost (Proceeds) | Notional Value | Expiration Date | Unrealized Appreciation (Depreciation) | ||||||||||||
(1,002) 90 Day Euro | $ | (246,727,610 | ) | $ | (245,464,950 | ) | 12/18/18 | $ | 1,262,660 | |||||||
(344) 90 Day Euro | (85,079,134 | ) | (84,576,700 | ) | 3/20/18 | 502,434 | ||||||||||
(235) 90 Day Euro | (57,914,207 | ) | (57,704,250 | ) | 6/19/18 | 209,957 | ||||||||||
(39) 90 Day Euro | (9,613,433 | ) | (9,565,725 | ) | 9/18/18 | 47,708 | ||||||||||
(4) 90 Day Euro | (989,605 | ) | (984,500 | ) | 12/19/17 | 5,105 | ||||||||||
(647) 90 Day Euro | (159,009,302 | ) | (159,436,975 | ) | 9/19/17 | (427,673 | ) | |||||||||
(120) 90 Day Sterling | (18,659,627 | ) | (18,671,344 | ) | 12/20/18 | (11,717 | ) | |||||||||
86 Australian 3 yr Bonds | 6,403,839 | 6,442,277 | 6/16/17 | 38,438 | ||||||||||||
111 Australian 10 yr Bonds | 8,218,811 | 8,248,885 | 6/16/17 | 30,074 | ||||||||||||
(40) Euro-Bund | (6,888,698 | ) | (6,888,114 | ) | 6/9/17 | 584 | ||||||||||
(258) Euro-O.A.T | (40,546,292 | ) | (40,470,466 | ) | 6/9/17 | 75,826 | ||||||||||
(449) U.S. Treasury 2 yr Notes | (97,102,543 | ) | (97,187,453 | ) | 7/1/17 | (84,910 | ) | |||||||||
2,835 U.S. Treasury 5 yr Notes | 333,271,939 | 333,754,804 | 7/3/17 | 482,865 | ||||||||||||
1,398 U.S. Treasury 10 yr Notes | 174,090,227 | 174,138,375 | 6/22/17 | 48,148 | ||||||||||||
248 U.S. Treasury Ultra Bond | 37,059,421 | 37,409,250 | 6/22/17 | 349,829 | ||||||||||||
|
|
|
| |||||||||||||
| $ | (163,486,214 | ) | $ | 2,529,328 | ||||||||||||
|
|
|
| |||||||||||||
| 86 |
Table of Contents
Swap Contracts
CDS Contracts2
Counterparty | Swap Referenced Obligation | Notional Value3 | Annual Protection Payments | Termination Date | Upfront Payments Paid (Received) | Unrealized Appreciation (Depreciation)4 | ||||||||||||||||
Protection Purchased / Moody’s ratings: | ||||||||||||||||||||||
HSBC | CDX.EM.275 | 2,240,000 | 1.00% | 6/20/22 | $124,850 | $ | (5,993 | ) | ||||||||||||||
ICE | CSFB CDX.NA.HY.276 | 5,742,000 | 5.00% | 12/20/21 | (263,103) | (191,054 | ) | |||||||||||||||
ICE | CSFB CDX.NA.IG.267 | 10,300,000 | 1.00% | 6/20/21 | (105,063) | (104,441 | ) | |||||||||||||||
ICE | JPMC CDX.NA.HY.276 | 3,960,000 | 5.00% | 12/20/21 | (276,640) | (36,572 | ) | |||||||||||||||
|
| |||||||||||||||||||||
| (338,060 | ) | |||||||||||||||||||||
|
| |||||||||||||||||||||
| Protection Sold / Moody’s ratings: | ||||||||||||||||||||||
BAML | Citigroup 6.125% 5/15/18 Baa1 | 700,000 | 1.00% | 12/20/20 | (1,106) | 14,345 | ||||||||||||||||
BAML | Republic of Brazil 4.25% 1/7/25 Ba2 CDS | 700,000 | 1.00% | 12/20/21 | (61,562) | 29,306 | ||||||||||||||||
BAML | Republic of Colombia 10.375% 1/28/33 Baa2 | 100,000 | 1.00% | 6/20/21 | (2,763) | 2,727 | ||||||||||||||||
BAML | Republic of Colombia 10.375% 1/28/33 Baa2 | 500,000 | 1.00% | 12/20/21 | (22,350) | 18,036 | ||||||||||||||||
BAML | Republic of Italy 6.875% 9/27/23 Baa2 | 9,800,000 | 1.00% | 6/20/21 | (138,384) | (68,439 | ) | |||||||||||||||
BNP | Republic of Colombia 10.375% 1/28/33 Baa2 | 200,000 | 1.00% | 6/20/21 | (5,594) | 5,522 | ||||||||||||||||
DB | CMBX.NA.AAA8 | 14,200,000 | 0.50% | 10/17/57 | (933,206) | 740,000 | ||||||||||||||||
DB | Republic of Colombia 10.375% 1/28/33 Baa2 | 200,000 | 1.00% | 6/20/21 | (5,525) | 5,453 | ||||||||||||||||
GSC | Republic of Colombia 10.375% 1/28/33 Baa2 | 3,100,000 | 1.00% | 6/20/21 | (87,900) | 86,789 | ||||||||||||||||
JPMC | Mexico LA 5 yr 5.950% 3/19/19 A3 | 12,900,000 | 1.00% | 12/20/19 | 66,915 | 58,799 | ||||||||||||||||
JPMC | Republic of Colombia 10.375% 1/28/33 Baa2 | 100,000 | 1.00% | 6/20/21 | (2,797) | 2,761 | ||||||||||||||||
JPMC | Volkswagen International 5.375% 5/22/18 A3 | EUR | 2,500,000 | 1.00% | 12/20/17 | (16,473) | 27,497 | |||||||||||||||
|
| |||||||||||||||||||||
| $ | 922,796 | |||||||||||||||||||||
|
| |||||||||||||||||||||
Total | $ | 584,736 | ||||||||||||||||||||
|
| |||||||||||||||||||||
| (continues) | 87 |
Table of Contents
Schedules of investments
Optimum Fixed Income Fund
Interest Rate Swap Contracts9
Counterparty | Swap Referenced Obligation | Notional Value3 | Fixed Interest Rate Paid (Received) | Variable Interest Rate Paid (Received) | Termination Date | Upfront Payments Paid (Received) | Unrealized Appreciation (Depreciation)4 | |||||||||||||||
CME | BAML 10 yr USD-ICE- 3-month LIBOR | 1,490,000 | 1.686% | (0.999%) | 4/5/26 | $ | — | $ | 82,776 | |||||||||||||
CME | BAML 30 yr USD-ICE- 3-month LIBOR | 1,770,000 | 2.767% | (1.152%) | 12/21/46 | — | (27,905 | ) | ||||||||||||||
CME | BAML 5 yr USD-ICE- 3-month LIBOR | 5,035,000 | 1.199% | (1.005%) | 4/6/21 | — | 145,869 | |||||||||||||||
CME | BAML 5 yr USD-ICE- 3-month LIBOR | 6,220,000 | 1.190% | (1.038%) | 8/9/21 | — | 208,066 | |||||||||||||||
CME | BAML 7 yr USD-ICE- 3-month LIBOR | 750,000 | 1.416% | (1.005%) | 4/6/23 | — | 31,600 | |||||||||||||||
CME | CSFB 10 yr USD-ICE- 3-month LIBOR | 20,700,000 | (1.500%) | 1.149% | 6/21/27 | (1,791,289 | ) | (864 | ) | |||||||||||||
CME | CSFB 10 yr USD-ICE- 3-month LIBOR | 6,600,000 | 1.500% | (1.148%) | 6/21/27 | 582,211 | (10,797 | ) | ||||||||||||||
CME | CSFB 2 yr USD-ICE- 3-month LIBOR | 7,200,000 | 1.350% | (1.350%) | 12/28/18 | — | (26,667 | ) | ||||||||||||||
CME | CSFB 2 yr USD-ICE- 3-month LIBOR | 30,100,000 | 1.450% | (1.148%) | 6/28/21 | — | 497,716 | |||||||||||||||
CME | CSFB 3 yr USD-ICE- 3-month LIBOR | 32,700,000 | 1.250% | (1.148%) | 6/21/20 | 733,215 | (119,703 | ) | ||||||||||||||
CME | CSFB 30 yr USD-ICE- 3-month LIBOR | 500,000 | 2.500% | (1.131%) | 6/15/46 | (20,715 | ) | 41,500 | ||||||||||||||
CME | CSFB 30 yr USD-ICE- 3-month LIBOR | 900,000 | 2.250% | (1.152%) | 12/21/46 | (71,604 | ) | 158,454 | ||||||||||||||
CME | CSFB 4 yr USD-ICE- 3-month LIBOR | 16,500,000 | 1.250% | (1.042%) | 6/21/21 | 489,597 | (1,379 | ) | ||||||||||||||
CME | CSFB 4 yr USD-ICE- 3-month LIBOR | 1,600,000 | 2.000% | (1.137%) | 12/16/19 | (4,459 | ) | (5,670 | ) | |||||||||||||
CME | CSFB 5 yr Mexico TIEE-Banxico 28D | MXN | 82,500,000 | (5.797%) | 6.606% | 9/6/21 | (146,999 | ) | (89,575 | ) | ||||||||||||
CME | CSFB 5 yr USD-ICE- 3-month LIBOR | 2,900,000 | 1.250% | (1.148%) | 6/21/22 | 118,951 | 2,504 | |||||||||||||||
CME | CSFB 5yr Mexico TIEE-Banxico 28D | MXN | 17,900,000 | (7.199%) | 6.606% | 12/3/21 | (19,232 | ) | 20,036 | |||||||||||||
LCH | BAML 3 yr USD-ICE- 3-month LIBOR | 5,860,000 | 1.666% | (1.156%) | 1/25/20 | — | 17,665 | |||||||||||||||
LCH | BAML 30 yr USD-ICE- 3-month LIBOR | 440,000 | 2.596% | (1.041%) | 1/23/47 | — | 5,253 | |||||||||||||||
LCH | BAML 30 yr USD-ICE- 3-month LIBOR | 440,000 | 2.623% | (1.043%) | 1/24/47 | — | 2,706 | |||||||||||||||
LCH | BAML 30 yr USD-ICE- 3-month LIBOR | 440,000 | 2.661% | (1.037%) | 1/27/47 | — | (959 | ) | ||||||||||||||
LCH | BAML 30 yr USD-ICE- 3-month LIBOR | 705,000 | 2.686% | (1.039%) | 1/30/47 | — | (5,471 | ) | ||||||||||||||
LCH | BAML 30 yr USD-ICE- 3-month LIBOR | 620,000 | 2.480% | (1.015%) | 1/11/47 | — | 23,086 | |||||||||||||||
| 88 |
Table of Contents
Counterparty | Swap Referenced Obligation | Notional Value3 | Fixed Interest Rate Paid (Received) | Variable Interest Rate Paid (Received) | Termination Date | Upfront Payments Paid (Received) | Unrealized Appreciation (Depreciation)4 | |||||||||||||||||||
LCH | BAML 7 yr USD-ICE- 3-month LIBOR |
| 3,260,000 |
|
| 2.125% |
|
| (1.038%) |
|
| 1/25/24 |
| $ | — |
| $ | 17,016 |
| |||||||
LCH | BAML JPMC 30 yr USD-ICE-3-month LIBOR |
| 885,000 |
|
| 2.715% |
|
| (1.156%) |
|
| 12/22/46 |
|
| — |
|
| (12,316 | ) | |||||||
LCH | CSFB 30 yr USD-ICE- 3-month LIBOR |
| 16,600,000 |
|
| 2.250% |
|
| (1.131%) |
|
| 6/15/46 |
|
| (1,106,464 | ) |
| 1,644,082 |
| |||||||
LCH | CSFB 7 yr USD-ICE- 3-month LIBOR |
| 42,500,000 |
|
| 2.250% |
|
| (1.137%) |
|
| 12/16/22 |
|
| 317,758 |
|
| (624,558 | ) | |||||||
|
| |||||||||||||||||||||||||
| $ | 1,972,465 | |||||||||||||||||||||||||
|
| |||||||||||||||||||||||||
The use of foreign currency exchange contracts, futures contracts, and swap contracts involves elements of market risk and risks in excess of the amounts disclosed in these financial statements. The foreign currency exchange contracts and notional values presented above represent the Fund’s total exposure in such contracts, whereas only the net unrealized appreciation (depreciation) is reflected in the Fund’s net assets.
Reverse Repurchase Agreement10
Counterparty | Interest Rate | Trade Date | Maturity Date | Face Value | Repurchase Price | |||||||||||||||
MLP - U.S. Treasury Note 1.125% 1/31/19 | 1.00% | 3/30/17 | 4/6/17 | $ | (2,400,000 | ) | $ | (2,400,467 | ) | |||||||||||
The type of underlying collateral and the remaining maturity of open reverse repurchase agreement in relation to the reverse repurchase agreement is as follows:
Remaining Contracted Maturity of the Agreement
Reverse Repurchase Agreement | Up to 30 days | Total | ||||
U.S. Treasury Note | $(2,400,000) | $(2,400,000) | ||||
Unfunded Loan Commitments11
The Fund may invest in floating rate loans. In connection with these investments, the Fund may also enter into unfunded corporate loan commitments (commitments). Commitments may obligate the Fund to furnish temporary financing to a borrower until permanent financing can be arranged. In connection with these commitments, the Fund earns a commitment fee, typically set as a percentage of the commitment amount. The following unfunded loan commitments were outstanding at March 31, 2017:
| Borrower | Principal Amount | Cost | Value | Unrealized Appreciation (Depreciation) | ||||||||||||
Allied Universal | ||||||||||||||||
Holdco | ||||||||||||||||
5.50% 7/28/22 | $ 104,387 | $ 102,732 | $ 105,248 | $ 2,516 | ||||||||||||
CenturyLink | ||||||||||||||||
6.034% 2/23/18 | 1,700,000 | 1,691,500 | 1,700,000 | 8,500 | ||||||||||||
CH Hold | ||||||||||||||||
0.50% 2/1/24 | 40,909 | 40,807 | 41,259 | 452 | ||||||||||||
Total | $1,845,296 | $1,835,039 | $1,846,507 | $11,468 | ||||||||||||
| (continues) | 89 |
Table of Contents
Schedules of investments
Optimum Fixed Income Fund
1See Note 7 in “Notes to financial statements.”
2A CDS contract is a risk-transfer instrument through which one party (purchaser of protection) transfers to another party (seller of protection) the financial risk of a credit event (as defined in the CDS agreement), as it relates to a particular reference security or basket of securities (such as an index). Periodic payments (receipts) on such contracts are accrued daily and recorded as unrealized losses (gains) on swap contracts. Upon payment (receipt), such amounts are recorded as realized losses (gains) on swap contracts. Upfront payments made or received in connection with CDS contracts are amortized over the expected life of the CDS contracts as unrealized losses (gains) on swap contracts. The change in value of CDS contracts is recorded daily as unrealized appreciation or depreciation. A realized gain or loss is recorded upon a credit event (as defined in the CDS agreement) or the maturity or termination of the agreement.
3 Notional value shown is stated in U.S. dollars unless noted that the swap is denominated in another currency.
4 Unrealized appreciation (depreciation) does not include periodic interest payments on swap contracts accrued daily in the amount of ($428,922).
5 Markit’s Emerging markets CDX Index, or the CDX.EM Index is composed of 15 sovereign issuers from the following countries: Argentina, Brazil, Chile, China, Columbia, Indonesia, Malaysia, Mexico, Panama, Peru, Philippines, Russia, South Africa, Turkey and Venezuela, which have a S&P credit quality rating of CCC and above.
6 Markit’s North America High Yield CDX Index, or the CDX.NA.HY Index, is composed of 100 of the most liquid North American entities with high yield credit ratings that trade is in the CDS market.
7Markit’s North America Investment Grade Index, or CDX.NA.IG Index, is composed of 125 of the most liquid North American entities with investment grade credit ratings that trade in the CDS market.
8 Markit’s CMBX Index or the CMBX.NA.AAA Index is a synthetic tradable index referencing a basket of 25 commercial mortgage-backed securities in North America. Credit-quality rating are measured on a scale that generally ranges from AAA (highest) to D (lowest). U.S. Agency and U.S. Agency mortgage-backed securities appear under U.S. Government.
9 An interest rate swap agreement is an exchange of interest rates between counterparties. Periodic payments (receipt) on such contracts are accrued daily and recorded as unrealized appreciation (depreciation) on swap contracts. Upon periodic payment (receipt) or termination of the contract, such amounts are recorded as realized gains (losses) on swap contracts.
10See Note 1 in “Notes to financial statements.”
11See Note 10 in “Notes to financial statements.”
Summary of abbreviations:
AGC – Assured Guaranty Corporation
ARM – Adjustable Rate Mortgage
ARS – Argentine Peso
AUD – Australian Dollar
BAML – Bank of America Merrill Lynch
BCLY – Barclays Bank
BNP – BNP Paribas
BNYM – Bank of New York Mellon
BRL – Brazilian Real
CAD – Canadian Dollar
CDO – Collateralized Debt Obligation
CDS – Credit Default Swap
CDX.EM – Credit Default Swap Index Emerging Markets
CDX.NA.HY – Credit Default Swap Index North America High Yield
CDX.NA.IG – Credit Default Swap Index North America Investment Grade
CITI – Citigroup Global Markets
CLO – Collateralized Loan Obligation
CMBX.NA.AAA – Commercial Mortgage-Backed Index North America
CME – Chicago Mercantile Exchange Inc.
COP – Colombian Peso
CSFB – Credit Suisse First Boston
DB – Deutsche Bank
DKK – Danish Krone
EUR – European Monetary Unit
FREMF – Freddie Mac Multifamily
GBP – British Pound Sterling
GNMA – Government National Mortgage Association
GSC – Goldman Sachs Capital
HSBC – Hong Kong Shanghai Bank
ICE – Intercontinental Exchange
IDR – Indonesian Rupiah
INR – Indian Rupee
IRS – Interest Rate Swaptions
JPMC – JPMorgan Chase Bank
JPY – Japanese Yen
KRW – South Korean Won
LB – Lehman Brothers
LCH – London Clearing House
MASTR – Mortgage Asset Securitization Transactions, Inc.
MBIA – Municipal Bond Insurance Association Group
MLP – Merrill Lynch Pierce Fenner & Smith
MSC – Morgan Stanley Capital
MXN – Mexican Peso
NOK – Norwegian Krone
NZD – New Zealand Dollar
O.A.T. – Obligations Assimilables du Tresor
PEN – Peruvian Nuevo Sol
PIK – Payment-in-Kind
PLN – Polish Zloty
REMIC – Real Estate Mortgage Investment Conduit
S&P – Standard & Poor’s Financial Services LLC
S.F. – Single Family
SEK – Swedish Krona
| 90 |
Table of Contents
Summary of Abbreviations: (continued)
SGD – Singapore Dollar
TBA – To be announced
TD – Toronto Dominion Bank
THB – Thailand Baht
TIEE – Banxico – Interbank Equilibrium Interest Rate Banco de Mexico
TRY – Turkish Lira
TWD – Taiwan Dollar
USD – U.S. Dollar
yr – Year
ZAR – South African Rand
See accompanying notes, which are an integral part of the financial statements.
| (continues) | 91 |
Table of Contents
Schedules of investments
Optimum International Fund
March 31, 2017
| Number of shares | Value (U.S. $) | |||||||
| ||||||||
Common Stock – 98.64%D |
| |||||||
| ||||||||
Australia – 1.86% |
| |||||||
AGL Energy | 29,476 | $ | 593,843 | |||||
BHP Billiton ADR * | 66,770 | 2,425,086 | ||||||
Fortescue Metals Group | 581,123 | 2,765,983 | ||||||
Qantas Airways | 1,582,213 | 4,702,274 | ||||||
|
| |||||||
| 10,487,186 | ||||||||
|
| |||||||
Austria – 2.73% | ||||||||
Erste Group Bank | 197,810 | 6,441,499 | ||||||
Lenzing | 6,846 | 1,151,367 | ||||||
Raiffeisen Bank International † | 28,408 | 641,116 | ||||||
Schoeller-Bleckmann Oilfield Equipment * | 45,335 | 3,158,129 | ||||||
voestalpine | 101,662 | 4,001,916 | ||||||
|
| |||||||
| 15,394,027 | ||||||||
|
| |||||||
Bermuda – 1.03% | ||||||||
Everest Re Group | 24,884 | 5,818,128 | ||||||
|
| |||||||
| 5,818,128 | ||||||||
|
| |||||||
Brazil – 1.33% | ||||||||
Banco Bradesco ADR | 456,617 | 4,675,758 | ||||||
Magazine Luiza † | 49,400 | 2,798,061 | ||||||
|
| |||||||
| 7,473,819 | ||||||||
|
| |||||||
Canada – 3.79% | ||||||||
Bank of Montreal | 7,900 | 590,072 | ||||||
Canadian Imperial Bank of Commerce | 73,700 | 6,354,987 | ||||||
Dominion Diamond | 76,600 | 968,840 | ||||||
Magna International Class A | 93,437 | 4,032,296 | ||||||
Power Corp of Canada | 24,900 | 584,935 | ||||||
Power Financial | 21,700 | 573,891 | ||||||
Rogers Communications Class B * | 59,198 | 2,617,736 | ||||||
Royal Bank of Canada | 75,900 | 5,529,910 | ||||||
Tourmaline Oil † | 6,200 | 138,234 | ||||||
|
| |||||||
| 21,390,901 | ||||||||
|
| |||||||
China/Hong Kong – 6.54% | ||||||||
Anhui Conch Cement | 957,000 | 3,250,956 | ||||||
ASM Pacific Technology | 52,000 | 707,251 | ||||||
BYD Class H * | 396,000 | 2,196,178 | ||||||
China Construction Bank | 1,587,000 | 1,276,298 | ||||||
China Life Insurance Class H | 2,079,000 | 6,380,255 | ||||||
CLP Holdings | 889,500 | 9,299,604 | ||||||
Galaxy Entertainment Group | 114,000 | 624,165 | ||||||
HKT Trust & HKT | 964,000 | 1,242,911 | ||||||
Jardine Strategic Holdings | 15,500 | 651,000 | ||||||
| Number of shares | Value (U.S. $) | |||||||
| ||||||||
Common StockD (continued) |
| |||||||
| ||||||||
China/Hong Kong (continued) | ||||||||
Melco Crown Entertainment ADR | 158,536 | $ | 2,939,257 | |||||
Orient Overseas International | 493,000 | 2,632,632 | ||||||
Shanghai Fosun Pharmaceutical Group Class H * | 911,500 | 3,354,423 | ||||||
Wharf Holdings | 269,000 | 2,308,731 | ||||||
|
| |||||||
| 36,863,661 | ||||||||
|
| |||||||
Colombia – 0.59% | ||||||||
Bancolombia ADR | 83,992 | 3,348,761 | ||||||
|
| |||||||
| 3,348,761 | ||||||||
|
| |||||||
Czech Republic – 0.41% | ||||||||
Komercni banka | 62,893 | 2,333,973 | ||||||
|
| |||||||
| 2,333,973 | ||||||||
|
| |||||||
Denmark – 1.49% | ||||||||
Danske Bank | 17,001 | 579,003 | ||||||
H. Lundbeck | 168,229 | 7,801,603 | ||||||
|
| |||||||
| 8,380,606 | ||||||||
|
| |||||||
Finland – 0.32% | ||||||||
Neste | 46,316 | 1,806,426 | ||||||
|
| |||||||
| 1,806,426 | ||||||||
|
| |||||||
France – 3.88% | ||||||||
Danone | 36,386 | 2,474,945 | ||||||
Derichebourg | 87,294 | 435,267 | ||||||
Ipsen | 20,818 | 2,082,282 | ||||||
IPSOS | 23,199 | 720,187 | ||||||
Metropole Television | 22,770 | 508,168 | ||||||
Peugeot † | 150,150 | 3,023,398 | ||||||
Safran | 60,540 | 4,522,823 | ||||||
Societe Generale | 75,691 | 3,839,528 | ||||||
Sodexo | 36,276 | 4,266,591 | ||||||
|
| |||||||
| 21,873,189 | ||||||||
|
| |||||||
Germany – 3.38% | ||||||||
Continental | 22,220 | 4,871,233 | ||||||
Deutsche Lufthansa | 453,002 | 7,345,590 | ||||||
Merck | 27,674 | 3,153,016 | ||||||
OSRAM Licht | 17,048 | 1,068,475 | ||||||
Suedzucker | 58,820 | 1,475,861 | ||||||
TUI | 82,466 | 1,140,592 | ||||||
|
| |||||||
| 19,054,767 | ||||||||
|
| |||||||
India – 3.81% | ||||||||
Bharat Petroleum | 261,420 | 2,616,213 | ||||||
ICICI Bank ADR | 587,217 | 5,050,066 | ||||||
Indian Oil | 119,100 | 709,904 | ||||||
| 92 |
Table of Contents
| Number of shares | Value (U.S. $) | |||||||
| ||||||||
Common StockD (continued) |
| |||||||
| ||||||||
India (continued) | ||||||||
Oil & Natural Gas | 2,093,246 | $ | 5,963,664 | |||||
Yes Bank | 299,308 | 7,129,509 | ||||||
|
| |||||||
| 21,469,356 | ||||||||
|
| |||||||
Indonesia – 2.72% | ||||||||
Barito Pacific † | 25,923,800 | 5,641,741 | ||||||
Delta Dunia Makmur † | 19,974,800 | 1,409,051 | ||||||
Indofood Sukses Makmur | 4,126,500 | 2,477,356 | ||||||
Telekomunikasi Indonesia Persero | 16,746,000 | 5,190,123 | ||||||
Telekomunikasi Indonesia Persero ADR | 19,743 | 615,389 | ||||||
|
| |||||||
| 15,333,660 | ||||||||
|
| |||||||
Ireland – 2.07% | ||||||||
ICON *† | 146,206 | 11,655,542 | ||||||
|
| |||||||
| 11,655,542 | ||||||||
|
| |||||||
Israel – 3.34% | ||||||||
Bank Hapoalim | 1,248,913 | 7,612,422 | ||||||
Bank Leumi Le-Israel † | 1,259,694 | 5,563,866 | ||||||
Teva Pharmaceutical Industries ADR | 87,503 | 2,807,971 | ||||||
Tower Semiconductor | 51,123 | 1,178,385 | ||||||
Wix.com † | 24,238 | 1,645,761 | ||||||
|
| |||||||
| 18,808,405 | ||||||||
|
| |||||||
Italy – 1.84% | ||||||||
Enel | 443,677 | 2,089,211 | ||||||
La Doria | 45,778 | 476,883 | ||||||
Prysmian | 185,311 | 4,898,752 | ||||||
Recordati | 86,469 | 2,930,628 | ||||||
|
| |||||||
| 10,395,474 | ||||||||
|
| |||||||
Japan – 17.37% | ||||||||
Adastria | 53,400 | 1,330,084 | ||||||
ANA Holdings | 187,000 | 570,759 | ||||||
Asahi Glass | 522,000 | 4,229,264 | ||||||
Astellas Pharma | 255,200 | 3,360,489 | ||||||
Canon Marketing Japan | 28,800 | 572,742 | ||||||
Daito Trust Construction | 26,300 | 3,613,209 | ||||||
Daiwa House Industry | 224,600 | 6,447,692 | ||||||
Daiwa Securities Group | 136,000 | 828,118 | ||||||
Denso | 152,100 | 6,690,323 | ||||||
EDION | 62,400 | 573,387 | ||||||
Fujitsu | 1,080,000 | 6,605,336 | ||||||
Furukawa Electric | 63,000 | 2,263,541 | ||||||
Gurunavi | 54,100 | 1,132,246 | ||||||
Hitachi | 606,000 | 3,279,574 | ||||||
Kansai Electric Power | 188,300 | 2,312,100 | ||||||
| Number of shares | Value (U.S. $) | |||||||
| ||||||||
Common StockD (continued) |
| |||||||
| ||||||||
Japan (continued) | ||||||||
Konami Holdings | 84,200 | $ | 3,573,565 | |||||
Lion | 228,000 | 4,100,027 | ||||||
Marubeni | 122,900 | 756,741 | ||||||
Medipal Holdings | 114,300 | 1,792,579 | ||||||
Miraca Holdings | 44,300 | 2,037,330 | ||||||
Mixi | 122,300 | 5,888,152 | ||||||
Morinaga Milk Industry | 97,000 | 719,680 | ||||||
NH Foods | 27,000 | 724,899 | ||||||
Nichiha | 22,800 | 669,685 | ||||||
Nippon Telegraph & Telephone | 110,700 | 4,725,109 | ||||||
North Pacific Bank | 164,700 | 624,301 | ||||||
NTT Data | 41,900 | 1,987,173 | ||||||
Okasan Securities Group | 89,000 | 542,810 | ||||||
Otsuka Holdings | 20,700 | 933,759 | ||||||
Panasonic | 54,500 | 615,836 | ||||||
Plenus | 26,000 | 575,909 | ||||||
SBI Holdings | 77,000 | 1,073,421 | ||||||
Secom | 75,700 | 5,418,605 | ||||||
Shimamura | 11,300 | 1,493,066 | ||||||
Shinmaywa Industries | 110,000 | 1,050,301 | ||||||
Sumitomo Dainippon Pharma | 162,400 | 2,681,139 | ||||||
Suntory Beverage & Food | 13,900 | 585,565 | ||||||
Suzuken | 88,500 | 2,901,509 | ||||||
Takeuchi Manufacturing | 58,600 | 1,104,310 | ||||||
T-Gaia | 78,900 | 1,357,168 | ||||||
Tokyo Electric Power Holdings † | 612,900 | 2,400,291 | ||||||
Toyota Tsusho | 19,500 | 590,272 | ||||||
Yamada Denki | 226,700 | 1,130,140 | ||||||
Yamazaki Baking | 100,700 | 2,071,346 | ||||||
|
| |||||||
| 97,933,552 | ||||||||
|
| |||||||
Mexico – 0.78% | ||||||||
Grupo Financiero Banorte | 759,900 | 4,372,959 | ||||||
|
| |||||||
| 4,372,959 | ||||||||
|
| |||||||
Netherlands – 4.00% | ||||||||
ASR Nederland † | 20,503 | 584,545 | ||||||
Core Laboratories * | 54,903 | 6,342,395 | ||||||
Heineken | 48,157 | 4,099,636 | ||||||
Royal Dutch Shell Class A | 439,546 | 11,542,162 | ||||||
|
| |||||||
| 22,568,738 | ||||||||
|
| |||||||
New Zealand – 0.84% | ||||||||
Spark New Zealand | 1,326,047 | 3,253,456 | ||||||
Xero Private Placement † | 104,850 | 1,454,562 | ||||||
|
| |||||||
| 4,708,018 | ||||||||
|
| |||||||
| (continues) | 93 |
Table of Contents
Schedules of investments
Optimum International Fund
| Number of shares | Value (U.S. $) | |||||||
| ||||||||
Common StockD (continued) |
| |||||||
| ||||||||
Norway – 2.59% | ||||||||
DNB | 415,075 | $ | 6,579,361 | |||||
Norsk Hydro | 718,899 | 4,174,641 | ||||||
Statoil ADR * | 223,872 | 3,846,121 | ||||||
|
| |||||||
| 14,600,123 | ||||||||
|
| |||||||
Republic of Korea – 3.73% | ||||||||
Hansol Paper | 11,277 | 192,101 | ||||||
Hyundai Mobis | 17,360 | 3,733,417 | ||||||
Korea Electric Power | 29,863 | 1,240,397 | ||||||
LG Display ADR | 46,312 | 630,769 | ||||||
Samsung Electronics | 7,696 | 14,176,661 | ||||||
SK Hynix | 22,885 | 1,033,437 | ||||||
|
| |||||||
| 21,006,782 | ||||||||
|
| |||||||
Singapore – 1.14% | ||||||||
DBS Group Holdings | 289,000 | 4,008,007 | ||||||
United Industrial | 1,095,000 | 2,418,808 | ||||||
|
| |||||||
| 6,426,815 | ||||||||
|
| |||||||
South Africa – 0.16% | ||||||||
Investec | 134,079 | 915,430 | ||||||
|
| |||||||
| 915,430 | ||||||||
|
| |||||||
Spain – 2.05% | ||||||||
Abertis Infraestructuras | 197,123 | 3,175,392 | ||||||
Amadeus IT Group | 164,894 | 8,366,228 | ||||||
|
| |||||||
| 11,541,620 | ||||||||
|
| |||||||
Sweden – 0.66% | ||||||||
Getinge Class B * | 206,415 | 3,621,215 | ||||||
Probi | 1,737 | 81,222 | ||||||
|
| |||||||
| 3,702,437 | ||||||||
|
| |||||||
Switzerland – 6.60% | ||||||||
Coca-Cola HBC † | 24,130 | 623,091 | ||||||
Credit Suisse Group ADR † | 232,731 | 3,453,728 | ||||||
Ferrexpo | 1,484,843 | 3,132,846 | ||||||
Galenica | 5,881 | 6,200,106 | ||||||
Lonza Group † | 26,838 | 5,074,744 | ||||||
Novartis ADR * | 85,885 | 6,378,679 | ||||||
Roche Holding | 25,070 | 6,402,342 | ||||||
STMicroelectronics | 362,462 | 5,541,045 | ||||||
Zehnder Group † | 11,237 | 366,845 | ||||||
|
| |||||||
| 37,173,426 | ||||||||
|
| |||||||
Taiwan – 2.56% | ||||||||
Advanced Semiconductor | ||||||||
Engineering | 3,801,344 | 4,854,645 | ||||||
Hon Hai Precision Industry | 1,741,500 | 5,222,922 | ||||||
Taiwan Semiconductor Manufacturing | 699,000 | 4,353,992 | ||||||
|
| |||||||
| 14,431,559 | ||||||||
|
| |||||||
| Number of shares | Value (U.S. $) | |||||||
| ||||||||
Common StockD (continued) |
| |||||||
| ||||||||
Thailand – 0.55% | ||||||||
Krung Thai Bank NVDR | 1,169,900 | $ | 694,535 | |||||
PTT Exploration & Production NVDR | 479,000 | 1,296,384 | ||||||
PTT NVDR | 97,400 | 1,096,946 | ||||||
|
| |||||||
| 3,087,865 | ||||||||
|
| |||||||
Turkey – 0.65% | ||||||||
Akbank | 1,261,392 | 2,960,468 | ||||||
Turkiye Halk Bankasi | 250,609 | 715,051 | ||||||
|
| |||||||
| 3,675,519 | ||||||||
|
| |||||||
United Kingdom – 11.25% | ||||||||
AstraZeneca ADR | 109,540 | 3,411,076 | ||||||
BAE Systems | 171,743 | 1,382,511 | ||||||
Barclays | 2,441,673 | 6,886,196 | ||||||
British American Tobacco | 40,185 | 2,668,433 | ||||||
Debenhams | 1,293,595 | 881,685 | ||||||
Diageo | 209,947 | 6,006,578 | ||||||
GlaxoSmithKline | 34,541 | 718,172 | ||||||
HSBC Holdings | 614,235 | 5,009,164 | ||||||
Imperial Brands | 47,294 | 2,291,377 | ||||||
Indivior | 377,052 | 1,521,628 | ||||||
Investec | 329,179 | 2,243,610 | ||||||
ITV | 1,663,631 | 4,562,671 | ||||||
Kingfisher | 419,430 | 1,713,668 | ||||||
Legal & General Group | 187,864 | 582,082 | ||||||
Metro Bank † | 60,572 | 2,469,482 | ||||||
Mondi | 62,180 | 1,501,235 | ||||||
Rio Tinto | 91,659 | 3,685,776 | ||||||
Rio Tinto ADR * | 96,369 | 3,920,291 | ||||||
Shire | 131,186 | 7,660,957 | ||||||
Worldpay Group 144A # | 1,163,401 | 4,305,825 | ||||||
|
| |||||||
| 63,422,417 | ||||||||
|
| |||||||
United States – 2.58% | ||||||||
Carnival | 119,036 | 7,012,411 | ||||||
Carnival (London Stock Exchange) | 10,323 | 592,104 | ||||||
International Game Technology | 257,548 | 6,103,888 | ||||||
Project Star =p† | 142 | 633,481 | ||||||
Project Star Series G =p† | 47 | 209,673 | ||||||
|
| |||||||
| 14,551,557 | ||||||||
|
| |||||||
Total Common Stock | 556,006,698 | |||||||
|
| |||||||
| 94 |
Table of Contents
| Principal amount° | Value (U.S. $) | |||||||
| ||||||||
Short-Term Investments – 0.89% |
| |||||||
| ||||||||
Discount Notes – 0.20%≠ | ||||||||
Federal Home Loan Bank | ||||||||
0.53% 4/25/17 | 25,231 | $ | 25,220 | |||||
0.55% 5/26/17 | 349,345 | 348,975 | ||||||
0.69% 4/28/17 | 607,331 | 607,045 | ||||||
0.765% 5/19/17 | 137,663 | 137,536 | ||||||
|
| |||||||
| 1,118,776 | ||||||||
|
| |||||||
Repurchase Agreements – 0.54% |
| |||||||
Bank of America Merrill Lynch | 999,296 | 999,296 | ||||||
Bank of Montreal | 999,297 | 999,297 | ||||||
BNP Paribas | 1,060,407 | 1,060,407 | ||||||
|
| |||||||
| 3,059,000 | ||||||||
|
| |||||||
U.S. Treasury Obligation – 0.15%≠ |
| |||||||
U.S. Treasury Bill | 844,055 | 843,888 | ||||||
|
| |||||||
| 843,888 | ||||||||
|
| |||||||
Total Short-Term Investments | 5,021,664 | |||||||
|
| |||||||
Total Value of Securities Before Securities Lending | 561,028,362 | |||||||
|
| |||||||
| Number of shares | Value (U.S. $) | |||||||
| ||||||||
Securities Lending Collateral** – 3.39% |
| |||||||
| ||||||||
Certificates of Deposit – 0.61%≠ |
| |||||||
Australia & New Zealand Banking Group (London) | 859,000 | $ | 859,000 | |||||
Canadian Imperial Bank of Commerce (Cayman) | 564,000 | 564,000 | ||||||
CommonWealth Bank Australia (London) | 331,000 | 331,000 | ||||||
National Australia Bank (Cayman) | 558,000 | 558,000 | ||||||
National Bank of Canada (Montrial) | 859,000 | 859,000 | ||||||
Royal Bank of Canada (Toronto) | 263,000 | 263,000 | ||||||
|
| |||||||
| 3,434,000 | ||||||||
|
| |||||||
Floating Rate Notes – 0.70% |
| |||||||
Bank of Montreal (Chicago) | 278,000 | 278,177 | ||||||
Bank of Nova Scotia | ||||||||
1.273% 3/2/18 ● | 305,000 | 304,923 | ||||||
1.516% 6/9/17 ● | 200,000 | 200,181 | ||||||
Canadian Imperial Bank of Commerce (New York) | 295,000 | 295,201 | ||||||
Chase Bank USA | 261,000 | 261,231 | ||||||
CommonWealth Bank Australia | ||||||||
1.335% 11/3/17 ● | 251,000 | 251,313 | ||||||
1.338% 2/16/18 ● | 276,000 | 276,150 | ||||||
National Australia Bank | 301,000 | 301,151 | ||||||
Royal Bank of Canada | 331,000 | 331,259 | ||||||
Royal Bank of Canada (New York) | 264,000 | 263,807 | ||||||
Wells Fargo Bank | ||||||||
1.398% 11/7/17 ● | 272,000 | 272,391 | ||||||
1.455% 6/1/17 ● | 315,000 | 315,229 | ||||||
Westpac Banking | 292,000 | 292,111 | ||||||
Westpac Banking (New York) | 285,000 | 285,132 | ||||||
|
| |||||||
| 3,928,256 | ||||||||
|
| |||||||
| (continues) | 95 |
Table of Contents
Schedules of investments
Optimum International Fund
| Number of shares | Value (U.S. $) | |||||||
| ||||||||
Securities Lending Collateral** (continued) |
| |||||||
| ||||||||
Repurchase Agreements – 2.08%≠ |
| |||||||
Bank of Montreal | 2,840,253 | $ | 2,840,253 | |||||
Credit Agricole | 4,444,601 | 4,444,601 | ||||||
J.P. Morgan Securities | 4,444,601 | 4,444,601 | ||||||
|
| |||||||
| 11,729,455 | ||||||||
|
| |||||||
Total Securities Lending Collateral | 19,091,711 | |||||||
|
| |||||||
Total Value of | $ | 580,120,073⬛ | ||||||
|
| |||||||
| # | Security exempt from registration under Rule 144A of the Securities Act of 1933, as amended. At March 31, 2017, the aggregate value of Rule 144A securities was $4,305,825, which represents 0.76% of the Fund’s net assets. See Note 10 in “Notes to financial statements.” |
| * | Fully or partially on loan. |
| ** | See Note 9 in “Notes to financial statements “for additional information on securities lending collateral and non-cash collateral. |
| = | Security is being fair valued in accordance with the Fund’s fair valuation policy. At March 31, 2017, the aggregate value of fair valued securities |
was $843,154, which represents 0.15% of the Fund’s net assets. See Note 1 in “Notes to financial statements.” |
| ≠ | The rate shown is the effective yield at the time of purchase. |
| ⬛ | Includes $26,639,200 of securities loaned. |
| ° | Principal amount shown is stated in U.S. dollars unless noted that the security is denominated in another currency. |
| D | Securities have been classified by country of origin. Aggregate classification by business sector has been presented on page 41 in “Security type / country and sector allocations.” |
| p | Restricted Security. These investments are in securities not registered under the Securities Act of 1933, as amended, and have certain restrictions on resale which may limit their liquidity. At March 31, 2017, the aggregate value of restricted securities was $843,154, which represented 0.15% of the Fund’s net assets. See Note 10 in “Notes to financial statements” and table below for additional details on restricted securities. |
| † | Non-income producing security. |
| ● | Variable rate security. Each rate shown is as of March 31, 2017. Interest rates reset periodically. |
Restricted Securities
Investment | Date of Acquisition | Cost | Value | |||||||||
Project Star | 5/7/20 14 | $ | 999,482 | $ | 633,481 | |||||||
Project Star Series G | 10/29/14 | 396,433 | 209,673 | |||||||||
|
|
|
| |||||||||
Total | $ | 1,395,915 | $ | 843,154 | ||||||||
|
|
|
| |||||||||
The following foreign currency exchange contract was outstanding at March 31, 2017:1
Foreign Currency Exchange Contracts
| Unrealized | ||||||||||||||
| Contract to | Settlement | Appreciation | ||||||||||||
Counterparty | Receive (Deliver) | In Exchange For | Date | (Depreciation) | ||||||||||
BBH | IDR | 8,894,957,571 | USD | (668,291) | 4/3/17 | $ | (530 | ) | ||||||
The use of foreign currency exchange contracts involves elements of market risk and risks in excess of the amounts disclosed in the financial statements. The foreign currency exchange contract presented above represents the Fund’s total exposure in such contracts, whereas only the net unrealized appreciation (depreciation) is reflected in the Fund’s net assets.
1See Note 7 in “Notes to financial statements.”
Summary of abbreviations:
ADR – American Depositary Receipt
BBH – Brown Brothers Harriman
IDR – Indonesian Rupiah
NVDR – Non-Voting Depositor Receipt
USD – U.S. Dollar
See accompanying notes, which are an integral part of the financial statements.
| 96 |
Table of Contents
Optimum Large Cap Growth Fund
March 31, 2017
Number of shares | Value (U.S. $) | |||||||
| ||||||||
Common Stock – 96.79%² | ||||||||
| ||||||||
Consumer Discretionary – 22.05% |
| |||||||
Amazon.com † | 112,809 | $ | 100,009,691 | |||||
AutoZone † | 10,586 | 7,654,207 | ||||||
CBS Class B | 168,579 | 11,692,639 | ||||||
Charter Communications Class A † | 11,367 | 3,720,646 | ||||||
Comcast Class A | 527,700 | 19,836,243 | ||||||
Ctrip.com International ADR † | 78,000 | 3,833,700 | ||||||
Delphi Automotive (United Kingdom) | 154,807 | 12,460,415 | ||||||
Dollar General | 71,500 | 4,985,695 | ||||||
eBay † | 99,615 | 3,344,076 | ||||||
Ferrari (Italy) | 85,709 | 6,373,321 | ||||||
Flipkart Limited =p† | 1,530 | 142,520 | ||||||
Flipkart Limited Series A =p† | 522 | 48,624 | ||||||
Flipkart Limited Series C =p† | 921 | 85,791 | ||||||
Flipkart Limited Series E =p† | 1,712 | 159,473 | ||||||
Flipkart Limited Series G =p† | 7,188 | 669,562 | ||||||
Flipkart Limited Series H =p† | 6,977 | 649,908 | ||||||
Hilton Grand Vacations † | 13,120 | 376,019 | ||||||
Hilton Worldwide Holdings | 33,233 | 1,942,801 | ||||||
Home Depot | 134,636 | 19,768,604 | ||||||
Johnson Controls | ||||||||
International | 86,694 | 3,651,551 | ||||||
Lowe’s | 91,300 | 7,505,773 | ||||||
Marriott International Class A | 92,663 | 8,727,001 | ||||||
MGM Resorts International | 116,670 | 3,196,758 | ||||||
Netflix † | 33,467 | 4,946,757 | ||||||
Newell Brands | 172,028 | 8,114,561 | ||||||
NIKE Class B | 46,379 | 2,584,702 | ||||||
O’Reilly Automotive † | 17,900 | 4,830,136 | ||||||
Priceline Group † | 19,600 | 34,887,412 | ||||||
PVH | 42,623 | 4,410,202 | ||||||
Ross Stores | 72,700 | 4,788,749 | ||||||
Starbucks | 176,649 | 10,314,535 | ||||||
Tesla † | 41,707 | 11,607,058 | ||||||
Time Warner | 42,234 | 4,126,684 | ||||||
Tractor Supply | 52,497 | 3,620,718 | ||||||
Walt Disney | 77,601 | 8,799,177 | ||||||
Yum! Brands | 59,200 | 3,782,880 | ||||||
|
| |||||||
| 327,648,589 | ||||||||
|
| |||||||
Consumer Staples – 3.42% | ||||||||
Costco Wholesale | 28,282 | 4,742,609 | ||||||
Molson Coors Brewing Class B | 70,424 | 6,740,281 | ||||||
Mondelez International | 100,400 | 4,325,232 | ||||||
PepsiCo | 62,037 | 6,939,459 | ||||||
Philip Morris International | 188,184 | 21,245,974 | ||||||
Number of shares | Value (U.S. $) | |||||||
| ||||||||
Common Stock² (continued) | ||||||||
| ||||||||
Consumer Staples (continued) | ||||||||
Walgreens Boots Alliance | 82,894 | $ | 6,884,347 | |||||
|
| |||||||
| 50,877,902 | ||||||||
|
| |||||||
Energy – 1.02% | ||||||||
Anadarko Petroleum | 123,045 | 7,628,790 | ||||||
Halliburton | 76,706 | 3,774,702 | ||||||
Pioneer Natural Resources | 20,014 | 3,727,207 | ||||||
|
| |||||||
| 15,130,699 | ||||||||
|
| |||||||
Financials – 4.69% | ||||||||
Bank of America | 246,708 | 5,819,842 | ||||||
Charles Schwab | 137,400 | 5,607,294 | ||||||
First Republic Bank | 45,006 | 4,222,013 | ||||||
Intercontinental Exchange | 289,659 | 17,341,884 | ||||||
JPMorgan Chase & Co. | 71,963 | 6,321,230 | ||||||
Morgan Stanley | 335,877 | 14,388,971 | ||||||
S&P Global | 28,623 | 3,742,171 | ||||||
State Street | 63,200 | 5,031,352 | ||||||
TD Ameritrade Holding | 108,823 | 4,228,862 | ||||||
Wells Fargo & Co. | 51,158 | 2,847,454 | ||||||
WeWork Companies =p† | 2,473 | 121,720 | ||||||
|
| |||||||
| 69,672,793 | ||||||||
|
| |||||||
Healthcare – 14.85% | ||||||||
ACADIA Pharmaceuticals † | 68,100 | 2,341,278 | ||||||
Aetna | 94,576 | 12,063,169 | ||||||
Alexion Pharmaceuticals † | 69,778 | 8,459,885 | ||||||
Allergan | 65,782 | 15,716,635 | ||||||
Anthem | 19,100 | 3,158,758 | ||||||
Biogen † | 26,757 | 7,315,899 | ||||||
BioMarin Pharmaceutical † | 38,873 | 3,412,272 | ||||||
Boston Scientific † | 144,466 | 3,592,869 | ||||||
Bristol-Myers Squibb | 91,693 | 4,986,265 | ||||||
Celgene † | 142,892 | 17,780,052 | ||||||
Centene † | 67,417 | 4,804,135 | ||||||
Cigna | 40,685 | 5,959,946 | ||||||
Danaher | 187,136 | 16,005,742 | ||||||
DexCom † | 49,340 | 4,180,578 | ||||||
Edwards Lifesciences † | 54,536 | 5,130,202 | ||||||
Envision Healthcare † | 12,378 | 759,019 | ||||||
HCA Holdings † | 54,573 | 4,856,451 | ||||||
Humana | 59,337 | 12,231,729 | ||||||
Illumina † | 22,213 | 3,790,426 | ||||||
Incyte † | 48,281 | 6,453,721 | ||||||
Intuitive Surgical † | 15,700 | 12,033,579 | ||||||
Medtronic | 49,946 | 4,023,650 | ||||||
Merck & Co. | 75,700 | 4,809,978 | ||||||
Stryker | 67,600 | 8,899,540 | ||||||
UnitedHealth Group | 174,726 | 28,656,811 | ||||||
| (continues) | 97 |
Table of Contents
Schedules of investments
Optimum Large Cap Growth Fund
Number of shares | Value (U.S. $) | |||
| ||||
Common Stock² (continued) |
| |||||||
| ||||||||
Healthcare (continued) |
| |||||||
Vertex Pharmaceuticals † | 124,441 | $ | 13,607,623 | |||||
Zoetis | 105,800 | 5,646,546 | ||||||
|
| |||||||
| 220,676,758 | ||||||||
|
| |||||||
Industrials – 6.23% | ||||||||
Acuity Brands | 18,299 | 3,732,996 | ||||||
American Airlines Group | 130,200 | 5,507,460 | ||||||
Boeing | 61,500 | 10,876,890 | ||||||
Equifax | 36,394 | 4,976,516 | ||||||
Fortive | 49,200 | 2,962,824 | ||||||
Fortune Brands Home & Security | 7,434 | 452,359 | ||||||
HD Supply Holdings † | 157,153 | 6,462,917 | ||||||
Honeywell International | 258,885 | 32,326,970 | ||||||
IHS Markit (United Kingdom) Class A † | 66,698 | 2,797,981 | ||||||
Illinois Tool Works | 29,300 | 3,881,371 | ||||||
Rockwell Automation | 24,391 | 3,797,923 | ||||||
Roper Technologies | 34,989 | 7,224,879 | ||||||
Union Pacific | 61,284 | 6,491,201 | ||||||
Wabtec | 13,960 | 1,088,880 | ||||||
|
| |||||||
| 92,581,167 | ||||||||
|
| |||||||
Information Technology – 39.83% |
| |||||||
Adobe Systems † | 68,433 | 8,905,186 | ||||||
Alibaba Group Holding ADR † | 191,512 | 20,650,739 | ||||||
Alphabet Class A † | 31,400 | 26,620,920 | ||||||
Alphabet Class C † | 79,707 | 66,121,739 | ||||||
Apple | 638,186 | 91,681,801 | ||||||
Applied Materials | 91,804 | 3,571,176 | ||||||
ASML Holding (Netherlands) † | 29,100 | 3,864,480 | ||||||
Autodesk † | 63,507 | 5,491,450 | ||||||
Broadcom | 77,390 | 16,945,314 | ||||||
Cognizant Technology Solutions Class A † | 93,404 | 5,559,406 | ||||||
Dropbox Class A =p† | 61,727 | 477,921 | ||||||
Electronic Arts † | 123,245 | 11,032,892 | ||||||
Facebook Class A † | 487,731 | 69,282,189 | ||||||
Fidelity National Information Services | 53,100 | 4,227,822 | ||||||
Fiserv † | 53,494 | 6,168,393 | ||||||
Intuit | 37,500 | 4,349,625 | ||||||
Mastercard Class A | 142,300 | 16,004,481 | ||||||
MercadoLibre (Argentina) | 17,200 | 3,637,284 | ||||||
Microchip Technology | 69,982 | 5,163,272 | ||||||
Micron Technology † | 275,662 | 7,966,632 | ||||||
Microsemi † | 77,528 | 3,995,018 | ||||||
Number of shares | Value (U.S. $) | |||||||
| ||||||||
Common Stock² (continued) |
| |||||||
| ||||||||
Information Technology (continued) | ||||||||
Microsoft | 1,045,064 | $ | 68,827,915 | |||||
NVIDIA | 13,173 | 1,434,935 | ||||||
NXP Semiconductors (Netherlands) † | 72,416 | 7,495,056 | ||||||
PayPal Holdings † | 345,300 | 14,854,806 | ||||||
Red Hat † | 37,101 | 3,209,238 | ||||||
salesforce.com † | 305,656 | 25,213,563 | ||||||
ServiceNow † | 92,316 | 8,074,881 | ||||||
Snap Class A † | 77,373 | 1,743,214 | ||||||
Snap Class A =p† | 37,203 | 796,274 | ||||||
Snap Class B =p† | 37,203 | 796,274 | ||||||
Tencent Holdings (China) (Hong Kong Exchange) | 331,900 | 9,515,193 | ||||||
VeriSign † | 46,843 | 4,080,494 | ||||||
Visa Class A | 594,503 | 52,833,482 | ||||||
Western Digital | 83,234 | 6,869,302 | ||||||
Workday Class A † | 52,100 | 4,338,888 | ||||||
|
| |||||||
| 591,801,255 | ||||||||
|
| |||||||
Materials – 1.08% | ||||||||
Air Products & Chemicals | 50,000 | 6,764,500 | ||||||
Ashland Global Holdings | 14,200 | 1,758,102 | ||||||
Monsanto | 32,528 | 3,682,170 | ||||||
Vulcan Materials | 19,180 | 2,310,806 | ||||||
WR Grace & Co. | 20,978 | 1,462,376 | ||||||
|
| |||||||
| 15,977,954 | ||||||||
|
| |||||||
Real Estate – 2.28% | ||||||||
American Tower | 96,800 | 11,765,072 | ||||||
Crown Castle International | 126,254 | 11,924,690 | ||||||
Equinix | 25,308 | 10,132,564 | ||||||
|
| |||||||
| 33,822,326 | ||||||||
|
| |||||||
Telecommunication Services – 0.93% |
| |||||||
Level 3 Communications † | 68,342 | 3,910,529 | ||||||
T-Mobile US † | 152,333 | 9,839,188 | ||||||
|
| |||||||
| 13,749,717 | ||||||||
|
| |||||||
Utilities – 0.41% | ||||||||
NextEra Energy | 47,700 | 6,123,249 | ||||||
|
| |||||||
| 6,123,249 | ||||||||
|
| |||||||
Total Common Stock | 1,438,062,409 | |||||||
|
| |||||||
| ||||||||
Convertible Preferred Stock – 0.57% |
| |||||||
| ||||||||
Airbnb Private Placement | ||||||||
Series D =p† | 23,130 | 2,307,218 | ||||||
Series E =p† | 13,611 | 1,357,697 | ||||||
Magic Leap =p† | 43,435 | 950,416 | ||||||
| 98 |
Table of Contents
Number of shares | Value (U.S. $) | |||||||
| ||||||||
Convertible Preferred Stock (continued) |
| |||||||
| ||||||||
Uber Technologies |
| |||||||
Series G =p† | 34,197 | $ | 1,584,470 | |||||
WeWork Companies | ||||||||
Series E =p† | 22,244 | 1,094,839 | ||||||
Xiaoju Kuaizhi (China) =p† | 32,416 | 1,177,211 | ||||||
|
| |||||||
Total Convertible Preferred Stock (cost $6,497,745) | 8,471,851 | |||||||
|
| |||||||
| ||||||||
U.S. Master Limited Partnerships – 0.47% |
| |||||||
| ||||||||
Blackstone Group | 235,308 | 6,988,648 | ||||||
|
| |||||||
Total U.S. Master Limited Partnerships | 6,988,648 | |||||||
|
| |||||||
| Principal amount° | ||||||||
| ||||||||
Short-Term Investments – 1.47% |
| |||||||
| ||||||||
Repurchase Agreements – 1.47% |
| |||||||
Bank of America Merrill Lynch | 7,137,179 | 7,137,179 | ||||||
Bank of Montreal | 7,137,179 | 7,137,179 | ||||||
Principal amount° | Value (U.S. $) | |||||||
| ||||||||
Short-Term Investments (continued) |
| |||||||
| ||||||||
Repurchase Agreements (continued) |
| |||||||
BNP Paribas | 7,573,642 | $ | 7,573,642 | |||||
|
| |||||||
| 21,848,000 | ||||||||
|
| |||||||
Total Short-Term Investments | 21,848,000 | |||||||
|
| |||||||
Total Value of Securities – 99.30% | $ | 1,475,370,908 | ||||||
|
| |||||||
| ² | Narrow industries are utilized for compliance purposes for diversification whereas broad sectors are used for financial reporting. |
| = | Security is being fair valued in accordance with the Fund’s fair valuation policy. At March 31, 2017, the aggregate value of fair valued securities was $12,419,918, which represents 0.84% of the Fund’s net assets. See Note 1 in “Notes to financial statements.” |
| ° | Principal amount shown is stated in U.S. dollars unless noted that the security is denominated in another currency. |
| p | Restricted Security. These investments are in securities not registered under the Securities Act of 1933, as amended, and have certain restrictions on resale which may limit their liquidity. At March 31,2017, the aggregate value of restricted securities was $12,419,918, which represented 0.84% of the Fund’s net assets. See Note 10 in “Notes to financial statements” and table on the next page for additional details on restricted securities. |
| † | Non-income producing security. |
| (continues) | 99 |
Table of Contents
Schedules of investments
Optimum Large Cap Growth Fund
Restricted securities
Investment | Date of Acquisition | Cost | Value | |||||||||
Airbnb Private Placement Series D | 4/16/14 | $ | 941,692 | $ | 2,307,218 | |||||||
Airbnb Private Placement Series E | 7/14/15 | 1,267,108 | 1,357,697 | |||||||||
Dropbox Class A | 11/07/14 | 1,179,060 | 477,921 | |||||||||
Flipkart Limited | 3/19/15 | 174,419 | 142,520 | |||||||||
Flipkart Limited Series A | 3/19/15 | 59,508 | 48,624 | |||||||||
Flipkart Limited Series C | 3/19/15 | 104,994 | 85,791 | |||||||||
Flipkart Limited Series E | 3/19/15 | 195,167 | 159,473 | |||||||||
Flipkart Limited Series G | 12/17/14 | 860,835 | 669,562 | |||||||||
Flipkart Limited Series H | 4/17/15 | 992,408 | 649,908 | |||||||||
Magic Leap | 1/20/16 | 1,000,438 | 950,416 | |||||||||
Snap Class A | 5/06/16 | 571,438 | 796,274 | |||||||||
Snap Class B | 5/06/16 | 571,438 | 796,274 | |||||||||
Uber Technologies Series G | 12/03/15 | 1,667,863 | 1,584,470 | |||||||||
WeWork Companies | 6/23/15 | 81,336 | 121,720 | |||||||||
WeWork Companies Series E | 6/23/15 | 731,596 | 1,094,839 | |||||||||
Xiaoju Kuaizhi (China) | 10/19/15 | 889,048 | 1,177,211 | |||||||||
|
|
|
| |||||||||
Total | $ | 11,288,348 | $ | 12,419,918 | ||||||||
|
|
|
| |||||||||
ADR – American Depositary Receipt
See accompanying notes, which are an integral part of the financial statements.
| 100 |
Table of Contents
Optimum Large Cap Value Fund
March 31, 2017
| Number of shares | Value (U.S. $) | |||||||
| ||||||||
Common Stock – 98.50%² |
| |||||||
| ||||||||
Consumer Discretionary – 7.12% |
| |||||||
Advance Auto Parts | 12,326 | $ | 1,827,453 | |||||
CBS Class B | 121,298 | 8,413,229 | ||||||
Comcast Class A Special | 493,580 | 18,553,672 | ||||||
Delphi Automotive (United Kingdom) | 82,476 | 6,638,493 | ||||||
Hanesbrands | 127,158 | 2,639,800 | ||||||
Harley-Davidson | 32,843 | 1,987,002 | ||||||
Home Depot | 32,955 | 4,838,783 | ||||||
Interpublic Group | 140,041 | 3,440,807 | ||||||
Newell Brands | 23,345 | 1,101,184 | ||||||
Omnicom Group | 108,695 | 9,370,596 | ||||||
PulteGroup | 319,022 | 7,512,968 | ||||||
PVH | 67,396 | 6,973,464 | ||||||
Skechers | 239,496 | 6,574,165 | ||||||
Target | 43,542 | 2,403,083 | ||||||
Time Warner | 119,640 | 11,690,024 | ||||||
Walt Disney | 14,296 | 1,621,023 | ||||||
|
| |||||||
| 95,585,746 | ||||||||
|
| |||||||
Consumer Staples – 9.67% |
| |||||||
Altria Group | 53,752 | 3,838,968 | ||||||
Archer-Daniels-Midland | 74,896 | 3,448,212 | ||||||
Coty Class A | 178,081 | 3,228,609 | ||||||
CVS Health | 134,399 | 10,550,322 | ||||||
Danone (France) | 41,316 | 2,810,280 | ||||||
Diageo (United Kingdom) | 239,616 | 6,855,407 | ||||||
General Mills | 96,642 | 5,702,844 | ||||||
Hershey | 75,212 | 8,216,911 | ||||||
JM Smucker | 23,278 | 3,051,280 | ||||||
Kroger | 185,186 | 5,461,135 | ||||||
Mead Johnson Nutrition | 22,606 | 2,013,742 | ||||||
Nestle (Switzerland) | 137,780 | 10,570,951 | ||||||
PepsiCo | 133,199 | 14,899,640 | ||||||
Philip Morris International | 226,035 | 25,519,352 | ||||||
Procter & Gamble | 178,269 | 16,017,470 | ||||||
Tyson Foods Class A | 123,053 | 7,593,601 | ||||||
|
| |||||||
| 129,778,724 | ||||||||
|
| |||||||
Energy – 7.71% |
| |||||||
Antero Resources † | 189,995 | 4,333,786 | ||||||
Chevron | 198,212 | 21,282,022 | ||||||
ConocoPhillips | 176,452 | 8,799,661 | ||||||
Energen † | 109,240 | 5,947,026 | ||||||
EOG Resources | 181,393 | 17,694,887 | ||||||
Exxon Mobil | 226,895 | 18,607,659 | ||||||
Halliburton | 135,229 | 6,654,619 | ||||||
Occidental Petroleum | 76,697 | 4,859,522 | ||||||
Schlumberger | 110,625 | 8,639,813 | ||||||
| Number of shares | Value (U.S. $) | |||||||
| ||||||||
Common Stock² (continued) |
| |||||||
| ||||||||
Energy (continued) |
| |||||||
Valero Energy | 99,388 | $ | 6,588,431 | |||||
|
| |||||||
| 103,407,426 | ||||||||
|
| |||||||
Financials – 26.50% |
| |||||||
Allstate | 121,098 | 9,868,276 | ||||||
American Express | 173,786 | 13,748,211 | ||||||
Ameriprise Financial | 63,979 | 8,296,797 | ||||||
Aon (United Kingdom) | 92,405 | 10,967,549 | ||||||
Bank of America | 1,026,854 | 24,223,486 | ||||||
Bank of New York Mellon | 154,413 | 7,292,926 | ||||||
Berkshire Hathaway Class B † | 26,289 | 4,381,850 | ||||||
BlackRock | 15,814 | 6,064,827 | ||||||
Chubb (Switzerland) | 193,192 | 26,322,410 | ||||||
Citigroup | 193,539 | 11,577,503 | ||||||
Discover Financial Services | 147,123 | 10,061,742 | ||||||
Franklin Resources | 82,819 | 3,489,993 | ||||||
Goldman Sachs Group | 64,990 | 14,929,503 | ||||||
Huntington Bancshares | 700,381 | 9,378,102 | ||||||
JPMorgan Chase & Co. | 641,385 | 56,339,258 | ||||||
MetLife | 270,243 | 14,274,235 | ||||||
Moody’s | 41,111 | 4,606,076 | ||||||
Morgan Stanley | 154,385 | 6,613,853 | ||||||
Nasdaq | 100,566 | 6,984,309 | ||||||
PNC Financial Services Group | 70,715 | 8,502,772 | ||||||
Prudential Financial | 47,750 | 5,093,970 | ||||||
S&P Global | 11,139 | 1,456,313 | ||||||
State Street | 201,327 | 16,027,642 | ||||||
SunTrust Banks | 227,524 | 12,582,077 | ||||||
T Rowe Price Group | 17,501 | 1,192,693 | ||||||
Travelers | 106,302 | 12,813,643 | ||||||
U.S. Bancorp | 291,078 | 14,990,517 | ||||||
Wells Fargo & Co. | 603,533 | 33,592,647 | ||||||
|
| |||||||
| 355,673,180 | ||||||||
|
| |||||||
Healthcare – 13.59% | ||||||||
Abbott Laboratories | 225,504 | 10,014,633 | ||||||
Amgen | 34,501 | 5,660,579 | ||||||
Celgene † | 69,260 | 8,618,022 | ||||||
Cigna | 23,973 | 3,511,805 | ||||||
Danaher | 159,871 | 13,673,767 | ||||||
Eli Lilly & Co. | 125,231 | 10,533,179 | ||||||
Express | 50,195 | 3,308,352 | ||||||
Gilead Sciences | 78,061 | 5,301,903 | ||||||
Hill-Rom Holdings | 53,225 | 3,757,685 | ||||||
Johnson & Johnson | 264,777 | 32,977,975 | ||||||
McKesson | 29,749 | 4,410,587 | ||||||
Medtronic (Ireland) | 306,640 | 24,702,918 | ||||||
Merck & Co. | 100,983 | 6,416,460 | ||||||
| (continues) | 101 |
Table of Contents
Schedules of investments
Optimum Large Cap Value Fund
| Number of shares | Value (U.S. $) | |||||||
| ||||||||
Common Stock² (continued) |
| |||||||
| ||||||||
Healthcare (continued) |
| |||||||
Novartis (Switzerland) | 19,774 | $ | 1,467,775 | |||||
Pfizer | 819,859 | 28,047,376 | ||||||
Roche Holding (Switzerland) | 5,623 | 1,435,994 | ||||||
Thermo Fisher Scientific | 48,164 | 7,397,990 | ||||||
UnitedHealth Group | 68,258 | 11,194,995 | ||||||
|
| |||||||
| 182,431,995 | ||||||||
|
| |||||||
Industrials – 13.22% |
| |||||||
3M | 70,673 | 13,521,865 | ||||||
Canadian National Railway (Canada) | 49,745 | 3,677,648 | ||||||
Delta Air Lines | 175,990 | 8,088,500 | ||||||
Eaton | 81,398 | 6,035,662 | ||||||
Equifax | 22,850 | 3,124,509 | ||||||
Fluor | 103,508 | 5,446,591 | ||||||
General Electric | 289,325 | 8,621,885 | ||||||
Honeywell International | 100,149 | 12,505,606 | ||||||
Illinois Tool Works | 47,069 | 6,235,230 | ||||||
Ingersoll-Rand | 46,308 | 3,765,767 | ||||||
Johnson Controls International | 321,139 | 13,526,375 | ||||||
Lockheed Martin | 29,062 | 7,776,991 | ||||||
Northrop Grumman | 71,524 | 17,011,268 | ||||||
Parker-Hannifin | 76,067 | 12,195,061 | ||||||
Quanta Services † | 137,984 | 5,120,586 | ||||||
Raytheon | 33,681 | 5,136,353 | ||||||
Stanley Black & Decker | 97,864 | 13,003,190 | ||||||
Union Pacific | 45,543 | 4,823,915 | ||||||
United Parcel Service Class B | 89,846 | 9,640,476 | ||||||
United Technologies | 66,601 | 7,473,298 | ||||||
Waste Management | 146,213 | 10,661,852 | ||||||
|
| |||||||
| 177,392,628 | ||||||||
|
| |||||||
Information Technology – 7.82% |
| |||||||
Accenture Class A (Ireland) | 140,659 | 16,862,201 | ||||||
Amdocs | 26,719 | 1,629,592 | ||||||
Apple | 39,976 | 5,742,952 | ||||||
Booz Allen Hamilton Holding | 150,290 | 5,318,763 | ||||||
Cisco Systems | 329,887 | 11,150,181 | ||||||
Cognizant Technology Solutions Class A † | 42,475 | 2,528,112 | ||||||
Fidelity National Information Services | 78,423 | 6,244,039 | ||||||
Fiserv † | 26,792 | 3,089,386 | ||||||
Hewlett Packard Enterprise | 327,459 | 7,760,778 | ||||||
Intel | 184,613 | 6,658,991 | ||||||
International Business Machines | 26,482 | 4,611,575 | ||||||
| Number of shares | Value (U.S. $) | |||||||
| ||||||||
Common Stock² (continued) |
| |||||||
| ||||||||
Information Technology (continued) |
| |||||||
Microsoft | 160,155 | $ | 10,547,808 | |||||
Oracle | 81,172 | 3,621,083 | ||||||
QUALCOMM | 163,723 | 9,387,877 | ||||||
Texas Instruments | 121,058 | 9,752,432 | ||||||
|
| |||||||
| 104,905,770 | ||||||||
|
| |||||||
Materials – 4.58% |
| |||||||
Crown Holdings † | 56,951 | 3,015,555 | ||||||
Dow Chemical | 233,448 | 14,833,286 | ||||||
EI du Pont de Nemours & Co. | 41,469 | 3,331,205 | ||||||
LyondellBasell Industries | ||||||||
Class A | 72,396 | 6,601,791 | ||||||
Monsanto | 22,833 | 2,584,696 | ||||||
Nucor | 136,076 | 8,126,459 | ||||||
PPG Industries | 122,191 | 12,839,830 | ||||||
Sherwin-Williams | 15,595 | 4,837,413 | ||||||
WestRock | 100,584 | 5,233,385 | ||||||
|
| |||||||
| 61,403,620 | ||||||||
|
| |||||||
Real Estate – 1.58% |
| |||||||
Equity LifeStyle Properties | 78,920 | 6,081,575 | ||||||
Kimco Realty | 237,616 | 5,248,937 | ||||||
Prologis | 152,647 | 7,919,326 | ||||||
Public Storage | 9,087 | 1,989,235 | ||||||
|
| |||||||
| 21,239,073 | ||||||||
|
| |||||||
Telecommunication Services – 2.72% |
| |||||||
AT&T | 515,502 | 21,419,108 | ||||||
Verizon Communications | 307,956 | 15,012,855 | ||||||
|
| |||||||
| 36,431,963 | ||||||||
|
| |||||||
Utilities – 3.99% |
| |||||||
American Electric Power | 119,347 | 8,011,764 | ||||||
DTE Energy | 86,618 | 8,844,564 | ||||||
Duke Energy | 86,003 | 7,053,106 | ||||||
Edison International | 134,391 | 10,698,868 | ||||||
Public Service Enterprise Group | 183,430 | 8,135,122 | ||||||
Xcel Energy | 243,536 | 10,825,175 | ||||||
|
| |||||||
| 53,568,599 | ||||||||
|
| |||||||
Total Common Stock |
| 1,321,818,724 | ||||||
|
| |||||||
| 102 |
Table of Contents
| Principal amount° | Value (U.S. $) | |||||||
| ||||||||
Short-Term Investments – 1.29% |
| |||||||
| ||||||||
Discount Notes – 0.48%≠ |
| |||||||
Federal Home Loan Bank | ||||||||
0.53% 4/25/17 | 124,861 | $ | 124,809 | |||||
0.55% 5/26/17 | 269,001 | 268,716 | ||||||
0.69% 4/28/17 | 1,055,265 | 1,054,767 | ||||||
0.765% 5/19/17 | 4,973,759 | 4,969,183 | ||||||
|
| |||||||
| 6,417,475 | ||||||||
|
| |||||||
Repurchase Agreements – 0.71% |
| |||||||
Bank of America Merrill Lynch | 3,112,552 | 3,112,552 | ||||||
Bank of Montreal | 3,112,552 | 3,112,553 | ||||||
| Principal amount° | Value (U.S. $) | |||||||
| ||||||||
Short-Term Investments (continued) |
| |||||||
| ||||||||
Repurchase Agreements (continued) |
| |||||||
BNP Paribas | 3,302,895 | $ | 3,302,895 | |||||
|
| |||||||
| 9,528,000 | ||||||||
|
| |||||||
U.S. Treasury Obligation – 0.10%≠ |
| |||||||
U.S. Treasury Bill | 1,406,339 | 1,406,060 | ||||||
|
| |||||||
| 1,406,060 | ||||||||
|
| |||||||
Total Short-Term Investments | 17,351,535 | |||||||
|
| |||||||
Total Value of |
| $ | 1,339,170,259 | |||||
|
| |||||||
| ² | Narrow industries are utilized for compliance purposes for diversification whereas broad sectors are used for financial reporting. |
| ≠ | The rate shown is the effective yield at the time of purchase. |
| ° | Principal amount shown is stated in U.S. dollars unless noted that the security is denominated in another currency. |
| † | Non-income producing security. |
See accompanying notes, which are an integral part of the financial statements.
| 103 |
Table of Contents
Schedules of investments
Optimum Small-Mid Cap Growth Fund
March 31, 2017
| Number of shares | Value (U.S. $) | |||||||
| ||||||||
Common Stock – 97.06%² |
| |||||||
| ||||||||
Consumer Discretionary – 17.43% |
| |||||||
At Home Group † | 46,673 | $ | 707,563 | |||||
BorgWarner | 78,890 | 3,296,813 | ||||||
Burlington Stores † | 83,988 | 8,171,192 | ||||||
Chico’s FAS | 89,745 | 1,274,379 | ||||||
Children’s Place | 25,600 | 3,073,280 | ||||||
Darden Restaurants | 28,800 | 2,409,696 | ||||||
Dave & Buster’s Entertainment † | 27,540 | 1,682,419 | ||||||
Del Taco Restaurants † | 99,421 | 1,318,322 | ||||||
Dick’s Sporting Goods | 42,630 | 2,074,376 | ||||||
DR Horton | 46,800 | 1,558,908 | ||||||
Expedia | 8,500 | 1,072,445 | ||||||
Extended Stay America | 123,307 | 1,965,514 | ||||||
Gentherm † | 49,608 | 1,947,114 | ||||||
G-III Apparel Group † | 26,673 | 583,872 | ||||||
Houghton Mifflin Harcourt † | 91,058 | 924,239 | ||||||
IMAX (Canada) † | 87,272 | 2,967,248 | ||||||
iRobot † | 18,895 | 1,249,715 | ||||||
Kate Spade † | 59,965 | 1,392,987 | ||||||
Lions Gate Entertainment Class A † | 33,691 | 894,833 | ||||||
Lions Gate Entertainment Class B † | 33,691 | 821,386 | ||||||
Mohawk Industries † | 19,155 | 4,395,881 | ||||||
Monro Muffler Brake | 26,228 | 1,366,479 | ||||||
Nexstar Media Group | 18,269 | 1,281,570 | ||||||
Norwegian Cruise Line Holdings † | 85,340 | 4,329,298 | ||||||
Panera Bread Class A † | 6,255 | 1,637,997 | ||||||
Party City Holdco † | 109,774 | 1,542,325 | ||||||
Restaurant Brands International (Canada) | 19,000 | 1,059,060 | ||||||
Royal Caribbean Cruises | 56,360 | 5,529,480 | ||||||
Sportsman’s Warehouse Holdings † | 100,628 | 481,002 | ||||||
Tenneco | 54,905 | 3,427,170 | ||||||
Ulta Beauty † | 14,265 | 4,068,806 | ||||||
Vail Resorts | 21,137 | 4,056,190 | ||||||
Wynn Resorts | 19,700 | 2,257,817 | ||||||
Zoe’s Kitchen † | 65,141 | 1,205,108 | ||||||
Zumiez † | 57,960 | 1,060,668 | ||||||
|
| |||||||
| 77,085,152 | ||||||||
|
| |||||||
Consumer Staples – 3.24% |
| |||||||
Central Garden & Pet | 61,595 | 2,138,578 | ||||||
Energizer Holdings | 40,000 | 2,230,000 | ||||||
Inter Parfums | 64,245 | 2,348,155 | ||||||
Performance Food | 89,130 | 2,121,294 | ||||||
| Number of shares | Value (U.S. $) | |||||||
| ||||||||
Common Stock² (continued) |
| |||||||
| ||||||||
Consumer Staples (continued) |
| |||||||
Snyder’s-Lance | 136,409 | $ | 5,498,647 | |||||
|
| |||||||
| 14,336,674 | ||||||||
|
| |||||||
Energy – 1.97% |
| |||||||
Diamondback Energy † | 11,929 | 1,237,216 | ||||||
Fairmount Santrol | 128,537 | 942,176 | ||||||
GasLog (Monaco) | 86,354 | 1,325,534 | ||||||
Keane Group † | 84,190 | 1,203,917 | ||||||
Matador Resources † | 38,100 | 906,399 | ||||||
Oasis Petroleum † | 86,882 | 1,238,938 | ||||||
Parsley Energy Class A † | 30,330 | 986,028 | ||||||
QEP Resources † | 67,243 | 854,659 | ||||||
|
| |||||||
| 8,694,867 | ||||||||
|
| |||||||
Financials – 7.24% |
| |||||||
Argo Group International Holdings (Bermuda) | 41,555 | 2,817,429 | ||||||
Comerica | 28,530 | 1,956,587 | ||||||
Essent Group † | 70,247 | 2,540,834 | ||||||
Evercore Partners Class A | 31,674 | 2,467,405 | ||||||
First Republic Bank | 39,205 | 3,677,821 | ||||||
MarketAxess Holdings | 5,800 | 1,087,442 | ||||||
Radian Group | 126,100 | 2,264,756 | ||||||
ServisFirst Bancshares | 38,702 | 1,407,979 | ||||||
Signature Bank † | 9,599 | 1,424,396 | ||||||
Stifel Financial † | 42,826 | 2,149,437 | ||||||
SVB Financial Group † | 16,056 | 2,987,861 | ||||||
Virtu Financial Class A | 92,630 | 1,574,710 | ||||||
Virtus Investment Partners | 13,916 | 1,473,704 | ||||||
Zions Bancorporation | 100,060 | 4,202,520 | ||||||
|
| |||||||
| 32,032,881 | ||||||||
|
| |||||||
Healthcare – 18.60% |
| |||||||
Alder Biopharmaceuticals † | 32,613 | 678,350 | ||||||
Alnylam Pharmaceuticals † | 17,269 | 885,036 | ||||||
AMN Healthcare Services † | 53,175 | 2,158,905 | ||||||
Analogic | 13,618 | 1,033,606 | ||||||
athenahealth † | 13,633 | 1,536,303 | ||||||
AtriCure † | 87,310 | 1,671,986 | ||||||
Bioverativ † | 26,649 | 1,451,304 | ||||||
Bluebird Bio † | 11,375 | 1,033,987 | ||||||
Cerus † | 287,609 | 1,279,860 | ||||||
Coherus Biosciences † | 47,755 | 1,010,018 | ||||||
DexCom † | 45,031 | 3,815,477 | ||||||
Emergent BioSolutions † | 25,772 | 748,419 | ||||||
Evolent Health Class A † | 89,012 | 1,984,968 | ||||||
Flexion Therapeutics † | 55,579 | 1,495,631 | ||||||
Galapagos ADR † | 9,082 | 782,778 | ||||||
HealthEquity † | 60,248 | 2,557,528 | ||||||
ICON (Ireland) † | 32,471 | 2,588,588 | ||||||
| 104 |
Table of Contents
| Number of shares | Value (U.S. $) | |||||||
| ||||||||
Common Stock² (continued) |
| |||||||
| ||||||||
Healthcare (continued) |
| |||||||
IDEXX Laboratories † | 35,975 | $ | 5,562,095 | |||||
Inogen † | 31,761 | 2,463,383 | ||||||
Integra LifeSciences Holdings † | 51,300 | 2,161,269 | ||||||
Intra-Cellular Therapies † | 40,863 | 664,024 | ||||||
Intrexon † | 31,902 | 632,298 | ||||||
K2M Group Holdings † | 200,075 | 4,103,538 | ||||||
Lexicon Pharmaceuticals † | 68,266 | 978,934 | ||||||
LifePoint Health † | 17,687 | 1,158,499 | ||||||
Medidata Solutions † | 24,646 | 1,421,828 | ||||||
Mettler-Toledo International † | 7,985 | 3,824,096 | ||||||
Neurocrine Biosciences † | 24,315 | 1,052,839 | ||||||
Nevro † | 72,838 | 6,824,921 | ||||||
Novocure (United Kingdom) † | 95,377 | 772,554 | ||||||
NuVasive † | 21,350 | 1,594,418 | ||||||
Pacira Pharmaceuticals † | 28,002 | 1,276,891 | ||||||
Radius Health † | 18,415 | 711,740 | ||||||
Spectranetics † | 70,489 | 2,052,992 | ||||||
Surgery Partners † | 94,430 | 1,841,385 | ||||||
Teladoc † | 66,495 | 1,662,375 | ||||||
TESARO † | 22,712 | 3,494,695 | ||||||
Vocera Communications † | 185,113 | 4,596,356 | ||||||
WellCare Health Plans † | 30,905 | 4,333,190 | ||||||
Wright Medical Group (Netherlands) † | 75,772 | 2,358,025 | ||||||
|
| |||||||
| 82,255,089 | ||||||||
|
| |||||||
Industrials – 15.53% |
| |||||||
AMETEK | 80,800 | 4,369,664 | ||||||
AO Smith | 48,058 | 2,458,647 | ||||||
Apogee Enterprises | 53,207 | 3,171,669 | ||||||
Copart † | 50,191 | 3,108,329 | ||||||
Dycom Industries † | 13,665 | 1,270,162 | ||||||
EnPro Industries | 33,678 | 2,396,526 | ||||||
Foundation Building Materials † | 58,956 | 941,527 | ||||||
Genesee & Wyoming † | 46,381 | 3,147,415 | ||||||
Granite Construction | 41,966 | 2,106,274 | ||||||
Hub Group Class A † | 30,334 | 1,407,498 | ||||||
JELD-WEN Holding † | 22,766 | 747,863 | ||||||
John Bean Technologies | 20,200 | 1,776,590 | ||||||
KAR Auction Services | 40,853 | 1,784,050 | ||||||
Masonite International † | 21,145 | 1,675,741 | ||||||
Mercury Systems † | 64,000 | 2,499,200 | ||||||
Middleby † | 34,215 | 4,668,637 | ||||||
NCI Building Systems † | 105,701 | 1,812,772 | ||||||
Nordson | 17,500 | 2,149,700 | ||||||
On Assignment † | 92,043 | 4,466,847 | ||||||
PGT Innovations † | 127,091 | 1,366,228 | ||||||
| Number of shares | Value (U.S. $) | |||||||
| ||||||||
Common Stock² (continued) |
| |||||||
| ||||||||
Industrials (continued) |
| |||||||
REV Group † | 68,762 | $ | 1,895,768 | |||||
RPX † | 73,725 | 884,700 | ||||||
Spirit Airlines † | 20,375 | 1,081,301 | ||||||
SPX † | 36,371 | 881,997 | ||||||
Swift Transportation † | 61,526 | 1,263,744 | ||||||
Terex | 38,000 | 1,193,200 | ||||||
Timken | 49,600 | 2,241,920 | ||||||
TransUnion † | 50,300 | 1,929,005 | ||||||
United Rentals † | 14,100 | 1,763,205 | ||||||
Wabash National | 131,543 | 2,721,625 | ||||||
WABCO Holdings † | 32,000 | 3,757,440 | ||||||
West | 71,842 | 1,754,382 | ||||||
|
| |||||||
| 68,693,626 | ||||||||
|
| |||||||
Information Technology – 27.90% |
| |||||||
2U † | 65,274 | 2,588,767 | ||||||
Acxiom † | 102,407 | 2,915,527 | ||||||
Atlassian (Australia) † | 48,979 | 1,466,921 | ||||||
Axcelis Technologies † | 11,861 | 222,987 | ||||||
Benefitfocus † | 54,800 | 1,531,660 | ||||||
Booz Allen Hamilton Holding | 62,050 | 2,195,949 | ||||||
CACI International Class A † | 10,185 | 1,194,701 | ||||||
Cadence Design Systems † | 94,552 | 2,968,933 | ||||||
Ciena † | 99,542 | 2,350,187 | ||||||
Cognex | 33,215 | 2,788,399 | ||||||
Coherent † | 12,270 | 2,523,203 | ||||||
CommScope Holding † | 106,445 | 4,439,821 | ||||||
Cornerstone OnDemand † | 44,956 | 1,748,339 | ||||||
CyberArk Software (Israel) † | 38,157 | 1,941,047 | ||||||
Cypress Semiconductor | 191,725 | 2,638,136 | ||||||
Finisar † | 69,500 | 1,900,130 | ||||||
Five9 † | 95,054 | 1,564,589 | ||||||
FormFactor † | 169,449 | 2,007,971 | ||||||
GrubHub † | 29,405 | 967,130 | ||||||
Hortonworks † | 98,076 | 962,126 | ||||||
Inphi † | 48,400 | 2,362,888 | ||||||
IPG Photonics † | 9,300 | 1,122,510 | ||||||
MACOM Technology Solutions | ||||||||
Holdings † | 18,670 | 901,761 | ||||||
Micron Technology † | 192,345 | 5,558,771 | ||||||
Microsemi † | 61,550 | 3,171,671 | ||||||
Mimecast † | 55,954 | 1,252,810 | ||||||
MINDBODY Class A † | 108,775 | 2,985,874 | ||||||
MKS Instruments | 34,330 | 2,360,187 | ||||||
Nanometrics † | 46,750 | 1,424,005 | ||||||
New Relic † | 40,796 | 1,512,308 | ||||||
Nuance Communications † | 114,661 | 1,984,782 | ||||||
OSI Systems † | 25,086 | 1,831,027 | ||||||
| (continues) | 105 |
Table of Contents
Schedules of investments
Optimum Small-Mid Cap Growth Fund
Number of shares | Value (U.S. $) | |||||||
| ||||||||
Common Stock² (continued) |
| |||||||
| ||||||||
Information Technology (continued) |
| |||||||
Pandora Media † | 93,685 | $ | 1,106,420 | |||||
PTC † | 93,135 | 4,894,244 | ||||||
Pure Storage Class A † | 36,123 | 355,089 | ||||||
RealPage † | 89,585 | 3,126,517 | ||||||
RingCentral Class A † | 73,840 | 2,089,672 | ||||||
ServiceNow † | 57,660 | 5,043,520 | ||||||
Shopify Class A (Canada) Class A † | 53,349 | 3,632,533 | ||||||
Silicon Motion Technology ADR | 32,315 | 1,510,726 | ||||||
Square Class A † | 210,653 | 3,640,084 | ||||||
SS&C Technologies Holdings | 123,127 | 4,358,696 | ||||||
Stamps.com † | 18,810 | 2,226,163 | ||||||
Synchronoss Technologies † | 30,147 | 735,587 | ||||||
Take-Two Interactive Software † | 40,600 | 2,406,362 | ||||||
Talend ADR † | 35,540 | 1,058,381 | ||||||
Teradyne | 98,883 | 3,075,261 | ||||||
Trimble † | 82,355 | 2,636,183 | ||||||
Ultimate Software Group † | 7,749 | 1,512,682 | ||||||
Universal Display | 77,545 | 6,676,624 | ||||||
Vantiv Class A † | 63,282 | 4,057,642 | ||||||
Zendesk † | 65,641 | 1,840,574 | ||||||
|
| |||||||
| 123,368,077 | ||||||||
|
| |||||||
Materials – 4.63% | ||||||||
Albemarle | 51,895 | 5,482,188 | ||||||
Boise Cascade † | 84,337 | 2,251,798 | ||||||
Carpenter Technology | 40,570 | 1,513,261 | ||||||
FMC | 35,700 | 2,484,363 | ||||||
Forterra † | 84,921 | 1,655,959 | ||||||
Olin | 66,400 | 2,182,568 | ||||||
Platform Specialty Products † | 93,600 | 1,218,672 | ||||||
Steel Dynamics | 54,934 | 1,909,506 | ||||||
US Concrete † | 27,610 | 1,782,225 | ||||||
|
| |||||||
| 20,480,540 | ||||||||
|
| |||||||
Real Estate – 0.52% | ||||||||
QTS Realty Trust | 47,021 | 2,292,274 | ||||||
|
| |||||||
| 2,292,274 | ||||||||
|
| |||||||
Total Common Stock | 429,239,180 | |||||||
|
| |||||||
| ||||||||
Convertible Preferred Stock – 1.21% |
| |||||||
| ||||||||
Cloudera=p† | 30,243 | 718,876 | ||||||
DocuSign | ||||||||
Series B =p† | 1,166 | 20,533 | ||||||
Number of shares | Value (U.S. $) | |||||||
| ||||||||
Convertible Preferred Stock (continued) |
| |||||||
| ||||||||
DocuSign | ||||||||
Series B-1 =p† | 349 | $ | 6,146 | |||||
Series C =p† | 4,474 | 78,787 | ||||||
Series D =p† | 838 | 14,757 | ||||||
Series E =p† | 21,664 | 381,503 | ||||||
DraftKings | ||||||||
Series D =p† | 56,648 | 164,279 | ||||||
Series D-1 =p† | 50,706 | 147,048 | ||||||
Honest=p† | 15,249 | 642,440 | ||||||
MarkLogic=p† | 83,588 | 1,027,297 | ||||||
Nutanix=p† | 40,185 | 754,273 | ||||||
Veracode Series 8=p† | 30,584 | 611,068 | ||||||
Zuora=p† | 209,844 | 772,226 | ||||||
|
| |||||||
Total Convertible Preferred Stock (cost $5,103,829) | 5,339,233 | |||||||
|
| |||||||
| Principal amount° | ||||||||
| ||||||||
Short-Term Investments – 2.42% |
| |||||||
| ||||||||
Discount Notes – 1.25%≠ | ||||||||
Federal Home Loan Bank | ||||||||
0.53% 4/25/17 | 1,154,799 | 1,154,319 | ||||||
0.55% 5/26/17 | 1,322,047 | 1,320,646 | ||||||
0.69% 4/28/17 | 615,439 | 615,148 | ||||||
0.765% 5/19/17 | 2,458,848 | 2,456,586 | ||||||
|
| |||||||
| 5,546,699 | ||||||||
|
| |||||||
Repurchase Agreements – 0.71% |
| |||||||
Bank of America Merrill Lynch | 1,024,124 | 1,024,124 | ||||||
Bank of Montreal | 1,024,124 | 1,024,124 | ||||||
| 106 |
Table of Contents
| Principal amount° | Value (U.S. $) | |||||||
| ||||||||
Short-Term Investments (continued) |
| |||||||
| ||||||||
Repurchase Agreements (continued) |
| |||||||
BNP Paribas | 1,086,752 | $ | 1,086,752 | |||||
|
| |||||||
| 3,135,000 | ||||||||
|
| |||||||
U.S. Treasury Obligation – 0.46%≠ |
| |||||||
U.S. Treasury Bill | 2,017,768 | 2,017,369 | ||||||
|
| |||||||
Total Short-Term Investments | 10,699,068 | |||||||
|
| |||||||
Total Value of | $ | 445,277,481 | ||||||
|
| |||||||
| ² | Narrow industries are utilized for compliance purposes for diversification whereas broad sectors are used for financial reporting. |
| = | Security is being fair valued in accordance with the Fund’s fair valuation policy. At March 31, 2017, the aggregate value of fair valued securities was $5,339,233, which represents 1.21% of the Fund’s net assets. See Note 1 in “Notes to financial statements.” |
| ≠ | The rate shown is the effective yield at the time of purchase. |
| ° | Principal amount shown is stated in U.S. dollars unless noted that the security is denominated in another currency. |
| p | Restricted Security. These investments are in securities not registered under the Securities Act of 1933, as amended, and have certain restrictions on resale which may limit their liquidity. At March 31, 2017, the aggregate value of restricted securities was $5,339,233, which represented 1.21% of the Fund’s net assets. See Note 10 in “Notes to financial statements” and table below for additional details on restricted securities. |
| † | Non-income producing security. |
ADR – American Depositary Receipt
Restricted Securities |
| |||||||||||
Investment | Date of Acquisition | Cost | Value | |||||||||
Cloudera | 2/5/14 | $ | 440,338 | $ | 718,876 | |||||||
DocuSign Series B | 2/28/14 | 15,312 | 20,533 | |||||||||
DocuSign Series B-1 | 2/28/14 | 4,583 | 6,146 | |||||||||
DocuSign Series C | 4/30/15 | 85,423 | 78,787 | |||||||||
DocuSign Series D | 2/28/14 | 11,005 | 14,757 | |||||||||
DocuSign Series E | 2/28/14 | 284,500 | 381,503 | |||||||||
DraftKings Series D | 7/16/15 | 160,995 | 86,687 | |||||||||
DraftKings Series D | 7/17/15 | 11,634 | 6,264 | |||||||||
DraftKings Series D | 8/11/15 | 132,472 | 71,329 | |||||||||
DraftKings Series D-1 | 8/11/15 | 346,062 | 130,923 | |||||||||
DraftKings Series D-1 | 8/18/15 | 42,620 | 16,124 | |||||||||
Honest | 8/3/15 | 697,718 | 642,440 | |||||||||
MarkLogic | 4/27/15 | 970,808 | 1,027,297 | |||||||||
Nutanix | 8/25/14 | 538,338 | 754,273 | |||||||||
Veracode Series 8 | 8/26/14 | 564,761 | 611,068 | |||||||||
Zuora | 1/15/15 | 797,260 | 772,226 | |||||||||
|
|
|
| |||||||||
Total | $ | 5,103,829 | $ | 5,339,233 | ||||||||
|
|
|
| |||||||||
See accompanying notes, which are an integral part of the financial statements.
| (continues) | 107 |
Table of Contents
Schedules of investments
Optimum Small-Mid Cap Value Fund
March 31, 2017
| Number of shares | Value (U.S. $) | |||||||
| ||||||||
Common Stock – 98.83% |
| |||||||
| ||||||||
Consumer Discretionary – 9.41% |
| |||||||
AMC Networks Class A † | 23,572 | $ | 1,383,205 | |||||
American Eagle Outfitters | 62,200 | 872,666 | ||||||
Bed Bath & Beyond | 23,600 | 931,256 | ||||||
Bloomin’ Brands | 72,500 | 1,430,425 | ||||||
Brinker International | 33,200 | 1,459,472 | ||||||
Cable One | 6,202 | 3,872,963 | ||||||
Carriage Services | 30,300 | 821,736 | ||||||
Children’s Place | 7,100 | 852,355 | ||||||
Columbia Sportswear | 31,900 | 1,874,125 | ||||||
Cooper-Standard Holdings † | 17,300 | 1,919,089 | ||||||
Goodyear Tire & Rubber | 56,700 | 2,041,200 | ||||||
Hanesbrands | 77,300 | 1,604,748 | ||||||
Harley-Davidson | 28,800 | 1,742,400 | ||||||
Haverty Furniture | 43,900 | 1,068,965 | ||||||
Helen of Troy † | 42,160 | 3,971,472 | ||||||
KB Home | 50,600 | 1,005,928 | ||||||
Kohl’s | 23,900 | 951,459 | ||||||
Lear | 11,700 | 1,656,486 | ||||||
Marcus | 30,500 | 979,050 | ||||||
Murphy USA † | 16,500 | 1,211,430 | ||||||
Penske Automotive Group | 19,700 | 922,157 | ||||||
Scripps Networks Interactive Class A | 12,800 | 1,003,136 | ||||||
Shoe Carnival | 31,500 | 773,955 | ||||||
Sonic Automotive Class A | 76,300 | 1,529,815 | ||||||
Tenneco | 26,400 | 1,647,888 | ||||||
Unifi † | 14,500 | 411,655 | ||||||
Wyndham Worldwide | 24,229 | 2,042,262 | ||||||
|
| |||||||
| 39,981,298 | ||||||||
|
| |||||||
Consumer Staples – 5.36% |
| |||||||
Bunge | 27,700 | 2,195,502 | ||||||
Dean Foods | 87,300 | 1,716,318 | ||||||
Edgewell Personal Care † | 23,800 | 1,740,732 | ||||||
Energizer Holdings | 69,624 | 3,881,538 | ||||||
Flowers Foods | 103,800 | 2,014,758 | ||||||
Ingles Markets Class A | 35,400 | 1,527,510 | ||||||
J&J Snack Foods | 23,024 | 3,121,133 | ||||||
Pilgrim’s Pride | 59,400 | 1,336,797 | ||||||
Sanderson Farms | 17,400 | 1,806,816 | ||||||
SUPERVALU † | 124,600 | 480,956 | ||||||
Universal | 33,100 | 2,341,825 | ||||||
Whole Foods Market | 21,200 | 630,064 | ||||||
|
| |||||||
| 22,793,949 | ||||||||
|
| |||||||
Energy – 5.00% |
| |||||||
Bristow Group | 39,700 | 603,837 | ||||||
Diamond Offshore Drilling † | 42,600 | 711,846 | ||||||
Diamondback Energy † | 37,642 | 3,904,040 | ||||||
| Number of shares | Value (U.S. $) | |||||||
| ||||||||
Common Stock (continued) |
| |||||||
| ||||||||
Energy (continued) |
| |||||||
HollyFrontier | 70,400 | $ | 1,995,136 | |||||
Murphy Oil | 28,700 | 820,533 | ||||||
Parsley Energy Class A † | 125,500 | 4,080,005 | ||||||
PDC Energy † | 30,900 | 1,926,615 | ||||||
Rowan † | 54,795 | 853,706 | ||||||
RSP Permian † | 99,700 | 4,130,571 | ||||||
Tesoro | 27,300 | 2,212,938 | ||||||
|
| |||||||
| 21,239,227 | ||||||||
|
| |||||||
Financials – 21.84% |
| |||||||
American Financial Group | 30,900 | 2,948,478 | ||||||
Annaly Capital Management | 139,300 | 1,547,623 | ||||||
Apollo Commercial Real Estate Finance | 77,600 | 1,459,656 | ||||||
Ares Capital | 56,000 | 973,280 | ||||||
Aspen Insurance Holdings (Bermuda) | 15,300 | 796,365 | ||||||
Assurant | 18,600 | 1,779,462 | ||||||
Assured Guaranty (Bermuda) | 34,400 | 1,276,584 | ||||||
Banc of California | 121,100 | 2,506,770 | ||||||
Banco Latinoamericano de Comercio Exterior (Panama) | 32,105 | 890,593 | ||||||
Berkshire Hills Bancorp | 44,099 | 1,589,769 | ||||||
Blackstone Mortgage Trust | 41,500 | 1,284,840 | ||||||
Central Pacific Financial | 34,200 | 1,044,468 | ||||||
Chemical Financial | 95,626 | 4,891,270 | ||||||
CIT Group | 61,800 | 2,653,074 | ||||||
CNA Financial | 60,200 | 2,659,034 | ||||||
CNO Financial Group | 127,400 | 2,611,700 | ||||||
Customers Bancorp † | 37,700 | 1,188,681 | ||||||
Everest Re Group (Bermuda) | 12,200 | 2,852,482 | ||||||
First Busey | 45,200 | 1,328,880 | ||||||
Great Western Bancorp | 105,450 | 4,472,135 | ||||||
Hancock Holding | 19,200 | 874,560 | ||||||
Hanmi Financial | 47,900 | 1,472,925 | ||||||
Hanover Insurance Group | 21,400 | 1,927,284 | ||||||
Heritage Insurance Holdings | 32,300 | 412,471 | ||||||
Home BancShares | 76,300 | 2,065,441 | ||||||
International Bancshares | 26,600 | 941,640 | ||||||
Kemper | 13,900 | 554,610 | ||||||
MGIC Investment † | 107,200 | 1,085,936 | ||||||
New Mountain Finance | 71,900 | 1,071,310 | ||||||
Old National Bancorp | 86,500 | 1,500,775 | ||||||
Opus Bank | 31,100 | 626,665 | ||||||
Piper Jaffray | 9,900 | 632,115 | ||||||
Prospect Capital | 159,200 | 1,439,168 | ||||||
| 108 |
Table of Contents
| Number of shares | Value (U.S. $) | |||||||
| ||||||||
Common Stock (continued) |
| |||||||
| ||||||||
Financials (continued) |
| |||||||
Radian Group | 69,500 | $ | 1,248,220 | |||||
Reinsurance Group of America | 21,200 | 2,691,976 | ||||||
South State | 22,100 | 1,974,635 | ||||||
Starwood Property Trust | 81,600 | 1,842,528 | ||||||
TCF Financial | 163,600 | 2,784,472 | ||||||
TriCo Bancshares | 45,200 | 1,605,956 | ||||||
Universal Insurance Holdings | 41,300 | 1,011,850 | ||||||
Unum Group | 75,700 | 3,549,573 | ||||||
Validus Holdings (Bermuda) | 35,000 | 1,973,650 | ||||||
Washington Federal | 43,100 | 1,426,610 | ||||||
Western Alliance Bancorp † | 96,800 | 4,751,912 | ||||||
Wintrust Financial | 66,200 | 4,575,744 | ||||||
XL Group | 96,700 | 3,854,462 | ||||||
Zions Bancorporation | 98,093 | 4,119,906 | ||||||
|
| |||||||
| 92,771,538 | ||||||||
|
| |||||||
Healthcare – 6.72% |
| |||||||
Akorn † | 31,000 | 746,480 | ||||||
Centene † | 16,400 | 1,168,664 | ||||||
Cooper | 9,785 | 1,955,924 | ||||||
Kindred Healthcare | 107,600 | 898,460 | ||||||
Lannett † | 44,200 | 987,870 | ||||||
LifePoint Health † | 21,100 | 1,382,050 | ||||||
PAREXEL International † | 16,000 | 1,009,760 | ||||||
Patterson | 89,274 | 4,037,863 | ||||||
PerkinElmer | 54,600 | 3,170,076 | ||||||
Premier Class A † | 95,900 | 3,052,497 | ||||||
Quest Diagnostics | 11,600 | 1,139,004 | ||||||
SciClone Pharmaceuticals † | 4,500 | 44,100 | ||||||
STERIS (United Kingdom) | 29,300 | 2,035,178 | ||||||
Sucampo Pharmaceuticals Class A † | 67,400 | 741,400 | ||||||
Teleflex | 22,800 | 4,417,044 | ||||||
United Therapeutics † | 12,900 | 1,746,402 | ||||||
|
| |||||||
| 28,532,772 | ||||||||
|
| |||||||
Industrials – 14.04% |
| |||||||
ACCO Brands † | 146,000 | 1,919,900 | ||||||
Aircastle | 55,700 | 1,344,041 | ||||||
Alaska Air Group | 14,800 | 1,364,856 | ||||||
Briggs & Stratton | 39,700 | 891,265 | ||||||
Chicago Bridge & Iron (Netherlands) | 29,200 | 897,900 | ||||||
Crane | 13,900 | 1,040,137 | ||||||
Curtiss-Wright | 40,580 | 3,703,331 | ||||||
Deluxe | 29,800 | 2,150,666 | ||||||
Ennis | 45,800 | 778,600 | ||||||
Equifax | 23,307 | 3,186,999 | ||||||
GATX | 20,400 | 1,243,584 | ||||||
| Number of shares | Value (U.S. $) | |||||||
| ||||||||
Common Stock (continued) |
| |||||||
| ||||||||
Industrials (continued) |
| |||||||
Hawaiian Holdings † | 37,700 | $ | 1,751,165 | |||||
Herman Miller | 111,500 | 3,517,825 | ||||||
Hillenbrand | 25,966 | 930,881 | ||||||
Hubbell | 29,165 | 3,501,258 | ||||||
Huntington Ingalls Industries | 28,570 | 5,720,857 | ||||||
Interface | 151,100 | 2,878,455 | ||||||
ITT | 31,330 | 1,285,157 | ||||||
JetBlue Airways † | 69,200 | 1,426,212 | ||||||
Moog Class A † | 19,600 | 1,320,060 | ||||||
Oshkosh | 24,800 | 1,701,032 | ||||||
Owens Corning | 22,400 | 1,374,688 | ||||||
Pentair (United Kingdom) | 42,855 | 2,690,437 | ||||||
Pitney Bowes | 45,300 | 593,883 | ||||||
Ryder System | 31,700 | 2,391,448 | ||||||
Spirit AeroSystems Holdings Class A | 51,200 | 2,965,504 | ||||||
Timken | 24,600 | 1,111,920 | ||||||
Trinity Industries | 50,400 | 1,338,120 | ||||||
Wabash National | 130,500 | 2,700,045 | ||||||
Woodward | 28,656 | 1,946,316 | ||||||
|
| |||||||
| 59,666,542 | ||||||||
|
| |||||||
Information Technology – 13.40% |
| |||||||
Amdocs | 83,300 | 5,080,467 | ||||||
Arrow Electronics † | 11,500 | 844,215 | ||||||
Avnet | 117,900 | 5,395,104 | ||||||
Benchmark Electronics † | 29,100 | 925,380 | ||||||
Booz Allen Hamilton Holding | 106,274 | 3,761,037 | ||||||
Broadridge Financial Solutions | 58,276 | 3,959,854 | ||||||
Brocade Communications Systems | 159,400 | 1,989,312 | ||||||
Cirrus Logic † | 27,400 | 1,662,906 | ||||||
Convergys | 31,400 | 664,110 | ||||||
CSG Systems International | 18,200 | 688,142 | ||||||
Electronics For Imaging † | 42,470 | 2,073,810 | ||||||
Flex † | 158,900 | 2,669,520 | ||||||
FLIR Systems | 107,207 | 3,889,470 | ||||||
IXYS | 29,700 | 432,135 | ||||||
j2 Global | 53,800 | 4,514,358 | ||||||
Jabil Circuit | 43,700 | 1,263,804 | ||||||
Juniper Networks | 47,000 | 1,308,010 | ||||||
NCR † | 67,500 | 3,083,400 | ||||||
OSI Systems † | 45,851 | 3,346,664 | ||||||
Plantronics | 27,500 | 1,488,025 | ||||||
Sanmina † | 59,300 | 2,407,580 | ||||||
Tech Data † | 23,100 | 2,169,090 | ||||||
Teradyne | 73,300 | 2,279,630 | ||||||
| (continues) | 109 |
Table of Contents
Schedules of investments
Optimum Small-Mid Cap Value Fund
| Number of shares | Value (U.S. $) | |||||||
| ||||||||
Common Stock (continued) |
| |||||||
| ||||||||
Information Technology (continued) |
| |||||||
Western Union | 51,400 | $ | 1,045,990 | |||||
|
| |||||||
| 56,942,013 | ||||||||
|
| |||||||
Materials – 7.15% |
| |||||||
Albemarle | 38,007 | 4,015,059 | ||||||
Cabot | 26,400 | 1,581,624 | ||||||
Clearwater Paper † | 25,400 | 1,422,400 | ||||||
Domtar | 45,500 | 1,661,660 | ||||||
Eagle Materials | 40,800 | 3,963,312 | ||||||
Eastman Chemical | 15,700 | 1,268,560 | ||||||
KapStone Paper & Packaging | 168,200 | 3,885,420 | ||||||
Packaging Corp of America | 24,100 | 2,208,042 | ||||||
PolyOne | 62,404 | 2,127,352 | ||||||
Reliance Steel & Aluminum | 21,500 | 1,720,430 | ||||||
Schweitzer-Mauduit International | 32,700 | 1,354,434 | ||||||
Sensient Technologies | 38,600 | 3,059,436 | ||||||
Stepan | 26,600 | 2,096,346 | ||||||
|
| |||||||
| 30,364,075 | ||||||||
|
| |||||||
Real Estate – 10.06% |
| |||||||
Alexandria Real Estate Equities | 36,692 | 4,055,200 | ||||||
Brandywine Realty Trust | 249,400 | 4,047,762 | ||||||
CBL & Associates Properties | 63,700 | 607,698 | ||||||
City Office REIT (Canada) | 41,300 | 501,795 | ||||||
Franklin Street Properties | 70,484 | 855,676 | ||||||
Getty Realty | 54,693 | 1,382,092 | ||||||
Government Properties Income Trust | 37,700 | 789,061 | ||||||
Highwoods Properties | 68,510 | 3,365,896 | ||||||
Hospitality Properties Trust | 104,300 | 3,288,579 | ||||||
Hudson Pacific Properties | 70,300 | 2,435,192 | ||||||
Independence Realty Trust | 82,300 | 771,151 | ||||||
Lexington Realty Trust | 201,200 | 2,007,976 | ||||||
Mack-Cali Realty | 69,300 | 1,866,942 | ||||||
Medical Properties Trust | 157,100 | 2,025,019 | ||||||
One Liberty Properties | 51,900 | 1,212,384 | ||||||
Parkway | 23,737 | 472,129 | ||||||
Piedmont Office Realty Trust | 58,900 | 1,259,282 | ||||||
Preferred Apartment Communities | 33,100 | 437,251 | ||||||
Select Income REIT | 88,800 | 2,290,152 | ||||||
Senior Housing Properties Trust | 123,300 | 2,496,825 | ||||||
STAG Industrial | 158,500 | 3,965,670 | ||||||
Summit Hotel Properties | 162,100 | 2,590,358 | ||||||
|
| |||||||
| 42,724,090 | ||||||||
|
| |||||||
| Number of shares | Value (U.S. $) | |||||||
| ||||||||
Common Stock (continued) |
| |||||||
| ||||||||
Telecommunication Services – 1.10% |
| |||||||
Iridium Communications † | 178,100 | $ | 1,718,665 | |||||
magicJack VocalTec (Israel) † | 123,200 | 1,053,360 | ||||||
Zayo Group Holdings † | 57,900 | 1,904,910 | ||||||
|
| |||||||
| 4,676,935 | ||||||||
|
| |||||||
Utilities – 4.75% |
| |||||||
AES | 97,300 | 1,087,814 | ||||||
Alliant Energy | 102,632 | 4,065,254 | ||||||
CenterPoint Energy | 119,800 | 3,302,886 | ||||||
IDACORP | 51,000 | 4,230,960 | ||||||
NorthWestern | 69,542 | 4,082,115 | ||||||
OGE Energy | 98,000 | 3,428,040 | ||||||
|
| |||||||
| 20,197,069 | ||||||||
|
| |||||||
Total Common Stock | 419,889,508 | |||||||
|
| |||||||
| Principal amount° | ||||||||
| ||||||||
Short-Term Investments – 0.22% |
| |||||||
| ||||||||
Discount Notes – 0.06%≠ |
| |||||||
Federal Home Loan Bank | ||||||||
0.55% 5/26/17 | 5,011 | 5,006 | ||||||
0.69% 4/28/17 | 222,375 | 222,270 | ||||||
0.765% 5/19/17 | 40,506 | 40,469 | ||||||
|
| |||||||
| 267,745 | ||||||||
|
| |||||||
Repurchase Agreements – 0.15% |
| |||||||
Bank of America Merrill Lynch 0.73%, dated 3/31/17, to be repurchased on 4/3/17, repurchase price $212,351 (collateralized by U.S. government obligations 0.125% 4/15/18; market value $216,585) | 212,338 |
| 212,338 |
| ||||
Bank of Montreal 0.66%, dated 3/31/17, to be repurchased on 4/3/17, repurchase price $212,350 (collateralized by U.S. government obligations 0.75%–2.00% 2/28/19–2/15/45; market value $216,585) | 212,338 |
| 212,338 |
| ||||
| 110 |
Table of Contents
| Principal amount° | Value (U.S. $) | |||||||
| ||||||||
Short-Term Investments (continued) |
| |||||||
| ||||||||
Repurchase Agreements (continued) |
| |||||||
BNP Paribas 0.76%, dated 3/31/17, to be repurchased on 4/3/17, repurchase price $225,338 (collateralized by U.S. government obligations 0.00%–3.125% 6/30/17–2/15/43; market value $229,830) |
| 225,324 |
| $ | 225,324 |
| ||
|
| |||||||
| 650,000 | ||||||||
|
| |||||||
U.S. Treasury Obligation – 0.01%≠ | ||||||||
U.S. Treasury Bill 0.44% 4/13/17 |
| 24,699 |
|
| 24,694 |
| ||
|
| |||||||
| 24,694 | ||||||||
|
| |||||||
Total Short-Term Investments | 942,439 | |||||||
|
| |||||||
Total Value of Securities – 99.05% (cost $339,890,068) |
| $ | 420,831,947 |
| ||||
|
| |||||||
| ≠ | The rate shown is the effective yield at the time of purchase. |
| ° | Principal amount shown is stated in U.S. dollars unless noted that the security is denominated in another currency. |
| † | Non-income producing security. |
REIT – Real Estate Investment Trust
See accompanying notes, which are an integral part of the financial statements.
| 111 |
Table of Contents
Statements of assets and liabilities
Optimum Fund Trust
March 31, 2017
| Optimum Fixed Income Fund | Optimum International Fund | Optimum Large Cap Growth Fund | Optimum Large Cap Value Fund | Optimum Small-Mid Cap Growth Fund | Optimum Small-Mid Cap Value Fund | |||||||||||||||||||
Assets: | ||||||||||||||||||||||||
Investments, at value1,2 | $ | 1,998,296,233 | $ | 556,006,698 | $ | 1,453,522,908 | $ | 1,321,818,724 | $ | 434,578,413 | $ | 419,889,508 | ||||||||||||
Short-term investments, at value3 | 173,718,136 | 5,021,664 | 21,848,000 | 17,351,535 | 10,699,068 | 942,439 | ||||||||||||||||||
Short-term investments held as collateral for loaned securities, at value4 | — | 19,091,711 | — | — | — | — | ||||||||||||||||||
Cash collateral due from brokers | 4,738,554 | — | — | — | — | — | ||||||||||||||||||
Cash | 2,772,682 | 108,252 | 450,263 | 547,479 | — | — | ||||||||||||||||||
Foreign currencies, at value5 | 2,021,578 | 313,256 | — | 15,708 | — | — | ||||||||||||||||||
Receivable for securities sold | 159,165,737 | — | 25,874,020 | 6,369,094 | 2,404,513 | 5,122,426 | ||||||||||||||||||
Dividends and interest receivable | 12,551,484 | 2,764,787 | 562,746 | 1,762,878 | 155,214 | 574,550 | ||||||||||||||||||
Unrealized appreciation of interest rate swap contracts | 2,898,329 | — | — | — | — | — | ||||||||||||||||||
Receivable for fund shares sold | 2,265,359 | 671,443 | 1,625,713 | 1,623,264 | 563,613 | 580,815 | ||||||||||||||||||
Unrealized appreciation of foreign currency exchange contracts | 1,367,637 | — | — | — | — | — | ||||||||||||||||||
Unrealized appreciation of credit default swap contracts | 991,235 | — | — | — | — | — | ||||||||||||||||||
Variation margin due from broker on futures contracts | 731,699 | — | — | — | — | — | ||||||||||||||||||
Swap payments receivable | 142,379 | — | — | — | — | — | ||||||||||||||||||
Securities lending income receivable | — | 16,246 | — | — | — | — | ||||||||||||||||||
Foreign tax reclaims receivable | — | 861,341 | 27,617 | 363,891 | — | — | ||||||||||||||||||
Upfront payments paid on interest rate swap contracts | 2,241,732 | — | — | — | — | — | ||||||||||||||||||
Upfront payments paid on credit default swap contracts | 191,765 | — | — | — | — | — | ||||||||||||||||||
Other assets6 | 415,736 | — | — | — | — | — | ||||||||||||||||||
|
|
|
|
|
|
|
|
|
|
|
| |||||||||||||
Total assets | 2,364,510,275 | 584,855,398 | 1,503,911,267 | 1,349,852,573 | 448,400,821 | 427,109,738 | ||||||||||||||||||
|
|
|
|
|
|
|
|
|
|
|
| |||||||||||||
112
Table of Contents
| Optimum Fixed Income Fund | Optimum International Fund | Optimum Large Cap Growth Fund | Optimum Large Cap Value Fund | Optimum Small-Mid Cap Growth Fund | Optimum Small-Mid Cap Value Fund | |||||||||||||||||||
Liabilities: | ||||||||||||||||||||||||
Reverse repurchase agreement payable | $ | 2,400,000 | $ | — | $ | — | $ | — | $ | — | $ | — | ||||||||||||
Options written, at value7 | 701,385 | — | — | — | — | — | ||||||||||||||||||
Cash overdraft | — | — | — | — | 428,331 | 578,587 | ||||||||||||||||||
Payable for securities purchased | 461,947,831 | 671,291 | 15,167,505 | 5,155,658 | 4,732,855 | 710,819 | ||||||||||||||||||
Cash collateral due to brokers | 2,852,000 | — | — | — | — | — | ||||||||||||||||||
Payable for fund shares redeemed | 1,830,234 | 463,103 | 1,221,685 | 1,194,192 | 378,617 | 379,350 | ||||||||||||||||||
Swap payments payable | 589,522 | — | — | — | — | — | ||||||||||||||||||
Dividend disbursing and transfer agent fees payable | 319,900 | 96,484 | 252,627 | 231,266 | 74,872 | 72,506 | ||||||||||||||||||
Variation margin due to brokers on centrally cleared interest rate swap contracts | 105,256 | — | — | — | — | — | ||||||||||||||||||
Variation margin due to brokers on centrally cleared credit default swap contracts | 2,777 | — | — | — | — | — | ||||||||||||||||||
Interest payable for reverse repurchase agreements | 607 | — | — | — | — | — | ||||||||||||||||||
Obligation to return securities lending collateral | — | 19,077,705 | — | — | — | — | ||||||||||||||||||
Investment management fees payable to affiliates | 829,492 | 372,764 | 920,331 | 730,753 | 334,449 | 308,814 | ||||||||||||||||||
Other accrued expenses | 654,258 | 280,904 | 366,595 | 338,474 | 136,744 | 114,534 | ||||||||||||||||||
Administration expenses payable to affiliates | 143,814 | 56,446 | 120,269 | 112,793 | 44,924 | 43,504 | ||||||||||||||||||
Distribution fees payable to affiliates | 112,718 | 27,176 | 96,465 | 88,861 | 15,281 | 13,150 | ||||||||||||||||||
Trustees’ fees and expenses payable to affiliates | 51,069 | 15,392 | 40,287 | 36,397 | 11,993 | 11,524 | ||||||||||||||||||
Accounting fees payable to affiliates | 11,434 | 3,449 | 9,030 | 8,266 | 2,676 | 2,592 | ||||||||||||||||||
Upfront receipts on interest rate swap contracts | 3,160,762 | — | — | — | — | — | ||||||||||||||||||
Upfront receipts on credit default swap contracts | 1,922,466 | — | — | — | — | — | ||||||||||||||||||
Unrealized depreciation of foreign currency exchange contracts | 1,101,958 | 530 | — | — | — | — | ||||||||||||||||||
Unrealized depreciation of interest rate swap contracts | 820,608 | — | — | — | — | — | ||||||||||||||||||
Unrealized depreciation of credit default swap contracts | 403,722 | — | — | — | — | — | ||||||||||||||||||
Bond proceeds payable6 | 1,385,788 | — | — | — | — | — | ||||||||||||||||||
Other liabilities | 11,581 | 134,816 | — | — | — | — | ||||||||||||||||||
|
|
|
|
|
|
|
|
|
|
|
| |||||||||||||
Total liabilities | 481,359,182 | 21,200,060 | 18,194,794 | 7,896,660 | 6,160,742 | 2,235,380 | ||||||||||||||||||
|
|
|
|
|
|
|
|
|
|
|
| |||||||||||||
Total Net Assets | $ | 1,883,151,093 | $ | 563,655,338 | $ | 1,485,716,473 | $ | 1,341,955,913 | $ | 442,240,079 | $ | 424,874,358 | ||||||||||||
|
|
|
|
|
|
|
|
|
|
|
| |||||||||||||
Net Assets Consist of: |
| |||||||||||||||||||||||
Paid-in capital | $ | 1,905,050,974 | $ | 545,624,793 | $ | 1,128,928,892 | $ | 1,098,748,396 | $ | 368,909,369 | $ | 335,338,237 | ||||||||||||
Undistributed (accumulated) net investment income (loss) | 13,181,364 | 1,599,942 | — | 3,293,407 | (1,114,999 | ) | 1,701,989 | |||||||||||||||||
Accumulated net realized gain (loss) | (42,555,678 | ) | (21,181,051 | ) | 50,168,461 | 40,192,990 | 41,667 | 6,892,253 | ||||||||||||||||
Net unrealized appreciation of investments | 2,535,499 | 37,760,442 | 306,620,591 | 199,741,054 | 74,404,042 | 80,941,879 | ||||||||||||||||||
Net unrealized depreciation of foreign currencies | (7,225 | ) | (148,258 | ) | (1,471 | ) | (19,934 | ) | — | — | ||||||||||||||
Net unrealized appreciation (depreciation) of foreign currency exchange contracts | 265,679 | (530 | ) | — | — | — | — | |||||||||||||||||
Net unrealized appreciation of futures contracts | 2,529,328 | — | — | — | — | — | ||||||||||||||||||
Net unrealized depreciation of options purchased | (493,456 | ) | ||||||||||||||||||||||
Net unrealized appreciation of options written | 516,329 | — | — | — | — | — | ||||||||||||||||||
Net unrealized appreciation of swap contracts | 2,128,279 | — | — | — | — | — | ||||||||||||||||||
|
|
|
|
|
|
|
|
|
|
|
| |||||||||||||
Total Net Assets | $ | 1,883,151,093 | $ | 563,655,338 | $ | 1,485,716,473 | $ | 1,341,955,913 | $ | 442,240,079 | $ | 424,874,358 | ||||||||||||
|
|
|
|
|
|
|
|
|
|
|
| |||||||||||||
| (continues) | 113 |
Table of Contents
Statements of assets and liabilities
Optimum Fund Trust
| Optimum Fixed Income Fund | Optimum International Fund | Optimum Large Cap Growth Fund | Optimum Large Cap Value Fund | Optimum Small-Mid Cap Growth Fund | Optimum Small-Mid Cap Value Fund | |||||||||||||||||||
Net Asset Value |
| |||||||||||||||||||||||
Class A: | ||||||||||||||||||||||||
Net assets | $ | 33,838,055 | $ | 8,680,265 | $ | 32,214,755 | $ | 28,739,366 | $ | 5,292,917 | $ | 4,279,389 | ||||||||||||
Shares of beneficial interest outstanding, unlimited authorization, no par | 3,602,048 | 707,371 | 1,913,398 | 1,863,360 | 397,802 | 310,874 | ||||||||||||||||||
Net asset value per share | $ | 9.39 | $ | 12.27 | $ | 16.84 | $ | 15.42 | $ | 13.31 | $ | 13.77 | ||||||||||||
Sales charge | 4.50 | % | 5.75 | % | 5.75 | % | 5.75 | % | 5.75 | % | 5.75 | % | ||||||||||||
Offering price per share, equal to net asset value per share / (1 – sales charge) | $ | 9.83 | $ | 13.02 | $ | 17.87 | $ | 16.36 | $ | 14.12 | $ | 14.61 | ||||||||||||
Class C: | ||||||||||||||||||||||||
Net assets | $ | 124,024,135 | $ | 29,544,526 | $ | 105,082,273 | $ | 95,495,129 | $ | 16,667,720 | $ | 14,267,782 | ||||||||||||
Shares of beneficial interest outstanding, unlimited authorization, no par | 13,216,480 | 2,466,621 | 7,093,812 | 6,262,382 | 1,438,213 | 1,168,323 | ||||||||||||||||||
Net asset value per share | $ | 9.38 | $ | 11.98 | $ | 14.81 | $ | 15.25 | $ | 11.59 | $ | 12.21 | ||||||||||||
Institutional Class: | ||||||||||||||||||||||||
Net assets | $ | 1,725,288,903 | $ | 525,430,547 | $ | 1,348,419,445 | $ | 1,217,721,418 | $ | 420,279,442 | $ | 406,327,187 | ||||||||||||
Shares of beneficial interest outstanding, unlimited authorization, no par | 183,760,473 | 42,533,735 | 75,725,300 | 78,777,220 | 29,626,226 | 27,979,463 | ||||||||||||||||||
Net asset value per share | $ | 9.39 | $ | 12.35 | $ | 17.81 | $ | 15.46 | $ | 14.19 | $ | 14.52 | ||||||||||||
| ||||||||||||||||||||||||
1 Investments, at cost | $ | 1,996,258,906 | $ | 518,248,296 | $ | 1,146,902,317 | $ | 1,122,078,077 | $ | 360,174,179 | $ | 338,947,641 | ||||||||||||
2 Including securities on loan | — | 26,639,200 | — | — | — | — | ||||||||||||||||||
3 Short-term investments, at cost | 173,713,385 | 5,021,744 | 21,848,000 | 17,351,128 | 10,699,260 | 942,427 | ||||||||||||||||||
4 Short-term investments held as collateral for loaned securities, at cost | — | 19,089,591 | — | — | — | — | ||||||||||||||||||
5 Foreign currencies, at cost | 2,026,067 | 309,114 | — | 15,667 | — | — | ||||||||||||||||||
6 See Note 13 in “Notes to financial statements.” | (970,052 | ) | — | — | — | — | — | |||||||||||||||||
7 Premium received | (1,217,714 | ) | — | — | — | — | — | |||||||||||||||||
See accompanying notes, which are an integral part of the financial statements.
| 114 |
Table of Contents
Optimum Fund Trust
Year ended March 31, 2017
| Optimum Fixed Income Fund | Optimum International Fund | Optimum Large Cap Growth Fund | Optimum Large Cap Value Fund | Optimum Small-Mid Cap Growth Fund | Optimum Small-Mid Cap Value Fund | |||||||||||||||||||
Investment Income: | ||||||||||||||||||||||||
Interest | $ | 66,148,158 | $ | 13,838 | $ | 87,529 | $ | 71,232 | $ | 27,207 | $ | 13,518 | ||||||||||||
Dividends | 224,177 | 14,945,370 | 14,623,551 | 32,690,104 | 1,785,432 | 9,070,505 | ||||||||||||||||||
Securities lending income | — | 180,863 | — | — | — | — | ||||||||||||||||||
Foreign tax withheld | (11,341 | ) | (1,362,160 | ) | (15,706 | ) | (110,626 | ) | (4,243 | ) | (1,358 | ) | ||||||||||||
|
|
|
|
|
|
|
|
|
|
|
| |||||||||||||
| 66,360,994 | 13,777,911 | 14,695,374 | 32,650,710 | 1,808,396 | 9,082,665 | |||||||||||||||||||
|
|
|
|
|
|
|
|
|
|
|
| |||||||||||||
Expenses: | ||||||||||||||||||||||||
Management fees | 10,881,235 | 4,417,359 | 10,896,027 | 9,573,320 | 4,734,712 | 4,287,247 | ||||||||||||||||||
Distribution expenses — Class A | 93,820 | 22,592 | 82,709 | 75,456 | 13,185 | 11,031 | ||||||||||||||||||
Distribution expenses — Class C | 1,403,125 | 303,762 | 1,079,611 | 995,891 | 167,176 | 147,061 | ||||||||||||||||||
Dividend disbursing and transfer agent fees and expenses | 4,080,764 | 1,170,842 | 2,997,844 | 2,776,697 | 887,861 | 873,431 | ||||||||||||||||||
Administration expenses | 1,784,623 | 668,303 | 1,407,986 | 1,331,753 | 516,514 | 507,720 | ||||||||||||||||||
Accounting fees | 733,547 | 208,329 | 537,833 | 497,895 | 156,798 | 154,130 | ||||||||||||||||||
Reports and statements to shareholders expenses | 385,796 | 113,552 | 273,117 | 319,392 | 84,173 | 131,876 | ||||||||||||||||||
Trustees’ fees and expenses | 218,972 | 62,809 | 160,911 | 149,948 | 47,869 | 46,990 | ||||||||||||||||||
Custodian fees | 211,341 | 155,419 | 68,967 | 63,859 | 43,188 | 21,913 | ||||||||||||||||||
Professional fees | 203,812 | 78,632 | 140,362 | 118,511 | 80,933 | 52,844 | ||||||||||||||||||
Pricing fees | 135,963 | 32,947 | 1,127 | 1,488 | 1,004 | 885 | ||||||||||||||||||
Registration fees | 75,415 | 54,541 | 63,657 | 62,849 | 55,692 | 53,795 | ||||||||||||||||||
Insurance fees | 40,986 | 10,679 | 29,868 | 25,679 | 9,331 | 8,873 | ||||||||||||||||||
Interest expense | 5,523 | — | — | — | — | — | ||||||||||||||||||
Tax services | 1,771 | 38,028 | 2,434 | 733 | 874 | 511 | ||||||||||||||||||
Other | 23,544 | 9,799 | 18,592 | 18,071 | 8,964 | 10,388 | ||||||||||||||||||
|
|
|
|
|
|
|
|
|
|
|
| |||||||||||||
| 20,280,237 | 7,347,593 | 17,761,045 | 16,011,542 | 6,808,274 | 6,308,695 | |||||||||||||||||||
Less expenses waived | (244,551 | ) | — | (408,030 | ) | (178,075 | ) | (888,915 | ) | (832,874 | ) | |||||||||||||
Less expense paid indirectly | (843 | ) | (823 | ) | (927 | ) | (929 | ) | (906 | ) | (913 | ) | ||||||||||||
|
|
|
|
|
|
|
|
|
|
|
| |||||||||||||
Total operating expenses | 20,034,843 | 7,346,770 | 17,352,088 | 15,832,538 | 5,918,453 | 5,474,908 | ||||||||||||||||||
|
|
|
|
|
|
|
|
|
|
|
| |||||||||||||
Net Investment Income (Loss) | 46,326,151 | 6,431,141 | (2,656,714 | ) | 16,818,172 | (4,110,057 | ) | 3,607,757 | ||||||||||||||||
|
|
|
|
|
|
|
|
|
|
|
| |||||||||||||
| (continues) | 115 |
Table of Contents
Statements of operations
Optimum Fund Trust
| Optimum Fixed Income Fund | Optimum International Fund | Optimum Large Cap Growth Fund | Optimum Large Cap Value Fund | Optimum Small-Mid Cap Growth Fund | Optimum Small-Mid Cap Value Fund | |||||||||||||||||||
Net Realized and Unrealized Gain (Loss): | ||||||||||||||||||||||||
Net realized gain (loss) on: | ||||||||||||||||||||||||
Investments1 | $ | 7,992,078 | $ | 6,829,604 | $ | 102,466,450 | $ | 221,783,804 | $ | 19,561,084 | $ | 34,020,737 | ||||||||||||
Foreign currencies | (4,573,028 | ) | 242,644 | 210 | (137,412 | ) | (4,747 | ) | — | |||||||||||||||
Foreign currency exchange contracts | 3,099,794 | (211,679 | ) | 86,479 | (2,644 | ) | 6,831 | — | ||||||||||||||||
Futures contracts | (13,948,762 | ) | — | — | — | — | — | |||||||||||||||||
Options purchased | (157,060 | ) | — | — | — | — | — | |||||||||||||||||
Options written | 1,954,209 | — | — | — | — | — | ||||||||||||||||||
Swap contracts | (2,812,669 | ) | — | — | — | — | — | |||||||||||||||||
|
|
|
|
|
|
|
|
|
|
|
| |||||||||||||
Net realized gain (loss) | (8,445,438 | ) | 6,860,569 | 102,553,139 | 221,643,748 | 19,563,168 | 34,020,737 | |||||||||||||||||
|
|
|
|
|
|
|
|
|
|
|
| |||||||||||||
Net change in unrealized appreciation (depreciation) of: | ||||||||||||||||||||||||
Investments2 | (12,146,514 | ) | 58,274,025 | 131,161,619 | (43,645,912 | ) | 68,639,734 | 38,728,388 | ||||||||||||||||
Foreign currencies | 91,880 | (153,559 | ) | (283 | ) | (11,380 | ) | 183 | — | |||||||||||||||
Foreign currency exchange contracts | 2,823,705 | (509 | ) | — | — | — | — | |||||||||||||||||
Futures contracts | 4,565,500 | — | — | — | — | — | ||||||||||||||||||
Options purchased | 321,608 | — | — | — | — | — | ||||||||||||||||||
Options written | (298,864 | ) | — | — | — | — | — | |||||||||||||||||
Swap contracts | 13,264,658 | — | — | — | — | — | ||||||||||||||||||
|
|
|
|
|
|
|
|
|
|
|
| |||||||||||||
Net change in unrealized appreciation (depreciation) | 8,621,973 | 58,119,957 | 131,161,336 | (43,657,292 | ) | 68,639,917 | 38,728,388 | |||||||||||||||||
|
|
|
|
|
|
|
|
|
|
|
| |||||||||||||
Net Realized and Unrealized Gain | 176,535 | 64,980,526 | 233,714,475 | 177,986,456 | 88,203,085 | 72,749,125 | ||||||||||||||||||
|
|
|
|
|
|
|
|
|
|
|
| |||||||||||||
Net Increase in Net Assets Resulting from Operations | $ | 46,502,686 | $ | 71,411,667 | $ | 231,057,761 | $ | 194,804,628 | $ | 84,093,028 | $ | 76,356,882 | ||||||||||||
|
|
|
|
|
|
|
|
|
|
|
| |||||||||||||
1Includes $25,140 capital gain taxes paid for Optimum Fixed Income Fund.
2Includes $11,503 and $119,254 capital gain taxes accrued for Optimum Fixed Income Fund and Optimum International Fund, respectively.
See accompanying notes, which are an integral part of the financial statements.
116
Table of Contents
Statements of changes in net assets
Optimum Fund Trust
| Optimum Fixed Income Fund | Optimum International Fund | |||||||||||||||
| Year ended | Year ended | |||||||||||||||
| 3/31/17 | 3/31/16 | 3/31/17 | 3/31/16 | |||||||||||||
Increase (Decrease) in Net Assets from Operations: | ||||||||||||||||
Net investment income | $ | 46,326,151 | $ | 47,403,894 | $ | 6,431,141 | $ | 5,015,942 | ||||||||
Net realized gain (loss) | (8,445,438 | ) | (27,629,119 | ) | 6,860,569 | (10,956,221 | ) | |||||||||
Net change in unrealized appreciation (depreciation) | 8,621,973 | (30,091,919 | ) | 58,119,957 | (23,203,947 | ) | ||||||||||
|
|
|
|
|
|
|
| |||||||||
Net increase (decrease) in net assets resulting from operations | 46,502,686 | (10,317,144 | ) | 71,411,667 | (29,144,226 | ) | ||||||||||
|
|
|
|
|
|
|
| |||||||||
Dividends and Distributions to Shareholders from: | ||||||||||||||||
Net investment income: | ||||||||||||||||
Class A | (676,539 | ) | (1,085,313 | ) | (80,080 | ) | (50,629 | ) | ||||||||
Class C | (1,524,429 | ) | (3,029,706 | ) | (65,461 | ) | — | |||||||||
Institutional Class | (37,864,252 | ) | (54,756,893 | ) | (5,899,992 | ) | (4,309,148 | ) | ||||||||
Net realized gain: | ||||||||||||||||
Class A | — | (85,457 | ) | — | — | |||||||||||
Class C | — | (332,935 | ) | — | — | |||||||||||
Institutional Class | — | (3,939,345 | ) | — | — | |||||||||||
|
|
|
|
|
|
|
| |||||||||
| (40,065,220 | ) | (63,229,649 | ) | (6,045,533 | ) | (4,359,777 | ) | |||||||||
|
|
|
|
|
|
|
| |||||||||
Capital Share Transactions: | ||||||||||||||||
Proceeds from shares sold: | ||||||||||||||||
Class A | 2,615,487 | 4,608,270 | 626,232 | 1,203,348 | ||||||||||||
Class C | 7,193,141 | 20,019,238 | 1,814,846 | 4,103,792 | ||||||||||||
Institutional Class | 378,540,581 | 480,837,856 | 85,837,495 | 183,077,658 | ||||||||||||
Net asset value of shares issued upon reinvestment of dividends and distributions: | ||||||||||||||||
Class A | 674,466 | 1,167,080 | 79,845 | 50,419 | ||||||||||||
Class C | 1,523,427 | 3,361,112 | 65,389 | — | ||||||||||||
Institutional Class | 37,826,389 | 58,657,351 | 5,894,688 | 4,306,426 | ||||||||||||
|
|
|
|
|
|
|
| |||||||||
| 428,373,491 | 568,650,907 | 94,318,495 | 192,741,643 | |||||||||||||
|
|
|
|
|
|
|
| |||||||||
Cost of shares redeemed: | ||||||||||||||||
Class A | (9,136,395 | ) | (7,872,126 | ) | (2,172,483 | ) | (1,788,908 | ) | ||||||||
Class C | (38,409,617 | ) | (30,460,309 | ) | (7,546,843 | ) | (5,982,044 | ) | ||||||||
Institutional Class | (589,700,192 | ) | (406,639,728 | ) | (169,259,362 | ) | (92,688,776 | ) | ||||||||
|
|
|
|
|
|
|
| |||||||||
| (637,246,204 | ) | (444,972,163 | ) | (178,978,688 | ) | (100,459,728 | ) | |||||||||
|
|
|
|
|
|
|
| |||||||||
Increase (decrease) in net assets derived from capital share transactions | (208,872,713 | ) | 123,678,744 | (84,660,193 | ) | 92,281,915 | ||||||||||
|
|
|
|
|
|
|
| |||||||||
Net Increase (Decrease) in Net Assets | (202,435,247 | ) | 50,131,951 | (19,294,059 | ) | 58,777,912 | ||||||||||
Net Assets: | ||||||||||||||||
Beginning of year | 2,085,586,340 | 2,035,454,389 | 582,949,397 | 524,171,485 | ||||||||||||
|
|
|
|
|
|
|
| |||||||||
End of year | $ | 1,883,151,093 | $ | 2,085,586,340 | $ | 563,655,338 | $ | 582,949,397 | ||||||||
|
|
| �� |
|
|
|
| |||||||||
Undistributed net investment income | $ | 13,181,364 | $ | 5,660,130 | $ | 1,599,942 | $ | 1,160,288 | ||||||||
|
|
|
|
|
|
|
| |||||||||
See accompanying notes, which are an integral part of the financial statements.
| (continues) | 117 |
Table of Contents
Statements of changes in net assets
Optimum Fund Trust
| Optimum Large Cap Growth Fund | Optimum Large Cap Value Fund | |||||||||||||||
| Year ended | Year ended | |||||||||||||||
| 3/31/17 | 3/31/16 | 3/31/17 | 3/31/16 | |||||||||||||
Increase (Decrease) in Net Assets from Operations: | ||||||||||||||||
Net investment income (loss) | $ | (2,656,714 | ) | $ | (7,209,710 | ) | $ | 16,818,172 | $ | 15,708,179 | ||||||
Net realized gain | 102,553,139 | 96,753,459 | 221,643,748 | 1,430,982 | ||||||||||||
Net change in unrealized appreciation (depreciation) | 131,161,336 | (122,893,611 | ) | (43,657,292 | ) | (75,770,012 | ) | |||||||||
|
|
|
|
|
|
|
| |||||||||
Net increase (decrease) in net assets resulting from operations | 231,057,761 | (33,349,862 | ) | 194,804,628 | (58,630,851 | ) | ||||||||||
|
|
|
|
|
|
|
| |||||||||
Dividends and Distributions to Shareholders from: | ||||||||||||||||
Net investment income: | ||||||||||||||||
Class A | — | — | (322,766 | ) | (321,261 | ) | ||||||||||
Class C | — | — | (382,046 | ) | (274,376 | ) | ||||||||||
Institutional Class | — | — | (16,045,433 | ) | (14,327,950 | ) | ||||||||||
Net realized gain: | ||||||||||||||||
Class A | (1,203,358 | ) | (3,719,537 | ) | (3,180,253 | ) | — | |||||||||
Class C | (4,316,642 | ) | (13,957,426 | ) | (10,410,746 | ) | — | |||||||||
Institutional Class | (45,828,776 | ) | (136,563,101 | ) | (129,552,015 | ) | — | |||||||||
|
|
|
|
|
|
|
| |||||||||
| (51,348,776 | ) | (154,240,064 | ) | (159,893,259 | ) | (14,923,587 | ) | |||||||||
|
|
|
|
|
|
|
| |||||||||
Capital Share Transactions: | ||||||||||||||||
Proceeds from shares sold: | ||||||||||||||||
Class A | 1,584,659 | 2,170,167 | 1,599,717 | 2,199,582 | ||||||||||||
Class C | 4,926,393 | 8,435,040 | 5,099,592 | 8,104,091 | ||||||||||||
Institutional Class | 227,791,648 | 290,002,877 | 320,762,276 | 254,483,230 | ||||||||||||
Net asset value of shares issued upon reinvestment of dividends and distributions: | ||||||||||||||||
Class A | 1,200,552 | 3,677,396 | 3,494,971 | 317,257 | ||||||||||||
Class C | 4,311,583 | 13,948,506 | 10,774,076 | 274,091 | ||||||||||||
Institutional Class | 45,764,351 | 136,409,018 | 145,399,962 | 14,310,905 | ||||||||||||
|
|
|
|
|
|
|
| |||||||||
| 285,579,186 | 454,643,004 | 487,130,594 | 279,689,156 | |||||||||||||
|
|
|
|
|
|
|
| |||||||||
Cost of shares redeemed: | ||||||||||||||||
Class A | (8,255,058 | ) | (8,356,642 | ) | (7,586,746 | ) | (6,085,917 | ) | ||||||||
Class C | (30,464,822 | ) | (27,572,016 | ) | (26,404,995 | ) | (20,750,036 | ) | ||||||||
Institutional Class | (445,881,165 | ) | (317,836,544 | ) | (409,895,778 | ) | (220,344,722 | ) | ||||||||
|
|
|
|
|
|
|
| |||||||||
| (484,601,045 | ) | (353,765,202 | ) | (443,887,519 | ) | (247,180,675 | ) | |||||||||
|
|
|
|
|
|
|
| |||||||||
Increase (decrease) in net assets derived from capital share transactions | (199,021,859 | ) | 100,877,802 | 43,243,075 | 32,508,481 | |||||||||||
|
|
|
|
|
|
|
| |||||||||
Net Increase (Decrease) in Net Assets | (19,312,874 | ) | (86,712,124 | ) | 78,154,444 | (41,045,957 | ) | |||||||||
Net Assets: | ||||||||||||||||
Beginning of year | 1,505,029,347 | 1,591,741,471 | 1,263,801,469 | 1,304,847,426 | ||||||||||||
|
|
|
|
|
|
|
| |||||||||
End of year | $ | 1,485,716,473 | $ | 1,505,029,347 | $ | 1,341,955,913 | $ | 1,263,801,469 | ||||||||
|
|
|
|
|
|
|
| |||||||||
Undistributed (accumulated) net investment income (loss) | $ | — | $ | (1,408,686 | ) | $ | 3,293,407 | $ | 3,365,536 | |||||||
|
|
|
|
|
|
|
| |||||||||
See accompanying notes, which are an integral part of the financial statements.
118
Table of Contents
| Optimum Small-Mid Cap Growth Fund | Optimum Small-Mid Cap Value Fund | |||||||||||||||
| Year ended | Year ended | |||||||||||||||
| 3/31/17 | 3/31/16 | 3/31/17 | 3/31/16 | |||||||||||||
Increase (Decrease) in Net Assets from Operations: | ||||||||||||||||
Net investment income (loss) | $ | (4,110,057 | ) | $ | (4,546,430 | ) | $ | 3,607,757 | $ | (655,163 | ) | |||||
Net realized gain (loss) | 19,563,168 | 22,927,598 | 34,020,737 | (16,532,077 | ) | |||||||||||
Net change in unrealized appreciation (depreciation) | 68,639,917 | (111,069,637 | ) | 38,728,388 | (45,591,581 | ) | ||||||||||
|
|
|
|
|
|
|
| |||||||||
Net increase (decrease) in net assets resulting from operations | 84,093,028 | (92,688,469 | ) | 76,356,882 | (62,778,821 | ) | ||||||||||
|
|
|
|
|
|
|
| |||||||||
Dividends and Distributions to Shareholders from: | ||||||||||||||||
Net investment income: | ||||||||||||||||
Class A | — | — | (16,209 | ) | — | |||||||||||
Institutional Class | — | — | (2,284,918 | ) | — | |||||||||||
Return of capital: | ||||||||||||||||
Class A | — | (108 | ) | — | (325 | ) | ||||||||||
Class C | — | (416 | ) | — | (1,284 | ) | ||||||||||
Institutional Class | — | (8,917 | ) | — | (31,607 | ) | ||||||||||
Net realized gain: | ||||||||||||||||
Class A | — | (848,264 | ) | — | (181,566 | ) | ||||||||||
Class C | — | (3,111,096 | ) | — | (716,111 | ) | ||||||||||
Institutional Class | — | (64,692,634 | ) | — | (16,831,364 | ) | ||||||||||
|
|
|
|
|
|
|
| |||||||||
| — | (68,661,435 | ) | (2,301,127 | ) | (17,762,257 | ) | ||||||||||
|
|
|
|
|
|
|
| |||||||||
Capital Share Transactions: | ||||||||||||||||
Proceeds from shares sold: | ||||||||||||||||
Class A | 420,894 | 451,922 | 372,174 | 413,183 | ||||||||||||
Class C | 1,008,435 | 1,541,727 | 624,715 | 1,260,654 | ||||||||||||
Institutional Class | 78,489,396 | 118,186,291 | 76,824,883 | 116,775,502 | ||||||||||||
Net asset value of shares issued upon reinvestment of dividends and distributions: | ||||||||||||||||
Class A | — | 837,719 | 16,178 | 181,312 | ||||||||||||
Class C | — | 3,109,916 | — | 716,788 | ||||||||||||
Institutional Class | — | 64,636,607 | 2,282,053 | 16,847,228 | ||||||||||||
|
|
|
|
|
|
|
| |||||||||
| 79,918,725 | 188,764,182 | 80,120,003 | 136,194,667 | |||||||||||||
|
|
|
|
|
|
|
| |||||||||
Cost of shares redeemed: | ||||||||||||||||
Class A | (1,198,557 | ) | (1,341,729 | ) | (1,195,842 | ) | (923,567 | ) | ||||||||
Class C | (4,441,565 | ) | (3,951,373 | ) | (4,032,657 | ) | (3,003,693 | ) | ||||||||
Institutional Class | (178,827,032 | ) | (117,328,470 | ) | (184,660,997 | ) | (115,400,981 | ) | ||||||||
|
|
|
|
|
|
|
| |||||||||
| (184,467,154 | ) | (122,621,572 | ) | (189,889,496 | ) | (119,328,241 | ) | |||||||||
|
|
|
|
|
|
|
| |||||||||
Increase (decrease) in net assets derived from capital share transactions | (104,548,429 | ) | 66,142,610 | (109,769,493 | ) | 16,866,426 | ||||||||||
|
|
|
|
|
|
|
| |||||||||
Net Decrease in Net Assets | (20,455,401 | ) | (95,207,294 | ) | (35,713,738 | ) | (63,674,652 | ) | ||||||||
Net Assets: | ||||||||||||||||
Beginning of year | 462,695,480 | 557,902,774 | 460,588,096 | 524,262,748 | ||||||||||||
|
|
|
|
|
|
|
| |||||||||
End of year | $ | 442,240,079 | $ | 462,695,480 | $ | 424,874,358 | $ | 460,588,096 | ||||||||
|
|
|
|
|
|
|
| |||||||||
Undistributed (accumulated) net investment income (loss) | $ | (1,114,999 | ) | $ | (1,156,797 | ) | $ | 1,701,989 | $ | (167,745 | ) | |||||
|
|
|
|
|
|
|
| |||||||||
See accompanying notes, which are an integral part of the financial statements.
| (continues) | 119 |
Table of Contents
Optimum Fixed Income Fund Class A
Selected data for each share of the Fund outstanding throughout each period were as follows:
| Year ended | ||||||||||||||||||||
| 3/31/17 | 3/31/16 | 3/31/15 | 3/31/14 | 3/31/13 | ||||||||||||||||
Net asset value, beginning of period | $ | 9.370 | $ | 9.720 | $ | 9.540 | $ | 9.850 | $ | 9.710 | ||||||||||
Income (loss) from investment operations: | ||||||||||||||||||||
Net investment income1 | 0.201 | 0.202 | 0.203 | 0.213 | 0.225 | |||||||||||||||
Net realized and unrealized gain (loss) | (0.004 | ) | (0.278 | ) | 0.194 | (0.353 | ) | 0.302 | ||||||||||||
|
|
|
|
|
|
|
|
|
| |||||||||||
Total from investment operations | 0.197 | (0.076 | ) | 0.397 | (0.140 | ) | 0.527 | |||||||||||||
|
|
|
|
|
|
|
|
|
| |||||||||||
Less dividends and distributions from: | ||||||||||||||||||||
Net investment income | (0.177 | ) | (0.254 | ) | (0.217 | ) | (0.142 | ) | (0.172 | ) | ||||||||||
Net realized gain | — | (0.020 | ) | — | (0.028 | ) | (0.215 | ) | ||||||||||||
|
|
|
|
|
|
|
|
|
| |||||||||||
Total dividends and distributions | (0.177 | ) | (0.274 | ) | (0.217 | ) | (0.170 | ) | (0.387 | ) | ||||||||||
|
|
|
|
|
|
|
|
|
| |||||||||||
Net asset value, end of period | $ | 9.390 | $ | 9.370 | $ | 9.720 | $ | 9.540 | $ | 9.850 | ||||||||||
|
|
|
|
|
|
|
|
|
| |||||||||||
Total return2 | 2.03% | (0.63% | ) | 4.21% | (1.40% | ) | 5.47% | |||||||||||||
Ratios and supplemental data: | ||||||||||||||||||||
Net assets, end of period (000 omitted) | $ | 33,838 | $ | 39,545 | $ | 43,144 | $ | 43,241 | $ | 41,210 | ||||||||||
Ratio of expenses to average net assets | 1.17% | 1.23% | 1.17% | 1.31% | 1.35% | |||||||||||||||
Ratio of expenses to average net assets prior to fees waived | 1.18% | 1.23% | 1.17% | 1.34% | 1.40% | |||||||||||||||
Ratio of net investment income to average net assets | 2.12% | 2.13% | 2.11% | 2.24% | 2.27% | |||||||||||||||
Ratio of net investment income to average net assets prior to fees waived | 2.11% | 2.13% | 2.11% | 2.21% | 2.22% | |||||||||||||||
Portfolio turnover | 419% | 536% | 482%3 | 323%3 | 208% | |||||||||||||||
| 1 | The average shares outstanding method has been applied for per share information. |
| 2 | Total investment return is based on the change in net asset value of a share during the period and assumes reinvestment of dividends and distributions at net asset value and does not reflect the impact of a sales charge. Total investment return during some of the periods reflects a waiver by the manager. Performance would have been lower had the waiver not been in effect. |
| 3 | As a result of the addition of Delaware Management Company’s diversified floating rate investment strategy and Pacific Investment Management Company, LLC ’s low-duration investment strategy on Feb. 1, 2014, to the Fund’s principal investment strategy, the Fund’s portfolio turnover rate increased substantially during the years ended March 31, 2015 and 2014. |
See accompanying notes, which are an integral part of the financial statements.
| 120 |
Table of Contents
Optimum Fixed Income Fund Class C
Selected data for each share of the Fund outstanding throughout each period were as follows:
| Year ended | ||||||||||||||||||||
| 3/31/17 | 3/31/16 | 3/31/15 | 3/31/14 | 3/31/13 | ||||||||||||||||
Net asset value, beginning of period | $ | 9.370 | $ | 9.710 | $ | 9.530 | $ | 9.840 | $ | 9.710 | ||||||||||
Income (loss) from investment operations: | ||||||||||||||||||||
Net investment income1 | 0.130 | 0.131 | 0.131 | 0.148 | 0.161 | |||||||||||||||
Net realized and unrealized gain (loss) | (0.013 | ) | (0.269 | ) | 0.194 | (0.351 | ) | 0.292 | ||||||||||||
|
|
|
|
|
|
|
|
|
| |||||||||||
Total from investment operations | 0.117 | (0.138 | ) | 0.325 | (0.203 | ) | 0.453 | |||||||||||||
|
|
|
|
|
|
|
|
|
| |||||||||||
Less dividends and distributions from: | ||||||||||||||||||||
Net investment income | (0.107 | ) | (0.182 | ) | (0.145 | ) | (0.079 | ) | (0.108 | ) | ||||||||||
Net realized gain | — | (0.020 | ) | — | (0.028 | ) | (0.215 | ) | ||||||||||||
|
|
|
|
|
|
|
|
|
| |||||||||||
Total dividends and distributions | (0.107 | ) | (0.202 | ) | (0.145 | ) | (0.107 | ) | (0.323 | ) | ||||||||||
|
|
|
|
|
|
|
|
|
| |||||||||||
Net asset value, end of period | $ | 9.380 | $ | 9.370 | $ | 9.710 | $ | 9.530 | $ | 9.840 | ||||||||||
|
|
|
|
|
|
|
|
|
| |||||||||||
Total return2 | 1.27% | (1.39% | ) | 3.44% | (2.06% | ) | 4.69% | |||||||||||||
Ratios and supplemental data: | ||||||||||||||||||||
Net assets, end of period (000 omitted) | $ | 124,024 | $ | 153,266 | $ | 166,154 | $ | 161,353 | $ | 155,728 | ||||||||||
Ratio of expenses to average net assets | 1.92% | 1.98% | 1.92% | 1.99% | 2.00% | |||||||||||||||
Ratio of expenses to average net assets prior to fees waived | 1.93% | 1.98% | 1.92% | 2.02% | 2.05% | |||||||||||||||
Ratio of net investment income to average net assets | 1.37% | 1.38% | 1.36% | 1.56% | 1.62% | |||||||||||||||
Ratio of net investment income to average net assets prior to fees waived | 1.36% | 1.38% | 1.36% | 1.53% | 1.57% | |||||||||||||||
Portfolio turnover | 419% | 536% | 482%3 | 323%3 | 208% | |||||||||||||||
| 1 | The average shares outstanding method has been applied for per share information. |
| 2 | Total investment return is based on the change in net asset value of a share during the period and assumes reinvestment of dividends and distributions at net asset value and does not reflect the impact of a sales charge. Total investment return during some of the periods reflects a waiver by the manager. Performance would have been lower had the waiver not been in effect. |
| 3 | As a result of the addition of Delaware Management Company’s diversified floating rate investment strategy and Pacific Investment Management Company, LLC ’s low-duration investment strategy on Feb. 1, 2014, to the Fund’s principal investment strategy, the Fund’s portfolio turnover rate increased substantially during the years ended March 31, 2015 and 2014. |
See accompanying notes, which are an integral part of the financial statements.
| (continues) | 121 |
Table of Contents
Financial highlights
Optimum Fixed Income Fund Institutional Class
Selected data for each share of the Fund outstanding throughout each period were as follows:
| Year ended | ||||||||||||||||||||
| 3/31/17 | 3/31/16 | 3/31/15 | 3/31/14 | 3/31/13 | ||||||||||||||||
Net asset value, beginning of period | $ | 9.370 | $ | 9.720 | $ | 9.540 | $ | 9.850 | $ | 9.710 | ||||||||||
Income (loss) from investment operations: | ||||||||||||||||||||
Net investment income1 | 0.225 | 0.226 | 0.227 | 0.244 | 0.260 | |||||||||||||||
Net realized and unrealized gain (loss) | (0.004 | ) | (0.278 | ) | 0.194 | (0.350 | ) | 0.301 | ||||||||||||
|
|
|
|
|
|
|
|
|
| |||||||||||
Total from investment operations | 0.221 | (0.052 | ) | 0.421 | (0.106 | ) | 0.561 | |||||||||||||
|
|
|
|
|
|
|
|
|
| |||||||||||
Less dividends and distributions from: | ||||||||||||||||||||
Net investment income | (0.201 | ) | (0.278 | ) | (0.241 | ) | (0.176 | ) | (0.206 | ) | ||||||||||
Net realized gain | — | (0.020 | ) | — | (0.028 | ) | (0.215 | ) | ||||||||||||
|
|
|
|
|
|
|
|
|
| |||||||||||
Total dividends and distributions | (0.201 | ) | (0.298 | ) | (0.241 | ) | (0.204 | ) | (0.421 | ) | ||||||||||
|
|
|
|
|
|
|
|
|
| |||||||||||
Net asset value, end of period | $ | 9.390 | $ | 9.370 | $ | 9.720 | $ | 9.540 | $ | 9.850 | ||||||||||
|
|
|
|
|
|
|
|
|
| |||||||||||
Total return2 | 2.40% | (0.48% | ) | 4.47% | (1.05% | ) | 5.72% | |||||||||||||
Ratios and supplemental data: | ||||||||||||||||||||
Net assets, end of period (000 omitted) | $ | 1,725,289 | $ | 1,892,775 | $ | 1,826,156 | $ | 1,509,156 | $ | 1,297,154 | ||||||||||
Ratio of expenses to average net assets | 0.92% | 0.98% | 0.92% | 0.99% | 1.00% | |||||||||||||||
Ratio of expenses to average net assets prior to fees waived | 0.93% | 0.98% | 0.92% | 1.02% | 1.05% | |||||||||||||||
Ratio of net investment income to average net assets | 2.37% | 2.38% | 2.36% | 2.56% | 2.62% | |||||||||||||||
Ratio of net investment income to average net assets prior to fees waived | 2.36% | 2.38% | 2.36% | 2.53% | 2.57% | |||||||||||||||
Portfolio turnover | 419% | 536% | 482%3 | 323%3 | 208% | |||||||||||||||
| 1 | The average shares outstanding method has been applied for per share information. |
| 2 | Total investment return is based on the change in net asset value of a share during the period and assumes reinvestment of dividends and distributions at net asset value. Total investment return during some of the periods shown reflects a waiver by the manager. Performance would have been lower had the waiver not been in effect. |
| 3 | As a result of the addition of Delaware Management Company’s diversified floating rate investment strategy and Pacific Investment Management Company, LLC ’s low-duration investment strategy on Feb. 1, 2014, to the Fund’s principal investment strategy, the Fund’s portfolio turnover rate increased substantially during the years ended March 31, 2015 and 2014. |
See accompanying notes, which are an integral part of the financial statements.
122
Table of Contents
Optimum International Fund Class A
Selected data for each share of the Fund outstanding throughout each period were as follows:
| Year ended | ||||||||||||||||||||
| 3/31/17 | 3/31/16 | 3/31/15 | 3/31/14 | 3/31/13 | ||||||||||||||||
Net asset value, beginning of period | $ | 10.950 | $ | 11.660 | $ | 12.570 | $ | 10.970 | $ | 10.420 | ||||||||||
Income (loss) from investment operations: | ||||||||||||||||||||
Net investment income1 | 0.106 | 0.083 | 0.062 | 0.142 | 0.185 | |||||||||||||||
Net realized and unrealized gain (loss) | 1.318 | (0.734 | ) | (0.846 | ) | 1.540 | 0.620 | |||||||||||||
|
|
|
|
|
|
|
|
|
| |||||||||||
Total from investment operations | 1.424 | (0.651 | ) | (0.784 | ) | 1.682 | 0.805 | |||||||||||||
|
|
|
|
|
|
|
|
|
| |||||||||||
Less dividends and distributions from: | ||||||||||||||||||||
Net investment income | (0.104 | ) | (0.059 | ) | (0.126 | ) | (0.082 | ) | (0.255 | ) | ||||||||||
|
|
|
|
|
|
|
|
|
| |||||||||||
Total dividends and distributions | (0.104 | ) | (0.059 | ) | (0.126 | ) | (0.082 | ) | (0.255 | ) | ||||||||||
|
|
|
|
|
|
|
|
|
| |||||||||||
Net asset value, end of period | $ | 12.270 | $ | 10.950 | $ | 11.660 | $ | 12.570 | $ | 10.970 | ||||||||||
|
|
|
|
|
|
|
|
|
| |||||||||||
Total return2 | 13.08% | (5.58% | ) | (6.25% | ) | 15.31% | 8.10% | |||||||||||||
Ratios and supplemental data: | ||||||||||||||||||||
Net assets, end of period (000 omitted) | $ | 8,680 | $ | 9,117 | $ | 10,291 | $ | 11,277 | $ | 9,553 | ||||||||||
Ratio of expenses to average net assets | 1.48% | 1.56% | 1.47% | 1.68% | 1.75% | |||||||||||||||
Ratio of expenses to average net assets prior to fees waived | 1.48% | 1.56% | 1.47% | 1.68% | 1.84% | |||||||||||||||
Ratio of net investment income to average net assets | 0.93% | 0.74% | 0.51% | 1.20% | 1.81% | |||||||||||||||
Ratio of net investment income to average net assets prior to fees waived | 0.93% | 0.74% | 0.51% | 1.20% | 1.72% | |||||||||||||||
Portfolio turnover | 68% | 47% | 117% | 126% | 70% | |||||||||||||||
| 1 | The average shares outstanding method has been applied for per share information. |
| 2 | Total investment return is based on the change in net asset value of a share during the period and assumes reinvestment of dividends and distributions at net asset value and does not reflect the impact of a sales charge. Total investment return during some of the periods shown reflects a waiver by the manager. Performance would have been lower had the waiver not been in effect. |
See accompanying notes, which are an integral part of the financial statements.
| (continues) | 123 |
Table of Contents
Financial highlights
Optimum International Fund Class C
Selected data for each share of the Fund outstanding throughout each period were as follows:
| Year ended | ||||||||||||||||||||
| 3/31/17 | 3/31/16 | 3/31/15 | 3/31/14 | 3/31/13 | ||||||||||||||||
Net asset value, beginning of period | $ | 10.690 | $ | 11.410 | $ | 12.290 | $ | 10.760 | $ | 10.230 | ||||||||||
Income (loss) from investment operations: | ||||||||||||||||||||
Net investment income (loss)1 | 0.020 | (0.001 | ) | (0.028 | ) | 0.061 | 0.116 | |||||||||||||
Net realized and unrealized gain (loss) | 1.295 | (0.719 | ) | (0.832 | ) | 1.512 | 0.606 | |||||||||||||
|
|
|
|
|
|
|
|
|
| |||||||||||
Total from investment operations | 1.315 | (0.720 | ) | (0.860 | ) | 1.573 | 0.722 | |||||||||||||
|
|
|
|
|
|
|
|
|
| |||||||||||
Less dividends and distributions from: | ||||||||||||||||||||
Net investment income | (0.025 | ) | — | (0.020 | ) | (0.043 | ) | (0.192 | ) | |||||||||||
|
|
|
|
|
|
|
|
|
| |||||||||||
Total dividends and distributions | (0.025 | ) | — | (0.020 | ) | (0.043 | ) | (0.192 | ) | |||||||||||
|
|
|
|
|
|
|
|
|
| |||||||||||
Net asset value, end of period | $ | 11.980 | $ | 10.690 | $ | 11.410 | $ | 12.290 | $ | 10.760 | ||||||||||
|
|
|
|
|
|
|
|
|
| |||||||||||
Total return2 | 12.32% | (6.31% | ) | (7.00% | ) | 14.56% | 7.37% | |||||||||||||
Ratios and supplemental data: | ||||||||||||||||||||
Net assets, end of period (000 omitted) | $ | 29,544 | $ | 31,777 | $ | 35,996 | $ | 37,893 | $ | 32,064 | ||||||||||
Ratio of expenses to average net assets | 2.23% | 2.31% | 2.22% | 2.36% | 2.40% | |||||||||||||||
Ratio of expenses to average net assets prior to fees waived | 2.23% | 2.31% | 2.22% | 2.36% | 2.49% | |||||||||||||||
Ratio of net investment income (loss) to average net assets | 0.18% | (0.01% | ) | (0.24% | ) | 0.52% | 1.16% | |||||||||||||
Ratio of net investment income (loss) to average net assets prior to fees waived | 0.18% | (0.01% | ) | (0.24% | ) | 0.52% | 1.07% | |||||||||||||
Portfolio turnover | 68% | 47% | 117% | 126% | 70% | |||||||||||||||
| 1 | The average shares outstanding method has been applied for per share information. |
| 2 | Total investment return is based on the change in net asset value of a share during the period and assumes reinvestment of dividends and distributions at net asset value and does not reflect the impact of a sales charge. Total investment return during some of the periods shown reflects a waiver by the manager. Performance would have been lower had the waiver not been in effect. |
See accompanying notes, which are an integral part of the financial statements.
124
Table of Contents
Optimum International Fund Institutional Class
Selected data for each share of the Fund outstanding throughout each period were as follows:
| Year ended | ||||||||||||||||||||
| 3/31/17 | 3/31/16 | 3/31/15 | 3/31/14 | 3/31/13 | ||||||||||||||||
Net asset value, beginning of period | $ | 11.020 | $ | 11.740 | $ | 12.660 | $ | 11.050 | $ | 10.490 | ||||||||||
Income (loss) from investment operations: | ||||||||||||||||||||
Net investment income1 | 0.136 | 0.111 | 0.093 | 0.182 | 0.223 | |||||||||||||||
Net realized and unrealized gain (loss) | 1.326 | (0.743 | ) | (0.856 | ) | 1.551 | 0.627 | |||||||||||||
|
|
|
|
|
|
|
|
|
| |||||||||||
Total from investment operations | 1.462 | (0.632 | ) | (0.763 | ) | 1.733 | 0.850 | |||||||||||||
|
|
|
|
|
|
|
|
|
| |||||||||||
Less dividends and distributions from: | ||||||||||||||||||||
Net investment income | (0.132 | ) | (0.088 | ) | (0.157 | ) | (0.123 | ) | (0.290 | ) | ||||||||||
|
|
|
|
|
|
|
|
|
| |||||||||||
Total dividends and distributions | (0.132 | ) | (0.088 | ) | (0.157 | ) | (0.123 | ) | (0.290 | ) | ||||||||||
|
|
|
|
|
|
|
|
|
| |||||||||||
Net asset value, end of period | $ | 12.350 | $ | 11.020 | $ | 11.740 | $ | 12.660 | $ | 11.050 | ||||||||||
|
|
|
|
|
|
|
|
|
| |||||||||||
Total return2 | 13.36% | (5.38% | ) | (6.04% | ) | 15.79% | 8.41% | |||||||||||||
Ratios and supplemental data: | ||||||||||||||||||||
Net assets, end of period (000 omitted) | $ | 525,431 | $ | 542,055 | $ | 477,884 | $ | 589,098 | $ | 426,258 | ||||||||||
Ratio of expenses to average net assets | 1.23% | 1.31% | 1.22% | 1.36% | 1.40% | |||||||||||||||
Ratio of expenses to average net assets prior to fees waived | 1.23% | 1.31% | 1.22% | 1.36% | 1.49% | |||||||||||||||
Ratio of net investment income to average net assets | 1.18% | 0.99% | 0.76% | 1.52% | 2.16% | |||||||||||||||
Ratio of net investment income to average net assets prior to fees waived | 1.18% | 0.99% | 0.76% | 1.52% | 2.07% | |||||||||||||||
Portfolio turnover | 68% | 47% | 117% | 126% | 70% | |||||||||||||||
| 1 | The average shares outstanding method has been applied for per share information. |
| 2 | Total investment return is based on the change in net asset value of a share during the period and assumes reinvestment of dividends and distributions at net asset value. Total investment return during some of the periods shown reflects a waiver by the manager. Performance would have been lower had the waiver not been in effect. |
See accompanying notes, which are an integral part of the financial statements.
| (continues) | 125 |
Table of Contents
Financial highlights
Optimum Large Cap Growth Fund Class A
Selected data for each share of the Fund outstanding throughout each period were as follows:
| Year ended | ||||||||||||||||||||
| 3/31/17 | 3/31/16 | 3/31/15 | 3/31/14 | 3/31/13 | ||||||||||||||||
Net asset value, beginning of period | $ | 14.970 | $ | 17.000 | $ | 16.390 | $ | 14.530 | $ | 13.480 | ||||||||||
Income (loss) from investment operations: | ||||||||||||||||||||
Net investment income (loss)1 | (0.055 | ) | (0.102 | ) | (0.083 | ) | (0.099 | ) | 0.014 | |||||||||||
Net realized and unrealized gain (loss) | 2.515 | (0.200 | ) | 2.711 | 3.631 | 1.042 | ||||||||||||||
|
|
|
|
|
|
|
|
|
| |||||||||||
Total from investment operations | 2.460 | (0.302 | ) | 2.628 | 3.532 | 1.056 | ||||||||||||||
|
|
|
|
|
|
|
|
|
| |||||||||||
Less dividends and distributions from: | ||||||||||||||||||||
Net investment income | — | — | — | — | (0.006 | ) | ||||||||||||||
Net realized gain | (0.590 | ) | (1.728 | ) | (2.018 | ) | (1.672 | ) | — | |||||||||||
|
|
|
|
|
|
|
|
|
| |||||||||||
Total dividends and distributions | (0.590 | ) | (1.728 | ) | (2.018 | ) | (1.672 | ) | (0.006 | ) | ||||||||||
|
|
|
|
|
|
|
|
|
| |||||||||||
Net asset value, end of period | $ | 16.840 | $ | 14.970 | $ | 17.000 | $ | 16.390 | $ | 14.530 | ||||||||||
|
|
|
|
|
|
|
|
|
| |||||||||||
Total return2 | 16.83% | (2.27% | ) | 17.27% | 25.17% | 7.76% | ||||||||||||||
Ratios and supplemental data: | ||||||||||||||||||||
Net assets, end of period (000 omitted) | $ | 32,215 | $ | 33,787 | $ | 40,790 | $ | 39,044 | $ | 34,182 | ||||||||||
Ratio of expenses to average net assets | 1.35% | 1.42% | 1.37% | 1.54% | 1.60% | |||||||||||||||
Ratio of expenses to average net assets prior to fees waived | 1.38% | 1.44% | 1.37% | 1.55% | 1.63% | |||||||||||||||
Ratio of net investment income (loss) to average net assets | (0.35% | ) | (0.62% | ) | (0.50% | ) | (0.62% | ) | 0.10% | |||||||||||
Ratio of net investment income (loss) to average net assets prior to fees waived | (0.38% | ) | (0.64% | ) | (0.50% | ) | (0.63% | ) | 0.07% | |||||||||||
Portfolio turnover | 52% | 88% | 86% | 98% | 102% | |||||||||||||||
| 1 | The average shares outstanding method has been applied for per share information. |
| 2 | Total investment return is based on the change in net asset value of a share during the period and assumes reinvestment of dividends and distributions at net asset value and does not reflect the impact of a sales charge. Total investment return during some of the periods shown reflects a waiver by the manager. Performance would have been lower had the waiver not been in effect. |
See accompanying notes, which are an integral part of the financial statements.
126
Table of Contents
Optimum Large Cap Growth Fund Class C
Selected data for each share of the Fund outstanding throughout each period were as follows:
| Year ended | ||||||||||||||||||||
| 3/31/17 | 3/31/16 | 3/31/15 | 3/31/14 | 3/31/13 | ||||||||||||||||
Net asset value, beginning of period | $ | 13.340 | $ | 15.440 | $ | 15.160 | $ | 13.630 | $ | 12.720 | ||||||||||
Income (loss) from investment operations: | ||||||||||||||||||||
Net investment loss1 | (0.152 | ) | (0.203 | ) | (0.189 | ) | (0.192 | ) | (0.069 | ) | ||||||||||
Net realized and unrealized gain (loss) | 2.212 | (0.169 | ) | 2.487 | 3.394 | 0.979 | ||||||||||||||
|
|
|
|
|
|
|
|
|
| |||||||||||
Total from investment operations | 2.060 | (0.372 | ) | 2.298 | 3.202 | 0.910 | ||||||||||||||
|
|
|
|
|
|
|
|
|
| |||||||||||
Less dividends and distributions from: | ||||||||||||||||||||
Net realized gain | (0.590 | ) | (1.728 | ) | (2.018 | ) | (1.672 | ) | — | |||||||||||
|
|
|
|
|
|
|
|
|
| |||||||||||
Total dividends and distributions | (0.590 | ) | (1.728 | ) | (2.018 | ) | (1.672 | ) | — | |||||||||||
|
|
|
|
|
|
|
|
|
| |||||||||||
Net asset value, end of period | $ | 14.810 | $ | 13.340 | $ | 15.440 | $ | 15.160 | $ | 13.630 | ||||||||||
|
|
|
|
|
|
|
|
|
| |||||||||||
Total return2 | 15.88% | (2.98% | ) | 16.44% | 24.27% | 7.15% | ||||||||||||||
Ratios and supplemental data: | ||||||||||||||||||||
Net assets, end of period (000 omitted) | $ | 105,082 | $ | 114,907 | $ | 137,892 | $ | 127,540 | $ | 115,242 | ||||||||||
Ratio of expenses to average net assets | 2.10% | 2.17% | 2.12% | 2.22% | 2.25% | |||||||||||||||
Ratio of expenses to average net assets prior to fees waived | 2.13% | 2.19% | 2.12% | 2.23% | 2.28% | |||||||||||||||
Ratio of net investment loss to average net assets | (1.10% | ) | (1.37% | ) | (1.25% | ) | (1.30% | ) | (0.55% | ) | ||||||||||
Ratio of net investment loss to average net assets prior to fees waived | (1.13% | ) | (1.39% | ) | (1.25% | ) | (1.31% | ) | (0.58% | ) | ||||||||||
Portfolio turnover | 52% | 88% | 86% | 98% | 102% | |||||||||||||||
| 1 | The average shares outstanding method has been applied for per share information. |
| 2 | Total investment return is based on the change in net asset value of a share during the period and assumes reinvestment of dividends and distributions at net asset value and does not reflect the impact of a sales charge. Total investment return during some of the periods shown reflects a waiver by the manager. Performance would have been lower had the waiver not been in effect. |
See accompanying notes, which are an integral part of the financial statements.
| (continues) | 127 |
Table of Contents
Financial highlights
Optimum Large Cap Growth Fund Institutional Class
Selected data for each share of the Fund outstanding throughout each period were as follows:
| Year ended | ||||||||||||||||||||
| 3/31/17 | 3/31/16 | 3/31/15 | 3/31/14 | 3/31/13 | ||||||||||||||||
Net asset value, beginning of period | $ | 15.760 | $ | 17.760 | $ | 17.000 | $ | 14.970 | $ | 13.880 | ||||||||||
Income (loss) from investment operations: | ||||||||||||||||||||
Net investment income (loss)1 | (0.017 | ) | (0.064 | ) | (0.044 | ) | (0.049 | ) | 0.062 | |||||||||||
Net realized and unrealized gain (loss) | 2.657 | (0.208 | ) | 2.822 | 3.754 | 1.068 | ||||||||||||||
|
|
|
|
|
|
|
|
|
| |||||||||||
Total from investment operations | 2.640 | (0.272 | ) | 2.778 | 3.705 | 1.130 | ||||||||||||||
|
|
|
|
|
|
|
|
|
| |||||||||||
Less dividends and distributions from: | ||||||||||||||||||||
Net investment income | — | — | — | (0.003 | ) | (0.040 | ) | |||||||||||||
Net realized gain | (0.590 | ) | (1.728 | ) | (2.018 | ) | (1.672 | ) | — | |||||||||||
|
|
|
|
|
|
|
|
|
| |||||||||||
Total dividends and distributions | (0.590 | ) | (1.728 | ) | (2.018 | ) | (1.675 | ) | (0.040 | ) | ||||||||||
|
|
|
|
|
|
|
|
|
| |||||||||||
Net asset value, end of period | $ | 17.810 | $ | 15.760 | $ | 17.760 | $ | 17.000 | $ | 14.970 | ||||||||||
|
|
|
|
|
|
|
|
|
| |||||||||||
Total return2 | 17.14% | (2.00% | ) | 17.55% | 25.51% | 8.25% | ||||||||||||||
Ratios and supplemental data: | ||||||||||||||||||||
Net assets, end of period (000 omitted) | $ | 1,348,419 | $ | 1,356,335 | $ | 1,413,059 | $ | 1,026,377 | $ | 728,104 | ||||||||||
Ratio of expenses to average net assets | 1.10% | 1.17% | 1.12% | 1.22% | 1.25% | |||||||||||||||
Ratio of expenses to average net assets prior to fees waived | 1.13% | 1.19% | 1.12% | 1.23% | 1.28% | |||||||||||||||
Ratio of net investment income (loss) to average net assets | (0.10% | ) | (0.37% | ) | (0.25% | ) | (0.30% | ) | 0.45% | |||||||||||
Ratio of net investment income (loss) to average net assets prior to fees waived | (0.13% | ) | (0.39% | ) | (0.25% | ) | (0.31% | ) | 0.42% | |||||||||||
Portfolio turnover | 52% | 88% | 86% | 98% | 102% | |||||||||||||||
| 1 | The average shares outstanding method has been applied for per share information. |
| 2 | Total investment return is based on the change in net asset value of a share during the period and assumes reinvestment of dividends and distributions at net asset value. Total investment return during some of the periods shown reflects a waiver by the manager. Performance would have been lower had the waiver not been in effect. |
See accompanying notes, which are an integral part of the financial statements.
128
Table of Contents
Optimum Large Cap Value Fund Class A
Selected data for each share of the Fund outstanding throughout each period were as follows:
| Year ended | ||||||||||||||||||||
| 3/31/17 | 3/31/16 | 3/31/15 | 3/31/14 | 3/31/13 | ||||||||||||||||
Net asset value, beginning of period | $ | 15.130 | $ | 16.010 | $ | 15.360 | $ | 12.900 | $ | 11.750 | ||||||||||
Income (loss) from investment operations: | ||||||||||||||||||||
Net investment income1 | 0.165 | 0.165 | 0.124 | 0.157 | 0.173 | |||||||||||||||
Net realized and unrealized gain (loss) | 2.046 | (0.890 | ) | 0.692 | 2.399 | 1.259 | ||||||||||||||
|
|
|
|
|
|
|
|
|
| |||||||||||
Total from investment operations | 2.211 | (0.725 | ) | 0.816 | 2.556 | 1.432 | ||||||||||||||
|
|
|
|
|
|
|
|
|
| |||||||||||
Less dividends and distributions from: | ||||||||||||||||||||
Net investment income | (0.177 | ) | (0.155 | ) | (0.166 | ) | (0.096 | ) | (0.282 | ) | ||||||||||
Net realized gain | (1.744 | ) | — | — | — | — | ||||||||||||||
|
|
|
|
|
|
|
|
|
| |||||||||||
Total dividends and distributions | (1.921 | ) | (0.155 | ) | (0.166 | ) | (0.096 | ) | (0.282 | ) | ||||||||||
|
|
|
|
|
|
|
|
|
| |||||||||||
Net asset value, end of period | $ | 15.420 | $ | 15.130 | $ | 16.010 | $ | 15.360 | $ | 12.900 | ||||||||||
|
|
|
|
|
|
|
|
|
| |||||||||||
Total return2 | 14.99% | (4.54% | ) | 5.34% | 19.96% | 12.48% | ||||||||||||||
Ratios and supplemental data: | ||||||||||||||||||||
Net assets, end of period (000 omitted) | $ | 28,739 | $ | 30,502 | $ | 35,952 | $ | 37,299 | $ | 32,995 | ||||||||||
Ratio of expenses to average net assets | 1.33% | 1.40% | 1.33% | 1.50% | 1.57% | |||||||||||||||
Ratio of expenses to average net assets prior to fees waived | 1.34% | 1.41% | 1.33% | 1.51% | 1.59% | |||||||||||||||
Ratio of net investment income to average net assets | 1.06% | 1.07% | 0.79% | 1.12% | 1.48% | |||||||||||||||
Ratio of net investment income to average net assets prior to fees waived | 1.05% | 1.06% | 0.79% | 1.11% | 1.46% | |||||||||||||||
Portfolio turnover | 82%3 | 39% | 35% | 37% | 49% | |||||||||||||||
| 1 | The average shares outstanding method has been applied for per share information. |
| 2 | Total investment return is based on the change in net asset value of a share during the period and assumes reinvestment of dividends and distributions at net asset value and does not reflect the impact of a sales charge. Total investment return during some of the periods shown reflects a waiver by the manager. Performance would have been lower had the waiver not been in effect. |
| 3 | As a result of Rothschild Asset Management Inc. replacing Herdon Capital Management, LLC as one of the sub-advisors to Optimum Large Cap Value Fund during the Fund’s fiscal year ending March 31, 2017, the Fund’s portfolio turnover rate increased substantially during the year ended March 31, 2017. |
See accompanying notes, which are an integral part of the financial statements.
| (continues) | 129 |
Table of Contents
Financial highlights
Optimum Large Cap Value Fund Class C
Selected data for each share of the Fund outstanding throughout each period were as follows:
| Year ended | ||||||||||||||||||||
| 3/31/17 | 3/31/16 | 3/31/15 | 3/31/14 | 3/31/13 | ||||||||||||||||
Net asset value, beginning of period | $ | 14.990 | $ | 15.850 | $ | 15.220 | $ | 12.780 | $ | 11.590 | ||||||||||
Income (loss) from investment operations: | ||||||||||||||||||||
Net investment income1 | 0.047 | 0.049 | 0.007 | 0.061 | 0.096 | |||||||||||||||
Net realized and unrealized gain (loss) | 2.021 | (0.871 | ) | 0.674 | 2.389 | 1.254 | ||||||||||||||
|
|
|
|
|
|
|
|
|
| |||||||||||
Total from investment operations | 2.068 | (0.822 | ) | 0.681 | 2.450 | 1.350 | ||||||||||||||
|
|
|
|
|
|
|
|
|
| |||||||||||
Less dividends and distributions from: | ||||||||||||||||||||
Net investment income | (0.064 | ) | (0.038 | ) | (0.051 | ) | (0.010 | ) | (0.160 | ) | ||||||||||
Net realized gain | (1.744 | ) | — | — | — | — | ||||||||||||||
|
|
|
|
|
|
|
|
|
| |||||||||||
Total dividends and distributions | (1.808 | ) | (0.038 | ) | (0.051 | ) | (0.010 | ) | (0.160 | ) | ||||||||||
|
|
|
|
|
|
|
|
|
| |||||||||||
Net asset value, end of period | $ | 15.250 | $ | 14.990 | $ | 15.850 | $ | 15.220 | $ | 12.780 | ||||||||||
|
|
|
|
|
|
|
|
|
| |||||||||||
Total return2 | 14.13% | (5.19% | ) | 4.48% | 19.17% | 11.85% | ||||||||||||||
Ratios and supplemental data: | ||||||||||||||||||||
Net assets, end of period (000 omitted) | $ | 95,495 | $ | 103,693 | $ | 122,772 | $ | 123,541 | $ | 111,806 | ||||||||||
Ratio of expenses to average net assets | 2.08% | 2.15% | 2.08% | 2.18% | 2.22% | |||||||||||||||
Ratio of expenses to average net assets prior to fees waived | 2.09% | 2.16% | 2.08% | 2.19% | 2.24% | |||||||||||||||
Ratio of net investment income to average net assets | 0.31% | 0.32% | 0.04% | 0.44% | 0.83% | |||||||||||||||
Ratio of net investment income to average net assets prior to fees waived | 0.30% | 0.31% | 0.04% | 0.43% | 0.81% | |||||||||||||||
Portfolio turnover | 82%3 | 39% | 35% | 37% | 49% | |||||||||||||||
| 1 | The average shares outstanding method has been applied for per share information. |
| 2 | Total investment return is based on the change in net asset value of a share during the period and assumes reinvestment of dividends and distributions at net asset value and does not reflect the impact of a sales charge. Total investment return during some of the periods shown reflects a waiver by the manager. Performance would have been lower had the waiver not been in effect. |
| 3 | As a result of Rothschild Asset Management Inc. replacing Herdon Capital Management, LLC as one of the sub-advisors to Optimum Large Cap Value Fund during the Fund’s fiscal year ending March 31, 2017, the Fund’s portfolio turnover rate increased substantially during the year ended March 31, 2017. |
See accompanying notes, which are an integral part of the financial statements.
130
Table of Contents
Optimum Large Cap Value Fund Institutional Class
Selected data for each share of the Fund outstanding throughout each period were as follows:
| Year ended | ||||||||||||||||||||
| 3/31/17 | 3/31/16 | 3/31/15 | 3/31/14 | 3/31/13 | ||||||||||||||||
Net asset value, beginning of period | $ | 15.160 | $ | 16.040 | $ | 15.390 | $ | 12.920 | $ | 11.800 | ||||||||||
Income (loss) from investment operations: | ||||||||||||||||||||
Net investment income1 | 0.204 | 0.204 | 0.165 | 0.203 | 0.214 | |||||||||||||||
Net realized and unrealized gain (loss) | 2.056 | (0.890 | ) | 0.690 | 2.410 | 1.255 | ||||||||||||||
|
|
|
|
|
|
|
|
|
| |||||||||||
Total from investment operations | 2.260 | (0.686 | ) | 0.855 | 2.613 | 1.469 | ||||||||||||||
|
|
|
|
|
|
|
|
|
| |||||||||||
Less dividends and distributions from: | ||||||||||||||||||||
Net investment income | (0.216 | ) | (0.194 | ) | (0.205 | ) | (0.143 | ) | (0.349 | ) | ||||||||||
Net realized gain | (1.744 | ) | — | — | — | — | ||||||||||||||
|
|
|
|
|
|
|
|
|
| |||||||||||
Total dividends and distributions | (1.960 | ) | (0.194 | ) | (0.205 | ) | (0.143 | ) | (0.349 | ) | ||||||||||
|
|
|
|
|
|
|
|
|
| |||||||||||
Net asset value, end of period | $ | 15.460 | $ | 15.160 | $ | 16.040 | $ | 15.390 | $ | 12.920 | ||||||||||
|
|
|
|
|
|
|
|
|
| |||||||||||
Total return2 | 15.30% | (4.29% | ) | 5.60% | 20.31% | 12.92% | ||||||||||||||
Ratios and supplemental data: | ||||||||||||||||||||
Net assets, end of period (000 omitted) | $ | 1,217,722 | $ | 1,129,606 | $ | 1,146,123 | $ | 1,002,553 | $ | 730,785 | ||||||||||
Ratio of expenses to average net assets | 1.08% | 1.15% | 1.08% | 1.18% | 1.22% | |||||||||||||||
Ratio of expenses to average net assets prior to fees waived | 1.09% | 1.16% | 1.08% | 1.19% | 1.24% | |||||||||||||||
Ratio of net investment income to average net assets | 1.31% | 1.32% | 1.04% | 1.44% | 1.83% | |||||||||||||||
Ratio of net investment income to average net assets prior to fees waived | 1.30% | 1.31% | 1.04% | 1.43% | 1.81% | |||||||||||||||
Portfolio turnover | 82%3 | 39% | 35% | 37% | 49% | |||||||||||||||
| 1 | The average shares outstanding method has been applied for per share information. |
| 2 | Total investment return is based on the change in net asset value of a share during the period and assumes reinvestment of dividends and distributions at net asset value. Total investment return during some of the periods shown reflects a waiver by the manager. Performance would have been lower had the waiver not been in effect. |
| 3 | As a result of Rothschild Asset Management Inc. replacing Herdon Capital Management, LLC as one of the sub-advisors to Optimum Large Cap Value Fund during the Fund’s fiscal year ending March 31, 2017, the Fund’s portfolio turnover rate increased substantially during the year ended March 31, 2017. |
See accompanying notes, which are an integral part of the financial statements.
| (continues) | 131 |
Table of Contents
Financial highlights
Optimum Small-Mid Cap Growth Fund Class A
Selected data for each share of the Fund outstanding throughout each period were as follows:
| Year ended | ||||||||||||||||||||
| 3/31/17 | 3/31/16 | 3/31/15 | 3/31/14 | 3/31/13 | ||||||||||||||||
Net asset value, beginning of period | $ | 10.950 | $ | 15.370 | $ | 15.570 | $ | 14.260 | $ | 13.000 | ||||||||||
Income (loss) from investment operations: | ||||||||||||||||||||
Net investment loss1 | (0.139 | ) | (0.148 | ) | (0.164 | ) | (0.193 | ) | (0.079 | ) | ||||||||||
Net realized and unrealized gain (loss) | 2.499 | (2.264 | ) | 1.442 | 3.073 | 1.653 | ||||||||||||||
|
|
|
|
|
|
|
|
|
| |||||||||||
Total from investment operations | 2.360 | (2.412 | ) | 1.278 | 2.880 | 1.574 | ||||||||||||||
|
|
|
|
|
|
|
|
|
| |||||||||||
Less dividends and distributions from: | ||||||||||||||||||||
Return of capital | — | — | 2 | — | — | — | ||||||||||||||
Net realized gain | — | (2.008 | ) | (1.478 | ) | (1.570 | ) | (0.314 | ) | |||||||||||
|
|
|
|
|
|
|
|
|
| |||||||||||
Total dividends and distributions | — | (2.008 | ) | (1.478 | ) | (1.570 | ) | (0.314 | ) | |||||||||||
|
|
|
|
|
|
|
|
|
| |||||||||||
Net asset value, end of period | $ | 13.310 | $ | 10.950 | $ | 15.370 | $ | 15.570 | $ | 14.260 | ||||||||||
|
|
|
|
|
|
|
|
|
| |||||||||||
Total return3 | 21.55% | (16.77% | ) | 8.93% | 21.63% | 12.50% | ||||||||||||||
Ratios and supplemental data: | ||||||||||||||||||||
Net assets, end of period (000 omitted) | $ | 5,293 | $ | 5,040 | $ | 7,050 | $ | 7,158 | $ | 6,415 | ||||||||||
Ratio of expenses to average net assets | 1.58% | 1.66% | 1.63% | 1.76% | 1.86% | |||||||||||||||
Ratio of expenses to average net assets prior to fees waived | 1.79% | 1.85% | 1.77% | 1.96% | 2.05% | |||||||||||||||
Ratio of net investment loss to average net assets | (1.16% | ) | (1.09% | ) | (1.09% | ) | (1.28% | ) | (0.62% | ) | ||||||||||
Ratio of net investment loss to average net assets prior to fees waived | (1.37% | ) | (1.28% | ) | (1.23% | ) | (1.48% | ) | (0.81% | ) | ||||||||||
Portfolio turnover | 180%4 | 104% | 72% | 58% | 78% | |||||||||||||||
| 1 | The average shares outstanding method has been applied for per share information. |
| 2 | For the year ended March 31, 2016, return of capital distribution of $108 for Class A calculated to a de minimis amount of $0.000 per share. |
| 3 | Total investment return is based on the change in net asset value of a share during the period and assumes reinvestment of dividends and distributions at net asset value and does not reflect the impact of a sales charge. Total investment return during all of the periods shown reflects a waiver by the manager. Performance would have been lower had the waiver not been in effect. |
| 4 | As a result of Peregrine Capital Management, LLC and Columbus Circle Investors replacing Columbia Wanger Asset Management and Wellington Management as the sub-advisors to Optimum Small-Mid Cap Growth Fund during the Fund’s fiscal year ending March 31, 2017, the Fund’s portfolio turnover rate increased substantially during the year ended March 31, 2017. |
See accompanying notes, which are an integral part of the financial statements.
132
Table of Contents
Optimum Small-Mid Cap Growth Fund Class C
Selected data for each share of the Fund outstanding throughout each period were as follows:
| Year ended | ||||||||||||||||||||
| 3/31/17 | 3/31/16 | 3/31/15 | 3/31/14 | 3/31/13 | ||||||||||||||||
Net asset value, beginning of period | $ | 9.610 | $ | 13.860 | $ | 14.290 | $ | 13.280 | $ | 12.220 | ||||||||||
Income (loss) from investment operations: | ||||||||||||||||||||
Net investment loss1 | (0.200 | ) | (0.223 | ) | (0.252 | ) | (0.274 | ) | (0.151 | ) | ||||||||||
Net realized and unrealized gain (loss) | 2.180 | (2.019 | ) | 1.300 | 2.854 | 1.525 | ||||||||||||||
|
|
|
|
|
|
|
|
|
| |||||||||||
Total from investment operations | 1.980 | (2.242 | ) | 1.048 | 2.580 | 1.374 | ||||||||||||||
|
|
|
|
|
|
|
|
|
| |||||||||||
Less dividends and distributions from: | ||||||||||||||||||||
Return of capital | — | — | 2 | — | — | — | ||||||||||||||
Net realized gain | — | (2.008 | ) | (1.478 | ) | (1.570 | ) | (0.314 | ) | |||||||||||
|
|
|
|
|
|
|
|
|
| |||||||||||
Total dividends and distributions | — | (2.008 | ) | (1.478 | ) | (1.570 | ) | (0.314 | ) | |||||||||||
|
|
|
|
|
|
|
|
|
| |||||||||||
Net asset value, end of period | $ | 11.590 | $ | 9.610 | $ | 13.860 | $ | 14.290 | $ | 13.280 | ||||||||||
|
|
|
|
|
|
|
|
|
| |||||||||||
Total return3 | 20.60% | (17.39% | ) | 8.08% | 20.82% | 11.73% | ||||||||||||||
Ratios and supplemental data: | ||||||||||||||||||||
Net assets, end of period (000 omitted) | $ | 16,668 | $ | 16,972 | $ | 23,206 | $ | 22,581 | $ | 20,921 | ||||||||||
Ratio of expenses to average net assets | 2.33% | 2.41% | 2.38% | 2.45% | 2.51% | |||||||||||||||
Ratio of expenses to average net assets prior to fees waived | 2.54% | 2.60% | 2.52% | 2.65% | 2.70% | |||||||||||||||
Ratio of net investment loss to average net assets | (1.91% | ) | (1.84% | ) | (1.84% | ) | (1.97% | ) | (1.27% | ) | ||||||||||
Ratio of net investment loss to average net assets prior to fees waived | (2.12% | ) | (2.03% | ) | (1.98% | ) | (2.17% | ) | (1.46% | ) | ||||||||||
Portfolio turnover | 180%4 | 104% | 72% | 58% | 78% | |||||||||||||||
| 1 | The average shares outstanding method has been applied for per share information. |
| 2 | For the year ended March 31, 2016, return of capital distribution of $416 for Class C calculated to a de minimis amount of $0.000 per share. |
| 3 | Total investment return is based on the change in net asset value of a share during the period and assumes reinvestment of dividends and distributions at net asset value and does not reflect the impact of a sales charge. Total investment return during all of the periods shown reflects a waiver by the manager. Performance would have been lower had the waiver not been in effect. |
| 4 | As a result of Peregrine Capital Management, LLC and Columbus Circle Investors replacing Columbia Wanger Asset Management and Wellington Management as the sub-advisors to Optimum Small-Mid Cap Growth Fund during the Fund’s fiscal year ending March 31, 2017, the Fund’s portfolio turnover rate increased substantially during the year ended March 31, 2017. |
See accompanying notes, which are an integral part of the financial statements.
| (continues) | 133 |
Table of Contents
Financial highlights
Optimum Small-Mid Cap Growth Fund Institutional Class
Selected data for each share of the Fund outstanding throughout each period were as follows:
| Year ended | ||||||||||||||||||||
| 3/31/17 | 3/31/16 | 3/31/15 | 3/31/14 | 3/31/13 | ||||||||||||||||
Net asset value, beginning of period | $ | 11.650 | $ | 16.170 | $ | 16.270 | $ | 14.780 | $ | 13.420 | ||||||||||
Income (loss) from investment operations: | ||||||||||||||||||||
Net investment loss1 | (0.116 | ) | (0.120 | ) | (0.132 | ) | (0.152 | ) | (0.036 | ) | ||||||||||
Net realized and unrealized gain (loss) | 2.656 | (2.392 | ) | 1.510 | 3.212 | 1.710 | ||||||||||||||
|
|
|
|
|
|
|
|
|
| |||||||||||
Total from investment operations | 2.540 | (2.512 | ) | 1.378 | 3.060 | 1.674 | ||||||||||||||
|
|
|
|
|
|
|
|
|
| |||||||||||
Less dividends and distributions from: | ||||||||||||||||||||
Return of capital | — | — | 2 | — | — | — | ||||||||||||||
Net realized gain | — | (2.008 | ) | (1.478 | ) | (1.570 | ) | (0.314 | ) | |||||||||||
|
|
|
|
|
|
|
|
|
| |||||||||||
Total dividends and distributions | — | (2.008 | ) | (1.478 | ) | (1.570 | ) | (0.314 | ) | |||||||||||
|
|
|
|
|
|
|
|
|
| |||||||||||
Net asset value, end of period | $ | 14.190 | $ | 11.650 | $ | 16.170 | $ | 16.270 | $ | 14.780 | ||||||||||
|
|
|
|
|
|
|
|
|
| |||||||||||
Total return3 | 21.80% | (16.54% | ) | 9.18% | 22.03% | 12.94% | ||||||||||||||
Ratios and supplemental data: | ||||||||||||||||||||
Net assets, end of period (000 omitted) | $ | 420,279 | $ | 440,683 | $ | 527,647 | $ | 436,823 | $ | 321,441 | ||||||||||
Ratio of expenses to average net assets | 1.33% | 1.41% | 1.38% | 1.45% | 1.51% | |||||||||||||||
Ratio of expenses to average net assets prior to fees waived | 1.54% | 1.60% | 1.52% | 1.65% | 1.70% | |||||||||||||||
Ratio of net investment loss to average net assets | (0.91% | ) | (0.84% | ) | (0.84% | ) | (0.97% | ) | (0.27% | ) | ||||||||||
Ratio of net investment loss to average net assets prior to fees waived | (1.12% | ) | (1.03% | ) | (0.98% | ) | (1.17% | ) | (0.46% | ) | ||||||||||
Portfolio turnover | 180%4 | 104% | 72% | 58% | 78% | |||||||||||||||
| 1 | The average shares outstanding method has been applied for per share information. |
| 2 | For the year ended March 31, 2016, return of capital distribution of $8,916 for Institutional Class calculated to a de minimis amount of $0.000 per share. |
| 3 | Total investment return is based on the change in net asset value of a share during the period and assumes reinvestment of dividends and distributions at net asset value. Total investment return during all of the periods shown reflects a waiver by the manager. Performance would have been lower had the waiver not been in effect. |
| 4 | As a result of Peregrine Capital Management, LLC and Columbus Circle Investors replacing Columbia Wanger Asset Management and Wellington Management as the sub-advisors to Optimum Small-Mid Cap Growth Fund during the Fund’s fiscal year ending March 31, 2017, the Fund’s portfolio turnover rate increased substantially during the year ended March 31, 2017. |
See accompanying notes, which are an integral part of the financial statements.
134
Table of Contents
Optimum Small-Mid Cap Value Fund Class A
Selected data for each share of the Fund outstanding throughout each period were as follows:
| Year ended | ||||||||||||||||||||
| 3/31/17 | 3/31/16 | 3/31/15 | 3/31/14 | 3/31/13 | ||||||||||||||||
Net asset value, beginning of period | $ | 11.530 | $ | 13.640 | $ | 14.880 | $ | 13.740 | $ | 12.590 | ||||||||||
Income (loss) from investment operations: | ||||||||||||||||||||
Net investment income (loss)1 | 0.080 | (0.043 | ) | (0.092 | ) | (0.092 | ) | (0.027 | ) | |||||||||||
Net realized and unrealized gain (loss) | 2.207 | (1.579 | ) | (0.032 | ) | 2.873 | 1.609 | |||||||||||||
|
|
|
|
|
|
|
|
|
| |||||||||||
Total from investment operations | 2.287 | (1.622 | ) | (0.124 | ) | 2.781 | 1.582 | |||||||||||||
|
|
|
|
|
|
|
|
|
| |||||||||||
Less dividends and distributions from: | ||||||||||||||||||||
Net investment income | (0.047 | ) | — | — | — | — | ||||||||||||||
Return of capital | — | (0.001 | ) | — | — | — | ||||||||||||||
Net realized gain | — | (0.487 | ) | (1.116 | ) | (1.641 | ) | (0.432 | ) | |||||||||||
|
|
|
|
|
|
|
|
|
| |||||||||||
Total dividends and distributions | (0.047 | ) | (0.488 | ) | (1.116 | ) | (1.641 | ) | (0.432 | ) | ||||||||||
|
|
|
|
|
|
|
|
|
| |||||||||||
Net asset value, end of period | $ | 13.770 | $ | 11.530 | $ | 13.640 | $ | 14.880 | $ | 13.740 | ||||||||||
|
|
|
|
|
|
|
|
|
| |||||||||||
Total return2 | 19.84% | (11.96% | ) | (0.69% | ) | 21.85% | 13.23% | |||||||||||||
Ratios and supplemental data: | ||||||||||||||||||||
Net assets, end of period (000 omitted) | $ | 4,279 | $ | 4,302 | $ | 5,440 | $ | 6,058 | $ | 5,711 | ||||||||||
Ratio of expenses to average net assets | 1.51% | 1.61% | 1.62% | 1.70% | 1.76% | |||||||||||||||
Ratio of expenses to average net assets prior to fees waived | 1.71% | 1.75% | 1.68% | 1.86% | 1.98% | |||||||||||||||
Ratio of net investment income (loss) to average net assets | 0.64% | (0.35% | ) | (0.65% | ) | (0.64% | ) | (0.22% | ) | |||||||||||
Ratio of net investment income (loss) to average net assets prior to fees waived | 0.44% | (0.49% | ) | (0.71% | ) | (0.80% | ) | (0.44% | ) | |||||||||||
Portfolio turnover | 30% | 90%3 | 31% | 33% | 36% | |||||||||||||||
| 1 | The average shares outstanding method has been applied for per share information. |
| 2 | Total investment return is based on the change in net asset value of a share during the period and assumes reinvestment of dividends and distributions at net asset value and does not reflect the impact of a sales charge. Total investment return during all of the periods shown reflects a waiver by the manager. Performance would have been lower had the waiver not been in effect. |
| 3 | As a result of LSV Asset Management replacing The Delafield Group, a division of Tocqueville Asset Management L.P., and The Killen Group, Inc. as one of the sub-advisors to Optimum Small-Mid Cap Value Fund during the Fund’s fiscal year ending March 31, 2016, the Fund’s portfolio turnover rate increased substantially during the year ended March 31, 2016. |
See accompanying notes, which are an integral part of the financial statements.
| (continues) | 135 |
Table of Contents
Financial highlights
Optimum Small-Mid Cap Value Fund Class C
Selected data for each share of the Fund outstanding throughout each period were as follows:
| Year ended | ||||||||||||||||||||
| 3/31/17 | 3/31/16 | 3/31/15 | 3/31/14 | 3/31/13 | ||||||||||||||||
Net asset value, beginning of period | $ | 10.270 | $ | 12.300 | $ | 13.630 | $ | 12.800 | $ | 11.830 | ||||||||||
Income (loss) from investment operations: | ||||||||||||||||||||
Net investment loss1 | (0.012 | ) | (0.122 | ) | (0.179 | ) | (0.175 | ) | (0.100 | ) | ||||||||||
Net realized and unrealized gain (loss) | 1.952 | (1.420 | ) | (0.035 | ) | 2.646 | 1.502 | |||||||||||||
|
|
|
|
|
|
|
|
|
| |||||||||||
Total from investment operations | 1.940 | (1.542 | ) | (0.214 | ) | 2.471 | 1.402 | |||||||||||||
|
|
|
|
|
|
|
|
|
| |||||||||||
Less dividends and distributions from: | ||||||||||||||||||||
Return of capital | — | (0.001 | ) | — | — | — | ||||||||||||||
Net realized gain | — | (0.487 | ) | (1.116 | ) | (1.641 | ) | (0.432 | ) | |||||||||||
|
|
|
|
|
|
|
|
|
| |||||||||||
Total dividends and distributions | — | (0.488 | ) | (1.116 | ) | (1.641 | ) | (0.432 | ) | |||||||||||
|
|
|
|
|
|
|
|
|
| |||||||||||
Net asset value, end of period | $ | 12.210 | $ | 10.270 | $ | 12.300 | $ | 13.630 | $ | 12.800 | ||||||||||
|
|
|
|
|
|
|
|
|
| |||||||||||
Total return2 | 18.89% | (12.62% | ) | (1.45% | ) | 21.08% | 12.45% | |||||||||||||
Ratios and supplemental data: | ||||||||||||||||||||
Net assets, end of period (000 omitted) | $ | 14,268 | $ | 15,136 | $ | 19,245 | $ | 20,846 | $ | 20,058 | ||||||||||
Ratio of expenses to average net assets | 2.26% | 2.36% | 2.37% | 2.40% | 2.41% | |||||||||||||||
Ratio of expenses to average net assets prior to fees waived | 2.46% | 2.50% | 2.43% | 2.56% | 2.63% | |||||||||||||||
Ratio of net investment loss to average net assets | (0.11% | ) | (1.10% | ) | (1.40% | ) | (1.34% | ) | (0.87% | ) | ||||||||||
Ratio of net investment loss to average net assets prior to fees waived | (0.31% | ) | (1.24% | ) | (1.46% | ) | (1.50% | ) | (1.09% | ) | ||||||||||
Portfolio turnover | 30% | 90%3 | 31% | 33% | 36% | |||||||||||||||
| 1 | The average shares outstanding method has been applied for per share information. |
| 2 | Total investment return is based on the change in net asset value of a share during the period and assumes reinvestment of dividends and distributions at net asset value and does not reflect the impact of a sales charge. Total investment return during all of the periods shown reflects a waiver by the manager. Performance would have been lower had the waiver not been in effect. |
| 3 | As a result of LSV Asset Management replacing The Delafield Group, a division of Tocqueville Asset Management L.P., and The Killen Group, Inc. as one of the sub-advisors to Optimum Small-Mid Cap Value Fund during the Fund’s fiscal year ending March 31, 2016, the Fund’s portfolio turnover rate increased substantially during the year ended March 31, 2016. |
See accompanying notes, which are an integral part of the financial statements.
136
Table of Contents
Optimum Small-Mid Cap Value Fund Institutional Class
Selected data for each share of the Fund outstanding throughout each period were as follows:
| Year ended | ||||||||||||||||||||
| 3/31/17 | 3/31/16 | 3/31/15 | 3/31/14 | 3/31/13 | ||||||||||||||||
Net asset value, beginning of period | $ | 12.160 | $ | 14.310 | $ | 15.530 | $ | 14.230 | $ | 12.990 | ||||||||||
Income (loss) from investment operations: | ||||||||||||||||||||
Net investment income (loss)1 | 0.117 | (0.013 | ) | (0.059 | ) | (0.050 | ) | 0.016 | ||||||||||||
Net realized and unrealized gain (loss) | 2.320 | (1.649 | ) | (0.045 | ) | 2.995 | 1.661 | |||||||||||||
|
|
|
|
|
|
|
|
|
| |||||||||||
Total from investment operations | 2.437 | (1.662 | ) | (0.104 | ) | 2.945 | 1.677 | |||||||||||||
|
|
|
|
|
|
|
|
|
| |||||||||||
Less dividends and distributions from: | ||||||||||||||||||||
Net investment income | (0.077 | ) | — | — | (0.004 | ) | (0.005 | ) | ||||||||||||
Return of capital | — | (0.001 | ) | — | — | — | ||||||||||||||
Net realized gain | — | (0.487 | ) | (1.116 | ) | (1.641 | ) | (0.432 | ) | |||||||||||
|
|
|
|
|
|
|
|
|
| |||||||||||
Total dividends and distributions | (0.077 | ) | (0.488 | ) | (1.116 | ) | (1.645 | ) | (0.437 | ) | ||||||||||
|
|
|
|
|
|
|
|
|
| |||||||||||
Net asset value, end of period | $ | 14.520 | $ | 12.160 | $ | 14.310 | $ | 15.530 | $ | 14.230 | ||||||||||
|
|
|
|
|
|
|
|
|
| |||||||||||
Total return2 | 20.05% | (11.67% | ) | (0.53% | ) | 22.29% | 13.56% | |||||||||||||
Ratios and supplemental data: | ||||||||||||||||||||
Net assets, end of period (000 omitted) | $ | 406,327 | $ | 441,150 | $ | 499,578 | $ | 439,417 | $ | 318,758 | ||||||||||
Ratio of expenses to average net assets | 1.26% | 1.36% | 1.37% | 1.40% | 1.41% | |||||||||||||||
Ratio of expenses to average net assets prior to fees waived | 1.46% | 1.50% | 1.43% | 1.56% | 1.63% | |||||||||||||||
Ratio of net investment income (loss) to average net assets | 0.89% | (0.10% | ) | (0.40% | ) | (0.34% | ) | 0.13% | ||||||||||||
Ratio of net investment income (loss) to average net assets prior to fees waived | 0.69% | (0.24% | ) | (0.46% | ) | (0.50% | ) | (0.09% | ) | |||||||||||
Portfolio turnover | 30% | 90%3 | 31% | 33% | 36% | |||||||||||||||
| 1 | The average shares outstanding method has been applied for per share information. |
| 2 | Total investment return is based on the change in net asset value of a share during the period and assumes reinvestment of dividends and distributions at net asset value. Total investment return during all of the periods shown reflects a waiver by the manager. Performance would have been lower had the waiver not been in effect. |
| 3 | As a result of LSV Asset Management replacing The Delafield Group, a division of Tocqueville Asset Management L.P., and The Killen Group, Inc. as one of the sub-advisors to Optimum Small-Mid Cap Value Fund during the Fund’s fiscal year ending March 31, 2016, the Fund’s portfolio turnover rate increased substantially during the year ended March 31, 2016. |
See accompanying notes, which are an integral part of the financial statements.
| (continues) | 137 |
Table of Contents
Optimum Fund Trust
March 31, 2017
Optimum Fund Trust (Trust) is organized as a Delaware statutory trust and offers six series: Optimum Fixed Income Fund, Optimum International Fund, Optimum Large Cap Growth Fund, Optimum Large Cap Value Fund, Optimum Small-Mid Cap Growth Fund, and Optimum Small-Mid Cap Value Fund, (each, a Fund, or collectively, the Funds). The Trust is an open-end investment company. The Funds are considered diversified under the Investment Company Act of 1940 (1940 Act), as amended, and offer Class A, Class C, and Institutional Class shares. Class A shares are sold with a maximum front-end sales charge of 4.50% for Optimum Fixed Income Fund and 5.75% for Optimum International Fund, Optimum Large Cap Growth Fund, Optimum Large Cap Value Fund, Optimum Small-Mid Cap Growth Fund, and Optimum Small-Mid Cap Value Fund. Class A share purchases of $1,000,000 or more will incur a contingent deferred sales charge (CDSC) instead of front-end sales charge of 1.00% if redeemed during the first year and 0.50% during the second year, provided that Delaware Distributors, L.P. (DDLP) paid a financial advisor a commission on the purchase of those shares. Class C shares are sold with a CDSC of 1.00%, if redeemed during the first 12 months. Institutional Class shares are not subject to a sales charge and are offered for sale exclusively to certain eligible investors.
The investment objective of Optimum Fixed Income Fund is to seek a high level of income. The Fund may also seek growth of capital.
The investment objective of Optimum International Fund is to seek long-term growth of capital. The Fund may also seek income.
The investment objective of Optimum Large Cap Growth Fund is to seek long-term growth of capital.
The investment objective of Optimum Large Cap Value Fund is to seek long-term growth of capital. The Fund may also seek income.
The investment objective of Optimum Small-Mid Cap Growth Fund is to seek long-term growth of capital.
The investment objective of Optimum Small-Mid Cap Value Fund is to seek long-term growth of capital.
1. Significant Accounting Policies
The following accounting policies are in accordance with U.S. generally accepted accounting principles (U.S. GAAP) and are consistently followed by the Funds.
Security Valuation — Equity securities and exchange-traded funds (ETFs), except those traded on the Nasdaq Stock Market LLC (Nasdaq), are valued at the last quoted sales price as of the time of the regular close of the New York Stock Exchange on the valuation date. Equity securities and ETFs traded on the Nasdaq are valued in accordance with the Nasdaq Official Closing Price, which may not be the last sales price. If, on a particular day, an equity security or ETF does not trade, the mean between the bid and ask prices will be used, which approximates fair value. Equity securities listed on a foreign exchange are normally valued at the last quoted sales price on the valuation date. Open-end investment company securities are valued at net asset value (NAV) per share, as reported by the underlying investment company. U.S. government and agency securities are valued at the mean between the bid and ask prices, which approximates fair value. Other debt securities, credit default swap (CDS) contracts, interest rate swap options contracts (swaptions) and interest rate swap contracts are valued based upon valuations provided by an independent pricing service or broker/counterparty and reviewed by management. To the extent current market prices are not available, the pricing service may take into account developments related to the specific security, as well as transactions in comparable securities. Valuations for fixed income securities utilize matrix systems, which reflect such factors as security prices, yields, maturities, and ratings, and are supplemented by dealer and exchange quotations. For asset-backed securities, collateralized mortgage obligations, commercial mortgage securities, and U.S. government agency mortgage securities, pricing vendors utilize matrix pricing which considers prepayment speed, attributes of the collateral, yield or price of bonds of comparable quality, coupon, maturity, and type as well as broker/dealer-supplied prices. Swap prices are derived using daily swap curves and models that incorporate a number of market data factors, such as discounted cash flows, trades, and values of the underlying reference instruments. Foreign currency exchange contracts and foreign cross currency exchange contracts are valued at the mean between the bid and the ask prices, which approximates fair value. Interpolated values are derived when the settlement date of the contract is an interim date for which quotations are not available. Futures contracts and options on futures contracts are valued at the daily quoted settlement prices. Exchange-traded options are valued at the last reported sale price or, if no sales are reported, at the mean between the last reported bid and ask prices, which approximates fair value. Generally, other securities and assets for which market quotations are not readily available are valued at fair value as determined in good faith under the direction of the Trust’s Board of Trustees (Board). In determining whether market quotations are readily available or fair valuation will be used, various factors will be taken into consideration, such as market closures or suspension of trading in a security. Each Fund may use fair value pricing more frequently for securities traded primarily in non-U.S. markets because, among other things, most foreign markets close well before each Fund values its securities, generally as of 4:00 p.m. Eastern time. The earlier close of these foreign markets gives rise to the possibility that significant events, including broad market moves,
| 138 |
Table of Contents
government actions or pronouncements, aftermarket trading, or news events may have occurred in the interim. Whenever such a significant event occurs, each Fund may value foreign securities using fair value prices based on third-party vendor modeling tools (international fair value pricing).
Federal and Foreign Income Taxes — No provision for federal income taxes has been made as each Fund intends to continue to qualify for federal income tax purposes as a regulated investment company (RIC) under Subchapter M of the Internal Revenue Code of 1986, as amended, and make the requisite distributions to shareholders. The Funds evaluate tax positions taken or expected to be taken in the course of preparing each Fund’s tax returns to determine whether the tax positions are “more-likely-than-not” of being sustained by the applicable tax authority. Tax positions not deemed to meet the “more-likely-than-not” threshold are recorded as a tax benefit or expense in the current year. Management has analyzed each Fund’s tax positions taken for all open federal income tax years (March 31, 2014–March 31, 2017) and has concluded that no provision for federal income tax is required in any Fund’s financial statements. In regard to foreign taxes only, each Fund has open tax years in certain foreign countries in which it invests that may date back to the inception of each Fund.
Class Accounting — Investment income, common expenses, and realized and unrealized gain (loss) on investments are allocated to the various classes of the Funds on the basis of daily net assets of each class. Distribution expenses relating to a specific class are charged directly to that class.
Repurchase Agreements — Each Fund may purchase certain U.S. government securities subject to the counterparty’s agreement to repurchase them at an agreed upon date and price. The counterparty will be required on a daily basis to maintain the value of the collateral subject to the agreement at not less than the repurchase price (including accrued interest). The agreements are conditioned upon the collateral being deposited under the Federal Reserve book-entry system with each Fund’s custodian or a third-party sub-custodian. In the event of default or bankruptcy by the other party to the agreement, retention of the collateral may be subject to legal proceedings. All open repurchase agreements as of the date of this report were entered into on March 31, 2017, and matured on the next business day.
Reverse Repurchase Agreements — Optimum Fixed Income Fund may enter into reverse repurchase agreements. In a reverse repurchase agreement, the Fund sells securities to a bank or broker/dealer and agrees to repurchase the securities at an agreed upon date and price. The Fund will maintain in a segregated account, cash, cash equivalents, or U.S. government securities in an amount sufficient to cover its obligations under reverse repurchase agreements with broker/dealers (but no collateral is required on reverse repurchase agreements with banks). The Fund will subject its investments in reverse repurchase agreements to the borrowing provisions set forth in the 1940 Act. The use of reverse repurchase agreements by the Fund creates leverage, which increases the Fund’s investment risk. If the income and gains on securities purchased with the proceeds of reverse repurchase agreements exceed the costs of the agreements, the Fund’s earnings or NAV will increase faster than otherwise would be the case; conversely, if the income and gains fail to exceed the costs, earnings or NAV would decline faster than otherwise would be the case. For the year ended March 31, 2017, the Fund had average reverse repurchase agreements of $468,942, for which it paid interest at an average rate of 1.18%. At March 31, 2017, the Fund posted $2,395,358 in securities collateral for reverse repurchase agreements, which comprised of U.S. treasury obligations.
To Be Announced Trades (TBA) — Optimum Fixed Income Fund may contract to purchase or sell securities for a fixed price at a transaction date beyond the customary settlement period (examples: when issued, delayed delivery, forward commitment, or TBA transactions) consistent with the Fund’s ability to manage its investment portfolio and meet redemption requests. These transactions involve a commitment by the Fund to purchase or sell securities for a predetermined price or yield with payment and delivery taking place more than three days in the future, or after a period longer than the customary settlement period for that type of security. No interest will be earned by the Fund on such purchases until the securities are delivered or the transaction is completed; however, the market value may change prior to delivery. Optimum Fixed Income Fund received $2,172,000 cash collateral for TBA trades as of March 31, 2017, which is shown as “Cash collateral due to brokers” on the “Statements of assets and liabilities.” The Fund also received $721,800 in securities collateral for TBA trades comprised of U.S. treasury obligations.
Foreign Currency Transactions — Transactions denominated in foreign currencies are recorded at the prevailing exchange rates on the valuation date in accordance with the Funds’ prospectus. The value of all assets and liabilities denominated in foreign currencies is translated daily into U.S. dollars at the exchange rate of such currencies against the U.S. dollar. Transaction gains or losses resulting from changes in exchange rates during the reporting period or upon settlement of the foreign currency transaction are reported in operations for the current period. The Funds generally bifurcate that portion of realized gains and losses on investments in debt securities which is due to changes in foreign exchange rates from that which is due to changes in market prices of debt securities. That portion of gains (losses), which is due to changes in foreign exchange rates is included on the “Statements of operations” under “Net realized gain (loss) on foreign currencies.” For
| (continues) | 139 |
Table of Contents
Notes to financial statements
Optimum Fund Trust
1. Significant Accounting Policies (continued)
foreign equity securities, the realized gains and losses are included on the “Statements of operations” under “Net realized and unrealized gain (loss) on investments.” The Funds report certain foreign currency related transactions as components of realized gains (losses) for financial reporting purposes, whereas such components are treated as ordinary income (loss) for federal income tax purposes.
Use of Estimates — Each Fund is an investment company, whose financial statements are prepared in conformity with U.S. GAAP. Therefore, each Fund follows the accounting and reporting guidelines for investment companies. The preparation of financial statements in conformity with U.S. GAAP requires management to make estimates and assumptions that affect the fair value of investments, the reported amounts of assets and liabilities and disclosure of contingent assets and liabilities at the date of the financial statements, and the reported amounts of revenues and expenses during the reporting period. Actual results could differ from those estimates and the differences could be material.
Other — Expenses directly attributable to a Fund are charged directly to that Fund. Other expenses common to various funds within the Trust are generally allocated among such funds on the basis of average net assets. Management fees and certain other expenses are paid monthly. Security transactions are recorded on the date the securities are purchased or sold (trade date) for financial reporting purposes. Costs used in calculating realized gains and losses on the sale of investment securities are those of the specific securities sold. Dividend income is recorded on the ex-dividend date and interest income is recorded on the accrual basis. Discounts and premiums on debt securities are accreted or amortized to interest income, respectively, over the lives of the respective securities using the effective interest method. Realized gains (losses) on paydowns of asset- and mortgage-backed securities are classified as interest income. Distributions received from investments in real estate investment trusts (REITs) are recorded as dividend income on the ex-dividend date, subject to reclassification upon notice of the character of such distributions by the issuer. Distributions received from investments in master limited partnerships are recorded as return of capital on investments on the ex-dividend date. Foreign dividends are also recorded on the ex-dividend date or as soon after the ex-dividend date that the Funds are aware of such dividends, net of all tax withholdings, a portion of which may be reclaimable. Withholding taxes and reclaims on foreign dividends and interest have been recorded in accordance with the Funds’ understanding of the applicable country’s tax rules and rates. Each Fund may pay foreign capital gains taxes on certain foreign securities held, which are reported as components of realized losses for financial reporting purposes, whereas such components are treated as ordinary loss for federal income tax purposes. Each Fund declares and pays distributions from net investment income and net realized gain on investments, if any, at least annually. The Funds may distribute more frequently, if necessary for tax purposes. Dividends and distributions, if any, are recorded on the ex-dividend date.
Each Fund may receive earnings credits from its custodian when positive cash balances are maintained, which may be used to offset custody fees. There were no such earnings credits for the year ended March 31, 2017.
Each Fund receives earnings credits from its transfer agent when positive cash balances are maintained, which may be used to offset transfer agent fees. If the amount earned is greater than $1.00 dollar, the expense paid under this arrangement is included on the “Statements of operations” under “Dividend disbursing and transfer agent fees and expenses” with the corresponding expense offset shown under “Less expense paid indirectly.” For the year ended March 31, 2017, each Fund earned the following amounts under this agreement:
Optimum Fixed Income Fund | Optimum International Fund | Optimum Large Cap Growth Fund | Optimum Large Cap Value Fund | Optimum Small-Mid Cap Growth Fund | Optimum Small-Mid Cap Value Fund | |||||||
| $843 | $823 | $927 | $929 | $906 | $913 |
2. Investment Management, Administration Agreements, and Other Transactions with Affiliates
Delaware Management Company (DMC), a series of Delaware Management Business Trust, furnishes investment management services to each Fund and has full discretion and responsibility, subject to the overall supervision of the Board, to select and contract with one or more investment sub-advisors to manage the investment operations and composition of each Fund, and to render investment advice for each Fund, including the purchase, retention, and dispositions of investments, securities, and cash contained in each Fund. The investment management agreement obligates DMC to implement decisions with respect to the allocation or reallocation of each Fund’s assets among one or more current or additional sub-advisors, and to monitor the sub-advisors’ compliance with the relevant Fund’s investment objective, policies and restrictions. DMC pays the sub-advisors out of its fees.
140
Table of Contents
In accordance with the terms of its respective investment management agreement, DMC is entitled to receive an annual fee equal to the following percentage rates of the average daily net assets of each Fund:
Optimum Fixed Income Fund | 0.7000% of net assets up to $25 million | |
| 0.6500% of net assets from $25 million to $100 million | ||
| 0.6000% of net assets from $100 million to $500 million | ||
| 0.5500% of net assets from $500 million to $1 billion | ||
| 0.5000% of net assets from $1 billion to $2.5 billion | ||
| 0.4750% of net assets over $2.5 billion | ||
Optimum International Fund | 0.8750% of net assets up to $50 million | |
| 0.8000% of net assets from $50 million to $100 million | ||
| 0.7800% of net assets from $100 million to $300 million | ||
| 0.7650% of net assets from $300 million to $400 million | ||
| 0.7300% of net assets over $400 million | ||
Optimum Large Cap Growth Fund | 0.8000% of net assets up to $250 million | |
| 0.7875% of net assets from $250 million to $300 million | ||
| 0.7625% of net assets from $300 million to $400 million | ||
| 0.7375% of net assets from $400 million to $500 million | ||
| 0.7250% of net assets from $500 million to $1 billion | ||
| 0.7100% of net assets from $1 billion to $1.5 billion | ||
| 0.7000% of net assets over $1.5 billion | ||
Optimum Large Cap Value Fund | 0.8000% of net assets up to $100 million | |
| 0.7375% of net assets from $100 million to $250 million | ||
| 0.7125% of net assets from $250 million to $500 million | ||
| 0.6875% of net assets from $500 million to $1 billion | ||
| 0.6675% of net assets from $1 billion to $1.5 billion | ||
| 0.6475% of net assets over $1.5 billion | ||
Optimum Small-Mid Cap Growth Fund | 1.1000% of net assets | |
Optimum Small-Mid Cap Value Fund | 1.0500% of net assets up to $75 million | |
| 1.0250% of net assets from $75 million to $150 million | ||
| 1.0000% of net assets over $150 million | ||
DMC has entered into sub-advisory agreements for the Trust as follows: Optimum Fixed Income Fund – Pacific Investment Management Company, LLC (PIMCO); Optimum International Fund – Acadian Asset Management LLC (Acadian), and EARNEST Partners, LLC (EARNEST); Optimum Large Cap Growth Fund – T. Rowe Price Associates, Inc. (T. Rowe Price), and Fred Alger Management, Inc. (Alger); Optimum Large Cap Value Fund – Massachusetts Financial Services Company (MFS) and Rothschild Asset Management Inc. (Rothschild); Optimum Small-Mid Cap Growth Fund – Columbus Circle Investors (CCI) and Peregrine Capital Management LLC (Peregrine); Optimum Small-Mid Cap Value Fund – LSV Asset Management (LSV) and Westwood Management Corp. (Westwood). Prior to Oct. 3, 2016, Herdon Capital Management, LLC (Herdon) was also a sub-advisor for Optimum Large Cap Value Fund.
For the year ended March 31, 2017, DMC paid the following sub-advisory fees:
Optimum Fixed Income Fund | Optimum International Fund | Optimum Large Cap Growth Fund | Optimum Large Cap Value Fund | Optimum Small-Mid Cap Growth Fund | Optimum Small-Mid Cap Value Fund | |||||||
| $2,448,536 | $2,242,737 | $5,289,578 | $4,076,492 | $1,990,338 | $2,195,301 |
| (continues) | 141 |
Table of Contents
Notes to financial statements
Optimum Fund Trust
2. Investment Management, Administration Agreements, and Other Transactions with Affiliates (continued)
DMC has contractually agreed to waive that portion, if any, of its management fee and/or pay/reimburse each Fund to the extent necessary to ensure that total annual fund operating expenses (excluding any distribution and service (12b-1) fees, acquired fund fees and expenses, taxes, interest, short sale and dividend interest expenses, brokerage fees, certain insurance costs, and nonroutine expenses or costs, including, but not limited to, those relating to reorganizations, litigation, conducting shareholder meetings, and liquidations (collectively, nonroutine expenses)) do not exceed the following percentages of each Fund’s average daily net assets. For purposes of these waivers and reimbursements, nonroutine expenses may also include such additional costs and expenses as may be agreed upon from time to time by the Board and DMC. These waivers and reimbursements may be terminated only by agreement of DMC and the Funds.
| Optimum Fixed Income Fund | Optimum International Fund | Optimum Large Cap Growth Fund | Optimum Large Cap Value Fund | Optimum Small-Mid Cap Growth Fund | Optimum Small-Mid Cap Value Fund | |||||||
Operating expense limitation as a percentage of average daily net assets (per annum) for the period | 0.92% | 1.25% | 1.10% | 1.08% | 1.33% | 1.25% | ||||||
Operating expense limitation as a percentage of average daily net assets (per annum) for the period | 0.92% | 1.25% | 1.09% | 1.08% | 1.34% | 1.27% |
Delaware Investments Fund Services Company (DIFSC), an affiliate of DMC, provides fund accounting and financial administration oversight services to the Trust. Those services include overseeing the Funds’ pricing process, the calculation and payment of fund expenses, and financial reporting in shareholder reports, registration statements and other regulatory filings. DIFSC also manages the process for the payment of dividends and distributions and the dissemination of Funds’ NAVs and performance data. For these services, the Funds pay DIFSC an asset-based fee, plus certain out-of-pocket expenses and transactional charges. DIFSC fees are calculated based on the aggregate daily net assets of the Trust at the following annual rate: 0.0075% of the first $3 billion; 0.0070% of the next $2 billion; 0.0065% of the next $2.5 billion; 0.0055% of the next $2.5 billion; and 0.0050% of aggregate average daily net assets in excess of $10 billion. The fees payable to DIFSC under the service agreement described above are allocated among all funds in the Trust on a relative NAV basis. These amounts are included on the “Statements of operations” under “Accounting fees.” For the year ended March 31, 2017, each Fund was charged for these services as follows:
Optimum Fixed Income Fund | Optimum International Fund | Optimum Large Cap Growth Fund | Optimum Large Cap Value Fund | Optimum Small-Mid Cap Growth Fund | Optimum Small-Mid Cap Value Fund | |||||||
| $143,713 | $40,815 | $105,317 | $97,546 | $30,719 | $30,197 |
DIFSC provides the Trust with administrative services including: preparation, filing and maintaining governing documents; preparation of materials and reports for the Board; and preparation and filing of registration statements and other regulatory filings. For these administrative services, each Fund pays DIFSC a fee at an annual rate (plus out-of-pocket expenses) of 0.120% of assets up to $500 million of the Funds’ average daily net assets; 0.095% of assets from $500 million to $1 billion; and 0.070% of assets over $1 billion.
DIFSC is also the shareholder servicing, dividend disbursing, and transfer agent for each Fund. For these services, the Trust pays DIFSC a fee at an annual rate of 0.200% of the Trust’s total average daily net assets, subject to certain minimums, plus out-of-pocket expenses. Pursuant to a sub-transfer agency agreement between DIFSC and BNY Mellon Investment Servicing (US) Inc. (BNYMIS), BNYMIS provides certain sub-transfer agency services to the Funds. Sub-transfer agency fees are paid by the Funds and are also included on the “Statements of operations” under “Dividend disbursing and transfer agent fees and expenses.”
142
Table of Contents
DDLP, an affiliate of DMC, serves as the national distributor of each Fund’s shares pursuant to a Distribution Agreement. Pursuant to the Distribution Agreement and Rule 12b-1 plan, each Fund pays DDLP an annual 12b-1 fee of 0.25% of the average daily net assets of the Class A shares and 1.00% of the average daily net assets of the Class C shares. Institutional Class shares pay no 12b-1 fees.
For the year ended March 31, 2017, DDLP earned commissions on sales of Class A shares for each Fund as follows:
Optimum Fixed Income Fund | Optimum International Fund | Optimum Large Cap Growth Fund | Optimum Large Cap Value Fund | Optimum Small-Mid Cap Growth Fund | Optimum Small-Mid Cap Value Fund | |||||||
| $33,326 | $2,814 | $8,546 | $8,474 | $2,592 | $2,249 |
For the year ended March 31, 2017, DDLP received gross CDSC commissions on redemptions of each Fund’s Class C shares, and these commissions were entirely used to offset upfront commissions previously paid by DDLP to broker/dealers on sales of those shares. The amounts received were as follows:
| Optimum Fixed Income Fund | Optimum International Fund | Optimum Large Cap Growth Fund | Optimum Large Cap Value Fund | Optimum Small-Mid Cap Growth Fund | Optimum Small-Mid Cap Value Fund | |||||||
| $15,380 | $3,194 | $9,337 | $9,535 | $1,648 | $1,126 |
DMC, DIFSC and DDLP are indirect, wholly owned subsidiaries of Delaware Management Holdings, Inc. Certain officers of DMC, DIFSC and DDLP are officers and/or Trustees of the Trust. These officers and Trustees are paid no compensation by the Funds.
Cross trades for the year ended March 31, 2017, were executed by the Funds pursuant to procedures adopted by the Board designed to ensure compliance with Rule 17a-7 under the 1940 Act. Cross trading is the buying or selling of portfolio securities between funds of investment companies, or between a fund of an investment company and another entity, that are or could be considered affiliates by virtue of having a common investment advisor (or affiliated investment advisors), common directors/trustees and/or common officers. At its regularly scheduled meetings, the Board reviews such transactions for compliance with the procedures adopted by the Board. Optimum Large Cap Growth Fund did not engage in securities cross trades for the year ended March 31, 2017. Pursuant to these procedures, for the year ended March 31, 2017, the Funds engaged in securities purchases and securities sales, which resulted in net realized gain as follows.
| Optimum Fixed Income Fund | Optimum International Fund | Optimum Large Cap Value Fund | Optimum Small-Mid Cap Growth Fund | Optimum Small-Mid Cap Value Fund | ||||||||||||||||
Purchases | $ | 12,806,169 | $ | — | $ | — | $ | — | $ | — | ||||||||||
Sales | 44,576,914 | 1,778,377 | 71,090,160 | 4,474,431 | 5,673,779 | |||||||||||||||
Net realized gain | 933 | 16 | 24,065 | 1,419 | 265 | |||||||||||||||
3. Investments
For the year ended March 31, 2017, each Fund made purchases and sales of investments securities other than short-term investments as follows:
| Optimum Fixed Income Fund | Optimum International Fund | Optimum Large Cap Growth Fund | Optimum Large Cap Value Fund | Optimum Small-Mid Cap Growth Fund | Optimum Small-Mid Cap Value Fund | |||||||||||||||||||
Purchases other than U.S. government securities | $ | 6,086,188,597 | $ | 385,091,868 | $ | 745,296,820 | $ | 1,098,280,410 | $ | 755,522,036 | $ | 127,856,370 | ||||||||||||
Purchases of U.S. government securities | 3,368,627,459 | — | — | — | — | — | ||||||||||||||||||
Sales other than U.S. government securities | 6,143,886,167 | 467,209,617 | 998,796,633 | 1,192,222,897 | 855,576,347 | 229,962,121 | ||||||||||||||||||
Sales of U.S. government securities | 3,609,807,688 | — | — | — | — | — | ||||||||||||||||||
| (continues) | 143 |
Table of Contents
Notes to financial statements
Optimum Fund Trust
3. Investments (continued)
At March 31, 2017, the cost and unrealized appreciation (depreciation) of investments for federal income tax purposes for each Fund were as follows:
| Optimum Fixed Income Fund | Optimum International Fund | Optimum Large Cap Growth Fund | Optimum Large Cap Value Fund | Optimum Small-Mid Cap Growth Fund | Optimum Small-Mid Cap Value Fund | |||||||||||||||||||
Cost of investments | $ | 2,177,677,148 | $ | 544,690,259 | $ | 1,185,781,576 | $ | 1,145,298,394 | $ | 372,621,111 | $ | 341,104,621 | ||||||||||||
|
|
|
|
|
|
|
|
|
|
|
| |||||||||||||
Aggregate unrealized appreciation of investments | $ | 29,762,821 | $ | 82,525,590 | $ | 313,057,883 | $ | 217,943,288 | $ | 83,694,407 | $ | 86,516,989 | ||||||||||||
Aggregate unrealized depreciation of investments | (35,425,600 | ) | (47,095,776 | ) | (23,468,551 | ) | (24,071,423 | ) | (11,038,037 | ) | (6,789,663 | ) | ||||||||||||
|
|
|
|
|
|
|
|
|
|
|
| |||||||||||||
Net unrealized appreciation (depreciation) of investments | $ | (5,662,779 | ) | $ | 35,429,814 | $ | 289,589,332 | $ | 193,871,865 | $ | 72,656,370 | $ | 79,727,326 | |||||||||||
|
|
|
|
|
|
|
|
|
|
|
| |||||||||||||
U.S. GAAP defines fair value as the price that each Fund would receive to sell an asset or pay to transfer a liability in an orderly transaction between market participants at the measurement date under current market conditions. A three-level hierarchy for fair value measurements has been established based upon the transparency of inputs to the valuation of an asset or liability. Inputs may be observable or unobservable and refer broadly to the assumptions that market participants would use in pricing the asset or liability. Observable inputs reflect the assumptions market participants would use in pricing the asset or liability based on market data obtained from sources independent of the reporting entity. Unobservable inputs reflect the reporting entity’s own assumptions about the assumptions that market participants would use in pricing the asset or liability based on the best information available under the circumstances. Each Fund’s investment in its entirety is assigned a level based upon the observability of the inputs which are significant to the overall valuation. The three-level hierarchy of inputs is summarized below.
| Level 1 | – | Inputs are quoted prices in active markets for identical investments. (Examples: equity securities, open-end investment companies, futures contracts, exchange-traded options contracts) | ||
| Level 2 | – | Other observable inputs, including, but not limited to: quoted prices for similar assets or liabilities in markets that are active, quoted prices for identical or similar assets or liabilities in markets that are not active, inputs other than quoted prices that are observable for the assets or liabilities (such as interest rates, yield curves, volatilities, prepayment speeds, loss severities, credit risks, and default rates) or other market-corroborated inputs. (Examples: debt securities, government securities, swap contracts, foreign currency exchange contracts, foreign securities utilizing international fair value pricing, broker-quoted securities, fair valued securities) | ||
| Level 3 | – | Significant unobservable inputs, including each Fund’s own assumptions used to determine the fair value of investments. (Examples: broker-quoted securities, fair valued securities) | ||
Level 3 investments are valued using significant unobservable inputs. Each Fund may also use an income-based valuation approach in which the anticipated future cash flows of the investment are discounted to calculate fair value. Discounts may also be applied due to the nature or duration of any restrictions on the disposition of the investments. Valuations may also be based upon current market prices of securities that are comparable in coupon, rating, maturity, and industry. The derived value of a Level 3 investment may not represent the value which is received upon disposition and this could impact the results of operations.
144
Table of Contents
The following tables summarize the valuation of each Fund’s investments by fair value hierarchy levels as of March 31, 2017:
| Optimum Fixed Income Fund | ||||||||||||||||||||||||||||||
Securities | Level 1 | Level 2 | Level 3 | Total | ||||||||||||||||||||||||||
Assets: | ||||||||||||||||||||||||||||||
Agency, Asset- & Mortgage-Backed Securities1 | $ | — | $ | 726,322,247 | $ | 281,348 | $ | 726,603,595 | ||||||||||||||||||||||
Corporate Debt | — | 881,103,675 | — | 881,103,675 | ||||||||||||||||||||||||||
Foreign Debt | — | 89,273,525 | — | 89,273,525 | ||||||||||||||||||||||||||
Municipal Bonds | — | 19,248,506 | — | 19,248,506 | ||||||||||||||||||||||||||
Loan Agreements1 | — | 124,238,400 | 4,332,705 | 128,571,105 | ||||||||||||||||||||||||||
Common Stock | — | — | — | — | ||||||||||||||||||||||||||
Convertible Preferred Stock1 | 103,434 | 3,397,720 | — | 3,501,154 | ||||||||||||||||||||||||||
Preferred Stock | — | 5,196,176 | — | 5,196,176 | ||||||||||||||||||||||||||
U.S. Treasury Obligations | — | 144,306,164 | — | 144,306,164 | ||||||||||||||||||||||||||
Short-Term Investments | — | 173,718,136 | — | 173,718,136 | ||||||||||||||||||||||||||
Options Purchased | — | 492,333 | — | 492,333 | ||||||||||||||||||||||||||
|
|
|
|
|
|
|
| |||||||||||||||||||||||
Total Value of Securities | $ | 103,434 | $ | 2,167,296,882 | $ | 4,614,053 | $ | 2,172,014,369 | ||||||||||||||||||||||
|
|
|
|
|
|
|
| |||||||||||||||||||||||
Liabilities: | ||||||||||||||||||||||||||||||
Reverse Repurchase Agreements | $ | — | $ | (2,400,000 | ) | $ | — | $ | (2,400,000 | ) | ||||||||||||||||||||
Derivatives: | ||||||||||||||||||||||||||||||
Foreign Currency Exchange Contracts | $ | — | $ | 265,679 | $ | — | $ | 265,679 | ||||||||||||||||||||||
Futures Contracts | 2,529,328 | — | — | 2,529,328 | ||||||||||||||||||||||||||
Swap Contracts | — | 2,557,201 | — | 2,557,201 | ||||||||||||||||||||||||||
Options Written1 | (255,938 | ) | (445,447 | ) | — | (701,385 | ) | |||||||||||||||||||||||
1Security type is valued across multiple levels. Level 1 investments represent exchange-traded investments, Level 2 investments represent investments with observable inputs or matrix-priced investments, and Level 3 investments represent investments without observable inputs. The amounts attributed to Level 1 investments, Level 2 investments, and Level 3 investments represent the following percentages of the total market value of these security types:
| Level 1 | Level 2 | Level 3 | Total | |||||||||||||||||||||||||
Agency, Asset & Mortgage-Backed Securities | — | 99.96 | % | 0.04 | % | 100.00 | % | |||||||||||||||||||||
Convertible Preferred Stock | 2.95 | % | 97.05 | % | — | 100.00 | % | |||||||||||||||||||||
Loan Agreements | — | 96.63 | % | 3.37 | % | 100.00 | % | |||||||||||||||||||||
Options Written | 36.49 | % | 63.51 | % | — | 100.00 | % | |||||||||||||||||||||
| (continues) | 145 |
Table of Contents
Notes to financial statements
Optimum Fund Trust
3. Investments (continued)
Optimum International Fund | ||||||||||||||||||||
Securities | Level 1 | Level 2 | Level 3 | Total | ||||||||||||||||
Assets: | ||||||||||||||||||||
Common Stock | ||||||||||||||||||||
Australia | $ | 10,487,186 | $ | — | $ | — | $ | 10,487,186 | ||||||||||||
Austria | 15,394,027 | — | — | 15,394,027 | ||||||||||||||||
Bermuda | 5,818,128 | — | — | 5,818,128 | ||||||||||||||||
Brazil | 7,473,819 | — | — | 7,473,819 | ||||||||||||||||
Canada | 21,390,901 | — | — | 21,390,901 | ||||||||||||||||
China/Hong Kong | 36,863,661 | — | — | 36,863,661 | ||||||||||||||||
Colombia | 3,348,761 | — | — | 3,348,761 | ||||||||||||||||
Czech Republic | 2,333,973 | — | — | 2,333,973 | ||||||||||||||||
Denmark | 8,380,606 | — | — | 8,380,606 | ||||||||||||||||
Finland | 1,806,426 | — | — | 1,806,426 | ||||||||||||||||
France | 21,873,189 | — | — | 21,873,189 | ||||||||||||||||
Germany | 19,054,767 | — | — | 19,054,767 | ||||||||||||||||
India | 21,469,356 | — | — | 21,469,356 | ||||||||||||||||
Indonesia | 15,333,660 | — | — | 15,333,660 | ||||||||||||||||
Ireland | 11,655,542 | — | — | 11,655,542 | ||||||||||||||||
Israel | 18,808,405 | — | — | 18,808,405 | ||||||||||||||||
Italy | 10,395,474 | — | — | 10,395,474 | ||||||||||||||||
Japan | 97,933,552 | — | — | 97,933,552 | ||||||||||||||||
Mexico | 4,372,959 | — | — | 4,372,959 | ||||||||||||||||
Netherlands | 22,568,738 | — | — | 22,568,738 | ||||||||||||||||
New Zealand | 4,708,018 | — | — | 4,708,018 | ||||||||||||||||
Norway | 14,600,123 | — | — | 14,600,123 | ||||||||||||||||
Republic of Korea | 21,006,782 | — | — | 21,006,782 | ||||||||||||||||
Singapore | 6,426,815 | — | — | 6,426,815 | ||||||||||||||||
South Africa | 915,430 | — | — | 915,430 | ||||||||||||||||
Spain | 11,541,620 | — | — | 11,541,620 | ||||||||||||||||
Sweden | 3,702,437 | — | — | 3,702,437 | ||||||||||||||||
Switzerland | 37,173,426 | — | — | 37,173,426 | ||||||||||||||||
Taiwan | 14,431,559 | — | — | 14,431,559 | ||||||||||||||||
Thailand | 3,087,865 | — | — | 3,087,865 | ||||||||||||||||
Turkey | 3,675,519 | — | — | 3,675,519 | ||||||||||||||||
United Kingdom | 63,422,417 | — | — | 63,422,417 | ||||||||||||||||
United States | 13,708,403 | — | 843,154 | 14,551,557 | ||||||||||||||||
Short-Term Investments | — | 5,021,664 | — | 5,021,664 | ||||||||||||||||
Securities Lending Collateral | — | 19,091,711 | — | 19,091,711 | ||||||||||||||||
|
|
|
|
|
|
|
| |||||||||||||
Total Value of Securities | $ | 555,163,544 | $ | 24,113,375 | $ | 843,154 | $ | 580,120,073 | ||||||||||||
|
|
|
|
|
|
|
| |||||||||||||
Derivatives: | ||||||||||||||||||||
Foreign Currency Exchange Contract | $ | — | $ | (530 | ) | $ | — | $ | (530 | ) | ||||||||||
146
Table of Contents
| Optimum Large Cap Growth Fund | ||||||||||||||||||||||
Securities | Level 1 | Level 2 | Level 3 | Total | ||||||||||||||||||
Assets: | ||||||||||||||||||||||
Common Stock | ||||||||||||||||||||||
Consumer Discretionary | $ | 325,892,711 | $ | — | $ | 1,755,878 | $ | 327,648,589 | ||||||||||||||
Consumer Staples | 50,877,902 | — | — | 50,877,902 | ||||||||||||||||||
Energy | 15,130,699 | — | — | 15,130,699 | ||||||||||||||||||
Financials | 69,551,073 | — | 121,720 | 69,672,793 | ||||||||||||||||||
Healthcare | 220,676,758 | — | — | 220,676,758 | ||||||||||||||||||
Industrials | 92,581,167 | — | — | 92,581,167 | ||||||||||||||||||
Information Technology | 589,730,786 | 2,070,469 | — | 591,801,255 | ||||||||||||||||||
Materials | 15,977,954 | — | — | 15,977,954 | ||||||||||||||||||
Real Estate | 33,822,326 | — | — | 33,822,326 | ||||||||||||||||||
Telecommunication Services | 13,749,717 | — | — | 13,749,717 | ||||||||||||||||||
Utilities | 6,123,249 | — | — | 6,123,249 | ||||||||||||||||||
Convertible Preferred Stock | — | — | 8,471,851 | 8,471,851 | ||||||||||||||||||
U.S. Master Limited Partnerships | 6,988,648 | — | — | 6,988,648 | ||||||||||||||||||
Short-Term Investments | — | 21,848,000 | — | 21,848,000 | ||||||||||||||||||
|
|
|
|
|
|
|
| |||||||||||||||
Total Value of Securities | $ | 1,441,102,990 | $ | 23,918,469 | $ | 10,349,449 | $ | 1,475,370,908 | ||||||||||||||
|
|
|
|
|
|
|
| |||||||||||||||
Optimum Large Cap Value Fund | ||||||||||||||||||||||
Securities | Level 1 | Level 2 | Total | |||||||||||||||||||
Assets: | ||||||||||||||||||||||
Common Stock | $ | 1,321,818,724 | $ | — | $ | 1,321,818,724 | ||||||||||||||||
Short-Term Investments | — | 17,351,535 | 17,351,535 | |||||||||||||||||||
|
|
|
|
|
| |||||||||||||||||
Total Value of Securities | $ | 1,321,818,724 | $ | 17,351,535 | $ | 1,339,170,259 | ||||||||||||||||
|
|
|
|
|
| |||||||||||||||||
| Optimum Small-Mid Cap Growth Fund | ||||||||||||||||||||||
Securities | Level 1 | Level 2 | Level 3 | Total | ||||||||||||||||||
Assets: | ||||||||||||||||||||||
Common Stock | $ | 429,239,180 | $ | — | $ | — | $ | 429,239,180 | ||||||||||||||
Convertible Preferred Stock | — | 754,273 | 4,584,960 | 5,339,233 | ||||||||||||||||||
Short-Term Investments | — | 10,699,068 | — | 10,699,068 | ||||||||||||||||||
|
|
|
|
|
|
|
| |||||||||||||||
Total Value of Securities | $ | 429,239,180 | $ | 11,453,341 | $ | 4,584,960 | $ | 445,277,481 | ||||||||||||||
|
|
|
|
|
|
|
| |||||||||||||||
Optimum Small-Mid Cap Value Fund | ||||||||||||||||||||||
Securities | Level 1 | Level 2 | Total | |||||||||||||||||||
Assets: | ||||||||||||||||||||||
Common Stock | $ | 419,889,508 | $ | — | $ | 419,889,508 | ||||||||||||||||
Short-Term Investments | — | 942,439 | 942,439 | |||||||||||||||||||
|
|
|
|
|
| |||||||||||||||||
Total Value of Securities | $ | 419,889,508 | $ | 942,439 | $ | 420,831,947 | ||||||||||||||||
|
|
|
|
|
| |||||||||||||||||
Securities valued at zero on the “Schedules of investments” are considered to be Level 3 investments in these tables.
| (continues) | 147 |
Table of Contents
Notes to financial statements
Optimum Fund Trust
3. Investments (continued)
During the year ended March 31, 2017, there were no transfers between Level 1 investments, Level 2 investments, or Level 3 investments that had a significant impact to the Funds. This does not include transfers between Level 1 investments and Level 2 investments due to the Funds utilizing international fair value pricing during the year. In accordance with the fair valuation procedures described in Note 1, international fair value pricing of securities in each Fund occurs when market volatility exceeds an established rolling threshold. If the threshold is exceeded on a given date, then prices of international securities (those that traded on exchanges that close at a different time than the time that the Funds’ NAV is determined) are established using a separate pricing feed from a third-party vendor designed to establish a price for each such security as of the time that the Funds’ NAV is determined. Further, international fair value pricing uses other observable market-based inputs in place of the closing exchange price due to the events occurring after the close of the exchange or market on which the investment is principally traded, causing a change in classification between levels. International fair value pricing was not utilized at March 31, 2017. Each Fund’s policy is to recognize transfers between levels at the beginning of the reporting period.
A reconciliation of Level 3 investments is presented when each Fund has a significant amount of Level 3 investments at the beginning, interim, or end of the period in relation to each Fund’s net assets. With the exception of Optimum Small-Mid Cap Growth Fund, management has determined not to provide a reconciliation of Level 3 investments as they are not considered significant to each Fund’s net assets at the beginning, interim, or end of the year. Management has determined not to provide additional disclosure on Level 3 inputs since the Level 3 investments are not considered significant to each Fund’s net assets at the end of the year. There were no Level 3 investments during the year ended March 31, 2017 for Optimum Large Cap Value Fund and Optimum Small-Mid Cap Value Fund.
The following is a reconciliation of investments in which significant unobservable inputs (Level 3) were used in determining fair value for Optimum Small-Mid Cap Growth Fund:
| Common Stock | Convertible Preferred Stock | Total | ||||||||||
Beginning balance March 31, 2016 | $ | 296,387 | $ | 6,108,877 | $ | 6,405,264 | ||||||
Transfers out of Level 3 | (366,983 | ) | (1,093,633 | ) | (1,460,616 | ) | ||||||
Net change in unrealized appreciation (depreciation) | 70,596 | (430,284 | ) | (359,688 | ) | |||||||
|
|
|
|
|
| |||||||
Ending balance March 31, 2017 | $ | — | $ | 4,584,960 | $ | 4,584,960 | ||||||
|
|
|
|
|
| |||||||
Net change in unrealized appreciation (depreciation) from investments still held at the end of the year | $ | — | $ | 164,731 | $ | 164,731 | ||||||
Each Fund fair values its financial instruments at fair value using independent pricing sources under the policies approved by the Board. The Pricing Committee is the committee formed by the advisor to develop pricing policies and procedures and to provide oversight of the pricing function for the Funds.
When market quotations are not readily available for one or more portfolio securities, the Funds’ NAV shall be calculated by using the “fair value” of the securities as determined by the Pricing Committee. Such “fair value” is the amount that a Fund might reasonably expect to receive for the security (or asset) upon its current sale. Each such determination should be based on a consideration of all relevant factors, which are likely to vary from one pricing context to another. Examples of such factors may include, but are not limited to: (i) the type of security, (ii) the size of the holding, (iii) the initial cost of the security, (iv) the existence of any contractual restrictions of the security’s disposition, (v) the price and extent of public trading in similar securities of the issuer or of comparable companies, (vi) quotations or evaluated prices from broker/dealers and/or pricing services, (vii) information obtained from the issuer, analysts, and/or appropriate stock exchange (for exchange-traded securities), (viii) an analysis of the company’s financial statements, and (ix) an evaluation of the forces that influence the issuer and the market(s) in which the security is purchased and sold.
The Pricing Committee, or its delegate, employs various methods for calibrating these valuation approaches, including due diligence of the Funds’ pricing vendors and periodic back-testing of the prices that are fair valued under these procedures and reviews of any market related activity. The pricing of all securities fair valued by the Pricing Committee is subsequently reported to and approved by the Board on a quarterly basis.
148
Table of Contents
Quantitative information about Level 3 fair value measurements for Optimum Small-Mid Cap Growth Fund are as follows:
Assets | Value | Valuation | Unobservable Inputs | Range of Unobservable Inputs | Weighted Average Discounted Enterprise Value / Revenue Multiple | |||||
Convertible | $4,584,960 | Comparable company approach | Enterprise value /revenue multiple Range of comparable companies | 1.7x to 12.4x | 4.93× |
A significant change to the inputs may result in a significant change to the valuation.
4. Dividend and Distribution Information
Income and long-term capital gain distributions are determined in accordance with federal income tax regulations, which may differ from U.S. GAAP. Additionally, distributions from net gains on foreign currency transactions and net short-term gains on sales of investment securities are treated as ordinary income for federal income tax purposes. The tax character of dividends and distributions paid during the years ended March 31, 2017 and 2016 were as follows:
Year ended March 31, 2017
| Optimum Fixed Income Fund | Optimum International Fund | Optimum Large Cap Growth Fund | Optimum Large Cap Value Fund | Optimum Small-Mid Cap Growth Fund | Optimum Small-Mid Cap Value Fund | |||||||||||||||||||||||||
Ordinary income | $ | 40,065,220 | $ | 6,045,533 | $ | — | $ | 16,750,245 | $— | $ | 2,301,127 | |||||||||||||||||||
Long-term capital gains | — | — | 51,348,776 | 143,143,014 | — | — | ||||||||||||||||||||||||
|
|
|
|
|
|
|
|
|
| |||||||||||||||||||||
Total | $ | 40,065,220 | $ | 6,045,533 | $ | 51,348,776 | $ | 159,893,259 | $— | $ | 2,301,127 | |||||||||||||||||||
|
|
|
|
|
|
|
|
|
| |||||||||||||||||||||
Year ended March 31, 2016 |
| |||||||||||||||||||||||||||||
| Optimum Fixed Income Fund | Optimum International Fund | Optimum Large Cap Growth Fund | Optimum Large Cap Value Fund | Optimum Small-Mid Cap Growth Fund | Optimum Small-Mid Cap Value Fund | |||||||||||||||||||||||||
Ordinary income | $ | 62,183,208 | $ | 4,359,777 | $ | 15,880,220 | $ | 14,923,587 | $ | 269,821 | $ | 303,097 | ||||||||||||||||||
Long-term capital gains | 1,046,441 | — | 138,359,844 | — | 68,382,173 | 17,425,944 | ||||||||||||||||||||||||
Return of capital | — | — | — | — | 9,441 | 33,216 | ||||||||||||||||||||||||
|
|
|
|
|
|
|
|
|
|
|
| |||||||||||||||||||
Total | $ | 63,229,649 | $ | 4,359,777 | $ | 154,240,064 | $ | 14,923,587 | $ | 68,661,435 | $ | 17,762,257 | ||||||||||||||||||
|
|
|
|
|
|
|
|
|
|
|
| |||||||||||||||||||
| (continues) | 149 |
Table of Contents
Notes to financial statements
Optimum Fund Trust
5. Components of Net Assets on a Tax Basis
As of March 31, 2017, the components of net assets on a tax basis were as follows:
| Optimum Fixed Income Fund | Optimum International Fund | Optimum Large Cap Growth Fund | ||||||||||
Shares of beneficial interest | $ | 1,905,050,974 | $ | 545,624,793 | $ | 1,128,928,892 | ||||||
Undistributed ordinary income | 14,262,271 | 1,627,894 | 921,920 | |||||||||
Undistributed long-term capital gains | — | — | 66,277,800 | |||||||||
Capital loss carryforwards | (32,138,119 | ) | (18,878,375 | ) | — | |||||||
Other temporary difference* | (970,052 | ) | — | — | ||||||||
Unrealized appreciation (depreciation) of investments, foreign currencies, and derivatives | (3,053,981 | ) | 35,281,026 | 289,587,861 | ||||||||
|
|
|
|
|
| |||||||
Net assets | $ | 1,883,151,093 | $ | 563,655,338 | $ | 1,485,716,473 | ||||||
|
|
|
|
|
| |||||||
| Optimum Large Cap Value Fund | Optimum Small-Mid Cap Growth Fund | Optimum Small-Mid Cap Value Fund | ||||||||||
Share of beneficial interest | $ | 1,098,748,396 | $ | 368,909,369 | $ | 335,338,237 | ||||||
Undistributed ordinary income | 3,293,407 | — | 1,942,057 | |||||||||
Undistributed long-term capital gains | 46,062,179 | 1,789,339 | 7,866,738 | |||||||||
Qualified late year ordinary losses deferred | — | (1,114,999 | ) | — | ||||||||
Unrealized appreciation of investments and foreign currencies | 193,851,931 | 72,656,370 | 79,727,326 | |||||||||
|
|
|
|
|
| |||||||
Net assets | $ | 1,341,955,913 | $ | 442,240,079 | $ | 424,874,358 | ||||||
|
|
|
|
|
| |||||||
*See Note 13.
The differences between book basis and tax basis components of net assets are primarily attributable to tax deferral of losses on wash sales, tax deferral of losses on straddles, mark-to-market of foreign currency exchange contracts, mark-to-market of futures contracts, tax recognition of unrealized gain on passive foreign investment companies, tax treatment of contingent payment on debt instruments, amortization of premium on convertible securities, treasury inflation protected securities, troubled debt, partnership interest and swap contracts.
Qualified late year ordinary represent losses realized from Jan. 1, 2017 through March 31, 2017 that in accordance with federal income tax regulations, the Funds have elected to defer and treat as having arisen in the following fiscal year.
150
Table of Contents
For financial reporting purposes, capital accounts are adjusted to reflect the tax character of permanent book/tax differences. Reclassifications are primarily due to tax treatment of net operating losses, redesignation of dividends and distributions, gain (loss) on foreign currency transactions, tax treatment of partnerships, amortization of premium on convertible securities, treasury inflation protected securities, CDS contracts, foreign capital gain tax, contingent payment on debt instruments, sale of passive foreign investment companies, and paydown gains (losses) of asset- and mortgage-backed securities. Results of operations and net assets were not affected by these reclassifications. For the year ended March 31, 2017, the Funds recorded the following reclassifications:
| Optimum Fixed Income Fund | Optimum International Fund | Optimum Large Cap Growth Fund | Optimum Large Cap Value Fund | Optimum Small-Mid Cap Growth Fund | Optimum Small-Mid Cap Value Fund | |||||||||||||||||||||||||
Undistributed (accumulated) net investment income (loss) | $ | 1,260,303 | $ | 54,046 | $ | 4,065,400 | $ | (140,056 | ) | $ | 4,151,855 | $ | 563,104 | |||||||||||||||||
Accumulated net realized gain (loss) | (1,260,303 | ) | (54,046 | ) | (4,065,394 | ) | 140,056 | (2,084 | ) | (417,892 | ) | |||||||||||||||||||
Paid-in capital | — | — | (6 | ) | — | (4,149,771 | ) | (145,212 | ) | |||||||||||||||||||||
For federal income tax purposes, capital loss carryforwards may be carried forward and applied against future capital gains. At March 31, 2017, Optimum International Fund and Optimum Large Cap Value Fund utilized $7,606,077 and $13,066,441, respectively, of capital loss carryforwards.
Under the Regulated Investment Company Modernization Act of 2010 (Act), net capital losses recognized for tax years beginning after Dec. 22, 2010 may be carried forward indefinitely, and their character is retained as short-term and/or long-term losses. Previously, net capital losses were carried forward for eight years and treated as short-term losses. As a transition rule, the Act requires that post-enactment net capital losses be used before pre-enactment net capital losses.
At March 31, 2017, there were no capital loss carryforwards for Optimum Large Cap Growth Fund, Optimum Large Cap Value Fund, Optimum Small-Mid Cap Growth Fund, and Optimum Small-Mid Cap Value Fund. Capital loss carryforwards available to offset future realized capital gains, through the indicated expiration dates for Optimum Fixed Income Fund and Optimum International Fund were as follows:
| Pre-enactment capital loss | No expiration | |||||||||||||||||||||||||||||||||
| Expiration date | Post-enactment capital loss character | |||||||||||||||||||||||||||||||||
| 2018 | Short-term | Long-term | Total | |||||||||||||||||||||||||||||||
Optimum Fixed Income Fund | $ | — | $ | 11,736,396 | $ | 20,401,723 | $ | 32,138,119 | ||||||||||||||||||||||||||
Optimum International Fund | 4,316,656 | 9,162,162 | 5,399,557 | 18,878,375 | ||||||||||||||||||||||||||||||
| (continues) | 151 |
Table of Contents
Notes to financial statements
Optimum Fund Trust
6. Capital Shares
Transactions in capital shares were as follows:
Optimum Fixed Income Fund | Optimum International Fund | Optimum Large Cap Growth Fund | ||||||||||||||||||||||
| Year ended | Year ended | Year ended | ||||||||||||||||||||||
| 3/31/17 | 3/31/16 | 3/31/17 | 3/31/16 | 3/31/17 | 3/31/16 | |||||||||||||||||||
Shares sold: | ||||||||||||||||||||||||
Class A | 277,152 | 484,087 | 55,487 | 106,661 | 102,264 | 134,056 | ||||||||||||||||||
Class C | 762,019 | 2,109,294 | 164,385 | 370,858 | 359,119 | 569,981 | ||||||||||||||||||
Institutional Class | 39,990,811 | 50,670,245 | 7,475,950 | 16,417,062 | 13,872,596 | 16,932,034 | ||||||||||||||||||
Shares issued upon reinvestment of dividends and distributions: | ||||||||||||||||||||||||
Class A | 73,073 | 126,444 | 6,992 | 4,638 | 78,519 | 233,634 | ||||||||||||||||||
Class C | 164,873 | 363,757 | 5,854 | — | 319,613 | 992,070 | ||||||||||||||||||
Institutional Class | 4,107,100 | 6,368,876 | 513,028 | 394,001 | 2,831,952 | 8,237,260 | ||||||||||||||||||
|
|
|
|
|
|
|
|
|
|
|
| |||||||||||||
| 45,375,028 | 60,122,703 | 8,221,696 | 17,293,220 | 17,564,063 | 27,099,035 | |||||||||||||||||||
|
|
|
|
|
|
|
|
|
|
|
| |||||||||||||
Shares redeemed: | ||||||||||||||||||||||||
Class A | (966,352 | ) | (831,370 | ) | (188,046 | ) | (160,976 | ) | (524,169 | ) | (510,659 | ) | ||||||||||||
Class C | (4,076,187 | ) | (3,222,618 | ) | (675,780 | ) | (552,865 | ) | (2,200,265 | ) | (1,879,403 | ) | ||||||||||||
Institutional Class | (62,330,129 | ) | (43,001,210 | ) | (14,653,443 | ) | (8,328,689 | ) | (27,022,876 | ) | (18,670,206 | ) | ||||||||||||
|
|
|
|
|
|
|
|
|
|
|
| |||||||||||||
| (67,372,668 | ) | (47,055,198 | ) | (15,517,269 | ) | (9,042,530 | ) | (29,747,310 | ) | (21,060,268 | ) | |||||||||||||
|
|
|
|
|
|
|
|
|
|
|
| |||||||||||||
Net increase (decrease) | (21,997,640 | ) | 13,067,505 | (7,295,573 | ) | 8,250,690 | (12,183,247 | ) | 6,038,767 | |||||||||||||||
|
|
|
|
|
|
|
|
|
|
|
| |||||||||||||
Optimum Large Cap Value Fund | Optimum Small-Mid Cap Growth Fund | Optimum Small-Mid Cap Value Fund | ||||||||||||||||||||||
| Year ended | Year ended | Year ended | ||||||||||||||||||||||
| 3/31/17 | 3/31/16 | 3/31/17 | 3/31/16 | 3/31/17 | 3/31/16 | |||||||||||||||||||
Shares sold: | ||||||||||||||||||||||||
Class A | 103,359 | 143,327 | 35,937 | 33,959 | 30,413 | 33,499 | ||||||||||||||||||
Class C | 333,639 | 531,160 | 97,187 | 127,921 | 57,348 | 113,119 | ||||||||||||||||||
Institutional Class | 20,845,005 | 16,516,757 | 6,203,398 | 8,398,792 | 5,847,685 | 8,991,621 | ||||||||||||||||||
Shares issued upon reinvestment of dividends and distributions: | ||||||||||||||||||||||||
Class A | 233,309 | 20,818 | — | 70,219 | 1,195 | 15,444 | ||||||||||||||||||
Class C | 726,016 | 18,116 | — | 296,465 | — | 68,396 | ||||||||||||||||||
Institutional Class | 9,693,331 | 937,805 | — | 5,097,525 | 159,920 | 1,361,942 | ||||||||||||||||||
|
|
|
|
|
|
|
|
|
|
|
| |||||||||||||
| 31,934,659 | 18,167,983 | 6,336,522 | 14,024,881 | 6,096,561 | 10,584,021 | |||||||||||||||||||
|
|
|
|
|
|
|
|
|
|
|
| |||||||||||||
Shares redeemed: | ||||||||||||||||||||||||
Class A | (489,275 | ) | (394,347 | ) | (98,337 | ) | (102,565 | ) | (93,744 | ) | (74,853 | ) | ||||||||||||
Class C | (1,716,380 | ) | (1,375,133 | ) | (425,001 | ) | (332,514 | ) | (362,310 | ) | (273,196 | ) | ||||||||||||
Institutional Class | (26,278,928 | ) | (14,408,404 | ) | (14,415,539 | ) | (8,288,503 | ) | (14,304,324 | ) | (8,979,943 | ) | ||||||||||||
|
|
|
|
|
|
|
|
|
|
|
| |||||||||||||
| (28,484,583 | ) | (16,177,884 | ) | (14,938,877 | ) | (8,723,582 | ) | (14,760,378 | ) | (9,327,992 | ) | |||||||||||||
|
|
|
|
|
|
|
|
|
|
|
| |||||||||||||
Net increase (decrease) | 3,450,076 | 1,990,099 | (8,602,355 | ) | 5,301,299 | (8,663,817 | ) | 1,256,029 | ||||||||||||||||
|
|
|
|
|
|
|
|
|
|
|
| |||||||||||||
152
Table of Contents
Certain shareholders may exchange shares of one class for another class in the same Fund. There were no exchange transactions for the year ended March 31, 2017. For the year ended March 31, 2016, each Fund had the following exchange transactions. These exchange transactions are included as subscriptions and redemptions in the table on the previous page and the “Statements of changes in net assets.”
Year ended 3/31/16 | |||||||||||||||
| Exchange Redemptions | Exchange Subscriptions | ||||||||||||||
| Class C Shares | Class A Shares | Value | |||||||||||||
Optimum Fixed Income Fund | 10,722 | 10,688 | $ | 102,288 | |||||||||||
Optimum International Fund | 1,512 | 1,476 | 17,488 | ||||||||||||
Optimum Large Cap Growth Fund | 4,535 | 4,109 | 73,970 | ||||||||||||
Optimum Large Cap Value Fund | 3,867 | 3,821 | 61,640 | ||||||||||||
Optimum Small-Mid Cap Growth Fund | 837 | 753 | 11,843 | ||||||||||||
Optimum Small-Mid Cap Value Fund | 652 | 587 | 7,731 | ||||||||||||
7. Derivatives
U.S. GAAP requires disclosures that enable investors to understand: (1) how and why an entity uses derivatives; (2) how they are accounted for; and (3) how they affect an entity’s results of operations and financial position.
Foreign Currency Exchange Contracts — Each Fund may enter into foreign currency exchange contracts and foreign cross currency exchange contracts as a way of managing foreign exchange rate risk. Each Fund may also enter into these contracts to fix the U.S. dollar value of a security that it has agreed to buy or sell for the period between the date the trade was entered into and the date the security is delivered and paid for. Each Fund may enter into these contracts to hedge the U.S. dollar value of securities it already owns that are denominated in foreign currencies. In addition, each Fund may enter into these contracts to facilitate or expedite the settlement of portfolio transactions. The change in value is recorded as an unrealized gain or loss. When the contract is closed, a realized gain or loss is recorded equal to the difference between the value of the contract at the time it was opened and the value at the time it was closed.
The use of foreign currency exchange contracts and foreign cross currency exchange contracts does not eliminate fluctuations in the underlying prices of the securities, but does establish a rate of exchange that can be achieved in the future. Although foreign currency exchange contracts and foreign cross currency exchange contracts limit the risk of loss due to an unfavorable change in the value of the hedged currency, they also limit any potential gain that might result should the value of the currency change favorably. In addition, each Fund could be exposed to risks if the counterparties to the contracts are unable to meet the terms of their contracts. Each Fund’s maximum risk of loss from counterparty credit risk is the value of its currency exchanged with the counterparty. The risk is generally mitigated by having a netting arrangement between the Funds and the counterparty and by the posting of collateral by the counterparty to the Funds to cover the Funds’ exposure to the counterparty.
During the year ended March 31, 2017, with the exception of Optimum Small-Mid Cap Value Fund, the Funds used foreign currency exchange contracts to fix the U.S. dollar value of a security between trade date and settlement date, to hedge the U.S. dollar value of securities the Funds already own that are denominated in foreign currencies, and to facilitate or expedite the settlement of portfolio transactions.
During the year ended March 31, 2017, with the exception of Optimum Small-Mid Cap Value, held foreign currency exchange contracts which are reflected on the “Statements of operations” under “Net realized and unrealized gain (loss) on foreign currency exchange contracts.”
Futures Contracts — A futures contract is an agreement in which the writer (or seller) of the contract agrees to deliver to the buyer an amount of cash or securities equal to a specific dollar amount times the difference between the value of a specific security or index at the close of the last trading day of the contract and the price at which the agreement is made. Optimum Fixed Income Fund may use futures in the normal course of pursuing its investment objective. Optimum Fixed Income Fund may invest in futures contracts to hedge its existing portfolio securities against fluctuations in fair value caused by changes in interest rates or market conditions. Upon entering into a futures contract, the Fund deposits cash or pledges U.S. government securities to a broker, equal to the minimum “initial margin” requirements of the exchange on which the contract is traded. Subsequent payments are received from the broker or paid to the broker each day, based on the daily fluctuation in the market value of the contract. These receipts or payments are known as “variation margin” and are recorded daily by the Fund as unrealized gains or losses until the contracts are closed. When the contracts are closed, the Fund records a realized gain or loss equal to the difference between the value of the contract at the time it was opened and the value at the time it was closed. Risks of entering into futures contracts include potential imperfect correlation between the futures contracts and the underlying securities and the possibility of an illiquid
| (continues) | 153 |
Table of Contents
Notes to financial statements
Optimum Fund Trust
7. Derivatives (continued)
secondary market for these instruments. When investing in futures, there is reduced counterparty credit risk to the Fund because futures are exchange-traded and the exchange’s clearinghouse, as counterparty to all exchange-traded futures, guarantees against default. The Fund posted $1,832,000 cash and securities collateral valued at $4,887,228, as margin for open futures contracts. Securities collateral are presented on the “Schedules of investments” and cash collateral is presented on the “Statements of assets and liabilities” as “Cash collateral due from brokers.”
During the year ended March 31, 2017, Optimum Fixed Income Fund used futures contracts to hedge the Fund’s existing portfolio securities against fluctuations in value caused by changes in interest rates or market conditions and to facilitate investments in portfolio securities.
Options Contracts —Optimum Fixed Income Fund may enter into options contracts in the normal course of pursuing its investment objective. The Fund may buy or write options contracts for any number of reasons, including without limitation: to manage the Fund’s exposure to changes in securities prices caused by interest rates or market conditions and foreign currencies; as an efficient means of adjusting the Fund’s overall exposure to certain markets; to protect the value of portfolio securities; and as a cash management tool. The Fund may buy or write call or put options on securities, futures, swaps, swaptions, financial indices, and foreign currencies. When the Fund buys an option, a premium is paid and an asset is recorded and adjusted on a daily basis to reflect the current market value of the option purchased. When the Fund writes an option, a premium is received and a liability is recorded and adjusted on a daily basis to reflect the current market value of the option written. Premiums received from writing options that expire unexercised are treated by the Fund on the expiration date as realized gains. The difference between the premium received and the amount paid on effecting a closing purchase transaction, including brokerage commissions, is treated as realized gain or loss. If a call option is exercised, the premium is added to the proceeds from the sale of the underlying security in determining whether the Fund has a realized gain or loss. If a put option is exercised, the premium reduces the cost basis of the securities purchased by the Fund. The Fund, as writer of an option, bears the market risk of an unfavorable change in the price of the security underlying the written option. When writing options, the Fund is subject to minimal counterparty risk because the counterparty is only obligated to pay premiums and does not bear the market risk of an unfavorable market change.
Transactions in options written during the year ended March 31, 2017 for Optimum Fixed Income Fund were as follows:
| Number of | ||||||||
Call options | contracts | Premiums | ||||||
Options outstanding March 31, 2016 | 73,110,000 | $ | 255,102 | |||||
Options written | 108,662,827 | 1,626,440 | ||||||
Options expired | (148,472,100 | ) | (701,211 | ) | ||||
Options terminated in closing purchase transactions | (14,200,363 | ) | (412,865 | ) | ||||
|
|
|
| |||||
Options outstanding March 31, 2017 | 19,100,364 | $ | 767,466 | |||||
|
|
|
| |||||
| Number of | ||||||||
Put options | contracts | Premiums | ||||||
Options outstanding March 31, 2016 | 268,400,364 | $ | 1,351,614 | |||||
Options written | 164,162,769 | 1,096,441 | ||||||
Options expired | (300,762,920 | ) | (1,370,893 | ) | ||||
Options terminated in closing purchase transactions | (108,400,213 | ) | (626,914 | ) | ||||
|
|
|
| |||||
Options outstanding March 31, 2017 | 23,400,000 | $ | 450,248 | |||||
|
|
|
| |||||
During the year ended March 31, 2017, Optimum Fixed Income Fund used options contracts to manage the Fund’s exposure to changes in securities prices caused by interest rates or market conditions, to adjust the Fund’s overall exposure to certain markets, to protect the value of portfolio securities, to manage the Fund’s exposure to changes in foreign currencies, and to receive premiums for writing options.
Swap Contracts —Optimum Fixed Income Fund may enter into currency swap contracts, index swap contracts, inflation swaps, interest rate swap contracts, and CDS contracts in the normal course of pursuing its investment objective. The Fund may invest in interest rate swaps to manage the Fund’s sensitivity to interest rates or to hedge against changes in interest rates. The Fund may use currency swaps to protect against currency fluctuations. The Fund may use inflation swaps to hedge the inflation risk in nominal bonds, thereby creating synthetic inflation-indexed bonds. The Fund may enter into CDS contracts in order to hedge against a credit event, to enhance total return or to gain exposure to certain securities or markets. The Fund will not be permitted to enter into any swap transactions unless, at the time of entering into
154
Table of Contents
such transactions, the unsecured long-term debt of the actual counterparty, combined with any credit enhancements, is rated at least BBB- by Standard & Poor’s Financial Services LLC. (S&P) or Baa3 by Moody’s Investors Service Inc. (Moody’s) or is determined to be of equivalent credit quality by DMC.
Inflation Swaps. Inflation swap agreements involve commitments to pay a regular stream of inflation-indexed cash payments in exchange for receiving a stream of nominal interest payments (or vice versa), where both payment streams are based on notional amounts. The nominal interest payments may be based on either a fixed interest rate or variable interest rate such as the London Interbank Offered Rate (LIBOR). The change in value of swap contracts outstanding, if any, is recorded as unrealized appreciation or depreciation. A realized gain or loss is recorded on maturity or termination of the swap contract. The Fund’s maximum risk of loss from counterparty credit risk is the discounted net value of the cash flows to be received from/paid to the counterparty over the swap contract’s remaining life, to the extent that the amount is positive. This risk is mitigated, for bilateral swap contracts, by having a netting arrangement between the Fund and the counterparty and by the posting of collateral by the counterparty to the Fund to cover the Fund’s exposure to the counterparty.
During the year ended March 31, 2017, Optimum Fixed Income Fund used inflation swaps to hedge the inflation risk in nominal bonds (i.e., non-inflation-protected bonds) thereby creating “synthetic” inflation-indexed bonds.
Interest Rate Swaps. An interest rate swap contract is an exchange of interest rates between counterparties. In one instance, an interest rate swap involves payments received by Optimum Fixed Income Fund from another party based on a variable or floating interest rate, in return for making payments based on a fixed interest rate. An interest rate swap can also work in reverse with the Fund receiving payments based on a fixed interest rate and making payments based on a variable or floating interest rate. Interest rate swaps may be used to adjust the Fund’s sensitivity to interest rates or to hedge against changes in interest rates. Periodic payments on such contracts are accrued daily and recorded as unrealized appreciation (depreciation) on swap contracts. Upon periodic payment (receipt) or termination of the contract, such amounts are recorded as realized gains or losses on swap contracts. The Fund’s maximum risk of loss from counterparty credit risk is the discounted net value of the cash flows to be received from/paid to the counterparty over the interest rate swap contract’s remaining life, to the extent that the amount is positive. This risk is mitigated by (1) for bilateral swap contracts, having a netting arrangement between the Fund and the counterparty and by the posting of collateral by the counterparty to the Fund to cover the Fund’s exposure to the counterparty and (2) for cleared swaps, trading these instruments through a central counterparty.
During the year ended March 31, 2017, Optimum Fixed Income Fund entered into interest rate swap contracts to manage the Fund’s sensitivity to interest rates or to hedge against changes in interest rates.
Credit Default Swaps. A CDS contract is a risk-transfer instrument through which one party (purchaser of protection) transfers to another party (seller of protection) the financial risk of a credit event (as defined in the CDS agreement), as it relates to a particular reference security or basket of securities (such as an index). In exchange for the protection offered by the seller of protection, the purchaser of protection agrees to pay the seller of protection a periodic amount at a stated rate that is applied to the notional amount of the CDS contract. In addition, an upfront payment may be made or received by the Fund in connection with an unwinding or assignment of a CDS contract. Upon the occurrence of a credit event, the seller of protection would pay the par (or other agreed-upon) value of the reference security (or basket of securities) to the counterparty. Credit events generally include, among others, bankruptcy, failure to pay, and obligation default.
During the year ended March 31, 2017, Optimum Fixed Income Fund entered into CDS contracts as a purchaser and seller of protection, as a hedge against credit events. Periodic payments (receipts) on such contracts are accrued daily and recorded as unrealized losses (gains) on swap contracts. Upon payment (receipt), such amounts are recorded as realized losses (gains) on swap contracts. Upfront payments made or received in connection with CDS contracts are amortized over the expected life of the CDS contracts as unrealized losses (gains) on swap contracts. The change in value of CDS contracts is recorded daily as unrealized appreciation or depreciation. A realized gain or loss is recorded upon a credit event (as defined in the CDS agreement) or the maturity or termination of the agreement. Initial margin and variation margin are posted to central counterparties for centrally cleared CDS basket trades, as determined by the applicable central counterparty.
As disclosed in the footnotes to the “Schedules of investments,” at March 31, 2017, the notional value of the protection sold was EUR 2,500,000 and USD 42,500,000, which reflects the maximum potential amount Optimum Fixed Income Fund would have been required to make as a seller of credit protection if a credit event had occurred. In addition to serving as the source of the current value of the securities, the quoted market prices and resulting market values for credit default swap agreements on securities and credit indices serve as an indicator of the current status of the payment/performance risk and represent the likelihood of an expected liability (or profit) for the credit derivative if the swap agreement has been closed/sold as of the period end. Increasing market values, in absolute terms when compared to the notional amount
| (continues) | 155 |
Table of Contents
Notes to financial statements
Optimum Fund Trust
7. Derivatives (continued)
of the swap, represent a deterioration of the reference entity’s credit soundness and a greater likelihood of risk of default or other credit event occurring as defined under the terms of the agreement. At March 31, 2017, net unrealized appreciation of the protection sold was $922,796.
CDS contracts may involve greater risks than if Optimum Fixed Income Fund had invested in the reference obligation directly. CDS contracts are subject to general market risk, liquidity risk, counterparty risk, and credit risk. The Fund’s maximum risk of loss from counterparty credit risk, either as the seller of protection or the buyer of protection, is the fair value of the contract. This risk is mitigated by (1) for bilateral swap contracts, having a netting arrangement between the Fund and the counterparty and by the posting of collateral by the counterparty to the Fund to cover the Fund’s exposure to the counterparty and (2) for cleared swaps, trading these instruments through a central counterparty.
During the year ended March 31, 2017, Optimum Fixed Income Fund used CDS contracts to hedge against credit events, to enhance total return, and to gain exposure to certain securities or markets.
Swaps Generally. The value of open swaps may differ from that which would be realized in the event Optimum Fixed Income Fund terminated its position in the contract on a given day. Risks of entering into these contracts include the potential inability of the counterparty to meet the terms of the contracts. This type of risk is generally limited to the amount of favorable movement in the value of the underlying security, instrument or basket of instruments, if any, at the day of default. Risks also arise from potential losses from adverse market movements and such losses could exceed the unrealized amounts shown on the “Schedules of investments.”
At March 31, 2017, for bilateral derivative contracts, Optimum Fixed Income Fund posted $640,000 in cash collateral for certain open derivatives, which is presented as “Cash collateral due from brokers” on the “Statements of assets and liabilities.” Optimum Fixed Income Fund posted $2,266,553 cash and $3,193,991 securities collateral respectively for certain centrally cleared derivatives. Cash collateral is presented as “Cash collateral due from brokers” on the “Statements of assets and liabilities” and securities collateral is presented on the “Schedules of investments.” At March 31, 2017, for bilateral derivative contracts, the Fund received $680,000 in cash collateral. Cash collateral received is presented as “Cash collateral due to brokers” on the “Statements of assets and liabilities.”
Fair values of derivative instruments for Optimum Fixed Income Fund as of March 31, 2017 were as follows:
| Asset Derivatives | ||||||||||||||||||||
| Fair Value | ||||||||||||||||||||
| Currency | Interest rate | Credit | ||||||||||||||||||
| Statements of Assets and Liabilities Location | Contracts | Contracts | Contracts | Total | ||||||||||||||||
Unrealized appreciation of foreign currency exchange contracts | $ | 1,367,637 | $ | — | $ | — | $ | 1,367,637 | ||||||||||||
Variation margin due from broker on futures contracts* | 2,027,864 | 1,025,764 | — | 3,053,628 | ||||||||||||||||
Unrealized appreciation of swap contracts | — | 2,898,329 | 991,235 | 3,889,564 | ||||||||||||||||
|
|
|
|
|
|
|
| |||||||||||||
Total | $ | 3,395,501 | $ | 3,924,093 | $ | 991,235 | $ | 8,310,829 | ||||||||||||
|
|
|
|
|
|
|
| |||||||||||||
| Liability Derivatives | ||||||||||||||||||||
| Fair Value | ||||||||||||||||||||
| Currency | Interest | Credit | ||||||||||||||||||
| Statements of Assets and Liabilities Location | Contracts | Contracts | Contracts | Total | ||||||||||||||||
Unrealized depreciation of foreign currency exchange contracts | $ | (1,101,958 | ) | $ | — | $ | — | $ | (1,101,958 | ) | ||||||||||
Variation margin due from broker on futures contracts* | (439,390 | ) | (84,910 | ) | — | (524,300 | ) | |||||||||||||
Options written, at value | — | (701,385 | ) | — | (701,385 | ) | ||||||||||||||
Variation margin due to brokers on centrally cleared swap contracts | — | (105,256 | ) | (2,777 | ) | (108,033 | ) | |||||||||||||
Unrealized depreciation of swap contracts | — | (820,608 | ) | (403,722 | ) | (1,224,330 | ) | |||||||||||||
|
|
|
|
|
|
|
| |||||||||||||
Total | $ | (1,541,348 | ) | $ | (1,712,159 | ) | $ | (406,499 | ) | $ | (3,660,006 | ) | ||||||||
|
|
|
|
|
|
|
| |||||||||||||
*Includes cumulative appreciation (depreciation) of futures contracts from the date the contracts were opened through March 31, 2017. Only current day variation margin is reported on Optimum Fixed Income Fund’s “Statements of assets and liabilities.”
156
Table of Contents
The effect of derivative instruments on Optimum Fixed Income Fund’s “Statements of operations” for the year ended March 31, 2017 was as follows:
| Net Realized Gain (Loss) on: | ||||||||||||||||||||||||||||||
| Foreign Currency Exchange Contracts | Futures Contracts | Options Purchased | Options Written | Swap Contracts | Total | |||||||||||||||||||||||||
Currency contracts | $ | 3,099,794 | $ | (1,268,969 | ) | $ | (7,710 | ) | $ | 886,324 | $ | — | $ | 2,709,439 | ||||||||||||||||
Equity contracts | — | (1,182,939 | ) | — | — | — | (1,182,939 | ) | ||||||||||||||||||||||
Interest rate contracts | — | (11,496,854 | ) | (149,350 | ) | 1,017,464 | (2,517,361 | ) | (13,146,101 | ) | ||||||||||||||||||||
Credit contracts | — | — | 50,421 | (295,308 | ) | (244,887 | ) | |||||||||||||||||||||||
|
|
|
|
|
|
|
|
|
|
|
| |||||||||||||||||||
Total | $ | 3,099,794 | $ | (13,948,762 | ) | $ | (157,060 | ) | $ | 1,954,209 | $ | (2,812,669 | ) | $ | (11,864,488 | ) | ||||||||||||||
|
|
|
|
|
|
|
|
|
|
|
| |||||||||||||||||||
| Net Change in Unrealized Appreciation (Depreciation) of: | ||||||||||||||||||||||||||||||
| Foreign | ||||||||||||||||||||||||||||||
| Currency | ||||||||||||||||||||||||||||||
| Exchange | Futures | Options | Options | Swap | ||||||||||||||||||||||||||
| Contracts | Contracts | Purchased | Written | Contracts | Total | |||||||||||||||||||||||||
Currency contracts | $ | 2,823,705 | $ | 4,302,511 | $ | (6,213 | ) | $ | 141,422 | $ | — | $ | 7,261,425 | |||||||||||||||||
Equity contracts | — | 77,415 | — | — | — | 77,415 | ||||||||||||||||||||||||
Interest rate contracts | — | 185,574 | 327,821 | (409,383 | ) | 12,913,848 | 13,017,860 | |||||||||||||||||||||||
Credit contracts | — | — | — | (30,903 | ) | 350,810 | 319,907 | |||||||||||||||||||||||
|
|
|
|
|
|
|
|
|
|
|
| |||||||||||||||||||
Total | $ | 2,823,705 | $ | 4,565,500 | $ | 321,608 | $ | (298,864 | ) | $ | 13,264,658 | $ | 20,676,607 | |||||||||||||||||
|
|
|
|
|
|
|
|
|
|
|
| |||||||||||||||||||
Derivatives generally. The tables below summarize the average balance of derivative holdings by the Funds during the year ended March 31, 2017.
| Long Derivative Volume | ||||||||||||||||||||||||||||
| Optimum Fixed Income Fund | Optimum International Fund | Optimum Large Cap Growth Fund | Optimum Large Cap Value Fund | |||||||||||||||||||||||||
Foreign currency exchange contracts (average cost) | USD | 50,814,217 | USD 872,751 | USD | — | USD | 30,579 | |||||||||||||||||||||
Futures contracts | 390,822,572 | — | — | — | ||||||||||||||||||||||||
Options contracts | 381,711 | — | — | — | ||||||||||||||||||||||||
CDS contracts | EUR | 612,075 | — | — | — | |||||||||||||||||||||||
| USD | 15,636,490 | — | — | — | ||||||||||||||||||||||||
Inflation swap contracts | 158,103 | — | — | — | ||||||||||||||||||||||||
Interest rate swap contracts | — | — | — | |||||||||||||||||||||||||
| CAD | 4,122,925 | — | — | — | ||||||||||||||||||||||||
| MXN | 322,062,055 | — | — | — | ||||||||||||||||||||||||
| USD | 11,218,636 | — | — | — | ||||||||||||||||||||||||
| (continues) | 157 |
Table of Contents
Notes to financial statements
Optimum Fund Trust
7. Derivatives (continued)
| Short Derivative Volume | ||||||||||||||||||||||||||
| Optimum Fixed Income Fund | Optimum International Fund | Optimum Large Cap Growth Fund | Optimum Large Cap Value Fund | |||||||||||||||||||||||
Foreign currency exchange contracts | USD | 147,204,543 | USD 920,882 | USD | 18,564 | USD | 24,965 | |||||||||||||||||||
Futures contracts | 934,390,947 | — | — | — | ||||||||||||||||||||||
Options contracts | 501,242 | — | — | — | ||||||||||||||||||||||
CDS contracts | EUR | 3,822,134 | — | — | — | |||||||||||||||||||||
| USD | 40,811,166 | — | — | — | ||||||||||||||||||||||
Interest rate swap contracts | GBP | 3,568,379 | — | — | — | |||||||||||||||||||||
| MXN | 10,131,225 | — | — | — | ||||||||||||||||||||||
| USD | 242,306,937 | — | — | — | ||||||||||||||||||||||
* Long represents buying protection and short represents selling protection.
** Long represents receiving fixed interest payments and short represents paying fixed interest payments.
8. Offsetting
In December 2011, the Financial Accounting Standards Board (FASB) issued guidance that expanded disclosure requirements on the offsetting of certain assets and liabilities. The disclosures are required for investments and derivative financial instruments subject to master netting or similar agreements which are eligible for offset on the “Statements of assets and liabilities” and require an entity to disclose both gross and net information about such investments and transactions in the financial statements. In January 2013, the FASB issued guidance that clarified which investments and transactions are subject to the offsetting disclosure requirements. The scope of the disclosure requirements for offsetting is limited to derivative instruments, repurchase agreements and reverse repurchase agreements, and securities borrowing.
In order to better define its contractual rights and to secure rights that will help the Funds mitigate its counterparty risk, each Fund entered into an International Swaps and Derivatives Association, Inc. Master Agreement (ISDA Master Agreement) or a similar agreement with certain of its derivative contract counterparties. An ISDA Master Agreement is a bilateral agreement between each Fund and a counterparty that governs certain over-the-counter (OTC) derivatives and foreign exchange contracts and typically contains, among other things, collateral posting items and netting provisions in the event of a default and/or termination event. Under an ISDA Master Agreement, each Fund may, under certain circumstances, offset with the counterparty certain derivative financial instruments’ payables and/or receivables with collateral held and/or posted and create one single net payment. The provisions of the ISDA Master Agreement typically permit a single net payment in the event of default (close-out), including the bankruptcy or insolvency of the counterparty. However, bankruptcy, or insolvency laws of a particular jurisdiction may impose restrictions on or prohibitions against the right of offset in bankruptcy, insolvency, or other events.
For financial reporting purposes, each Fund does not offset derivative assets and derivative liabilities that are subject to netting arrangements on the “Statements of assets and liabilities.”
158
Table of Contents
At March 31, 2017, Optimum Fixed Income Fund and Optimum International Fund had the following assets and liabilities subject to offsetting provisions:
Offsetting of Financial Assets and Liabilities and Derivative Assets and Liabilities
| Optimum Fixed Income Fund | |||||||||||||||
| Gross Value of | Gross Value of | ||||||||||||||
Counterparty | Derivative Asset | Derivative Liability | Net Position | ||||||||||||
Bank of America Merrill Lynch | $ | 521,784 | $ | (478,028 | ) | $ | 43,756 | ||||||||
Barclays Bank | 17,069 | (4,208 | ) | 12,861 | |||||||||||
BNP Paribas | 319,005 | (429,363 | ) | (110,358 | ) | ||||||||||
Bank of New York Mellon | — | (9 | ) | (9 | ) | ||||||||||
Citigroup Global Markets | 4,872 | (1,900 | ) | 2,972 | |||||||||||
Deutsche Bank | 745,453 | — | 745,453 | ||||||||||||
Goldman Sachs | 86,789 | — | 86,789 | ||||||||||||
Hong Kong Shanghai Bank | 2,778 | (6,880 | ) | (4,102 | ) | ||||||||||
JPMorgan Chase Bank | 654,299 | (259,159 | ) | 395,140 | |||||||||||
Morgan Stanley Capital | 500,515 | (458,618 | ) | 41,897 | |||||||||||
Toronto Dominion Bank | 15,137 | (11,478 | ) | 3,659 | |||||||||||
|
|
|
|
|
| ||||||||||
Total | $ | 2,867,701 | $ | (1,649,643 | ) | $ | 1,218,058 | ||||||||
|
|
|
|
|
| ||||||||||
| Optimum Fixed Income Fund | ||||||||||||||||||||||||||||||
Counterparty | Net Position | Fair Value of Non-Cash Collateral Received | Cash Collateral Received | Fair Value of Non-Cash Collateral Pledged | Cash Collateral Pledged | Net Exposure(b) | ||||||||||||||||||||||||
Bank of America Merrill Lynch | $ | 43,756 | $ | — | $ | — | $ | — | $ | — | $ | 43,756 | ||||||||||||||||||
Barclays Bank | 12,861 | — | — | — | — | 12,861 | ||||||||||||||||||||||||
BNP Paribas | (110,358 | ) | — | — | — | 110,358 | — | |||||||||||||||||||||||
Bank of New York Mellon | (9 | ) | — | — | — | — | (9 | ) | ||||||||||||||||||||||
Citigroup Global Markets | 2,972 | — | — | — | — | 2,972 | ||||||||||||||||||||||||
Deutsche Bank | 745,453 | — | — | — | — | 745,453 | ||||||||||||||||||||||||
Goldman Sachs | 86,789 | — | — | — | — | 86,789 | ||||||||||||||||||||||||
Hong Kong Shanghai Bank | (4,102 | ) | — | — | — | (4,102 | ) | |||||||||||||||||||||||
JPMorgan Chase Bank | 395,140 | — | (395,140 | ) | — | — | — | |||||||||||||||||||||||
Morgan Stanley Capital | 41,897 | — | (10,000 | ) | — | — | 31,897 | |||||||||||||||||||||||
Toronto Dominion Bank | 3,659 | — | — | — | — | 3,659 | ||||||||||||||||||||||||
|
|
|
|
|
|
|
|
|
|
|
| |||||||||||||||||||
Total | $ | 1,218,058 | $ | — | $ | (405,140 | ) | $ | — | $ | 110,358 | $ | 923,276 | |||||||||||||||||
|
|
|
|
|
|
|
|
|
|
|
| |||||||||||||||||||
| (continues) | 159 |
Table of Contents
Notes to financial statements
Optimum Fund Trust
8. Offsetting (continued)
| Optimum International Fund | ||||||
| Gross Value of | Gross Value of | |||||
Counterparty | Derivative Asset | Derivative Liability | Net Position | |||
Brown Brothers Harriman | $— | $(530) | $(530) | |||
| Optimum International Fund | ||||||||||||
| Fair Value of | Fair Value of | |||||||||||
| Non-Cash | Cash Collateral | Non-Cash | Cash Collateral | |||||||||
Counterparty | Net Position | Collateral Received | Received | Collateral Pledged | Pledged | Net Exposure(b) | ||||||
Brown Brothers Harriman | $(530) | $— | $— | $— | $— | $(530) | ||||||
Master Repurchase Agreements
| Optimum Fixed Income Fund | |||||||||||||||||||||||||
Counterparty | Repurchase Agreements | Fair Value of Non-Cash Collateral Received(a) | Cash Collateral Received | Net Collateral Received | Net Exposure(b) | ||||||||||||||||||||
Bank of America Merrill Lynch | $ | 5,743,260 | $ | (5,743,260 | ) | $ | — | $ | (5,743,260 | ) | $ | — | |||||||||||||
Bank of Montreal | 5,743,260 | (5,743,260 | ) | — | (5,743,260 | ) | — | ||||||||||||||||||
BNP Paribas | 6,094,480 | (6,094,480 | ) | — | (6,094,480 | ) | — | ||||||||||||||||||
|
|
|
|
|
|
|
|
|
| ||||||||||||||||
Total | $ | 17,581,000 | $ | (17,581,000 | ) | $ | — | $ | (17,581,000 | ) | $ | — | |||||||||||||
|
|
|
|
|
|
|
|
|
| ||||||||||||||||
| Optimum International Fund | |||||||||||||||||||||||||
Counterparty | Repurchase Agreements | Fair Value of Non-Cash Collateral Received(a) | Cash Collateral Received | Net Collateral Received | Net Exposure(b) | ||||||||||||||||||||
Bank of America Merrill Lynch | $ | 999,296 | $ | (999,296 | ) | $ | — | $ | (999,296 | ) | $ | — | |||||||||||||
Bank of Montreal | 999,297 | (999,297 | ) | — | (999,297 | ) | — | ||||||||||||||||||
BNP Paribas | 1,060,407 | (1,060,407 | ) | — | (1,060,407 | ) | — | ||||||||||||||||||
|
|
|
|
|
|
|
|
|
| ||||||||||||||||
Total | $ | 3,059,000 | $ | (3,059,000 | ) | $ | — | $ | (3,059,000 | ) | $ | — | |||||||||||||
|
|
|
|
|
|
|
|
|
| ||||||||||||||||
| Optimum Large Cap Growth Fund | |||||||||||||||||||||||||
Counterparty | Repurchase Agreements | Fair Value of Non-Cash Collateral Received(a) | Cash Collateral Received | Net Collateral Received | Net Exposure(b) | ||||||||||||||||||||
Bank of America Merrill Lynch | $ | 7,137,179 | $ | (7,137,179 | ) | $ | — | $ | (7,137,179 | ) | $ | — | |||||||||||||
Bank of Montreal | 7,137,179 | (7,137,179 | ) | — | (7,137,179 | ) | — | ||||||||||||||||||
BNP Paribas | 7,573,642 | (7,573,642 | ) | — | (7,573,642 | ) | — | ||||||||||||||||||
|
|
|
|
|
|
|
|
|
| ||||||||||||||||
Total | $ | 21,848,000 | $ | (21,848,000 | ) | $ | — | $ | (21,848,000 | ) | $ | — | |||||||||||||
|
|
|
|
|
|
|
|
|
| ||||||||||||||||
160
Table of Contents
| Optimum Large Cap Value Fund | |||||||||||||||||||||||||
Counterparty | Repurchase Agreements | Fair Value of Non-Cash Collateral Received(a) | Cash Collateral Received | Net Collateral Received | Net Exposure(b) | ||||||||||||||||||||
Bank of America Merrill Lynch | $ | 3,112,552 | $ | (3,112,552 | ) | $ | — | $ | (3,112,552 | ) | $ | — | |||||||||||||
Bank of Montreal | 3,112,553 | (3,112,553 | ) | — | (3,112,553 | ) | — | ||||||||||||||||||
BNP Paribas | 3,302,895 | (3,302,895 | ) | — | (3,302,895 | ) | — | ||||||||||||||||||
|
|
|
|
|
|
|
|
|
| ||||||||||||||||
Total | $ | 9,528,000 | $ | (9,528,000 | ) | $ | — | $ | (9,528,000 | ) | $ | — | |||||||||||||
|
|
|
|
|
|
|
|
|
| ||||||||||||||||
| Optimum Small-Mid Cap Growth Fund | |||||||||||||||||||||||||
Counterparty | Repurchase Agreements | Fair Value of Non-Cash Collateral Received(a) | Cash Collateral Received | Net Collateral Received | Net Exposure(b) | ||||||||||||||||||||
Bank of America Merrill Lynch | $ | 1,024,124 | $ | (1,024,124 | ) | $ | — | $ | (1,024,124 | ) | $ | — | |||||||||||||
Bank of Montreal | 1,024,124 | (1,024,124 | ) | — | (1,024,124 | ) | — | ||||||||||||||||||
BNP Paribas | 1,086,752 | (1,086,752 | ) | — | (1,086,752 | ) | — | ||||||||||||||||||
|
|
|
|
|
|
|
|
|
| ||||||||||||||||
Total | $ | 3,135,000 | $ | (3,135,000 | ) | $ | — | $ | (3,135,000 | ) | $ | — | |||||||||||||
|
|
|
|
|
|
|
|
|
| ||||||||||||||||
Optimum Small-Mid Cap Value Fund | |||||||||||||||||||||||||
Counterparty | Repurchase Agreements | Fair Value of Non-Cash Collateral Received(a) | Cash Collateral Received | Net Collateral Received | Net Exposure(b) | ||||||||||||||||||||
Bank of America Merrill Lynch | $ | 212,338 | $ | (212,338 | ) | $ | — | $ | (212,338 | ) | $ | — | |||||||||||||
Bank of Montreal | 212,338 | (212,338 | ) | — | (212,338 | ) | — | ||||||||||||||||||
BNP Paribas | 225,324 | (225,324 | ) | — | (225,324 | ) | — | ||||||||||||||||||
|
|
|
|
|
|
|
|
|
| ||||||||||||||||
Total | $ | 650,000 | $ | (650,000 | ) | $ | — | $ | (650,000 | ) | $ | — | |||||||||||||
|
|
|
|
|
|
|
|
|
| ||||||||||||||||
Reverse repurchase agreements
Reverse repurchase transactions are entered into by Optimum Fixed Income Fund under Master Repurchase Agreements (each, an “MRA”). MRA which permits the Fund, under certain circumstances, including an event of default (such as bankruptcy or insolvency), to offset payables and/or receivables under the MRA with collateral posted to the counterparty and create one single net payment due to or from the Fund. With reverse repurchase transactions, typically the Fund and the counterparties are permitted to sell, repledge, or use the collateral associated with the transaction. Bankruptcy or insolvency laws of a particular jurisdiction may impose restrictions on or prohibitions against such a right of offset in the event of the MRA counterparty’s bankruptcy or insolvency. Pursuant to the terms of the MRA, the Fund posts securities as collateral with a market value in excess of the repurchase price to be paid or received by the Fund upon the maturity of the transaction. Upon a bankruptcy or insolvency of the MRA counterparty, the Fund is considered an unsecured creditor with respect to excess collateral and, as such, the return of excess collateral may be delayed.
| (continues) | 161 |
Table of Contents
Notes to financial statements
Optimum Fund Trust
8. Offsetting (continued)
As of March 31, 2017, the following table is a summary of Optimum Fixed Income Fund’s open reverse repurchase agreements by counterparty which are subject to offset under an MRA on a net basis:
| Optimum Fixed Income Fund | |||||||||||||||||||||||||
Counterparty | Reverse Repurchase Agreements | Fair Value of Non-Cash Collateral Pledged | Cash Collateral Pledged | Net Collateral Pledged | Net Exposure(b) | ||||||||||||||||||||
Merrill Lynch Pierce Fenner & Smith | $ | (2,400,000 | ) | $ | 2,395,358 | $ | — | $ | 2,395,358 | $ | (4,642 | ) | |||||||||||||
In the event the counterparty of securities under an MRA files for bankruptcy or becomes insolvent, the Optimum Fixed Income Fund’s use of the proceeds of the agreement may be restricted while the other party, or its trustee or receiver, determines whether or not to enforce the Fund’s obligation to repurchase the securities.
Securities Lending
Securities lending transactions are entered into by Optimum International Fund under Master Securities Lending Agreements (each, an “MSLA”) which provide the right, in the event of default (including bankruptcy or insolvency), for the non-defaulting party to liquidate the collateral and calculate a net exposure to the defaulting party or request additional collateral. In the event that a borrower defaults, the Fund, as lender, would offset the market value of the collateral received against the market value of the securities loaned. When the value of the collateral is greater than that of the market value of the securities loaned, the lender is left with a net amount payable to the defaulting party. However, bankruptcy or insolvency laws of a particular jurisdiction may impose restrictions on or prohibitions against such a right of offset in the event of an MSLA counterparty’s bankruptcy or insolvency. Under the MSLA, the borrower can resell or re-pledge the loaned securities, and the Fund can reinvest cash collateral, or, upon an event of default, resell or re-pledge the collateral.
As of March 31, 2017, the following table is a summary of Optimum International Fund’s securities lending agreements by counterparty which are subject to offset under an MSLA:
Counterparty | Securities Loaned at Value | Cash Collateral Received(a) | Fair value of Non-Cash Collateral Received | Net Exposure(b) | ||||||||||||||||
The Bank of New York Mellon | $ | 26,639,200 | $ | (15,212,230 | ) | $ | (11,426,970 | ) | $ | — | ||||||||||
(a)The value of the related collateral exceeded the value of the repurchase agreements and securities lending transactions as of March 31, 2017.
(b)Net exposure represents the receivable (payable) that would be due from (to) the counterparty in the event of default.
9. Securities Lending
Each Fund may lend its securities pursuant to a security lending agreement (Lending Agreement) with The Bank of New York Mellon (BNY Mellon). At the time a security is loaned, the borrower must post collateral equal to the required percentage of the market value of the loaned security, including any accrued interest. The required percentage is: (1) 102% with respect to U.S. securities and foreign securities that are denominated and payable in U.S. dollars; and (2) 105% with respect to foreign securities. With respect to each loan, if on any business day the aggregate market value of securities collateral plus cash collateral held is less than the aggregate market value of the securities that are the subject of such loan, the borrower will be notified to provide additional collateral by the end of the following business day, which, together with the collateral already held, will be not less than the applicable initial collateral requirements for such security loan. If the aggregate market value of securities collateral and cash collateral held with respect to a security loan exceeds the applicable initial collateral requirement, upon the request of the borrower, BNY Mellon must return enough collateral to the borrower by the end of the following business day to reduce the value of the remaining collateral to the applicable initial collateral requirement for such security loan. As a result of the foregoing, the value of the collateral held with respect to a loaned security on any particular day may be more or less than the value of the security on loan.
162
Table of Contents
Cash collateral received by each Fund of the Trust is generally invested in a series of individual separate accounts, each corresponding to a Fund. The investment guidelines permit each separate account to hold certain securities that would be considered eligible securities for a money market fund. Cash collateral received is generally invested in government securities; certain obligations issued by government sponsored enterprises; repurchase agreements collateralized by U.S. Treasury securities; obligations issued by the central government of any Organization for Economic Cooperation and Development (OECD) country or its agencies, instrumentalities, or establishments; obligations of supranational organizations; commercial paper, notes, bonds, and other debt obligations; certificates of deposit, time deposits, and other bank obligations; and asset-backed securities as disclosed on the “Schedules of investments.” Securities purchased with cash collateral are valued at the market value. A Fund can also accept U.S. government securities and letters of credit (non-cash collateral) in connection with securities loans.
In the event of default or bankruptcy by the lending agent, realization and/or retention of the collateral may be subject to legal proceedings. In the event the borrower fails to return loaned securities and the collateral received is insufficient to cover the value of the loaned securities and provided such collateral shortfall is not the result of investment losses, the lending agent has agreed to pay the amount of the shortfall to the Funds or, at the discretion of the lending agent, replace the loaned securities. The Funds continue to record dividends or interest, as applicable, on the securities loaned and are subject to changes in value of the securities loaned that may occur during the term of the loan. The Funds have the right under the Lending Agreement to recover the securities from the borrower on demand. With respect to security loans collateralized by non-cash collateral, the Funds receive loan premiums paid by the borrower. With respect to security loans collateralized by cash collateral, the earnings from the collateral investments are shared among the Funds, the security lending agent, and the borrower. The Funds record security lending income net of allocations to the security lending agent and the borrower.
Each Fund may incur investment losses as a result of investing securities lending collateral. This could occur if an investment in the collateral investment account defaulted or became impaired. Under those circumstances, the value of a Fund’s cash collateral account may be less than the amount a Fund would be required to return to the borrowers of the securities and that Fund would be required to make up for this shortfall.
During the year ended March 31, 2017, Optimum Fixed Income Fund, Optimum Large Cap Growth Fund, Optimum Large Cap Value Fund, Optimum Small-Mid Cap Growth Fund, and Optimum Small-Mid Cap Value Fund had no securities on loan.
The following table reflects a breakdown of transactions accounted for as secured borrowings, the gross obligation by the type of collateral pledged, and the remaining contractual maturity of those transactions as of March 31, 2017 for the Optimum International Fund:
Securities Lending Transactions | Overnight and Continuous | Under 30 days | Between 30 & 90 days | Over 90 days | Total | ||||||||||||||||||||
Common stock | $ | 19,091,711 | $ | — | $ | — | $ | — | $ | 19,091,711 | |||||||||||||||
10. Credit and Market Risk
Some countries in which the Funds may invest require governmental approval for the repatriation of investment income, capital, or the proceeds of sales of securities by foreign investors. In addition, if there is deterioration in a country’s balance of payments or for other reasons, a country may impose temporary restrictions on foreign capital remittances abroad.
The securities exchanges of certain foreign markets are substantially smaller, less liquid and more volatile than the major securities markets in the United States. Consequently, acquisition and disposition of securities by the Funds may be inhibited. In addition, a significant portion of the aggregate market value of securities listed on the major securities exchanges in emerging markets is held by a smaller number of investors. This may limit the number of shares available for acquisition or disposition by the Funds.
Optimum Fixed Income Fund invests in high yield fixed income securities, which are securities rated lower than BBB by S&P and lower than Baa3 by Moody’s, or similarly rated by another nationally recognized statistical rating organization. Investments in these higher yielding securities are generally accompanied by a greater degree of credit risk than higher rated securities. Additionally, lower rated securities may be more susceptible to adverse economic and competitive industry conditions than investment grade securities.
Optimum Fixed Income Fund invests in bank loans and other securities that may subject it to direct indebtedness risk, the risk that the Fund will not receive payment of principal, interest and other amounts due in connection with these investments and will depend primarily on the financial condition of the borrower. Loans that are fully secured offer the Fund more protection than unsecured loans in the event of nonpayment of scheduled interest or principal, although there is no assurance that the liquidation of collateral from a secured loan would satisfy the corporate borrower’s obligation, or that the collateral can be liquidated. Some loans or claims may be in default at the time of purchase. Certain of the loans and the other direct indebtedness acquired by the Fund may involve revolving credit facilities or other standby
| (continues) | 163 |
Table of Contents
Notes to financial statements
Optimum Fund Trust
financing commitments that obligate the Fund to pay additional cash on a certain date or on demand. These commitments may require the Fund to increase its investment in a company at a time when the Fund might not otherwise decide to do so (including at a time when the company’s financial condition makes it unlikely that such amounts will be repaid). To the extent that the Fund is committed to advance additional funds, it will at all times hold and maintain cash or other high grade debt obligations in an amount sufficient to meet such commitments. As the Fund may be required to rely upon another lending institution to collect and pass on to the Fund amounts payable with respect to the loan and to enforce the Fund’s rights under the loan and other direct indebtedness, an insolvency, bankruptcy, or reorganization of the lending institution may delay or prevent the Fund from receiving such amounts. The highly leveraged nature of many loans may make them especially vulnerable to adverse changes in economic or market conditions. Investments in such loans and other direct indebtedness may involve additional risk to the Fund.
Optimum Fixed Income Fund invests in certain obligations that may have liquidity protection designed to ensure that the receipt of payments due on the underlying security is timely. Such protection may be provided through guarantees, insurance policies, or letters of credit obtained by the issuer or sponsor through third parties, through various means of structuring the transaction or through a combination of such approaches. The Fund will not pay any additional fees for such credit support, although the existence of credit support may increase the price of a security.
Optimum Fixed Income Fund invests in fixed income securities whose value is derived from an underlying pool of mortgages or consumer loans. The value of these securities is sensitive to changes in economic conditions, including delinquencies and/or defaults, and may be adversely affected by shifts in the market’s perception of the issuers and changes in interest rates. Investors receive principal and interest payments as the underlying mortgages and consumer loans are paid back. Some of these securities are collateralized mortgage obligations (CMOs). CMOs are debt securities issued by U.S. government agencies or by financial institutions and other mortgage lenders, which are collateralized by a pool of mortgages held under an indenture. Prepayment of mortgages may shorten the stated maturity of the obligations and can result in a loss of premium, if any has been paid. Certain of these securities may be stripped (securities which provide only the principal or interest feature of the underlying security). The yield to maturity on an interest-only CMO is extremely sensitive not only to changes in prevailing interest rates, but also to the rate of principal payments (including prepayments) on the related underlying mortgage assets. A rapid rate of principal payments may have a material adverse effect on the Fund’s yield to maturity. If the underlying mortgage assets experience greater than anticipated prepayments of principal, the Fund may fail to fully recoup its initial investment in these securities even if the securities are rated in the highest rating categories.
Optimum Small-Mid Cap Growth Fund and Optimum Small-Mid Cap Value Fund invest a significant portion of their assets in small- and mid-sized companies. Investments in small- and mid-sized companies may be more volatile than investments in larger companies for a number of reasons, which include more limited financial resources or a dependence on narrow product lines.
Optimum Large Cap Growth Fund, Optimum Large Cap Value Fund, Optimum Small-Mid Cap Growth Fund, and Optimum Small-Mid Cap Value Fund may invest in REITs and are subject to the risks associated with that industry. If a Fund holds real estate directly as a result of defaults or receives rental income directly from real estate holdings, its tax status as a regulated investment company may be jeopardized. There were no direct real estate holdings during the year ended March 31, 2017. The Funds’ REIT holdings are also affected by interest rate changes, particularly if the REITs they hold use floating rate debt to finance their ongoing operations. The Funds also invests in real estate acquired as a result of ownership of securities or other instruments, including issuers that invest, deal, or otherwise engage in transactions in real estate or interests therein. These instruments may include interests in private equity limited partnerships or limited liability companies that hold real estate investments (Real Estate Limited Partnerships). The Funds will limit their investments in Real Estate Limited Partnerships to 5% of their total assets at the time of purchase.
Each Fund may invest up to 15% of its net assets in illiquid securities, which may include securities with contractual restrictions on resale, securities exempt from registration under Rule 144A promulgated under the Securities Act of 1933 (the Act), as amended, and other securities which may not be readily marketable. The Funds may also invest in securities exempt from registration under Section 4(a)(2) of the Act, which exempts from registration transactions by an issuer not involving any public offering. The relative illiquidity of these securities may impair the Funds from disposing of them in a timely manner and at a fair price when it is necessary or desirable to do so. While maintaining oversight, the Trust’s Board has delegated to DMC, the day-to-day functions of determining whether individual securities are liquid for purposes of the Funds’ limitation on investments in illiquid securities. Securities eligible for resale pursuant to Rule 144A, which are determined to be liquid, are not subject to the Funds’ 15% limit on investments in illiquid securities. Rule 144A and restricted securities have been identified on the “Schedules of investments.”
164
Table of Contents
11. Contractual Obligations
Each Fund enters into contracts in the normal course of business that contain a variety of indemnifications. Each Fund’s maximum exposure under these arrangements is unknown. However, each Fund has not had prior claims or losses pursuant to these contracts. Management has reviewed the Funds’ existing contracts and expects the risk of loss to be remote.
12. Recent Accounting Pronouncements
On Oct. 13, 2016, the Securities and Exchange Commission amended existing rules intended to modernize reporting and disclosure of information. These amendments relate to Regulation S-X which sets forth the form and content of financial statements. At this time, management is evaluating the implications of adopting these amendments and their impact on the financial statements and accompanying notes.
13. General Motors Term Loan Litigation
Optimum Fixed Income Fund received notice of a litigation proceeding related to a General Motors Corporation (G.M.) term loan participation previously held by the Fund in 2009. We believe the matter subject to the litigation notice will likely lead to a recovery from the Fund of certain amounts received by the Fund because a U.S. Court of Appeals has ruled that the Fund and similarly situated investors were unsecured creditors rather than secured lenders of G.M. as a result of an erroneous Uniform Commercial Code filing made by a third party. The Fund received the full principal on the loans in 2009 after the G.M. bankruptcy. However, based upon the court ruling the estate is seeking to recover such amounts arguing that, as unsecured creditors, the Fund should not have received payment in full. Based upon currently available information related to the litigation and the Fund’s potential exposure, the Fund recorded a liability of $1,385,788 and an asset of $415,736 based on the expected recoveries to unsecured creditors as of March 31, 2017 that resulted in a net decrease in the Fund’s NAV to reflect this likely recovery.
14. Subsequent Events
At a meeting held on Dec. 14–15, 2016 (the “Meeting”), the Board approved an amended and restated fee schedule for the Investment Management Agreement between DMC and the Trust in connection with each of the Funds that became effective on April 1, 2017. In accordance with the terms of the amended and restated fee schedule for the Investment Management Agreement, DMC is entitled to receive an annual fee equal to the following percentage rates of the average daily net assets of each Fund beginning April 1, 2017:
| Optimum Fixed Income Fund | 0.6000% of net assets up to $500 million | |
| 0.5500% of net assets from $500 million to $1 billion | ||
| 0.5000% of net assets from $1 billion to $1.5 billion | ||
| 0.4500% of net assets from $1.5 billion to $2 billion | ||
| 0.4250% of net assets from $2 billion to $2.5 billion | ||
| 0.4000% of net assets from $2.5 billion to $5 billion | ||
| 0.3750% of net assets over $5 billion | ||
| Optimum International Fund | 0.7500% of net assets up to $500 million | |
| 0.7150% of net assets from $500 million to $1 billion | ||
| 0.7000% of net assets from $1 billion to $1.5 billion | ||
| 0.6750% of net assets from $1.5 billion to $2 billion | ||
| 0.6500% of net assets from $2 billion to $2.5 billion | ||
| 0.6000% of net assets over $2.5 billion | ||
| Optimum Large Cap Growth Fund | 0.7500% of net assets up to $500 million | |
| 0.7000% of net assets from $500 million to $1 billion | ||
| 0.6500% of net assets from $1 billion to $1.5 billion | ||
| 0.6250% of net assets from $1.5 billion to $2 billion | ||
| 0.6000% of net assets from $2 billion to $2.5 billion | ||
| 0.5750% of net assets from $2.5 billion to $5 billion | ||
| 0.5500% of net assets over $5 billion | ||
| (continues) | 165 |
Table of Contents
Notes to financial statements
Optimum Fund Trust
14. Subsequent Events (continued)
| Optimum Large Cap Value Fund | 0.7000% of net assets up to $500 million | |
| 0.6500% of net assets from $500 million to $1 billion | ||
| 0.6000% of net assets from $1 billion to $1.5 billion | ||
| 0.5750% of net assets from $1.5 billion to $2 billion | ||
| 0.5500% of net assets from $2 billion to $2.5 billion | ||
| 0.5250% of net assets from 2.5 billion to $5 billion | ||
| 0.5000% of net assets over $5 billion | ||
| Optimum Small-Mid Cap Growth Fund | 1.1000% of net assets up to $250 million | |
| 1.0000% of net assets from $250 million to $500 million | ||
| 0.9000% of net assets from $500 million to $750 million | ||
| 0.8000% of net assets from $750 million to $1 billion | ||
| 0.7500% of net assets from $1 billion to $1.5 billion | ||
| 0.7000% of net assets over $1.5 billion | ||
| Optimum Small-Mid Cap Value Fund | 1.0000% of net assets up to $250 million | |
| 0.9000% of net assets from $250 million to $500 million | ||
| 0.8000% of net assets from $500 million to $750 million | ||
| 0.7500% of net assets from $750 million to $1 billion | ||
| 0.7000% of net assets from $1 billion to $1.5 billion | ||
| 0.6500% of net assets over $1.5 billion | ||
In addition, at the Meeting the Board also approved an amended and restated fee schedule for the administrative, shareholder servicing, dividend disbursing and transfer agency services provided to the Funds by DIFSC under the Amended and Restated Mutual Fund Services Agreement between the Trust and DIFSC. The amended and restated fee schedule for these services became effective on April 1, 2017.
For these administrative services, effective April 1, 2017, the Trust pays DIFSC a fee at an annual rate (plus out-of-pocket expenses) of 0.0525% of assets up to $7.5 billion of the Trust’s average daily net assets; 0.0475% of assets from $7.5 billion to $10 billion; 0.0425% of assets from $10 billion to $12 billion; 0.0375% of assets from $12 billion to $14 billion; and 0.0325% of assets over $14 billion.
For these shareholder servicing, dividend disbursing and transfer agency services, effective April 1, 2017, the Trust pays DIFSC a fee at an annual rate of 0.18% of the Trust’s total average daily net assets, subject to certain minimums, plus out-of-pocket expenses.
Effective April 3, 2017, Delaware Investments® Family of Funds became Delaware FundsSM by Macquarie and Delaware Investments changed its name to Macquarie Investment Management (MIM). MIM is the marketing name for the companies comprising the asset management division of Macquarie Group Limited. Certain entities providing services to the Funds have also changed their names to reflect the use of the MIM name.
Management has determined that no other material events or transactions occurred subsequent to March 31, 2017 that would require recognition or disclosure in the Funds’ financial statements.
166
Table of Contents
registered public accounting firm
To the Board of Trustees of Optimum Fund Trust and Shareholders of the Funds, as defined:
In our opinion, the accompanying statements of assets and liabilities, including the schedules of investments, and the related statements of operations and of changes in net assets and the financial highlights present fairly, in all material respects, the financial position of Optimum Fixed Income Fund, Optimum International Fund, Optimum Large Cap Growth Fund, Optimum Large Cap Value Fund, Optimum Small-Mid Cap Growth Fund and Optimum Small-Mid Cap Value Fund (constituting Optimum Fund Trust, hereafter referred to as the “Funds”) as of March 31, 2017, the results of each of their operations for the year then ended, the changes in each of their net assets for each of the two years in the period then ended and the financial highlights for each of the five years in the period then ended, in conformity with accounting principles generally accepted in the United States of America. These financial statements and financial highlights (hereafter referred to as “financial statements”) are the responsibility of the Funds’ management. Our responsibility is to express an opinion on these financial statements based on our audits. We conducted our audits of these financial statements in accordance with the standards of the Public Company Accounting Oversight Board (United States). Those standards require that we plan and perform the audit to obtain reasonable assurance about whether the financial statements are free of material misstatement. An audit includes examining, on a test basis, evidence supporting the amounts and disclosures in the financial statements, assessing the accounting principles used and significant estimates made by management, and evaluating the overall financial statement presentation. We believe that our audits, which included confirmation of securities as of March 31, 2017 by correspondence with the custodian and brokers, provide a reasonable basis for our opinion.
PricewaterhouseCoopers LLP
Philadelphia, Pennsylvania
May 26, 2017
| 167 |
Table of Contents
(Unaudited)
Optimum Fund Trust
Tax Information
The information set forth below is for each Fund’s fiscal year as required by federal income tax laws. Shareholders, however, must report distributions on a calendar year basis for income tax purposes, which may include distributions for portions of two fiscal years of the Funds. Accordingly, the information needed by shareholders for income tax purposes will be sent to them in January of each year. Please consult your tax advisor for proper treatment of this information.
All disclosures are based on financial information available as of the date of this annual report and, accordingly are subject to change. For any and all items requiring reporting, it is the intention of the Funds to report the maximum amount permitted under the Internal Revenue Code and the regulations thereunder.
For the fiscal year ended March 31, 2017, each Fund reports distributions paid during the year as follows:
| (A) Long-Term Capital Gains Distributions (Tax Basis) | (B) Ordinary Income Distributions* (Tax Basis) | Total Distributions (Tax Basis) | (C) Qualifying Dividends1 | |||||||||||||||||
Optimum Fixed Income Fund | — | 100.00 | % | 100.00 | % | 0.33 | % | |||||||||||||
Optimum International Fund | — | 100.00 | % | 100.00 | % | — | ||||||||||||||
Optimum Large Cap Growth Fund | 100.00 | % | — | 100.00 | % | — | ||||||||||||||
Optimum Large Cap Value Fund | 89.52 | % | 10.48 | % | 100.00 | % | 100.00 | % | ||||||||||||
Optimum Small-Mid Cap Value Fund | — | 100.00 | % | 100.00 | % | 100.00 | % | |||||||||||||
(A) and (B) are based on a percentage of each Fund’s total distributions.
(C) is based on a percentage of each Fund’s ordinary income distributions.
1Qualifying dividends represent dividends which qualify for the corporate dividends received deduction.
*For the fiscal year ended March 31, 2017, certain dividends paid by the Funds may be subject to a maximum tax rate of 20%. The percentage of dividends paid by the Funds from ordinary income reported as qualified income are as reported in the following table. Complete information will be computed and reported in conjunction with your 2017 Form 1099-DIV.
Optimum Fixed Income Fund | Optimum International Fund | Optimum Large Cap Growth Fund | Optimum Large Cap Value Fund | Optimum Small-Mid Cap Growth Fund | Optimum Small-Mid Cap Value Fund | |||||||
0.37% | 100.00% | — | 100.00% | — | 100.00% |
Optimum International Fund intends to pass through foreign tax credits in the maximum amount of $793,429. The gross foreign source income earned during the fiscal year 2017 by the Fund was $14,850,429.
| 168 |
Table of Contents
Board Consideration of Amended Fee Schedule for Investment Management Agreement for Optimum Fund Trust at a Meeting Held Dec. 14–15, 2016
At a meeting held Dec. 14–15, 2016 (the “Meeting”), the Board of Trustees (the “Board” or “Trustees”) of Optimum Fund Trust (the “Trust”), including a majority of non-interested or independent Trustees (the “Independent Trustees”), approved a fee restructuring proposal that lowered current investment management fees charged to the Funds by Delaware Management Company (“DMC” or “Management”) and lowered the administration and transfer agency fees charged to the Funds by DMC’s affiliate. In particular, the Board approved an amended and restated fee schedule (the “Amended Fee Schedule”) for the Investment Management Agreement between DMC and the Trust on behalf of each of the six separate series within the Trust (each, a “Fund” or collectively, the “Funds”).
In reaching its decision with regard to the Amended Fee Schedule, the Board took into account information provided, and discussions held, in connection with the Investment Management Agreement renewal process undertaken by the Board that culminated in the renewal of DMC’s Investment Management Agreement at the Board’s September 2016 meeting (the “September Renewal”) and additional materials provided to the Board in regards to the Amended Fee Schedule proposal in connection with the Meeting.
In considering the Amended Fee Schedule, the Independent Trustees received assistance and advice from and met separately with independent counsel. In this regard, the Independent Trustees reviewed with independent counsel their legal duties and obligations in connection with the approval of the Amended Fee Schedule and discussed, in detail, the matters related to such approval. The materials prepared by Management specifically in connection with the approval of the Amended Fee Schedule were provided to the Independent Trustees in advance of the Meeting. While attention was given to all information furnished, the following discusses some primary factors relevant to the Board’s decision. This discussion of the information and factors considered by the Board (as well as the discussion above) is not intended to be exhaustive, but rather summarizes certain factors considered by the Board. In view of the wide variety of factors considered, the Board did not, unless otherwise noted, find it practicable to quantify or otherwise assign relative weights to the following factors. In addition, individual Trustees may have assigned different weights to various factors.
Nature, extent, and quality of services. Following discussions in this regard and for reasons underlying the Board’s decision in connection with the September Renewal, the Trustees were satisfied with the nature, extent and quality of the services provided by DMC to each of the Funds. In addition, the Board took into consideration Management’s representation that there would be no change in the nature, quality and quantity of the services DMC provides to the Funds.
Investment performance. As noted in connection with the September Renewal, the Board was either satisfied with the overall investment performance of a Fund or the Board believed that DMC had taken appropriate steps to improve the performance of a Fund. The Funds’ and DMC’s performance during the period between the September Renewal and the Meeting had not altered the Board’s assessment of DMC in regards to investment performance.
Comparative expenses. In considering the appropriateness of the investment management fees charged to the Funds, the Board also reviewed and considered the investment management fees in light of the nature, extent and quality of the investment management services provided, and to be provided, by DMC. It was noted that at the September Renewal the Trustees considered various other products, portfolios and entities that are advised by DMC, as well as their relative fees and reasons for differences with respect thereto and any potential conflicts of interest. Attention was also given to an analysis of each Fund’s Institutional Class share expenses, including investment management fees, as compared to a group of other multi-advised institutional funds deemed comparable by Lipper Inc. (an independent third-party analyst and subsidiary of Broadridge Inc.), provided in connection with the September Renewal. It was noted that the Board’s analysis in regards to these items had not materially changed from the September Renewal.
The Trustees noted that DMC was proposing fee concessions for the services provided for investment management. Materials were furnished to the Board ahead of the Meeting detailing these fee schedule changes and information on pro forma Fund expenses were also provided to the Board showing the expected impact of the Amended Fee Schedule on the Funds’ expense ratios. The Trustees also noted that DMC, since inception, had waived fees to the extent necessary to keep expenses of each Fund from exceeding a designated percentage of the applicable Fund’s average daily net assets, and that the Trustees had also previously discussed in detail the current cap on expenses in effect for each Fund through July 29, 2017. It was noted that DMC plans on continuing to utilize expense caps to strategically reduce a Fund’s total expenses after the Amended Fee Schedule goes into effect on April 1, 2017. While intending to continuously monitor the fee structure of each Fund, the Trustees found the revised expense structure of each Fund to be acceptable in view of the nature and structure of Fund operations and Management’s cap on expenses.
| (continues) | 169 |
Table of Contents
Other Fund information
(Unaudited)
Optimum Fund Trust
Board Consideration of Amended Fee Schedule for Investment Management Agreement for Optimum Fund Trust at a Meeting Held Dec. 14–15, 2016 (continued)
DMC’s profitability; economies of scale. Based on the asset size of each Fund and the reimbursement and/or waiver of expenses by DMC, as well as the profitability information furnished to them by DMC, the Trustees did not believe that the level of profit being realized by DMC and its affiliates from services provided to any of the Funds was excessive. The profitability for DMC and its affiliates was provided both prior to the proposed fee restructuring and post-fee restructuring based on pro forma profitability reports. In connection with the September Renewal, the Board was also provided with information on potential fall-out benefits derived or to be derived by DMC and its affiliates in connection with their relationship to the Funds, such as the fees received for non-investment management services provided to the Funds by certain affiliates of DMC, soft dollar arrangements, and commissions paid to affiliated broker-dealers.
The Trustees recognized that as the Funds get larger at some point, economies of scale may result in DMC realizing a larger profit margin on management services provided to a Fund. The Trustees also noted that economies of scale are shared with a Fund and its shareholders through investment management fee breakpoints so that as a Fund grows in size, its effective investment management fee rate declines. After the implementation of the Amended Fee Schedule, the Board noted that each Fund’s fee schedule with DMC would have breakpoints and the last breakpoint for each Fund would be set at an asset level that is higher than each Fund’s current assets under management.
| 170 |
Table of Contents
Board of trustees and officers addendum
Optimum Fund Trust
A mutual fund is governed by a Board of Trustees, which has oversight responsibility for the management of a fund’s business affairs. Trustees establish procedures and oversee and review the performance of the investment manager, the distributor and others that perform services for the fund. The independent fund trustees, in particular, are advocates for shareholder interests. The following is a list of the Trustees and Officers of the Trust with certain background and related information.
Name, Address, and Age | Position(s) Held with Fund(s) | Length of Time Served | Principal Occupation(s) During Past 5 Years | Number of Portfolios in Fund or Officer | Other Directorships Held by Trustee or Officer | |||||
| INTERESTED TRUSTEES | ||||||||||
Matt Audette2 2005 Market Street Philadelphia, PA 19103 | Trustee | Dec.16, 2016 to present | Chief Financial Officer and Managing Director — LPL Financial LLC (2015-Present) | 6 | None | |||||
May 1974 | ||||||||||
| Chief Financial Officer — E*TRADE Financial Corporation (2011-2015) | ||||||||||
Shawn K. Lytle2,4 2005 Market Street Philadelphia, PA 19103 | Trustee, President and Chief Executive Officer | Trustee since Oct. 14, 2015; President and Chief | Mr. Lytle has served as President of Delaware Investments3,4 | 6 | Trustee — Delaware Investments® Family of Funds | |||||
| Executive Officer | since June 2015 | (62 funds) | ||||||||
February 1970 | since June 18, 2015 | and was the Regional Head | (September 2015-Present) | |||||||
| of Americas for UBS Global | ||||||||||
| Asset Management from 2010 through 2015.
| ||||||||||
| INDEPENDENT TRUSTEES | ||||||||||
Robert J. Christian | Chairman | Nov. 1, 2007 | Private Investor | 6 | Trustee — FundVantage | |||||
2005 Market Street | and Trustee | to present | (2006-Present) | Trust (34 mutual funds) | ||||||
Philadelphia, PA 19103 | (2007-Present) | |||||||||
February 1949 | ||||||||||
| Durant Adams Hunter | Trustee | July 17, 2003 | Managing Partner — Ridgeway Partners | 6 | None | |||||
2005 Market Street | to present | (Executive recruiting) | ||||||||
Philadelphia, PA 19103 | (2004-Present) | |||||||||
November 1948 | ||||||||||
Pamela J. Moret | Trustee | Oct. 1, 2013 | Private Investor | 6 | Director – Blue Cross | |||||
2005 Market Street | to present | (2015–Present) | Blue Shield of Minnesota | |||||||
Philadelphia, PA 19103 | (2014-Present) | |||||||||
| Chief Executive Officer — | ||||||||||
February 1956 | brightpeak financial | |||||||||
| (2011-June 2015) | ||||||||||
| Senior Vice President — | ||||||||||
| Thrivent Financial for Lutherans | ||||||||||
| (2002-2015) | ||||||||||
Stephen Paul Mullin | Trustee | July 17, 2003 | President — | 6 | Director – Nasdaq | |||||
2005 Market Street | to present | Econsult Solutions, Inc. | Futures, Inc. | |||||||
Philadelphia, PA 19103 | (Economic Consulting) | (2007-Present) | ||||||||
| (2013-Present) | ||||||||||
February 1956 | ||||||||||
| Senior Vice President — | ||||||||||
| Econsult Corp. | ||||||||||
| (Economic consulting) | ||||||||||
| (2000-2012) | ||||||||||
| (continues) | 171 |
Table of Contents
Board of trustees and officers addendum
Optimum Fund Trust
Name, Address, and Age | Position(s) Held with Fund(s) | Length of Time Served | Principal Occupation(s) During Past 5 Years | Number of Portfolios in Fund or Officer | Other Directorships Held by Trustee or Officer | |||||
| INDEPENDENT TRUSTEES (continued) | ||||||||||
Robert A. Rudell 2005 Market Street Philadelphia, PA 19103 | Trustee | July 17, 2003 to present | Private Investor (2002-Present) | 6 | Director and Independent Chairman — Heartland Funds | |||||
| (3 mutual funds) | ||||||||||
September 1948 | (2005-Present) | |||||||||
Jon Edward | Trustee | July 17, 2003 | President — H&S | 6 | None | |||||
Socolofsky | to present | Enterprises of Minocqua, LLC | ||||||||
2005 Market Street | (Commercial real estate developer) | |||||||||
Philadelphia, PA 19103 | (2005-Present) | |||||||||
March 1946 | Private Investor | |||||||||
| (2002-Present) | ||||||||||
Susan M. Stalnecker | Trustee | Dec. 14, 2016 | Private Investor | 6 | Trustee — Duke University | |||||
2005 Market Street | to present | (2016-Present) | Health System, Audit | |||||||
Philadelphia, PA 19103 | Committee member | |||||||||
| Vice President — Productivity & Shared | (2010–Present) | |||||||||
January 1953 | Services — E.I. du Pont de Nemours and | |||||||||
| Company (2012-2016) | Director — Leidos | |||||||||
| (2016-Present) | ||||||||||
| Vice President and Treasurer — | ||||||||||
| E.I. du Pont de Nemours and | ||||||||||
| Company (2006-2012) | ||||||||||
| OFFICERS | ||||||||||
David F. Connor | Senior Vice President, | Senior Vice President | David F. Connor has served in | 6 | None4 | |||||
2005 Market Street | General Counsel, | since May 2013; | various capacities at | |||||||
Philadelphia, PA 19103 | and Secretary | General Counsel | different times at | |||||||
| since May 2015; | Delaware Investments3. | |||||||||
December 1963 | Secretary since | |||||||||
| Oct. 2005 | ||||||||||
Daniel V. Geatens | Vice President | Sept. 20, 2007 | Daniel V. Geatens has served in | 6 | None4 | |||||
2005 Market Street | and Treasurer | to present | various capacities at | |||||||
Philadelphia, PA 19103 | different times at | |||||||||
| Delaware Investments3. | ||||||||||
October 1972 | ||||||||||
Richard Salus | Senior | Jan. 1, 2006 | Richard Salus has served in | 6 | None4 | |||||
2005 Market Street | Vice President | to present | various executive capacities | |||||||
Philadelphia, PA 19103 | and | at different times at | ||||||||
| Chief Financial | Delaware Investments3. | |||||||||
October 1963 | Officer | |||||||||
| 1 | The term “Fund Complex” refers to the Funds in the Optimum Fund Trust. |
| 2 | “Interested persons” of the Funds by virtue of their executive and management positions or relationships with the Fund’s service providers or sub-service providers. |
| 3 | Delaware Investments is the marketing name for Delaware Management Holdings, Inc. and its subsidiaries, including the Trust’s manager, principal underwriters, and transfer agent. |
| 4 | Messrs, Lytle, Connor, Geatens, and Salus also serve in similar capacities for the Delaware Investments® Family of Funds, a fund complex that has the same manager, principal underwriter, and transfer agent as the Trust. |
The Statement of Additional Information for the Funds includes additional information about the Trustees and Officers and is available, without charge, upon request by calling your financial advisor or 800 914-0278.
| 172 |
Table of Contents
This annual report is for the information of Optimum Fund Trust shareholders, but it may be used with prospective investors when preceded or accompanied by a current prospectus for Optimum Fund Trust and the fact sheet for the most recently completed calendar quarter. The prospectus sets forth details about charges, expenses, investment objectives, and operating policies of the investment company. You should read the prospectus carefully before you invest. The figures in this report represent past results that are not a guarantee of future results. The return and principal value of an investment in the investment company will fluctuate so that shares, when redeemed, may be worth more or less than their original cost.
| Board of trustees | Affiliated officers | Contact information | ||
| Matt Audette | David F. Connor | Investment manager | ||
Chief Financial Officer and Managing Director — LPL Financial LLC | Senior Vice President, General Counsel, and Secretary Optimum Fund Trust Philadelphia, PA | Delaware Management Company, a series of Delaware Management Business Trust Philadelphia, PA | ||
Shawn K. Lytle
President — Delaware Investments Philadelphia, PA
Robert J. Christian
Private Investor
Durant Adams Hunter
Managing Partner — Ridgeway Partners
Pamela J. Moret
Private Investor
Stephen Paul Mullin
President — Econsult Solutions, Inc.
Robert A. Rudell
Private Investor
Jon Edward Socolofsky
Private Investor
Susan M. Stalnecker
Private Investor |
Daniel V. Geatens
Vice President and Treasurer Optimum Fund Trust Philadelphia, PA
Richard Salus
Senior Vice President and Chief Financial Officer Optimum Fund Trust Philadelphia, PA | National distributor
Delaware Distributors, L.P.
Shareholder servicing, dividend disbursing, and transfer agent
Delaware Investments Fund Services Company 2005 Market Street Philadelphia, PA 19103-7094
For shareholders
800 914-0278
For securities dealers and financial institutions representatives only
800 362-7500
Website
optimummutualfunds.com | ||
Each Fund files its complete schedule of portfolio holdings with the Securities and Exchange Commission (SEC) for the first and third quarters of each fiscal year on Forms N-Q. Each Fund’s Forms N-Q, as well as a description of the policies and procedures that the Funds use to determine how to vote proxies (if any) relating to portfolio securities and the Schedules of Investments included in the Funds’ most recent Forms N-Q are available without charge (i) upon request, by calling 800 914-0278; (ii) on the Funds’ website at optimummutualfunds.com/literature; and (iii) on the SEC’s website at sec.gov. Each Fund’s Forms N-Q may be reviewed and copied at the SEC’s Public Reference Room in Washington, D.C.; information on the operation of the Public Reference Room may be obtained by calling 800 SEC-0330.
Information (if any) regarding how the Funds voted proxies relating to portfolio securities during the most recently disclosed 12-month period ended June 30 is available without charge (i) through the Funds’ website at optimummutualfunds.com/proxy; and (ii) on the SEC’s website at sec.gov.
| 173 |
Item 2. Code of Ethics
The registrant has adopted a code of ethics that applies to the registrant’s principal executive officer, principal financial officer, principal accounting officer or controller, or persons performing similar functions, regardless of whether these individuals are employed by the registrant or a third party. A copy of the registrant’s Code of Business Ethics has been posted on the Optimum Mutual Funds’ Internet Web site at www.optimummutualfunds.com. Any amendments to the Code of Business Ethics, and information on any waiver from its provisions granted by the registrant, will also be posted on this Web site within five business days of such amendment or waiver and will remain on the Web site for at least 12 months.
Item 3. Audit Committee Financial Expert
The registrant’s Board of Trustees/Directors has determined that certain members of the registrant’s Audit Committee are audit committee financial experts, as defined below. For purposes of this item, an “audit committee financial expert” is a person who has the following attributes:
a. An understanding of generally accepted accounting principles and financial statements;
b. The ability to assess the general application of such principles in connection with the accounting for estimates, accruals, and reserves;
c. Experience preparing, auditing, analyzing, or evaluating financial statements that present a breadth and level of complexity of accounting issues that are generally comparable to the breadth and complexity of issues that can reasonably be expected to be raised by the registrant’s financial statements, or experience actively supervising one or more persons engaged in such activities;
d. An understanding of internal controls and procedures for financial reporting; and
e. An understanding of audit committee functions.
An “audit committee financial expert” shall have acquired such attributes through:
a. Education and experience as a principal financial officer, principal accounting officer, controller, public accountant, or auditor or experience in one or more positions that involve the performance of similar functions;
b. Experience actively supervising a principal financial officer, principal accounting officer, controller, public accountant, auditor, or person performing similar functions;
c. Experience overseeing or assessing the performance of companies or public accountants with respect to the preparation, auditing, or evaluation of financial statements; or
d. Other relevant experience.
The registrant’s Board of Trustees/Directors has also determined that each member of the registrant’s Audit Committee is independent. In order to be “independent” for purposes of this item, the Audit Committee member may not: (i) other than in his or her capacity as a member of the Board of Trustees/Directors or any committee thereof, accept directly or indirectly any consulting, advisory or other compensatory fee from the issuer; or (ii) be an “interested person” of the registrant as defined in Section 2(a)(19) of the Investment Company Act of 1940.
The names of the audit committee financial experts on the registrant’s Audit Committee are set forth below:
| Robert J. Christian | |
| Robert A. Rudell | |
| Jon E. Socolofsky |
Item 4. Principal Accountant Fees and Services
PricewaterhouseCoopers LLP (“PwC”), the Independent Accountant to the series portfolios of Optimum Fund Trust (“Funds”), has advised the Audit Committee of the Board of Trustees of the Funds (“Audit Committee”) that, as of the date of the filing of this Annual Report on Form N-CSR, it is in discussions with the staff of the Securities and Exchange Commission (“SEC Staff”), or the SEC, regarding the interpretation and application of Rule 2-01(c)(1)(ii)(A) of Regulation S-X, or the Loan Rule.
The Loan Rule prohibits accounting firms, such as PwC, from having certain financial relationships with their audit clients and affiliated entities. Specifically, the Loan Rule provides, in relevant part, that an accounting firm generally would not be independent if it receives a loan from a lender that is a “record or beneficial owner of more than ten percent of the audit client’s equity securities.” Under the SEC Staff’s interpretation of the Loan Rule, based on information provided to us by PwC, some of PwC’s relationships with its lenders who also own shares of one or more funds within the Delaware FundsSM by Macquarie investment company complex (which includes the Funds) implicate the Loan Rule, calling into question PwC’s independence with respect to the Funds. PwC believes that, in light of the facts of these lending relationships, its ability to exercise objective judgment with respect to the audit of the Funds has not been impaired.
The Audit Committee has considered the lending relationships described by PwC and has concluded that (1) the lending relationships did not affect PwC’s application of objective judgment in conducting its audits and issuing reports on the Funds’ financial statements; and (2) a reasonable investor with knowledge of the lending relationships described by PwC would reach the same conclusion. In making this determination, the Audit Committee considered, among other things, PwC’s description of the relevant lending relationships and PwC’s representation that its objectivity was not impaired in conducting its audit of the Funds’ financial statements. In connection with this determination, PwC advised the Audit Committee that it believes PwC is independent and it continues to have discussions with the SEC Staff.
If the SEC were ultimately to determine that PwC was not independent with respect to the Funds for certain time periods, the Funds’ filings with the SEC that contain the Funds’ financial statements for such periods would be non-compliant with the applicable securities laws. If the SEC determines that PwC was not independent, among other things, the Funds could be required to have independent audits conducted on the Funds’ previously audited financial statements by another registered public accounting firm for the affected periods. The time involved to conduct such independent audits may impair the Funds’ ability to issue shares. Any of the foregoing possible outcomes potentially could have a material adverse effect on the Funds.
(a) Audit fees.
The aggregate fees billed for services provided to the registrant by its independent auditors for the audit of the registrant’s annual financial statements and for services normally provided by the independent auditors in connection with statutory and regulatory filings or engagements were $153,000 for the fiscal year ended March 31, 2017.
The aggregate fees billed for services provided to the registrant by its independent auditors for the audit of the registrant’s annual financial statements and for services normally provided by the independent auditors in connection with statutory and regulatory filings or engagements were $148,500 for the fiscal year ended March 31, 2016.
(b) Audit-related fees.
The aggregate fees billed by the registrant’s independent auditors for services relating to the performance of the audit of the registrant’s financial statements and not reported under paragraph (a) of this Item were $0 for the fiscal year ended March 31, 2017.
The aggregate fees billed by the registrant’s independent auditors for services relating to the performance of the audit of the financial statements of the registrant’s investment adviser and other service providers under common control with the adviser and that relate directly to the operations or financial reporting of the registrant were $640,000 for the registrant’s fiscal year ended March 31, 2017. The percentage of these fees relating to services approved by the registrant’s Audit Committee pursuant to the de minimis exception from the pre-approval requirement in Rule 2-01(c)(7)(i)(C) of Regulation S-X was 0%. These audit-related services were as follows: year-end audit procedures; group reporting and subsidiary statutory audits.
The aggregate fees billed by the registrant’s independent auditors for services relating to the performance of the audit of the registrant’s financial statements and not reported under paragraph (a) of this Item were $0 for the fiscal year ended March 31, 2016.
The aggregate fees billed by the registrant’s independent auditors for services relating to the performance of the audit of the financial statements of the registrant’s investment adviser and other service providers under common control with the adviser and that relate directly to the operations or financial reporting of the registrant were $667,000 for the registrant’s fiscal year ended March 31, 2016. The percentage of these fees relating to services approved by the registrant’s Audit Committee pursuant to the de minimis exception from the pre-approval requirement in Rule 2-01(c)(7)(i)(C) of Regulation S-X was 0%. These audit-related services were as follows: year end audit procedures; group reporting and subsidiary statutory audits.
(c) Tax fees.
The aggregate fees billed by the registrant’s independent auditors for tax-related services provided to the registrant were $29,175 for the fiscal year ended March 31, 2017. The percentage of these fees relating to services approved by the registrant’s Audit Committee pursuant to the de minimis exception from the pre-approval requirement in Rule 2-01(c)(7)(i)(C) of Regulation S-X was 0%. These tax-related services were as follows: review of income tax returns and review of annual excise distribution calculations.
The aggregate fees billed by the registrant’s independent auditors for tax-related services provided to the registrant’s investment adviser and other service providers under common control with the adviser and that relate directly to the operations or financial reporting of the registrant were $0 for the registrant’s fiscal year ended March 31, 2017.
The aggregate fees billed by the registrant’s independent auditors for tax-related services provided to the registrant were $29,175 for the fiscal year ended March 31, 2016. The percentage of these fees relating to services approved by the registrant’s Audit Committee pursuant to the de minimis exception from the pre-approval requirement in Rule 2-01(c)(7)(i)(C) of Regulation S-X was 0%. These tax-related services were as follows: review of income tax returns and review of annual excise distribution calculations.
The aggregate fees billed by the registrant’s independent auditors for tax-related services provided to the registrant’s investment adviser and other service providers under common control with the adviser and that relate directly to the operations or financial reporting of the registrant were $0 for the registrant’s fiscal year ended March 31, 2016.
(d) All other fees.
The aggregate fees billed for all services provided by the independent auditors to the registrant other than those set forth in paragraphs (a), (b) and (c) of this Item were $0 for the fiscal year ended March 31, 2017.
The aggregate fees billed for all services other than those set forth in paragraphs (b) and (c) of this Item provided by the registrant’s independent auditors to the registrant’s adviser and other service providers under common control with the adviser and that relate directly to the operations or financial reporting of the registrant were $0 for the registrant’s fiscal year ended March 31, 2017. The percentage of these fees relating to services approved by the registrant’s Audit Committee pursuant to the de minimis exception from the pre-approval requirement in Rule 2-01(c)(7)(i)(C) of Regulation S-X was 0%.
The aggregate fees billed for all services provided by the independent auditors to the registrant other than those set forth in paragraphs (a), (b) and (c) of this Item were $0 for the fiscal year ended March 31, 2016.
The aggregate fees billed for all services other than those set forth in paragraphs (b) and (c) of this Item provided by the registrant’s independent auditors to the registrant’s adviser and other service providers under common control with the adviser and that relate directly to the operations or financial reporting of the registrant were $0 for the registrant’s fiscal year ended March 31, 2016. The percentage of these fees relating to services approved by the registrant’s Audit Committee pursuant to the de minimis exception from the pre-approval requirement in Rule 2-01(c)(7)(i)(C) of Regulation S-X was 0%.
(e) The registrant’s Audit Committee has established pre-approval policies and procedures as permitted by Rule 2-01(c)(7)(i)(B) of Regulation S-X (the “Pre-Approval Policy”) with respect to services provided by the registrant’s independent auditors. Pursuant to the Pre-Approval Policy, the Audit Committee has pre-approved the services set forth in the table below with respect to the registrant up to the specified fee limits. Certain fee limits are based on aggregate fees to the registrant and other registrants within the Optimum Fund Trust.
| Service | Range of Fees |
| Audit Services | |
Statutory audits or financial audits for new Funds | up to $25,000 per Fund |
Services associated with SEC registration statements (e.g., Form N-1A, Form N-14, etc.), periodic reports and other documents filed with the SEC or other documents issued in connection with securities offerings (e.g., comfort letters for closed-end Fund offerings, consents), and assistance in responding to SEC comment letters | up to $10,000 per Fund |
Consultations by Fund management as to the accounting or disclosure treatment of transactions or events and/or the actual or potential impact of final or proposed rules, standards or interpretations by the SEC, FASB, or other regulatory or standard-setting bodies (Note: Under SEC rules, some consultations may be considered “audit-related services” rather than “audit services”) | up to $25,000 in the aggregate |
Audit-Related Services | |
Consultations by Fund management as to the accounting or disclosure treatment of transactions or events and /or the actual or potential impact of final or proposed rules, standards or interpretations by the SEC, FASB, or other regulatory or standard-setting bodies (Note: Under SEC rules, some consultations may be considered “audit services” rather than “audit-related services”) | up to $25,000 in the aggregate |
Tax Services | |
U.S. federal, state and local and international tax planning and advice (e.g., consulting on statutory, regulatory or administrative developments, evaluation of Funds’ tax compliance function, etc.) | up to $25,000 in the aggregate |
U.S. federal, state and local tax compliance (e.g., excise distribution reviews, etc.) | up to $5,000 per Fund |
Review of federal, state, local and international income, franchise and other tax returns | up to $5,000 per Fund |
Under the Pre-Approval Policy, the Audit Committee has also pre-approved the services set forth in the table below with respect to the registrant’s investment adviser and other entities controlling, controlled by or under common control with the investment adviser that provide ongoing services to the registrant (the “Control Affiliates”) up to the specified fee limit. This fee limit is based on aggregate fees to the investment adviser and its Control Affiliates.
| Service | Range of Fees |
| Non-Audit Services | |
| Services associated with periodic reports and other documents filed with the SEC and assistance in responding to SEC comment letters | up to $10,000 in the aggregate |
The Pre-Approval Policy requires the registrant’s independent auditors to report to the Audit Committee at each of its regular meetings regarding all services initiated since the last such report was rendered, including those services authorized by the Pre-Approval Policy.
(f) Not applicable.
(g) The aggregate non-audit fees billed by the registrant’s independent auditors for services rendered to the registrant and to its investment adviser and other service providers under common control with the adviser were $11,180,000 and $10,036,000 for the registrant’s fiscal years ended March 31, 2017 and March 31, 2016, respectively.
(h) In connection with its selection of the independent auditors, the registrant’s Audit Committee has considered the independent auditors’ provision of non-audit services to the registrant’s investment adviser and other service providers under common control with the adviser that were not required to be pre-approved pursuant to Rule 2-01(c)(7)(ii) of Regulation S-X. The Audit Committee has determined that the independent auditors’ provision of these services is compatible with maintaining the auditors’ independence.
Item 5. Audit Committee of Listed Registrants
Not applicable.
Item 6. Investments
(a) Included as part of report to shareholders filed under Item 1 of this Form N-CSR.
(b) Divestment of securities in accordance with Section 13(c) of the Investment Company Act of 1940.
Not applicable.
Item 7. Disclosure of Proxy Voting Policies and Procedures for Closed-End Management Investment Companies
Not applicable.
Item 8. Portfolio Managers of Closed-End Management Investment Companies
Not applicable.
Item 9. Purchases of Equity Securities by Closed-End Management Investment Company and Affiliated Purchasers
Not applicable.
Item 10. Submission of Matters to a Vote of Security Holders
Not applicable.
Item 11. Controls and Procedures
The registrant’s principal executive officer and principal financial officer have evaluated the registrant’s disclosure controls and procedures within 90 days of the filing of this report and have concluded that they are effective in providing reasonable assurance that the information required to be disclosed by the registrant in its reports or statements filed under the Securities Exchange Act of 1934 is recorded, processed, summarized and reported within the time periods specified in the rules and forms of the Securities and Exchange Commission.
There were no significant changes in the registrant’s internal control over financial reporting that occurred during the second fiscal quarter of the period covered by the report to stockholders included herein (i.e., the registrant’s fourth fiscal quarter) that have materially affected, or are reasonably likely to materially affect, the registrant’s internal control over financial reporting.
Item 12. Exhibits
(a) (1) Code of Ethics
Not applicable.
(2) Certifications of Principal Executive Officer and Principal Financial Officer pursuant to Rule 30a-2 under the Investment Company Act of 1940 are attached hereto as Exhibit 99.CERT.
(3) Written solicitations to purchase securities pursuant to Rule 23c-1 under the Securities Exchange Act of 1934.
Not applicable.
(b) Certifications pursuant to Section 906 of the Sarbanes-Oxley Act of 2002 are furnished herewith as Exhibit 99.906CERT.
SIGNATURES
Pursuant to the requirements of the Securities Exchange Act of 1934 and the Investment Company Act of 1940, the registrant has duly caused this report to be signed on its behalf, by the undersigned, thereunto duly authorized.
OPTIMUM FUND TRUST
| /s/ SHAWN LYTLE | |
| By: | Shawn Lytle |
| Title: | President and Chief Executive Officer |
| Date: | June 6, 2017 |
Pursuant to the requirements of the Securities Exchange Act of 1934 and the Investment Company Act of 1940, this report has been signed below by the following persons on behalf of the registrant and in the capacities and on the dates indicated.
| /s/ SHAWN LYTLE | |
| By: | Shawn Lytle |
| Title: | President and Chief Executive Officer |
| Date: | June 6, 2017 |
| /s/ RICHARD SALUS | |
| By: | Richard Salus |
| Title: | Chief Financial Officer |
| Date: | June 6, 2017 |