UNITED STATES SECURITIES AND EXCHANGE COMMISSION
Washington, D.C. 20549
FORM N-CSR
CERTIFIED SHAREHOLDER REPORT OF REGISTERED MANAGEMENT
INVESTMENT COMPANIES
| Investment Company Act file number: | 811-21335 | |
| Exact name of registrant as specified in charter: | Optimum Fund Trust | |
| Address of principal executive offices: | 2005 Market Street | |
| Philadelphia, PA 19103 | ||
| Name and address of agent for service: | David F. Connor, Esq. | |
| 2005 Market Street | ||
| Philadelphia, PA 19103 | ||
| Registrant’s telephone number, including area code: | (800) 523-1918 | |
| Date of fiscal year end: | March 31 | |
| Date of reporting period: | March 31, 2018 |
Item 1. Reports to Stockholders
Table of Contents

Optimum Fixed Income Fund
Optimum International Fund
Optimum Large Cap Growth Fund
Optimum Large Cap Value Fund
Optimum Small-Mid Cap Growth Fund
Optimum Small-Mid Cap Value Fund
March 31, 2018
Carefully consider the Funds’ investment objectives, risk factors, charges, and expenses before investing. This and other information can be found in the Funds’ prospectus and, if available, their summary prospectuses, which may be obtained by visiting optimummutualfunds.com/literature or calling 800 914-0278. Investors should read the prospectus and, if available, the summary prospectus carefully before investing.
Table of Contents
Portfolio management reviews | ||||
| 1 | ||||
| 5 | ||||
| 8 | ||||
| 11 | ||||
| 14 | ||||
| 17 | ||||
Performance summaries | ||||
| 20 | ||||
| 23 | ||||
| 26 | ||||
| 29 | ||||
| 32 | ||||
| 35 | ||||
| 38 | ||||
Security type / sector / country allocations | 40 | |||
Financial statements | ||||
| 45 | ||||
| 124 | ||||
| 127 | ||||
| 129 | ||||
| 132 | ||||
| 150 | ||||
| 178 | ||||
| 179 | ||||
| 182 | ||||
| 184 | ||||
Other than Macquarie Bank Limited (MBL), none of the entities noted are authorized deposit-taking institutions for the purposes of the Banking Act 1959 (Commonwealth of Australia). The obligations of these entities do not represent deposits or other liabilities of MBL. MBL does not guarantee or otherwise provide assurance in respect of the obligations of these entities, unless noted otherwise. The Funds are governed by US laws and regulations.
Unless otherwise noted, views expressed herein are current as of March 31, 2018, and subject to change for events occurring after such a date.
The Funds are not FDIC insured and are not guaranteed. It is possible to lose the principal amount invested.
Mutual fund advisory services provided by Delaware Management Company, a series of Macquarie Investment Management Business Trust (MIMBT), which is a US registered investment advisor. The Funds are distributed by Delaware Distributors, L.P. (DDLP), an affiliate of Macquarie Investment Management Business Trust and Macquarie Group Limited. Macquarie Investment Management (MIM) is the marketing name for certain companies comprising the asset management division of Macquarie Group Limited and its subsidiaries and affiliates worldwide.
All third-party marks cited are the property of their respective owners.
© 2018 Macquarie Management Holdings, Inc.
Table of Contents
Portfolio management reviews
April 10, 2018 (Unaudited)
Performance review (for the year ended March 31, 2018)
Optimum Fixed Income Fund (Institutional Class shares) | 1-year return | +1.96 | % | |||
Optimum Fixed Income Fund (Class A shares) | 1-year return | +1.81 | % | |||
Bloomberg Barclays US Aggregate Index (benchmark) | 1-year return | +1.20 | % |
Past performance does not guarantee future results.
For complete, annualized performance for Optimum Fixed Income Fund, please see the table on page 20.
Institutional Class shares are not subject to a sales charge and are offered for sale exclusively to certain eligible investors. In addition, Institutional Class shares pay no distribution and service fee.
The performance of Class A shares excludes the applicable sales charge. Both Institutional Class shares and Class A shares reflect the reinvestment of all distributions.
Index performance returns do not reflect any management fees, transaction costs, or expenses. Indices are unmanaged and one cannot invest directly in an index.
Advisor
Delaware Management Company (DMC)
Sub-advisor
Pacific Investment Management Company LLC (PIMCO)
Market overview
Geopolitics was front and center early in the fiscal year ended March 31, 2018. Emmanuel Macron’s election victory in France helped to bolster risk appetite, while controversies surrounding the US and Brazilian administrations seemed to add to market uncertainty. The US yield curve continued to flatten in the second quarter of 2017 as short-term rates rose while longer-term rates fell. In addition, inflation expectations pulled back, leading Treasury inflation-protected securities (TIPS) to underperform like-duration nominal Treasurys.
Geopolitical uncertainties continued as US-North Korea tensions escalated and political turmoil grew within the Trump administration. Although this briefly weighed on yields, risk assets generally were resilient. Meanwhile, central banks shifted toward less monetary accommodation, pushing yields higher by late summer 2017. The US Federal Reserve detailed plans to unwind its balance sheet, the Bank of England and European Central Bank (ECB) each suggested it would employ less stimulus in the future, and the Bank of Canada raised rates twice.
Less-accommodative global monetary policy dominated headlines by late 2017. The ECB said it would taper its monthly asset purchases starting in January 2018, and the Fed began its balance sheet reduction while continuing to raise interest rates. US tax reform and solid economic fundamentals pushed US markets to all-time highs into early 2018.
Volatility then roared back into global markets after strong equity performance for more than a year. Concerns over the potential for both higher inflation and a more aggressive Fed contributed to equity-market jitters. Global growth remained solid, but signs of
rising US price pressures sparked some concern. Political developments remained in focus globally. The US Congress passed fiscal stimulus in the form of additional spending measures. In addition, central banks were in the news: Jerome Powell was sworn in as Fed chairman and Haruhiko Kuroda was appointed to a second term as governor of the Bank of Japan.
Source: Bloomberg
Fund performance
For the fiscal year, Optimum Fixed Income Fund outperformed its benchmark index, the Bloomberg Barclays US Aggregate Index, with all four components of the Fund, managed between DMC and PIMCO, outpacing their respective benchmarks covering intermediate-term, floating-rate, and low duration securities. The following remarks describe factors that affected relative performance within the Fund’s respective portions.
DMC
Note: The portfolio-level discussion presented below appears in two sections. The first covers DMC’s portion of the Fund that focused on a multisector, intermediate-term strategy, while the second covers its portion that focused on a short duration, floating-rate strategy.
Intermediate-term component
For the fiscal year ended March 31, 2018, DMC’s fixed-rate intermediate-term portion of Optimum Fixed Income Fund returned +3.43% (before expenses), outperforming the Fund’s benchmark, the Bloomberg Barclays US Aggregate Index, which returned +1.20% for the fiscal year. (All return references below are before expenses.)
In this portion of the Fund, DMC’s allocation favored higher yielding sectors, including corporate bonds, emerging market bonds, and structured product sectors, and kept a low exposure to US Treasurys. In the third quarter of 2017 and first quarter of 2018, exposure was slightly increased in less interest rate sensitive sectors, including
(continues) | 1 |
Table of Contents
Portfolio management reviews
Optimum Fixed Income Fund
interest-only investments, collateralized loan obligations (CLOs), convertible bonds, bank loans, and emerging market local-currency bonds.
Emerging market bonds were a major contributor to the benchmark-relative returns for the Fund’s fiscal year, aided by US dollar weakness against emerging market currencies. DMC’s US dollar-denominated emerging market bonds returned +6.8% for the fiscal year. DMC’s allocation to emerging market bonds increased from 11.6% to 13.2% in this portion of the Fund during the fiscal year. Yield premiums generally declined among emerging market corporates and sovereigns, while local-currency sovereigns returned 13%, based on J.P. Morgan indices. Emerging market assets prospered from constructive macroeconomic conditions, including a weak US dollar, contained developed-market interest rates, and benign global inflation.
DMC’s investments in traditional high yield bonds (7.3% allocation at the end of the fiscal year) returned +3.3%, supported by strength in the economy and corporate earnings. Key sectors within high yield were basic industries, healthcare, media, leisure, and energy companies. DMC’s intermediate-term portion of the Fund was underweight in financial services, but DMC found value in insurance brokerage bonds. DMC reduced exposure to the wireline space in the middle of the Fund’s fiscal year on disappointing earnings. Building materials, chemical, bank, and utility company bonds were standout performers for DMC’s intermediate-term component of the Fund.
Bank loan investments (9.5% allocation at year end) returned +3.9% for the fiscal year, outperforming the Bloomberg Barclays US Aggregate Index. DMC reduced exposure to bank loans in this portion of the Fund because of the significant refinancing of outstanding corporate loans and the anticipated dampening impact on potential returns. DMC added to exposure again early in 2018 as interest rates rose.
As risk premiums declined, DMC slowly reduced investment grade corporate exposure from 37% to 28% by fiscal year end. This sector outperformed the benchmark sector by 0.38 percentage points during the fiscal year. DMC found bank and finance securities attractive. As economic and competitive challenges arose, DMC reduced exposure in the retailing, food and beverage, and pharmaceutical sectors. As the yield curve flattened, 30-year issues performed relatively well during the Fund’s fiscal year. Long bonds from Bank of New York Mellon and Microsoft were among the strongest performers for DMC’s intermediate-term portion of the Fund, while bonds from Broadcom and Verizon were laggards.
The returns in collateralized mortgage obligations (CMO) structures helped offset subpar performance in agency fixed-rate pass-through investments in DMC’s intermediate-term portion of the Fund. DMC’s mortgage-backed securities (MBS) subportfolio returned +2.7% during the fiscal year, outperforming the benchmark component.
DMC’s MBS exposure grew to a 15% allocation at fiscal year end. The CMO basket earned 4.0%, outpacing both the Bloomberg Barclays US Aggregate Index and the Bloomberg Barclays US Mortgage-Backed Securities (MBS) Index.
The high-coupon agency pass-through securities in DMC’s intermediate-term portion of the Fund underperformed the benchmark in the flattening curve environment. In addition, DMC’s fixed-rate agency MBS subportfolio detracted from the Fund’s relative performance. Exposure increased in both fixed-rate pools and CMO investments as corporate exposure declined.
During the fiscal year, the yield difference between 2-year and 30-year US Treasurys compressed by 1.04 percentage points. Overall, the duration in DMC’s intermediate-term portion of the Fund remained shorter than the benchmark’s duration for most of the fiscal year.
DMC also engaged in cross-country rate arbitrage in this portion of the Fund. Based on expectations for stronger rate increases in German and French government bonds, DMC employed futures hedges in its portion of the Fund in an attempt to capture this increase and to hedge the portfolio against US yield curve rate rises. Additionally, DMC used 30-year interest rate swap instruments to further hedge rate moves and capitalize on widening swap spreads. The country hedge and the interest rate swap actions were not effective, resulting in a 0.12-percentage-point drag on the Fund’s returns (before expenses). DMC reduced both positions during the fiscal year.
Floating-rate component
In managing its short-duration, floating-rate portion of the Fund, DMC focuses on a diversified group of floating-rate securities. For the fiscal year, the floating-rate portion of the Fund returned +2.74% (before expenses), outperforming DMC’s internal benchmark, the ICE BofAML US Dollar 3-Month Deposit Offered Rate Constant Maturity Index, which returned +1.21% for the fiscal year. (All returns are before expenses.)
Investment grade credit exposure of 56% of the Fund’s floating-rate portion was the largest contributor to performance. With a total return of +2.34%, investment grade credit outperformed the ICE BofAML US Dollar 3-Month Deposit Offered Rate Constant Maturity Index. All four of the major investment grade sectors within this portion of the Fund – industrial, financial, utility, and noncorporate – outperformed the ICE BofAML US Dollar 3-Month Deposit Offered Rate Constant Maturity Index.
Industrial holdings (at 24% of this portion of the Fund on average during the fiscal year) returned +2.18%. Leading performers for DMC’s floating-rate portion of the Fund included General Motors, Abbott Laboratories,and First Data. Detractors among industrials included General Electric, Becton Dickinson,and Crown Castle International.
2
Table of Contents
Financials (23% allocation) returned +2.53%. Banks were significant contributors among financials holdings. Citigroup and Morgan Stanley were leading contributors for DMC’s floating-rate portion of the Fund. Detractors among financials included Huntington National Bank and SunTrust Banks. DMC’s utility exposure (a 3% weighting) and the noncorporate sector (6%) returned +2.55% and +1.89%, respectively.
Bank loan holdings returned +3.77% for DMC’s floating-rate portion of the Fund, outperforming the ICE BofAML US Dollar 3-Month Deposit Offered Rate Constant Maturity Index. Contributors included Builders FirstSource, Sinclair Television Group,and Univision Communications. Detractors included Forterra, PetSmart, and Revlon. The average quality of the bank loans was Ba3, which was higher than most bank loan indices. DMC viewed floating-rate coupons as an attractive alternative to fixed-rate securities.
During the fiscal year, lower-quality assets generally outperformed higher-quality assets in DMC’s floating-rate portion of the Fund, with bank loans, high yield, and emerging market bonds posting strong returns. High yield and emerging market bonds each accounted for roughly 1% of the portfolio, returning +9.68% and +4.23%, respectively.
In DMC’s floating-rate portion of the Fund, structured credit (15% allocation) posted competitive returns, outperforming the 3-month London interbank offered rate (Libor). Asset-backed securities (11% allocation) outperformed the ICE BofAML US Dollar 3-Month Deposit Offered Rate Constant Maturity Index with a +1.72% return. DMC’s asset-backed securities (ABS) exposure was primarily nonresidential, including credit cards and autos, providing high-quality liquidity and income, and returned +2.78%. CLOs in DMC’s floating-rate portion of the Fund had an average allocation of 4% and outperformed the ICE BofAML US Dollar 3-Month Deposit Offered Rate Constant Maturity Index. These CLO holdings continued to be senior in the capital structure and carried an AAA rating.
DMC uses derivative products such as interest rate swaps to hedge the duration of fixed-rate bonds within the Fund’s floating-rate portion. During the fiscal year, interest rate swaps hedged fixed-rate exposure in 22% of this portion of the Fund. During the year, the Treasury curve flattened significantly as the Fed continued to hike rates and began to normalize its balance sheet. The yield on 2-year notes rose more than 1 percentage point, while 5- and 10-year yields climbed 0.63 and 0.35 percentage points, respectively. The yield on 30-year Treasurys fell by 0.04 percentage points. These interest rate hedges helped DMC’s floating-rate portion of the Fund as interest rates rose in the front and intermediate areas of the curve.
DMC uses interest rate swaps to hedge its fixed-rate bonds with a duration of 2.5 years and longer, to maintain an overall portfolio duration of roughly 0.25 years. DMC also initiated a credit hedge during the fiscal year in an attempt to protect the Fund against
potential spread volatility. This credit hedge did not have a significant effect on the Fund’s performance.
PIMCO
Note: The portfolio-level discussion presented below appears in two sections. The first covers PIMCO’s portion of the Fund that focused on an intermediate-term strategy, while the second covers its portion that focused on a low duration strategy.
Intermediate-term component
During the fiscal year, the intermediate-term component of PIMCO’s portion of the Fund returned +2.57% (before expenses) and outperformed its benchmark, the Bloomberg Barclays US Aggregate Index, which returned +1.20% for the same period.
Interest rate strategies added to performance for PIMCO’s intermediate-term component of the Fund. US yield curve positioning, specifically an underweight to front-end rates, helped as the yield curve flattened. Non-US interest rate exposures detracted from performance, including an underweight to Italian and French duration.
Spread sector strategies were positive for returns. Exposure to nonagency mortgages, high yield credit, and taxable municipals added to performance as these sectors outperformed like-duration Treasurys. An underweight to investment grade credit detracted from performance for PIMCO’s intermediate-term component of the Fund as the sector outperformed like-duration Treasurys. Lastly, an overweight to agency MBS was a plus as the sector outperformed like-duration Treasurys.
Currency positioning contributed modestly to performance for PIMCO’s portion of the Fund. Exposure to higher yielding emerging market currencies, including the Brazilian real, added to returns. A long-dollar bias versus a basket of Asian emerging market currencies partly offset this since these currencies generally appreciated relative to the US dollar.
PIMCO continued to favor US duration against rate exposure in other developed regions as of the end of the Fund’s fiscal year, as US rates generally offer better starting yields and PIMCO believes US rates are likely to be relatively range bound. PIMCO maintained an underweight to investment grade credit as of the end of the Fund’s fiscal year, given tight valuations, seeking more diversified credit exposures, and focusing on security selection over generic broad-market exposures.
Low duration component
The low duration component of PIMCO’s portion of the Fund returned +1.38% (before expenses) and outperformed PIMCO’s internal benchmark, the ICE BofAML 1-3 Year US Treasury Index, which returned +0.03% for the same period.
(continues) | 3 |
Table of Contents
Portfolio management reviews
Optimum Fixed Income Fund
Interest rate strategies contributed to performance for PIMCO’s low duration portion of the Fund. An underweight to US duration added to performance as US Treasury yields rose during the fiscal year. Additionally, US yield curve positioning was positive as the yield curve flattened. Outside of the United States, short exposure to UK interest rates was positive for performance in PIMCO’s low duration portion of the Fund as yields in this region rose. PIMCO remained tactical with US duration, adjusting exposures as rates recalibrated higher. Preferring US duration during the fiscal year versus other developed regions including the United Kingdom and Japan, PIMCO has focused its underweight at the front end of the curve, where it sees potential for volatility as the Fed continues its hiking cycle.
Spread sector strategies added to returns for PIMCO’s low duration portion of the Fund. Exposure to investment grade credit, nonagency mortgages, and emerging market external debt also contributed to performance. Short exposure to a basket of high yield corporate credit detracted from performance as the high yield sector
outperformed like-duration Treasurys during the fiscal year. PIMCO found attractive opportunities in specific credits that have benefited from US growth and a resurgent housing sector.
Currency positioning held back relative performance for PIMCO’s low duration portion of the Fund during the fiscal year. A long-dollar bias against the Japanese yen hurt returns as the yen appreciated versus the US dollar. PIMCO maintained a long-dollar bias against the yen, the euro, and the Canadian, Australian, and New Zealand dollars during the fiscal year as part of its tactical currency positioning.
PIMCO used several types of derivatives to manage risks associated with market volatility and interest rate risk. However, the use of money market and government futures, currency forwards, options, interest rate swaps, and credit default swaps did not have a material impact on performance during the fiscal year within either component of PIMCO’s portion of the Fund.
4
Table of Contents
April 10, 2018 (Unaudited)
Performance review (for the year ended March 31, 2018) | ||||||||
Optimum International Fund (Institutional Class shares)* | 1-year return | +19.42% | ||||||
Optimum International Fund (Class A shares)* | 1-year return | +19.11% | ||||||
MSCI ACWI ex USA Index (gross) (current benchmark) | 1-year return | +17.05% | ||||||
MSCI ACWI ex USA Index (net) (current benchmark) | 1-year return | +16.53% | ||||||
MSCI EAFE Index (gross) (former benchmark) | 1-year return | +15.32% | ||||||
MSCI EAFE Index (net) (former benchmark) | 1-year return | +14.80% |
Past performance does not guarantee future results.
For complete, annualized performance for Optimum International Fund, please see the table on page 23.
Institutional Class shares are not subject to a sales charge and are offered for sale exclusively to certain eligible investors. In addition, Institutional Class shares pay no distribution and service fee.
The performance of Class A shares excludes the applicable sales charge. Both Institutional Class shares and Class A shares reflect the reinvestment of all distributions.
Index performance returns do not reflect any management fees, transaction costs, or expenses. Indices are unmanaged and one cannot invest directly in an index.
*Total returns for the report period presented in the table differ from the returns in “Financial highlights.” The total returns presented in the above table are calculated based on the net asset value (NAV) at which shareholder transactions were processed. The total returns presented in “Financial highlights” are calculated in the same manner, but also take into account certain adjustments that are necessary under US generally accepted accounting principles (US GAAP) required in the annual report.
Advisor
Delaware Management Company (DMC)
Sub-advisors
Acadian Asset Management LLC (Acadian)
EARNEST Partners LLC (EARNEST)
Effective Jan. 19, 2018, the MSCI ACWI ex USA Index replaced the MSCI EAFE Index in order to reflect the Fund’s ability to invest in emerging market securities. Please see the supplement to the Fund’s prospectus for more information.
Market overview
Developed international, emerging market, and US equities all posted strong absolute returns during the Fund’s fiscal year ended March 31, 2018. The MSCI Emerging Markets Index gained 24.9% (net), outpacing the MSCI EAFE Index, which rose 14.8% (net) over the fiscal year. The MSCI ACWI ex USA Index gained 16.5% (net) during the fiscal year. US large caps, as represented by the Russell 1000® Index, rose 14.0%, while the small cap market, as represented by the Russell 2000® Index, gained 11.8% for the fiscal year.
European economies continued to rebound in the wake of improved economic data. The region experienced its lowest unemployment rate since 2009. Fourth-quarter 2017 gross domestic product (GDP) rose 0.6%, bringing the total euro zone expansion to 2.5% for 2017 — the fastest growth rate since 2007. The European Central Bank (ECB) maintained a negative deposit rate of -0.4%, consistent with the last seven quarters of the Fund’s fiscal year.
China’s economy expanded by 6.9% in 2017. While heavy industry and finished goods are a large part of the Chinese economy, services and high-tech manufacturing continued to make up a greater portion of the world’s second-largest economy. Emerging markets as a whole were a bright spot over the Fund’s fiscal year, showing considerable strength relative to their developed counterparts.
Geopolitical tensions influenced equity market performance globally during much of the fiscal year. Concerns included North Korea’s intensified testing of nuclear weapons, and the effects of US trade policy. Despite periodic dips, developed markets continued on a positive trajectory, in general, for much of the fiscal year amid indications of momentum in global economic growth. Non-US markets benefited from a weakening US dollar.
During the final three months of the Fund’s fiscal year, equity markets initially rallied following the passage of US tax reform legislation. However, volatility returned to the markets and stocks pulled back in February 2018 following indications of rising inflation, concerns over interest rate increases, and escalating news about US protectionist policies.
Source: Bloomberg
Fund performance
For the fiscal year, Optimum International Fund outperformed its current benchmark, the MSCI ACWI ex USA Index, and its former benchmark, the MSCI EAFE Index. Acadian’s portion of the Fund turned in a healthy performance as a result of stock selection and
(continues) | 5 |
Table of Contents
Portfolio management reviews
Optimum International Fund
country allocations. Strong stock selection across developed markets contributed to EARNEST’s portion of the Fund.
Acadian
For the fiscal year, Acadian’s portion of the Fund returned 23.2% (gross of fees), outperforming the MSCI EAFE Index, which returned 15.3% (gross), and outperforming the MSCI ACWI ex USA Index, which returned 17.1% (gross).
Opportunistic exposure to Brazil, stock selection and a market underweight in Germany, and stock selection in New Zealand all contributed to performance for Acadian’s portion of the Fund during the fiscal year. Stock selection in Japan and Hong Kong reduced these gains on a relative basis, as did an opportunistic exposure to India.
Acadian’s overweight in the information technology sector and underweight in the consumer staples sector also added to its portion of the Fund. For the better part of the Fund’s fiscal year, markets were in “risk on” mode – that is, investors’ greater appetite for risk led them to invest in higher-risk industries such as information technology. This strongly benefited Acadian’s portion of the Fund. Lower-risk industries such as consumer staples posted more modest returns for its portion of the Fund.
Acadian’s emphasis on the healthcare sector detracted, as mounting competition from generics and regulatory pressures dampened stock performance. Acadian’s underweight in consumer discretionary also hurt relative performance in its portion of the Fund, when the sector rallied on the heels of accelerating economic growth and improved consumer confidence.
Contributors to Acadian’s portion of the Fund were Magazine Luiza SA and Deutsche Lufthansa AG. Magazine Luiza, a Brazilian appliance retailer, has seen strong growth in recent years as its leadership dedicated significant resources to developing the ecommerce side of its business. During the Fund’s fiscal year, its stock price rose after reporting a double-digit increase in same-store sales during the second quarter of 2017. Deutsche Lufthansa, Germany’s largest air carrier, climbed after European regulators approved a deal allowing the company to acquire the assets of defunct industry peer Air Berlin.
Detractors from Acadian’s portion of the Fund were International Game Technology PLC and Tokyo Electric Power Co. Holdings Inc. International Game Technology produces slot machines and other gaming technology, including lotteries and interactive gaming. The company’s share price slumped after it reported first-quarter 2018 results that fell short of market estimates. Tokyo Electric Power declined after the utility company disclosed that it had been hit with a new US lawsuit over the 2011 Fukushima nuclear accident.
Acadian continued to hold Tokyo Electric Power as a result of its favorable reading of the company’s valuation attributes. Acadian sold
International Game Technology in November 2017, based on declining quality and growth signals.
As of the end of the fiscal year, Acadian’s largest country overweights compared to the MSCI EAFE Index were Japan and Hong Kong. Acadian also maintained significant opportunistic exposures to Thailand and Canada. The United Kingdom, Germany, France, and Switzerland were the largest underweight positions held in Acadian’s portion of the Fund. At the sector level, Acadian continued its overweight emphasis on healthcare and information technology, while financials and consumer discretionary were significantly underweighted.
EARNEST
EARNEST’s portion of the Fund ended the fiscal year with a strong positive absolute return of 18.3% (gross of fees), outperforming the MSCI EAFE Index (gross) by 3.00 percentage points and outperforming the MSCI ACWI ex USA Index (gross) by 1.20 percentage points.
As a bottom-up (stock-by-stock), fundamental manager, EARNEST looks beyond the quarter-over-quarter noise of the market, and positions its portion of the Fund for growth over a full market cycle. In achieving its strong relative and absolute performance for the fiscal year, EARNEST’s portion of the Fund benefited from investments in fundamentally robust companies that continue to grow earnings and gain market share.
Strong stock selection across the portfolio, but in particular within the industrials and financials sectors, contributed to outperformance for EARNEST’s portion of the Fund. In terms of detractors, EARNEST’s underweight to the industrials sector as a whole and a slight overweight to the healthcare sector posed minor headwinds.
Madrid-based Amadeus IT Group SA, a leading transaction processor for the global travel and tourism industry, was a significant contributor to EARNEST’s portion of the Fund. Amadeus’ total air bookings continued to outpace the overall travel industry, and it expanded its market share in large distribution areas such as North America. The company also continued its consistent track record of revenue and profitability growth, and prudent deployment of capital, while trading at a discount to industry peers on an earnings-multiple basis.
Another strong contributor to EARNEST’s portion of the Fund was Shanghai Fosun Pharmaceutical Group Co., a leading Chinese manufacturer of both generic drugs and Chinese traditional medicines. Its stock rose in 2017 as healthcare valuations rebounded and investors seemed to pay closer attention to individual companies with defensible products. With a deep pipeline of patented drugs and a vast array of first-generation generic drugs, Shanghai Fosun has taken market share from less innovative regional competitors. Also, the company trades at a price-to-earnings ratio in the mid-teens
6
Table of Contents
which, in EARNEST’s view, represents an attractive discount compared to its developed-market peers.
ITV, the UK commercial television network, detracted from performance for EARNEST’s portion of the Fund. ITV delivers its content through traditional television broadcasting as well as on demand via its ITV Hub, a digital home for content that reaches a younger audience. Over the fiscal year, investors focused on the challenges facing traditional pay-TV networks from online streaming video outlets such as Netflix, Hulu, and Amazon Video. ITV’s stock fell despite ITV Hub’s strong online performance, as investors failed, in EARNEST’s view, to recognize the firm’s competitive positioning.
The world’s largest electronics manufacturer Hon Hai Precision Co. also detracted from EARNEST’s portion of the Fund. Based in Taiwan, Hon Hai provides electronic manufacturing services for computers, communications, and consumer electronic products. Advances in screen technology from the company’s 2016 acquisition of Sharp are used in Apple’s iPhone X, which was released in late 2017. Due to delays in the mass production of the iPhone X, Hon Hai had to idle significant parts of its labor force. The stock finished the Fund’s fiscal year up, but it trailed the benchmark.
At the end of the fiscal year period, EARNEST continued to hold ITV and Hon Hai in its portion of the Fund. ITV’s chief competition is
public services broadcaster British Broadcasting Corp. (BBC); both target the same demographic and broadcast similar content. As BBC is in the midst of a significant cost cutting initiative, EARNEST believes ITV has the potential to capture more viewership and add revenue. In Hon Hai’s case, its stock continued to trade at a discount to industry peers. In addition, the Sharp acquisition exceeded analyst expectations and has contributed to Hon Hai’s overall profitability faster than anticipated. EARNEST believes that this profitability from the Sharp acquisition should continue over its targeted investment horizon.
As of the end of the Fund’s fiscal year, EARNEST held overweights in the information technology, financials, consumer discretionary, and materials sectors and underweights in consumer staples, industrials, real estate, telecommunication services, and utilities. These relative overweight and underweight positions compared to the benchmark are an outgrowth of where EARNEST perceives individual opportunities.
Overall, Optimum International Fund used derivatives, including foreign currency exchange contracts, during the fiscal year. However, these had a minimal effect on performance.
(continues) | 7 |
Table of Contents
Portfolio management reviews
April 10, 2018 (Unaudited)
Performance review (for the year ended March 31, 2018) | ||||||||
Optimum Large Cap Growth Fund (Institutional Class shares) | 1-year return | +22.50% | ||||||
Optimum Large Cap Growth Fund (Class A shares) | 1-year return | +22.17% | ||||||
Russell 1000® Growth Index (benchmark) | 1-year return | +21.25% |
Past performance does not guarantee future results.
For complete, annualized performance for Optimum Large Cap Growth Fund, please see the table on page 26.
Institutional Class shares are not subject to a sales charge and are offered for sale exclusively to certain eligible investors. In addition, Institutional Class shares pay no distribution and service fee.
The performance of Class A shares excludes the applicable sales charge. Both Institutional Class shares and Class A shares reflect the reinvestment of all distributions.
Index performance returns do not reflect any management fees, transaction costs, or expenses. Indices are unmanaged and one cannot invest directly in an index.
Advisor
Delaware Management Company (DMC)
Sub-advisors
ClearBridge Investments, LLC (ClearBridge)
T. Rowe Price Associates, Inc. (T. Rowe Price)
The Board of the Trustees of the Fund approved the appointment of ClearBridge Investments, LLC (ClearBridge) as a sub-advisor to the Fund during the fiscal year. ClearBridge replaced Fred Alger Management, Inc. (Alger) as a sub-advisor to Optimum Large Cap Growth Fund. Please see the supplement to the Fund’s prospectus, dated Sept. 25, 2017, for more information.
Market overview
US equities posted strong returns for the fiscal year ended March 31, 2018. Throughout 2017 — a period of particularly low volatility — US equities were boosted by strong corporate earnings and anticipation that President Trump’s proposals for lower tax rates, reduced regulation, and increased infrastructure spending would be enacted. Overseas markets also were strong as economies of both developed and developing countries joined in a period of global synchronized growth.
Although an infrastructure bill has not materialized, the Trump administration was successful in cutting regulations. Passage of the tax reform bill at the end of 2017 that reduced the corporate tax rate to 21% spurred major stock indices to soar to record highs through late January 2018.
Markets turned highly volatile in the final two months of the Fund’s fiscal year, however, as rising global tensions, notably in Iran, North Korea, and Syria, and the Trump administration’s announcement that it would implement tariffs on aluminum and steel — raising the possibility of a global trade war — led to a sharp market selloff. In March, the US Federal Reserve’s sixth interest rate hike since the global financial crisis (and third during the Fund’s fiscal year) further
roiled the markets as investors grew concerned with the possibility of accelerating inflation.
Technology stocks were particularly hard hit following the news that a politically oriented data firm had gained access to private information of more than 50 million Facebook users. The possibility that new regulations would hinder the growth of Facebook and other companies dependent on an advertising model led to a broad decline in the sector.
Source: Bloomberg
Fund performance
Optimum Large Cap Growth Fund outperformed its benchmark, the Russell 1000 Growth Index, for the Fund’s fiscal year. Alger’s portion of the Fund outperformed the benchmark for the period it managed the Fund. Alger’s outperformance was attributable to both favorable sector allocations and stock selection in the information technology and consumer staples sectors, mitigated somewhat by the energy and industrials sectors, which detracted from relative performance. ClearBridge outperformed the benchmark for its portion of the Fund during the time it managed the Fund. ClearBridge’s portion of the Fund also benefited from stock selection and sector allocation decisions. In particular, its technology and consumer staples stocks were strong contributors, while healthcare was the primary detractor. Managing its portion of the Fund for the entire year, T. Rowe Price also outperformed the benchmark. Information technology, consumer discretionary, and consumer staples were the leading relative contributors; financials was the largest relative detractor.
T. Rowe Price
T. Rowe Price managed its portion of the Fund for the entire fiscal year. T. Rowe Price normally invests in stocks of large-capitalization companies with one or more of the following characteristics: strong cash flow and an above-average rate of earnings growth; the ability to sustain earnings momentum during economic downturns; and
8
Table of Contents
occupation of a lucrative niche in the economy and ability to expand even during times of slow economic growth.
Overall, stock selection and sector weighting combined to produce relative outperformance in T. Rowe Price’s portion of the Fund during the fiscal year. Information technology was the leading relative outperformer, driven by stock selection. Shares of Alibaba Group Holding Ltd. rallied during the fiscal year largely driven by the impressive strength in its core Chinese ecommerce business, which continued to benefit from improving user engagement and ongoing mobile monetization efforts. The company, which is rapidly transforming into a global leader in data, continues to see accelerating growth in its AliCloud and Alipay businesses.
Higher-than-expected revenue growth in its gaming and cloud-computing businesses helped drive shares of Tencent Holdings Ltd. higher over the fiscal year. The company, which operates the dominant social media platform in China, is the strongest-positioned mobile Internet player in the region.
In T. Rowe Price’s portion of the Fund, the consumer discretionary sector outperformed due to stock selection. Amazon.com Inc.’s dominant ecommerce platform, with improved profitability and accelerating revenue growth, helped drive shares higher by more than 60% during the fiscal year.
Shares of Booking Holdings Inc. (formerly Priceline) rose during the Fund’s fiscal year as it benefited from secular growth in travel booking shifting to online and mobile. By leveraging technology to drive efficiency across its platform, the company is building a powerful network effect that T. Rowe Price believes should allow it to continue capturing market share in the vast and underpenetrated global hotel market.
In the consumer staples and materials sectors, a significant underweighting benefited relative performance in T. Rowe Price’s portion of the Fund. Financials was the largest relative detractor due to stock selection. Shares of Chubb Corp., the leading global property and casualty insurance broker, came under pressure due to lingering uncertainty across the industry in the wake of the recent hurricanes, floods, and wildfires. While heightened claims have weighed on Chubb’s recent performance, T. Rowe Price thinks the industry could be nearing an inflection point. In T. Rowe Price’s view, Chubb is well positioned to benefit from accelerating premiums as the insurance pricing cycle improves following the catastrophes that occurred during the fiscal year.
First Republic Bank, Inc., a California-based US regional bank, has been negatively affected by margin pressures from higher funding costs and a less-than-expected lift in loan yields. T. Rowe Price continues to maintain a position in the company in its portion of the Fund — it views First Republic as a high-quality bank that has developed an opportunistic niche in mortgage banking for high-net
worth individuals. Additionally, T. Rowe Price believes the company has a high-quality management team and trades at a compelling valuation.
The industrials and business services sector detracted modestly from performance in the T. Rowe Price portion of the Fund, due to an underweight and stock selection. After breakneck growth over the past few years, weakness in the light-emitting diode (LED) lighting market caused Acuity Brands, Inc. to miss earnings expectations in the second half of 2017. Despite the weakness in the stock, T. Rowe Price maintains a constructive view on the company’s growth prospects based on the potential for LED system conversions of big-box retailers, where there is relatively low current penetration. Also, T. Rowe Price anticipates that growth should accelerate as Acuity Brands enters its next phase of development, shifting from a lighting manufacturer to a provider of smart lighting solutions and data analytics that help clients drive energy-efficiency savings.
Telecommunication services detracted slightly due to stock selection that consisted of a sole holding in the sector, T-Mobile US Inc., which T. Rowe Price sold during the fiscal year. T. Rowe Price’s underweight to the underperforming sector mostly mitigated its negative stock selection in the sector.
As of the end of the fiscal year, T. Rowe Price believed that economic and earnings fundamentals remained supportive for equity valuations, and recent US economic reports indicated strong fixed investment spending and continued healthy consumer demand.
Alger
Alger managed its portion of the Fund from April 1, 2017 to Oct. 3, 2017, when the management of the sleeve transitioned to ClearBridge. With its strategy of investing in companies undergoing “positive dynamic change,” Alger seeks what it views as high-quality, domestic growth stocks that can potentially generate strong earnings growth and free cash flow. Both sector allocation and stock selection were responsible for outperformance in Alger’s portion of the Fund.
The information technology and consumer staples sectors contributed the most to performance during the period when Alger managed its portion of the Fund. Sector allocation and stock selection were the contributing factors in the information technology sector, as the portfolio was overweight relative to the Russell 1000 Growth Index while the stocks outperformed. Consumer staples was the second-strongest sector on an absolute basis. Alger’s portion of the Fund benefited from both its underweight relative to the benchmark and stock selection within the sector.
Energy and industrials detracted from performance during the period when Alger managed its portion of the Fund. In energy, stock selection and a slight overweight relative to the benchmark drove underperformance. Industrials was the second-largest detractor on an
(continues) | 9 |
Table of Contents
Portfolio management reviews
Optimum Large Cap Growth Fund
absolute basis as an underweight allocation and stock selection within this sector hurt performance.
Alibaba Group Holding Ltd., which engages in providing online and mobile marketplaces in retail and wholesale trade, strongly added to performance in Alger’s portion of the Fund. Alibaba has created an online ecosystem for buyers, sellers, third-party service providers, Alipay (third-party payments), and strategic partners in China. Alger believes the company has good upside potential as it is not yet getting full credit for its cloud or third-party-payment business segments. Facebook Inc., another leading contributor to performance in Alger’s portion of the Fund, is engaged in the development of social media applications that enable people to connect through mobile devices, personal computers, and other devices, sharing opinions, ideas, photos, videos, and other activities online.
Anadarko Petroleum Corp., an oil and gas exploration company that acquires, explores, develops, produces, and markets oil and natural gas, detracted significantly from performance in Alger’s portion of the Fund. CBS Corp. also detracted from performance in Alger’s portion of the Fund. CBS is a mass media company that operates broadcasting, television production, and publishing businesses.
ClearBridge
ClearBridge managed its portion of the Fund from Oct. 12, 2017 to March 31, 2018. ClearBridge normally invests in equity securities (or other instruments with similar economic characteristics) of US companies with large market capitalizations. ClearBridge’s core holdings are large-capitalization companies that it believes are dominant in their industries due to product, distribution, or service strength. ClearBridge became more assured about the trajectory of the economy under a new presidential administration after its initial skepticism when it began managing its portion of the Fund. Its view of the strength and duration of the current expansion has since improved, given ClearBridge’s belief that capital spending, driven by the cut in corporate tax rates, should be good for growth in gross domestic product (GDP), while earnings growth, a key driver of stock-price appreciation, has accelerated across the large-cap market.
In the belief that this could benefit cyclical sectors including industrials and materials, ClearBridge added positions in Praxair Inc., a supplier of industrial gases, and Caterpillar Inc., which manufactures construction equipment.
During the period when ClearBridge managed its portion of the Fund, the information technology sector was a strong contributor, led by Akamai Technologies Inc., a provider of cloud computing services, and Microsoft Corp., a provider of systems and applications software, cloud services, computers, and consumer electronics. Consumer discretionary companies, including online retailer Amazon.com, Inc., also contributed meaningfully to ClearBridge’s portion of the Fund.
The healthcare sector was the most significant detractor from performance during the period when ClearBridge managed its portion of the Fund, as negative investor sentiment and increased competition hurt biotechnology holdings. Celgene Corp., Biogen Inc., Alexion Pharmaceuticals Inc., and Regeneron Pharmaceuticals Inc. all declined due to a combination of disappointing clinical trials, the threat of increased competition in their primary treatment areas, and lack of investor enthusiasm for recent deals. ClearBridge thinks that the innovative treatments on the market and in the pipelines of these companies should eventually be recognized. ClearBridge continues to own all four stocks in its portion of the Fund. ClearBridge’s holdings in consumer staples, including Anheuser-Busch InBev SA/NV and CVS Health Corp., also somewhat weakened performance in its portion of the Fund.
As of the end of the fiscal year, ClearBridge believed the long running bull market may be at an inflection point, with the Fed steadily withdrawing liquidity and volatility showing signs of normalizing. It is focused on striking a balance between allowing fundamentally sound growth franchises time to execute and earn the recognition of investors, and sourcing new ideas among what it views as particularly well-positioned companies.
Overall, Optimum Large Cap Growth Fund used derivatives, including foreign currency exchange contracts, during the fiscal year. However, these had a minimal effect on performance.
10
Table of Contents
April 10, 2018 (Unaudited)
Performance review (for the year ended March 31, 2018) | ||||||||
Optimum Large Cap Value Fund (Institutional Class shares) | 1-year return | +8.90% | ||||||
Optimum Large Cap Value Fund (Class A shares) | 1-year return | +8.68% | ||||||
Russell 1000® Value Index (benchmark) | 1-year return | +6.95% |
Past performance does not guarantee future results.
For complete, annualized performance for Optimum Large Cap Value Fund, please see the table on page 29.
Institutional Class shares are not subject to a sales charge and are offered for sale exclusively to certain eligible investors. In addition, Institutional Class shares pay no distribution and service fee.
The performance of Class A shares excludes the applicable sales charge. Both Institutional Class shares and Class A shares reflect the reinvestment of all distributions.
Index performance returns do not reflect any management fees, transaction costs, or expenses. Indices are unmanaged and one cannot invest directly in an index.
Advisor
Delaware Management Company (DMC)
Sub-advisors
Massachusetts Financial Services Company (MFS) Rothschild Asset Management Inc. (Rothschild)
Market overview
On balance, throughout the Fund’s fiscal year ended March 31, 2018, both economic and political developments provided a favorable backdrop. Manufacturing activity and consumer confidence remained high, unemployment continued to decline, wage growth increased, and inflation remained benign, despite three 0.25-percentage-point increases in the federal funds rate.
Outside of the United States, many countries exhibited positive gross domestic product (GDP) growth simultaneously, creating a favorable environment in which there were strong markets for US goods and services, as well as continued foreign direct investment into the US. Domestic markets largely shook off international concerns, including heightened tensions with Iran and with North Korea.
Tax reform enacted by Congress and signed into law by President Trump at the end of 2017 reduced corporate tax rates from 35% to 21%. While tax rates were also reduced for individuals, some deductions (including the ability to deduct state and local taxes) were limited.
Beginning in January 2018, increased volatility buffeted financial markets, initially pushing markets significantly higher before broad selloffs took their toll. A seemingly overenthusiastic response to the tax bill quickly reversed when the Trump administration announced plans to implement broad-based tariffs on aluminum and steel that were later narrowed to focus principally on China.
As the Fund’s fiscal year drew to a close, both the prospect of a trade war with China and growing concern that corporations —
especially those engaged in social media — had not properly protected individuals’ private data combined to put a dent in consumer confidence.
Source: Bloomberg
Fund performance
Optimum Large Cap Value Fund outperformed its benchmark, the Russell 1000 Value Index, for the Fund’s fiscal year ended March 31, 2018, with both the MFS and Rothschild portions of the Fund outpacing the index. The MFS portion of the Fund benefited from an overweight position in special products and services as well as an underweight in utilities and communications. Underweight positions relative to the benchmark in both technology and retailing detracted somewhat from relative results. The Rothschild portion of the Fund benefited from underweight positions in both consumer staples and real estate, while an overweight position in industrials and an underweight relative to financials detracted from relative performance.
MFS
MFS has maintained a consistent investment approach since its strategy’s inception. For its portion of the Fund, MFS uses a long-term time horizon in making investment decisions. Its disciplined investment philosophy and process focuses on investing in what it views as high-quality companies trading at inexpensive valuations.
In the MFS portion of the Fund, strong stock selection in the industrial goods and services sector contributed to performance relative to the Russell 1000 Value Index. Since the weak performance of industrial conglomerate General Electric Co. was a drag on the benchmark for the fiscal year, the MFS portion of the Fund’s lack of exposure to the stock was beneficial and provided a significant boost to relative performance during the period.
During the fiscal year, Northrop Grumman Corp. (in the industrial goods and services sector) contributed to relative performance,
(continues) | 11 |
Table of Contents
Portfolio management reviews
Optimum Large Cap Value Fund
having reported earnings and revenue that exceeded forecasts for the final quarter of 2017. It is engaged in the provision of security services including cyber security for computers and communications. The company is also involved in aerospace systems, designing and producing manned aircraft, spacecraft, and high-energy laser systems.
An overweight allocation and favorable security selection in the special products and services sector also strengthened relative results for the MFS portion of the Fund, led by a position in management consulting firm Accenture plc.
An underweight allocation to the utilities and communications sector also bolstered relative performance. In this case, the MFS portion of the Fund did not own telecommunications services provider AT&T Inc., which performed poorly for the Fund’s fiscal year.
Other leading relative contributors in the MFS portion of the Fund included overweight positions in global financial services firm JPMorgan Chase & Co., which advanced steadily through the first 10 months of the Fund’s fiscal year before leveling off, and credit rating agency Moody’s Corp. Positions in semiconductor company Texas Instruments Inc. and diversified technology company 3M Co. also contributed to relative returns during the fiscal year. The absence of a position in weak-performing specialty pharmaceutical company Allergan plc, which lost its patent on dry-eye drug Restasis, and an underweight position in integrated oil and gas company Exxon Mobil Corp. further aided relative returns for the MFS portion of the Fund.
An underweight allocation to the technology sector hampered relative results for the MFS portion of the Fund. In this case, lack of exposure to strong-performing semiconductor company Intel Corp. and network-equipment company Cisco Systems Inc. detracted from relative performance.
A combination of an underweight position and weak stock selection in the retailing sector further weighed on relative performance. In this case, not owning shares of retail giant Walmart Inc. detracted from relative performance in the MFS portion of the Fund.
Elsewhere, the absence of positions in financial services firm Bank of America Corp. and insurance and investment firm Berkshire Hathaway Inc. detracted from relative results. In the MFS portion of the Fund, overweight holdings of diversified technology and multi-industrial company Johnson Controls International plc, global food company General Mills Inc., tobacco company Philip Morris International Inc., and cable services provider Comcast Corp. also detracted from performance relative to the benchmark. Additionally, the MFS’s position in global marketing and communications company Omnicom Group Inc. detracted from results. Not owning shares of energy firm and benchmark constituent NextEra Energy Inc., which appreciated during the fiscal year, detracted from relative
results, as did ownership in oilfield services specialist Schlumberger Ltd., which underperformed during the period.
Rothschild
Rothschild maintains a bottom-up (stock by stock) approach to investing while being cognizant of macroeconomic factors that could affect the companies in which it invests. A current example of such a macro event is the Trump administration’s recently announced intent to levy tariffs on Chinese imports, should China not agree to certain restrictions on its policies regarding intellectual property, trade, and other commercial practices. While the extent of the tariffs and their effect has yet to be fully realized, Rothschild recognizes that many industries and companies, including those in aircraft manufacturing and agriculture, could be affected if a trade war occurs that has the potential to limit US exports.
The fiscal year ended March 31, 2018 marked the first full year that Rothschild managed its portion of the Fund, which benefited on a relative basis from advantageous stock selection in the industrials, energy, and financials sectors. Investments in consumer discretionary, information technology, and materials detracted somewhat relative to the benchmark during the fiscal year.
The industrials and energy sectors contributed the most to performance relative to the benchmark, as stock selection was strong in both sectors. Conversely, weak stock selection in the consumer discretionary and information technology sectors detracted from performance for Rothschild’s portion of the Fund.
An underweight position in General Electric Co., which declined sharply during the course of the fiscal year, contributed significantly to the relative outperformance of Rothschild’s portion of the Fund. Rothschild exited the Fund’s position in 2017; the stock continued to decline after announcing significant downward earnings revisions and a dividend cut. Rothschild’s portion of the Fund also benefited from a position in Northrop Grumman Corp., shares of which gained 49% during the fiscal period. The company is likely to benefit further from increases in defense spending and its pending acquisition of Orbital ATK, a firm engaged in the production of missile defense systems, space launch vehicles, and imaging satellites.
Rothschild’s decision in 2017 to exit a position in Intel Corp. detracted from relative performance in its portion of the Fund. Subsequent to the sale, Intel outperformed after reporting solid results in its PC segment and improvement in its Data Center Group. Retail chain Foot Locker Inc. also detracted from performance for Rothschild’s portion of the Fund. The shares declined more than 35% during the fiscal year following reports, which indicated a weak environment for the athletic footwear and athletic apparel segments of the retail industry. Decelerating traffic in US malls, coupled with fears that vendors such as Nike will disintermediate (that is, remove the middleman or intermediary from future transactions) retail
12
Table of Contents
partners such as Foot Locker by selling through online-only channels, led Rothschild to question whether Foot Locker would return to positive mid-single-digit same-store sales. Subsequently, Rothschild exited the position.
Overall, Optimum Large Cap Value Fund used derivatives, including foreign currency exchange contracts, during the fiscal year. However, these had a minimal effect on performance.
(continues) | 13 |
Table of Contents
Portfolio management reviews
Optimum Small-Mid Cap Growth Fund
April 10, 2018 (Unaudited)
Performance review (for the year ended March 31, 2018) |
| |||||
Optimum Small-Mid Cap Growth Fund (Institutional Class shares) | 1-year return | +22.22 | % | |||
Optimum Small-Mid Cap Growth Fund (Class A shares) | 1-year return | +21.88 | % | |||
Russell 2500™ Growth Index (benchmark) | 1-year return | +19.92 | % | |||
Past performance does not guarantee future results.
For complete, annualized performance for Optimum Small-Mid Cap Growth Fund, please see the table on page 32.
Institutional Class shares are not subject to a sales charge and are offered for sale exclusively to certain eligible investors. In addition, Institutional Class shares pay no distribution and service fee.
The performance of Class A shares excludes the applicable sales charge. Both Institutional Class shares and Class A shares reflect the reinvestment of all distributions.
Index performance returns do not reflect any management fees, transaction costs, or expenses. Indices are unmanaged and one cannot invest directly in an index.
Advisor
Delaware Management Company (DMC)
Sub-advisors
Columbia Circle Investors (CCI)
Peregrine Capital Management, LLC (PCM)
Market overview
The US economy rebounded at the start of the Fund’s fiscal year ended March 31, 2018, and consumer spending picked up. Labor force participation was at its highest level since November 2014. Growth stocks markedly outpaced value stocks in general, and the small-cap growth segment of the market saw a notable turnaround. The Russell 2500™ Growth Index returned 19.9% for the fiscal year versus returns of 5.7% for the Russell 2500™ Value Index.
The Trump administration continued to promote both deregulatory and pro-infrastructure policies, two moves that helped keep markets optimistic. Tax reform legislation that was passed in late December 2017 set the stage for the possibility of increased profits for many corporations.
Continued normalization of monetary policy marked the Fund’s fiscal year, with new US Federal Reserve Chairman Jerome Powell replacing Janet Yellen. The United States has been transitioning from a period of considerable turmoil that began with the global financial crisis of 2008, when the Fed launched a series of large-scale quantitative easing (QE) programs that ultimately increased the size of its balance sheet by $3.6 trillion. In October 2017, the Fed began to gradually unwind its asset purchases.
Source: Bloomberg
Fund performance
Optimum Small-Mid Cap Growth Fund outperformed its benchmark, the Russell 2500 Growth Index, for the fiscal year. Strong performance in the information technology sector for both sub-advisors’ portions of the Fund contributed to performance, but PCM’s portion of the Fund trailed the benchmark due to market conditions at odds with its valuation-sensitive growth style. Weakness in healthcare and poor stock selection in consumer discretionary also dragged on PCM’s portion of the Fund.
CCI
CCI’s portion of the Fund outperformed the Russell 2500 Growth Index for the fiscal year. Stock selection in the technology sector contributed to relative outperformance, led by individual stock holdings such as Universal Display Corp. and Square Inc. Other contributors for CCI’s portion of the Fund were energy and a lack of exposure to the real estate, notably real estate investment trust (REITs), which are negatively affected by rising interest rates. An overweight in the consumer discretionary sector and an underweight in healthcare detracted from performance.
CCI uses a growth-oriented, investment philosophy of “positive momentum and positive surprise” in which CCI strives to invest in what it views as good companies getting stronger and in companies whose fundamentals are exceeding investor expectations. Given the likely continued normalization of the Fed’s large balance sheet and expected higher future interest rates, CCI continues to weight its portfolios toward secular growth stocks, particularly within the technology and consumer discretionary sectors, which it believes will be rewarded for positive fundamentals and surprise.
The leading contributor to performance in CCI’s portion of the Fund was Universal Display Corporation, the intellectual property leader in organic light emitting diode (OLED) technology. OLED technology has begun to replace LCD screens in high-end televisions and smartphones, most recently the iPhone X. Universal Display is a
14
Table of Contents
major beneficiary of the adoption of the new screen technology, which has driven both royalty income and the sale of higher priced materials for the company.
Another technology contributor to CCI’s portion of the Fund was Square Inc., a leading provider of payment processing, point-of-sale, financial, and marketing services to merchants. Revenue growth continued to accelerate during the fiscal year, which led to strong results and forward guidance. At the same time, the company has attracted larger merchants to its payment platform while also successfully cross-selling additional services to its existing customer base.
A leading detractor from performance in CCI’s portion of the Fund was CommScope Holding Company, Inc. — a communications-related company that provides connectivity and infrastructure services for wireless, enterprise, and residential broadband markets — reported disappointing quarterly results and provided forward guidance below expectations. Challenging business conditions were due primarily to reduced spending from some of its key customers and a delayed start to the FirstNet public safety broadband network buildout. CCI sold the position during the fiscal year as the prospect of consolidation between two of its major customers augmented already-existing uncertainty.
Snyder’s-Lance Inc., a snack-food manufacturer whose products include pretzels, crackers, chips and nuts, was another disappointing stock for CCI’s portion of the Fund. Sales through traditional channels performed relatively well, but sales through secondary channels, which are often difficult to track, proved disappointing and failed to leverage increased marketing expenditures. In addition, the unexpected announcement of the CEO’s retirement reinforced CCI’s decision to exit the position.
At the end of the fiscal year, CCI’s portion of the Fund was most overweight the technology sector, tied to secular trends such as cloud computing, cyber security, and Internet of Things (IoT). CCI was also overweight the consumer discretionary sector, seeking to benefit from strength in employment and consumer confidence. CCI generally tilted its exposure away from Internet-based competitors such as Amazon. CCI was overweight financials, where it was exposed to companies it considered likely to benefit from rising interest rates. CCI was most underweight industrials and materials, choosing to gain cyclical exposure in other sectors, due to a lack of compelling secular growth ideas. As previously mentioned, CCI had no exposure to the real estate sector.
PCM
PCM’s portion of the Fund underperformed the benchmark Russell 2500 Growth Index for the fiscal year, largely due to market conditions that were at odds with the team’s overall investment strategy. The PCM process centers on the acquisition of rapidly growing companies at what it views as reasonable valuations. During
the Fund’s fiscal year, however, it was the most highly valued stocks within the small- and mid-cap growth arena that persistently outperformed. That created a headwind for PCM’s valuation-sensitive style. An average cash holding of 3.7% in PCM’s portion of the Fund further hindered relative performance during a year marked by strong benchmark performance.
Healthcare dragged overall on performance for PCM’s portion of the Fund. The biotechnology subsector was a source of relative strength but PCM’s portion of the Fund held a larger proportion of smaller companies within the equipment and supplies industry, which strained overall results in the sector. Information technology and basic materials contributed to returns in PCM’s portion of the Fund. Strong stock selection in the semiconductor field and overweights in the software and Internet industries bolstered performance during the fiscal year. Stock selection in the materials sector also drove outperformance, as did holdings in the paper product and metals industries, which directly benefited from newly enacted trade policies.
Stock selection in the consumer discretionary sector also hampered performance in PCM’s portion of the Fund, driven primarily by IMAX Corp, the original developer of large-format motion picture technologies via its proprietary “IMAX” offering. Film-based projectors for large-format films had been expensive and size prohibitive, limiting their use to the museum setting. The shift to digital film distribution removed these limitations and opened the market so that traditional theaters could adopt IMAX’s format. An additional change in its go-to-market strategy enabled IMAX to grow its theater footprint to more than 1,000 worldwide while participating in box-office economics. A combination of persistent box-office weakness, and an increasing reliance on international markets such as China for theater growth, resulted in underperformance for the company. PCM sold the position in IMAX in its portion of the Fund during the fiscal year.
Apogee Enterprises Inc., which designs and develops architectural glass used in windows and curtainwall systems on commercial buildings, was another detractor in PCM’s portion of the Fund. A strong and growing backlog position had given Apogee good visibility into future results which, when coupled with steady margin improvement, provided the basis from strong growth. The company acquired EFCO Corporation in May 2017, which expanded its reach into mid-sized buildings. Still, competitive pressures within this and other end markets caused the company to stumble, as did challenges integrating the EFCO acquisition. The combination led to disappointing results and a tempered intermediate-term outlook. PCM sold the position in Apogee during the fiscal year.
Also detracting from performance in PCM’s portion of the Fund was TESARO, Inc., a commercial biotechnology company focused on the development of novel treatments for cancer. Tesaro’s product Zejula® is a PARP inhibitor (a pharmacological inhibitor of the enzyme poly
(continues) | 15 |
Table of Contents
Portfolio management reviews
Optimum Small-Mid Cap Growth Fund
ADP ribose polymerase) approved for the treatment of recurrent ovarian cancer. PARP inhibitors are a new and exciting class of oncology treatments effective for a broad and growing list of cancers, including ovarian, breast, and prostate in combination with other approved products. Tesaro’s clinical program in ovarian cancer demonstrated the most robust outcomes seen among PARP inhibitors. However, increasing competition in PARP inhibitors from larger oncology companies created a significant commercial headwind for Tesaro in its launch and PCM subsequently sold the position during the fiscal year.
2U Inc., which offers a cloud-based software as a service to colleges and universities, and acts as a turnkey solution for delivering online education, was the leading contributor to PCM’s portion of the Fund. Shifting student learning habits have driven strong demand for courses delivered online. Creating a digital education offering involves significant technical and administrative expertise that is often beyond the capabilities of traditional universities. It can also be quite expensive. 2U currently has partnerships with 24 universities including New York University and Yale, as well as 51 online programs across 23 areas of study. Adoption of online learning by
traditional universities remains low. By leveraging its leading market position and industry expertise, PCM thinks 2U could be well positioned to benefit from strong growth as adoption increases.
Another contributor was SS&C Technologies, Inc., a leading provider of software to more than 11,000 financial services firms. The company offers a diverse lineup of integrated software solutions that are often viewed as “mission critical.” It is also expensive to switch to another provider. This combination creates, in PCM’s view, an unusual degree of revenue visibility. In addition, 94% of the company’s revenues are recurring. The company has successfully grown through a combination of organic and acquired growth, as well as through the successful completion of many acquisitions. Most recently, the company announced a deal to acquire DST Systems, a large deal with significant accretion, which drove estimates higher during the fiscal year.
Overall, Optimum Small-Mid Cap Growth Fund used derivatives, including foreign currency exchange contracts, during the fiscal year. However, these had a minimal effect on performance.
16
Table of Contents
Optimum Small-Mid Cap Value Fund
April 10, 2018 (Unaudited)
Performance review (for the year ended March 31, 2018)
Optimum Small-Mid Cap Value Fund (Institutional Class shares)* | 1-year return | +4.94 | % | |||
Optimum Small-Mid Cap Value Fund (Class A shares) | 1-year return | +4.59 | % | |||
Russell 2500™ Value Index (benchmark) | 1-year return | +5.72 | % |
Past performance does not guarantee future results.
For complete, annualized performance for Optimum Small-Mid Cap Value Fund please see the table on page 35.
Institutional Class shares are not subject to a sales charge and are offered for sale exclusively to certain eligible investors. In addition, Institutional Class shares pay no distribution and service fee.
The performance of Class A shares excludes the applicable sales charge. Both Institutional Class shares and Class A shares reflect the reinvestment of all distributions.
Index performance returns do not reflect any management fees, transaction costs, or expenses. Indices are unmanaged and one cannot invest directly in an index.
*Total returns for the report period presented in the table differ from the returns in “Financial highlights.” The total returns presented in the above table are calculated based on the net asset value (NAV) at which shareholder transactions were processed. The total returns presented in “Financial highlights” are calculated in the same manner, but also take into account certain adjustments that are necessary under US generally accepted accounting principles (US GAAP) required in the annual report.
Advisor
Delaware Management Company (DMC)
Sub-advisors
LSV Asset Management (LSV)
Westwood Management Corp. (Westwood)
Market overview
Shifts in the investing landscape that started nearly two years ago continued during the Fund’s fiscal year ended March 31, 2018. The US Federal Reserve trimmed assets on its balance sheet and on March 21, increased the federal funds rate for the sixth time since it started tightening monetary policy in December 2015.
Fiscal policies remained at the forefront of investors’ minds as initial attempts to reform the Affordable Care Act (ACA) fell short. Focus shifted to changing the tax code, however, and the Tax Cuts and Jobs Act was signed into law in late December 2017. The corporate tax cuts set the stage for the likelihood of further profit increases for many corporations.
Favorable treatment for capital expenditures further added to investor expectations for faster economic growth. Easing regulatory burdens (while difficult to quantify), also aided businesses, as both large- and small-cap stocks produced double-digit returns, though large-cap stocks outpaced small-cap stocks.
The US economy continued to see strong employment trends and a possible pickup in inflation. In conjunction with rising interest rates, albeit from very low levels, tax legislation produced a smooth path higher for equities, with historically low volatility entering 2018. Investors’ fears over increasing inflation and a change in sentiment led to choppy markets to close out the Fund’s fiscal year.
The environment during the fiscal year was a strong one for US equities, particularly for large-cap growth stocks, which returned 21.3%, as measured by the Russell 1000® Growth Index. Small-cap value stocks, as measured by the Russell 2000® Value Index, advanced just 5.1% during the fiscal year. The spread between value and growth stocks in the small/mid-cap segment was -14.2% as the Russell 2500™ Growth Index gained 19.9% and the Russell 2500 Value Index rose just 5.7%. Within the Russell 2500™ Index, technology, healthcare, industrials, consumer discretionary, and financials were the strongest-performing sectors, while energy stocks lagged.
The specter of a trade war further exacerbated fears that inflation could outpace estimates and drive the price of goods higher. In a trade war, companies could also face headwinds to their profit margins. Oil prices rose, adding fuel to the fears of higher inflation, although they remained below levels that would be restrictive to global economies.
Source: Bloomberg
Fund performance
Optimum Small-Mid Cap Value Fund underperformed its benchmark, the Russell 2500™ Value Index, for the fiscal year. Westwood’s portion of the Fund outperformed the benchmark as a result of strong stock selection in the energy, real estate, and healthcare sectors. LSV’s portion of the Fund underperformed the benchmark. LSV’s portion of the Fund trades at a significant discount relative to the Russell 2500 Value Index and given the underperformance of value stocks during the fiscal year, it proved difficult for LSV to keep up with the benchmark. Additionally, weak stock selection in the technology, industrials, consumer discretionary, and real estate sectors hurt LSV’s performance.
(continues) | 17 |
Table of Contents
Portfolio management reviews
Optimum Small-Mid Cap Value Fund
Westwood
Westwood employs a consistent, disciplined approach that seeks to provide attractive risk-adjusted returns while protecting capital during unfavorable market periods. Extensive research to identify companies that it believes are attractively valued regarding future earnings and cash flow prospects, underpinned by limited downside risk due to strong fundamentals, drives Westwood’s stock selection.
The fiscal year saw a strong equity market with historically low volatility. Fiscal policies, less regulation, and the passage of the Tax Cuts and Jobs Act effectively reduced tax rates, serving as further catalysts for specific companies. These policies, in conjunction with other market dynamics, led to lower intra-market correlations and greater dispersion of operating results. The Fund benefited, as it was well positioned to take advantage of that shift.
At the same time, crude oil prices rose as quotas for the Organization of the Petroleum Exporting Countries (OPEC) helped to balance global supply and demand. These dynamics contributed to Westwood’s energy holdings, primarily located in the Permian basin. These holdings, generally characterized by their low cost of production, have the potential to weather challenging commodity price environments and produce strong cash flow at higher prices. Rising interest rates put pressure on bond proxies, and Westwood’s underweight to real estate and company-specific attributes for those holdings fostered strong relative performance in that area. Additionally, the financials sector benefited as net interest margins and the rate increase boosted the returns on investment portfolios.
Security selection in Westwood’s portion of the Fund was positive in most sectors, with particularly strong returns in healthcare and financials. Westwood’s healthcare holdings are characterized as companies with high-quality medical products and those that generally avoid reimbursement risk and focus on value-added consumable areas within the healthcare space.
Security selection in information technology and consumer discretionary detracted from performance in Westwood’s portion of the Fund. Negative company-specific developments hurt relative performance in information technology while continued disruptions from companies adjusting inventory and trying to adapt to the changing patterns of consumer behavior put pressure on consumer discretionary holdings in Westwood’s portion of the Fund.
Teleflex Inc., Wintrust Financial Corp., and Zions Bancorporation were standout contributors. Teleflex saw accelerating organic growth, as acquisitions of medical products expanded its portfolio and created potential opportunities for cost savings and market share gains. Both Wintrust Financial and Zions Bancorp gained from rising interest rates and saw better-than-expected loan growth as positive consumer sentiment translated into increased demand for loans. Zions Bancorp is presently undertaking a system upgrade that is likely to save costs, simplify operations, and
further expand profitability. Wintrust Financial remains focused on what Westwood views as its high-quality franchise, while supplementing organic growth with potential acquisitions, should it find favorably priced opportunities.
Equifax Inc., Electronics for Imaging, Inc., and Edgewell Personal Care, LLC detracted from performance. Equifax experienced a data breach that affected more than 140 million people in the United States, depressing shares given the sensitive nature of the personal financial information, including Social Security numbers and credit card information. Westwood sold the position during the Fund’s fiscal year. Electronics for Imaging delayed its earnings conference call after it discovered a material weakness related to the timing of recognizing revenues. Westwood sold that position as well. Edgewell faced tough competition in its wet shave segment from Procter & Gamble, the largest player in the space. That pressured pricing and volumes, causing results to lag expectations. Westwood continued to hold Edgewell, believing that its shares were attractively valued.
Transparent free cash flow generation has historically supported Westwood’s strategy in several areas, including industrial innovators and building products. Further, Westwood believes this improvement could also help regional banks, which may be poised to benefit from incremental loan growth, easing regulatory burdens, and rising interest rates. Westwood relies on its well-tested process of fundamental stock picking with a long-term view.
LSV
Stock selection hampered LSV’s relative returns in the technology, industrials, consumer discretionary, and real estate sectors. LSV limits its sector weights to a range of 5% higher or lower than the benchmark weights. Therefore, they generally don’t have a significant impact on relative performance. However, allocations contributed about 1.75 percentage points to relative performance for LSV’s portion of the Fund during the fiscal year. An underweight to the weak energy sector was the largest contributor.
Turnover is generally low in LSV’s portion of the Fund (20-25% annually). Because this is still a relatively new portfolio relative to Westwood, the turnover was somewhat lower than that, at 16.5% for the fiscal year. When stocks fall out of the top 40% of LSV’s overall rankings, LSV sells the positions and seeks to replace them with higher-ranked names. There were no significant sector weight changes during the year. LSV’s portion of the Fund was underweight oil exploration companies and overweight oil refineries, which contributed to a positive overall allocation to the energy sector. In contrast, stock selection within technology was weak, detracting nearly 1.50 percentage points relative to the benchmark.
Because LSV’s portion of the Fund is broadly diversified, no individual name had too large of an impact on overall returns given each stocks’ fairly small position weights.
18
Table of Contents
NCR Corporation, a technology and omni-channel solutions company, was the largest detractor from relative performance. NCR had disappointing results largely due to order weakness in its ATM business. LSV’s portion of the Fund had an average 1% position in this out-of-benchmark stock during the period and it detracted about 0.50 percentage points from returns. Dean Foods Co. was the second largest detractor. With a 0.5% average overweight and the stock falling more than 50%, the negative impact was about 0.40 percentage points. A long-term reduction in milk consumption along with increased competition hurt Dean Foods which is now considered a takeover candidate. Sanmina Corporation, an electronics manufacturing services provider, was the third largest detractor. An average weight of 0.9% and loss of 36% during the fiscal year resulted in a negative impact of 0.37 percentage points. Sanmina came under pressure after recent quarterly earnings reports were below expectations due to material shortages and year-end order cancellations. LSV continued to own all three names as they remained in the top 40% of LSV’s overall rankings.
ON Semiconductor Corp. and Spirit Aerosystems, Inc.,were the leading contributors. Each contributed 0.40 percentage points to
relative performance for LSV’s portion of the Fund. ON Semiconductor gained nearly 60% during the fiscal year as semi-conductor/chip stocks generally outperformed the broader market on strong demand. Further, the semiconductor industry benefited from the tax plan overhaul. Spirit Aerosystems, which builds aircraft for both commercial and defense customers, rose 45% during the fiscal year, as the aerospace industry generally performed well. Spirit produces aircraft for commercial and defense purposes and benefited from a broader agreement with former parent Boeing. Both names continue to rank attractively based on LSV’s model and remain in its portion of the Fund.
At the end of the fiscal year, LSV’s portion of the Fund was underweight utilities, real estate, energy, and healthcare, and overweight consumer discretionary, industrials, technology, and materials.
Overall, Optimum Small-Mid Cap Value Fund used derivatives, including foreign currency exchange contracts, during the fiscal year. However, these had a minimal effect on performance.
(continues) | 19 |
Table of Contents
Performance summaries
March 31, 2018
(Unaudited)
The performance quoted represents past performance and does not guarantee future results. Investment return and principal value of an investment will fluctuate so that shares, when redeemed, may be worth more or less than their original cost. Current performance may be lower or higher than the performance quoted. Please obtain the performance data for the most recent month end by calling 800 914-0278 or visiting our website at optimummutualfunds.com/performance.
Fund and benchmark performance1,2
Average annual total returns through March 31, 2018
|
| 1 year
|
|
| 5 years
|
|
| 10 years
|
| |||||
Class A (Est. Aug. 1, 2003) | ||||||||||||||
Excluding sales charge | +1.81% | +1.18% | +4.21% | |||||||||||
Including sales charge | –2.75% | +0.26% | +3.73% | |||||||||||
Class C (Est. Aug. 1, 2003) | ||||||||||||||
Excluding sales charge | +1.06% | +0.44% | +3.49% | |||||||||||
Including sales charge | +0.06% | +0.44% | +3.49% | |||||||||||
Institutional Class (Est. Aug. 1, 2003) | ||||||||||||||
Excluding sales charge | +1.96% | +1.44% | +4.52% | |||||||||||
Including sales charge | +1.96% | +1.44% | +4.52% | |||||||||||
Bloomberg Barclays US Aggregate Index | +1.20% | +1.82% | +3.63% |
1Returns reflect the reinvestment of all distributions and are presented both with and without the applicable sales charges described below. Returns do not reflect the deduction of taxes the shareholder would pay on Fund distributions or redemptions of Fund shares.
Expense limitations were in effect for certain classes during some or all of the periods shown in the “Fund and benchmark performance” graph. The current expenses for each class are listed on the “Fund expense ratios” table on the next page. Performance would have been lower had expense limitations not been in effect.
Institutional Class shares are not subject to a sales charge and are offered for sale exclusively to certain eligible investors. In addition, Institutional Class shares pay no distribution and service fee.
Class A shares are sold with a maximum front-end sales charge of up to 4.50%, and have an annual distribution and service fee of up to 0.25% of average daily net assets. Performance for Class A shares, excluding sales charges, assumes that no front-end sales charge applied.
Class C shares are sold with a contingent deferred sales charge of 1.00% if redeemed during the first 12 months. They are also subject to an annual distribution and service fee of up to 1.00% of average daily net assets.
Performance for Class C shares, excluding sales charges, assumes either that contingent deferred sales charges did not apply or that the investment was not redeemed.
The “Fund and benchmark performance” table and the “Performance of a $10,000 investment” graph do not reflect the deduction of taxes the shareholder would pay on Fund distributions or redemptions of Fund shares.
20
Table of Contents
2The Fund’s expense ratios, as described in the most recent prospectus, are disclosed in the “Fund expense ratios” table below. Delaware Management Company has agreed to reimburse certain expenses and/or waive certain fees in order to prevent total fund operating expenses (excluding any 12b-1 fees and certain other expenses) from exceeding 0.86% of the Fund’s average daily net assets from July 29, 2017 through March 31, 2018. From April 1, 2017 through July 28, 2017, the expense waiver was 0.92% of the Fund’s average daily net assets.* Please see the most recent prospectus and any applicable supplement(s) for additional information on these fee waivers and/or reimbursements.
Fund expense ratios | Class A | Class C | Institutional Class | |||
Total annual operating expenses (without fee waivers) | 1.11% | 1.86% | 0.86% | |||
Net Expenses (including fee waivers, if any) | 1.11% | 1.86% | 0.86% | |||
Type of waiver | Contractual | Contractual | Contractual |
* The aggregate contractual waiver period covering this report is from July 29, 2016 to July 30, 2018.
Fixed income securities and bond funds can lose value, and investors can lose principal, as interest rates rise. They also may be affected by economic conditions that hinder an issuer’s ability to make interest and principal payments on its debt.
The Fund may also be subject to prepayment risk, the risk that the principal of a bond that is held by a portfolio will be prepaid prior to maturity, at the time when interest rates are lower than what the bond was paying. A portfolio may then have to reinvest that money at a lower interest rate.
Securities in the lowest of the rating categories considered to be investment grade (that is, Baa or BBB) have some speculative characteristics.
High yielding, non-investment-grade bonds (junk bonds) involve higher risk than investment grade bonds.
The high yield secondary market is particularly susceptible to liquidity problems when institutional investors, such as mutual funds and certain other financial institutions, temporarily stop buying bonds for regulatory, financial, or other reasons. In addition, a less liquid secondary market makes it more difficult for the Fund to obtain precise valuations of the high yield securities in its portfolio.
If and when the Fund invests in forward foreign currency contracts or uses other investments to hedge against currency risks, the Fund will be subject to special risks, including counterparty risk.
The Fund may invest in derivatives, which may involve additional expenses and are subject to risk, including the risk that an underlying security or securities index moves in the opposite direction from what the portfolio manager anticipated. A derivatives transaction depends upon the counterparties’ ability to fulfill their contractual obligations.
Portfolio turnover is a measure of how frequently the managers buy and sell assets within a fund over a particular period. It is usually reported for a 12-month time period.
Investments in collateralized loan obligations (CLO) may involve risks. CLOs are securities backed by a pool of debt, often low-rated corporate loans. Investors receive scheduled debt payments from the underlying loans but assume most of the risk in the event that borrowers default.
(continues) | 21 |
Table of Contents
Performance summaries
Optimum Fixed Income Fund
Performance of a $10,000 Investment1
Average annual total returns from March 31, 2008 through March 31, 2018
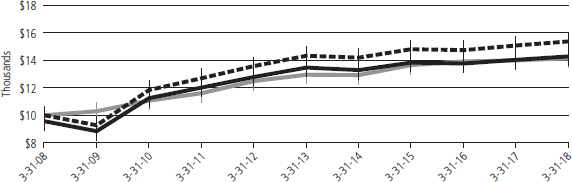
| Starting value (March 31, 2008) | Ending value (March 31, 2018) | |||||
| Optimum Fixed Income Fund — Institutional Class shares | $10,000 | $15,562 | |||
| Optimum Fixed Income Fund — Class A shares | $9,550 | $14,421 | |||
| Bloomberg Barclays US Aggregate Index | $10,000 | $14,286 |


1The “Performance of $10,000 investment” graph assumes $10,000 invested in Class A and Institutional Class shares of the Fund on March 31, 2008, and includes the effect of a 4.50% front-end sales charge (for Class A shares) and the reinvestment of all distributions. The graph does not reflect the deduction of taxes the shareholders would pay on Fund distributions or redemptions of Fund shares. Expense limitations were in effect for some or all of the periods shown. Performance would have been lower had expense limitations not been in effect. Current expenses are listed in the “Fund expense ratios” table on page 21. Please note additional details on pages 20 through 22.
The graph also assumes $10,000 invested in the Bloomberg Barclays US Aggregate Index as of March 31, 2008. The Bloomberg Barclays US Aggregate Index is a broad composite that tracks the investment grade domestic bond market.
The Bloomberg Barclays US Mortgage-Backed Securities (MBS) Index, mentioned on page 2, measures the performance of agency mortgage-backed pass-through securities (both fixed-rate and hybrid adjustable-rate mortgage) issued by the Federal National Mortgage Association (Fannie Mae), Federal Home Loan Mortgage Association (Freddie Mac), and Government National Mortgage Association (Ginnie Mae).
The ICE BofAML US Dollar 3-Month Deposit Offered Rate Constant Maturity Index (formerly known as the BofA Merrill Lynch US Dollar 3-Month Deposit Offered Rate Constant Maturity Index), mentioned on page 2, represents the London interbank offered rate (Libor) with a constant 3-month average maturity. Libor is a composite of the rates of interest at which banks borrow from one another in the London market, and it is a widely used benchmark for short-term interest rates.
Index performance returns do not reflect any management fees, transaction costs, or expenses. Indices are unmanaged and one cannot invest directly in an index. Past performance is not a guarantee of future results.
Performance of other Fund classes will vary due to different charges and expenses.
Stock symbols and CUSIP numbers
| Nasdaq symbols | CUSIPs | |||||||
Class A | OAFIX | 246118681 | ||||||
Class C | OCFIX | 246118665 | ||||||
Institutional Class | OIFIX | 246118657 | ||||||
22
Table of Contents
March 31, 2018
(Unaudited)
The performance quoted represents past performance and does not guarantee future results. Investment return and principal value of an investment will fluctuate so that shares, when redeemed, may be worth more or less than their original cost. Current performance may be lower or higher than the performance quoted. Please obtain the performance data for the most recent month end by calling 800 914-0278 or visiting our website at optimummutualfunds.com/performance.
Fund and benchmark performance1,2
Average annual total returns through March 31, 2018
| 1 year
| 5 years
| 10 years
| |||||||||||
Class A (Est. Aug. 1, 2003) | ||||||||||||||
Excluding sales charge | +19.11% | * | +6.73% | +2.28% | ||||||||||
Including sales charge | +12.30% | * | +5.47% | +1.68% | ||||||||||
Class C (Est. Aug. 1, 2003) | ||||||||||||||
Excluding sales charge | +18.28% | * | +5.95% | +1.57% | ||||||||||
Including sales charge | +17.28% | * | +5.95% | +1.57% | ||||||||||
Institutional Class (Est. Aug. 1, 2003) | ||||||||||||||
Excluding sales charge | +19.42% | * | +7.02% | +2.59% | ||||||||||
Including sales charge | +19.42% | * | +7.02% | +2.59% | ||||||||||
MSCI ACWI ex USA Index (net) | +16.53% | +5.89% | +2.70% | |||||||||||
MSCI ACWI ex USA Index (gross) | +17.05% | +6.37% | +3.17% | |||||||||||
MSCI EAFE Index (net) | +14.80% | +6.50% | +2.74% | |||||||||||
MSCI EAFE Index (gross) | +15.32% | +6.98% | +3.22% | |||||||||||
*Total returns for the report period presented in the table differ from the returns in “Financial highlights.” The total returns presented in the above table are calculated based on the net asset value (NAV) at which shareholder transactions were processed. The total returns presented in “Financial highlights” are calculated in the same manner, but also take into account certain adjustments that are necessary under US generally accepted accounting principles (US GAAP) required in the annual report.
1Returns reflect the reinvestment of all distributions and are presented both with and without the applicable sales charges described below. Returns do not reflect the deduction of taxes the shareholder would pay on Fund distributions or redemptions of Fund shares.
Expense limitations were in effect for certain classes during some or all of the periods shown in the “Fund and benchmark performance” graph. The current expenses for each class are listed on the “Fund expense ratios” table on the next page. Performance would have been lower had expense limitations not been in effect.
Institutional Class shares are not subject to a sales charge and are offered for sale exclusively to certain eligible investors. In addition, Institutional Class shares pay no distribution and service fee.
Class A shares are sold with a maximum front-end sales charge of up to 5.75%, and have an annual distribution and service fee of up to 0.25% of average daily net assets. Performance for Class A shares, excluding sales charges, assumes that no front-end sales charge applied.
Class C shares are sold with a contingent deferred sales charge of 1.00% if redeemed during the first 12 months. They are also subject to an annual distribution and service fee of up to 1.00% of average daily net assets.
Performance for Class C shares, excluding sales charges, assumes either that contingent deferred sales charges did not apply or that the investment was not redeemed.
The “Fund and benchmark performance” table and the “Performance of a $10,000 investment” graph do not reflect the deduction of taxes the shareholder would pay on Fund distributions or redemptions of Fund shares.
2 The Fund’s expense ratios, as described in the most recent prospectus, are disclosed in the “Fund expense ratios” table on the next page. Delaware Management Company has agreed to reimburse certain expenses and/or waive certain fees in order to prevent total fund
(continues) | 23 |
Table of Contents
Performance summaries
Optimum International Fund
operating expenses (excluding any 12b-1 fees and certain other expenses) from exceeding 1.13% of the Fund’s average daily net assets from July 29, 2017, through March 31, 2018. From April 1, 2017 through July 28, 2017, the expense waiver was 1.25% of the Fund’s average daily net assets.* Please see the most recent prospectus and any applicable supplement(s) for additional information on these fee waivers and/or reimbursements.
| Fund expense ratios | Class A | Class C | Institutional Class | |||
Total annual operating expenses (without fee waivers) | 1.37% | 2.12% | 1.12% | |||
Net expenses (including fee waivers, if any) | 1.37% | 2.12% | 1.12% | |||
Type of waiver | Contractual | Contractual | Contractual |
* The aggregate contractual waiver period covering this report is from July 29, 2016 to July 30, 2018.
International investments entail risks not ordinarily associated with US investments including fluctuation in currency values, differences in accounting principles, or economic or political instability in other nations. Investing in emerging markets can be riskier than investing in established foreign markets due to increased volatility and lower trading volume.
The Fund may invest in derivatives, which may involve additional expenses and are subject to risk, including the risk that an underlying security or securities index moves in the opposite direction from what the portfolio manager anticipated. A derivative transaction depends upon the counterparties’ ability to fulfill their contractual obligations.
There is no guarantee that dividend-paying stocks will continue to pay dividends.
Performance of a $10,000 Investment1
Average annual total returns from March 31, 2008 through March 31, 2018
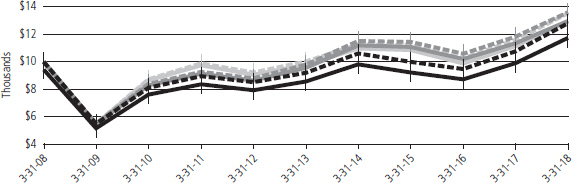
| Starting value (March 31, 2008) | Ending value (March 31, 2018) | |||||
| MSCI EAFE Index (gross) | $10,000 | $13,735 | |||
| MSCI ACWI ex USA Index (gross) | $10,000 | $13,665 | |||
| MSCI EAFE Index (net) | $10,000 | $13,078 | |||
| MSCI ACWI ex USA Index (net) | $10,000 | $13,053 | |||
| Optimum International Fund — Institutional Class shares | $10,000 | $12,914 | |||
| Optimum International Fund — Class A shares | $9,425 | $11,811 |


1The “Performance of $10,000 investment” graph assumes $10,000 invested in Class A and Institutional Class shares of the Fund on March 31, 2008, and includes the effect of a 5.75% front-end sales charge (for Class A shares) and the reinvestment of all distributions. The graph does not reflect the deduction of taxes the shareholders would pay on Fund distributions or redemptions of Fund shares. Expense
24
Table of Contents
limitations were in effect for some or all of the periods shown. Performance would have been lower had expense limitations not been in effect. Current expenses are listed in the “Fund expense ratios” table on page 24. Please note additional details on pages 23 through 25.
The graph also assumes $10,000 invested in the MSCI EAFE Index and the MSCI ACWI ex USA Index as of March 31, 2008.
The MSCI EAFE (Europe, Australasia, Far East) Index is a free float-adjusted market capitalization weighted index designed to measure equity market performance of developed markets, excluding the United States and Canada. Index “gross” return approximates the maximum possible dividend reinvestment. Index “net” return approximates the minimum possible dividend reinvestment, after deduction of withholding tax at the highest possible rate.
The MSCI ACWI (All Country World Index) ex USA Index is a free float-adjusted market capitalization weighted index that is designed to measure equity market performance across developed and emerging markets worldwide, excluding the United States. Index “gross” return approximates the maximum possible dividend reinvestment. Index “net” return approximates the minimum possible dividend reinvestment, after deduction of withholding tax at the highest possible rate.
Effective Jan. 19, 2018, the MSCI ACWI ex USA Index replaced the MSCI EAFE Index in order to reflect the Fund’s ability to invest in emerging market securities. Please see the supplement to the Fund’s prospectus for more information.
The MSCI Emerging Markets Index, mentioned on page 5, is a free float-adjusted market capitalization index designed to measure equity market performance across emerging market countries worldwide. Index “net” return approximates the minimum possible dividend reinvestment, after deduction of withholding tax at the highest possible rate.
The Russell 1000 Index, mentioned on page 5, measures the performance of the large-cap segment of the US equity universe.
The Russell 2000 Index, mentioned on page 5, measures the performance of the small-cap segment of the US equity universe.
Russell Investment Group is the source and owner of the trademarks, service marks, and copyrights related to the Russell Indexes. Russell® is a trademark of Russell Investment Group.
Index performance returns do not reflect any management fees, transaction costs, or expenses. Indices are unmanaged and one cannot invest directly in an index. Past performance is not a guarantee of future results.
Performance of other Fund classes will vary due to different charges and expenses.
Stock symbols and CUSIP numbers
| Nasdaq symbols | CUSIPs | |||||||
Class A | OAIEX | 246118731 | ||||||
Class C | OCIEX | 246118715 | ||||||
Institutional Class | OIIEX | 246118699 | ||||||
(continues) | 25 |
Table of Contents
Performance summaries
March 31, 2018
(Unaudited)
The performance quoted represents past performance and does not guarantee future results. Investment return and principal value of an investment will fluctuate so that shares, when redeemed, may be worth more or less than their original cost. Current performance may be lower or higher than the performance quoted. Please obtain the performance data for the most recent month end by calling 800 914-0278 or visiting our website at optimummutualfunds.com/performance.
Fund and benchmark performance1,2
Average annual total returns through March 31, 2018
| 1 year
| 5 years
| 10 years
| |||||||||||||
Class A (Est. Aug. 1, 2003) | ||||||||||||||||
Excluding sales charge | +22.17% | +15.41% | +10.24% | |||||||||||||
Including sales charge | +15.13% | +14.04% | +9.59% | |||||||||||||
Class C (Est. Aug. 1, 2003) | ||||||||||||||||
Excluding sales charge | +21.30% | +14.56% | +9.48% | |||||||||||||
Including sales charge | +20.31% | +14.56% | +9.48% | |||||||||||||
Institutional Class (Est. Aug. 1, 2003) | ||||||||||||||||
Excluding sales charge | +22.50% | +15.71% | +10.58% | |||||||||||||
Including sales charge | +22.50% | +15.71% | +10.58% | |||||||||||||
Russell 1000 Growth Index | +21.25% | +15.53% | +11.34% | |||||||||||||
1Returns reflect the reinvestment of all distributions and are presented both with and without the applicable sales charges described below. Returns do not reflect the deduction of taxes the shareholder would pay on Fund distributions or redemptions of Fund shares.
Expense limitations were in effect for certain classes during some or all of the periods shown in the “Fund and benchmark performance” graph. The current expenses for each class are listed on the “Fund expense ratios” table on the next page. Performance would have been lower had expense limitations not been in effect.
Institutional Class shares are not subject to a sales charge and are offered for sale exclusively to certain eligible investors. In addition, Institutional Class shares pay no distribution and service fee.
Class A shares are sold with a maximum front-end sales charge of up to 5.75%, and have an annual distribution and service fee of up to 0.25% of average daily net assets. Performance for Class A shares, excluding sales charges, assumes that no front-end sales charge applied.
Class C shares are sold with a contingent deferred sales charge of 1.00% if redeemed during the first 12 months. They are also subject to an annual distribution and service fee of up to 1.00% of average daily net assets.
Performance for Class C shares, excluding sales charges, assumes either that contingent deferred sales charges did not apply or that the investment was not redeemed.
The “Fund and benchmark performance” table and the “Performance of a $10,000 investment” graph do not reflect the deduction of taxes the shareholder would pay on Fund distributions or redemptions of Fund shares.
2 The Fund’s expense ratios, as described in the most recent prospectus, are disclosed in the “Fund expense ratios” table on the next page. Delaware Management Company has agreed to reimburse certain expenses and/or waive certain fees in order to prevent total fund operating expenses (excluding any 12b-1 fees and certain other expenses) from exceeding 1.02% of the Fund’s average daily net assets from July 29, 2017, through March 31, 2018. From April 1, 2017 through July 28, 2017, the expense waiver was 1.10% of the Fund’s average daily net assets.* Please see the most recent prospectus and any applicable supplement(s) for additional information on these fee waivers and/or reimbursements.
26
Table of Contents
| Fund expense ratios | Class A | Class C | Institutional Class | |||
Total annual operating expenses (without fee waivers) | 1.27% | 2.02% | 1.02% | |||
Net expenses (including fee waivers, if any) | 1.27% | 2.02% | 1.02% | |||
Type of waiver | Contractual | Contractual | Contractual |
* The aggregate contractual waiver period covering this report is from July 29, 2016 to July 29, 2018.
Narrowly focused investments may exhibit higher volatility than investments in multiple industry sectors.
REIT investments are subject to many of the risks associated with direct real estate ownership, including changes in economic conditions, credit risk, and interest rate fluctuations.
Performance of a $10,000 Investment1
Average annual total returns from March 31, 2008 through March 31, 2018
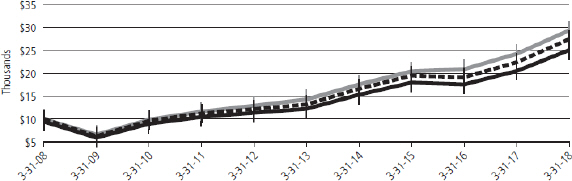
| Starting value (March 31, 2008) | Ending value (March 31, 2018) | |||||
| Russell 1000 Growth Index | $10,000 | $29,278 | |||
| Optimum Large Cap Growth Fund — Institutional Class shares | $10,000 | $27,347 | |||
| Optimum Large Cap Growth Fund — Class A shares | $9,425 | $24,994 |
1The “Performance of $10,000 investment” graph assumes $10,000 invested in Class A and Institutional Class shares of the Fund on March 31, 2008, and includes the effect of a 5.75% front-end sales charge (for Class A shares) and the reinvestment of all distributions. The graph does not reflect the deduction of taxes the shareholders would pay on Fund distributions or redemptions of Fund shares. Expense limitations were in effect for some or all of the periods shown. Performance would have been lower had expense limitations not been in effect. Current expenses are listed in the “Fund expense ratios” table above. Please note additional details on pages 26 through 28.
The graph also assumes $10,000 invested in the Russell 1000 Growth Index as of March 31, 2008. The Russell 1000 Growth Index measures the performance of the large-cap growth segment of the US equity universe. It includes those Russell 1000 companies with higher price-to-book ratios and higher forecasted growth values.
Russell Investment Group is the source and owner of the trademarks, service marks, and copyrights related to the Russell Indexes. Russell® is a trademark of Russell Investment Group.
Index performance returns do not reflect any management fees, transaction costs, or expenses. Indices are unmanaged and one cannot invest directly in an index. Past performance is not a guarantee of future results.
Performance of other Fund classes will vary due to different charges and expenses.
| (continues) | 27 |
Table of Contents
Performance summaries
Optimum Large Cap Growth Fund
Stock symbols and CUSIP numbers
| Nasdaq symbols | CUSIPs | |||||||
Class A | OALGX | 246118707 | ||||||
Class C | OCLGX | 246118889 | ||||||
Institutional Class | OILGX | 246118871 | ||||||
28
Table of Contents
March 31, 2018
(Unaudited)
The performance quoted represents past performance and does not guarantee future results. Investment return and principal value of an investment will fluctuate so that shares, when redeemed, may be worth more or less than their original cost. Current performance may be lower or higher than the performance quoted. Please obtain the performance data for the most recent month end by calling 800 914-0278 or visiting our website at optimummutualfunds.com/performance.
Fund and benchmark performance1,2
Average annual total returns through March 31, 2018
| 1 year
| 5 years
| 10 years
| |||||||||||
Class A (Est. Aug. 1, 2003) | ||||||||||||||
Excluding sales charge | +8.68% | +8.56% | +6.59% | |||||||||||
Including sales charge | +2.43% | +7.27% | +5.96% | |||||||||||
Class C (Est. Aug. 1, 2003) | ||||||||||||||
Excluding sales charge | +7.82% | +7.76% | +5.85% | |||||||||||
Including sales charge | +6.82% | +7.76% | +5.85% | |||||||||||
Institutional Class (Est. Aug. 1, 2003) | ||||||||||||||
Excluding sales charge | +8.90% | +8.83% | +6.91% | |||||||||||
Including sales charge | +8.90% | +8.83% | +6.91% | |||||||||||
Russell 1000 Value Index | +6.95% | +10.78% | +7.77% | |||||||||||
1Returns reflect the reinvestment of all distributions and are presented both with and without the applicable sales charges described below. Returns do not reflect the deduction of taxes the shareholder would pay on Fund distributions or redemptions of Fund shares.
Expense limitations were in effect for certain classes during some or all of the periods shown in the “Fund and benchmark performance” graph. The current expenses for each class are listed on the “Fund expense ratios” table on the next page. Performance would have been lower had expense limitations not been in effect.
Institutional Class shares are not subject to a sales charge and are offered for sale exclusively to certain eligible investors. In addition, Institutional Class shares pay no distribution and service fee.
Class A shares are sold with a maximum front-end sales charge of up to 5.75%, and have an annual distribution and service fee of up to 0.25% of average daily net assets. Performance for Class A shares, excluding sales charges, assumes that no front-end sales charge applied.
Class C shares are sold with a contingent deferred sales charge of 1.00% if redeemed during the first 12 months. They are also subject to an annual distribution and service fee of up to 1.00% of average daily net assets.
Performance for Class C shares, excluding sales charges, assumes either that contingent deferred sales charges did not apply or that the investment was not redeemed.
The “Fund and benchmark performance” table and the “Performance of a $10,000 investment” graph do not reflect the deduction of taxes the shareholder would pay on Fund distributions or redemptions of Fund shares.
2 The Fund’s expense ratios, as described in the most recent prospectus, are disclosed in the “Fund expense ratios” table on the next page. Delaware Management Company has agreed to reimburse certain expenses and/or waive certain fees in order to prevent total fund operating expenses (excluding any 12b-1 fees and certain other expenses) from exceeding 0.98% of the Fund’s average daily net assets from July 29, 2017 through March 31, 2018. From April 1, 2017 through July 28, 2017, the expense waiver was 1.08% of the Fund’s average daily net assets.* Please see the most recent prospectus and any applicable supplement(s) for additional information on these fee waivers and/or reimbursements.
(continues) | 29 |
Table of Contents
Performance summaries
Optimum Large Cap Value Fund
| Fund expense ratios | Class A | Class C | Institutional Class | |||
Total annual operating expenses (without fee waivers) | 1.23% | 1.98% | 0.98% | |||
Net expenses (including fee waivers, if any) | 1.23% | 1.98% | 0.98% | |||
Type of waiver | Contractual | Contractual | Contractual |
*The aggregate contractual waiver period covering this report is from July 29, 2016 to July 30, 2018.
Performance of a $10,000 Investment1
Average annual total returns from March 31, 2008 through March 31, 2018

| Starting value (March 31, 2008) | Ending value (March 31, 2018) | |||||||
| Russell 1000 Value Index | $10,000 | $21,143 | |||||
| Optimum Large Cap Value Fund — Institutional Class shares | $10,000 | $19,510 | |||||
| Optimum Large Cap Value Fund — Class A shares | $9,425 | $17,838 | |||||
1The “Performance of $10,000 investment” graph assumes $10,000 invested in Class A and Institutional Class shares of the Fund on March 31, 2008, and includes the effect of a 5.75% front-end sales charge (for Class A shares) and the reinvestment of all distributions. The graph does not reflect the deduction of taxes the shareholders would pay on Fund distributions or redemptions of Fund shares. Expense limitations were in effect for some or all of the periods shown. Performance would have been lower had expense limitations not been in effect. Current expenses are listed in the “Fund expense ratios” table above. Please note additional details on pages 29 through 31.
The graph also assumes $10,000 invested in the Russell 1000 Value Index as of March 31, 2008. The Russell 1000 Value Index measures the performance of the large-cap value segment of the US equity universe. It includes those Russell 1000 companies with lower price-to-book ratios and lower forecasted growth values.
Russell Investment Group is the source and owner of the trademarks, service marks, and copyrights related to the Russell Indexes. Russell® is a trademark of Russell Investment Group.
Index performance returns do not reflect any management fees, transaction costs, or expenses. Indices are unmanaged and one cannot invest directly in an index. Past performance is not a guarantee of future results.
Performance of other Fund classes will vary due to different charges and expenses.
30
Table of Contents
Stock symbols and CUSIP numbers
| Nasdaq symbols | CUSIPs | |||||||||
Class A | OALVX | 246118863 | ||||||||
Class C | OCLVX | 246118848 | ||||||||
Institutional Class | OILVX | 246118830 | ||||||||
| (continues) | 31 |
Table of Contents
Performance summaries
Optimum Small-Mid Cap Growth Fund
| (Unaudited) | March 31, 2018 |
The performance quoted represents past performance and does not guarantee future results. Investment return and principal value of an investment will fluctuate so that shares, when redeemed, may be worth more or less than their original cost. Current performance may be lower or higher than the performance quoted. Please obtain the performance data for the most recent month end by calling 800 914-0278 or visiting our website at optimummutualfunds.com/performance.
Fund and benchmark performance1,2
Average annual total returns through March 31, 2018
| 1 year
| 5 years
| 10 years
| |||||||||||||||||
Class A (Est. Aug. 1, 2003) | ||||||||||||||||||||
Excluding sales charge | +21.88% | +10.31% | +8.55% | |||||||||||||||||
Including sales charge | +14.89% | +9.02% | +7.91% | |||||||||||||||||
Class C (Est. Aug. 1, 2003) | ||||||||||||||||||||
Excluding sales charge | +21.06% | +9.51% | +7.80% | |||||||||||||||||
Including sales charge | +20.06% | +9.51% | +7.80% | |||||||||||||||||
Institutional Class (Est. Aug. 1, 2003) | ||||||||||||||||||||
Excluding sales charge | +22.22% | +10.60% | +8.88% | |||||||||||||||||
Including sales charge | +22.22% | +10.60% | +8.88% | |||||||||||||||||
Russell 2500 Growth Index | +19.92% | +13.37% | +11.17% | |||||||||||||||||
1Returns reflect the reinvestment of all distributions and are presented both with and without the applicable sales charges described below. Returns do not reflect the deduction of taxes the shareholder would pay on Fund distributions or redemptions of Fund shares.
Expense limitations were in effect for certain classes during some or all of the periods shown in the “Fund and benchmark performance” graph. The current expenses for each class are listed on the “Fund expense ratios” table on the next page. Performance would have been lower had expense limitations not been in effect.
Institutional Class shares are not subject to a sales charge and are offered for sale exclusively to certain eligible investors. In addition, Institutional Class shares pay no distribution and service fee.
Class A shares are sold with a maximum front-end sales charge of up to 5.75%, and have an annual distribution and service fee of up to 0.25% of average daily net assets. Performance for Class A shares, excluding sales charges, assumes that no front-end sales charge applied.
Class C shares are sold with a contingent deferred sales charge of 1.00% if redeemed during the first 12 months. They are also subject to an annual distribution and service fee of up to 1.00% of average daily net assets.
Performance for Class C shares, excluding sales charges, assumes either that contingent deferred sales charges did not apply or that the investment was not redeemed.
The “Fund and benchmark performance” table and the “Performance of a $10,000 investment” graph do not reflect the deduction of taxes the shareholder would pay on Fund distributions or redemptions of Fund shares.
2The Fund’s expense ratios, as described in the most recent prospectus, are disclosed in the “Fund expense ratios” table on the next page. Delaware Management Company has agreed to reimburse certain expenses and/or waive certain fees in order to prevent total fund operating expenses (excluding any 12b-1 fees and certain other expenses) from exceeding 1.29% of the Fund’s average daily net assets from July 29, 2017 through March 31, 2018. From April 1, 2017 through July 28, 2017, the expense waiver was 1.33% of the Fund’s average daily net assets.* Please see the most recent prospectus and any applicable supplement(s) for additional information on these fee waivers and/or reimbursements.
32
Table of Contents
| Fund expense ratios | Class A | Class C | Institutional Class | |||
Total annual operating expenses (without fee waivers) | 1.66% | 2.41% | 1.41% | |||
Net expenses (including fee waivers, if any) | 1.54% | 2.29% | 1.29% | |||
Type of waiver | Contractual | Contractual | Contractual |
*The aggregate contractual waiver period covering this report is from July 29, 2016 to July 30, 2018.
Investments in small and/or medium-sized companies typically exhibit greater risk and higher volatility than larger, more established companies.
Performance of a $10,000 Investment1
Average annual total returns from March 31, 2008 through March 31, 2018
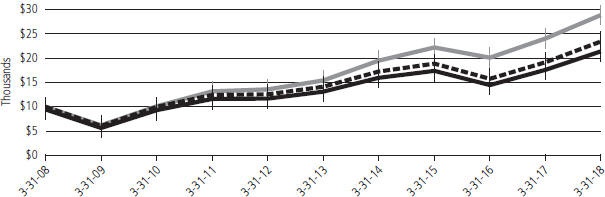
| Starting value (March 31, 2008) | Ending value (March 31, 2018) | |||||||
| Russell 2500 Growth Index | $10,000 | $28,843 | |||||
| Optimum Small-Mid Cap Growth Fund — Institutional Class shares | $10,000 | $23,414 | |||||
| Optimum Small-Mid Cap Growth Fund — Class A shares | $9,425 | $21,414 | |||||
1The “Performance of $10,000 investment” graph assumes $10,000 invested in Class A and Institutional Class shares of the Fund on March 31, 2008, and includes the effect of a 5.75% front-end sales charge (for Class A shares) and the reinvestment of all distributions. The graph does not reflect the deduction of taxes the shareholders would pay on Fund distributions or redemptions of Fund shares. Expense limitations were in effect for some or all of the periods shown. Performance would have been lower had expense limitations not been in effect. Current expenses are listed in the “Fund expense ratios” table on page 33. Please note additional details on pages 32 through 34.
The graph also assumes $10,000 invested in the Russell 2500 Growth Index as of March 31, 2008. The Russell 2500 Growth Index measures the performance of the small- to mid-cap growth segment of the US equity universe. It includes those Russell 2500 companies with higher price-to-book ratios and higher forecasted growth values.
The Russell 2500 Value Index, mentioned on page 14, measures the performance of the small- to mid-cap value segment of the US equity universe. It includes those Russell 2500 companies with lower price-to-book ratios and lower forecasted growth values.
Russell Investment Group is the source and owner of the trademarks, service marks, and copyrights related to the Russell Indexes. Russell® is a trademark of Russell Investment Group.
Index performance returns do not reflect any management fees, transaction costs, or expenses. Indices are unmanaged and one cannot invest directly in an index. Past performance is not a guarantee of future results.
Performance of other Fund classes will vary due to different charges and expenses.
| (continues) | 33 |
Table of Contents
Performance summaries
Optimum Small-Mid Cap Growth Fund
Stock symbols and CUSIP numbers
| Nasdaq symbols | CUSIPs | |||||
Class A | OASGX | 246118822 | ||||
Class C | OCSGX | 246118798 | ||||
Institutional Class | OISGX | 246118780 | ||||
34
Table of Contents
Optimum Small-Mid Cap Value Fund
| (Unaudited) | March 31, 2018 |
The performance quoted represents past performance and does not guarantee future results. Investment return and principal value of an investment will fluctuate so that shares, when redeemed, may be worth more or less than their original cost. Current performance may be lower or higher than the performance quoted. Please obtain the performance data for the most recent month end by calling 800 914-0278 or visiting our website at optimummutualfunds.com/performance.
Fund and benchmark performance1,2
Average annual total returns through March 31, 2018
|
| 1 year
|
|
| 5 years
|
|
| 10 years
|
| |||||||||||
Class A (Est. Aug. 1, 2003) | ||||||||||||||||||||
Excluding sales charge | +4.59% | +5.96% | +6.39% | |||||||||||||||||
Including sales charge | –1.42% | +4.71% | +5.77% | |||||||||||||||||
Class C (Est. Aug. 1, 2003) | ||||||||||||||||||||
Excluding sales charge | +3.85% | +5.18% | +5.64% | |||||||||||||||||
Including sales charge | +2.87% | +5.18% | +5.64% | |||||||||||||||||
Institutional Class (Est. Aug. 1, 2003) | ||||||||||||||||||||
Excluding sales charge | +4.94%* | +6.24% | +6.72% | |||||||||||||||||
Including sales charge | +4.94%* | +6.24% | +6.72% | |||||||||||||||||
Russell 2500 Value Index | +5.72% | +9.88% | +9.34% | |||||||||||||||||
*Total returns for the report period presented in the table differ from the returns in “Financial highlights.” The total returns presented in the above table are calculated based on the net asset value (NAV) at which shareholder transactions were processed. The total returns presented in “Financial highlights” are calculated in the same manner, but also take into account certain adjustments that are necessary under US generally accepted accounting principles (US GAAP) required in the annual report.
1Returns reflect the reinvestment of all distributions and are presented both with and without the applicable sales charges described below. Returns do not reflect the deduction of taxes the shareholder would pay on Fund distributions or redemptions of Fund shares.
Expense limitations were in effect for certain classes during some or all of the periods shown in the “Fund and benchmark performance” graph. The current expenses for each class are listed on the “Fund expense ratios” table on the next page. Performance would have been lower had expense limitations not been in effect.
Institutional Class shares are not subject to a sales charge and are offered for sale exclusively to certain eligible investors. In addition, Institutional Class shares pay no distribution and service fee.
Class A shares are sold with a maximum front-end sales charge of up to 5.75%, and have an annual distribution and service fee of up to 0.25% of average daily net assets. Performance for Class A shares, excluding sales charges, assumes that no front-end sales charge applied.
Class C shares are sold with a contingent deferred sales charge of 1.00% if redeemed during the first 12 months. They are also subject to an annual distribution and service fee of up to 1.00% of average daily net assets.
Performance for Class C shares, excluding sales charges, assumes either that contingent deferred sales charges did not apply or that the investment was not redeemed.
The “Fund and benchmark performance” table and the “Performance of a $10,000 investment” graph do not reflect the deduction of taxes the shareholder would pay on Fund distributions or redemptions of Fund shares.
2The Fund’s expense ratios, as described in the most recent prospectus, are disclosed in the “Fund expense ratios” table on the next page. Delaware Management Company has agreed to reimburse certain expenses and/or waive certain fees in order to prevent total fund operating expenses (excluding any 12b-1 fees and certain other expenses) from exceeding 1.22% of the Fund’s average daily net assets from
| (continues) | 35 |
Table of Contents
Performance summaries
Optimum Small-Mid Cap Value Fund
July 29, 2017 through March 31, 2018. From April 1, 2017 through July 28, 2017, the expense waiver was 1.25% of the Fund’s average daily net assets.* Please see the most recent prospectus and any applicable supplement(s) for additional information on these fee waivers and/or reimbursements.
| Fund expense ratios | Class A | Class C | Institutional Class | |||
Total annual operating expenses (without fee waivers) | 1.56% | 2.31% | 1.31% | |||
Net expenses (including fee waivers, if any) | 1.47% | 2.22% | 1.22% | |||
Type of waiver | Contractual | Contractual | Contractual |
*The aggregate contractual waiver period covering this report is from July 29, 2016 to July 30, 2018.
Investing involves risk, including the possible loss of principal.
Investments in small and/or medium-sized companies typically exhibit greater risk and higher volatility than larger, more established companies.
Performance of a $10,000 Investment1
Average annual total returns from March 31, 2008 through March 31, 2018
| Starting value (March 31, 2008) | Ending value (March 31, 2018) | |||||||
| Russell 2500 Value Index | $10,000 | $24,433 | |||||
| Optimum Small-Mid Cap Value Fund — Institutional Class shares | $10,000 | $19,164 | |||||
| Optimum Small-Mid Cap Value Fund — Class A shares | $9,425 | $17,522 | |||||
1The “Performance of $10,000 investment” graph assumes $10,000 invested in Class A and Institutional Class shares of the Fund on March 31, 2008, and includes the effect of a 5.75% front-end sales charge (for Class A shares) and the reinvestment of all distributions. The graph does not reflect the deduction of taxes the shareholders would pay on Fund distributions or redemptions of Fund shares. Expense limitations were in effect for some or all of the periods shown. Performance would have been lower had expense limitations not been in effect. Current expenses are listed in the “Fund expense ratios” table on page 36. Please note additional details on pages 35 through 37.
The graph also assumes $10,000 invested in the Russell 2500 Value Index as of March 31, 2008. The Russell 2500 Value Index measures the performance of the small- to mid-cap value segment of the US equity universe. It includes those Russell 2500 companies with lower price-to-book ratios and lower forecasted growth values.
The Russell 1000 Growth Index, mentioned on page 17, measures the performance of the large-cap growth segment of the US equity universe. It includes those Russell 1000 companies with higher price-to-book ratios and higher forecasted growth values.
The Russell 2000 Value Index, mentioned on page 17, measures the performance of the small-cap value segment of the US equity universe. It includes those Russell 2000 companies with lower price-to-book ratios and lower forecasted growth values.
36
Table of Contents
The Russell 2500 Growth Index, mentioned on page 17, measures the performance of the small- to mid-cap growth segment of the US equity universe. It includes those Russell 2500 companies with higher price-to-book ratios and higher forecasted growth values.
The Russell 2500 Index, mentioned on page 17, measures the performance of the small- to mid-cap segment of the US equity universe. The Russell 2500 Index is a subset of the Russell 3000® Index, representing approximately 2,500 of the smallest securities based on a combination of their market cap and current index membership.
Russell Investment Group is the source and owner of the trademarks, service marks, and copyrights related to the Russell Indexes. Russell® is a trademark of Russell Investment Group.
Index performance returns do not reflect any management fees, transaction costs, or expenses. Indices are unmanaged and one cannot invest directly in an index. Past performance is not a guarantee of future results.
Performance of other Fund classes will vary due to different charges and expenses.
Stock symbols and CUSIP numbers
| Nasdaq symbols | CUSIPs | |||||
Class A | OASVX | 246118772 | ||||
Class C | OCSVX | 246118756 | ||||
Institutional Class | OISVX | 246118749 | ||||
| (continues) | 37 |
Table of Contents
For the six-month period from October 1, 2017 to March 31, 2018 (Unaudited)
As a shareholder of a Fund, you incur two types of costs: (1) transaction costs, including sales charges (loads) on purchase payments, reinvested dividends, or other distributions; redemption fees; and exchange fees; and (2) ongoing costs, including management fees; distribution and/or service (12b-1) fees; and other Fund expenses. These following examples are intended to help you understand your ongoing costs (in dollars) of investing in a Fund and to compare these costs with the ongoing costs of investing in other mutual funds.
The examples are based on an investment of $1,000 invested at the beginning of the period and held for the entire six-month period from Oct. 1, 2017 to March 31, 2018.
Actual Expenses
The first section of the tables shown, “Actual Fund Return,” provides information about actual account values and actual expenses. You may use the information in this section of the table, together with the amount you invested, to estimate the expenses that you paid over the period. Simply divide your account value by $1,000 (for example, an $8,600 account value divided by $1,000 = 8.6), then multiply the result by the number in the first section under the heading entitled “Expenses Paid During Period” to estimate the expenses you paid on your account during this period.
Hypothetical Example for Comparison Purposes
The second section of the tables shown, “Hypothetical 5% Return,” provides information about hypothetical account values and hypothetical expenses based on the Funds’ actual expense ratios and an assumed rate of return of 5% per year before expenses, which is not the Funds’ actual return. The hypothetical account values and expenses may not be used to estimate the actual ending account balance or expenses you paid for the period. You may use this information to compare the ongoing costs of investing in a Fund and other funds. To do so, compare this 5% hypothetical example with the 5% hypothetical examples that appear in the shareholder reports of the other funds.
Please note that the expenses shown in the tables are meant to highlight your ongoing costs only and do not reflect any transactional costs, such as sales charges (loads), redemption fees, or exchange fees. Therefore, the second section of each table is useful in comparing ongoing costs only, and will not help you determine the relative total costs of owning different funds. In addition, if these transactional costs were included, your costs would have been higher. Each Fund’s expenses shown in the tables reflect fee waivers in effect. The expenses shown in each table assume reinvestment of all dividends and distributions.
Optimum Fixed Income Fund
Expense analysis of an investment of $1,000
| Beginning Account Value 10/1/17 | Ending Account Value 3/31/18 | Annualized Expense Ratio | Expenses Paid During Period 10/1/17 to 3/31/18* | |||||||||||||
Actual Fund return† |
| |||||||||||||||
Class A | $1,000.00 | $991.70 | 1.10% | $5.46 | ||||||||||||
Class C | 1,000.00 | 988.50 | 1.85% | 9.17 | ||||||||||||
Institutional Class | 1,000.00 | 992.10 | 0.85% | 4.22 | ||||||||||||
Hypothetical 5% return (5% return before expenses) |
| |||||||||||||||
Class A | $1,000.00 | $1,019.45 | 1.10% | $5.54 | ||||||||||||
Class C | 1,000.00 | 1,015.71 | 1.85% | 9.30 | ||||||||||||
Institutional Class | 1,000.00 | 1,020.69 | 0.85% | 4.28 | ||||||||||||
Optimum International Fund
Expense analysis of an investment of $1,000
| Beginning Account Value 10/1/17 | Ending Account Value 3/31/18 | Annualized Expense Ratio | Expenses Paid During Period 10/1/17 to 3/31/18* | |||||||||||||
Actual Fund return† |
| |||||||||||||||
Class A | $1,000.00 | $1,035.30 | 1.34% | $ 6.80 | ||||||||||||
Class C | 1,000.00 | 1,031.50 | 2.09% | 10.59 | ||||||||||||
Institutional Class | 1,000.00 | 1,036.00 | 1.09% | 5.53 | ||||||||||||
Hypothetical 5% return (5% return before expenses) |
| |||||||||||||||
Class A | $1,000.00 | $1,018.25 | 1.34% | $ 6.74 | ||||||||||||
Class C | 1,000.00 | 1,014.51 | 2.09% | 10.50 | ||||||||||||
Institutional Class | 1,000.00 | 1,019.50 | 1.09% | 5.49 | ||||||||||||
38
Table of Contents
Optimum Large Cap Growth Fund
Expense analysis of an investment of $1,000
| Beginning Account Value 10/1/17 | Ending Account Value 3/31/18 | Annualized Expense Ratio | Expenses Paid During Period 10/1/17 to 3/31/18* | |||||||||||||
Actual Fund return† |
| |||||||||||||||
Class A | $1,000.00 | $1,092.00 | 1.25% | $ 6.52 | ||||||||||||
Class C | 1,000.00 | 1,088.10 | 2.00% | 10.41 | ||||||||||||
Institutional Class | 1,000.00 | 1,093.60 | 1.00% | 5.22 | ||||||||||||
Hypothetical 5% return (5% return before expenses) |
| |||||||||||||||
Class A | $1,000.00 | $1,018.70 | 1.25% | $ 6.29 | ||||||||||||
Class C | 1,000.00 | 1,014.96 | 2.00% | 10.05 | ||||||||||||
Institutional Class | 1,000.00 | 1,019.95 | 1.00% | 5.04 | ||||||||||||
Optimum Large Cap Value Fund
Expense analysis of an investment of $1,000
| Beginning Account Value 10/1/17 | Ending Account Value 3/31/18 | Annualized Expense Ratio | Expenses Paid During Period 10/1/17 to 3/31/18* | |||||||||||||
Actual Fund return† |
| |||||||||||||||
Class A | $1,000.00 | $1,028.10 | 1.20% | $6.07 | ||||||||||||
Class C | 1,000.00 | 1,024.50 | 1.95% | 9.84 | ||||||||||||
Institutional Class | 1,000.00 | 1,029.70 | 0.95% | 4.81 | ||||||||||||
Hypothetical 5% return (5% return before expenses) |
| |||||||||||||||
Class A | $1,000.00 | $1,018.95 | 1.20% | $6.04 | ||||||||||||
Class C | 1,000.00 | 1,015.21 | 1.95% | 9.80 | ||||||||||||
Institutional Class | 1,000.00 | 1,020.19 | 0.95% | 4.78 | ||||||||||||
Optimum Small-Mid Cap Growth Fund
Expense analysis of an investment of $1,000
| Beginning Account Value 10/1/17 | Ending Account Value 3/31/18 | Annualized Expense Ratio | Expenses Paid During Period 10/1/17 to 3/31/18* | |||||||||||||
Actual Fund return† |
| |||||||||||||||
Class A | $1,000.00 | $1,117.20 | 1.54% | $ 8.13 | ||||||||||||
Class C | 1,000.00 | 1,113.50 | 2.29% | 12.07 | ||||||||||||
Institutional Class | 1,000.00 | 1,118.90 | 1.29% | 6.81 | ||||||||||||
Hypothetical 5% return (5% return before expenses) |
| |||||||||||||||
Class A | $1,000.00 | $1,017.25 | 1.54% | $ 7.75 | ||||||||||||
Class C | 1,000.00 | 1,013.51 | 2.29% | 11.50 | ||||||||||||
Institutional Class | 1,000.00 | 1,018.50 | 1.29% | 6.49 | ||||||||||||
Optimum Small-Mid Cap Value Fund
Expense analysis of an investment of $1,000
| Beginning Account Value 10/1/17 | Ending Account Value 3/31/18 | Annualized Expense Ratio | Expenses Paid During Period 10/1/17 to 3/31/18* | |||||||||||||
Actual Fund return† |
| |||||||||||||||
Class A | $1,000.00 | $1,010.00 | 1.47% | $ 7.37 | ||||||||||||
Class C | 1,000.00 | 1,006.40 | 2.22% | 11.11 | ||||||||||||
Institutional Class | 1,000.00 | 1,011.10 | 1.22% | 6.12 | ||||||||||||
Hypothetical 5% return (5% return before expenses) |
| |||||||||||||||
Class A | $1,000.00 | $1,017.60 | 1.47% | $ 7.39 | ||||||||||||
Class C | 1,000.00 | 1,013.86 | 2.22% | 11.15 | ||||||||||||
Institutional Class | 1,000.00 | 1,018.85 | 1.22% | 6.14 | ||||||||||||
*“Expenses Paid During Period” are equal to the relevant Fund’s annualized expense ratio, multiplied by the average account value over the period, multiplied by 182/365 (to reflect the one-half year period).
†Because actual returns reflect only the most recent six-month period, the returns shown may differ significantly from fiscal year returns.
(continues) | 39 |
Table of Contents
Security type / sector allocations
Optimum Fixed Income Fund
As of March 31, 2018 (Unaudited)
Sector designations may be different than the sector designations presented in other Fund materials. The sector designations may represent the investment manager or sub-advisor’s internal sector classifications, which may result in the sector designations for one fund being different than another fund’s sector designations.
| Security type / sector | Percentage of net assets | |||
Agency Asset-Backed Securities | 0.12% | |||
Agency Collateralized Mortgage Obligations | 7.80% | |||
Agency Commercial Mortgage-Backed Securities | 0.69% | |||
Agency Mortgage-Backed Securities | 15.84% | |||
Agency Obligation | 0.11% | |||
Collateralized Debt Obligations | 5.88% | |||
Convertible Bonds | 1.62% | |||
Corporate Bonds | 36.26% | |||
Banking | 13.41% | |||
Basic Industry | 1.78% | |||
Brokerage | 0.28% | |||
Capital Goods | 1.27% | |||
Communications | 2.95% | |||
Consumer Cyclical | 1.69% | |||
Consumer Non-Cyclical | 3.37% | |||
Energy | 3.97% | |||
Finance Companies | 1.19% | |||
Insurance | 0.73% | |||
Natural Gas | 0.09% | |||
Real Estate Investment Trusts | 1.06% | |||
Technology | 0.99% | |||
Transportation | 0.74% | |||
Utilities | 2.74% | |||
Municipal Bonds | 0.82% | |||
| Security type / sector | Percentage of net assets | |||
Non-Agency Asset-Backed Securities | 4.38% | |||
Non-Agency Collateralized Mortgage Obligations | 1.53% | |||
Non-Agency Commercial Mortgage-Backed Securities | 3.65% | |||
Regional Bonds | 0.52% | |||
Loan Agreements | 5.72% | |||
Sovereign Bonds | 11.28% | |||
Supranational Banks | 1.02% | |||
US Treasury Obligations | 14.97% | |||
Common Stock | 0.00% | |||
Convertible Preferred Stock | 0.37% | |||
Preferred Stock | 0.25% | |||
Options Purchased | 0.01% | |||
Short-Term Investments | 5.49% | |||
Total Value of Securities Before Options Written | 118.33% | |||
Options Written | (0.01% | ) | ||
Liabilities Net of Receivables and Other Assets | (18.32% | ) | ||
Total Net Assets | 100.00% | |||
40
Table of Contents
Security type / country and sector allocations
Optimum International Fund
As of March 31, 2018 (Unaudited)
Sector designations may be different than the sector designations presented in other Fund materials. The sector designations may represent the investment manager or sub-advisor’s internal sector classifications, which may result in the sector designations for one fund being different than another fund’s sector designations.
| Security type / country | Percentage of net assets | |||
Common Stock by Country | 96.86% | |||
Australia | 1.48% | |||
Austria | 2.84% | |||
Bermuda | 0.92% | |||
Brazil | 1.34% | |||
Canada | 3.84% | |||
China/Hong Kong | 7.94% | |||
Colombia | 0.63% | |||
Czech Republic | 0.41% | |||
Denmark | 1.24% | |||
Finland | 0.64% | |||
France | 5.74% | |||
Germany | 5.07% | |||
India | 2.70% | |||
Indonesia | 1.41% | |||
Ireland | 1.94% | |||
Israel | 3.01% | |||
Italy | 1.30% | |||
Japan | 19.30% | |||
Macau | 0.18% | |||
Mexico | 0.67% | |||
Netherlands | 5.24% | |||
New Zealand | 1.25% | |||
Norway | 2.70% | |||
Republic of Korea | 2.96% | |||
Singapore | 1.52% | |||
South Africa | 0.16% | |||
Spain | 2.50% | |||
Sweden | 0.27% | |||
Switzerland | 4.94% | |||
Taiwan | 2.60% | |||
| Security type / country | Percentage of net assets | |||
Thailand | 2.73% | |||
Turkey | 0.44% | |||
United Kingdom | 5.90% | |||
United States | 1.05% | |||
Short-Term Investments | 1.53% | |||
Securities Lending Collateral | 3.32% | |||
Total Value of Securities | 101.71% | |||
Obligation to Return Securities Lending Collateral | (3.32% | ) | ||
Receivables and Other Assets Net of Liabilities | 1.61% | |||
Total Net Assets | 100.00% | |||
| Common stock by sector | Percentage of net assets | |||
Consumer Discretionary | 11.25% | |||
Consumer Staples | 6.65% | |||
Energy | 7.10% | |||
Financials | 19.49% | |||
Healthcare | 12.29% | |||
Industrials | 9.59% | |||
Information Technology | 11.92% | |||
Materials | 8.05% | |||
Real Estate | 3.77% | |||
Telecommunication Services | 3.13% | |||
Utilities | 3.62% | |||
Total | 96.86% | |||
| (continues) | 41 |
Table of Contents
Security type / sector allocations and top 10 equity holdings
Sector designations may be different than the sector designations presented in other Fund materials. The sector designations may represent the investment manager or sub-advisor’s internal sector classifications, which may result in the sector designations for one fund being different than another fund’s sector designations.
Optimum Large Cap Growth Fund
As of March 31, 2018 (Unaudited)
| Security type / sector | Percentage of net assets | |||
Common Stock² | 98.55% | |||
Consumer Discretionary | 18.15% | |||
Consumer Staples | 4.39% | |||
Energy | 1.66% | |||
Financials | 6.29% | |||
Healthcare | 15.09% | |||
Industrials | 8.88% | |||
Information Technology1 | 39.37% | |||
Materials | 1.85% | |||
Real Estate | 1.85% | |||
Utilities | 1.02% | |||
Convertible Preferred Stock | 0.52% | |||
Convertible Bond | 0.10% | |||
Short-Term Investments | 0.89% | |||
Total Value of Securities | 100.06% | |||
Liabilities Net of Receivables and Other Assets | (0.06% | ) | ||
Total Net Assets | 100.00% | |||
| ² | Narrow industries are utilized for compliance purposes for diversification whereas broad sectors are used for financial reporting. |
Holdings are for informational purposes only and are subject to change at any time. They are not a recommendation to buy, sell, or hold any security.
| Top 10 equity holdings | Percentage of net assets | |||
Amazon.com | 6.38% | |||
Microsoft | 4.32% | |||
Visa Class A | 3.14% | |||
Facebook Class A | 3.10% | |||
Alphabet Class C | 2.89% | |||
UnitedHealth Group | 2.49% | |||
Booking Holdings | 2.47% | |||
Alphabet Class A | 2.32% | |||
Apple | 1.93% | |||
Boeing | 1.76% | |||
Optimum Large Cap Value Fund
As of March 31, 2018 (Unaudited)
| Security type / sector | Percentage of net assets | |||
Common Stock² | 98.11% | |||
Consumer Discretionary | 5.80% | |||
Consumer Staples | 8.11% | |||
Energy | 7.83% | |||
Financials2 | 27.98% | |||
Healthcare | 14.68% | |||
Industrials | 12.99% | |||
Information Technology | 8.80% | |||
Materials | 3.78% | |||
Real Estate | 1.64% | |||
Telecommunication Services | 2.65% | |||
Utilities | 3.85% | |||
Short-Term Investments | 1.63% | |||
Total Value of Securities | 99.74% | |||
Receivables and Other Assets Net of Liabilities | 0.26% | |||
Total Net Assets | 100.00% | |||
| ² | Narrow industries are utilized for compliance purposes for diversification whereas broad sectors are used for financial reporting. |
Holdings are for informational purposes only and are subject to change at any time. They are not a recommendation to buy, sell, or hold any security.
| Top 10 equity holdings | Percentage of net assets | |||
JPMorgan Chase & Co. | 4.58% | |||
Johnson & Johnson | 2.71% | |||
Pfizer | 2.12% | |||
Wells Fargo & Co. | 2.06% | |||
Bank of America | 1.91% | |||
Chubb (Switzerland) | 1.85% | |||
Northrop Grumman | 1.79% | |||
Medtronic (Ireland) | 1.58% | |||
Chevron | 1.53% | |||
Philip Morris International | 1.49% | |||
42
Table of Contents
Sector designations may be different than the sector designations presented in other Fund materials. The sector designations may represent the investment manager or sub-advisor’s internal sector classifications, which may result in the sector designations for one fund being different than another fund’s sector designations.
Optimum Small-Mid Cap Growth Fund
As of March 31, 2018 (Unaudited)
| Security type / sector | Percentage of net assets |
Common Stock² | 97.18 | % | ||
Consumer Discretionary | 14.69 | % | ||
Consumer Staples | 1.64 | % | ||
Energy | 2.00 | % | ||
Financials | 9.82 | % | ||
Healthcare | 18.43 | % | ||
Industrials | 16.00 | % | ||
Information Technology3 | 31.71 | % | ||
Materials | 2.61 | % | ||
Real Estate | 0.28 | % | ||
Convertible Preferred Stock | 1.11 | % | ||
Short-Term Investments | 2.00 | % | ||
Total Value of Securities | 100.29 | % | ||
Liabilities Net of Receivables and Other Assets | (0.29 | %) | ||
Total Net Assets | 100.00 | % |
| ² | Narrow industries are utilized for compliance purposes for diversification whereas broad sectors are used for financial reporting. |
Holdings are for informational purposes only and are subject to change at any time. They are not a recommendation to buy, sell, or hold any security.
| Top 10 equity holdings | Percentage of net assets |
SVB Financial Group | 1.93 | % | ||
Teradyne | 1.80 | % | ||
Diamondback Energy | 1.74 | % | ||
2U | 1.71 | % | ||
ASGN | 1.65 | % | ||
G-III Apparel Group | 1.54 | % | ||
Melco Resorts & Entertainment ADR | 1.44 | % | ||
Mimecast | 1.43 | % | ||
Norwegian Cruise Line Holdings | 1.37 | % | ||
PTC | 1.34 | % |
Optimum Small-Mid Cap Value Fund
As of March 31, 2018 (Unaudited)
| Security type / sector | Percentage of net assets |
Common Stock | 97.53 | % | ||
Consumer Discretionary | 10.90 | % | ||
Consumer Staples | 4.41 | % | ||
Energy | 4.61 | % | ||
Financials | 23.49 | % | ||
Healthcare | 5.81 | % | ||
Industrials | 14.73 | % | ||
Information Technology | 11.50 | % | ||
Materials | 7.91 | % | ||
Real Estate | 9.50 | % | ||
Telecommunication Services | 0.94 | % | ||
Utilities | 3.73 | % | ||
Short-Term Investments | 1.42 | % | ||
Total Value of Securities | 98.95 | % | ||
Receivables and Other Assets Net of Liabilities | 1.05 | % | ||
Total Net Assets | 100.00 | % |
Holdings are for informational purposes only and are subject to change at any time. They are not a recommendation to buy, sell, or hold any security.
| Top 10 equity holdings | Percentage of net assets |
Zions Bancorporation | 1.80 | % | ||
Everest Re Group (Bermuda) | 1.49 | % | ||
Wintrust Financial | 1.24 | % | ||
Western Alliance Bancorp | 1.23 | % | ||
Chemical Financial | 1.14 | % | ||
Curtiss-Wright | 1.11 | % | ||
Home BancShares | 1.10 | % | ||
Arthur J. Gallagher & Co. | 1.09 | % | ||
Diamondback Energy | 1.09 | % | ||
Eagle Materials | 1.05 | % |
(continues) | 43 |
Table of Contents
Security type / sector allocations and top 10 equity holdings
1To monitor compliance with Optimum Large Cap Growth Fund’s concentration guidelines as described in the Fund’s Prospectus and Statement of Additional Information, the Information Technology sector (as disclosed herein for financial reporting purposes) is subdivided into a variety of “industries” (in accordance with the requirements of the Investment Company Act of 1940 (1940 Act)). The Information Technology sector consisted of Commercial Services, Computers, Internet, Semiconductors, and Software. As of March 31, 2018, such amounts, as percentage of total net assets, were 6.56%, 1.93%, 12.66%, 2.69%, and 15.53%, respectively. The percentage in any such single industry will comply with the Fund’s concentration policy even if the percentages in the Information Technology sector for financial reporting purposes may exceed 25%.
2To monitor compliance with Optimum Large Cap Value Fund’s concentration guidelines as described in the Fund’s Prospectus and Statement of Additional Information, the Financials sector (as disclosed herein for financial reporting purposes) is subdivided into a variety of “industries” (in accordance with the requirements of the 1940 Act). The Financials sector consisted of Banks, Commercial Services, Diversified Financial Services, & Insurance. As of March 31, 2018, such amounts, as percentage of total net assets, were 16.97%, 0.35%, 5.18%, and 5.48%, respectively. The percentage in any such single industry will comply with the Fund’s concentration policy even if the percentages in the Financials sector for financial reporting purposes may exceed 25%.
3To monitor compliance with Optimum Small-Mid Cap Growth Fund’s concentration guidelines as described in the Fund’s Prospectus and Statement of Additional Information, the Information Technology (as disclosed herein for financial reporting purposes) are subdivided into a variety of “industries” (in accordance with the requirements of the 1940 Act). The Information Technology sector consisted of Building Materials, Commercial Services, Computers, Electronics, Energy-Alternate Sources, Internet, Machinery-Diversified, Semiconductors, Software, and Telecommunications. As of March 31, 2018, such amounts, a percentage of total net assets, were 0.79%, 1.30%, 1.38%, 1.83%, 0.72%, 6.88%, 1.20%, 5.34%, 11.37% and 0.90%, respectively. The percentage in any such single industry will comply with the Fund’s concentration policy even if the percentages in the Information Technology sector for financial reporting purposes may exceed 25%.
44
Table of Contents
Optimum Fixed Income Fund
March 31, 2018
| Principal amount° | Value (US $) | |||||||
Agency Asset-Backed Securities – 0.12% | ||||||||
Navient Student Loan Trust | 162,701 | $ | 166,707 | |||||
SLM Student Loan Trust Series 2003-11 A6 144A 2.675% (LIBOR03M + 0.55%, Floor 0.29%) 12/15/25 #● | 370,109 | 371,955 | ||||||
Series 2008-9 A 3.245% (LIBOR03M + 1.50%) 4/25/23 ● | 1,867,565 | 1,905,991 | ||||||
|
| |||||||
Total Agency Asset-Backed Securities (cost $2,415,392) | 2,444,653 | |||||||
|
| |||||||
Agency Collateralized Mortgage Obligations – 7.80% | ||||||||
Fannie Mae Connecticut | 60,901 | 61,827 | ||||||
Series 2016-C04 1M1 3.322% (LIBOR01M + 1.45%) 1/25/29 ● | 34,897 | 35,176 | ||||||
Series 2017-C01 1M1 3.172% (LIBOR01M + 1.30%) 7/25/29 ● | 27,400 | 27,621 | ||||||
Series 2017-C04 2M2 4.722% (LIBOR01M + 2.85%) 11/25/29 ● | 420,000 | 437,349 | ||||||
Series 2018-C01 1M2 4.122% (LIBOR01M + 2.25%, Floor 2.25%) 7/25/30 ● | 690,000 | 698,893 | ||||||
Series 2018-C02 2M2 4.072% (LIBOR01M + 2.20%, Floor 2.20%) 8/25/30 ● | 630,000 | 633,406 | ||||||
Fannie Mae Grantor Trust | 8,024 | 8,728 | ||||||
Series 2002-T4 A3 7.50% 12/25/41 | 28,119 | 31,118 | ||||||
Series 2004-T1 1A2 6.50% 1/25/44 | 9,294 | 10,421 | ||||||
Fannie Mae Interest Strip Series 409 C3 3.00% 5/25/27 S | 648,971 | 57,022 | ||||||
Series 418 C12 3.00% 8/25/33 S | 2,403,615 | 317,090 | ||||||
| Principal amount° | Value (US $) | |||||||
Agency Collateralized Mortgage Obligations (continued) |
| |||||||
Fannie Mae Interest Strip Series 419 C3 3.00% 11/25/43 S | 403,430 | $ | 80,486 | |||||
Fannie Mae REMIC Trust | ||||||||
Series 2004-W4 A5 5.50% 6/25/34 | 361,441 | 368,707 | ||||||
Series 2004-W11 1A2 6.50% 5/25/44 | 48,362 | 54,018 | ||||||
Series 2004-W15 1A1 6.00% 8/25/44 | 42,819 | 46,878 | ||||||
Fannie Mae REMICs Series 1996-46 ZA 7.50% 11/25/26 | 5,506 | 6,108 | ||||||
Series 1999-19 PH 6.00% 5/25/29 | 98,052 | 106,449 | ||||||
Series 2001-14 Z 6.00% 5/25/31 | 5,859 | 6,276 | ||||||
Series 2002-90 A1 6.50% 6/25/42 | 8,103 | 9,148 | ||||||
Series 2002-90 A2 6.50% 11/25/42 | 27,301 | 30,490 | ||||||
Series 2005-70 PA 5.50% 8/25/35 | 54,275 | 59,657 | ||||||
Series 2005-110 MB 5.50% 9/25/35 | 37,491 | 38,601 | ||||||
Series 2007-30 OE 1.894% 4/25/37 W^ | 3,036,500 | 2,455,186 | ||||||
Series 2008-15 SB 4.729% (6.60% minus LIBOR01M, Cap 6.60%) 8/25/36 S● | 122,993 | 21,463 | ||||||
Series 2008-24 ZA 5.00% 4/25/38 | 11,688,255 | 12,446,595 | ||||||
Series 2009-2 AS 3.829% (5.70% minus LIBOR01M, Cap 5.70%) 2/25/39 S● | 864,646 | 82,162 | ||||||
Series 2009-68 SA 4.879% (6.75% minus LIBOR01M, Cap 6.75%) 9/25/39 S● | 241,169 | 34,638 | ||||||
Series 2009-94 AC 5.00% 11/25/39 | 151,549 | 163,667 | ||||||
Series 2010-41 PN 4.50% 4/25/40 | 475,000 | 497,862 | ||||||
Series 2010-43 HJ 5.50% 5/25/40 | 85,380 | 93,726 | ||||||
Series 2010-96 DC 4.00% 9/25/25 | 346,728 | 367,452 | ||||||
| (continues) | 45 |
Table of Contents
Schedules of investments
Optimum Fixed Income Fund
| Principal amount° | Value (US $) | |||||||
Agency Collateralized Mortgage Obligations (continued) |
| |||||||
Fannie Mae REMICs Series 2010-123 FE 2.352% (LIBOR01M + 0.48%, Cap 6.50%, Floor 0.48%) 11/25/40 ● | 1,908,592 | $ | 1,921,031 | |||||
Series 2010-129 SM 4.129% (6.00% minus LIBOR01M, Cap 6.00%) 11/25/40 S● | 932,624 | 129,726 | ||||||
Series 2011-118 DC 4.00% 11/25/41 | 1,090,438 | 1,113,518 | ||||||
Series 2012-98 DI | 1,364,720 | 139,861 | ||||||
Series 2012-98 IY | 621,847 | 57,962 | ||||||
Series 2012-98 MI | 1,340,099 | 153,020 | ||||||
Series 2012-99 AI | 458,689 | 50,309 | ||||||
Series 2012-115 MI 3.50% 3/25/42 S | 248,258 | 30,655 | ||||||
Series 2012-120 WI 3.00% 11/25/27 S | 1,080,191 | 106,087 | ||||||
Series 2012-122 SD 4.229% (6.10% minus LIBOR01M, Cap 6.10%) 11/25/42 S● | 1,309,629 | 239,769 | ||||||
Series 2012-128 IC 3.00% 11/25/32 S | 2,066,893 | 273,724 | ||||||
Series 2012-132 AI 3.00% 12/25/27 S | 1,473,463 | 137,138 | ||||||
Series 2012-137 AI 3.00% 12/25/27 S | 503,268 | 46,483 | ||||||
Series 2012-139 NS 4.829% (6.70% minus LIBOR01M, Cap 6.70%) 12/25/42 S● | 2,441,589 | 556,886 | ||||||
Series 2012-144 EI 3.00% 1/25/28 S | 688,098 | 60,337 | ||||||
Series 2012-144 PI 3.50% 6/25/42 S | 398,316 | 53,954 | ||||||
Series 2012-146 IO 3.50% 1/25/43 S | 1,815,345 | 362,600 | ||||||
Series 2012-149 IC 3.50% 1/25/28 S | 1,359,253 | 145,506 | ||||||
Series 2012-150 DI 3.00% 1/25/28 S | 1,613,182 | 154,361 | ||||||
Series 2013-1 YI | 1,642,753 | 222,801 | ||||||
| Principal amount° | Value (US $) | |||||||
Agency Collateralized Mortgage Obligations (continued) |
| |||||||
Fannie Mae REMICs | 1,308,842 | $ | 238,098 | |||||
Series 2013-7 EI | 752,130 | 102,002 | ||||||
Series 2013-26 ID | 729,954 | 104,563 | ||||||
Series 2013-35 IB | 1,202,387 | 159,542 | ||||||
Series 2013-35 IG | 894,039 | 83,460 | ||||||
Series 2013-38 AI | 704,958 | 93,426 | ||||||
Series 2013-41 HI | 1,376,429 | 154,878 | ||||||
Series 2013-43 IX | 4,029,952 | 976,327 | ||||||
Series 2013-44 DI | 2,196,448 | 316,476 | ||||||
Series 2013-45 PI | 143,126 | 20,482 | ||||||
Series 2013-55 AI | 1,720,728 | 249,931 | ||||||
Series 2013-59 PY | 110,000 | 101,147 | ||||||
Series 2013-69 IJ | 325,549 | 46,087 | ||||||
Series 2013-87 IW | 3,899,665 | 297,507 | ||||||
Series 2013-92 SA 4.079% (5.95% minus LIBOR01M, Cap 5.95%) 9/25/43 S● | 2,034,000 | 392,654 | ||||||
Series 2013-101 HS 4.629% (6.50% minus LIBOR01M, Cap 6.50%) 10/25/43 S● | 645,881 | 143,963 | ||||||
Series 2013-103 SK 4.049% (5.92% minus LIBOR01M, Cap 5.92%) 10/25/43 S● | 1,741,160 | 362,275 | ||||||
Series 2014-36 ZE | 680,879 | 623,536 | ||||||
Series 2014-68 BS 4.279% (6.15% minus LIBOR01M, Cap 6.15%) 11/25/44 S● | 1,331,228 | 254,533 | ||||||
46
Table of Contents
| Principal amount° | Value (US $) | |||||||
Agency Collateralized Mortgage Obligations (continued) |
| |||||||
Fannie Mae REMICs | 6,898,383 | $ | 1,285,669 | |||||
Series 2015-27 SA 4.579% (6.45% minus LIBOR01M, Cap 6.45%) 5/25/45 S● | 502,281 | 101,693 | ||||||
Series 2015-40 GZ 3.50% 5/25/45 | 442,740 | 438,020 | ||||||
Series 2015-43 PZ 3.50% 6/25/45 | 463,718 | 456,097 | ||||||
Series 2015-44 Z | 1,634,167 | 1,569,818 | ||||||
Series 2015-57 LI 3.50% 8/25/35 S | 1,765,148 | 283,129 | ||||||
Series 2015-59 CI 3.50% 8/25/30 S | 621,993 | 60,830 | ||||||
Series 2015-89 AZ 3.50% 12/25/45 | 158,405 | 154,210 | ||||||
Series 2015-95 SH 4.129% (6.00% minus LIBOR01M, Cap 6.00%) 1/25/46 S● | 1,286,840 | 254,740 | ||||||
Series 2016-6 AI | 1,057,786 | 134,738 | ||||||
Series 2016-30 CI 3.00% 5/25/36 S | 846,637 | 120,130 | ||||||
Series 2016-33 DI 3.50% 6/25/36 S | 2,088,007 | 314,029 | ||||||
Series 2016-36 SB 4.129% (6.00% minus LIBOR01M, Cap 6.00%) 3/25/43 S● | 693,362 | 95,759 | ||||||
Series 2016-40 IO 3.50% 7/25/36 S | 277,658 | 45,633 | ||||||
Series 2016-40 ZC 3.00% 7/25/46 | 350,927 | 322,398 | ||||||
Series 2016-50 IB 3.00% 2/25/46 S | 128,701 | 20,022 | ||||||
Series 2016-51 LI 3.00% 8/25/46 S | 2,684,307 | 423,641 | ||||||
Series 2016-55 SK 4.129% (6.00% minus LIBOR01M, Cap 6.00%) 8/25/46 S● | 1,076,311 | 218,662 | ||||||
Series 2016-62 SA 4.129% (6.00% minus LIBOR01M, Cap 6.00%) 9/25/46 S● | 2,130,892 | 446,964 | ||||||
| Principal amount° | Value (US $) | |||||||
Agency Collateralized Mortgage Obligations (continued) |
| |||||||
Fannie Mae REMICs | 1,035,175 | $ | 140,318 | |||||
Series 2016-71 PI | 1,309,626 | 199,747 | ||||||
Series 2016-74 GS 4.129% (6.00% minus LIBOR01M, Cap 6.00%) 10/25/46 S● | 1,426,449 | 325,424 | ||||||
Series 2016-79 JS 4.179% (6.05% minus LIBOR01M, Cap 6.05%) 11/25/46 S● | 2,640,724 | 558,634 | ||||||
Series 2016-85 SA 4.129% (6.00% minus LIBOR01M, Cap 6.00%) 11/25/46 S● | 2,221,571 | 467,911 | ||||||
Series 2016-99 DI | 624,716 | 110,845 | ||||||
Series 2016-105 SA 4.129% (6.00% minus LIBOR01M, Cap 6.00%) 1/25/47 S● | 1,380,860 | 272,517 | ||||||
Series 2017-1 EI | 452,940 | 73,506 | ||||||
Series 2017-4 AI | 1,073,897 | 129,131 | ||||||
Series 2017-4 BI | 622,755 | 93,218 | ||||||
Series 2017-6 NI | 126,535 | 22,782 | ||||||
Series 2017-8 BZ | 1,113,243 | 1,005,655 | ||||||
Series 2017-8 SG | 1,802,732 | 362,199 | ||||||
Series 2017-11 EI | 1,820,943 | 281,558 | ||||||
Series 2017-12 JI | 569,320 | 83,929 | ||||||
Series 2017-16 SM | 2,166,541 | 432,552 | ||||||
Series 2017-16 WI | 390,029 | 59,426 | ||||||
Series 2017-16 YT | 403,000 | 395,953 | ||||||
Series 2017-21 ZD | 396,622 | 386,994 | ||||||
| (continues) | 47 |
Table of Contents
Schedules of investments
Optimum Fixed Income Fund
| Principal amount° | Value (US $) | |||||||
Agency Collateralized Mortgage Obligations (continued) |
| |||||||
Fannie Mae REMICs | 157,000 | $ | 148,731 | |||||
Series 2017-25 GS 4.829% (6.70% minus LIBOR01M, Cap 6.70%) 4/25/47 S● | 132,692 | 20,781 | ||||||
Series 2017-26 VZ | 918,101 | 834,443 | ||||||
Series 2017-39 CY | 904,000 | 899,056 | ||||||
Series 2017-40 GZ | 341,776 | 337,488 | ||||||
Series 2017-45 JZ | 117,908 | 103,437 | ||||||
Series 2017-45 ZK | 252,240 | 240,851 | ||||||
Series 2017-46 VG | 201,000 | 200,186 | ||||||
Series 2017-61 SB | 2,926,482 | 603,597 | ||||||
Series 2017-69 SG 4.279% (6.15% minus LIBOR01M, Cap 6.15%) 9/25/47 S● | 1,480,852 | 302,491 | ||||||
Series 2017-77 HZ | 485,409 | 484,905 | ||||||
Series 2017-88 EI | 1,228,793 | 234,784 | ||||||
Series 2017-94 CZ | 304,401 | 299,170 | ||||||
Series 2017-95 FA 1.925% (LIBOR01M + 0.35%, Floor 0.35%) 11/25/47 ● | 889,770 | 890,592 | ||||||
Series 2017-96 EZ | 540,257 | 532,981 | ||||||
Series 2017-99 IE | 957,300 | 194,099 | ||||||
Series 2018-8 MU | 885,000 | 833,429 | ||||||
Freddie Mac REMICs | 24,825 | 27,062 | ||||||
Series 2165 PE | 77,213 | 84,084 | ||||||
Series 2326 ZQ | 44,058 | 49,944 | ||||||
Series 3143 BC | 1,818,922 | 1,957,956 | ||||||
| Principal amount° | Value (US $) | |||||||
Agency Collateralized Mortgage Obligations (continued) |
| |||||||
Freddie Mac REMICs | 917,806 | $ | 135,423 | |||||
Series 3656 PM | 565,434 | 608,568 | ||||||
Series 4016 AI | 1,674,640 | 62,847 | ||||||
Series 4050 EI | 1,091,622 | 115,714 | ||||||
Series 4065 DE | 120,000 | 117,749 | ||||||
Series 4096 EI | 1,431,621 | 136,250 | ||||||
Series 4101 WI | 583,008 | 97,732 | ||||||
Series 4109 AI | 2,504,122 | 278,326 | ||||||
Series 4120 IK | 2,076,458 | 301,119 | ||||||
Series 4123 DI | 3,226,459 | 280,851 | ||||||
Series 4135 AI | 1,037,212 | 217,442 | ||||||
Series 4139 IP | 394,949 | 52,001 | ||||||
Series 4142 IO | 721,939 | 66,586 | ||||||
Series 4146 AI | 845,045 | 74,728 | ||||||
Series 4146 IA | 1,060,221 | 167,727 | ||||||
Series 4150 UI | 1,717,404 | 191,273 | ||||||
Series 4159 KS 4.373% (6.15% minus LIBOR01M, Cap 6.15%) 1/15/43 S● | 973,968 | 196,523 | ||||||
Series 4161 IM | 321,716 | 73,538 | ||||||
Series 4161 UI | 591,819 | 45,077 | ||||||
Series 4181 DI | 689,075 | 86,588 | ||||||
Series 4184 GS 4.343% (6.12% minus LIBOR01M, Cap 6.12%) 3/15/43 S● | 1,131,536 | 227,706 | ||||||
Series 4185 LI | 546,069 | 80,334 | ||||||
48
Table of Contents
| Principal amount° | Value (US $) | |||||||
Agency Collateralized Mortgage Obligations (continued) |
| |||||||
Freddie Mac REMICs Series 4186 IB 3.00% 3/15/33 S | 983,547 | $ | 129,666 | |||||
Series 4188 JI 3.00% 4/15/33 S | 1,377,878 | 162,967 | ||||||
Series 4191 CI 3.00% 4/15/33 S | 228,122 | 32,755 | ||||||
Series 4216 KI 3.50% 6/15/28 S | 1,316,918 | 135,595 | ||||||
Series 4342 CI | 402,188 | 50,120 | ||||||
Series 4435 DY 3.00% 2/15/35 | 1,305,000 | 1,283,836 | ||||||
Series 4448 TS | 3,849,986 | 279,988 | ||||||
Series 4453 DI | 498,962 | 68,148 | ||||||
Series 4464 DA 2.50% 1/15/43 | 180,263 | 165,209 | ||||||
Series 4494 SA 4.403% (6.18% minus LIBOR01M, Cap 6.18%) 7/15/45 S● | 289,044 | 56,347 | ||||||
Series 4504 IO 3.50% 5/15/42 S | 494,154 | 57,733 | ||||||
Series 4527 CI 3.50% 2/15/44 S | 1,371,234 | 241,652 | ||||||
Series 4543 HI 3.00% 4/15/44 S | 569,067 | 90,971 | ||||||
Series 4581 LI 3.00% 5/15/36 S | 514,865 | 72,281 | ||||||
Series 4592 WT 5.50% 6/15/46 | 1,996,022 | 2,189,196 | ||||||
Series 4594 SG 4.223% (6.00% minus LIBOR01M, Cap 6.00%) 6/15/46 S● | 3,146,407 | 700,748 | ||||||
Series 4600 WI 3.50% 5/15/36 S | 936,462 | 164,712 | ||||||
Series 4601 IN 3.50% 7/15/46 S | 5,185,964 | 1,109,085 | ||||||
Series 4610 IB 3.00% 6/15/41 S | 4,572,561 | 574,865 | ||||||
Series 4614 HB 2.50% 9/15/46 | 605,000 | 542,498 | ||||||
Series 4618 SA 4.223% (6.00% minus LIBOR01M, Cap 6.00%) 9/15/46 S● | 658,340 | 152,012 | ||||||
Series 4623 LZ | 534,583 | 449,388 | ||||||
| Principal amount° | Value (US $) | |||||||
Agency Collateralized Mortgage Obligations (continued) |
| |||||||
Freddie Mac REMICs | 610,000 | $ | 550,897 | |||||
Series 4625 BI | 2,041,473 | 422,174 | ||||||
Series 4625 PZ | 279,621 | 256,287 | ||||||
Series 4627 PI | 1,827,626 | 264,396 | ||||||
Series 4631 GS 4.223% (6.00% minus LIBOR01M, Cap 6.00%) 11/15/46 S● | 2,225,360 | 407,236 | ||||||
Series 4631 LJ | 168,000 | 162,720 | ||||||
Series 4636 NZ | 687,264 | 625,924 | ||||||
Series 4644 GI | 788,344 | 111,346 | ||||||
Series 4648 MZ | 119,091 | 110,119 | ||||||
Series 4648 SA 4.223% (6.00% minus LIBOR01M, Cap 6.00%) 1/15/47 S● | 1,549,038 | 324,846 | ||||||
Series 4650 JE | 112,000 | 107,383 | ||||||
Series 4655 WI | 617,385 | 110,036 | ||||||
Series 4657 JZ | 133,978 | 130,835 | ||||||
Series 4657 NW | 146,000 | 141,471 | ||||||
Series 4657 PS 4.223% (6.00% minus LIBOR01M, Cap 6.00%) 2/15/47 S● | 1,583,144 | 314,450 | ||||||
Series 4660 GI | 470,280 | 83,239 | ||||||
Series 4663 AI | 1,114,892 | 151,708 | ||||||
Series 4663 HZ | 158,442 | 156,226 | ||||||
Series 4664 ZC | 116,437 | 103,216 | ||||||
Series 4665 NI | 3,254,040 | 424,038 | ||||||
Series 4673 WI | 794,553 | 117,765 | ||||||
| (continues) | 49 |
Table of Contents
Schedules of investments
Optimum Fixed Income Fund
| Principal amount° | Value (US $) | |||||||
Agency Collateralized Mortgage Obligations (continued) |
| |||||||
Freddie Mac REMICs | 1,263,109 | $ | 252,531 | |||||
Series 4676 KZ | 342,758 | 289,576 | ||||||
Series 4681 WI | 3,952,241 | 281,911 | ||||||
Series 4690 WI | 1,049,580 | 167,571 | ||||||
Series 4693 EI | 547,571 | 82,283 | ||||||
Series 4700 WI | 1,418,490 | 231,613 | ||||||
Series 4703 CI | 1,630,975 | 213,422 | ||||||
Freddie Mac Strips | 1,400,266 | 254,081 | ||||||
Series 299 S1 4.223% (6.00% minus LIBOR01M, Cap 6.00%) 1/15/43 S● | 1,068,532 | 187,166 | ||||||
Series 304 C38 3.50% 12/15/27 S | 799,096 | 73,678 | ||||||
Series 319 S2 4.223% (6.00% minus LIBOR01M, Cap 6.00%) 11/15/43 S● | 431,217 | 83,084 | ||||||
Series 326 S2 4.173% (5.95% minus LIBOR01M, Cap 5.95%) 3/15/44 S● | 1,086,012 | 184,796 | ||||||
Series 337 S1 4.273% (6.05% minus LIBOR01M, Cap 6.05%) 9/15/44 S● | 954,974 | 181,731 | ||||||
Series 350 S5 | 1,916,513 | 110,599 | ||||||
Freddie Mac Structured Agency Credit Risk Debt Notes | 36,365 | 36,399 | ||||||
Series 2017-DNA1 M2 5.122% (LIBOR01M + 3.25%, Floor 3.25%) 7/25/29 ● | 750,000 | 809,307 | ||||||
| Principal amount° | Value (US $) | |||||||
Agency Collateralized Mortgage Obligations (continued) |
| |||||||
Freddie Mac Structured Agency Credit Risk Debt Notes | 315,000 | $ | 322,888 | |||||
Series 2017-HQA3 M2 4.222% (LIBOR01M + 2.35%) 4/25/30 ● | 790,000 | 800,019 | ||||||
Series 2018-DNA1 M2 3.672% (LIBOR01M + 1.80%) 7/25/30 ● | 1,040,000 | 1,029,319 | ||||||
Series 2018-HQA1 M2 4.154% (LIBOR01M + 2.30%) 9/25/30 ● | 345,000 | 346,725 | ||||||
Freddie Mac Structured Pass Through Certificates | 14,431 | 16,446 | ||||||
Series T-58 2A | 7,381 | 8,288 | ||||||
GNMA | 724,608 | 77,677 | ||||||
Series 2009-2 SE 3.998% (5.82% minus LIBOR01M, Cap 5.82%) 1/20/39 S● | 2,163,253 | 241,649 | ||||||
Series 2010-113 KE 4.50% 9/20/40 | 1,170,000 | 1,248,127 | ||||||
Series 2011-H21 FT 2.49% (H15T1Y + 0.70%, Cap 15.25%, Floor 0.70%) 10/20/61 ● | 9,206,760 | 9,284,497 | ||||||
Series 2011-H23 FA 2.275% (LIBOR01M + 0.70%, Cap 11.00%, Floor 0.70%) 10/20/61 ● | 6,147,839 | 6,190,289 | ||||||
Series 2012-108 KI 4.00% 8/16/42 S | 1,862,469 | 341,817 | ||||||
Series 2012-136 MX 2.00% 11/20/42 | 240,000 | 208,779 | ||||||
Series 2012-H08 FB 2.175% (LIBOR01M + 0.60%, Cap 11.00%, Floor 0.60%) 3/20/62 ● | 1,018,178 | 1,022,666 | ||||||
Series 2012-H18 NA 2.095% (LIBOR01M + 0.52%, Cap 10.50%, Floor 0.52%) 8/20/62 ● | 589,706 | 591,671 | ||||||
50
Table of Contents
Principal amount° | Value (US $) | |||||||
Agency Collateralized Mortgage Obligations (continued) |
| |||||||
GNMA | 4,698,149 | $ | 4,715,671 | |||||
Series 2013-113 AZ 3.00% 8/20/43 | 2,055,791 | 1,981,488 | ||||||
Series 2013-113 LY 3.00% 5/20/43 | 173,000 | 170,084 | ||||||
Series 2015-64 GZ 2.00% 5/20/45 | 647,651 | 500,588 | ||||||
Series 2015-74 CI 3.00% 10/16/39 S | 1,124,168 | 152,693 | ||||||
Series 2015-76 MZ 3.00% 5/20/45 | 447,415 | 430,568 | ||||||
Series 2015-111 IH 3.50% 8/20/45 S | 1,699,737 | 232,998 | ||||||
Series 2015-133 AL 3.00% 5/20/45 | 1,725,000 | 1,695,250 | ||||||
Series 2015-142 AI 4.00% 2/20/44 S | 335,885 | 42,704 | ||||||
Series 2015-H10 FA 2.175% (LIBOR01M + 0.60%, Cap 7.50%) 4/20/65 ● | 14,452,380 | 14,499,129 | ||||||
Series 2015-H11 FC 2.125% (LIBOR01M + 0.55%, Cap 7.50%, Floor 0.55%) 5/20/65 ● | 1,807,159 | 1,809,345 | ||||||
Series 2015-H12 FB 2.175% (LIBOR01M + 0.60%, Cap 7.50%, Floor 0.60%) 5/20/65 ● | 7,315,616 | 7,338,457 | ||||||
Series 2015-H20 FB 2.175% (LIBOR01M + 0.60%, Cap 7.50%, Floor 0.60%) 8/20/65 ● | 1,866,902 | 1,873,195 | ||||||
Series 2015-H30 FD 2.175% (LIBOR01M + 0.60%, Cap 11.00%, Floor 0.60%) 10/20/65 ● | 156,554 | 157,356 | ||||||
Series 2016-75 JI 3.00% 9/20/43 S | 3,883,525 | 521,324 | ||||||
Series 2016-89 QS 4.228% (6.05% minus LIBOR01M, Cap 6.05%) 7/20/46 S● | 998,256 | 214,294 | ||||||
Series 2016-108 SK 4.228% (6.05% minus LIBOR01M, Cap 6.05%) 8/20/46 S● | 1,676,076 | 341,980 | ||||||
Principal amount° | Value (US $) | |||||||
Agency Collateralized Mortgage Obligations (continued) |
| |||||||
GNMA | 579,000 | $ | 514,105 | |||||
Series 2016-115 SA 4.278% (6.10% minus LIBOR01M, Cap 6.10%) 8/20/46 S● | 2,943,924 | 588,600 | ||||||
Series 2016-116 GI 3.50% 11/20/44 S | 2,045,323 | 358,921 | ||||||
Series 2016-118 DI 3.50% 3/20/43 S | 2,294,468 | 355,549 | ||||||
Series 2016-118 ES 4.278% (6.10% minus LIBOR01M, Cap 6.10%) 9/20/46 S● | 1,030,606 | 217,578 | ||||||
Series 2016-120 AS 4.278% (6.10% minus LIBOR01M, Cap 6.10%) 9/20/46 S● | 1,774,680 | 387,808 | ||||||
Series 2016-120 NS 4.278% (6.10% minus LIBOR01M, Cap 6.10%) 9/20/46 S● | 2,402,109 | 502,225 | ||||||
Series 2016-121 JS 4.278% (6.10% minus LIBOR01M, Cap 6.10%) 9/20/46 S● | 1,754,045 | 368,063 | ||||||
Series 2016-126 NS 4.278% (6.10% minus LIBOR01M, Cap 6.10%) 9/20/46 S● | 1,173,763 | 242,465 | ||||||
Series 2016-134 MW 3.00% 10/20/46 | 98,000 | 96,635 | ||||||
Series 2016-147 ST 4.228% (6.05% minus LIBOR01M, Cap 6.05%) 10/20/46 S● | 1,117,017 | 229,920 | ||||||
Series 2016-149 GI 4.00% 11/20/46 S | 1,061,719 | 241,904 | ||||||
Series 2016-156 PB 2.00% 11/20/46 | 362,000 | 289,063 | ||||||
Series 2016-160 GI 3.50% 11/20/46 S | 1,408,412 | 330,216 | ||||||
Series 2016-160 GS 4.278% (6.10% minus LIBOR01M, Cap 6.10%) 11/20/46 S● | 3,242,379 | 690,426 | ||||||
Series 2016-160 VZ 2.50% 11/20/46 | 179,892 | 146,891 | ||||||
Series 2016-163 MI 3.50% 11/20/46 S | 1,042,929 | 129,946 | ||||||
| (continues) | 51 |
Table of Contents
Schedules of investments
Optimum Fixed Income Fund
Principal amount° | Value (US $) | |||||||
Agency Collateralized Mortgage Obligations (continued) |
| |||||||
GNMA | 2,925,447 | $ | 482,097 | |||||
Series 2016-163 XI 3.00% 10/20/46 S | 1,605,171 | 229,494 | ||||||
Series 2016-171 IO 3.00% 7/20/44 S | 2,518,499 | 306,952 | ||||||
Series 2016-171 IP 3.00% 3/20/46 S | 1,455,699 | 226,876 | ||||||
Series 2016-H06 FD 2.495% (LIBOR01M + 0.92%, Cap 7.50%, Floor 0.92%) 7/20/65 • | 1,873,555 | 1,904,682 | ||||||
Series 2017-4 BW 3.00% 1/20/47 | 106,000 | 102,034 | ||||||
Series 2017-10 IB 4.00% 1/20/47 S | 1,319,803 | 285,717 | ||||||
Series 2017-10 KZ 3.00% 1/20/47 | 124,269 | 114,516 | ||||||
Series 2017-18 QI 4.00% 3/16/41 S | 1,105,687 | 204,605 | ||||||
Series 2017-18 QS 4.314% (6.10% minus LIBOR01M, Cap 6.10%) 2/16/47 S● | 1,335,058 | 259,235 | ||||||
Series 2017-25 CZ 3.50% 2/20/47 | 470,480 | 470,795 | ||||||
Series 2017-25 WZ 3.00% 2/20/47 | 257,215 | 244,302 | ||||||
Series 2017-26 SA 4.278% (6.10% minus LIBOR01M, Cap 6.10%) 2/20/47 S● | 1,326,347 | 260,093 | ||||||
Series 2017-34 DY 3.50% 3/20/47 | 230,000 | 233,276 | ||||||
Series 2017-56 JZ 3.00% 4/20/47 | 277,519 | 252,516 | ||||||
Series 2017-56 QS 4.328% (6.15% minus LIBOR01M, Cap 6.15%) 4/20/47 S● | 1,776,768 | 338,173 | ||||||
Series 2017-68 SB 4.328% (6.15% minus LIBOR01M, Cap 6.15%) 5/20/47 S● | 2,675,714 | 458,231 | ||||||
Series 2017-80 AS 4.378% (6.20% minus LIBOR01M, Cap 6.20%) 5/20/47 S● | 3,460,772 | 682,864 | ||||||
Principal amount° | Value (US $) | |||||||
Agency Collateralized Mortgage Obligations (continued) |
| |||||||
GNMA | 97,372 | $ | 19,877 | |||||
Series 2017-101 AI 4.00% 7/20/47 S | 848,085 | 165,000 | ||||||
Series 2017-101 KS 4.378% (6.20% minus LIBOR01M, Cap 6.20%) 7/20/47 S● | 1,371,084 | 267,492 | ||||||
Series 2017-101 SK 4.378% (6.20% minus LIBOR01M, Cap 6.20%) 7/20/47 S● | 3,453,990 | 673,669 | ||||||
Series 2017-101 TI 4.00% 3/20/44 S | 1,295,392 | 207,828 | ||||||
Series 2017-107 QZ 3.00% 8/20/45 | 221,378 | 196,044 | ||||||
Series 2017-107 T 3.00% 1/20/47 | 614,000 | 599,682 | ||||||
Series 2017-113 LB 3.00% 7/20/47 | 595,000 | 560,859 | ||||||
Series 2017-114 IK 4.00% 10/20/44 S | 1,885,237 | 400,211 | ||||||
Series 2017-117 SD 4.378% (6.20% minus LIBOR01M, Cap 6.20%) 8/20/47 S● | 97,127 | 19,133 | ||||||
Series 2017-120 QS 4.378% (6.20% minus LIBOR01M, Cap 6.20%) 8/20/47 S● | 1,500,217 | 312,553 | ||||||
Series 2017-130 YJ 2.50% 8/20/47 | 270,000 | 244,784 | ||||||
Series 2017-134 ES 4.378% (6.20% minus LIBOR01M, Cap 6.20%) 9/20/47 S● | 833,240 | 160,498 | ||||||
Series 2017-134 KI 4.00% 5/20/44 S | 1,084,070 | 188,155 | ||||||
Series 2017-137 CZ 3.00% 9/20/47 | 1,644,452 | 1,597,529 | ||||||
Series 2017-137 IO 3.00% 6/20/45 S | 2,014,324 | 306,802 | ||||||
Series 2017-141 JS 4.378% (6.20% minus LIBOR01M, Cap 6.20%) 9/20/47 S● | 1,302,542 | 273,398 | ||||||
Series 2017-144 EI 3.00% 12/20/44 S | 1,878,002 | 278,891 | ||||||
52
Table of Contents
Principal amount° | Value (US $) | |||||||
Agency Collateralized Mortgage Obligations (continued) |
| |||||||
GNMA | 702,744 | $ | 81,484 | |||||
Series 2017-156 LP | 159,000 | 138,916 | ||||||
Series 2017-163 HS 4.378% (6.20% minus LIBOR01M, Cap 6.20%) 11/20/47 S● | 5,837,482 | 1,094,657 | ||||||
Series 2017-163 ZK | 3,341,292 | 3,252,866 | ||||||
Series 2017-164 IG | 3,399,594 | 405,991 | ||||||
Series 2017-174 HI | 1,664,187 | 260,809 | ||||||
Series 2018-1 SA 4.378% (6.20% minus LIBOR01M, Cap 6.20%) 1/20/48 S● | 1,312,495 | 252,162 | ||||||
Series 2018-1 ST 4.378% (6.20% minus LIBOR01M, Cap 6.20%) 1/20/48 S● | 2,714,436 | 559,426 | ||||||
Series 2018-8 VZ | 442,203 | 435,675 | ||||||
Series 2018-11 AI | 1,129,101 | 186,312 | ||||||
Series 2018-37 SA 4.604% (6.20% minus LIBOR01M, Cap 6.20%) 3/20/48 S● | 920,000 | 176,525 | ||||||
Series 2018-46 AS 4.482% (6.20% minus LIBOR01M, Cap 6.20%) 3/20/48 S● | 3,212,000 | 697,606 | ||||||
|
| |||||||
Total Agency Collateralized Mortgage Obligations |
| 157,402,905 | ||||||
|
| |||||||
Agency Commercial Mortgage-Backed | ||||||||
Freddie Mac Multifamily Structured Pass Through Certificates Series KS03 A4 | 920,000 | 916,081 | ||||||
FREMF Mortgage Trust Series 2011-K10 B 144A | 550,000 | 569,626 | ||||||
Series 2011-K12 B 144A | 685,000 | 702,913 | ||||||
Series 2011-K15 B 144A 4.949% | 75,000 | 78,590 | ||||||
Principal amount° | Value (US $) | |||||||
Agency Commercial Mortgage-Backed Securities (continued) |
| |||||||
FREMF Mortgage Trust Series 2011-K704 B 144A | 370,000 | $ | 371,100 | |||||
Series 2012-K22 B 144A | 665,000 | 671,412 | ||||||
Series 2012-K23 B 144A | 1,500,000 | 1,490,058 | ||||||
Series 2013-K32 B 144A | 510,000 | 508,131 | ||||||
Series 2013-K33 B 144A | 505,000 | 502,068 | ||||||
Series 2013-K712 B 144A | 470,000 | 472,749 | ||||||
Series 2013-K713 B 144A | 285,000 | 285,856 | ||||||
Series 2013-K713 C 144A | 945,000 | 943,196 | ||||||
Series 2014-K41 B 144A | 1,245,000 | 1,245,224 | ||||||
Series 2014-K716 B 144A | 500,000 | 511,009 | ||||||
Series 2014-K717 144A | 1,225,000 | 1,239,883 | ||||||
Series 2015-K49 B 144A | 840,000 | 836,221 | ||||||
Series 2015-K721 C 144A | 475,000 | 458,106 | ||||||
Series 2016-K53 144A | 280,000 | 284,343 | ||||||
Series 2016-K722 B 144A | 425,000 | 428,865 | ||||||
Series 2016-K723 B 144A | 620,000 | 617,108 | ||||||
Series 2017-K71 B 144A | 470,000 | 454,117 | ||||||
Series 2017-K729 B 144A | 310,000 | 300,428 | ||||||
|
| |||||||
Total Agency Commercial Mortgage-Backed Securities | 13,887,084 | |||||||
|
| |||||||
Agency Mortgage-Backed Securities – 15.84% | ||||||||
Fannie Mae | ||||||||
5.50% 3/1/37 | 10,378 | 10,798 | ||||||
5.50% 7/1/37 | 32,240 | 33,440 | ||||||
Fannie Mae ARM | ||||||||
2.903% (LIBOR12M + 1.60%, Cap 7.903%) 7/1/45 ● | 225,789 | 225,518 | ||||||
| (continues) | 53 |
Table of Contents
Schedules of investments
Optimum Fixed Income Fund
Principal amount° | Value (US $) | |||||||
Agency Mortgage-Backed Securities (continued) |
| |||||||
Fannie Mae ARM | 971,945 | $ | 977,108 | |||||
3.45% (LIBOR12M + 1.70%, Cap 11.097%) 8/1/37 ● | 34,627 | 34,363 | ||||||
3.489% (LIBOR12M + 1.739%, Cap 11.239%) 7/1/37 ● | 17,824 | 18,515 | ||||||
3.58% (LIBOR12M + 1.83%, Cap 10.179%) 8/1/35 ● | 10,280 | 10,801 | ||||||
Fannie Mae FHAVA | 466,789 | 490,609 | ||||||
Fannie Mae S.F. 15 yr | 2,925 | 2,947 | ||||||
4.50% 7/1/20 | 29,129 | 29,346 | ||||||
Fannie Mae S.F. 30 yr | 1,304,198 | 1,283,015 | ||||||
4.00% 10/1/40 | 22,938 | 23,697 | ||||||
4.00% 11/1/40 | 129,992 | 134,304 | ||||||
4.50% 5/1/35 | 80,561 | 84,817 | ||||||
4.50% 8/1/35 | 154,956 | 162,982 | ||||||
4.50% 9/1/35 | 147,986 | 155,663 | ||||||
4.50% 5/1/39 | 538,486 | 568,334 | ||||||
4.50% 11/1/39 | 398,922 | 423,407 | ||||||
4.50% 6/1/40 | 446,543 | 472,739 | ||||||
4.50% 8/1/40 | 119,061 | 125,740 | ||||||
4.50% 4/1/41 | 71,600 | 75,684 | ||||||
4.50% 10/1/43 | 585,046 | 619,180 | ||||||
4.50% 10/1/44 | 321,112 | 339,415 | ||||||
4.50% 3/1/46 | 707,790 | 745,705 | ||||||
4.50% 5/1/46 | 1,697,900 | 1,790,451 | ||||||
4.50% 7/1/46 | 1,100,891 | 1,158,281 | ||||||
5.00% 3/1/34 | 2,358 | 2,550 | ||||||
5.00% 4/1/34 | 14,335 | 15,468 | ||||||
5.00% 8/1/34 | 22,655 | 24,453 | ||||||
5.00% 4/1/35 | 6,571 | 7,108 | ||||||
5.00% 12/1/37 | 2,345 | 2,506 | ||||||
5.00% 3/1/38 | 137,888 | 147,656 | ||||||
5.00% 6/1/38 | 7,029 | 7,521 | ||||||
5.00% 2/1/39 | 4,165 | 4,451 | ||||||
5.00% 5/1/40 | 96,203 | 103,981 | ||||||
5.00% 6/1/44 | 1,076,263 | 1,169,170 | ||||||
5.50% 12/1/33 | 14,821 | 16,123 | ||||||
5.50% 2/1/35 | 336,275 | 372,477 | ||||||
5.50% 3/1/38 | 94,266 | 103,433 | ||||||
5.50% 6/1/39 | 297,672 | 327,045 | ||||||
5.50% 9/1/41 | 485,063 | 544,435 | ||||||
Principal amount° | Value (US $) | |||||||
Agency Mortgage-Backed Securities (continued) |
| |||||||
Fannie Mae S.F. 30 yr 5.50% 5/1/44 | 12,889,802 | $ | 14,163,231 | |||||
6.00% 9/1/36 | 154,916 | 176,278 | ||||||
6.00% 12/1/36 | 21,966 | 24,683 | ||||||
6.00% 6/1/37 | 11,436 | 12,834 | ||||||
6.00% 7/1/37 | 8,460 | 9,456 | ||||||
6.00% 8/1/38 | 48,191 | 53,546 | ||||||
6.00% 9/1/38 | 438,659 | 492,169 | ||||||
6.00% 10/1/38 | 101,489 | 113,619 | ||||||
6.00% 11/1/38 | 50,332 | 56,667 | ||||||
6.00% 12/1/38 | 140,945 | 158,496 | ||||||
6.00% 10/1/39 | 1,016,646 | 1,148,189 | ||||||
6.00% 11/1/40 | 34,131 | 38,545 | ||||||
6.00% 5/1/41 | 217,325 | 244,253 | ||||||
6.00% 7/1/41 | 3,195,500 | 3,577,628 | ||||||
6.50% 11/1/33 | 3,892 | 4,342 | ||||||
6.50% 2/1/36 | 39,958 | 44,655 | ||||||
6.50% 3/1/36 | 59,122 | 65,972 | ||||||
6.50% 6/1/36 | 144,197 | 160,906 | ||||||
6.50% 2/1/38 | 27,019 | 30,150 | ||||||
6.50% 11/1/38 | 7,848 | 8,853 | ||||||
Fannie Mae S.F. 30 yr TBA | 2,623,000 | 2,556,024 | ||||||
3.00% 5/1/48 | 48,600,000 | 47,294,497 | ||||||
3.50% 4/1/48 | 122,000,000 | 122,173,081 | ||||||
4.00% 5/1/48 | 78,100,000 | 79,972,440 | ||||||
4.50% 5/1/48 | 6,100,000 | 6,374,044 | ||||||
5.00% 4/1/48 | 1,575,000 | 1,681,922 | ||||||
Freddie Mac ARM 2.559% (LIBOR12M + 1.63%, Cap 7.559%) 10/1/46● | 621,958 | 611,371 | ||||||
2.918% (LIBOR12M + 1.63%, Cap 7.919%) 10/1/45 ● | 407,356 | 406,870 | ||||||
3.50% (LIBOR12M + 1.625%, Cap 10.50%) 2/1/38 ● | 15,509 | 16,127 | ||||||
3.933% (LIBOR12M + 2.18%, Cap 10.609%) 5/1/37 ● | 207,928 | 221,390 | ||||||
Freddie Mac S.F. 20 yr 5.50% 10/1/23 | 25,339 | 27,469 | ||||||
5.50% 8/1/24 | 10,217 | 11,076 | ||||||
Freddie Mac S.F. 30 yr | 65,464 | 69,005 | ||||||
4.50% 7/1/42 | 613,530 | 648,940 | ||||||
4.50% 12/1/43 | 134,265 | 140,639 | ||||||
4.50% 8/1/44 | 842,280 | 886,372 | ||||||
4.50% 11/1/45 | 1,924,819 | 2,017,220 | ||||||
54
Table of Contents
| Principal amount° | Value (US $) | |||||||
Agency Mortgage-Backed Securities (continued) |
| |||||||
Freddie Mac S.F. 30 yr | 422,927 | $ | 457,869 | |||||
5.00% 12/1/41 | 398,798 | 431,476 | ||||||
5.00% 4/1/44 | 458,817 | 495,979 | ||||||
5.00% 12/1/44 | 592,000 | 640,422 | ||||||
5.50% 3/1/34 | 25,790 | 28,381 | ||||||
5.50% 12/1/34 | 22,997 | 25,353 | ||||||
5.50% 12/1/35 | 22,259 | 24,578 | ||||||
5.50% 11/1/36 | 28,455 | 31,325 | ||||||
5.50% 12/1/36 | 6,002 | 6,594 | ||||||
5.50% 4/1/38 | 120,554 | 132,195 | ||||||
5.50% 6/1/38 | 17,095 | 18,726 | ||||||
5.50% 1/1/39 | 123,891 | 135,966 | ||||||
5.50% 6/1/39 | 150,075 | 164,555 | ||||||
5.50% 3/1/40 | 69,132 | 75,856 | ||||||
5.50% 4/1/40 | 242,636 | 266,363 | ||||||
5.50% 8/1/40 | 265,222 | 290,785 | ||||||
5.50% 1/1/41 | 75,187 | 82,305 | ||||||
5.50% 6/1/41 | 1,399,317 | 1,533,491 | ||||||
6.00% 2/1/36 | 191,646 | 214,260 | ||||||
6.00% 3/1/36 | 180,869 | 203,474 | ||||||
6.00% 9/1/37 | 73,140 | 81,926 | ||||||
6.00% 1/1/38 | 27,084 | 30,236 | ||||||
6.00% 6/1/38 | 75,432 | 84,565 | ||||||
6.00% 8/1/38 | 123,584 | 139,538 | ||||||
6.00% 5/1/40 | 201,842 | 226,080 | ||||||
6.00% 7/1/40 | 461,525 | 517,795 | ||||||
6.50% 11/1/33 | 24,339 | 27,408 | ||||||
6.50% 1/1/35 | 87,945 | 99,901 | ||||||
6.50% 8/1/38 | 11,214 | 12,628 | ||||||
7.00% 1/1/38 | 18,686 | 20,772 | ||||||
Freddie Mac S.F. 30 yr TBA | 6,000,000 | 6,010,174 | ||||||
GNMA I S.F. 30 yr | 244,187 | 266,406 | ||||||
7.00% 12/15/34 | 140,644 | 160,425 | ||||||
GNMA II S.F. 30 yr 5.00% 9/20/46 | 76,855 | 81,982 | ||||||
5.50% 5/20/37 | 169,644 | 182,238 | ||||||
6.00% 4/20/34 | 4,731 | 5,103 | ||||||
6.00% 2/20/39 | 191,077 | 210,155 | ||||||
6.00% 10/20/39 | 316,385 | 347,584 | ||||||
6.00% 2/20/40 | 739,429 | 816,077 | ||||||
6.00% 4/20/46 | 216,826 | 238,987 | ||||||
GNMA II S.F. 30 yr TBA | 6,000,000 | 6,165,192 | ||||||
|
| |||||||
Total Agency Mortgage-Backed Securities |
| 319,523,320 | ||||||
|
| |||||||
| Principal amount° | Value (US $) | |||||||
Agency Obligation – 0.11% | ||||||||
Federal Home Loan Mortgage | 2,300,000 | $ | 2,289,087 | |||||
|
| |||||||
Total Agency Obligation | 2,289,087 | |||||||
|
| |||||||
Collateralized Debt Obligations – 5.88% | ||||||||
Allegro CLO VI | 400,000 | 402,392 | ||||||
AMMC CLO 16 | 145,000 | 145,613 | ||||||
AMMC CLO 21 | 2,400,000 | 2,424,478 | ||||||
AMMC CLO 22 | 1,300,000 | 1,300,000 | ||||||
AMMC CLO XII | 2,000,000 | 2,014,852 | ||||||
AMMC CLO XIII | 1,500,000 | 1,516,597 | ||||||
Apex Credit CLO | 105,000 | 104,980 | ||||||
Series 2017-1A A1 144A 3.211% (LIBOR03M + 1.47%, Floor 1.47%) 4/24/29 #● | 1,275,000 | 1,283,429 | ||||||
Series 2018-1A A2 144A 3.325% (LIBOR03M + 1.03%) 4/25/31 #● | 2,400,000 | 2,400,000 | ||||||
Arbor Realty CLO | 250,000 | 250,250 | ||||||
(continues) | 55 |
Table of Contents
Schedules of investments
Optimum Fixed Income Fund
| Principal amount° | Value (US $) | |||||||
Collateralized Debt Obligations (continued) |
| |||||||
Atlas Senior Loan Fund X | 1,500,000 | $ | 1,500,555 | |||||
Atrium XII | 2,500,000 | 2,499,025 | ||||||
Atrium XIII | 250,000 | 251,515 | ||||||
Avery Point VI CLO | 250,000 | 250,393 | ||||||
Benefit Street Partners CLO IV | 2,400,000 | 2,413,106 | ||||||
Blue Hill CLO | 1,156,115 | 1,155,836 | ||||||
BlueMountain CLO | 400,000 | 399,900 | ||||||
Series 2015-2A A1 144A 3.164% (LIBOR03M + 1.43%, Floor 1.43%) 7/18/27 #● | 710,000 | 711,779 | ||||||
Carlyle Global Market Strategies CLO | 1,900,000 | 1,900,063 | ||||||
Series 2014-5A A1R 144A 2.862% (LIBOR03M + 1.14%) 10/16/25 #● | 400,000 | 399,890 | ||||||
Catamaran CLO | 3,500,000 | 3,499,689 | ||||||
Cedar Funding V CLO | 530,000 | 531,218 | ||||||
Cedar Funding VI CLO | 1,230,000 | 1,234,999 | ||||||
| Principal amount° | Value (US $) | |||||||
Collateralized Debt Obligations (continued) |
| |||||||
CFIP CLO | 2,300,000 | $ | 2,315,941 | |||||
CIFC Funding | 2,050,000 | 2,049,012 | ||||||
CVP CLO 2017-2 | 400,000 | 400,768 | ||||||
ECP CLO | 3,000,000 | 3,000,951 | ||||||
Emerson Park CLO | 197,942 | 197,883 | ||||||
Figueroa CLO | 400,000 | 400,452 | ||||||
Flagship CLO VIII | 2,300,000 | 2,299,328 | ||||||
Galaxy XXI CLO | 1,650,000 | 1,652,467 | ||||||
GoldenTree Loan Management US CLO 1 | 1,190,000 | 1,197,140 | ||||||
Halcyon Loan Advisors Funding | 121,114 | 121,233 | ||||||
Hull Street CLO | 500,000 | 499,842 | ||||||
Jamestown CLO IV | 1,500,000 | 1,500,264 | ||||||
56
Table of Contents
| Principal amount° | Value (US $) | |||||||
Collateralized Debt Obligations (continued) |
| |||||||
Jamestown CLO VII | 700,000 | $ | 699,672 | |||||
Jamestown CLO VIII | 1,500,000 | 1,498,506 | ||||||
KKR CLO 20 | 300,000 | 301,311 | ||||||
KVK CLO | 2,000,000 | 1,999,338 | ||||||
Series 2015-1A AR 144A 3.142% (LIBOR03M + 1.25%) 5/20/27 #● | 1,750,000 | 1,750,408 | ||||||
Limerock CLO II | 1,997,162 | 1,996,817 | ||||||
Madison Park Funding XIII | 1,500,000 | 1,499,651 | ||||||
Marathon CLO V | 1,100,000 | 1,100,493 | ||||||
Mariner CLO 5 | 1,800,000 | 1,800,868 | ||||||
Midocean Credit CLO VIII | 1,750,000 | 1,754,809 | ||||||
Monarch Grove CLO Series 2018-1A A1 144A 2.443% (LIBOR03M + 0.88%) 1/25/28 #● | 5,100,000 | 5,099,490 | ||||||
Mountain View CLO X | 2,000,000 | 2,000,526 | ||||||
| Principal amount° | Value (US $) | |||||||
Collateralized Debt Obligations (continued) |
| |||||||
MP CLO VI | 2,000,000 | $ | 1,999,494 | |||||
MP CLO VII | 2,500,000 | 2,499,415 | ||||||
Nelder Grove CLO | 1,500,000 | 1,500,649 | ||||||
Northwoods Capital XV | 3,000,000 | 3,021,642 | ||||||
Northwoods Capital XVII | 1,700,000 | 1,700,814 | ||||||
Oak Hill Credit Partners X Series 2014-10A AR 144A 2.875% (LIBOR03M + 1.13%) 7/20/26 #● | 1,000,000 | 999,703 | ||||||
Oaktree CLO | 250,000 | 252,058 | ||||||
OCP CLO | 2,100,000 | 2,098,939 | ||||||
Series 2015-10A A1R 144A 2.572% (LIBOR03M + 0.82%) 10/26/27 #● | 3,200,000 | 3,198,416 | ||||||
Series 2017-13A A1A 144A 2.982% (LIBOR03M + 1.26%) 7/15/30 #● | 1,000,000 | 1,010,153 | ||||||
Octagon Investment Partners XIX | 1,000,000 | 999,673 | ||||||
OFSI Fund VI | 2,400,000 | 2,397,497 | ||||||
OFSI Fund VII | 2,100,000 | 2,099,219 | ||||||
(continues) | 57 |
Table of Contents
Schedules of investments
Optimum Fixed Income Fund
| Principal amount° | Value (US $) | |||||||
Collateralized Debt Obligations (continued) |
| |||||||
OZLM IX Series 2014-9A A1R 144A 2.965% (LIBOR03M + 1.22%) 1/20/27 #● | 1,800,000 | $ | 1,799,510 | |||||
OZLM XVIII Series 2018-18A A 144A 3.35% (LIBOR03M + 1.02%, Floor 1.02%) 4/15/31 #● | 1,350,000 | 1,350,000 | ||||||
Saranac CLO II Series 2014-2A A1AR 144A 3.115% (LIBOR03M + 1.23%) 11/20/29 #● | 250,000 | 251,849 | ||||||
Shackleton III CLO Series 2013-3A AR 144A 2.842% (LIBOR03M + 1.12%, Floor 1.12%) 7/15/30 #● | 1,750,000 | 1,754,267 | ||||||
Sound Point CLO III Series 2013-2A A1R 144A 2.712% (LIBOR03M + 0.99%) 7/15/25 #● | 218,576 | 218,507 | ||||||
Sound Point CLO VIII Series 2015-1A AR 144A 2.582% (LIBOR03M + 0.86%) 4/15/27 #● | 3,200,000 | 3,198,570 | ||||||
Staniford Street CLO Series 2014-1A AR 144A 3.305% (LIBOR03M + 1.18%) 6/15/25 #● | 1,500,000 | 1,500,431 | ||||||
Steele Creek CLO Series 2017-1A A 144A 2.884% (LIBOR03M + 1.25%) 1/15/30 #● | 250,000 | 250,515 | ||||||
TIAA CLO II Series 2017-1A A 144A 3.025% (LIBOR03M + 1.28%) 4/20/29 #● | 1,040,000 | 1,045,799 | ||||||
TICP CLO I Series 2015-1A AR 144A 2.55% (LIBOR03M + 0.80%) 7/20/27 #● | 1,200,000 | 1,197,167 | ||||||
TICP CLO IX Series 2017-9A A 144A 2.871% (LIBOR03M + 1.14%) 1/20/31 #● | 400,000 | 402,895 | ||||||
Venture 31 CLO Series 2018-31A A1 144A 0.00% (LIBOR03M + 1.03%, Floor 1.03%) 4/20/31 #● | 1,500,000 | 1,500,000 | ||||||
| Principal amount° | Value (US $) | |||||||
Collateralized Debt Obligations (continued) |
| |||||||
Venture XVI CLO Series 2014-16A ARR 144A 2.567% (LIBOR03M + 0.85%, Floor 0.85%) 1/15/28 #● | 1,200,000 | $ | 1,199,536 | |||||
Venture XVII CLO Series 2014-17A AR 144A 2.802% (LIBOR03M + 1.08%) 7/15/26 #● | 400,000 | 399,852 | ||||||
Venture XX CLO Series 2015-20A AR 144A 2.542% (LIBOR03M + 0.82%) 4/15/27 #● | 2,000,000 | 1,999,162 | ||||||
Venture XXII CLO Series 2015-22A AR 144A 2.801% (LIBOR03M + 1.08%) 1/15/31 #● | 1,750,000 | 1,750,651 | ||||||
Venture XXIV CLO Series 2016-24A A1D 144A 3.165% (LIBOR03M + 1.42%) 10/20/28 #● | 1,115,000 | 1,118,847 | ||||||
Venture XXVIII CLO Series 2017-28A A2 144A 2.855% (LIBOR03M + 1.11%) 7/20/30 #● | 2,100,000 | 2,109,511 | ||||||
Venture CDO Series 2016-25A A1 144A 3.235% (LIBOR03M + 1.49%) 4/20/29 #● | 490,000 | 493,811 | ||||||
Voya CLO Series 2014-3A A1R 144A 2.465% (LIBOR03M + 0.72%) 7/25/26 #● | 1,100,000 | 1,099,597 | ||||||
WhiteHorse IX Series 2014-9A AR 144A 2.891% (LIBOR03M + 1.16%) 7/17/26 #● | 400,000 | 399,891 | ||||||
WhiteHorse VI Series 2012-1A A1R 144A 2.978% (LIBOR03M + 1.20%) 2/3/25 #● | 1,542,488 | 1,541,891 | ||||||
Z Capital Credit Partners CLO Series 2015-1A A1R 144A 2.672% (LIBOR03M + 0.95%, Floor 0.95%) 7/16/27 #● | 2,600,000 | 2,600,796 | ||||||
|
| |||||||
Total Collateralized Debt Obligations | 118,688,456 | |||||||
|
| |||||||
58
Table of Contents
| Principal amount° | Value (US $) | |||||||
Convertible Bonds – 1.62% |
| |||||||
Aerojet Rocketdyne Holdings 2.25% exercise price $26.00, maturity date 12/15/23 | 230,000 | $ | 292,643 | |||||
Alaska Communications Systems Group 6.25% exercise price $10.28, maturity date 5/1/18 | 216,000 | 220,640 | ||||||
Ares Capital 3.75% exercise price $19.39, maturity date 2/1/22 | 176,000 | 180,292 | ||||||
BioMarin Pharmaceutical 1.50% exercise price $94.15, maturity date 10/15/20 | 882,000 | 975,713 | ||||||
Blackhawk Network Holdings 1.50% exercise price $49.83, maturity date 1/15/22 | 677,000 | 749,354 | ||||||
Blackstone Mortgage Trust 4.375% exercise price $35.67, maturity date 5/5/22 | 811,000 | 800,538 | ||||||
4.75% exercise price $36.23, maturity date 3/15/23 | 210,000 | 207,291 | ||||||
5.25% exercise price $27.36, maturity date 12/1/18 | 919,000 | 1,045,050 | ||||||
Booking Holdings 0.35% exercise price $1,315.10, maturity date 6/15/20 | 715,000 | 1,149,704 | ||||||
Brookdale Senior Living 2.75% exercise price $29.33, maturity date 6/15/18 | 862,000 | 863,077 | ||||||
Cemex 3.72% exercise price $11.01, maturity date 3/15/20 | 1,521,000 | 1,570,155 | ||||||
Chart Industries 144A 1.00% exercise price $58.73, maturity date 11/15/24 # | 724,000 | 849,573 | ||||||
Cheniere Energy 4.25% exercise price $138.38, maturity date 3/15/45 | 1,050,000 | 820,202 | ||||||
Ciena 3.75% exercise price $20.17, maturity date 10/15/18 | 221,000 | 291,947 | ||||||
DISH Network 2.375% exercise price $82.22, maturity date 3/15/24 | 396,000 | 352,159 | ||||||
| Principal amount° | Value (US $) | |||||||
Convertible Bonds (continued) |
| |||||||
DISH Network 3.375% exercise price $65.18, maturity date 8/15/26 | 912,000 | $ | 880,718 | |||||
Empire State Realty OP 144A 2.625% exercise price $19.32, maturity date 8/15/19 # | 547,000 | 563,236 | ||||||
GAIN Capital Holdings 144A 5.00% exercise price $8.20, maturity date 8/15/22 # | 748,000 | 847,294 | ||||||
Helix Energy Solutions Group 4.125% exercise price $9.47, maturity date 9/15/23 | 34,000 | 34,443 | ||||||
4.25% exercise price $13.89, maturity date 5/1/22 | 805,000 | 764,089 | ||||||
Huron Consulting Group 1.25% exercise price $79.89, maturity date 10/1/19 | 237,000 | 223,956 | ||||||
IAC FinanceCo. 144A 0.875% exercise price $152.18, maturity date 10/1/22 # | 510,000 | 610,928 | ||||||
Infinera 1.75% exercise price $12.58, maturity date 6/1/18 | 353,000 | 375,899 | ||||||
Insulet | 770,000 | 1,195,956 | ||||||
144A 1.375% exercise price $93.18, maturity date 11/15/24 # | 410,000 | 470,279 | ||||||
Kaman 144A 3.25% exercise price $65.26, maturity date 5/1/24 # | 845,000 | 962,828 | ||||||
Knowles 3.25% exercise price $18.43, maturity date 11/1/21 | 441,000 | 460,308 | ||||||
Liberty Interactive 144A 1.75% exercise price $341.10, maturity date 9/30/46 # | 756,000 | 841,277 | ||||||
Liberty Media 2.25% exercise price $104.55, maturity date 9/30/46 | 103,000 | 107,703 | ||||||
(continues) | 59 |
Table of Contents
Schedules of investments
Optimum Fixed Income Fund
| Principal amount° | Value (US $) | |||||||
Convertible Bonds (continued) |
| |||||||
Live Nation Entertainment 144A 2.50% exercise price $68.02, maturity date 3/15/23 # | 133,000 | $ | 134,554 | |||||
Medicines 2.75% exercise price $48.97, maturity date 7/15/23 | 1,139,000 | 1,099,273 | ||||||
Microchip Technology 1.625% exercise price $98.85, maturity date 2/15/27 | 631,000 | 749,137 | ||||||
Neurocrine Biosciences 144A 2.25% exercise price $75.92, maturity date 5/15/24 # | 844,000 | 1,107,654 | ||||||
New Mountain Finance 5.00% exercise price $15.80, maturity date 6/15/19 | 381,000 | 392,771 | ||||||
Novellus Systems 2.625% exercise price $33.36, maturity date 5/15/41 | 96,000 | 581,559 | ||||||
ON Semiconductor 1.00% exercise price $18.50, maturity date 12/1/20 | 295,000 | 422,493 | ||||||
Pacira Pharmaceuticals 2.375% exercise price $66.89, maturity date 4/1/22 | 1,041,000 | 953,816 | ||||||
PDC Energy 1.125% exercise price $85.39, maturity date 9/15/21 | 833,000 | 812,965 | ||||||
PROS Holdings 2.00% exercise price $33.79, maturity date 12/1/19 | 661,000 | 755,126 | ||||||
Quotient Technology 144A 1.75% exercise price $17.36, maturity date 12/1/22 # | 403,000 | 418,647 | ||||||
RPM International 2.25% exercise price $52.28, maturity date 12/15/20 | 403,000 | 454,578 | ||||||
Sarepta Therapeutics 144A 1.50% exercise price $73.42, maturity date 11/15/24 # | 87,000 | 108,638 | ||||||
Spectrum Pharmaceuticals 2.75% exercise price $10.53, maturity date 12/15/18 | 98,000 | 157,290 | ||||||
Spirit Realty Capital 3.75% exercise price $12.93, maturity date 5/15/21 | 595,000 | 604,597 | ||||||
| Principal amount° | Value (US $) | |||||||
Convertible Bonds (continued) |
| |||||||
Supernus Pharmaceuticals 144A 0.625% exercise price $59.33, maturity date 4/1/23 # | 90,000 | $ | 95,971 | |||||
Synaptics 144A 0.50% exercise price $73.02, maturity date 6/15/22 # | 565,000 | 534,278 | ||||||
Synchronoss Technologies 0.75% exercise price $53.17, maturity date 8/15/19 | 303,000 | 287,133 | ||||||
Team 144A 5.00% exercise price $21.70, maturity date 8/1/23 # | 572,000 | 567,745 | ||||||
Tesla Energy Operations 1.625% exercise price $759.35, maturity date 11/1/19 | 648,000 | 592,917 | ||||||
Vector Group 1.75% exercise price $22.35, maturity date 4/15/20 ● | 490,000 | 540,048 | ||||||
2.50% exercise price $14.50, maturity date 1/15/19 ● | 692,000 | 993,016 | ||||||
VEREIT 3.75% exercise price $14.99, maturity date 12/15/20 | 729,000 | 736,782 | ||||||
Verint Systems 1.50% exercise price $64.46, maturity date 6/1/21 | 785,000 | 768,130 | ||||||
|
| |||||||
Total Convertible Bonds | 32,576,370 | |||||||
|
| |||||||
| ||||||||
Corporate Bonds – 36.26% |
| |||||||
Banking – 13.41% | ||||||||
Akbank Turk 144A 7.20% 3/16/27 #µ | 840,000 | 859,371 | ||||||
Ally Financial 3.50% 1/27/19 | 100,000 | 100,375 | ||||||
4.125% 3/30/20 | 200,000 | 201,250 | ||||||
4.75% 9/10/18 | 200,000 | 202,040 | ||||||
ANZ New Zealand International 144A 2.60% 9/23/19 # | 200,000 | 199,008 | ||||||
Banco Bilbao Vizcaya Argentaria 6.75%µy | EUR | 400,000 | 533,789 | |||||
Banco de Credito e Inversiones 144A 3.50% 10/12/27 # | 570,000 | 534,090 | ||||||
Banco do Brasil 144A 4.625% 1/15/25 # | 1,120,000 | 1,093,680 | ||||||
60
Table of Contents
| Principal amount° | Value (US $) | |||||||
Corporate Bonds (continued) |
| |||||||
Banking (continued) | ||||||||
Banco Nacional de Desenvol-vimento Economico e Social 6.369% 6/16/18 | 1,500,000 | $ | 1,517,280 | |||||
6.50% 6/10/19 | 2,500,000 | 2,596,200 | ||||||
Banco Santander 3.80% 2/23/28 | 600,000 | 579,610 | ||||||
4.25% 4/11/27 | 600,000 | 598,361 | ||||||
6.25%µy | EUR | 400,000 | 543,403 | |||||
Banco Santander Mexico 144A 4.125% 11/9/22 # | 520,000 | 520,000 | ||||||
Bancolombia 4.875% 10/18/27 µ | 965,000 | 936,774 | ||||||
Banistmo 144A 3.65% 9/19/22 # | 240,000 | 230,700 | ||||||
Bank Nederlandse Gemeenten 3.50% 7/19/27 | AUD | 292,000 | 229,361 | |||||
Bank of America 2.405% (LIBOR03M + 0.66%) 7/21/21● | 900,000 | 903,193 | ||||||
2.557% (LIBOR03M + 0.77%) 2/5/26 ● | 1,340,000 | 1,314,163 | ||||||
2.60% 1/15/19 | 174,000 | 174,192 | ||||||
2.625% 4/19/21 | 2,300,000 | 2,266,177 | ||||||
144A 3.004% 12/20/23 #µ | 2,001,000 | 1,963,320 | ||||||
3.30% 8/5/21 | AUD | 240,000 | 186,112 | |||||
3.30% 1/11/23 | 716,000 | 714,526 | ||||||
3.55% 3/5/24 µ | 4,585,000 | �� | 4,600,524 | |||||
3.97% 3/5/29 µ | 245,000 | 245,758 | ||||||
4.183% 11/25/27 | 2,105,000 | 2,089,447 | ||||||
5.625% 7/1/20 | 510,000 | 538,081 | ||||||
5.65% 5/1/18 | 3,300,000 | 3,308,349 | ||||||
5.875%µy | 900,000 | 906,803 | ||||||
6.875% 4/25/18 | 4,125,000 | 4,135,847 | ||||||
Bank of China 144A 5.00% 11/13/24 # | 795,000 | 820,510 | ||||||
Bank of Montreal 3.803% 12/15/32 µ | 1,525,000 | 1,446,645 | ||||||
Bank of New York Mellon 2.20% 3/4/19 | 1,640,000 | 1,634,202 | ||||||
2.817% (LIBOR03M + 1.05%) 10/30/23● | 990,000 | 1,006,862 | ||||||
4.625%µy | 1,365,000 | 1,334,287 | ||||||
Bank of Nova Scotia 1.875% 4/26/21 | 4,500,000 | 4,364,049 | ||||||
Barclays 6.50%µy | EUR | 600,000 | 786,030 | |||||
8.25%µy | 1,775,000 | 1,836,078 | ||||||
| Principal amount° | Value (US $) | |||||||
Corporate Bonds (continued) |
| |||||||
Banking (continued) |
| |||||||
Barclays Bank 7.625% 11/21/22 | 1,800,000 | $ | 1,978,605 | |||||
BB&T 1.993% (LIBOR03M + 0.22%) 2/1/21 ● | 980,000 | 975,031 | ||||||
BBVA Bancomer 144A 6.50% 3/10/21 # | 255,000 | 271,575 | ||||||
144A 7.25% 4/22/20 # | 100,000 | 106,649 | ||||||
BGEO Group 144A 6.00% 7/26/23 # | 690,000 | 699,489 | ||||||
BNP Paribas 144A 7.375%#µy | 700,000 | 763,000 | ||||||
7.375%µy | 500,000 | 545,000 | ||||||
Branch Banking & Trust 2.25% 6/1/20 | 1,085,000 | 1,068,497 | ||||||
2.85% 4/1/21 | 670,000 | 667,379 | ||||||
CIT Group 144A 5.50% 2/15/19 # | 936,000 | 959,985 | ||||||
Citigroup 2.647% (LIBOR03M + 0.88%) 7/30/18 ● | 2,300,000 | 2,304,800 | ||||||
2.965% (LIBOR03M + 0.93%) 6/7/19 ● | 2,300,000 | 2,315,591 | ||||||
2.985% (LIBOR03M + 1.10%) 5/17/24● | 1,350,000 | 1,363,087 | ||||||
3.20% 10/21/26 | 1,000,000 | 952,322 | ||||||
3.75% 10/27/23 | AUD | 498,000 | 388,719 | |||||
4.05% 7/30/22 | 150,000 | 152,536 | ||||||
Citizens Bank 2.55% 5/13/21 | 1,655,000 | 1,616,504 | ||||||
2.65% 5/26/22 | 250,000 | 242,412 | ||||||
3.70% 3/29/23 | 565,000 | 567,728 | ||||||
Citizens Financial Group 2.375% 7/28/21 | 115,000 | 111,597 | ||||||
4.30% 12/3/25 | 965,000 | 976,977 | ||||||
Compass Bank 2.875% 6/29/22 | 1,220,000 | 1,183,692 | ||||||
3.875% 4/10/25 | 1,145,000 | 1,121,384 | ||||||
Cooperatieve Rabobank 2.50% 9/4/20 | NOK | 1,740,000 | 227,334 | |||||
3.375% 2/2/23 | NZD | 561,000 | 406,740 | |||||
3.75% 7/21/26 | 2,155,000 | 2,082,225 | ||||||
4.375% 8/4/25 | 2,000,000 | 2,022,144 | ||||||
6.875% 3/19/20 | EUR | 2,400,000 | 3,329,524 | |||||
Credit Suisse Group 2.507% (LIBOR01M + 0.62%) 9/28/18● | 2,900,000 | 2,900,000 | ||||||
144A 3.869% 1/12/29 #µ | 1,975,000 | 1,913,968 | ||||||
144A 4.282% 1/9/28 # | 455,000 | 456,073 | ||||||
144A 6.25%#µy | 2,035,000 | 2,093,282 | ||||||
(continues) | 61 |
Table of Contents
Schedules of investments
Optimum Fixed Income Fund
| Principal amount° | Value (US $) | |||||||
Corporate Bonds (continued) |
| |||||||
Banking (continued) | ||||||||
Credit Suisse Group Funding Guernsey 2.75% 3/26/20 | 2,199,000 | $ | 2,178,140 | |||||
3.125% 12/10/20 | 250,000 | 248,729 | ||||||
3.80% 9/15/22 | 3,350,000 | 3,375,786 | ||||||
3.80% 6/9/23 | 2,300,000 | 2,306,220 | ||||||
4.55% 4/17/26 | 430,000 | 439,811 | ||||||
Deutsche Bank 2.85% 5/10/19 | 3,100,000 | 3,089,619 | ||||||
4.25% 10/14/21 | 1,700,000 | 1,727,747 | ||||||
Dexia Credit Local 144A 2.339% (LIBOR03M + 0.50%) 2/15/19 #● | 560,000 | 561,657 | ||||||
Fifth Third Bancorp 2.60% 6/15/22 | 630,000 | 611,270 | ||||||
2.875% 7/27/20 | 725,000 | 723,897 | ||||||
3.95% 3/14/28 | 1,865,000 | 1,877,764 | ||||||
Fifth Third Bank 2.30% 3/15/19 | 800,000 | 796,738 | ||||||
2.795% (LIBOR03M + 0.91%) 8/20/18 ● | 905,000 | 907,001 | ||||||
Goldman Sachs Group 3.009% (LIBOR03M + 1.17%) 11/15/21 ● | 1,700,000 | 1,721,420 | ||||||
3.065% (BBSW3M+ 1.30%) 8/21/19 ● | AUD | 140,000 | 108,331 | |||||
3.075% (LIBOR03M + 1.05%) 6/5/23 ● | 505,000 | 507,967 | ||||||
3.105% (LIBOR03M + 1.36%) 4/23/21 ● | 1,300,000 | 1,329,610 | ||||||
3.20% 2/23/23 | 2,200,000 | 2,169,914 | ||||||
3.325% (LIBOR03M + 1.20%) 9/15/20 ● | 1,700,000 | 1,727,430 | ||||||
3.55% 2/12/21 | CAD | 100,000 | 79,299 | |||||
3.584% (LIBOR03M + 1.60%) 11/29/23 ● | 875,000 | 903,030 | ||||||
5.15% 5/22/45 | 265,000 | 286,061 | ||||||
5.20% 12/17/19 | NZD | 206,000 | 154,261 | |||||
6.00% 6/15/20 | 2,635,000 | 2,789,410 | ||||||
HSBC Bank 144A 2.479% (LIBOR03M + 0.64%) 5/15/18 #● | 620,000 | 620,085 | ||||||
HSBC Holdings | ||||||||
2.65% 1/5/22 | 200,000 | 194,508 | ||||||
3.604% (LIBOR03M + 1.66%) 5/25/21 ● | 900,000 | 930,988 | ||||||
3.821% (LIBOR03M + 1.50%) 1/5/22 ● | 2,000,000 | 2,060,721 | ||||||
6.00%µy | EUR | 900,000 | 1,272,556 | |||||
6.50%µy | 830,000 | 847,637 | ||||||
| Principal amount° | Value (US $) | |||||||
Corporate Bonds (continued) |
| |||||||
Banking (continued) | ||||||||
Huntington Bancshares 2.30% 1/14/22 | 670,000 | $ | 642,239 | |||||
Huntington National Bank 2.50% 8/7/22 | 1,245,000 | 1,200,976 | ||||||
ICICI Bank 144A 4.00% 3/18/26 # | 1,070,000 | 1,040,880 | ||||||
ING Bank 144A 2.665% (LIBOR03M + 0.78%) 8/17/18 #● | 4,500,000 | 4,509,978 | ||||||
Intesa Sanpaolo 144A 3.875% 1/12/28 # | 2,600,000 | 2,455,436 | ||||||
ITAU CorpBanca 2.50% 12/7/18 | 500,000 | 498,493 | ||||||
2.57% 1/11/19 | 300,000 | 299,046 | ||||||
JPMorgan Chase & Co. 2.25% 1/23/20 | 9,100,000 | 8,990,845 | ||||||
2.39% (LIBOR03M + 0.63%) 1/28/19 ● | 200,000 | 200,646 | ||||||
2.645% (LIBOR03M + 0.90%) 4/25/23 ● | 895,000 | 898,976 | ||||||
2.971% (LIBOR03M + 1.23%) 10/24/23 ● | 375,000 | 380,791 | ||||||
3.135% (LIBOR03M + 1.10%) 6/7/21 ● | 2,900,000 | 2,958,352 | ||||||
3.897% 1/23/49 µ | 1,845,000 | 1,762,959 | ||||||
3.964% 11/15/48 µ | 495,000 | 476,746 | ||||||
4.40% 7/22/20 | 400,000 | 412,310 | ||||||
6.75%µy | 865,000 | 944,796 | ||||||
KeyBank 2.30% 9/14/22 | 730,000 | 701,449 | ||||||
2.40% 6/9/22 | 810,000 | 782,810 | ||||||
3.18% 5/22/22 | 250,000 | 248,928 | ||||||
3.375% 3/7/23 | 1,730,000 | 1,737,404 | ||||||
3.40% 5/20/26 | 2,245,000 | 2,172,084 | ||||||
6.95% 2/1/28 | 1,220,000 | 1,506,909 | ||||||
Korea Development Bank 3.00% 3/17/19 | 850,000 | 851,948 | ||||||
Landwirtschaftliche Rentenbank 5.375% 4/23/24 | NZD | 648,000 | 522,850 | |||||
Lloyds Bank 2.40% 3/17/20 | 400,000 | 394,646 | ||||||
144A 12.00%#µy | 2,300,000 | 2,902,421 | ||||||
Lloyds Banking Group 3.574% 11/7/28 µ | 1,555,000 | 1,469,586 | ||||||
7.00%µy | GBP | 400,000 | 588,893 | |||||
7.50%µy | 860,000 | 934,175 | ||||||
7.625%µy | GBP | 2,500,000 | 3,926,415 | |||||
7.875%µy | GBP | 1,300,000 | 2,204,894 | |||||
62
Table of Contents
| Principal amount° | Value (US $) | |||||||
Corporate Bonds (continued) |
| |||||||
Banking (continued) | ||||||||
Manufacturers & Traders Trust 2.05% 8/17/20 | 485,000 | $ | 474,093 | |||||
2.50% 5/18/22 | 555,000 | 539,102 | ||||||
Mitsubishi UFJ Financial Group 2.19% 9/13/21 | 2,050,000 | 1,978,991 | ||||||
3.149% (LIBOR03M + 1.06%) 9/13/21 ● | 450,000 | 456,843 | ||||||
Mitsubishi UFJ Trust & Banking 144A | 500,000 | 495,724 | ||||||
144A 2.65% 10/19/20 # | 500,000 | 493,778 | ||||||
Mizuho Bank 144A | 600,000 | 597,365 | ||||||
Morgan Stanley | 3,450,000 | 3,449,191 | ||||||
2.294% (LIBOR03M + 0.55%) 2/10/21 ● | 3,000,000 | 3,002,460 | ||||||
2.50% 4/21/21 | 3,500,000 | 3,430,289 | ||||||
3.011% (LIBOR03M + 1.22%) 5/8/24 ● | 875,000 | 889,656 | ||||||
3.125% 8/5/21 | CAD | 387,000 | 303,544 | |||||
3.125% 1/23/23 | 400,000 | 394,585 | ||||||
3.772% 1/24/29 µ | 2,530,000 | 2,492,104 | ||||||
3.95% 4/23/27 | 565,000 | 550,799 | ||||||
4.375% 1/22/47 | 815,000 | 834,549 | ||||||
5.00% 9/30/21 | AUD | 359,000 | 293,820 | |||||
5.50% 1/26/20 | 915,000 | 955,295 | ||||||
Nationwide Building Society 144A 3.766% 3/8/24 #µ | 800,000 | 798,405 | ||||||
144A 4.125% 10/18/32 #µ | 1,740,000 | 1,662,638 | ||||||
144A 4.302% 3/8/29 #µ | 385,000 | 384,357 | ||||||
10.25%y● | GBP | 625,000 | 1,315,313 | |||||
Nederlandse Waterschapsbank 144A 2.145% (LIBOR03M + 0.02%) 3/15/19 #● | 1,500,000 | 1,499,884 | ||||||
Northern Trust | ||||||||
3.375% 5/8/32 µ | 330,000 | 317,137 | ||||||
Oesterreichische Kontrollbank 2.875% 3/13/23 | 280,000 | 280,352 | ||||||
PNC Bank | 1,000,000 | 1,003,687 | ||||||
2.45% 11/5/20 | 250,000 | 246,193 | ||||||
2.70% 11/1/22 | 500,000 | 484,221 | ||||||
6.875% 4/1/18 | 1,415,000 | 1,415,000 | ||||||
PNC Financial Services Group 5.00%µy | 1,100,000 | 1,097,800 | ||||||
| Principal amount° | Value (US $) | |||||||
Corporate Bonds (continued) |
| |||||||
Banking (continued) | ||||||||
Popular 7.00% 7/1/19 | 645,000 | $ | 661,125 | |||||
QNB Finance 2.75% 10/31/18 | 300,000 | 300,007 | ||||||
Regions Bank | 345,000 | 344,415 | ||||||
Regions Financial 2.75% 8/14/22 | 430,000 | 418,108 | ||||||
Royal Bank of Canada | 2,300,000 | 2,261,530 | ||||||
2.75% 2/1/22 | 185,000 | 182,492 | ||||||
Royal Bank of Scotland Group 3.309% (LIBOR03M + 1.47%) 5/15/23 ● | 390,000 | 393,633 | ||||||
3.498% 5/15/23 µ | 500,000 | 491,653 | ||||||
3.875% 9/12/23 | 690,000 | 681,990 | ||||||
8.625%µy | 4,970,000 | 5,411,087 | ||||||
Santander Holdings USA 2.70% 5/24/19 | 1,135,000 | 1,132,452 | ||||||
Santander UK 2.087% (LIBOR03M + 0.30%) 11/3/20 ● | 1,000,000 | 998,475 | ||||||
2.794% (LIBOR03M + 0.85%) 8/24/18 ● | 730,000 | 731,849 | ||||||
144A 5.00% 11/7/23 # 1,540,000 | 1,595,343 | |||||||
Santander UK Group Holdings 3.823% 11/3/28 µ | 1,025,000 | 977,930 | ||||||
7.375%µy | GBP | 2,200,000 | 3,368,638 | |||||
Sberbank of Russia Via SB Capital 4.15% 3/6/19 | 700,000 | 704,627 | ||||||
Societe Generale 144A 4.25% 4/14/25 # | 3,600,000 | 3,551,386 | ||||||
Standard Chartered 144A 3.015% (LIBOR03M + 1.13%) 8/19/19 #● | 3,200,000 | 3,232,243 | ||||||
State Bank of India 3.271% (LIBOR03M + 0.95%) 4/6/20 ● | 900,000 | 901,260 | ||||||
State Street 2.653% 5/15/23 µ | 45,000 | 43,957 | ||||||
3.10% 5/15/23 | 525,000 | 522,014 | ||||||
3.30% 12/16/24 | 100,000 | 99,192 | ||||||
Sumitomo Mitsui Financial Group 3.737% (LIBOR03M + 1.68%) 3/9/21 ● | 2,300,000 | 2,379,000 | ||||||
SunTrust Banks 2.45% 8/1/22 | 1,160,000 | 1,118,393 | ||||||
2.70% 1/27/22 | 1,105,000 | 1,081,347 | ||||||
3.00% 2/2/23 | 585,000 | 574,979 | ||||||
3.30% 5/15/26 | 540,000 | 515,536 | ||||||
5.05% 6/15/22 µy | 280,000 | 278,950 | ||||||
(continues) | 63 |
Table of Contents
Schedules of investments
Optimum Fixed Income Fund
| Principal amount° | Value (US $) | |||||||
Corporate Bonds (continued) |
| |||||||
Banking (continued) | ||||||||
SVB Financial Group 3.50% 1/29/25 | 2,205,000 | $ | 2,156,632 | |||||
Toronto-Dominion Bank 2.317% (LIBOR03M + 0.55%) 4/30/18 ● | 835,000 | 835,199 | ||||||
Turkiye Garanti Bankasi 144A 5.25% 9/13/22 # | 355,000 | 353,138 | ||||||
144A 6.25% 4/20/21 # | 590,000 | 608,594 | ||||||
Turkiye Is Bankasi 144A 7.00% 6/29/28 #µ | 560,000 | 552,779 | ||||||
UBS | 2,000,000 | 2,001,874 | ||||||
144A 2.627% (LIBOR03M + 0.58%) 6/8/20 #● | 2,000,000 | 2,008,430 | ||||||
4.75% 5/22/23 µ | 1,300,000 | 1,303,177 | ||||||
5.125% 5/15/24 | 200,000 | 204,562 | ||||||
7.625% 8/17/22 | 500,000 | 562,500 | ||||||
UBS Group | 555,000 | 586,011 | ||||||
UBS Group Funding Switzerland 144A 2.859% 8/15/23 #µ | 820,000 | 793,199 | ||||||
144A 3.00% 4/15/21 # | 2,705,000 | 2,677,878 | ||||||
144A 3.491% 5/23/23 # | 1,145,000 | 1,132,133 | ||||||
144A 3.50% (LIBOR03M + 1.78%) 4/14/21 #● | 400,000 | 414,646 | ||||||
144A 4.125% 9/24/25 # | 870,000 | 875,180 | ||||||
144A 4.125% 4/15/26 # | 845,000 | 848,865 | ||||||
144A 4.253% 3/23/28 # | 515,000 | 519,040 | ||||||
US Bancorp 2.375% 7/22/26 | 1,815,000 | 1,648,854 | ||||||
2.625% 1/24/22 | 1,435,000 | 1,414,437 | ||||||
3.15% 4/27/27 | 1,830,000 | 1,760,180 | ||||||
3.60% 9/11/24 | 1,275,000 | 1,278,642 | ||||||
USB Capital IX | 1,820,000 | 1,645,826 | ||||||
Wells Fargo & Co. 2.55% 12/7/20 | 2,800,000 | 2,752,473 | ||||||
2.741% (LIBOR03M + 0.93%) 2/11/22 ● | 200,000 | 201,334 | ||||||
3.00% 7/27/21 | AUD | 979,000 | 751,862 | |||||
3.002% (LIBOR03M + 1.23%) 10/31/23 ● | 1,440,000 | 1,461,850 | ||||||
3.50% 9/12/29 | GBP | 196,000 | 299,099 | |||||
Westpac Banking 5.00%µy | 280,000 | 259,035 | ||||||
Woori Bank 144A 4.75% 4/30/24 # | 800,000 | 817,836 | ||||||
| Principal amount° | Value (US $) | |||||||
Corporate Bonds (continued) |
| |||||||
Banking (continued) | ||||||||
Zions Bancorporation 4.50% 6/13/23 | 690,000 | $ | 702,866 | |||||
|
| |||||||
| 270,499,701 | ||||||||
|
| |||||||
Basic Industry – 1.78% | ||||||||
AK Steel 6.375% 10/15/25 | 220,000 | 208,450 | ||||||
Allegheny Technologies 7.875% 8/15/23 | 205,000 | 223,706 | ||||||
Anglo American Capital 144A 4.75% 4/10/27 # | 1,665,000 | 1,685,757 | ||||||
144A 4.875% 5/14/25 # | 2,000,000 | 2,050,993 | ||||||
Barrick North America Finance 5.75% 5/1/43 | 1,530,000 | 1,787,657 | ||||||
BHP Billiton Finance USA 144A 6.25% 10/19/75 #µ | 2,795,000 | 2,950,123 | ||||||
Braskem Netherlands Finance | 320,000 | 308,640 | ||||||
144A 4.50% 1/10/28 # | 905,000 | 882,058 | ||||||
Builders FirstSource 144A 5.625% 9/1/24 # | 715,000 | 721,256 | ||||||
Chemours 5.375% 5/15/27 | 180,000 | 180,900 | ||||||
CK Hutchison International 17 144A 2.875% 4/5/22 # | 655,000 | 642,692 | ||||||
CSN Resources 144A 7.625% 2/13/23 # | 805,000 | 755,694 | ||||||
Cydsa 144A | 785,000 | 782,056 | ||||||
Dow Chemical | 3,662,000 | 3,887,711 | ||||||
Equate Petrochemical 144A 3.00% 3/3/22 # | 625,000 | 604,561 | ||||||
First Quantum Minerals 144A 6.50% 3/1/24 # | 465,000 | 441,750 | ||||||
144A 7.25% 4/1/23 # | 830,000 | 819,625 | ||||||
FMG Resources August 2006 | 225,000 | 223,031 | ||||||
144A 5.125% 5/15/24 # | 630,000 | 623,694 | ||||||
Freeport-McMoRan | 650,000 | 641,875 | ||||||
6.875% 2/15/23 | 410,000 | 441,775 | ||||||
Georgia-Pacific | 1,050,000 | 1,043,780 | ||||||
8.00% 1/15/24 | 2,242,000 | 2,779,274 | ||||||
Hudbay Minerals | 10,000 | 10,425 | ||||||
144A 7.625% 1/15/25 # | 325,000 | 344,906 | ||||||
Joseph T Ryerson & Son 144A | 160,000 | 176,800 | ||||||
Kraton Polymers 144A 7.00% 4/15/25 # | 120,000 | 124,800 | ||||||
64
Table of Contents
| Principal amount° | Value (US $) | |||||||
Corporate Bonds (continued) |
| |||||||
Basic Industry (continued) | ||||||||
Mexichem 144A 5.50% 1/15/48 # | 915,000 | $ | 854,381 | |||||
Mosaic 5.625% 11/15/43 | 540,000 | 565,670 | ||||||
Nexa Resources 144A 5.375% 5/4/27 # | 1,150,000 | 1,180,188 | ||||||
NOVA Chemicals | 526,000 | 506,117 | ||||||
144A 5.25% 6/1/27 # | 180,000 | 171,450 | ||||||
Novelis 144A | 280,000 | 287,700 | ||||||
Novolipetsk Steel Via Steel Funding DAC 144A | 715,000 | 698,485 | ||||||
OCP | 980,000 | 967,775 | ||||||
144A 6.875% 4/25/44 # | 210,000 | 235,181 | ||||||
Olin 5.125% 9/15/27 | 360,000 | 355,950 | ||||||
Petkim Petrokimya Holding 144A 5.875% 1/26/23 # | 675,000 | 662,739 | ||||||
Phosagro OAO via Phosagro Bond Funding DAC 144A 3.95% 11/3/21 # | 955,000 | 947,121 | ||||||
PolyOne 5.25% 3/15/23 | 530,000 | 545,900 | ||||||
Summit Materials | 30,000 | 32,475 | ||||||
Suzano Austria 144A 7.00% 3/16/47 # | 805,000 | 915,527 | ||||||
US Concrete 6.375% 6/1/24 | 600,000 | 625,500 | ||||||
Vedanta Resources | 365,000 | 357,569 | ||||||
144A 6.375% 7/30/22 # | 455,000 | 464,555 | ||||||
WR Grace & Co. 144A 5.625% 10/1/24 # | 228,000 | 235,695 | ||||||
|
| |||||||
| 35,953,967 | ||||||||
|
| |||||||
Brokerage – 0.28% | ||||||||
Charles Schwab 5.00%µy | 355,000 | 347,338 | ||||||
E*TRADE Financial 3.80% 8/24/27 | 655,000 | 636,791 | ||||||
5.30%µy | 250,000 | 245,937 | ||||||
5.875%µy | 950,000 | 973,750 | ||||||
Jefferies Group | 780,000 | 728,262 | ||||||
6.45% 6/8/27 | 331,000 | 374,352 | ||||||
6.50% 1/20/43 | 270,000 | 299,976 | ||||||
Lazard Group | 2,100,000 | 2,068,608 | ||||||
|
| |||||||
| 5,675,014 | ||||||||
|
| |||||||
Capital Goods – 1.27% | ||||||||
3M 2.875% 10/15/27 | 825,000 | 797,715 | ||||||
| Principal amount° | Value (US $) | |||||||
Corporate Bonds (continued) |
| |||||||
Capital Goods (continued) | ||||||||
Advanced Disposal Services 144A 5.625% 11/15/24 # | 80,000 | $ | 81,000 | |||||
Allegion US Holding 3.20% 10/1/24 | 1,295,000 | 1,259,271 | ||||||
3.55% 10/1/27 | 25,000 | 23,847 | ||||||
Ardagh Packaging Finance 144A 6.00% 2/15/25 # | 205,000 | 206,537 | ||||||
144A 7.25% 5/15/24 # | 200,000 | 213,500 | ||||||
BMC East 144A | 250,000 | 250,625 | ||||||
Boise Cascade 144A 5.625% 9/1/24 # | 750,000 | 770,625 | ||||||
BWAY Holding 144A 5.50% 4/15/24 # | 460,000 | 464,025 | ||||||
CCL Industries 144A | 655,000 | 607,478 | ||||||
Corning 4.375% 11/15/57 | 485,000 | 447,737 | ||||||
Covanta Holding 5.875% 7/1/25 | 230,000 | 223,675 | ||||||
Crane 4.45% 12/15/23 | 1,050,000 | 1,073,389 | ||||||
CRH America Finance 144A 3.95% 4/4/28 # | 705,000 | 703,720 | ||||||
Eaton 3.103% 9/15/27 | 55,000 | 51,811 | ||||||
General Electric | 920,000 | 878,648 | ||||||
4.65% 10/17/21 | 89,000 | 93,080 | ||||||
5.55% 5/4/20 | 470,000 | 492,217 | ||||||
6.00% 8/7/19 | 1,025,000 | 1,062,714 | ||||||
Grupo Cementos de Chihuahua 144A 5.25% 6/23/24 # | 730,000 | 733,650 | ||||||
Harris | 2,100,000 | 2,101,736 | ||||||
2.431% (LIBOR03M + 0.48%) 2/27/19 ● | 2,400,000 | 2,400,790 | ||||||
Heathrow Funding 144A | 200,000 | 211,317 | ||||||
Herc Rentals 144A | 434,000 | 471,975 | ||||||
Koppers 144A 6.00% 2/15/25 # | 60,000 | 61,452 | ||||||
Leggett & Platt 3.50% 11/15/27 | 125,000 | 120,399 | ||||||
Lennox International | 710,000 | 692,412 | ||||||
Martin Marietta Materials 3.50% 12/15/27 | 385,000 | 367,381 | ||||||
4.25% 12/15/47 | 680,000 | 630,151 | ||||||
(continues) | 65 |
Table of Contents
Schedules of investments
Optimum Fixed Income Fund
| Principal amount° | Value (US $) | |||||||
Corporate Bonds (continued) |
| |||||||
Capital Goods (continued) |
| |||||||
Masco 5.95% 3/15/22 | 304,000 | $ | 329,180 | |||||
New Enterprise Stone & Lime 144A 10.125% 4/1/22 # | 405,000 | 436,387 | ||||||
Northrop Grumman 2.55% 10/15/22 | 735,000 | 712,811 | ||||||
3.25% 8/1/23 | 490,000 | 487,127 | ||||||
Nvent Finance | 475,000 | 476,764 | ||||||
144A 4.55% 4/15/28 # | 1,260,000 | 1,267,457 | ||||||
Parker-Hannifin 3.30% 11/21/24 | 65,000 | 64,650 | ||||||
Republic Services 3.375% 11/15/27 | 475,000 | 459,254 | ||||||
Siemens Financierings-maatschappij 144A 2.224% (LIBOR03M + 0.28%) 5/25/18 #● | 610,000 | 610,093 | ||||||
Standard Industries 144A 5.00% 2/15/27 # | 520,000 | 506,059 | ||||||
StandardAero Aviation Holdings 144A 10.00% 7/15/23 # | 30,000 | 32,737 | ||||||
Textron 2.361% (LIBOR03M + 0.55%) 11/10/20 ● | 1,900,000 | 1,898,662 | ||||||
TransDigm 6.375% 6/15/26 | 350,000 | 353,500 | ||||||
WestRock 144A 3.00% 9/15/24 # | 480,000 | 459,358 | ||||||
Zekelman Industries 144A 9.875% 6/15/23 # | 90,000 | 99,225 | ||||||
|
| |||||||
| 25,686,141 | ||||||||
|
| |||||||
Communications – 2.95% |
| |||||||
Alibaba Group Holding 4.00% 12/6/37 | 545,000 | 521,343 | ||||||
Altice France 144A 6.25% 5/15/24 # | 590,000 | 558,287 | ||||||
Amazon.com 144A 3.15% 8/22/27 # | 1,700,000 | 1,642,377 | ||||||
AMC Networks 4.75% 8/1/25 | 440,000 | 425,097 | ||||||
AT&T | 500,000 | 505,527 | ||||||
2.723% (LIBOR03M + 0.89%) 2/14/23 ● | 810,000 | 821,794 | ||||||
3.20% 3/1/22 | 100,000 | 99,532 | ||||||
3.40% 8/14/24 | 325,000 | 326,942 | ||||||
3.80% 3/1/24 | 100,000 | 100,250 | ||||||
3.90% 8/14/27 | 740,000 | 746,017 | ||||||
144A 4.10% 2/15/28 # | 2,276,000 | 2,262,856 | ||||||
| Principal amount° | Value (US $) | |||||||
Corporate Bonds (continued) |
| |||||||
Communications (continued) |
| |||||||
AT&T | 690,000 | $ | 688,159 | |||||
4.90% 8/14/37 | 2,105,000 | 2,127,051 | ||||||
144A 5.15% 11/15/46 # | 220,000 | 225,311 | ||||||
5.25% 3/1/37 | 530,000 | 561,605 | ||||||
Baidu | 805,000 | 807,723 | ||||||
Bell Canada | CAD | 219,000 | 172,785 | |||||
CCO Holdings | 900,000 | 848,250 | ||||||
144A 5.125% 5/1/27 # | 215,000 | 204,659 | ||||||
144A 5.50% 5/1/26 # | 530,000 | 520,063 | ||||||
144A 5.75% 2/15/26 # | 80,000 | 79,801 | ||||||
144A 5.875% 5/1/27 # | 60,000 | 60,150 | ||||||
Charter Communications Operating | 800,000 | 818,266 | ||||||
Cincinnati Bell 144A 7.00% 7/15/24 # | 185,000 | 166,500 | ||||||
Comunicaciones Celulares via Comcel Trust 144A | 795,000 | 833,335 | ||||||
Crown Castle Towers | 110,000 | 109,201 | ||||||
144A 4.883% 8/15/20 # | 2,090,000 | 2,164,568 | ||||||
Deutsche Telekom International Finance 1.25% 10/6/23 | GBP | 318,000 | 433,087 | |||||
144A 1.95% 9/19/21 # | 1,155,000 | 1,108,027 | ||||||
6.50% 4/8/22 | GBP | 36,000 | 60,004 | |||||
Digicel Group | 890,000 | 697,537 | ||||||
144A 8.25% 9/30/20 # | 455,000 | 393,575 | ||||||
Discovery Communications 5.20% 9/20/47 | 1,765,000 | 1,764,902 | ||||||
DISH DBS 4.25% 4/1/18 | 200,000 | 200,000 | ||||||
Gray Television 144A | 415,000 | 404,625 | ||||||
GTP Acquisition Partners I 144A 2.35% 6/15/20 # | 530,000 | 524,182 | ||||||
Level 3 Financing 5.375% 5/1/25 | 871,000 | 847,047 | ||||||
Myriad International Holdings 144A 4.85% 7/6/27 # | 570,000 | 582,127 | ||||||
NBCUniversal Enterprise 144A 2.405% (LIBOR03M + 0.69%) 4/15/18 #● | 840,000 | 840,088 | ||||||
Nexstar Broadcasting 144A 5.625% 8/1/24 # | 635,000 | 623,697 | ||||||
SBA Tower Trust 144A 2.898% 10/8/19 # | 600,000 | 596,990 | ||||||
66
Table of Contents
| Principal amount° | Value (US $) | |||||||
Corporate Bonds (continued) |
| |||||||
Communications (continued) |
| |||||||
Sirius XM Radio 144A 5.00% 8/1/27 # | 100,000 | $ | 94,500 | |||||
144A 5.375% 4/15/25 # | 1,147,000 | 1,141,265 | ||||||
Sprint | 300,000 | 293,250 | ||||||
7.625% 3/1/26 | 200,000 | 195,750 | ||||||
7.875% 9/15/23 | 628,000 | 642,915 | ||||||
Sprint Capital 6.90% 5/1/19 | 1,300,000 | 1,342,250 | ||||||
Sprint Communications 7.00% 8/15/20 | 260,000 | 271,050 | ||||||
Sprint Spectrum 144A 4.738% 3/20/25 # | 1,050,000 | 1,057,875 | ||||||
Telecom Italia 144A 5.303% 5/30/24 # | 400,000 | 408,500 | ||||||
Telefonica Emisiones 4.895% 3/6/48 | 2,645,000 | 2,699,319 | ||||||
Time Warner Cable 6.75% 7/1/18 | 1,500,000 | 1,514,207 | ||||||
7.30% 7/1/38 | 2,120,000 | 2,542,286 | ||||||
Time Warner Entertainment 8.375% 3/15/23 | 1,415,000 | 1,680,616 | ||||||
T-Mobile USA 6.375% 3/1/25 | 50,000 | 52,375 | ||||||
6.50% 1/15/26 | 760,000 | 809,400 | ||||||
Tribune Media 5.875% 7/15/22 | 233,000 | 237,369 | ||||||
UPCB Finance IV 144A 5.375% 1/15/25 # | 488,000 | 473,360 | ||||||
VEON Holdings | 510,000 | 503,304 | ||||||
144A 5.95% 2/13/23 # | 925,000 | 967,559 | ||||||
Verizon Communications 2.625% 2/21/20 | 850,000 | 846,288 | ||||||
3.125% 3/16/22 | 1,600,000 | 1,586,859 | ||||||
3.145% (LIBOR03M + 1.00%) 3/16/22 ● | 1,800,000 | 1,835,424 | ||||||
3.25% 2/17/26 | EUR | 323,000 | 452,833 | |||||
3.376% 2/15/25 | 2,691,000 | 2,647,633 | ||||||
3.857% (LIBOR03M + 1.75%) 9/14/18 ● | 250,000 | 251,522 | ||||||
4.125% 3/16/27 | 1,500,000 | 1,521,209 | ||||||
4.125% 8/15/46 | 970,000 | 874,906 | ||||||
4.50% 8/17/27 | AUD | 900,000 | 710,604 | |||||
4.50% 8/10/33 | 1,485,000 | 1,505,997 | ||||||
5.50% 3/16/47 | 380,000 | 421,977 | ||||||
Virgin Media Secured Finance 144A 5.25% 1/15/26 # | 790,000 | 763,338 | ||||||
VTR Finance 144A 6.875% 1/15/24 # | 855,000 | 892,629 | ||||||
| Principal amount° | Value (US $) | |||||||
Corporate Bonds (continued) |
| |||||||
Communications (continued) |
| |||||||
Zayo Group | 805,000 | $ | 787,894 | |||||
6.375% 5/15/25 | 110,000 | 114,263 | ||||||
|
| |||||||
| 59,613,863 | ||||||||
|
| |||||||
Consumer Cyclical – 1.69% |
| |||||||
AMC Entertainment Holdings 6.125% 5/15/27 | 405,000 | 399,937 | ||||||
American Axle & Manufacturing 6.25% 3/15/26 | 350,000 | 348,145 | ||||||
American Tire Distributors 144A 10.25% 3/1/22 # | 60,000 | 61,575 | ||||||
Beacon Escrow 144A 4.875% 11/1/25 # | 640,000 | 612,800 | ||||||
BMW US Capital 144A 1.50% 4/11/19 # | 500,000 | 494,279 | ||||||
Boyd Gaming 6.375% 4/1/26 | 1,000,000 | 1,049,470 | ||||||
Daimler | NOK | 1,870,000 | 241,301 | |||||
Daimler Finance North America | 3,800,000 | 3,794,278 | ||||||
144A 3.35% 2/22/23 # | 1,430,000 | 1,425,447 | ||||||
DR Horton | 200,000 | 200,951 | ||||||
4.00% 2/15/20 | 400,000 | 406,900 | ||||||
Ford Motor Credit 1.897% 8/12/19 | 1,000,000 | 984,629 | ||||||
2.24% 6/15/18 | 4,000,000 | 3,995,320 | ||||||
3.20% 1/15/21 | 4,200,000 | 4,167,464 | ||||||
3.565% (LIBOR03M + 1.27%) 3/28/22 ● | 400,000 | 405,934 | ||||||
5.75% 2/1/21 | 700,000 | 740,888 | ||||||
General Motors 6.75% 4/1/46 | 245,000 | 284,955 | ||||||
General Motors Financial 4.375% 9/25/21 | 800,000 | 822,915 | ||||||
5.25% 3/1/26 | 725,000 | 766,544 | ||||||
GLP Capital 5.375% 4/15/26 | 730,000 | 742,775 | ||||||
Hyundai Capital America 144A 2.55% 2/6/19 # | 715,000 | 713,172 | ||||||
144A 3.00% 3/18/21 # | 580,000 | 573,412 | ||||||
JD.com 3.125% 4/29/21 | 930,000 | 912,661 | ||||||
KFC Holding 144A 5.25% 6/1/26 # | 393,000 | 392,509 | ||||||
Lithia Motors 144A 5.25% 8/1/25 # | 345,000 | 346,725 | ||||||
Live Nation Entertainment 144A 5.625% 3/15/26 # | 215,000 | 218,225 | ||||||
(continues) | 67 |
Table of Contents
Schedules of investments
Optimum Fixed Income Fund
| Principal amount° | Value (US $) | |||||||
Corporate Bonds (continued) |
| |||||||
Consumer Cyclical (continued) |
| |||||||
Lowe’s 2.491% (LIBOR03M + 0.42%) 9/10/19 ● | 520,000 | $ | 522,408 | |||||
4.05% 5/3/47 | 170,000 | 168,159 | ||||||
Marriott International 4.50% 10/1/34 | 160,000 | 163,475 | ||||||
MGM Resorts International 4.625% 9/1/26 | 605,000 | 580,800 | ||||||
5.25% 3/31/20 | 200,000 | 205,522 | ||||||
New Red Finance 144A 5.00% 10/15/25 # | 310,000 | 296,732 | ||||||
PACCAR Financial 2.625% (LIBOR03M + 0.60%) 12/6/18 ● | 835,000 | 837,878 | ||||||
Penn National Gaming 144A 5.625% 1/15/27 # | 930,000 | 895,125 | ||||||
Penske Automotive Group 5.50% 5/15/26 | 490,000 | 482,650 | ||||||
PulteGroup 5.00% 1/15/27 | 75,000 | 73,196 | ||||||
Royal Caribbean Cruises 3.70% 3/15/28 | 1,505,000 | 1,444,601 | ||||||
Schaeffler Finance 144A 4.75% 5/15/23 # | 200,000 | 201,500 | ||||||
Scientific Games International 10.00% 12/1/22 | 575,000 | 621,359 | ||||||
Toyota Motor Credit 2.80% 7/13/22 | 420,000 | 416,145 | ||||||
Volkswagen Financial Services 2.375% 11/13/18 | GBP 800,000 | 1,130,588 | ||||||
Wolverine World Wide 144A 5.00% 9/1/26 # | 400,000 | 391,000 | ||||||
Wyndham Worldwide 4.15% 4/1/24 | 255,000 | 254,572 | ||||||
ZF North America Capital 144A 4.00% 4/29/20 # | 250,000 | 252,813 | ||||||
|
| |||||||
| 34,041,734 | ||||||||
|
| |||||||
Consumer Non-Cyclical – 3.37% |
| |||||||
Abbott Laboratories 2.90% 11/30/21 | 745,000 | 738,510 | ||||||
4.90% 11/30/46 | 1,700,000 | 1,868,079 | ||||||
AbbVie 2.85% 5/14/23 | 1,400,000 | 1,356,941 | ||||||
4.45% 5/14/46 | 955,000 | 951,827 | ||||||
Adani Abbot Point Terminal 144A 4.45% 12/15/22 # | 1,500,000 | 1,414,949 | ||||||
Air Medical Group Holdings 144A 6.375% 5/15/23 # | 110,000 | 104,775 | ||||||
Albertsons 5.75% 3/15/25 | 298,000 | 255,624 | ||||||
| Principal amount° | Value (US $) | |||||||
Corporate Bonds (continued) |
| |||||||
Consumer Non-Cyclical (continued) |
| |||||||
Albertsons 6.625% 6/15/24 | 35,000 | $ | 31,544 | |||||
Allergan Finance 3.25% 10/1/22 | 300,000 | 293,958 | ||||||
Allergan Funding 3.00% 3/12/20 | 900,000 | 895,678 | ||||||
3.45% 3/15/22 | 1,000,000 | 992,079 | ||||||
Amgen 4.00% 9/13/29 | GBP | 216,000 | 341,340 | |||||
Anheuser-Busch InBev Finance 2.173% (LIBOR03M + 0.40%) 2/1/19 ● | 490,000 | 491,038 | ||||||
2.65% 2/1/21 | 900,000 | 893,404 | ||||||
3.30% 2/1/23 | 2,650,000 | 2,653,522 | ||||||
3.65% 2/1/26 | 685,000 | 681,667 | ||||||
4.60% 4/15/48 | 685,000 | 709,028 | ||||||
5.375% 1/15/20 | 1,000,000 | 1,046,480 | ||||||
Atento Luxco 1 144A 6.125% 8/10/22 # | 740,000 | 754,338 | ||||||
BAT Capital | 275,000 | 269,740 | ||||||
144A 2.764% 8/15/22 # | 440,000 | 425,887 | ||||||
144A 3.222% 8/15/24 # | 1,975,000 | 1,906,020 | ||||||
BAT International Finance 144A | 700,000 | 694,301 | ||||||
Becton Dickinson 3.363% 6/6/24 | 1,375,000 | 1,324,697 | ||||||
Boston Scientific | 600,000 | 596,329 | ||||||
3.375% 5/15/22 | 800,000 | 797,995 | ||||||
4.00% 3/1/28 | 890,000 | 890,980 | ||||||
Campbell Soup | 385,000 | 387,487 | ||||||
3.65% 3/15/23 | 230,000 | 230,645 | ||||||
Cardinal Health | 1,200,000 | 1,187,249 | ||||||
Celgene | 320,000 | 314,196 | ||||||
3.90% 2/20/28 | 1,730,000 | 1,697,509 | ||||||
4.55% 2/20/48 | 585,000 | 574,773 | ||||||
Central Nippon Expressway 2.079% 11/5/19 | 1,200,000 | 1,185,007 | ||||||
Cott Holdings 144A 5.50% 4/1/25 # | 380,000 | 376,200 | ||||||
CVS Health 2.125% 6/1/21 | 450,000 | 434,993 | ||||||
2.687% (LIBOR03M + 0.63%) 3/9/20 ● | 1,400,000 | 1,405,646 | ||||||
3.35% 3/9/21 | 1,595,000 | 1,604,516 | ||||||
68
Table of Contents
| Principal amount° | Value (US $) | |||||||
Corporate Bonds (continued) |
| |||||||
Consumer Non-Cyclical (continued) |
| |||||||
CVS Health | 940,000 | $ | 943,927 | |||||
4.10% 3/25/25 | 1,030,000 | 1,037,935 | ||||||
4.30% 3/25/28 | 1,775,000 | 1,789,488 | ||||||
4.78% 3/25/38 | 370,000 | 375,570 | ||||||
CVS Pass Through Trust 144A 5.773% 1/10/33 #◆ | 79,841 | 85,415 | ||||||
DaVita 5.00% 5/1/25 | 516,000 | 500,030 | ||||||
Encompass Health 5.125% 3/15/23 | 235,000 | 239,113 | ||||||
5.75% 11/1/24 | 643,000 | 655,860 | ||||||
5.75% 9/15/25 | 270,000 | 276,750 | ||||||
ESAL 144A 6.25% 2/5/23 # | 465,000 | 445,237 | ||||||
HCA | 2,600,000 | 2,616,380 | ||||||
5.375% 2/1/25 | 1,025,000 | 1,030,125 | ||||||
7.58% 9/15/25 | 30,000 | 33,037 | ||||||
Hill-Rom Holdings | 245,000 | 244,081 | ||||||
144A 5.75% 9/1/23 # | 325,000 | 338,000 | ||||||
Imperial Brands Finance 144A 2.95% 7/21/20 # | 700,000 | 695,274 | ||||||
144A 3.75% 7/21/22 # | 470,000 | 472,149 | ||||||
JBS USA | 155,000 | 145,313 | ||||||
144A 5.875% 7/15/24 # | 320,000 | 313,296 | ||||||
144A 6.75% 2/15/28 # | 490,000 | 471,013 | ||||||
KAR Auction Services 144A 5.125% 6/1/25 # | 200,000 | 199,500 | ||||||
Kernel Holding 144A | 890,000 | 960,515 | ||||||
Kraft Heinz Foods 2.631% (LIBOR03M + 0.82%) 8/10/22 ● | 300,000 | 302,345 | ||||||
Marfrig Holdings Europe 144A 8.00% 6/8/23 # | 935,000 | 944,350 | ||||||
Merck & Co. 2.233% (LIBOR03M + 0.36%) 5/18/18 ● | 680,000 | 680,093 | ||||||
MHP | 455,000 | 454,909 | ||||||
144A 7.75% 5/10/24 # | 520,000 | 549,063 | ||||||
Molson Coors Brewing 4.20% 7/15/46 | 35,000 | 33,156 | ||||||
MPH Acquisition Holdings 144A 7.125% 6/1/24 # | 330,000 | 341,550 | ||||||
Mylan 144A | 705,000 | 705,153 | ||||||
| Principal amount° | Value (US $) | |||||||
Corporate Bonds (continued) |
| |||||||
Consumer Non-Cyclical (continued) |
| |||||||
New York and Presbyterian Hospital 4.063% 8/1/56 | 690,000 | $ | 684,739 | |||||
Nielsen Co. Luxembourg 144A 5.00% 2/1/25 # | 790,000 | 781,113 | ||||||
Pernod Ricard 144A 4.45% 1/15/22 # | 1,665,000 | 1,729,587 | ||||||
Pfizer 2.425% (LIBOR03M + 0.30%) 6/15/18 ● | 754,000 | 754,171 | ||||||
Prime Security Services Borrower 144A 9.25% 5/15/23 # | 605,000 | 657,181 | ||||||
Rede D’or Finance 144A 4.95% 1/17/28 # | 945,000 | 899,522 | ||||||
Reynolds American 4.00% 6/12/22 | 900,000 | 916,186 | ||||||
Shire Acquisitions Investments Ireland 2.875% 9/23/23 | 300,000 | 286,652 | ||||||
Tenet Healthcare 144A 5.125% 5/1/25 # | 1,105,000 | 1,066,325 | ||||||
Teva Pharmaceutical Finance Netherlands III 144A 6.00% 4/15/24 # | 2,350,000 | 2,284,089 | ||||||
144A 6.75% 3/1/28 # | 720,000 | 711,662 | ||||||
Thermo Fisher Scientific 3.00% 4/15/23 | 1,980,000 | 1,934,319 | ||||||
Tyson Foods 2.65% 8/15/19 | 1,500,000 | 1,491,885 | ||||||
Universal Health Services 144A 3.75% 8/1/19 # | 1,400,000 | 1,412,250 | ||||||
144A 5.00% 6/1/26 # | 210,000 | 212,100 | ||||||
Zimmer Biomet Holdings 3.15% 4/1/22 | 300,000 | 295,891 | ||||||
4.625% 11/30/19 | 1,270,000 | 1,303,394 | ||||||
|
| |||||||
| 68,078,644 | ||||||||
|
| |||||||
Energy – 3.97% | ||||||||
Abu Dhabi Crude Oil Pipeline | 680,000 | 650,930 | ||||||
144A 4.60% 11/2/47 # | 780,000 | 759,545 | ||||||
Alta Mesa Holdings 7.875% 12/15/24 | 80,000 | 83,700 | ||||||
Anadarko Petroleum 6.60% 3/15/46 | 1,555,000 | 1,958,948 | ||||||
Andeavor Logistics 5.25% 1/15/25 | 390,000 | 396,981 | ||||||
Cheniere Corpus Christi Holdings 5.875% 3/31/25 | 295,000 | 309,750 | ||||||
Chevron 2.555% (LIBOR03M + 0.53%) 3/3/22 ● | 575,000 | 581,736 | ||||||
ConocoPhillips 2.739% (LIBOR03M + 0.90%) 5/15/22 ● | 575,000 | 586,538 | ||||||
(continues) | 69 |
Table of Contents
Schedules of investments
Optimum Fixed Income Fund
| Principal amount° | Value (US $) | |||||||
| ||||||||
Corporate Bonds (continued) |
| |||||||
| ||||||||
Energy (continued) | ||||||||
Crestwood Midstream Partners 5.75% 4/1/25 | 405,000 | $ | 402,975 | |||||
Diamondback Energy 4.75% 11/1/24 | 775,000 | 769,187 | ||||||
Ecopetrol | 410,000 | 439,725 | ||||||
7.375% 9/18/43 | 270,000 | 317,587 | ||||||
Enbridge | 2,550,000 | 2,545,379 | ||||||
2.825% (LIBOR03M + 0.70%) 6/15/20 ● | 1,350,000 | 1,355,597 | ||||||
3.70% 7/15/27 | 1,580,000 | 1,516,459 | ||||||
6.00% 1/15/77 µ | 555,000 | 549,450 | ||||||
6.25% 3/1/78 µ | 420,000 | 416,840 | ||||||
Energy Transfer Equity 5.50% 6/1/27 | 50,000 | 50,250 | ||||||
7.50% 10/15/20 | 475,000 | 512,703 | ||||||
Energy Transfer Partners 5.00% 10/1/22 | 1,500,000 | 1,560,415 | ||||||
5.75% 9/1/20 | 400,000 | 418,537 | ||||||
6.125% 12/15/45 | 1,370,000 | 1,424,535 | ||||||
6.625%µy | 1,235,000 | 1,177,109 | ||||||
9.70% 3/15/19 | 694,000 | 736,213 | ||||||
Enlink Midstream Partners 6.00%µy | 455,000 | 425,788 | ||||||
Enterprise Products Operating 4.25% 2/15/48 | 595,000 | 581,263 | ||||||
Exxon Mobil 2.395% (LIBOR03M + 0.37%) 3/6/22 ● | 1,125,000 | 1,134,402 | ||||||
Florida Gas Transmission 144A 7.90% 5/15/19 # | 320,000 | 337,596 | ||||||
Gazprom OAO Via Gaz Capital 144A | 1,065,000 | 1,058,757 | ||||||
Genesis Energy | 690,000 | 711,563 | ||||||
Gran Tierra Energy International Holdings 144A 6.25% 2/15/25 # | 560,000 | 548,800 | ||||||
Gulfport Energy | 520,000 | 495,950 | ||||||
6.625% 5/1/23 | 245,000 | 248,675 | ||||||
Hilcorp Energy I 144A 5.75% 10/1/25 # | 40,000 | 39,800 | ||||||
Holly Energy Partners 144A 6.00% 8/1/24 # | 40,000 | 41,000 | ||||||
Kinder Morgan 4.30% 3/1/28 | 965,000 | 962,965 | ||||||
| Principal amount° | Value (US $) | |||||||
| ||||||||
Corporate Bonds (continued) | ||||||||
| ||||||||
Energy (continued) | ||||||||
Kinder Morgan Energy Partners 5.00% 10/1/21 | 620,000 | $ | 647,202 | |||||
6.85% 2/15/20 | 2,000,000 | 2,125,656 | ||||||
9.00% 2/1/19 | 2,200,000 | 2,306,185 | ||||||
Laredo Petroleum 6.25% 3/15/23 | 285,000 | 287,137 | ||||||
Marathon Oil 5.20% 6/1/45 | 285,000 | 300,312 | ||||||
MPLX | 900,000 | 885,443 | ||||||
4.70% 4/15/48 | 1,065,000 | 1,046,561 | ||||||
4.875% 12/1/24 | 1,795,000 | 1,883,971 | ||||||
5.20% 3/1/47 | 125,000 | 130,898 | ||||||
Murphy Oil 6.875% 8/15/24 | 1,030,000 | 1,076,350 | ||||||
Murphy Oil USA 6.00% 8/15/23 | 895,000 | 926,325 | ||||||
Nabors Industries 144A 5.75% 2/1/25 # | 315,000 | 297,675 | ||||||
Newfield Exploration 5.375% 1/1/26 | 50,000 | 51,875 | ||||||
5.75% 1/30/22 | 475,000 | 498,750 | ||||||
Noble Energy | 2,020,000 | 1,988,741 | ||||||
4.95% 8/15/47 | 155,000 | 161,839 | ||||||
5.05% 11/15/44 | 500,000 | 523,711 | ||||||
NuStar Logistics 5.625% 4/28/27 | 285,000 | 277,163 | ||||||
Oasis Petroleum | 260,000 | 264,550 | ||||||
6.875% 3/15/22 | 40,000 | 40,670 | ||||||
Occidental Petroleum | 1,145,000 | 1,154,243 | ||||||
ONEOK 7.50% 9/1/23 | 1,485,000 | 1,731,946 | ||||||
Pertamina Persero 144A 4.875% 5/3/22 # | 525,000 | 542,920 | ||||||
144A 5.625% 5/20/43 # | 255,000 | 262,089 | ||||||
Petrobras Global Finance | 520,000 | 514,150 | ||||||
144A 5.999% 1/27/28 # | 2,816,000 | 2,791,360 | ||||||
6.125% 1/17/22 | 500,000 | 535,500 | ||||||
6.75% 1/27/41 | 985,000 | 962,837 | ||||||
6.85% 6/5/15 | 1,700,000 | 1,615,000 | ||||||
7.25% 3/17/44 | 600,000 | 613,500 | ||||||
7.375% 1/17/27 | 385,000 | 417,533 | ||||||
Petroleos Mexicanos | 110,000 | 120,364 | ||||||
6.50% 3/13/27 | 390,000 | 417,007 | ||||||
6.75% 9/21/47 | 460,000 | 466,615 | ||||||
70
Table of Contents
| Principal amount° | Value (US $) | |||||||
| ||||||||
Corporate Bonds (continued) |
| |||||||
| ||||||||
Energy (continued) | ||||||||
Precision Drilling 144A 7.125% 1/15/26 # | 165,000 | $ | 163,763 | |||||
7.75% 12/15/23 | 235,000 | 245,281 | ||||||
QEP Resources 5.25% 5/1/23 | 565,000 | 546,660 | ||||||
Raizen Fuels Finance 144A 5.30% 1/20/27 # | 430,000 | 435,590 | ||||||
Rio Energy 144A 6.875% 2/1/25 # | 880,000 | 871,200 | ||||||
Rio Oil Finance Trust | 174,200 | 189,965 | ||||||
Rockies Express Pipeline 144A 6.85% 7/15/18 # | 500,000 | 505,050 | ||||||
Sabine Pass Liquefaction 5.625% 3/1/25 | 835,000 | 898,008 | ||||||
5.75% 5/15/24 | 6,950,000 | 7,487,304 | ||||||
5.875% 6/30/26 | 980,000 | 1,072,231 | ||||||
6.25% 3/15/22 | 400,000 | 434,288 | ||||||
SEPLAT Petroleum Development 144A 9.25% 4/1/23 # | 530,000 | 531,325 | ||||||
Shell International Finance 2.261% (LIBOR03M + 0.45%) 5/11/20 ● | 595,000 | 598,567 | ||||||
4.375% 5/11/45 | 151,000 | 160,570 | ||||||
Southwestern Energy 4.10% 3/15/22 | 220,000 | 211,750 | ||||||
6.70% 1/23/25 | 95,000 | 92,625 | ||||||
Spectra Energy Partners 2.725% (LIBOR03M + 0.70%) 6/5/20 ● | 500,000 | 503,502 | ||||||
Statoil 2.251% (LIBOR03M + 0.46%) 11/8/18 ● | 835,000 | 836,674 | ||||||
Summit Midstream Holdings 5.75% 4/15/25 | 425,000 | 406,937 | ||||||
Targa Resources Partners 5.375% 2/1/27 | 680,000 | 680,000 | ||||||
Tecpetrol 144A 4.875% 12/12/22 # | 1,340,000 | 1,311,525 | ||||||
Tengizchevroil Finance Co. International 144A 4.00% 8/15/26 # | 785,000 | 752,226 | ||||||
Transcanada Trust 5.875% 8/15/76 µ | 560,000 | 585,200 | ||||||
Transcontinental Gas Pipe Line | 405,000 | 396,029 | ||||||
144A 4.60% 3/15/48 # | 470,000 | 455,936 | ||||||
| Principal amount° | Value (US $) | |||||||
| ||||||||
Corporate Bonds (continued) |
| |||||||
| ||||||||
Energy (continued) | ||||||||
Transocean 144A 9.00% 7/15/23 # | 70,000 | $ | 74,725 | |||||
Transocean Proteus 144A 6.25% 12/1/24 # | 292,500 | 298,716 | ||||||
Tullow Oil 144A 7.00% 3/1/25 # | 960,000 | 961,200 | ||||||
Western Gas Partners 5.30% 3/1/48 | 590,000 | 585,540 | ||||||
WildHorse Resource Development 6.875% 2/1/25 | 80,000 | 80,600 | ||||||
Williams Partners 4.85% 3/1/48 | 370,000 | 367,052 | ||||||
Woodside Finance 144A 3.70% 9/15/26 # | 400,000 | 394,337 | ||||||
144A 4.60% 5/10/21 # | 400,000 | 412,193 | ||||||
144A 8.75% 3/1/19 # | 1,125,000 | 1,186,197 | ||||||
YPF 144A 7.00% 12/15/47 # | 470,000 | 422,530 | ||||||
144A 27.125% | ||||||||
(BADLARPP + 4.00%) 7/7/20 #● | 1,205,000 | 970,025 | ||||||
|
| |||||||
| 80,099,047 | ||||||||
|
| |||||||
Finance Companies – 1.19% |
| |||||||
AerCap Global Aviation Trust 144A 6.50% 6/15/45 #µ | 1,585,000 | 1,717,744 | ||||||
AerCap Ireland Capital 3.65% 7/21/27 | 1,990,000 | 1,865,883 | ||||||
4.625% 10/30/20 | 1,000,000 | 1,029,799 | ||||||
Air Lease 3.00% 9/15/23 | 985,000 | 944,575 | ||||||
3.625% 4/1/27 | 715,000 | 682,549 | ||||||
Aviation Capital Group 144A 2.875% 9/17/18 # | 300,000 | 299,915 | ||||||
144A 3.50% 11/1/27 # | 480,000 | 450,955 | ||||||
144A 4.875% 10/1/25 # | 1,090,000 | 1,144,090 | ||||||
144A 6.75% 4/6/21 # | 500,000 | 550,333 | ||||||
BOC Aviation 144A 2.375% 9/15/21 # | 910,000 | 876,546 | ||||||
2.375% 9/15/21 | 600,000 | 577,942 | ||||||
3.00% 5/23/22 | 300,000 | 291,623 | ||||||
Citicorp Lease Pass Through Trust Series 1999-1 144A 8.04% 12/15/19 #◆ | 148,870 | 160,867 | ||||||
GATX 2.507% (LIBOR03M + 0.72%) 11/5/21 ● | 1,300,000 | 1,307,434 | ||||||
GE Capital International Funding Unlimited 2.342% 11/15/20 | 251,000 | 245,523 | ||||||
(continues) | 71 |
Table of Contents
Schedules of investments
Optimum Fixed Income Fund
| Principal amount° | Value (US $) | |||||||
| ||||||||
Corporate Bonds (continued) |
| |||||||
| ||||||||
Finance Companies (continued) |
| |||||||
International Lease Finance 6.25% 5/15/19 | 200,000 | $ | 206,907 | |||||
144A 7.125% 9/1/18 # | 100,000 | 101,676 | ||||||
8.625% 1/15/22 | 1,455,000 | 1,697,889 | ||||||
LeasePlan 144A 2.875% 1/22/19 # | 1,600,000 | 1,595,300 | ||||||
Navient 5.50% 1/15/19 | 2,500,000 | 2,533,750 | ||||||
NFP 144A | 964,000 | 961,590 | ||||||
ORIX 3.20% 1/19/22 | 500,000 | 495,805 | ||||||
SMBC Aviation Capital | ||||||||
Finance 144A 3.00% 7/15/22 # | 400,000 | 391,532 | ||||||
Springleaf Finance 8.25% 12/15/20 | 2,500,000 | 2,728,125 | ||||||
Temasek Financial I 144A 2.375% 1/23/23 # | 560,000 | 542,985 | ||||||
Waha Aerospace 3.925% 7/28/20 | 525,000 | 530,712 | ||||||
|
| |||||||
| 23,932,049 | ||||||||
|
| |||||||
Insurance – 0.73% | ||||||||
Acrisure 144A 7.00% 11/15/25 # | 940,000 | 904,750 | ||||||
AIA Group 144A 3.90% 4/6/28 # | 1,000,000 | 1,010,547 | ||||||
Allstate 2.932% (LIBOR03M + 0.63%) 3/29/23 ● | 200,000 | 200,521 | ||||||
Ambac Assurance 144A 5.10% 6/7/20 # | 29,743 | 39,558 | ||||||
Ambac LSNI 144A 6.811% (LIBOR03M + 5.00%) 2/12/23 #● | 142,988 | 144,775 | ||||||
AssuredPartners 144A 7.00% 8/15/25 # | 1,038,000 | 1,027,620 | ||||||
Athene Global Funding 144A 3.538% (LIBOR03M + 1.23%) 7/1/22 #● | 700,000 | 712,073 | ||||||
AXIS Specialty Finance 4.00% 12/6/27 | 1,170,000 | 1,129,858 | ||||||
HUB International 144A 7.875% 10/1/21 # | 120,000 | 124,350 | ||||||
Liberty Mutual Group 144A 4.95% 5/1/22 # | 320,000 | 338,107 | ||||||
MetLife 144A | 1,100,000 | 1,501,500 | ||||||
MetLife Capital Trust IV 144A 7.875% 12/15/37 # | 300,000 | 378,000 | ||||||
Metropolitan Life Global Funding I 144A 3.45% 12/18/26 # | 765,000 | 747,560 | ||||||
| Principal amount° | Value (US $) | |||||||
| ||||||||
Corporate Bonds (continued) | ||||||||
| ||||||||
Insurance (continued) | ||||||||
Nuveen Finance 144A 2.95% 11/1/19 # | 1,130,000 | $ | 1,127,539 | |||||
144A 4.125% 11/1/24 # | 770,000 | 784,745 | ||||||
Progressive 2.45% 1/15/27 | 380,000 | 348,748 | ||||||
4.125% 4/15/47 | 20,000 | 20,254 | ||||||
Prudential Financial 5.375% 5/15/45 µ | 765,000 | 785,081 | ||||||
USIS Merger Sub 144A 6.875% 5/1/25 # | 1,338,000 | 1,341,345 | ||||||
Voya Financial 144A 4.70% 1/23/48 #µ | 795,000 | 724,111 | ||||||
XLIT 4.179% (LIBOR03M + 2.46%) 12/29/49 y● | 510,000 | 507,450 | ||||||
5.50% 3/31/45 | 725,000 | 796,859 | ||||||
|
| |||||||
| 14,695,351 | ||||||||
|
| |||||||
Natural Gas – 0.09% | ||||||||
AmeriGas Partners 5.875% 8/20/26 | 615,000 | 604,237 | ||||||
KazTransGas 144A 4.375% 9/26/27 # | 630,000 | 606,551 | ||||||
Perusahaan Gas Negara Persero 144A 5.125% 5/16/24 # | 615,000 | 635,956 | ||||||
|
| |||||||
| 1,846,744 | ||||||||
|
| |||||||
Real Estate Investment Trusts – 1.06% |
| |||||||
Alexandria Real Estate Equities 3.45% 4/30/25 | 715,000 | 692,373 | ||||||
American Tower 3.60% 1/15/28 | 1,110,000 | 1,055,292 | ||||||
5.05% 9/1/20 | 500,000 | 520,628 | ||||||
American Tower Trust I 144A 3.07% 3/15/23 # | 1,285,000 | 1,269,927 | ||||||
Corporate Office Properties 3.60% 5/15/23 | 690,000 | 676,232 | ||||||
5.25% 2/15/24 | 670,000 | 705,184 | ||||||
Crown Castle International 3.80% 2/15/28 | 2,125,000 | 2,046,453 | ||||||
5.25% 1/15/23 | 975,000 | 1,036,844 | ||||||
CubeSmart 3.125% 9/1/26 | 670,000 | 623,560 | ||||||
Digital Realty Trust 3.40% 10/1/20 | 2,100,000 | 2,113,531 | ||||||
Education Realty Operating Partnership 4.60% 12/1/24 | 950,000 | 964,698 | ||||||
Equinix 5.375% 5/15/27 | 350,000 | 356,125 | ||||||
ESH Hospitality 144A 5.25% 5/1/25 # | 510,000 | 497,403 | ||||||
72
Table of Contents
| Principal amount° | Value (US $) | |||||||
Corporate Bonds (continued) |
| |||||||
Real Estate Investment Trusts (continued) |
| |||||||
GEO Group | 140,000 | $ | 138,950 | |||||
6.00% 4/15/26 | 85,000 | 83,725 | ||||||
Goodman US Finance Three | 330,000 | 317,552 | ||||||
HCP 5.375% 2/1/21 | 359,000 | 377,625 | ||||||
Hospitality Properties Trust | 870,000 | 879,832 | ||||||
Host Hotels & Resorts | 1,270,000 | 1,256,430 | ||||||
3.875% 4/1/24 | 250,000 | 247,139 | ||||||
4.50% 2/1/26 | 45,000 | 45,604 | ||||||
Hudson Pacific Properties | 425,000 | 407,868 | ||||||
Iron Mountain US Holdings | 380,000 | 365,275 | ||||||
Kilroy Realty | 720,000 | 699,304 | ||||||
Life Storage | 695,000 | 664,735 | ||||||
3.875% 12/15/27 | 175,000 | 168,764 | ||||||
Regency Centers | 125,000 | 119,963 | ||||||
SBA Communications | 525,000 | 516,469 | ||||||
WEA Finance 144A | 1,800,000 | 1,802,928 | ||||||
WP Carey 4.60% 4/1/24 | 695,000 | 712,978 | ||||||
|
| |||||||
| 21,363,391 | ||||||||
|
| |||||||
Technology – 0.99% | ||||||||
Analog Devices | 640,000 | 638,203 | ||||||
Apple | 1,040,000 | 1,047,059 | ||||||
2.30% (LIBOR03M + 0.50%) 2/9/22 ● | 180,000 | 182,216 | ||||||
2.75% 1/13/25 | 2,215,000 | 2,132,610 | ||||||
Broadcom | 1,400,000 | 1,374,587 | ||||||
3.50% 1/15/28 | 895,000 | 842,382 | ||||||
CDK Global | 305,000 | 294,325 | ||||||
5.00% 10/15/24 | 910,000 | 930,475 | ||||||
CDW Finance 5.00% 9/1/25 | 90,000 | 90,000 | ||||||
Cisco Systems | 650,000 | 652,783 | ||||||
| Principal amount° | Value (US $) | |||||||
Corporate Bonds (continued) |
| |||||||
Technology (continued) | ||||||||
CommScope Technologies | 740,000 | $ | 704,850 | |||||
Dell International | 1,600,000 | 1,642,418 | ||||||
144A 4.42% 6/15/21 # | 300,000 | 307,898 | ||||||
144A 5.45% 6/15/23 # | 600,000 | 636,499 | ||||||
144A 6.02% 6/15/26 # | 1,550,000 | 1,670,950 | ||||||
144A 8.10% 7/15/36 # | 15,000 | 18,262 | ||||||
EMC 2.65% 6/1/20 | 900,000 | 870,154 | ||||||
First Data 144A | 510,000 | 515,100 | ||||||
Genesys Telecommunications Laboratories 144A | 20,000 | 22,250 | ||||||
Infor US 6.50% 5/15/22 | 70,000 | 71,575 | ||||||
International Business Machines | 440,000 | 429,989 | ||||||
NXP 144A 4.625% 6/1/23 # | 575,000 | 586,673 | ||||||
Oracle 2.214% (LIBOR03M + 0.51%) 10/8/19 ● | 940,000 | 946,261 | ||||||
Solera 144A | 50,000 | 55,875 | ||||||
Symantec | 2,000,000 | 2,029,597 | ||||||
144A 5.00% 4/15/25 # | 530,000 | 535,687 | ||||||
Tencent Holdings 144A | 690,000 | 655,740 | ||||||
|
| |||||||
| 19,884,418 | ||||||||
|
| |||||||
Transportation – 0.74% | ||||||||
American Airlines 2011-1 Class A Pass Through Trust 5.25% 1/31/21 ◆ | 282,184 | 292,314 | ||||||
American Airlines 2015-1 Class A Pass Through Trust 3.375% 5/1/27 ◆ | 329,496 | 322,906 | ||||||
American Airlines 2015-2 Class AA Pass Through Trust 3.60% 9/22/27 ◆ | 221,797 | 219,978 | ||||||
American Airlines 2016-1 Class AA Pass Through Trust 3.575% 1/15/28 ◆ | 450,143 | 446,492 | ||||||
American Airlines 2016-3 Class AA Pass Through Trust 3.00% 10/15/28 ◆ | 1,264,102 | 1,197,092 | ||||||
AP Moller - Maersk 144A 2.875% 9/28/20 # | 200,000 | 198,389 | ||||||
Avis Budget Car Rental 144A 6.375% 4/1/24 # | 235,000 | 239,113 | ||||||
(continues) | 73 |
Table of Contents
Schedules of investments
Optimum Fixed Income Fund
| Principal amount° | Value (US $) | |||||||
Corporate Bonds (continued) |
| |||||||
Transportation (continued) |
| |||||||
Continental Airlines 2009-2 Class A Pass Through Trust 7.25% 11/10/19 ◆ | 567,087 | $ | 598,957 | |||||
Delta Air Lines 3.625% 3/15/22 | 500,000 | 499,701 | ||||||
Delta Air Lines 2007-1 Class A Pass Through Trust 6.821% 8/10/22 ◆ | 233,148 | 257,944 | ||||||
Doric Nimrod Air Finance Alpha 2012-1 Class A Pass Through Trust 144A 5.125% 11/30/22 #◆ | 1,193,108 | 1,226,352 | ||||||
Kansas City Southern 3.00% 5/15/23 | 500,000 | 485,148 | ||||||
Latam Airlines 2015-1 Pass Through Trust Class A 4.20% 11/15/27 ◆ | 441,988 | 436,463 | ||||||
Penske Truck Leasing 144A 3.30% 4/1/21 # | 435,000 | 435,969 | ||||||
144A 3.95% 3/10/25 # | 1,000,000 | 1,003,087 | ||||||
144A 4.20% 4/1/27 # | 1,275,000 | 1,286,826 | ||||||
Transnet SOC 144A 4.00% 7/26/22 # | 575,000 | 561,895 | ||||||
United Airlines 2014-1 Class A Pass Through Trust 4.00% 4/11/26 ◆ | 301,106 | 304,902 | ||||||
United Airlines 2014-2 Class A Pass Through Trust 3.75% 9/3/26 ◆ | 557,241 | 554,204 | ||||||
United Airlines 2016-1 Class AA Pass Through Trust 3.10% 7/7/28 ◆ | 540,356 | 522,188 | ||||||
United Parcel Service 5.125% 4/1/19 | 2,210,000 | 2,270,691 | ||||||
United Rentals North America 5.50% 5/15/27 | 685,000 | 691,850 | ||||||
US Airways 2012-2 Class A Pass Through Trust 4.625% 6/3/25 ◆ | 500,043 | 516,545 | ||||||
XPO Logistics 144A 6.125% 9/1/23 # | 406,000 | 420,718 | ||||||
|
| |||||||
| 14,989,724 | ||||||||
|
| |||||||
Utilities – 2.74% | ||||||||
Aegea Finance 144A 5.75% 10/10/24 # | 785,000 | 781,075 | ||||||
AEP Texas 2.40% 10/1/22 | 245,000 | 235,974 | ||||||
AES Andres 144A 7.95% 5/11/26 # | 840,000 | 901,034 | ||||||
AES Gener 144A 5.25% 8/15/21 # | 20,000 | 20,528 | ||||||
| Principal amount° | Value (US $) | |||||||
Corporate Bonds (continued) |
| |||||||
Utilities (continued) |
| |||||||
Ameren Illinois 9.75% 11/15/18 | 2,110,000 | $ | 2,197,805 | |||||
American Transmission Systems 144A 5.25% 1/15/22 # | 2,445,000 | 2,604,836 | ||||||
Avangrid 3.15% 12/1/24 | 305,000 | 296,402 | ||||||
Berkshire Hathaway Energy 3.75% 11/15/23 | 1,145,000 | 1,168,622 | ||||||
Calpine 144A 5.25% 6/1/26 # | 1,040,000 | 1,007,500 | ||||||
Cerro del Aguila 144A 4.125% 8/16/27 # | 870,000 | 833,025 | ||||||
Cleveland Electric Illuminating 5.50% 8/15/24 | 515,000 | 572,258 | ||||||
CMS Energy 6.25% 2/1/20 | 1,080,000 | 1,138,886 | ||||||
ComEd Financing III 6.35% 3/15/33 | 680,000 | 729,300 | ||||||
Dominion Energy 2.00% 8/15/21 | 280,000 | 267,553 | ||||||
3.625% 12/1/24 | 820,000 | 813,453 | ||||||
DTE Energy | 475,000 | 437,986 | ||||||
3.30% 6/15/22 | 715,000 | 715,263 | ||||||
Duke Energy | 480,000 | 457,168 | ||||||
2.65% 9/1/26 | 205,000 | 187,318 | ||||||
3.15% 8/15/27 | 820,000 | 772,868 | ||||||
Dynegy 144A 8.00% 1/15/25 # | 136,000 | 148,580 | ||||||
E.ON International Finance 144A 5.80% 4/30/18 # | 200,000 | 200,458 | ||||||
Emera 6.75% 6/15/76 µ | 1,365,000 | 1,481,025 | ||||||
Enel 144A 8.75% 9/24/73 #µ | 1,605,000 | 1,907,944 | ||||||
Enel Finance International 144A 3.625% 5/25/27 # | 2,905,000 | 2,770,203 | ||||||
Entergy Arkansas 3.75% 2/15/21 | 200,000 | 203,899 | ||||||
Entergy Louisiana 3.12% 9/1/27 | 80,000 | 77,047 | ||||||
4.05% 9/1/23 | 1,555,000 | 1,592,390 | ||||||
4.95% 1/15/45 | 235,000 | 240,311 | ||||||
Exelon 2.45% 4/15/21 | 200,000 | 195,575 | ||||||
3.497% 6/1/22 | 1,075,000 | 1,065,380 | ||||||
3.95% 6/15/25 | 670,000 | 672,639 | ||||||
FirstEnergy 2.85% 7/15/22 | 200,000 | 194,122 | ||||||
Fortis 2.10% 10/4/21 | 325,000 | 310,879 | ||||||
3.055% 10/4/26 | 1,245,000 | 1,155,182 | ||||||
74
Table of Contents
| Principal amount° | Value (US $) | |||||||
Corporate Bonds (continued) |
| |||||||
Utilities (continued) | ||||||||
Great Plains Energy 4.85% 6/1/21 | 545,000 | $ | 564,521 | |||||
Israel Electric 144A | 750,000 | 737,198 | ||||||
ITC Holdings 144A | 330,000 | 320,442 | ||||||
Jersey Central Power & Light 7.35% 2/1/19 | 1,000,000 | 1,035,417 | ||||||
Kansas City Power & Light 3.65% 8/15/25 | 1,350,000 | 1,355,384 | ||||||
LG&E &KU Energy | 165,000 | 167,410 | ||||||
4.375% 10/1/21 | 1,555,000 | 1,613,413 | ||||||
Majapahit Holding | 400,000 | 430,080 | ||||||
Mississippi Power | 795,000 | 801,014 | ||||||
National Rural Utilities Cooperative Finance 4.75% 4/30/43 µ | 1,195,000 | 1,226,600 | ||||||
5.25% 4/20/46 µ | 865,000 | 921,606 | ||||||
New York State Electric & Gas 144A 3.25% 12/1/26 # | 1,015,000 | 989,648 | ||||||
Newfoundland & Labrador Hydro 3.60% 12/1/45 | CAD | 100,000 | 81,308 | |||||
NextEra Energy Capital Holdings | 450,000 | 448,741 | ||||||
3.55% 5/1/27 | 385,000 | 374,602 | ||||||
NV Energy 6.25% 11/15/20 | 935,000 | 1,009,563 | ||||||
Pedernales Electric Cooperative (MBIA) 144A 6.202% 11/15/32 # | 620,000 | 679,443 | ||||||
Pennsylvania Electric 5.20% 4/1/20 | 280,000 | 289,631 | ||||||
Perusahaan Listrik Negara 144A 4.125% 5/15/27 # | 500,000 | 481,982 | ||||||
144A 5.25% 5/15/47 # | 410,000 | 402,043 | ||||||
Public Service Co. of New Hampshire 3.50% 11/1/23 | 635,000 | 641,798 | ||||||
Public Service Co. of Oklahoma 5.15% 12/1/19 | 645,000 | 667,269 | ||||||
Puget Energy 6.50% 12/15/20 | 3,800,000 | 4,100,845 | ||||||
Sempra Energy 2.575% (LIBOR03M + 0.45%) 3/15/21 ● | 2,050,000 | 2,056,694 | ||||||
2.90% 2/1/23 | 195,000 | 190,904 | ||||||
3.40% 2/1/28 | 540,000 | 517,471 | ||||||
| Principal amount° | Value (US $) | |||||||
Corporate Bonds (continued) |
| |||||||
Utilities (continued) | ||||||||
Sempra Energy 3.80% 2/1/38 | 675,000 | $ | 637,139 | |||||
Southern 2.95% 7/1/23 | 500,000 | 486,129 | ||||||
Southern Power 144A 2.752% (LIBOR03M + 0.55%) 12/20/20 #● | 1,700,000 | 1,702,191 | ||||||
Southwestern Electric Power 3.85% 2/1/48 | 875,000 | 833,062 | ||||||
6.45% 1/15/19 | 690,000 | 709,766 | ||||||
Trans-Allegheny Interstate Line 144A 3.85% 6/1/25 # | 525,000 | 528,797 | ||||||
|
| |||||||
| 55,356,599 | ||||||||
|
| |||||||
Total Corporate Bonds | 731,716,387 | |||||||
|
| |||||||
| ||||||||
Municipal Bonds – 0.82% |
| |||||||
| ||||||||
American Municipal Power, Ohio (Combined Hydroelectric Projects) Series B 8.084% 2/15/50 | 1,500,000 | 2,536,155 | ||||||
Buckeye, Ohio Tobacco Settlement Financing Authority (Asset-Backed Senior Turbo) Series A-2 5.875% 6/1/47 | 145,000 | 143,369 | ||||||
California State Various Purposes (Build America Bonds) 7.55% 4/1/39 | 395,000 | 602,967 | ||||||
(High Speed Passenger) Series C 2.663% 4/1/47 ● | 1,250,000 | 1,259,675 | ||||||
Chicago, Illinois Transit Authority (Pension Funding) Series A 6.899% 12/1/40 | 1,800,000 | 2,380,032 | ||||||
(Retiree Health Care Funding) Series B 6.899% 12/1/40 | 1,800,000 | 2,380,032 | ||||||
Commonwealth of Massachusetts Series C 5.00% 10/1/25 | 50,000 | 59,056 | ||||||
Municipal Electric Authority of Georgia (Build America Bond Plant Vogtle Units 3 & 4 Project) 6.655% 4/1/57 | 1,800,000 | 2,221,902 | ||||||
(continues) | 75 |
Table of Contents
Schedules of investments
Optimum Fixed Income Fund
Principal amount° | Value (US $) | |||||||
Municipal Bonds (continued) |
| |||||||
New Jersey Transportation Trust Fund Authority (Build America Bond) | 1,590,000 | $ | 1,783,376 | |||||
New York City, New York Transitional Finance Authority Future Tax Secured Revenue (Build America Bond) 5.508% 8/1/37 | 700,000 | 870,597 | ||||||
New York State Urban Development (Build America Bond) 5.77% 3/15/39 | 800,000 | 958,632 | ||||||
Oregon State Taxable Pension 5.892% 6/1/27 | 30,000 | 35,468 | ||||||
Pennsylvania Higher Education Assistance Agency Revenue (Guaranteed Student Loans) Series 2006-2 A3 2.086% (LIBOR03M + 0.13%) 10/25/36 ● | 644,548 | 636,600 | ||||||
South Carolina Public Service Authority | 145,000 | 158,189 | ||||||
Texas Water Development Board (2016 State Water Implementation) | 130,000 | 146,294 | ||||||
Series B 5.00% 10/15/46 | 305,000 | 349,387 | ||||||
|
| |||||||
Total Municipal Bonds |
| 16,521,731 | ||||||
|
| |||||||
| ||||||||
Non-Agency Asset-Backed Securities – 4.38% |
| |||||||
ABFC Trust | 390,070 | 264,758 | ||||||
Ally Master Owner Trust | 1,200,000 | 1,203,615 | ||||||
American Express Credit Account Master Trust | 500,000 | 500,487 | ||||||
| Principal amount° | Value (US $) | |||||||
Non-Agency Asset-Backed Securities (continued) |
| |||||||
American Express Credit Account Master Trust Series 2013-2 A 2.197% (LIBOR01M + 0.42%, Floor 0.42%) 5/17/21 ● | 530,000 | $ | 531,007 | |||||
Series 2017-2 A 2.227% (LIBOR01M + 0.45%) 9/16/24 ● | 135,000 | 136,223 | ||||||
Series 2017-5 A 2.157% (LIBOR01M + 0.38%) 2/18/25 ● | 620,000 | 624,146 | ||||||
Series 2017-8 A 1.897% (LIBOR01M + 0.12%, Floor 0.12%) 5/16/22 ● | 760,000 | 759,645 | ||||||
Argent Securities Asset-Backed Pass Through Certificates Series 2003-W9 M1 2.907% (LIBOR01M + 1.035%, Floor 0.69%) 1/25/34 ● | 255,831 | 256,200 | ||||||
Argent Securities Trust | 1,318,122 | 544,762 | ||||||
Series 2006-W4 A2C 2.032% (LIBOR01M + 0.16%, Floor 0.16%) 5/25/36 ● | 688,504 | 263,583 | ||||||
Avis Budget Rental Car Funding AESOP Series 2014-1A A 144A 2.46% 7/20/20 # | 665,000 | 662,438 | ||||||
Barclays Dryrock Issuance Trust | 1,220,000 | 1,224,169 | ||||||
Bayview Opportunity Master Fund IIIa Trust | 236,921 | 236,201 | ||||||
Bear Stearns Asset-Backed Securities I Trust | 2,000,000 | 1,997,978 | ||||||
Series 2007-HE2 1A2 2.042% (LIBOR01M + 0.17%, Floor 0.17%) 3/25/37 ● | 307,837 | 375,007 | ||||||
76
Table of Contents
| Principal amount° | Value (US $) | |||||||
Non-Agency Asset-Backed Securities (continued) |
| |||||||
Bear Stearns Asset-Backed Securities Trust | 198,804 | $ | 146,034 | |||||
BMW Floorplan Master Owner Trust | 500,000 | 500,564 | ||||||
BMW Vehicle Lease Trust | 890,000 | 890,160 | ||||||
Centex Home Equity Loan Trust | 863 | 874 | ||||||
Chase Issuance Trust | 500,000 | 500,519 | ||||||
Series 2014-A5 A5 2.147% (LIBOR01M + 0.37%, Floor 0.37%) 4/15/21 ● | 500,000 | 501,292 | ||||||
Series 2016-A3 2.327% (LIBOR01M + 0.55%, Floor 0.55%) 6/15/23 ● | 500,000 | 504,955 | ||||||
Series 2017-A1 A 2.077% (LIBOR01M + 0.30%) 1/18/22 ● | 1,370,000 | 1,373,687 | ||||||
Citibank Credit Card Issuance Trust | 200,000 | 200,080 | ||||||
Series 2016-A3 A3 2.192% (LIBOR01M + 0.49%) 12/7/23 ● | 500,000 | 504,142 | ||||||
Series 2017-A5 A5 2.474% (LIBOR01M + 0.62%, Floor 0.62%) 4/22/26 ● | 1,195,000 | 1,203,202 | ||||||
Series 2017-A7 A7 2.081% (LIBOR01M + 0.37%) 8/8/24 ● | 500,000 | 501,699 | ||||||
Series 2018-A2 A2 2.152% (LIBOR01M + 0.33%) 1/21/25 ● | 515,000 | 515,000 | ||||||
| Principal amount° | Value (US $) | |||||||
Non-Agency Asset-Backed Securities (continued) |
| |||||||
Citicorp Residential Mortgage Trust Series 2006-3 A5 5.40% 11/25/36 ● | 900,000 | $ | 930,925 | |||||
CNH Equipment Trust | 12,724 | 12,726 | ||||||
Countrywide Asset-Backed Certificates | 55,162 | 54,032 | ||||||
Series 2005-AB2 2A3 2.642% (LIBOR01M + 0.77%, Floor 0.39%) 11/25/35 ● | 45,968 | 46,017 | ||||||
Series 2006-1 AF6 4.774% 7/25/36 ● | 361,318 | 364,097 | ||||||
Series 2006-26 2A4 2.092% (LIBOR01M + 0.22%, Floor 0.22%) 6/25/37 ● | 2,000,000 | 1,892,155 | ||||||
Series 2007-6 2A4 2.182% (LIBOR01M + 0.31%, Floor 0.31%) 9/25/37 ● | 1,000,000 | 602,872 | ||||||
CSMC | 201,186 | 201,608 | ||||||
CWABS Asset-Backed Certificates Trust | 4,200,000 | 4,171,303 | ||||||
Series 2005-7 MV3 2.452% (LIBOR01M + 0.58%, Floor 0.58%) 11/25/35 ● | 336,739 | 336,026 | ||||||
Series 2006-11 1AF6 4.40% 9/25/46 ● | 235,468 | 227,625 | ||||||
Series 2006-17 2A2 2.022% (LIBOR01M + 0.15%, Floor 0.15%) 3/25/47 ● | 1,964,256 | 1,887,502 | ||||||
Discover Card Execution Note Trust | 560,000 | 561,019 | ||||||
| (continues) | 77 |
Table of Contents
Schedules of investments
Optimum Fixed Income Fund
| Principal amount° | Value (US $) | |||||||
Non-Agency Asset-Backed Securities (continued) |
| |||||||
Discover Card Execution Note Trust | 1,190,000 | $ | 1,192,896 | |||||
Series 2017-A1 A1 2.267% (LIBOR01M + 0.49%) 7/15/24 ● | 1,205,000 | 1,215,941 | ||||||
Series 2017-A3 A3 2.007% (LIBOR01M + 0.23%) 10/17/22 ● | 8,940,000 | 8,953,550 | ||||||
Series 2017-A5 A5 2.377% (LIBOR01M + 0.60%) 12/15/26 ● | 1,940,000 | 1,956,650 | ||||||
Series 2017-A7 A7 2.137% (LIBOR01M + 0.36%) 4/15/25 ● | 2,625,000 | 2,634,742 | ||||||
EquiFirst Mortgage Loan Trust | 662,361 | 647,626 | ||||||
Ford Credit Auto Lease Trust | 930,000 | 929,814 | ||||||
Ford Credit Auto Owner Trust | 840,000 | 837,120 | ||||||
Golden Credit Card Trust Series 2014-2A A 144A 2.227% (LIBOR01M + 0.45%) 3/15/21 #● | 420,000 | 421,005 | ||||||
GSAMP Trust | 1,097,417 | 662,035 | ||||||
Series 2007-SEA1 A 144A 2.172% (LIBOR01M + 0.30%, Floor 0.30%) 12/25/36 #● | 978,630 | 944,730 | ||||||
HOA Funding | 1,004,400 | 978,959 | ||||||
Home Equity Mortgage Loan Asset-Backed Trust | 1,595,067 | 1,200,624 | ||||||
| Principal amount° | Value (US $) | |||||||
Non-Agency Asset-Backed Securities (continued) |
| |||||||
HSI Asset Securitization Trust | 32,700 | $ | 16,887 | |||||
JPMorgan Mortgage Acquisition Trust | 500,000 | 450,942 | ||||||
Long Beach Mortgage Loan Trust | 3,442,562 | 2,917,723 | ||||||
Series 2006-7 1A 2.027% (LIBOR01M + 0.155%, Floor 0.16%) 8/25/36 ● | 3,755,211 | 2,512,979 | ||||||
Mercedes-Benz Master Owner Trust Series 2016-AA A 144A 2.357% (LIBOR01M + 0.58%) 5/15/20 #● | 915,000 | 915,549 | ||||||
Series 2016-BA A 144A 2.477% (LIBOR01M + 0.70%, Floor 0.75%) 5/17/21 #● | 1,021,000 | 1,026,938 | ||||||
Merrill Lynch Mortgage Investors Trust | 1,730,851 | 1,730,888 | ||||||
Morgan Stanley ABS Capital I Trust | 5,454,485 | 3,750,277 | ||||||
Series 2007-HE5 A2D 2.212% (LIBOR01M + 0.34%, Floor 0.34%) 3/25/37 ● | 3,685,944 | 1,949,916 | ||||||
Navistar Financial Dealer Note Master Owner Trust II | 525,000 | 527,386 | ||||||
78
Table of Contents
Principal amount° | Value (US $) | |||||||
Non-Agency Asset-Backed Securities (continued) |
| |||||||
New Century Home Equity Loan Trust | 233,599 | $ | 221,896 | |||||
New Residential Mortgage Loan Trust | 266,100 | 270,168 | ||||||
Series 2018-1A A1A 144A 4.00% 12/25/57 #● | 300,853 | 307,531 | ||||||
Nissan Auto Receivables Owner Trust | 25,488 | 25,479 | ||||||
Option One Mortgage Loan Trust | 2,155,252 | 2,005,382 | ||||||
Series 2007-4 2A4 2.182% (LIBOR01M + 0.31%, Floor 0.31%) 4/25/37 ● | 6,950,068 | 4,394,911 | ||||||
PFS Financing | 445,000 | 444,989 | ||||||
RAAC Trust | 507,990 | 458,028 | ||||||
RAMP Trust | 6,389 | 6,389 | ||||||
Series 2007-RZ1 A2 2.032% (LIBOR01M + 0.16%, Cap 14.00%, Floor 0.16%) 2/25/37 ● | 461,761 | 457,787 | ||||||
Rise | 1,729,920 | 1,732,515 | ||||||
Sofi Consumer Loan Program | 1,497,254 | 1,486,922 | ||||||
Series 2018-1 A1 144A 2.55% 2/25/27 # | 1,311,192 | 1,307,127 | ||||||
Principal amount° | Value (US $) | |||||||
Non-Agency Asset-Backed Securities (continued) |
| |||||||
Sofi Professional Loan Program | 502,880 | $ | 494,470 | |||||
Soundview Home Loan Trust | 327,889 | 326,934 | ||||||
SpringCastle America Funding | 2,791,152 | 2,787,469 | ||||||
Structured Asset Investment Loan Trust | 15,778 | 15,434 | ||||||
Structured Asset Securities Mortgage Loan Trust Series 2006-BC1 A6 2.142% (LIBOR01M + 0.27%, Floor 0.27%) 3/25/36 ● | 1,800,000 | 1,490,203 | ||||||
Towd Point Mortgage Trust | 335,278 | 331,556 | ||||||
Series 2017-2 A1 144A 2.75% 4/25/57 #● | 184,896 | 183,551 | ||||||
Series 2017-4 M1 144A 3.25% 6/25/57 #● | 615,000 | 589,697 | ||||||
Series 2018-1 A1 144A 3.00% 1/25/58 #● | 304,573 | 302,948 | ||||||
Verizon Owner Trust | 680,000 | 672,333 | ||||||
VOLT LIX | 59,756 | 59,478 | ||||||
VOLT LVIII | 227,019 | 226,639 | ||||||
VOLT LX | 186,925 | 186,130 | ||||||
VOLT LXI | 61,866 | 61,548 | ||||||
VOLT LXIII | 499,682 | 495,013 | ||||||
| (continues) | 79 |
Table of Contents
Schedules of investments
Optimum Fixed Income Fund
| Principal amount° | Value (US $) | |||||||
Non-Agency Asset-Backed Securities (continued) |
| |||||||
VOLT XL | 66,069 | $ | 66,068 | |||||
Wendys Funding | 478,800 | 472,978 | ||||||
|
| |||||||
Total Non-Agency Asset-Backed Securities | 88,467,084 | |||||||
|
| |||||||
Non-Agency Collateralized Mortgage |
| |||||||
Alternative Loan Trust Resecuritization | 1,337,795 | 1,066,549 | ||||||
ARM Mortgage Trust | 547,546 | 551,314 | ||||||
Series 2005-10 3A31 3.461% 1/25/36 ● | 232,206 | 222,723 | ||||||
Series 2006-2 1A4 3.827% 5/25/36 ● | 939,752 | 872,081 | ||||||
Banc of America Funding Trust | 203,885 | 170,103 | ||||||
Series 2006-I 1A1 3.454% 12/20/36 ● | �� | 310,680 | 313,962 | |||||
Banc of America Mortgage Trust | 266,204 | 269,958 | ||||||
Bank of America Alternative Loan Trust | 27,883 | 26,460 | ||||||
Bear Stearns ARM Trust | 49,330 | 49,331 | ||||||
Chase Mortgage Finance Trust | 121,273 | 119,436 | ||||||
CHL Mortgage Pass Through Trust | 1,211,959 | 986,004 | ||||||
CSMC Mortgage-Backed Trust | 1,398,314 | 1,320,308 | ||||||
Series 2007-1 5A14 6.00% 2/25/37 | 269,157 | 243,094 | ||||||
| Principal amount° | Value (US $) | |||||||
Non-Agency Collateralized Mortgage |
| |||||||
CSMC Mortgage-Backed Trust | 236,981 | $ | 202,621 | |||||
Series 2007-3 4A12 4.879% (6.75% minus LIBOR01M, Cap 6.75%) 4/25/37 S● | 242,490 | 29,819 | ||||||
Series 2007-3 4A15 5.50% 4/25/37 | 105,227 | 104,108 | ||||||
Flagstar Mortgage Trust | 636,991 | 635,299 | ||||||
Galton Funding Mortgage Trust | 533,597 | 535,173 | ||||||
GMACM Mortgage Loan Trust | 47,950 | 47,107 | ||||||
GSR Mortgage Loan Trust | 924,406 | 850,209 | ||||||
JPMorgan Mortgage Trust | 554,902 | 502,389 | ||||||
Series 2006-A7 2A2 3.589% 1/25/37 ● | 102,382 | 103,315 | ||||||
Series 2007-A1 6A1 3.631% 7/25/35 ● | 171,050 | 171,454 | ||||||
Series 2014-2 B1 144A 3.424% 6/25/29 #● | 71,120 | 70,506 | ||||||
Series 2014-2 B2 144A 3.424% 6/25/29 #● | 71,120 | 70,050 | ||||||
Series 2015-1 B1 144A 2.717% 12/25/44 #● | 648,322 | 645,689 | ||||||
Series 2015-4 B1 144A 3.624% 6/25/45 #● | 801,863 | 788,117 | ||||||
Series 2015-4 B2 144A 3.624% 6/25/45 #● | 342,717 | 330,019 | ||||||
Series 2015-5 B2 144A 2.889% 5/25/45 #● | 625,625 | 615,159 | ||||||
Series 2015-6 B1 144A 3.616% 10/25/45 #● | 345,864 | 337,170 | ||||||
Series 2015-6 B2 144A 3.616% 10/25/45 #● | 336,516 | 319,880 | ||||||
Series 2016-4 B1 144A 3.901% 10/25/46 #● | 241,487 | 242,020 | ||||||
Series 2016-4 B2 144A 3.901% 10/25/46 #● | 410,528 | 406,517 | ||||||
80
Table of Contents
Principal amount° | Value (US $) | |||||||
Non-Agency Collateralized Mortgage Obligations (continued) |
| |||||||
JPMorgan Mortgage Trust | 718,021 | $ | 693,227 | |||||
Series 2017-2 A3 144A 3.50% 5/25/47 #● | 332,259 | 329,508 | ||||||
Series 2017-6 B1 144A 3.857% 12/25/48 #=● | 467,771 | 452,605 | ||||||
Series 2018-3 A5 144A 3.50% 4/25/48 #● | 750,000 | 747,825 | ||||||
Lehman Mortgage Trust Series 2007-10 2A2 6.50% 1/25/38 | 1,770,080 | 1,325,172 | ||||||
Ludgate Funding | GBP | 1,658,679 | 2,240,667 | |||||
Series 2008-W1X A1 1.119% (BP0003M + 0.60%) 1/1/61 ● | GBP | 729,126 | 1,006,186 | |||||
Mansard Mortgages Parent | GBP | 781,943 | 1,060,768 | |||||
MASTR Alternative Loan Trust | 2,438 | 2,569 | ||||||
Series 2004-5 6A1 7.00% 6/25/34 | 37,329 | 38,975 | ||||||
MASTR ARM Trust | 85,848 | 85,621 | ||||||
Merrill Lynch Mortgage Investors Trust | 6,334 | 6,341 | ||||||
New Residential Mortgage Loan Trust | 612,487 | 619,879 | ||||||
Opteum Mortgage Acceptance Trust | 434,445 | 435,784 | ||||||
Reperforming Loan REMIC Trust | 1,337,790 | 1,265,956 | ||||||
RFMSI Trust | 34,987 | 35,025 | ||||||
| Principal amount° | Value (US $) | |||||||
Non-Agency Collateralized Mortgage Obligations (continued) |
| |||||||
Sequoia Mortgage Trust | 213,828 | $ | 205,580 | |||||
Series 2007-1 4A1 3.602% 9/20/46 ● | 663,986 | 548,768 | ||||||
Series 2015-1 B2 144A 3.875% 1/25/45 #● | 365,448 | 368,390 | ||||||
Series 2017-4 A1 144A 3.50% 7/25/47 #● | 355,966 | 352,897 | ||||||
Structured ARM Loan Trust | 473,310 | 444,805 | ||||||
Structured Asset Mortgage Investments II Trust | 411,449 | 402,289 | ||||||
Thrones | GBP | 1,063,966 | 1,496,684 | |||||
TORRENS | AUD | 1,163,192 | 895,218 | |||||
WaMu Mortgage Pass Through Certificates Trust | 490,643 | 476,490 | ||||||
Series 2007-HY1 3A3 3.316% 2/25/37 ◆● | 266,446 | 254,968 | ||||||
Series 2007-HY7 4A1 3.396% 7/25/37 ◆● | 549,493 | 509,364 | ||||||
Washington Mutual Mortgage Pass Through Certificates Trust | 21,197 | 4,803 | ||||||
Wells Fargo Mortgage-Backed Securities Trust | 132,488 | 135,696 | ||||||
Series 2006-2 3A1 5.75% 3/25/36 | 56,466 | 55,481 | ||||||
Series 2006-3 A11 5.50% 3/25/36 | 83,080 | 84,961 | ||||||
Series 2006-6 1A3 5.75% 5/25/36 | 37,645 | 37,717 | ||||||
| (continues) | 81 |
Table of Contents
Schedules of investments
Optimum Fixed Income Fund
| Principal amount° | Value (US $) | |||||||
Non-Agency Collateralized Mortgage |
| |||||||
Wells Fargo Mortgage-Backed Securities Trust | 46,128 | $ | 43,727 | |||||
Series 2006-AR11 A6 3.489% 8/25/36 ● | 517,938 | 495,231 | ||||||
Series 2006-AR17 A1 3.631% 10/25/36 ● | 293,641 | 286,622 | ||||||
Series 2007-10 1A36 6.00% 7/25/37 | 216,001 | 215,544 | ||||||
|
| |||||||
Total Non-Agency Collateralized Mortgage Obligations | 30,879,287 | |||||||
|
| |||||||
Non-Agency Commercial Mortgage-Backed |
| |||||||
Banc of America Commercial Mortgage Trust | 325,000 | 325,240 | ||||||
BANK | 1,430,000 | 1,411,733 | ||||||
Series 2017-BNK5 B 3.896% 6/15/60 ● | 605,000 | 610,264 | ||||||
Series 2017-BNK7 A5 3.435% 9/15/60 | 715,000 | 710,254 | ||||||
Series 2017-BNK7 B 3.949% 9/15/60 | 1,085,000 | 1,098,915 | ||||||
Series 2017-BNK8 A4 3.488% 11/15/50 | 515,000 | 513,650 | ||||||
BBCMS Trust | 4,306,285 | 4,322,886 | ||||||
BENCHMARK Mortgage Trust | 2,370,000 | 2,392,032 | ||||||
BX Trust | 542,624 | 544,328 | ||||||
Caesars Palace Las Vegas Trust | 650,000 | 656,170 | ||||||
CD Mortgage Trust | 620,000 | 619,803 | ||||||
Series 2017-CD6 B 3.911% 11/13/50 ● | 440,000 | 441,949 | ||||||
| Principal amount° | Value (US $) | |||||||
Non-Agency Commercial Mortgage-Backed |
| |||||||
CFCRE Commercial Mortgage Trust Series 2016-C7 A3 3.839% 12/10/54 | 1,100,000 | $ | 1,115,305 | |||||
Citigroup Commercial Mortgage Trust | 785,000 | 795,871 | ||||||
Series 2015-GC27 A5 3.137% 2/10/48 | 3,085,000 | 3,033,716 | ||||||
Series 2016-P3 A4 3.329% 4/15/49 | 1,895,000 | 1,874,543 | ||||||
Series 2017-C4 A4 3.471% 10/12/50 | 635,000 | 629,253 | ||||||
COMM Mortgage Trust Series 2013-WWP A2 144A 3.424% 3/10/31 # | 1,100,000 | 1,121,146 | ||||||
Series 2014-CR20 AM 3.938% 11/10/47 | 2,225,000 | 2,270,667 | ||||||
Series 2015-3BP A 144A 3.178% 2/10/35 # | 605,000 | 596,124 | ||||||
Series 2015-CR23 A4 3.497% 5/10/48 | 780,000 | 781,782 | ||||||
Commercial Mortgage Pass Through Certificates | 1,295,000 | 1,313,531 | ||||||
DBJPM Mortgage Trust | 1,970,000 | 1,942,495 | ||||||
Series 2016-C3 A5 2.89% 9/10/49 | 945,000 | 901,365 | ||||||
DBUBS Mortgage Trust | 955,000 | 1,007,582 | ||||||
GRACE Mortgage Trust Series 2014-GRCE A 144A 3.369% 6/10/28 # | 2,200,000 | 2,223,161 | ||||||
Series 2014-GRCE B 144A 3.52% 6/10/28 # | 1,455,000 | 1,450,771 | ||||||
GS Mortgage Securities II | 560,000 | 578,644 | ||||||
GS Mortgage Securities Trust | 375,000 | 386,448 | ||||||
Series 2016-RENT A 144A 3.203% 2/10/29 # | 2,300,000 | 2,306,730 | ||||||
Series 2017-GS5 A4 3.674% 3/10/50 | 1,205,000 | 1,217,744 | ||||||
82
Table of Contents
Principal amount° | Value (US $) | |||||||
| ||||||||
Non-Agency Commercial Mortgage-Backed Securities (continued) |
| |||||||
| ||||||||
GS Mortgage Securities Trust Series 2017-GS6 A3 3.433% 5/10/50 | 1,935,000 | $ | 1,919,637 | |||||
Series 2017-GS6 XA | 21,958,170 | 1,702,893 | ||||||
JPMBB Commercial Mortgage Securities Trust Series 2015-C31 A3 3.801% 8/15/48 | 4,250,000 | 4,331,844 | ||||||
Series 2015-C33 A4 3.77% 12/15/48 | 570,000 | 581,537 | ||||||
JPMDB Commercial Mortgage Securities Trust Series 2016-C2 A4 3.144% 6/15/49 | 1,640,000 | 1,596,674 | ||||||
Series 2016-C4 A3 3.141% 12/15/49 | 1,065,000 | 1,033,522 | ||||||
Series 2017-C7 A5 3.409% 10/15/50 | 1,395,000 | 1,377,462 | ||||||
JPMorgan Chase Commercial Mortgage Securities Trust Series 2005-CB11 E 5.548% 8/12/37 ● | 230,000 | 232,739 | ||||||
Series 2013-LC11 B 3.499% 4/15/46 | 355,000 | 348,699 | ||||||
Series 2016-JP2 A4 2.822% 8/15/49 | 2,555,000 | 2,424,375 | ||||||
Series 2016-JP2 AS 3.056% 8/15/49 | 1,250,000 | 1,190,953 | ||||||
Series 2016-JP3 B 3.397% 8/15/49 ● | 1,550,000 | 1,489,587 | ||||||
Series 2016-WIKI A 144A 2.798% 10/5/31 # | 705,000 | 695,046 | ||||||
Series 2016-WIKI B 144A 3.201% 10/5/31 # | 690,000 | 682,058 | ||||||
LB-UBS Commercial Mortgage Trust Series 2006-C6 AJ 5.452% 9/15/39 ● | 708,412 | 561,258 | ||||||
Morgan Stanley Bank of America Merrill Lynch Trust Series 2015-C23 A4 3.719% 7/15/50 | 1,275,000 | 1,294,995 | ||||||
Series 2015-C26 A5 3.531% 10/15/48 | 820,000 | 822,574 | ||||||
Series 2015-C27 ASB 3.557% 12/15/47 | 2,200,000 | 2,240,953 | ||||||
Series 2016-C29 A4 3.325% 5/15/49 | 795,000 | 785,093 | ||||||
Principal amount° | Value (US $) | |||||||
| ||||||||
Non-Agency Commercial Mortgage-Backed Securities (continued) |
| |||||||
| ||||||||
Morgan Stanley Capital I Trust Series 2014-CPT AM 144A 3.402% 7/13/29 #● | 2,200,000 | $ | 2,208,910 | |||||
Series 2016-BNK2 A4 3.049% 11/15/49 | 2,066,000 | 1,993,616 | ||||||
UBS Commercial Mortgage Trust Series 2018-C9 A4 4.117% 3/15/51 | 970,000 | 1,004,721 | ||||||
Wells Fargo Commercial Mortgage Trust Series 2014-LC18 A5 3.405% 12/15/47 | 275,000 | 274,506 | ||||||
Series 2015-C30 XA 0.951% 9/15/58 ● | 6,360,929 | 341,410 | ||||||
Series 2015-NXS3 A4 3.617% 9/15/57 | 510,000 | 513,462 | ||||||
Series 2016-BNK1 A3 2.652% 8/15/49 | 1,220,000 | 1,144,996 | ||||||
Series 2017-C38 A5 3.453% 7/15/50 | 905,000 | 897,750 | ||||||
Series 2017-RB1 XA 1.284% 3/15/50 ● | 8,501,201 | 757,477 | ||||||
|
| |||||||
Total Non-Agency Commercial Mortgage-Backed Securities (cost $76,062,047) | 73,642,849 | |||||||
|
| |||||||
| ||||||||
Regional Bonds – 0.52%D |
| |||||||
| ||||||||
Argentina – 0.05% |
| |||||||
Provincia de Cordoba 144A 7.125% 8/1/27 # | 675,000 | 671,463 | ||||||
144A 7.45% 9/1/24 # | 395,000 | 416,330 | ||||||
|
| |||||||
| 1,087,793 | ||||||||
|
| |||||||
Australia – 0.05% |
| |||||||
New South Wales Treasury 4.00% 5/20/26 | AUD | 404,900 | 336,937 | |||||
Queensland Treasury 144A 2.75% 8/20/27 # | AUD | 446,000 | 333,140 | |||||
144A 3.25% 7/21/28 # | AUD | 495,000 | 384,170 | |||||
|
| |||||||
| 1,054,247 | ||||||||
|
| |||||||
Canada – 0.16% |
| |||||||
Province of New Brunswick 2.50% 12/12/22 | 300,000 | 293,795 | ||||||
Province of Ontario 2.60% 6/2/27 | CAD | 203,000 | 155,697 | |||||
3.45% 6/2/45 | CAD | 551,000 | 460,704 | |||||
Province of Quebec 1.65% 3/3/22 | CAD | 419,000 | 318,139 | |||||
| (continues) | 83 |
Table of Contents
Schedules of investments
Optimum Fixed Income Fund
| Principal amount° | Value (US $) | |||||||
Regional BondsD (continued) |
| |||||||
Canada (continued) |
| |||||||
Province of Quebec | 1,805,000 | $ | 1,746,182 | |||||
6.00% 10/1/29 | CAD | 155,000 | 157,591 | |||||
|
| |||||||
| 3,132,108 | ||||||||
|
| |||||||
Finland – 0.02% | ||||||||
Municipality Finance 144A | 485,000 | 486,246 | ||||||
|
| |||||||
| 486,246 | ||||||||
|
| |||||||
Japan – 0.05% | ||||||||
Japan Finance Organization For Municipalities | 900,000 | 896,290 | ||||||
|
| |||||||
| 896,290 | ||||||||
|
| |||||||
Spain – 0.19% | ||||||||
Autonomous Community of Catalonia | EUR | 1,800,000 | 2,401,961 | |||||
4.95% 2/11/20 | EUR | 1,100,000 | 1,453,336 | |||||
|
| |||||||
| 3,855,297 | ||||||||
|
| |||||||
Total Regional Bonds | 10,511,981 | |||||||
|
| |||||||
| ||||||||
Loan Agreements – 5.72% |
| |||||||
Acrisure Tranche B 1st Lien | 905,000 | 920,272 | ||||||
Air Medical Group Holdings 1st Lien | 1,235,409 | 1,242,069 | ||||||
Albertsons Tranche B 1st Lien | 1,030,565 | 1,020,546 | ||||||
Alpha 3 Tranche B1 1st Lien | 198,500 | 200,237 | ||||||
Altice France Tranche B 1st Lien | 1,404,388 | 1,364,011 | ||||||
Altice France Tranche B12 1st Lien | 637,044 | 618,252 | ||||||
American Airlines Tranche B 1st Lien | 1,228,083 | 1,230,606 | ||||||
| Principal amount° | Value (US $) | |||||||
Loan Agreements (continued) |
| |||||||
American Tire Distributors 1st Lien 6.244% (LIBOR03M + 4.25%) 9/1/21 ● | 567,602 | $ | 575,140 | |||||
Applied Systems 2nd Lien 8.693% (LIBOR03M + 7.00%) 9/19/25 ● | 765,000 | 792,731 | ||||||
Aramark Services Tranche B 1st Lien | 384,038 | 387,718 | ||||||
Assured Partners Tranche B 1st Lien | 1,006,994 | 1,010,518 | ||||||
5.609% 10/22/24 ● | 155,000 | 155,000 | ||||||
ATI Holdings Acquisition Tranche B 1st Lien | 850,392 | 857,434 | ||||||
ATS Consolidated Tranche B 1st Lien | 785,000 | 792,850 | ||||||
Avaya Tranche B Exit 1st Lien | 219,450 | 221,393 | ||||||
Avis Budget Car Rental Tranche B 1st Lien | 558,600 | 560,258 | ||||||
Blue Ribbon 1st Lien | 726,558 | 726,103 | ||||||
Builders FirstSource 1st Lien 5.302% (LIBOR03M + 3.00%) 2/29/24 ● | 1,998,763 | 2,009,470 | ||||||
BWAY Tranche B 1st Lien 4.958% (LIBOR03M + 3.25%) 4/3/24 ● | 977,613 | 983,621 | ||||||
Calpine Construction Finance 1st Lien | 253,356 | 254,374 | ||||||
CenturyLink Tranche B 1st Lien 4.627% (LIBOR03M + 2.75%) 1/31/25 ● | 847,875 | 835,952 | ||||||
CH Hold 2nd Lien | 385,000 | 391,738 | ||||||
84
Table of Contents
| Principal amount° | Value (US $) | |||||||
Loan Agreements (continued) |
| |||||||
Change Healthcare Holdings Tranche B 1st Lien | 942,844 | $ | 946,184 | |||||
Charter Communications Operating 1st Lien | 719,538 | 722,955 | ||||||
Chemours 1st Lien | 1,000,000 | 1,000,625 | ||||||
Chemours Tranche B1 1st Lien 4.15% (LIBOR03M + 2.50%) 5/12/22 ● | 545,000 | 545,341 | ||||||
Chesapeake Energy 1st Lien 9.444% (LIBOR03M + 7.50%) 8/23/21 ● | 1,345,000 | 1,429,482 | ||||||
CityCenter Holdings Tranche B 1st Lien 4.377% (LIBOR03M + 2.50%) 4/18/24 ● | 921,550 | 926,806 | ||||||
Community Health Systems Tranche G 1st Lien 5.112% (LIBOR03M + 2.75%) 12/31/19 ● | 445,000 | 434,988 | ||||||
Community Health Systems Tranche H 1st Lien 4.984% (LIBOR03M + 3.00%) 1/27/21 ● | 220,000 | 211,918 | ||||||
Constellis Holdings 1st Lien 7.302% (LIBOR03M + 5.00%) 4/21/24 ● | 561,755 | 567,548 | ||||||
Constellis Holdings 2nd Lien 11.302% (LIBOR03M + 9.00%) 4/21/25 ● | 237,000 | 240,555 | ||||||
Core & Main Tranche B 1st Lien 5.006% (LIBOR03M + 3.00%) 8/1/24 ● | 555,000 | 557,862 | ||||||
Crown Americas Tranche B 1st Lien 4.355% (LIBOR03M + 2.00%) 1/29/25 ● | 870,000 | 878,623 | ||||||
CSC Holdings Tranche B 1st Lien | 426,775 | 426,882 | ||||||
4.277% (LIBOR03M + 2.50%) 1/12/26 ● | 295,000 | 295,415 | ||||||
Dakota Holdings Tranche B 1st Lien | 440,000 | 441,925 | ||||||
| Principal amount° | Value (US $) | |||||||
Loan Agreements (continued) |
| |||||||
DaVita Tranche B | 123,196 | $ | 124,438 | |||||
Deck Chassis Acquisition 2nd Lien | 285,000 | 290,344 | ||||||
Delek US Holdings Tranche B | 335,000 | 336,675 | ||||||
DG Investment Intermediate Holdings 2 1st Lien | 560,000 | 559,534 | ||||||
Digicel International Finance Tranche B 1st Lien 5.02% (LIBOR03M + 3.25%) 5/10/24 ● | 936,478 | 933,551 | ||||||
Dynegy Tranche C 1st Lien 4.604% (LIBOR03M + 2.75%) 2/7/24 ● | 785,050 | 790,938 | ||||||
Energy Transfer Equity Tranche B 1st Lien | 390,000 | 389,695 | ||||||
ESH Hospitality Tranche B 1st Lien | 648,877 | 653,439 | ||||||
ExamWorks Group Tranche B 1st Lien | 240,000 | 242,130 | ||||||
ExamWorks Group Tranche B1 1st Lien | 1,241,139 | 1,252,155 | ||||||
First Data 1st Lien 4.122% (LIBOR03M + 2.25%) 7/10/22 ● | 661,064 | 662,758 | ||||||
First Data Tranche 1st Lien 4.122% (LIBOR03M + 2.25%) 4/26/24 ● | 2,604,227 | 2,611,415 | ||||||
First Eagle Holdings Tranche B 1st Lien | 802,565 | 810,841 | ||||||
Flex Acquisition 1st Lien | 431,738 | 434,301 | ||||||
Flying Fortress Holdings Tranche B 1st Lien | 496,000 | 498,613 | ||||||
(continues) | 85 |
Table of Contents
Schedules of investments
Optimum Fixed Income Fund
| Principal amount° | Value (US $) | |||||||
Loan Agreements (continued) |
| |||||||
Frontier Communications Tranche B 1st Lien | 551,487 | $ | 545,283 | |||||
Gardner Denver Tranche B 1st Lien | 1,499,278 | 1,508,546 | ||||||
Gates Global Tranche B2 1st Lien | 717,014 | 721,899 | ||||||
Genoa A Qol Healthcare 1st Lien | 950,579 | 957,709 | ||||||
Gopher Resource 1st Lien 5.478% (LIBOR03M + 3.25%) 2/9/25 ● | 555,000 | 560,377 | ||||||
Gray Television Tranche B 1st Lien | 618,434 | 621,849 | ||||||
Greeneden US Holdings II Tranche B3 1st Lien | 1,022,114 | 1,029,700 | ||||||
Greenhill & Co. Tranche B 1st Lien | 553,000 | 557,839 | ||||||
GVC Holdings Tranche B2 1st Lien | 755,000 | 756,179 | ||||||
HCA Tranche 11 | 222,871 | 224,065 | ||||||
HCA Tranche B10 1st Lien | 1,325,000 | 1,336,318 | ||||||
Hilton Worldwide Finance Tranche B2 1st Lien | 2,345,122 | 2,360,578 | ||||||
Houghton International | 10,896 | 10,923 | ||||||
Hoya Midco Tranche B 1st Lien 5.648% (LIBOR03M + 4.00%) 6/30/24 ● | 704,675 | 706,877 | ||||||
HUB International Tranche B 1st Lien | 749,227 | 753,909 | ||||||
HVSC Merger Sub 1st Lien 6.302% (LIBOR03M + 4.00%) 10/20/24 ● | 493,763 | 498,854 | ||||||
| Principal amount° | Value (US $) | |||||||
Loan Agreements (continued) |
| |||||||
HVSC Merger Sub 2nd Lien 10.022% (LIBOR03M + 8.25%) 10/26/25 ● | 260,000 | $ | 262,600 | |||||
Hyperion Insurance Group Tranche B 1st Lien 5.188% (LIBOR03M + 3.50%) 12/20/24 ● | 1,284,780 | 1,298,270 | ||||||
INEOS US Finance Tranche B 1st Lien | 957,600 | 961,490 | ||||||
Iron Mountain Tranche B | 1,590,000 | 1,590,663 | ||||||
JBS USA Tranche B 1st Lien 4.678% (LIBOR03M + 2.50%) 10/30/22 ● | 1,178,217 | 1,176,156 | ||||||
Jeld-Wen Tranche B4 1st Lien 4.302% (LIBOR03M + 2.00%) 12/14/24 ● | 558,600 | 561,323 | ||||||
Kingpin Intermediate Holdings Tranche B 1st Lien 5.92% (LIBOR03M + 4.25%) 7/3/24 ● | 471,438 | 479,688 | ||||||
Kloeckner Pentaplast of America Tranche B 1st Lien 6.127% (LIBOR03M + 4.25%) 6/30/22 ● | 781,424 | 755,051 | ||||||
Kraton Polymers Tranche B | 349,765 | 352,553 | ||||||
Kronos 2nd Lien | 505,000 | 524,989 | ||||||
Kronos Tranche B 1st Lien | 534,610 | 538,252 | ||||||
Lamar Media Tranche B 1st Lien | 500,000 | 503,334 | ||||||
Las Vegas Sands 1st Lien 3.648% (LIBOR03M + 2.00%) 3/29/24 ● | 195,980 | 196,669 | ||||||
Lucid Energy Group II Borrower 1st Lien | 930,000 | 927,094 | ||||||
LUX HOLDCO III 1st Lien 4.901% (LIBOR03M + 3.00%) 3/28/25 ● | 560,000 | 565,163 | ||||||
Marketo Tranche B 1st Lien 5.043% (LIBOR03M + 3.25%) 2/7/25 ● | 335,000 | 334,738 | ||||||
86
Table of Contents
| Principal amount° | Value (US $) | |||||||
Loan Agreements (continued) |
| |||||||
MGM Growth Properties Operating Partnership Tranche B 3.901% (LIBOR03M + 2.00%) 3/25/25 ● | 555,000 | $ | 557,012 | |||||
MGM Growth Properties Operating Partnership Tranche B 1st Lien 3.898% (LIBOR03M + 2.25%) 4/25/23 ● | 249,900 | 250,748 | ||||||
MPH Acquisition Holdings Tranche B 1st Lien 5.302% (LIBOR03M + 3.00%) 6/7/23 ● | 1,513,630 | 1,522,618 | ||||||
NCI Building Systems Tranche B 1st Lien | 865,000 | 866,946 | ||||||
NFP Tranche B 1st Lien | 603,472 | 605,811 | ||||||
Nielsen Finance Tranche B4 1st Lien | 810,000 | 813,488 | ||||||
ON Semiconductor Tranche B 1st Lien | 878,857 | 884,515 | ||||||
Panda Hummel Tranche B1 1st Lien | 525,000 | 511,219 | ||||||
Panda Stonewall Tranche B 7.193% (LIBOR03M + 5.50%) 11/13/21 =● | 588,045 | 577,754 | ||||||
Patriot Container 1st Lien 5.322% (LIBOR03M + 3.50%) 3/20/25 ● | 505,000 | 508,788 | ||||||
Patriot Container 2nd Lien 9.572% (LIBOR03M + 7.75%) 3/20/26 ● | 170,000 | 167,025 | ||||||
Penn National Gaming Tranche B 1st Lien | 781,300 | 787,322 | ||||||
PharMerica Tranche B 1st Lien 5.211% (LIBOR03M + 3.50%) 12/6/24 ● | 500,000 | 502,813 | ||||||
PharMerica Tranche B 2nd Lien 9.461% (LIBOR03M + 7.75%) 12/7/25 ● | 500,000 | 502,500 | ||||||
| Principal amount° | Value (US $) | |||||||
Loan Agreements (continued) |
| |||||||
Phoenix Services Merger Sub 5.414% (LIBOR03M + 3.75%) 3/1/25 ● | 335,000 | $ | 337,094 | |||||
Pisces Midco Tranche B | 660,000 | 656,700 | ||||||
Plastipak Holdings Tranche B 1st Lien | 558,597 | 562,321 | ||||||
PQ 1st Lien 1st Lien | 1,542,522 | 1,549,547 | ||||||
Prestige Brands Tranche B4 4.222% (LIBOR03M + 2.00%) 1/26/24 ● | 535,000 | 537,006 | ||||||
Radiate Holdco 1st Lien | 1,366,200 | 1,364,776 | ||||||
Republic of Angola | 1,387,500 | 1,262,625 | ||||||
Ring Container Technologies Group 1st Lien 4.627% (LIBOR03M + 2.75%) 10/31/24 ● | 438,900 | 440,820 | ||||||
RPI Finance Trust Tranche B6 1st Lien | 198,368 | 199,484 | ||||||
Russell Investments US Institutional Holdco Tranche B 1st Lien | 2,048,298 | 2,065,260 | ||||||
Sable International Finance Tranche B4 1st Lien 5.127% (LIBOR03M + 3.25%) 2/2/26 ● | 265,000 | 266,056 | ||||||
Scientific Games International Tranche B5 1st Lien | 2,160,663 | 2,171,129 | ||||||
Sigma US Tranche B 1st Lien 5.035% (LIBOR03M + 3.00%) 3/7/25 ● | 920,000 | 923,066 | ||||||
Sinclair Television Group Tranche B 1st Lien | 715,000 | 719,555 | ||||||
Sinclair Television Group Tranche B2 1st Lien | 2,607,000 | 2,621,122 | ||||||
(continues) | 87 |
Table of Contents
Schedules of investments
Optimum Fixed Income Fund
| Principal amount° | Value (US $) | |||||||
Loan Agreements (continued) |
| |||||||
SMG US Midco 2 1st Lien 4.89% (LIBOR03M + 3.25%) 1/23/25 ● | 220,000 | $ | 222,429 | |||||
SMG US Midco 2 2nd Lien 2nd Lien 8.877% (LIBOR03M + 7.00%) 1/23/26 ● | 220,000 | 225,133 | ||||||
Sprint Communications Tranche B 1st Lien 4.438% (LIBOR03M + 2.50%) 2/2/24 ● | 1,915,500 | 1,918,193 | ||||||
SS&C Technologies Tranche B3 1st Lien 4.397% (LIBOR03M + 2.50%) 3/9/25 ��� | 2,070,000 | 2,083,099 | ||||||
StandardAero Aviation Holdings 1st Lien 5.63% (LIBOR03M + 3.75%) 7/7/22 ● | 939,074 | 948,979 | ||||||
Staples 1st Lien 5.787% (LIBOR03M + 4.00%) 9/12/24 ● | 259,350 | 257,405 | ||||||
Stars Group Holdings 2nd Lien 9.302% (LIBOR03M + 7.00%) 8/1/22 ● | 274,643 | 276,222 | ||||||
Stars Group Holdings Tranche B 1st Lien | 1,650,000 | 1,645,875 | ||||||
Tranche B 1st Lien 5.802% (LIBOR03M + 3.50%) 8/1/21 ● | 1,400,964 | 1,409,633 | ||||||
Summit Materials Tranche B 1st Lien 4.127% (LIBOR03M + 2.25%) 11/10/24 ● | 733,163 | 738,890 | ||||||
Summit Midstream Partners Holdings Tranche B 1st Lien 7.877% (LIBOR03M + 6.00%) 5/21/22 ● | 868,522 | 881,550 | ||||||
Surgery Center Holdings 1st Lien 5.13% (LIBOR03M + 3.25%) 8/31/24 ● | 1,091,857 | 1,092,709 | ||||||
Syneos Health Tranche B 1st Lien 3.898% (LIBOR03M + 2.25%) 6/26/24 ● | 654,121 | 657,084 | ||||||
Team Holdings Tranche B 1st Lien 4.627% (LIBOR03M + 2.75%) 2/6/24 ● | 383,523 | 368,182 | ||||||
Telenet Financing USD 1st Lien 4.277% (LIBOR03M + 2.50%) 3/1/26 ● | 370,000 | 372,246 | ||||||
| Principal amount° | Value (US $) | |||||||
Loan Agreements (continued) |
| |||||||
Telenet Financing USD Tranche B 1st Lien 4.855% (LIBOR03M + 2.50%) 3/1/26 ● | 675,000 | $ | 679,098 | |||||
TerraForm Power Operating Tranche B 1st Lien 4.627% (LIBOR03M + 2.75%) 11/8/22 ● | 555,000 | 558,296 | ||||||
Titan Acquisition 1st Lien 5.056% (LIBOR03M + 3.00%) 3/28/25 ● | 830,000 | 829,287 | ||||||
TMS International Tranche B 4.627% (LIBOR03M + 2.75%) 8/14/24 ● | 225,000 | 225,914 | ||||||
TransDigm Tranche F 1st Lien 5.052% (LIBOR03M + 2.75%) 6/9/23 ● | 699,624 | 703,122 | ||||||
Tribune Media Tranche B 1st Lien 4.877% (LIBOR03M + 3.00%) 12/27/20 ● | 33,149 | 33,242 | ||||||
Tribune Media Tranche C 1st Lien 4.877% (LIBOR03M + 3.00%) 1/27/24 ● | 413,162 | 414,386 | ||||||
Trident TPI Holdings 1st Lien 5.127% (LIBOR03M + 3.25%) 10/5/24 ● | 703,238 | 706,314 | ||||||
Tronox Finance Tranche B 1st Lien 5.302% (LIBOR03M + 3.00%) 9/22/24 ● | 410,000 | 413,972 | ||||||
Unitymedia Finance Tranche D 1st Lien 4.027% (LIBOR03M + 2.25%) 1/15/26 ● | 295,000 | 294,954 | ||||||
Univision Communications Tranche C 1st Lien 4.627% (LIBOR03M + 2.75%) 3/15/24 ● | 1,436,147 | 1,415,726 | ||||||
UPC Financing Partnership Tranche AR 1st Lien 4.277% (LIBOR03M + 2.50%) 1/15/26 ● | 290,000 | 291,243 | ||||||
USI Tranche B 1st Lien 5.302% (LIBOR03M + 3.00%) 5/16/24 ● | 1,999,950 | 2,008,074 | ||||||
USIC Holdings Tranche SR 5.004% (LIBOR03M + 3.50%) 12/9/23 ● | 1,017,125 | 1,024,965 | ||||||
USS Ultimate Holdings 2nd Lien 9.627% (LIBOR03M + 7.75%) 8/25/25 ● | 110,000 | 111,535 | ||||||
Utz Quality Foods 1st Lien 5.354% (LIBOR03M + 3.50%) 11/21/24 ● | 330,000 | 333,661 | ||||||
88
Table of Contents
| Principal amount° | Value (US $) | |||||||
Loan Agreements (continued) |
| |||||||
Valeant Pharmaceuticals International Tranche B 1st Lien 5.24% (LIBOR03M + 3.50%) 4/1/22 ● | 417,649 | $ | 422,582 | |||||
VC GB Holdings 2nd Lien 9.877% (LIBOR03M + 8.00%) 2/28/25 =● | 194,000 | 196,183 | ||||||
Virgin Media Bristol Tranche K 1st Lien 4.277% (LIBOR03M + 2.50%) 1/15/26 ● | 315,000 | 316,969 | ||||||
Western Digital Tranche B 1st Lien 3.877% (LIBOR03M + 2.00%) 4/29/23 ● | 250,044 | 251,842 | ||||||
WideOpenWest Finance Tranche B 1st Lien 5.104% (LIBOR03M + 3.25%) 8/19/23 ● | 752,923 | 736,689 | ||||||
Wink Holdco 2nd Lien 8.42% (LIBOR03M + 6.75%) 12/1/25 ● | 246,000 | 245,539 | ||||||
WR Grace -Conn Tranche B2 1st Lien 4.058% (LIBOR03M + 1.75%) 2/23/25 ● | 250,000 | 251,302 | ||||||
Wyndham Hotels & Resorts Tranche B 1st Lien | 425,000 | 425,000 | ||||||
XPO Logistics Tranche B 1st Lien 3.92% (LIBOR03M + 2.00%) 2/24/25 ● | 1,360,000 | 1,366,546 | ||||||
Zayo Group Tranche B2 1st Lien 3.871% (LIBOR03M + 2.25%) 1/19/24 ● | 691,567 | 695,997 | ||||||
Zekelman Industries 1st Lien 4.999% (LIBOR03M + 2.75%) 6/14/21 ● | 992,247 | 998,821 | ||||||
|
| |||||||
Total Loan Agreements | 115,331,175 | |||||||
|
| |||||||
| ||||||||
Sovereign Bonds – 11.28%D |
| |||||||
Argentina – 0.32% |
| |||||||
Argentine Bonos del Tesoro | ARS | 21,516,000 | 1,125,453 | |||||
21.20% 9/19/18 | ARS | 33,982,000 | 1,683,656 | |||||
Argentine Republic Government International Bonds | EUR | 2,441,000 | 2,081,445 | |||||
| Principal amount° | Value (US $) | |||||||
Sovereign BondsD (continued) |
| |||||||
Argentina (continued) |
| |||||||
Argentine Republic Government International Bonds | 930,000 | $ | 945,810 | |||||
6.875% 1/11/48 | 650,000 | 594,344 | ||||||
|
| |||||||
| 6,430,708 | ||||||||
|
| |||||||
Azerbaijan – 0.03% |
| |||||||
Republic of Azerbaijan International Bond 144A | 635,000 | 534,965 | ||||||
|
| |||||||
| 534,965 | ||||||||
|
| |||||||
Bermuda – 0.04% |
| |||||||
Bermuda Government International Bond 144A | 800,000 | 784,000 | ||||||
|
| |||||||
| 784,000 | ||||||||
|
| |||||||
Brazil – 0.63% |
| |||||||
Brazil Letras do Tesouro Nacional | BRL | 17,100,000 | 5,101,683 | |||||
Brazil Notas do Tesouro Nacional | BRL | 3,737,000 | 1,183,368 | |||||
Series F 10.00% 1/1/25 | BRL | 18,615,000 | 5,855,326 | |||||
Series F 10.00% 1/1/27 | BRL | 1,786,000 | 558,999 | |||||
|
| |||||||
| 12,699,376 | ||||||||
|
| |||||||
Canada – 0.01% |
| |||||||
Canadian Government Bond | CAD | 171,000 | 148,071 | |||||
|
| |||||||
| 148,071 | ||||||||
|
| |||||||
Chile – 0.12% |
| |||||||
Bonos de la Tesoreria de la Republica en pesos | CLP | 1,420,000,000 | 2,420,161 | |||||
|
| |||||||
| 2,420,161 | ||||||||
|
| |||||||
Colombia – 0.39% |
| |||||||
Colombian TES | COP | 21,676,000,000 | 7,870,616 | |||||
|
| |||||||
| 7,870,616 | ||||||||
|
| |||||||
Costa Rica – 0.03% |
| |||||||
Costa Rica Government International Bond 144A | 645,000 | 622,103 | ||||||
|
| |||||||
| 622,103 | ||||||||
|
| |||||||
(continues) | 89 |
Table of Contents
Schedules of investments
Optimum Fixed Income Fund
| Principal amount° | Value (US $) | |||||||
Sovereign BondsD (continued) |
| |||||||
Croatia – 0.02% |
| |||||||
Croatia Government International Bond | 455,000 | $ | 488,878 | |||||
|
| |||||||
| 488,878 | ||||||||
|
| |||||||
Cyprus – 0.08% |
| |||||||
Cyprus Government International Bond | EUR | 1,200,000 | 1,658,497 | |||||
|
| |||||||
| 1,658,497 | ||||||||
|
| |||||||
Ecuador – 0.07% |
| |||||||
Ecuador Government International Bonds | 760,000 | 734,502 | ||||||
144A 8.875% 10/23/27 # | 600,000 | 612,870 | ||||||
|
| |||||||
| 1,347,372 | ||||||||
|
| |||||||
Egypt – 0.05% |
| |||||||
Egypt Government International Bonds | 480,000 | 487,837 | ||||||
144A 7.903% 2/21/48 # | 500,000 | 527,233 | ||||||
|
| |||||||
| 1,015,070 | ||||||||
|
| |||||||
Greece – 0.44% |
| |||||||
Hellenic Republic Treasury Bills | EUR | 1,800,000 | 2,211,521 | |||||
1.194% 8/31/18 ≠ | EUR | 5,500,000 | 6,738,882 | |||||
|
| |||||||
| 8,950,403 | ||||||||
|
| |||||||
Hungary – 0.15% |
| |||||||
Hungary Government Bonds | HUF | 288,800,000 | 1,184,667 | |||||
3.00% 10/27/27 | HUF | 441,600,000 | 1,832,523 | |||||
|
| |||||||
| 3,017,190 | ||||||||
|
| |||||||
Indonesia – 0.01% |
| |||||||
Indonesia Government International Bond | 200,000 | 208,617 | ||||||
|
| |||||||
| 208,617 | ||||||||
|
| |||||||
Italy – 0.38% |
| |||||||
Italy Buoni Ordinari del Tesoro Bot | EUR | 6,200,000 | 7,631,971 | |||||
|
| |||||||
| 7,631,971 | ||||||||
|
| |||||||
| Principal amount° | Value (US $) | |||||||
Sovereign BondsD (continued) |
| |||||||
Ivory Coast – 0.05% |
| |||||||
Ivory Coast Government International Bond | 1,150,000 | $ | 1,096,339 | |||||
|
| |||||||
| 1,096,339 | ||||||||
|
| |||||||
Japan – 6.60% |
| |||||||
Japan Bank For International Cooperation | 700,000 | 691,079 | ||||||
2.375% 11/16/22 | 536,000 | 521,256 | ||||||
2.514% (LIBOR03M + 0.57%) 2/24/20 ● | 1,018,000 | 1,025,232 | ||||||
Japan Treasury Discount Bills | JPY | 2,376,900,000 | 22,338,348 | |||||
0.00% 4/9/18 ^ | JPY | 6,007,800,000 | 56,462,592 | |||||
0.00% 5/14/18 ^ | JPY | 837,100,000 | 7,868,425 | |||||
0.00% 5/21/18 ^ | JPY | 4,715,200,000 | 44,322,393 | |||||
|
| |||||||
| 133,229,325 | ||||||||
|
| |||||||
Jordan – 0.02% |
| |||||||
Jordan Government International Bond | 400,000 | 390,128 | ||||||
|
| |||||||
| 390,128 | ||||||||
|
| |||||||
Kuwait – 0.17% |
| |||||||
Kuwait International Government Bond | 3,400,000 | 3,336,250 | ||||||
|
| |||||||
| 3,336,250 | ||||||||
|
| |||||||
Mexico – 0.43% |
| |||||||
Mexican Bonos | MXN | 43,668,400 | 2,183,420 | |||||
6.50% 6/9/22 | MXN | 82,842,000 | 4,442,983 | |||||
10.00% 12/5/24 | MXN | 19,178,000 | 1,211,210 | |||||
Mexico Government International Bonds | 200,000 | 202,450 | ||||||
4.35% 1/15/47 | 600,000 | 549,828 | ||||||
|
| |||||||
| 8,589,891 | ||||||||
|
| |||||||
Mongolia – 0.04% |
| |||||||
Mongolia Government International Bond | 890,000 | 880,320 | ||||||
|
| |||||||
| 880,320 | ||||||||
|
| |||||||
90
Table of Contents
| Principal amount° | Value (US $) | |||||||
Sovereign BondsD (continued) |
| |||||||
Nigeria – 0.06% | ||||||||
Nigeria Government International Bonds | 205,000 | $ | 216,220 | |||||
144A 7.875% 2/16/32 # | 1,000,000 | 1,091,220 | ||||||
|
| |||||||
| 1,307,440 | ||||||||
|
| |||||||
Peru – 0.19% | ||||||||
Peruvian Government International Bonds 144A 6.85% 2/12/42 # | PEN | 5,088,000 | 1,791,235 | |||||
144A 8.20% 8/12/26 # | PEN | 5,055,000 | 1,955,777 | |||||
|
| |||||||
| 3,747,012 | ||||||||
|
| |||||||
Poland – 0.14% | ||||||||
Republic of Poland Government Bonds 1.75% 7/25/21 | PLN | 6,850,000 | 1,998,079 | |||||
2.50% 1/25/23 | PLN | 1,846,000 | 543,422 | |||||
3.25% 7/25/25 | PLN | 1,087,000 | 325,346 | |||||
|
| |||||||
| 2,866,847 | ||||||||
|
| |||||||
Republic of Korea – 0.06% |
| |||||||
Export-Import Bank of Korea 4.00% 6/7/27 | AUD | 210,000 | 162,434 | |||||
Inflation Linked Korea Treasury Bond 1.125% 6/10/23 | KRW | 1,121,505,298 | 1,066,378 | |||||
|
| |||||||
| 1,228,812 | ||||||||
|
| |||||||
Russia – 0.03% | ||||||||
Russian Foreign Bond - Eurobond 144A 5.25% 6/23/47 # | 600,000 | 600,390 | ||||||
|
| |||||||
| 600,390 | ||||||||
|
| |||||||
Saudi Arabia – 0.20% |
| |||||||
Saudi Government International Bonds 2.375% 10/26/21 | 200,000 | 192,839 | ||||||
144A 2.875% 3/4/23 # | 2,200,000 | 2,120,474 | ||||||
3.25% 10/26/26 | 1,000,000 | 938,157 | ||||||
144A 4.50% 10/26/46 # | 800,000 | 748,851 | ||||||
|
| |||||||
| 4,000,321 | ||||||||
|
| |||||||
Senegal – 0.05% | ||||||||
Senegal Government International Bond 144A 6.75% 3/13/48 # | 960,000 | 942,912 | ||||||
|
| |||||||
| 942,912 | ||||||||
|
| |||||||
| Principal amount° | Value (US $) | |||||||
Sovereign BondsD (continued) |
| |||||||
South Africa – 0.12% | ||||||||
Republic of South Africa Government Bond 8.75% 1/31/44 | ZAR | 30,000,000 | $ | 2,494,297 | ||||
|
| |||||||
| 2,494,297 | ||||||||
|
| |||||||
Sri Lanka – 0.03% | ||||||||
Sri Lanka Government International Bond 144A 5.75% 1/18/22 # | 510,000 | 516,912 | ||||||
|
| |||||||
| 516,912 | ||||||||
|
| |||||||
Turkey – 0.22% | ||||||||
Turkey Government Bonds 10.50% 8/11/27 | TRY | 6,108,000 | 1,402,450 | |||||
11.10% 5/15/19 | TRY | 8,628,000 | 2,126,351 | |||||
Turkey Government International Bonds 3.25% 3/23/23 | 1,000,000 | 929,518 | ||||||
|
| |||||||
| 4,458,319 | ||||||||
|
| |||||||
Ukraine – 0.08% | ||||||||
Ukraine Government International Bonds 144A 7.375% 9/25/32 # | 705,000 | 681,206 | ||||||
144A 7.75% 9/1/26 # | 900,000 | 923,261 | ||||||
|
| |||||||
| 1,604,467 | ||||||||
|
| |||||||
United Kingdom – 0.02% |
| |||||||
United Kingdom Gilt 1.75% 9/7/22 | GBP | 100,000 | 144,908 | |||||
3.50% 1/22/45 | GBP | 138,800 | 268,331 | |||||
|
| |||||||
| 413,239 | ||||||||
|
| |||||||
Total Sovereign Bonds |
| 227,531,219 | ||||||
|
| |||||||
Supranational Banks – 1.02% |
| |||||||
Asian Development Bank 3.50% 5/30/24 | NZD | 921,000 | 677,857 | |||||
Banque Ouest Africaine de Developpement 144A 5.00% 7/27/27 # | 1,000,000 | 998,600 | ||||||
European Bank for Reconstruction & Development 2.271% (LIBOR03M + 0.00%) 3/23/20 ● | 505,000 | 504,775 | ||||||
6.00% 5/4/20 | INR | 90,400,000 | 1,375,463 | |||||
European Investment Bank 1.00% 9/21/26 | GBP | 318,000 | 425,785 | |||||
| (continues) | 91 |
Table of Contents
Schedules of investments
Optimum Fixed Income Fund
| Principal amount° | Value (US $) | |||||||
Supranational Banks (continued) |
| |||||||
Inter-American Development Bank 1.942% (LIBOR03M + 0.22%) 10/15/20 ● | 890,000 | $ | 894,285 | |||||
5.50% 8/23/21 | INR | 151,000,000 | 2,269,428 | |||||
6.25% 6/15/21 | IDR | 43,200,000,000 | 3,159,865 | |||||
7.875% 3/14/23 | IDR | 36,240,000,000 | 2,847,210 | |||||
International Bank for Reconstruction & Development 1.878% (LIBOR01M + 0.07%) 4/17/19 ● | 440,000 | 440,165 | ||||||
2.50% 11/25/24 | 440,000 | 431,200 | ||||||
3.00% 2/2/23 | NZD | 705,000 | 510,243 | |||||
3.375% 1/25/22 | NZD | 300,000 | 221,507 | |||||
4.625% 10/6/21 | NZD | 380,000 | 292,110 | |||||
4.75% 1/15/21 | COP | 3,400,000,000 | 1,211,403 | |||||
International Finance 1.764% (LIBOR03M + 0.06%) 1/9/19 ● | 600,000 | 600,230 | ||||||
3.625% 5/20/20 | NZD | 163,000 | 120,733 | |||||
3.75% 8/9/27 | NZD | 305,000 | 222,850 | |||||
6.30% 11/25/24 | INR | 106,720,000 | 1,612,099 | |||||
7.00% 7/20/27 | MXN | 33,060,000 | 1,736,123 | |||||
|
| |||||||
Total Supranational Banks | 20,551,931 | |||||||
|
| |||||||
US Treasury Obligations – 14.97% |
| |||||||
US Treasury Bonds 2.50% 2/15/45 | 37,100,000 | 33,810,699 | ||||||
2.75% 8/15/42 | 900,000 | 868,062 | ||||||
2.75% 11/15/42 | 1,400,000 | 1,348,937 | ||||||
2.875% 5/15/43 | 2,200,000 | 2,164,681 | ||||||
2.875% 8/15/45 ¥ | 16,700,000 | 16,368,948 | ||||||
3.00% 5/15/47 | 900,000 | 902,638 | ||||||
4.375% 5/15/40 | 100,000 | 123,787 | ||||||
US Treasury Floating Rate Note 1.748% (USBMMY3M + 0.00%) 1/31/20 ● | 1,930,000 | 1,928,095 | ||||||
US Treasury Inflation Indexed Notes 0.125% 4/15/19 ¥ | 1,269,384 | 1,268,460 | ||||||
0.125% 4/15/22 ¥ | 14,212,883 | 14,009,329 | ||||||
0.125% 7/15/26 | 20,681 | 19,865 | ||||||
0.25% 1/15/25 | 9,209,200 | 9,002,034 | ||||||
0.375% 7/15/27 | 6,890,304 | 6,717,643 | ||||||
0.625% 1/15/26 | 8,449,596 | 8,444,130 | ||||||
1.75% 1/15/28 | 14,339,899 | 15,757,220 | ||||||
2.375% 1/15/25 | 8,941,796 | 10,008,541 | ||||||
2.375% 1/15/27 | 1,597,843 | 1,829,551 | ||||||
| Principal amount° | Value (US $) | |||||||
US Treasury Obligations (continued) |
| |||||||
US Treasury Inflation Indexed Notes 2.50% 1/15/29 | 34,634 | $ | 41,002 | |||||
US Treasury Notes 1.125% 8/31/21 ¥ | 13,800,000 | 13,198,361 | ||||||
1.50% 1/31/19 | 2,100,000 | 2,089,508 | ||||||
1.50% 10/31/19 | 54,700,000 | 54,060,995 | ||||||
1.875% 7/31/22 | 39,700,000 | 38,628,414 | ||||||
2.00% 10/31/21 ¥ | 1,600,000 | 1,574,162 | ||||||
2.00% 11/30/22 | 7,700,000 | 7,514,536 | ||||||
2.00% 5/31/24 | 25,200,000 | 24,253,060 | ||||||
2.00% 6/30/24 | 7,700,000 | 7,406,991 | ||||||
2.125% 11/30/24 | 9,400,000 | 9,079,396 | ||||||
2.25% 2/15/27 | 3,400,000 | 3,266,068 | ||||||
2.375% 5/15/27 | 12,800,000 | 12,411,809 | ||||||
2.75% 2/15/24 | 4,000,000 | 4,024,449 | ||||||
2.75% 2/15/28 | 20,000 | 19,998 | ||||||
|
| |||||||
Total US Treasury Obligations (cost $305,328,566) | 302,141,369 | |||||||
|
| |||||||
| Number of shares | ||||||||
Common Stock – 0.00% |
| |||||||
Century Communications =† | 1,975,000 | — | ||||||
|
| |||||||
Total Common Stock (cost $59,790) | — | |||||||
|
| |||||||
Convertible Preferred Stock – 0.37% |
| |||||||
A Schulman 6.00% exercise price $52.33 y | 1,004 | 1,030,800 | ||||||
AMG Capital Trust II 5.15% exercise price $200.00, maturity date 10/15/37 | 12,759 | 793,966 | ||||||
Assurant 6.50% exercise price $106.91, maturity date 3/15/21 | 874 | 91,027 | ||||||
Bank of America 7.25% exercise price $50.00 y | 417 | 537,701 | ||||||
Becton Dickinson 6.125% exercise price $211.80, maturity date 5/1/20 | 17,282 | 1,009,787 | ||||||
Crown Castle International 6.875% exercise price $115.20, maturity date 8/1/20 | 293 | 327,553 | ||||||
DTE Energy 6.50% exercise price $116.31, maturity date 10/1/19 | 9,605 | 500,324 | ||||||
92
Table of Contents
| Number of shares | Value (US $) | |||||||
Convertible Preferred Stock (continued) |
| |||||||
El Paso Energy Capital Trust I 4.75% exercise price $50.00, maturity date 3/31/28 | 9,952 | $ | 476,452 | |||||
Electronics For Imaging 0.75% exercise price $52.72, maturity date 9/1/19 | 502,000 | 487,893 | ||||||
Kinder Morgan 9.75% exercise price $32.38, maturity date 10/26/18 | 23,325 | 725,174 | ||||||
NextEra Energy 6.123% exercise price $159.03, maturity date 9/1/19 | 5,664 | 326,586 | ||||||
6.371% exercise price $113.33, maturity date 9/1/18 | 3,162 | 230,656 | ||||||
Wells Fargo & Co. 7.50% exercise price $156.71 y | 325 | 419,250 | ||||||
Welltower 6.50% exercise price $57.42 y | 10,732 | 597,128 | ||||||
|
| |||||||
Total Convertible Preferred Stock | 7,554,297 | |||||||
|
| |||||||
Preferred Stock – 0.25% |
| |||||||
Bank of America 6.50%µy | 1,150,000 | 1,237,803 | ||||||
General Electric 5.00%µy | 2,148,000 | 2,129,205 | ||||||
Integrys Holdings 6.00% 8/1/73 µ | 35,650 | 940,269 | ||||||
Morgan Stanley | 240,000 | 247,745 | ||||||
USB Realty 144A 2.867% (LIBOR03M + 1.15%)#y● | 500,000 | 451,875 | ||||||
|
| |||||||
Total Preferred Stock (cost $4,984,714) | 5,006,897 | |||||||
|
| |||||||
| Number of contracts | ||||||||
Options Purchased – 0.01% |
| |||||||
Call Swaptions – 0.00% | ||||||||
2 yr IRS pay a fixed rate 1.65% and receive a floating rate based on 3-month USD-ICE LIBOR expiration date 11/15/18, notional amount $88,800,000 (MSC) | 88,800,000 | 9,147 | ||||||
| Number of contracts | Value (US $) | |||||||
Options Purchased (continued) |
| |||||||
Call Swaptions (continued) |
| |||||||
2 yr IRS pay a fixed rate 2.50% and receive a floating rate based on 3-month USD-ICE LIBOR expiration date 6/1/18, notional amount $17,800,000 (MSC) | 17,800,000 | $ | 12,905 | |||||
|
| |||||||
| 22,052 | ||||||||
|
| |||||||
Put Swaption – 0.01% |
| |||||||
30 yr IRS pay a fixed rate 2.90% and receive a floating rate based on 3-month USD-ICE LIBOR expiration date 8/20/18, notional amount $4,400,000 (MSC) | 4,400,000 | 113,005 | ||||||
|
| |||||||
| 113,005 | ||||||||
|
| |||||||
Total Options Purchased (premium paid $960,455) | 135,057 | |||||||
|
| |||||||
Principal amount° | ||||||||
Short-Term Investments – 5.49% |
| |||||||
Bankers’ Acceptances – 1.57%≠ | ||||||||
Bank of Montreal 1.487% 4/13/18 | CAD | 1,800,000 | 1,396,228 | |||||
1.504% 4/2/18 | CAD | 3,500,000 | 2,716,110 | |||||
Canadian Imperial Bank 1.504% 4/16/18 | CAD | 11,400,000 | 8,841,714 | |||||
Halifax | CAD | 22,500,000 | 17,460,706 | |||||
Royal Bank of Canada 1.44% 4/5/18 | CAD | 1,500,000 | 1,163,896 | |||||
|
| |||||||
| 31,578,654 | ||||||||
|
| |||||||
Certificates of Deposit – 0.29%≠ |
| �� | ||||||
Barclays Bank 1.94% 9/4/18 | 4,450,000 | 4,439,988 | ||||||
First Republic Bank 2.395% 4/17/18 | 1,500,000 | 1,499,910 | ||||||
|
| |||||||
| 5,939,898 | ||||||||
|
| |||||||
Commercial Paper – 0.19% |
| |||||||
Dominion Gas Holdings 2.154% 4/16/18 ≠ | 1,000,000 | 998,965 | ||||||
Schlumberger Holdings 2.527% 6/20/18 ≠³ | 900,000 | 895,078 | ||||||
Walloon Region 0.00% 5/9/18 ^ | EUR | 1,500,000 | 1,847,137 | |||||
|
| |||||||
| 3,741,180 | ||||||||
|
| |||||||
(continues) | 93 |
Table of Contents
Schedules of investments
Optimum Fixed Income Fund
Principal amount° | Value (US $) | |||||||
| ||||||||
Short-Term Investments (continued) |
| |||||||
| ||||||||
Discount Notes – 0.39%≠ | ||||||||
Federal Home Loan Bank 0.80% 4/3/18 | 3,661,046 | $ | 3,660,878 | |||||
1.569% 4/25/18 | 900,000 | 899,051 | ||||||
1.597% 5/15/18 | 3,400,000 | 3,393,135 | ||||||
|
| |||||||
| 7,953,064 | ||||||||
|
| |||||||
Repurchase Agreements – 2.72% |
| |||||||
Bank of America Merrill Lynch 1.71%, dated 3/29/18, to be repurchased on 4/2/18, repurchase price $4,938,023 (collateralized by US government obligations 1.50%-3.75% 11/15/18-8/15/44; market value $5,035,831) | 4,937,085 | 4,937,085 | ||||||
Bank of Montreal 1.60%, dated 3/29/18, to be repurchased on 4/2/18, repurchase price $14,813,888 (collateralized by US government obligations 0.00%-2.875% 8/16/18-8/15/47; market value $15,107,480) | 14,811,254 | 14,811,254 | ||||||
BNP Paribas 1.75%, dated 3/29/18, to be repurchased on 4/2/18, repurchase price $14,563,973 (collateralized by US government obligations 0.00%-3.625% 5/31/18-11/15/45; market value $14,852,368) | 14,561,142 | 14,561,142 | ||||||
US Treasury repurchase agreement with Barclays Capital 1.84%, dated 4/2/18, to be repurchased 4/3/18, repurchase price $20,501,048 (collateralized by US government obligation; 1.50% 4/15/20; market value $21,095,000) | 20,500,000 | 20,500,000 | ||||||
|
| |||||||
| 54,809,481 | ||||||||
|
| |||||||
Principal amount° | Value (US $) | |||||||
| ||||||||
Short-Term Investments (continued) |
| |||||||
| ||||||||
US Treasury Obligations – 0.33%≠ | ||||||||
US Treasury Bills 1.007% 4/5/18 | 2,890,399 | $ | 2,890,008 | |||||
1.35% 4/12/18 | 3,774,670 | 3,772,960 | ||||||
|
| |||||||
| 6,662,968 | ||||||||
|
| |||||||
Total Short-Term Investments (cost $110,561,295) | 110,685,245 | |||||||
|
| |||||||
Total Value of Securities Before Options Written – 118.33% (cost $2,391,112,125) | $ | 2,387,488,384 | ||||||
|
| |||||||
| Number of contracts | ||||||||
| ||||||||
Options Written – (0.01%) | ||||||||
| ||||||||
Call Swaptions – 0.00% | ||||||||
10 yr IRS pay a fixed rate 2.00% and receive a floating rate based on 3-month USD-ICE LIBOR expiration date 11/15/18, notional amount ($19,100,000) (MSC) | (19,100,000 | ) | (32,107 | ) | ||||
30 yr IRS pay a fixed rate 2.80% and receive a floating rate based on 3-month USD-ICE LIBOR expiration date 6/1/18, notional amount ($1,800,000) (MSC) | (1,800,000 | ) | (33,887 | ) | ||||
|
| |||||||
| (65,994 | ) | |||||||
|
| |||||||
Currency Call Option – 0.00% | ||||||||
AUD vs USD strike price $0.79, expiration date 5/25/18, notional amount ($1,027,000) (BNP) | (1,300,000 | ) | (3,440 | ) | ||||
|
| |||||||
| (3,440 | ) | |||||||
|
| |||||||
Put Swaptions – (0.01%) | ||||||||
5 yr IRS pay a fixed rate 2.80% and receive a floating rate based on 3-month USD-ICE LIBOR expiration date 8/20/18, notional amount ($19,500,000) (MSC) | (19,500,000 | ) | (119,652 | ) | ||||
CDX.OP.IG 29 5 yr VII strike price $0.80, expiration date 5/16/18, notional amount ($200,000) (DB) | (200,000 | ) | (105 | ) | ||||
94
Table of Contents
| Number of contracts | Value (US $) | |||||||
| ||||||||
Options Written (continued) |
| |||||||
| ||||||||
Put Swaptions (continued) | ||||||||
CDX.OP.IG 30 5 yr VII strike price $0.85, expiration date 6/20/18, notional amount ($800,000) (BAML) | (800,000 | ) | $ | (1,122 | ) | |||
CDX.OP.IG 30 5 yr VII strike price $0.90, expiration date 6/20/18, notional amount ($500,000) (BAML) | (500,000 | ) | (579 | ) | ||||
CDX.OP.IG 30 5 yr VII strike price $0.90, expiration date 6/20/18, notional amount ($800,000) (BNP) | (800,000 | ) | (927 | ) | ||||
CDX.OP.IG 30 5 yr VII strike price $0.90, expiration date 6/20/18, notional amount ($400,000) (CITI) | (400,000 | ) | (464 | ) | ||||
CDX.OP.IG 30 5 yr VII strike price $0.90, expiration date 6/20/18, notional amount ($1,500,000) (JPMC) | (1,500,000 | ) | (1,738 | ) | ||||
|
| |||||||
| (124,587 | ) | |||||||
|
| |||||||
Total Options Written (premium received $972,458) | (194,021 | ) | ||||||
|
| |||||||
| # | Security exempt from registration under Rule 144A of the Securities Act of 1933, as amended.At March 31, 2018, the aggregate value of Rule 144A securities was $427,856,703,which represents 21.20% of the Fund’s net assets. See Note 10 in “Notes to financial statements.” |
| ◆ | Pass Through Agreement. Security represents the contractual right to receive a proportionate amount of underlying payments due to the counterparty pursuant to various agreements related to the rescheduling of obligations and the exchange of certain notes. |
| = | The value of this security was determined using significant unobservable inputs and is reported as a Level 3 security in the disclosure table located in Note 3 in “Notes to financial statements.” |
| ≠ | The rate shown is the effective yield at the time of purchase. |
| ³ | Commercial paper exempt from registration under Section 4(a)(2) and/or Rule 144A of the Securities Act of 1933, as amended, and may be resold in transactions exempt from registration only to dealers in that program or other “accredited investors.” At March 31, 2018, the aggregate value of these securities was $895,078,which represents 0.04% of the Fund’s net assets. See Note 10 in “Notes to financial statements.” |
| ° | Principal amount shown is stated in US dollars unless noted that the security is denominated in another currency. |
| D | Securities have been classified by country of origin. |
| µ | Fixed to variable rate investment. The rate shown reflects the fixed rate in effect at March 31, 2018. Rate will reset at a future date. |
| S | Interest only security. An interest only security is the interest only portion of a fixed income security, which is separated and sold individually from the principal portion of the security. |
| y | No contractual maturity date. |
| W | Principal only security. A principal only security is the principal only portion of a fixed income security which is separated and sold individually from the interest portion of the security. |
| † | Non-income producing security. |
| ● | Variable rate investment.Rates reset periodically.Rates shown reflect the rate in effect at March 31,2018.For securities based on a published reference rate and spread,the reference rate and spread are indicated in their description above. Certain variable rate securities are not based on a published reference rate and spread but are determined by the issuer or agent and are based on current market conditions, or for mortgage-backed securities, are impacted by the individual mortgages which are paying off over time. These securities do not indicate a reference rate and spread in their description above. |
| ¥ | Fully or partially pledged as collateral for futures and swap contracts. |
| ^ | Zero coupon security. The rate shown is the effective yield at the time of purchase. |
| ~ | Step-up bond that pays an initial coupon rate for the first period and then a higher coupon rate for the following periods. Stated rate in effect at March 31, 2018. |
The following foreign currency exchange contracts, futures contracts, and swap contracts were outstanding at March 31, 2018:1
Foreign Currency Exchange Contracts
Counterparty | Contracts to Receive (Deliver) | In Exchange For | Settlement Date | Unrealized Appreciation | Unrealized Depreciation | |||||||||||||||||||
BAML | AUD | (768,607) | USD | 590,340 | 5/18/18 | $ | — | $ | (27 | ) | ||||||||||||||
BAML | BRL | (8,900,000) | USD | 2,624,594 | 7/3/18 | — | (48,397 | ) | ||||||||||||||||
BAML | CAD | 6,634,000 | USD | (5,195,761) | 4/4/18 | — | (45,957 | ) | ||||||||||||||||
BAML | CAD | (8,400,000) | USD | 6,691,382 | 5/15/18 | 165,607 | — | |||||||||||||||||
BAML | CAD | 2,317,394 | USD | (1,796,558) | 5/18/18 | 3,872 | — | |||||||||||||||||
| (continues) | 95 |
Table of Contents
Schedules of investments
Optimum Fixed Income Fund
Counterparty | Contracts to Receive (Deliver) | In Exchange For | Settlement Date | Unrealized Appreciation | Unrealized Depreciation | |||||||||||||||||||
BAML | EUR | (11,229,000 | ) | USD | 13,882,262 | 4/4/18 | $ | 59,767 | $ | — | ||||||||||||||
BAML | EUR | (216,069 | ) | USD | 267,011 | 5/18/18 | 188 | — | ||||||||||||||||
BAML | EUR | (5,500,000 | ) | USD | 6,807,218 | 8/31/18 | — | (42,613 | ) | |||||||||||||||
BAML | GBP | 11,227,000 | USD | (15,875,989 | ) | 4/4/18 | — | (120,563 | ) | |||||||||||||||
BAML | GBP | (11,336,000 | ) | USD | 16,045,110 | 5/3/18 | 117,315 | — | ||||||||||||||||
BAML | JPY | 264,000,000 | USD | (2,515,399 | ) | 4/4/18 | — | (33,376 | ) | |||||||||||||||
BAML | JPY | (2,376,900,000 | ) | USD | 22,432,557 | 4/5/18 | 84,472 | — | ||||||||||||||||
BAML | JPY | (730,000,000 | ) | USD | 6,968,208 | 5/2/18 | 92,790 | — | ||||||||||||||||
BAML | JPY | (215,379,453 | ) | USD | 2,030,973 | 5/18/18 | 217 | — | ||||||||||||||||
BAML | JPY | (3,740,000,000 | ) | USD | 35,014,136 | 5/21/18 | — | (256,602 | ) | |||||||||||||||
BAML | NZD | (1,970,489 | ) | USD | 1,420,045 | 5/18/18 | — | (3,785 | ) | |||||||||||||||
BNP | AUD | 1,203,000 | USD | (927,239 | ) | 4/4/18 | — | (3,285 | ) | |||||||||||||||
BNP | AUD | 225,457 | USD | (173,126 | ) | 5/18/18 | 46 | — | ||||||||||||||||
BNP | BRL | 17,054,720 | USD | (5,220,539 | ) | 5/3/18 | — | (69,418 | ) | |||||||||||||||
BNP | CAD | (1,800,000 | ) | USD | 1,391,860 | 4/13/18 | — | (5,679 | ) | |||||||||||||||
BNP | EUR | 10,189,000 | USD | (12,649,643 | ) | 4/4/18 | — | (107,349 | ) | |||||||||||||||
BNP | EUR | (10,189,000 | ) | USD | 12,675,880 | 5/3/18 | 107,401 | — | ||||||||||||||||
BNP | EUR | (1,500,000 | ) | USD | 1,863,644 | 5/9/18 | 12,525 | — | ||||||||||||||||
BNP | EUR | (1,221,827 | ) | USD | 1,509,603 | 5/18/18 | 771 | — | ||||||||||||||||
BNP | IDR | 42,710,845,891 | USD | (3,099,480 | ) | 5/18/18 | 712 | — | ||||||||||||||||
BNP | JPY | (264,000,000 | ) | USD | 2,473,109 | 4/4/18 | — | (8,914 | ) | |||||||||||||||
BNP | JPY | (837,100,000 | ) | USD | 7,861,192 | 5/14/18 | — | (29,433 | ) | |||||||||||||||
BNP | MXN | 3,079,632 | USD | (167,414 | ) | 5/18/18 | 639 | — | ||||||||||||||||
BNP | NOK | (3,327,664 | ) | USD | 424,030 | 5/18/18 | — | (1,131 | ) | |||||||||||||||
BNP | TWD | (186,760,561 | ) | USD | 6,461,632 | 6/20/18 | — | (9,553 | ) | |||||||||||||||
BNYM | AUD | (8,975 | ) | USD | 6,882 | 4/3/18 | — | (10 | ) | |||||||||||||||
BNYM | CAD | (4,650 | ) | USD | 3,605 | 4/2/18 | — | (4 | ) | |||||||||||||||
CITI | BRL | 5,200,000 | USD | (1,567,823 | ) | 5/3/18 | 2,758 | — | ||||||||||||||||
CITI | BRL | (2,700,000 | ) | USD | 803,236 | 7/3/18 | — | (7,671 | ) | |||||||||||||||
CITI | CAD | (1,500,000 | ) | USD | 1,146,134 | 4/5/18 | — | (18,299 | ) | |||||||||||||||
CITI | CAD | (11,400,000 | ) | USD | 8,733,101 | 4/16/18 | — | (118,500 | ) | |||||||||||||||
CITI | EUR | 299,000 | USD | (368,078 | ) | 4/4/18 | — | (20 | ) | |||||||||||||||
CITI | EUR | (6,200,000 | ) | USD | 7,696,031 | 4/30/18 | 49,810 | — | ||||||||||||||||
CITI | GBP | (11,336,000 | ) | USD | 15,943,069 | 4/4/18 | 34,678 | — | ||||||||||||||||
CITI | INR | 23,338,266 | USD | (354,706 | ) | 6/20/18 | 553 | — | ||||||||||||||||
CITI | JPY | (6,007,800,000 | ) | USD | 56,841,574 | 4/9/18 | 340,855 | — | ||||||||||||||||
CITI | MXN | (1,891,000 | ) | USD | 100,180 | 5/10/18 | — | (3,149 | ) | |||||||||||||||
CITI | MXN | (22,965,424 | ) | USD | 1,248,100 | 5/18/18 | — | (5,113 | ) | |||||||||||||||
CITI | NZD | (650,000 | ) | USD | 475,419 | 5/15/18 | 5,738 | — | ||||||||||||||||
DB | AUD | (2,366,000 | ) | USD | 1,830,067 | 4/4/18 | 12,882 | — | ||||||||||||||||
DB | BRL | 7,811,451 | USD | (2,336,449 | ) | 5/18/18 | 19,840 | — | ||||||||||||||||
DB | CAD | (26,000,000 | ) | USD | 20,160,493 | 4/2/18 | — | (21,880 | ) | |||||||||||||||
DB | GBP | (16,000 | ) | USD | 22,622 | 4/4/18 | 169 | — | ||||||||||||||||
DB | KRW | (6,985,745,800 | ) | USD | 6,556,000 | 6/20/18 | — | (34,668 | ) | |||||||||||||||
DB | SGD | (9,478,080 | ) | USD | 7,218,638 | 6/20/18 | — | (24,445 | ) | |||||||||||||||
HSBC | EUR | (1,295,488 | ) | USD | 1,600,239 | 5/18/18 | 442 | — | ||||||||||||||||
HSBC | GBP | (2,122,407 | ) | USD | 2,989,220 | 5/18/18 | 5,364 | — | ||||||||||||||||
JPMC | BRL | (5,500,000 | ) | USD | 1,621,466 | 7/3/18 | — | (30,382 | ) | |||||||||||||||
JPMC | CAD | (6,634,000 | ) | USD | 5,153,822 | 4/4/18 | 4,018 | — | ||||||||||||||||
JPMC | CAD | 6,634,000 | USD | (5,156,627 | ) | 5/3/18 | — | (3,939 | ) | |||||||||||||||
JPMC | EUR | (1,800,000 | ) | USD | 2,245,437 | 6/8/18 | 18,890 | — | ||||||||||||||||
96
Table of Contents
Counterparty | Contracts to Receive (Deliver) | In Exchange For | Settlement Date | Unrealized Appreciation | Unrealized Depreciation | |||||||||||||||||
JPMC | JPY | (975,200,000 | ) | USD | 9,161,890 | 5/21/18 | $ | — | $ | (34,907 | ) | |||||||||||
JPMC | KRW | (1,149,723,270 | ) | USD | 1,082,092 | 5/18/18 | — | (1,496 | ) | |||||||||||||
JPMC | KRW | 6,857,306,825 | USD | (6,452,099 | ) | 6/20/18 | 17,394 | — | ||||||||||||||
JPMC | PLN | (1,265,105 | ) | USD | 370,699 | 5/18/18 | 828 | — | ||||||||||||||
TD | JPY | 578,420,753 | USD | (5,459,883 | ) | 5/18/18 | — | (6,109 | ) | |||||||||||||
TD | NZD | (1,875,000 | ) | USD | 1,352,034 | 5/18/18 | — | (2,797 | ) | |||||||||||||
|
|
|
| |||||||||||||||||||
Total Foreign Currency Exchange Contracts |
| $ | 1,160,541 | $ | (1,099,471 | ) | ||||||||||||||||
|
|
|
| |||||||||||||||||||
Futures Contracts
Contracts to Buy (Sell) | Notional Amount | Notional Cost | Expiration Date | Value/ Unrealized Appreciation | Value/ Unrealized Depreciation | |||||||||||||||||
(243) | E-mini S&P 500 Index | $ | (32,112,450 | ) | $ | (32,256,565 | ) | 6/18/18 | $ | 144,115 | $ | — | ||||||||||
(235) | 90 Day Euro | (57,398,750 | ) | (57,914,207 | ) | 6/19/18 | 515,457 | — | ||||||||||||||
(39) | 90 Day Euro | (9,518,438 | ) | (9,613,433 | ) | 9/18/18 | 94,995 | — | ||||||||||||||
(1,002) | 90 Day Euro | (244,250,025 | ) | (246,727,610 | ) | 12/18/18 | 2,477,585 | — | ||||||||||||||
168 | 90 Day Euro | 40,952,100 | 40,969,542 | 12/18/18 | — | (17,442 | ) | |||||||||||||||
(1,193) | 90 Day Euro | (290,271,813 | ) | (292,476,275 | ) | 6/18/19 | 2,204,462 | — | ||||||||||||||
409 | 90 Day Euro | 99,514,813 | 99,510,531 | 6/18/19 | 4,282 | — | ||||||||||||||||
(189) | 90 Day Euro | (45,934,088 | ) | (46,189,555 | ) | 12/17/19 | �� | 255,467 | — | |||||||||||||
26 | Bankers’ Acceptance | 4,930,434 | 4,936,082 | 3/19/19 | — | (5,648 | ) | |||||||||||||||
67 | Bankers’ Acceptance | 12,694,949 | 12,694,207 | 6/18/19 | 742 | — | ||||||||||||||||
(185) | Euro-B.T.P | (31,593,219 | ) | (30,952,139 | ) | 6/8/18 | — | (641,080 | ) | |||||||||||||
(42) | Euro-Bund | (8,239,167 | ) | (8,080,224 | ) | 6/8/18 | — | (158,943 | ) | |||||||||||||
(76) | Long 10 yr Gilt | (13,096,051 | ) | (12,868,058 | ) | 6/28/18 | — | (227,993 | ) | |||||||||||||
1,217 | US Treasury 10 yr Notes | 147,428,117 | 146,180,562 | 6/20/18 | 1,247,555 | — | ||||||||||||||||
(246) | US Treasury 5 yr Notes | (28,157,391 | ) | (28,043,136 | ) | 7/2/18 | — | (114,255 | ) | |||||||||||||
4,043 | US Treasury 5 yr Notes | 462,765,570 | 460,843,734 | 7/2/18 | 1,921,836 | — | ||||||||||||||||
491 | US Treasury Long Bonds | 71,992,875 | 70,840,239 | 6/21/18 | 1,152,636 | — | ||||||||||||||||
|
|
|
|
|
| |||||||||||||||||
Total Futures Contracts | $ | 70,853,695 | $ | 10,019,132 | $ | (1,165,361 | ) | |||||||||||||||
|
|
|
|
|
| |||||||||||||||||
Swap Contracts
CDS Contracts2
Counterparty/ | Notional Amount3 | Annual Protection Payments | Value | Upfront Payments Paid (Received) | Unrealized Appreciation4 | Unrealized Depreciation4 | Variation Margin Due from (Due to) Brokers | |||||||||||||||||||||
Centrally Cleared: | ||||||||||||||||||||||||||||
Protection Purchased/Moody’s Ratings: |
| |||||||||||||||||||||||||||
CDX.EM.295 6/20/23- Quarterly | 4,660,000 | 1.000 | % | $ | 83,689 | $ | 97,915 | $ | — | $ | (14,226 | ) | $ | (55,645 | ) | |||||||||||||
CDX.NA.HY.296 12/20/22-Quarterly | 13,950,000 | 5.000 | % | (900,843 | ) | (892,283 | ) | — | (8,561 | ) | (8,014 | ) | ||||||||||||||||
CDX.NA.IG.297 12/20/22-Quarterly | 3,900,000 | 1.000 | % | (72,341 | ) | (91,254 | ) | 18,913 | — | (3,170 | ) | |||||||||||||||||
CDX.NA.HY.296 12/20/22-Quarterly | 1,300,000 | 5.000 | % | (83,950 | ) | (93,955 | ) | 10,006 | — | (5,117 | ) | |||||||||||||||||
| (continues) | 97 |
Table of Contents
Schedules of investments
Optimum Fixed Income Fund
Counterparty/ | Notional Amount3 | Annual Protection Payments | Value | Upfront Payments Paid (Received) | Unrealized Appreciation4 | Unrealized Depreciation4 | Variation Margin Due from (Due to) Brokers | |||||||||||||||||||||
Protection Sold/Moody’s Ratings: |
| |||||||||||||||||||||||||||
Citigroup CDS 6.125% 5/15/18 Baa1 12/20/20-Quarterly | 700,000 | 1.000 | % | $ | 12,339 | $ | 9,981 | $ | 2,358 | $ | — | $ | (3 | ) | ||||||||||||||
Daimler CDS 0.625% 3/5/20 A2 12/20/20- Quarterly | EUR800,000 | 1.000 | % | 18,940 | 12,801 | 6,139 | — | (35 | ) | |||||||||||||||||||
|
|
|
|
|
|
|
|
|
| |||||||||||||||||||
| (942,166 | ) | (956,795 | ) | 37,416 | (22,787 | ) | (71,984 | ) | ||||||||||||||||||||
|
|
|
|
|
|
|
|
|
| |||||||||||||||||||
Over-The-Counter: | ||||||||||||||||||||||||||||
Protection Purchased/Moody’s Ratings: |
| |||||||||||||||||||||||||||
GSC CDX.EM.295 6/20/23-Quarterly | 4,660,000 | 1.000 | % | 83,689 | 92,298 | — | (8,609 | ) | — | |||||||||||||||||||
HSBC CDX.EM.295 6/20/23-Quarterly | 2,180,000 | 1.000 | % | 39,151 | 40,120 | — | (969 | ) | — | |||||||||||||||||||
Protection Sold/Moody’s Ratings: |
| |||||||||||||||||||||||||||
BAML Republic of Colombia 10.375% 1/28/33 Baa2 6/20/22-Quarterly | 250,000 | 1.000 | % | 1,844 | (3,213 | ) | 5,057 | — | — | |||||||||||||||||||
BAML Republic of Colombia 10.375% 1/28/33 /Baa2 6/20/21-Quarterly | 100,000 | 1.000 | % | 1,281 | (2,109 | ) | 3,390 | — | — | |||||||||||||||||||
BNP Republic of Colombia 10.375% 1/28/33 /Baa2 6/20/21-Quarterly | 200,000 | 1.000 | % | 2,563 | (4,269 | ) | 6,832 | — | — | |||||||||||||||||||
CITI Republic of Brazil 4.25% 1/7/25 /Ba2 6/20/22-Quarterly | 100,000 | 1.000 | % | (1,238 | ) | (5,343 | ) | 4,105 | — | — | ||||||||||||||||||
CITI Republic of Colombia 10.375% 1/28/33 /Baa2 12/20/22-Quarterly | 200,000 | 1.000 | % | 407 | (2,325 | ) | 2,732 | — | — | |||||||||||||||||||
DB CMBX.NA.AAA8 10/17/57-Quarterly | 14,200,000 | 0.500 | % | 54,549 | (910,205 | ) | 964,754 | — | — | |||||||||||||||||||
DB Republic of Colombia 10.375% 1/28/33 /Baa2 6/20/21-Quarterly | 200,000 | 1.000 | % | 2,563 | (4,216 | ) | 6,779 | — | — | |||||||||||||||||||
GSC Republic of Brazil 4.25% 1/7/25 /Ba2 6/20/22-Quarterly | 500,000 | 1.000 | % | (6,192 | ) | (27,423 | ) | 21,231 | — | — | ||||||||||||||||||
GSC Republic of Colombia 10.375% 1/28/33 /Baa2 6/20/21-Quarterly | 3,100,000 | 1.000 | % | 39,720 | (67,080 | ) | 106,800 | — | — | |||||||||||||||||||
98
Table of Contents
Counterparty/ Reference Obligation/ Termination Date/ Payment Frequency | Notional Amount3 | Annual Protection Payments | Value | Upfront Payments Paid (Received) | Unrealized Appreciation4 | Unrealized Depreciation4 | Variation Margin Due from (Due to) Brokers | |||||||||||||||||||||
Protection Sold/Moody’s Ratings (continued): |
| |||||||||||||||||||||||||||
JPMC Mexico 5 yr CDS 5.950% 3/19/19 /WR 12/20/19-Quarterly | 7,100,000 | 1.000% | $ | 66,748 | $ | 23,292 | $ | 43,456 | $ | — | $ | — | ||||||||||||||||
JPMC Republic of Colombia 10.375% 1/28/33 /Baa2 6/20/21-Quarterly | 100,000 | 1.000% | 1,281 | (2,134 | ) | 3,415 | — | — | ||||||||||||||||||||
MSC CMBX.NA.BBB.68 5/11/63-Quarterly | 5,405,000 | 3.000% | (796,309 | ) | (638,488 | ) | — | (157,821 | ) | — | ||||||||||||||||||
|
|
|
|
|
|
|
|
|
| |||||||||||||||||||
| (509,943 | ) | (1,511,095 | ) | 1,168,551 | (167,399 | ) | — | |||||||||||||||||||||
|
|
|
|
|
|
|
|
|
| |||||||||||||||||||
Total CDS Contracts |
| $ (1,452,109 | ) | $ (2,467,890 | ) | $ | 1,205,967 | $ | (190,186 | ) | $ | (71,984 | ) | |||||||||||||||
|
|
|
|
|
|
|
|
|
| |||||||||||||||||||
IRS Contracts9
Reference Obligation/ Termination Date/ Payment Frequency (Fixed Rate/Floating Rate) | Notional Amount3 | Fixed/Floating Interest Rate Paid (Received) | Value | Upfront Payments Paid (Received) | Unrealized Appreciation4 | Unrealized Depreciation4 | Variation Margin Due from (Due to Brokers) | |||||||||||||||||||||
Centrally Cleared: |
| |||||||||||||||||||||||||||
1 yr OIS FEDL0110 9/19/18-(Maturity/1 Day) | 93,500,000 | 1.675%/(1.68%) | $ | 46,468 | $ | — | $ | 46,468 | $ | — | $ | (96 | ) | |||||||||||||||
1 yr OIS FEDL0110 9/19/18-(Maturity/1 Day) | 112,200,000 | 1.696%/(1.68%) | 49,787 | — | 49,787 | — | (116 | ) | ||||||||||||||||||||
1 yr OIS FEDL0110 9/19/18-(Maturity/1 Day) | 34,500,000 | 1.723%/(1.68%) | 12,931 | — | 12,931 | — | (36 | ) | ||||||||||||||||||||
1 yr OIS FEDL0110 9/19/18-(Maturity/1 Day) | 86,400,000 | 1.785%/(1.68%) | 18,930 | — | 18,930 | — | (90 | ) | ||||||||||||||||||||
2 yr IRS11 12/20/19- (Semiannually/ Quarterly) | 1,100,000 | 2.00%/(2.202%) | 9,760 | (5,967 | ) | 15,727 | — | 191 | ||||||||||||||||||||
2 yr IRS11 6/28/21- (Semiannually/ Quarterly) | 30,100,000 | 1.45%/(2.308%) | 770,606 | — | 770,606 | — | (5,577 | ) | ||||||||||||||||||||
3 yr IRS11 6/21/20- (Semiannually/ Quarterly) | 32,700,000 | 1.25%/(2.222%) | 952,682 | 494,628 | 458,054 | — | 2,856 | |||||||||||||||||||||
3 yr IRS11 6/20/21- (Semiannually/ Quarterly) | 17,800,000 | 1.75%/(2.308%) | 476,865 | 497,557 | — | (20,692 | ) | 811 | ||||||||||||||||||||
4 yr IRS11 12/16/19- (Semiannually/ Quarterly) | 1,600,000 | 2.00%/(2.145%) | 13,877 | (2,813 | ) | 16,690 | — | 280 | ||||||||||||||||||||
| (continues) | 99 |
Table of Contents
Schedules of investments
Optimum Fixed Income Fund
Reference Obligation/ Termination Date/ Payment Frequency (Fixed Rate/Floating Rate) | Notional Amount3 | Fixed/Floating Interest Rate Paid (Received) | Value | Upfront Payments Paid (Received) | Unrealized Appreciation4 | Unrealized Depreciation4 | Variation Margin Due from (Due to Brokers) | |||||||||||||||||||
Centrally Cleared (continued): |
| |||||||||||||||||||||||||
5 yr IRS11 | 5,035,000 | 1.199%/(1.704%) | $ | 213,007 | $ | — | $ | 213,007 | $ | — | $ | (91 | ) | |||||||||||||
5 yr IRS11 | 6,220,000 | 1.19%/(1.80%) | 293,907 | — | 293,907 | — | (400 | ) | ||||||||||||||||||
5 yr IRS11 | 2,005,000 | 1.976%/(1.76%) | 54,216 | — | 54,216 | — | (749 | ) | ||||||||||||||||||
5 yr IRS USA 3002011 | 1,400,000 | 2.026%/(2.222%) | 36,501 | — | 36,501 | — | (602 | ) | ||||||||||||||||||
5 yr IRS11 8/30/22- | 3,035,000 | 1.798%/(1.984%) | 111,863 | — | 111,863 | — | (1,450 | ) | ||||||||||||||||||
5 yr IRS11 6/20/23- | 2,500,000 | 2.00%/(2.308%) | 84,632 | 92,590 | — | (7,958 | ) | (1,451 | ) | |||||||||||||||||
5 yr IRS BP0006M12 | GBP | 26,700,000 | 1.50%/(0.816%) | (153,595 | ) | (16,894 | ) | — | (136,701 | ) | (5,370 | ) | ||||||||||||||
5 yr MXIBTIIE14 9/6/21-(28 days) | MXN | 26,200,000 | (5.797)%/7.841% | (71,131 | ) | (42,029 | ) | — | (29,102 | ) | — | |||||||||||||||
5 yr MXIBTIIE14 12/3/21-(28 days) | MXN | 61,000,000 | (7.199)%/7.841% | (20,845 | ) | (47,746 | ) | 26,901 | — | — | ||||||||||||||||
7 yr IRS11 12/16/22- | 42,500,000 | 2.25%/(2.145%) | 835,952 | 262,131 | 573,821 | — | (22,543 | ) | ||||||||||||||||||
7 yr IRS11 | 750,000 | 1.416%/(1.704%) | 46,068 | — | 46,068 | — | (377 | ) | ||||||||||||||||||
7 yr IRS11 10/31/24- | 1,750,000 | 2.25%/(1.772%) | 49,568 | — | 49,568 | — | (1,768 | ) | ||||||||||||||||||
10 yr IRS11 | 1,490,000 | 1.686%/(1.696%) | 117,501 | — | 117,501 | — | (1,635 | ) | ||||||||||||||||||
10 yr IRS11 6/21/27- | 4,100,000 | 1.50%/(2.222%) | 437,563 | 341,690 | 95,873 | — | (5,119 | ) | ||||||||||||||||||
10 yr IRS11 1/30/28- | 1,780,000 | 2.68%/(1.767%) | 13,893 | — | 13,893 | — | (3,275 | ) | ||||||||||||||||||
10 yr IRS JY0006M13 | JPY | 4,890,000,000 | 0.30%/(0.015%) | (214,103 | ) | 277,544 | — | (491,647 | ) | 19,418 | ||||||||||||||||
100
Table of Contents
Reference Obligation/ Termination Date/ Payment Frequency (Fixed Rate/Floating Rate) | Notional Amount3 | Fixed/Floating Interest Rate Paid (Received) | Value | Upfront Payments Paid (Received) | Unrealized Appreciation4 | Unrealized Depreciation4 | Variation Margin Due from (Due to Brokers) | |||||||||||||||||||||||||
Centrally Cleared (continued): |
| |||||||||||||||||||||||||||||||
10 yr IRS JY0006M13 6/18/28-(Semiannually) | JPY | 200,000,000 | 0.38%/(0.013%) | $ | (21,018 | ) | $ | 121 | $ | — | $ | (21,139 | ) | $ | 875 | |||||||||||||||||
30 yr IRS11 6/15/46-(Semiannually/ Quarterly) | 16,600,000 | 2.50%/(2.125%) | 1,107,288 | (1,068,603 | ) | 2,175,891 | — | (71,267 | ) | |||||||||||||||||||||||
30 yr IRS11 6/15/46-(Semiannually/ Quarterly) | 500,000 | 2.50%/(2.125%) | 37,714 | (20,007 | ) | 57,721 | — | (2,776 | ) | |||||||||||||||||||||||
30 yr IRS11 12/21/46-(Semiannually/ Quarterly) | 900,000 | 2.25%/(2.222%) | 115,023 | (69,196 | ) | 184,219 | — | (4,951 | ) | |||||||||||||||||||||||
30 yr IRS11 12/21/46-(Semiannually/ Quarterly) | 1,770,000 | 2.767%/(2.222%) | 37,598 | — | 37,598 | — | (10,390 | ) | ||||||||||||||||||||||||
30 yr IRS11 1/27/47-(Semiannually/ Quarterly) | 440,000 | 2.661%/(1.76%) | 14,942 | — | 14,942 | — | (1,952 | ) | ||||||||||||||||||||||||
30 yr IRS11 1/30/47-(Semiannually/ Quarterly) | 705,000 | 2.686%/(1.773%) | 20,230 | — | 20,230 | — | (3,141 | ) | ||||||||||||||||||||||||
30 yr IRS11 6/20/48-(Semiannually/ Quarterly) | 9,000,000 | 2.50%/(2.308%) | 706,561 | 1,033,449 | — | (326,888 | ) | (54,270 | ) | |||||||||||||||||||||||
FRA 3-month LIBOR IRS11 9/19/18-(Maturity) | 93,500,000 | 0.50%/(1.89%) | (96,391 | ) | — | — | (96,391 | ) | (3,514 | ) | ||||||||||||||||||||||
FRA 3-month LIBOR IRS11 9/19/18-(Maturity) | 112,200,000 | 0.50%/(1.91%) | (110,052 | ) | — | — | (110,052 | ) | (4,216 | ) | ||||||||||||||||||||||
FRA 3-month LIBOR IRS11 9/19/18-(Maturity) | 34,500,000 | 0.50%/(1.945%) | (30,817 | ) | — | — | (30,817 | ) | (1,296 | ) | ||||||||||||||||||||||
FRA 3-month LIBOR IRS11 9/19/18-(Maturity) | 86,400,000 | 0.50%/(2.13%) | (37,162 | ) | — | — | (37,162 | ) | (3,247 | ) | ||||||||||||||||||||||
|
|
|
|
|
|
|
|
|
| |||||||||||||||||||||||
Total IRS Contracts | $ | 5,930,819 | $ | 1,726,455 | $ | 5,512,913 | $ | (1,308,549 | ) | $ | (187,334 | ) | ||||||||||||||||||||
|
|
|
|
|
|
|
|
|
| |||||||||||||||||||||||
The use of foreign currency exchange contracts, futures contracts, and swap contracts involves elements of market risk and risks in excess of the amounts disclosed in these financial statements. The foreign currency exchange contracts and notional amounts presented above represent the Fund’s total exposure in such contracts, whereas only the net unrealized appreciation (depreciation) is reflected in the Fund’s net assets.
1See Note 7 in “Notes to financial statements.”
2A CDS contract is a risk-transfer instrument through which one party (purchaser of protection) transfers to another party (seller of protection) the financial risk of a credit event (as defined in the CDS agreement), as it relates to a particular reference security or basket of securities (such as an index). Periodic payments (receipts) on such contracts are accrued daily and recorded as unrealized losses (gains) on swap contracts. Upon payment (receipt), such amounts are
recorded as realized losses (gains) on swap contracts. Upfront payments made or received in connection with CDS contracts are amortized over the expected life of the CDS contracts as unrealized losses (gains) on swap contracts. The change in value of CDS contracts is recorded daily as unrealized appreciation or depreciation. A realized gain or loss is recorded upon a credit event (as defined in the CDS agreement) or the maturity or termination of the agreement.
| (continues) | 101 |
Table of Contents
Schedules of investments
Optimum Fixed Income Fund
3Notional amount shown is stated in US dollars unless noted that the swap is denominated in another currency.
4Unrealized appreciation (depreciation) does not include periodic interest payments on swap contracts accrued daily in the amount of ($497,871).
5Markit’s Emerging markets CDX Index, or the CDX.EM Index is composed of 15 sovereign issuers from the following countries: Argentina, Brazil, Chile, China, Colombia, Indonesia, Malaysia, Mexico, Panama, Peru, Philippines, Russia, South Africa, Turkey, and Venezuela, which have S&P credit quality rating of CCC and above.
6Markit’s North America High Yield CDX Index, or the CDX.NA.HY Index, is composed of 100 of the most liquid North American entities with high yield credit ratings that trade is in the CDS market.
7Markit’s North America Investment Grade Index, or CDX.NA.IG Index, is composed of 125 of the most liquid North American entities with investment grade credit ratings that trade in the CDS market.
8Markit’s CMBX Index or the CMBX.NA Index is a synthetic tradable index referencing a basket of 25 commercial mortgage-backed securities in North America. Credit-quality rating are measured on a scale that generally ranges from AAA (highest) to BB (lowest). US Agency and US Agency mortgage-backed securities appear under US Government.
9An IRS agreement is an exchange of interest rates between counterparties. Periodic payments (receipt) on such contracts are accrued daily and recorded as unrealized appreciation (depreciation) on swap contracts. Upon periodic payment (receipt) or termination of the contract, such amounts are recorded as realized gains (losses) on swap contracts.
10Rate resets based on FEDL01.
11Rate resets based on LIBOR03M.
12Rate resets based on BP0006M.
13Rate resets based on MXIBTIIE.
14Rate resets based on JPY0006M.
Summary of abbreviations:
ABS – Asset-Backed Security
ARM – Adjustable Rate Mortgage
ARS – Argentine Peso
AUD – Australian Dollar
BADLARPP – Argentina Term Deposit Rate
BAML – Bank of America Merrill Lynch
BBSW1M – Bank Bill Swap 1 Month
BBSW3M – Bank Bill Swap 3 Months
BNP – BNP Paribas
BNYM – BNY Mellon
BP0003M – 3 Month Sterling LIBOR Interest Rate
BP0006M – 6 Month Sterling LIBOR Interest Rate
BRL – Brazilian Real
B.T.P. – Buoni del Tesoro Poliennali
CAD – Canadian Dollar
CDO – Collateralized Debt Obligation
CDS – Credit Default Swap
CDX.EM – Credit Default Swap Index Emerging Markets
CDX.NA.HY – Credit Default Swap Index North America High Yield
CITI – Citigroup Global Markets
CLO – Collateralized Loan Obligation
CLP – Chilean Peso
CMBX.NA – Commercial Mortgage-Backed Index North America
COF 11 – Cost of Funds for the 11th District of San Francisco
COP – Colombian Peso
DB – Deutsche Bank
EUR – European Monetary Unit
FEDL01 – Federal Funds Rate at Maturity
FHAVA – Federal Housing Administration and Veterans Administration
FRA – Forward Rate Agreement
FREMF – Freddie Mac Multifamily
GBP – British Pound Sterling
GNMA – Government National Mortgage Association
GSC – Goldman Sachs Capital
H15T1Y – US Treasury Yield Curve Rate T Note Constant Maturity 1 Year
HSBC – Hong Kong Shanghai Bank
HUF – Hungarian Forint
ICE – Intercontinental Exchange
IDR – Indonesian Rupiah
IG – Investment Grade
INR – Indian Rupee
IRS – Interest Rate Swap
JPMBB – JPMorgan Barclays Bank
JPMC – JPMorgan Chase Bank
JPMDB – JPMorgan Deutsche Bank
JPY – Japanese Yen
JPY0006M – Japanese Yen 6 Month LIBOR Interest Rate
KRW – South Korean Won
LB – Lehman Brothers
LIBOR – London Interbank Offered Rate
LIBOR01M – ICE LIBOR USD 1 Month
LIBOR03M – ICE LIBOR USD 3 Month
LIBOR06M – ICE LIBOR USD 6 Month
LIBOR12M – ICE LIBOR USD 12 Month
MASTR – Mortgage Asset Securitization Transactions, Inc.
MBIA – Municipal Bond Insurance Association Group
MSC – Morgan Stanley Capital
102
Table of Contents
Summary of abbreviations: (continued)
MXIBTIIE – Mexico Interbank 28 day
MXN – Mexican Peso
NOK – Norwegian Krone
NZD – New Zealand Dollar
OIS – Overnight Indexed Swaps
PEN – Peruvian Nuevo Sol
PLN – Polish Zloty
REMIC – Real Estate Mortgage Investment Conduit
S&P – Standard & Poor’s Financial Services LLC
S.F. – Single Family
SGD – Singapore Dollar
TBA – To be announced
TD – Toronto Dominion Bank
TIIE – Banxico – Interbank Equilibrium Interest Rate Banco de Mexico
TRY – Turkish Lira
TWD – Taiwan Dollar
USBMMY3M – US Treasury 3 Months Bill Money Market Yield
USD – USDollar
yr – Year
ZAR – South African Rand
See accompanying notes, which are an integral part of the financial statements.
| (continues) | 103 |
Table of Contents
Schedules of investments
Optimum International Fund
March 31, 2018
| Number of shares | Value (US $) | |||||
Common Stock - 96.86%D | ||||||
Australia – 1.48% | ||||||
BHP Billiton ADR * | 64,505 | $ 2,865,957 | ||||
Qantas Airways | 1,359,263 | 6,132,387 | ||||
South32 | 349,153 | 877,483 | ||||
9,875,827 | ||||||
Austria – 2.84% | ||||||
Erste Group Bank | 131,701 | 6,621,049 | ||||
Raiffeisen Bank International † | 61,546 | 2,397,193 | ||||
Schoeller-Bleckmann Oilfield Equipment *† | 43,595 | 4,808,070 | ||||
voestalpine | 97,762 | 5,128,320 | ||||
18,954,632 | ||||||
Bermuda – 0.92% | ||||||
Everest Re Group | 23,929 | 6,145,446 | ||||
6,145,446 | ||||||
Brazil – 1.34% | ||||||
Banco Bradesco ADR | 483,005 | 5,738,099 | ||||
JBS | 1,139,300 | 3,223,148 | ||||
8,961,247 | ||||||
Canada – 3.84% | ||||||
BCE | 42,579 | 1,832,600 | ||||
BRP | 29,600 | 1,136,809 | ||||
Constellation Software | 1,100 | 746,354 | ||||
Empire | 80,900 | 1,623,840 | ||||
Magna International Class A | 90,268 | 5,084,603 | ||||
Rogers Communications Class B | 33,800 | 1,509,568 | ||||
Rogers Communications Class B (US Shares) | 56,927 | 2,543,498 | ||||
Royal Bank of Canada | 52,034 | 4,019,423 | ||||
Stars Group † | 118,100 | 3,259,701 | ||||
West Fraser Timber | 58,000 | 3,854,061 | ||||
25,610,457 | ||||||
China/Hong Kong – 7.94% | ||||||
Anhui Conch Cement Class H * | 920,000 | 5,062,727 | ||||
ASM Pacific Technology | 146,700 | 2,066,759 | ||||
BYD Class H * | 473,500 | 3,770,444 | ||||
China Construction Bank Class H | 815,000 | 851,271 | ||||
China Life Insurance Class H | 1,710,000 | 4,780,803 | ||||
CK Asset Holdings | 608,500 | 5,135,176 | ||||
CK Hutchison Holdings | 328,500 | 3,947,016 | ||||
CLP Holdings | 889,500 | 9,069,350 | ||||
Hang Seng Bank | 43,300 | 1,006,058 | ||||
| Number of shares | Value (US $) | |||||
Common StockD (continued) |
| |||||
China/Hong Kong (continued) |
| |||||
HKT Trust & HKT | 964,000 | $ 1,215,396 | ||||
Hong Kong Exchanges & Clearing | 72,800 | 2,397,817 | ||||
Industrial & Commercial Bank of China Class H | 5,040,000 | 4,392,290 | ||||
Li & Fung | 2,558,000 | 1,261,035 | ||||
Shanghai Fosun Pharmaceutical Group Class H | 769,000 | 4,764,082 | ||||
Sun Hung Kai Properties | 145,000 | 2,301,581 | ||||
Wharf Holdings | 269,000 | 931,356 | ||||
52,953,161 | ||||||
Colombia – 0.63% | ||||||
Bancolombia ADR | 99,940 | 4,199,479 | ||||
4,199,479 | ||||||
Czech Republic – 0.41% | ||||||
Komercni banka | 59,575 | 2,717,246 | ||||
2,717,246 | ||||||
Denmark – 1.24% | ||||||
Bavarian Nordic † | 19,270 | 604,746 | ||||
H. Lundbeck | 136,375 | 7,659,700 | ||||
8,264,446 | ||||||
Finland – 0.64% | ||||||
Upm-Kymmene | 115,134 | 4,268,460 | ||||
4,268,460 | ||||||
France – 5.74% | ||||||
Air France-KLM † | 163,515 | 1,824,637 | ||||
Criteo ADR † | 46,617 | 1,204,583 | ||||
Derichebourg | 87,294 | 768,819 | ||||
Eramet † | 29,118 | 4,013,205 | ||||
Ipsen | 44,679 | 6,944,710 | ||||
IPSOS | 23,199 | 911,638 | ||||
Peugeot | 46,622 | 1,122,629 | ||||
Publicis Groupe | 73,416 | 5,112,089 | ||||
Safran | 58,218 | 6,178,657 | ||||
Societe Generale | 72,787 | 3,953,090 | ||||
Sodexo | 42,616 | 4,289,217 | ||||
Thales | 16,125 | 1,964,403 | ||||
38,287,677 | ||||||
Germany – 5.07% | ||||||
Allianz | 10,305 | 2,329,520 | ||||
Continental | 21,367 | 5,901,812 | ||||
Deutsche Lufthansa | 315,133 | 10,074,023 | ||||
Merck | 45,277 | 4,344,235 | ||||
Siltronic † | 20,907 | 3,585,813 | ||||
104
Table of Contents
| Number of shares | Value (US $) | |||||
Common StockD (continued) | ||||||
Germany (continued) | ||||||
TUI | 82,466 | $ 1,767,820 | ||||
TUI (London Shares) | 108,556 | 2,327,832 | ||||
Vonovia | 69,341 | 3,438,608 | ||||
33,769,663 | ||||||
India – 2.70% | ||||||
ICICI Bank ADR | 620,656 | 5,492,806 | ||||
Rain Industries | 127,628 | 744,575 | ||||
South Indian Bank | 4,253,356 | 1,500,053 | ||||
SpiceJet † | 393,285 | 758,176 | ||||
Tata Consultancy Services | 45,802 | 2,007,037 | ||||
Tata Steel | 72,979 | 645,750 | ||||
Yes Bank | 1,445,790 | 6,827,485 | ||||
17,975,882 | ||||||
Indonesia – 1.41% | ||||||
Barito Pacific † | 8,586,700 | 1,446,567 | ||||
Delta Dunia Makmur † | 38,784,100 | 2,686,522 | ||||
Indofood Sukses Makmur | 3,908,800 | 2,049,213 | ||||
Telekomunikasi Indonesia Persero | 12,310,400 | 3,237,082 | ||||
9,419,384 | ||||||
Ireland – 1.94% | ||||||
ICON † | 109,555 | 12,942,828 | ||||
12,942,828 | ||||||
Israel – 3.01% | ||||||
Bank Hapoalim | 1,155,160 | 7,943,942 | ||||
Bank Leumi Le-Israel | 1,262,147 | 7,623,930 | ||||
Check Point Software Technologies † | 38,000 | 3,774,920 | ||||
Tower Semiconductor † | 25,795 | 694,143 | ||||
20,036,935 | ||||||
Italy – 1.30% | ||||||
Gefran | 63,514 | 645,332 | ||||
La Doria | 45,778 | 693,316 | ||||
Prysmian | 178,201 | 5,595,897 | ||||
Recordati | 47,876 | 1,766,402 | ||||
8,700,947 | ||||||
Japan – 19.30% | ||||||
ANA Holdings | 121,000 | 4,682,844 | ||||
Asahi Glass | 114,800 | 4,752,540 | ||||
Astellas Pharma | 299,000 | 4,535,370 | ||||
Benesse Holdings | 26,400 | 956,459 | ||||
Bic Camera | 99,900 | 1,571,661 | ||||
Daiichi Sankyo | 58,300 | 1,931,919 | ||||
Daito Trust Construction | 5,300 | 916,000 | ||||
| Number of shares | Value (US $) | |||||
Common StockD (continued) | ||||||
Japan (continued) | ||||||
Daiwa House Industry | 222,200 | $ 8,561,816 | ||||
Denso | 124,400 | 6,804,267 | ||||
Fujitsu | 962,000 | 5,920,000 | ||||
Furukawa Electric | 36,400 | 1,953,329 | ||||
Geo Holdings | 54,900 | 879,184 | ||||
Hitachi | 583,000 | 4,223,264 | ||||
Kirin Holdings | 320,900 | 8,542,355 | ||||
Konami Holdings | 71,000 | 3,729,994 | ||||
K’s Holdings | 217,800 | 3,010,984 | ||||
Medipal Holdings | 115,900 | 2,374,531 | ||||
Mixi | 122,300 | 4,517,072 | ||||
Morinaga Milk Industry | 34,700 | 1,412,067 | ||||
Nexon † | 82,600 | 1,366,252 | ||||
Nichiha | 22,800 | 871,031 | ||||
Nippon Telegraph & Telephone | 212,700 | 9,794,934 | ||||
NTT DOCOMO | 29,100 | 742,918 | ||||
Pola Orbis Holdings | 20,000 | 819,510 | ||||
Rohto Pharmaceutical | 136,000 | 3,802,453 | ||||
Secom | 72,800 | 5,418,693 | ||||
Shinmaywa Industries | 110,000 | 904,563 | ||||
Shiseido | 15,900 | 1,018,060 | ||||
Sony | 67,200 | 3,249,953 | ||||
Sumitomo Dainippon Pharma | 561,100 | 9,418,022 | ||||
Suzuken | 88,500 | 3,655,444 | ||||
Taisei | 33,800 | 1,715,333 | ||||
T-Gaia | 78,900 | 2,195,601 | ||||
Tokyo Electric Power Holdings † | 1,815,100 | 6,993,948 | ||||
Toray Industries | 573,200 | 5,421,980 | ||||
128,664,351 | ||||||
Macau – 0.18% | ||||||
Wynn Macau | 320,400 | 1,174,340 | ||||
1,174,340 | ||||||
Mexico – 0.67% | ||||||
Grupo Financiero Banorte | 734,200 | 4,487,989 | ||||
4,487,989 | ||||||
Netherlands – 5.24% | ||||||
Core Laboratories * | 52,796 | 5,713,583 | ||||
EXOR | 22,702 | 1,616,023 | ||||
Heineken | 56,338 | 6,059,380 | ||||
Koninklijke Ahold Delhaize | 155,283 | 3,679,574 | ||||
Royal Dutch Shell ADR | 14,497 | 925,054 | ||||
Royal Dutch Shell Class A | 531,140 | 16,920,631 | ||||
34,914,245 | ||||||
| (continues) | 105 |
Table of Contents
Schedules of investments
Optimum International Fund
| Number of shares | Value (US $) | |||||
Common StockD (continued) |
| |||||
New Zealand – 1.25% | ||||||
a2 Milk † | 629,624 | $ 5,625,001 | ||||
Xero Private Placement † | 104,850 | 2,692,924 | ||||
8,317,925 | ||||||
Norway – 2.70% | ||||||
DNB | 399,151 | 7,862,171 | ||||
Norsk Hydro | 691,318 | 4,100,683 | ||||
Statoil ADR * | 254,814 | 6,026,351 | ||||
17,989,205 | ||||||
Republic of Korea – 2.96% | ||||||
Hyundai Mobis | 16,694 | 3,751,021 | ||||
LG Electronics | 18,597 | 1,910,471 | ||||
Samsung Electronics | 3,849 | 8,886,752 | ||||
SK Hynix | 67,863 | 5,176,153 | ||||
19,724,397 | ||||||
Singapore – 1.52% | ||||||
DBS Group Holdings | 278,000 | 5,872,014 | ||||
United Industrial | 1,053,000 | 2,610,113 | ||||
United Overseas Bank | 80,000 | 1,683,378 | ||||
10,165,505 | ||||||
South Africa – 0.16% | ||||||
Investec | 134,079 | 1,045,557 | ||||
1,045,557 | ||||||
Spain – 2.50% | ||||||
Amadeus IT Group | 115,793 | 8,569,045 | ||||
Atlantica Yield | 413,657 | 8,099,404 | ||||
16,668,449 | ||||||
Sweden – 0.27% | ||||||
G5 Entertainment | 49,155 | 1,807,608 | ||||
1,807,608 | ||||||
Switzerland – 4.94% | ||||||
Allreal Holding | 7,743 | 1,274,315 | ||||
Bucher Industries | 1,813 | 757,581 | ||||
Coca-Cola HBC † | 24,130 | 892,971 | ||||
Credit Suisse Group ADR | 302,984 | 5,087,101 | ||||
Ferrexpo | 1,036,110 | 3,560,528 | ||||
Flughafen Zurich | 3,523 | 778,087 | ||||
Nestle | 20,574 | 1,626,200 | ||||
Novartis ADR | 82,590 | 6,677,401 | ||||
Roche Holding | 30,936 | 7,096,629 | ||||
STMicroelectronics | 78,026 | 1,736,370 | ||||
Swiss Life Holding † | 8,137 | 2,899,762 | ||||
Zehnder Group | 11,237 | 519,142 | ||||
32,906,087 | ||||||
| Number of shares | Value (US $) | |||||
Common StockD (continued) |
| |||||
Taiwan – 2.60% | ||||||
Advanced Semiconductor Engineering | 3,615,343 | $ 5,207,820 | ||||
Hon Hai Precision Industry | 1,682,500 | 5,106,878 | ||||
Taiwan Semiconductor Manufacturing | 825,000 | 7,003,035 | ||||
17,317,733 | ||||||
Thailand – 2.73% | ||||||
Bangkok Bank NVDR | 119,400 | 752,216 | ||||
Indorama Ventures Class F | 848,000 | 1,552,542 | ||||
IRPC GDR NVDR | 4,722,200 | 1,117,502 | ||||
Krung Thai Bank NVDR | 3,976,500 | 2,403,449 | ||||
PTT Exploration & Production | 224,800 | 823,140 | ||||
PTT Exploration & Production NVDR | 911,700 | 3,338,332 | ||||
PTT Global Chemical | 401,200 | 1,212,453 | ||||
PTT Global Chemical GDR NVDR | 416,400 | 1,258,388 | ||||
PTT NVDR | 238,000 | 4,201,343 | ||||
Thai Oil NVDR | 276,600 | 811,578 | ||||
Thanachart Capital GDR NVDR | 435,300 | 748,237 | ||||
18,219,180 | ||||||
Turkey – 0.44% | ||||||
Akbank Turk | 1,212,999 | 2,936,187 | ||||
2,936,187 | ||||||
United Kingdom – 5.90% | ||||||
Barclays | 2,070,195 | 6,049,331 | ||||
Debenhams | 385,489 | 113,248 | ||||
Diageo | 201,892 | 6,827,929 | ||||
Evraz | 138,163 | 842,515 | ||||
Ferroglobe † | 189,798 | 2,036,533 | ||||
HSBC Holdings | 590,670 | 5,546,813 | ||||
Indivior † | 377,052 | 2,155,356 | ||||
ITV | 1,599,807 | 3,238,443 | ||||
Kingfisher | 270,060 | 1,107,867 | ||||
RELX | 208,015 | 4,311,922 | ||||
Rio Tinto ADR * | 92,672 | 4,775,388 | ||||
Smith & Nephew | 66,299 | 1,240,255 | ||||
Thomas Cook Group | 657,751 | 1,092,144 | ||||
39,337,744 | ||||||
United States – 1.05% | ||||||
Carnival | 103,352 | 6,777,824 | ||||
106
Table of Contents
| Number of shares | Value (US $) | |||||
Common StockD (continued) |
| |||||
United States (continued) |
| |||||
Project Star =p† | 142 | $ 166,904 | ||||
Project Star Series G =p† | 47 | 67,530 | ||||
7,012,258 | ||||||
Total Common Stock | 645,772,477 | |||||
| Principal amount° | ||||||
Short-Term Investments – 1.53% |
| |||||
Discount Note – 0.07%≠ | ||||||
Federal Home Loan Bank 0.80% 4/3/18 | 454,854 | 454,833 | ||||
454,833 | ||||||
Repurchase Agreements – 1.32% |
| |||||
Bank of America Merrill Lynch 1.71%, dated 3/29/18, to be repurchased on 4/2/18, repurchase price $1,264,804 (collateralized by US government obligations | 1,264,563 | 1,264,563 | ||||
Bank of Montreal | 3,793,690 | 3,793,690 | ||||
BNP Paribas | 3,729,627 | 3,729,627 | ||||
8,787,880 | ||||||
US Treasury Obligations – 0.14%≠ | ||||||
US Treasury Bills | 509,277 | 509,209 | ||||
| Principal amount° | Value (US $) | |||||
Short-Term Investments (continued) |
| |||||
US Treasury Obligations≠ (continued) |
| |||||
US Treasury Bills 1.35% 4/12/18 | 440,869 | $ 440,669 | ||||
949,878 | ||||||
Total Short-Term Investments | 10,192,591 | |||||
Total Value of Securities Before Securities Lending Collateral – 98.39% | 655,965,068 | |||||
Securities Lending Collateral** – 3.32% | ||||||
Certificates of Deposit – 0.34%≠ | ||||||
Australia & New Zealand Banking Group (London) 1.70% 4/2/18 | 418,000 | 418,000 | ||||
Bank of Nova Scotia (Toronto) | 471,000 | 471,000 | ||||
CommonWealth Bank of Australia (London) | 374,000 | 374,000 | ||||
Royal Bank of Canada (Toronto) 1.68% 4/2/18 | 995,000 | 995,000 | ||||
2,258,000 | ||||||
Repurchase Agreements – 2.59% |
| |||||
Bank of Montreal 1.76%, dated 3/29/18, to be repurchased on 4/2/18, repurchase price $4,894,117 (collateralized by US government obligations | 4,893,160 | 4,893,160 | ||||
Bank of Nova Scotia 1.77%, dated 3/29/18, to be repurchased on 4/2/18, repurchase price $2,053,667 (collateralized by US government obligations | 2,053,263 | 2,053,263 | ||||
| (continues) | 107 |
Table of Contents
Schedules of investments
Optimum International Fund
| Principal amount° | Value (US $) | |||||
Securities Lending Collateral** (continued) | ||||||
Repurchase Agreements (continued) |
| |||||
Credit Agricole | 5,145,873 | $ 5,145,873 | ||||
JP Morgan Securities 1.80%, dated 3/29/18, to be repurchased on 4/2/18, repurchase price $5,146,902 (collateralized by US government obligations 0.625%–1.375% | 5,145,873 | 5,145,873 | ||||
17,238,169 | ||||||
Short-Term Floating Rate Notes – 0.39% |
| |||||
Australia & New Zealand Banking Group | ||||||
1.86% (LIBOR01M + 0.17%) 9/5/18 ● | 310,000 | 309,741 | ||||
1.86% (LIBOR01M + 0.16%) 9/7/18 ● | 267,000 | 266,753 | ||||
Bank of Montreal (Chicago) | ||||||
2.45% (LIBOR03M + 0.25%) 3/18/19 ● | 329,000 | 328,967 | ||||
2.61% (LIBOR01M + 0.41%) 9/12/18 ● | 288,000 | 287,924 | ||||
Bank of Nova Scotia (Houston) | ||||||
1.89% (LIBOR01M + 0.20%) 7/6/18 ● | 223,000 | 222,993 | ||||
2.10% (LIBOR01M + 0.34%) 9/7/18 ● | 300,000 | 299,954 | ||||
CommonWealth Bank of Australia (New York) 2.32% (LIBOR03M + 0.20%) 3/18/19 ● | 619,000 | 619,976 | ||||
Wells Fargo Bank 1.92% (LIBOR01M + 0.22%) 10/5/18 ● | 273,000 | 272,687 | ||||
2,608,995 | ||||||
Total Securities Lending Collateral | 22,105,164 | |||||
Total Value of Securities – 101.71% | $678,070,232∎ |
| * | Fully or partially on loan. |
| ** | See Note 9 in “Notes to financial statements” for additional information on securities lending collateral and non-cash collateral. |
| = | The value of this security was determined using significant unobservable inputs and is reported as a Level 3 security in the disclosure table located in Note 3 in “Notes to financial statements.” |
| ≠ | The rate shown is the effective yield at the time of purchase. |
| ∎ | Includes $23,055,600 of securities loaned. |
| ° | Principal amount shown is stated in US dollars unless noted that the security is denominated in another currency. |
| D | Securities have been classified by country of origin. Aggregate classification by business sector has been presented on page 41 in “Security type / country and sector allocations.” |
| p | Restricted security. These investments are in securities not registered under the Securities Act of 1933, as amended, and have certain restrictions on resale which may limit their liquidity. At March 31, 2018, the aggregate value of restricted securities was $234,434, which represented 0.04% of the Fund’s net assets. The Fund has various registration rights (exercisable under a variety of circumstances) with respect to these securities. See Note 10 in “Notes to financial statements” and the following table for additional details on restricted securities. |
| † | Non-income producing security. |
| · | Variable rate investment. Rates reset periodically. Rates shown reflect the rate in effect at March 31, 2018. For securities based on a published reference rate and spread, the reference rate and spread are indicated in their description above. Certain variable rate securities are not based on a published reference rate and spread but are determined by the issuer or agent and are based on current market conditions, or for mortgage-backed securities, are impacted by the individual mortgages which are paying off over time. These securities do not indicate a reference rate and spread in their description above. |
Restricted Securities
Investment | Date of Acquisition | Cost | Value | ||||||||||||
Project Star | 5/7/14 | $ | 999,482 | $ | 166,904 | ||||||||||
Project Star Series G | 10/29/14 | 396,443 | 67,530 | ||||||||||||
|
|
|
| ||||||||||||
Total | $ | 1,395,925 | $ | 234,434 | |||||||||||
|
|
|
| ||||||||||||
108
Table of Contents
The following foreign currency exchange contracts were outstanding at March 31, 2018:1
Foreign Currency Exchange Contracts
| Counterparty | Contracts to Receive (Deliver) | In Exchange For | Settlement Date | Unrealized Appreciation | Unrealized Depreciation | |||||||||||||||||||
BBH | GBP | (1,760,369 | ) | USD | 2,477,786 | 4/3/18 | $ | 7,474 | $ | — | ||||||||||||||
BBH | GBP | (2,618,426 | ) | USD | 3,671,481 | 4/4/18 | — | (3,092 | ) | |||||||||||||||
BNYM | ILS | (240,999 | ) | USD | 68,670 | 4/2/18 | — | (54 | ) | |||||||||||||||
BNYM | KRW | (2,987,731,050 | ) | USD | 2,803,893 | 4/2/18 | — | (4,690 | ) | |||||||||||||||
NT | CAD | 899,301 | USD | (698,052 | ) | 4/3/18 | 39 | — | ||||||||||||||||
NT | CHF | 160,041 | USD | (167,372 | ) | 4/4/18 | 113 | — | ||||||||||||||||
NT | GBP | 90,444 | USD | (126,875 | ) | 4/4/18 | 50 | — | ||||||||||||||||
SSB | EUR | 292,198 | USD | (359,549 | ) | 4/4/18 | 136 | — | ||||||||||||||||
SSB | HKD | 6,121,315 | USD | (779,974 | ) | 4/4/18 | 182 | — | ||||||||||||||||
|
|
|
| |||||||||||||||||||||
Total Foreign Currency Exchange Contracts |
| $ | 7,994 | $ | (7,836 | ) | ||||||||||||||||||
|
|
|
| |||||||||||||||||||||
The use of foreign currency exchange contracts involves elements of market risk and risks in excess of the amounts disclosed in the financial statements. The foreign currency exchange contracts presented above represent the Fund’s total exposure in such contracts, whereas only the net unrealized appreciation (depreciation) is reflected in the Fund’s net assets.
1See Note 7 in “Notes to financial statements.”
Summary of abbreviations:
ADR – American Depositary Receipt
BBH – Brown Brothers Harriman & Co.
BNYM – BNY Mellon
CAD – Canadian Dollar
CHF – Swiss Franc
EUR – Euro
GBP – British Pound Sterling
GDR – Global Depository Receipt
HKD – Hong Kong Dollar
ICE – Intercontinental Exchange
ILS – Israeli Shekel
KRW – South Korean Won
LIBOR – London Interbank Offered Rate
LIBOR01M – ICE LIBOR USD 1 Month
LIBOR03M – ICE LIBOR USD 3 Month
NT – Northern Trust
NVDR – Non-Voting Depositary Receipt
SSB – State Street Bank
USD – US Dollar
See accompanying notes, which are an integral part of the financial statements.
| (continues) | 109 |
Table of Contents
Schedules of investments
Optimum Large Cap Growth Fund
March 31, 2018
| Number of shares | Value (US $) | |||||
Common Stock – 98.55%² |
| |||||
Consumer Discretionary – 18.15% | ||||||
Amazon.com † | 76,710 | $ 111,025,451 | ||||
Aptiv | 64,900 | 5,514,553 | ||||
Booking Holdings † | 20,700 | 43,064,073 | ||||
Caesars Entertainment † | 414,163 | 4,659,334 | ||||
Chipotle Mexican Grill † | 25,500 | 8,239,305 | ||||
Comcast Class A | 493,510 | 16,863,237 | ||||
Dollar General | 38,000 | 3,554,900 | ||||
Dollarama | 32,975 | 4,007,626 | ||||
Ferrari (Italy) | 39,625 | 4,775,605 | ||||
Flipkart Limited =p† | 1,281 | 105,988 | ||||
Flipkart Limited Series A =p† | 437 | 36,157 | ||||
Flipkart Limited Series C =p† | 771 | 63,792 | ||||
Flipkart Limited Series E =p† | 1,433 | 118,564 | ||||
Flipkart Limited Series G =p† | 6,017 | 676,640 | ||||
Flipkart Limited Series H =p† | 5,840 | 780,010 | ||||
Home Depot | 118,670 | 21,151,741 | ||||
Marriott International Class A | 15,604 | 2,121,832 | ||||
MGM Resorts International | 65,370 | 2,289,257 | ||||
Netflix † | 36,600 | 10,809,810 | ||||
NIKE Class B | 55,900 | 3,713,996 | ||||
NVR † | 1,060 | 2,968,000 | ||||
Tesla † | 55,149 | 14,676,803 | ||||
Walt Disney | 251,200 | 25,230,528 | ||||
Wynn Resorts | 40,642 | 7,411,475 | ||||
Yum China Holdings | 377,200 | 15,653,800 | ||||
Yum! Brands | 75,000 | 6,384,750 | ||||
315,897,227 | ||||||
Consumer Staples – 4.39% |
| |||||
Anheuser-Busch InBev ADR | 159,950 | 17,584,903 | ||||
Coca-Cola | 295,330 | 12,826,182 | ||||
Costco Wholesale | 73,040 | 13,762,927 | ||||
CVS Health | 127,620 | 7,939,240 | ||||
McCormick Class N/V | 91,620 | 9,747,452 | ||||
Philip Morris International | 145,966 | 14,509,020 | ||||
76,369,724 | ||||||
Energy – 1.66% | ||||||
Pioneer Natural Resources | 71,140 | 12,220,429 | ||||
Schlumberger | 257,300 | 16,667,894 | ||||
28,888,323 | ||||||
Financials – 6.29% | ||||||
American Express | 147,200 | 13,730,816 | ||||
BlackRock | 37,260 | 20,184,487 | ||||
Charles Schwab | 419,600 | 21,911,512 | ||||
Chubb (Switzerland) | 57,300 | 7,836,921 | ||||
First Republic Bank | 35,866 | 3,321,550 | ||||
Intercontinental Exchange | 108,700 | 7,882,924 | ||||
| Number of shares | Value (US $) | |||||
Common Stock² (continued) | ||||||
Financials (continued) | ||||||
JPMorgan Chase & Co. | 94,600 | $ 10,403,162 | ||||
Morgan Stanley | 154,000 | 8,309,840 | ||||
State Street | 37,900 | 3,779,767 | ||||
TD Ameritrade Holding | 203,723 | 12,066,513 | ||||
WeWork Companies =p† | 881 | 38,374 | ||||
109,465,866 | ||||||
Healthcare – 15.09% | ||||||
Alexion Pharmaceuticals † | 201,149 | 22,420,068 | ||||
Alnylam Pharmaceuticals † | 31,200 | 3,715,920 | ||||
Anthem | 46,700 | 10,259,990 | ||||
Becton Dickinson and Co. | 79,113 | 17,143,787 | ||||
Biogen † | 59,600 | 16,319,672 | ||||
Celgene † | 219,490 | 19,580,703 | ||||
Centene † | 37,805 | 4,040,220 | ||||
Cigna | 28,435 | 4,769,687 | ||||
Danaher | 41,900 | 4,102,429 | ||||
DENTSPLY SIRONA | 232,530 | 11,698,584 | ||||
Incyte † | 47,800 | 3,983,174 | ||||
Intuitive Surgical † | 31,300 | 12,921,579 | ||||
Johnson & Johnson | 95,200 | 12,199,880 | ||||
Regeneron Pharmaceuticals † | 29,040 | 10,000,214 | ||||
Stryker | 85,200 | 13,710,384 | ||||
Thermo Fisher Scientific | 82,600 | 17,053,596 | ||||
UnitedHealth Group | 202,517 | 43,338,638 | ||||
Vertex Pharmaceuticals † | 89,748 | 14,627,129 | ||||
Zoetis | 248,900 | 20,785,639 | ||||
262,671,293 | ||||||
Industrials – 8.88% | ||||||
Acuity Brands | 46,955 | 6,535,666 | ||||
American Airlines Group | 178,029 | 9,250,387 | ||||
Boeing | 93,318 | 30,597,106 | ||||
Caterpillar | 74,110 | 10,922,332 | ||||
Equifax | 53,405 | 6,291,643 | ||||
Fortive | 101,851 | 7,895,490 | ||||
Fortune Brands Home & Security | 67,044 | 3,948,221 | ||||
Honeywell International | 162,600 | 23,497,326 | ||||
Illinois Tool Works | 28,700 | 4,496,142 | ||||
Roper Technologies | 32,185 | 9,034,008 | ||||
TransUnion † | 121,864 | 6,919,438 | ||||
United Parcel Service Class B | 131,700 | 13,783,722 | ||||
Wabtec | 48,177 | 3,921,608 | ||||
WW Grainger | 61,800 | 17,444,286 | ||||
154,537,375 | ||||||
Information Technology – 39.37% | ||||||
Activision Blizzard | 74,100 | 4,998,786 | ||||
Adobe Systems † | 124,200 | 26,837,136 | ||||
110
Table of Contents
| Number of shares | Value (US $) | |||||
Common Stock² (continued) | ||||||
Information Technology (continued) | ||||||
Akamai Technologies † | 311,900 | $ 22,138,662 | ||||
Alibaba Group Holding ADR † | 140,233 | 25,738,365 | ||||
Alphabet Class A † | 39,000 | 40,448,460 | ||||
Alphabet Class C † | 48,810 | 50,361,670 | ||||
Apple | 200,421 | 33,626,635 | ||||
ASML Holding (Netherlands) | 30,000 | 5,956,800 | ||||
Broadcom | 37,800 | 8,907,570 | ||||
Dropbox Class A † | 9,020 | 281,875 | ||||
Dropbox Class A =p† | 41,151 | 1,221,680 | ||||
eBay † | 203,300 | 8,180,792 | ||||
Electronic Arts † | 82,700 | 10,026,548 | ||||
Facebook Class A † | 337,904 | 53,993,680 | ||||
Fidelity National Information Services | 60,100 | 5,787,630 | ||||
Fiserv † | 105,188 | 7,500,956 | ||||
Intuit | 79,649 | 13,807,154 | ||||
Mastercard Class A | 118,700 | 20,791,492 | ||||
Microsoft | 823,900 | 75,197,353 | ||||
Oracle | 333,280 | 15,247,560 | ||||
Palo Alto Networks † | 90,600 | 16,445,712 | ||||
PayPal Holdings † | 385,352 | 29,236,656 | ||||
QUALCOMM | 71,300 | 3,950,733 | ||||
Red Hat † | 184,719 | 27,617,338 | ||||
salesforce.com † | 124,800 | 14,514,240 | ||||
ServiceNow † | 45,162 | 7,472,053 | ||||
Snap Class A † | 111,600 | 1,771,092 | ||||
Splunk † | 144,720 | 14,239,001 | ||||
Symantec | 447,782 | 11,575,165 | ||||
Tencent Holdings (China) (Hong Kong Exchange) | 218,200 | 11,712,882 | ||||
Texas Instruments | 234,252 | 24,336,440 | ||||
Visa Class A | 457,100 | 54,678,302 | ||||
VMware Class A † | 137,934 | 16,727,256 | ||||
Workday Class A † | 52,668 | 6,694,630 | ||||
Worldpay Class A † | 114,600 | 9,424,704 | ||||
Xilinx | 50,505 | 3,648,481 | ||||
685,095,489 | ||||||
Materials – 1.85% | ||||||
DowDuPont | 78,700 | 5,013,977 | ||||
Ecolab | 113,600 | 15,571,152 | ||||
Praxair | 80,810 | 11,660,883 | ||||
32,246,012 | ||||||
Real Estate – 1.85% | ||||||
American Tower | 30,200 | 4,389,268 | ||||
Crown Castle International | 134,021 | 14,690,042 | ||||
Equinix | 31,190 | 13,041,787 | ||||
32,121,097 | ||||||
| Number of shares | Value (US $) | |||||
Common Stock² (continued) | ||||||
Utilities – 1.02% | ||||||
American Water Works | 56,000 | $ 4,599,280 | ||||
NextEra Energy | 32,000 | 5,226,560 | ||||
Sempra Energy | 70,551 | 7,846,682 | ||||
17,672,522 | ||||||
Total Common Stock | 1,714,964,928 | |||||
| ||||||
Convertible Preferred Stock – 0.52% | ||||||
Airbnb Private Placement |
| |||||
Series D =p† | 23,130 | 2,707,368 | ||||
Series E =p† | 13,611 | 1,593,168 | ||||
Magic Leap =p† | 43,435 | 1,114,108 | ||||
Uber Technologies | 34,197 | 1,117,464 | ||||
WeWork Companies | 22,244 | 968,893 | ||||
Xiaoju Kuaizhi (China) =p† | 32,416 | 1,537,808 | ||||
| ||||||
Total Convertible Preferred Stock | 9,038,809 | |||||
| ||||||
| Principal Amount° | ||||||
Convertible Bond – 0.10% | ||||||
Caesars Entertainment 5.00% maturity date 10/1/24 | 1,045,509 | 1,827,680 | ||||
| ||||||
Total Convertible Bond |
| 1,827,680 | ||||
| ||||||
Short-Term Investments – 0.89% |
| |||||
Repurchase Agreements – 0.89% |
| |||||
Bank of America Merrill Lynch 1.71%, dated 3/29/18, to be repurchased on 4/2/18, repurchase price $2,236,179 (collateralized by US government obligations 1.50%–3.75% 11/15/18–8/15/44; market value $2,280,471) | 2,235,754 | 2,235,754 | ||||
| (continues) | 111 |
Table of Contents
Schedules of investments
Optimum Large Cap Growth Fund
Principal Amount° | Value (US $) | |||||
Short-Term Investments (continued) |
| |||||
Repurchase Agreements (continued) | ||||||
Bank of Montreal | 6,707,262 | $ 6,707,262 | ||||
BNP Paribas | 6,593,998 | 6,593,998 | ||||
15,537,014 | ||||||
Total Short-Term | 15,537,014 | |||||
Total Value of | $1,741,368,431 | |||||
| ² | Narrow industries are utilized for compliance purposes for diversification whereas broad sectors are used for financial reporting. |
| = | The value of this security was determined using significant unobservable inputs and is reported as a Level 3 security in the disclosure table located in Note 3 in “Notes to financial statements.” |
| ° | Principal amount shown is stated in US dollars unless noted that the security is denominated in another currency. |
| p | Restricted security. These investments are in securities not registered under the Securities Act of 1933, as amended, and have certain restrictions on resale which may limit their liquidity. At March 31, 2018, the aggregate value of restricted securities was $12,080,014, which represented 0.69% of the Fund’s net assets. The Fund has various registration rights (exercisable under a variety of circumstances) with respect to these securities. See Note 10 in “Notes to financial statements” and the following table for additional details on restricted securities. |
| † | Non-income producing security. |
Restricted securities
Investment | Date of Acquisition | Cost | Value | |||||||
Airbnb Private Placement Series D | 4/16/14 | $ | 941,692 | $ | 2,707,368 | |||||
Airbnb Private Placement Series E | 7/14/15 | 1,267,108 | 1,593,168 | |||||||
| Dropbox Class A | 11/7/14 | 1,179,060 | 1,221,680 | |||||||
Flipkart Limited | 3/19/15 | 146,033 | 105,988 | |||||||
Flipkart Limited Series A | 3/19/15 | 49,818 | 36,157 | |||||||
Flipkart Limited Series C | 3/19/15 | 87,894 | 63,792 | |||||||
Flipkart Limited Series E | 3/19/15 | 163,361 | 118,564 | |||||||
Flipkart Limited Series G | 12/17/14 | 720,596 | 676,640 | |||||||
Flipkart Limited Series H | 4/17/15 | 830,682 | 780,010 | |||||||
Magic Leap | 1/20/16 | 1,000,438 | 1,114,108 | |||||||
Uber Technologies Series G | 12/3/15 | 1,667,863 | 1,117,464 | |||||||
WeWork Companies | 6/23/15 | 28,976 | 38,374 | |||||||
WeWork Companies Series E | 6/23/15 | 731,596 | 968,893 | |||||||
Xiaoju Kuaizhi (China) | 10/19/15 | 889,048 | 1,537,808 | |||||||
Total | $ | 9,704,165 | $ | 12,080,014 | ||||||
ADR – American Depositary Receipt
See accompanying notes, which are an integral part of the financial statements.
112
Table of Contents
Optimum Large Cap Value Fund
March 31, 2018
Number of shares | Value (US $) | |||||
Common Stock – 98.11%² | ||||||
Consumer Discretionary – 5.80% |
| |||||
Aptiv | 67,773 | $ 5,758,672 | ||||
BorgWarner | 173,819 | 8,730,928 | ||||
CBS Class B | 121,285 | 6,232,836 | ||||
Comcast Class A Special | 605,785 | 20,699,673 | ||||
Hanesbrands | 162,209 | 2,987,890 | ||||
Harley-Davidson | 23,801 | 1,020,587 | ||||
Hasbro | 15,907 | 1,340,960 | ||||
Home Depot | 33,451 | 5,962,306 | ||||
Interpublic Group of Cos | 248,310 | 5,718,579 | ||||
Newell Brands | 73,389 | 1,869,952 | ||||
NIKE Class B | 26,494 | 1,760,261 | ||||
Omnicom Group | 121,696 | 8,843,648 | ||||
PVH | 47,912 | 7,255,314 | ||||
Time Warner | 13,853 | 1,310,217 | ||||
Walt Disney | 64,929 | 6,521,469 | ||||
86,013,292 | ||||||
Consumer Staples – 8.11% | ||||||
Altria Group | 94,372 | 5,881,263 | ||||
Archer-Daniels-Midland | 97,647 | 4,234,950 | ||||
Coty Class A | 182,434 | 3,338,542 | ||||
CVS Health | 18,063 | 1,123,699 | ||||
Danone (France) | 43,563 | 3,532,188 | ||||
Diageo (United Kingdom) | 247,358 | 8,365,576 | ||||
General Mills | 179,080 | 8,069,345 | ||||
Hershey | 40,307 | 3,988,781 | ||||
JM Smucker | 26,783 | 3,321,360 | ||||
Kimberly-Clark | 13,437 | 1,479,817 | ||||
Nestle (Switzerland) | 142,232 | 11,242,235 | ||||
PepsiCo | 132,313 | 14,441,964 | ||||
Philip Morris International | 221,458 | 22,012,925 | ||||
Procter & Gamble | 167,614 | 13,288,438 | ||||
Reckitt Benckiser Group (United Kingdom) | 44,504 | 3,756,484 | ||||
Tyson Foods Class A | 164,999 | 12,076,277 | ||||
120,153,844 | ||||||
Energy – 7.83% | ||||||
Chevron | 198,195 | 22,602,158 | ||||
ConocoPhillips | 216,627 | 12,843,815 | ||||
Devon Energy | 172,913 | 5,496,904 | ||||
Energen † | 117,342 | 7,376,118 | ||||
EOG Resources | 195,491 | 20,579,338 | ||||
Exxon Mobil | 220,488 | 16,450,610 | ||||
Halliburton | 135,215 | 6,346,992 | ||||
Marathon Petroleum | 93,994 | 6,871,901 | ||||
Occidental Petroleum | 79,176 | 5,143,273 | ||||
Schlumberger | 188,974 | 12,241,736 | ||||
115,952,845 | ||||||
Number of shares | Value (US $) | |||||
Common Stock² (continued) |
| |||||
Financials – 27.98% | ||||||
Allstate | 79,731 | $ 7,558,499 | ||||
American Express | 176,347 | 16,449,648 | ||||
Ameriprise Financial | 50,155 | 7,419,931 | ||||
Aon (United Kingdom) | 95,390 | 13,386,079 | ||||
Bank of America | 944,287 | 28,319,167 | ||||
Bank of New York Mellon | 159,401 | 8,213,934 | ||||
Berkshire Hathaway Class B † | 26,287 | 5,243,731 | ||||
BlackRock | 16,324 | 8,843,037 | ||||
Chubb (Switzerland) | 200,249 | 27,388,056 | ||||
Citigroup | 239,387 | 16,158,623 | ||||
Discover Financial Services | 153,805 | 11,063,194 | ||||
E*TRADE Financial † | 182,445 | 10,109,277 | ||||
Franklin Resources | 63,081 | 2,187,649 | ||||
Goldman Sachs Group | 75,046 | 18,901,086 | ||||
Huntington Bancshares | 817,178 | 12,339,388 | ||||
Intercontinental Exchange | 123,882 | 8,983,923 | ||||
JPMorgan Chase & Co. | 616,466 | 67,792,766 | ||||
MetLife | 178,895 | 8,209,492 | ||||
Moody’s | 32,210 | 5,195,473 | ||||
Morgan Stanley | 154,369 | 8,329,751 | ||||
Nasdaq | 93,350 | 8,048,637 | ||||
PNC Financial Services Group | 78,218 | 11,829,690 | ||||
Prudential Financial | 39,786 | 4,119,840 | ||||
State Street | 203,461 | 20,291,166 | ||||
SunTrust Banks | 189,688 | 12,906,371 | ||||
T Rowe Price Group | 34,195 | 3,692,034 | ||||
Travelers | 109,736 | 15,237,941 | ||||
US Bancorp | 312,891 | 15,800,995 | ||||
Wells Fargo & Co. | 582,780 | 30,543,500 | ||||
414,562,878 | ||||||
Healthcare – 14.68% | ||||||
Abbott Laboratories | 163,156 | 9,776,307 | ||||
AbbVie | 77,747 | 7,358,754 | ||||
Allergan | 40,941 | 6,889,961 | ||||
Biogen † | 26,499 | 7,255,956 | ||||
Cigna | 38,802 | 6,508,647 | ||||
Danaher | 156,522 | 15,325,069 | ||||
Eli Lilly & Co. | 55,332 | 4,281,037 | ||||
Express Scripts Holding † | 50,195 | 3,467,471 | ||||
Gilead Sciences | 120,520 | 9,086,003 | ||||
Hill-Rom Holdings | 53,221 | 4,630,227 | ||||
Johnson & Johnson | 313,780 | 40,210,907 | ||||
Laboratory Corp of America Holdings † | 53,498 | 8,653,301 | ||||
McKesson | 35,900 | 5,057,233 | ||||
Medtronic (Ireland) | 292,410 | 23,457,130 | ||||
Merck & Co. | 104,246 | 5,678,280 | ||||
| (continues) | 113 |
Table of Contents
Schedules of investments
Optimum Large Cap Value Fund
| Number of shares | Value (US $) | |||||
Common Stock² (continued) |
| |||||
Healthcare (continued) | ||||||
Novartis (Switzerland) | 20,413 | $ 1,651,021 | ||||
Pfizer | 884,282 | 31,383,168 | ||||
Roche Holding (Switzerland) | 5,804 | 1,331,421 | ||||
Thermo Fisher Scientific | 87,272 | 18,018,177 | ||||
UnitedHealth Group | 34,945 | 7,478,230 | ||||
217,498,300 | ||||||
Industrials – 12.99% | ||||||
3M | 42,220 | 9,268,134 | ||||
Canadian National Railway (Canada) | 51,352 | 3,755,372 | ||||
Caterpillar | 49,429 | 7,284,846 | ||||
Deere | 38,503 | 5,980,286 | ||||
Delta Air Lines | 185,010 | 10,140,398 | ||||
Eaton | 92,694 | 7,407,178 | ||||
Equifax | 33,769 | 3,978,326 | ||||
HD Supply Holdings † | 36,603 | 1,388,718 | ||||
Honeywell International | 145,925 | 21,087,622 | ||||
Illinois Tool Works | 42,854 | 6,713,508 | ||||
Ingersoll-Rand | 47,804 | 4,087,720 | ||||
Johnson Controls International | 359,170 | 12,657,151 | ||||
Lockheed Martin | 15,017 | 5,074,695 | ||||
Northrop Grumman | 76,099 | 26,567,683 | ||||
Parker-Hannifin | 52,233 | 8,933,410 | ||||
Quanta Services † | 150,975 | 5,185,991 | ||||
Raytheon | 52,851 | 11,406,303 | ||||
Stanley Black & Decker | 60,246 | 9,229,687 | ||||
Union Pacific | 56,951 | 7,655,923 | ||||
United Parcel Service Class B | 38,017 | 3,978,859 | ||||
United Technologies | 68,752 | 8,650,377 | ||||
Waste Management | 143,317 | 12,055,826 | ||||
192,488,013 | ||||||
Information Technology – 8.80% |
| |||||
Accenture Class A (Ireland) | 136,464 | 20,947,224 | ||||
Amdocs | 27,582 | 1,840,271 | ||||
Analog Devices | 21,531 | 1,962,120 | ||||
Broadcom | 24,736 | 5,829,038 | ||||
Cisco Systems | 428,400 | 18,374,076 | ||||
Cognizant Technology Solutions Class A | 30,339 | 2,442,289 | ||||
DXC Technology | 38,838 | 3,904,384 | ||||
eBay † | 206,361 | 8,303,967 | ||||
Fidelity National Information Services | 80,957 | 7,796,159 | ||||
Fiserv † | 80,944 | 5,772,117 | ||||
International Business Machines | 13,810 | 2,118,868 | ||||
| Number of shares | Value (US $) | |||||
Common Stock² (continued) |
| |||||
Information Technology (continued) | ||||||
Microsoft | 111,187 | $ 10,148,037 | ||||
ON Semiconductor † | 386,361 | 9,450,390 | ||||
Oracle | 344,980 | 15,782,835 | ||||
QUALCOMM | 87,611 | 4,854,525 | ||||
Texas Instruments | 103,959 | 10,800,300 | ||||
130,326,600 | ||||||
Materials – 3.78% | ||||||
Air Products & Chemicals | 59,370 | 9,441,611 | ||||
Crown Holdings † | 58,791 | 2,983,643 | ||||
DowDuPont | 132,535 | 8,443,805 | ||||
Monsanto | 23,570 | 2,750,383 | ||||
Nucor | 76,762 | 4,689,391 | ||||
PPG Industries | 126,138 | 14,077,001 | ||||
Sherwin-Williams | 16,100 | 6,313,132 | ||||
Westlake Chemical | 65,282 | 7,256,094 | ||||
55,955,060 | ||||||
Real Estate – 1.64% | ||||||
Equity LifeStyle Properties | 87,160 | 7,650,033 | ||||
Highwoods Properties | 99,094 | 4,342,299 | ||||
Prologis | 152,629 | 9,614,101 | ||||
Public Storage | 13,322 | 2,669,596 | ||||
24,276,029 | ||||||
Telecommunication Services – 2.65% |
| |||||
AT&T | 580,219 | 20,684,807 | ||||
Verizon Communications | 389,953 | 18,647,552 | ||||
39,332,359 | ||||||
Utilities – 3.85% | ||||||
American Electric Power | 119,335 | 8,185,188 | ||||
DTE Energy | 64,003 | 6,681,913 | ||||
Duke Energy | 151,661 | 11,749,178 | ||||
Public Service Enterprise Group | 195,907 | 9,842,368 | ||||
Southern | 98,858 | 4,414,998 | ||||
Xcel Energy | 355,115 | 16,150,630 | ||||
57,024,275 | ||||||
Total Common Stock | 1,453,583,495 | |||||
114
Table of Contents
Principal amount° | Value (US $) | |||||
Short-Term Investments – 1.63% |
| |||||
Discount Note – 0.39%≠ | ||||||
Federal Home Loan Bank 0.80% 4/3/18 | 5,715,949 | $ 5,715,686 | ||||
5,715,686 | ||||||
Repurchase Agreements – 0.71% |
| |||||
Bank of America Merrill Lynch 1.71%, dated 3/29/18, to be repurchased on 4/2/18, repurchase price $1,525,607 (collateralized by US government obligations 1.50%–3.75% 11/15/18–8/15/44; market value $1,555,824) | 1,525,317 | 1,525,317 | ||||
Bank of Montreal 1.60%, dated 3/29/18, to be repurchased on 4/2/18, repurchase price $4,576,764 (collateralized by US government obligations 0.00%–2.875% 8/16/18–8/15/47; market value $4,667,469) | 4,575,950 | 4,575,950 | ||||
BNP Paribas 1.75%, dated 3/29/18, to be repurchased on 4/2/18, repurchase price $4,499,553 (collateralized by US government obligations 0.00%–3.625% 5/31/18–11/15/45; market value $4,588,652) | 4,498,678 | 4,498,678 | ||||
10,599,945 | ||||||
Principal amount° | Value (US $) | |||||
Short-Term Investments (continued) |
| |||||
US Treasury Obligations – 0.53%≠ | ||||||
US Treasury Bills | ||||||
1.007% 4/5/18 | 3,443,076 | $ 3,442,611 | ||||
1.35% 4/12/18 | 4,396,129 | 4,394,137 | ||||
7,836,748 | ||||||
Total Short-Term Investments | 24,152,379 | |||||
Total Value of | $1,477,735,874 | |||||
| ² | Narrow industries are utilized for compliance purposes for diversification whereas broad sectors are used for financial reporting. |
| ≠ | The rate shown is the effective yield at the time of purchase. |
| ° | Principal amount shown is stated in US dollars unless noted that the security is denominated in another currency. |
| † | Non-income producing security. |
See accompanying notes, which are an integral part of the financial statements.
| (continues) | 115 |
Table of Contents
Schedules of investments
Optimum Small-Mid Cap Growth Fund
March 31, 2018
| Number of shares | Value (US $) | |||||
Common Stock – 97.18%² |
| |||||
Consumer Discretionary – 14.69% |
| |||||
At Home Group † | 58,617 | $ 1,878,089 | ||||
BorgWarner | 56,035 | 2,814,639 | ||||
Burlington Stores † | 21,786 | 2,900,806 | ||||
Chegg † | 202,795 | 4,189,745 | ||||
Dave & Buster’s Entertainment † | 32,879 | 1,372,369 | ||||
DR Horton | 121,011 | 5,305,122 | ||||
Eldorado Resorts † | 67,944 | 2,242,152 | ||||
Extended Stay America | 128,784 | 2,546,060 | ||||
Floor & Decor Holdings Class A † | 58,029 | 3,024,471 | ||||
Fox Factory Holding † | 58,935 | 2,056,831 | ||||
G-III Apparel Group † | 211,541 | 7,970,865 | ||||
Golden Entertainment † | 39,143 | 909,292 | ||||
Houghton Mifflin Harcourt † | 95,958 | 666,908 | ||||
International Game Technology | 111,577 | 2,982,453 | ||||
Lions Gate Entertainment Class A | 27,611 | 713,192 | ||||
Lions Gate Entertainment Class B | 40,599 | 977,624 | ||||
Lululemon Athletica (Canada) † | 29,735 | 2,649,983 | ||||
Malibu Boats Class A † | 52,345 | 1,738,377 | ||||
MarineMax † | 66,576 | 1,294,903 | ||||
Melco Resorts & Entertainment ADR | 255,642 | 7,408,505 | ||||
Monro | 27,640 | 1,481,504 | ||||
Norwegian Cruise Line Holdings † | 133,261 | 7,058,835 | ||||
Party City Holdco † | 94,572 | 1,475,323 | ||||
Skechers U.S.A. Class A † | 131,474 | 5,113,024 | ||||
TopBuild † | 22,296 | 1,706,090 | ||||
Vail Resorts | 10,784 | 2,390,813 | ||||
Zoe’s Kitchen † | 66,356 | 958,181 | ||||
75,826,156 | ||||||
Consumer Staples – 1.64% | ||||||
Central Garden & Pet Class A † | 72,409 | 2,868,120 | ||||
Inter Parfums | 59,296 | 2,795,806 | ||||
Performance Food Group † | 93,925 | 2,803,661 | ||||
8,467,587 | ||||||
Energy – 2.00% | ||||||
Diamondback Energy † | 71,005 | 8,983,553 | ||||
GasLog (Monaco) | 80,269 | 1,320,425 | ||||
10,303,978 | ||||||
| Number of shares | Value (US $) | |||||
Common Stock² (continued) |
| |||||
Financials – 9.82% | ||||||
Argo Group International Holdings (Bermuda) | 50,359 | $ 2,890,607 | ||||
Comerica | 68,596 | 6,580,414 | ||||
E*TRADE Financial † | 109,189 | 6,050,162 | ||||
Essent Group † | 66,624 | 2,835,517 | ||||
Evercore Class A | 36,348 | 3,169,546 | ||||
Green Dot Class A † | 39,713 | 2,547,986 | ||||
MSCI Class A | 10,289 | 1,537,897 | ||||
ServisFirst Bancshares | 40,784 | 1,664,803 | ||||
Signature Bank † | 6,301 | 894,427 | ||||
Sterling Bancorp | 60,261 | 814,126 | ||||
Stifel Financial | 45,130 | 2,673,050 | ||||
SVB Financial Group † | 41,510 | 9,962,815 | ||||
Virtu Financial Class A | 54,436 | 1,796,388 | ||||
Virtus Investment Partners | 14,666 | 1,815,651 | ||||
Zions Bancorporation | 103,453 | 5,455,077 | ||||
50,688,466 | ||||||
Healthcare – 18.43% | ||||||
ABIOMED † | 5,527 | 1,608,302 | ||||
Aerie Pharmaceuticals † | 60,399 | 3,276,646 | ||||
Alnylam Pharmaceuticals † | 11,684 | 1,391,564 | ||||
AMN Healthcare Services † | 84,242 | 4,780,733 | ||||
Array BioPharma † | 171,825 | 2,804,184 | ||||
athenahealth † | 11,492 | 1,643,701 | ||||
AtriCure † | 97,414 | 1,998,935 | ||||
Cerus † | 179,899 | 985,847 | ||||
DexCom † | 41,910 | 3,108,046 | ||||
Emergent BioSolutions † | 29,460 | 1,551,069 | ||||
Epizyme † | 40,121 | 712,148 | ||||
Esperion Therapeutics † | 51,759 | 3,743,728 | ||||
Evolent Health Class A † | 118,751 | 1,692,202 | ||||
Flexion Therapeutics † | 53,284 | 1,194,094 | ||||
Foundation Medicine † | 20,344 | 1,602,090 | ||||
Galapagos ADR † | 8,695 | 867,413 | ||||
Glaukos † | 45,830 | 1,412,939 | ||||
Global Blood Therapeutics † | 25,737 | 1,243,097 | ||||
GlycoMimetics † | 75,749 | 1,229,406 | ||||
Haemonetics † | 38,048 | 2,783,592 | ||||
HealthEquity † | 77,094 | 4,667,271 | ||||
ICON (Ireland) † | 24,637 | 2,910,615 | ||||
IDEXX Laboratories † | 14,206 | 2,718,886 | ||||
Inogen † | 17,394 | 2,136,679 | ||||
Insulet † | 43,770 | 3,793,984 | ||||
Intercept Pharmaceuticals † | 9,680 | 595,514 | ||||
Intra-Cellular Therapies † | 55,779 | 1,174,148 | ||||
Intrexon † | 39,870 | 611,207 | ||||
K2M Group Holdings † | 50,913 | 964,801 | ||||
116
Table of Contents
| Number of shares | Value (US $) | |||||
Common Stock² (continued) |
| |||||
Healthcare (continued) | ||||||
Medidata Solutions † | 25,455 | $ 1,598,829 | ||||
Nektar Therapeutics † | 15,478 | 1,644,692 | ||||
Neurocrine Biosciences † | 32,903 | 2,728,646 | ||||
Nevro † | 30,111 | 2,609,720 | ||||
Novocure (United Kingdom) † | 77,603 | 1,691,745 | ||||
Optinose † | 26,853 | 537,597 | ||||
OraSure Technologies † | 79,715 | 1,346,386 | ||||
Pacira Pharmaceuticals † | 27,305 | 850,551 | ||||
Sage Therapeutics † | 2,824 | 454,862 | ||||
Sangamo Therapeutics † | 33,566 | 637,754 | ||||
Tabula Rasa HealthCare † | 26,066 | 1,011,361 | ||||
Tactile Systems Technology † | 65,323 | 2,077,271 | ||||
Teladoc † | 110,499 | 4,453,110 | ||||
Tenet Healthcare † | 228,412 | 5,538,991 | ||||
TG Therapeutics † | 52,224 | 741,581 | ||||
Vocera Communications † | 38,454 | 900,593 | ||||
WellCare Health Plans † | 28,652 | 5,547,887 | ||||
Wright Medical Group (Netherlands) † | 79,850 | 1,584,224 | ||||
95,158,641 | ||||||
Industrials – 16.00% | ||||||
AMETEK | 84,928 | 6,451,980 | ||||
AO Smith | 45,579 | 2,898,369 | ||||
ASGN † | 104,081 | 8,522,152 | ||||
Copart † | 77,116 | 3,927,518 | ||||
CoStar Group † | 13,696 | 4,967,265 | ||||
Dycom Industries † | 13,147 | 1,415,012 | ||||
EnPro Industries | 28,481 | 2,203,860 | ||||
Gardner Denver Holdings † | 84,071 | 2,579,298 | ||||
Gates Industrial † | 104,443 | 1,828,797 | ||||
Genesee & Wyoming † | 36,164 | 2,560,050 | ||||
Granite Construction | 52,632 | 2,940,024 | ||||
Hub Group Class A † | 31,966 | 1,337,777 | ||||
ICF International | 11,647 | 680,767 | ||||
JELD-WEN Holding † | 36,255 | 1,110,128 | ||||
John Bean Technologies | 14,623 | 1,658,248 | ||||
KAR Auction Services | 38,745 | 2,099,979 | ||||
Kennametal | 47,571 | 1,910,451 | ||||
Knight-Swift Transportation Holdings | 132,977 | 6,118,272 | ||||
Korn/Ferry International | 28,244 | 1,457,108 | ||||
Kratos Defense & Security Solutions † | 135,238 | 1,391,599 | ||||
Masonite International † | 22,282 | 1,367,001 | ||||
Middleby † | 22,360 | 2,767,944 | ||||
NCI Building Systems † | 83,122 | 1,471,259 | ||||
PGT Innovations † | 92,061 | 1,716,938 | ||||
REV Group | 76,259 | 1,583,137 | ||||
| Number of shares | Value (US $) | |||||
Common Stock² (continued) |
| |||||
Industrials (continued) | ||||||
RPX | 77,692 | $ 830,527 | ||||
Schneider National Class B | 89,326 | 2,327,836 | ||||
SPX † | 61,990 | 2,013,435 | ||||
TransUnion † | 75,991 | 4,314,769 | ||||
United Rentals † | 17,182 | 2,967,847 | ||||
Wabash National | 88,222 | 1,835,900 | ||||
WABCO Holdings † | 10,003 | 1,339,102 | ||||
82,594,349 | ||||||
Information Technology – 31.71% |
| |||||
2U † | 105,330 | 8,850,880 | ||||
Acxiom † | 98,361 | 2,233,778 | ||||
Arista Networks † | 7,628 | 1,947,428 | ||||
Atlassian (Australia) † | 41,612 | 2,243,719 | ||||
Axcelis Technologies † | 70,150 | 1,725,690 | ||||
Benefitfocus † | 51,974 | 1,268,166 | ||||
Box Class A † | 105,139 | 2,160,606 | ||||
Cadence Design Systems † | 80,043 | 2,943,181 | ||||
Ciena † | 103,849 | 2,689,689 | ||||
Cloudera † | 96,243 | 2,076,924 | ||||
Cornerstone OnDemand † | 47,375 | 1,852,836 | ||||
Cree † | 101,814 | 4,104,122 | ||||
CyberArk Software (Israel) † | 32,169 | 1,641,262 | ||||
Cypress Semiconductor | 181,837 | 3,083,956 | ||||
First Solar † | 52,648 | 3,736,955 | ||||
Five9 † | 141,726 | 4,222,018 | ||||
FLIR Systems | 93,709 | 4,686,387 | ||||
FormFactor † | 163,684 | 2,234,287 | ||||
GrubHub † | 56,915 | 5,775,165 | ||||
Hortonworks † | 69,636 | 1,418,485 | ||||
IAC/InterActiveCorp † | 33,045 | 5,167,577 | ||||
IPG Photonics † | 5,714 | 1,333,533 | ||||
Lumentum Holdings † | 50,511 | 3,222,602 | ||||
Microsemi † | 58,376 | 3,778,095 | ||||
Mimecast † | 208,419 | 7,384,285 | ||||
MKS Instruments | 27,297 | 3,156,898 | ||||
Nanometrics † | 49,265 | 1,325,229 | ||||
New Relic † | 46,993 | 3,483,121 | ||||
Nuance Communications † | 119,842 | 1,887,512 | ||||
Nutanix Class A † | 29,794 | 1,463,183 | ||||
Okta † | 20,196 | 804,811 | ||||
PTC † | 88,858 | 6,931,813 | ||||
Pure Storage Class A † | 122,017 | 2,434,239 | ||||
Q2 Holdings † | 28,412 | 1,294,167 | ||||
RealPage † | 61,598 | 3,172,297 | ||||
RingCentral Class A † | 72,919 | 4,630,357 | ||||
ServiceNow † | 6,001 | 992,865 | ||||
Shopify Class A (Canada) † | 29,171 | 3,634,415 | ||||
| (continues) | 117 |
Table of Contents
Schedules of investments
Optimum Small-Mid Cap Growth Fund
Number of shares | Value (US $) | |||||
Common Stock² (continued) | ||||||
Information Technology (continued) | ||||||
Silicon Motion Technology ADR | 33,377 | $ 1,606,101 | ||||
Splunk † | 25,199 | 2,479,330 | ||||
Square Class A † | 83,367 | 4,101,656 | ||||
SS&C Technologies Holdings | 99,146 | 5,318,191 | ||||
Talend ADR † | 32,398 | 1,558,992 | ||||
Tech Data † | 24,109 | 2,052,399 | ||||
Teradyne | 203,657 | 9,309,161 | ||||
Trimble † | 75,042 | 2,692,507 | ||||
Ultimate Software Group † | 8,165 | 1,989,811 | ||||
WEX † | 16,549 | 2,591,904 | ||||
Zebra Technologies † | 44,420 | 6,182,820 | ||||
Zendesk † | 142,438 | 6,818,507 | ||||
163,693,912 | ||||||
Materials – 2.61% | ||||||
Boise Cascade | 57,588 | 2,222,897 | ||||
Carpenter Technology | 40,525 | 1,787,963 | ||||
Chemours | 56,362 | 2,745,393 | ||||
KMG Chemicals | 21,799 | 1,306,850 | ||||
Orion Engineered Carbons (Luxembourg) | 65,404 | 1,772,448 | ||||
Steel Dynamics | 46,312 | 2,047,916 | ||||
US Concrete † | 26,088 | 1,575,715 | ||||
13,459,182 | ||||||
Real Estate – 0.28% | ||||||
QTS Realty Trust Class A | 40,311 | 1,460,064 | ||||
1,460,064 | ||||||
Total Common Stock (cost $397,815,320) | 501,652,335 | |||||
Convertible Preferred Stock – 1.11% |
| |||||
DocuSign | ||||||
Series B =p† | 1,166 | 33,336 | ||||
Series B-1 =p† | 349 | 9,978 | ||||
Series C =p† | 4,474 | 127,912 | ||||
Series D =p† | 838 | 23,958 | ||||
Series E =p† | 21,664 | 619,374 | ||||
Draftkings | ||||||
Series D =p† | 83,549 | 233,937 | ||||
Series D-1 =p† | 100,507 | 281,420 | ||||
Honest=p† | 15,249 | 445,728 | ||||
MarkLogic=p† | 83,588 | 711,334 | ||||
Number of shares | Value (US $) | |||||
Convertible Preferred Stock (continued) | ||||||
Nutanix† | 40,185 | $ 1,973,485 | ||||
Veracode Series 8=p† | 30,584 | 140,075 | ||||
Zuora=p† | 209,844 | 1,135,256 | ||||
Total Convertible Preferred Stock | 5,735,793 | |||||
Principal amount° | ||||||
Short-Term Investments – 2.00% | ||||||
Discount Note – 0.62%≠ | ||||||
Federal Home Loan Bank 0.80% 4/3/18 | 3,187,321 | 3,187,175 | ||||
3,187,175 | ||||||
Repurchase Agreements – 0.77% | ||||||
Bank of America Merrill Lynch 1.71%, dated 3/29/18, to be repurchased on 4/2/18, repurchase price $575,498 (collateralized by US government obligations 1.50%–3.75% 11/15/18–8/15/44; market value $586,897) | 575,388 | 575,388 | ||||
Bank of Montreal 1.60%, dated 3/29/18, to be repurchased on 4/2/18, repurchase price $1,726,472 (collateralized by US government obligations 0.00%–2.875% 8/16/18–8/15/47; market value $1,760,688) | 1,726,165 | 1,726,165 | ||||
BNP Paribas 1.75%, dated 3/29/18, to be repurchased on 4/2/18, repurchase price $1,697,346 (collateralized by US government obligations 0.00%–3.625% 5/31/18–11/15/45; market value $1,730,956) | 1,697,016 | 1,697,016 | ||||
3,998,569 | ||||||
118
Table of Contents
Principal amount° | Value (US $) | |||||
Short-Term Investments (continued) |
| |||||
US Treasury Obligations – 0.61%≠ | ||||||
US Treasury Bills | ||||||
1.007% 4/5/18 | 1,298,816 | $ 1,298,640 | ||||
1.35% 4/12/18 | 1,837,812 | 1,836,980 | ||||
3,135,620 | ||||||
Total Short-Term Investments | 10,321,364 | |||||
Total Value of Securities – 100.29% | $517,709,492 | |||||
| ² | Narrow industries are utilized for compliance purposes for diversification whereas broad sectors are used for financial reporting. |
| = | The value of this security was determined using significant un observable inputs and is reported as a Level 3 security in the disclosure table located in Note 3 in “Notes to financial statements.” |
| ≠ | The rate shown is the effective yield at the time of purchase. |
| ° | Principal amount shown is stated in US dollars unless noted that the security is denominated in another currency. |
| p | Restricted security. These investments are in securities not registered under the Securities Act of 1933, as amended, and have certain restrictions on resale which may limit their liquidity. At March 31, 2018, the aggregate value of restricted securities was $3,762,308, which represented 0.73% of the Fund’s net assets. The Fund has various registration rights (exercisable under a variety of circumstances) with respect to these securities. See Note 10 in “Notes to financial statements” and the following table for additional details on restricted securities. |
| † | Non-income producing security. |
Restricted Securities
Investments | Date of Acquisition | Cost | Value | |||||||||
DocuSign Series B | 2/28/14 | $ | 15,312 | $ | 33,336 | |||||||
DocuSign Series B-1 | 2/28/14 | 4,583 | 9,978 | |||||||||
DocuSign Series C | 4/30/15 | 85,422 | 127,912 | |||||||||
DocuSign Series D | 2/28/14 | 11,005 | 23,958 | |||||||||
DocuSign Series E | 2/28/14 | 284,500 | 619,374 | |||||||||
DraftKings Series D | 8/11/15 | 305,094 | 233,937 | |||||||||
DraftKings Series D-1 | 8/18/15 | 388,676 | 281,420 | |||||||||
Honest | 8/3/15 | 697,718 | 445,728 | |||||||||
MarkLogic | 4/27/15 | 970,808 | 711,334 | |||||||||
Veracode Series 8 | 6/14/17 | — | 140,075 | |||||||||
Zuora | 1/15/15 | 797,260 | 1,135,256 | |||||||||
|
|
|
| |||||||||
Total | $ | 3,560,378 | $ | 3,762,308 | ||||||||
|
|
|
| |||||||||
ADR – American Depositary Receipt
See accompanying notes, which are an integral part of the financial statements.
| (continues) | 119 |
Table of Contents
Schedules of investments
Optimum Small-Mid Cap Value Fund
March 31, 2018
Number of shares | Value (US $) | |||||
Common Stock – 97.53% |
| |||||
Consumer Discretionary – 10.90% |
| |||||
AMC Networks Class A † | 19,000 | $ 982,300 | ||||
American Eagle Outfitters | 62,200 | 1,239,646 | ||||
Bed Bath & Beyond | 23,600 | 495,364 | ||||
Bloomin’ Brands | 64,000 | 1,553,920 | ||||
BorgWarner | 30,000 | 1,506,900 | ||||
Brinker International | 33,200 | 1,198,520 | ||||
Burlington Stores † | 13,200 | 1,757,580 | ||||
Cable One | 5,502 | 3,780,479 | ||||
Carriage Services | 30,300 | 838,098 | ||||
Children’s Place | 7,100 | 960,275 | ||||
Columbia Sportswear | 31,900 | 2,438,117 | ||||
Cooper-Standard Holdings † | 17,300 | 2,124,613 | ||||
Discovery † | 13,547 | 264,437 | ||||
Goodyear Tire & Rubber | 70,000 | 1,860,600 | ||||
Hanesbrands | 154,675 | 2,849,113 | ||||
Harley-Davidson | 28,800 | 1,234,944 | ||||
Haverty Furniture | 43,900 | 884,585 | ||||
Helen of Troy † | 32,260 | 2,806,620 | ||||
Installed Building Products † | 36,425 | 2,187,321 | ||||
KB Home | 50,600 | 1,439,570 | ||||
Kohl’s | 36,100 | 2,364,911 | ||||
Lear | 11,700 | 2,177,253 | ||||
Marcus | 30,500 | 925,675 | ||||
MDC Holdings | 28,700 | 801,304 | ||||
Michael Kors Holdings (United Kingdom) † | 15,000 | 931,200 | ||||
Murphy USA † | 16,500 | 1,201,200 | ||||
Office Depot | 174,900 | 376,035 | ||||
Penske Automotive Group | 19,700 | 873,301 | ||||
PulteGroup | 53,000 | 1,562,970 | ||||
Shoe Carnival | 31,500 | 749,700 | ||||
Sonic Automotive Class A | 76,300 | 1,445,885 | ||||
Tenneco | 26,400 | 1,448,568 | ||||
Unifi † | 14,500 | 525,625 | ||||
Whirlpool | 5,200 | 796,172 | ||||
Wyndham Worldwide | 12,500 | 1,430,375 | ||||
50,013,176 | ||||||
Consumer Staples – 4.41% | ||||||
Bunge | 20,500 | 1,515,770 | ||||
Dean Foods | 87,300 | 752,526 | ||||
Edgewell Personal Care † | 20,125 | 982,503 | ||||
Energizer Holdings | 70,504 | 4,200,628 | ||||
Ingles Markets Class A | 35,400 | 1,198,290 | ||||
Ingredion | 9,300 | 1,198,956 | ||||
J&J Snack Foods | 22,679 | 3,097,044 | ||||
Number of shares | Value (US $) | |||||
Common Stock (continued) | ||||||
Consumer Staples (continued) | ||||||
Nomad Foods (United Kingdom) † | 160,915 | $ 2,532,802 | ||||
Pilgrim’s Pride † | 59,400 | 1,461,834 | ||||
Sanderson Farms | 17,400 | 2,070,948 | ||||
SUPERVALU † | 17,800 | 271,094 | ||||
Weis Markets | 23,400 | 958,932 | ||||
20,241,327 | ||||||
Energy – 4.61% | ||||||
Andeavor | 7,000 | 703,920 | ||||
Carrizo Oil & Gas † | 64,400 | 1,030,400 | ||||
Centennial Resource Development Class A † | 108,303 | 1,987,360 | ||||
Diamond Offshore Drilling † | 8,400 | 123,144 | ||||
Diamondback Energy † | 39,542 | 5,002,854 | ||||
Laredo Petroleum † | 95,600 | 832,676 | ||||
McDermott International † | 140,000 | 852,600 | ||||
Newfield Exploration † | 34,500 | 842,490 | ||||
Par Pacific Holdings † | 51,000 | 875,670 | ||||
PBF Energy | 50,100 | 1,698,390 | ||||
RSP Permian † | 46,415 | 2,175,935 | ||||
SRC Energy † | 128,400 | 1,210,812 | ||||
WPX Energy † | 258,320 | 3,817,970 | ||||
21,154,221 | ||||||
Financials – 23.49% | ||||||
Ally Financial | 39,800 | 1,080,570 | ||||
American Financial Group | 11,800 | 1,324,196 | ||||
Annaly Capital Management | 139,300 | 1,452,899 | ||||
Apollo Commercial Real Estate Finance | 77,600 | 1,395,248 | ||||
Ares Capital | 56,000 | 888,720 | ||||
Arthur J. Gallagher & Co. | 73,000 | 5,017,290 | ||||
Assurant | 14,900 | 1,362,009 | ||||
Assured Guaranty (Bermuda) | 34,400 | 1,245,280 | ||||
Axis Capital Holdings | 16,500 | 949,905 | ||||
Banco Latinoamericano de Comercio Exterior (Panama) | 32,105 | 914,993 | ||||
BankUnited | 34,200 | 1,367,316 | ||||
Berkshire Hills Bancorp | 44,099 | 1,673,557 | ||||
Blackstone Mortgage Trust | 41,500 | 1,303,930 | ||||
Central Pacific Financial | 34,200 | 973,332 | ||||
Chemical Financial | 95,626 | 5,228,830 | ||||
CIT Group | 61,800 | 3,182,700 | ||||
CNA Financial | 60,200 | 2,970,870 | ||||
CNO Financial Group | 127,400 | 2,760,758 | ||||
Customers Bancorp † | 37,700 | 1,098,955 | ||||
120
Table of Contents
Number of shares | Value (US $) | |||||||
Common Stock (continued) |
| |||||||
Financials (continued) | ||||||||
Everest Re Group (Bermuda) | 26,700 | $ | 6,857,094 | |||||
First Busey | 45,200 | 1,343,344 | ||||||
Great Western Bancorp | 30,172 | 1,215,026 | ||||||
Hancock Holding | 19,200 | 992,640 | ||||||
Hanmi Financial | 47,900 | 1,472,925 | ||||||
HCI Group | 17,300 | 660,168 | ||||||
Heritage Insurance Holdings | 32,300 | 489,668 | ||||||
Home BancShares | 221,750 | 5,058,117 | ||||||
Hope Bancorp | 77,200 | 1,404,268 | ||||||
Lazard Class A | 39,600 | 2,081,376 | ||||||
Legg Mason | 24,200 | 983,730 | ||||||
MGIC Investment † | 107,200 | 1,393,600 | ||||||
New Mountain Finance | 71,900 | 945,485 | ||||||
Oaktree Specialty Lending | 4,294 | 18,078 | ||||||
Old National Bancorp | 86,500 | 1,461,850 | ||||||
Piper Jaffray | 9,900 | 822,195 | ||||||
Prospect Capital | 160,841 | 1,053,509 | ||||||
Radian Group | 69,500 | 1,323,280 | ||||||
Reinsurance Group of America | 21,200 | 3,264,800 | ||||||
Renasant | 70,450 | 2,998,352 | ||||||
South State | 28,250 | 2,409,725 | ||||||
Starwood Property Trust | 81,600 | 1,709,520 | ||||||
TCF Financial | 163,600 | 3,731,716 | ||||||
TriCo Bancshares | 45,200 | 1,682,344 | ||||||
Universal Insurance Holdings | 41,300 | 1,317,470 | ||||||
Unum Group | 75,700 | 3,604,077 | ||||||
Validus Holdings (Bermuda) | 2,700 | 182,115 | ||||||
Washington Federal | 43,100 | 1,491,260 | ||||||
Western Alliance Bancorp † | 96,800 | 5,625,048 | ||||||
Wintrust Financial | 66,200 | 5,696,510 | ||||||
Zions Bancorporation | 156,393 | 8,246,603 | ||||||
| 107,727,251 | ||||||||
Healthcare – 5.81% | ||||||||
Centene † | 16,400 | 1,752,668 | ||||||
Cooper | 11,735 | 2,685,085 | ||||||
Integer Holdings † | 24,100 | 1,362,855 | ||||||
Integra LifeSciences Holdings † | 40,805 | 2,258,149 | ||||||
Lannett † | 44,200 | 709,410 | ||||||
LifePoint Health † | 24,900 | 1,170,300 | ||||||
Mallinckrodt † | 41,000 | 593,680 | ||||||
Owens & Minor | 32,200 | 500,710 | ||||||
PerkinElmer | 56,700 | 4,293,324 | ||||||
Premier Class A † | 61,250 | 1,917,738 | ||||||
Quest Diagnostics | 11,600 | 1,163,480 | ||||||
Number of shares | Value (US $) | |||||||
Common Stock (continued) |
| |||||||
Healthcare (continued) | ||||||||
STERIS (United Kingdom) | 34,410 | $ | 3,212,518 | |||||
Teleflex | 15,900 | 4,054,182 | ||||||
United Therapeutics † | 8,600 | 966,296 | ||||||
| 26,640,395 | ||||||||
Industrials – 14.73% | ||||||||
ACCO Brands | 146,000 | 1,832,300 | ||||||
Aircastle | 55,700 | 1,106,202 | ||||||
Alaska Air Group | 43,550 | 2,698,358 | ||||||
Albany International | 43,087 | 2,701,555 | ||||||
Allison Transmission Holdings | 33,100 | 1,292,886 | ||||||
Briggs & Stratton | 39,700 | 849,977 | ||||||
Chicago Bridge & Iron (Netherlands) | 29,200 | 420,480 | ||||||
Comfort Systems USA | 56,488 | 2,330,130 | ||||||
Crane | 8,400 | 779,016 | ||||||
Curtiss-Wright | 37,580 | 5,075,931 | ||||||
Deluxe | 29,800 | 2,205,498 | ||||||
Ennis | 45,800 | 902,260 | ||||||
GATX | 20,400 | 1,397,196 | ||||||
Gibraltar Industries † | 65,900 | 2,230,715 | ||||||
Hawaiian Holdings | 37,700 | 1,458,990 | ||||||
Herman Miller | 46,400 | 1,482,480 | ||||||
Hubbell | 29,165 | 3,551,714 | ||||||
Huntington Ingalls Industries | 15,565 | 4,012,034 | ||||||
Interface | 42,370 | 1,067,724 | ||||||
ITT | 31,330 | 1,534,543 | ||||||
JetBlue Airways † | 81,700 | 1,660,144 | ||||||
Middleby † | 25,450 | 3,150,455 | ||||||
Moog Class A † | 19,600 | 1,615,236 | ||||||
Oshkosh | 24,800 | 1,916,296 | ||||||
Owens Corning | 22,400 | 1,800,960 | ||||||
Pentair (United Kingdom) | 44,240 | 3,014,071 | ||||||
Pitney Bowes | 45,300 | 493,317 | ||||||
Regal Beloit | 11,600 | 850,860 | ||||||
Ryder System | 31,700 | 2,307,443 | ||||||
Spirit AeroSystems Holdings Class A | 51,200 | 4,285,440 | ||||||
Timken | 24,600 | 1,121,760 | ||||||
Trinity Industries | 50,400 | 1,644,552 | ||||||
Wabash National | 130,500 | 2,715,705 | ||||||
Woodward | 28,656 | 2,053,489 | ||||||
| 67,559,717 | ||||||||
Information Technology – 11.50% | ||||||||
Advanced Energy Industries † | 15,200 | 971,280 | ||||||
Amdocs | 30,850 | 2,058,312 | ||||||
Arrow Electronics † | 11,500 | 885,730 | ||||||
| (continues) | 121 |
Table of Contents
Schedules of investments
Optimum Small-Mid Cap Value Fund
Number of shares | Value (US $) | |||||||
Common Stock (continued) |
| |||||||
Information Technology (continued) | ||||||||
Avnet | 44,000 | $ | 1,837,440 | |||||
Booz Allen Hamilton Holding | 93,849 | 3,633,833 | ||||||
Ciena † | 39,900 | 1,033,410 | ||||||
Cirrus Logic † | 27,400 | 1,113,262 | ||||||
Coherent † | 5,000 | 937,000 | ||||||
Convergys | 31,400 | 710,268 | ||||||
CSG Systems International | 18,200 | 824,278 | ||||||
Flex † | 139,500 | 2,278,035 | ||||||
FLIR Systems | 64,062 | 3,203,741 | ||||||
Genpact | 66,200 | 2,117,738 | ||||||
Jabil | 43,700 | 1,255,501 | ||||||
Juniper Networks | 80,500 | 1,958,565 | ||||||
Littelfuse | 18,500 | 3,851,330 | ||||||
Methode Electronics | 64,800 | 2,533,680 | ||||||
MKS Instruments | 40,025 | 4,628,891 | ||||||
NCR † | 67,500 | 2,127,600 | ||||||
ON Semiconductor † | 111,200 | 2,719,952 | ||||||
OSI Systems † | 55,751 | 3,638,868 | ||||||
Plantronics | 27,500 | 1,660,175 | ||||||
Sanmina † | 59,300 | 1,550,695 | ||||||
Tech Data † | 23,100 | 1,966,503 | ||||||
Teradyne | 28,900 | 1,321,019 | ||||||
TTM Technologies † | 60,000 | 917,400 | ||||||
Western Union | 51,400 | 988,422 | ||||||
| 52,722,928 | ||||||||
Materials – 7.91% | ||||||||
Albemarle | 32,907 | 3,051,795 | ||||||
Cabot | 26,400 | 1,471,008 | ||||||
Celanese Class A | 19,000 | 1,903,990 | ||||||
Clearwater Paper † | 25,400 | 993,140 | ||||||
Domtar | 45,500 | 1,935,570 | ||||||
Eagle Materials | 46,900 | 4,833,045 | ||||||
Eastman Chemical | 15,700 | 1,657,606 | ||||||
Kronos Worldwide | 37,500 | 847,500 | ||||||
Owens-Illinois † | 45,000 | 974,700 | ||||||
Packaging Corp. of America | 10,300 | 1,160,810 | ||||||
PolyOne | 75,564 | 3,212,981 | ||||||
Reliance Steel & Aluminum | 21,500 | 1,843,410 | ||||||
RPM International | 84,145 | 4,011,192 | ||||||
Schweitzer-Mauduit International | 32,700 | 1,280,205 | ||||||
Stepan | 26,600 | 2,212,588 | ||||||
Summit Materials Class A † | 84,146 | 2,547,941 | ||||||
Trinseo | 31,700 | 2,347,385 | ||||||
| 36,284,866 | ||||||||
Number of shares | Value (US $) | |||||||
Common Stock (continued) |
| |||||||
Real Estate – 9.50% | ||||||||
Alexandria Real Estate Equities | 26,477 | $ | 3,306,713 | |||||
Brandywine Realty Trust | 228,275 | 3,625,007 | ||||||
CBL & Associates Properties | 63,700 | 265,629 | ||||||
City Office REIT (Canada) | 41,300 | 477,428 | ||||||
DDR | 101,300 | 742,529 | ||||||
Franklin Street Properties | 93,612 | 787,277 | ||||||
Getty Realty | 44,591 | 1,124,585 | ||||||
Government Properties Income Trust | 37,700 | 514,982 | ||||||
Hospitality Properties Trust | 104,300 | 2,642,962 | ||||||
Hudson Pacific Properties | 119,075 | 3,873,510 | ||||||
Independence Realty Trust | 13,300 | 122,094 | ||||||
InfraREIT † | 58,000 | 1,126,940 | ||||||
LaSalle Hotel Properties | 27,000 | 783,270 | ||||||
Lexington Realty Trust | 201,200 | 1,583,444 | ||||||
Mack-Cali Realty | 69,300 | 1,158,003 | ||||||
Medical Properties Trust | 157,100 | 2,042,300 | ||||||
Omega Healthcare Investors | 39,200 | 1,059,968 | ||||||
One Liberty Properties | 51,900 | 1,146,990 | ||||||
Physicians Realty Trust | 176,075 | 2,741,488 | ||||||
Piedmont Office Realty Trust | 58,900 | 1,036,051 | ||||||
Preferred Apartment Communities | 33,100 | 469,689 | ||||||
Retail Properties of America | 174,620 | 2,036,069 | ||||||
Select Income REIT | 88,800 | 1,729,824 | ||||||
Senior Housing Properties Trust | 123,300 | 1,930,878 | ||||||
STAG Industrial | 180,445 | 4,316,244 | ||||||
Summit Hotel Properties | 63,000 | 857,430 | ||||||
VEREIT | 128,600 | 895,056 | ||||||
Xenia Hotels & Resorts | 60,500 | 1,193,060 | ||||||
| 43,589,420 | ||||||||
Telecommunication Services – 0.94% |
| |||||||
Iridium Communications † | 96,600 | 1,086,750 | ||||||
magicJack VocalTec (Israel) † | 87,700 | 736,680 | ||||||
Zayo Group Holdings † | 72,825 | 2,487,702 | ||||||
| 4,311,132 | ||||||||
Utilities – 3.73% | ||||||||
AES | 97,300 | 1,106,301 | ||||||
ALLETE | 45,274 | 3,271,047 | ||||||
Alliant Energy | 102,632 | 4,193,544 | ||||||
CenterPoint Energy | 49,000 | 1,342,600 | ||||||
IDACORP | 45,275 | 3,996,424 | ||||||
122
Table of Contents
Number of shares | Value (US $) | |||||||
Common Stock (continued) |
| |||||||
Utilities (continued) | ||||||||
OGE Energy | 98,000 | $ | 3,211,460 | |||||
| 17,121,376 | ||||||||
Total Common Stock | 447,365,809 | |||||||
Principal amount° | ||||||||
Short-Term Investments – 1.42% |
| |||||||
Discount Note – 0.17%≠ | ||||||||
Federal Home Loan Bank 0.80% 4/3/18 | 785,086 | 785,049 | ||||||
| 785,049 | ||||||||
Repurchase Agreements – 0.98% | ||||||||
Bank of America Merrill Lynch 1.71%, dated 3/29/18, to be repurchased on 4/2/18, repurchase price $647,101 (collateralized by US government obligations 1.50%–3.75% 11/15/18–8/15/44; market value $659,918) | 646,978 | 646,978 | ||||||
Bank of Montreal 1.60%, dated 3/29/18, to be repurchased on 4/2/18, repurchase price $1,941,279 (collateralized by US government obligations 0.00%–2.875% 8/16/18–8/15/47; market value $1,979,753) | 1,940,933 | 1,940,933 | ||||||
BNP Paribas 1.75%, dated 3/29/18, to be repurchased on 4/2/18, repurchase price $1,908,529 (collateralized by US government obligations 0.00%–3.625% 5/31/18–11/15/45; market value $1,946,322) | 1,908,158 | 1,908,158 | ||||||
| 4,496,069 | ||||||||
Principal amount° | Value (US $) | |||||||
Short-Term Investments (continued) |
| |||||||
US Treasury Obligations – 0.27%≠ | ||||||||
US Treasury Bills | ||||||||
1.007% 4/5/18 | 544,095 | $ | 544,022 | |||||
1.35% 4/12/18 | 685,293 | 684,982 | ||||||
| 1,229,004 | ||||||||
Total Short-Term Investments | 6,510,122 | |||||||
Total Value of | $ | 453,875,931 | ||||||
| ≠ | The rate shown is the effective yield at the time of purchase. |
| ° | Principal amount shown is stated in US dollars unless noted that the security is denominated in another currency. |
| † | Non-income producing security. |
REIT – Real Estate Investment Trust
See accompanying notes, which are an integral part of the financial statements.
| 123 |
Table of Contents
Statements of assets and liabilities
Optimum Fund Trust
March 31, 2018
| Optimum Fixed Income Fund | Optimum International Fund | Optimum Large Cap Growth Fund | Optimum Large Cap Value Fund | Optimum Small-Mid Cap Growth Fund | Optimum Small-Mid Cap Value Fund | |||||||||||||||||||
Assets: | ||||||||||||||||||||||||
Investments, at value1,2 | $ | 2,387,488,384 | $ | 655,965,068 | $ | 1,741,368,431 | $ | 1,477,735,874 | $517,709,492 | $453,875,931 | ||||||||||||||
Short-term investments held as collateral for loaned securities, at value3 | — | 22,105,164 | — | — | — | — | ||||||||||||||||||
Cash | 8,449,037 | 256,417 | 365,641 | 1,469,937 | — | 170,620 | ||||||||||||||||||
Foreign currencies, at value4 | 5,235,630 | 1,137,311 | — | 17,963 | — | — | ||||||||||||||||||
Cash collateral due from brokers | 4,614,129 | — | — | — | — | — | ||||||||||||||||||
Receivable for securities sold | 138,854,881 | 22,974,196 | 52,178 | — | 2,155,552 | 4,858,779 | ||||||||||||||||||
Dividends and interest receivable | 13,620,867 | 2,423,284 | 736,157 | 1,942,472 | 164,333 | 598,517 | ||||||||||||||||||
Receivable for fund shares sold | 3,765,470 | 1,058,734 | 2,574,993 | 2,588,275 | 802,605 | 861,808 | ||||||||||||||||||
Upfront payments paid on credit default swap contracts | 276,407 | — | — | — | — | — | ||||||||||||||||||
Upfront payments paid on interest rate swap contracts | 2,999,710 | — | — | — | — | — | ||||||||||||||||||
Unrealized appreciation of credit default swap contracts | 1,168,551 | — | — | — | — | — | ||||||||||||||||||
Unrealized appreciation of foreign currency exchange contracts | 1,160,541 | 7,994 | — | — | — | — | ||||||||||||||||||
Variation margin due from broker on futures contracts | 463,463 | — | — | — | — | — | ||||||||||||||||||
Swap payments receivable | 190,086 | — | — | — | — | — | ||||||||||||||||||
Variation margin due from brokers on centrally cleared interest rate swap contracts | 24,431 | — | — | — | — | — | ||||||||||||||||||
Securities lending income receivable | — | 19,226 | — | — | — | — | ||||||||||||||||||
Foreign tax reclaims receivable | — | 1,219,645 | 22,758 | 503,858 | — | — | ||||||||||||||||||
Other assets6 | 415,736 | — | — | — | — | — | ||||||||||||||||||
|
|
|
|
|
|
|
|
|
|
|
| |||||||||||||
Total assets | 2,568,727,323 | 707,167,039 | 1,745,120,158 | 1,484,258,379 | 520,831,982 | 460,365,655 | ||||||||||||||||||
|
|
|
|
|
|
|
|
|
|
|
| |||||||||||||
124
Table of Contents
| Optimum | Optimum | Optimum | Optimum | Optimum | Optimum | |||||||||||||||||||||||||
| Fixed Income | International | Large Cap | Large Cap | Small-Mid Cap | Small-Mid Cap | |||||||||||||||||||||||||
| Fund | Fund | Growth Fund | Value Fund | Growth Fund | Value Fund | |||||||||||||||||||||||||
Liabilities: | ||||||||||||||||||||||||||||||
Options written, at value5 | $ | 194,021 | $ | — | $ | — | $ | — | $ | — | $ | — | ||||||||||||||||||
Cash due to custodian | — | — | — | — | 1,832,135 | — | ||||||||||||||||||||||||
Payable for securities purchased | 536,937,110 | 16,973,226 | 1,456,721 | — | 1,595,387 | 687,929 | ||||||||||||||||||||||||
Payable for fund shares redeemed | 2,196,088 | 487,782 | 1,604,800 | 1,251,358 | 527,148 | 424,270 | ||||||||||||||||||||||||
Cash collateral due to brokers | 2,112,000 | — | — | — | — | — | ||||||||||||||||||||||||
Swap payments payable | 742,927 | — | — | — | — | — | ||||||||||||||||||||||||
Dividend disbursing and transfer agent fees payable | 306,370 | 102,423 | 273,616 | 229,453 | 80,854 | 70,459 | ||||||||||||||||||||||||
Variation margin due to brokers on centrally cleared interest rate swap contracts | 211,765 | — | — | — | — | — | ||||||||||||||||||||||||
Variation margin due to brokers on centrally cleared credit default swap contracts | 71,984 | — | — | — | — | — | ||||||||||||||||||||||||
Obligation to return securities lending collateral | — | 22,076,603 | — | — | — | — | ||||||||||||||||||||||||
Investment management fees payable to affiliates | 893,238 | 421,710 | 1,045,602 | 828,521 | 432,502 | 367,204 | ||||||||||||||||||||||||
Other accrued expenses | 398,206 | 262,788 | 250,066 | 190,490 | 73,529 | 74,278 | ||||||||||||||||||||||||
Distribution fees payable to affiliates | 96,272 | 26,158 | 93,626 | 77,876 | 15,174 | 11,236 | ||||||||||||||||||||||||
Administration expenses payable to affiliates | 89,358 | 29,873 | 79,805 | 66,924 | 23,582 | — | ||||||||||||||||||||||||
Trustees’ fees and expenses payable to affiliates | 58,303 | 19,147 | 49,980 | 42,376 | 14,901 | 13,043 | ||||||||||||||||||||||||
Accounting fees payable to affiliates | 11,739 | 4,151 | 10,520 | 8,877 | 3,348 | 23,512 | ||||||||||||||||||||||||
Upfront payments received on credit default swap contracts | 2,744,297 | — | — | — | — | — | ||||||||||||||||||||||||
Upfront payments received on interest rate swap contracts | 1,273,255 | — | — | — | — | — | ||||||||||||||||||||||||
Unrealized depreciation of foreign currency exchange contracts | 1,099,471 | 7,836 | — | — | — | — | ||||||||||||||||||||||||
Unrealized depreciation of credit default swap contracts | 167,399 | — | — | — | — | — | ||||||||||||||||||||||||
Contingent liabilities6 | 1,385,788 | — | — | — | — | — | ||||||||||||||||||||||||
Other liabilities | 80 | 71,573 | — | — | — | — | ||||||||||||||||||||||||
|
|
|
|
|
|
|
|
|
|
|
| |||||||||||||||||||
Total liabilities | 550,989,671 | 40,483,270 | 4,864,736 | 2,695,875 | 4,598,560 | 1,671,931 | ||||||||||||||||||||||||
|
|
|
|
|
|
|
|
|
|
|
| |||||||||||||||||||
Total Net Assets | $ | 2,017,737,652 | $ | 666,683,769 | $ | 1,740,255,422 | $ | 1,481,562,504 | $ | 516,233,422 | $ | 458,693,724 | ||||||||||||||||||
|
|
|
|
|
|
|
|
|
|
|
| |||||||||||||||||||
Net Assets Consist of: | ||||||||||||||||||||||||||||||
Paid-in capital | $ | 2,050,728,322 | $ | 551,003,834 | $ | 1,323,809,728 | $ | 1,200,494,188 | $ | 367,200,531 | $ | 372,155,215 | ||||||||||||||||||
Undistributed (accumulated) net investment income (loss) | 10,301,910 | 2,168,493 | — | 4,123,503 | — | 1,372,317 | ||||||||||||||||||||||||
Accumulated net realized gain (loss) | (54,161,024 | ) | 15,927,791 | 57,598,741 | 17,219,473 | 43,558,557 | 13,101,762 | |||||||||||||||||||||||
Net unrealized appreciation (depreciation) of investments | (2,798,343 | ) | 97,557,406 | 358,847,935 | 259,724,095 | 105,474,334 | 72,064,430 | |||||||||||||||||||||||
Net unrealized appreciation (depreciation) of foreign currencies | 76,633 | 26,087 | (982 | ) | 1,245 | — | — | |||||||||||||||||||||||
Net unrealized appreciation of foreign currency exchange contracts | 61,070 | 158 | — | — | — | — | ||||||||||||||||||||||||
Net unrealized appreciation of futures contracts | 8,853,771 | — | — | — | — | — | ||||||||||||||||||||||||
Net unrealized depreciation of options purchased | (825,398 | ) | ||||||||||||||||||||||||||||
Net unrealized appreciation of options written | 778,437 | — | — | — | — | — | ||||||||||||||||||||||||
Net unrealized appreciation of swap contracts | 4,722,274 | — | — | — | — | — | ||||||||||||||||||||||||
|
|
|
|
|
|
|
|
|
|
|
| |||||||||||||||||||
Total Net Assets | $ | 2,017,737,652 | $ | 666,683,769 | $ | 1,740,255,422 | $ | 1,481,562,504 | $ | 516,233,422 | $ | 458,693,724 | ||||||||||||||||||
|
|
|
|
|
|
|
|
|
|
|
| |||||||||||||||||||
| (continues) | 125 |
Table of Contents
Statements of assets and liabilities
Optimum Fund Trust
| Optimum | Optimum | Optimum | Optimum | Optimum | Optimum | |||||||||||||||||||
| Fixed Income | International | Large Cap | Large Cap | Small-Mid Cap | Small-Mid Cap | |||||||||||||||||||
| Fund | Fund | Growth Fund | Value Fund | Growth Fund | Value Fund | |||||||||||||||||||
Net Asset Value | ||||||||||||||||||||||||
Class A: | ||||||||||||||||||||||||
Net assets | $ | 30,149,594 | $ | 8,703,913 | $ | 32,254,223 | $ | 26,447,591 | $ | 5,414,558 | $ | 3,855,599 | ||||||||||||
Shares of beneficial interest outstanding, unlimited authorization, no par | 3,224,584 | 603,516 | 1,872,741 | 1,664,151 | 349,068 | 282,270 | ||||||||||||||||||
Net asset value per share | $ | 9.35 | $ | 14.42 | $ | 17.22 | $ | 15.89 | $ | 15.51 | $ | 13.66 | ||||||||||||
Sales charge | 4.50 | % | 5.75 | % | 5.75 | % | 5.75 | % | 5.75 | % | 5.75 | % | ||||||||||||
Offering price per share, equal to net asset value per share / (1 – sales charge) | $ | 9.79 | $ | 15.30 | $ | 18.27 | $ | 16.86 | $ | 16.46 | $ | 14.49 | ||||||||||||
Class C: | ||||||||||||||||||||||||
Net assets | $ | 105,193,624 | $ | 28,046,032 | $ | 97,658,456 | $ | 82,610,014 | $ | 15,925,000 | $ | 12,029,566 | ||||||||||||
Shares of beneficial interest outstanding, unlimited authorization, no par | 11,263,706 | 1,994,627 | 6,678,501 | 5,263,838 | 1,195,996 | 1,001,580 | ||||||||||||||||||
Net asset value per share | $ | 9.34 | $ | 14.06 | $ | 14.62 | $ | 15.69 | $ | 13.32 | $ | 12.01 | ||||||||||||
Institutional Class: | ||||||||||||||||||||||||
Net assets | $ | 1,882,394,434 | $ | 629,933,824 | $ | 1,610,342,743 | $ | 1,372,504,899 | $ | 494,893,864 | $ | 442,808,559 | ||||||||||||
Shares of beneficial interest outstanding, unlimited authorization, no par | 201,445,867 | 43,373,544 | 87,230,355 | 86,141,186 | 29,762,541 | 30,636,012 | ||||||||||||||||||
Net asset value per share | $ | 9.34 | $ | 14.52 | $ | 18.46 | $ | 15.93 | $ | 16.63 | $ | 14.45 | ||||||||||||
| ||||||||||||||||||||||||
1Investments, at cost | $ | 2,391,112,125 | $ | 558,369,940 | $ | 1,382,520,496 | $ | 1,218,011,779 | $ | 412,235,158 | $ | 381,811,501 | ||||||||||||
2Including securities on loan | — | 23,055,600 | — | — | — | — | ||||||||||||||||||
3Short-term investments held as collateral for loaned securities, at cost | — | 22,105,169 | — | — | — | — | ||||||||||||||||||
4Foreign currencies, at cost | 5,173,993 | 1,124,409 | — | 17,905 | — | — | ||||||||||||||||||
6Premium received | (972,458 | ) | — | — | — | — | — | |||||||||||||||||
5See Note 12 in “Notes to financial statements.” | ||||||||||||||||||||||||
See accompanying notes, which are an integral part of the financial statements.
126
Table of Contents
Optimum Fund Trust
Year ended March 31, 2018
| Optimum Fixed Income Fund | Optimum International Fund | Optimum Large Cap Growth Fund | Optimum Large Cap Value Fund | Optimum Small-Mid Cap Growth Fund | Optimum Small-Mid Cap Value Fund | |||||||||||||||||||||||||
Investment Income: | ||||||||||||||||||||||||||||||
Interest | $ | 65,614,383 | $ | 51,757 | $ | 172,645 | $ | 235,484 | $ | 218,577 | $ | 66,134 | ||||||||||||||||||
Dividends | 335,118 | 15,696,352 | 15,483,659 | 32,024,378 | 2,065,149 | 8,190,981 | ||||||||||||||||||||||||
Securities lending income | — | 194,950 | — | — | — | — | ||||||||||||||||||||||||
Foreign tax withheld | (34,316 | ) | (1,680,892 | ) | (54,031 | ) | (86,205 | ) | (5,509 | ) | (613 | ) | ||||||||||||||||||
|
|
|
|
|
|
|
|
|
|
|
| |||||||||||||||||||
| 65,915,185 | 14,262,167 | 15,602,273 | 32,173,657 | 2,278,217 | 8,256,502 | |||||||||||||||||||||||||
|
|
|
|
|
|
|
|
|
|
|
| |||||||||||||||||||
Expenses: | ||||||||||||||||||||||||||||||
Management fees | 10,258,511 | 4,687,542 | 11,408,519 | 9,284,706 | 5,029,705 | 4,212,607 | ||||||||||||||||||||||||
Distribution expenses — Class A | 81,300 | 22,828 | 83,566 | 70,565 | 13,438 | 10,311 | ||||||||||||||||||||||||
Distribution expenses — Class C | 1,157,083 | 303,902 | 1,054,958 | 912,492 | 164,979 | 133,272 | ||||||||||||||||||||||||
Dividend disbursing and transfer agent fees and expenses | 3,548,622 | 1,161,541 | 3,005,480 | 2,601,008 | 886,651 | 817,562 | ||||||||||||||||||||||||
Administration expenses | 1,021,836 | 331,341 | 863,839 | 746,917 | 251,226 | 231,152 | ||||||||||||||||||||||||
Accounting fees | 518,279 | 181,492 | 438,681 | 382,786 | 142,820 | 133,552 | ||||||||||||||||||||||||
Trustees’ fees and expenses | 245,555 | 79,514 | 207,021 | 178,493 | 60,297 | 55,123 | ||||||||||||||||||||||||
Reports and statements to shareholders expenses | 234,666 | 83,708 | 263,100 | 173,756 | 63,772 | 58,902 | ||||||||||||||||||||||||
Professional fees | 195,816 | 105,496 | 153,827 | 127,155 | 86,720 | 56,896 | ||||||||||||||||||||||||
Pricing fees | 167,371 | 32,181 | 1,120 | 1,557 | 1,035 | 1,273 | ||||||||||||||||||||||||
Custodian fees | 116,176 | 241,967 | 82,381 | 63,502 | 510 | 11,533 | ||||||||||||||||||||||||
Registration fees | 100,227 | 65,292 | 107,615 | 92,472 | 62,368 | 67,060 | ||||||||||||||||||||||||
Insurance fees | 38,987 | 11,853 | 30,261 | 27,033 | 8,863 | 8,361 | ||||||||||||||||||||||||
Investment interest expense | 21,236 | — | — | — | — | — | ||||||||||||||||||||||||
Tax services | 1,771 | 20,031 | 1,197 | 695 | 1,121 | 1,023 | ||||||||||||||||||||||||
Other | 45,481 | 17,031 | 36,624 | 33,348 | 13,638 | 13,752 | ||||||||||||||||||||||||
|
|
|
|
|
|
|
|
|
|
|
| |||||||||||||||||||
| 17,752,917 | 7,345,719 | 17,738,189 | 14,696,485 | 6,787,143 | 5,812,379 | |||||||||||||||||||||||||
Less expenses waived | — | (2,512 | ) | (32 | ) | — | (382,250 | ) | (258,497 | ) | ||||||||||||||||||||
Less expenses paid indirectly | (16,552 | ) | (1,439 | ) | (1,647 | ) | (2,615 | ) | (1,502 | ) | (1,234 | ) | ||||||||||||||||||
|
|
|
|
|
|
|
|
|
|
|
| |||||||||||||||||||
Total operating expenses | 17,736,365 | 7,341,768 | 17,736,510 | 14,693,870 | 6,403,391 | 5,552,648 | ||||||||||||||||||||||||
|
|
|
|
|
|
|
|
|
|
|
| |||||||||||||||||||
Net Investment Income (Loss) | 48,178,820 | 6,920,399 | (2,134,237 | ) | 17,479,787 | (4,125,174 | ) | 2,703,854 | ||||||||||||||||||||||
|
|
|
|
|
|
|
|
|
|
|
| |||||||||||||||||||
| (continues) | 127 |
Table of Contents
Statements of operations
Optimum Fund Trust
| Optimum | Optimum | Optimum | Optimum | Optimum | Optimum | |||||||||||||||||||||||||
| Fixed Income | International | Large Cap | Large Cap | Small-Mid Cap | Small-Mid Cap | |||||||||||||||||||||||||
| Fund | Fund | Growth Fund | Value Fund | Growth Fund | Value Fund | |||||||||||||||||||||||||
Net Realized and Unrealized Gain (Loss): | ||||||||||||||||||||||||||||||
Net realized gain (loss) on: | ||||||||||||||||||||||||||||||
Investments1 | $ | (354,923 | ) | $ | 43,764,652 | $ | 275,474,324 | $ | 40,243,084 | $ | 69,241,224 | $ | 26,596,406 | |||||||||||||||||
Foreign currencies | 2,753,158 | 116,971 | 300 | 42,097 | (28 | ) | — | |||||||||||||||||||||||
Foreign currency exchange contracts | (7,163,367 | ) | (164,005 | ) | (4,024 | ) | (38,890 | ) | — | — | ||||||||||||||||||||
Futures contracts | (10,929,358 | ) | — | — | — | — | — | |||||||||||||||||||||||
Options purchased | (198,214 | ) | — | — | — | — | — | |||||||||||||||||||||||
Options written | 410,764 | — | — | — | — | — | ||||||||||||||||||||||||
Swap contracts | (48,937 | ) | — | — | — | — | — | |||||||||||||||||||||||
|
|
|
|
|
|
|
|
|
|
|
| |||||||||||||||||||
Net realized gain (loss) | (15,530,877 | ) | 43,717,618 | 275,470,600 | 40,246,291 | 69,241,196 | 26,596,406 | |||||||||||||||||||||||
|
|
|
|
|
|
|
|
|
|
|
| |||||||||||||||||||
Net change in unrealized appreciation (depreciation) of: | ||||||||||||||||||||||||||||||
Investments2 | (5,333,842 | ) | 59,916,218 | 52,227,344 | 59,983,041 | 31,070,292 | (8,877,449 | ) | ||||||||||||||||||||||
Foreign currencies | 83,858 | 55,091 | 489 | 21,179 | — | — | ||||||||||||||||||||||||
Foreign currency exchange contracts | (204,609 | ) | 688 | — | — | — | — | |||||||||||||||||||||||
Futures contracts | 6,324,443 | — | — | — | — | — | ||||||||||||||||||||||||
Options purchased | (331,942 | ) | — | — | — | — | — | |||||||||||||||||||||||
Options written | 262,108 | — | — | — | — | — | ||||||||||||||||||||||||
Swap contracts | 2,593,995 | — | — | — | — | — | ||||||||||||||||||||||||
|
|
|
|
|
|
|
|
|
|
|
| |||||||||||||||||||
Net change in unrealized appreciation (depreciation) | 3,394,011 | 59,971,997 | 52,227,833 | 60,004,220 | 31,070,292 | (8,877,449 | ) | |||||||||||||||||||||||
|
|
|
|
|
|
|
|
|
|
|
| |||||||||||||||||||
Net Realized and Unrealized Gain (Loss) | (12,136,866 | ) | 103,689,615 | 327,698,433 | 100,250,511 | 100,311,488 | 17,718,957 | |||||||||||||||||||||||
|
|
|
|
|
|
|
|
|
|
|
| |||||||||||||||||||
Net Increase in Net Assets Resulting from Operations | $ | 36,041,954 | $ | 110,610,014 | $ | 325,564,196 | $ | 117,730,298 | $ | 96,186,314 | $ | 20,422,811 | ||||||||||||||||||
|
|
|
|
|
|
|
|
|
|
|
| |||||||||||||||||||
1Includes $23,655 and $127,826 capital gain taxes paid for Optimum Fixed Income Fund and Optimum International Fund.
2Includes decrease of $11,503 and $81,537 capital gain taxes accrued for Optimum Fixed Income Fund and Optimum International Fund.
See accompanying notes, which are an integral part of the financial statements.
128
Table of Contents
Statements of changes in net assets
Optimum Fund Trust
| Optimum Fixed Income Fund | Optimum International Fund | |||||||||||||||
| Year ended | Year ended | |||||||||||||||
| 3/31/18 | 3/31/17 | 3/31/18 | 3/31/17 | |||||||||||||
Increase (Decrease) in Net Assets from Operations: | ||||||||||||||||
Net investment income | $ | 48,178,820 | $ | 46,326,151 | $ | 6,920,399 | $ | 6,431,141 | ||||||||
Net realized gain (loss) | (15,530,877 | ) | (8,445,438 | ) | 43,717,618 | 6,860,569 | ||||||||||
Net change in unrealized appreciation (depreciation) | 3,394,011 | 8,621,973 | 59,971,997 | 58,119,957 | ||||||||||||
|
|
|
|
|
|
|
| |||||||||
Net increase in net assets resulting from operations | 36,041,954 | 46,502,686 | 110,610,014 | 71,411,667 | ||||||||||||
|
|
|
|
|
|
|
| |||||||||
Dividends and Distributions to Shareholders from: | ||||||||||||||||
Net investment income: | ||||||||||||||||
Class A | (700,572 | ) | (676,539 | ) | (71,145 | ) | (80,080 | ) | ||||||||
Class C | (1,651,789 | ) | (1,524,429 | ) | (38,744 | ) | (65,461 | ) | ||||||||
Institutional Class | (44,780,382 | ) | (37,864,252 | ) | (6,067,099 | ) | (5,899,992 | ) | ||||||||
Net realized gain: | ||||||||||||||||
Class A | — | — | (96,329 | ) | — | |||||||||||
Class C | — | — | (329,319 | ) | — | |||||||||||
Institutional Class | — | — | (6,357,988 | ) | — | |||||||||||
|
|
|
|
|
|
|
| |||||||||
| (47,132,743 | ) | (40,065,220 | ) | (12,960,624 | ) | (6,045,533 | ) | |||||||||
|
|
|
|
|
|
|
| |||||||||
Capital Share Transactions: | ||||||||||||||||
Proceeds from shares sold: | ||||||||||||||||
Class A | 2,691,823 | 2,615,487 | 425,861 | 626,232 | ||||||||||||
Class C | 5,853,573 | 7,193,141 | 788,640 | 1,814,846 | ||||||||||||
Institutional Class | 410,586,301 | 378,540,581 | 118,448,217 | 85,837,495 | ||||||||||||
Net asset value of shares issued upon reinvestment of dividends and distributions: | ||||||||||||||||
Class A | 697,909 | 674,466 | 166,852 | 79,845 | ||||||||||||
Class C | 1,650,329 | 1,523,427 | 367,589 | 65,389 | ||||||||||||
Institutional Class | 44,744,263 | 37,826,389 | 12,414,824 | 5,894,688 | ||||||||||||
|
|
|
|
|
|
|
| |||||||||
| 466,224,198 | 428,373,491 | 132,611,983 | 94,318,495 | |||||||||||||
|
|
|
|
|
|
|
| |||||||||
Cost of shares redeemed: | ||||||||||||||||
Class A | (6,985,182 | ) | (9,136,395 | ) | (2,050,607 | ) | (2,172,483 | ) | ||||||||
Class C | (26,057,224 | ) | (38,409,617 | ) | (7,599,191 | ) | (7,546,843 | ) | ||||||||
Institutional Class | (287,504,444 | ) | (589,700,192 | ) | (117,583,144 | ) | (169,259,362 | ) | ||||||||
|
|
|
|
|
|
|
| |||||||||
| (320,546,850 | ) | (637,246,204 | ) | (127,232,942 | ) | (178,978,688 | ) | |||||||||
|
|
|
|
|
|
|
| |||||||||
Increase (decrease) in net assets derived from capital share transactions | 145,677,348 | (208,872,713 | ) | 5,379,041 | (84,660,193 | ) | ||||||||||
|
|
|
|
|
|
|
| |||||||||
Net Increase (Decrease) in Net Assets | 134,586,559 | (202,435,247 | ) | 103,028,431 | (19,294,059 | ) | ||||||||||
Net Assets: | ||||||||||||||||
Beginning of year | 1,883,151,093 | 2,085,586,340 | 563,655,338 | 582,949,397 | ||||||||||||
|
|
|
|
|
|
|
| |||||||||
End of year | $ | 2,017,737,652 | $ | 1,883,151,093 | $ | 666,683,769 | $ | 563,655,338 | ||||||||
|
|
|
|
|
|
|
| |||||||||
Undistributed net investment income | $ | 10,301,910 | $ | 13,181,364 | $ | 2,168,493 | $ | 1,599,942 | ||||||||
|
|
|
|
|
|
|
| |||||||||
See accompanying notes, which are an integral part of the financial statements.
| (continues) | 129 |
Table of Contents
Statements of changes in net assets
Optimum Fund Trust
| Optimum Large Cap Growth Fund | Optimum Large Cap Value Fund | |||||||||||||||
| Year ended | Year ended | |||||||||||||||
| 3/31/18 | 3/31/17 | 3/31/18 | 3/31/17 | |||||||||||||
Increase (Decrease) in Net Assets from Operations: | ||||||||||||||||
Net investment income (loss) | $ | (2,134,237 | ) | $ | (2,656,714 | ) | $ | 17,479,787 | $ | 16,818,172 | ||||||
Net realized gain | 275,470,600 | 102,553,139 | 40,246,291 | 221,643,748 | ||||||||||||
Net change in unrealized appreciation (depreciation) | 52,227,833 | 131,161,336 | 60,004,220 | (43,657,292 | ) | |||||||||||
|
|
|
|
|
|
|
| |||||||||
Net increase in net assets resulting from operations | 325,564,196 | 231,057,761 | 117,730,298 | 194,804,628 | ||||||||||||
|
|
|
|
|
|
|
| |||||||||
Dividends and Distributions to Shareholders from: | ||||||||||||||||
Net investment income: | ||||||||||||||||
Class A | — | — | (273,497 | ) | (322,766 | ) | ||||||||||
Class C | — | — | (256,730 | ) | (382,046 | ) | ||||||||||
Institutional Class | — | — | (16,122,671 | ) | (16,045,433 | ) | ||||||||||
Net realized gain: | ||||||||||||||||
Class A | (5,495,119 | ) | (1,203,358 | ) | (1,219,830 | ) | (3,180,253 | ) | ||||||||
Class C | (19,625,204 | ) | (4,316,642 | ) | (3,971,117 | ) | (10,410,746 | ) | ||||||||
Institutional Class | (240,785,863 | ) | (45,828,776 | ) | (58,025,654 | ) | (129,552,015 | ) | ||||||||
|
|
|
|
|
|
|
| |||||||||
| (265,906,186 | ) | (51,348,776 | ) | (79,869,499 | ) | (159,893,259 | ) | |||||||||
|
|
|
|
|
|
|
| |||||||||
Capital Share Transactions: | ||||||||||||||||
Proceeds from shares sold: | ||||||||||||||||
Class A | 1,294,218 | 1,584,659 | 1,327,875 | 1,599,717 | ||||||||||||
Class C | 1,816,781 | 4,926,393 | 2,091,578 | 5,099,592 | ||||||||||||
Institutional Class | 259,275,981 | 227,791,648 | 257,769,560 | 320,762,276 | ||||||||||||
Net asset value of shares issued upon reinvestment of dividends and distributions: | ||||||||||||||||
Class A | 5,479,590 | 1,200,552 | 1,489,597 | 3,494,971 | ||||||||||||
Class C | 19,589,493 | 4,311,583 | 4,218,812 | 10,774,076 | ||||||||||||
Institutional Class | 240,538,379 | 45,764,351 | 74,082,666 | 145,399,962 | ||||||||||||
|
|
|
|
|
|
|
| |||||||||
| 527,994,442 | 285,579,186 | 340,980,088 | 487,130,594 | |||||||||||||
|
|
|
|
|
|
|
| |||||||||
Cost of shares redeemed: | ||||||||||||||||
Class A | (7,970,218 | ) | (8,255,058 | ) | (6,031,113 | ) | (7,586,746 | ) | ||||||||
Class C | (29,888,435 | ) | (30,464,822 | ) | (22,154,334 | ) | (26,404,995 | ) | ||||||||
Institutional Class | (295,254,850 | ) | (445,881,165 | ) | (211,048,849 | ) | (409,895,778 | ) | ||||||||
|
|
|
|
|
|
|
| |||||||||
| (333,113,503 | ) | (484,601,045 | ) | (239,234,296 | ) | (443,887,519 | ) | |||||||||
|
|
|
|
|
|
|
| |||||||||
Increase (decrease) in net assets derived from capital share transactions | 194,880,939 | (199,021,859 | ) | 101,745,792 | 43,243,075 | |||||||||||
|
|
|
|
|
|
|
| |||||||||
Net Increase (Decrease) in Net Assets | 254,538,949 | (19,312,874 | ) | 139,606,591 | 78,154,444 | |||||||||||
Net Assets: | ||||||||||||||||
Beginning of year | 1,485,716,473 | 1,505,029,347 | 1,341,955,913 | 1,263,801,469 | ||||||||||||
|
|
|
|
|
|
|
| |||||||||
End of year | $ | 1,740,255,422 | $ | 1,485,716,473 | $ | 1,481,562,504 | $ | 1,341,955,913 | ||||||||
|
|
|
|
|
|
|
| |||||||||
Undistributed net investment income | $ | — | $ | — | $ | 4,123,503 | $ | 3,293,407 | ||||||||
|
|
|
|
|
|
|
| |||||||||
See accompanying notes, which are an integral part of the financial statements.
130
Table of Contents
| Optimum Small-Mid Cap Growth Fund | Optimum Small-Mid Cap Value Fund | |||||||||||||||
| 3/31/18 | 3/31/17 | 3/31/18 | 3/31/17 | |||||||||||||
Increase (Decrease) in Net Assets from Operations: | ||||||||||||||||
Net investment income (loss) | $ | (4,125,174 | ) | $ | (4,110,057 | ) | $ | 2,703,854 | $ | 3,607,757 | ||||||
Net realized gain | 69,241,196 | 19,563,168 | 26,596,406 | 34,020,737 | ||||||||||||
Net change in unrealized appreciation (depreciation) | 31,070,292 | 68,639,917 | (8,877,449 | ) | 38,728,388 | |||||||||||
|
|
|
|
|
|
|
| |||||||||
Net increase in net assets resulting from operations | 96,186,314 | 84,093,028 | 20,422,811 | 76,356,882 | ||||||||||||
|
|
|
|
|
|
|
| |||||||||
Dividends and Distributions to Shareholders from: | ||||||||||||||||
Net investment income: | ||||||||||||||||
Class A | — | — | (20,465 | ) | (16,209 | ) | ||||||||||
Institutional Class | — | — | (3,036,210 | ) | (2,284,918 | ) | ||||||||||
Net realized gain: | ||||||||||||||||
Class A | (236,782 | ) | — | (194,992 | ) | — | ||||||||||
Class C | (835,216 | ) | — | (702,964 | ) | — | ||||||||||
Institutional Class | (19,412,135 | ) | — | (19,465,792 | ) | — | ||||||||||
|
|
|
|
|
|
|
| |||||||||
| (20,484,133 | ) | — | (23,420,423 | ) | (2,301,127 | ) | ||||||||||
|
|
|
|
|
|
|
| |||||||||
Capital Share Transactions: | ||||||||||||||||
Proceeds from shares sold: | ||||||||||||||||
Class A | 270,437 | 420,894 | 223,637 | 372,174 | ||||||||||||
Class C | 348,498 | 1,008,435 | 363,232 | 624,715 | ||||||||||||
Institutional Class | 80,505,865 | 78,489,396 | 84,337,853 | 76,824,883 | ||||||||||||
Net asset value of shares issued upon reinvestment of dividends and distributions: | ||||||||||||||||
Class A | 235,651 | — | 214,986 | 16,178 | ||||||||||||
Class C | 834,362 | — | 702,150 | — | ||||||||||||
Institutional Class | 19,396,388 | — | 22,481,400 | 2,282,053 | ||||||||||||
|
|
|
|
|
|
|
| |||||||||
| 101,591,201 | 79,918,725 | 108,323,258 | 80,120,003 | |||||||||||||
|
|
|
|
|
|
|
| |||||||||
Cost of shares redeemed: | ||||||||||||||||
Class A | (1,216,862 | ) | (1,198,557 | ) | (841,912 | ) | (1,195,842 | ) | ||||||||
Class C | (4,252,643 | ) | (4,441,565 | ) | (3,124,350 | ) | (4,032,657 | ) | ||||||||
Institutional Class | (97,830,534 | ) | (178,827,032 | ) | (67,540,018 | ) | (184,660,997 | ) | ||||||||
|
|
|
|
|
|
|
| |||||||||
| (103,300,039 | ) | (184,467,154 | ) | (71,506,280 | ) | (189,889,496 | ) | |||||||||
|
|
|
|
|
|
|
| |||||||||
Increase (decrease) in net assets derived from capital share transactions | (1,708,838 | ) | (104,548,429 | ) | 36,816,978 | (109,769,493 | ) | |||||||||
|
|
|
|
|
|
|
| |||||||||
Net Increase (Decrease) in Net Assets | 73,993,343 | (20,455,401 | ) | 33,819,366 | (35,713,738 | ) | ||||||||||
Net Assets: | ||||||||||||||||
Beginning of year | 442,240,079 | 462,695,480 | 424,874,358 | 460,588,096 | ||||||||||||
|
|
|
|
|
|
|
| |||||||||
End of year | $ | 516,233,422 | $ | 442,240,079 | $ | 458,693,724 | $ | 424,874,358 | ||||||||
|
|
|
|
|
|
|
| |||||||||
Undistributed (accumulated) net investment income (loss) | $ | — | $ | (1,114,999 | ) | $ | 1,372,317 | $ | 1,701,989 | |||||||
|
|
|
|
|
|
|
| |||||||||
See accompanying notes, which are an integral part of the financial statements.
| (continues) | 131 |
Table of Contents
Optimum Fixed Income Fund Class A
Selected data for each share of the Fund outstanding throughout each period were as follows:
| Year ended | ||||||||||||||||||||
| 3/31/18 | 3/31/17 | 3/31/16 | 3/31/15 | 3/31/14 | ||||||||||||||||
Net asset value, beginning of period | $ | 9.39 | $ | 9.37 | $ | 9.72 | $ | 9.54 | $ | 9.85 | ||||||||||
Income (loss) from investment operations: | ||||||||||||||||||||
Net investment income1 | 0.22 | 0.20 | 0.20 | 0.20 | 0.21 | |||||||||||||||
Net realized and unrealized gain (loss) | (0.05 | ) | — | 2 | (0.28 | ) | 0.20 | (0.35 | ) | |||||||||||
|
|
|
|
|
|
|
|
|
| |||||||||||
Total from investment operations | 0.17 | 0.20 | (0.08 | ) | 0.40 | (0.14 | ) | |||||||||||||
|
|
|
|
|
|
|
|
|
| |||||||||||
Less dividends and distributions from: | ||||||||||||||||||||
Net investment income | (0.21 | ) | (0.18 | ) | (0.25 | ) | (0.22 | ) | (0.14 | ) | ||||||||||
Net realized gain | — | — | (0.02 | ) | — | (0.03 | ) | |||||||||||||
|
|
|
|
|
|
|
|
|
| |||||||||||
Total dividends and distributions | (0.21 | ) | (0.18 | ) | (0.27 | ) | (0.22 | ) | (0.17 | ) | ||||||||||
|
|
|
|
|
|
|
|
|
| |||||||||||
Net asset value, end of period | $ | 9.35 | 9.39 | 9.37 | 9.72 | 9.54 | ||||||||||||||
|
|
|
|
|
|
|
|
|
| |||||||||||
Total return3 | 1.81% | 2.03% | (0.63% | ) | 4.21% | (1.40% | ) | |||||||||||||
Ratios and supplemental data: | ||||||||||||||||||||
Net assets, end of period (000 omitted) | $ | 30,150 | $ | 33,838 | $ | 39,545 | $ | 43,144 | $ | 43,241 | ||||||||||
Ratio of expenses to average net assets | 1.10% | 1.17% | 1.23% | 1.17% | 1.31% | |||||||||||||||
Ratio of expenses to average net assets prior to fees waived4 | 1.10% | 1.18% | 1.23% | 1.17% | 1.34% | |||||||||||||||
Ratio of net investment income to average net assets | 2.29% | 2.12% | 2.13% | 2.11% | 2.24% | |||||||||||||||
Ratio of net investment income to average net assets prior to fees waived4 | 2.29% | 2.11% | 2.13% | 2.11% | 2.21% | |||||||||||||||
Portfolio turnover | 403% | 419% | 536% | 482% | 5 | 323%5 | ||||||||||||||
| 1 | The average shares outstanding method has been applied for per share information. |
| 2 | Amount is less than $0.005 per share. |
| 3 | Total investment return is based on the change in net asset value of a share during the period and assumes reinvestment of dividends and distributions at net asset value and does not reflect the impact of a sales charge. Total investment return during some of the periods shown reflects a waiver by the manager. Performance would have been lower had the waiver not been in effect. |
| 4 | Expenses paid indirectly were not material and had no impact on the ratios disclosed. Expenses paid indirectly for the year ended March 31,2018 are reflected on the “Statements of operations.” |
| 5 | As a result of the addition of Delaware Management Company’s diversified floating rate investment strategy and Pacific Investment Management Company, LLC’s low-duration investment strategy on Feb. 1, 2014, to the Fund’s principal investment strategy, the Fund’s portfolio turnover rate increased substantially during the years ended March 31, 2015 and 2014. |
See accompanying notes, which are an integral part of the financial statements.
132
Table of Contents
Optimum Fixed Income Fund Class C
Selected data for each share of the Fund outstanding throughout each period were as follows:
| Year ended | ||||||||||||||||||||
| 3/31/18 | 3/31/17 | 3/31/16 | 3/31/15 | 3/31/14 | ||||||||||||||||
Net asset value, beginning of period | $ | 9.38 | $ | 9.37 | $ | 9.71 | $ | 9.53 | $ | 9.84 | ||||||||||
Income (loss) from investment operations: | ||||||||||||||||||||
Net investment income1 | 0.15 | 0.13 | 0.13 | 0.13 | 0.15 | |||||||||||||||
Net realized and unrealized gain (loss) | (0.05 | ) | (0.01 | ) | (0.27 | ) | 0.20 | (0.35 | ) | |||||||||||
|
|
|
|
|
|
|
|
|
| |||||||||||
Total from investment operations | 0.10 | 0.12 | (0.14 | ) | 0.33 | (0.20 | ) | |||||||||||||
|
|
|
|
|
|
|
|
|
| |||||||||||
Less dividends and distributions from: | ||||||||||||||||||||
Net investment income | (0.14 | ) | (0.11 | ) | (0.18 | ) | (0.15 | ) | (0.08 | ) | ||||||||||
Net realized gain | — | — | (0.02 | ) | — | (0.03 | ) | |||||||||||||
|
|
|
|
|
|
|
|
|
| |||||||||||
Total dividends and distributions | (0.14 | ) | (0.11 | ) | (0.20 | ) | (0.15 | ) | (0.11 | ) | ||||||||||
|
|
|
|
|
|
|
|
|
| |||||||||||
Net asset value, end of period | $ | 9.34 | $ | 9.38 | $ | 9.37 | $ | 9.71 | $ | 9.53 | ||||||||||
|
|
|
|
|
|
|
|
|
| |||||||||||
Total return2 | 1.06% | 1.27% | (1.39% | ) | 3.44% | (2.06% | ) | |||||||||||||
Ratios and supplemental data: | ||||||||||||||||||||
Net assets, end of period (000 omitted) | $ | 105,194 | $ | 124,024 | $ | 153,266 | $ | 166,154 | $ | 161,353 | ||||||||||
Ratio of expenses to average net assets | 1.85% | 1.92% | 1.98% | 1.92% | 1.99% | |||||||||||||||
Ratio of expenses to average net assets prior to fees waived3 | 1.85% | 1.93% | 1.98% | 1.92% | 2.02% | |||||||||||||||
Ratio of net investment income to average net assets | 1.54% | 1.37% | 1.38% | 1.36% | 1.56% | |||||||||||||||
Ratio of net investment income to average net assets prior to fees waived3 | 1.54% | 1.36% | 1.38% | 1.36% | 1.53% | |||||||||||||||
Portfolio turnover | 403% | 419% | 536% | 482%4 | 323%4 | |||||||||||||||
| 1 | The average shares outstanding method has been applied for per share information. |
| 2 | Total investment return is based on the change in net asset value of a share during the period and assumes reinvestment of dividends and distributions at net asset value and does not reflect the impact of a sales charge. Total investment return during some of the periods shown reflects a waiver by the manager. Performance would have been lower had the waiver not been in effect. |
| 3 | Expenses paid indirectly were not material and had no impact on the ratios disclosed. Expenses paid indirectly for the year ended March 31,2018 are reflected on the “Statements of operations.” |
| 4 | As a result of the addition of Delaware Management Company’s diversified floating rate investment strategy and Pacific Investment Management Company, LLC’s low-duration investment strategy on Feb. 1, 2014, to the Fund’s principal investment strategy, the Fund’s portfolio turnover rate increased substantially during the years ended March 31, 2015 and 2014. |
See accompanying notes, which are an integral part of the financial statements.
| (continues) | 133 |
Table of Contents
Financial highlights
Optimum Fixed Income Fund Institutional Class
Selected data for each share of the Fund outstanding throughout each period were as follows:
| Year ended | ||||||||||||||||||||
| 3/31/18 | 3/31/17 | 3/31/16 | 3/31/15 | 3/31/14 | ||||||||||||||||
Net asset value, beginning of period | $ | 9.39 | $ | 9.37 | $ | 9.72 | $ | 9.54 | $ | 9.85 | ||||||||||
Income (loss) from investment operations: | ||||||||||||||||||||
Net investment income1 | 0.24 | 0.23 | 0.23 | 0.23 | 0.24 | |||||||||||||||
Net realized and unrealized gain (loss) | (0.05 | ) | (0.01 | ) | (0.28 | ) | 0.19 | (0.34 | ) | |||||||||||
|
|
|
|
|
|
|
|
|
| |||||||||||
Total from investment operations | 0.19 | 0.22 | (0.05 | ) | 0.42 | (0.10 | ) | |||||||||||||
|
|
|
|
|
|
|
|
|
| |||||||||||
Less dividends and distributions from: | ||||||||||||||||||||
Net investment income | (0.24 | ) | (0.20 | ) | (0.28 | ) | (0.24 | ) | (0.18 | ) | ||||||||||
Net realized gain | — | — | (0.02 | ) | — | (0.03 | ) | |||||||||||||
|
|
|
|
|
|
|
|
|
| |||||||||||
Total dividends and distributions | (0.24 | ) | (0.20 | ) | (0.30 | ) | (0.24 | ) | (0.21 | ) | ||||||||||
|
|
|
|
|
|
|
|
|
| |||||||||||
Net asset value, end of period | $ | 9.34 | $ | 9.39 | $ | 9.37 | $ | 9.72 | $ | 9.54 | ||||||||||
|
|
|
|
|
|
|
|
|
| |||||||||||
Total return2 | 1.96% | 2.40% | (0.48% | ) | 4.47% | (1.05% | ) | |||||||||||||
Ratios and supplemental data: | ||||||||||||||||||||
Net assets, end of period (000 omitted) | $ | 1,882,394 | $ | 1,725,289 | $ | 1,892,775 | $ | 1,826,156 | $ | 1,509,156 | ||||||||||
Ratio of expenses to average net assets | 0.85% | 0.92% | 0.98% | 0.92% | 0.99% | |||||||||||||||
Ratio of expenses to average net assets prior to fees waived3 | 0.85% | 0.93% | 0.98% | 0.92% | 1.02% | |||||||||||||||
Ratio of net investment income to average net assets | 2.54% | 2.37% | 2.38% | 2.36% | 2.56% | |||||||||||||||
Ratio of net investment income to average net assets prior to fees waived3 | 2.54% | 2.36% | 2.38% | 2.36% | 2.53% | |||||||||||||||
Portfolio turnover | 403% | 419% | 536% | 482%4 | 323%4 | |||||||||||||||
| 1 | The average shares outstanding method has been applied for per share information. |
| 2 | Total investment return is based on the change in net asset value of a share during the period and assumes reinvestment of dividends and distributions at net asset value. Total investment return during some of the periods shown reflects a waiver by the manager. Performance would have been lower had the waiver not been in effect. |
| 3 | Expenses paid indirectly were not material and had no impact on the ratios disclosed. Expenses paid indirectly for the year ended March 31,2018 are reflected on the “Statements of operations.” |
| 4 | As a result of the addition of Delaware Management Company’s diversified floating rate investment strategy and Pacific Investment Management Company, LLC’s low-duration investment strategy on Feb. 1, 2014, to the Fund’s principal investment strategy, the Fund’s portfolio turnover rate increased substantially during the years ended March 31, 2015 and 2014. |
See accompanying notes, which are an integral part of the financial statements.
134
Table of Contents
Optimum International Fund Class A
Selected data for each share of the Fund outstanding throughout each period were as follows:
| Year ended | ||||||||||||||||||||
| 3/31/18 | 3/31/17 | 3/31/16 | 3/31/15 | 3/31/14 | ||||||||||||||||
Net asset value, beginning of period | $ | 12.27 | $ | 10.95 | $ | 11.66 | $ | 12.57 | $ | 10.97 | ||||||||||
Income (loss) from investment operations: | ||||||||||||||||||||
Net investment income1 | 0.12 | 0.11 | 0.08 | 0.06 | 0.14 | |||||||||||||||
Net realized and unrealized gain (loss) | 2.29 | 1.31 | (0.73 | ) | (0.84 | ) | 1.54 | |||||||||||||
|
|
|
|
|
|
|
|
|
| |||||||||||
Total from investment operations | 2.41 | 1.42 | (0.65 | ) | (0.78 | ) | 1.68 | |||||||||||||
|
|
|
|
|
|
|
|
|
| |||||||||||
Less dividends and distributions from: | ||||||||||||||||||||
Net investment income | (0.11 | ) | (0.10 | ) | (0.06 | ) | (0.13 | ) | (0.08 | ) | ||||||||||
Net realized gain | (0.15 | ) | — | — | — | — | ||||||||||||||
|
|
|
|
|
|
|
|
|
| |||||||||||
Total dividends and distributions | (0.26 | ) | (0.10 | ) | (0.06 | ) | (0.13 | ) | (0.08 | ) | ||||||||||
|
|
|
|
|
|
|
|
|
| |||||||||||
Net asset value, end of period | $ | 14.42 | $ | 12.27 | $ | 10.95 | $ | 11.66 | $ | 12.57 | ||||||||||
|
|
|
|
|
|
|
|
|
| |||||||||||
Total return2 | 19.74% | 13.08% | (5.58% | ) | (6.25% | ) | 15.31% | |||||||||||||
Ratios and supplemental data: | ||||||||||||||||||||
Net assets, end of period (000 omitted) | $ | 8,704 | $ | 8,680 | $ | 9,117 | $ | 10,291 | $ | 11,277 | ||||||||||
Ratio of expenses to average net assets3 | 1.36% | 1.48% | 1.56% | 1.47% | 1.68% | |||||||||||||||
Ratio of net investment income to average net assets3 | 0.90% | 0.93% | 0.74% | 0.51% | 1.20% | |||||||||||||||
Portfolio turnover | 52% | 68% | 47% | 117% | 126% | |||||||||||||||
| 1 | The average shares outstanding method has been applied for per share information. |
| 2 | Total investment return is based on the change in net asset value of a share during the period and assumes reinvestment of dividends and distributions at net asset value and does not reflect the impact of a sales charge. Total investment return during some of the periods shown reflects a waiver by the manager. Performance would have been lower had the waiver not been in effect. |
| 3 | Expenses paid indirectly were not material and had no impact on the ratios disclosed. Expenses paid indirectly for the year ended March 31,2018 are reflected on the “Statements of operations.” |
See accompanying notes, which are an integral part of the financial statements.
| (continues) | 135 |
Table of Contents
Financial highlights
Optimum International Fund Class C
Selected data for each share of the Fund outstanding throughout each period were as follows:
| Year ended | ||||||||||||||||||||
| 3/31/18 | 3/31/17 | 3/31/16 | 3/31/15 | 3/31/14 | ||||||||||||||||
Net asset value, beginning of period | $ | 11.98 | $ | 10.69 | $ | 11.41 | $ | 12.29 | $ | 10.76 | ||||||||||
Income (loss) from investment operations: | ||||||||||||||||||||
Net investment income (loss)1 | 0.02 | 0.02 | — | 2 | (0.03 | ) | 0.06 | |||||||||||||
Net realized and unrealized gain (loss) | 2.23 | 1.30 | (0.72 | ) | (0.83 | ) | 1.51 | |||||||||||||
|
|
|
|
|
|
|
|
|
| |||||||||||
Total from investment operations | 2.25 | 1.32 | (0.72 | ) | (0.86 | ) | 1.57 | |||||||||||||
|
|
|
|
|
|
|
|
|
| |||||||||||
Less dividends and distributions from: | ||||||||||||||||||||
Net investment income | (0.02 | ) | (0.03 | ) | — | (0.02 | ) | (0.04 | ) | |||||||||||
Net realized gain | (0.15 | ) | — | — | — | — | ||||||||||||||
|
|
|
|
|
|
|
|
|
| |||||||||||
Total dividends and distributions | (0.17 | ) | (0.03 | ) | — | (0.02 | ) | (0.04 | ) | |||||||||||
|
|
|
|
|
|
|
|
|
| |||||||||||
Net asset value, end of period | $ | 14.06 | $ | 11.98 | $ | 10.69 | $ | 11.41 | $ | 12.29 | ||||||||||
|
|
|
|
|
|
|
|
|
| |||||||||||
Total return3 | 18.82% | 12.32% | (6.31% | ) | (7.00% | ) | 14.56% | |||||||||||||
Ratios and supplemental data: | ||||||||||||||||||||
Net assets, end of period (000 omitted) | $ | 28,046 | $ | 29,544 | $ | 31,777 | $ | 35,996 | $ | 37,893 | ||||||||||
Ratio of expenses to average net assets4 | 2.11% | 2.23% | 2.31% | 2.22% | 2.36% | |||||||||||||||
Ratio of net investment income (loss) to average net assets4 | 0.15% | 0.18% | (0.01% | ) | (0.24% | ) | 0.52% | |||||||||||||
Portfolio turnover | 52% | 68% | 47% | 117% | 126% | |||||||||||||||
| 1 | The average shares outstanding method has been applied for per share information. |
| 2 | Amount is less than $(0.005) per share. |
| 3 | Total investment return is based on the change in net asset value of a share during the period and assumes reinvestment of dividends and distributions at net asset value and does not reflect the impact of a sales charge. Total investment return during some of the periods shown reflects a waiver by the manager. Performance would have been lower had the waiver not been in effect. |
| 4 | Expenses paid indirectly were not material and had no impact on the ratios disclosed. Expenses paid indirectly for the year ended March 31,2018 are reflected on the “Statements of operations.” |
See accompanying notes, which are an integral part of the financial statements.
136
Table of Contents
Optimum International Fund Institutional Class
Selected data for each share of the Fund outstanding throughout each period were as follows:
| Year ended | ||||||||||||||||||||
| 3/31/18 | 3/31/17 | 3/31/16 | 3/31/15 | 3/31/14 | ||||||||||||||||
Net asset value, beginning of period | $ | 12.35 | $ | 11.02 | $ | 11.74 | $ | 12.66 | $ | 11.05 | ||||||||||
Income (loss) from investment operations: | ||||||||||||||||||||
Net investment income1 | 0.16 | 0.14 | 0.11 | 0.09 | 0.18 | |||||||||||||||
Net realized and unrealized gain (loss) | 2.31 | 1.32 | (0.74 | ) | (0.85 | ) | 1.55 | |||||||||||||
|
|
|
|
|
|
|
|
|
| |||||||||||
Total from investment operations | 2.47 | 1.46 | (0.63 | ) | (0.76 | ) | 1.73 | |||||||||||||
|
|
|
|
|
|
|
|
|
| |||||||||||
Less dividends and distributions from: | ||||||||||||||||||||
Net investment income | (0.15 | ) | (0.13 | ) | (0.09 | ) | (0.16 | ) | (0.12 | ) | ||||||||||
Net realized gain | (0.15 | ) | — | — | — | — | ||||||||||||||
|
|
|
|
|
|
|
|
|
| |||||||||||
Total dividends and distributions | (0.30 | ) | (0.13 | ) | (0.09 | ) | (0.16 | ) | (0.12 | ) | ||||||||||
|
|
|
|
|
|
|
|
|
| |||||||||||
Net asset value, end of period | $ | 14.52 | $ | 12.35 | $ | 11.02 | $ | 11.74 | $ | 12.66 | ||||||||||
|
|
|
|
|
|
|
|
|
| |||||||||||
Total return2 | 20.05% | 13.36% | (5.38% | ) | (6.04% | ) | 15.79% | |||||||||||||
Ratios and supplemental data: | ||||||||||||||||||||
Net assets, end of period (000 omitted) | $ | 629,934 | $ | 525,431 | $ | 542,055 | $ | 477,884 | $ | 589,098 | ||||||||||
Ratio of expenses to average net assets3 | 1.11% | 1.23% | 1.31% | 1.22% | 1.36% | |||||||||||||||
Ratio of net investment income to average net assets3 | 1.15% | 1.18% | 0.99% | 0.76% | 1.52% | |||||||||||||||
Portfolio turnover | 52% | 68% | 47% | 117% | 126% | |||||||||||||||
| 1 | The average shares outstanding method has been applied for per share information. |
| 2 | Total investment return is based on the change in net asset value of a share during the period and assumes reinvestment of dividends and distributions at net asset value. Total investment return during some of the periods shown reflects a waiver by the manager. Performance would have been lower had the waiver not been in effect. |
| 3 | Expenses paid indirectly were not material and had no impact on the ratios disclosed. Expenses paid indirectly for the year ended March 31,2018 are reflected on the “Statements of operations.” |
See accompanying notes, which are an integral part of the financial statements.
| (continues) | 137 |
Table of Contents
Financial highlights
Optimum Large Cap Growth Fund Class A
Selected data for each share of the Fund outstanding throughout each period were as follows:
| Year ended | ||||||||||||||||||||
| 3/31/18 | 3/31/17 | 3/31/16 | 3/31/15 | 3/31/14 | ||||||||||||||||
Net asset value, beginning of period | $ | 16.84 | $ | 14.97 | $ | 17.00 | $ | 16.39 | $ | 14.53 | ||||||||||
Income (loss) from investment operations: | ||||||||||||||||||||
Net investment loss1 | (0.06 | ) | (0.06 | ) | (0.10 | ) | (0.08 | ) | (0.10 | ) | ||||||||||
Net realized and unrealized gain (loss) | 3.70 | 2.52 | (0.20 | ) | 2.71 | 3.63 | ||||||||||||||
|
|
|
|
|
|
|
|
|
| |||||||||||
Total from investment operations | 3.64 | 2.46 | (0.30 | ) | 2.63 | 3.53 | ||||||||||||||
|
|
|
|
|
|
|
|
|
| |||||||||||
Less dividends and distributions from: | ||||||||||||||||||||
Net realized gain | (3.26 | ) | (0.59 | ) | (1.73 | ) | (2.02 | ) | (1.67 | ) | ||||||||||
|
|
|
|
|
|
|
|
|
| |||||||||||
Total dividends and distributions | (3.26 | ) | (0.59 | ) | (1.73 | ) | (2.02 | ) | (1.67 | ) | ||||||||||
|
| �� |
|
|
|
|
|
|
|
| ||||||||||
Net asset value, end of period | $ | 17.22 | $ | 16.84 | $ | 14.97 | $ | 17.00 | $ | 16.39 | ||||||||||
|
|
|
|
|
|
|
|
|
| |||||||||||
Total return2 | 22.17% | 16.83% | (2.27% | ) | 17.27% | 25.17% | ||||||||||||||
Ratios and supplemental data: | ||||||||||||||||||||
Net assets, end of period (000 omitted) | $ | 32,254 | $ | 32,215 | $ | 33,787 | $ | 40,790 | $ | 39,044 | ||||||||||
Ratio of expenses to average net assets | 1.26% | 1.35% | 1.42% | 1.37% | 1.54% | |||||||||||||||
Ratio of expenses to average net assets prior to fees waived3 | 1.26% | 1.38% | 1.44% | 1.37% | 1.55% | |||||||||||||||
Ratio of net investment loss to average net assets | (0.31% | ) | (0.35% | ) | (0.62% | ) | (0.50% | ) | (0.62% | ) | ||||||||||
Ratio of net investment loss to average net assets prior to fees waived3 | (0.31% | ) | (0.38% | ) | (0.64% | ) | (0.50% | ) | (0.63% | ) | ||||||||||
Portfolio turnover | 77% | 4 | 52% | 88% | 86% | 98% | ||||||||||||||
| 1 | The average shares outstanding method has been applied for per share information. |
| 2 | Total investment return is based on the change in net asset value of a share during the period and assumes reinvestment of dividends and distributions at net asset value and does not reflect the impact of a sales charge. Total investment return during some of the periods shown reflects a waiver by the manager. Performance would have been lower had the waiver not been in effect. |
| 3 | Expenses paid indirectly were not material and had no impact on the ratios disclosed. Expenses paid indirectly for the year ended March 31,2018 are reflected on the “Statements of operations.” |
| 4 | As a result of ClearBridge Investment LLC replacing Fred Alger Management Inc. as one of the sub-advisors to Optimum Large Cap Growth Fund during the Fund’s fiscal year ending March 31, 2018, the Fund’s portfolio turnover rate increased during the year ended March 31, 2018. |
See accompanying notes, which are an integral part of the financial statements.
138
Table of Contents
Optimum Large Cap Growth Fund Class C
Selected data for each share of the Fund outstanding throughout each period were as follows:
| Year ended | ||||||||||||||||||||
| 3/31/18 | 3/31/17 | 3/31/16 | 3/31/15 | 3/31/14 | ||||||||||||||||
Net asset value, beginning of period | $ | 14.81 | $ | 13.34 | $ | 15.44 | $ | 15.16 | $ | 13.63 | ||||||||||
Income (loss) from investment operations: | ||||||||||||||||||||
Net investment loss1 | (0.17 | ) | (0.15 | ) | (0.20 | ) | (0.19 | ) | (0.19 | ) | ||||||||||
Net realized and unrealized gain (loss) | 3.24 | 2.21 | (0.17 | ) | 2.49 | 3.39 | ||||||||||||||
|
|
|
|
|
|
|
|
|
| |||||||||||
Total from investment operations | 3.07 | 2.06 | (0.37 | ) | 2.30 | 3.20 | ||||||||||||||
|
|
|
|
|
|
|
|
|
| |||||||||||
Less dividends and distributions from: | ||||||||||||||||||||
Net realized gain | (3.26 | ) | (0.59 | ) | (1.73 | ) | (2.02 | ) | (1.67 | ) | ||||||||||
|
|
|
|
|
|
|
|
|
| |||||||||||
Total dividends and distributions | (3.26 | ) | (0.59 | ) | (1.73 | ) | (2.02 | ) | (1.67 | ) | ||||||||||
|
|
|
|
|
|
|
|
|
| |||||||||||
Net asset value, end of period | $ | 14.62 | $ | 14.81 | $ | 13.34 | $ | 15.44 | $ | 15.16 | ||||||||||
|
|
|
|
|
|
|
|
|
| |||||||||||
Total return2 | 21.30% | 15.88% | (2.98% | ) | 16.44% | 24.27% | ||||||||||||||
Ratios and supplemental data: | ||||||||||||||||||||
Net assets, end of period (000 omitted) | $ | 97,658 | $ | 105,082 | $ | 114,907 | $ | 137,892 | $ | 127,540 | ||||||||||
Ratio of expenses to average net assets | 2.01% | 2.10% | 2.17% | 2.12% | 2.22% | |||||||||||||||
Ratio of expenses to average net assets prior to fees waived3 | 2.01% | 2.13% | 2.19% | 2.12% | 2.23% | |||||||||||||||
Ratio of net investment loss to average net assets | (1.06% | ) | (1.10% | ) | (1.37% | ) | (1.25% | ) | (1.30% | ) | ||||||||||
Ratio of net investment loss to average net assets prior to fees waived3 | (1.06% | ) | (1.13% | ) | (1.39% | ) | (1.25% | ) | (1.31% | ) | ||||||||||
Portfolio turnover | 77% | 4 | 52% | 88% | 86% | 98% | ||||||||||||||
| 1 | The average shares outstanding method has been applied for per share information. |
| 2 | Total investment return is based on the change in net asset value of a share during the period and assumes reinvestment of dividends and distributions at net asset value and does not reflect the impact of a sales charge. Total investment return during some of the periods shown reflects a waiver by the manager. Performance would have been lower had the waiver not been in effect. |
| 3 | Expenses paid indirectly were not material and had no impact on the ratios disclosed. Expenses paid indirectly for the year ended March 31,2018 are reflected on the “Statements of operations.” |
| 4 | As a result of ClearBridge Investment LLC replacing Fred Alger Management Inc. as one of the sub-advisors to Optimum Large Cap Growth Fund during the Fund’s fiscal year ending March 31, 2018, the Fund’s portfolio turnover rate increased during the year ended March 31, 2018. |
See accompanying notes, which are an integral part of the financial statements.
| (continues) | 139 |
Table of Contents
Financial highlights
Optimum Large Cap Growth Fund Institutional Class
| Selected data for each share of the Fund outstanding throughout each period were as follows: |
| Year ended | ||||||||||||||||||||
| 3/31/18 | 3/31/17 | 3/31/16 | 3/31/15 | 3/31/14 | ||||||||||||||||
Net asset value, beginning of period | $ | 17.81 | $ | 15.76 | $ | 17.76 | $ | 17.00 | $ | 14.97 | ||||||||||
Income (loss) from investment operations: | ||||||||||||||||||||
Net investment loss1 | (0.01 | ) | (0.02 | ) | (0.06 | ) | (0.04 | ) | (0.05 | ) | ||||||||||
Net realized and unrealized gain (loss) | 3.92 | 2.66 | (0.21 | ) | 2.82 | 3.75 | ||||||||||||||
|
|
|
|
|
|
|
|
|
| |||||||||||
Total from investment operations | 3.91 | 2.64 | (0.27 | ) | 2.78 | 3.70 | ||||||||||||||
|
|
|
|
|
|
|
|
|
| |||||||||||
Less dividends and distributions from: | ||||||||||||||||||||
Net investment income | — | — | — | — | — | 2 | ||||||||||||||
Net realized gain | (3.26 | ) | (0.59 | ) | (1.73 | ) | (2.02 | ) | (1.67 | ) | ||||||||||
|
|
|
|
|
|
|
|
|
| |||||||||||
Total dividends and distributions | (3.26 | ) | (0.59 | ) | (1.73 | ) | (2.02 | ) | (1.67 | ) | ||||||||||
|
|
|
|
|
|
|
|
|
| |||||||||||
Net asset value, end of period | $ | 18.46 | $ | 17.81 | $ | 15.76 | $ | 17.76 | $ | 17.00 | ||||||||||
|
|
|
|
|
|
|
|
|
| |||||||||||
Total return3 | 22.50% | 17.14% | (2.00% | ) | 17.55% | 25.51% | ||||||||||||||
Ratios and supplemental data: | ||||||||||||||||||||
Net assets, end of period (000 omitted) | $ | 1,610,343 | $ | 1,348,419 | $ | 1,356,335 | $ | 1,413,059 | $ | 1,026,377 | ||||||||||
Ratio of expenses to average net assets | 1.01% | 1.10% | 1.17% | 1.12% | 1.22% | |||||||||||||||
Ratio of expenses to average net assets prior to fees waived4 | 1.01% | 1.13% | 1.19% | 1.12% | 1.23% | |||||||||||||||
Ratio of net investment loss to average net assets | (0.06% | ) | (0.10% | ) | (0.37% | ) | (0.25% | ) | (0.30% | ) | ||||||||||
Ratio of net investment loss to average net assets prior to fees waived4 | (0.06% | ) | (0.13% | ) | (0.39% | ) | (0.25% | ) | (0.31% | ) | ||||||||||
Portfolio turnover | 77% | 5 | 52% | 88% | 86% | 98% | ||||||||||||||
| 1 | The average shares outstanding method has been applied for per share information. |
| 2 | For the year ended March 31, 2014, net investment income distributions of $149,730 was made by the Fund’s Institutional Class, which calculated to a de minimis amount of $0.00 per share. |
| 3 | Total investment return is based on the change in net asset value of a share during the period and assumes reinvestment of dividends and distributions at net asset value. Total investment return during some of the periods shown reflects a waiver by the manager. Performance would have been lower had the waiver not been in effect. |
| 4 | Expenses paid indirectly were not material and had no impact on the ratios disclosed. Expenses paid indirectly for the year ended March 31,2018 are reflected on the “Statements of operations.” |
| 5 | As a result of ClearBridge Investment LLC replacing Fred Alger Management Inc. as one of the sub-advisors to Optimum Large Cap Growth Fund during the Fund’s fiscal year ending March 31, 2018, the Fund’s portfolio turnover rate increased during the year ended March 31, 2018. |
See accompanying notes, which are an integral part of the financial statements.
140
Table of Contents
Optimum Large Cap Value Fund Class A
Selected data for each share of the Fund outstanding throughout each period were as follows:
| Year ended | ||||||||||||||||||||
| 3/31/18 | 3/31/17 | 3/31/16 | 3/31/15 | 3/31/14 | ||||||||||||||||
Net asset value, beginning of period | $ | 15.42 | $ | 15.13 | $ | 16.01 | $ | 15.36 | $ | 12.90 | ||||||||||
Income (loss) from investment operations: | ||||||||||||||||||||
Net investment income1 | 0.17 | 0.17 | 0.17 | 0.12 | 0.16 | |||||||||||||||
Net realized and unrealized gain (loss) | 1.19 | 2.04 | (0.89 | ) | 0.70 | 2.40 | ||||||||||||||
|
|
|
|
|
|
|
|
|
| |||||||||||
Total from investment operations | 1.36 | 2.21 | (0.72 | ) | 0.82 | 2.56 | ||||||||||||||
|
|
|
|
|
|
|
|
|
| |||||||||||
Less dividends and distributions from: | ||||||||||||||||||||
Net investment income | (0.16 | ) | (0.18 | ) | (0.16 | ) | (0.17 | ) | (0.10 | ) | ||||||||||
Net realized gain | (0.73 | ) | (1.74 | ) | — | — | — | |||||||||||||
|
|
|
|
|
|
|
|
|
| |||||||||||
Total dividends and distributions | (0.89 | ) | (1.92 | ) | (0.16 | ) | (0.17 | ) | (0.10 | ) | ||||||||||
|
|
|
|
|
|
|
|
|
| |||||||||||
Net asset value, end of period | $ | 15.89 | $ | 15.42 | $ | 15.13 | $ | 16.01 | $ | 15.36 | ||||||||||
|
|
|
|
|
|
|
|
|
| |||||||||||
Total return2 | 8.68% | 14.99% | (4.54% | ) | 5.34% | 19.96% | ||||||||||||||
Ratios and supplemental data: | ||||||||||||||||||||
Net assets, end of period (000 omitted) | $ | 26,448 | $ | 28,739 | $ | 30,502 | $ | 35,952 | $ | 37,299 | ||||||||||
Ratio of expenses to average net assets | 1.21% | 1.33% | 1.40% | 1.33% | 1.50% | |||||||||||||||
Ratio of expenses to average net assets prior to fees waived3 | 1.21% | 1.34% | 1.41% | 1.33% | 1.51% | |||||||||||||||
Ratio of net investment income to average net assets | 1.05% | 1.06% | 1.07% | 0.79% | 1.12% | |||||||||||||||
Ratio of net investment income to average net assets prior to fees waived3 | 1.05% | 1.05% | 1.06% | 0.79% | 1.11% | |||||||||||||||
Portfolio turnover | 25% | 82% | 4 | 39% | 35% | 37% | ||||||||||||||
| 1 | The average shares outstanding method has been applied for per share information. |
| 2 | Total investment return is based on the change in net asset value of a share during the period and assumes reinvestment of dividends and distributions at net asset value and does not reflect the impact of a sales charge. Total investment return during some of the periods shown reflects a waiver by the manager. Performance would have been lower had the waiver not been in effect. |
| 3 | Expenses paid indirectly were not material and had no impact on the ratios disclosed. Expenses paid indirectly for the year ended March 31,2018 are reflected on the “Statements of operations.” |
| 4 | As a result of Rothschild Asset Management Inc. replacing Herndon Capital Management, LLC as one of the sub-advisors to Optimum Large Cap Value Fund during the Fund’s fiscal year ending March 31, 2017, the Fund’s portfolio turnover rate increased substantially during the year ended March 31, 2017. |
See accompanying notes, which are an integral part of the financial statements.
| (continues) | 141 |
Table of Contents
Financial highlights
Optimum Large Cap Value Fund Class C
Selected data for each share of the Fund outstanding throughout each period were as follows:
| Year ended | ||||||||||||||||||||
3/31/18 | 3/31/17 | 3/31/16 | 3/31/15 | 3/31/14 | ||||||||||||||||
Net asset value, beginning of period | $ | 15.25 | $ | 14.99 | $ | 15.85 | $ | 15.22 | $ | 12.78 | ||||||||||
Income (loss) from investment operations: | ||||||||||||||||||||
Net investment income1 | 0.05 | 0.05 | 0.05 | 0.01 | 0.06 | |||||||||||||||
Net realized and unrealized gain (loss) | 1.17 | 2.01 | (0.87 | ) | 0.67 | 2.39 | ||||||||||||||
|
|
|
|
|
|
|
|
|
| |||||||||||
Total from investment operations | 1.22 | 2.06 | (0.82 | ) | 0.68 | 2.45 | ||||||||||||||
|
|
|
|
|
|
|
|
|
| |||||||||||
Less dividends and distributions from: | ||||||||||||||||||||
Net investment income | (0.05 | ) | (0.06 | ) | (0.04 | ) | (0.05 | ) | (0.01 | ) | ||||||||||
Net realized gain | (0.73 | ) | (1.74 | ) | — | — | — | |||||||||||||
|
|
|
|
|
|
|
|
|
| |||||||||||
Total dividends and distributions | (0.78 | ) | (1.80 | ) | (0.04 | ) | (0.05 | ) | (0.01 | ) | ||||||||||
|
|
|
|
|
|
|
|
|
| |||||||||||
Net asset value, end of period | $ | 15.69 | $ | 15.25 | $ | 14.99 | $ | 15.85 | $ | 15.22 | ||||||||||
|
|
|
|
|
|
|
|
|
| |||||||||||
Total return2 | 7.82% | 14.13% | (5.19% | ) | 4.48% | 19.17% | ||||||||||||||
Ratios and supplemental data: | ||||||||||||||||||||
Net assets, end of period (000 omitted) | $ | 82,610 | $ | 95,495 | $ | 103,693 | $ | 122,772 | $ | 123,541 | ||||||||||
Ratio of expenses to average net assets | 1.96% | 2.08% | 2.15% | 2.08% | 2.18% | |||||||||||||||
Ratio of expenses to average net assets prior to fees waived3 | 1.96% | 2.09% | 2.16% | 2.08% | 2.19% | |||||||||||||||
Ratio of net investment income to average net assets | 0.30% | 0.31% | 0.32% | 0.04% | 0.44% | |||||||||||||||
Ratio of net investment income to average net assets prior to fees waived3 | 0.30% | 0.30% | 0.31% | 0.04% | 0.43% | |||||||||||||||
Portfolio turnover | 25% | 82% | 4 | 39% | 35% | 37% | ||||||||||||||
| 1 | The average shares outstanding method has been applied for per share information. |
| 2 | Total investment return is based on the change in net asset value of a share during the period and assumes reinvestment of dividends and distributions at net asset value and does not reflect the impact of a sales charge. Total investment return during some of the periods shown reflects a waiver by the manager. Performance would have been lower had the waiver not been in effect. |
| 3 | Expenses paid indirectly were not material and had no impact on the ratios disclosed. Expenses paid indirectly for the year ended March 31,2018 are reflected on the “Statements of operations.” |
| 4 | As a result of Rothschild Asset Management Inc. replacing Herndon Capital Management, LLC as one of the sub-advisors to Optimum Large Cap Value Fund during the Fund’s fiscal year ending March 31, 2017, the Fund’s portfolio turnover rate increased substantially during the year ended March 31, 2017. |
See accompanying notes, which are an integral part of the financial statements.
142
Table of Contents
Optimum Large Cap Value Fund Institutional Class
Selected data for each share of the Fund outstanding throughout each period were as follows:
| Year ended | ||||||||||||||||||||
3/31/17 | 3/31/16 | 3/31/15 | 3/31/14 | 3/31/13 | ||||||||||||||||
Net asset value, beginning of period | $ | 15.46 | $ | 15.16 | $ | 16.04 | $ | 15.39 | $ | 12.92 | ||||||||||
Income (loss) from investment operations: | ||||||||||||||||||||
Net investment income1 | 0.21 | 0.20 | 0.20 | 0.17 | 0.20 | |||||||||||||||
Net realized and unrealized gain (loss) | 1.19 | 2.06 | (0.89 | ) | 0.69 | 2.41 | ||||||||||||||
|
|
|
|
|
|
|
|
|
| |||||||||||
Total from investment operations | 1.40 | 2.26 | (0.69 | ) | 0.86 | 2.61 | ||||||||||||||
|
|
|
|
|
|
|
|
|
| |||||||||||
Less dividends and distributions from: | ||||||||||||||||||||
Net investment income | (0.20 | ) | (0.22 | ) | (0.19 | ) | (0.21 | ) | (0.14 | ) | ||||||||||
Net realized gain | (0.73 | ) | (1.74 | ) | — | — | — | |||||||||||||
|
|
|
|
|
|
|
|
|
| |||||||||||
Total dividends and distributions | (0.93 | ) | (1.96 | ) | (0.19 | ) | (0.21 | ) | (0.14 | ) | ||||||||||
|
|
|
|
|
|
|
|
|
| |||||||||||
Net asset value, end of period | $ | 15.93 | $ | 15.46 | $ | 15.16 | $ | 16.04 | $ | 15.39 | ||||||||||
|
|
|
|
|
|
|
|
|
| |||||||||||
Total return2 | 8.90% | 15.30% | (4.29% | ) | 5.60% | 20.31% | ||||||||||||||
Ratios and supplemental data: | ||||||||||||||||||||
Net assets, end of period (000 omitted) | $ | 1,372,505 | $ | 1,217,722 | $ | 1,129,606 | $ | 1,146,123 | $ | 1,002,553 | ||||||||||
Ratio of expenses to average net assets | 0.96% | 1.08% | 1.15% | 1.08% | 1.18% | |||||||||||||||
Ratio of expenses to average net assets prior to fees waived3 | 0.96% | 1.09% | 1.16% | 1.08% | 1.19% | |||||||||||||||
Ratio of net investment income to average net assets | 1.30% | 1.31% | 1.32% | 1.04% | 1.44% | |||||||||||||||
Ratio of net investment income to average net assets prior to fees waived3 | 1.30% | 1.30% | 1.31% | 1.04% | 1.43% | |||||||||||||||
Portfolio turnover | 25% | 82% | 4 | 39% | 35% | 37% | ||||||||||||||
| 1 | The average shares outstanding method has been applied for per share information. |
| 2 | Total investment return is based on the change in net asset value of a share during the period and assumes reinvestment of dividends and distributions at net asset value. Total investment return during some of the periods shown reflects a waiver by the manager. Performance would have been lower had the waiver not been in effect. |
| 3 | Expenses paid indirectly were not material and had no impact on the ratios disclosed. Expenses paid indirectly for the year ended March 31,2018 are reflected on the “Statements of operations.” |
| 4 | As a result of Rothschild Asset Management Inc. replacing Herndon Capital Management, LLC as one of the sub-advisors to Optimum Large Cap Value Fund during the Fund’s fiscal year ending March 31, 2017, the Fund’s portfolio turnover rate increased substantially during the year ended March 31, 2017. |
See accompanying notes, which are an integral part of the financial statements.
| (continues) | 143 |
Table of Contents
Financial highlights
Optimum Small-Mid Cap Growth Fund Class A
Selected data for each share of the Fund outstanding throughout each period were as follows:
| Year ended | ||||||||||||||||||||
3/31/18 | 3/31/17 | 3/31/16 | 3/31/15 | 3/31/14 | ||||||||||||||||
Net asset value, beginning of period | $ | 13.31 | $ | 10.95 | $ | 15.37 | $ | 15.57 | $ | 14.26 | ||||||||||
Income (loss) from investment operations: | ||||||||||||||||||||
Net investment loss1 | (0.16 | ) | (0.14 | ) | (0.15 | ) | (0.16 | ) | (0.19 | ) | ||||||||||
Net realized and unrealized gain (loss) | 3.03 | 2.50 | (2.26 | ) | 1.44 | 3.07 | ||||||||||||||
|
|
|
|
|
|
|
|
|
| |||||||||||
Total from investment operations | 2.87 | 2.36 | (2.41 | ) | 1.28 | 2.88 | ||||||||||||||
|
|
|
|
|
|
|
|
|
| |||||||||||
Less dividends and distributions from: | ||||||||||||||||||||
Return of capital | — | — | — | 2 | — | — | ||||||||||||||
Net realized gain | (0.67 | ) | — | (2.01 | ) | (1.48 | ) | (1.57 | ) | |||||||||||
|
|
|
|
|
|
|
|
|
| |||||||||||
Total dividends and distributions | (0.67 | ) | — | (2.01 | ) | (1.48 | ) | (1.57 | ) | |||||||||||
|
|
|
|
|
|
|
|
|
| |||||||||||
Net asset value, end of period | $ | 15.51 | $ | 13.31 | $ | 10.95 | $ | 15.37 | $ | 15.57 | ||||||||||
|
|
|
|
|
|
|
|
|
| |||||||||||
Total return3 | 21.88% | 21.55% | (16.77% | ) | 8.93% | 21.63% | ||||||||||||||
Ratios and supplemental data: | ||||||||||||||||||||
Net assets, end of period (000 omitted) | $ | 5,414 | $ | 5,293 | $ | 5,040 | $ | 7,050 | $ | 7,158 | ||||||||||
Ratio of expenses to average net assets | 1.55% | 1.58% | 1.66% | 1.63% | 1.76% | |||||||||||||||
Ratio of expenses to average net assets prior to fees waived4 | 1.63% | 1.79% | 1.85% | 1.77% | 1.96% | |||||||||||||||
Ratio of net investment loss to average net assets | (1.07% | ) | (1.16% | ) | (1.09% | ) | (1.09% | ) | (1.28% | ) | ||||||||||
Ratio of net investment loss to average net assets prior to fees waived4 | (1.15% | ) | (1.37% | ) | (1.28% | ) | (1.23% | ) | (1.48% | ) | ||||||||||
Portfolio turnover | 89% | 180% | 5 | 104% | 72% | 58% | ||||||||||||||
| 1 | The average shares outstanding method has been applied for per share information. |
| 2 | For the year ended March 31, 2016, return of capital distribution of $108 for Class A calculated to a de minimis amount of $0.00 per share. |
| 3 | Total investment return is based on the change in net asset value of a share during the period and assumes reinvestment of dividends and distributions at net asset value and does not reflect the impact of a sales charge. Total investment return during all of the periods shown reflects a waiver by the manager. Performance would have been lower had the waiver not been in effect. |
| 4 | Expenses paid indirectly were not material and had no impact on the ratios disclosed. Expenses paid indirectly for the year ended March 31,2018 are reflected on the “Statements of operations.” |
| 5 | As a result of Peregrine Capital Management, LLC and Columbus Circle Investors replacing Columbia Wanger Asset Management and Wellington Management as the sub-advisors to Optimum Small-Mid Cap Growth Fund during the Fund’s fiscal year ending March 31, 2017, the Fund’s portfolio turnover rate increased substantially during the year ended March 31, 2017. |
See accompanying notes, which are an integral part of the financial statements.
144
Table of Contents
Optimum Small-Mid Cap Growth Fund Class C
Selected data for each share of the Fund outstanding throughout each period were as follows:
| Year ended | ||||||||||||||||||||
3/31/18 | 3/31/17 | 3/31/16 | 3/31/15 | 3/31/14 | ||||||||||||||||
Net asset value, beginning of period | $ | 11.59 | $ | 9.61 | $ | 13.86 | $ | 14.29 | $ | 13.28 | ||||||||||
Income (loss) from investment operations: | ||||||||||||||||||||
Net investment loss1 | (0.23 | ) | (0.20 | ) | (0.22 | ) | (0.25 | ) | (0.27 | ) | ||||||||||
Net realized and unrealized gain (loss) | 2.63 | 2.18 | (2.02 | ) | 1.30 | 2.85 | ||||||||||||||
|
|
|
|
|
|
|
|
|
| |||||||||||
Total from investment operations | 2.40 | 1.98 | (2.24 | ) | 1.05 | 2.58 | ||||||||||||||
|
|
|
|
|
|
|
|
|
| |||||||||||
Less dividends and distributions from: | ||||||||||||||||||||
Return of capital | — | — | — | 2 | — | — | ||||||||||||||
Net realized gain | (0.67 | ) | — | (2.01 | ) | (1.48 | ) | (1.57 | ) | |||||||||||
|
|
|
|
|
|
|
|
|
| |||||||||||
Total dividends and distributions | (0.67 | ) | — | (2.01 | ) | (1.48 | ) | (1.57 | ) | |||||||||||
|
|
|
|
|
|
|
|
|
| |||||||||||
Net asset value, end of period | $ | 13.32 | $ | 11.59 | $ | 9.61 | $ | 13.86 | $ | 14.29 | ||||||||||
|
|
|
|
|
|
|
|
|
| |||||||||||
Total return3 | 21.06% | 20.60% | (17.39% | ) | 8.08% | 20.82% | ||||||||||||||
Ratios and supplemental data: | ||||||||||||||||||||
Net assets, end of period (000 omitted) | $ | 15,925 | $ | 16,668 | $ | 16,972 | $ | 23,206 | $ | 22,581 | ||||||||||
Ratio of expenses to average net assets | 2.30% | 2.33% | 2.41% | 2.38% | 2.45% | |||||||||||||||
Ratio of expenses to average net assets prior to fees waived4 | 2.38% | 2.54% | 2.60% | 2.52% | 2.65% | |||||||||||||||
Ratio of net investment loss to average net assets | (1.82% | ) | (1.91% | ) | (1.84% | ) | (1.84% | ) | (1.97% | ) | ||||||||||
Ratio of net investment loss to average net assets prior to fees waived4 | (1.90% | ) | (2.12% | ) | (2.03% | ) | (1.98% | ) | (2.17% | ) | ||||||||||
Portfolio turnover | 89% | 180% | 5 | 104% | 72% | 58% | ||||||||||||||
| 1 | The average shares outstanding method has been applied for per share information. |
| 2 | For the year ended March 31, 2016, return of capital distribution of $416 for Class C calculated to a de minimis amount of $0.00 per share. |
| 3 | Total investment return is based on the change in net asset value of a share during the period and assumes reinvestment of dividends and distributions at net asset value and does not reflect the impact of a sales charge. Total investment return during all of the periods shown reflects a waiver by the manager. Performance would have been lower had the waiver not been in effect. |
| 4 | Expenses paid indirectly were not material and had no impact on the ratios disclosed. Expenses paid indirectly for the year ended March 31,2018 are reflected on the “Statements of operations.” |
| 5 | As a result of Peregrine Capital Management, LLC and Columbus Circle Investors replacing Columbia Wanger Asset Management and Wellington Management as the sub-advisors to Optimum Small-Mid Cap Growth Fund during the Fund’s fiscal year ending March 31, 2017, the Fund’s portfolio turnover rate increased substantially during the year ended March 31, 2017. |
See accompanying notes, which are an integral part of the financial statements.
| (continues) | 145 |
Table of Contents
Financial highlights
Optimum Small-Mid Cap Growth Fund Institutional Class
Selected data for each share of the Fund outstanding throughout each period were as follows:
| Year ended | ||||||||||||||||||||
3/31/18 | 3/31/17 | 3/31/16 | 3/31/15 | 3/31/14 | ||||||||||||||||
Net asset value, beginning of period | $ | 14.19 | $ | 11.65 | $ | 16.17 | $ | 16.27 | $ | 14.78 | ||||||||||
Income (loss) from investment operations: | ||||||||||||||||||||
Net investment loss1 | (0.13 | ) | (0.12 | ) | (0.12 | ) | (0.13 | ) | (0.15 | ) | ||||||||||
Net realized and unrealized gain (loss) | 3.24 | 2.66 | (2.39 | ) | 1.51 | 3.21 | ||||||||||||||
|
|
|
|
|
|
|
|
|
| |||||||||||
Total from investment operations | 3.11 | 2.54 | (2.51 | ) | 1.38 | 3.06 | ||||||||||||||
|
|
|
|
|
|
|
|
|
| |||||||||||
Less dividends and distributions from: | ||||||||||||||||||||
Return of capital | — | — | — | 2 | — | — | ||||||||||||||
Net realized gain | (0.67 | ) | — | (2.01 | ) | (1.48 | ) | (1.57 | ) | |||||||||||
|
|
|
|
|
|
|
|
|
| |||||||||||
Total dividends and distributions | (0.67 | ) | — | (2.01 | ) | (1.48 | ) | (1.57 | ) | |||||||||||
|
|
|
|
|
|
|
|
|
| |||||||||||
Net asset value, end of period | $ | 16.63 | $ | 14.19 | $ | 11.65 | $ | 16.17 | $ | 16.27 | ||||||||||
|
|
|
|
|
|
|
|
|
| |||||||||||
Total return3 | 22.22% | 21.80% | (16.54% | ) | 9.18% | 22.03% | ||||||||||||||
Ratios and supplemental data: | ||||||||||||||||||||
Net assets, end of period (000 omitted) | $ | 494,894 | $ | 420,279 | $ | 440,683 | $ | 527,647 | $ | 436,823 | ||||||||||
Ratio of expenses to average net assets | 1.30% | 1.33% | 1.41% | 1.38% | 1.45% | |||||||||||||||
Ratio of expenses to average net assets prior to fees waived4 | 1.38% | 1.54% | 1.60% | 1.52% | 1.65% | |||||||||||||||
Ratio of net investment loss to average net assets | (0.82% | ) | (0.91% | ) | (0.84% | ) | (0.84% | ) | (0.97% | ) | ||||||||||
Ratio of net investment loss to average net assets prior to fees waived4 | (0.90% | ) | (1.12% | ) | (1.03% | ) | (0.98% | ) | (1.17% | ) | ||||||||||
Portfolio turnover | 89% | 180% | 5 | 104% | 72% | 58% | ||||||||||||||
| 1 | The average shares outstanding method has been applied for per share information. |
| 2 | For the year ended March 31, 2016, return of capital distribution of $8,916 for Institutional Class calculated to a de minimis amount of $0.00 per share. |
| 3 | Total investment return is based on the change in net asset value of a share during the period and assumes reinvestment of dividends and distributions at net asset value. Total investment return during all of the periods shown reflects a waiver by the manager. Performance would have been lower had the waiver not been in effect. |
| 4 | Expenses paid indirectly were not material and had no impact on the ratios disclosed. Expenses paid indirectly for the year ended March 31,2018 are reflected on the “Statements of operations.” |
| 5 | As a result of Peregrine Capital Management, LLC and Columbus Circle Investors replacing Columbia Wanger Asset Management and Wellington Management as the sub-advisors to Optimum Small-Mid Cap Growth Fund during the Fund’s fiscal year ending March 31, 2017, the Fund’s portfolio turnover rate increased substantially during the year ended March 31, 2017. |
See accompanying notes, which are an integral part of the financial statements.
146
Table of Contents
Optimum Small-Mid Cap Value Fund Class A
Selected data for each share of the Fund outstanding throughout each period were as follows:
| Year ended | ||||||||||||||||||||
3/31/18 | 3/31/17 | 3/31/16 | 3/31/15 | 3/31/14 | ||||||||||||||||
Net asset value, beginning of period | $ | 13.77 | $ | 11.53 | $ | 13.64 | $ | 14.88 | $ | 13.74 | ||||||||||
Income (loss) from investment operations: | ||||||||||||||||||||
Net investment income (loss)1 | 0.06 | 0.08 | (0.04 | ) | (0.09 | ) | (0.09 | ) | ||||||||||||
Net realized and unrealized gain (loss) | 0.59 | 2.21 | (1.58 | ) | (0.03 | ) | 2.87 | |||||||||||||
|
|
|
|
|
|
|
|
|
| |||||||||||
Total from investment operations | 0.65 | 2.29 | (1.62 | ) | (0.12 | ) | 2.78 | |||||||||||||
|
|
|
|
|
|
|
|
|
| |||||||||||
Less dividends and distributions from: | ||||||||||||||||||||
Net investment income | (0.07 | ) | (0.05 | ) | — | — | — | |||||||||||||
Return of capital | — | — | — | 2 | — | — | ||||||||||||||
Net realized gain | (0.69 | ) | — | (0.49 | ) | (1.12 | ) | (1.64 | ) | |||||||||||
|
|
|
|
|
|
|
|
|
| |||||||||||
Total dividends and distributions | (0.76 | ) | (0.05 | ) | (0.49 | ) | (1.12 | ) | (1.64 | ) | ||||||||||
|
|
|
|
|
|
|
|
|
| |||||||||||
Net asset value, end of period | $ | 13.66 | $ | 13.77 | $ | 11.53 | $ | 13.64 | $ | 14.88 | ||||||||||
|
|
|
|
|
|
|
|
|
| |||||||||||
Total return3 | 4.59% | 19.84% | (11.96% | ) | (0.69% | ) | 21.85% | |||||||||||||
Ratios and supplemental data: | ||||||||||||||||||||
Net assets, end of period (000 omitted) | $ | 3,856 | $ | 4,279 | $ | 4,302 | $ | 5,440 | $ | 6,058 | ||||||||||
Ratio of expenses to average net assets | 1.48% | 1.51% | 1.61% | 1.62% | 1.70% | |||||||||||||||
Ratio of expenses to average net assets prior to fees waived4 | 1.54% | 1.71% | 1.75% | 1.68% | 1.86% | |||||||||||||||
Ratio of net investment income (loss) to average net assets | 0.40% | 0.64% | (0.35% | ) | (0.65% | ) | (0.64% | ) | ||||||||||||
Ratio of net investment income (loss) to average net assets prior to fees waived4 | 0.34% | 0.44% | (0.49% | ) | (0.71% | ) | (0.80% | ) | ||||||||||||
Portfolio turnover | 31% | 30% | 90% | 5 | 31% | 33% | ||||||||||||||
| 1 | The average shares outstanding method has been applied for per share information. |
| 2 | For the year ended March 31, 2016, return of capital distribution of $325 for Class A calculated to a de minimis amount of $0.001 per share |
| 3 | Total investment return is based on the change in net asset value of a share during the period and assumes reinvestment of dividends and distributions at net asset value and does not reflect the impact of a sales charge. Total investment return during all of the periods shown reflects a waiver by the manager. Performance would have been lower had the waiver not been in effect. |
| 4 | Expenses paid indirectly were not material and had no impact on the ratios disclosed. Expenses paid indirectly for the year ended March 31,2018 are reflected on the “Statements of operations.” |
| 5 | As a result of LSV Asset Management replacing The Delafield Group, a division of Tocqueville Asset Management L.P., and The Killen Group, Inc. as one of the sub-advisors to Optimum Small-Mid Cap Value Fund during the Fund’s fiscal year ending March 31, 2016, the Fund’s portfolio turnover rate increased substantially during the year ended March 31, 2016. |
See accompanying notes, which are an integral part of the financial statements.
| (continues) | 147 |
Table of Contents
Financial highlights
Optimum Small-Mid Cap Value Fund Class A
Selected data for each share of the Fund outstanding throughout each period were as follows:
| Year ended | ||||||||||||||||||||
3/31/18 | 3/31/17 | 3/31/16 | 3/31/15 | 3/31/14 | ||||||||||||||||
Net asset value, beginning of period | $ | 12.21 | $ | 10.27 | $ | 12.30 | $ | 13.63 | $ | 12.80 | ||||||||||
Income (loss) from investment operations: | ||||||||||||||||||||
Net investment loss1 | (0.04 | ) | (0.01 | ) | (0.12 | ) | (0.18 | ) | (0.18 | ) | ||||||||||
Net realized and unrealized gain (loss) | 0.53 | 1.95 | (1.42 | ) | (0.03 | ) | 2.65 | |||||||||||||
|
|
|
|
|
|
|
|
|
| |||||||||||
Total from investment operations | 0.49 | 1.94 | (1.54 | ) | (0.21 | ) | 2.47 | |||||||||||||
|
|
|
|
|
|
|
|
|
| |||||||||||
Less dividends and distributions from: | ||||||||||||||||||||
Return of capital | — | — | — | 2 | — | — | ||||||||||||||
Net realized gain | (0.69 | ) | — | (0.49 | ) | (1.12 | ) | (1.64 | ) | |||||||||||
|
|
|
|
|
|
|
|
|
| |||||||||||
Total dividends and distributions | (0.69 | ) | — | (0.49 | ) | (1.12 | ) | (1.64 | ) | |||||||||||
|
|
|
|
|
|
|
|
|
| |||||||||||
Net asset value, end of period | $ | 12.01 | $ | 12.21 | $ | 10.27 | $ | 12.30 | $ | 13.63 | ||||||||||
|
|
|
|
|
|
|
|
|
| |||||||||||
Total return3 | 3.85% | 18.89% | (12.62% | ) | (1.45% | ) | 21.08% | |||||||||||||
Ratios and supplemental data: | ||||||||||||||||||||
Net assets, end of period (000 omitted) | $ | 12,030 | $ | 14,268 | $ | 15,136 | $ | 19,245 | $ | 20,846 | ||||||||||
Ratio of expenses to average net assets | 2.23% | 2.26% | 2.36% | 2.37% | 2.40% | |||||||||||||||
Ratio of expenses to average net assets prior to fees waived4 | 2.29% | 2.46% | 2.50% | 2.43% | 2.56% | |||||||||||||||
Ratio of net investment loss to average net assets | (0.35% | ) | (0.11% | ) | (1.10% | ) | (1.40% | ) | (1.34% | ) | ||||||||||
Ratio of net investment loss to average net assets prior to fees waived4 | (0.41% | ) | (0.31% | ) | (1.24% | ) | (1.46% | ) | (1.50% | ) | ||||||||||
Portfolio turnover | 31% | 30% | 90% | 5 | 31% | 33% | ||||||||||||||
| 1 | The average shares outstanding method has been applied for per share information. |
| 2 | For the year ended March 31, 2016, return of capital distribution of $1,284 for Class C calculated to a de minimis amount of $0.001 per share. |
| 3 | Total investment return is based on the change in net asset value of a share during the period and assumes reinvestment of dividends and distributions at net asset value and does not reflect the impact of a sales charge. Total investment return during all of the periods shown reflects a waiver by the manager. Performance would have been lower had the waiver not been in effect. |
| 4 | Expenses paid indirectly were not material and had no impact on the ratios disclosed. Expenses paid indirectly for the year ended March 31,2018 are reflected on the “Statements of operations.” |
| 5 | As a result of LSV Asset Management replacing The Delafield Group, a division of Tocqueville Asset Management L.P., and The Killen Group, Inc. as one of the sub-advisors to Optimum Small-Mid Cap Value Fund during the Fund’s fiscal year ending March 31, 2016, the Fund’s portfolio turnover rate increased substantially during the year ended March 31, 2016. |
See accompanying notes, which are an integral part of the financial statements.
148
Table of Contents
Optimum Small-Mid Cap Value Fund Institutional Class
Selected data for each share of the Fund outstanding throughout each period were as follows:
| Year ended | ||||||||||||||||||||
3/31/18 | 3/31/17 | 3/31/16 | 3/31/15 | 3/31/14 | ||||||||||||||||
Net asset value, beginning of period | $ | 14.52 | $ | 12.16 | $ | 14.31 | $ | 15.53 | $ | 14.23 | ||||||||||
Income (loss) from investment operations: | ||||||||||||||||||||
Net investment income (loss)1 | 0.10 | 0.12 | (0.01 | ) | (0.06 | ) | (0.05 | ) | ||||||||||||
Net realized and unrealized gain (loss) | 0.63 | 2.32 | (1.65 | ) | (0.04 | ) | 3.00 | |||||||||||||
|
|
|
|
|
|
|
|
|
| |||||||||||
Total from investment operations | 0.73 | 2.44 | (1.66 | ) | (0.10 | ) | 2.95 | |||||||||||||
|
|
|
|
|
|
|
|
|
| |||||||||||
Less dividends and distributions from: | ||||||||||||||||||||
Net investment income | (0.11 | ) | (0.08 | ) | — | — | (0.01 | ) | ||||||||||||
Return of capital | — | — | — | 2 | — | — | ||||||||||||||
Net realized gain | (0.69 | ) | — | (0.49 | ) | (1.12 | ) | (1.64 | ) | |||||||||||
|
|
|
|
|
|
|
|
|
| |||||||||||
Total dividends and distributions | (0.80 | ) | (0.08 | ) | (0.49 | ) | (1.12 | ) | (1.65 | ) | ||||||||||
|
|
|
|
|
|
|
|
|
| |||||||||||
Net asset value, end of period | $ | 14.45 | $ | 14.52 | $ | 12.16 | $ | 14.31 | $ | 15.53 | ||||||||||
|
|
|
|
|
|
|
|
|
| |||||||||||
Total return3 | 4.87% | 20.05% | (11.67% | ) | (0.53% | ) | 22.29% | |||||||||||||
Ratios and supplemental data: | ||||||||||||||||||||
Net assets, end of period (000 omitted) | $ | 442,808 | $ | 406,327 | $ | 441,150 | $ | 499,578 | $ | 439,417 | ||||||||||
Ratio of expenses to average net assets | 1.23% | 1.26% | 1.36% | 1.37% | 1.40% | |||||||||||||||
Ratio of expenses to average net assets prior to fees waived4 | 1.29% | 1.46% | 1.50% | 1.43% | 1.56% | |||||||||||||||
Ratio of net investment income (loss) to average net assets | 0.65% | 0.89% | (0.10% | ) | (0.40% | ) | (0.34% | ) | ||||||||||||
Ratio of net investment income (loss) to average net assets prior to fees waived4 | 0.59% | 0.69% | (0.24% | ) | (0.46% | ) | (0.50% | ) | ||||||||||||
Portfolio turnover | 31% | 30% | 90% | 5 | 31% | 33% | ||||||||||||||
| 1 | The average shares outstanding method has been applied for per share information. |
| 2 | For the year ended March 31, 2016, return of capital distribution of $31,607 for Institutional Class calculated to a de minimis amount of $0.001 per share. |
| 3 | Total investment return is based on the change in net asset value of a share during the period and assumes reinvestment of dividends and distributions at net asset value. Total investment return during all of the periods shown reflects a waiver by the manager. Performance would have been lower had the waiver not been in effect. |
| 4 | Expenses paid indirectly were not material and had no impact on the ratios disclosed. Expenses paid indirectly for the year ended March 31,2018 are reflected on the “Statements of operations.” |
| 5 | As a result of LSV Asset Management replacing The Delafield Group, a division of Tocqueville Asset Management L.P., and The Killen Group, Inc. as one of the sub-advisors to Optimum Small-Mid Cap Value Fund during the Fund’s fiscal year ending March 31, 2016, the Fund’s portfolio turnover rate increased substantially during the year ended March 31, 2016. |
See accompanying notes, which are an integral part of the financial statements.
| (continues) | 149 |
Table of Contents
Optimum Fund Trust
March 31, 2018
Optimum Fund Trust (Trust) is organized as a Delaware statutory trust and offers six series: Optimum Fixed Income Fund, Optimum International Fund, Optimum Large Cap Growth Fund, Optimum Large Cap Value Fund, Optimum Small-Mid Cap Growth Fund, and Optimum Small-Mid Cap Value Fund, (each, a Fund, or collectively, the Funds). The Trust is an open-end investment company. The Funds are considered diversified under the Investment Company Act of 1940, as amended, (1940 Act), and offer Class A, Class C, and Institutional Class shares. Class A shares are sold with a maximum front-end sales charge of 4.50% for Optimum Fixed Income Fund and 5.75% for Optimum International Fund, Optimum Large Cap Growth Fund, Optimum Large Cap Value Fund, Optimum Small-Mid Cap Growth Fund, and Optimum Small-Mid Cap Value Fund. Class A share purchases of $1,000,000 or more will incur a contingent deferred sales charge (CDSC) instead of front-end sales charge of 1.00% if redeemed during the first year and 0.50% during the second year, provided that Delaware Distributors, L.P. (DDLP) paid a financial advisor a commission on the purchase of those shares. Class C shares are sold with a CDSC of 1.00%, if redeemed during the first 12 months.
Institutional Class shares are not subject to a sales charge and are offered for sale exclusively to certain eligible investors.
The investment objective of Optimum Fixed Income Fund is to seek a high level of income. The Fund may also seek growth of capital.
The investment objective of Optimum International Fund is to seek long-term growth of capital. The Fund may also seek income.
The investment objective of Optimum Large Cap Growth Fund is to seek long-term growth of capital.
The investment objective of Optimum Large Cap Value Fund is to seek long-term growth of capital. The Fund may also seek income.
The investment objective of Optimum Small-Mid Cap Growth Fund is to seek long-term growth of capital.
The investment objective of Optimum Small-Mid Cap Value Fund is to seek long-term growth of capital.
1. Significant Accounting Policies
The following accounting policies are in accordance with US generally accepted accounting principles (US GAAP) and are consistently followed by the Funds.
Security Valuation — Equity securities, except those traded on the Nasdaq Stock Market LLC (Nasdaq), are valued at the last quoted sales price as of the time of the regular close of the New York Stock Exchange on the valuation date. Equity securities traded on the Nasdaq are valued in accordance with the Nasdaq Official Closing Price, which may not be the last sales price. If, on a particular day, an equity security does not trade, the mean between the bid and ask prices will be used, which approximates fair value. Equity securities listed on a foreign exchange are normally valued at the last quoted sales price on the valuation date. Open-end investment company securities are valued at net asset value (NAV) per share, as reported by the underlying investment company. US government and agency securities are valued at the mean between the bid and ask prices, which approximates fair value. Other debt securities, credit default swap (CDS) contracts, interest rate swap contracts, CDS and interest rate swap options contracts (swaptions) are valued based upon valuations provided by an independent pricing service or broker/ counterparty and reviewed by management. To the extent current market prices are not available, the pricing service may take into account developments related to the specific security, as well as transactions in comparable securities. Valuations for fixed income securities utilize matrix systems, which reflect such factors as security prices, yields, maturities, and ratings, and are supplemented by dealer and exchange quotations. For asset-backed securities, collateralized mortgage obligations, commercial mortgage securities, and US government agency mortgage securities, pricing vendors utilize matrix pricing which considers prepayment speed, attributes of the collateral, yield or price of bonds of comparable quality, coupon, maturity, and type as well as broker/dealer-supplied prices. Swap prices are derived using daily swap curves and models that incorporate a number of market data factors, such as discounted cash flows, trades, and values of the underlying reference instruments. Foreign currency exchange contracts and foreign cross currency exchange contracts are valued at the mean between the bid and the ask prices, which approximates fair value. Interpolated values are derived when the settlement date of the contract is an interim date for which quotations are not available. Futures contracts and options on futures contracts are valued at the daily quoted settlement prices. Exchange-traded options are valued at the last reported sale price or, if no sales are reported, at the mean between the last reported bid and ask prices, which approximates fair value. Generally, other securities and assets for which market quotations are not readily available are valued at fair value as determined in good faith under the direction of the Trust’s Board of Trustees (Board). In determining whether market quotations are readily available or fair valuation will be used, various factors will be taken into consideration, such as market closures or suspension of trading in a security. Each Fund may use fair value pricing more frequently for securities traded primarily in non-US markets because, among other things, most foreign markets close well before each Fund values its securities, generally as of 4:00pm Eastern time. The earlier close of these foreign markets gives rise to the possibility that significant events, including broad market moves, government actions or pronouncements, aftermarket trading, or news events may have occurred in the interim. Whenever such a significant event occurs, each Fund may value foreign
150
Table of Contents
securities using fair value prices based on third-party vendor modeling tools (international fair value pricing). Restricted securities are valued at fair value using methods approved by the Board.
Federal and Foreign Income Taxes — No provision for federal income taxes has been made as each Fund intends to continue to qualify for federal income tax purposes as a regulated investment company (RIC) under Subchapter M of the Internal Revenue Code of 1986, as amended, and make the requisite distributions to shareholders. The Funds evaluate tax positions taken or expected to be taken in the course of preparing each Fund’s tax returns to determine whether the tax positions are “more-likely-than-not” of being sustained by the applicable tax authority. Tax positions not deemed to meet the “more-likely-than-not” threshold are recorded as a tax benefit or expense in the current year. Management has analyzed each Fund’s tax positions taken or to be taken on each Fund’s federal income tax returns through the year ended March 31, 2018 and for all open federal income tax years (March 31, 2015–March 31, 2017) and has concluded that no provision for federal income tax is required in any Fund’s financial statements. In regard to foreign taxes only, each Fund has open tax years in certain foreign countries in which it invests that may date back to the inception of each Fund. If applicable, the Funds recognize interest accrued in unrecognized tax benefits in interest expense and penalties in other expenses on the “Statements of operations.” During the year ended March 31, 2018, the Funds did not incur any interest or tax penalties.
Class Accounting — Investment income, common expenses, and realized and unrealized gain (loss) on investments are allocated to the various classes of the Funds on the basis of daily net assets of each class. Distribution expenses relating to a specific class are charged directly to that class.
Repurchase Agreements — Each Fund may purchase certain US government securities subject to the counterparty’s agreement to repurchase them at an agreed upon date and price. The counterparty will be required on a daily basis to maintain the value of the collateral subject to the agreement at not less than the repurchase price (including accrued interest). The agreements are conditioned upon the collateral being deposited under the Federal Reserve book-entry system with each Fund’s custodian or a third-party sub-custodian. In the event of default or bankruptcy by the other party to the agreement, retention of the collateral may be subject to legal proceedings. All open repurchase agreements as of the date of this report were entered into on March 29, 2018, and matured on the next business day.
Reverse Repurchase Agreements — Optimum Fixed Income Fund may enter into reverse repurchase agreements. In a reverse repurchase agreement, the Fund sells securities to a bank or broker/dealer and agrees to repurchase the securities at an agreed upon date and price. The Fund will maintain in a segregated account, cash, cash equivalents, or US government securities in an amount sufficient to cover its obligations under reverse repurchase agreements with broker/dealers (but no collateral is required on reverse repurchase agreements with banks). The Fund will subject its investments in reverse repurchase agreements to the borrowing provisions set forth in the 1940 Act. The use of reverse repurchase agreements by the Fund creates leverage, which increases the Fund’s investment risk. If the income and gains on securities purchased with the proceeds of reverse repurchase agreements exceed the costs of the agreements, the Fund’s earnings or NAV will increase faster than otherwise would be the case; conversely, if the income and gains fail to exceed the costs, earnings or NAV would decline faster than otherwise would be the case. For the year ended March 31, 2018, the Fund had average reverse repurchase agreements of $80,547 for which it paid interest at an average rate of 1.19%. At March 31, 2018, there were no open reverse repurchase agreements in the Fund.
To Be Announced Trades (TBA) — Optimum Fixed Income Fund may contract to purchase or sell securities for a fixed price at a transaction date beyond the customary settlement period (examples: when issued, delayed delivery, forward commitment, or TBA transactions) consistent with the Fund’s ability to manage its investment portfolio and meet redemption requests. These transactions involve a commitment by the Fund to purchase or sell securities for a predetermined price or yield with payment and delivery taking place more than three days in the future, or after a period longer than the customary settlement period for that type of security. No interest will be earned by the Fund on such purchases until the securities are delivered or the transaction is completed; however, the market value may change prior to delivery. At March 31, 2018, the Fund received $1,562,000 cash collateral for TBA trades, which is included in “Cash collateral due to brokers” on the “Statements of assets and liabilities.”
Foreign Currency Transactions — Transactions denominated in foreign currencies are recorded at the prevailing exchange rates on the valuation date in accordance with the Funds’ prospectus. The value of all assets and liabilities denominated in foreign currencies is translated daily into US dollars at the exchange rate of such currencies against the US dollar. Transaction gains or losses resulting from changes in exchange rates during the reporting period or upon settlement of the foreign currency transaction are reported in operations for the current period. The Funds generally bifurcate that portion of realized gains and losses on investments in debt securities which is due to changes in foreign exchange rates from that which is due to changes in market prices of debt securities. That portion of gains (losses), which is due to changes in foreign exchange rates is included on the “Statements of operations” under “Net realized gain (loss) on foreign currencies.” For
| (continues) | 151 |
Table of Contents
Notes to financial statements
Optimum Fund Trust
1. Significant Accounting Policies (continued)
foreign equity securities, the realized gains and losses are included on the “Statements of operations” under “Net realized and unrealized gain (loss) on investments.” The Funds report certain foreign currency related transactions as components of realized gains (losses) for financial reporting purposes, whereas such components are treated as ordinary income (loss) for federal income tax purposes.
Use of Estimates — Each Fund is an investment company, whose financial statements are prepared in conformity with US GAAP. Therefore, each Fund follows the accounting and reporting guidelines for investment companies. The preparation of financial statements in conformity with US GAAP requires management to make estimates and assumptions that affect the fair value of investments, the reported amounts of assets and liabilities and disclosure of contingent assets and liabilities at the date of the financial statements, and the reported amounts of revenues and expenses during the reporting period. Actual results could differ from those estimates and the differences could be material.
Other — Expenses directly attributable to a Fund are charged directly to that Fund. Other expenses common to various funds within the Trust are generally allocated among such funds on the basis of average net assets. Management fees and certain other expenses are paid monthly. Security transactions are recorded on the date the securities are purchased or sold (trade date) for financial reporting purposes. Costs used in calculating realized gains and losses on the sale of investment securities are those of the specific securities sold. Dividend income is recorded on the ex-dividend date and interest income is recorded on the accrual basis. Discounts and premiums on debt securities are accreted or amortized to interest income, respectively, over the lives of the respective securities using the effective interest method. Realized gains (losses) on paydowns of asset- and mortgage-backed securities are classified as interest income. Distributions received from investments in real estate investment trusts (REITs) are recorded as dividend income on the ex-dividend date, subject to reclassification upon notice of the character of such distributions by the issuer. Distributions received from investments in master limited partnerships are recorded as return of capital on investments on the ex-dividend date. Foreign dividends are also recorded on the ex-dividend date or as soon after the ex-dividend date that the Funds are aware of such dividends, net of all tax withholdings, a portion of which may be reclaimable. Withholding taxes and reclaims on foreign dividends and interest have been recorded in accordance with the Funds’ understanding of the applicable country’s tax rules and rates. Each Fund may pay foreign capital gains taxes on certain foreign securities held, which are reported as components of realized losses for financial reporting purposes, whereas such components are treated as ordinary loss for federal income tax purposes. Each Fund declares and pays distributions from net investment income and net realized gain on investments, if any, at least annually. The Funds may distribute more frequently, if necessary for tax purposes. Dividends and distributions, if any, are recorded on the ex-dividend date.
Each Fund receives earnings credits from its custodian when positive cash balances are maintained, which may be used to offset custody fees. The expense paid under this agreement is included on the “Statements of operations” under “Custodian fees” with the corresponding offset included under “Less expenses paid indirectly.” For the year ended March 31, 2018, each Fund earned the following amounts under this agreement:
Optimum Fixed Income Fund | Optimum International Fund | Optimum Large Cap Growth Fund | Optimum Large Cap Value Fund | Optimum Small-Mid Cap Growth Fund | Optimum Small-Mid Cap Value Fund | |||||
| $15,688 | $626 | $711 | $1,683 | $588 | $314 |
Each Fund receives earnings credits from its transfer agent when positive cash balances are maintained, which may be used to offset transfer agent fees. If the amount earned is greater than $1, the expense paid under this arrangement is included on the “Statements of operations” under “Dividend disbursing and transfer agent fees and expenses” with the corresponding expense offset included under “Less expenses paid indirectly.” For the year ended March 31, 2018, each Fund earned the following amounts under this agreement:
Optimum Fixed Income Fund | Optimum International Fund | Optimum Large Cap Growth Fund | Optimum Large Cap Value Fund | Optimum Small-Mid Cap Growth Fund | Optimum Small-Mid Cap Value Fund | |||||
| $864 | $813 | $936 | $932 | $914 | $920 |
2. Investment Management, Administration Agreements, and Other Transactions with Affiliates
Delaware Management Company (DMC), a series of Macquarie Investment Management Business Trust, furnishes investment management services to each Fund and has full discretion and responsibility, subject to the overall supervision of the Board, to select and contract with one or more investment sub-advisors to manage the investment operations and composition of each Fund, and to render investment advice for each Fund, including the purchase, retention, and dispositions of investments, securities, and cash contained in each Fund. The investment
152
Table of Contents
management agreement obligates DMC to implement decisions with respect to the allocation or reallocation of each Fund’s assets among one or more current or additional sub-advisors, and to monitor the sub-advisors’ compliance with the relevant Fund’s investment objective, policies and restrictions. DMC pays the sub-advisors out of its fees, which are calculated daily and paid monthly.
In accordance with the terms of its respective investment management agreement, DMC is entitled to receive an annual fee equal to the following percentage rates of the average daily net assets of each Fund, which is calculated daily and paid monthly:
| Optimum Fixed Income Fund | 0.6000% of net assets up to $500 million | |
| 0.5500% of net assets from $500 million to $1 billion | ||
| 0.5000% of net assets from $1 billion to $1.5 billion | ||
| 0.4500% of net assets from $1.5 billion to $2 billion | ||
| 0.4250% of net assets from $2 billion to $2.5 billion | ||
| 0.4000% of net assets from $2.5 billion to $5 billion | ||
| 0.3750% of net assets over $5 billion | ||
| Optimum International Fund | 0.7500% of net assets up to $500 million | |
| 0.7150% of net assets from $500 million to $1 billion | ||
| 0.7000% of net assets from $1 billion to $1.5 billion | ||
| 0.6750% of net assets from $1.5 billion to $2 billion | ||
| 0.6500% of net assets from $2 billion to $2.5 billion | ||
| 0.6000% of net assets over $2.5 billion | ||
| Optimum Large Cap Growth Fund | 0.7500% of net assets up to $500 million | |
| 0.7000% of net assets from $500 million to $1 billion | ||
| 0.6500% of net assets from $1 billion to $1.5 billion | ||
| 0.6250% of net assets from $1.5 billion to $2 billion | ||
| 0.6000% of net assets from $2 billion to $2.5 billion | ||
| 0.5750% of net assets from $2.5 billion to $5 billion | ||
| 0.5500% of net assets over $5 billion | ||
| Optimum Large Cap Value Fund | 0.7000% of net assets up to $500 million | |
| 0.6500% of net assets from $500 million to $1 billion | ||
| 0.6000% of net assets from $1 billion to $1.5 billion | ||
| 0.5750% of net assets from $1.5 billion to $2 billion | ||
| 0.5500% of net assets from $2 billion to $2.5 billion | ||
| 0.5250% of net assets from 2.5 billion to $5 billion | ||
| 0.5000% of net assets over $5 billion | ||
| Optimum Small-Mid Cap Growth Fund | 1.1000% of net assets up to $250 million | |
| 1.0000% of net assets from $250 million to $500 million | ||
| 0.9000% of net assets from $500 million to $750 million | ||
| 0.8000% of net assets from $750 million to $1 billion | ||
| 0.7500% of net assets from $1 billion to $1.5 billion | ||
| 0.7000% of net assets over $1.5 billion | ||
| Optimum Small-Mid Cap Value Fund | 1.0000% of net assets up to $250 million | |
| 0.9000% of net assets from $250 million to $500 million | ||
| 0.8000% of net assets from $500 million to $750 million | ||
| 0.7500% of net assets from $750 million to $1 billion | ||
| 0.7000% of net assets from $1 billion to $1.5 billion | ||
| 0.6500% of net assets over $1.5 billion | ||
| (continues) | 153 |
Table of Contents
Notes to financial statements
Optimum Fund Trust
2. Investment Management, Administration Agreements, and Other Transactions with Affiliates (continued)
DMC has entered into sub-advisory agreements for the Trust as follows: Optimum Fixed Income Fund – Pacific Investment Management Company, LLC (PIMCO); Optimum International Fund – Acadian Asset Management LLC (Acadian), and EARNEST Partners, LLC (EARNEST); Optimum Large Cap Growth Fund –T. Rowe Price Associates, Inc. (T. Rowe Price), and effective Oct. 12, 2017, ClearBridge Investment LLC, (ClearBridge); Optimum Large Cap Value Fund – Massachusetts Financial Services Company (MFS) and Rothschild Asset Management Inc. (Rothschild); Optimum Small-Mid Cap Growth Fund – Columbus Circle Investors (CCI) and Peregrine Capital Management LLC (Peregrine); Optimum Small-Mid Cap Value Fund – LSV Asset Management (LSV) and Westwood Management Corp. (Westwood). Prior to Oct. 12, 2017, Fred Alger Management Inc. was also a sub-advisor for Optimum Large Cap Growth Fund.
For the year ended March 31, 2018, DMC paid the following sub-advisory fees:
Optimum Fixed Income Fund | Optimum International Fund | Optimum Large Cap Growth Fund | Optimum Large Cap Value Fund | Optimum Small-Mid Cap Growth Fund | Optimum Small-Mid Cap Value Fund | |||||
| $2,362,534 | $2,482,317 | $5,630,270 | $4,362,779 | $2,329,793 | $2,281,661 |
DMC has contractually agreed to waive that portion, if any, of its management fee and/or pay/reimburse each Fund to the extent necessary to ensure that total annual fund operating expenses (excluding any distribution and service (12b-1) fees, acquired fund fees and expenses, taxes, interest, short sale and dividend interest expenses, brokerage fees, certain insurance costs, and nonroutine expenses or costs, including, but not limited to, those relating to reorganizations, litigation, conducting shareholder meetings, and liquidations (collectively, nonroutine expenses)) do not exceed the following percentages of each Fund’s average daily net assets. For purposes of these waivers and reimbursements, nonroutine expenses may also include such additional costs and expenses as may be agreed upon from time to time by the Board and DMC. These waivers and reimbursements may be terminated only by agreement of DMC and the Funds.
| Optimum Fixed Income Fund | Optimum International Fund | Optimum Large Cap Growth Fund | Optimum Large Cap Value Fund | Optimum Small-Mid Cap Growth Fund | Optimum Small-Mid Cap Value Fund | |||||||
Operating expense limitation as a percentage of average daily net assets (per annum) for the period July 29, 2017 – July 30, 2018 | 0.86% | 1.13% | 1.02% | 0.98% | 1.29% | 1.22% | ||||||
Operating expense limitation as a percentage of average daily net assets (per annum) for the period July 29, 2016 – July 29, 2017 | 0.92% | 1.25% | 1.10% | 1.08% | 1.33% | 1.25% |
Delaware Investments Fund Services Company (DIFSC), an affiliate of DMC, provides fund accounting and financial administration oversight services to the Trust. Those services include overseeing the Funds’ pricing process, the calculation and payment of fund expenses, and financial reporting in shareholder reports, registration statements and other regulatory filings. DIFSC also manages the process for the payment of dividends and distributions and the dissemination of Funds’ NAVs and performance data. For these services, the Funds pay DIFSC an asset-based fee, plus certain out-of-pocket expenses and transactional charges. Effective July 1, 2017, DIFSC fees are calculated daily and paid monthly based on the aggregate daily net assets of the Trust at the following annual rate: 0.0075% of the first $3.5 billion; 0.0070% of the next $2 billion; 0.0060% of the next $2 billion; and 0.0050% of aggregate average daily net assets in excess of $7.5 billion. The fees payable
154
Table of Contents
to DIFSC under the service agreement described above are allocated among all funds in the Trust on a relative NAV basis. Prior to July 1, 2017, DIFSC fees were calculated daily and paid monthly based on the aggregate daily net assets of the Trust at the following annual rate: 0.0075% of the first $3 billion; 0.0070% of the next $2 billion; 0.0065% of the next $2.5 billion; 0.0055% of the next $2.5 billion; and 0.0050% of aggregate average daily net assets in excess of $10 billion. These amounts are included on the “Statements of operations” under “Accounting fees.” For the year ended March 31, 2018, each Fund was charged for these services as follows:
Optimum Fixed Income Fund | Optimum International Fund | Optimum Large Cap Growth Fund | Optimum Large Cap Value Fund | Optimum Small-Mid Cap Growth Fund | Optimum Small-Mid Cap Value Fund | |||||
| $136,152 | $45,915 | $115,413 | $100,171 | $35,454 | $32,849 |
DIFSC provides the Trust with administrative services including: preparation, filing and maintaining governing documents; preparation of materials and reports for the Board; and preparation and filing of registration statements and other regulatory filings. For these administrative services, the Trust pays DIFSC the following fee as a percentage of the Trust’s average daily net assets (plus out-of-pocket expenses): 0.0525% of assets up to $7.5 billion; 0.0475% of assets from $7.5 billion to $10 billion; 0.0425% of assets from $10 billion to $12 billion; 0.0375% of assets from $12 billion to $14 billion; and 0.0325% of assets over $14 billion.
DIFSC is also the shareholder servicing, dividend disbursing, and transfer agent for each Fund. For these services, the Trust pays DIFSC a fee at an annual rate of 0.18% of the Trust’s total average daily net assets, subject to a minimum fee of $2,000 per class per fund each month, plus out-of-pocket expenses. The fee is calculated daily and paid monthly. Pursuant to a sub-transfer agency agreement between DIFSC and BNY Mellon Investment Servicing (US) Inc. (BNYMIS), BNYMIS provides certain sub-transfer agency services to the Funds. Sub-transfer agency fees are paid by the Funds and are also included on the “Statements of operations” under “Dividend disbursing and transfer agent fees and expenses.”
DDLP, an affiliate of DMC, serves as the national distributor of each Fund’s shares pursuant to a Distribution Agreement. Pursuant to the Distribution Agreement and Rule 12b-1 plan, each Fund pays DDLP an annual 12b-1 fee of 0.25% of the average daily net assets of the Class A shares and 1.00% of the average daily net assets of the Class C shares. The fees are calculated daily and paid monthly. Institutional Class shares pay no 12b-1 fees.
For the year ended March 31, 2018, DDLP earned commissions on sales of Class A shares for each Fund as follows:
Optimum Fixed Income Fund | Optimum International Fund | Optimum Large Cap Growth Fund | Optimum Large Cap Value Fund | Optimum Small-Mid Cap Growth Fund | Optimum Small-Mid Cap Value Fund | |||||
| $34,918 | $2,284 | $6,771 | $7,040 | $1,541 | $1,102 |
For the year ended March 31, 2018, DDLP received gross CDSC commissions on redemptions of each Fund’s Class C shares, and these commissions were entirely used to offset upfront commissions previously paid by DDLP to broker/dealers on sales of those shares. The amounts received were as follows:
Optimum Fixed Income Fund | Optimum International Fund | Optimum Large Cap Growth Fund | Optimum Large Cap Value Fund | Optimum Small-Mid Cap Growth Fund | Optimum Small-Mid Cap Value Fund | |||||
| $6,303 | $1,617 | $3,609 | $4,230 | $682 | $543 |
| (continues) | 155 |
Table of Contents
Notes to financial statements
Optimum Fund Trust
2. Investment Management, Administration Agreements, and Other Transactions with Affiliates (continued)
DMC, DIFSC and DDLP are indirect, wholly owned subsidiaries of Macquarie Management Holdings, Inc. Certain officers of DMC, DIFSC and DDLP are officers and/or Trustees of the Trust. These officers and Trustees are paid no compensation by the Funds.
Cross trades for the year ended March 31, 2018, were executed by the Funds pursuant to procedures adopted by the Board designed to ensure compliance with Rule 17a-7 under the 1940 Act. Cross trading is the buying or selling of portfolio securities between funds of investment companies, or between a fund of an investment company and another entity, that are or could be considered affiliates by virtue of having a common investment advisor (or affiliated investment advisors), common directors/trustees and/or common officers. At its regularly scheduled meetings, the Board reviews such transactions for compliance with the procedures adopted by the Board. Optimum Large Cap Growth Fund, Optimum Large Cap Value Fund, and Optimum Small Cap Value Fund did not engage in securities cross trades for the year ended March 31, 2018. Pursuant to these procedures, for the year ended March 31, 2018, the following Funds engaged in securities purchases and sales, which resulted in net realized gains (losses) as follows:
| Optimum Fixed Income Fund | Optimum International Fund | Optimum Large Cap Growth Fund | Optimum Small-Mid Cap Growth Fund | |||||||||||||
Purchases | $3,209,659 | $ | — | $5,474,926 | $ | — | ||||||||||
Sales | 3,189,163 | 1,963,032 | 1,720,850 | 3,791,652 | ||||||||||||
Net realized gain (loss) | 427 | (103) �� | 524,495 | (239) | ||||||||||||
3. Investments
For the year ended March 31, 2018, each Fund made purchases and sales of investments securities other than short-term investments as follows:
Optimum Fixed Income Fund | Optimum International Fund | Optimum Large Cap Growth Fund | Optimum Large Cap Value Fund | Optimum Small-Mid Cap Growth Fund | Optimum Small-Mid Cap Value Fund | |||||||||||||||||||
Purchases other than US government securities | $ 989,745,151 | $322,512,767 | $1,252,862,346 | $377,352,069 | $415,471,409 | $143,988,531 | ||||||||||||||||||
Purchases of US government securities | 7,589,382,270 | — | — | — | — | — | ||||||||||||||||||
Sales other than US government securities | 1,026,593,675 | 336,383,618 | 1,307,483,223 | 344,849,416 | 442,639,792 | 133,280,501 | ||||||||||||||||||
Sales of US government securities | 7,400,883,731 | — | — | — | — | — | ||||||||||||||||||
156
Table of Contents
The tax cost of investments includes adjustments to net unrealized appreciation (depreciation) which may not necessarily be final tax cost basis adjustments, but approximate the tax basis unrealized gains and losses that may be realized and distributed to shareholders. At March 31, 2018, the cost and unrealized appreciation (depreciation) of investments and derivatives for federal income tax purposes for each Fund were as follows:
Optimum Fixed Income Fund | Optimum International Fund | Optimum Large Cap Growth Fund | Optimum Large Cap Value Fund | Optimum Small-Mid Cap Growth Fund | Optimum Small-Mid Cap Value Fund | |||||||||||||||||||
Cost of investments and derivatives | $ | 2,410,988,408 | $ | 583,068,288 | $ | 1,389,059,001 | $ | 1,222,951,237 | $ | 414,064,732 | $ | 382,304,751 | ||||||||||||
|
|
|
|
|
|
|
|
|
|
|
| |||||||||||||
Aggregate unrealized appreciation of investments and derivatives | $ | 33,687,187 | $ | 123,949,578 | $ | 405,585,548 | $ | 290,718,271 | $ | 116,603,486 | $ | 86,995,930 | ||||||||||||
Aggregate unrealized depreciation of investments and derivatives | (43,246,246 | ) | (28,947,476 | ) | (53,276,118 | ) | (35,933,634 | ) | (12,958,726 | ) | (15,424,750 | ) | ||||||||||||
|
|
|
|
|
|
|
|
|
|
|
| |||||||||||||
Net unrealized appreciation (depreciation) of investments and derivatives | $ | (9,559,059 | ) | $ | 95,002,102 | $ | 352,309,430 | $ | 254,784,637 | $ | 103,644,760 | $ | 71,571,180 | |||||||||||
|
|
|
|
|
|
|
|
|
|
|
| |||||||||||||
US GAAP defines fair value as the price that each Fund would receive to sell an asset or pay to transfer a liability in an orderly transaction between market participants at the measurement date under current market conditions. A three-level hierarchy for fair value measurements has been established based upon the transparency of inputs to the valuation of an asset or liability. Inputs may be observable or unobservable and refer broadly to the assumptions that market participants would use in pricing the asset or liability. Observable inputs reflect the assumptions market participants would use in pricing the asset or liability based on market data obtained from sources independent of the reporting entity. Unobservable inputs reflect the reporting entity’s own assumptions about the assumptions that market participants would use in pricing the asset or liability based on the best information available under the circumstances. Each Fund’s investment in its entirety is assigned a level based upon the observability of the inputs which are significant to the overall valuation. The three-level hierarchy of inputs is summarized below.
| Level 1 – | Inputs are quoted prices in active markets for identical investments. (Examples: equity securities, open-end investment companies, futures contracts, exchange-traded options contracts) | |
| Level 2 – | Other observable inputs, including, but not limited to: quoted prices for similar assets or liabilities in markets that are active, quoted prices for identical or similar assets or liabilities in markets that are not active, inputs other than quoted prices that are observable for the assets or liabilities (such as interest rates, yield curves, volatilities, prepayment speeds, loss severities, credit risks, and default rates) or other market-corroborated inputs. (Examples: debt securities, government securities, swap contracts, foreign currency exchange contracts, foreign securities utilizing international fair value pricing, broker-quoted securities, fair valued securities) | |
| Level 3 – | Significant unobservable inputs, including each Fund’s own assumptions used to determine the fair value of investments. (Examples: broker-quoted securities, fair valued securities) | |
Level 3 investments are valued using significant unobservable inputs. Each Fund may also use an income-based valuation approach in which the anticipated future cash flows of the investment are discounted to calculate fair value. Discounts may also be applied due to the nature or duration of any restrictions on the disposition of the investments. Valuations may also be based upon current market prices of securities that are comparable in coupon, rating, maturity, and industry. The derived value of a Level 3 investment may not represent the value which is received upon disposition and this could impact the results of operations.
| (continues) | 157 |
Table of Contents
Notes to financial statements
Optimum Fund Trust
3. Investments (continued)
The following tables summarize the valuation of each Fund’s investments by fair value hierarchy levels as of March 31, 2018:
Optimum Fixed Income Fund | ||||||||||||||||
Level 1 | Level 2 | Level 3 | Total | |||||||||||||
Securities | ||||||||||||||||
Assets: | ||||||||||||||||
Agency, Asset- & Mortgage-Backed Securities1 | $ | — | $ | 807,224,725 | $ | — | $ | 807,224,725 | ||||||||
Corporate Debt | — | 764,292,757 | — | 764,292,757 | ||||||||||||
Foreign Debt | — | 258,595,131 | — | 258,595,131 | ||||||||||||
Municipal Bonds | — | 16,521,731 | — | 16,521,731 | ||||||||||||
Loan Agreements1 | — | 112,612,531 | 2,718,644 | 115,331,175 | ||||||||||||
Common Stock | — | — | — | — | ||||||||||||
Convertible Preferred Stock1 | 4,765,186 | 2,789,111 | — | 7,554,297 | ||||||||||||
Preferred Stock | — | 5,006,897 | — | 5,006,897 | ||||||||||||
US Treasury Obligations | — | 302,141,369 | — | 302,141,369 | ||||||||||||
Short-Term Investments | — | 110,685,245 | — | 110,685,245 | ||||||||||||
Options Purchased | — | 135,057 | — | 135,057 | ||||||||||||
|
|
|
|
|
|
|
| |||||||||
Total Value of Securities Before Options Written | $ | 4,765,186 | $ | 2,380,004,554 | $ | 2,718,644 | $ | 2,387,488,384 | ||||||||
|
|
|
|
|
|
|
| |||||||||
Liabilities: | ||||||||||||||||
Options Written | $ | — | $ | (194,021 | ) | $ | — | $ | (194,021 | ) | ||||||
Derivatives2 | ||||||||||||||||
Assets: | ||||||||||||||||
Foreign Currency Exchange Contracts | $ | — | $ | 1,160,541 | $ | — | $ | 1,160,541 | ||||||||
Futures Contracts | 10,019,132 | — | — | 10,019,132 | ||||||||||||
Swap Contracts | — | 6,718,880 | — | 6,718,880 | ||||||||||||
Liabilities: | ||||||||||||||||
Foreign Currency Exchange Contracts | — | (1,099,471 | ) | — | (1,099,471 | ) | ||||||||||
Futures Contracts | (1,165,361 | ) | — | — | (1,165,361 | ) | ||||||||||
Swap Contracts | — | (1,498,735 | ) | — | (1,498,735 | ) | ||||||||||
1Security type is valued across multiple levels. Level 1 investments represent exchange-traded investments, Level 2 investments represent investments with observable inputs or matrix-priced investments, and Level 3 investments represent investments without observable inputs. The amounts attributed to Level 1 investments, Level 2 investments, and Level 3 investments represent the following percentages of the total market value of these security types:
Level 1 | Level 2 | Level 3 | Total | |||||||||||||
Loan Agreements | — | 98.23 | % | 1.77 | % | 100.00 | % | |||||||||
Convertible Preferred Stock | 63.08 | % | 36.92 | % | — | 100.00 | % | |||||||||
2Foreign currency exchange contracts, futures contracts, and swap contracts are valued at the unrealized appreciation (depreciation) on the instrument at the year end.
158
Table of Contents
Optimum International Fund | ||||||||||||||||
Level 1 | Level 2 | Level 3 | Total | |||||||||||||
Securities | ||||||||||||||||
Assets: | ||||||||||||||||
Common Stock | ||||||||||||||||
Australia | $ | 2,865,957 | $ | 7,009,870 | $ | — | $ | 9,875,827 | ||||||||
Austria | — | 18,954,632 | — | 18,954,632 | ||||||||||||
Bermuda | 6,145,446 | — | — | 6,145,446 | ||||||||||||
Brazil | 8,961,247 | — | — | 8,961,247 | ||||||||||||
Canada | 25,610,457 | — | — | 25,610,457 | ||||||||||||
China/Hong Kong | — | 52,953,161 | — | 52,953,161 | ||||||||||||
Colombia | 4,199,479 | — | — | 4,199,479 | ||||||||||||
Czech Republic | — | 2,717,246 | — | 2,717,246 | ||||||||||||
Denmark | — | 8,264,446 | — | 8,264,446 | ||||||||||||
Finland | — | 4,268,460 | — | 4,268,460 | ||||||||||||
France | 1,204,583 | 37,083,094 | — | 38,287,677 | ||||||||||||
Germany | — | 33,769,663 | — | 33,769,663 | ||||||||||||
India | 5,492,806 | 12,483,076 | — | 17,975,882 | ||||||||||||
Indonesia | — | 9,419,384 | — | 9,419,384 | ||||||||||||
Ireland | 12,942,828 | — | — | 12,942,828 | ||||||||||||
Israel | 4,469,063 | 15,567,872 | — | 20,036,935 | ||||||||||||
Italy | — | 8,700,947 | — | 8,700,947 | ||||||||||||
Japan | 128,664,351 | — | — | 128,664,351 | ||||||||||||
Macau | — | 1,174,340 | — | 1,174,340 | ||||||||||||
Mexico | 4,487,989 | — | — | 4,487,989 | ||||||||||||
Netherlands | 6,638,637 | 28,275,608 | — | 34,914,245 | ||||||||||||
New Zealand | — | 8,317,925 | — | 8,317,925 | ||||||||||||
Norway | 6,026,351 | 11,962,854 | — | 17,989,205 | ||||||||||||
Republic of Korea | 19,724,397 | — | — | 19,724,397 | ||||||||||||
Singapore | 2,610,113 | 7,555,392 | — | 10,165,505 | ||||||||||||
South Africa | — | 1,045,557 | — | 1,045,557 | ||||||||||||
Spain | 8,099,404 | 8,569,045 | — | 16,668,449 | ||||||||||||
Sweden | — | 1,807,608 | — | 1,807,608 | ||||||||||||
Switzerland | 11,764,502 | 21,141,585 | — | 32,906,087 | ||||||||||||
Taiwan | 17,317,733 | — | — | 17,317,733 | ||||||||||||
Thailand | 18,219,180 | — | — | 18,219,180 | ||||||||||||
Turkey | 2,936,187 | — | — | 2,936,187 | ||||||||||||
United Kingdom | 6,811,921 | 32,525,823 | — | 39,337,744 | ||||||||||||
United States | 6,777,824 | — | 234,434 | 7,012,258 | ||||||||||||
Short-Term Investments | — | 10,192,591 | — | 10,192,591 | ||||||||||||
Securities Lending Collateral | — | 22,105,164 | — | 22,105,164 | ||||||||||||
|
|
|
|
|
|
|
| |||||||||
Total Value of Securities | $ | 311,970,455 | $ | 365,865,343 | $ | 234,434 | $ | 678,070,232 | ||||||||
|
|
|
|
|
|
|
| |||||||||
Derivatives:1 | ||||||||||||||||
Assets: | ||||||||||||||||
Foreign Currency Exchange Contracts | $ | — | $ | 7,994 | $ | — | $ | 7,994 | ||||||||
Liabilities: | ||||||||||||||||
Foreign Currency Exchange Contracts | — | (7,836 | ) | — | (7,836 | ) | ||||||||||
1Foreign Currency exchange contracts are valued at the unrealized appreciation (depreciation) on the instrument at the year end.
| (continues) | 159 |
Table of Contents
Notes to financial statements
Optimum Fund Trust
3. Investments (continued)
Optimum Large Cap Growth Fund | ||||||||||||||||
Level 1 | Level 2 | Level 3 | Total | |||||||||||||
Securities | ||||||||||||||||
Assets: | ||||||||||||||||
Common Stock | ||||||||||||||||
Consumer Discretionary | $ | 314,116,076 | $ | — | $ | 1,781,151 | $ | 315,897,227 | ||||||||
Consumer Staples | 76,369,724 | — | — | 76,369,724 | ||||||||||||
Energy | 28,888,323 | — | — | 28,888,323 | ||||||||||||
Financials | 109,427,492 | — | 38,374 | 109,465,866 | ||||||||||||
Healthcare | 262,671,293 | — | — | 262,671,293 | ||||||||||||
Industrials | 154,537,375 | — | — | 154,537,375 | ||||||||||||
Information Technology | 672,160,927 | 12,934,562 | — | 685,095,489 | ||||||||||||
Materials | 32,246,012 | — | — | 32,246,012 | ||||||||||||
Real Estate | 32,121,097 | — | — | 32,121,097 | ||||||||||||
Utilities | 17,672,522 | — | — | 17,672,522 | ||||||||||||
Convertible Preferred Stock | — | — | 9,038,809 | 9,038,809 | ||||||||||||
Corporate Debt | — | 1,827,680 | — | 1,827,680 | ||||||||||||
Short-Term Investments | — | 15,537,014 | — | 15,537,014 | ||||||||||||
|
|
|
|
|
|
|
| |||||||||
Total Value of Securities | $ | 1,700,210,841 | $ | 30,299,256 | $ | 10,858,334 | $ | 1,741,368,431 | ||||||||
|
|
|
|
|
|
|
| |||||||||
Optimum Large Cap Value Fund | ||||||||||||
Level 1 | Level 2 | Total | ||||||||||
Securities | ||||||||||||
Assets: | ||||||||||||
Common Stock | ||||||||||||
Consumer Discretionary | $ | 86,013,292 | $ | — | $ | 86,013,292 | ||||||
Consumer Staples | 93,257,361 | 26,896,483 | 120,153,844 | |||||||||
Energy | 115,952,845 | — | 115,952,845 | |||||||||
Financials | 414,562,878 | — | 414,562,878 | |||||||||
Healthcare | 214,515,858 | 2,982,442 | 217,498,300 | |||||||||
Industrials | 192,488,013 | — | 192,488,013 | |||||||||
Information Technology | 130,326,600 | — | 130,326,600 | |||||||||
Materials | 55,955,060 | — | 55,955,060 | |||||||||
Real Estate | 24,276,029 | — | 24,276,029 | |||||||||
Telecommunication Services | 39,332,359 | — | 39,332,359 | |||||||||
Utilities | 57,024,275 | — | 57,024,275 | |||||||||
Short-Term Investments | — | 24,152,379 | 24,152,379 | |||||||||
|
|
|
|
|
| |||||||
Total Value of Securities | $ | 1,423,704,570 | $ | 54,031,304 | $ | 1,477,735,874 | ||||||
|
|
|
|
|
| |||||||
160
Table of Contents
Optimum Small-Mid Cap Growth Fund | ||||||||
Level 1 | Level 2 | Level 3 | Total | |||||||||||||||||||||||||
Securities | ||||||||||||||||||||||||||||
Assets: | ||||||||||||||||||||||||||||
Common Stock | $ | 501,652,335 | $ | — | $ | — | $ | 501,652,335 | ||||||||||||||||||||
Convertible Preferred Stock1 | 1,973,485 | — | 3,762,308 | 5,735,793 | ||||||||||||||||||||||||
Short-Term Investments | — | 10,321,364 | — | 10,321,364 | ||||||||||||||||||||||||
|
|
|
|
|
|
|
| |||||||||||||||||||||
Total Value of Securities | $ | 503,625,820 | $ | 10,321,364 | $ | 3,762,308 | $ | 517,709,492 | ||||||||||||||||||||
|
|
|
|
|
|
|
| |||||||||||||||||||||
1Security type is valued across multiple levels. Level 1 investments represent exchange-traded investments, Level 2 investments represent investments with observable inputs or matrix-priced investments, and Level 3 investments represent investments without observable inputs. The amounts attributed to Level 1 investments, Level 2 investments, and Level 3 investments represent the following percentages of the total market value of this security type:
Level 1 | Level 3 | Total | ||||||||||
Convertible Preferred Stock | 34.41 | % | 65.59 | % | 100 | % | ||||||
| Optimum Small-Mid Cap Value Fund | ||||||
Level 1 | Level 2 | Total | ||||||||||||||||||
Securities | ||||||||||||||||||||
Assets: | ||||||||||||||||||||
Common Stock | $ | 447,365,809 | $ | — | $ | 447,365,809 | ||||||||||||||
Short-Term Investments | — | 6,510,122 | 6,510,122 | |||||||||||||||||
|
|
|
|
|
| |||||||||||||||
Total Value of Securities | $ | 447,365,809 | $ | 6,510,122 | $ | 453,875,931 | ||||||||||||||
|
|
|
|
|
| |||||||||||||||
Securities valued at zero on the “Schedules of investments” are considered to be Level 3 investments in these tables.
As a result of utilizing international fair value pricing at March 31, 2018, the majority of Optimum International Fund’s common stock investments and a portion of Optimum Large Cap Growth Fund’s and Optimum Large Cap Value Fund’s common stock investments were categorized as Level 2.
During the year ended March 31, 2018, there were no transfers between Level 1 investments, Level 2 investments, or Level 3 investments that had a significant impact to the Funds. This does not include transfers between Level 1 investments and Level 2 investments due to the Funds utilizing international fair value pricing during the year. In accordance with the fair valuation procedures described in Note 1, international fair value pricing of securities in each Fund occurs when market volatility exceeds an established rolling threshold. If the threshold is exceeded on a given date, then prices of international securities (those that traded on exchanges that close at a different time than the time that the Funds’ NAV is determined) are established using a separate pricing feed from a third-party vendor designed to establish a price for each such security as of the time that the Funds’ NAV is determined. Further, international fair value pricing uses other observable market-based inputs in place of the closing exchange price due to the events occurring after the close of the exchange or market on which the investment is principally traded, causing a change in classification between levels. Each Fund’s policy is to recognize transfers between levels based on fair value at the beginning of the reporting period.
A reconciliation of Level 3 investments is presented when each Fund has a significant amount of Level 3 investments at the beginning, interim, or end of the period in relation to each Fund’s net assets. With the exception of Optimum Small-Mid Cap Growth Fund, management has determined not to provide a reconciliation of Level 3 investments as they are not considered significant to each Fund’s net assets at the beginning, interim, or end of the year. Management has determined not to provide additional disclosure on Level 3 inputs since the Level 3 investments are not considered significant to each Fund’s net assets at the end of the year. There were no Level 3 investments during the year ended March 31, 2018 for Optimum Large Cap Value Fund and Optimum Small-Mid Cap Value Fund.
| (continues) | 161 |
Table of Contents
Notes to financial statements
Optimum Fund Trust
3. Investments (continued)
The following is a reconciliation of investments in which significant unobservable inputs (Level 3) were used in determining fair value for Optimum Small-Mid Cap Growth Fund:
| Convertible Preferred Stock | ||||
Beginning balance March 31, 2017 | $ | 4,584,960 | ||
Sales | (1,065,862 | ) | ||
Net realized gain | 501,100 | |||
Transfers into Level 3 | 693,770 | |||
Transfers out of Level 3 | (1,134,120 | ) | ||
Net change in unrealized appreciation (depreciation) | 182,460 | |||
|
| |||
Ending balance March 31, 2018 | $ | 3,762,308 | ||
|
| |||
Net change in unrealized appreciation from investments still held at the end of the year | $ | 78,542 | ||
4. Dividend and Distribution Information
Income and long-term capital gain distributions are determined in accordance with federal income tax regulations, which may differ from US GAAP. Additionally, distributions from net gains on foreign currency transactions and net short-term gains on sales of investment securities are treated as ordinary income for federal income tax purposes. The tax character of dividends and distributions paid during the years ended March 31, 2018 and 2017 were as follows:
Year ended March 31, 2018
| Optimum | Optimum | Optimum | Optimum | Optimum | Optimum | |||||||||||||||||||
| Fixed Income | International | Large Cap | Large Cap | Small-Mid Cap | Small-Mid Cap | |||||||||||||||||||
| Fund | Fund | Growth Fund | Value Fund | Growth Fund | Value Fund | |||||||||||||||||||
Ordinary income | $ | 47,132,743 | $ | 6,176,988 | $ | 33,279,056 | $ | 16,652,898 | $ | — | $ | 3,056,675 | ||||||||||||
Long-term capital gains | — | 6,783,636 | 232,627,130 | 63,216,601 | 20,484,133 | 20,363,748 | ||||||||||||||||||
|
|
|
|
|
|
|
|
|
|
|
| |||||||||||||
Total | $ | 47,132,743 | $ | 12,960,624 | $ | 265,906,186 | $ | 79,869,499 | $ | 20,484,133 | $ | 23,420,423 | ||||||||||||
|
|
|
|
|
|
|
|
|
|
|
| |||||||||||||
Year ended March 31, 2017 |
| |||||||||||||||||||||||
| Optimum | Optimum | Optimum | Optimum | Optimum | Optimum | |||||||||||||||||||
| Fixed Income | International | Large Cap | Large Cap | Small-Mid Cap | Small-Mid Cap | |||||||||||||||||||
| Fund | Fund | Growth Fund | Value Fund | Growth Fund | Value Fund | |||||||||||||||||||
Ordinary income | $ | 40,065,220 | $ | 6,045,533 | $ | — | $ | 16,750,245 | $— | $ | 2,301,127 | |||||||||||||
Long-term capital gains | — | — | 51,348,776 | 143,143,014 | — | — | ||||||||||||||||||
|
|
|
|
|
|
|
|
|
| |||||||||||||||
Total | $ | 40,065,220 | $ | 6,045,533 | $ | 51,348,776 | $ | 159,893,259 | $— | $ | 2,301,127 | |||||||||||||
|
|
|
|
|
|
|
|
|
| |||||||||||||||
162
Table of Contents
5. Components of Net Assets on a Tax Basis
As of March 31, 2018, the components of net assets on a tax basis were as follows:
Optimum Fixed Income Fund | Optimum International Fund | Optimum Large Cap Growth Fund | ||||||||||
| Shares of beneficial interest | $ | 2,050,728,322 | $ | 551,003,834 | $ | 1,323,809,728 | ||||||
| Undistributed ordinary income | 11,954,974 | 5,407,268 | 14,628,115 | |||||||||
| Undistributed long-term capital gains | — | 15,270,565 | 49,508,149 | |||||||||
| Capital loss carryforwards | (34,416,533 | ) | — | — | ||||||||
| Troubled debt litigation* | (970,052 | ) | — | — | ||||||||
| Unrealized appreciation (depreciation) of investments, foreign currencies, and derivatives | (9,559,059 | ) | 95,002,102 | 352,309,430 | ||||||||
|
|
|
|
|
| |||||||
| Net assets | $ | 2,017,737,652 | $ | 666,683,769 | $ | 1,740,255,422 | ||||||
|
|
|
|
|
| |||||||
Optimum Large Cap Value Fund | Optimum Small-Mid Cap Growth Fund | Optimum Small-Mid Cap Value Fund | ||||||||||
| Share of beneficial interest | $ | 1,200,494,188 | $ | 367,200,531 | $ | 372,155,215 | ||||||
| Undistributed ordinary income | 5,837,926 | 9,638,591 | 1,380,524 | |||||||||
| Undistributed long-term capital gains | 20,445,753 | 35,749,540 | 13,586,805 | |||||||||
| Unrealized appreciation of investments and foreign currencies | 254,784,637 | 103,644,760 | 71,571,180 | |||||||||
|
|
|
|
|
| |||||||
| Net assets | $ | 1,481,562,504 | $ | 516,233,422 | $ | 458,693,724 | ||||||
|
|
|
|
|
| |||||||
*See Note 12.
The differences between book basis and tax basis components of net assets are primarily attributable to tax deferral of losses on wash sales, tax deferral of losses on straddles, mark-to-market of foreign currency exchange contracts, mark-to-market of futures contracts, tax recognition of unrealized gain on passive foreign investment companies, tax treatment of swap contracts, contingent payment debt instruments, amortization of premium on convertible securities, trust preferred securities, troubled debt, partnership interest and deemed dividend income.
For financial reporting purposes, capital accounts are adjusted to reflect the tax character of permanent book/tax differences. Reclassifications are primarily due to tax treatment of net operating losses, redesignation of dividends and distributions, gain (loss) on foreign currency transactions, tax treatment of partnerships, amortization of premium on convertible securities, treasury inflation protected securities, swap contracts, foreign capital gain tax, deemed dividend income, contingent payment on debt instruments, sale of passive foreign investment companies, and paydown gains (losses) of asset- and mortgage-backed securities. Results of operations and net assets were not affected by these reclassifications. For the year ended March 31, 2018, the Funds recorded the following reclassifications:
Optimum Fixed Income Fund | Optimum International Fund | Optimum Large Cap Growth Fund | Optimum Large Cap Value Fund | Optimum Small-Mid Cap Growth Fund | Optimum Small-Mid Cap Value Fund | |||||||||||||||||||||||||
Undistributed (accumulated) net investment income (loss) | $ | (3,925,531 | ) | $ | (174,860 | ) | $ | 2,134,237 | $ | 3,207 | $ | 5,240,173 | $ | 23,149 | ||||||||||||||||
Accumulated net realized gain (loss) | 3,925,531 | 174,860 | (2,134,134 | ) | (3,207 | ) | (5,240,173 | ) | (23,149 | ) | ||||||||||||||||||||
Paid-in capital | — | — | (103 | ) | — | — | | — | ||||||||||||||||||||||
For federal income tax purposes, capital loss carryforwards may be carried forward and applied against future capital gains. At March 31, 2018, Optimum International Fund utilized $18,878,375 of capital loss carryforwards.
| (continues) | 163 |
Table of Contents
Notes to financial statements
Optimum Fund Trust
5. Components of Net Assets on a Tax Basis (continued)
Under the Regulated Investment Company Modernization Act of 2010 (Act), net capital losses recognized for tax years beginning after Dec. 22, 2010 may be carried forward indefinitely, and their character is retained as short-term and/or long-term losses. At March 31, 2018, there were no capital loss carryforwards for Optimum International Fund, Optimum Large Cap Growth Fund, Optimum Large Cap Value Fund, Optimum Small-Mid Cap Growth Fund, and Optimum Small-Mid Cap Value Fund. Capital loss carryforwards available to offset future realized capital gains for Optimum Fixed Income Fund at March 31, 2018 were as follows:
No expiration Post-enactment capital loss character |
| |||||||||||
| Short-term | Long-term | Total | ||||||||||
Optimum Fixed Income | ||||||||||||
Fund | $13,150,054 | $21,266,479 | $34,416,533 | |||||||||
6. Capital Shares
Transactions in capital shares were as follows:
Optimum Fixed Income Fund | Optimum International Fund | Optimum Large Cap Growth Fund | ||||||||||||||||||||||
| Year ended | Year ended | Year ended | ||||||||||||||||||||||
| 3/31/18 | 3/31/17 | 3/31/18 | 3/31/17 | 3/31/18 | 3/31/17 | |||||||||||||||||||
Shares sold: | ||||||||||||||||||||||||
Class A | 282,639 | 277,152 | 32,258 | 55,487 | 72,689 | 102,264 | ||||||||||||||||||
Class C | 617,287 | 762,019 | 59,224 | 164,385 | 115,858 | 359,119 | ||||||||||||||||||
Institutional Class | 43,178,438 | 39,990,811 | 8,390,457 | 7,475,950 | 13,467,891 | 13,872,596 | ||||||||||||||||||
Shares issued upon reinvestment of dividends and distributions: | ||||||||||||||||||||||||
Class A | 73,931 | 73,073 | 11,816 | 6,992 | 327,335 | 78,519 | ||||||||||||||||||
Class C | 174,638 | 164,873 | 26,637 | 5,854 | 1,374,702 | 319,613 | ||||||||||||||||||
Institutional Class | 4,744,885 | 4,107,100 | 873,668 | 513,028 | 13,415,414 | 2,831,952 | ||||||||||||||||||
|
|
|
|
|
|
|
|
|
|
|
| |||||||||||||
| 49,071,818 | 45,375,028 | 9,394,060 | 8,221,696 | 28,773,889 | 17,564,063 | |||||||||||||||||||
|
|
|
|
|
|
|
|
|
|
|
| |||||||||||||
Shares redeemed: | ||||||||||||||||||||||||
Class A | (734,034 | ) | (966,352 | ) | (147,929 | ) | (188,046 | ) | (440,681 | ) | (524,169 | ) | ||||||||||||
Class C | (2,744,699 | ) | (4,076,187 | ) | (557,855 | ) | (675,780 | ) | (1,905,871 | ) | (2,200,265 | ) | ||||||||||||
Institutional Class | (30,237,929 | ) | (62,330,129 | ) | (8,424,316 | ) | (14,653,443 | ) | (15,378,250 | ) | (27,022,876 | ) | ||||||||||||
|
|
|
|
|
|
|
|
|
|
|
| |||||||||||||
| (33,716,662 | ) | (67,372,668 | ) | (9,130,100 | ) | (15,517,269 | ) | (17,724,802 | ) | (29,747,310 | ) | |||||||||||||
|
|
|
|
|
|
|
|
|
|
|
| |||||||||||||
Net increase (decrease) | 15,355,156 | (21,997,640 | ) | 263,960 | (7,295,573 | ) | 11,049,087 | (12,183,247 | ) | |||||||||||||||
|
|
|
|
|
|
|
|
|
|
|
| |||||||||||||
164
Table of Contents
Optimum Large Cap Value Fund | Optimum Small-Mid Cap Growth Fund | Optimum Small-Mid Cap Value Fund | ||||||||||||||||||||||
| Year ended | Year ended | Year ended | ||||||||||||||||||||||
| 3/31/18 | 3/31/17 | 3/31/18 | 3/31/17 | 3/31/18 | 3/31/17 | |||||||||||||||||||
Shares sold: | ||||||||||||||||||||||||
Class A | 84,253 | 103,359 | 19,248 | 35,937 | 16,085 | 30,413 | ||||||||||||||||||
Class C | 133,200 | 333,639 | 28,529 | 97,187 | 29,509 | 57,348 | ||||||||||||||||||
Institutional Class | 15,925,346 | 20,845,005 | 5,180,608 | 6,203,398 | 5,713,301 | 5,847,685 | ||||||||||||||||||
Shares issued upon reinvestment of dividends and distributions: | ||||||||||||||||||||||||
Class A | 91,386 | 233,309 | 16,151 | — | 15,411 | 1,195 | ||||||||||||||||||
Class C | 261,551 | 726,016 | 66,430 | — | 57,132 | — | ||||||||||||||||||
Institutional Class | 4,536,599 | 9,693,331 | 1,240,971 | — | 1,524,163 | 159,920 | ||||||||||||||||||
|
|
|
|
|
|
|
|
|
|
|
| |||||||||||||
| 21,032,335 | 31,934,659 | 6,551,937 | 6,336,522 | 7,355,601 | 6,096,561 | |||||||||||||||||||
|
|
|
|
|
|
|
|
|
|
|
| |||||||||||||
Shares redeemed: | ||||||||||||||||||||||||
Class A | (374,848 | ) | (489,275 | ) | (84,133 | ) | (98,337 | ) | (60,100 | ) | (93,744 | ) | ||||||||||||
Class C | (1,393,295 | ) | (1,716,380 | ) | (337,176 | ) | (425,001 | ) | (253,384 | ) | (362,310 | ) | ||||||||||||
Institutional Class | (13,097,979 | ) | (26,278,928 | ) | (6,285,264 | ) | (14,415,539 | ) | (4,580,915 | ) | (14,304,324 | ) | ||||||||||||
|
|
|
|
|
|
|
|
|
|
|
| |||||||||||||
| (14,866,122 | ) | (28,484,583 | ) | (6,706,573 | ) | (14,938,877 | ) | (4,894,399 | ) | (14,760,378 | ) | |||||||||||||
|
|
|
|
|
|
|
|
|
|
|
| |||||||||||||
Net increase (decrease) | 6,166,213 | 3,450,076 | (154,636 | ) | (8,602,355 | ) | 2,461,202 | (8,663,817 | ) | |||||||||||||||
|
|
|
|
|
|
|
|
|
|
|
| |||||||||||||
Certain shareholders may exchange shares of one class for another class in the same Fund. There were no exchange transactions for the year ended March 31, 2017. For the year ended March 31, 2018, each Fund had the following exchange transactions. These exchange transactions are included as subscriptions and redemptions in the tables above and on the previous page and the “Statements of changes in net assets.”
Year ended 3/31/18 | |||||||||||||||
| Exchange Redemptions Class A Shares | Exchange Subscriptions Institutional Class Shares | Value | |||||||||||||
Optimum Fixed Income Fund | 12,118 | 12,116 | $ | 115,129 | |||||||||||
Optimum International Fund | 2,210 | 2,193 | 29,216 | ||||||||||||
Optimum Large Cap Growth Fund | 6,256 | 5,915 | 111,692 | ||||||||||||
Optimum Large Cap Value Fund | 6,186 | 6,170 | 96,292 | ||||||||||||
Optimum Small-Mid Cap Growth Fund | 1,258 | 1,179 | 17,354 | ||||||||||||
Optimum Small-Mid Cap Value Fund | 845 | 800 | 11,661 | ||||||||||||
7. Derivatives
US GAAP requires disclosures that enable investors to understand: (1) how and why an entity uses derivatives; (2) how they are accounted for; and (3) how they affect an entity’s results of operations and financial position.
Foreign Currency Exchange Contracts — Each Fund may enter into foreign currency exchange contracts and foreign cross currency exchange contracts as a way of managing foreign exchange rate risk. Each Fund may enter into these contracts to fix the US dollar value of a security that it has agreed to buy or sell for the period between the date the trade was entered into and the date the security is delivered and paid for. Each Fund may also enter into these contracts to hedge the US dollar value of securities it already owns that are denominated in foreign currencies. In addition, each Fund may enter into these contracts to facilitate or expedite the settlement of portfolio transactions. The change in value is recorded as an unrealized gain or loss. When the contract is closed, a realized gain or loss is recorded equal to the difference between the value of the contract at the time it was opened and the value at the time it was closed.
The use of foreign currency exchange contracts and foreign cross currency exchange contracts does not eliminate fluctuations in the underlying prices of the securities, but does establish a rate of exchange that can be achieved in the future. Although foreign currency exchange contracts
| (continues) | 165 |
Table of Contents
Notes to financial statements
Optimum Fund Trust
7. Derivatives (continued)
and foreign cross currency exchange contracts limit the risk of loss due to an unfavorable change in the value of the hedged currency, they also limit any potential gain that might result should the value of the currency change favorably. In addition, each Fund could be exposed to risks if the counterparties to the contracts are unable to meet the terms of their contracts. Each Fund’s maximum risk of loss from counterparty credit risk is the value of its currency exchanged with the counterparty. The risk is generally mitigated by having a netting arrangement between the Funds and the counterparty and by the posting of collateral by the counterparty to the Funds to cover the Funds’ exposure to the counterparty. During the year ended March 31, 2018, Optimum Small-Mid Cap Growth Fund and Optimum Small-Mid Cap Value Fund did not use foreign currency exchange contracts.
During the year ended March 31, 2018, Optimum Fixed Income Fund used foreign currency exchange contracts to hedge the US dollar value of securities it already owns that are denominated in foreign currencies.
During the year ended March 31, 2018, Optimum International Fund, Optimum Large Cap Growth Fund, and Optimum Large Cap Value Fund each used foreign currency exchange contracts to facilitate or expedite the settlement of portfolio transactions. Optimum International Fund also used foreign currency exchange contracts to fix the US dollar value of a security between trade date and settlement date.
Futures Contracts — A futures contract is an agreement in which the writer (or seller) of the contract agrees to deliver to the buyer an amount of cash or securities equal to a specific dollar amount times the difference between the value of a specific security or index at the close of the last trading day of the contract and the price at which the agreement is made. Optimum Fixed Income Fund may use futures in the normal course of pursuing its investment objective. Optimum Fixed Income Fund may invest in futures contracts to hedge its existing portfolio securities against fluctuations in fair value caused by changes in interest rates or market conditions. Upon entering into a futures contract, the Fund deposits cash or pledges US government securities to a broker, equal to the minimum “initial margin” requirements of the exchange on which the contract is traded. Subsequent payments are received from the broker or paid to the broker each day, based on the daily fluctuation in the market value of the contract. These receipts or payments are known as “variation margin” and are recorded daily by the Fund as unrealized gains or losses until the contracts are closed. When the contracts are closed, the Fund records a realized gain or loss equal to the difference between the value of the contract at the time it was opened and the value at the time it was closed. Risks of entering into futures contracts include potential imperfect correlation between the futures contracts and the underlying securities and the possibility of an illiquid secondary market for these instruments. When investing in futures, there is reduced counterparty credit risk to the Fund because futures are exchange-traded and the exchange’s clearinghouse, as counterparty to all exchange-traded futures, guarantees against default. The Fund posted $482,934 cash and securities collateral valued at $6,285,780, as margin for open futures contracts. Securities collateral are presented on the “Schedules of investments” and cash collateral is included in “Cash collateral due from brokers” on the “Statements of assets and liabilities.”
During the year ended March 31, 2018, Optimum Fixed Income Fund used futures contracts to hedge the Fund’s existing portfolio securities against fluctuations in value caused by changes in interest rates or market conditions and to facilitate investments in portfolio securities.
Options Contracts — Optimum Fixed Income Fund may enter into options contracts in the normal course of pursuing its investment objective. The Fund may buy or write options contracts for any number of reasons, including without limitation: to manage the Fund’s exposure to changes in securities prices caused by interest rates or market conditions and foreign currencies; as an efficient means of adjusting the Fund’s overall exposure to certain markets; to protect the value of portfolio securities; and as a cash management tool. The Fund may buy or write call or put options on securities, futures, swaps, swaptions, financial indices, and foreign currencies. When the Fund buys an option, a premium is paid and an asset is recorded and adjusted on a daily basis to reflect the current market value of the option purchased. When the Fund writes an option, a premium is received and a liability is recorded and adjusted on a daily basis to reflect the current market value of the option written. Premiums received from writing options that expire unexercised are treated by the Fund on the expiration date as realized gains. The difference between the premium received and the amount paid on effecting a closing purchase transaction, including brokerage commissions, is treated as realized gain or loss. If a call option is exercised, the premium is added to the proceeds from the sale of the underlying security in determining whether the Fund has a realized gain or loss. If a put option is exercised, the premium reduces the cost basis of the securities purchased by the Fund. The Fund, as writer of an option, bears the market risk of an unfavorable change in the price of the security underlying the written option. When writing options, the Fund is subject to minimal counterparty risk because the counterparty is only obligated to pay premiums and does not bear the market risk of an unfavorable market change.
166
Table of Contents
During the year ended March 31, 2018, Optimum Fixed Income Fund used options contracts to manage the Fund’s exposure to changes in securities prices caused by interest rates or market conditions, to adjust the Fund’s overall exposure to certain markets, to receive premiums for writing options, and to manage the Fund’s exposure to changes in foreign currencies.
Swap Contracts — Optimum Fixed Income Fund may enter into currency swap contracts, index swap contracts, inflation swaps, interest rate swap contracts, and CDS contracts in the normal course of pursuing its investment objective. The Fund may invest in interest rate swaps to manage the Fund’s sensitivity to interest rates or to hedge against changes in interest rates. The Fund may use currency swaps to protect against currency fluctuations. The Fund may use inflation swaps to hedge the inflation risk in nominal bonds, thereby creating synthetic inflation-indexed bonds. The Fund may enter into CDS contracts in order to hedge against a credit event, to enhance total return or to gain exposure to certain securities or markets. The Fund will not be permitted to enter into any swap transactions unless, at the time of entering into such transactions, the unsecured long-term debt of the actual counterparty, combined with any credit enhancements, is rated at least BBB- by Standard & Poor’s Financial Services LLC. (S&P) or Baa3 by Moody’s Investors Service Inc. (Moody’s) or is determined to be of equivalent credit quality by DMC.
Interest Rate Swaps. An interest rate swap contract is an exchange of interest rates between counterparties. In one instance, an interest rate swap involves payments received by Optimum Fixed Income Fund from another party based on a variable or floating interest rate, in return for making payments based on a fixed interest rate. An interest rate swap can also work in reverse with the Fund receiving payments based on a fixed interest rate and making payments based on a variable or floating interest rate. Interest rate swaps may be used to adjust the Fund’s sensitivity to interest rates or to hedge against changes in interest rates. Periodic payments on such contracts are accrued daily and recorded as unrealized appreciation (depreciation) on swap contracts. Upon periodic payment (receipt) or termination of the contract, such amounts are recorded as realized gains or losses on swap contracts. The Fund’s maximum risk of loss from counterparty credit risk is the discounted net value of the cash flows to be received from/paid to the counterparty over the interest rate swap contract’s remaining life, to the extent that the amount is positive. This risk is mitigated by (1) for bilateral swap contracts, having a netting arrangement between the Fund and the counterparty and by the posting of collateral by the counterparty to the Fund to cover the Fund’s exposure to the counterparty and (2) for cleared swaps, trading these instruments through a central counterparty.
During the year ended March 31, 2018, Optimum Fixed Income Fund used interest rate swap contracts to manage the Fund’s sensitivity to interest rates or to hedge against changes in interest rates.
Credit Default Swaps. A CDS contract is a risk-transfer instrument through which one party (purchaser of protection) transfers to another party (seller of protection) the financial risk of a credit event (as defined in the CDS agreement), as it relates to a particular reference security or basket of securities (such as an index). In exchange for the protection offered by the seller of protection, the purchaser of protection agrees to pay the seller of protection a periodic amount at a stated rate that is applied to the notional amount of the CDS contract. In addition, an upfront payment may be made or received by the Fund in connection with an unwinding or assignment of a CDS contract. Upon the occurrence of a credit event, the seller of protection would pay the par (or other agreed-upon) value of the reference security (or basket of securities) to the counterparty. Credit events generally include, among others, bankruptcy, failure to pay, and obligation default.
During the year ended March 31, 2018, Optimum Fixed Income Fund entered into CDS contracts as a purchaser and seller of protection, as a hedge against credit events. Periodic payments (receipts) on such contracts are accrued daily and recorded as unrealized losses (gains) on swap contracts. Upon payment (receipt), such amounts are recorded as realized losses (gains) on swap contracts. Upfront payments made or received in connection with CDS contracts are amortized over the expected life of the CDS contracts as unrealized losses (gains) on swap contracts. The change in value of CDS contracts is recorded daily as unrealized appreciation or depreciation. A realized gain or loss is recorded upon a credit event (as defined in the CDS agreement) or the maturity or termination of the agreement. Initial margin and variation margin are posted to central counterparties for centrally cleared CDS basket trades, as determined by the applicable central counterparty.
As disclosed in the footnotes to the “Schedules of investments,” at March 31, 2018, the notional value of the protection sold was EUR800,000 and USD32,155,000, which reflects the maximum potential amount Optimum Fixed Income Fund would have been required to make as a seller of credit protection if a credit event had occurred. In addition to serving as the source of the current value of the securities, the quoted market prices and resulting market values for credit default swap agreements on securities and credit indices serve as an indicator of the current status of the payment/performance risk and represent the likelihood of an expected liability (or profit) for the credit derivative if the swap agreement has been closed/sold as of the period end. Increasing market values, in absolute terms when compared to the notional amount of the swap, represent a deterioration of the reference entity’s credit soundness and a greater likelihood of risk of default or other credit event occurring as defined under the terms of the agreement. At March 31, 2018, there were no recourse provisions with third parties to recover any amounts paid
| (continues) | 167 |
Table of Contents
Notes to financial statements
Optimum Fund Trust
7. Derivatives (continued)
under the credit derivative agreement (including any purchased credit protection) nor was any collateral held by the Fund and other third parties which the Fund can obtain in the event of the occurrence of a credit event. At March 31, 2018, net unrealized appreciation of the protection sold was $1,019,227.
CDS contracts may involve greater risks than if Optimum Fixed Income Fund had invested in the reference obligation directly. CDS contracts are subject to general market risk, liquidity risk, counterparty risk, and credit risk. The Fund’s maximum risk of loss from counterparty credit risk, either as the seller of protection or the buyer of protection, is the fair value of the contract. This risk is mitigated by (1) for bilateral swap contracts, having a netting arrangement between the Fund and the counterparty and by the posting of collateral by the counterparty to the Fund to cover the Fund’s exposure to the counterparty and (2) for cleared swaps, trading these instruments through a central counterparty.
During the year ended March 31, 2018, Optimum Fixed Income Fund used CDS contracts to hedge against credit events, and to gain exposure to certain securities or markets.
Swaps Generally. For centrally cleared swaps, payments are received from the broker or paid to the broker each day, based on the daily fluctuation in the market value of the contract. These receipts or payments are known as “variation margin” and are recorded by Optimum Fixed Income Fund as unrealized gains or losses until the contracts are closed. When the contracts are closed, Optimum Fixed Income Fund records a realized gain or loss equal to the difference between the value of the contract at the time it was opened and the value at the time it was closed. The value of open swaps may differ from that which would be realized in the event Optimum Fixed Income Fund terminated its position in the contract on a given day. Risks of entering into these contracts include the potential inability of the counterparty to meet the terms of the contracts. This type of risk is generally limited to the amount of favorable movement in the value of the underlying security, instrument or basket of instruments, if any, at the day of default. Risks also arise from potential losses from adverse market movements and such losses could exceed the unrealized amounts shown on the “Schedules of investments.”
At March 31, 2018, for bilateral derivative contracts, Optimum Fixed Income Fund posted $990,000 in cash collateral for certain open derivatives, which is included in “Cash collateral due from brokers” on the “Statements of assets and liabilities.” Optimum Fixed Income Fund posted $3,141,195 cash collateral for certain centrally cleared derivatives. The Fund also posted $4,043,196 in securities collateral comprised of US treasury obligations for certain open centrally cleared derivative contracts. Cash collateral is included in “Cash collateral due from brokers” on the “Statements of assets and liabilities” and securities collateral is presented on the “Schedules of investments.” At March 31, 2018, for bilateral derivative contracts, the Fund received $550,000 in cash collateral, which is included in as “Cash collateral due to brokers” on the “Statements of assets and liabilities.”
Fair values of derivative instruments for Optimum Fixed Income Fund as of March 31, 2018 were as follows:
| Asset Derivatives | |||||||||||||||||||||||||
| Fair Value | |||||||||||||||||||||||||
|
| ||||||||||||||||||||||||
| Statements of Assets and Liabilities Location | Currency Contracts | Equity Contracts | Interest rate Contracts | Credit Contracts | Total | ||||||||||||||||||||
| Unrealized appreciation of foreign currency exchange contracts | $ | 1,160,541 | $ | — | $ | — | $ | — | $ | 1,160,541 | |||||||||||||||
| Variation margin due from broker on futures contracts* | 5,552,248 | 144,115 | 4,322,769 | — | 10,019,132 | ||||||||||||||||||||
| Variation margin due to brokers on centrally cleared credit default swap contracts** | — | — | — | 37,416 | 37,416 | ||||||||||||||||||||
| Variation margin due to brokers on centrally cleared interest rate swap contracts** | — | — | 5,512,913 | — | 5,512,913 | ||||||||||||||||||||
| Unrealized appreciation of credit default swap contracts | — | — | — | 1,168,551 | 1,168,551 | ||||||||||||||||||||
|
|
|
|
|
|
|
|
|
| ||||||||||||||||
| Total | $ | 6,712,789 | $ | 144,115 | $ | 9,835,682 | $ | 1,205,967 | $ | 17,898,553 | |||||||||||||||
|
|
|
|
|
|
|
|
|
| ||||||||||||||||
168
Table of Contents
Liability Derivatives Fair Value | |||||||||||||||||||||||
Statements of Assets and Liabilities Location | Currency Contracts | Interest Contracts | Credit Contracts | Total |
| ||||||||||||||||||
| Unrealized depreciation of foreign currency exchange contracts | $ | (1,099,471 | ) | $ | — | $ | — | $ | (1,099,471 | ) | |||||||||||||
| Variation margin due from broker on futures contracts* | (17,442 | ) | (1,147,919 | ) | — | (1,165,361 | ) | ||||||||||||||||
| Options written, at value | (3,440 | ) | (185,646 | ) | (4,935 | ) | (194,021 | ) | |||||||||||||||
| Variation margin due to brokers on centrally cleared credit default swap contracts** | — | — | (22,787 | ) | (22,787 | ) | |||||||||||||||||
| Variation margin due to brokers on centrally cleared interest rate swap contracts** | — | (1,308,549 | ) | — | (1,308,549 | ) | |||||||||||||||||
| Unrealized depreciation of credit default swap contracts | — | — | (167,399 | ) | (167,399 | ) | |||||||||||||||||
|
|
|
|
|
|
|
| ||||||||||||||||
Total | $ | (1,120,353 | ) | $ | (2,642,114 | ) | $ | (195,121 | ) | $ | (3,957,588 | ) | |||||||||||
|
|
|
|
|
|
|
| ||||||||||||||||
*Includes cumulative appreciation (depreciation) of futures contracts from the date the contracts were opened through March 31, 2018. Only current day variation margin is reported on Optimum Fixed Income Fund’s “Statements of assets and liabilities.”
**Includes cumulative appreciation (depreciation) of centrally cleared swap contracts from the date the contracts were opened through March 31, 2018. Only current day variation margin is reported on Optimum Fixed Income Fund’s “Statements of assets and liabilities.”
The effect of derivative instruments on Optimum Fixed Income Fund’s “Statements of operations” for the year ended March 31, 2018 was as follows:
| Net Realized Gain (Loss) on: | ||||||||||||||||||||||||||||||
| Foreign | ||||||||||||||||||||||||||||||
| Currency | ||||||||||||||||||||||||||||||
| Exchange | Futures | Options | Options | Swap | ||||||||||||||||||||||||||
| Contracts | Contracts | Purchased | Written | Contracts | Total | |||||||||||||||||||||||||
Currency contracts | $ | (7,163,367 | ) | $ | (263,007 | ) | $ | (232,186 | ) | $ | — | $ | — | $ | (7,658,560 | ) | ||||||||||||||
Equity contracts | — | (941,173 | ) | — | — | — | (941,173 | ) | ||||||||||||||||||||||
Interest rate contracts | — | (9,725,178 | ) | 33,972 | 410,764 | 237,025 | (9,043,417 | ) | ||||||||||||||||||||||
Credit contracts | — | — | — | — | (285,962 | ) | (285,962 | ) | ||||||||||||||||||||||
|
|
|
|
|
|
|
|
|
|
|
| |||||||||||||||||||
Total | $ | (7,163,367 | ) | $ | (10,929,358 | ) | $ | (198,214 | ) | $ | 410,764 | $ | (48,937 | ) | $ | (17,929,112 | ) | |||||||||||||
|
|
|
|
|
|
|
|
|
|
|
| |||||||||||||||||||
| Net Change in Unrealized Appreciation (Depreciation) of: | ||||||||||||||||||||||||||||||
| Foreign | ||||||||||||||||||||||||||||||
| Currency | ||||||||||||||||||||||||||||||
| Exchange | Futures | Options | Options | Swap | ||||||||||||||||||||||||||
| Contracts | Contracts | Purchased | Written | Contracts | Total | |||||||||||||||||||||||||
Currency contracts | $ | (204,609 | ) | $ | 3,946,332 | $ | 13,722 | $ | 1,268 | $ | — | $ | 3,756,713 | |||||||||||||||||
Equity contracts | — | 144,115 | — | — | — | 144,115 | ||||||||||||||||||||||||
Interest rate contracts | — | 2,233,996 | (345,664 | ) | 260,558 | 2,162,587 | 4,311,477 | |||||||||||||||||||||||
Credit contracts | — | — | — | 282 | 431,408 | 431,690 | ||||||||||||||||||||||||
|
|
|
|
|
|
|
|
|
|
|
| |||||||||||||||||||
Total | $ | (204,609 | ) | $ | 6,324,443 | $ | (331,942 | ) | $ | 262,108 | $ | 2,593,995 | $ | 8,643,995 | ||||||||||||||||
|
|
|
|
|
|
|
|
|
|
|
| |||||||||||||||||||
During the year ended March 31, 2018, Optimum International Fund, Optimum Large Cap Growth Fund, and Optimum Large Cap Value Fund experienced net realized and unrealized gains or losses attributable to foreign currency holdings, which are disclosed on the “Statements of assets and liabilities” and/or “Statements of operations.”
| (continues) | 169 |
Table of Contents
Notes to financial statements
Optimum Fund Trust
7. Derivatives (continued)
Derivatives Generally. The tables below summarize the average balance of derivative holdings by the Funds during the year ended March 31, 2018:
| Long Derivative Volume | ||||||||||||||||||
| Optimum | Optimum | Optimum | Optimum | |||||||||||||||
| Fixed Income | International | Large Cap | Large Cap | |||||||||||||||
| Fund | Fund | Growth Fund | Value Fund | |||||||||||||||
Foreign currency exchange contracts (average cost) | USD | 47,541,910 | USD | 526,999 | USD | 44,950 | USD 19,618 | |||||||||||
Futures contracts | 561,742,132 | — | — | — | ||||||||||||||
Options contracts | 360,639 | — | — | — | ||||||||||||||
CDS contracts | USD | 12,803,648 | — | — | — | |||||||||||||
Interest rate swap contracts | CAD | 7,110,800 | — | — | — | |||||||||||||
| MXN | 77,150,000 | — | — | — | ||||||||||||||
| USD | 107,951,600 | — | — | — | ||||||||||||||
| Short Derivative Volume | ||||||||||||||||||
| Optimum | Optimum | Optimum | Optimum | |||||||||||||||
| Fixed Income | International | Large Cap | Large Cap | |||||||||||||||
| Fund | Fund | Growth Fund | Value Fund | |||||||||||||||
Foreign currency exchange contracts (average cost) | USD | 114,807,275 | USD | 479,857 | USD | 60,604 | USD — | |||||||||||
Futures contracts | 800,782,184 | — | — | — | ||||||||||||||
Options contracts | 373,481 | — | — | — | ||||||||||||||
CDS contracts | EUR | 1,877,200 | — | — | — | |||||||||||||
| USD | 38,830,780 | — | — | — | ||||||||||||||
Interest rate swap contracts | GBP | 10,786,800 | — | — | — | |||||||||||||
| JPY | 1,059,880,000 | — | — | — | ||||||||||||||
| USD | 268,849,400 | — | — | — | ||||||||||||||
* Long represents buying protection and short represents selling protection.
** Long represents receiving fixed interest payments and short represents paying fixed interest payments.
8. Offsetting
Each Fund entered into an International Swaps and Derivatives Association, Inc. Master Agreement (ISDA Master Agreement) or a similar agreement with certain of its derivative contract counterparties in order to better define its contractual rights and to secure rights that will help each Fund mitigate its counterparty risk. An ISDA Master Agreement is a bilateral agreement between each Fund and a counterparty that governs certain over-the-counter (OTC) derivatives and foreign exchange contracts and typically contains, among other things, collateral posting items and netting provisions in the event of a default and/or termination event. Under an ISDA Master Agreement, each Fund may, under certain circumstances, offset with the counterparty certain derivative financial instruments’ payables and/or receivables with collateral held and/or posted and create one single net payment. The provisions of the ISDA Master Agreement typically permit a single net payment in the event of default (close-out), including the bankruptcy or insolvency of the counterparty. However, bankruptcy, or insolvency laws of a particular jurisdiction may impose restrictions on or prohibitions against the right of offset in bankruptcy, insolvency, or other events.
170
Table of Contents
For financial reporting purposes, each Fund does not offset derivative assets and derivative liabilities that are subject to netting arrangements on the “Statements of assets and liabilities.”
At March 31, 2018, the Funds had the following assets and liabilities subject to offsetting provisions:
Offsetting of Financial Assets and Liabilities and Derivative Assets and Liabilities
| Optimum Fixed Income Fund | |||||||||||||||
| Gross Value of | Gross Value of | ||||||||||||||
Counterparty | Derivative Asset | Derivative Liability | Net Position | ||||||||||||
Bank of America Merrill Lynch | $ | 532,675 | $ | (551,743 | ) | $ | (19,068 | ) | |||||||
BNP Paribas | 130,476 | (234,762 | ) | (104,286 | ) | ||||||||||
BNY Mellon | — | (14 | ) | (14 | ) | ||||||||||
Citigroup Global Markets | 441,236 | (152,752 | ) | 288,484 | |||||||||||
Deutsche Bank | 1,004,569 | (80,993 | ) | 923,576 | |||||||||||
Goldman Sachs | 128,031 | (8,609 | ) | 119,422 | |||||||||||
Hong Kong Shanghai Bank | 5,806 | (969 | ) | 4,837 | |||||||||||
JPMorgan Chase Bank | 88,273 | (70,724 | ) | 17,549 | |||||||||||
Morgan Stanley Capital | 787,390 | (993,722 | ) | (206,332 | ) | ||||||||||
Toronto Dominion Bank | — | (8,906 | ) | (8,906 | ) | ||||||||||
|
|
|
|
|
| ||||||||||
Total | $ | 3,118,456 | $ | (2,103,194 | ) | $ | 1,015,262 | ||||||||
|
|
|
|
|
| ||||||||||
Counterparty | Net Position | Fair Value of Non-Cash Collateral Received | Cash Collateral Received(a) | Fair Value of Non-Cash Collateral Pledged | Cash Collateral Pledged | Net Exposure(b) | ||||||||||||||||||||||||
Bank of America Merrill Lynch | $ | (19,068 | ) | $ | — | $ | — | $ | — | $ | — | $ | (19,068 | ) | ||||||||||||||||
BNP Paribas | (104,286 | ) | — | — | — | 104,286 | — | |||||||||||||||||||||||
BNY Mellon | (14 | ) | — | — | — | — | (14 | ) | ||||||||||||||||||||||
Citigroup Global Markets | 288,484 | — | — | — | — | 288,484 | ||||||||||||||||||||||||
Deutsche Bank | 923,576 | — | (90,000 | ) | — | — | 833,576 | |||||||||||||||||||||||
Goldman Sachs | 119,422 | — | (119,422 | ) | — | — | — | |||||||||||||||||||||||
Hong Kong Shanghai Bank | 4,837 | — | — | — | — | 4,837 | ||||||||||||||||||||||||
JPMorgan Chase Bank | 17,549 | — | — | — | — | 17,549 | ||||||||||||||||||||||||
Morgan Stanley Capital | (206,332 | ) | — | — | — | 206,332 | — | |||||||||||||||||||||||
Toronto Dominion Bank | (8,906 | ) | — | — | — | — | (8,906 | ) | ||||||||||||||||||||||
|
|
|
|
|
|
|
|
|
|
|
| |||||||||||||||||||
Total | $ | 1,015,262 | $ | — | $ | (209,422 | ) | $ | — | $ | 310,618 | $ | 1,116,458 | |||||||||||||||||
|
|
|
|
|
|
|
|
|
|
|
| |||||||||||||||||||
| (continues) | 171 |
Table of Contents
Notes to financial statements
Optimum Fund Trust
8. Offsetting (continued)
| Optimum International Fund | |||||||||||||||
| Gross Value of | Gross Value of | ||||||||||||||
Counterparty | Derivative Asset | Derivative Liability | Net Position | ||||||||||||
Brown Brothers Harriman | $ | 7,474 | $ | (3,092 | ) | $ | 4,382 | ||||||||
BNY Mellon | — | (4,744 | ) | (4,744 | ) | ||||||||||
Northern Trust | 202 | — | 202 | ||||||||||||
State Street Bank | 318 | — | 318 | ||||||||||||
|
|
|
|
|
| ||||||||||
Total | $ | 7,994 | $ | (7,836 | ) | $ | 158 | ||||||||
|
|
|
|
|
| ||||||||||
Counterparty | Net Position | Fair Value of Non-Cash Collateral Received | Cash Collateral Received | Fair Value of Non-Cash Collateral Pledged | Cash Collateral Pledged | Net Exposure(b) | ||||||||||||||||||||||||
Brown Brothers Harriman | $ | 4,382 | $ | — | $ | — | $ | — | $ | — | $ | 4,382 | ||||||||||||||||||
BNY Mellon | (4,744 | ) | — | — | — | — | (4,744 | ) | ||||||||||||||||||||||
Northern Trust | 202 | — | — | — | — | 202 | ||||||||||||||||||||||||
State Street Bank | 318 | — | — | — | — | 318 | ||||||||||||||||||||||||
|
|
|
|
|
|
|
|
|
|
|
| |||||||||||||||||||
Total | $ | 158 | $ | — | $ | — | $ | — | $ | — | $ | 158 | ||||||||||||||||||
|
|
|
|
|
|
|
|
|
|
|
| |||||||||||||||||||
Master Repurchase Agreements
Repurchase agreements are entered into by each Fund under Master Repurchase Agreements (each, an “MRA”). The MRA permits each Fund, under certain circumstances including an event of default (such as bankruptcy or insolvency), to offset payables and/or receivables with collateral held by and/or posted to the counterparty. As a result, one single net payment is created. Bankruptcy or insolvency laws of a particular jurisdiction may impose restrictions on or prohibitions against such a right of offset in the event of the MRA counterparty’s bankruptcy or insolvency. Based on the terms of the MRA, each Fund receives securities as collateral with a market value in excess of the repurchase price at maturity. Upon a bankruptcy or insolvency of the MRA counterparty, each Fund would recognize a liability with respect to such excess collateral. The liability reflects each Fund’s obligation under bankruptcy law to return the excess to the counterparty. As of March 31, 2018, the following table is a summary of each Fund’s repurchase agreements by counterparty which are subject to offset under an MRA:
| Optimum Fixed Income Fund | |||||||||||||||||||||||||
Counterparty | Repurchase Agreements | Fair Value of Non-Cash Collateral Received(a) | Cash Collateral Received | Net Collateral Received | Net Exposure(b) | ||||||||||||||||||||
Bank of America Merrill Lynch | $ | 4,937,085 | $ | (4,937,085 | ) | $ | — | $ | (4,937,085 | ) | $ | — | |||||||||||||
Bank of Montreal | 14,811,254 | (14,811,254 | ) | — | (14,811,254 | ) | — | ||||||||||||||||||
BNP Paribas | 14,561,142 | (14,561,142 | ) | — | (14,561,142 | ) | — | ||||||||||||||||||
Barclays Bank | 20,500,000 | (20,500,000 | ) | — | (20,500,000 | ) | — | ||||||||||||||||||
|
|
|
|
|
|
|
|
|
| ||||||||||||||||
Total | $ | 54,809,481 | $ | (54,809,481 | ) | $ | — | $ | (54,809,481 | ) | $ | — | |||||||||||||
|
|
|
|
|
|
|
|
|
| ||||||||||||||||
| Optimum International Fund | |||||||||||||||||||||||||
Counterparty | Repurchase Agreements | Fair Value of Non-Cash Collateral Received(a) | Cash Collateral Received | Net Collateral Received | Net Exposure(b) | ||||||||||||||||||||
Bank of America Merrill Lynch | $ | 1,264,563 | $ | (1,264,563 | ) | $ | — | $(1,264,563) | $ | — | |||||||||||||||
Bank of Montreal | 3,793,690 | (3,793,690 | ) | — | (3,793,690 | ) | — | ||||||||||||||||||
BNP Paribas | 3,729,627 | (3,729,627 | ) | — | (3,729,627 | ) | — | ||||||||||||||||||
|
|
|
|
|
|
|
|
|
| ||||||||||||||||
Total | $ | 8,787,880 | $ | (8,787,880 | ) | $ | — | $(8,787,880) | $ | — | |||||||||||||||
|
|
|
|
|
|
|
|
|
| ||||||||||||||||
172
Table of Contents
| Optimum Large Cap Growth Fund | |||||||||||||||||||||||||
Counterparty | Repurchase Agreements | Fair Value of Non-Cash Collateral Received(a) | Cash Collateral Received | Net Collateral Received | Net Exposure(b) | ||||||||||||||||||||
Bank of America Merrill Lynch | $ | 2,235,754 | $ | (2,235,754 | ) | $ | — | $ | (2,235,754 | ) | $ | — | |||||||||||||
Bank of Montreal | 6,707,262 | (6,707,262 | ) | — | (6,707,262 | ) | — | ||||||||||||||||||
BNP Paribas | 6,593,998 | (6,593,998 | ) | — | (6,593,998 | ) | — | ||||||||||||||||||
|
|
|
|
|
|
|
|
|
| ||||||||||||||||
Total | $ | 15,537,014 | $ | (15,537,014 | ) | $ | — | $ | (15,537,014 | ) | $ | — | |||||||||||||
|
|
|
|
|
|
|
|
|
| ||||||||||||||||
| Optimum Large Cap Value Fund | |||||||||||||||||||||||||
Counterparty | Repurchase Agreements | Fair Value of Non-Cash Collateral Received(a) | Cash Collateral Received | Net Collateral Received | Net Exposure(b) | ||||||||||||||||||||
Bank of America Merrill Lynch | $ | 1,525,317 | $ | (1,525,317 | ) | $ | — | $ | (1,525,317 | ) | $ | — | |||||||||||||
Bank of Montreal | 4,575,950 | (4,575,950 | ) | — | (4,575,950 | ) | — | ||||||||||||||||||
BNP Paribas | 4,498,678 | (4,498,678 | ) | — | (4,498,678 | ) | — | ||||||||||||||||||
|
|
|
|
|
|
|
|
|
| ||||||||||||||||
Total | $ | 10,599,945 | $ | (10,599,945 | ) | $ | — | $ | (10,599,945 | ) | $ | — | |||||||||||||
|
|
|
|
|
|
|
|
|
| ||||||||||||||||
| Optimum Small-Mid Cap Growth Fund | |||||||||||||||||||||||||
Counterparty | Repurchase Agreements | Fair Value of Non-Cash Collateral Received(a) | Cash Collateral Received | Net Collateral Received | Net Exposure(b) | ||||||||||||||||||||
Bank of America Merrill Lynch | $ | 575,388 | $ | (575,388 | ) | $ | — | $ | (575,388 | ) | $ | — | |||||||||||||
Bank of Montreal | 1,726,165 | (1,726,165 | ) | — | (1,726,165 | ) | — | ||||||||||||||||||
BNP Paribas | 1,697,016 | (1,697,016 | ) | — | (1,697,016 | ) | — | ||||||||||||||||||
|
|
|
|
|
|
|
|
|
| ||||||||||||||||
Total | $ | 3,998,569 | $ | (3,998,569 | ) | $ | — | $ | (3,998,569 | ) | $ | — | |||||||||||||
|
|
|
|
|
|
|
|
|
| ||||||||||||||||
| Optimum Small-Mid Cap Value Fund | |||||||||||||||||||||||||
Counterparty | Repurchase Agreements | Fair Value of Non-Cash Collateral Received(a) | Cash Collateral Received | Net Collateral Received | Net Exposure(b) | ||||||||||||||||||||
Bank of America Merrill Lynch | $ | 646,978 | $ | (646,978 | ) | $ | — | $ | (646,978 | ) | $ | — | |||||||||||||
Bank of Montreal | 1,940,933 | (1,940,933 | ) | — | (1,940,933 | ) | — | ||||||||||||||||||
BNP Paribas | 1,908,158 | (1,908,158 | ) | — | (1,908,158 | ) | — | ||||||||||||||||||
|
|
|
|
|
|
|
|
|
| ||||||||||||||||
Total | $ | 4,496,069 | $ | (4,496,069 | ) | $ | — | $ | (4,496,069 | ) | $ | — | |||||||||||||
|
|
|
|
|
|
|
|
|
| ||||||||||||||||
| (continues) | 173 |
Table of Contents
Notes to financial statements
Optimum Fund Trust
8. Offsetting (continued)
Securities Lending
Securities lending transactions are entered into by Optimum International Fund under Master Securities Lending Agreements (each, an MSLA) which provide the right, in the event of default (including bankruptcy or insolvency), for the non-defaulting party to liquidate the collateral and calculate a net exposure to the defaulting party or request additional collateral. In the event that a borrower defaults, the Fund, as lender, would offset the market value of the collateral received against the market value of the securities loaned. When the value of the collateral is greater than that of the market value of the securities loaned, the lender is left with a net amount payable to the defaulting party. However, bankruptcy or insolvency laws of a particular jurisdiction may impose restrictions on or prohibitions against such a right of offset in the event of an MSLA counterparty’s bankruptcy or insolvency. Under the MSLA, the borrower can resell or re-pledge the loaned securities, and the Fund can reinvest cash collateral, or, upon an event of default, resell or re-pledge the collateral (See also Note 9).
As of March 31, 2018, the following table is a summary of Optimum International Fund’s securities lending agreements by counterparty which are subject to offset under an MSLA:
| Fair value of | ||||||||
| Securities Loaned | Cash Collateral | Non-Cash Collateral | ||||||
Counterparty | at Value | Received(a) | Received | Net Exposure(b) | ||||
The Bank of New York Mellon | $23,055,600 | $(21,759,575) | $(1,296,025) | $— | ||||
(a)The value of the related collateral exceeded the value of the repurchase agreements and securities lending transactions as of March 31, 2018.
(b)Net exposure represents the receivable (payable) that would be due from (to) the counterparty in the event of default.
9. Securities Lending
Each Fund may lend its securities pursuant to a security lending agreement (Lending Agreement) with The Bank of New York Mellon (BNY Mellon). At the time a security is loaned, the borrower must post collateral equal to the required percentage of the market value of the loaned security, including any accrued interest. The required percentage is: (1) 102% with respect to US securities and foreign securities that are denominated and payable in US dollars; and (2) 105% with respect to foreign securities. With respect to each loan, if on any business day the aggregate market value of securities collateral plus cash collateral held is less than the aggregate market value of the securities that are the subject of such loan, the borrower will be notified to provide additional collateral by the end of the following business day, which, together with the collateral already held, will be not less than the applicable initial collateral requirements for such security loan. If the aggregate market value of securities collateral and cash collateral held with respect to a security loan exceeds the applicable initial collateral requirement, upon the request of the borrower, BNY Mellon must return enough collateral to the borrower by the end of the following business day to reduce the value of the remaining collateral to the applicable initial collateral requirement for such security loan. As a result of the foregoing, the value of the collateral held with respect to a loaned security on any particular day may be more or less than the value of the security on loan. The collateral percentage with respect to the market value of the loaned security is determined by the security lending agent.
Cash collateral received by each Fund is generally invested in a series of individual separate accounts, each corresponding to a fund. The investment guidelines permit each separate account to hold certain securities that would be considered eligible securities for a money market fund. Cash collateral received is generally invested in government securities; certain obligations issued by government sponsored enterprises; repurchase agreements collateralized by US Treasury securities; obligations issued by the central government of any Organization for Economic Cooperation and Development (OECD) country or its agencies, instrumentalities, or establishments; obligations of supranational organizations; commercial paper, notes, bonds, and other debt obligations; certificates of deposit, time deposits, and other bank obligations; and asset-backed securities as disclosed on the “Schedules of investments.” Securities purchased with cash collateral are valued at the market value. A Fund can also accept US government securities and letters of credit (non-cash collateral) in connection with securities loans.
In the event of default or bankruptcy by the lending agent, realization and/or retention of the collateral may be subject to legal proceedings. In the event the borrower fails to return loaned securities and the collateral received is insufficient to cover the value of the loaned securities and provided such collateral shortfall is not the result of investment losses, the lending agent has agreed to pay the amount of the shortfall to the Funds or, at the discretion of the lending agent, replace the loaned securities. The Funds continue to record dividends or interest, as applicable,
174
Table of Contents
on the securities loaned and are subject to changes in value of the securities loaned that may occur during the term of the loan. The Funds have the right under the Lending Agreement to recover the securities from the borrower on demand. With respect to security loans collateralized by non-cash collateral, the Funds receive loan premiums paid by the borrower. With respect to security loans collateralized by cash collateral, the earnings from the collateral investments are shared among the Funds, the security lending agent, and the borrower. The Funds record security lending income net of allocations to the security lending agent and the borrower.
Each Fund may incur investment losses as a result of investing securities lending collateral. This could occur if an investment in the collateral investment account defaulted or became impaired. Under those circumstances, the value of a Fund’s cash collateral account may be less than the amount a Fund would be required to return to the borrowers of the securities and that Fund would be required to make up for this shortfall.
During the year ended March 31, 2018, Optimum Fixed Income Fund, Optimum Large Cap Growth Fund, Optimum Large Cap Value Fund, Optimum Small-Mid Cap Growth Fund, and Optimum Small-Mid Cap Value Fund had no securities on loan.
The following table reflects a breakdown of transactions accounted for as secured borrowings, the gross obligation by the type of collateral pledged, and the remaining contractual maturity of those transactions as of March 31, 2018 for Optimum International Fund:
| Overnight | ||||||||||
| and | Under | Between | Over | |||||||
Securities Lending Transactions | Continuous | 30 days | 30 & 90 days | 90 days | Total | |||||
Certificates of Deposit, Repurchase Agreements, and Short-Term Floating Rate Notes | $22,105,164 | $— | $— | $— | $22,105,164 |
At March 31, 2018, the value of securities on loan for Optimum International Fund was $23,055,600, for which the Fund received cash collateral of $22,076,603 and non-cash collateral with a fair value of $1,296,025. At March 31, 2018, the value of invested collateral was $22,105,164. Investments purchased with cash collateral are presented on the “Schedule of investments” under the caption “Securities Lending Collateral.”
10. Credit and Market Risk
Some countries in which the Funds may invest require governmental approval for the repatriation of investment income, capital, or the proceeds of sales of securities by foreign investors. In addition, if there is deterioration in a country’s balance of payments or for other reasons, a country may impose temporary restrictions on foreign capital remittances abroad.
The securities exchanges of certain foreign markets are substantially smaller, less liquid and more volatile than the major securities markets in the United States. Consequently, acquisition and disposition of securities by the Funds may be inhibited. In addition, a significant portion of the aggregate market value of securities listed on the major securities exchanges in emerging markets is held by a smaller number of investors. This may limit the number of shares available for acquisition or disposition by the Funds.
Optimum Fixed Income Fund invests in high yield fixed income securities, which are securities rated lower than BBB by S&P and lower than Baa3 by Moody’s, or similarly rated by another nationally recognized statistical rating organization. Investments in these higher yielding securities are generally accompanied by a greater degree of credit risk than higher rated securities. Additionally, lower rated securities may be more susceptible to adverse economic and competitive industry conditions than investment grade securities.
Optimum Fixed Income Fund invests in bank loans and other securities that may subject it to direct indebtedness risk, the risk that the Fund will not receive payment of principal, interest and other amounts due in connection with these investments and will depend primarily on the financial condition of the borrower. Loans that are fully secured offer the Fund more protection than unsecured loans in the event of nonpayment of scheduled interest or principal, although there is no assurance that the liquidation of collateral from a secured loan would satisfy the corporate borrower’s obligation, or that the collateral can be liquidated. Some loans or claims may be in default at the time of purchase. Certain of the loans and the other direct indebtedness acquired by the Fund may involve revolving credit facilities or other standby financing commitments that obligate the Fund to pay additional cash on a certain date or on demand. These commitments may require the Fund to increase its investment in a company at a time when the Fund might not otherwise decide to do so (including at a time when the company’s financial condition makes it unlikely that such amounts will be repaid). To the extent that the Fund is committed to advance additional funds, it will at all times hold and maintain cash or other high grade debt obligations in an amount sufficient to meet such commitments. When a loan agreement is purchased, the Fund may pay an assignment fee. On an ongoing basis, the Fund may receive a commitment fee based on the undrawn portion of the underlying line of credit portion of a loan agreement. Prepayment penalty fees are
| (continues) | 175 |
Table of Contents
Notes to financial statements
Optimum Fund Trust
10. Credit and Market Risk (continued)
received upon the prepayment of a loan agreement by the borrower. Prepayment penalty, facility, commitment, consent, and amendment fees are recorded to income as earned or paid. As the Fund may be required to rely upon another lending institution to collect and pass on to the Fund amounts payable with respect to the loan and to enforce the Fund’s rights under the loan and other direct indebtedness, an insolvency, bankruptcy, or reorganization of the lending institution may delay or prevent the Fund from receiving such amounts. The highly leveraged nature of many loans may make them especially vulnerable to adverse changes in economic or market conditions. Investments in such loans and other direct indebtedness may involve additional risk to the Fund.
Optimum Fixed Income Fund invests in certain obligations that may have liquidity protection designed to ensure that the receipt of payments due on the underlying security is timely. Such protection may be provided through guarantees, insurance policies, or letters of credit obtained by the issuer or sponsor through third parties, through various means of structuring the transaction or through a combination of such approaches. The Fund will not pay any additional fees for such credit support, although the existence of credit support may increase the price of a security.
Optimum Fixed Income Fund invests in fixed income securities whose value is derived from an underlying pool of mortgages or consumer loans. The value of these securities is sensitive to changes in economic conditions, including delinquencies and/or defaults, and may be adversely affected by shifts in the market’s perception of the issuers and changes in interest rates. Investors receive principal and interest payments as the underlying mortgages and consumer loans are paid back. Some of these securities are collateralized mortgage obligations (CMOs). CMOs are debt securities issued by US government agencies or by financial institutions and other mortgage lenders, which are collateralized by a pool of mortgages held under an indenture. Prepayment of mortgages may shorten the stated maturity of the obligations and can result in a loss of premium, if any has been paid. Certain of these securities may be stripped (securities which provide only the principal or interest feature of the underlying security). The yield to maturity on an interest-only CMO is extremely sensitive not only to changes in prevailing interest rates, but also to the rate of principal payments (including prepayments) on the related underlying mortgage assets. A rapid rate of principal payments may have a material adverse effect on the Fund’s yield to maturity. If the underlying mortgage assets experience greater than anticipated prepayments of principal, the Fund may fail to fully recoup its initial investment in these securities even if the securities are rated in the highest rating categories.
Optimum Small-Mid Cap Growth Fund and Optimum Small-Mid Cap Value Fund invest a significant portion of their assets in small- and mid-sized companies. Investments in small- and mid-sized companies may be more volatile than investments in larger companies for a number of reasons, which include more limited financial resources or a dependence on narrow product lines.
Optimum Large Cap Growth Fund, Optimum Large Cap Value Fund, Optimum Small-Mid Cap Growth Fund, and Optimum Small-Mid Cap Value Fund may invest in REITs and are subject to the risks associated with that industry. If a Fund holds real estate directly as a result of defaults or receives rental income directly from real estate holdings, its tax status as a regulated investment company may be jeopardized. There were no direct real estate holdings during the year ended March 31, 2018. The Funds’ REIT holdings are also affected by interest rate changes, particularly if the REITs they hold use floating rate debt to finance their ongoing operations. The Funds also invests in real estate acquired as a result of ownership of securities or other instruments, including issuers that invest, deal, or otherwise engage in transactions in real estate or interests therein. These instruments may include interests in private equity limited partnerships or limited liability companies that hold real estate investments (Real Estate Limited Partnerships). The Funds will limit their investments in Real Estate Limited Partnerships to 5% of their total assets at the time of purchase.
Optimum Large Cap Growth Fund, Optimum Large Cap Value Fund and Optimum Small-Mid Cap Growth Fund invested in growth stocks (such as those in the technology sector), which reflect projections of future earnings and revenue. These prices may rise or fall dramatically depending on whether those projections are met. These companies’ stock prices may be more volatile, particularly over the short-term.
Each Fund may invest up to 15% of its net assets in illiquid securities, which may include securities with contractual restrictions on resale, securities exempt from registration under Rule 144A promulgated under the Securities Act of 1933 (the Act), as amended, and other securities which may not be readily marketable. The Funds may also invest in securities exempt from registration under Section 4(a)(2) of the Act, which exempts from registration transactions by an issuer not involving any public offering. The relative illiquidity of these securities may impair the Funds from disposing of them in a timely manner and at a fair price when it is necessary or desirable to do so. While maintaining oversight, the Trust’s Board has delegated to DMC, the day-to-day functions of determining whether individual securities are liquid for purposes of the Funds’ limitation on investments in illiquid securities. Securities eligible for resale pursuant to Rule 144A, which are determined to be liquid, are not subject to the Funds’ 15% limit on investments in illiquid securities. Rule 144A, 4(a)(2) and restricted securities have been identified on the “Schedules of investments.” Restricted securities are valued pursuant to the security valuation procedures noted in Note 1.
176
Table of Contents
11. Contractual Obligations
Each Fund enters into contracts in the normal course of business that contain a variety of indemnifications. Each Fund’s maximum exposure under these arrangements is unknown. However, each Fund has not had prior claims or losses pursuant to these contracts. Management has reviewed the Funds’ existing contracts and expects the risk of loss to be remote.
12. General Motors Term Loan Litigation
Optimum Fixed Income Fund received notice of a litigation proceeding related to a General Motors Corporation (G.M.) term loan participation previously held by the Fund in 2009. We believe the matter subject to the litigation notice will likely lead to a recovery from the Fund of certain amounts received by the Fund because a US Court of Appeals has ruled that the Fund and similarly situated investors were unsecured creditors rather than secured lenders of G.M. as a result of an erroneous Uniform Commercial Code filing made by a third-party. The Fund received the full principal on the loans in 2009 after the G.M. bankruptcy. However, based upon the court ruling the estate is seeking to recover such amounts arguing that, as unsecured creditors, the Fund should not have received payment in full. Based upon currently available information related to the litigation and the Fund’s potential exposure, the Fund recorded a contingent liability of $1,385,788 and an asset of $415,736 based on the expected recoveries to unsecured creditors as of March 31, 2018 that resulted in a net decrease in the Fund’s NAV to reflect this likely recovery.
13. Recent Accounting Pronouncements
In March 2017, the Financial Accounting Standards Board issued an Accounting Standards Update, ASU 2017-08, Receivables — Nonrefundable Fees and Other Costs (Subtopic 310-20), Premium Amortization on Purchased Callable Debt Securities (ASU) which amends the amortization period for certain purchased callable debt securities held at a premium, shortening such period to the earliest call date. The ASU does not require any accounting change for debt securities held at a discount; the discount continues to be amortized to maturity. The ASU is effective for fiscal years, and interim periods within those fiscal years, beginning after Dec. 15, 2018. At this time, management is evaluating the implications of these changes on the financial statements.
14. Subsequent Events
Management has determined that no material events or transactions occurred subsequent to March 31, 2018, that would require recognition or disclosure in the Funds’ financial statements.
| (continues) | 177 |
Table of Contents
registered public accounting firm
To the Board of Trustees of Optimum Fund Trust and Shareholders of Optimum Fixed Income Fund, Optimum International Fund, Optimum Large Cap Growth Fund, Optimum Large Cap Value Fund, Optimum Small-Mid Cap Growth Fund and Optimum Small-Mid Cap Value Fund
Opinions on the Financial Statements
We have audited the accompanying statements of assets and liabilities, including the schedules of investments, of Optimum Fixed Income Fund, Optimum International Fund, Optimum Large Cap Growth Fund, Optimum Large Cap Value Fund, Optimum Small-Mid Cap Growth Fund and Optimum Small-Mid Cap Value Fund (constituting Optimum Fund Trust, hereafter collectively referred to as the “Funds”) as of March 31, 2018, the related statements of operations for the year ended March 31, 2018, the statements of changes in net assets for each of the two years in the period ended March 31, 2018, including the related notes, and the financial highlights for each of the five years in the period ended March 31, 2018 (collectively referred to as the “financial statements”). In our opinion, the financial statements present fairly, in all material respects, the financial position of each of the Funds as of March 31, 2018, the results of each of their operations for the year then ended, the changes in each of their net assets for each of the two years in the period ended March 31, 2018 and each of the financial highlights for each of the five years in the period ended March 31, 2018 in conformity with accounting principles generally accepted in the United States of America.
Basis for Opinions
These financial statements are the responsibility of the Funds’ management. Our responsibility is to express an opinion on the Funds’ financial statements based on our audits. We are a public accounting firm registered with the Public Company Accounting Oversight Board (United States) (“PCAOB”) and are required to be independent with respect to the Funds in accordance with the U.S. federal securities laws and the applicable rules and regulations of the Securities and Exchange Commission and the PCAOB.
We conducted our audits of these financial statements in accordance with the standards of the PCAOB. Those standards require that we plan and perform the audit to obtain reasonable assurance about whether the financial statements are free of material misstatement, whether due to error or fraud.
Our audits included performing procedures to assess the risks of material misstatement of the financial statements, whether due to error or fraud, and performing procedures that respond to those risks. Such procedures included examining, on a test basis, evidence regarding the amounts and disclosures in the financial statements. Our audits also included evaluating the accounting principles used and significant estimates made by management, as well as evaluating the overall presentation of the financial statements. Our procedures included confirmation of securities owned as of March 31, 2018 by correspondence with the custodian and brokers; when replies were not received from brokers, we performed other auditing procedures. We believe that our audits provide a reasonable basis for our opinions.
PricewaterhouseCoopers LLP
Philadelphia, Pennsylvania
May 18, 2018
We have served as the auditor of one or more investment companies in Optimum Fund Trust since 2010.
178
Table of Contents
(Unaudited)
Optimum Fund Trust
Tax Information
The information set forth below is for each Fund’s fiscal year as required by federal income tax laws. Shareholders, however, must report distributions on a calendar year basis for income tax purposes, which may include distributions for portions of two fiscal years of the Funds. Accordingly, the information needed by shareholders for income tax purposes will be sent to them in January of each year. Please consult your tax advisor for proper treatment of this information.
All disclosures are based on financial information available as of the date of this annual report and, accordingly are subject to change. For any and all items requiring reporting, it is the intention of the Funds to report the maximum amount permitted under the Internal Revenue Code and the regulations thereunder.
For the fiscal year ended March 31, 2018, each Fund reports distributions paid during the year as follows:
| (A) Long-Term Capital Gains Distributions (Tax Basis) | (B) Ordinary Income Distributions* (Tax Basis) | Total Distributions (Tax Basis) | (C) Qualifying Dividends1 | |||||||||||||
Optimum Fixed Income Fund | — | 100.00 | % | 100.00 | % | — | ||||||||||
Optimum International Fund | 52.34 | % | 47.66 | % | 100.00 | % | — | |||||||||
Optimum Large Cap Growth Fund | 87.48 | % | 12.52 | % | 100.00 | % | 30.46 | % | ||||||||
Optimum Large Cap Value Fund | 79.15 | % | 20.85 | % | 100.00 | % | 100.00 | % | ||||||||
Optimum Small-Mid Cap Growth Fund | 100.00 | % | — | 100.00 | % | — | ||||||||||
Optimum Small-Mid Cap Value Fund | 86.95 | % | 13.05 | % | 100.00 | % | 100.00 | % | ||||||||
(A) and (B) are based on a percentage of each Fund’s total distributions.
(C) is based on a percentage of each Fund’s ordinary income distributions.
1Qualifying dividends represent dividends which qualify for the corporate dividends received deduction.
*For the fiscal year ended March 31, 2018, certain dividends paid by the Funds may be subject to a maximum tax rate of 20%. The percentage of dividends paid by the Funds from ordinary income reported as qualified income are as reported in the following table. Complete information will be computed and reported in conjunction with your 2018 Form 1099-DIV.
| Optimum Fixed Income Fund | Optimum International Fund | Optimum Large Cap Growth Fund | Optimum Large Cap Value Fund | Optimum Small-Mid Cap Growth Fund | Optimum Small-Mid Cap Value Fund | |||||
| — | 73.65% | 32.93% | 100.00% | — | 100.00% |
For the fiscal year ended March 31, 2018, certain interest income paid by the Funds, determined to be Qualified Interest Income or Qualified Short-Term Capital Gains may be subject to relief from US tax withholding for foreign shareholders, as provided by the American Jobs Creation Act of 2004; the Tax Relief Unemployment Insurance Reauthorization, and Job Creations Act of 2010; and as extended by the American Taxpayer Relief Act of 2012. For the fiscal year ended March 31, 2018, the Funds have reported maximum distributions of Qualified Interest Income and Qualified Short-Term Capital Gains as follows:
| Qualified Interest Income | Short-Term Capital Gain | |||||||
Optimum Fixed Income Fund | $46,395,478 | $ | — | |||||
Optimum International Fund | — | 3,158,624 | ||||||
Optimum Large Cap Growth Fund | — | 46,985,251 | ||||||
Optimum Large Cap Value Fund | — | 1,714,423 | ||||||
Optimum International Fund intends to pass through foreign tax credits in the maximum amount of $1,002,889. The gross foreign source income earned during the fiscal year 2018 by the Fund was $15,696,352.
| (continues) | 179 |
Table of Contents
Other Fund information
(Unaudited)
Optimum Fund Trust
Board Consideration of Optimum Fixed Income Fund Sub-Advisory Agreements at a Meeting Held Dec. 13-14, 2017
At a meeting held on Dec. 13-14, 2017, the Board of Trustees of Optimum Fund Trust, including a majority of non-interested or independent Trustees (the “Independent Trustees”), approved a new Sub Advisory Agreement between Delaware Management Company (“DMC” or “Management”) and each of Macquarie Investment Management Europe Limited (“MIMEL”) and Macquarie Investment Management Global Limited (“MIMGL”) for Optimum Fixed Income Fund (the “Fund” or “Fixed Income Fund”). MIMEL and MIMGL may also be referenced as “Sub-Advisor(s)” below.
In reaching the decision to approve the Sub-Advisory Agreements, the Board considered and reviewed information .about each of MIMEL and MIMGL, including its personnel, operations and financial condition, which had been provided by MIMEL and MIMGL, respectively. The Board also reviewed material furnished by DMC, including: a memorandum from DMC reviewing the Sub-Advisory Agreements and the various services proposed to be rendered by MIMEL and MIMGL; information concerning MIMEL’s and MIMGL’s organizational structure and the experience of their key investment management personnel; copies of MIMEL’s and MIMGL’s Form ADV, financial statements, compliance policies and procedures, and Codes of Ethics; relevant performance information provided with respect to MIMEL and MIMGL; and a copy of the Sub-Advisory Agreements.
In considering such information and materials, the Independent Trustees received assistance and advice from and met separately with independent counsel. The materials prepared by Management in connection with the approval of the Sub-Advisory Agreements were sent to the Independent Trustees in advance of the meeting. While attention was given to all information furnished, the following discusses some primary factors relevant to the Board’s decision. This discussion of the information and factors considered by the Board (as well as the discussion above) is not intended to be exhaustive, but rather summarizes certain factors considered by the Board. In view of the wide variety of factors considered, the Board did not, unless otherwise noted, find it practicable to quantify or otherwise assign relative weights to the following factors. In addition, individual Trustees may have assigned different weights to various factors.
Nature, extent, and quality of services. In considering the nature, extent and quality of the services to be provided by the Sub-Advisors, the Board reviewed the services to be provided by each Sub-Advisor pursuant to each Sub-Advisory Agreement and as described at the meeting. The Board reviewed materials provided by the Sub-Advisors regarding the experience and qualifications of the personnel who will be responsible for providing services to a portion of the Fixed Income Fund. The Board also considered relevant performance information provided with respect to each Sub-Advisor. In discussing the nature of the services proposed to be provided by the Sub-Advisors, it was observed that, unlike traditional sub-advisors who make the investment related decisions with respect to a sub-advised portfolio, the relationship between DMC (the Fund’s investment manager) and the Sub-Advisors as currently contemplated is more of a collaborative effort between DMC and the Sub-Advisors and a cross pollination of investment ideas. Moreover, the Board noted the stated intention that DMC retain the decision-making authority with respect to purchases and sales of securities in the Fixed Income Fund. Based upon these considerations, the Board was satisfied with the nature and quality of the overall services to be provided by the Sub-Advisors to the Fund and its shareholders and was confident in the abilities of the Sub-Advisors to provide quality services to the Fund and its shareholders.
Investment performance. In regards to the appointment of the Sub-Advisors for the Fixed Income Fund, the Board reviewed information on prior performance for the Sub-Advisors. In evaluating performance, the Board considered that the Sub-Advisors would provide investment advice and recommendations, including with respect to specific securities, for consideration and evaluation by DMC’s portfolio managers, but that DMC’s portfolio managers for the Fund would retain final portfolio management discretion.
Sub-advisory fees. The Board considered that DMC would not pay the Sub-Advisors any fees in conjunction with the services that would.be rendered to the Fixed Income Fund. The Board concluded that, in light of the quality and extent of the services to be provided and the business relationships between DMC and the Sub-Advisors, the proposed fee arrangement was understandable and reasonable.
Profitability, economies of scale and fall out benefits. Information about each Sub-Advisor’s profitability from its relationship with the Fixed Income Fund was not available because it had not begun to provide services to the Fund. It was also noted that the Sub-Advisors would be receiving no fees in connection with their services under the Sub-Advisory Agreement. With regard to potential fall-out benefits derived or to be derived by the Sub-Advisors and their affiliates in connection with their relationship to the Fund, the Board considered the potential benefit to DMC and the Sub-Advisors of marketing a global approach on the portfolio management of their fixed income investment strategies. The Trustees also noted that economies of scale are shared with the Fixed Income Fund and its shareholders through investment management fee breakpoints in DMC’s fee schedule for the Fixed Income Fund so that as the Fund grows in size, its effective investment management fee rate declines.
180
Table of Contents
This page intentionally left blank.
Table of Contents
Board of trustees and officers addendum
Optimum Fund Trust
A mutual fund is governed by a Board of Trustees, which has oversight responsibility for the management of a fund’s business affairs. Trustees establish procedures and oversee and review the performance of the investment manager, the distributor and others that perform services for the fund. The independent fund trustees, in particular, are advocates for shareholder interests. The following is a list of the Trustees and Officers of the Trust with certain background and related information.
Name, Address, and Age | Position(s) Held with Fund(s) | Length of Time Served | Principal Occupation(s) During Past 5 Years | Number of Portfolios in Fund Complex1 Overseen by Trustee or Officer | Other Directorships Held by Trustee or Officer | |||||
| INTERESTED TRUSTEES | ||||||||||
Matt Audette2 2005 Market Street Philadelphia, PA 19103
May 1974 | Trustee | Dec. 16, 2016 to present | Chief Financial Officer and Managing Director — LPL Financial LLC (2015-Present)
Chief Financial Officer — E*TRADE Financial Corporation (2011-2015)
| 6 | None | |||||
Shawn K. Lytle2,4 2005 Market Street Philadelphia, PA 19103
February 1970 | Trustee, President and Chief Executive Officer | Trustee since Oct. 14, 2015; President and Chief Executive Officer since June 18, 2015 | President — Macquarie Investment Management3 (June 2015-Present)
Regional Head of Americas — UBS Global Asset Management (April 2010-May 2015)
| 6 | Trustee — Delaware Funds® by Macquarie (60 funds) (September 2015-Present) | |||||
| INDEPENDENT TRUSTEES | ||||||||||
Robert J. Christian 2005 Market Street Philadelphia, PA 19103
| Chairman and Trustee | Nov. 1, 2007 to present | Private Investor (2006-Present) | 6 | Trustee — FundVantage Trust (34 mutual funds) (2007-Present) | |||||
February 1949
| ||||||||||
Durant Adams Hunter 2005 Market Street Philadelphia, PA 19103
November 1948 | Trustee | July 17, 2003 to present | Managing Partner — Ridgeway Partners (Executive recruiting) (2004-Present) | 6 | None | |||||
Pamela J. Moret 2005 Market Street Philadelphia, PA 19103
February 1956 | Trustee | Oct. 1, 2013 to present | Private Investor (2015–Present)
Chief Executive Officer — brightpeak financial (2011-June 2015)
Senior Vice President — Thrivent Financial for Lutherans (2002-2015)
| 6 | Director – Blue Cross Blue Shield of Minnesota (2014-Present) | |||||
| Stephen Paul Mullin | Trustee | July 17, 2003 | President — | 6 | Director – Nasdaq | |||||
| 2005 Market Street | to present | Econsult Solutions, Inc. | Futures, Inc. | |||||||
| Philadelphia, PA 19103 | (Economic Consulting) | (2007-Present) | ||||||||
| (2013-Present) | ||||||||||
| February 1956 | Senior Vice President — Econsult Corp. (Economic consulting) (2000-2012) | |||||||||
182
Table of Contents
Name, Address, and Age | Position(s) Held with Fund(s) | Length of Time Served | Principal Occupation(s) During Past 5 Years | Number of Portfolios in Fund Complex1 Overseen by Trustee or Officer | Other Directorships Held by Trustee or Officer | |||||
| INDEPENDENT TRUSTEES (continued) | ||||||||||
| Robert A. Rudell | Trustee | July 17, 2003 | Private Investor | 6 | Director and Independent | |||||
| 2005 Market Street | to present | (2002-Present) | Chairman — | |||||||
| Philadelphia, PA 19103 | Heartland Funds | |||||||||
| (3 mutual funds) | ||||||||||
| September 1948 | (2005-Present) | |||||||||
| Jon Edward | Trustee | July 17, 2003 | President — H&S | 6 | None | |||||
| Socolofsky | to present | Enterprises of Minocqua, LLC | ||||||||
| 2005 Market Street | (Commercial real estate developer) | |||||||||
| Philadelphia, PA 19103 | (2005-Present) | |||||||||
| March 1946 | Private Investor | |||||||||
| (2002-Present) | ||||||||||
| Susan M. Stalnecker | Trustee | Dec. 14, 2016 | Senior Advisor — Boston Consulting Group | 6 | Trustee — Duke University | |||||
| 2005 Market Street | to present | (2016-Present) | Health System, Audit | |||||||
| Philadelphia, PA 19103 | Committee member | |||||||||
| Vice President — Productivity & Shared | (2010–Present) | |||||||||
| January 1953 | Services — E.I. du Pont de Nemours and | |||||||||
| Company (2012-2016) | Director — Leidos | |||||||||
| (2016-Present) | ||||||||||
| Vice President and Treasurer — | ||||||||||
| E.I. du Pont de Nemours and | ||||||||||
| Company (2006-2012) | ||||||||||
| OFFICERS | ||||||||||
| David F. Connor | Senior Vice President, | Senior Vice President | David F. Connor has served in | 6 | None4 | |||||
| 2005 Market Street | General Counsel, | since May 2013; | various capacities at | |||||||
| Philadelphia, PA 19103 | and Secretary | General Counsel | different times at | |||||||
| since May 2015; | Macquarie Investment Management3. | |||||||||
| December 1963 | Secretary since | |||||||||
| Oct. 2005 | ||||||||||
| Daniel V. Geatens | Vice President | Sept. 20, 2007 | Daniel V. Geatens has served in | 6 | None4 | |||||
| 2005 Market Street | and Treasurer | to present | various capacities at | |||||||
| Philadelphia, PA 19103 | different times at | |||||||||
| Macquarie Investment Management3. | ||||||||||
| October 1972 | ||||||||||
| Richard Salus | Senior | Jan. 1, 2006 | Richard Salus has served in | 6 | None4 | |||||
| 2005 Market Street | Vice President | to present | various executive capacities | |||||||
| Philadelphia, PA 19103 | and | at different times at | ||||||||
| Chief Financial | Macquarie Investment Management3. | |||||||||
| October 1963 | Officer | |||||||||
| 1 | The term “Fund Complex” refers to the Funds in the Optimum Fund Trust. |
| 2 | “Interested persons” of the Funds by virtue of their executive and management positions or relationships with the Fund’s service providers or sub-service providers. |
| 3 | Macquarie Investment Management is the marketing name for Macquarie Management Holdings, Inc. and its subsidiaries, including the Fund’s(s’) investment advisor, principal underwriter, and its transfer agent. Mr. Geatens also serves as the Chief Financial Officer and Treasurer for Macquarie Global Infrastructure Total Return Fund Inc., which shares an affiliated investment manager. |
| 4 | Messrs, Lytle, Connor, Geatens, and Salus also serve in similar capacities for the Delaware Funds® by Macquarie, a fund complex that has the same manager, principal underwriter, and transfer agent as the Trust. |
The Statement of Additional Information for the Funds includes additional information about the Trustees and Officers and is available, without charge, upon request by calling your financial advisor or 800 914-0278.
| (continues) | 183 |
Table of Contents
This annual report is for the information of Optimum Fund Trust shareholders, but it may be used with prospective investors when preceded or accompanied by a current prospectus for Optimum Fund Trust and the fact sheet for the most recently completed calendar quarter. The prospectus sets forth details about charges, expenses, investment objectives, and operating policies of the investment company. You should read the prospectus carefully before you invest. The figures in this report represent past results that are not a guarantee of future results. The return and principal value of an investment in the investment company will fluctuate so that shares, when redeemed, may be worth more or less than their original cost.
| Board of trustees | Affiliated officers | Contact information | ||
| Matt Audette | David F. Connor | Investment manager | ||
Chief Financial Officer and Managing Director — LPL Financial LLC | Senior Vice President, General Counsel, and Secretary Optimum Fund Trust Philadelphia, PA | Delaware Management Company, a series of Macquarie Investment Management Business Trust, Philadelphia, PA | ||
| Shawn K. Lytle | National distributor | |||
| Daniel V. Geatens | ||||
| President — Macquarie Investment | Delaware Distributors, L.P. | |||
| Management | Vice President and Treasurer | Philadelphia, PA | ||
| Philadelphia, PA | Optimum Fund Trust | |||
| Philadelphia, PA | Shareholder servicing, dividend | |||
| Robert J. Christian | disbursing, and transfer agent | |||
Private Investor
| Richard Salus
| |||
Durant Adams Hunter
Managing Partner — Ridgeway Partners
| Senior Vice President and Chief Financial Officer Optimum Fund Trust Philadelphia, PA
| Delaware Investments Fund Services Company 2005 Market Street Philadelphia, PA 19103-7094 | ||
Pamela J. Moret
| For shareholders | |||
Private Investor
| 800 914-0278 | |||
Stephen Paul Mullin
President — Econsult Solutions, Inc. | For securities dealers and financial institutions representatives only
| |||
Robert A. Rudell
| 800 362-7500 | |||
Private Investor
| Website | |||
Jon Edward Socolofsky
| optimummutualfunds.com | |||
Private Investor
| ||||
Susan M. Stalnecker
| ||||
| Senior Advisor — Boston Consulting | ||||
| Group | ||||
Each Fund files its complete schedule of portfolio holdings with the Securities and Exchange Commission (SEC) for the first and third quarters of each fiscal year on Forms N-Q. Each Fund’s Forms N-Q, as well as a description of the policies and procedures that the Funds use to determine how to vote proxies (if any) relating to portfolio securities and the Schedules of Investments included in the Funds’ most recent Forms N-Q are available without charge (i) upon request, by calling 800 914-0278; (ii) on the Funds’ website at optimummutualfunds.com/literature; and (iii) on the SEC’s website at sec.gov. Each Fund’s Forms N-Q may be reviewed and copied at the SEC’s Public Reference Room in Washington, D.C.; information on the operation of the Public Reference Room may be obtained by calling 800 SEC-0330.
Information (if any) regarding how the Funds voted proxies relating to portfolio securities during the most recently disclosed 12-month period ended June 30 is available without charge (i) through the Funds’ website at optimummutualfunds.com/proxy; and (ii) on the SEC’s website at sec.gov. | ||||
184
Item 2. Code of Ethics
The registrant has adopted a code of ethics that applies to the registrant’s principal executive officer, principal financial officer, principal accounting officer or controller, or persons performing similar functions, regardless of whether these individuals are employed by the registrant or a third party. A copy of the registrant’s Code of Business Ethics has been posted on the Optimum Mutual Funds’ Internet Web site at www.optimummutualfunds.com. Any amendments to the Code of Business Ethics, and information on any waiver from its provisions granted by the registrant, will also be posted on this Web site within five business days of such amendment or waiver and will remain on the Web site for at least 12 months.
Item 3. Audit Committee Financial Expert
The registrant’s Board of Trustees/Directors has determined that certain members of the registrant’s Audit Committee are audit committee financial experts, as defined below. For purposes of this item, an “audit committee financial expert” is a person who has the following attributes:
a. An understanding of generally accepted accounting principles and financial statements;
b. The ability to assess the general application of such principles in connection with the accounting for estimates, accruals, and reserves;
c. Experience preparing, auditing, analyzing, or evaluating financial statements that present a breadth and level of complexity of accounting issues that are generally comparable to the breadth and complexity of issues that can reasonably be expected to be raised by the registrant’s financial statements, or experience actively supervising one or more persons engaged in such activities;
d. An understanding of internal controls and procedures for financial reporting; and
e. An understanding of audit committee functions.
An “audit committee financial expert” shall have acquired such attributes through:
a. Education and experience as a principal financial officer, principal accounting officer, controller, public accountant, or auditor or experience in one or more positions that involve the performance of similar functions;
b. Experience actively supervising a principal financial officer, principal accounting officer, controller, public accountant, auditor, or person performing similar functions;
c. Experience overseeing or assessing the performance of companies or public accountants with respect to the preparation, auditing, or evaluation of financial statements; or
d. Other relevant experience.
The registrant’s Board of Trustees/Directors has also determined that each member of the registrant’s Audit Committee is independent. In order to be “independent” for purposes of this item, the Audit Committee member may not: (i) other than in his or her capacity as a member of the Board of Trustees/Directors or any committee thereof, accept directly or indirectly any consulting, advisory or other compensatory fee from the issuer; or (ii) be an “interested person” of the registrant as defined in Section 2(a)(19) of the Investment Company Act of 1940.
The names of the audit committee financial experts on the registrant’s Audit Committee are set forth below:
Robert J. Christian
Robert A. Rudell
Jon E. Socolofsky
Susan M. Stalnecker
Item 4. Principal Accountant Fees and Services
(a) Audit fees.
The aggregate fees billed for services provided to the registrant by its independent auditors for the audit of the registrant’s annual financial statements and for services normally provided by the independent auditors in connection with statutory and regulatory filings or engagements were $153,000 for the fiscal year ended March 31, 2018.
The aggregate fees billed for services provided to the registrant by its independent auditors for the audit of the registrant’s annual financial statements and for services normally provided by the independent auditors in connection with statutory and regulatory filings or engagements were $153,000 for the fiscal year ended March 31, 2017.
(b) Audit-related fees.
The aggregate fees billed by the registrant’s independent auditors for services relating to the performance of the audit of the registrant’s financial statements and not reported under paragraph (a) of this Item were $0 for the fiscal year ended March 31, 2018.
The aggregate fees billed by the registrant’s independent auditors for services relating to the performance of the audit of the financial statements of the registrant’s investment adviser and other service providers under common control with the adviser and that relate directly to the operations or financial reporting of the registrant were $640,000 for the registrant’s fiscal year ended March 31, 2018. The percentage of these fees relating to services approved by the registrant’s Audit Committee pursuant to the de minimis exception from the pre-approval requirement in Rule 2-01(c)(7)(i)(C) of Regulation S-X was 0%. These audit-related services were as follows: year-end audit procedures; group reporting and subsidiary statutory audits.
The aggregate fees billed by the registrant’s independent auditors for services relating to the performance of the audit of the registrant’s financial statements and not reported under paragraph (a) of this Item were $0 for the fiscal year ended March 31, 2017.
The aggregate fees billed by the registrant’s independent auditors for services relating to the performance of the audit of the financial statements of the registrant’s investment adviser and other service providers under common control with the adviser and that relate directly to the operations or financial reporting of the registrant were $640,000 for the registrant’s fiscal year ended March 31, 2017. The percentage of these fees relating to services approved by the registrant’s Audit Committee pursuant to the de minimis exception from the pre-approval requirement in Rule 2-01(c)(7)(i)(C) of Regulation S-X was 0%. These audit-related services were as follows: year end audit procedures; group reporting and subsidiary statutory audits.
(c) Tax fees.
The aggregate fees billed by the registrant’s independent auditors for tax-related services provided to the registrant were $29,175 for the fiscal year ended March 31, 2018. The percentage of these fees relating to services approved by the registrant’s Audit Committee pursuant to the de minimis exception from the pre-approval requirement in Rule 2-01(c)(7)(i)(C) of Regulation S-X was 0%. These tax-related services were as follows: review of income tax returns and review of annual excise distribution calculations.
The aggregate fees billed by the registrant’s independent auditors for tax-related services provided to the registrant’s investment adviser and other service providers under common control with the adviser and that relate directly to the operations or financial reporting of the registrant were $0 for the registrant’s fiscal year ended March 31, 2018.
The aggregate fees billed by the registrant’s independent auditors for tax-related services provided to the registrant were $29,175 for the fiscal year ended March 31, 2017. The percentage of these fees relating to services approved by the registrant’s Audit Committee pursuant to the de minimis exception from the pre-approval requirement in Rule 2-01(c)(7)(i)(C) of Regulation S-X was 0%. These tax-related services were as follows: review of income tax returns and review of annual excise distribution calculations.
The aggregate fees billed by the registrant’s independent auditors for tax-related services provided to the registrant’s investment adviser and other service providers under common control with the adviser and that relate directly to the operations or financial reporting of the registrant were $0 for the registrant’s fiscal year ended March 31, 2017.
(d) All other fees.
The aggregate fees billed for all services provided by the independent auditors to the registrant other than those set forth in paragraphs (a), (b) and (c) of this Item were $0 for the fiscal year ended March 31, 2018.
The aggregate fees billed for all services other than those set forth in paragraphs (b) and (c) of this Item provided by the registrant’s independent auditors to the registrant’s adviser and other service providers under common control with the adviser and that relate directly to the operations or financial reporting of the registrant were $0 for the registrant’s fiscal year ended March 31, 2018. The percentage of these fees relating to services approved by the registrant’s Audit Committee pursuant to the de minimis exception from the pre-approval requirement in Rule 2-01(c)(7)(i)(C) of Regulation S-X was 0%.
The aggregate fees billed for all services provided by the independent auditors to the registrant other than those set forth in paragraphs (a), (b) and (c) of this Item were $0 for the fiscal year ended March 31, 2017.
The aggregate fees billed for all services other than those set forth in paragraphs (b) and (c) of this Item provided by the registrant’s independent auditors to the registrant’s adviser and other service providers under common control with the adviser and that relate directly to the operations or financial reporting of the registrant were $0 for the registrant’s fiscal year ended March 31, 2017. The percentage of these fees relating to services approved by the registrant’s Audit Committee pursuant to the de minimis exception from the pre-approval requirement in Rule 2-01(c)(7)(i)(C) of Regulation S-X was 0%.
(e) The registrant’s Audit Committee has established pre-approval policies and procedures as permitted by Rule 2-01(c)(7)(i)(B) of Regulation S-X (the “Pre-Approval Policy”) with respect to services provided by the registrant’s independent auditors. Pursuant to the Pre-Approval Policy, the Audit Committee has pre-approved the services set forth in the table below with respect to the registrant up to the specified fee limits. Certain fee limits are based on aggregate fees to the registrant and other registrants within the Optimum Fund Trust.
| Service | Range of Fees |
| Audit Services | |
| Statutory audits or financial audits for new Funds | up to $25,000 per Fund |
| Services associated with SEC registration statements (e.g., Form N-1A, Form N-14, etc.), periodic reports and other documents filed with the SEC or other documents issued in connection with securities offerings (e.g., comfort letters for closed-end Fund offerings, consents), and assistance in responding to SEC comment letters | up to $10,000 per Fund |
| Consultations by Fund management as to the accounting or disclosure treatment of transactions or events and/or the actual or potential impact of final or proposed rules, standards or interpretations by the SEC, FASB, or other regulatory or standard-setting bodies (Note: Under SEC rules, some consultations may be considered “audit-related services” rather than “audit services”) | up to $25,000 in the aggregate |
| Audit-Related Services | |
| Consultations by Fund management as to the accounting or disclosure treatment of transactions or events and /or the actual or potential impact of final or proposed rules, standards or interpretations by the SEC, FASB, or other regulatory or standard-setting bodies (Note: Under SEC rules, some consultations may be considered “audit services” rather than “audit-related services”) | up to $25,000 in the aggregate |
| Tax Services | |
| U.S. federal, state and local and international tax planning and advice (e.g., consulting on statutory, regulatory or administrative developments, evaluation of Funds’ tax compliance function, etc.) | up to $25,000 in the aggregate |
| U.S. federal, state and local tax compliance (e.g., excise distribution reviews, etc.) | up to $5,000 per Fund |
| Review of federal, state, local and international income, franchise and other tax returns | up to $5,000 per Fund |
Under the Pre-Approval Policy, the Audit Committee has also pre-approved the services set forth in the table below with respect to the registrant’s investment adviser and other entities controlling, controlled by or under common control with the investment adviser that provide ongoing services to the registrant (the “Control Affiliates”) up to the specified fee limit. This fee limit is based on aggregate fees to the investment adviser and its Control Affiliates.
| Service | Range of Fees |
| Non-Audit Services | |
| Services associated with periodic reports and other documents filed with the SEC and assistance in responding to SEC comment letters | up to $10,000 in the aggregate |
The Pre-Approval Policy requires the registrant’s independent auditors to report to the Audit Committee at each of its regular meetings regarding all services initiated since the last such report was rendered, including those services authorized by the Pre-Approval Policy.
(f) Not applicable.
(g) The aggregate non-audit fees billed by the registrant’s independent auditors for services rendered to the registrant and to its investment adviser and other service providers under common control with the adviser were $11,180,000 and $11,180,000 for the registrant’s fiscal years ended March 31, 2018 and March 31, 2017, respectively.
(h) In connection with its selection of the independent auditors, the registrant’s Audit Committee has considered the independent auditors’ provision of non-audit services to the registrant’s investment adviser and other service providers under common control with the adviser that were not required to be pre-approved pursuant to Rule 2-01(c)(7)(ii) of Regulation S-X. The Audit Committee has determined that the independent auditors’ provision of these services is compatible with maintaining the auditors’ independence.
Item 5. Audit Committee of Listed Registrants
Not applicable.
Item 6. Investments
(a) Included as part of report to shareholders filed under Item 1 of this Form N-CSR.
(b) Divestment of securities in accordance with Section 13(c) of the Investment Company Act of 1940.
Not applicable.
Item 7. Disclosure of Proxy Voting Policies and Procedures for Closed-End Management Investment Companies
Not applicable.
Item 8. Portfolio Managers of Closed-End Management Investment Companies
Not applicable.
Item 9. Purchases of Equity Securities by Closed-End Management Investment Company and Affiliated Purchasers
Not applicable.
Item 10. Submission of Matters to a Vote of Security Holders
Not applicable.
Item 11. Controls and Procedures
The registrant’s principal executive officer and principal financial officer have evaluated the registrant’s disclosure controls and procedures within 90 days of the filing of this report and have concluded that they are effective in providing reasonable assurance that the information required to be disclosed by the registrant in its reports or statements filed under the Securities Exchange Act of 1934 is recorded, processed, summarized and reported within the time periods specified in the rules and forms of the Securities and Exchange Commission.
There were no significant changes in the registrant’s internal control over financial reporting that occurred during the second fiscal quarter of the period covered by the report to stockholders included herein (i.e., the registrant’s fourth fiscal quarter) that have materially affected, or are reasonably likely to materially affect, the registrant’s internal control over financial reporting.
Item 12. Disclosure of Securities Lending Activities for Closed-End Management Investment Companies
Not applicable
Item 13. Exhibits
(a) (1) Code of Ethics
Not applicable.
(2) Certifications of Principal Executive Officer and Principal Financial Officer pursuant to Rule 30a-2 under the Investment Company Act of 1940 are attached hereto as Exhibit 99.CERT.
(3) Written solicitations to purchase securities pursuant to Rule 23c-1 under the Securities Exchange Act of 1934.
Not applicable.
(b) Certifications pursuant to Section 906 of the Sarbanes-Oxley Act of 2002 are furnished herewith as Exhibit 99.906CERT.
SIGNATURES
Pursuant to the requirements of the Securities Exchange Act of 1934 and the Investment Company Act of 1940, the registrant has duly caused this report to be signed on its behalf, by the undersigned, thereunto duly authorized.
OPTIMUM FUND TRUST
| /s/ SHAWN K. LYTLE | |
| By: | Shawn K. Lytle |
| Title: | President and Chief Executive Officer |
| Date: | June 6, 2018 |
Pursuant to the requirements of the Securities Exchange Act of 1934 and the Investment Company Act of 1940, this report has been signed below by the following persons on behalf of the registrant and in the capacities and on the dates indicated.
| /s/ SHAWN K. LYTLE | |
| By: | Shawn K. Lytle |
| Title: | President and Chief Executive Officer |
| Date: | June 6, 2018 |
| /s/ RICHARD SALUS | |
| By: | Richard Salus |
| Title: | Chief Financial Officer |
| Date: | June 6, 2018 |