SECURITIES AND EXCHANGE COMMISSION
Washington, D.C. 20549
(Exact name of registrant as specified in charter)
(Address of principal executive offices) (Zip code)
(Name and address of agent for service)

ZEVENBERGEN GROWTH FUND
INVESTOR CLASS (ZVNBX)
INSTITUTIONAL CLASS (ZVNIX)
ZEVENBERGEN GENEA FUND
INVESTOR CLASS (ZVGNX)
INSTITUTIONAL CLASS (ZVGIX)
SEMI ANNUAL REPORT TO SHAREHOLDERS
DECEMBER 31, 2020
Important Notice: In accordance with the U.S. Securities and Exchange Commission, shareholder reports will be available electronically beginning July 1, 2021. Accordingly, paper copies will no longer be mailed. Instead, at that time, the Zevenbergen Growth Fund and the Zevenbergen Genea Fund will send a notice, either by mail or e-mail, each time an updated report is available on the Fund’s website (www.zci.com/funds). Investors enrolled in electronic delivery will receive the notices by e-mail, with links to the updated report and will not need to take any action. Investors who are not enrolled in electronic delivery by July 1, 2021 will receive the notices in the mail.
All investors who prefer to receive shareholder reports in a printed format may, at any time, choose that option free of charge. Contact your financial intermediary to make this election, or direct investors can call 1-844-ZVNBRGN.
TABLE OF CONTENTS
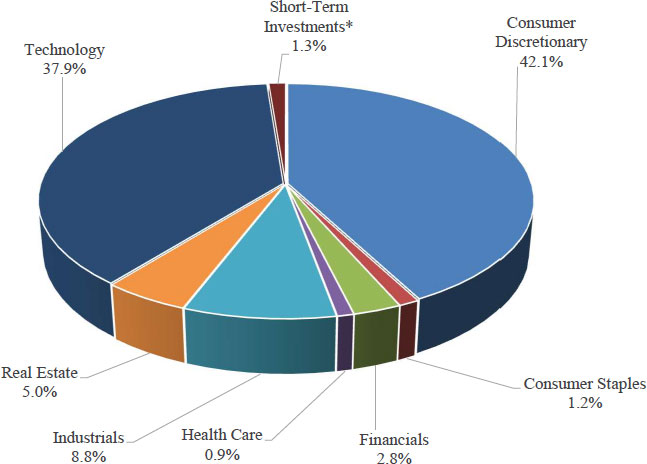
| Zevenbergen Growth Fund |
| Allocation of Portfolio Holdings |
| (Calculated as a percentage of Total Investments) |
| December 31, 2020 (Unaudited) |

| * | Short-Term Investments consist of amounts held in money market funds. The Fund strategy does not seek to hold large cash balances (more than 5% of total investments), and any significant cash holdings are typically due to trade settlement timing. |
| Zevenbergen Growth Fund |
| Schedule of Investments |
| December 31, 2020 (Unaudited) |
| Number of Shares | Value | |||||||
| COMMON STOCKS ― 98.8% | ||||||||
| CONSUMER DISCRETIONARY ― 38.8% | ||||||||
| 1,750 | Amazon.com, Inc. (a) | $ | 5,699,627 | |||||
| 24,950 | Chegg, Inc. (a) | 2,253,734 | ||||||
| 28,000 | Chewy, Inc. (a) | 2,516,920 | ||||||
| 4,300 | lululemon athletica inc. (a) | 1,496,529 | ||||||
| 3,800 | MercadoLibre, Inc. (a) | 6,365,836 | ||||||
| 8,000 | Netflix, Inc. (a) | 4,325,840 | ||||||
| 19,000 | Peloton Interactive, Inc. (a) | 2,882,680 | ||||||
| 13,100 | Tesla, Inc. (a) | 9,244,277 | ||||||
| 7,050 | The Trade Desk, Inc. (a) | 5,647,050 | ||||||
| 67,475 | Uber Technologies, Inc. (a) | 3,441,225 | ||||||
| 43,873,718 | ||||||||
| CONSUMER STAPLES ― 0.9% | ||||||||
| 8,000 | Beyond Meat, Inc. (a) | 1,000,000 | ||||||
| FINANCIALS ― 1.6% | ||||||||
| 9,000 | Goosehead Insurance, Inc. | 1,122,840 | ||||||
| 5,700 | Lemonade, Inc. (a) | 698,250 | ||||||
| 1,821,090 | ||||||||
| HEALTH CARE ― 13.9% | ||||||||
| 20,100 | Adaptive Biotechnologies Corporation (a) | 1,188,513 | ||||||
| 42,400 | Exact Sciences Corporation (a) | 5,617,576 | ||||||
| 33,350 | GoodRx Holdings, Inc. (a) | 1,345,339 | ||||||
| 7,000 | Seagen Inc. (a) | 1,225,980 | ||||||
| 22,275 | Teladoc Health, Inc. (a) | 4,454,109 | ||||||
| 6,800 | Veeva Systems Inc. (a) | 1,851,300 | ||||||
| 15,682,817 | ||||||||
| INDUSTRIALS ― 8.1% | ||||||||
| 9,500 | Paylocity Holding Corporation (a) | 1,956,145 | ||||||
| 12,000 | PayPal Holdings, Inc. (a) | 2,810,400 | ||||||
| 20,300 | Square, Inc. (a) | 4,418,092 | ||||||
| 9,184,637 | ||||||||
| REAL ESTATE ― 5.6% | ||||||||
| 1,630 | CoStar Group, Inc. (a) | 1,506,576 | ||||||
| 37,100 | Zillow Group, Inc. Class C (a) | 4,815,580 | ||||||
| 6,322,156 | ||||||||
The accompanying notes are an integral part of these financial statements.
| Zevenbergen Growth Fund |
| Schedule of Investments |
| December 31, 2020 (Unaudited) |
| Number of Shares | Value | |||||||
| TECHNOLOGY ― 29.9% | ||||||||
| 6,405 | Coupa Software Incorporated (a) | $ | 2,170,719 | |||||
| 8,140 | NVIDIA Corporation | 4,250,708 | ||||||
| 16,925 | Okta, Inc. (a) | 4,303,350 | ||||||
| 19,000 | QUALCOMM Incorporated | 2,894,460 | ||||||
| 10,175 | RingCentral, Inc. (a) | 3,856,020 | ||||||
| 6,100 | ServiceNow, Inc. (a) | 3,357,623 | ||||||
| 5,725 | Shopify Inc. (a) | 6,480,414 | ||||||
| 35,000 | Snap Inc. (a) | 1,752,450 | ||||||
| 1,650 | Snowflake Inc. (a) | 464,310 | ||||||
| 16,800 | Sprout Social, Inc. (a) | 762,888 | ||||||
| 13,200 | Unity Software Inc. (a) | 2,025,804 | ||||||
| 4,485 | Zoom Video Communications, Inc. (a) | 1,512,880 | ||||||
| 33,831,626 | ||||||||
| TOTAL COMMON STOCKS (Cost $59,290,789) | $ | 111,716,044 | ||||||
| MONEY MARKET FUNDS ― 0.8% | ||||||||
| 972,040 | First American U.S. Treasury Money Market Fund, Class Z, 0.01% (b) | 972,040 | ||||||
| TOTAL SHORT-TERM INVESTMENTS (Cost $972,040) | $ | 972,040 | ||||||
| TOTAL INVESTMENTS ― 99.6% (Cost $60,262,829) | 112,688,084 | |||||||
| Other Assets in Excess of Liabilities ― 0.4% | 441,301 | |||||||
| TOTAL NET ASSETS ― 100.0% | $ | 113,129,385 | ||||||
| (a): | Non Income Producing. |
| (b): | Variable rate security. The rate disclosed is the annualized seven-day effective yield as of December 31, 2020. |
| Zevenbergen Growth Fund Statement of Assets and Liabilities December 31, 2020 (Unaudited) |
| Assets | ||||
| Investments in securities, at value (cost $60,262,829) | $ | 112,688,084 | ||
| Dividend and interest receivable | 8 | |||
| Receivable for Fund shares sold | 1,491,744 | |||
| Prepaid expenses | 26,281 | |||
| Total Assets | 114,206,117 | |||
| Liabilities | ||||
| Payable for Fund shares redeemed | 364,445 | |||
| Payable for securities purchased | 513,420 | |||
| Payable to Adviser | 141,047 | |||
| Distribution fees - Investor Class | 16,420 | |||
| Accrued other expenses and other liabilities | 41,400 | |||
| Total Liabilities | 1,076,732 | |||
| Net Assets | $ | 113,129,385 | ||
| Components of Net Assets | ||||
| Paid-in capital | $ | 60,563,557 | ||
| Total distributable earnings | 52,565,828 | |||
| Net Assets | $ | 113,129,385 | ||
| Investor Class: | ||||
| Net assets | $ | 43,437,235 | ||
| Shares outstanding (unlimited number of shares authorized, no par value) | 1,016,978 | |||
| Net asset value, offering and redemption price per share * | $ | 42.71 | ||
| Institutional Class: | ||||
| Net assets | $ | 69,692,150 | ||
| Shares outstanding (unlimited number of shares authorized, no par value) | 1,609,623 | |||
| Net asset value, offering and redemption price per share * | $ | 43.30 | ||
| * | Shares redeemed or exchanged within 90 days of purchase are charged a 1.00% redemption fee (Note 9). |
The accompanying notes are an integral part of these financial statements.
| Zevenbergen Growth Fund Statement of Operations For the Six Months Ended December 31, 2020 (Unaudited) |
| Investment Income | ||||
| Dividends and interest income | $ | 35,943 | ||
| Expenses | ||||
| Advisory fees | 329,183 | |||
| Administration fees (Note 3) | 49,422 | |||
| Shareholder servicing fees | 48,856 | |||
| Distribution fees - Investor Class | 38,539 | |||
| Transfer agent fees and expenses (Note 3) | 21,160 | |||
| Registration fees | 20,782 | |||
| Legal fees | 10,844 | |||
| Audit fees | 7,912 | |||
| Custody fees (Note 3) | 7,626 | |||
| Compliance fees (Note 3) | 6,624 | |||
| Trustees' fees | 5,888 | |||
| Shareholder reporting fees | 2,128 | |||
| Insurance fees | 1,409 | |||
| Miscellaneous expenses | 954 | |||
| Total expenses | 551,327 | |||
| Expenses waived and reimbursed by the Adviser (Note 3) | (93,602 | ) | ||
| Net Expenses | 457,725 | |||
| Net Investment Loss | (421,782 | ) | ||
| Realized and Unrealized Gain on Investments | ||||
| Net realized gain on investments | 1,343,231 | |||
| Change in unrealized appreciation on investments | 29,649,248 | |||
| Net Realized and Unrealized Gain on Investments | 30,992,479 | |||
| Net Increase in Net Assets from Operations | $ | 30,570,697 | ||
The accompanying notes are an integral part of these financial statements.
Zevenbergen Growth Fund Statements of Changes in Net Assets |
| Operations | For the Six Months Ended December 31, 2020 (Unaudited) | For the Year Ended June 30, 2020 | ||||||
| Net investment loss | $ | (421,782 | ) | $ | (272,739 | ) | ||
| Net realized gain (loss) on investments | 1,343,231 | (499,239 | ) | |||||
| Net change in unrealized appreciation on investments | 29,649,248 | 15,723,445 | ||||||
| Net Increase in Net Assets from Operations | 30,570,697 | 14,951,467 | ||||||
| Distributions to shareholders from | ||||||||
| Net realized loss on investments | ||||||||
| Investor Class | (28,530 | ) | — | |||||
| Institutional Class | (44,888 | ) | — | |||||
| Total distributions to shareholders | (73,418 | ) | — | |||||
| Capital Transactions | ||||||||
| Proceeds from shares sold | ||||||||
| Investor Class | 23,321,406 | 13,574,932 | ||||||
| Institutional Class | 26,892,096 | 15,697,643 | ||||||
| Proceeds from shares reinvested | ||||||||
| Investor Class | 28,457 | — | ||||||
| Institutional Class | 44,273 | — | ||||||
| Cost of shares redeemed | ||||||||
| Investor Class | (9,791,865 | ) | (3,969,298 | ) | ||||
| Institutional Class | (13,700,105 | ) | (3,633,206 | ) | ||||
| Redemption fees | ||||||||
| Investor Class | 16,868 | 7,748 | ||||||
| Institutional Class | 27,952 | 17,169 | ||||||
| Net Increase in Net Assets from Capital Share Transactions | 26,839,082 | 21,694,988 | ||||||
| Total Increase in Net Assets | 57,336,361 | 36,646,455 | ||||||
| Net Assets | ||||||||
| Beginning of year | 55,793,024 | 19,146,569 | ||||||
| End of year | $ | 113,129,385 | $ | 55,793,024 | ||||
| Capital Shares Transactions | ||||||||
| Investor Class | ||||||||
| Shares sold | 650,184 | 601,012 | ||||||
| Shares reinvested | 631 | |||||||
| Shares redeemed | (270,378 | ) | (199,182 | ) | ||||
| Net increase in shares outstanding | 380,437 | 401,830 | ||||||
| Institutional Class | ||||||||
| Shares sold | 744,216 | 672,998 | ||||||
| Shares reinvested | 968 | |||||||
| Shares redeemed | (404,110 | ) | (169,981 | ) | ||||
| Net increase in shares outstanding | 341,074 | 503,017 | ||||||
The accompanying notes are an integral part of these financial statements.
| Zevenbergen Growth Fund |
| Financial Highlights |
Investor Class |
| For a Capital Share Outstanding Throughout Each Period Presented: |
| For the Six Months Ended December 31, 2020 (Unaudited) | For the Year Ended June 30, 2020 | For the Year Ended June 30, 2019 | For the Year Ended June 30, 2018 | For the Year Ended June 30, 2017 | ||||||||||||||||
| Net Asset Value, Beginning of Period | $ | 29.05 | $ | 19.00 | $ | 16.33 | $ | 12.27 | $ | 9.05 | ||||||||||
| Gain (Loss) from Investment Operations: | ||||||||||||||||||||
| Net investment loss (1) | (0.01 | ) | (0.27 | ) | (0.20 | ) | (0.17 | ) | (0.13 | ) | ||||||||||
| Net realized and unrealized gain on investments | 13.70 | 10.30 | 2.85 | 4.22 | 3.35 | |||||||||||||||
| Total Gain from Investment Operations | 13.69 | 10.03 | 2.65 | 4.05 | 3.22 | |||||||||||||||
| Less Distributions from Net Realized Gain: | (0.03 | ) | — | — | — | — | ||||||||||||||
| Redemption Fee Proceeds (1) | — | * | 0.02 | 0.02 | 0.01 | — | ||||||||||||||
| Net Asset Value, End of Period | $ | 42.71 | $ | 29.05 | $ | 19.00 | $ | 16.33 | $ | 12.27 | ||||||||||
| Total Return | 47.02 | %(2) | 52.89 | % | 16.35 | % | 33.09 | % | 35.58 | % | ||||||||||
| Supplemental Data and Ratios: | ||||||||||||||||||||
| Net assets, end of period (in thousands) | $ | 43,437 | $ | 18,492 | $ | 4,460 | $ | 1,292 | $ | 194 | ||||||||||
| Ratio of expenses to average net assets | ||||||||||||||||||||
| Before fees waived and reimbursed by the Adviser | 1.52 | %(3) | 2.14 | % | 2.78 | % | 3.63 | % | 5.89 | % | ||||||||||
| After fees waived and reimbursed by the Adviser | 1.30 | %(3) | 1.30 | % | 1.30 | % | 1.30 | % | 1.30 | % | ||||||||||
| Ratio of net investment loss to average net assets | ||||||||||||||||||||
| Before fees waived and reimbursed by the Adviser | -1.44 | %(3) | -2.12 | % | -2.69 | % | -3.53 | % | -5.76 | % | ||||||||||
| After fees waived and reimbursed by the Adviser | -1.21 | %(3) | -1.28 | % | -1.21 | % | -1.20 | % | -1.17 | % | ||||||||||
| Portfolio turnover rate (4) | 21.21 | %(2) | 38.74 | % | 28.68 | % | 31.12 | % | 25.90 | % | ||||||||||
| * | Less than $0.01 per share |
| (1) | Per share amounts have been calculated using the average shares method |
| (2) | Not annualized |
| (3) | Annualized |
| (4) | Portfolio turnover rate is calculated for the Fund without distinguishing between classes. |
The accompanying notes are an integral part of these financial statements.
| Zevenbergen Growth Fund |
| Financial Highlights |
| Institutional Class |
For a Capital Share Outstanding Throughout Each Period Presented:
| For the Six Months Ended December 31, 2020 (Unaudited) | For the Year Ended June 30, 2020 | For the Year Ended June 30, 2019 | For the Year Ended June 30, 2018 | For the Year Ended June 30, 2017 | ||||||||||||||||
| Net Asset Value, Beginning of Period | $ | 29.40 | $ | 19.18 | $ | 16.45 | $ | 12.33 | $ | 9.07 | ||||||||||
| Gain (Loss) from Investment Operations: | ||||||||||||||||||||
| Net investment loss (1) | — | (0.20 | ) | (0.15 | ) | (0.13 | ) | (0.09 | ) | |||||||||||
| Net realized and unrealized gain on investments | 13.93 | 10.40 | 2.87 | 4.24 | 3.35 | |||||||||||||||
| Total Gain from Investment Operations | 13.93 | 10.20 | 2.72 | 4.11 | 3.26 | |||||||||||||||
| Less Distributions from Net Realized Gain: | (0.03 | ) | — | — | — | — | ||||||||||||||
| Redemption Fee Proceeds (1) | — | * | 0.02 | 0.01 | 0.01 | — | * | |||||||||||||
| Net Asset Value, End of Period | $ | 43.30 | $ | 29.40 | $ | 19.18 | $ | 16.45 | $ | 12.33 | ||||||||||
| Total Return | 47.28 | %(2) | 53.28 | % | 16.60 | % | 33.41 | % | 35.94 | % | ||||||||||
| Supplemental Data and Ratios: | ||||||||||||||||||||
| Net assets, end of period (in thousands) | $ | 69,692 | $ | 37,302 | $ | 14,686 | $ | 10,970 | $ | 6,427 | ||||||||||
| Ratio of expenses to average net assets | ||||||||||||||||||||
| Before fees waived and reimbursed by the Adviser | 1.23 | %(3) | 1.90 | % | 2.52 | % | 3.55 | % | 5.86 | % | ||||||||||
| After fees waived and reimbursed by the Adviser | 1.00 | %(3) | 1.00 | % | 1.00 | % | 1.00 | % | 1.00 | % | ||||||||||
| Ratio of net investment loss to average net assets | ||||||||||||||||||||
| Before fees waived and reimbursed by the Adviser | -1.14 | %(3) | -1.88 | % | -2.43 | % | -3.45 | % | -5.72 | % | ||||||||||
| After fees waived and reimbursed by the Adviser | -0.91 | %(3) | -0.98 | % | -0.91 | % | -0.90 | % | -0.87 | % | ||||||||||
| Portfolio turnover rate (4) | 21.21 | %(2) | 38.74 | % | 28.68 | % | 31.12 | % | 25.90 | % | ||||||||||
| * | Less than $0.01 per share |
| (1) | Per share amounts have been calculated using the average shares method |
| (2) | Not annualized |
| (3) | Annualized |
| (4) | Portfolio turnover rate is calculated for the Fund without distinguishing between classes. |
The accompanying notes are an integral part of these financial statements.
| Zevenbergen Genea Fund |
| Allocation of Portfolio Holdings |
| (Calculated as a percentage of Total Investments) |
| December 31, 2020 (Unaudited) |
| * | Short-Term Investments consist of amounts held in money market funds. The Fund strategy does not seek to hold large cash balances (more than 5% of total investments), and any significant cash holdings are typically due to trade settlement timing. |
Zevenbergen Genea Fund December 31, 2020 (Unaudited) |
| Number of | ||||||||
| Shares | Value | |||||||
| COMMON STOCKS ― 97.4% | ||||||||
| CONSUMER DISCRETIONARY ― 41.6% | ||||||||
| 2,640 | Amazon.com, Inc. (a) | $ | 8,598,295 | |||||
| 42,550 | Chegg, Inc. (a) | 3,843,542 | ||||||
| 42,500 | Chewy, Inc. (a) | 3,820,325 | ||||||
| 20,085 | Etsy, Inc. (a) | 3,573,323 | ||||||
| 5,180 | MercadoLibre, Inc. (a) | 8,677,640 | ||||||
| 10,610 | Netflix, Inc. (a) | 5,737,145 | ||||||
| 44,860 | Peloton Interactive, Inc. (a) | 6,806,159 | ||||||
| 19,775 | Tesla, Inc. (a) | 13,954,624 | ||||||
| 10,290 | The Trade Desk, Inc. (a) | 8,242,290 | ||||||
| 104,800 | Uber Technologies, Inc. (a) | 5,344,800 | ||||||
| 68,598,143 | ||||||||
| CONSUMER STAPLES ― 1.2% | ||||||||
| 15,300 | Beyond Meat, Inc. (a) | 1,912,500 | ||||||
| FINANCIALS ― 2.7% | ||||||||
| 36,815 | Lemonade, Inc. (a) | 4,509,838 | ||||||
| HEALTH CARE ― 0.9% | ||||||||
| 38,345 | GoodRx Holdings, Inc. (a) | 1,546,837 | ||||||
| INDUSTRIALS ― 8.7% | ||||||||
| 20,650 | Axon Enterprise, Inc. (a) | 2,530,244 | ||||||
| 21,100 | Bill.com Holdings, Inc. (a) | 2,880,150 | ||||||
| 36,500 | Square, Inc. (a) | 7,943,860 | ||||||
| 37,868 | Virgin Galactic Holdings, Inc. (a) | 898,608 | ||||||
| 14,252,862 | ||||||||
| REAL ESTATE ― 4.9% | ||||||||
| 62,315 | Zillow Group, Inc. Class C (a) | 8,088,487 | ||||||
| TECHNOLOGY ― 37.4% | ||||||||
| 10,400 | Coupa Software Incorporated (a) | 3,524,664 | ||||||
| 29,300 | Datadog, Inc. (a) | 2,884,292 | ||||||
| 12,140 | MongoDB, Inc. (a) | 4,358,746 | ||||||
| 11,865 | NVIDIA Corporation | 6,195,903 | ||||||
| 21,375 | Okta, Inc. (a) | 5,434,807 | ||||||
| 84,030 | Pinterest, Inc. (a) | 5,537,577 | ||||||
| 6,050 | ServiceNow, Inc. (a) | 3,330,102 | ||||||
| 7,515 | Shopify Inc. (a) | 8,506,604 | ||||||
The accompanying notes are an integral part of these financial statements.
Zevenbergen Genea Fund Schedule of Investments December 31, 2020 (Unaudited) |
Number of Shares | Value | |||||||
| TECHNOLOGY ― 37.4% (Continued) | ||||||||
| 64,500 | Snap Inc. (a) | $ | 3,229,515 | |||||
| 12,100 | Snowflake Inc. (a) | 3,404,940 | ||||||
| 37,540 | Sprout Social, Inc. (a) | 1,704,691 | ||||||
| 15,550 | Twilio Inc. (a) | 5,263,675 | ||||||
| 25,400 | Unity Software Inc. (a) | 3,898,138 | ||||||
| 12,850 | Zoom Video Communications, Inc. (a) | 4,334,562 | ||||||
| 61,608,216 | ||||||||
| TOTAL COMMON STOCKS | ||||||||
| (Cost $86,572,556) | $ | 160,516,883 | ||||||
| SHORT-TERM INVESTMENTS ― 1.2% | ||||||||
| 2,046,095 | First American U.S. Treasury Money Market Fund, Class Z, 0.01% (b) | 2,046,095 | ||||||
| TOTAL SHORT-TERM INVESTMENTS (Cost $2,046,095) | $ | 2,046,095 | ||||||
| TOTAL INVESTMENTS ― 98.6% (Cost $88,618,651) | 162,562,978 | |||||||
| Other Assets in Excess of Liabilities ― 1.4% | 2,373,139 | |||||||
| TOTAL NET ASSETS ― 100.0% | $ | 164,936,117 | ||||||
| (a): | Non Income Producing. |
| (b): | Variable rate security. The rate disclosed is the annualized seven-day effective yield as of December 31, 2020. |
The accompanying notes are an integral part of these financial
| Zevenbergen Genea Fund |
| Statement of Assets and Liabilities |
| December 31, 2020 (Unaudited) |
| Assets | ||||
| Investments in securities, at value (cost $88,618,651) | $ | 162,562,978 | ||
| Receivable for Fund shares sold | 2,832,120 | |||
| Interest receivable | 17 | |||
| Prepaid expenses | 28,753 | |||
| Total Assets | 165,423,868 | |||
| Liabilities | ||||
| Payable for Fund shares redeemed | 164,876 | |||
| Payable to Adviser | 242,832 | |||
| Distribution fees - Investor Class | 24,013 | |||
| Accrued other expenses and other liabilities | 56,030 | |||
| Total Liabilities | 487,751 | |||
| Net Assets | $ | 164,936,117 | ||
| Components of Net Assets | ||||
| Paid-in capital | $ | 94,164,454 | ||
| Total distributable earnings | 70,771,663 | |||
| Net Assets | $ | 164,936,117 | ||
| Investor Class: | ||||
| Net assets | $ | 98,712,828 | ||
| Shares outstanding (unlimited number of shares authorized, no par value) | 1,817,008 | |||
| Net asset value, offering and redemption price per share * | $ | 54.33 | ||
| Institutional Class: | ||||
| Net assets | $ | 66,223,289 | ||
| Shares outstanding (unlimited number of shares authorized, no par value) | 1,202,884 | |||
| Net asset value, offering and redemption price per share * | $ | 55.05 | ||
* Shares redeemed or exchanged within 90 days of purchase are charged a 1.00% redemption fee (Note 9).
The accompanying notes are an integral part of these financial statements.
| Zevenbergen Genea Fund |
| Statement of Operations |
| For the Six Months Ended December 31, 2020 (Unaudited) |
| Investment Income | ||||
| Dividends and interest income | $ | 3,445 | ||
| Expenses | ||||
| Advisory fees | 441,530 | |||
| Distribution fees - Investor Class | 71,149 | |||
| Shareholder servicing fees | 63,289 | |||
| Administration fees (Note 3) | 47,146 | |||
| Transfer agent fees and expenses (Note 3) | 22,044 | |||
| Registration fees | 17,713 | |||
| Legal fees | 11,914 | |||
| Audit fees | 7,912 | |||
| Compliance fees (Note 3) | 6,072 | |||
| Trustees' fees | 5,888 | |||
| Shareholder reporting fees | 4,600 | |||
| Miscellaneous expenses | 3,864 | |||
| Custody fees (Note 3) | 3,624 | |||
| Insurance fees | 1,472 | |||
| Total expenses | 708,217 | |||
| Expenses waived by the Adviser (Note 3) | (83,190 | ) | ||
| Net Expenses | 625,027 | |||
| Net Investment Loss | (621,582 | ) | ||
| Realized and Unrealized Gain on Investments | ||||
| Net realized gain on investments | 1,233,689 | |||
| Change in unrealized appreciation on investments | 45,340,706 | |||
| Net Realized and Unrealized Gain on Investments | 46,574,395 | |||
| Net Increase in Net Assets from Operations | $ | 45,952,813 | ||
The accompanying notes are an integral part of these financial statements.
| Zevenbergen Genea Fund |
| Statements of Changes in Net Assets |
| Operations | For the Six Months Ended December 31, 2020 (Unaudited) | For the Year Ended June 30, 2020 | ||||||
| Net investment loss | $ | (621,582 | ) | $ | (503,696 | ) | ||
| Net realized gain (loss) on investments | 1,233,689 | (2,559,382 | ) | |||||
| Net change in unrealized appreciation on investments | 45,340,706 | 17,999,600 | ||||||
| Net Increase in Net Assets from Operations | 45,952,813 | 14,936,522 | ||||||
| Capital Transactions | ||||||||
| Proceeds from shares sold | ||||||||
| Investor Class | 54,464,049 | 13,742,698 | ||||||
| Institutional Class | 27,862,666 | 6,071,493 | ||||||
| Cost of shares redeemed | ||||||||
| Investor Class | (15,190,154 | ) | (17,810,000 | ) | ||||
| Institutional Class | (6,173,792 | ) | (4,320,587 | ) | ||||
| Redemption fees | ||||||||
| Investor Class | 45,927 | 12,696 | ||||||
| Institutional Class | 32,945 | 10,340 | ||||||
| Net Increase/(Decrease) in Net Assets from Capital Share Transactions | 61,041,641 | (2,293,360 | ) | |||||
| Total Increase in Net Assets | 106,994,454 | 12,643,162 | ||||||
| Net Assets | ||||||||
| Beginning of year | 57,941,663 | 45,298,501 | ||||||
| End of year | $ | 164,936,117 | $ | 57,941,663 | ||||
| Capital Shares Transactions | ||||||||
| Investor Class | ||||||||
| Shares sold | 1,174,119 | 544,623 | ||||||
| Shares reinvested | — | — | ||||||
| Shares redeemed | (339,760 | ) | (815,815 | ) | ||||
| Net increase in shares outstanding | 834,359 | 645,716 | ||||||
| Institutional Class | ||||||||
| Shares sold | 590,649 | 248,310 | ||||||
| Shares reinvested | — | — | ||||||
| Shares redeemed | (134,075 | ) | (201,126 | ) | ||||
| Net increase in shares outstanding | 456,574 | 265,641 | ||||||
The accompanying notes are an integral part of these financial statements.
| Zevenbergen Genea Fund |
| Financial Highlights |
| Investor Class |
| For a Capital Share Outstanding Throughout Each Period Presented: | ||||||||||||||||||||
| For the Six Months Ended December 31, 2020 (Unaudited) | For the Year Ended June 30, 2020 | For the Year Ended June 30, 2019 | For the Year Ended June 30, 2018 | For the Year Ended June 30, 2017 | ||||||||||||||||
| Net Asset Value, Beginning of Period | $ | 33.34 | $ | 23.12 | $ | 20.77 | $ | 14.20 | $ | 9.40 | ||||||||||
| Gain (Loss) from Investment Operations: | ||||||||||||||||||||
| Net investment loss (1) | (0.01 | ) | (0.32 | ) | (0.29 | ) | (0.23 | ) | (0.16 | ) | ||||||||||
| Net realized and unrealized gain on investments | 21.00 | 10.53 | 2.68 | 6.79 | 4.96 | |||||||||||||||
| Total Gain from Investment Operations | 20.99 | 10.21 | 2.39 | 6.56 | 4.80 | |||||||||||||||
| Less Distributions from Net Realized Gain: | — | — | (0.06 | ) | — | — | ||||||||||||||
| Redemption Fee Proceeds (1) | — | * | 0.01 | 0.02 | 0.01 | — | * | |||||||||||||
| Net Asset Value, End of Period | $ | 54.33 | $ | 33.34 | $ | 23.12 | $ | 20.77 | $ | 14.20 | ||||||||||
| Total Return | 62.96 | %(2) | 44.20 | % | 11.72 | % | 46.27 | % | 51.06 | % | ||||||||||
| Supplemental Data and Ratios: | ||||||||||||||||||||
| Net assets, end of period (in thousands) | $ | 98,713 | $ | 32,763 | $ | 28,986 | $ | 12,633 | $ | 2,074 | ||||||||||
| Ratio of expenses to average net assets | ||||||||||||||||||||
| Before fees waived and reimbursed by the Adviser | 1.57 | %(3) | 1.98 | % | 2.09 | % | 3.35 | % | 7.96 | % | ||||||||||
| After fees waived and reimbursed by the Adviser | 1.40 | %(3) | 1.40 | % | 1.40 | % | 1.40 | % | 1.40 | % | ||||||||||
| Ratio of net investment loss to average net assets | ||||||||||||||||||||
| Before fees waived and reimbursed by the Adviser | -1.56 | %(3) | -1.96 | % | -2.04 | % | -3.27 | % | -7.89 | % | ||||||||||
| After fees waived and reimbursed by the Adviser | -1.39 | %(3) | -1.38 | % | -1.35 | % | -1.32 | % | -1.33 | % | ||||||||||
| Portfolio turnover rate (4) | 7.26 | %(2) | 61.63 | % | 35.25 | % | 22.35 | % | 67.59 | % | ||||||||||
| * | Less than $0.01 per share |
| (1) | Per share amounts have been calculated using the average shares method |
| (2) | Not annualized |
| (3) | Annualized |
| (4) | Portfolio turnover rate is calculated for the Fund without distinguishing between classes. |
The accompanying notes are an integral part of these financial statements.
| Zevenbergen Genea Fund |
| Financial Highlights |
| Institutional Class |
| For a Capital Share Outstanding Throughout Each Period Presented: | ||||||||||||||||||||
| For the Six Months Ended December 31, 2020 (Unaudited) | For the Year Ended June 30, 2020 | For the Year Ended June 30, 2019 | For the Year Ended June 30, 2018 | For the Year Ended June 30, 2017 | ||||||||||||||||
| Net Asset Value, Beginning of Period | $ | 33.74 | $ | 23.33 | $ | 20.93 | $ | 14.30 | $ | 9.41 | ||||||||||
| Gain (Loss) from Investment Operations: | ||||||||||||||||||||
| Net investment loss (1) | (0.01 | ) | (0.25 | ) | (0.22 | ) | (0.18 | ) | (0.12 | ) | ||||||||||
| Net realized and unrealized gain on investments | 21.32 | 10.65 | 2.66 | 6.80 | 4.99 | |||||||||||||||
| Total Gain from Investment Operations | 21.31 | 10.40 | 2.44 | 6.62 | 4.87 | |||||||||||||||
| Less Distributions from Net Realized Gain: | — | — | (0.06 | ) | — | — | ||||||||||||||
| Redemption Fee Proceeds (1) | — | * | 0.01 | 0.02 | 0.01 | 0.02 | ||||||||||||||
| Net Asset Value, End of Period | $ | 55.05 | $ | 33.74 | $ | 23.33 | $ | 20.93 | $ | 14.30 | ||||||||||
| Total Return | 63.16 | %(2) | 44.62 | % | 11.87 | % | 46.36 | % | 51.97 | % | ||||||||||
| Supplemental Data and Ratios: | ||||||||||||||||||||
| Net assets, end of period (in thousands) | $ | 66,223 | $ | 25,179 | $ | 16,312 | $ | 9,073 | $ | 3,669 | ||||||||||
| Ratio of expenses to average net assets | ||||||||||||||||||||
| Before fees waived and reimbursed by the Adviser | 1.27 | %(3) | 1.70 | % | 1.80 | % | 3.21 | % | 8.08 | % | ||||||||||
| After fees waived and reimbursed by the Adviser | 1.10 | %(3) | 1.10 | % | 1.10 | % | 1.10 | % | 1.10 | % | ||||||||||
| Ratio of net investment loss to average net assets | ||||||||||||||||||||
| Before fees waived and reimbursed by the Adviser | -1.26 | %(3) | -1.68 | % | -1.75 | % | -3.14 | % | -8.02 | % | ||||||||||
| After fees waived and reimbursed by the Adviser | -1.09 | %(3) | -1.08 | % | -1.05 | % | -1.03 | % | -1.04 | % | ||||||||||
| Portfolio turnover rate (4) | 7.26 | %(2) | 61.63 | % | 35.25 | % | 22.35 | % | 67.59 | % | ||||||||||
| * | Less than $0.01 per share |
| (1) | Per share amounts have been calculated using the average shares method |
| (2) | Not annualized |
| (3) | Annualized |
| (4) | Portfolio turnover rate is calculated for the Fund without distinguishing between classes. |
The accompanying notes are an integral part of these financial statements.
| Zevenbergen Funds |
| Notes to the Financial Statements |
| December 31, 2020 (Unaudited) |
NOTE 1 – ORGANIZATION
Zevenbergen Growth Fund (the “Growth Fund”) and Zevenbergen Genea Fund (the “Genea Fund”; each a “Fund” collectively the “Funds”) are non-diversified series of Trust for Advised Portfolios (the “Trust”). The Trust, a Delaware Statutory Trust, is registered under the Investment Company Act of 1940, as amended (the “1940 Act”) as an open-end management investment company. Zevenbergen Capital Investments LLC (the “Adviser”) serves as the investment manager to the Funds. The inception date of the Funds was August 31, 2015. The Funds’ investment objective is long-term capital appreciation.
Growth Fund and Genea Fund, each, currently offer two classes of shares, Institutional Class and Investor Class. Each share class represents an equal interest in the Fund, except the difference of class specific expenses, which reflects the difference in the range of services provided to each class. Income, expenses (other than class specific), and realized and unrealized gains and losses on investments are allocated daily to each class based on relative net assets.
NOTE 2 – SIGNIFICANT ACCOUNTING POLICIES
The following is a summary of significant accounting policies consistently followed by the Funds in preparation of their financial statements. These policies are in conformity with accounting principles generally accepted in the United States of America (“U.S. GAAP”) for investment companies. Each Fund is considered an investment company under U.S. GAAP and follows the accounting and reporting guidance applicable to investment companies in the Financial Accounting Standards Board Accounting Standards Codification Topic 946. The presentation of financial statements in conformity with U.S. GAAP requires management to make estimates and assumptions that affect the reported amounts of assets and liabilities and disclosure of contingent assets and liabilities at the date of the financial statements and the reported amounts of income and expenses during the period. Actual results may differ from those estimates.
A. Securities Valuation
The Funds follow a fair value hierarchy that distinguishes between market data obtained from independent sources (observable inputs) and the Funds’ own market assumptions (unobservable inputs). The inputs or methodology used in determining the value of each Fund’s investments are not necessarily an indication of the risk associated with investing in those securities.
Various inputs are used in determining the value of the Funds’ investments. These inputs are summarized into three broad categories as defined below:
| Level 1 - | Quoted prices in active markets for identical securities. An active market for a security is a market in which transactions occur with sufficient frequency and volume to provide pricing information on an ongoing basis. A quoted price in an active market provides the most reliable evidence of fair value. |
| Level 2 - | Observable inputs other than quoted prices included in Level 1 that are observable for the asset or liability either directly or indirectly. These inputs may include quoted prices for the identical instrument on an inactive market, prices for similar instruments, interest rates, prepayment speeds, credit risk, yield curves, default rates, and similar data. |
| Level 3 - | Significant unobservable inputs, including the Funds’ own assumptions in determining fair value of investments. |
Equity securities that are traded on a national securities exchange are stated at the last reported sales price on the day of valuation. To the extent these securities are actively traded and valuation adjustments are not applied, they are categorized as Level 1 of the fair value hierarchy.
Short-term investments classified as money market instruments are valued at NAV. These investments are categorized as Level 1 of the fair value hierarchy.
| Zevenbergen Funds |
| Notes to the Financial Statements |
| December 31, 2020 (Unaudited) |
NOTE 2 – SIGNIFICANT ACCOUNTING POLICIES (Continued)
The inputs or methodology used for valuing securities are not necessarily an indication of the risk associated with investing in those securities. The following is a summary of the fair values of the Funds’ investments in each category investment type as of December 31, 2020:
| Growth Fund | ||||||||||||||||
| Description | Level 1 | Level 2 | Level 3 | Total | ||||||||||||
| Assets | ||||||||||||||||
| Common Stocks | $ | 111,716,044 | $ | — | $ | — | $ | 111,716,044 | ||||||||
| Short-Term Investments | 972,040 | — | — | 972,040 | ||||||||||||
| Total Assets | $ | 112,688,084 | $ | — | $ | — | $ | 112,688,084 | ||||||||
| Growth Fund | ||||||||||||||||
| Description | Level 1 | Level 2 | Level 3 | Total | ||||||||||||
| Assets | ||||||||||||||||
| Common Stocks | $ | 160,516,883 | $ | — | $ | — | $ | 160,516,883 | ||||||||
| Short-Term Investments | 2,046,095 | — | — | 2,046,095 | ||||||||||||
| Total Assets | $ | 162,562,978 | $ | — | $ | — | $ | 162,562,978 | ||||||||
Please refer to the Schedule of Investments for further classification.
B. Security Transactions, Investment Income and Distributions
The Funds record security transactions based on trade date. Realized gains and losses on sales of securities are calculated by comparing the original cost of the specifically identified security lot sold with the net sales proceeds. Dividend income is recognized on the ex-dividend date, and interest income is recognized on an accrual basis. Withholding taxes on foreign dividends have been provided for in accordance with the Trust’s understanding of the applicable country’s tax rules and rates.
C. Federal Income Taxes
The Funds have elected to be taxed as Regulated Investment Companies (“RIC”) under the U.S. Internal Revenue Code of 1986, as amended, and intend to maintain this qualification and to distribute substantially all of their net taxable income to their shareholders. Therefore no provision is made for federal income taxes. Due to the timing of dividend distributions (if any) and the differences in accounting for income and realized gains and losses for financial statement and federal income tax purposes, the fiscal year in which amounts are distributed may differ from the year in which the income and realized gains and losses are recorded by the Funds.
Management of the Funds is required to analyze all open tax years, as defined by IRS statute of limitations for all major jurisdictions, including federal tax authorities and certain state tax authorities. As of and during the period ended December 31, 2020, the Funds did not have a liability for any unrecognized tax benefits. Generally, tax authorities can examine tax returns filed for the preceding three years. As of December 31, 2020, the tax years ended June 30, 2020, June 30, 2019, and June 30, 2018, are open to examination. The Funds are not aware of any tax positions for which it is reasonably possible that the total amounts of unrecognized tax benefits will significantly change in the next twelve months.
| Zevenbergen Funds |
| Notes to the Financial Statements |
| December 31, 2020 (Unaudited) |
NOTE 3 – INVESTMENT MANAGEMENT AGREEMENT AND OTHER RELATED PARTY TRANSACTIONS
The Trust entered into an agreement for the Adviser to furnish investment advisory services to the Funds. Under the terms of this agreement, Growth Fund and Genea Fund will pay the Adviser a monthly fee based on each Fund’s average daily net assets at the annual rate of 0.80% and 0.90%, respectively.
The Adviser has contractually agreed to waive its management fee and/or reimburse each Fund’s operating expenses (excluding shareholder servicing fees, any front-end or contingent deferred loads, taxes, leverage interest, brokerage commissions, acquired fund fees and expenses, merger or reorganization-related expenses, portfolio transaction expenses, interest expense and dividends paid on short sales, and extraordinary expenses) to ensure they do not exceed, on an annual basis, the expense limitations, expressed as a percentage rate of the average daily net assets of each Fund, listed below. Waivers or reimbursements are calculated daily and settled monthly or quarterly in conjunction with each Fund's payment of advisory fees.
| Fund | Investor Class | Institutional Class |
| Growth Fund | 1.15% | 0.90% |
| Genea Fund | 1.25% | 1.00% |
See Note 6 – Shareholder Servicing Plan for shareholder servicing fees charged in addition to fees outlined in this table.
The Adviser is permitted to recapture amounts waived and/or reimbursed to a class within three years if the class’s total annual operating expenses have fallen to a level below the expense limitation (“expense cap”) in effect at the time the fees were earned or the expenses incurred, however, in no case will the Adviser recapture any amount that would result, on any particular business day of the Funds, in the class’s total annual operating expenses exceeding the expense cap or any other lower limit then in effect.
At December 31, 2020, the expenses reimbursed and contractual fees waived by the Adviser and subject to potential recapture by period were as follows:
| Fiscal Year waived/reimbursed | Growth Fund | Genea Fund | Expiration | |||||||
| FYE June 30, 2018 | $ | 107,238 | $ | 107,463 | June 30, 2021 | |||||
| FYE June 30, 2019 | 227,826 | 224,757 | June 30, 2022 | |||||||
| FYE June 30, 2020 | 230,107 | 236,776 | June 30, 2023 | |||||||
| FYE June 30, 2021 | 93,602 | 83,190 | December 31, 2023 | |||||||
| $ | 658,773 | $ | 652,186 | |||||||
U.S. Bancorp Fund Services, LLC, doing business as U.S. Bank Global Fund Services (“Fund Services”), serves as the Funds’ administrator and fund accountant and transfer agent. The officers of the Trust are employees of Fund Services. U.S. Bank serves as the Funds’ custodian and provides compliance services to the Funds. Quasar Distributors, LLC (“Quasar” or the “Distributor”), an affiliate of Fund Services until March 31, 2020, acts as the Funds’ distributor and principal underwriter. For the six months ended December 31, 2020, the Funds incurred the following expenses for administration and fund accounting, custody, transfer agent and compliance fees:
| Growth Fund | Genea Fund | ||||||
| Administration | $ | 49,422 | $ | 47,146 | |||
| Custody | 7,626 | 3,624 | |||||
| Transfer Agency | 21,160 | 22,044 | |||||
| Chief Compliance Officer | 6,624 | 6,072 |
| Zevenbergen Funds |
| Notes to the Financial Statements |
| December 31, 2020 (Unaudited) |
At December 31, 2020, the Funds had payables due to Fund Services and its affiliates for administration and fund accounting, custody, transfer agent and compliance fees in the following amounts:
| Growth Fund | Genea Fund | |||||||
| Administration | $ | 12,815 | $ | 12,110 | ||||
| Custody | 1,639 | 2,331 | ||||||
| Transfer Agency | 3,193 | 4,887 | ||||||
| Chief Compliance Officer | 2,493 | 2,952 | ||||||
The above payable amounts are included in the Accrued other expenses and other liabilities line item in the Statement of Assets and Liabilities.
The Independent Trustees were paid $11,776 for their services to the Funds during the six months ended December 31, 2020. No compensation is paid directly by the Funds to the Interested Trustee or officers of the Trust.
NOTE 4 – INVESTMENT TRANSACTIONS
Purchases and sales of investment securities (excluding short-term investments) for each Fund for the six months ended December 31, 2020, were as follows:
| Growth Fund | |||||
| Purchases | $ | 42,379,419 | |||
| Sales | $ | 17,299,901 | |||
| Genea Fund | |||||
| Purchases | $ | 63,628,128 | |||
| Sales | $ | 7,093,666 | |||
NOTE 5 – FEDERAL INCOME TAX INFORMATION
At June 30, 2020, the components of distributable earnings for income tax purposes were as follows:
| Growth | Genea | |||||||
| Fund | Fund | |||||||
| Cost of investments | $ | 33,129,054 | $ | 29,897,596 | ||||
| Gross unrealized appreciation | 23,113,394 | 28,956,567 | ||||||
| Gross unrealized depreciation | (357,006 | ) | (673,955 | ) | ||||
| Net unrealized appreciation on investments | 22,756,388 | 28,282,612 | ||||||
| Undistributed ordinary income | — | — | ||||||
| Undistributed long-term capital gains | — | — | ||||||
| Accumulated earnings | — | — | ||||||
| Capital loss carryforwards | (523,514 | ) | (3,331,481 | ) | ||||
| Other book/tax temporary differences | (164,325 | ) | (132,281 | ) | ||||
| Total distributable earnings | $ | 22,068,549 | $ | 24,818,850 | ||||
The difference between book basis and tax basis unrealized appreciation/(depreciation) is attributable in part to the tax deferral of losses on wash sales.
| Zevenbergen Funds |
| Notes to the Financial Statements |
| December 31, 2020 (Unaudited) |
GAAP requires that certain components of net assets be reclassified between financial and tax reporting. These reclassifications have no effect on net assets or net asset value per share. For the year ended June 30, 2020, permanent differences, due to net operating losses, in book and tax accounting have been reclassified to capital and distributable earnings as follows:
| Distributable Earnings | Paid In Capital | ||||||||
| Growth Fund | $ | 189,971 | $ | (189,971 | ) | ||||
| Genea Fund | $ | 608,595 | $ | (608,595 | ) | ||||
The following table summarizes the characteristics of distributions paid during the six months ended December 31, 2020:
| Short-Term | Long-Term | Total | ||||||||
| Capital Gains | Capital Gains | Distributions Paid | ||||||||
Growth Fund | $ | — | $ | 73,415 | $ | — | ||||
Genea Fund | — | $ | — | $ | — |
No distributions were paid by the Growth Fund or Genea Fund during the year ended June 30, 2020.
The Funds are required, in order to meet certain excise tax requirements, to measure and distribute annually, net capital gains realized during the twelve month period ending October 31. In connection with this requirement, the Funds are permitted, for tax purposes, to defer into their next fiscal year any net capital losses incurred from November 1 through the end of the fiscal year. Late year losses incurred after December 31 within the fiscal year are deemed to arise on the first business day of the following fiscal year for tax purposes. At June 30, 2020, the Funds deferred the following, on a tax basis, losses:
| Late Year Loss | Post October Loss | ||||||||
| Growth Fund | $ | (164,325 | ) | $ | — | ||||
| Genea Fund | $ | (132,281 | ) | $ | — | ||||
At June 30, 2020, the Funds had capital loss carryforwards, which reduce the Funds’ taxable income arising from future net realized gains on investments, if any, to the extent permitted by the Internal Revenue Code, and thus will reduce the amount of distributions to shareholders which would otherwise be necessary to relieve the Funds of any liability for federal tax. Pursuant to the Internal Revenue Code, the character of such capital loss carryforwards is as follows:
| Capital Loss Carryforwards Not Subject to Expiration | |||||||||||||
| Short-Term | Long-Term | Total | |||||||||||
Growth Fund | $ | (523,514 | ) | $ | — | $ | (523,514 | ) | |||||
Genea Fund | $ | (3,331,481 | ) | $ | — | $ | (3,331,481 | ) | |||||
| Zevenbergen Funds |
| Notes to the Financial Statements |
| December 31, 2020 (Unaudited) |
NOTE 6 – SHAREHOLDER SERVICING PLAN
The Trust, on behalf of the Funds, has adopted a Shareholder Servicing Plan to pay a fee at an annual rate on average daily net assets as follows:
| Fund | Investor Class | Institutional Class |
| Growth Fund | 0.15% | 0.10% |
| Genea Fund | 0.15% | 0.10% |
The Shareholder Servicing Plan authorizes payment of a shareholder servicing fee to the financial intermediaries and other service providers who provide administrative and support services to Fund shareholders.
For the six months ended December 31, 2020, class specific Shareholder Servicing fees were as follows:
| Fund | Investor Class | Institutional Class | ||||||
| Growth Fund | $ | 23,123 | $ | 25,733 | ||||
| Genea Fund | 42,690 | 27,284 | ||||||
NOTE 7 – DISTRIBUTION PLAN
The Trust, on behalf of the Funds, has adopted a Distribution Plan (the “Plan”) pursuant to Rule 12b-1 under the 1940 Act that allows each Fund to pay distribution fees for the sale and distribution of its Investor Class shares. The Plan provides for the payment of distribution fees at the annual rate of up to 0.25% of average daily net assets of the Investor Class shares. For the six months ended December 31, 2020, distribution fees incurred are disclosed on the Statement of Operations.
NOTE 8 – COMMITMENTS AND CONTINGENCIES
In the normal course of business, each Fund enters into contracts that provide general indemnifications by each Fund to the counterparty to the contract. Each Fund’s maximum exposure under these arrangements is dependent on future claims that may be made against each Fund and, therefore, cannot be estimated; however, based on experience, the risk of loss from such claims is considered remote.
NOTE 9 – REDEMPTION FEES
Each Fund charges a 1.00% redemption fee on the redemption of Investor Class and Institutional Class shares held for 90 days or less. This fee (which is paid into the Fund) is imposed in order to help offset the transaction costs and administrative expenses associated with the activities of short-term “market timers” that engage in the frequent purchase and sale of Fund shares. The fee is accounted for as an addition to paid-in capital. Each Fund reserves the right to modify the terms of or terminate the fee at any time. There are limited exceptions to the imposition of the redemption fee. Please refer to Statements of Changes in Net Assets for fees recognized.
NOTE 10 – SUBSEQUENT EVENTS
In preparing these financial statements, the Funds have evaluated events and transactions for potential recognition or disclosure through the date the financial statements were available to be issued. The Funds have determined that there were no subsequent events that would need to be disclosed in the Funds’ financial statements.
| Zevenbergen Funds |
| Notes to the Financial Statements |
| December 31, 2020 (Unaudited) |
NOTE 11 – COVID-19 RISK
The global outbreak of COVID-19 (commonly referred to as “coronavirus”) has disrupted economic markets and the prolonged economic impact is uncertain. The ultimate economic fallout from the pandemic, and the long-term impact on economies, markets, industries and individual issuers, are not known. The operational and financial performance of the issuers of securities in which the Funds invest depend on future developments, including the duration and spread of the outbreak, and such uncertainty may in turn adversely affect the value and liquidity of the Funds’ investments, impair the Funds’ ability to satisfy redemption requests, and negatively impact the Funds’ performance.
NOTE 12 – NEW ACCOUNTING PRONOUNCEMENT
In August 2018, FASB issued ASU 2018-13, Fair Value Measurement (Topic 820): Disclosure Framework — Changes to the Disclosure Requirements for Fair Value Measurement (“ASU 2018-13”). The primary focus of ASU 2018-13 is to improve the effectiveness of the disclosure requirements for fair value measurements. The changes affect all companies that are required to include fair value measurement disclosures. In general, the amendments in ASU 2018-13 are effective for all entities for fiscal years and interim periods within those fiscal years, beginning after December 15, 2019. The Funds have adopted all applicable provisions of ASU 2018-13.
| Zevenbergen Funds | |
| Expense Example | |
| December 31, 2020 (Unaudited) | |
As a shareholder of the Funds, you incur two types of costs: (1) transaction costs, including redemption fees; and (2) ongoing costs, including management fees and other Fund expenses. This Example is intended to help you understand your ongoing costs (in dollars) of investing in the Funds and to compare these costs with the ongoing costs of investing in other mutual funds.
The Example is based on an investment of $1,000 invested at the beginning of the six month period and held for the entire six month period from July 1, 2020 to December 31, 2020 (the “six month period”).
Actual Expenses
The “Actual Fund Return” lines in the table below provide information about actual account values and actual expenses. You may use the information in these lines, together with the amount you invested, to estimate the expenses you paid over the six month period. Simply divide your account value by $1,000 (for example, an $8,600 account value divided by $1,000 equals 8.6), then multiply the result by the number in the corresponding line under the heading entitled “Expenses Paid During the Six Month Period” to estimate the expenses you paid on your account during the six month period.
Hypothetical Example for Comparison Purposes
The information in the table with the lines titled “Hypothetical 5% Return” provides information about hypothetical account values and hypothetical expenses based on the Funds’ actual expense ratio and an assumed rate of return of 5% per year before expenses, which is not the Funds’ actual return. The hypothetical account values and expenses may not be used to estimate the actual ending account balance or expenses you paid for the six month period. You may use this information to compare the ongoing costs of investing in the Funds and other funds. To do so, compare this 5% hypothetical example with the 5% hypothetical examples that appear in the shareholder reports of the other funds.
Please note that the expenses shown in the table are meant to highlight your ongoing costs only and do not reflect any transaction costs, such as redemption fees. Therefore, the information in the lines titled “Hypothetical 5% Return” is useful in comparing ongoing costs only, and will not help you determine the relative total costs of owning different funds. In addition, if transactional costs were included, your costs would have been higher.
Expenses Paid During the Six Month Period
| Beginning Account Value | Ending Account Value | Annualized Expense Ratio | Expenses Paid During the Six Month Period (1) | |||||
| Growth Fund | ||||||||
| Investor Class | ||||||||
| Actual Fund Return | $1,000.00 | $1,471.20 | 1.30% | $8.10 | ||||
| Hypothetical 5% Return | $1,000.00 | $1,018.65 | 1.30% | $6.61 | ||||
| Institutional Class | ||||||||
| Actual Fund Return | $1,000.00 | $1,473.20 | 1.00% | $6.23 | ||||
| Hypothetical 5% Return | $1,000.00 | $1,020.16 | 1.00% | $5.09 | ||||
| Genea Fund | ||||||||
| Investor Class | ||||||||
| Actual Fund Return | $1,000.00 | $1,630.60 | 1.40% | $9.28 | ||||
| Hypothetical 5% Return | $1,000.00 | $1,018.15 | 1.40% | $7.12 | ||||
| Institutional Class | ||||||||
| Actual Fund Return | $1,000.00 | $1,633.00 | 1.10% | $7.30 | ||||
| Hypothetical 5% Return | $1,000.00 | $1,019.66 | 1.10% | $5.60 |
| (1) | Expenses are equal to each of the Funds’ annualized expense ratio as indicated, multiplied by the average account value over the six month period, multiplied by 184/366 (to reflect the “six month period”) |
Zevenbergen Funds
December 31, 2020 (Unaudited)
Form N-Q
The Funds file a complete schedule of portfolio holdings with the U.S. Securities and Exchange Commission (the “SEC”) for the first and third quarters of each fiscal year on Form N-Q or Part F of Form N-PORT (beginning with filings after March 31, 2020). The Funds’ Forms N-Q or Part F of Form N-PORT are available on the SEC’s website at www.sec.gov and may be reviewed and copied at the SEC’s Public Reference Room in Washington, D.C. Information on the operation of the Public Reference Room may be obtained by calling 1-800- SEC-0330.
Proxy Voting
You may obtain a description of the Funds’ proxy voting policy and voting records, without charge, upon request by contacting the Funds directly at 1-844-986-2746 or on the EDGAR Database on the SEC’s website at www.sec.gov. The Funds file their proxy voting records annually as of June 30, with the SEC on Form N-PX. The Funds’ Form N-PX is available without charge by visiting the SEC’s website at www.sec.gov and may be reviewed and copied at the SEC’s Public Reference Room in Washington D.C. You may obtain information on the operation of the Public Reference Room by calling 1-800-SEC-0330.
Approval of Investment Advisory Agreement (Unaudited)
Zevenbergen Growth Fund
At a meeting held on August 13 and 14, 2020, the Board of the Trust, including all Trustees who are not “interested persons” of the Trust (“Independent Trustees”), as that term is defined in the Investment Company Act of 1940, considered and approved the continuance of the investment advisory agreement (“Advisory Agreement”) with Zevenbergen Capital Investments LLC (the “Adviser”), for the Zevenbergen Growth Fund (the “Fund”).
Ahead of the August meeting, the Board received and reviewed substantial information regarding the Fund, the Adviser and the services provided by the Adviser to the Fund under the Advisory Agreement. This information formed the primary (but not exclusive) basis for the Board’s determinations. The information prepared specifically for the annual review of the Advisory Agreement supplemented the information provided to the Board and its committees throughout the year. The Board and its committees met regularly during the year and the information provided and topics discussed at such meetings were relevant to the review of the Advisory Agreement. Some of these reports and other data included, among other things, materials that outlined the investment performance of the Fund; compliance, regulatory, and risk management matters; the trading practices of the Adviser; valuation of investments; fund expenses; and overall market and regulatory developments. The Trustees considered the review of the Advisory Agreement to be an ongoing process and employed the accumulated information, knowledge, and experience they had gained during their tenure on the Board governing the Fund and working with the Adviser in their review of the Advisory Agreement. The Independent Trustees were advised by independent legal counsel during the annual review process as well as throughout the year, including meeting in executive sessions with such counsel without representatives from the Adviser present. In connection with their annual review, the Independent Trustees also received a memorandum from independent legal counsel outlining their fiduciary duties and legal standards in reviewing the Advisory Agreement.
In considering the continuance of the Advisory Agreement, the Board evaluated the following factors and made the following determinations. In its deliberations, the Board did not identify any single factor or piece of information as all important, controlling, or determinative of its decision, and each Trustee may have attributed different weights to the various factors and information.
| ● | In considering the nature, extent and quality of the services provided by the Adviser, the Trustees considered the Adviser’s specific responsibilities in all aspects of the day-to-day management of the Fund, as well as the qualifications, experience and responsibilities of the portfolio managers and other key personnel involved in the day-to-day activities of the Fund. The Board also considered the resources and compliance structure of the Adviser, including information regarding its compliance program, chief compliance officer, and compliance record and its disaster recovery/business continuity plan, including how the Adviser has operated through the COVID-19 pandemic. The Board also considered the existing relationship between the Adviser and the Trust, as well as the Board’s knowledge of the Adviser’s operations, and noted that during its February 2020 meeting it met with representatives of the Adviser to discuss Fund performance and investment outlook, as well as various marketing and compliance topics, including the Adviser’s risk management process. The Board concluded that the Adviser had sufficient quality and depth of personnel, resources, investment methods and compliance policies and procedures essential to performing its duties under the Advisory Agreement and that, in the Board’s view, the nature, overall quality, and extent of the management services provided were and would continue to be satisfactory and reliable. |
Zevenbergen Funds
Additional Information
December 31, 2020 (Unaudited)
| ● | In assessing the quality of the portfolio management delivered by the Adviser, the Board reviewed the performance of the Fund on both an absolute basis and in comparison to its peer group, relevant benchmark index, and a comparable composite of accounts managed by the Adviser. The Board considered that the Fund had significantly outperformed relative to its peer group median/average and its benchmark index for all periods as of June 30, 2020. The Board also considered that the Fund performed in-line with the Adviser’s composite performance for all periods as of June 30, 2020. The Board noted that the Fund had a performance record of nearly five years. The Board also considered the secular growth exposure of the Fund’s strategy and the long-term performance of the Adviser’s separately managed accounts. |
| ● | The Trustees also reviewed the cost of the services, and the structure and level of advisory fee payable by the Fund, including a comparison of the fee to fees charged by a peer group of funds. The Board noted that the Adviser had contractually agreed to maintain an annual expense cap for each of the Fund’s classes. The Board noted that the Fund’s advisory fee was higher than, and the net expense ratio was slightly higher than, its peer group median/average. After reviewing the materials that were provided, the Trustees noted that the fee to be received by the Adviser was within the range of advisory fees charged to comparable funds and concluded that such fee was fair and reasonable. |
| ● | The Trustees considered whether, based on the asset size of the Fund, economies of scale had been achieved. The Board also considered the Adviser’s commitment to maintain its caps on Fund expenses. The Trustees concluded that they will have the opportunity to periodically reexamine whether economies of scale have been achieved. |
| ● | The Trustees considered the profitability of the Adviser from managing the Fund. In assessing the Adviser’s profitability, the Trustees reviewed the Adviser’s financial information that was provided in the materials and took into account both the direct and indirect benefits to the Adviser from managing the Fund. The Trustees concluded that the Adviser’s profits from managing the Fund were not excessive and, after a review of the relevant financial information, that the Adviser appeared to have adequate capitalization and/or would maintain adequate profit levels to support the Fund. |
Zevenbergen Genea Fund
At a meeting held on August 13 and 14, 2020, the Board of the Trust, including all Trustees who are not “interested persons” of the Trust (“Independent Trustees”), as that term is defined in the Investment Company Act of 1940, considered and approved the continuance of the investment advisory agreement (“Advisory Agreement”) with Zevenbergen Capital Investments LLC (the “Adviser”), for the Zevenbergen Genea Fund (the “Fund”).
Ahead of the August meeting, the Board received and reviewed substantial information regarding the Fund, the Adviser and the services provided by the Adviser to the Fund under the Advisory Agreement. This information formed the primary (but not exclusive) basis for the Board’s determinations. The information prepared specifically for the annual review of the Advisory Agreement supplemented the information provided to the Board and its committees throughout the year. The Board and its committees met regularly during the year and the information provided and topics discussed at such meetings were relevant to the review of the Advisory Agreement. Some of these reports and other data included, among other things, materials that outlined the investment performance of the Fund; compliance, regulatory, and risk management matters; the trading practices of the Adviser; valuation of investments; fund expenses; and overall market and regulatory developments. The Trustees considered the review of the Advisory Agreement to be an ongoing process and employed the accumulated information, knowledge, and experience they had gained during their tenure on the Board governing the Fund and working with the Adviser in their review of the Advisory Agreement. The Independent Trustees were advised by independent legal counsel during the annual review process as well as throughout the year, including meeting in executive sessions with such counsel without representatives from the Adviser present. In connection with their annual review, the Independent Trustees also received a memorandum from independent legal counsel outlining their fiduciary duties and legal standards in reviewing the Advisory Agreement.
Zevenbergen Funds
Additional Information
December 31, 2020 (Unaudited)
In considering the continuance of the Advisory Agreement, the Board evaluated the following factors and made the following determinations. In its deliberations, the Board did not identify any single factor or piece of information as all important, controlling, or determinative of its decision, and each Trustee may have attributed different weights to the various factors and information.
| ● | In considering the nature, extent and quality of the services provided by the Adviser, the Trustees considered the Adviser’s specific responsibilities in all aspects of the day-to-day management of the Fund, as well as the qualifications, experience and responsibilities of the portfolio managers and other key personnel who are involved in the day-to-day activities of the Fund. The Board also considered the Adviser’s resources and compliance structure, including information regarding its compliance program, chief compliance officer, and compliance record, and its disaster recovery/business continuity plan, including how the Adviser has operated through the COVID-19 pandemic. The Board also considered the existing relationship between the Adviser and the Trust, as well as the Board’s knowledge of the Adviser’s operations, and noted that during its February 2020 meeting it met with representatives of the Adviser to discuss Fund performance and investment outlook, as well as various marketing and compliance topics, including the Adviser’s risk management process. The Board concluded that the Adviser had sufficient quality and depth of personnel, resources, investment methods and compliance policies and procedures essential to performing its duties under the Advisory Agreement and that, in the Board’s view, the nature, overall quality, and extent of the management services provided were and would continue to be satisfactory and reliable. |
| ● | In assessing the quality of the portfolio management delivered by the Adviser, the Board reviewed the performance of the Fund on both an absolute basis and in comparison to its peer group, relevant benchmark index, and a comparable composite of accounts managed by the Adviser. The Board considered that the Fund had significantly outperformed relative to its peer group average/median and its benchmark index for all periods as of June 30, 2020, and that its performance was slightly lower than the Adviser’s composite performance for all periods as of June 30, 2020. The Board noted that the Fund had a performance record of nearly five years. The Board also considered the secular growth exposure of the Fund’s strategy and the long-term performance of the Adviser’s separately managed accounts. |
| ● | The Trustees also reviewed the cost of the services, and the structure and level of advisory fees payable by the Fund, including a comparison of the fee to fees payable by a peer group of funds. The Board noted that the Adviser had contractually agreed to maintain an annual expense cap for each of the Fund’s classes. The Board noted that the Fund’s advisory fee and net expense ratio were higher than its peer group median/average, but were within the peer group range. After reviewing the materials that were provided, the Trustees concluded that the fee to be received by the Adviser was fair and reasonable. |
| ● | The Trustees considered whether, based on the asset size of the Fund, economies of scale had been achieved. The Board also considered the Adviser’s commitment to maintain its caps on Fund expenses. The Trustees concluded that they will have the opportunity to periodically reexamine whether economies of scale have been achieved. |
| ● | The Trustees considered the profitability of the Adviser from managing the Fund. In assessing the Adviser’s profitability, the Trustees reviewed the Adviser’s financial information that was provided in the materials and took into account both the direct and indirect benefits to The Adviser from managing the Fund. The Trustees concluded that the Adviser’s profits from managing the Fund were not excessive and, after a review of the relevant financial information, that the Adviser appeared to have adequate capitalization and/or would maintain adequate profit levels to support the Fund. |
The Funds collect non-public information about you from the following sources:
| ● | Information we receive about you on applications or other forms; |
| ● | Information you give us orally; and/or |
| ● | Information about your transactions with us or others. |
We do not disclose any non-public personal information about our customers or former customers without the customer’s authorization, except as permitted by law or in response to inquiries from governmental authorities. We may share information with affiliated and unaffiliated third parties with whom we have contracts for servicing the Funds. We will provide unaffiliated third parties with only the information necessary to carry out their assigned responsibilities. We maintain physical, electronic and procedural safeguards to guard your non-public personal information and require third parties to treat your personal information with the same high degree of confidentiality.
In the event that you hold shares of the Funds through a financial intermediary, including, but not limited to, a broker-dealer, bank, or trust company, the privacy policy of your financial intermediary would govern how your non-public personal information would be shared by those entities with unaffiliated third parties.
Investment Adviser
Zevenbergen Capital Investments LLC
601 Union Street, Suite 4600
Seattle, Washington 98101
Distributor
Quasar Distributors, LLC
111 East Kilbourn Ave. Suite 2200
Milwaukee, Wisconsin 53202
Custodian
U.S. Bank National Association
Custody Operations
1555 North River Center Drive, Suite 302
Milwaukee, Wisconsin 53212
Transfer Agent, Fund Accountant and Fund Administrator
U.S. Bancorp Fund Services, LLC
615 East Michigan Street
Milwaukee, Wisconsin 53202
Independent Registered Public Accounting Firm
BBD, LLP
1835 Market Street, 3rd Floor
Philadelphia, Pennsylvania 19103
Legal Counsel
Morgan, Lewis & Bockius LLP
1111 Pennsylvania Avenue, NW
Washington, DC 20004
This report has been prepared for shareholders and may be distributed to others only if preceded or accompanied by a current prospectus.
(b) | Not applicable for this Registrant. |
(a) | The Registrant’s President and Treasurer have reviewed the Registrant's disclosure controls and procedures (as defined in Rule 30a-3(c) under the Investment Company Act of 1940 (the “Act”)) as of a date within 90 days of the filing of this report, as required by Rule 30a-3(b) under the Act and Rules 13a-15(b) or 15d‑15(b) under the Securities Exchange Act of 1934. Based on their review, such officers have concluded that the disclosure controls and procedures are effective in ensuring that information required to be disclosed in this report is appropriately recorded, processed, summarized and reported and made known to them by others within the Registrant and by the Registrant’s service provider. |
(b) | There were no changes in the Registrant's internal control over financial reporting (as defined in Rule 30a-3(d) under the Act) that occurred during the period covered by this report that have materially affected, or are reasonably likely to materially affect, the Registrant's internal control over financial reporting. |
(a) | (1) Any code of ethics or amendment thereto, that is the subject of the disclosure required by Item 2, to the extent that the registrant intends to satisfy Item 2 requirements through filing an exhibit. Not applicable for semi-annual reports. |
| (b) | Certifications pursuant to Section 906 of the Sarbanes‑Oxley Act of 2002. Furnished herewith. |