EXHIBIT 99.2

MANAGEMENT’S DISCUSSION AND ANALYSIS OF
OPERATIONS AND FINANCIAL CONDITION
FOR THE YEAR ENDED DECEMBER 31, 2013
TABLE OF CONTENTS
| Page | |||
| 1. | Core Business | ||
| 2. | Highlights | ||
| 3. | Outlook and Strategy | ||
| 4. | Summary of Financial and Operating Statistics | ||
| 4.1: | Annual Financial Statistics | ||
| 4.2: | Annual Operating Statistics | ||
| 4.3: | Quarterly Financial Statistics | ||
| 4.4: | Quarterly Operating Statistics | ||
| 5. | Overview of Annual Results | ||
| 5.1: | Overview of Annual Financial Results | ||
| 5.2: | Overview of Annual Operating Results | ||
| 5.3: | Overview of Quarterly Financial Results | ||
| 5.4: | Overview of Quarterly Operating Results | ||
| 6. | Operating Mines | ||
| 7. | Construction, Development and Exploration | ||
| 8. | Mineral Reserves and Mineral Resources | ||
| 9. | Liquidity, Capital Resources and Contractual Commitments | ||
| 10. | Income Taxes | ||
| 11. | Economic Trends, Risks and Uncertainties | ||
| 12. | Contingencies | ||
| 13. | Critical Accounting Policies and Estimates | ||
| 14. | Non-GAAP Measures | ||
| 15. | Selected Quarterly Financial and Operating Summary | ||
| 16. | Disclosures Controls and Procedures | ||
MANAGEMENT’S DISCUSSION AND ANALYSIS OF OPERATIONS AND FINANCIAL CONDITION
(All figures are in United States Dollars unless otherwise specified and are in accordance with International Financial Reporting Standards as issued by the International Accounting Standards Board (“IFRS”). This Management’s Discussion and Analysis of Operations and Financial Condition should be read in conjunction with the Company’s most recently issued annual consolidated financial statements for the year ended December 31, 2013 ("Consolidated Annual Financial Statements").
Cautionary notes regarding forward-looking statements follow this Management’s Discussion and Analysis of Operations and Financial Condition.
1. CORE BUSINESS
Yamana Gold Inc. (the “Company” or “Yamana”) is a Canadian-headquartered gold producer engaged in gold mining and related activities including exploration, extraction, processing and reclamation. The Company has significant precious metal properties and land positions throughout the Americas including in Brazil, Chile, Argentina and Mexico.
The Company plans to continue to build on its current production base through existing operating mine expansions and development of new mines, advancement of its exploration properties and by targeting other gold consolidation opportunities with a primary focus in the Americas.
Note 34(a) Related Parties to the most recently audited Consolidated Annual Financial Statements lists Yamana’s significant subsidiaries with 100% equity interest. The Company does not have any material off-balance sheet arrangements, except as noted in Note 32 Contractual Commitments to the Consolidated Annual Financial Statements.
Yamana is listed on the Toronto Stock Exchange (Symbol: YRI) and the New York Stock Exchange (Symbol: AUY).
2. HIGHLIGHTS
The Company’s focus continues to be on ensuring a balance between costs and production, margin preservation and on the generation and protection of cash flow. The Company continues to believe this balanced approach is appropriate and prudent to create value in the prevailing commodity price environment.
Financial
For the year ended December 31, 2013
| • | Revenues of $1.84 billion. |
| • | Net loss(a) of $446.2 million or $0.59 loss per share, after impairment charges related to mineral properties of $546.1 million, net of taxes. |
| • | Adjusted earnings(b) of $273.4 million or $0.36 adjusted basic and diluted earnings per share(b). |
| • | Mine operating earnings of $540.8 million. |
| • | Cash flows from operating activities after changes in non-cash working capital of $653.1 million and cash flows from operating activities before changes in non-cash working capital* of $707.9 million. |
For the three months ended December 31, 2013
| • | Revenues of $420.7 million. |
| • | Net loss(a) of $583.9 million or $0.78 loss per share, after impairment charges related to mineral properties of $535.8 million, net of taxes. |
| • | Adjusted earnings(b) of $36.7 million or $0.05 adjusted basic and diluted earnings per share(b). |
| • | Mine operating earnings of $70.1 million. |
| • | Cash flows from operating activities after changes in non-cash working capital of $184.8 million and cash flows from operating activities before changes in non-cash working capital* of $165.3 million. |
________________________________________
(a) Attributable to Yamana equity holders, after deducting non-controlling interest’s share of non-recurring impairment charge.
(b) A non-GAAP measure - Refer to Section 14.
1
Operational
For the year ended December 31, 2013
| • | Production of 1.20 million gold equivalent ounces ("GEO")(a). |
| • | Commercial production of 1.14 million GEO. |
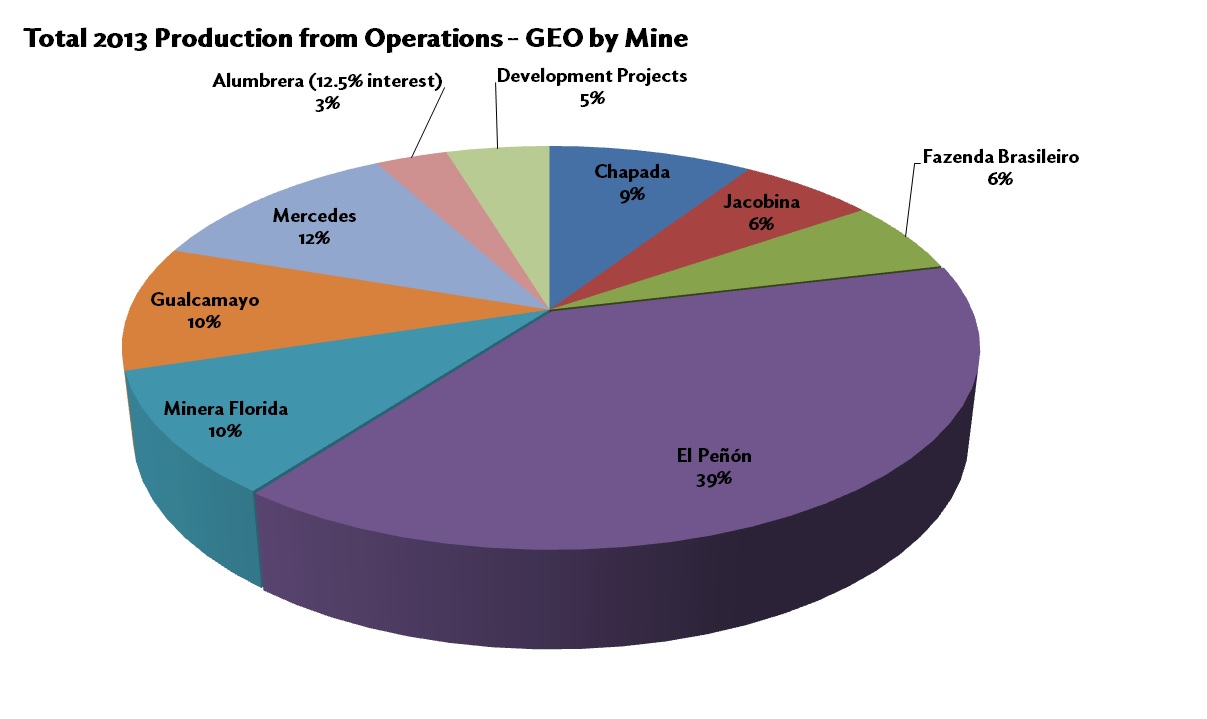
| • | Production from operating mines is summarized as follows: |
| For the years ended December 31, | ||||||
| (In GEO) | 2013 | 2012 | ||||
| Chapada | 110,618 | 128,171 | ||||
| El Peñón | 467,523 | 462,496 | ||||
Mercedes (d) | 141,618 | 126,010 | ||||
| Gualcamayo | 120,337 | 147,310 | ||||
| Jacobina | 73,695 | 116,863 | ||||
| Minera Florida | 118,590 | 105,679 | ||||
| Fazenda Brasileiro | 70,079 | 67,130 | ||||
Ernesto/Pau-a-Pique (b) | 27,571 | 1,274 | ||||
C1 Santa Luz (b) | 12,997 | — | ||||
Pilar (b) | 15,374 | — | ||||
| Alumbrera (12.5%) | 39,157 | 46,077 | ||||
| Total | 1,197,559 | 1,201,010 | ||||
| • | Production of 8.4 million silver ounces. |
| • | Copper production from Chapada of 130.2 million pounds. |
| • | By-product cash costs(c) of $410 per GEO. |
| • | Co-product cash costs(c) of $596 per GEO and $1.65 per pound of copper from Chapada. |
| • | All-in sustaining cash costs(c) of $814 per GEO on a by-product basis and $947 per GEO on a co-product basis. |
| • | Average all-in sustaining cash cost on a co-product basis for the last three quarters was below $925 per GEO exceeding expectations of the cost containment initiative implemented in the second quarter. |
| • | Jacobina, Brazil — Production met the revised goals that were set in the first quarter of 2013 and more importantly, the near term objectives relating to the improvement of costs and underground development were met. |
| • | Mercedes, Mexico — GEO production was 12% higher than 2012. |
| • | Minera Florida, Chile — GEO production was 12% higher than 2012 with new production from the tailings retreatment plant that started in September 2012. |
For the three months ended December 31, 2013
| • | Production of 303,768 GEO. |
| • | Commercial production of 277,447 GEO. |
| • | Production from operating mines is summarized as follows: |
| For the three months ended December 31, | ||||||
| (In GEO) | 2013 | 2012 | ||||
| Chapada | 29,817 | 32,498 | ||||
| El Peñón | 101,364 | 128,119 | ||||
| Mercedes | 31,716 | 39,443 | ||||
| Gualcamayo | 34,929 | 31,502 | ||||
| Jacobina | 19,519 | 28,337 | ||||
| Minera Florida | 30,513 | 32,797 | ||||
| Fazenda Brasileiro | 18,270 | 18,251 | ||||
Ernesto/Pau-a-Pique (b) | 9,707 | 1,274 | ||||
C1 Santa Luz (b) | 6,120 | — | ||||
Pilar (b) | 10,494 | — | ||||
| Alumbrera (12.5%) | 11,319 | 10,769 | ||||
| Total | 303,768 | 322,990 | ||||
2
| • | Production of 2.2 million silver ounces. |
| • | Copper production from Chapada of 36.0 million pounds. |
| • | By-product cash costs(c) of $417 per GEO. |
| • | Co-product cash costs(c) of $647 per GEO and $1.53 per pound of copper from Chapada. |
| • | All-in sustaining cash costs(c) of $754 per GEO on a by-product basis and $935 per GEO on a co-product basis. |
| • | Minera Florida, Chile — GEO production increased each consecutive quarter; fourth quarter production was 11% higher than the third quarter and 15% higher than the second quarter of 2013 with decreases in co-product costs by 22% and 35% for the corresponding periods. |
| • | Gualcamayo, Argentina — Gold production was 26% higher than the third quarter of 2013 with December and January 2014 production averaging over 14,000 ounces per month, consistent with plan and production objectives for the expanded operation. |
| • | Fazenda Brasileiro, Brazil — Gold production was 9.3% higher than the third quarter of 2013. |
| • | El Peñón, Chile & Mercedes, Mexico — Production levels decreased according to normal sequencing of mine plan to contain costs and better position those mines for 2014, although both produced at above guidance expectations. |
| • | Pilar and Ernesto/Pau-a-Pique production increased by 115% and 46% respectively in the fourth quarter over third quarter levels with significant improvements occurring in December. |
| • | Pilar, Brazil — Commissioning continued in the quarter. An infill drilling program is currently underway with a focus to ensure higher grade ore shoots can be mined efficiently. Additionally, the Company has elected to take Maria Lazarus through the development cycle on an expedited basis as the exploration drilling results to date indicate possible contribution to future production. Completion of commissioning is expected in the third quarter of 2014. New low-profile equipment arrived on site early in 2014. |
| • | C1 Santa Luz, Brazil — Commissioning continued in the quarter. The gradual ramp-up at C1 Santa Luz was due to permitting, availability of equipment and the need to ensure sufficient water reserves for continuous operations, which are now in place. |
| • | Ernesto/Pau-a-Pique, Brazil — The project (operation) was originally planned as a combination of an open-pit at Ernesto and an underground operation at Pau-a-Pique with a common plant. A plan has been developed which continues to include an underground operation at Pau-a-Pique but now contemplates a near-to-surface underground operation at Ernesto. These alternatives are under consideration. |
______________________________
(a) GEO assumes gold plus the gold equivalent of silver using a ratio of 50:1 for all periods presented.
(b) Commissioning production as the mine is not yet in commercial operation.
| (c) | A non-GAAP measure - refer to Section 14. |
(d) Includes commissioning production of 8,959 GEO in January of 2012, commercial production started on February 1, 2012.
Construction and Development
| • | Chapada, Brazil — The Company continues to advance programs relating to the optimization of production that include the installation of an in-pit crusher and modifications to the grinding circuit. These initiatives will increase throughput and facilitate the development of new ore bodies including Corpo Sul in the fourth quarter of 2014. This will enable future production to continue at a rate of at least 130,000 GEO and 130 million pounds of copper annually. |
| • | Cerro Moro, Argentina — Work continued at Cerro Moro toward the completion of its updated feasibility study including pre-development work and drilling to support the study and to grow the mineral resource base as well as further advancing the project for a reduced-scale operation. Subject to a positive feasibility study and market conditions, the Company plans to make a construction decision with a goal of initial production in 2016. |
| • | Suyai, Argentina — The Company plans to apply for environmental permits in 2014. A number of relevant studies have already been completed and others are ongoing, which would position the Company well to apply for permitting this year. The current plan being evaluated includes an underground operation without any chemical processing onsite that will produce a precious metal concentrate that could be sold to third parties or potentially processed at Cerro Moro. |
| • | Gualcamayo, Argentina — The QDD Lower West ("QDDLW") underground mine has started to contribute to production. Completion of the underground conveyor is expected in the second quarter and production is expected to ramp-up each quarter during the year. |
Exploration
| • | Gualcamayo, Argentina — Exploration at Gualcamayo has focused on drilling targets surrounding the Rodado and QDD Lower West (“QDDLW”) systems. Positive assays received from drilling in the fourth quarter continued to expand the mineral envelope of Rodado southwest and the potential orebody, which remains open along strike and down dip. |
3
| • | Minera Florida, Chile — The near mine exploration program completed 4,510 metres distributed in 29 holes during the fourth quarter of 2013. The program tested targets within Mina Este such as Triangulo Mineralizado, Lisset and PVO and additional targets including Tribuna, Victoria and Hallazgo. Assay results continue to show positive results from most targets. |
| • | C1 Santa Luz, Brazil — During the fourth quarter of 2013, the near-mine and district exploration drill programs completed 1,634 metres in eight holes. The near-mine program tested the up-dip extension of the southwestern deep target and completed infill holes and tested the northern extensions at Antas III. The regional program tested the Gravata and Rancho do Carneiro targets. Results from both programs are in-line with prior results and are being evaluated for economic potential. |
| • | Ernesto/Pau-a-Pique, Brazil — A total of 13,928 meters were completed in 95 drill holes at the mine during the year to test near-mine targets and extensions. Several new mineral traps were discovered that host potential ore grade gold mineralization which could increase mineral resources and extend the life of mine. |
| • | Pilar, Brazil — Underground mapping at Caiamar and sampling along with computer modeling of drill data has identified moderate to high grade inferred mineral resource ore shoots that will be drill-tested from the surface during 2014 to expand the mineral resource and mineral reserve base at Pilar. |
| • | Cerro Moro, Argentina — The focus of the 2013 exploration program was to develop and test new targets that are both within and outside of the known mineralized structural blocks. During the fourth quarter, 1,077 metres in five holes were drilled to complete the 2013 exploration drill program. This drilling tested the Carlita, Patricia and Margarita veins in an effort to build and expand the known mineralization envelopes. The final hole of the year drilled at the southeast end of the Margarita system cut important gold and silver values leaving the structure open to the southeast and to depth. |
3. OUTLOOK AND STRATEGY
The Company continues to strive to deliver sustainable value. In doing so, the Company remains focused on cost control, operational performance and sustainable volume growth, always with a "simple to understand" objective of performing financially and maximizing cash flows. Emphasis remains on comparatively low costs to drive margins and cash flows, delivery of higher quality ounces and projects while maintaining disciplined capital spending, along with our commitment to adhere to the best practices for health, safety and environmental protection.
In response to the current volatile gold price environment which puts margins at risk, the Company has initiated cost containment and margin reclamation initiatives to focus on quality of ounces produced measured by contribution to cash flows instead of production volume alone. The cost containment and margin reclamation initiatives are consistent with the Company's established focus on cash flow generation. The Company believes prioritizing financial performance over production is an approach that will deliver value, particularly in periods of volatile and uncertain metal prices.
These initiatives have progressed since they were announced in the second quarter. Cost savings are being realized through reductions in operating costs, capital expenditures, exploration costs, and general and administrative costs, in addition to other areas. The Company's progress in executing its cost containment and margin reclamation initiatives is evidenced by a reduction of its all-in sustaining co-product cash costs per gold equivalent ounce ("GEO"). Average all-in sustaining cash costs ("AISC") for the last three quarters was below $925 per GEO on a co-product basis. The reduction in AISC on a co-product basis was primarily driven by:
| • | General and administrative expenses were $66 per GEO in the fourth quarter, compared to $88 per GEO in the second quarter, representing a 25% decrease. |
| • | Sustaining capital expenditures were $197 per GEO in the fourth quarter, compared to $260 per GEO in the second quarter, representing a 24% decrease. Compared to the previous guidance of sustaining capital expenditure at $310 per GEO for 2013, the reduction was in excess of 55%. |
Given the current metal price environment and significant precious metal price volatility, the Company continues to align its production expectation with the new price environment. As marginal ounces are at risk of eroding margins, the Company will be diligent in protecting margins through creating a base production level at a sustainable contained cost structure that will generate cash flow in the current and lower price environments. The Company will not sacrifice margin, or compromise cost structure, for volume growth until costs are believed to be contained so that new production will generate margins in current and lower metal price environments. With costs stabilizing at lower levels, the focus is now returning to maximizing production growth, while generating cash flows and free cash flows will always be the core focus.
The Company has budgeted production of 1.4 million GEO in 2014 at AISC below $850 per GEO on a by-product basis and $925 per GEO on a co-product basis. Silver production is expected to be approximately 8.8 million ounces in 2014 which is included in GEO. Estimated cash costs for 2014 are forecast to be in line with 2013 on both a co-product and by-product basis.
4
Cash costs on a by-product basis are calculated after base metal by-product credits, which assumes a price forecast for copper of $3.20 per pound.
As part of the annual budgeting process, the Company has performed various evaluations to maximize the level of confidence and reliability in the forecast production, costs and cash flow generation capacity at every operation. These evaluations identify ounces that the Company considers to have a lower level of certainty or reliability on any of: production, costs or cash flow generation. For budgeted production in 2014, all of these ounces relate to new operations as they progress to full capacity. The Company considers 70,000 production ounces, or less than five per cent, of its budgeted production for 2014 to be within this category and most of these ounces would be in pre-commercial production and as such not impact its cash flow expectations for the year.
The Company strives to achieve budgeted production and conducts these evaluations for the purposes of stress testing its business plan and for evaluation of the proper balance between production and costs and other factors that may influence or affect cash flow. While the Company will make every effort to produce at budget levels, this approach provides a reasonable tool for assessing downside risk to production or where costs are at risk or where the level of reliability for certain production is below the level of total of its expected production. The Company remains focused on the generation and maximization of cash flow.
The table below provides the mine-by-mine 2014 production expectations according to budget.
| (in GEO) | 2014 Estimate | |
Chapada (i) | 103,000 | |
El Peñón (i) | 448,000 | |
Mercedes (i) | 129,000 | |
| Gualcamayo | 170,000 | |
| Jacobina | 89,000 | |
Minera Florida (i) | 114,000 | |
| C1 Santa Luz | 90,000 | |
| Ernesto/Pau-a-Pique | 58,000 | |
| Pilar | 90,000 | |
| Fazenda Brasileiro | 64,000 | |
| Alumbrera (12.5% interest) | 45,000 | |
| Total GEO | 1,400,000 | |
| Total Copper - Chapada (millions of pounds) | 134 | |
________________________________________________________
(i) Silver production is reported as GEO at a ratio of 50:1.
Production in 2015 is expected to further increase. The Company is evaluating proposed plans for production increases in light of its philosophy of balancing production with costs.
Copper production is expected to be approximately 134 million pounds in 2014. This estimate reflects the production from Chapada and does not include the attributable copper production from the Company’s 12.5% interest in Alumbrera.
Expansionary capital spending for 2014 is expected to be approximately $150 million (excluding capitalized interest), which is significantly lower than 2013 as the Company’s newest operations ramp-up to commercial production and the Company continues to allocate capital to those opportunities that can most readily contribute to cash flow.
The Company expects to spend approximately $70 million on exploration in 2014. The 2014 exploration program will continue to focus on increasing mineral reserves and mineral resources with its near-mine and regional exploration programs, as well as continuing to explore identified greenfield targets and generate new targets.
In 2014, sustaining capital expenditures are expected to be in the range of $320 million to $340 million or approximately $250 per GEO. This allocates all capital to gold ounces with no consideration for copper. The Company treats copper as a by-product and applies all sustaining capital to GEOs. Sustaining capital expenditures are expected to decline in future years as a result, in part, of the cost saving initiatives related to maintenance and the expected growth in gold production. Sustaining capital is included in AISC.
5
For 2014, depreciation, depletion and amortization ("DD&A") is expected to be approximately $340 per GEO when excluding any allocation to copper as the Company treats copper as a by-product and applies all DD&A to GEO. General and administrative expenses are expected to be below $140 million, in line with 2013 levels. The effective tax rate for 2014 is forecast to be between 30% to 32%.
The Company continues to work toward the stated target of 1.5 million to 1.7 million GEO which it believes remains achievable with its existing portfolio of assets. However, with an extended timetable, this further growth can more efficiently be delivered at better costs. Exploration results continue to support the higher level of sustainable production through its producing mines. Details of the exploration program year to date can be found in Section 7 Construction, Development and Exploration.
The Company had approximately $830 million of available cash and undrawn credit at December 31, 2013.
6
4. SUMMARY OF FINANCIAL AND OPERATING STATISTICS
4.1 Annual Financial Statistics
| For the years ended | |||||||||||
| Dec 31, 2013 | Dec 31, 2012 | Dec 31, 2011 | |||||||||
| (Loss)/earnings per share attributable to Yamana equity holders - basic & diluted | $ | (0.59 | ) | $ | 0.59 | $ | 0.74 | ||||
Adjusted earnings per share (i) - basic and diluted | $ | 0.36 | $ | 0.93 | $ | 0.96 | |||||
| Dividends declared per share | $ | 0.260 | $ | 0.240 | $ | 0.155 | |||||
| Dividends paid per share | $ | 0.260 | $ | 0.225 | $ | 0.135 | |||||
Weighted average number of common shares outstanding - basic ( in thousands) | 752,697 | 748,095 | 744,600 | ||||||||
Weighted average number of common shares outstanding - diluted (in thousands) | 752,697 | 749,591 | 746,144 | ||||||||
| (In thousands of United States Dollars; unless otherwise noted) | |||||||||||
| Net (loss)/earnings attributable to Yamana equity holders | $ | (446,247 | ) | $ | 442,064 | $ | 548,294 | ||||
Adjusted earnings (i) | $ | 273,358 | $ | 694,333 | $ | 712,896 | |||||
| Revenues | $ | 1,842,682 | $ | 2,336,762 | $ | 2,173,325 | |||||
| Mine operating earnings | $ | 540,778 | $ | 1,121,270 | $ | 1,099,874 | |||||
| Cash flows from operating activities | $ | 653,135 | $ | 1,158,057 | $ | 1,225,782 | |||||
Cash flows from operating activities before changes in non-cash working capital (i) | $ | 707,861 | $ | 1,044,946 | $ | 1,266,373 | |||||
| Cash flows to investing activities | $ | (1,053,410 | ) | $ | (1,498,030 | ) | $ | (846,075 | ) | ||
| Cash flows (to)/from financing activities | $ | 283,843 | $ | 146,399 | $ | (142,678 | ) | ||||
Average realized gold price per ounce (ii) | $ | 1,408 | $ | 1,670 | $ | 1,567 | |||||
Average realized copper price per pound (ii) | $ | 3.28 | $ | 3.60 | $ | 3.93 | |||||
Average realized silver price per ounce (ii) | $ | 23.73 | $ | 30.46 | $ | 35.19 | |||||
Average market gold price per ounce (iii) | $ | 1,411 | $ | 1,669 | $ | 1,573 | |||||
Average market copper price per pound (iii) | $ | 3.32 | $ | 3.61 | $ | 4.00 | |||||
Average market silver price per ounce (iii) | $ | 23.85 | $ | 31.17 | $ | 35.32 | |||||
| As at | |||||||||||
| Dec 31, 2013 | Dec 31, 2012 | Dec 31, 2011 | |||||||||
| Total assets | $ | 11,410,717 | $ | 11,800,163 | $ | 10,769,940 | |||||
| Total long-term liabilities | $ | 3,615,242 | $ | 3,269,266 | $ | 2,783,786 | |||||
| Total equity | $ | 7,158,105 | $ | 7,861,878 | $ | 7,491,523 | |||||
| Working capital | $ | 81,093 | $ | 255,134 | $ | 608,021 | |||||
_____________________________
| (i) | A cautionary note regarding non-GAAP measures and their respective reconciliations are included in Section 14 including a discussion and definition of Adjusted Earnings, Adjusted Earnings per Share, and additional measures. |
| (ii) | Realized prices based on gross sales compared to market prices for metals may vary due to infrequent shipments and depending on timing of the sales. |
| (iii) | Source of information: Bloomberg. |
7
4.2 Annual Operating Statistics
| For the years ended | |||||||
| Dec 31, 2013 | Dec 31, 2012 | ||||||
Gold Equivalent Ounces (GEO) Production (i) | |||||||
| Brazil | |||||||
Chapada (ii) | 110,618 | 128,171 | |||||
| Jacobina | 73,695 | 116,863 | |||||
| Fazenda Brasileiro | 70,079 | 67,130 | |||||
| Chile | |||||||
El Peñón (ii) | 467,523 | 462,496 | |||||
Minera Florida (ii) | 118,590 | 103,818 | |||||
| Argentina | |||||||
| Gualcamayo | 120,337 | 147,310 | |||||
Alumbrera (iii) | 39,157 | 46,077 | |||||
| Mexico | |||||||
Mercedes (ii)(v) | 141,618 | 117,051 | |||||
Total commercial GEO production (i) | 1,141,617 | 1,188,916 | |||||
Commissioning GEO (i)(v) | 55,942 | 12,094 | |||||
Total GEO production (i) | 1,197,559 | 1,201,010 | |||||
By-product Cash Costs per GEO (i) (iv) | |||||||
| Brazil | |||||||
| Chapada | $ | (1,296 | ) | $ | (1,865 | ) | |
| Jacobina | 1,174 | 747 | |||||
| Fazenda Brasileiro | 808 | 872 | |||||
| Chile | |||||||
| El Peñón | 485 | 440 | |||||
| Minera Florida | 747 | 797 | |||||
| Argentina | |||||||
| Gualcamayo | 772 | 536 | |||||
Alumbrera (iii) | (252 | ) | (1,203 | ) | |||
| Mexico | |||||||
| Mercedes | 496 | 485 | |||||
By-product cash costs per GEO produced (i) (iv) | $ | 410 | $ | 230 | |||
Co-product cash costs per GEO produced (i) (iv) | $ | 596 | $ | 525 | |||
Co-product cash costs per pound of copper produced (iv) | $ | 1.75 | $ | 1.48 | |||
All-in sustaining cash costs per GEO, by-product basis (i) (iv) | $ | 814 | n/a | ||||
All-in sustaining cash costs per GEO, co-product basis (i) (iv) | $ | 947 | n/a | ||||
| Concentrate Production | |||||||
| Chapada concentrate production (tonnes) | 239,811 | 268,135 | |||||
| Chapada copper contained in concentrate production (millions of lbs) | 130.2 | 150.6 | |||||
Chapada co-product cash costs per pound of copper (iv) | $ | 1.65 | $ | 1.40 | |||
Alumbrera attributable concentrate production (tonnes) (iii) | 55,115 | 65,140 | |||||
Alumbrera attributable copper contained in concentrate production (millions of lbs) (iii) | 30.2 | 37.4 | |||||
Alumbrera co-product cash costs per lb of copper (iii) (iv) | $ | 2.21 | $ | 1.81 | |||
| Gold Equivalent Ounces Breakdown | |||||||
| Gold ounces produced | 1,029,863 | 1,019,969 | |||||
| Silver ounces produced (millions) | 8.4 | 9.0 | |||||
| Sales | |||||||
| Total GEO sales (including 12.5% interest in Alumbrera) | 1,178,972 | 1,186,991 | |||||
| - Total gold sales (ounces) | 1,013,697 | 1,007,414 | |||||
| - Total silver sales (millions of ounces) | 8.3 | 9.0 | |||||
| Chapada concentrate sales (tonnes) | 242,681 | 263,704 | |||||
| Chapada payable copper contained in concentrate sales (millions of lbs) | 126.0 | 139.0 | |||||
______________________________
8
(i) | Silver production is treated as a gold equivalent. Gold equivalent ounce calculations are based on an average historical silver to gold ratio (50:1) which is used and presented solely for period-over-period comparative purposes only. |
(ii) | 2013 gold production: El Peñón — 338,231 ounces; Minera Florida — 99,000 ounces, Chapada — 104,096 ounces, and Mercedes — 129,327 ounces; and 2013 silver production: El Peñón — 6.5 million ounces; Minera Florida — 1.0 million ounces, Chapada — 0.3 million ounces and Mercedes — 0.6 million ounces. |
(iii) | The Company holds a 12.5% equity interest in Alumbrera. |
(iv) | A cautionary note regarding non-GAAP measures and their respective reconciliations are included in Section 14 including a discussion and definition of Cash Costs. |
(v) | Commissioning is ongoing at Ernesto/Pau-a-Pique, C1 Santa Luz and Pilar. Commissioning at Mercedes started in 2011 and concluded on February 1, 2012. |
4.3 Quarterly Financial Statistics
| For the three months ended | ||||||||
| Dec 31, 2013 | Dec 31, 2012 | |||||||
| (Loss)/earnings per share attributable to Yamana equity holders - basic | $ | (0.78 | ) | $ | 0.23 | |||
| (Loss)/earnings per share attributable to Yamana equity holders - diluted | $ | (0.78 | ) | $ | 0.22 | |||
Adjusted earnings per share (i) - basic and diluted | $ | 0.05 | $ | 0.26 | ||||
| Dividends declared per share | $ | 0.065 | $ | 0.065 | ||||
| Dividends paid per share | $ | 0.065 | $ | 0.055 | ||||
Weighted average number of common shares outstanding - basic ( in thousands) | 752,995 | 751,780 | ||||||
Weighted average number of common shares outstanding - diluted (in thousands) | 752,995 | 753,325 | ||||||
| (In thousands of United States Dollars; unless otherwise noted) | ||||||||
| Net (loss)/earnings attributable to Yamana equity holders | $ | (583,936 | ) | $ | 169,161 | |||
Adjusted earnings (i) | $ | 36,719 | $ | 197,368 | ||||
| Revenues | $ | 420,663 | $ | 629,505 | ||||
| Mine operating earnings | $ | 70,113 | $ | 322,082 | ||||
| Cash flows from operating activities | $ | 184,845 | $ | 367,881 | ||||
Cash flows from operating activities before changes in non-cash working capital (i) | $ | 165,315 | $ | 298,064 | ||||
| Cash flows to investing activities | $ | (259,992 | ) | $ | (375,544 | ) | ||
| Cash flows to/(from) financing activities | $ | 66,711 | $ | (44,467 | ) | |||
Average realized gold price per ounce (ii) | $ | 1,277 | $ | 1,692 | ||||
Average realized copper price per pound (ii) | $ | 3.37 | $ | 3.54 | ||||
Average realized silver price per ounce (ii) | $ | 20.63 | $ | 31.37 | ||||
Average market gold price per ounce (iii) | $ | 1,272 | $ | 1,718 | ||||
Average market copper price per pound (iii) | $ | 3.25 | $ | 3.59 | ||||
Average market silver price per ounce (iii) | $ | 20.80 | $ | 32.58 | ||||
_____________________________
(i) | A cautionary note regarding non-GAAP measures and their respective reconciliations are included in Section 14 including a discussion and definition of Adjusted Earnings, Adjusted Earnings per Share, and additional measures. |
(ii) | Realized prices based on gross sales compared to market prices for metals may vary due to infrequent shipments and depending on timing of the sales. |
(iii) | Source of information: Bloomberg. |
9
4.4 Quarterly Operating Statistics
| For the three months ended | |||||||
| Dec 31, 2013 | Dec 31, 2012 | ||||||
Gold Equivalent Ounces (GEO) Production (i) | |||||||
| Brazil | |||||||
Chapada (ii) | 29,817 | 32,498 | |||||
| Jacobina | 19,519 | 28,337 | |||||
| Fazenda Brasileiro | 18,270 | 18,251 | |||||
| Chile | |||||||
El Peñón (ii) | 101,364 | 128,119 | |||||
Minera Florida (ii) | 30,513 | 32,797 | |||||
| Argentina | |||||||
| Gualcamayo | 34,929 | 31,502 | |||||
Alumbrera (iii) | 11,319 | 10,769 | |||||
| Mexico | |||||||
Mercedes (ii)(v) | 31,716 | 39,443 | |||||
Total commercial GEO production (i) | 277,447 | 321,716 | |||||
Commissioning GEO (i)(v) | 26,321 | 1,274 | |||||
Total GEO production (i) | 303,768 | 322,990 | |||||
| By-product Cash Costs per GEO (i) (iv) | |||||||
| Brazil | |||||||
| Chapada | $ | (1,547 | ) | $ | (2,021 | ) | |
| Jacobina | 1,140 | 825 | |||||
| Fazenda Brasileiro | 809 | 856 | |||||
| Chile | |||||||
| El Peñón | 593 | 415 | |||||
| Minera Florida | 592 | 805 | |||||
| Argentina | |||||||
| Gualcamayo | 825 | 485 | |||||
Alumbrera (iii) | (261 | ) | (2,012 | ) | |||
| Mexico | |||||||
| Mercedes | 656 | 435 | |||||
By-product cash costs per GEO produced (i) (iv) | $ | 417 | $ | 198 | |||
Co-product cash costs per GEO produced (i) (iv) | $ | 647 | $ | 517 | |||
Co-product cash costs per pound of copper produced (iv) | $ | 1.58 | $ | 1.51 | |||
All-in sustaining cash costs per GEO, by-product basis (i) (iv) | $ | 754 | n/a | ||||
All-in sustaining cash costs per GEO, co-product basis (i) (iv) | $ | 935 | n/a | ||||
| Concentrate Production | |||||||
| Chapada concentrate production (tonnes) | 67,395 | 72,518 | |||||
| Chapada copper contained in concentrate production (millions of lbs) | 36.0 | 40.5 | |||||
Chapada co-product cash costs per pound of copper (iv) | $ | 1.53 | $ | 1.38 | |||
Alumbrera attributable concentrate production (tonnes) (iii) | 17,547 | 14,669 | |||||
Alumbrera attributable copper contained in concentrate production (millions of lbs) (iii) | 9.6 | 8.5 | |||||
Alumbrera co-product cash costs per lb of copper (iii) (iv) | $ | 1.75 | $ | 2.15 | |||
| Gold Equivalent Ounces Breakdown | |||||||
| Gold ounces produced | 260,187 | 276,373 | |||||
| Silver ounces produced (millions) | 2.2 | 2.3 | |||||
| Sales | |||||||
| Total GEO sales (including 12.5% interest in Alumbrera) | 305,376 | 317,615 | |||||
| - Total gold sales (ounces) | 263,031 | 272,524 | |||||
| - Total silver sales (millions of ounces) | 2.1 | 2.3 | |||||
| Chapada concentrate sales (tonnes) | 67,616 | 69,589 | |||||
| Chapada payable copper contained in concentrate sales (millions of lbs) | 34.5 | 37.3 | |||||
______________________________
10
(i) | Silver production is treated as a gold equivalent. Gold equivalent ounce calculations are based on an average historical silver to gold ratio (50:1) which is used and presented solely for quarter-over-quarter comparative purposes only. |
(ii) | Three-month gold production for the periods ended December 31, 2013: El Peñón — 68,246 ounces; Minera Florida — 24,539 ounces, Chapada — 28,223 ounces, and Mercedes — 28,821 ounces; and three-month silver production: El Peñón — 1.7 million ounces; Minera Florida — 298,696 ounces, Chapada — 79,696 ounces, and Mercedes — 144,715 ounces. |
(iii) | The Company holds a 12.5% equity interest in Alumbrera. |
(iv) | A cautionary note regarding non-GAAP measures and their respective reconciliations are included in Section 14 including a discussion and definition of Cash Costs. |
(v) | Commissioning is ongoing at Ernesto/Pau-a-Pique, C1 Santa Luz and Pilar. Commissioning at Mercedes started in 2011 and concluded on February 1, 2012. |
5. OVERVIEW OF RESULTS
5.1 Overview of Annual Financial Results
| For the years ended December 31, | |||||||
| (In thousands of United States Dollars; unless otherwise noted) | 2013 | 2012 | |||||
| Revenues | $ | 1,842,682 | $ | 2,336,762 | |||
| Cost of sales excluding depletion, depreciation and amortization | (900,789 | ) | (831,754 | ) | |||
| Gross margin | 941,893 | 1,505,008 | |||||
| Depletion, depreciation and amortization | (401,115 | ) | (383,738 | ) | |||
| Mine operating earnings | 540,778 | 1,121,270 | |||||
Other expenses (i) | (249,841 | ) | (289,100 | ) | |||
| Equity (loss)/earnings from associate | (3,905 | ) | 50,642 | ||||
| Impairment of mineral properties and other assets | (682,273 | ) | (67,684 | ) | |||
| Earnings from operations before income taxes | (395,241 | ) | 815,128 | ||||
| Income tax expense | (79,110 | ) | (373,064 | ) | |||
| Net (loss) earnings | $ | (474,351 | ) | $ | 442,064 | ||
Earnings adjustments (ii): | |||||||
| Non-cash unrealized foreign exchange losses | 45,709 | 64,648 | |||||
| Reorganization costs | 3,969 | — | |||||
| Share-based payments/mark-to-market of deferred share units | 7,683 | 26,292 | |||||
| Impact of change in Mexican tax rates on non-cash deferred tax expense | 28,323 | — | |||||
| Impact of change in Chilean tax rates on non-cash deferred tax expense | — | 83,830 | |||||
| Deferred income tax expense on translation of intercompany debt | — | (2,983 | ) | ||||
| Impairment of mineral properties | 682,273 | — | |||||
| Impairment of investment in available-for-sale securities and other assets | 70,285 | 67,684 | |||||
| Other non-cash and non-recurring losses | 44,566 | 16,592 | |||||
| Adjusted earnings before income tax effect | 408,457 | 698,127 | |||||
| Income tax effect of adjustments | (135,099 | ) | (3,794 | ) | |||
Adjusted earnings (ii) | $ | 273,358 | $ | 694,333 | |||
Net (loss) earnings per share attributable to Yamana Gold Inc. equity holders - basic and diluted | $ | (0.59 | ) | $ | 0.59 | ||
Adjusted earnings per share (ii) - basic and diluted | $ | 0.36 | $ | 0.93 | |||
______________________________
| (i) | For 2013, other expenses represent the aggregate of the following expenses: general and administrative of $135.3 million (2012 - $145.9 million), exploration and evaluation of $30.2 million (2012 - $58.0 million), other operating expenses of $78.1 million (2012 - $99.3 million) and net finance expense of 6.3 million (2012 - expense $53.5 million). |
| (ii) | A cautionary note regarding non-GAAP measures and their respective reconciliations are included in Section 14 including a discussion and definition of Adjusted Earnings and Adjusted Earnings per Share. |
11
Impairment
The Company assesses at the end of each reporting period whether there is any indication, from external and internal sources of information, that an asset or cash generating unit (“CGU”) may be impaired. Impairment testing is performed using life of mine after-tax cash flow projections. During the second quarter, the Company updated its after-tax life of mine cash flow projections with updated economic assumptions as a result of the decline in metal prices towards the latter half of the second quarter of 2013. Based on its assessment during the second quarter, the Company concluded that there were no impairment charges in respect to its mineral properties as at June 30, 2013 as a result of the decline in metal prices at that time. Adverse changes in metal price assumptions were partially offset by other inputs that resulted in lower costs and updated mine plans. The recoverable values in the impairment assessment in the second quarter were calculated assuming long-term prices of $1,375 per ounce of gold and $3.00 per pound of copper.
In early October of 2013, after the spot price for gold returned to the $1,350 per ounce level, it started a continuous decline during the fourth quarter and dipped below $1,200 per ounce by late December. During the fourth quarter, the Company performed its impairment test updating its life of mine after-tax cash flow projections for updated reasonable estimates of future metal prices, production based on current estimates of recoverable mineral reserves and mineral resources, recent operating and exploration results, exploration potential, future operating costs, capital expenditures, inflation and long-term foreign exchange rates. The Company examined future cash flows, the intrinsic value beyond proven and probable mineral reserves, value of land holdings, as well as other factors, which are determinants of commercial viability of each mining property in its portfolio, and concluded that a total of $672.0 million ($563.9 million, net of taxes) of impairment charges should be recognized. The impairment charges in the fourth quarter include the following:
| For the periods ended December 31, 2013 | ||||||||||||||||
| (in million dollars) | Three months | Twelve months | ||||||||||||||
| Mine/Project | Impairment | After-tax Impairment | Impairment | After-tax Impairment | ||||||||||||
| Jacobina (goodwill) | $ | 55.0 | $ | 55.0 | $ | 55.0 | $ | 55.0 | ||||||||
| Ernesto/Pau-a-Pique | 175.0 | 168.2 | 175.0 | 168.2 | ||||||||||||
| Alumbrera (12.5% Interest) | 70.0 | 70.0 | 70.0 | 70.0 | ||||||||||||
Jeronimo (a) | 110.0 | 88.0 | 110.0 | 88.0 | ||||||||||||
| Exploration properties | $ | 262.0 | $ | 182.8 | $ | 272.3 | $ | 193.0 | ||||||||
Impairment on mineral properties (b) | $ | 672.0 | $ | 563.9 | $ | 682.3 | $ | 574.2 | ||||||||
| Less: Non-controlling interest (43.3%) - Jeronimo | (28.1 | ) | (28.1 | ) | ||||||||||||
| Impact on net earnings | $ | 535.8 | $ | 546.1 | ||||||||||||
_________________
| (a) | The Company holds 56.7% interest in the Agua de La Falda ("ADLF") project. The ADLF project is an exploration project which includes the Jeronimo deposit and is located in northern Chile. |
| (b) | An impairment charge of $10.3 million was recognized in the second quarter of 2013. |
The Company expects there is further or additional value in these properties over and above what they are being written down to but not at the metal price assumptions used in the impairment testing. The valuation of impairment is based on current forecasts for long-term metal prices which have been influenced by the recent decline in spot prices over the last nine months of 2013. These metal price assumptions are then held constant over mine lives which in some cases are in excess of fifteen years. The fair values in the impairment assessment in the fourth quarter were calculated assuming long-term prices of $1,300 per ounce of gold and $3.00 per pound of copper. The historical three-year average gold price was approximately $1,550 per ounce well in excess of the long-term gold price assumption used in its impairment testing. The Company believes that it is prudent to update its metal price assumption used in its impairment testing to reflect current forecasts and it does not rely on higher prices to drive its business plans, however, the Company remains positive on the long-term price fundamentals for its metals. The Company will continue to monitor the valuation of its assets and the impact of changes in economic assumptions and mine plans on these valuations. Higher prices in the future could result in greater volatility in earnings, as the Company reassesses the fair value of its mineral properties and could potentially reverse a portion or all of the impairment charges taken.
In addition to the impairment charges mentioned above, an additional $10.3 million (before and net of taxes) related to minor exploration properties was recognized during the year on the decision of not proceeding with further exploration and/or disposition in the prior quarters of 2013, bringing the impairment charges against mineral properties for the year to a total of $682.3 million (574.2 million, net of taxes).
12
For the year ended December 31, 2013
Cash flows from operating activities before changes in non-cash working capital for the year ended December 31, 2013 were $653.1 million compared to $1.16 billion for the year ended December 31, 2012. Cash flows from operating activities before changes in non-cash working capital items (a non-GAAP measure, see Section 14) for the year ended December 31, 2013 were $707.9 million compared to $1.04 billion for the year ended December 31, 2012. Cash and cash equivalents as at December 31, 2013 were $220.0 million compared to $349.6 million as at December 31, 2012.
Net loss for the year 2013 was $446.2 million or $0.59 per share(a), compared with net earnings of $442.1 million or basic and diluted earnings per share of $0.59 for the year 2012. Net loss for the year includes an impairment charge of $574.2 million, net of taxes in respect to certain mineral properties. Adjusted earnings were $273.4 million or $0.36 per share in 2013, compared with $694.3 million or $0.93 per share in 2012. Lower adjusted earnings were mainly attributed to the decline in metal prices and lower sales volume of gold, copper and silver, combined with inflationary impacts on costs and lower equity earnings from the Company's 12.5% of interest in Alumbrera.
Revenues were $1.84 billion in 2013 compared with $2.3 billion in 2012. Mine operating earnings were $540.8 million, compared with $1.12 billion in 2012. Lower revenues and mine operating earnings were due to lower metal prices and lower sales volumes of gold, copper in concentrate and silver. Higher cost of sales, including depletion, depreciation and amortization expenses, was mainly related to higher cost inflation relative to that of 2012.
The average realized gold price in 2013 was $1,408 per ounce versus $1,670 per ounce in 2012 or 16% lower. The average realized copper price was $3.28 per pound versus $3.60 per pound in 2012 or 9% lower. The average realized silver price was $23.73 per ounce compared to $30.46 per ounce in 2012 or 22% lower.
Revenues for 2013 were generated from the sale of 925,496 ounces of gold, 8.3 million ounces of silver and 126.0 million pounds of copper, excluding Alumbrera which is accounted for as an equity investment. This compares to sales, excluding Alumbrera, of 963,833 ounces of gold, 9.0 million ounces of silver and 139.0 million pounds of copper in 2012.
Revenues for the year are comprised of the following:
| For the years ended December 31, | 2013 | 2012 | |||||||||||||
| (In thousands of United States Dollars; unless otherwise noted) | Quantity Sold (ii) | Realized Price | Revenues | Revenues | |||||||||||
Gold (i) | 925,496 | oz | $ | 1,408 | $ | 1,302,687 | $ | 1,609,172 | |||||||
| Silver | 8,263,729 | oz | $ | 23.73 | 196,129 | 273,455 | |||||||||
| Total precious metals | 1,090,771 | GEO | 1,498,816 | 1,882,627 | |||||||||||
Copper (i) | 125,999,185 | lbs | $ | 3.28 | 413,609 | 499,895 | |||||||||
| Gross Revenues | $ | 1,912,425 | $ | 2,382,522 | |||||||||||
| Add (deduct): | |||||||||||||||
- Treatment and refining charges of gold and copper concentrate | $ | (33,163 | ) | $ | (30,099 | ) | |||||||||
| - Sales taxes | (26,417 | ) | (36,718 | ) | |||||||||||
| - Metal price adjustments related to concentrate revenues | (10,493 | ) | 19,325 | ||||||||||||
| - Other adjustments | 330 | 1,732 | |||||||||||||
Revenues (ii) | $ | 1,842,682 | $ | 2,336,762 | |||||||||||
______________________________
| (i) | Includes payable copper and gold contained in concentrate. |
| (ii) | Excludes Alumbrera which is accounted for as an equity investment. |
Cost of sales excluding depletion, depreciation and amortization for 2013 was $900.8 million compared with $831.8 million in the same period of 2012. The increase in cost of sales was mainly due to higher co-product cash costs as a result of inflationary pressures in the countries where the Company operates.
The following table provides a reconciliation of the co-product cash costs to the cost of sales excluding depletion, depreciation and amortization for the year:
13
| 2013 | 2012 | ||||||||||||||
| For the years ended December 31, | GEO or Pounds of Copper Produced | Co-product Cash Cost per Unit | Total Costs | Total Costs | |||||||||||
| (In thousands of United States Dollars; unless otherwise noted) | |||||||||||||||
Chapada — GEO (i) | 110,618 | oz | $ | 400 | $ | 44,297 | $ | 42,681 | |||||||
| Chapada — Copper | 130,239,902 | lbs | 1.65 | 214,481 | 210,072 | ||||||||||
El Peñón — GEO (i) | 467,523 | oz | 485 | 226,628 | 203,724 | ||||||||||
| Jacobina | 73,695 | oz | 1,174 | 86,488 | 87,316 | ||||||||||
| Gualcamayo | 120,337 | oz | 772 | 92,844 | 78,952 | ||||||||||
Minera Florida — GEO (i) | 118,590 | oz | 747 | 88,621 | 82,793 | ||||||||||
| Fazenda Brasileiro | 70,079 | oz | 808 | 56,622 | 58,554 | ||||||||||
Mercedes — GEO (i) | 141,618 | oz | 496 | 70,301 | 60,915 | ||||||||||
Co-product cash cost of sales (ii) | $ | 880,282 | $ | 825,007 | |||||||||||
| Add (deduct): | |||||||||||||||
| - Inventory movements and adjustments | 21,005 | 5,278 | |||||||||||||
| - Chapada concentrate treatment and refining charges | (33,163 | ) | (32,369 | ) | |||||||||||
| - Commercial & other costs | 16,108 | 17,795 | |||||||||||||
| - Overseas freight for Chapada concentrate | 16,557 | 16,043 | |||||||||||||
| Cost of sales excluding depletion, depreciation and amortization | $ | 900,789 | $ | 831,754 | |||||||||||
______________________________
| (i) | Silver ounces reported from Chapada, El Peñón, Minera Florida and Mercedes are treated as gold equivalent ounces ("GEO"). |
| (ii) | A cautionary note regarding non-GAAP measures is included in Section 14 of this Management’s Discussion and Analysis of Operations and Financial Condition. |
Depletion, depreciation and amortization (“DDA”) expense for the year 2013 was $401.1 million, compared to $383.7 million in the same period of 2012. The increase in DDA is attributable to higher levels of depletable capital expenditures and higher cost ore bodies being depleted.
Other expenses including general and administrative, exploration and evaluation, other operating and net finance expenses were $249.8 million in the year ended December 31, 2013, compared to $289.1 million in the year ended December 31, 2012. The net decrease in other expenses is detailed below:
General and administrative expenses were $135.3 million in 2013 compared to $145.9 million in the year ended December 31, 2012. General and administrative expenses have declined mainly as a result of the Company's cost containment initiative introduced in May 2013, and are expected to be maintained at these lower levels in 2014.
Exploration and evaluation expenses were $30.2 million in 2013, compared to $58.0 million incurred in 2012 as a result of the Company's reduced focus on greenfield exploration.
Other operating expenses were $78.1 million in the year compared to $99.3 million in 2012. Lower other operating expenses reflect lower impairment of investments in available-for-sale securities of $16.3 million for the year compared to $67.7 million in 2012, an $18.1 million write-off of long-term tax credits and a loss of $38.4 million incurred on the sale of non-core exploration properties with no 2012 comparative.
Net finance expenses were $6.3 million for the year compared with net finance expenses of $53.5 million in the same period of 2012. Lower net finance expense was mainly due to higher foreign exchange gains in the amount of $17.7 million compared to a foreign exchange loss of $25.9 million in the comparative period.
Equity loss from associate was $3.9 million for 2013 compared with earnings of $50.6 million in 2012. The equity loss was driven by lower revenues as a result of lower metal prices and lower sales volume of copper and gold concentrate due to lower production from Alumbrera. Cash dividends from the Company’s equity investment in Alumbrera during 2013 were $27.9 million compared to $nil in 2012. During the year, the Company also received loan proceeds of $44.6 million from Alumbrera.
The Company recorded an income tax expense of $79.1 million in 2013 compared to $373.1 million in the same period of 2012. The decrease in the income tax expense is a result of lower earnings relative to the comparative year. The income tax provision for the year ended December 31, 2013 reflects a current income tax expense of $140.6 million compared to current tax expense of $265.5 million in 2012, and a deferred income tax recovery of $61.5 million compared to deferred tax expense of $107.6 million. The effective tax rate on adjusted earnings for the year of 2013 was 30.0% compared to 25.0% for 2012.
14
_______________
(a) Attributable to Yamana equity holders.
5.2 Overview of Annual Operating Results
For the year ended December 31, 2013
Total production for the Company was 1.20 million GEO comparable to 2012 production level of 1.20 million GEO. Total production for the year consisted of 1.03 million ounces of gold and 8.4 million ounces of silver, representing an increase of 1% in gold production and a 7% decrease in silver production over the period of 2012. Total production included the Company’s attributable production from Alumbrera of 39,157 ounces of gold and production during commissioning from Ernesto/Pau-a-Pique, C1 Santa Luz and Pilar of 55,942 ounces of gold. This compares with total production in 2012 of 1.20 million GEO that consisted of 1.01 million ounces of gold and 9.0 million ounces of silver. The 2012 production also included commissioning production of 12,094 GEO from Mercedes, Minera Florida and Ernesto/Pau-a-Pique.
Commercial production for the year consisted of 1.14 million GEO compared with 1.19 million GEO produced in 2012. Commercial production for 2013 consisted of 973,921 ounces of gold and 8.38 million ounces of silver, representing a 1% increase in gold production and a 7% decrease in silver production over the commercial production of 733,910 ounces of gold and 8.93 million ounces of silver in 2012.
By-product cash costs (a non-GAAP measure, see Section 14) for the year averaged $410 per GEO, compared with $230 per GEO in the same period of 2012. By-product cash costs were impacted by a lower copper credit contribution due to lower copper market prices and lower copper sales volume. The average market price for copper in 2013 was 8% lower than the average of 2012. By-product cash costs for 2013 exceeded the Company's previous guidance for a 2013 year-average of below $365 per GEO, which assumed a copper price of $4.00 per pound compared to average market price for the year of $3.32 per pound and the Company's average realized price of $3.28 per pound.
Co-product cash costs (a non-GAAP measure, see Section 14) for the year were $596 per GEO compared with $525 per GEO in 2012.
15
Effective January 1, 2013, the Company began reporting all-in sustaining cash costs (a non-GAAP measure, see Section 14), which seeks to represent total sustaining expenditures of producing gold equivalent ounces from current operations, based on by-product and co-product cash costs, including cost components of mine sustaining capital expenditures, corporate general and administrative expense excluding stock-based compensation and exploration and evaluation expense. For 2013, all-in sustaining cash costs were $814 per GEO on a by-product basis and $947 per GEO on a co-product basis. Average all-in sustaining cash cost on a co-product basis for the last three quarters was below $925 per GEO meeting expectations of the cost containment initiative implemented in the second quarter.
Copper production for the year was 130.2 million pounds from the Chapada mine, compared with 150.6 million pounds for the same period of 2012. Chapada copper production was lower primarily as a result of expected lower copper grade and recovery rate compared with 2012. A total of 30.2 million pounds of copper produced from Alumbrera were attributable to the Company in 2013, compared to 37.4 million pounds for the year ended December 31, 2012. Total copper production for 2013 was 160.5 million pounds, compared with 188.0 million pounds in 2012. The new orebody, Corpo Sul, and the regrinding project at Chapada are expected to contribute to future gold and copper production.
Co-product cash costs per pound of copper (a non-GAAP measure, see Section 14) averaged $1.65 per pound from the Chapada mine in 2013, compared with $1.40 per pound in the year ended December 31, 2012. Co-product cash costs per pound of copper for the year including the Company’s interest in the Alumbrera mine were $1.75 per pound compared to $1.48 per pound for the year ended December 31, 2012.
The Company's total proven and probable mineral reserves including all projects were 18.5 million GEO compared to 19.3 million GEO in 2012 representing a decrease of 4%. This is offset by significant increases in measured and indicated mineral resources, almost all of which are at existing operations. Total measured and indicated mineral resources increased from 2012 mainly due to the addition of mineral resources from Gualcamayo, El Peñón and Chapada, partly offset the reduction of measured and indicated mineral resources at Cerro Moro, which had been upgraded to an initial proven and probable mineral reserves estimate. Total measured and indicated mineral resources including all projects were 17.3 million GEO compared to 15.6 million GEO in 2012, representing an increase in contained ounces of 10%. Total inferred mineral resources increased by 32% to 15.0 million GEO (contained gold - 13.4 million ounces; contained silver - 81.2 million ounces). The overall focus of the exploration program for 2014 will be on the upgrade of the increases in mineral resources in 2013 to mineral reserves and the extension of mine life.
Refer to Section 8 - “Mineral Reserve and Mineral Resource Estimates” for a detailed discussion on the Company's mineral reserve and mineral resource estimates and metal price assumptions. Complete information relating to mineral reserves and mineral resources is also contained in a mineral reserve and mineral resource table which indicates complete information on tonnage and grade. This mineral reserve and mineral resource table accompanies the 2013 annual report and is also available on the Company's website, www.yamana.com.
16
5.3 Overview of Quarterly Financial Results
| For the three months ended | ||||||||
| (In thousands of United States Dollars; unless otherwise noted) | Dec 31, 2013 | Dec 31, 2012 | ||||||
| Revenues | $ | 420,663 | $ | 629,505 | ||||
| Cost of sales excluding depletion, depreciation and amortization | (239,030 | ) | (207,228 | ) | ||||
| Gross margin | 181,633 | 422,277 | ||||||
| Depletion, depreciation and amortization | (111,520 | ) | (100,195 | ) | ||||
| Mine operating earnings | 70,113 | 322,082 | ||||||
Other expenses (i) | (62,708 | ) | (66,934 | ) | ||||
| Equity earnings from associate | (5,086 | ) | 18,147 | |||||
| Impairment of mineral properties | (672,000 | ) | (10,896 | ) | ||||
| Earnings from operations before income taxes | (669,681 | ) | 262,399 | |||||
| Income tax expense | 57,641 | (93,238 | ) | |||||
| Net (loss) earnings | $ | (612,040 | ) | $ | 169,161 | |||
Earnings adjustments (ii): | ||||||||
| Non-cash unrealized foreign exchange losses | (284 | ) | 12,371 | |||||
| Reorganization costs | 842 | — | ||||||
| Share-based payments/mark-to-market of deferred share units | 3,474 | 4,086 | ||||||
| Impact of change in Mexican tax rates on non-cash deferred tax expense | 28,323 | — | ||||||
| Impairment of mineral properties | 672,000 | — | ||||||
| Impairment of investment in available-for-sale securities and other assets | 29,271 | 10,896 | ||||||
| Other non-cash and non-recurring losses | 43,649 | 1,064 | ||||||
| Adjusted earnings before income tax effect | 165,235 | 197,578 | ||||||
| Income tax effect of adjustments | (128,516 | ) | (210 | ) | ||||
Adjusted earnings (ii) | $ | 36,719 | $ | 197,368 | ||||
| Net (loss) earnings per share attributable to Yamana Gold Inc. equity holders - basic | $ | (0.78 | ) | $ | 0.23 | |||
| Net (loss) earnings per share attributable to Yamana Gold Inc. equity holders - diluted | $ | (0.78 | ) | $ | 0.22 | |||
Adjusted earnings per share (ii) - basic and diluted | $ | 0.05 | $ | 0.26 | ||||
______________________________
(i) | For the three-months ended December 31, 2013, other expenses represent the aggregate of the following expenses: general and administrative of $29.8 million (2012 - 39.0 million), exploration and evaluation of $8.0 million (2012 - $15.1 million), other operating expense of $47.1 million (2012 - $5.8 million) and net finance income of $22.1 million (2012 - expense $7.0 million). |
(ii) | A cautionary note regarding non-GAAP measures and their respective reconciliations are included in Section 14 including a discussion and definition of Adjusted Earnings and Adjusted Earnings per Share. |
For the three months ended December 31, 2013
Cash flows from operating activities before changes in non-cash working capital (a non-GAAP measure, see Section 14) for the quarter ended December 31, 2013 were $165.3 million, lower than the $298.1 million generated for the same period of 2012. Lower cash flows from operating activities compared to that of the same quarter in the prior year were mainly due to a decline in revenue as a result of a decline in metal prices and lower sale volumes. However, cash flows from operating activities before changes in non-cash working capital were 10% above levels in the second quarter when the Company’s cost savings and containment program was initiated. Cash flows from operating activities after taking into effect changes in non-cash working capital items for the three month period ended December 31, 2013 were inflows of $184.8 million, compared to inflows of $367.9 million for the three month period ended December 31, 2012, which reflects a decrease in trade receivables.
Net loss for the quarter was $583.9 million or $0.78 per share(a), compared with net earnings of $169.2 million or basic earnings per share of $0.23 and diluted earnings per share of $0.22 for the three months ended December 31, 2012. Net loss for the year includes an impairment charge of 535.8 million, net of taxes in respect to certain mineral properties. Adjusted earnings were $36.7 million or $0.05 per share in the fourth quarter, compared with $197.4 million or $0.26 per share in the fourth quarter of 2012. Lower adjusted earnings were attributed to lower realized metal prices, lower volume of metal sales, higher cash costs and an equity loss from the Company's 12.5% of interest in Alumbrera.
17
Revenues were $420.7 million in the fourth quarter compared with $629.5 million in the fourth quarter of 2012. Mine operating earnings were $70.1 million, compared with $322.1 million in the fourth quarter of 2012. Lower revenues and mine operating earnings were primarily due to lower metal prices in addition to lower volume of gold and copper sales. Lower metal prices accounted for 58% of the variance in revenues in comparison to the fourth quarter of 2012 representing approximately $0.16 per share in earnings. Lower cost of sales, including depletion, depreciation and amortization expenses, corresponded to lower sales volumes of gold and copper.
Revenues for the fourth quarter were generated from the sale of 218,223 ounces of gold, 2.1 million ounces of silver and 34.5 million pounds of copper, excluding Alumbrera which is accounted for as an equity investment. This compares to sales, excluding Alumbrera, of 258,978 ounces of gold, 2.3 million ounces of silver and 37.3 million pounds of copper in the three months ended December 31, 2012.
The average realized price of gold in the fourth quarter of 2013 was $1,277 per ounce compared to $1,692 per ounce in the same quarter of 2012, representing a decrease of 24%. The average realized price of copper was $3.37 per pound compared to $3.54 per pound in the fourth quarter of last year, representing a decrease of 5%, and the average realized silver price was $20.63 per ounce compared to $31.37 per ounce in the fourth quarter of 2012, representing a decrease of 33%.
Revenues for the year are comprised of the following:
| For the three months ended December 31, | 2013 | 2012 | |||||||||||||
| (In thousands of United States Dollars; unless otherwise noted) | Quantity Sold (ii) | Realized Price | Revenues | Revenues | |||||||||||
Gold (i) | 218,223 | oz | $ | 1,277 | $ | 278,744 | $ | 438,199 | |||||||
| Silver | 2,117,273 | oz | $ | 20.63 | 43,670 | 70,721 | |||||||||
| Total precious metals | 260,568 | GEO | 322,414 | 508,920 | |||||||||||
Copper (i) | 34,510,774 | lbs | $ | 3.37 | 116,247 | 131,875 | |||||||||
| Gross Revenues | $ | 438,661 | $ | 640,795 | |||||||||||
| Add (deduct): | |||||||||||||||
- Treatment and refining charges of gold and copper concentrate | $ | (8,717 | ) | $ | (8,913 | ) | |||||||||
| - Sales taxes | (5,205 | ) | (7,246 | ) | |||||||||||
| - Metal price adjustments related to concentrate revenues | (136 | ) | 4,053 | ||||||||||||
| - Other adjustments | (3,940 | ) | 816 | ||||||||||||
Revenues (ii) | $ | 420,663 | $ | 629,505 | |||||||||||
______________________________
(i) | Includes payable copper and gold contained in concentrate. |
(ii) | Excludes Alumbrera which is accounted for as an equity investment. |
18
The following table provides a reconciliation of the co-product cash costs to the cost of sales excluding depletion, depreciation and amortization for the year:
| 2013 | 2012 | ||||||||||||||
| For the three months ended December 31, | GEO or Pounds of Copper Produced | Co-product Cash Cost per Unit | Total Costs | Total Costs | |||||||||||
| (In thousands of United States Dollars; unless otherwise noted) | |||||||||||||||
Chapada — GEO (i) | 29,817 | oz | $ | 377 | $ | 11,253 | $ | 11,327 | |||||||
| Chapada — Copper | 35,958,765 | lbs | 1.53 | 55,148 | 55,857 | ||||||||||
El Peñón — GEO (i) | 101,364 | oz | 593 | 60,062 | 53,187 | ||||||||||
| Jacobina | 19,519 | oz | 1,140 | 22,254 | 23,384 | ||||||||||
| Gualcamayo | 34,929 | oz | 825 | 28,816 | 15,271 | ||||||||||
| Minera Florida — GEO (i) | 30,513 | oz | 592 | 18,069 | 26,416 | ||||||||||
| Fazenda Brasileiro | 18,270 | oz | 809 | 14,771 | 15,615 | ||||||||||
| Mercedes — GEO (i) | 31,716 | oz | 656 | 20,792 | 17,154 | ||||||||||
Co-product cash cost of sales (ii) | $ | 231,165 | $ | 218,211 | |||||||||||
| Add (deduct): | |||||||||||||||
| - Inventory movements and adjustments | 8,707 | (8,984 | ) | ||||||||||||
| - Chapada concentrate treatment and refining charges | (8,717 | ) | (8,913 | ) | |||||||||||
| - Commercial & other costs | 2,943 | 3,262 | |||||||||||||
| - Overseas freight for Chapada concentrate | 4,933 | 3,652 | |||||||||||||
| Cost of sales excluding depletion, depreciation and amortization | $ | 239,031 | $ | 207,228 | |||||||||||
______________________________
(i) | Silver ounces reported for Chapada, El Peñón, Minera Florida and Mercedes are treated as gold equivalent ounces ("GEO"). |
(ii) | A cautionary note regarding non-GAAP measures is included in Section 14 of this Management’s Discussion and Analysis of Operations and Financial Condition. |
Cost of sales excluding depletion, depreciation and amortization for the fourth quarter of 2013 was $239.0 million compared with $207.2 million in same quarter of 2012. Cost of sales excluding depletion, depreciation and amortization was higher compared to the same period in 2012 was mainly due to the higher co-product cash cost of production.
Depletion, depreciation and amortization (“DDA”) expense for the quarter was $111.5 million, compared to $100.2 million in the fourth quarter of 2012. The increase was attributable to higher DDA at Gualcamayo from AIM which contributed to production levels in 2013 and DDA from the tailings retreatment plant at Minera Florida which also started to contribute to production in 2013.
Other expenses including of general and administrative, exploration and evaluation, other operating and net finance expenses were $62.7 million in the quarter, compared to $66.9 million in the three months ended December 31, 2012. The net decrease in other expenses is detailed below:
General and administrative expenses were $29.8 million in the fourth quarter compared to $39.0 million in the same quarter of 2012. It is expected that general and administrative expenses will continue to be maintained at current levels as a result of the cost containment initiatives undertaken by the Company.
Exploration and evaluation expenses were $8.0 million, compared to $15.1 million incurred in the fourth quarter of 2012 as a result of the Company's reduced focus on greenfield exploration relative to 2012.
Other operating expenses were $47.1 million in the quarter compared to $5.8 million in the fourth quarter of 2012. The increase in other operating expenses primarily reflects a $38.4 million loss on sale of non-core exploration properties during the quarter.
Net finance income was $22.1 million mainly related to foreign exchange gains in the quarter compared to net finance expenses of $7.0 million in the fourth quarter of 2012. Foreign exchange gains resulted from favourable exchange rates of country currencies with which the Company settled its mine operating expenses compared to foreign exchange losses in the comparative period of 2012.
Equity loss from associate was $5.1 million for the quarter compared with earnings of $50.6 million in the fourth quarter of 2012. The lower equity earnings were mainly due to lower revenues as a result of lower metal prices and lower sales volume of concentrate in addition to higher co-product cash costs from Alumbrera. Lower volume of concentrate produced was due to mining in lower
19
grade areas. Cash dividends from the Company’s equity investment in Alumbrera received in the quarter were $6.8 million compared to $nil in the fourth quarter of 2012.
The Company recorded an income tax recovery of $57.6 million in the fourth quarter of 2013 compared to tax expense of $93.2 million in the same quarter of 2012. The lower income tax expense in the fourth quarter of 2013 is attributable to lower earnings relative to that of the fourth quarter of 2012. The income tax provision for the fourth quarter of 2013 reflects a current income tax expense of $40.7 million compared to current tax expense of $106.1 million in the same quarter of 2012, and a deferred income tax recovery of $98.3 million compared to deferred tax recovery of $12.9 million. During the quarter, the exchange rates of Brazilian Real and Argentinean Peso devalued against the US Dollar increased. As a result for local purposes, a reduction of $2.4 million relating to unrealized foreign exchange gain was recorded in the deferred tax expense. The impact of these foreign exchange movements on taxes are non-cash and as such excluded from adjusted earnings. The adjusted tax rate for the fourth quarter of 2013 was 22.3% compared to 29.7% for the fourth quarter of 2012. See Note 29 to the Condensed Consolidated Interim Financial Statements for a breakdown of the foreign exchange and interest and penalties charged to the income tax expense.
____________________
(a) Attributable to Yamana equity holders.
5.4 Overview of Quarterly Operating Results
For the three months ended December 31, 2013
Total production for the fourth quarter of 2013 was 303,768 GEO, a decrease of 6% from the 322,990 GEO produced in the fourth quarter of 2012. Total fourth quarter production consisted of 260,187 ounces of gold and 2.2 million ounces of silver, compared to 276,373 ounces of gold and 2.3 million ounces of silver produced in the same quarter of 2012. Total production included the Company’s attributable production from Alumbrera of 11,319 ounces of gold and production during commissioning from Ernesto/Pau-a-Pique, C1 Santa Luz and Pilar of 26,321 ounces of gold.
Commercial production for the fourth quarter comprised of 277,447 GEO compared with 321,716 GEO produced in the fourth quarter of 2012. Total commercial production consisted of 233,866 of gold and 2.2 million ounces of silver, compared to commercial production of 264,888 ounces of gold and 2.2 million ounces of silver in the same quarter of 2012. The decrease in gold production was mainly due to the decreased production levels from Chapada, Jacobina, El Peñón, Minera Florida and Mercedes, partly offset by increased production levels from Gualcamayo and Alumbrera.

20
By-product cash costs (a non-GAAP measure, see Section 14) for the fourth quarter of 2013 averaged $417 per GEO, compared with $198 per GEO in the fourth quarter of 2012. By-product cash costs were impacted by a lower copper credit contribution from Chapada and Alumbrera due to the decline in the copper price and lower copper sales volume. The average market price for copper in the fourth quarter of 2013 was 9% lower than the average of the same quarter in 2012.
Co-product cash costs (a non-GAAP measure, see Section 14) for the fourth quarter averaged $647 per GEO, compared to $517 per GEO for the fourth quarter of 2012. Planned lower grades at certain mines and higher input costs during the quarter relative to the same quarter of 2012 impacted costs compared to the three months ended December 31, 2012. In comparison to the third quarter of 2013, production levels at El Peñón and Mercedes were tapered to contain increasing costs and better position those mines for 2014.
All-in sustaining cash costs (a non-GAAP measure, see Section 14) were $754 per GEO on a by-product basis well below the guidance level of $850 per GEO and $935 per GEO on a co-product basis for the fourth quarter of 2013 in line with the guidance level of $925 per GEO on a co-product basis.
Copper production for the quarter was 36.0 million pounds from the Chapada mine, compared with 40.5 million pounds for same quarter of 2012. Chapada copper production was lower primarily as a result of expected lower copper grade compared to the fourth quarter of 2012. A total of 9.6 million pounds of copper produced from Alumbrera were attributable to the Company, compared with 8.5 million pounds for the quarter ended December 31, 2012 mainly due to higher copper feed grade. Total copper production for the fourth quarter of 2013 was 45.6 million pounds, compared with 49.0 million pounds in the fourth quarter of 2012.
Co-product cash costs per pound of copper (a non-GAAP measure, see Section 14) averaged $1.53 per pound from the Chapada mine compared to $1.38 per pound of copper in the same quarter of 2012. Co-product cash costs per pound of copper for the quarter including the Company’s interest in Alumbrera were $1.58 per pound compared to $1.51 per pound for the fourth quarter of 2012.
6. OPERATING MINES
CHAPADA, BRAZIL
21
| For the three months ended December 31, | For the years ended December 31, | ||||||||||||||
| Operating Statistics | 2013 | 2012 | 2013 | 2012 | |||||||||||
| Production | |||||||||||||||
| Concentrate (tonnes) | 67,395 | 72,518 | 239,811 | 268,135 | |||||||||||
GEO contained in concentrate production (i) | 29,817 | 32,498 | 110,618 | 128,171 | |||||||||||
| Gold contained in concentrate (ounces) | 28,223 | 30,121 | 104,096 | 119,655 | |||||||||||
| Silver contained in concentrate (ounces) | 79,696 | 118,874 | 326,087 | 425,805 | |||||||||||
| Copper contained in concentrate (millions of pounds) | 36.0 | 40.5 | 130.2 | 150.6 | |||||||||||
By-product cash costs per GEO produced (ii) | $ | (1,547 | ) | $ | (2,021 | ) | $ | (1,296 | ) | $ | (1,865 | ) | |||
Co-product cash costs per GEO produced (ii) | $ | 377 | $ | 349 | $ | 400 | $ | 333 | |||||||
Co-product cash costs per pound of copper produced (ii) | $ | 1.53 | $ | 1.38 | $ | 1.65 | $ | 1.40 | |||||||
| Ore mined (tonnes) | 5,753,649 | 5,924,456 | 21,833,258 | 22,490,266 | |||||||||||
| Ore processed (tonnes) | 5,540,262 | 5,734,592 | 21,347,439 | 21,591,482 | |||||||||||
| Gold feed grade (g/t) | 0.28 | 0.28 | 0.26 | 0.29 | |||||||||||
| Copper feed grade (%) | 0.37 | 0.40 | 0.35 | 0.39 | |||||||||||
| Concentrate grade - gold (g/t) | 13.03 | 12.92 | 13.50 | 13.88 | |||||||||||
| Concentrate grade - copper (%) | 24.20 | 25.33 | 24.63 | 25.47 | |||||||||||
| Gold recovery rate (%) | 57.5 | 59.4 | 57.9 | 59.4 | |||||||||||
| Copper recovery rate (%) | 80.4 | 81.1 | 79.7 | 82.2 | |||||||||||
Sales (iii) | |||||||||||||||
| Concentrate (tonnes) | 67,616 | 69,589 | 242,681 | 263,704 | |||||||||||
| Payable gold contained in concentrate (ounces) | 26,805 | 27,692 | 98,680 | 115,443 | |||||||||||
| Payable silver contained in concentrate (ounces) | 45,103 | 81,949 | 166,917 | 279,371 | |||||||||||
| Payable copper contained in concentrate (millions of pounds) | 34.5 | 37.3 | 126.0 | 139.0 | |||||||||||
| Depletion, depreciation and amortization | |||||||||||||||
| Per GEO sold | $ | 98 | $ | 76 | $ | 97 | $ | 72 | |||||||
| Per copper pound sold | $ | 0.32 | $ | 0.24 | $ | 0.31 | $ | 0.25 | |||||||
______________________________
| (i) | GEO assumes gold plus the gold equivalent of silver using a ratio of 50:1 for all periods presented. |
| (ii) | A cautionary note regarding non-GAAP measures is included in Section 14 of this Management’s Discussion and Analysis. |
| (iii) | Quantities sold include quantity adjustment on provisional and final invoice settlements. |
Chapada produced a total of 110,618 GEO contained in concentrate in 2013 compared with 128,171 GEO contained in concentrate in 2012. The 2013 production consisted of 104,096 ounces of gold and 326,087 ounces of silver compared with 119,655 ounces of gold and 425,805 ounces of silver contained in 2012. Chapada copper production was 130.2 million pounds in 2013 compared with production of 150.6 million pounds of copper in 2012. Production for the current year was lower than 2012 as a result of anticipated lower grades and recovery rates.
By-product cash costs for 2013 were negative $1,296 per GEO, compared with negative $1,865 per GEO for 2012. Higher by-product cash costs per GEO was mainly due to the effect of lower copper sales volume and lower average copper prices in 2013 compared to 2012 resulting in a lower copper revenue by-product credit. Copper prices were 8% lower in 2013 compared to 2012.
Co-product cash costs were $400 per GEO in 2013, compared to $333 per GEO in 2012. Co-product cash costs for copper were $1.65 per pound in 2013 versus $1.40 per pound in 2012.
Chapada revenues for the year net of sales taxes and treatment and refining costs were $504.2 million (2012 - $675.1 million). Revenues included mark-to-market adjustments and provisional pricing settlements in the year of negative $10.5 million (2012 - positive $19.4 million).
In the fourth quarter of 2013, Chapada produced a total of 29,817 GEO, which consisted of 28,223 ounces of gold and 79,696 ounces of silver, contained in concentrate compared with 32,498 GEO, which consisted of 30,121 ounces of gold and 118,874
22
ounces of silver contained in concentrate in the same quarter of 2012. Chapada copper production was 36.0 million pounds in the quarter compared with production of 40.5 million pounds of copper in the fourth quarter of 2012.
Production for the quarter was lower than the fourth quarter of 2012 as a result of the anticipated lower copper grades and recovery rates for 2013 relative to 2012. Production for the second half of 2013 was 22% higher than the first half of the year, reflecting a pattern similar to previous years.
By-product cash costs for the quarter were negative $1,547 per GEO, compared with negative $2,021 per GEO for the same quarter in 2012. Higher by-product cash costs per GEO was mainly due to the effect of lower copper sales volume and lower copper prices in the fourth quarter of 2013 compared to 2012, resulting in a lower copper by-product credit for the quarter.
Co-product cash costs were $377 per GEO in the fourth quarter, compared to $349 per GEO in the same quarter of 2012. Co-product cash costs for copper were $1.53 per pound in the fourth quarter versus $1.38 per pound in the same quarter of 2012.
Chapada revenues for the quarter net of sales taxes and treatment and refining costs were $135.6 million (Q4 2012 - $174.9 million). Revenues included mark-to-market adjustments and provisional pricing settlements in the quarter of positive $0.1 million (Q4 2012 - positive $4.1 million).
The Company is evaluating the level of profitable production with minimal capital requirements. Initiatives planned for 2014 include modifications to the grinding circuit, the installation of an in-pit crusher to increase throughput, and the development of new ore bodies including Corpo Sul. These opportunities provide the potential for increased production at Chapada with Corpo Sul being the largest and most prospective new opportunity that are planned to increase production at Chapada towards sustainable future production levels of at least 130,000 GEO and 130 million pounds of copper at an optimal cost structure.
Corpo Sul is a gold and copper deposit at the southwest end of the main ore body of Chapada with mineral resources of higher average grade ores especially near the current Chapada pit. Development and geotechnical work, including the rock mechanics study, the hydrogeological study and the mine study, continued in support of the development of the new Corpo Sul area. Infill drilling at Corpo Sul continues to support the view that ore from this deposit will be higher grade in both copper and gold and thereby, when blended with ore from the main pit, should increase overall gold and copper production at the operation.
Other opportunities under evaluation include Suruca and Arco Sul.
23
EL PEÑÓN, CHILE
| For the three months ended December 31, | For the years ended December 31, | ||||||||||||||
| Operating Statistics | 2013 | 2012 | 2013 | 2012 | |||||||||||
| Production | |||||||||||||||
GEO production (i) | 101,364 | 128,119 | 467,523 | 462,496 | |||||||||||
| Gold production (ounces) | 68,246 | 93,448 | 338,231 | 317,557 | |||||||||||
| Silver production (ounces) | 1,655,910 | 1,733,573 | 6,464,623 | 7,246,951 | |||||||||||
Co-product cash costs per GEO produced (ii) | $ | 593 | $ | 415 | $ | 485 | $ | 440 | |||||||
| Ore mined (tonnes) | 354,547 | 377,341 | 1,376,428 | 1,442,245 | |||||||||||
| Ore processed (tonnes) | 352,276 | 362,874 | 1,422,054 | 1,415,292 | |||||||||||
| Gold feed grade (g/t) | 6.46 | 8.59 | 7.94 | 7.47 | |||||||||||
| Silver feed grade (g/t) | 183.42 | 195.00 | 187.16 | 199.21 | |||||||||||
| Gold recovery rate (%) | 93.0 | 93.0 | 93.0 | 93.5 | |||||||||||
| Silver recovery rate (%) | 80.3 | 76.0 | 75.7 | 80.0 | |||||||||||
| Sales | |||||||||||||||
GEO sales (i) | 99,546 | 127,431 | 466,093 | 457,704 | |||||||||||
| Gold (ounces) | 66,700 | 92,941 | 337,337 | 314,079 | |||||||||||
| Silver (ounces) | 1,642,279 | 1,724,509 | 6,437,790 | 7,181,263 | |||||||||||
Depletion, depreciation and amortization per GEO sold | $ | 325 | $ | 269 | $ | 260 | $ | 295 | |||||||
______________________________
| (i) | GEO assumes gold plus the gold equivalent of silver using a ratio of 50:1 for all periods presented. |
| (ii) | A cautionary note regarding non-GAAP measures is included in Section 14 of this Management’s Discussion and Analysis. |
In 2013, El Peñón produced 467,523 GEO, which consisted of 338,231 ounces of gold and 6.5 million ounces of silver, representing an increase from 462,496 GEO, which consisted of 317,557 ounces of gold and 7.2 million ounces of silver in 2012. Production at El Peñón is expected to normalize to an average of approximately 440,000 GEO per year.
Co-product cash costs for 2013 were $485 per gold ounce, compared with $440 per gold ounce in 2012. The increase in co-product cash costs per GEO was mainly due to labour inflation partially offset by higher gold feed grades.
In the fourth quarter of 2013, El Peñón produced 101,364 GEO, which consisted of 68,246 ounces of gold and 1.7 million ounces of silver, compared to 128,119 GEO, which consisted of 93,448 ounces of gold and 1.7 million ounces of silver in the same quarter of 2012. Production decreased mainly as a result of normal sequencing in the mine plan which called for mining in lower gold and silver grade areas. Silver recoveries which vary according to the blending of ore being fed to the mill also impacted production.
Co-product cash costs were $593 per gold ounce, compared with $415 per gold ounce in the fourth quarter of 2012. The increase in co-product cash costs per GEO was mainly due to labour inflation and higher per-unit fixed cost as a result of lower GEO production.
24
MERCEDES, MEXICO (i)
| For the three months ended December 31, | For the years ended December 31, | ||||||||||||||
| Operating Statistics | 2013 | 2012 | 2013 | 2012 | |||||||||||
| Production | |||||||||||||||
| Total GEO production | 31,716 | 39,443 | 141,618 | 126,010 | |||||||||||
Commercial GEO production (ii) | 31,716 | 39,443 | 141,618 | 117,051 | |||||||||||
| Commissioning GEO production | — | — | — | 8,959 | |||||||||||
| Total gold production (ounces) | 28,821 | 36,057 | 129,327 | 116,215 | |||||||||||
| Commercial gold production (ounces) | 28,821 | 36,057 | 129,327 | 108,014 | |||||||||||
| Commissioning gold production (ounces) | — | — | — | 8,201 | |||||||||||
| Total silver production (ounces) | 144,715 | 169,313 | 614,562 | 489,747 | |||||||||||
| Commercial silver production (ounces) | 144,715 | 169,313 | 614,562 | 451,835 | |||||||||||
| Commissioning silver production (ounces) | — | — | — | 37,912 | |||||||||||
Co-product cash costs per GEO produced (iii) | $ | 656 | $ | 435 | $ | 496 | $ | 485 | |||||||
| Ore mined (tonnes) | 166,401 | 136,105 | 640,967 | 513,684 | |||||||||||
| Ore processed (tonnes) | 169,768 | 164,285 | 670,867 | 603,188 | |||||||||||
| Gold feed grade (g/t) | 5.58 | 7.38 | 6.16 | 6.43 | |||||||||||
| Silver feed grade (g/t) | 72.84 | 85.17 | 79.39 | 78.42 | |||||||||||
| Gold recovery rate (%) | 94.3 | 95.8 | 94.5 | 94.8 | |||||||||||
| Silver recovery rate (%) | 35.5 | 39.0 | 34.4 | 32.0 | |||||||||||
| Sales | |||||||||||||||
GEO sales (ii) | 33,062 | 36,879 | 146,438 | 126,515 | |||||||||||
| Gold (ounces) | 30,102 | 34,085 | 133,421 | 116,894 | |||||||||||
| Silver (ounces) | 148,020 | 139,686 | 650,873 | 481,071 | |||||||||||
| Depletion, depreciation and amortization per GEO sold | $ | 331 | $ | 241 | $ | 281 | $ | 254 | |||||||
______________________________
| (i) | Mercedes was under construction in 2011. Commissioning of the mine started in November 2011 and was completed February 1, 2012. |
| (ii) | GEO assumes gold plus the gold equivalent of silver using a ratio of 50:1 for all periods presented. |
| (iii) | A cautionary note regarding non-GAAP measures is included in Section 14 of this Management’s Discussion and Analysis. |
In 2013, Mercedes produced 141,618 GEO, which consisted of 129,327 ounces of gold and 614,562 ounces of silver, compared with 126,010 GEO, which consisted of 116,215 ounces of gold and 489,747 ounces of silver in 2012. The production increase was driven by increased tonnage of ore processed which as planned offset lower gold feed grades.
Co-product cash costs averaged $496 per GEO which were 2% higher than the average of $485 per GEO in 2012. Co-product cash costs increased slightly due to higher mining costs per GEO associated with mining in lower grade areas as part of the mine plan.
Production of 31,716 GEO in the fourth quarter consisted of 28,821 ounces of gold and 144,715 ounces of silver, compared with 39,443 GEO, which consisted of 36,057 ounces of gold and 169,313 ounces of silver in the fourth quarter of 2012. The lower quarterly production was the result of normal mine sequencing in areas of lower gold and silver grades.
Co-product cash costs of $656 per GEO were 51% higher than $435 in the same quarter of 2012. Higher co-product cash costs were due to higher mining costs associated with mining in lower grade areas as part of the mine plan.
Development continued at the Barrancas zone, where the higher grade Lagunas Norte vein, one of the newest discoveries at the mine, is located. Production of the Barrancas zone started in the third quarter of 2012. Confirmation of the width and grades of mineralization by infill drilling at Lupita and the recent discovery of high-grade mineralization at Rey del Oro that may be amenable to underground mining methods have positively impacted measured and indicated mineral resources. Development of Diluvio will commence in 2014.
25
GUALCAMAYO, ARGENTINA
| For the three months ended December 31, | For the years ended December 31, | ||||||||||||||
| Operating Statistics | 2013 | 2012 | 2013 | 2012 | |||||||||||
| Production | |||||||||||||||
| Gold production (ounces) | 34,929 | 31,502 | 120,337 | 147,310 | |||||||||||
Co-product cash costs per gold ounce produced (i) | $ | 825 | $ | 485 | $ | 772 | $ | 536 | |||||||
| Ore mined (tonnes) | 1,258,735 | 1,294,174 | 4,005,487 | 9,720,842 | |||||||||||
| Ore processed (tonnes) | 1,561,180 | 2,002,170 | 6,568,912 | 7,742,140 | |||||||||||
| Gold feed grade (g/t) | 1.61 | 0.66 | 0.88 | 0.80 | |||||||||||
| Gold recovery rate (%) | 43.7 | 75.8 | 72.5 | 75.5 | |||||||||||
| Sales | |||||||||||||||
| Gold sales (ounces) | 34,264 | 33,568 | 111,134 | 149,372 | |||||||||||
| Depletion, depreciation and amortization per gold ounce sold | $ | 522 | $ | 383 | $ | 489 | $ | 352 | |||||||
______________________________
| (i) | A cautionary note regarding non-GAAP measures is included in Section 14 of this Management’s Discussion and Analysis. |
In 2013, Gualcamayo produced 120,337 ounces of gold compared with 147,310 ounces produced in 2012. Lower production was the result of fewer tonnes processed and lower recovery rates, partly offset by improved feed grade. Gualcamayo underwent a transition in 2013 as the mine's open-pit operations at QDD Main transitioned to the new Phase III, resulting in a decline in ore processed compared to that of 2012. Production at QDD Main Phase III began in August and ramp-up, which has been slower than plan, continued into the fourth quarter impacting the total tonnage. The QDD Lower West ("QDDLW") underground mine also began to contribute to heap leach stacking. Completion of the underground conveyor for QDDLW is expected in the second quarter and production is expected to ramp-up each quarter during 2014.
Co-product cash costs in 2013 averaged $772 per ounce compared with $536 per ounce in 2012. Co-product cash costs were impacted by the inflationary pressures on the local cost escalation of labour, operational services and contractors.
Gualcamayo produced 34,929 ounces of gold in the fourth quarter compared with 31,502 ounces produced in the fourth quarter of 2012. Higher production was the result of feed from higher grade ore from QDD Main Phase III, Amelia Ines ("AIM") and QDDLW underground which was partially offset by lower recoveries from AIM and QDDLW ore. Production at Gualcamayo for December and January averaged over 14,000 ounces per month, consistent with expected production levels of the expanded operation.
The metallurgy of the ore from AIM and QDDLW requires a longer leaching cycle than that of QDD Main and will result in lower recoveries. Planned improvements to the existing plant including the installation of a filtering station and an increase in the volume of treatment capacity are planned in 2014 to improve recovery rates.
Co-product cash costs were $825 per ounce in the fourth quarter compared with $485 per ounce in the fourth quarter of 2012. Higher co-product cash costs were mainly due to delays in the transition to QDD Main Phase III, start-up of higher cost underground mining at QDDLW and the duration of the leaching cycle. Higher cash costs were further exacerbated by the effect of local inflationary pressure on labour and services.
Mining costs decreased by 10% from the third quarter and the trend is expected to continue in the first quarter of 2014. Efforts are being made to reduce development costs by transitioning the underground mine development to be performed fully in-house by the second half of 2014. To date, most of the equipment has been delivered and the Company is now operating with a planned reduction of contractors. Additionally, the Company is looking at renting equipment for QDD Main as a means of increasing equipment availability and reducing maintenance and overhaul costs. Cash costs per ounce will, however, vary depending on the
26
area from which ore is being sourced. Periods with a higher proportion of ore sourced from the underground mine will generate higher operating costs.
The Company continues to have exploration success with the increase of the sulphide resource at QDDLW and related areas including Rodado (refer to Section 8 - Mineral Reserves and Mineral Resources). As the sulphide portion of the orebody grows, the Company is continuing to progress with studies of the options for processing these newly discovered resources.
JACOBINA, BRAZIL
| For the three months ended December 31, | For the years ended December 31, | ||||||||||||||
| Operating Statistics | 2013 | 2012 | 2013 | 2012 | |||||||||||
| Production | |||||||||||||||
| Gold production (ounces) | 19,519 | 28,337 | 73,695 | 116,863 | |||||||||||
Co-product cash costs per gold ounce produced (i) | $ | 1,140 | $ | 825 | $ | 1,174 | $ | 747 | |||||||
| Ore mined (tonnes) | 390,768 | 503,669 | 1,569,937 | 2,109,613 | |||||||||||
| Ore processed (tonnes) | 396,235 | 508,737 | 1,575,629 | 2,104,683 | |||||||||||
| Gold feed grade (g/t) | 1.64 | 1.87 | 1.57 | 1.84 | |||||||||||
| Gold recovery rate (%) | 93.2 | 92.5 | 92.2 | 93.8 | |||||||||||
| Sales | |||||||||||||||
| Gold (ounces) | 19,105 | 25,843 | 77,190 | 114,786 | |||||||||||
| Depletion, depreciation and amortization per gold ounce sold | $ | 585 | $ | 487 | $ | 561 | $ | 428 | |||||||
______________________________
| (i) | A cautionary note regarding non-GAAP measures is included in Section 14 of this Management’s Discussion and Analysis. |
In 2013, Jacobina produced 73,695 ounces of gold, compared with 116,863 ounces of gold produced in 2012. Production was lower resulting from lower throughput, lower feed grade and higher dilution. Production at Jacobina met the revised goals set in the first quarter of 2013 and more importantly the near term objective for improvement of costs and underground development have been met, and the longer term objective of development of higher grade areas is in progress.
Co-product cash costs averaged $1,174 per ounce for the year compared with $747 per ounce in 2012 as a result of lower production volume in 2013.
Gold production at Jacobina was 19,519 ounces in the fourth quarter, compared with 28,337 ounces produced in the same quarter of 2012. Production was lower resulting from lower feed grade, higher dilution and lower tonnage processed.
Co-product cash costs were $1,140 per ounce for the fourth quarter, a decline from the beginning of the year as a result of the cost containment initiatives implemented since the second quarter, compared to co-product cash costs of $825 per ounce for the fourth quarter of 2012. Higher co-product cash costs in the fourth quarter compared to the same quarter last year reflect reduced production volume but are expected to return to levels of approximately $800 to $850 per ounce in the longer-term.
The Company has taken an impairment charge of $55.0 million against the carrying value of the goodwill allocated to the Jacobina mine in the fourth quarter. For further details please refer to Section 5.1 of this MD&A.
MINERA FLORIDA, CHILE
27
| For the three months ended December 31, | For the years ended December 31, | ||||||||||||||
| Operating Statistics | 2013 | 2012 | 2013 | 2012 | |||||||||||
| Production | |||||||||||||||
GEO total production (i) | 30,513 | 32,797 | 118,590 | 105,679 | |||||||||||
| GEO commissioning production | — | — | — | 1,861 | |||||||||||
| GEO commercial production | 30,513 | 32,797 | 118,590 | 103,818 | |||||||||||
| Gold total production (ounces) | 24,539 | 27,889 | 99,000 | 89,163 | |||||||||||
| Gold commissioning production (ounces) | — | — | — | 1,486 | |||||||||||
| Gold commercial production (ounces) | 24,539 | 27,889 | 99,000 | 87,677 | |||||||||||
| Silver total production (ounces) | 298,696 | 245,383 | 979,514 | 825,812 | |||||||||||
| Silver commissioning production (ounces) | — | — | — | 18,737 | |||||||||||
| Silver commercial production (ounces) | 298,696 | 245,383 | 979,514 | 807,075 | |||||||||||
Co-product cash costs per GEO produced (ii) | $ | 592 | $ | 805 | $ | 747 | $ | 797 | |||||||
| Ore mined (tonnes) | 228,086 | 205,882 | 798,062 | 859,953 | |||||||||||
| Ore processed (tonnes) | 492,257 | 222,440 | 1,754,785 | 902,788 | |||||||||||
| Gold feed grade (g/t) | 2.07 | 3.53 | 2.45 | 3.34 | |||||||||||
| Silver feed grade (g/t) | 39.16 | 46.90 | 32.02 | 39.29 | |||||||||||
| Gold recovery rate (%) | 79.0 | 81.6 | 76.1 | 81.1 | |||||||||||
| Silver recovery rate (%) | 61.6 | 69.8 | 57.2 | 67.6 | |||||||||||
| Sales | |||||||||||||||
GEO sales (i) | 29,732 | 33,244 | 118,687 | 107,198 | |||||||||||
| Gold (ounces) | 24,095 | 27,075 | 98,524 | 86,455 | |||||||||||
| Silver (ounces) | 281,871 | 308,436 | 1,008,148 | 1,037,150 | |||||||||||
Depletion, depreciation and amortization per GEO sold | $ | 657 | $ | 582 | $ | 599 | $ | 600 | |||||||
______________________________
| (i) | GEO assumes gold plus the gold equivalent of silver using a ratio of 50:1 for all periods presented. |
| (ii) | A cautionary note regarding non-GAAP measures is included in Section 14 of this Management’s Discussion and Analysis. |
In 2013, Minera Florida produced 118,590 GEO, which consisted of 99,000 ounces of gold and 979,514 ounces of silver, compared to 105,679 GEO, which consisted of 89,163 ounces of gold and 825,812 ounces of silver in 2012, representing an increase in GEO production by 12%. Production at Minera Florida was as expected as the expansion for the retreatment of historic tailings made a contribution in the first of a five year planned production profile. Production in 2013 included commissioning production of 1,861 GEO from the tailings retreatment plant.
In addition, the mine produced and sold 5,997 tonnes of zinc in 2013, compared with 5,381 tonnes of zinc produced and sold in 2012. Zinc is accounted for as a by-product credit to cash costs.
Co-product cash costs for the year were $747 per GEO compared with $797 per GEO in 2012. The retreatment of the tailings has contributed lower cost ounces to Minera Florida’s production profile benefiting from no mining costs. Additionally cash costs benefited from higher credits from the sale of zinc resulting from an 11% increase in volume of zinc sold and higher prices for zinc compared to 2012.
In the fourth quarter of 2013, Minera Florida produced 30,513 GEO, which consisted of 24,539 ounces of gold and 298,696 ounces of silver, compared to 32,797 GEO, which consisted of 27,889 ounces of gold and 245,383 ounces of silver in the fourth quarter of 2012. Lower production was mainly attributed to lower feed grades and lower recovery rates.
Co-product cash costs for the quarter were $592 per GEO, representing a 26% reduction, compared with $805 per GEO in the same quarter in 2012. In 2013, the Company initiated a plan of headcount reductions and cost improvements that resulted in co-product cash costs per GEO in the fourth quarter 22% lower than that of the third quarter and 35% lower than that of the second quarter. Production from the tailings retreatment plant has also benefited from no mining costs associated with the reprocessing of tailings material.
28
The mine produced and sold 1,647 tonnes of zinc concentrate in the quarter, compared with 1,353 tonnes of zinc concentrate produced and sold in the fourth quarter of 2012. Higher credits from the sale of zinc resulted from a 22% increase in volume of zinc sold compared to the fourth quarter of 2012.
29
OTHER MINES
The following table presents key operating statistics for the Company's other continuing mining operations and its equity investment in Alumbrera:
| For the three months ended December 31, | For the years ended December 31, | ||||||||||||||
| 2013 | 2012 | 2013 | 2012 | ||||||||||||
| FAZENDA BRASILEIRO, BRAZIL | |||||||||||||||
| Production | |||||||||||||||
| Gold production (ounces) | 18,270 | 18,251 | 70,079 | 67,130 | |||||||||||
Co-product cash costs per ounce produced (i) | $ | 809 | $ | 856 | $ | 808 | $ | 872 | |||||||
| Ore mined (tonnes) | 263,584 | 260,855 | 1,036,744 | 1,018,911 | |||||||||||
| Ore processed (tonnes) | 284,684 | 270,998 | 1,103,248 | 1,048,489 | |||||||||||
| Gold feed grade (g/t) | 2.15 | 2.28 | 2.17 | 2.22 | |||||||||||
| Gold recovery rate (%) | 93.3 | 91.8 | 91.1 | 89.5 | |||||||||||
| Sales | |||||||||||||||
| Gold sales (ounces) | 17,152 | 17,773 | 69,193 | 66,805 | |||||||||||
| Depletion, depreciation and amortization per gold ounce sold | $ | 220 | $ | 173 | $ | 214 | $ | 181 | |||||||
ALUMBRERA (12.5% interest), ARGENTINA | |||||||||||||||
| Production | |||||||||||||||
| Concentrate (tonnes) | 17,547 | 14,669 | 55,115 | 65,140 | |||||||||||
| Gold production (ounces) | 845 | 1,112 | 3,445 | 3,849 | |||||||||||
| Gold production in concentrate (ounces) | 10,474 | 9,657 | 35,712 | 42,228 | |||||||||||
| Total gold produced | 11,319 | 10,769 | 39,157 | 46,077 | |||||||||||
| Copper contained in concentrate (millions of pounds) | 9.6 | 8.5 | 30.2 | 37.4 | |||||||||||
By-product cash costs per ounce of gold produced (i) | $ | (261 | ) | $ | (2,012 | ) | $ | (252 | ) | $ | (1,203 | ) | |||
Co-product cash costs per ounce of gold produced (i) | $ | 313 | $ | 343 | $ | 364 | $ | 308 | |||||||
Co-product cash costs per pound of copper produced (i) | $ | 1.75 | $ | 2.15 | $ | 2.21 | $ | 1.81 | |||||||
| Ore mined (tonnes) | 1,195,276 | 978,841 | 3,181,381 | 3,923,822 | |||||||||||
| Ore processed (tonnes) | 1,211,561 | 1,305,186 | 4,671,322 | 4,962,373 | |||||||||||
| Gold feed grade (g/t) | 0.40 | 0.36 | 0.37 | 0.40 | |||||||||||
| Copper feed grade (%) | 0.43 | 0.30 | 0.37 | 0.40 | |||||||||||
| Concentrate grade - gold (g/t) | 18.55 | 20.47 | 20.32 | 20.13 | |||||||||||
| Concentrate grade - copper (%) | 24.80 | 26.20 | 24.90 | 26.10 | |||||||||||
| Gold recovery rate (%) | 73.0 | 71.0 | 70.0 | 71.0 | |||||||||||
| Copper recovery rate (%) | 84.0 | 85.0 | 79.0 | 84.0 | |||||||||||
| Sales | |||||||||||||||
| Concentrate (tonnes) | 12,986 | 20,139 | 49,304 | 64,086 | |||||||||||
| Payable gold contained in concentrate (ounces) | 7,246 | 12,593 | 31,243 | 40,455 | |||||||||||
| Gold doré (ounces) | 1,045 | 953 | 3,278 | 3,125 | |||||||||||
| Total gold sales (ounces) | 8,291 | 13,546 | 34,521 | 43,580 | |||||||||||
| Payable copper contained in concentrate (millions of pounds) | 6.6 | 11.1 | 25.8 | 35.4 | |||||||||||
______________________________
| (i) | A cautionary note regarding non-GAAP measures is included in Section 14 of this Management’s Discussion and Analysis. |
30
FAZENDA BRASILEIRO, BRAZIL
In 2013, Fazenda Brasileiro produced 70,079 ounces of gold compared to 67,130 ounces of gold in 2012, representing a 4% year-over-year increase and its second consecutive yearly increase. Co-product cash costs averaged $808 per ounce for the year, representing a 7% decrease from $872 per ounce in 2012.
Production was 18,270 ounces of gold in the quarter compared to 18,251 ounces of gold in the same quarter of 2012.
Co-product cash costs averaged $809 per ounce for the fourth quarter, 5% lower than $856 per ounce in the fourth quarter of 2012. In 2013, the Company initiated a plan to reduce costs and now will return the focus to the production growth objectives at Fazenda Brasileiro.
The Company has continued to extend mine life since the operation was acquired in 2003 with two and a half years of mine life remaining based on the known mineral reserves at that time. The Company continues infill and extension drilling at Fazenda Brasileiro with a focus on finding additional mineral reserves and mineral resources.
ALUMBRERA, ARGENTINA
The Company’s interest in Alumbrera is accounted for as an equity investment. The Company recorded a loss from its 12.5% interest in Alumbrera of $3.9 million and $5.1 million for the year and three months ended December 31, 2013, respectively, compared with earnings of $50.6 million and $18.1 million for the same periods of 2012. Decrease in equity earnings was mainly due to lower revenues as a result of lower metal prices and lower sales volume of the gold and copper concentrate.
The Company received cash distributions $27.9 million in 2013 of which $6.8 million in the quarter ended December 31, 2013, compared with $nil cash distribution in the 2012.
Through its annual impairment testing, the Company has recorded an impairment charge in the amount of $70.0 million in respect to its 12.5% interest in Alumbrera. Further details can be found in Section 5.1 of this MD&A.
Attributable production from Alumbrera was 39,157 ounces of gold and 30.2 million pounds of copper for 2013, compared with 46,077 ounces of gold and 37.4 million pounds of copper for 2012. For the quarter, attributable production from Alumbrera was 11,319 ounces of gold and 9.6 million pounds of copper. This compares with attributable production of 10,769 ounces of gold and 8.5 million pounds of copper in the fourth quarter of 2012.
By-product cash costs per ounce of gold averaged negative $252 for the year and negative $261 for the quarter ended December 31, 2013 compared with negative $1,203 and negative $2,012 per ounce for the comparable periods in 2012. By-product cash costs were higher due to the decrease in copper sale credit as a result of lower average market prices for copper and lower volume of copper sales by Alumbrera in 2013. Co-product cash costs per ounce for gold averaged $364 and $313 for the year and quarter ended December 31, 2013, compared with $308 and $343 per ounce for the same periods of 2012. Co-product cash costs for copper averaged $2.21 per pound and $1.75 per pound for the year and quarter ended December 31, 2013, compared with $1.81 per pound and $2.15 per pound for the comparable periods of 2012.
ERNESTO/PAU-A-PIQUE, BRAZIL
Ernesto/Pau-a-Pique was originally planned as a combination of an open-pit operation at Ernesto and an underground operation at Pau-a-Pique with a common plant. A plan has now been developed which continues to include an underground operation at Pau-a-Pique but now also contemplates a near-to-surface underground operation at Ernesto. The Company continues to evaluate other opportunities including the various satellite open-pit deposits already identified that could further positively contribute to the operation. Commissioning continued in the quarter from the underground Pau-a-Pique with less ore from the first open-pit in Ernesto as an access ramp is being developed in order to evaluate and better understand the near surface underground orebody at Ernesto.
Commissioning production was 27,571 ounces in 2013 and 9,707 ounces for the fourth quarter, representing an increase of 46% from the third quarter. During the fourth quarter, the Company continued to address challenges associated with start-up. In 2013, a loss during commissioning of $30.4 million was capitalized and netted to the capital expenditures of the project. Completion of commissioning is expected in the second quarter of 2014.
31
As a result of the delayed start-up of operations and the decline in the metal prices, the Company has taken an impairment charge of $168.2 million, net of taxes against the carrying value of the Ernesto/Pau-a-Pique mine in the fourth quarter. For further details please refer to Section 5.1 of this MD&A.
C1 SANTA LUZ, BRAZIL
Commissioning began in mid-2013 which was delayed due to permitting, availability of equipment and the need to ensure sufficient water reserves for continuous operations. With permits in place and sufficient water secured, C1 Santa Luz is continuing to ramp-up. Process improvements will be a key factor to improve production at the mine.
The Company has developed and is now implementing certain processing improvements which includes the introduction of a thickener and a regeneration furnace. In addition, recoveries should improve as mining transitions to fresh sulphide ore. During the commissioning phase a stockpile was accumulated which will provide additional flexibility increasing reliability for the operation as process improvements are implemented and take hold.
Commissioning production was 12,997 in 2013 and 6,120 ounces of gold in the fourth quarter due to lower recoveries. In 2013, loss during commissioning of $25.9 million was capitalized and netted to the capital expenditures of the project. Completion of commissioning is expected in the third quarter of 2014.
PILAR, BRAZIL
Commissioning began at the beginning of the third quarter and has progressed more gradually than expected due to the decline in metal prices and delays in equipment delivery. However, most of the delayed equipment whose purpose is to improve dilution and productivity has now arrived on site and now better positions the operation to meet 2014 expectations. This new low profile mining equipment is one of a series of initiatives being implemented to increase mining efficiencies at the operation and reduce dilution. The mine infrastructure to support the new low profile equipment will be fully operational in Q2. The Company is also evaluating further opportunities including the potential for more selectively mining the higher grade ore shoots that would have positive impact on the operation as the in-situ grades are higher than the current mineral reserve grade. Efforts are focused on an infill drilling program that is currently underway to ensure these higher grade ore shoots can be mined efficiently.
Commissioning production for the fourth quarter was 10,494 ounces of gold, representing an increase of 115% from the third quarter. Total commissioning production for the year 2013 was 15,374 gold ounces. In 2013, loss during commissioning of $22.1 million was capitalized and netted to the capital expenditures of the project.
Underground development at Pilar continued to progress. The ore from Caiamar, a satellite deposit, is expected to be processed at Pilar with the higher grades offsetting the additional transportation costs. Additionally, the Company has elected to take Maria Lazarus through the development cycle on an expedited basis as the exploration drilling results to date indicate possible contribution to future production. Completion of commissioning is expected in the third quarter of 2014.
7. CONSTRUCTION, DEVELOPMENT AND EXPLORATION
DEVELOPMENT
All construction projects and all intermediate stage development projects were advancing towards planned start-up. The following summary highlights key updates from the development projects of the Company for 2013. Refer to Section 6 Operating Mines for discussion on construction projects.
Cerro Moro, Argentina
Cerro Moro was obtained through the acquisition of Extorre Resources Ltd. in 2012 for total consideration of approximately $449.2 million.
32
Cerro Moro is a low sulphidation epithermal vein deposit with similarities to the deposits at the El Peñón and Mercedes mines. As of the end of 2013, the deposit hosted probable mineral reserves of 1.53 million GEO, an indicated mineral resource of 352,000 million GEO and an inferred mineral resource of 486,000 GEO.
Work continued on updating the feasibility study and is expected to be completed sometime in 2014. The updated feasibility study includes the following parameters:
| • | Initial capital costs expected to be approximately $150 million; |
| • | Throughput rate of fewer than 750 tonnes per day; |
| • | Expected production of approximately 150,000 GEO per annum; |
| • | All-in sustaining cash costs are expected to be consistent with the Company’s current costs structure. |
Certain pre-development work, including the development of a production ready decline into one of the ore bodies, continues. Depending on the outcome of the studies and subsequent construction decision, production could begin in 2016. This reduced-scale operation aligns with Yamana’s focus to balance production growth and capital spending to maximize value creation, and allows the option to expand the operation in the future if economically justified. The design is consistent with the Company’s objective to be prudent in its capital spending in the current market environment.
Suyai, Argentina
The Company plans to apply for the needed permits in 2014. A number of relevant studies have already been completed and others are ongoing, which would position the Company well to apply for permitting this year. The current plan being evaluated includes an underground operation. The plan does not contemplate the use of chemical processes at site for the extraction of precious metals that will produce a precious metal concentrate that could be sold to third parties or potentially processed at Cerro Moro.
The current plan also includes the following parameters:
| • | Initial capital costs expected to be approximately $220 million; |
| • | Throughput rate initially of approximately 1,150 tonnes per day, with a plan to expand over time; |
| • | Expected production of approximately 150,000 GEO per annum; |
| • | All-in sustaining cash costs are expected to be below the Company's current costs structure. |
This smaller scale mining approach and processing off-site is a new approach not previously contemplated for the development of Suyai.
This high grade gold-silver deposit has similarities to the deposits at El Peñón, Mercedes, and Cerro Moro, and has the potential to add significant value to the Company’s portfolio of producing mines. Consistent with the Company’s focus to balance production growth and capital allocation the plan for Suyai is being evaluated to ensure it maximizes value creation while mitigating costs. The Company remains committed to working with local communities and governments to ensure its plan is in compliance with applicable laws and regulations.
EXPLORATION
Exploration at Yamana continues to be a key to unlocking value at existing operations. The 2014 program will continue to focus on finding higher quality ounces, those with the greatest potential to most quickly generate cash flow allowing the Company to grow prudently and profitably.
The exploration expenditure for 2013 was $112.0 million. Exploration expenditures included an infill program at Cerro Moro and Gualcamayo, which added new mineral resources. Exploration will continue to focus on mineral resource discovery and development as well as mineral reserve growth at existing operations, development projects and on new discoveries to continue developing the Company's project pipeline. A total of 242,200 metres of drilling at 12 mines and projects were completed as part of the 2013 exploration program.
Consistent with the Company’s cost containment initiatives and the focus on ounces that can best contribute to cash flow, the Company has evaluated its exploration program and where prudent has reallocated funds to those programs delivering the most encouraging results.
33
The following is a summary of the exploration and evaluation expenditures for the current year and comparative years.
| For the years ended December 31, | |||||||
| (In millions of Dollars) | 2013 | 2012 | |||||
Exploration and evaluation capitalized (i) | $ | 81.8 | $ | 101.3 | |||
Exploration and evaluation expensed (ii) | 30.2 | 58.0 | |||||
| Total exploration and evaluation | $ | 112.0 | $ | 159.3 | |||
______________________________
| (i) | Capitalized exploration and evaluation costs are reflected in the consolidated balance sheet, property, plant and equipment as part of the additions to mining property costs not subject to depreciation for near-mine exploration and tangible exploration and evaluation assets with probable future economic benefits. |
| (ii) | Expensed exploration and evaluation costs are reported in the consolidated statements of operations. |
The following summary highlights key updates from the exploration program at the Company for 2013.
Chapada, Brazil
The focus of the 2013 exploration program at Chapada was the completion of an infill program at Corpo Sul to further upgrade the mineral resources to mineral reserves. The program at Chapada included 3,545 metres in 51 holes with favorable results. Closer spaced drilling identified southwest trending high grade gold and copper mineralized zones that will improve the average grade of the Corpo Sul and Chapada deposits and add both copper pounds and gold ounces to the mineral resource and mineral reserve inventory. Exploration efforts at Chapada have resulted in increased gold and copper mineral reserves for year end 2013 and have developed important additional targets that will be tested in 2014. The Chapada near mine exploration program investigated several targets including Hidrothermalito Sul, South Mundinho, Suruca and Suruca West using geophysics, geologic mapping and stream and outcrop geochemical sampling to develop drill targets.
Hidrothermalito Sul - Assay results received early in the fourth quarter define drill intercepts of anomalous gold up to 12 metres in length in several holes The Company is encouraged by these initial results and will incorporate this information to develop new targets to be tested in 2014.
Suruca - Final assay results from the 50 by 50 metre infill drill program are in hand and will be evaluated for mineral resource and mineral reserve potential in 2014.
Arco Sul - Arco Sul is a discovery made in late 2010 located in Western Goias State, 260 kilometres southwest of Yamana's Chapada mine. Grade shell models were constructed during the fourth quarter utilizing a 1.5 g/t cut-off grade for the high grade envelopes and 0.5 g/t Au for the low grade envelopes for both the Lavrinha and Vital deposits. A total of 16 mineral zones are defined at Lavrinha and 11 at Vital. Mineral resources will be reported internally at a 1.5, 2.0 and 2.5 cut-off grade to help define deposit economics and sensitivity.
Ernesto/Pau-a-Pique, Brazil
The 2013 exploration program included a total of 13,928 meters that were completed in 95 drill holes investigating near-mine targets and extensions. This program discovered several new mineral traps that host potential ore grade gold mineralization which may lead to higher production rates and extend the life of mine profile. Surface mapping and geochemical sampling located the Upper, Bonus and Ponces Lacerda traps, which are new discoveries on the surface, and drilling has confirmed that the Upper and Bonus traps extend laterally and down dip.
Pilar, Brazil
Underground mapping and sampling along with computer modeling of drill data has identified moderate to high grade inferred resource ore shoots that will be drill-tested from the surface during 2014 to expand the mineral resource and mineral reserve base at Pilar.
Maria Lazarus - The Maria Lazarus target is located 15 kilometres west of the Pilar mine in the Guarinos greenstone belt. The Maria Lazarus access ramp drilling was completed in October with 1,002 metres drilled in 13 holes. A geologic model of Maria Lazarus was developed outlining eight identifiable units including quartz-biotite-chlorite schist which hosts the majority of the gold bearing quartz and quartz-albite vein mineralization at Maria Lazarus. The mineral resource model
34
was also developed into three regions (south, central and north) and divided into five levels. The mineral zones at Maria Lazarus dip 40-50 degrees and are thought to be extractable using common underground mining techniques.
Caiamar - Geologic work was focused on mapping the underground exposures. Mapping identified two main phases of deformation via thrust faulting and northwestern to southeastern structural movement.
C1 Santa Luz, Brazil
The 2013 exploration program was successful in identifying and outlining a deep down dip extension to the C1 near-surface deposit that will add important ounces and grade to the mineral resource inventory. The new mineralization is thought to be of sufficient width and grade to be economically extracted using common underground mining techniques. An economic evaluation will be initiated in 2014.
During the year, the near-mine and district exploration drill programs completed 21,332 metres distributed in 66 holes. The near mine program tested the up-dip extension of the southwestern deep target and completed infill holes and tested the northern extensions at Antas III. The regional program tested the Gravata and Rancho do Carneiro targets. Results from both programs are in line with prior results and are being evaluated for economic potential.
Results of additional surveys to be performed to collect IP Resistivity data at C1 and Magnetotellurics (MT) activity over the meta-volcanic rocks to the west will be incorporated into the exploration program for 2014.
Cerro Moro, Argentina
The focus of the 2013 exploration program was to develop and test new targets that are both within and outside of the known mineralized structural blocks. During the fourth quarter, 1,077 metres in five holes were drilled to complete the 2013 exploration drill program. This drilling tested the Carlita, Patricia and Margarita veins in an effort to build and expand the known mineralization envelopes. The final hole of the year drilled at the southeast end of the Margarita system cut important gold and silver values directly beneath the P0/P1 contact leaving the structure open to the southeast and to depth.
Following completion of the exploration drill program, the geology department focused on end of year data compilation, local mapping and sampling programs, development support activities, mineral resource estimation and outlining the 2014 exploration program.
Gualcamayo, Argentina
Due to positive results returned from drill holes testing the Rodado southwest and beneath QDDLW early in the year, exploration drilling was focused on Rodado southwest. During the fourth quarter, two diamond core rigs completed a total of 3,878 metres distributed in nine holes positioned from two underground drill stations. Positive assay results from these holes continued to expand the mineral envelope of Rodado southwest and the potential ore body, which remains open along strike and down dip. This deep mineralization is unoxidized and found largely within hydrothermal and tectonic breccia. A feasibility study is needed to determine the viability of the mineral zones.
El Peñón, Chile
The 2013 exploration program tested the limits of near-mine veins and ore zones for extensions and probed the limits of the El Peñón mine complex for new discoveries. Both programs were successful in finding new veins, such as the NW("north west")1, NW2 and NW3 structures within the Providencia system and the a new vein structure referred to as the Borde Oeste vein located one kilometer east of the Cerro Martillo operations. Both discoveries will be subject to infill drilling during 2014 to upgrade the mineral resources to mineral reserves and find a spot in the life of mine production tables at El Peñón.
Surface and underground based drill-testing of targets within the El Peñón mine area continued through the fourth quarter with 29,514 metres distributed in 95 holes completed, bringing the year 2013 drill totals to 93,333 metres completed in 298 holes. Exploration and limited infill drill-testing of the NW1, NW2 and NW3 targets within the Providencia structural trend continued along with a similarly focused program on the newly discovered Borde Oeste trend.
At the NW1, NW2 and NW3 northwest trending structures tested within the Providencia system, narrow to moderate widths of moderate to high grade gold and silver are being defined.
35
In an effort to expand near-mine targets and develop new structures, long horizontal holes have been completed. One drill hole to the west from the south end of the Providencia tunnel cut three potential structural extensions as evidenced by narrow high grade gold and silver assay results. The final 0.5 metre intercept of moderate gold and silver values is 300 meters south of the Pampa Campamento structure. These intercepts will be followed up with both surface and underground based drilling in the first quarter of 2014.
Minera Florida, Chile
The 2013 exploration program at Minera Florida tested numerous targets within the Mina Este structural zone adjacent to the Milenium complex and Tribuna northwest, Sorpresa and Peumo to the northwest, and also executed a near-mine exploration program, testing surface targets close to the Minera Florida mine compex. Exploration was successful testing most of the targets for mineral resource extensions, added new mineral resource ounces and developed new target areas for testing in 2014. In the fourth quarter the program completed 4,510 metres distributed in 29 holes. The program tested targets within Mina Este such as Triangulo Mineralizado, Lisset and PVO and additional targets including Tribuna, Victoria and Hallazgo. Assay results continue to show positive results from most targets. As an example, a hole drilled at the Triangulo Mineralizado target cut 10 mineral intercepts in the first 70 metres of the hole that are characterized as narrow to moderately wide zones of potential ore grade gold equivalent grades.
The near-mine exploration program completed 3,069 metres in 13 holes to test the down dip extensions of the Las Lauras-Fantasma and Gasparin-Lazo-Polvorin structural system from surface based drill locations. Results received to date are mixed. The structural trends were cut by all of the drill holes yet grade continuity was not firmly established. Evaluation of the results is on-going.
8. MINERAL RESERVE AND MINERAL RESOURCE ESTIMATES
The figures for mineral reserves and mineral resources are determined in accordance with National Instrument 43-101, issued by the Canadian Securities Administrators. This National Instrument lays out the standards of disclosure for mineral projects including rules relating to the determination of mineral reserves and mineral resources. This includes a requirement that a “qualified person” (as defined under the NI 43-101) supervises the preparation of the mineral reserves and mineral resources reports. The Company's mineral reserve and mineral resource reports are reviewed by William Wulftange, Senior Vice President Exploration who is a qualified person.
Complete information relating to mineral reserves and mineral resources indicating tonnage, grade and the various mines and projects will be contained in a complete mineral resource and mineral reserve table accompanying the 2013 annual report.
Total year end 2013 proven and probable mineral reserves were 18.5 million gold equivalent ounces ("GEO") compared to 19.3 million GEO in 2012 representing a decrease of 4%. This is offset by significant increases in measured and indicated mineral resources, almost of all which are at existing operations. On a gold equivalent basis, the average grade of mineral reserves decreased by approximately 6% to 0.90 grams per tonne (“g/t”) from 0.96 g/t in 2012.
Measured and indicated mineral resources on a GEO basis increased by 10% to 17.3 million GEO (contained gold - 16.3 million ounces; contained silver - 51.7 million ounces) as at December 31, 2013, compared with measured and indicated mineral resources of 15.6 million GEO (contained gold - 14.1 million ounces; contained silver - 78.8 million ounces) in 2012. Measured and indicated mineral resources increased from 2012 mainly due to the addition of mineral resources from Cerro Moro and new mineral resources from Gualcamayo. Total inferred mineral resources increased by 32% to 15.0 million GEO (contained gold - 13.4 million ounces; contained silver - 81.2 million ounces).
Assumptions for metal prices used in the estimates of mineral reserves and mineral resources changed for silver and copper from 2012: gold price of $950 per ounce, silver price of $18 per ounce, and copper price of $2.80 per pound, except where noted in the mineral reserve and mineral resource tables contained in the Company's 2013 annual report. Please refer to the mineral reserve and mineral resource table contained in the Company's 2013 annual report and the Company's website for a complete listing of metal-price assumptions used in the calculation of mineral reserves and mineral resources by project.
Exploration continues to be a key to unlocking value at existing operations. The 2014 program will continue to focus on finding higher quality ounces, those with the greatest potential to most quickly generate cash flow allowing the Company to grow prudently and profitably. The Company expects to spend approximately $70 million on exploration in 2014.
The most notable changes are detailed below:
36
El Peñón, Chile
Gold equivalent measured and indicated mineral resources increased by more than 100% to 1.4 million GEO at 12.41 g/t contained in 3.4 million tonnes of ore. Gold equivalent mineral reserves decreased by 13% to 3.3 million GEO after production of 534,500 contained GEO. Gold equivalent mineral reserve tonnage at an average grade of 9.66 g/t decreased by 19%. The 2014 exploration program at El Peñón will focus on converting mineral resources to mineral reserves. This includes focused infill drill programs at Providencia Este, Al Este Foot Wall, Al Este East and Borde Oeste. Gold equivalent inferred resources increased to 2.3 million GEO from 1.8 million GEO, representing a 31% increase in contained GEO and an increase in the average grade to 12.6 g/t.
There are currently 35 active mining areas within the El Peñón mine complex. Production of gold and silver at El Peñón was only partly offset by conversion of resource ounces to reserves in 2013. Losses due to mining at Providencia, Al Este, Bonanza, Dominador and other zones were replaced by gains in mineral reserves at Veta Norweste, PAV, Dorada southwest and others. The 2014 exploration program at El Peñón will focus on converting mineral resources to mineral reserves. This includes focused infill drill programs at Providencia Este, Al Este Foot Wall, Al Este East and Borde Oeste.
Chapada, Brazil
Gold equivalent mineral reserves were 3.8 million GEO, at an average grade of 0.25 g/t contained in 479.8 million tonnes, an increase of 156,000 GEO over 2012, after production of 188,000 contained GEO. Measured and indicated gold equivalent mineral resources decreased by approximately 8% to 2.2 million GEO contained in 176.6 million tonnes at 0.38 g/t, mainly as a result of the conversion of mineral resources to mineral reserves at Corpo Sul. Gold equivalent inferred mineral resources also increased by 9% to 933,000 GEO contained in 171.9 million tonnes at 0.17 g/t.
Copper proven and probable mineral reserves increased by 7% to 2.6 billion pounds with an average grade of 0.29%. Copper measured and indicated mineral resources decreased by 62% to 422 million pounds of copper with an average grade of 0.20%.
Chapada mineral reserves increased in both gold and copper content due to several factors. The 50 meter by 50 meter infill program at Corpo Sul encountered long intervals of higher grade copper and gold values compared to those drilled previously resulting in higher average grades, more tonnes and a larger overall ore body despite using a 1.0 revenue factor pit versus the 1.25 revenue factor pit used for the 2012 mineral reserve calculation. Mineral resource tonnes, gold ounces and copper pounds were lower than 2012 levels due to the conversion of measured and indicated mineral resources and the upgrade of inferred mineral resource tonnes, gold ounces and copper pounds to mineral reserves.
Jacobina, Brazil
Measured and indicated gold mineral resources increased by 26% to 2.6 million ounces contained in 33.9 million tonnes of mineral resources at 2.40 g/t. Inferred mineral resources increased by 30% to 1.6 million ounces contained in 15.8 million tonnes of mineral resources at 3.11g/t. Proven and probable gold mineral reserves decreased by approximately 11.0% to 2.2 million ounces, after production of 77,000 contained ounces.
Increases in measured and indicated mineral resources at Moro do Vento, Morro do Cuscuz and Serra do Corrego were accomplished by infill drilling and updates to the geologic model. Reductions in mineral reserves at Jacobina are a result of mining and changes to the resource model at Joao Belo. At Joao Belo, an infill and ore delineation program indicated that portions of the resource model were narrower than previously modeled resulting in a reduction of contained gold mineral reserves. Additional minor mineral reserve losses at Canavieiras Central and Moro Corrego were largely offset by gains due to infill and extension drilling at Canavieiras South and Moro do Vento.
Gualcamayo, Argentina
Gold measured and indicated mineral resources were 94.8 million tonnes at 1.01 g/t containing 3.1 million gold ounces. This represents an increase in gold measured and indicated mineral resources of 163% from the prior year. Similarly, gold inferred mineral resources increased by 268%, partly explained by an increase in the average grade of gold inferred resources of 25% from the prior year. Inferred gold mineral resources were 30.4 million tonnes at 2.08 g/t containing 2.0 million gold ounces. Gold mineral reserves were 32.2 million tonnes at 1.33 g/t containing 1.4 million gold ounces.
Mineral reserves at Gualcamayo decreased by 690,000 gold ounces during 2013 as a result of mining and a revision of planned mining techniques and associated higher mining costs. Gold mineral reserves at the QDD open pit decreased due to the extraction and the degrading of a portion of in-pit mineral reserves to mineral resource status due to a redesign of the life-of-mine pit limits that excludes some ounces previously thought to be more economic. A reduction of 2012 mineral reserves was due to increased costs and a change in mining techniques that were made at QDD Lower West ("QDDLW") and Rodado.
The focus in 2013 at Gualcamayo was on the definition and expansion of the Rodado breccia, a new zone discovered in 2011 southwest of QDDLW. As a result, measured and indicated mineral resources increased by 163% with an 8% decrease in grade.
37
A significant amount of gold mineral resources at Gualcamayo are within the Rodado breccia and QDDLW, and given the current size of the sulphide portion of the mineral resources in these zones, further mineral resource increases are expected in these areas hence the Company is undertaking a study to evaluate the installation of a mill.
Minera Florida, Chile
Proven and probable gold equivalent mineral reserves were 706,000 GEO compared to 974,000 GEO in 2012 after production of 164,000 contained GEO. There are 64 individual ore shoots or veins that contribute to the mineral reserve totals at Minera Florida. The majority of production during 2013 was sourced from the Tribuna, Puemo, Hallazgo, Falla Hallazgo, Rafael and Marilyn ore zones. Mining of these zones during 2013 were only partly offset by additions to mineral reserves at Maqui Clavo II, Gasparin, Mejas and other veins.
Measured and indicated mineral resources increased by 49% to 848,000 GEO at an average gold equivalent grade of 6.02 g/t while inferred mineral resources increased by 36%. The increase in mineral resources is the result of many moderate additions to the mineral resource inventory with the more substantial additions from new discoveries and extensions of the Maqui Sur, Aqua Fria, Marisol, Florencia, HME Centro, PVO Sur and Megias veins and mineral zones.
Mercedes, Mexico
Gold equivalent proven and probable mineral reserves were 5.6 million tonnes at 5.03 g/t containing 905,000 GEO. The average grade contained in gold equivalent mineral reserves increased by 4% from prior year. Mineral reserve reductions due to mining and/or a change in estimation parameters occurred at the Corona de Oro, Klondike, Lagunas, and Corona de Oro CAF ore bodies. These mineral reserve losses were partly offset by new discoveries, extensions and mineral resource to mineral reserve upgrades at Casa Blanca, Barrancas Centro, Rey del Oro and Tarasito. The reduction in mineral reserves is also attributable to production and a focus of exploration efforts on adding new gold equivalent ounces to the mineral resource inventory. Measured and indicated gold equivalent mineral resources were 3.6 million tonnes at 3.37 g/t containing 388,000 GEO. This represents an increase of 26% in gold equivalent ounces. Inferred gold equivalent mineral resources were 3.3 million tonnes at 4.15 g/t containing 441,000 GEO. This represents an increase in grade of 10% from the prior year. Important additions to the mineral resource inventory were made at the Klondike, Rey del Oro and Barrancas mineral zones.
Fazenda Brasileiro, Brazil
Proven and probable gold mineral reserves decreased by approximately 45% while grade contained in gold mineral proven and probable reserves increased by 5%. Measured and indicated gold mineral resources decreased by approximately 30% and inferred gold mineral resources remained unchanged from 2012. The Company acquired the mine in 2003 with a 2.5 year mine life remaining based on known mineral reserves. Based on current mineral reserves mine life is approximately three years after having been mined by the Company for ten years.
Ernesto/Pau-a-Pique, Brazil
Proven and probable gold mineral reserves were 4.7 million tonnes at 3.47 g/t containing 526,000 ounces. Measured and indicated gold mineral resources were 324,000 ounces in 4.2 million tonnes at 2.38 g/t, and inferred gold mineral resources of 157,000 ounces in 1.6 million tonnes of ore at 3.03 g/t of gold.
C1 Santa Luz, Brazil
Proven and probable gold mineral reserves were 26.7 million tonnes at 1.57 g/t containing 1.3 million ounces. Measured and indicated gold mineral resources were 478,000 ounces in 11.7 million tonnes at 1.27 g/t. Inferred gold mineral resources increased by 596,000 ounces to 1.1 million ounces at 2.49 g/t of gold due to additions from C1 southwest deep extensions and reductions in inferred and indicated mineral resource zones in the C1 open pit.
Pilar, Brazil
Proven and probable gold mineral reserves were 10.8 million tonnes at 4.03 g/t containing 1.4 million ounces. Measured and indicated gold mineral resources were 270,000 ounces in 1.9 million tonnes at 4.44 g/t. Inferred gold mineral resources increased by 299,000 ounces to 1.7 million ounces contained in 12.7 million tonnes of ore at 4.12 g/t of gold. At Pilar, the zones mined during commissioning in 2013 were depleted from the 2012 mineral reserve estimates as the mine continued in commissioning. The planned use of hydraulic mining techniques has been replaced by more conventional drilling and blasting methods. Room and pillar extraction for zones that dip less than 25 degrees and selective blasting for zones that dip greater than 25 degrees remains in place. Smaller underground equipment is on site and will replace the larger equipment currently employed at the Jordino mine.
Cerro Moro, Argentina
Cerro Moro was acquired as a result of the acquisition of Extorre by the Company in August 2012. The Company commenced an aggressive infill exploration program in October 2012 to re-categorize inferred and indicated mineral resources to support a feasibility study.
38
As at December 31, 2013, 2.0 million tonnes of proven and probable GEO mineral reserves at 24.34 g/t containing 1.5 million GEO have been converted from mineral resources. Measured and indicated gold mineral resources at the end of the year were 1.8 million tonnes at 6.16g/t containing 352,000 GEO. The decrease in measured and indicated mineral resources was due to the upgrade of mineral resources to mineral reserves.
Arco Sul, Brazil
Arco Sul is a new discovery made in late 2010. It is located in western Goias State, 200 kilometres from Goiania, 370 kilometres from Brasilia and 295 kilometres from Pilar. Gold mineralization is hosted in a stock work system within a contact zone of subvolcanic intrusives and the Neoproterozoic volcano-sedimentary basement. The Company's closed and reclaimed mine, Fazenda Nova, represents the small, near surface part of the Arco Sul mineralized system. Sulphide potential at depth has been identified and the Company is now exploring this potential. Diamond drilling started in late September 2010 and to date 72 diamond drill holes totaling 29,979 metres have been completed. Mineralization remains open in all directions and an inferred mineral resource estimate has outlined 646,000 ounces of gold in 5.0 million tonnes of ore at an average grade of 4.02 g/t.
Suyai, Argentina
Measured, indicated and inferred gold equivalent mineral resources are unchanged year-over-year as the development focus at Suyai in 2013 was on the execution of further studies to better position the Company to apply for required permits. A number of relevant studies have already been completed and others are ongoing, which should support the Company in applying for permitting this year. This high grade gold-silver deposit has similarities to the deposits at El Peñón and Mercedes, and has the potential to add significant value to the Company’s portfolio of producing mines. The current plan being evaluated includes an underground operation without any chemical processing onsite that will produce a precious metals concentrate that could be sold to third parties or potentially processed at Cerro Moro. Initial capital costs are expected to be low at approximately $220 million, producing approximately 150,000 GEO per annum at an estimated throughput rate of 1,150 tonnes/day.
Lavra Velha, Brazil
Lavra Velha is an early stage exploration target, discovered in 2010, located in Central Bahia State, 550 kilometres from Salvador, 350 kilometres from Jacobina and 480 kilometres from Fazenda Brasileiro. The project lies within a 400 kilometres northwestern trending sequence of Paleoproterozoic acid volcanics which overlie the Archean São Francisco Craton consisting of granitic and mafic intrusions. Four sub-horizontal mineralized levels have been defined at Lavra Velha to date, covering an area of approximately 900 metres by 350 metres. Drilling started in 2010 and 70 diamond drill holes totaling 18,231 metres have been completed to date. Inferred mineral resources of 543,000 ounces of gold have been estimated in 3.9 million tonnes of ore with an average grade of 4.29 g/t. The mineralization is characterized by iron oxide/sulfide rich breccias and remains open in all directions.
The Company's mineral reserves and mineral resources as at December 31, 2013 are summarized in the following table. Complete information relating to mineral reserves and mineral resources indicating tonnage, and grade is contained in a complete mineral resource and mineral reserve table accompanying the 2013 annual report available on the Company's website, www.yamana.com.
39
Mineral Reserves & Resources Estimates (a) | Contained Gold | Contained Silver | GEO (b) | Contained Copper | |||||||||||||||
(in 000's ounces) | (in 000's ounces) | (in 000's GEO) | (in million pounds) | ||||||||||||||||
| Mine/Project | 2013 | 2012 | 2013 | 2012 | 2013 | 2012 | 2013 | 2012 | |||||||||||
| Proven & Probable Mineral Reserves | |||||||||||||||||||
| Chapada | 3,832 | 3,676 | — | — | 3,832 | 3,676 | 2,649 | 2,474 | |||||||||||
| El Peñón | 1,961 | 2,291 | 64,456 | 72,587 | 3,250 | 3,743 | — | — | |||||||||||
| Jacobina | 2,157 | 2,422 | — | — | 2,157 | 2,422 | — | — | |||||||||||
| Gualcamayo | 1,375 | 2,065 | — | — | 1,375 | 2,065 | — | — | |||||||||||
| Minera Florida | 623 | 845 | 4,164 | 6,473 | 706 | 974 | — | — | |||||||||||
| Fazenda Brasileiro | 168 | 306 | — | — | 168 | 306 | — | — | |||||||||||
| Mercedes | 845 | 953 | 8,419 | 10,131 | 905 | 1,025 | — | — | |||||||||||
| Ernesto/Pau-a-Pique | 526 | 791 | — | — | 526 | 791 | — | — | |||||||||||
| C1 Santa Luz | 1,345 | 1,495 | — | — | 1,345 | 1,495 | — | — | |||||||||||
| Pilar | 1,402 | 1,440 | — | — | 1,402 | 1,440 | — | — | |||||||||||
| Cerro Moro | 715 | — | 40,723 | — | 1,529 | — | — | — | |||||||||||
| Jeronimo (57%) | 1,082 | 1,082 | — | — | 1,082 | 1,082 | — | — | |||||||||||
| Alumbrera (12.5%) | 254 | 310 | — | — | 254 | 310 | 175 | 213 | |||||||||||
| Total Proven & Probable Mineral Reserves | 16,285 | 17,676 | 117,762 | 89,191 | 18,531 | 19,329 | 2,824 | 2,687 | |||||||||||
| Measured & Indicated Mineral Resources | |||||||||||||||||||
| Chapada | 2,104 | 2,296 | 3,775 | 3,775 | 2,180 | 2,372 | 874 | 1,097 | |||||||||||
| El Peñón | 870 | 432 | 24,130 | 12,040 | 1,353 | 673 | — | — | |||||||||||
| Jacobina | 2,614 | 2,077 | — | — | 2,614 | 2,077 | — | — | |||||||||||
| Gualcamayo | 3,076 | 1,171 | — | — | 3,076 | 1,171 | — | — | |||||||||||
| Minera Florida | 759 | 512 | 4,459 | 2,922 | 848 | 570 | — | — | |||||||||||
| Fazenda Brasileiro | 116 | 165 | — | — | 116 | 165 | — | — | |||||||||||
| Mercedes | 357 | 287 | 4,351 | 3,086 | 388 | 309 | — | — | |||||||||||
| Ernesto/Pau-a-Pique | 324 | 141 | — | — | 324 | 141 | — | — | |||||||||||
| C1 Santa Luz | 478 | 678 | — | — | 478 | 678 | — | — | |||||||||||
| Pilar | 270 | 267 | — | — | 270 | 267 | — | — | |||||||||||
| Cerro Moro | 122 | 884 | 11,488 | 53,500 | 352 | 1,954 | — | — | |||||||||||
| Jeronimo (57%) | 139 | 139 | — | — | 139 | 139 | — | — | |||||||||||
| La Pepa | 2,760 | 2,760 | — | — | 2,760 | 2,760 | — | — | |||||||||||
| Suyai | 2,286 | 2,286 | 3,523 | 3,523 | 2,356 | 2,356 | — | — | |||||||||||
| Total Measured & Indicated Mineral Resources | 16,275 | 14,095 | 51,726 | 78,846 | 17,254 | 15,632 | 874 | 1,097 | |||||||||||
| Inferred Mineral Resources | |||||||||||||||||||
| Chapada | 913 | 839 | 982 | 982 | 933 | 859 | 731 | 565 | |||||||||||
| El Peñón | 1,252 | 962 | 53,231 | 40,493 | 2,317 | 1,772 | — | — | |||||||||||
| Jacobina | 1,584 | 1,215 | — | — | 1,584 | 1,215 | — | — | |||||||||||
| Gualcamayo | 2,029 | 552 | — | — | 2,029 | 552 | — | — | |||||||||||
| Minera Florida | 907 | 664 | 6,023 | 4,691 | 1,027 | 758 | — | — | |||||||||||
| Fazenda Brasileiro | 611 | 611 | — | — | 611 | 611 | — | — | |||||||||||
| Mercedes | 414 | 372 | 3,843 | 4,284 | 441 | 403 | — | — | |||||||||||
| Ernesto/Pau-a-Pique | 157 | 293 | — | — | 157 | 293 | — | — | |||||||||||
| C1 Santa Luz | 1,086 | 490 | — | — | 1,086 | 490 | — | — | |||||||||||
| Pilar | 1,676 | 1,377 | — | — | 1,676 | 1,377 | — | — | |||||||||||
| Cerro Moro | 220 | 222 | 13,297 | 13,408 | 486 | 490 | — | — | |||||||||||
| Jeronimo (57%) | 161 | 161 | — | — | 161 | 161 | — | — | |||||||||||
| La Pepa | 620 | 620 | — | — | 620 | 620 | — | — | |||||||||||
| Lavra Velha | 543 | 543 | — | — | 543 | 543 | — | — | |||||||||||
| Arco Sul | 646 | 522 | — | — | 646 | 522 | — | — | |||||||||||
| Suyai | 274 | 274 | 575 | 575 | 286 | 286 | — | — | |||||||||||
| Amancaya | 351 | 351 | 3,270 | 3,270 | 416 | 416 | — | — | |||||||||||
| Total Inferred Mineral Resources | 13,444 | 10,068 | 81,221 | 67,703 | 15,019 | 11,368 | 731 | 565 | |||||||||||
__________________
(a) Refer to the complete Mineral Reserves & Mineral Resources tables in the Company's 2013 Annual Report.
| (b) | GEO assumes gold plus the gold equivalent of silver using a ratio of 50:1 with the exception of Mercedes which uses a ratio of 140:1. |
40
9. LIQUIDITY, CAPITAL RESOURCES AND CONTRACTUAL COMMITMENTS
LIQUIDITY
In response to the current volatile gold price environment, the Company continues to focus on containing costs in order to maximize available cash. For the year ended 2013, cash flows from operating activities remained strong notwithstanding significant declines in precious metals prices. In the second quarter, the Company implemented a cost savings program which continued into year end.
The following is a summary of liquidity and capital resources balances:
| As at December 31, | ||||||||
| (in thousands of United States Dollars) | 2013 | 2012 | ||||||
| Cash | $ | 220,018 | $ | 349,594 | ||||
| Trade and other receivables | $ | 80,101 | $ | 175,297 | ||||
| Long-term debt | $ | 1,189,762 | $ | 765,912 | ||||
| Working capital (i) | $ | 81,093 | $ | 255,134 | ||||
______________________________
(i)Working capital is defined as the excess of current assets over current liabilities.
Cash and cash equivalents were $220.0 million as at December 31, 2013 compared to $349.6 million as at December 31, 2012. Cash and cash equivalents were comprised of cash in bank and bank term deposits. The sources and uses of cash and cash equivalent during the year are explained below.
Trade and other receivables at the end of the year were $80.1 million compared with $175.3 million as at December 31, 2012. Gold sales are made at spot prices and gold sale receivables are settled in less than a month. Copper concentrate sales are made in accordance with certain smelter off-take agreements whereby provisional payments of approximately 90% are received within one to four weeks after shipping. Final assays and payment related to these sales are received approximately two to three months thereafter.
Working capital was $81.1 million as at December 31, 2013, compared to $255.1 million as at December 31, 2012.
The following table summarizes yearly cash inflows and outflows:
| For the years ended December 31, | |||||||
| (In thousands of United States Dollars of inflows/(outflows)) | 2013 | 2012 | |||||
| Cash flows from operating activities | $ | 653,135 | $ | 1,158,057 | |||
| Cash flows from operating activities before changes in non-cash working capital | $ | 707,861 | $ | 1,044,946 | |||
| Cash flows from financing activities | $ | 283,843 | $ | 146,399 | |||
| Cash flows used in investing activities | $ | (1,053,410 | ) | $ | (1,498,030 | ) | |
CASH FLOWS FROM OPERATING ACTIVITIES
Cash flows from operating activities after taking into effect changes in working capital items for 2013 were $653.1 million, compared to $1.16 billion for 2012.
Changes in non-cash working capital items for the year ended December 31, 2013 were cash outflows of $54.7 million compared to inflows of $113.1 million for 2012. As at December 31, 2013, accounts receivable balances were $114.0 million lower relative to the balance as at December 31, 2012 due to lower sales volume and a lower mark-to-market adjustment on concentrate receivables as a result of lower metal prices. Additionally, trade and other payables also declined year-over-year as at December 31, 2013.
Cash flows from operating activities before changes in non-cash working capital (a non-GAAP measure, see Section 14) were $707.9 million for the year compared to $1.04 billion for 2012 mainly due to lower earnings before tax.
The Company considers the undistributed earnings of some of our foreign subsidiaries, as disclosed in Note 29 of the Consolidated Financial Statements, as of December 31, 2013, to be indefinitely reinvested, and accordingly, no distribution taxes have been provided thereon. As of December 31, 2013, the amount of cash associated with indefinitely reinvested foreign earnings was
41
approximately $39.7 million. We have not, nor do we anticipate the need to repatriate these funds to Canada to satisfy domestic liquidity needs arising in the ordinary course of business, including liquidity needs associated with our domestic debt service requirements.
CASH FLOWS FROM FINANCING ACTIVITIES
For the year 2013, cash inflows from financing activities were $283.8 million compared to inflows of $146.4 million in 2012. During the year, the Company drew down on its revolving facility in the amount of $145.0 million compared to $nil million in 2012. In the second quarter of 2013, the Company issued senior debt notes for a total of $300.0 million of which $35.0 million has a maturity date of June 10, 2023 bearing interest at a rate of 4.78% per annum. Also included in cash flows from financing activities are dividends in the amount of $196.3 million at a rate of $0.26 per share per annum. this compares to $168.2 million of dividends paid in 2012 at a rate of $0.25 per share per annum.
CASH FLOWS USED IN INVESTING ACTIVITIES
Cash outflows for investing activities were $1.05 billion for the year ended December 31, 2013, compared to cash outflows of $1.50 billion for the year ended December 31, 2012. Lower cash outflows used in investing activities was a result of lower capital expenditures as all construction projects were in the commissioning phase by the end of the year.
The following is a summary of capital expenditures including sustaining, expansionary and capitalized exploration and evaluation by mine, which represented the majority of the cash flows used in investing activities:
| For the three months ended December 31, | For the years ended December 31, | ||||||||||
| (in thousands of United States Dollars) | 2013 | 2013 | 2012 | ||||||||
| BRAZIL | |||||||||||
| Chapada | $ | 34,084 | $ | 101,152 | $ | 155,396 | |||||
| Jacobina | 11,374 | 52,815 | 60,494 | ||||||||
| Fazenda Brasileiro | 5,200 | 18,701 | 32,025 | ||||||||
Ernesto/Pau-a-Pique (i) | 18,835 | 87,459 | 123,488 | ||||||||
C1 Santa Luz (i) | 27,920 | 90,395 | 122,973 | ||||||||
Pilar (i) | 68,219 | 186,174 | 135,453 | ||||||||
| CHILE | |||||||||||
| El Peñón | 29,163 | 131,176 | 109,481 | ||||||||
| Minera Florida | 21,065 | 84,670 | 142,951 | ||||||||
| Other | 350 | 1,726 | 8,783 | ||||||||
| ARGENTINA | |||||||||||
| Gualcamayo | 34,018 | 149,699 | 136,369 | ||||||||
| Cerro Moro | 13,258 | 49,099 | 386,105 | ||||||||
| Other | 691 | 2,410 | 8,575 | ||||||||
| MEXICO | |||||||||||
| Mercedes | 12,245 | 51,058 | 52,076 | ||||||||
| CANADA & OTHER | 12,254 | 40,992 | 63,825 | ||||||||
| Total capital expenditures | $ | 288,676 | $ | 1,047,526 | $ | 1,537,994 | |||||
______________________________
| (i) | Net of movement in accounts payable. |
CAPITAL RESOURCES
In order to maintain or adjust its capital structure, the Company may issue shares or debt securities, pay dividends, or undertake other activities as deemed appropriate under the specific circumstances.
The Company is authorized to issue an unlimited number of common shares at no par value and a maximum of eight million first preference shares. There are no first preference shares issued or outstanding. As of February 14, 2014, the total number of shares
42
outstanding were 753.4 million, the total number of stock options outstanding were 2.7 million, the total number of DSUs outstanding were 2.6 million and the total number of RSUs outstanding were 2.1 million.
In 2013, the Company paid annual dividends of $0.26 per share compared to 2012 of $0.25 per share per annum. Total dividend payments in 2013 were $196.3 million, representing a 14% increase over the dividends payments of $168.2 million in 2012.
The following table summarizes the weighted average common shares and dilutive equity instruments outstanding as at December 31, 2013:
Equity instruments outstanding as at | Dilutive equity instruments (i), three months ended | Dilutive equity instruments (i), year ended | |||||||
| (In thousands) | December 31, 2013 | December 31, 2013 | December 31, 2013 | ||||||
| Common shares | 753,303 | 752,995 | 752,697 | ||||||
| Options | 2,728 | — | — | ||||||
| RSUs | 2,192 | — | — | ||||||
| DSUs | 2,634 | — | — | ||||||
| 752,995 | 752,697 | ||||||||
______________________________
| (i) | Total options excluded from the computation of diluted earnings per share because the exercise prices exceeded the average market value of the common shares for the three- and twelve-month periods ended December 31, 2013 were 2.1 million and 0.9 million, respectively (three and twelve months ended December 31, 2012 — 1.1 million and 1.1 million , respectively). |
CONTRACTUAL COMMITMENTS
Day-to-day mining, sustaining and expansionary capital expenditures as well as administrative operations give rise to contracts requiring agreed upon future minimum payments. Management is of the view that such commitments will be sufficiently funded by current working capital, future operating cash flows and available credit facilities which provide access to additional funds.
As at December 31, 2013, the Company is contractually committed to the following:
| (In thousands of United States Dollars) | Within 1 year | Between 1 to 3 years | Between 3 to 5 years | After 5 years | Total | |||||||||||||||
| Mine operating/construction and service contracts and other | $ | 583,989 | $ | 397,255 | $ | 142,121 | $ | 7,236 | $ | 1,130,601 | ||||||||||
Long-term debt principal repayments (i) | 15,000 | 73,500 | 255,000 | 871,500 | 1,215,000 | |||||||||||||||
| Decommissioning, Restoration and Similar Liabilities (undiscounted) | 4,904 | 17,950 | 24,772 | 193,218 | 240,844 | |||||||||||||||
| $ | 603,893 | $ | 488,705 | $ | 421,893 | $ | 1,071,954 | $ | 2,586,445 | |||||||||||
______________________________
| (i) | Excludes interest expense. |
10. INCOME TAXES
The Company recorded an income tax expense of $79.1 million for the year (2012 - $373.1 million). The decrease in the income tax expense for the year is a result of lower earnings for the year relative to the prior year. The income tax provision reflects a current income tax expense of $140.6 million (2012 - $265.5 million) and a deferred income tax recovery of $61.5 million (2012 - $107.6 million).
The Consolidated Balance Sheet reflects recoverable tax installments in the amount of $34.2 million and an income tax liability of $53.5 million. Additionally, the balance sheet reflects a deferred tax asset of $121.6 million and a deferred tax liability of $2.0 billion.
The income tax provision is subject to a number of factors including the allocation of income between different countries, different tax rates in the various jurisdictions, the non-recognition of tax assets, foreign currency exchange movements, changes in tax laws and the impact of specific transaction and assessments. Due to the number of factors that can potentially impact the effective tax
43
rate, it is expected that the Company's effective tax rate will fluctuate in future periods. The effective tax rate on adjusted earnings for 2013 was 30.0% (2012 - 25.0%)
The Company has elected, under IFRS, to record foreign exchange related to deferred income tax assets and liabilities and interest and penalties in the income tax expense, therefore, due to foreign exchange differences, the tax rate will fluctuate during the year with the change in the Brazilian Real, Argentinean Peso and Mexican Peso.
During the year the Brazilian Real, Argentinean Peso, Chilean Peso and Mexican Peso devalued against the US Dollar. As a result for local purposes, a charge of $68.6 million relating to unrealized foreign exchange was recorded in the deferred tax expense. The impact of these foreign exchange movements on taxes are non-cash and, as such, are excluded from adjusted earnings.
On September 23, 2013, Argentina's federal Income Tax Statute was amended to include a 10% income tax withholding on dividend distributions by Argentine corporations.
On December 26, 2013, the 2014 Tax Reform Bill was enacted by Presidential Decree in Mexico. Included in the bill was the cancellation of previously announced tax rate decreases thereby keeping the corporate income tax rate at 30%. The bill also introduced a new dividend withholding tax of 10%, subject to any treaty reductions. Also included in the bill was the introduction of a Special Mining Duty of 7.5% on taxable EBITDA and the introduction of an Extraordinary Mining Duty of 0.5% on gross revenues from the sale of gold, silver and platinum. Both of these new taxes are deductible for corporate income tax purposes. As a result of this change, a non-cash charge of $28.3 million to the deferred tax liabilities was recognized in the financial statements. This deferred tax liability will decrease in the future as the mine is depleted. This charge has been added back in the calculation of adjusted earnings.
The deferred taxes relating to the operating mines will reverse in the future as the assets are depreciated or depleted. The deferred tax liabilities relating to exploration will not reverse until the property becomes a mine subject to depletion, is written off or sold. The deferred income taxes would only be paid on a direct disposition of the asset that may never occur.
The largest components of the deferred tax liabilities relate to:
| (in thousands of United States Dollars) | ||||
| Gualcamayo | $ | 230,748 | ||
| Agua Rica | $ | 396,096 | ||
| El Peñón | $ | 289,305 | ||
| Exploration Potential | $ | 405,740 | ||
See Note 29 to the Consolidated Financial Statements for a breakdown of the foreign exchange and interest and penalties charged to the income tax expense and Section 11 - Economic trends, risks and uncertainties - foreign operations and political risks of this Management Discussion and Analysis of Operations and Financial Condition for additional information.
11. ECONOMIC TRENDS, RISKS AND UNCERTAINTIES
Exploration, development and mining of precious metals involve numerous inherent risks as a result of the nature of the business, global economic trends as well as local social, political, environmental and economic conditions in the various geographical areas of operation. As such, the Company is subject to several financial and operational risks that could have a significant impact on its profitability and levels of operating cash flows.
The Company assesses and minimizes these risks by adhering to its internal risk management protocols which include the application of high operating standards empowering individuals and establishing processes to be able to identify, assess, report and monitor risk at all levels of the organization. Through careful management and planning of its facilities, hiring qualified personnel and developing a skilled workforce through training and development programs, the Company is able to generate shareholder value in a safe, resilient and responsible manner.
Below is a summary of the principal risks and related uncertainties facing the Company. Readers are also encouraged to read and consider the risk factors more particularly described in the Company’s Annual Information Form for the period ended December
44
31, 2013. Such risk factors could materially affect the future operating results of the Company and could cause actual events to differ materially from those described in forward-looking statements relating to the Company.
Metal Price Risk
The mining industry is highly dependent on commodity prices which are the result of the economic interplay of supply and demand. The profitability of the Company is directly related to the market prices of gold and copper and to a lesser extent, silver. Market price fluctuations of these commodities could adversely affect profitability of the Company's operations and might lead to impairment of mineral properties. The market prices for the aforementioned commodities fluctuate widely and these fluctuations are caused by numerous factors beyond the Company's control. For example, the market price of gold may change for a variety of reasons, including:
| • | the strength of the United States Dollar, in which the gold price trades internationally, relative to other currencies; |
| • | financial market expectations regarding the rate of inflation; |
| • | monetary policies announced, changed or implemented by central banks; |
| • | changes in the demand for gold, including the demand from the gold exchange traded fund ("ETF"), as an investment or as a result of leasing arrangements; |
| • | changes in the physical demand for gold used in jewelry; |
| • | changes in the supply of gold from production, divestment, scrap and hedging; |
| • | global or regional political or economic events, and |
| • | speculative positions taken by investors or traders in gold. |
Gold Price Three-Year Trend (Bloomberg: USD per ounce of gold)

For the quarter ended December 31, 2013, spot gold prices averaged $1,272 per ounce, or 26% lower, compared with $1,718 per ounce in the fourth quarter of 2012. The average spot price for the year ended December 31, 2013 was $1,411 per ounce, a decline of 15% versus the average spot price for 2012.
Gold prices generally trended lower over the course of the quarter primarily due to reduced investor demand as the US dollar strengthened, US Treasury yields increased and equity markets performed very well. While both exchange traded fund (“ETF”) holdings and net futures exchange positioning declined during the quarter, the selling pressure was not as pronounced as earlier in the year. The US Dollar was aided by generally strong US economic data and the expectation that the United States Federal Reserve (“US Fed”) would slow the pace of its quantitative easing (“QE”) programs. This expectation was realized in December, when the US Fed announced that it would begin to slow the pace of QE. The anticipation of this announcement was a significant contributor to the lower year-over-year gold price.
The US Fed's QE programs have been supportive of gold prices, but with the reduction in QE and the expectation of further reductions, a benign inflation outlook and rising US Treasury yields, investors have been reallocating investments in gold to other investments. While it is expected that the US Fed will to continue to slow the pace of its QE programs, it will still be several quarters before an increase in the Fed Funds rate is considered and the US Fed continues to reiterate this. Global monetary policy continues to be generally easy and most governments are struggling with the fiscal situations they face and this should be supportive for gold over the longer term. Physical demand, particularly in China, continues to be robust on pullbacks and this has provided support to the market. While central bank purchases are estimated to have declined year-over-year, it is expected that they will
45
remain net buyers in 2014. Physical and central bank demand should help offset any further investment related liquidation in 2014.
In spite of the positive signs with respect to the physical demand for gold, following the recent decline in gold prices, the Company has revised its production targets for future years to favour a lower cost structure. The Company is evaluating the producing mines whose all-in cost exceeds the Company's average cost structure. The objective is to pursue quality ounces with sustainable margins and maximize profitability and as such, in the short term the emphasis will be on reducing costs rather than maximizing production.
The Company has not hedged any of its gold sales.
Copper Price Three-Year Trend (Bloomberg: USD per pound of copper)

For the quarter ended December 31, 2013, spot copper prices averaged $3.25 per pound, representing a decrease of 9% compared with $3.59 per pound in 2012. The average spot price for the year ended December 31, 2013 was $3.32 per ounce, declined by 8% versus the average spot price for 2012.
Over the past few years copper prices have been driven by tight supply/demand fundamentals and steady appetite from emerging markets, mainly China. However, concerns about the sustainability of current economic growth levels in China, reduced investor demand and, more recently, the prospect of new mine supply have negatively impacted copper prices and have been the primary drivers of the year-over-year decline in price. In the short-term, these factors would likely limit the potential upside for copper prices but longer-term concerns surrounding supply should result in a situation that is much more supportive of copper price.
The Company periodically uses forward contracts to economically hedge against the risk of declining copper prices for a portion of its forecast copper concentrate sales.
Currency Risk
Conducting exploration, development and production operations in Latin America exposes the Company to currency risk. The Company’s revenues are denominated in United States Dollars (USD). However, the Company’s operating expenses are incurred in United States Dollars, Brazilian Reais (BRL), Chilean Pesos (CLP), Argentine Pesos (ARG), Mexican Pesos (MXN) and to a lesser extent in Canadian Dollars (CAD). Accordingly, fluctuations in the exchange rates can significantly impact the results of operations.
The following summarizes the movement in key currencies vis-à-vis the United States Dollar:
46
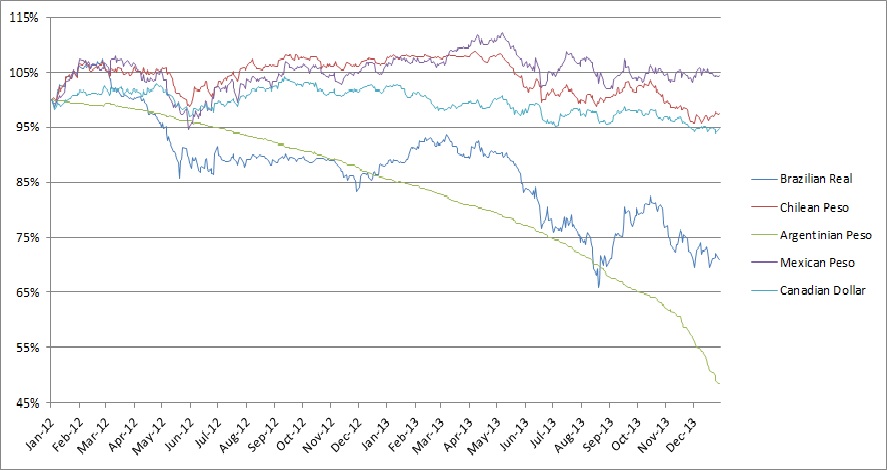
Average and Period-end Market Exchange Rates
| For the three months ended | Dec 31, 2013 | Dec 31, 2012 | Variance | ||||||
| Average Exchange Rate | |||||||||
| USD-CAD | 1.0494 | 0.9883 | 6.2 | % | |||||
| USD-BRL | 2.2763 | 2.0566 | 10.7 | % | |||||
| USD-ARG | 6.065 | 4.7688 | 27.2 | % | |||||
| USD-CLP | 516.65 | 476.40 | 8.4 | % | |||||
| USD-MXN | 13.019 | 12.932 | 0.7 | % | |||||
| For the year ended | Dec 31, 2013 | Dec 31, 2012 | Variance | ||||||
| Average Exchange Rate | |||||||||
| USD-CAD | 1.0299 | 1.0003 | 3.0 | % | |||||
| USD-BRL | 2.1585 | 1.9537 | 10.5 | % | |||||
| USD-ARG | 5.4777 | 4.5272 | 21.0 | % | |||||
| USD-CLP | 495.37 | 487.06 | 1.7 | % | |||||
| USD-MXN | 12.756 | 13.177 | -3.2 | % | |||||
| As at | Dec 31, 2013 | Dec 31, 2012 | Variance | Dec 31, 2012 | Variance | |||||||||
| Period-end Exchange Rate | ||||||||||||||
| USD-CAD | 1.0623 | 0.9921 | 7.1 | % | 1.0213 | 4.0 | % | |||||||
| USD-BRL | 2.3621 | 2.0435 | 15.6 | % | 1.8758 | 25.9 | % | |||||||
| USD-ARG | 6.5197 | 4.9155 | 32.6 | % | 4.3000 | 51.6 | % | |||||||
| USD-CLP | 525.45 | 479.20 | 9.7 | % | 519.55 | 1.1 | % | |||||||
| USD-MXN | 13.037 | 12.853 | 1.4 | % | 13.936 | -6.5 | % | |||||||
The Company entered into forward contracts to economically hedge against the risk of an increase in the value of the Brazilian Real versus the United States Dollar. Currency contracts totaling 1.0 billion Reais at an average rate of 2.17 Reais to the United States Dollar have been designated against forecast Reais denominated expenditures as a hedge against the variability of the United States Dollar amount of those expenditures caused by changes in the currency exchange rates for 2014 through to 2015.
The Company also entered into forward contracts to economically hedge against the risk of an increase in the value of the Mexican Pesos versus the United States Dollar. Currency contracts totaling 221.0 million Pesos at an average rate of 13.32 Pesos to the
47
United States Dollar have been designated against forecast Pesos denominated expenditures as a hedge against the variability of the United States Dollar amount of those expenditures caused by changes in the currency exchange rates for 2014 through to 2015.
The currency hedge has been accounted for as a cash flow hedge with the effective portion taken to other comprehensive income and the ineffective portion taken to income. Although the currency hedging program has provided additional cash flow over the years in excess of $100 million, the value of the program can become negative in a short period of time due to the volatility of foreign currency relative to the Dollar.
The following table summarizes the details of the currency hedging program as at December 31, 2013:
| (Quantities in thousands) | Brazilian Real | Mexican Peso | ||||||||||||||||||
Year of Settlement | Notional Amount | Weighted Average Contract Rate | Market rate as at Dec 31, 2013 | Year of Settlement | Notional Amount | Weighted Average Contract Rate | Market rate as at Dec 31, 2013 | |||||||||||||
| 2014 | 483,360 | 2.0677 | 2.3621 | 2014 | 156,000 | 13.320 | 13.037 | |||||||||||||
| 2015 | 519,048 | 2.2828 | 2.3621 | 2015 | 65,000 | 13.320 | 13.037 | |||||||||||||
| 1,002,408 | 2.1738 | 2.3621 | 221,000 | 13.320 | 13.037 | |||||||||||||||
Interest Rate Risk
The Company is exposed to interest rate risk on its variable rate debt. Monetary policy by central banks in the countries in which the Company operates have maintained interest rates relatively low to avoid a relapse of the credit crisis and incentivize economic growth. At December 31, 2013, the majority of the Company’s long-term debt was carried at fixed rates, hence there is limited market risk arising from fluctuations in floating interest rate.
Credit Risk
Credit risk is the risk that a third party might fail to fulfill its performance obligations under the terms of a financial instrument. For cash, cash equivalents and trade and other receivables, credit risk is represented by the carrying amount on the balance sheet. For derivatives, the Company assumes no credit risk when the fair value of the instruments is negative. When the fair value of the instruments is positive, this is a reasonable measure of credit risk. The Company limits credit risk by entering into business arrangements with high credit-quality counterparties, limiting the amount of exposure to each counterparty and monitoring the financial condition of counterparties.
Liquidity Risk
Liquidity risk is the risk that an entity will encounter difficulty in meeting obligations associated with financial liabilities that are settled by delivering cash or another financial asset. Under the terms of our trading agreements, counterparties cannot require the Company to immediately settle outstanding derivatives except upon the occurrence of customary events of default. The Company mitigates liquidity risk through the implementation of its Capital Management Policy by spreading the maturity dates of derivatives over time, managing its capital expenditures and operation cash flows, and by maintaining adequate lines of credit.
Investment Risk
Investment risk is the risk that a financial instrument’s value will deviate from the expected returns as a result of changes in market conditions, whether those changes are caused by factors specific to the individual investment or factors affecting all investments traded in the market. Although the factors that affect investment risk are outside the Company’s control, the Company mitigates investment risk by limiting its investment exposure in terms of total funds to be invested and by being selective of high quality investments.
Construction and Start-up of New Mines Risk
The success of construction projects and the start-up of new mines by the Company is subject to a number of factors including the availability and performance of engineering and construction contractors, mining contractors, suppliers and consultants, the receipt of required governmental approvals and permits in connection with the construction of mining facilities and the conduct of mining operations (including environmental permits), the successful completion and operation of ore passes, the ADR plants and conveyors to move ore, among other operational elements. Any delay in the performance of any one or more of the contractors,
48
suppliers, consultants or other persons on which the Company is dependent in connection with its construction activities, a delay in or failure to receive the required governmental approvals and permits in a timely manner or on reasonable terms, or a delay in or failure in connection with the completion and successful operation of the operational elements in connection with new mines could delay or prevent the construction and start-up of new mines as planned. There can be no assurance that current or future construction and start-up plans implemented by the Company will be successful; that the Company will be able to obtain sufficient funds to finance construction and start-up activities; that available personnel and equipment will be available in a timely manner or on reasonable terms to successfully complete construction projects; that the Company will be able to obtain all necessary governmental approvals and permits; and that the completion of the construction, the start-up costs and the ongoing operating costs associated with the development of new mines will not be significantly higher than anticipated by the Company. Any of the foregoing factors could adversely impact the operations and financial condition of the Company.
The Company's projects have no operating history upon which to base estimates of future cash flow. The capital expenditures and time required to develop new mines or other projects are considerable and changes in costs or construction schedules can affect project economics. Thus, it is possible that actual costs may change significantly and economic returns may differ materially from the Company's estimates.
Currently, the Company has three mines under construction in Brazil, namely, Ernesto/Pau-a-Pique, C1 Santa Luz and Pilar. While C1 Santa Luz and Pilar commenced commissioning in the second half of 2013, both of which remain within the normal progression expectation of the commissioning process, Ernesto/Pau-a-Pique has been commissioning since the fourth quarter of 2012. Commercial viability of a new mine or development project is predicated on many factors. There is no certainty that the realization of mineral reserves and mineral resources projected by the feasibility study and technical assessment performed on the project may be realized, the necessary permits can be obtained and future metal prices to ensure commercial viability will materialize. Consequently, there is a risk that start-up of new mine and development projects may be subject to write-down and/or closure as there is no certainties that they are commercially viable.
Foreign Operations and Political Risk
The Company holds mining and exploration properties in Brazil, Argentina, Chile and Mexico exposing it to the socioeconomic conditions as well as the laws governing the mining industry in those countries. Inherent risks with conducting foreign operations include, but are not limited to, high rates of inflation; military repression; war or civil war; social and labour unrest; organized crime and hostage taking which cannot be timely predicted and could have a material adverse effect on the Company’s operations and profitability. The governments in those countries are currently generally supportive of the mining industry but changes in government laws and regulations including taxation, royalties, the repatriation of profits, restrictions on production, export controls, changes in taxation policies, environmental and ecological compliance, expropriation of property and shifts in the political stability of the country could adversely affect the Company’s exploration, development and production initiatives in these countries.
In efforts to tighten capital flows and protect foreign exchange reserves, the Government of Argentina issued foreign exchange resolutions with respect to export revenues that resulted in a temporary suspension of export sales of concentrate at Alumbrera during the second quarter of 2012 as management evaluated how to comply with the new resolution. The Government of Argentina subsequently announced amendment to the foreign exchange resolution extending the time for exporters to repatriate net proceeds from export sales enabling Alumbrera to resume exports in July 2012. The Government of Argentina has also introduced certain protocols relating to the importation of goods and services and providing where possible for the substitution of Argentine produced goods and services. During 2012, Alumbrera was unable to obtain permission to repatriate dividends although certain accommodations have since been made to permit distribution of profits from Argentina. Discussion between the joint venture and the Argentine government on approval to remit dividends are ongoing. The Company continues to monitor developments and policies in all its jurisdictions and the impact thereof to its operations.
Brazil is in the process of reviewing the royalties on mining companies. The finalization of the royalty rates are subject to change during the review and approval process therefore the final rates are not determinable at this time. The magnitude of change in royalty rates might affect net earnings and cash flows from the Company's operations in Brazil.
In Mexico, a Tax Reform Bill was enacted on December 26, 2013 regarding the decree to reform and add certain provisions to the Mining and Fiscal Coordination Laws. The proposal submitted through this bill focuses on creating an obligation for mining concession holders whose mines are currently in production, which consists of a compensation payment equal to 7.5% of the amount by applying the regular and other deductions allowed by the Income Tax Law (LISR) to the taxable revenues generated by the mining company, while excluding interest, taxes and amortization. In addition, the bill also includes a new royalty of 0.5% on all sales. These amounts are deductible for income tax purposes which would bring the effective rate of the taxes to approximately 5.8%. The Company has determined this to be approximately 3.8% on a net smelter royalty ("NSR") basis. The bill also proposes
49
to double the payment of duties by hectare by differentiating nonproductive mining concessions. The magnitude of new royalty rates might affect net earnings and cash flows from the Company's operations in Mexico.
On September 23, 2013, Argentina's federal Income Tax Statute was amended to include a 10% income tax withholding on dividend distributions by Argentine corporations.
Consistent with its risk management protocol, to mitigate land title risks, the Company makes no commitments and does not undertake exploration without first determining that necessary property rights are in good standing. However, despite the Company’s best efforts, land title may still be affected by undetected defects.
Health, Safety and Environmental Risk
Mining, like many other extractive natural resource industries, is subject to potential risks and liabilities due to accidents that could result in serious injury or death and or material damage to the environment and Company assets. The impact of such accidents could affect the profitability of the operations, cause an interruption to operations, lead to a loss of licenses, affect the reputation of the Company and its ability to obtain further licenses, damage community relations and reduce the perceived appeal of the Company as an employer. Yamana has rigorous procedures in place to manage health and safety protocols in order to reduce the risk of occurrence and the severity of any accident and is continually investing time and resources to enhance health and safety at all operations.
The Company’s operations are subject to various laws and regulations governing the protection of the environment, exploration, development, production, exports, taxes, labour standards, occupational health, waste disposal, toxic substances, mine safety, and other matters. Permits from various governmental authorities are necessary in order to engage in mining operations in all jurisdictions in which the Company operates. Such permits relate to many aspects of mining operations, including maintenance of air, water and soil quality standards. In most jurisdictions, the requisite permits cannot be obtained prior to completion of an environmental impact statement and, in some cases, public consultation. Further, the Company may be required to submit for government approval a reclamation plan, to post financial assurance for the reclamation costs of the mine site, and to pay for the reclamation of the mine site upon the completion of mining activities. The Company mitigates this risk by performing certain reclamation activities concurrent with production.
Environmental liability may result from mining activities conducted by others prior to the Company’s ownership of a property. To the extent Yamana is subject to uninsured environmental liabilities, the payment of such liabilities would reduce funds otherwise available for business activities and could have a material adverse effect on the Company. Should the Company be unable to fully fund the cost of remedying an environmental problem, the Company might be required to suspend operations or enter into interim compliance measures pending completion of the required remedy, which may have a material adverse effect. The Company mitigates the likelihood and potential severity of these environmental risks it encounters in its day-to-day operations through the application of its high operating standards as dictated by the Yamana management system.
The Company has insurance policies in place to cover accidents and business interruption and regularly monitors the adequacy of such policies.
Energy Risk
The Company consumes energy in mining activities, primarily in the form of diesel fuel, electricity and natural gas. As many of the Company’s mines are in remote locations and energy is generally a limited resource, the Company faces the risk that there may not be sufficient energy available to carry out mining activities efficiently or that certain sources of energy may not be available. The Company manages this risk by means of long-term electricity agreements with local power authorities and inventory control process on consumables including fuel. Many of the mines have on-site generator sets as back-up to mitigate the anticipated and unanticipated interruptions from the energy providers. Furthermore, the Company’s operations are continually improved to reduce input costs and maximize output.
Nature and Climatic Condition Risk
The Company and the mining industry are facing continued geotechnical challenges, which could adversely impact the Company's production and profitability. No assurances can be given that unanticipated adverse geotechnical and hydrological conditions, such as landslides, droughts and pit wall failures, will not occur in the future or that such events will be detected in advance. Geotechnical instabilities and adverse climatic conditions can be difficult to predict and are often affected by risks and hazards outside of the Company's control, such as severe weather and considerable rainfall, which may lead to periodic floods, mudslides, wall instability and seismic activity, which may result in slippage of material.
50
Geotechnical failures could result in limited or restricted access to mine sites, suspension of operations, government investigations, increased monitoring costs, remediation costs, loss of ore and other impacts, which could cause one or more of the Company's projects to be less profitable than currently anticipated and could result in a material adverse effect on the Company's results of operations and financial position.
12. CONTINGENCIES
Due to the size, complexity and nature of the Company’s operations, various legal and tax matters arise in the ordinary course of business. The Company accrues for such items when a liability is both probable and the amount can be reasonably estimated. In the opinion of management, these matters will not have a material effect on the Condensed Consolidated Interim Financial Statements of the Company.
In 2004, a former director of Northern Orion commenced proceedings in Argentina against Northern Orion claiming damages in the amount of $177.0 million for alleged breaches of agreements entered into with the plaintiff. The plaintiff alleged that the agreements entitled him to a pre-emption right to participate in acquisitions by Northern Orion in Argentina and claimed damages in connection with the acquisition by Northern Orion of its 12.5% equity interest in the Alumbrera project. On August 22, 2008, the National Commercial Court No. 13 of the City of Buenos Aires issued a first-instance judgment rejecting the claim. The plaintiff appealed this judgment to the National Commercial Appeals Court. On May 22, 2013, the appellate court overturned the first-instance decision. The appellate court determined that the plaintiff was entitled to make 50% of Northern Orion’s investment in the Alumbrera acquisition, although weighted the chance of the plaintiff's 50% participation at 15%. The matter was remanded to the first instance court to determine the value. On June 12, 2013, Northern Orion filed an extraordinary recourse with the appellate court in order to bring the matter before the Supreme Court for considering the National Commercial Appeals Court’s decision to be arbitrary. The extraordinary recourse was denied by the appellate court and this decision was notified to Northern Orion on December 20, 2013. Based on this decision, Northern Orion filed an appeal directly with the Supreme Court of Argentina on February 3, 2014. Pending the decision of the Supreme Court, Northern Orion will make submissions to the first instance court to address value. The outcome of this case is uncertain and cannot be reasonably estimated.
The Company has received assessments from the Brazilian federal tax authorities disallowing certain deductions relating to debentures for the periods 2007-2010. The Company believes these debentures were issued on commercial terms permitted under applicable laws and is challenging these assessments. As such, the Company does not believe it is probable that any amounts will be paid with respect to these assessments with the Brazilian authorities and the amount and timing of any assessments cannot be reasonably estimated.
13. CRITICAL ACCOUNTING POLICIES AND ESTIMATES
The Company's consolidated financial statements are prepared in accordance with International Financial Reporting Standards as issued by the International Accounting Standards Board (“IFRS”). The significant accounting policies applied and recent accounting pronouncements are described in Note 3 and Note 5 to the Company's annual consolidated financial statements for the year ended December 31, 2013.
In preparing the consolidated financial statements in accordance with the IFRS, management is required to make estimates and assumptions that affect the reported amounts of assets, liabilities, revenues and expenses for the period end. Critical accounting estimates represent estimates that are uncertain and for which changes in those estimates could materially impact on the Company's consolidated financial statements. Actual future outcomes could differ from present estimates. Management reviews its estimates and assumptions on an ongoing basis using the most current information available.
The critical judgements and key sources of estimation uncertainty in the application of accounting policies during the year ended December 31, 2013 were similar to those disclosed in Note 4 to the Company's annual consolidated financial statements for the year ended December 31, 2012. Additional information has been provided in Note 4 to the Company's annual consolidated financial statements for the year ended December 31, 2013.
Impairment of mineral properties and goodwill
The Company assesses at the end of each reporting period whether there is any indication, from external and internal sources of information, that an asset or cash generating unit (“CGU”) and goodwill may be impaired. While assessing whether any indications of impairment exist for mineral properties and goodwill, consideration is given to both external and internal sources of information. Information the Company considers include changes in the market, economic and legal environment in which the Company
51
operates that are not within its control and affect the recoverable amount of mineral properties and goodwill. Internal sources of information include the manner in which property and plant and equipment are being used or are expected to be used and indications of economic performance of the assets. Estimates include but are not limited to estimates of the discounted future after-tax cash flows expected to be derived from the Company's mining properties, costs to sell the mining properties and the discount rate. Reductions in metal price forecasts, increases in estimated future costs of production, increases in estimated future capital costs, reductions in the amount of recoverable mineral reserves and mineral resources and/or adverse current economics can result in a write-down of the carrying amounts of the Company's mineral properties and/or goodwill. An impairment loss is recognized when the carrying amount exceeds the recoverable amount. When there is an indication of impairment on a CGU containing goodwill, the impairment loss is recognized on goodwill first and then any remaining impairment loss is applied to the mineral property. In testing impairment, including goodwill, the following are the key applicable assumptions: discount rate of 4.6% (2012 - 5.9%) as determined by the real weighted average cost of capital and long-term gold price of $1,300 per ounce (2012 - $1,375 per ounce) and copper price of $3.00 per pound (2012 - $3.00 per pound).
During the second quarter, the Company updated its after-tax life of mine cash flow projections with updated economic assumptions as a result of the decline in metal prices towards the latter half of the second quarter of 2013. Based on its assessment during the second quarter, the Company concluded that there were no impairment charges in respect to its mineral properties as at June 30, 2013 as a result of the decline in metal prices at that time. Adverse changes in metal price assumptions were partially offset by other inputs that resulted in lower costs and updated mine plans. The impairment assessment in the second quarter was calculated assuming long-term prices of $1,375 per ounce of gold and $3.00 per pound of copper. In early October of 2013, after the spot price for gold returned to the $1,350 per ounce level, it started a continuous decline during the fourth quarter and dipped below $1,200 per ounce by late December.
During the fourth quarter, the Company performed its impairment test updating its life of mine after-tax cash flow projects for updated reasonable estimates of future metal prices, production based on current estimates of recoverable mineral reserves and mineral resources, recent operating and exploration results, exploration potential, future operating costs, capital expenditures, inflation and long-term foreign exchange rates.
The value-in-use in the impairment assessments in the fourth quarter were calculated assuming long-term prices of $1,300 per ounce of gold and $3.00 per pound of copper. The Company examined future cash flows, the intrinsic value of value beyond proven and probable mineral reserves, value of land holdings, as well as other factors, which are determinants of commercial viability of each and every mining property in its portfolio, and concluded that a total of $672.0 million ($563.9 million, net of taxes) (2012 - $nil) of impairment charges on the following mineral properties, goodwill and investment in associate should be recognized in the fourth quarter:
| • | Various exploration properties, Argentina and Chile - A total impairment charge $181.1 million in respect to exploration properties in Argentina and $80.9 million in respect to Amancaya in Chile for a total of $262.0 million ($182.7 million, net of taxes) as a result of the continuous downward trend in metal prices resulting in lower in situ market and income values for exploration potential and below-expectation exploration results. |
| • | Ernesto/Pau-a-Pique, Brazil - Impairment charge of $175.0 million ($168.2 million, net of taxes) against the carrying value was recognized due to the continuous downward trend in metal prices and commissioning delays resulting in higher capital expenditures. |
| • | Jeronimo, Chile - Impairment charge of $110.0 million ($88.0 million, net of taxes) against the carrying value of the project was recognized on the decision of not proceeding with construction at this time; future construction decision is subject to finding additional project enhancements. |
| • | Alumbrera, Argentina - Impairment charge of $70.0 million (before and net of taxes) is recognized against the carrying value of the Company’s 12.5% equity interest in the Alumbrera mine due to the continuous downward trend in metal prices. Additionally, Alumbrera is near the end of its mine life requiring greater waste removal to access mineable ore resulting in higher future operating costs. |
| • | Jacobina, Brazil - Impairment of Goodwill of $55.0 million (before and net of taxes) (Refer to Note 14 to the Consolidated Financial Statements) as a result of the continuous downward trend in metal prices, the mine's recent operating and exploration results and exploration potential. |
In addition to the impairment charges mentioned above, an additional $10.3 million (before and net of taxes) related to minor exploration properties was recognized during the year on the decision of not proceeding with further exploration and/or disposition in the prior quarters of 2013, bringing the impairment charges against mineral properties for the year to a total of $682.3 million ($574.2 million, net of taxes).
The Company expects there is further or additional value in these properties over and above what they are being written down to but not at the metal price assumption used in the impairment testing. The valuation of impairment is based on current forecasts for long-term metal prices which have been influenced by the recent decline in spot prices over the last nine months of 2013.
52
These metal price assumptions are then held constant over mine lives which in some cases are in excess of fifteen years. The Company believes that it is prudent to update its metal price assumption used in its impairment testing to reflect current forecasts and it does not rely on higher prices to drive its business plans, however, the Company remains positive on the long-term price fundamentals for its metals. The Company will continue to monitor the valuation of its assets and the impact of changes in economic assumptions and mine plans on these valuations. Higher prices in the future could result in greater volatility in earnings, as the Company reassesses the fair value of its mineral properties and could potentially reverse a portion or all of the impairment charges taken.
Estimated Recoverable Ounces
The carrying amounts of the Company’s mining properties are depleted based on recoverable ounces contained in mineral proven and probable reserves plus a portion in mineral resources. The Company includes a portion of mineral resources where it is considered probable that those mineral resources will be economically extracted. Changes to estimates of recoverable ounces and depletable costs including changes resulting from revisions to the Company’s mine plans and changes in metal price forecasts can result in a change in future depletion rates.
14. NON-GAAP MEASURES
The Company has included certain non-GAAP measures including “Co-product cash costs per gold equivalent ounce”, “Co-product cash costs per pound of copper”, “By-product cash costs per gold equivalent ounce”, “Adjusted Earnings or Loss and Adjusted Earnings or Loss per share” to supplement its condensed consolidated interim financial statements, which are presented in accordance with International Financial Reporting Standards as issued by the International Accounting Standards Board (“IFRS”). The term IFRS and generally accepted accounting principles (“GAAP”) are used interchangeably throughout this MD&A.
The Company believes that these measures, together with measures determined in accordance with IFRS, provide investors with an improved ability to evaluate the underlying performance of the Company. Non-GAAP measures do not have any standardized meaning prescribed under IFRS, and therefore they may not be comparable to similar measures employed by other companies. The data is intended to provide additional information and should not be considered in isolation or as a substitute for measures of performance prepared in accordance with IFRS.
CASH COSTS
The Company discloses “cash costs” because it understands that certain investors use this information to determine the Company’s ability to generate earnings and cash flows for use in investing and other activities. The Company believes that conventional measures of performance prepared in accordance with IFRS do not fully illustrate the ability of its operating mines to generate cash flows. The measures, as determined under IFRS, are not necessarily indicative of operating profit or cash flows from operating activities. Cash costs figures are calculated in accordance with a standard developed by The Gold Institute, which was a worldwide association of suppliers of gold and gold products and included leading North American gold producers. The Gold Institute ceased operations in 2002, but the standard remains the generally accepted standard of reporting cash costs of production in North America. Adoption of the standard is voluntary and the cost measures presented herein may not be comparable to other similarly titled measures of other companies.
The Company’s business model is focused on the production and sale of precious metals - gold and silver, which accounts for a significant portion of the Company's total revenue generated. The emphasis on precious metals therefore entails the necessity to provide investors with cash costs information that is relevant to their evaluation of the Company’s ability to generate earnings and cash flows for use in investing and other activities. Cash costs are computed on a co-product, by-product, all-in sustaining co-product and all-in sustaining by-product basis. Cash costs include mine site operating costs such as mining, processing, administration, royalties and production taxes, but are exclusive of amortization, reclamation, capital, development and exploration costs.
In excess of 75% of the Company's revenues are generated from sales of precious metals, therefore, cash costs are also calculated on a by-product basis in order to provide investors with a measure that focuses on the Company's core business in mining and producing precious metals. Cash costs per gold equivalent ounce on a by-product basis is calculated by applying copper and zinc net revenue as a credit to the cost of gold production and as such the by-product gold equivalent ounce cash costs are impacted by realized copper and zinc prices. These costs are then divided by gold equivalent ounces produced. Gold equivalent ounces are determined by converting silver production to its gold equivalent using relative gold/silver metal prices at an assumed ratio and adding the converted silver production expressed in gold ounces to the ounces of gold production.
53
Effective 2013, the Company is adopting an all-in sustaining cash costs measure, which seeks to represent total sustaining expenditures of producing gold equivalent ounces from current operations, based on by-product and co-product cash costs, including cost components of mine sustaining capital expenditures, corporate general and administrative expense excluding stock-based compensation, and exploration and evaluation expense. All-in sustaining by-product cash costs reflects by-product copper revenue credits and 100% of the aforementioned cost components. All-in sustaining co-product cash costs reflects allocations of the aforementioned cost components on the basis that is consistent with the nature of each of the cost component to the gold or copper production activities.
As such, it does not include capital expenditures attributable to projects or mine expansions, exploration and evaluation costs attributable to growth projects, income tax payments, financing costs and dividend payments. Consequently, this measure is not representative of all of the Company's cash expenditures. In addition, our calculation of all-in sustaining cash costs does not include depletion, depreciation and amortization expense as it does not reflect the impact of expenditures incurred in prior periods. This performance measure has no standard meaning and is intended to provide additional information and should not be considered in isolation or as a substitute for measures prepared in accordance with GAAP.
Cash costs per gold equivalent ounce and per pound of copper are calculated on a weighted average basis.
The measure of cash costs, along with revenue from sales, is considered to be a key indicator of a company’s ability to generate operating earnings and cash flow from its mining operations. This data is furnished to provide additional information and is a non-GAAP measure. It should not be considered in isolation as a substitute for measures of performance prepared in accordance with IFRS and is not necessarily indicative of operating costs, operating profit or cash flows presented under IFRS.
Per Gold Equivalent Ounce (“GEO”)
Silver production is treated as a gold equivalent. GEO calculations are based on an average historical silver to gold price ratio (50:1) which is used and presented for comparative purposes only.
The following tables provide a reconciliation of cost of sales per the condensed consolidated interim financial statements to (i) By-product cash costs per GEO, (ii) Co-product cash costs per GEO, (iii) Co-product cash costs per pound of copper, (iv) All-in sustaining by-product cash costs per GEO, and (v) All-in sustaining co-product cash costs per GEO.
(i) Reconciliation of Cost of Sales per the consolidated financial statements to by-product cash costs per GEO:
| GEO | In thousands of United States Dollars | United States Dollars per gold equivalent ounce | ||||||||||||||
| For the three months ended December 31, | 2013 | 2012 | 2013 | 2012 | ||||||||||||
Cost of sales (i) | $ | 239,030 | $ | 207,228 | $ | 898 | $ | 666 | ||||||||
| Adjustments: | ||||||||||||||||
| Chapada treatment and refining costs related to gold and copper | 8,717 | 8,913 | 33 | 29 | ||||||||||||
| Inventory movements and adjustments | (8,707 | ) | 10,375 | (33 | ) | 33 | ||||||||||
| Commercial, overseas freight and other costs | (7,868 | ) | (8,305 | ) | (30 | ) | (27 | ) | ||||||||
By-product credits from Chapada copper revenue including copper pricing adjustment | (112,521 | ) | (132,877 | ) | (423 | ) | (426 | ) | ||||||||
| Total GEO by-product cash costs (excluding Alumbrera) | $ | 118,651 | $ | 85,334 | $ | 445 | $ | 275 | ||||||||
| Minera Alumbrera (12.5% interest) by-product cash costs | (2,951 | ) | (21,666 | ) | (261 | ) | (2,012 | ) | ||||||||
Total GEO by-product cash costs (i) | $ | 115,700 | $ | 63,668 | $ | 417 | $ | 198 | ||||||||
| Commercial GEO produced excluding Alumbrera | 266,128 | 310,947 | ||||||||||||||
| Commercial GEO produced including Alumbrera | 277,446 | 321,716 | ||||||||||||||
54
| GEO | In thousands of United States Dollars | United States Dollars per gold equivalent ounce | ||||||||||||||
| For the twelve months ended December 31, | 2013 | 2012 | 2013 | 2012 | ||||||||||||
Cost of sales (i) (ii) | $ | 900,789 | $ | 831,754 | $ | 817 | $ | 728 | ||||||||
| Adjustments: | ||||||||||||||||
| Chapada treatment and refining costs related to gold and copper | 33,880 | 30,111 | 31 | 26 | ||||||||||||
| Inventory movements and adjustments | (23,221 | ) | (13,976 | ) | (21 | ) | (12 | ) | ||||||||
| Commercial, overseas freight and other costs | (30,611 | ) | (28,856 | ) | (28 | ) | (25 | ) | ||||||||
| By-product credits from Chapada copper revenue including copper pricing adjustment | (402,824 | ) | (491,638 | ) | (365 | ) | (430 | ) | ||||||||
| Total GEO by-product cash costs (excluding Alumbrera) | $ | 478,013 | $ | 327,395 | $ | 434 | $ | 287 | ||||||||
| Minera Alumbrera (12.5% interest) by-product cash costs | (9,857 | ) | (53,815 | ) | (252 | ) | (1,168 | ) | ||||||||
Total GEO by-product cash costs (ii) | $ | 468,156 | $ | 273,580 | $ | 410 | $ | 230 | ||||||||
| Commercial GEO produced excluding Alumbrera | 1,102,460 | 1,142,838 | ||||||||||||||
| Commercial GEO produced including Alumbrera | 1,141,617 | 1,188,915 | ||||||||||||||
______________________________
| (i) | Cost of sales includes non-cash items including the impact of the movement in inventory. |
| (ii) | Depletion, depreciation and amortization are excluded from both total cash costs and cost of sales. |
(ii) Reconciliation of cost of sales per the consolidated financial statements to co-product cash costs per GEO:
| GEO | In thousands of United States Dollars | United States Dollars per gold equivalent ounce | ||||||||||||||
| For the three months ended December 31, | 2013 | 2012 | 2013 | 2012 | ||||||||||||
Cost of sales (i) (iii) | $ | 239,030 | $ | 207,228 | $ | 898 | $ | 666 | ||||||||
| Adjustments: | ||||||||||||||||
Copper contained in concentrate related cash costs (excluding related TCRC’s) (ii) | (47,713 | ) | (48,222 | ) | (179 | ) | (154 | ) | ||||||||
| Treatment and refining costs (“TCRC”) related to Chapada gold | 1,281 | 1,279 | 5 | 4 | ||||||||||||
| Inventory movements and adjustments | (8,707 | ) | 10,375 | (33 | ) | 33 | ||||||||||
| Commercial, overseas freight and other costs | (7,868 | ) | (8,305 | ) | (30 | ) | (27 | ) | ||||||||
| Total GEO co-product cash costs (excluding Alumbrera) | $ | 176,023 | $ | 162,355 | $ | 661 | $ | 522 | ||||||||
| Minera Alumbrera (12.5% interest) GEO cash costs | 3,547 | 3,695 | 313 | 343 | ||||||||||||
Total GEO co-product cash costs (iii) | $ | 179,570 | $ | 166,050 | $ | 647 | $ | 516 | ||||||||
| Commercial GEO produced excluding Alumbrera | 266,128 | 310,947 | ||||||||||||||
| Commercial GEO produced including Alumbrera | 277,446 | 321,716 | ||||||||||||||
| GEO | In thousands of United States Dollars | United States Dollars per gold equivalent ounce | ||||||||||||||
| For the twelve months ended December 31, | 2013 | 2012 | 2013 | 2012 | ||||||||||||
Cost of sales (i) (iii) | $ | 900,789 | $ | 831,754 | $ | 817 | $ | 728 | ||||||||
| Adjustments: | ||||||||||||||||
Copper contained in concentrate related cash costs (excluding related TCRC’s) (ii) | (186,143 | ) | (184,362 | ) | (168 | ) | (161 | ) | ||||||||
| TCRC related to Chapada gold | 4,817 | 4,650 | 4 | 4 | ||||||||||||
| Inventory movements and adjustments | (23,221 | ) | (13,976 | ) | (21 | ) | (12 | ) | ||||||||
| Commercial, overseas freight and other costs | (30,611 | ) | (28,856 | ) | (28 | ) | (25 | ) | ||||||||
| Total GEO co-product cash costs (excluding Alumbrera) | $ | 665,631 | $ | 609,210 | $ | 604 | $ | 534 | ||||||||
| Minera Alumbrera (12.5% interest) GEO cash costs | 14,257 | 14,178 | 364 | 308 | ||||||||||||
Total GEO co-product cash costs (iii) | $ | 679,888 | $ | 623,388 | $ | 596 | $ | 524 | ||||||||
| Commercial GEO produced excluding Alumbrera | 1,102,460 | 1,142,839 | ||||||||||||||
| Commercial GEO produced including Alumbrera | 1,141,617 | 1,188,917 | ||||||||||||||
| (i) | Cost of sales includes non-cash items including the impact of the movement in inventory. |
| (ii) | Costs directly attributed to a specific metal are allocated to that metal. Costs not directly attributed to a specific metal are allocated based on relative value. As a rule of thumb, the relative value has been 80/75% copper and 20/25% gold. TCRC’s are defined as treatment and refining charges. |
| (iii) | Depletion, depreciation and amortization are excluded from both total cash costs and cost of sales. |
55
(iii) Reconciliation of cost of sales per the consolidated financial statements to co-product cash costs per pound of copper:
| Copper | In thousands of United States Dollars | United States Dollars per pound of copper | ||||||||||||||
| For the three months ended December 31, | 2013 | 2012 | 2013 | 2012 | ||||||||||||
Cost of sales (i) (iii) | $ | 239,030 | $ | 207,228 | $ | 6.65 | $ | 5.12 | ||||||||
| Adjustments: | ||||||||||||||||
GEO related cash costs (excluding related TCRC’s) (ii) | (174,741 | ) | (161,076 | ) | (4.87 | ) | (3.99 | ) | ||||||||
| TCRC related to Chapada copper | 7,435 | 7,634 | 0.21 | 0.19 | ||||||||||||
| Inventory movements and adjustments | (8,707 | ) | 10,375 | (0.24 | ) | 0.27 | ||||||||||
| Commercial, overseas freight and other costs | (7,868 | ) | (8,305 | ) | (0.22 | ) | (0.21 | ) | ||||||||
| Total copper co-product cash costs (excluding Alumbrera) | $ | 55,149 | $ | 55,856 | $ | 1.53 | $ | 1.38 | ||||||||
| Minera Alumbrera (12.5% interest) copper cash costs | 16,777 | 18,220 | 1.75 | 2.15 | ||||||||||||
Total copper co-product cash costs (iii) | $ | 71,926 | $ | 74,076 | $ | 1.58 | $ | 1.51 | ||||||||
Commercial copper produced excluding Alumbrera (millions of lbs) | 36.0 | 40.5 | ||||||||||||||
Commercial copper produced including Alumbrera (millions of lbs) | 45.6 | 48.9 | ||||||||||||||
| Copper | In thousands of United States Dollars | United States Dollars per pound of copper | ||||||||||||||
| For the twelve months ended December 31, | 2013 | 2012 | 2013 | 2012 | ||||||||||||
Cost of sales (i) (iii) | $ | 900,789 | $ | 831,754 | $ | 6.92 | $ | 5.52 | ||||||||
| Adjustments: | ||||||||||||||||
GEO related cash costs (excluding related TCRC’s) (ii) | (660,997 | ) | (604,560 | ) | (5.07 | ) | (4.01 | ) | ||||||||
| TCRC related to Chapada copper | 28,510 | 25,461 | 0.22 | 0.17 | ||||||||||||
| Inventory movements and adjustments | (23,221 | ) | (13,976 | ) | (0.18 | ) | (0.09 | ) | ||||||||
| Commercial, overseas freight and other costs | (30,611 | ) | (28,856 | ) | (0.24 | ) | (0.19 | ) | ||||||||
| Total copper co-product cash costs (excluding Alumbrera) | $ | 214,470 | $ | 209,823 | $ | 1.65 | $ | 1.40 | ||||||||
| Minera Alumbrera (12.5% interest) copper cash costs | 66,625 | 67,837 | 2.21 | 1.81 | ||||||||||||
Total copper co-product cash costs (iii) | $ | 281,095 | $ | 277,660 | $ | 1.75 | $ | 1.48 | ||||||||
Commercial copper produced excluding Alumbrera (millions of lbs) | 130.2 | 150.6 | ||||||||||||||
Commercial copper produced including Alumbrera (millions of lbs) | 160.5 | 188.0 | ||||||||||||||
______________________________
| (i) | Cost of sales includes non-cash items including the impact of the movement in inventory. |
| (ii) | Costs directly attributed to a specific metal are allocated to that metal. Costs not directly attributed to a specific metal are allocated based on relative value. As a rule of thumb, the relative value has been 80/75% copper and 20/25% gold. TCRC’s are defined as treatment and refining charges. |
| (iii) | Depletion, depreciation and amortization are excluded from both total cash costs and cost of sales. |
(iv) All-in sustaining cash costs per GEO on a by-product basis:
| GEO | In thousands of United States Dollars | United States Dollars per GEO | |||||||||||
| For the periods ended December 31, 2013 | Three months | Twelve months | Three months | Twelve months | |||||||||
Total GEO by-product cash costs (i) | $ | 115,700 | $ | 468,156 | $ | 417 | $ | 410 | |||||
General and administrative, excluding share-based compensation (ii) | 22,657 | 110,283 | 82 | 97 | |||||||||
Sustaining capital expenditures (ii) | 63,010 | 321,483 | 226 | 281 | |||||||||
Exploration and evaluation expense (ii) | 7,910 | 29,713 | 29 | 26 | |||||||||
| Total all-in sustaining by-product cash costs per GEO | $ | 209,277 | $ | 929,635 | $ | 754 | $ | 814 | |||||
| Commercial GEO produced including Alumbrera | 277,446 | 1,141,617 | |||||||||||
___________
| (i) | Chapada copper revenue credits reflected in GEO by-product cash costs. |
| (ii) | 100% of the cost component is included. |
(v) All-in sustaining cash costs per GEO on a co-product basis:
56
| GEO | In thousands of United States Dollars | United States Dollars per GEO | |||||||||||
| For the periods ended December 31, 2013 | Three months | Twelve months | Three months | Twelve months | |||||||||
| Total GEO co-product cash costs | $ | 179,570 | $ | 679,888 | $ | 647 | $ | 596 | |||||
General and administrative, excluding share-based compensation (i) | 18,175 | 88,092 | 66 | 77 | |||||||||
Sustaining capital expenditures (ii) | 54,731 | 285,348 | 197 | 250 | |||||||||
Exploration and evaluation expense (i) | 7,019 | 27,286 | 25 | 24 | |||||||||
| Total all-in sustaining co-product cash costs per GEO | $ | 259,495 | $ | 1,080,614 | $ | 935 | $ | 947 | |||||
| Commercial GEO produced including Alumbrera | 277,446 | 1,141,617 | |||||||||||
___________
| (i) | Chapada's general and administrative ("G&A") expense and exploration expense are allocated 20% to gold and 80% to copper, reflecting costs incurred on the related activities at Chapada. G&A and exploration expenses of all other operations are allocated 80% to gold and 20% to copper based on the relative proportions of consolidated revenues from gold and copper sales. |
| (ii) | Chapada's sustaining capital expenditures are allocated 20% to gold and 80% to copper, reflecting costs incurred on the related activities at Chapada. Sustaining capital expenditures of all other operations are allocated 100% to gold. |
ADJUSTED EARNINGS OR LOSS AND ADJUSTED EARNINGS OR LOSS PER SHARE
The Company uses the financial measures “Adjusted Earnings or Loss” and “Adjusted Earnings or Loss per share” to supplement information in its consolidated financial statements. The Company believes that in addition to conventional measures prepared in accordance with IFRS, the Company and certain investors and analysts use this information to evaluate the Company’s performance. The presentation of adjusted measures are not meant to be a substitute for net earnings or loss or net earnings or loss per share presented in accordance with IFRS, but rather should be evaluated in conjunction with such IFRS measures. Adjusted Earnings or Loss and Adjusted Earnings or Loss per share are calculated as net earnings excluding (a) share-based payments and other compensation, (b) unrealized foreign exchange (gains) losses related to revaluation of deferred income tax asset and liability on non-monetary items, (c) unrealized foreign exchange (gains) losses related to other items, (d) unrealized (gains) losses on commodity derivatives, (e) impairment losses and reversals, (f) deferred income tax expense (recovery) on the translation of foreign currency inter-corporate debt, (g) mark-to-market (gains) losses on share-purchase warrants, (h) write-down of investments and other assets and any other non-recurring adjustments. Non-recurring adjustments from unusual events or circumstances are reviewed from time to time based on materiality and the nature of the event or circumstance. Earnings adjustments for the comparative period reflect both continuing and discontinued operations.
The terms “Adjusted Earnings (Loss)” and “Adjusted Earnings (Loss) per share” do not have a standardized meaning prescribed by IFRS, and therefore the Company’s definitions are unlikely to be comparable to similar measures presented by other companies. Management believes that the presentation of Adjusted Earnings or Loss and Adjusted Earnings or Loss per share provide useful information to investors because they exclude non-cash and other charges and are a better indication of the Company’s profitability from operations. The items excluded from the computation of Adjusted Earnings or Loss and Adjusted Earnings or Loss per share, which are otherwise included in the determination of net earnings or loss and net earnings or loss per share prepared in accordance with IFRS, are items that the Company does not consider to be meaningful in evaluating the Company’s past financial performance or the future prospects and may hinder a comparison of its period-to-period profitability. Reconciliation of Adjusted Earnings to net earnings is provided in Section 5.1, Overview of Financial Results for the three and twelve months ended December 31, 2013.
ADDITIONAL MEASURES
The Company uses other financial measures the presentation of which is not meant to be a substitute for other subtotals or totals presented in accordance with IFRS, but rather should be evaluated in conjunction with such IFRS measures. The following other financial measures are used:
• | Gross margin - represents the amount of revenues in excess of cost of sales excluding depletion, depreciation and amortization. |
• | Mine operating earnings - represents the amount of revenues in excess of cost of sales excluding depletion, depreciation and amortization and depletion, depreciation and amortization. |
• | Operating earnings - represents the amount of earnings before net finance income/expense and income tax expense. |
• | Cash flows from operating activities before changes in non-cash working capital — excludes the non-cash movement from period-to-period in working capital items including trade and other receivables, other assets, inventories, trade and other payables. |
57
The terms described above do not have a standardized meaning prescribed by IFRS, and therefore the Company’s definitions are unlikely to be comparable to similar measures presented by other companies. The Company’s management believes that their presentation provides useful information to investors because gross margin excludes the non-cash operating cost item (i.e. depreciation, depletion and amortization), cash flows from operating activities before changes in non-cash working capital excludes the non-cash movement in working capital items, mine operating earnings excludes expenses not directly associate with commercial production and operating earnings excludes finance and tax related expenses and income/recoveries. These, in management’s view, provide useful information of the Company’s cash flows from operating activities and are considered to be meaningful in evaluating the Company’s past financial performance or the future prospects.
58
15. SELECTED QUARTERLY FINANCIAL AND OPERATING SUMMARY
| December 31, | September 30, | June 30, | March 31, | |||||||||||||
| (In thousands of United States Dollars, unless otherwise noted) | 2013 | 2013 | 2013 | 2013 | ||||||||||||
| Financial results | ||||||||||||||||
Revenues (i) | $ | 420,663 | $ | 456,675 | $ | 430,471 | $ | 534,873 | ||||||||
| Mine operating earnings | $ | 70,113 | $ | 144,010 | $ | 118,646 | $ | 208,009 | ||||||||
| Net (loss)/earnings attributed to Yamana equity holders | $ | (583,936 | ) | $ | 43,450 | $ | (7,898 | ) | $ | 102,096 | ||||||
Adjusted earnings (ii) | $ | 36,719 | $ | 69,530 | $ | 50,181 | $ | 116,980 | ||||||||
| Cash flows from operating activities | $ | 184,845 | $ | 99,078 | $ | 195,418 | $ | 173,801 | ||||||||
Cash flows from operating activities before changes in non-cash working capital (ii) | $ | 165,315 | $ | 177,416 | $ | 150,918 | $ | 214,219 | ||||||||
| Cash flows to investing activities | $ | (259,992 | ) | $ | (217,601 | ) | $ | (300,368 | ) | $ | (275,452 | ) | ||||
| Cash flows from (to) financing activities | $ | 66,711 | $ | (27,308 | ) | $ | 150,089 | $ | 94,350 | |||||||
| Per share financial results | ||||||||||||||||
| Earnings per share attributable to Yamana equity holders | ||||||||||||||||
| Basic and diluted | $ | (0.78 | ) | $ | 0.06 | $ | (0.01 | ) | $ | 0.14 | ||||||
| Adjusted earnings per share (ii) | ||||||||||||||||
| Basic and diluted | $ | 0.05 | $ | 0.09 | $ | 0.07 | $ | 0.16 | ||||||||
| Financial position | ||||||||||||||||
| Cash and cash equivalents | $ | 220,018 | $ | 232,125 | $ | 379,817 | $ | 342,596 | ||||||||
| Total assets | $ | 11,410,717 | $ | 12,026,181 | $ | 11,960,854 | $ | 11,806,864 | ||||||||
| Total long-term liabilities | $ | 3,615,242 | $ | 3,589,579 | $ | 3,593,059 | $ | 3,269,266 | ||||||||
| Production | ||||||||||||||||
Commercial GEO produced (iii) | 277,447 | 289,176 | 287,791 | 287,203 | ||||||||||||
Commissioning GEO produced (iii)(iv) | 26,321 | 17,758 | 7,754 | 4,109 | ||||||||||||
Total GEO produced (iii) | 303,768 | 306,934 | 295,545 | 291,312 | ||||||||||||
By-product cash costs per GEO produced, including 12.5% equity interest in Alumbrera (ii)(iii) | $ | 417 | $ | 365 | $ | 476 | $ | 383 | ||||||||
Co-product cash costs per GEO produced, including 12.5% equity interest in Alumbrera (ii)(iii) | $ | 647 | $ | 574 | $ | 577 | $ | 587 | ||||||||
All-in by-product cash costs per GEO produced, including 12.5% equity interest in Alumbrera (ii)(iii) | $ | 754 | $ | 730 | $ | 916 | $ | 855 | ||||||||
All-in co-product cash costs per GEO produced, including 12.5% equity interest in Alumbrera (ii)(iii) | $ | 935 | $ | 888 | $ | 950 | 1,014 | |||||||||
| Chapada concentrate production (tonnes) | 67,395 | 67,315 | 55,511 | 49,591 | ||||||||||||
Chapada copper contained in concentrate production (millions of pounds) | 36.0 | 36.8 | 30.1 | 27.4 | ||||||||||||
| Chapada co-product cash costs per pound of copper | $ | 1.53 | $ | 1.48 | $ | 1.76 | $ | 1.90 | ||||||||
| Alumbrera (12.5% interest) attributable concentrate production (tonnes) | 17,547 | 13,179 | 13,129 | 11,260 | ||||||||||||
| Alumbrera (12.5% interest) attributable copper contained in concentrate production (millions of pounds) | 9.6 | 7.1 | 7.2 | 6.3 | ||||||||||||
Alumbrera co-product cash costs per pound of copper (ii) | 1.75 | 2.45 | 2.40 | 2.40 | ||||||||||||
| Gold Equivalent Ounces Breakdown | ||||||||||||||||
| Total gold ounces produced | 260,187 | 263,830 | 257,608 | 248,239 | ||||||||||||
| Total silver ounces produced (millions of ounces) | 2.2 | 2.2 | 1.9 | 2.2 | ||||||||||||
| Sales | ||||||||||||||||
Total GEO sales (iii) | 305,376 | 297,225 | 278,909 | 292,039 | ||||||||||||
| Total gold sales (ounces) | 263,031 | 254,062 | 242,416 | 248,766 | ||||||||||||
| Total silver sales (millions of ounces) | 2.1 | 2.2 | 1.8 | 2.2 | ||||||||||||
| Total gold sales, excluding Alumbrera (ounces) | 254,740 | 243,385 | 234,370 | 241,259 | ||||||||||||
| Chapada concentrate sales (tonnes) | 67,616 | 68,512 | 50,728 | 55,826 | ||||||||||||
Chapada payable copper contained in concentrate sales (millions of pounds) | 34.5 | 35.7 | 26.7 | 29.1 | ||||||||||||
Average realized gold price per ounce (i) | $ | 1,277 | $ | 1,332 | $ | 1,385 | $ | 1,620 | ||||||||
Average realized copper price per pound (i) | $ | 3.37 | $ | 3.13 | $ | 3.05 | $ | 3.58 | ||||||||
Average realized silver price per ounce (i) | $ | 20.63 | $ | 21.45 | $ | 22.55 | $ | 29.81 | ||||||||
59
| December 31, | September 30, | June 30, | March 31, | |||||||||||||
| (in thousands of United States Dollars) | 2012 | 2012 | 2012 | 2012 | ||||||||||||
| Financial results | ||||||||||||||||
Revenues (i) | $ | 629,505 | $ | 611,807 | $ | 535,705 | $ | 559,745 | ||||||||
| Mine operating earnings | $ | 322,082 | $ | 279,158 | $ | 239,896 | $ | 280,134 | ||||||||
| Net earnings attributed to Yamana equity holders | $ | 169,161 | $ | 59,965 | $ | 42,913 | $ | 170,025 | ||||||||
Adjusted earnings (ii) | $ | 197,368 | $ | 177,588 | $ | 134,887 | $ | 184,306 | ||||||||
| Cash flows from operating activities | $ | 367,881 | $ | 363,059 | $ | 139,213 | $ | 287,902 | ||||||||
Cash flows from operating activities before changes in non-cash working capital (ii) | $ | 298,064 | $ | 285,696 | $ | 240,767 | $ | 220,417 | ||||||||
| Cash flows to investing activities | $ | (375,544 | ) | $ | (619,134 | ) | $ | (247,177 | ) | $ | (256,173 | ) | ||||
| Cash flows (to) from financing activities | $ | (44,467 | ) | $ | (42,678 | ) | $ | (48,636 | ) | $ | 282,181 | |||||
| Per share financial results | ||||||||||||||||
| Earnings per share attributable to Yamana equity holders | ||||||||||||||||
| Basic | $ | 0.23 | $ | 0.08 | $ | 0.06 | $ | 0.23 | ||||||||
| Diluted | $ | 0.22 | $ | 0.08 | $ | 0.06 | $ | 0.02 | ||||||||
| Adjusted earnings per share (ii) | ||||||||||||||||
| Basic and diluted | $ | 0.26 | $ | 0.24 | $ | 0.18 | $ | 0.25 | ||||||||
| Financial position | ||||||||||||||||
| Cash and cash equivalents | $ | 349,594 | $ | 400,419 | $ | 698,884 | $ | 867,577 | ||||||||
| Total assets | $ | 11,800,163 | $ | 11,495,917 | $ | 11,190,392 | $ | 11,238,213 | ||||||||
| Total long-term liabilities | $ | 3,269,266 | $ | 3,248,086 | $ | 3,150,730 | $ | 3,117,393 | ||||||||
| Production | ||||||||||||||||
Commercial GEO produced (iii) | 321,716 | 308,629 | 288,700 | 269,873 | ||||||||||||
Commissioning GEO produced (iii) (iv) | 1,274 | 1,861 | — | 8,959 | ||||||||||||
Total GEO produced (iii) | 322,990 | 310,490 | 288,700 | 278,832 | ||||||||||||
By-product cash costs per GEO produced, including 12.5% equity interest in Alumbrera (ii)(iii) | n/a | n/a | n/a | n/a | ||||||||||||
Co-product cash costs per GEO produced, including 12.5% equity interest in Alumbrera (ii)(iii) | n/a | n/a | n/a | n/a | ||||||||||||
All-in by-product cash costs per GEO produced, including 12.5% equity interest in Alumbrera (ii)(iii) | 754 | 730 | 916 | 1 | ||||||||||||
All-in co-product cash costs per GEO produced, including 12.5% equity interest in Alumbrera (ii)(iii) | 935 | 888 | 950 | 1 | ||||||||||||
| Chapada concentrate production (tonnes) | 72,518 | 70,151 | 71,801 | 53,665 | ||||||||||||
Chapada copper contained in concentrate production (millions of pounds) | 40.5 | 39.4 | 40.4 | 30.3 | ||||||||||||
| Chapada co-product cash costs per pound of copper | $ | 1.38 | $ | 1.38 | $ | 1.34 | $ | 1.51 | ||||||||
| Alumbrera (12.5% interest) attributable concentrate production (tonnes) | 14,669 | 17,830 | 18,492 | 14,149 | ||||||||||||
| Alumbrera (12.5% interest) attributable copper contained in concentrate production (millions of pounds) | 8.5 | 10.4 | 10.5 | 8.0 | ||||||||||||
Alumbrera co-product cash costs per pound of copper (ii) | 2.15 | 1.92 | 1.41 | 1.85 | ||||||||||||
| Gold Equivalent Ounces Breakdown | ||||||||||||||||
| Total gold ounces produced | 276,373 | 266,374 | 242,692 | 234,532 | ||||||||||||
| Total silver ounces produced (millions of ounces) | 2.3 | 2.2 | 2.3 | 2.2 | ||||||||||||
| Sales | ||||||||||||||||
Total GEO sales (iii) | 317,615 | 315,972 | 271,683 | 281,721 | ||||||||||||
| Total gold sales (ounces) | 272,524 | 271,380 | 226,521 | 236,990 | ||||||||||||
| Total Silver sales (millions of ounces) | 2.3 | 2.2 | 2.3 | 2.2 | ||||||||||||
| Total gold sales, excluding Alumbrera (ounces) | 258,978 | 252,814 | 223,279 | 228,763 | ||||||||||||
| Chapada concentrate sales (tonnes) | 69,589 | 69,694 | 71,656 | 52,765 | ||||||||||||
Chapada payable copper contained in concentrate sales (millions of pounds) | 37.3 | 37.1 | 37.4 | 27.3 | ||||||||||||
Average realized gold price per ounce (i) | $ | 1,692 | $ | 1,680 | $ | 1,605 | $ | 1,696 | ||||||||
Average realized copper price per pound (i) | $ | 3.54 | $ | 3.54 | $ | 3.60 | $ | 3.73 | ||||||||
Average realized silver price per ounce (i) | $ | 31.37 | $ | 30.76 | $ | 26.93 | $ | 32.94 | ||||||||
______________________________
60
| (i) | Revenues consist of sales net of sales taxes. Revenue per ounce data is calculated based on gross sales. Realized prices reflect continuing operations. |
| (ii) | A cautionary note regarding non-GAAP measures is included in Section 14 of this Management’s Discussion and Analysis of Operations and Financial Condition. |
| (iii) | GEO assumes gold plus the gold equivalent of silver using a ratio of 50:1. |
| (iv) | Including commissioning GEO from Mercedes (Q4 2011 to Q1 2012), Minera Florida's tailings retreatment project (Q3 2012 to Q4, 2012), Ernesto/Pau-a-Pique (since Q4 2012), C1 Santa Luz (since Q2 2013) and Pilar (since Q3 2013). |
61
16. DISCLOSURE CONTROLS AND PROCEDURES
Disclosure controls and procedures are designed to provide reasonable assurance that all relevant information is gathered and reported to senior management, including the Company’s Chairman and Chief Executive Officer and Executive Vice President, Finance and Chief Financial Officer, on a timely basis so that appropriate decisions can be made regarding public disclosure. The Company’s system of disclosure controls and procedures includes, but is not limited to, our Timely Disclosure and Confidentiality Policy, our Code of Conduct, our Insider Trading Policy, our Corporate Controls Policy, the effective functioning of our Audit Committee and procedures in place to systematically identify matters warranting consideration of disclosure by the Audit Committee.
As at the end of the period covered by this Management’s Discussion and Analysis, management of the Company, with the participation of the Chairman and Chief Executive Officer and the Executive Vice President, Finance and Chief Financial Officer, evaluated the effectiveness of the Company’s disclosure controls and procedures as required by applicable rules of the Canadian Securities Administrators (or Canadian securities regulatory authorities). The evaluation included documentation review, enquiries and other procedures considered by management to be appropriate in the circumstances. Based on that evaluation, the Chairman and Chief Executive Officer and the Executive Vice President, Finance and Chief Financial Officer have concluded that, as of the end of the period covered by this management’s discussion and analysis, the disclosure controls and procedures (as defined in Rule 13a-15(e) under the Securities Exchange Act of 1934) were effective to provide reasonable assurance that information required to be disclosed in the Company’s annual filings and interim filings and other reports filed or submitted under applicable securities laws, is recorded, processed, summarized and reported within time periods specified by those laws and that material information is accumulated and communicated to management of the Company, including the Chairman and Chief Executive Officer and the Executive Vice President, Finance and Chief Financial Officer, as appropriate to allow timely decisions regarding required disclosure.
MANAGEMENT’S REPORT ON INTERNAL CONTROL OVER FINANCIAL REPORTING
Management of the Company is responsible for establishing and maintaining effective internal control over financial reporting as such term is defined in the rules of the United States Securities and Exchange Commission and the Canadian Securities Administrators. The Company’s internal control over financial reporting is designed to provide reasonable assurance regarding the reliability of the Company’s financial reporting for external purposes in accordance with IFRS. The Company’s internal control over financial reporting includes:
| • | maintaining records, that in reasonable detail, accurately and fairly reflect our transactions and dispositions of the assets of the Company; |
| • | providing reasonable assurance that transactions are recorded as necessary for preparation of our consolidated financial statements in accordance with generally accepted accounting principles; |
| • | providing reasonable assurance that receipts and expenditures are made in accordance with authorizations of management and the directors of the Company; and |
| • | providing reasonable assurance that unauthorized acquisition, use or disposition of Company assets that could have a material effect on the Company’s consolidated financial statements would be prevented or detected on a timely basis. |
The Company’s internal control over financial reporting may not prevent or detect all misstatements because of inherent limitations. Additionally, projections of any evaluation of effectiveness to future periods are subject to the risk that controls may become inadequate because changes in conditions or deterioration in the degree of compliance with the Company’s policies and procedures.
Management assessed the effectiveness of the Company's internal control over financial reporting as of December 31, 2013 based on the criteria set forth in Internal Control - Integrated Framework issued by the Committee of Sponsoring Organizations of the Treadway Commission (COSO). Based on this assessment, management has concluded that, as of December 31, 2013, the Company's internal control over financial reporting is effective and no material weaknesses were identified. The Company has certified the above in its annual filings with both the U.S. Securities and Exchange Commission on Form 40-F as required by the United States Sarbanes-Oxley Act and with Canadian securities regulatory authorities.
Deloitte LLP, the Company's Independent Registered Chartered Accountants, have audited the annual consolidated financial statements of the Company for the year ended December 31, 2013, and have also issued a report on the internal controls over financial reporting based on the criteria established in the Internal Control - Integrated Framework issued by the Committee of Sponsoring Organizations of the Treadway Commission.
62
CHANGES IN INTERNAL CONTROLS
During the year ended December 31, 2013, there has been no change in the Company’s internal control over financial reporting that has materially affected, or is reasonably likely to materially affect, the Company’s internal control over financial reporting.
LIMITATIONS OF CONTROLS AND PROCEDURES
The Company’s management, including the Chairman and Chief Executive Officer and the Executive Vice President, Finance and Chief Financial Officer, believe that any disclosure controls and procedures or internal controls over financial reporting, no matter how well conceived and operated, can provide only reasonable, not absolute, assurance that the objectives of the control system are met. Further, the design of a control system must reflect the fact that there are resource constraints, and the benefits of controls must be considered relative to their costs. Because of the inherent limitations in all control systems, they cannot provide absolute assurance that all control issues and instances of fraud, if any, within the Company have been prevented or detected. These inherent limitations include the realities that judgments in decision-making can be faulty, and that breakdowns can occur because of simple error or mistake. Additionally, controls can be circumvented by the individual acts of some persons, by collusion of two or more people, or by unauthorized override of the control. The design of any systems of controls also is based in part upon certain assumptions about the likelihood of future events, and there can be no assurance that any design will succeed in achieving its stated goals under all potential future conditions. Accordingly, because of the inherent limitations in a cost effective control system, misstatements due to error or fraud may occur and not be detected.
This report provides a discussion and analysis of the financial condition and results of operations (“Management’s Discussion and Analysis”) to enable a reader to assess material changes in financial condition between December 31, 2013 and December 31, 2012 and results of operations for the periods ended December 31, 2013 and December 31, 2012.
This Management’s Discussion and Analysis has been prepared as of February 18, 2014. The condensed consolidated interim financial statements prepared in accordance with IFRS as issued by the IASB follow this Management’s Discussion and Analysis. This Management’s Discussion and Analysis is intended to supplement and complement the annual audited consolidated financial statements and notes thereto as at and for the year ended December 31, 2013 (collectively the “Financial Statements”). You are encouraged to review the financial statements in conjunction with your review of this Management’s Discussion and Analysis. This Management’s Discussion and Analysis should be read in conjunction with both the annual audited consolidated financial statements for the year ended December 31, 2013 and the most recent Annual Information Form for the year ended December 31, 2013 on file with the Securities Commissions of all of the provinces in Canada, which are included in the 2013 Annual Report on Form 40-F on file with the United States Securities and Exchange Commission. Certain notes to the Financial Statements are specifically referred to in this Management’s Discussion and Analysis and such notes are incorporated by reference herein. All Dollar amounts in the Management’s Discussion and Analysis are in United States Dollars, unless otherwise specified.
CAUTIONARY NOTE REGARDING FORWARD-LOOKING STATEMENTS
This Management’s Discussion and Analysis contains or incorporates by reference “forward-looking statements” within the meaning of the United States Private Securities Litigation Reform Act of 1995 and “forward-looking information” under applicable Canadian securities legislation. Except for statements of historical fact relating to the Company, information contained herein constitutes forward-looking statements, including any information as to the Company’s strategy, plans or future financial or operating performance. Forward-looking statements are characterized by words such as “plan,” “expect”, “budget”, “target”, “project”, “intend”, “believe”, “anticipate”, “estimate” and other similar words, or statements that certain events or conditions “may” or “will” occur. Forward-looking statements are based on the opinions, assumptions and estimates of management considered reasonable at the date the statements are made, and are inherently subject to a variety of risks and uncertainties and other known and unknown factors that could cause actual events or results to differ materially from those projected in the forward-looking statements. These factors include the Company’s expectations in connection with the expected production and exploration, development and expansion plans at the Company's projects discussed herein being met, the impact of proposed optimizations at the Company's projects, the impact of the proposed new mining law in Brazil, and the impact of general business and economic conditions, global liquidity and credit availability on the timing of cash flows and the values of assets and liabilities based on projected future conditions, fluctuating metal prices (such as gold, copper, silver and zinc), currency exchange rates (such as the Brazilian Real, the Chilean Peso, the Argentine Peso and the Mexican Peso versus the United States Dollar), the impact of inflation, possible variations in ore grade or recovery rates, changes in the Company’s hedging program, changes in accounting policies, changes in mineral resources and mineral reserves, risks related to non-core mine disposition, risks related to acquisitions, changes in project parameters as plans continue to be refined, changes in project development, construction, production and commissioning time frames, risks related to joint venture operations, the possibility of project cost overruns or unanticipated costs and expenses, higher prices for fuel, steel, power, labour and other consumables contributing to higher costs and general risks of the mining
63
industry, failure of plant, equipment or processes to operate as anticipated, unexpected changes in mine life, final pricing for concentrate sales, unanticipated results of future studies, seasonality and unanticipated weather changes, costs and timing of the development of new deposits, success of exploration activities, permitting time lines, government regulation and the risk of government expropriation or nationalization of mining operations, environmental risks, unanticipated reclamation expenses, title disputes or claims, limitations on insurance coverage and timing and possible outcome of pending litigation and labour disputes, as well as those risk factors discussed or referred to herein and in the Company's Annual Information Form filed with the securities regulatory authorities in all provinces of Canada and available at www.sedar.com, and the Company’s Annual Report on Form 40-F filed with the United States Securities and Exchange Commission. Although the Company has attempted to identify important factors that could cause actual actions, events or results to differ materially from those described in forward-looking statements, there may be other factors that cause actions, events or results not to be anticipated, estimated or intended. There can be no assurance that forward-looking statements will prove to be accurate, as actual results and future events could differ materially from those anticipated in such statements. The Company undertakes no obligation to update forward-looking statements if circumstances or management’s estimates, assumptions or opinions should change, except as required by applicable law. The reader is cautioned not to place undue reliance on forward-looking statements. The forward-looking information contained herein is presented for the purpose of assisting investors in understanding the Company’s expected financial and operational performance and results as at and for the periods ended on the dates presented in the Company’s plans and objectives and may not be appropriate for other purposes.
CAUTIONARY NOTE REGARDING MINERAL RESERVES AND MINERAL RESOURCES
Readers should refer to the Annual Information Form of the Company for the year ended December 31, 2013 and other continuous disclosure documents filed by the Company since January 1, 2014 available at www.sedar.com, for further information on mineral reserves and mineral resources, which is subject to the qualifications and notes set forth therein.
CAUTIONARY NOTE TO UNITED STATES INVESTORS CONCERNING ESTIMATES OF MINERAL RESERVES AND MINERAL RESOURCES
This Management’s Discussion and Analysis has been prepared in accordance with the requirements of the securities laws in effect in Canada, which differ in certain material respects from the disclosure requirements of United States securities laws. The terms “mineral reserve”, “proven mineral reserve” and “probable mineral reserve” are Canadian mining terms as defined in accordance with Canadian National Instrument 43-101 Standards of Disclosure for Mineral Projects (“NI 43-101”) and the Canadian Institute of Mining, Metallurgy and Petroleum (the “CIM”) - CIM Definition Standards on Mineral Resources and Mineral Reserves, adopted by the CIM Council, as amended. These definitions differ from the definitions in the disclosure requirements promulgated by the Securities and Exchange Commission (the “Commission”) and contained in Industry Guide 7 (“Industry Guide 7”). Under Industry Guide 7 standards, a “final” or “bankable” feasibility study is required to report mineral reserves, the three-year historical average price is used in any mineral reserve or cash flow analysis to designate mineral reserves and the primary environmental analysis or report must be filed with the appropriate governmental authority.
In addition, the terms “mineral resource”, “measured mineral resource”, “indicated mineral resource” and “inferred mineral resource” are defined in and required to be disclosed by NI 43-101. However, these terms are not defined terms under Industry Guide 7 and are not permitted to be used in reports and registration statements of United States companies filed with the Commission. Investors are cautioned not to assume that any part or all of the mineral deposits in these categories will ever be converted into mineral reserves. “Inferred mineral resources” have a great amount of uncertainty as to their existence, and great uncertainty as to their economic and legal feasibility. It cannot be assumed that all or any part of an inferred mineral resource will ever be upgraded to a higher category. Under Canadian rules, estimates of inferred mineral resources may not form the basis of feasibility or pre-feasibility studies, except in rare cases. Investors are cautioned not to assume that all or any part of an inferred mineral resource exists or is economically or legally mineable. Disclosure of “contained ounces” in a mineral resource is permitted disclosure under Canadian regulations. In contrast, the Commission only permits U.S. companies to report mineralization that does not constitute “mineral reserves” by Commission standards as in place tonnage and grade without reference to unit measures.
Accordingly, information contained in this Management’s Discussion and Analysis may not be comparable to similar information made public by U.S. companies subject to the reporting and disclosure requirements under the United States federal securities laws and the rules and regulations of the Commission thereunder.
*************
64