Exhibit 99.2

MANAGEMENT’S DISCUSSION AND ANALYSIS OF
OPERATIONS AND FINANCIAL CONDITION
FOR THE YEAR ENDED DECEMBER 31, 2014
TTABLE OF CONTENTS
| Page | |||
| 1. | Core Business | ||
| 2. | Highlights | ||
| 3. | Outlook and Strategy | ||
| 4. | Summary of Financial and Operating Statistics | ||
| 4.1: | Annual Financial Statistics | ||
| 4.2: | Annual Operating Statistics | ||
| 4.3: | Fourth Quarter Financial Statistics | ||
| 4.4: | Fourth Quarter Operating Statistics | ||
| 5. | Overview of Results | ||
| 5.1: | Annual Overview of Financial Results | ||
| 5.2: | Annual Overview of Operating Results | ||
| 5.3: | Fourth Quarter Overview of Financial Results | ||
| 5.4: | Fourth Quarter Overview of Operating Results | ||
| 6. | Operating Mines | ||
| 7. | Construction, Development and Exploration | ||
| 8. | Mineral Reserves and Mineral Resources | ||
| 9. | Liquidity, Capital Resources and Contractual Commitments | ||
| 10. | Income Taxes | ||
| 11. | Economic Trends, Business Risks and Uncertainties | ||
| 12. | Contingencies | ||
| 13. | Critical Accounting Policies and Estimates | ||
| 14. | Non-GAAP Measures | ||
| 15. | Selected Quarterly Financial and Operating Summary | ||
| 16. | Disclosures Controls and Procedures | ||
MANAGEMENT’S DISCUSSION AND ANALYSIS OF OPERATIONS AND FINANCIAL CONDITION
(All figures are in United States Dollars unless otherwise specified and are in accordance with International Financial Reporting Standards as issued by the International Accounting Standards Board (“IFRS”). This Management’s Discussion and Analysis of Operations and Financial Condition should be read in conjunction with the Company’s most recently issued annual consolidated financial statements for the year ended December 31, 2014 ("Consolidated Annual Financial Statements").
Cautionary notes regarding forward-looking statements follow this Management’s Discussion and Analysis of Operations and Financial Condition.
1. CORE BUSINESS
Yamana Gold Inc. (the “Company” or “Yamana”) is a Canadian-headquartered gold producer engaged in gold mining and related activities including exploration, extraction, processing and reclamation. The Company has significant precious metal properties and land positions throughout the Americas including in Brazil, Chile, Argentina, Mexico and Canada.
The Company plans to continue to build on its current production base through existing operating mine expansions and development of new mines, advancement of its exploration properties and by targeting other gold consolidation opportunities with a primary focus in the Americas.
Note 3(a) Significant Accounting Policies - Basis of Consolidation to the most recently audited Consolidated Annual Financial Statements lists Yamana’s significant subsidiaries with 100% equity interest and its joint operation of the Canadian Malartic mine. The Company does not have any material off-balance sheet arrangements, except as noted in Note 32 Contractual Commitments to the Consolidated Annual Financial Statements.
Yamana is listed on the Toronto Stock Exchange (Symbol: YRI) and the New York Stock Exchange (Symbol: AUY).
2. HIGHLIGHTS
The Company’s focus continues to be on ensuring a balance between costs and production, margin preservation and on the generation, growth and protection of cash flow. The Company continues to believe this balanced approach is appropriate and prudent to create value in the prevailing commodity price environment.
Financial
For the year ended December 31, 2014
| • | Revenue from continuing operations of $1.8 billion on the sale of 1.3 million GEO(a) and 123.5 million pounds of copper(b). |
| • | Net loss from continuing operations of $1.2 billion or $1.46 per share which includes certain non-cash charges mostly relating to a non-cash tax accrual on deferred tax liabilities resulting from newly enacted Chilean tax changes and impairment charges in respect of certain mineral interests. |
| • | Adjusted earnings(c) from continuing operations of $41.5 million or $0.05 per share(c). |
| • | Mine operating earnings from continuing operations of $285.8 million. |
| • | Cash flows from operating activities from continuing operations after changes in non-cash working capital of $513.9 million and cash flows from operating activities before changes in non-cash working capital(c) of $595.0 million. Adjusted operating cash flows from continuing operations(c) of $647.6 million. |
| • | Issued $500 million of 4.95% Senior Debt Notes due July 15, 2024. The net proceeds from the offering were used to repay in full the Company's $500 million unsecured senior term loan due June 2016. The proceeds of the term loan were used to partly fund Yamana's joint acquisition of Osisko. |
| • | Subsequent to year end, the Company closed on a C$299.3 million bought deal offering of 56.5 million common shares at a share price of C$5.30 per share. The net proceeds of the offering are being used to reduce the amount outstanding under the Company’s revolving credit facility thereby further strengthening the balance sheet and providing flexibility to fund its internal growth opportunities. |
For the three months ended December 31, 2014
| • | Revenue from continuing operations of $542.9 million on the sale of 402,043 GEO(a) and 33.8 million pounds of copper(b). |
| • | Net loss from continuing operations of $299.6 million or $0.34 per share basic and $0.35 per share diluted, after deducting non-cash charges mostly relating to an impairment charge in respect of certain mineral interests. |
| • | Adjusted loss(c) from continuing operations of $16.2 million or $0.02 per share(c) basic and diluted. |
| • | Mine operating earnings from continuing operations of $87.6 million. |
| • | Cash flows from operating activities from continuing operations after changes in non-cash working capital of $183.6 million and cash flows from operating activities before changes in non-cash working capital(c) of $166.4 million. Adjusted operating cash flows from continuing operations(c) of $176.7 million. |
_____________________________________
(a) Gold equivalent ounce ("GEO") assumes gold plus the gold equivalent of silver using a ratio of 50:1 for all periods presented.
(b) Excluding attributable sales from Alumbrera.
(c) A non-GAAP measure - Refer to Section 14.
Operational
For the year ended December 31, 2014
| • | Record production of 1.40 million GEO(a) and commercial production of 1.33 million GEO. |
| • | Production from continuing operations is 16% higher than 2013 with the following GEO production highlights: |
| • | Gualcamayo - record production which was 50% higher than 2013 production. |
| • | Chapada - gold production was higher than 2013. |
| • | El Peñón - exceeded production expectations for the year. |
| • | Minera Florida - record production with cash costs 17% lower than 2013 following substantial cost improvements. |
| • | Jacobina - higher production with cash costs 8% lower than 2013 with a focus on producing quality ounces with sustainable margins. |
| • | Canadian Malartic - Attributable production of 143,008 ounces of gold since acquisition. The mine achieved a record production of 535,470 ounces of gold for the year (100% basis). |
| • | Production during the year is summarized as follows: |
| For the year ended December 31, (In GEO) (c) | 2014 | 2013 |
Chapada (a) | 113,386 | 110,618 |
El Peñón (a) | 452,120 | 467,523 |
| Gualcamayo | 180,412 | 120,337 |
Mercedes (a) | 113,174 | 141,618 |
Canadian Malartic (d) | 143,008 | n/a |
Minera Florida (a) | 119,582 | 118,590 |
| Jacobina | 75,650 | 73,695 |
| Alumbrera | 39,650 | 39,157 |
Brio Gold (b) | 144,663 | 98,450 |
| Total production from continuing operations | 1,381,645 | 1,169,988 |
Ernesto/Pau-a-Pique (discontinued operations) (f) | 18,917 | 27,571 |
| Total | 1,400,562 | 1,197,559 |
| • | Silver production of 10.1 million ounces and 21% higher than 2013. |
| • | Copper production from Chapada of 133.5 million pounds. |
| • | Cash costs from continuing operations(c) of $482 per GEO. Co-product cash costs from continuing operations of $622 per GEO and $1.68 per pound of copper from Chapada. |
| • | All-in sustaining costs from continuing operations(c) of $807 per GEO. All-in sustaining costs from continuing operations of $899 per GEO on a co-product basis. All-in sustaining costs from continuing operations(c) from cornerstone assets(e) of $747 per GEO and $840 per GEO on a co-product basis. |
For the three months ended December 31, 2014
| • | Record production of 405,615 GEO. Production from continuing operations of 403,201 GEO. |
| • | Production from continuing operations is 37% higher than the same quarter of 2013 and 5% higher than the third quarter of 2014. GEO production highlights included the following: |
| • | Gualcamayo - 32% higher production than the fourth quarter of 2013 and higher production than the third quarter of 2014. |
| • | El Peñón - 21% higher production and 19% lower cash costs than the fourth quarter of 2013 and higher production and lower cash costs than the third quarter of 2014. |
| • | Minera Florida - higher production than the fourth quarter of 2013 and the third quarter of 2014. |
| • | Mercedes - higher production than the fourth quarter of 2013 and the third quarter of 2014. |
| • | Chapada and Jacobina - higher production than the fourth quarter of 2013. Cash costs for Jacobina were 16% lower than the fourth quarter of 2013. |
| • | Canadian Malartic - Monthly record gold production of 51,163 ounces in December with a record average of 53,232 tonnes per day for the mill. Attributable production of 66,369 gold ounces. |
| • | Production for the three months is summarized as follows: |
| For the three months ended December 31, (In GEO) (c) | 2014 | 2013 |
Chapada (a) | 30,737 | 29,817 |
El Peñón (a) | 122,850 | 101,364 |
| Gualcamayo | 46,009 | 34,929 |
Mercedes (a) | 32,512 | 31,716 |
Canadian Malartic (d) | 66,369 | n/a |
Minera Florida (a) | 31,641 | 30,513 |
| Jacobina | 20,909 | 19,519 |
| Alumbrera | 13,704 | 11,319 |
Brio Gold (b) | 38,470 | 34,884 |
| Total from continuing operations | 403,201 | 294,061 |
Ernesto/Pau-a-Pique (discontinued operations) (f) | 2,414 | 9,707 |
| Total | 405,615 | 303,768 |
| • | Silver production of 2.7 million ounces. |
| • | Copper production from Chapada of 35.0 million pounds. |
| • | Cash costs from continuing operations(c) of $484 per GEO. Co-product cash costs from continuing operations(c) of $608 per GEO and $1.57 per pound of copper from Chapada. |
| • | All-in sustaining costs from continuing operations(c) of $774 per GEO and $852 per GEO on a co-product basis. All-in sustaining costs from continuing operations(c) from cornerstone assets(e) of $729 per GEO and $818 per GEO on a co-product basis. |
______________________________
(a) GEO assumes gold plus the gold equivalent of silver using a ratio of 50:1 for all periods presented.
| (b) | Brio Gold holdings include Fazenda Brasileiro, Pilar and C1 Santa Luz. Currently, C1 Santa Luz is on care and maintenance. Commissioning production related to Brio Gold is included in the respective lines for each year. |
| (c) | A non-GAAP measure - refer to Section 14. |
(d) For the period from acquisition on June 16, 2014.
(e) Includes Chapada, El Peñón, Gualcamayo, Mercedes, Canadian Malartic, Minera Florida and Jacobina.
(f) Commissioning production related to Ernesto/Pau-a-Pique is included in the respective lines for each year.
Strategic Developments and Updates
| • | Added another cornerstone asset, the Canadian Malartic mine located in Canada, through its agreement with Agnico Eagle Mines Limited ("Agnico") with whom it jointly acquired 100% of all issued and outstanding common shares (with each company owning 50%) of Osisko Mining Corporation ("Osisko"). Total consideration paid by the Company was $1.5 billion which consisted of approximately $0.5 billion in cash and $1.0 billion in Yamana shares. |
| • | Completed the initial development of Corpo Sul at Chapada with initial production contribution in the third quarter. |
| • | Underground exploration results at Gualcamayo continue to support the potential for a large scale, bulk tonnage underground operation. A pre-feasibility study is commencing in 2015. |
| • | Pilar completed commissioning and declared commercial production effective October 1, 2014. |
| • | Management developed, initiated and committed to a plan to divest Ernesto/Pau-a-Pique. |
| • | Suspended commissioning activities at C1 Santa Luz and placed the project on care and maintenance while several identified alternative metallurgical processes continue to be evaluated. |
| • | Advanced on strategic plans to segregate non-core assets improving the prospects for certain underperforming assets that have yet to reach their potential, notably Pilar and C1 Santa Luz, through the creation of a new operating unit, Brio Gold Inc. that now includes Fazenda Brasileiro, Pilar and C1 Santa Luz (in aggregate called “Brio Gold”). A new management team for Brio will carry on efforts of operational improvements and optimizations of the Brio Gold assets allowing existing management to focus on the Company’s core asset portfolio. |
Construction and Development
| • | Cerro Moro, Argentina - A formal decision to proceed with the construction of Cerro Moro was made with most of the physical construction expected to begin late in 2015 after the completion of the balance of detailed engineering and with production expected to begin in mid-2017. |
| • | Agua Rica, Argentina - Positive independent technical review completed further supporting various development scenarios previously studied and potential for the delivery of value from this high quality asset. |
Exploration
| • | El Peñón, Chile - The newly discovered north-south vein, Ventura, is expected to lead to expansion of the mineral resource base at higher grade than the current mineral reserve grade. Proximity to existing mine plant improves operational outlook. |
| • | Chapada, Brazil - The discovery of Sucupira and Santa Cruz combined with Corpo Sul suggests the potential of a system that could be larger than originally contemplated. |
| • | Mercedes, Mexico - Drilling of the GAP zone has outlined a mineral envelope approximately 100 metres wide by 250 metres long that extends to the southwest area. |
| • | Cerro Moro, Argentina - Infill drilling results supporting upgraded inferred mineral resources to indicated category. |
| • | Canadian Malartic, Canada - Drilling at South Odyssey and Pandora are retuning positive results and will continue to be evaluated in the 2015 exploration program. |
3. OUTLOOK AND STRATEGY
The Company strives to balance production, capital and operating costs to maximize investment and returns while balancing risk and rewards and by demonstrating strong financial performance.
2014 was a transition year for the Company with its continued focus on ensuring production and cost stability at its cornerstone operations in a context of ongoing volatility in precious metal prices. The approach was a continuation of the cost containment and margin reclamation initiatives begun by the Company in 2013. In addition, 2014 was a challenging year as some projects did not meet expectations, however the Company implemented plans to improve the outlook for these projects. The addition of Canadian Malartic in mid-2014 contributed significantly to an enhanced core portfolio positioned to deliver high quality ounces. The focus on cornerstone operations has resulted in a core portfolio with a stabilized production and cost base, and sustainable cash flow levels.
Consistent with this focus, in 2014 the Company advanced plans to separate its core and non-core portfolios, and in the case of the latter, improving the prospects for certain previously underperforming assets that have yet to reach their potential. To this end, the Company announced it is structuring its inter-corporate holdings to form a new operating unit, Brio Gold Inc. (“Brio Gold”) that includes Fazenda Brasileiro, Pilar and C1 Santa Luz as well as some related exploration concessions, all of which are currently held as non-core assets within Yamana. The separation of the portfolios better focuses management's efforts, and allows in the fullness of time, to evaluate how to best maximize value for our non-core portfolio which may include divestment of the same.
Starting in 2015, this new Yamana operating unit and the optimization and improvement of its assets will be led by a new management team. Although this company will initially be a 100% owned subsidiary, Yamana is entrusting Brio Gold’s management to both manage and improve these assets and evaluate various strategic alternatives with respect to Brio Gold. All of these efforts will progress through 2015 with an optimization plan and evaluation of strategic options expected by end of 2015.
Also in 2015, the Company will begin reporting production and cost information for gold, silver and copper separately. Silver production will no longer be treated as a gold equivalent and copper by-product credits will be applied based on relative revenue
contribution of gold and silver. The decision to report production and cost information for gold and silver separately reflects the Company’s commitment to stability and predictability with respect to financial and operating results.
Over the period 2015 to 2017, the Company will build on the stabilized production, cost and cash flow levels established in 2014 by returning to a focus on mineral reserve and mineral resource growth, and further production growth. The focus on growth will not come at the expense of the significant achievements to date in cost containment and margin reclamation. Rather, costs are expected to remain stable at established levels with the potential for further reductions from lower input costs as the Company anticipates the further realization of the benefits from declining fuel prices and in country labour payments due to currency devaluations.
The flexibility to manage the business is reflected in the security of the Company’s balance sheet. Subsequent to year end, the Company closed an equity financing with gross proceeds of approximately C$300 million and will use the net proceeds to reduce debt under the Company’s revolving credit facility. This reduction in debt in combination with the previously announced debt reduction initiative and long-term debt maturities that are matched to expected asset lives ensures the Company has the financial flexibility to pursue its growth objectives.
For 2015, the Company expects to deliver production growth across its portfolio with gold production increasing by approximately 8% to 1.30 million ounces of gold in addition to 9.6 million ounces of silver production and 120 million pounds of copper production. Gold production is expected to consist of approximately 1.17 million ounces of gold from the Company’s cornerstone operations and its other producing mines, and approximately 130,000 ounces attributable to Brio Gold consisting of 60,000 ounces from Fazenda Brasileiro and 70,000 ounces from Pilar.
2016 production is expected to increase by a further 5% to approximately 1.37 million ounces of gold in addition to 8.9 million ounces of silver production and 120 million pounds of copper production. Gold production is expected to consist of approximately 1.19 million ounces of gold from the Company’s cornerstone operations and its other producing mines, and approximately 180,000 ounces attributable to Brio Gold consisting of stable production from Fazenda Brasileiro and Pilar, and the addition of 50,000 ounces based on the assumption that C1 Santa Luz resumes contributing during the year.
2017 production is expected to increase further to approximately 1.44 million ounces of gold and 11.15 million ounces of silver based on Cerro Moro beginning to contribute to production. Copper production is expected to increase to 130 million pounds. Gold production is expected to consist of approximately 1.21 million ounces of gold from the Company’s cornerstone operations and its other producing mines, and approximately 230,000 ounces attributable to Brio Gold consisting of stable production from Fazenda Brasileiro and Pilar, and the addition of a full year of production from C1 Santa Luz, representing approximately 100,000 ounces.
The Company will continue to evaluate opportunities for optimizations and other operational improvements across its portfolio to further increase its production profile. These opportunities include optimizations currently being evaluated for the mine plan at Chapada to mitigate planned one time lower gold production in 2017.
Table 3.1 below provides the mine-by-mine 2015-2017 production expectations. The figures in the table reflect the mid-range of expectations within a range of plus or minus 2.5%.
Table 3.1
| Estimated Production | 2015E | 2016E | 2017E | ||
| Mid-Point of Range | Mid-Point of Range | Mid-Point of Range | |||
| Gold | |||||
| Chapada | 120,000 | 110,000 | 100,000 | ||
| El Peñón | 252,000 | 265,000 | 250,000 | ||
| Gualcamayo | 175,000 | 170,000 | 170,000 | ||
| Mercedes | 105,000 | 105,000 | 105,000 | ||
| Canadian Malartic (50%) | 280,000 | 290,000 | 290,000 | ||
| Minera Florida | 100,000 | 100,000 | 100,000 | ||
| Jacobina | 110,000 | 120,000 | 130,000 | ||
| Alumbrera | 25,000 | 25,000 | 20,000 | ||
| Cerro Moro | — | — | 45,000 | ||
| Brio Gold * | 130,000 | 180,000 | 230,000 | ||
| Total Gold Production | 1,297,000 | 1,365,000 | 1,440,000 | ||
| Silver | |||||
| Chapada | 305,000 | 300,000 | 290,000 | ||
| El Peñón | 8,400,000 | 7,725,000 | 8,600,000 | ||
| Mercedes | 320,000 | 350,000 | 325,000 | ||
| Minera Florida | 575,000 | 490,000 | 235,000 | ||
| Cerro Moro | — | — | 1,700,000 | ||
| Total Silver Production | 9,600,000 | 8,865,000 | 11,150,000 | ||
Total Copper (M lbs.)(Chapada) | 120 | 120 | 130 | ||
*Assumes resumption of production from C1 Santa Luz in 2016.
Estimated cash costs for 2015 are forecast to be approximately $545 per ounce of gold and $6.00 per ounce of silver. For Yamana’s portfolio excluding Brio Gold, estimated cash costs for 2015 are forecast to be approximately $525 per ounce of gold. For Brio Gold, estimated cash costs for 2015 are forecast to be approximately $730 per ounce of gold. Table 3.2 below provides the mine-by-mine 2015 estimated cash costs per ounce for gold and silver.
Table 3.2
| 2015 Estimated Cash Costs Per Oz | Gold | Silver | ||||
| Chapada * | $ | (595 | ) | $ | (40.00 | ) |
| El Peñón | $ | 530 | $ | 7.35 | ||
| Gualcamayo | $ | 855 | $ | — | ||
| Mercedes | $ | 635 | $ | 8.85 | ||
| Canadian Malartic (50%) | $ | 605 | $ | — | ||
| Minera Florida | $ | 645 | $ | 8.95 | ||
| Jacobina | $ | 680 | $ | — | ||
| Alumbrera | $ | 975 | $ | — | ||
| Brio Gold | $ | 730 | $ | — | ||
| Total | $ | 545 | $ | 6.00 | ||
* On a copper co-product basis Chapada cash costs are forecast to be $1.70 per pound.
Estimated by-product all-in sustaining costs for 2015 are forecast to be between $800 and $830 per ounce of gold, and $10.30 and $10.50 per ounce of silver. Estimated co-product all-in sustaining costs for 2015 are forecast to be between $880 and $910 per ounce of gold, and $11.10 and $11.30 per ounce of silver.
For 2015, sustaining capital is expected to be approximately $265 million or approximately $176 per ounce of gold and $2.75 per ounce of silver when allocating all capital to gold and silver ounces with no consideration for copper. The Company expects approximately $238 million of total sustaining capital will be spent at its cornerstone assets, and approximately $23 million at Brio Gold. The Company treats copper as a by-product and applies all sustaining capital to gold and silver ounces.
Expansionary capital spending for 2015 is expected to be approximately $90 to $140 million, this includes initial capital spend on the construction of Cerro Moro and projects to increase recoveries at Chapada. The Company remains committed to allocating capital to those opportunities that can most readily contribute to cash flow.
The Company expects to spend between $70 to $98 million, including $7 million at Brio Gold, on exploration where the focus continues to be on near mine exploration and ounces that can most quickly be brought into production and contribute to cash flow generation.
For 2015, depreciation, depletion and amortization (“DD&A”) is expected to be approximately $570 million or approximately $395 per ounce of gold and $6 per ounce of silver. All of DD&A has been applied to gold and silver. None has been allocated to copper as the Company treats copper as a by-product credit to operating costs.
General and administrative (“G&A”) expenses for 2015 are expected to be approximately $120 million including Brio and other mine G&A expenses. This excludes continuing rationalization of corporate G&A expenses at the São Paulo office for which the full benefit will be realized in 2016.
Key 2015 commodity and foreign exchange price assumptions are presented below in table 3.3.
Table 3.3
| 2015 Metal and Currency Assumptions | |||
| Gold (US$/oz) | $ | 1,150.00 | |
| Silver (US$/oz) | $ | 16.00 | |
| Copper (US$/lb) | $ | 3.00 | |
| Zinc (US$/lb) | $ | 0.90 | |
| C$/US$ | $ | 1.18 | |
| BRL/US$ | $ | 2.70 | |
| ARS/US$ | $ | 10.50 | |
| CLP/US$ | $ | 625.00 | |
| MXP/US$ | $ | 14.00 | |
4. SUMMARY OF FINANCIAL AND OPERATING STATISTICS
4.1 Annual Financial Statistics
| For the years ended December 31, | 2014 | 2013 | 2012 | ||||||
Net (loss)/earnings per share attributable to Yamana Gold Inc. equity holders - basic and diluted | $ | (1.69 | ) | $ | (0.59 | ) | $ | 0.59 | |
| (Loss)/earnings from continuing operations per share attributable to Yamana Gold Inc. equity holders - basic and diluted | $ | (1.46 | ) | $ | (0.36 | ) | $ | 0.59 | |
Adjusted earnings per share (i)(ii) from continuing operations attributable to Yamana Gold Inc. equity holders. - basic and diluted | $ | 0.05 | $ | 0.36 | $ | 0.93 | |||
| Dividends declared per share | $ | 0.1275 | $ | 0.2600 | $ | 0.2400 | |||
| Dividends paid per share | $ | 0.1775 | $ | 0.2600 | $ | 0.2250 | |||
| Weighted average number of common shares outstanding - basic (in thousands) | 820,782 | 752,697 | 748,095 | ||||||
| Weighted average number of common shares outstanding - diluted (in thousands) | 822,505 | 752,697 | 749,591 | ||||||
| (In thousands of Dollars; unless otherwise noted) | |||||||||
(Loss)/earnings from continuing operations attributable to Yamana Gold Inc. equity holders | $ | (1,194,867 | ) | $ | (302,330 | ) | $ | 447,113 | |
| Adjusted earnings from continuing operations attributable to Yamana Gold Inc. equity holders (i) | $ | 41,532 | $ | 274,054 | $ | 697,203 | |||
| Revenue | $ | 1,835,122 | $ | 1,842,682 | $ | 2,336,762 | |||
| Mine operating earnings | $ | 285,776 | $ | 540,778 | $ | 1,121,270 | |||
| Cash flows from operating activities from continuing operations (v) | $ | 513,929 | $ | 564,996 | $ | 1,044,442 | |||
Cash flows from operating activities before changes in non-cash working capital (i) (v) | $ | 594,998 | $ | 707,814 | $ | 1,047,380 | |||
| Cash flows used in investing activities from continuing operations (v) | $ | (1,081,699 | ) | $ | 965,548 | $ | (1,374,540 | ) | |
| Cash flows from financing activities from continuing operations (v) | $ | 540,143 | $ | 283,843 | $ | 146,399 | |||
Average realized gold price per ounce (iii) | $ | 1,256 | $ | 1,408 | $ | 1,670 | |||
Average realized copper price per pound (iii) | $ | 3.12 | $ | 3.28 | $ | 3.60 | |||
Average realized silver price per ounce (iii) | $ | 18.84 | $ | 23.73 | $ | 30.46 | |||
Average market gold price per ounce (iv) | $ | 1,266 | $ | 1,411 | $ | 1,669 | |||
Average market copper price per pound (iv) | $ | 3.11 | $ | 3.32 | $ | 3.61 | |||
Average market silver price per ounce (iv) | $ | 19.07 | $ | 23.85 | $ | 31.17 | |||
| As at December 31, | 2014 | 2013 | 2012 |
| Total assets | 12,538,853 | 11,410,717 | 11,800,163 |
| Total long-term liabilities | 5,077,884 | 3,615,464 | 3,269,266 |
| Total equity | 6,732,861 | 7,158,105 | 7,861,878 |
| Working capital | 55,899 | 79,725 | 255,152 |
_____________________________
| (i) | A cautionary note regarding non-GAAP measures and their respective reconciliations is included in Section 14 of this Management's Discussion and Analysis including a discussion and definition of Adjusted Earnings, Adjusted Earnings per Share, and additional measures. |
| (ii) | The dilution effect of the convertible debt recognized in net earnings is a non-cash factor which is excluded in determining Adjusted Earnings. Therefore, the dilution effect of the convertible debt has no effect on the calculation of Adjusted Earnings per share. |
| (iii) | Realized prices based on gross sales compared to market prices for metals may vary due to infrequent shipments and depending on timing of the sales. |
| (iv) | Source of information: Bloomberg. |
| (v) | Cash flow balances are attributable to Yamana Gold Inc. equity holders. |
4.2 Annual Operating Statistics
| For the years ended December 31, | 2014 | 2013 | ||||
| Gold Equivalent Ounces (GEO) Production (i) | ||||||
Chapada (ii) | 113,386 | 110,618 | ||||
El Peñón (ii) | 452,120 | 467,523 | ||||
| Gualcamayo | 180,412 | 120,337 | ||||
Mercedes (ii) | 113,174 | 141,618 | ||||
Canadian Malartic (iv) | 143,008 | n/a | ||||
Minera Florida (ii) | 119,582 | 118,590 | ||||
| Jacobina | 75,650 | 73,695 | ||||
| Alumbrera | 39,650 | 39,157 | ||||
Brio Gold (vi) | 144,663 | 98,450 | ||||
Total GEO production (i), from continuing operations | 1,381,645 | 1,169,988 | ||||
| Ernesto Pau-a-Pique (discontinued operations) | 18,917 | 27,571 | ||||
Total GEO production (i) | 1,400,562 | 1,197,559 | ||||
Cash costs from continuing operations per GEO (i) (v) | ||||||
| Chapada | $ | (981 | ) | $ | (1,296 | ) |
| El Peñón | 488 | 485 | ||||
| Gualcamayo | 796 | 772 | ||||
| Mercedes | 671 | 496 | ||||
Canadian Malartic (iv) | 702 | n/a | ||||
| Minera Florida | 617 | 747 | ||||
| Jacobina | 1,078 | 1,174 | ||||
| Alumbrera | (351) | (252) | ||||
Brio Gold (vi) | 798 | 808 | ||||
Cash costs from continuing operations per GEO produced (i) (v) | $ | 482 | $ | 410 | ||
Co-product cash costs from continuing operations per GEO produced (i) (v) | $ | 622 | $ | 596 | ||
Co-product cash costs per pound of copper produced (v) | $ | 1.77 | $ | 1.75 | ||
All-in sustaining costs from continuing operations per GEO (i) (v) | $ | 807 | $ | 814 | ||
All-in sustaining costs from continuing operations per GEO, co-product basis (i) (v) | $ | 899 | $ | 947 | ||
| Concentrate Production | ||||||
| Chapada concentrate production (tonnes) | 245,779 | 239,811 | ||||
| Chapada copper contained in concentrate production (millions of lbs) | 133.5 | 130.2 | ||||
Chapada co-product cash costs per pound of copper (v) | $ | 1.68 | $ | 1.65 | ||
Alumbrera attributable concentrate production (tonnes) (iii) | 49,734 | 55,115 | ||||
Alumbrera attributable copper contained in concentrate production (millions of lbs) (iii) | 28.3 | 30.2 | ||||
Alumbrera co-product cash costs per lb of copper (iii) (v) | $ | 2.24 | $ | 2.21 | ||
| Gold Equivalent Ounces Breakdown | ||||||
| Gold ounces produced | 1,197,653 | 1,029,863 | ||||
| Silver ounces produced (millions) | 10.1 | 8.4 | ||||
| Sales Included in Revenue | ||||||
| Total GEO sales (excluding 12.5% interest in Alumbrera) | 1,266,251 | 1,090,771 | ||||
| - Total gold sales (ounces) | 1,068,662 | 925,496 | ||||
| - Total silver sales (millions of ounces) | 9.9 | 8.3 | ||||
| Chapada concentrate sales (tonnes) | 241,578 | 242,681 | ||||
| Chapada payable copper contained in concentrate sales (millions of lbs) | 123.5 | 126.0 | ||||
______________________________
| (i) | Silver production is treated as a gold equivalent. Gold equivalent ounce calculations are based on an average historical silver to gold ratio (50:1). |
| (ii) | For the year ended December 31, 2014, gold production: Chapada — 107,447 ounces (2013 - 104,096 ounces), El Peñón — 282,617 ounces (2013 - 338,231), Mercedes — 105,212 ounces (2013 - 129,327 ounces), and Minera Florida — 100,076 ounces (2013 - 99,000 ounces), respectively; and the year ended silver production: Chapada — 0.3 million ounces (2013 - 0.3 million ounces), El Peñón — 8.5 million ounces (2013 - 6.5 million ounces), Mercedes — 0.4 million ounces (2013 - 0.6 million ounces), and Minera Florida — 1.0 million ounces (2013 - 1.0 million ounces), respectively. |
| (iii) | The Company holds a 12.5% equity interest in Alumbrera. |
| (iv) | On June 16, 2014, the Company acquired a 50% interest in the Canadian Malartic mine (Refer to Note 6 to the Consolidated Financial Statements). Amounts shown are for the period from June 16, 2014. |
| (v) | A cautionary note regarding non-GAAP measures and their respective reconciliations are included in Section 14 including a discussion and definition of Cash Costs. |
| (vi) | Brio Gold holdings include Fazenda Brasileiro, Pilar and C1 Santa Luz. Currently, Santa Luz is on care and maintenance. |
4.3 Fourth Quarter Financial Statistics
| For the three months ended December 31, | 2014 | 2013 | ||||
| Net loss per share attributable to Yamana equity holders - basic | $ | (0.38 | ) | $ | (0.78 | ) |
| Net loss per share attributable to Yamana equity holders - diluted | $ | (0.39 | ) | $ | (0.78 | ) |
| Loss per share from continuing operations attributable to Yamana equity holders - basic | $ | (0.34 | ) | $ | (0.55 | ) |
| Loss per share from continuing operations attributable to Yamana equity holders - diluted | $ | (0.35 | ) | $ | (0.55 | ) |
Adjusted (loss)/earnings per share (i)(ii) from continuing operations attributable to Yamana Gold Inc. equity holders. - basic and diluted | $ | (0.02 | ) | $ | 0.05 | |
| Dividends declared per share | $ | 0.0150 | $ | 0.0650 | ||
| Dividends paid per share | $ | 0.0375 | $ | 0.0650 | ||
| Weighted average number of common shares outstanding - basic (in thousands) | 877,664 | 752,995 | ||||
| Weighted average number of common shares outstanding - diluted (in thousands) | 880,841 | 752,995 | ||||
| (In thousands of United States Dollars; unless otherwise noted) | ||||||
| Loss from continuing operations attributable to Yamana equity holders | $ | (299,550 | ) | $ | (442,764 | ) |
| Adjusted (loss)/earnings from continuing operations attributable to Yamana Gold Inc. equity holders (i) | $ | (16,208 | ) | $ | 36,795 | |
| Revenues | $ | 542,943 | $ | 420,663 | ||
| Mine operating earnings | $ | 87,626 | $ | 70,113 | ||
| Cash flows from operating activities from continuing operations (v) | $ | 183,627 | $ | 165,925 | ||
Cash flows from operating activities before changes in non-cash working capital (i) (v) | $ | 166,420 | $ | 165,249 | ||
| Cash flows to investing activities from continuing operations (v) | $ | (150,670 | ) | $ | (241,157 | ) |
| Cash flows (to)/from financing activities from continuing operations (v) | $ | (10,415 | ) | $ | 66,711 | |
Average realized gold price per ounce (iii) | $ | 1,199 | $ | 1,277 | ||
Average realized copper price per pound (iii) | $ | 2.99 | $ | 3.37 | ||
Average realized silver price per ounce (iii) | $ | 16.39 | $ | 20.63 | ||
Average market gold price per ounce (iv) | $ | 1,201 | $ | 1,272 | ||
Average market copper price per pound (iv) | $ | 3.01 | $ | 3.25 | ||
Average market silver price per ounce (iv) | $ | 16.50 | $ | 20.80 | ||
_____________________________
| (i) | A cautionary note regarding non-GAAP measures and their respective reconciliations are included in Section 14 including a discussion and definition of Adjusted Earnings, Adjusted Earnings per Share, and additional measures. |
| (ii) | The dilution effect of the convertible debt recognized in net earnings is a non-cash factor which is excluded in determining Adjusted Earnings. Therefore, the dilution effect of the convertible debt has no effect on the calculation of Adjusted Earnings per share. |
| (iii) | Realized prices based on gross sales compared to market prices for metals may vary due to infrequent shipments and depending on timing of the sales. |
| (iv) | Source of information: Bloomberg. |
| (v) | Cash flow balances are attributable to Yamana Gold Inc. equity holders. |
4.4 Fourth Quarter Operating Statistics
| For the three months ended December 31, | 2014 | 2013 | ||||
| Gold Equivalent Ounces (GEO) Production (i) | ||||||
Chapada (ii) | 30,737 | 29,817 | ||||
El Peñón (ii) | 122,850 | 101,364 | ||||
| Gualcamayo | 46,009 | 34,929 | ||||
Mercedes (ii) | 32,512 | 31,716 | ||||
Canadian Malartic (iv) | 66,369 | n/a | ||||
Minera Florida (ii) | 31,641 | 30,513 | ||||
| Jacobina | 20,909 | 19,519 | ||||
| Alumbrera | 13,704 | 11,319 | ||||
Brio Gold (vi) | 38,470 | 34,884 | ||||
Total GEO production (i), from continuing operations | 403,201 | 294,061 | ||||
| Ernesto Pau-a-Pique (discontinued operations) | 2,414 | 9,707 | ||||
Total GEO production (i) | 405,615 | 303,768 | ||||
Cash costs from continuing operations per GEO (i) (v) | ||||||
| Chapada | $ | (1,150 | ) | $ | (1,547 | ) |
| El Peñón | 482 | 593 | ||||
| Gualcamayo | 886 | 825 | ||||
| Mercedes | 620 | 656 | ||||
Canadian Malartic (iv) | 684 | n/a | ||||
| Minera Florida | 609 | 592 | ||||
| Jacobina | 959 | 1,140 | ||||
| Alumbrera | (14 | (261 | ||||
Brio Gold (vi) | 671 | 809 | ||||
Cash costs from continuing operations per GEO produced (i) (iv) | $ | 484 | $ | 417 | ||
Co-product cash costs from continuing operations per GEO produced (i) (iv) | $ | 608 | $ | 647 | ||
Co-product cash costs per pound of copper produced (iv) | $ | 1.61 | $ | 1.58 | ||
All-in sustaining costs from continuing operations per GEO (i) (iv) | $ | 774 | $ | 754 | ||
All-in sustaining costs from continuing operations per GEO, co-product basis (i) (iv) | $ | 852 | $ | 935 | ||
| Concentrate Production | ||||||
| Chapada concentrate production (tonnes) | 63,955 | 67,395 | ||||
| Chapada copper contained in concentrate production (millions of lbs) | 35.0 | 36.0 | ||||
Chapada co-product cash costs per pound of copper (iv) | $ | 1.57 | $ | 1.53 | ||
Alumbrera attributable concentrate production (tonnes) (iii) | 16,043 | 17,547 | ||||
Alumbrera attributable copper contained in concentrate production (millions of lbs) (iii) | 9.1 | 9.6 | ||||
Alumbrera co-product cash costs per lb of copper (iii) (iv) | $ | 1.78 | $ | 1.75 | ||
| Gold Equivalent Ounces Breakdown | ||||||
| Gold ounces produced | 352,574 | 233,816 | ||||
| Silver ounces produced (millions) | 2.7 | 2.2 | ||||
| Sales Included in Revenue | ||||||
| Total GEO sales (excluding 12.5% interest in Alumbrera) | 402,043 | 260,568 | ||||
| - Total gold sales (ounces) | 346,588 | 218,223 | ||||
| - Total silver sales (millions of ounces) | 2.8 | 2.1 | ||||
| Chapada concentrate sales (tonnes) | 66,534 | 67,616 | ||||
| Chapada payable copper contained in concentrate sales (millions of lbs) | 33.8 | 34.5 | ||||
______________________________
| (i) | Silver production is treated as a gold equivalent. Gold equivalent ounce calculations are based on an average historical silver to gold ratio (50:1) which is used and presented solely for quarter-over-quarter comparative purposes only. |
| (ii) | Three-month gold production for the periods ended December 31, 2014: Chapada - 29,270 ounces (2013 - 28,223 ounces), El Peñón - 77,111 ounces (2013 - 68,246 ounces), Mercedes - 30,364 ounces (2013 - 28,821 ounces), and Minera Florida - 27,953 ounces (2013 - 24,539 ounces); and three-month silver production: Chapada - 73,310 ounces (2013 - 79,696 ounces), El Peñón - 2.3 million ounces (2013 - 1.7 million ounces), Mercedes - 107,396 ounces (2013 - 144,715 ounces), and Minera Florida - 184,382 ounces (2013 - 298,696 ounces). |
| (iii) | The Company holds a 12.5% equity interest in Alumbrera. |
| (iv) | On June 16, 2014, the Company acquired a 50% interest in the Canadian Malartic mine (Refer to Note 6 to the Consolidated Financial Statements). Amounts shown for the period from June 16, 2014. |
| (v) | A cautionary note regarding non-GAAP measures and their respective reconciliations are included in Section 14 including a discussion and definition of Cash Costs. |
| (vi) | Brio Gold holdings include Fazenda Brasileiro, Pilar and C1 Santa Luz. Currently, Santa Luz is on care and maintenance. Commissioning production related to Brio Gold is included. |
5. OVERVIEW OF RESULTS
5.1 Annual Overview of Financial Results
| For the years ended December31, (In thousands of Dollars; unless otherwise noted) | 2014 | 2013 | ||||||||||
| Revenue | $ | 1,835,122 | $ | 1,842,682 | ||||||||
| Cost of sales excluding depletion, depreciation and amortization | (1,045,827) | (900,789) | ||||||||||
| Gross margin excluding depletion, depreciation and amortization | 789,295 | 941,893 | ||||||||||
| Depletion, depreciation and amortization | (503,519) | (401,115) | ||||||||||
| Mine operating earnings | 285,776 | 540,778 | ||||||||||
Other expenses (i) | (361,836) | (246,518) | ||||||||||
| Equity loss from associate | (7,107) | (3,905) | ||||||||||
| Impairment of mineral properties | (752,919) | (507,273 | ||||||||||
| Loss from operations before income taxes | (836,086 | (216,918) | ||||||||||
| Income tax expense | (358,781) | (85,412 | ||||||||||
| Net loss from continuing operations | (1,194,867 | ) | (302,330 | ) | ||||||||
| Loss from discontinuing operations | (188,206 | ) | (172,021 | ) | ||||||||
| Net loss | $ | (1,383,073 | ) | $ | (474,351 | ) | ||||||
Adjusted earnings adjustments (ii): | ||||||||||||
| Net loss from continuing operations | $ | (1,194,867 | ) | $ | (302,330 | ) | ||||||
| Non-cash unrealized foreign exchange losses | 60,813 | 42,503 | ||||||||||
| Impact of change in Mexican tax rates on non-cash deferred tax expense | — | 28,323 | ||||||||||
| Impact of change in Chilean tax rates on non-cash deferred tax expense | 329,498 | — | ||||||||||
| Share-based payments/mark-to-market of deferred share units | 5,832 | 7,683 | ||||||||||
| Transaction costs related to the acquisition of Osisko | 30,766 | — | ||||||||||
| Loss on sale of assets | 4,429 | — | ||||||||||
| Impairment of mineral properties | 752,919 | 507,273 | ||||||||||
| Impairment of investment in available-for-sale securities and other assets | 43,044 | 70,234 | ||||||||||
| Other non-recurring provisions, reorganization, demobilization and other adjustments | 91,335 | 20,695 | ||||||||||
| Adjusted earnings before income tax effect | 123,769 | 374,381 | ||||||||||
| Income tax effect of adjustments | (82,237 | ) | (100,327 | ) | ||||||||
Adjusted earnings from continuing operations attributable to Yamana Gold Inc. equity holders (ii) | $ | 41,532 | $ | 274,054 | ||||||||
| Loss per share from continuing operations attributable to Yamana equity holders - basic and diluted | $ | (1.46 | ) | $ | (0.36 | ) | ||||||
Adjusted earnings per share from continuing operations attributable to Yamana Gold Inc. equity holders (ii)(iii) - basic and diluted | $ | 0.05 | $ | 0.36 | ||||||||
Adjusted Operating Cash Flows (ii): | ||||||||||||
| Cash flows from operating activities before non-cash working capital | $ | 594,998 | $ | 707,814 | ||||||||
| Cash portion of reorganization costs | 12,206 | — | ||||||||||
| Cash portion of demobilization costs | 9,625 | — | ||||||||||
| Transaction costs related to the acquisition of Osisko | 30,766 | — | ||||||||||
| Adjusted Operating Cash Flows | $ | 647,595 | $ | 707,814 | ||||||||
______________________________
| (i) | For the year ended December 31, 2014, other expenses represent the aggregate of the following expenses: general and administrative of $122.4 million (2013 - 135.3 million), exploration and evaluation of $20.0 million (2013 - $30.2 million), other expense of $189.2 million (2013 - $78.1 million) and net finance expense of $30.3 million (2013 - expense $2.9 million). |
| (ii) | A cautionary note regarding non-GAAP measures and their respective reconciliations are included in Section 14 of this Management's Discussion and Analysis including a discussion and definition of Adjusted Earnings and Adjusted Earnings per Share. Cash flow balances are attributable to Yamana Gold Inc. equity holders. |
| (iii) | The dilution effect of the convertible debt recognized in net earnings is a non-cash factor which is excluded in determining Adjusted Earnings. Therefore, the dilution effect of the convertible debt has no effect on the calculation of Adjusted Earnings per share. |
Impairment of Assets
During the year ended December 31, 2014, the Company recorded impairment charges totalling $904.3 million ($823.7 million on an after-tax basis), of which $236.0 million was recognized in the fourth quarter and $668.3 million was recognized in the third quarter as follows:
| (In millions) | Q3 2014 | Q4 2014 | Total 2014 | |||||||||||||||||||||||||
| Project | Impairment (Pre-Tax) | Impairment (After-Tax) | Impairment (Pre-Tax) | Impairment (After-Tax) | Impairment (Pre-Tax) | Impairment (After-Tax) | Net Book Value - as at Dec. 31, 2014 | |||||||||||||||||||||
| Jacobina | $ | — | $ | — | $ | 186.4 | $ | 158.0 | $ | 186.4 | $ | 158.0 | $ | 723.7 | ||||||||||||||
| Minera Florida | — | — | 26.6 | 17.3 | 26.6 | 17.3 | 659.5 | |||||||||||||||||||||
| Pilar | 179.2 | 164.0 | — | — | 179.2 | 164.0 | 365.0 | |||||||||||||||||||||
| C1 Santa Luz | 360.7 | 334.1 | — | — | 360.7 | 334.1 | 41.6 | |||||||||||||||||||||
| Total impairments from continuing operations | 539.9 | 498.1 | 213.0 | 175.3 | 752.9 | 673.4 | — | |||||||||||||||||||||
| Ernesto/Pau-a-Pique - discontinued operations | 128.4 | 137.3 | 23.0 | 23.0 | 151.4 | 160.3 | — | |||||||||||||||||||||
| Total impairments | $ | 668.3 | $ | 635.4 | $ | 236.0 | $ | 198.3 | $ | 904.3 | $ | 833.7 | $ | — | ||||||||||||||
During the fourth quarter, the Company performed its annual impairment test based on updated life of mine after-tax cash flow projections which were revised for updated reasonable estimates of future metal prices, production based on current estimates of recoverable mineral reserves and mineral resources, recent operating and exploration results, exploration potential, future operating costs, capital expenditures, inflation and long-term foreign exchange rates. The Company examined future cash flows, the intrinsic value beyond proven and probable mineral reserves, value of land holdings, as well as other factors, which are determinants of commercial viability of each mining property in its portfolio.
Based on updated life of mine plans, Jacobina’s return on capital expenditures over the last seven years is below the Company’s acceptable expected return on investment. In 2009, the Company completed a $50 million expansion to the plant to provide an additional throughput capacity level of 6,500 to 7,000 tonnes per day. In 2014, the average throughput level declined to below 4,000 tonnes per day and current life of mine plans contemplate a throughput rate in this range going forward. While attempting to reach capacity at the plant, dilution controls were lost and development wasted in veins without proper definition resulting in lower than expected grades. As a result, Jacobina has experienced low operational flexibility with development and drilling behind schedule and catch up is required in areas to improve grade reconciliation; and dilution has increased as a result of drilling and blasting techniques that were not optimized leading to higher costs. In 2013, the Company impaired $55 million in goodwill relating to Jacobina. During the fourth quarter, the Company concluded that an impairment charge of $186.4 million ($158.0 million on an after-tax basis) should be recognized in respect to Jacobina. In response to the operational challenges at Jacobina, the Company undertook a remediation plan that included:
| • | Reassignment of oversight of the mine to the Chilean operations with underground expertise. |
| • | Implementation of a revised mine plan focusing and targeting development of higher grade areas with a goal to increase the high grade stockpile improving the definition gap and grade controls/dilution while reducing costs. |
| • | Re-training of staff on underground mining and blasting techniques by experienced operators from El Peñón. |
| • | Underground improvements on ventilation and drainage. |
During the third quarter, in light of the operational challenges with C1 Santa Luz, Ernesto/Pau-Pique and Pilar, a critical review of carrying values of these assets was performed and the Company recognized an impairment charge in the amount of $668.3 million ($635.4 million on an after-tax basis). In the fourth quarter, efforts to improve grade reconciliation in certain areas of Ernesto/Pau-Pique did not achieve the expected levels set by management requiring an update to the life of mine plan projections. This resulted in a further impairment charge of $23.0 million on a pre- and after-tax basis in respect of Ernesto/Pau-Pique in the fourth quarter including $10 million in respect to indirect tax balances which are not expected to be recoverable at Ernesto/Pau-a-Pique. In 2011, the Company began to construct a portfolio of projects including Mercedes, Ernesto/Pau-a-Pique, C1 Santa Luz and Pilar in an environment where metal prices were 20% higher than they are today. The Company was successful in the delivery of certain projects, on time and on budget, while others have been met with certain challenges in the current volatile economic environment. The development of Mercedes was a success and met all initial objectives. While there have been challenges with certain other projects, the Company is committed to a consistent business philosophy of following a balanced strategy and remains
focused on value creation even if that means producing fewer ounces. As such in the third quarter, the Company felt it necessary to suspend commissioning activities at C1 Santa Luz and place the project on care and maintenance, such that the potential future viability of the project is preserved while several identified alternative metallurgical processes continue to be evaluated to improve recovery. The Company had also previously reduced activity at Ernesto/Pau-a-Pique and the mineral interests have been written down to $nil in 2014. While commercial production has been declared at Pilar effective October 1, 2014, it too has been met with challenges during commissioning and now has a decreased production expectation relative to feasibility levels.
The Company continues to review all options to maximize value above current carrying values and in the case of these assets, the evaluation of new metallurgical plans and the possible monetization of some or all of these assets. In the fourth quarter, the Company announced its strategic plans to segregate non-core assets improving the prospects for certain underperforming assets that have yet to reach their potential, notably Pilar and C1 Santa Luz, through the creation of a new operational unit, that includes Fazenda Brasileiro, Pilar and C1 Santa Luz (in aggregate called “Brio Gold”) and the addition of a new management team that will carry on efforts of operational improvements and optimizations of the Brio Gold assets allowing existing management to focus on the Company’s core asset portfolio.
In addition to the impairment charges noted above, an additional $26.6 million was recognized in 2014 in respect of the Minera Florida mine.
In 2013, impairment charges included:
| • | $181.1 million in respect of exploration properties in Argentina, |
| • | $80.9 million in respect of Amancaya in Chile as a result of the continuous downward trend in metal prices resulting in a lower in situ market and income values for exploration potential and below-expectation exploration results, |
| • | $110.0 million was recognized against the carrying value of the Jeronimo in Chile on the decision of not proceeding with construction, |
| • | $70.0 million in respect of Alumbrera was recognized against the carrying value of the Company’s 12.5% equity interest in the Alumbrera mine due to the continuous downward trend in metal prices, and |
| • | $10.3 million related to minor exploration properties on the decision of not proceeding with further exploration and/or disposition. |
The Company has also determined that there is no indication that an impairment loss recognized in prior periods should be reversed in whole or in part.
The Company continues to consider, on a regular basis, whether other indicators exist that suggest that the carrying values of its assets are impaired for accounting purposes. While the market capitalization relative to the carrying value of the Company’s assets is reviewed on a regular basis, it is not considered as the sole indicator of impairment. Given recent strategic developments the Company has achieved, and the volatility of the market reflecting the current economic sentiment, using the current share price as a sole determinant of fair value is not reasonable; however the Company monitors the magnitude of the gap between the Company market capitalization and the asset carrying values. Although the Company's market capitalization around December 31, 2014 is below the carrying value of the net assets (net of long term debt), based on the impairment assessments, the Company has determined that the impairment recognized in the year ended December 31, 2014 are appropriate. The Company believes that its share price has been penalized recently due to the decline in metal prices and, relative to industry peers, as a result of underperforming construction projects. However, the Company believes that this does not impact the Company’s ability to generate cash flows from its cornerstone assets which support the net book values on a discounted cash flow basis. The Company believes that the recent decline in the Company’s market capitalization is not due to any fundamental changes or adverse events in the Company’s operations and has previously impaired projects that have been met with certain operational challenges.
Additionally, below are certain factors which the Company believes further support the carrying values of its assets and are not fully reflected in the Company’s market capitalization:
| • | The addition of another cornerstone asset, the Canadian Malartic mine located in Canada with aggregate proven and probable mineral reserves of 8.9 million ounces of gold (100% basis). |
| • | The Company has obtained necessary permits to carry out its operations including new areas for development in 2015 and future periods. |
| • | The Company completed or is in the process of completing feasibility studies that demonstrate net present values in excess of the carrying values of the respective projects involved. |
| • | Subsequent to the year end, the Company closed on a C$299.3 million bought deal offering of 56.5 million common shares at a share price of C$5.30 per shares. |
For the year ended December 31, 2014
Cash flows from operating activities from continuing operations after changes in non-cash working capital items for the year ended December 31, 2014 were $513.9 million compared to $565.0 million for the year ended December 31, 2013. Cash flows from operating activities before changes in non-cash working capital for the year ended December 31, 2014 were $595.0 million compared to $707.9 million in 2013. Lower cash flows from operating activities compared to that of 2013 were due to $32.4 million in transaction costs associated with the acquisition of a 50% interest in Osisko and reorganization and demobilization costs of $21.8 million. Adjusted operating cash flows excluding these one-time expenditures were $647.6 million.
Net loss from continuing operations attributable to Yamana equity holders for the year ended December 31, 2014 was $1.2 billion or $1.46 per share, compared to net loss from continuing operations attributable to Yamana equity holders of $274.2 million or $0.36 per share for the year ended December 31, 2013. Net loss from continuing operations of $1.2 billion was after a non-cash tax accrual on deferred tax liabilities resulting from newly enacted Chilean tax changes of $329.5 million, impairment charges in respect of certain mines of $752.9 million and non-recurring charges including $32.4 million in transaction costs related to the acquisition of a 50% interest in Osisko, $17.9 million in respect of reorganization and demobilization costs relating to placing C1 Santa Luz on care and maintenance and non-recurring provisions. Consistent with IFRS, these items have been recognized during the period incurred. The Company has excluded these items from its adjusted loss as these items are non-cash and non-recurring in nature and do not reflect the underlying performance of ongoing operations.
Adjusted earnings (a non-GAAP measure, see Section 14) from continuing operations was $41.5 million or $0.05 per share for the year ended December 31, 2014, compared to adjusted earnings from continuing operations of $274.1 million or $0.36 per share for the year ended December 31, 2013. Mine operating earnings for the year ended December 31, 2014 were $285.8 million, compared to $540.8 million in 2013. Lower adjusted earnings and mine operating earnings for 2014 was attributed to lower realized metal prices of approximately 11% for gold, 21% for silver and 5% for copper, higher cash costs and depletion, depreciation and amortization expense. Adjusted earnings from continuing operations for the year does not include tax benefits associated with taxable losses from certain mines including mines in commissioning and reflects interest expense on additional and assumed debt. Income tax expense included in adjusted earnings from continuing operations was $82.2 million for the year ended December 31, 2014 compared to a tax expense of $100.3 million in 2013.
Income tax expense for the year ended December 31, 2014 was $358.8 million compared to an income tax expense of $85.4 million in 2013. In September 2014, the Chilean government enacted a Chilean tax reform package. Approximately $329.5 million of the income tax expense for the year relates to the impact of the tax reform package on historical deferred tax balances. This change in the income tax expense was excluded from adjusted loss. Section 10 - Income Taxes describes further details on the change to the Chilean tax rates.
Revenue was $1.84 billion for the year ended December 31, 2014 compared to $1.84 billion in 2013. Higher volume of sales was offset by lower metal prices relative to 2013. Revenue for the year ended December 31, 2014 was generated from the sale of 1.1 million ounces of gold, 9.9 million ounces of silver and 123.5 million pounds of copper, excluding attributable sales from Alumbrera which is accounted for as an equity investment. This compares to sales, excluding Alumbrera, of 925,496 ounces of gold, 8.3 million ounces of silver and 126.0 million pounds of copper for the year ended December 31, 2013.
The average realized price of gold in 2014 was $1,256 per ounce compared to $1,408 per ounce in 2013, or 11% lower. The average realized price of copper was $3.12 per pound in 2014 compared to $3.28 per pound in 2013, or 5% lower, and the average realized price of silver was $18.84 per ounce in 2014 compared to $23.73 per ounce in 2013, or 21% lower.
Revenue for the year ended December 31, 2014 was comprised of the following:
| For the year ended December 31, | 2014 | 2013 | ||||||||||
| (In thousands of Dollars; unless otherwise noted) | Quantity Sold (ii) | Realized Price | Revenue | Revenue | ||||||||
Gold (i) | 1,068,662 | oz | $ | 1,256 | $ | 1,342,762 | $ | 1,302,687 | ||||
| Silver | 9,879,448 | oz | $ | 18.84 | 186,149 | 196,129 | ||||||
| Total precious metals | 1,266,251 | GEO | 1,528,911 | 1,498,816 | ||||||||
Copper (i) | 123,463,744 | lbs | $ | 3.12 | 384,692 | 413,609 | ||||||
| Gross revenue | $ | 1,913,603 | $ | 1,912,425 | ||||||||
| (Deduct)/add: | ||||||||||||
| - Treatment and refining charges of gold and copper concentrate | $ | (36,246) | $ | (33,163) | ||||||||
| - Sales taxes | (30,794) | (26,417) | ||||||||||
| - Metal price adjustments related to concentrate revenue | (14,579) | (10,493) | ||||||||||
| - Other adjustments | 3,138 | 330 | ||||||||||
Revenue (ii) | $ | 1,835,122 | $ | 1,842,682 | ||||||||
______________________________
| (i) | Includes payable copper and gold contained in concentrate. |
| (ii) | Excludes Alumbrera which is accounted for as an equity investment and Ernesto/Pau-a-Pique which is an asset held-for-sale |
Cost of sales excluding depletion, depreciation and amortization for the year ended December 31, 2014 was $1.0 billion compared to $900.8 million in 2013. Cost of sales excluding depletion, depreciation and amortization was higher than that of 2013 due to higher sales volume.
The following table provides a reconciliation of the co-product cash cost to the cost of sales excluding depletion, depreciation and amortization for the year ended December 31, 2014:
| For the year ended December 31, | 2014 | 2013 | |||||||||
| (In thousands of Dollars; unless otherwise noted) | GEO or Pounds of Copper Produced (iii) | Co-product Cash Cost per Unit | Total Costs | Total Costs | |||||||
Chapada — GEO (i) | 113,386 | oz | $ | 406 | $ | 46,082 | $ | 44,297 | |||
| Chapada — Copper | 133,451,807 | lbs | 1.68 | 223,631 | 214,481 | ||||||
El Peñón — GEO (i) | 452,120 | oz | 488 | 220,614 | 226,628 | ||||||
| Gualcamayo | 180,412 | oz | 796 | 143,531 | 92,844 | ||||||
Mercedes — GEO (i) | 113,174 | oz | 671 | 75,907 | 70,301 | ||||||
Canadian Malartic (50% interest) (ii) | 143,008 | oz | 702 | 100,347 | — | ||||||
Minera Florida — GEO (i) | 119,582 | oz | 617 | 73,773 | 88,621 | ||||||
| Jacobina | 75,650 | oz | 1,078 | 81,559 | 86,488 | ||||||
| Brio Gold | 82,945 | oz | 798 | $ | 66,170 | $ | 56,622 | ||||
Co-product cash cost of sales (iv) | $ | 1,031,614 | $ | 880,282 | |||||||
| Add (deduct): | |||||||||||
| - Inventory movements and adjustments | 28,891 | 25,788 | |||||||||
| - Chapada concentrate treatment and refining charges | (36,247) | (33,163) | |||||||||
| - Commercial and other costs | 7,012 | 11,325 | |||||||||
| - Overseas freight for Chapada concentrate | 14,557 | 16,557 | |||||||||
| Cost of sales excluding depletion, depreciation and amortization | $ | 1,045,827 | $ | 900,789 | |||||||
______________________________
| (i) | Silver ounces reported for Chapada, El Peñón, Minera Florida and Mercedes are treated as gold equivalent ounces ("GEO"). |
| (ii) | For the period from acquisition on June 16, 2014. |
| (iii) | Excludes Alumbrera which is accounted for as an equity investment and Ernesto/Pau-a-Pique which is a discontinued operation. |
| (iv) | A cautionary note regarding non-GAAP measures is included in Section 14 of this Management’s Discussion and Analysis of Operations and Financial Condition. |
Depletion, depreciation and amortization (“DDA”) expense for the year ended December 31, 2014 was $503.5 million, compared to $401.1 million in 2013. Higher DDA was attributable to additional DDA following the acquisition of Canadian Malartic which closed at the end of the second quarter, Amelia Inés (open-pit) and QDD Lower West (underground) at Gualcamayo which started to contribute to production in late 2013 and Pilar which completed commissioning October 1, 2014.
Other expenses, as discussed below, include general and administrative, exploration and evaluation, other and net finance expenses were $361.8 million for the year ended December 31, 2014, compared to $246.5 million in 2013. For the year ended December 31, 2014:
| • | General and administrative expenses were $122.4 million, compared to $135.3 million in 2013. Lower general and administrative expenses reflect cost containment initiatives undertaken by the Company more than offsetting the additional general and administrative expenses following the acquisition of Canadian Malartic for six months with no comparative balance in 2013 and Pilar as general and administrative expenses were capitalized for 2013 as it was in commissioning. |
| • | Exploration and evaluation expenses were $20.0 million, compared to $30.2 million incurred in 2013. The lower exploration and evaluation expenses is a result of the Company's reduced focus on greenfield exploration relative to the comparative period of 2013. |
| • | Other expenses were $189.2 million, compared to $78.1 million in 2013. Other expenses reflect non-recurring provisions, demobilization and reorganization costs and transaction costs related to the acquisition of a 50% interest in Osisko. |
| • | Net finance expense was $30.3 million, compared to $2.9 million in 2013. Higher net finance expense reflects higher interest expense due to additional long-term debt and lower capitalized interest on projects compared to the same period of 2013. |
Equity loss from Alumbrera was $7.1 million for the year ended December 31, 2014 compared to equity loss of $3.9 million for the same period of 2013. Equity loss was due to lower metal prices and impairment of assets attributable from Alumbrera. Cash dividends received from the Company’s equity investment in Alumbrera during 2014 were $44.2 million compared to $27.9 million in 2013.
Acquisition of 50% interest of Osisko Mining Corporation
On June 16, 2014, the Company and Agnico jointly acquired 100% of all issued and outstanding common shares (with each company owning 50%) of Osisko. Osisko operated the Canadian Malartic mine in the Abitibi Gold Belt, immediately south of the town of Malartic located in the province of Quebec, Canada. Additionally, Osisko conducted advanced exploration activities at the Kirkland Lake and Hammond Reef properties in Northern Ontario, Canada and additional exploration projects located in the Americas. As of June 15, 2014, the estimated global measured and indicated mineral resources for Canadian Malartic was estimated at 10.8 million ounces of gold, inclusive of proven and probable mineral reserves of 8.9 million ounces of gold. The estimated gold inferred mineral resources were 1.14 million ounces. Total consideration paid by Yamana was $1.5 billion based on a Yamana share price of $8.18 (C$8.88) per share which consisted of approximately $0.5 billion in cash and $1.0 billion in Yamana shares.
The acquisition supports the Company’s strategy, adding another high quality, high margin cornerstone asset that increases the sustainable production level and is expected to contribute significantly to cash flow.
The Company has recognized its interest in the assets, liabilities, revenues and expenses of Osisko in accordance with the Company's rights and obligations prescribed by the transaction, as the joint arrangement was determined to be a joint operation under IFRS. The preliminary fair value of net assets acquired is included in the Consolidated Balance Sheet as at December 31, 2014, was based on estimates and has not been finalized. The Company is undergoing a detailed valuation of the fair value of assets acquired, liabilities assumed and potential goodwill. The actual fair values of the assets and liabilities may differ materially from the amounts disclosed in the preliminary purchase price allocation and are subject to change.
Bought Deal Equity Offering
Subsequent to the year ended December 31, 2014, the Company closed on a bought deal offering of 49.1 million common shares at a share price of C$5.30 per share for gross proceeds of approximately C$260.2 million (the "Offering"). The shares were offered by way of a short-form prospectus in all of the provinces of Canada. In addition, the Company granted to the underwriters an option (the “Over-Allotment Option”) to purchase from the Company up to an additional 7.4 million common shares at a price of C$5.30 per share for a total of 56.5 million common shares, on the same terms and conditions as the Offering, exercisable any time, in whole or in part, until the date that was 30 days after and including the closing date (February 3, 2014) of the Offering. The Over-Allotment Option was exercised in full, bringing the total gross proceeds to the Company of C$299.3 million. The net proceeds of the Offering are being used for general corporate purposes, to reduce the Company’s debt position and to overall further strengthen the balance sheet. This action provides flexibility and places the Company in a stronger position to deliver future growth.
5.2 Annual Overview of Quarterly Operating Results
For the year ended December 31, 2014
Record production for the year ended December 31, 2014 of 1.40 million GEO, compared to 1.20 million GEO produced in 2013. Total production includes production from continuing operations of 1.38 million GEO, compared to 1.17 million in 2013. The Company's portfolio of cornerstone assets demonstrates reliability and the flexibility to compensate for the operational challenges of the remaining non-core portfolio. Total production included production during commissioning of 68,716 ounces of gold for 2014 compared to 55,942 for the year ended December 31, 2013. Total production from cornerstone assets was 1.2 million GEO compared to 1.0 million GEO in 2013 representing an increase of 16%.
The following summarizes the cumulative effect of GEO production at each mine for the years ended December 31, 2014 and December 31, 2013:

| (i) | On June 16, 2014, the Company acquired a 50% interest in the Canadian Malartic mine. Amounts shown for the period from June 16, 2014. |
Total commercial production for the year ended December 31, 2014 was 1.3 million GEO compared to 1.1 million GEO produced in 2013. Total commercial production consisted of 1.13 million of gold and 10.1 million ounces of silver, compared to 973,921 ounces of gold and 8.4 million ounces of silver produced in 2013. The Company continued to focus on its cornerstone portfolio in 2014 as these contribute most significantly to production at lower costs, cash flow and have significant upside and potential. Total annual production includes the production contribution from QDD Lower West underground mine and from Amelia Inés at Gualcamayo which achieved a new record for the mine, additional attributable production from the newly acquired 50% interest in Canadian Malartic which also achieved a record annual production at 100% basis. Additionally, developments at Jacobina and Minera Florida where efforts to focus on producing quality ounces with sustainable margins and maximizing profitability continued. In particular, the Company completed a new life of mine plan for Jacobina which contemplates a more consistent production level at higher grades starting late 2014 with further grade increases beginning in 2015. Following several cost containment initiatives, Jacobina achieved a 8% reduction in cash costs relative to 2013. Mineral Florida achieving a record production with a 17% reduction in cash costs relative to 2013. At Mercedes, annual production was impacted by unplanned production events delaying access to originally planned higher grade areas and the mine sequencing. Several initiatives are under review and will be mostly driven by continuous improvement and re-engineering of processes which should result in a gain in productivity at a lower cost.
The Company continues to unlock significant potential from cornerstone assets particularly with the recent discovery of the Ventura vein at El Peñón and Sucupira and Santa Cruz at Chapada improving the operational outlook in the long term as these are close to existing mine infrastructure and could be quickly and easily be brought into production. Similarly at Gualcamayo, results gathered from the newly discovered carbonates mineral resource continue to support the potential for a large scale, bulk tonnage underground operation with several drilling intersections exceeding 100 metres.
Building on the success of a record setting year, focusing on liquidity and cash flow while streamlining the asset base to deliver organic growth firmly positions the Company providing the ability to respond to economic conditions.
During the year, developments were made in other non-core assets. In the third quarter, the Company concluded that the optimal plan for C1 Santa Luz would be to suspend commissioning activities and place the project on care and maintenance while several identified alternative metallurgical processes continue to be evaluated such that the potential future viability of the project is preserved. Pilar completed commissioning and declared commercial production effective October 1, 2014. Ernesto Pau/pique completed commissioning effective May 1, 2014, but continued to operate at sub economic production and cost levels and operated at a loss. There is a formal plan in progress to sell this non-core asset and as such it has been treated as a discontinued operation in the consolidated financial statements for year ended December 31, 2014.
Cash costs from continuing operations (a non-GAAP measure, see Section 14) for the year ended December 31, 2014 averaged $482 per GEO, compared to $410 per GEO in 2013. Cash costs were impacted by a lower copper credit contribution due to lower copper quantities sold and a decline in the copper price. The average market price for copper in the year ended 2014 was 6% lower compared to the average in 2013. Cash costs and co-product cash costs were impacted by planned lower grades at certain mines, unplanned equipment maintenance and repair costs slightly offset by the devaluation of foreign currencies compared to the year ended December 31, 2013. Co-product cash costs from continuing operations (a non-GAAP measure, see Section 14) for the year ended 2014 were $622 per GEO compared to $596 per GEO for the same period of 2013. Co-product cash costs for the year ended 2014 from cornerstone assets were $620 per GEO.
All-in sustaining costs from continuing operations ("AISC", a non-GAAP measure, see Section 14) were $807 per GEO, compared to $814 per GEO for the year ended 2013. AISC from cornerstone assets were $747 per GEO for the year ended 2014. On a co-product basis AISC were $899 per GEO for the year ended 2014 compared to $947 for the year ended 2013.
Copper production for the year ended 2014 was 133.5 million pounds from the Chapada mine, compared to 130.2 million pounds in 2013. A total of 28.3 million pounds of copper produced from Alumbrera were attributable to the Company, compared to 30.2 million pounds for the year ended December 31, 2013. Total copper production for the year ended 2014 was 161.7 million pounds, compared to 160.5 million pounds in 2013.
Co-product cash costs per pound of copper (a non-GAAP measure, see Section 14) were $1.68 per pound for the year ended December 31, 2014 from the Chapada mine compared to $1.65 per pound of copper in 2013. Co-product cash costs per pound of copper for the year ended 2014 including the Company’s interest in Alumbrera was $1.77 per pound in line compared to $1.75 per pound in 2013.
Creating Brio Gold
The Company made significant progress in 2014 in separating its core and non-core portfolios and, in the case of the latter, improving the prospects for certain previously underperforming assets that have yet to reach their potential, notably Pilar and C1 Santa Luz. To this end, the Company restructured its inter-corporate holdings to form a new operating unit, Brio Gold Inc. ("Brio Gold" or "Brio") that will hold Fazenda Brasileiro, Pilar and C1 Santa Luz as well as some related exploration concessions, all of which are currently held as non-core assets within Yamana. A new management team will carry on efforts of operational improvements and optimizations of the Brio assets allowing existing management to focus on the Company’s cornerstone assets portfolio while providing oversight and direction to the new management of the Brio assets. This approach segregates the Company’s portfolios, better focuses its efforts and allows management, in the fullness of time, to evaluate how to best maximize value of the non-core portfolio. Although this company will initially be a 100% owned subsidiary, Yamana is entrusting Brio Gold's management to both manage these assets and evaluate various strategic alternatives with respect to Brio Gold. An optimization plan and evaluation of strategic options is expected by the end of 2015. Yamana will provide oversight as alternatives are evaluated. In the short term, Yamana has committed to provide initial working capital in the form of a bridge loan of up to $10 million to Brio Gold, such loan being repayable to Yamana. Further funding of operations will be part of Brio Gold's management role in cooperation with Yamana. This approach is consistent with the Company's continuing focus on its cornerstone assets, those assets that currently or have the potential to most significantly contribute to growth in production and cash flow.
5.3 Fourth Quarter Overview of Financial Results
| For the three months ended December 31, (In thousands of United States Dollars; unless otherwise noted) | 2014 | 2013 | ||||
| Revenues | $ | 542,943 | $ | 420,663 | ||
| Cost of sales excluding depletion, depreciation and amortization | (318,661) | (239,030) | ||||
| Gross margin | 224,282 | 181,633 | ||||
| Depletion, depreciation and amortization | (136,656) | (111,520) | ||||
| Mine operating earnings | 87,626 | 70,113 | ||||
Other expenses (i) | (142,138) | (51,470) | ||||
| Equity earnings from associate | 3,580 | (5,086) | ||||
| Impairment of mineral properties | (212,980) | (507,273) | ||||
| Earnings from operations before income taxes | (263,912) | (493,716) | ||||
| Income tax (expense)/recovery | (35,637) | 50,952 | ||||
| Net loss from continuing operations | $ | (299,549 | ) | $ | (442,764 | ) |
| Loss from discontinuing operations | $ | (35,749 | ) | $ | (169,276 | ) |
| Net loss | $ | (335,298 | ) | $ | (612,040 | ) |
Earnings adjustments (ii): | ||||||
| Net loss from continuing operations | $ | (299,549 | ) | $ | (442,764 | ) |
| Non-cash unrealized foreign exchange losses | 29,609 | (1,322) | ||||
| Share-based payments/mark-to-market of deferred share units | (2,005) | 3,474 | ||||
| Transaction costs related to the acquisition of Osisko | (1,605) | — | ||||
| Impact of change in Mexican tax rates on non-cash deferred tax expense | — | 28,323 | ||||
| Impairment of mineral properties | 212,980 | 507,273 | ||||
| Impairment of investment in available-for-sale securities and other assets | 19,683 | 18,998 | ||||
| Other non-recurring provisions, reorganization, demobilization and other adjustments | 63,240 | 16,191 | ||||
| Adjusted earnings before income tax effect | 22,353 | 130,173 | ||||
| Income tax effect of adjustments | (38,561) | (93,378) | ||||
Adjusted (loss)/earnings from continuing operations (ii) | $ | (16,208 | ) | $ | 36,795 | |
| Loss per share from continuing operations attributable to Yamana Gold Inc. equity holders - basic | $ | (0.34 | ) | $ | (0.55 | ) |
| Loss per share from continuing operations attributable to Yamana Gold Inc. equity holders - diluted | $ | (0.35 | ) | $ | (0.55 | ) |
| Loss per share attributable to Yamana Gold Inc. equity holders - basic | $ | (0.38 | ) | $ | (0.78 | ) |
| Loss per share attributable to Yamana Gold Inc. equity holders - diluted | $ | (0.39 | ) | $ | (0.78 | ) |
Adjusted (loss)/earnings per share from continuing operations attributable to Yamana Gold Inc. equity holders (ii)(iii) - basic and diluted | $ | (0.02 | ) | $ | 0.05 | |
Adjusted Operating Cash Flows (ii): | ||||||
| Cash flows from operating activities before non-cash working capital | $ | 166,420 | $ | 165,249 | ||
| Cash portion of reorganization costs | $ | 10,251 | $ | — | ||
| Cash portion demobilization costs | $ | — | $ | — | ||
| Transaction costs related to the Osisko acquisition | $ | — | $ | — | ||
| Adjusted Operating Cash Flows | $ | 176,671 | $ | 165,249 | ||
______________________________
| (i) | For the three-months ended December 31, 2014, other expenses represent the aggregate of the following expenses: general and administrative of $29.4 million (2013 - $29.8 million), exploration and evaluation of $5.9 million (2013 - $8.0 million), other operating expense of $99.0 million (2013 - $36.7 million) and net finance expense of $7.8 million (2013 - finance income $23.2 million). |
| (ii) | A cautionary note regarding non-GAAP measures and their respective reconciliations are included in Section 14 including a discussion and definition of Adjusted Earnings and Adjusted Earnings per Share. Cash flow balances are attributable to Yamana Gold Inc. equity holders. |
| (iii) | The dilution effect of the convertible debt recognized in net earnings is a non-cash factor which is excluded in determining Adjusted Earnings. Therefore, the dilution effect of the convertible debt has no effect on the calculation of Adjusted Earnings per share. |
For the three months ended December 31, 2014
Cash flows from operating activities from continuing operations after changes in non-cash working capital items for three months ended December 31, 2014 were $183.6 million, compared to $165.9 million for the three months ended December 31, 2013.
Cash flows from operating activities before changes in non-cash working capital (a non-GAAP measure, see Section 14) for the three months ended December 31, 2014 were $166.4 million, compared to $165.3 million generated for the same period of 2013. Cash flows from operating activities from continuing operations for the quarter include $10.3 million in reorganization costs. Adjusted operating cash flows from continuing operations (a non-GAAP measure, see Section 14) excluding these reorganization costs were $176.7 million.
Net loss from continuing operations attributable to Yamana equity holders for the three months ended December 31, 2014 was $299.6 million or $0.34 per share basic and $0.35 per share diluted, compared to net loss from continuing operations attributable to Yamana equity holders of $414.7 million or $0.55 per share basic and diluted for the three months ended December 31, 2013. Net loss attributable to Yamana equity holders of $335.3 million after deducting certain non-cash charges mostly relating to impairment charges discussed above and provisions recognized during the period. The Company has excluded these non-cash and one-time charges from its adjusted loss as these items are non-cash and non-recurring in nature and do not reflect the underlying performance of ongoing operations.
Adjusted loss (a non-GAAP measure, see Section 14) from continuing operations was $16.2 million or $0.02 per share for the three months ended December 31, 2014, compared to adjusted earnings of $36.7 million or $0.05 per share for the same period of 2013. Mine operating earnings for the three months ended December 31, 2014 were $87.6 million, compared to $70.1 million for the same period in 2013. The lower adjusted earnings and mine operating earnings for the period were, in part, due to lower realized metal prices of approximately 6% for gold, 21% for silver and 11% for copper, and higher depletion, depreciation and amortization, higher taxes offset by higher sales volume. Mine operating earnings included additional depletion, depreciation and amortization as a result of the acquisition of Canadian Malartic in the second quarter and Pilar which completed commissioning in the third quarter of 2014. The adjusted loss from continuing operations for the period also does not include tax benefits associated with taxable losses from certain mines including mines in commissioning and reflects interest expense on additional and assumed debt.
Income tax expense for the three months ended December 31, 2014 was $35.6 million compared to an income tax recovery of $51.0 million for the same period in 2013.
Revenue for the three months ended December 31, 2014 of $542.9 million was higher than the $420.7 million for the same period of 2013 as a result of higher sales quantities offset by lower metal prices. Revenue for the fourth quarter was generated from the sale of 346,588 ounces of gold, 2.8 million ounces of silver and 33.8 million pounds of copper, excluding attributable sales from Alumbrera which is accounted for as an equity investment. This compares to sales, excluding Alumbrera, of 218,223 ounces of gold, 2.1 million ounces of silver and 34.5 million pounds of copper for the three months ended December 31, 2013.
The average realized price of gold in the fourth quarter of 2014 was $1,199 per ounce compared to $1,277 per ounce for the same quarter in 2013, or 6% lower and the average realized silver price was $16.39 per ounce compared to $20.63 per ounce for the same quarter in 2013, or 21% lower. The average realized price of copper was $2.99 per pound comparable to the $3.37 per pound for the fourth quarter in 2013, or 11% lower.
Revenue for the quarter was comprised of the following:
| For the three months ended December 31, | 2014 | 2013 | |||||||
| (In thousands of Dollars; unless otherwise noted) | Quantity Sold (ii) | Realized Price | Revenue | Revenue | |||||
Gold (i) | 346,588 | oz | 1,199 | $ | 415,647 | $ | 278,744 | ||
| Silver | 2,772,732 | oz | 16.39 | 45,432 | 43,670 | ||||
| Total precious metals | 402,043 | GEO | 461,079 | 322,414 | |||||
Copper (i) | 33,755,776 | lbs | 2.99 | 100,957 | 116,247 | ||||
| Gross revenue | $ | 562,036 | $ | 438,661 | |||||
| (Deduct)/add: | |||||||||
| - Treatment and refining charges of gold and copper concentrate | $ | (10,281 | ) | $ | (8,717 | ) | |||
| - Sales taxes | (7,277) | (5,205) | |||||||
| - Metal price adjustments related to concentrate revenue | (8,363) | (136) | |||||||
| - Other adjustments | 6,828 | (3,940) | |||||||
Revenue (ii) | $ | 542,943 | $ | 420,663 | |||||
______________________________
| (i) | Includes payable copper and gold contained in concentrate. |
| (ii) | Excludes Alumbrera which is accounted for as an equity investment and Ernesto/Pau-a-Pique which is an asset held-for-sale |
Cost of sales excluding depletion, depreciation and amortization for the three months ended December 31, 2014 was $318.7 million compared to $239.0 million for the same period in 2013. Cost of sales excluding depletion, depreciation and amortization for the fourth quarter was higher than that of the same period in 2013 due to higher sales volume and higher input costs as planned mine sequencing called for mining from lower grade areas at certain mines.
The following table provides a reconciliation of the co-product cash cost (a non-GAAP measure, see Section 14) to the cost of sales excluding depletion, depreciation and amortization for the quarter:
| For the three months ended December 31, | 2014 | 2013 | |||||||||||||||
| (In thousands of Dollars; unless otherwise noted) | GEO or Pounds of Copper Produced (iii) | Co-product Cash Cost per Unit | Total Costs | Total Costs | |||||||||||||
Chapada — GEO (i) | 30,737 | oz | $ | 361 | $ | 11,094 | $ | 11,253 | |||||||||
| Chapada — Copper | 34,968,118 | lbs | 1.57 | 54,833 | 55,148 | ||||||||||||
El Peñón — GEO (i) | 122,850 | oz | 482 | 59,260 | 60,062 | ||||||||||||
| Gualcamayo | 46,009 | oz | 886 | 40,756 | 28,816 | ||||||||||||
Mercedes — GEO (i) | 32,512 | oz | 620 | 20,148 | 20,792 | ||||||||||||
Canadian Malartic (50% interest) | 66,369 | oz | 684 | 45,418 | — | ||||||||||||
Minera Florida — GEO (i) | 31,641 | oz | 609 | 19,258 | 18,069 | ||||||||||||
| Jacobina | 20,909 | oz | 959 | 20,060 | 22,254 | ||||||||||||
| Brio Gold | 38,469 | oz | 671 | 25,818 | 14,771 | ||||||||||||
Co-product cash cost of sales (iii) | $ | 296,645 | $ | 231,165 | |||||||||||||
| Add (deduct): | |||||||||||||||||
| - Inventory movements and adjustments | 23,070 | 8,707 | |||||||||||||||
| - Chapada concentrate treatment and refining charges | (10,281) | (8,717) | |||||||||||||||
| - Commercial and other costs | 5,361 | 2,943 | |||||||||||||||
| - Overseas freight for Chapada concentrate | 3,866 | 4,932 | |||||||||||||||
| Cost of sales excluding depletion, depreciation and amortization | $ | 318,661 | $ | 239,030 | |||||||||||||
______________________________
| (i) | Silver ounces reported for Chapada, El Peñón, Minera Florida and Mercedes are treated as gold equivalent ounces ("GEO"). |
| (ii) | Excludes Alumbrera which is accounted for as an equity investment and Ernesto/Pau-a-Pique which is a discontinued operation. |
| (iii) | A cautionary note regarding non-GAAP measures is included in Section 14 of this Management’s Discussion and Analysis of Operations and Financial Condition. |
Depletion, depreciation and amortization ("DDA") expense for the three months ended December 31, 2014 was $136.7 million compared to $111.5 million for the same period of 2013. Higher DDA was attributable to additional DDA following the acquisition of Canadian Malartic which closed at the end of the second quarter including DDA on the amount of purchase price in excess of book value. Furthermore, additional DDA was also recognized relative to the comparative period in 2013 from Amelia Inés (open-pit), QDD Lower West (underground) at Gualcamayo which started to contribute to production in late 2013 and Pilar which completed commissioning effective October 1, 2014.
Other expenses, as discussed below, include general and administrative, exploration and evaluation, other and net finance expenses were $142.1 million for the three months ended December 31, 2014, compared to $51.5 million for the same period in 2013:
| • | General and administrative expenses were $29.4 million, compared to $29.8 million for the same period in 2013. Lower general and administrative reflect cost containment initiatives undertaken by the Company and more than offset the additional general and administrative expenses following the acquisition of Canadian Malartic with no comparative balance in 2013 and Pilar where general and administrative expenses were capitalized for the same period in 2013 as it was in commissioning. |
| • | Exploration and evaluation expenses were $5.9 million, compared to $8.2 million for the same period of 2013. Lower exploration and evaluation expenses were the result of the Company's reduced focus on greenfield exploration relative to the fourth quarter of 2013. |
| • | Other expenses were $99.0 million, compared to $36.7 million for the same period of 2013. Other expenses includes increases during the period due to increases in provisions for legal proceeding including silicosis and other provisions, reorganization costs, and the write down of tax credits and other assets. |
| • | Net of finance income was $7.8 million compared to net finance expense of $23.3 million for the same period of 2013. Lower net finance expense was due to the mark-to-market gain on convertible debt and unrealized derivative gains in the period with no prior year comparatives. |
Equity earnings from Alumbrera of $3.6 million for the three months ended December 31, 2014 compared to equity loss of $5.1 million for the three months ended December 31, 2013. Cash dividends received during the three months ended December 31, 2014 from the Company’s equity investment in Alumbrera were $3.6 million compared to $6.8 million for the same period of 2013.
5.4 Fourth Quarter Overview of Operating Results
For the three months ended December 31, 2014
Record fourth quarter production of 405,615 GEO, compared to 303,768 GEO produced in the fourth quarter of 2013. Total production includes production from continuing operations of 403,201 GEO, compared to 294,061 GEO in the fourth quarter of 2013. Production from cornerstone assets for the quarter was 351,027 GEO compared to 247,858 GEO in 2013 representing an increase of 42%. Increase in production from the fourth quarter of 2013 included a 32% increase at Gualcamayo; 21% increase at El Peñón and increases at Chapada, Mercedes, Minera Florida and Jacobina, as well as the attributable ounces from Canadian Malartic.
The following summarizes the GEO production by mine for the fourth quarter relative to the comparative quarter in 2013:
 On June 16, 2014, the Company acquired a 50% interest in the Canadian Malartic mine. Amounts shown for the period from June 16, 2014.
Total fourth quarter GEO production was 10% higher than the third quarter of 2014. Fourth quarter production from cornerstone mines was also higher than that of the third quarter. Increases in production from the third quarter included increases at Gualcamayo, Mercedes, El Peñón and Minera Florida.
Cash costs from continuing operations (a non-GAAP measure, see Section 14) for the fourth quarter of 2014 averaged $484 per GEO, compared to $417 per GEO in the fourth quarter of 2013. Cash costs were impacted by lower by-product copper credits. Co-product cash costs from continuing operations (a non-GAAP measure, see Section 14) for the fourth quarter were $608 per GEO lower, compared to $647 per GEO for the fourth quarter of 2013.
All-in sustaining costs from continuing operations ("AISC", a non-GAAP measure, see Section 14) were $774 per GEO compared to $754 per GEO for the fourth quarter of 2013. AISC for the fourth quarter from cornerstone assets were $729 per GEO compared to $744 per GEO in the third quarter. On a co-product basis, AISC from continuing operations were $852 per GEO for the fourth quarter compared to $935 per GEO for the fourth quarter of 2013. AISC on a co-product basis for the fourth quarter from cornerstone assets were $818 per GEO compared to $845 per GEO in the third quarter and $883 per GEO in the fourth quarter of 2013.
Total copper production for the three months ended December 31, 2014 was 44.0 million pounds, compared to 45.6 million pounds for the same period of 2013. Copper production for the three months ended December 31, 2014 was 35.0 million pounds from the Chapada mine, compared to 36.0 million pounds for the same period of 2013. A total of 9.1 million pounds of copper produced from Alumbrera were attributable to the Company, compared to 9.6 million pounds for the three months ended December 31, 2013.
Co-product cash costs per pound of copper (a non-GAAP measure, see Section 14) were $1.57 per pound from the Chapada mine compared to $1.53 per pound of copper in the fourth quarter of 2013. Co-product cash costs per pound of copper for the quarter including the Company’s interest in Alumbrera were $1.61 per pound compared to $1.58 per pound for the fourth quarter of 2013.
6. OPERATING MINES
CHAPADA, BRAZIL
| For the three months ended December 31, | For the years ended December 31, | |||||||||||||
| Operating Statistics | 2014 | 2013 | 2014 | 2013 | ||||||||||
| Production | ||||||||||||||
| Concentrate (tonnes) | 63,955 | 67,395 | (5)% | 245,779 | 239,811 | 2% | ||||||||
GEO contained in concentrate production (i) | 30,737 | 29,817 | 3% | 113,386 | 110,618 | 3% | ||||||||
| Gold contained in concentrate (ounces) | 29,270 | 28,223 | 4% | 107,447 | 104,096 | 3% | ||||||||
| Silver contained in concentrate (ounces) | 73,310 | 79,696 | (8)% | 296,955 | 326,087 | (9)% | ||||||||
| Copper contained in concentrate (millions of pounds) | 35.0 | 36.0 | (3)% | 133.5 | 130.2 | 3% | ||||||||
Cash costs per GEO produced (ii) | $ | (1,150 | ) | $ | (1,547 | ) | (26)% | $ | (981 | ) | $ | (1,296 | ) | (24)% |
Co-product cash costs per GEO produced (ii) | $ | 360 | $ | 377 | (5)% | $ | 406 | $ | 400 | 2% | ||||
Co-product cash costs per pound of copper produced (ii) | $ | 1.57 | $ | 1.53 | 3% | $ | 1.68 | $ | 1.65 | 2% | ||||
| Ore mined (tonnes) | 4,650,263 | 5,753,649 | (19)% | 18,828,710 | 21,833,258 | (14)% | ||||||||
| Ore processed (tonnes) | 5,041,152 | 5,540,262 | (9)% | 20,360,659 | 21,347,439 | (5)% | ||||||||
| Gold feed grade (g/t) | 0.31 | 0.28 | 11% | 0.28 | 0.26 | 8% | ||||||||
| Copper feed grade (%) | 0.40 | 0.37 | 8% | 0.37 | 0.35 | 6% | ||||||||
| Concentrate grade - gold (g/t) | 14.24 | 13.03 | 9% | 13.60 | 13.50 | 1% | ||||||||
| Concentrate grade - copper (%) | 24.80 | 24.20 | 2% | 24.63 | 24.63 | —% | ||||||||
| Gold recovery rate (%) | 57.7 | 57.5 | —% | 58.9 | 57.9 | 2% | ||||||||
| Copper recovery rate (%) | 78.0 | 80.4 | (3)% | 79.6 | 79.7 | —% | ||||||||
Sales (iii) | ||||||||||||||
| Concentrate (tonnes) | 66,534 | 67,616 | (2)% | 241,578 | 242,681 | —% | ||||||||
| Payable GEO contained in concentrate | 32,431 | 27,707 | 17% | 100,394 | 102,018 | (2)% | ||||||||
| Payable gold contained in concentrate (ounces) | 31,533 | 26,805 | 18% | 97,775 | 98,680 | (1)% | ||||||||
| Payable silver contained in concentrate (ounces) | 44,884 | 45,103 | —% | 130,949 | 166,917 | (22)% | ||||||||
| Payable copper contained in concentrate (millions of pounds) | 33.8 | 34.5 | (2)% | 123.5 | 126.0 | (2)% | ||||||||
| Depletion, depreciation and amortization | ||||||||||||||
| Per GEO sold | $ | 74 | $ | 98 | (24)% | $ | 91 | $ | 97 | (6)% | ||||
| Per copper pound sold | $ | 0.28 | $ | 0.32 | (13)% | $ | 0.33 | $ | 0.31 | 6% | ||||
______________________________
| (i) | GEO assumes gold plus the gold equivalent of silver using a ratio of 50:1 for all periods presented. |
| (ii) | A cautionary note regarding non-GAAP measures is included in Section 14 of this Management’s Discussion and Analysis. |
| (iii) | Quantities sold include quantity adjustment on provisional and final invoice settlements. |
At Chapada, higher production and lower co-product cash costs over the comparative fourth quarter of 2013 were the result of the increased contribution from Corpo Sul and the processing of high grade stockpiles partially offset by reduced throughput due to planned maintenance. Commissioning of the in-pit crusher continued in the fourth quarter with full benefits expected in 2015. In addition, copper production was impacted by the planned higher grades and lower recoveries resulting from the increased Corpo Sul contribution. By-product cash cost in the quarter and for the year were impacted by lower by-product credits due to the reduction in copper prices and lower sales than the production of copper. The credit arising from the copper production during the period and not sold will be realized when the copper is sold in the first quarter of 2015.
Chapada produced a total of 30,737 GEO for the fourth quarter of 2014, which consisted of 29,270 and 73,310 ounces of gold and silver contained in concentrate compared to 29,817 GEO, which consisted of 28,223 and 79,696 ounces of gold and silver contained in concentrate, in the comparable period of 2013. Copper production was 35.0 million pounds in the fourth quarter of 2014 compared to production of 36.0 million pounds of copper for the same quarter of 2013.
Cash costs for the fourth quarter were negative $1,150 per GEO, compared to negative $1,547 per GEO for the same quarter in 2013. Co-product cash costs were $360 per GEO in the fourth quarter compared to $377 per GEO for the same quarter of 2013 and $406 per GEO in the third quarter of 2014. Co-product cash costs for copper were $1.57 per pound in the four quarter compared to $1.53 per pound for the same quarter of 2013 and $1.59 per pound in the third quarter of 2014.
Annual production increased compared to 2013 as Corpo Sul contributed to increased gold grades partially offset by reduced throughput. Co-product cash costs per GEO were relatively in line with the same period and were slightly impacted by higher treatment and refining costs. Co-product cash costs per pound of copper was $1.68 compared to $1.65 for 2013.
Production of 113,386 GEO consisted of 107,447 ounces of gold and 296,955 ounces of silver, contained in concentrate compared to 110,618 GEO, which consisted of 104,096 ounces of gold and 326,087 ounces of silver contained in concentrate in 2013. Chapada copper production was 133.5 million pounds in 2014 compared to production of 130.2 million pounds of copper in 2013.
Cash costs for 2014 were negative $981 per GEO, compared to negative $1,296 per GEO for 2013. Co-product cash costs were $406 per GEO in 2014 compared with $400 per GEO in 2013. Co-product cash costs for copper were $1.68 per pound in 2014 compared with $1.65 per pound in 2013.
Among various optimization opportunities, the Company has determined to proceed with projects to increase recoveries. Current testing of metallurgical processing options indicates potential higher recoveries than a minimum of 5% are achievable, although the Company is assuming an increase of only 5% in the current production profile.
The production profile at Chapada includes a planned decrease in 2017 due to mine sequencing before reverting in 2018 to expected production levels of 2015 and 2016. The Company is currently evaluating optimizations that may have the potential to increase 2017 production. The recent discoveries of Sucupira and Santa Cruz are also expected to improve the operational outlook for Chapada in the long term as they are close to existing mine infrastructure and have the potential to be brought to production in a fast track manner similar to that of Corpo Sul.
EL PEÑÓN, CHILE
| For the three months ended December 31, | For the years ended December 31, | |||||||||||||
| Operating Statistics | 2014 | 2013 | 2014 | 2013 | ||||||||||
| Production | ||||||||||||||
GEO production (i) | 122,850 | 101,364 | 21% | 452,120 | 467,523 | (3)% | ||||||||
| Gold production (ounces) | 77,111 | 68,246 | 13% | 282,617 | 338,231 | (16)% | ||||||||
| Silver production (ounces) | 2,286,949 | 1,655,910 | 38% | 8,475,133 | 6,464,623 | 31% | ||||||||
Co-product cash costs per GEO produced (ii) | $ | 482 | $ | 593 | (19)% | $ | 488 | $ | 485 | 1% | ||||
| Ore mined (tonnes) | 369,872 | 354,547 | 4% | 1,499,030 | 1,376,428 | 9% | ||||||||
| Ore processed (tonnes) | 382,194 | 352,276 | 8% | 1,475,858 | 1,422,054 | 4% | ||||||||
| Gold feed grade (g/t) | 6.66 | 6.46 | 3% | 6.36 | 7.94 | (20)% | ||||||||
| Silver feed grade (g/t) | 215.87 | 183.42 | 18% | 211.96 | 187.16 | 13% | ||||||||
| Gold recovery rate (%) | 92.8 | 93.0 | —% | 93.3 | 93.0 | —% | ||||||||
| Silver recovery rate (%) | 84.9 | 80.3 | 6% | 83.9 | 75.0 | 12% | ||||||||
| Sales | ||||||||||||||
| GEO sales | 126,565 | 99,546 | 27% | 447,318 | 466,093 | (4)% | ||||||||
| Gold (ounces) | 79,086 | 66,700 | 19% | 280,471 | 337,337 | (17)% | ||||||||
| Silver (ounces) | 2,373,974 | 1,642,279 | 45% | 8,342,367 | 6,437,790 | 30% | ||||||||
Depletion, depreciation and amortization per GEO sold | $ | 308 | $ | 325 | (5)% | $ | 328 | $ | 260 | 26% | ||||
______________________________
| (i) | GEO assumes gold plus the gold equivalent of silver using a ratio of 50:1 for all periods presented. |
| (ii) | A cautionary note regarding non-GAAP measures is included in Section 14 of this Management’s Discussion and Analysis. |
At El Peñón, fourth quarter production was the highest quarterly level of the year and it continued the trend of quarter over quarter production increases with a 5% increase over the third quarter. Increased production was the result of improved plant productivity and a planned increase in gold grade. Production was impacted by lower silver grades and gold recoveries relating to the ore from Pampa Augusta Victoria, which was partially offset by increasing the volume of ore processed. Cash costs in the quarter were lower than the third quarter and approximately 19% lower than the same period last year. Cash costs were impacted by the improved gold grades and production partially offset by unplanned repairs and replacement costs.
During the fourth quarter of 2014, El Peñón produced 122,850 GEO, which consisted of 77,111 ounces of gold and 2.3 million ounces of silver, 21% higher compared to 101,364 GEO, which consisted of 68,246 ounces of gold and 1.7 million ounces of silver for the same quarter of 2013. Cash costs were $482 per GEO in the fourth quarter compared to $486 per GEO in the third quarter of 2014 and $593 per GEO in the fourth quarter of 2013.
Annual production was 3% less than 2013 and was impacted by lower gold production due to planned mining in lower gold grade areas, which was partially offset by increased silver production due to higher silver grades and recoveries. Cash costs per GEO were marginally higher than 2013 due to lower production and certain one-time repair and replacement costs offset by improvements achieved from new underground equipment and the devaluation of the Chilean Peso.
El Peñón produced 452,120 GEO in 2014, which consisted of 282,617 ounces of gold and 8.5 million ounces of silver, compared to 467,523 GEO, which consisted of 338,231 ounces of gold and 6.5 million ounces of silver in 2013. Cash costs for the year ended December 31, 2014 were $488 per gold ounce, compared to $485 per gold ounce in 2013.
The new discovery of the Ventura vein will be the focus for exploration this year, and these new ounces are expected to enhance mine life and the future production profile. In the near term, the Company is focused on optimizing productivity and reducing costs. A third party operations optimizations expert has been engaged to identify further opportunities.
GUALCAMAYO, ARGENTINA
| For the three months ended December 31, | For years ended December 31, | |||||||||||||
| Operating Statistics | 2014 | 2013 | 2014 | 2013 | ||||||||||
| Production | ||||||||||||||
| Gold production (ounces) | 46,009 | 34,929 | 32% | 180,412 | 120,337 | 50% | ||||||||
Co-product cash costs per gold ounce produced (i) | $ | 886 | $ | 825 | 7% | $ | 796 | $ | 772 | 3% | ||||
| Ore mined (tonnes) | 2,048,894 | 1,258,735 | 63% | 6,843,580 | 4,005,487 | 71% | ||||||||
| Ore processed (tonnes) | 1,994,019 | 1,561,180 | 28% | 6,775,855 | 6,568,912 | 3% | ||||||||
| Gold feed grade (g/t) | 1.24 | 1.61 | (23)% | 1.43 | 0.88 | 63% | ||||||||
| Gold recovery rate (%) | 42.0 | 43.7 | (4)% | 62.2 | 72.5 | (14)% | ||||||||
| Sales | ||||||||||||||
| Gold sales (ounces) | 45,165 | 34,264 | 32% | 177,660 | 111,134 | 60% | ||||||||
| Depletion, depreciation and amortization per gold ounce sold | $ | 322 | $ | 522 | (38)% | $ | 418 | $ | 489 | (15)% | ||||
______________________________
| (i) | A cautionary note regarding non-GAAP measures is included in Section 14 of this Management’s Discussion and Analysis. |
At Gualcamayo, fourth quarter production increased from the third quarter, representing a 32% increase from the fourth quarter 2013. Increased production was the result of more tonnes of ore processed at lower grade. Lower grade was consistent with normal mine sequencing with lower grade ore from the open-pit partially offset by an increase in grade from the underground. Normal sequencing of stacking at the leach pad impacted recoveries as material placed at the leach pad late in the quarter had not entered irrigation and thus increased the level of material in progress. Cash costs in the quarter were higher than the fourth quarter 2013 and were impacted by costs relating to local inflation and a 13% increase in waste tonnes moved.
During the fourth quarter of 2014, Gualcamayo produced 46,009 ounces of gold, exceeding 2013 fourth quarter production of 34,929 ounces of gold by 32% and higher than the third quarter of 2014.
Annual production was 50% higher than 2013. Improved production was the result of higher grades and throughput with the contribution from the new QDD Lower West (“QDDLW”) underground mine. Cash costs increased by approximately 3% and were impacted by local inflationary pressures partially offset by the devaluation of the Argentine Peso.
Gualcamayo produced of 180,412 GEO in 2014, compared to 120,337 GEO in 2013. Cash costs for the year ended December 31, 2014 were $796 per gold ounce, compared to $772 per gold ounce in same period of 2013.
During the fourth quarter, work continued on Rodado Southwest, the newly discovered mineral resource beneath the current QDD pit limits and SW of QDDLW. The metallurgical work done in the quarter allowed for the further definition of ore characteristics and identified the mineral resource as a carbonate ore body. The Company is now referring to the potential large scale, bulk tonnage underground operation as the Deep Carbonates Alternative project. In 2015, work will focus on further evaluating potential mining methods and building on the 2014 mineral resource increase to continue to grow the mineral resource and economic potential of the deposit.
Gualcamayo’s first full year of production from QDDLW in 2014 has increased the production expectations for 2015. The expansion of the Adsorption and Desorption (ADR) plant is ongoing, although at a slightly slower pace than originally planned and is expected to begin accelerating recoveries in 2016 and 2017.
MERCEDES, MEXICO
| For the three months ended December 31, | For the years ended December 31, | |||||||||||||
| Operating Statistics | 2014 | 2013 | 2014 | 2013 | ||||||||||
| Production | ||||||||||||||
GEO production (i) | 32,512 | 31,716 | 3% | 113,174 | 141,618 | (20)% | ||||||||
| Gold production (ounces) | 30,364 | 28,821 | 5% | 105,212 | 129,327 | (19)% | ||||||||
| Silver production (ounces) | 107,396 | 144,715 | (26)% | 398,137 | 614,562 | (35)% | ||||||||
Co-product cash costs per GEO produced (ii) | $ | 620 | $ | 656 | (5)% | $ | 671 | $ | 496 | 35% | ||||
| Ore mined (tonnes) | 152,045 | 166,401 | (9)% | 648,568 | 640,967 | 1% | ||||||||
| Ore processed (tonnes) | 178,409 | 169,768 | 5% | 681,833 | 670,867 | 2% | ||||||||
| Gold feed grade (g/t) | 5.57 | 5.58 | —% | 5.09 | 6.16 | (17)% | ||||||||
| Silver feed grade (g/t) | 50.57 | 72.84 | (31)% | 55.88 | 79.39 | (30)% | ||||||||
| Gold recovery rate (%) | 94.9 | 94.3 | 1% | 94.6 | 94.5 | —% | ||||||||
| Silver recovery rate (%) | 37.1 | 35.5 | 5% | 32.6 | 34.4 | (5)% | ||||||||
| Sales | ||||||||||||||
| GEO sales | 33,654 | 33,062 | 2% | 111,657 | 146,438 | (24)% | ||||||||
| Gold (ounces) | 31,490 | 30,102 | 5% | 103,850 | 133,421 | (22)% | ||||||||
| Silver (ounces) | 108,196 | 148,020 | (27)% | 390,331 | 650,873 | (40)% | ||||||||
| Depletion, depreciation and amortization per GEO sold | $ | 327 | $ | 331 | (1)% | $ | 381 | $ | 281 | 36% | ||||
______________________________
| (i) | GEO assumes gold plus the gold equivalent of silver using a ratio of 50:1 for all periods presented. |
| (ii) | A cautionary note regarding non-GAAP measures is included in Section 14 of this Management’s Discussion and Analysis. |
At Mercedes, production and cash costs each improved approximately 7% compared to the third quarter, and continued the trend of improving quarter over quarter as ore processed and gold grades were at the highest levels of the year. Increased gold grades were the result of the contribution from Lagunas while silver grades were impacted by expected lower grades from Barrancas. Gold and silver recoveries increased in the quarter as the result of the installation of pump equipment in the thickener tank and recoveries are expected to continue at these levels going forward. The reduction in cash costs was due to increased production and the outsourcing of some secondary development work.
Mercedes produced 32,512 GEO in the fourth quarter which consisted of 30,364 ounces of gold and 107,396 ounces of silver compared to 31,716 GEO, which consisted of 28,821 ounces of gold and 144,715 ounces of silver in the fourth quarter of 2013.
Planned lower annual production was approximately 20% less than 2013. Lower production was the result of planned lower gold and silver grades. Annual production was also impacted by labour interruptions, unplanned maintenance and unplanned dilution in some stopes that delayed access to originally planned higher grade areas. Cash costs were also impacted by planned lower production and were approximately 35% higher than 2013. The Company has undertaken initiatives to reduce costs including outsourcing in areas where it is more efficient and cost effective.
For 2014, production totaled 113,174 GEO consisting of 105,212 ounces of gold and 398,137 ounces of silver, compared to 2013 production of 141,618 GEO, which consisted of 129,327 ounces of gold and 614,562 ounces of silver. Cash costs were $671 per GEO for the year ended December 31, 2014, compared to $496 in 2013.
The Company has identified several opportunities to further improve efficiencies of the underground mine related to grade and dilution control. This will be an ongoing initiative at the operation, and could further improve costs and the production profile.
CANADIAN MALARTIC (50% interest), CANADA
| For the three months ended December 31, | For the years ended December 31, | |||||||
Operating Statistics (i) | 2014 | 2013 | 2014 | 2013 | ||||
| Production | ||||||||
| Gold production (ounces) | 66,369 | n/a | 143,008 | n/a | ||||
Co-product cash costs per gold ounce produced (ii) | $ | 684 | n/a | $ | 702 | n/a | ||
| Ore mined (tonnes) | 2,623,252 | n/a | 5,451,124 | n/a | ||||
| Ore processed (tonnes) | 2,448,662 | n/a | 5,263,271 | n/a | ||||
| Gold feed grade (g/t) | 0.95 | n/a | 0.95 | n/a | ||||
| Gold recovery rate (%) | 89.2 | n/a | 89.2 | n/a | ||||
| Sales | ||||||||
| Gold sales (ounces) | 69,965 | n/a | 149,952 | n/a | ||||
| Depletion, depreciation and amortization per gold ounce sold | $ | 289 | n/a | $ | 336 | n/a | ||
______________________
| (i) | For the period from acquisition on June 16, 2014. |
| (ii) | A cautionary note regarding non-GAAP measures is included in Section 14 of this Management’s Discussion and Analysis. |
At Canadian Malartic, production increased approximately 3% and cash costs decreased approximately 7% quarter over quarter. These improvements were the result of an increase in the volume of ore processed, feed grades and recovery rates. During the quarter, the mill processed a record average of over 53,000 tonnes per day as efforts continue to advance work towards the target of reaching 55,000 tonnes per day by the end of 2015. Cash costs in the quarter were also positively impacted by the decline in fuel costs.
In 2014, Canadian Malartic produced a record 535,470 ounces of gold at $659 cash costs per ounce on a 100% basis. Since the day of acquisition, the Company's 50% of share production for 2014 is 143,008 ounces of gold at cash costs of $702 per ounce.
The Company continues to execute on the refinements and potential improvements identified since the acquisition was completed in mid-2014. Some of these initiatives include:
| • | Projects to improve the current crushing and grinding constraints including re-design of the pre-crushing setup to achieve 55,000 tonnes per day. |
| • | The improvement of drilling and blasting techniques in the open pit (fragmentation), producing finer material to feed into the crushing and grinding circuit. |
| • | The use of a loader to manage the stockpile and keep the crusher full at all times, which has also led to improved haul truck cycle times. |
| • | The optimization of the mining activities in the North. |
| • | The reduction of delay related to blasting time and shift changes. |
| • | The optimization of the maintenance of the mobile equipment. |
The study evaluating increasing throughput rates to 60,000 tonnes per day has been put on hold until the 55,000 tonnes per day pre-crushing throughput level has been consistently achieved.
In addition, the positive grade reconciliation that has been experienced since mid-2014 may continue to improve production expectations.
MINERA FLORIDA, CHILE
| For the three months ended December 31, | For the years ended December 30, | |||||||||||||
| Operating Statistics | 2014 | 2013 | 2014 | 2013 | ||||||||||
| Production | ||||||||||||||
GEO production (i) | 31,641 | 30,513 | 4% | 119,582 | 118,590 | 1% | ||||||||
| Gold production (ounces) | 27,953 | 24,539 | 14% | 100,076 | 99,000 | 1% | ||||||||
| Silver production (ounces) | 184,382 | 298,696 | (38)% | 975,297 | 979,514 | —% | ||||||||
Co-product cash costs per GEO produced (ii) | $ | 609 | $ | 592 | 3% | $ | 617 | $ | 747 | (17)% | ||||
| Ore mined (tonnes) | 217,514 | 228,086 | (5)% | 841,485 | 798,062 | 5% | ||||||||
| Ore processed (tonnes) | 439,401 | 492,257 | (11)% | 1,729,861 | 1,754,785 | (1)% | ||||||||
| Gold feed grade (g/t) | 2.37 | 2.07 | 14% | 2.23 | 2.45 | (9)% | ||||||||
| Silver feed grade (g/t) | 22.78 | 39.16 | (42)% | 29.87 | 32.02 | (7)% | ||||||||
| Gold recovery rate (%) | 83.3 | 79.0 | (99)% | 80.8 | 76.1 | 6% | ||||||||
| Silver recovery rate (%) | 57.3 | 61.6 | (99)% | 58.7 | 57.2 | 3% | ||||||||
| Sales | ||||||||||||||
GEO sales (i) | 32,698 | 29,732 | 10% | 119,346 | 118,687 | 1% | ||||||||
| Gold (ounces) | 27,784 | 24,095 | 15% | 99,030 | 98,524 | 1% | ||||||||
| Silver (ounces) | 245,678 | 281,871 | (13)% | 1,015,801 | 1,008,148 | 1% | ||||||||
| Depletion, depreciation and amortization per GEO sold | $ | 572 | $ | 657 | (13)% | $ | 600 | $ | 599 | —% | ||||
______________________________
| (i) | GEO assumes gold plus the gold equivalent of silver using a ratio of 50:1 for all periods presented. |
| (ii) | A cautionary note regarding non-GAAP measures is included in Section 14 of this Management’s Discussion and Analysis. |
At Minera Florida, fourth quarter production was the highest quarterly level of the year and it continued the trend of quarter over quarter production increases with an approximate 3% increase over the third quarter representing an approximate 4% increase over the fourth quarter 2013. Increased production was due to increased ore processed and, as expected, increased gold grades and gold recoveries. Cash costs in the quarter were higher than the previous quarter partially offset by devaluation of the Chilean Peso and an increase in by-product zinc credits.
During the fourth quarter of 2014, Minera Florida produced 31,641 GEO, which consisted of 27,953 ounces of gold and 184,382 ounces of silver compared to 30,513 GEO, which consisted of 24,539 ounces of gold and 298,696 ounces of silver in the fourth quarter of 2013.
Record annual production was higher than 2013. Production was impacted by improved gold and silver recoveries offset by planned lower gold and silver grades. Cash costs for the year were approximately 17% lower than 2013 reflecting continuous efforts to reduce costs, the devaluation of the Chilean Peso and an increase in by-product zinc credits.
For 2014, production totaled 119,582 GEO, which consisted of 100,076 ounces of gold and 975,297 ounces of silver, exceeding the 118,590 GEO produced in 2013, which consisted of 99,000 ounces of gold and 979,514 ounces of silver. Cash costs for the year ended 2014 were $617 per gold ounce, compared to $747 per gold ounce in the comparable period of 2013.
Gold production is expected to increase in 2015 as gold grades and recoveries are expected to continue at levels established in the fourth quarter. Silver production is expected to be lower due to anticipated lower silver grades. The Company is currently evaluating options to improve silver recoveries to offset mining in lower grade areas.
JACOBINA
| For the three months ended December 31, | For the years ended December 30, | |||||||||||||
| Operating Statistics | 2014 | 2013 | 2014 | 2013 | ||||||||||
| Production | ||||||||||||||
| Gold production (ounces) | 20,909 | 19,519 | 7% | 75,650 | 73,695 | 3% | ||||||||
Co-product cash costs per gold ounce produced (i) | $ | 959 | $ | 1,140 | (16)% | $ | 1,078 | $ | 1,174 | (8)% | ||||
| Ore mined (tonnes) | 352,044 | 390,768 | (10)% | 1,419,932 | 1,569,937 | (10)% | ||||||||
| Ore processed (tonnes) | 355,987 | 396,235 | (10)% | 1,419,031 | 1,575,629 | (10)% | ||||||||
| Gold feed grade (g/t) | 1.91 | 1.64 | 16% | 1.78 | 1.57 | 13% | ||||||||
| Gold recovery rate (%) | 95.6 | 93.2 | 3% | 92.9 | 92.2 | 1% | ||||||||
| Sales | ||||||||||||||
| Gold Sales (ounces) | 21,359 | 19,105 | 12% | 74,405 | 77,190 | (4)% | ||||||||
| Depletion, depreciation and amortization per gold ounce sold | $ | 435 | $ | 585 | (26)% | $ | 507 | $ | 561 | (10)% | ||||
______________
| (i) | A cautionary note regarding non-GAAP measures is included in Section 14 of this Management’s Discussion and Analysis. |
At Jacobina, production was approximately 7% higher than the fourth quarter 2013 as production in the fourth quarter was impacted by grade and recovery rates that continued to improve quarter over quarter and were at the highest quarterly levels of the year partially offset by a delay in development and reduced throughput. Improved recoveries were the result of various initiatives including optimizations of the gravity circuit, preventative maintenance and increased mill power. Fourth quarter cash costs were at the lowest quarterly level of the year as they continued the trend of quarter over quarter reductions resulting in full year cash costs that were 8% lower than the previous year, and reflects execution of continuous cost containment initiatives.
Gold production at Jacobina was 20,909 ounces in the fourth quarter of 2014, compared to 19,519 ounces produced for the same quarter of 2013.
Annual production was approximately 3% higher than 2013 and was the result of improved grade and recovery offset by lower throughput. In particular, mine sequencing called for mining of higher grade areas in the second half of the year. Cash costs for the year also reflect the continuous cost containment initiatives as they were approximately 10% lower than 2013. Operational performance in 2014 continues to demonstrate the Company’s focus on producing quality ounces with sustainable margins to maximize profitability at Jacobina.
For the year ended December 31, 2014, Jacobina produced 75,650 ounces compared to 73,695 ounces in 2013. Cash costs for 2014 were $1,060 per gold ounce, compared to $1,174 per gold ounce in the comparable period of 2013
Jacobina's full year 2014 production increase over 2013 is expected to continue with further annual production increases expected in 2015 through 2017 as grades are expected to continue increasing into 2015.
The Company has recorded an impairment charge of $158.0 million on an after tax basis against the carrying value of Jacobina during the fourth quarter in addition to the impairment of $55 million in 2013. For further details, refer to Section 5.1 of this MD&A.
OTHER MINES
ALUMBRERA (12.5% interest)
| For the three months ended December 31, | For the years ended December 30, | |||||||||||||
| Operating Statistics | 2014 | 2013 | 2014 | 2013 | ||||||||||
| Production | ||||||||||||||
| Gold production | 13,704 | 11,319 | 21% | 39,650 | 39,157 | 1% | ||||||||
| Concentrate (tonnes) | 16,043 | 17,547 | (9)% | 49,734 | 55,115 | (10)% | ||||||||
| Copper contained in concentrate (millions of pounds) | 9.1 | 9.6 | (5)% | 28.3 | 30.2 | (6)% | ||||||||
Cash costs per ounce of gold produced (i) | $ | (14 | ) | $ | (261 | ) | (95)% | $ | (351 | ) | $ | (252 | ) | 39% |
Co-product cash costs per GEO produced (i) | $ | 244 | $ | 313 | (22)% | $ | 324 | $ | 364 | (11)% | ||||
Co-product cash costs per pound of copper produced (i) | $ | 1.78 | $ | 1.75 | 2% | $ | 2.24 | $ | 2.21 | 1% | ||||
| Ore mined (tonnes) | 866,647 | 1,195,276 | (27)% | 2,116,259 | 3,181,381 | (33)% | ||||||||
| Ore processed (tonnes) | 1,175,382 | 1,211,561 | (3)% | 4,435,651 | 4,671,322 | (5)% | ||||||||
| Gold feed grade (g/t) | 0.47 | 0.40 | 18% | 0.39 | 0.37 | 5% | ||||||||
| Copper feed grade (%) | 0.39 | 0.43 | (9)% | 0.36 | 0.37 | (3)% | ||||||||
| Concentrate grade - gold (g/t) | 23.46 | 18.55 | 26% | 22.46 | 20.32 | 11% | ||||||||
| Concentrate grade - copper (%) | 25.66 | 24.82 | 3% | 25.78 | 24.86 | 4% | ||||||||
| Gold recovery rate (%) | 77.5 | 73.0 | 6% | 70.6 | 70.0 | 1% | ||||||||
| Copper recovery rate (%) | 89.3 | 84.0 | 6% | 80.6 | 79.0 | 2% | ||||||||
| Sales | ||||||||||||||
| Gold sales (ounces) | 11,322 | 8,291 | 37% | 37,776 | 34,521 | 9% | ||||||||
| Concentrate (tonnes) | 12,273 | 12,986 | (5)% | 51,117 | 49,304 | 4% | ||||||||
| Payable copper contained in concentrate (millions of pounds) | 6.7 | 6.6 | 2% | 28.0 | 25.8 | 9% | ||||||||
______________________________
| (i) | A cautionary note regarding non-GAAP measures is included in Section 14 of this Management’s Discussion and Analysis. |
In 2014, Alumbrera produced a total of 39,650 ounces of gold, compared to 39,157 ounces of gold in 2013. Production was higher from higher gold grades and recovery rates offset by lower throughput. Cash costs for the year ended 2014 were negative $351 per gold ounce, compared to negative $252 per gold ounce in 2013. Cash costs were impacted by higher copper by-product credit due to higher copper quantities sold offset by lower copper prices.
In the fourth quarter of 2014, production from Alumbrera was 13,704 ounces of gold compared to 11,319 ounces of gold produced in the fourth quarter of 2013 resulting from higher gold grade and higher recoveries. Cash costs for the fourth quarter were negative $14 per GEO, compared to negative $261 per GEO for the same quarter in 2013.
BRIO GOLD
| For the three months ended December 31, | For the years ended December 30, | |||||||||||||
| Operating Statistics | 2014 | 2013 | 2014 | 2013 | ||||||||||
| Production | ||||||||||||||
Gold production from Brio Gold mines (i) | 38,470 | 18,270 | 111% | 82,945 | 70,079 | 18% | ||||||||
Gold production from Commissioning Brio Gold mines (ii) | — | 16,614 | (100)% | 61,718 | 28,371 | 118% | ||||||||
| Total production from Brio Gold mines | 38,470 | 34,884 | 10% | 144,663 | 98,450 | 47% | ||||||||
Cash costs per ounce of gold produced (iii) | $ | 671 | $ | 809 | (17)% | $ | 798 | $ | 808 | (1)% | ||||
| Ore mined (tonnes) | 527,347 | 1,109,971 | (52)% | 3,452,142 | 2,680,726 | 29% | ||||||||
| Ore processed (tonnes) | 535,790 | 869,588 | (38)% | 3,281,882 | 2,349,001 | 40% | ||||||||
| Gold feed grade (g/t) | 2.40 | 1.77 | 36% | 1.86 | 1.84 | 1% | ||||||||
| Gold recovery rate (%) | 92.9 | 67.9 | (99)% | 73.6 | 70.3 | (99)% | ||||||||
| Sales | ||||||||||||||
| Gold sales (ounces) | 41,060 | 43,712 | (6)% | 141,321 | 95,753 | 48% | ||||||||
| Depletion, depreciation and amortization per gold ounce sold | $ | 198 | $ | 220 | (10)% | $ | 261 | $ | 214 | 22% | ||||
______________________________
| (i) | Includes Fazenda Brasileiro, Pilar and C1 Santa Luz. |
| (ii) | Commissioning at Pilar and C1 Santa Luz was completed as of September 30, 2014. Currently, C1 Santa Luz is on care and maintenance. |
| (iii) | A cautionary note regarding non-GAAP measures is included in Section 14 of this Management’s Discussion and Analysis. |
In the fourth quarter, the Company announced plans to separate its core and non-core portfolios, and, in the case of the latter, that it is advanced in the process of forming a subsidiary company Brio Gold that will hold Fazenda Brasileiro, Pilar and C1 Santa Luz as well as some related exploration concessions. The operational improvements at Pilar as well as continued on budget production at Fazenda Brasileiro demonstrate the potential for the new management of Brio Gold to pursue opportunities to unlock value from these assets for Yamana.
Brio Gold production in the fourth quarter was over 110% higher than the fourth quarter of 2013 and reflects a first full quarter of commercial production at Pilar, high grades and improved recoveries offset by lower throughput due to the absence of contribution from C1 Santa Luz.
In the fourth quarter of 2014, total production from Brio Gold was 38,470 ounces of gold compared to 34,884 ounces of gold produced in the fourth quarter of 2013. Cash costs for the fourth quarter were $671 per GEO, compared to $809 per GEO for the same quarter in 2013.
Annual production was approximately 47% higher than 2013 and was the result of increased throughput, recoveries and average grades. Cash costs were approximately $10 per ounce lower than the previous year and were the result of cost reduction initiatives including the optimization of the efficient utilization and procurement of consumables and non-critical headcount reductions.
For the year ended December 31, 2014, Brio Gold produced at total of 144,663 ounces of gold compared to 98,450 ounces of gold in 2013. Cash costs for the year ended 2014 were $798 per gold ounce, compared to $808 per gold ounce in the comparable period of 2013.
DISCONTINUED OPERATIONS
ERNESTO/PAU-A-PIQUE, BRAZIL
Ernesto/Pau-a-Pique continues to operate at sub economic production and cost levels and continues to operate at a loss. There is a formal process in progress to sell this non-core asset.
Ernesto/Pau-a-Pique began commissioning the fourth quarter of 2012 and completed commissioning effective May 1, 2014. As a result of the delayed start-up of operations and the lower metal prices, the Company has recorded an impairment charge of $160.3
million on an after tax basis at Ernesto/Pau-a-Pique during 2014 in addition to the $168.2 million, net of taxes recorded in 2013. For further details, refer to Section 5.1 of this MD&A.
7. CONSTRUCTION, DEVELOPMENT AND EXPLORATION
DEVELOPMENT
The following summary highlights key updates from the development projects of the Company since December 31, 2013.
Cerro Moro, Argentina
The Company has made a formal decision to proceed with the construction of Cerro Moro. Most of the physical construction is expected to begin late in 2015 after the completion of the balance of detailed engineering and with production expected to begin in mid-2017. Best practices are being followed with specific consideration given to sociopolitical events and the most appropriate approach for the jurisdiction.
Project capital construction costs are estimated at approximately $265 million which includes $31 million in 2015 for detailed engineering and pre-development. Project capital costs are higher than previous estimates due to an increase in design capacity from 700 tonnes per day to 1,000 tonnes per day. Other capital cost increases include revised estimates for reclamation, local productivity levels, owner team costs and contingency. The Company is currently evaluating further optimizations that could reduce capital costs estimates by $10-20 million.
The Cerro Moro project contains a number of high grade epithermal gold and silver deposits, some of which will be mined via open pit and some via underground mining. The feasibility study is based on annual production averaging approximately 102,000 ounces of gold and 5 million ounces of silver at a throughput of 1,000 tonnes per day. A typical circuit is expected consisting of a standard crushing, grinding and flotation circuit with a CCD and Merrill Crowe circuit included.
The Company has initiated discussions with Argentine authorities to determine the ultimate tax and royalty framework for Cerro Moro. The project and eventual operations at Cerro Moro are expected to provide significant benefits to Argentina and the province of Santa Cruz during construction and over the life of the mine, and form the basis for the review of the tax and royalty framework.
The Company believes that the Cerro Moro project offers significant opportunities for the conversion of mineral resources into mineral reserves and for further discoveries on the property. This will serve to significantly improve the returns and value from this high grade project.
Agua Rica, Argentina
Agua Rica is a low cost, large scale porphyry copper, molybdenum, gold and silver deposit located in the province of Catamarca, Argentina with proven and probable mineral reserves of approximately 10 billion pounds of copper and 6.5 million ounces of gold contained in approximately 910 million tonnes at copper and gold grades of 0.49% and 0.22 grams per tonne respectively.
The Company has received a positive independent technical review relating to previous studies on Agua Rica and on the potential development options for Agua Rica. The independent review included comparing and consolidating prior technical studies done on Agua Rica and the evaluation of various conceptual development alternatives, as well as providing an updated view on projected operating costs, capital expenditures and conceptual economics. The results of the review continue to support the potential to deliver value from this high quality asset, and help to validate the various potential development options for the Agua Rica. The two development scenarios for Agua Rica primarily focused on by the review are summarized below.
BASE CASE SCENARIO
The Base Case Scenario assumes the full integration of Agua Rica with existing infrastructure at Alumbrera and considers a 110,000 tonnes per day operation. In effect, Agua Rica would be the mine replacement for Alumbrera as Alumbrera is currently projected to exhaust its mineral reserves in 2019. The Company has begun discussions to secure access to Alumbrera’s infrastructure. The integrated operation would produce a copper concentrate with low arsenic (“As”) content in the first five years. This concentrate would be transported using existing Alumbrera infrastructure (pipeline, railway, port and ship loading facilities) for sale to smelters outside Argentina. After the first five years, the processing facilities would be modified such that a dual concentrate would be produced. Approximately 80% of the concentrate would contain low As levels and would continue to be shipped to smelters via
currently existing infrastructure. The remaining concentrate would be further treated through a POX/CIL and SX/EW process to produce copper cathodes for domestic sale. The costs for the construction of the POX/CIL and SX/EW plants are included in the sustaining capital expenditure estimate. The low As content concentrate is expected to be highly marketable.
ALTERNATIVE CASE SCENARIO
The Alternative Case Scenario is based on a stand-alone project and considers a 90,000 tonnes per day operation utilizing the POX/CIL and SX/EW process to treat 100% of the concentrate to produce copper cathodes for domestic sale. The Alumbrera facilities or infrastructure would not be required under this scenario.
The key advantages offered by the Alternative Case Scenario include:
•Expected additional copper recoveries and more gold per tonne of concentrate;
•Improved margins from incremental processing of copper;
•Reduced freight and port services costs;
•Reduced export tax as cathode can be sold in domestic market for internal consumption; and
•Reduced penalty costs relating to content of arsenic and other impurities.
For the Alternative Case Scenario, the recovery rates for recovered metal were assumed to be the same as they are for the Base Case Scenario. This could ultimately be proven to be conservative given that the process methods used for the production of cathode copper typically yield higher recoveries for copper, molybdenum and gold. However, further metallurgical test work would be required for more certainty on projected recoveries.
On October 6, 2014, the Company announced the signing of a Memorandum of Understanding (“MOU”) with the Government of Catamarca (“the Government”) represented by Catamarca Minera y Energetica Sociedad del Estado that lays the groundwork for the Company to work with the Government and other companies, including Yacimientos Mineros Agua de Dionisio, for further advancement of the development of Agua Rica. The MOU, one of the first of its kind in Argentina, does not restrict Yamana’s ability to deal with Agua Rica; rather, it provides a framework of cooperation that would see it advance to development more efficiently and on an expedited timeline.
Suyai, Argentina
Suyai is a high-grade gold and silver deposit located in the Chubut province of Argentina. An application for the environmental impact study ("EIS") for exploration and development work is continuing which will be followed by permitting for an operational EIS within the current mining and environmental laws of the Chubut Province.
EXPLORATION
The Company continues to consider exploration to be a key to unlocking and creating further value for shareholders at existing operations. The 2014 exploration program focused on finding higher quality ounces, being those ounces with the greatest potential to most quickly generate cash flow, and on infill drilling to do the work necessary to upgrade the existing inferred mineral resources. A total of 315,698 metres of drilling at 12 mines and projects were completed as part of the 2014 program.
Building on the success of the 2014 exploration program, the Company expects to spend between $70 to $98 million on exploration in 2015 where the focus continues to be on near mine exploration and ounces that can most quickly be brought into production and contribute to cash flow generation.
The following is a summary of the exploration and evaluation expenditures for the current and comparative periods.
| For the years ended December 31, (In millions of Dollars) | 2014 | 2013 | ||||
Exploration and evaluation capitalized (i) | $ | 53.7 | $ | 81.8 | ||
Exploration and evaluation expensed (ii) | 20.0 | 30.2 | ||||
| Total exploration and evaluation | $ | 73.7 | $ | 112.0 | ||
______________________________
| (i) | Capitalized exploration and evaluation costs are reflected in the Consolidated Balance Sheet's property, plant and equipment as part of the additions to mining property costs not subject to depreciation for near-mine exploration and tangible exploration and evaluation assets with probable future economic benefits. |
| (ii) | Expensed exploration and evaluation costs are reported in the consolidated statements of operations. |
The following summary highlights key updates from the exploration program.
El Peñón, Chile
The 2014 exploration program at El Peñón built on the success of the 2013 program focusing on mineral resource conversion, mineral resource extension and mineral resource growth. It involves a combination of surface and underground infill and exploration drill programs coupled with additional surface detailed mapping, sampling and brownfield target development. Significant exploration opportunities continue to be developed particularly with the recent discovery of the Ventura-vein which runs parallel to the existing Bonanza vein structure in a north-south direction (open in all directions) for more than 950 metres. The 2015 exploration program will focus on tighter drill spacing to outline and categorize these mineral resources. Concurrently, engineering will be determining how to best access Ventura from the existing underground infrastructure. The higher grade mineral is expected to quickly and easily be brought into production, and provides flexibility and optionality for further enhancements.
During the fourth quarter, exploration completed the infill drill programs at Esmeralda Nueva and Esperanza while the Exploration Program was focused on Borde Oeste, Esmeralda, Esmeralda Nueva, Pampa Este, Providencia Norte, HW3, Dominador, Orito, Providencia FW, Laguna, Aleste FW, FW2 and Pampa Campamento with positive results. Mineral resource expansion drill targets Borde Oeste, Providencia Norte, Esmerelda, Dominador, Pampa Este, Caracoles and Providencia HW1 and HW3, also returning positive results. A total of 19,874 metres were completed in 107 holes during the fourth quarter for a total of 125,843 metres completed in 526 holes during 2014. District exploration completed 6,490 metres distributed in 15 holes in the fourth quarter and 20,371 metres in 43 holes during 2014. The Laguna target located 5 kilometres south of the Dominador mine was infill drilled to upgrade mineral resource category with positive results.
Chapada, Brazil
At Chapada, the 2014 exploration program focused on mineral resource infill and expansion work at Corpo Sul, and the discovery of new satellite mineral deposits that can be quickly defined and added to the mineral resource inventory. The results of the program have been unprecedented with intersects with the widest width and highest grades to date in Chapada's history at the newly discovered Sucupira. The new mineralization is located immediately west of the main Chapada pit at a depth of approximately 180 metres which roughly coincides with the current bottom of the ultimate pit. Mineralization appears to be porphyry related and is completely open to the northeast and southwest along a 1.8 kilometre strike length. Re-modeling of magnetic data previously collected at Chapada suggests this mineral body could continue beneath the main Chapada pit. The 2015 exploration program will begin to define the extent of Sucupira and continue defining other recent discoveries. This new discovery, combined with the recently identified Santa Cruz mineralization southwest of Corpo Sul with mineralization from surface to depth, along with Corpo Sul itself, which was only discovered a few years earlier, continue to suggest the potential of a mineralized system that could be significantly larger than was originally envisioned at Chapada.
The 12,000 metres infill and extension exploration drill program and the 9,700 metre near-mine exploration drill program where completed during the fourth quarter. A total of 7,285 metres distributed in 30 holes were completed in the 50 by 50 metres infill program and 5,760 metres distributed in 21 holes were completed in the 100 by 100 metre infill programs at the Corpo Sul deposit. Assay results from the infill program are support mineral resource category upgrade at the Corpo Sul deposit and better define the mineral continuity of the infill area. The near mine exploration program completed 2,116 metres in 9 holes testing the Santa Cruz, Sucupira and other targets during the fourth quarter with a total of 8,194 metres in 32 holes for 2014.
Gualcamayo, Argentina
The 2014 exploration program at Gualcamayo focused on expanding the Rodado Southwest mineral body near current underground mine workings and testing new near surface target areas for oxide mineral potential. With the assistance of third-party consultants, the Company continues to assess the economic viability and options for processing the newly discovered carbonates and sulphide mineral resource beneath the current QDD pit limits, the Deep Carbonates Alternative project. Results support the potential for a large scale, bulk tonnage underground operation with several drilling intersections exceeding 100 metres. Company continues with technical analysis and assays that provide information to complete a preliminary economic assessment towards a pre-feasibility study completion by the end of 2015. The 2015 exploration program is designed to discover and extend additional oxide mineralization surrounding the QDDLW deposit.
During the fourth quarter, underground drill exploration was temporarily suspended to review the exploration plans. It is anticipated the drilling to test and extend the oxide ore bodies at QDDLW will resume during the first quarter of 2015. Detailed surface mapping was completed on over 200 hectares in the Las Vacas, Quebrada Rodado and Virgin de Lourdes project. A survey to characterize geophysical properties of lithologies in the Las Vacas area was conducted by a third-party consultant gathering new data to support the exploration drill targeting.
Minera Florida, Chile
The 2014 exploration program at Minera Florida focused on upgrading mineral resources to indicated mineral resource status as the first step to replace and increase mineral reserves, exploring anomalies east of the current mine complex and developing new surgical targets through surface mapping and sampling. The 2015 exploration program will emphasize infill drill programs to upgrade portions of the Maqui, Peumo and Mina Este inferred mineral resource blocks to indicated status, to complete a resource extension program at the Marisol block and to discover additional mineral resources in the Florida Este block.
During the fourth quarter, exploration efforts focused on the mineral resource upgrade and mineral resource expansion programs in the Mina Este, Rafael Satellite, Lisset, and Hallazgo vein structures. The infill program completed a total of 3,600 metres distributed in 30 holes during the fourth quarter for a total of 17,238 metres completed in 121 holes during 2014. The majority of drill holes intersected multiple intercepts of anomalous to potential ore grade assays over narrow to moderate widths. Mineral resource modeling was completed during the fourth quarter. Lower drill costs allowed the infill program to complete 5,238 metres above the original plan.
Mercedes, Mexico
The 2014 exploration program at Mercedes focused on testing for extensions of known ore bodies along the Mercedes-Barrancas-Marianas trend, upgrading inferred mineral resources to indicated mineral resource status, and discovering new mineralization. The Company completed surface and underground drilling, construct development drifts and underground drill stations, and completed local and district target reconnaissance. The 2015 exploration program will continue resource infill and extension programs, complete limited ore definition drilling and to drill test near mine and regional targets developed in prior exploration campaigns.
During the fourth quarter, 15,308 metres were completed in 73 holes testing exploration targets along the Corona de Oro to Marianas structural trend, the newly identified Axis trend and testing near mine delineation targets to delineate mining activities. A total of 49,706 metres distributed in 199 holes were completed during 2014. Drilling of the GAP zone has outlined a mineral envelope approximately 100 metres wide by 250 metres long that extends to the southwest area. Resource modeling of all mineral envelopes is complete.
Cerro Moro, Argentina
The 2014 exploration program at Cerro Moro was focused on upgrading the newly discovered mineral resources at Margarita and improving mineral resource classifications at Carlota, Nine and other targets as the Company continues to advance development of the project. The 2015 exploration program will support limited drilling of targets developed in previous exploration campaigns in the La Negrita Block.
The infill drill program to upgrade inferred mineral resources to indicated category focused on areas including Nini, Carlita, Margaritas and other targets was completed in the fourth quarter to support the update to the mineral resource model. District area targets including Zoe Southeast, Deborah Parallel and Natalia surrounding Cerro Moro are under evaluation with exploration techniques of geologic mapping and sample collection. Targets were not drill tested during the fourth quarter as activities concentrated on data compilation and interpretation.
Canadian Malartic and Kirkland Lake, Canada
As part of the Canadian Malartic Partnership, Yamana and Agnico jointly explore and may potentially develop the Kirkland Lake assets, and continue exploration at the Hammond Reef, Pandora, and the Wood-Pandora properties. The 2015 exploration programs include the following:
| • | Pandora - continued drill testing from surface and construction of an exploration tunnel from the Lapa mine 101 level to the west for approximately 1 kilometre facilitating additional subsurface drill testing, |
| • | Kirkland Lake - limited drill testing of the various targets, |
| • | Upper Beaver - initiation of a Preliminary Economic Assessment on the deposit and |
| • | Canadian Malartic mine - limited drilling of the South Odyssey mineral body. |
During the fourth quarter, exploration activities focused on Canadian Malartic, Pandora and Kirkland Lake assets. At Canadian Malartic on a 100% basis, 2,395 metres were completed in 4 holes testing the South Odyssey porphyry mineralization at depth of approximately 1,000 to 1,500 metres. Exploration drilling of the Pandora property completed 8,525 metres distributed in 22 holes during 2014. This program confirmed and expanded the near surface mineral body and testing the deeper exploration targets from the 101 level of the Lapa mine complex. The target of this underground based drilling was to explore for mineral bodies 900 to 1,200 metres beneath the surface. Drill results are positive and have validated some of the historic results from previous operators in 2014 and the 2015 exploration program will continue to define this target. At the Kirkland Lake properties, exploration drilling tested the near surface targets and sub-surface mineral extension. Work at Upper Beaver focused on testing for near surface mineralization, and several holes were drilled to test for mineralization below the current intercepts that encountered high-grade intervals at depths below 1,500 metres. Near surface, drilling outlined a small, potentially open-pitable mineral resource. Drilling at depth below 1,500 metres encountered mineralization that is comparable in grade and width to that obtained by previous operators. A total of 7,278 metres were completed in 22 holes with positive results.
Brio Gold
The 2014 exploration program at Brio Gold was focused on delineating the high grade mineral shoots within the Pilar mine and expanding the high grade zones beyond the current mineral reserve boundaries. The defining of higher grade ore shoots through tightened drill spacing is expected to support more efficient mining and reduced dilution to get increased production from lower tonnage. The 2015 drill program at Pilar is designed to meet mineral resource upgrade objectives at both the Jordino and Maria Lazarus mines and to explore the boundaries of these areas for mineral resource growth.
The Pilar infill in the fourth quarter completed 365 metres in 2 holes for a total of 17,013 metres in 112 holes for the infill program and a total of 4,382 metres were completed in 26 exploration holes from the beginning of 2014. Additionally, 400 metres of a 2,940 metre infill program at Maria Lazarus were completed in the fourth quarter to better define the mineral horizons and guide underground tunnel development. Results from the Maria Lazarus infill program confirm the extent of the mineral body and support the current grade shells and widths. Infill drilling of the Jordino mine area has confirmed high grade shoots and internal known waste areas.
8. MINERAL RESERVE AND MINERAL RESOURCE ESTIMATES
Mineral reserves and mineral resources are determined in accordance with National Instrument 43-101, issued by the Canadian Securities Administrators. This National Instrument lays out the standards of disclosure for mineral projects including rules relating to the determination of mineral reserves and mineral resources. This includes a requirement that a “qualified person” (as defined under the NI 43-101) supervises the preparation of the mineral reserves and mineral resources reports. The Company's mineral reserve and mineral resource reports are reviewed by William Wulftange, Senior Vice President Exploration who is a qualified person.
Complete information relating to mineral reserves and mineral resources indicating tonnage, grade and the various mines and projects will be contained in a complete mineral resource and mineral reserve table accompanying the 2014 annual report.
Beginning in 2015, the Company will be reporting production and cost information for gold, silver and copper separately.
Total 2014 proven and probable mineral reserves were 19.6 million ounces of gold and 110.1 million ounces of silver compared to 16.3 million ounces of gold and 117.8 million ounces of silver, respectively, in 2013 representing an increase of 21% gold and a decrease of 7% silver. The increase in gold mineral reserves is mainly due to the acquisition of Canadian Malartic contributing
4.33 million ounces of gold to the reserve base. Proven and probable mineral reserves include approximately 2.7 million ounces of gold attributable to the Brio Gold assets( Brio Gold includes Fazenda Brasileiro, Pilar, C1 Santa Luz and some related exploration concessions.).
Measured and indicated mineral resources increased 32% to 21.6 million ounces of gold and 25% to 64.7 million ounces of silver, compared with measured and indicated mineral resources of 15.4 million ounces of gold and 51.7 million ounces of silver in 2013. The increase in measured and indicated mineral resources is mainly due to the additions from the Company’s 50% acquisition of Osisko Mining Corporation, infill drilling at Gualcamayo (gold) and infill programs at Cerro Moro (silver) and El Peñón (silver). Total inferred mineral resources increased 6% to 13.9 million ounces of gold and increased 6% to 85.7 million ounces of silver.
Assumptions for metal prices used in the estimates of mineral reserves and mineral resources changed for gold and copper from 2013: gold price of $1150 per ounce, silver price of $18 per ounce, and copper price of $3.00 per pound, except where noted in the mineral reserve and mineral resource tables contained in the Company's 2014 annual report. Please refer to the mineral reserve and mineral resource table contained in the Company's 2014 annual report and the Company's website for a complete listing of metal-price assumptions used in the calculation of mineral reserves and mineral resources by project.
The most notable changes are detailed below:
Canadian Malartic, Canada (50%)
| • | Gold mineral reserves of 126.9 million tonnes at 1.06 g/t containing 4.3 million gold ounces |
| • | Gold mineral resources of 35.6 million tonnes at 0.85 g/t containing 968,000 gold ounces |
| • | Inferred gold mineral resources of 22.7 million tonnes at 0.76 g/t containing 556,000 gold ounces |
On August 14, 2014, the Company and its partner, Agnico Eagle Mines Limited, jointly filed a National Instrument 43-101 updated technical report for Canadian Malartic with an updated estimate of mineral reserves and mineral resources as of June 16, 2014. The current inventory of mineral reserves and mineral resources reflects that estimate and has been depleted due to production from June 16, 2014 until the end of the year.
El Peñón,Chile
| • | Mineral reserves of 10.4 million tonnes at 5.03 g/t gold containing 1.7 million gold ounces and 173.7 g/t silver containing 58.1 million silver ounces |
| • | Mineral resources of 3.7 million tonnes at 7.83 g/t gold containing 919,000 gold ounces and 228.0 g/t silver containing 26.8 million silver ounces |
| • | Inferred mineral resources of 6.9 million tonnes at 6.85 g/t gold containing 1.5 million gold ounces and 274.6 g/t silver containing 61.0 million silver ounces |
Gold mineral reserves decreased 14% to approximately 1.7 million ounces and silver mineral reserves decreased 10% to approximately 58.1 million ounces after production of 282,617 gold ounces and approximately 8.5 million silver ounces. Mineral reserve tonnage decreased slightly while grade decreased for gold and silver by 14% and 9% respectively. Mineral resources increased to 919,000 ounces and 26.8 million silver ounces, increases of 6% and 11% respectively, contained in 3.7 million tonnes at 7.83 g/t gold and 228.0 g/t silver. Inferred mineral resources increased 21% for gold and 15% for silver.
The decline in mineral reserves can be attributed, in part, to the mining in 2014 of the higher grade areas that includes Bonanza. The expected conversion of mineral resources to mineral reserves was not achieved due to the narrower widths in some areas and less drilling being completed in 2014 which also contributed to the decline. Mineral resources increased as targets that were previously identified were drilled to begin to delineate and verify the mineralization.
The 2015 exploration program at El Peñón will focus on converting mineral resources to mineral reserves and the discovery of new mineral deposits. This includes focused infill drill programs at Esmeralda Sur, Laguna, Borde Este, Caracoles, Sorpresa and the Providencia Norte structures.
Chapada, Brazil
| • | Gold mineral reserves of 509.1 million tonnes at 0.25 g/t containing 4.0 million gold ounces |
| • | Gold mineral resources of 247.1 million tonnes at 0.27 g/t containing 2.1 million gold ounces |
| • | Inferred gold mineral resources of 79.8 million tonnes at 0.25 g/t containing 648,000 gold ounces |
Gold mineral reserves increased 5% to approximately 4.0 million ounces contained in 509.1 million tonnes, a 6% increase in tonnage, at 0.25 g/t. Gold mineral resources increased slightly to 2.1 million ounces in 247.1 million tonnes, a 3 % decrease, at 0.27 g/t, a 5% increase. Gold inferred mineral resources were 648,000 ounces contained in 79.8 million tonnes at 0.25 g/t, a 39% increase in grade.
Copper mineral reserves also increased 5% to approximately 2,794 million pounds contained in 450 million tonnes at 0.28%. Copper mineral resources decreased slightly to 867 million pounds contained in 157,669 million tonnes at 0.25%. Copper inferred mineral resources were 332 million pounds, a 55% decrease, contained in 52,230 million tonnes at 0.29%
Mineral reserves increased in both gold and copper net of depletion due to production mainly as a result of infill drilling at Corpo Sul, upgrading mineral resources. As a consequence of the conversion, inferred gold and copper mineral resources inventory declined.
Jacobina, Brazil
| • | Gold mineral reserves of 22.8 million tonnes at 2.82 g/t containing 2.1 million gold ounces |
| • | Gold mineral resources of 32.9 million tonnes at 2.41 g/t containing 2.6 million gold ounces |
| • | Inferred gold mineral resources of 15.9 million tonnes at 3.22 g/t containing 1.6 million gold ounces |
Gold mineral reserves decreased 4% to approximately 2.1 million ounces contained in 22.8 million tonnes, a 5% decrease in tonnage. Gold mineral resources decreased 2% to 2.6 million ounces contained in 32.9 million tonnes, a 3% decrease. Gold inferred mineral resources increased 4% to 1.6 million ounces contained in 15.9 million tonnes at 3.22 g/t, a 4% increase in grade.
Mineral reserves and mineral resources declined due to depletion from production as the estimate was not updated from year end 2013. Inferred mineral resources increased as a result of drilling during the year. A deposit wide definition, infill and expansion drill program is planned for 2015. Following these programs, a new mineral resource and mineral reserve estimation will be calculated.
Gualcamayo, Argentina
| • | Gold mineral reserves of 29.2 million tonnes at 1.33 g/t containing 1.2 million gold ounces |
| • | Gold mineral resources of 104.6 million tonnes at 1.14 g/t containing 3.8 million gold ounces |
| • | Inferred gold mineral resources of 27.5 million tonnes at 2.19 g/t containing 1.9 million gold ounces |
Gold mineral reserves decreased 10% to approximately 1.2 million ounces contained in 29.2 million tonnes, a 10% decrease in tonnage, at 1.33 g/t. Gold mineral resources increased 25% to 3.8 million ounces contained in 104.6 million tonnes, a 10% increase in tonnage, at 1.14 g/t, a 13% increase in grade. Contained gold inferred mineral resources decreased 5%.
Mineral reserves declined due to depletion from production which was partially offset by mineral reserve gains at QDD Lower West. Mineral resources increased as a result of infill and expansion drilling at Rodado SW, the focus of the 2014 program. Mineral resources also increased due to the conversion of the resources from inferred categories.
Minera Florida, Chile
| • | Mineral reserves of 7.9 million tonnes at 2.41 g/t gold containing 613,000 gold ounces and 16.76 g/t silver containing 4.2 million silver ounces |
| • | Mineral resources of 4.6 million tonnes at 5.30 g/t gold containing 784,000 gold ounces and 29.9 g/t silver containing 4.4 million silver ounces |
| • | Inferred mineral resources of 5.3 million tonnes at 5.58 g/t gold containing 954,000 gold ounces and 35.7 g/t containing 6.1 million silver ounces |
Gold mineral reserves decreased 2% to approximately 613,000 ounces and silver mineral reserves increased 2% to approximately 4.2 million ounces in 7.9 million tonnes at 2.41 g/t gold and 16.76 g/t silver. Gold mineral resources increased 3% to 784,000 ounces and silver mineral resources decreased slightly to 4.4 million silver ounces. Inferred mineral resources increased 5% for gold and slightly for silver.
Mineral reserves decreased due to depletion from production which was partially offset by mineral reserve additions. Mineral reserves were also impacted by a reclassification of a sill pillar that was previously scheduled to be mined at the end of the mine life.
Gold mineral resources increased due to infill drilling and minor changes to estimation parameters.
Mercedes, Mexico
| • | Mineral reserves of 4.0 million tonnes at 5.03 g/t gold containing 648,000 gold ounces and 54.1 g/t silver containing 7.0 million silver ounces |
| • | Mineral resources of 5.2 million tonnes at 3.35 g/t gold containing 559,000 gold ounces and 35.3 g/t silver containing 5.9 million silver ounces |
| • | Inferred mineral resources of 2.7 million tonnes at 3.99 g/t gold containing 342,000 gold ounces and 30.6 g/t silver containing 2.6 million silver ounces |
Mineral reserves decreased 23% to 648,000 gold ounces and 17% to 7.0 million silver ounces in 4.0 million tonnes at 5.03 g/t gold and 54.1 g/t silver. Mineral reserve tonnage decreased 28%, and grade increased for gold and silver by 7% and 16% respectively. Mineral resources of 559,000 gold ounces and 5.9 million silver ounces represent increases of 57% and 35% respectively. Inferred mineral resources decreased 17% for gold and 32% for silver.
Mineral reserves reflect depletion due to production, and a change in estimation parameters in high grade zones at Mercedes and Klondike partially offset by improved silver recoveries for ore at Diluvio and Lupita, and gains in mineral reserves in other areas including Barrancas Norte and Breccia Hill.
Fazenda Brasileiro, Brazil
| • | Gold mineral reserves of 2.1 million tonnes at 2.19 g/t containing 145,000 gold ounces |
| • | Gold mineral resources of 6.5 million tonnes at 2.09 g/t containing 437,000 gold ounces |
| • | Inferred gold mineral resources of 2.3 million tonnes at 2.26 g/t containing 167,000 gold ounces |
Gold mineral reserves decreased 14% to approximately 145,000 ounces contained in 2.1 million tonnes, a 5% decrease in tonnage. Gold mineral resources increased 278% to 437,000 ounces contained in 6.5 million tonnes, a 220% increase in tonnage. Gold inferred mineral resources decreased 73%.
Pilar, Brazil
| • | Gold mineral reserves of 10.6 million tonnes at 3.98 g/t containing 1.4 million gold ounces |
| • | Gold mineral resources of 1.5 million tonnes at 4.35 g/t containing 214,000 gold ounces |
| • | Inferred gold mineral resources of 13.0 million tonnes at 4.1 g/t containing 1.7 million gold ounces |
Gold mineral reserves decreased 3% to approximately 1.4 million ounces contained in 10.6 million tonnes, a 2% increase in tonnage. Gold mineral resources decreased 21% to 214,000 ounces contained in 1.5 million tonnes, a 19% decrease in tonnage. Gold inferred mineral resources increased 2%.
Cerro Moro, Argentina
| • | Probable mineral reserves of 2.0 million tonnes at 11.38 g/t gold containing 715,000 gold ounces and 648.3 g/t silver containing 40.7 million silver ounces |
| • | Mineral resources of 3.3 million tonnes at 2.23 g/t gold containing 238,000 gold ounces and 190.3 g/t silver containing 20.3 million silver ounces |
| • | Inferred mineral resources of 4.4 million tonnes at 1.96 g/t gold containing 279,000 gold ounces and 101.3 g/t silver containing 14.4 million silver ounces |
Probable mineral reserves were unchanged from 2013. Mineral resources were 238,000 gold ounces and 20.3 million silver ounces, representing increases of 95% and 77% respectively, contained in 3.3 million tonnes, an 87% increase, at 2.23 g/t gold and 190.3 g/t silver. Inferred mineral resources contained ounces also increased by 27% for gold and 8% for silver.
The increase in silver mineral resources at Cerro Moro is directly attributed to the expansion of mineral resources at Nini-Esperanza and increased average grades at Carlita following infill drilling.
The Company's mineral reserves and mineral resources as at December 31, 2014 are summarized in the following table. Complete information relating to mineral reserves and mineral resources indicating tonnage, and grade is contained in a complete mineral resource and mineral reserve table accompanying the 2014 annual report available on the Company's website, www.yamana.com.
Mineral Reserves & Resources Estimates (a) | Contained Gold | Contained Silver | Contained Copper | |||||||
| (in 000's ounces) | (in 000's ounces) | (in million pounds) | ||||||||
| 2014 | 2013 | 2014 | 2013 | 2014 | 2013 | |||||
| Proven & Probable Mineral Reserves | ||||||||||
| Chapada | 4,033 | 3,832 | — | — | 2,794 | 2,649 | ||||
| El Peñón | 1,682 | 1,961 | 58,135 | 64,456 | — | — | ||||
| Gualcamayo | 1,244 | 1,375 | — | — | — | — | ||||
| Mercedes | 648 | 845 | 6,977 | 8,419 | — | — | ||||
| Canadian Malartic (50%) | 4,329 | n/a | ||||||||
| Minera Florida | 613 | 623 | 4,230 | 4,164 | — | — | ||||
| Jacobina | 2,074 | 2,157 | — | — | — | — | ||||
| Alumbrera (12.5%) | 185 | 254 | — | — | 135 | 175 | ||||
| Ernesto/Pau-a-Pique | 321 | 526 | — | — | — | — | ||||
| Cerro Moro | 715 | 715 | 40,723 | 40,723 | — | — | ||||
| Jeronimo (57%) | 1,082 | 1,082 | — | — | — | — | ||||
| 16,926 | 13,370 | 110,065 | 117,762 | 2,929 | 2,824 | |||||
| Brio Gold Projects | ||||||||||
| Fazenda Brasileiro | 145 | 168 | — | — | — | — | ||||
| Pilar | 1,355 | 1,402 | — | — | — | — | ||||
| C1 Santa Luz | 1,200 | 1,345 | — | — | — | — | ||||
| Total Proven & Probable Mineral Reserves | 19,626 | 16,285 | 110,065 | 117,762 | 2,929 | 2,824 | ||||
| Measured & Indicated Mineral Resources | ||||||||||
| Chapada | 2,130 | 2,104 | 3,775 | 3,775 | 867 | 874 | ||||
| El Peñón | 919 | 870 | 26,761 | 24,130 | — | — | ||||
| Gualcamayo | 3,841 | 3,076 | — | — | — | — | ||||
| Mercedes | 559 | 357 | 5,883 | 4,351 | — | — | ||||
| Canadian Malartic (50%) | 968 | n/a | ||||||||
| Minera Florida | 784 | 759 | 4,424 | 4,459 | — | — | ||||
| Jacobina | 2,553 | 2,614 | — | — | — | — | ||||
| Ernesto/Pau-a-Pique | 279 | 324 | — | — | — | — | ||||
| Cerro Moro | 238 | 122 | 20,313 | 11,488 | — | — | ||||
| Jeronimo (57%) | 139 | 139 | — | — | — | — | ||||
| La Pepa | 2,760 | 2,760 | — | — | — | — | ||||
| Suyai | 2,286 | 2,286 | 3,523 | 3,523 | — | — | ||||
| Hammond Reef (50%) | 2,251 | n/a | — | n/a | — | n/a | ||||
| Upper Beaver (50%) | 722 | n/a | — | n/a | 18 | n/a | ||||
| 20,429 | 15,411 | 64,679 | 51,726 | 885 | 874 | |||||
| Brio Gold Projects | ||||||||||
| Fazenda Brasileiro | 437 | 116 | — | — | — | — | ||||
| Pilar | 214 | 270 | — | — | — | — | ||||
| C1 Santa Luz | 478 | 478 | — | — | — | — | ||||
| Total Measured & Indicated Mineral Resources | 21,558 | 16,275 | 64,679 | 51,726 | 885 | 874 | ||||
| Inferred Mineral Resources | ||||||||||
| Chapada | 648 | 913 | 982 | 982 | 332 | 731 | ||||
| El Peñón | 1,521 | 1,252 | 60,969 | 53,231 | — | — | ||||
| Gualcamayo | 1,938 | 2,029 | — | — | — | — | ||||
| Mercedes | 342 | 414 | 2,625 | 3,843 | — | — | ||||
| Canadian Malartic (50%) | 556 | n/a | n/a | n/a | ||||||
| Minera Florida | 954 | 907 | 6,100 | 6,023 | — | — | ||||
| Jacobina | 1,644 | 1,584 | — | — | — | — | ||||
| Ernesto/Pau-a-Pique | 260 | 157 | — | — | — | — | ||||
| Cerro Moro | 279 | 220 | 14,415 | 13,297 | — | — | ||||
| Jeronimo (57%) | 161 | 161 | — | — | — | — | ||||
| La Pepa | 620 | 620 | — | — | — | — | ||||
| Lavra Velha | 543 | 543 | — | — | — | — | ||||
| Arco Sul | 646 | 646 | — | — | — | — | ||||
| Suyai | 274 | 274 | 575 | 575 | — | — | ||||
| Hammond Reef (50%) | 6 | n/a | — | n/a | — | n/a | ||||
| Upper Beaver (50%) | 523 | n/a | — | n/a | 26 | n/a | ||||
| 10,915 | 9,720 | 85,666 | 77,951 | 358 | 731 | |||||
| Brio Gold Projects | ||||||||||
| Fazenda Brasileiro | 167 | 611 | — | — | — | — | ||||
| Pilar | 1,713 | 1,676 | — | — | — | — | ||||
| C1 Santa Luz | 1,093 | 1,086 | — | — | — | — | ||||
| Total Inferred Mineral Resources | 13,888 | 13,093 | 85,666 | 77,951 | 358 | 731 | ||||
__________________
(a) Refer to the complete Mineral Reserves & Mineral Resources tables in the Company's 2014 Annual Report.
9. LIQUIDITY, CAPITAL RESOURCES AND CONTRACTUAL COMMITMENTS
LIQUIDITY
The Company continues to focus on containing costs in order to maximize available cash. The following is a summary of liquidity and capital resources balances:
| As at December 31, (in thousands of Dollars) | 2014 | 2013 | ||||
| Cash | $ | 191,027 | $ | 220,018 | ||
| Trade and other receivables | $ | 51,014 | $ | 80,101 | ||
| Long term debt | $ | 2,025,383 | $ | 1,189,762 | ||
Working capital (i) | $ | 55,899 | $ | 79,725 | ||
______________________________
(i)Working capital is defined as the excess of current assets over current liabilities which includes the current portion of long term debt.
Cash and cash equivalents were $191.0 million as at December 31, 2014 compared to $220.0 million as at December 31, 2013. Cash and cash equivalents were comprised of cash in bank and bank term deposits. The sources and uses of cash and cash equivalent during the year are explained below. The Company has considered the changes in taxes in Chile and believes that it will not impact liquidity. Section 10 - Income Taxes describes further details on the change to the Chilean tax rates.
Working capital was $55.9 million as at December 31, 2014, compared to $79.7 million as at December 31, 2013. Working capital was impacted by an increase in current liabilities from non-recurring provisions recorded during the year.
The following table summarizes yearly cash inflows and outflows:
| For the years ended December 31, (In thousands of Dollars of inflows/(outflows)) | 2014 | 2013 | ||||
| Cash flows from operating activities from continuing operations (ii) | $ | 513,929 | $ | 564,996 | ||
Cash flows from operating activities before changes in non-cash working capital (i) (ii) | $ | 594,998 | $ | 707,814 | ||
| Cash flows from financing activities from continuing operations (ii) | $ | 540,143 | $ | 283,843 | ||
| Cash flows used in investing activities from continuing operations (ii) | $ | (1,081,699 | ) | $ | (965,548 | ) |
| (i) | A cautionary note regarding non-GAAP measures is included in Section 14 of this Management’s Discussion and Analysis. |
| (ii) | Cash flow balances are attributable to Yamana Gold Inc. equity holders. |
CASH FLOWS FROM OPERATING ACTIVITIES FROM CONTINUING OPERATIONS
Cash flows from operating activities from continuing operations after changes in non-cash working capital items for the year ended December 31, 2014 were $513.9 million, compared to $565.0 million for the year ended December 31, 2013. Cash flows from operating activities before changes in non-cash working capital (a non-GAAP measure, see Section 14) for the year ended December 31, 2014 were $595.0 million, compared to $707.8 million generated for the same period of 2013.
Cash flows from operating activities for the year were impacted by lower metal prices but also reflect one-time cash outflows including $32.4 million for the year in transaction costs associated with acquisition of Osisko and $21.8 million of reorganization and the demobilization costs. Excluding these one-time items, that are non-recurring in nature and do not reflect the underlying performance of ongoing operations, adjusted operating cash flows (a non-GAAP measure, see Section 14) were $176.7 million for the quarter and $647.6 million for the year ended December 31, 2014.
Changes in non-cash working capital items for the year ended December 31, 2014 were cash outflows of $81.1 million compared to $142.8 million.
CASH FLOWS FROM FINANCING ACTIVITIES FROM CONTINUING OPERATIONS
For the year 2014, cash inflows from financing activities from continuing operations were $540.1 million compared to inflows of $283.8 million in the same quarter of 2013. On June 25, 2014, the Company issued $500 million of 4.95% Senior Notes due July 15, 2024. The notes are unsecured, senior obligations of the Company and are unconditionally guaranteed by certain of the Company's subsidiaries that are also guarantors under the Company's unsecured senior credit facility. The net proceeds from the debt offering were used to repay in full its $500 million unsecured senior term loan due June 2016. The proceeds of the term loan were used to partly fund the Company's joint acquisition of Osisko. Other outflows from financing activities for the year included interest and other finance expenses paid of $90.9 million and dividends paid of $142.9 million.
Net debt as at December 31, 2014 excluding debt assumed from the Company's 50% interest in Canadian Malartic which is neither corporate nor guaranteed by the Company was $1.76 billion.
The principal repayment schedule of senior debt notes to be repaid in the next five years is as follows:
| (in thousands of Dollars) | 2015 | 2016 | 2017 | 2018 | 2019 | ||||||||||
| Senior debt notes | $ | — | $ | 73,500 | $ | — | $ | 110,000 | $ | 596,500 | |||||
The balance of senior debt notes due after 2019 is $1.19 billion of which $1.10 billion is due in and after 2022.
The Company has a revolving credit facility with a long maturity date of 2019. The Company will, from time to time, repay balances outstanding on its revolving credit with operating cash flow and cash flow from other sources. Additionally, the Company intends to renew the credit facility upon maturity in 2019.
Subsequent to year end, the Company closed on a C$299.3 million bought deal offering of 56.5 million common shares at a share price of C$5.30 per share. The net proceeds of the Offering are being used to reduce the amount outstanding under the Company’s revolving credit facility thereby further strengthening the balance sheet and providing flexibility to fund its internal growth opportunities.
CASH FLOWS USED IN INVESTING ACTIVITIES FROM CONTINUING OPERATIONS
Cash outflows used in investing activities from continuing operations were $1.08 billion for the quarter ended December 31, 2014, compared to cash outflows of $965.5 million for the quarter ended December 31, 2013. Cash outflows used in investing activities from continuing operations for the year included $462.7 million of cash consideration on the acquisition of a 50% interest in Osisko.
Capital expenditures including sustaining, expansionary and capitalized exploration and evaluation for the three and twelve months ended December 31, 2014, were $140.2 million and $662.1 million, respectively. These expenditures were incurred as follows:
| For the three months ended December 31, | For the year ended December 31, | ||||||||
| (in thousands of Dollars) | 2014 | 2014 | 2013 | ||||||
| Chapada | $ | 31,769 | $ | 115,025 | $ | 101,152 | |||
| El Peñón | 20,886 | 111,466 | 131,176 | ||||||
| Gualcamayo | 5,254 | 38,324 | 149,699 | ||||||
| Mercedes | 10,158 | 41,649 | 51,058 | ||||||
Canadian Malartic (i) | 18,340 | 43,313 | n/a | ||||||
| Minera Florida | 16,036 | 58,166 | 84,670 | ||||||
| Jacobina | 10,311 | 34,637 | 52,815 | ||||||
| Cerro Moro | 6,401 | 30,227 | 49,099 | ||||||
Brio Gold (iii) | 15,678 | 170,847 | 295,270 | ||||||
| Other | 5,397 | 18,457 | 44,725 | ||||||
Total capital expenditures (ii) | $ | 140,230 | $ | 662,111 | $ | 959,664 | |||
______________________________
| (i) | For the period from acquisition on June 16, 2014. |
| (ii) | Net of movement in accounts payable as applicable. |
| (iii) | Includes Fazenda Brasileiro, Pilar and C1 Santa Luz. |
CAPITAL RESOURCES
In order to maintain or adjust its capital structure, the Company may issue shares or debt securities, pay dividends, or undertake other activities as deemed appropriate under the specific circumstances.
The Company is authorized to issue an unlimited number of common shares at no par value and a maximum of eight million first preference shares. There are no first preference shares issued or outstanding. As of Feb 05, 2015, the total number of shares outstanding were 878.1 million, the total number of stock options outstanding were 2.9 million, the total number of DSUs outstanding is 3.1 million, the total number of RSUs outstanding were 2.3 million, and the total number of PSUs outstanding were 2.0 million.
In 2014, the Company declared quarterly dividends totalling $0.13 per share compared to 2013 dividends of $0.26 per share.
The following table summarizes the weighted average common shares and equity instruments outstanding as at December 31, 2014:
Equity instruments outstanding as at | Weighted average dilutive equity instruments (i), three months ended | Weighted average dilutive equity instruments, year ended | |||
| (In thousands) | December 31, 2014 | December 31, 2014 | December 31, 2014 | ||
| Common shares | 878,053 | 877,664 | 820,782 | ||
| Dilutive shares relating to convertible debt held in trust | 3,177 | 3,177 | 1,723 | ||
Options (i) | 1,570 | — | — | ||
RSU (i) | 1,972 | — | — | ||
DSU (ii) | 3,074 | — | — | ||
| PSU | 1,347 | — | — | ||
| n/a | 880,841 | 822,505 | |||
______________________________
| (i) | For the three and twelve months ended December 31, 2014, these items have not been included in the weighted average number of shares as they are anti-dilutive. |
| (ii) | DSU is settled in cash and, as such, excluded from the calculation of the weighted average number of shares outstanding. |
Subsequent to the year end, the Company established a dividend reinvestment plan to provide holders of common shares of the Company with a simple and convenient method to purchase additional common shares by reinvesting cash dividends, less any applicable withholding tax. A plan participant may obtain additional common shares by electing to automatically reinvest all or any portion of cash dividends paid on common shares held by the plan participant without paying any brokerage commissions, administrative costs or other service charges. The common shares are listed on the Toronto Stock Exchange and on the New York Stock Exchange.
Loss Per Share Calculation
| For the three months ended December 31, | For the year ended December 31, | |||||||||||
| 2014 | 2013 | 2014 | 2013 | |||||||||
| Weighted average number of common shares - basic ('000 shares) | 877,664 | 752,995 | 820,782 | 752,697 | ||||||||
| Weighted average number of dilutive shares relating to convertible debt | 3,177 | — | 1,723 | — | ||||||||
| Weighted average number of common shares - diluted | 880,841 | 752,995 | 822,505 | 752,697 | ||||||||
| Basic and Diluted Loss Per Share from Continuing Operations Attributable to Yamana Equity Holders | ||||||||||||
| Loss from continuing operations attributable to Yamana equity holders - basic | $ | (299,549 | ) | $ | (414,660 | ) | $ | (1,194,867 | ) | $ | (274,226 | ) |
| Dilution effects related to the convertible debt | (4,625 | ) | — | (9,792 | ) | — | ||||||
| Loss from continuing operations attributable to Yamana equity holders - diluted | $ | (304,174 | ) | $ | (414,660 | ) | $ | (1,204,659 | ) | $ | (274,226 | ) |
| Loss per share from continuing operations attributable to Yamana equity holders - basic | $ | (0.34 | ) | $ | (0.55 | ) | $ | (1.46 | ) | $ | (0.36 | ) |
| Loss per share from continuing operations attributable to Yamana equity holders - diluted | $ | (0.35 | ) | $ | (0.55 | ) | $ | (1.46 | ) | $ | (0.36 | ) |
| Basic and Diluted Loss Per Share from Continuing Operations | ||||||||||||
| Loss from continuing operations - basic | $ | (299,549 | ) | $ | (442,764 | ) | $ | (1,194,867 | ) | $ | (302,330 | ) |
| Dilution effects related to the convertible debt | $ | (4,625 | ) | $ | — | $ | (9,792 | ) | $ | — | ||
| Loss from continuing operations - diluted | $ | (304,174 | ) | $ | (442,764 | ) | $ | (1,204,659 | ) | $ | (302,330 | ) |
| Loss per share from continuing operations - basic | $ | (0.34 | ) | $ | (0.59 | ) | $ | (1.46 | ) | $ | (0.40 | ) |
| Loss per share from continuing operations - diluted | $ | (0.35 | ) | $ | (0.59 | ) | $ | (1.46 | ) | $ | (0.40 | ) |
| Basic and Diluted Loss Per Share Attributable to Yamana Equity Holders | ||||||||||||
| Net loss attributable to Yamana Gold Inc. equity holders - basic | $ | (335,298 | ) | $ | (583,936 | ) | $ | (1,383,073 | ) | $ | (446,247 | ) |
| Dilution effects related to the convertible debt | (4,625) | — | (9,792) | — | ||||||||
| Net loss attributable to Yamana Gold Inc. equity holders - diluted | $ | (339,923 | ) | $ | (583,936 | ) | $ | (1,392,865 | ) | $ | (446,247 | ) |
| Net loss per share attributable to Yamana Inc. equity holders - basic | $ | (0.38 | ) | $ | (0.78 | ) | $ | (1.69 | ) | $ | (0.59 | ) |
| Net loss per share attributable to Yamana Inc. equity holders - diluted | $ | (0.39 | ) | $ | (0.78 | ) | $ | (1.69 | ) | $ | (0.59 | ) |
| Basic and Diluted Loss Per Share | ||||||||||||
| Net loss - basic | $ | (335,298 | ) | $ | (612,040 | ) | $ | (1,383,073 | ) | $ | (474,351 | ) |
| Dilution effects related to the convertible debt | (4,625) | — | (9,792) | — | ||||||||
| Net loss - diluted | $ | (339,923 | ) | $ | (612,040 | ) | $ | (1,392,865 | ) | $ | (474,351 | ) |
| Net loss per share - basic | $ | (0.38 | ) | $ | (0.81 | ) | $ | (1.69 | ) | $ | (0.63 | ) |
| Net loss per share - diluted | $ | (0.39 | ) | $ | (0.81 | ) | $ | (1.69 | ) | $ | (0.63 | ) |
CONTRACTUAL COMMITMENTS
Day-to-day mining, sustaining and expansionary capital expenditures as well as administrative operations give rise to contracts requiring agreed upon future minimum payments. Management is of the view that such commitments will be sufficiently funded by current working capital, future operating cash flows and available credit facilities which provide access to additional funds.
As at December 31, 2014, the Company is contractually committed to the following:
| (In thousands of Dollars) | Within 1 year | Between 1 to 3 years | Between 3 to 5 years | After 5 years | Total | ||||||||||
| Mine operating/construction and service contracts and other | $ | 476,702 | $ | 392,801 | $ | 70,694 | $ | 1,818 | $ | 942,015 | |||||
Long-term debt principal repayments (i) | 34,557 | 152,295 | 709,202 | 1,190,000 | 2,086,054 | ||||||||||
| Decommissioning, restoration and similar liabilities (undiscounted) | 5,202 | 25,539 | 65,177 | 187,143 | 283,061 | ||||||||||
| $ | 516,461 | $ | 570,635 | $ | 845,073 | $ | 1,378,961 | $ | 3,311,130 | ||||||
______________________________
| (i) | Excludes interest expense. |
10. INCOME TAXES
The Company recorded an income tax expense of $358.8 million for the year (2013 - $85.4 million). The income tax provision reflects a current income tax expense of $115.0 million (2013 - $146.9 million) and a deferred income tax expense of $243.8 million (2013 - $61.5 million recovery).
The income tax expense was impacted by a change in the Chile tax rate, losses and impairments in foreign subsidiaries where it is not probable that the losses will be utilized, and foreign exchange.
The Consolidated Balance Sheet reflects recoverable tax installments in the amount of $35.4 million and an income tax liability of $24.7 million. Additionally, the balance sheet reflects a deferred tax asset of $112.9 million and a deferred tax liability of $2.7 billion.
The income tax provision is subject to a number of factors including the allocation of income between different countries, different tax rates in the various jurisdictions, the non-recognition of tax assets, foreign currency exchange movements, changes in tax laws and the impact of specific transaction and assessments. Due to the number of factors that can potentially impact the effective tax rate, it is expected that the Company's effective tax rate will fluctuate in future periods. Additionally, tax benefits associated with taxable losses from certain mines including mines in commissioning have not been recorded.
The Company has elected, under IFRS, to record foreign exchange related to deferred income tax assets and liabilities and interest and penalties in the income tax expense, therefore, due to foreign exchange differences, the tax rate will fluctuate during the year with the change in the Brazilian Real, Argentine Peso and Mexican Peso.
During the year, the Brazilian Real and the Argentine Peso declined in value against the US Dollar. As a result, for local purposes, an expense of $89.3 million relating to unrealized foreign exchange was recorded in the deferred tax expense. The impact of these foreign exchange movements on taxes are non-cash and, as such, are excluded from adjusted earnings.
In September, the Chilean government enacted changes to its tax laws. Under the previous tax system, companies were subject to a First Category Income Tax of 20% and effectively paid an additional Second Category Tax of 15% when profits were distributed resulting in an overall income tax rate of 35%. Under the prior tax regime the Company was able to defer the Second Category Tax. Under the new tax regime, there are limitations on the Company's ability to defer the Second Category Tax. In summary, the new tax regime results in the Company’s cumulative effective income tax rate increasing to 35% in 2017, regardless of if and when profits are distributed.
The following summarizes the key changes under the tax reform:
| • | Prior to 2017, the First Category Tax increases to 21% in 2014, retroactive to January 1, 2014; 22.5% in 2015 and 24% in 2016. The Second Category Tax is 35% with a credit ranging from 17% to 24% of prior profits paid. |
| • | Starting in 2017, the law creates two alternative tax regimes for payments of Corporate Tax (First Category tax) whereby taxpayers must elect to pay taxes either under the attributed income tax system or the semi-integrated tax system: |
| • | Under the attributed income system, the effective tax rate is 35% in 2017 and onwards, with 25% paid by the company, and the shareholders paying the additional tax of 35% with an offsetting credit for the First Category Tax paid by the company. Shareholders will be taxed on an accrual basis such that profits are required to be attributed to shareholders, irrespective of whether a distribution is actually made. |
| • | Under the semi-integrated system, shareholders will be taxed on a cash basis when profits are actually distributed. The tax rate paid by the Company is 25.5% in 2017 and 27% in 2018 and onwards, with the additional 35% paid by the shareholders when dividends are actually paid, with an offsetting credit of 100% for taxes paid by the company with shareholders in a treaty country, resulting in an overall effective tax rate of 35%. |
As a result of the changes to the Chilean tax laws, an additional current tax of $1.0 million was recorded retroactive to January 1st and an additional non-cash deferred tax of $328.5 million has been recorded on the timing differences in Chile. The deferred taxes on the timing differences will reverse through depletion, write-off or a sale. The deferred taxes would only be paid on a disposition of the assets which may never occur and only if the sales proceeds exceed its local tax value. These items have been excluded from the adjusted earnings for the year. The reform package also includes the introduction of general anti-avoidance rules and the imputation of income on passive controlled foreign affiliates. The Company continues to evaluate aspects of the tax reform package on its business.
The deferred taxes relating to the operating mines will reverse in the future as the assets are depreciated or depleted. The deferred tax liabilities relating to exploration will not reverse until the property becomes a mine subject to depletion, is written off or sold. The deferred income taxes would only be paid on a direct disposition of the asset that may never occur.
The largest components of the deferred tax liabilities relate to:
| (in thousands of United States Dollars) | |||
| Gualcamayo | $ | 202,771 | |
| Agua Rica | $ | 396,096 | |
| El Peñón | $ | 432,153 | |
| Canadian Malartic | $ | 326,512 | |
| Exploration Potential | $ | 551,400 | |
See Note 30 to the Consolidated Financial Statements for a breakdown of the foreign exchange and interest and penalties charged to the income tax expense and Section 11 - Economic trends, risks and uncertainties - foreign operations and political risks of this Management Discussion and Analysis of Operations and Financial Condition for additional information.
11. ECONOMIC TRENDS, BUSINESS RISKS AND UNCERTAINTIES
Exploration, development and mining of precious metals involve numerous risks as a result of the inherent nature of the business, global economic trends and the influences of local social, political, environmental and economic conditions in the various geographical areas of operation. As such, the Company is subject to several financial and operational risks that could have a significant impact on its profitability and levels of operating cash flows.
The Company assesses and minimizes these risks by adhering to its internal risk management protocols which include the application of high operating standards empowering individuals and establishing processes to be able to identify, assess, report and monitor risk at all levels of the organization. Through careful management and planning of its facilities, hiring qualified personnel and developing a skilled workforce through training and development programs, the Company is able to generate shareholder value in a safe, resilient and responsible manner.
Below is a summary of the principal risks and related uncertainties facing the Company. Readers are also encouraged to read and consider the risk factors more particularly described in the Company’s Annual Information Form for the year ended December 31, 2014. Such risk factors could materially affect the future operating results of the Company and could cause actual events to differ materially from those described in forward-looking statements relating to the Company.
Metal Price Risk
The Company's profitability and long-term viability depend, in large part, upon the market price of metals that may be produced from the Company's properties, primarily gold, copper and silver. Market price fluctuations of these commodities could adversely affect profitability of operations and lead to impairments and write downs of mineral properties. Metal prices fluctuate widely and are affected by numerous factors beyond the Company's control, including:
| • | global and regional supply and demand for industrial products containing metals generally; |
| • | changes in global or regional investment or consumption patterns; |
| • | increased production due to new mine developments and improved mining and production methods; |
| • | decreased production due to mine closures; |
| • | interest rates and interest rate expectation; |
| • | expectations with respect to the rate of inflation or deflation; |
| • | fluctuations in the value of the U.S. dollar and other currencies; |
| • | availability and costs of metal substitutes; |
| • | global or regional political or economic conditions; and |
| • | sales by central banks, holders, speculators and other producers of metals in response to any of the above factors. |
There can be no assurance that metal prices will remain at current levels or that such prices will improve. A decrease in the market prices could adversely affect the profitability of the Company's existing mines and projects as well as the Company's ability to finance the exploration and development of additional properties, which would have a material adverse effect on the Company's results of operations, cash flows and financial position. A decline in metal prices may require us to write-down the Company's Mineral Reserve and Mineral Resource estimates by removing ores from mineral reserves that would not be economically processed at lower metal prices and revise the Company's life-of-mine plans, which could result in material write-downs of the Company's investments in mining properties. Any of these factors could result in a material adverse effect on the Company's results of operations, cash flows and financial position. Further, if revenue from metal sales declines, we may experience liquidity difficulties. The Company's cash flow from mining operations may be insufficient to meet operating needs, and as a result we could be forced to discontinue production and could lose the Company's interest in, or be forced to sell, some or all of the Company's properties.
In addition to adversely affecting Mineral Reserve and Mineral Resource estimates and results of operations, cash flows and financial position, declining metal prices can impact operations by requiring a reassessment of the feasibility of a particular project. Even if a project is ultimately determined to be economically viable, the need to conduct such a reassessment may cause substantial delays and/or may interrupt operations until the reassessment can be completed, which may have a material adverse effect on results of operations, cash flows and financial position. In addition, lower metal prices may require the Company to reduce funds available for exploration with the result that the depleted reserves may not be replaced.
Gold Price - Market Update

Gold Price Two-Year Trend (Bloomberg: USD per ounce of gold)
For the year ended December 31, 2014, spot gold prices averaged $1,266 per ounce, or 10% lower, compared to $1,411 per ounce in the fourth quarter of 2013. Prices ranged between $1,140 and $1,383 per ounce and ended the year at $1,184 per ounce.
For the quarter ended December 31, 2014, spot gold prices averaged $1,201 per ounce, or 6% lower, compared to $1,272 per ounce in the fourth quarter of 2013. Prices ranged between $1,140 and $1,248 per ounce and ended the quarter at $1,184 per ounce.
For a substantial part of the quarter gold price moved laterally. Physical demand provided support on gold price pullbacks and the continuing strength of the US dollar limited gold price rallies. The US dollar strength was primarily driven by generally improving US economic data and shifting expectations surrounding the timing of a future increase to the U.S. Federal Government (U.S. Fed) Funds rate.
As expected, the U.S. Fed finished its quantitative easing (QE) program during the fourth quarter. The timing of an increase in the U.S. Fed Funds rate is not expected to occur for at least a few more quarters. The European Central Bank has continued its move towards an easier monetary policy with their announcement in early 2015 that they will move to implement a quantitative easing program due to concerns over weak economic growth and the prospect of deflation. Overall global monetary policy continues to be generally very easy. Most governments continue to struggle with the fiscal situations they face and this should be supportive for gold over the longer term.
Physical demand for gold continues to be steady and it is expected that physical demand, particularly from China, will continue to be supportive during periods of price weakness. Central Banks were once again net buyers in 2014 with Iraq, Kazakhstan and Russia making notable purchases in 2014. It is expected that Central Banks will continue to be net buyers in 2015. ETF holdings continued to remain stable over the course of the quarter with only a modest decline in total ounces held.
In spite of the positive signs with respect to the physical demand for gold, following the recent decline in gold prices, the Company has revised its production targets for future years to favour a lower cost structure. The Company is evaluating the producing mines whose all-in sustaining costs exceed the Company's average cost structure. The objective is to pursue quality ounces with sustainable margins and maximize profitability and as such, in the short term the emphasis will be on reducing costs rather than maximizing production.
The Company has not hedged any of its gold sales.
Copper Price - Market Update

Copper Price Two-Year Trend (Bloomberg: USD per pound of copper)
For the year ended December 31, 2014, spot copper prices averaged $3.11 per pound, representing a decrease of 6% compared to $3.32 per pound in 2013. Prices ranged between $2.89 and $3.36 per pound and ended the year at $2.89 per pound
For the quarter ended December 31, 2014, spot copper prices averaged $3.01 per pound, representing a decrease of 7% compared to $3.25 per pound in 2013. Prices ranged between $2.89 and $3.13 per pound and ended the quarter at $2.89 per pound
Copper prices continued to trend lower over the course of the fourth quarter due to concerns about slowing economic growth in China and the expectations of near term supply growth. It is expected that the copper market will be in surplus over the next few years and concerns about the impact of slowing economic growth in China will likely persist. In the short-term these factors may limit the potential upside for copper prices but over the longer term, supply constraints should result in a situation that is much more supportive of copper price.
During the fourth quarter, the Company entered into contracts whereby 73 million pounds of 2015 copper production was purchased at a price of $3.00 per pound, which represents approximately 60% of expected Chapada production. The Company periodically uses forward contracts to economically hedge against the risk of declining copper prices for a portion of its forecast copper concentrate sales.
Currency Risk
Currency fluctuations may affect the Company’s capital costs and the costs that the Company incurs at its operations. Gold is sold throughout the world based principally on a U.S. dollar price, but a portion of the Company’s operating and capital expenses are incurred in Brazilian reals, Argentine pesos, Chilean pesos, Mexican pesos, Canadian dollars and, to a lesser extent, the Euro. The appreciation of foreign currencies, particularly the Brazilian real and the Chilean peso, against the United States dollar would increase the costs of gold production at such mining operations, which could materially and adversely affect the Company’s earnings and financial condition. The Company has hedged only a portion of its Brazilian real risks and Mexican pesos risks, and none of the other currencies in which it functions, and is therefore exposed to currency fluctuation risks.
Additionally, the assets acquired in the Osisko Acquisition are primarily located in Canada and the costs associated with such assets are primarily denominated in Canadian dollars. However, revenue generated from the sale of gold and silver from such assets is in U.S. dollars and some of the costs associated with such assets are denominated in currencies other than the Canadian
dollar. Any appreciation of the Canadian dollar vis-á-vis these currencies could have a material adverse effect on the Company’s business, financial condition and results of operation.
United States Dollar - Market Update
The United States Dollar ("USD") has strengthened over the past 12 months with strength more pronounced during the fourth quarter. The strength has been broad based and all of the Company's operating currencies weakened against the USD during both the quarter and year ending December 31, 2014. Despite the USD strengthening that has already occurred there remains potential for additional strength going forward due to diverging monetary policy between the US and the rest of the world and better US economic performance relative to many other countries.
The US Fed took extraordinary monetary policy actions before other central banks and completed its QE program in 2014 before the ECB announced its own QE program in early 2015. With The Bank of Japan currently operating a QE program and the Bank of Canada recently cutting its benchmark interest rate, the US Fed is likely headed towards tighter monetary policy while other G10 central banks move towards easier policies. This divergence along with the expectation of better US economic growth going forward relative to other G10 countries is likely to attract investment flows into the US which should result in continued USD strength going forward. Should the USD continue to strengthen against the Company’s operating currencies, the Company will benefit in the form of lower operating costs, given that the majority of foreign exchange requirements in 2015 are unhedged and fully unhedged thereafter.
The following summarizes the movement in key currencies vis-à-vis the United States Dollar:
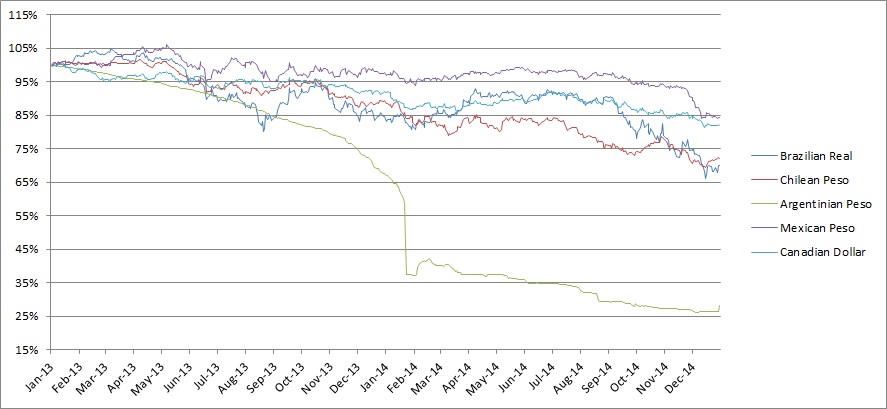
Average and Period-end Market Exchange Rate
| For the three months ended December 31, | 2014 | 2013 | Variance | |
| Average Exchange Rate | ||||
| USD-CAD | 1.1364 | 1.0494 | 8.3 | % |
| USD-BRL | 2.5499 | 2.2763 | 12.0 | % |
| USD-ARG | 8.5123 | 6.0650 | 40.4 | % |
| USD-CLP | 598.46 | 516.65 | 15.8 | % |
| USD-MXN | 13.902 | 13.019 | 6.8 | % |
| For the year ended December 31, | 2014 | 2013 | Variance | |
| Average Exchange Rate | ||||
| USD-CAD | 1.1046 | 1.0299 | 7.3 | % |
| USD-BRL | 2.3534 | 2.1585 | 9.0 | % |
| USD-ARG | 8.1247 | 5.4777 | 48.3 | % |
| USD-CLP | 570.87 | 495.37 | 15.2 | % |
| USD-MXN | 13.312 | 12.756 | 4.4 | % |
| As at December 31, | 2014 | 2013 | Variance | 2013 | Variance | |||||
| Period-end Exchange Rate | ||||||||||
| USD-CAD | 1.1621 | 1.0623 | 9.4 | % | 1.0309 | 12.7 | % | |||
| USD-BRL | 2.6576 | 2.3621 | 12.5 | % | 2.2170 | 19.9 | % | |||
| USD-ARG | 8.4650 | 6.5197 | 29.8 | % | 5.7915 | 46.2 | % | |||
| USD-CLP | 606.45 | 525.45 | 15.4 | % | 504.67 | 20.2 | % | |||
| USD-MXN | 14.752 | 13.037 | 13.2 | % | 13.091 | 12.7 | % | |||
The Company entered into forward contracts to economically hedge against the risk of an increase in the value of the Brazilian Real versus the United States Dollar. Currency contracts totaling 0.5 billion Reais at an average rate of 2.28 Reais to the United States Dollar have been designated against forecast Reais denominated expenditures as a hedge against the variability of the United States Dollar amount of those expenditures caused by changes in the currency exchange rates for 2014 through to 2015.
The Company also entered into forward contracts to economically hedge against the risk of an increase in the value of the Mexican Pesos versus the United States Dollar. Currency contracts totaling 65.0 million Pesos at an average rate of 13.32 Pesos to the United States Dollar have been designated against forecast Pesos denominated expenditures as a hedge against the variability of the United States Dollar amount of those expenditures caused by changes in the currency exchange rates for 2014 through to 2015.
The currency hedge has been accounted for as a cash flow hedge with the effective portion taken to other comprehensive income and the ineffective portion taken to income. Although the currency hedging program has provided additional cash flow over the years in excess of $100 million, the value of the program can become negative in a short period of time due to the volatility of foreign currency relative to the Dollar.
The following table summarizes the details of the currency hedging program as at December 31, 2014:
| (Quantities in thousands) | Brazilian Real | Mexican Peso | |||||||||||
Year of Settlement | Notional Amount | Weighted Average Contract Rate | Market rate as at December 31, 2014 | Year of Settlement | Notional Amount | Weighted Average Contract Rate | Market rate as at December 31, 2014 | ||||||
| 2015 | 519,048 | 2.283 | 2.658 | 2015 | 65,000 | 13.320 | 14.752 | ||||||
| 519,048 | 2.283 | 2.658 | 65,000 | 13.320 | 14.752 | ||||||||
Counterparty, Credit and Interest Rate Risk
The Company is exposed to various counterparty risks including, but not limited to: (i) financial institutions that hold the Company’s cash and short term investments; (ii) companies that have payables to the Company, including concentrate and bullion customers; (iii) providers of its risk management services (including hedging arrangements); (iv) shipping service providers that move the Company’s material; (v) the Company’s insurance providers; and (vi) the Company’s lenders. the Company seeks to limit counterparty risk by entering into business arrangements with high credit-quality counterparties, limiting the amount of exposure to each counterparty and monitoring the financial condition of counterparties. For cash, cash equivalents and accounts receivable, credit risk is represented by the carrying amount on the balance sheet. For derivatives, the Company assumes no credit risk when the fair value of the instruments is negative. When the fair value of the instruments is positive, this is a reasonable measure of credit risk. The Company is also exposed to liquidity risks in meeting its operating and capital expenditure requirements in instances where cash positions are unable to be maintained or appropriate financing is unavailable. Under the terms of the Company’s trading agreements, counterparties cannot require the Company to immediately settle outstanding derivatives except
upon the occurrence of customary events of default. The Company mitigates liquidity risk through the implementation of its capital management policy by spreading the maturity dates of derivatives over time, managing its capital expenditures and operation cash flows, and by maintaining adequate lines of credit. The Company is exposed to interest rate risk on its variable rate debt and may enter into interest rate swap agreements to hedge this risk. These factors may impact the ability of the Company to obtain loans and other credit facilities and refinance existing facilities in the future and, if obtained, on terms favorable to the Company. Such failures to obtain loans and other credit facilities could require us to take measures to conserve cash and could adversely affect the Company's access to the liquidity needed for the business in the longer term.
The development of the Company’s projects and the construction of mining facilities and commencement of mining operations may require substantial additional financing. Failure to obtain sufficient financing will result in a delay or indefinite postponement of exploration, development or production on any or all of the Company’s properties or even a loss of a property interest. Additional financing may not be available when needed, or if available, the terms of such financing might not be favorable to the Company. Failure to raise capital when needed would have a material adverse effect on the Company’s business, financial condition and results of operations.
Liquidity Risk
Liquidity risk is the risk that an entity will encounter difficulty in meeting obligations associated with financial liabilities that are settled by delivering cash or another financial asset. Under the terms of the Company's trading agreements, counterparties cannot require the Company to immediately settle outstanding derivatives except upon the occurrence of customary events of default. The Company mitigates liquidity risk through the implementation of its Capital Management Policy by spreading the maturity dates of derivatives over time, managing its capital expenditures, forecast and operational cash flows, and by maintaining adequate lines of credit. As part the capital allocation strategy, the Company examines opportunities to divest assets that do not meet the Company’s investment criteria.
The Company has considered the changes in taxes in Chile and believes that it will not impact liquidity. Section 10 - Income Taxes describes further details on the change to the Chilean tax rates.
The Company's ability to make scheduled payments on or refinance the Company's debt obligations (if necessary) depends on the Company's financial condition and operating performance, which are subject to prevailing economic and competitive conditions and to certain financial, business, legislative, regulatory and other factors beyond the Company's control, including the market prices of gold, silver and copper. The Company may be unable to maintain a level of cash flow from operating activities sufficient to permit us to pay the principal, premium, if any, and interest on the Company's indebtedness.
If the Company's cash flows and capital resources are insufficient to fund the Company's debt service obligations, we could face substantial liquidity problems and could be forced to reduce or delay investments and capital expenditures or to dispose of material assets or operations, seek additional debt or equity capital or restructure or refinance the Company's indebtedness. The Company may not be able to effect any such alternative measures, if necessary, on commercially reasonable terms or at all and, even if successful, those alternative actions may not allow us to meet the Company's scheduled debt service obligations.
In addition, we conduct a substantial portion of the Company's operations through the Company's subsidiaries, certain of which in the future may not be guarantors of the Company's indebtedness. Accordingly, repayment of the Company's indebtedness is dependent on the generation of cash flow by the Company's subsidiaries and their ability to make such cash available to us, by dividend, debt repayment or otherwise. Unless they are guarantors of the Company's indebtedness, the Company's subsidiaries do not have any obligation to pay amounts due on the Company's indebtedness or to make funds available for that purpose. The Company's subsidiaries may not be able to, or may not be permitted to, make distributions to enable us to make payments in respect of the Company's indebtedness.
Each subsidiary is a distinct legal entity, and, under certain circumstances, legal and contractual restrictions may limit the Company's ability to obtain cash from the Company's subsidiaries. While the indenture governing the Company's Notes limits the ability of the Company's subsidiaries to incur consensual restrictions on their ability to pay dividends or make other intercompany payments to us, these limitations are subject to qualifications and exceptions. In the event that we do not receive distributions from the Company's subsidiaries, we may be unable to make required principal and interest payments on the Company's indebtedness.
the Company's inability to generate sufficient cash flows to satisfy the Company's debt obligations, or to refinance the Company's indebtedness on commercially reasonable terms or at all, would materially and adversely affect the Company's financial position and results of operations and the Company's ability to satisfy the Company's obligations.
The exploration and development of the Company’s properties, including continuing exploration and development projects, and the construction or expansion of mining facilities and commencement or expansion of mining operations, may require substantial additional financing. Failure to obtain sufficient financing will result in a delay or indefinite postponement of exploration, development or production on any or all of the Company’s properties or even a loss of a property interest. Additional financing may not be available when needed or if available, the terms of such financing might not be favourable to the Company and might involve substantial dilution to existing shareholders. Failure to raise capital when needed could have a material adverse effect on the Company’s business, financial condition and results of operations.
There can be no assurance that the credit ratings and outlook assigned to the Company's debt securities or to the Company will remain in effect for any given period of time or that any such rating or outlook will not be revised downward or withdrawn entirely by a rating agency. Real or anticipated changes in credit ratings or outlook assigned to the Company's debt securities will generally affect the market price of the Company's debt securities. In addition, real or anticipated changes in the Company's credit ratings may also affect the cost at which we can access the capital markets. If such ratings decline and the Company's cost of accessing capital markets increases, we may not be able to fund proposed capital expenditures and other operations in the future.
Investment Risk
Investment risk is the risk that a financial instrument’s value will deviate from the expected returns as a result of changes in market conditions, whether those changes are caused by factors specific to the individual investment or factors affecting all investments traded in the market. Although the factors that affect investment risk are outside the Company’s control, the Company mitigates investment risk by limiting its investment exposure in terms of total funds to be invested and by being selective of high quality investments.
Available for sale financial assets are reviewed quarterly for possible significant or prolonged decline in fair value requiring impairment and more frequently when economic or market concerns warrant such evaluation. The review includes an analysis of the fact and circumstances of the financial assets, the market price of actively traded securities, as well as the severity of loss, the financial position and near-term prospects of the investment, credit risk of the counterparties, the length of time the fair value has been below costs, both positive and negative evidence that the carrying amount is recoverable within a reasonable period of time, management’s intent and ability to hold the financial assets for a period of time sufficient to allow for any anticipated recovery of fair value and management’s market view and outlook. When a decline in the fair value of an available-for-sale investment has been recognized in Other Comprehensive Income (“OCI”) and there is objective evidence that the asset is impaired after management’s review, any cumulative losses that had been recognized in OCI are reclassified to net income in that period as an impairment loss. The reclassification is calculated as the difference between the acquisition cost and current fair value, less any impairment loss on that financial asset previously recognized, if applicable. Impairment losses recognized in net income for an investment are subject to reversal, except for an equity instrument classified as available-for-sale.
From time to time, the Company may use certain derivative products as hedging instruments and to manage the risks associated with changes in gold prices, silver prices, copper prices, interest rates, foreign currency exchange rates and energy prices. The use of derivative instruments involves certain inherent risks including, among other things: (i) credit risk - the risk of default on amounts owing to the Company by the counterparties with which the Company has entered into transactions; (ii) market liquidity risk - the risk that the Company has entered into a derivative position that cannot be closed out quickly, by either liquidating such derivative instrument or by establishing an offsetting position; and (iii) unrealized mark-to-market risk - the risk that, in respect of certain derivative products, an adverse change in market prices for commodities, currencies or interest rates will result in the Company incurring an unrealized mark-to-market loss in respect of such derivative products.
Uncertainty in the Estimation of Mineral Reserves and Mineral Resources
To extend the lives of its mines and projects, ensure the continued operation of the business and realize its growth strategy, it is essential that the Company continues to realize its existing identified Mineral Reserves, convert Mineral Resources into Mineral Reserves, increase its Mineral Resource base by adding new Mineral Resources from areas of identified mineralized potential, and/or undertake successful exploration or acquire new Mineral Resources.
No assurance can be given that the anticipated tonnages and grades in respect of Mineral Reserves and Mineral Resources will be achieved, that the indicated level of recovery will be realized or that Mineral Reserves will be mined or processed profitably. Actual Mineral Reserves may not conform to geological, metallurgical or other expectations, and the volume and grade of ore recovered may differ from estimated levels. There are numerous uncertainties inherent in estimating Mineral Reserves and Mineral Resources, including many factors beyond the Company’s control. Such estimation is a subjective process, and the accuracy of any Mineral Reserve or Mineral Resource estimate is a function of the quantity and quality of available data and of the assumptions made and judgments used in engineering and geological interpretation. Short-term operating factors relating to the Mineral
Reserves, such as the need for orderly development of the ore bodies or the processing of new or different ore grades, may cause the mining operation to be unprofitable in any particular accounting period. In addition, there can be no assurance that gold recoveries in small scale laboratory tests will be duplicated in larger scale tests under on-site conditions or during production. Lower market prices, increased production costs, reduced recovery rates and other factors may result in a revision of the Company's Mineral Reserve estimates from time to time or may render the Company’s Mineral Reserves uneconomic to exploit. Mineral Reserve data is not indicative of future results of operations. If the Company’s actual Mineral Reserves and Mineral Resources are less than current estimates or if the Company fails to develop its Mineral Resource base through the realization of identified mineralized potential, its results of operations or financial condition may be materially and adversely affected. Evaluation of Mineral Reserves and Mineral Resources occurs from time to time and they may change depending on further geological interpretation, drilling results and metal prices. The category of Inferred Mineral Resource is often the least reliable Mineral Resource category and is subject to the most variability. The Company regularly evaluates its Mineral Resources and it often determines the merits of increasing the reliability of its overall Mineral Resources.
Given that mines have limited lives based on Proven Mineral Reserves and Probable Mineral Reserves, the Company must continually replace and expand its Mineral Reserves at its mines. The life-of-mine estimates included in this prospectus and in the documents incorporated by reference may not be correct. The Company’s ability to maintain or increase its annual production will be dependent in part on its ability to bring new mines into production and to expand Mineral Reserves at existing mines.
Mineral Resources that are not Mineral Reserves do not have demonstrated economic viability. Due to the uncertainty which may attach to Inferred Mineral Resources, there is no assurance that Inferred Mineral Resources will be upgraded to Proven Mineral Reserves and Probable Mineral Reserves as a result of continued exploration.
Exploration, Development and Operating Risks
Mining operations are inherently dangerous and generally involve a high degree of risk. the Company’s operations are subject to all the hazards and risks normally encountered in the exploration, development and production of gold, copper and silver, including, without limitation, unusual and unexpected geologic formations, seismic activity, rock bursts, cave-ins, flooding, pit wall failure and other conditions involved in the drilling and removal of material, any of which could result in damage to, or destruction of, mines and other producing facilities, personal injury or loss of life, damage to property and environmental damage, all of which may result in possible legal liability. Although we expect that adequate precautions to minimize risk will be taken, mining operations are subject to hazards such as fire, rock falls, geomechanical issues, equipment failure or failure of retaining dams around tailings disposal areas which may result in environmental pollution and consequent liability. The occurrence of any of these events could result in a prolonged interruption of the Company's operations that would have a material adverse effect on the Company's business, financial condition, results of operations and prospects.
The exploration for and development of mineral deposits involves significant risks, which even a combination of careful evaluation, experience and knowledge may not eliminate. While the discovery of an ore body may result in substantial rewards, few properties that are explored are ultimately developed into producing mines. Major expenses may be required to locate and establish Mineral Reserves, to develop metallurgical processes and to construct mining and processing facilities at a particular site. It is impossible to ensure that the exploration or development programs planned by the Company will result in a profitable commercial mining operation. Whether a mineral deposit will be commercially viable depends on a number of factors, some of which are: the particular attributes of the deposit, such as size, grade and proximity to infrastructure; metal prices that are highly cyclical; and government regulations, including regulations relating to prices, taxes, royalties, land tenure, land use, importing and exporting of minerals and environmental protection. The exact effect of these factors cannot be accurately predicted, but the combination of these factors may result in the Company not receiving an adequate return on invested capital.
There is no certainty that the expenditures made by the Company towards the search and evaluation of mineral deposits will result in discoveries or development of commercial quantities of ore.
The mineral exploration activities of the Company are subject to various laws governing prospecting, development, production, taxes, labour standards and occupational health, mine safety, toxic substances and other matters. Mining and exploration activities are also subject to various laws and regulations relating to the protection of the environment. Although the Company believes that its exploration activities are currently carried out in accordance with all applicable rules and regulations, no assurance can be given that new rules and regulations will not be enacted or that existing rules and regulations will not be applied in a manner that could limit or curtail production or development of the Company’s properties. Amendments to current laws and regulations governing the operations and activities of the Company or more stringent implementation thereof could have a material adverse effect on the Company’s business, financial condition and results of operations.
Mining, processing, development and exploration activities depend, to one degree or another, on adequate infrastructure. Reliable roads, bridges, power sources and water supply are important determinants that affect capital and operating costs. Unusual or infrequent weather phenomena, sabotage, government or other interference in the maintenance or provision of such infrastructure could adversely affect the Company’s operations, financial condition and results of operations.
Changes in the Company’s production costs could have a major impact on its profitability. Its main production expenses are personnel and contractor costs, materials and energy. Changes in costs of the Company’s mining and processing operations could occur as a result of unforeseen events, including international and local economic and political events, a change in commodity prices, increased costs (including oil, steel and diesel) and scarcity of labour, and could result in changes in profitability or Mineral Reserve estimates. Many of these factors may be beyond the Company’s control.
The Company relies on third party suppliers for a number of raw input materials. Any material increase in the cost of raw materials, or the inability by the Company to source third party suppliers for the supply of its raw materials, could have a material adverse effect on the Company’s results of operations or financial condition.
The Company prepares estimates of future cash costs and capital costs for its operations and projects. There is no assurance that actual costs will not exceed such estimates. Exceeding cost estimates could have an adverse impact on the Company’s future results of operations or financial condition.
Mineral rights, Permits and Mining Concession Risk
The acquisition and maintenance of title to mineral properties is a very detailed and time-consuming process. Title to, and the area of, mineral concessions may be disputed. Title insurance is generally not available for mineral properties and the Company's ability to ensure that the Company have obtained secure mine tenure may be severely constrained. There is no guarantee that title to any of the Company's properties will not be challenged or impaired. Third parties may have valid claims underlying portions of the Company’s interests, including prior unregistered liens, agreements, royalty transfers or claims, including native land claims, other encumbrances and title may be affected by, among other things, undetected defects. If these challenges are successful, this could have an adverse effect on the development of the Company's properties as well as the Company's results of operations, cash flows and financial position. In addition, the Company may be unable to operate its properties as permitted or to enforce its rights with respect to its properties.
The Company’s operations are subject to receiving and maintaining permits from appropriate governmental authorities. There is no assurance that delays will not occur in connection with obtaining all necessary renewals of permits for the Company's existing operations, additional permits for any possible future changes to operations, or additional permits associated with new legislation. Prior to any development on any of its properties, the Company must receive permits from appropriate governmental authorities. There can be no assurance that the Company will continue to hold all permits necessary to develop or continue operating at any particular property. Any of these factors could have a material adverse effect on the Company's results of operations and financial position.
The Company’s mining concessions may be terminated in certain circumstances. Under the laws of the jurisdictions where the Company’s operations, development projects and prospects are located, Mineral Resources belong to the state and governmental concessions are required to explore for, and exploit, Mineral Reserves. The Company holds mining, exploration and other related concessions in each of the jurisdictions where it is operating and where it is carrying on development projects and prospects. The concessions held by the Company in respect of its operations, development projects and prospects may be terminated under certain circumstances, including where minimum production levels are not achieved by the Company (or a corresponding penalty is not paid), if certain fees are not paid or if environmental and safety standards are not met. Termination of any one or more of the Company’s mining, exploration or other concessions could have a material adverse effect on the Company’s financial condition or results of operations.
Construction and Start-up of New Mines Risk
The success of construction projects and the start-up of new mines by the Company is subject to a number of factors including the availability and performance of engineering and construction contractors, mining contractors, suppliers and consultants, the receipt of required governmental approvals and permits in connection with the construction of mining facilities and the conduct of mining operations (including environmental permits), the successful completion and operation of ore passes, the adsorption/desorption/recovery plants and conveyors to move ore, among other operational elements. Any delay in the performance of any one or more of the contractors, suppliers, consultants or other persons on which the Company is dependent in connection with its construction activities, a delay in or failure to receive the required governmental approvals and permits in a timely manner or on reasonable terms, or a delay in or failure in connection with the completion and successful operation of the operational elements
in connection with new mines could delay or prevent the construction and start-up of new mines as planned. There can be no assurance that current or future construction and start-up plans implemented by the Company will be successful, that the Company will be able to obtain sufficient funds to finance construction and start-up activities, that personnel and equipment will be available in a timely manner or on reasonable terms to successfully complete construction projects, that the Company will be able to obtain all necessary governmental approvals and permits or that the completion of the construction, the start-up costs and the ongoing operating costs associated with the development of new mines will not be significantly higher than anticipated by the Company. Any of the foregoing factors could adversely impact the operations and financial condition of the Company.
Some of the Company’s projects have no operating history upon which to base estimates of future cash flow. The capital expenditures and time required to develop new mines or other projects are considerable and changes in costs or construction schedules can affect project economics. Thus, it is possible that actual costs may change significantly and economic returns may differ materially from the Company’s estimates.
As an example, C1 Santa Luz and Ernesto/Pau-a-Pique have both underperformed. As such, during the third quarter of 2014, the Company suspended commissioning activities at C1 Santa Luz and placed the project on care and maintenance and, following previous reduction of activity at Ernesto/Pau-a-Pique, the Company reduced the carrying value of both C1 Santa Luz and Ernest/Pau-a-Pique. While commercial production at Pilar was declared effective October 1, 2014, this project has also been met with challenges during commissioning and now has a decreased production expectation relative to feasibility levels and, as such, the Company has reduced the carrying value of this project as well.
Commercial viability of a new mine or development project is predicated on many factors. Mineral Reserves and Mineral Resources projected by feasibility studies and technical assessments performed on the projects may not be realized, and the level of future metal prices needed to ensure commercial viability may not materialize. Consequently, there is a risk that start-up of new mine and development projects may be subject to write-down and/or closure as they may not be commercially viable.
Foreign Operations and Political Risk
The Company holds mining and exploration properties in Brazil, Argentina, Chile, Mexico and Canada, exposing it to the socioeconomic conditions as well as the laws governing the mining industry in those countries. Inherent risks with conducting foreign operations include, but are not limited to: high rates of inflation; military repression; war or civil war; social and labour unrest; organized crime; hostage taking; terrorism; violent crime; extreme fluctuations in currency exchange rates; expropriation and nationalization; renegotiation or nullification of existing concessions, licenses, permits and contracts; illegal mining; changes in taxation policies; restrictions on foreign exchange and repatriation; and changing political norms, currency controls and governmental regulations that favor or require the Company to award contracts in, employ citizens of, or purchase supplies from, a particular jurisdiction.
Changes, if any, in mining or investment policies or shifts in political attitude in any of the jurisdictions in which the Company operates may adversely affect the Company’s operations or profitability. Operations may be affected in varying degrees by government regulations with respect to, but not limited to, restrictions on production, price controls, export controls, currency remittance, importation of parts and supplies, income and other taxes, expropriation of property, foreign investment, maintenance of claims, environmental legislation, land use, land claims of local people, water use and mine safety.
Failure to comply strictly with applicable laws, regulations and local practices relating to mineral right applications and tenure could result in loss, reduction or expropriation of entitlements, or the imposition of additional local or foreign parties as joint venture partners with carried or other interests. In addition, changes in government laws and regulations, including taxation, royalties, the repatriation of profits, restrictions on production, export controls, changes in taxation policies, environmental and ecological compliance, expropriation of property and shifts in the political stability of the country, could adversely affect the Company’s exploration, development and production initiatives in these countries.
The Company is a holding company that conducts operations through foreign subsidiaries and substantially all of its assets are held in such entities. Accordingly, any limitation on the transfer of cash or other assets between the parent corporation and such entities, or among such entities, could restrict the Company’s ability to fund its operations efficiently. Any such limitations, or the perception that such limitations may exist now or in the future, could have an adverse impact on the Company’s valuation and stock price.
In the past, the Government of Argentina introduced certain protocols relating to the importation of goods and services and providing where possible for the substitution of Argentine produced goods and services. There continues to be a tightening of controls on capital flow and strict protocols for payments of goods and services to protect foreign exchange reserves. Since the implementation
of these controls and protocols, Minas Argentina S.A. has not had any imports disapproved, as such there has been no impact on the operations to date.
Furthermore, two new regulations were enacted late in the fourth quarter of 2014 that impact the Company:
As of December 1, 2014, mining companies and its suppliers are required to register on a new system created by the Federal Revenue Service (FRS). The system will ensure mining companies and its suppliers keeps updated information on all stages of mining since exploration, development and operation of deposits. Companies will continue to be required to remit the withholding tax on a regular basis. Furthermore, FRS requires companies and vendors and suppliers to ensure updated records of its activities are documented within the platform. Refusal to maintain proper registration could impact the maintenance of the benefits of the local mining investment law.
The fees for mining rights permits increased significantly, impacting the cost of mineral property in Argentina and all related commitments and regulations provided by different mining provincial departments in the different jurisdictions.
On September 23, 2013, Argentina’s federal income tax statute was amended to include a 10% income tax withholding on dividend distributions by Argentine corporations.
Brazil is in the process of reviewing the royalties on mining companies. The finalization of the royalty rates are subject to change during the review and approval process therefore the final rates are not determinable at this time. The magnitude of change in royalty rates might affect net earnings and cash flows from the Company's operations in Brazil.
In September, the Chilean government enacted changes to its tax laws. Under the previous tax system, companies were subject to a First Category Income Tax of 20% and effectively paid an additional Second Category Tax of 15% when profits were distributed resulting in an overall income tax rate of 35%. Under the prior tax regime the Company was able to defer the Second Category Tax. Under the new tax regime, there are limitations on the Company's ability to defer the Second Category Tax. In summary, the new tax regime results in the Company’s cumulative effective income tax rate increasing to 35% in 2017, regardless of if and when profits are distributed. The company continues to evaluate the impact of the changes resulting from the tax reform package.
In Mexico, a tax reform bill was enacted on December 26, 2013 with respect to the reform of the Mining and Fiscal Coordination Laws. The proposals submitted through this bill include a 7.5% compensation payment on earnings before depreciation, interest and taxes generated by mining companies with producing mines. In addition, the bill includes a new royalty of 0.5% on all sales of doré. These amounts are deductible for income tax purposes which would bring the effective rate of the taxes to approximately 5.8%. The Company estimates this to be approximately 3.8% on an NSR basis. The bill also doubles the payment of duties by hectare by differentiating nonproductive mining concessions. The magnitude of new royalty rates may affect net earnings and cash flows from the Company’s operations in Mexico.
On November 12, 2013, the Québec government introduced amendment to Québec’s Mining Tax Act under Québec Bill 55. The Bill introduced a new method for computing mining tax, amongst other changes. The new regime is scheduled to come into effect as of January 1, 2014. Subsequent to the election, the new government re-introduced the Bill in the Québec National Assembly and became law on December 5, 2014, making the changes retroactive to the beginning of the year. The new changes are not expected to have a material impact to the mining taxes over the life of Canadian Malartic.
The Company has material subsidiaries organized under the laws of Brazil, Argentina, Chile and Mexico and certain of the Company’s directors, management and personnel are located in foreign jurisdictions. Given that the majority of the Company’s material assets and certain of its directors, management and personnel are located outside of Canada, investors may have difficulty in effecting service of process within Canada and collecting from or enforcing against the Company, or its directors and officers, any judgments issued by the Canadian courts or Canadian securities regulatory authorities and predicated on the civil liability provisions of Canadian securities legislation or other laws of Canada. Similarly, in the event a dispute arises in connection with the Company’s foreign operations, the Company may be subject to the exclusive jurisdiction of foreign courts or may not be successful in subjecting foreign persons to the jurisdiction of courts in Canada.
The Company continues to monitor developments and policies in all its jurisdictions and the impact thereof to its operations.
Health, Safety and Environmental Risk and related regulations
Mining, like many other extractive natural resource industries, is subject to potential risks and liabilities due to accidents that could result in serious injury or death and or material damage to the environment and Company assets. The impact of such accidents could affect the profitability of the operations, cause an interruption to operations, lead to a loss of licenses, affect the reputation
of the Company and its ability to obtain further licenses, damage community relations and reduce the perceived appeal of the Company as an employer. The Company has rigorous procedures in place to manage health and safety protocols in order to reduce the risk of occurrence and the severity of any accident and is continually investing time and resources to enhance health and safety at all operations.
All phases of the Company’s operations are subject to environmental regulation in the various jurisdictions in which it operates. These regulations mandate, among other things, water quality standards and land reclamation and regulate the generation, transportation, storage and disposal of hazardous waste. Environmental legislation is evolving in a manner that will require stricter standards and enforcement, increased fines and penalties for non-compliance, more stringent environmental assessments of proposed projects and a heightened degree of responsibility for companies and their officers, directors and employees. There is no assurance that the Company has been or will at all times be in full compliance with all environmental laws and regulations or hold, and be in full compliance with, all required environmental and health and safety permits. The potential costs and delays associated with compliance with such laws, regulations and permits could prevent the Company from proceeding with the development of a project or the operation or further development of a project, and any non-compliance therewith may adversely affect the Company’s business, financial condition and results of operations.
At the Alumbrera Mine, in which the Company holds a 12.5% interest, a sulphate seepage plume has developed in the natural groundwater downstream of the tailings facility, currently within the mining concession. After completing the original model, an initial pump back well mesh was designed and completed before start up, in order to capture the seepage, which is characterized by high levels of dissolved calcium and sulphate. It will be necessary to augment the pump-back wells over the life of the mine in order to contain the plume within the concession and to provide for monitoring wells for the Vis Vis River. Based on the latest groundwater model, the pump-back system will need to be operated for several years after mine closure. The concentrate pipeline at the Alumbrera Mine crosses areas of mountainous terrain, significant rivers, high rainfall and active agriculture. Although various control structures and monitoring programs have been implemented, any rupture of the pipeline poses an environmental risk from spillage of concentrate. The Company does not have any indemnities from the previous vendors of its interests in the Alumbrera Mine against any potential environmental liabilities that may arise from operations, including, but not limited to, potential liabilities that may arise from the seepage plume or a rupture of the pipeline.
Environmental hazards may also exist on the properties on which the Company holds interests that are unknown to the Company at present and that have been caused by previous or existing owners or operators of the properties.
Government environmental approvals and permits are currently, or may in the future be, required in connection with the Company’s operations. To the extent such approvals are required and not obtained, the Company may be curtailed or prohibited from proceeding with planned exploration or development of mineral properties.
Failure to comply with applicable laws, regulations and permitting requirements may result in enforcement actions, including orders issued by regulatory or judicial authorities causing operations to cease or be curtailed, and may include corrective measures requiring capital expenditures, installation of additional equipment, or remedial actions. Parties engaged in mining operations, including the Company may be required to compensate those suffering loss or damage by reason of the mining activities and may have civil or criminal fines or penalties imposed for violations of applicable laws or regulations.
In 2013, Osisko received 41 notices of non-compliance pertaining to exceeding noise level parameters, NOx gas production and surpassing limits for over pressure and vibrations during blasting operations, exceeding noise levels and blast-induced vibrations at the Canadian Malartic Mine in which the Company now owns a 50% interest. As a result of the Osisko Acquisition (as defined below), the Company may face administrative fines or other charges in connection with such notices, Osisko’s other former operations or the properties that the Company acquired in the Osisko Acquisition.
Amendments to current laws, regulations and permits governing operations and activities of mining companies, or more stringent implementation thereof, could have a material adverse impact on the Company and cause increases in exploration expenses, capital expenditures or production costs, reduction in levels of production at producing properties, or abandonment or delays in development of new mining properties.
In certain jurisdictions, the Company may be required to submit, for government approval, a reclamation plan for each of its mining/project sites. The reclamation plan establishes the Company’s obligation to reclaim property after minerals have been mined from the sites. In some jurisdictions, bonds or other forms of financial assurances are required as security to ensure performance of the required reclamation activities. The Company may incur significant reclamation costs which may materially exceed the provisions the Company has made for such reclamation. In addition, the potential for additional regulatory requirements relating to reclamation or additional reclamation activities may have a material adverse effect on the Company’s financial condition, liquidity or results of operations. When a previously unrecognized reclamation liability becomes known or a previously estimated
cost is increased, the amount of that liability or additional cost may be expensed, which may materially reduce net income in that period.
Production at certain of the Company’s mines involves the use of cyanide which is toxic material if not handled properly. Should cyanide leak or otherwise be discharged from the containment system, the Company could suffer a material impact on its business, financial condition and results of operations. The Company became a signatory to the International Cyanide Management Institute (“ICMC”) in September 2008. Further information regarding the ICMC can be found at the International Cyanide Management Institute website located at www.cyanidecode.org.
The mineral exploration activities of the Company are subject to various laws governing prospecting, development, production, taxes, labour standards and occupational health, mine safety, toxic substances and other matters. Although the Company believes that its exploration activities are currently carried out in accordance with all applicable rules and regulations, new rules and regulations may be enacted or existing rules and regulations may be applied in a manner that could limit or curtail production or development of the Company’s properties. Amendments to current laws and regulations governing the operations and activities of the Company or more stringent implementation thereof could have a material adverse effect on the Company’s business, financial condition and results of operations.
Community and Labour Risk
The Company's relationships with the communities in which the Company operates and other stakeholders are critical to ensure the future success of the Company's existing operations and the construction and development of the Company's projects. There is an increasing level of public concern relating to the perceived effect of mining activities on the environment and on communities impacted by such activities. Publicity adverse to us, the Company's operations or extractive industries generally, could have an adverse effect on us and may impact relationships with the communities in which the Company operate and other stakeholders. While the Company is committed to operating in a socially responsible manner, there can be no assurance that the Company's efforts, in this respect will mitigate this potential risk.
The Canadian Malartic Mine, the principal asset the Company jointly acquired in the Osisko Acquisition is located adjacent to the community of Malartic. Commercial open-pit production of the deposit requires not only the collaboration and support of the town council and residents of Malartic, but also the relocation of a portion of Highway 117, for which permits have not yet been obtained. There is no guarantee that the Company will continue to be able to maintain the Company's relationships with these communities during commercial production of the deposit.
The Company's other projects, including exploration projects, may also be impacted by relations with various community stakeholders, and the Company's ability to develop related mining assets may still be affected by unforeseen outcomes from such community relations.
Production at the Company's mining operations is dependent upon the efforts of the Company’s employees and the Company’s operations would be adversely affected if the Company fails to maintain satisfactory labour relations. In addition, relations between the Company and its employees may be affected by changes in the scheme of labour relations that may be introduced by the relevant governmental authorities in whose jurisdictions the Company carries on business. Changes in such legislation or in the relationship between the Company and its employees may have a material adverse effect on the Company’s business, results of operations and financial condition.
Commodities Consumed and Energy Risk
The profitability of the Company’s operations will be dependent upon the cost and availability of commodities which are consumed or otherwise used in connection with the Company’s operations and projects, including, but not limited to, diesel, fuel, natural gas, electricity, steel, concrete and cyanide. Commodity prices fluctuate widely and are affected by numerous factors beyond the control of the Company. Further, as many of the Company’s mines are in remote locations and energy is generally a limited resource, the Company faces the risk that there may not be sufficient energy available to carry out mining activities efficiently or that certain sources of energy may not be available. The Company manages this risk by means of long term electricity agreements with local power authorities and inventory control process on consumables including fuel. Many of the mines have on-site generator sets as back-up to mitigate the anticipated and unanticipated interruptions from the energy providers. Furthermore, the Company’s operations are continually improved to reduce input costs and maximize output. Crude oil prices have declined sharply over the past few months as supply has been growing faster than demand. In the near term this supply/demand dynamic is not expected to change significantly and crude oil prices should remain subdued. Lower crude oil prices should eventually translate into lower diesel prices, which would benefit the Company in the form of lower operating costs.
Nature and Climatic Condition Risk
The Company and the mining industry are facing continued geotechnical challenges, which could adversely impact the Company’s production and profitability. Unanticipated adverse geotechnical and hydrological conditions, such as landslides, droughts and pit wall failures, rock fragility may occur in the future and such events may not be detected in advance. Geotechnical instabilities and adverse climatic conditions can be difficult to predict and are often affected by risks and hazards outside of the Company’s control, such as severe weather and considerable rainfall, which may lead to periodic floods, mudslides, wall instability and seismic activity, which may result in slippage of material.
Geotechnical failures could result in limited or restricted access to mine sites, suspension of operations, government investigations, increased monitoring costs, remediation costs, loss of ore and other impacts, which could cause one or more of the Company’s projects to be less profitable than currently anticipated and could result in a material adverse effect on the Company’s results of operations and financial position.
Management’s Assumptions and Market Conditions Risk
Mineral interests are the most significant assets of the Company and represent capitalized expenditures related to the development and construction of mining properties and related property, plant and equipment and the value assigned to exploration potential on acquisition. The costs associated with mining properties are separately allocated to exploration potential, Mineral Reserves and Mineral Resources and include acquired interests in production, development and exploration-stage properties representing the fair value at the time they were acquired. The values of such mineral properties are primarily driven by the nature and amount of material interests believed to be contained or potentially contained in properties to which they relate.
The Company reviews and evaluates its mining interests and any associated or allocated goodwill for impairment at least annually or when events or changes in circumstances indicate that the related carrying amounts may not be recoverable. An impairment is considered to exist if the recoverable value of the asset is less than the carrying amount of the asset. An impairment loss is measured and recorded to the net recoverable value of the asset. The recoverable value of the asset is the higher of: (i) value in use (being the net present value of total expected future cash flows); and (ii) fair value less costs to sell.
The Company assesses at the end of each reporting period whether there is any indication that an impairment loss recognized in prior periods for an asset other than goodwill may no longer exist or may have decreased. If any such indication exists, the Company estimates the recoverable amount and considers the reversal of the impairment loss recognized in prior periods for all assets other than goodwill. An impairment loss recognized for goodwill is not reversed in a subsequent period.
Fair value is the value obtained from an active market or binding sale agreement. Where neither exists, fair value is based on the best information available to reflect the amount the Company could receive for the asset in an arm’s length transaction. This is often estimated using discounted cash flow techniques. For value in use, recent cost levels are considered, together with expected changes in costs that are compatible with the current condition of the business and which meet the requirements of International Accounting Standards 36 in a discounted cash flow model. Where a recoverable amount is assessed using discounted cash flow techniques, the resulting estimates are based on detailed mine and/or production plans. Assumptions underlying fair value estimates are subject to significant risks and uncertainties. Where third-party pricing services are used, the valuation techniques and assumptions used by the pricing services are reviewed by the Company to ensure compliance with the accounting policies and internal control over financial reporting of the Company. Future cash flows are estimated based on expected future production, commodity prices, operating costs and capital costs. There are numerous uncertainties inherent in estimating Mineral Reserves and Mineral Resources. Differences between management’s assumptions and market conditions could have a material effect in the future on the Company’s financial position and results of operation.
The assumptions used in the valuation of work-in process inventories by the Company include estimates of metal contained in the ore stacked on leach pads, assumptions of the amount of metal stacked that is expected to be recovered from the leach pads, estimates of metal contained in ore stock piles, assumptions of the amount of metal that will be crushed for concentrate, estimates of metal-in-circuit, estimated costs of completion to final product to be incurred and an assumption of the gold, silver and copper price expected to be realized when the gold, silver and copper is recovered. If these estimates or assumptions prove to be inaccurate, the Company could be required to write-down the recorded value of its work-in-process inventories to net realizable value, which would reduce the Company’s earnings and working capital. Net realizable value is determined as the difference between costs to complete production into a saleable form and the estimated future precious metal prices based on prevailing and long-term metal prices. When the circumstances that previously caused inventories to be written down below cost no longer exist or when there is clear evidence of an increase in net realizable value because of changed economic circumstances, the amount of write-down is reversed up to the lower of the new net realizable value or the original cost.
The Company assesses at the end of each reporting period whether there are any indicators, from external and internal sources of information that an asset or cash generating unit (“CGU”) may be impaired requiring an adjustment to the carrying value in order not to exceed its recoverable amount. A CGU is defined as the smallest identifiable group of mineral assets that generates independent cash flows. External sources of information considered could include changes in market conditions, the economic and legal environment in which the Company operates that are not within its control and the impact these changes may have on the recoverable amount. Internal sources of information include the manner in which the mineral properties are being used or are expected to be used and indications of the economic performance of the assets. The recoverable amounts of CGU’s are based on each CGU’s future after-tax cash flows expected to be derived from the Company’s mining properties. Reductions in metal price forecasts, increases in estimated future costs of production, increases in estimated future capital costs and reductions in the amount of recoverable mineral reserves and mineral resources are each examples of factors and estimates that could each result in a write-down of the carrying amount of the Company’s mineral properties. Although management makes its best estimates, it is possible that material changes could occur which may adversely affect management’s estimate of the net cash flows expected to be generated from its properties. Any impairment estimates, which are based on applicable key assumptions and sensitivity analysis, are based on management’s best knowledge of the amounts, events or actions at such time, and the actual future outcomes may differ from any estimates that are provided by the Company. Any impairment charges on the Company’s mineral projects could adversely affect the Company's results of operations.
Litigation Risk
All industries, including the mining industry, are subject to legal claims, with and without merit. The Company is currently involved in litigation and may become involved in legal disputes in the future. Defense and settlement costs can be substantial, even with respect to claims that have no merit. Due to the inherent uncertainty of the litigation process, the resolution of any particular legal proceeding may have a material adverse effect on the Company’s financial position or results of operations.
In 2004, a former director of Northern Orion (now named 0805346 B.C. Ltd.) commenced proceedings in Argentina against Northern Orion claiming damages in the amount of $177.0 million for alleged breaches of agreements entered into with the plaintiff. The plaintiff alleged that the agreements entitled him to a pre-emptive right to participate in acquisitions by Northern Orion in Argentina and claimed damages in connection with the acquisition by Northern Orion of its 12.5% equity interest in the Alumbrera Mine. On August 22, 2008, the National Commercial Court No. 13 of the City of Buenos Aires issued a first-instance judgment rejecting the claim. The plaintiff appealed this judgment to the National Commercial Appeals Court. On May 22, 2013, the appellate court overturned the first-instance decision. The appellate court determined that the plaintiff was entitled to make 50% of Northern Orion’s investment in the Alumbrera acquisition, although weighted the chance of the plaintiff’s 50% participation at 15%. The matter was remanded to the first-instance court to determine the value. On June 12, 2013, Northern Orion filed an extraordinary recourse with the appellate court in order to bring the matter before the Supreme Court of Argentina to consider whether the appellate court’s decision was arbitrary. The extraordinary recourse was denied by the appellate court and Northern Orion was notified of this decision on December 20, 2013. Based on this decision, 0805346 B.C. Ltd. filed an appeal directly with the Supreme Court on February 3, 2014. On October 28, 2014, the Supreme Court denied 0805346 B.C. Ltd.’s motion for leave to appeal and accordingly the determination of the National Commercial Appeals Court regarding the plaintiff’s entitlement to damages stands, and the court appointed valuator subsequently delivered an assessment order of the value of lost opportunity to the plaintiff at $244 million. 0805346 B.C. Ltd. is seeking an annulment of this assessment order through the judicial process in Argentina and will vigorously defend its position in this case. On January 15, 2015 the Argentine courts granted 0805346 B.C. Ltd. an order which suspends all effects, including enforcement, of the award rendered by the valuator until the application by Northern Orion to annul the valuation is considered by the courts, which is expected to occur in February 2015. If successful, the previous assessment will be annulled and a new court appointed valuator will be assigned to determine the assessment. There can be no assurance that 0805346 B.C. Ltd. will be successful in its annulment request. In the event the annulment is denied, the valuator’s award stands and our results of operations and the financial condition of the Corporation could be adversely affected.
In December 2012, the Company received assessments from the Brazilian federal tax authorities disallowing certain deductions relating to debentures for the years 2007 to 2010. The Company believes that these debentures were issued on commercial terms permitted under applicable laws and is challenging these assessments. As such, the Company does not believe it is probable that any amounts will be paid with respect to these assessments with the Brazilian authorities and the amount and timing of any assessments cannot be reasonably estimated.
Business Combinations Risk
From time to time, the Company examines opportunities to acquire additional mining assets and businesses. Any acquisition that the Company may choose to complete may be of a significant size, may change the scale of the Company’s business and operations, and may expose the Company to new geographic, political, operating, financial and geological risks. The Company’s success in its acquisition activities depends on its ability to identify suitable acquisition candidates, negotiate acceptable terms for any such
acquisition, and integrate the acquired operations successfully with those of the Company. Any acquisitions would be accompanied by risks. For example, there may be a significant change in commodity prices after the Company has committed to complete the transaction and established the purchase price or exchange ratio; a material ore body may prove to be below expectations; the Company may have difficulty integrating and assimilating the operations and personnel of any acquired companies, realizing anticipated synergies and maximizing the financial and strategic position of the combined enterprise, and maintaining uniform standards, policies and controls across the organization; the integration of the acquired business or assets may disrupt the Company’s ongoing business and its relationships with employees, customers, suppliers and contractors; and the acquired business or assets may have unknown liabilities which may be significant. In the event that the Company chooses to raise debt capital to finance any such acquisition, the Company’s leverage will be increased. If the Company chooses to use equity as consideration for such acquisition, existing shareholders may experience dilution. Alternatively, the Company may choose to finance any such acquisition with its existing resources. There can be no assurance that the Company would be successful in overcoming these risks or any other problems encountered in connection with such acquisitions.
In 2014, the Company completed the Osisko Acquisition to gain exposure to a high quality gold asset, to diversify the Company's operations, to strengthen the Company's position as a gold producer and to create the opportunity to realize certain other benefits. Achieving the anticipated benefits of the Osisko Acquisition depends on a number of factors, some of which will not be in the Company's control. In addition, there may be risks associated with Osisko that the Company are not aware of and have no control over that could adversely affect the Company's investment in Osisko. The Company may fail to realize any of the anticipated benefits of the Osisko Acquisition.
In connection with the Osisko Acquisition, there may be liabilities that the Company failed to discover or were unable to quantify in the Company's due diligence (which the Company conducted prior to the execution of the arrangement agreement with Agnico and Osisko on April 16, 2014). The representations, warranties and indemnities contained in the arrangement agreement did not survive closing of the Osisko Acquisition.
The Company has formed a 50/50 partnership with Agnico in connection with the Osisko Acquisition (the “Partnership”). There are a variety of general risks associated with this Partnership, particularly because the Company is not the sole operator. These risks include, but are not limited to:
| • | disagreement with Agnico about how to develop, operate or finance a project; |
| • | that Agnico may at any time have economic or business interests or goals that are, or become, inconsistent with the Company's business interests or goals; |
| • | that Agnico may not comply with the Partnership agreement; |
| • | the possibility that Agnico might become bankrupt; |
| • | that Agnico may be in a position to take action contrary to the Company's instructions, requests, policies, objectives or interests; |
| • | possible litigation with Agnico about Partnership matters; and |
| • | the possibility that the Company may not be able to sell the Company's interest in the Partnership if the Company desires to exit the Partnership. |
These risks could result in legal liability or affect the Company's ability to develop or operate the Partnership project, either of which could have a material adverse effect on the Company's future growth, results of operations, cash flows and financial position.
Information Systems Risk
The Company has entered into agreements with third parties for hardware, software, telecommunications and other information technology (“IT”) services in connection with the Company's operations. the Company's operations depend, in part, on how well the Company and the Company's suppliers protect networks, equipment, IT systems and software against damage from a number of threats, including, but not limited to, cable cuts, damage to physical plants, natural disasters, terrorism, fire, power loss, hacking, computer viruses, vandalism and theft. The Company's operations also depend on the timely maintenance, upgrade and replacement of networks, equipment, IT systems and software, as well as pre-emptive expenses to mitigate the risks of failures. Any of these and other events could result in information system failures, delays and/or increase in capital expenses. The failure of information systems or a component of information systems could, depending on the nature of any such failure, adversely impact the Company's reputation and results of operations.
Although to date the Company has not experienced any material losses relating to cyber-attacks or other information security breaches, there can be no assurance that the Company will not incur such losses in the future. The Company's risk and exposure to these matters cannot be fully mitigated because of, among other things, the evolving nature of these threats. As a result, cyber security and the continued development and enhancement of controls, processes and practices designed to protect systems,
computers, software, data and networks from attack, damage or unauthorized access remain a priority. As cyber threats continue to evolve, the Company may be required to expend additional resources to continue to modify or enhance protective measures or to investigate and remediate any security vulnerabilities.
Uninsured or Uninsurable Risk
The Company’s business is subject to a number of risks and hazards generally, including adverse environmental conditions, industrial accidents, labour disputes, unusual or unexpected geological conditions, ground or slope failures, cave-ins, catastrophic equipment failures or unavailability of materials and equipment, changes in the regulatory environment and natural phenomena such as inclement weather conditions, floods and earthquakes. Such occurrences could result in damage to mineral properties or production facilities, personal injury or death, environmental damage to the Company’s properties or the properties of others, delays in mining, monetary losses and possible legal liability.
The Company’s insurance will not cover all the potential risks associated with the company’s operations. Even if available, the Company may also be unable to maintain insurance to cover these risks at economically feasible premiums. Insurance coverage may not continue to be available or may not be adequate to cover any resulting liability. Moreover, insurance against risks such as environmental pollution or other hazards as a result of exploration and production (such as underground coverage) is not generally available to the Company or to other companies in the mining industry on acceptable terms. The Company might also become subject to liability for pollution or other hazards that may not be insured against or that the Company may elect not to insure against because of premium costs or other reasons. Losses from these events could cause the Company to incur significant costs that could have a material adverse effect upon its financial performance and results of operations. Should the Company be unable to fully fund the cost of remedying an environmental problem, the Company might be required to suspend operations or enter into interim compliance measures pending completion of the required remedy, which may have a material adverse effect. The Company may suffer a material adverse effect on the Company's business, results of operations, cash flows and financial position if the Company incurs a material loss related to any significant event that is not covered, or adequately covered, by the Company's insurance policies.
12. CONTINGENCIES
Due to the size, complexity and nature of the Company’s operations, various legal and tax matters arise in the ordinary course of business. The Company accrues for such items when a liability is both probable and the amount can be reasonably estimated. In the opinion of management, these matters will not have a material effect on the Consolidated Financial Statements of the Company.
The Company has received assessments from the Brazilian federal tax authorities disallowing certain deductions relating to debentures for the periods 2007-2010. The Company believes these debentures were issued on commercial terms permitted under applicable laws and is challenging these assessments. As such, the Company does not believe it is probable that any amounts will be paid with respect to these assessments with the Brazilian authorities and the amount and timing of any assessments cannot be reasonably estimated.
13. CRITICAL ACCOUNTING POLICIES AND ESTIMATES
The Company's consolidated financial statements are prepared in accordance with IFRS. The significant accounting policies applied and recent accounting pronouncements are described in Note 3 and Note 5 to the Company's annual consolidated financial statements for the year ended December 31, 2014.
In preparing the consolidated financial statements in accordance with the IFRS, management is required to make estimates and assumptions that affect the reported amounts of assets, liabilities, revenues and expenses for the period end. Critical accounting estimates represent estimates that are uncertain and for which changes in those estimates could materially impact on the Company's consolidated financial statements. Actual future outcomes could differ from present estimates. Management reviews its estimates and assumptions on an ongoing basis using the most current information available.
The critical judgments and key sources of estimation uncertainties in the application of accounting policies during the year ended December 31, 2014 are disclosed in Note 4 to the Company's annual consolidated financial statements for the year ended December 31, 2014.
14. NON-GAAP AND ADDITIONAL MEASURES
The Company has included certain non-GAAP measures including “Cash costs per GEO”, “Co-product cash costs per GEO”, “Co-product cash costs per pound of copper”, "All-in sustaining costs per GEO", "All-in sustaining co-product costs per GEO", “Adjusted Earnings or Loss, Adjusted Earnings or Loss per share” and "Adjusted Operating Cash Flows" to supplement its Consolidated Financial Statements, which are presented in accordance with IFRS. The term IFRS and generally accepted accounting principles (“GAAP”) are used interchangeably throughout this MD&A.
The Company believes that these measures, together with measures determined in accordance with IFRS, provide investors with an improved ability to evaluate the underlying performance of the Company. Non-GAAP measures do not have any standardized meaning prescribed under IFRS, and therefore they may not be comparable to similar measures employed by other companies. The data is intended to provide additional information and should not be considered in isolation or as a substitute for measures of performance prepared in accordance with IFRS.
CASH COSTS AND ALL-IN SUSTAINING COSTS
The Company discloses “cash costs” because it understands that certain investors use this information to determine the Company’s ability to generate earnings and cash flows for use in investing and other activities. The Company believes that conventional measures of performance prepared in accordance with IFRS do not fully illustrate the ability of its operating mines to generate cash flows. The measures, as determined under IFRS, are not necessarily indicative of operating profit or cash flows from operating activities. Cash costs figures are calculated in accordance with a standard developed by The Gold Institute, which was a worldwide association of suppliers of gold and gold products and included leading North American gold producers. The Gold Institute ceased operations in 2002, but the standard remains the generally accepted standard of reporting cash costs of production in North America. Adoption of the standard is voluntary and the cost measures presented herein may not be comparable to other similarly titled measures of other companies.
The measure of cash costs, along with revenue from sales, is considered to be a key indicator of a company’s ability to generate operating earnings and cash flows from its mining operations. This data is furnished to provide additional information and is a non-GAAP measure. It should not be considered in isolation as a substitute for measures of performance prepared in accordance with IFRS and is not necessarily indicative of operating costs, operating profit or cash flows presented under IFRS.
The Company’s business model is focused on the production and sale of precious metals - gold and silver, which accounts for a significant portion of the Company's total revenue generated. The emphasis on precious metals therefore entails the necessity to provide investors with cash costs information that is relevant to their evaluation of the Company’s ability to generate earnings and cash flows for use in investing and other activities.
Cash costs per GEO, Co-product cash costs per GEO and Co-product cash costs per pound of copper
Cash costs include mine site operating costs such as mining, processing, administration, production taxes and royalties which are not based on sales or taxable income calculations, but are exclusive of amortization, reclamation, capital, development and exploration costs. The Company believes that such measure provides useful information about the Company’s underlying cash costs of operations in isolating the impact of precious metal production volumes and the impact of by-product credits on the Company’s cost structure. Cash costs are computed net of by-products or on a co-product basis.
| • | Cash costs per GEO is calculated net of by-products by applying copper and zinc net revenues, which are incidental to the production of precious metals, as a credit to the cost of gold equivalent ounces produced. Cash costs are impacted by realized copper and zinc revenue, thereby allowing the Company’s management and stakeholders to assess net costs of precious metal production. These costs are then divided by gold equivalent ounces produced. |
| • | Co-product cash costs per GEO do not reflect a reduction in costs for costs associated with non-precious metals. |
| • | Co-product cash costs per pound of copper reflect a reduction in costs for costs associated with GEO production reflecting copper-only costs. These costs are then divided by commercial copper produced. |
Cash costs per gold equivalent ounce and per pound of copper are calculated on a weighted average basis.
All-in sustaining costs per GEO and All-in sustaining co-product costs per GEO
All-in sustaining costs per GEO seeks to represent total sustaining expenditures of producing gold equivalent ounces from current operations, based on cash costs and co-product costs, including cost components of mine sustaining capital expenditures, corporate general and administrative expense excluding stock-based compensation, and exploration and evaluation expense. It does not include capital expenditures attributable to projects or mine expansions, exploration and evaluation costs attributable to growth projects, income tax payments, financing costs and dividend payments. Consequently, this measure is not representative of all of the Company's cash expenditures. In addition, the calculation of all-in sustaining costs does not include depletion, depreciation and amortization expense as it does not reflect the impact of expenditures incurred in prior periods.
| • | All-in sustaining costs reflect by-product copper revenue credits and 100% of the aforementioned cost components. |
| • | All-in sustaining co-product costs reflect allocations of the aforementioned cost components on the basis that is consistent with the nature of each of the cost component to the gold or copper production activities. |
Cash costs per GEO, Co-product cash costs per GEO, all-in sustaining costs per GEO and all-in sustaining co-product costs per GEO are from continuing operations and exclude Ernesto/Pau-a-Pique a discontinued operation.
Per Gold Equivalent Ounce
Silver production is treated as a gold equivalent in determining a combined precious metal production unit. Specifically, gold equivalent ounces are calculated by converting silver production to its gold equivalent using relative gold/silver metal prices at an assumed ratio and adding the converted silver production expressed in gold ounces to the ounces of gold production. GEO calculations are based on an average historical silver to gold price ratio of 50:1.
The following tables provide a reconciliation of cost of sales per the Consolidated Financial Statements to (i) Cash costs per GEO, (ii) Co-product cash costs per GEO, (iii) Co-product cash costs per pound of copper, (iv) All-in sustaining costs per GEO, and (v) All-in sustaining co-product costs per GEO.
(i) Reconciliation of Cost of Sales per the Consolidated Financial Statements to cash costs per GEO from continuing operations:
| GEO Cash Costs | In thousands of Dollars | Dollars per GEO | ||||||||||||||||||
| For the three months ended December 31, | 2014 | 2013 | 2014 | 2013 | ||||||||||||||||
Cost of sales (ii) | $ | 318,661 | $ | 239,030 | $ | 818 | $ | 898 | ||||||||||||
| Adjustments: | ||||||||||||||||||||
| Chapada treatment and refining costs related to gold and copper | 10,281 | 8,717 | 26 | 33 | ||||||||||||||||
| Inventory movements and adjustments | (23,070) | (8,707) | (59) | (33) | ||||||||||||||||
| Commercial, overseas freight and other costs | (9,227) | (7,868) | (24) | (30) | ||||||||||||||||
By-product credits from Chapada copper revenue including copper pricing adjustment | (101,270) | (112,521) | (260) | (423) | ||||||||||||||||
| Total GEO cash costs (excluding Alumbrera) | $ | 195,375 | $ | 118,651 | $ | 501 | $ | 445 | ||||||||||||
| Minera Alumbrera (12.5% interest) cash costs | (185) | (2,951) | (17) | (261) | ||||||||||||||||
Total GEO cash costs (ii) | $ | 195,190 | $ | 115,700 | $ | 484 | $ | 417 | ||||||||||||
| Commercial GEO produced excluding Alumbrera | 389,496 | 266,128 | ||||||||||||||||||
| Commercial GEO produced including Alumbrera | 403,200 | 277,446 | ||||||||||||||||||
| GEO Cash Costs | In thousands of Dollars | Dollars per GEO | ||||||||||||||||||
| For the years ended December 31, | 2014 | 2013 | 2014 | 2013 | ||||||||||||||||
Cost of sales (ii) | $ | 1,045,827 | $ | 900,789 | $ | 817 | $ | 817 | ||||||||||||
| Adjustments: | ||||||||||||||||||||
| Chapada treatment and refining costs related to gold and copper | 36,247 | 33,880 | 28 | 31 | ||||||||||||||||
| Inventory movements and adjustments | (28,891) | (23,221) | (23) | (21) | ||||||||||||||||
| Commercial, overseas freight and other costs | (21,568) | (30,611) | (17) | (28) | ||||||||||||||||
By-product credits from Chapada copper revenue including copper pricing adjustment | (380,954) | (402,824) | (297) | (365) | ||||||||||||||||
| Total GEO cash costs (excluding Alumbrera) | $ | 650,661 | $ | 478,013 | $ | 508 | $ | 434 | ||||||||||||
| Minera Alumbrera (12.5% interest) cash costs | (13,925) | (9,857) | (26) | (24) | ||||||||||||||||
Total GEO cash costs (ii) | $ | 636,736 | $ | 468,156 | $ | 482 | $ | 410 | ||||||||||||
| Commercial GEO produced excluding Alumbrera | 1,280,278 | 1,102,460 | ||||||||||||||||||
| Commercial GEO produced including Alumbrera | 1,319,928 | 1,141,617 | ||||||||||||||||||
______________________________
| (i) | Cost of sales includes non-cash items including the impact of the movement in inventory. |
| (ii) | Depletion, depreciation and amortization are excluded from both total cash costs and cost of sales. |
(ii) Reconciliation of cost of sales per the Consolidated Financial Statements to co-product cash costs per GEO from continuing operations:
| GEO Cash Costs | In thousands of Dollars | Dollars per GEO | ||||||||||||||||||
| For the three months ended December 31, | 2014 | 2013 | 2014 | 2013 | ||||||||||||||||
Cost of sales (i) (iii) | $ | 318,661 | $ | 239,030 | $ | 818 | $ | 898 | ||||||||||||
| Adjustments: | ||||||||||||||||||||
Copper contained in concentrate related cash costs (excluding related TCRC’s) (ii) | (46,041) | (47,713) | (117) | (179) | ||||||||||||||||
| Treatment and refining costs (“TCRC”) related to Chapada gold | 1,490 | 1,281 | 4 | 5 | ||||||||||||||||
| Inventory movements and adjustments | (23,070) | (8,707) | (59) | (33) | ||||||||||||||||
| Commercial, overseas freight and other costs | (9,227) | (7,868) | (24) | (30) | ||||||||||||||||
| Total GEO co-product cash costs (excluding Alumbrera) | $ | 241,813 | $ | 176,023 | $ | 622 | $ | 661 | ||||||||||||
| Minera Alumbrera (12.5% interest) GEO cash costs | 3,342 | 3,547 | (14) | (14) | ||||||||||||||||
Total GEO co-product cash costs (iii) | $ | 245,155 | $ | 179,570 | $ | 608 | $ | 647 | ||||||||||||
| Commercial GEO produced excluding Alumbrera | 389,496 | 266,128 | ||||||||||||||||||
| Commercial GEO produced including Alumbrera | 403,200 | 277,446 | ||||||||||||||||||
| GEO Cash Costs | In thousands of Dollars | Dollars per GEO | ||||||||||||||||||
| For the years ended December 31, | 2014 | 2013 | 2014 | 2013 | ||||||||||||||||
Cost of sales (i) (iii) | $ | 1,045,827 | $ | 900,789 | $ | 817 | $ | 817 | ||||||||||||
| Adjustments: | ||||||||||||||||||||
Copper contained in concentrate related cash costs (excluding related TCRC’s) (ii) | (192,563) | (186,143) | (150) | (168) | ||||||||||||||||
| Treatment and refining costs (“TCRC”) related to Chapada gold | 5,179 | 4,817 | 4 | 4 | ||||||||||||||||
| Inventory movements and adjustments | (28,891) | (23,221) | (23) | (21) | ||||||||||||||||
| Commercial, overseas freight and other costs | (21,569) | (30,611) | (17) | (28) | ||||||||||||||||
| Total GEO co-product cash costs (excluding Alumbrera) | $ | 807,983 | $ | 665,631 | $ | 631 | $ | 604 | ||||||||||||
| Minera Alumbrera (12.5% interest) GEO cash costs | 12,831 | 14,257 | (9) | (8) | ||||||||||||||||
Total GEO co-product cash costs (iii) | $ | 820,814 | $ | 679,888 | $ | 622 | $ | 596 | ||||||||||||
| Commercial GEO produced excluding Alumbrera | 1,280,278 | 1,102,460 | ||||||||||||||||||
| Commercial GEO produced including Alumbrera | 1,319,928 | 1,141,617 | ||||||||||||||||||
_____________________________
| (i) | Cost of sales includes non-cash items including the impact of the movement in inventory. |
| (ii) | Costs directly attributed to a specific metal are allocated to that metal. Costs not directly attributed to a specific metal are allocated based on relative value. As a rule of thumb, the relative value has been 80/75% copper and 20/25% gold. TCRC’s are defined as treatment and refining charges. |
| (iii) | Depletion, depreciation and amortization are excluded from both total cash costs and cost of sales. |
(iii) Reconciliation of cost of sales per the Consolidated Financial Statements to co-product cash costs per pound of copper:
| Copper Cash Costs | In thousands of Dollars | Dollars per pound of copper | ||||||||||||||||||
| For the three months ended December 31, | 2014 | 2013 | 2014 | 2013 | ||||||||||||||||
Cost of sales (i) (iii) | $ | 318,661 | $ | 239,030 | $ | 9.11 | $ | 6.65 | ||||||||||||
| Adjustments: | ||||||||||||||||||||
GEO related cash costs (excluding related TCRC’s) (ii) | (240,322) | (174,741) | (6.87) | (4.87) | ||||||||||||||||
| TCRC related to Chapada copper | 8,791 | 7,435 | 0.25 | 0.21 | ||||||||||||||||
| Inventory movements and adjustments | (23,070) | (8,707) | (0.66) | (0.24) | ||||||||||||||||
| Commercial, overseas freight and other costs | (9,227) | (7,868) | (0.26) | (0.22) | ||||||||||||||||
| Total copper co-product cash costs (excluding Alumbrera) | $ | 54,833 | $ | 55,149 | $ | 1.57 | $ | 1.53 | ||||||||||||
| Minera Alumbrera (12.5% interest) copper cash costs | 16,160 | 16,777 | 0.04 | 0.05 | ||||||||||||||||
Total copper co-product cash costs (iii) | $ | 70,993 | $ | 71,926 | $ | 1.61 | $ | 1.58 | ||||||||||||
Commercial copper produced excluding Alumbrera (millions of lbs) | 35.0 | 36.0 | ||||||||||||||||||
Commercial copper produced including Alumbrera (millions of lbs) | 44.0 | 45.6 | ||||||||||||||||||
| Copper Cash Costs | In thousands of Dollars | Dollars per pound of copper | ||||||||||||||||||
| For the years ended December 31, | 2014 | 2013 | 2014 | 2013 | ||||||||||||||||
Cost of sales (i) (iii) | $ | 1,045,827 | $ | 900,789 | $ | 7.84 | $ | 6.92 | ||||||||||||
| Adjustments: | ||||||||||||||||||||
GEO related cash costs (excluding related TCRC’s) (ii) | (802,805) | (660,997) | (6.02) | (5.07) | ||||||||||||||||
| TCRC related to Chapada copper | 31,069 | 28,510 | 0.23 | 0.22 | ||||||||||||||||
| Inventory movements and adjustments | (28,891) | (23,221) | (0.22) | (0.18) | ||||||||||||||||
| Commercial, overseas freight and other costs | (21,568) | (30,611) | (0.15) | (0.24) | ||||||||||||||||
| Total copper co-product cash costs (excluding Alumbrera) | $ | 223,632 | $ | 214,470 | $ | 1.68 | $ | 1.65 | ||||||||||||
| Minera Alumbrera (12.5% interest) copper cash costs | 63,171 | 66,625 | 0.09 | 0.10 | ||||||||||||||||
Total copper co-product cash costs (iii) | $ | 286,803 | $ | 281,095 | $ | 1.77 | $ | 1.75 | ||||||||||||
Commercial copper produced excluding Alumbrera (millions of lbs) | 133.5 | 130.2 | ||||||||||||||||||
Commercial copper produced including Alumbrera (millions of lbs) | 161.7 | 160.5 | ||||||||||||||||||
______________________________
| (i) | Cost of sales includes non-cash items including the impact of the movement in inventory. |
| (ii) | Costs directly attributed to a specific metal are allocated to that metal. Costs not directly attributed to a specific metal are allocated based on relative value. As a rule of thumb, the relative value has been 80/75% copper and 20/25% gold. TCRC’s are defined as treatment and refining charges. |
| (iii) | Depletion, depreciation and amortization are excluded from both total cash costs and cost of sales. |
(iv) All-in sustaining costs per GEO from continuing operations:
| GEO Cash Costs | In thousands of Dollars | Dollars per GEO | ||||||||||||||||||
| For the three months ended December 31, | 2014 | 2013 | 2014 | 2013 | ||||||||||||||||
Total GEO cash costs (i) | $ | 195,190 | $ | 115,700 | $ | 484 | $ | 417 | ||||||||||||
General and administrative, excluding share-based compensation (ii) | 25,880 | 22,657 | 64 | 82 | ||||||||||||||||
Sustaining capital expenditures (ii) | 85,378 | 63,010 | 211 | 226 | ||||||||||||||||
Exploration and evaluation expense (ii) | 5,949 | 7,910 | 15 | 29 | ||||||||||||||||
| Total all-in sustaining costs per GEO | $ | 312,397 | $ | 209,277 | $ | 774 | $ | 754 | ||||||||||||
| Commercial GEO produced including Alumbrera | 403,200 | 277,446 | ||||||||||||||||||
| GEO Cash Costs | In thousands of Dollars | Dollars per GEO | ||||||||||||||||||
| For the year ended December 31, | 2014 | 2013 | 2014 | 2013 | ||||||||||||||||
Total GEO cash costs (i) | $ | 636,737 | $ | 468,156 | $ | 482 | $ | 410 | ||||||||||||
General and administrative, excluding share-based compensation (ii) | 104,478 | 110,283 | 79 | 97 | ||||||||||||||||
Sustaining capital expenditures (ii) | 303,718 | 321,483 | 231 | 281 | ||||||||||||||||
Exploration and evaluation expense (ii) | 20,059 | 29,713 | 15 | 26 | ||||||||||||||||
| Total all-in sustaining costs per GEO | $ | 1,064,992 | $ | 929,635 | $ | 807 | $ | 814 | ||||||||||||
| Commercial GEO produced including Alumbrera | 1,319,928 | 1,141,617 | ||||||||||||||||||
___________
| (i) | Chapada copper revenue credits reflected in GEO cash costs. |
| (ii) | 100% of the cost component is included. |
(v) All-in sustaining costs per GEO on a co-product basis from continuing operations:
| GEO Cash Costs | In thousands of Dollars | Dollars per GEO | ||||||||||||||||||
| For the three months ended December 31, | 2014 | 2013 | 2014 | 2013 | ||||||||||||||||
| Total GEO co-product cash costs | $ | 245,155 | $ | 179,570 | $ | 608 | $ | 647 | ||||||||||||
General and administrative, excluding share-based compensation (i) | 21,047 | 18,175 | 52 | 66 | ||||||||||||||||
Sustaining capital expenditures (ii) | 71,912 | 54,731 | 179 | 197 | ||||||||||||||||
Exploration and evaluation expense (i) | 5,092 | 7,019 | 13 | 25 | ||||||||||||||||
| Total all-in sustaining co-product costs per GEO | $ | 343,206 | $ | 259,495 | $ | 852 | $ | 935 | ||||||||||||
| Commercial GEO produced including Alumbrera | 403,200 | 277,446 | ||||||||||||||||||
| GEO Cash Costs | In thousands of Dollars | Dollars per GEO | ||||||||||||||||||
| For the year ended December 31, | 2014 | 2013 | 2014 | 2013 | ||||||||||||||||
| Total GEO co-product cash costs | $ | 820,814 | $ | 679,888 | $ | 622 | $ | 596 | ||||||||||||
General and administrative, excluding share-based compensation (i) | 84,696 | 88,092 | 64 | 77 | ||||||||||||||||
Sustaining capital expenditures (ii) | 264,049 | 285,348 | 200 | 250 | ||||||||||||||||
Exploration and evaluation expense (i) | 16,462 | 27,286 | 13 | 24 | ||||||||||||||||
| Total all-in sustaining co-product costs per GEO | $ | 1,186,021 | $ | 1,080,614 | $ | 899 | $ | 947 | ||||||||||||
| Commercial GEO produced including Alumbrera | 1,319,928 | 1,141,617 | ||||||||||||||||||
___________
| (i) | Chapada's general and administrative ("G&A") expense and exploration expense are allocated 20% to gold and 80% to copper, reflecting costs incurred on the related activities at Chapada. G&A and exploration expenses of all other operations are allocated 80% to gold and 20% to copper based on the relative proportions of consolidated revenues from gold and copper sales. |
| (ii) | Chapada's sustaining capital expenditures are allocated 20% to gold and 80% to copper, reflecting costs incurred on the related activities at Chapada. Sustaining capital expenditures of all other operations are allocated 100% to gold. |
PRODUCTION OUNCES AND CASH COSTS - Going Forward
Beginning January 1, 2015, the Company has realigned key performance indicators ("KPIs") to support its objective of financial and operating predictability, as such, it will no longer disclose a combined precious metal production unit in GEO. Silver production will no longer be treated as a gold equivalent. The Company will be reporting production and cost information for gold, silver and copper separately and in addition, by-product costs for gold and silver, applying copper as the credit based on revenue contribution.
With this realignment, the significant changes to the KPIs are as follows:
| • | Production - ounces for gold and silver; |
| • | Cash costs on a co-product basis - shown on a per ounce basis for gold and silver. |
| • | Attributable Cost - Costs directly attributed to gold and silver will be allocated to each metal. Costs not directly attributed to each metal will be allocated based on the relative value of revenues which will be determined annually |
at the beginning of each year. The relative value of gold and silver for 2015 is expected to be approximately 90%/10%, respectively.
| • | The Attributable Cost for each metal will then be divided by the production of each metal in calculating cash costs per ounce on a co-product basis for the period. |
| • | Cash costs on a by-product basis - shown on a per ounce basis for gold and silver. |
| • | The Attributable Cost for each metal is calculated net of by-products by applying copper and zinc net revenues, which are incidental to the production of precious metals, as a credit to ounces produced. These costs are then divided by gold and silver ounces produced. |
ADJUSTED EARNINGS OR LOSS AND ADJUSTED EARNINGS OR LOSS PER SHARE
The Company uses the financial measures “Adjusted Earnings or Loss” and “Adjusted Earnings or Loss per share” to supplement information in its consolidated financial statements. The Company believes that in addition to conventional measures prepared in accordance with IFRS, the Company and certain investors and analysts use this information to evaluate the Company’s performance. The presentation of adjusted measures are not meant to be a substitute for net earnings or loss or net earnings or loss per share presented in accordance with IFRS, but rather should be evaluated in conjunction with such IFRS measures. Adjusted Earnings or Loss and Adjusted Earnings or Loss per share are calculated as net earnings excluding (a) share-based payments and other compensation, (b) unrealized foreign exchange (gains) losses related to revaluation of deferred income tax asset and liability on non-monetary items, (c) unrealized foreign exchange (gains) losses related to other items, (d) unrealized (gains) losses on derivatives, (e) impairment losses and reversals, (f) deferred income tax expense (recovery) on the translation of foreign currency inter-corporate debt, (g) mark-to-market (gains) losses on share-purchase warrants and revaluation of convertible debt, (h) write-down of investments and other assets, (i) one-time tax adjustments to historical deferred income tax balances relating to changes in enacted tax rates; (j) reorganization costs; (h) non-recurring provisions and any other non-recurring adjustments. Non-recurring adjustments from unusual events or circumstances are reviewed from time to time based on materiality and the nature of the event or circumstance. Earnings adjustments for the comparative period reflect both continuing and discontinued operations.
The terms “Adjusted Earnings or Loss” and “Adjusted Earnings or Loss per share” do not have a standardized meaning prescribed by IFRS, and therefore the Company’s definitions are unlikely to be comparable to similar measures presented by other companies. Management believes that the presentation of Adjusted Earnings or Loss and Adjusted Earnings or Loss per share provide useful information to investors because they exclude non-cash and other charges and are a better indication of the Company’s profitability from operations. The items excluded from the computation of Adjusted Earnings or Loss and Adjusted Earnings or Loss per share, which are otherwise included in the determination of net earnings or loss and net earnings or loss per share prepared in accordance with IFRS, are items that the Company does not consider to be meaningful in evaluating the Company’s past financial performance or the future prospects and may hinder a comparison of its period-to-period profitability. Reconciliations of Adjusted Earnings to net earnings is provided in Section 5.1, Annual Overview of Financial Results and Section 5.3 Fourth Overview of Financial Results for the year and three months ended December 31, 2014, respectively.
ADJUSTED OPERATING CASH FLOWS
The Company uses the financial measures “Adjusted Operating Cash Flows" to supplement information in its consolidated financial statements. The Company believes that in addition to conventional measures prepared in accordance with IFRS, the Company and certain investors and analysts use this information to evaluate the Company’s performance. The presentation of Adjusted Operating Cash Flows is not meant to be a substitute for the cash flows information presented in accordance with IFRS, but rather should be evaluated in conjunction with such IFRS measures. Adjusted Operating Cash Flows is calculated as the sum of cash flows from operating activities before non-cash working capital and non-recurring items such as transaction costs on acquisition, reorganization and demobilization costs which are paid in cash. Reconciliations of Adjusted Operating Cash Flows to cash flows from operating activities before non-cash working capital is provided in Section 5.1, Annual Overview of Financial Results and Section 5.3 Fourth Overview of Financial Results for the year and three months ended December 31, 2014, respectively.
NET DEBT
The Company uses the financial measure "Net Debt" to supplement information in its consolidated financial statements. The Company believes that in addition to conventional measures prepared in accordance with IFRS, the Company and certain investors and analysts use this information to evaluate the Company’s performance. The presentation of Net Debt is not meant to be a substitute for the debt information presented in accordance with IFRS, but rather should be evaluated in conjunction with such IFRS measures. Net Debt is calculated as the sum of the current and non-current portions of long-term debt excluding debt assumed
from the Company's 50% interest in Canadian Malartic which is neither corporate nor guaranteed by the Company net of the cash and cash equivalent balance as at the balance sheet date. A reconciliation of the non-GAAP measure is provided below:
| For the years ended December 31, | 2014 | 2013 | ||||||
| Long-term debt (excluding non-corporate debt of Canadian Malartic) | ||||||||
| Non-current portion | $ | 2,025,383 | $ | 1,189,762 | ||||
| Current portion | 34,557 | 15,000 | ||||||
| Total Long-term debt | $ | 2,059,940 | $ | 1,204,762 | ||||
| Less: Canadian Malartic debt | 105,164 | — | ||||||
| Less: Cash and cash equivalents | 191,027 | 220,018 | ||||||
| Net Debt | $ | 1,763,749 | $ | 984,744 | ||||
ADDITIONAL MEASURES
The Company uses other financial measures the presentation of which is not meant to be a substitute for other subtotals or totals presented in accordance with IFRS, but rather should be evaluated in conjunction with such IFRS measures. The following other financial measures are used:
| • | Gross margin excluding depletion, depreciation and amortization- represents the amount of revenue in excess of cost of sales excluding depletion, depreciation and amortization. |
| • | Mine operating earnings - represents the amount of revenue in excess of cost of sales excluding depletion, depreciation and amortization and depletion, depreciation and amortization. |
| • | Operating earnings - represents the amount of earnings before net finance income/expense and income tax expense. |
| • | Cash flows from operating activities before changes in non-cash working capital — excludes the non-cash movement from period-to-period in working capital items including trade and other receivables, other assets, inventories, trade and other payables. |
The terms described above do not have a standardized meaning prescribed by IFRS, and therefore the Company’s definitions are unlikely to be comparable to similar measures presented by other companies. The Company’s management believes that their presentation provides useful information to investors because gross margin excluding depletion, depreciation and amortization excludes the non-cash operating cost item (i.e. depreciation, depletion and amortization), cash flows from operating activities before changes in non-cash working capital excludes the non-cash movement in working capital items, mine operating earnings excludes expenses not directly associate with commercial production and operating earnings excludes finance and tax related expenses and income/recoveries. These, in management’s view, provide useful information of the Company’s cash flows from operating activities and are considered to be meaningful in evaluating the Company’s past financial performance or the future prospects.
15. SELECTED QUARTERLY FINANCIAL AND OPERATING SUMMARY
| December 31, | September 30, | June 30, | March 31, | |||||||||||||||||||
| (In thousands of Dollars, unless otherwise noted) | 2014 | 2014 | 2014 | 2014 | ||||||||||||||||||
| Financial results | ||||||||||||||||||||||
Revenues (i) | $ | 542,943 | $ | 494,421 | $ | 443,842 | $ | 353,916 | ||||||||||||||
| Mine operating earnings | $ | 87,626 | $ | 84,209 | $ | 80,840 | $ | 33,101 | ||||||||||||||
| Net (loss)/earnings from continuing operations attributed to Yamana equity holders | $ | (299,549 | ) | $ | (879,610 | ) | $ | 15,672 | $ | (31,374 | ) | |||||||||||
Adjusted (loss)/earnings (ii) from continuing operations attributable to Yamana equity holders | $ | (16,208 | ) | $ | (2,048 | ) | $ | 49,878 | $ | 9,914 | ||||||||||||
| Cash flows from operating activities from continuing operations (v) | $ | 183,627 | $ | 156,496 | $ | 142,981 | $ | 30,822 | ||||||||||||||
Cash flows from operating activities before changes in non-cash working capital (ii) (v) | $ | 166,420 | $ | 185,616 | $ | 148,932 | $ | 94,028 | ||||||||||||||
| Cash flows to investing activities from continuing operations (v) | $ | (150,670 | ) | $ | (138,099 | ) | $ | (653,667 | ) | $ | (139,263 | ) | ||||||||||
| Cash flows (to) from financing activities operations from continuing operations (v) | $ | (10,415 | ) | $ | 34,090 | $ | 419,276 | $ | 97,192 | |||||||||||||
| Per share financial results | ||||||||||||||||||||||
| (Loss)/earnings per share from continuing operations attributable to Yamana equity holders | ||||||||||||||||||||||
| Basic | $ | (0.34 | ) | $ | (1.00 | ) | $ | 0.02 | $ | (0.04 | ) | |||||||||||
| Diluted | $ | (0.35 | ) | $ | (1.00 | ) | $ | 0.02 | $ | (0.04 | ) | |||||||||||
| Adjusted (loss)/earnings per share (ii) from continuing operations attributable to Yamana equity holders | ||||||||||||||||||||||
| Basic and diluted | $ | (0.02 | ) | $ | 0.00 | $ | 0.06 | $ | 0.02 | |||||||||||||
| Financial position | ||||||||||||||||||||||
| Cash and cash equivalents | $ | 191,027 | $ | 167,035 | $ | 174,013 | $ | 209,558 | ||||||||||||||
| Total assets | $ | 12,538,853 | $ | 12,784,660 | $ | 13,473,735 | $ | 11,375,496 | ||||||||||||||
| Total long term liabilities | $ | 5,077,884 | $ | 5,057,473 | $ | 4,678,011 | $ | 3,717,249 | ||||||||||||||
| Production | ||||||||||||||||||||||
Commercial GEO produced from continuing operations (iii) | 403,201 | 361,810 | 307,128 | 247,792 | ||||||||||||||||||
Commissioning GEO produced from continuing operations (iii)(iv)(v) | — | 23,722 | 19,390 | 18,606 | ||||||||||||||||||
| Discontinued operations - GEO | 2,414 | 5,745 | 5,247 | 5,511 | ||||||||||||||||||
Total GEO produced (iii) | 405,615 | 391,277 | 331,765 | 271,909 | ||||||||||||||||||
Cash costs from continuing operations per GEO produced, including 12.5% equity interest in Alumbrera (ii)(iii)(v) | $ | 484 | $ | 481 | $ | 508 | $ | 450 | ||||||||||||||
Co-product cash costs from continuing operations per GEO produced, including 12.5% equity interest in Alumbrera (ii)(iii)(v) | $ | 608 | $ | 637 | $ | 609 | $ | 640 | ||||||||||||||
All-in costs from continuing operations per GEO produced, including 12.5% equity interest in Alumbrera (ii)(iii)(v) | $ | 774 | $ | 798 | $ | 849 | $ | 820 | ||||||||||||||
All-in co-product costs from continuing operations per GEO produced, including 12.5% equity interest in Alumbrera (ii)(iii)(v) | $ | 852 | $ | 896 | $ | 902 | $ | 976 | ||||||||||||||
| Chapada concentrate production (tonnes) | 63,955 | 69,279 | 60,975 | 51,570 | ||||||||||||||||||
Chapada copper contained in concentrate production (millions of pounds) | 35.0 | 38.0 | 33.0 | 27.6 | ||||||||||||||||||
| Chapada co-product cash costs per pound of copper | $ | 1.57 | $ | 1.59 | $ | 1.75 | $ | 1.84 | ||||||||||||||
| Alumbrera (12.5% interest) attributable concentrate production (tonnes) | 16,043 | 9,893 | 11,188 | 12,610 | ||||||||||||||||||
| Alumbrera (12.5% interest) attributable copper contained in concentrate production (millions of pounds) | 9.1 | 5.6 | 6.4 | 7.2 | ||||||||||||||||||
Alumbrera co-product cash costs per pound of copper (ii) | 1.78 | 2.67 | 2.32 | 2.40 | ||||||||||||||||||
| Gold Equivalent Ounces Breakdown | ||||||||||||||||||||||
| Total gold ounces produced | 352,574 | 332,342 | 284,366 | 228,372 | ||||||||||||||||||
| Total silver ounces produced (millions of ounces) | 2.7 | 2.9 | 2.4 | 2.2 | ||||||||||||||||||
| Sales Included in Revenue | ||||||||||||||||||||||
Total GEO sales, excluding 12.5% interest in Alumbrera (iii) | 402,043 | 340,985 | 297,467 | 236,561 | ||||||||||||||||||
| Total gold sales (ounces) | 346,588 | 287,180 | 253,111 | 192,587 | ||||||||||||||||||
| Total silver sales (millions of ounces) | 2.8 | 2.7 | 2.2 | 2.2 | ||||||||||||||||||
| Chapada concentrate sales (tonnes) | 66,534 | 70,288 | 56,010 | 48,747 | ||||||||||||||||||
Chapada payable copper contained in concentrate sales (millions of pounds) | 33.8 | 35.7 | 28.7 | 25.4 | ||||||||||||||||||
Average realized gold price per ounce (i) | $ | 1,199 | $ | 1,276 | $ | 1,292 | $ | 1,300 | ||||||||||||||
Average realized copper price per pound (i) | $ | 2.99 | $ | 3.14 | $ | 3.11 | $ | 3.25 | ||||||||||||||
Average realized silver price per ounce (i) | $ | 16.39 | $ | 19.27 | $ | 19.81 | $ | 20.43 | ||||||||||||||
| December 31, | September 30, | June 30, | March 31, | |||||||||||||||||
| (In thousands of Dollars, unless otherwise noted) | 2013 | 2013 | 2013 | 2013 | ||||||||||||||||
| Financial results | ||||||||||||||||||||
Revenue (i) | $ | 420,663 | $ | 456,675 | $ | 430,471 | $ | 534,873 | ||||||||||||
| Mine operating earnings | $ | 70,113 | $ | 144,010 | $ | 118,646 | $ | 208,009 | ||||||||||||
| Net (loss)/earnings from continuing operations attributed to Yamana equity holders | $ | (414,660 | ) | $ | 45,578 | $ | (9,109 | ) | $ | 103,964 | ||||||||||
Adjusted earnings (ii) from continuing operations attributable to Yamana equity holders | $ | 36,795 | $ | 69,860 | $ | 48,411 | $ | 118,988 | ||||||||||||
| Cash flows from operating activities operations from continuing operations (v) | $ | 165,925 | $ | 94,785 | $ | 157,055 | $ | 147,231 | ||||||||||||
Cash flows from operating activities before changes in non-cash working capital (ii) (v) | $ | 165,249 | $ | 177,530 | $ | 149,738 | $ | 215,297 | ||||||||||||
| Cash flows to investing activities from continuing operations (v) | $ | (241,157 | ) | $ | (205,631 | ) | $ | (262,830 | ) | $ | (255,930 | ) | ||||||||
| Cash flows from (to) financing activities from continuing operations (v) | $ | 66,711 | $ | (27,307 | ) | $ | 150,089 | $ | 94,350 | |||||||||||
| Per share financial results | ||||||||||||||||||||
| (Loss)/earnings per share from continuing operations attributable to Yamana equity holders | ||||||||||||||||||||
| Basic and diluted | $ | (0.55 | ) | $ | 0.06 | $ | (0.01 | ) | $ | 0.14 | ||||||||||
| Adjusted earnings per share (ii) from continuing operations attributable to Yamana equity holders | ||||||||||||||||||||
| Basic and diluted | $ | 0.05 | $ | 0.09 | $ | 0.07 | $ | 0.16 | ||||||||||||
| Financial position | ||||||||||||||||||||
| Cash and cash equivalents | $ | 220,018 | $ | 232,125 | $ | 379,817 | $ | 342,596 | ||||||||||||
| Total assets | $ | 11,410,717 | $ | 12,026,181 | $ | 11,960,854 | $ | 11,806,864 | ||||||||||||
| Total long term liabilities | $ | 3,615,464 | $ | 3,589,579 | $ | 3,593,059 | $ | 3,341,054 | ||||||||||||
| Production | ||||||||||||||||||||
Commercial GEO produced from continuing operations (iii) | 277,447 | 289,176 | 287,791 | 287,203 | ||||||||||||||||
Commissioning GEO produced from continuing operations (iii)(iv)(v) | 16,614 | 11,101 | 656 | — | ||||||||||||||||
| Discontinued operations - GEO | 9,707 | 6,657 | 7,098 | 4,109 | ||||||||||||||||
Total GEO produced (iii) | 303,768 | 306,934 | 295,545 | 291,312 | ||||||||||||||||
Cash costs per GEO produced, including 12.5% equity interest in Alumbrera (ii)(iii) | $ | 417 | $ | 365 | $ | 476 | $ | 383 | ||||||||||||
Co-product cash costs per GEO produced, including 12.5% equity interest in Alumbrera (ii)(iii) | $ | 647 | $ | 574 | $ | 577 | $ | 587 | ||||||||||||
All-in costs per GEO produced, including 12.5% equity interest in Alumbrera (ii)(iii) | 754 | 730 | 916 | 855 | ||||||||||||||||
All-in co-product costs per GEO produced, including 12.5% equity interest in Alumbrera (ii)(iii) | 935 | 888 | 950 | 1,014 | ||||||||||||||||
| Chapada concentrate production (tonnes) | 67,395 | 67,315 | 55,511 | 49,591 | ||||||||||||||||
Chapada copper contained in concentrate production (millions of pounds) | 36.0 | 36.8 | 30.1 | 27.4 | ||||||||||||||||
| Chapada co-product cash costs per pound of copper | $ | 1.53 | $ | 1.48 | $ | 1.76 | $ | 1.90 | ||||||||||||
| Alumbrera (12.5% interest) attributable concentrate production (tonnes) | 17,547 | 13,179 | 13,129 | 11,260 | ||||||||||||||||
| Alumbrera (12.5% interest) attributable copper contained in concentrate production (millions of pounds) | 9.6 | 7.1 | 7.2 | 6.3 | ||||||||||||||||
Alumbrera co-product cash costs per pound of copper (ii) | 1.75 | 2.45 | 2.40 | 2.40 | ||||||||||||||||
| Gold Equivalent Ounces Breakdown | ||||||||||||||||||||
| Total gold ounces produced | 260,187 | 263,830 | 257,608 | 248,239 | ||||||||||||||||
| Total silver ounces produced (millions of ounces) | 2.2 | 2.2 | 1.9 | 2.2 | ||||||||||||||||
| Sales Included in Revenue | ||||||||||||||||||||
Total GEO sales, excluding 12.5% interest in Alumbrera (iii) | 260,568 | 275,447 | 270,207 | 284,872 | ||||||||||||||||
| Total gold sales (ounces) | 218,223 | 232,284 | 233,714 | 241,259 | ||||||||||||||||
| Total silver sales (millions of ounces) | 2.1 | 2.2 | 1.8 | 2.2 | ||||||||||||||||
| Chapada concentrate sales (tonnes) | 67,616 | 68,512 | 50,728 | 55,826 | ||||||||||||||||
Chapada payable copper contained in concentrate sales (millions of pounds) | 34.5 | 35.7 | 26.7 | 29.1 | ||||||||||||||||
Average realized gold price per ounce (i) | $ | 1,277 | $ | 1,332 | $ | 1,385 | $ | 1,620 | ||||||||||||
Average realized copper price per pound (i) | $ | 3.37 | $ | 3.13 | $ | 3.05 | $ | 3.58 | ||||||||||||
Average realized silver price per ounce (i) | $ | 20.63 | $ | 21.45 | $ | 22.55 | $ | 29.81 | ||||||||||||
______________________________
| (i) | Revenue consists of sales net of sales taxes. Revenue per ounce data is calculated based on gross sales. Realized prices reflect continuing operations. |
| (ii) | A cautionary note regarding non-GAAP measures is included in Section 14 of this Management’s Discussion and Analysis of Operations and Financial Condition. |
| (iii) | GEO assumes gold plus the gold equivalent of silver using a ratio of 50:1 for all periods presented. |
| (iv) | Including commissioning GEO from C1 Santa Luz and Pilar. |
| (v) | Cash flow balances are attributable to Yamana Gold Inc. equity holders. |
16. DISCLOSURE CONTROLS AND PROCEDURES
Disclosure controls and procedures are designed to provide reasonable assurance that all relevant information is gathered and reported to senior management, including the Company’s Chairman and Chief Executive Officer and Executive Vice President, Finance and Chief Financial Officer, on a timely basis so that appropriate decisions can be made regarding public disclosure. The Company’s system of disclosure controls and procedures includes, but is not limited to, our Timely Disclosure and Confidentiality Policy, our Code of Conduct, our Insider Trading Policy, our Corporate Controls Policy, the effective functioning of our Audit Committee and procedures in place to systematically identify matters warranting consideration of disclosure by the Audit Committee.
As at the end of the period covered by this Management’s Discussion and Analysis, management of the Company, with the participation of the Chairman and Chief Executive Officer and the Executive Vice President, Finance and Chief Financial Officer, evaluated the effectiveness of the Company’s disclosure controls and procedures as required by applicable rules of the Canadian Securities Administrators (or Canadian securities regulatory authorities). The evaluation included documentation review, inquiries and other procedures considered by management to be appropriate in the circumstances. Based on that evaluation, the Chairman and Chief Executive Officer and the Executive Vice President, Finance and Chief Financial Officer have concluded that, as of the end of the period covered by this management’s discussion and analysis, the disclosure controls and procedures (as defined in Rule 13a-15(e) under the Securities Exchange Act of 1934) were effective to provide reasonable assurance that information required to be disclosed in the Company’s annual filings and interim filings and other reports filed or submitted under applicable securities laws, is recorded, processed, summarized and reported within time periods specified by those laws and that material information is accumulated and communicated to management of the Company, including the Chairman and Chief Executive Officer and the Executive Vice President, Finance and Chief Financial Officer, as appropriate to allow timely decisions regarding required disclosure.
MANAGEMENT’S REPORT ON INTERNAL CONTROL OVER FINANCIAL REPORTING
Management of the Company is responsible for establishing and maintaining effective internal control over financial reporting as such term is defined in the rules of the United States Securities and Exchange Commission and the Canadian Securities Administrators. The Company’s internal control over financial reporting is designed to provide reasonable assurance regarding the reliability of the Company’s financial reporting for external purposes in accordance with IFRS. The Company’s internal control over financial reporting includes:
| • | maintaining records, that in reasonable detail, accurately and fairly reflect our transactions and dispositions of the assets of the Company; |
| • | providing reasonable assurance that transactions are recorded as necessary for preparation of our consolidated financial statements in accordance with generally accepted accounting principles; |
| • | providing reasonable assurance that receipts and expenditures are made in accordance with authorizations of management and the directors of the Company; and |
| • | providing reasonable assurance that unauthorized acquisition, use or disposition of Company assets that could have a material effect on the Company’s consolidated financial statements would be prevented or detected on a timely basis. |
For the year ended December 31, 2014, management excluded from its assessment the internal control over financial reporting of Canadian Malartic Corporation (“Malartic”), which was acquired in June 2014, and whose financial statements constitute $2.0 billion and $1.5 billion of net and total assets, $185.3 million of total revenue and $24.8 million of net income of the consolidated financial statement amounts as of and for the year ended December 31, 2014.
The Company’s internal control over financial reporting may not prevent or detect all misstatements because of inherent limitations. Additionally, projections of any evaluation of effectiveness to future periods are subject to the risk that controls may become inadequate because changes in conditions or deterioration in the degree of compliance with the Company’s policies and procedures.
CHANGES IN INTERNAL CONTROLS
During the year ended December 31, 2014, there has been no change in the Company’s internal control over financial reporting that has materially affected, or is reasonably likely to materially affect, the Company’s internal control over financial reporting.
LIMITATIONS OF CONTROLS AND PROCEDURES
The Company’s management, including the Chairman and Chief Executive Officer and the Executive Vice President, Finance and Chief Financial Officer, believe that any disclosure controls and procedures or internal controls over financial reporting, no matter how well conceived and operated, can provide only reasonable, not absolute, assurance that the objectives of the control system are met. Further, the design of a control system must reflect the fact that there are resource constraints, and the benefits of controls must be considered relative to their costs. Because of the inherent limitations in all control systems, they cannot provide absolute assurance that all control issues and instances of fraud, if any, within the Company have been prevented or detected. These inherent limitations include the realities that judgments in decision-making can be faulty, and that breakdowns can occur because of simple error or mistake. Additionally, controls can be circumvented by the individual acts of some persons, by collusion of two or more people, or by unauthorized override of the control. The design of any systems of controls also is based in part upon certain assumptions about the likelihood of future events, and there can be no assurance that any design will succeed in achieving its stated goals under all potential future conditions. Accordingly, because of the inherent limitations in a cost effective control system, misstatements due to error or fraud may occur and not be detected.
This report provides a discussion and analysis of the financial condition and results of operations (“Management’s Discussion and Analysis”) to enable a reader to assess material changes in financial condition between December 31, 2014 and December 31, 2013 and results of operations for the periods ended December 31, 2014 and December 31, 2013.
This Management’s Discussion and Analysis has been prepared as of February 11, 2015. The consolidated interim financial statements prepared in accordance with IFRS follow this Management’s Discussion and Analysis. This Management’s Discussion and Analysis is intended to supplement and complement the annual audited consolidated financial statements and notes thereto as at and for the year ended December 31, 2014 (collectively the “Financial Statements”). You are encouraged to review the financial statements in conjunction with your review of this Management’s Discussion and Analysis. This Management’s Discussion and Analysis should be read in conjunction with both the annual audited consolidated financial statements for the year ended December 31, 2014 and the most recent Annual Information Form for the year ended December 31, 2014 on file with the Securities Commissions of all of the provinces in Canada, which are included in the 2014 Annual Report on Form 40-F on file with the United States Securities and Exchange Commission. Certain notes to the Financial Statements are specifically referred to in this Management’s Discussion and Analysis and such notes are incorporated by reference herein. All Dollar amounts in the Management’s Discussion and Analysis are in United States Dollars, unless otherwise specified.
CAUTIONARY STATEMENT REGARDING FORWARD-LOOKING INFORMATION
This Management’s Discussion and Analysis contains or incorporates by reference “forward-looking statements” and “forward-looking information” under applicable Canadian securities legislation within the meaning of the United States Private Securities Litigation Reform Act of 1995. Forward-looking information includes, but is not limited to information with respect to the Company’s strategy, plans or future financial or operating performance. Forward-looking statements are characterized by words such as “plan,” “expect”, “budget”, “target”, “project”, “intend”, “believe”, “anticipate”, “estimate” and other similar words, or statements that certain events or conditions “may” or “will” occur. Forward-looking statements are based on the opinions, assumptions and estimates of management considered reasonable at the date the statements are made, and are inherently subject to a variety of risks and uncertainties and other known and unknown factors that could cause actual events or results to differ materially from those projected in the forward-looking statements. These factors include the Company’s expectations in connection with the production and exploration, development and expansion plans at the Company's projects discussed herein being met, the impact of proposed optimizations at the Company's projects, the impact of the proposed new mining law in Brazil, the new tax reform bill in Mexico, the amended federal income tax statute in Argentina and the new Chilean tax reform package, and the impact of general business and economic conditions, global liquidity and credit availability on the timing of cash flows and the values of assets and liabilities based on projected future conditions, fluctuating metal prices (such as gold, copper, silver and zinc), currency exchange rates (such as the Brazilian real, the Chilean peso, the Argentine peso and the Mexican peso versus the United States dollar) possible variations in ore grade or recovery rates, changes in the Company’s hedging program, changes in accounting policies, changes in mineral resources and mineral reserves, risks related to non-core mine disposition, our expectations relating to the Osisko Acquisition (as defined herein), including with respect to anticipated benefits thereof and the magnitude of synergies therefrom, and the performance of the assets acquired from Osisko (as defined herein), and risks related to other acquisitions, changes in project parameters as plans continue to be refined, changes in project development, construction, production and commissioning time frames, the possibility of project cost overruns or unanticipated costs and expenses, higher prices for fuel, steel, power, labour and other consumables contributing to higher costs and general risks of the mining industry, including but not limited to, failure of plant, equipment or processes to operate as anticipated, unexpected changes in mine life, final pricing for concentrate sales, unanticipated results of future studies, seasonality and unanticipated weather changes, costs and timing of the development of new deposits, success of exploration activities, permitting timelines, government regulation and the risk of government expropriation or nationalization of mining operations, risks related to relying on local advisors and consultants in foreign jurisdictions, environmental risks, unanticipated reclamation expenses, risks relating to joint venture operations, title
disputes or claims, limitations on insurance coverage and timing and possible outcome of pending and outstanding litigation and labour disputes, risks related to enforcing legal rights in foreign jurisdictions, as well as those risk factors discussed or referred to herein and in the Company's Annual Information Form filed with the securities regulatory authorities in all provinces of Canada and available at www.sedar.com, and the Company’s Annual Report on Form 40-F filed with the United States Securities and Exchange Commission. Although the Company has attempted to identify important factors that could cause actual actions, events or results to differ materially from those described in forward-looking statements, there may be other factors that cause actions, events or results not to be anticipated, estimated or intended. There can be no assurance that forward-looking statements will prove to be accurate, as actual results and future events could differ materially from those anticipated in such statements. The Company undertakes no obligation to update forward-looking statements if circumstances or management’s estimates, assumptions or opinions should change, except as required by applicable law. The reader is cautioned not to place undue reliance on forward-looking statements. The forward-looking information contained herein is presented for the purpose of assisting investors in understanding the Company’s expected financial and operational performance and results as at and for the periods ended on the dates presented in the Company’s plans and objectives and may not be appropriate for other purposes.
CAUTIONARY STATEMENT REGARDING MINERAL RESERVES AND MINERAL RESOURCES
Readers should refer to the Annual Information Form of the Company for the year ended December 31, 2014 and other continuous disclosure documents filed by the Company since January 1, 2015 available at www.sedar.com, for further information on mineral reserves and mineral resources, which is subject to the qualifications and notes set forth therein.
CAUTIONARY STATEMENT TO UNITED STATES INVESTORS CONCERNING ESTIMATES OF MINERAL RESERVES AND MINERAL RESOURCES
This Management’s Discussion and Analysis has been prepared in accordance with the requirements of the securities laws in effect in Canada, which differ in certain material respects from the disclosure requirements of United States securities laws. The terms “mineral reserve”, “proven mineral reserve” and “probable mineral reserve” are Canadian mining terms as defined in accordance with Canadian National Instrument 43-101 Standards of Disclosure for Mineral Projects (“NI 43-101”) and the Canadian Institute of Mining, Metallurgy and Petroleum (the “CIM”) - CIM Definition Standards on Mineral Resources and Mineral Reserves, adopted by the CIM Council, as amended. These definitions differ from the definitions in the disclosure requirements promulgated by the Securities and Exchange Commission (the “Commission”) and contained in Industry Guide 7 (“Industry Guide 7”). Under Industry Guide 7 standards, a “final” or “bankable” feasibility study is required to report mineral reserves, the three-year historical average price is used in any mineral reserve or cash flow analysis to designate mineral reserves and the primary environmental analysis or report must be filed with the appropriate governmental authority.
In addition, the terms “mineral resource”, “measured mineral resource”, “indicated mineral resource” and “inferred mineral resource” are defined in and required to be disclosed by NI 43-101. However, these terms are not defined terms under Industry Guide 7 and are not permitted to be used in reports and registration statements of United States companies filed with the Commission. Investors are cautioned not to assume that any part or all of the mineral deposits in these categories will ever be converted into mineral reserves. “Inferred mineral resources” have a great amount of uncertainty as to their existence, and great uncertainty as to their economic and legal feasibility. It cannot be assumed that all or any part of an inferred mineral resource will ever be upgraded to a higher category. Under Canadian rules, estimates of inferred mineral resources may not form the basis of feasibility or pre-feasibility studies, except in rare cases. Investors are cautioned not to assume that all or any part of an inferred mineral resource exists or is economically or legally mineable. Disclosure of “contained ounces” in a mineral resource is permitted disclosure under Canadian regulations. In contrast, the Commission only permits U.S. companies to report mineralization that does not constitute “mineral reserves” by Commission standards as in place tonnage and grade without reference to unit measures.
Accordingly, information contained in this Management’s Discussion and Analysis may not be comparable to similar information made public by U.S. companies subject to the reporting and disclosure requirements under the United States federal securities laws and the rules and regulations of the Commission thereunder.
*************