EXHIBIT 99.1

MANAGEMENT’S DISCUSSION AND ANALYSIS OF
OPERATIONS AND FINANCIAL CONDITION
FOR THE THREE AND NINE MONTHS ENDED SEPTEMBER 30, 2015
TABLE OF CONTENTS
| Page | ||||
| 1. | Core Business | |||
| 2. | Highlights | |||
| 3. | Outlook and Strategy | |||
| 4. | Summary of Financial and Operating Statistics | |||
| 4.1: | Financial Statistics | |||
| 4.2: | Operating Statistics | |||
| 5. | Overview of Results | |||
| 5.1: | Overview of Financial Results | |||
| 5.2: | Overview of Operating Results | |||
| 6. | Operating Mines | |||
| 7. | Construction, Development and Exploration | |||
| 8. | Liquidity, Capital Resources and Contractual Commitments | |||
| 9. | Income Taxes | |||
| 10. | Economic Trends, Business Risks and Uncertainties | |||
| 11. | Contingencies | |||
| 12. | Critical Accounting Policies and Estimates | |||
| 13. | Non-GAAP Measures | |||
| 14. | Selected Quarterly Financial and Operating Summary | |||
| 15. | Disclosure Controls and Procedures | |||
MANAGEMENT’S DISCUSSION AND ANALYSIS OF OPERATIONS AND FINANCIAL CONDITION
(All figures are in United States Dollars ("US Dollars") unless otherwise specified and are in accordance with International Financial Reporting Standards as issued by the International Accounting Standards Board (“IFRS”). This Management’s Discussion and Analysis of Operations and Financial Condition ("MD&A") should be read in conjunction with the Company’s most recently issued annual consolidated financial statements for the year ended December 31, 2014 ("Consolidated Financial Statements").
Cautionary notes regarding forward-looking statements and mineral reserves and mineral resources follow this MD&A.
1. CORE BUSINESS
Yamana Gold Inc. (TSX:YRI and NYSE:AUY) (the “Company” or “Yamana”) is a Canadian-headquartered gold producer with significant precious metal properties in Brazil, Chile, Argentina, Mexico and Canada.
Note 3(a) Significant Accounting Policies - Basis of Consolidation to the most recently audited Consolidated Annual Financial Statements lists Yamana’s significant subsidiaries with 100% equity interest and its joint operation of the Canadian Malartic mine. The Company does not have any material off-balance sheet arrangements, except as noted in Note 33 Contractual Commitments to the Consolidated Financial Statements.
2. HIGHLIGHTS
For the three months ended September 30, 2015 (unless otherwise specified)
Financial
| • | Revenue from continuing operations of $448.9 million on the sale of 317,859 ounces of gold, 2.2 million ounces of silver, and 29.1 million pounds of copper(i). |
| • | Net loss from continuing operations of $115.0 million or $0.12 per share basic and diluted, after a $132.7 million charge arising from a non-cash tax expense relating to unrealized foreign exchange rate fluctuations, partially offset by unrealized foreign exchange gains of $38.4 million. After eliminating the impact of the aforementioned exchange rate fluctuations, Adjusted loss(ii) from continuing operations was $20.2 million or $0.02 per share. |
| • | Mine operating earnings from continuing operations of $49.7 million. |
| • | Cash flows of $77.6 million from operating activities from continuing operations after changes in non-cash working capital and cash flows of $127.6 million from operating activities before changes in non-cash working capital(ii). |
| • | General and Administrative ("G&A") expenses were $28.5 million, compared to $32.0 million for the second quarter of 2015, representing a decrease of 11%. G&A for the nine months ended September 30, 2015 were $89.9 million, compared to $93.0 million for the same period of 2014 or 3% lower. |
The non-cash tax expense referred to above, is notional only and results from foreign exchange rate fluctuations in the quarter, which was determined at a low point of the Brazilian Real exchange rate, vis-à-vis the US Dollar. Results on calculations of foreign exchange and taxes on foreign exchange are subject to high volatility and may swing favourably or unfavourably from period to period. If the Brazilian Real was to strengthen to previous levels, the Company would experience a tax recovery. In either case, they are notional and non-cash. Due to the unrealized, non-cash nature of these charges, it is the Company’s policy to exclude them from adjusted earnings.
Operational
| • | Gold production from continuing operations of 325,897 ounces of gold, in line with the third quarter of 2014, with gold production from core assets(iii) of 281,915 ounces of gold, also in line with the third quarter of 2014. |
| • | Individual mine highlights include the following: |
| ◦ | Record quarterly production from Canadian Malartic of 76,603 ounces of gold, representing an 18% increase in production over the third quarter of 2014 and a 12% increase over the second quarter of 2015. |
| ◦ | Quarterly production from Chapada of 32,029 ounces of gold, representing an 11% increase in production over the third quarter of 2014 and a 6% increase over the second quarter of 2015. |
| ◦ | Quarterly production from Jacobina of 28,080 ounces of gold, representing a 33% increase in production over the third quarter of 2014 and a 32% increase over the second quarter of 2015. |
1
| ◦ | Quarterly production from Minera Florida of 28,989 ounces of gold, representing a 29% increase in production over the third quarter of 2014 and a 10% increase over the second quarter of 2015. |
| ◦ | Increase in production at Gualcamayo to 44,076 ounces of gold, representing a 2% increase in production over the third quarter of 2014 and a 17% increase over the second quarter of 2015. |
| ◦ | Increase in production from Brio Gold Inc.(iv) ("Brio Gold") to 38,430 ounces of gold, representing a 9% increase in production over the second quarter of 2015 and in the case of Fazenda Brasileiro, a 21% increase over the second quarter of 2015. |
| • | Cash costs(ii)of $594 per ounce of gold ($653 per ounce of gold on a co-product basis). |
| • | All-in sustaining costs(ii) ("AISC") of $841 per ounce of gold, 3% lower than the third quarter of 2014 ($856 per ounce of gold on a co-product basis, 12% lower than the third quarter of 2014). |
| • | Silver production of 2.2 million ounces at cash costs of $7.37 per ounce and AISC of $11.32 per ounce. |
| • | Copper production from Chapada of 34.0 million pounds at cash costs of $1.41 per pound of copper, representing a decrease in costs of 11% over the third quarter of 2014. |
| • | Given the advancement of the Brio Gold monetization plan, the table below has been provided to give a preview of the Company's cost profile for its core mines, Brio Gold and continuing operations, all other inputs remaining equal. Additionally, the table shows that in the absence of the foreign exchange hedges, that will be extinguished by year end, the Company's cash costs, AISC and cash costs on a co-product basis would have come in at lower levels. |
Core Mines(1)(iii) | Cash cost per ounce | AISC per ounce | Gold co-product cash cost per ounce | ||||||
| Costs including hedge impact | $ | 570 | $ | 748 | $ | 652 | |||
Impact of hedge (4) | (40 | ) | (40 | ) | (18 | ) | |||
| Costs excluding hedge impact | $ | 530 | $ | 708 | $ | 634 | |||
Brio Gold(2)(iv) | |||||||||
| Costs including hedge impact | $ | 658 | $ | 866 | $ | 658 | |||
Impact of hedge (4) | — | — | — | ||||||
| Costs excluding hedge impact | $ | 658 | $ | 866 | $ | 658 | |||
Continuing Operations(3) | |||||||||
| Costs including hedge impact | $ | 594 | $ | 841 | $ | 653 | |||
Impact of hedge (4) | (35 | ) | (35 | ) | (16 | ) | |||
| Costs excluding hedge impact | $ | 559 | $ | 806 | $ | 637 | |||
______________________________
| (1) | Based on gold production of 281,915 ounces from the Company's core mines. |
| (2) | Based on gold production of 38,430 ounces from Brio Gold. Brio Gold costs exclude impact of copper by-product credits, as those are attributable to Chapada, which is part of the Company's core mines. |
| (3) | Based on gold production of 325,897 ounces from the Company's continuing operations. |
| (4) | Based on realized foreign exchange hedges settled during the third quarter of 2015. |
Strategic Developments and Updates
| • | Subsequent to the quarter end, the Company announced a streaming transaction with Sandstorm Gold Ltd, for which Sandstorm has paid the Company an advanced payment of $148 million and has issued the Company 15 million common share purchase warrants with a strike price of $3.50 and a term of five years (valued at approximately $15-20 million, depending on valuation assumptions used). Sandstorm will also pay the Company an additional $4 million in six months. The metal purchase agreements include a silver purchase transaction related to production from Cerro Moro, Minera Florida and Chapada, a copper purchase transaction related to production from Chapada, and a gold purchase transaction related to production from Agua Rica. The full amount of the advanced payment will be used by the Company to reduce the balance outstanding on its revolving credit facility. |
| • | Subsequent to the quarter end, the Company announced the engagement of an investment bank in the United States to pursue several alternatives relating to the monetization of Brio Gold. |
Construction and Development
2
| • | Continued with detailed engineering of the processing plant and mine at Cerro Moro, with preparations underway including the mobilization of the bulk earthworks construction contractor, whose site activities are expected to commence in late 2015. The Company is concurrently investigating various modifications to the development timetable and capital schedule in order to enhance the overall value of, and further de-risk the Cerro Moro project. For all the new development scenarios under consideration, production is expected to commence towards the end of the first quarter of 2018. A final decision on the development timetable and capital schedule is expected in the first quarter of 2016. |
Exploration
| • | El Peñón, Chile - Drilling at the Ventura vein advanced with results continuing to support the economic potential of the target and the objective of upgrading the mineral resources. |
| • | Chapada, Brazil - Drilling at Sucupira continued, supporting a 1.5 kilometre high grade extension of the mineralization previously identified from the southwest limits of the Cava Norte Pit with the aim of upgrading mineral resources. |
| • | Jacobina, Brazil - Drilling continued at the Canavieras North and South, Morro do Vento and João Belo mines, with results continuing to support the higher grades in the mineral resource and mineral reserve models. Infilling drilling during the quarter returned above average grades and widths at all targets. |
| • | Minera Florida, Chile - Drilling program continued with positive results at Manda, Lisset, Lorena, Falla Hallazgo, Florencia, Mina Este and Polvorin. The positive assay results continue to support the objective of upgrading mineral resources and mineral reserves replacement. |
| • | Fazenda Brasileiro, Brazil - Drilling advanced at E388 East with preliminary results that are similar in thickness and grade to those seen in the early years of the mine, and support the potential for mineral resource expansion. |
______________________________
| (i) | Excluding attributable sales from Alumbrera. |
| (ii) | A non-GAAP measure - Refer to Section 13. |
| (iii) | "Core assets" or "core operations" include Chapada, El Peñón, Gualcamayo, Mercedes, Canadian Malartic, Minera Florida and Jacobina. |
| (iv) | Brio Gold holdings include Fazenda Brasileiro, Pilar and C1 Santa Luz. Currently, C1 Santa Luz is on care and maintenance. |
3
3. OUTLOOK AND STRATEGY
The Company strives to maximize production with the lowest level of capital and operating costs, with the objective of generating sustainable and increasing cash flow.
In 2015, the Company expects to deliver gold production in line with previous guidance. Annual copper production is expected to exceed guidance of 120 million pounds, while silver production is expected to come in under guidance of 9.6 million ounces, driven mostly by lower than expected silver grades at the El Peñón mine. Consistent with prior years, the Company expects higher gold production in the second half of the year compared to the first half of the year, which was evidenced by the increase in production at most mines during the third quarter. Consolidated fourth quarter production levels are also expected to exceed third quarter production levels. The expected increases will come from increases in production improvements at Mercedes, El Peñón, Gualcamayo and Chapada.
With respect to costs, the table below summarizes company-wide cash costs and AISC for the third quarter, first nine months of the year and projections for the second half of 2015, clearly demonstrating the positive trend in costs over the first nine months of the year:
| Third Quarter | Third Quarter YTD | Second Half Projection | |
| Cash costs for continuing operations per ounce of gold | $594 | $616 | $570 |
| AISC for continuing operations per ounce of gold | $841 | $876 | $820 |
With the advancement of the Brio Gold monetization plan, the table below provides a preview of the Company's profile excluding the non-core operations. The impact of the consolidated costs for the Company’s seven core mines for the same periods demonstrate an even more favourable trend, summarized as follows:
| Third Quarter | Third Quarter YTD | Second Half Projection | |
| Cash costs for core mines per ounce of gold | $570 | $581 | $560 |
| AISC for core mines per ounce of gold | $748 | $766 | $740 |
Consistent with expected gold production increases, cash costs are expected to be lower in the second half of the year compared to the first half of the year, with a further decrease expected in the fourth quarter from that of the third quarter.
For Brio Gold, estimated cash costs for 2015 are forecast to be approximately $710 per ounce of gold, and AISC approximately $905 per ounce of gold. However, on a go forward basis costs are expected to be lower as evidenced by third quarter results showing cash costs and AISC at $658 and $866 per ounce of gold, respectively.
In the absence of the foreign exchange hedges, that will be extinguished by year end, the Company's cash costs on a co-product basis, cash costs and AISC would have improved as follows:
| Third Quarter | Third Quarter YTD | |
| Co-product cash costs per ounce of gold | $16/oz | $13/oz |
| Co-product cash costs per pound of copper | $0.18/lb | $0.16/lb |
| Cash cost and AISC per ounce of gold | $35/oz | $28/oz |
| Cash cost and AISC per ounce of gold of core mines | $40/oz | $32/oz |
The expiry of the hedges in the fourth quarter will fuel lower cash costs starting in January of 2016 for gold and will coincide with an improving production profile and cost structure at certain mining operations. For Brazilian operations, the average exchange rate for the quarter and the first nine months of 2015 was 3.54 and 3.17 Reais per US Dollar, respectively. This compares to an after-hedge realized rate of 3.13 and 2.90 Reais per US Dollar, which had an unfavourable impact on cash costs. Should the exchange rate remain at the 3.95 Reais per US Dollar level observed at the end of the quarter, the Company will continue to benefit from a lower costing structure, partially offset by the remaining hedges in place for the fourth quarter. Starting in 2016, the Company will begin to fully benefit from the expected weaker foreign currency.
For the second half of 2015, projected cash costs and AISC are generally in line with the levels guided for full year cash costs of $545 per ounce of gold and AISC at between $800 and $830 per ounce of gold. Cash costs and AISC for 2015 are impacted by lower than expected copper by-product credits during the second half of the year. By-product credits for purposes of cost guidance
4
used a $3.00 per pound assumption. However, realized copper prices for the quarter were $2.85 per pound, and for the nine months ended, averaged at $2.88 per pound. Forecasted copper prices are expected to be lower in the fourth quarter. The lower cash costs and AISC costs associated with the Company's core operation vis-à-vis its consolidated operations, provide insight over the positive impact on cash costs expected subsequent to the pending monetization of Brio Gold.
In terms of other non-production related targets, results in the first nine months of the year support the Company's ability to meet or report below previous guidance, as follows:
| • | Sustaining capital to come in under $265 million (which represents approximately $176 per ounce of gold and $2.75 per ounce of silver); |
| • | Expansionary capital spending expected to be at the low end of the $90 to $140 million range previously provided; |
| • | Exploration spending to come in under $98 million; |
| • | Depreciation, depletion and amortization to come in under $570 million (which represents approximately $395 per ounce of gold and $6 per ounce of silver); and |
| • | G&A expense which is expected to be approximately $120 million in 2015 with potential for further reductions beginning in 2016, resulting from additional savings related to the streamlining of management, the downsizing and relocation of its Brazilian and other South American offices, and the disposition of Brio Gold. |
Overall, the Company expects improved operating results for the remainder of 2015 and production growth into the next several years. As previously announced, the Company made a construction decision for the Cerro Moro project in early 2015. Cerro Moro is a high quality project that has the potential to add significantly to the Company’s production growth at a low cost. The Company remains committed to advancing the project in a prudent manner and decided to de-risk project ramp-up by advancing the underground mining ahead of the original schedule. Project capital expenditures are expected to be approximately $25 million for 2015 comprised of costs related to detailed engineering and pre-development. The expenditures for 2016 are expected to be $56 million. Including these expenditures, the Company expects its expansionary capital to not exceed the levels observed in 2015. The development timetable has been adjusted to accommodate the aforementioned works and now reflects a capital schedule which maximizes cash preservation in 2016. Simultaneously, this allows for a more thorough evaluation of the economic factors in Argentina, including the impact of the currency in relation to the outcome of the presidential ballot in the November 2015 election. Furthermore, this approach allows for further exploration drilling to take place to increase the size of the Cerro Moro mineral resources, in addition to improving the current mineral resource categorization. Production is expected to commence in the first quarter of 2018.
Several other developing projects that are not as advanced as Cerro Moro are advancing through technical and economical evaluation. One of these projects is Upper Beaver, in relation to which the Company is completing an internal Preliminary Economic Assessment which is expected to be completed by the end of the year. The Deep Carbonates project at Gualcamayo is also similar. The Company undertook the initial technical and financial analysis which is complete and supports a viable project with recoverable gold currently estimated at more than 1.1 million ounces. The Company’s ongoing work is considering a number of mining method alternatives to further improve the capital spend profile and de-risk the project. The results to date and the ongoing work are expected to support a decision in 2016 to advance the project to the pre-feasibility stage.
Importantly, the Company is first and foremost focused on its core assets, which include its cornerstone operations of Chapada, Canadian Malartic and El Peñón, and opportunities which have the best prospects for exploration successes, optimization and cash flow generation. The corollary is that the Company is also committed to rationalizing its portfolio which includes monetizing non-core assets. Consistent with this strategy, the Company continues to pursue its planned monetization of Brio Gold and is currently advancing on a number of strategic alternatives. These alternatives include an initial public offering, reverse takeover, joint venture with private equity firms, a disposition to, or merger with, other companies, and other financing and liquidity options. The Company has an emphasis on transactions that could be completed on an accelerated timeline and may allow Brio Gold to continue to operate as a private company in the short term. Additionally, the Company continues to advance its efforts at realizing value from other non-producing assets including Agua Rica.
While the Company is focused on operations and deriving significant and increasing cash flow and earnings before interest, taxes depreciation and amortization ("EBITDA") from its operations, a strategic objective has been to also focus on monetization initiatives, which serve as catalysts to reducing debt and increasing cash balances. As part of this strategy, the Company has committed to reducing the outstanding balance on its revolving credit facility to zero and holding sufficient funds for some or all of the scheduled debt repayments in 2016 and 2017. The Company's monetization initiatives are on track to achieve this strategic objective before the end of 2015 with the first of which, the metal purchasing arrangements, having already been completed, resulting in a sizable cash inflow. With the completion of these catalysts, the Company will be well positioned to focus entirely on operations, having secured a stronger balance sheet, and maximizing cash flow and EBITDA as noted above.
5
6
4. SUMMARY OF FINANCIAL AND OPERATING STATISTICS
4.1 Financial Statistics
| For the three months ended | For the nine months ended | |||||||||||
| September 30, 2015 | September 30, 2014 | September 30, 2015 | September 30, 2014 | |||||||||
| Net loss per share attributable to Yamana equity holders - basic and diluted | $ | (0.12 | ) | $ | (1.17 | ) | $ | (0.29 | ) | $ | (1.31 | ) |
| Net loss per share from continuing operations attributable to Yamana equity holders - basic and diluted | $ | (0.12 | ) | $ | (1.00 | ) | $ | (0.28 | ) | $ | (1.12 | ) |
Adjusted (loss)/earnings per share (i) from continuing operations attributable to Yamana Gold Inc. equity holders. - basic and diluted | $ | (0.02 | ) | $ | — | $ | (0.07 | ) | $ | 0.07 | ||
| Dividends declared per share | $ | 0.0150 | $ | 0.0375 | $ | 0.0450 | $ | 0.1125 | ||||
| Dividends paid per share | $ | 0.0150 | $ | 0.0375 | $ | 0.0450 | $ | 0.1400 | ||||
| Weighted average number of common shares outstanding - basic (in thousands) | 946,563 | 877,551 | 933,180 | 801,613 | ||||||||
| Weighted average number of common shares outstanding - diluted (in thousands) | 946,563 | 877,551 | 933,180 | 801,613 | ||||||||
| (In millions of United States Dollars; unless otherwise noted) | ||||||||||||
| Net loss from continuing operations attributable to Yamana equity holders | $ | (115.0 | ) | $ | (879.6 | ) | $ | (257.2 | ) | $ | (895.4 | ) |
Adjusted (loss)/earnings from continuing operations attributable to Yamana Gold Inc. equity holders (i) | $ | (20.2 | ) | $ | (1.3 | ) | $ | (65.9 | ) | $ | 58.4 | |
| Revenues | $ | 448.9 | $ | 494.4 | $ | 1,361.9 | $ | 1,292.2 | ||||
| Mine operating earnings | $ | 49.7 | $ | 84.2 | $ | 148.3 | $ | 198.1 | ||||
| Cash flows from operating activities from continuing operations | $ | 77.6 | $ | 156.6 | $ | 203.1 | $ | 330.2 | ||||
Cash flows from operating activities before changes in non-cash working capital (i) | $ | 127.6 | $ | 180.7 | $ | 373.0 | $ | 419.4 | ||||
| Cash flows to investing activities from continuing operations | $ | (65.7 | ) | $ | (197.3 | ) | $ | (240.3 | ) | $ | (930.8 | ) |
| Cash flows from/(used in) financing activities from continuing operations | $ | 9.0 | $ | 34.1 | $ | (11.8 | ) | $ | 550.6 | |||
Average realized gold price per ounce (ii) | $ | 1,122 | $ | 1,276 | $ | 1,176 | $ | 1,286 | ||||
Average realized silver price per ounce (ii) | $ | 14.88 | $ | 19.27 | $ | 15.99 | $ | 19.79 | ||||
Average realized copper price per pound (ii) | $ | 2.85 | $ | 3.14 | $ | 2.88 | $ | 3.16 | ||||
Average market gold price per ounce (iii) | $ | 1,124 | $ | 1,282 | $ | 1,178 | $ | 1,288 | ||||
Average market silver price per ounce (iii) | $ | 14.91 | $ | 19.71 | $ | 15.99 | $ | 19.94 | ||||
Average market copper price per pound (iii) | $ | 2.39 | $ | 3.17 | $ | 2.59 | $ | 3.15 | ||||
_____________________________
| (i) | A cautionary note regarding non-GAAP measures is included in Section 13 of this Management’s Discussion and Analysis. Comparatives have been restated to conform to the change in presentation adopted in the current period. |
| (ii) | Realized prices based on gross sales compared to market prices for metals may vary due to infrequent shipments and depending on timing of the sales. |
| (iii) | Source of information: LBMA p.m. price and LME Cash. |
7
4.2 Operating Statistics
| For the three months ended September 30, | 2015 | 2014 | 2015 | 2014 | ||||||||
| Ounces of Production | Gold | Silver | ||||||||||
| Chapada | 32,029 | 28,847 | 69,067 | 83,769 | ||||||||
| El Peñón | 51,983 | 70,111 | 1,914,356 | 2,349,577 | ||||||||
| Canadian Malartic | 76,603 | 64,761 | — | — | ||||||||
| Gualcamayo | 44,076 | 43,060 | — | — | ||||||||
| Mercedes | 20,155 | 28,459 | 88,456 | 103,642 | ||||||||
| Minera Florida | 28,989 | 22,402 | 124,865 | 409,676 | ||||||||
| Jacobina | 28,080 | 21,112 | — | — | ||||||||
Alumbrera (i) | 5,552 | 7,520 | — | — | ||||||||
Brio Gold (ii) | 38,430 | 40,327 | — | — | ||||||||
| Total from continuing operations | 325,897 | 326,599 | 2,196,744 | 2,946,664 | ||||||||
Ernesto/Pau-a-Pique (discontinued operations) | — | 5,745 | — | — | ||||||||
| Total production | 325,897 | 332,344 | 2,196,744 | 2,946,664 | ||||||||
Cash costs from continuing operations per ounce (iii) | ||||||||||||
| Chapada | $ | (420 | ) | $ | (1,173 | ) | $ | (31.69 | ) | $ | (66.95 | ) |
| El Peñón | $ | 676 | $ | 567 | $ | 8.39 | $ | 7.30 | ||||
Canadian Malartic (i) | $ | 544 | $ | 735 | $ | — | $ | — | ||||
| Gualcamayo | $ | 892 | $ | 867 | $ | — | $ | — | ||||
| Mercedes | $ | 865 | $ | 671 | $ | 8.00 | $ | 11.02 | ||||
| Minera Florida | $ | 710 | $ | 745 | $ | 12.86 | $ | 3.56 | ||||
| Jacobina | $ | 712 | $ | 981 | $ | — | $ | — | ||||
Alumbrera (i) | $ | 1,347 | $ | (205 | ) | $ | — | $ | — | |||
Brio Gold (ii) | $ | 658 | $ | 844 | $ | — | $ | — | ||||
Cash costs from continuing operations per ounce produced (iii) | $ | 594 | $ | 528 | $ | 7.37 | $ | 4.80 | ||||
Co-product cash costs from continuing operations per ounce produced (iii) | $ | 653 | $ | 695 | $ | 8.46 | $ | 6.84 | ||||
All-in sustaining costs from continuing operations per ounce (iii) | $ | 841 | $ | 867 | $ | 11.32 | $ | 8.80 | ||||
All-in sustaining co-product costs from continuing operations per ounce (iii) | $ | 856 | $ | 971 | $ | 11.67 | $ | 9.99 | ||||
| Concentrate Production | 2015 | 2014 | ||||||||||
| Chapada concentrate production (tonnes) | 63,259 | 69,279 | ||||||||||
| Chapada copper contained in concentrate production (millions of lbs) | 34.0 | 38.0 | ||||||||||
Chapada co-product cash costs per pound of copper (iii) | $ | 1.41 | $ | 1.59 | ||||||||
Co-product cash costs per pound of copper produced (iii) | $ | 1.68 | $ | 1.73 | ||||||||
| Sales Included in Revenue (excluding 12.5% interest in Alumbrera) | 2015 | 2014 | ||||||||||
| Gold (ounces) | 317,859 | 281,681 | ||||||||||
| Silver (ounces) | 2,247,068 | 2,690,232 | ||||||||||
| Chapada concentrate (tonnes) | 55,460 | 70,288 | ||||||||||
| Chapada payable copper contained in concentrate (millions of lbs) | 29.1 | 35.7 | ||||||||||
____________________
| (i) | The Company holds a 12.5% equity interest in Alumbrera and a 50% interest in Canadian Malartic. |
| (ii) | Brio Gold holdings include Fazenda Brasileiro, Pilar and C1 Santa Luz. Currently, C1 Santa Luz is on care and maintenance. Commissioning production related to Brio Gold is included in the respective balance. |
| (iii) | A cautionary note regarding non-GAAP measures is included in Section 13 of this Management’s Discussion and Analysis. Comparatives have been restated to conform to the change in presentation adopted in the current period. |
8
| For the nine months ended September 30, | 2015 | 2014 | 2015 | 2014 | ||||||||
| Ounces of Production | Gold | Silver | ||||||||||
| Chapada | 84,561 | 78,177 | 203,987 | 223,645 | ||||||||
| El Peñón | 167,914 | 205,506 | 6,108,532 | 6,188,184 | ||||||||
Canadian Malartic (iv) | 212,937 | 76,639 | — | — | ||||||||
| Gualcamayo | 127,811 | 134,404 | — | — | ||||||||
| Mercedes | 63,731 | 74,847 | 280,827 | 290,741 | ||||||||
| Minera Florida | 83,400 | 72,123 | 458,354 | 790,915 | ||||||||
| Jacobina | 67,988 | 54,741 | — | — | ||||||||
Alumbrera (i) | 15,969 | 25,946 | — | — | ||||||||
Brio Gold (ii) | 104,819 | 106,193 | — | — | ||||||||
| Total from continuing operations | 929,130 | 828,576 | 7,051,700 | 7,493,485 | ||||||||
Ernesto/Pau-a-Pique (discontinued operations) | 460 | 16,503 | — | — | ||||||||
| Total production | 929,590 | 845,079 | 7,051,700 | 7,493,485 | ||||||||
| Cash costs from continuing operations per ounce (iii) | ||||||||||||
| Chapada | $ | (556 | ) | $ | (821 | ) | $ | (35.71 | ) | $ | (52.52 | ) |
| El Peñón | $ | 648 | $ | 548 | $ | 8.13 | $ | 7.86 | ||||
Canadian Malartic (iv) | $ | 593 | $ | 717 | $ | — | $ | — | ||||
| Gualcamayo | $ | 820 | $ | 765 | $ | — | $ | — | ||||
| Mercedes | $ | 899 | $ | 703 | $ | 8.28 | $ | 10.82 | ||||
| Minera Florida | $ | 727 | $ | 695 | $ | 10.33 | $ | 5.54 | ||||
| Jacobina | $ | 864 | $ | 1,123 | $ | — | $ | — | ||||
Alumbrera (i) | $ | 1,563 | $ | (530 | ) | $ | — | $ | — | |||
Brio Gold (ii) | $ | 746 | $ | 907 | $ | — | $ | — | ||||
Cash costs from continuing operations per ounce produced (iii) | $ | 616 | $ | 518 | $ | 7.01 | $ | 5.93 | ||||
Co-product cash costs from continuing operations per ounce produced (iii) | $ | 683 | $ | 676 | $ | 8.14 | $ | 7.64 | ||||
All-in sustaining costs from continuing operations per ounce (iii) | $ | 876 | $ | 875 | $ | 10.81 | $ | 10.86 | ||||
All-in sustaining co-product costs from continuing operations per ounce (iii) | $ | 899 | $ | 981 | $ | 11.32 | $ | 11.87 | ||||
| Concentrate Production | 2015 | 2014 | ||||||||||
| Chapada concentrate production (tonnes) | 172,268 | 181,824 | ||||||||||
| Chapada copper contained in concentrate production (millions of lbs) | 94.4 | 98.5 | ||||||||||
Chapada co-product cash costs per pound of copper (iii) | $ | 1.52 | $ | 1.71 | ||||||||
Co-product cash costs per pound of copper produced (iii) | $ | 1.79 | $ | 1.83 | ||||||||
| Sales Included in Revenue (excluding 12.5% interest in Alumbrera) | 2015 | 2014 | ||||||||||
| Gold (ounces) | 906,208 | 721,928 | ||||||||||
| Silver (ounces) | 7,017,562 | 7,106,716 | ||||||||||
| Chapada concentrate (tonnes) | 166,252 | 175,044 | ||||||||||
| Chapada payable copper contained in concentrate (millions of lbs) | 87.4 | 89.7 | ||||||||||
____________________
| (i) | The Company holds a 12.5% equity interest in Alumbrera. |
| (ii) | Brio Gold holdings include Fazenda Brasileiro, Pilar and C1 Santa Luz. Currently, C1 Santa Luz is on care and maintenance. Commissioning production related to Brio Gold is included. |
| (iii) | A cautionary note regarding non-GAAP measures is included in Section 13 of this Management’s Discussion and Analysis. Comparatives have been restated to conform to the change in presentation adopted in the current period. |
| (iv) | The Company holds a 50% interest in Canadian Malartic, the acquisition of which closed June 16, 2014. |
9
5. OVERVIEW OF RESULTS
5.1 Overview of Financial Results
| For the three months ended | For the nine months ended | |||||||||||
| (In millions of United States Dollars; unless otherwise noted) | September 30, 2015 | September 30, 2014 | September 30, 2015 | September 30, 2014 | ||||||||
| Revenues | $ | 448.9 | $ | 494.4 | $ | 1,361.9 | $ | 1,292.2 | ||||
| Cost of sales excluding depletion, depreciation and amortization | (266.0 | ) | (275.0 | ) | (818.2 | ) | (727.2 | ) | ||||
| Gross margin excluding depletion, depreciation and amortization | 182.9 | 219.4 | 543.7 | 565.0 | ||||||||
| Depletion, depreciation and amortization | (133.2 | ) | (135.2 | ) | (395.4 | ) | (366.9 | ) | ||||
| Mine operating earnings | 49.7 | 84.2 | 148.3 | 198.1 | ||||||||
Other expenses (i) | (41.1 | ) | (65.6 | ) | (194.5 | ) | (219.8 | ) | ||||
| Equity loss from associate | (6.3 | ) | (12.1 | ) | (17.2 | ) | (10.7 | ) | ||||
| Impairment of mineral properties | — | (539.9 | ) | — | (539.9 | ) | ||||||
| Income/(Loss) before income taxes | 2.3 | (533.4 | ) | (63.4 | ) | (572.3 | ) | |||||
| Income tax expense | (117.3 | ) | (346.2 | ) | (193.8 | ) | (323.1 | ) | ||||
| Net loss from continuing operations | (115.0 | ) | (879.6 | ) | (257.2 | ) | (895.4 | ) | ||||
| Net income/(loss) from discontinued operations | 2.0 | (143.7 | ) | (15.4 | ) | (152.4 | ) | |||||
| Net loss attributable to Yamana Gold Inc. equity holders | $ | (113.0 | ) | $ | (1,023.3 | ) | $ | (272.6 | ) | $ | (1,047.8 | ) |
Adjustments (ii): | ||||||||||||
| Net loss from continuing operations | $ | (115.0 | ) | $ | (879.6 | ) | $ | (257.2 | ) | $ | (895.4 | ) |
| Non-cash unrealized foreign exchange gain | (38.4 | ) | (18.2 | ) | (38.0 | ) | (19.6 | ) | ||||
| Share-based payments/mark-to-market of deferred share units | (1.5 | ) | (1.6 | ) | 3.6 | 7.8 | ||||||
| Demobilization and reorganization costs | 6.3 | 14.7 | 6.8 | 16.6 | ||||||||
| Mark-to-market of investment in available-for-sale securities and other assets | (7.6 | ) | 6.0 | (8.0 | ) | 12.7 | ||||||
| Impairment of mineral properties | — | 539.9 | — | 539.9 | ||||||||
| (Gain)/loss on sale of assets | (0.4 | ) | 3.9 | (0.5 | ) | 4.6 | ||||||
| Transaction costs related to the Osisko acquisition | — | — | — | 32.4 | ||||||||
| Other non-recurring adjustments | 4.4 | 17.9 | 18.3 | 22.2 | ||||||||
| Adjusted loss before income tax effect | $ | (152.2 | ) | $ | (317.0 | ) | $ | (275.0 | ) | $ | (278.8 | ) |
| Non-cash tax on unrealized foreign exchange gains | 132.7 | 33.3 | 209.4 | 51.4 | ||||||||
| Income tax effect of adjustments | (0.7 | ) | 282.4 | (0.3 | ) | 285.8 | ||||||
Adjusted (loss)/earnings from continuing operations (ii) | $ | (20.2 | ) | $ | (1.3 | ) | $ | (65.9 | ) | $ | 58.4 | |
| Net loss per share from continuing operations attributable to Yamana Gold Inc. equity holders - basic and diluted | $ | (0.12 | ) | $ | (1.00 | ) | $ | (0.28 | ) | $ | (1.12 | ) |
| Net loss per share attributable to Yamana Gold Inc. equity holders - basic and diluted | $ | (0.12 | ) | $ | (1.17 | ) | $ | (0.29 | ) | $ | (1.31 | ) |
Adjusted (loss)/earnings per share from continuing operations attributable to Yamana Gold Inc. equity holders (ii)- basic and diluted | $ | (0.02 | ) | $ | — | $ | (0.07 | ) | $ | 0.07 | ||
Adjusted Operating Cash Flows (ii): | ||||||||||||
| Cash flows from operating activities before non-cash working capital | $ | 127.6 | $ | 180.7 | $ | 373.0 | $ | 419.4 | ||||
| Reorganization costs | 6.3 | — | 6.3 | 2.0 | ||||||||
| Demobilization costs | — | — | — | 9.6 | ||||||||
| Transaction costs related to the Osisko acquisition | — | — | — | 32.4 | ||||||||
| Adjusted Operating Cash Flows | $ | 133.9 | $ | 180.7 | $ | 379.3 | $ | 463.4 | ||||
______________________________
| (i) | For the three and nine month periods ended September 30, 2015, other expenses represent the aggregate of the following expenses: general and administrative of $28.5 million and $89.9 million (2014 - $24.9 million and $93.0 million), exploration and evaluation of $6.6 million and $16.1 million (2014 - $5.2 million and $14.1 million), other expenses of $7.4 million and $34.2 million, (2014 - $39.3 million and $90.2 million) and net finance income of $1.4 million and net finance expense $54.3 million (2014 - finance income $3.8 million and finance expense $22.5 million), and charges related to impairment of mineral properties of $nil and $nil (2014 - $539.9 million and $539.9 million). |
| (ii) | A cautionary note regarding non-GAAP measures and their respective reconciliations are included in Section 13. |
10
For the three months ended September 30, 2015
Net loss from continuing operations attributable to Yamana equity holders for the three months ended September 30, 2015 was $115.0 million or $0.12 per share basic, compared to a net loss from continuing operations attributable to Yamana equity holders of $879.6 million or $1.00 per share basic and diluted for the three months ended September 30, 2014. Net loss was impacted by a higher income tax expense and an equity loss from Alumbrera (12.5% interest). The income tax expense for the quarter reflects the impact of the non-cash tax relating to unrealized foreign exchange gains of $132.7 million as during the period, the Brazilian Real, Argentinean Peso and Mexican Peso devalued significantly against the US Dollar. The following chart outlines the components of the income tax expense including the foreign exchange impact for the quarter.
| In millions of United States Dollars | Current Taxes | Deferred Taxes | September 30, 2015 | September 30, 2014 | ||||||||
| Income tax expense/(recovery) before foreign exchange in taxes | $ | 41.3 | $ | (56.7 | ) | $ | (15.4 | ) | $ | 353.5 | ||
| Non-cash tax expense/(recovery) related to unrealized foreign exchange | (3.2 | ) | 135.9 | 132.7 | (7.3 | ) | ||||||
| Income tax expense | 38.1 | 79.2 | 117.3 | 346.2 | ||||||||
The impact of these foreign exchange movements on taxes are non-cash and, as such, are excluded from adjusted earnings.
Adjusted loss (a non-GAAP measure, see Section 13) from continuing operations was $20.2 million or $0.02 per share basic for the three months ended September 30, 2015, compared to adjusted loss of $1.3 million or $nil per share for the same period of 2014. Mine operating earnings for the three months ended September 30, 2015 were $49.7 million, compared to $84.2 million for the same period of 2014. Adjusted loss and mine operating earnings for the period were primarily impacted by lower realized metal prices than the same quarter of 2014 by approximately 12% for gold, 23% for silver and 9% for copper, partially offset by higher sales volume for gold. Revenue for the three months ended September 30, 2015 was lower by $45.5 million compared to the same period last year largely due to lower metal prices.
Cash flows from operating activities from continuing operations for the three months ended September 30, 2015, after and before (a non-GAAP measure, see Section 13) changes in non-cash working capital, were $77.6 million and $127.6 million, respectively. The Company generated $0.30 of adjusted operating cash flows before changes in non-cash working capital for every dollar of revenue generated during the period, notwithstanding lower metal prices in 2015. This compares to $0.34 for the same period of 2014 which was lower predominantly related to the lower metal prices during the period.
Revenue for the three months ended September 30, 2015 was $448.9 million, lower compared to $494.4 million for the same period of 2014 as increase in gold and copper sales volumes were more than offset by a decline in metal prices. Revenue for the third quarter of 2015 was generated from the sale of 317,859 ounces of gold, 2.2 million ounces of silver and 29.1 million pounds of copper, excluding attributable sales from Alumbrera which is accounted for as an equity investment. This compares to sales, excluding Alumbrera, of 281,681 ounces of gold, 2.7 million ounces of silver and 35.7 million pounds of copper for the three months ended September 30, 2014.
The average realized price of gold for the quarter was $1,122 per ounce, compared to $1,276 per ounce for the same quarter in 2014, or 12% lower and the average realized silver price was $14.88 per ounce, compared to $19.27 per ounce for the same quarter in 2014, or 23% lower. The average realized price of copper was $2.85 per pound, compared to the $3.14 per pound for the same quarter in 2014, or 9% lower.
11
Revenue for the quarter was comprised of the following:
| For the three months ended September 30, | 2015 | 2014 | ||||||||||
| (In millions of Dollars; unless otherwise noted) | Quantity Sold (ii) | Realized Prices (iii) | Revenue | Revenue | ||||||||
Gold (i) | 317,859 | oz | $ | 1,122 | $ | 356.6 | $ | 359.4 | ||||
Silver (i) | 2,247,068 | oz | 14.88 | 33.4 | 51.8 | |||||||
Copper (i) | 29,136,112 | lbs | 2.85 | 83.0 | 112.1 | |||||||
| Gross revenue | $ | 473.0 | $ | 523.3 | ||||||||
| (Deduct)/add: | ||||||||||||
- Treatment and refining charges of gold and copper concentrate | (8.7 | ) | (10.4 | ) | ||||||||
| - Sales taxes | (6.6 | ) | (7.8 | ) | ||||||||
| - Metal price adjustments related to concentrate revenue | (8.8 | ) | (7.4 | ) | ||||||||
| - Other adjustments | — | (3.3 | ) | |||||||||
Revenue (ii) | $ | 448.9 | $ | 494.4 | ||||||||
______________________________
| (i) | Includes payable gold, silver and copper contained in concentrate. |
| (ii) | Excludes Alumbrera which is accounted for as an equity investment and Ernesto/Pau-a-Pique which is a discontinued operation. |
| (iii) | Realized prices based on gross sales compared to market prices for metals may vary due to infrequent shipments and depending on timing of the sales. Realized price for copper of $2.85 is higher than market price reflecting the settlements on copper forward contracts entered into by the Company. |
Cost of sales excluding depletion, depreciation and amortization for the three months ended September 30, 2015 was $266.0 million, compared to $275.0 million for the same period in 2014. Cost of sales excluding depletion, depreciation and amortization for the third quarter was lower than that of the same period in 2014, despite higher sales volume for gold, reflecting cost reduction initiatives implemented by Company and the impact of the depreciation of foreign currency rates from the strengthening of the US Dollar against the Brazilian Real, the Argentinean Peso, the Mexican Peso and the Canadian Dollar.
The following table provides a reconciliation of the co-product cash cost (a non-GAAP measure, see Section 13) to the cost of sales excluding depletion, depreciation and amortization for the quarter:
| For the three months ended September 30, | 2015 | 2014 | ||||||||||
| (In millions of Dollars; unless otherwise noted) | Gold/Silver Ounces or Pounds of Copper Produced (i) | Co-product Cash Cost per Unit (ii) | Total Costs | Total Costs | ||||||||
| Chapada — Gold | 32,029 | oz | $ | 307 | $ | 9.8 | $ | 12.0 | ||||
| Chapada — Silver | 69,067 | oz | 3.20 | 0.2 | 0.4 | |||||||
| Chapada — Copper | 33,950,544 | lbs | 1.41 | 48.0 | 60.3 | |||||||
| El Peñón — Gold | 51,983 | oz | 676 | 35.2 | 39.8 | |||||||
| El Peñón — Silver | 1,914,356 | oz | 8.39 | 16.1 | 17.2 | |||||||
| Gualcamayo — Gold | 44,076 | oz | 892 | 39.3 | 37.4 | |||||||
| Mercedes — Gold | 20,155 | oz | 865 | 17.4 | 19.1 | |||||||
| Mercedes — Silver | 88,456 | oz | 8.00 | 0.7 | 1.1 | |||||||
Canadian Malartic — Gold (50% interest) | 76,603 | oz | 544 | 41.6 | 47.6 | |||||||
| Minera Florida — Gold | 28,989 | oz | 710 | 20.6 | 16.7 | |||||||
| Minera Florida — Silver | 124,865 | oz | 13.00 | 1.6 | 1.5 | |||||||
| Jacobina — Gold | 28,080 | oz | 712 | 20.0 | 20.7 | |||||||
| Brio Gold — Gold | 38,430 | oz | 658 | 25.3 | 14.0 | |||||||
Co-product cash cost of sales (ii) | $ | 275.8 | $ | 287.8 | ||||||||
| Add (deduct): | ||||||||||||
| - Inventory movements and adjustments | (2.6 | ) | (6.6 | ) | ||||||||
- Treatment and refining charges of gold and copper concentrate | (8.7 | ) | (10.5 | ) | ||||||||
| - Commercial and other costs | (1.5 | ) | 1.5 | |||||||||
| - Overseas freight for Chapada concentrate | 3.0 | 2.8 | ||||||||||
Cost of sales excluding depletion, depreciation and amortization (i) | $ | 266.0 | $ | 275.0 | ||||||||
______________________________
12
| (i) | Excludes Alumbrera which is accounted for as an equity investment and Ernesto/Pau-a-Pique which is a discontinued operation. |
| (ii) | A cautionary note regarding non-GAAP measures is included in Section 13 of this Management’s Discussion and Analysis of Operations and Financial Condition. |
Depletion, depreciation and amortization ("DDA") expense for the three months ended September 30, 2015 was $133.2 million, in line with the $135.2 million for the same period of 2014.
G&A, exploration and evaluation, other and net finance income were $41.1 million for the three months ended September 30, 2015, compared to $65.6 million for the same period in 2014, representing a decrease of 37%, a breakdown of which is as follows:
| • | G&A expenses were $28.5 million, compared to $24.9 million for the same period in 2014. Higher G&A than in the comparative period of 2014 resulted mainly from adjustments on stock based compensation and other recoveries for which there is no current period comparative. The Company has continued to implement cost saving initiatives resulting in a decrease of 11% in G&A from that of the second quarter of 2015. |
| • | Exploration and evaluation expenses were $6.6 million, compared to $5.2 million for the same period of 2014 mainly from additional exploration and evaluation on new properties acquired. |
| • | Other expenses were $7.4 million, compared to $39.3 million for the same period of 2014 or 81% lower. Other expenses in the comparative period included provisions, demobilization and reorganization costs relating to C1 Santa Luz with no current period comparative. |
| • | Net finance income was $1.4 million, compared to net finance income of $3.8 million for the same period of 2014, predominantly from higher foreign exchange gains partly offset by a loss on derivatives compared to a gain in the same period of 2014. Additionally, included in net finance income are proceeds of $12.4 million following the closeout of forward copper derivative contracts during the period. The realized contracts associated with the copper price protection program for the period and the closeout of the fourth quarter contracts during the period, generated total cash proceeds of $24.8 million. Of the total proceeds, $12.4 million was related to third quarter production and was included in revenue and the remainder in net finance income. |
Equity loss from Alumbrera was $6.3 million for the three months ended September 30, 2015, compared to equity loss of $12.1 million for the three months ended September 30, 2014. The equity loss was a result of lower metal prices and planned reduced production from Alumbrera as the mine is near the end of its life. No cash dividends were received during the three months ended September 30, 2015 from the Company’s equity investment in Alumbrera compared to $12.4 million of the same period of 2014.
For the nine months ended September 30, 2015
Net loss from continuing operations attributable to Yamana equity holders for the nine months ended September 30, 2015 was $257.2 million or $0.28 per share, impacted by higher income tax expense and a higher equity loss from Alumbrera. This compares to net loss from continuing operations attributable to Yamana equity holders of $895.4 million or $1.12 per share basic for the nine months ended September 30, 2014. The income tax expense for the first nine months reflects the impact of non-cash tax of $209.4 million relating to unrealized foreign exchange gains, as during the period the Brazilian Real, Argentinean Peso and Mexican Peso devalued against the US Dollar (for a detailed discussion, see Section 9).
Adjusted loss (a non-GAAP measure, see Section 13) from continuing operations was $65.9 million or $0.07 per share basic for the nine months ended September 30, 2015, compared to adjusted earnings of $58.4 million or $0.07 per share for the same period of 2014. Mine operating earnings for the nine months ended September 30, 2015 were $148.3 million, compared to $198.1 million for the same period of 2014. Adjusted loss and mine operating earnings for the period were impacted by lower realized metal prices of approximately 9% for gold, 19% for silver and 9% for copper, higher costs and DDA offset by higher gold sales volume. Mine operating earnings was impacted by higher costs and DDA on higher sales volume and also included additional depletion, depreciation and amortization as a result of the acquisition of Canadian Malartic in the third quarter of 2014 and Pilar which completed commissioning in the third quarter of 2014.
Cash flows from operating activities from continuing operations for the nine months ended September 30, 2015, after and before (a non-GAAP measure, see Section 13) changes in non-cash working capital, were $203.1 million and $373.0 million, respectively. The Company generated $0.28 of adjusted operating cash flows before changes in non-cash working capital for every dollar of revenue generated during the period notwithstanding lower metal prices in 2015. This compares to $0.33 for the same period of 2014, not including dividends from Alumbrera. The decrease was predominantly related to the lower metal prices during the period.
Revenue for the nine months ended September 30, 2015 of $1,361.9 million, compared to $1,292.2 million for the same period of 2014 as a result of higher sales quantities driven by the contribution from Canadian Malartic acquired at the end of the second
13
quarter of 2014, offset by lower metal prices. Revenue for the first nine months of 2015 was generated from the sale of 906,208 ounces of gold, 7.0 million ounces of silver and 87.4 million pounds of copper, excluding attributable sales from Alumbrera which is accounted for as an equity investment. This compares to sales, excluding Alumbrera, of 721,928 ounces of gold, 7.1 million ounces of silver and 89.7 million pounds of copper for the nine months ended September 30, 2014. The average realized price of gold for the nine months ended September 30, 2015 was $1,176 per ounce, compared to $1,286 per ounce for the same period in 2014, or 9% lower and the average realized silver price was $15.99 per ounce, compared to $19.79 per ounce for the same period in 2014, or 19% lower. The average realized price of copper was $2.88 per pound, compared to the $3.16 per pound for the same period in 2014, or 9% lower.
Revenue for the period was comprised of the following:
| For the nine months ended September 30, | 2015 | 2014 | ||||||||||
| (In millions of Dollars; unless otherwise noted) | Quantity Sold (ii) | Realized Prices (iii) | Revenue | Revenue | ||||||||
Gold (i) | 906,208 | oz | $ | 1,176 | $ | 1,066.0 | $ | 928.6 | ||||
Silver (i) | 7,017,562 | oz | 15.99 | 112.2 | 141.0 | |||||||
Copper (i) | 87,371,179 | lbs | 2.88 | 252.0 | 283.7 | |||||||
| Gross revenue | $ | 1,430.2 | $ | 1,353.3 | ||||||||
| (Deduct)/add: | ||||||||||||
- Treatment and refining charges of gold and copper concentrate | (27.2 | ) | (26.1 | ) | ||||||||
| - Sales taxes | (19.8 | ) | (23.6 | ) | ||||||||
| - Metal price adjustments related to concentrate revenue | (21.3 | ) | (7.7 | ) | ||||||||
| - Other adjustments | — | (3.7 | ) | |||||||||
Revenue (ii) | $ | 1,361.9 | $ | 1,292.2 | ||||||||
______________________________
| (i) | Includes payable gold, silver and copper contained in concentrate. |
| (ii) | Excludes Alumbrera which is accounted for as an equity investment and Ernesto/Pau-a-Pique which is a discontinued operation. |
| (iii) | Realized prices based on gross sales compared to market prices for metals may vary due to infrequent shipments and depending on timing of the sales. Realized price for copper of $2.88 is higher than market price reflecting the settlements on copper forward contracts entered into by the Company. |
Cost of sales excluding depletion, depreciation and amortization for the nine months ended September 30, 2015 was $818.2 million, compared to $727.2 million for the same period in 2014. Cost of sales excluding depletion, depreciation and amortization for the third quarter was higher than that of the same period in 2014 due to higher sales volume and higher cash costs partly offset by the strengthening of the US Dollar against the foreign currencies in which the Company operates.
The following table provides a reconciliation of the co-product cash cost (a non-GAAP measure, see Section 13) to the cost of sales excluding depletion, depreciation and amortization for the period:
14
| For the nine months ended September 30, | 2015 | 2014 | ||||||||||
| (In millions of Dollars; unless otherwise noted) | Gold/Silver Ounces or Pounds of Copper Produced (i) | Co-product Cash Cost per Unit (ii) | Total Costs | Total Costs | ||||||||
| Chapada — Gold | 84,561 | oz | $ | 352 | $ | 29.7 | $ | 33.9 | ||||
| Chapada — Silver | 203,987 | oz | 3.23 | 0.7 | 1.1 | |||||||
| Chapada — Copper | 94,413,310 | lbs | 1.52 | 143.2 | 168.8 | |||||||
| El Peñón — Gold | 167,914 | oz | 648 | 108.8 | 112.7 | |||||||
| El Peñón — Silver | 6,108,532 | oz | 8.13 | 49.7 | 48.6 | |||||||
| Gualcamayo — Gold | 127,811 | oz | 820 | 104.8 | 102.8 | |||||||
| Mercedes — Gold | 63,731 | oz | 899 | 57.3 | 52.6 | |||||||
| Mercedes — Silver | 280,827 | oz | 8.28 | 2.3 | 3.1 | |||||||
Canadian Malartic — Gold (50% interest) | 212,937 | oz | 593 | 126.2 | 64.3 | |||||||
| Minera Florida — Gold | 83,400 | oz | 727 | 60.7 | 50.1 | |||||||
| Minera Florida — Silver | 458,354 | oz | 10.33 | 4.7 | 4.4 | |||||||
| Jacobina — Gold | 67,988 | oz | 864 | 58.7 | 61.5 | |||||||
| Brio Gold — Gold | 104,819 | oz | 746 | 78.2 | 39.0 | |||||||
Co-product cash cost of sales (ii) | $ | 825.0 | $ | 742.9 | ||||||||
| Add (deduct): | ||||||||||||
| - Inventory movements and adjustments | 7.8 | (13.6 | ) | |||||||||
- Treatment and refining charges of gold and copper concentrate | (27.2 | ) | (26.0 | ) | ||||||||
| - Commercial and other costs | 3.8 | 12.6 | ||||||||||
| - Overseas freight for Chapada concentrate | 8.8 | 11.3 | ||||||||||
Cost of sales excluding depletion, depreciation and amortization (i) | $ | 818.2 | $ | 727.2 | ||||||||
______________________________
| (i) | Excludes Alumbrera which is accounted for as an equity investment and Ernesto/Pau-a-Pique which is a discontinued operation. |
| (ii) | A cautionary note regarding non-GAAP measures is included in Section 13 of this Management’s Discussion and Analysis of Operations and Financial Condition. |
Depletion, depreciation and amortization ("DDA") expense for the nine months ended September 30, 2015 was $395.4 million, compared to $366.9 million for the same period of 2014. Higher DDA was attributed to additional DDA following the acquisition of Canadian Malartic which closed at the end of the third quarter of 2014 including DDA on the amount of purchase price in excess of historical cost. Furthermore, additional DDA was recognized relative to the comparative period in 2014 from Pilar which completed commissioning effective October 1, 2014.
G&A, exploration and evaluation, other and net finance expenses were $194.5 million for the nine months ended September 30, 2015, lower by 12% compared to $219.8 million for the same period in 2014, a breakdown of which is as follows:
| • | G&A expenses were $89.9 million, compared to $93.0 million for the same period in 2014, or 3% lower. |
| • | Exploration and evaluation expenses were $16.1 million, compared to $14.1 million for the same period of 2014 mainly from additional exploration and evaluation on new properties acquired. |
| • | Other expenses were $34.2 million, compared to $90.2 million for the same period of 2014, or 62% lower, as other expenses for the 2014 period include transaction costs on the acquisition of Canadian Malartic, provisions, demobilization and restructuring costs with no current period comparative cost. |
| • | Net finance expense was $54.3 million, compared to net finance expense of $22.5 million for the same period of 2014. Higher net finance expense resulted from higher interest expense on additional long-term debt following the acquisition of Canadian Malartic. It was further impacted by the reduced amount of interest capitalized following the completion of mine commissioning, partially offset by a higher net foreign exchange gain. |
Equity loss from Alumbrera was $17.2 million for the nine months ended September 30, 2015, compared to equity loss of $10.7 million for the nine months ended September 30, 2014. Equity loss was mainly a result of lower metal prices and reduced production from Alumbrera as the mine is near the end of its life. No cash dividends were received during the nine months ended September 30, 2015 from the Company’s equity investment in Alumbrera compared to $40.5 million of the same period of 2014.
5.2 Overview of Operating Results
15
For the three months ended September 30, 2015
Gold production for the third quarter was in line with the comparative period in 2014 and lower for silver. Production at most mines was generally in line with or above targets, except for El Peñón and Mercedes. The Company continues to expect to be in line with overall annual gold production guidance. For the third quarter, El Peñón's production continued to be impacted by lower grades from the more erratic areas in the periphery of higher grade ore bodies encountered during the second quarter, while at Mercedes, operational improvements including measures to improve dilution control began to take effect towards the end of the quarter as evidenced by higher production at lower cash costs relative to the second quarter of 2015. Production at these mines will continue to improve for the remainder of the year.
Gold
Third quarter gold production from continuing operations of 325,897 ounces was in line with the 326,599 ounces of gold in the third quarter of 2014. Production from core assets for the quarter was 281,915 ounces of gold and compares to 278,750 ounces of gold in the third quarter of 2014, representing a 1% increase. The most notable production increases from the third quarter of 2014 was a 33% increase at Jacobina, a 29% increase at Minera Florida, an 11% increase at Chapada and an 18% increase at Canadian Malartic. Production increases from the second quarter of 2015 included a 32% increase at Jacobina, a 17% increase at Gualcamayo, a 12% increase at Canadian Malartic (which also achieved at fifth consecutive quarterly record), a 10% increase at Minera Florida, a 6% increase at Chapada and a 9% increase at Brio Gold. The Company is well positioned for higher production for the remainder of 2015 with the largest impact at mines that contribute most significantly to the operating cash flow generation of the Company.
The following summarizes total production of gold ounces by mine for the third quarter relative to the comparative quarter in 2014:

| (i) | The Company holds a 50% interest in Canadian Malartic, the acquisition of which closed June 16, 2014. |
Cash costs (a non-GAAP measure, see Section 13) for the third quarter were $594 per ounce of gold, compared to $528 per ounce of gold in the same quarter of 2014. Cash costs were impacted by a 9% decline in the realized price of copper and lower sales volume resulting in lower by-product credits for the quarter. On a co-product basis, cash costs (a non-GAAP measure, see Section 13) for the third quarter were $653 per ounce of gold or 6% lower, compared to the $695 per ounce of gold in the third quarter of 2014. Relative to the second quarter of 2015, cash costs on a co-product basis were 7% lower reflecting the impact of higher
16
production. Late in the quarter, further improvements in co-product cash costs occurred due to further weakening of the currencies in the countries in which the Company operates. The Company expects this trend to continue into the fourth quarter.
All-in sustaining costs ("AISC", a non-GAAP measure, see Section 13) were $841 per ounce of gold, compared to $867 per ounce of gold for the third quarter of 2014 and $896 per ounce of gold for the second quarter of 2015. On a co-product basis, AISC were $856 per ounce of gold for the third quarter compared to $971 per ounce of gold for the third quarter of 2014 and $949 per ounce of gold for the second quarter of 2015. AISC from core assets were $790 per ounce of gold on a co-product basis or 15% and 10% lower than the third quarter of 2014 and the second quarter of 2015, respectively.
Lower cash costs overall reflect the implementation of several mine specific cost reduction initiatives implemented during the period and the depreciation of foreign currencies against the US Dollar, partly offset by planned lower grades at some mines.
Silver
Third quarter silver production was 2.2 million ounces compared to the 2.9 million ounces of silver in the third quarter of 2014 as mine plan in certain locations called for mining from areas with lower silver grades and was also impacted by lower grades from the more erratic areas in the periphery of higher grade ore bodies at El Peñón. Cash costs for the third quarter of 2015 were $7.37 per ounce of silver, impacted by lower production and lower by-product copper credits when compared to $4.80 per ounce of silver in the third quarter of 2014. Cash costs on a co-product basis for the third quarter were $8.46 per ounce of silver, compared to $6.84 per ounce of silver in the third quarter of 2014.
Copper
Total copper production for the three months ended September 30, 2015 was 38.0 million pounds, compared to 43.5 million pounds for the same period of 2014. Copper production for the three months ended September 30, 2015 was 34.0 million pounds from the Chapada mine, compared to 38.0 million pounds for the same period of 2014. Lower copper production compared to the third quarter of 2014 was due to planned lower copper feed grades and lower throughput. Cash costs per pound of copper on a co-product basis were $1.41 per pound from the Chapada mine compared to $1.59 per pound of copper in the third quarter of 2014.
For the nine months ended September 30, 2015
Production for the first nine months of the year was higher than 2014 levels. Overall, production was in line with target, positioning the Company towards achieving its annual gold production guidance.
Gold
Production in the first nine months of 2015 was 929,590 ounces of gold of which 929,130 ounces were gold from continuing operations or 10% and 12% higher than the 845,079 ounces of gold and 828,576 ounces of gold from continuing operations in the same period of 2014, respectively. Production from core assets of 808,341 ounces of gold was 16% higher than the 696,437 ounces of gold in the same period of 2014. Higher production included a 24% increase at Jacobina, a 16% increase at Minera Florida and an 8% increase at Chapada as well as the attributable ounces from Canadian Malartic.
The following summarizes the cumulative effect of gold production at each mine for the current and comparative period of 2014:
17

| (i) | Canadian Malartic acquisition closed June 16, 2014. |
Cash costs from continuing operations in the first nine months of 2015 were $616 per ounce of gold, compared to $518 per ounce of gold in the same period of 2014. While production increased 12% compared to the first nine months of 2014, cash costs were impacted by a 9% decline in the realized price of copper resulting in lower by-product credits for the first nine months of the year. On a co-product basis, cash costs from continuing operations for the first nine months of 2015 were $683 per ounce of gold, in line with the $676 per ounce of gold in the same period of 2014.
In the first nine months of 2015, AISC were $876 per ounce of gold, compared to $875 per ounce of gold for the same period of 2014. On a co-product basis, AISC from continuing operations were $899 per ounce of gold for the first nine months of 2015, compared to $981 per ounce of gold for the same period of 2014. All-in sustaining costs from core assets of $826 per ounce of gold a co-product basis for the first nine months of 2015, or 10% lower compared with the same period of 2014.
Lower cash costs overall reflect the implementation of several cost reduction initiatives during the period and the depreciation of foreign currencies against the US Dollar.
Silver
Silver production for the first nine months of 2015 was 7.1 million ounces compared to 7.5 million ounces of silver for the same period of 2014. Cash costs from continuing operations for the first nine months of 2015 were $7.01 per ounce of silver, impacted by lower by-product copper credits when compared to $5.93 per ounce of silver in the same period of 2014. Cash costs from continuing operations on a co-product basis were $8.14 per ounce of silver, compared to $7.64 per ounce of silver in the first nine months of 2014.
Copper
Copper production for the first nine months of 2015 was 104.3 million pounds including Alumbrera, compared to 117.7 million pounds for the same period of 2014. Copper production for the first nine months of 2015 was 94.4 million pounds from the Chapada mine, in line with the 98.5 million pounds for the same period of 2014. Cash costs per pound of copper on a co-product basis were $1.52 per pound from the Chapada mine compared to $1.71 per pound of copper in the first nine months of 2014.
18
6. OPERATING MINES
CHAPADA, BRAZIL
| For the three months ended September 30, | For the nine months ended September 30, | |||||||||||||
| Operating Statistics | 2015 | 2014 | 2015 | 2014 | ||||||||||
| Production | ||||||||||||||
| Concentrate (tonnes) | 63,259 | 69,279 | (9)% | 172,268 | 181,824 | (5)% | ||||||||
| Gold contained in concentrate (ounces) | 32,029 | 28,847 | 11% | 84,561 | 78,177 | 8% | ||||||||
| Silver contained in concentrate (ounces) | 69,067 | 83,769 | (18)% | 203,987 | 223,645 | (9)% | ||||||||
| Copper contained in concentrate (millions of pounds) | 34.0 | 38.0 | (11)% | 94.4 | 98.5 | (4)% | ||||||||
Cash costs per gold ounce produced (ii) | $ | (420 | ) | $ | (1,173 | ) | (64)% | $ | (556 | ) | $ | (821 | ) | (32)% |
Cash costs per silver ounce produced (ii) | $ | (31.69 | ) | $ | (66.95 | ) | (53)% | $ | (35.71 | ) | $ | (52.52 | ) | (32)% |
Co-product cash costs per gold ounce produced (ii) | $ | 307 | $ | 416 | (26)% | $ | 352 | $ | 434 | (19)% | ||||
| Co-product cash costs per silver ounce produced (ii) | $ | 3.20 | $ | 4.58 | (30)% | $ | 3.23 | $ | 4.81 | (33)% | ||||
Co-product cash costs per pound of copper produced (ii) | $ | 1.41 | $ | 1.59 | (11)% | $ | 1.52 | $ | 1.71 | (11)% | ||||
| Ore mined (tonnes) | 5,388,684 | 5,449,798 | (1)% | 13,818,088 | 14,178,447 | (3)% | ||||||||
| Ore processed (tonnes) | 5,215,213 | 5,440,264 | (4)% | 14,475,375 | 15,319,507 | (6)% | ||||||||
| Gold feed grade (g/t) | 0.34 | 0.28 | 22% | 0.31 | 0.27 | 15% | ||||||||
| Copper feed grade (%) | 0.36 | 0.39 | (7)% | 0.37 | 0.36 | 3% | ||||||||
| Concentrate grade - gold (g/t) | 15.75 | 12.95 | 22% | 15.27 | 13.37 | 14% | ||||||||
| Concentrate grade - copper (%) | 24.34 | 24.85 | (2)% | 24.86 | 24.57 | 1% | ||||||||
| Gold recovery rate (%) | 56.1 | 59.3 | (5)% | 58.0 | 59.4 | (2)% | ||||||||
| Copper recovery rate (%) | 81.0 | 81.2 | —% | 80.5 | 80.3 | —% | ||||||||
Sales (iii) | ||||||||||||||
| Concentrate (tonnes) | 55,460 | 70,288 | (21)% | 166,252 | 175,044 | (5)% | ||||||||
| Payable ounces contained in concentrate | ||||||||||||||
| Payable gold contained in concentrate (ounces) | 31,138 | 26,284 | 18% | 80,323 | 66,242 | 21% | ||||||||
| Payable silver contained in concentrate (ounces) | 54,072 | 42,258 | 28% | 144,219 | 86,065 | 68% | ||||||||
| Payable copper contained in concentrate (millions of pounds) | 29.1 | 35.7 | (18)% | 87.4 | 89.7 | (3)% | ||||||||
| Depletion, depreciation and amortization | ||||||||||||||
| Per gold ounces sold | $ | 82 | $ | 103 | (20)% | $ | 107 | $ | 118 | (9)% | ||||
| Per silver ounces sold | $ | 1.09 | $ | 1.53 | (29)% | $ | 1.47 | $ | 1.87 | (21)% | ||||
| Per copper pound sold | $ | 0.17 | $ | 0.26 | (35)% | $ | 0.24 | $ | 0.29 | (17)% | ||||
______________________________
| (i) | A cautionary note regarding non-GAAP measures is included in Section 13 of this Management’s Discussion and Analysis. Comparatives have been restated to conform to the change in presentation adopted in the current period. |
| (ii) | Quantities sold include quantity adjustment on provisional and final invoice settlements. |
Chapada continued to deliver on expectations in the third quarter of 2015, following a strong first half. Gold production continued sequential quarter-over-quarter increases in 2015, exceeding targets and was higher compared to the third quarter of 2014. Gold and silver production are expected to further increase in the fourth quarter with copper production expected to be in line with the third quarter of 2015.
Higher gold production, compared to the third quarter of 2014 and to the second quarter of 2015, was due to planned higher gold feed grades partially offset by lower recoveries. Payable ounces of gold also increased due to higher ore grade. Lower copper
19
production compared to the third quarter of 2014 was due to planned lower copper feed grades and lower throughput. Silver production was in line with the second quarter of 2015 and lower compared to the third quarter of 2014.
Throughput at Chapada increased compared to the second quarter of 2015 due to more efficient flow of material through the crushers, partly offset by the unplanned maintenance to a feeder. As a result of increased throughput, Chapada produced approximately 6,200 dry metric tonnes of concentrate inventory in excess of plan. Due to the fixed schedule of shipments versus the aforementioned increased production, inventory levels increased during the third quarter, which will be sold during the fourth quarter. The approximate market value at the end of the period, related to the increased inventory that was not sold, was $9.3 million. Efforts to further improve operational performance continue at the site, with targets to increase recoveries and throughput in addition to the implementation of cost improvement initiatives.
Cash costs were impacted by a 9% decline in the realized price of copper and lower sales volume, resulting in a lower by-product credit for the third quarter of 2015 compared to the third quarter of 2014. Lower co-product cash costs for gold compared to the third quarter of 2014 were due to increased production and the depreciation of the Brazilian Real. Co-product cash costs for copper were lower compared to the third quarter of 2014 due to the depreciation of the Brazilian Real.
In the absence of the foreign exchange hedges, the third quarter co-product cash costs would have improved by $51 per gold ounce and by $0.20 per copper pound, or $19 per gold ounce and $0.07 per copper pound in the comparative period. Cash costs and AISC, net of by-product credits, for the third quarter would have improved by $260 per gold ounce and $110 per gold ounce for the comparative period. The average exchange rate for the quarter and the first nine months of 2015 was 3.54 and 3.17 Reais per US Dollar, respectively. This compares to an after-hedge realized rate of 3.00 and 2.82 Reais per US Dollar for Chapada, which had a unfavourable impact on cash costs. Should the exchange rate remain at the 3.95 Reais per US Dollar level observed at the end of the quarter, the Company will continue to benefit from a lower costing structure, partially offset by the remaining hedges in place. Starting in 2016, the Company will begin to fully benefit from the expected weaker foreign currency resulting in a lower cash cost for both gold and copper.
The Company periodically uses forward contracts to economically hedge against the risk of declining copper prices for a portion of Chapada's forecast copper concentrate sales. Settlements for the period are reflected on the effective realized copper price of $2.85 and $2.88 per pound as compared to average market copper prices of $2.39 and $2.59 per pound, for the three and nine months ended September 30, 2015, respectively. During the third quarter the Company bought back 18 million pounds of fourth quarter copper contracts that were previously entered into with a contract price of $3.00 per pound. Upon the closeout of these contracts the Company received proceeds of $12.4 million.
In the third quarter of 2015, Chapada produced 32,029 ounces of gold and 69,067 ounces of silver compared to 28,847 ounces of gold and 83,769 ounces of silver for the same quarter of 2014. Co-product cash costs were $307 per ounce of gold and $3.20 per ounce of silver in the third quarter, compared to $416 per ounce of gold and $4.58 per ounce of silver in the same quarter of 2014.
Copper production was 34.0 million pounds in the third quarter of 2015, compared to production of 38.0 million pounds of copper for the same quarter of 2014. Co-product cash costs for copper were $1.41 per pound in the third quarter compared to $1.59 per pound for the same quarter of 2014.
Chapada produced 84,561 ounces of gold and 203,987 ounces of silver in the first nine months of 2015, compared to 78,177 ounces of gold and 223,645 ounces of silver in the same period of 2014. Co-product cash costs were $352 per ounce of gold and $3.23 per ounce of silver in the first nine months of 2015, compared to $434 per ounce of gold and $4.81 per ounce of silver in the same period of 2014.
Copper production was 94.4 million pounds in the first nine months of 2015, compared to production of 98.5 million pounds of copper for the same period of 2014. Co-product cash costs for copper were $1.52 per pound in the first nine months of 2015, compared to $1.71 per pound for the same period of 2014.
20
EL PEÑÓN, CHILE
| For the three months ended September 30, | For the nine months ended September 30, | |||||||||||||
| Operating Statistics | 2015 | 2014 | 2015 | 2014 | ||||||||||
| Production | ||||||||||||||
| Gold production (ounces) | 51,983 | 70,111 | (26)% | 167,914 | 205,506 | (18)% | ||||||||
| Silver production (ounces) | 1,914,356 | 2,349,577 | (19)% | 6,108,532 | 6,188,184 | (1)% | ||||||||
Co-product cash costs per gold ounce produced (i) | $ | 676 | $ | 567 | 19% | $ | 648 | $ | 548 | 18% | ||||
Co-product cash costs per silver ounce produced (i) | $ | 8.39 | $ | 7.30 | 15% | $ | 8.13 | $ | 7.86 | 3% | ||||
| Ore mined (tonnes) | 265,966 | 389,115 | (32)% | 881,145 | 1,129,158 | (22)% | ||||||||
| Ore processed (tonnes) | 331,793 | 375,507 | (12)% | 1,075,049 | 1,093,663 | (2)% | ||||||||
| Gold feed grade (g/t) | 5.15 | 6.19 | (17)% | 5.21 | 6.26 | (17)% | ||||||||
| Silver feed grade (g/t) | 203.97 | 227.73 | (10)% | 203.01 | 210.59 | (4)% | ||||||||
| Gold recovery rate (%) | 94.2 | 93.7 | 1% | 93.3 | 93.5 | —% | ||||||||
| Silver recovery rate (%) | 87.5 | 85.2 | 3% | 87.2 | 83.5 | 4% | ||||||||
| Sales | ||||||||||||||
| Gold (ounces) | 52,633 | 67,775 | (22)% | 168,045 | 201,385 | (17)% | ||||||||
| Silver (ounces) | 1,970,069 | 2,201,354 | (11)% | 6,130,827 | 5,968,393 | 3% | ||||||||
| Depletion, depreciation and amortization | ||||||||||||||
| Per gold ounce sold | $ | 396 | $ | 356 | 11% | $ | 405 | $ | 367 | 10% | ||||
| Per silver ounce sold | $ | 5.26 | $ | 5.39 | (2)% | $ | 5.51 | $ | 5.65 | (2)% | ||||
______________________________
| (i) | A cautionary note regarding non-GAAP measures is included in Section 13 of this Management’s Discussion and Analysis. Comparatives have been restated to conform to the change in presentation adopted in the current period. |
Mining at El Peñón in the third quarter of 2015 continued to transition from the periphery areas of Bonanza, where grades have been more erratic, into other vein structures, the result of which was anticipated lower production in the third quarter. Production is expected to increase in the fourth quarter and to be consistent with, or above, the levels established in the first quarter of the year. Fourth quarter production levels are expected to become the normalized average quarterly production for 2016. The fourth quarter increase is expected from planned production contribution from higher grade areas in both the north and south mines. Operations were not impacted by the earthquake that occurred in central Chile during the third quarter. Gold and silver feed grades increased in the third quarter compared to the second quarter of 2015, and are anticipated to increase further in the fourth quarter. The Company continues to expect better overall production and costs for the second half of 2015.
At El Peñón, gold and silver production were lower compared to the third quarter of 2014, mostly as a result of lower gold and silver grades partially offset by higher recoveries. Higher costs during the quarter compared to the third quarter of 2014 were due to the relative increase in ore development due to mining of fringe areas at a lower grade compared to the third quarter of 2014. Costs are expected to be lower in the second half of the year mostly due to operational improvements initiated in the first half of the year. This is evidenced by an improving month-over-month cost trend resulting in cash costs of $624 per ounce of gold for the month of September, the lowest in the third quarter.
In the third quarter of 2015, El Peñón produced 51,983 ounces of gold and 1.9 million ounces of silver, compared to 70,111 ounces of gold and 2.3 million ounces of silver for the same quarter of 2014. Cash costs were $676 per ounce of gold and $8.39 per ounce of silver in the third quarter of 2015, compared to $567 per ounce of gold and $7.30 per ounce of silver in the same quarter of 2014.
El Peñón produced 167,914 ounces of gold and 6.1 million ounces of silver in the first nine months of 2015, compared to 205,506 ounces of gold and 6.2 million ounces of silver in the same period of 2014. Cash costs were $648 per ounce of gold and $8.13 per ounce of silver in the first nine months of 2015, compared to $548 per ounce of gold and $7.86 per ounce of silver in the same period of 2014.
21
CANADIAN MALARTIC (50% interest), CANADA
| For the three months ended September 30, | For the nine months ended September 30, | ||||||||||||||
Operating Statistics (i) | 2015 | 2014 | 2015 | 2014 | |||||||||||
| Production | |||||||||||||||
| Gold production (ounces) | 76,603 | 64,761 | 18% | 212,937 | 76,639 | 178 | % | ||||||||
Co-product cash costs per gold ounce produced (ii) | $ | 544 | $ | 735 | (26)% | $ | 593 | $ | 717 | (17 | )% | ||||
| Ore mined (tonnes) | 2,624,657 | 2,461,087 | 7% | 7,838,402 | 2,827,873 | 177 | % | ||||||||
| Ore processed (tonnes) | 2,470,342 | 2,416,797 | 2% | 7,116,897 | 2,814,609 | 153 | % | ||||||||
| Gold feed grade (g/t) | 1.08 | 0.94 | 15% | 1.04 | 0.95 | 9 | % | ||||||||
| Gold recovery rate (%) | 89.0 | 89.0 | —% | 89.1 | 89.2 | — | % | ||||||||
| Sales | |||||||||||||||
| Gold sales (ounces) | 76,620 | 63,684 | 20% | 211,687 | 79,987 | 165 | % | ||||||||
| Depletion, depreciation and amortization | |||||||||||||||
| Per gold ounce sold | $ | 362 | $ | 387 | (6)% | $ | 379 | $ | 372 | 2 | % | ||||
______________________
| (i) | Canadian Malartic acquisition closed June 16, 2014. |
| (ii) | A cautionary note regarding non-GAAP measures is included in Section 13 of this Management’s Discussion and Analysis. |
Canadian Malartic continues to operate at levels that are in line with, or above target, and production in the third quarter of 2015 achieved a fifth consecutive quarterly record of 76,603 ounces of gold on a 50%-basis.
Third quarter production exceeded the second quarter of 2015 and the third quarter of 2014 by 12% and 18%, and was the result of planned higher grades, recoveries and record throughput. Grade for the reminder of the year and into 2016 is expected to remain at the same levels of 2015. Throughput in the third quarter reached a new record and was slightly higher than the planned average of 53,000 tonnes per day for the second half of 2015, due to improved crusher operating time. Cash costs in the third quarter were significantly lower than the second quarter of 2015 and the third quarter of 2014. Cash costs were positively impacted by increased production at higher grades and lower production costs in all sectors as well as the depreciation of the Canadian Dollar.
The Company and its partner continue to pursue opportunities to optimize the operations and generate further value from this cornerstone asset. Some of the recent initiatives include improvements to the SAG mill and crusher liners in an attempt to reduce the number of scheduled shutdowns, improvements to the crusher availability, acquiring additional equipment, among others.
In the third quarter of 2015, Canadian Malartic produced 76,603 ounces of gold on a 50%-basis, compared to 68,440 ounces of gold in the second quarter of 2015. Cash costs were $544 per ounce of gold in the third quarter, compared to $609 per ounce in the second quarter of 2015.
Canadian Malartic produced 212,937 ounces of gold on a 50%-basis at cash costs of $593 per ounce in the first nine months of 2015.
22
GUALCAMAYO, ARGENTINA
| For the three months ended September 30, | For the nine months ended September 30, | |||||||||||||
| Operating Statistics | 2015 | 2014 | 2015 | 2014 | ||||||||||
| Production | ||||||||||||||
| Gold production (ounces) | 44,076 | 43,060 | 2% | 127,811 | 134,404 | (5)% | ||||||||
Co-product cash costs per gold ounce produced (i) | $ | 892 | $ | 867 | 3% | $ | 820 | $ | 765 | 7% | ||||
| Ore mined (tonnes) | 1,939,607 | 1,471,610 | 32% | 5,531,976 | 4,794,686 | 15% | ||||||||
| Ore processed (tonnes) | 1,886,053 | 1,440,285 | 31% | 5,385,009 | 4,781,836 | 13% | ||||||||
| Gold feed grade (g/t) | 1.06 | 1.43 | (26)% | 1.26 | 1.51 | (17)% | ||||||||
| Gold recovery rate (%) | 68.3 | 73.5 | (7)% | 58.7 | 69.1 | (15)% | ||||||||
| Sales | ||||||||||||||
| Gold sales (ounces) | 41,902 | 40,124 | 4% | 124,839 | 132,495 | (6)% | ||||||||
| Depletion, depreciation and amortization | ||||||||||||||
| Per gold ounce sold | $ | 404 | $ | 433 | (7)% | $ | 325 | $ | 683 | (52)% | ||||
______________________________
| (i) | A cautionary note regarding non-GAAP measures is included in Section 13 of this Management’s Discussion and Analysis. Comparatives have been restated to conform to the change in presentation adopted in the current period. |
Production was in line with target at Gualcamayo for the third quarter of 2015, increasing 17% from the second quarter as recoveries and throughput improved. Production is expected to increase further in the fourth quarter, having a positive impact on cash costs and underpinning annual expectations.
At Gualcamayo, production was slightly higher than the third quarter of 2014 as improved recoveries of inventories in the heap leach pad offset the overall lower gold grades mined and fed, in line with the mining sequence. Gold grades in the quarter were consistent with the mine plan as the open pit transitioned to a new phase starting with lower grades partially offset by a 45% higher contribution from the underground mine compared to the previous quarter. Higher cash costs compared to the third quarter of 2014 were the result of lower grades partially offset by the depreciation of the Argentinian Peso.
The expansion of the Adsorption and Desorption plant is now complete and is expected to further increase production beginning in the fourth quarter of 2015. Further optimizations on production and increasing operating cash flows are expected in the fourth quarter. While most of the initiatives implemented in the last months have been related to reductions in expenditures including halting non-critical underground mine development, prioritizing capital investment and headcount reductions having a favourable impact to AISC, resources are now focused on increasing production over plan and sustaining 2014 annual production levels.
During the third quarter, the Company completed the initial technical and financial analysis of the Deep Carbonates project. The Deep Carbonates project is a potential large scale, bulk tonnage underground operation beneath the current QDD pit limits. The results of this analysis support a viable project with recoverable gold currently estimated at more than 1.1 million ounces. As part of the ongoing work, the Company is considering a number of mining method alternatives to improve the capital spend profile and to de-risk the project. The mineralization is open in almost every direction, and continued exploration is expected to further improve project economics. The results to date and the ongoing work are expected to support a decision in 2016 to advance the project to the pre-feasibility stage.
In the third quarter of 2015, Gualcamayo produced 44,076 ounces of gold, compared to 43,060 ounces of gold in the same quarter of 2014. Cash costs were $892 per ounce of gold in the third quarter of 2015, compared to $867 per ounce of gold in the third quarter of 2014.
Gualcamayo produced 127,811 ounces of gold in the first nine months of 2015, compared to 134,404 ounces of gold in the same period of 2014. Cash costs were $820 per ounce of gold in the first nine months of 2015, compared to $765 per ounce of gold in the same period of 2014.
23
MERCEDES, MEXICO
| For the three months ended September 30, | For the nine months ended September 30, | |||||||||||||
| Operating Statistics | 2015 | 2014 | 2015 | 2014 | ||||||||||
| Production | ||||||||||||||
| Gold production (ounces) | 20,155 | 28,459 | (29)% | 63,731 | 74,847 | (15)% | ||||||||
| Silver production (ounces) | 88,456 | 103,642 | (15)% | 280,827 | 290,741 | (3)% | ||||||||
Co-product cash costs per gold ounce produced (i) | $ | 865 | $ | 671 | 29% | $ | 899 | $ | 703 | 28% | ||||
Co-product cash costs per silver ounce produced (i) | $ | 8.00 | $ | 11.02 | (27)% | $ | 8.28 | $ | 10.82 | (23)% | ||||
| Ore mined (tonnes) | 151,090 | 168,260 | (10)% | 385,448 | 496,523 | (22)% | ||||||||
| Ore processed (tonnes) | 187,056 | 176,310 | 6% | 542,962 | 503,424 | 8% | ||||||||
| Gold feed grade (g/t) | 3.64 | 5.30 | (31)% | 3.94 | 4.92 | (20)% | ||||||||
| Silver feed grade (g/t) | 39.43 | 54.91 | (28)% | 43.32 | 57.77 | (25)% | ||||||||
| Gold recovery rate (%) | 92.6 | 94.8 | (2)% | 93.0 | 94.5 | (2)% | ||||||||
| Silver recovery rate (%) | 37.6 | 33.3 | 13% | 37.3 | 31.2 | 20% | ||||||||
| Sales | ||||||||||||||
| Gold (ounces) | 20,920 | 25,571 | (18)% | 64,884 | 72,360 | (10)% | ||||||||
| Silver (ounces) | 89,757 | 93,960 | (4)% | 285,207 | 282,135 | 1% | ||||||||
| Depletion, depreciation and amortization | ||||||||||||||
| Per gold ounce sold | $ | 404 | $ | 385 | 5% | $ | 421 | $ | 412 | 2% | ||||
| Per silver ounce sold | $ | 5.41 | $ | 5.58 | (3)% | $ | 5.76 | $ | 6.28 | (8)% | ||||
______________________________
| (i) | A cautionary note regarding non-GAAP measures is included in Section 13 of this Management’s Discussion and Analysis. Comparatives have been restated to conform to the change in presentation adopted in the current period. |
At Mercedes, the Company continued to advance measures to improve dilution control and the mine's cost structure in the third quarter. Increased gold and silver production at lower costs for the third quarter of 2015 compared to the second quarter resulted from higher feed grades and recoveries as well as the implementation of cost reduction initiatives. In addition, gold and silver cash costs in the third quarter benefited from local currency depreciation as hedges dominated in Mexican Pesos expired in the second quarter of 2015. The Company expects gold and silver production to further increase in the fourth quarter as efforts to improve dilution control continue.
At Mercedes, the Company is undergoing initiatives to transition some mining areas from bulk mining to a more selective mining method, in addition to optimizing drilling accuracy and improving drilling and blasting practices. Additionally, higher production at lower costs continues to demonstrate advancement of the Company's plan for improvement at the operation and the focus on producing ounces at lower costs. This is evidenced by an improving cost trend resulting in cash costs of $768 per ounce of gold for the month of September, the lowest in 2015. Mining productivity from higher grade veins such as Lagunas and Barrancas is increasing as per the mining plan and is continuing to deliver according to the model. Higher production, in addition to several cost reduction initiatives initiated during the year, are expected to have a positive impact on cash costs in the near-term.
In the third quarter of 2015, Mercedes produced 20,155 ounces of gold and 88,456 ounces of silver, compared to 28,459 ounces of gold and 103,642 ounces of silver in the same quarter of 2014. Third quarter gold and silver production exceeded the second quarter by 4% and 12%, respectively. Cash costs were $865 per ounce of gold and $8.00 per ounce of silver in the third quarter of 2015, compared to $671 per ounce of gold and $11.02 per ounce of silver in the same quarter of 2014. Third quarter cash costs for gold and silver production were 15% and 21% lower than the second quarter, respectively.
Mercedes produced 63,731 ounces of gold and 280,827 ounces of silver in the first nine months of 2015, compared to 74,847 ounces of gold and 290,741 ounces of silver in the same period of 2014. Cash costs were $899 per ounce of gold and $8.28 per ounce of silver in the first nine months of 2015, compared to $703 per ounce of gold and $10.82 per ounce of silver in the same period of 2014.
24
MINERA FLORIDA, CHILE
| For the three months ended September 30, | For the nine months ended September 30, | |||||||||||||
| Operating Statistics | 2015 | 2014 | 2015 | 2014 | ||||||||||
| Production | ||||||||||||||
| Gold production (ounces) | 28,989 | 22,402 | 29% | 83,400 | 72,123 | 16% | ||||||||
| Silver production (ounces) | 124,865 | 409,676 | (70)% | 458,354 | 790,915 | (42)% | ||||||||
Co-product cash costs per gold ounce produced (i) | $ | 710 | $ | 745 | (5)% | $ | 727 | $ | 695 | 5% | ||||
Co-product cash costs per silver ounce produced (i) | $ | 12.86 | $ | 3.56 | 261% | $ | 10.33 | $ | 5.54 | 86% | ||||
| Ore mined (tonnes) | 220,053 | 208,139 | 6% | 637,192 | 623,972 | 2% | ||||||||
| Ore processed (tonnes) | 462,319 | 437,202 | 6% | 1,383,200 | 1,290,460 | 7% | ||||||||
| Gold feed grade (g/t) | 2.41 | 1.99 | 21% | 2.30 | 2.18 | 6% | ||||||||
| Silver feed grade (g/t) | 14.45 | 45.59 | (68)% | 17.96 | 32.28 | (44)% | ||||||||
| Gold recovery rate (%) | 80.9 | 80.1 | 1% | 81.1 | 79.9 | 2% | ||||||||
| Silver recovery rate (%) | 52.2 | 63.9 | (18)% | 56.8 | 59.1 | (4)% | ||||||||
| Sales | ||||||||||||||
| Gold (ounces) | 28,659 | 22,516 | 27% | 83,015 | 71,246 | 17% | ||||||||
| Silver (ounces) | 133,850 | 352,660 | (62)% | 457,309 | 770,123 | (41)% | ||||||||
| Depletion, depreciation and amortization | ||||||||||||||
| Per gold ounce sold | $ | 503 | $ | 603 | (17)% | $ | 524 | $ | 636 | (18)% | ||||
| Per silver ounce sold | $ | 6.73 | $ | 9.28 | (27)% | $ | 7.15 | $ | 9.88 | (28)% | ||||
_____________________________
| (i) | A cautionary note regarding non-GAAP measures is included in Section 13 of this Management’s Discussion and Analysis. Comparatives have been restated to conform to the change in presentation adopted in the current period. |
Minera Florida continued to deliver on expectations with a strong third quarter, following a strong first half of 2015, as production continues to track above target. Operations were not impacted by the earthquake that occurred in central Chile during the third quarter. For the fourth quarter, production for gold is expected to be in line with the quarterly average in 2015 and higher for silver.
At Minera Florida, 29% higher gold production at lower cash costs compared to third quarter of 2014 was the result of increased gold grades and throughput. Increase in gold grade also contributed to the 10% increase in gold production, compared to the second quarter of 2015. Silver production was lower compared to the third quarter of 2014 with lower planned silver grades as mining continued in lower silver grade areas. Silver cash costs were impacted by lower silver grades and recoveries partially offset by higher throughput.
In the third quarter of 2015, Minera Florida produced 28,989 ounces of gold and 124,865 ounces of silver, compared to 22,402 ounces of gold and 409,676 ounces of silver in the same quarter of 2014. Cash costs were $710 per ounce of gold and $12.86 per ounce of silver in the third quarter of 2015, compared to $745 per ounce of gold and $3.56 per ounce of silver in the same quarter of 2014.
Minera Florida produced 83,400 ounces of gold and 458,354 ounces of silver in the first nine months of 2015, compared to 72,123 ounces of gold and 790,915 ounces of silver in the same period of 2014. Cash costs were $727 per ounce of gold and $10.33 per ounce of silver in the first nine months of 2015, compared to $695 per ounce of gold and $5.54 per ounce of silver in the same period of 2014.
25
JACOBINA, BRAZIL
| For the three months ended September 30, | For the nine months ended September 30, | |||||||||||||
| Operating Statistics | 2015 | 2014 | 2015 | 2014 | ||||||||||
| Production | ||||||||||||||
| Gold production (ounces) | 28,080 | 21,112 | 33% | 67,988 | 54,741 | 24% | ||||||||
Co-product cash costs per gold ounce produced (i) | $ | 712 | $ | 981 | (27)% | $ | 864 | $ | 1,123 | (23)% | ||||
| Ore mined (tonnes) | 372,511 | 367,957 | 1% | 1,087,724 | 1,067,887 | 2% | ||||||||
| Ore processed (tonnes) | 357,686 | 372,243 | (4)% | 1,072,267 | 1,063,044 | 1% | ||||||||
| Gold feed grade (g/t) | 2.59 | 1.89 | 37% | 2.10 | 1.74 | 21% | ||||||||
| Gold recovery rate (%) | 94.2 | 93.6 | 1% | 94.1 | 92.0 | 2% | ||||||||
| Sales | ||||||||||||||
| Gold Sales (ounces) | 27,287 | 19,396 | 41% | 68,576 | 53,046 | 29% | ||||||||
| Depletion, depreciation and amortization | ||||||||||||||
| Per gold ounce sold | $ | 190 | $ | 486 | (61)% | $ | 296 | $ | 536 | (45)% | ||||
______________
| (i) | A cautionary note regarding non-GAAP measures is included in Section 13 of this Management’s Discussion and Analysis. Comparatives have been restated to conform to the change in presentation adopted in the current period. |
Operational performance at Jacobina was consistent with plan during the third quarter of 2015, with significant improvements in production and cash costs compared to the first half of 2015. Higher production and lower cash costs in the quarter were the result of higher grades, which were consistent with expectations and averaged 2.59 grams per tonne, an increase of 40% compared to the first half of 2015. Development into higher grade areas continues to advance. Production and grade levels observed in the third quarter are expected to continue in the fourth quarter and onwards.
At Jacobina, increased production at lower costs in the third quarter of 2015 compared to the third quarter of 2014 continues to demonstrate advancement of the Company's plan for improvement at the operation and the focus on producing more ounces at lower costs. Production in the third quarter increased compared to the third quarter of 2014 and the second quarter of 2015 by 33% and 32%, respectively, resulting from higher feed grade partially offset by lower throughput. Cash costs in the quarter were lower compared to the third quarter of 2014 and the second quarter of 2015 by 27% for each period.
In the absence of the foreign exchange hedges, the third quarter AISC and cash costs would have improved by $124 per gold ounce, or by $49 per gold ounce in the comparative period. The expiry of the hedges in the fourth quarter will result in a lower cash cost for gold and will coincide with an improving production profile and cost structure. The average exchange rate for the quarter and the first nine months of 2015 was 3.54 and 3.17 Reais per US Dollar, respectively. This compares to an after-hedge realized rate of 2.94 and 2.78 Reais per US Dollar for Jacobina, which had an unfavourable impact on cash costs. Should the exchange rate remain at the 3.95 Reais per US Dollar level observed at the end of the quarter, the Company will continue to benefit from a lower costing structure, partially offset by the remaining hedges in place. Starting in 2016, the Company will begin to fully benefit from the expected weaker foreign currency.
In the third quarter of 2015, Jacobina produced 28,080 ounces of gold, compared to 21,112 ounces of gold in the same quarter of 2014. Cash costs were $712 per ounce of gold in the third quarter of 2015, compared to $981 per ounce of gold in the third quarter of 2014.
Jacobina produced 67,988 ounces of gold in the first nine months of 2015, compared to 54,741 ounces of gold in the same period of 2014. Cash costs were $864 per ounce of gold in the first nine months of 2015, compared to $1,123 per ounce of gold in the same period of 2014.
BRIO GOLD, BRAZIL
26
| For the three months ended September 30, | For the nine months ended September 30, | |||||||||||||
| Operating Statistics | 2015 | 2014 | 2015 | 2014 | ||||||||||
| Production | ||||||||||||||
Gold production from Brio Gold mines (i) | 38,430 | 16,605 | 131% | 104,819 | 44,475 | 136% | ||||||||
Gold production from Commissioning Brio Gold mines (ii) | — | 23,722 | (100)% | — | 61,718 | (100)% | ||||||||
| Total production from Brio Gold mines | 38,430 | 40,327 | (5)% | 104,819 | 106,193 | (1)% | ||||||||
Cash costs per ounce of gold produced (iii) | $ | 658 | $ | 844 | (22)% | $ | 746 | $ | 907 | (18)% | ||||
______________________________
| (i) | Includes Fazenda Brasileiro, Pilar and C1 Santa Luz. |
| (ii) | Commissioning at Pilar was completed as of September 30, 2014. C1 Santa Luz is on care and maintenance. |
| (iii) | A cautionary note regarding non-GAAP measures is included in Section 13 of this Management’s Discussion and Analysis. Comparatives have been restated to conform to the change in presentation adopted in the current period. |
In the third quarter of 2015, Brio Gold produced a total of 38,430 ounces of gold, compared to 40,327 ounces of gold in the same quarter of 2014, which included areas of production from the C1 Santa Luz mine which is now under care and maintenance. Cash costs were $658 per ounce of gold in the third quarter of 2015, compared to $844 per ounce of gold in the third quarter of 2014.
Brio Gold produced 104,819 ounces of gold in the first nine months of 2015, compared to 106,193 ounces of gold in the same period of 2014. Cash costs were $746 per ounce of gold in the first nine months of 2015, compared to $907 per ounce of gold in the same period of 2014.
PILAR, BRAZIL
| For the three months ended September 30, | For the nine months ended September 30, | |||||||||||||
| Operating Statistics | 2015 | 2014 | 2015 | 2014 | ||||||||||
| Production | ||||||||||||||
Gold production (ounces) (i) | 21,468 | 16,486 | 30% | 61,858 | 41,333 | 50% | ||||||||
Co-product cash costs per gold ounce produced (ii) | $ | 648 | $ | — | —% | $ | 742 | $ | — | —% | ||||
| Ore mined (tonnes) | 277,019 | 226,154 | 22% | 800,414 | 593,507 | 35% | ||||||||
| Ore processed (tonnes) | 281,788 | 283,559 | (1)% | 855,066 | 833,423 | 3% | ||||||||
| Gold feed grade (g/t) | 2.51 | 1.89 | 33% | 2.40 | 1.69 | 42% | ||||||||
| Gold recovery rate (%) | 94.3 | 95.5 | (1)% | 93.7 | 91.3 | 3% | ||||||||
| Sales | ||||||||||||||
| Gold Sales (ounces) | 21,588 | — | —% | 60,507 | — | —% | ||||||||
| Depletion, depreciation and amortization | ||||||||||||||
| Per gold ounce sold | $ | 466 | $ | — | —% | $ | 268 | $ | — | —% | ||||
______________
| (i) | Comparative includes commissioning production as commissioning at Pilar was completed as of September 30, 2014. |
| (ii) | A cautionary note regarding non-GAAP measures is included in Section 13 of this Management’s Discussion and Analysis. Comparatives have been restated to conform to the change in presentation adopted in the current period. |
At Pilar, production continued to average approximately 7,000 ounces per month in the third quarter with total production slightly higher compared to the second quarter of 2015. Higher production was the result of increased feed grade as well as the contribution of production from Maria Lazarus, partially offset by lower throughput. Maria Lazarus commenced production in August of 2015 and is expected to contribute, at full production, approximately 25,000 ounces of gold per year. Cash costs continued to improve quarter-over-quarter and were approximately 14% lower than the second quarter of 2015.
In the third quarter of 2015, Pilar produced a total of 21,468 ounces of gold, compared to 16,486 ounces of gold in the same quarter of 2014. Cash costs were $648 per ounce of gold in the third quarter of 2015.
27
Pilar produced 61,858 ounces of gold in the first nine months of 2015, compared to 41,333 ounces of gold in the same period of 2014. Cash costs were $742 per ounce of gold in the first nine months of 2015.
FAZENDA BRASILEIRO, BRAZIL
| For the three months ended September 30, | For the nine months ended September 30, | |||||||||||||
| Operating Statistics | 2015 | 2014 | 2015 | 2014 | ||||||||||
| Production | ||||||||||||||
| Gold production (ounces) | 16,963 | 16,605 | 2% | 42,961 | 44,475 | (3)% | ||||||||
Co-product cash costs per gold ounce produced (i) | $ | 670 | $ | 844 | (21)% | $ | 751 | $ | 912 | (18)% | ||||
| Ore mined (tonnes) | 323,959 | 331,427 | (2)% | 892,648 | 862,731 | 3% | ||||||||
| Ore processed (tonnes) | 311,470 | 285,400 | 9% | 861,629 | 828,838 | 4% | ||||||||
| Gold feed grade (g/t) | 1.94 | 2.05 | (5)% | 1.82 | 1.89 | (4)% | ||||||||
| Gold recovery rate (%) | 87.5 | 88.3 | (1)% | 85.4 | 88.7 | (4)% | ||||||||
| Sales | ||||||||||||||
| Gold Sales (ounces) | 17,111 | 16,331 | 5% | 44,331 | 45,167 | (2)% | ||||||||
| Depletion, depreciation and amortization | ||||||||||||||
| Per gold ounce sold | $ | 473 | $ | 337 | 40% | $ | 483 | $ | 318 | 52% | ||||
______________
| (i) | A cautionary note regarding non-GAAP measures is included in Section 13 of this Management’s Discussion and Analysis. Comparatives have been restated to conform to the change in presentation adopted in the current period. |
At Fazenda Brasileiro, production and costs continued to improve quarter-over-quarter with production increasing approximately 21% and costs decreasing approximately 16% compared to the second quarter of 2015. Improved production and costs in the quarter were the result of higher throughput, grade and recoveries from the previous quarter of 2015.
In the third quarter of 2015, Fazenda Brasileiro produced a total of 16,963 ounces of gold, compared to 16,605 ounces of gold in the same quarter of 2014. Cash costs were $670 per ounce of gold in the third quarter, compared to $844 per ounce of gold in the third quarter of 2014.
Fazenda Brasileiro produced 42,961 ounces of gold in the first nine months of 2015, compared to 44,475 ounces of gold in the same period of 2014. Cash costs were $751 per ounce of gold in the first nine months of 2015, compared to $912 per ounce of gold in the same period of 2014.
C1 SANTA LUZ, BRAZIL
In the third quarter, the modified process flowsheet was identified and a five month detailed metallurgical testwork program was completed. The results of the work were incorporated into a Preliminary Economic Assessment (“PEA”), which included an updated mine design and production schedule based on a new resource in connection with current operating cost estimates and recovery parameters. The modified process flowsheet allows for the processing of the carbonaceous minerals at C1 Santa Luz and the overall weighted average recoveries is expected to be approximately 83.7%.
Further detailed metallurgical testwork, in order to optimize the modified process flowsheet, as well as a drilling program primarily focused on upgrading the current resource to reserves, is currently underway and is expected to continue through to the end of 2015. The results of this work will be included in a pre-feasibility study expected to be completed in the second quarter of 2016. Detailed engineering and construction is planned to be completed by mid-2016 with commissioning to commence in the third quarter of 2016.
This work is being directed by Brio Gold’s management in consultation with the Company's technical services group.
Total capital spending at C1 Santa Luz is currently expected to be approximately $47.9 million for the remainder of 2015 and full year of 2016. This includes capital cost for the plant modifications of approximately $32.6 million.
28
Once operations resume, C1 Santa Luz is targeted to produce approximately 100,000 ounces of gold annually, which would bring the total Brio production to 240,000 ounces of gold per annum.
OTHER MINES
ALUMBRERA (12.5% interest), ARGENTINA
In the third quarter of 2015, Alumbrera produced 5,552 ounces of gold, compared to 7,520 ounces of gold in the same quarter of 2014. Cash costs were $617 per ounce of gold in the third quarter on a co-product basis, compared to $412 per ounce of gold in the third quarter of 2014.
Alumbrera produced 15,969 ounces of gold in the nine months of 2015, compared to 25,946 ounces of gold in the same period of 2014. Cash costs were $613 per ounce of gold in the first nine months of 2015 on a co-product basis, compared to $366 per ounce of gold in the same period of 2014.
29
7. CONSTRUCTION, DEVELOPMENT AND EXPLORATION
CONSTRUCTION AND DEVELOPMENT
The following summary highlights key updates from the development projects of the Company since June 30, 2015.
Cerro Moro, Argentina
The Company previously announced the formal decision to proceed with the construction of Cerro Moro and provided updated project parameters with the announcement of year end 2014 results. During the third quarter, detailed engineering continued for the 1,000 tonnes per day processing plant and mine. Notable advancements in the quarter included improvements to the access road, conclusion of the locked-cycle metallurgical tests, the placement of orders on various long-lead time items such as the tailings thickeners and the continuation of the first stage of the construction camp.
The Company remains committed to advancing the project in a prudent manner and decided to de-risk project ramp-up by advancing the underground mining ahead of the original schedule. Project capital expenditures are expected to be approximately $25 million for 2015 comprised of costs related to detailed engineering and pre-development. The expenditures for 2016 are expected to be $56 million. Including these expenditures, the Company expects its expansionary capital to not exceed the levels observed in 2015. The development timetable has been adjusted to accommodate the aforementioned works and now reflects a capital schedule which maximizes cash preservation in 2016. Simultaneously, this allows for a more thorough evaluation of the economic factors in Argentina, including the impact of the currency in relation to the outcome of the presidential ballot in the November 2015 election. Furthermore, this approach allows for further exploration drilling to take place to increase the size of the Cerro Moro mineral resources, in addition to improving the current mineral resource categorization. Production is expected to commence in the first quarter of 2018.
The Cerro Moro project contains a number of high grade epithermal gold and silver deposits, some of which will be mined via open pit and some via underground mining. The feasibility study is based on annual production in the first three years of 135,000 ounces of gold and 6.7 million ounces of silver, with annual production averaging approximately 102,000 ounces of gold and 5 million ounces of silver over an initial 8 year mine life at a throughput of 1,000 tonnes per day. The concentrator will consist of a standard crushing, grinding and flotation circuit with a counter current decantation and a Merrill Crowe circuit included.
The Company believes that the Cerro Moro project offers significant opportunities for the conversion of mineral resources into mineral reserves and for further discoveries on the property. This will serve to significantly improve the returns and value from this high grade project.
Agua Rica, Argentina
Agua Rica is a low cost, large scale porphyry copper, molybdenum, gold and silver deposit located in the province of Catamarca, Argentina with proven and probable mineral reserves of approximately 10 billion pounds of copper and 6.5 million ounces of gold contained in approximately 910 million tonnes at copper and gold grades of 0.49% and 0.22 grams per tonne respectively.
In the third quarter, the Company continued to evaluate multiple alternatives to unlock the significant value inherent in Agua Rica and this program is expected to continue into 2016. In addition, exploration activities at the Cerro Atajo prospect, which was included in the Definitive Agreement signed with the provincial Government of Catamarca, Argentina (the "Government”), represented by the provincial mining company Catamarca Mineria y Energetica Sociedad del Estado (“CAMYEN”), advanced in the quarter.
The Cerro Atajo prospect lies 10 km east of Alumbrera and 25 km west of Agua Rica, a region in which both the Company and the Government have interests. The property is prospective for both high grade gold-copper-silver veins and large tonnage copper-gold porphyry mineralization. Cerro Atajo is centered on an intrusive complex within the same host rock as the nearby Alumbrera mine.
EXPLORATION
The Company continues to consider exploration to be a key to unlocking and creating further value for shareholders at existing operations. The 2015 exploration program focuses on finding higher quality ounces, being those ounces with the greatest potential to most quickly generate cash flow, and on infill drilling to do the work necessary to upgrade the existing inferred mineral resources.
30
The following is a summary of the exploration and evaluation expenditures for the current and comparative periods.
| For the three months ended September 30, | For the nine months ended September 30, | |||||||||||
| (In millions of United States Dollars) | 2015 | 2014 | 2015 | 2014 | ||||||||
Exploration and evaluation capitalized (i) | $ | 20.3 | $ | 18.0 | $ | 46.5 | $ | 48.6 | ||||
Exploration and evaluation expensed (ii) | 6.6 | 5.2 | 16.1 | 14.1 | ||||||||
| Total exploration and evaluation expenditures | $ | 26.9 | $ | 23.2 | $ | 62.6 | $ | 62.7 | ||||
______________________________
| (i) | Capitalized exploration and evaluation costs are reflected in the Consolidated Balance Sheet's property, plant and equipment as part of the additions to mining property costs not subject to depreciation for near-mine exploration and tangible exploration and evaluation assets with probable future economic benefits. |
| (ii) | Expensed exploration and evaluation costs are reported in the Consolidated Statements of Operations. |
The following summary highlights the areas of focus for the 2015 exploration program and provides key updates from the third quarter of 2015.
Monument Bay, Canada
In June 2015, as part of the Mega Precious Metals Inc. acquisition, the Company acquired the Monument Bay property, which is located in Manitoba, approximately 570 kilometres northeast of Winnipeg, and consists of 136 contiguous claims totaling 338,000 square kilometres. The Twin Lakes deposit contains the majority of the gold and tungsten mineralization found on the property to date. The deposit occurs within the Archean North Caribou Terrane along and adjacent to the Stull-Wunnumin structural break. The large mineral resource base provides opportunities for future mineral resource growth through the potential expansion of the existing measured and indicated mineral resource base of 2.2 million ounces of gold in 46.9 million tonnes at an average grade of 1.43 grams per tonne.
Core drilling was re-initiated in September, with a total of approximately 1,000 metres of core (NQ) completed in five holes. The new holes were all focused on expanding or infilling zones of near surface high grade mineralization. Each hole encountered strong evidence of gold/tungsten mineralization with all assays pending. Additionally, approximately 2,100 metres of core were re-evaluated in the old core assay program and over 1,000 samples were collected for assay.
Chapada, Brazil
The 2015 exploration program at Chapada is focused on further testing of the Sucupira and Santa Cruz targets that were discovered in 2014, and on mineral resource infill drilling of select areas at Corpo Sul. The Company expects to complete 10,000 metres of exploration drilling and 12,000 metres of infill drilling over the course of 2015.
During the third quarter, Sucupira was defined as a 1.8 kilometre extension of the Cava Norte ore body and remains open to the southwest and to depth. The Sucupira mineral body is comprised of a high grade gold and copper cigar-shaped core surrounded by a broad, low grade halo. Exploration and limited infill drilling at Sucupira advanced in the third quarter with the focus on the delineation of new mineral resources along strike, testing the mineral body to the northeast and beginning a closer spaced drill pattern that will help to define mineral resources.
The infill drilling program at Cava Norte continued in the third quarter and completed 21 holes with the aim of upgrading mineral resources.
El Peñón, Chile
The 2015 exploration program at El Peñón is focused on exploring near mine targets, including the recently discovered Ventura vein, and on infill and limited definition drilling at the El Peñón, Fortuna and Pampa Augusta Victoria mine complexes. The Company expects to complete 30,000 metres of local and 36,000 metres of district exploration drilling, along with 117,000 metres of combined underground and surface infill drilling over the course of 2015. The drill program metres have increased due to extra funds made available during the quarter.
31
During the third quarter, infill drilling at the Ventura vein advanced with results continuing to support the economic potential of the target and the objective of upgrading the mineral resource. The El Peñón district exploration program continued in the quarter with drilling completed at the Laguna and Chiquilla Chica targets and results now being evaluated for economic potential.
Gualcamayo, Argentina
The 2015 exploration program at Gualcamayo is focused on discovering and extending near surface oxide mineral zones to both the east and west of current QDD Lower West ("QDDLW") underground operation limits, and on infill and expansion of the carbonate deposits that form the Southwest and parts of the Santiago mineral deposits in the Rodado target area. The Company expects to complete a total of 17,000 metres of drilling over the course of 2015.
During the third quarter, underground based mineral resource expansion drilling continued with the objective of finding additional oxide ore at the east and west extensions of QDDLW. Significant oxide intercepts have been reported from QDDLW and samples have been sent to the laboratory for analysis and metallurgical testing. At the Las Vacas area, the geophysical campaign was completed during the third quarter and drilling of identified anomalies began late in the quarter.
Mercedes, Mexico
The 2015 exploration program at Mercedes is focused on mineral resource infill and extension drilling, completing limited ore definition drilling, and testing near mine and regional targets developed in prior exploration campaigns. The Company expects to complete approximately 39,000 metres of combined surface and underground drilling, an increase of 16,000 metres more than the program outlined in the second quarter.
During the third quarter, infill drilling advanced at Mercedes and results continue to support the reserve model with the most significant results returned from Casa Blanca.
Minera Florida, Chile
The 2015 exploration program at Minera Florida is focused on infill drilling to replace mineral resources that were previously upgraded to mineral reserves, testing new areas with the aim to discover a new high potential target, and delineation drilling to further improve the reliability of life-of-mine mineral reserves. The Company expects to complete 10,000 metres of infill drilling, 5,000 metres of exploration drilling and 2,000 metres of delineation drilling over the course of 2015.
During the third quarter, the underground infill program continued with Manda, Lisset, Lorena, Falla Hallazgo, Florencia, Mina Este and Polvorin returning positive results. The positive assay results at most infill targets continue support the objective of upgrading mineral resources and mineral reserve replacement.
Jacobina, Brazil
The 2015 exploration program at Jacobina is focused on extensive infill drilling with the aim to improve geologic knowledge and mineral continuity in support of mineral resource conversion and mineral reserve delineation.
During the third quarter, infill drilling continued at the Canavieras North and South, Morro do Vento and João Belo mines, with results continuing to support the higher grades in the mineral resource and mineral reserve models. Infilling drilling during the quarter returned above average grades and widths at all targets. Development activities to access the Canavieiras ore bodies supported by the infill programs began in the third quarter.
Cerro Moro, Argentina
The 2015 exploration program at Cerro Moro is focused on detailed mapping, outcrop and soil sampling, and targeted core drilling with the aim to discover a new high grade structure within the current property boundaries. The Company expects to complete 10,500 metres of drilling over the course of 2015.
During the quarter, exploration drilling continued to test the Gabriela Northwest, Michelle and Guillermina targets. Exploration drilling has intercepted broad intervals of continuous low grade gold and silver, and follow-up drilling is planned to test for the potential of higher grade veins within the structures. Results from condemnation drilling completed in June at the Escondida Central Dump area returned no anomalous values that could identify potential exploration targets.
Canadian Malartic Corporation, Canada
32
As 50-50 partners in the Canadian Malartic Corporation, Yamana and Agnico jointly explore the Kirkland Lake, Hammond Reef, Pandora, and the Wood-Pandora properties. The 2015 exploration programs include the following:
| • | Pandora - continued drill testing of near surface and underground targets while concurrently constructing an exploration tunnel from the Lapa mine 101 level to the west for approximately 1 kilometre ("101-W") to facilitate additional subsurface drill testing; |
| • | Kirkland Lake - focused drill testing of the Upper Canada, AK and other surface targets; |
| • | Upper Beaver - an internal Preliminary Economic Assessment on the deposit; and |
| • | Canadian Malartic mine - limited drilling of the South Odyssey mineral body. |
At Pandora, underground development on the 101-W exploration drift from the adjacent Lapa mine commenced in February 2015 and approximately 691 metres of development was completed by the end of the third quarter of 2015. For the full year, approximately 940 metres of development is planned. In mid-June 2015, underground drilling resumed from the 101-W exploration drift and approximately half of the proposed 2015 program (approximately 7,000 metres) was completed by the end of the third quarter. The focus of the current exploration program is to test for extensions to the Branch zone and C zone on the Pandora property.
During the third quarter, drilling at Kirkland Lake continued to add value as assays returned both high grade and broad low grade results. A review of an internal Preliminary Economic Assessment for Upper Beaver continued during the quarter and is expected to be completed by the end of the year. Compilation and limited exploration drilling is ongoing on the district land holdings.
At the end of the third quarter of 2015, 28 holes (24,537 metres) of drilling had been completed on the Odyssey zones. Drilling and data compilation will continue in the fourth quarter.
Brio Gold
The 2015 exploration program for Brio Gold is focused at Pilar on infill drilling in support of operations, limited mineral resource expansion drilling and delineation drilling at Maria Lazarus, and at Fazenda Brasileiro on replacing the mineral resource base. Brio Gold expects to complete 40,000 metres of drilling at Pilar and Maria Lazarus over the course of 2015, an increase of 14,500 metres more than the program outlined in the second quarter. The increase is due to an internal reallocation of funds at the operation and the impact of the depreciation of the Brazilian Real. At Fazenda Brasileiro, 36,000 metres of exploration drilling and 44,000 metres of infill drilling are expected over the course of 2015.
During the third quarter, infill drilling at Pilar continued to return positive results including narrow intervals at mineable grades and the discovery of ore shoots in an area previously identified as internal waste will be tested further for possible mineral resource classification. At Maria Lazarus, delineation and exploration drilling continued during the quarter.
During the third quarter, drilling advanced at E388 East, the new discovery at Fazenda Brasileiro that is at relatively shallow depth (350 metres) and near existing primary infrastructure. Exploration drilling continues to return results at E388 East that are similar in thickness and grade to those seen in the early years of the mine, and support the potential for mineral resource expansion. Infill drilling during the third quarter at Fazenda Brasileiro intercepted intervals of above average thickness and grades that support the potential to extend the eastern portion of the mineralized zone.
8. LIQUIDITY, CAPITAL RESOURCES AND CONTRACTUAL COMMITMENTS
LIQUIDITY
The Company continues to focus on containing costs in order to maximize available cash. The following is a summary of liquidity and capital resources balances:
| As at, (In millions of United States Dollars) | September 30, 2015 | December 31, 2014 | ||||
| Cash | $ | 137.8 | $ | 191.0 | ||
| Trade and other receivables | $ | 33.0 | $ | 51.0 | ||
Long term debt (excluding current portion) | $ | 1,861.6 | $ | 2,025.4 | ||
Working capital (i) | $ | 185.9 | $ | 42.6 | ||
______________________________
33
(i)Working capital is defined as the excess of current assets over current liabilities which includes the current portion of long term debt.
Cash and cash equivalents were $137.8 million as at September 30, 2015 compared to $191.0 million as at December 31, 2014. Cash and cash equivalents were comprised of cash in bank and bank term deposits. The sources and uses of cash and cash equivalent during the year are explained below. Working capital was $185.9 million as at September 30, 2015, compared to $42.6 million as at December 31, 2014. Net debt (a non-GAAP measure, see Section 13) improved by $61.0 million compared to December 31, 2014.
The following table summarizes cash inflows and outflows:
| Three months ended September 30, | Nine months ended September 30, | |||||||||||
| (In millions of United States Dollars) | 2015 | 2014 | 2015 | 2014 | ||||||||
| Cash flows from operating activities from continuing operations | $ | 77.6 | $ | 156.6 | $ | 203.1 | $ | 330.2 | ||||
Cash flows from operating activities before changes in non-cash working capital (i) | $ | 127.6 | $ | 180.7 | $ | 373.0 | $ | 419.4 | ||||
| Cash flows from/(used in) financing activities from continuing operations | $ | 9.0 | $ | 34.1 | $ | (11.8 | ) | $ | 550.6 | |||
| Cash flows used in investing activities from continuing operations | $ | (65.7 | ) | $ | (197.3 | ) | $ | (240.3 | ) | $ | (930.8 | ) |
| (i) | A cautionary note regarding non-GAAP measures is included in Section 13 of this Management’s Discussion and Analysis. |
CASH FLOWS FROM OPERATING ACTIVITIES FROM CONTINUING OPERATIONS
Cash flows from operating activities from continuing operations after changes in non-cash working capital items for the three months ended September 30, 2015 were $77.6 million, compared to $156.6 million for the three months ended September 30, 2014. Cash flows from operating activities before changes in non-cash working capital (a non-GAAP measure, see Section 13) for the three months ended September 30, 2015 were $127.6 million, compared to $180.7 million generated for the same period of 2014. Cash flows from operating activities for the period were impacted by lower metal prices. Additionally, no cash distributions were received from Alumbrera for the period, compared to $12.4 million for the three months ended September 30, 2014.
Changes in non-cash working capital items for the three months ended September 30, 2015 were cash outflows of $50.0 million, compared to outflows of $24.1 million for the three months ended September 30, 2014. Outflows in non-cash working capital items for the current period reflect the more significant items of the repayment of $12 million on the export credit facility and an Alumbrera loan repayment of $11.4 million. Additionally, non-cash working capital items in the second quarter of 2015 reflect a $24.8 million in accounts receivable factoring with no current period comparative, thereby increasing the receivables balance as at September 30, 2015. These demonstrate management's focus on a debt reduction strategy and working capital management.
CASH FLOWS FROM FINANCING ACTIVITIES FROM CONTINUING OPERATIONS
In the third quarter of 2015, cash flows from financing activities of continuing operations were $9.0 million compared to inflows of $34.1 million in the same quarter of 2014. Cash flows from financing activities for the period included dividends paid of $13.9 million, interest and other finance expenses paid of $8.8 million offset by debt proceeds of $31.7 million, net of repayments during the period.
Net debt (a non-GAAP measure, see Section 13) as at September 30, 2015, excluding debt assumed from the Company's 50% interest in Canadian Malartic which is neither corporate nor guaranteed by the Company, was $1.70 billion.
The principal repayment schedule of senior debt notes to be repaid in the next five years is as follows:
| (In millions of United States Dollars) | 2016 | 2017 | 2018 | 2019 | 2020 | |||||
| Senior debt notes | 73.5 | — | 110.0 | 181.5 | 85.0 | |||||
The balance of senior debt notes of $1.11 billion is due in and after 2022.
The Company has a revolving credit facility with a maturity date of 2020. The Company will, from time to time, repay balances outstanding on its revolving credit with operating cash flow and cash flow from other sources. Additionally, the Company intends to renew the credit facility upon maturity in 2020.
34
CASH FLOWS USED IN INVESTING ACTIVITIES FROM CONTINUING OPERATIONS
Cash outflows used in investing activities from continuing operations were $65.7 million for the quarter ended September 30, 2015, compared to cash outflows of $197.3 million for the quarter ended September 30, 2014.
Cash flows used in investing activities include the release of $18.6 million of restricted cash, relating to a bond previously set aside with the Government of Quebec by Canadian Malartic for environmental protection purposes. The bond was replaced during the quarter with a letter of credit.
Capital expenditures including sustaining, expansionary and capitalized exploration and evaluation for the three months ended September 30, 2015, were $102.8 million. These expenditures were incurred as follows:
| Three months ended September 30, | Nine months ended September 30, | |||||||||||
| (In millions of United States Dollars) | 2015 | 2014 | 2015 | 2014 | ||||||||
| Chapada | $ | 15.5 | $ | 41.9 | $ | 42.5 | $ | 83.3 | ||||
| El Peñón | 19.2 | 25.8 | 60.0 | 90.6 | ||||||||
| Gualcamayo | 5.2 | 8.2 | 12.7 | 33.1 | ||||||||
| Mercedes | 5.8 | 10.5 | 17.9 | 31.5 | ||||||||
| Canadian Malartic | 19.4 | 22.2 | 43.2 | 25.0 | ||||||||
| Minera Florida | 8.4 | 14.3 | 32.5 | 42.1 | ||||||||
| Jacobina | 8.2 | 10.2 | 20.8 | 24.3 | ||||||||
| Cerro Moro | 9.1 | 8.3 | 20.5 | 23.8 | ||||||||
Brio Gold (i) | 7.6 | 50.9 | 23.0 | 155.1 | ||||||||
| Other | 4.4 | 3.7 | 7.2 | 13.1 | ||||||||
Total capital expenditures (ii) | $ | 102.8 | $ | 196.0 | $ | 280.3 | $ | 521.9 | ||||
______________________________
| (i) | Includes Fazenda Brasileiro, Pilar and C1 Santa Luz. |
| (ii) | Net of movement in accounts payable as applicable for projects under construction. |
CAPITAL RESOURCES
In order to maintain or adjust its capital structure, the Company may issue shares or debt securities, pay dividends, or undertake other activities as deemed appropriate under the specific circumstances.
The Company is authorized to issue an unlimited number of common shares at no par value and a maximum of eight million first preference shares. There are no first preference shares issued or outstanding. As of October 28, 2015, the total number of shares outstanding were 946.7 million, the total number of stock options outstanding were 2.9 million, the total number of Deferred Share Units ("DSU") outstanding were 3.4 million, the total number of Restricted Share Units ("RSU") outstanding were 1.3 million, and the total number of Performance Share Units ("PSU") outstanding were 1.3 million.
For the third quarter, the Company declared a quarterly dividend of $0.0150 per share compared to third quarter 2014 dividend of $0.0375 per share.
The following table summarizes the weighted average common shares and equity instruments outstanding as at September 30, 2015:
35
Equity instruments outstanding as at | Weighted average dilutive equity instruments (i), three months ended | Weighted average dilutive equity instruments (i), nine months ended | ||||
| (In thousands) | September 30, 2015 | September 30, 2015 | September 30, 2015 | |||
Common shares (i) | 946,620 | 946,563 | 933,180 | |||
Options (ii) | 2,881 | — | — | |||
RSU (ii) | 1,323 | — | — | |||
DSU (iii) | 3,383 | — | — | |||
PSU (iii) | 1,265 | — | — | |||
| 946,563 | 933,180 | |||||
______________________________
| (i) | The Company has a dividend reinvestment plan to provide holders of common shares a simple and convenient method to purchase additional common shares by reinvesting cash dividends, less any applicable withholding tax. A plan participant may obtain additional common shares by electing to automatically reinvest all or any portion of cash dividends paid on common shares held by the plan participant without paying any brokerage commissions, administrative costs or other service charges. During the period ended September 30, 2015, a total of 14,546,717 shares were subscribed to under the plan. |
| (ii) | For the three and nine months ended September 30, 2015, these items have not been included in the weighted average number of shares as they are anti-dilutive. |
| (iii) | DSU and PSU are settled in cash and, as such, excluded from the calculation of the weighted average number of shares outstanding. |
CONTRACTUAL COMMITMENTS
Day-to-day mining, sustaining and expansionary capital expenditures as well as administrative operations give rise to contracts requiring agreed upon future minimum payments. Management is of the view that such commitments will be sufficiently funded by current working capital, future operating cash flows and available credit facilities which provide access to additional funds.
As at September 30, 2015, the Company is contractually committed to the following:
| (In millions of United States Dollars) | Within 1 year | Between 1 to 3 years | Between 3 to 5 years | After 5 years | Total | ||||||||||
| Mine operating/construction and service contracts and other | $ | 421.1 | $ | 301.5 | $ | 55.3 | $ | — | $ | 777.9 | |||||
Long-term debt principal repayments (i) | 4.8 | 114.8 | 295.0 | 1,490.0 | 1,904.7 | ||||||||||
| Decommissioning, restoration and similar liabilities (undiscounted) | 5.7 | 26.6 | 66.7 | 196.3 | 295.4 | ||||||||||
| $ | 431.6 | $ | 442.9 | $ | 417.0 | $ | 1,686.3 | $ | 2,978.0 | ||||||
______________________________
| (i) | Excludes interest expense. |
9. INCOME TAXES
The Company recorded an income tax expense of 117.3 million for the quarter ended September 30, 2015 compared to an income tax expense of $346.2 million in the third quarter of 2014. The decrease in the income tax expense for the quarter is a result of the movement in foreign exchange for the period relative to the same period of the prior year. The income tax provision reflects a current income tax expense of $38.1 million and a deferred income tax expense of $79.2 million versus a current income tax expense of $16.1 million and a deferred income tax recovery of $330.1 million for the three months ended September 30, 2014.
The income tax provision is subject to a number of factors including the allocation of income between different countries, different tax rates in the various jurisdictions, the non-recognition of tax assets, foreign currency exchange movements, changes in tax laws and the impact of specific transaction and assessments. Due to the number of factors that can potentially impact the effective tax rate, it is expected that the Company's effective tax rate will fluctuate in future periods.
The Company has elected, under IFRS, to record foreign exchange related to deferred income tax assets and liabilities and interest and penalties in income tax expense, therefore, due to foreign exchange differences, the tax rate will fluctuate during the year with the change in the Brazilian Real, Argentinean Peso, Mexican Peso and Canadian Dollar. Under IFRS, the US Dollar value of non-
36
monetary assets are converted into local currency each quarter for the purpose of calculating the deferred tax owing in the event of the disposition of that asset. The difference in the value of the deferred tax owing from period to period as a result of fluctuations in local currency is recorded in the income tax expense. As a local currency depreciates in value relative to the US Dollar, an asset becomes more valuable in local currency resulting in a higher notional non-cash deferred tax expense increasing the Company’s consolidated income tax expense. When local currencies appreciate, relative to the US Dollar, the value of the asset is diminished in local currency, reducing the notional deferred tax owing resulting in a non-cash tax recovery.
During the period, the US Dollar strengthened against the Brazilian Real, the Argentinean Peso, the Mexican Peso and the Canadian Dollar. As a result, an expense of $132.7 million relating to unrealized foreign exchange gains was recorded in the tax expense. The impact of these foreign exchange movements on taxes are non-cash and, as such, are excluded from adjusted earnings.
The deferred tax liabilities relating to the operating mines will reverse in the future as the assets are depreciated or depleted. The deferred tax liabilities relating to exploration will not reverse until the property becomes a mine subject to depletion, is written-off or sold. The deferred income taxes would only be paid on a direct disposition of the asset that may never occur.
See Note 6 to the Condensed Consolidated Interim Financial Statements for the period ended September 30, 2015 for a breakdown of the foreign exchange charged to the income tax expense. Readers are also encouraged to read and consider the tax related risk factors and uncertainties in the Company’s Annual Information and Annual Management Discussion and Analysis Form for the year ended December 31, 2014.
10. ECONOMIC TRENDS, BUSINESS RISKS AND UNCERTAINTIES
Exploration, development and mining of precious metals involve numerous risks as a result of the inherent nature of the business and global economic trends that could have a significant impact on its profitability and levels of operating cash flows.
The Company manages its exposure to these risks in accordance with its Risk Management Policy. Readers are also encouraged to read and consider the risk factors and related uncertainties in the Company’s Annual Information and Annual Management Discussion and Analysis Form for the year ended December 31, 2014. Such risk factors could materially affect the future operating results of the Company and could cause actual events to differ materially from those described in forward-looking statements relating to the Company. There were no significant changes to those risks or to the Company's management of exposure to those risks during the three months ended September 30, 2015, except as noted below:
Metal Price Risk
Gold Price - Market Update

Gold Price Two-Year Trend (LBMA p.m. price: USD per ounce of gold)
For the quarter ended September 30, 2015, spot gold prices averaged $1,124 per ounce, or 12% lower, compared to $1,282 per ounce in the third quarter of 2014. Prices ranged between $1,081 and $1,168 per ounce and ended the quarter at $1,114 per ounce.
37
Gold prices moved lower early in the quarter before recovering modestly. The US Dollar continues to be relatively strong, particularly against emerging market currencies, providing headwinds to gold price rallies. US Dollar strength has been driven primarily by improving US labour market data and the continued adoption of easier monetary policies by other central banks which have made US treasury bonds more attractive relative to other sovereign bonds. Conversely, the change in monetary policies combined with many governments facing challenging fiscal situations and elevated levels of debt, should be supportive of gold over the longer term. Lastly, gold price continues to be sensitive to the changing expectations around the timing of a US Fed Funds Rate hike and this should continue going forward.
It is expected that physical demand will continue to be supportive during periods of price weakness. The Peoples Bank of China has been steadily purchasing gold since 2009 up to and including the current quarter. Central banks continue to be net buyers and are expected to continue for the foreseeable future. Global ETF holdings continued to remain stable over the course of the quarter with a slight decrease in total ounces held.
The Company has not hedged any of its gold sales.
Copper Price - Market Update

Copper Price Two-Year Trend (LME Cash: USD per pound of copper)
For the quarter ended September 30, 2015, spot copper prices averaged $2.39 per pound, representing a decrease of 25% compared to $3.17 per pound in 2014. Prices ranged between $2.25 and $2.62 per pound and ended the quarter at $2.35 per pound.
Copper prices declined steadily during the quarter before increasing modestly towards the end of the quarter on the back of announced planned production cuts. The supply constraint will help push the market towards balance and be more supportive of copper prices over the longer term. Concerns about slowing economic growth in China continued to weigh on copper prices during the quarter and may limit the potential upside in the short term.
The Company periodically uses forward contracts to economically hedge against the risk of declining copper prices for a portion of its forecast copper concentrate sales.
Currency Risk
United States Dollar - Market Update
The US Dollar continues to show strength and all of the Company's operating currencies weakened between 4% and 27% against the US Dollar during the quarter ended September 30, 2015. There is potential for additional strengthening going forward, as US economic performance is expected to surpass that of many other countries.
The aforementioned divergence in global monetary policies, and the expectation of better US economic growth relative to other G10 countries, is likely to attract investment flows into the US which should result in continued US Dollar strength. Should this occur, the Company will continue to benefit in the form of lower operating costs, given that the majority of foreign exchange requirements for the fourth quarter of 2015 are unhedged and fully unhedged thereafter.
38
The following summarizes the movement in key currencies vis-à-vis the US Dollar:
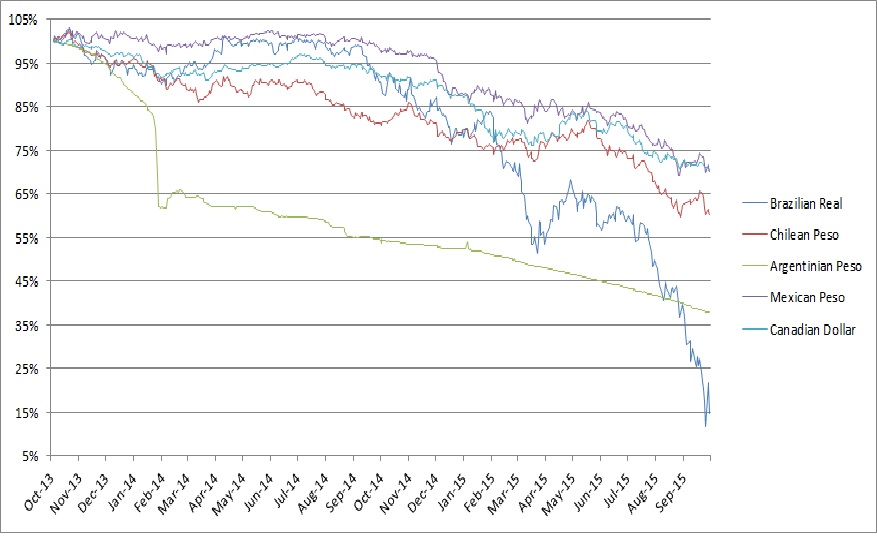
Average and Period-end Market Exchange Rate
| For the three months ended September 30, | 2015 | 2014 | Variance |
| Average Exchange Rate | |||
| USD-CAD | 1.3088 | 1.0890 | 20.2% |
| USD-BRL | 3.5431 | 2.2762 | 55.7% |
| USD-ARG | 9.2484 | 8.2959 | 11.5% |
| USD-CLP | 676.95 | 577.78 | 17.2% |
| USD-MXN | 16.446 | 13.124 | 25.3% |
| For the nine months ended September 30, | 2015 | 2014 | Variance |
| Average Exchange Rate | |||
| USD-CAD | 1.2605 | 1.0942 | 15.2% |
| USD-BRL | 3.1677 | 2.2886 | 38.4% |
| USD-ARG | 8.9688 | 7.9969 | 12.2% |
| USD-CLP | 640.36 | 561.76 | 14.0% |
| USD-MXN | 15.591 | 13.117 | 18.9% |
| As at, | September 30, 2015 | December 31, 2014 | Variance | September 30, 2014 | Variance |
| Period-end Exchange Rate | |||||
| USD-CAD | 1.3313 | 1.1621 | 14.6% | 1.1198 | 18.9% |
| USD-BRL | 3.9475 | 2.6576 | 48.5% | 2.4469 | 61.3% |
| USD-ARG | 9.4186 | 8.4650 | 11.3% | 8.4275 | 11.8% |
| USD-CLP | 696.38 | 606.45 | 14.8% | 598.31 | 16.4% |
| USD-MXN | 16.918 | 14.752 | 14.7% | 13.429 | 26.0% |
The following table summarizes the details of the remaining currency derivatives as at September 30, 2015:
39
| (Amount in millions) | Brazilian Real to USD | ||
Year of Settlement | Brazilian Real Notional Amount (i) | Weighted Average Contract Rate | Market rate as at September 30, 2015 |
| 2015 | 129.8 | 2.283 | 4.117 |
(i) As at September 30, 2015, 78.4 million of the 129.8 million Reais of the notional amount are designated as hedging instruments in the currency hedging program.
11. CONTINGENCIES
Due to the size, complexity and nature of the Company’s operations, various legal and tax matters arise in the ordinary course of business. The Company accrues for such items when a liability is both probable and the amount can be reasonably estimated. In the opinion of management, these matters will not have a material effect on the Condensed Interim Consolidated Financial Statements of the Company.
In December 2012, the Company received assessments from the Brazilian federal tax authorities disallowing certain deductions relating to debentures for the years 2007 to 2010. The Company believes that these debentures were issued on commercial terms permitted under applicable laws and is challenging these assessments. As such, the Company does not believe it is probable that any amounts will be paid with respect to these assessments with the Brazilian authorities and the amount and timing of any assessments cannot be reasonably estimated.
12. CRITICAL ACCOUNTING POLICIES AND ESTIMATES
The Company's Consolidated Financial Statements are prepared in accordance with International Financial Reporting Standards as issued by the International Accounting Standards Board. The significant accounting policies applied and recent accounting pronouncements are described in Note 3 and Note 5 to the Company's Annual Consolidated Financial Statements for the year ended December 31, 2014.
In preparing the Consolidated Financial Statements in accordance with IFRS, management is required to make estimates and assumptions that affect the reported amounts of assets, liabilities, revenues and expenses for the period end. Critical accounting estimates represent estimates that are uncertain and for which changes in those estimates could materially impact the Company's Consolidated Financial Statements. Actual future outcomes may differ from present estimates. Management reviews its estimates and assumptions on an ongoing basis using the most current information available.
The critical judgments and key sources of estimation uncertainties in the application of accounting policies during the third quarter ended September 30, 2015 are disclosed in Note 4 to the Company's Annual Consolidated Financial Statements for the year ended December 31, 2014.
40
13. NON-GAAP AND ADDITIONAL MEASURES
The Company has included certain non-GAAP measures including Cash costs per ounce of gold, Cash costs per ounce of silver, Co-product cash costs per ounce of gold, Co-product cash costs per ounce of silver, Co-product cash costs per pound of copper, All-in sustaining costs per ounce of gold, All-in sustaining costs per ounce of silver, All-in sustaining co-product costs per ounce of gold, All-in sustaining co-product costs per ounce of silver, Adjusted earnings or loss, Adjusted earnings or loss per share, Adjusted Operating Cash Flows and Net debt, to supplement its Consolidated Financial Statements, which are presented in accordance with IFRS. The term IFRS and generally accepted accounting principles (“GAAP”) are used interchangeably throughout this MD&A.
The Company believes that these measures, together with measures determined in accordance with IFRS, provide investors with an improved ability to evaluate the underlying performance of the Company. Non-GAAP measures do not have any standardized meaning prescribed under IFRS, and therefore they may not be comparable to similar measures employed by other companies. The data is intended to provide additional information and should not be considered in isolation or as a substitute for measures of performance prepared in accordance with IFRS.
CASH COSTS AND ALL-IN SUSTAINING COSTS
For definitions and descriptions, refer to Section 14 of the Company’s Annual Management Discussion and Analysis for the year ended December 31, 2014.
(i) Reconciliation of Cost of Sales per the Consolidated Financial Statements to cash costs of gold and silver from continuing operations:
| Gold Cash Costs | Three months ended September 30, | Nine months ended September 30, | ||||||||||
| (In millions of US Dollars, except ounces and cash costs per ounce produced) | 2015 | 2014 | 2015 | 2014 | ||||||||
Cost of sales (i) (ii) | $ | 266.0 | $ | 275.0 | $ | 818.2 | $ | 727.2 | ||||
| Adjustments: | ||||||||||||
| Chapada treatment and refining costs related to gold, silver and copper | 8.5 | 10.4 | 26.9 | 25.9 | ||||||||
| By-product costs related to silver | (16.2 | ) | (14.2 | ) | (49.5 | ) | (44.4 | ) | ||||
| Inventory movements and adjustments | 1.2 | 6.6 | (9.0 | ) | (2.3 | ) | ||||||
| Commercial, overseas freight and other costs | 2.6 | (4.4 | ) | (8.7 | ) | (15.9 | ) | |||||
By-product credits from Chapada copper revenue including copper pricing adjustment | (76.0 | ) | (112.1 | ) | (230.1 | ) | (279.7 | ) | ||||
| Total gold cash costs (excluding Alumbrera) | $ | 186.1 | $ | 161.3 | $ | 547.8 | $ | 410.8 | ||||
| Minera Alumbrera (12.5% interest) cash costs | 7.5 | (1.5 | ) | 24.6 | (13.6 | ) | ||||||
Total gold cash costs (ii) | $ | 193.6 | $ | 159.8 | $ | 572.4 | $ | 397.2 | ||||
| Commercial gold ounces produced excluding Alumbrera | 320,346 | 295,355 | 913,161 | 740,912 | ||||||||
| Commercial gold ounces produced including Alumbrera | 325,897 | 302,875 | 929,130 | 766,858 | ||||||||
| Total cash costs (excluding Alumbrera) per gold ounce produced | $ | 581 | $ | 547 | $ | 600 | $ | 555 | ||||
| Minera Alumbrera (12.5% interest) cash costs per gold ounce produced | 13 | (19 | ) | 16 | (37 | ) | ||||||
| Total cash costs per gold ounce produced | $ | 594 | $ | 528 | $ | 616 | $ | 518 | ||||
41
| Silver Cash Costs | Three months ended September 30, | Nine months ended September 30, | ||||||||||
| (In millions of US Dollars, except ounces and cash costs per ounce produced) | 2015 | 2014 | 2015 | 2014 | ||||||||
Cost of sales (i) (ii) | $ | 266.0 | $ | 275.0 | $ | 818.2 | 727.2 | |||||
| Adjustments: | ||||||||||||
| Chapada treatment and refining costs related to gold, silver and copper | 8.5 | 10.4 | 26.9 | 25.9 | ||||||||
| By-product costs related to gold | (186.2 | ) | (161.1 | ) | (548.0 | ) | (410.4 | ) | ||||
| Inventory movements and adjustments | 1.2 | 6.3 | (9.0 | ) | (2.6 | ) | ||||||
| Commercial, overseas freight and other costs | 2.6 | (4.4 | ) | (8.7 | ) | (15.9 | ) | |||||
By-product credits from Chapada copper revenue including copper pricing adjustment | (76.0 | ) | (112.1 | ) | (230.1 | ) | (279.7 | ) | ||||
Total silver cash costs (ii) | $ | 16.1 | $ | 14.1 | $ | 49.3 | $ | 44.5 | ||||
| Commercial silver ounces produced | 2,196,744 | 2,946,664 | 7,051,700 | 7,493,485 | ||||||||
| Total cash costs per silver ounce produced | $ | 7.37 | $ | 4.80 | $ | 7.01 | $ | 5.93 | ||||
___________________________
| (i) | Cost of sales includes non-cash items including the impact of the movement in inventory. Beginning January 1, 2015, the Company revised the presentation of the reportable cash costs and all-in sustaining costs. Comparatives have been restated to conform to the change in presentation adopted in the current period. |
| (ii) | Depletion, depreciation and amortization are excluded from both total cash costs and cost of sales. |
(ii) Reconciliation of cost of sales per the Consolidated Financial Statements to co-product cash costs of gold and silver from continuing operations:
| Gold Cash Costs | Three months ended September 30, | Nine months ended September 30, | ||||||||||
| (In millions of US Dollars, except ounces and cash costs per ounce produced) | 2015 | 2014 | 2015 | 2014 | ||||||||
Cost of sales (i) (iii) | $ | 266.0 | $ | 275.0 | $ | 818.2 | $ | 727.2 | ||||
| Adjustments: | ||||||||||||
Copper contained in concentrate related cash costs (excluding related TCRC’s) (ii) | (40.6 | ) | (51.3 | ) | (120.0 | ) | (145.1 | ) | ||||
Silver related cash costs (excluding related TCRC’s) (ii) | (18.6 | ) | (20.1 | ) | (57.4 | ) | (57.3 | ) | ||||
| Treatment and refining costs (“TCRC”) related to Chapada gold | 1.2 | 1.5 | 3.8 | 3.6 | ||||||||
| Inventory movements and adjustments | 2.6 | 6.6 | (7.5 | ) | (3.7 | ) | ||||||
| Commercial, overseas freight and other costs | (1.4 | ) | (4.4 | ) | (12.7 | ) | (15.9 | ) | ||||
| Total gold co-product cash costs (excluding Alumbrera) | $ | 209.2 | $ | 207.3 | $ | 624.4 | $ | 508.8 | ||||
| Minera Alumbrera (12.5% interest) gold cash costs | 3.4 | 3.2 | 9.8 | 9.7 | ||||||||
Total gold co-product cash costs (iii) | $ | 212.6 | $ | 210.5 | $ | 634.2 | $ | 518.5 | ||||
| Commercial gold ounces produced excluding Alumbrera | 320,346 | 295,355 | 913,161 | 740,912 | ||||||||
| Commercial gold ounces produced including Alumbrera | 325,897 | 302,875 | 929,130 | 766,858 | ||||||||
| Total co-product cash costs (excluding Alumbrera) per gold ounce produced | $ | 653 | $ | 702 | $ | 684 | $ | 687 | ||||
| Minera Alumbrera (12.5% interest) cash costs per gold ounce produced | — | (7 | ) | (1 | ) | (11 | ) | |||||
| Total co-product cash costs per gold ounce produced | $ | 653 | $ | 695 | $ | 683 | $ | 676 | ||||
42
| Silver Cash Costs | Three months ended September 30, | Nine months ended September 30, | ||||||||||
| (In millions of US Dollars, except ounces and cash costs per ounce produced) | 2015 | 2014 | 2015 | 2014 | ||||||||
Cost of sales (i) (iii) | $ | 266.0 | $ | 275.0 | $ | 818.2 | $ | 727.2 | ||||
| Adjustments: | ||||||||||||
Copper contained in concentrate related cash costs (excluding related TCRC’s) (ii) | (208.1 | ) | (205.5 | ) | (620.7 | ) | (411.5 | ) | ||||
Gold related cash costs (excluding related TCRC’s) (ii) | (40.6 | ) | (51.3 | ) | (120.0 | ) | (239.6 | ) | ||||
| Treatment and refining costs (“TCRC”) related to Chapada silver | 0.1 | 0.1 | 0.2 | 1.2 | ||||||||
| Inventory movements and adjustments | 2.6 | 6.2 | (7.7 | ) | (4.2 | ) | ||||||
| Commercial, overseas freight and other costs | (1.4 | ) | (4.4 | ) | (12.7 | ) | (15.9 | ) | ||||
Total silver co-product cash costs (iii) | $ | 18.6 | $ | 20.1 | $ | 57.3 | $ | 57.2 | ||||
| Commercial silver ounces produced | 2,196,744 | 2,946,664 | 7,051,700 | 7,493,485 | ||||||||
| Total co-product cash costs per silver ounce produced | $ | 8.46 | $ | 6.84 | $ | 8.14 | $ | 7.64 | ||||
___________________________
| (i) | Cost of sales includes non-cash items including the impact of the movement in inventory. Beginning January 1, 2015, the Company revised the presentation of the reportable cash costs and all-in sustaining costs. Comparatives have been restated to conform to the change in presentation adopted in the current period. |
| (ii) | Costs directly attributed to a specific metal are allocated to that metal. Costs not directly attributed to a specific metal are allocated based on relative value. As a rule of thumb, the relative value is 80% copper, 20% gold and silver at Chapada (2014 - 80% copper and 20% gold and silver). TCRC’s are defined as treatment and refining charges. |
| (iii) | Depletion, depreciation and amortization are excluded from both total cash costs and cost of sales. |
(iii) Reconciliation of cost of sales per the Consolidated Financial Statements to co-product cash costs of copper:
| Copper Cash Costs | Three months ended September 30, | Nine months ended September 30, | ||||||||||
| (In millions of US Dollars, except pounds and cash costs per pound produced) | 2015 | 2014 | 2015 | 2014 | ||||||||
Cost of sales (i) (iii) | $ | 266.0 | $ | 275.0 | $ | 818.2 | $ | 727.2 | ||||
| Adjustments: | ||||||||||||
Gold related cash costs (excluding related TCRC’s) (ii) | (208.1 | ) | (205.5 | ) | (620.7 | ) | (504.8 | ) | ||||
Silver related cash costs (excluding related TCRC’s) (ii) | (18.6 | ) | (20.1 | ) | (57.4 | ) | (57.3 | ) | ||||
| TCRC related to Chapada copper | 7.3 | 9.0 | 23.2 | 22.3 | ||||||||
| Inventory movements and adjustments | 2.6 | 6.3 | (7.5 | ) | (2.5 | ) | ||||||
| Commercial, overseas freight and other costs | (1.4 | ) | (4.4 | ) | (12.7 | ) | (15.9 | ) | ||||
| Total copper co-product cash costs (excluding Alumbrera) | $ | 47.8 | $ | 60.3 | $ | 143.1 | $ | 169.0 | ||||
| Minera Alumbrera (12.5% interest) copper cash costs | 15.8 | 14.9 | 43.8 | 47.0 | ||||||||
Total copper co-product cash costs (iii) | $ | 63.6 | $ | 75.2 | $ | 186.9 | $ | 216.0 | ||||
Commercial copper produced excluding Alumbrera (millions of lbs) | 34.0 | 38.0 | 94.4 | 98.5 | ||||||||
Commercial copper produced including Alumbrera (millions of lbs) | 38.0 | 43.5 | 104.3 | 117.7 | ||||||||
| Total co-product cash costs (excluding Alumbrera) per pound of copper produced | $ | 1.42 | $ | 1.59 | $ | 1.51 | $ | 1.71 | ||||
| Minera Alumbrera (12.5% interest) co-product cash costs per pound of copper produced | 0.26 | 0.14 | 0.28 | 0.12 | ||||||||
| Total co-product cash costs per pound of copper produced | $ | 1.68 | $ | 1.73 | $ | 1.79 | $ | 1.83 | ||||
___________________________
| (i) | Cost of sales includes non-cash items including the impact of the movement in inventory. Beginning January 1, 2015, the Company revised the presentation of the reportable cash costs and all-in sustaining costs. Comparatives have been restated to conform to the change in presentation adopted in the current period. |
| (ii) | Costs directly attributed to a specific metal are allocated to that metal. Costs not directly attributed to a specific metal are allocated based on relative value. As a rule of thumb, the relative value is 80% copper, 20% gold and silver at Chapada (2014 - 80% copper and 20% gold and silver). TCRC’s are defined as treatment and refining charges. |
| (iii) | Depletion, depreciation and amortization are excluded from both total cash costs and cost of sales. |
43
(iv) All-in sustaining costs from continuing operations:
| Gold All-in Sustaining Costs | Three months ended September 30, | Nine months ended September 30, | ||||||||||
| (In millions of US Dollars, except ounces and all-in sustaining costs per ounce produced) | 2015 | 2014 | 2015 | 2014 | ||||||||
Total gold cash costs (i) | $ | 193.6 | $ | 159.8 | $ | 572.4 | $ | 397.2 | ||||
| General and administrative, excluding share-based compensation | 22.7 | 18.8 | 72.7 | 70.0 | ||||||||
| Sustaining capital expenditures | 52.2 | 79.4 | 154.3 | 191.7 | ||||||||
| Exploration and evaluation expense | 5.7 | 4.6 | 14.1 | 12.4 | ||||||||
| Total gold all-in sustaining costs | $ | 274.2 | $ | 262.6 | $ | 813.5 | $ | 671.3 | ||||
| Commercial gold ounces produced including Alumbrera | 325,897 | 302,875 | 929,130 | 766,858 | ||||||||
| Total all-in sustaining costs per gold ounce produced | $ | 841 | $ | 867 | $ | 876 | $ | 875 | ||||
| Silver All-in Sustaining Costs | Three months ended September 30, | Nine months ended September 30, | ||||||||||
| (In millions of US Dollars, except ounces and all-in sustaining costs per ounce produced) | 2015 | 2014 | 2015 | 2014 | ||||||||
Total silver cash costs (i) | $ | 16.1 | $ | 14.1 | $ | 49.3 | $ | 44.5 | ||||
| General and administrative, excluding share-based compensation | 2.2 | 2.2 | 7.0 | 8.6 | ||||||||
| Sustaining capital expenditures | 5.8 | 8.9 | 18.2 | 26.7 | ||||||||
| Exploration and evaluation expense | 0.7 | 0.6 | 1.7 | 1.7 | ||||||||
| Total silver all-in sustaining costs | $ | 24.8 | $ | 25.8 | $ | 76.2 | $ | 81.5 | ||||
| Commercial silver ounces produced | 2,196,744 | 2,946,664 | 7,051,700 | 7,493,485 | ||||||||
| Total all-in sustaining costs per silver ounce produced | $ | 11.32 | $ | 8.80 | $ | 10.81 | $ | 10.86 | ||||
___________________________
| (i) | Chapada copper revenue credits are reflected in cash costs. Beginning January 1, 2015, the Company revised the presentation of the reportable cash costs and all-in sustaining costs. Comparatives have been restated to conform to the change in presentation adopted in the current period. |
(v) All-in sustaining costs on a co-product basis from continuing operations:
| Gold All-in Sustaining Co-product Costs | Three months ended September 30, | Nine months ended September 30, | ||||||||||
| (In millions of US Dollars, except ounces and all-in sustaining costs per ounce produced) | 2015 | 2014 | 2015 | 2014 | ||||||||
| Total gold co-product cash costs | $ | 212.6 | $ | 210.5 | $ | 634.2 | $ | 518.5 | ||||
General and administrative, excluding share-based compensation (i) | 19.7 | 15.2 | 61.6 | 56.8 | ||||||||
Sustaining capital expenditures (ii) | 41.8 | 65.7 | 127.9 | 168.5 | ||||||||
Exploration and evaluation expense (i) | 4.9 | 3.0 | 11.7 | 8.6 | ||||||||
Total gold all-in sustaining co-product costs (iii) | $ | 279.0 | $ | 294.4 | $ | 835.4 | $ | 752.4 | ||||
| Commercial gold ounces produced including Alumbrera | 325,897 | 302,875 | 929,130 | 766,858 | ||||||||
| Total all-in sustaining co-product costs per gold ounce produced | $ | 856 | $ | 971 | $ | 899 | $ | 981 | ||||
44
| Silver All-in Sustaining Co-product Costs | Three months ended September 30, | Nine months ended September 30, | ||||||||||
| (In millions of US Dollars, except ounces and all-in sustaining costs per ounce produced) | 2015 | 2014 | 2015 | 2014 | ||||||||
| Total silver co-product cash costs | $ | 18.6 | $ | 20.1 | $ | 57.3 | $ | 57.2 | ||||
General and administrative, excluding share-based compensation (i) | 1.8 | 1.7 | 5.7 | 6.9 | ||||||||
Sustaining capital expenditures (ii) | 4.7 | 7.2 | 15.4 | 23.6 | ||||||||
Exploration and evaluation expense (i) | 0.5 | 0.4 | 1.3 | 1.2 | ||||||||
Total silver all-in sustaining co-product costs (iii) | $ | 25.6 | $ | 29.4 | $ | 79.7 | $ | 88.9 | ||||
| Commercial silver ounces produced | 2,196,744 | 2,946,664 | 7,051,700 | 7,493,485 | ||||||||
| Total all-in sustaining co-product costs per silver ounce produced | $ | 11.67 | $ | 9.99 | $ | 11.32 | $ | 11.87 | ||||
___________________________
| (i) | Chapada's general and administrative expense and exploration expense are allocated reflecting costs incurred on the related activities at Chapada. G&A and exploration expenses of all other operations are allocated based on the relative proportions of consolidated revenues from gold and silver sales. |
| (ii) | Chapada's sustaining capital expenditures are allocated reflecting costs incurred on the related activities at Chapada. Sustaining capital expenditures of all other operations are allocated based on the relative proportions of consolidated revenues from gold and silver sales. |
| (iii) | Beginning January 1, 2015, the Company revised the presentation of the reportable cash costs and all-in sustaining costs. Comparatives have been restated to conform to the change in presentation adopted in the current period. |
ADJUSTED EARNINGS OR LOSS AND ADJUSTED EARNINGS OR LOSS PER SHARE
For definitions and descriptions, refer to Section 14 of the Company���s Annual Management Discussion and Analysis for the year ended December 31, 2014.
Reconciliations of Adjusted Earnings to Net Earnings are provided in Section 5.1, Overview of Financial Results of the MD&A for the three and nine months ended September 30, 2015. The reconciliations on a per share basis are as follows:
45
| For the three months ended | For the nine months ended | |||||||||||
| September 30, 2015 | September 30, 2014 | September 30, 2015 | September 30, 2014 | |||||||||
Net (loss)/earnings per share from continuing operations attributable to Yamana Gold Inc. equity holders - basic | $ | (0.12 | ) | $ | (1.00 | ) | $ | (0.28 | ) | $ | (1.12 | ) |
| Non-cash unrealized foreign exchange gain | (0.04 | ) | (0.02 | ) | (0.04 | ) | (0.02 | ) | ||||
| Share-based payments/mark-to-market of deferred share units | — | — | — | 0.01 | ||||||||
| Demobilization and reorganization costs | 0.01 | 0.02 | 0.01 | 0.02 | ||||||||
| Mark-to-market of investment in available-for-sale securities and other assets | (0.01 | ) | 0.01 | (0.01 | ) | 0.02 | ||||||
| Impairment of mineral properties | — | 0.62 | — | 0.67 | ||||||||
| (Gain)/loss on sale of assets | — | — | — | 0.01 | ||||||||
| Transaction costs related to the Osisko acquisition | — | — | — | 0.04 | ||||||||
| Other non-recurring adjustments | — | 0.01 | 0.02 | 0.02 | ||||||||
| Adjusted earnings/(loss) before income tax effect | $ | (0.16 | ) | $ | (0.36 | ) | $ | (0.30 | ) | $ | (0.35 | ) |
| Non-cash tax on unrealized foreign exchange gains | 0.14 | 0.04 | 0.23 | 0.06 | ||||||||
| Income tax effect of adjustments | — | 0.32 | — | 0.36 | ||||||||
Adjusted (loss)/earnings per share from continuing operations attributable to Yamana Gold Inc. equity holders - basic | $ | (0.02 | ) | $ | — | $ | (0.07 | ) | $ | 0.07 | ||
Net (loss)/earnings per share from continuing operations attributable to Yamana Gold Inc. equity holders - diluted | $ | (0.12 | ) | $ | (1.00 | ) | $ | (0.28 | ) | $ | (1.12 | ) |
| Non-cash unrealized foreign exchange gain | (0.04 | ) | (0.02 | ) | (0.04 | ) | (0.02 | ) | ||||
| Share-based payments/mark-to-market of deferred share units | — | — | — | 0.01 | ||||||||
| Demobilization and reorganization costs | 0.01 | 0.02 | 0.01 | 0.02 | ||||||||
| Mark-to-market of investment in available-for-sale securities and other assets | (0.01 | ) | 0.01 | (0.01 | ) | 0.02 | ||||||
| Impairment of mineral properties | — | 0.62 | — | 0.67 | ||||||||
| (Gain)/loss on sale of assets | — | — | — | 0.01 | ||||||||
| Transaction costs related to the Osisko acquisition | — | — | — | 0.04 | ||||||||
| Other non-recurring adjustments | — | 0.01 | 0.02 | 0.02 | ||||||||
| Adjusted earnings/(loss) before income tax effect | $ | (0.16 | ) | $ | (0.36 | ) | $ | (0.30 | ) | $ | (0.35 | ) |
| Non-cash tax on unrealized foreign exchange gains | 0.14 | 0.04 | 0.23 | 0.06 | ||||||||
| Income tax effect of adjustments | — | 0.32 | — | 0.36 | ||||||||
Adjusted (loss)/earnings per share from continuing operations attributable to Yamana Gold Inc. equity holders - diluted | $ | (0.02 | ) | $ | — | $ | (0.07 | ) | $ | 0.07 | ||
Weighted average number of shares outstanding (in thousands) | ||||||||||||
| Basic and diluted | 946,563 | 877,551 | 933,180 | 801,613 | ||||||||
ADJUSTED OPERATING CASH FLOWS
For definitions and descriptions, refer to Section 14 of the Company’s Annual Management Discussion and Analysis for the year ended December 31, 2014.
Reconciliations of Adjusted Operating Cash Flows are provided in Section 5.1, Overview of Financial Results of the MD&A for the three and nine months ended September 30, 2015.
NET DEBT
For definitions and descriptions, refer to Section 14 of the Company’s Annual Management Discussion and Analysis for the year ended December 31, 2014.
A reconciliation of the non-GAAP measure is provided below:
46
As at, (In millions of United States Dollars) | September 30, 2015 | December 31, 2014 | ||||
| Debt | ||||||
| Non-current portion | $ | 1,861.6 | $ | 2,025.4 | ||
| Current portion | 27.8 | 34.6 | ||||
| Total debt | $ | 1,889.4 | $ | 2,060.0 | ||
| Less: Canadian Malartic debt | 48.8 | 105.2 | ||||
| Less: Cash and cash equivalents | 137.8 | 191.0 | ||||
| Net Debt | $ | 1,702.8 | $ | 1,763.8 | ||
ADDITIONAL MEASURES
The Company uses other financial measures the presentation of which is not meant to be a substitute for other subtotals or totals presented in accordance with IFRS, but rather should be evaluated in conjunction with such IFRS measures. The following other financial measures are used:
• | Gross margin excluding depletion, depreciation and amortization- represents the amount of revenue in excess of cost of sales excluding depletion, depreciation and amortization. |
• | Mine operating earnings - represents the amount of revenue in excess of cost of sales excluding depletion, depreciation and amortization and depletion, depreciation and amortization. |
• | Operating earnings - represents the amount of earnings before net finance income/expense and income tax recovery/expense. |
• | Cash flows from operating activities before changes in non-cash working capital — excludes the non-cash movement from period-to-period in working capital items including trade and other receivables, other assets, inventories, trade and other payables. |
| • | Depletion, depreciation and amortization ("DDA") per ounce of gold and silver, and per pound of copper — is a unitary measure of DD&A, based on ounces of gold and silver, and pound of copper sold to supplement the Company's disclosure with respect to the performance of each of the operation mines. |
The terms described above do not have a standardized meaning prescribed by IFRS, and therefore the Company’s definitions are unlikely to be comparable to similar measures presented by other companies. The Company’s management believes that their presentation provides useful information to investors because gross margin excluding depletion, depreciation and amortization excludes the non-cash operating cost item (i.e. depreciation, depletion and amortization), cash flows from operating activities before changes in non-cash working capital excludes the non-cash movement in working capital items, mine operating earnings excludes expenses not directly associate with commercial production and operating earnings excludes finance and tax related expenses and income/recoveries. These, in management’s view, provide useful information of the Company’s cash flows from operating activities and are considered to be meaningful in evaluating the Company’s past financial performance or the future prospects.
47
14. SELECTED QUARTERLY FINANCIAL AND OPERATING SUMMARY
| Sept. 30, | Jun. 30, | Mar. 31, | Dec. 31 | |||||||||
| (In millions of United States Dollars, unless otherwise noted) | 2015 | 2015 | 2015 | 2014 | ||||||||
| Financial results | ||||||||||||
Revenue (i) | $ | 448.9 | $ | 455.0 | $ | 458.1 | $ | 542.9 | ||||
| Mine operating earnings | $ | 49.7 | $ | 58.4 | $ | 40.2 | $ | 87.6 | ||||
Net loss from continuing operations (iv) | $ | (115.0 | ) | $ | (7.0 | ) | $ | (135.2 | ) | $ | (299.5 | ) |
Adjusted loss (ii) from continuing operations (iv) | $ | (20.2 | ) | $ | (8.3 | ) | $ | (37.5 | ) | $ | (16.2 | ) |
Net loss (iv) | $ | (113.0 | ) | $ | (7.8 | ) | $ | (151.8 | ) | $ | (335.3 | ) |
| Cash flows from operating activities from continuing operations | $ | 77.6 | $ | 123.4 | $ | 2.0 | $ | 183.6 | ||||
Cash flows from operating activities before changes in non-cash working capital (ii) | $ | 127.6 | $ | 149.3 | $ | 96.0 | $ | 166.4 | ||||
| Cash flows to investing activities from continuing operations | $ | (65.7 | ) | $ | (101.4 | ) | $ | (73.2 | ) | $ | (150.7 | ) |
Cash flows (to)/from financing activities operations from continuing operations | $ | 9.0 | $ | (23.8 | ) | $ | 2.9 | $ | (10.4 | ) | ||
| Per share financial results | ||||||||||||
| Net loss per share from continuing operations attributable to Yamana equity holders | ||||||||||||
| Basic | $ | (0.12 | ) | $ | (0.01 | ) | $ | (0.15 | ) | $ | (0.34 | ) |
| Diluted | $ | (0.12 | ) | $ | (0.01 | ) | $ | (0.15 | ) | $ | (0.35 | ) |
| Adjusted loss per share (ii) from continuing operations attributable to Yamana equity holders | ||||||||||||
| Basic and diluted | $ | (0.02 | ) | $ | (0.01 | ) | $ | (0.04 | ) | $ | (0.02 | ) |
| Weighted average number of common shares outstanding - basic (in thousands) | 946,563 | 938,900 | 913,716 | 877,664 | ||||||||
| Weighted average number of common shares outstanding - diluted (in thousands) | 946,563 | 938,900 | 913,716 | 880,841 | ||||||||
| Financial position | ||||||||||||
| Cash and cash equivalents | $ | 137.8 | $ | 0.2 | $ | 121.1 | $ | 191.0 | ||||
| Total assets | $ | 12,162.5 | $ | 12,086.1 | $ | 12,405.4 | $ | 12,530.7 | ||||
| Total long term liabilities | $ | 4,929.9 | $ | 4,847.3 | $ | 4,925.7 | $ | 5,066.1 | ||||
| Production - Gold | ||||||||||||
Commercial gold ounces produced (v) | 325,897 | 298,818 | 304,414 | 350,159 | ||||||||
Commissioning gold ounces produced (iii) (v) | — | — | — | — | ||||||||
| Discontinued operations - gold ounces | — | — | 460 | 2,414 | ||||||||
| Total gold ounces produced | 325,897 | 298,818 | 304,874 | 352,573 | ||||||||
Cash costs per gold ounce produced (ii) (v) | $ | 594 | $ | 603 | $ | 654 | $ | 513 | ||||
Co-product cash costs per gold ounce produced (ii) (v) | $ | 653 | $ | 701 | $ | 696 | $ | 640 | ||||
All-in sustaining costs per gold ounce produced (ii) (v) | $ | 841 | $ | 896 | $ | 893 | $ | 816 | ||||
All-in sustaining co-product costs per gold ounce produced (ii) (v) | $ | 856 | $ | 949 | $ | 896 | $ | 893 | ||||
| Production - Silver | ||||||||||||
Commercial silver ounces produced (v) | 2,196,744 | 2,372,047 | 2,482,910 | 2,652,036 | ||||||||
Cash costs per silver ounce produced (ii) (v) | $ | 7.37 | $ | 6.59 | $ | 7.10 | $ | 5.86 | ||||
Co-product cash costs per silver ounce produced (ii) (v) | $ | 8.46 | $ | 8.29 | $ | 7.71 | $ | 7.88 | ||||
All-in sustaining costs per silver ounce produced (ii) (v) | $ | 11.32 | $ | 10.72 | $ | 10.45 | $ | 10.02 | ||||
All-in sustaining co-product costs per silver ounce produced (ii) (v) | $ | 11.67 | $ | 11.81 | $ | 10.55 | $ | 11.17 | ||||
| Production - Other | ||||||||||||
| Chapada concentrate production (tonnes) | 63,259 | 61,324 | 47,685 | 63,955 | ||||||||
| Chapada copper contained in concentrate (millions of pounds) | 34.0 | 33.6 | 26.8 | 35.0 | ||||||||
| Chapada co-product cash costs per pound of copper produced | $ | 1.41 | $ | 1.39 | $ | 1.81 | $ | 1.57 | ||||
| Sales Included in Revenue (excluding 12.5% interest in Alumbrera) | ||||||||||||
| Gold (ounces) | 317,859 | 292,181 | 296,167 | 346,588 | ||||||||
| Silver (millions of ounces) | 2.2 | 2.3 | 2.4 | 2.8 | ||||||||
| Chapada concentrate (tonnes) | 55,460 | 60,455 | 50,337 | 66,534 | ||||||||
| Chapada payable copper contained in concentrate (millions of pounds) | 29.1 | 31.5 | 26.7 | 33.8 | ||||||||
| Average Realized Prices | ||||||||||||
Gold - per ounce (i) | $ | 1,122 | $ | 1,195 | $ | 1,217 | $ | 1,199 | ||||
Silver - per ounce (i) | $ | 14.88 | $ | 16.28 | $ | 16.74 | $ | 16.39 | ||||
Copper - per pound (i) | $ | 2.85 | $ | 2.91 | $ | 2.89 | $ | 2.99 | ||||
48
| Sept. 30, | Jun. 30, | Mar. 31, | Dec. 31, | |||||||||
| (In millions of United States Dollars, unless otherwise noted) | 2014 | 2014 | 2014 | 2013 | ||||||||
| Financial results | ||||||||||||
Revenues (i) | $ | 494.4 | $ | 443.8 | $ | 353.9 | $ | 420.7 | ||||
| Mine operating earnings | $ | 84.2 | $ | 80.8 | $ | 33.1 | $ | 70.1 | ||||
Net (loss)/earnings from continuing operations (iv) | $ | (879.6 | ) | $ | 15.7 | $ | (31.4 | ) | $ | (414.7 | ) | |
Adjusted (loss)/earnings (ii) from continuing operations (iv) | $ | (1.3 | ) | $ | 49.9 | $ | 9.9 | $ | 36.8 | |||
Net (loss)/earnings (iv) | $ | (1,023.3 | ) | $ | 5.1 | $ | (29.6 | ) | $ | (583.9 | ) | |
| Cash flows from operating activities from continuing operations | $ | 156.6 | $ | 143.0 | $ | 30.7 | $ | 165.9 | ||||
Cash flows from operating activities before changes in non-cash working capital (ii) | $ | 180.7 | $ | 148.9 | $ | 93.9 | $ | 165.2 | ||||
| Cash flows to investing activities from continuing operations | $ | (197.3 | ) | $ | (653.7 | ) | $ | (139.2 | ) | $ | (241.2 | ) |
| Cash flows from/(to) financing activities operations from continuing operations | $ | 34.1 | $ | 419.3 | $ | 97.2 | $ | 66.7 | ||||
| Per share financial results | ||||||||||||
| (Loss)/earnings per share from continuing operations attributable to Yamana equity holders | ||||||||||||
| Basic and diluted | $ | (1.00 | ) | $ | 0.02 | $ | (0.04 | ) | $ | (0.55 | ) | |
| Adjusted (loss)/earnings per share (ii) from continuing operations attributable to Yamana equity holders | ||||||||||||
| Basic and diluted | $ | — | $ | 0.06 | $ | 0.01 | $ | 0.05 | ||||
| Weighted average number of common shares outstanding - basic (in thousands) | 877,551 | 772,565 | 753,356 | 752,995 | ||||||||
| Weighted average number of common shares outstanding - diluted (in thousands) | 877,551 | 773,602 | 753,356 | 752,995 | ||||||||
| Financial position | ||||||||||||
| Cash and cash equivalents | $ | 167.0 | $ | 174.0 | $ | 209.5 | $ | 220.0 | ||||
| Total assets | $ | 12,784.7 | $ | 13,473.7 | $ | 11,375.5 | $ | 11,410.7 | ||||
| Total long term liabilities | $ | 5,057.5 | $ | 4,678.0 | $ | 3,717.2 | $ | 3,615.5 | ||||
| Production - Gold | ||||||||||||
Commercial gold ounces produced (v) | 302,875 | 259,728 | 204,254 | 233,866 | ||||||||
Commissioning gold ounces produced (iii) (v) | 23,722 | 19,390 | 18,605 | 16,614 | ||||||||
| Discontinued operations - gold ounces | 5,745 | 5,246 | 5,511 | 9,707 | ||||||||
| Total gold ounces produced | 332,342 | 284,364 | 228,370 | 260,187 | ||||||||
Cash costs per gold ounce produced (ii) (v) | $ | 528 | $ | 540 | $ | 474 | $ | 429 | ||||
Co-product cash costs per gold ounce produced (ii) (v) | $ | 695 | $ | 646 | $ | 687 | $ | 674 | ||||
All-in sustaining costs per gold ounce produced (ii) (v) | $ | 867 | $ | 897 | $ | 859 | $ | 779 | ||||
All-in sustaining co-product costs per gold ounce produced (ii) (v) | $ | 971 | $ | 951 | $ | 1,034 | $ | 975 | ||||
| Production - Silver | ||||||||||||
Commercial silver ounces produced (v) | 2,946,664 | 2,369,969 | 2,176,853 | 2,179,016 | ||||||||
Cash costs per silver ounce produced (ii) (v) | $ | 4.80 | $ | 6.57 | $ | 6.76 | $ | 7.10 | ||||
Co-product cash costs per silver ounce produced (ii) (v) | $ | 6.84 | $ | 8.01 | $ | 8.32 | $ | 10.05 | ||||
All-in sustaining costs per silver ounce produced (ii) (v) | $ | 8.80 | $ | 11.76 | $ | 12.67 | $ | 12.40 | ||||
All-in sustaining co-product costs per silver ounce produced (ii) (v) | $ | 9.99 | $ | 12.47 | $ | 13.77 | $ | 14.67 | ||||
| Production - Other | ||||||||||||
| Chapada concentrate production (tonnes) | 69,279 | 60,975 | 51,570 | 67,395 | ||||||||
| Chapada copper contained in concentrate production (millions of pounds) | 38.0 | 33.0 | 27.6 | 36.0 | ||||||||
| Chapada co-product cash costs per pound of copper produced | $ | 1.59 | $ | 1.75 | $ | 1.84 | $ | 1.53 | ||||
| Sales Included in Revenue (excluding 12.5% interest in Alumbrera) | ||||||||||||
| Gold (ounces) | 281,681 | 247,661 | 192,586 | 218,223 | ||||||||
| Silver (millions of ounces) | 2.7 | 2.2 | 2.2 | 2.1 | ||||||||
| Chapada concentrate (tonnes) | 70,288 | 56,010 | 48,747 | 67,616 | ||||||||
| Chapada payable copper contained in concentrate (millions of pounds) | 35.7 | 28.7 | 25.4 | 34.5 | ||||||||
| Average Realized Prices | ||||||||||||
Gold - per ounce (i) | $ | 1,276 | $ | 1,292 | $ | 1,300 | $ | 1,277 | ||||
Silver - per ounce (i) | $ | 19.27 | $ | 19.81 | $ | 20.43 | $ | 20.63 | ||||
Copper - per pound (i) | $ | 3.14 | $ | 3.11 | $ | 3.25 | $ | 3.37 | ||||
| (i) | Revenue consists of sales net of sales taxes. Revenue per ounce data is calculated based on gross sales. Realized prices reflect continuing operations. |
| (ii) | A cautionary note regarding non-GAAP measures is included in Section 13 of this Management’s Discussion and Analysis. Comparatives have been restated to conform to the change in presentation adopted in the current period. |
| (iii) | Including commissioning ounces from C1 Santa Luz and Pilar. |
49
| (iv) | Balances are attributable to Yamana Gold Inc. equity holders. |
| (v) | Balances are from continuing operations. |
15. DISCLOSURE CONTROLS AND PROCEDURES
Disclosure controls and procedures are designed to provide reasonable assurance that all relevant information is gathered and reported to senior management, including the Company’s Chairman and Chief Executive Officer and Executive Vice President, Finance and Chief Financial Officer, on a timely basis so that appropriate decisions can be made regarding public disclosure. The Company’s system of disclosure controls and procedures includes, but is not limited to, our Timely Disclosure and Confidentiality Policy, our Code of Conduct, our Insider Trading Policy, our Corporate Controls Policy, the effective functioning of our Audit Committee and procedures in place to systematically identify matters warranting consideration of disclosure by the Audit Committee.
As at the end of the period covered by this Management’s Discussion and Analysis, management of the Company, with the participation of the Chairman and Chief Executive Officer and the Executive Vice President, Finance and Chief Financial Officer, evaluated the effectiveness of the Company’s disclosure controls and procedures as required by applicable rules of the Canadian Securities Administrators (or Canadian securities regulatory authorities). The evaluation included documentation review, inquiries and other procedures considered by management to be appropriate in the circumstances. Based on that evaluation, the Chairman and Chief Executive Officer and the Executive Vice President, Finance and Chief Financial Officer have concluded that, as of the end of the period covered by this Management’s Discussion and Analysis, the disclosure controls and procedures (as defined in Rule 13a-15(e) under the Securities Exchange Act of 1934) were effective to provide reasonable assurance that information required to be disclosed in the Company’s annual filings and interim filings and other reports filed or submitted under applicable securities laws, is recorded, processed, summarized and reported within time periods specified by those laws and that material information is accumulated and communicated to management of the Company, including the Chairman and Chief Executive Officer and the Executive Vice President, Finance and Chief Financial Officer, as appropriate to allow timely decisions regarding required disclosure.
MANAGEMENT’S REPORT ON INTERNAL CONTROL OVER FINANCIAL REPORTING
Management of the Company is responsible for establishing and maintaining effective internal control over financial reporting as such term is defined in the rules of the United States Securities and Exchange Commission and the Canadian Securities Administrators. The Company’s internal control over financial reporting is designed to provide reasonable assurance regarding the reliability of the Company’s financial reporting for external purposes in accordance with IFRS. The Company’s internal control over financial reporting includes:
| • | maintaining records, that in reasonable detail, accurately and fairly reflect our transactions and dispositions of the assets of the Company; |
| • | providing reasonable assurance that transactions are recorded as necessary for preparation of our Consolidated Financial Statements in accordance with generally accepted accounting principles; |
| • | providing reasonable assurance that receipts and expenditures are made in accordance with authorizations of management and the directors of the Company; and |
| • | providing reasonable assurance that unauthorized acquisition, use or disposition of Company assets that could have a material effect on the Company’s Consolidated Financial Statements would be prevented or detected on a timely basis. |
The Company’s internal control over financial reporting may not prevent or detect all misstatements because of inherent limitations. Additionally, projections of any evaluation of effectiveness to future periods are subject to the risk that controls may become inadequate because changes in conditions or deterioration in the degree of compliance with the Company’s policies and procedures.
CHANGES IN INTERNAL CONTROLS
During the period ended September 30, 2015, there has been no change in the Company’s internal control over financial reporting that has materially affected, or is reasonably likely to materially affect, the Company’s internal control over financial reporting.
LIMITATIONS OF CONTROLS AND PROCEDURES
The Company’s management, including the Chairman and Chief Executive Officer and the Executive Vice President, Finance and Chief Financial Officer, believe that any disclosure controls and procedures or internal controls over financial reporting, no matter how well conceived and operated, can provide only reasonable, not absolute, assurance that the objectives of the control system
50
are met. Further, the design of a control system must reflect the fact that there are resource constraints, and the benefits of controls must be considered relative to their costs. Because of the inherent limitations in all control systems, they cannot provide absolute assurance that all control issues and instances of fraud, if any, within the Company have been prevented or detected. These inherent limitations include the realities that judgments in decision-making can be faulty, and that breakdowns can occur because of simple error or mistake. Additionally, controls can be circumvented by the individual acts of some persons, by collusion of two or more people, or by unauthorized override of the control. The design of any systems of controls also is based in part upon certain assumptions about the likelihood of future events, and there can be no assurance that any design will succeed in achieving its stated goals under all potential future conditions. Accordingly, because of the inherent limitations in a cost effective control system, misstatements due to error or fraud may occur and not be detected.
This report provides a discussion and analysis of the financial condition and results of operations (“Management’s Discussion and Analysis”) to enable a reader to assess material changes in financial condition between September 30, 2015 and December 31, 2014 and results of operations for the periods ended September 30, 2015 and September 30, 2014.
This Management’s Discussion and Analysis has been prepared as of October 29, 2015. The Condensed Consolidated Interim Financial Statements prepared in accordance with IFRS as issued by IASB follow this Management’s Discussion and Analysis. This Management’s Discussion and Analysis is intended to supplement and complement the annual audited consolidated financial statements and notes thereto as at and for the year ended December 31, 2014 (collectively the “Financial Statements”). You are encouraged to review the financial statements in conjunction with your review of this Management’s Discussion and Analysis. This Management’s Discussion and Analysis should be read in conjunction with both the annual audited consolidated financial statements for the year ended December 31, 2014 and the most recent Annual Information Form for the year ended December 31, 2014 on file with the Securities Commissions of all of the provinces in Canada, which are included in the 2014 Annual Report on Form 40-F on file with the United States Securities and Exchange Commission. Certain notes to the Financial Statements are specifically referred to in this Management’s Discussion and Analysis and such notes are incorporated by reference herein. All Dollar amounts in the Management’s Discussion and Analysis are in United States Dollars, unless otherwise specified.
CAUTIONARY STATEMENT REGARDING FORWARD-LOOKING INFORMATION
This Management’s Discussion and Analysis contains or incorporates by reference “forward-looking statements” and “forward-looking information” under applicable Canadian securities legislation within the meaning of the United States Private Securities Litigation Reform Act of 1995. Forward-looking information includes, but is not limited to information with respect to the Company’s strategy, plans or future financial or operating performance. Forward-looking statements are characterized by words such as “plan,” “expect”, “budget”, “target”, “project”, “intend”, “believe”, “anticipate”, “estimate” and other similar words, or statements that certain events or conditions “may” or “will” occur. Forward-looking statements are based on the opinions, assumptions and estimates of management considered reasonable at the date the statements are made, and are inherently subject to a variety of risks and uncertainties and other known and unknown factors that could cause actual events or results to differ materially from those projected in the forward-looking statements. These factors include the Company’s expectations in connection with the production and exploration, development and expansion plans at the Company's projects discussed herein being met, the impact of proposed optimizations at the Company's projects, the impact of the proposed new mining law in Brazil, the new tax reform bill in Mexico, the amended federal income tax statute in Argentina and the new Chilean tax reform package, and the impact of general business and economic conditions, global liquidity and credit availability on the timing of cash flows and the values of assets and liabilities based on projected future conditions, fluctuating metal prices (such as gold, copper, silver and zinc), currency exchange rates (such as the Brazilian real, the Chilean peso, the Argentine peso and the Mexican peso versus the United States dollar) possible variations in ore grade or recovery rates, changes in the Company’s hedging program, changes in accounting policies, changes in mineral resources and mineral reserves, risks related to non-core asset disposition, our expectations relating to the Osisko Acquisition (as defined herein), including with respect to anticipated benefits thereof and the magnitude of synergies therefrom, and the performance of the assets acquired from Osisko (as defined herein), and risks related to other acquisitions, changes in project parameters as plans continue to be refined, changes in project development, construction, production and commissioning time frames, the possibility of project cost overruns or unanticipated costs and expenses, higher prices for fuel, steel, power, labour and other consumables contributing to higher costs and general risks of the mining industry, including but not limited to, failure of plant, equipment or processes to operate as anticipated, unexpected changes in mine life, final pricing for concentrate sales, unanticipated results of future studies, seasonality and unanticipated weather changes, costs and timing of the development of new deposits, success of exploration activities, permitting timelines, government regulation and the risk of government expropriation or nationalization of mining operations, risks related to relying on local advisors and consultants in foreign jurisdictions, environmental risks, unanticipated reclamation expenses, risks relating to joint venture operations, title disputes or claims, limitations on insurance coverage and timing and possible outcome of pending and outstanding litigation and labour disputes, risks related to enforcing legal rights in foreign jurisdictions, as well as those risk factors discussed or referred to herein and in the Company's Annual Information Form filed with the securities regulatory authorities in all provinces of Canada
51
and available at www.sedar.com, and the Company’s Annual Report on Form 40-F filed with the United States Securities and Exchange Commission. Although the Company has attempted to identify important factors that could cause actual actions, events or results to differ materially from those described in forward-looking statements, there may be other factors that cause actions, events or results not to be anticipated, estimated or intended. There can be no assurance that forward-looking statements will prove to be accurate, as actual results and future events could differ materially from those anticipated in such statements. The Company undertakes no obligation to update forward-looking statements if circumstances or management’s estimates, assumptions or opinions should change, except as required by applicable law. The reader is cautioned not to place undue reliance on forward-looking statements. The forward-looking information contained herein is presented for the purpose of assisting investors in understanding the Company’s expected financial and operational performance and results as at and for the periods ended on the dates presented in the Company’s plans and objectives and may not be appropriate for other purposes.
CAUTIONARY STATEMENT REGARDING MINERAL RESERVES AND MINERAL RESOURCES
Readers should refer to the Annual Information Form of the Company for the year ended December 31, 2014 and other continuous disclosure documents filed by the Company since January 1, 2015 available at www.sedar.com, for further information on mineral reserves and mineral resources, which is subject to the qualifications and notes set forth therein.
CAUTIONARY STATEMENT TO UNITED STATES INVESTORS CONCERNING ESTIMATES OF MINERAL RESERVES AND MINERAL RESOURCES
This Management’s Discussion and Analysis has been prepared in accordance with the requirements of the securities laws in effect in Canada, which differ in certain material respects from the disclosure requirements of United States securities laws. The terms “mineral reserve”, “proven mineral reserve” and “probable mineral reserve” are Canadian mining terms as defined in accordance with Canadian National Instrument 43-101 Standards of Disclosure for Mineral Projects (“NI 43-101”) and the Canadian Institute of Mining, Metallurgy and Petroleum (the “CIM”) - CIM Definition Standards on Mineral Resources and Mineral Reserves, adopted by the CIM Council, as amended. These definitions differ from the definitions in the disclosure requirements promulgated by the Securities and Exchange Commission (the “Commission”) and contained in Industry Guide 7 (“Industry Guide 7”). Under Industry Guide 7 standards, a “final” or “bankable” feasibility study is required to report mineral reserves, the three-year historical average price is used in any mineral reserve or cash flow analysis to designate mineral reserves and the primary environmental analysis or report must be filed with the appropriate governmental authority.
In addition, the terms “mineral resource”, “measured mineral resource”, “indicated mineral resource” and “inferred mineral resource” are defined in and required to be disclosed by NI 43-101. However, these terms are not defined terms under Industry Guide 7 and are not permitted to be used in reports and registration statements of United States companies filed with the Commission. Investors are cautioned not to assume that any part or all of the mineral deposits in these categories will ever be converted into mineral reserves. “Inferred mineral resources” have a great amount of uncertainty as to their existence, and great uncertainty as to their economic and legal feasibility. It cannot be assumed that all or any part of an inferred mineral resource will ever be upgraded to a higher category. Under Canadian rules, estimates of inferred mineral resources may not form the basis of feasibility or pre-feasibility studies, except in rare cases. Investors are cautioned not to assume that all or any part of an inferred mineral resource exists or is economically or legally mineable. Disclosure of “contained ounces” in a mineral resource is permitted disclosure under Canadian regulations. In contrast, the Commission only permits U.S. companies to report mineralization that does not constitute “mineral reserves” by Commission standards as in place tonnage and grade without reference to unit measures.
Accordingly, information contained in this Management’s Discussion and Analysis may not be comparable to similar information made public by U.S. companies subject to the reporting and disclosure requirements under the United States federal securities laws and the rules and regulations of the Commission thereunder.
*************
52