| Table 64: Santo Nino - Manto Descriptive Statistics for Raw, Non-Composited, Metal Data |
| |
Santo Nino - RAW Non - Composited Data-Manto | Ag (gpt) | Au (gpt) | Cu (%) | Pb (%) | Zn (%) | W (ppm) | Mo (ppm) |
| Mean | 7.74 | 0.04 | 0.17 | 0.012 | 0.099 | 193.24 | 64.06 |
| Standard Error | 1.22 | 0.01 | 0.03 | 0.003 | 0.015 | 16.53 | 8.74 |
| Median | 2.3 | 0.02 | 0.02 | 0.000 | 0.015 | 90 | 18 |
| Mode | 0.5 | 0 | 0 | 0.000 | 0.010 | 10 | 1 |
| Standard Deviation | 18.13 | 0.12 | 0.38 | 0.051 | 0.221 | 246.34 | 130.17 |
| Sample Variance | 328.87 | 0.01 | 0.14 | 0.003 | 0.049 | 60,683 | 16,944 |
| Skewness | 5.68 | 10.28 | 4.47 | 7.222 | 3.353 | 1.90 | 4.76 |
| Range | 178.9 | 1.61 | 2.86 | 0.540 | 1.280 | 1190 | 1149 |
| Minimum | 0.1 | 0 | 0 | 0.000 | 0.000 | 10 | 1 |
| Maximum | 179 | 1.61 | 2.86 | 0.540 | 1.280 | 1200 | 1150 |
| Count | 222 | 222 | 222 | 222 | 222 | 222 | 222 |
| 97.5th | 53.63 | 0.18 | 0.91 | 0.120 | 0.894 | 878.00 | 396.13 |
| 99th | 88.06 | 0.45 | 2.08 | 0.240 | 1.131 | 1027.90 | 607.56 |

| Table 65: Santo Nino – Manto 2 metre Composited Descriptive Metal Data |
| |
Santo Nino- 2 m- Composited Data-Manto | Ag (gpt) | Au (gpt) | Cu (%) | Pb (%) | Zn (%) | W (ppm) | Mo (ppm) |
| Mean | 5.41 | 0.03 | 0.10 | 0.009 | 0.068 | 137.83 | 63.13 |
| Standard Error | 0.665 | 0.005 | 0.016 | 0.002 | 0.010 | 12.431 | 7.686 |
| Median | 1.8 | 0.01 | 0.01 | 0.001 | 0.015 | 60 | 19 |
| Mode | 0.1 | 0.01 | 0 | 0.000 | 0.006 | 10 | 5 |
| Standard Deviation | 9.93 | 0.08 | 0.23 | 0.027 | 0.155 | 185.64 | 114.78 |
| Sample Variance | 98.54 | 0.01 | 0.05 | 0.001 | 0.024 | 34,462 | 13,175 |
| Skewness | 3.945 | 7.463 | 5.076 | 4.428 | 4.615 | 2.230 | 3.718 |
| Range | 74.4 | 0.89 | 2.21 | 0.200 | 1.173 | 1010 | 850 |
| Minimum | 0.1 | 0 | 0 | 0.000 | 0.002 | 10 | 1 |
| Maximum | 74.5 | 0.89 | 2.21 | 0.200 | 1.175 | 1020 | 851 |
| Count | 223 | 223 | 223 | 223 | 223 | 223 | 223 |
| 97.5th | 55.78 | 0.456 | 1.136 | 0.157 | 0.929 | 829 | 121.4 |
| 99th | 64.708 | 0.6468 | 1.73 | 0.184 | 1.035 | 978.4 | 127.76 |
| Table 66: Santo Nino – Manto 2 metre Composited >15 AgEQ Descriptive Metal Data |
| |
Santo Nino- 2 m Composited Manto Data; AgEQ >15 gpt | Ag (gpt) | Au (gpt) | Cu (%) | Pb (%) | Zn (%) | W (ppm) | Mo (ppm) |
| Mean | 44.34 | 0.07 | 0.31 | 0.019 | 0.143 | 239.86 | 26.74 |
| Standard Error | 4.72 | 0.02 | 0.04 | 0.005 | 0.029 | 29.54 | 3.96 |
| Median | 33.85 | 0.04 | 0.22 | 0.001 | 0.049 | 150 | 12 |
| Mode | 16 | 0.04 | 0.17 | 0.000 | 0.026 | 20 | 7 |
| Standard Deviation | 38.05 | 0.13 | 0.35 | 0.042 | 0.232 | 238.12 | 31.92 |
| Sample Variance | 1447.94 | 0.02 | 0.12 | 0.002 | 0.054 | 56,702 | 1018.6 |
| Skewness | 3.76 | 4.58 | 3.21 | 2.866 | 2.931 | 1.49 | 1.87 |
| Range | 250.48 | 0.89 | 2.21 | 0.2 | 1.169 | 1010 | 137 |
| Minimum | 15.22 | 0 | 0 | 0 | 0.006 | 10 | 1 |
| Maximum | 265.7 | 0.89 | 2.21 | 0.2 | 1.175 | 1020 | 138 |
| Count | 65 | 65 | 65 | 65 | 65 | 65 | 65 |
| 97.5th | 55.78 | 0.456 | 1.136 | 0.157 | 0.929 | 829 | 121.4 |
| 99th | 64.708 | 0.6468 | 1.73 | 0.184 | 1.035 | 978.4 | 127.76 |
| Table 67: Santo Nino – Manto 2 metre Composited >30 AgEQ Descriptive Metal Data |
| |
Santo Nino- 2 m Composited Manto Data; AgEQ >30 gpt | Ag (gpt) | Au (gpt) | Cu (%) | Pb (%) | Zn (%) | W (ppm) | Mo (ppm) |
| Mean | 19.08 | 0.09 | 0.44 | 0.027 | 0.189 | 299.16 | 30.84 |
| Standard Error | 2.94 | 0.03 | 0.07 | 0.009 | 0.047 | 45.72 | 5.43 |
| Median | 11.6 | 0.04 | 0.34 | 0.001 | 0.059 | 195 | 18 |
| Mode | 4.8 | 0.04 | 0.23 | 0.000 | 0.026 | 75 | 5 |
| Standard Deviation | 17.89 | 0.16 | 0.42 | 0.053 | 0.288 | 278.10 | 33.01 |
| Sample Variance | 320.23 | 0.03 | 0.17 | 0.003 | 0.083 | 77,342 | 1089.8 |
| Skewness | 1.48 | 4.07 | 2.56 | 2.15 | 2.28 | 1.09 | 1.60 |
| Range | 73.1 | 0.88 | 2.21 | 0.200 | 1.169 | 990 | 121 |
| Minimum | 1.4 | 0.01 | 0 | 0.000 | 0.006 | 30 | 1 |
| Maximum | 74.5 | 0.89 | 2.21 | 0.200 | 1.175 | 1020 | 122 |
| Count | 37 | 37 | 37 | 37 | 37 | 37 | 37 |
| 97.5th | 60.73 | 0.55 | 1.54 | 0.178 | 0.979 | 961.50 | 121.10 |
| 99th | 68.99 | 0.75 | 1.94 | 0.191 | 1.097 | 996.60 | 121.64 |
| Table 68: Santo Nino – Manto 2 metre Composited >60 AgEQ Descriptive Metal Data |
| |
Santo Nino- 2m Composited Data-Manto AgEQ >60 gpt | Ag (gpt) | Au (gpt) | Cu (%) | Pb (%) | Zn (%) | W (ppm) | Mo (ppm) |
| Mean | 28.764 | 0.046 | 0.724 | 0.040 | 0.180 | 427.500 | 31.429 |
| Standard Error | 6.267 | 0.008 | 0.146 | 0.019 | 0.065 | 88.058 | 10.814 |
| Median | 26.650 | 0.040 | 0.640 | 0.000 | 0.113 | 367.500 | 15.000 |
| Mode | 6.800 | 0.030 | 0.640 | 0.000 | - | 710.000 | 4.000 |
| Standard Deviation | 23.451 | 0.028 | 0.545 | 0.070 | 0.244 | 329.482 | 40.462 |
| Sample Variance | 549.935 | 0.001 | 0.298 | 0.005 | 0.060 | 108,558 | 1637.19 |
| Skewness | 0.573 | 1.709 | 1.712 | 1.670 | 2.783 | 0.525 | 1.809 |
| Range | 69.700 | 0.100 | 2.160 | 0.200 | 0.946 | 990.00 | 121.00 |
| Minimum | 4.8 | 0.02 | 0.05 | 0 | 0.0114 | 30 | 1 |
| Maximum | 74.5 | 0.12 | 2.21 | 0.2 | 0.957 | 1020 | 122 |
| Count | 14 | 14 | 14 | 14 | 14 | 14 | 14 |
| 97.5th | 69.528 | 0.110 | 1.966 | 0.192 | 0.743 | 998.875 | 121.675 |
| 99th | 72.511 | 0.116 | 2.113 | 0.197 | 0.871 | 1011.550 | 121.870 |
| Table 69: Santo Nino Structure Descriptive Statistics for Raw, Non-Composited, Metal Data |
| |
Santo Nino- RAW Non - Composited Data-Structure | Ag (gpt) | Au (gpt) | Cu (%) | Pb (%) | Zn (%) | W (ppm) | Mo (ppm) |
| Mean | 22.42 | 0.04 | 0.45 | 0.025 | 0.253 | 208.54 | 71.18 |
| Standard Error | 4.00 | 0.00 | 0.11 | 0.009 | 0.069 | 16.04 | 8.50 |
| Median | 3.85 | 0.02 | 0.03 | 0.000 | 0.020 | 130 | 24.5 |
| Mode | 0.3 | 0.01 | 0.01 | 0.000 | 0.010 | 10 | 5 |
| Standard Deviation | 53.38 | 0.06 | 1.43 | 0.116 | 0.914 | 214.03 | 113.37 |
| Sample Variance | 2849.5 | 0.00 | 2.03 | 0.014 | 0.836 | 45,808 | 12,852 |
| Skewness | 3.64 | 3.09 | 4.64 | 6.675 | 5.684 | 1.35 | 3.30 |
| Range | 300.7 | 0.48 | 10.25 | 1.000 | 7.540 | 900 | 699 |
| Minimum | 0.3 | 0 | 0 | 0.000 | 0.000 | 10 | 1 |
| Maximum | 301 | 0.48 | 10.25 | 1.000 | 7.540 | 910 | 700 |
| Count | 178 | 178 | 178 | 178 | 178 | 178 | 178 |
| 97.5th | 221.80 | 0.22 | 6.01 | 0.199 | 2.857 | 747.25 | 365.70 |
| 99th | 279.44 | 0.25 | 7.48 | 0.747 | 5.545 | 852.30 | 644.49 |
| Table 70: Santo Nino Structure Descriptive Statistics for 2 metre Composited, Metal Data |
| |
Santo Nino- 2 m- Composited Data-Structure | Ag (gpt) | Au (gpt) | Cu (%) | Pb %) | Zn (%) | W (ppm) | Mo (ppm) |
| Mean | 12.84 | 0.03 | 0.24 | 0.015 | 0.142 | 169.08 | 69.43 |
| Standard Error | 2.09 | 0.00 | 0.06 | 0.004 | 0.036 | 14.16 | 8.35 |
| Median | 2.9 | 0.01 | 0.03 | 0.000 | 0.020 | 100 | 27 |
| Mode | 0.3 | 0.01 | 0 | 0.000 | 0.007 | 10 | 14 |
| Standard Deviation | 26.99 | 0.04 | 0.73 | 0.056 | 0.462 | 182.41 | 107.58 |
| Sample Variance | 728.51 | 0.00 | 0.53 | 0.003 | 0.213 | 33,273 | 11,573 |
| Skewness | 3.61 | 2.33 | 4.93 | 5.589 | 5.304 | 1.39 | 3.24 |
| Range | 179.6 | 0.24 | 6.06 | 0.397 | 3.115 | 810 | 699 |
| Minimum | 0.2 | 0 | 0 | 0.000 | 0.002 | 10 | 1 |
| Maximum | 179.8 | 0.24 | 6.06 | 0.397 | 3.118 | 820 | 700 |
| Count | 166 | 166 | 166 | 166 | 166 | 166 | 166 |
| 97.5th | 92.63 | 0.15 | 2.51 | 0.178 | 1.412 | 651.75 | 389.75 |
| 99th | 123.15 | 0.20 | 3.21 | 0.344 | 3.046 | 710.50 | 525.35 |
| Table 71: Santo Nino Structure Descriptive Statistics for 2 metre Composited >15 AgEQ Descriptive Metal Data |
| |
Santo Nino- 2 m- Composited Structure Data; AgEQ >15 gpt | Ag (gpt) | Au (gpt) | Cu (%) | Pb %) | Zn (%) | W (ppm) | Mo (ppm) |
| Mean | 34.67 | 0.06 | 0.71 | 0.037 | 0.367 | 254.50 | 47.83 |
| Standard Error | 5.34 | 0.01 | 0.16 | 0.013 | 0.102 | 25.96 | 7.94 |
| Median | 16 | 0.04 | 0.195 | 0.000 | 0.095 | 199.5 | 21.5 |
| Mode | 5.1 | 0.01 | 0.11 | 0.000 | - | 120 | 12 |
| Standard Deviation | 39.22 | 0.06 | 1.15 | 0.095 | 0.746 | 190.74 | 58.36 |
| Sample Variance | 1538.3 | 0.00 | 1.33 | 0.009 | 0.557 | 36,384 | 3405.58 |
| Skewness | 1.89 | 1.59 | 2.68 | 3.003 | 2.989 | 0.99 | 2.02 |
| Range | 177.2 | 0.23 | 6.04 | 0.397 | 3.106 | 800 | 233 |
| Minimum | 2.6 | 0.01 | 0.02 | 0.000 | 0.012 | 20 | 4 |
| Maximum | 179.8 | 0.24 | 6.06 | 0.397 | 3.118 | 820 | 237 |
| Count | 54 | 54 | 54 | 54 | 54 | 54 | 54 |
| 97.5th | 139.725 | 0.21375 | 3.35375 | 0.357 | 3.061 | 690.25 | 223.175 |
| 99th | 167.345 | 0.2347 | 4.7032 | 0.383 | 3.095 | 756.4 | 233.29 |
| Table 72: Santo Nino Structure Descriptive Statistics for 2 metre Composited >30 AgEQ Descriptive Metal Data |
| |
| Santo Nino- 2 m Composited Structure Data; AgEQ >30 gpt | Ag (gpt) | Au (gpt) | Cu (%) | Pb (%) | Zn (%) | W (ppm) | Mo (ppm) |
| Mean | 18.8 | 0.136 | 0.226 | 0.05 | 0.53 | 213.4 | 31.8 |
| Standard Error | 4.22 | 0.05 | 0.04 | 0.02 | 0.16 | 100.03 | 12.11 |
| Median | 14.6 | 0.2 | 0.24 | 0 | 0.1519 | 115 | 30 |
| Mode | - | - | - | 0 | - | - | - |
| Standard Deviation | 9.45 | 0.11 | 0.10 | 0.12 | 0.91 | 223.67 | 27.09 |
| Sample Variance | 89.22 | 0.01 | 0.01 | 0.01 | 0.83 | 50,029 | 733.70 |
| Skewness | 1.76 | -0.57 | -1.23 | 2.20 | 2.25 | 2.09 | 1.18 |
| Range | 23.7 | 0.22 | 0.25 | 0.40 | 3.10 | 533 | 68 |
| Minimum | 11.2 | 0.01 | 0.07 | 0 | 0.0216 | 75 | 7 |
| Maximum | 34.9 | 0.23 | 0.32 | 0.40 | 3.12 | 608 | 75 |
| Count | 5 | 5 | 5 | 33 | 33 | 5 | 5 |
| 97.5th | 31.37 | 0.23 | 0.31 | 0.38 | 3.08 | 718.05 | 227.68 |
| 99th | 33.49 | 0.23 | 0.32 | 0.39 | 3.10 | 737.22 | 254.27 |
| Table 73: Santo Nino Structure Descriptive Statistics for 2 metre Composited >60 AgEQ Descriptive Metal Data |
| |
Santo Nino - 2m Composited Data- Structure AgEQ >60 gpt | Ag (gpt) | Au (gpt) | Cu (%) | Pb (%) | Zn (%) | W (ppm) | Mo (ppm) |
| Mean | 71.495 | 0.082 | 1.606 | 0.065 | 0.816 | 297.550 | 36.550 |
| Standard Error | 9.697 | 0.011 | 0.341 | 0.029 | 0.241 | 37.010 | 8.168 |
| Median | 61.250 | 0.075 | 1.410 | 0.000 | 0.278 | 273.500 | 20.500 |
| Mode | - | 0.040 | - | 0.000 | - | - | 9.000 |
| Standard Deviation | 43.366 | 0.051 | 1.525 | 0.129 | 1.079 | 165.514 | 36.530 |
| Sample Variance | 1880.6 | 0.003 | 2.326 | 0.017 | 1.165 | 27,395 | 1334.5 |
| Skewness | 0.976 | 1.347 | 1.333 | 1.845 | 1.509 | 0.583 | 1.154 |
| Range | 164 | 0.22 | 6.04 | 0.3965 | 3.0834 | 585 | 117 |
| Minimum | 15.8 | 0.01 | 0.02 | 0 | 0.0342 | 85 | 4 |
| Maximum | 179.8 | 0.23 | 6.06 | 0.3965 | 3.1176 | 670 | 121 |
| Count | 20 | 20 | 20 | 20 | 20 | 20 | 20 |
| 97.5th | 168.638 | 0.192 | 4.844 | 0.365 | 3.098 | 603.500 | 109.125 |
| 99th | 175.335 | 0.215 | 5.574 | 0.384 | 3.110 | 643.400 | 116.250 |
| Table 74: Santo Nino Contact Skarn Descriptive Statistics for Raw, Non-Composited Descriptive Metal Data |
| |
Santo Nino - RAW Non - Composited Data- Contact Skarn | Ag (gpt) | Au (gpt) | Cu (%) | Pb (%) | Zn (%) | W (ppm) | Mo (ppm) |
| Mean | 2.697 | 0.017 | 0.027 | 0.007 | 0.055 | 152.099 | 57.481 |
| Standard Error | 0.499 | 0.004 | 0.006 | 0.003 | 0.013 | 17.071 | 6.091 |
| Median | 0.7 | 0 | 0.01 | 0.0005 | 0.01 | 70 | 31 |
| Mode | 0.2 | 0 | 0 | 0 | 0.01 | 10 | 3 |
| Standard Deviation | 6.72 | 0.05 | 0.08 | 0.04 | 0.17 | 229.67 | 81.95 |
| Sample Variance | 45.112 | 0.003 | 0.007 | 0.002 | 0.030 | 52,749 | 6716.05 |
| Skewness | 5.250 | 5.905 | 5.726 | 10.903 | 5.943 | 3.912 | 3.255 |
| Range | 56.300 | 0.440 | 0.690 | 0.500 | 1.480 | 1870.0 | 559.00 |
| Minimum | 0.1 | 0 | 0 | 0 | 0 | 10 | 1 |
| Maximum | 56.4 | 0.44 | 0.69 | 0.5 | 1.48 | 1880 | 560 |
| Count | 181 | 181 | 181 | 181 | 181 | 181 | 181 |
| 97.5th | 20.15 | 0.145 | 0.2 | 0.04 | 0.4405 | 695 | 258 |
| 99th | 35.44 | 0.3 | 0.476 | 0.098 | 1.004 | 1024 | 370.4 |
| Table 75: Santo Nino Contact Skarn Descriptive Statistics for 2 metre Composited Descriptive Metal Data |
| |
Santo Nino - 2 m Composited Contact Skarn Data | Ag (gpt) | Au (gpt) | Cu (%) | Pb (%) | Zn (%) | W (ppm) | Mo (ppm) |
| Mean | 2.00 | 0.01 | 0.02 | 0.005 | 0.050 | 122.49 | 53.33 |
| Standard Error | 0.28 | 0.00 | 0.00 | 0.002 | 0.011 | 11.35 | 4.99 |
| Median | 0.6 | 0.01 | 0.01 | 0.001 | 0.008 | 63 | 28 |
| Mode | 0.2 | 0 | 0 | 0.000 | 0.003 | 10 | 3 |
| Standard Deviation | 3.99 | 0.03 | 0.04 | 0.028 | 0.162 | 162.90 | 71.66 |
| Sample Variance | 15.91 | 0.00 | 0.00 | 0.001 | 0.026 | 26,538 | 5134.85 |
| Skewness | 4.46 | 4.74 | 4.76 | 12.544 | 6.769 | 2.59 | 2.89 |
| Range | 34.8 | 0.23 | 0.32 | 0.385 | 1.478 | 1025 | 539 |
| Minimum | 0.1 | 0 | 0 | 0.000 | 0.002 | 10 | 1 |
| Maximum | 34.9 | 0.23 | 0.32 | 0.385 | 1.480 | 1035 | 540 |
| Count | 206 | 206 | 206 | 206 | 206 | 206 | 206 |
| 97.5th | 14.10 | 0.08 | 0.12 | 0.033 | 0.439 | 573.75 | 243.25 |
| 99th | 17.25 | 0.21 | 0.24 | 0.040 | 0.643 | 759.50 | 314.05 |
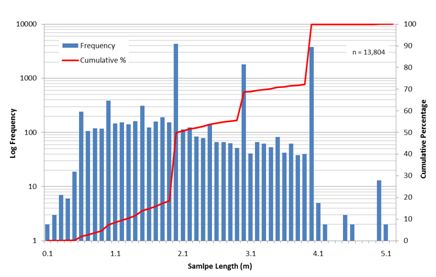
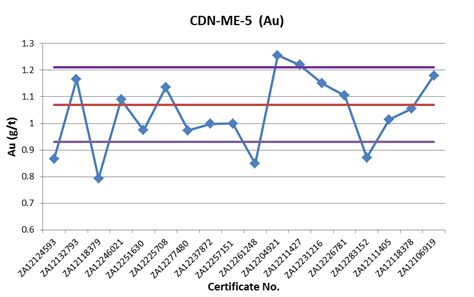
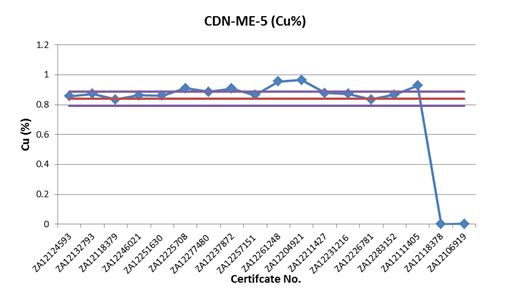
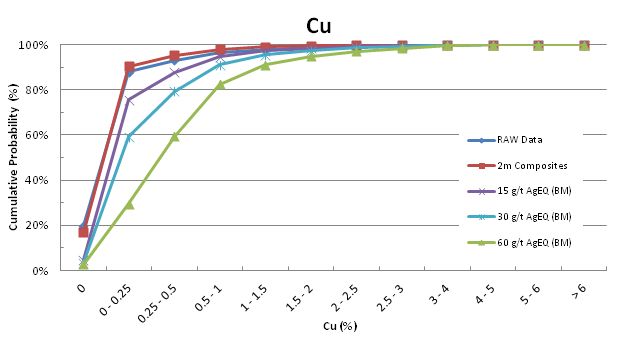
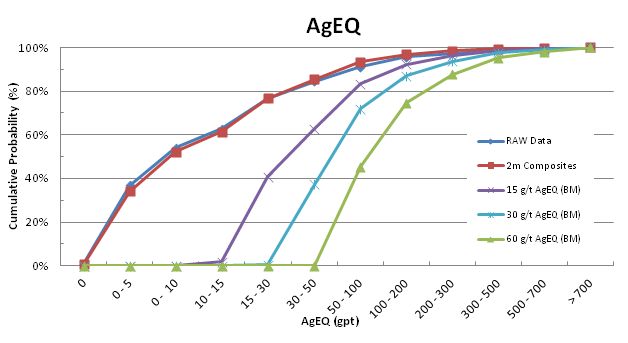
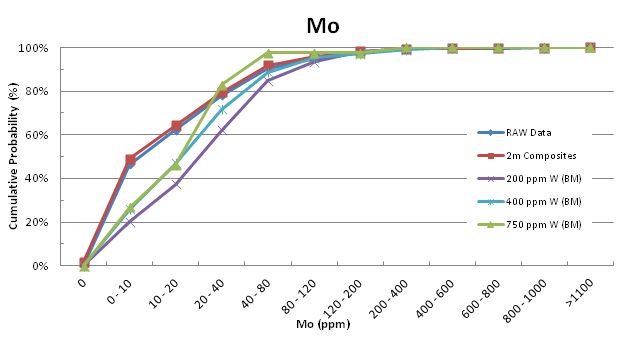
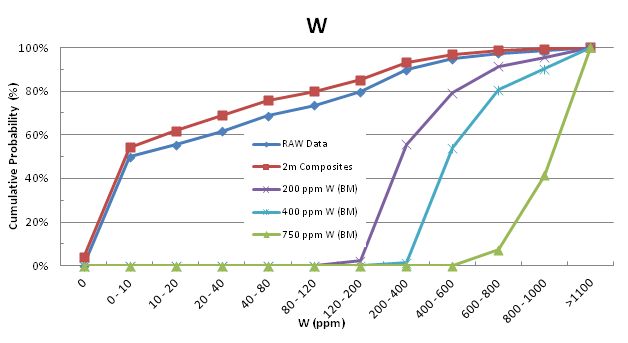
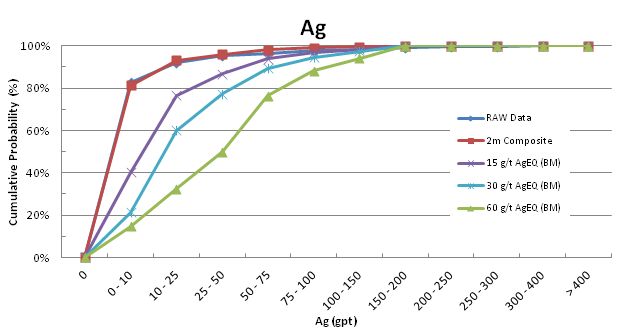
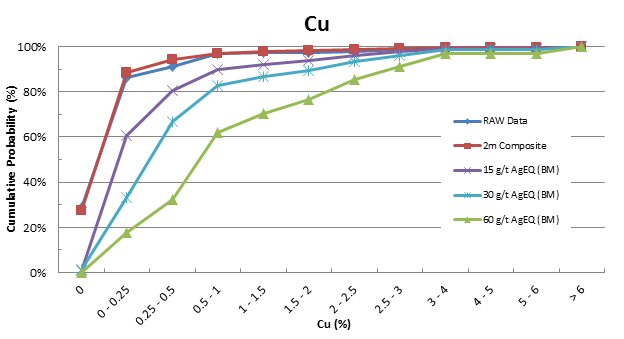
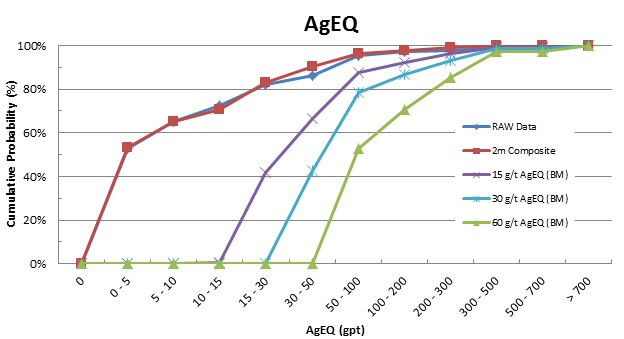
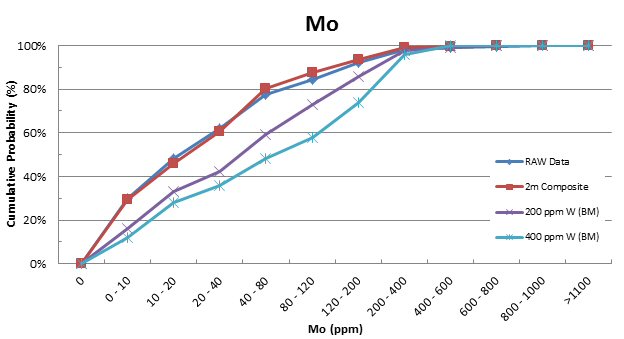
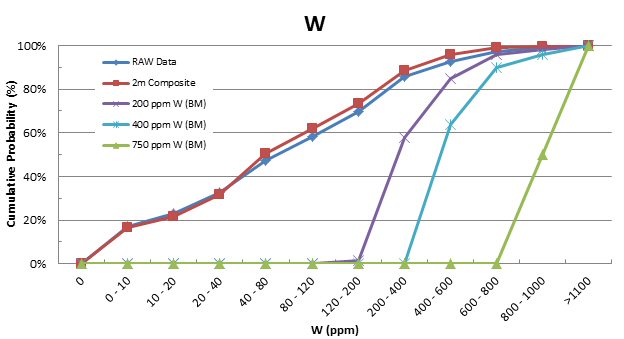
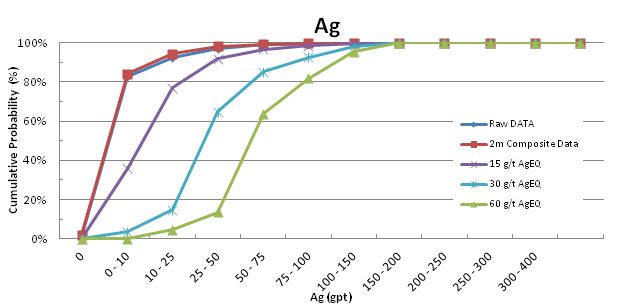
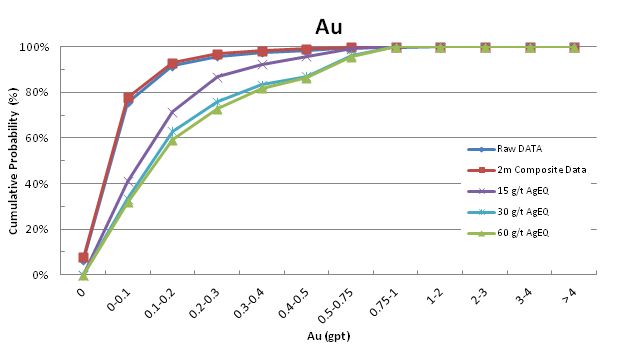
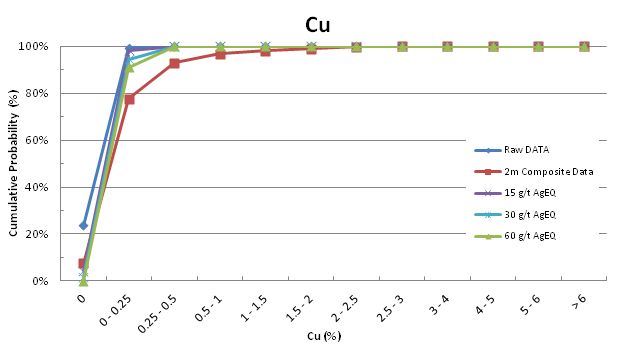
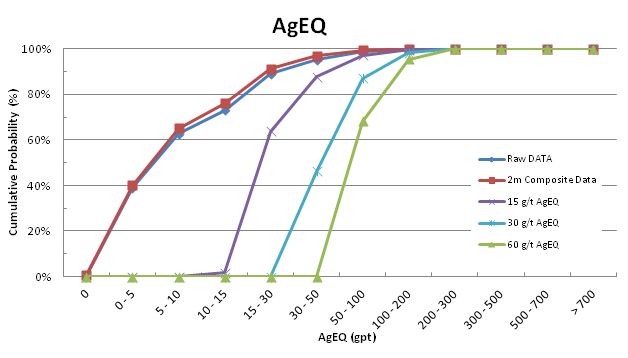
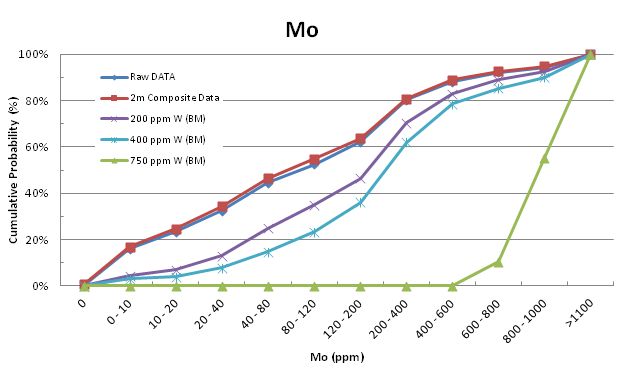
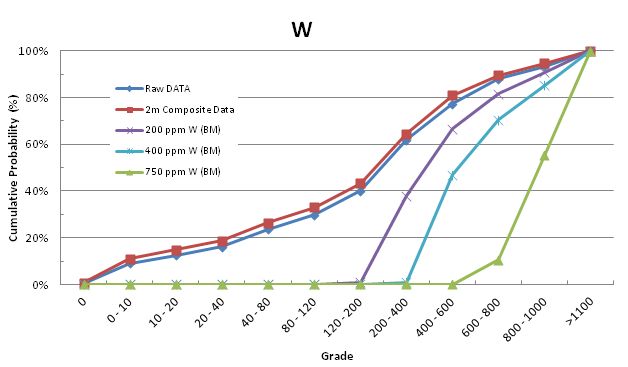
Tetra Tech feels that the reduction and interpolation of data values into the Santo Nino block model is well constrained and representative of the raw assay values. Cumulative probability plots shown in Figure 49 show an increase in grade control and elimination of lower grade dilution with successive data constraint.
Figure 49: Santo Nino cumulative probability plots for silver, gold, copper, AgEQ, molybdenum and tungsten
14.3.3.1 Santo Nino High Grade Capping
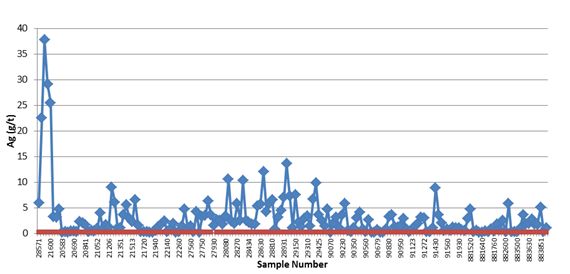
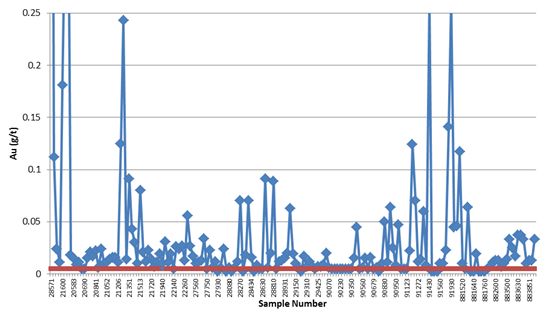
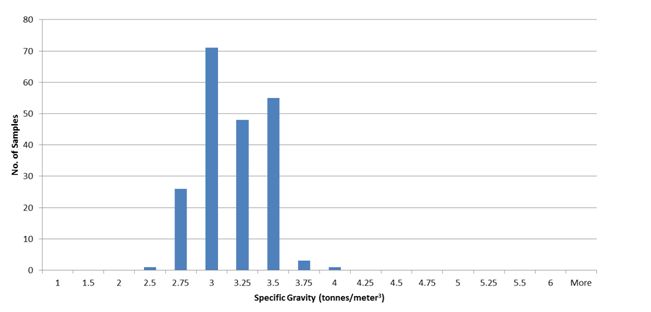
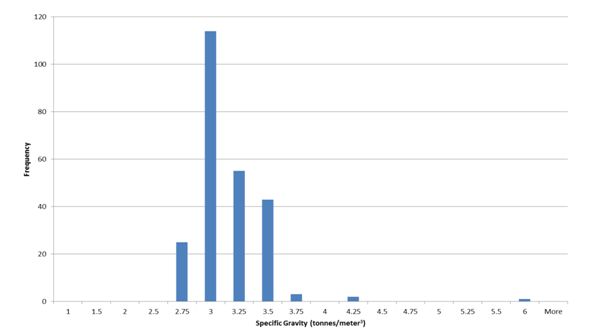
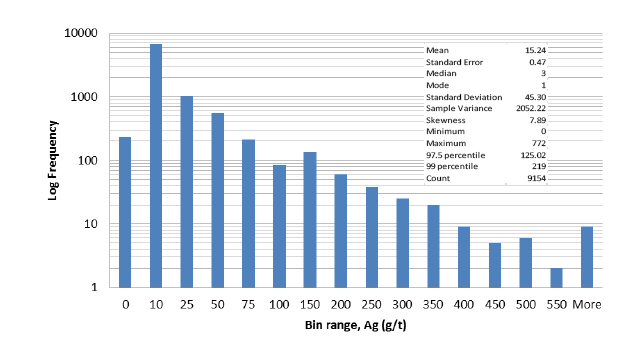
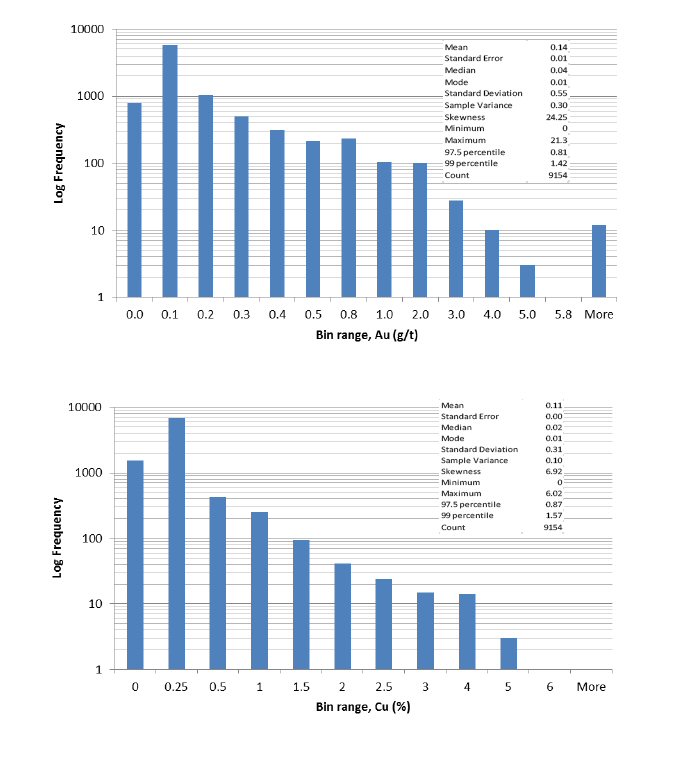
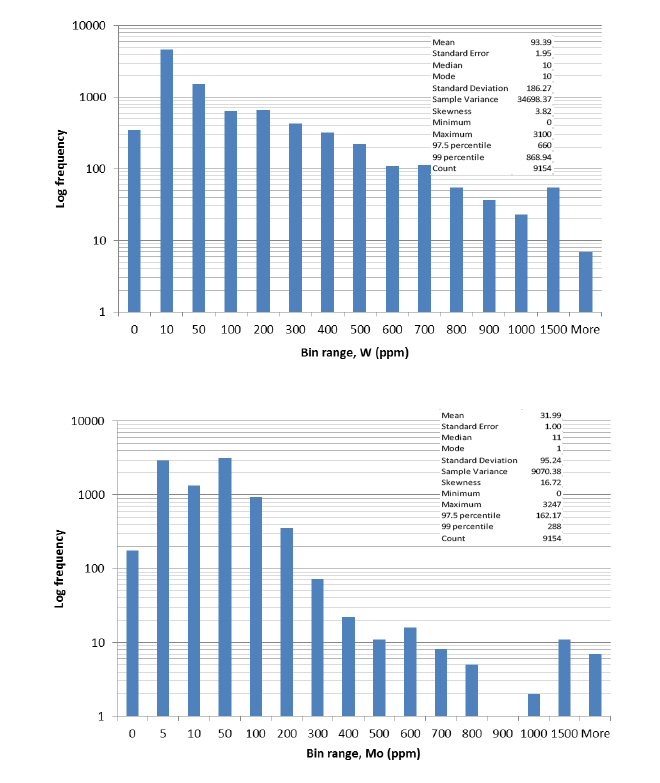
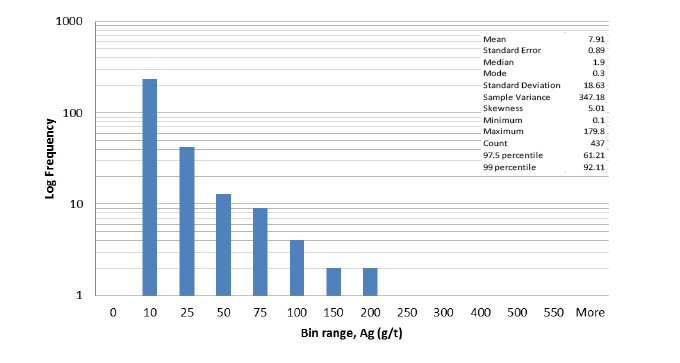
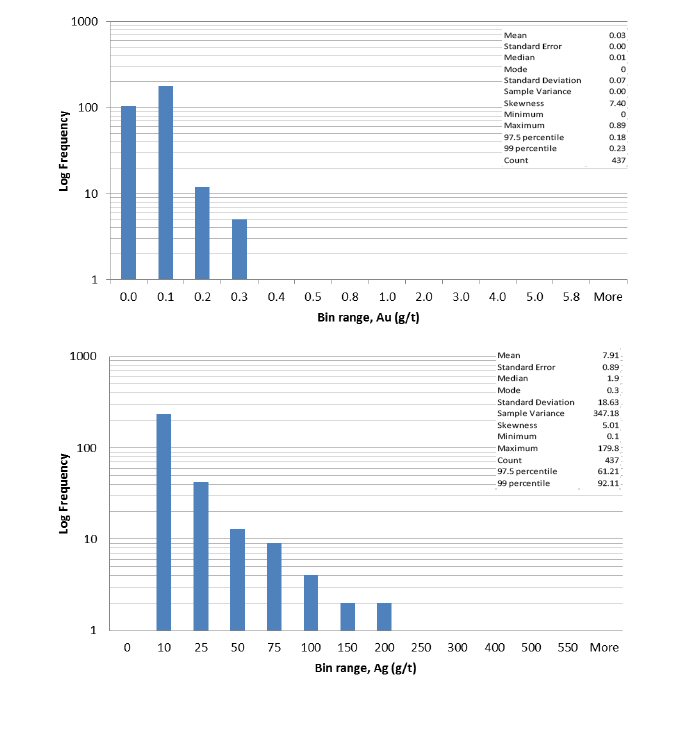
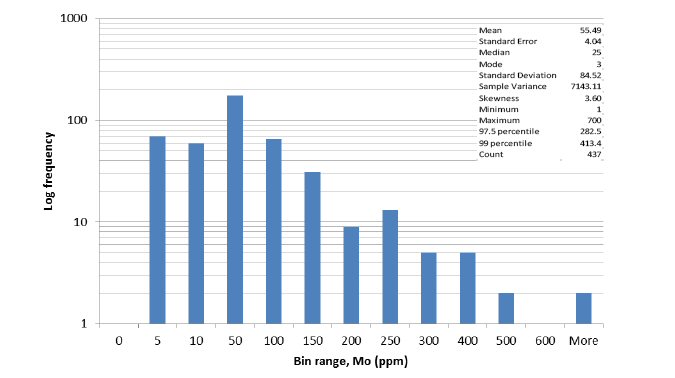
Inspection of 2 metre composite grade distributions (Figure 50) in Santo Nino mineralized solids for silver, copper, gold, tungsten and molybdenum indicated that the data populations were positively skewed and may include multiple internal grade populations. Histogram distributions for each metal were used for visual determination of anomalous values and for the basis of high grade metal caps. High grade caps were applied to the 2 metre composites during interpolation of the block model using values of 550 gpt for silver, 6% for copper and 5.8 gpt for gold. No grade cap was applied to molybdenum or tungsten data as distributions appear to be continuous and where outliers were noted, visual inspection confirmed that these samples occurred adjacent to other high grade samples in drill core records and are thereby not felt to be anomalous.
Figure 50: Santo Nino histogram for distributions of 2 metre composite data
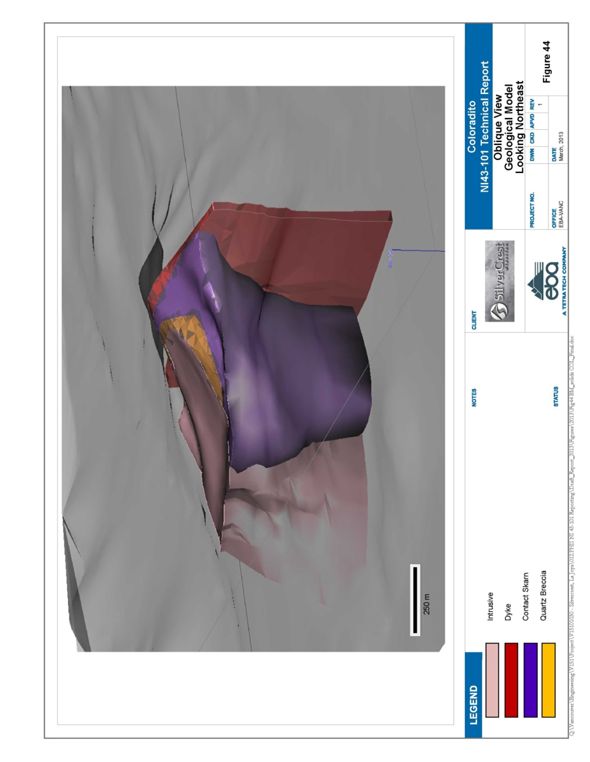
14.3.4 Coloradito Geostatistics
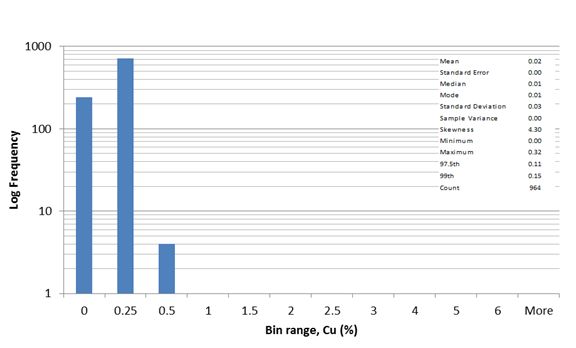
Coloradito used 2,784 recent and historically verified raw samples within two solids of contact skarn designation, one large primary solid and a second smaller solid constrained by 200 ppm W. These were used in the development of the geological and resource estimation model. Raw samples within the contact skarn were composited to 2 metre weighted averages, with the data ‘reduction’ resulting in 964 normalized composite samples. Minor Ag, Au & Cu mineralization was also located in the primary and secondary solids. Descriptive statistics for the raw and 2 metre composite samples contained within contact skarn, along with the resulting >15 gpt, 30 gpt and >60 gpt AgEQ cutoff and 200 ppm and 400 ppm W cutoffs, are listed in Table 76 to Table 82.
| Table 76: Coloradito Contact Skarn - Descriptive Statistics for Raw, Non-Composited, Metal Data |
| |
Coloradito - RAW Data Contact Skarn | Ag (gpt) | Au (gpt) | Cu (%) | Mo (ppm) | W (ppm) |
| Mean | 7.85 | 0.08 | 0.03 | 274.91 | 390.82 |
| Standard Error | 0.33 | 0.00 | 0.00 | 9.24 | 7.57 |
| Median | 2.4 | 0.04 | 0.01 | 105.5 | 300 |
| Mode | 1 | 0.01 | 0.01 | 4 | 10 |
| Standard Deviation | 17.55 | 0.12 | 0.04 | 487.74 | 399.32 |
| Sample Variance | 307.94 | 0.02 | 0.00 | 237,890 | 159,460 |
| Skewness | 6.18 | 4.78 | 4.00 | 5.20 | 2.33 |
| Minimum | 0 | 0 | 0 | 0 | 0 |
| Maximum | 230 | 1.43 | 0.41 | 6520 | 3970 |
| Count | 2784 | 2784 | 2784 | 2784 | 2784 |
| 97.5th | 58 | 0.39 | 0.17 | 1570 | 1360.2 |
| 99th | 83 | 0.5651 | 0.2217 | 2240 | 1816.8 |
| Table 77: Coloradito Contact Skarn – 2 metre Composited Descriptive Metal Data |
| |
Coloradito - 2 metre- Composited Data | Ag (gpt) | Au (gpt) | Cu (%) | Mo (ppm) | W (ppm) |
| Mean | 6.71 | 0.07 | 0.02 | 254.08 | 352.60 |
| Standard Error | 0.45 | 0.00 | 0.00 | 13.67 | 11.34 |
| Median | 2.20 | 0.04 | 0.01 | 94.00 | 260 |
| Mode | 1.00 | 0.01 | 0.01 | 4.00 | 10 |
| Standard Deviation | 13.91 | 0.10 | 0.03 | 424.41 | 352.07 |
| Sample Variance | 193.48 | 0.01 | 0.00 | 180,126 | 123,951 |
| Skewness | 5.90 | 3.28 | 4.30 | 4.22 | 1.84 |
| Minimum | 0.00 | 0.00 | 0.00 | 0.00 | 0 |
| Maximum | 191.00 | 0.84 | 0.32 | 4710.00 | 3060 |
| Count | 964 | 964 | 964 | 964 | 964 |
| 97.5th | 40.93 | 0.34 | 0.11 | 1470.13 | 1272.00 |
| 99th | 66.37 | 0.49 | 0.15 | 2048.10 | 1512.36 |
| Table 78: Coloradito Contact Skarn – Composited >15 AgEQ Descriptive Metal Data |
| |
Coloradito - 2 metre- Composited Contact Skarn Data; >15 gpt AgEQ | Ag (gpt) | Au (gpt) | Cu (%) | Mo (ppm) | W (ppm) |
| Mean | 20.4 | 0.2 | 0.0 | 469.2 | 531.6 |
| Standard Error | 1.5 | 0.0 | 0.0 | 43.8 | 25.1 |
| Median | 13.2 | 0.13 | 0.02 | 238.5 | 478 |
| Mode | 13.10 | 0.06 | 0.01 | 4 | 40 |
| Standard Deviation | 23.2 | 0.1 | 0.1 | 670.6 | 383.5 |
| Sample Variance | 536.1 | 0.0 | 0.0 | 449,751 | 147,071 |
| Skewness | 3.4 | 1.9 | 2.7 | 3.0 | 1.2 |
| Minimum | 0.8 | 0.01 | 0 | 1 | 10 |
| Maximum | 191 | 0.84 | 0.32 | 4710 | 2430 |
| Count | 234 | 234 | 234 | 234 | 234 |
| 97.5th | 94.01 | 0.54275 | 0.21525 | 2165.75 | 1394.68 |
| Table 79: Coloradito Contact Skarn - >30 AgEQ Descriptive Metal Data |
| |
Coloradito – 2 metre- Composited Contact Skarn Data; >30 gpt AgEQ | Ag (gpt) | Au (gpt) | Cu (%) | Mo (ppm) | W (ppm) |
| Mean | 37.69 | 0.23 | 0.05 | 559.14 | 503.05 |
| Standard Error | 3.21 | 0.02 | 0.01 | 81.50 | 40.63 |
| Median | 29.75 | 0.175 | 0.03 | 242 | 481.5 |
| Mode | 60 | 0.05 | 0.02 | 20 | 30 |
| Standard Deviation | 30.08 | 0.19 | 0.07 | 764.56 | 381.13 |
| Sample Variance | 904.74 | 0.04 | 0.00 | 584,551 | 145,259 |
| Skewness | 2.32 | 1.50 | 2.65 | 2.46 | 1.63 |
| Minimum | 1.3 | 0.03 | 0 | 2 | 10 |
| Maximum | 191 | 0.84 | 0.32 | 3670 | 2430 |
| 97.5th | 103.40 | 0.72 | 0.27 | 3271.25 | 1125.00 |
| 99th | 141.15 | 0.81 | 0.31 | 3574.30 | 1442.55 |
| Table 80: Coloradito Contact Skarn - >60 AgEQ Descriptive Metal Data |
| |
Coloradito - 2m- Composited Data-60 gpt AgEQ | Ag (gpt) | Au (gpt) | Cu (%) | Mo (ppm) | W (ppm) |
| Mean | 7.75 | 2.57 | 0.005 | 31 | 10 |
| Standard Error | 2.25 | 0.79 | 0.005 | 3 | 0 |
| Median | 7.75 | 2.57 | 0.005 | 31 | 10 |
| Mode | - | - | - | - | 10 |
| Standard Deviation | 3.18 | 1.12 | 0.01 | 4.24 | 0 |
| Sample Variance | 10.13 | 1.25 | 0.00 | 18.00 | 0 |
| Skewness | - | - | - | - | - |
| Minimum | 5.5 | 1.78 | 0 | 28 | 10 |
| Maximum | 10 | 3.36 | 0.01 | 34 | 10 |
| Count | 2 | 2 | 2 | 2 | 2 |
| 97.5th | 9.888 | 3.321 | 0.010 | 33.850 | 10.000 |
| 99th | 9.955 | 3.344 | 0.010 | 33.940 | 10.000 |
| Table 81: Coloradito Contact Skarn - >200 ppm W Descriptive Metal Data |
| |
Coloradito - 2 metre Composited Data >200 ppm W | Mo (ppm) | W (ppm) |
| Mean | 360.85 | 562.46 |
| Standard Error | 18.98 | 14.17 |
| Median | 226.50 | 471.50 |
| Mode | 13 | 240 |
| Standard Deviation | 445.87 | 332.86 |
| Sample Variance | 198,799 | 110,799 |
| Skewness | 3.33 | 2.16 |
| Minimum | 2 | 200 |
| Maximum | 4710 | 3060 |
| Count | 552 | 552 |
| 97.5th | 0.07225 | 288.45 |
| 99th | 0.1298 | 390.98 |
| Table 82: Coloradito Contact Skarn - >200 ppm W Descriptive Metal Data |
| |
Coloradito - 2 metre- Composited Data >400 ppm W | Mo (ppm) | W (ppm) |
| Mean | 432.47 | 720.16 |
| Standard Error | 25.64 | 17.68 |
| Median | 289 | 625 |
| Mode | 829 | 420 |
| Standard Deviation | 476.88 | 328.92 |
| Sample Variance | 227,413 | 108,188 |
| Skewness | 3.33 | 2.39 |
| Minimum | 2 | 400 |
| Maximum | 4710 | 3060 |
| Count | 346 | 346 |
| 97.5th | 1541.25 | 1662.75 |
| 99th | 1758.65 | 2074.25 |
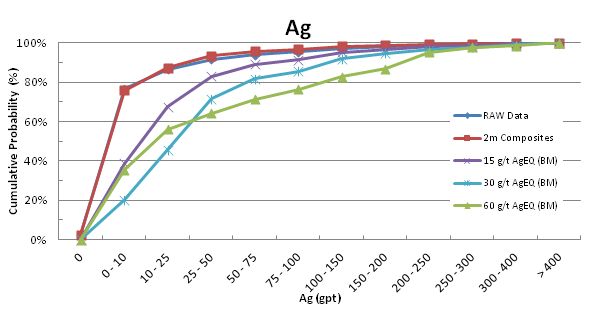
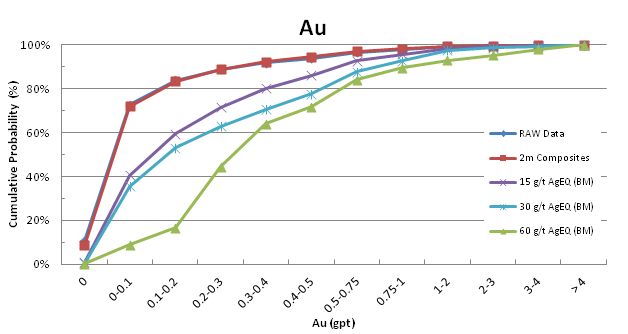
Tetra Tech feels that the reduction and interpolation of data values into the Coloradito block model is well constrained and representative of the raw assay values. Cumulative probability plots shown in
Figure 51 show an increase in grade control and elimination of lower grade dilution with successive data constraint.

Figure 51: Coloradito cumulative probability plots for silver, gold, copper, AgEQ, Molybdenum and Tungsten.
14.3.4.1 Coloradito High Grade Capping
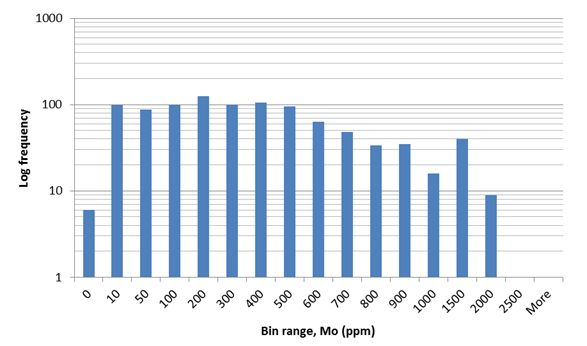
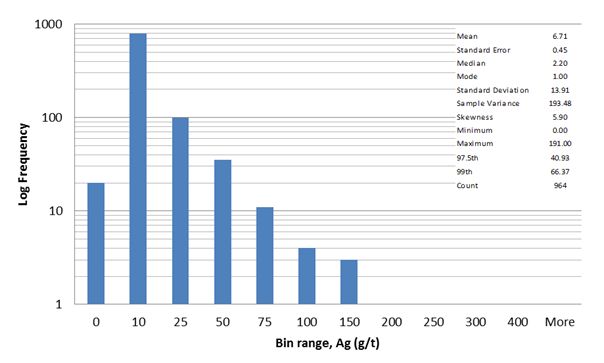
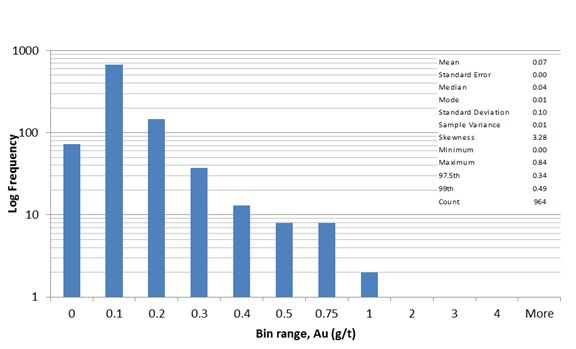
Inspection of 2 metre composite (Figure 52) grade distributions of the Coloradito for tungsten, molybdenum, silver, copper and gold indicated that the data populations were positively skewed and may include multiple internal grade populations. Histogram distributions for each metal were used for visual determination of anomalous values and as the basis of high grade metal caps. High grade caps were applied to the 2 metre composites during interpolation of the block model using values of 550 gpt for silver, 6% for copper and 5.8 gpt for gold. No high grade caps were applied to the composite dataset as distributions appear to be continuous and where outliers were noted, visual inspection confirmed that these samples occurred adjacent to other high grade samples in drill core records and are thereby not felt to be anomalous.
Figure 52: Coloradito histogram distributions of 2 metre composite data
14.3.5 Interpolation and Modelling Parameters
Based on the low sample density available within each mineralized solid, Tetra Tech determined that variography analysis was not effective in determination of orientation and anisotropy values of elliptical search parameters. Instead, the orientations of the search ellipses were aligned corresponding to the geological interpretation. Anisotropy and search axis ranges listed in Table 83 were based on iterative interpolation and field observations.
14.3.5.1 Main Mineralized Trend
The resource is based on verified information from historical and recent (Phase I and II) SilverCrest sources. Raw assay data was composited to 2 metre and interpolated into a block model using 5 m x 5 m x 5 m block size using inverse distance squared (ID2) methodology. A series of distinct search ellipses were defined for each mineralized domains based on geological field observation, geostatistical analysis and iterative interpolation. High grade ranges are based on +2SD from the mean values of each reporting metal for this specific model.Error! Reference source not found.Table 83 lists the anisotropic search ellipses for silver, copper and gold mineralization within the stratabound mantos. High grade range limiting ellipses, where manto grades exceeded 150 gpt Ag, 1 gpt Au, or 1 % Cu, are shown in parentheses. High grade ranges limits the lateral influence of high grades associated with proximal skarn near the SCSV corridors.
| Table 83: Model Search Parameters |
| | Mineralization Type | Orientation | Major Axis Range | Semi-major Axis Range | Minor Axis Range | Min - Max Composites | Reporting Composites |
| MMT | Manto | 110,5,0 (Z,Y,Z) | 75 (40*) | 75 (40*) | 35 (20*) | 2 to 12 | 3 |
| SCSV | 10,90,-90 (Z,Y,Z) | 80 (30*) | 80 (30*) | 20 (15*) | 2 to 12 | 3 |
| Contact Skarn | 0,-15,0 (Z,Y,Z) | 150 | 150 | 75 | 2 to 12 | 5 |
| Contact Skarn | 240,-10,0 (Z,Y,Z) | 200 | 200 | 100 | 2 to 12 | 5 |
| Contact Skarn | 0,0,0 (Z,Y,Z) | 200 | 200 | 100 | 2 to 12 | 5 |
| HT | 10,-90,90 (Z,Y,Z) | 70 | 70 | 35 | 2 to 12 | 3 |
| Santo Nino | Manto | 55,10,55 (Z,Y,Z) | 75 (40**) | 75 (40**) | 30 (20**) | 2 to 12 | 3 |
| SCSV | 10, 90,-90 (Z,Y,Z) | 80 (30**) | 80 (30**) | 20 (15**) | 2 to 12 | 3 |
| Contact Skarn | 50,12, 0 (Z,Y,Z) | 150 | 150 | 75 | 2 to 12 | 5 |
| HT | 30,90,-90 (Z,Y,Z) | 100 | 100 | 40 | 2 to 12 | 3 |
| Coloradito | Manto | 250,25,250 (Z,Y,Z) | 90 | 75 | 50 | 2 to 20 | 6 |
| Contact Skarn A | 250,25,145 (Z,Y,Z) | 125 | 125 | 60 | 2 to 20 | 6 |
| Contact Skarn B | 18, 80, 60 (Z,Y,Z) | 60 | 50 | 20 | 2 to 20 | 6 |
*MMT high grade threshold (150 gpt Ag, 1 gpt Au and 1% Cu) limiting search ellipse ranges
**Santo Nino high grade threshold (92 gpt Ag, 0.21 gpt Au and 2.39% Cu) limiting search ellipse ranges
Silver, copper, gold, lead, zinc, tungsten and molybdenum grades were interpolated into blocks contained within the interpreted SCSV corridors Table 83 list search ellipse orientation and ranges. High grade range limiting ellipses, where manto grades exceeded 150 gpt Ag, 1 gpt Au, or 1 % Cu, are shown in parentheses. Mineralization contained within these solids demonstrated continuity and is considered to be the most recent mineralization event. Grades within the SCSV solids were interpolated into the block model to overprint all other forms of mineralization.
Tungsten and molybdenum mineralization has been recognized as continuous within the intrusive draping contact skarn. Table 83 list the three search ellipses orientations and ranges relating to the three individual solids segregated from the contact skarn to aid interpolation.
For volume and grade calculations in the mineralized and overprinting manto and structure (SCSV) intercepts, a series of HT solids were created. The HT solids constrained grade interpolation bleed into the adjoining manto and SCSV zones. The HT zones interpolated silver, copper, silver, lead, zinc, tungsten and molybdenum with the search ellipse and ranges listed in Table 83.
Table 84 provides a summary of average reporting composite data by solid. Average reporting composite distances indicate that sample density may be low. Infill drilling is recommended in order to increase sample density and improve geostatistical characterization of the individual mineralized trends.
Table 84: Average Reporting Composite Data for Block Model by Mineralized Solid Type for the MMT |
| Solid Type | Average Distance to Nearest Reporting Composite (m) | Average Number of Reporting Composites | Average Number of Reporting Drill holes |
| Manto | 53 | 7 | 2 |
| SCSV | 60 | 7 | 2 |
| Contact Skarn | 108 | 9 | 3 |
| HT | 40 | 7 | 2 |
The resource is based on verified historical and recent (Phase II) SilverCrest drilling. Raw assay data was composited to 2 metre and interpolated into a block model using 5 m x 5 m x 5 m block size model using inverse distance squared (ID2) methodology. A series of distinct search ellipses were defined for each of spatially associated mineralized domain, based on geological field observation, geostatistical analysis and iterative interpolation. High grade ranges are based on +2SD from the mean values of each reporting metal for this specific model.Error! Reference source not found. Table 83 lists the anisotropic search ellipses for silver, copper and gold mineralization within the stratabound mantos. High grade range limiting search ellipses, where manto grades exceeded 92 gpt Ag, 0.21 gpt Au, or 2.39%, are shown in parentheses. High grade ranges limits the lateral influence of high grades associated with proximal skarn near the SCSV corridors.
Silver, copper, gold, lead, zinc, tungsten and molybdenum grades were interpolated into blocks contained within the interpreted SCSV corridors using an anisotropic ellipse with orientation and ranges listed in Table 83. High grade range limiting ellipses, where manto grades exceeded 92 gpt Ag, 0.21 gpt Au, or 2.39% Cu, are shown in parentheses. Mineralization contained within these solids has demonstrated continuity and is considered to be the most recent mineralization event. Grades within the SCSV solids were interpolated into the block model to overprint all other forms of mineralization. Tungsten and molybdenum mineralization has been recognized to be continuous within the contact skarn. Grades were interpolated into blocks contained within the interpreted contact skarn using an anisotropic ellipse (Table 83).
The HT solids restricted grade interpolation into the adjoining manto and SCSV corridors. These zones interpolated silver, copper, silver, lead, zinc, tungsten and molybdenum. Table 83 list the search ellipse orientation and range parameters.
Table 85 provides a summary of the average reporting composite data by solid. Average distances indicate that sample density may be moderate. Infill drilling is recommended to increase sample density with the aim to improve geostatistical characterization of the individual mineralized trends.
| Table 85: Main Mineralized Trend – Manto 2 metre Composited >30 AgEQ Descriptive Metal Data |
| Solid Type | Average Distance to Nearest Reporting Composite (m) | Average Number of Reporting Composites | Average Number of Reporting Drill holes |
| Manto | 15 | 6 | 2 |
| SCSV | 24 | 7 | 53 |
| Contact Skarn | 2 | 8 | 91 |
| HT | 12 | 10 | 50 |
The resource is based on verified and resampled historical and recent Phase II SilverCrest drilling. Raw assay data was composited to 2 metre and interpolated into a block model using 5 m x 5 m x 5 m block size model using inverse distance squared (ID2) methodology. A series of distinct search ellipses were defined for each of spatially associated mineralized domain, based on geological field observation, geostatistical analysis and iterative interpolation. Tungsten and molybdenum mineralization is of primary interest at Coloradito and occur in two grade solids. Both are constrained by tungsten grades with a >200 ppm cut off. Table 83 lists search ellipse orientation and ranges.
Table 86 lists the average data of blocks within the >200 ppm W tungsten contact skarn grade solid. Average distances indicate that sample density may be low for contact skarn A. Infill drilling is recommended to increase sample density with the aim to improve geostatistical characterization of the individual mineralized trends.
| Table 86: Average Reporting Composite Data for Block Model by Mineralized Solid Type for Coloradito |
| Solid Type | Average Distance to Nearest Reporting Composite (m) | Average Number of Reporting Composites | Average Number of Reporting Drill holes |
| Contact Skarn A | 71 | 11 | 2 |
| Contact Skarn B | 30 | 5 | 2 |
The current Mineral Resources were previously estimated for the MMT , Santo Nino and Coloradito deposits and disclosed in the previous Technical Report titled “Updated Resource Estimate for the La Joya Property, Durango, Mexico, NI 43-101 Technical Report, Effective Date: December 16, 2012, Released Date: March 27, 2013” which is available on SEDAR. The estimates in this report remain current and are described in the following section.
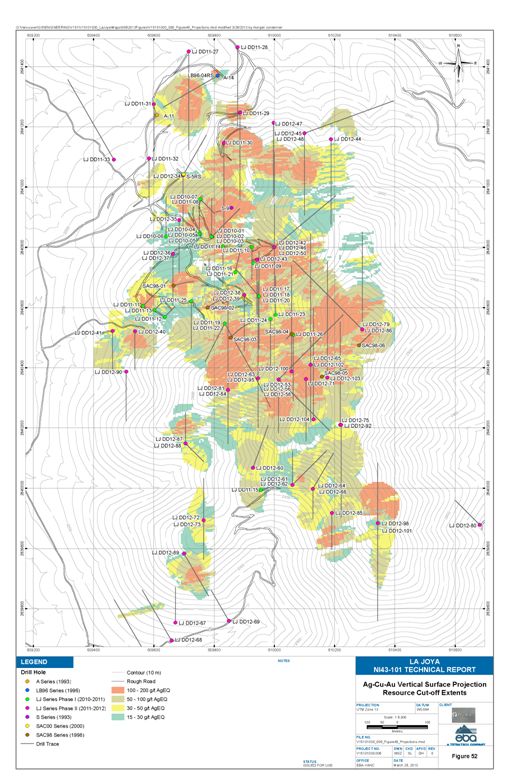
Silver, copper, gold, tungsten and molybdenum hosted in Manto and Structure mineralization at the MMT and Santo Nino deposits have been reported as Inferred Mineral Resources at a 30 gpt AgEQ6 cut-off in Table 87 below. Block model sensitivities using 15 gpt AgEQ6 and 60 gpt AgEQ6 cut-offs have been included in the table. Grade contours for MMT of the 15, 30, 50, 100 and 200 gpt AgEQ6 are plotted in Figure 53.
Tungsten and molybdenum hosted in Contact Zone mineralization at the MMT, Santo Nino and Coloradito deposits have been reported as Inferred Mineral Resources at a 0.050% WO3 cut-off in Table 88, below. Block model sensitivities using 0.025% WO3 and 0.095% WO3 cut-offs have been included in the table. Tetra Tech classified the resources as Inferred using 30gpt AgEQ and 0.05% WO3 (tungsten trioxide) as appropriate reporting cut-offs. The materials containing the Ag-Cu-Au mineralization estimate are reported independently from the the mineralized material containing the W mineralization. These estimates represent discrete, non-overlapping, units of rock, however in reality the boundary between the mineraliztion is gradational and not abrupt.
| Table 87: Inferred Ag-Cu-Au Resource Estimation for MMT and, Santo Nino Deposits, Effective Date Dec. 16, 2012 |
| Zone | Category7 | AgEQ Cut off (gpt) 6 | Rounded Tonnes | SG | Ag (gpt) | Au (gpt) | Cu (%) | Contained Ag (oz) | Contained Au (oz) | Contained Cu (lbs) | Contained AgEQ (oz)6 |
MMT 8 (Ag, Au, Cu) | Inferred | 15 | 120,570,000 | 3.00 | 23.7 | 0.18 | 0.18 | 91,855,000 | 708,000 | 466,474,000 | 185,757,000 |
| 30 | 67,618,000 | 3.00 | 34.6 | 0.24 | 0.25 | 75,367,000 | 519,000 | 377,392,000 | 148,671,000 |
| 60 | 26,109,000 | 3.00 | 58.5 | 0.3 | 0.42 | 49,129,000 | 256,000 | 240,114,000 | 92,035,000 |
Santo Nino 8 (Ag, Au, Cu) | Inferred | 15 | 6,169,000 | 3.00 | 20.3 | 0.04 | 0.49 | 4,039,000 | 8,000 | 66,775,000 | 12,826,000 |
| 30 | 3,586,000 | 3.00 | 29.1 | 0.05 | 0.75 | 3,363,000 | 5,000 | 59,384,000 | 11,079,000 |
| 60 | 1,818,000 | 3.00 | 43.0 | 0.05 | 1.2 | 2,517,000 | 3,000 | 48,269,000 | 872,000 |
| TOTAL | Inferred | 15 | 126,739,000 | | 23.5 | 0.17 | 0.20 | 95,894,000 | 716,000 | 533,249,000 | 198,583,000 |
| 30 | 71,204,000 | | 34.4 | 0.23 | 0.28 | 78,730,000 | 524,000 | 436,776,000 | 159,750,000 |
| 60 | 27,927,000 | | 57.5 | 0.28 | 0.47 | 51,646,000 | 259,000 | 288,383,000 | 92,907,000 |
| 6 | Silver equivalency includes silver, gold and copper and excludes lead, zinc, molybdenum and tungsten values. Ag:Au is 50:1, Ag:Cu is 86:1, based on 5 year historic metal price trends of US$24/oz silver, US$1200/oz gold, US$3/lb copper. 100% metallurgical recovery is assumed. |
| 7 | Classified by Tetra Tech, A Tetra Tech Company and conforms to NI 43-101 and CIM definitions for resources. All numbers are rounded. Inferred Resources have been estimated from geological evidence and limited sampling and must be treated with a lower level of confidence than Measured and Indicated Resources. The reported mineral resource for each zone is based on the 30 gpt AgEQ cut-off and is highlighted in light blue. |
| 8 | Mineralization boundaries used in the interpretation of the geological model and resource estimate are based on a cut-off of 15 gpt AgEQ using the metal price ratios described above. Manto and Structure Resource blocks, and their associated volumes, are exclusive of Contact Zone blocks. |
| Table 88: Inferred W-Mo- Resource Estimation for MMT, Santo Nino and Coloradito Deposits, Effective Date Dec. 16, 2012 |
| Zone | Category9 | WO3 Cut off (%) | Rounded Tonnes | SG | Mo (%) | WO3 (%) | Contained WO3 (lbs) | Contained Mo (lbs) |
MMT Contact Zone 10 (W, Mo, Ag, Au, Cu) | Inferred | 0.025 | 60,508,000 | 3 | 0.0035 | 0.053 | 70,526,000 | 4,232,000 |
| 0.050 | 25,136,000 | 3 | 0.0039 | 0.075 | 41,438,000 | 1,942,000 |
| 0.095 | 4,395,000 | 3 | 0.0023 | 0.109 | 10,587,000 | 205,000 |
Santo Nino Contact Zone 10 (W, Mo, Ag, Au, Cu) | Inferred | 0.025 | 5,220,000 | 3 | 0.0077 | 0.04 | 4,591,000 | 806,000 |
| 0.050 | 950,000 | 3 | 0.0132 | 0.07 | 1,456,000 | 250,000 |
| 0.095 | 750 | 3 | 0.0115 | 0.101 | 2,000 | 172 |
Coloradito Contact Zone 10 (W, Mo, Ag, Au, Cu) | Inferred | 0.025 | 31,907,000 | 3 | 0.0283 | 0.062 | 43,302,000 | 18,045,000 |
| 0.050 | 18,486,000 | 3 | 0.0322 | 0.079 | 32,252,000 | 11,921,000 |
| 0.095 | 4,159,000 | 3 | 0.0335 | 0.112 | 10,282,000 | 2,784,000 |
| TOTAL | Inferred | 0.025 | 97,635,000 | | 0.0118 | 0.055 | 118,419,000 | 23,083,000 |
| 0.05 | 44,573,000 | | 0.0158 | 0.076 | 75,147,000 | 14,113,000 |
| 0.095 | 4,159,184 | | 0.0175 | 0.111 | 20,871,000 | 2,989,000 |
| 9 | Classified by Tetra Tech and conforms to NI 43-101 and CIM definitions for resources. All numbers are rounded. Inferred Resources have been estimated from geological evidence and limited sampling and must be treated with a lower level of confidence than Measured and Indicated Resources. The reported mineral resource for each zone is based on the 0.050% WO3 cut-off and is highlighted in light blue |
| 10 | Mineralization boundaries used in the interpretation of the geological model and resource estimate are based on a cut-off of 15 gpt AgEQ using the metal price ratios described above. Contact Zone Resource blocks, and their associated volumes, are exclusive of Manto and Structure blocks. |
Figure 53: Resource contours of 15, 30, 50, 100 and 200 gpt AgEQ cut-offs for MMT
14.4.1 Mineral Resource Classification
Mineral Resources have been classified by James Barr, P.Geo, an independent Qualified Person, based on the CIM Definition Standards for Mineral Resources and Mineral Reserves. The category for which the resources have been assigned is based on the confidence in geological information available relating to the mineral deposit, the quantity and quality of data available on the deposit, the level of detail of the technical and economic information which has been generated for the deposit and the interpretation of the data and information.
All Mineral Resources for the La Joya Deposit, as presented in the above discussion, are classified as Inferred Mineral Resources. Drilling, surface sampling and mapping information from exploration on the property to date is sufficient to allow a reasonable geological interpretation and assumption of grade continuity. Drill spacing remains wide and the associated level of confidence in the ranges of mineralized zones remains low. The geological understanding of the property is considered to remain in the developing stages for the project and will require further ongoing detailed knowledge on the distribution of mineralization to improve overall confidence of the deposit. In particular, detailed logging and study of the SCSV and intercepting manto mineralization, manto and mineralization variability and the relationships between other controls on mineralization including distribution along axial planes to D3 deformation and the extent of lateral manto and SCSV development would be beneficial to future resource estimation.
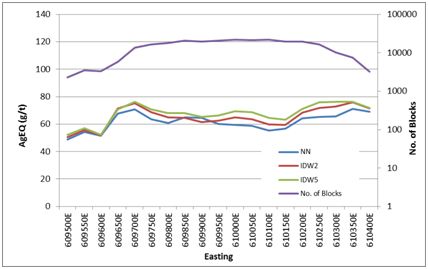
Visual estimated block grade were compared to drill hole grades along sections for Santo Nino, Coloradito and the MMT with statistical method also used for the latter. Nearest Neighbor (NN) and Inverse Distance Weighted method (IDW5) grade models were run for AgEQ (gpt) along 50m wide corridors in both the easterly and northerly directions throughout the MMT. The results from each section of each direction were plotted (Figure 54 and Figure 55) to check for potential global biases in the inverse distance grade models (IDW2) using grade summaries for the 30 gpt AgEQ attribute..
Figure 54: Comparison of >30 gpt AgEQ from NN, IDW2 and IDW5 methods of easting corridor through the La Joya MMT model.
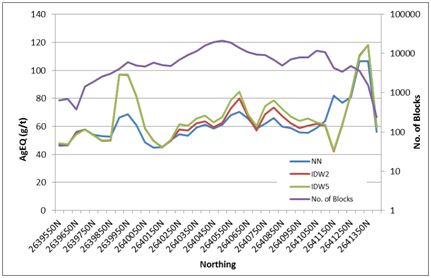
Figure 55: Comparison of >30 gpt AgEQ from NN, IDW2 and IDW5 methods of northing corridors through the La Joya MMT model.
Figure 54 shows good correlation and increasing offset with less influence. Figure 55 shows a general correlation between the different interpolation methods with decreased grades of the NN method with samples receiving identical weighting compared to the IDW2 and IDW5 method where samples closer to the sample point have a higher weighting increasing grades with the increased power. Overall the repeatability of the NN and IDW5 model display acceptable levels and the original model is valid and unbiased. The number of reporting blocks per sections over AgEQ 30 gpt are also plotted.
15.0 MINERAL RESERVE ESTIMATES
A Mineral Reserve has not been estimated for the Project as part of this PEA study.
A Mineral Reserve is the economically mineable part of a Measured or Indicated Mineral Resource.
Tetra Tech was retained by SilverCrest to prepare a PEA study for the MMT deposit from the La Joya project based on a 5,000 tpd mill capacity and an estimated mine life ranging from 8 to 10 years.
On the basis of the Inferred Mineral Resources presented in Section 14, initial open pit conceptualization of the mining methods and mine plan has been undertaken for the PEA. Preliminary economic, geotechnical and metallurgical and additional non-economic criteria such as mine life have been applied to the Inferrred mineral rsource block model to create a series of Lerch-Grossman nested pit shells using Geovia WhittleTM software. The input parameters used to generate the nested pit shells are shown in Table 89.
Additional objectives to minimize the capital cost requirements and to design an open pit with an 8 to 10 year mine life were considered in the selection of the pit shell to be used for further designs. The selected pit is therefore only a portion of what may be considered economically extractable under selected costs-recoveries and commodities assumptions.
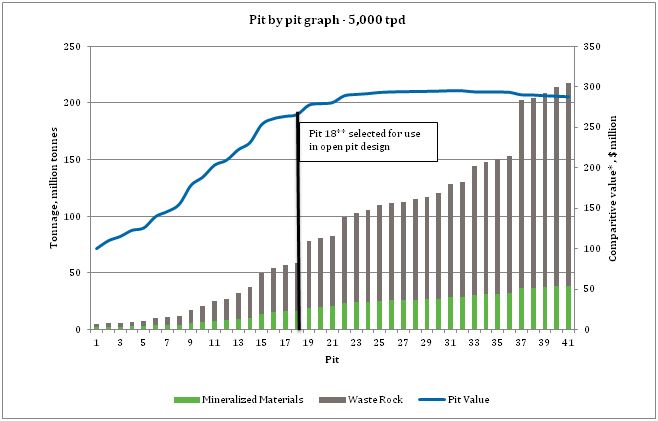
Since the pit shell selection includes criteria other than pure economic, the pit shells used in the PEA for the final pit design do not constrain the Inferred Mineral Resources economically. Tetra Tech has not assessed Inferred mineralization contained in pits larger than pit 41 as shown in Figure 56 for potential economic extraction. Additionally Tetra Tech has not assessed potential for underground mining of any resources that may currently fall outside of the pit shells created for the PEA. The selected pit and the subsequent open pit design are therefore characterised as a “Starter Pit”.
Pit 18 as shown in Figure 56 was selected for further designs and production scheduling. The selected pit will provide guidance to subsequent drilling to increase confidence within the target mining areas defined by the preliminary mine design done for the PEA.
Table 89: La Joya Pit Optimization Parameters
| La Joya Pit Optimization Parameters |
| Items | Units | Proposed Parameters |
| | | | ($US) | Value |
| Discount Rate | | % | | 8 |
| Production Rate | Plant feed | tpd | | 5,000 |
| | Mt/year | | 1.8 |
| Metal Market Price | Gold | $US/oz. | $1,200.00 | |
| Copper | $US/lb. | $3.00 |
| Silver | $US/oz. | $22.00 |
| Royalty | | % of NSR | | 2% |
| | Structure | Manto |
Metal Recovery1 | Copper | % | | 84.1 | 86.2 |
| Gold | % | | 49.8 | 64.6 |
| Silver | % | | 82.6 | 83.2 |
Operating Costs2 | Mining (Ore & Waste) | $US/t mined | $1.77 | |
| Process | $US/t mined | $14.63 |
| Tailing | $US/t mined | $0.60 |
| G&A | $US/t mined | $1.81 |
| Block Model | Block dimensions | m | | 5 x 5 x 5 |
| Density | Ore | t/m3 | | 3 |
| Waste | t/m3 | | 2.8 |
| Mining Dilution | | % | | 5 |
| Mining Recovery | | % | | 95 |
Pit Slope Angles3 | | degrees | | 48 |
| | 1 – Metal recoveries are based on test work as described in section 13 |
| | 2 – Operating costs are based on conceptual understanding of the mining operation factored comparison to similar mines. The costs provided here have not been used to assess the economic value of the property as discussed in section 21 and 22 |
| | 3 – Overall pit slope angle of 48 degrees was recommended by the geotechnical team of EBA, A Tetra Tech Company |
| | 4 – Mining (Ore & Waste) cost per tonne mined reflected in table 91 above does not represent the actual contract mining cost used in the economic analysis. |
Note that no additional costs were considered for increased depth in the pit optimisation. However, for the final costing, the costs were adjusted based on haul distances and will thus reflect lower costs for the initial years and higher costs at the end of the planned life of mine, when haul distances increase.
Figure 56: Pit by pit graph for the 5,000 tpd case (result of pit optimization process)
| | * Pit value shown here is not representative of the actual net present value of the pit, but is purely for comparison purposes |
The 41 pit shells shown in Figure 56 were generated using the optimization parameters listed in Table 89 and by varying the price factor from 0.3 to 1.1 at 0.02 intervals. The selection of pit 18 was undertaken to fall in line with SilverCrest’s scenario for mine life of roughly 8-10 years at 5,000 tpd mill capacity. Pit 18 corresponds to a price factor of 0.64, gold price of $768/oz, copper price of $1.92/lb and silver price of $14.08/oz. The selected pit was then subjected to mine design parameters as shown in Table 90 which resulted in the final pit as shown in Figure 59: 3D Starter Pit Design with Dump and Infrastructure (Figure 59). The ultimate pit was subsequently scheduled which resulted in the final PEA mining schedule, which includes the stockpiling of ore to achieve a better head grade scenario.
16.2 Geotechnical Considerations for open pit design
Analyses of the pit slope angles at PEA level performed by the geotechnical team of Tetra Tech were based on geotechnical information collected in seventy-seven exploration diamond holes drilled in 2011 and 2012 (LJ-11-27 through LJ11-33 drilled in 2011 and LJ12-34 through LJ-12-105 drilled in 2012). The length of the holes ranged in general between 250 and 600 m. The geotechnical parameters were measured by SilverCrest field mine geologists. It should be noted that Tetra Tech had provided training to the site geologist on methods of geotechnical logging rock core. Geotechnical logs for rock mass characterization were made available to Tetra Tech in raw spreadsheets. Core photographs were also made available. Neither oriented core data nor geotechnical laboratory test were part of the investigation.
The geotechnical data recorded consists of percent total of recovery, rock hardness (strength index property), weathering, rock quality designation (RQD), the number of natural and mechanical fractures, as well as characterization and orientation of structural discontinuities. The descriptions follow those set out in the International Society for Rock Mechanics (ISRM) guide to rock characterization. Parameters for characterization of joints and discontinuities were collected based on two widely used empirical rock classification systems. The Norwegian Geotechnical Institute NGI Q-System was used to assess joint roughness (Jr), joint alteration (Ja) and joint number (Jn). The Bieniawski’s rock mass rating (RMR76) was used to assess the overall condition of the joints, by assessing individual parameters such as separation, roughness, infilling, and joint weathering.
Tetra Tech processed the geotechnical data and calculated the RQD, RMR and Q values for each of the runs of the above referred drill holes. From the available data, it was determined that the rock mass geotechnical conditions tend to be homogeneous. According to the RMR, the quality of the rock mass of the main rock types (limestone, skarn, hornfels) was determined to be good to very good rock (RMR76 rating varying between 70-90), and good according to RQD system (RQD rating varying between 75-90).
As stated above, the rock mass quality according to the Bieniawski’s rock mass rating system, indicates that the RMR76 throughout the country rock and ore is generally over 70, and therefore, the structure of the rock is likely to be the main controlling factor governing the stability of the pit walls at bench, inter-ramp and overall scales. However, no structural information is available (rock fabric and major structures) at this PEA level which allowed to assess the pit slope angles. Therefore, at the PEA level a conservative pit slope angle of 48 degrees is recommended (Table 89). To achieve steep angles in competent rock as for the rock in this proposed open pit carefully controlled blasting are of paramount importance. Further project stages (Pre-Feasibility or Feasibility stages) should implement geotechnical programs (mapping and subsurface investigations) such that structural conditions data of the rock mass is obtained with the purpose of pit slope design.
16.3 Open Pit Design (Starter Pit)
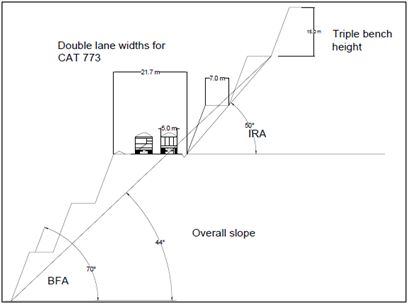
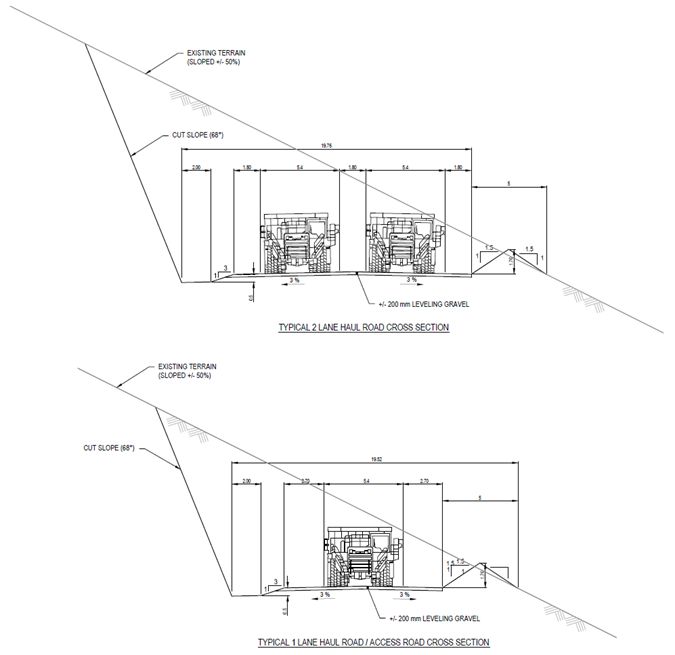
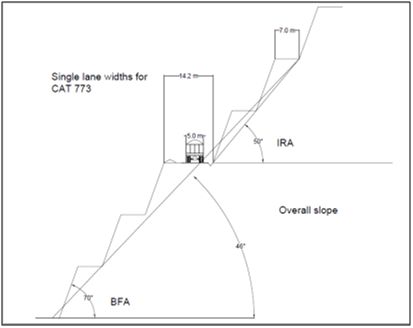
The selected pit shell (Pit 18) was then imported into Dassault Systemes Geovia GEMS™ (GEMS) and was used as a reference to design the Starter Pit. The bench face angle, inter-ramp angle, overall pit slope angle recommended by the geotechnical studies, as well as road widths and ramp gradient requirements were all incorporated into the design. Single lane haul roads have been considered for final pit layouts with double lane haul roads for the longer term haul roads between the open pit, waste dumps, and crusher. The values for each of these parameters are listed in Table 90. The approach was to create a pit including ramps and switchbacks as closely aligned with the selected pit shell as possible, while keeping the design within the stated open pit design parameters.
Table 90: La Joya Open Pit Design Parameters
| Open pit slope |
| Overall pit slope | Maximum 50 °, dependent on haul roads |
| Inter ramp angle max | 50° |
| Bench face angle | 68° |
| Berm width minimum | 7 m |
| Minimum mining width | 30 m |
| Bench height | 15 m (triple benching) |
| Haul roads |
| Double lane * | 21.7 m |
| Single lane * | 14.2 m |
| In pit haul road grades | 8%-10% max |
| Design parameter - waste dumps bottom up |
| Bench face angle | 34° |
| Overall slope when benched | 1:2.5 (22°) |
| Bench width | 10 m |
| Lift heights for bottom up construction | 10 m |
| Design parameter – waste dumps top down |
| Overall slope angle** | 1:1.8 (30°) |
| | * The haul roads widths are based on a truck design width of 5 m applicable to a CAT 773E and Komatsu HD 605 |
| | ** Lifts will be considered in design to achieve overall slope angle |
Figure 57 and Figure 58 show conceptual profile views of both a double lane and single lane haul road.
Figure 57: Shows a conceptual profile view of the pit slopes with double lane haul road
Figure 58: Shows a conceptual profile view of the pit slopes with single lane haul road
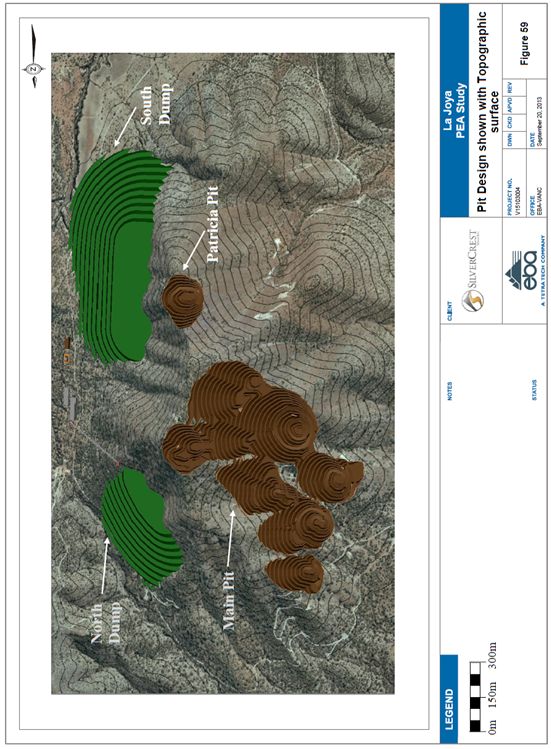
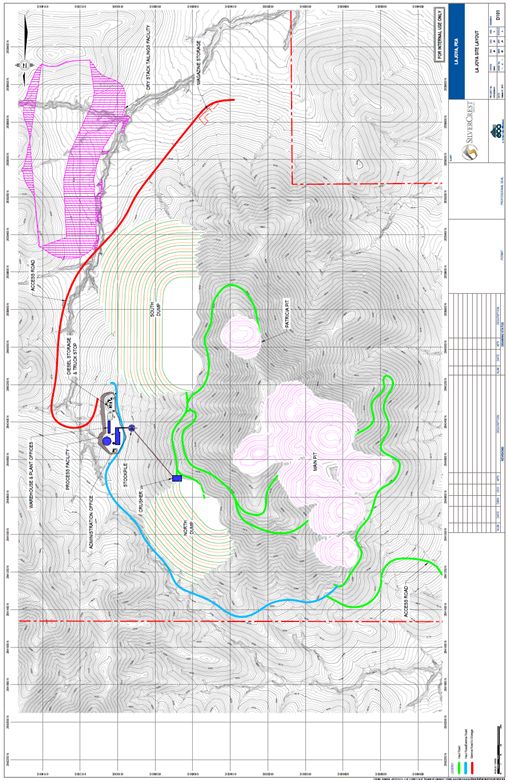
Various haul roads were considered from pit entry/exit points over the life of mine to the waste rock storage locations (waste dumps) and the selected primary crusher location. Where possible the length of these roads were minimized by cutting through the mining area and providing access around the Cerro Sacrificio ridge east of the open pit to the selected waste rock management areas. The average haul distance from the pit to the crusher over the life of mine is 4,250 m. The haul roads within the open pit were placed on the western side of the pit as far as possible, so that the high walls on the eastern side could better match the optimized pit shell. Figure 59 shows a 3D view of the open pit design for the Starter Pit and Figure 63 shows a plan view of the open pit in relation to other infrastructure planned for the property. The two separate pits namely the Main pit and Patricia pit may be a consequence of drill spacing and further infill drilling may allow for geological continuity that spans the area between the two pits, an area which currently does not support any economical mining.

Figure 59: 3D Starter Pit Design with Dump and Infrastructure
The open pit created for the PEA as shown in Figure 54 and Figure 63, is estimated to contain 15.5 Mt of mill feed with an overall stripping ratio of 2.9 tonnes of waste per tonne of mill feed. The total rock in the pit was estimated to be 61 Mt.
The preliminary pit design has two separate entities, namely the Main pit and isolated Patricia pit located roughly 200 m to the south. The Patricia pit is mined out in the initial 5 years of the mine life concurrently with the Main pit.
The pits have been scheduled using Geovia WhittleTM software. The scheduling parameters used to create the mining schedule are:
| 1. | 1.8 M tonnes processed per year from open pit or reclaiming stockpile. |
| 2. | 360 days of operations per year. |
| 3. | Target of 8 to 10 year mine life. |
| 4. | NSR cut-off of $17.9 /tonne. |
| 5. | Stockpiling to buffer mill feed capacity. |
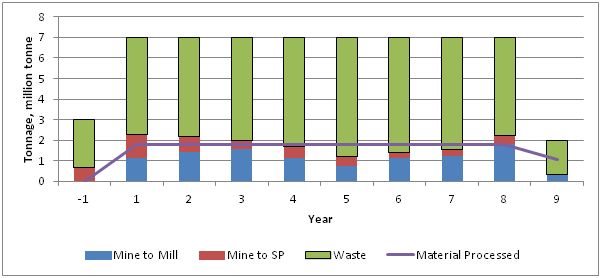
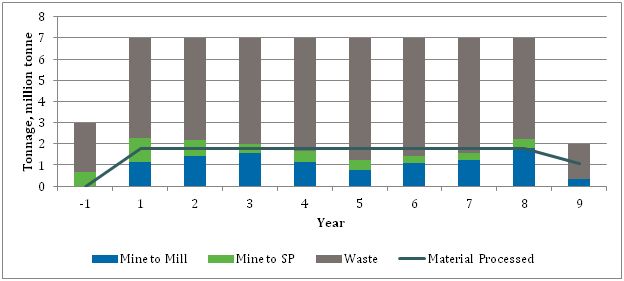
The preliminary mining schedule, shown in Table 91 and Figure 60, provides the estimated breakdown of the mill feed and waste rock throughout the proposed 9 years of La Joya’s mine life. This schedule is based on maintaining consistent total mining tonnage, with stockpiling used to maintain the mill feed at 1.8 Mt per year and maximizing head grades in the earlier years of the project life.
The schedule, shown in Appendix C, differentiates the grades and tonnages associated with the two different rock types as well as the split between material placed on stockpile and material transported from the pit directly to the processing plant for each year. Figure 60 shows the scheduled tonnages of waste, material processed, and mined material split between material moved directly to the mill and material stockpiled.
For the PEA, a mining plan was considered which allowed for a pre-production construction period with pre-stripping initiated in advance of commercial production. Pre-stripping will commence in Year -1 and will include the mining of both waste and 650Kt of mineralised material which will be stockpiled until the processing plant is completed towards the end of the construction Year -1. Processing from the stockpile as well as directly from the open pit will then begin in Year 1, where 1.8 Mt per annum will be processed.
Figure 60: Annual tonnages
Table 91: Project Schedule Summary
| Year | Mine to Mill | Mine to SP* | SP to Mill | Total mineralized material mined | Total tonnes processed | Mill feed grade | Waste | Strip ratio | Total tonnes mined |
| | | | | | | AG | AU | CU | AG EQ** | | | |
| | t | t | t | t | t | gpt | gpt | % | gpt | t | | t |
| -1 | 0 | 666,441*** | 0 | 666,441*** | | | | | | 2,333,559 | | 3,000,000 |
| 1 | 1,133,604 | 1,119,763 | 666,396 | 2,253,367 | 1,800,000 | 71 | 0.25 | 0.57 | 132 | 4,746,632 | 2.6 | 7,000,000 |
| 2 | 1,411,747 | 774,387 | 388,253 | 2,186,134 | 1,800,000 | 65 | 0.30 | 0.40 | 114 | 4,813,865 | 2.7 | 7,000,000 |
| 3 | 1,547,449 | 419,833 | 252,551 | 1,967,282 | 1,800,000 | 61 | 0.19 | 0.37 | 102 | 5,032,718 | 2.8 | 7,000,000 |
| 4 | 1,147,466 | 523,698 | 652,534 | 1,671,164 | 1,800,000 | 46 | 0.20 | 0.32 | 84 | 5,328,836 | 3.0 | 7,000,000 |
| 5 | 743,761 | 480,777 | 1,056,239 | 1,224,538 | 1,800,000 | 31 | 0.15 | 0.21 | 56 | 5,775,462 | 3.2 | 7,000,000 |
| 6 | 1,109,843 | 308,084 | 690,157 | 1,417,927 | 1,800,000 | 36 | 0.14 | 0.23 | 63 | 5,582,072 | 3.1 | 7,000,000 |
| 7 | 1,245,819 | 297,612 | 554,181 | 1,543,431 | 1,800,000 | 39 | 0.19 | 0.23 | 69 | 5,456,569 | 3.0 | 7,000,000 |
| 8 | 1,800,000 | 431,933 | 0 | 2,231,933 | 1,800,000 | 65 | 0.18 | 0.40 | 109 | 4,768,068 | 2.7 | 7,000,000 |
| 9 | 317,455 | 0 | 762,219 | 317,455 | 1,079,674 | 27 | 0.11 | 0.19 | 49 | 1,662,584 | 1.5 | 1,980,000 |
| | | | | | | | | | | | | |
| Total | 10,457,144 | 5,022,528 | 5,022,530 | 15,479,672 | 15,479,674 | 50 | 0.19 | 0.33 | 88 | 45,500,365 | 2.94 | 60,980,000 |
*SP means stockpile
**Head Grade means combined grade to the mill from all sources
**Silver equivalency includes silver, gold and copper and excludes lead, zinc, molybdenum and tungsten values. Ag:Au is 50:1, Ag:Cu is 86:1, based on 5 year historic metal price trends of US$22/oz silver, US$1200/oz gold, US$3/lb copper.
*** No grade is reflected for the material mined in year -1, as the material is not fed into the mill during that year. Please refer to appendix C for the grade of mined, stockpiled and mill feed material.
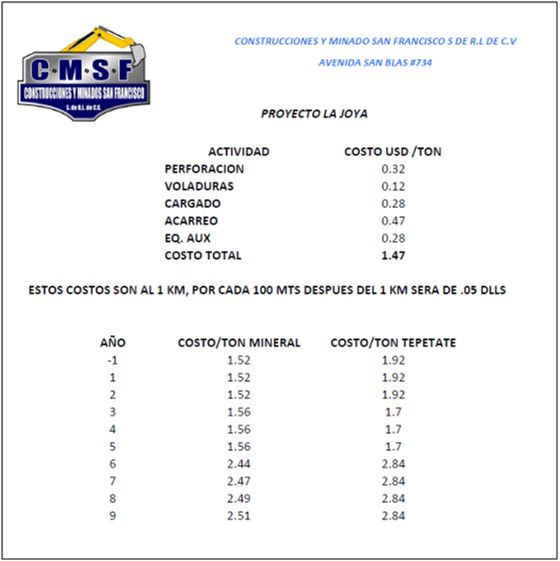
Tetra Tech has considered the use of a mining contractor for the La Joya project for the purpose of the PEA. A quote was obtained from a mining contractor from Mexico by the name of Construcciones Y Minado San Francisco S De R.L De C.V (CMSF). Conceptualization of the proposed mining method has been undertaken for the PEA. Tetra Tech has considered conventional benched open pit mining. The mined rock will require drill and blast prior to loading onto haul trucks as part of the mining process.
For the preliminary pit design, bench heights of 5 m for mineralized material and 5 m for waste have been used. Triple benching has been considered for waste benches. Triple benching allows for three benches to be stacked on top of on another without a berm in between, this is conventional practice in open pit mining to enable steeper pit walls. The estimated powder factor used in the design was 0.3 kg/m3 of rock (Schnelder 1999). Two drilling rigs are proposed to be used, with a smaller machine for mineralized material such as a crawler mounted drilling rig capable of drilling up to 150 mm holes, with a larger machine for drilling waste rock capable of drilling up to 180 mm holes.
The blasting for mineralized material and waste could be undertaken daily or in larger blasts providing material for a longer duration. During drilling, blast hole samples will be taken for analysis to enable a decision on whether rock is considered mineralized above a cut-off grade or waste rock. A similar practice is undertaken at SilverCrest’s operating mine, Santa Elena.
The loading of blasted material within the pits will be completed with a combination of hydraulic shovel or excavator and a large wheeled front end loader. The hydraulic shovel or excavator is operable in poorly prepared areas or narrow mining areas but cannot be moved quickly between loading sites, whereas the wheeled loader requires a relatively competent working surface and a larger working area but can move quickly between multiple sites for loading of trucks.
Hauling has been considered using 60 tonne mining haul trucks, for which current commercial models typically have an operating width of 5 m. The trucks will transport blasted material to either the waste dumps, stockpile or directly to the crusher as required. Single lane haul roads have been considered for final pit layouts with double lane haul roads for the longer term haul roads between the open pit, waste dumps and crusher. A minimum of a 30 m mining width has been applied to the final pit design for the PEA.
The schedule includes placement of mineralized material, mined from the open pit into a low grade stockpile, with higher grade material supplied directly to the process facility.
Mining equipment will be allocated for the re-handling of the stockpile from the existing fleet. Any mineralized material mined in excess of the annual mill feed capacity of 1.8 Mtpa will be deposited at the stockpile location. Tetra Tech has investigated sites for the location of the stockpile, and due to the terrain and the PEA site layout, Tetra Tech have considered a system of progressive placement of the stockpile on top of the north waste dump, as the waste dump is enlarged. The stockpiled material will form a lift off the north waste dump, with the waste dump forming a stable platform for stockpile formation.
This stockpiled material will be loaded and handled by a wheeled loader and loaded back onto haul trucks to be transported to the crusher site.
16.5.4 Waste Rock Storage
Tetra Tech investigated optimal waste dump locations within the mining concession for La Joya and ultimately considered two sites. A smaller area to the northeast side of the ridge focuses on depositing the non-mineralized material from the northern side of the Main pit and the larger site to the southeast of the Patricia pit. This would serve not only the Patricia pit, but the remaining waste from the Main pit too. The volume of the two waste dump sites is 8.5 Mt for the North Dump, and 36.4 Mt for the South Dump with a total capacity of 45 Mt.
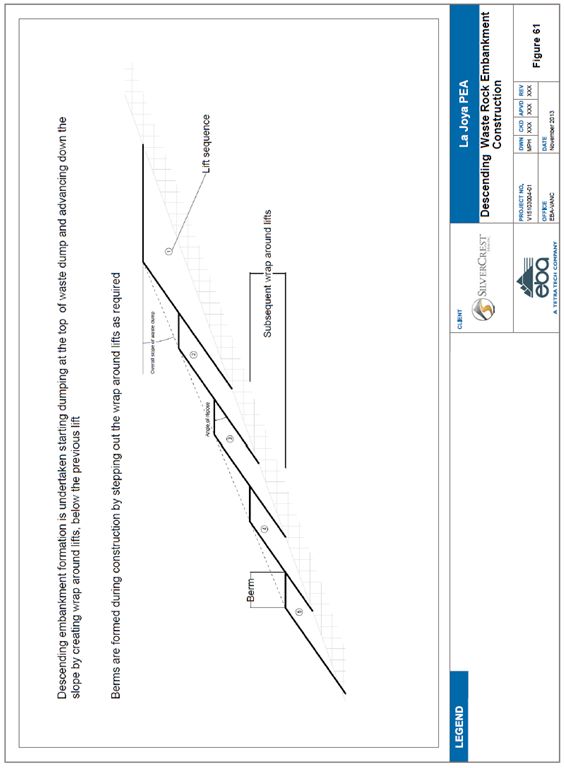
To fit into the topography Tetra Tech has proposed side hill dumps. However stability analysis and waste dump slope design has not been completed. The construction of the waste dump will be undertaken using descending methods, involving the advancement of the waste dump from the top of the slope, progressing down the slope through adding subsequent wrap around lifts at a lower elevation, successively around the toe of each previous lift. The latter approach will provide for long term enhanced stability where the dump slopes can be adjusted to be less than the natural angle of repose. A schematic of this approach is shown in Figure 61. Figure 59 and Figure 63 show the proposed waste dump locations and design.
Figure 61: Descending Waste Rock Embankment Construction
Tetra Tech has considered contract mining for the La Joya project. This was undertaken by conducting a trade-off study of contractor versus in house mining. The trade-off included consideration of inhouse mining equipment purchase and costs as opposed to contractor costs. Tetra Tech has selected an equipment fleet based on the configuration of the open pit mining, haul roads and the processing plant.
Tetra Tech has reviewed the mining quote provided by Construcciones Y Minado San Francisco S De R.L De C.V. (CMSF) in Mexico, by doing an evaluation of the cost of operation of the required mining machinery. The quote has been found to be 20% greater than the estimate by Tetra Tech which is in line with expectations for contract mining in Mexico.
Tetra Tech estimated cycle times for the haul trucks using manufacturer specifications for the trucks and the associated loader/shovel. Data such as number of passes required to fill the truck in conjunction with time taken per pass were incorporated into the cycle time study.
Runge Limited Xeras© (2011) software was used to obtain equipment operating costs, which were compared to the costs provided by CMSF in Mexico. This software aided in estimating manning requirements for each individual equipment, which in turn provided more accurate total operating costs. Xeras also provided estimates for number of trucks, loaders, and shovels required to mine 5,000 tpd based on the man hours available per annum.
Mechanical availability was considered and assumptions were made as to total working hours available from the equipment. These included both scheduled and unscheduled downtime as well as operating efficiency to account for unforeseen events applicable to open pit mining scenarios. Shift changes, meal breaks, fueling/lubing time, and blasting stoppages were all factored into the XERAS model when sizing the equipment fleet.
The estimated equipment requirements are shown in Table 92.
Table 92: Mining Equipment
| Equipment | Key Productivity input | Hourly capacity | LOM Hours | LOM units required |
| Drill rig ore | 25 m/ hr. | 486 tonnes/ hr. | 31,000 | 2 |
| Drill rig waste | 25 m/ hr. | 1503 tonnes/hr. | 29,000 | 1 |
| 60 t haul trucks | 58 to 60 tonnes per load | 121 to 409 tonnes per hour depending on use | 352,000 | 12 |
| Waste loader | 220 secs per 60 t load | 890 Tonnes/hr. | 27,000 | 2 |
| Ore shovel | 195 secs per 60 t load | 910 Tonnes/hr. | 17,000 | 1 |
| Service and stockpile loader | 60 Secs per bucket plus 1500 hours per year | 332 tonnes/hr. | 51,000 | 2 |
| Bull dozer | 52 cycles per hour | 563 BCMs per hour | 74,000 | 3 |
| Grader | 20% of truck hours | 17,000 | 1 |
| Fuel truck | 1500 hours per year | 14,000 | 1 |
| Maintenance truck | 1500 hours per year | 13,500 | 1 |
| Water truck | 8% of truck hours | 18,000 | 1 |
| Welding truck | 1500 hours per year | | 13,500 | 1 |
| Lighting plant | 9 Hours per day | | 28,800 | 2 |
| Light vehicles | 5,181 hours per year | | 51,000 | 5 |
Tetra Tech has considered contractor mining for the La Joya property; however, estimates of the labour force required for mining have been undertaken. The conceptual staffing for the mining operation is shown in Table 93. Management and technical services staff such as geology and mining engineering are included in G & A.
Table 93: Mining Operation workforce
| Labour type | Year -1 | Year 1 | Year 2 | Year 3 | Year 4 | Year 5 | Year 6 | Year 7 | Year 8 | Year 9 | Maximum Life of Mine |
| Blasting crews | 4 | 4 | 4 | 4 | 4 | 4 | 4 | 4 | 4 | 4 | 4 |
| 7 Day operators | 28 | 58 | 56 | 53 | 54 | 56 | 81 | 80 | 79 | 35 | 81 |
| Total operators | 32 | 62 | 60 | 57 | 58 | 60 | 85 | 84 | 83 | 39 | 85 |
| Maintenance | 11 | 26 | 25 | 23 | 24 | 24 | 34 | 33 | 34 | 13 | 34 |
| Pit management and Supervision | 4 | 4 | 4 | 4 | 4 | 4 | 4 | 4 | 4 | 4 | 4 |
| Total mining workforce per year | 47 | 92 | 89 | 84 | 86 | 88 | 123 | 121 | 121 | 56 | 123 |
The impact on the local hydrogeological regime in the vicinity of the pit excavation area has not been thoroughly assessed. Due to the arid climate of the area in which the La Joya project occurs, the presence of significant quantities of ground water is not expected. The hill side nature of the mining operation also allows for easy drainage of the mining area duringmine life. Once pits are formed completely below the ground surface, pumping to dewater the pits is likely to become necessary but currently this is not expected to be onerous.
16.5.8 Qualified person statement
Tetra Tech has estimated the mining methodology and mining equipment requirements and finds that the open pit nature of the operation will be comparable to many other operations and therefore no significant issues are foreseen. In addition, it is acknowledged that SilverCrest operates a mine in Mexico, which includes an open pit with contractor mining. A similar model thus applied to the La Joya property is expected to be reasonable. The precise details of the mining machinery are likely to vary from what Tetra Tech has proposed without significantly impacting the potential operations or mining costs.
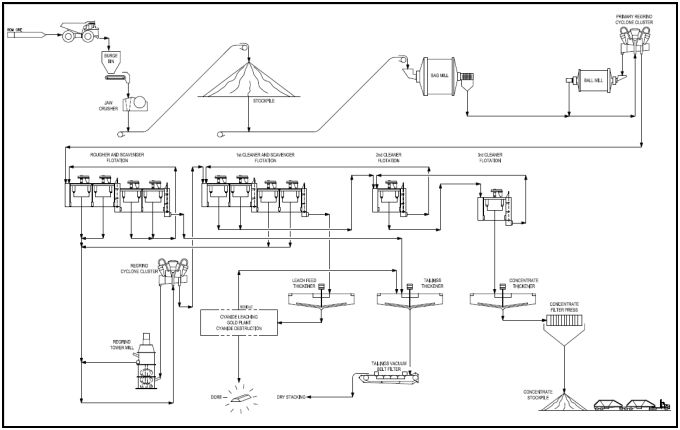
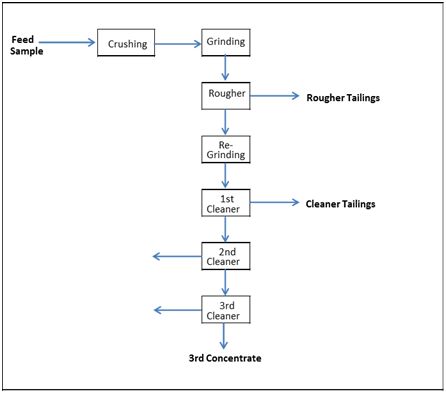
Tetra Tech Wardrop designed a 5,000 tonne/d mill to process ROM ore from the MMT mineralisation at the La Joya property. Two products will be produced: one is copper concentrate with silver and gold components; the other is silver doré bars (with gold) recovered from the first cleaner scavenger tailings. The process design is mainly based on currently available test results as summarised in Section 13.0 and industry experience. This section will describe the major design parameters and unit process. The complete process design criteria are included in Appendix D, with detailed process flow sheets and general site and plant layouts are available in Appendix D.
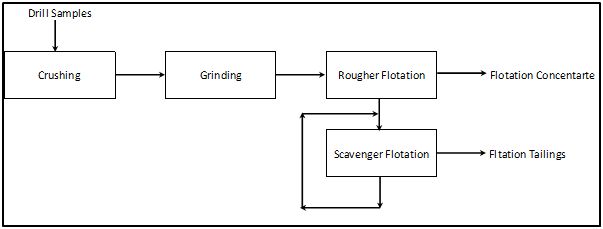
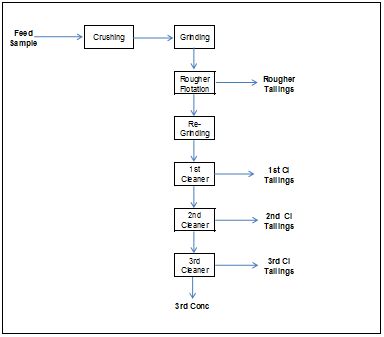
ROM ore will be trucked and fed to a jaw crusher at the mine site. The crushed ore will be conveyed to a coarse ore stockpile at the plant site to compensate for the throughput imbalance between mining and processing. The crushed ore will then be reclaimed and conveyed to the grinding circuit of a conventional SAB milling arrangement. The particle size of the ground ore will be reduced to a P80 of 150 µm from a F80 of 150 mm.
Product from the primary grinding circuits will feed copper-gold/silver bulk rougher flotation cells. The floated copper rougher concentrate will be reground to a particle size of P80 of 20 µm in the high-efficiency tower milling process. The rougher tailings will be thickened, filtered and then directed to the dray stacking area.
The reground rougher concentrate will be further upgraded in a cleaner flotation circuit with three stages of copper cleaner flotation and one cleaner scavenger stage, producing the final bulk copper-gold/silver concentrate. The copper-gold concentrate will be dewatered in thickening and filtration processes and then stored on the plant site.
The first cleaner scavenger tailings will be thickened and pumped to a gold leaching plant to recover silver and gold components. The plant will be composed of leach feed thickening, cyanide leaching, zinc precipitation (Merrill Crowe process), and cyanide destruction stages. The treated leaching residues will join the rougher tailings in the same thickening process as part of the final tailings.
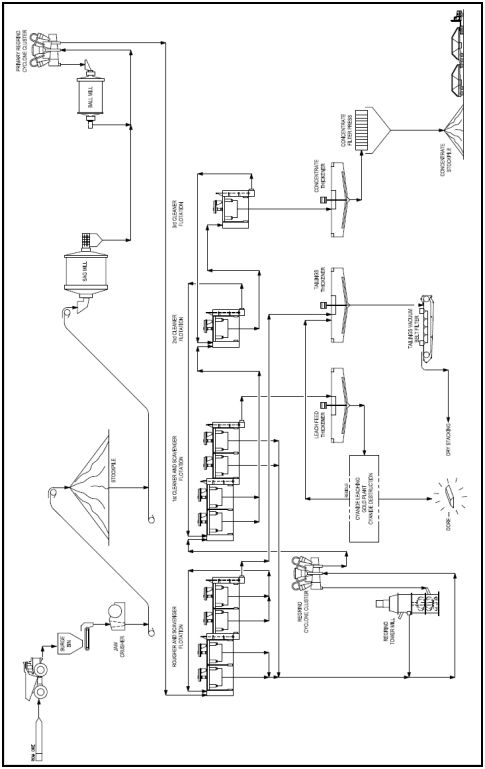
Figure 62 shows a simplified process diagram for the designed processing facilities.
Figure 62: Simplified Process Diagram
17.3 Process Design Criteria
The processing facility has been designed to accept a blended ROM ore of half Manto and half Structure at a nominal rate 5,000 tpd. The facility will operate 24 hours per day, 360 days per year. Operation availability for the process plant will be 92%, and for the primary crushing circuit, 75%. The major process design criteria are shown in Table 94.
Table 94: Major Processing Design Criteria
| Description | Units | Values |
| Operating Schedule | | |
| Annual Operating Days | d/a | 360 |
| Shift per day | | 2 |
| Hours per shift | | 12 |
| Plant Throughput | | |
| Annual Rate | t/a | 1,800,000 |
| Daily Rate | tpd | 5,000 |
| Hourly Rate - Crushing Plant | t/h | 278 |
- Grinding/Flotation/Gold Leaching Plant | t/h | 226 |
| Feed Properties | | |
| ROM Ore Rock Type | | 50%Manto, 50% Structure |
| Coarse Ore Work Index, Mia | kWh/t | 17.6 |
| SAG Mill Specific Energy Requirement | kWh/t | 9.1 |
| Bond Ball Mill Working Index, BWI | kWh/t | 14.8 |
| Abrasion Index | g | 0.12 |
| Head Grades - Copper | %, Cu | 0.41 |
- Silver | gpt | 58 |
- Gold | gpt | 0.2 |
| Product Quality | | |
| Copper Concentrate | %, Cu | 35 |
| | gpt, Ag | 4,380 |
| | gpt, Au | 11.5 |
| Silver/Gold Dore | %, Ag | >99% |
One jaw crusher will perform primary crushing on the ROM ore. Haul trucks will deliver ROM ore from the open pit to one surge bin which will be equipped with one apron feeder to feed the primary jaw crusher. The top feed ore size to the crushers is approximately 1,000 mm, which will be reduced to a particle size of P80 of 150mm. The product from the primary crushers, the coarse ore, will be discharged onto dedicated ore transfer conveyors. These conveyors will deliver the coarse ore to the coarse ore stockpile. Dust collectors and sumps will be located in the facility to remove dust and runoff water. The crushing plant availability of 75% is considered with current plant design practice and industry experience.
The primary crushing circuit comprises the following major equipment:
| § | one 950 mm x 1,250 mm jaw crusher, driven by a 160 kW motor; |
| § | one 1.2 m wide discharge conveyors driven by a 12 kW motor, and one 1.2 m wide coarse ore stockpile feed conveyor driven by a 52 kW motor; and |
| § | one 7.5 kW apron feeder. |
17.4.2 Coarse Material Storage
The coarse ore will be sent to a 3,000 t live capacity ore transfer stockpile via the coarse ore transfer conveyors. The ore then will be reclaimed by three 1.2 m wide x 9.0 m long apron feeders (including one standby) to the SAG mill.
17.4.3 Comminution Circuit
Grinding will be conducted in a SAB circuit with an average throughput of 5,000 tpd. The main equipment includes:
| § | one 6.7 m diameter x 3.2 m long SAG Mill, driven by a 2,100 kW motor; |
| § | one 4.3 m diameter x 7.2 m long ball mill, driven by a 2,100 kW motor; and, |
| § | pumps and classification hydro cyclones. |
The crushed ore will be fed to the SAG Mill feed chute along with process water, making a slurry with 65% solid content. One automatic ball charging systems will deliver grinding media to SAG mill feed chute. Discharge from the SAG mill will be sent through a trommel screen and a SAG mill screen. Undersize from the screens will be sent to the cyclone feed pump box. Oversize from the SAG mill screen will be conveyed back to the SAG mill.
Slurry from the hydrocyclone pump box is pumped to the hydrocyclone cluster. Process water is added to the cyclone feed pump box as required. The hydrocyclone underflow will gravity-flow to the ball mill feed chute with solids content of 75%, while the overflow will flow to the bulk rougher flotation bank with solids content of 30% by gravity. The hydrocyclone clusters will have a cut size of P80 of 150 µm, and the circulation load to the ball mill circuits will be 300%. One automatic ball charging systems will deliver grinding media to each ball milling feed system.
17.4.4 Copper-Gold/Silver Flotation
17.4.4.1 Bulk rougher/Scavenger Flotation
The hydrocyclone overflow of the grinding circuit will feed one rougher flotation bank that will be consisted of four 70 m3 flotation cells. The flotation reagents will include potassium amyl xanthate (PAX) and methyl isobutyl carbinol (MIBC). The bulk copper-gold/silver bulk rougher concentrate will be sent to a tower mills for regrinding. The flotation tailings will be sent to the rougher scavenger flotation stage, with scavenger concentrate pumped back to rougher flotation, and scavenger tailings pumped a dewatering circuit prior to being dry-stacked on the site.
17.4.4.2 Bulk Concentrate Regrinding
The copper-gold/silver bulk concentrate will be reground to a particle size of P80 of 20 µm, together with the 1st cleaner scavenger tailings. The regrinding process will be conducted in a regrind tower mill closed with a hydrocyclone cluster. The overflow from the hydrocyclone cluster will gravity-flow to the cleaner flotation circuit, while the underflow of the hydrocyclones will flow to the regrinding mill feed distributor. The major equipment in the regrind circuit are:
| § | one tower mill, driven by a 265 kW motor; |
| § | pumps and classification hydrocyclones. |
Reagent cyanide and lime will be added in the regrind cyclone feed pump box to depress the arsenopyrite associated with Manto and Structure mineralisation.
17.4.4.3 Cleaner Flotation
The hydrocyclone overflow will be cleaned in three cleaner flotation stages. In the first stage of cleaner flotation, a bank of five 5 m3 tank cells will be used. The 1st cleaner concentrate is fed to a single 2nd/3rdcleaner flotation circuit. The 1st cleaner tailings will pass to a scavenger stage. The 1st cleaner scavenger concentrate will be sent back to regrind circuit by slurry pumps; the scavenger tailings will be discharged and sent to leaching circuit. For the 2nd and 3rd cleaner stages, the same size cell of 5 m3 will be used with two for the 2nd cleaner stage and one for the 3rd cleaner flotation. The tailings from the 2nd and 3rd cleaner flotation stages will be returned to the head of the preceding cleaner flotation circuit. The final concentrate will be sent to a dewatering circuit.
The same reagents used in the rougher flotation circuit will be used in the cleaner circuit.
17.4.4.4 Copper Concentrate Dewatering
The final copper-gold/silver concentrate will be thickened to 55% solids by weight in a 4.5 m diameter high-rate thickener. The thickener overflow will return to various circuits for use as process water. The thickener underflow will be directed to a thickened concentrate stock tank. The concentrate will then be pumped and filtered to contain about 8 to 9% moisture.
The key equipment used in the concentrate dewatering processes will include:
| § | one 4.5 m diameter high-rate thickener; |
| § | one 30 m2 filter press; and |
17.4.5 Cyanidation Leaching/Gold Plant/Cyanide Destruction
The 1st cleaner scavenger tailings will be further processed in a Cyanidation leaching process to recover silver and gold components. The separation will employ the feed thickening, cyanidation leaching, zinc precipitation (Merrill Crowe process), and cyanide destruction stages.
The circuit will include the following key equipment:
| § | one 10 m diameter high rate thickener; |
| § | one cyanidation leaching circuit; |
| § | one zinc precipitation plant; and |
| § | one cyanidation destruction circuit. |
The first cleaner scavenger tailings will be thickened prior to the cyanidation leaching. The thickener underflow will be pumped to leaching tanks.
The discharge from cyanidation will be pumped to a Merrill-Crowe zinc precipitation plant for recovery of silver and gold from cyanide solutions. The plant is typically composed of a solid and liquid separation such as a CCD circuit, a de-aeration stage of the pregnant solution typically in a packed tower under vacuum, and zinc precipitation followed by a filtration. The predicated silver and gold will be sent to the on-site electro winning and fire refining to produce silver/gold dore.
The leaching residues will be discharged in the form of the CCD thickener underflow and treated by using Inco sulfur dioxide /air process. The equipment used will include one high pre-aeration agitation tank, SO2 oxidation tanks and a wet alkaline scrubbing system. The treated residues will join the rougher flotation tailings in the tailings dewatering area.
Typical reagents will be added including cyanide, lime, lead nitrate, zinc dust, filter aid, sodium metabisulphite (SMBS) and anti-scalant.
17.4.6 Tailings Management
The tailings will be generated in the recovery processes of valued metals, namely the rougher flotation tailings, and the treated cyanidation residues. The tailings streams will be combined and dewatered to a dry stacking level. The circuit will include the following key equipment:
| § | one 45 m diameter high rate thickener; |
| § | two 90 m2 vacuum belt filters packages; and |
The combine tailings will be directed to one 45 m diameter high rate thickeners, where the tailings will be thickened to 60% solids. The thickener overflow will be pumped to the process water tank, and the underflow will be pumped and filtered in two vacuum belter filters each with a filtration area of 90 m2. The filtered tailings will be trucked to a dedicated area for dry stacking storage. Tetra Tech WEI recommends a trade-off study comparing the conventional tailings pond storage.
All the reagents will be prepared in a bermed containment area in a separate reagent preparation and storage facility. The reagent storage tanks will be equipped with level indicators and instrumentation to ensure that spills do not occur during operation. Appropriate ventilation and fire and safety protection will be provided at the facility.
The liquid reagents (including CMC, MIBC, and antiscalant) will be added in undiluted form to various process circuits via individual metering pumps.
All the solid type reagents (including PAX, NaCN, CuSO4 and SMBS) will be mixed with fresh water to 10% to 25% solution strengths in their respective mixing tanks, and stored in separate holding tanks before being injected into the process circuits at various addition points by metering pumps.
Lime milk of a 20% strength will be prepared onsite from quicklime.
Flocculent will be dissolved, diluted to 0.5% strength and then added to various thickener feed wells by metering pumps.
17.4.8 Assay and Metallurgical Laboratory
The assay laboratory will be equipped with the necessary analytical instruments to provide routine assays for the mine, process and environmental departments.
The metallurgical laboratory will be fully equipped with all necessary laboratory equipment and instruments, and will undertake all necessary testwork to monitor the metallurgical performance and to improve the process’s flowsheet and efficiency.
17.4.9.1 Freshwater Supply System
Freshwater will be supplied from a reservoir or underground source for the following applications:
| § | fire water for emergency use; |
| § | cooling water for mill motors and mill lubrication systems; and |
Water to be used as gland water or for reagent preparation will undergo filtration, and will be stored in a separate tank.
17.4.9.2 Process Water Supply System
Process water will consist primarily of reclaimed water from the concentrate and tailings dewatering stages. On average, total makeup water, including freshwater for process requirements, is estimated to be approximately 30 m3/h.
Plant air service systems will supply air to the following areas:
| § | low pressure air for flotation cells by air blowers; |
| § | high pressure air by dedicated oil-free air compressors in leaching circuit; |
| § | high pressure air by dedicated oil-free air compressors in cyanide destruction circuits; and |
| § | Instrumentation air and other plant service air for primary crusher and mill. |
17.4.11 Process Control Philosophy
The process control systems will typically consist of a Distributed Control System (DCS) with PC-based Operator Interface Stations (OIS). These stations are located in the following two control rooms:
| § | primary crusher control room; and, |
| § | mill grinding/thickening/dewatering control room. |
The control rooms will be staffed by trained personnel 24 h/d.
In addition to the plant control system, a closed-circuit television (CCTV) system will be installed at various locations throughout the plant, including the ore transfer stockpile, stockpile, coarse ore stockpile, the stockpile conveyor discharge point, the grinding/flotation facility, the TSF, the concentrate dewatering/storage building and the gold recovery facilities. The cameras will be monitored from both local control rooms and a central control room.
An automatic sampling system will be installed to collect samples from various streams for online analysis and the daily metallurgical balance.
Cyanide monitoring/alarm systems will be installed at the cyanide leaching area and at the cyanide destruction areas. A sulphur dioxide monitor/alarm system will monitor the cyanide destruction area as well.
18.0 PROJECT INFRASTRUCTURE
The existing infrastructure on the La Joya property includes an access road and tracks used during the exploratory drilling. Figure 63 shows the planned layout for the La Joya property.
The property is 9.4 km away from the town of La Joya. The close proximity enables the use of the towns as a source of labour as well as accommodation for labour sourced from elsewhere in Mexico or other countries. It is anticipated that workers will be able to travel to and from La Joya or other nearby towns each day during mine construction and operation, eliminating the need for temporary camp accommodations. For the purpose of the PEA, Tetra Tech has provided for the following project infrastructure and facilities:
| 1. | Upgrade of the site access road |
| 3. | Administration office buildings, a mine dry/change house and warehouse. |
| 4. | Fresh water supply systems including a pump house to treat and piping to distribute the water as process water, fire water, and potable water. |
| 5. | Water management infrastructure, including diversion ditches. |
| 6. | Waste rock storage facilities. |
| 7. | A dry stack tailings storage facility (DSTSF) including a tailings water pond, diversion berms and necessary liners. |
| 8. | Solid waste disposal pad with solid waste skips/bins and hazardous waste skips/bins. |
| 10. | On-site explosive magazines and storage. |
| 11. | Process facilities including a crusher, mill building and process plant. |
| 13. | Power supply and distribution, including: |
| IV. | power cables and lines. |
| 14. | A security/weigh station |
| 15. | Process control and instrumentation. |
| 16. | Communication systems. |
Please refer to site layout Figure 63 for locations of the planned infrastructure for La Joya.
Figure 63: Conceptual general arrangement for the La Joya Property
18.1 Waste Rock and Tailings Storage Facilities
Two waste rock storage facilities and one dry stack tailings storage facility (DSTSF) are planned at La Joya (Figure 63). The waste dump design consists of a total storage of 18 Million cubic metres in two side hill dumps to the east of the Cerro Sacrificio ridge. Currently, no geochemical or geotechnical characterisation of the waste rock units has been completed.
Dry stack tailings (or dewatered tailings) are the preferred method given the reduced environmental footprint, increased return water efficiency, ability for concurrent reclamation, elimination of post-closure maintenance of the facility, and ease of permitting. Dry stack tailings management involves filtering of the process tailings to a moisture content (by dry mass) typically ranging between 15 percent and 18 percent using pressure
The tailings will be conveyed downhill to the tailings storage facility using overland conveyors, which include mobile ramp conveyors and grasshoppers and a mobile radial stacker. A bulldozer has also been considered for the movement of material on the DSTSF in conjunction with the radial stacker and grasshoppers.
Conceptual design of the proposed DSTSF is based on a 5,000 tpd open pit operation over a period of nine years. The DSTSF will be located approximately 2000 m southeast of the deposit and approximately 1000 m south of the proposed mill site. General characteristics of the DSTSF are summarized in
Table 95.
Table 95: Summary of Dry Stack Tailings Storage Facility
| Description | Amount |
| Tailings Storage Volume | 8.6 Mm3 |
| Tailings Storage Tonnage | 15.5 million tonnes |
| Average Dry Density | 1.8 t/m3 |
| Highest Crest Elevation | 2,292 m |
| Lowest Toe Elevation | 2,192 m |
| Side Slope | 3H:1V |
| Tailings Storage Facility Footprint | 331,000 m2 |
Geotechnical and geochemical characterization, including acid rock drainage and metal leaching, of the tailings and waste rock materials has not yet been completed for the project. Given the abundance of limestone in host rocks of the deposit , it is reasonable to assume that net neutral tailings chemistry may be facilitated after processing.
Even though it is expected that the tailings seepage will be benign, the current design incorporates an engineered liner across the full footprint of the facility as redundant measure to minimize seepage. The liner system currently is envisioned to include a low permeability compacted tailings base layer (a seepage barrier) overlain by a mine waste rock layer (a free-draining layer) wrapped with geotextile. Any seepage (the entrained pore water within the tailings) and storm water will be collected using a lined perimeter ditch around the DSTSF, and eventually directed to the combined seepage/runoff collection pond located to the southwest of the DSTSF. A presumed storage capacity of 100,000 m3 plus 1 m freeboard has been used for sizing of the pond.
18.2 Dry Stack Tailings Management Facility
The conceptual design of the proposed dry stack tailings storage facility is based on a nominal production rate of 5,000 tpd over a period of nine years. Site specific geotechnical information and tailings characteristics are unavailable at the current PEA level. General assumptions made in the conceptual design of the DSTSF include: geotechnically sound subsoil conditions for supporting the proposed dry stack tailings within the DSTSF; easy handling of tailings by conveyors, dozers, compactors and other construction equipment; benign tailings and non-active mine rock.
18.3 Access and Site Roads
The La Joya property is currently accessible from Highway 241 starting from either La Joya, or alternatively from south of Villa Union. The proposed access road to the site is the latter route east on Highway 241 south of Villa Union following existing farming and agricultural roads as sketched in Figure 64. The existing condition of these roads has not been observed in the field by Tetra Tech but is assumed to be dirt roads in the range of 6 to 10 m wide. In order to use this route as the access road to the La Joya Deposit for initial transport of equipment and supplies for exploration activities, upgrading is required to accommodate the anticipated traffic. The total length of the access road is approximately 15 km through mainly flat terrain in the valley, but will need to climb approximately 120 m vertically from the base up to the exploration site. The road grades for this section may be at the maximum of 10%, depending on the alignment and amount of profile cutting into the existing slope face. Further studies will provide a better concept of the grades and volumes for construction of the access road through this challenging section.
The design criteria for the access road include roadway width 6 m (minimum), roadside turnouts at regular intervals, and embankment height of 0.5 m (minimum). It has been assumed that the access road will be upgraded using suitable fill material available from local sources. The top 200 mm will consist of granular material for the roadway surface. Ditching and culverts are needed to provide for drainage and will be installed at existing drainage locations or at regular intervals if existing drainage facilities are not adequate.
It may be necessary to acquire road right-of-way or obtain easement through properties that are not owned by the federal government. SilverCrest has advised that the majority of the road is registered as a federal public road not requiring easement rights. Tetra Tech has not sought legal confirmation of this and until further review assumes this to be correct. This unknown will be better identified with further design and discussions with stakeholders. For the PEA, right-of-way requirements (if any) have not been accounted for.
Figure 64: Access Road
The current road layout at the site was developed to a conceptual level to provide access to the pits, waste dumps, other site infrastructure and facilities. Haul roads were sketched out in coordination with the open pit design to minimize slope angle in the pit and total cut volumes. Two lane haul roads connect pit entry/exit points to the primary crusher and waste rock storage locations. Where possible, the length of roads was minimized by selecting the shortest route around the mining area and reducing the number of site roads to the minimum.
Figure 63 shows 2-lane haul roads from Main Pit and Patricia Pit to the crusher and North and South Waste Dump. The total length of the 2-lane haul roads is approximately 5,200 m but may change during more detail design as the terrain is very steep and challenging to weave the road through. A single lane haul road or site service road that is approximately 2200 m long connects the Main Pit location to the Diesel Storage & Truck Shop, administration office and other buildings. A road to the explosive storage will be required and is sketched on the site layout; however, the locations for both the building and road have not been confirmed at this stage.
Typical sections in Figure 65 shows dimensions for 2 lanes and 1 lane haul roads including width of a safety berm. The design vehicle for haul roads is a 60 tonne haul truck (CAT 773E). The following parameters for site roads have been used in the preliminary economic analysis:
| § | Width of 2 lane haul roads – 21.2 m (including safety berm). |
| § | Width of 1 lane haul roads – 15.8 m (including safety berm). |
| § | Maximum grade – 8 to 10%. |
| § | Cut slope – 68 degrees (rock). |
| § | Sub-base and surface thickness – 0.5 m. |
The typical sections show the haul roads in cut for the entire roadway width. Constructing the road by some filling on the downslope side was considered but large fill volumes and potential road instability concerns negated the benefits of a cut and fill section. Note that the existing slope has an angle of approximately 28 degrees and a proposed roadway fill slope may be 1.5:1 or 2:1 (32 or 27 degrees) depending on the geotechnical recommendations.
The site roads will be constructed using quarried rock or waste rock from the site with surfacing aggregate possibly coming from a local crushing pit. The road cut material will also be available for use as fill at other facilities, and excess or unsuitable material will be deposited as waste. It is assumed that there is no significant overburden as bedrock is exposed at most locations. It is recommended that a geotechnical site investigation program be carried out to fully assess the in-situ rock conditions and provide more geotechnical engineering for the road design during future studies.
All site roads will incorporate ditches and culverts as necessary to prevent erosion and improve road performance. The ditch configuration will be influenced by many factors including design storm event and road grade. Culverts will be protected with rip-rap at both the inlet and outlets.
A properly designed and constructed road can significantly reduce the frequency and magnitude of on-going maintenance, but some seasonal work will be required. The maintenance program will include dust suppression, ditch and culvert cleaning and regular surface re-grading.
Figure 65: Haul Road Cross Section
Structural reinforced concrete for the construction of crushing plant equipment supports, process plant equipment supports, building and substation foundations, tanks and miscellaneous storage pads have been included in the capital cost estimates.
18.5.1 Water Storage and Distribution
No drilling for process or potable water has yet been undertaken for the property. Tetra Tech has considered two water wells on-site, to provide the water source for all mine site operations. From the water wells water will be pumped into a large water storage tank (600 kℓ) within the process plant with piping to the rest of the water distribution system. Tetra Tech has included the piping, pumps, electrical cabling and buildings required for pumping from the wells in the PEA. Drilling of the wells could be undertaken by local contractor once a study on the ground water has been completed. Concrete pump mounts are likely to be required at the wellheads.
Two 5 kℓ tanks are planned to be located near the open pit mine fresh water needs and fire water storage. No provision has been made for potable water due to the proximity of the local town.
18.5.2 Sewage Collection and Treatment
A single package sewage treatment plant has been envisaged to handle water borne sewage from the mine office, warehouse, truck shop, administration office and dry/change house facilities.
18.6.1 Offices, Warehouse and Change Houses
The mine site office and administration office have been planned as two complexes of interlocked containers. Tetra Tech has provided for the equipping of the offices with modest furnishings, office supplies, fire protection, HVAC. A mine warehouse is planned near the process facility, complete with shelving, a concrete base, as well as fire sprinklers, electrical and plumbing. Five additional containers have been provided for the construction of a dry/change house facility on-site. All site buildings will be equipped with electrical and plumbing.
A truck/maintenance shop has been planned near the other mine site infrastructure. The truck shop will include a concrete loading bay and 45 to 50 tonne overhead crane. Provisions have been made in the PEA for basic and specialized tools including spanner sets, lathes, a compressor, hand tools, welding and metal work supplies. Two additional shipping containers have been planned for use as general shop and utility storage.
18.7 Waste Collection Facility
Tetra Tech have considered the use of a contractor to ship all non-hazardous waste to the nearby municipal landfill or permitted landfill site. A provision for onsite storage of waste has been included in the form of three domestic waste skips/bins and three hazardous waste skips/bins on a designated concrete pad. Hazardous waste will be shipped as required by regulation to a permitted hazardous waste facility.
18.8 Fuel Storage Facility
A fuel storage facility has been envisaged at the La Joya mine site with a concrete base and bund wall to contain spillage. The capacity of the tanks is expected to be the order of; two 56,000L diesel tanks and one 7,500L gasoline tank. Tetra Tech has included the costs for construction of the fuel storage facility, but has considered that the mine life is sufficiently long, with sufficient potential for the use of contract diesel suppliers, who conventionally provide and maintain the diesel storage facility under contract for the life of mine.
18.9 Explosive Magazine Storage
Tetra Tech has selected a provisional location south of the open pit and processing facility, for the storage of explosives. This location of the selected site is expected to comply with requirements for explosive storage in terms of distance from other infrastructure. The preliminary plan for the site includes concrete storage pad, an ANFO bin, a detonator magazine, and cartridge and booster magazine storage. The explosive magazine area will need to be secured by a gated fence equipped with power. Tetra Tech has made provision for this in the capital budget.
18.10 Processing Plant Infrastructure
The Concentrator Building (90 m by 24 m) is a steel structure with insulated steel roof deck and wall cladding. Two overhead cranes (a 30/10 t crane operating over the mill area, and a 15/3 t crane over the flotation and leaching area) are supported on steel beams cantilevered from building columns.
Interior steel platforms on multiple levels are provided to service ongoing operation and maintenance for equipment. The building will house modular pre-fabricated units for electrical, MCC, control, change rooms, and offices. Heavy mat concrete foundations and piers are provided to support mills.
Section 17.4.8 describes the onsite laboratory for the site.
18.11 Security and Weigh Scale
A small container building is provided for the in the PEA for the site with a 50t weigh scale as a security building.
18.12 Electrical Substation
The proximity of the La Joya property to a nearby power grid located 15 km from the site, favours the use of utility power for the mining operation. SilverCrest has begun preliminary engagement with the Mexican utilities on accessing power and the associated required infrastructure. It is expected that SilverCrest will need to fund the main power line and connections from the local village to the mine. The details of the infrastructure required are not yet available. Tetra Tech has estimated costs for this electrical infrastructure based on similar projects.
The concept for the electrical substation on-site consists of a switchgear and transformer secured on a concrete pad with security fencing. Another switchgear and 10km of power line and timber poles have been considered for connection to the existing power supply. The electrical power for the mine is considered as a radial distribution system, using three phase power. It is expected that multiple voltages systems will be used to provide power to throughout the mine, with larger equipment such as crushing and grinding equipment running on higher voltage three phase systems, with a medium voltage three phase network for pumps and smaller equipment. A lower single phase voltage network will be available for offices, control systems and general mine requirements. Smaller generators may be used to provide power during early mine construction.
The main substation will include transformers to provide a variety of voltages to the mine site. The majority of the power will be supplied to the process facility via a high voltage cable or line. Within the process facility various drop down transformers will provide electrical power at the required voltage to the processing equipment. The electrical distribution will consist of unit transformers where required, power centres, distribution boards with overload protection, control panels as required and electrical cabling and grounding networks. Tetra Tech has provided for limited power to the open pit, largely for lighting and for mine site truck maintenance facilities. None of the mining equipment has been planned as electrically powered.
Grounding and protection circuits will be installed as required by Mexican electrical codes and best practice for the mining industry. Full time certified electrical maintenance staff will be employed by the mining operation, with qualified electrical contractors to undertake specialist work where required.
Provision in the capital budget has been made for the purchase and installation of an onsite communication system. This will include communications in mobile equipment and external communications of telephone and electronic communication.
19.0 MARKET STUDIES AND CONTRACTS
No market studies have been conducted at this time.
20.0 ENVIRONMENTAL STUDIES, PERMITTING AND SOCIAL OR COMMUNITY IMPACT
Permits required for the exploration Phase III drilling permit are under review and awaits issuance in Q4 2013. Tetra Tech understands that SilverCrest has held the appropriate permits required for the exploration phases completed to date on the property.
The Mexican government issued an environmental permit (Environmental Assessment) for all proposed Phase I and II exploration work in December, 2010. Phase I inspection of the site was conducted in May 2011.
Water permits are not required for exploration work since the water is purchased locally from private active wells.
SilverCrest will be required to obtain the appropriate permits from SEMARNAT and other regulatory authorities prior to mine development or construction as listed in Table 96. Due to the early stage of the project, these permits are not yet required for the project.
Table 96: Future project permitting requirements
| Permit | Mining Stage | Agency | Status |
| Environmental Impact Statement (MIA) | Construction/operation/abandonment | Secretary of environment and natural Resources (SEMARNAT)-State offices | Not yet required |
| Land use change study | Construction/operation | SEMARNAT-General Department of Permitting for Forestry and soils (DGGFS)-State offices | Not yet required |
| Land use license | Construction | Local Municipality | Not yet required |
| Explosive handling and storage permits | Construction | National Secretary of Defense (SEDENA). (Need approval from state and municipal authorities) | Not yet required |
| Archaeological release letter | Construction | Construction Nation Institute of Archaeology and History (INAH) | Not yet required |
| Water use concession title | Construction/operation/prior to utilization of water | National Commission of Water (CAN)-State offices | Not yet required |
| Water discharge permit | Operation | CAN-(State offices) | Not yet required |
| Construction permit | Construction | Local Municipality | Not yet required |
SilverCrest has signed an agreement with the civil co-operative for the community of La Joya as described in Section 4.3.
21.0 CAPITAL AND OPERATING COSTS
Introduction Table 97 summarizes the capital and operating costs for the Project, which are discussed in greater detail in the following subsections. The details of the capital cost estimate are included in Appendix E.
Table 97: Summary of Capital & Operating Costs
| Cost Type | Total ($) | Unit Cost ($/t processed) |
| Total Capital Costs | 141,189,928.00 | - |
| Total Sustaining capital | 6,335,869.00 | - |
| Total Operating Costs | - | $24.25 |
21.1 Capital Cost Summary
Tetra Tech has estimated preproduction capital costs totalling $141 million, including contingency of $17 million and indirect costs. The sustaining capital is estimated to be $6.3 million over the operational life of the project. $6 million has been estimated for closure costs, based on $150,000 per hectare of open pit reclamation (Wernstedt and Hersh 2010, suggest that $120,000 per hectare should be considered for funding of mine rehabilitation), in addition to the closure provision, Tetra Tech has included operating costs for progressive reclamation of waste dumps, as well as funds for the reclamation of the DSTSF. Tetra Tech has estimated a total of $7 million for working capital, which will be recovered over the life of the operations from the cash flow. The preproduction capital cost includes all major EPCM encountered by SVL during the initial 2 years of the project, namely Year -1 and Year -2. The preproduction capital cost is also inclusive of the pre-stripping costs planned for year -1. Note that the mining costs that would typically be associated for the pre-strip in Year -1, have been translated to capital cost. Table 98 summarizes the main components of the project and the associated costs while
Figure 66 shows the distribution of these costs.
Table 98: Capital Cost Summary
| Capital Expense Item | Estimated cost in $US ($000) |
| | |
| Overall Site | $17,915 |
| Open Pit Mining | $6,700 |
| Ore Handling | $9,095 |
| Process | $44,992 |
| Tailings & Water Management | $6,850 |
| On-Site Infrastructure | $9,116 |
| Total Direct Costs | $94,666 |
| | |
| Total Project Indirects | $24,824 |
| | |
| Total Owner's Costs | $4,733 |
| | |
| Total Contingency | $16,965 |
| | |
| Preproduction capital costs including indirect and contingency | $141,190 |
*Subtotals and Totals do not add correctly due to the rounding of values to $000
Figure 66: Capital Cost Distribution
Tetra Tech has considered the use of mining contractors for the PEA, and thus has not included the major mining equipment required for the operation in the mining capital. Tetra Tech has however included additional equipment that is not expected to be provided by a mining contractor including; light vehicles, electrical generator sets, a mechanic truck, a crane truck, and a welding truck which will be required for operation and maintenance of the processing plant.
The pre-stripping cost has been estimated using a contract mining cost. Referring back to the schedule, Year -1 has a total stripping tonnage of 3Mt which will result in the mine incurring a cost of $5.8M for the pre-stripping.
The total pre-production capital expenditure for mining is thus $6.7 million, including $800 thousand for the additional mobile equipment over and above that expected to be provided by a mining contractor as well as $77 thousand for mining engineering office and site equipment.
21.1.2 Overall Site Capital
Tetra Tech has accounted for costs associated with site preparation work as well as electrical and communication expenses. These can be seen in Table 99. The summary focuses on the major components of the mining project with the sections following breaking down the components into further categories. Full details are outlined in Appendix E showing breakdown of the costs.
Table 99: Overall Site Costs
| Capital Expense Item | Estimated cost in $US ($000) |
| | |
| Bulk Earthworks/Site Preparation | $1,386 |
| Site Roads | $9,924 |
| Site Drainage | $118 |
| Fencing/Gates | $109 |
| Yard Lighting | $87 |
| Site | $11,624 |
| | |
| Power Supply & Distribution (includes E-rooms & substations) | $4,669 |
| Fire Alarm | $376 |
| Site Electrical | $5,044 |
| | |
| Control System | $509 |
| Communications | $739 |
| Site Controls & Communications | $1,247 |
| | |
| Site Costs Total | $17,915 |
*Subtotals and Totals may not add correctly due to the rounding of values to $000
21.1.3 Primary Crushing & Material Handling Capital
The crushing plant as described in section 17 has been used as a basis for the estimate below. The estimate includes consideration of earth walls and other civil works as well as power supply, controls, and other auxiliary equipment required for the construction and operation of primary crushing and ore handling facilities. Table 100 shows the material handling and primary crushing capital estimate.
Table 100: Material Handling Capital and Primary Crushing
| Capital Expense Item | Estimated cost in $US ($000) |
| | |
| Jaw Crushing | $3,652 |
| Coarse Stockpile | $5,210 |
| Discharge Conveyor | $233 |
| | |
| Ore Handling Total | $9,095 |
21.1.4 Processing Capital
The estimate of the processing plant capital is based on the required infrastructure to support a facility as described in section 17 and further illustrated in Appendix D. Where appropriate, quantities were developed from general arrangement drawings, process design criteria, process flow diagrams, and equipment lists. Percentage allowances are applied to bulk materials based on discussions between the process team and the estimator. Table 101 shows a summary of the estimated capital cost for the processing facility.
Table 101: Processing Capital Estimate
| Capital Expense Item | Estimated cost in $US ($000) |
| | |
| Mill Building | $5,305 |
| | |
| Grinding & Regrinding | $19,314 |
| Flotation | $4,484 |
| Grinding, Flotation, and Refining | $23,797 |
| | |
| Concentrate Handling | $1,375 |
| Tailings Handling | $10,405 |
| Leach / Gold Plant / Cyanide Destruction | $2,824 |
| Concentrate & Tailings Handling | $14,603 |
| | |
| Reagents | $1,286 |
| | |
| Process Costs Total | $44,992 |
*Subtotals and Totals do not add correctly due to the rounding of values to $000
21.1.5 Tailings & Water Management Capital
21.1.5.1 Dry stack tailings storage facility
The scope of work included in the capital cost estimate consists of the following:
| § | Site preparation including grubbing, clearing, stripping, and rough grading for the tailings storage facility site. |
| § | A perimeter containment dyke and seepage collection ditch around the DSTSF. |
| § | Placement of a compacted tailings base layer. |
| § | Installation of the underdrain. |
| § | Construction of the runoff/seepage collection pond. |
| § | Installation of the diversion ditch above the DSTSF. |
Capital costs associated with the conveyor system, power supply, and access road to the DSTSF site are not included in this section.
The capital cost estimate includes the initial capital (pre-production) and sustaining capital for the duration of the mine’s operating life. Since insufficient detail design information is available at the current PEA level, the initial capital cost estimate has been based on equipment and material supplies and historical costing data used on mine facility structures. In the sustaining capital cost estimate, costs for the remaining earthworks are projected from Year 1 to Year 9 into the mine’s operating life.
The total estimated capital expenditures over the 9 year operating period are $12.9 million.
In addition to the initial Capital Cost of $5.2 M for the DSTSF, Tetra Tech has also accounted for grasshoppers and ramp conveyors both 30 meters in length as well as a radial stacker that will transport the dry tailings from the overland conveyor to be deposited in their final location. This brings the total initial capital cost for the DSTSF to $6.7 million.
Due to the fact that the PEA considered dry stack tailings, there is minimal associated water management related to dry stack tailings. However, Tetra Tech has considered additional costs of water management for distribution of water to remote areas of the mining operation outside of the plant and administration area. Tetra Tech has considered tanks, pipes, pumps and electrical installations as part of this cost, totalling $117 thousand for this aspect of the operations.
21.1.7 On-site Infrastructure
Tetra Tech has estimated the onsite infrastructure required for an operating mine. Section 18 high lights the infrastructure requirements. Table 102 shows a summary of the estimated capital costs for onsite infrastructure.
Table 102: On-site Infrastructure Capital
| Capital Expense Item | Estimated cost in $US ($000) |
| | |
| Administration Complex | $427 |
| First Aid/emergency vehicle garage | $52 |
| Assay and Metallurgical lab | $771 |
| Main Warehouse and Mill Shop Building | $796 |
| Security/Weigh Station | $122 |
Truck Maintenance Complex1 | 0 |
| Dry/Change house | $50 |
| ANFO Emulsion Plant and Magazine Storage | $172 |
| Ancillary Buildings | $2,391 |
| | |
| Plant and Instrument Air | $666 |
| Sewage Collection and Treatment | $95 |
| Process Water, Fire/Freshwater Storage and Distribution | $945 |
| Water Supply | $481 |
| Fuel Storage Area | $731 |
| Main Substation Building | $64 |
| Waste Collection Facilities and Incineration Plant | $30 |
| Site Services and Utilities | $3,013 |
| | |
| Plant Mobile Fleet | $3,397 |
| | |
| Mine Site Admin/SHE offices/Mine Planning/Engineering | $192 |
| Temporary Works | $112 |
| Temporary Services (For Construction) | $303 |
| | |
| On-Site Infrastructure Total | $9,104 |
*Subtotals and Totals do not add correctly due to the rounding of values to $000
1 Considered to be provided by contractor. Tetra Tech has provided for contractor mobilization fees of $500 thousand to cover costs for the contractor including erection of trucks shops etc.
Tetra Tech has made provision in the capital estimate for indirect capital. These costs are shown in Table 103. These cost are largely obtained by factoring and experience of other projects.
Table 103: Indirect Costs
| Capital Expense Item | Estimated cost in $US ($000) |
| | |
| Construction Indirects | $9,315 |
| Spares | $1,673 |
| Initial Fills | $566 |
| Freight and Logistics | $2,776 |
| Commissioning and Start-Up | $667 |
| EPCM | $9,502 |
| Vendors | $326 |
| | |
| Project Indirects Total | $24,825 |
Tetra Tech has estimated owner’s costs applicable to the preproduction period to be $4.7 million.
Various rates of contingency were applied based on the type of information available for the costs estimates. Quotes for machinery and processing equipment from suppliers were given low contingency whereas industry reference material or estimates based on project experience were given higher contingencies. The total contingency is $17 million representing 12% of total capital costs.
21.1.11 Sustaining Capital
A total of $6.3 million has been estimated for sustaining capital. This includes provision for expansion of the DSTSF, as well as additional haul road construction later in the mine life as a result of pit expansion.
Operating costs were estimated by Tetra Tech into 4 categories namely, mining, processing, general and administrative (G & A) and tailings management. Table 104 shows a summary of the operating costs estimated for the La Joya property. Figure 67 shows a visual for the operating cost distribution. Note that the mining costs have been sourced from a quote supplied by Construcciones Y Minado San Francisco S De R.L De C.V (CMSF), the processing, tailings and G & A costs are estimated costs based on similar projects, quotes or budgetary costs of consumables, Mexican labour rates, estimated fuel and electricity costs. These costs are further broken down in the section below.
Table 104: Operating Costs
| Aspects of Operation | Estimated Average Cost per tonne, over LOM |
| Mining (contract) per tonne rock handled | $2.16 |
| Average mining cost per tonne processed | $8.09 |
| Costs per tonne processed | $13.86 |
| Tailings per tonne processed | $0.49 |
| G & A per tonne processed | $1.81 |
| Total per tonne processed | $24.25 |
Figure 67: Operating Cost Distribution
Tetra Tech has been provided with a mining contractor quote by Construcciones Y Minado San Francisco S De R.L De C.V (CMSF) for the mining of the open pit as described in the schedule in section 16. Figure 68 shows the quote provided to Tetra Tech.
Figure 68: Quote received by Tetra Tech from CMSF for open pit mining at the La Joya Property
Note that costs in the quote above are per metric tonne.
21.2.2 Verification of contractor mining costs by Tetra Tech
Tetra Tech has additionally estimated mining costs using Runge™ XERAS. The software undertakes an estimate of cost based on inputs that the user provides on mining equipment to be used and factoring of maintenance and labour costs.
Tetra Tech’s estimate of mining costs has been based on the schedule and the geometry of the open pit. The estimated fleet includes 60 tonne haul trucks being loaded by either a wheel loader for waste and a hydraulic shovel or excavator for ore. Other support equipment includes drill rigs, bull dozers, graders, maintenance vehicles, smaller loaders, pumping and lighting equipment. Tetra Tech obtained supplier quotes from Makomex and Maqsa in Mexico for Komatsu and CAT equipment, as well as other budgetary costs from suppliers in USA and Canada. For minor equipment requirements (less than $100,000) Infomine USA Inc. Mining Cost Service publications were used or other various sources, such as similar projects or verbal discussions with suppliers. Tire costs and tire life for the 60 ton haul trucks were also acquired from Goodyear. Tetra Tech entered the mining schedule and estimated productivities for the mining equipment, into XERAS. Additional mining consumable costs were entered including:
| § | Powder Factor = 0.25 kg/tonne |
| § | Labour rate for all equipment operators and Mechanics= $8.00/hour |
Using XERAS daily shift schedules, availability and utilization inputs; machinery annual hour usage was estimated. Similarly, estimating machinery costs per hour resulted in annual costs for machinery. The mining schedule information enabled the conversion of this annual cost to cost per tonne. The results for the mine life are shown in Table 105 below.
Table 105: Tetra Tech estimate of mining costs done using Runge™ XERAS software
| Weighted average cost per tonne LOM | Year 1 | Year 2 | Year 3 | Year 4 | Year 5 | Year 6 | Year 7 | Year 8 | Year 9 |
| $1.80 | $1.58 | $1.54 | $1.48 | $1.51 | $1.57 | $2.14 | $2.13 | $2.12 | $2.96 |
On the basis of the Tetra Tech estimate of mining costs as shown in Table 105, Tetra Tech finds that the quote by CMSF is 20% higher than the Tetra Tech weighted average estimate, which is reasonable for contractor mining. Tetra Tech has compared the XERAS estimate of $1.80 with other similar projects by plotting the cost per tonne mined against daily production rate as shown in Figure 69. A trend line has been fitted to the results, and on the basis of this trend line, a 5,000 tonne per day operation in Mexico is estimated to have a mining cost of roughly $1.80 per tonne.
Figure 69: Estimated mining costs versus daily production for similar operations
21.2.3 Processing Cost Estimate
21.2.3.1 Process Operating Cost Estimate Summary
The operating cost estimates on the designed process include primary crushing, grinding, flotation, regrinding, cyanide leaching, Merrill-Crowe zinc precipitation/on-site smelting, cyanide destruction, and dewatering stages of concentrate and tailings. The estimate accuracy level is within 35% range plus or minus.
Table 106 gives the overall estimated cost summary for the processing facility, based on a daily mill throughput of 5,000 tpd, an operation availability of 92% and 360 operating days per year. The annual operating cost is approximately US$13.86/t of mill feed, including manpower cost of US$1.99/t milled and supplies cost of US$11.87/t milled. The details of manpower estimate can be found in Appendix F.
Table 106: Processing Operating Cost Summary
| Description | Personnel | Annual Cost US$ '000s | Unit Cost US$/t Milled |
| Operations Staff | 3 | $213 | $0.118 |
| Operations Labour | 52 | $966 | $0.537 |
| Maintenance Staff | 4 | $534 | $0.296 |
| Maintenance Labour | 54 | $1,592 | $0.884 |
| Metallurgical Laboratory | 11 | $274 | $0.152 |
| Subtotal Manpower | 124 | $3,579 | $1.988 |
| Operating Supplies | | $13,577 | $7.543 |
| Maintenance Supplies | | $3,320 | $1.844 |
| Operating Power Supply | | $4,466 | $2.481 |
| Subtotal Supplies | | $21,363 | $11.868 |
| Total Process Operating Cost | 124 | $24,942 | $13.857 |
The annual process operating cost estimate is based on the following considerations:
| § | Staff, operating, and maintenance labour force complements and base salaries are based on a local labour rate in Mexico and converted to US dollars with an exchange rate of 0.077. A burden of 71% was applied for all the employees to calculate the loaded salary values. |
| § | The unit electronic power cost of $0.07/kWh is applied in the estimate by assuming a local power grid system as the mill power supply. |
| § | The unit cost of processing reagents, liners, and grinding media are based on the budget prices received from the suppliers in North America in the third quarter of 2013. |
The maintenance cost estimates for spares and other maintenance supplies are based on an annual allowance at a ratio of the equipment capital cost.
21.2.3.2 Process Manpower Cost
The designed mill at this PEA level will require a total of 124 people in production that will mainly include 52 operators, 54 maintenance workers, and 11 people working in the metallurgical lab. Table 107 shows the manpower distribution in operation and maintenance area.
Table 107: Processing Manpower Requirement per Area
| Description | Personnel | Annual Cost US$ '000s | Unit Cost US$/t Milled |
| Operations Staff | 3 | $213 | $0.118 |
| Operations Labour | | | |
Ø Shift Supervisor | 4 | $143 | $0.079 |
Ø Crushing/Conveying | 12 | $197 | $0.109 |
Ø Grinding/Flotation | 16 | $298 | $0.166 |
Ø Concentrate Dewatering | 4 | $66 | $0.036 |
Ø Leaching/Gold Plant | 12 | $197 | $0.109 |
Ø Tailings Filtration | 4 | $66 | $0.036 |
| Operation Labor Subtotal | 52 | $966 | $0.537 |
| Maintenance Staff | 4 | $534 | $0.296 |
| Maintenance Labour | | | |
Ø Shift Supervisor | 4 | $171 | $0.095 |
Ø Mechanical | 24 | $625 | $0.348 |
Ø Welders | 4 | $82 | $0.046 |
Ø Electrical | 14 | $465 | $0.258 |
Ø Instrumentation | 8 | $248 | $0.138 |
| Maintenance Labor Subtotal | 54 | $1,592 | $0.884 |
| Metallurgical Laboratory | 11 | $274 | $0.152 |
| Total Manpower | 124 | $3,579 | $1.988 |
21.2.3.3 Process Operation Supply Cost
The estimated process operation supply consumptions and annual costs are shown in Table 108. Metal consumption rates were based on the hardness and abrasion testwork on La Joya mineralogy samples together with industry experience. Most reagent consumption rates were estimated from the locked cycle flotation and preliminary cyanide leaching tests except for those required in the gold plant. These material consumption rates were obtained from internal data on similar projects to simulate the generated cost from zinc precipitation to cyanide destruction. Other cost will include mill vehicle operation and miscellaneous items.
Table 108: Process Operation supply Consumption and Cost
| Description | Consumption kg/t ore | Annual Cost US$ '000s | Unit Cost US$/t Milled |
| Liners | - | $2,918 | $1.621 |
| Grinding Balls | | | |
Ø SAG Mill | 0.45 | $1,130 | $0.628 |
Ø Ball Mill | 0.60 | $1,415 | $0.786 |
Ø Tower Mill | 0.11 | $264 | $0.147 |
| Screen Panels/Tower Mil Spares/Filter Cloth | - | $1,115 | $0.619 |
| Flotation Reagents | | | |
Ø PAX | 0.05 | $419 | $0.233 |
Ø MIBC | 0.045 | $284 | $0.158 |
Ø NaCN | 0.025 | $146 | $0.081 |
Ø Lime | 0.55 | $197 | $0.110 |
Ø Flocculant | 0.01 | $104 | $0.058 |
| Gold Plant Reagents | | | |
Ø NaCN | 0.59 | $3,450 | $1.917 |
Ø Lime | 0.10 | $35 | $0.02 |
Ø Zn Dust | 0.06 | $349 | $0.194 |
Ø Lead Nitrate | 0.01 | $5 | $0.003 |
Ø Filter-Aid | 0.1 | $153 | $0.085 |
Ø Pre-Coat | 0.1 | $16 | $0.009 |
Ø Na2S2O5 | 0.15 | $125 | $0.070 |
Ø CuSO4.5H2O | 0.003 | $14 | $0.008 |
| Laboratory Supplies | - | $500 | $0.278 |
| Others | - | $971 | $0.539 |
| Total Operation Supplies | | $13,577 | $7.543 |
21.2.4 Process Power Supply Cost
Process power cost estimate is presented in Table 109. The energy consumption is obtained from the process equipment load list at a total value of about 63,800 GWh per year. At a unit power cost of US$$0.07/kWh, the estimated power cost is about US$4.5 million per year.
Table 109: Processing Electrical Power Requirement per Area
| Description | 000’ kWh/a | Annual Cost US$ '000s | Unit Cost US$/t Milled |
| Primary Crushing | 2,740 | $192 | $0.107 |
| Grinding/Regrinding | 41,890 | $2,932 | $1.629 |
| Flotation | 4,864 | $340 | $0.189 |
| Leaching and Gold Plant | 4,447 | $311 | $0.173 |
| Tailings Thickening/Filtration | 2,296 | $161 | $0.089 |
| Concentrate Filtration Circuit | 804 | $56 | $0.031 |
| Reagent/Auxiliary | 6,756 | $473 | $0.263 |
| Total Power Supply | 63,799 | $4,466 | $2.481 |
21.2.5 Tailings Cost Estimate
The estimated operating costs for the tailings storage facility are based on labour for spreading and compacting tailings, dust suppression, and maintenance and replacement of equipment. Conveyor installation and operational power costs are not included in this section.
The annual operating cost is estimated to be $604,000. The estimated operating costs over the 9 year operating period are totaled at $7.6 million. Table 110 presents the operating cost breakdown for the tailings storage facility.
Table 110: Estimated Operating Costs for DSTSF
| Item | Amount $000 |
| Total Operating Cost (for 9 Years) | $5,436 |
| Indirect Cost (25%) | $1,359 |
| Contingency (15%) | $815 |
| Total | $7,600 |
The estimated operating cost stated above of $7.6 million, is equivalent to $0.49 per tonne processed over the life of mine.
21.2.6 G & A Cost Estimate
G & A has been estimated at $1.81 per tonne processed for the PEA. G & A includes all costs involved in administration, site maintenance and general management of the operation.
Table 111 and Table 112 break down the costs for G & A.
Table 111: Non-Salary Costs Estimated for the La Joya Project
| Non salary | Annual cost $000 |
| Corporate expenses | $40 |
| Professional Development | $25 |
| Consultants and regulatory | $250 |
| Environmental (non-labor) | $70 |
| Legal services | $150 |
| Property Taxes | $100 |
| Computers and IT | $75 |
| Public relations and donations | $100 |
| Insurance | $500 |
| Access Road Maintenance | $18 |
| Engineering and surveying Supplies | $18 |
| Communications, telephone | $36 |
| Office Supplies | $24 |
| Crew Transport | $43 |
| Crew Transport - Rotation FIFO | $48 |
| Skilled staff accommodation in La Joya | $72 |
| Accounting services | $24 |
| Employee Physical | $5 |
| Waste Disposal | $12 |
| Water Treatment and sanitation - offices | $25 |
| Light Vehicle costs | $87 |
| Office power and water | $26 |
| Safety Supplies & Training | $103 |
| Total | $1,851 |
Table 112: Salary based Costs Estimated for the La Joya Project
| Salary | Salary | Burden | Number | Cost to company |
| General manager | $180,000 | $63,000 | 1 | $243,000 |
| Mine manager | $96,000 | $33,600 | 1 | $129,600 |
| Engineering manager | $96,000 | $33,600 | 1 | $129,600 |
| Environmental manager | $42,000 | $14,700 | 1 | $56,700 |
| Safety manager | $30,000 | $10,500 | 0 | $0 |
| Accounts manager | $60,000 | $21,000 | 2 | $162,000 |
| Human resources manager | $60,000 | $21,000 | 1 | $81,000 |
| Chief geologist | $90,000 | $31,500 | 1 | $121,500 |
| Social/community liaison | $24,000 | $8,400 | 1 | $32,400 |
| Admin manager | $24,000 | $8,400 | 1 | $32,400 |
| Surveyor | $24,000 | $8,400 | 2 | $64,800 |
| Pit supervisors | $14,400 | $5,040 | 1 | $19,440 |
| Safety officers / first aid | $14,400 | $5,040 | 1 | $19,440 |
| Administration personnel | $14,400 | $5,040 | 2 | $38,880 |
| General maintenance personnel | $9,600 | $3,360 | 2 | $25,920 |
| IT Manager | $25,000 | $8,750 | 1 | $33,750 |
| Payroll clerk | $9,600 | $3360 | 1 | $12,960 |
| Security manager | $14,400 | $5040 | 2 | $38,880 |
| Security guards | $9,600 | $3,360 | 6 | $77,760 |
| Warehouse clerks | $9,600 | $3,360 | 3 | $38,880 |
| Bus drivers | $9,600 | $3,360 | 3 | $38,880 |
| Janitor and cleaning | $7,200 | $2,520 | 1 | $9,720 |
| Diesel clerks | $9,600 | $3,360 | 3 | $38,880 |
| Total | $873,400 | $305,690 | 38 | $1,446,390 |
The combination of non-salary based costs and salary based costs totals to $3.3 million per annum. Based on processing of 1.8 million tonnes per annum, G & A is estimated to be $1.81 per tonne processed. The G & A cost has been multiplied by the tonnes processed per annum to get to the figures used in the financial analysis.
Tetra Tech prepared an economic evaluation of the La Joya Project based on a pre-tax and post-tax financial model. The analysis is based on Q2 2013 US dollars. No gearing or adjustment for inflation/currency gap is assumed. The complete economic evaluation spreadsheet is provided in Appendix G. The commodity prices used for the base case are the same as applied in the resource model, as shown in Table 45.
On the basis of the current Inferred Mineral Resources, preliminary mine design and preliminary process engineering, Tetra Tech have estimated a positive net present value (NPV @5%) for the project of $92 million post-tax and $133 million pre-tax, with internal rate of return (IRR) of 22% post-tax and 30% pre-tax. The economic analysis was based on a 9 year mine Starter Pit operating life, with a 2.6 year payback period, for the La Joya property.
Note: This preliminary economic assessment is preliminary in nature and includes Inferred Mineral resources that are considered too speculative geologically to have the economic considerations applied to them that would enable them to be categorized as mineral reserves, and there is no certainty that the preliminary economic assessment will be realized.
22.2 Technical Assumptions
The economic assumptions used in the analysis are summarized in Table 113. Refinery costs reflect estimated contract terms based on similar projects and include provision for freight and marketing costs assuming export of the silver copper concentrate. Income tax is included at a rate of 30% on operating profit less depreciation, applicable loss-carry forwards and employee profit share payments.
Table 113: Economic Modeling Assumptions
| Parameter | Value |
| Metal prices: | |
Gold Price1 | US$1,200/troy oz. |
Silver Price1 | US$22/troy oz. |
Copper Price1 | US$3/lb |
Exchange rates: Currency Exchange CDN:US$2 | 1.00:0.97 |
Currency Exchange US$:MEX$2 | 1.00:13 |
| Penalty Elements | $0.00/tonne concentrate |
| Concentrate treatment Charge | $70.00/tonne concentrate |
| Deductions: | |
| Concentrate: | |
| Copper | Pay for 97%, $US x/payable lb. |
| Silver | Pay for 93.5%, $US y/payable oz. |
| Gold | Pay for 97.5%, $US z/payable oz. |
| Dore: | |
| Silver | Pay for 99.5%, $US y/payable oz. |
| Gold | Pay for 99.5%, $US z/payable oz. |
| Refinery Charges: | |
| Concentrate: | |
| Copper | $0.07/lbs |
| Silver | $0.60/troy oz. |
| Gold | $10.00/troy oz. |
| Dore: | |
| Silver | $0.18/troy oz. |
| Gold | $10.00/troy oz. |
| Financing: | |
| Analysis Basis | Q2 2013 US dollars |
| Gearing | None |
| Income Tax Rate | 30% |
| Depreciation | 12% per year, Straight Line |
| 1. | Based on 5 year historic metal price trends of US$22/oz silver, US$1200/oz gold, US$3/lb copper. |
| 2. | Based on three year trailing average and rounded –off to two decimals |
22.3 Summary of Financial Results
The pre-tax and post-tax economic analysis results for the base case are shown in Table 114.
Table 114: Base Case Economic Analysis Results
| Aspects of financial analysis | Units | Value | Per tonne processed | Per Ag oz. eq produced |
| | | | | $/troy oz. |
| Production |
| Silver Ounces Sold | k.oz | 19,271,300 | 38.72 | |
| Gold Ounces Sold | k.oz | 53,221 | 0.11 | |
| Copper lbs. | k.lbs. | 92,691,737 | 0.27 | |
| Silver Eq ounces | k.oz | 34.814.064 | 69.95 | |
| Average annual Silver Equivalent Ounces | k.oz | 3,868,229 | | |
| Concentrate Sold | tonnes | 124,519 | | |
| Revenue |
| Silver Sales | US$’000 | $410,856 | $27 | $12 |
| Gold Sales | US$’000 | $63,024 | $4 | $2 |
| Copper sales | US$’000 | $270,005 | $17 | $8 |
| Gross Sales before expenses | US$’000 | $743,884 | $48 | $21 |
| Operating Expenses |
| Open pit mining | US$’000 | $125,208 | $8.09 | $3.60 |
| Processing | US$’000 | $214,548 | $13.86 | $6.16 |
| Tailings | US$’000 | $7,600 | $0.49 | $0.22 |
| G&A | US$’000 | $28,018 | $1.81 | $0.80 |
| Total Operating Costs | US$’000 | $375,375 | $24.25 | $10.78 |
| | | | | |
| Freight, concentrate transport & Refining | US$’000 | $15,903 | $1.03 | $0.46 |
| Post-tax financial results |
| Operating Margin | US$’000 | $352,606 | $22.78 | $10.13 |
| Capital Costs Total | US$’000 | ($147,526) | -$9.53 | -$4.24 |
| Capital Costs Pre-production | US$’000 | ($141,190) | | |
| Capital Costs Sustaining | US$’000 | ($6,336) | | |
| Mine closure costs | US$’000 | ($,6000) | -$0.39 | -$0.17 |
| Working Capital | US$’000 | ($6,971) | -$0.45 | -$0.20 |
| Post-tax cash flow | US$’000 | $147,401 | $9.52 | $4.23 |
| Post-tax NPV 5% - Base Case | US$’000 | $92,563 | $5.98 | $2.66 |
| Post-tax IRR - Base case | % | 22% | | |
| Payback period | 2.6 Years | |
| Pre - tax financial results |
| Pre-tax NPV 5% - Base Case | US$’000 | $133,387 | | |
| Pre-tax IRR - Base Case | % | 30% | | |
Note: This preliminary economic assessment is preliminary in nature and includes Inferred Mineral resources that are considered too speculative geologically to have the economic considerations applied to them that would enable them to be categorized as mineral reserves, and there is no certainty that the preliminary economic assessment will be realized.
The post-tax financial model was established on a 100% equity basis, excluding debt financing and loan interest charges. Figure 70 shows a comparison of pre-tax NPV5% and IRR both pre-tax and post-tax between the base case and varying commodity prices.
Figure 70: Sensitivity of NPV & IRR to Varying Commodity Prices
Figure 71 shows the pre-tax and post-tax cash flows over 2 preproduction years, 9 years of mine operating life and a three year closure and reclamation period. The estimated peak cash flow occurs in the first year of mining, where the mill feed grade estimates in the schedule for gold, silver, and copper are highest and the open pit mining schedule reflects the lowest strip ratio for operations except for the final year of mining. Figure 72 provides a visual representation for the contribution of taxes payable and how it affects the post-tax cash flow.
Both Figure 71 and Figure 72 below include pre-production, the proposed Starter Pit mine life, as well as closure and reclamation periods. Year -1 and Year -2 correspond to the pre-production years. Years 1 through 9 represent the duration of the Starter Pit mine life, and lastly Years 10 through 12 represent the three closure years post production.
Figure 71: Starter Pit Proposed Schedule – Cashflow Analysis
Figure 72: Starter Pit Proposed Schedule – Cashflow with Tax Payable
Tetra Tech has estimated the estimated tax payable to be $48 million over the life of mine. This figure is 16% of the estimated operating profits, which is in line with current tax payable by SilverCrest for current operations. Initial and sustaining capital costs were incorporated on a year-by-year basis over the LOM. Closure costs and working capital have been included in the cash flow. Capital expenditures were then deducted from the operating cash flow to determine the net cash flow before taxes.
The following assumptions have been used in development of the post-tax model:
| 2. | Any employee profit share is included in the G & A and is structured according to current SilverCrest operations. |
| 3. | Depreciation has been deducted from taxable earning as straight-line depreciation at a rate of 12% per year. |
| 4. | No losses or sunk costs have been carried forward. |
| 5. | Other deductions applicable to pre-tax financial results are applicable to post-tax financial results. |
| 6. | Excludes new tax reforms. |
The post-tax cash flows used to estimate the NPV, IRR and payback period for the project are shown in Table 115. Note that this cash flow includes the preproduction period, the mine operating life of 9 years and a period for closure and reclamation, inserted as three years of equal expenditure at the end of the operating life of the mine.
Table 115: Discounted Post-Tax Cash Flow Model
| Discount cash flow model |
| | Total | Year -2 | Year -1 | Year 1 | Year 2 | Year 3 | Year 4 | Year 5 | Year 6 | Year 7 | Year 8 | Year 9 | Year 10 | Year 11 | Year 12 |
| Concentrate: |
| AU koz sold | 46,531 | - | - | 6,876 | 8,680 | 5,328 | 5,319 | 4,313 | 3,828 | 5,317 | 4,955 | 1,916 | - | - | - |
| AG koz sold | 18,939,144 | - | - | 3,131,882 | 2,848,344 | 2,665,226 | 2,026,787 | 1,352,872 | 1,594,076 | 1,722,778 | 2,876,874 | 720,306 | - | - | - |
| CU lbs sold | 96,053,613 | - | - | 19,228,193 | 13,527,441 | 12,434,911 | 10,874,740 | 7,149,947 | 7,699,305 | 7,769,150 | 13,559,124 | 3,810,802 | - | - | - |
| Dore: |
| AU koz sold | 7,893 | - | - | 1,208 | 1,282 | 882 | 1,038 | 623 | 759 | 967 | 823 | 312 | - | - | - |
| AG koz sold | 1,571,055 | - | - | 240,383 | 262,347 | 230,966 | 150,151 | 114,984 | 110,380 | 151,105 | 264,975 | 45,765 | - | - | - |
| Total Metal Sold: |
| AU koz sold | 54,424 | - | - | 8,084 | 9,961 | 6,210 | 6,357 | 4,936 | 4,587 | 6,284 | 5,777 | 2,228 | - | - | - |
| AG koz sold | 20,510,200 | - | - | 3,372,265 | 3,110,691 | 2,896,192 | 2,176,939 | 1,467,855 | 1,704,455 | 1,873,883 | 3,141,849 | 766,071 | - | - | - |
| CU lbs sold | 96,053,613 | - | - | 19,228,193 | 13,527,441 | 12,434,911 | 10,874,740 | 7,149,947 | 7,699,305 | 7,769,150 | 13,559,124 | 3,810,802 | - | - | - |
| Metal Deductions |
| AU metal deductions (koz) | (1,203) | - | - | (178) | (223) | (138) | (138) | (111) | (99) | (138) | (128) | (49) | - | - | - |
| AG metal deductions (koz) | (1,238,900) | - | - | (204,774) | (186,454) | (174,395) | (132,492) | (88,512) | (104,167) | (112,736) | (188,322) | (47,049) | - | - | - |
| CU metal deductions (lbs) | (3,361,876) | - | - | (672,987) | (473,460) | (435,222) | (380,616) | (250,248) | (269,476) | (271,920) | (474,569) | (133,378) | - | - | - |
| Payable Metal |
| Payable Metal Au(koz) | 53,221 | - | - | 7,906 | 9,738 | 6,072 | 6,219 | 4,825 | 4,488 | 6,146 | 5,649 | 2,178 | - | - | - |
| Payable Metal Ag(koz) | 19,271,300 | - | - | 3,167,490 | 2,924,237 | 2,721,797 | 2,044,447 | 1,379,344 | 1,600,288 | 1,761,147 | 2,953,527 | 719,022 | - | - | - |
| Payable Metal Cu(lbs) | 92,691,737 | - | - | 18,555,206 | 13,053,981 | 11,999,689 | 10,494,124 | 6,899,699 | 7,429,829 | 7,497,230 | 13,084,555 | 3,677,424 | - | - | - |
| |
| Operating revenue ($000s) | $743,884 | - | - | $130,933 | $111,912 | $100,177 | $81,511 | $55,220 | $61,064 | $66,668 | $107,785 | $28,614 | - | - | - |
| |
| Freight & Marketing ($000s) | (15,903) | - | - | ($3,184) | ($2,240) | ($2,059) | ($1,800) | ($1,184) | ($1,275) | ($1,286) | ($2,245) | ($631) | - | - | - |
| |
| Operating costs ($000s) | (375,375) | - | - | ($41,741) | ($41,765) | ($40,813) | ($40,839) | ($40,880) | ($48,658) | ($48,660) | ($48,669) | ($23,351) | - | - | - |
| | | | | | | | | | | | | | | | |
| Operating Profit ($000s) | 352,606 | - | - | $86,008 | $67,908 | $57,306 | $38,872 | $13,156 | $11,132 | $16,722 | $56,871 | $4,632 | - | - | - |
| |
| Capital ($000s) | (147,526) | (34,924) | (106,266) | (350) | (1,141) | (350) | (350) | (350) | (2,744) | (350) | (350) | (350) | - | - | - |
| Working capital ($000s) | 0 | - | - | ($6,971) | ($4) | $159 | ($4) | ($7) | ($1,299) | ($0) | ($1) | $8,128 | - | - | - |
| Closure costs ($000s) | (6,000) | - | - | - | - | - | - | - | - | - | - | - | ($2,000) | ($2,000) | ($2,000) |
| Royalty ($000s) | (3,719) | - | - | ($1,223) | ($854) | ($668) | ($337) | $0 | $0 | $0 | ($637) | $0 | - | - | - |
| | | | | | | | | | | | | | | | |
| Pre-tax Cash Flow | $195,361 | ($34,924) | ($106,266) | $77,464 | $65,907 | $56,447 | $38,180 | $12,800 | $7,089 | $16,372 | $55,883 | $12,409 | ($2,000) | ($2,000) | ($2,000) |
| | | | | | | | | | | | | | | | |
| Income Tax Payable ($000s) | (47,960) | - | - | ($17,978) | ($12,559) | ($9,824) | ($4,951) | $0 | $0 | $0 | ($2,647) | $0 | - | - | - |
| Post-tax cash flow ($000s) | 147,401 | (34,924) | (106,266) | $59,486 | $53,348 | $46,622 | $33,229 | $12,800 | $7,089 | $16,372 | $53,236 | $12,409 | ($2,000) | ($2,000) | ($2,000) |
22.5 Sensitivity Analysis
The scenario shown in Table 115 above is used as the base case for the sensitivity analysis. The sensitivities are determined by initially determining which key variable the project is most sensitive to and then selecting those for further analysis. The key variables are adjusted from -30% to +30%. The results for pre-tax NPV and are IRR are shown in Figure 73 and Figure 74. Table 115 shows the cash flow analysis used to derive the post-tax sensitivities.
Figure 73: NPV Sensitivity Analysis
*Refer back to Table 113 for base case commodity prices used for economic evaluation
Figure 74: IRR Sensitivity Analysis
*Refer back to Table 113 for base case commodity prices used for economic evaluation
No adjacent properties of relevance have been identified in this study.
24.0 OTHER RELEVANT DATA AND INFORMATION
The following figure reflects the project development schedule developed by Tetra Tech. Further engineering is required for more confidence in the activity durations and the required start times. However, it provides a representation of the allocation of time and finances required to get each of the elements of the project completed.
Engineering, Procurement, and Design will be carried out at the start of Year -2. It is estimated that thorough design work will require at least 6 months. Any ordering of equipment and the subsequent construction of infrastructure would occur following this 6 month period. The processing plant would require the longest lead time in ordering equipment. Another 6 months from the end of the engineering and design phase is considered before equipment would arrive on site. A minimum 3 month lead time is designated for all other equipment, materials and supplies before their arrival on site. Based on the mining schedule and the design for La Joya to mine 7 Mtpa, an estimated time of 9 months was allocated for the pre-stripping of the 3 Mt in Year -1. By allowing 9 months for the first year of production consideration is given for a production ramp up phase for the mining contractor.
The construction of the facilities on site have been schedule in a way so to give some time for site preparation which may include clearing, cut and fill, and any foundation work required before any other construction proceeds. The preliminary schedule is shown in Figure 75 below.
Figure 75: La Joya Project Development Schedule
25.0 INTERPRETATION AND CONCLUSIONS
The resource model, and preliminary open pit design, and subsequent preliminary economic analysis favour the undertaking of further drilling into the Starter Pit area aiming further delineation of resources and potential integration of all pits. The PEA also provides guidance on the expected metallurgical and mining constraints which require further work to increase the confidence level so that they can be applied to future resource delineation and any subsequent Pre-Feasibility assessment.
Tetra Tech has compiled the following recommendations for assessment.
26.1 Drilling and Mineral Resources
It is recommended that SilverCrest proceed with further delineation drilling on the project to infill the existing MMT resource area near to the conceptual Starter Pit to a 50 metre grid in order to increase geological understanding and improve confidence in the continuity of Ag-Cu-Au mineralization. Drilling should continue to focus on manto and structure style mineralization and aim to have 2-3 holes along dip for each drilling fence and for each individual structure. SilverCrest should consider the use of oriented drill core or application of a downhole televiewer to collect information on discontinuity and structural orientations.
26.2 Location of Project Infrastructure
It is recommended that SilverCrest investigate the possibility of placement of the processing and administration facilities for the operation on the west side of the current open pit, in the valley and the saddle formed between Cerro Sacrificio and Santo Nino. This will reduce access road and power line costs, as well as reducing the hauling distance from the open pit to the crushing facility, especially in the later years of the mine life. Confidence in the road design and costs will benefit from better topographical and geotechnical investigations moving forward. Review of user rights and costs , right of way issues should be investigated moving forward.
26.3 Pit Selection for Open Pit Design
It is noted that the pit selected for the open pit design is not the pit with the highest value as assessed in Lerch-Grossman evaluation. It is therefore suggested that SilverCrest assess the “optimal” pit and undertake scheduling and economic analysis as the larger pit would be expected to have better economics.
It is recommended that further work be undertaken on mine scheduling, after further drilling and resource modelling has been undertaken, to evaluate the impact on the economics of alternate open pit scheduling scenarios.
26.5 Waste Dump Locations
Tetra Tech recommends that SilverCrest further investigate the proposed positions of the waste rock dumps. Tetra Tech has identified areas closer to the pit which if used would reduce haul distances for waste rock and thereby lower the mining costs. .
26.6 Geotechnical and Hydrogeological Assessments
It is recommended that a geotechnical and hydrogeological site investigation program be carried out to fully assess the in-situ rock conditions and more importantly the stability of the pit slopes.
26.7 Dry Stack Tailings Management Facility
A geotechnical site investigation program should be conducted for the proposed dry stack tailings storage facility site to collect geotechnical and hydrogeological information for prefeasibility-level engineering design and cost estimates. Geotechnical laboratory tests should be conducted on tailings samples to enhance prefeasibility-level engineering design of the tailings storage facility.
Geochemical characterization with regards to ARD/ML potential is required for the dewatered tailings, seepage water and the various waste rock units, as well as, all potential construction materials (ie. local borrow sources and/or mine waste).
Tetra Tech recommends that SilverCrest undertake investigation to source sufficient water for the potential milling operation, in conjunction with further investigating water recycling techniques to reduce water consumption of the potential operations.
26.9 Mineral Processing and Metallurgical Testing
The current processing design is based on the bench scale testwork with two types of composite samples, Manto and Structure, from central MMT mineralogy of the La Joya property. Tetra Tech recommends verifying the process design criteria by completing additional metallurgical test work on varied mineral feed grades.
With Manto and Structure zone samples, Tetra Tech suggests conducting further test work to define penalty elements levels in the copper concentrate, to reduce cyanide consumption in the 1st cleaner tailings leaching process, and to develop a baseline cyanide destruction process.
With Contact zone mineralogy samples, Tetra Tech recommends further investigations for tungsten recovery with gravity and magnetic separation methods, as well as the concentration of molybdenum from copper flotation concentrate.
| | Albinson, T.F. and Sanchez, E. (1977), Geologic evaluation of the Sacrificio Prospect, Puanas Municipality, Durango, Minas San Luis, S.A. geologic report, 51 p. |
| | Atkinson, T. 1992. Selection and Sizing of Excavating Equipment. Chapter 13.3. SME Mining Engineering Handbook. 2nd Edition. Volume 2. Society for Mining and Mineral Exploration. |
| | Atkinson, T. 1992. Design and Layout of Haul Roads. Chapter 13.4. SME Mining Engineering Handbook. 2nd Edition. Volume 2. Society for Mining and Mineral Exploration. |
| | Burkhardt, R. (2006), Sacrificio Project, Durango Mexico. Vancouver: Solid Resources Ltd. |
| | EBA, A Tetra Tech Company, (2012) Resource Estimation for the La Joya Property Durango, Mexico. NI 43-101 Technical Report Prepared for SilverCrest Mines Inc. (Effective date: January 5th 2012), 83 p. |
| | EBA, A Tetra Tech Company, 2013 (EBA, 2013), Updated Resource Estimate for the La Joya Property, Durango, Mexico, NI 43-101 Technical Report, Effective Date December 16, 2013, Released Date March 27, 2013. |
| | Einaudi, M.T., and Burt, D.M., (1982), Introduction – Terminology, Classification and Composition of Skarn Deposits, Economic Geology, v77, pp. 745-754. |
| | Ferrari, L. Valencia-Moreo, M., Bryan, S., (2007), Magmatism and tectonics of the Sierra Madre Occidental and its relation with the evolution of the western margin of north America, p. 1-29; in Geology of Mexico: Celebrating the Centenary of the Geological Society of Mexico, The Geological Society of America, Special Paper 422, 2007, edited by Susana A. Alaniz-Alvarez and Angel F. Nieto-Samaniego; 465pp. |
| | Meinert, L. D. (1993), Skarns and Skarn Deposits, in Ore Deposit Models Volume II, edited by P. A. Sheaman and M. E. Cherry, Geological Association of Canada Series, 1993, 154pp. |
| | Meinert, L. D. (2011), Exploration Review of La Joya (Sacrificio) district, unpublished. Vancouver: SilverCrest Mines Inc. |
| | Megaw, P.K.M., Ruiz, J., and Titley, S.R. (1988), High-temperature, carbonate-hosted , Ag-Pb-Zn-(Cu) deposits of northern Mexico: Economic Geology, v. 83, p. 1856-1885. |
| | Myers, G.L., and Meinert, L.D. (1991), Alteration, mineralization, and gold distribution in the Fortitude gold skarn: in Raines, G.L., Lisle, R.E., Schafer, R.W., and Wilkinson, W.H. (eds), Geology and Ore Deposits of the Great Basin, Geol. Soc. Nevada, Reno, v.1,p 407-418. |
| | Muñoz, F. (2001), Geologia de Superficie, Proyecto Sacrificio, Minas San Luis S.A. de C.V. ,1:5,000 scale map listed as Figure 3. |
| | Nieto-Samaniego, A.F., Alaniz-Alvarez, S.A., and Camprubi, A. (2007), Mesa Central of Mexico: Stratigraphy, structure, and Cenozoic tectonic evolution, p. 41-70; in Geology of Mexico: Celebrating the Centenary of the Geological Society of Mexico, The Geological Society of America, Special Paper 422, 2007, edited by Susana A. Alaniz-Alvarez and Angel F. Nieto-Samaniego; 465pp. |
| | Patterson. K, M. (2001), Structural Controls on Mineralization and Constraints on Fluid Evolution at the Sacrificio Cu (Zn-Pb-Ag-Au) Skarn, Durango, Mexico. Vancouver: Department of Earth and Ocean Sciences. The University of British Columbia. |
| | Rubin, J.N. and Kyle, J.R. (1988), Mineralogy and Geochemistry of the San Martin Skarn Deposit, Zacatecas, Mexico: Economic Geology, v. 83, p. 1760-1781 |
| | Schnelder, L.C., 1999. Chapter 11. SME Mining Engineering Handbook. Society for Mining and Mineral Exploration. Published 2002. Edited by R.R. Lowrie. |
| | Terry, D. P. (1999), Report on Diamond Drilling, Geological Mapping and Geophysical Surveys carried out on the Cerro Sacrificio Project, Durango State, Mexico. Ontario: Boliden Limited. |
| | Wernstedt, K. and Hersh, R. 2010. Abandoned Hardrock Mines in the United States: Escape from a Regulatory Impasse? William and Mary Policy Review. Volume 1. |
APPENDIX A
CERTIFICATES OF QUALIFIED PERSONS
Certificate of Qualified Person – Sabry Abdel Hafez
I, Sabry Abdel Hafez, Ph.D, P.Eng., do hereby declare that:
| 1) | I currently reside in Vancouver, British Columbia, Canada, and am currently employed as a Senior Mining Engineer by Tetra Tech WEI Inc., with office address is 800-555 West Hastings St., Vancouver, British Columbia, V6B 1M1. |
| 2) | I hold a B.Sc. Mining Engineering (1991), M.Sc. Mining Engineering (1996), and Ph.D. in Mineral Economics (2000) from Assiut University. |
| 3) | I am a member in good standing in Association of Professional Engineers and Geoscientists of British Columbia (APEGBC), member #34975 |
| 4) | I am an author and Qualified Person (within the meaning of National Instrument 43-101) responsible for the preparation of the Technical Report entitled: |
“PRELIMINARY ECONOMIC ASSESSMENT FOR THE LA JOYA PROPERTY”
DURANGO, MEXICO
NI 43-101 TECHNICAL REPORT
PREPARED FOR SILVERCREST MINES INC.
December 5, 2013
Effective Date: October 21, 2013
| 5) | I am responsible, for sections 1.9, 16.1 and 16.4 of this Technical Report. |
| 6) | As a Qualified Person for this report, I have read the National Instrument 43-101 and Companion Policy and confirm that this report has been prepared in compliance to National Instrument 43-101. |
| 7) | I have not visited the La Joya property. |
| 8) | My relevant experience is mine evaluation, with more than 19 years of experience in the evaluation of mining projects, advanced financial analysis, and mine planning and optimization. My capabilities range from conventional mine planning and evaluation to the advanced simulation-based techniques that incorporate both market and geological uncertainties. I have been involved in technical studies of several base metals, gold, coal, and aggregate mining projects in Canada and abroad. |
| 9) | I am independent of SilverCrest Mines as independence is described in Section 1.5 of the National Instrument 43-101. In addition I am currently not a shareholder of SilverCrest nor am I directly entitled to financially benefit from its success. |
| 10) | Prior to this report, I have had no prior involvement on this property. |
| 11) | To the best of my knowledge, information and belief, as of the effective date of the Technical Report, the parts of the Technical Report for which I am responsible contains all scientific and technical information that is required to be disclosed to make the Technical Report not misleading. |
Dated this 5 December, 2013,
Original signed and sealed by
“Sabry Abdel Hafez”
________________________________
Sabry Abdel Hafez, Ph.D., P.Eng.
Senior Mining Engineer, Tetra Tech WEI Inc.
Certificate of Qualified Person – P. James F. Barr
I, P. James F. Barr, P.Geo, do hereby declare that:
| 1) | I currently reside in Vancouver, British Columbia, Canada, and am currently employed as Senior Geologist by EBA, Engineering Consultants Ltd., with office address at 9th floor, 1066 W Hastings Street, Vancouver, British Columbia. |
| 2) | I hold a Bachelors of Science with Honours from the University of Waterloo (2003), Ontario, Canada, with a major in Environmental Science, Earth Science and Chemistry and I have practiced as an exploration and resource geologist in Canada and Mexico since 2003. |
| 3) | I am a member in good standing in the Association of Professional Engineers and Geoscientists of British Columbia (APEGBC), member #35150. |
| 4) | I am a co-author and Qualified Person responsible for the preparation of the Technical Report entitled: |
“PRELIMINARY ECONOMIC ASSESSMENT FOR THE LA JOYA PROPERTY”
DURANGO, MEXICO
NI 43-101 TECHNICAL REPORT
PREPARED FOR SILVERCREST MINES INC
December 5, 2013
Effective Date: October 21, 2013
| 5) | I am responsible for sections 1.3, 1.4, 1.6, 6.0, 7.0, 8.0, 9.0, 10.0, 11.0, 12.0 and 14.0 of this Technical Report. |
| 6) | As a Qualified Person for this report, I have read the National Instrument 43-101 and Companion Policy and confirm that this report has been prepared in compliance to National Instrument 43-101. |
| 7) | I visited the La Joya property most recently on October 18, 2012. |
| 8) | I have worked on and visited numerous epithermal, skarn and geologically related properties in this and other regions of Mexico, and have been conducting Mineral Resource Estimates for more than 5 years. |
| 9) | I am independent of SilverCrest Mines Inc. as independence is described in Section 1.5 of the National Instrument 43-101. In addition, I am currently not a shareholder of SilverCrest nor am I directly entitled to financially benefit from its success. |
| 10) | Prior to this report, I was co-author to the Technical Report entitled “Updated Resource Estimate For The La Joya Property, Durango, Mexico, NI 43-101 Technical Report, Prepared for SilverCrest Mines Inc.” Effective date: December 16, 2012. Released: March 27, 2013. |
| 11) | To the best of my knowledge, information and belief, as of the Effective Date of the report, the parts of the Technical Report for which I am responsible contain all scientific and technical information that is required to be disclosed to make the Technical Report not mis-leading. |
Dated this 5 December, 2013
Original signed and sealed by
“P. James F. Barr”
________________________________
P. James F. Barr, P.Geo
Senior Geologist, EBA Engineering Consultants Ltd.
Certificate of Qualified Person – Carlos Chaparro
I, Carlos Chaparro, P.Eng., do hereby declare that:
| 1) | I currently reside in Vancouver, British Columbia, Canada, and am currently employed as Senior Geotechnical Engineer by EBA, Engineering Consultants Ltd., with office address at 9th floor, 1066 W Hastings Street, Vancouver, British Columbia. |
| 2) | I hold a Bachelors of Science in Civil Engineering from Universidad Javeriana in Bogota, Colombia and a Masters Degree in Civil Geotechnical Engineering from University of Illinois. I have practiced as geotechnical engineer in Colombia, USA, Canada and Mexico since 1995. |
| 3) | I am a member in good standing in the Association of Professional Engineers and Geoscientists of British Columbia (APEGBC), member 148633. |
| 4) | I am a co-author and Qualified Person responsible for the preparation of the Technical Report entitled: |
“PRELIMINARY ECONOMIC ASSESSMENT FOR THE LA JOYA PROPERTY”
DURANGO, MEXICO
NI 43-101 TECHNICAL REPORT
PREPARED FOR SILVERCREST MINES INC.
December 5, 2013
Effective Date: October 21, 2013
| 5) | I am responsible for section 16.2 of this Technical Report. |
| 6) | As a Qualified Person for this report, I have read the National Instrument 43-101 and Companion Policy and confirm that this report has been prepared in compliance to National Instrument 43-101. |
| 7) | I have not visited the La Joya property. |
| 8) | I have worked on and visited several underground and numerous open pit mines: underground projects in Central BC, Yukon, Nunavut and Mexico; open pit projects in Northwest Territories, Yukon, Nunavut, Ontario, Alaska, Greenland, Mexico and West Africa. Numbers in parentheses indicate the number of jobs in the given location. |
| 9) | I am independent of SilverCrest Mines Inc. as independence is described in Section 1.5 of the National Instrument 43-101. In addition, I am currently not a shareholder of SilverCrest nor am I directly entitled to financially benefit from its success. |
| 10) | Prior to this report, I have had no previous involvement with the property that is subject of the report. |
| 11) | To the best of my knowledge, information and belief, as of the Effective Date of the report, the parts of the Technical Report for which I am responsible contain all scientific and technical information that is required to be disclosed to make the Technical Report not mis-leading. |
Dated this 5 December, 2013,
Original signed and sealed by
“Carlos Chaparro”
________________________________
Carlos Chaparro, P.Eng.
Senior Geotechnical Engineer, EBA Engineering Consultants Ltd.
Certificate of Qualified Person – Hassan Ghaffari
I, Hassan Ghaffari, P.Eng., M.A.Sc., do hereby declare that:
| 1) | I currently reside in Vancouver, British Columbia, Canada, and am currently employed as a Director, Metallurgy by Tetra Tech WEI Inc., with office address is 800-555 West Hastings St., Vancouver, British Columbia, V6B 1M1. |
| 2) | I hold a Master of Applied Science degree in Mining Engineering from the University of Tehran in 1990 and a Master of Applied Science degree in Mineral Process Engineering from the University of British Columbia in 2004. |
| 3) | I am a member in good standing in the Association of Professional Engineers and Geoscientists of British Columbia (APEGBC), member #30408. |
| 4) | I am a co-author and Qualified Person responsible for the preparation of the Technical Report entitled: |
“PRELIMINARY ECONOMIC ASSESSMENT FOR THE LA JOYA PROPERTY”
DURANGO, MEXICO
NI 43-101 TECHNICAL REPORT
PREPARED FOR SILVERCREST MINES INC.
December 5, 2013
Effective Date: October 21, 2013
| 5) | I am responsible for sections 18.11, 18.12, 21.2.3 – 21.2.4, 21.3.3, 21.3.4 and 26.8 of this Technical Report. |
| 6) | As a Qualified Person for this report, I have read the National Instrument 43-101 and Companion Policy and confirm that this report has been prepared in compliance to National Instrument 43-101. |
| 7) | I visited the La Joya property on May 14-15, 2012. |
| 8) | I have worked on projects with various commodities including base metals, coal, gold/silver bearing minerals, tungsten, manganese, and molybdenum for over 23 years. |
| 9) | I am independent of SilverCrest Mines Inc. as independence is described in Section 1.5 of the National Instrument 43-101. In addition, I am currently not a shareholder of SilverCrest nor am I directly entitled to financially benefit from its success. |
| 10) | Prior to this report, I have had no involvement with the property that is subject of this report. |
| 11) | To the best of my knowledge, information and belief, as of the Effective Date of the report, the parts of the Technical Report for which I am responsible contain all scientific and technical information that is required to be disclosed to make the Technical Report not mis-leading. |
Dated this 5 December, 2013,
Original signed and sealed by
“Hassan Ghaffari”
________________________________
Hassan Ghaffari, P.Eng., M.A.Sc.
Director, Metallurgy, Tetra Tech WEI Inc.
Certificate of Qualified Person – Mark P. Horan
I, Mark P. Horan, P.Eng., do hereby declare that:
| 1) | I currently reside in Vancouver, British Columbia, Canada, and am currently employed as Senior Mining Engineer by EBA, Engineering Consultants Ltd., with office address at 9th floor, 1066 W Hastings Street, Vancouver, British Columbia. |
| 2) | I hold a BSc. Mining Engineering degree from the University of the Witwatersrand, South Africa and a MSc. from Rhodes University, South Africa. |
| 3) | I am a member in good standing in the Association of Professional Engineers and Geoscientists of British Columbia (APEGBC), member 170768. |
| 4) | I am a co-author and Qualified Person responsible for the preparation of the Technical Report entitled: |
“PRELIMINARY ECONOMIC ASSESSMENT FOR THE LA JOYA PROPERTY”
DURANGO, MEXICO
NI 43-101 TECHNICAL REPORT
PREPARED FOR SILVERCREST MINES INC.
December 5, 2013
Effective Date: October 21, 2013
| 5) | I am responsible for sections 1.1, 1.2, 1.7, 1.8, 1.11, 1.12, 1.13, 1.15, 2.0, 4.0, 5.0, 15.0, 16.3, 16.5, 18.1, 18.2, 18.5 – 18.10, 18.13, 18.14, 19.0, 20.0, 21.1, 21.2.1 – 21.2.2, 21.2.6 – 21.2.10, 21.2.11, 21.3.1, 21.3.2, 21.3.6, 23.0, 24.0, 25.0, 26.1 – 26.5, 26.7 and 27.0 of this Technical Report. |
| 6) | As a Qualified Person for this report, I have read the National Instrument 43-101 and Companion Policy and confirm that this report has been prepared in compliance to National Instrument 43-101. |
| 7) | I have not visited the La Joya property. |
| 8) | My work experience includes operational mine experience and I have worked on and visited numerous open pit mines including mines in Canada, Mexico and South Africa. |
| 9) | I am independent of SilverCrest Mines Inc. as independence is described in Section 1.5 of the National Instrument 43-101. In addition, I am currently not a shareholder of SilverCrest nor am I directly entitled to financially benefit from its success. |
| 10) | I have had no prior involvement with the property that is the subject of this report. However, I have done work for SilverCrest Mines Inc. relating to two other properties held by SilverCrest prior to my involvement with this report. |
| 11) | To the best of my knowledge, information and belief, as of the Effective Date of the report, the parts of the Technical Report for which I am responsible contain all scientific and technical information that is required to be disclosed to make the Technical Report not mis-leading. |
Dated this 5 December, 2013,
Original signed and sealed by
“Mark P. Horan”
________________________________
Mark P. Horan, P.Eng.
Senior Mining Engineer, EBA Engineering Consultants Ltd.
Certificate of Qualified Person – Ting Lu
I, Ting Lu, P.Eng., M Sc., do hereby declare that:
| 1) | I currently reside in Vancouver, British Columbia, Canada, and am currently employed as a Senior Metallurgical Engineer by Tetra Tech WEI Inc., with office address is 800-555 West Hastings St., Vancouver, British Columbia, V6B 1M1. |
| 2) | I hold a Masters of Engineering degree from Queen’s University, Ontario, Canada, with a major in mineral processing. |
| 3) | I am a member in good standing in the Association of Professional Engineers and Geoscientists of British Columbia (APEGBC), member # 32897 |
| 4) | I am a co-author and Qualified Person responsible for the preparation of the Technical Report entitled: |
“PRELIMINARY ECONOMIC ASSESSMENT FOR THE LA JOYA PROPERTY”
DURANGO, MEXICO
NI 43-101 TECHNICAL REPORT
PREPARED FOR SILVERCREST MINES INC.
December 5, 2013
Effective Date: October 21, 2013
| 5) | I am responsible for sections 1.5, 1.10, 13.0, 17.0 and 26.9 of this Technical Report. |
| 6) | As a Qualified Person for this report, I have read the National Instrument 43-101 and Companion Policy and confirm that this report has been prepared in compliance to National Instrument 43-101. |
| 7) | I visited the La Joya property on May 14-15, 2012. |
| 8) | I have worked on projects with various commodities including coal, base metals, gold/silver bearing minerals, tungsten, manganese, and molybdenum for over 15 years. |
| 9) | I am independent of SilverCrest Mines Inc. as independence is described in Section 1.5 of the National Instrument 43-101. In addition, I am currently not a shareholder of SilverCrest nor am I directly entitled to financially benefit from its success. |
| 10) | Prior to this report, I was co-author to the Technical Report entitled “Updated Resource Estimate For The La Joya Property, Durango, Mexico, NI 43-101 Technical Report, Prepared for SilverCrest Mines Inc.” Effective date: December 16, 2012. Released: March 27, 2013. |
| 11) | To the best of my knowledge, information and belief, as of the Effective Date of the report, the parts of the Technical Report for which I am responsible contain all scientific and technical information that is required to be disclosed to make the Technical Report not mis-leading. |
Dated this 5 December, 2013,
Original signed and sealed by
“Ting Lu”
________________________________
Ting Lu, P.Eng., M Sc.
Senior Metallurgical Engineer, Tetra Tech WEI Inc.
Certificate of Qualified Person – Scott Martin
I, Scott Martin, P.Eng., do hereby declare that:
| 1) | I currently reside in Kelowna, British Columbia, Canada, and am currently employed as Vice President, Pacific Engineering by EBA, Engineering Consultants Ltd., with office address at #150, 1715 Dickson Ave., Kelowna BC, V1Y 9G6 |
| 2) | I hold a Bachelors of Applied Science in Geological Engineering |
| 3) | I am a member in good standing in the Association of Professional Engineers and Geoscientists of British Columbia (APEGBC), member 24984 |
| 4) | I am a co-author and Qualified Person responsible for the preparation of the Technical Report entitled: |
“PRELIMINARY ECONOMIC ASSESSMENT FOR THE LA JOYA PROPERTY”
DURANGO, MEXICO
NI 43-101 TECHNICAL REPORT
PREPARED FOR SILVERCREST MINES INC.
December 5, 2013
Effective Date: October 21, 2013
| 5) | I am responsible for sections 18.3, 21.2.5, 21.3.5 and 26.6 of this Technical Report. |
| 6) | As a Qualified Person for this report, I have read the National Instrument 43-101 and Companion Policy and confirm that this report has been prepared in compliance to National Instrument 43-101. |
| 7) | I have not visited the La Joya property. |
| 8) | I have worked on numerous mine waste projects, including: Pebble Gold-Copper Project, Alaska; Minto Mine, YK; Ketza Mine, YK; Baker Lake Mine, BC; Rice Lake Mine, MB; Magino Gold Project, ONT; Mirador Copper Project, Equador; Aur Resources, Cantung Mine, Tungsten, NT; Bucko Mine, MB; Bralorne, BC. |
| 9) | I am independent of SilverCrest Mines Inc. as independence is described in Section 1.5 of the National Instrument 43-101. In addition, I am currently not a shareholder of SilverCrest nor am I directly entitled to financially benefit from its success. |
| 10) | Prior to this report, I have had no previous involvement with the property that is subject of this report. |
| 11) | To the best of my knowledge, information and belief, as of the Effective Date of the report, the parts of the Technical Report for which I am responsible contain all scientific and technical information that is required to be disclosed to make the Technical Report not mis-leading. |
Dated this 5 December, 2013,
Original signed and sealed by
“Scott Martin”
________________________________
Scott Martin, P.Eng.
Vice President – Pacific Engineer, EBA Engineering Consultants Ltd.
Certificate of Qualified Person – Nick Michael
I, Nick Michael, BS, MBA, do hereby declare that:
| 1) | I am a Principal Mineral Economist with Tetra Tech, Inc. with a business address at 350 Indiana Street, Suite 500, Golden, Colorado 80401, USA. |
| 2) | I am a graduate of the Colorado School of Mines in Golden, Colorado USA in mining engineering (1983) and received and received an MBA from Willamette University (1986). I have practiced my profession continuously since 1987. |
| 3) | I am a Registered Member in good standing (#4104304) with the Society for Mining, Metallurgy and Exploration, Inc (SME). |
| 4) | I have read the definition of “qualified person” set out in National Instrument 43-101 – Standards of Disclosure for Mineral Projects (“NI 43-101”) and certify that by reason of my education, affiliation with a professional association (as defined in NI 43-101) and past relevant work experience, I fulfill the requirements to be a “qualified person” for the purposes of NI 43-101. |
| 5) | I am a Qualified Person (within the meaning of National Instrument 43-101) responsible for the preparation of the Technical Report entitled: |
“PRELIMINARY ECONOMIC ASSESSMENT FOR THE LA JOYA PROPERTY”
DURANGO, MEXICO
NI 43-101 TECHNICAL REPORT
PREPARED FOR SILVERCREST MINES INC.
December 5, 2013
Effective Date: October 21, 2013
| 6) | I am responsible for section 1.14 and 22.0 of this Technical Report. |
| 7) | As a Qualified Person for this report, I have read the National Instrument 43-101 and Companion Policy and confirm that this report has been prepared in compliance to National Instrument 43-101. |
| 8) | I have never visited nor have I had involvement with the La Joya property prior to this report. |
| 9) | Since 1990, I have completed valuations, evaluations (technical-economic models), and have audited a variety of projects including exploration, pre-production (feasibility-level), operating and mine closure projects. I have also served as expert witness with respect to technical-economic issues. |
| 10) | I am independent of SilverCrest Mines as independence is described in Section 1.5 of the National Instrument 43-101. In addition I am currently not a shareholder of SilverCrest nor am I directly entitled to financially benefit from its success. |
| 11) | Prior to this report, I have had no prior involvement on this property. |
| 12) | To the best of my knowledge, information and belief, as of the effective date of the Technical Report, the part of the Technical Report for which I am responsible contain all scientific and technical information that is required to be disclosed to make the Technical Report not misleading. |
Dated this 5 December, 2013,
Original signed and sealed by
“Nick Michael”
________________________________
Nick Michael, BS, MBA
Mineral Economist, Tetra Tech
Certificate of Qualified Person –Graham Wilkins
Certificate of qualified person – Graham Wilkins
I, Graham Wilkins, P.Eng., do hereby declare that:
| 1) | I currently reside in Vancouver, British Columbia, Canada, and am currently employed as Project Director by EBA, Engineering Consultants Ltd., with office address at 800-555 West Hastings Street, Vancouver, BC V6B 1M1. |
| 2) | I hold a Bachelors of Civil Engineering, Carleton University, 1986 |
| 3) | I am a member in good standing in the Association of Professional Engineers and Geoscientists of British Columbia (APEGBC), member 16255. |
| 4) | I am a co-author and Qualified Person responsible for the preparation of the Technical Report entitled: |
“PRELIMINARY ECONOMIC ASSESSMENT FOR THE LA JOYA PROPERTY”
DURANGO, MEXICO
NI 43-101 TECHNICAL REPORT
PREPARED FOR SILVERCREST MINES INC.
December 5, 2013
Effective Date: October 21, 2013
| 5) | I am responsible for section 18.4 of this Technical Report. |
| 6) | As a Qualified Person for this report, I have read the National Instrument 43-101 and Companion Policy and confirm that this report has been prepared in compliance to National Instrument 43-101. |
| 7) | I have not visited the La Joya property. |
| 8) | I have 27 years relevant transportation experience. I have worked on projects from the initial planning stages right through to detailed design and construction completion. My transportation roles are comprehensive including construction supervision, design, specs and project management. I have worked on resource and mining projects throughout BC, Alaska, Yukon, NWT and Nunavut. I was involved in the planning and design of the transportation infrastructure to the Kiggavik Mine near Baker Lake, Nunavut. Elements of the infrastructure included 100 km of an all-weather road and an option of a 100 km long winter road, 400 m bridge, port facility and an airstrip. I am a “Qualified Person” for the purposes of National Instrument 43-101 (the “instrument”). |
| 9) | I am independent of SilverCrest Mines Inc. as independence is described in Section 1.5 of the National Instrument 43-101. In addition, I am currently not a shareholder of SilverCrest nor am I directly entitled to financially benefit from its success. |
| 10) | Prior to this report, I have had no previous involvement with the property that is the subject of the report. |
| 11) | To the best of my knowledge, information and belief, as of the Effective Date of the report, the parts of the Technical Report for which I am responsible contain all scientific and technical information that is required to be disclosed to make the Technical Report not mis-leading. |
Dated this 5 December, 2013,
Original signed and sealed by
“Graham Wilkins”
________________________________
Graham Wilkins, P.Eng.
Project Director – Northern and Pacific Transportation
EBA Engineering Consultants Ltd.
APPENDIX B
CERTIFICATE OF STANDARD REFERENCE MATERIALS
APPENDIX C
SAMPLE SELECTION FOR LA JOYA PHASE II METALLURGICAL TESTWORK PROGRAM
APPENDIX D
METALLURGICAL FLOWSHEET DEVELOPMENT LABORATORY TESTWORK RESULTS
APPENDIX E
CONCEPTUAL PROCESS PLANT DESIGN CRITERIA AND FLOWSHEET
APPENDIX F
SUMMARY OF PROCESS PLANT OPERATING EXPENDITURES
APPENDIX G
PEA CAPITAL EXPENDITURE BREAKDOWN
APPENDIX H
CONCEPTUAL DISCOUNTED CASH FLOW
APPENDIX I
CONCEPTUAL MINING SCHEDULE
APPENDIX J
GENERAL SITE LAYOUT