The composite intervals described in Section 14.3 were calculated within the boundaries of the modelled grade shell using raw assay data, and then subjected to additional geostatistics and analysis as described below.
The model is based on verified drilling completed by SilverCrest between 2006 and 2013 which has provided near continuous drill intersection at approximately 40 metres spacing within the mineralization. Grade distribution and the drill sample density supports variography analysis to estimate the orientation and anisotropy of elliptical search parameters for modeling the mineralization.
Initially, variograms were created for both gold and silver in each of the 3 subdivided domains to determine internal ellipse orientations and then for the overall vein to determine a reasonable search range. The variograms were verified with field observation and matched well with expected grade trends within the Main Mineralized Zone. Slight variance was noted between the ranges of gold and silver variograms, so the gold variogram parameters were selected as the controlling values of the primary elliptical interpolation pass.
A second set of ellipse parameters was generated for a second interpolation pass, which were set at 130% of the range of the primary parameters.
Table 14.10 below summarizes the ellipse and variogram parameters generated from the primary variogram analysis for the separate domains.
Table 14.10: Ellipse and Variogram Parameters based on Experimental Variogram Analysis for the Santa Elena Model
Metal grade values were interpolated into the block model from the one metre composite dataset using the variogram and ellipse parameters applied to and Ordinary Kriging algorithm. A minimum of 2 composites, to a maximum of 15, were required to interpolate block grades with no more than 5 composites reporting from any one drill hole.
Mineral resources have been classified based on the CIM Definition Standards for Mineral Resources and Mineral Reserves. The category the resources have been assigned is based on the confidence in geological information available relating to the mineral deposit, the quantity and quality of data available, the level of detail of the technical and economic information which has been generated and the interpretation of the data and information. EBA confirms that the resources for the Santa Elena deposit meet the test of being a reasonable prospect for consideration of economic extraction based on the success of currently open pit production and continuity of mineralization along defined structural trends.
Interpolation of gold and silver grades used the variogram and search parameters outlined above as the basis for estimation. Following the interpolation, a script was run to assign classification scheme to each block to represent a level of confidence for the reported grades.
An Inferred classification has been applied to the block model to target peripheral blocks that indicate the presence and continuity of mineralization, but lack the density of data necessary for confirmation. Inferred blocks within the Santa Elena deposit lie within the maximum variogram range of 117 metres and have grade support from at least 1 drill hole and a minimum of 2 individual composite grades. All mineralized blocks within the Cholugo and Cholugo Dos veins were assigned as Inferred.
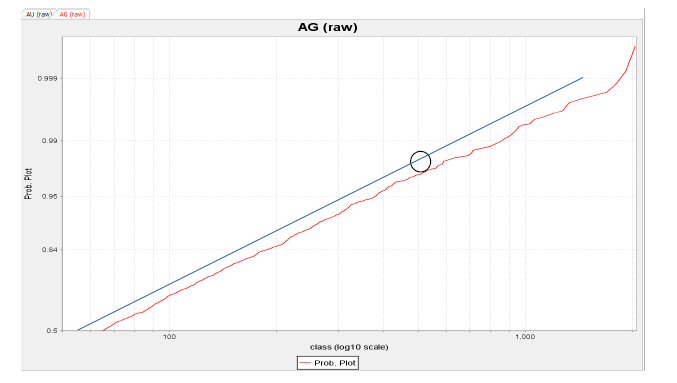
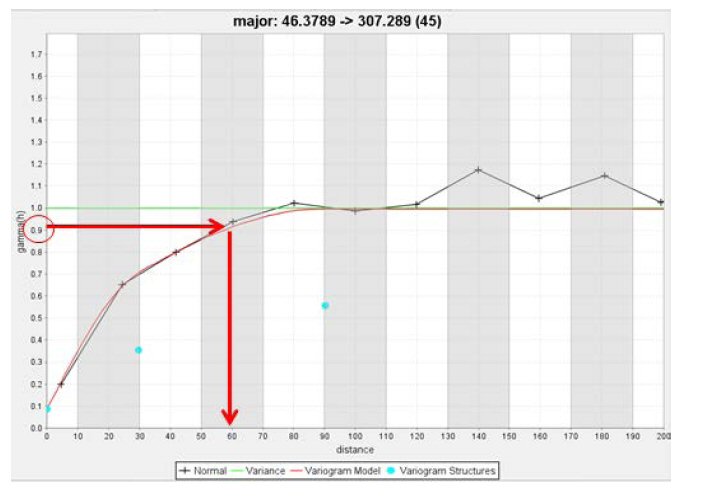
An Indicated classification has been applied to the block model to target portions of the mineralized body where data density confirms the presence and continuity of mineralization with a moderate level of confidence. A factor of 0.9 was applied to the total sill of the experimental variogram to determine the range with a level of confidence to support classification of Indicated Mineral Resources as seen below in Figure 14.11. This resulted in a value of 60 metres. All mineralized blocks with grade support from at least 2 drill holes and a minimum of 10 reporting composites within a distance of 60 metres were assigned to the Indicated category.
Figure 14.11: Factor applied to Total Sill of the Major Experimental Variogram Range
Mineral Resource Estimates have been completed for the underground portion of the Santa Elena deposit (MMZ), including the co-trending Cholugo and Cholugo Dos zones. The estimates have been prepared by EBA using to the Standards of Disclosure for Mineral Projects as documented in National Instrument 43-101 and adhering to the Canadian Institute of Mining, Metallurgy and Petroleum Best Practice Guidelines. A summary of the estimates are presented with variable cut-off grades in Table 14.11 including the reserve estimate from Section 15, and in Table 14.12 as mineral resources excluding the reserves.
Table 14.12: Updated Underground Mineral Resource Estimate Excluding Reserves for Santa Elena (Effective April 30th, 2013)
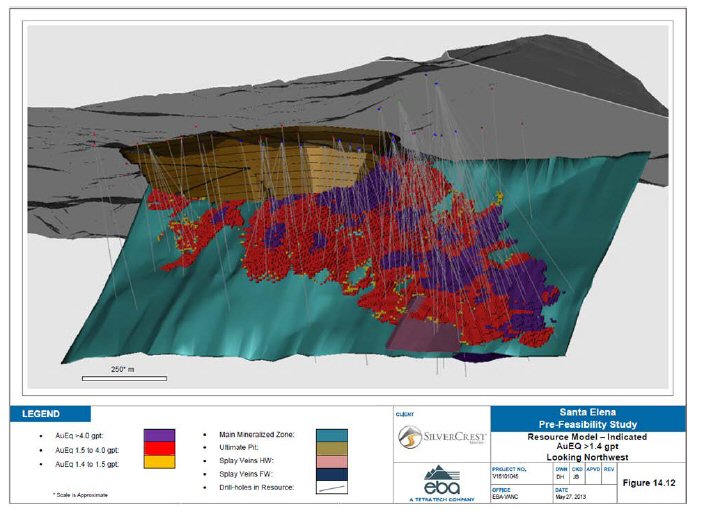
Figure14.12 below shows the block model for the Santa Elena underground resource, inclusive of reserves. Blocks displayed are above 1.4 gpt AuEQ and are classified as Indicated. Also shown are the drill holes used in resource estimation.
Figure 14.12: Oblique Perspective of Santa Elena Block Model, Indicated Resource (AuEq >1.4 gpt)
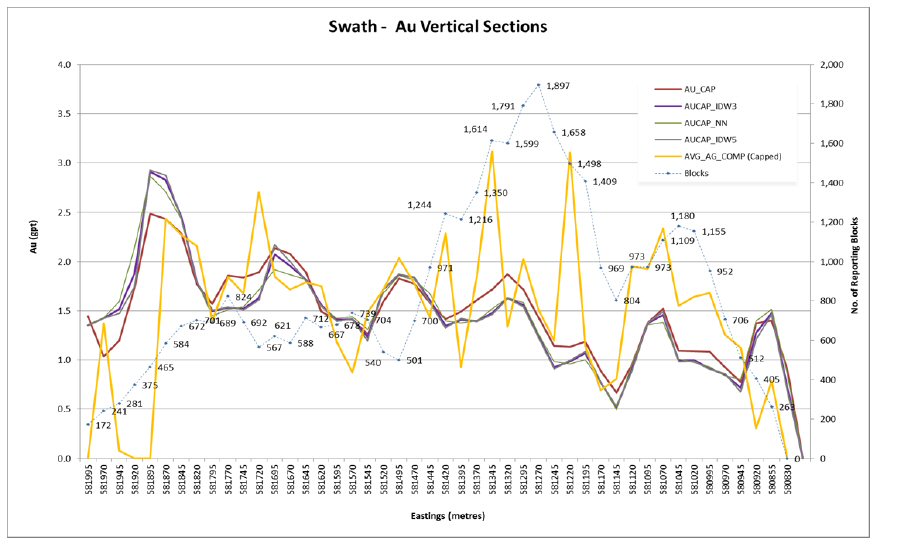
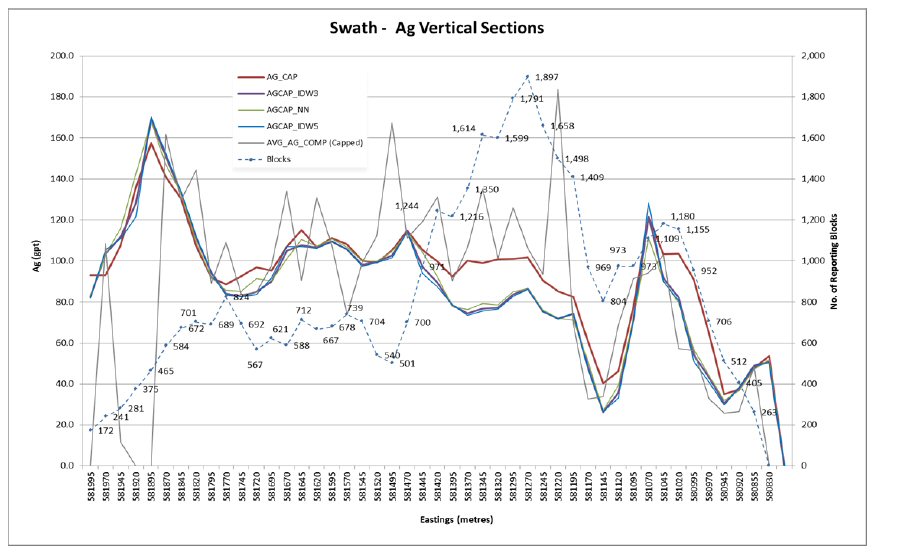
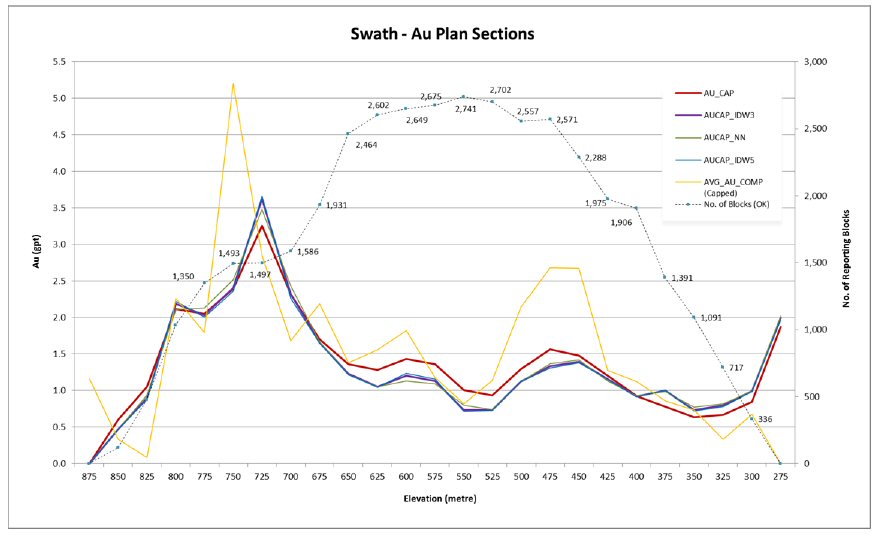
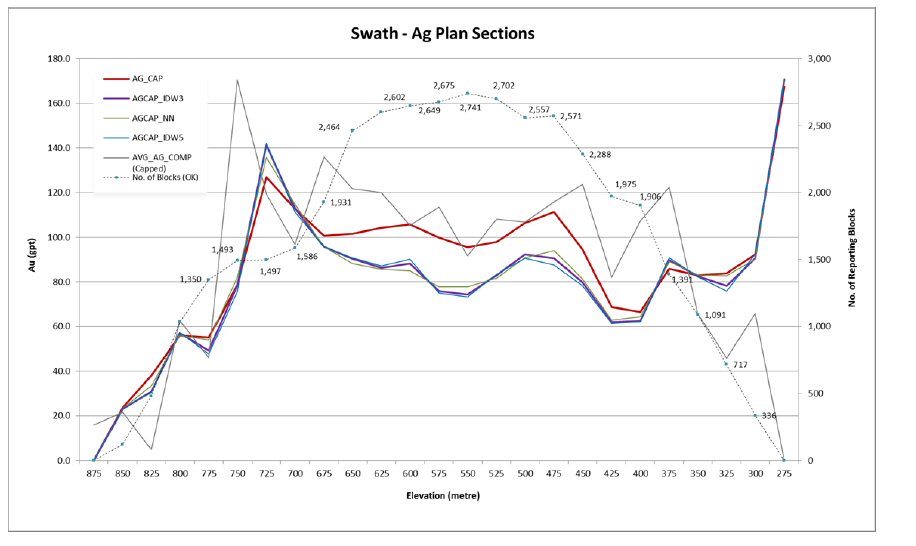
Estimated block grades were visually compared to drill hole grades along horizontal and vertical sections using the Santa Elena GEMS model (Figures 14.13 to 14.16). In addition, Nearest Neighbor (NN), Inverse Distance Weighted methods, (IDW5 and IDW3) were run to compare against the Ordinary Kriging method (OK) used in the actual resource estimate. Average Au and Ag grades were reported for 25 metre vertical and horizontal slices of the resulting verification and plotted for comparison against the average input composite grades within the same sections. The results were compared to check for potential global biases of the primary OK calculation method. In general, an overall grade smoothing trend is observed in all methods. The smoothing effect in areas with discreet high grade peaks in the composite samples data effectively accounts for the declustering of data within the block model in higher grade areas which are represented by high number of densely populated sampling points. OK has declustered the data but a directional bias as part of the OK algorithm highlights high grade trends in areas with high density of sample points which is not seen in the IDW runs.
Overall, the four methods depict a close approximation to the overall grade trends shown by the composite sampling data. The individual methods show repeatability and do not indicate that biases have been introduced during the modelling process. The OK method is thought to support the local variation in grade and is felt to be an adequate representation of the grade distribution throughout the deposit.
EBA has compared and reviewed the available datasets for the block model resources and feels that the block models used to report the mineral resource estimate as stated above are valid and represent the source data in a reasonable manner.
A block model from validation drilling was completed on 25 holes spaced on a 25 metre by 25 metre grid as described below. The validation results support the estimation by the Company utilizing daily production data.
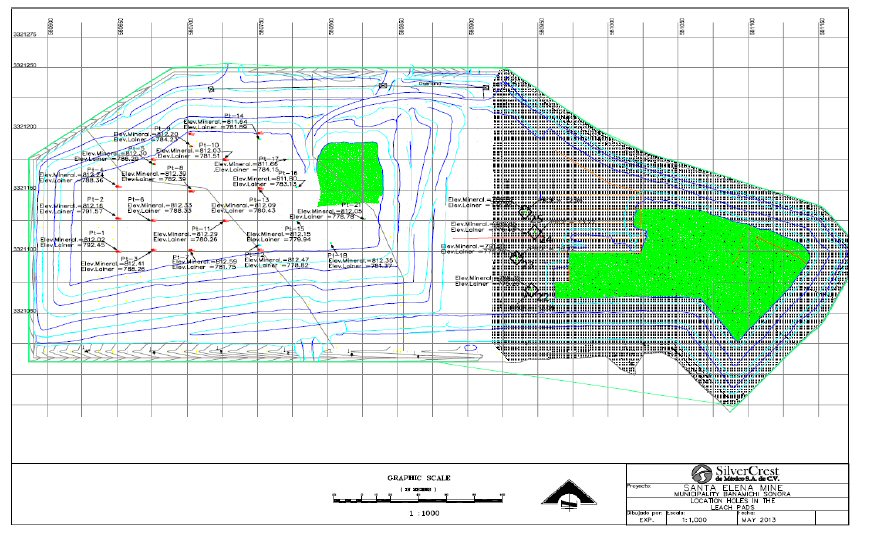
The drilling database used for the grade interpolation includes 25 large diameter reverse circulation Becker Hammer, Tandem Mounted hydraulic drill holes for a total length of 355 metres. A total of 169 samples were integrated in an Access/ Dassault Systemes database together with the most recent topographic survey of the heap leach pad. The drill hole data is spaced on a 25 metre grid on the pad (Figure 14.17).
A block model comprising the volumetric of the current leach pad area was built with the following specifications:
Original samples were not composited, maintaining the original length. An inverse distance squared methodology was applied with a single domain and isotropic search ellipse (200 meters -same search distance in all directions). This provides a close to polygonal estimation approach for the resource estimation due to small area and limited number of samples. The grade interpolation parameters included no grade capping. A minimum of 2s and a maximum of 12 composites were used to interpolate block grades, with no more than 3 composites reporting from any one drill hole in multi stage search radiuses to populate all blocks. Visual validation was performed to assess the results and final resource numbers were benchmarked against production data for validation purposes.
The updated open pit Resources have been estimated by SilverCrest utilizing Company production data (blastholes), exploration drilling data and computer modelling. All Indicated Resources in the operating open pit have been converted to Reserves as of December 31, 2012.
The Open Pit Mineral Resource estimates are based on verified information from historical and recent SilverCrest sources. Solid boundaries for the mineralization were constrained at 0.20 gpt AuEQ cut off and the open pit limits defines the mineralized material dated as December 31, 2012. The Resource estimation was completed using Gemcom GEMS software applying Ordinary Kriging. Raw data (blast holes, core and RC samples) were composited to a 5 metre length for blast holes and 2 metre length for in-pit core and RC samples. These composites were assessed for spatial and geostatistical purposes. A capping of 8 gpt Au and 300 gpt Ag was applied to core and RC data only. The composite data was interpolated into a 5 metre x 5 metre x 5 metre block size model using Ordinary Kriging in two passes. The first pass using only blast hole data with an average spacing of 4 metres and interpolating grades to a maximum distance of 15 metres from the sample location. The second pass used only core and RC drilling data spaced on average 50 metres to interpolate 5 metre x 5 metre x 5 metre blocks located in distances beyond 15 metres from the sample location. The blasthole resource model was compared against the production data for verification purposes.
Three individual Mineral Reserve estimates are presented in this report and are combined into the mine schedule and economic analysis that comprises the Santa Elena Expansion Project.
An updated Reserve estimate for the Santa Elena open pit and a new Reserve estimate for spent ore material on the existing leach pads have been prepared by Eric Fier, CPG, Chief Operating Officer of SilverCrest and non-Independent Qualified Person, and has accounted for production up to the Effective Date. A new Reserve estimate for the proposed underground mine has been prepared by Mike Tansey, P.Eng, Senior Mining Engineer with EBA and an Independent Qualified Person.
On the basis of resources classified as Indicated in Section 14, EBA has estimated Santa Elena underground diluted and recoverable Reserves. SilverCrest have estimated leach pad and open pit Reserves (Table 15.2).
An updated reserve estimate for open pit mining operations at Santa Elena was previously completed by SilverCrest, with the assistance of Dassault Systemes Software International, and reviewed by EBA in January, 2011. This Reserve estimate was released by EBA in May 2011 in the report “NI 43-101 Technical Report, Reserve Update for the Santa Elena Open Pit and Preliminary Assessment for the Santa Elena and Cruz de Mayo Expansion Project, Sonora Mexico (amended date May 11, 2011)”.
The open pit Reserves reported in 2011, and shown in table 15.1 below, are superseded by the current open pit Reserve estimate described in this report. Significant variance from the current open pit Reserve estimate is attributed to the open pit design which was recently reduced in size from the 2011 pit.
The classification of Reserves follows the Standards of Disclosure for Mineral Projects as documented in National Instrument 43-101 and adheres to the Canadian Institute of Mining, Metallurgy and Petroleum Best Practice Guidelines. Indicated Resources demonstrating economic viability are assigned the Probable category. No Measured Resources have been estimated, and therefore none of the Reserves estimated will be classified as Proven. The Mineral Reserves (open pit, underground, leach pad) in table 15.2 are based on the following parameters where applicable:
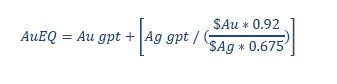
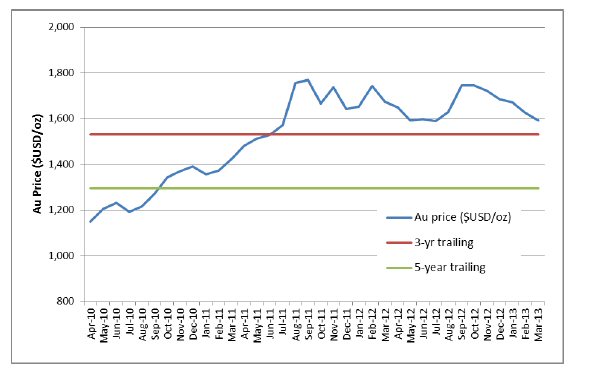
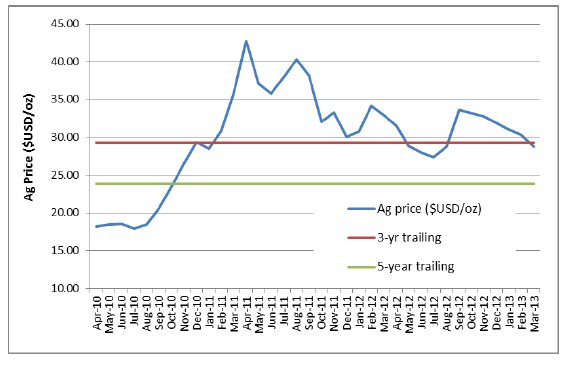
Note: Tonnes and ounces are rounded. Underground and Leach Pad Reserves are based on 3 year historic metal price trends of US$28/oz silver, US$1450/oz gold and metallurgical recoveries of 92% Au and 67.5% Ag with a metal ratio of Ag:Au at 70:1. All Mineral Resources and Reserves conform to NI 43-101 and CIM definitions for Resources and Reserves.
*Open Pit and Leach Pad Probable Reserves were Classified by SilverCrest. Underground Reserves and Resources were classified by EBA.
**Underground Probable Reserve is based on a cut-off grade of 1.47 gpt AuEq with an average 11% dilution and 90% mine recovery.
***Open Pit Reserve is based on a cutoff grade of 0.20 gpt AuEq in a constrained pit shell with applied capping of 8 gpt Au and 300 gpt Ag.
****Leach Pad Reserve based on production and drill hole data for volumetrics and grade model using a cutoff grade of 0.5 gpt AuEq. No capping was applied.
*****Underground Resources are based on 1 gpt AuEq grade shell and cutoff grade of 1.4 gpt AuEq with applied capping of 12 gpt Au and 600 gpt Ag.
The underground Mineral Reserve tonnages are based on the block model used for Indicated Resources. The block model has been developed using 5 metre x 5 metre x 5 metre blocks based on a grade shells modeled into a grade (mineralization) model created using drill hole intersections of greater than 1.0 g/t AU EQ. The Block model represents estimated Au and Ag grades interpolated using capped composite samples calculated by Ordinary Kriging (OK) into each block (refer to section 14 for details of resource modelling). The block model is clipped to the topography and/or the currently planned ultimate pit. Reserves were calculated using the grade shell model, restricted laterally by the grade (vein) model, and running various stope length and height iterations to obtain the optimal stope dimension.
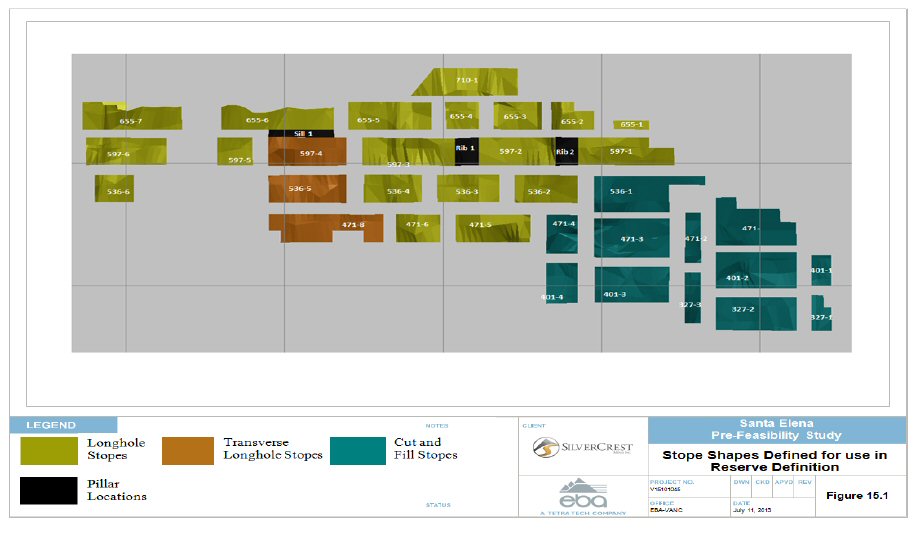
EBA estimated reserve grade and tonnage through cost approximation and thereby determination of a cut-off grade for AUEQ based on gold price and metallurgical recovery (see section 13 and 17). Rock engineering criteria and analysis results (see section 16.2) were used to determine provisional stable stope spans, using a set stope height of 45 m. The stope height was based on a conceptual model for long hole stoping, with two sublevels in each stope, separated by 22.5 m. Mineral reserves were initially estimated at a cut-off of 1.5 g/t Au Eq for all stopes. Specific cut-off grades were then determined by mining method after mining costs were established by an iterative optimization process. Within the stope shapes created, Indicated Resources above and below the cut-off grades were then considered for definition of undiluted Reserves. Other material within the stope shapes, including Inferred Resources, are considered as zero grade dilution, resulting in internally diluted Reserves. Optimization was undertaken by excluding low grade areas from the stopes and through placement of ground stability rib and sill pillars outside of high grade areas. Figure 15.1 shows the stope shapes generated for the Reserve definition.
External dilution (outside of the modelled stope) is added to the grade and tonnage to determine the Probable Reserves. The external dilution is based on the type of stoping being undertaken, rock engineering design spans and resultant dilution, minimum mining widths and consideration for blast damage.
Table 15.3 below summarizes the Santa Elena underground reserves by tonnage contained in stopes, recoverable pillars, and development drifts situated in ore. Table 15.4 shows the breakdown of the reserves, with the estimation of dilution and mining recovery on a stope by stope basis. Table 15.4 also shows the reserves sourced from pillars and ore development.
| Stope ID | Type | Internally Diluted Ore - From Stope Shapes | External Dilution And Mining Recovery Parameters | Diluted Ore Tonnage And Grade | Cut-Off |
| | | Stope Tonnes | AuEQ Grade | Au Cap Grade | Ag Cap Grade | Mining Recovery | External Dilution Percentage | AuEQ Dilution Grade | Au Dilution Grade | Ag Dilution gpt | Net Tonnes | Stope Length | Tonnes Stoping | Net Grade AuEQ | Net Grade Au | Net Grade Ag | Cut-off |
| | Units | Metric Tonnes | gpt | gpt | gpt | % | % | gpt | gpt | gpt | metric tonnes | | | gpt | gpt | gpt | gpt |
| | Calculation | A | B | C | D | G | H | I | J | K | L=A x G + H x A x G | | | = (A x B + A x H x I) x G / L | = (A x C + A x H x J) x G / L | = (A x D + A x H x K) x G / L | |
| | Notes/source | GEMS Model | Mining Parameters by QP | GEMS Model | Calculation | Costing |
| 710-1 | LH | 69,477 | 4.26 | 2.39 | 130.82 | 85.0% | 15.0% | 0.23 | 0.13 | 6.52 | 67,914 | 125 | 52,314 | 3.74 | 2.10 | 114.61 | 1.65 |
| 655-1 | LH | 3,262 | 2.86 | 1.84 | 88.69 | 85.0% | 28.1% | 0.41 | 0.06 | 24.58 | 3,551 | 45 | 3,551 | 2.32 | 1.45 | 74.64 | 1.65 |
| 655-2 | LH | 19,430 | 1.85 | 1.19 | 46.48 | 85.0% | 14.5% | 0.15 | 0.06 | 6.25 | 18,912 | 53 | 12,298 | 1.64 | 1.04 | 41.38 | 1.65 |
| 655-3 | LH | 68,023 | 2.54 | 1.47 | 74.44 | 85.0% | 15.0% | 0.38 | 0.25 | 8.91 | 66,492 | 60 | 59,004 | 2.26 | 1.31 | 65.89 | 1.50 |
| 655-4 | LH | 44,578 | 5.62 | 3.11 | 176.27 | 85.0% | 15.0% | 0.34 | 0.18 | 11.02 | 43,575 | 43 | 38,208 | 4.93 | 2.72 | 154.71 | 1.50 |
| 655-5 | LH | 137,989 | 5.98 | 3.42 | 180.86 | 85.0% | 15.0% | 0.30 | 0.14 | 11.45 | 134,885 | 105 | 121,781 | 5.24 | 3.00 | 158.76 | 1.50 |
| 655-6 | TVLH | 208,387 | 3.20 | 1.46 | 122.44 | 90.0% | 10.0% | 0.34 | 0.09 | 17.60 | 206,303 | 145 | 206,303 | 2.94 | 1.33 | 112.91 | 1.43 |
| 655-7 | LH | 181,527 | 2.08 | 0.98 | 78.79 | 85.0% | 15.0% | 0.37 | 0.16 | 14.84 | 177,443 | 125 | 161,843 | 1.86 | 0.87 | 70.45 | 1.28 |
| 597-1 | LH | 49,648 | 4.81 | 2.81 | 159.83 | 85.0% | 27.3% | 0.22 | 0.07 | 10.82 | 53,708 | 120 | 38,732 | 3.83 | 2.22 | 127.90 | 1.65 |
| 597-2 | LH | 137,487 | 3.71 | 2.12 | 111.16 | 85.0% | 15.0% | 0.56 | 0.30 | 18.39 | 134,393 | 96 | 122,413 | 3.30 | 1.88 | 99.06 | 1.50 |
| 597-3 | LH | 188,369 | 4.11 | 2.20 | 134.42 | 85.0% | 15.0% | 0.32 | 0.15 | 11.74 | 184,131 | 120 | 169,155 | 3.62 | 1.94 | 118.42 | 1.50 |
| 597-4 | TVLH | 207,563 | 2.81 | 1.11 | 118.83 | 90.0% | 10.0% | 0.32 | 0.13 | 12.81 | 205,488 | 100 | 205,488 | 2.58 | 1.02 | 109.19 | 1.46 |
| 597-5 | LH | 73,086 | 2.27 | 1.18 | 76.17 | 85.0% | 15.0% | 0.34 | 0.12 | 15.14 | 71,441 | 43 | 66,075 | 2.02 | 1.04 | 68.21 | 1.22 |
| 597-6 | LH | 172,058 | 2.19 | 0.88 | 105.33 | 85.0% | 15.0% | 0.42 | 0.19 | 16.37 | 168,187 | 102 | 155,457 | 1.96 | 0.79 | 93.73 | 1.22 |
| 536-1 | CF | 112,971 | 4.06 | 2.23 | 133.41 | 95.0% | 5.0% | 0.11 | 0.04 | 4.73 | 112,688 | 0 | 112,688 | 3.87 | 2.12 | 127.29 | 1.59 |
| 536-2 | LH | 147,956 | 3.60 | 1.41 | 153.59 | 85.0% | 15.0% | 0.27 | 0.16 | 7.86 | 144,627 | 80 | 134,643 | 3.17 | 1.24 | 134.58 | 1.22 |
| 536-3 | LH | 128,602 | 3.06 | 1.41 | 115.61 | 85.0% | 15.0% | 0.28 | 0.14 | 9.51 | 125,708 | 80 | 115,724 | 2.70 | 1.25 | 101.77 | 1.22 |
| 536-4 | LH | 124,514 | 2.61 | 1.05 | 109.39 | 85.0% | 15.0% | 0.39 | 0.18 | 14.82 | 121,713 | 75 | 112,353 | 2.32 | 0.94 | 97.05 | 1.22 |
| 536-5 | TVLH | 262,753 | 2.33 | 0.96 | 96.36 | 90.0% | 10.0% | 0.30 | 0.12 | 12.63 | 260,126 | 100 | 260,126 | 2.15 | 0.88 | 88.75 | 1.43 |
| 536-6 | LH | 35,994 | 1.78 | 0.50 | 105.42 | 85.0% | 15.0% | 0.22 | 0.06 | 11.27 | 35,184 | 0 | 35,184 | 1.58 | 0.45 | 93.14 | 1.65 |
| 471-1 | CF | 153,808 | 4.84 | 3.86 | 114.30 | 95.0% | 3.3% | 0.17 | 0.07 | 6.70 | 150,988 | 0 | 150,988 | 4.69 | 3.74 | 110.83 | 1.53 |
| 471-2 | CF | 57,771 | 5.36 | 3.73 | 113.66 | 95.0% | 3.6% | 0.18 | 0.08 | 7.01 | 56,842 | 0 | 56,842 | 5.18 | 3.61 | 109.99 | 1.53 |
| 471-3 | CF | 194,022 | 5.87 | 3.56 | 161.85 | 95.0% | 4.0% | 0.17 | 0.06 | 7.50 | 191,693 | 0 | 191,693 | 5.65 | 3.42 | 155.91 | 1.53 |
| 471-4 | CF | 46,026 | 2.75 | 1.28 | 102.53 | 95.0% | 6.7% | 0.31 | 0.09 | 15.09 | 46,640 | 0 | 46,640 | 2.60 | 1.21 | 97.07 | 1.59 |
| 471-5 | LH | 54,512 | 2.22 | 0.97 | 87.78 | 85.0% | 15.0% | 0.31 | 0.14 | 11.96 | 53,285 | 95 | 41,429 | 1.97 | 0.86 | 77.89 | 1.65 |
| 471-6 | LH | 67,625 | 1.91 | 0.63 | 89.88 | 85.0% | 15.0% | 0.36 | 0.18 | 12.05 | 66,103 | 56 | 59,115 | 1.71 | 0.57 | 79.72 | 1.50 |
| 471-8 | TVLH | 223,073 | 1.36 | 0.51 | 56.77 | 90.0% | 10.0% | 0.21 | 0.06 | 10.53 | 220,842 | 150 | 220,842 | 1.26 | 0.47 | 52.56 | 1.46 |
| 401-1 | CF | 32,822 | 3.93 | 2.92 | 163.82 | 95.0% | 5.0% | 0.19 | 0.11 | 6.00 | 32,740 | 0 | 32,740 | 3.75 | 2.79 | 156.31 | 1.59 |
| 401-2 | CF | 169,232 | 5.18 | 2.80 | 167.10 | 95.0% | 4.0% | 0.36 | 0.18 | 13.16 | 167,201 | 0 | 167,201 | 5.00 | 2.70 | 161.18 | 1.59 |
| 401-3 | CF | 158,590 | 1.98 | 0.98 | 70.53 | 95.0% | 5.0% | 0.45 | 0.15 | 20.90 | 158,194 | 0 | 158,194 | 1.91 | 0.94 | 68.17 | 1.59 |
| 401-4 | CF | 62,318 | 1.92 | 1.10 | 62.74 | 95.0% | 6.3% | 0.10 | 0.03 | 5.42 | 62,902 | 0 | 62,902 | 1.81 | 1.04 | 59.37 | 1.59 |
| 327-1 | CF | 22,856 | 3.63 | 1.54 | 165.37 | 95.0% | 7.1% | 0.26 | 0.14 | 7.83 | 23,264 | 0 | 23,264 | 3.41 | 1.45 | 154.86 | 1.68 |
NATIONAL INSTRUMENT 43-101 TECHNICAL REPORT
EFFECTIVE DATE: APRIL30, 2013 | AMENDED DATE: MARCH 04, 2014
| Stope ID | Type | Internally Diluted Ore - From Stope Shapes | External Dilution And Mining Recovery Parameters | Diluted Ore Tonnage And Grade | Cut-Off |
| | | Stope Tonnes | AuEQ Grade | Au Cap Grade | Ag Cap Grade | Mining Recovery | External Dilution Percentage | AuEQ Dilution Grade | Au Dilution Grade | Ag Dilution gpt | Net Tonnes | Stope Length | Tonnes Stoping | Net Grade AuEQ | Net Grade Au | Net Grade Ag | Cut-off |
| | Units | Metric Tonnes | gpt | gpt | gpt | % | % | gpt | gpt | gpt | metric tonnes | | | gpt | gpt | gpt | gpt |
| | Calculation | A | B | C | D | G | H | I | J | K | L=A x G + H x A x G | | | = (A x B + A x H x I) x G / L | = (A x C + A x H x J) x G / L | = (A x D + A x H x K) x G / L | |
| | Notes/source | GEMS Model | Mining Parameters by QP | GEMS Model | Calculation | Costing |
| 327-2 | CF | 148,618 | 3.60 | 1.34 | 173.05 | 95.0% | 7.1% | 0.37 | 0.13 | 16.64 | 151,272 | 0 | 151,272 | 3.39 | 1.26 | 162.62 | 1.68 |
| 327-3 | CF | 68,480 | 2.85 | 0.94 | 133.62 | 95.0% | 3.6% | 0.44 | 0.17 | 18.84 | 67,380 | 0 | 67,380 | 2.77 | 0.91 | 129.66 | 1.53 |
| Subtotal Stopes Only | | 3,833,427 | 3.34 | 1.74 | 119.25 | 90.5% | 10.2% | 0.32 | 0.14 | 12.62 | 3,785,816 | | | 3.07 | 1.58 | 108.02 | 1.47 |
| Rib pillar 1 | Rib pillar | 36,908 | 3.21 | 1.64 | 110.06 | 80.0% | 15.0% | 0.34 | 0.15 | 12.86 | 32,528 | 0 | 20,131 | 2.96 | 1.50 | 101.65 | 1.50 |
| Rib pillar 2 | Rib pillar | 21,882 | 5.24 | 2.51 | 191.17 | 80.0% | 15.0% | 0.55 | 0.23 | 22.34 | 20,131 | 0 | 57,039 | 4.63 | 2.22 | 169.15 | 1.65 |
| Sill pillar 1 | Sill pillar | 61,999 | 3.00 | 1.12 | 132.22 | 80.0% | 15.0% | 0.32 | 0.10 | 15.45 | 57,039 | 0 | 77,466 | 2.65 | 0.98 | 116.99 | 1.46 |
| | | | | | | | | | | | | | | | | | |
| Subtotal Pillar Extraction | | 120,788 | 3.47 | 1.68 | 149.89 | 80.0% | 13.2% | 0.37 | 0.14 | 15.91 | 109,699 | | | 3.11 | 1.36 | 122.01 | 1.51 |
| | | | | | | | | | | | | | | | | | |
| Subtotal Stoping | | 3,954,000 | 3.34 | 1.74 | 120.10 | 90.4% | 10.3% | 0.32 | 0.14 | 12.74 | 3,896,000 | | | 3.07 | 1.58 | 108.40 | 1.47 |
| | | | | | | | | | | | | | | | | | |
| Ore drifting outside stopes | Stope access ore drifts in the vein | 24,518 | 1.67 | 0.76 | 63.40 | 100.0% | 0.0% | 0.00 | 0.00 | 0.00 | 24,518 | 0 | 20,131 | 1.67 | 0.76 | 63.40 | 0.55 |
| | | | | | | | | | | | | | | | | | |
| Total Stopes & Ore Drifts | | 3,978,518 | 3.33 | 1.74 | 119.75 | 90.5% | 10.2% | 0.32 | 0.14 | 12.66 | 3,920,518 | | | 3.06 | 1.57 | 108.12 | 1.47 |
NATIONAL INSTRUMENT 43-101 TECHNICAL REPORT
EFFECTIVE DATE: APRIL30, 2013 | AMENDED DATE: MARCH 04, 2014
| 15.4.1 | Underground Mining Methodologies Consideration for Underground Reserves |
Three primary mining methods were considered for estimation of costs and thereby mineral reserves, namely; longitudinal long hole stoping, transverse long hole stoping, and mechanized cut and fill (refer to Section 16.3 for explanation of mining methods).
Longitudinal long hole stoping has the highest estimated external dilution for the three methods in, with an average of 15% with select few stopes as high as 28% (due to the width of the vein being lower than the minimum mining width). This method constitutes the lowest overall operating cost and has been applied to all stopes with widths less than 15 m (hanging wall to footwall) and a footwall dip angle of greater than 50 °.
For stopes with dip angles greater than 50 ° and width greater than 15 m, transverse long hole stoping has been selected. This method requires more waste footwall development and is thereby marginally higher cost than longitudinal long hole stoping. Lower dilution has been included for transverse stopes, as the spans of the stope are limited to 20 m widths at any one point; see section 16 for mining method descriptions. Table 15.5 shows the breakdown of mining methods utilized throughout the life of the mine. Calculations are based on tonnages mined and mining method employed in each stope.
Table 15.5: Mining Methods % Utilization throughout LOM
| Mining Methods Percent Utilization throughout LOM |
| Mining Method | % Utilization |
| Long hole Stoping | 69% |
| Cut & Fill | 31% |
Mechanised cut and fill stoping has been applied to all areas with footwall dip angle of less than 50° from the horizontal. This method has the highest cost, due to footwall development requirements and productivity constraints due to reduced size of cuts taken at any point and the need to backfill . External dilution is estimated to be less for mechanized cut and fill due to hanging wall exposures being limited to a single cut at any point. In addition, sloughage of the hanging wall will be controlled by the backfill and through placement of support in the form of rock bolts and/or split sets in the active cut.
| 15.5 | Open Pit Reserves (SVL) |
All open pit Mineral Resources are declared as Reserves (table 15.6). Open pit production from January 1 to April 30, 2013 was subtracted from the December 2012 Resource estimation.
NATIONAL INSTRUMENT 43-101 TECHNICAL REPORT
EFFECTIVE DATE: APRIL30, 2013 | AMENDED DATE: MARCH 04, 2014
Table 15.6: Santa Elena Open Pit Mineral Reserves (Effective December 31, 2012)
| Classification* | Tonnes | Au gpt | Ag gpt | Au oz | Ag oz |
| SANTA ELENA OPEN PIT RESERVES (As of April 30, 2013)*** |
| PROBABLE | 1,426,710 | 1.52 | 66.8 | 69,890 | 3,064,980 |
*Open Pit and Leach Pad Probable Reserves were Classified by SilverCrest. ***Open Pit Reserve is based on a cutoff grade of 0.20 gpt AuEq in a constrained pit shell with applied capping of 8 gpt Au and 300 gpt Ag. |
| 15.6 | Heap leach Reserves (SVL) |
Section 14.4 details the estimation of heap leach Indicated Resources. Based on mining practicality, no cut-off grades between 0 and 1 gpt AuEQ were applied. All average grades for the leach pad spent ore are above 1gpt AuEQ, therefore all tested resource tonnes on the pad are considered reserves.
All spent ore material on the leach pad will be reprocessed through the processing facility once operational in the first quarter of 2014. Only the material currently on the pad and leached (300 day cycle completed or estimated full cycle) has been declared as Reserves. Approximately 882,000 tonnes of open pit material is planned to be placed on the pad during the remainder of 2013 and will undergo only partial leaching before being re-processed through the new facility. Once this material is placed on the pad and leaching has been discontinued, it will be declared as leach pad Reserves for processing and metal recovery in 2014. Extensive metallurgical test work including ongoing operations data show that all declared Reserves are amenable to conventional leaching either by heap leach technology or standard CCD milling with a Merrill Crowe recovery system for doré bar production.
Table 15.7: Heap Leach Material Mineral Reserve Estimate (Effective April 30th, 2013)
| Area | Classification* | AuEQ** Cut-off (g/t) | Tonnage | Au | Ag | Contained Au Ounces | Contained Ag Ounces |
| Leach Pad | Probable | 0.50 | 2,844,530 | 0.65 | 33.3 | 59,420 | 3,048,200 |
*Classified by SilverCrest Mines Inc. and conforms to NI 43-101 and CIM definitions for resources. Mineral Resources have been estimated from drill hole data and validated using company production data and sampling. The estimate must not be considered to imply economic mineability. The reported baseline Mineral Resource for the leach pad material is based on a 0.5 gpt AuEQ cut-off and is highlighted in light blue. No grade capping has been applied. **Based on Au:Ag ratio of 70, incorporating metal price assumptions of $1,450/oz Au, $28/oz Ag and using metallurgical recoveries of 92% Au and 67.5% Ag. All leach pad spent ore is considered above cutoff grade of 1gpt AuEQ |
NATIONAL INSTRUMENT 43-101 TECHNICAL REPORT
EFFECTIVE DATE: APRIL30, 2013 | AMENDED DATE: MARCH 04, 2014
This section includes a geotechnical analysis, explanation of mining methods and mine design methodology completed for the Prefeasibility Study based on the information available and with the assumption that further investigation and detailed engineering will be completed prior to or during development. In practice the actual conditions will vary based on actual ground conditions encountered. As more drilling is completed and the mine is developed, the mining methods, stope layouts and rock engineering criteria will be modified in favour of actual conditions.
Conventional open pit mining will continue using a contractor until the third quarter of 2014 when the open pit reserves will be depleted. Mining of the heap leach spent ore will be completed by loader and conveyor to transport material to the plant.
The analysis was completed using the basis of assumptions for geological model described in Section 14, and mining methods were selected based on the results of preliminary geotechnical and rock mechanic analysis and to account for variations in vein thickness and orientation. A detailed geotechnical analysis was conducted to determine specific parameters for each mining method.
| 16.2 | Geotechnical Analysis for Underground Mining |
The geotechnical analysis of underground production stoping at Santa Elena is based on geotechnical data collected from sixteen exploration drill holes, six of which were oriented, advanced as part of the 2012 subsurface exploration program and test work conducted on core samples at the University of Sonora, Hermosillo, Mexico.
This section addresses the present work conducted for the proposed Santa Elena Expansion Project and provides a summary of the range of variance of the rock mass conditions (by means of RMR76 and NGI-Q classification systems) at the following five zones:
| § | Ore zone (referred herein as Zone D1). |
| § | Country rock above the hanging wall, from 5-6 m to 50-60 m above the upper ore zone/country rock interface (referred here in as Zone D2). |
| § | Country rock above the hanging wall, between the upper ore zone/country rock interface and about 5-6 m above it (referred here in as Zone D3). |
| § | Country rock below the foot wall, from 5-6 m to 50-60 m below the lower ore zone/country rock interface (referred here in as Zone D4). |
| § | Country rock below the foot wall, between the lower ore zone/country rock interface and about 5-6 m below it (referred here in as Zone D5). |
NATIONAL INSTRUMENT 43-101 TECHNICAL REPORT
EFFECTIVE DATE: APRIL30, 2013 | AMENDED DATE: MARCH 04, 2014
| 16.2.2 | Geotechnical Data Collection |
Table 16.1: 2012 Borehole Summary |
| Hole ID | Northing (m) | Easting (m) | Surface Elevation (m) | Azimuth (°) | Plunge (°) | Total Length (m) | Oriented Core Data |
| GT-12-09 | 3321358.7 | 81322.9 | 784.8 | 360 | 60 | 280.35 | Y |
| GT-12-10 | 3321349.6 | 581448.9 | 776.8 | 360 | 70 | 310.50 | Y |
| GT-12-11 | 3321348.7 | 581449.5 | 777.0 | 315 | 70 | 344.45 | Y |
| GT-12-12 | 3321449.8 | 581599.1 | 808.1 | 315 | 45 | 240.35 | Y |
| GT-12-13 | 3321383.0 | 581450.1 | 784 | 360 | 70 | 280.70 | Y |
| SERC-12-32 | 3321351.7 | 581551.5 | 790.3 | 045 | 70 | 380.00 | Y |
| SE-12-41 | 3321385 | 581450 | 784 | 360 | 45 | 234 | N |
| SE-12-47 | 3321404 | 581525 | 793 | 015 | 60 | 228.45 | N |
| SE-12-48 | 3321403.4 | 581525.8 | 788.9 | 010 | 50 | 215.15 | N |
| SE-12-50 | 3321466.4 | 581607.9 | 808.6 | 345 | 78 | 278 | N |
| SE-12-51 | 3321467.0 | 581608.0 | 808.7 | 015 | 70 | 275 | N |
| SE-12-66 | 3321391.7 | 581579.7 | 802.0 | 358 | 86 | 359 | N |
| SE-12-71 | 3321391.7 | 581579.7 | 802.0 | 320 | 82 | 332 | N |
| SE-12-72 | 3321182.3 | 581734.3 | 853 | 030 | 65 | 600 | N |
| SE-12-90 | 3321358.7 | 581323.0 | 784 | 020 | 55 | 218.75 | N |
| SE-12-91 | 3321200.5 | 581640.6 | 853 | 013 | 59 | 455 | N |
The geotechnical investigation consisted of:
| § | Geotechnical data collection on 16 exploration drill holes advanced as part of the 2012 subsurface exploration program. The coordinates and elevations of the 16 drill holes are presented in Table 16.1. |
| § | Geological and geotechnical logging of the drill holes is listed in Table 16.1. This work was conducted by Silver Crest’s mine geologist prior to splitting the core. The geotechnical logging includes collection of geotechnical parameters to estimate the Rock Mass Rating (RMR) system (Bieniawski 1976) and the Norwegian Geotechnical Institute’s NGI Q-System (after Barton et al. 1974). EBA undertook QA/QC of the rock core during site visits at the Santa Elena project. |
| § | Six (6) of the 16 drill holes with core orientation (refer to Table 16.1). |
| § | Collection of rock samples for geotechnical laboratory purposes. |
NATIONAL INSTRUMENT 43-101 TECHNICAL REPORT
EFFECTIVE DATE: APRIL30, 2013 | AMENDED DATE: MARCH 04, 2014
| 16.2.3 | Rock Mass Characteristics |
EBA evaluated the rock mass quality using the NGI-Q and RMR systems for the 16 drill holes listed in Table 16.1. For this purpose, the geotechnical logs were processed in raw spread sheets. During this process, EBA reviewed (QA/QC) the geotechnical logs against the core photos and made corrections where appropriate.
The rock mass was subdivided into five geotechnically distinct zones as described in Section 16.2.1.
| 16.2.4.1 | Rock Mass parameters |
The cumulative percentage distributions of the NGI-Q and RMR values were calculated for the 5 zones. The cumulative percentage distribution plots provide the means of progressively estimating the likelihood that an RMR or NGI-Q value will be equaled or exceeded. For this Prefeasibility study the NGI-Q and RMR values at 50% were chosen. The purpose of adopting the 50% design values for Prefeasibility design is to provide stope dimension and reinforcement that are not too conservative or too optimistic, and therefore serve for reasonable economic estimation.
Table 16.2 summarizes the NGI-Q and RMR values used for the preliminary design.
Table 16.2: RMR’ and NGI-Q’ Values for Design – at 50% |
| Zone | Elevation | RMR’76 | NGI-Q’ |
| D1 | Above El. 580 m | 75 | 29 |
| Below El. 580 m | 76 | 11 |
| D2 | From surface to bottom of planned workings | 52 | 4 |
| D3 | Above El. 580 m | 67 (711) | 12 (211) |
| Below El. 580 m | 52 | 3 |
| D4 | Above El. 580 m | 70 | 13 |
| Below El. 580 m | 67 | 13 |
| D5 | Above El. 580 m | 67 | 7 |
| Below El. 580 m | 72 | 14 |
1 Two values are presented; (i) the first value considers the data from all the drill holes, and (ii) the second (in brackets) does not consider three of the drill holes where potential faults were encountered. |
In addition to this assessment set out in Table 2, NGI-Q values were assessed for the 655 Level. Core runs were isolated over a 45m run length at this level to give an individual rock mass characterization for stoping at this level. NGI-Q values of 15 and 6 were calculated for zones D1 and D3 for stopes at this level.
Rock strength is based on laboratory testing results from University of Sonora together with a small sample of test work undertaken at University of British Columbia, Vancouver. The test work completed at Sonora consisted of simple Uniaxial Compressive Tests (UCS) without strain measurements, Brazilian Tests and Point Load Tests (PLT). The test work at UBC consisted of simple UCS and Brazilian tests for comparison.
NATIONAL INSTRUMENT 43-101 TECHNICAL REPORT
EFFECTIVE DATE: APRIL30, 2013 | AMENDED DATE: MARCH 04, 2014
The average ore body strength from the test work undertaken at the two institutes is 87 MPa.
The strength of the hanging wall for the prefeasibility analysis is taken as 92 MPa. This is based on the average point load testing data from University of Sonora. Three UCS tests were carried out in hanging wall material at University of Sonora giving an average of 95 MPa which ties in closely with the PLT results.
The design approach presented in this report consists of empirical and analytical methods using the rock mass quality approach. In this respect, it should be noted that as with all the empirical methods, assumptions should be validated once mining starts by comparing actual with anticipated results. Below is presented the empirical method used for the assessment.
| 16.2.5.2 | Design Assumptions |
The following assumptions have been made during the geotechnical design approach at Prefeasibility level for Santa Elena.
| § | Modelling of the orebody and mine openings was undertaken using RocScience Examine 2Dtm software. As such, the rockmass is assumed isotropic and homogenous. See geotechnical recommendations in section 26.2. |
| § | Hoek-Brown parameters and deformation characteristics are generic dependent on rock type as established from the RocScience RocLabtm software program. |
| § | The orebody was split into three sections – West, Central and East and an average dip and strike was assigned to each. |
| § | Stopes are assumed to be of fixed width along strike with average dip and strike dependent on their location within the orebody. |
| § | Stope vertical height is set at 45 m. |
| § | No stress data is available at site. Stress is assumed to be depth dependent based on overburden. No variation in the horizontal to vertical stress ratio was incorporated at prefeasibility level. |
| § | Based on the ground water report undertaken by Global Resource Engineering (2011) and observations undertaken during ramp development the excavations were assumed to be dry or have minor inflow. A second hydro-geological assessment is recommended to confirm the initial findings of Global Resource Engineering. |
| 16.2.5.3 | Tabulation of Results |
The stope configuration were summarised for each level for longitudinal and cut and fill mining. They indicate a stable span without support, a stable span with support and a measure of anticipated dilution with greater span lengths. Effective cable bolt support has been considered when designing maximum spans for stable spans with support. These stope design summary tables present the results of the analysis with respect to the rectangular stope design and are referred to in the body of this summary. They are split into West, Central and East locations at each level dependent on average strike and dip of the orebody.
NATIONAL INSTRUMENT 43-101 TECHNICAL REPORT
EFFECTIVE DATE: APRIL30, 2013 | AMENDED DATE: MARCH 04, 2014
These reference tables are meant for general design purposes only at a Prefeasibility level as the stope spans assume continuous width and dip profiles. As actual stopes vary in width and dip across their span, further geotechnical study of individual stopes is advised beyond Prefeasibility level.
Actual stope and pillar performance should be consistently monitored during mining and a database created. This will allow for any modifications of initial design to be made based on actual mining of the orebody.
Dilution levels for span lengths greater than those recommended from Potvin’s method are indicative only and it is strongly recommended that a site based dilution data base be established to monitor sloughage based on stope spans and rockmass quality. Further rockmass classification through mapping and logging can assist in defining stope dimensions to a higher level of detail. Actual stope and pillar performance should be consistently monitored during mining. This will allow for any modifications of initial design to be made based on actual mining of the orebody.
| 16.2.5.4 | Methodology of Stability Graph for Stope Design |
The stability graph method (developed by Mathews et al. (1981) and modified by Potvin (1988) and Nickson (1992) is widely used by designers to qualitatively assess the stability of open stopes.
The stability number N is defined as:
N = Q' x A x B x C (1)
Where A is the stress factor (ratio of intact rock strength to induced stress), B is rock defect orientation factor, and C is the gravity factor related to orientation of design surface.
See Table 16.3 for summary of NGI-Q’ values.
Table 16.3: NGI-Q' Values for Stope Design
| Zone | Elevation | NGI-Q’ (50% level of cumulative frequency) |
| Mineralized Vein | Above El. 580 m | 29 |
| Below El. 580 m | 11 |
| Waste Rock | Above El. 580 m | 12 |
| Below El. 580 m | 3 |
In addition to this NGI-Q values were assessed for the 655 Level. Core runs were isolated over a 45m run length at this level to give an individual rock mass characterization for stoping at this level. NGI-Q values of 15 and 6 were calculated for zones D1 and D3 for stopes at this level.
NATIONAL INSTRUMENT 43-101 TECHNICAL REPORT
EFFECTIVE DATE: APRIL30, 2013 | AMENDED DATE: MARCH 04, 2014
| 16.2.6 | Span Length Design – Longitudinal and Transverse |
| | The following key mining parameters / assumptions were used as the basis of the initial stope design: |
| § | Non-man entry to production level. |
| § | With an initial assessment of the effect of both hanging wall and the stope back it was found that the hanging wall will govern the stope size. Therefore, the hanging wall effect was considered throughout the design process. |
| § | Cable bolted stopes and stable stope spans were assessed. |
| § | Two scenarios were considered for stope length design in longitudinal mining: When the hanging wall is excavated in waste rock, and when mineralized vein is left in place as part of the hanging wall. |
| § | Stope widths of 7 metres, 12 metres, 17 metres and 22 metres were considered. |
Sloughage was considered using the ELOS graph developed by Clark and Pakalnis (1997). This seeks to quantify the degree of dilution anticipated for a given span length and corresponding shape factor.
It must be noted that this graph was developed for weak rock masses. There is no measure of time dependent behaviour but nevertheless this approach provides an indication as to predicted dilution at this stage and should be used in conjunction with observational data during mining. Acceptable sloughage levels of 15% or less were also calculated for stope design utilizing the ELOS criteria for the stability graph after Clark and Pakalnis (1997).
| 16.2.7 | Stope Back Width Design |
The stability graph method was utilized for designing the “stable” back length similar to hanging wall stope length design.
At this Prefeasibility level it may be advisable to consider supporting stope backs greater than 10 metres width with cable bolts at the 536 Level and below due to stress effects. However, as spans will likely vary across levels and also in individual stopes, the magnitude and orientation of the in-situ stress regime is recommended beyond Prefeasibility level to verify stress effects on the mine openings and hence the need for localized support in individual stopes.
The dimensions for the cut and fill mining method were estimated using the span design curve (Lang, 1994).
A maximum span of 15 metres is recommended in current cut and fill mining levels. The spans refer to spans which may not require intensive ground support such as timber sets, cable bolts or post pillars, but still requires local support within the immediate back to confine potential blocks (loose) which may open due to nearby blasting and/or redistribution caused by subsequent mining activity. 2 metre by 2 metre pattern bolting is recommended in slashed stopes with spans less than these stable back span figures. Due to the nature of the ore body, spans will vary across levels and also in individual stopes. An assessment of the need of support required for individual stopes needs to be undertaken at a stage beyond the scope of this PFS.
With a 5 metre cut and a maximum stope length of 100 metres dilution from blast damage only along the hanging wall should be expected.
NATIONAL INSTRUMENT 43-101 TECHNICAL REPORT
EFFECTIVE DATE: APRIL30, 2013 | AMENDED DATE: MARCH 04, 2014
| 16.2.9 | Transverse Long Hole Stoping |
With reference to Table 16.4 assuming a 20 metre stope width and a maximum length of 30 metre the stope back should remain stable. Loose from the stope back may be created during the last 10 metre of stope production at 471 m and 536 m Level. Timely mucking and backfill placement is recommended. Stope sidewalls should remain stable. A 10% dilution can be expected from hanging wall sloughage at the 471 m and 536 m Levels. However, as the hanging wall forms the stope end, dilution will be dependent upon the speed at which the stope is blasted and mucked. If low grade mineralized vein forms the hanging wall then expect blast damage only.
Table 16.4: Transverse Stope Design
| | | | | | | | | | | | | |
| Level | Location | Average ore dip | Average ore strike | Q' | N | Stope Back | N | Stope Vertical Sidewall | N | Hangingwall ELOS (%) waste | N | Hangingwall ELOS (%) mineralized vein |
| 655 | West | 55 | 90 | 15 | 11 | Stable | 45 | Stable | 6 | 5 | 31 | Blast damage |
| Central | 62 | 72 | 15 | 21 | Stable | 84 | Stable | 7 | 4.5 | 22 | Blast damage |
| East | 47 | 90 | 15 | 11 | Stable | 45 | Stable | 5 | 6 | 25 | Blast damage |
| 597 | West | 55 | 90 | 29 | 22 | Stable | 87 | Stable | 11 | 3 | 60 | Blast damage |
| Central | 62 | 72 | 29 | 41 | Stable | 163 | Stable | 15 | 2 | 43 | Blast damage |
| East | 47 | 90 | 29 | 22 | Stable | 87 | Stable | 11 | 3 | 49 | Blast damage |
| 536 | West | 55 | 90 | 11 | 8 | Transition | 33 | Stable | 3 | 7 | 23 | Blast damage |
| Central | 62 | 72 | 11 | 15 | Stable | 62 | Stable | 4 | 7 | 16 | Blast damage |
| East | 47 | 90 | 11 | 8 | Transition | 33 | Stable | 3 | 7 | 19 | Blast damage |
| 471 | West | 55 | 90 | 11 | 8 | Transition | 30 | Stable | 3 | 7 | 23 | Blast damage |
| Central | 62 | 72 | 11 | 14 | Stable | 56 | Stable | 4 | 7 | 16 | Blast damage |
| East | 47 | 90 | 11 | 8 | Transition | 30 | Stable | 3 | 7 | 19 | Blast damage |
| 16.2.10.1 | Sill Pillar Design |
For Prefeasibility Study purposes, sill stress was estimated in Examine 2D in four cases of stope width 7 metre, 12 metre, 17 metre, and 22 metre.
A constant sill pillar thickness was assumed across the entire mining level for practical mining purposes. This constant thickness corresponds to the maximum ore width analyzed. Additionally blast damage of 1 metre was also assumed on each side of the pillar.
Table 16.5 shows the corresponding sill thickness stability above each mine level with the greatest ore span considered having the most effect on stability due to the ratio of width to height.
NATIONAL INSTRUMENT 43-101 TECHNICAL REPORT
EFFECTIVE DATE: APRIL30, 2013 | AMENDED DATE: MARCH 04, 2014
Table 16.5: Sill Pillar Stability
| Level | Sill thickness (m) | W/H Ratio | Av. Pillar Stress | Pillar Stress/UCS | Pillar Stability Graph |
7m ore width | 22m ore width | 7m ore width | 22m ore width | 7m ore width | 22m ore width | 7m ore width | 22m ore width |
| 655 | 10 | 1.1 | 0.4 | 8.5 | 10.5 | 0.10 | 0.12 | Stable | Stable |
| 597 | 13 | 1.6 | 0.5 | 12 | 13.5 | 0.14 | 0.16 | Stable | Stable |
| 536 | 16 | 2.0 | 0.6 | 21.3 | 15.8 | 0.24 | 0.18 | Stable | Stable F.o.S 1.4 |
| 471 | 20 | 2.6 | 0.8 | 17 | 20.4 | 0.20 | 0.23 | Stable | Stable F.o.S 1.4 |
| 401 | 25 | 3.3 | 1.0 | 20.6 | 20 | 0.24 | 0.23 | Stable | Stable F.o.S 1.4 |
| 328 | 28 | 3.7 | 1.2 | 26 | 22 | 0.30 | 0.25 | Stable | Stable F.o.S 1.4 |
| 16.2.10.2 | Crown Pillar Design |
Underground mining will result in a temporary surface crown pillar below the open pit, as well as permanent crown pillars in some areas. The minimum thickness for crown pillar design was assessed as 25 metres using the empirical crown pillar stability graph (Carter, 1990) taking a typical Q value of 11.6 for the ore at near surface stress conditions. The maximum span of the orebody was taken as 25 metres giving a thickness/span ratio of 1.
| 16.2.10.3 | Rib Pillar Design |
Rib pillar widths have been assessed based on two-dimensional analysis utilizing brittle Hoek Brown parameters and the pillar stability chart as used for sill pillar analysis.
For two dimensional modelling a horizontal cross section was taken across the pillar midpoint in order to incorporate the pillar shape factor in the stress analysis. A constant stress field dependent on depth was imposed onto the cross section.
For efficiency purposes at this stage of prefeasibility level study the rib pillar widths were modelled at the mid-point of the mine at 536 m level. Five “fixed” stope span length classes of 25, 50, 75, 100 and 125 metres were modelled. An average pillar sub-vertical height of 56 metres was used during the analysis based on average dip of the ore body across the West, Central and East domains. Rib widths of 15 metres, 18 metres, 20 metres, 25 metres, and 30 metres, respectively, were found to give an adequate factor of safety for these span lengths, as shown in Table 16.6. Stress analysis was conducted on a pillar width 2 metres less than the final pillar width to take into consideration pillar blast damage. An in-situ stress testing and tri-axial strength testing regime is recommended to refine pillar dimensions beyond Pre-Feasibility level.
NATIONAL INSTRUMENT 43-101 TECHNICAL REPORT
EFFECTIVE DATE: APRIL30, 2013 | AMENDED DATE: MARCH 04, 2014
Table 16.6: Rib Pillar Stability
| Level | Span Length | Pillar Height | Pillar Width | Width/Height | Average Stress | Pillar Stress/UCS | Pillar Stability Graph |
| |
| 536 | 25 | 56 | 15 | 0.27 | 13.8 | 0.16 | F.o.S* 1.6 |
| 50 | 56 | 18 | 0.32 | 17 | 0.20 | F.o.S* 1.4 |
| 75 | 56 | 20 | 0.36 | 18.5 | 0.21 | F.o.S* 1.4 |
| 100 | 56 | 25 | 0.45 | 20 | 0.23 | F.o.S* 1.4 |
| 125 | 56 | 30 | 0.54 | 20 | 0.23 | F.o.S* 1.4 |
*Factor of Safety
| 16.3 | Proposed Underground Mining Methods |
The Santa Elena ore body varies in dip and thickness along strike and at depth. As a result, three well established underground mining methods have been selected for ore extraction. These mining methods are categorized in table 16.7 below:
Table 16.7: Mining Method Selection Criteria
| Orebody Geometry | Mining Method |
| Dip > 50 degrees, Thickness < 15m | Longitudinal Longhole Stoping |
| Dip > 50 degrees, Thickness > 15m | Transverse Longhole Stoping |
| Dip < 50 Degrees, Any Thickness | Mechanized Cut and Fill |
In general, conventional mechanised mining methods have been selected. The basis of the development of the mining methods and consequent equipment selection has been that SilverCrest will undertake production drilling, blasting and loading using a contractor for the waste rock and ore haulage to surface. Initially a contractor will be retained to carry out mine development, with jumbo drill rigs purchased later in the mining life, after which development will be done in-house. The roles played for operation of the underground mine will be as follows:
| 1. | SilverCrest will undertake: |
| a. | General mine infrastructure development, |
| b. | Mine management and planning, |
| c. | General underground maintenance and provision of supplies, |
| d. | Ore drilling and blasting, |
| f. | Ore development and tunnelling (after purchase of a drilling jumbo) |
| 2. | Haulage contractor will undertake: |
NATIONAL INSTRUMENT 43-101 TECHNICAL REPORT
EFFECTIVE DATE: APRIL30, 2013 | AMENDED DATE: MARCH 04, 2014
| a. | Haulage of all waste rock and ore to surface. |
| b. | Backhaul of all backfill rock and tailings to underground. |
| 3. | Development contractor will undertake: |
| a. | Initial ramp, ore drift and other tunnelling underground |
| 16.3.1 | Longitudinal Long Hole Stoping |
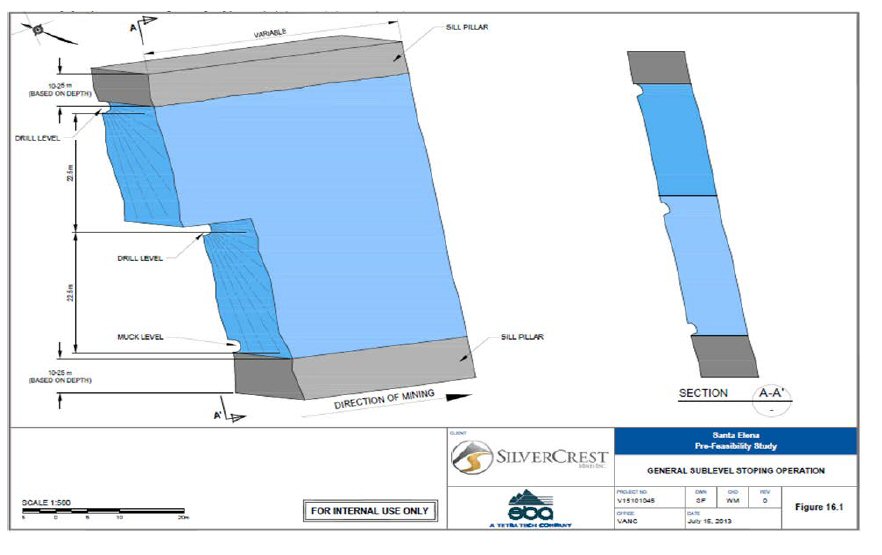
Longitudinal long hole stoping is a sublevel bulk mining method involving a narrow, steeply dipping vein with competent ore and host rock. Santa Elena will employ longitudinal long hole stoping when the ore has a width less than 15m. Figure 16.1 below shows typical layout and dimensions for sublevel long hole mining.
NATIONAL INSTRUMENT 43-101 TECHNICAL REPORT
EFFECTIVE DATE: APRIL30, 2013 | AMENDED DATE: MARCH 04, 2014
Figure 16.1: General Sublevel Stoping Operation
NATIONAL INSTRUMENT 43-101 TECHNICAL REPORT
EFFECTIVE DATE: APRIL30, 2013 | AMENDED DATE: MARCH 04, 2014
The stope design done for the purpose of this PFS considers two single drifts for drilling and blasting the ore to develop sublevels every 22.5 m, with a drift developed at the base of the stope for mucking the blasted ore. This results in stopes of 45 m in height. The stope spans along strike are dependent on the rock engineering criteria for managing hanging wall dilution.
The long hole mining concept takes advantage of the dip of the footwall, such that the broken ore will run to the base of the stope towards the mucking points. The stope inclination will vary between 50o and 62o depending on which level and domain the mining is taking place.
The sill pillars separate the stoping blocks vertically with the sublevels further dividing each block. Rib pillars will be left between adjacent stopes, separating the stoping blocks horizontally. Stope spans are based on geotechnical analysis by depth and geotechnical domain, see section 16.1.
A detailed geotechnical study based on geotechnical drilling and rock mass assessment was conducted and the results reported the recommended stope dimensions for each mining level and the different domains. These parameters along with the Indicated Resources where used to develop the stope layout. Where possible, the stopes have been placed in high grade areas, with sill and rib pillars placed in the lower grade areas. EBA has considered that rib pillar extraction is reasonably possible where rib pillars are located close to the access ramp to limit footwall development, have high grade and with a strike width to pillar thickness ratio of more than 2:1 to ensure that there is reasonable expectation of pillar stability prior to extraction.
Stoping will begin by drilling and blasting the lower sublevel to initiate ore flow and provide an open face into which ore will be blasted. The mining will then continue on the upper level and will retreat towards the cross cut intersection from the ramp, from which the stope is accessed.
| 16.3.2 | Transverse Long Hole Stoping |
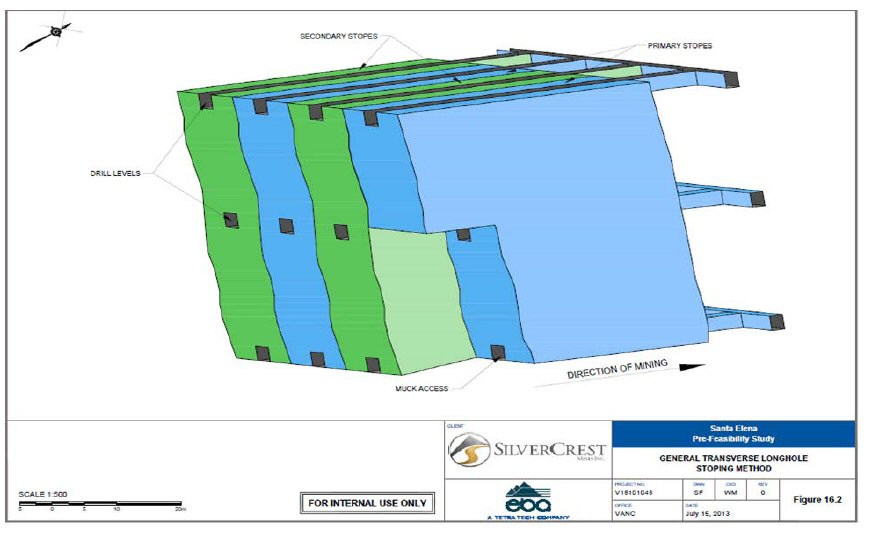
In areas with a proposed stope thickness of greater than 15 metres, the transverse long hole mining method will be used. When mining transversely, access drifts will be driven perpendicular to the strike of the ore body from the initial footwall developments. The drawpoints will also be oriented perpendicular to strike and will be accessed from crosscuts which extend from the footwall access drifts to the stope hanging wall. Mining occurs by retreating from the hanging wall to the footwall, initiating ore flow by blasting from the footwall towards free face created against the hanging wall. To mine the stope, it is divided into primary, secondary and possibly tertiary stopes. The primary stopes are the first to be mined, with secondary and tertiary stopes mined after backfilling. Note that for the purpose of the PFS, cemented rock fill is being considered to prevent backfill from contaminating the ore while mining the secondary and tertiary stopes.
The primary and secondary stopes will span from the footwall to the hanging wall and are planned to be 20 m wide. Figure 16.2 shows the primary stopes in blue and secondary stopes in green. Once the primary stopes are mined out, they are backfilled using a cemented rock fill, which will be sourced from development and surface waste rock dumps. The secondary and tertiary stopes are then mined between the filled stopes. The overall stope heights are set at 45 m to allow levels to coincide with longitudinal stopes. A sublevel interval of 22.5 m has been considered, as in the case of longitudinal long hole method.
NATIONAL INSTRUMENT 43-101 TECHNICAL REPORT
EFFECTIVE DATE: APRIL30, 2013 | AMENDED DATE: MARCH 04, 2014
Figure 16.2: General Transverse Long Hole Stoping Method
NATIONAL INSTRUMENT 43-101 TECHNICAL REPORT
EFFECTIVE DATE: APRIL30, 2013 | AMENDED DATE: MARCH 04, 2014
| 16.3.3 | Mechanized Cut and Fill |
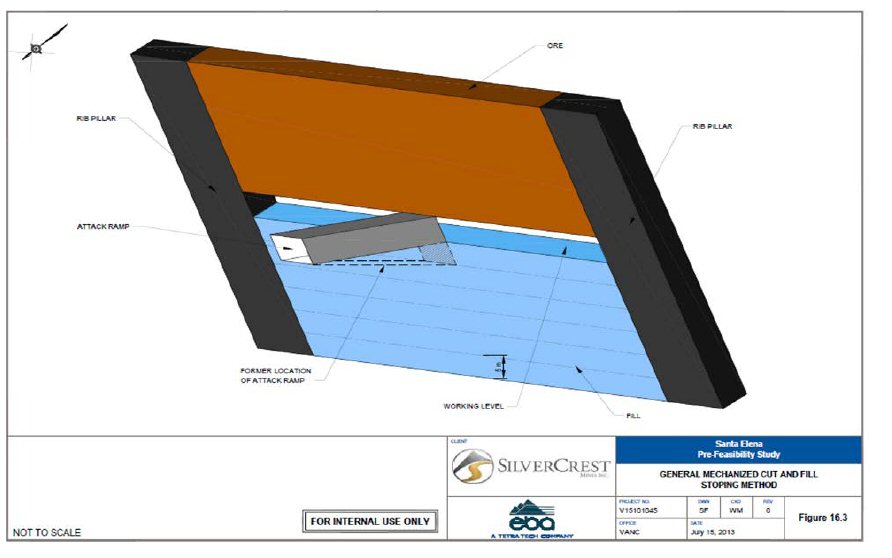
Where the dip of ore body results in stopes with a footwall inclination of less than 50°, long hole stoping will not be suitable due to the increased length of blastholes, potential blast hole inaccuracy and the potential for ore to hang up on the footwall. EBA has thus considered mechanized cut and fill mining for these areas. The lower east portion of the reserve model, as seen in figure 15.1, has been assessed to have conditions conducive to cut and fill mining.
Though cut and fill stoping can consider large vertical spans, rib pillars and sill pillars have been included in the stope layout to separate stoping blocks and to limit the hanging wall spans for each cut. Once each cut is mined out, it will be filled with cemented rock fill, which can include tailings and waste rock from ongoing underground development. Dilution from hanging wall geotechnical failure will be minimal with cut and fill mining because there will be limited exposure to the hanging wall during mining. Support will be required for the exposed cut back (roof) of each cut during mining, for safety of personnel operating machinery and working in the stopes.
The ore will typically be mined in 5 m high cuts, with each cut silled out from hanging wall to footwall. Each cut will be accessed by attack ramps from the footwall development drifts. Once the cut has been filled all the way back into the attack ramp, the brow of the ramp is slashed into, and another cut can begin. This process will continue until the attack ramp grade becomes too steep for ore haulage. The orebody is then accessed from a higher footwall development. Figure 16.3 below represents the cut and fill method discussed here.
Trucks will backhaul fill material from tailings and waste rock stockpiles on surface, when rock is not available from underground development. This material will be mixed with water and 5% cement to create a consolidated fill, and be placed in the stopes via scoop tram.
NATIONAL INSTRUMENT 43-101 TECHNICAL REPORT
EFFECTIVE DATE: APRIL30, 2013 | AMENDED DATE: MARCH 04, 2014
Figure 16.3: General Mechanized Cut and Fill Stoping Method
NATIONAL INSTRUMENT 43-101 TECHNICAL REPORT
EFFECTIVE DATE: APRIL30, 2013 | AMENDED DATE: MARCH 04, 2014
| 16.3.4 | Rib and Sill Pillar Recovery |
Wherever economically feasible, sill and rib pillars will be recovered. Specifically, the rib pillars between the 597-3 and 597-2 stopes and the 597-2 and 597-1 stopes have been estimated to contain high grade ore and are accessible with minimal additional development, see figure 15.1 The sill pillar above the 597-4 stope also includes high grade ore, which could be extracted based on backfilling of the 597 level stope.
Table 16.8 shows the mining equipment selected for the underground mine. The purchasing of the equipment has been scheduled based on when the equipment will be required in the capital cost estimate schedule (Table 21.2), with consideration for equipment delivery lead times. Note that the mine trucks and one jumbo drilling are based on contractor equipment hire.
Table 16.8: Mining Equipment List
| Description | Number | kW | Ownership |
| Mine trucks (20 ton) | 6 | 250 | Contractor |
| Long hole drill (Sandvik) | 1 | 130 | SilverCrest |
| Scoop trams (Sandvik) | 3 | 200 | SilverCrest |
| Jackleg/stoppers (based on 200 cfm air consumption) | 4 | 37 | SilverCrest |
| Jumbo drills (cut and fill stopes) DD321-40 (110kW) | 2 | 110 | Contract and SilverCrest |
| Anfo loader (will require compressor) | 1 | NA | SilverCrest |
| Scissor lift 92 HP | 1 | 69 | SilverCrest |
| Grader - 110 HP | 1 | 82.1 | SilverCrest |
| Kubota/s | 3 | 14 | SilverCrest |
| Crew transport | 2 | 96 | SilverCrest |
| Service truck | 1 | 96 | SilverCrest |
| Shotcrete Pump (Airplaco Shotcrete Mixer/Pump) | 1 | 34 | SilverCrest |
| Underground diamond drill/Gopher (HydraCore Gopher) | 2 | 37 | SilverCrest |
For other equipment and machinery related to mining refer to section 18.
For the purpose of completion of this Prefeasibility study, the layout of the Santa Elena underground was completed using Dassault Systemes GEMS 6.5 software. This allowed for the digitization and visualization of the mine stope layout as it evolved through the design process.
The underground layout for Santa Elena was developed by initial placement of the sill pillars according to Indicated Resources above 1.5 g/t Au equivalent, rock engineering criteria, the depth of the open pit and the desired crown pillar vertical thickness. Refer to section 16.2 for the geotechnical analysis and geotechnical design parameters and resulting sill pillar thickness. Subsequently, rib pillars were positioned on each level according to the rock engineering analysis, using the maximum allowable open span for each level as the distance between rib pillars. Where possible low grade areas where targeted for rib pillar placement.
NATIONAL INSTRUMENT 43-101 TECHNICAL REPORT
EFFECTIVE DATE: APRIL30, 2013 | AMENDED DATE: MARCH 04, 2014
Solids were digitised in between the pillars, delineating the mineable area of the underground Indicated Resources. These solids provided the initial stope shapes to calculate internally diluted grade and tonnage. These initial reports highlighted stopes which could be feasibly mined where grades were higher than cut-off grade for the planned mining method, and allowed the exclusion of stopes that had grades below the economic cut-off grade. Where stopes where found to have grades lower than the cut-off grade of 1.5 g/t AUEQ or the stopes grades where only marginally higher than the cut-off grade, the stopes were clipped or adjusted to exclude some low grade materials on the stope edges. In some instances entire stopes were excluded from the reserves as the stope grades were below the cut-off grade and there was too little material to justify reasonable extraction.
The layout of the cut and fill stopes was undertaken to create shapes above cut-off grade in the lower east portion of the mine where the deposit shallows out in dip. More flexibility in the stope shape is possible for the cut and fill stopes, due to the mining method, though as far as possible stope shapes were kept to blocks with strike lengths of a maximum of 100 m to limit the hanging wall spans within the cuts. Sill pillars are not necessary but have been left to allow the upper most stopes to be mined first This creates an opportunity for stoping to be undertaken concurrently with ongoing development, and thereby the use of waste development muck for cut and fill stope backfill.
The stopes that are situated directly underneath the open pit include material that is considered crown pillar for the duration of mining. These stopes are scheduled for extraction at the end of the mine life. These stopes will be mined by long hole method, but will only require a single development drift on the bottom sublevel for haulage. The other access points for these stopes will be via drop-raises through the bottom of the open pit.
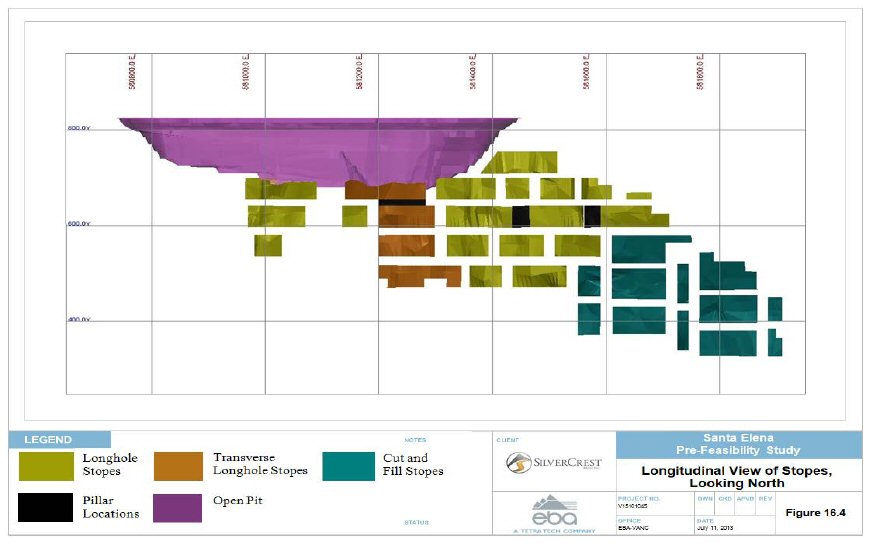
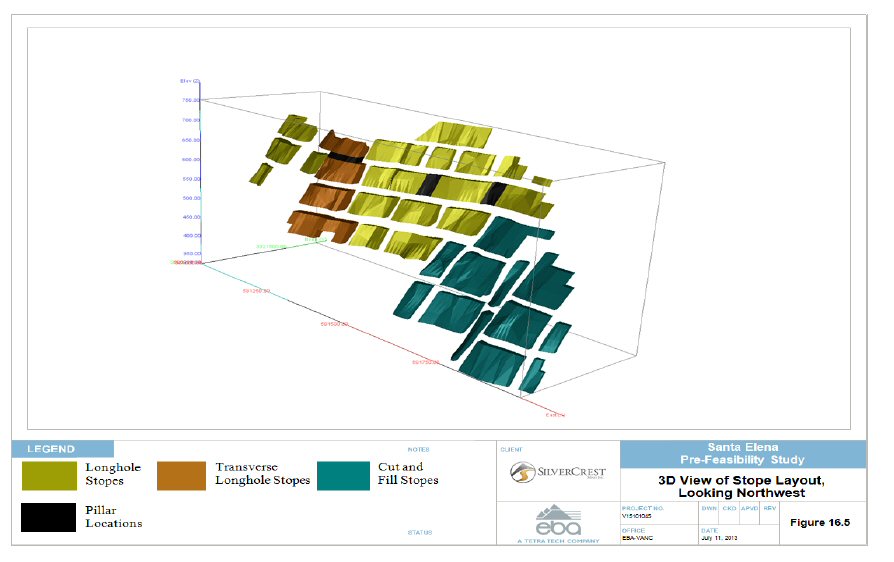
Figures 16.4 and 16.5 show the PFS arrangement of stopes, coloured by mining method. In yellow are the longitudinal long hole stopes, in orange are the transverse longhole stopes and in green are the cut and fill stopes. The black regions are the pillars that were identified as recoverable
NATIONAL INSTRUMENT 43-101 TECHNICAL REPORT
EFFECTIVE DATE: APRIL30, 2013 | AMENDED DATE: MARCH 04, 2014
Figure 16.4: Longitudinal View of Stopes, Looking North
NATIONAL INSTRUMENT 43-101 TECHNICAL REPORT
EFFECTIVE DATE: APRIL30, 2013 | AMENDED DATE: MARCH 04, 2014
Figure 16.5: 3D View of Stope Layout, Looking Northwest
NATIONAL INSTRUMENT 43-101 TECHNICAL REPORT
EFFECTIVE DATE: APRIL30, 2013 | AMENDED DATE: MARCH 04, 2014
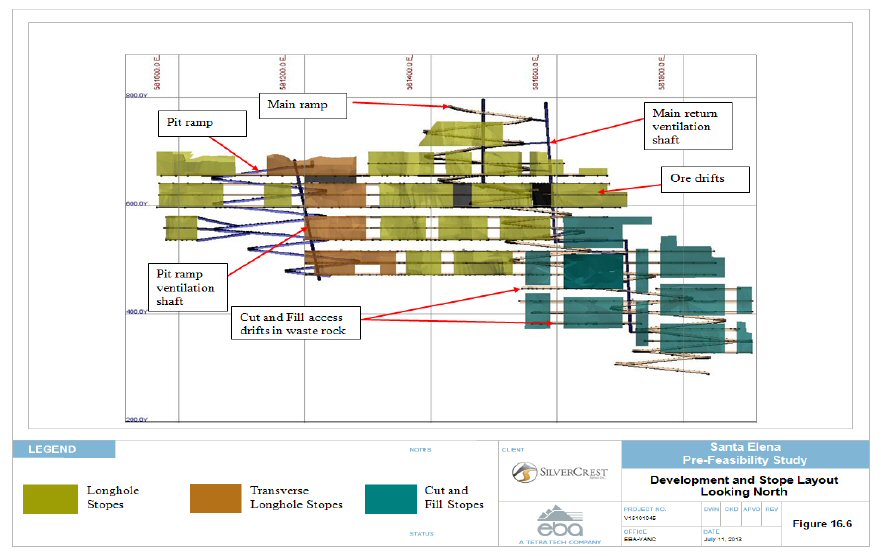
| 16.4.3 | Development Layout |
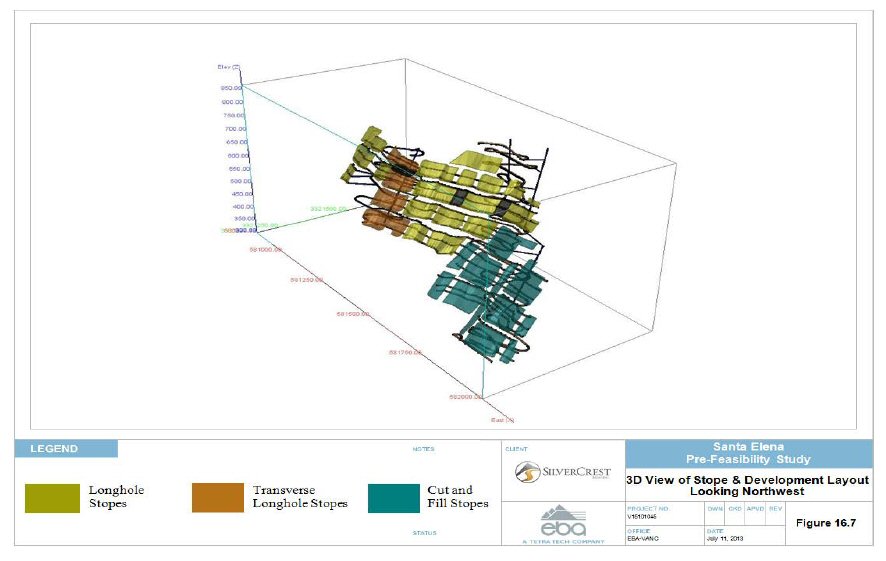
Figure 16.6 and 16.7 show the development layout developed for the PFS.
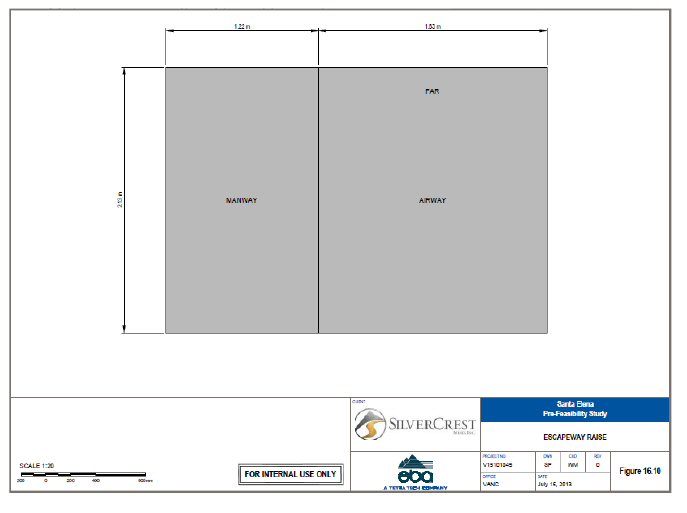
Access to the underground stopes will be via a main ramp, and a secondary ramp called the pit ramp, which will be developed from the bottom of the ultimate pit at an elevation of 675 m a.m.s.l. The main ramp will continue from the current exploration drift which is being driven from surface, east of the open pit. The ramps will be ventilated using a shaft that is driven within the centroid of the ramp with the fresh air carried by bag ducting to the face. A main exhaust ventilation shaft will be developed to the east of the main ramp. Details of the preliminary ventilation design are in section 16.7 of this report.
The stopes will be accessed from crosscuts driven from the ramps towards the ore body from the closest point on the ramp to the ore body on each level. From these crosscuts, the sublevel developments will be driven.
For longitudinal stopes, the sublevel development drifts are situated within the ore, meaning this material will be sent for processing and recovery of gold and silver if above the marginal cut-off grade of 0.5 g/t AU EQ (to ensure the ore will at minimum pay the processing costs). The stopes will be developed on three sublevels: one abutting the upper sill pillar, one abutting the lower sill pillar, and one halfway between the sills. The lower development will be used as a loading and haulage drift, and the upper two will be used as drilling and blasting drifts.
The transverse stopes will be developed similarly to the longitudinal stopes, except the development drifts must be in the footwall waste rock, and the stopes will be accessed from perpendicular crosscuts. These drifts will serve as entry points through the ore body to the hanging wall, and mining will retreat to the footwall. The drifts into the transverse stopes will be silled out to allow more accurate drilling of long holes between sublevels.
The cut and fill stopes access will be developed in the footwall waste rock. The stopes will be accessed using attack ramps from these main development drifts. As a sublevel is finished, the backfill provides a working floor from which to mine the next cut.
Table 16.9 shows a summary of the linear metres of development over the life of mine, by development aspect.
Table 16.9: Linear Meters of development over LOM
| Aspect of underground development | Total length in meters |
| Waste Development | 10,454 |
| Ore Development | 6,300 |
| Ramps | 5,300 |
| Main ventilation shafts | 800 |
Figure 16.6 and figure 16.7 shows the developments in relation to the planned stopes. Stope numbering is shown in figure 15.1 and the list of stopes with tonnage and grades is shown in Table 15.4.
NATIONAL INSTRUMENT 43-101 TECHNICAL REPORT
EFFECTIVE DATE: APRIL30, 2013 | AMENDED DATE: MARCH 04, 2014
Figure 16.6: Development and Stope Layout, Looking North
NATIONAL INSTRUMENT 43-101 TECHNICAL REPORT
EFFECTIVE DATE: APRIL30, 2013 | AMENDED DATE: MARCH 04, 2014
Figure 16.7: 3D View of Stope and Development Layout, Looking Northwest
NATIONAL INSTRUMENT 43-101 TECHNICAL REPORT
EFFECTIVE DATE: APRIL30, 2013 | AMENDED DATE: MARCH 04, 2014
For the transverse long hole stoping and mechanized cut and fill mining methods, backfilling is required. For the transverse long hole stoping the backfill will be comprised of a combination of waste rock mixed with 5% Portland cement by weight to create a consolidated fill. For cut and fill stoping the backfill does not need to be cemented; however, for the purpose of the PFS cement has been included in the backfill costs to provide for the opportunity to extract rib and sill pillars between cut and fill stopes if it is determined it is safe to do so.
The waste rock will either be transported from surface waste dumps or from adjacent mining stopes. Rock fill will be run of mine and therefore the overall sizing curve will be short on fines, however detoxified mill tailings will also be available for use in backfilling.
| 16.5.1 | Backfilling Cut and Fill Stopes |
Mining will begin at the lower most section of each stope by slashing through the width of the ore body in (5 m) lifts. The openings will then be backfilled with cemented rock fill. During mining of each 5 m high cut, support in the form of rock bolts or split sets will be installed in the back and sidewalls as informed by geotechnical conditions and daily inspections. The backfill is placed in order to provide a new working platform for the level above.
| 16.5.2 | Backfilling Transverse Long Hole Stopes |
For transverse stoping, primary stopes will be mined leaving behind an adjacent secondary stope of the same width. Primary stopes will be laid out so that temporary pillars are left in place to allow for the safe extraction of all primary stopes. The primary stopes will then be backfilled using cemented rock fill to allow for the extraction of secondary stopes. The process may be done in two or more phases of extraction to allow time for the cemented rock fill to set prior to extraction of the adjacent stopes.
| 16.5.3 | Backfilling to Extract Pillars |
For the purpose of the PFS, EBA has included the extraction of high grade accessible pillars. In the case of rib pillars, the stopes on either side of the rib pillar to be extracted will be backfilled. In the case of sill pillars the stope below the sill pillar must be backfilled. This will provide the necessary support to allow the rib and sill pillars to be extracted safely. New access drifts will have to be developed from the decline ramps for rib pillar extraction as the sublevel drifts will have been mined out during the initial extraction of the stopes.
| 16.6 | Overall Mining Schedule |
The mining schedule describes the estimates tonnages which will be mined from the underground, open pit and the existing heap leach facility to feed the expansion plan process plant. Table 16.10 shows the combined schedule for the Santa Elena Expansion Project.
NATIONAL INSTRUMENT 43-101 TECHNICAL REPORT
EFFECTIVE DATE: APRIL30, 2013 | AMENDED DATE: MARCH 04, 2014
Table 16.10: Summary of Overall Production Schedule
Aspect of operations | 2014 | 2015 | 2016 | 2017 | 2018 | 2019 | 2020 | 2021 | Total life of mine |
Total tonnes from underground | 127,707 | 392,412 | 535,520 | 646,088 | 708,359 | 684,604 | 580,407 | 245,225 | 3,920,323 |
Total tonnes from old heap leach | 335,426 | 615,588 | 472,480 | 361,912 | 299,641 | 323,396 | 427,593 | 8,495 | 2,844,530 |
Total tonnes from open pit | 544,867 | - | - | - | - | - | - | - | 544,867 |
Total tonnes processed | 1,008,000 | 1,008,000 | 1,008,000 | 1,008,000 | 1,008,000 | 1,008,000 | 1,008,000 | 253,720 | 8,191,760 |
Total AU ounces sold | 36,173 | 39,606 | 29,361 | 27,557 | 27,924 | 53,357 | 37,535 | 11,226 | 262,739 |
Total AG ounces sold | 1,345,248 | 1,594,643 | 1,409,639 | 1,742,741 | 1,556,867 | 1,951,279 | 1,816,118 | 702,392 | 12,118,926 |
The schedule in table 16.10 excludes 882 kilo tonnes of material to be mined during 2013 and processed on the existing heap leach facility.
| 16.6.1 | Underground Mine Production Schedule |
For the purpose of the PFS, a preliminary schedule has been developed so that the stope tonnes and grades can be applied to a mining timeline. The mining schedule has been developed for the stopes in the reserve model and for the required development to access the stopes throughout the life of mine.
The mining schedule has been developed based on the parameters as shown in Table 16.11 below.
Table 16.11: Scheduling Parameters
| Scheduling parameters | Value |
| Maximum daily production from each longitudinal long hole stope | 750 tonnes per day |
| Maximum daily production from each transverse long hole stope | 1,000 tonnes per day |
| Maximum daily production from each cut and fill stope | 350 tonnes per day |
| Heading/ drift advance rate per blast round | 3.8 m |
| Maximum development advance per jumbo drill with one heading available | 1.5 rounds |
Based on the above parameters the mine stoping and development schedule was developed by targeting high grade stopes for the earlier in the schedule, where possible and ensuring that at all times at least 3 stopes are available for production, to allow flexibility in the mining operation. Additionally, mechanised cut and fill stoping areas have been scheduled for the end of the life of mine. The development schedule was established by ensuring that the required development for all stopes operating in a particular time period was completed in advance of production commencing. Allowance has also been made for a ramp up period.
NATIONAL INSTRUMENT 43-101 TECHNICAL REPORT
EFFECTIVE DATE: APRIL30, 2013 | AMENDED DATE: MARCH 04, 2014
After completion of the schedule, verification has been undertaken to ensure that the ore tonnes and grade in the schedule are consistent with the Probable Reserve numbers for underground as shown in section 15.
Mining costs applicable to various types of stoping have been applied to each stope in the Probable Reserves and scheduled. Development costs are included separately as the timing of development of a stope and mining of a stope may be months apart and thus need separate consideration.
Table 16.12 shows the underground mining schedule developed for the PFS.
Table 16.12: Underground Mining Schedule
| Aspects | 2012 | 2013 | 2014 | 2015 | 2016 | 2017 | 2018 | 2019 | 2020 | 2021 | Totals |
| Ramp development | 1,005 | 742 | - | 542 | 1,758 | - | 584 | 617 | - | - | 3,501 |
| Waste development | 1,005 | 1,178 | 506 | 1,018 | 3,331 | 2,221 | 2,177 | 772 | 429 | - | 10,454 |
| Ore development | - | - | 1,652 | 2,222 | 583 | 1,029 | 830 | - | - | - | 6,316 |
| Stope development tonnes | - | - | 71,863 | 66,343 | 12,016 | 149,270 | 183,731 | - | - | - | 483,223 |
| Stope develop AU grade | - | - | 2.08 | 1.28 | 0.58 | 0.93 | 0.89 | - | - | - | 6 |
| Stope development AG grade | - | - | 93 | 91 | 41 | 91 | 81 | - | - | - | 398 |
| Stope mining tonnes | - | - | 55,844 | 326,069 | 523,504 | 496,818 | 524,628 | 684,604 | 580,407 | 245,225 | 3,437,100 |
| Stope grade AU | - | - | 2.58 | 2.38 | 1.27 | 1.07 | 1.05 | 2.32 | 1.70 | 1.52 | 14 |
| Stope grade AG | - | - | 138 | 135 | 92 | 106 | 87 | 116 | 120 | 131 | 924 |
Total tonnes from underground | | | 127,707 | 392,412 | 535,520 | 646,088 | 708,359 | 684,604 | 580,407 | 245,225 | 3,920,323 |
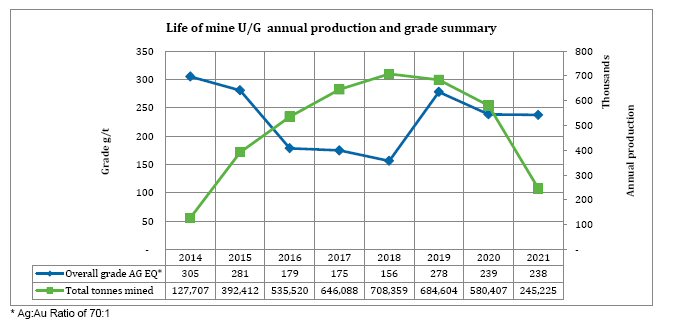
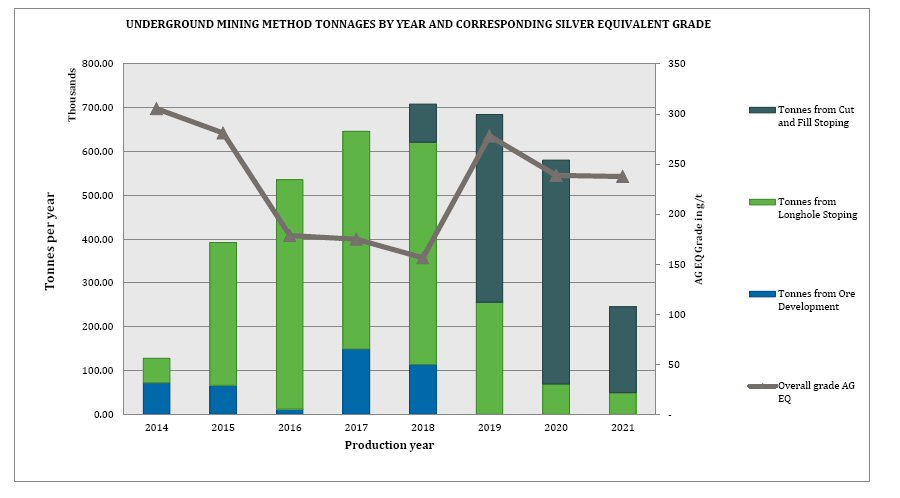
The mining schedule results in grade and tonnage performance as shown in Figure 16.8. Peak production is reached in year 6, when both access ramps are actively producing. Mechanised cut and fill mining in the lower portions of the mine have been scheduled later in the life of mine.
NATIONAL INSTRUMENT 43-101 TECHNICAL REPORT
EFFECTIVE DATE: APRIL30, 2013 | AMENDED DATE: MARCH 04, 2014
Figure 16.8: Summary of Annual Tonnes by Underground Mining Methods and Grade for the Life of Mine
NATIONAL INSTRUMENT 43-101 TECHNICAL REPORT
EFFECTIVE DATE: APRIL30, 2013 | AMENDED DATE: MARCH 04, 2014
| 16.6.2 | Open Pit Mining Schedule |
The remaining ore reserves as shown in section 15, within the open pit reserves will be mined from the 30th of April 2013 until completion in July 2014. In terms of Santa Elena’s current production schedule for 2013, 881,843 tonnes will be mined in 2013 and the remaining 544,867 will be mined in 2014.
| 16.6.3 | Heap Leach Mining Schedule |
The heap leach mining schedule has been created in such a way as to increase mill feed to mill capacity for each year of operation. The heap leach resulted in a tonnage of 2.8M tonnes at an average grade of 0.66 g/t Au and 33 g/t Ag for the life of mine. This schedule is not optimized and increases in grade are possible once open pit heap leaching is complete by Q1 2013.
A preliminary ventilation study was performed for the Santa Elena Mine. The purpose of the ventilation study was to determine the ventilation requirements in terms of airflow and circuits, as well as provide an estimate of ventilation equipment, infrastructure and the excavations required.
| 16.7.1 | Ventilation Requirements |
Ventilation requirements were based on a common industry minimum of 0.06 m3/s per kW of equipment. Based on the equipment usage at the mine, the total air requirement is 146 m3/s. Table 16.13 shows the estimated power and utilization of the underground equipment.
Table 16.13: Equipment Power and Utilization
| Equipment | Engine | No. | Utilization | Required |
| kW | in use | % | m3 /sec |
| Mine trucks (20 ton) | 250 | 6 | 100 | 90 |
| Long hole drill (Sandvik) | 130 | 1 | 6 | 0 |
| Scoop trams (Sandvik) | 200 | 3 | 1 00 | 36 |
| Jackleg/stoppers (based on 200 cfm air consumption) | 37 | 4 | 1 00 | 9 |
| Jumbo drills (cut and fill stopes) DD321-40 (110kW) | 110 | 2 | 6 | 1 |
| Scissor lift 92 HP | 69 | 1 | 25 | 1 |
| Grader - 110 HP | 82 | 1 | 20 | 1 |
| Kubota/s | 14 | 3 | 33 | 1 |
| Crew transport | 96 | 2 | 20 | 2 |
| Service truck | 96 | 1 | 20 | 1 |
| Shotcrete Pump (Airplaco Shotcrete Mixer/Pump) | 34 | 1 | 50 | 1 |
| Underground diamond drill/Gopher (HydraCore Gopher) | 37 | 2 | 50 | 2 |
| Total | 1,270 | | | 146 |
NATIONAL INSTRUMENT 43-101 TECHNICAL REPORT
EFFECTIVE DATE: APRIL30, 2013 | AMENDED DATE: MARCH 04, 2014
Operational constraints guided the ventilation design. In particular, hauling will be performed on the lower drift of each stope. LHD’s are a large proportion of the overall ventilation load, and the ventilation has been planned to avoid ventilation doors on haulage levels. As a result, air flow has been routed to reach the haulage drifts last.
| 16.7.2.1 | Conceptual ventilation design |
In order to undertake the ventilation design, conceptual design work was undertaken to create parameters for friction for various types of conduits. This resulted in conceptual designs for ventilation as shown in Tables 16.14 through 16.17.
| 16.7.2.2 | Intake airway / Escape way Raise |
This arrangement may apply to the intake fresh air raise, as is currently being excavated along with the main ramp. Figure 16.10 below shows a partition within the raise, separating the man way from the airway itself. The complete raise has dimensions of 2.13 m by 3.05 m. This raise was sized to provide ventilation, and an escape way route, for the ramp development only (3 trucks, 1 scoop, 1 jumbo, 1 Kabota). It is not meant to be the sole conduit of fresh air for the mine when in production.
NATIONAL INSTRUMENT 43-101 TECHNICAL REPORT
EFFECTIVE DATE: APRIL30, 2013 | AMENDED DATE: MARCH 04, 2014
Figure 16.9: Escape Way Raise
NATIONAL INSTRUMENT 43-101 TECHNICAL REPORT
EFFECTIVE DATE: APRIL30, 2013 | AMENDED DATE: MARCH 04, 2014
Table 16.14: Design Parameters for Escape Way Raise
| Friction Factor (K) | 100 | x10-10 lb.*min2/ft4 |
| Friction Factor (K) | 0.019 | kg/m3 |
| Perimeter (P) | 7.9 | m |
| Length (L) | 152 | m |
| Area (A) | 3.9 | m2 |
| Air Flow (Q) | 61.4 | m3/s required |
| Velocity (V) | 15.75 | m/s |
Static Pressure (Ps) | 1426 | Pa |
Velocity Pressure (Pv) | 152 | Pa |
Total Pressure (Pt) | 1578 | Pa |
| Fan Power | 97 | kW |
| Fan Power @ 70% efficiency | 138 | kW |
| 16.7.2.3 | Fresh Air Raise Head Without separate man way |
This arrangement applies to a fresh air raise without a separate man way. The dimensions used to study the discussed fresh air raise are for a square with 3.4 m sides (Figure 16.11).
Table 16.15: Design Parameters for Fresh Air Raise
| Friction Factor (K) | 70 | x10-10 lb.*min2/ft4 |
| Friction Factor (K) | 0.013 | kg/m3 |
| Perimeter (P) | 13.6 | m |
| Length (L) | 455 | m |
| Area (A) | 11.6 | m2 |
| Air Flow (Q) | 146 | m3/s required |
| Velocity (V) | 12.63 | m/s |
| Static Pressure (Ps) | 1109 | Pa |
| Velocity Pressure (Pv) | 98 | Pa |
| Total Pressure (Pt) | 1207 | Pa |
| Fan Power | 176 | kW |
| Fan Power @ 70% efficiency | 252 | kW |
NATIONAL INSTRUMENT 43-101 TECHNICAL REPORT
EFFECTIVE DATE: APRIL30, 2013 | AMENDED DATE: MARCH 04, 2014
| 16.7.2.4 | Raised Bore for main exhaust ventilation airway |
Table 16.16 below shows the design parameters and resulting fan power required for an exhaust raise bore with a 3.3 m diameter.
Table 16.16: Design Parameters for Exhaust Raise
| Friction Factor (K) | 27 | x10-10 lb.*min2/ft4 |
| Friction Factor (K) | 0.005 | kg/m3 |
| Perimeter (P) | 10.4 | m |
| Length (L) | 455 | m |
| Area (A) | 8.55 | m2 |
| Air Flow (Q) | 146 | m3/s required |
| Velocity (V) | 17 | m/s |
Static Pressure (Ps) | 805 | Pa |
Velocity Pressure (Pv) | 178 | Pa |
Total Pressure (Pt) | 983 | Pa |
| Fan Power | 144 | kW |
| Fan Power @ 70% efficiency | 205 | kW |
| 16.7.2.5 | Vent Tubing Head For Tunnels and Ore drifts |
The design parameters covered in table 16.16 below are calculated for the infrastructure needed to achieve the airflow required at the working faces. The friction factor used is for a smooth plastic fabric, which would be most representative of the material used for the tubing throughout the tunnels and ore drifts. The results take into account both static and velocity pressure head as well as any coupling and exit losses. The size of the tubing was chosen to be 1.07 m in diameter.
NATIONAL INSTRUMENT 43-101 TECHNICAL REPORT
EFFECTIVE DATE: APRIL30, 2013 | AMENDED DATE: MARCH 04, 2014
Table 16.17: Design Parameters for Vent Tubing
| Friction Factor (K) | 20 | x10-10 lb.*min2/ft4 |
| Friction Factor (K) | 0.004 | kg/m3 |
| Perimeter (P) | 3.4 | m |
| Length (L) | 305 | m |
| Area (A) | 0.89 | m2 |
| Air Flow (Q) | 14.17 | m3/s required |
| Velocity (V) | 15.84 | m/s |
| Coupling Loss Equivalent Length | 34.76 | m |
| Exit loss Equivalent Length | 30.49 | m |
Number of 90o Bends | 0 | m |
| Bend Loss | 0 | m |
| Total Theoretical Length of Tubing | 370 | m |
Static Pressure (Ps) | 1292 | Pa |
Velocity Pressure (Pv) | 154 | Pa |
Total Pressure (Pt) | 1446 | Pa |
| Fan Power | 20.5 | kW |
| Fan Power @ 70% efficiency | 29 | kW |
| 16.7.2.6 | Setup of ventilation model |
Ventsim Visual Advanced (Ventsim) was used as the ventilation modeling software. Ventsim provides a number of features useful for underground ventilation design, including fan specification, and airflow modeling throughout the mine workings. The software utilizes the Hardy-Cross method to iterate to a ventilation solution. Minimum inputs to the software are a tunnel system, surface connection, and air moving device, such as a fan.
Initially, solid files were imported from the mine design software as centerlines of the mine workings. Tunnels were constructed around the centerlines, and then set as their actual type. Group properties were set for each of the tunnel types. The tunnel types have specific shapes, as well as friction factors. Tunnel types and their properties are shown in Table 16.18.
NATIONAL INSTRUMENT 43-101 TECHNICAL REPORT
EFFECTIVE DATE: APRIL30, 2013 | AMENDED DATE: MARCH 04, 2014
Table 16.18: Dimensions and Friction Factors for Underground Workings
| Type | Dimension 1 | Dimension 2 | Shape | Material | Friction Factor |
| Drifts | 4 | 4 | Square | Average Blasted | 0.01 |
| Ramps | 4 | 4 | Square | Average Blasted | 0.01 |
| Duct | 1.07 | 1.07 | Round | Smooth Plastic Duct | 0.00371 |
| Vent Shaft | 3 | 3 | Round | Bored Raise | 0.005 |
| Stope Raises | 2 | 2 | Round | Average Blasted | 0.01 |
| Stope Access | 4 | 4 | Square | Average Blasted | 0.01 |
The ventilation model is sensitive to an accurate friction factor being chosen. The friction factors ultimately chosen are shown in Table 16.17. After the initial setup of the model, three phases were created for ventilation planning purposes only. These phases are representative of early, mid, and late mining stages. Figures 16.12, 16.13 and 16.14 show the ventilation phases and the ventilation requirements for each phase.
Ventsim supports a forced airflow method that allows a specific required airflow to be placed where a fan would be placed, and the required fan pressure, and then models the airflow throughout the mine. A forced airflow of 146 cu.m/s was selected from the initial ventilation calculations, and used throughout the modeling as the target flow rate.
A final step was connecting the various workings to the ramps and drifts with attack ramps and small ventilation raises. These were selected for ease of ventilation modeling and not mining feasibility. As a result, the actual location of access ramps into the drifts is not reflected in the Ventsim model. Additionally, some of the drifts will require in-place ducting to supply air to the working face.
NATIONAL INSTRUMENT 43-101 TECHNICAL REPORT
EFFECTIVE DATE: APRIL30, 2013 | AMENDED DATE: MARCH 04, 2014
Figure 16.10: Phase 1 Ventilation Air Flow Diagram
NATIONAL INSTRUMENT 43-101 TECHNICAL REPORT
EFFECTIVE DATE: APRIL30, 2013 | AMENDED DATE: MARCH 04, 2014
Figure 16.11: Phase 2 Ventilation Air Flow Diagram
NATIONAL INSTRUMENT 43-101 TECHNICAL REPORT
EFFECTIVE DATE: APRIL30, 2013 | AMENDED DATE: MARCH 04, 2014
Figure 16.12: Phase 3 Ventilation Air Flow Diagram
NATIONAL INSTRUMENT 43-101 TECHNICAL REPORT
EFFECTIVE DATE: APRIL30, 2013 | AMENDED DATE: MARCH 04, 2014
| 16.7.3 | Interpretation of Ventilation Conceptual Design |
Based on the three sample phases, Santa Elena can be ventilated by one main exhaust fan. During development under the pit, auxiliary fans and ducting will be required, until the under pit developments are attached to the main developments. Ventilation velocities are reasonable in the ramp and shafts, and airflow is adequate at the most distant drifts.
It may be advantageous to use two main fans, to provide redundancy in the event of mechanical failures. As well, a stench gas system should be installed as warning to evacuate the mine in case of emergency.
| 16.8 | Open Pit Mining Method |
Santa Elena is a conventional open pit. All drilling, blasting and mining is completed by a local Mexican mine contractor utilizing a fleet of:
| § | 4 – 40 tonnes Caterpillar 740 articulating trucks. |
| § | 3 – 70 tonnes Caterpillar 769 haul trucks. |
| § | Support equipment including one D8 and two D9 dozers, two excavators, two air track drills (Tamrock and G. Denver), one 140H Caterpillar grader, explosives truck, and maintenance vehicles. |
| § | Auxiliary equipment includes a water truck and light vehicles. |
The current optimized pit (Tinaja Pit) is designed for an estimated mine life of 4 years which was originally 6.5 years. The design was changed to avoid a strip ratio up to 10:1 in year 3 and prevent excavation with a subsequent high cost diversion of the adjacent Tinaja gulch which has high water flows in the rainy season. With the optimization of the original pit, a portion of the original reserves have been transferred to underground. The overall strip ratio for the Tinaja Pit is approximately 4:1.
Standard operating procedures for the open pit includes:
| § | Daily meetings between owner (Santa Elena operations) and mine contractor to review safety, production objectives and ore control for the day. |
| § | Blasthole drilling of ore is on an average 3.5 by 3.0 metre pattern, 6 metre hole depth with a 1 metre sub-drill. Blasthole drilling of waste is on an average of 4.0 by 4.0 metre pattern. |
| § | Blastholes are loaded with mixture of ANFO or emulsions depending on standing water in the hole. Standing ignition is used for basting and fragmentation. |
| § | Typically, a blast pattern consists of 50 to 100 blastholes with blasting occurring on average 3 times per week. |
| § | Blastholes considered to be in or near ore are systematically sampled and sent to the onsite lab for gold, silver and copper analysis. Turnaround time for the lab is estimated at 24 hours. Analytical results are given to the geology department and standard ore control is completed using AutoCAD and Gemcom software. |
| § | Ore control is flagged and cut lines are established in the pit for extraction of ore and waste. |
NATIONAL INSTRUMENT 43-101 TECHNICAL REPORT
EFFECTIVE DATE: APRIL30, 2013 | AMENDED DATE: MARCH 04, 2014
| § | Daily surveys are completed in the pit to determine volumes extracted and for floor grade control. Truck counts are also completed by the mine contractor and owner personnel. Invoicing for the contractor is based on a cost per tonne with the reconciliation of surveys and truck counts. |
| § | Mine production is guided by a pre-set mine design that is considered geotechnically adequate to extract materials while operating in a safe manner. |
| § | Blasted ore from the pit is hauled to the nearby crushing facility and either end dumped into the primary jaw crusher or stockpiled for loader feed crushing. As of April 31, 2103, an estimated 2.84 million tonnes of ore have been extracted from the pit delivered to the crusher and leach pad. |
| § | Blasted waste rock from the pit is hauled to the waste dump on the northwest of the pit. As of April 31, 2013, an estimated 10.1 million tonnes of waste have been excavated and delivered to the waste facility (see Figure 18.1). |
| 16.9 | Spent Ore Mining And Rehandling Methods |
Spent ore will be delivered to the mill using of a 3.5 cubic meter loader and a conveyor belt (grasshopper and stacker). A loader will load the spent ore from the leach pad on to a 24 inch wide conveyor belt capable of handling 220 tonnes per hour to be delivered to a stockpile area for blending with underground ore using a reclaim tunnel at the processing facility. Grade control will be performed on spent ore as using a belt sampler. The amount of spent ore required to be processed is flexible. For this report a 50/50 blend is used to maintain a nominal 3,000 tonnes per day feed to the processing facility (1,500 tonnes per day underground ore and 1,500 tonne per day spent ore from the leach pad). Refer to figure 17.2 for a layout of the plant and 16.15 for the overall site layout which shows the heap leach facility in relation to the plant site and ROM stockpiles.
Figure 16.15 Layout of the open pit and waste dump on April 30 2013
The tailings produced from the processing facility will be filtered and deposited as dry-stack tailings. The tailings handling circuit will have the following equipment:
| § | final CCD thickener underflow pumps, |
| § | filter feed slurry pumps, |
| § | filter feed stock tank; 3,200 mm diameter × 7,600 mm, |
| § | three belt filters with a capacity , |
| § | filter press conveyor belts, |
| § | tailings conveyor belt, |
| § | tailings filtrate pump box. |
NATIONAL INSTRUMENT 43-101 TECHNICAL REPORT
EFFECTIVE DATE: APRIL30, 2013 | AMENDED DATE: MARCH 04, 2014
The final CCD thickener underflow will be the final plant tailings. The thickened tailings will be pumped from the final CCD thickener at a density of approximately 65% solids. Slurry will enter the pump box which will feed the tailings filter feed stock tank. The plate and frame filters will dewater the tailings slurry to a moisture content of about 20%. The dewatered solids will be conveyed to the lined leach pad for aeration and cyanide destruction. Once the cyanide toxicity in the dry tailings is at acceptable levels, it will be transported by conveyor to the waste facility for deposition and reclamation in the future. The filtrate from the filter presses will be collected in a filtrate pump box and will be pumped to the barren solution tank for reuse within the leach circuit.
The ore from both underground and open pit resources will be processed by conventional cyanide leaching technology, shown in Figures 17.1 and 17.2. In addition partially leached material from the existing heap leach operations will be blended with underground ore at a variable rate and reprocessed through the same plant.
Metallurgical test work has demonstrated that Santa Elena ore is amenable to conventional processing. Test work has also demonstrated that the existing heap leach residue can be further treated to recover most of the residual gold and silver.
Santa Elena ore contains an estimated average grade (open pit, underground and heap leach) of 1.24 g/t Au and 75 g/t Ag and after crushing and grinding can be leached in cyanide to yield approximately 92% Au Recovery and 67.5% Ag recovery. Because of the relatively high level of silver in the ore (and hence solutions) there are advantages and benefits to using traditional CCD and Merrill-Crowe for metal recovery rather than CIL/CIP. The partially leached heap ore yielded recoveries of approximately 52% Au and 29% Ag when crushed to 10 mm and processed on the heap leach. Since the leach cycle is being prematurely terminated to start the mill on re-leaching after grinding the balance of the metals are recovered to the level expected from new ore.
The process plant has been designed to treat a nominal 3000 tonne per day (tpd) of ore, a mixture of freshly mined material and partially leached heap residue. The plant has been designed to treat any proportion of these two types of feed. Because this may include up to 100% of fine crushed material from the heap leach pads it was considered that this would be unsuitable feed for a SAG milling circuit and so it was elected to go to a conventional crushing and grinding circuit.
ROM ore is delivered to a dump pocket ahead of the crushing plant. Ore is reclaimed from the dump pocket by vibrating grizzly feeder and fed to a 30``x54`` jaw crusher (the one from the existing heap leach crushing plant). Product is screened and oversize fed to a XL400 secondary cone crusher. The cone crushed product is again screened and the oversize to a bin ahead of two XL 400 tertiary cone crushers, operated on close circuit with the same screen.
Crushed ore is placed on an open stockpile above a reclaim tunnel. Reclaimed heap leach material is collected and conveyed to a second stockpile located above the same reclaim tunnel. Each stockpile has two feeders under it (total 4). There is a weightometer between the two piles on the reclaim conveyor and another after the reclaimed material has been combined (as well as a sampler) to allow for accounting of both the fresh ore and heap leach residue. The stacking belts feeding the stockpiles also have weightometers and cross belt samplers.
NATIONAL INSTRUMENT 43-101 TECHNICAL REPORT
EFFECTIVE DATE: APRIL30, 2013 | AMENDED DATE: MARCH 04, 2014
Ore is reclaimed from the stockpiles and fed to a 15’x21’ (4.62 m x 6.77 m) ball mill fitted with a 2200 kW motor. This mill is designed to produce a 100µm (P80) product and the mill circuit is closed by Hydrocyclones. The ore grinding takes place in barren solution and so significant amounts of gold and silver will dissolve in the grinding circuit. The cyclone overflow is thickened ahead of the leach circuit, and the supernatant solution advanced as pregnant solution or used elsewhere in the circuit depending on the grade. Lime and Cyanide are also added to the grinding circuit to maintain desired leaching conditions of pH10.5 and 1000mg/L NaCN strength.
The thickener underflow pulp at 55% solids is fed to the leach circuit consisting of five 13.6mx 12.8m high tanks giving a total of 48 hrs. residence time. These tanks are aerated. In a slight departure from conventional practice after the first leach tank the leach slurry can be diluted and washed with lower grade solution before being re-introduced into the leach circuit (tank #2). This solution change has been shown to boost the leaching rate, reducing the overall leach time required which provides opportunities to maximize capacity at the plant.
The last leach tank discharges to the CCD (counter current decantation) circuit: This consists of three thickeners in addition to the grinding circuit thickener and the intermediate thickener, making 5 thickeners in all. A wash water ratio of 3.2:1 is anticipated.
The washed residue from the final CCD thickener underflow is fed to a surge tank ahead of the two tailings belt filters. Filtration of tailings and dry stacking the cake was selected to minimize water usage, and produce stable tailings. The dry tailings will be conveyed to an intermediate point adjacent to the disposal area (leach pads), and then distributed over the disposal area (waste dump) after detoxification. Provision has been made for cyanide detoxification of residue, but calculation of the likely concentration in the residue suggests it will not be required. The intermediate transfer point will be sealed and any drainage from the residue collected and returned to the ore process plant.
The pregnant solution is collected in the existing pregnant solution pond. The various qualities of the possible solution (grinding thickener, intermediate thickener and #1 CCD thickener overflows) will be monitored to maintain a relatively high grade solution, with lower tenor solutions used elsewhere in the circuit.
The pregnant solution is reclaimed from the pond and fed to a conventional Merrill-Crowe (MC) recovery circuit. Solution is first clarified in a vertical leaf precoat clarifier using DE (diatomaceous earth) as the clarifying medium. The solutions are then de-aerated under vacuum to remove oxygen, and then zinc dust is added to precipitate gold and silver which is removed from the solution by plate and frame filter press. The existing MC plant will be utilized alongside a new MC plant.
The barren solution from the precipitation press is recycled for re-use in the plant as process water. The filter cake is discharged, dried and mixed with flux for smelting to Dore.
The plant also has reagent handling systems. Lime is added dry to the mill feed belt. Cyanide is mixed as a 10% solution and distributed in the plant. Flocculent, zinc, anti-scalent, systems are in place as well as systems for Copper Sulphate and Sodium Metabisulphate if required for cyanide de-toxification.
NATIONAL INSTRUMENT 43-101 TECHNICAL REPORT
EFFECTIVE DATE: APRIL30, 2013 | AMENDED DATE: MARCH 04, 2014
Figure 17.1: Santa Elena Expansion 3000 tpd Process Flowsheet
NATIONAL INSTRUMENT 43-101 TECHNICAL REPORT
EFFECTIVE DATE: APRIL30, 2013 | AMENDED DATE: MARCH 04, 2014
Figure 17.2: Santa Elena Expansion Plan Plant Mechanical General Arrangement
NATIONAL INSTRUMENT 43-101 TECHNICAL REPORT
EFFECTIVE DATE: APRIL30, 2013 | AMENDED DATE: MARCH 04, 2014
| 18.0 | PROJECT INFRASTRUCTURE |
The project infrastructure is shown in figure 18.1
The Santa Elena open pit heap leach mine was constructed in late 2009 and 2010, and has been operational since 2010. There are a number of facilities currently in use at the Santa Elena site.
The Santa Elena Expansion Project will be undertaken within the current infrastructure. Broadly speaking the Expansion requires the addition of a processing plant and facilities for the underground mine. The same infrastructure facilities utilized by the open pit mine will continue to be used for the expansion.
Current facilities at the mine consist of (see Figure 18.1 for general site plan):
| § | 7 km long main access road from paved highway and local community of Banamichi, |
| § | 2,500 tpd ore open pit mine utilizing a mine contractor, |
| § | Waste dump with the capacity of an estimated 35 million tonnes, |
| § | 3-stage crusher provided by Excel Machinery of Amarillo, Texas, |
| § | Lined and certified leach pad designed by Vector Engineering of Denver, Colorado, |
| § | Lined and certified barren and pregnant solution pond designed by Vector Engineering of Denver, Colorado, |
| § | Lined and certified emergency pond designed for 100 year event, |
| § | Merrill Crowe plant and refinery, |
| § | On-site laboratory for production and exploration work, |
| § | Maintenance shop for mine contractor, |
| § | All required piping, power and security. |
The material on the existing heap leach facility will be removed, and there is space on the facility for rehandling of the tailings prior to transport to the waste dump as dry stack tailings.
In January of 2012, the expansion of the mine from an open pit heap leach operation to an underground mill operation commenced with ground breaking of the underground portal. As of April 31, 2013, the expansion was approximately 30% complete with all major equipment purchased and the completion of all earthworks for the new processing facility, tank construction underway, and approximately 1,300 metres of underground ramping and development.
NATIONAL INSTRUMENT 43-101 TECHNICAL REPORT
EFFECTIVE DATE: APRIL30, 2013 | AMENDED DATE: MARCH 04, 2014
Figure 18.1: Site General Arrangement Plan
NATIONAL INSTRUMENT 43-101 TECHNICAL REPORT
EFFECTIVE DATE: APRIL30, 2013 | AMENDED DATE: MARCH 04, 2014
| 18.1 | Surface Infrastructure for the Expansion Plan |
The access road to the Santa Elena mine is a 7 km unpaved road, which connects to a nearby paved highway and the local community of Banamichi. This road is currently operated and maintained by SilverCrest.
| 18.1.2 | Offices, Cafeteria, Warehouse and Change Houses |
The existing offices, cafeteria, warehouse and change house at Santa Elena are expected to be adequate for the Santa Elena Expansion Project. Currently, the office space consists of a main office located where the access road enters the mine area and a smaller mobile office for the surveying and the underground manager/s. The process plant being constructed will include office space for the technical staff operating the processing facility. No additional office space is required for the expansion plan.
| 18.1.3 | Fuel Storage Facility |
The diesel storage requirements for the mining machinery for the open pit mine will be sufficient for the underground mining equipment. The consumption of each individual equipment type is highlighted in table 18.1 with the total daily diesel consumption also listed. Diesel for power generation will be stored at the power generation site/facility.
Table 18.1: Diesel Consumption (Litres) per day
| Description | Number | kW | Estimated Hours Operated/day | Fuel Consumption/Day |
| Mine trucks (20 ton) | 6 | 250 | 16 | 2851.2 |
| Long hole drill (Sandvik) | 1 | 130 | 1.5 | 23.2 |
| Scoop trams (Sandvik) | 3 | 200 | 16 | 1140.5 |
| | | | | |
| Jumbo drills (cut and fill stopes) DD321-40 (110kW) | 2 | 110 | 1.5 | 39.2 |
| Scissor lift 92 HP | 1 | 69 | 2 | 16.4 |
| Grader - 110 HP | 1 | 82 | 4 | 39 |
| Kubota/s | 3 | 14 | 2 | 10 |
| Crew transport | 2 | 96 | 2 | 45.6 |
| Service truck | 1 | 96 | 3 | 34.2 |
| | | | TOTAL | 4199.3 |
NATIONAL INSTRUMENT 43-101 TECHNICAL REPORT
EFFECTIVE DATE: APRIL30, 2013 | AMENDED DATE: MARCH 04, 2014
| 18.1.4 | Water storage facility |
A water storage facility is located as shown in Figure 18.1, no additional water storage is required for the expansion plan.
| 18.1.5 | Electrical Distribution |
The underground mine will received power from surface generators supplying power to the process plant and the underground mine. The overall installed capacity will be in the order of 6.5 MW. Roughly 1 MW of the installed capacity will be required for underground. The generators will produce power which will feed a surface substation, from which power will be drawn for the process facility and the underground. A 5 kV cable will take power underground, either via the fresh air raise or via a borehole.
| 18.1.6 | Explosive Magazine |
Santa Elena currently has powder magazines for the open pit mining. This will be used for surface bulk storage of explosives for the underground operation. Underground temporary storage of explosives will be undertaken in suitable areas or containers, as directed by Mexican mining health and safety regulations.
A maintenance shop exists for the underground machinery used in the ramp development. This shop is adjacent to the current underground adit as seen in figure 18.1 above. In addition to surface maintenance shops, and underground maintenance shop will be constructed on the 536 level. This shop will consist of 3 to 4 bays, which have been slashed to accommodate an underground truck with the load body in the tipping position. The underground shops will be fitted with overhead trolleys for lifting of heavy equipment and will include tools and equipment as required for maintenance.
| 18.1.8 | On-site Laboratory |
The existing laboratory used for the open pit will continue to be used for the underground mining.
Santa Elena may require a cement storage area. This cement may then be added to waste rockfill and mixed in transport trucks on their way to the open stopes. The rate of backfilling will vary with the production rate and the type of mining undertaken. The maximum backfill requirements will occur when mostly transverse long hole stoping is being carried out from year 6 to year 8 of mining. The volumes will average around 360 to 400 m3 of backfill per day. The daily requirement for Portland Cement has been estimated at around 32 tonnes. Storage for cement is sized in a manner such that there will be at minimum a week’s worth of cement on site to feed the backfill requirements. At this rate the weekly storage capacity should be 225 tonnes. EBA has estimated that a 300 tonne silo will be required for the cement storage. Cement will be delivered to site as required to maintain the storage inventory.
| 18.2 | Underground Infrastructure |
Additional facilities will be required to support the mining operations underground. SilverCrest has completed the main ramp from the adit at 780 elevation to the 625 level as of the end of April 2013. The current ramp includes muck bays, sumps and a fresh air raise to surface. This arrangement will be continued to the 536 level after which a return airway will be raise bored from surface to create a ventilation circuit. In addition to the ramp, cross cuts and drifts required for the mining of the ore, further infrastructure is required as stated below.
NATIONAL INSTRUMENT 43-101 TECHNICAL REPORT
EFFECTIVE DATE: APRIL30, 2013 | AMENDED DATE: MARCH 04, 2014
| 18.2.1 | Underground Maintenance Shop/Warehouse |
The underground shop will be situated on the 536 level, in a more central location where equipment from all areas of the mine can easily access the shop. The shop will include 3 bays with dimensions to allow for work on scoop trams, jumbo drills, and underground haul trucks. The bays will accommodate scoop trams with a raised bucket. Next to the maintenance shop will be a bay equipped with shelving to store frequently used parts as well as other parts on consignment, consumables, and tires. A concrete floor will be placed in working areas in the workshop to enable working on level surfaces and for containment of spilled contaminants.
A prefabricated refuge station will be located in an unused drift or a muck bay to serve as an emergency shelter, as required by health and safety regulations.
All development headings will be sloped at a 2% gradient towards the ramps to allow for water to drain in a controlled direction. Sumps will be developed on each level to collect any inflow water and from there the water will be either recycled and used as drill water, or pumped to surface. The sumps will be installed at a vertical interval of 60 to 70 m. A conceptual arrangement for the dewatering of the mine is shown in Figure 18.2, equipment and flow rates are expected to very considerably over the life of mine.
NATIONAL INSTRUMENT 43-101 TECHNICAL REPORT
EFFECTIVE DATE: APRIL30, 2013 | AMENDED DATE: MARCH 04, 2014
Figure 18.2: Conceptual Water Balance
NATIONAL INSTRUMENT 43-101 TECHNICAL REPORT
EFFECTIVE DATE: APRIL30, 2013 | AMENDED DATE: MARCH 04, 2014
| 18.2.4 | Underground Electrical Installations |
A conceptual layout of the underground electrical installations up until the 536 level is shown in Figure 18.3.
The site currently has no grid power and the use of diesel power generators will continue for the Expansion of the project. The power generation capacity will be increased to supply power for the process plant and the underground mining requirements. The underground power consumption has been estimated at 800 kW effective power, requiring an estimated 1MW of installed power generation capacity. The primary use of power underground will be by ventilation fans, drills, lighting plants, sump pumps and the workshop, while the majority of power used on the overall Santa Elena site will be by the crusher and process plant. To extend the services to underground, a 5 kV high tension power cable will be run down the ventilation raises or a dedicated borehole, connecting to a substation on each of the active levels. The underground machinery will be run on 440 V, with step down transformers mounted on skids delivering the power to the levels as required. Where required, smaller transformers will step down the voltage for underground lighting, shops and lunch rooms. All electrical installations will be done under supervision of a qualified electrician. The electrical equipment required for underground will include:
| § | Underground cable vacuum breaker |
| § | Main underground cable from substation to adit – 5kV |
| § | Cable from adit to ventilation shaft collar – 5kV |
| § | Ventilation fan transformers and switchgear |
| § | Main underground cable – 5 kV |
| § | Underground power centres mounted on skids including circuit protection, transformers, 5 kV feed couplings and 480/440 /120 V output couplings |
| § | 480/440 V underground feeder cables |
| § | Surface cap lamp charger stations |
| § | Miscellaneous electrical equipment including distribution boards, lighting and low voltage cables |
NATIONAL INSTRUMENT 43-101 TECHNICAL REPORT
EFFECTIVE DATE: APRIL30, 2013 | AMENDED DATE: MARCH 04, 2014
Figure 18.3: Conceptual U/G Electrical Distribution Diagram
NATIONAL INSTRUMENT 43-101 TECHNICAL REPORT
EFFECTIVE DATE: APRIL30, 2013 | AMENDED DATE: MARCH 04, 2014
Underground water requirements include both potable and non-potable water. Non potable water for the jumbo and long hole drills will be sourced from sumps on each level if possible, or from surface water storage tanks. A service water pipeline will be provided down the ramp or down the ventilation shafts as required. Potable water will be taken down in bottles for each shift.
The main explosives magazine will be on surface. A temporary storage area for a short term supply will be developed on some of the levels underground. The underground explosive magazines will hold enough charge and detonators to be able to supply the underground workings for 1 week.
A mobile compressor will be used to provide compressed air for jackleg drilling power as well as ANFO loading. This compressor will be powered by electricity.
| 18.3 | Processing Plant Infrastructure |
The major equipment to be installed by January 2014 for the processing plant is shown in table 18.2 (see Figure 17.1, 17.2 and 18.1 for details and layouts for the processing plant);
Table 18.2: Major Equipment Components as part of the Processing Plant
| Class | Vendor | Item |
| Crushing & Screening | FLS | Cone Crushers |
| FLS | Vibrating Screens (Secondary & Tertiary) |
| BATSA | Conveyor Belts |
| FLS | Vibrating Pan Feeders |
| PPI Pella | Conveyor Idlers |
| THERMOSFISHER | Conveyor Belt Sampler |
| Grinding & Crushing | FLS | Ball Mill |
| FLS | Cyclones |
| Leaching & CCD | Outotec | Thickeners |
| Mixtec | 12 Agitators |
| Recovery (MC Plant) | FLS | MC Plant + Refinery |
| FLOWSERVE | Process Water Pumps |
| Warehouse & Management | FLS | Slurry Pumps |
| Kolberg Pioneer, Inc. | Belt Feeders |
| Reagents | BASF | Flocculant Mixing System |
| Process IQ | Wad Analyzer |
NATIONAL INSTRUMENT 43-101 TECHNICAL REPORT
EFFECTIVE DATE: APRIL30, 2013 | AMENDED DATE: MARCH 04, 2014
| Thickening & Tailings Management | FLS | Horizontal Belt Filters |
| Auxiliary Buildings | LYM (IR) | Compressor Air Equipment |
| Generators | WWWILLIAMS | Power House Project Gear |
| WWWILLIAMS | 7-E9000 Evolution LV MCC |
| GE | Switchgears |
| CONDUMEX | Transformers |
| Other Equipment | BATSA | Grasshoppers/Stackers |
| Nixon Grua | Crane 2004 Link Belt RTC |
| | Dozer |
| 18.4 | Waste Rock and Tailings Storage Facilities |
The waste rock storage facility at Santa Elena has been designed for a capacity of 35 million tonnes and fully covers all planned open pit and underground waste and dry stack tailings. Of the 35 million tonne capacity, 20 million tonnes has been used for the open pit waste rock, leaving roughly 15 million tonnes of capacity for underground waste rock and tailings. Note that not all waste rock from underground will be deposited at the waste dump sites as roughly 14% will be used to backfill some of the underground stopes. Figure 18.1 above shows the waste dump location and design. Table 18.3 below shows the estimated volumes of waste rock and tailings which will be placed on the waste dump for the Santa Elena Expansion Project.
Table 18.3: Waste Rock Volumes
| Source of waste rock | Volume in m3 | Tonnes |
| Open pit waste stripping 2014 | 1,625,000 | 2,600,000 |
| Underground ramp development LOM | 91,026 | 145,641 |
| Underground waste development LOM | 281,228 | 449,965 |
| Open pit ore tailings 2014 | 417,944 | 668,710 |
| Underground ore tailings LOM | 2,450,202 | 3,920,323* |
| Heap leach reprocessing ore tailings LOM | 2,251,581 | 3,602,530 |
| Total capacity required | 7,116,981 | 11,387,169 |
| Less underground backfill capacity | 1,002,889** | 1,604,622 |
| Required capacity on waste rock storage facility | 6,114,092 | 9,782,547 |
| Remaining capacity on the waste rock dump | 8,000,000 | 12,800,000 |
| Excess capacity | 1,885,908 | 3,017,453 |
| | * Includes heap leach reserves up to April 30 2013 plus all open pit ore mined from April 30 2013 to December 30 2013 |
| | ** Based on cut and fill stopes, transverse stopes and stopes on 597 level (rib pillar removal on 597 level required the adjacent stopes to be backfilled) |
Tailings from the processing facility will be washed, filtered to approximately 18% moisture content, drained on an exposed portion of the existing leach pad for at least week and conveyed for dry stacking on top of the ROM waste rock dump. Removal and cyanide detoxification will be achieved in combination with multiple filtering, a wash cycle and photo-degradation on the leach pad prior to be conveyed to the waste dump. The estimated tonnage of tailings to be delivered to the waste dump will depend on the plant processing capacity, with a planned nominal throughput of 3,000 tpd. The tailings are estimated to have a bulk density of 1.61 t/m3.
NATIONAL INSTRUMENT 43-101 TECHNICAL REPORT
EFFECTIVE DATE: APRIL30, 2013 | AMENDED DATE: MARCH 04, 2014
The infrastructure required for handling the dry stack tailings that has been included for the PFS include an overland conveyor to transport the material to the waste rock storage dump and a loader to rehandle the material from the heap leach pad onto the over land conveyor. Note that the existing bull dozer used on the current heap leach facility is of sufficient size to move 3,000 tonnes of dry stack tailings per day on the waste rock dump.
It must be noted that additional capacity will also be available for detoxified tailings material on the current heap leach facility, later in the mine life, when a significant portion of the material on the existing heap leach has been reprocessed. No further waste rock storage facilities are foreseeably required.
| 19.0 | MARKET STUDIES AND CONTRACT |
| 19.1 | Sales of gold and silver doré |
EBA is satisfied that SilverCrest currently sells gold and silver from the open pit operations and therefore an assessment of the market for silver and gold is not regarded as material to this PFS.
EBA has included costs for refining, transportation and customs expenses for selling of the mine poured doré bars within the economic analysis presented in Section 22.
| 20.0 | ENVIRONMANTAL STUDIES, PERMITTING AND SOCIAL OR COMMUNITY IMPACT |
| 20.1 | Land Use Change Permit |
Nusantara is authorized by SEMARNAT (May 2, 2013) from the environmental impact assessment view to develop the Project Expansion of the Santa Elena Mine which consists on adding 71.12 ha surrounding the already authorized surface of 99.35 ha for a total of 170.47 ha. The authorization is valid for 10 years from the next day of the day of reception of this document. It may be extended by written request within 30 days before the date of expiration.
The permitted new construction includes: portal and ramp, diesel gens, crusher and mill, tanks construction for leaching by CCD for underground mining, Merrill Crowe area, stacking area for ROM material, offices, mill shop and warehouse and internal road network to communicate the area of underground process.
| 20.1.1 | Summary of ARD/ML Work for Santa Elena |
Geochemical characterization of mine waste and geochemical modelling has been undertaken at the Santa Elena Mine and includes consideration for acid rock drainage (ARD) and metal leaching (ML) potential. This work was undertaken by Global Resource Engineering Ltd. (GRE, Breckenridge, 2009). Testing was completed in two phases, the first in 2006 and the second in 2009. Phase II of the program was based on preliminary findings in Phase I and includes additional analyses and measured analytes. The results for both programs are typically reported together without distinction for phase.
NATIONAL INSTRUMENT 43-101 TECHNICAL REPORT
EFFECTIVE DATE: APRIL30, 2013 | AMENDED DATE: MARCH 04, 2014
Mine waste material was characterized by a series of static tests, including acid base accounting (ABA), whole rock metals analysis and Synthetic Precipitation Leaching Procedure (SPLP). Testing was completed on a variety of lithological units defined as andesite. Apart from the mineralized andesite ore, the mine waste material considered for geochemical characterization include the following:
| § | Geo-thermally altered andesite near the mineralized zone - Andesite within the sulfide-rich halo. |
| § | Unaltered andesite distant from the mineralized zone - Andesite outside the mineralized halo |
ABA testing has been completed on 42 samples. Results indicate that the andesite units inside and outside of the sulfide-rich halo are classified as potentially acid-generating (PAG) and that the andesite in the calcite-rich zones is net neutralizing. Samples from the sulfide-rich halo zone show a strong variance in net neutralization potential, with variable levels of sulfide and calcite present.
Whole Rock Metals analysis was completed on 14 samples. Results indicate that there is a significant difference in calcite concentrations between the various lithological groupings, and no significant difference in sulfide concentrations. Manganese was noted in elevated concentrations in select samples, and has also been noted in elevated levels in groundwater samples from site.
SPLP testing, with variable analytes measured, has been completed on a total of 42 samples. Results indicate that only concentrations of aluminium in the acid leachate are elevated. Key indicators of alkaline rock drainage, including arsenic, selenium and zinc were not noted at high concentrations.
Based on the results of the static testing, kinetic test cells were established to evaluate reaction kinetics and the potential time to onset of acidic conditions. Six samples were composited to form two kinetic test cells.
Geochemical modelling was undertaken to predict ARD/ML potential for the mine waste material over an extended period of storage on surface at the mine site. The geochemical model includes consideration for precipitation, surface water flow, reaction kinetics and geochemical reactions.
Kinetic test result and the experience of storing mine waste on surface at the mine site indicate that geochemical reactions at the site are slow. This is in large part due to the water supply and flow dynamics of the site. It is not expected that the mine waste material will generate acidic leachate or leachate with elevated metal concentrations. The current geochemical risk mitigation plan includes infiltration management to manage any leachate and runoff that may develop. The mitigation plan includes continual testing and monitoring as well as concurrent reclamation.
An independent Closure and Mine Reclamation Plan was created for the Santa Elena project in March, 2010, by Global Resource Engineering Ltd. (Breckenridge, 2010). This plan incorporated study results from baseline environmental impact, water quality and geotechnical stability studies for the original open pit, processing and waste dump. Closure plan activities included, but were not limited to closure and capping of the waste facility, closure and capping of the spent heap leach facility, disposal and/or treatment of hazardous site chemicals and impacted soils, and re-contouring of impacted grounds. A closure cost of $USD 2.28M (NPV projected to 2017) was included with a 10% contingency in place.
NATIONAL INSTRUMENT 43-101 TECHNICAL REPORT
EFFECTIVE DATE: APRIL30, 2013 | AMENDED DATE: MARCH 04, 2014
EBA has included consideration for mine closure, remediation and ongoing monitoring and stewardship activities within the economic model at an estimated value of $USD 5M. A revision to this closure plan is recommended.
| 21.0 | CAPITAL AND OPERATING COSTS |
EBA has estimated total capital costs remaining of $88 million, which excludes $24.2 million spent on the project as of the 30 April, 2013. The total remaining capital is made up of $48 million initial, required for construction of the plant, initial underground mining equipment purchases and preproduction underground development, and a further $40 million sustaining capital, which includes ongoing development, ongoing mining equipment purchases and ongoing infrastructure requirements. EBA has included an estimated of contingency of $9.3 million over the life of mine the Santa Elena Expansion Project.
EBA has estimated total operating costs at an average of $39 per tonne of ore processed.
The sources of information for these costs include:
| § | Overall cost and equipment and materials for the processing plant |
| § | Underground design work for pre-production development costs |
| § | Quotes from equipment suppliers |
| § | Equipment operating costs from equipment suppliers |
| § | Industry cost publications including Costmine |
| § | SilverCrest financial reporting |
| § | Santa Elena actual costs including salaries, general and administrative costs (G and A), and consumables costs per unit |
The capital costs have been entered into a capital cost schedule, which takes into consideration when the expense occurs, as well as lead times on equipment purchases and payment terms for equipment. As of April 30, 2013, approximately 30% of the new process facility had been constructed with a schedule for completion by January 2014.
The operating costs have been entered into a cost model to determine the cost per tonne of rock material handled to the processing plant or to surface, whether waste or mineralized material. The operating cost is divided into cost per tonne underground mining, cost per tonne processing and cost per tonne General and Administrative.
NATIONAL INSTRUMENT 43-101 TECHNICAL REPORT
EFFECTIVE DATE: APRIL30, 2013 | AMENDED DATE: MARCH 04, 2014
EBA has collected information on the budgeted capital costs for the Santa Elena Expansion Project from SilverCrest, and used the underground mine design to estimate the capital required to start and sustain the operation. Table 21.1 below shows a summary of the breakdown of the capital estimate, including total capital cost estimated for initial, sustaining and costs already spent on the Expansion Project. Total capital required including sustaining, direct and indirect and contingency but excluding sunk costs is estimated at $US 88 M.
Table 21.1: Capital Cost Summary
| Capital expense item | Estimated cost in US $ |
| Total capital – Life of Mine including contingency | 87,813,477 |
| | |
| Initial capital including contingency | 48,067,874 |
| Mining equipment purchases | 2,343,810 |
| Development – UG | 3,480,550 |
| Process plant including EPCM | 41,928,472 |
| Electrical and services – UG | 72,042 |
| Indirect | 243,000 |
| | |
| Sustaining capital including contingency | 39,745,603 |
| Mining equipment purchases | 5,144,587 |
| Development | 31,284,348 |
| Electrical and services | 2,283,346 |
| Health and safety | 143,442 |
| Construction (incl. labour) | 322,880 |
| Indirect | 567,000 |
| | |
| Contingency included in the above items | 9,304,765 |
| | |
| Budget spent from January 2012 to April 30, 2013 (sunk costs) | 24,263,480 |
| Underground development completed as of April 30, 2013 | 5,300,000 |
| Processing plant construction and mill equipment purchases completed as of April 30, 2013 | 18,963,479 |
| 21.1.1 | Mining Capital Costs |
Mining equipment expenses for the project are summarised in table 21.2, and have been estimated based on production requirements, the mining schedule, ventilation requirements, and general operational requirements including provision for ongoing mining related equipment expenses over the life of mine.
NATIONAL INSTRUMENT 43-101 TECHNICAL REPORT
EFFECTIVE DATE: APRIL30, 2013 | AMENDED DATE: MARCH 04, 2014
Table 21.2: Equipment Capital Expenditure
| Mining Equipment Type | No. | Estimated Cost Including Contingency And Freight |
| Long hole drills | 1 | 1,107,750 |
| Scoop trams | 3 | 1,854,090 |
| Jackleg/stopers | 4 | 65,000 |
| Jumbo drills (cut and fill stopes) DD321-40 (110kW) | 2 | 2,085,300 |
| Jumbo accessories | 2 | 304,460 |
| Primary ventilation | 5 | 205,023 |
| Auxiliary fans | 10 | 133,245 |
| Anfo loader | 1 | 30,030 |
| Scissor lift 92 HP | 1 | 115,500 |
| Grader – 110 HP | 1 | 209,000 |
| Kubota/s | 3 | 82,500 |
| Crew transport | 2 | 132,000 |
| Service truck | 1 | 86,900 |
| Shotcrete plant | 1 | 20,790 |
| Underground diamond drill | 2 | 221,463 |
| Compressor | 1 | 60,972 |
| Pipe fusing machine | 1 | 38,375 |
| Ongoing mining related capex | | 736,000 |
| Cement storage silo for backfill | 1 | 91,125 |
| Total | | 7,579,523 |
| 21.1.2 | Underground Development |
EBA has estimated the required preproduction and sustaining development required for the underground operations. This is summarised in table 21.3
NATIONAL INSTRUMENT 43-101 TECHNICAL REPORT
EFFECTIVE DATE: APRIL30, 2013 | AMENDED DATE: MARCH 04, 2014
Table 21.3: Development Expenditure
| Underground development component | Estimated cost including contingency |
| | |
| Ramp Year -1 | 1,791,930 |
| Ramp Year 2 | 1,433,590 |
| Ramp Year 3 | 4,649,910 |
| Ramp Year 5 | 1,309,620 |
| Waste development year -1 | 1,493,620 |
| Waste development year 1 | 1,338,370 |
| Waste development year 2 | 1,259,020 |
| Waste development year 3 | 4,522,375 |
| Waste development year 4 | 6,385,375 |
| Waste development year 5 | 3,882,938 |
| Waste development year 6 | 377,813 |
| Waste development year 7 | 1,045,688 |
| Ventilation shaft/raise pre-production | 652,447 |
| Ventilation shaft/raise year 4 | 626,251 |
| Ventilation drifts year 1 | 558,095 |
| Ventilation drifts sustaining | 1,646,531 |
| Raise bore underground station 536 level | 28,124 |
| Raise bore underground station 325 level | 28,124 |
| Pit ramp shaft | 707,470 |
| Ventilation cross cuts - pit ramp | 28,124 |
| Fresh air raises year 1 | 133,115 |
| Fresh air raises year 3 | 97,235 |
| Fresh air raises year 4 | 315,385 |
| Underground shops | 258,750 |
| Underground definition drilling - preproduction | 195,000 |
| Total underground development | 34,764,898 |
| 21.1.3 | Underground Electrical Installations |
Underground electrical installations have been estimated based on the layout of the underground mine and the planned supply voltage of 5000 V as well as the equipment voltages of 440 V. Table 21.4 shows the estimated underground electrical equipment and services required and the estimated cost
NATIONAL INSTRUMENT 43-101 TECHNICAL REPORT
EFFECTIVE DATE: APRIL30, 2013 | AMENDED DATE: MARCH 04, 2014
Table 21.4: Underground Electrical and Service Cost
| Component of underground electrical distribution | Estimated cost including contingency |
| Surface main underground vacuum breaker | 28,750 |
| Main 5kV line to adit area | 50,000 |
| Surface to underground high voltage line initial | 18,188 |
| Surface to underground high voltage line sustaining | 46,875 |
| Cable to surface ventilation fans | 12,500 |
| Transformer at surface ventilation | 27,500 |
| 440v underground line/s | 97,500 |
| Underground power centers incl. transformer 500kVA | 280,600 |
| Miscellaneous electrical equipment and lighting | 67,500 |
| Surface cap lamp battery charger | 37,984 |
| Underground water line initial | 70,200 |
| Underground water line sustaining | 585,000 |
| Underground dewater line - initial | 32,500 |
| Underground dewater line - sustaining | 65,000 |
| Underground dewater pumps centrifugal initial - 60kW | 68,611 |
| Underground dewater pumps centrifugal initial - 45kW | 137,223 |
| Submersible pumps 40 HP | 57,590 |
| Pump valves/ suction pipes etc. | 6,861 |
| Underground dewater pumps centrifugal sustaining | 196,726 |
| Trash pumps for slurry | 92,508 |
| Compressed air line | 195,000 |
| Ventilation tubing | 81,900 |
| Leaky feeder communication | 98,872 |
| Total | 2,355,388 |
| 21.1.4 | Construction Consumables and Labour |
EBA has estimated construction work required to establish the underground systems including ventilation infrastructure, maintenance and safety infrastructure. Table 21.5 shows a breakdown of the estimated costs.
NATIONAL INSTRUMENT 43-101 TECHNICAL REPORT
EFFECTIVE DATE: APRIL30, 2013 | AMENDED DATE: MARCH 04, 2014
Table 21.5: Construction Consumables and Labour
| Underground infrastructure construction costs | Estimated costs including contingency |
| Vent shaft collar concrete | 3,837 |
| Vent shaft collar labour | 6,750 |
| Vent shaft steel | 266 |
| general underground electrical labour | 8,100 |
| Fan electrical labour | 5,400 |
| Underground ventilation doors | 41,885 |
| Ventilation walls materials | 9,592 |
| Ventilation walls labour | 24,300 |
| Refuge chambers | 202,500 |
| Underground machine shop | 20,250 |
| Underground pump stations concrete | 9,592 |
| Underground pump stations labour | 9,281 |
| Ladder ways in fresh air raise year 1 | 29,925 |
| Ladder ways in fresh air raise year 2 | 19,007 |
| Ladder ways in fresh air raise year 3 | 26,982 |
| Ladder ways in fresh air raise year 4 | 44,876 |
| Ladder ways in fresh air raise year 5 | 19,007 |
| Ladder ways in fresh air raise year 6 | 19,130 |
| General underground installations labour hrs. | 121,500 |
| Total | 622,180 |
| 21.1.5 | Processing Capital Costs |
The estimate as confirmed by John Fox, P.Eng for the cost of construction for the processing plant is as shown in table 21.6 below. This process plant construction is budgeted to be completed by the end of 2013. The table illustrates that a portion of the process plant budget is already spent. The budget includes the equipment purchases, tailings facility, engineering procurement and construction management, as well as power generation.
NATIONAL INSTRUMENT 43-101 TECHNICAL REPORT
EFFECTIVE DATE: APRIL30, 2013 | AMENDED DATE: MARCH 04, 2014
Table 21.6: Processing Capital Expenditure
| | Opening Balance – Dec 31, 2012 | 2013 Bod Budget – USD$ | Estimated Total – Dec 31, 2013 | Paid To Date (Sunk Costs) - In USD$ | Paid % Apr 30, 13 | Estimate To Complete | Total Projected |
| Crushing & Screening | 409,235 | 7,420,795 | 7,830,031 | 2,189,006 | 28% | 5,641,025 | 7,830,031 |
| Storage & Handling | - | 4,060,339 | 4,060,339 | 471,881 | 12% | 3,588,459 | 4,060,339 |
| Grinding & Classification | 630,360 | 8,470,280 | 9,100,639 | 1,340,650 | 15% | 7,759,989 | 9,100,639 |
| Leaching and CCD | 444,606 | 7,012,128 | 7,456,735 | 2,717,322 | 36% | 4,739,413 | 7,456,735 |
| Recovery (MC Plant) | 524,523 | 5,979,879 | 6,504,402 | 2,267,527 | 35% | 4,236,875 | 6,504,402 |
| Reagents | - | 2,499,638 | 2,499,638 | 101,571 | 4% | 2,398,067 | 2,499,638 |
| Water storage | - | 347,384 | 347,384 | 8,009 | 2% | 339,375 | 347,384 |
| Tailings | 144,431 | 5,444,546 | 5,588,977 | 1,235,010 | 22% | 4,353,967 | 5,588,977 |
| Auxiliaries | 119,000 | 1,395,271 | 1,514,271 | 621,636 | 41% | 892,635 | 1,514,271 |
| EPCM Group | 1,909,259 | 4,154,638 | 6,063,897 | 4,352,395 | 72% | 1,711,502 | 6,063,897 |
| Gent Sets | - | 6,191,048 | 6,191,048 | 2,276,429 | 37% | 3,914,619 | 6,191,048 |
| Stackers | 790,869 | | 1,020,869 | 1,018,479 | 100% | - | 1,018,479 |
| Other Equipment | 363,565 | | 363,565 | 363,565 | 100% | - | 363,565 |
| Total mill and process plant | 5,335,849 | 53,205,946 | 58,541,795 | 18,963,479 | 32% | 39,575,926 | 58,539,404 |
| 21.1.6 | Indirect Capital Costs |
EBA has considered a cost of $900,000 for indirect capital costs this includes:
| 1. | $200,000 for staff recruiting and expatriation costs |
| 2. | $400,000 for underground design and engineering |
SilverCrest has advised that the capital spent up to the April 30 2013 includes $5,3 million on the underground development, which has reached the 625 level, and $18.9 million on the processing facility as shown in table 21.6. These sunk costs have not been included in the economic analysis.
The estimation of operating costs has been undertaken by dividing the operation into four areas for costing, these are:
| 1. | Mining of the underground ore, estimated by EBA |
| 2. | Mining of the reprocessing ore on the heap leach facility , estimated by SilverCrest |
| 3. | Processing the ore estimated by John Fox of Laurion Consulting |
NATIONAL INSTRUMENT 43-101 TECHNICAL REPORT
EFFECTIVE DATE: APRIL30, 2013 | AMENDED DATE: MARCH 04, 2014
| 4. | General and Administrative (G and A) costs, estimated by EBA |
EBA has summarised the mining costs in Table 21.7 below:
Table 21.7: Operating Costs
| Aspects of operations | Cost per tonne ore |
| Average underground mining cost including ore development | $25 / tonne ore |
| Rehandling cost of heap leach ore | $0.62 / tonne ore |
| Processing of fresh ore | $20.50 / tonne ore |
| Processing of old heap leach ore | $18.50 / tonne ore |
| Handling of ore to tailings storage facility | $1 / tonne ore |
| G and A | $ 3.75 / tonne ore processed |
| G and A per year – based on Santa Elena operating costs for 2013 | $3,650,000 /year |
| | |
| Average operating cost per ounce gold equivalent sold* | $569 / oz. |
| Average operating cost per ounce silver equivalent sold | $11 / oz. |
| | * Gold equivalent ounces calculated at gold to silver post recovery equivalency ratio of 1:52 |
| | ** Silver equivalent ounces calculated at gold to silver post recovery equivalency ratio of 1:52 |
| 21.2.1 | Underground Mining Cost Estimate |
Assumptions for Underground Mining Costs Estimation
The interim cost estimates for the Santa Elena underground are based on several assumptions. These assumptions include:
| 1. | Any part of the ore body that has a dip shallower than 50° cannot be mined by long hole stoping, and will be extracted using mechanized cut and fill. |
| 2. | All underground development has been costed at $2,300 / m, as per recent quote by contractor. |
| 3. | Diesel cost is $0.80 / litre of diesel or $3.02 / gal. |
| 4. | Ammonium nitrate explosives is costed at $0.96 / kg of explosive, with emulsion or water gel cost at $3.42 per kg. |
| 5. | Underground haulage of ore has been assumed to be carried out by contractor at a rate of $45/hour for a 20 tonne truck. |
| 6. | The rock engineering work has only be completed at the level required for PFS, further rock engineering work may result in changes to the costs. |
Notes
| 2. | Currency is in US dollars |
NATIONAL INSTRUMENT 43-101 TECHNICAL REPORT
EFFECTIVE DATE: APRIL30, 2013 | AMENDED DATE: MARCH 04, 2014
| 3. | Price used for cut-off grade is US $1,450 for gold and $28 for silver, based on projected prices and recovery |
| 4. | Cut-off grades are presented as gold equivalent grades using a gold to silver ratio of 70:1 EBA has undertaken costing for two mining methods, namely long hole stoping and mechanized cut and fill. The long hole stoping costs are divided into longitudinal long hole stoping and transverse long hole stoping (see section 16 for details of the mining methods). The costing has further been divided by stoping width, this has been done to provide for the fact that some costs are fixed per length of stope, whereas others are estimable per tonne regardless of the width of the stope. |
Summary of mining operating costs for long hole stoping is shown in Table 21.8.
Table 21.8: Long Hole Mining Cost Summary
| Summary of estimated costs and cut-off grade calculation - Long Hole |
| | Long hole stopes < 15m | Long hole stopes > 15m | Units |
| Mining width | 5 | 10 | 15 | 20 | 25 | m |
| Salary staff* | $1.35 | $1.01 | $0.68 | $0.68 | $0.68 | |
| Production labour | $3.35 | $2.51 | $1.68 | $1.68 | $1.68 | $/tonne |
| Drilling | $1.06 | $1.06 | $1.06 | $1.06 | $1.06 | $/tonne |
| Blasting | $0.54 | $0.54 | $0.54 | $0.54 | $0.54 | $/tonne |
| Loading | $2.02 | $2.02 | $2.02 | $2.02 | $2.02 | $/tonne |
| Service vehicle costs | $1.20 | $1.20 | $1.20 | $1.20 | $1.20 | $/tonne |
| Power costs | $5.55 | $5.55 | $5.55 | $5.55 | $5.55 | $/tonne |
| Underground haulage ore** | $1.76 | $1.76 | $1.76 | $1.76 | $1.76 | $/tonne |
| Long hole backfill / transverse stopes only*** | | | | $6.10 | $6.10 | $/tonne |
| Cable bolting**** | $2.24 | $6.76 | | | | $/tonne |
| Bolting of slashed drifts to access hanging wall ***** | | $0.06 | | | | $/tonne |
| Maintenance labour | $1.67 | $1.26 | $0.84 | $0.84 | $0.84 | $/tonne |
| Exploration | $0.80 | $0.80 | $0.80 | $0.80 | $0.80 | $/tonne |
| Underground stope development per tonne | $14.78 | $7.39 | $4.93 | $10.10 | $9.05 | $/tonne |
| | | | | | | |
| Underground mining cost diluted ore per tonne (including stope development) | $36.33 | $31.92 | $21.04 | $32.32 | $31.27 | $/tonne |
| | | | | | | |
| Cut-off grade gold equivalent ****** | 1.39 | 1.29 | 1.04 | 1.30 | 1.28 | g/tonne |
| | * This includes salary staff over and above that already included in Santa Elena open pit operations which is costed under G and A |
| | ** Underground haulage by contractor at an estimated contract rate of $45/hour for trucking which is averaged over the life of mine |
| | *** Backfill applicable only to transverse stopes to enable extraction of primary and secondary stopes (see section 16 for details) |
| | **** Cable bolting is only considered for narrow ore and mining width areas, to reduce dilution, this cost estimate includes an estimate of the cost of slashing the drift to access the hanging wall to place cable bolts |
| | ***** Additional bolting required for drifts slashed to access hanging wall for cable bolting |
| | ****** Cut of grade includes consideration of processing cost and G and A costs |
NATIONAL INSTRUMENT 43-101 TECHNICAL REPORT
EFFECTIVE DATE: APRIL30, 2013 | AMENDED DATE: MARCH 04, 2014
Summary of mining operating costs for mechanised cut and fill stoping is shown in table 21.9
Table 21.9: Cut and Fill Cost Summary
| Summary of estimated costs and cut-off grade calculation - Cut and Fill |
| | Stope widths | Units |
| Mining width | 5 | 10 | 15 | 20 | 25 | m |
| Salary staff on mining* | $1.35 | $1.01 | $0.68 | $0.68 | $0.68 | |
| Production labour | $3.00 | $2.25 | $1.50 | $1.50 | $1.50 | $/tonne |
| Drilling | $2.82 | $2.82 | $2.82 | $2.82 | $2.82 | $/tonne |
| Blasting | $1.42 | $1.42 | $1.42 | $1.42 | $1.42 | $/tonne |
| Loading | $2.14 | $2.14 | $2.14 | $2.14 | $2.14 | $/tonne |
| Service vehicle costs | $1.78 | $1.78 | $1.78 | $1.78 | $1.78 | $/tonne |
| Power costs | $10.88 | $10.88 | $10.88 | $10.88 | $10.88 | $/tonne |
| Underground haulage ore ** | $2.07 | $2.07 | $2.07 | $2.07 | $2.07 | $/tonne |
| Backfilling of stopes *** | $7.56 | $7.56 | $7.56 | $7.56 | $7.56 | $/tonne |
| Bolting of slashed drifts to access hanging wall | $0.11 | $0.11 | $0.11 | $0.11 | $0.11 | $/tonne |
| Maintenance labour | $1.67 | $1.26 | $0.84 | $0.84 | $0.84 | $/tonne |
| Exploration | $0.80 | $0.80 | $0.80 | $0.80 | $0.80 | $/tonne |
| Underground stope development per tonne | $13.54 | $7.65 | $5.33 | $4.09 | $3.32 | $/tonne |
| | | | | | | |
| Underground mining cost | $47.80 | $40.74 | $37.26 | $36.02 | $35.24 | $/tonne |
| | | | | | | |
| Cut-off grade gold equivalent**** | 1.66 | 1.50 | 1.42 | 1.39 | 1.37 | g/tonne |
| | * This includes salary staff over and above that already included in Santa Elena open pit operations which is costed under G and A |
| | ** Underground haulage by contractor at an estimated contract rate of $45/hour for trucking which is averaged over the life of mine |
| | *** Backfilling is considered to be done with waste rock and dry stack tailings, with up to 5% cement, hydraulic backfill may also be considered involving pulping underground |
| | **** Cut of grade includes consideration of processing cost and G and A costs |
| 21.2.2 | Costs for Loading and Transporting Existing Heap Leach Material to the Mill for Reprocessing |
EBA has estimated the cost of loading and transporting the material on the existing heap leach pad to the mill for reprocessing. This cost is based on using a loader (by contractor, including 25% markup) to load the material onto grasshoppers (portable jump conveyors) which will deliver the material to the reprocess stockpile. Tables 21.10 to 21.12 show the heap leach reprocessing cost and assumptions.
NATIONAL INSTRUMENT 43-101 TECHNICAL REPORT
EFFECTIVE DATE: APRIL30, 2013 | AMENDED DATE: MARCH 04, 2014
Table 21.10: Reprocess Material Rehandling Cost
| Loader Cost |
| Fuel Consumption Rate | 0.04 | gallons/HP/hour |
| CAT 950K | 211 | HP |
Fuel Consumption per hour | 8.44 | gallons/hour |
| 32.07 | Litres/hour |
| Fuel Cost/Litre | $0.78 | $/L |
| Cost of Fuel per hour | $25.02 | $/hour |
| Labour Cost per hour | $8.00 | $/hour |
| Overhaul | *Costs taken from 2010 CostMine Estimators Guide for 3.8 m3 Wheeled Loader. Converted to 2013 costs |
| Parts | $1.64 |
| Labour | $1.51 |
| Maintenance |
| Parts | $3.05 |
| Labour | $2.81 |
| Lube | $2.14 |
| Tires | $11.36 |
| Wear Parts | $0.39 |
| Loader Maintenance Cost/hour | $22.89 | $/hour |
| Total Cost per hour | $55.91 | $/hour total |
| Total Cost per Day | $782.73 | $/day |
| Final Cost per tonne | $0.39 | $/tonne |
| Contractor Cost per tonne | $0.49 | $/tonne |
NATIONAL INSTRUMENT 43-101 TECHNICAL REPORT
EFFECTIVE DATE: APRIL30, 2013 | AMENDED DATE: MARCH 04, 2014
Table 21.11: Grasshopper Conveyor Costs
| Grasshopper Conveyor Operating Costs |
| Consumables/Grasshopper |
| Replacement Part | Cost/Unit | Replacements/Year | Cost |
| Motor | $2300/motor | 0.5 | $1,152 |
| Belt | $31/meter | 25 | $773 |
| Idlers | $210/Idler | 12 | $2,520 |
| Bearings | $164/Bearing | 4 | $656 |
| | | Total Consumables Cost | $5,101 |
| Electrical Cost |
| | 7.5 HP conversion to kW | 5.63 | kW |
| | Power Draw kWhr | 47.25 | kWhr |
| | Power Cost @ $0.22/kWhr | $10.40 | Cost/Day |
| | | Total Power Cost | $3,794 |
| | | Total Cost/Grasshopper | $8,895 |
| | | Cost for 10 Grasshopper | $88,949 |
| | | Cost/tonne | $0.12 |
Table 21.12: Material Handling Cost from Heap Leach to Mill
| Aspect | Value | Units |
| Front end loader to grasshopper | $0.49 | $/tonne |
| Grasshopper operating costs | $0.12 | $/tonne |
| Total Heap Leach to Processing Cost/tonne | $0.61 | $/tonne |
| 21.2.3 | Processing Plant Operating Costs |
The proposed plant for Santa Elena has been designed to process 1million Tonnes/annum of Santa Elena ore. Power will be generated on site from diesel fuel. Reagent consumption is based on test work for the major consumables (Lime, Cyanide, etc.), but general experience for minor reagents (Zinc, DE etc.). Steel consumption in comminution is based on power consumption and other relationships established by FC Bond. Manpower levels and maintenance supplies are based on experience in similar operations. The breakdown of the estimates for processing cost is shown in Table 21.13.
NATIONAL INSTRUMENT 43-101 TECHNICAL REPORT
EFFECTIVE DATE: APRIL30, 2013 | AMENDED DATE: MARCH 04, 2014
Table 21.13: Summary of Processing Costs
| | US$/year | US$/Tonne | Notes |
| Manpower | 2,097,227 | 2.10 | Revised by Santa Elena |
| Reagents | 4,329,600 | 4.33 | Includes freight allowance |
| Steel (Comminution) | 1,568,684 | 1.57 | Includes freight allowance |
| Power | 8,580,000 | 8.58 | Based on 9.8 Peso/L Diesel (22c/kWh) |
| Water | 400,000 | 0.40 | New item |
| Tailings management | 1,000,000 | 1.00 | Moving dry tailings by dozer |
| Maintenance Supplies | 1,500,000 | 1.50 | Based on % of Capital Cost (revised) |
| TOTAL | 19,475,511 | 19.48 | |
The figures in Table 21.13 are averaged for the whole resource (mined ore and reclaimed heap leach). Mined ore has to be crushed and thus this material would cost perhaps $1.00/t above average, and the heap leach material doesn’t require crushing and would be about $1.00/t below average ($20.50 for Underground and $18.50 for spent heap leach material).
| 21.3 | Tailings Handling Costs |
EBA has estimated the cost of handling of tailings by from end loader, overland conveyor and a bull dozer onto the waste rock dump at $1 / tonne ore processed.
| 21.4 | General and Administrative Operating Costs |
In order to assess the general and administrative costs associated with the cost of production, EBA has reviewed the 2012 and 2013 financial statements produced by SilverCrest. It is the opinion of EBA that the current and historic costs are a reflection of the expected costs for the expanded operation. EBA has also noted that the production rates achieved during the current operations will be comparable with the initial phases of the Santa Elena underground operation, during a time when the heap leach reprocessing is being undertaken, subsequent to that production rate overall will decrease marginally. EBA has determined that the current open pit scenario and operational cost framework for G and A is roughly $3,650,000 per year. EBA expects that G and A to remain relatively similar motivated by the following points:
| 1. | The current open pit is operated by contractor mining, and therefore much of the skilled staff required for mining are included in the G and A cost and not the mining cost |
| 2. | The production rate for the future underground mining, including the heap leach is similar |
| 3. | Santa Elena currently has staff related expenses under G and A who work on the underground operation, who will continue working on the underground operation |
| 4. | The key changes from the current operational scenario applicable to the Expansion are the construction of a plant and the underground mine. Both aspects of the Expansion include costs estimates relative to current operations, therefore additional costs are included in the mining and /or processing cost. |
NATIONAL INSTRUMENT 43-101 TECHNICAL REPORT
EFFECTIVE DATE: APRIL30, 2013 | AMENDED DATE: MARCH 04, 2014
Therefore G and A costs for the Expansion have been estimated at $3.65 Million per year, averaging an estimated $3.60 per tonne over the life of mine.
Tetra Tech prepared an economic evaluation of the Santa Elena Expansion Project based on a pre-tax financial model and post-tax financial results. The analysis is based on Q2 2013 US dollars. No gearing or adjustment for inflation/currency gap is assumed. This economic analysis includes current Sandstorm agreement terms (see section 4.3). Note that Sandstorm’s participation in the underground production is pending. This economic analysis does not include sunk costs for all expenses applicable to the Santa Elena expansion up to the 30th of April 2013.
| 22.2 | Technical Assumptions |
Technical-Economic assumptions used in the analysis are summarized in Table 22.1.
Currency exchange rates are based on three-year trailing averages.
Refinery costs, as described in Section19.1, reflect actual contract terms and include provision for freight and marketing costs.
Income tax is calculated at a rate of 30% on operating profit less depreciation, applicable loss-carry forwards and employee profit share payments. Employee profit share is included in the G&A and is structured according to current SilverCrest operations.
Table 22.1: Technical-Economic Modeling Assumptions
| Parameter | Value |
| Markets: | |
Gold Price1 | US$1,450/troy-oz |
Silver Price1 | US$28.00/troy-oz |
Currency Exchange CDN:US$2 | 1.00:1.00 |
Currency Exchange US$:MEX$2 | 1.00:13 |
| Refinery Terms: | |
| Gold | Pay for 99.98%, US$ x/payable oz |
| Silver | Pay For 99.85%, US$ y/payable oz |
| Financing: | |
| Analysis Basis | Q2 2013 US dollars |
| Gearing | None |
| Income Tax Rate | 30% |
| Depreciation | 10-year, Straight Line |
| i. | EBA’s long-term consensus metal prices as of April 30, 2013. |
| ii. | Based on three year trailing average (as of April 30, 2013) and rounded –off to two decimals |
NATIONAL INSTRUMENT 43-101 TECHNICAL REPORT
EFFECTIVE DATE: APRIL30, 2013 | AMENDED DATE: MARCH 04, 2014
| 22.3 | Summary of Financial Results |
The pre-tax and post tax economic analysis results for the base case are shown in table 22.2.
Table 22.2: Base Case Economic Analysis Results
| Aspects of financial analysis | Units | Value | Per Au oz eq produced | Per Ag oz eq produced |
| Production |
| Gold Sold post refiner | k.oz | 262 | | |
| Silver Sold post refiner | k.oz | 12,101 | | |
| Gold Eq ounces | k.oz | 496 | | |
| Silver Eq ounces | k.oz | 25,680 | | |
| Revenue |
| Gold Sales | US$’000 | $346,110 | | |
| Silver Sales | US$’000 | $338,821 | | |
| Gross Sales | US$’000 | $684,931 | | |
| Operating Expenses |
| Underground mining | US$’000 | $99,443 | 200.5 | 3.87 |
| Open pit mining | US$’000 | $2,166 | 4.4 | 0.08 |
| Heap leach mining | US$’000 | $1,764 | 3.6 | 0.07 |
| Processing | US$’000 | $151,470 | 305.4 | 5.90 |
| G&A | US$’000 | $27,381 | 55.2 | 1.07 |
| Total Operating Costs* | US$’000 | $282,223 | 569 | 11.0 |
| | | | | |
| Freight & Refining | US$’000 | $5,579 | 11.2 | 0.22 |
| Pre-tax financial results |
| Operating Margin | US$’000 | $397,130 | 800.7 | 15.46 |
| Capital Costs | US$’000 | -$87,813 | -177 | -3.42 |
| Mine closure costs | US$’000 | -$5,000 | -10.1 | -0.19 |
| Working Capital | US$’000 | -$1,836 | -3.7 | -0.07 |
| Pre-tax cash flow | US$’000 | $302,481 | 609.8 | 11.8 |
| Pre-tax NPV 5% | US$’000 | $223,670 | 450.9 | 8.7 |
| Pre-tax IRR** | % | 88% | | |
| Post tax financial analysis results |
| Taxes | US$’000 | $100,839 | 203 | 3.93 |
| Cash Flow post tax | US$’000 | $201,642 | 406.5 | 7.85 |
| Post tax NPV 5% | US$’000 | $145,556 | 293.5 | 5.7 |
| Post tax IRR** | % | 60% | | |
| | * Operating cost per AU EQ oz. sold varies between $496 and $639 over the life of mine |
| | ** The IRR presented here do not reflect total project economics but reflect incremental project economics as they do not include sunk costs for the Santa Elena expansion prior to April 30 2013 |
NATIONAL INSTRUMENT 43-101 TECHNICAL REPORT
EFFECTIVE DATE: APRIL30, 2013 | AMENDED DATE: MARCH 04, 2014
The economic analysis does not include 2013 open pit heap leach production, which has an estimated NPV of $20 million based on projected production cash flows at a gold price of $1,250 and a silver price of $19.50. The economics also excludes the fact that the heap leach reserves will be increased by the open pit production in 2013, and this material will be available for milling. The heap leach pad reserves will be restated in 2014, first quarter to include the material placed on the pad for 2013.
The post tax financial model was established on a 100% equity basis, excluding debt financing and loan interest charges. The post tax financial results of the base case are compared to roughly the spot price in the first week of July 2013 in Table 22.3 below.
Table 22.3: Comparison of Base Case Post Tax Results used in the PFS with Spot Price Post Tax Results at mid July 2013
| | Item | Base Case | Spot Price |
| Gold Price (US$/oz) | $1,450 | $1,250 |
| Silver price (US$/oz | $28 | $19.50 |
| Pre tax | Pretax IRR (%)** | 88% | 49% |
| DCF NPV @ 5.0% in millions | $223.7 | $108.7 |
| Payback (production years) | 1.1 | 1.7 |
| Post tax | IRR (%)** | 60% | 32% |
| DCF NPV @ 5.0% in millions | $145.6 | $65.1 |
| DCF NPV @ 8.0% in millions | $120.4 | $50.8 |
| Payback (production years) | 1.5 | 3.1 |
| | * IRR numbers shown here do not reflect full project economics as they do not consider sunk costs |
Figure 22.1 shows the pretax and post tax cash flows. The peak cash flow occurs in sixth year of operation when higher underground production is achieved and higher grades are being mined in the schedule.
NATIONAL INSTRUMENT 43-101 TECHNICAL REPORT
EFFECTIVE DATE: APRIL30, 2013 | AMENDED DATE: MARCH 04, 2014
Figure 22.1: Pre-tax and Post-tax Cash Flows
| 22.5 | Post - tax Results and Sensitivity Analysis |
The post tax model has been developed for the PFS by Tetra Tech. The following assumptions have been used in development of the after tax model:
| 2. | Any employee profit share is included in the G & A and is structured according to current SilverCrest operations. |
| 3. | Depreciation has been deducted from taxable earning as straight-line depreciation over 10 years. |
| 4. | No losses have been carried forward. |
| 5. | Other deductions applicable to pre-tax financial results are applicable to post tax financial results. |
The base case as shown Table 22.3 above is used as the base case for the sensitivity analysis. The sensitivities are determined by initially determining which key variable the project is most sensitive to and then selecting those for further analysis. In the case of the Santa Elena Expansion Project, these are in order of most sensitive to least sensitive; gold and silver price, operating and capital cost. The key variables are adjusted from -30% to +30%. The results for NPV and are IRR shown in Figures 22.2 and 22.3. Tables 22.4 shows the cash flow analysis used to derive the post-tax sensitivities.
NATIONAL INSTRUMENT 43-101 TECHNICAL REPORT
EFFECTIVE DATE: APRIL30, 2013 | AMENDED DATE: MARCH 04, 2014
To evaluate the financial performance of the Project, the production schedule was incorporated into the 100% equity pre-tax financial model to develop annual recovered metal production from the relationships of tonnage processed, head grades, and recoveries.
All costs and revenues were assumed to occur at the end of each year in which they were scheduled to occur.
Gold and silver payable values were calculated based on base case metal price and exchange rate. Unit operating costs for mining, processing and G&A were applied to monthly mined or processed tonnages, to determine the overall operating cost, which was deducted from the revenues to derive monthly operating cash flow. Monthly operating cash flows were totaled into annual cash flows, and the financial analysis was run on annual cash flows.
Initial and sustaining capital costs were incorporated on a year-by-year basis over the LOM. Reclamation bond, working capital and capital equipment salvation value have been included in the cash flow. Capital expenditures were then deducted from the operating cash flow to determine the net cash flow before taxes.
Initial capital expenditures presented in this study include costs accumulated prior to first production of doré for the new process facility but excludes cost for exploration, open pit, and heap leach. Sustaining capital includes expenditures for mining and processing additions, equipment replacement, and process plant expansion.
The undiscounted annual net cash flow (NCF) and cumulative net cash flow (CNCF) are shown in Figure 22.1
NATIONAL INSTRUMENT 43-101 TECHNICAL REPORT
EFFECTIVE DATE: APRIL30, 2013 | AMENDED DATE: MARCH 04, 2014
Table 22.4: Discounted Post Tax Cash Flow Model
| Discount cash flow model |
| | Total | Year -1 | Year 1 | Year 2 | Year 3 | Year 4 | Year 5 | Year 6 | Year 7 | Year 8 | Year 9 |
| AU ounces sold | 262,739 | | 36,173 | 39,606 | 29,361 | 27,557 | 27,924 | 53,357 | 37,535 | 11,226 | 0 |
| AG Ounces sold | 12,118,926 | | 1,345,248 | 1,594,643 | 1,409,639 | 1,742,741 | 1,556,867 | 1,951,279 | 1,816,118 | 702,392 | 0 |
| | | | | | | | | | | | |
| AU Refinery deductions (oz) | (525) | | (72) | (79) | (59) | (55) | (56) | (107) | (75) | (22) | 0 |
| AG Refinery deductions (oz) | (18,178) | | (2,018) | (2,392) | (2,114) | (2,614) | (2,335) | (2,927) | (2,724) | (1,054) | 0 |
| | | | | | | | | | | | |
| Payable Metal Au(oz) @ Spot | 231,214 | | 28,881 | 31,622 | 23,442 | 17,488 | 27,868 | 53,250 | 37,460 | 11,204 | 0 |
| Payable Metal Au(oz) Sandstorm | 31,000 | | 7,220 | 7,905 | 5,861 | 10,014 | 0 | 0 | 0 | 0 | 0 |
| Payable Metal Ag(oz) | 12,100,747 | | 1,343,231 | 1,592,251 | 1,407,525 | 1,740,126 | 1,554,531 | 1,948,352 | 1,813,393 | 701,339 | 0 |
| | | | | | | | | | | | |
| Operating revenue | $684,931,142 | | $82,014,419 | $93,201,266 | $75,453,077 | $77,586,387 | $83,935,732 | $131,766,045 | $105,091,482 | $35,882,733 | $0 |
| | | | | | | | | | | | |
| Dore transport and selling costs | ($5,578,528) | | ($625,767) | ($739,498) | ($649,770) | ($797,224) | ($714,497) | ($893,445) | ($836,931) | ($321,395) | $0 |
| | | | | | | | | | | | |
| Operating costs | ($282,222,851) | | ($31,815,916) | ($35,254,445) | ($35,232,343) | ($35,874,143) | ($37,792,957) | ($45,464,850) | ($44,930,788) | ($15,857,410) | $0 |
| | | | | | | | | | | | |
| Operating Profit | $397,129,763 | | $49,572,736 | $57,207,324 | $39,570,964 | $40,915,021 | $45,428,278 | $85,407,749 | $59,323,763 | $19,703,928 | $0 |
| | | | | | | | | | | | |
| Capital | ($87,813,477) | ($48,067,874) | ($6,272,455) | ($3,605,930) | ($11,554,820) | ($10,982,336) | ($5,379,848) | ($553,384) | ($1,221,259) | ($175,571) | $0 |
| Working capital | ($1,835,534) | | ($1,835,534) | $0 | $0 | $0 | $0 | $0 | $0 | $0 | $0 |
| Closure costs | ($5,000,000) | | | | | | | | | | ($5,000,000) |
| | | | | | | | | | | | |
| Income Tax Payable | ($100,838,858) | | ($13,241,611) | ($15,423,809) | ($9,786,257) | ($9,860,004) | ($11,052,586) | ($23,029,825) | ($15,167,992) | ($3,276,774) | $0 |
| | | | | | | | | | | | |
| Post-tax cash flow | $201,641,895 | ($48,067,874) | $28,223,136 | $38,177,584 | $18,229,888 | $20,072,681 | $28,995,845 | $61,824,540 | $42,934,512 | $16,251,583 | ($5,000,000) |
| | * Appendix F shows the financial analysis including tax calculations and capital cost schedules |
NATIONAL INSTRUMENT 43-101 TECHNICAL REPORT
EFFECTIVE DATE: APRIL30, 2013 | AMENDED DATE: MARCH 04, 2014
Figure 22.2: NPV Sensitivity Analysis
Figure 22.3: IRR Sensitivity Analysis
NATIONAL INSTRUMENT 43-101 TECHNICAL REPORT
EFFECTIVE DATE: APRIL30, 2013 | AMENDED DATE: MARCH 04, 2014
It should be noted that the sensitivity of the Santa Elena Expansion Project to gold and silver price volatility is nearly equal. It can be seen that the NPV and IRR return similar results when either one of the commodity prices is changed.
On May 14, 2009, SilverCrest entered into a definitive Purchase Agreement with Sandstorm Gold Ltd. under which Nusantara agreed to sell 20% of future gold production from the Santa Elena open pit to Sandstorm, up to 50,000 ounces of gold, in exchange for an Upfront Deposit of $USD 12,000,000. The agreement also provides for ongoing per-ounce payments by Sandstorm equal to the lesser of $350 and the prevailing spot gold market price upon delivery of gold. The per ounce price of $USD 350 is subject to an increase of 1% per annum commencing on the 3rd anniversary of the date that Santa Elena Project began commercial production (i.e. July 2014).
Santa Elena is an operating mine and currently sells gold and silver as part of ongoing operations. Based on information provided by SilverCrest, EBA has added a cost to account for smelter and refinery costs.
There are no issues related to adjacent properties.
| 24.0 | OTHER RELEVANT DATA AND INFORMATION |
The following information has been considered useful to understand the Santa Elena expansion Project.
| 24.1 | Project Execution Plan – Progress Completed |
It should be noted that progress towards executing the Santa Elena Expansion Project has already been achieved. In particular the main ramp, from the 780 level adit, has been advanced to the 625 level (at an elevation of 625 m a.s.l.). At this elevation a crosscut has been developed into the ore body. At this elevation inflows of ground water at over 200 gallon per minute, were experienced. This water will be managed by SilverCrest and may be available to the mine for the process plant.
Progress has also been made in purchasing equipment for the construction of the process plant. Table 24.1 shows the progress on equipment purchases and construction of the process plant.
NATIONAL INSTRUMENT 43-101 TECHNICAL REPORT
EFFECTIVE DATE: APRIL30, 2013 | AMENDED DATE: MARCH 04, 2014
Table 24.1: Process Plant Equipment Purchase Progress
Process plant (Mill) budget as of 30th April 2013 |
| | Opening Balance | 2013 Budget | Estimated Total | Paid to Date | Paid % |
| | Dec 31, 2012 | USD$ | Dec 31, 2013 | USD$ | Apr 30, 2013 |
| MILL | US$ | US$ | US$ | US$ | US$ |
| Crushing & Screening | 409,235 | 7,077,357 | 7,486,593 | 2,189,006 | 28% |
| Storage & Handling | - | 3,154,074 | 3,154,074 | 471,881 | 12% |
| Grinding & Classification | 630,360 | 7,206,496 | 7,836,856 | 1,340,650 | 15% |
| Leaching and CCD | 444,606 | 7,906,602 | 8,351,209 | 2,717,322 | 36% |
| Recovery (MC Plant) | 524,523 | 5,838,728 | 6,363,251 | 2,267,527 | 35% |
| Reagents | - | 2,109,104 | 2,109,104 | 101,571 | 4% |
| Water storage | - | 337,083 | 337,083 | 8,009 | 2% |
| Tailings | 144,431 | 5,349,124 | 5,493,555 | 1,235,010 | 22% |
| Auxiliaries | 119,000 | 1,890,270 | 2,009,271 | 621,636 | 41% |
| Engineering procurement and construction management | 1,683,882 | 4,153,794 | 5,837,675 | 4,352,395 | 72% |
| Power generation (diesel generators) | - | 7,953,312 | 7,953,312 | 2,276,429 | 37% |
| Stackers | 790,869 | 230,000 | 1,020,869 | 1,018,479 | 100% |
| Other Equipment | 363,565 | | 363,565 | 363,565 | 100% |
| Total | 5,110,472 | 53,205,945 | 58,316,417 | 18,963,479 | 32% |
| 24.2 | Schedule to the Start of Underground Stoping |
Based on the progress to date, there is no concern for slippage in the schedule for the Santa Elena Expansion Project. Also, the availability of spent ore can mitigate this risk. In addition, schedule slippage of 2 to 3 months will not cause a significant loss to the project as in that case the mined ore would be heap leached until completion of the process mill. Though recoveries would be lower in the heap leach than in the mill, the heap leached ore is planned to be reprocessed and thereby resulting in similar overall recoveries. The critical date for the underground mining to commence is after exhaustion of the open pit reserves. Figure 24.1 shows the schedule for the project as a Gantt chart with the milestone of commencement with stoping as the objective.
Figure 24.1 shows Project schedule up to commencement with stoping (two stopes available).
NATIONAL INSTRUMENT 43-101 TECHNICAL REPORT
EFFECTIVE DATE: APRIL30, 2013 | AMENDED DATE: MARCH 04, 2014
Figure 24.1: Santa Elena Expansion Project Development Schedule
NATIONAL INSTRUMENT 43-101 TECHNICAL REPORT
EFFECTIVE DATE: APRIL30, 2013 | AMENDED DATE: MARCH 04, 2014
| 25.0 | INTERPRETATION AND CONCLUSION |
| 25.1 | Geology and Underground Resource Estimate |
The Santa Elena vein is a low sulphidation quartz-calcite epithermal vein striking in E-NE and dipping between 45-75° to the south. The principal trend of mineralization has a rake of approximately 25° to the southeast and has been delineated to a depth of approximately 475 metres below surface. Gold and silver grades are constrained within the main quartz vein with some additional mineralization noted in stringers and quartz breccia along the hanging wall and footwall contacts of the vein. The metal grades are zoned with silver proportions increasing with depth.
The deposit is strongly oxidized at surface and down to depths of at least 150 metres below surface. However, weak to moderate alteration associated with disseminated fine grained pyrite is noted where northwest trending structures crosscut the main vein. The oxide zone transitions at depth to sulphide bearing, noted by trace amounts of visible argentite noted in the drill core.
| 25.2 | Underground Reserves and Mining Methods |
Underground probable reserves of 3.9 million tonnes at an average grade of 3 g/t Au equivalent have potential for economic extraction at current metal prices. A combination of longitudinal and transverse long hole stoping and mechanised cut and fill methods will be suitable for underground mining.
| 25.3 | Costs and Project Economics |
EBA has estimated that approximately $48 million in capital investment is required to commence with production as part of the expansion plan with approximately another $40 million required over the life of mine, this including a contingency of $ 9.3 million over the life of mine. Operating costs are estimated to be approximately $569 per ounce of gold equivalent and $11 per ounce silver equivalent. At the base case metal prices the estimated post tax net present value estimate of the operation is roughly $ 145 million at a discount rate of 5%. At the current metal prices the estimated post tax net present value estimate of the operation is roughly $ 65 million at a discount rate of 5%.
| 26.1 | Geology and Underground Resource Estimate |
| 26.1.1 | Risks and Opportunities |
Mineralization within the southeasterly plunging trend has been well delineated by the recent 2012-2013 drilling campaign; however, more drilling is required in preparation for underground mining. Additional drilling on the property should aim to test and confirm the following items:
NATIONAL INSTRUMENT 43-101 TECHNICAL REPORT
EFFECTIVE DATE: APRIL30, 2013 | AMENDED DATE: MARCH 04, 2014
| § | Delineation drilling along the eastern strike extent of the main vein between the 600 and the 400 metre level elevation to delineate trends with elevated grades and increase resource classification for blocks in this area, |
| § | Infill drilling on 12 metre centres within the current Indicated resource to upgrade block model confidence for underground mining, |
| § | accurately delineate the distribution of sulphide bearing mineralization and the transition from near surface oxide to un-oxidized material at depth as this change in mineralogy may have a significant impact of metal recoveries, |
| § | Dedicated drilling within the Cholugo and Cholugo Dos veins to upgrade current resource and as exploration to depth, |
| § | Map and delineate the mineralized NW trending structure which cross-cut the main Santa Elena vein as these may support additional resources, |
| § | Extensively map the Tinaja fault in drilling and from underground development to characterize the vein width and to project the fault into the proposed mine development for planning purposes, and |
| § | Conduct detailed drill core and underground mapping to assist in determining control and orientation of high grade mineralization trends and ore shoots. |
| 26.2 | Geotechnical Recommendation |
Geotechnical recommendations are split into two sections for this Pre-Feasibility report:
| § | Key recommendations to improve stope size and refine pillar dimensions. |
| § | Geotechnical considerations in overall mine design. |
| 26.2.1 | Stope Size and Pillar Dimensioning |
| 26.2.1.1 | Hanging wall and orebody NGI-Q values |
| § | Due to the apparent degradation of rock mass quality with depth in the 2012 drilling program it is recommended that further drilling be conducted underground. This degradation could be due to limited availability of geotechnical data at present as footwall rock quality appears fairly consistent at depth. This apparent degradation could create overly conservative stope design parameters and it is recommended that rockmass quality at depth requires further clarification through a drilling program. |
| 26.2.1.2 | Joint set orientation |
Joint set orientation can play a key role in stope stability. The orientation data at Santa Elena is limited with six orientated holes gleaning a limited number of measurements to gain joint set data for stope layout.
| § | Further joint set measurements can be taken through consistent geotechnical mapping of the ore zone and hanging wall during mining activities. |
| § | Further orientated boreholes can be undertaken during subsurface and surface exploration. During the 2012 surface drilling program a limited number of joint orientation data was able to be retrieved. It is strongly recommended that the use of a Televiewer be incorporated into further data collection. This allows for in-situ joint orientation data to be collected that will aid in stope definition. |
NATIONAL INSTRUMENT 43-101 TECHNICAL REPORT
EFFECTIVE DATE: APRIL30, 2013 | AMENDED DATE: MARCH 04, 2014
| 26.2.1.3 | In-situ stress regime |
The in-situ stress regime at Santa Elena needs clarification as the stress regime has been assumed at pre-feasibility level.
| § | It is strongly advised that in-situ stress analysis be conducted at Santa Elena in order to determine principal stress magnitude and trajectory and horizontal to vertical stress ratio. This should be done in order to maximize ore extraction, minimize pillar dimensions, assist in pillar recovery design and minimize support cost to local rather than regional zones based on the in-situ stress regime. EBA can assist in developing a cost effective stress measurement program in conjunction with Silver Crest for this purpose. |
| 26.2.1.4 | Hanging wall and ore body strength and deformation characteristics |
Clarification of hanging wall and ore body strength characteristics is recommended beyond pre-feasibility level as there is concern that the UCS strength results that have been returned so far are relatively low for the general rock types encountered.
| § | In addition to simple UCS strengths for the footwall, hanging wall and orebody the Hoek-Brown parameters and deformation characteristics need to be determined for the rock conditions found at Santa Elena in order to refine stope and pillar design to a higher degree of accuracy beyond pre-feasibility level. |
| § | It is strongly recommended that tri-axial testing be carried out on hanging wall, footwall and ore samples together with further UCS testing with strain measurements in order to determine site specific strength and deformation characteristics of the rock types at Santa Elena for inclusion into future geotechnical modelling of the mine and for stope and pillar refinement. It is recommended that 80% of future testing be carried out at Sonora University, Mexico and 20% at UBC, Vancouver as a reference check. |
| 26.2.2 | Geotechnical Considerations in Overall Mine Design |
| § | As the orebody varies in dip and dip direction and thickness, both along strike and down dip, it is strongly advised that three dimensional geotechnical analysis be conducted on the orebody once the stress regime and rock deformation characteristics have been determined. This can be advantageous to mine sequencing, backfill addition and pillar recovery in order to further maximise ore extraction. |
| § | It is recommended to space rib pillars across levels so as to avoid stacking of pillars. This will minimize the creation and effect of tall slender pillars on the overall mine wide excavation. |
| § | This PFS does not consider the interaction between the pit and the proposed underground stopes. This should be reviewed once stoping outlines have been defined for feasibility or design stages. |
NATIONAL INSTRUMENT 43-101 TECHNICAL REPORT
EFFECTIVE DATE: APRIL30, 2013 | AMENDED DATE: MARCH 04, 2014
| 26.3 | Recommendations on Mining Methods and Mining Costs |
EBA recommend that SilverCrest further investigate the purchase of commercial underground mining trucks as opposed to use of an underground haulage contractor. EBA suggests that the reliability and productivity of commercial underground mining trucks, may improve the efficiency of haulage of ore and waste rock to surface.
EBA recommend that SilverCrest investigate hydraulic and/or paste fill as a means of disposing of mill tailings, and the use of boreholes drilled from surface to deliver the tailings underground, as opposed to backhaul by trucks.
| 26.4 | Environmental, Closure and Asset Retirement |
A previous independent closure and reclamation plan was created in 2010 for the original open pit mining and heap leaching operations. Numerous elements of the project and impacts to the property have been modified from the original project scope for the current Expansion Project. It is recommended that SilverCrest update the estimated funding, or bond, requirements that will be necessary for site closure and long term monitoring activities.
| 26.5 | Breakdown of costs for future work |
EBA Engineering has estimated the costs for completion of the above recommended studies as summarised in the table 26.1 below:
Table 26.1: Breakdown of future costs related to recommendations
| Recommendation | Future work | Estimated cost |
| 26.1 Geology and Underground Resources | An infill drilling programme consisting of roughly 5,000m of drilling | $1.25 million |
| 26.2 Geotechnical Recommendations | Geotechnical design study for underground | $ 50,000 |
| 26.3 Recommendations on Mining Methods and Costs | In house study on options for mining methods | $ 50,000 |
| 26.4 Environmental, closure and Asset retirement | Review of existing bond for closure held on the property | $ 25,000 |
| Total future costs related to recommendations | $ 1.375 million |
Note that since Santa Elena is an operating mine, much of the above work is ongoing or is being undertaken in house with current in house equipment and expertise.
NATIONAL INSTRUMENT 43-101 TECHNICAL REPORT
EFFECTIVE DATE: APRIL30, 2013 | AMENDED DATE: MARCH 04, 2014
| | Aguirre-Díaz, G., and McDowell, F., 1991, The volcanic section at Nazas, Durango, Mexico, and the possibility of widespread Eocene volcanism within the Sierra Madre Occidental: Journal of Geophysical Research, v. 96, p. 13,373–13,388. |
| | Aguirre-Díaz, G., and McDowell, F., 1993, Nature and timing of faulting and synextensional magmatism in the southern Basin and Range, central-eastern Durango, Mexico: Geological Society of America Bulletin, v. 105, p. 1435–1444. |
| | Alaniz-Alvarez and Nieto-Samaniego, A.F., 2007, the Taxco-San Miguel de Allende fault system and the Trans-Mexican Volcanic Belt: Two tectonic boundaries in central Mexico active during the Cenozoic, in Alaniz-Alvarez, S.A and Nieto-Samaniego, A.F., ed., Geology of Mexico: Celebrating the Centenary of the Geological Society of Mexico: Geological society of America special Paper 422, p. 301-316. |
| | Anderson, T. A., and Schmidt,V. A., 1983, The evolution of Middle America and the Gulf of Mexico-Caribbean Sea during Mesozoic time: Geological Society of America Bulletin, v. 9, p. 941–966. |
| | Barr, P.J.F, Chow, J., Allard, G. and Wallis., C.S. 2011. NI 43-101 Technical Report Reserve Update for the Santa Elena Open Pit and Preliminary Assessment for the Santa Elena and Cruz de Mayo Expansion Project Sonora, Mexico. Prepared for SilverCrest Mines Ltd, Effective Date; April 1st, 2011. |
| | Barton, N.R., Lien, R. and Lunde, J. 1974. Engineering classification of rock masses for the design of tunnel support. Rock Mech. 6(4), 189-239. Global Resource Engineering (2011) |
| | Bieniawski, Z.T. 1976. Rock mass classification in rock engineering. In exploration for rock engineering, proc. of the symp., (ed. Z.T. Bieniawski) 1, 97-106. Cape Town: Balkema. |
| | Campa, M. F., and P., Coney, 1983, Tectonostratigraphic terranes and mineral resources distribution in Mexico: Canadian Journal of Earth Sciences, v. 20, p. 1040–1051. |
| | Carter, 1990) or Carter, T.G. (1992), .A new approach to Surface Crown Pillar Design,. Proc. 16th Can. Rock Mechanics Symposium, Sudbury, pp. 75-83. |
| | Clark, L.M. and Pakalnis, R.C. (1997). An Empirical Design Approach for Estimating Unplanned Dilution from Open Stope Hanging walls and Footwalls. Proceedings of the 99th AGM - CIM. Vancouver, pp. 25. |
| | Mining Cost Service. 2012. Costmine Infomine USA, Inc. |
| | Index Mundi. >http://www.indexmundi.com/<. Accessed May 20th 2013 |
| | Nieto-Samaniego, A.F., Alaniz-Alvarez, S.A., and Camprubi, A. (2007), Mesa Central of Mexico: Stratigraphy, structure, and Cenozoic tectonic evolution, p. 41-70; in Geology of Mexico: Celebrating the Centenary of the Geological Society of Mexico, The Geological Society of America, Special Paper 422, 2007, edited by Susana A. Alaniz-Alvarez and Angel F. Nieto-Samaniego; 465pp. |
| | Ferrari, L. Valencia-Moreo, M., Bryan, S., (2007), Magmatism and tectonics of the Sierra Madre Occidental and its relation with the evolution of the western margin of north America, p. 1-29; in Geology of Mexico: Celebrating the Centenary of the Geological Society of Mexico, The Geological Society of America, Special Paper 422, 2007, edited by Susana A. Alaniz-Alvarez and Angel F. Nieto-Samaniego; 465pp. |
NATIONAL INSTRUMENT 43-101 TECHNICAL REPORT
EFFECTIVE DATE: APRIL30, 2013 | AMENDED DATE: MARCH 04, 2014
| | Fier, E.N, and Wallis, C.S., 2007, Technical Report On The Cruz De Mayo Property, Sonora Mexico, Prepared For SilverCrest Mines Inc. December 10, 2007. |
| | Fier, E. N., 2009, Technical Report On The Santa Elena Property, Sonora Mexico, Prepared For Silvercrest Mines Inc., February 15, 2009. |
| | Johnson, C. M., 1991, Large-scale crust formation and lithosphere modification beneath middle to late Cenozoic calderas and volcanic fields, Western North-America: Journal of Geophysical Research, v. 96, p. 13485–13507. |
| | Lang, B., 1994, Span Design for entry type excavations, MASC Thesis, University of British Columbia, Vancouver, BC. |
| | Mathews, K.E. et al., 1981, Prediction of stable excavation spans for mining at depths below 1000m in hard rock, CAMMET) Report DSS Serial No. OSQ80-00081. |
| | Prosser, B.S and Wallace K.G 1999. Practical Values of Friction Factors. Mine Ventilation Services, Inc. (MVS) |
| | Potvin, Y., M. Hudyma, H.D.S. Miller, 1988, Design guidelines for open stope support, CIM Bulletin, vol. 82, No. 926, June, pp. 53-62.Nickson (1992) |
| | Rogers, John J.W et.al 2004. Continents and Supercontinents. Chapter 6. p85. |
| | Wark, D. A., Kempter, K. A., and McDowell, F. W., 1990, Evolution of waning subduction-related magmatism, northern Sierra Madre Occidental, Mexico: Geological Society of America Bulletin, v. 102, p. 1555–1564. |
NATIONAL INSTRUMENT 43-101 TECHNICAL REPORT
EFFECTIVE DATE: APRIL30, 2013 | AMENDED DATE: MARCH 04, 2014
APPENDIX A
QUALIFIED PERSON CERTIFICATES
NATIONAL INSTRUMENT 43-101 TECHNICAL REPORT
EFFECTIVE DATE: APRIL30, 2013 | AMENDED DATE: MARCH 04, 2014
Certificate of qualified person – Nathan Eric Fier
I, Nathan Eric Fier, do hereby declare that:
| 1. | I currently reside in Mission, British Columbia, Canada, and am currently the President and Chief Operating Officer for SilverCrest Mines Inc. My office address is Suite 501, 570 Granville Street, Vancouver, B.C., V6C 3P1. |
| 2. | I hold two Bachelors of Science degrees in Geological Engineering (1984) and Mining Engineering (1986) from Montana Tech, Butte, Montana. |
| 3. | I am a member in good standing in the Association of Professional Engineers and Geoscientists of British Columbia (APEGBC), member # 135165, (APEGSK), member # 23381 and a Certified Professional Geologist registered with the American Institute of Professional Geologists (AIPG, USA) member # 10622. |
| 4. | I am an author and Qualified Person (within the meaning of National Instrument 43-101) responsible for the preparation of the Technical Report entitled: |
“SANTA ELENA EXPANSION PRE-FEASIBILITY STUDY AND OPEN PIT RESERVE UPDATE” SONORA, MEXICO
NI 43-101 TECHNICAL REPORT
PREPARED FOR SILVERCREST MINE S INC.
Effective Date: April 30, 2013
Amended Date: 04 March, 2014
| 5. | I am responsible for sections 1, 4.2 to 4.4, 10.3, 11.5, 12.6, 13.2, 14.5 to 15.6 excluding 15.4, 16.6.2 to 16.10 excluding 16.7, 18.1, 18.4, 19, 21.1.6, 21.1.7, 21.2.2, 21.3, 21.4, 23, 24, 26.4 and 26.5. |
| 6. | As a Qualified Person for this report, I have read the National Instrument 43-101 and Companion Policy and confirm that the sections of this report for which I am responsible have been prepared in compliance to National Instrument 43-101. |
| 7. | I have visited the Santa Elena property on numerous occasions between January 2005 to July 2013. |
| 8. | I have worked on numerous related properties over 28 years of worldwide geologic and mining experience including but not limited to; |
| a. | Various Technical Reports on Santa Elena Property, Mexico – low sulfidation epithermal deposit (LSED). |
| b. | Technical Report on Cruz de Mayo Property, Mexico – LSED. |
| c. | Technical Report on San Marcial Property, Mexico – LSED. |
| d. | Due Diligence on Gold Road Property, Arizona – LSED. |
| e. | Technical Report on La Joya Property, Mexico – Skarn. |
| f. | Development manager for the La Colorada and La Trinidad mines, Mexico – LSED. |
| g. | Technical Report on El Zapote Property, El Salvador – Breccia Pipe. |
| h. | Technical Report on El Ocote Property, Honduras – Breccia Pipe. |
| i. | Work on several Carlin-type gold deposits – Gold Quarry, Betze-Post, Leeville. |
| j. | Work on several Copper-gold-moly porphyry deposits – Batu Hijau, Endako. |
| 9. | I am not independent of SilverCrest Mines as independence is described in Section 1.5 of the National Instrument 43-101. In addition I am currently a shareholder of SilverCrest and am I directly entitled to financially benefit from its success. |
| 10. | Prior to this report, I have had extensive prior involvement on the Santa Elena property including multiple previous Technical Reports, exploration, development, construction and production. |
| 11. | To the best of my knowledge, information and belief, as of the effective date of the Technical Report, the Technical Report contains all scientific and technical information that is required to be disclosed to make the Technical Report not misleading. |
Dated this 04 March, 2014,
Original signed and sealed by
“N. Eric Fier”
________________________________
N. Eric Fier, CPG, P.Eng., President and Chief Operating Officer for SilverCrest Mines Inc.
NATIONAL INSTRUMENT 43-101 TECHNICAL REPORT
EFFECTIVE DATE: APRIL30, 2013 | AMENDED DATE: MARCH 04, 2014
Certificate of qualified person - P. James F. Barr
I, P. James F. Barr, do hereby declare that:
| 1) | I currently reside in Vancouver, British Columbia, Canada, and am currently employed as Senior Geologist by Tetra Tech EBA Inc., with office address at 9th floor, 1066 W Hastings Street, Vancouver, British Columbia. |
| 2) | I hold a Bachelors of Science with Honours from the University of Waterloo (2003), Ontario, Canada, with a major in Environmental Science, Earth Science and Chemistry and I have practiced as an exploration and resource geologist in Canada and Mexico since 2003. |
| 3) | I am a member in good standing in the Association of Professional Engineers and Geoscientists of British Columbia (APEGBC), member 35150. |
| 4) | I am a co-author and Qualified Person responsible for the preparation of the Technical Report entitled: |
“SANTA ELENA EXPANSION PRE-FEASIBILITY STUDY AND OPEN PIT RESERVE UPDATE”
SONORA, MEXICO
NI 43-101 TECHNICAL REPORT
PREPARED FOR SILVERCREST MINES INC
Effective Date: April 30th, 2013
Amended Date: 04 March. 2014
| 5) | I am responsible for sections 2-10, 11.1-11.4, 11.6, 12.1-12.5, 14.1-14.4, 20, 25.1, 26.1 and 27 of this Technical Report. |
| 6) | As a Qualified Person for this report, I have read the National Instrument 43-101 and Companion Policy and confirm that this report has been prepared in compliance to National Instrument 43-101. |
| 7) | I have visited the Santa Elena property on 4 separate occasions since November 2010, the most recent of which occurred from Oct 13-14, 2012, |
| 8) | I have worked on and visited numerous epithermal, skarn and geologically related properties in this and other regions of Mexico, and have been conducting Mineral Resource Estimates for more than 5 years. |
| 9) | I am independent of SilverCrest Mines Inc. as independence is described in Section 1.5 of the National Instrument 43-101. In addition, I am currently not a shareholder of SilverCrest nor am I directly entitled to financially benefit from its success. |
| 10) | Prior to this report, I was a co-author of the May 11, 2011, Technical Report titled “NI 43-101 Technical Report, Reserve Update for the Santa Elena Open Pit and Preliminary Assessment for the Santa Elena and Cruz de Mayo Expansion Project, Sonora, Mexico”, with Effective Date April 1st, 2011. |
| 11) | To the best of my knowledge, information and belief, as of the Effective Date of the report, the parts of the Technical Report for which I am responsible contain all scientific and technical information that is required to be disclosed to make the Technical Report not mis-leading. |
Dated this 04 of March, 2014
Original signed and sealed by
“P. James F. Barr”
________________________________
P. James F. Barr, P.Geo
Senior Geologist, Tetra Tech EBA Inc.
NATIONAL INSTRUMENT 43-101 TECHNICAL REPORT
EFFECTIVE DATE: APRIL30, 2013 | AMENDED DATE: MARCH 04, 2014
Certificate of qualified person – C. Michael Tansey
I, C. Michael Tansey, do hereby declare that:
| | 1) I currently reside in St. Albert, Alberta, Canada, and am currently employed as a senior mining engineer Tetra Tech EBA Inc. My address is 32 Windsor Crescent, St. Albert, Alberta. |
| | 2) I hold a Bachelors of Science in Geotechnical Sciences from the University of Montreal (Loyola College), graduating in 1970. |
| | 3) I am a member in good standing in Northwest Territories and Nunavut Association of Professional Engineers and Geoscientists (NAPEG), member #1368 |
| | 4) I am an author and Qualified Person (within the meaning of National Instrument 43-101) responsible for the preparation of the Technical Report entitled: |
| | “SANTA ELENA EXPANSION PRE-FEASIBILITY STUDY AND OPEN PIT RESERVE UPDATE” |
| | NI 43-101 TECHNICAL REPORT |
| | PREPARED FOR SILVERCREST MINES INC. |
| | Effective Date: April 30, 2013 |
| | Amended Date: 04 March, 2014 |
| | 5) I am responsible, for sections 15.4, 16 excluding 16.2, 16.8, 16.9 and 16.10, 18.2, section 21 excluding 21.1.5, 21.1.6, 21.1.7, 21.2.2, 21.2.3 and 21.3, 25.2 and section 26.3. |
| | 6) As a Qualified Person for this report, I have read the National Instrument 43-101 and Companion |
| | Policy and confirm that this report has been prepared in compliance to National Instrument 43-101. |
| | 7) I have visited the Santa Elena property in August 2011 for 4 days and January 2012 for 4 days. |
| | 8) I have practiced my profession continuously from 1971 to 2006, semi-retired from 2007 to present, and have worked in mine engineering positions at underground nickel, copper, zinc and gold operations in Canada, including senior technical and operations supervision; conducted mining project evaluations, project permitting and closure planning for underground gold properties; and conducted mining research and development projects in the potash industry. |
| | 9) I am independent of SilverCrest Mines as independence is described in Section 1.5 of the National |
| | Instrument 43-101. In addition I am currently not a shareholder of SilverCrest nor am I directly entitled to financially benefit from its success. |
| | 10) Prior to this report, I have had no prior involvement on this property. |
| | 11) To the best of my knowledge, information and belief, as of the effective date of the Technical Report, the parts of the Technical Report for which I am responsible contains all scientific and technical information that is required to be disclosed to make the Technical Report not misleading. |
Dated this 04 March, 2014,
Original signed and sealed by
“C. Michael Tansey”
________________________________
C. Michael Tansey, P.Eng.
Senior Mining Engineer, Tetra Tech EBA Inc.
NATIONAL INSTRUMENT 43-101 TECHNICAL REPORT
EFFECTIVE DATE: APRIL30, 2013 | AMENDED DATE: MARCH 04, 2014
Certificate of qualified person – John Fox
I, John R.W. Fox, do hereby declare that:
| 1) | I currently reside in Vancouver, British Columbia, Canada, and am currently a consulting metallurgical engineer with Laurion Consulting Inc with offices at 302-304 West Cordova St. Vancouver, B.C , V6B 1E8 |
| 2) | I hold a Bachelors of Science in Applied Mineral Sciences and Extractive Metallurgy from the University of Leeds, UK. |
| 3) | I am a member in good standing in the Association of Professional Engineers and Geoscientists of British Columbia (APEGBC), member #12578. |
| 4) | I am an author and Qualified Person (within the meaning of National Instrument 43-101) responsible for part of the preparation of the Technical Report entitled: |
“SANTA ELENA EXPANSION PRE-FEASIBILITY STUDY AND OPEN PIT RESERVE UPDATE”
SONORA, MEXICO
NI 43-101 TECHNICAL REPORT
PREPARED FOR SILVERCREST MINES INC.
Effective Date: April 30, 2013
Amended Date: 04 March, 2014
| 5) | I am responsible for sections 13 except 13.2, 17, 1.5, 18.3, 21.1.5 & 21.2.3. |
| 6) | As a Qualified Person for this report, I have read the National Instrument 43-101 and Companion Policy and confirm that this report has been prepared in compliance to National Instrument 43101. |
| 7) | I have visited the Santa Elena property in June 2013. |
| 8) | I have been involved in numerous gold and silver properties including, Escalante Silver (Utah USA) Patchway, Brompton & Renco Gold (Zimbabwe) Snip & Bronson Creek (B.C) Ketza River (Yukon) Kremnica (Czeck Republic) Congress (Arizona, USA) La Colorado (Mexico) Equis (Colombia) La Victoria(Venezuela) Pangkut and Way Linggo (Indonesia) and many more. |
| 9) | I am independent of SilverCrest Mines as independence is described in Section 1.5 of the National Instrument 43-101. In addition I am currently not a shareholder of SilverCrest nor am I directly entitled to financially benefit from its success. |
| 10) | Prior to this report, I have had no prior involvement on this property. |
| 11) | To the best of my knowledge, information and belief, as of the Effective Date of the report, the parts of the Technical Report for which I am responsible contain all scientific and technical information that is required to be disclosed to make the Technical Report not mis-leading. |
Dated this 04 March, 2014,
Original signed and sealed by
“John R.W. Fox”
________________________________
John R.W. Fox, P.Eng.
Consulting Metallurgical Engineer
Laurion Consulting Inc.
NATIONAL INSTRUMENT 43-101 TECHNICAL REPORT
EFFECTIVE DATE: APRIL30, 2013 | AMENDED DATE: MARCH 04, 2014
I, Carlos Chaparro, do hereby declare that:
| 1) | I currently reside in Vancouver, British Columbia, Canada, and am currently employed as Senior Geotechnical Engineer for Tetra Tech EBA Inc., with office address at 9th floor, 1066 W Hastings Street, Vancouver, British Columbia. |
| 2) | I hold a Bachelors of Science in Civil Engineering from Universidad Javeriana in Bogota, Colombia and a Masters Degree in Civil Geotechnical Engineering from University of Illinois. I have practiced as geotechnical engineer in Colombia, USA, Canada and Mexico since 1995. |
| 3) | I am a member in good standing in the Association of Professional Engineers and Geoscientists of British Columbia (APEGBC), member 148633. |
| 4) | I am a co-author and Qualified Person responsible for the preparation of the Technical Report entitled: |
“SANTA ELENA EXPANSION PRE-FEASIBILITY STUDY AND OPEN PIT RESERVE UPDATE”
SONORA, MEXICO
NI 43-101 TECHNICAL REPORT
PREPARED FOR SILVERCREST MINES INC.
Effective Date: April 30, 2013
Amended Date: March 04, 2014
| 5) | I am responsible for sections 16.2 and 26.2 of this Technical Report. |
| 6) | As a Qualified Person for this report, I have read the National Instrument 43-101 and Companion Policy and confirm that this report has been prepared in compliance to National Instrument 43-101. |
| 7) | I have visited the Santa Elena property on 4th, 5th and 6th of September, 2011 and the 7th, 8th, 11th and 12th of July, 2012. |
| 8) | I have worked on and visited several underground and numerous open pit mines: underground projects in Central BC, Yukon, Nunavut and Mexico; open pit projects in Northwest Territories, Yukon, Nunavut, Ontario, Alaska, Greenland, Mexico and West Africa. |
| 9) | I am independent of SilverCrest Mines Inc. as independence is described in Section 1.5 of the National Instrument 43-101. In addition, I am currently not a shareholder of SilverCrest nor am I directly entitled to financially benefit from its success. |
| 10) | Prior to this report, I have no previous involvement with the property which is the subject of the technical report. |
| 11) | To the best of my knowledge, information and belief, as of the Effective Date of the report, the parts of the Technical Report for which I am responsible contain all scientific and technical information that is required to be disclosed to make the Technical Report not mis-leading. |
Dated this 04 day of March, 2014
Original signed and sealed by
“Carlos Chaparro”
Senior Geotechnical Engineer, Tetra Tech EBA Inc.
NATIONAL INSTRUMENT 43-101 TECHNICAL REPORT
EFFECTIVE DATE: APRIL30, 2013 | AMENDED DATE: MARCH 04, 2014
I, Nick Michael, BS, MBA, do hereby declare that:
| 1) | I am a Principal Mineral Economist with Tetra Tech, Inc. with a business address at 350 Indiana Street, Suite 500, Golden, Colorado 80401, USA. |
| 2) | I am a graduate of the Colorado School of Mines in Golden, Colorado USA in mining engineering (1983) and received and received an MBA from Willamette University (1986). I have practiced my profession continuously since 1987. |
| 3) | I am a Registered Member in good standing (#4104304) with the Society for Mining, Metallurgy and Exploration, Inc (SME). |
| 4) | I have read the definition of “qualified person” set out in National Instrument 43-101 – Standards of Disclosure for Mineral Projects (“NI 43-101”) and certify that by reason of my education, affiliation with a professional association (as defined in NI 43-101) and past relevant work experience, I fulfill the requirements to be a “qualified person” for the purposes of NI 43-101. |
| 5) | I am a Qualified Person (within the meaning of National Instrument 43-101) responsible for the preparation of the Technical Report entitled: |
SANTA ELENA EXPANSION PRE-FEASIBILITY STUDY AND OPEN PIT RESERVE UPDATE”
SONORA, MEXICO
NI 43-101 TECHNICAL REPORT
PREPARED FOR SILVERCREST MINES INC.
Effective Date: April 30, 2013
Amended Date: March 04, 2014
| 6) | I am responsible for section 22 and 25.3 of this Technical Report. |
| 7) | As a Qualified Person for this report, I have read the National Instrument 43-101 and Companion Policy and confirm that this report has been prepared in compliance to National Instrument 43-101. |
| 8) | I have never visited nor have I had involvement with the Santa Elena property prior to this report. |
| 9) | Since 1990, I have completed valuations, evaluations (technical-economic models), and have audited a variety of projects including exploration, pre-production (feasibility-level), operating and mine closure projects. I have also served as expert witness with respect to technical-economic issues. |
| 10) | I am independent of SilverCrest Mines as independence is described in Section 1.5 of the National Instrument 43-101. In addition I am currently not a shareholder of SilverCrest nor am I directly entitled to financially benefit from its success. |
| 11) | Prior to this report, I have had no prior involvement on this property. |
| 12) | To the best of my knowledge, information and belief, as of the effective date of the Technical Report, the part of the Technical Report for which I am responsible contain all scientific and technical information that is required to be disclosed to make the Technical Report not misleading. |
Dated this 04 March, 2014,
Original signed and sealed by
“Nick Michael”
________________________________
Nick Michael, BS, MBA
Mineral Economist, Tetra Tech Inc.