UNITED STATES
SECURITIES AND EXCHANGE COMMISSION
Washington, D.C. 20549
FORM N-CSR
CERTIFIED SHAREHOLDER REPORT OF REGISTERED
MANAGEMENT INVESTMENT COMPANIES
Investment Company Act file number 811-21503
The FBR Funds
(Exact name of registrant as specified in charter)
| | |
| 4922 Fairmont Avenue Bethesda, MD 20814 |
| (Address of principal executive offices) (Zip code) |
FBR Mutual Fund Services, 4922 Fairmont Avenue Bethesda, MD 20814
(Name and address of agent for service)
Registrant’s telephone number, including area code: (301) 657-1500
Date of fiscal year end: October 31, 2004
Date of reporting period: October 31, 2004
| ITEM 1. | REPORT TO SHAREHOLDERS |
The following is a copy of the report transmitted to shareholders pursuant to Rule 30e-1 under the Investment Company Act of 1940 (17CRF 270.30e-1).
FRIEDMAN BILLINGS RAMSEY

THE FBR FUNDS
FBR Large Cap Financial Fund
FBR Small Cap Financial Fund
FBR Small Cap Fund
FBR Large Cap Technology Fund
FBR Small Cap Technology Fund
FBR Gas Utility Index Fund
FBR Fund for Government Investors
FBR Maryland Tax-Free Portfolio
FBR Virginia Tax-Free Portfolio
Annual Report
October 31, 2004
The FBR Funds
Letter to Shareholders
Dear Shareholder,
Fiscal 2004 was another active year for The FBR Funds. We launched the Small Cap Technology Fund (FBRCX) in January and hired Robert Barringer to manage that fund. Robert has 16 years of experience in the investment business and is a valuable addition to our portfolio management team. We have implemented polices and procedures under the Sarbanes-Oxley Act and adopted a fund compliance program as required under new SEC rules. We continue to improve and expand our marketing efforts. We have worked to reduce the Fund’s administrative costs and you should see the benefits reflected in lower administrative fees in the coming year. Finally, record inflows combined with solid investment performance allowed the Funds to surpass $2 billion in assets under management in late October. All of us at The FBR Funds want to thank you for your continued support and trust in our efforts to bring you quality mutual fund products.
At The FBR Funds, we believe that quality mutual fund products begin and end with a consistent investment approach. Our equity funds strive to give you diversified exposure to segments of the market that offer long-term potential for growth. We look for companies that believe in what we believe - that durable equity returns are driven by consistent profitability. Consistent profits begin with conservative accounting, an aversion to debt, a low cost operating structure, an uncomplicated business plan, and an overall philosophy of building for the long-term. Our fixed income funds follow a conservative strategy consistent with owning the highest quality government and municipal securities. Preservation of capital is the main objective of our fixed income funds.
The FBR Funds are in sum about respecting your money. We understand the capital markets are not always favorable and strive to preserve capital during these turbulent periods. We believe that losing less money in difficult markets is more important than making the most in rising ones. We believe you want a return on your money and the return of your money. Our goal is to give your money the best chance of achieving returns that are balanced, mindful of the downside and sustainable over the long run.
What follows is a discussion about each of our Fund’s performance during the year and the outlook going forward. Thanks again for your support.
|
Sincerely, |
|
 |
David Ellison |
President and Trustee |
The FBR Funds |
Investors should consider the investment objectives, risks, charges and expenses carefully before investing. This and other important information about The FBR Funds can be found in the prospectus. To obtain a free prospectus, please call 888.888.0025 or visit www.fbrfunds.com. Please read the prospectus carefully before investing.
The FBR Funds are distributed by FBR Investment Services, Inc., member NASD/SIPC
2
The FBR Funds
Standardized Annual Returns
As of September 30, 2004
| | | | | | | | | | | | | | |
| | | | | Average Annual Returns
| |
| | | Inception
Date
| | One
Year
| | | Five
Years
| | | Ten
Years
| | | Since
Inception
| |
| | | | | |
Money Market Fund | | | | | | | | | | | | | | |
FBR Fund for Government Investors (FUSXX)1 | | Feb-75 | | 0.43 | % | | 2.26 | % | | 3.36 | % | | n/a | |
| | | | | |
Fixed Income Funds | | | | | | | | | | | | | | |
FBR Maryland Tax-Free Portfolio (RSXLX)2, 5 | | Sep-83 | | 3.01 | % | | 5.40 | % | | 5.49 | % | | 6.47 | % |
FBR Virginia Tax-Free Portfolio (RSXIX)2, 5 | | Sep-83 | | 2.81 | % | | 5.81 | % | | 5.62 | % | | 6.36 | % |
| | | | | |
Equity Funds | | | | | | | | | | | | | | |
FBR Large Cap Financial Fund (FBRFX)3, 5 | | Jan-97 | | 18.36 | % | | 12.02 | % | | n/a | | | 12.13 | % |
FBR Small Cap Financial Fund (FBRSX)3, 4, 5 | | Jan-97 | | 21.51 | % | | 23.10 | % | | n/a | | | 18.84 | % |
FBR Small Cap Fund (FBRVX)4, 5 | | Jan-97 | | 22.44 | % | | 18.50 | % | | n/a | | | 17.10 | % |
FBR Large Cap Technology Fund (FBRTX)5, 6 | | Feb-02 | | 4.22 | % | | n/a | | | n/a | | | 2.25 | % |
FBR Small Cap Technology Fund (FBRCX)4, 5, 6 | | Jan-04 | | n/a | | | n/a | | | n/a | | | n/a | |
FBR Gas Utility Index Fund (GASFX)7 | | May-89 | | 18.82 | % | | 5.62 | % | | 10.20 | % | | 8.86 | % |
TOTAL RETURNS REPRESENT PAST PERFORMANCE WHICH IS NO GUARANTEE OF FUTURE RESULTS.
The current performance may be lower or higher than performance data quoted.
To obtain performance data current to the most recent month-end please call 888.888.0025.
| 1 | Investments in money market funds are not guaranteed by the Federal Deposit Insurance Corporation or any other government agency. Although money market funds seek to preserve the NAV (Net Asset Value) at $1.00 per share, it is possible to lose money by investing in the Fund. |
| 2 | Some income earned in the Fixed Income Funds may be subject to the Federal Alternative Minimum Tax. Income earned by non-Maryland or non-Virginian residents will be subject to applicable state and local taxes. |
| 3 | Fund investments are focused in the financial services industry, which may be adversely affected by regulatory or other market conditions, such as rising interest rates. |
| 4 | Investing in a small-cap fund involves the risks of investing in small-cap companies, which generally involve greater risk than investing in larger, more established companies. |
| 5 | The non-diversified nature of the fund may subject investors to greater volatility than other diversified funds. |
| 6 | Fund investments are focused in the technology sector, which may be affected by developments in the technology industry and its related businesses. In addition, the Fund may be subject to risks posed by use of derivative instruments. The value of the FBR Technology Funds’ shares may fluctuate more than shares of funds investing in a broader range of industries. |
| 7 | The Fund is subject to risks associated with the natural gas industry which is sensitive to interest rates, weather and competition risks. |
Investors are asked to consider the investment objectives, risks, charges and expenses carefully before investing. For more complete information about The FBR Funds, including fees and expenses, and a copy of a free prospectus please call 888.888.0025 or visit us at www.fbrfunds.com. Please read the prospectus carefully before you invest or send money.
The FBR Funds are distributed by FBR Investment Services, Inc., member NASD/SPIC.
3
The FBR Funds
FBR Large Cap Financial Fund
Management Overview
Portfolio Manager: David Ellison
Over the recent fiscal year, how did the Fund perform?
For the one-year period ended October 31, 2004, the FBR Large Cap Financial Fund appreciated 9.76%. This compares to the S&P 500 Composite Index and the Lipper Financial Services Fund Index which returned 9.42% and 9.92% for the same period, respectively.
What factors contributed to the Fund’s performance?
The fear of rising interest rates in early 2004 had a significant impact on the Fund’s performance this past year. Even with this fear, the Fund was able to perform in line with the relevant indices. We have historically used fundamental valuation metrics and overall business risk assessments as keys to stock selection, a process which served shareholders well this year as the more highly valued and interest rate sensitive financial stocks fared worse than the Fund and relevant indexes.
What is the outlook for the Fund and the financial services sector?
Fundamental business conditions for the financial services industry have been favorable over the last couple years. Interest rates have fluctuated within a narrow range. Credit conditions have been improving. Commercial and residential loan growth has been slow but positive. Capital market activities have continued to show signs of improvement from depressed levels last year. Capital expenditures by companies have continued to improve customer service efforts and reduce operating costs. Mergers and acquisitions have created modest benefits to operating leverage. Regulatory control continues to be focused while not hampering industry competitiveness. I expect these favorable fundamental trends will continue in 2005 and expect the stocks to follow these trends.
The risks to these favorable trends are numerous but all hinge on two concerns — interest rates and overall economic activity. If interest rates were to rise too quickly, operating margins could be negatively impacted. A slowdown in economic activity could lead to unfavorable credit conditions. Also, historical valuations have crept up to the high end of the range which present downside risk should the fundamental trends deteriorate.
We will continue to concentrate the funds holdings in financial stocks that follow low-risk business strategies and trade at below average valuations. This strategy has the intended effect of reducing the potential downside risks over the long-term.
4
The FBR Funds
FBR Large Cap Financial Fund
Comparison of Change in Value of $10,000 Investment in
Fund Shares(1)(2) vs. Various Indices(1)(3)
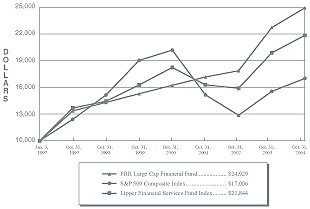
Total Returns—For the Periods Ended October 31, 2004(4)
| | | | | | | | | |
| | | One
Year
| | | Annualized
Five Year
| | | Annualized
Since
Inception(5)
| |
FBR Large Cap Financial Fund(1)(2) | | 9.76 | % | | 10.28 | % | | 12.38 | % |
S&P 500 Composite Index(1)(3) | | 9.42 | % | | (2.22 | %) | | 7.01 | % |
Lipper Financial Services Fund Index(1)(3) | | 9.92 | % | | 6.07 | % | | 10.49 | % |
TOTAL RETURNS REPRESENT PAST PERFORMANCE, WHICH IS NO GUARANTEE OF FUTURE RESULTS.
Investment return and principal value will fluctuate so that investors’ shares, when redeemed, may be
worth more or less than their original cost. Returns shown assume reinvestment of distributions.
The current performance may be lower or higher than the performance data quoted.
| (1) | The graph assumes a hypothetical $10,000 initial investment in the Fund and reflects all Fund expenses. Investors should note that the Fund is a professionally managed mutual fund while the indices are unmanaged, do not incur sales charges or expenses and are not available for investment. |
| (2) | FBR Fund Advisers, Inc. waived a portion of its advisory fees and agreed to contractually reimburse a portion of the Fund’s operating expenses, as necessary, to maintain existing expense limitations, as set forth in the notes to the financial statements. Total returns shown include fee waivers and expense reimbursements, if any; total returns would have been lower had there been no waiver of fees and/or reimbursement of expenses in excess of expense limitations. |
| (3) | S&P 500 Composite Index is a capitalization-weighted index of 500 stocks. The index is designed to represent the broad domestic economy through changes in aggregate market value of 500 stocks representing all major industries. Lipper Analytical Services, Inc., is a nationally recognized organization that reports on mutual fund total return performance and calculates fund rankings. Peer averages are based on universes of funds with the same investment objective. Peer group averages include reinvested dividends and capital gains, if any, and exclude sales charges. |
| (4) | The total returns shown do not reflect the deduction of taxes that a shareholder would pay on fund distributions or the redemption of fund shares. |
| (5) | For the period January 3, 1997 (commencement of investment operations) through October 31, 2004. Certain purchases made by shareholders within this period would have been subject to an initial maximum sales charge of up to 5.50%. As a result, total returns for such shareholders would have been lower. |
5
The FBR Funds
FBR Large Cap Financial Fund
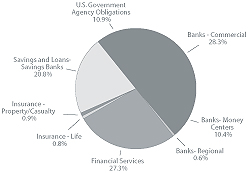
Portfolio Summary
October 31, 2004
The following chart provides a visual breakdown of the Fund by industry sectors. The underlying securities represent a percentage of the portfolio investments.
6
The FBR Funds
FBR Large Cap Financial Fund
Portfolio of Investments
October 31, 2004
| | | | | |
SHARES
| | | | VALUE (NOTE 2)
|
| | | COMMON STOCKS — 89.2% | | | |
| | | Banks - Commercial — 28.3% | | | |
| 29,000 | | Comerica, Inc. | | $ | 1,783,790 |
| 24,000 | | Hibernia Corp. | | | 696,000 |
| 44,000 | | KeyCorp. | | | 1,477,960 |
| 27,000 | | North Fork Bancorporation, Inc. | | | 1,190,700 |
| 27,500 | | SunTrust Banks, Inc. | | | 1,935,450 |
| 25,000 | | UnionBanCal Corp. | | | 1,518,750 |
| | | | |
|
|
| | | | | | 8,602,650 |
| | | | |
|
|
| | | Banks - Money Centers — 10.5% | | | |
| 35,000 | | Bank of America Corp. | | | 1,567,650 |
| 24,000 | | Citigroup, Inc. | | | 1,064,880 |
| 11,000 | | Wachovia Corp. | | | 541,310 |
| | | | |
|
|
| | | | | | 3,173,840 |
| | | | |
|
|
| | | Banks - Regional — 0.6% | | | |
| 5,000 | | Banknorth Group, Inc. | | | 176,350 |
| | | | |
|
|
| | | Financial Services — 27.3% | | | |
| 20,000 | | Capital One Financial Corp. | | | 1,475,200 |
| 44,000 | | CIT Group, Inc. | | | 1,777,600 |
| 12,000 | | Countrywide Financial Corp. | | | 383,160 |
| 15,500 | | Fannie Mae (Federal National Mortgage) | | | 1,087,325 |
| 16,000 | | Freddie Mac (Federal Home Loan) | | | 1,065,600 |
| 15,000 | | JP Morgan Chase & Co. | | | 579,000 |
| 23,000 | | MBNA Corp. | | | 589,490 |
| 11,000 | | Merrill Lynch & Co. | | | 593,340 |
| 11,000 | | Morgan Stanley | | | 561,990 |
| 2,000 | | The Goldman Sachs Group, Inc. | | | 196,760 |
| | | | |
|
|
| | | | | | 8,309,465 |
| | | | |
|
|
| | | Insurance - Life — 0.8% | | | |
| 15,000 | | Conseco, Inc.* | | | 251,400 |
| | | | |
|
|
| | | Insurance - Property/Casualty — 0.9% | | | |
| 7,000 | | PMI Group, Inc. | | | 271,740 |
| | | | |
|
|
| | | Savings and Loans - Savings Banks — 20.8% | | | |
| 60,000 | | Astoria Financial Corp. | | | 2,345,400 |
| 19,000 | | Golden West Financial Corp. | | | 2,221,480 |
| 59,000 | | Sovereign Bancorp, Inc. | | | 1,277,350 |
| 11,000 | | Washington Mutual, Inc. | | | 425,810 |
| 1,000 | | Webster Financial Corp. | | | 47,800 |
| | | | |
|
|
| | | | | | 6,317,840 |
| | | | |
|
|
| | | Total Common Stocks (Amortized Cost $20,481,972) | | | 27,103,285 |
| | | | |
|
|
7
The FBR Funds
FBR Large Cap Financial Fund
Portfolio of Investments (continued)
October 31, 2004
| | | | | | |
PAR
| | | | VALUE (NOTE 2)
| |
| | | U.S. GOVERNMENT AND AGENCY OBLIGATIONS — 10.9% | | | | |
| $3,298,000 | | Federal Home Loan Bank Discount Note, 1.69%**, due 11/01/04
(Amortized Cost $3,298,000) | | $ | 3,298,000 | |
| | | | |
|
|
|
| | | Total Investments — 100.1%
(Amortized Cost $23,779,972) | | | 30,401,285 | |
| | | Liabilities Less Other Assets — (0.1%) | | | ( 17,148 | ) |
| | | | |
|
|
|
| | | Net Assets — 100.0% | | $ | 30,384,137 | |
| | | | |
|
|
|
| * | Non-income producing security. |
| ** | This issue shows the rate of discount at time of purchase. |
The accompanying notes are an integral part of the financial statements.
8
The FBR Funds
FBR Small Cap Financial Fund
Management Overview
Portfolio Manager: David Ellison
Over the recent fiscal year, how did the Fund perform?
For the one-year period ended October 31, 2004, the FBR Small Cap Financial Fund appreciated 14.29%. This compares to the Russell 2000 Index and the Lipper Financial Services Fund Index which returned 11.73% and 9.92% for the same period, respectively.
What factors contributed to the Fund’s performance?
In 2004, the pervasive fear of a sharp spike in short-term rates caused significant investor outflows around mid-year, but had little impact on fund performance. The Fund outperformed the relevant indices as investors’ fears about rising rates were overblown and the companies held in the Fund’s portfolio continued to generally outperform market expectations. Historically, we have focused on fundamental valuation metrics and overall business risk assessments as keys to stock selection. This process served shareholders well over the year as the more highly valued and interest rate sensitive small cap financial stocks fared worse than the Fund and relevant indexes.
What is the outlook for the Fund and the financial services sector?
Fundamental business conditions for the small cap financial services industry have been favorable over the last two years. Interest rates have fluctuated within a narrow range. Credit conditions have been improving. Loan growth has been slow but positive. Capital expenditures have continued to expand customer service and reduce operating costs. Consolidation has created benefits to operating leverage and internal efficiencies. Regulatory control continues to be tough while not reducing industry competitiveness. I expect these favorable fundamental trends will continue in 2005 and expect the stocks to follow these trends.
The risks to these favorable trends are numerous but the two major concerns are interest rates and overall economic activity. Also, historical valuations have crept up to the high side of the range, which presents downside risk if fundamental trends should deteriorate.
We will continue to concentrate the Fund’s holdings in financial stocks that follow low-risk business strategies and trade at below average valuations. This strategy has the intended effect of reducing the potential downside risk over the long-term.
9
The FBR Funds
FBR Small Cap Financial Fund
Comparison of Change in Value of $10,000 Investment in
Fund Shares(1)(2) vs. Various Indices(1)(3)
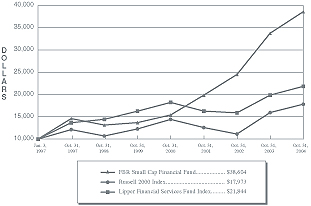
Total Returns—For the Periods Ended October 31, 2004(4)
| | | | | | | | | |
| | | One Year
| | | Annualized
Five Year
| | | Annualized
Since
Inception(5)
| |
FBR Small Cap Financial Fund(1)(2) | | 14.29 | % | | 23.02 | % | | 18.84 | % |
Russell 2000 Index(1)(3) | | 11.73 | % | | 7.74 | % | | 7.78 | % |
Lipper Financial Services Fund Index(1)(3) | | 9.92 | % | | 6.07 | % | | 10.49 | % |
TOTAL RETURNS REPRESENT PAST PERFORMANCE, WHICH IS NO GUARANTEE OF FUTURE RESULTS.
Investment return and principal value will fluctuate so that investors’ shares, when redeemed, may be
worth more or less than their original cost. Returns shown assume reinvestment of distributions.
The current performance may be lower or higher than the performance data quoted.
| (1) | The graph assumes a hypothetical $10,000 initial investment in the Fund and reflects all Fund expenses. Investors should note that the Fund is a professionally managed mutual fund while the indices are unmanaged, do not incur sales charges or expenses and are not available for investment. |
| (2) | FBR Fund Advisers, Inc. waived a portion of its advisory fees and agreed to contractually reimburse a portion of the Fund’s operating expenses, as necessary, to maintain existing expense limitations, as set forth in the notes to the financial statements. Total returns shown include fee waivers and expense reimbursements, if any; total returns would have been lower had there been no waiver of fees and/or reimbursement of expenses in excess of expense limitations. |
| (3) | Russell 2000 Index is comprised of the smallest of the 2000 companies of the Russell 3000 Index, representing approximately 11% of the Russell 3000’s total market-capitalization. Lipper Analytical Services, Inc., is a nationally recognized organization that reports on mutual fund total return performance and calculates fund rankings. Peer averages are based on universes of funds with the same investment objective. Peer group averages include reinvested dividends and capital gains, if any, and exclude sales charges. |
| (4) | The total returns shown do not reflect the deduction of taxes that a shareholder would pay on fund distributions or the redemption of fund shares. |
| (5) | For the period January 3, 1997 (commencement of investment operations) through October 31, 2004. Certain purchases made by shareholders within this period would have been subject to an initial maximum sales charge of up to 5.50%. As a result, total returns for such shareholders would have been lower. |
10
The FBR Funds
FBR Small Cap Financial Fund
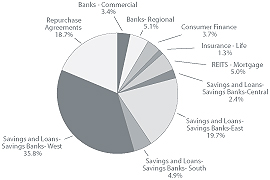
Portfolio Summary
October 31, 2004
The following chart provides a visual breakdown of the Fund by industry sectors. The underlying securities represent a percentage of the portfolio investments.
11
The FBR Funds
FBR Small Cap Financial Fund
Portfolio of Investments
October 31, 2004
| | | | | |
SHARES
| | | | VALUE
(NOTE 2)
|
| | | COMMON STOCKS — 81.3% | | | |
| | | Banks - Commercial — 3.4% | | | |
| 470,000 | | Provident Financial Services, Inc. | | $ | 8,460,000 |
| 402,645 | | Taylor Capital Group, Inc. | | | 11,817,631 |
| | | | |
|
|
| | | | | | 20,277,631 |
| | | | |
|
|
| | | Banks - Regional — 5.1% | | | |
| 937,895 | | Bank Mutual Corp. | | | 11,517,350 |
| 69,012 | | Cheviot Financial Corp. | | | 769,484 |
| 88,800 | | City Holding Co. | | | 3,076,920 |
| 166,150 | | Hanmi Financial Corp. | | | 5,047,637 |
| 622,769 | | NewAlliance Bancshares, Inc. | | | 8,644,034 |
| 115,118 | | Partners Trust Financial Group, Inc. | | | 1,171,901 |
| | | | |
|
|
| | | | | | 30,227,326 |
| | | | |
|
|
| | | Consumer Finance — 3.7% | | | |
| 311,000 | | AmeriCredit Corp.* | | | 6,033,400 |
| 421,322 | | ASTA Funding, Inc. | | | 7,615,395 |
| 423,000 | | Saxon Capital, Inc.* | | | 8,121,600 |
| | | | | | 21,770,395 |
| | | Insurance - Life — 1.3% | | | |
| 35,000 | | Ceres Group, Inc.* | | | 189,000 |
| 99,000 | | StanCorp Financial Group, Inc. | | | 7,462,620 |
| | | | |
|
|
| | | | | | 7,651,620 |
| | | | |
|
|
| | | REITs - Mortgage — 5.0% | | | |
| 275,000 | | Annaly Mortgage Management, Inc. | | | 4,944,500 |
| 50,000 | | Anthracite Capital, Inc. | | | 579,000 |
| 313,000 | | Anworth Mortgage Asset Corp. | | | 3,201,990 |
| 325,500 | | Government Properties Trust, Inc. | | | 3,264,765 |
| 185,000 | | Luminent Mortgage Capital, Inc. | | | 2,127,500 |
| 373,000 | | MFA Mortgage Investments, Inc. | | | 3,148,120 |
| 27,000 | | Redwood Trust, Inc. | | | 1,624,320 |
| 375,000 | | Thornburg Mortgage, Inc. | | | 10,713,750 |
| | | | |
|
|
| | | | | | 29,603,945 |
| | | | |
|
|
| | | Savings and Loans - Savings Banks - Central — 2.4% | | | |
| 219,500 | | Capitol Federal Financial | | | 7,458,609 |
| 49,174 | | First Place Financial Corp. | | | 971,187 |
| 116,369 | | HMN Financial, Inc. | | | 3,461,978 |
| 98,000 | | TierOne Corp. | | | 2,183,440 |
| | | | |
|
|
| | | | | | 14,075,214 |
| | | | |
|
|
12
The FBR Funds
FBR Small Cap Financial Fund
Portfolio of Investments (continued)
October 31, 2004
| | | | | | |
SHARES
| | | | VALUE
(NOTE 2)
| |
| | | Savings and Loans - Savings Banks - East — 19.7% | | | | |
| 278,497 | | Bancorp Rhode Island, Inc. | | $ | 10,652,510 | † |
| 535,054 | | Brookline Bancorp, Inc. | | | 8,287,986 | |
| 333,497 | | Dime Community Bancshares, Inc. | | | 5,355,962 | |
| 49,961 | | Flushing Financial Corp. | | | 962,748 | |
| 107,600 | | Hingham Institution for Savings | | | 4,478,850 | † |
| 803,000 | | Hudson City Bancorp, Inc. | | | 29,341,621 | |
| 287,000 | | Independence Community Bank Corp. | | | 10,799,810 | |
| 130,956 | | MASSBANK Corp. | | | 4,910,850 | |
| 264,020 | | New York Community Bancorp, Inc. | | | 4,847,407 | |
| 28,518 | | Pamrapo Bancorp, Inc. | | | 641,655 | |
| 241,311 | | Parkvale Financial Corp. | | | 6,459,895 | |
| 35,950 | | PennFed Financial Services, Inc. | | | 1,165,499 | |
| 266,000 | | Sovereign Bancorp, Inc. | | | 5,758,900 | |
| 90,523 | | TF Financial Corp. | | | 2,650,513 | |
| 334,291 | | Waypoint Financial Corp. | | | 9,179,631 | |
| 356,662 | | Yardville National Bancorp | | | 11,834,046 | |
| | | | |
|
|
|
| | | | | | 117,327,883 | |
| | | | |
|
|
|
| | | Savings and Loans - Savings Banks - South — 4.9% | | | | |
| 569,833 | | BankUnited Financial Corp., Class A* | | | 16,952,532 | |
| 26,800 | | FFLC Bancorp, Inc. | | | 813,916 | |
| 620,100 | | Franklin Bank Corp.* | | | 10,231,650 | |
| 49,600 | | Greenville First Bancshares, Inc.* | | | 992,000 | |
| | | | |
|
|
|
| | | | | | 28,990,098 | |
| | | | |
|
|
|
| | | Savings and Loans - Savings Banks - West — 35.8% | | | | |
| 421,376 | | Banner Corp. | | | 12,599,142 | |
| 1,181,116 | | Commercial Capital Bancorp, Inc. | | | 26,492,432 | |
| 419,300 | | Downey Financial Corp. | | | 23,170,518 | |
| 108,243 | | First PacTrust Bancorp, Inc. | | | 3,012,403 | |
| 717,100 | | FirstFed Financial Corp.* | | | 36,858,940 | |
| 354,822 | | ITLA Capital Corp.* | | | 17,180,836 | † |
| 255,550 | | Pacific Premier Bancorp, Inc.* | | | 3,002,713 | |
| 457,800 | | PFF Bancorp, Inc. | | | 18,060,210 | |
| 675,000 | | Sterling Financial Corp.* | | | 25,359,750 | |
| 1,128,600 | | Washington Federal, Inc. | | | 28,801,872 | |
| 472,900 | | Westcorp | | | 18,878,168 | |
| | | | |
|
|
|
| | | | | | 213,416,984 | |
| | | | |
|
|
|
| | | Total Common Stocks (Amortized Cost $354,428,750) | | | 483,341,096 | |
| | | | |
|
|
|
13
The FBR Funds
FBR Small Cap Financial Fund
Portfolio of Investments (continued)
October 31, 2004
| | | | | |
PAR
| | | | VALUE
(NOTE 2)
|
| | | REPURCHASE AGREEMENTS — 18.7% | | | |
| $111,064,000 | | With Mizuho Securities, Inc. dated 10/29/04 at 1.75% to be repurchased at $111,080,197 on 11/01/04, collateralized by U.S. Treasury Notes, 1.875% due 1/31/06, value $65,108,964; U.S. Treasury Bonds, 8.75% due 8/15/20, value $48,367,295 (Amortized Cost $ 111,064,000) | | $ | 111,064,000 |
| | | | |
|
|
| | | Total Investments — 100.0%
(Amortized Cost $465,492,750) | | | 594,405,096 |
| | | Other Assets Less Liabilities — 0.0% | | | 220,208 |
| | | | |
|
|
| | | Net Assets — 100.0% | | $ | 594,625,304 |
| | | | |
|
|
| * | Non-income producing security |
| † | Affiliated issuer as defined in the Investment Company Act of 1940 (ownership of at least 5% of the outstanding voting securities of an issuer) |
The accompanying notes are an integral part of the financial statements.
14
The FBR Funds
FBR Small Cap Fund
Management Overview
Portfolio Manager: Charles T. Akre, Jr.
Over the recent fiscal year, how did the Fund perform?
For the one-year period ended October 31, 2004 the FBR Small Cap Fund appreciated 19.46%. This compares to the Russell 2000 Index and the Lipper Small Cap Growth Fund Index which returned 11.73% and 1.95% for the same period, respectively.
What factors contributed to the Fund’s performance?
During the course of the year, we were able to maintain, and in some cases grow, the capital committed to our four largest holdings. Each of the four continued to solidify their leadership positions in their respective industries: property casualty insurance; wireless telecommunications infrastructure; gaming; and specialty retailing. Each of the four had solid years building intrinsic value on a per share basis, our key metric for evaluating and monitoring securities. We have owned shares in these companies for seven, seven, five and two years, respectively. We maintained or increased our allocations during the year because we felt that they remained undervalued, superbly managed and possessed excellent prospects to continue to compound their intrinsic values at high rates.
We also enjoyed success with several holdings in industry groupings new to the Fund. We successfully added shares in energy pipeline operators, discount retailers and in the homebuilding industry. As you would expect, we added to individual holdings in these select industries cautiously over the year as market pullbacks gave us buying opportunities. We approached each of these purchases in the same bottom-up oriented, company specific process we have followed for years. Our aim is never to own an industry or to rotate amongst industries chasing trends, but instead, to make selective additions to the portfolio in superior businesses when the opportunities arise.
What is the outlook for the Fund and the small cap sector?
As we have said in the past, we offer no opinion on the direction of the market or for small cap stocks. We do affirm to you that we will continue to be diligent in searching out a small number of outstanding businesses to own in our portfolio. We remain totally committed to our goal of compounding your capital at an above average rate, while incurring a level of risk compatible with that goal.
As may be evident from the sector breakdown of assets found in the annual report, the Fund does not own a wide cross section of small cap stocks. The Fund owns fewer securities, but with real commitment. As such, the outlook for the Fund is a function of its basket of holdings rather than the market in general. We remain enthusiastic about the individual company prospects within the Fund’s portfolio and continue to work hard to find new places to commit capital. That said, market prices are higher today for many of our businesses and our valuation discipline means that we are typically more active in periods of declining prices and less active during periods of rising prices.
15
The FBR Funds
FBR Small Cap Fund
Comparison of Change in Value of $10,000 Investment in
Fund Shares(1)(2) vs. Various Indices(1)(3)
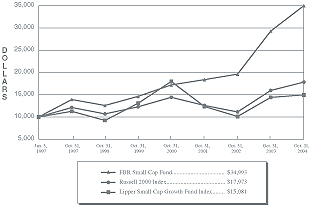
Total Returns—For the Periods Ended October 31, 2004(4)
| | | | | | | | | |
| | | One Year
| | | Annualized
Five Year
| | | Annualized
Since
Inception(5)
| |
FBR Small Cap Fund(1)(2) | | 19.46 | % | | 19.06 | % | | 17.36 | % |
Russell 2000 Index(1)(3) | | 11.73 | % | | 7.74 | % | | 7.78 | % |
Lipper Small Cap Growth Fund Index(1)(3) | | 1.95 | % | | 2.34 | % | | 5.39 | % |
TOTAL RETURNS REPRESENT PAST PERFORMANCE, WHICH IS NO GUARANTEE OF FUTURE RESULTS.
Investment return and principal value will fluctuate so that investors’ shares, when redeemed, may be
worth more or less than their original cost. Returns shown assume reinvestment of distributions.
The current performance may be lower or higher than the performance data quoted.
| (1) | The graph assumes a hypothetical $10,000 initial investment in the Fund and reflects all Fund expenses. Investors should note that the Fund is a professionally managed mutual fund while the indices are unmanaged, do not incur sales charges or expenses and are not available for investment. |
| (2) | FBR Fund Advisers, Inc. waived a portion of its advisory fees and agreed to contractually reimburse a portion of the Fund’s operating expenses, as necessary, to maintain existing expense limitations, as set forth in the notes to the financial statements. Total returns shown include fee waivers and expense reimbursements, if any; total returns would have been lower had there been no waiver of fees and/or reimbursement of expenses in excess of expense limitations. |
| (3) | Russell 2000 Index is comprised of the smallest of the 2000 companies of the Russell 3000 Index, representing approximately 11% of the Russell 3000’s total market-capitalization. Lipper Analytical Services, Inc., is a nationally recognized organization that reports on mutual fund total return performance and calculates fund rankings. Peer averages are based on universes of funds with the same investment objective. Peer group averages include reinvested dividends and capital gains, if any, and exclude sales charges. |
| (4) | The total returns shown do not reflect the deduction of taxes that a shareholder would pay on fund distributions or the redemption of fund shares. |
| (5) | For the period January 3, 1997 (commencement of investment operations) through October 31, 2004. Certain purchases made by shareholders within this period would have been subject to an initial maximum sales charge of up to 5.50%. As a result, total returns for such sharesholders would have been lower. |
16
The FBR Funds
FBR Small Cap Fund
Portfolio Summary
October 31, 2004
The following chart provides a visual breakdown of the Fund by industry sectors. The underlying securities represent a percentage of the portfolio investments.

17
The FBR Funds
FBR Small Cap Fund
Portfolio of Investments
October 31, 2004
| | | | | |
SHARES
| | | | VALUE (NOTE 2)
|
| | | COMMON STOCKS — 72.4% | | | |
| | | Beverages — 1.1% | | | |
| 170,800 | | Coca-Cola Bottling Co. | | $ | 9,027,634 |
| | | | |
|
|
| | |
| | | Biotechnology and Drugs — 1.1% | | | |
| 542,000 | | Bradley Pharmaceuticals, Inc.* | | | 8,975,520 |
| | | | |
|
|
| | |
| | | Capital Goods-Miscellaneous — 1.7% | | | |
| 200,000 | | Briggs & Stratton Corp. | | | 14,362,000 |
| | | | |
|
|
| | |
| | | Casinos and Gaming — 12.0% | | | |
| 1,595,324 | | Alliance Gaming Corp.* | | | 14,756,747 |
| 27,500 | | Florida Gaming Corp.* | | | 404,250 |
| 20,000 | | International Game Technology | | | 660,800 |
| 515,500 | | Monarch Casino & Resort, Inc.* | | | 14,397,915 |
| 1,105,584 | | Penn National Gaming, Inc.* | | | 45,914,904 |
| 369,450 | | Pinnacle Entertainment, Inc.* | | | 5,430,915 |
| 105,000 | | Shuffle Master, Inc.* | | | 4,419,450 |
| 250,000 | | Station Casinos, Inc. | | | 12,737,500 |
| | | | |
|
|
| | | | | | 98,722,481 |
| | | | |
|
|
| | |
| | | Communication Services — 6.9% | | | |
| 3,100,000 | | American Tower Corp., Class A* | | | 53,289,000 |
| 10,700 | | Outdoor Channel Holdings, Inc.* | | | 147,339 |
| 74,650 | | SpectraSite, Inc.* | | | 3,829,545 |
| | | | |
|
|
| | | | | | 57,265,884 |
| | | | |
|
|
| | |
| | | Computer Peripherals — 0.3% | | | |
| 118,500 | | Metrologic Instruments, Inc.* | | | 2,210,025 |
| | | | |
|
|
| | |
| | | Construction Services — 4.0% | | | |
| 425,000 | | D.R. Horton, Inc. | | | 12,750,000 |
| 90,000 | | Hovnanian Enterprises, Inc., Class A* | | | 3,378,600 |
| 60,000 | | Standard Pacific Corp. | | | 3,369,000 |
| 300,000 | | Toll Brothers, Inc.* | | | 13,905,000 |
| | | | |
|
|
| | | | | | 33,402,600 |
| | | | |
|
|
| | |
| | | Construction-Supplies and Fixtures — 1.5% | | | |
| 143,000 | | American Woodmark Corp. | | | 5,316,740 |
| 107,471 | | Simpson Manufacturing Company, Inc. | | | 6,908,236 |
| | | | |
|
|
| | | | | | 12,224,976 |
| | | | |
|
|
18
The FBR Funds
FBR Small Cap Fund
Portfolio of Investments (continued)
October 31, 2004
| | | | | |
SHARES
| | | | VALUE
(NOTE 2)
|
| | | Consumer Financial Services — 2.1% | | | |
| 873,000 | | AmeriCredit Corp.* | | $ | 16,936,200 |
| | | | |
|
|
| | |
| | | Electric Utilities — 1.7% | | | |
| 1,316,400 | | The AES Corp.* | | | 14,348,760 |
| | | | |
|
|
| | |
| | | Insurance-Life — N.M. | | | |
| 3,007 | | Independence Holding Co. | | | 57,103 |
| | | | |
|
|
| | |
| | | Insurance-Miscellaneous — 1.6% | | | |
| 25,000 | | Brown & Brown, Inc. | | | 1,044,000 |
| 393,500 | | Hilb, Rogal, and Hobbs Co. | | | 12,473,950 |
| | | | |
|
|
| | | | | | 13,517,950 |
| | | | |
|
|
| | |
| | | Insurance-Mortgage Insurance — 0.2% | | | |
| 30,000 | | Triad Guaranty, Inc.* | | | 1,635,300 |
| | | | |
|
|
| | |
| | | Insurance-Property and Casualty — 16.7% | | | |
| 523,000 | | Allmerica Financial Corp.* | | | 15,742,300 |
| 80 | | Berkshire Hathaway, Inc., Class B* | | | 224,320 |
| 33,000 | | Fairfax Financial Holdings Ltd. | | | 4,853,970 |
| 255,400 | | Markel Corp.* | | | 81,217,199 |
| 275,000 | | PartnerRe Ltd. | | | 15,991,250 |
| 500,000 | | Platinum Underwriters Holdings Ltd. | | | 14,625,000 |
| 300,000 | | PMA Capital Corp., Class A* | | | 2,460,000 |
| 75,000 | | ProAssurance Corp.* | | | 2,676,750 |
| | | | |
|
|
| | | | | | 137,790,789 |
| | | | |
|
|
| | |
| | | Insurance-Title Insurance — 0.2% | | | |
| 61,000 | | Investors Title Co. | | | 2,019,100 |
| | | | |
|
|
| | |
| | | Motion Pictures — 0.6% | | | |
| 220,800 | | AMC Entertainment, Inc.* | | | 4,241,568 |
| 40,000 | | Regal Entertainment Group | | | 796,400 |
| | | | |
|
|
| | | | | | 5,037,968 |
| | | | |
|
|
| | | Office Equipment — 2.3% | | | |
| 542,700 | | Global Imaging Systems, Inc.* | | | 19,103,040 |
| | | | |
|
|
| | |
| | | Oil and Gas Operations — 3.1% | | | |
| 400,600 | | Kaneb Services LLC | | | 12,578,840 |
| 326,290 | | MarkWest Hydrocarbon, Inc. | | | 5,253,269 |
| 211,800 | | Penn Virginia Corp. | | | 7,624,800 |
| | | | |
|
|
| | | | | | 25,456,909 |
| | | | |
|
|
19
The FBR Funds
FBR Small Cap Fund
Portfolio of Investments (continued)
October 31, 2004
| | | | | |
SHARES/
PAR
| | | | VALUE
(NOTE 2)
|
| | | Personal Services — 0.2% | | | |
| 200,000 | | Service Corporation International* | | $ | 1,322,000 |
| | | | |
|
|
| | |
| | | Recreational Activities — 0.8% | | | |
| 603,800 | | Dover Motorsports, Inc. | | | 2,868,050 |
| 60,000 | | International Speedway Corp., Class A | | | 2,822,400 |
| 19,000 | | International Speedway Corp., Class B | | | 883,500 |
| | | | |
|
|
| | | | | | 6,573,950 |
| | | | |
|
|
| | |
| | | Regional Banks — 0.1% | | | |
| 14,000 | | Corus Bankshares, Inc. | | | 644,140 |
| | | | |
|
|
| | |
| | | Restaurants — 0.8% | | | |
| 586,100 | | Krispy Kreme Doughnuts, Inc.* | | | 6,212,660 |
| | | | |
|
|
| | |
| | | Retail - Apparel — 1.6% | | | |
| 412,500 | | Aeropostale, Inc.* | | | 13,014,375 |
| | | | |
|
|
| | |
| | | Retail - Specialty — 11.5% | | | |
| 1,700,000 | | 99 Cents Only Stores* | | | 26,197,000 |
| 150,000 | | Advance Auto Parts, Inc.* | | | 5,868,000 |
| 1,500,000 | | CarMax, Inc.* | | | 39,510,000 |
| 800,000 | | Dollar Tree Stores, Inc.* | | | 23,120,000 |
| | | | |
|
|
| | | | | | 94,695,000 |
| | | | |
|
|
| | |
| | | Software and Programming — 0.1% | | | |
| 16,000 | | MICROS Systems, Inc.* | | | 945,920 |
| | | | |
|
|
| | |
| | | Transportation Services — 0.2% | | | |
| 90,000 | | Dynamex, Inc.* | | | 1,863,000 |
| | | | |
|
|
| | | Total Common Stocks (Amortized Cost $449,934,674) | | | 597,365,284 |
| | | | |
|
|
| | |
| | | MASTER LIMITED PARTNERSHIPS — N.M. Casinos — N.M. | | | |
| 61,650 | | Equus Gaming Company L.P.* (Amortized Cost $110,489) | | | 67,815 |
| | | | |
|
|
20
The FBR Funds
FBR Small Cap Fund
Portfolio of Investments (continued)
October 31, 2004
| | | | | | | | | | |
PAR
| | | | RATE
| | | MATURITY
| | VALUE
(NOTE 2)
|
| | | U.S. GOVERNMENT AGENCY OBLIGATION — 2.4% | | | | | | | | |
| $20,000,000 | | Student Loan Marketing Association | | | | | | | | |
| | | (Amortized Cost $20,114,104) | | 2.25 | % | | 12/15/32 | | | 19,876,800 |
| | | | | | | | | |
|
|
| | | | |
| | | SHORT-TERM INVESTMENTS — 25.0% | | | | | | | | |
| | | Commercial Paper — 15.2% | | | | | | | | |
| 15,000,000 | | Ford Motor Credit Co. | | 1.89 | ** | | 11/24/04 | | | 14,981,888 |
| 15,000,000 | | Ford Motor Credit Co. | | 1.89 | ** | | 12/9/04 | | | 14,970,075 |
| 16,000,000 | | General Electric Capital Corp. | | 1.96 | ** | | 1/5/05 | | | 15,943,378 |
| 25,000,000 | | Lockhart Funding LLC | | 1.93 | ** | | 12/2/04 | | | 24,958,451 |
| 15,000,000 | | Lockhart Funding LLC | | 1.93 | ** | | 12/8/04 | | | 14,970,246 |
| 8,500,000 | | National Grid Transco PLC | | 1.845 | ** | | 12/14/04 | | | 8,481,268 |
| 20,000,000 | | Prudential Funding LLC | | 1.82 | ** | | 12/16/04 | | | 19,954,500 |
| 11,571,000 | | Sunbelt Funding Corp. | | 1.82 | ** | | 12/8/04 | | | 11,549,356 |
| | | | | | | | | |
|
|
| | | Total Commercial Paper (Amortized Cost $125,809,162) | | | | | | | | 125,809,162 |
| | | | | | | | | |
|
|
| | | | |
| | | U.S. Government Agency Obligation — 3.0% | | | | | | | | |
| 24,850,000 | | Federal National Mortgage Association, Discount Note (Amortized Cost $24,850,000) | | 1.78 | ** | | 11/1/04 | | | 24,850,000 |
| | | | | | | | | |
|
|
| | | | |
| | | Repurchase Agreements — 6.8% | | | | | | | | |
| 56,074,000 | | With Mizuho Securities, Inc. dated 10/29/04 at 1.75 % to be repurchased at $56,082,177 on 11/01/04, collateralized by U.S. Treasury Notes, 1.875% due 1/31/06, value $32,872,218; U.S. Treasury Bonds, 8.75% due 8/15/20, value $24,419,683 (Amortized Cost $56,074,000) | | | 56,074,000 |
| | | | | | | | | |
|
|
| | | Total Short-Term Investments (Amortized Cost $206,733,162) | | | | | | 206,733,162 |
| | | | | | | | | |
|
|
| | | Total Investments — 99.8% | | | | | | |
| | | (Amortized Cost $676,892,429) | | | | | | 824,043,061 |
| | | Other Assets Less Liabilities — 0.2% | | | | | | 1,453,825 |
| | | | | | | | | |
|
|
| | | Net Assets — 100.0% | | | | | $ | 825,496,886 |
| | | | | | | | | |
|
|
| * | Non-income producing security |
| † | Affiliated issuer as defined in the Investment Company Act of 1940 (ownership of at least 5% of the outstanding voting securities of an issuer) |
| ** | This issue shows the rate of discount at time of purchase. |
N.M. Not Meaningful
The accompanying notes are an integral part of the financial statements.
21
The FBR Funds
FBR Large Cap Technology Fund
Management Overview
Portfolio Manager: Winsor Aylesworth
Over the recent fiscal year, how did the fund perform?
For the one-year period ended October 31, 2004 the FBR Large Cap Technology Fund appreciated 1.17%. This compares to the S&P 500 Composite Index, the NASDAQ Comp Index and the Lipper Science & Technology Fund Index which returned 9.42%, 2.68% and -3.08% for the same period, respectively.
What factors contributed to the Fund’s performance?
Historically, the technology sector has tended to track the nation’s economy. Companies spend more on technology as the economy improves and cut back as the economy slows. The first half of the 12-month period, characterized by broad based economic growth, ran into a soft patch in the second half due to decelerating economic indicators, the expectation and realization of rising rates and sharply increasing commodity prices. Investors tended to stay on the sidelines as such high profile events as the Olympics, the political conventions and our national election played out. As all these internationally visible events reached successful conclusions, and corporate executives and investors became more optimistic about the prospects for growth, investors and companies appeared ready to get back to business.
Our overall strategy of investing in large cap technology companies with earnings and minimal debt, that are selling at reasonable valuations is an inherently conservative approach that served the Fund well during this period.
What is the outlook for the Fund and the technology sector?
As one of the major “pillars” of the economy, the technology sector will always be linked to the overall growth of the global economy. As a society, we are perpetually looking for new ways and the latest gadgets that allow us to do what we want any time and any place. This all bodes well for technology. Currently, consumer items such as flat panel displays, digital cameras, mp3 players, and entertainment convergence are all examples of segments that will continue to fuel growth for the sector. Corporately, our desire for smaller, faster, and lighter will feed the demand for new technological breakthroughs. The changing demographic of the population will continue to drive advances in healthcare technology and biotechnology. Even the war on terrorism will create opportunities for technology over the long term.
The FBR Large Cap Technology Fund offers investors exposure to the technology industry by owning a wide range of fundamentally sound companies with attractive and sustainable profit margins. These market leaders should continue to participate in the inherent growth of the sector and most importantly, weather any market downturn as well as, if not better than the industry averages.
22
The FBR Funds
FBR Large Cap Technology Fund
Comparison of Change in Value of $10,000 Investment in
Fund Shares(1)(2) vs. Various Indices(1)(3)
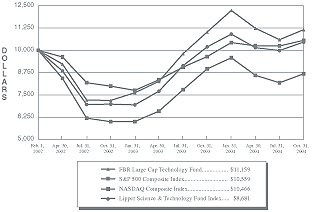
Total Returns—For the Periods Ended October 31, 2004(4)
| | | | | | |
| | | One Year
| | | Annualized
Since
Inception(5)
| |
FBR Large Cap Technology Fund(1)(2) | | 1.17 | % | | 4.08 | % |
S&P 500 Composite Index(1)(3) | | 9.42 | % | | 1.99 | % |
NASDAQ Composite Index(1)(3) | | 2.68 | % | | 1.67 | % |
Lipper Science & Technology Fund Index(1)(3) | | (3.08 | %) | | (5.01 | %) |
TOTAL RETURNS REPRESENT PAST PERFORMANCE, WHICH IS NO GUARANTEE OF FUTURE RESULTS.
Investment return and principal value will fluctuate so that investors’ shares, when redeemed, may be
worth more or less than their original cost. Returns shown assume reinvestment of distributions.
The current performance may be lower or higher than the performance data quoted.
| (1) | The graph assumes a hypothetical $10,000 initial investment in the Fund and reflects all Fund expenses. Investors should note that the Fund is a professionally managed mutual fund while the indices are unmanaged, do not incur sales charges or expenses and are not available for investment. |
| (2) | FBR Fund Advisers, Inc. waived a portion of its advisory fees and agreed to contractually reimburse a portion of the Fund’s operating expenses, as necessary, to maintain existing expense limitations, as set forth in the notes to the financial statements. Total returns shown include fee waivers and expense reimbursements, if any; total returns would have been lower had there been no waiver of fees and/or reimbursement of expenses in excess of expense limitations. |
| (3) | S&P500 Composite Index is a capitalization-weighted index of 500 stocks. The index is designed to represent the broad domestic economy through changes in aggregate market value of 500 stocks representing all major industries. The NASDAQ Composite Index is a broad-based capitalization-weighted index of all NASDAQ National Market and Small Cap stocks. Lipper Analytical Services, Inc., is a national recognized organization that reports on mutual fund total return performance and calculates fund rankings. Peer averages are based on a universe of funds with the same investment objective. Peer group averages include reinvested dividends and capital gains, if any, and exclude sales charges. |
| (4) | The total returns shown do not reflect the deduction of taxes that a shareholder would pay on fund distributions or the redemption of fund shares. |
| (5) | For the period February 1, 2002 (commencement of investment operations) through October 31, 2004. |
23
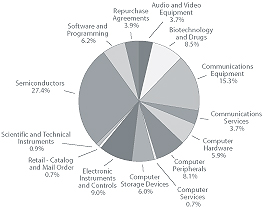
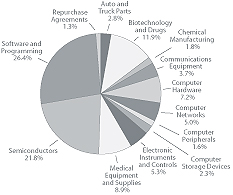
The FBR Funds
FBR Large Cap Technology Fund
Portfolio Summary
October 31, 2004
The following chart provides a visual breakdown of the Fund by industry sectors. The underlying securities represent a percentage of the portfolio investments.
24
The FBR Funds
FBR Large Cap Technology Fund
Portfolio of Investments
October 31, 2004
| | | | | |
SHARES
| | | | VALUE
(NOTE 2)
|
| | | COMMON STOCKS — 96.2% | | | |
| | | Audio and Video Equipment — 3.7% | | | |
| 7,075 | | Sony Corp. ADR | | $ | 246,564 |
| | | | |
|
|
| | | Biotechnology and Drugs — 8.5% | | | |
| 1,100 | | AmerisourceBergen Corp. | | | 60,544 |
| 1,150 | | Barr Pharmaceuticals, Inc.* | | | 43,298 |
| 4,550 | | Cardinal Health, Inc. | | | 212,712 |
| 2,700 | | MedImmune, Inc.* | | | 76,734 |
| 4,000 | | Mylan Laboratories, Inc. | | | 68,880 |
| 6,425 | | Serono S.A. ADR | | | 98,688 |
| | | | |
|
|
| | | | | | 560,856 |
| | | | |
|
|
| | | Communications Equipment — 15.3% | | | |
| 4,800 | | Cisco Systems, Inc.* | | | 92,208 |
| 2,050 | | Comverse Technology, Inc.* | | | 42,312 |
| 14,500 | | Corning, Inc.* | | | 166,024 |
| 15,200 | | Motorola, Inc. | | | 262,352 |
| 18,525 | | Nokia Oyj ADR | | | 285,655 |
| 1,300 | | Qualcomm, Inc. | | | 54,353 |
| 2,100 | | Scientific-Atlanta, Inc. | | | 57,519 |
| 6,250 | | Tellabs, Inc.* | | | 50,000 |
| | | | |
|
|
| | | | | | 1,010,423 |
| | | | |
|
|
| | | Communications Services — 3.7% | | | |
| 9,675 | | SBC Communications, Inc. | | | 244,391 |
| | | | |
|
|
| | | Computer Hardware — 5.9% | | | |
| 3,400 | | Apple Computer, Inc.* | | | 178,602 |
| 755 | | International Business Machines Corp. | | | 67,761 |
| 30,900 | | Sun Microsystems, Inc.* | | | 139,977 |
| | | | |
|
|
| | | | | | 386,340 |
| | | | |
|
|
| | | Computer Peripherals — 8.1% | | | |
| 5,600 | | Canon, Inc. ADR | | | 277,200 |
| 13,900 | | Hewlett-Packard Co. | | | 259,374 |
| | | | |
|
|
| | | | | | 536,574 |
| | | | |
|
|
| | | Computer Services — 0.7% | | | |
| 850 | | NCR Corp.* | | | 47,898 |
| | | | |
|
|
| | | Computer Storage Devices — 6.0% | | | |
| 20,875 | | EMC Corp.* | | | 268,662 |
| 3,275 | | SanDisk Corp.* | | | 68,349 |
| 4,800 | | Seagate Technology | | | 60,672 |
| | | | |
|
|
| | | | | | 397,683 |
| | | | |
|
|
25
The FBR Funds
FBR Large Cap Technology Fund
Portfolio of Investments (continued)
October 31, 2004
| | | | | |
SHARES
| | | | VALUE
(NOTE 2)
|
| | | Electronic Instruments and Controls — 9.0% | | | |
| 5,115 | | Agilent Technologies, Inc.* | | $ | 128,181 |
| 2,225 | | American Power Conversion Corp. | | | 42,898 |
| 8,700 | | AU Optronics Corp. ADR | | | 91,350 |
| 3,150 | | Jabil Circuit, Inc.* | | | 76,577 |
| 4,900 | | LG.Philips LCD Company, Ltd. ADR* | | | 66,395 |
| 3,200 | | Molex, Inc. | | | 94,624 |
| 1,400 | | TDK Corp. ADR | | | 97,075 |
| | | | |
|
|
| | | | | | 597,100 |
| | | | |
|
|
| | | Retail - Catalog and Mail Order — 0.7% | | | |
| 750 | | CDW Corp. | | | 46,523 |
| | | | |
|
|
| | |
| | | Scientific and Technical Instruments — 0.9% | | | |
| 2,950 | | Applera Corp. - Applied Biosystems Group | | | 56,286 |
| | | | |
|
|
| | |
| | | Semiconductors — 27.5% | | | |
| 16,200 | | Applied Materials, Inc.* | | | 260,820 |
| 2,900 | | Freescale Semiconductor, Inc. Class A* | | | 45,066 |
| 8,700 | | Infineon Technologies AG ADR* | | | 95,091 |
| 12,000 | | Intel Corp. | | | 267,119 |
| 2,000 | | KLA-Tencor Corp.* | | | 91,060 |
| 1,800 | | Kyocera Corp. ADR | | | 129,780 |
| 9,050 | | Micron Technology, Inc.* | | | 110,229 |
| 4,100 | | National Semiconductor Corp. | | | 68,470 |
| 2,950 | | Novellus Systems, Inc.* | | | 76,435 |
| 3,150 | | NVIDIA Corp.* | | | 45,581 |
| 9,600 | | STMicroelectronics N.V | | | 177,696 |
| 11,950 | | Texas Instruments, Inc. | | | 292,177 |
| 5,025 | | Xilinx, Inc. | | | 153,765 |
| | | | |
|
|
| | | | | | 1,813,289 |
| | | | |
|
|
| | | Software and Programming — 6.2% | | | |
| 2,800 | | Check Point Software Technologies Ltd.* | | | 63,339 |
| 1,650 | | Electronic Arts, Inc.* | | | 74,118 |
| 4,725 | | Microsoft Corp. | | | 132,253 |
| 2,200 | | PeopleSoft, Inc.* | | | 45,694 |
| 6,600 | | Siebel Systems, Inc.* | | | 62,700 |
| 1,850 | | Synopsys, Inc.* | | | 30,045 |
| | | | |
|
|
| | | | | | 408,149 |
| | | | |
|
|
| | |
| | | Total Common Stocks (Amortized Cost $6,086,462) | | | 6,352,076 |
| | | | |
|
|
26
The FBR Funds
FBR Large Cap Technology Fund
Portfolio of Investments (continued)
October 31, 2004
| | | | | | |
PAR
| | | | VALUE
(NOTE 2)
| |
| | | REPURCHASE AGREEMENTS — 3.9% | | | | |
| $259,000 | | With Mizuho Securities, Inc. dated 10/29/04 at 1.75% to be repurchased at $259,038 on 11/01/04, collateralized by U.S. Treasury Notes, 1.875% due 1/31/06, value $151,833; U.S. Treasury Bonds, 8.75% due 8/15/20, value $112,792 (Amortized Cost $259,000) | | $ | 259,000 | |
| | | | |
|
|
|
| | | Total Investments— 100.1%
(Amortized Cost $6,345,462) | | | 6,611,076 | |
| | | Liabilities Less Other Assets — (0.1%) | | | (3,340 | ) |
| | | | |
|
|
|
| | | Net Assets — 100.0% . | | $ | 6,607,736 | |
| | | | |
|
|
|
| * | Non-income producing security ADR American Depository Receipts |
The accompanying notes are an integral part of the financial statements.
27
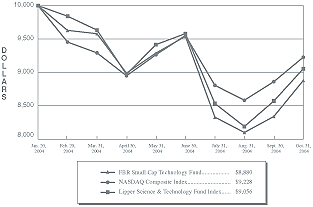
The FBR Funds
FBR Small Cap Technology Fund
Management Overview
Portfolio Manager: Robert C. Barringer, CFA
Over the recent fiscal year, how did the fund perform?
The FBR Small Cap Technology Fund commenced operations on January 20, 2004. Since inception through the end of the fiscal year (October 31, 2004), the Fund returned -11.20% while the NASDAQ Composite Index and the Lipper Science & Technology Fund Index returned -7.72% and -9.44%, respectively.
What factors contributed to the Fund’s performance?
There has been a lot of uncertainty about the strength and duration of the technology spending recovery since its bottoming in late 2001, both from the standpoint of the companies and the investment community. The Fund’s performance was impacted by the continued uncertainty surrounding the corporate spending environment and its attendant effects on companies’ earnings visibility and financial performance. This uncertainty or lack of visibility, as it has been called, has been caused by such issues as the elections and the war in Iraq, which impacted consumer and corporate confidence. In addition, the semiconductor industry faced an excess inventory issue from the beginning of the year, resulting in poor operating and stock performance. Lastly, size played a role as small cap companies were more negatively impacted by these factors.
What is the outlook for the Fund and the technology sector?
The outlook for the technology sector remains bright as technology is integrated into larger parts of our economy and everyday lives. Broadband and wireless penetration are continuing to grow, enabling greater communication and productivity in our business and personal lives. The Fund positions itself in the stocks of companies that should take advantage of these and other major technology trends, companies with differentiated strategies, and solid balance sheets.
I was named portfolio manager of the FBR Small Cap Technology Fund this past August and I am very excited to create and maintain a portfolio of future leaders in technology. There is progress being made on numerous fronts in technology, including communications, energy, medical devices and biotechnology. These and other areas should provide fertile ground for investment opportunities into the future.
28
The FBR Funds
FBR Small Cap Technology Fund
Comparison of Change in Value of $10,000 Investment in
Fund Shares(1)(2) vs. Various Indices(1)(3)
Total Returns—For the Period Ended October 31, 2004(4)
| | | |
| | | Since
Inception(5)
| |
FBR Small Cap Technology Fund (1)(2) | | (11.20 | %) |
NASDAQ Composite Index (1)(3) | | (7.72 | %) |
Lipper Science & Technology Fund Index (1)(3) | | (9.44 | %) |
TOTAL RETURNS REPRESENT PAST PERFORMANCE, WHICH IS NO GUARANTEE OF FUTURE RESULTS.
Investment return and principal value will fluctuate so that investors’ shares, when redeemed, may be
worth more or less than their original cost. Returns shown assume reinvestment of distributions.
The current performance may be lower or higher than the performance data quoted.
| (1) | The graph assumes a hypothetical $10,000 initial investment in the Fund and reflects all Fund expenses. Investors should note that the Fund is a professionally managed mutual fund while the indices are unmanaged, do not incur sales charges or expenses and are not available for investment. |
| (2) | FBR Fund Advisers, Inc. waived a portion of its advisory fees and agreed to contractually reimburse a portion of the Fund’s operating expenses, as necessary, to maintain existing expense limitations, as set forth in the notes to the financial statements. Total return shown includes fee waivers and expense reimbursements, if any; total return would have been lower had there been no waiver of fees and/or reimbursement of expenses in excess of expense limitations. |
| (3) | The NASDAQ Composite Index is a broad-based capitalization-weighted index of all NASDAQ National Market and Small Cap stocks. Lipper Analytical Services, Inc., is a national recognized organization that reports on mutual fund total return performance and calculates fund rankings. Peer averages are based on a universe of funds with the same investment objective. Peer group averages include reinvested dividends and capital gains, if any, and exclude sales charges. |
| (4) | The total returns shown do not reflect the deduction of taxes that a shareholder would pay on fund distributions or the redemption of fund shares. |
| (5) | For the period January 20, 2004 (commencement of investment operations) through October 31, 2004. |
29
The FBR Funds
FBR Small Cap Technology Fund
Portfolio Summary
October 31, 2004
The following chart provides a visual breakdown of the Fund by industry sectors. The underlying securities represent a percentage of the portfolio investments.
30
The FBR Funds
FBR Small Cap Technology Fund
Portfolio of Investments
October 31, 2004
| | | | | |
SHARES
| | | | VALUE
(NOTE 2)
|
| | | COMMON STOCKS — 97.3% | | | |
| | | Auto and Truck Parts — 2.8% | | | |
1,200 | | Gentex Corp. | | $ | 39,612 |
| | | | |
|
|
| | | Biotechnology and Drugs — 11.8% | | | |
2,200 | | Abaxis, Inc.* | | | 28,435 |
2,000 | | Angiotech Pharmaceuticals, Inc.* | | | 36,559 |
1,700 | | Dendreon Corp.* | | | 17,578 |
950 | | Eon Labs, Inc.* | | | 23,380 |
600 | | Martek Biosciences Corp.* | | | 28,234 |
900 | | Par Pharmaceutical Companies, Inc.* | | | 35,505 |
| | | | |
|
|
| | | | | | 169,691 |
| | | | |
|
|
| | | Chemical Manufacturing — 1.8% | | | |
725 | | Cabot Microelectronics Corp.* | | | 26,122 |
| | | | |
|
|
| | | Communications Equipment — 3.6% | | | |
2,000 | | Foundry Networks, Inc.* | | | 24,260 |
1,350 | | Polycom, Inc.* | | | 27,878 |
| | | | |
|
|
| | | | | | 52,138 |
| | | | |
|
|
| | | Computer Hardware — 7.1% | | | |
12,300 | | Cray, Inc.* | | | 41,144 |
1,225 | | Ingram Micro, Inc., Class A* | | | 21,131 |
700 | | Park Electrochemical Corp. | | | 14,707 |
625 | | Tech Data Corp.* | | | 25,244 |
| | | | |
|
|
| | | | | | 102,226 |
| | | | |
|
|
| | | Computer Networks — 4.9% | | | |
1,675 | | Intergraph Corp.* | | | 41,766 |
4,100 | | Novell, Inc.* | | | 29,479 |
| | | | |
|
|
| | | | | | 71,245 |
| | | | |
|
|
| | | Computer Peripherals — 1.6% | | | |
1,250 | | Metrologic Instruments, Inc.* | | | 23,313 |
| | | | |
|
|
| | | Computer Storage Devices — 2.3% | | | |
1,200 | | Storage Technology Corp.* | | | 32,424 |
| | | | |
|
|
| | | Electronic Instruments and Controls — 5.2% | | | |
975 | | Benchmark Electronics, Inc.* | | | 33,120 |
2,675 | | Power-One, Inc.* | | | 18,779 |
1,400 | | Technitrol, Inc.* | | | 22,848 |
| | | | |
|
|
| | | | | | 74,747 |
| | | | |
|
|
31
The FBR Funds
FBR Small Cap Technology Fund
Portfolio of Investments (continued)
October 31, 2004
| | | | | |
SHARES
| | | | VALUE
(NOTE 2)
|
| | | Medical Equipment and Supplies — 8.8% | | | |
| 600 | | Atrion Corp. | | $ | 27,496 |
| 1,700 | | Kensey Nash Corp.* | | | 48,619 |
| 1,450 | | Wright Medical Group, Inc.* | | | 37,454 |
| 400 | | ZOLL Medical Corp.* | | | 12,800 |
| | | | |
|
|
| | | | | | 126,369 |
| | | | |
|
|
| | | Semiconductors — 21.4% | | | |
| 1,850 | | Actel Corp.* | | | 28,065 |
| 3,390 | | Cirrus Logic, Inc.* | | | 17,120 |
| 900 | | Coherent, Inc.* | | | 21,717 |
| 3,800 | | ESS Technology, Inc.* | | | 24,852 |
| 1,800 | | Exar Corp.* | | | 27,036 |
| 1,150 | | Genesis Microchip, Inc.* | | | 16,296 |
| 4,200 | | Integrated Silicon Solution, Inc.* | | | 31,541 |
| 2,900 | | MEMC Electronic Materials, Inc.* | | | 27,260 |
| 2,500 | | Mykrolis Corp.* | | | 26,275 |
| 950 | | Power Integrations, Inc.* | | | 20,330 |
| 1,400 | | Semtech Corp.* | | | 29,232 |
| 1,150 | | Standard Microsystems Corp.* | | | 25,323 |
| 400 | | Varian Semiconductor Equipment Associates, Inc.* | | | 13,844 |
| | | | |
|
|
| | | | | | 308,891 |
| | | | |
|
|
| | | Software and Programming — 26.0% | | | |
| 3,112 | | Activision, Inc.* | | | 45,061 |
| 1,950 | | Ascential Software Corp.* | | | 27,476 |
| 3,850 | | Compuware Corp.* | | | 22,292 |
| 1,500 | | FileNet Corp.* | | | 41,744 |
| 4,550 | | Informatica Corp.* | | | 35,536 |
| 1,500 | | Internet Security Systems, Inc.* | | | 32,640 |
| 1,225 | | Manhattan Associates, Inc.* | | | 25,198 |
| 3,400 | | NetIQ Corp.* | | | 43,111 |
| 2,350 | | Sybase, Inc.* | | | 37,201 |
| 815 | | Take-Two Interactive Software, Inc.* | | | 26,862 |
| 1,200 | | THQ, Inc.* | | | 22,680 |
| 1,500 | | TIBCO Software, Inc.* | | | 14,580 |
| | | | |
|
|
| | | | | | 374,381 |
| | | | |
|
|
| | | Total Common Stocks (Amortized Cost $1,403,262) | | | 1,401,159 |
| | | | |
|
|
32
The FBR Funds
FBR Small Cap Technology Fund
Portfolio of Investments (continued)
October 31, 2004
| | | | | |
PAR
| | | | VALUE
(NOTE 2)
|
| | | REPURCHASE AGREEMENTS — 1.3% | | | |
| $19,000 | | With Mizuho Securities, Inc. dated 10/29/04 at 1.75% to be repurchased at $19,003 on 11/01/04, collateralized by U.S. Treasury Notes, 1.875% due 1/31/06, value $11,138; U.S. Treasury Bonds, 8.75% due 8/15/20, value $8,274 (Amortized Cost $19,000) | | $ | 19,000 |
| | | | |
|
|
| | | Total Investments — 98.6%
(Amortized Cost $1,422,262) | | $ | 1,420,159 |
| | | Other Assets Less Liabilities — 1.4% | | | 19,952 |
| | | | |
|
|
| | | Net Assets — 100.0% | | $ | 1,440,111 |
| | | | |
|
|
| * | Non-income producing security |
The accompanying notes are an integral part of the financial statements.
33
The FBR Funds
FBR Gas Utility Index Fund
Management Overview
Portfolio Manager: Winsor Aylesworth
Over the recent fiscal year, how did the fund perform?
For the one-year period ended October 31, 2004 the FBR Gas Utility Index Fund appreciated 20.63%. This compares to the AGA Stock Index, the Dow Jones Utility Index and the Lipper Utility Index which returned 21.59%, 28.68% and 22.97% for the same period, respectively.
What factors contributed to the Fund’s performance?
Three major factors impacted the Fund’s performance during the fiscal year, the continued post “Enron” balance sheet restructuring issues; the broad economic recovery; and the overall weather patterns and trends.
The overriding “Back to Basics” philosophy adopted by the utility industry in the aftermath of the “Enron” debacle has begun to pay dividends to investors. Companies sold non-core assets, reduced debt and focused efforts on electricity generation and gas distribution within their respective markets. As a result, many of the Fund’s holdings have either resumed or increased their dividend payout which in turn has increased overall investor interest in the industry.
The utility business is driven by a straight forward supply and demand dynamic. When demand is up, the companies sell more energy, increase revenues and usually profits. A decrease in overall energy demand generally indicates an oversupply of generating capacity. As a result, revenues and subsequent profits tend to fall. Over the course of the fiscal year, the continued economic recovery and overall stronger job environment drove demand for energy which helped off-set the mild weather experienced in the Midwest and Northeast.
What is the outlook for the Fund and the utility sector?
We have made some exciting changes which should bode well for the Fund and its investors.
First, we changed the name of the Fund to the FBR Gas Utility Index Fund. The ticker symbol remains GASFX and the underlying investment methodology is unchanged. We feel the new name better reflects the Fund’s investment objectives and will help prevent the notion that the Fund’s performance is directly correlated to the price of the underlying commodity.
Second, the Fund now includes some foreign based utility holdings. Since the demise of Enron and others, many domestic companies have been divesting non-core assets. This has provided international companies with opportunities to acquire valuable natural gas distribution assets throughout North America. Recently, several of these international companies have acquired significant U.S. based natural gas assets and have become members of the American Gas Association. As a result, in late October, these companies were added to the AGA stock Index and the Fund.
Finally, barring any terrorism and major geopolitical issues, we feel the economy is poised to continue its recovery in 2005. This should fuel the overall demand for energy which is a positive for the Fund’s holdings. We also expect the portfolio companies to continue to strengthen their balance sheets and where possible, increase their dividends. Unfortunately we can’t predict the weather, but baring any major variances in seasonal temperatures we remain moderately positive on the long-term fundamental trends of the natural gas industry.
34
The FBR Funds
FBR Gas Utility Index Fund
Comparison of Change in Value of $10,000 Investment in
Fund Shares(1)(2) vs. Index(1)(3)
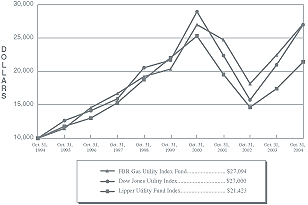
Total Returns—For the Years Ended October 31, 2004(4)(5)
| | | | | | | | | |
| | | One
Year
| | | Annualized
Five Year
| | | Annualized
Ten Year
| |
FBR Gas Utility Index Fund (1)(2) | | 20.63 | % | | 5.89 | % | | 10.48 | % |
Dow Jones Utility Index(1)(3) | | 28.68 | % | | 4.47 | % | | 10.42 | % |
Lipper Utility Fund Index(1)(3) | | 22.97 | % | | (0.57 | %) | | 7.92 | % |
TOTAL RETURNS REPRESENT PAST PERFORMANCE, WHICH IS NO GUARANTEE OF FUTURE RESULTS.
Investment return and principal value will fluctuate so that investors’ shares, when redeemed, may be
worth more or less than their original cost. Returns shown assume reinvestment of distributions.
The current performance may be lower or higher than the performance data quoted.
| (1) | The graph assumes a hypothetical investment of $10,000. The Fund’s performance assumes reinvestment of all dividends and distributions and reflects all Fund expenses. The indices are unmanaged and do not incur charges or expenses and are not available for investment. |
| .(2) | FBR Fund Advisers, Inc. waived a portion of its advisory fees and agreed to contractually reimburse a portion of the Fund’s operating expenses, as necessary, to maintain existing expense limitations, as set forth in the notes to the financial statements. Total returns shown include fee waivers and expense reimbursements, if any; total returns would have been lower had there been no waiver of fees and/or reimbursement of expenses in excess of expense limitations. |
| (3) | Dow Jones Utility Index is a price weighted average of 15 utility companies listed on the New York Stock Exchange and involved in the production of electrical energy. Lipper Analytical Services, Inc., is a nationally recognized organization that reports on mutual fund total return performance and calculates fund rankings. Peer averages are based on universes of funds with the same investment objective. Peer group averages include reinvested dividends and capital gains, if any, and exclude sales charges. |
| (4) | The total returns shown do not reflect the deduction of taxes that a shareholder would pay on fund distributions or the redemption of fund shares. |
| (5) | In 2003, the Fund changed its fiscal year-end from March to October. |
35
The FBR Funds
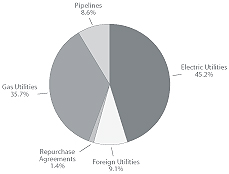
FBR Gas Utility Index Fund
Portfolio Summary
October 31, 2004
The following chart provides a visual breakdown of the Fund by industry sectors. The underlying securities represent a percentage of the portfolio investments.
36
The FBR Funds
FBR Gas Utility Index Fund
Portfolio of Investments
October 31, 2004
| | | | | | | | |
SHARES
| | | | VALUE
(NOTE 2)
| | PERCENT OF
NET ASSETS
| |
| | | COMMON STOCKS — 99.52% | | | | | | |
| 452,000 | | Duke Energy Corp. | | $ | 11,087,559 | | 5.03 | % |
| 340,175 | | PG&E Corp.* | | | 10,899,206 | | 4.94 | |
| 267,850 | | KeySpan Corp. | | | 10,700,607 | | 4.85 | |
| 124,200 | | E.ON AG - ADR | | | 10,128,509 | | 4.59 | |
| 142,850 | | Dominion Resources, Inc. | | | 9,188,111 | | 4.17 | |
| 423,950 | | NiSource, Inc. | | | 9,093,727 | | 4.12 | |
| 174,100 | | Enbridge, Inc. | | | 7,557,680 | | 3.43 | |
| 169,200 | | National Grid Transco PLC ADR | | | 7,461,719 | | 3.38 | |
| 735,850 | | El Paso Corp. | | | 6,578,499 | | 2.98 | |
| 141,350 | | Public Service Enterprise Group, Inc. | | | 6,020,097 | | 2.73 | |
| 124,400 | | Questar Corp. | | | 5,971,200 | | 2.71 | |
| 242,683 | | Southern Union Co.* | | | 5,331,746 | | 2.42 | |
| 165,000 | | AGL Resources, Inc. | | | 5,148,000 | | 2.33 | |
| 112,700 | | Piedmont Natural Gas Companies, Inc. | | | 5,131,231 | | 2.32 | |
| 409,900 | | The Williams Companies, Inc. | | | 5,127,849 | | 2.32 | |
| 115,275 | | Consolidated Edison, Inc. | | | 5,008,699 | | 2.27 | |
| 180,750 | | Atmos Energy Corp. | | | 4,665,158 | | 2.12 | |
| 123,650 | | Nicor, Inc. | | | 4,639,348 | | 2.10 | |
| 164,400 | | ONEOK, Inc. | | | 4,409,208 | | 2.00 | |
| 148,400 | | National Fuel Gas Co. | | | 4,158,168 | | 1.89 | |
| 96,550 | | Peoples Energy Corp. | | | 4,130,409 | | 1.87 | |
| 101,050 | | Exelon Corp. | | | 4,003,601 | | 1.82 | |
| 140,300 | | WGL Holdings, Inc. | | | 3,991,535 | | 1.81 | |
| 71,350 | | Equitable Resources, Inc. | | | 3,945,655 | | 1.78 | |
| 142,600 | | Energy East Corp. | | | 3,593,520 | | 1.63 | |
| 322,800 | | CenterPoint Energy, Inc. | | | 3,392,628 | | 1.54 | |
| 128,825 | | Vectren Corp. | | | 3,332,703 | | 1.51 | |
| 76,775 | | DTE Energy Co. | | | 3,279,060 | | 1.49 | |
| 53,400 | | TXU Corp. | | | 3,269,148 | | 1.48 | |
| 74,850 | | Cinergy Corp. | | | 2,958,072 | | 1.34 | |
| 70,050 | | New Jersey Resources Corp. | | | 2,879,756 | | 1.31 | |
| 52,025 | | Energen Corp. | | | 2,797,905 | | 1.27 | |
| 86,750 | | Northwest Natural Gas Co. | | | 2,749,975 | | 1.25 | |
| 109,250 | | Southwest Gas Corp. | | | 2,668,978 | | 1.21 | |
| 116,100 | | TransCanada Corp. | | | 2,627,343 | | 1.19 | |
| 77,800 | | American Electric Power Company, Inc. | | | 2,561,954 | | 1.16 | |
| 131,550 | | Xcel Energy, Inc. | | | 2,249,505 | | 1.02 | |
| 86,100 | | Puget Energy, Inc. | | | 2,002,686 | | 0.90 | |
| 61,350 | | The Laclede Group, Inc. | | | 1,849,703 | | 0.84 | |
37
The FBR Funds
FBR Gas Utility Index Fund
Portfolio of Investments (continued)
October 31, 2004
| | | | | | | | |
SHARES
| | | | VALUE
(NOTE 2)
| | PERCENT OF
NET ASSETS
| |
| 69,700 | | MDU Resources Group, Inc. | | $ | 1,787,805 | | 0.81 | % |
| 36,880 | | South Jersey Industries, Inc. | | | 1,740,736 | | 0.79 | |
| 40,975 | | Constellation Energy Group, Inc. | | | 1,664,405 | | 0.75 | |
| 42,575 | | UGI Corp. | | | 1,644,672 | | 0.74 | |
| 48,350 | | Wisconsin Energy Corp. | | | 1,578,144 | | 0.72 | |
| 29,375 | | Ameren Corp. | | | 1,410,000 | | 0.64 | |
| 123,000 | | CMS Energy Corp.* | | | 1,151,280 | | 0.52 | |
| 22,925 | | Southwestern Energy Co.* | | | 1,053,175 | | 0.48 | |
| 19,925 | | NSTAR | | | 985,690 | | 0.45 | |
| 34,000 | | Alliant Energy Corp. | | | 896,920 | | 0.41 | |
| 39,875 | | Northeast Utilities | | | 770,784 | | 0.35 | |
| 232,300 | | Aquila, Inc.* | | | 736,391 | | 0.33 | |
| 29,925 | | PNM Resources, Inc. | | | 696,654 | | 0.32 | |
| 24,486 | | EnergySouth, Inc. | | | 662,836 | | 0.30 | |
| 13,530 | | WPS Resources Corp. | | | 642,675 | | 0.29 | |
| 41,960 | | NUI Corp. | | | 564,782 | | 0.26 | |
| 10,625 | | PPL Corp. | | | 552,500 | | 0.25 | |
| 38,675 | | TECO Energy, Inc. | | | 541,450 | | 0.24 | |
| 29,450 | | Avista Corp. | | | 523,621 | | 0.24 | |
| 15,535 | | MGE Energy, Inc. | | | 492,304 | | 0.22 | |
| 81,375 | | SEMCO Energy, Inc. | | | 430,474 | | 0.20 | |
| 9,450 | | CH Energy Group, Inc. | | | 421,754 | | 0.19 | |
| 5,950 | | Entergy Corp. | | | 388,892 | | 0.18 | |
| 18,841 | | Pepco Holdings, Inc. | | | 388,313 | | 0.18 | |
| 14,940 | | Chesapeake Utilities Corp. | | | 373,500 | | 0.17 | |
| 10,347 | | Delta Natural Gas Company, Inc. | | | 258,054 | | 0.12 | |
| 13,150 | | Allegheny Energy, Inc.* | | | 240,777 | | 0.11 | |
| 12,950 | | Sierra Pacific Resources* | | | 124,320 | | 0.06 | |
| 5,075 | | RGC Resources, Inc. | | | 121,902 | | 0.05 | |
| 5,075 | | Energy West, Inc.* | | | 29,232 | | 0.01 | |
| 500 | | ALLETE, Inc. | | | 16,990 | | 0.01 | |
| 1,275 | | Corning Natural Gas Corp. | | | 13,515 | | 0.01 | |
| | | | |
|
| |
|
|
| | | Total Common Stocks
(Amortized Cost $134,338,595) | | | 219,495,004 | | 99.52 | |
| | | | |
|
| |
|
|
The FBR Funds
FBR Gas Utility Index Fund
Portfolio of Investments (continued)
October 31, 2004
| | | | | | | | | |
PAR
| | | | VALUE
(NOTE 2)
| | | PERCENT OF
NET ASSETS
| |
| | | REPURCHASE AGREEMENTS — 1.38% | | | | | | | |
| $3,035,000 | | With Mizuho Securities, Inc. dated 10/29/04 at 1.75% to be repurchased at $3,035,443 on 11/01/04, collateralized by U.S. Treasury Notes, 1.875% due 1/31/06, value $1,779,206; U.S. Treasury Bonds, 8.75% due 8/15/20, value $1,321,713 (Amortized Cost $3,035,000) | | $ | 3,035,000 | | | 1.38 | % |
| | | | |
|
|
| |
|
|
| | | Total Investments (Amortized Cost $137,373,595) | | | 222,530,004 | | | 100.90 | |
| | | Liabilities Less Other Assets | | | (1,985,159 | ) | | (0.90 | ) |
| | | | |
|
|
| |
|
|
| | | Net Assets | | $ | 220,544,845 | | | 100.00 | % |
| | | | |
|
|
| |
|
|
| * | Non-income producing security. |
ADR Amercian Depository Receipt
The accompanying notes are an integral part of the financial statements.
39
The FBR Funds
FBR Fund for Government Investors
Management Overview
Portfolio Manager: Betsy Piper/Bach
Over the recent fiscal year, how did the Fund perform?
For the ten months ended October 31, 2004, the FBR Fund for Government Investors appreciated 0.42%.
What factors contributed to the Fund’s performance?
For the ten months ended October 31, 2004, the FBR Fund for Government Investors’ (“FGI”) return moved up in concert with the increases made by the Federal Open Market Committee (“FOMC”). This fiscal year, the FOMC raised interest rates on three different occasions from a low of 1.00% to 1.75% by the September meeting. This directly impacted FGI’s holdings which are primarily comprised of the highest quality fixed income assets on the short end of the yield curve. These assets are most often Federal Home Loan Bank Discount Notes and Federal Farm Credit Notes. Thus, you have seen your returns begin to rise.
What is the outlook for the Fund?
We expect the Fed will continue to ease rates up through the end of the year as signs of improving economic growth continue. Interestingly, the rate increases are not yet reflected in the yields on the long end of the yield curve to the same degree we are seeing them along the short end. Some of these increases have already been anticipated by the market and FGI’s returns should continue to benefit into the new year.
Portfolio Summary
October 31, 2004
The following chart provides a visual breakdown of the Fund by days to maturity ranges. The underlying securities represent a percentage of the portfolio investments.
40
The FBR Funds
FBR Fund for Government Investors
Portfolio of Investments
October 31, 2004
| | | | | | | | | | |
PAR
| | | | RATE
| | | MATURITY
DATE
| | VALUE
(NOTE 2)
|
| | | U.S. GOVERNMENT AND AGENCY OBLIGATIONS — 94.1% | | | | | | | | |
| $28,000,000 | | Federal Agricultural Mortgage Discount Note | | 1.86 | %* | | 12/27/04 | | $ | 27,918,987 |
| 15,000,000 | | Federal Home Loan Bank Discount Note | | 1.765 | * | | 11/10/04 | | | 14,993,512 |
| 50,000,000 | | Federal Home Loan Bank Discount Note | | 1.79 | * | | 11/24/04 | | | 49,943,299 |
| 5,000,000 | | Federal Home Loan Bank Discount Note | | 1.88 | * | | 12/15/04 | | | 4,988,511 |
| 20,000,000 | | Federal Home Loan Bank Discount Note | | 1.96 | * | | 1/14/05 | | | 19,919,422 |
| 14,000,000 | | Federal Home Loan Bank Step Bond | | 1.67 | ^ | | 12/22/04 | | | 14,000,000 |
| 40,000,000 | | Federal Home Loan Bank Step Bond | | 1.7 | ^ | | 2/28/05 | | | 40,000,000 |
| 40,000,000 | | Federal Home Loan Bank Step Bond | | 1.35 | ^ | | 4/4/05 | | | 40,000,000 |
| 25,000,000 | | Federal Home Loan Bank Step Bond | | 2.0 | ^ | | 2/5/05 | | | 25,000,000 |
| 20,000,000 | | Federal Home Loan Bank Discount Bond | | 1.17 | * | | 12/16/04 | | | 19,986,476 |
| 15,000,000 | | Federal Home Loan Bank Variable Bond** | | 1.3 | * | | 4/26/05 | | | 15,000,000 |
| | | | | | | | | |
|
|
| | | Total Investments — 94.1% (Amortized Cost $271,750,207)† | | | | | | | | 271,750,207 |
| | | Other Assets Less Liabilities — 5.9% | | | | | | | | 17,010,573 |
| | | | | | | | | |
|
|
| | | Net Assets — 100.0% | | | | | | | $ | 288,760,780 |
| | | | | | | | | |
|
|
| * | These issues show the rate of discount at time of purchase. |
| ^ | Stepped coupon is a security with a predetermined schedule of interest or dividend rate changes. |
| ** | Indexed Security - The rates of interest earned on this security are tied to the London Interbank Offered Rate (“LIBOR”). The coupon rate is as of October 31, 2004. |
| † | Same cost is used for Federal income tax purposes. |
Weighted Average Maturity of Portfolio: 48 Days
The accompanying notes are an integral part of the financial statements.
41
The FBR Funds
FBR Maryland Tax-Free Portfolio &
FBR Virginia Tax-Free Portfolio
Management Overview
Portfolio Manager: Craig A. Pernick
Over the recent fiscal year, how did the Funds perform?
For the ten months ended October 31, 2004, the FBR Maryland Tax-Free Portfolio appreciated 2.81% and the FBR Virginia Tax-Free Portfolio appreciated 2.82%. This compares to the Lehman Brothers Municipal Bond Index which returned 4.08% for the same period.
What factors contributed to the Fund’s performance?
In last year’s letter to shareholders, we commented that the Funds were positioned for a rising interest rate environment. Improving GDP, improving consumer confidence, and a rising U.S. budget deficit all led me to believe that we would see upward pressure on interest rates fueled by a strong economy and rising inflationary pressure. In fact, this scenario did play out and we saw a dramatic rise in interest rates during the second quarter of 2004. However, the Funds’ defensive positioning hindered their performances during the latter part of the fiscal year. During this period, weaker than expected employment numbers, crude oil prices above $50 per barrel, pre-election terrorism concerns and continued buying of U.S. securities by foreign investors, led to a decline in interest rates. The Funds achieved moderate returns during a very volatile interest rate environment; however, both underperformed the index due to being positioned for rising interest rates during the year.
What is the outlook for the Funds and the Municipal Bond Market?
The Federal Reserve has continued on its “measured” path scenario, raising the Federal Funds rate to 2% in November, 2004. We believe the Fed may feel pressure to raise rates again in December, given the recent strong employment report, expectations of 4.0% to 4.5% GDP growth in the fourth quarter, and mild inflationary pressures from continued high energy prices. We also respect the long-term view of the Federal Reserve that energy prices will moderate and the economy will not be significantly dampened in the long run. Our analysis therefore leads us to believe that the economy continues to show signs of moderate, sustained growth which will lead to a continued rise in interest rates. Therefore, the Funds will continue to be managed with a somewhat defensive posture, which we expect will lead to sustained out-performance by the Funds relative to their index.
42
The FBR Funds
FBR Maryland Tax-Free Portfolio
FBR Virginia Tax-Free Portfolio
Comparison of Change in Value of $10,000 Investment in
Fund Shares(1) vs. Index(1)(2)
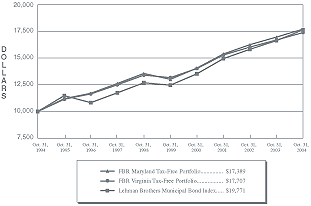
Total Returns—For the Years Ended October 31, 2004(3)(4)
| | | | | | | | | |
| | | One Year
| | | Annualized
Five Year
| | | Annualized
Ten Year
| |
FBR Maryland Tax-Free Portfolio(1) | | 4.17 | % | | 5.72 | % | | 5.69 | % |
FBR Virginia Tax-Free Portfolio(1) | | 4.36 | % | | 6.36 | % | | 5.88 | % |
Lehman Brothers Municipal Bond Index(1)(2) | | 6.03 | % | | 7.19 | % | | 7.05 | % |
TOTAL RETURNS REPRESENT PAST PERFORMANCE, WHICH IS NO GUARANTEE OF FUTURE RESULTS.
Investment return and principal value will fluctuate so that investors’ shares, when redeemed, may be
worth more or less than their original cost. Returns shown assume reinvestment of distributions.
The current performance may be lower or higher than the performance data quoted.
| (1) | The graph assumes a hypothetical investment of $10,000. The Funds’ performance assumes reinvestment of all dividends and distributions and reflects all Fund expenses. The Lehman Brothers Municipal Bond Index is unmanaged and does not reflect any expenses. |
| (2) | The Lehman Brothers Municipal Bond Index is a total return performance benchmark for the long-term, investment-grade tax-exempt bond market. |
| (3) | The total returns shown do not reflect the deduction of taxes that a shareholder would pay on fund distributions or the redemption of fund shares. |
| (4) | In March 2004, the Funds changed their fiscal year-ends from December 31 to October 31. |
Some income earned in the FBR Maryland or the Virginia Tax-Free Portfolios may be subject to the Federal Alternative Minimum Tax. Income earned by non-Maryland or non-Virginian residents will be subject to applicable state and local taxes. Non-Maryland or non-Virginian residents will be subject to applicable state and local taxes.
43
The FBR Funds
FBR Maryland Tax-Free Portfolio
FBR Virginia Tax-Free Portfolio
Portfolio Summaries
October 31, 2004
The following chart provides a visual breakdown of each Fund by bond ratings*. The underlying securities represent a percentage of the portfolio investments.
Maryland Tax-Free Portfolio
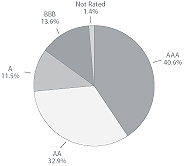
Virginia Tax-Free Portfolio
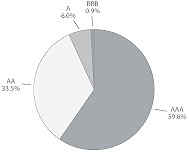
| * | All ratings are by Standard & Poor’s Rating Service (“Standard & Poor’s”) except for those that did not have a Standard & Poor’s rating, a rating by Moody’s Investors Services was used. |
44
The FBR Funds
FBR Maryland Tax-Free Portfolio
Portfolio of Investments
October 31, 2004
| | | | | | | | | | | | | | | |
PAR
| | | | RATE
| | | MATURITY
DATE
| | | VALUE
(NOTE 2)
| | RATING2
| |
| $ | 95,000 | | Anne Arundel County GO | | 4.125 | % | | 3/1/19 | | | $ | 96,182 | | AA+ | |
| | 1,230,000 | | Anne Arundel County PCR Baltimore Gas and Electric Co. Project | | 6.0 | | | 4/1/24 | | | | 1,258,229 | | BBB+ | |
| | 500,000 | | Anne Arundel County Solid Waste Project GO | | 5.5 | | | 9/1/15 | | | | 530,930 | | AA+ | |
| | 725,000 | | Anne Arundel County Water and Sewer GO | | 6.2 | | | 8/1/05 | 1 | | | 755,776 | | AA+ | |
| | 335,000 | | Baltimore County GO | | 5.0 | | | 6/1/19 | | | | 363,244 | | AAA | |
| | 1,000,000 | | Baltimore, MD Public Improvement, Series A | | 5.5 | | | 10/15/06 | 1 | | | 1,087,050 | | AAA | |
| | 500,000 | | Baltimore, MD GO, Series C | | 5.5 | | | 10/15/15 | | | | 589,675 | | AAA | |
| | 100,000 | | Baltimore, MD School Board Commissioners, Series A | | 5.0 | | | 5/1/18 | | | | 108,896 | | AA+ | |
| | 700,000 | | Baltimore, MD Metropolitan District GO | | 5.5 | | | 6/1/06 | 1 | | | 745,997 | | AAA | |
| | 400,000 | | Baltimore, MD Port Facility Revenue | | 6.5 | | | 12/1/10 | | | | 422,184 | | AA- | |
| | 500,000 | | Baltimore, MD Wastewater Project, Series A | | 6.0 | | | 7/1/15 | | | | 603,335 | | AAA | |
| | 500,000 | | Baltimore, MD Wastewater Project, Series A | | 5.125 | | | 7/1/42 | | | | 516,785 | | AAA | |
| | 300,000 | | Frederick County Public Facilities GO | | 5.25 | | | 7/1/17 | | | | 327,093 | | AA | |
| | 500,000 | | Howard County Public Improvement GO | | 5.5 | | | 2/15/08 | 1 | | | 556,795 | | AAA | |
| | 500,000 | | Howard County Housing Opportunity MFH Development | | 4.9 | | | 7/1/24 | | | | 508,620 | | Baa1 | * |
| | | | Maryland Community Development Administration | | | | | | | | | | | | |
| | 500,000 | | Series B | | 5.15 | | | 3/1/08 | | | | 523,275 | | Aa2 | * |
| | 500,000 | | Series 2 | | 5.0 | | | 4/1/17 | | | | 510,695 | | Aa2 | * |
| | 360,000 | | Series E | | 5.7 | | | 9/1/17 | | | | 376,675 | | Aa2 | * |
| | 250,000 | | Series B | | 5.5 | | | 5/15/21 | | | | 260,627 | | Aa2 | * |
| | 275,000 | | Series A | | 5.0 | | | 6/1/21 | | | | 292,042 | | Aaa | * |
| | 115,000 | | Series A | | 5.3 | | | 5/15/22 | | | | 119,852 | | Aa2 | * |
| | 250,000 | | Series B | | 5.375 | | | 9/1/22 | | | | 255,430 | | Aa2 | * |
| | 160,000 | | Series A | | 4.85 | | | 7/1/24 | | | | 160,812 | | Aa2 | * |
| | 10,000 | | Maryland Industrial Development Revenue, Series 1-11 | | 7.125 | | | 7/1/06 | | | | 10,043 | | A- | |
45
The FBR Funds
FBR Maryland Tax-Free Portfolio
Portfolio of Investments (continued)
October 31, 2004
| | | | | | | | | | | | | | |
PAR
| | | | RATE
| | | MATURITY
DATE
| | | VALUE
(NOTE 2)
| | RATING2
| |
| | | Maryland Stadium Authority | | | | | | | | | | | | |
| $1,000,000 | | Convention Center Expansion | | 5.875 | % | | 12/15/13 | | | $ | 1,024,630 | | AAA | |
| 500,000 | | Ocean City Convention Center | | 5.375 | | | 12/15/15 | | | | 522,965 | | AA+ | |
| 500,000 | | Sports Lease Revenue | | 5.55 | | | 3/1/13 | | | | 527,045 | | AAA | |
| | | Maryland State Economic Development | | | | | | | | | | | | |
| 750,000 | | Department of Transportation Headquarters | | 5.375 | | | 6/1/19 | | | | 841,627 | | AA+ | |
| 500,000 | | Morgan State University, Series A | | 6.0 | | | 7/1/22 | | | | 519,640 | | Baa3 | * |
| 350,000 | | University of Maryland, Series A | | 5.75 | | | 10/1/33 | | | | 364,840 | | Baa3 | * |
| | | Maryland State Health and Higher Education | | | | | | | | | | | | |
| 400,000 | | Board of Child Care | | 4.75 | | | 7/1/14 | | | | 424,808 | | A | |
| 500,000 | | Frederick Memorial Hospital | | 5.25 | | | 7/1/13 | | | | 560,270 | | AAA | |
| 500,000 | | Good Samaritan Hospital | | 5.7 | | | 7/1/09 | | | | 554,655 | | NR | |
| 250,000 | | Greater Baltimore Medical Center | | 5.0 | | | 7/1/20 | | | | 255,785 | | A+ | |
| 250,000 | | Hebrew Home of Greater Washington | | 5.6 | | | 1/1/20 | | | | 260,900 | | BBB+ | |
| 1,000,000 | | Hebrew Home of Greater Washington | | 5.8 | | | 1/1/32 | | | | 1,050,020 | | BBB+ | |
| 1,030,000 | | Helix Health | | 5.0 | | | 7/1/27 | | | | 1,107,065 | | AAA | |
| 900,000 | | Johns Hopkins | | 5.0 | | | 5/15/26 | | | | 918,468 | | AA- | |
| 500,000 | | Johns Hopkins | | 5.125 | | | 11/15/34 | | | | 516,350 | | AA- | |
| 1,000,000 | | Johns Hopkins | | 6.0 | | | 7/1/09 | 1 | | | 1,160,040 | | AA | |
| 250,000 | | Kennedy Krieger Issue | | 4.875 | | | 7/1/18 | | | | 256,335 | | Baa2 | * |
| 500,000 | | Kennedy Krieger Issue | | 5.5 | | | 7/1/33 | | | | 513,200 | | Baa2 | * |
| 1,205,000 | | Loyola College | | 5.5 | | | 10/1/16 | | | | 1,301,400 | | AAA | |
| 250,000 | | MedStar Health | | 4.375 | | | 8/15/13 | | | | 251,398 | | BBB | |
| 250,000 | | MedStar Health | | 5.5 | | | 8/15/33 | | | | 255,167 | | BBB | |
| 500,000 | | Sheppard Pratt, Series A | | 5.25 | | | 7/1/35 | | | | 510,510 | | A- | |
| 500,000 | | Suburban Hospital, Series A | | 5.5 | | | 7/1/16 | | | | 551,365 | | A2 | * |
| 500,000 | | Maryland State Transportation Authority BWI Airport | | 5.25 | | | 3/1/12 | | | | 552,410 | | AAA | |
| 1,000,000 | | Maryland Water Quality Finance Administration Revenue, Series A | | 6.0 | | | 9/1/15 | | | | 1,005,110 | | AA | |
| 600,000 | | Montgomery County Economic Development Trinity Health Group | | 5.125 | | | 12/1/22 | | | | 629,160 | | AA- | |
| 475,000 | | Montgomery County GO, Series A | | 5.0 | | | 5/1/09 | 1 | | | 530,509 | | AAA | |
| 500,000 | | Montgomery County GO, Series A | | 5.0 | | | 5/1/19 | | | | 533,300 | | AAA | |
46
The FBR Funds
FBR Maryland Tax-Free Portfolio
Portfolio of Investments (continued)
October 31, 2004
| | | | | | | | | | | | | | | |
PAR
| | | | RATE
| | | MATURITY
DATE
| | | VALUE
(NOTE 2)
| | RATING2
| |
| $ | 250,000 | | Montgomery County Housing Opportunity MFH Development, Series B | | 4.5 | % | | 7/1/23 | | | $ | 244,123 | | Aaa | * |
| | 300,000 | | Morgan State University Academic Revenue, Series A | | 5.0 | | | 7/1/20 | | | | 322,524 | | AAA | |
| | 250,000 | | North East Maryland Waste Disposal Authority Revenue | | 6.0 | | | 7/1/06 | | | | 264,140 | | A2 | * |
| | 250,000 | | North East Maryland Waste Disposal Authority Revenue | | 5.25 | | | 3/15/14 | | | | 269,125 | | AAA | |
| | 100,000 | | Prince George’s County Construction Public Improvement | | 5.5 | | | 10/1/10 | | | | 112,562 | | AAA | |
| | 1,000,000 | | Prince George’s County GO, Series A | | 5.25 | | | 3/15/07 | 1 | | | 1,084,270 | | AAA | |
| | 55,000 | | Prince George’s County Housing Authority Revenue FHLMC/FNMA/GNMA Collateral, Series A | | 5.55 | | | 12/1/33 | | | | 56,364 | | AAA | |
| | 1,250,000 | | Prince George’s County PCR Potomac Electric Project | | 5.75 | | | 3/15/10 | | | | 1,414,300 | | A | |
| | 400,000 | | Puerto Rico Commonwealth Authority Revenue Highway and Transportation, Series B | | 1.76 | | | 11/4/04 | | | | 400,000 | | AAA | |
| | 150,000 | | Puerto Rico Electric Power Authority, Capital Appreciation | | 0 3 | | | 7/1/17 | | | | 86,157 | | A- | |
| | 80,000 | | Puerto Rico Electric Power Authority Revenue | | 5.0 | | | 7/1/19 | | | | 91,095 | | AAA | |
| | | | Puerto Rico Public Buildings Authority Revenue | | | | | | | | | | | | |
| | 315,000 | | Government Facilities, Series G | | 5.25 | | | 7/1/13 | | | | 352,028 | | A- | |
| | 500,000 | | Government Facilities, Series A | | 5.5 | | | 7/1/18 | | | | 575,410 | | A- | |
| | 500,000 | | Puerto Rico Public Finance Corporation, Series A | | 5.0 | | | 8/1/11 | 1 | | | 563,555 | | AAA | |
| | | | University of Maryland System Auxiliary Revenue | | | | | | | | | | | | |
| | 1,000,000 | | Series A | | 5.6 | | | 4/1/06 | 1 | | | 1,061,280 | | AA+ | |
| | 250,000 | | Series A | | 5.125 | | | 4/1/15 | | | | 265,550 | | AA+ | |
| | 1,000,000 | | Series A | | 5.6 | | | 4/1/16 | 1 | | | 1,035,750 | | AA+ | |
| | 265,000 | | Series A | | 5.0 | | | 4/1/18 | | | | 279,413 | | AA+ | |
47
The FBR Funds
FBR Maryland Tax-Free Portfolio
Portfolio of Investments (continued)
October 31, 2004
| | | | | | | | | | | | | |
PAR
| | | | RATE
| | | MATURITY
DATE
| | VALUE
(NOTE 2)
| | RATING2
|
| $ | 500,000 | | Washington DC Metropolitan Area Transportation Authority Revenue | | 6.0 | % | | 7/1/10 | | $ | 581,725 | | AAA |
| | 1,000,000 | | Washington Suburban Sanitary District GO | | 5.0 | | | 6/1/23 | | | 1,041,450 | | AAA |
| | | | | | | | | | |
|
| | |
| | | | Total Investments — 98.2% (Amortized Cost $36,230,475) | | | | | | | | 38,580,035 | | |
| | | | Other Assets Less Liabilities — 1.8% | | | | | | | | 688,479 | | |
| | | | | | | | | | |
|
| | |
| | | | Net Assets — 100.0% | | | | | | | $ | 39,268,514 | | |
| | | | | | | | | | |
|
| | |
| 1 | Date represents pre-refunded date. |
| 2 | All ratings are by Standared & Poor’s Rating Service (“Standard & Poor’s”), except for those which are identified by an asterick (*), are rated by Moody’s Investors Services (“Moody’s”). |
| PCR | Pollution Control Revenue |
The accompanying notes are an integral part of the financial statements.
48
The FBR Funds
FBR Virginia Tax-Free Portfolio
Portfolio of Investments
October 31, 2004
| | | | | | | | | | | | | | | | |
PAR
| | | | RATE
| | MATURITY
DATE
| | VALUE
(NOTE 2)
| | RATING2
| |
| $ | 250,000 | | Albermarle County, VA IDA Martha Jefferson Hospital | | 5.25 | % | | 10/1/15 | | $ | 270,945 | | A2 | * |
| | 500,000 | | Alexandria, VA Construction Public Improvement | | 5.75 | | | 6/15/101 | | | 579,295 | | AAA | |
| | 115,000 | | Alexandria, VA Redevelopment and Housing Authority | | 5.5 | | | 1/1/29 | | | 115,819 | | A | |
| | 350,000 | | Arlington County GO | | 5.25 | | | 2/1/121 | | | 397,502 | | AAA | |
| | 1,000,000 | | Arlington County GO | | 5.375 | | | 12/1/061 | | | 1,081,660 | | AAA | |
| | 350,000 | | Arlington County IDA MFH Arna Valley View Apartments | | 4.85 | | | 6/1/12 | | | 369,271 | | Aaa | * |
| | 500,000 | | Arlington County IDA MFH Colonial Village Apartments | | 5.15 | | | 11/1/31 | | | 518,575 | | AAA | |
| | 1,000,000 | | Brunswick County IDA Lease Revenue | | 5.5 | | | 7/1/061 | | | 1,077,260 | | AAA | |
| | 50,000 | | Chesterfield County IDA Lease Revenue | | 4.75 | | | 11/1/16 | | | 52,845 | | AA | |
| | 650,000 | | Fairfax County IDA Revenue Inova Health System Hospitals | | 5.25 | | | 8/15/19 | | | 705,828 | | AA+ | |
| | 100,000 | | Fairfax County IDA Revenue Inova Health System Project | | 5.0 | | | 8/15/13 | | | 112,012 | | AAA | |
| | 50,000 | | Fairfax County Sewer Revenue | | 5.875 | | | 7/15/061 | | | 54,240 | | AAA | |
| | 825,000 | | Fairfax County Water Authority Revenue | | 5.8 | | | 1/1/16 | | | 940,087 | | AAA | |
| | 400,000 | | Fairfax County Water Authority Revenue | | 5.0 | | | 4/1/16 | | | 424,848 | | AAA | |
| | 630,000 | | Fairfax County Water Authority Revenue | | 6.0 | | | 4/1/22 | | | 694,235 | | AAA | |
| | 705,000 | | Frederick County IDA Lease Revenue Government Complex Facilities | | 5.0 | | | 12/1/14 | | | 799,026 | | Aaa | * |
| | 250,000 | | Fredericksburg, VA IDA Student Housing Revenue MWC Apartments Project | | 5.35 | | | 4/1/29 | | | 253,030 | | Baa2 | * |
| | 300,000 | | Hampton Roads Regional Jail Authority, Series A | | 5.5 | | | 7/1/24 | | | 321,171 | | AAA | |
| | 1,000,000 | | Hanover County GO | | 5.4 | | | 7/15/16 | | | 1,073,040 | | AA | |
| | 75,000 | | Henrico County Development Authority | | 5.1 | | | 10/15/29 | | | 76,485 | | A- | |
| | 500,000 | | Loudoun County GO, Series B | | 5.25 | | | 12/1/14 | | | 578,195 | | AA+ | |
| | 245,000 | | Metropolitan Washington DC Airport System, Series A | | 5.375 | | | 10/1/18 | | | 266,991 | | AAA | |
| | 335,000 | | Metropolitan Washington DC Airport System, Series A | | 5.375 | | | 10/1/19 | | | 362,001 | | AAA | |
49
The FBR Funds
FBR Virginia Tax-Free Portfolio
Portfolio of Investments (continued)
October 31, 2004
| | | | | | | | | | | | | | |
PAR
| | | | RATE
| | | MATURITY
DATE
| | | VALUE
(NOTE 2)
| | RATING2
|
| $ | 500,000 | | Montgomery County IDA, Series C | | 5.125 | % | | 1/15/19 | | | $ | 537,230 | | AAA |
| | 500,000 | | Newport News, VA GO | | 5.75 | | | 1/15/07 | 1 | | | 549,715 | | AA |
| | 500,000 | | Newport News, VA GO | | 5.0 | | | 3/1/18 | | | | 528,840 | | AA |
| | 500,000 | | Norfolk, VA Water Revenue | | 5.75 | | | 11/1/12 | | | | 528,330 | | AAA |
| | 500,000 | | Norfolk, VA Water Revenue | | 5.875 | | | 11/1/15 | | | | 528,685 | | AAA |
| | 500,000 | | Portsmouth, VA Redevelopment and MFH Authority Revenue | | 6.05 | | | 12/1/08 | | | | 514,000 | | AAA |
| | 500,000 | | Prince William County Water and Sewer System | | 5.5 | | | 7/1/19 | | | | 554,700 | | AAA |
| | 100,000 | | Puerto Rico Commonwealth Highway and Transportation Authority, Series B | | 1.76 | | | 11/4/04 | | | | 100,000 | | AAA |
| | 400,000 | | Puerto Rico Electric Power Authority Revenue | | 5.0 | | | 7/1/19 | | | | 455,476 | | AAA |
| | 1,000,000 | | Puerto Rico Public Buildings Authority Revenue Government Facilities, Series G | | 5.25 | | | 7/1/13 | | | | 1,117,550 | | A- |
| | 250,000 | | Puerto Rico Public Finance Corporation Commonwealth, Series A | | 5.0 | | | 8/1/11 | 1 | | | 281,778 | | AAA |
| | 200,000 | | Richmond, VA Metropolitan Authority Expressway Revenue | | 5.25 | | | 7/15/17 | | | | 230,706 | | AAA |
| | 1,000,000 | | Richmond, VA Public Utilities Revenue, Series A | | 5.25 | | | 1/15/18 | | | | 1,069,920 | | A+ |
| | 500,000 | | Richmond, VA Refunding and Improvement GO, Series A | | 5.125 | | | 1/15/16 | | | | 541,100 | | AAA |
| | 300,000 | | Roanoke, VA GO Public Improvement, Series B | | 5.0 | | | 10/1/11 | | | | 331,293 | | AAA |
| | 1,000,000 | | Southeastern Public Servicing Authority, Series B | | 5.0 | | | 7/1/15 | | | | 1,128,370 | | AAA |
| | 100,000 | | Spotsylvania County, VA Water and Sewer Revenue | | 5.0 | | | 6/1/30 | | | | 102,634 | | AAA |
| | 580,000 | | Suffolk, VA Redevelopment and Housing Authority MFH Village Apartments, Series A | | 5.6 | | | 2/1/33 | | | | 612,045 | | AAA |
50
The FBR Funds
FBR Virginia Tax-Free Portfolio
Portfolio of Investments (continued)
October 31, 2004
| | | | | | | | | | | | | | | |
PAR
| | | | RATE
| | | MATURITY
DATE
| | | VALUE
(NOTE 2)
| | RATING2
| |
| $ | 575,000 | | Upper Occoquan Sewer Authority Revenue, Series A | | 5.15 | % | | 7/1/20 | | | $ | 659,358 | | AAA | |
| | 50,000 | | Virginia Beach, VA Development Authority Revenue General Hospital Project | | 5.125 | | | 2/15/18 | | | | 56,404 | | AAA | |
| | 1,075,000 | | Virginia Beach, VA Public Improvement GO | | 5.0 | | | 8/1/08 | 1 | | | 1,190,444 | | AA+ | |
| | 500,000 | | Virginia Beach, VA Public Improvement GO, Series B | | 5.0 | | | 5/1/20 | | | | 551,675 | | AA+ | |
| | 50,000 | | Virginia Beach, VA Development Authority Revenue Town Center Project, Series A | | 4.25 | | | 8/1/13 | | | | 52,703 | | AA | |
| | 250,000 | | Virginia Commonwealth Transportation Revenue U.S. Route 58 Corridor Development | | 5.5 | | | 5/15/09 | 1 | | | 279,870 | | AA+ | |
| | | | Virginia Housing Development Authority Revenue. | | | | | | | | | | | | |
| | 100,000 | | Series L | | 5.35 | | | 2/1/09 | | | | 106,704 | | AA+ | |
| | 80,000 | | Series H | | 5.25 | | | 11/1/10 | | | | 84,970 | | Aa1 | * |
| | 500,000 | | Series N | | 5.125 | | | 1/1/15 | | | | 528,635 | | AA+ | |
| | 300,000 | | Virginia MFH Development Authority, Series G | | 5.0 | | | 11/1/13 | | | | 314,763 | | AA+ | |
| | 500,000 | | Virginia Port Authority Commonwealth Revenue | | 5.9 | | | 7/1/16 | | | | 532,695 | | AA+ | |
| | 350,000 | | Virginia Public School Authority Revenue, Series A | | 5.0 | | | 8/1/18 | | | | 370,570 | | AA+ | |
| | 750,000 | | Virginia State GO | | 5.25 | | | 6/1/19 | | | | 813,263 | | AAA | |
| | 350,000 | | Wincher, VA Public Improvement | | 5.625 | | | 6/1/101 | | | | 402,938 | | AA | |
| | | | | | | | | | | |
|
| | | |
| | | | Total Investments — 98.4% (Amortized Cost $24,838,443) | | | | | | | | | 26,781,725 | | | |
| | | | Other Assets Less Liabilities — 1.6% | | | | | | | | | 436,608 | | | |
| | | | | | | | | | | |
|
| | | |
| | | | Net Assets — 100.0% | | | | | | | | $ | 27,218,333 | | | |
| | | | | | | | | | | |
|
| | | |
| 1 | Date represents pre-refunded date. |
| 2 | All ratings are by Standard & Poor’s Rating Service (“Standard & Poor’s), except for those which are identified by an asterick (*), are rated by Moody’s Investors Services (“Moody’s”). |
GO General Obligation
IDA Industrial Development Authority
MFH Multi-Family Housing
The accompanying notes are an integral part of the financial statements.
51
The FBR Funds
Statements of Assets and Liabilities
October 31, 2004
| | | | | | | | | |
| | | FBR
Large Cap
Financial Fund
| | FBR
Small Cap
Financial Fund
| | FBR
Small Cap Fund
|
ASSETS | | | | | | | | | |
Investment Securities | | | | | | | | | |
Securities at Amortized Cost: | | | | | | | | | |
Unaffiliated issuers | | $ | 23,779,972 | | $ | 336,793,127 | | $ | 672,136,712 |
Affiliated issuers | | | — | | | 17,635,623 | | | 4,755,717 |
Repurchase agreements | | | — | | | 111,064,000 | | | — |
| | |
|
| |
|
| |
|
|
Total securities | | $ | 23,779,972 | | $ | 465,492,750 | | $ | 676,892,429 |
| | |
|
| |
|
| |
|
|
Securities at Value (Note 2): | | | | | | | | | |
Unaffiliated issuers | | $ | 30,401,285 | | $ | 451,028,900 | | $ | 809,645,146 |
Affiliated issuers | | | — | | | 32,312,196 | | | 14,397,915 |
Repurchase Agreements | | | — | | | 111,064,000 | | | — |
| | |
|
| |
|
| |
|
|
Total securities | | | 30,401,285 | | | 594,405,096 | | | 824,043,061 |
Cash | | | 1,412 | | | 572 | | | 659 |
Receivable for Capital Shares Sold | | | 354 | | | 983,657 | | | 1,998,025 |
Investment Securities Sold | | | — | | | 2,002,364 | | | 252,506 |
Dividends and Interest Receivable | | | 40,480 | | | 409,645 | | | 298,579 |
| | |
|
| |
|
| |
|
|
Total Assets | | | 30,443,531 | | | 597,801,334 | | | 826,592,830 |
| | |
|
| |
|
| |
|
|
LIABILITIES | | | | | | | | | |
Investment Advisory Fee Payable (Note 3) | | | 16,764 | | | 442,638 | | | 604,284 |
Administration Fee Payable (Note 3) | | | 19,725 | | | 167,012 | | | 216,405 |
Distribution Fee Payable (Note 3) | | | 6,326 | | | 122,955 | | | 151,070 |
Payable for Capital Shares Redeemed | | | 14,283 | | | 349,630 | | | 86,345 |
Investment Securities Purchased | | | — | | | 2,046,812 | | | — |
Other Accrued Expenses | | | 2,296 | | | 46,983 | | | 37,840 |
| | |
|
| |
|
| |
|
|
Total Liabilities | | | 59,394 | | | 3,176,030 | | | 1,095,944 |
| | |
|
| |
|
| |
|
|
NET ASSETS | | $ | 30,384,137 | | $ | 594,625,304 | | $ | 825,496,886 |
| | |
|
| |
|
| |
|
|
Shares Outstanding | | | 1,242,439 | | | 16,331,880 | | | 21,908,667 |
| | |
|
| |
|
| |
|
|
Net Asset Value Per Share | | $ | 24.46 | | $ | 36.41 | | $ | 37.68 |
| | |
|
| |
|
| |
|
|
Net Assets Consist of: | | | | | | | | | |
Paid-in capital | | $ | 20,561,881 | | $ | 390,316,419 | | $ | 664,890,653 |
Undistributed net investment income | | | 90,933 | | | 1,183,931 | | | — |
Accumulated net realized gain on investments | | | 3,110,010 | | | 74,212,608 | | | 13,455,601 |
Net unrealized appreciation on investments | | | 6,621,313 | | | 128,912,346 | | | 147,150,632 |
| | |
|
| |
|
| |
|
|
NET ASSETS | | $ | 30,384,137 | | $ | 594,625,304 | | $ | 825,496,886 |
| | |
|
| |
|
| |
|
|
52
The FBR Funds
Statements of Assets and Liabilities (continued)
October 31, 2004
| | | | | | | | | | | |
| | | FBR
Large Cap
Technology Fund
| | FBR
Small Cap
Technology Fund
| | | FBR
Gas Utility
Index Fund
| |
ASSETS | | | | | | | | | | | |
Securities at Amortized Cost | | $ | 6,345,462 | | $ | 1,422,262 | | | $ | 137,373,595 | |
| | |
|
| |
|
|
| |
|
|
|
Securities at Value (Note 2) | | $ | 6,611,076 | | $ | 1,420,159 | | | $ | 222,530,004 | |
Cash | | | 821 | | | 877 | | | | 53 | |
Receivable for Capital Shares Sold | | | — | | | 21,500 | | | | 269,087 | |
Investment Securities Sold | | | 55,191 | | | 38,482 | | | | 592,496 | |
Dividends and Interest Receivable | | | 4,780 | | | 71 | | | | 573,293 | |
Receivable from Adviser | | | 6,818 | | | 13,724 | | | | — | |
| | |
|
| |
|
|
| |
|
|
|
Total Assets | | | 6,678,686 | | | 1,494,813 | | | | 223,964,933 | |
| | |
|
| |
|
|
| |
|
|
|
LIABILITIES | | | | | | | | | | | |
Investment Advisory Fee Payable (Note 3) | | | — | | | — | | | | 60,027 | |
Administration Fee Payable (Note 3) | | | 10,573 | | | 10,587 | | | | 86,813 | |
Distribution Fee Payable (Note 3) | | | 1,363 | | | 292 | | | | — | |
Payable for Capital Shares Redeemed | | | — | | | — | | | | 127,773 | |
Investment Securities Purchased | | | 57,910 | | | 43,088 | | | | 3,145,475 | |
Other Accrued Expenses | | | 1,104 | | | 735 | | | | — | |
| | |
|
| |
|
|
| |
|
|
|
Total Liabilities | | | 70,950 | | | 54,702 | | | | 3,420,088 | |
| | |
|
| |
|
|
| |
|
|
|
NET ASSETS | | $ | 6,607,736 | | $ | 1,440,111 | | | $ | 220,544,845 | |
| | |
|
| |
|
|
| |
|
|
|
Shares Outstanding | | | 602,888 | | | 162,167 | | | | 15,031,380 | |
| | |
|
| |
|
|
| |
|
|
|
Net Asset Value Per Share | | $ | 10.96 | | $ | 8.88 | | | $ | 14.67 | |
| | |
|
| |
|
|
| |
|
|
|
Net Assets Consist of: | | | | | | | | | | | |
Paid-in capital | | $ | 5,560,918 | | $ | 1,576,643 | | | $ | 172,306,027 | |
Undistributed net investment income | | | — | | | — | | | | 328,592 | |
Accumulated net realized gain (loss) on investments | | | 781,204 | | | (134,429 | ) | | | (37,246,183 | ) |
Net unrealized appreciation (depreciation) on investments | | | 265,614 | | | (2,103 | ) | | | 85,156,409 | |
| | |
|
| |
|
|
| |
|
|
|
NET ASSETS | | $ | 6,607,736 | | $ | 1,440,111 | | | $ | 220,544,845 | |
| | |
|
| |
|
|
| |
|
|
|
53
The FBR Funds
Statements of Assets and Liabilities (continued)
October 31, 2004
| | | | | | | | | | |
| | | FBR
Fund for
Government
Investors
| | | FBR
Maryland
Tax-Free
Portfolio
| | FBR
Virginia
Tax-Free
Portfolio
|
ASSETS | | | | | | | | | | |
Securities at Amortized Cost | | $ | 271,750,207 | | | $ | 36,230,475 | | $ | 24,838,443 |
| | |
|
|
| |
|
| |
|
|
Securities at Value (Note 2) | | $ | 271,750,207 | | | $ | 38,580,035 | | $ | 26,781,725 |
Cash | | | 356 | | | | 219,396 | | | 68,309 |
Interest Receivable | | | 353,002 | | | | 518,390 | | | 406,745 |
Receivable for Assets Sold | | | 16,848,656 | | | | — | | | — |
| | |
|
|
| |
|
| |
|
|
Total Assets | | | 288,952,221 | | | | 39,317,821 | | | 27,256,779 |
| | |
|
|
| |
|
| |
|
|
LIABILITIES | | | | | | | | | | |
Investment Advisory Fee Payable (Note 3) | | | 99,398 | | | | 9,741 | | | 5,392 |
Administration Fee Payable (Note 3) | | | 86,973 | | | | 9,903 | | | 6,913 |
Distribution Fee Payable (Note 3) | | | — | | | | 8,253 | | | 5,761 |
Distributions Payable | | | 5,070 | | | | 17,610 | | | 11,284 |
Payable for Capital Shares Redeemed | | | — | | | | 2,402 | | | 7,417 |
Other Accrued Expenses | | | — | | | | 1,398 | | | 1,679 |
| | |
|
|
| |
|
| |
|
|
Total Liabilities | | | 191,441 | | | | 49,307 | | | 38,446 |
| | |
|
|
| |
|
| |
|
|
NET ASSETS | | $ | 288,760,780 | | | $ | 39,268,514 | | $ | 27,218,333 |
| | |
|
|
| |
|
| |
|
|
Shares Outstanding | | | 288,949,740 | | | | 3,499,433 | | | 2,339,398 |
| | |
|
|
| |
|
| |
|
|
Net Asset Value Per Share | | $ | 1.00 | | | $ | 11.22 | | $ | 11.63 |
| | |
|
|
| |
|
| |
|
|
Net Assets Consist of: | | | | | | | | | | |
Paid-in capital | | $ | 288,949,740 | | | $ | 36,846,302 | | $ | 24,897,245 |
Accumulated net realized gain (loss) on investments | | | (188,960 | ) | | | 72,652 | | | 377,806 |
Net unrealized appreciation on investments | | | — | | | | 2,349,560 | | | 1,943,282 |
| | |
|
|
| |
|
| |
|
|
NET ASSETS | | $ | 288,760,780 | | | $ | 39,268,514 | | $ | 27,218,333 |
| | |
|
|
| |
|
| |
|
|
The accompanying notes are an integral part of the financial statements.
54
The FBR Funds
Statements of Operations
For the Year Ended October 31, 2004
| | | | | | | | | | | | | | | | | | | | | | | | |
| | | FBR Large Cap
Financial
Fund
| | | FBR Small Cap
Financial Fund
| | | FBR Small Cap
Fund
| | | FBR Large Cap
Technology
Fund
| | | FBR Small Cap
Technology
Fund(A)
| | | FBR Gas Utility
Index Fund
| |
Investment Income | | | | | | | | | | | | | | | | | | | | | | | | |
Unaffiliated dividends | | $ | 759,846 | | | $ | 10,297,103 | | | $ | 2,105,784 | | | $ | 45,569 | | | $ | 684 | | | $ | 7,557,969 | |
Affiliated dividends | | | — | | | | 292,738 | | | | — | | | | — | | | | — | | | | — | |
Interest | | | 21,106 | | | | 767,430 | | | | 2,037,861 | | | | 4,246 | | | | 854 | | | | 33,096 | |
| | |
|
|
| |
|
|
| |
|
|
| |
|
|
| |
|
|
| |
|
|
|
Total Investment Income | | | 780,952 | | | | 11,357,271 | | | | 4,143,645 | | | | 49,815 | | | | 1,538 | | | | 7,591,065 | |
| | |
|
|
| |
|
|
| |
|
|
| |
|
|
| |
|
|
| |
|
|
|
Expenses | | | | | | | | | | | | | | | | | | | | | | | | |
Advisory fees (Note 3) | | | 322,413 | | | | 5,126,556 | | | | 4,473,790 | | | | 62,654 | | | | 8,788 | | | | 809,342 | |
Administration and accounting fees (Note 3) | | | 252,755 | | | | 1,934,101 | | | | 1,700,673 | | | | 125,000 | | | | 41,290 | | | | 961,088 | |
Distribution fees (Note 3) | | | 89,559 | | | | 1,424,041 | | | | 1,225,931 | | | | 17,404 | | | | 2,441 | | | | — | |
Shareholder servicing fees | | | 24,455 | | | | 560,980 | | | | 479,280 | | | | 14,078 | | | | 6,067 | | | | — | |
Other fees | | | 5,291 | | | | 21,052 | | | | 19,792 | | | | 4,447 | | | | 4,420 | | | | 13,065 | |
| | |
|
|
| |
|
|
| |
|
|
| |
|
|
| |
|
|
| |
|
|
|
Total expenses before waivers and related reimbursements | | | 694,473 | | | | 9,066,730 | | | | 7,899,466 | | | | 223,583 | | | | 63,006 | | | | 1,783,495 | |
Less waivers and related reimbursements | | | (12,581 | ) | | | — | | | | — | | | | (87,821 | ) | | | (43,885 | ) | | | (59,415 | ) |
| | |
|
|
| |
|
|
| |
|
|
| |
|
|
| |
|
|
| |
|
|
|
Total expenses after waivers and related reimbursements | | | 681,892 | | | | 9,066,730 | | | | 7,899,466 | | | | 135,762 | | | | 19,121 | | | | 1,724,080 | |
| | |
|
|
| |
|
|
| |
|
|
| |
|
|
| |
|
|
| |
|
|
|
Net Investment Income (Loss) | | | 99,060 | | | | 2,290,541 | | | | (3,755,821 | ) | | | (85,947 | ) | | | (17,583 | ) | | | 5,866,985 | |
| | |
|
|
| |
|
|
| |
|
|
| |
|
|
| |
|
|
| |
|
|
|
Net Realized and Unrealized Gain (Loss) on Investments | | | | | | | | | | | | | | | | | | | | | | | | |
Net Realized Gain (Loss) on
Investment Transactions: | | | | | | | | | | | | | | | | | | | | | | | | |
Unaffiliated issuers | | | 3,599,098 | | | | 73,080,366 | | | | 17,262,557 | | | | 1,038,128 | | | | (134,429 | ) | | | 4,358,083 | |
Affiliated issuers | | | — | | | | 1,658,798 | | | | — | | | | — | | | | — | | | | — | |
Change in Net Unrealized Appreciation/Depreciation of Investments | | | (841,482 | ) | | | (15,239,532 | ) | | | 77,386,208 | | | | (973,795 | ) | | | (2,103 | ) | | | 27,261,460 | |
| | |
|
|
| |
|
|
| |
|
|
| |
|
|
| |
|
|
| |
|
|
|
Net Gain (Loss) on Investments | | | 2,757,616 | | | | 59,499,632 | | | | 94,648,765 | | | | 64,333 | | | | (136,532 | ) | | | 31,619,543 | |
| | |
|
|
| |
|
|
| |
|
|
| |
|
|
| |
|
|
| |
|
|
|
Net Increase (Decrease) in Net Assets Resulting from Operations | | $ | 2,856,676 | | | $ | 61,790,173 | | | $ | 90,892,944 | | | $ | (21,614 | ) | | $ | (154,115 | ) | | $ | 37,486,528 | |
| | |
|
|
| |
|
|
| |
|
|
| |
|
|
| |
|
|
| |
|
|
|
| (A) | Represents the period from commencement of operations (January 20, 2004) through October 31, 2004. |
55
The FBR Funds
Statements of Operations (continued)
| | | | | | | | | | | | | | | | | | | | | | | |
| | | FBR Fund for
Government Investors
| | | FBR Maryland
Tax-Free Portfolio
| | | FBR Virginia
Tax-Free Portfolio
|
| | | For the Period
January 1, 2004
through
October 31,
2004(A)
| | | For the Year
Ended
December 31,
2003
| | | For the Period
January 1, 2004
through
October 31,
2004(A)
| | | For the Year
Ended
December 31,
2003
| | | For the Period
January 1, 2004
through
October 31,
2004(A)
| | | For the Year
Ended
December 31,
2003
|
Interest Income (Note 2) | | $ | 3,382,637 | | | $ | 5,156,097 | | | $ | 1,660,444 | | | $ | 2,135,310 | | | $ | 1,142,146 | | | $ | 1,570,901 |
| | |
|
|
| |
|
|
| |
|
|
| |
|
|
| |
|
|
| |
|
|
Expenses | | | | | | | | | | | | | | | | | | | | | | | |
Advisory fees (Note 3) | | | 1,353,529 | | | | 2,188,148 | | | | 144,016 | | | | 267,140 | | | | 105,735 | | | | 207,853 |
Administration and accounting fees (Note 3) | | | 947,466 | | | | 1,414,773 | | | | 101,151 | | | | 128,227 | | | | 74,180 | | | | 99,770 |
Distribution fees (Note 3) | | | — | | | | — | | | | 66,715 | | | | — | | | | 48,807 | | | | — |
Shareholder services fees | | | — | | | | — | | | | 4,065 | | | | — | | | | 5,314 | | | | — |
Other fees | | | 10,708 | | | | 1,483 | | | | 5,079 | | | | — | | | | 5,045 | | | | 2 |
| | |
|
|
| |
|
|
| |
|
|
| |
|
|
| |
|
|
| |
|
|
Total expenses before waivers and related reimbursements | | | 2,311,703 | | | | 3,604,404 | | | | 321,026 | | | | 395,367 | | | | 239,081 | | | | 307,625 |
Less waivers and related reimbursements | | | (270, 778 | ) | | | (320,353 | ) | | | (2,638 | ) | | | — | | | | (3,249 | ) | | | — |
| | |
|
|
| |
|
|
| |
|
|
| |
|
|
| |
|
|
| |
|
|
Total expenses after waivers and related reimbursements | | | 2,040,925 | | | | 3,284,051 | | | | 318,388 | | | | 395,367 | | | | 235,832 | | | | 307,625 |
| | |
|
|
| |
|
|
| |
|
|
| |
|
|
| |
|
|
| |
|
|
Net Investment Income | | | 1,341,712 | | | | 1,872,046 | | | | 1,342,056 | | | | 1,739,943 | | | | 906,314 | | | | 1,263,276 |
| | |
|
|
| |
|
|
| |
|
|
| |
|
|
| |
|
|
| |
|
|
Net Realized and Unrealized Gain (Loss) on Investments | | | | | | | | | | | | | | | | | | | | | | | |
Net Realized Gain (Loss) on Investment Transactions | | | (165,106 | ) | | | (23,854 | ) | | | 72,716 | | | | 97,685 | | | | 285,954 | | | | 208,621 |
Change in Net Unrealized Appreciation/ Depreciation on Investments | | | — | | | | — | | | | (339,746 | ) | | | (120,945 | ) | | | (382,632 | ) | | | 51,540 |
| | |
|
|
| |
|
|
| |
|
|
| |
|
|
| |
|
|
| |
|
|
Net Gain (Loss) on Investments | | | (165,106 | ) | | | (23,854 | ) | | | (267,030 | ) | | | (23,260 | ) | | | (96,678 | ) | | | 260,161 |
| | |
|
|
| |
|
|
| |
|
|
| |
|
|
| |
|
|
| |
|
|
Net Increase in Net Assets Resulting from Operations | | $ | 1,176,606 | | | $ | 1,848,192 | | | $ | 1,075,026 | | | $ | 1,716,683 | | | $ | 809,636 | | | $ | 1,523,437 |
| | |
|
|
| |
|
|
| |
|
|
| |
|
|
| |
|
|
| |
|
|
| (A) | Effective March 1, 2004 the Fund changed its fiscal year end to October 31. |
The accompanying notes are an integral part of the financial statements.
56
The FBR Funds
Statements of Changes in Net Assets
| | | | | | | | | | | | | | | | | | | | | | | | |
| | | FBR Large Cap Financial Fund
| | | FBR Small Cap Financial Fund
| | | FBR Small Cap Fund
| |
| | | For the Years Ended October 31,
| | | For the Years Ended October 31,
| | | For the Years Ended October 31,
| |
| | | 2004
| | | 2003
| | | 2004
| | | 2003
| | | 2004
| | | 2003
| |
From Investment Activities | | | | | | | | | | | | | | | | | | | | | | | | |
Net Investment Income (Loss) | | $ | 99,060 | | | $ | 146,579 | | | $ | 2,290,541 | | | $ | 968,242 | | | | (3,755,821 | ) | | $ | (1,221,676 | ) |
Net Realized Gain on Investment Transactions | | | 3,599,098 | | | | 141,774 | | | | 74,739,164 | | | | 11,495,191 | | | | 17,262,557 | | | | 1,910,560 | |
Change in Net Unrealized Appreciation/Depreciation of Investments | | | (841,482 | ) | | | 6,889,586 | | | | (15,239,532 | ) | | | 112,784,921 | | | | 77,386,208 | | | | 64,409,243 | |
| | |
|
|
| |
|
|
| |
|
|
| |
|
|
| |
|
|
| |
|
|
|
Net Increase in Net Assets Resulting from Operations | | | 2,856,676 | | | | 7,177,939 | | | | 61,790,173 | | | | 125,248,354 | | | | 90,892,944 | | | | 65,098,127 | |
| | |
|
|
| |
|
|
| |
|
|
| |
|
|
| |
|
|
| |
|
|
|
Distributions to Shareholders | | | | | | | | | | | | | | | | | | | | | | | | |
From Net Investment Income | | | (110,335 | ) | | | (127,702 | ) | | | (1,312,042 | ) | | | (1,897,619 | ) | | | — | | | | — | |
From Net Realized Gain on Investments | | | (131,440 | ) | | | — | | | | (11,594,273 | ) | | | (8,819,518 | ) | | | (298,169 | ) | | | — | |
| | |
|
|
| |
|
|
| |
|
|
| |
|
|
| |
|
|
| |
|
|
|
Total Distributions to Shareholders | | | (241,775 | ) | | | (127,702 | ) | | | (12,906,315 | ) | | | (10,717,137 | ) | | | (298,169 | ) | | | — | |
| | |
|
|
| |
|
|
| |
|
|
| |
|
|
| |
|
|
| |
|
|
|
From Share Transactions | | | | | | | | | | | | | | | | | | | | | | | | |
Net Proceeds from Sales of Shares | | | 9,856,134 | | | | 9,950,115 | | | | 460,010,844 | | | | 406,131,694 | | | | 581,454,730 | | | | 388,948,626 | |
Reinvestment of Distributions | | | 236,420 | | | | 125,022 | | | | 11,693,265 | | | | 9,121,965 | | | | 279,051 | | | | — | |
Cost of Shares Redeemed(A) | | | (17,782,256 | ) | | | (8,207,184 | ) | | | (439,770,799 | ) | | | (335,739,214 | ) | | | (190,655,407 | ) | | | (139,025,733 | ) |
| | |
|
|
| |
|
|
| |
|
|
| |
|
|
| |
|
|
| |
|
|
|
Net Increase (Decrease) in Net Assets Resulting from Share Transactions | | | (7,689,702 | ) | | | 1,867,953 | | | | 31,933,310 | | | | 79,514,445 | | | | 391,078,374 | | | | 249,922,893 | |
| | |
|
|
| |
|
|
| |
|
|
| |
|
|
| |
|
|
| |
|
|
|
Total Increase (Decrease) in Net Assets | | | (5,074,801 | ) | | | 8,918,190 | | | | 80,817,168 | | | | 194,045,662 | | | | 481,673,149 | | | | 315,020,020 | |
Net Assets - Beginning of Year | | | 35,458,938 | | | | 26,540,748 | | | | 513,808,136 | | | | 319,762,474 | | | | 343,823,737 | | | | 28,802,717 | |
| | |
|
|
| |
|
|
| |
|
|
| |
|
|
| |
|
|
| |
|
|
|
Net Assets - End of Year | | $ | 30,384,137 | | | $ | 35,458,938 | | | $ | 594,625,304 | | | $ | 513,808,136 | | | $ | 825,496,886 | | | $ | 343,823,737 | |
| | |
|
|
| |
|
|
| |
|
|
| |
|
|
| |
|
|
| |
|
|
|
Undistributed Net Investment Income (Loss) | | $ | 90,933 | | | $ | 102,208 | | | $ | 1,183,931 | | | $ | 205,432 | | | $ | — | | | $ | — | |
Shares Issued and Redeemed | | | | | | | | | | | | | | | | | | | | | | | | |
Sold | | | 416,817 | | | | 516,380 | | | | 13,315,553 | | | | 15,088,764 | | | | 16,675,479 | | | | 14,469,517 | |
Issued in Reinvestment of Distributions | | | 10,359 | | | | 7,132 | | | | 353,376 | | | | 374,780 | | | | 8,789 | | | | — | |
Redeemed | | | (765,708 | ) | | | (439,215 | ) | | | (13,116,520 | ) | | | (12,801,915 | ) | | | (5,665,712 | ) | | | (4,941,558 | ) |
| | |
|
|
| |
|
|
| |
|
|
| |
|
|
| |
|
|
| |
|
|
|
Net Increase (Decrease) in Shares | | | (338,532 | ) | | | 84,297 | | | | 552,409 | | | | 2,661,629 | | | | 11,018,556 | | | | 9,527,959 | |
| | |
|
|
| |
|
|
| |
|
|
| |
|
|
| |
|
|
| |
|
|
|
| (A) | The cost of shares redeemed is net of the 1% redemption fee on fund shares which have been held 90 days or less. For the year ended October 31, 2004, these fees were $20,021, $642,244 and $228,399 for FBR Large Cap Financial Fund, FBR Small Cap Financial Fund, and FBR Small Cap Fund, respectively. For the year ended October 31, 2003, these fees were $2,588, $238,324 and $342,614 for FBR Large Cap Financial Fund, FBR Small Cap Financial Fund, and FBR Small Cap Fund, respectively. |
57
The FBR Funds
Statements of Changes in Net Assets (continued)
| | | | | | | | | | | | |
| | | FBR Large Cap Technology Fund
| | | FBR Small Cap
Technology Fund
| |
| | | For the Years Ended
October 31,
| | | For the Period
Ended
October 31,
2004(A)
| |
| | | 2004
| | | 2003
| | |
From Investment Activities | | | | | | | | | | | | |
Net Investment Loss | | $ | (85,947 | ) | | $ | (43,256 | ) | | $ | (17,583 | ) |
Net Realized Gain (Loss) on Investment Transactions | | | 1,038,128 | | | | 431,157 | | | | (134,429 | ) |
Change in Net Unrealized Appreciation/ Depreciation of Investments | | | (973,795 | ) | | | 1,316,186 | | | | (2,103 | ) |
| | |
|
|
| |
|
|
| |
|
|
|
Net Increase (Decrease) in Net Assets Resulting from Operations | | | (21,614 | ) | | | 1,704,087 | | | | (154,115 | ) |
| | |
|
|
| |
|
|
| |
|
|
|
Distributions to Shareholders | | | | | | | | | | | | |
From Net Realized Gain on Investments | | | (117,006 | ) | | | — | | | | — | |
| | |
|
|
| |
|
|
| |
|
|
|
| | | |
From Share Transactions | | | | | | | | | | | | |
Net Proceeds from Sales of Shares | | | 4,133,821 | | | | 7,156,107 | | | | 2,537,343 | |
Reinvestment of Distributions | | | 113,560 | | | | — | | | | — | |
Cost of Shares Redeemed(B) | | | (3,671,243 | ) | | | (5,174,558 | ) | | | (943,117 | ) |
| | |
|
|
| |
|
|
| |
|
|
|
Net Increase in Net Assets Resulting from Share Transactions | | | 576,138 | | | | 1,981,549 | | | | 1,594,226 | |
| | |
|
|
| |
|
|
| |
|
|
|
Total Increase in Net Assets | | | 437,518 | | | | 3,685,636 | | | | 1,440,111 | |
Net Assets – Beginning of Period | | | 6,170,218 | | | | 2,484,582 | | | | — | |
| | |
|
|
| |
|
|
| |
|
|
|
Net Assets – End of Period | | $ | 6,607,736 | | | $ | 6,170,218 | | | $ | 1,440,111 | |
| | |
|
|
| |
|
|
| |
|
|
|
Undistributed Net Investment Income | | $ | — | | | $ | — | | | $ | — | |
Shares Issued and Redeemed | | | | | | | | | | | | |
Sold | | | 360,702 | | | | 786,953 | | | | 271,549 | |
Issued in Reinvestment of Distributions | | | 10,495 | | | | — | | | | — | |
Redeemed | | | (327,955 | ) | | | (572,924 | ) | | | (109,382 | ) |
| | |
|
|
| |
|
|
| |
|
|
|
Net Increase in Shares | | | 43,242 | | | | 214,029 | | | | 162,167 | |
| | |
|
|
| |
|
|
| |
|
|
|
| (A) | From Commencement of Operations January 20, 2004. |
| (B) | The cost of shares redeemed is net of the 1% redemption fee on fund shares which have been held 90 days or less. For the period ended October 31, 2004 these fees were $17,360 and $7,497 for FBR Large Cap Technology Fund and FBR Small Cap Technology Fund, respectively. For the year ended October 31, 2003, these fees were $759 for FBR Large Cap Technology Fund. |
58
The FBR Funds
Statement of Changes in Net Assets (continued)
| | | | | | | | | | | | |
| | | FBR Gas Utility Index Fund
| |
| | | For the Year
Ended
October 31,
2004
| | | For the Period
April 1, 2003
through
October 31,
2003(A)
| | | For the Year
Ended
March 31,
2003
| |
From Investment Activities | | | | | | | | | | | | |
Net Investment Income | | $ | 5,866,985 | | | $ | 3,054,772 | | | $ | 6,018,871 | |
Net Realized Gain (Loss) on Investment Transactions | | | 4,358,083 | | | | (1,274,988 | ) | | | (28,778,357 | ) |
Change in Net Unrealized Appreciation/ Depreciation of Investments | | | 27,261,460 | | | | 30,464,368 | | | | (45,770,288 | ) |
| | |
|
|
| |
|
|
| |
|
|
|
Net Increase (Decrease) in Net Assets Resulting from Operations | | | 37,486,528 | | | | 32,244,152 | | | | (68,529,774 | ) |
| | |
|
|
| |
|
|
| |
|
|
|
Distributions to Shareholders | | | | | | | | | | | | |
From Net Investment Income | | | (5,900,543 | ) | | | (2,692,622 | ) | | | (6,020,369 | ) |
| | |
|
|
| |
|
|
| |
|
|
|
From Share Transactions | | | | | | | | | | | | |
Net Proceeds from Sales of Shares | | | 55,394,676 | | | | 29,622,724 | | | | 45,806,311 | |
Reinvestment of Distributions | | | 5,473,085 | | | | 2,514,162 | | | | 5,638,918 | |
Cost of Shares Redeemed(B) | | | (56,726,719 | ) | | | (22,533,323 | ) | | | (55,913,698 | ) |
| | |
|
|
| |
|
|
| |
|
|
|
Net Increase (Decrease) in Net Assets Resulting from Share Transactions | | | 4,141,042 | | | | 9,603,563 | | | | (4,468,469 | ) |
| | |
|
|
| |
|
|
| |
|
|
|
Total Increase (Decrease) in Net Assets | | | 35,727,027 | | | | 39,155,093 | | | | (79,018,612 | ) |
Net Assets – Beginning of Period | | | 184,817,818 | | | | 145,662,725 | | | | 224,681,337 | |
| | |
|
|
| |
|
|
| |
|
|
|
Net Assets – End of Period | | $ | 220,544,845 | | | $ | 184,817,818 | | | $ | 145,662,725 | |
| | |
|
|
| |
|
|
| |
|
|
|
Undistributed Net Investment Income | | $ | 328,592 | | | $ | 362,150 | | | $ | — | |
Shares Issued and Redeemed | | | | | | | | | | | | |
Sold | | | 4,137,546 | | | | 2,445,907 | | | | 3,763,123 | |
Issued in Reinvestment of Distributions | | | 401,452 | | | | 204,644 | | | | 500,639 | |
Redeemed | | | (4,278,069 | ) | | | (1,876,276 | ) | | | (4,731,266 | ) |
| | |
|
|
| |
|
|
| |
|
|
|
Net Increase (Decrease) in Shares | | | 260,929 | | | | 774,275 | | | | (467,504 | ) |
| | |
|
|
| |
|
|
| |
|
|
|
| (A) | Prior to April 1, 2003, the Fund’s fiscal year end was March 31. |
| (B) | The cost of shares redeemed is net of the 1% redemption fee on fund shares which have been held 90 days or less. For the year ended October 31, 2004 these fees were $34,027. For the period April 1, 2003 through October 31, 2003 these fees were $9,854. For the year ended March 31, 2003, there were no redemption fees collected. |
The accompanying notes are an integral part of the financial statements.
59
The FBR Funds
Statement of Changes in Net Assets (continued)
| | | | | | | | | | | | |
| | | FBR Fund for Government Investors
| |
| | | For the Period
January 1, 2004
through
October 31, 2004(A)
| | | For the Year
Ended
December 31, 2003
| | | For the Year
Ended
December 31, 2002
| |
From Investment Activities | | | | | | | | | | | | |
Net Investment Income | | $ | 1,341,712 | | | $ | 1,872,046 | | | $ | 4,786,339 | |
Net Realized Loss on Investment Transactions | | | (165,106 | ) | | | (23,854 | ) | | | — | |
| | |
|
|
| |
|
|
| |
|
|
|
Net Increase in Net Assets Resulting from Operations | | | 1,176,606 | | | | 1,848,192 | | | | 4,786,339 | |
| | |
|
|
| |
|
|
| |
|
|
|
Distributions to Shareholders | | | | | | | | | | | | |
From Net Investment Income | | | (1,341,712 | ) | | | (1,872,046 | ) | | | (4,786,339 | ) |
| | |
|
|
| |
|
|
| |
|
|
|
From Share Transactions (at constant net asset value of $ 1) | | | | | | | | | | | | |
Net Proceeds from Sales of Shares | | | 1,050,066,734 | | | | 2,493,526,280 | | | | 2,381,256,464 | |
Reinvestment of Distributions | | | 1,303,163 | | | | 1,834,981 | | | | 4,702,074 | |
Cost of Shares Redeemed | | | (1,103,856,775 | ) | | | (2,608,171,991 | ) | | | (2,416,393,077 | ) |
| | |
|
|
| |
|
|
| |
|
|
|
Net Decrease in Net Assets Resulting from Share Transactions | | | (52,486,878 | ) | | | (112,810,730 | ) | | | (30,434,539 | ) |
| | |
|
|
| |
|
|
| |
|
|
|
Total Decrease in Net Assets | | | (52,651,984 | ) | | | (112,834,584 | ) | | | (30,434,539 | ) |
Net Assets – Beginning of Period | | | 341,412,764 | | | | 454,247,348 | | | | 484,681,887 | |
| | |
|
|
| |
|
|
| |
|
|
|
Net Assets – End of Period | | $ | 288,760,780 | | | $ | 341,412,764 | | | $ | 454,247,348 | |
| | |
|
|
| |
|
|
| |
|
|
|
Undistributed Net Investment Income | | $ | — | | | $ | — | | | $ | — | |
Shares Issued and Redeemed | | | | | | | | | | | | |
Sold | | | 1,050,066,734 | | | | 2,493,526,280 | | | | 2,381,256,464 | |
Issued in Reinvestment of Distributions | | | 1,303,163 | | | | 1,834,981 | | | | 4,707,074 | |
Redeemed | | | (1,103,856,775 | ) | | | (2,608,171,991 | ) | | | (2,416,393,077 | ) |
| | |
|
|
| |
|
|
| |
|
|
|
Net Decrease in Shares | | | (52,486,878 | ) | | | (112,810,730 | ) | | | (30,434,539 | ) |
| | |
|
|
| |
|
|
| |
|
|
|
| (A) | Effective March 1, 2004 the Fund changed its fiscal year end to October 31. |
60
The FBR Funds
Statements of Changes in Net Assets (continued)
| | | | | | | | | | | | | | | | | | | | | | | | |
| | | FBR Maryland Tax-Free Portfolio
| | | FBR Virginia Tax-Free Portfolio
| |
| | | For the Period
January 1, 2004
through
October 31, 2004(A)
| | | For the
Years
Ended
December 31,
| | | For the Period
January 1, 2004
through
October 31, 2004(A)
| | | For the
Years
Ended
December 31,
| |
| | | | 2003
| | | 2002
| | | | 2003
| | | 2002
| |
From Investment Activities | | | | | | | | | | | | | | | | | | | | | | | | |
Net Investment Income | | $ | 1,342,056 | | | $ | 1,739,943 | | | $ | 1,758,533 | | | $ | 906,314 | | | $ | 1,263,276 | | | $ | 1,270,546 | |
Net Realized Gain on Investment Transactions | | | 72,716 | | | | 97,685 | | | | 63,027 | | | | 285,954 | | | | 208,621 | | | | 61,994 | |
Change in Net Unrealized Appreciation/ Depreciation on Investments | | | (339,746 | ) | | | (120,945 | ) | | | 1,328,574 | | | | (382,632 | ) | | | 51,540 | | | | 1,385,499 | |
| | |
|
|
| |
|
|
| |
|
|
| |
|
|
| |
|
|
| |
|
|
|
Net Increase in Net Assets Resulting from Operations | | | 1,075,026 | | | | 1,716,683 | | | | 3,150,134 | | | | 809,636 | | | | 1,523,437 | | | | 2,718,039 | |
| | |
|
|
| |
|
|
| |
|
|
| |
|
|
| |
|
|
| |
|
|
|
Distributions to Shareholders | | | | | | | | | | | | | | | | | | | | | | | | |
From Net Investment Income | | | (1,342,056 | ) | | | (1,739,943 | ) | | | (1,758,533 | ) | | | (906,314 | ) | | | (1,263,276 | ) | | | (1,270,546 | ) |
From Net Realized Gain | | | — | | | | (88,273 | ) | | | (20,055 | ) | | | — | | | | (31,055 | ) | | | — | |
| | |
|
|
| |
|
|
| |
|
|
| |
|
|
| |
|
|
| |
|
|
|
Total Distributions to Shareholders | | | (1,342,056 | ) | | | (1,828,216 | ) | | | (1,778,588 | ) | | | (906,314 | ) | | | (1,294,331 | ) | | | (1,270,546 | ) |
| | |
|
|
| |
|
|
| |
|
|
| |
|
|
| |
|
|
| |
|
|
|
From Share Transactions | | | | | | | | | | | | | | | | | | | | | | | | |
Net Proceeds from Sales of Shares | | | 2,426,437 | | | | 2,992,726 | | | | 7,124,546 | | | | 1,953,714 | | | | 6,997,552 | | | | 4,035,219 | |
Reinvestment of Distributions | | | 1,154,723 | | | | 1,559,157 | | | | 1,488,843 | | | | 779,326 | | | | 1,115,116 | | | | 1,068,593 | |
Cost of Shares Redeemed (B) | | | (6,779,452 | ) | | | (4,020,787 | ) | | | (7,627,875 | ) | | | (6,980,590 | ) | | | (9,152,648 | ) | | | (4,406,998 | ) |
| | |
|
|
| |
|
|
| |
|
|
| |
|
|
| |
|
|
| |
|
|
|
Net Increase (Decrease) in Net Assets Resulting from Share Transactions | | | (3,198,292 | ) | | | 531,096 | | | | 985,514 | | | | (4,247,550 | ) | | | (1,039,980 | ) | | | 696,814 | |
| | |
|
|
| |
|
|
| |
|
|
| |
|
|
| |
|
|
| |
|
|
|
Total Increase (Decrease) in Net Assets | | | (3,465,322 | ) | | | 419,563 | | | | 2,357,060 | | | | (4,344,228 | ) | | | (810,874 | ) | | | 2,144,307 | |
Net Assets - Beginning of Period | | | 42,733,836 | | | | 42,314,273 | | | | 39,957,213 | | | | 31,562,561 | | | | 32,373,435 | | | | 30,229,128 | |
| | |
|
|
| |
|
|
| |
|
|
| |
|
|
| |
|
|
| |
|
|
|
Net Assets - End of Period | | $ | 39,268,514 | | | $ | 42,733,836 | | | $ | 42,314,273 | | | $ | 27,218,333 | | | $ | 31,562,561 | | | $ | 32,373,435 | |
| | |
|
|
| |
|
|
| |
|
|
| |
|
|
| |
|
|
| |
|
|
|
Undistributed Net Investment Income | | $ | — | | | $ | — | | | $ | — | | | $ | — | | | $ | — | | | $ | — | |
Shares Issued and Redeemed | | | | | | | | | | | | | | | | | | | | | | | | |
Sold | | | 216,998 | | | | 263,700 | | | | 638,673 | | | | 168,922 | | | | 603,206 | | | | 354,693 | |
Issued in Reinvestment of Distributions | | | 103,436 | | | | 137,979 | | | | 133,367 | | | | 67,553 | | | | 95,866 | | | | 93,949 | |
Redeemed | | | (609,155 | ) | | | (356,334 | ) | | | (684,861 | ) | | | (604,355 | ) | | | (786,058 | ) | | | (389,468 | ) |
| | |
|
|
| |
|
|
| |
|
|
| |
|
|
| |
|
|
| |
|
|
|
Net Increase (Decrease) in Shares | | | (288,721 | ) | | | 45,345 | | | | 87,179 | | | | (367,880 | ) | | | (86,986 | ) | | | 59,174 | |
| | |
|
|
| |
|
|
| |
|
|
| |
|
|
| |
|
|
| |
|
|
|
| (A) | Effective March 1, 2004 the Fund changed its fiscal year end to October 31. |
| (B) | The cost of shares redeemed is net of the 1% redemption fee on fund shares which have been held 90 days or less. For the period ended October 31, 2004, these fees were $1,475 and $1,192 for the FBR Maryland Tax-Free Portfolio and the FBR Virginia Tax-Free Portfolio, respectively. For the years ended December 31, 2003 and 2002, there were no fees collected. |
The accompanying notes are an integral part of the financial statements.
61
The FBR Funds
Financial Highlights
Per Share Data for a Share Outstanding Throughout Each Period
| | | | | | | | | | | | | | | | | | | | |
| | | FBR Large Cap Financial Fund
| |
| | | For the Years Ended October 31,
| |
| | | 2004
| | | 2003
| | | 2002
| | | 2001
| | | 2000
| |
Per Share Operating Performance: | | | | | | | | | | | | | | | | | | | | |
| | | | | |
Net Asset Value – Beginning of Year | | $ | 22.43 | | | $ | 17.73 | | | $ | 18.18 | | | $ | 17.34 | | | $ | 16.59 | |
| | |
|
|
| |
|
|
| |
|
|
| |
|
|
| |
|
|
|
Income from Investment Operations: | | | | | | | | | | | | | | | | | | | | |
Net Investment Income1,3 | | | 0.08 | | | | 0.10 | | | | 0.07 | | | | 0.06 | | | | 0.18 | |
Net Realized and Unrealized Gain on Investments1,4 | | | 2.08 | | | | 4.69 | | | | 0.70 | | | | 0.94 | | | | 0.78 | |
| | |
|
|
| |
|
|
| |
|
|
| |
|
|
| |
|
|
|
Total from Investment Operations | | | 2.16 | | | | 4.79 | | | | 0.77 | | | | 1.00 | | | | 0.96 | |
| | |
|
|
| |
|
|
| |
|
|
| |
|
|
| |
|
|
|
Distributions to Shareholders: | | | | | | | | | | | | | | | | | | | | |
From Net Investment Income | | | (0.07 | ) | | | (0.09 | ) | | | (0.08 | ) | | | (0.16 | ) | | | (0.08 | ) |
From Net Realized Gain | | | (0.08 | ) | | | — | | | | (1.15 | ) | | | — | | | | (0.13 | ) |
| | |
|
|
| |
|
|
| |
|
|
| |
|
|
| |
|
|
|
Total Distributions | | | (0.15 | ) | | | (0.09 | ) | | | (1.23 | ) | | | (0.16 | ) | | | (0.21 | ) |
| | |
|
|
| |
|
|
| |
|
|
| |
|
|
| |
|
|
|
Paid-in Capital from Redemption Fees | | | 0.02 | | | | 0.002 | | | | 0.01 | | | | — | | | | — | |
| | |
|
|
| |
|
|
| |
|
|
| |
|
|
| |
|
|
|
Net Increase (Decrease) in Net Asset Value | | | 2.03 | | | | 4.70 | | | | (0.45 | ) | | | 0.84 | | | | 0.75 | |
| | |
|
|
| |
|
|
| |
|
|
| |
|
|
| |
|
|
|
Net Asset Value – End of Year | | $ | 24.46 | | | $ | 22.43 | | | $ | 17.73 | | | $ | 18.18 | | | $ | 17.34 | |
| | |
|
|
| |
|
|
| |
|
|
| |
|
|
| |
|
|
|
Total Investment Return5 | | | 9.76 | % | | | 27.13 | % | | | 4.11 | % | | | 5.72 | % | | | 6.21 | % |
| | | | | |
Ratios to Average Net Assets: | | | | | | | | | | | | | | | | | | | | |
Expenses After Waivers3 | | | 1.91 | % | | | 1.92 | % | | | 1.95 | % | | | 1.89 | % | | | 1.92 | % |
Expenses Before Waivers | | | 1.94 | % | | | 1.98 | % | | | 2.03 | % | | | 1.90 | % | | | 2.19 | % |
Net Investment Income After Waivers3 | | | 0.28 | % | | | 0.53 | % | | | 0.36 | % | | | 0.32 | % | | | 1.15 | % |
Net Investment Income Before Waivers | | | 0.25 | % | | | 0.47 | % | | | 0.28 | % | | | 0.31 | % | | | 0.88 | % |
| | | | | |
Supplementary Data: | | | | | | | | | | | | | | | | | | | | |
Portfolio Turnover Rate | | | 42 | % | | | 67 | % | | | 97 | % | | | 126 | % | | | 111 | % |
Net Assets at End of Year (in thousands) | | $ | 30,384 | | | $ | 35,459 | | | $ | 26,541 | | | $ | 25,577 | | | $ | 25,593 | |
Number of Shares Outstanding at End of Year (in thousands) | | | 1,242 | | | | 1,581 | | | | 1,497 | | | | 1,407 | | | | 1,476 | |
| 1 | Calculated based on shares outstanding on the first and last day of the respective periods, except for dividends and distributions, if any, which are based on the actual shares outstanding on the dates of distributions. |
| 3 | Reflects fees waived by FBR Funds Advisers, Inc. pursuant to a voluntary expense limitation of 1.95%. |
| 4 | The amounts shown for a share outstanding throughout the respective periods may not be in accordance with the changes in the aggregate gains and losses on investments during the respective periods because of the timing of sales and repurchases of Fund shares in relation to fluctuating net asset values during the respective periods. |
| 5 | Total investment return is calculated assuming a purchase of shares on the first day and a sale on the last day of each period reported and will include reinvestment of dividends and distributions, if any. |
62
The FBR Funds
Financial Highlights (continued)
| | | | | | | | | | | | | | | | | | | | |
| | | FBR Small Cap Financial Fund
| |
| | | For the Years Ended October 31,
| |
| | | 2004
| | | 2003
| | | 2002
| | | 2001
| | | 2000
| |
Per Share Operating Performance: | | | | | | | | | | | | | | | | | | | | |
| | | | | |
Net Asset Value – Beginning of Year | | $ | 32.56 | | | $ | 24.38 | | | $ | 20.53 | | | $ | 16.03 | | | $ | 14.26 | |
| | |
|
|
| |
|
|
| |
|
|
| |
|
|
| |
|
|
|
Income from Investment Operations: | | | | | | | | | | | | | | | | | | | | |
Net Investment Income1,2 | | | 0.13 | | | | 0.05 | | | | 0.15 | | | | 0.42 | | | | 0.08 | |
Net Realized and Unrealized Gain on Investments1,3. | | | 4.40 | | | | 8.88 | | | | 4.35 | | | | 4.18 | | | | 1.71 | |
| | |
|
|
| |
|
|
| |
|
|
| |
|
|
| |
|
|
|
Total from Investment Operations | | | 4.53 | | | | 8.93 | | | | 4.50 | | | | 4.60 | | | | 1.79 | |
| | |
|
|
| |
|
|
| |
|
|
| |
|
|
| |
|
|
|
Distributions to Shareholders: | | | | | | | | | | | | | | | | | | | | |
From Net Investment Income | | | (0.07 | ) | | | (0.13 | ) | | | (0.47 | ) | | | (0.10 | ) | | | (0.02 | ) |
From Net Realized Gain | | | (0.65 | ) | | | (0.64 | ) | | | (0.34 | ) | | | — | | | | — | |
| | |
|
|
| |
|
|
| |
|
|
| |
|
|
| |
|
|
|
Total Distributions | | | (0.72 | ) | | | (0.77 | ) | | | (0.81 | ) | | | (0.10 | ) | | | (0.02 | ) |
| | |
|
|
| |
|
|
| |
|
|
| |
|
|
| |
|
|
|
Paid-in Capital from Redemption Fees | | | 0.04 | | | | 0.02 | | | | 0.16 | | | | — | | | | — | |
| | |
|
|
| |
|
|
| |
|
|
| |
|
|
| |
|
|
|
Net Increase in Net Asset Value | | | 3.85 | | | | 8.18 | | | | 3.85 | | | | 4.50 | | | | 1.77 | |
| | |
|
|
| |
|
|
| |
|
|
| |
|
|
| |
|
|
|
Net Asset Value – End of year | | $ | 36.41 | | | $ | 32.56 | | | $ | 24.38 | | | $ | 20.53 | | | $ | 16.03 | |
| | |
|
|
| |
|
|
| |
|
|
| |
|
|
| |
|
|
|
Total Investment Return4 | | | 14.29 | % | | | 37.80 | % | | | 23.37 | % | | | 28.85 | % | | | 12.56 | % |
| | | | | |
Ratios to Average Net Assets: | | | | | | | | | | | | | | | | | | | | |
Expenses After Waivers2 | | | 1.59 | % | | | 1.57 | % | | | 1.56 | % | | | 1.53 | % | | | 1.90 | % |
Expenses Before Waivers | | | 1.59 | % | | | 1.57 | % | | | 1.56 | % | | | 1.53 | % | | | 2.13 | % |
Net Investment Income After Waivers2 | | | 0.40 | % | | | 0.26 | % | | | 0.54 | % | | | 1.63 | % | | | 0.84 | % |
Net Investment Income Before Waivers | | | 0.40 | % | | | 0.26 | % | | | 0.54 | % | | | 1.63 | % | | | 0.61 | % |
| | | | | |
Supplementary Data: | | | | | | | | | | | | | | | | | | | | |
Portfolio Turnover Rate | | | 36 | % | | | 16 | % | | | 44 | % | | | 68 | % | | | 82 | % |
Net Assets at End of Year (in thousands) | | $ | 594,625 | | | $ | 513,808 | | | $ | 319,762 | | | $ | 125,372 | | | $ | 47,313 | |
Number of Shares Outstanding at End of Year (in thousands) | | | 16,332 | | | | 15,779 | | | | 13,118 | | | | 6,107 | | | | 2,951 | |
| 1 | Calculated based on shares outstanding on the first and last day of the respective periods, except for dividends and distributions, if any, which are based on the actual shares outstanding on the dates of distributions. |
| 2 | Reflects fees waived by FBR Fund Advisers, Inc. pursuant to a voluntary expense limitation of 1.95%. |
| 3 | The amounts shown for a share outstanding throughout the respective periods may not be in accordance with the changes in the aggregate gains and losses on investments during the respective periods because of the timing of sales and repurchases of Fund shares in relation to fluctuating net asset values during the respective periods. |
| 4 | Total investment return is calculated assuming a purchase of shares on the first day and a sale on the last day of each period reported and will include reinvestment of dividends and distributions, if any. |
63
The FBR Funds
Financial Highlights (continued)
| | | | | | | | | | | | | | | | | | | | |
| | | FBR Small Cap Fund | |
| | | For the Years Ended October 31,
| |
| | | 2004
| | | 2003
| | | 2002
| | | 2001
| | | 2000
| |
Per Share Operating Performance: | | | | | | | | | | | | | | | | | | | | |
Net Asset Value – Beginning of Year | | $ | 31.57 | | | $ | 21.15 | | | $ | 19.97 | | | $ | 19.46 | | | $ | 16.55 | |
| | |
|
|
| |
|
|
| |
|
|
| |
|
|
| |
|
|
|
Income (Loss) from Investment Operations: | | | | | | | | | | | | | | | | | | | | |
Net Investment Loss1,2 | | | (0.17 | ) | | | (0.11 | ) | | | (0.25 | ) | | | (0.18 | ) | | | (0.39 | ) |
Net Realized and Unrealized Gain on Investments1,3 | | | 6.30 | | | | 10.50 | | | | 1.50 | | | | 1.34 | | | | 3.30 | |
| | |
|
|
| |
|
|
| |
|
|
| |
|
|
| |
|
|
|
Total from Investment Operations | | | 6.13 | | | | 10.39 | | | | 1.25 | | | | 1.16 | | | | 2.91 | |
| | |
|
|
| |
|
|
| |
|
|
| |
|
|
| |
|
|
|
Distributions to Shareholders: | | | | | | | | | | | | | | | | | | | | |
From Net Realized Gain | | | (0.03 | ) | | | — | | | | (0.17 | ) | | | (0.65 | ) | | | — | |
| | |
|
|
| |
|
|
| |
|
|
| |
|
|
| |
|
|
|
Paid-in Capital from Redemption Fees | | | 0.01 | | | | 0.03 | | | | 0.10 | | | | — | | | | — | |
| | |
|
|
| |
|
|
| |
|
|
| |
|
|
| |
|
|
|
Net Increase in Net Asset Value | | | 6.11 | | | | 10.42 | | | | 1.18 | | | | 0.51 | | | | 2.91 | |
| | |
|
|
| |
|
|
| |
|
|
| |
|
|
| |
|
|
|
Net Asset Value – End of Year | | $ | 37.68 | | | $ | 31.57 | | | $ | 21.15 | | | $ | 19.97 | | | $ | 19.46 | |
| | |
|
|
| |
|
|
| |
|
|
| |
|
|
| |
|
|
|
Total Investment Return4 | | | 19.46 | % | | | 49.27 | % | | | 6.76 | % | | | 6.87 | % | | | 17.58 | % |
Ratios to Average Net Assets: | | | | | | | | | | | | | | | | | | | | |
Expenses After Waivers3 | | | 1.59 | % | | | 1.60 | % | | | 1.94 | % | | | 1.95 | % | | | 1.95 | % |
Expenses Before Waivers | | | 1.59 | % | | | 1.60 | % | | | 2.07 | % | | | 2.37 | % | | | 2.96 | % |
Net Investment Loss After Waivers3 | | | (0.75 | )% | | | (0.75 | )% | | | (1.39 | )% | | | (1.34 | )% | | | (1.71 | )% |
Net Investment Loss Before Waivers | | | (0.75 | )% | | | (0.75 | )% | | | (1.52 | )% | | | (1.76 | )% | | | (2.72 | )% |
Supplementary Data: | | | | | | | | | | | | | | | | | | | | |
Portfolio Turnover Rate | | | 19 | % | | | 16 | % | | | 13 | % | | | 26 | % | | | 3 | % |
Net Assets at End of Year (in thousands) | | $ | 825,497 | | | $ | 343,824 | | | $ | 28,803 | | | $ | 16,571 | | | $ | 10,279 | |
Number of Shares Outstanding at End of Year (in thousands) | | | 21,909 | | | | 10,890 | | | | 1,362 | | | | 830 | | | | 528 | |
| 1 | Calculated based on shares outstanding on the first and last day of the respective periods, except for dividends and distributions, if any, which are based on the actual shares outstanding on the dates of distributions. |
| 2 | Reflects fees waived by FBR Fund Advisers, Inc. pursuant to a voluntary expense limitation of 1.95%. |
| 3 | The amounts shown for a share outstanding throughout the respective periods may not be in accordance with the changes in the aggregate gains and losses on investments during the respective periods because of the timing of sales and repurchases of Fund shares in relation to fluctuating net asset values during the respective periods. |
| 4 | Total investment return is calculated assuming a purchase of shares on the first day and a sale on the last day of each period reported and will include reinvestment of dividends and distributions, if any. |
The FBR Funds
Financial Highlights (continued)
| | | | | | | | | | | | |
| | | FBR Large Cap Technology Fund
| |
| | | For the Years Ended October 31,
| | | For the Period
Ended
October 31,
| |
| | | 2004
| | | 2003
| | | 2002*
| |
Per Share Operating Performance: | | | | | | | | | | | | |
Net Asset Value – Beginning of Period | | $ | 11.03 | | | $ | 7.19 | | | $ | 10.00 | |
| | |
|
|
| |
|
|
| |
|
|
|
Income (Loss) from Investment Operations: | | | | | | | | | | | | |
Net Investment Loss1,3 | | | (0.14 | ) | | | (0.08 | ) | | | (0.05 | ) |
Net Realized and Unrealized Gain (Loss) on Investments1,4 | | | 0.24 | | | | 3.92 | | | | (2.76 | ) |
| | |
|
|
| |
|
|
| |
|
|
|
Total from Investment Operations | | | 0.10 | | | | 3.84 | | | | (2.81 | ) |
| | |
|
|
| |
|
|
| |
|
|
|
Distributions to Shareholders: | | | | | | | | | | | | |
From Net Realized Gain | | | ( 0.20 | ) | | | — | | | | — | |
| | |
|
|
| |
|
|
| |
|
|
|
Paid-in Capital from Redemption Fees | | | 0.03 | | | | 0.00 2 | | | | 0.00 2 | |
| | |
|
|
| |
|
|
| |
|
|
|
Net Increase (Decrease) in Net Asset Value | | | ( 0.07 | ) | | | 3.84 | | | | (2.81 | ) |
| | |
|
|
| |
|
|
| |
|
|
|
Net Asset Value – End of Period | | $ | 10.96 | | | $ | 11.03 | | | $ | 7.19 | |
| | |
|
|
| |
|
|
| |
|
|
|
Total Investment Return5 | | | 1.17 | % | | | 53.41 | % | | | (28.10 | )% |
Ratios to Average Net Assets: | | | | | | | | | | | | |
Expenses After Waivers3 | | | 1.95 | % | | | 1.94 | % | | | 1.94 | % |
Expenses Before Waivers | | | 3.21 | % | | | 4.61 | % | | | 4.43 | % |
Net Investment Loss After Waivers3 | | | (1.23 | )% | | | (1.11 | )% | | | (1.37 | )% |
Net Investment Loss Before Waivers | | | (2.49 | )% | | | (3.78 | )% | | | (3.86 | )% |
Supplementary Data: | | | | | | | | | | | | |
Portfolio Turnover Rate | | | 99 | % | | | 146 | % | | | 165 | % |
Net Assets at End of Period (in thousands) | | $ | 6,608 | | | $ | 6,170 | | | $ | 2,485 | |
Number of Shares Outstanding at End of Period (in thousands) | | | 603 | | | | 560 | | | | 346 | |
| * | From Commencement of Operations February 1, 2002. |
| 1 | Calculated based on shares outstanding on the first and last day of the respective periods, except for dividends and distributions, if any, which are based on the actual shares outstanding on the dates of distributions. |
| 3 | Reflects fees waived by FBR Fund Advisers, Inc. pursuant to a voluntary expense limitation of 1.95%. |
| 4 | The amounts shown for a share outstanding throughout the respective periods may not be in accordance with the changes in the aggregate gains and losses on investments during the respective periods because of the timing of sales and repurchases of Fund shares in relation to fluctuating net asset values during the respective periods. |
| 5 | Total investment return is calculated assuming a purchase of shares on the first day and a sale on the last day of each period reported and will include reinvestment of dividends and distributions, if any. |
The FBR Funds
Financial Highlights (continued)
| | | | |
| | | FBR Small Cap
Technology Fund
| |
| | | For the Period
Ended
October 31,
2004*
| |
Per Share Operating Performance: | | | | |
Net Asset Value – Beginning of Period | | $ | 10.00 | |
| | |
|
|
|
Loss from Investment Operations: | | | | |
Net Investment Loss1,2 | | | (0.11 | ) |
Net Realized and Unrealized Loss on Investments1,3 | | | (1.06 | ) |
| | |
|
|
|
Total from Investment Operations | | | (1.17 | ) |
| | |
|
|
|
Paid-in Capital from Redemption Fees | | | 0.05 | |
| | |
|
|
|
Net Decrease in Net Asset Value | | | (1.12 | ) |
| | |
|
|
|
Net Asset Value – End of Period | | $ | 8.88 | |
| | |
|
|
|
Total Investment Return4 | | | (11.20 | )%(A) |
Ratios to Average Net Assets: | | | | |
Expenses After Waivers2 | | | 1.95 | %(B) |
Expenses Before Waivers | | | 6.43 | %(B) |
Net Investment Income After Waivers2 | | | (1.79 | )%(B) |
Net Investment Income Before Waivers | | | (6.27 | )%(B) |
Supplementary Data: | | | | |
Portfolio Turnover Rate | | | 150 | %(A) |
Net Assets at End of Period (in thousands) | | $ | 1,440 | |
Number of Shares Outstanding at End of Period (in thousands) | | | 162 | |
| * | From Commencement of Operations January 20, 2004. |
| 1 | Calculated based on shares outstanding on the first and last day of the period, except for dividends and distributions, if any, which are based on the actual shares outstanding on the dates of distributions. |
| 2 | Reflects fees waived by FBR Fund Advisers, Inc. pursuant to a voluntary expense limitation of 1.95%. |
| 3 | The amounts shown for a share outstanding throughout the period may not be in accordance with the changes in the aggregate gains and losses on investments during the period because of the timing of sales and repurchases of Fund shares in relation to fluctuating net asset values during the period. |
| 4 | Total investment return is calculated assuming a purchase of shares on the first day and a sale on the last day of the period reported and will include reinvestment of dividends and distributions, if any. |
The FBR Funds
Financial Highlights (continued)
| | | | | | | | | | | | | | | | | | | | | | | | |
| | | FBR Gas Utility Index Fund
| |
| | | For the
Year
Ended
October 31, 2004
| | | For the
Period
April 1,
2003
through
October 31, 2003*
| | | For the Years Ended March 31,
| |
| | | | | 2003
| | | 2002
| | | 2001
| | | 2000
| |
Per Share Operating Performance: | | | | | | | | | | | | | | | | | | | | | | | | |
Net Asset Value – Beginning of Period | | $ | 12.51 | | | $ | 10.41 | | | $ | 15.53 | | | $ | 19.42 | | | $ | 16.93 | | | $ | 16.28 | |
| | |
|
|
| |
|
|
| |
|
|
| |
|
|
| |
|
|
| |
|
|
|
Income (Loss) from Investment Operations: | | | | | | | | | | | | | | | | | | | | | | | | |
Net Investment Income1,3 | | | 0.38 | | | | 0.20 | | | | 0.43 | | | | 0.49 | | | | 0.52 | | | | 0.52 | |
Net Realized and Unrealized Gain (Loss) on Investments1,4 | | | 2.17 | | | | 2.08 | | | | (5.12 | ) | | | (1.86 | ) | | | 5.00 | | | | 2.07 | |
| | |
|
|
| |
|
|
| |
|
|
| |
|
|
| |
|
|
| |
|
|
|
Total from Investment Operations | | | 2.55 | | | | 2.28 | | | | (4.69 | ) | | | (1.37 | ) | | | 5.52 | | | | 2.59 | |
| | |
|
|
| |
|
|
| |
|
|
| |
|
|
| |
|
|
| |
|
|
|
Distributions to Shareholders: | | | | | | | | | | | | | | | | | | | | | | | | |
From Net Investment Income | | | (0.39 | ) | | | (0.18 | ) | | | (0.43 | ) | | | (0.49 | ) | | | (0.52 | ) | | | (0.52 | ) |
From Net Realized Gain | | | — | | | | — | | | | — | | | | (2.03 | ) | | | (2.51 | ) | | | (1.42 | ) |
| | |
|
|
| |
|
|
| |
|
|
| |
|
|
| |
|
|
| |
|
|
|
Total Distributions | | | (0.39 | ) | | | (0.18 | ) | | | (0.43 | ) | | | (2.52 | ) | | | (3.03 | ) | | | (1.94 | ) |
| | |
|
|
| |
|
|
| |
|
|
| |
|
|
| |
|
|
| |
|
|
|
Paid-in Capital from Redemption Fees | | | 0.00 | 2 | | | 0.00 | 2 | | | — | | | | — | | | | — | | | | — | |
| | |
|
|
| |
|
|
| |
|
|
| |
|
|
| |
|
|
| |
|
|
|
Net Increase (Decrease) in Net Asset Value | | | 2.16 | | | | 2.10 | | | | (5.12 | ) | | | (3.89 | ) | | | 2.49 | | | | 0.65 | |
| | |
|
|
| |
|
|
| |
|
|
| |
|
|
| |
|
|
| |
|
|
|
Net Asset Value – End of Period | | $ | 14.67 | | | $ | 12.51 | | | $ | 10.41 | | | $ | 15.53 | | | $ | 19.42 | | | $ | 16.93 | |
| | |
|
|
| |
|
|
| |
|
|
| |
|
|
| |
|
|
| |
|
|
|
Total Investment Return5 | | | 20.63 | % | | | 21.98 | %(A) | | | (30.40 | %) | | | ( 5.90 | %) | | | 32.88 | % | | | 17.18 | % |
Ratios to Average Net Assets: | | | | | | | | | | | | | | | | | | | | | | | | |
Expenses After Waivers3 | | | 0.85 | % | | | 0.85 | %(B) | | | 0.85 | % | | | 0.85 | % | | | 0.85 | % | | | 0.85 | % |
Expenses Before Waivers | | | 0.88 | % | | | 0.87 | %(B) | | | 0.86 | % | | | 0.85 | % | | | 0.85 | % | | | 0.85 | % |
Net Investment Income After Waivers3 | | | 2.90 | % | | | 3.02 | %(B) | | | 3.58 | % | | | 2.88 | % | | | 2.77 | % | | | 2.95 | % |
Net Investment Income Before Waivers | | | 2.87 | % | | | 3.00 | %(B) | | | 3.57 | % | | | 2.88 | % | | | 2.77 | % | | | 2.95 | % |
Supplementary Data: | | | | | | | | | | | | | | | | | | | | | | | | |
Portfolio Turnover Rate | | | 34 | % | | | 5 | %(A) | | | 39 | % | | | 29 | % | | | 38 | % | | | 16 | % |
Net Assets at End of Period (in thousands) | | $ | 220,545 | | | $ | 184,818 | | | $ | 145,663 | | | $ | 224,681 | | | $ | 269,504 | | | $ | 194,493 | |
Number of Shares Outstanding at End of Period (in thousands) | | | 15,031 | | | | 14,770 | | | | 13,996 | | | | 14,464 | | | | 13,878 | | | | 11,488 | |
| * | Prior to April 1, 2003, the Fund’s fiscal year end was March 31. |
| 1 | Calculated based on shares outstanding on the first and last day of the respective periods, except for dividends and distributions, if any, which are based on the actual shares outstanding on the dates of distributions. |
| 3 | Reflects fees waived by FBR Fund Advisers, Inc. pursuant to a voluntary expense limitation of 0.85%. |
| 4 | The amounts shown for a share outstanding throughout the respective periods may not be in accordance with the changes in the aggregate gains and losses on investments during the respective periods because of the timing of sales and repurchases of Fund shares in relation to fluctuating net asset values during the respective periods. |
| 5 | Total investment return is calculated assuming a purchase of shares on the first day and a sale on the last day of each period reported and will include reinvestment of dividends and distributions, if any. |
67
The FBR Funds
Financial Highlights (continued)
| | | | | | | | | | | | | | | | | | | | | | | | |
| | | FBR Fund for Government Investors
| |
| | | For the
Period
Ended
October 31,
2004*
| | | For the Years Ended December 31,
| |
| | | | 2003
| | | 2002
| | | 2001
| | | 2000
| | | 1999
| |
Per Share Operating Performance: | | | | | | | | | | | | | | | | | | | | | | | | |
Net Asset Value – Beginning of Period | | $ | 1.00 | | | $ | 1.00 | | | $ | 1.00 | | | $ | 1.00 | | | $ | 1.00 | | | $ | 1.00 | |
| | �� |
|
|
| |
|
|
| |
|
|
| |
|
|
| |
|
|
| |
|
|
|
Income from Investment Operations: | | | | | | | | | | | | | | | | | | | | | | | | |
Net Investment Income1,3 | | | 0.00 | 2 | | | 0.00 2 | | | | 0.01 | | | | 0.03 | | | | 0.05 | | | | 0.04 | |
Net Realized Gains on Investments1,4 | | | 0.00 | 2 | | | 0.00 2 | | | | — | | | | — | | | | — | | | | — | |
| | |
|
|
| |
|
|
| |
|
|
| |
|
|
| |
|
|
| |
|
|
|
Total From Investment Operations | | | 0.00 | 2 | | | 0.00 2 | | | | 0.01 | | | | 0.03 | | | | 0.05 | | | | 0.04 | |
| | |
|
|
| |
|
|
| |
|
|
| |
|
|
| |
|
|
| |
|
|
|
Distributions to Shareholders: | | | | | | | | | | | | | | | | | | | | | | | | |
From Net Investment Income | | | 0.00 | 2 | | | (0.00 | )2 | | | (0.01 | ) | | | (0.03 | ) | | | (0.05 | ) | | | (0.04 | ) |
| | |
|
|
| |
|
|
| |
|
|
| |
|
|
| |
|
|
| |
|
|
|
Net Asset Value - End of Period | | $ | 1.00 | | | $ | 1.00 | | | $ | 1.00 | | | $ | 1.00 | | | $ | 1.00 | | | $ | 1.00 | |
| | |
|
|
| |
|
|
| |
|
|
| |
|
|
| |
|
|
| |
|
|
|
Total Investment Return5 | | | 0.42 | %(A) | | | 0.42 | % | | | 1.03 | % | | | 3.25 | % | | | 5.27 | % | | | 3.97 | % |
Ratios to Average Net Assets: | | | | | | | | | | | | | | | | | | �� | | | | | | |
Expenses After Waivers3 | | | 0.75 | %(B) | | | 0.75 | % | | | 0.75 | % | | | 0.75 | % | | | 0.75 | % | | | 0.74 | % |
Expenses Before Waivers | | | 0.85 | %(B) | | | 0.82 | % | | | 0.75 | % | | | 0.75 | % | | | 0.75 | % | | | 0.74 | % |
Net Investment Income After Waivers3 | | | 0.50 | %(B) | | | 0.43 | % | | | 1.03 | % | | | 3.25 | % | | | 5.17 | % | | | 3.90 | % |
Net Investment Income Before Waivers | | | 0.40 | %(B) | | | 0.36 | % | | | 1.03 | % | | | 3.25 | % | | | 5.17 | % | | | 3.90 | % |
Supplementary Data: | | | | | | | | | | | | | | | | | | | | | | | | |
Net Assets at End of Period (in thousands) | | $ | 288,761 | | | $ | 341,413 | | | $ | 454,247 | | | $ | 484,682 | | | $ | 555,711 | | | $ | 492,627 | |
Number of Shares Outstanding at End of Period (in thousands) | | | 288,950 | | | | 341,437 | | | | 454,247 | | | | 484,682 | | | | 555,711 | | | | 492,627 | |
| * | Effective March 1, 2004, the Fund’s fiscal year end changed to October 31. |
| 1 | Calculated based on shares outstanding on the first and last day of the respective periods, except for dividends and distributions, if any, which are based on the actual shares outstanding on the dates of distributions. |
| 3 | Reflects fees waived by Money Management Advisers, Inc. pursuant to a voluntary expense limitation of 0.75%. |
| 4 | The amounts shown for a share outstanding throughout the respective periods may not be in accordance with the changes in the aggregate gains and losses on investments during the respective periods because of the timing of sales and repurchases of Fund shares in relation to fluctuating net asset values during the respective periods. |
| 5 | Total investment return is calculated assuming a purchase of shares on the first day and a sale on the last day of each period reported and will include reinvestment of dividends and distributions, if any. |
68
The FBR Funds
Financial Highlights (continued)
| | | | | | | | | | | | | | | | | | | | | | | | |
| | | FBR Maryland Tax-Free Portfolio
| |
| | | For the
Period
Ended
October 31, 2004*
| | | For the Years Ended December 31,
| |
| | | | 2003
| | | 2002
| | | 2001
| | | 2000
| | | 1999
| |
Per Share Operating Performance: | | | | | | | | | | | | | | | | | | | | | | | | |
Net Asset Value - Beginning of Period | | $ | 11.28 | | | $ | 11.31 | | | $ | 10.93 | | | $ | 10.93 | | | $ | 10.55 | | | $ | 11.23 | |
| | |
|
|
| |
|
|
| |
|
|
| |
|
|
| |
|
|
| |
|
|
|
Income (Loss) from Investment Operations: | | | | | | | | | | | | | | | | | | | | | | | | |
Net Investment Income1,3 | | | 0.37 | | | | 0.46 | | | | 0.47 | | | | 0.49 | | | | 0.51 | | | | 0.50 | |
Net Realized and Unrealized Gain (Loss) on Investments1,4 | | | (0.06 | ) | | | (0.01 | ) | | | 0.39 | | | | 0.00 2 | | | | 0.38 | | | | (0.68 | ) |
| | |
|
|
| |
|
|
| |
|
|
| |
|
|
| |
|
|
| |
|
|
|
Total from Investment Operations | | | 0.31 | | | | 0.45 | | | | 0.86 | | | | 0.49 | | | | 0.89 | | | | (0.18 | ) |
| | |
|
|
| |
|
|
| |
|
|
| |
|
|
| |
|
|
| |
|
|
|
Distributions to Shareholders: | | | | | | | | | | | | | | | | | | | | | | | | |
From Net Investment Income | | | (0.37 | ) | | | (0.46 | ) | | | (0.47 | ) | | | (0.49 | ) | | | (0.51 | ) | | | (0.50 | ) |
From Net Realized Gain | | | — | | | | (0.02 | ) | | | (0.01 | ) | | | — | | | | — | | | | — | |
| | |
|
|
| |
|
|
| |
|
|
| |
|
|
| |
|
|
| |
|
|
|
Total Distributions to Shareholders | | | (0.37 | ) | | | (0.48 | ) | | | (0.48 | ) | | | (0.49 | ) | | | (0.51 | ) | | | (0.50 | ) |
| | |
|
|
| |
|
|
| |
|
|
| |
|
|
| |
|
|
| |
|
|
|
Paid-in Capital from Redemption Fees | | | 0.00 | 2 | | | — | | | | — | | | | — | | | | — | | | | — | |
| | |
|
|
| |
|
|
| |
|
|
| |
|
|
| |
|
|
| |
|
|
|
Net Increase (Decrease) in Net Asset Value | | | (0.06 | ) | | | (0.03 | ) | | | 0.38 | | | | — | | | | 0.38 | | | | (0.68 | ) |
| | |
|
|
| |
|
|
| |
|
|
| |
|
|
| |
|
|
| |
|
|
|
Net Asset Value - End of Period | | $ | 11.22 | | | $ | 11.28 | | | $ | 11.31 | | | $ | 10.93 | | | $ | 10.93 | | | $ | 10.55 | |
| | |
|
|
| |
|
|
| |
|
|
| |
|
|
| |
|
|
| |
|
|
|
Total Investment Return5 | | | 2.81 | %(A) | | | 4.11 | % | | | 8.01 | % | | | 4.50 | % | | | 8.64 | % | | | (1.63 | )% |
Ratios to Average Net Assets: | | | | | | | | | | | | | | | | | | | | | | | | |
Expenses After Waivers3 | | | 0.94 | %(B) | | | 0.93 | % | | | 0.92 | % | | | 0.93 | % | | | 0.93 | % | | | 0.93 | % |
Expenses Before Waivers | | | 0.95 | %(B) | | | 0.93 | % | | | 0.92 | % | | | 0.93 | % | | | 0.93 | % | | | 0.93 | % |
Net Investment Income After Waivers3 | | | 3.98 | %(B) | | | 4.07 | % | | | 4.25 | % | | | 4.43 | % | | | 4.76 | % | | | 4.59 | % |
Net Investment Income Before Waivers | | | 3.97 | %(B) | | | 4.07 | % | | | 4.25 | % | | | 4.43 | % | | | 4.76 | % | | | 4.59 | % |
Supplementary Data: | | | | | | | | | | | | | | | | | | | | | | | | |
Portfolio Turnover Rate | | | 9 | %(A) | | | 11 | % | | | 17 | % | | | 17 | % | | | 7 | % | | | 12 | % |
Net Assets at End of Period (in thousands) | | $ | 39,269 | | | $ | 42,734 | | | $ | 42,314 | | | $ | 39,957 | | | $ | 39,500 | | | $ | 42,132 | |
Number of Shares Outstanding at End of Period (in thousands) | | | 3,499 | | | | 3,788 | | | | 3,743 | | | | 3,656 | | | | 3,613 | | | | 3,993 | |
| * | Effective March 1, 2004, the Fund’s fiscal year changed to October 31. |
| 1 | Calculated based on shares outstanding on the first and last day of the respective periods, except for dividends and distributions, if any, which are based on the actual shares outstanding on the dates of distributions. |
| 3 | Reflects fees waivered by Money Management Advisers, Inc. pursuant to a voluntary expense limitation of 1.00%. |
| 4 | The amounts shown for a share outstanding throughout the respective periods may not be in accordance with the changes in the aggregate gains and losses on investments during the respective periods because of the timing of sales and repurchases of Fund shares in relation to fluctuating net asset values during the respective periods. |
| 5 | Total investment return is calculated assuming a purchase of shares on the first day and a sale on the last day of each period reported and will include reinvestment of dividends and distributions, if any. |
69
The FBR Funds
Financial Highlights (continued)
| | | | | | | | | | | | | | | | | | | | | | | | |
| | | FBR Virginia Tax-Free Portfolio
| |
| | | For the
Period
Ended October 31,
2004*
| | | For the Years Ended December 31,
| |
| | | | 2003
| | | 2002
| | | 2001
| | | 2000
| | | 1999
| |
Per Share Operating Performance: | | | | | | | | | | | | | | | | | | | | | | | | |
Net Asset Value – Beginning of Period | | $ | 11.66 | | | $ | 11.59 | | | $ | 11.05 | | | $ | 11.13 | | | $ | 10.49 | | | $ | 11.42 | |
| | |
|
|
| |
|
|
| |
|
|
| |
|
|
| |
|
|
| |
|
|
|
Income (Loss) from Investment Operations: | | | | | | | | | | | | | | | | | | | | | | | | |
Net Investment Income1,3 | | | 0.35 | | | | 0.44 | | | | 0.46 | | | | 0.49 | | | | 0.50 | | | | 0.50 | |
Net Realized and Unrealized Gain (Loss) on Investments1,4 | | | (0.03 | ) | | | 0.08 | | | | 0.54 | | | | (0.08 | ) | | | 0.64 | | | | (0.91 | ) |
| | |
|
|
| |
|
|
| |
|
|
| |
|
|
| |
|
|
| |
|
|
|
Total from Investment Operations | | | 0.32 | | | | 0.52 | | | | 1.00 | | | | 0.41 | | | | 1.14 | | | | (0.41 | ) |
| | |
|
|
| |
|
|
| |
|
|
| |
|
|
| |
|
|
| |
|
|
|
Distributions to Shareholders: | | | | | | | | | | | | | | | | | | | | | | | | |
From Net Investment Income | | | (0.35 | ) | | | (0.44 | ) | | | (0.46 | ) | | | (0.49 | ) | | | (0.50 | ) | | | (0.50 | ) |
From Net Realized Gain | | | — | | | | (0.01 | ) | | | — | | | | — | | | | — | | | | (0.02 | ) |
| | |
|
|
| |
|
|
| |
|
|
| |
|
|
| |
|
|
| |
|
|
|
Total Distributions to Shareholders | | | (0.35 | ) | | | (0.45 | ) | | | (0.46 | ) | | | (0.49 | ) | | | (0.50 | ) | | | (0.52 | ) |
| | |
|
|
| |
|
|
| |
|
|
| |
|
|
| |
|
|
| |
|
|
|
Paid-in Capital from Redemption Fees | | | 0.00 | 2 | | | — | | | | — | | | | — | | | | — | | | | — | |
| | |
|
|
| |
|
|
| |
|
|
| |
|
|
| |
|
|
| |
|
|
|
Net Increase (Decrease) in Net Asset Value | | | (0.03 | ) | | | 0.07 | | | | 0.54 | | | | (0.08 | ) | | | 0.64 | | | | (0.93 | ) |
| | |
|
|
| |
|
|
| |
|
|
| |
|
|
| |
|
|
| |
|
|
|
Net Asset Value – End of Period | | $ | 11.63 | | | $ | 11.66 | | | $ | 11.59 | | | $ | 11.05 | | | $ | 11.13 | | | $ | 10.49 | |
| | |
|
|
| |
|
|
| |
|
|
| |
|
|
| |
|
|
| |
|
|
|
Total Investment Return5 | | | 2.82 | %(A) | | | 4.61 | % | | | 9.25 | % | | | 3.67 | % | | | 11.15 | % | | | (3.75 | )% |
Ratios to Average Net Assets: | | | | | | | | | | | | | | | | | | | | | | | | |
Expenses After Waivers3 | | | 0.95 | %(B) | | | 0.93 | % | | | 0.92 | % | | | 0.92 | % | | | 0.92 | % | | | 0.93 | % |
Expenses Before Waivers | | | 0.97 | %(B) | | | 0.93 | % | | | 0.92 | % | | | 0.92 | % | | | 0.92 | % | | | 0.93 | % |
Net Investment Income After Waivers3 | | | 3.67 | %(B) | | | 3.80 | % | | | 4.09 | % | | | 4.35 | % | | | 4.67 | % | | | 4.51 | % |
Net Investment Income Before Waivers | | | 3.65 | %(B) | | | 3.80 | % | | | 4.09 | % | | | 4.35 | % | | | 4.67 | % | | | 4.51 | % |
Supplementary Data: | | | | | | | | | | | | | | | | | | | | | | | | |
Portfolio Turnover Rate | | | 14 | %(A) | | | 24 | % | | | 19 | % | | | 22 | % | | | 8 | % | | | 26 | % |
Net Assets at End of Period (in thousands) | | $ | 27,218 | | | $ | 31,563 | | | $ | 32,373 | | | $ | 30,229 | | | $ | 28,898 | | | $ | 28,926 | |
Number of Shares Outstanding at End of Period (in thousands) | | | 2,339 | | | | 2,707 | | | | 2,794 | | | | 2,735 | | | | 2,597 | | | | 2,757 | |
| * | Effective March 1, 2004, the Fund’s fiscal year changed to October 31. |
| 1 | Calculated based on shares outstanding on the first and last day of the respective periods, except for dividends and distributions, if any, which are based on the actual shares outstanding on the dates of distributions. |
| 3 | Reflects fees waived by Money Management Advisers, Inc. pursuant to a voluntary expense limitation of 1.00%. |
| 4 | The amounts shown for a share outstanding throughout the respective periods may not be in accordance with the changes in the aggregate gains and losses on investments during the respective periods because of the timing of sales and repurchases of Fund shares in relation to fluctuating net asset values during the respective periods. |
| 5 | Total investment return is calculated assuming a purchase of shares on the first day and a sale on the last day of each period reported and will include reinvestment of dividends and distributions, if any. |
The accompanying notes are an integral part of the financial statements.
70
The FBR Funds
Schedule of Shareholder Expenses
As a shareholder of the Funds, you incur two types of costs: (1) transaction costs, including reinvested dividends or other distributions; redemption fees; and exchange fees; and (2) ongoing costs, including investment advisory fees; distribution (12b-1) fees; and other Fund expenses. This example is intended to help you understand your ongoing costs (in dollars) of investing in the Funds and to compare these costs with the ongoing costs of investing in other mutual funds.
The example is based on an investment of $1,000 invested at the beginning of the period and held for the entire period (May 1, 2004 through October 31, 2004).
Actual Expenses
The first line of the table on the following page provides information about actual account values and actual expenses. You may use the information in this line, together with the amount you invested, to estimate the expenses that you paid over the period. Simply divide your account value by $1,000 (for example, an $8,600 account value divided by $1,000 = 8.6), then multiply the result by the number in the first line under the heading entitled “Expenses Paid During the Six Months Ended October 31, 2004” to estimate the expenses you paid on your account during this period.
Hypothetical Example for Comparison Purposes
The second line of the table on the following page provides information about hypothetical account values and hypothetical expenses based on each Fund’s actual expense ratio and an assumed rate of return of 5% per year before expenses, which is not the Funds’ actual return. The hypothetical account values and expenses may not be used to estimate the actual ending account balance or expenses you paid for the period. You may use this information to compare the ongoing costs of investing in the Funds and other funds. To do so, compare this 5% hypothetical example with the 5% hypothetical examples that appear in the shareholder reports of the other funds.
71
The FBR Funds
Schedule of Shareholder Expenses (continued)
| | | | | | | | | | | | | | | |
| | | Net Expense
Ratio
Annualized
Oct. 31, 2004
| | | Total Return
Six Months
Ended
Oct. 31, 2004
| | | Beginning
Account
Value
May 1, 2004
| | Ending
Account
Value
Oct. 31, 2004
| | Expenses Paid
During the
Six Months
Ended Oct. 31, 2004*
|
Large Cap Financial Fund | | | | | | | | | | | | | | | |
Actual | | 1.91 | % | | 9.49 | % | | $ | 1,000.00 | | $ | 1,094.90 | | $ | 10.06 |
Hypothetical | | 1.91 | | | 2.51 | | | | 1,000.00 | | | 1,015.53 | | | 9.68 |
Small Cap Financial Fund | | | | | | | | | | | | | | | |
Actual | | 1.59 | | | 10.70 | | | | 1,000.00 | | | 1,107.00 | | | 8.42 |
Hypothetical | | 1.59 | | | 2.51 | | | | 1,000.00 | | | 1,017.14 | | | 8.06 |
Small Cap Fund | | | | | | | | | | | | | | | |
Actual | | 1.59 | | | 9.34 | | | | 1,000.00 | | | 1,093.40 | | | 8.37 |
Hypothetical | | 1.59 | | | 2.51 | | | | 1,000.00 | | | 1,017.14 | | | 8.06 |
Large Cap Technology Fund | | | | | | | | | | | | | | | |
Actual | | 1.95 | | | (0.72 | ) | | | 1,000.00 | | | 992.80 | | | 9.77 |
Hypothetical | | 1.95 | | | 2.51 | | | | 1,000.00 | | | 1,015.33 | | | 9.88 |
Small Cap Technology Fund | | | | | | | | | | | | | | | |
Actual | | 1.95 | | | (1.22 | ) | | | 1,000.00 | | | 987.80 | | | 9.74 |
Hypothetical | | 1.95 | | | 2.51 | | | | 1,000.00 | | | 1,015.33 | | | 9.88 |
Gas Utility Index Fund | | | | | | | | | | | | | | | |
Actual | | 0.85 | | | 13.48 | | | | 1,000.00 | | | 1,134.80 | | | 4.56 |
Hypothetical | | 0.85 | | | 2.51 | | | | 1,000.00 | | | 1,020.86 | | | 4.32 |
Fund for Government Investors | | | | | | | | | | | | | | | |
Actual | | 0.75 | | | 0.31 | | | | 1,000.00 | | | 1,003.10 | | | 3.78 |
Hypothetical | | 0.75 | | | 2.51 | | | | 1,000.00 | | | 1,021.37 | | | 3.81 |
Maryland Tax-Free Portfolio | | | | | | | | | | | | | | | |
Actual | | 0.93 | | | 3.47 | | | | 1,000.00 | | | 1,034.70 | | | 4.76 |
Hypothetical | | 0.93 | | | 2.51 | | | | 1,000.00 | | | 1,020.46 | | | 4.72 |
Virginia Tax-Free Portfolio | | | | | | | | | | | | | | | |
Actual | | 0.93 | | | 3.87 | | | | 1,000.00 | | | 1,038.70 | | | 4.77 |
Hypothetical | | 0.93 | | | 2.51 | | | | 1,000.00 | | | 1,020.46 | | | 4.72 |
| * | Expenses are equal to the Fund’s annualized expense ratio, multiplied by the average account value over the period, multiplied by the number of days in most recent fiscal half-year then divided by 366. |
72
The FBR Funds
Notes to Financial Statements
1. Organization
The FBR Funds (the “Trust”) is registered under the Investment Company Act of 1940, as amended, (“1940 Act”) as an open-end management investment company. The Trust was organized as a business trust under the laws of the State of Delaware on September 29, 2003. The Trust currently consists of nine series which represent interests in one of the following investment portfolios: FBR Large Cap Financial Fund (“Large Cap Financial Fund”), FBR Small Cap Financial Fund (“Small Cap Financial Fund”), FBR Small Cap Fund (“Small Cap Fund”), FBR Large Cap Technology Fund (“Large Cap Technology Fund”), FBR Small Cap Technology Fund (“Small Cap Technology Fund”), FBR Gas Utility Index Fund (“Gas Utility Index Fund”) (formerly known as the FBR American Gas Index Fund), FBR Fund for Government Investors (“Money Market Fund”), FBR Maryland Tax-Free Portfolio (“Maryland Tax-Free Portfolio”) and FBR Virginia Tax-Free Portfolio (“Virginia Tax-Free Portfolio”), (each a “Fund” and collectively, the “Funds”). The Trust is authorized to issue an unlimited number of shares of beneficial interest with no par value which may be issued in more than one class or series. Each Fund offers one class of shares, which are offered as no-load shares.
On February 27, 2004, the Large Cap Financial Fund, Small Cap Financial Fund, Small Cap Fund, Large Cap Technology Fund, Small Cap Technology Fund, Gas Utility Index Fund, Money Market Fund, Maryland Tax-Free Portfolio and Virginia Tax-Free Portfolio were reorganized as separate series of the Trust. Prior to February 27, 2004, the Large Cap Financial Fund, Small Cap Financial Fund, Small Cap Fund, Large Cap Technology Fund and Small Cap Technology Fund were separate series of the FBR Family of Funds. The Gas Utility Index Fund and Money Market Fund were each in their own respective company and trust, respectively. The Maryland Tax-Free Portfolio and Virginia Tax-Free Portfolio were separate series of the FBR Fund for Tax-Free Investors, Inc.
The Large Cap Financial Fund, a non-diversified fund, intends to invest at least 80% of its total assets in securities of large capitalization companies principally engaged in the business of financial services. The investment objective of the Fund is capital appreciation.
The Small Cap Financial Fund, a non-diversified fund, intends to invest at least 80% of its total assets in securities of small capitalization companies principally engaged in the business of financial services to consumers and industry. The investment objective of the Fund is capital appreciation.
The Small Cap Fund, a non-diversified fund, intends to invest at least 80% of its total assets in securities of small-cap companies. The investment objective of the Fund is capital appreciation.
The Large Cap Technology Fund, a non-diversified fund, intends to invest at least 80% of its total assets in securities of large-cap companies that are principally engaged in the research, design, development, manufacturing or distributing products or services in the technology industry. The investment objective of the Fund is long-term capital appreciation.
The Small Cap Technology Fund, a non-diversified fund, intends to invest at least 80% of its total assets in securities of small-capitalization companies that are principally engaged in the research, design, development, manufacturing or distributing products or services in the technology industry. The investment objective of the Fund is long-term capital appreciation.
73
The FBR Funds
Notes to Financial Statements (continued)
The Gas Utility Index Fund, a diversified fund, intends to invest at least 85% of its net assets in the common stock of companies that have natural gas distribution and transmission operations. The investment objective of the Fund is income and capital appreciation.
The Money Market Fund, a diversified fund, intends to invest at least 95% of its total assets in fixed-rate and floating-rate short-term instruments issued or guaranteed by the U.S. Government, its agencies or instrumentalities and in repurchase agreements secured by such instruments. The investment objective of the Fund is current income consistent with liquidity and preservation of capital.
The Maryland Tax-Free Portfolio, a non-diversified fund, intends to invest at least 80% of its assets in securities issued by the State of Maryland, its political subdivisions, agencies and instrumentalities exempt from federal and Maryland state income tax, including the Federal Alternative Minimum Tax (“AMT”). The investment objective of the Fund is to provide investors with income derived from investments exempt from federal and Maryland state and local income taxes, including AMT.
The Virginia Tax-Free Portfolio, a non-diversified fund, intends to invest at least 80% of its assets in securities issued by the Commonwealth of Virginia, its political subdivisions, agencies and instrumentalities exempt from federal and Virginia state income tax, including AMT. The investment objective of the Fund is to provide investors with income derived from investments exempt from federal and Virginia state and local income taxes, including AMT.
2. Significant Accounting Policies
The following is a summary of the Funds’ significant accounting policies:
Portfolio Valuation — The net asset value per share (“NAV”) of each Fund is determined as of the close of regular trading on the New York Stock Exchange (“NYSE”) (normally 4:00 p.m., Eastern time) on each business day that the exchange is open for trading. Each Fund’s securities are valued at the last sale price on the securities exchange or national securities market on which such securities are primarily traded. Securities that are quoted by NASDAQ are valued at the NASDAQ Official Closing Price. Securities not listed on an exchange or national securities market, or securities in which there were no transactions, are valued at the average of the most recent bid and ask prices, except in the case of open short positions where the ask price is used for valuation purposes. The bid price is used when no ask price is available. The securities of the Maryland Tax-Free Portfolio and Virginia Tax-Free Portfolio are valued on the basis of the mid-point of quoted bid and ask prices when market quotations are available. Short-term investments are carried at amortized cost, which approximates market value. Restricted securities, as well as securities or other assets for which market quotations are not readily available, or are not valued by a pricing service approved by the The Funds’ Board of Trustees (the “Board”), are valued at fair value in good faith by, or at the direction of, the Board.
Share Valuation — The NAV of each Fund is calculated by dividing the sum of the value of the securities held by each Fund, plus cash or other assets, minus all liabilities (including estimated accrued expenses) by the total number of shares outstanding of each Fund, rounded to the nearest cent. Each Fund’s shares will not be priced on the days on which the NYSE is
74
The FBR Funds
Notes to Financial Statements (continued)
closed for trading. The offering and redemption price per share of each Fund is equal to each Fund’s net asset value per share. The Funds, except for the Money Market Fund, charge a 1% redemption fee on shares redeemed within 90 days of purchase. These fees are deducted from the redemption proceeds otherwise payable to the shareholder. The Funds will retain the fee charged as paid-in capital and such fees become part of that Fund’s daily NAV calculation.
Investment Income — Dividend income is recorded on the ex-dividend date. Interest income, which includes the amortization of premium and accretion of discount, if any, is recorded on an accrual basis.
Distributions to Shareholders — Each Fund, except the Gas Utility Index Fund, Money Market Fund, Maryland Tax-Free Portfolio and Virginia Tax-Free Portfolio, declares and pays any dividends from its net investment income, if any, annually. The Gas Utility Index Fund declares and pays any such dividend quarterly. The Money Market Fund, Maryland Tax-Free Portfolio and Virginia Tax-Free Portfolio each declare dividends each day the Funds are open for business and pay monthly. Distributions from net realized capital gains, if any, will be distributed at least annually for each Fund. Income and capital gain distributions are determined in accordance with U.S. federal income tax regulations.
Security Transactions — Security transactions are accounted for on the trade date. Securities sold are determined on a specific identification basis.
Estimates — The preparation of financial statements in accordance with U.S. generally accepted accounting principles requires management to make estimates and assumptions that may affect the reported amounts of assets and liabilities and disclosure of contingent assets and liabilities at the date of the financial statements and the reported amounts of income and expenses during the reporting period. Actual results could differ from those estimates.
Options — Each Fund, except the Gas Utility Index Fund, Money Market Fund, Maryland Tax-Free Portfolio and Virginia Tax-Free Portfolio, may buy and sell call and put options to hedge against changes in net asset value or to attempt to realize a greater current return. The risk associated with purchasing an option is that a Fund pays a premium whether or not the option is exercised. Additionally, a Fund bears the risk of loss of premium and change in market value should the counterparty not perform under the contract. Put and call options purchased are accounted for in the same manner as portfolio securities. The cost of securities acquired through the exercise of call options is increased by the premiums paid. The proceeds from securities sold through the exercise of put options are decreased by the premiums paid. When a Fund writes an option, an amount equal to the premium received by the Fund is recorded as a liability and is subsequently adjusted to the current market value of the option written. Premiums received from writing options which expire unexercised are recorded by a Fund on the expiration date as realized gains from options transactions. The difference between the premium and the amount paid on effecting a closing purchase transaction, including brokerage commissions, is also treated as a realized gain, or if the premium is less than the amount paid for the closing purchase transaction, as a realized loss. If a call option is exercised, the premium is added to the proceeds from the sale of the underlying securities in determining whether a Fund has a realized gain or loss. If a put option is exercised, the
75
The FBR Funds
Notes to Financial Statements (continued)
premium reduces the cost basis of the securities purchased by a Fund. Each Fund’s use of written options involves, to varying degrees, elements of market risk in excess of the amount recognized in the Statement of Assets and Liabilities. The contract or notional amounts reflect the extent of a Fund’s involvement in these financial instruments. In writing an option, a Fund bears the market risk of an unfavorable change in the price of the security underlying the written option. Exercise of an option written by a Fund could result in a Fund selling or buying a security at a price different from the current market value. A Fund’s activities in written options are conducted through regulated exchanges which do not result in counterparty credit risks. The Small Cap Fund engaged in the following options transactions during the year ended October 31, 2004:
| | | | | | | |
| | | Call Options Purchased
| |
| | | Contracts
| | | Premium
| |
Outstanding, at beginning of year | | 60 | | | $ | 25,780 | |
Options purchases | | — | | | | — | |
Options expired | | (60 | ) | | | (25,780 | ) |
| | |
|
| |
|
|
|
Outstanding, at end of year | | — | | | $ | — | |
| | |
|
| |
|
|
|
Repurchase Agreements — The Large Cap Financial, Small Cap Financial, Small Cap, Large Cap Technology, Small Cap Technology and Gas Utility Index Funds (collectively the “Equity Funds”) have agreed to purchase securities from financial institutions subject to the seller’s agreement to repurchase them at an agreed-upon time and price (“repurchase agreement”). The financial institutions with whom each Fund enters into repurchase agreements are banks and broker/dealers which the Adviser considers creditworthy pursuant to criteria approved by the Trust’s Board of Trustees. The seller under a repurchase agreement will be required to maintain the value of the securities as collateral, subject to the agreement at not less than the repurchase price plus accrued interest. The Adviser marks to market daily the value of the collateral, and, if necessary, requires the seller to maintain additional securities, to ensure that the value is not less than the repurchase price. Default by or bankruptcy of the seller would, however, expose each Fund to possible loss because of adverse market action or delays in connection with the disposition of the underlying securities.
Securities Lending — With respect to the Equity Funds and the Money Market Fund, each may lend its portfolio securities to broker-dealers, banks or institutional borrowers of securities. Loans of securities are required at all times to be secured by collateral equal to at least 100% of the market value of the securities on loan. However, in the event of default or bankruptcy by the other party to the agreement, realization and/or retention of the collateral may be subject to legal proceedings. In the event that the borrower fails to return securities, and cash collateral being maintained by the borrower is insufficient to cover the value of loaned securities and provided such collateral insufficiency is not the result of investment losses, the lending agent has agreed to pay the amount of the shortfall to the Funds. The Funds had no securities on loan to brokers at October 31, 2004.
76
The FBR Funds
Notes to Financial Statements (continued)
Line of Credit — The Trust has a line of credit (“Credit Agreement”) with Custodial Trust Company (“CTC”) for temporary or emergency purposes. Under the Credit Agreement, CTC provides a line of credit in an amount up to the maximum amount permitted under the 1940 Act and each Fund’s prospectus. Pursuant to the Credit Agreement, each participating Fund is liable only for principal and interest payments related to borrowings made by that Fund. Borrowings under the Credit Agreement bear interest at 100 basis points (100 basis points = 1%) over the Fed Funds Rate, except for the Gas Utility Index Fund, Fund for Government Investors, Virginia Tax-Free Portfolio and Maryland Tax-Free Portfolio, which bear interest at 100 basis points over the LIBOR. The Funds had no borrowings outstanding at October 31, 2004.
3. Transactions with Affiliates
Investment Adviser — FBR Fund Advisers, Inc. (the “Adviser”) serves as investment adviser to the Large Cap Financial Fund, Small Cap Financial Fund, Small Cap Fund, Large Cap Technology Fund, Small Cap Technology Fund and Gas Utility Index Fund. For its advisory services, the Adviser receives a monthly fee at an annual rate of 0.90% of the average daily net assets of the Large Cap Financial Fund, Small Cap Financial Fund, Small Cap Fund, Large Cap Technology Fund and Small Cap Technology Fund and at an annual rate of 0.40% of the average daily net assets of the Gas Utility Index Fund. The Adviser has contractually agreed to limit each Fund’s total operating expenses to 1.95% of each Fund’s average daily net assets, except for the Gas Utility Index Fund which the Adviser has contractually agreed to limit total operating expenses to 0.85% of average daily net assets. The Adviser has agreed to maintain these limitations with regard to each Fund through October 31, 2005.
The Adviser has retained Akre Capital Management, LLC (“ACM”) as investment sub-adviser to the Small Cap Fund. In this capacity, subject to the supervision of the Adviser and the Board, ACM directs the investments of the Small Cap Fund’s assets, continually conducts investment research and supervision for the Small Cap Fund, and is responsible for the purchase and sale of the Small Cap Fund’s investments. For these services, the Adviser (and not the Fund) pays ACM a fee out of the Adviser’s advisory fee.
Money Management Advisers, Inc. (“MMA”) serves as the investment adviser to the Money Market Fund, Maryland Tax-Free Portfolio and Virginia Tax-Free Portfolio. MMA is a wholly-owned subsidiary of FBR National Trust Company (“FBR National”), the Funds’ administrator, custodian, fund accounting and transfer agent. Under the terms of an agreement with MMA, the Funds pay a management fee at an annual rate based on each Fund’s net assets as follows:
| | |
Money Market Fund | | 0.50% of the first $500 million; |
| | | 0.45% of the next $250 million; |
| | | 0.40% of the next $250 million; |
| | | 0.35% of the net assets over $1 billion. |
Maryland Tax-Free Portfolio Virginia Tax-Free Portfolio | | 0.375% |
Effective April 1, 2003, MMA contractually agreed to waive advisory fees in the amount of 0.10% of the average daily net assets of the Money Market Fund.
77
The FBR Funds
Notes to Financial Statements (continued)
MMA has retained Asset Management, Inc. (“AMI”) as investment sub-adviser to the Maryland Tax-Free Portfolio and Virginia Tax-Free Portfolio. In this capacity, subject to the supervision of the Adviser and the Board, AMI directs the investments of the Maryland Tax-Free Portfolio and Virginia Tax-Free Portfolio’s assets, continually conducts investment research and supervision for the Funds, and is responsible for the purchase and sale of the Funds’ investments. For these services, MMA (and not the Fund) pays AMI a fee out of the MMA advisory fee.
Plan of Distribution — The Trust, on behalf of each Fund, except the Gas Utility Index Fund and Money Market Fund, has adopted an amended and restated Distribution Plan (the “Plan”) pursuant to Rule 12b-1 under the 1940 Act. Under the Plan, each Fund may pay FBR Investment Services, Inc. (the “Distributor”) a fee at an annual rate of up to 0.25% of each Fund’s average daily net assets. Fees paid to the Distributor under the Plan are payable without regard to actual expenses incurred. The Maryland Tax-Free Portfolio and Virginia Tax-Free Portfolio adopted the Plan on March 1, 2004. The Distributor has voluntarily agreed to waive a portion of the distribution fees payable by the Small Cap Fund in an amount attributable to marketing expenses for the Fund until such time as the Fund is reopened to new investors.
Administrator, Transfer Agent and Custodian — FBR National (the “Administrator”), provides administrative, transfer agency and custodial services to the Funds and pays the operating expenses (not including extraordinary legal fees, marketing costs, outside of routine shareholder communications and interest costs) of the Funds. For these services, the Administrator receives a fee at an annual rate based on each Fund’s average daily net assets as follows:
| | |
Large Cap Financial Fund | | Greater of 1% or $125,000 of the first $20 million; |
Small Cap Financial Fund | | $200,000 plus 0.33 1/3% of assets greater than $20 million, but less than $50 million; |
Small Cap Fund | |
Large Cap Technology Fund | | $300,000 plus 0.10% of assets greater than $50 million, but less than $100 million; |
Small Cap Technology Fund | | 0.35% of assets greater than $100 million, but less than $500 million; |
Gas Utility Index Fund | | $1,750,000 plus 0.275% of assets greater than $500 million |
| |
| | | 0.375% |
| |
Money Market Fund | | $80,000 on assets less than $20 million; |
| | | 0.40% of assets less than or equal to $100 million; |
| | | 0.35% of assets greater than $100 million |
| |
Maryland Tax-Free Portfolio | | $60,000 on assets less than $20 million; |
Virginia Tax-Free Portfolio | | 0.30% on assets greater than $20 million but less than $100 million; |
| | | 0.25% on assets greater than $100 million |
Brokerage Commissions — For the year ended October 31, 2004, the following brokerage commissions from portfolio transactions executed on behalf of the Funds were paid to
78
The FBR Funds
Notes to Financial Statements (continued)
Friedman, Billings, Ramsey and Co., Inc., an affiliate of the Adviser, Distributor and Administrator, by the Large Cap Financial Fund, Small Cap Financial Fund, and Small Cap Fund, $2,650, $95,807 and $18,725, respectively.
4. Investment Transactions
For the period ended October 31, 2004, purchases and sales of investment securities (excluding short-term securities and U.S. government obligations) for each Fund were as follows:
| | | | | | |
| | | Purchases
| | Sales
|
Large Cap Financial Fund | | $ | 14,076,820 | | $ | 23,754,097 |
Small Cap Financial Fund | | | 180,664,621 | | | 197,872,671 |
Small Cap Fund | | | 345,439,888 | | | 70,278,696 |
Large Cap Technology Fund | | | 7,287,388 | | | 6,473,403 |
Small Cap Technology Fund | | | 3,325,504 | | | 1,787,813 |
Gas Utility Index Fund | | | 73,527,772 | | | 67,984,434 |
Maryland Tax-Free Portfolio | | | 3,534,890 | | | 6,988,492 |
Virginia Tax-Free Portfolio | | | 4,047,140 | | | 8,284,517 |
5. Federal Income Taxes
It is each Fund’s policy to comply with the special provisions of the Internal Revenue Code of 1986, as amended, applicable to regulated investment companies. As provided therein, in any fiscal year in which a Fund so qualifies and distributes at least 90% of its taxable net income, the Fund (but not the shareholders) will be relieved of federal income tax on the income distributed. Accordingly, no provision for income taxes has been made.
In order to avoid imposition of the excise tax applicable to regulated investment companies, it is also each Fund’s intention to declare and pay as dividends in each calendar year at least 98% of its net investment income (earned during the calendar year) and 98% of its net realized capital gains (earned during the twelve months ending October 31) plus undistributed amounts from prior years.
The FBR Funds
Notes to Financial Statements (continued)
The tax character of distributions paid for each Fund’s tax year was as follows:
| | | | | | | | | | | | |
| | | Ordinary Income
| | Long-Term Capital Gains
|
| | | Dollar
Amount
| | Per share
Amount
| | Dollar
Amount
| | Per share
Amount
|
Large Cap Financial Fund | | | | | | | | | | | | |
For the Year Ended October 31, 2004 | | $ | 110,335 | | $ | 0.067980 | | $ | 131,440 | | $ | 0.080984 |
For the Year Ended October 31, 2003 | | $ | 127,702 | | $ | 0.086100 | | $ | — | | $ | — |
Small Cap Financial Fund | | | | | | | | | | | | |
For the Year Ended October 31, 2004 | | $ | 2,277,539 | | $ | 0.126548 | | $ | 10,628,776 | | $ | 0.600311 |
For the Year Ended October 31, 2003 | | $ | 1,897,619 | | $ | 0.130900 | | $ | 8,819,518 | | $ | 0.639300 |
Small Cap Fund | | | | | | | | | | | | |
For the Year Ended October 31, 2004 | | $ | — | | $ | — | | $ | 298,169 | | $ | 0.027788 |
For the Year Ended October 31, 2003 | | $ | — | | $ | — | | $ | — | | $ | — |
Large Cap Technology Fund | | | | | | | | | | | | |
For the Year Ended October 31, 2004 | | $ | 107,767 | | $ | 0.181082 | | $ | 9,239 | | $ | 0.015524 |
For the Year Ended October 31, 2003 | | $ | — | | $ | — | | $ | — | | $ | — |
Small Cap Technology Fund | | | | | | | | | | | | |
For the Period Ended October 31, 2004 | | $ | — | | $ | — | | $ | — | | $ | — |
Gas Utility Index Fund | | | | | | | | | | | | |
For the Year Ended October 31, 2004 | | $ | 5,900,540 | | $ | 0.387304 | | $ | — | | $ | — |
For the Period Ended October 31, 2003 | | $ | 2,692,622 | | $ | 0.183900 | | $ | — | | $ | — |
Fund for Government Investors | | | | | | | | | | | | |
For the Period Ended October 31, 2004 | | $ | 1,341,712 | | $ | 0.0042 | | $ | — | | $ | — |
For the Year Ended December 31, 2003 | | $ | 1,872,046 | | $ | 0.0042 | | $ | — | | $ | — |
Maryland Tax-Free Portfolio | | | | | | | | | | | | |
For the Period Ended October 31, 2004 | | $ | 1,342,056 | | $ | 0.3706 | | $ | — | | $ | — |
For the Year Ended December 31, 2003 | | $ | 1,739,943 | | $ | 0.4615 | | $ | 88,273 | | $ | 0.0234 |
Virginia Tax-Free Portfolio | | | | | | | | | | | | |
For the Period Ended October 31, 2004 | | $ | 906,314 | | $ | 0.3524 | | $ | — | | $ | — |
For the Year Ended December 31, 2003 | | $ | 1,263,276 | | $ | 0.4416 | | $ | 31,055 | | $ | 0.0114 |
The following information is computed on a tax basis for each item:
| | | | | | | | | | | | | | | | |
| | | As of October 31, 2004
| |
| | | Large Cap
Financial Fund
| | | Small Cap
Financial Fund
| | | Small Cap
Fund
| | | Large Cap
Technology Fund
| |
Cost of investment securities | | $ | 24,200,668 | | | $ | 465,974,391 | | | $ | 676,892,429 | | | $ | 6,528,688 | |
| | |
|
|
| |
|
|
| |
|
|
| |
|
|
|
Gross unrealized appreciation | | | 6,392,541 | | | | 138,726,193 | | | | 160,751,354 | | | | 566,392 | |
Gross unrealized depreciation | | | (191,924 | ) | | | (10,295,488 | ) | | | (13,600,722 | ) | | | (484,004 | ) |
| | |
|
|
| |
|
|
| |
|
|
| |
|
|
|
Net unrealized appreciation | | | 6,200,617 | | | | 128,430,705 | | | | 147,150,632 | | | | 82,388 | |
Undistributed ordinary income | | | 1,118,794 | | | | 3,077,536 | | | | 8,078,532 | | | | 456,981 | |
Undistributed long-term capital gains | | | 2,502,845 | | | | 72,800,644 | | | | 5,377,069 | | | | 507,449 | |
| | |
|
|
| |
|
|
| |
|
|
| |
|
|
|
Accumulated earnings | | $ | 9,822,256 | | | $ | 204,308,885 | | | $ | 160,606,233 | | | $ | 1,046,818 | |
| | |
|
|
| |
|
|
| |
|
|
| |
|
|
|
80
The FBR Funds
Notes to Financial Statements (continued)
| | | | | | | | |
| | | As of October 31, 2004
| |
| | | Small Cap
Technology Fund
| | | Gas Utility
Index Fund
| |
Cost of investment securities | | $ | 1,466,033 | | | $ | 151,115,459 | |
| | |
|
|
| |
|
|
|
Gross unrealized appreciation | | | 84,720 | | | | 82,444,956 | |
Gross unrealized depreciation | | | (130,594 | ) | | | (11,030,411 | ) |
| | |
|
|
| |
|
|
|
Net unrealized appreciation (depreciation) | | | (45,874 | ) | | | 71,414,545 | |
Undistributed ordinary income | | | — | | | | 328,592 | |
Capital loss carryforward | | | (90,658 | )* | | | (23,504,319 | )** |
| | |
|
|
| |
|
|
|
Accumulated earnings | | $ | (136,532 | ) | | $ | 48,238,818 | |
| | |
|
|
| |
|
|
|
| * | Expires October 31, 2012 |
| ** | $21,943,018 expires October 31, 2011 and $1,561,301 expires October 31, 2012. |
| | | | | | | | | | | | |
| | | As of October 31, 2004
| |
| | | Fund for
Government
Investors
| | | Maryland
Tax-Free
Portfolio
| | | Virginia
Tax-Free
Portfolio
| |
Cost of investment securities | | $ | 271,750,207 | | | $ | 36,230,475 | | | $ | 24,838,443 | |
| | |
|
|
| |
|
|
| |
|
|
|
Gross unrealized appreciation | | | — | | | | 2,358,415 | | | | 1,943,799 | |
Gross unrealized depreciation | | | — | | | | (8,855 | ) | | | (517 | ) |
| | |
|
|
| |
|
|
| |
|
|
|
Net unrealized appreciation | | | — | | | | 2,349,560 | | | | 1,943,282 | |
Undistributed ordinary income | | | — | | | | — | | | | 5,091 | |
Undistributed long-term capital gains | | | — | | | | 72,652 | | | | 372,715 | |
Capital loss carryforward | | | (188,960 | )*** | | | — | | | | — | |
| | |
|
|
| |
|
|
| |
|
|
|
Accumulated earnings | | $ | (188,960 | ) | | $ | 2,422,212 | | | $ | 2,321,088 | |
| | |
|
|
| |
|
|
| |
|
|
|
| *** | $23,854 expires October 31, 2011 and $165,106 expires October 31, 2012. |
The difference between the cost of investment securities and financial statement cost for Funds is due to certain timing differences in the recognition of capital losses under tax regulations and generally accepted accounting principles.
The capital loss carryforward may be utilized in future years to offset net realized gains, if any, prior to distributing such gains to shareholders.
The following reclassifications, the result of permanent differences between financial statement and income tax reporting requirements, have been made to the components capital. These reclassifications have no impact on the net assets or net asset value per share of the Funds.
| | | | | | | | | | | |
| | | Undistributed
Income (Loss)
| | Accumulated Net
Realized Gain (Loss)
| | | Paid-In Capital
| |
Small Cap Financial Fund | | $ | — | | $ | 1,593 | | | $ | (1,593 | ) |
Small Cap Fund | | | 3,755,821 | | | (3,755,794 | ) | | | (27 | ) |
Large Cap Technology Fund | | | 85,947 | | | (85,947 | ) | | | — | |
Small Cap Technology Fund | | | 17,583 | | | — | | | | (17,583 | ) |
81
The FBR Funds
Notes to Financial Statements (continued)
6. Investments in Affiliates
Affiliated issuers, as defined by the 1940 Act, are those in which a Fund’s holdings represent 5% or more of the oustanding voting securities of the issuer. A summary of each Fund’s investments in affiliates, if any, for the period ended October 31, 2004, is noted below:
| | | | | | | | | | | | | | | | |
| | | SHARE ACTIVITY
| | | | | | | | |
Affiliate
| | Balance
10/31/03
| | Purchases
| | Sales
| | Balance
10/31/04
| | Realized
Gain
| | Dividends
| | Value
10/31/04
| | Acquisition
Cost
|
FBR Small Cap Financial | | | | | | | | | | | | | | | | |
Bankcorp Rhode Island, Inc. | | 367,000 | | — | | 88,503 | | 278,497 | | 1,506,238 | | 190,318 | | 10,652,510 | | 5,831,203 |
Hingham Institution for Savings | | 114,800 | | — | | 7,200 | | 107,600 | | 152,560 | | 102,420 | | 4,478,850 | | 2,271,745 |
ITLA Capital Corp. | | 283,300 | | 71,522 | | — | | 354,822 | | — | | — | | 17,180,836 | | 9,532,675 |
FBR Small Cap Fund | | | | | | | | | | | | | | | | |
Monarch Casino & Resort, Inc. | | 331,700 | | 183,800 | | — | | 515,500 | | — | | — | | 14,397,915 | | 4,755,717 |
7. Commitments and Contingencies
In the normal course of business, the Funds enter into contracts that contain a variety of representations and warranties and which provide general indemnifications. The Funds’ maximum exposure under these arrangements is unknown, as this would involve future claims that may be made against the Funds that have not yet occurred. However, based on experience, the Funds expect the risk of loss to be remote.
82
The FBR Funds
Report of Independent Registered Public Accounting Firm
To the Board of Trustees and Shareholders
The FBR Funds
Bethesda, Maryland
We have audited the accompanying statements of assets and liabilities, including the portfolios of investments of the FBR Large Cap Financial Fund, FBR Small Cap Financial Fund, FBR Small Cap Fund, FBR Large Cap Technology Fund, FBR Small Cap Technology Fund, FBR Gas Utility Index Fund (comprising the “Equity Funds”), and FBR Fund for Government Investors, FBR Maryland Tax-Free Portfolio, and FBR Virginia Tax-Free Portfolio (comprising the “Income Funds”) (collectively the “Funds”), each a series of The FBR Funds as of October 31, 2004, and the related statements of operations of the Equity Funds, excluding the FBR Small Cap Technology Fund, for the year ended October 31, 2004, the related statement of operations for the FBR Small Cap Technology Fund for the period from January 20, 2004 (commencement of operations) to October 31, 2004, the related statements of operations of the Income Funds for the period from January 1, 2004 to October 31, 2004, the related statements of changes in net assets of the Equity Funds, excluding the FBR Small Cap Technology Fund and the FBR Gas Utility Index Fund, for each of the two years in the period ended October 31, 2004, the financial highlights of the Equity Funds, except for the FBR Small Cap Technology Fund and the FBR Gas Utility Index Fund, for each of the three years in the period ended October 31, 2004, the related statement of changes in net assets and the financial highlights of the FBR Small Cap Technology Fund for the period from January 20, 2004 to October 31, 2004, the related statements of changes in net assets and financial highlights of the FBR Gas Utility Index Fund for the year ended October 31, 2004, for the period from April 1, 2003 to October 31, 2003 and for the year ended March 31, 2003, and the related statements of changes in net assets and financial highlights of the Income Funds for the period from January 1, 2004 to October 31, 2004. These financial statements and financial highlights are the responsibility of the Funds’ management. Our responsibility is to express an opinion on these financial statements and financial highlights based on our audits. The financial highlights of FBR Large Cap Financial Fund, FBR Small Cap Financial Fund, FBR Small Cap Fund, and FBR Large Cap Technology Fund for each of the two years in the period ended October 31, 2001 were audited by other auditors whose report dated December 7, 2001 expressed an unqualified opinion on such financial highlights. The financial highlights of FBR Gas Utility Index Fund for each of the three years in the period ended March 31, 2002 were audited by other auditors whose report dated April 19, 2002 expressed an unqualified opinion on such financial highlights. The statements of operations of the FBR Fund for Government Investors, FBR Maryland Tax-Free Portfolio and FBR Virginia Tax-Free Portfolio for the year ended December 31, 2003, the statements of changes in net assets for each of the two years in the period ended December 31, 2003, and the financial highlights for each of the four years in the period ended December 31, 2003 were audited by other auditors whose report dated February 20, 2004 expressed an unqualified opinion on such financial statements and financial highlights.
83
The FBR Funds
Report of Independent Registered Public Accounting Firm
(continued)
We conducted our audits in accordance with standards of the Public Company We conducted our audits in accordance with standards of the Public Company Accounting Oversight Board (United States). Those standards require that we plan and perform the audit to obtain reasonable assurance about whether the financial statements and financial highlights are free of material misstatement. An audit includes examining, on a test basis, evidence supporting the amounts and disclosures in the financial statements. Our procedures included confirmation of securities owned as of October 31, 2004, by correspondence with the custodian and brokers. An audit also includes assessing the accounting principles used and significant estimates made by management, as well as evaluating the overall financial statement presentation. We believe that our audits provide a reasonable basis for our opinion.
In our opinion, the financial statements and financial highlights referred to above present fairly, in all material respects, the financial position of the FBR Large Cap Financial Fund, FBR Small Cap Financial Fund, FBR Small Cap Fund, FBR Large Cap Technology Fund, FBR Small Cap Technology Fund, FBR Gas Utility Index Fund, FBR Fund for Government Investors, FBR Maryland Tax-Free Portfolio, and FBR Virginia Tax-Free Portfolio as of October 31, 2004, the results of their operations for the periods referred to above, the changes in their net assets for the periods referred to above, and the financial highlights for the periods referred to above, in conformity with accounting principles generally accepted in the United States of America.
TAIT, WELLER & BAKER
Philadelphia, Pennsylvania
December 10, 2004
84
The FBR Funds
Supplemental Information (unaudited)
Proxy Voting Guidelines
The Advisers are responsible for exercising the voting rights associated with the securities purchased and held by the Funds. A description of the policies and procedures the Advisers use in fulfilling this responsibility is included in the Funds’ Statement of Additional Information and is available without charge, upon request, by calling 888.888.0025. The policies and procedures are also available on the Securities and Exchange Commission’s website at http://www.sec.gov. Information on how the Funds voted proxies relating to portfolio securities during the most recent 12 month period ended June 30 is available without charge, upon request, by calling 888.888.0025 and is also available on the SEC’s website at http://www.sec.gov.
Portfolio Holdings
The Funds file their complete schedule of holdings with the SEC for the first and third quarters of each fiscal year on Form N-Q. The Funds’ Form N-Q is available on the SEC’s website, beginning with the July 31, 2004 report, at http://www.sec.gov. You may review and make copies at the SEC’s Public Reference Room in Washington, D.C. You may also obtain copies after paying a duplicating fee by writing the SEC’s Public Reference Section, Washington, D.C. 20549-0102 or by electronic request to publicinfo@sec.gov. A copy of the quarterly holdings report is available, without charge, upon request, by calling 888.888.0025.
85
The FBR Funds
Supplemental Information (unaudited) (continued)
Information About Trustees and Officers
Information pertaining to the Trustees and Officers of the Trust is set forth below. The address for each Trustee and Officer is 4922 Fairmont Avenue, Bethesda, MD 20814 unless otherwise stated. The statement of additional information (SAI) includes additional information about the Trustees and is available without charge upon request by calling 888.888.0025.
| | | | | | | | |
Name, Age, Address,
| | Term of
Office* and
Tenure**
| | Portfolios
Overseen in
the Trust
and Fund
Complex***
| | Principal Occupation(s) during past 5 years
| | Other Trusteeships/
Directorships by
Trustee
|
F. David Fowler, 71 | | Trustee Since 2000 | | 9 | | Retired, 1997. Dean, The George Washington University School of Business and Public Management, 1992-1997. | | MicroStrategy, Inc |
| | | | |
Charles O. Heller, 68 | | Trustee Since 2003 | | 9 | | Managing Director, Beacon Global Private Equity (venture capital firm), since 2003; Charles Heller Associates (management consulting), 1986 to present; Gabriel Venture Partners (venture capital firm), 2000-2003. | | None |
| | | | |
Larry R. Levitan, 63 | | Trustee Since 2003 | | 9 | | Retired; Oversight Board, Internal Revenue Service, September 2000 to present. | | Choice Hotels International, Inc. |
| | | | |
Michael A. Willner, 48 | | Trustee Since 2000 | | 9 | | CEO AlphaGrip, Inc. January 2001 to present; President, New Traders, Inc. from September 1996 to December 2000. | | AlphaGrip, Inc. |
| | | | |
David Ellison+, 46 100 Federal Street Boston, MA02110 | | Trustee Since 2003 President Since 2001 | | 9 | | Director, CEO and President, FBR Fund Advisers, Inc., since December 1999; Portfolio Manager for Equity Funds since October 1996; and President Money Management Advisers, Inc., April 2001 - March 2002. | | None |
| | | | |
Winsor H. Aylesworth, 57 100 Federal Street Boston, MA 02110 | | Executive Vice President Since 2000 | | 9 | | Portfolio Manager, FBR Fund Advisers, Inc. since September 1998; Vice President, Money Management Advisers, Inc., April 2001-March 2002. | | None |
| | | | |
Bart Sanders, 40 | | Executive Vice President Since 2000 | | 9 | | Senior Vice President of Fund Operations, FBR Fund Advisers, Inc. since August 1999. Head Trader for FBR Fund Advisers, Inc., since January 1997; and Vice President, Money Management Advisers, Inc. April 2001-March 2002. | | None |
| | | | |
Susan L. Silva, 37 | | Treasurer Since 2002 | | 9 | | Vice President, FBR National Trust Company since 2002; Employee of FBR National Trust Company since January 2000; Vice President and Treasurer of Money Management Advisers, Inc. since June 2000; Fund Accounting Manager, Legg Mason,Inc. 1996-1999. | | None |
| | | | |
Kimberly J. Ochterski, 30 | | Secretary Since 2003 | | 9 | | Assistant Vice President, FBR National Trust Company since 2003; Vice President and Secretary of Money Management Advisers, Inc. since October 2003; Employee of FBR National Trust Company since August 1998, serving in various capacities, including Fund Accounting Supervisor and Transfer Agent Operations Manager. | | None |
| | | | |
William Vastardis, 49 26 West 17th Street Suite 601 New York, NY 10011 | | Chief Compliance Officer Since 2004 | | 9 | | Co-Chief Executive Officer, EOS Compliance Services LLC since June 2004; President and founder, EOS Fund Services LLC since August 2003; Managing Director of Investors Capital Services, Inc. (affiliate of Investors Bank & Trust Company) from May 1998 through July 2003. | | None |
| * | Trustees serve until their resignation, removal, or death, or until they reach the mandatory retirement age of 75 established by the Board. The Trust’s President, Treasurer, and Secretary serve until their successor is chosen and qualified. The other Officers of the Trust serve at the pleasure of the Trustees. |
| ** | Length of time served is measured from the earliest date of service as a Trustee or Officer of any of the Funds or the Predecessor Funds. |
| *** | The “Fund Complex” consists of all mutual funds advised by Friedman, Billings Ramsey Group, Inc., (“FBR Group”) and its affiliate advisers. |
| + | Mr. Ellison is considered to be an “Interested Trustee” of the Trust due to his position with FBR Fund Advisers. |
86
[THIS PAGE INTENTIONALLY LEFT BLANK]
THE FBR FUNDS
888.888.0025
funds@fbr.com
www.fbrfunds.com
Investment Advisers
FBR FUND ADVISERS, INC.
MONEY MANAGEMENT ADVISERS, INC.
1001 NINETEENTH STREET NORTH
ARLINGTON, VIRGINIA 22209
Distributor
FBR INVESTMENT SERVICES, INC.
4922 FAIRMONT AVENUE
BETHESDA, MARYLAND 20814
Administrator, Custodian and Transfer Agent
FBR NATIONAL TRUST COMPANY
4922 FAIRMONT AVENUE
BETHESDA, MARYLAND 20814
Sub-Transfer Agent
INTEGRATED FUND SERVICES, INC.
P.O. BOX 5354
CINCINNATI, OHIO 45201
Independent Public Accountants
TAIT, WELLER & BAKER
1818 MARKET STREET
PHILADELPHIA, PENNSYLVANIA 19103
This report is not authorized
for distribution to prospective
investors unless it is preceded or
accompanied by a current prospectus.
As of the end of the period covered by this report, Registrant had adopted a code of ethics (the “Code”) that applies to Registrant’s principal executive officer (“PEO”) and principal financial officer (“PFO”). There were no amendments to the Code during the period covered by the report. The Registrant did not grant any waivers, including implicit waivers, from any provisions of the Code to the PEO or PFO during the period covered by this report. The Registrant undertakes to provide a copy of such code to any person upon request, without charge, by calling 888.888.0025.
| ITEM 3. | AUDIT COMMITTEE FINANCIAL EXPERT. |
The Board of Trustees determined at a meeting held September 29, 2003 that F. David Fowler qualifies as an Audit Committee Financial Expert and he is “independent” as defined under the relevant Securities and Exchange Commission rules and releases.
| ITEM 4. | PRINCIPAL ACCOUNTANT FEES AND SERVICES. |
| (a) | Audit Fees – The aggregate fees billed for the professional services rendered by Tait, Weller & Baker, Registrant’s principal accountant for the audit of the Registrant’s annual financial statements, were $99,500 for all series of the Registrant for the fiscal year ended October 31, 2004 and, $57,500 for certain series of the Registrant for the fiscal year ended October 31, 2003. The aggregate fees billed for the professional services rendered by Deloitte & Touche, principal accountant for the audit of the Registrant’s annual financial statements for the remaining series of the Registrant for the fiscal year ended December 31, 2003 were $53,812.50. |
| (b) | Audit Related Fees – The aggregate fees billed for assurance and related services rendered by Tait, Weller & Baker, Registrant’s principal accountant that are reasonably related to the performance of the audit of the Registrant’s financial statements and are not reported under paragraph (a) were $13,500 for all series of the Registrant for the fiscal year ended October 31, 2004 and $9,000 for certain series of the Registrant for the fiscal year ended October 31, 2003. The aggregate fees billed for assurance and related services rendered by Deloitte & Touche, principal accountant for the audit of the Registrant’s annual financial statements for the remaining series of the Registrant for the fiscal year ended December 31, 2003 were $12,240. The Audit Related Fees pertain to services performed in connection with Rule 17f-2 of the Investment Company Act of 1940. In compliance with this rule the principal accountant performed three examinations during the year. |
| (c) | Tax Fees – The aggregate fees billed by Tait, Weller & Baker, Registrant’s principal accountant for tax compliance, tax advice and tax planning for completing federal and excise tax returns, were $22,500 for all series of the Registrant for the fiscal year ended October 31, 2004. The Registrant did not engage the principal accountant for any tax services in 2003. |
| (d) | All Other Fees – There were no additional fees paid for audit and non-audit services other than those disclosed in (a) through (c) above. |
| (e) | (1) Pursuant to the Registrant’s Audit Committee Charter (“Charter”), the Audit Committee is responsible for approving in advance the firm to be employed as the Registrant’s independent auditor. In addition, the Charter provides that the Audit Committee is responsible for approving any and all proposals by the Registrant, its investment adviser or their affiliated persons or an entity controlling, controlled by, or under common control with the adviser that provides services to the Registrant to employ the independent auditor to render permissible non-audit services to such entity, provided those permissible non-audit services relate directly to the operations and financial reporting of the Registrant. In determining whether to approve non-audit services, the Audit Committee considers whether such services are consistent with the independent auditor’s independence. |
(2) None of the services described in (b) through (d) above were approved by the audit committee pursuant to paragraph (c)(7)(i)(C) of Rule 2-01 of Regulation S-X.
| (f) | Less than fifty percent of the hours expended on the principal accountant’s engagement to audit the Registrant’s financial statements for the most recent fiscal year was attributed to work performed by persons other than the principal accountant’s full-time, permanent employees. |
| (g) | There were no non-audit services fees billed by the Registrant’s accountant to the Registrant other than those described above. There were no non-audit services fees billed by the Registrant’s accountant to the Registrant’s investment adviser or to any entity controlling, controlled by, or under common control with the adviser that provides ongoing services to the Registrant over the past two years. |
| (h) | Not applicable as no non-audit services were provided to the Registrant’s investment adviser nor any entity controlling, controlled by, or under common control with the investment adviser that provides ongoing services to the Registrant that were not pre-approved pursuant to Rule 2-01(c)(7)(ii) of Regulation S-X. |
| ITEM 5. | AUDIT COMMITTEE OF LISTED REGISTRANTS |
Not applicable.
| ITEM 6. | SCHEDULE OF INVESTMENTS |
Contained in Item 1.
| ITEM 7. | DISCLOSURE OF PROXY VOTING POLICIES AND PROCEDURES FOR CLOSED-END MANAGEMENT INVESTMENT COMPANIES. |
Not applicable.
| ITEM 8. | PURCHASES OF EQUITY SECURITIES BY CLOSED-END MANAGEMENT INVESTMENT COMPANY AND AFFLIIATED PURCHASERS. |
Not applicable.
| ITEM 9. | SUBMISSION OF MATTERS TO A VOTE OF SECURITY HOLDERS. |
The Board of Trustees has not adopted procedures by which shareholders may recommend nominees to the Board.
| ITEM 10. | CONTROLS AND PROCEDURES. |
| (a) | Based upon their evaluation of the Registrant’s disclosure controls and procedures as conducted within 90 days of the filing date of this Form N-CSR, the Registrant’s PFO and PEO have concluded that those disclosure controls and procedures provide reasonable assurance that the material information required to be disclosed by the Registrant in this Form N-CSR has been recorded, processed, summarized and reported within the time periods specified in the Securities and Exchange Commission’s rules and forms. |
| (b) | There were no changes in the Registrant’s internal controls over financial reporting as defined in Rule 30a-3(d) under the Act (17 CFR 270.30a-3(d)) that occurred during the second fiscal half-year of the period covered by this report that has materially affected, or is reasonably likely to materially affect, the Registrant’s internal control over financial reporting. |
File the exhibits listed below as part of this Form. Letter or number the exhibits in the sequence indicated.
(2) A separate certification for each principal executive officer and principal financial officer of the Registrant as required by Rule 30a-2(a) under the Act (17 CFR 270.30a-2): Attached herewith.
| (b) | (1) The certifications required by Rule 30a-2(b) of the Investment Company Act of 1940 and Section 906 of the Sarbanes-Oxley Act of 2002: Attached herewith. |
SIGNATURES
Pursuant to the requirements of the Securities Exchange Act of 1934 and the Investment Company Act of 1940, the registrant has duly caused this report to be signed on its behalf by the undersigned, thereunto duly authorized.
| | | | | | | | | | |
(Registrant) The FBR Funds | | | | | | | | |
| | | | |
| By (Signature and Title)* | | | | | | /s/ Susan L. Silva | | 1/5/2005 |
| | | | | | | | | Susan L. Silva Treasurer The FBR Funds | | Date |
Pursuant to the requirements of the Securities Exchange Act of 1934 and the Investment Company Act of 1940, this report has been signed below by the following persons on behalf of the registrant and in the capacities and on the dates indicated.
| | | | | | | | | | |
| By (Signature and Title) | | | | | | /s/ David H. Ellison | | 1/5/2005 |
| | | | | | | | | David H. Ellison President The FBR Funds (Principal Executive Officer) | | Date |
| | | | |
| By (Signature and Title) | | | | | | /s/ Susan L. Silva | | 1/5/2005 |
| | | | | | | | | Susan L. Silva Treasurer The FBR Funds | | Date |
| | | | | | | | | (Principal Financial Officer and Accounting Officer) |