UNITED STATES
SECURITIES AND EXCHANGE COMMISSION
Washington, D.C. 20549
FORM N-CSR
CERTIFIED SHAREHOLDER REPORT OF REGISTERED
MANAGEMENT INVESTMENT COMPANIES
Investment Company Act file number 811-21503
The FBR Funds
———————————–
(Exact name of registrant as specified in charter)
1001 Nineteenth Street North
Arlington, VA 22209
————————————————
(Address of principal executive offices) (Zip code)
Registrant’s telephone number, including area code: 703.469.1040
William Ginivan
General Counsel
Friedman, Billings, Ramsey Group, Inc.
Potomac Tower
1001 Nineteenth Street North
Arlington, VA 22209
—————————————————————————
(Name and address of agent for service)
Date of fiscal year end: October 31, 2007
Date of reporting period: April 30, 2007
ITEM 1. REPORT TO SHAREHOLDERS
The following is a copy of the report transmitted to shareholders pursuant to Rule 30e-1 under the Investment Company Act of 1940 (17CRF 270.30e-1).
THE FBR FUNDS
FBR Pegasus FundTM
FBR Pegasus Mid Cap FundTM
FBR Pegasus Small Cap FundTM
FBR Large Cap Financial Fund
FBR Large Cap Technology Fund
FBR Small Cap Fund
FBR Small Cap Financial Fund
FBR Small Cap Technology Fund
FBR Gas Utility Index Fund
FBR Fund for Government Investors
Semi-Annual Report
April 30, 2007
[THIS PAGE INTENTIONALLY LEFT BLANK]
The FBR Funds
Semi-Annual Letter to Shareholders
Dear Shareholder,
Market returns were favorable for the first half of our fiscal year ended April 30, 2007. The S&P and Dow Jones indexes were up 8.60% and 8.13% respectively. These favorable returns were due to numerous positives including, stable interest rates, stable employment, moderate inflation and continued economic growth both in the U.S. and around the world. The primary off-set to these positives was the slowing housing market and related troubles in the subprime loan market. Overall, the positives have created a favorable environment for earnings growth and the stocks have generally followed.
For The FBR Funds in particular, we had a number of noteworthy events take place in the last six months. First, the three original FBR Funds celebrated their ten-year anniversary in January. Five of the ten funds we offer, now have over a decade of performance history. Second, we reopened the FBR Small Cap Fund (FBRVX) to all investors after being closed for over two years. We have seen significant inflows to that Fund and appreciate the confidence you have placed in us to manage this money. Finally, on February 28th, we formally launched our two newest additions to our product line-up, the Pegasus Small Cap (FBRYX) and Pegasus Mid Cap Funds (FBRMX). Due to their relatively short operating life, the manager’s discussion of performance and outlook for these Funds is not included in this report, but will be available in our annual shareholder report.
The two new Funds complete our diversified suite of equity fund solutions. We now offer investors the ability to construct a well-rounded equity portfolio anchored by FBR Funds that provide exposure to the large-, mid- and small-cap segments. We also continue to offer our sector focused funds to allow targeted growth opportunities, further diversifying and enhancing the overall return characteristics of your portfolio.
All of The FBR Funds, regardless of capitalization and industry sector, are about respecting your money. Our goal is to achieve attractive returns that are balanced, focused on the long-term and ever mindful of the downside risks associated with equity investing. If you would like more timely updates,fbrfunds.com provides daily prices, monthly performance data, and other important fund information.
All of us at The FBR Funds want to thank you for your continued support, and we look forward to serving your investment needs in the years ahead. As always, we welcome your questions and comments. You can reach us via e-mail at funds@fbr.com or toll free at 888.200.4710.
Sincerely,

David Ellison
President and Trustee
The FBR Funds
2
The FBR Funds
FBR Pegasus FundTM
Management Overview
Co-Portfolio Managers: Robert C. Barringer, CFA and Ryan Kelley, CFA
How did the Fund perform?
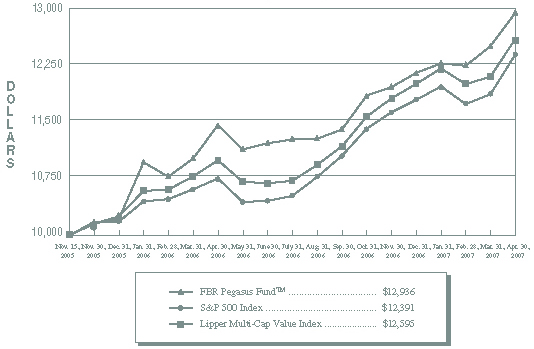
For the six months ended April 30, 2007, the Pegasus Fund appreciated 9.19%. During the same time period, the S&P 500 Index and the Lipper Multi-Cap Value Index returned 8.60% and 9.58%, respectively.
What factors contributed to the Fund’s performance?
The Fund benefited from our positions in railroads, iron and steel companies, electric utilities, and oil and gas operations, among other segments. In particular, three of the top ten positive contributors to the Fund’s performance over the past six months were our investments in large-cap railroad companies. Given our disciplined investment process, we continue to favor companies characterized by financial strength, attractive valuations and proven records of consistent growth.
What is the outlook for the Fund?
We continue to believe that the outlook for the Fund is positive. Our balanced approach to portfolio management, and our ability to underweight or overweight economic sectors based on the fundamental qualities of the companies, allows us to manage the portfolio for the long-term. Additionally, we find individual opportunities to invest in higher margin, strong growth companies, while adhering to our focus on valuation, low debt, and growing shareholders’ equity.
Currently, we continue to be invested in three segments of the market that have been largely in favor: large-cap companies (the Dow Jones Industrial Average continues to reach record levels), companies tied to hard assets (such as materials and mining companies), and utilities (which is this year’s best performing sector of the S&P 500 Index as of April 30, 2007). We continue to invest in companies which we believe show promise in the latter part of 2007. In particular, the Fund is invested in higher margin technology servicing companies as well as certain financial institutions, such as investment banks and asset managers, which are poised to benefit from continued strength in the capital markets. Overall, we are confident in our investment process and in the Fund’s position as we head in to the second half of 2007.
|
The opinions expressed in this commentary reflect those of the Portfolio Manager(s) as of the date written. Any such opinions are subject to change based on market or other conditions. These opinions may not be relied upon as investment advice. Investment decisions for The FBR Funds are based on several factors, and may not be relied upon as an indication of trading intent on behalf of any FBR Fund. Security positions can and do change. |
3
The FBR Funds
FBR Pegasus FundTM
Comparison of Changes in Value of $10,000 Investment in
Fund Shares(1)(2) vs. Various Indices(1)(3)
(unaudited)
| |
| Total Returns—For the Periods Ended April 30, 2007(4) |
| | | | | | Annualized | |
| | | | | | Since | |
| | | One Year | | Inception(5) | |
| | |
| |
| |
| FBR Pegasus FundTM(1)(2) | | 12.91 | % | | 19.34 | % | |
| S&P 500 Index(1)(3) | | 15.24 | % | | 15.84 | % | |
| Lipper Multi-Cap Value Index(1)(3) | | 14.57 | % | | 17.14 | % | |
| |
PAST PERFORMANCE IS NO GUARANTEE OF FUTURE RESULTS.
The performance data quoted represents past performance and the current performance may be lower or higher. The investment return and principal will fluctuate so that investors’ shares, when redeemed, may be worth more or less than their original cost. To obtain performance data current to the most recent month-end, please call 888.200.4710 or visit www.fbrfunds.com.
|
| (1) | | The graph assumes a hypothetical $10,000 initial investment in the Fund and reflects the reinvestment of dividends and all Fund expenses. Investors should note that the Fund is a professionally managed mutual fund while the indices are unmanaged, do not incur expenses and are not available for investment. The performance of the indices includes reinvested dividends, and does not reflect sales charges or expenses, except for the Lipper Multi-Cap Value Index which reflects fund expenses. |
| (2) | | FBR Fund Advisers, Inc. waived a portion of its advisory fees and agreed to contractually reimburse a portion of the Fund’s operating expenses, as necessary, to maintain existing expense limitations, as set forth in the notes to the financial statements. Total returns shown include fee waivers and expense reimbursements; total returns would have been lower had there been no waiver of fees and/or reimbursement of expenses in excess of expense limitations. |
| (3) | | S&P 500 Index is a capitalization-weighted index of 500 stocks. The index is designed to represent the broad domestic economy through changes in aggregate market value of 500 stocks representing all major industries. The Lipper Multi-Cap Value Index is an equally weighted index of the largest thirty funds within the multi-cap value fund classification as defined by Lipper Inc. The index is rebalanced quarterly. Lipper Analytical Services, Inc., is a nationally recognized organization that reports on mutual fund total return performance and calculates fund rankings. Each Lipper Average is based on a universe of funds with similar investment objectives. |
| (4) | | The total returns shown do not reflect the deduction of taxes that a shareholder would pay on fund distributions or the redemption of fund shares. |
| (5) | | For the period November 15, 2005 (commencement of investment operations) through April 30, 2007. |
4
The FBR Funds
FBR Pegasus FundTM
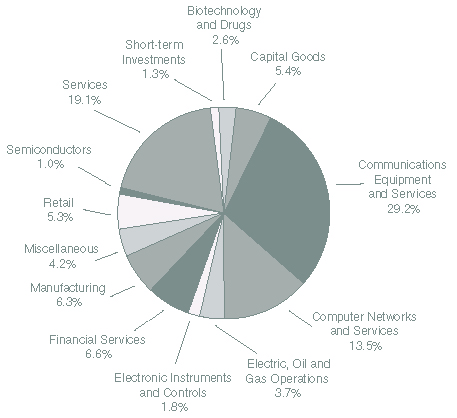
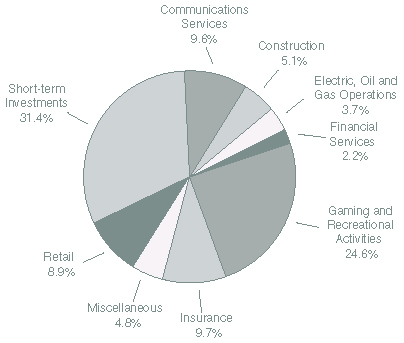
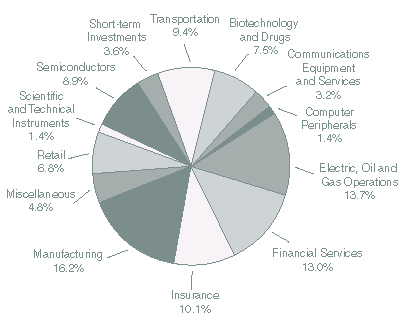
Portfolio Summary
April 30, 2007
(unaudited)
The following chart provides a visual breakdown of the Fund by industry sectors. The underlying securities represent a percentage of the portfolio investments.
5
The FBR Funds
FBR Pegasus FundTM
Portfolio of Investments
April 30, 2007
(unaudited)
|
| | | | | | VALUE | |
| | SHARES | | | | (NOTE 2) | |
|
| | | | COMMON STOCKS — 98.9% | | | | |
| | | | Banks - Regional — 4.6% | | | | |
| | 1,925 | | Allied Irish Banks PLC ADR | | $ | 116,828 | |
| | 2,081 | | Bank of Montreal | | | 130,437 | |
| | 1,110 | | Comerica, Inc. | | | 68,720 | |
| | 1,600 | | Commerce Bancorp, Inc. | | | 53,504 | |
| | 600 | | UnionBanCal Corp. | | | 36,888 | |
| | 4,000 | | Wells Fargo & Co. | | | 143,560 | |
| | | | | |
| |
| | | | | | | 549,937 | |
| | | | | |
| |
| | | | Biotechnology and Drugs — 7.7% | | | | |
| | 2,900 | | AstraZeneca PLC ADR | | | 157,499 | |
| | 900 | | Barr Pharmaceuticals, Inc.* | | | 43,524 | |
| | 3,450 | | Eli Lilly and Co. | | | 203,999 | |
| | 4,350 | | Novartis AG ADR | | | 252,692 | |
| | 2,700 | | Novo Nordisk A/S ADR | | | 265,706 | |
| | | | | |
| |
| | | | | | | 923,420 | |
| | | | | |
| |
| | | | Business Services — 2.7% | | | | |
| | 4,100 | | Accenture Ltd., Class A | | | 160,310 | |
| | 2,500 | | Moody’s Corp. | | | 165,300 | |
| | | | | |
| |
| | | | | | | 325,610 | |
| | | | | |
| |
| | | | Capital Goods - Miscellaneous — 1.2% | | | | |
| | 1,500 | | Cummins, Inc. | | | 138,240 | |
| | | | | |
| |
| | | | Communications Services — 1.9% | | | | |
| | 3,400 | | America Movil S.A.B. de C.V., Series L ADR | | | 178,602 | |
| | 1,800 | | Nippon Telegraph and Telephone Corp. ADR | | | 44,802 | |
| | | | | |
| |
| | | | | | | 223,404 | |
| | | | | |
| |
| | | | Computer Peripherals — 1.5% | | | | |
| | 6,500 | | Cisco Systems, Inc.* | | | 173,810 | |
| | | | | |
| |
| | | | Conglomerates — 2.4% | | | | |
| | 3,500 | | 3M Co. | | | 289,695 | |
| | | | | |
| |
| | | | Consumer Financial Services — 1.4% | | | | |
| | 2,800 | | American Express Co. | | | 169,876 | |
| | | | | |
| |
6
The FBR Funds
FBR Pegasus FundTM
Portfolio of Investments (continued)
April 30, 2007
(unaudited)
|
| | | | | | VALUE | |
| | SHARES | | | | (NOTE 2) | |
|
| | | | Electric Utilities — 5.0% | | | | |
| | 2,476 | | Edison International | | $ | 129,619 | |
| | 1,912 | | International Power PLC ADR | | | 168,791 | |
| | 3,700 | | Mirant Corp.* | | | 166,019 | |
| | 2,675 | | PG&E Corp. | | | 135,355 | |
| | | | | |
| |
| | | | | | | 599,784 | |
| | | | | |
| |
| | | | Food Processing — 5.3% | | | | |
| | 7,525 | | Archer Daniels Midland Co. | | | 291,218 | |
| | 1,375 | | Bunge Ltd. | | | 104,170 | |
| | 4,000 | | Wm. Wrigley Jr. Co. | | | 235,520 | |
| | | | | |
| |
| | | | | | | 630,908 | |
| | | | | |
| |
| | | | Insurance - Life — 2.5% | | | | |
| | 1,997 | | Prudential Financial, Inc. | | | 189,715 | |
| | 2,350 | | Sun Life Financial, Inc. | | | 111,273 | |
| | | | | |
| |
| | | | | | | 300,988 | |
| | | | | |
| |
| | | | Insurance - Property and Casualty — 7.8% | | | | |
| | 68 | | Berkshire Hathaway, Inc., Class B* | | | 246,705 | |
| | 2,695 | | Loews Corp. | | | 127,527 | |
| | 845 | | Safeco Corp. | | | 56,395 | |
| | 2,600 | | The Allstate Corp. | | | 162,032 | |
| | 1,319 | | The Hartford Financial Services Group, Inc. | | | 133,483 | |
| | 3,004 | | The Travelers Companies, Inc. | | | 162,516 | |
| | 1,500 | | W.R. Berkley Corp. | | | 48,735 | |
| | | | | |
| |
| | | | | | | 937,393 | |
| | | | | |
| |
| | | | Investment Services — 6.5% | | | | |
| | 1,025 | | Ameriprise Financial, Inc. | | | 60,957 | |
| | 3,151 | | Morgan Stanley | | | 264,715 | |
| | 1,900 | | NYSE Euronext, Inc.* | | | 160,227 | |
| | 3,400 | | T. Rowe Price Group, Inc. | | | 168,912 | |
| | 753 | | The Bear Stearns Companies, Inc. | | | 117,242 | |
| | | | | |
| |
| | | | | | | 772,053 | |
| | | | | |
| |
| | | | Iron and Steel — 1.8% | | | | |
| | 3,188 | | Arcelor Mittal, Class A NYS | | | 170,303 | |
| | 430 | | United States Steel Corp. | | | 43,662 | |
| | | | | |
| |
| | | | | | | 213,965 | |
| | | | | |
| |
7
The FBR Funds
FBR Pegasus FundTM
Portfolio of Investments (continued)
April 30, 2007
(unaudited)
|
| | | | | | | VALUE | |
| | SHARES | | | | | (NOTE 2) | |
|
| | | | Metal Mining — 7.0% | | | | |
| | 3,413 | | BHP Billiton PLC ADR | | $ | 155,223 | |
| | 4,100 | | Companhia Vale Do Rio Doce ADR | | | 166,501 | |
| | 2,300 | | Freeport-McMoRan Copper & Gold, Inc. | | | 154,468 | |
| | 653 | | Rio Tinto PLC ADR | | | 159,332 | |
| | 2,700 | | Teck Cominco Ltd., Class B | | | 205,281 | |
| | | | | |
| |
| | | | | | | 840,805 | |
| | | | | |
| |
| | | | Oil and Gas Operations — 8.1% | | | | |
| | 677 | | Apache Corp. | | | 49,083 | |
| | 1,250 | | Canadian Natural Resources Ltd. | | | 74,513 | |
| | 1,725 | | Chevron Corp. | | | 134,187 | |
| | 1,700 | | ConocoPhillips | | | 117,894 | |
| | 900 | | Devon Energy Corp. | | | 65,583 | |
| | 1,275 | | Newfield Exploration Co.* | | | 55,781 | |
| | 950 | | Noble Energy, Inc. | | | 55,870 | |
| | 1,985 | | Occidental Petroleum Corp. | | | 100,640 | |
| | 650 | | Questar Corp. | | | 63,135 | |
| | 1,848 | | Royal Dutch Shell PLC, Class A ADR | | | 128,158 | |
| | 1,992 | | Sempra Energy | | | 126,451 | |
| | | | | |
| |
| | | | | | | 971,295 | |
| | | | | |
| |
| | | | Oil Well Services and Equipment — 1.0% | | | | |
| | 1,025 | | ENSCO International, Inc. | | | 57,789 | |
| | 675 | | Noble Corp. | | | 56,842 | |
| | | | | |
| |
| | | | | | | 114,631 | |
| | | | | |
| |
| | | | Railroads — 9.7% | | | | |
| | 3,825 | | Burlington Northern Santa Fe Corp. | | | 334,840 | |
| | 5,522 | | CSX Corp. | | | 238,385 | |
| | 4,639 | | Norfolk Southern Corp. | | | 246,980 | |
| | 2,888 | | Union Pacific Corp. | | | 329,954 | |
| | | | | |
| |
| | | | | | | 1,150,159 | |
| | | | | |
| |
| | | | Retail - Apparel — 1.7% | | | | |
| | 11,500 | | The Gap, Inc. | | | 206,425 | |
| | | | | |
| |
| | | | Retail - Department and Discount — 2.3% | | | | |
| | 4,600 | | Target Corp. | | | 273,102 | |
| | | | | |
| |
8
The FBR Funds
FBR Pegasus FundTM
Portfolio of Investments (continued)
April 30, 2007
(unaudited)
|
| | | | | | | VALUE | |
| | SHARES | | | | | (NOTE 2) | |
|
| | | | Retail - Drugs — 2.1% | | | | |
| | 5,825 | | Walgreen Co. | | $ | 255,718 | |
| | | | | |
| |
| | | | Retail - Grocery — 0.8% | | | | |
| | 2,150 | | Whole Foods Market, Inc. | | | 100,599 | |
| | | | | |
| |
| | | | Savings and Loans – Savings Banks — 0.9% | | | | |
| | 2,425 | | Washington Mutual, Inc. | | | 101,802 | |
| | | | | |
| |
| | | | Schools — 1.0% | | | | |
| | 2,600 | | Apollo Group, Inc., Class A* | | | 122,980 | |
| | | | | |
| |
| | | | Scientific and Technical Instruments — 1.4% | | | | |
| | 2,900 | | Garmin Ltd. | | | 168,751 | |
| | | | | |
| |
| | | | Semiconductors — 9.2% | | | | |
| | 12,600 | | Intel Corp. | | | 270,900 | |
| | 2,885 | | Kyocera Corp. ADR | | | 281,288 | |
| | 26,200 | | Micron Technology, Inc.* | | | 300,514 | |
| | 12,350 | | STMicroelectronics N.V. NYS | | | 240,331 | |
| | | | | |
| |
| | | | | | | 1,093,033 | |
| | | | | |
| |
| | | | Software and Programming — 1.4% | | | | |
| | 9,100 | | Oracle Corp.* | | | 171,080 | |
| | | | | |
| |
| | | | Total Common Stocks (Cost $11,057,043) | | | 11,819,463 | |
| | | | | |
| |
9
The FBR Funds
FBR Pegasus FundTM
Portfolio of Investments (continued)
April 30, 2007
(unaudited)
|
| | | | | | | VALUE | |
| | PAR | | | | | (NOTE 2) | |
|
| | | | REPURCHASE AGREEMENT — 3.7% | | | | |
| | $443,000 | | With Mizuho Securities, Inc. dated 4/30/07 at 5.06% to be repurchased at $443,062 on 5/1/07, collateralized by U.S. Treasury Bill, 4.81% due 8/23/07, value $54,280, U.S. Treasury Bond, 7.5% due 11/15/16, value $158,280, U.S. Treasury Notes, interest rates ranging from 5.625% to 6.5%, maturities ranging from 5/15/08 to 2/15/10, value $177,433 & $62,417 (Cost $443,000) | | $ | 443,000 | |
| | | | | |
| |
| | | | Total Investments — 102.6% (Cost $11,500,043) | | | 12,262,463 | |
| | | | | | | | |
| | | | Liabilities Less Other Assets — (2.6%) | | | (313,556 | ) |
| | | | | |
| |
| | | | Net Assets — 100.0% | | $ | 11,948,907 | |
| | | | | |
| |
|
| * | | Non-income producing security |
| ADR | | American Depositary Receipts |
| NYS | | New York Shares |
| Note: | | For presentation purposes, the Fund has grouped some of the industry categories. For purposes of categorizing securities for compliance with Section 8(b)(1) of the Investment Company Act of 1940, the Fund uses more specific industry classifications. |
The accompanying notes are an integral part of the financial statements.
10
The FBR Funds
FBR Pegasus Mid Cap FundTM
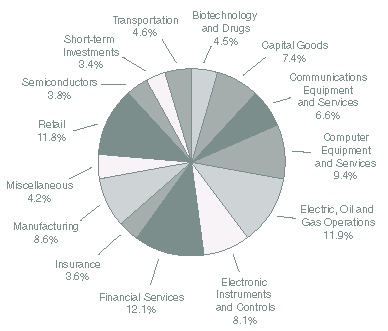
Portfolio Summary
April 30, 2007
(unaudited)
The following chart provides a visual breakdown of the Fund by industry sectors. The underlying securities represent a percentage of the portfolio investments.
11
The FBR Funds
FBR Pegasus Mid Cap FundTM
Portfolio of Investments
April 30, 2007
(unaudited)
|
| | | | | | VALUE | |
| | SHARES | | | | (NOTE 2) | |
|
| | | | COMMON STOCKS — 97.1% | | | | |
| | | | Airlines — 1.1% | | | | |
| | 675 | | Air France-KLM ADR | | $ | 34,351 | |
| | | | | |
| |
| | | | Apparel/Accessories — 1.5% | | | | |
| | 575 | | VF Corp. | | | 50,491 | |
| | | | | |
| |
| | | | Auto and Truck Parts — 2.5% | | | | |
| | 1,050 | | Magna International, Inc., Class A | | | 83,108 | |
| | | | | |
| |
| | | | Banks - Regional — 1.3% | | | | |
| | 500 | | Comerica, Inc. | | | 30,955 | |
| | 250 | | Marshall & Ilsley Corp. | | | 12,005 | |
| | | | | |
| |
| | | | | | | 42,960 | |
| | | | | |
| |
| | | | Biotechnology and Drugs — 4.5% | | | | |
| | 2,040 | | Barr Pharmaceuticals, Inc.* | | | 98,654 | |
| | 825 | | Techne Corp.* | | | 48,650 | |
| | | | | |
| |
| | | | | | | 147,304 | |
| | | | | |
| |
| | | | Capital Goods - Miscellaneous — 7.5% | | | | |
| | 700 | | Cummins, Inc. | | | 64,512 | |
| | 2,400 | | Graco, Inc. | | | 94,799 | |
| | 775 | | Lincoln Electric Holdings, Inc. | | | 49,391 | |
| | 400 | | W.W. Grainger, Inc. | | | 33,048 | |
| | | | | |
| |
| | | | | | | 241,750 | |
| | | | | |
| |
| | | | Chemical Manufacturing — 2.1% | | | | |
| | 2,900 | | Methanex Corp. | | | 69,542 | |
| | | | | |
| |
| | | | Computer Hardware — 2.5% | | | | |
| | 2,000 | | Ingram Micro, Inc., Class A* | | | 39,240 | |
| | 1,200 | | Tech Data Corp.* | | | 42,648 | |
| | | | | |
| |
| | | | | | | 81,888 | |
| | | | | |
| |
| | | | Computer Networks — 2.9% | | | | |
| | 4,000 | | Jack Henry & Associates, Inc. | | | 95,000 | |
| | | | | |
| |
| | | | Computer Services — 1.1% | | | | |
| | 1,200 | | NeuStar, Inc., Class A* | | | 34,512 | |
| | | | | |
| |
12
The FBR Funds
FBR Pegasus Mid Cap FundTM
Portfolio of Investments (continued)
April 30, 2007
(unaudited)
|
| | | | | | VALUE | |
| | SHARES | | | | (NOTE 2) | |
|
| | | | Computer Storage Devices — 2.9% | | | | |
| | 3,850 | | Micron Technology, Inc.* | | $ | 44,160 | |
| | 1,150 | | SanDisk Corp.* | | | 49,967 | |
| | | | | |
| |
| | | | | | | 94,127 | |
| | | | | |
| |
| | | | Consumer Financial Services — 1.2% | | | | |
| | 1,050 | | The First Marblehead Corp. | | | 38,063 | |
| | | | | |
| |
| | | | Electric Utilities — 2.7% | | | | |
| | 1,100 | | SCANA Corp. | | | 47,883 | |
| | 1,475 | | Westar Energy, Inc. | | | 40,150 | |
| | | | | |
| |
| | | | | | | 88,033 | |
| | | | | |
| |
| | | | Electronic Instruments and Controls — 2.1% | | | | |
| | 350 | | TDK Corp. ADR | | | 30,275 | |
| | 2,200 | | Vishay Intertechnology, Inc.* | | | 36,630 | |
| | | | | |
| |
| | | | | | | 66,905 | |
| | | | | |
| |
| | | | Fabricated Products - Miscellaneous — 1.6% | | | | |
| | 1,300 | | Fastenal Co. | | | 53,456 | |
| | | | | |
| |
| | | | Food Processing — 2.6% | | | | |
| | 1,125 | | Bunge Ltd. | | | 85,230 | |
| | | | | |
| |
| | | | Healthcare Facilities — 1.1% | | | | |
| | 575 | | Universal Health Services, Inc., Class B | | | 34,914 | |
| | | | | |
| |
| | | | Insurance – Accident and Health — 1.3% | | | | |
| | 1,700 | | Unum Group | | | 42,296 | |
| | | | | |
| |
| | | | Insurance - Life — 2.3% | | | | |
| | 4,250 | | Conseco, Inc.* | | | 75,183 | |
| | | | | |
| |
| | | | Investment Services — 4.5% | | | | |
| | 1,975 | | Eaton Vance Corp. | | | 75,484 | |
| | 1,450 | | T. Rowe Price Group, Inc. | | | 72,036 | |
| | | | | |
| |
| | | | | | | 147,520 | |
| | | | | |
| |
| | | | Iron and Steel — 0.9% | | | | |
| | 195 | | IPSCO, Inc. | | | 28,831 | |
| | | | | |
| |
13
The FBR Funds
FBR Pegasus Mid Cap FundTM
Portfolio of Investments (continued)
April 30, 2007
(unaudited)
|
| | | | | | VALUE | |
| | SHARES | | | | (NOTE 2) | |
|
| | | | Medical Equipment and Supplies — 6.2% | | | | |
| | 1,675 | | Kinetic Concepts, Inc.* | | $ | 83,749 | |
| | 1,250 | | Mentor Corp. | | | 48,638 | |
| | 1,625 | | Varian Medical Systems, Inc.* | | | 68,591 | |
| | | | | |
| |
| | | | | | | 200,978 | |
| | | | | |
| |
| | | | Metal Mining — 3.0% | | | | |
| | 1,475 | | Freeport-McMoRan Copper & Gold, Inc., Class B | | | 99,061 | |
| | | | | |
| |
| | | | Natural Gas Utilities — 1.7% | | | | |
| | 1,100 | | Nicor, Inc. | | | 56,364 | |
| | | | | |
| |
| | | | Oil and Gas - Integrated — 1.3% | | | | |
| | 3,100 | | Canetic Resources Trust | | | 41,540 | |
| | | | | |
| |
| | | | Oil and Gas Operations — 6.3% | | | | |
| | 2,000 | | Chesapeake Energy Corp. | | | 67,500 | |
| | 950 | | Forest Oil Corp.* | | | 33,478 | |
| | 725 | | Pogo Producing Co. | | | 34,989 | |
| | 700 | | Questar Corp. | | | 67,991 | |
| | | | | |
| |
| | | | | | | 203,958 | |
| | | | | |
| |
| | | | Paper and Related Products — 1.0% | | | | |
| | 1,850 | | Stora Enso Oyj ADR | | | 33,818 | |
| | | | | |
| |
| | | | Printing and Publishing — 2.3% | | | | |
| | 2,150 | | NAVTEQ Corp.* | | | 76,024 | |
| | | | | |
| |
| | | | Recreational Products — 1.5% | | | | |
| | 1,750 | | Mattel, Inc. | | | 49,525 | |
| | | | | |
| |
| | | | Retail - Apparel — 3.3% | | | | |
| | 720 | | Abercrombie & Fitch Co., Class A | | | 58,795 | |
| | 2,000 | | Foot Locker, Inc. | | | 47,580 | |
| | | | | |
| |
| | | | | | | 106,375 | |
| | | | | |
| |
| | | | Retail - Department and Discount — 1.3% | | | | |
| | 1,200 | | Dillard’s, Inc., Class A | | | 41,556 | |
| | | | | |
| |
14
The FBR Funds
FBR Pegasus Mid Cap FundTM
Portfolio of Investments (continued)
April 30, 2007
(unaudited)
|
| | | | | | VALUE | |
| | SHARES | | | | (NOTE 2) | |
|
| | | | Retail - Specialty — 4.4% | | | | |
| | 1,175 | | Bed Bath & Beyond, Inc.* | | $ | 47,870 | |
| | 1,400 | | BJ’s Wholesale Club, Inc.* | | | 48,342 | |
| | 1,675 | | Copart, Inc.* | | | 48,541 | |
| | | | | |
| |
| | | | | | | 144,753 | |
| | | | | |
| |
| | | | Retail - Technology — 1.4% | | | | |
| | 2,700 | | Circuit City Stores, Inc. | | | 47,115 | |
| | | | | |
| |
| | | | Savings and Loans – Savings Banks — 5.0% | | | | |
| | 800 | | Capitol Federal Financial | | | 30,896 | |
| | 3,600 | | Hudson City Bancorp, Inc. | | | 47,952 | |
| | 2,500 | | TFS Financial Corp.* | | | 29,300 | |
| | 2,325 | | Washington Federal, Inc. | | | 55,126 | |
| | | | | |
| |
| | | | | | | 163,274 | |
| | | | | |
| |
| | | | Semiconductors — 3.8% | | | | |
| | 1,150 | | International Rectifier Corp.* | | | 40,572 | |
| | 4,725 | | QLogic Corp.* | | | 84,483 | |
| | | | | |
| |
| | | | | | | 125,055 | |
| | | | | |
| |
| | | | Software and Programming — 3.3% | | | | |
| | 3,250 | | THQ, Inc.* | | | 108,452 | |
| | | | | |
| |
| | | | Water Transportation — 1.1% | | | | |
| | 500 | | Overseas Shipholding Group, Inc. | | | 35,400 | |
| | | | | |
| |
| | | | Total Common Stocks (Cost $3,031,230) | | | 3,168,712 | |
| | | | | |
| |
15
The FBR Funds
FBR Pegasus Mid Cap FundTM
Portfolio of Investments (continued)
April 30, 2007
(unaudited)
|
| | | | | | VALUE | |
| | PAR | | | | (NOTE 2) | |
|
| | | | REPURCHASE AGREEMENT — 3.4% | | | | |
| $ | 110,000 | | With Mizuho Securities, Inc. dated 4/30/07 at 5.06% to be repurchased at $110,015 on 5/1/07, collateralized by U.S. Treasury Bill, 4.81% due 8/23/07, value $13,478, U.S. Treasury Bond, 7.5% due 11/15/16, value $39,302, U.S. Treasury Notes, interest rates ranging from 5.625% to 6.5%, maturities ranging from 5/15/08 to 2/15/10, value $44,058 & $15,499 (Cost $110,000) | | $ | 110,000 | |
| | | | | |
| |
| | | | Total Investments — 100.5% (Cost $3,141,230) | | | 3,278,712 | |
| | | | | | | | |
| | | | Liabilities Less Other Assets — (0.5%) | | | (17,001 | ) |
| | | | | |
| |
| | | | Net Assets — 100.0% | | $ | 3,261,711 | |
| | | | | |
| |
|
| * | | Non-income producing |
| ADR | | American Depositary Receipts |
| Note: | | For presentation purposes, the Fund has grouped some of the industry categories. For purposes of categorizing securities for compliance with Section 8(b)(1) of the Investment Company Act of 1940, the Fund uses more specific industry classifications. |
The accompanying notes are an integral part of the financial statements.
16
The FBR Funds
FBR Pegasus Small Cap FundTM
Portfolio Summary
April 30, 2007
(unaudited)
The following chart provides a visual breakdown of the Fund by industry sectors. The underlying securities represent a percentage of the portfolio investments.
17
The FBR Funds
FBR Pegasus Small Cap FundTM
Portfolio of Investments
April 30, 2007
(unaudited)
|
| | | | | VALUE | |
| SHARES | | | | (NOTE 2) | |
|
| | | COMMON STOCKS — 99.7% | | | | |
| | | Advertising — 1.2% | | | | |
| 1,500 | | ValueClick, Inc.* | | $ | 42,900 | |
| | | | |
| |
| | | Aerospace and Defense — 3.0% | | | | |
| 2,600 | | FLIR Systems, Inc.* | | | 105,274 | |
| | | | |
| |
| | | Beverages — 1.3% | | | | |
| 2,900 | | National Beverage Corp.* | | | 45,124 | |
| | | | |
| |
| | | Biotechnology and Drugs — 2.6% | | | | |
| 700 | | IDEXX Laboratories, Inc.* | | | 63,119 | |
| 1,000 | | Meridian Bioscience, Inc. | | | 29,730 | |
| | | | |
| |
| | | | | | 92,849 | |
| | | | |
| |
| | | Business Services — 6.5% | | | | |
| 1,300 | | Global Payments, Inc. | | | 49,374 | |
| 700 | | Portfolio Recovery Associates, Inc.* | | | 38,955 | |
| 2,600 | | Rollins, Inc. | | | 59,982 | |
| 1,800 | | TNS, Inc.* | | | 21,852 | |
| 1,300 | | Watson Wyatt Worldwide, Inc., Class A | | | 61,269 | |
| | | | |
| |
| | | | | | 231,432 | |
| | | | |
| |
| | | Capital Goods - Miscellaneous — 2.5% | | | | |
| 2,250 | | Graco, Inc. | | | 88,875 | |
| | | | |
| |
| | | Casinos and Gaming — 1.0% | | | | |
| 1,300 | | Monarch Casino & Resort, Inc.* | | | 34,671 | |
| | | | |
| |
| | | Coal — 2.4% | | | | |
| 2,900 | | Alpha Natural Resources, Inc.* | | | 50,373 | |
| 6,000 | | International Coal Group, Inc.* | | | 33,540 | |
| | | | |
| |
| | | | | | 83,913 | |
| | | | |
| |
| | | Communications Services — 1.8% | | | | |
| 2,200 | | j2 Global Communications, Inc.* | | | 63,272 | |
| | | | |
| |
18
The FBR Funds
FBR Pegasus Small Cap FundTM
Portfolio of Investments (continued)
April 30, 2007
(unaudited)
|
| | | | | VALUE | |
| SHARES | | | | (NOTE 2) | |
|
| | | Computer Networks — 4.6% | | | | |
| 2,800 | | Convergys Corp.* | | $ | 70,728 | |
| 3,800 | | Jack Henry & Associates, Inc. | | | 90,250 | |
| | | | |
| |
| | | | | | 160,978 | |
| | | | |
| |
| | | Computer Services — 9.1% | | | | |
| 1,500 | | FactSet Research Systems, Inc. | | | 92,265 | |
| 1,250 | | Interactive Data Corp. | | | 35,788 | |
| 1,200 | | Morningstar, Inc.* | | | 62,484 | |
| 6,800 | | The Trizetto Group, Inc.* | | | 132,464 | |
| | | | |
| |
| | | | | | 323,001 | |
| | | | |
| |
| | | Construction – Supplies and Fixtures — 1.8% | | | | |
| 900 | | Chaparral Steel Co. | | | 63,450 | |
| | | | |
| |
| | | Electronic Instruments and Controls — 1.3% | | | | |
| 1,600 | | Raven Industries, Inc. | | | 46,224 | |
| | | | |
| |
| | | Healthcare Facilities — 1.9% | | | | |
| 1,700 | | VCA Antech, Inc.* | | | 67,031 | |
| | | | |
| |
| | | Investment Services — 4.4% | | | | |
| 1,025 | | International Securities Exchange Holdings, Inc. | | | 68,357 | |
| 1,600 | | Penson Worldwide, Inc.* | | | 42,912 | |
| 1,900 | | Waddell & Reed Financial, Inc., Class A | | | 46,018 | |
| | | | |
| |
| | | | | | 157,287 | |
| | | | |
| |
| | | Medical Equipment and Supplies — 0.5% | | | | |
| 500 | | Immucor, Inc.* | | | 16,315 | |
| | | | |
| |
| | | Metal Mining — 2.2% | | | | |
| 1,100 | | Cleveland-Cliffs, Inc. | | | 76,219 | |
| | | | |
| |
| | | Oil and Gas Operations — 3.7% | | | | |
| 1,650 | | Alon USA Energy, Inc. | | | 61,710 | |
| 875 | | Penn Virginia Corp. | | | 70,044 | |
| | | | |
| |
| | | | | | 131,754 | |
| | | | |
| |
| | | Personal Services — 1.8% | | | | |
| 1,900 | | Ambassadors Group, Inc. | | | 63,688 | |
| | | | |
| |
19
The FBR Funds
FBR Pegasus Small Cap FundTM
Portfolio of Investments (continued)
April 30, 2007
(unaudited)
|
| | | | | VALUE | |
| SHARES | | | | (NOTE 2) | |
|
| | | Real Estate Operations — 4.6% | | | | |
| 2,100 | | Hospitality Properties Trust | | $ | 95,613 | |
| 2,000 | | National Health Investors, Inc. | | | 67,840 | |
| | | | |
| |
| | | | | | 163,453 | |
| | | | |
| |
| | | Retail - Specialty — 5.4% | | | | |
| 1,000 | | Big Lots, Inc.* | | | 32,200 | |
| 1,000 | | Copart, Inc.* | | | 28,980 | |
| 1,125 | | Dick’s Sporting Goods, Inc.* | | | 63,101 | |
| 900 | | O’Reilly Automotive, Inc.* | | | 32,040 | |
| 1,800 | | The Pep Boys - Manny, Moe & Jack | | | 33,570 | |
| | | | |
| |
| | | | | | 189,891 | |
| | | | |
| |
| | | Savings and Loans – Savings Banks — 2.2% | | | | |
| 700 | | Downey Financial Corp. | | | 46,865 | |
| 1,300 | | Washington Federal, Inc. | | | 30,823 | |
| | | | |
| |
| | | | | | 77,688 | |
| | | | |
| |
| | | Schools — 6.3% | | | | |
| 1,575 | | Capella Education Co.* | | | 55,046 | |
| 750 | | ITT Educational Services, Inc.* | | | 72,908 | |
| 775 | | Strayer Education, Inc. | | | 96,363 | |
| | | | |
| |
| | | | | | 224,317 | |
| | | | |
| |
| | | Semiconductors — 1.0% | | | | |
| 1,500 | | Cypress Semiconductor Corp.* | | | 34,230 | |
| | | | |
| |
| | | Software and Programming — 26.6% | | | | |
| 2,000 | | Aladdin Knowledge Systems Ltd.* | | | 41,880 | |
| 800 | | Business Objects S.A. ADR* | | | 30,008 | |
| 800 | | Cognos, Inc.* | | | 34,488 | |
| 1,600 | | DealerTrack Holdings, Inc.* | | | 52,800 | |
| 1,200 | | MICROS Systems, Inc.* | | | 65,760 | |
| 800 | | MicroStrategy, Inc., Class A* | | | 91,008 | |
| 3,000 | | Parametric Technology Corp.* | | | 53,310 | |
| 800 | | Quality Systems, Inc. | | | 32,376 | |
| 3,100 | | SPSS, Inc.* | | | 113,646 | |
| 2,900 | | Sybase, Inc.* | | | 70,151 | |
| 3,675 | | THQ, Inc.* | | | 122,635 | |
20
The FBR Funds
FBR Pegasus Small Cap FundTM
Portfolio of Investments (continued)
April 30, 2007
(unaudited)
|
| | | | | VALUE | |
| SHARES | | | | (NOTE 2) | |
|
| | | Software and Programming — 26.6% (continued) | | | | |
| 13,300 | | TIBCO Software, Inc.* | | $ | 121,296 | |
| 3,500 | | Transaction Systems Architects, Inc.* | | | 111,055 | |
| | | | |
| |
| | | | | | 940,413 | |
| | | | |
| |
| | | Total Common Stocks (Cost $3,361,093) | | | 3,524,249 | |
| | | | |
| |
| PAR | | | | | | |
| | | | | | |
| | | REPURCHASE AGREEMENT — 1.3% | | | | |
| $46,000 | | With Mizuho Securities, Inc. dated 4/30/07 at 5.06% to be repurchased at $46,006 on 5/1/07, collateralized by U.S. Treasury Bill, 4.81% due 8/23/07, value $5,636, U.S. Treasury Bond, 7.5% due 11/15/16, value $16,435, U.S. Treasury Notes, interest rates ranging from 5.625% to 6.5%, maturities ranging from 5/15/08 to 2/15/10, value $18,424 & $6,481 (Cost $46,000) | | | 46,000 | |
| | | | |
| |
| | | Total Investments — 101.0% (Cost $3,407,093) | | | 3,570,249 | |
| | | | | | | |
| | | Liabilities Less Other Assets — (1.0%) | | | (33,757 | ) |
| | | | |
| |
| | | Net Assets — 100.0% | | $ | 3,536,492 | |
| | | | |
| |
|
| * | | Non-income producing security |
| ADR | | American Depositary Receipts |
| Note: | | For presentation purposes, the Fund has grouped some of the industry categories. For purposes of categorizing securities for compliance with Section 8(b)(1) of the Investment Company Act of 1940, the Fund uses more specific industry classifications. |
The accompanying notes are an integral part of the financial statements.
21
| The FBR Funds |
|
| FBR Large Cap Financial Fund |
| Management Overview |
Portfolio Manager: David Ellison
How did the Fund perform?
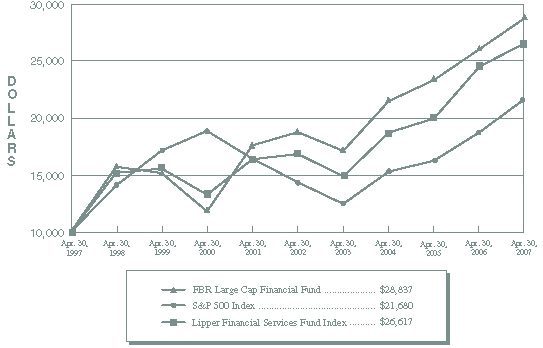
For the six month period ended April 30, 2007, the FBR Large Cap Financial Fund appreciated 6.12%. This compares to the Lipper Financial Services Fund Index and the S&P 500 Index, which returned 5.02% and 8.60% for the same period, respectively.
What factors contributed to the Fund’s performance?
The Fund out paced the Lipper Financial Services Index and lagged the broader market for the reporting period. The Fund’s out performance relative to its peers can be attributed to several factors. Our investments in high quality companies within the insurance and brokerage related sectors performed well during the period. Our lack of investments in the securities of companies primarily engaged in subprime lending practices also benefited shareholders. Finally, large-cap banks and thrifts, in general, performed better than similar mid-cap and small-cap securities during the period as investors favored business models with more diverse streams of revenue and the ability to participate in capital markets related activities. From a historical perspective, and more importantly over the last year, the Fund maintained its conservative investment philosophy and generally avoided the companies directly impacted by the negative effects of the flat yield curve and aggressive lending strategies.
The S&P 500 Index out performed the Fund and the Lipper Financial Services Index during the reporting period. This was due, in large part, to the non-financial services oriented sectors in the economy which were not as negatively impacted by the short-term interest rate increases and recent concerns and related costs associated with delinquencies and foreclosures in the housing market.
What is the outlook for the Fund and the financial services sector?
The financial services industry is fighting an uphill battle on a number of fronts, which is making it difficult to grow earnings and depressing market valuations. These battles include 1) the duration of the flat yield curve, which has lowered profits on lending margins, 2) sluggish loan growth, as the housing market has slowed, 3) pricing pressures from non-traditional lending institutions competing for market share, and 4) the developing increases in delinquency and foreclosure costs across the residential housing market.
The solution to these negative EPS (earnings per share) drivers is time. The lending markets are now making adjustments. We have seen evidence of credit tightening and renewed attention to funding reliability. We have also seen a modest regulatory response to the credit issues. I would expect to see a better fundamental environment for financial companies going forward as the industry corrects past lending and liability mistakes.
While all sub-segments of the financial services industry have not been equally impacted, it is generally in the most difficult times that real opportunities arise. I view the past six to twelve months as a period where problems developed. I view the next six to twelve months
22
| The FBR Funds |
|
| FBR Large Cap Financial Fund |
| Management Overview (continued) |
as a period where these problems will be identified and corrected. I view the period beyond that as having the potential for recovery in fundamentals which the stocks in this industry should follow.
The opinions expressed in this commentary reflect those of the Portfolio Manager(s) as of the date written. Any such opinions are subject to change based on market or other conditions. These opinions may not be relied upon as investment advice. Investment decisions for The FBR Funds are based on several factors, and may not be relied upon as an indication of trading intent on behalf of any FBR Fund. Security positions can and do change.
23
| The FBR Funds |
|
| FBR Large Cap Financial Fund |
| |
| Comparison of Changes in Value of $10,000 Investment in |
| Fund Shares(1)(2) vs. Various Indices(1)(3) |
| (unaudited) |
| | | | | | | | | | | | | |
| Total Returns—For the Periods Ended April 30, 2007(4) |
| | | | | | | | Annualized | | | | Annualized | |
| | | | One Year | | | | Five Year | | | | Ten Year | |
| | | |
| | | |
| | | |
| |
| FBR Large Cap Financial Fund(1)(2) | | | 10.29% | | | | 8.92% | | | | 11.17% | |
| S&P 500 Index(1)(3) | | | 15.24% | | | | 8.53% | | | | 8.04% | |
| Lipper Financial Services Fund Index(1)(3) | | | 8.13% | | | | 9.53% | | | | 10.29% | |
| | | | | | | | | | | | | |
PAST PERFORMANCE IS NO GUARANTEE OF FUTURE RESULTS.
The performance data quoted represents past performance and the current performance may be lower or higher. The investment return and principal will fluctuate so that investors’ shares, when redeemed, may be worth more or less than their original cost. To obtain performance data current to the most recent month-end, please call 888.200.4710 or visit www.fbrfunds.com.
|
| (1) | | The graph assumes a hypothetical $10,000 initial investment in the Fund and reflects the reinvestment of dividends and all Fund expenses. Investors should note that the Fund is a professionally managed mutual fund while the indices are unmanaged, do not incur expenses and are not available for investment. The performance of the indices includes reinvested dividends, and does not reflect sales charges or expenses, except for the Lipper Financial Services Fund Index which reflects fund expenses. |
| (2) | | FBR Fund Advisers, Inc. waived a portion of its advisory fees and agreed to contractually reimburse a portion of the Fund’s operating expenses, as necessary, to maintain existing expense limitations, as set forth in the notes to the financial statements. Total returns shown include fee waivers and expense reimbursements, if any; total returns would have been lower had there been no waiver of fees and/or reimbursement of expenses in excess of expense limitations. |
| (3) | | S&P 500 Index is a capitalization-weighted index of 500 stocks. The index is designed to represent the broad domestic economy through changes in aggregate market value of 500 stocks representing all major industries. The Lipper Financial Services Fund Index is an equally weighted index of the largest thirty funds within the financial services fund classification as defined by Lipper Inc. The index is rebalanced quarterly. Lipper Analytical Services, Inc., is a nationally recognized organization that reports on mutual fund total return performance and calculates fund rankings. Each Lipper Average is based on a universe of funds with similar investment objectives. |
| (4) | | The total returns shown do not reflect the deduction of taxes that a shareholder would pay on fund distributions or the redemption of fund shares. |
24
The FBR Funds
FBR Large Cap Financial Fund
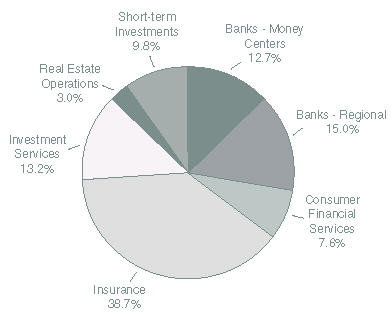
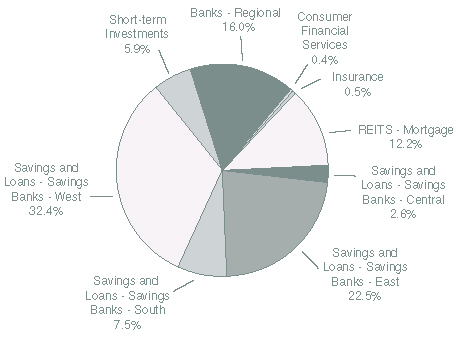
Portfolio Summary
April 30, 2007
(unaudited)
The following chart provides a visual breakdown of the Fund by industry sectors. The underlying securities represent a percentage of the portfolio investments.
25
The FBR Funds
FBR Large Cap Financial Fund
Portfolio of Investments
April 30, 2007
(unaudited)
|
| | | | | VALUE | |
| SHARES | | | | (NOTE 2) | |
|
| | | COMMON STOCKS — 93.4% | | | | |
| | | Banks - Money Centers — 13.2% | | | | |
| 17,000 | | Bank of America Corp. | | $ | 865,300 | |
| 16,500 | | Citigroup, Inc. | | | 884,730 | |
| 15,000 | | JP Morgan Chase & Co. | | | 781,500 | |
| 6,000 | | The Bank of New York Company, Inc. | | | 242,880 | |
| 8,000 | | U.S. BanCorp. | | | 274,800 | |
| 6,000 | | Wachovia Corp. | | | 333,240 | |
| | | | |
| |
| | | | | | 3,382,450 | |
| | | | |
| |
| | | Banks - Regional — 15.5% | | | | |
| 8,000 | | Capital One Financial Corp. | | | 594,080 | |
| 13,500 | | Comerica, Inc. | | | 835,785 | |
| 21,500 | | KeyCorp. | | | 767,120 | |
| 6,000 | | SunTrust Banks, Inc. | | | 506,520 | |
| 9,000 | | The PNC Financial Services Group, Inc. | | | 666,900 | |
| 7,500 | | Zions BanCorp. | | | 613,500 | |
| | | | |
| |
| | | | | | 3,983,905 | |
| | | | |
| |
| | | Consumer Financial Services — 7.9% | | | | |
| 8,000 | | CIT Group, Inc. | | | 477,200 | |
| 12,000 | | Fannie Mae (Federal National Mortgage) | | | 707,040 | |
| 13,000 | | Freddie Mac (Federal Home Loan) | | | 842,140 | |
| | | | |
| |
| | | | | | 2,026,380 | |
| | | | |
| |
| | | Insurance - Accident and Health — 3.4% | | | | |
| 35,000 | | Unum Group | | | 870,800 | |
| | | | |
| |
| | | Insurance - Life — 12.9% | | | | |
| 19,000 | | Genworth Financial, Inc., Class A | | | 693,310 | |
| 5,000 | | Lincoln National Corp. | | | 355,750 | |
| 13,500 | | MetLife, Inc. | | | 886,950 | |
| 11,000 | | Principal Financial Group, Inc. | | | 698,390 | |
| 7,000 | | Prudential Financial, Inc. | | | 665,000 | |
| | | | |
| |
| | | | | | 3,299,400 | |
| | | | |
| |
| | | Insurance - Property and Casualty — 23.7% | | | | |
| 10,000 | | ACE Ltd. | | | 594,600 | |
| 9,500 | | American International Group, Inc. | | | 664,145 | |
| 17,500 | | CNA Financial Corp.* | | | 816,725 | |
26
The FBR Funds
FBR Large Cap Financial Fund
Portfolio of Investments (continued)
April 30, 2007
(unaudited)
|
| | | | | | VALUE |
| SHARES | | | | | (NOTE 2) |
|
| | | Insurance - Property and Casualty — 23.7% (continued) | | | | |
| 13,000 | | Loews Corp. | | $ | 615,160 | |
| 7,000 | | MGIC Investment Corp. | | | 431,270 | |
| 9,000 | | Safeco Corp. | | | 600,660 | |
| 13,000 | | The Chubb Corp. | | | 699,790 | |
| 6,000 | | The Hartford Financial Services Group, Inc. | | | 607,200 | |
| 7,000 | | The PMI Group, Inc. | | | 339,290 | |
| 13,000 | | The Travelers Companies, Inc. | | | 703,300 | |
| | | | |
| |
| | | | | | 6,072,140 | |
| | | | |
| |
| | | Investment Services — 13.7% | | | | |
| 14,000 | | Ameriprise Financial, Inc. | | | 832,580 | |
| 8,000 | | Fortress Investment Group, LLC, Class A | | | 232,080 | |
| 7,000 | | Lehman Brothers Holdings, Inc. | | | 526,960 | |
| 6,000 | | Mellon Financial Corp. | | | 257,580 | |
| 6,000 | | Merrill Lynch & Company, Inc. | | | 541,380 | |
| 4,500 | | Morgan Stanley | | | 378,045 | |
| 2,000 | | The Bear Stearns Companies, Inc. | | | 311,400 | |
| 2,000 | | The Goldman Sachs Group, Inc. | | | 437,220 | |
| | | | |
| |
| | | | | | 3,517,245 | |
| | | | |
| |
| | | Real Estate Operations — 3.1% | | | | |
| 50,000 | | Annaly Capital Management, Inc. | | | 795,500 | |
| | | | |
| |
| | | Total Common Stocks (Cost $21,077,376) | | | 23,947,820 | |
| | | | |
| |
| PAR | | | | | | |
| | | | | | |
| | | REPURCHASE AGREEMENT — 10.2% | | | | |
| $2,612,000 | | With Mizuho Securities, Inc. dated 4/30/07 at 5.06% to be repurchased at $2,612,367 on 5/1/07, collateralized by U.S. Treasury Bill, 4.81% due 8/23/07, value $320,044, U.S. Treasury Bond, 7.5% due 11/15/16, value $933,245, U.S. Treasury Notes, interest rates ranging from 5.625% to 6.5%, maturities ranging from 5/15/08 to 2/15/10, value $1,046,176 & $368,019 (Cost $2,612,000) | | | 2,612,000 | |
| | | | |
| |
| | | Total Investments — 103.6% (Cost $23,689,376) | | | 26,559,820 | |
| | | | | | | |
| | | Liabilities Less Other Assets — (3.6%) | | | (926,820 | ) |
| | | | |
| |
| | | Net Assets — 100.0% | | $ | 25,633,000 | |
| | | | |
| |
|
| * | Non-income producing security |
The accompanying notes are an integral part of the financial statements.
27
| The FBR Funds |
|
| FBR Large Cap Technology Fund |
| Management Overview |
Portfolio Managers: David Ellison and Winsor Aylesworth
How did the Fund perform?
For the six month period ended April 30, 2007, the FBR Large Cap Technology Fund appreciated 5.85%. This compares to the S&P 500 Index, the Lipper Science & Technology Fund Index and the NASDAQ Composite Index which returned 8.60%, 8.28% and 7.10% for the same period respectively.
What factors contributed to the Fund’s performance?
For the first time in a long time the Fund under performed against its various benchmarks and peers. The Fund’s positions in the semiconductor industry, our largest exposure to an individual sector, detracted from overall performance. Short-term oversupply issues led to a very competitive pricing environment. This resulted in some disappointing earnings and revised expectations for the future growth by certain companies. Because of this, the stock prices remained flat or retracted during the reporting period.
As disappointing as these short-term results may be to shareholders, we should take comfort that the Fund’s investment philosophy of only investing in established large-cap technology companies with minimal debt and a history of growing book value continues to allow us to keep focused on the long-term and take advantage of any “price correction” periods.
What is the outlook for the Fund and the technology sector?
The technology sector continues to be driven by the consumer’s desire for the newest and greatest “gadget”. To that end, we await the delivery of the new Apple iPhone and wonder whether they will be as successful in the wireless handset market as they were with the introduction of the iPod. The release of Microsoft Windows Vista has been met by mixed reviews but, due to Microsoft’s dominance in the PC market, it can not be ignored.
On a larger scale, the world is talking more and more about certain issues that should continue to drive technological growth and innovation. The current main topic is global warming. Technology solutions will be sought to allow for energy efficient alternatives to any product that currently relies on fossil fuels and could be deemed to be polluting. “Green” technology is a powerful trend that will be with us for a long-time. We continue to believe that the large-cap technology companies best-suited to benefit from these trends have a capital structure that will allow them to invest in research and development or have a track record of profitably integrating acquisitions to drive their growth. Companies that exhibit these types of characteristics form the mantra for your Fund’s investment philosophy.
28
| The FBR Funds |
|
| FBR Large Cap Technology Fund |
| Management Overview (continued) |
As fellow shareholders, we remain confident that our investment process has positioned the Fund for continued growth as we head into the back half of our fiscal year.
The opinions expressed in this commentary reflect those of the Portfolio Manager(s) as of the date written. Any such opinions are subject to change based on market or other conditions. These opinions may not be relied upon as investment advice. Investment decisions for The FBR Funds are based on several factors, and may not be relied upon as an indication of trading intent on behalf of any FBR Fund. Security positions can and do change.
29
| The FBR Funds |
|
| FBR Large Cap Technology Fund |
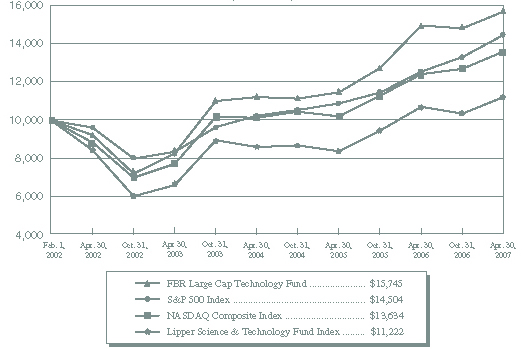
Comparison of Changes in Value of $10,000 Investment in
Fund Shares(1)(2) vs. Various Indices(1)(3)
(unaudited)
| |
| Total Returns—For the Periods Ended April 30, 2007(4) |
| | | | | | | | | Annualized | |
| | | | | | Annualized | | Since | |
| | | One Year | | Five Year | | Inception(5) | |
| | |
| |
| |
| |
| FBR Large Cap Technology Fund(1)(2) | | 4.80 | % | | 11.27 | % | | 9.05 | % | |
| S&P 500 Index(1)(3) | | 15.24 | % | | 8.53 | % | | 7.34 | % | |
| NASDAQ Composite Index(1)(3) | | 9.49 | % | | 9.05 | % | | 6.09 | % | |
| Lipper Science & Technology Fund Index(1)(3) | | 4.65 | % | | 5.89 | % | | 2.22 | % | |
| |
PAST PERFORMANCE IS NO GUARANTEE OF FUTURE RESULTS.
The performance data quoted represents past performance and the current performance may be lower or higher. The investment return and principal will fluctuate so that investors’ shares, when redeemed, may be worth more or less than their original cost. To obtain performance data current to the most recent month-end, please call 888.200.4710 or visit www.fbrfunds.com.
| (1) | | The graph assumes a hypothetical $10,000 initial investment in the Fund and reflects the reinvestment of dividends and all Fund expenses. Investors should note that the Fund is a professionally managed mutual fund while the indices are unmanaged, do not incur expenses and are not available for investment. The performance of the indices includes reinvested dividends, and does not reflect sales charges or expenses, except for the Lipper Science & Technology Fund Index which reflects fund expenses. |
| (2) | | FBR Fund Advisers, Inc. waived a portion of its advisory fees and agreed to contractually reimburse a portion of the Fund’s operating expenses, as necessary, to maintain existing expense limitations, as set forth in the notes to the financial statements. Total returns shown include fee waivers and expense reimbursements, if any; total returns would have been lower had there been no waiver of fees and/or reimbursement of expenses in excess of expense limitations. |
| (3) | | S&P 500 Index is a capitalization-weighted index of 500 stocks. The index is designed to represent the broad domestic economy through changes in aggregate market value of 500 stocks representing all major industries. The NASDAQ Composite Index is a broad-based capitalization-weighted index of all NASDAQ National Market and Small Cap stocks. The Lipper Technology & Science Fund Index is an equally weighted index of the largest thirty funds within the science and technology fund classification as defined by Lipper Inc. The index is rebalanced quarterly. Lipper Analytical Services, Inc., is a nationally recognized organization that reports on mutual fund total return performance and calculates fund rankings. Each Lipper Average is based on a universe of funds with similar investment objectives. |
| (4) | | The total returns shown do not reflect the deduction of taxes that a shareholder would pay on fund distributions or the redemption of fund shares. |
| (5) | | For the period February 1, 2002 (commencement of investment operations) through April 30, 2007. |
30
The FBR Funds
FBR Large Cap Technology Fund
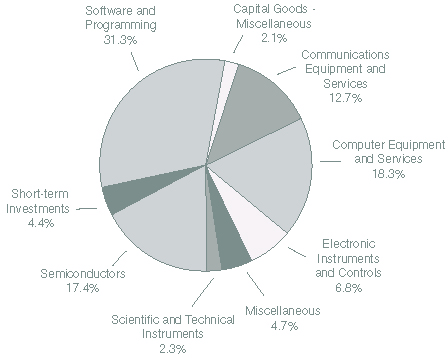
Portfolio Summary
April 30, 2007
(unaudited)
The following chart provides a visual breakdown of the Fund by industry sectors. The underlying securities represent a percentage of the portfolio investments.
31
The FBR Funds
FBR Large Cap Technology Fund
Portfolio of Investments
April 30, 2007
(unaudited)
|
| | | | | | | VALUE | |
| | SHARES | | | | | (NOTE 2) | |
|
| | | | COMMON STOCKS — 89.3% | | | | |
| | | | Aerospace and Defense — 0.2% | | | | |
| | 650 | | Precision Castparts Corp. | | $ | 67,672 | |
| | | | | |
| |
| | | | Audio and Video Equipment — 7.0% | | | | |
| | 70,100 | | Matsushita Electric Industrial Company Ltd. ADR | | | 1,362,043 | |
| | 22,900 | | Sony Corp. ADR | | | 1,219,654 | |
| | | | | |
| |
| | | | | | | 2,581,697 | |
| | | | | |
| |
| | | | Auto and Truck Parts — 1.1% | | | | |
| | 4,200 | | Autoliv, Inc. | | | 244,230 | |
| | 2,200 | | BorgWarner, Inc. | | | 171,402 | |
| | | | | |
| |
| | | | | | | 415,632 | |
| | | | | |
| |
| | | | Biotechnology and Drugs — 8.1% | | | | |
| | 6,100 | | AstraZeneca PLC ADR | | | 331,291 | |
| | 1,500 | | Barr Pharmaceuticals, Inc.* | | | 72,540 | |
| | 1,000 | | Biovail Corp. | | | 24,390 | |
| | 9,400 | | Eli Lilly and Co. | | | 555,822 | |
| | 2,000 | | Endo Pharmaceuticals Holdings, Inc.* | | | 61,880 | |
| | 2,000 | | King Pharmaceuticals, Inc.* | | | 40,900 | |
| | 3,000 | | Mylan Laboratories, Inc. | | | 65,790 | |
| | 13,005 | | Novartis AG ADR | | | 755,460 | |
| | 2,500 | | Novo Nordisk A/S ADR | | | 246,025 | |
| | 14,600 | | Pfizer, Inc. | | | 386,316 | |
| | 3,000 | | Watson Pharmaceuticals, Inc.* | | | 81,900 | |
| | 6,800 | | Wyeth | | | 377,400 | |
| | | | | |
| |
| | | | | | | 2,999,714 | |
| | | | | |
| |
| | | | Business Services — 0.4% | | | | |
| | 4,500 | | Hewitt Associates, Inc., Class A* | | | 133,875 | |
| | | | | |
| |
| | | | Capital Goods - Miscellaneous — 5.0% | | | | |
| | 5,700 | | Cummins, Inc. | | | 525,312 | |
| | 17,300 | | Hitachi Ltd. ADR | | | 1,313,762 | |
| | | | | |
| |
| | | | | | | 1,839,074 | |
| | | | | |
| |
| | | | Communications Equipment — 11.3% | | | | |
| | 22,100 | | Alcatel-Lucent ADR | | | 292,825 | |
| | 20,300 | | Avaya, Inc.* | | | 262,276 | |
32
The FBR Funds
FBR Large Cap Technology Fund
Portfolio of Investments (continued)
April 30, 2007
(unaudited)
|
| | | | | | | VALUE | |
| | SHARES | | | | | (NOTE 2) | |
|
| | | | Communications Equipment — 11.3% (continued) | | | | |
| | 19,300 | | Corning, Inc.* | | $ | 457,796 | |
| | 1,300 | | F5 Networks, Inc.* | | | 99,814 | |
| | 29,367 | | LM Ericsson Telephone Co. ADR | | | 1,120,938 | |
| | 28,500 | | Motorola, Inc. | | | 493,905 | |
| | 44,400 | | Nokia Corp. ADR | | | 1,121,100 | |
| | 31,200 | | Tellabs, Inc.* | | | 331,344 | |
| | | | | |
| |
| | | | | | | 4,179,998 | |
| | | | | |
| |
| | | | Communications Services — 1.2% | | | | |
| | 4,100 | | Telephone and Data Systems, Inc. | | | 233,495 | |
| | 2,800 | | United States Cellular Corp.* | | | 203,000 | |
| | | | | |
| |
| | | | | | | 436,495 | |
| | | | | |
| |
| | | | Computer Hardware — 5.3% | | | | |
| | 9,500 | | Apple Computer, Inc.* | | | 948,100 | |
| | 9,000 | | Ingram Micro, Inc., Class A* | | | 176,580 | |
| | 162,000 | | Sun Microsystems, Inc.* | | | 845,640 | |
| | | | | |
| |
| | | | | | | 1,970,320 | |
| | | | | |
| |
| | | | Computer Networks — 1.7% | | | | |
| | 2,900 | | Cerner Corp.* | | | 154,396 | |
| | 4,100 | | Convergys Corp.* | | | 103,566 | |
| | 6,382 | | Dassault Systemes S.A. ADR | | | 379,091 | |
| | | | | |
| |
| | | | | | | 637,053 | |
| | | | | |
| |
| | | | Computer Peripherals — 5.3% | | | | |
| | 24,975 | | Canon, Inc. ADR | | | 1,403,595 | |
| | 5,400 | | Lexmark International, Inc., Class A* | | | 294,300 | |
| | 10,500 | | Logitech International S.A.* | | | 282,555 | |
| | | | | |
| |
| | | | | | | 1,980,450 | |
| | | | | |
| |
| | | | Computer Services — 2.7% | | | | |
| | 20,000 | | Electronic Data Systems Corp. | | | 584,800 | |
| | 600 | | Google, Inc., Class A* | | | 282,828 | |
| | 3,900 | | Total System Services, Inc. | | | 121,134 | |
| | | | | |
| |
| | | | | | | 988,762 | |
| | | | | |
| |
| | | | Computer Storage Devices — 0.7% | | | | |
| | 4,900 | | Computer Sciences Corp.* | | | 272,146 | |
| | | | | |
| |
33
The FBR Funds
FBR Large Cap Technology Fund
Portfolio of Investments (continued)
April 30, 2007
(unaudited)
|
| | | | | | | VALUE | |
| | SHARES | | | | | (NOTE 2) | |
|
| | | | Conglomerates — 5.8% | | | | |
| | 15,500 | | ABB Ltd. ADR | | $ | 309,380 | |
| | 27,500 | | Koninklijke Philips Electronics N.V. NYS | | | 1,128,600 | |
| | 21,800 | | Tyco International Ltd. | | | 711,334 | |
| | | | | |
| |
| | | | | | | 2,149,314 | |
| | | | | |
| |
| | | | Electronic Instruments and Controls — 4.8% | | | | |
| | 6,600 | | Arrow Electronics, Inc.* | | | 260,832 | |
| | 8,500 | | Avnet, Inc.* | | | 347,650 | |
| | 23,600 | | Molex, Inc. | | | 705,168 | |
| | 5,425 | | TDK Corp. ADR | | | 469,263 | |
| | | | | |
| |
| | | | | | | 1,782,913 | |
| | | | | |
| |
| | | | IT Consulting and Other Services — 0.2% | | | | |
| | 1,000 | | Cognizant Technology Solutions Corp., Class A* | | | 89,400 | |
| | | | | |
| |
| | | | Medical Equipment and Supplies — 1.7% | | | | |
| | 3,300 | | Respironics, Inc.* | | | 134,508 | |
| | 5,900 | | Stryker Corp. | | | 383,146 | |
| | 2,500 | | Varian Medical Systems, Inc.* | | | 105,525 | |
| | | | | |
| |
| | | | | | | 623,179 | |
| | | | | |
| |
| | | | Office Equipment — 2.3% | | | | |
| | 45,300 | | Xerox Corp.* | | | 838,050 | |
| | | | | |
| |
| | | | Personal and Household Products — 1.7% | | | | |
| | 10,600 | | McKesson Corp. | | | 623,598 | |
| | | | | |
| |
| | | | Photography — 2.7% | | | | |
| | 24,434 | | FUJIFILM Holdings Corp. ADR | | | 999,106 | |
| | | | | |
| |
| | | | Printing and Publishing — 0.2% | | | | |
| | 2,500 | | NAVTEQ Corp.* | | | 88,400 | |
| | | | | |
| |
| | | | Scientific and Technical Instruments — 1.4% | | | | |
| | 7,000 | | Applera Corp. - Applied Biosystems Group | | | 218,680 | |
| | 2,000 | | Hillenbrand Industries, Inc. | | | 122,300 | |
| | 4,500 | | Pall Corp. | | | 188,775 | |
| | | | | |
| |
| | | | | | | 529,755 | |
| | | | | |
| |
34
The FBR Funds
FBR Large Cap Technology Fund
Portfolio of Investments (continued)
April 30, 2007
(unaudited)
|
| | | | | | | VALUE | |
| | SHARES | | | | | (NOTE 2) | |
|
| | | | Semiconductors — 16.4% | | | | |
| | 9,000 | | ASML Holding N.V. NYS* | | $ | 245,250 | |
| | 8,400 | | Broadcom Corp., Class A* | | | 273,420 | |
| | 9,800 | | Flextronics International Ltd.* | | | 109,270 | |
| | 59,600 | | Infineon Technologies AG ADR* | | | 925,588 | |
| | 2,475 | | KLA-Tencor Corp. | | | 137,486 | |
| | 6,150 | | Kyocera Corp. ADR | | | 599,625 | |
| | 4,803 | | Lam Research Corp.* | | | 258,305 | |
| | 31,200 | | LSI Logic Corp.* | | | 265,200 | |
| | 11,300 | | Marvell Technology Group Ltd.* | | | 182,269 | |
| | 11,100 | | Maxim Integrated Products, Inc. | | | 352,092 | |
| | 6,200 | | Microchip Technology, Inc. | | | 250,108 | |
| | 65,650 | | Micron Technology, Inc.* | | | 753,006 | |
| | 6,800 | | Novellus Systems, Inc.* | | | 220,116 | |
| | 5,650 | | NVIDIA Corp.* | | | 185,829 | |
| | 16,600 | | Qimonda AG ADR* | | | 244,020 | |
| | 51,100 | | STMicroelectronics N.V. NYS | | | 994,406 | |
| | 8,304 | | Taiwan Semiconductor Manufacturing Company Ltd. ADR | | | 87,524 | |
| | | | | |
| |
| | | | | | | 6,083,514 | |
| | | | | |
| |
| | | | Software and Programming — 2.1% | | | | |
| | 14,000 | | BEA Systems, Inc.* | | | 165,060 | |
| | 4,500 | | Cognos, Inc.* | | | 193,995 | |
| | 10,000 | | Compuware Corp.* | | | 98,700 | |
| | 7,500 | | KONAMI Corp. ADR | | | 202,500 | |
| | 4,100 | | Trend Micro, Inc. ADR | | | 128,002 | |
| | | | | |
| |
| | | | | | | 788,257 | |
| | | | | |
| |
| | | | Total Common Stocks (Cost $31,430,126) | | | 33,098,374 | |
| | | | | |
| |
35
The FBR Funds
FBR Large Cap Technology Fund
Portfolio of Investments (continued)
April 30, 2007
(unaudited)
|
| | | | | | | VALUE | |
| | PAR | | | | | (NOTE 2) | |
|
| | | | REPURCHASE AGREEMENT — 9.5% | | | | |
| $ | 3,505,000 | | With Mizuho Securities, Inc. dated 4/30/07 at 5.06% to be repurchased at $3,505,493 on 5/1/07, collateralized by U.S. Treasury Bill, 4.81% due 8/23/07, value $429,461, U.S. Treasury Bond, 7.5% due 11/15/16, value $1,252,307, U.S. Treasury Notes, interest rates ranging from 5.625% to 6.5%, maturities ranging from 5/15/08 to 2/15/10, value $1,403,846 & $493,839 (Cost $3,505,000) | | $ | 3,505,000 | |
| | | | | |
| |
| | | | | | | | |
| | | | Total Investments — 98.8% (Cost $34,935,126) | | | 36,603,374 | |
| | | | | | | | |
| | | | Other Assets Less Liabilities — 1.2% | | | 458,113 | |
| | | | | |
| |
| | | | Net Assets — 100.0% | | $ | 37,061,487 | |
| | | | | |
| |
| * | | Non-income producing security |
| ADR | | American Depositary Receipts |
| NYS | | New York Shares |
The accompanying notes are an integral part of the financial statements.
36
| The FBR Funds |
|
| FBR Small Cap Fund |
| Management Review |
Investment Sub Adviser: Akre Capital Management, LLC
Portfolio Manager: Charles T. Akre, Jr.
At the end of our 2006 fiscal year we wrote to you, our fellow shareholders, about our ten-year record, and more importantly the thought process which we believe is responsible for our better than average results. You also know by now, the Trustees of the Fund authorized it’s reopening at the first of this calendar year. Since that time the Fund has had net inflows in excess of five hundred and fifty million dollars. We at Akre Capital Management (the Fund’s Sub Adviser) have been surprised and flattered by this huge inflow of capital, and take very seriously our mandate to invest it well.
It will come as no surprise to you that our ability to put all this money to work quickly is limited at times by the overall level of valuations in the small cap arena. We will put the new funds to work as appropriate opportunities arise, using our long held and well recounted principles of investing. Please refer to the 2006 annual letter for an in-depth review of these principles; our view is unchanged as we write this semi-annual letter to you.
While the Fund is up around five percent through the middle of May, it nevertheless is behind the broader market. We would not be surprised to see the Fund’s performance “lag” should the market continue its upward momentum. Conversely, the Fund may do relatively better should we encounter a declining market, as our cash “gives us an anchor” and provides us with the where-with-all to take advantage of opportunities which might appear. We truly don’t know which outcome is more likely, so as you now expect from us, we just continue to search for outstanding businesses to own in our portfolio.
We have been busy during the last few months with annual meetings, annual reports, and other company visits. This is what we love to do, working this treasure hunt for the exceptional companies. It is likely that we will request that the Trustees consider closing the fund to new investors in the not distant future, so that those of us who have been long-term shareholders are not overly burdened by the new capital.
The opinions expressed in this commentary reflect those of the Portfolio Manager(s) as of the date written. Any such opinions are subject to change based on market or other conditions. These opinions may not be relied upon as investment advice. Investment decisions for The FBR Funds are based on several factors, and may not be relied upon as an indication of trading intent on behalf of any FBR Fund. Security positions can and do change.
37
| The FBR Funds |
|
| FBR Small Cap Fund |
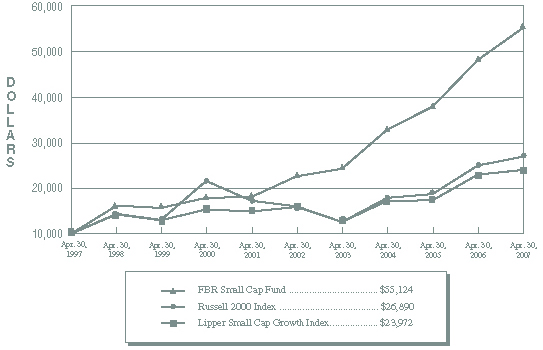
Comparison of Changes in Value of $10,000 Investment in
Fund Shares(1)(2) vs. Various Indices(1)(3)
(unaudited)
| |
| Total Returns—For the Periods Ended April 30, 2007(4) |
| | | | | | | Annualized | | Annualized | |
| | | | One Year | | Five Year | | Ten Year | |
| | | |
| |
| |
| |
| FBR Small Cap Fund(1)(2) | | | 14.65 | % | | 19.53 | % | | 18.61 | % | |
| Russell 2000 Index(1)(3) | | | 7.83 | % | | 11.14 | % | | 10.40 | % | |
| Lipper Small Cap Growth Index(1)(3) | | | 4.55 | % | | 8.45 | % | | 9.14 | % | |
| |
PAST PERFORMANCE IS NO GUARANTEE OF FUTURE RESULTS.
The performance data quoted represents past performance and the current performance may be lower or higher. The investment return and principal will fluctuate so that investors’ shares, when redeemed, may be worth more or less than their original cost. To obtain performance data current to the most recent month-end, please call 888.200.4710 or visit www.fbrfunds.com.
| (1) | | The graph assumes a hypothetical $10,000 initial investment in the Fund and reflects the reinvestment of dividends and all Fund expenses. Investors should note that the Fund is a professionally managed mutual fund while the indices are unmanaged, do not incur expenses and are not available for investment. The performance of the indices includes reinvested dividends, and does not reflect sales charges or expenses, except for the Lipper Small Cap Growth Index which reflects fund expenses. |
| (2) | | FBR Fund Advisers, Inc. waived a portion of its advisory fees and agreed to contractually reimburse a portion of the Fund’s operating expenses, as necessary, to maintain existing expense limitations, as set forth in the notes to the financial statements. Total returns shown include fee waivers and expense reimbursements, if any; total returns would have been lower had there been no waiver of fees and/or reimbursement of expenses in excess of expense limitations. |
| (3) | | Russell 2000 Index is comprised of the smallest of the 2000 companies of the Russell 3000 Index, representing approximately 8% of the Russell 3000’s total market-capitalization. The Lipper Small Cap Growth Index is an equally weighted index of the largest thirty funds within the small-cap fund classification as defined by Lipper Inc. The index is rebalanced quarterly. Lipper Analytical Services, Inc., is a nationally recognized organization that reports on mutual fund total return performance and calculates fund rankings. Each Lipper Average is based on a universe of funds with similar investment objectives. |
| (4) | | The total returns shown do not reflect the deduction of taxes that a shareholder would pay on fund distributions or the redemption of fund shares. |
38
The FBR Funds
FBR Small Cap Fund
Portfolio Summary
April 30, 2007
(unaudited)
The following chart provides a visual breakdown of the Fund by industry sectors. The underlying securities represent a percentage of the portfolio investments.
39
The FBR Funds
FBR Small Cap Fund
Portfolio of Investments
April 30, 2007
(unaudited)
|
| | | | | | | VALUE | |
| | SHARES | | | | | (NOTE 2) | |
|
| | | | COMMON STOCKS — 68.1% | | | | |
| | | | Banks - Regional — 0.1% | | | | |
| | 50,000 | | Bank of Florida Corp.* | | $ | 925,000 | |
| | | | | |
| |
| | | | Biotechnology and Drugs — 0.3% | | | | |
| | 228,100 | | Bradley Pharmaceuticals, Inc.* | | | 4,477,603 | |
| | | | | |
| |
| | | | Business Services — 0.3% | | | | |
| | 183,200 | | Iron Mountain, Inc.* | | | 5,147,920 | |
| | | | | |
| |
| | | | Casinos and Gaming — 20.6% | | | | |
| | 1,600,000 | | Bally Technologies, Inc.* | | | 37,440,000 | |
| | 20,000 | | International Game Technology | | | 762,800 | |
| | 555,943 | | Isle of Capri Casinos, Inc.* | | | 13,587,247 | |
| | 992,000 | | Monarch Casino & Resort, Inc.* † | | | 26,456,640 | |
| | 4,100,000 | | Penn National Gaming, Inc.* | | | 198,193,999 | |
| | 1,621,407 | | Pinnacle Entertainment, Inc.* | | | 45,529,109 | |
| | 157,500 | | Shuffle Master, Inc.* | | | 2,682,225 | |
| | 234,861 | | Station Casinos, Inc. | | | 20,432,907 | |
| | | | | |
| |
| | | | | | | 345,084,927 | |
| | | | | |
| |
| | | | Communications Services — 9.3% | | | | |
| | 4,107,256 | | American Tower Corp., Class A* | | | 156,075,728 | |
| | | | | |
| |
| | | | Construction - Supplies and Fixtures — 3.2% | | | | |
| | 730,850 | | American Woodmark Corp. | | | 25,221,634 | |
| | 902,300 | | Simpson Manufacturing Company, Inc. | | | 29,026,991 | |
| | | | | |
| |
| | | | | | | 54,248,625 | |
| | | | | |
| |
| | | | Construction Services — 1.8% | | | | |
| | 566,666 | | D.R. Horton, Inc. | | | 12,568,652 | |
| | 600,000 | | Toll Brothers, Inc.* | | | 17,868,000 | |
| | | | | |
| |
| | | | | | | 30,436,652 | |
| | | | | |
| |
| | | | Consumer Financial Services — 2.1% | | | | |
| | 1,350,000 | | AmeriCredit Corp.* | | | 34,060,500 | |
| | 28,200 | | White River Capital, Inc.* | | | 673,980 | |
| | | | | |
| |
| | | | | | | 34,734,480 | |
| | | | | |
| |
40
The FBR Funds
FBR Small Cap Fund
Portfolio of Investments (continued)
April 30, 2007
(unaudited)
|
| | | | | | | VALUE | |
| | SHARES | | | | | (NOTE 2) | |
|
| | | | Electric Utilities — 1.3% | | | | |
| | 1,000,000 | | The AES Corp.* | | $ | 21,990,000 | |
| | | | | |
| |
| | | | Electronic Instruments and Controls — 0.8% | | | | |
| | 200,000 | | WESCO International, Inc.* | | | 12,634,000 | |
| | | | | |
| |
| | | | Insurance - Miscellaneous — 1.1% | | | | |
| | 50,000 | | Brown & Brown, Inc. | | | 1,287,500 | |
| | 393,500 | | Hilb Rogal and Hobbs Co. | | | 17,097,575 | |
| | | | | |
| |
| | | | | | | 18,385,075 | |
| | | | | |
| |
| | | | Insurance - Property and Casualty — 8.3% | | | | |
| | 80 | | Berkshire Hathaway, Inc., Class B* | | | 290,240 | |
| | 1,385,600 | | Flagstone Reinsurance Holdings Ltd.* | | | 18,567,040 | |
| | 61,000 | | Investors Title Co. | | | 2,924,340 | |
| | 255,400 | | Markel Corp.* | | | 117,205,614 | |
| | | | | |
| |
| | | | | | | 138,987,234 | |
| | | | | |
| |
| | | | Office Equipment — 1.9% | | | | |
| | 1,085,400 | | Global Imaging Systems, Inc.* | | | 31,357,206 | |
| | | | | |
| |
| | | | Oil and Gas Operations — 2.4% | | | | |
| | 397,890 | | MarkWest Hydrocarbon, Inc. | | | 23,809,738 | |
| | 211,800 | | Penn Virginia Corp. | | | 16,954,590 | |
| | | | | |
| |
| | | | | | | 40,764,328 | |
| | | | | |
| |
| | | | Real Estate Operations — 0.4% | | | | |
| | 500,225 | | Affordable Residential Communities, Inc.* | | | 5,867,639 | |
| | | | | |
| |
| | | | Recreational Activities — 0.4% | | | | |
| | 603,800 | | Dover Motorsports, Inc. | | | 3,387,318 | |
| | 60,000 | | International Speedway Corp., Class A | | | 2,964,000 | |
| | 19,000 | | International Speedway Corp., Class B | | | 940,500 | |
| | | | | |
| |
| | | | | | | 7,291,818 | |
| | | | | |
| |
| | | | Recreational Products — 3.6% | | | | |
| | 1,500,000 | | Pool Corp. | | | 60,195,000 | |
| | | | | |
| |
| | | | Retail - Specialty — 8.9% | | | | |
| | 3,445,336 | | 99 Cents Only Stores* | | | 49,268,305 | |
| | 107,900 | | Big 5 Sporting Goods Corp. | | | 2,762,240 | |
41
The FBR Funds
FBR Small Cap Fund
Portfolio of Investments (continued)
April 30, 2007
(unaudited)
|
| | | | | | | VALUE | |
| | SHARES | | | | | (NOTE 2) | |
|
| | | | Retail - Specialty — 8.9% (continued) | | | | |
| | 3,000,000 | | CarMax, Inc.* | | $ | 74,759,999 | |
| | 598,846 | | O’Reilly Automotive, Inc.* | | | 21,318,918 | |
| | | | | |
| |
| | | | | | | 148,109,462 | |
| | | | | |
| |
| | | | Software and Programming — 0.2% | | | | |
| | 80,000 | | Blackbaud, Inc. | | | 1,766,400 | |
| | 32,000 | | MICROS Systems, Inc.* | | | 1,753,600 | |
| | | | | |
| |
| | | | | | | 3,520,000 | |
| | | | | |
| |
| | | | Transportation Services — 0.8% | | | | |
| | 490,680 | | Dynamex, Inc.* | | | 12,880,350 | |
| | | | | |
| |
| | | | Trucking — 0.3% | | | | |
| | 243,140 | | Knight Transportation, Inc. | | | 4,733,936 | |
| | | | | |
| |
| | | | Total Common Stocks (Cost $613,554,064) | | | 1,137,846,983 | |
| | | | | |
| |
| | | | PREFERRED STOCK — 0.3% | | | | |
| | | | Insurance - Life — 0.3% | | | | |
| | 200,000 | | ING Groep N.V., 6.125% (Cost $5,000,000) | | | 5,030,000 | |
| | | | | |
| |
| | PAR | | | | | | |
| | | | | | |
| | | | REPURCHASE AGREEMENT — 31.4% | | | | |
| $ | 525,352,000 | | With Mizuho Securities, Inc. dated 4/30/07 at 5.06% to be repurchased at $525,425,841 on 5/1/07, collateralized by U.S. Treasury Bill, 4.81% due 8/23/07, value $64,370,421, U.S. Treasury Bond, 7.5% due 11/15/16, value $187,703,795, U.S. Treasury Notes, interest rates ranging from 5.625% to 6.5%, maturities ranging from 5/15/08 to 2/15/10, value $210,417,460 & $74,019,765 (Cost $525,352,000) | | | 525,352,000 | |
| | | | | |
| |
| | | | Total Investments — 99.8% (Cost $1,143,906,064) | | | 1,668,228,983 | |
| | | | | | | | |
| | | | Other Assets Less Liabilities — 0.2% | | | 2,991,312 | |
| | | | | |
| |
| | | | Net Assets — 100.0% | | $ | 1,671,220,295 | |
| | | | | |
| |
| * | | Non-income producing security |
| † | | Affiliated issuer as defined in the Investment Company Act of 1940 (ownership of at least 5% of the outstanding voting securities of an issuer) |
| Note: | | For presentation purposes, the Fund has grouped some of the industry categories. For purposes of categorizing securities for compliance with Section 8(b)(1) of the Investment Company Act of 1940, the Fund uses more specific industry classifications. |
The accompanying notes are an integral part of the financial statements.
42
The FBR Funds
FBR Small Cap Financial Fund
Management Overview
Portfolio Manager: David Ellison
How did the Fund perform?
For the six months ended April 30, 2007, the FBR Small Cap Financial Fund returned -5.32%. This compares to the Lipper Financial Services Fund Index and the Russell 2000 Index, which returned 5.02% and 6.38% for the same period respectively.
What factors contributed to the Fund’s performance?
The operating environment over the last couple years has been difficult for small-cap financial stocks. The last six months in particular have become even more challenging. The flat yield curve has persisted, loan volumes continue to decline and concerns have developed regarding credit conditions in the residential housing market. While the Fund has no direct investments in subprime lenders, the portfolio was negatively impacted by association during the reporting period. While I am not satisfied with the Fund’s recent performance, I continue to believe that well-run small-cap banks and thrifts offer investors the potential for future gains as these numerous negatives outlined above are ultimately resolved by the capital markets in general and by company managements in particular.
What is the outlook for the Fund and the financial services sector?
Small-cap financial stocks are currently fighting three EPS (earnings per share) headwinds. These include pressure on lending profit margins, lower loan volumes and increasing costs related to bad debt. Lending profit margins continue to be impacted by the flat yield curve. Loan volumes have declined in-part because of tightened lending standards, a general decline in the demand for housing, and reduced refinancing activity. Bad debt costs have increased recently from record low levels as the slowdown in the housing market has increased delinquencies.
The performance of the Fund will continue to reflect fundamental conditions within the industry. Our goal, as in the past, is to construct a portfolio of companies that I believe offers protection against the downside in difficult times and provides the best chance to out perform as these EPS headwinds eventually abate over time.
The opinions expressed in this commentary reflect those of the Portfolio Manager(s) as of the date written. Any such opinions are subject to change based on market or other conditions. These opinions may not be relied upon as investment advice. Investment decisions for The FBR Funds are based on several factors, and may not be relied upon as an indication of trading intent on behalf of any FBR Fund. Security positions can and do change.
43
The FBR Funds
FBR Small Cap Financial Fund
Comparison of Changes in Value of $10,000 Investment in
Fund Shares(1)(2) vs. Various Indices(1)(3)
(unaudited)
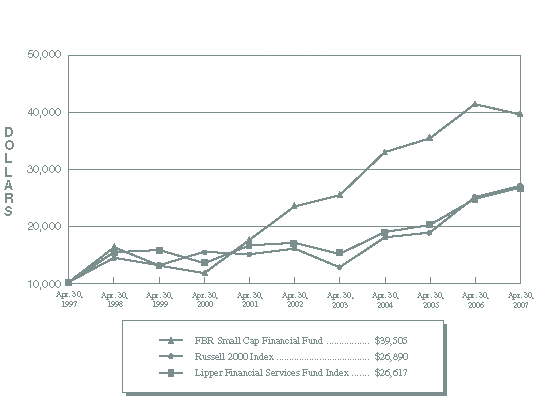
| | Total Returns—For the Periods Ended April 30, 2007(4) | |
| | | | | | | | Annualized | | Annualized | |
| | | | One Year | | Five Year | | Ten Year(5) | |
| | | |
| |
| |
| |
| | FBR Small Cap Financial Fund(1)(2) | | | (4.37 | %) | | | 11.15 | % | | | 14.73 | % | |
| | Russell 2000 Index(1)(3) | | | 7.83 | % | | | 11.14 | % | | | 10.40 | % | |
| | Lipper Financial Services Fund Index(1)(3) | | | 8.13 | % | | | 9.53 | % | | | 10.29 | % | |
PAST PERFORMANCE IS NO GUARANTEE OF FUTURE RESULTS.
The performance data quoted represents past performance and the current performance may be lower or higher. The investment return and principal will fluctuate so that investors’ shares, when redeemed, may be worth more or less than their original cost. To obtain performance data current to the most recent month-end, please call 888.200.4710 or visit www.fbrfunds.com.
|
| (1) | | The graph assumes a hypothetical $10,000 initial investment in the Fund and reflects the reinvestment of dividends and all Fund expenses. Investors should note that the Fund is a professionally managed mutual fund while the indices are unmanaged, do not incur expenses and are not available for investment. The performance of the indices includes reinvested dividends, and does not reflect sales charges or expenses, except for the Lipper Financial Services Fund Index which reflects fund expenses. |
| (2) | | FBR Fund Advisers, Inc. waived a portion of its advisory fees and agreed to contractually reimburse a portion of the Fund’s operating expenses, as necessary, to maintain existing expense limitations, as set forth in the notes to the financial statements. Total returns shown include fee waivers and expense reimbursements, if any; total returns would have been lower had there been no waiver of fees and/or reimbursement of expenses in excess of expense limitations. |
| (3) | | Russell 2000 Index is comprised of the smallest of the 2000 companies of the Russell 3000 Index, representing approximately 8% of the Russell 3000’s total market-capitalization. The Lipper Financial Services Fund Index is an equally weighted index of the largest thirty funds within the financial services fund classification as defined by Lipper Inc. The index is rebalanced quarterly. Lipper Analytical Services, Inc., is a nationally recognized organization that reports on mutual fund total return performance and calculates fund rankings. Each Lipper Average is based on a universe of funds with similar investment objectives. |
| (4) | | The total returns shown do not reflect the deduction of taxes that a shareholder would pay on fund distributions or the redemption of fund shares. |
44
The FBR Funds
FBR Small Cap Financial Fund
Portfolio Summary
April 30, 2007
(unaudited)
The following chart provides a visual breakdown of the Fund by industry sectors. The underlying securities represent a percentage of the portfolio investments.
45
The FBR Funds
FBR Small Cap Financial Fund
Portfolio of Investments
April 30, 2007
(unaudited)
|
| | | | | | VALUE | |
| | SHARES | | | | (NOTE 2) | |
|
| | | | COMMON STOCKS — 94.4% | | | | |
| | | | Banks - Commercial — 16.1% | | | | |
| | 178,811 | | Bancorp Rhode Island, Inc. | | $ | 7,676,356 | |
| | 617,895 | | Bank Mutual Corp. | | | 7,284,982 | |
| | 126,602 | | Banner Corp. | | | 4,724,787 | |
| | 21,900 | | Beverly National Corp. | | | 460,995 | |
| | 24,520 | | Greenville First Bancshares, Inc.* | | | 507,564 | |
| | 160,900 | | ITLA Capital Corp. | | | 8,191,418 | |
| | 67,310 | | Patriot National Bancorp, Inc. | | | 1,527,937 | |
| | 229,948 | | Taylor Capital Group, Inc. | | | 6,838,654 | |
| | 5,000 | | Trustmark Corp. | | | 133,050 | |
| | | | | |
| |
| | | | | | | 37,345,743 | |
| | | | | |
| |
| | | | Consumer Financial Services — 0.3% | | | | |
| | 25,000 | | AmeriCredit Corp.* | | | 630,750 | |
| | | | | |
| |
| | | | Financial Services – Miscellaneous — 0.1% | | | | |
| | 1,976 | | Enstar Group Ltd.* | | | 205,504 | |
| | | | | |
| |
| | | | Insurance - Property and Casualty — 0.5% | | | | |
| | 67,000 | | Affirmative Insurance Holdings, Inc. | | | 1,087,410 | |
| | | | | |
| |
| | | | REITs - Mortgage — 12.3% | | | | |
| | 556,250 | | Annaly Mortgage Management, Inc. | | | 8,849,938 | |
| | 438,850 | | Anworth Mortgage Asset Corp. | | | 4,212,960 | |
| | 148,600 | | Capstead Mortgage Corp. | | | 1,493,430 | |
| | 390,600 | | Luminent Mortgage Capital, Inc. | | | 3,226,356 | |
| | 520,000 | | MFA Mortgage Investments, Inc. | | | 3,796,000 | |
| | 250,000 | | Thornburg Mortgage, Inc. | | | 6,950,000 | |
| | | | | |
| |
| | | | | | | 28,528,684 | |
| | | | | |
| |
| | | | Savings and Loans - Savings Banks - Central — 2.6% | | | | |
| | 70,000 | | Capitol Federal Financial | | | 2,703,400 | |
| | 96,488 | | HMN Financial, Inc. | | | 3,285,416 | |
| | 10,000 | | TFS Financial Corp.* | | | 117,200 | |
| | | | | |
| |
| | | | | | | 6,106,016 | |
| | | | | |
| |
46
The FBR Funds
FBR Small Cap Financial Fund
Portfolio of Investments (continued)
April 30, 2007
(unaudited)
|
| | | | | | VALUE | |
| | SHARES | | | | (NOTE 2) | �� |
|
| | | | Savings and Loans - Savings Banks - East — 22.5% | | | | |
| | 288,725 | | Dime Community Bancshares, Inc. | | $ | 3,842,930 | |
| | 102,461 | | Flushing Financial Corp. | | | 1,593,269 | |
| | 99,148 | | Hingham Institution for Savings | | | 3,295,680 | |
| | 1,548,156 | | Hudson City Bancorp, Inc. | | | 20,621,437 | |
| | 145,000 | | Investors Bancorp, Inc.* | | | 2,073,500 | |
| | 50,921 | | MASSBANK Corp. | | | 1,674,282 | |
| | 20,000 | | Northwest Bancorp, Inc. | | | 545,200 | |
| | 90,000 | | Oritani Financial Corp.* | | | 1,359,900 | |
| | 251,864 | | Parkvale Financial Corp. | | | 7,523,178 | |
| | 331,525 | | People’s United Financial, Inc. | | | 6,600,663 | |
| | 78,188 | | TF Financial Corp. | | | 2,371,051 | |
| | 14,842 | | WSFS Financial Corp. | | | 957,457 | |
| | | | | |
| |
| | | | | | | 52,458,547 | |
| | | | | |
| |
| | | | Savings and Loans - Savings Banks - South — 7.5% | | | | |
| | 541,763 | | BankUnited Financial Corp., Class A | | | 11,729,169 | |
| | 370,084 | | Franklin Bank Corp.* | | | 5,773,310 | |
| | | | | |
| |
| | | | | | | 17,502,479 | |
| | | | | |
| |
| | | | Savings and Loans - Savings Banks - West — 32.5% | | | | |
| | 157,000 | | Downey Financial Corp. | | | 10,511,150 | |
| | 225,000 | | FirstFed Financial Corp.* | | | 13,833,000 | |
| | 75,335 | | Harrington West Financial Group, Inc. | | | 1,265,628 | |
| | 244,060 | | Pacific Premier Bancorp, Inc.* | | | 2,623,645 | |
| | 431,700 | | PFF Bancorp, Inc. | | | 12,148,038 | |
| | 466,000 | | Sterling Financial Corp. | | | 13,737,680 | |
| | 919,734 | | Washington Federal, Inc. | | | 21,806,894 | |
| | | | | |
| |
| | | | | | | 75,926,035 | |
| | | | | |
| |
| | | | Total Common Stocks (Cost $183,197,227) | | | 219,791,168 | |
| | | | | |
| |
47
The FBR Funds
FBR Small Cap Financial Fund
Portfolio of Investments (continued)
April 30, 2007
(unaudited)
|
| | | | | | VALUE | |
| PAR | | | | (NOTE 2) | |
|
| | | | REPURCHASE AGREEMENTS — 6.0% | | | | |
| $ | 13,855,000 | | With Mizuho Securities, Inc. dated 4/30/07 at 5.06% to be repurchased at $13,856,947 on 5/1/07, collateralized by U.S. Treasury Bill, 4.81% due 8/23/07, value $1,697,628, U.S. Treasury Bond, 7.5% due 11/15/16, value $4,950,273, U.S. Treasury Notes, interest rates ranging from 5.625% to 6.5%, maturities ranging from 5/15/08 to 2/15/10, value $5,549,296 & $1,952,108 (Cost $13,855,000) | | $ | 13,855,000 | |
| | | | | |
| |
| | | | Total Investments — 100.4% (Cost $197,052,227) | | | 233,646,168 | |
| | | | | | | | |
| | | | Liabilities Less Other Assets — (0.4%) | | | (992,411 | ) |
| | | | | |
| |
| | | | Net Assets — 100.0% | | $ | 232,653,757 | |
| | | | | |
| |
|
| * | Non-income producing security |
The accompanying notes are an integral part of the financial statements.
48
| The FBR Funds |
|
| FBR Small Cap Technology Fund |
| Management Overview |
Portfolio Manager: Robert C. Barringer, CFA
How did the Fund perform?
For the six months ended April 30, 2007 the FBR Small Cap Technology Fund appreciated 12.52%. This compares to the Lipper Science & Technology Fund Index, the NASDAQ Composite Index, and the Russell 2500 Technology Index which, returned 8.28%, 7.10%, and 9.06% for the same period, respectively.
What factors contributed to the Fund’s performance?
The Fund out performed its relevant benchmarks and indices during the reporting period. Our investment process led us to tilt the portfolio’s weighting towards the software and programming industry. This industry was buoyed by both strong underlying fundamentals as well as numerous merger and acquisition announcements with companies receiving attractive prices. The Fund owned a number of these companies, including Hyperion Solutions, taken over by Oracle and Kronos, which was taken private by an investment fund.
In addition, the Fund was underweight the electronic equipment and instruments industry relative the Russell 2500 Technology Index, which performed well during the reporting period. However, we owned large positions in a handful of high quality companies in this industry that did particularly well, namely Avnet and Arrow Electronics.
What is the outlook for the Fund and the technology sector?
The Fund continues to search for opportunities to invest in companies with strong margins, high returns on equity, solid balance sheets and good cash flow. Most importantly, our attention to valuation keeps us focused on companies we are able to purchase at reasonable prices. There are many exciting opportunities as we look to the foreseeable future in the small-cap technology sector, in continuing to figure out ways to improve productivity, communication, and health. We continue to search for companies with business models leveraged to take advantage of these larger trends using our disciplined process to participate in these opportunities while attempting to protect the downside.
The opinions expressed in this commentary reflect those of the Portfolio Manager(s) as of the date written. Any such opinions are subject to change based on market or other conditions. These opinions may not be relied upon as investment advice. Investment decisions for The FBR Funds are based on several factors, and may not be relied upon as an indication of trading intent on behalf of any FBR Fund. Security positions can and do change.49
| The FBR Funds |
|
| FBR Small Cap Technology Fund |
| |
| Comparison of Changes in Value of $10,000 Investment in |
| Fund Shares(1)(2) vs. Various Indices(1)(3) |
| (unaudited) |
| |
| Total Returns—For the Periods Ended April 30, 2007(4) |
| | | One Year | | Since Inception(5) | |
| | |
| |
| |
| FBR Small Cap Technology Fund(1)(2) | | 11.93 | % | | 7.72 | % | |
| NASDAQ Composite Index(1)(3) | | 9.49 | % | | 5.78 | % | |
| Russell 2500 Technology Index(1)(3) | | 1.70 | % | | 1.38 | % | |
| Lipper Science & Technology Fund Index(1)(3) | | 4.65 | % | | 3.37 | % | |
| |
PAST PERFORMANCE IS NO GUARANTEE OF FUTURE RESULTS.
The performance data quoted represents past performance and the current performance may be lower or higher. The investment return and principal will fluctuate so that investors’ shares, when redeemed, may be worth more or less than their original cost. To obtain performance data current to the most recent month-end, please call 888.200.4710 or visit www.fbrfunds.com.
| (1) | | The graph assumes a hypothetical $10,000 initial investment in the Fund and reflects the reinvestment of dividends and all Fund expenses. Investors should note that the Fund is a professionally managed mutual fund while the indices are unmanaged, do not incur expenses and are not available for investment. The performance of the indices includes reinvested dividends, and does not reflect sales charges or expenses, except for the Lipper Science & Technology Fund Index which reflects fund expenses. |
| (2) | | FBR Fund Advisers, Inc. waived a portion of its advisory fees and agreed to contractually reimburse a portion of the Fund’s operating expenses, as necessary, to maintain existing expense limitations, as set forth in the notes to the financial statements. Total returns shown includes fee waivers and expense reimbursements, if any; total returns would have been lower had there been no waiver of fees and/or reimbursement of expenses in excess of expense limitations. |
| (3) | | The NASDAQ Composite Index is a broad-based capitalization-weighted index of all NASDAQ National Market and Small Cap stocks. The Russell 2500 Technology Index is a capitalization-weighted index of companies that serve the electronics and computer industries or that manufacture products based on the latest applied science. The Lipper Science & Technology Fund Index is an equally weighted index of the largest thirty funds within the science and technology fund classification as defined by Lipper Inc. The index is rebalanced quarterly. Lipper Analytical Services, Inc., is a nationally recognized organization that reports on mutual fund total return performance and calculates fund rankings. Each Lipper Average is based on a universe of funds with similar investment objectives. |
| (4) | | The total returns shown do not reflect the deduction of taxes that a shareholder would pay on fund distributions or the redemption of fund shares. |
| (5) | | For the period January 20, 2004 (commencement of investment operations) through April 30, 2007. |
50
| The FBR Funds |
|
| FBR Small Cap Technology Fund |
| Portfolio Summary |
| April 30, 2007 |
| (unaudited) |
The following chart provides a visual breakdown of the Fund by industry sectors. The underlying securities represent a percentage of the portfolio investments.
51
The FBR Funds
FBR Small Cap Technology Fund
Portfolio of Investments
April 30, 2007
(unaudited)
|
| | | | | | VALUE | |
| | SHARES | | | | (NOTE 2) | |
|
| | | | COMMON STOCKS — 97.2% | | | | |
| | | | Advertising — 1.6% | | | | |
| | 1,400 | | aQuantive, Inc.* | | $ | 42,854 | |
| | 1,100 | | ValueClick, Inc.* | | | 31,460 | |
| | | | | |
| |
| | | | | | | 74,314 | |
| | | | | |
| |
| | | | Biotechnology and Drugs — 1.9% | | | | |
| | 500 | | IDEXX Laboratories, Inc.* | | | 45,085 | |
| | 1,500 | | Meridian Bioscience, Inc. | | | 44,595 | |
| | | | | |
| |
| | | | | | | 89,680 | |
| | | | | |
| |
| | | | Business Services — 2.1% | | | | |
| | 700 | | Forrester Research, Inc.* | | | 18,046 | |
| | 1,000 | | Global Payments, Inc. | | | 37,980 | |
| | 1,000 | | IHS, Inc., Class A* | | | 41,340 | |
| | | | | |
| |
| | | | | | | 97,366 | |
| | | | | |
| |
| | | | Capital Goods - Miscellaneous — 2.1% | | | | |
| | 1,100 | | Graco, Inc. | | | 43,450 | |
| | 975 | | Intermec, Inc.* | | | 21,772 | |
| | 900 | | Zebra Technologies Corp., Class A* | | | 35,811 | |
| | | | | |
| |
| | | | | | | 101,033 | |
| | | | | |
| |
| | | | Chemical Manufacturing — 0.8% | | | | |
| | 1,200 | | Cabot Microelectronics Corp.* | | | 38,568 | |
| | | | | |
| |
| | | | Communications Equipment — 8.1% | | | | |
| | 5,250 | | Andrew Corp.* | | | 57,330 | |
| | 2,300 | | Arris Group, Inc.* | | | 34,086 | |
| | 1,800 | | Coleman Cable, Inc.* | | | 42,300 | |
| | 700 | | CommScope, Inc.* | | | 32,655 | |
| | 1,500 | | Comverse Technology, Inc.* | | | 34,020 | |
| | 7,575 | | Foundry Networks, Inc.* | | | 114,534 | |
| | 800 | | NETGEAR, Inc.* | | | 26,888 | |
| | 5,000 | | Sonus Networks, Inc.* | | | 38,650 | |
| | | | | |
| |
| | | | | | | 380,463 | |
| | | | | |
| |
| | | | Communications Services — 3.4% | | | | |
| | 2,100 | | Cbeyond, Inc.* | | | 73,038 | |
| | 3,000 | | j2 Global Communications, Inc.* | | | 86,280 | |
| | | | | |
| |
| | | | | | | 159,318 | |
| | | | | |
| |
52
The FBR Funds
FBR Small Cap Technology Fund
Portfolio of Investments (continued)
April 30, 2007
(unaudited)
|
| | | | | | VALUE | |
| | SHARES | | | | (NOTE 2) | |
|
| | | | Computer Hardware — 2.9% | | | | |
| | 1,200 | | Agilysys, Inc. | | $ | 25,236 | |
| | 2,800 | | Ingram Micro, Inc., Class A* | | | 54,936 | |
| | 1,800 | | MIPS Technologies, Inc.* | | | 15,444 | |
| | 1,100 | | Tech Data Corp.* | | | 39,094 | |
| | | | | |
| |
| | | | | | | 134,710 | |
| | | | | |
| |
| | | | Computer Networks — 5.7% | | | | |
| | 3,675 | | Convergys Corp.* | | | 92,831 | |
| | 600 | | F5 Networks, Inc.* | | | 46,068 | |
| | 2,800 | | Jack Henry & Associates, Inc. | | | 66,500 | |
| | 2,000 | | Sykes Enterprises, Inc.* | | | 36,920 | |
| | 1,300 | | SYNNEX Corp.* | | | 25,415 | |
| | | | | |
| |
| | | | | | | 267,734 | |
| | | | | |
| |
| | | | Computer Peripherals — 0.9% | | | | |
| | 1,400 | | ScanSource, Inc.* | | | 40,208 | |
| | | | | |
| |
| | | | Computer Services — 6.8% | | | | |
| | 2,800 | | Epicor Software Corp.* | | | 40,600 | |
| | 1,100 | | FactSet Research Systems, Inc. | | | 67,661 | |
| | 2,000 | | Internet Initiative Japan, Inc. ADR* | | | 17,360 | |
| | 3,500 | | Perot Systems Corp., Class A* | | | 62,650 | |
| | 500 | | SAVVIS, Inc.* | | | 25,785 | |
| | 4,000 | | The TriZetto Group, Inc.* | | | 77,920 | |
| | 3,700 | | Unisys Corp.* | | | 29,008 | |
| | | | | |
| |
| | | | | | | 320,984 | |
| | | | | |
| |
| | | | Computer Storage Devices — 2.4% | | | | |
| | 4,550 | | Brocade Communications Systems, Inc.* | | | 44,454 | |
| | 2,225 | | Emulex Corp.* | | | 46,680 | |
| | 800 | | Komag, Inc.* | | | 22,008 | |
| | | | | |
| |
| | | | | | | 113,142 | |
| | | | | |
| |
| | | | Electronic Instruments and Controls — 6.9% | | | | |
| | 2,200 | | Arrow Electronics, Inc.* | | | 86,944 | |
| | 1,862 | | Benchmark Electronics, Inc.* | | | 39,437 | |
| | 4,000 | | KEMET Corp.* | | | 33,920 | |
| | 8,000 | | MRV Communications, Inc.* | | | 27,760 | |
53
The FBR Funds
FBR Small Cap Technology Fund
Portfolio of Investments (continued)
April 30, 2007
(unaudited)
|
| | | | | | VALUE | |
| | SHARES | | | | (NOTE 2) | |
|
| | | | Electronic Instruments and Controls — 6.9%(continued) | | | | |
| | 1,000 | | Multi-Fineline Electronix, Inc.* | | $ | 16,030 | |
| | 1,800 | | Nam Tai Electronics, Inc. | | | 23,328 | |
| | 2,450 | | Plexus Corp.* | | | 51,352 | |
| | 13,450 | | Solectron Corp.* | | | 45,058 | |
| | | | | |
| |
| | | | | | | 323,829 | |
| | | | | |
| |
| | | | Scientific and Technical Instruments — 2.3% | | | | |
| | 950 | | Analogic Corp. | | | 58,235 | |
| | 800 | | Coherent, Inc.* | | | 25,112 | |
| | 1,000 | | OSI Systems, Inc.* | | | 26,410 | |
| | | | | |
| |
| | | | | | | 109,757 | |
| | | | | |
| |
| | | | Semiconductors — 17.7% | | | | |
| | 7,275 | | Atmel Corp.* | | | 38,703 | |
| | 800 | | ATMI, Inc.* | | | 24,744 | |
| | 3,000 | | Axcelis Technologies, Inc.* | | | 22,950 | |
| | 2,050 | | Cirrus Logic, Inc.* | | | 16,974 | |
| | 3,100 | | Cypress Semiconductor Corp.* | | | 70,742 | |
| | 900 | | Diodes, Inc.* | | | 33,228 | |
| | 6,005 | | Entegris, Inc.* | | | 70,379 | |
| | 3,500 | | Fairchild Semiconductor International, Inc.* | | | 61,600 | |
| | 2,425 | | International Rectifier Corp.* | | | 85,553 | |
| | 1,000 | | Microsemi Corp.* | | | 23,110 | |
| | 1,775 | | MKS Instruments, Inc.* | | | 47,836 | |
| | 2,500 | | ON Semiconductor Corp.* | | | 26,775 | |
| | 2,300 | | QLogic Corp.* | | | 41,124 | |
| | 4,400 | | RF Micro Devices, Inc.* | | | 27,500 | |
| | 2,250 | | Standard Microsystems Corp.* | | | 72,135 | |
| | 4,000 | | STEC, Inc.* | | | 32,160 | |
| | 1,475 | | Teradyne, Inc.* | | | 25,739 | |
| | 4,000 | | TriQuint Semiconductor, Inc.* | | | 20,680 | |
| | 300 | | Varian Semiconductor Equipment Associates, Inc.* | | | 19,908 | |
| | 2,000 | | Verigy Ltd.* | | | 50,540 | |
| | 1,200 | | Zoran Corp.* | | | 23,832 | |
| | | | | |
| |
| | | | | | | 836,212 | |
| | | | | |
| |
54
The FBR Funds
FBR Small Cap Technology Fund
Portfolio of Investments (continued)
April 30, 2007
(unaudited)
|
| | | | | | VALUE | |
| | SHARES | | | | (NOTE 2) | |
|
| | | | Software and Programming — 31.6% | | | | |
| | 3,000 | | Aladdin Knowledge Systems Ltd.* | | $ | 62,820 | |
| | 1,000 | | Applix, Inc.* | | | 13,150 | |
| | 6,000 | | Aspen Technology, Inc.* | | | 81,480 | |
| | 2,000 | | Blackbaud, Inc. | | | 44,160 | |
| | 1,500 | | Business Objects S.A. ADR* | | | 56,265 | |
| | 10,300 | | Compuware Corp.* | | | 101,661 | |
| | 1,600 | | Concur Technologies, Inc.* | | | 28,432 | |
| | 2,600 | | DealerTrack Holdings, Inc.* | | | 85,800 | |
| | 1,400 | | Interwoven, Inc.* | | | 21,378 | |
| | 1,500 | | JDA Software Group, Inc.* | | | 26,700 | |
| | 3,100 | | Lawson Software, Inc.* | | | 27,590 | |
| | 1,900 | | MICROS Systems, Inc.* | | | 104,120 | |
| | 500 | | MicroStrategy, Inc., Class A* | | | 56,880 | |
| | 1,000 | | Nuance Communications, Inc.* | | | 15,410 | |
| | 1,300 | | Open Text Corp.* | | | 29,926 | |
| | 1,200 | | Progress Software Corp.* | | | 36,156 | |
| | 2,000 | | Quest Software, Inc.* | | | 34,020 | |
| | 1,850 | | RightNow Technologies, Inc.* | | | 27,491 | |
| | 2,850 | | SPSS, Inc.* | | | 104,481 | |
| | 3,800 | | Sybase, Inc.* | | | 91,922 | |
| | 3,925 | | THQ, Inc.* | | | 130,977 | |
| | 16,050 | | TIBCO Software, Inc.* | | | 146,375 | |
| | 2,700 | | Transaction Systems Architects, Inc.* | | | 85,671 | |
| | 1,500 | | Ulticom, Inc.* | | | 12,803 | |
| | 2,200 | | VASCO Data Security International, Inc.* | | | 47,058 | |
| | 800 | | Verint Systems, Inc.* | | | 22,940 | |
| | | | | |
| |
| | | | | | | 1,495,666 | |
| | | | | |
| |
| | | | Total Common Stocks (Cost $4,180,905) | | | 4,582,984 | |
| | | | | |
| |
55
The FBR Funds
FBR Small Cap Technology Fund
Portfolio of Investments (continued)
April 30, 2007
(unaudited)
|
| | | | | | VALUE | |
| PAR | | | | (NOTE 2) | |
|
| | | | REPURCHASE AGREEMENTS — 4.5% | | | | |
| $ | 213,000 | | With Mizuho Securities, Inc. dated 4/30/07 at 5.06% to be repurchased at $213,030 on 5/1/07, collateralized by U.S. Treasury Bill, 4.81% due 8/23/07, value $26,099, U.S. Treasury Bond, 7.5% due 11/15/16, value $76,103, U.S. Treasury Notes, interest rates ranging from 5.625% to 6.5%, maturities ranging from 5/15/08 to 2/15/10, value $85,312 & $30,011 (Cost $213,000) | | $ | 213,000 | |
| | | | | |
| |
| | | | | | | | |
| | | | Total Investments 101.7% (Cost $4,393,905) | | | 4,795,984 | |
| | | | | | | | |
| | | | Liabilities Less Other Assets (1.7%) | | | (80,900 | ) |
| | | | | |
| |
| | | | | | | | |
| | | | Net Assets 100.0% | | $ | 4,715,084 | |
| | | | | |
| |
|
| * | Non-income producing security |
| ADR | American Depositary Receipts |
The accompanying notes are an integral part of the financial statements.
56
The FBR Funds
FBR Gas Utility Index Fund
Management Overview
Portfolio Manager: Winsor Aylesworth
How did the Fund perform?
For the six months ended April 30, 2007, the FBR Gas Utility Index Fund appreciated 14.00%. This compares to the American Gas Association (AGA) Stock Index, the Lipper Utility Index and the S&P 500 Index which returned 13.86%, 17.60% and 8.60% for the same period respectively.
What factors contributed to the Fund’s performance?
The good times continue to roll for utility investors. The Fund achieved its objective and tracked its benchmark index as well as out performed the S&P 500 Index during the reporting period. The under performance of the Fund relative to its utility peers was attributable to the lack of exposure to non-gas related utility investments such as water, communication and telephone utilities, and non-gas oriented power generators. As mentioned in previous shareholder reports, the objective of the Fund is to track the AGA Stock Index. How the index performs against other measures is not our main focus.
The major macro issues of weather and economy remained relatively stable while the wholesale price of natural gas declined over the period. Interest rates remained stable. This environment was positive for the Fund’s investments.
What is the outlook for the Fund and the utility sector?
We continue to expect that the utility sector’s out performance versus other industry sectors will abate sometime in the future. Annual returns for utility stocks should revert to their long-term historical average rates of return. When this will happen is anybody’s guess. We all hope it is later rather than sooner.
The buzz in the industry this year is climate change and the impact on energy consumption patterns. Natural gas continues to benefit from this dialogue as it is the cleanest burning fuel among the major energy sources and has less of an impact on global warming than carbon emitting fossil fuels. So as we deal with the issue as a society, I would expect natural gas to increase its role as the fuel of choice for energy production.
The Fund’s portfolio companies are recognizing this phenomenon and are adjusting their business models to focus on the pending increased demand for their product. Many companies are diversifying their business by expanding their exposure to transmission pipelines, storage facilities and exploration and production (E&P) of natural gas. The role of liquefied natural gas is also a focus of some of the Fund’s holdings, with these companies investing in terminals to receive the product and pipelines and storage facilities to handle and effectively distribute the product. Although power production and gas distribution to the home remains the core of what these companies do, they are evolving to deal with the ever changing environment and trends involving natural gas.
57
The FBR Funds
FBR Gas Utility Index Fund
Management Overview (continued)
While many of these new initiatives may take years to pay-off for shareholders, the more immediate concern always centers on the weather, the economy, the wholesale price for gas and the world political situation.
How the hurricane season plays out will have short-term implications on domestic natural gas supplies. An active season in the Caribbean and Gulf of Mexico could result in a disruption of production. Prolonged summer heat waves, a possible global warming effect, would result in high demand for electricity to power air conditioners. This type of demand could benefit the producer’s revenues but, overall, it is not good for natural gas supplies. A stable or growing economy and a stable political world should always help the industry.
I think any pending move in interest rates by the Federal Reserve will have a short-term impact on the Fund’s holdings. If rates are cut, this would be bullish for our holdings as utilities tend to benefit from a declining rate environment. Of course the opposite holds true should rates increase. Do I know which way they will go? I’d rather predict tomorrow’s weather!!
The Fund continues to own a well-diversified portfolio of companies within an industry segment that should do well under most scenarios looking over the long-term. The future for natural gas and the Fund’s holdings appear solid as we begin to deal with the global warming issues that are being debated. As a fellow shareholder, I look forward to the future.
The opinions expressed in this commentary reflect those of the Portfolio Manager(s) as of the date written. Any such opinions are subject to change based on market or other conditions. These opinions may not be relied upon as investment advice. Investment decisions for The FBR Funds are based on several factors, and may not be relied upon as an indication of trading intent on behalf of any FBR Fund. Security positions can and do change.
58
The FBR Funds
FBR Gas Utility Index Fund
Comparison of Changes in Value of $10,000 Investment in
Fund Shares(1)(2) vs. Various Indices(1)(3)
(unaudited)
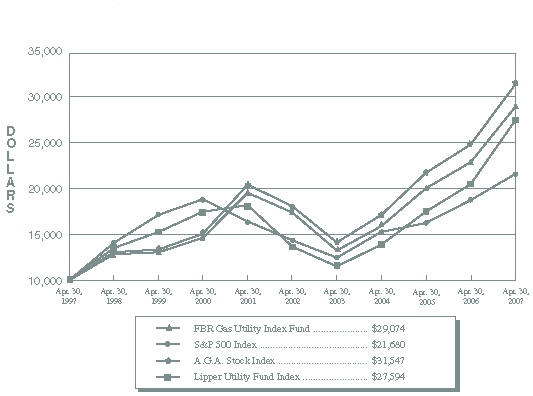
| |
| Total Returns—For the Periods Ended April 30, 2007(4)(5) |
| | | | | | Annualized | | Annualized | |
| | | One Year | | Five Year | | Ten Year | |
| | |
| |
| |
| |
| FBR Gas Utility Index Fund(1)(2) | | 26.53 | % | | 10.75 | % | | 11.26 | % | |
| S&P 500 Index(1)(3) | | 15.24 | % | | 8.53 | % | | 8.04 | % | |
| A.G.A. Stock Index(1)(3) | | 26.54 | % | | 11.70 | % | | 12.17 | % | |
| Lipper Utility Fund Index(1)(3) | | 34.16 | % | | 15.03 | % | | 10.68 | % | |
| |
PAST PERFORMANCE IS NO GUARANTEE OF FUTURE RESULTS.
The performance data quoted represents past performance and the current performance may be lower or higher. The investment return and principal will fluctuate so that investors’ shares, when redeemed, may be worth more or less than their original cost. To obtain performance data current to the most recent month-end, please call 888.200.4710 or visit www.fbrfunds.com.
|
| (1) | | The graph assumes a hypothetical $10,000 initial investment in the Fund and reflects the reinvestment of dividends and all Fund expenses. The indices are unmanaged, do not incur expenses and are not available for investment. The performance of the indices includes reinvested dividends, and does not reflect sales charges or expenses. |
| (2) | | FBR Fund Advisers, Inc. waived a portion of its advisory fees and agreed to contractually reimburse a portion of the Fund’s operating expenses, as necessary, to maintain existing expense limitations, as set forth in the notes to the financial statements. Total returns shown include fee waivers and expense reimbursements, if any; total returns would have been lower had there been no waiver of fees and/or reimbursement of expenses in excess of expense limitations. |
| (3) | | S&P 500 Index is a capitalization-weighted index of 500 stocks. The index is designed to represent the broad domestic economy through changes in aggregate market value of 500 stocks representing all major industries. The A.G.A. Stock Index is a market capitalization weighted index, adjusted monthly, consisting of member companies of the American Gas Association. The Lipper Utility Fund Index is an equally weighted index of the largest ten funds within the utility fund classification as defined by Lipper Inc. The index is rebalanced quarterly. Lipper Analytical Services, Inc., is a nationally recognized organization that reports on mutual fund total return performance and calculates fund rankings. Each Lipper Average is based on a universe of funds with similar objectives. |
| (4) | | The total returns shown do not reflect the deduction of taxes that a shareholder would pay on fund distributions or the redemption of fund shares. |
| (5) | | Effective April 1, 2003, the Fund changed its fiscal year-end from March 31 to October 31. |
59
The FBR Funds
FBR Gas Utility Index Fund
Portfolio Summary
April 30, 2007
(unaudited)
The following chart provides a visual breakdown of the Fund by industry sectors. The underlying securities represent a percentage of the portfolio investments.
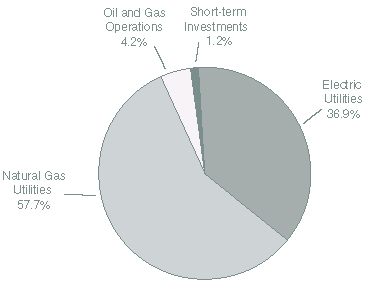
60
The FBR Funds
FBR Gas Utility Index Fund
Portfolio of Investments
April 30, 2007
(unaudited)
|
| | | | | VALUE |
| SHARES | | | | (NOTE 2) |
|
| | | COMMON STOCKS — 98.7% | | | | |
| | | Electric Utilities — 36.9% | | | | |
| 1,000 | | ALLETE, Inc. | | $ | 48,410 | |
| 29,175 | | Alliant Energy Corp. | | | 1,277,865 | |
| 29,125 | | Ameren Corp. | | | 1,531,101 | |
| 218,550 | | Aquila, Inc.* | | | 902,612 | |
| 22,375 | | Avista Corp. | | | 527,826 | |
| 1,575 | | Black Hills Corp. | | | 62,701 | |
| 253,300 | | CenterPoint Energy, Inc. | | | 4,769,639 | |
| 7,250 | | CH Energy Group, Inc. | | | 347,855 | |
| 110,650 | | CMS Energy Corp. | | | 2,049,238 | |
| 92,175 | | Consolidated Edison, Inc. | | | 4,724,891 | |
| 23,850 | | Constellation Energy Group, Inc. | | | 2,125,512 | |
| 126,850 | | Dominion Resources, Inc. | | | 11,568,720 | |
| 53,725 | | DTE Energy Co. | | | 2,717,948 | |
| 106,937 | | Duke Energy Corp. | | | 2,194,347 | |
| 307,840 | | E.ON AG ADR | | | 15,432,018 | |
| 121,509 | | Energy East Corp. | | | 2,942,948 | |
| 1,300 | | Entergy Corp. | | | 147,082 | |
| 69,725 | | Exelon Corp. | | | 5,257,962 | |
| 51,271 | | Integrys Energy Group, Inc. | | | 2,876,303 | |
| 12,003 | | MGE Energy, Inc. | | | 433,548 | |
| 188,076 | | National Grid PLC ADR | | | 14,814,747 | |
| 34,450 | | Northeast Utilities | | | 1,108,257 | |
| 25,416 | | NorthWestern Corp. | | | 893,118 | |
| 25,500 | | NSTAR | | | 915,450 | |
| 12,916 | | Pepco Holdings, Inc. | | | 381,280 | |
| 213,325 | | PG&E Corp. | | | 10,794,245 | |
| 24,375 | | PNM Resources, Inc. | | | 793,406 | |
| 18,450 | | PPL Corp. | | | 804,605 | |
| 116,200 | | Public Service Enterprise Group, Inc. | | | 10,045,490 | |
| 73,100 | | Puget Energy, Inc. | | | 1,887,442 | |
| 15,825 | | Sierra Pacific Resources* | | | 288,965 | |
| 50,975 | | TECO Energy, Inc. | | | 915,001 | |
| 4,900 | | The Empire District Electric Co. | | | 121,030 | |
61
The FBR Funds
FBR Gas Utility Index Fund
Portfolio of Investments (continued)
April 30, 2007
(unaudited)
|
| | | | | | VALUE | |
| SHARES | | | | | (NOTE 2) | |
|
| | | Electric Utilities — 36.9% (continued) | | | | |
| 6,305 | | UniSource Energy Corp. | | $ | 242,175 | |
| 35,325 | | Wisconsin Energy Corp. | | | 1,723,507 | |
| 102,350 | | Xcel Energy, Inc. | | | 2,465,612 | |
| | | | |
| |
| | | | | | 110,132,856 | |
| | | | |
| |
| | | Natural Gas Utilities — 57.6% | | | | |
| 131,250 | | AGL Resources, Inc. | | | 5,714,625 | |
| 176,350 | | Atmos Energy Corp. | | | 5,593,822 | |
| 25,600 | | Cascade Natural Gas Corp. | | | 665,600 | |
| 12,065 | | Chesapeake Utilities Corp. | | | 384,029 | |
| 1,000 | | Corning Natural Gas Corp.* | | | 15,075 | |
| 7,807 | | Delta Natural Gas Company, Inc. | | | 196,424 | |
| 723,000 | | El Paso Corp. | | | 10,845,000 | |
| 443,860 | | Enbridge, Inc. | | | 14,647,379 | |
| 59,625 | | Energen Corp. | | | 3,341,981 | |
| 4,689 | | Energy West, Inc. | | | 68,037 | |
| 17,189 | | EnergySouth, Inc. | | | 677,075 | |
| 113,050 | | Equitable Resources, Inc. | | | 5,879,731 | |
| 285,600 | | KeySpan Corp. | | | 11,826,696 | |
| 66,850 | | MDU Resources Group, Inc. | | | 2,025,555 | |
| 107,200 | | National Fuel Gas Co. | | | 5,039,472 | |
| 45,500 | | New Jersey Resources Corp. | | | 2,443,350 | |
| 94,250 | | Nicor, Inc. | | | 4,829,370 | |
| 338,950 | | NiSource, Inc. | | | 8,334,781 | |
| 62,000 | | Northwest Natural Gas Co. | | | 3,150,220 | |
| 93,700 | | ONEOK, Inc. | | | 4,536,017 | |
| 160,900 | | Piedmont Natural Gas Company, Inc. | | | 4,246,151 | |
| 4,743 | | RGC Resources, Inc. | | | 132,804 | |
| 80,125 | | SEMCO Energy, Inc.* | | | 607,348 | |
| 230,100 | | Sempra Energy | | | 14,606,748 | |
| 54,110 | | South Jersey Industries, Inc. | | | 2,124,900 | |
| 255,457 | | Southern Union Co. | | | 7,781,220 | |
| 88,050 | | Southwest Gas Corp. | | | 3,336,215 | |
| 562,168 | | Spectra Energy Corp. | | | 14,672,584 | |
| 42,150 | | The Laclede Group, Inc. | | | 1,323,089 | |
| 338,700 | | The Williams Companies, Inc. | | | 9,991,650 | |
62
The FBR Funds
FBR Gas Utility Index Fund
Portfolio of Investments (continued)
April 30, 2007
(unaudited)
|
| | | | | | VALUE | |
| SHARES | | | | | (NOTE 2) | |
|
| | | Natural Gas Utilities — 57.6% (continued) | | | | |
| 420,450 | | TransCanada Corp. | | $ | 15,031,087 | |
| 70,025 | | UGI Corp. | | | 1,985,909 | |
| 91,305 | | Vectren Corp. | | | 2,654,236 | |
| 104,900 | | WGL Holdings, Inc. | | | 3,549,816 | |
| | | | |
| |
| | | | | | 172,257,996 | |
| | | | |
| |
| | | Oil and Gas Operations — 4.2% | | | | |
| 73,700 | | Cheniere Energy, Inc.* | | | 2,457,895 | |
| 85,125 | | Questar Corp. | | | 8,268,191 | |
| 44,150 | | Southwestern Energy Co.* | | | 1,854,300 | |
| | | | |
| |
| | | | | | 12,580,386 | |
| | | | |
| |
| | | Total Common Stocks (Cost $140,123,896) | | | 294,971,238 | |
| | | | |
| |
| | | | | | | |
| PAR | | | | | | |
| | | | | | |
| | | REPURCHASE AGREEMENT — 1.2% | | | | |
| $3,646,000 | | With Mizuho Securities, Inc. dated 4/30/07 at 5.06% to be repurchased at $3,646,512 on 5/1/07, collateralized by U.S. Treasury Bill, 4.81% due 8/23/07, value $446,738, U.S. Treasury Bond, 7.5% due 11/15/16, value $1,302,685, U.S. Treasury Notes, interest rates ranging from 5.625% to 6.5%, maturities ranging from 5/15/08 to 2/15/10, value $1,460,320 & $513,705 (Cost $3,646,000) | | | 3,646,000 | |
| | | | |
| |
| | | Total Investments — 99.9% (Cost $143,769,896) | | | 298,617,238 | |
| | | | | | | |
| | | Other Assets Less Liabilities — 0.1% | | | 186,450 | |
| | | | |
| |
| | | Net Assets — 100.0% | | $ | 298,803,688 | |
| | | | |
| |
|
| * | | Non-income producing security |
| ADR | | American Depositary Receipts |
The accompanying notes are an integral part of the financial statements.
63
The FBR Funds
FBR Fund for Government Investors
Management Overview
Portfolio Manager: William B. Sanders, III
How did the Fund perform?
For the six months ended April 30, 2007, the FBR Fund for Government Investors appreciated 2.18%.
What factors contributed to the Fund’s performance?
The Federal Open Market Committee (the “Fed”) met three times over the reporting period. After each meeting they decided to leave the Fed Funds target rate unchanged at 5.25%, noting that “future policy adjustments will depend on the evolution of the outlook for both inflation and economic growth.” Due to the lag effect of monetary policy, the Fed remains cautious in their interpretation of the economic data which, at this point, continues to send mixed signals on the direction of the economy.
The good news is that the economy is slowing, but the bad news is that inflationary pressures persist. The Fed continues to see inflation risk as outweighing that of a recession. This means they are stuck in a holding pattern and can not risk exacerbating either situation by making an imprudent rate move. Another issue, which could be considered the most troublesome, is the fear of stagflation (a period of price inflation combined with slow economic growth). This scenario is very difficult to address as fiscal and monetary policies directed at either problem could possibly have a negative effect on the other.
What is the outlook for the Fund?
The Fed appears to be content with the current rates over the near-term. The performance of the Fund remains linked to the movements of the Fed Funds target rate. Regardless of the Fed’s next move (raising, lowering, or holding steady), the Fund will stay with our conservative investment style of owning only the highest quality and most liquid government issued securities.
The opinions expressed in this commentary reflect those of the Portfolio Manager(s) as of the date written. Any such opinions are subject to change based on market or other conditions. These opinions may not be relied upon as investment advice. Investment decisions for The FBR Funds are based on several factors, and may not be relied upon as an indication of trading intent on behalf of any FBR Fund. Security positions can and do change.
64
The FBR Funds
FBR Fund for Government Investors
Portfolio Summary
April 30, 2007
(unaudited)
The following chart provides a visual breakdown of the Fund by maturity schedule1. The underlying securities represent a percentage of the portfolio investments.
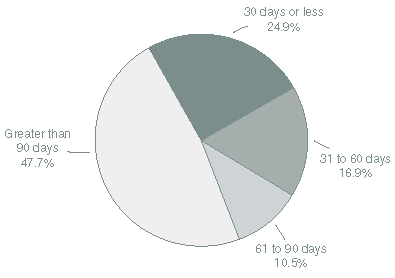
|
| 1 | | The maturity date used for each security in the portfolio to determine the schedule is the shorter of the next interest rate reset date or the final maturity date. |
65
The FBR Funds
FBR Fund for Government Investors
Portfolio of Investments
April 30, 2007
(unaudited)
|
| | | | | | | | | MATURITY | | | VALUE | |
| PAR | | | | | RATE | | | DATE | | | (NOTE 2) | |
|
| | | U.S. GOVERNMENT AND AGENCY OBLIGATIONS — 95.0% | | | | | | | | | | | | |
| | | Federal Farm Credit Bank — 4.8% | | | | | | | | | | | | |
| $10,000,000 | | Federal Farm Credit Bank Discount Note* | | | 5.09 | % | | | 6/13/07 | | | $ | 9,939,203 | |
| | | | | | | | | | | | |
| |
| | | Federal Home Loan Mortgage Corporation — 36.8% | | | | | | | | | | | | |
| 10,433,000 | | Freddie Mac | | | 4.0 | | | | 8/17/07 | | | | 10,392,930 | |
| 10,000,000 | | Freddie Mac Discount Note* | | | 5.06 | | | | 5/1/07 | | | | 10,000,000 | |
| 10,000,000 | | Freddie Mac Discount Note* | | | 5.1 | | | | 5/22/07 | | | | 9,970,250 | |
| 10,000,000 | | Freddie Mac Discount Note* | | | 5.1 | | | | 5/31/07 | | | | 9,957,500 | |
| 12,000,000 | | Freddie Mac Discount Note* | | | 5.09 | | | | 8/13/07 | | | | 11,823,547 | |
| 12,000,000 | | Freddie Mac Discount Note* | | | 5.08 | | | | 9/14/07 | | | | 11,769,707 | |
| 12,000,000 | | Freddie Mac Discount Note* | | | 5.055 | | | | 10/9/07 | | | | 11,728,715 | |
| | | | | | | | | | | | |
| |
| | | | | | | | | | | | | | 75,642,649 | |
| | | | | | | | | | | | |
| |
| | | Federal National Mortgage Association — 53.4% | | | | | | | | | | | | |
| 12,000,000 | | Fannie Mae | | | 4.875 | | | | 8/27/07 | | | | 11,983,905 | |
| 10,000,000 | | Fannie Mae Discount Note* | | | 5.11 | | | | 5/7/07 | | | | 9,991,483 | |
| 10,000,000 | | Fannie Mae Discount Note* | | | 5.09 | | | | 5/14/07 | | | | 9,981,619 | |
| 5,147,000 | | Fannie Mae Discount Note* | | | 5.14 | | | | 6/22/07 | | | | 5,108,786 | |
| 10,000,000 | | Fannie Mae Discount Note* | | | 5.1 | | | | 6/29/07 | | | | 9,916,417 | |
| 12,000,000 | | Fannie Mae Discount Note* | | | 5.12 | | | | 7/10/07 | | | | 11,880,533 | |
| 10,000,000 | | Fannie Mae Discount Note* | | | 5.09 | | | | 7/20/07 | | | | 9,886,889 | |
| 12,000,000 | | Fannie Mae Discount Note* | | | 5.1 | | | | 7/30/07 | | | | 11,847,000 | |
| 5,995,000 | | Fannie Mae Discount Note* | | | 5.085 | | | | 9/26/07 | | | | 5,869,675 | |
| 12,000,000 | | Fannie Mae Discount Note* | | | 5.065 | | | | 10/17/07 | | | | 11,714,672 | |
| 12,000,000 | | Fannie Mae Discount Note* | | | 5.06 | | | | 10/24/07 | | | | 11,703,147 | |
| | | | | | | | | | | | |
| |
| | | | | | | | | | | | | | 109,884,126 | |
| | | | | | | | | | | | |
| |
66
The FBR Funds
FBR Fund for Government Investors
Portfolio of Investments (continued)
April 30, 2007
(unaudited)
|
| | | | | | VALUE | |
| PAR | | | | | (NOTE 2) | |
|
| | | REPURCHASE AGREEMENT — 5.6% | | | | |
| $11,569,833 | | With Mizuho Securities, Inc. dated 4/30/07 at 5.06% to be repurchased at $11,571,460 on 5/1/07, collateralized by U.S. Treasury Bill, 4.81% due 8/23/07, value $11,750,000 | | $ | 11,569,833 | |
| | | | |
| |
| | | Total Investments — 100.6% (Amortized Cost $207,035,811) † | | | 207,035,811 | |
| | | | | | | |
| | | Liabilities Less Other Assets — (0.6%) | | | (1,175,151 | ) |
| | | | |
| |
| | | Net Assets — 100.0% | | $ | 205,860,660 | |
| | | | |
| |
|
| * | | Interest rates for the discount notes represent the yield to maturity at the date of purchase. |
| † | | Same cost is used for federal income tax purposes. |
Weighted Average Maturity of Portfolio: 82 Days
The accompanying notes are an integral part of the financial statements.
67
The FBR Funds
Statements of Assets and Liabilities
April 30, 2007
(unaudited)
| |
FBR
Pegasus FundTM | | FBR
Pegasus Mid Cap
FundTM | | FBR
Pegasus Small Cap
FundTM |
| | |
| |
| |
|
| ASSETS | | | | | | | | | | | | | | | |
Investment Securities | | | | | | | | | | | | | | | |
Securities at Cost: | | | | | | | | | | | | | | | |
Unaffiliated Issuers | | | $ | 11,057,043 | | | | $ | 3,031,230 | | | | $ | 3,361,093 | |
Repurchase Agreements | | | | 443,000 | | | | | 110,000 | | | | | 46,000 | |
| | | |
| | | |
| | | |
| |
Total securities | | | $ | 11,500,043 | | | | $ | 3,141,230 | | | | $ | 3,407,093 | |
| | | |
| | | |
| | | |
| |
Securities at Value (Note 2): | | | | | | | | | | | | | | | |
Unaffiliated Issuers | | | $ | 11,819,463 | | | | $ | 3,168,712 | | | | $ | 3,524,249 | |
Repurchase Agreements | | | | 443,000 | | | | | 110,000 | | | | | 46,000 | |
| | | |
| | | |
| | | |
| |
Total securities | | | | 12,262,463 | | | | | 3,278,712 | | | | | 3,570,249 | |
Cash | | | | 708 | | | | | 587 | | | | | 523 | |
Receivable for Capital Shares Sold | | | | 5,556 | | | | | — | | | | | — | |
Receivable for Investment Securities Sold | | | | — | | | | | 61,291 | | | | | — | |
Dividends and Interest Receivable | | | | 9,965 | | | | | 2,691 | | | | | 3,224 | |
Receivable from Adviser | | | | — | | | | | 3,999 | | | | | 3,758 | |
Prepaid Expenses | | | | 10,188 | | | | | 1,751 | | | | | 2,032 | |
| | | |
| | | |
| | | |
| |
Total Assets | | | | 12,288,880 | | | | | 3,349,031 | | | | | 3,579,786 | |
| | | |
| | | |
| | | |
| |
| LIABILITIES | | | | | | | | | | | | | | | |
Payable for Capital Shares Redeemed | | | | 16,205 | | | | | 1,980 | | | | | 1,980 | |
Payable for Investment Securities Purchased | | | | 279,545 | | | | | 69,439 | | | | | 25,379 | |
Investment Advisory Fee Payable (Note 3) | | | | 5,021 | | | | | — | | | | | — | |
Administration Fee Payable (Note 3) | | | | 556 | | | | | 155 | | | | | 163 | |
Distribution Fees Payable (Note 3) | | | | 2,395 | | | | | 665 | | | | | 702 | |
Trustees’ Fees Payable | | | | 2,400 | | | | | 2,400 | | | | | 2,400 | |
Other Accrued Expenses | | | | 33,851 | | | | | 12,681 | | | | | 12,670 | |
| | | |
| | | |
| | | |
| |
Total Liabilities | | | | 339,973 | | | | | 87,320 | | | | | 43,294 | |
| | | |
| | | |
| | | |
| |
| NET ASSETS | | | $ | 11,948,907 | | | | $ | 3,261,711 | | | | $ | 3,536,492 | |
| | | |
| | | |
| | | |
| |
| Shares of Beneficial Interest Outstanding | | | | | | | | | | | | | | | |
(unlimited number of shares authorized, no par value) | | | | 959,563 | | | | | 309,349 | | | | | 330,279 | |
| | | |
| | | |
| | | |
| |
| Net Asset Value Per Share | | | $ | 12.45 | | | | $ | 10.54 | | | | $ | 10.71 | |
| | | |
| | | |
| | | |
| |
| Net Assets Consist of: | | | | | | | | | | | | | | | |
Paid-in capital | | | $ | 10,326,761 | | | | $ | 3,096,322 | | | | $ | 3,318,645 | |
Accumulated net investment income (loss) | | | | (24,461 | ) | | | | 2,321 | | | | | 5,412 | |
Accumulated net realized gain on investments | | | | 884,187 | | | | | 25,586 | | | | | 49,279 | |
Net unrealized appreciation on investments | | | | 762,420 | | | | | 137,482 | | | | | 163,156 | |
| | | |
| | | |
| | | |
| |
| NET ASSETS | | | $ | 11,948,907 | | | | $ | 3,261,711 | | | | $ | 3,536,492 | |
| | | |
| | | |
| | | |
| |
68
The FBR Funds
Statements of Assets and Liabilities (continued)
April 30, 2007
(unaudited)
| | | FBR
Large Cap
Financial Fund | | FBR
Large Cap
Technology Fund | |
FBR
Small Cap Fund |
| | |
| |
| |
|
| ASSETS | | | | | | | | | | | | | | | |
Investment Securities | | | | | | | | | | | | | | | |
Securities at Cost: | | | | | | | | | | | | | | | |
Unaffiliated Issuers | | | $ | 21,077,376 | | | | $ | 31,430,126 | | | | $ | 614,042,097 | |
Affiliated Issuers | | | | — | | | | | — | | | | | 4,511,967 | |
Repurchase Agreements | | | | 2,612,000 | | | | | 3,505,000 | | | | | 525,352,000 | |
| | | |
| | | |
| | | |
| |
Total securities | | | $ | 23,689,376 | | | | $ | 34,935,126 | | | | $ | 1,143,906,064 | |
| | | |
| | | |
| | | |
| |
Securities at Value (Note 2): | | | | | | | | | | | | | | | |
Unaffiliated Issuers | | | $ | 23,947,820 | | | | $ | 33,098,374 | | | | $ | 1,116,420,343 | |
Affiliated Issuers | | | | — | | | | | — | | | | | 26,456,640 | |
Repurchase Agreements | | | | 2,612,000 | | | | | 3,505,000 | | | | | 525,352,000 | |
| | | |
| | | |
| | | |
| |
Total securities | | | | 26,559,820 | | | | | 36,603,374 | | | | | 1,668,228,983 | |
Cash | | | | 701 | | | | | 212 | | | | | 563 | |
Receivable for Capital Shares Sold | | | | 100 | | | | | 11,759 | | | | | 8,256,300 | |
Receivable for Investment Securities Sold | | | | — | | | | | 1,266,395 | | | | | — | |
Dividends and Interest Receivable | | | | 13,107 | | | | | 24,427 | | | | | 73,841 | |
Prepaid Expenses | | | | 10,094 | | | | | 12,094 | | | | | 92,233 | |
| | | |
| | | |
| | | |
| |
Total Assets | | | | 26,583,822 | | | | | 37,918,261 | | | | | 1,676,651,920 | |
| | | |
| | | |
| | | |
| |
| LIABILITIES | | | | | | | | | | | | | | | |
Payable for Capital Shares Redeemed | | | | 24,254 | | | | | 62,726 | | | | | 3,125,303 | |
Payable for Investment Securities Purchased | | | | 861,079 | | | | | 710,881 | | | | | 420,153 | |
Investment Advisory Fee Payable (Note 3) | | | | 19,048 | | | | | 27,448 | | | | | 1,215,756 | |
Administration Fee Payable (Note 3) | | | | 1,229 | | | | | 1,770 | | | | | 78,418 | |
Distribution Fees Payable (Note 3) | | | | 5,291 | | | | | 7,624 | | | | | 337,710 | |
Trustees’ Fees Payable | | | | 2,400 | | | | | 2,400 | | | | | 2,400 | |
Other Accrued Expenses | | | | 37,521 | | | | | 43,925 | | | | | 251,885 | |
| | | |
| | | |
| | | |
| |
Total Liabilities | | | | 950,822 | | | | | 856,774 | | | | | 5,431,625 | |
| | | |
| | | |
| | | |
| |
| NET ASSETS | | | $ | 25,633,000 | | | | $ | 37,061,487 | | | | $ | 1,671,220,295 | |
| | | |
| | | |
| | | |
| |
| Shares of Beneficial Interest Outstanding | | | | | | | | | | | | | | | |
(unlimited number of shares authorized, no par value) | | | | 1,231,877 | | | | | 3,023,823 | | | | | 29,891,008 | |
| | | |
| | | |
| | | |
| |
| Net Asset Value Per Share | | | $ | 20.81 | | | | $ | 12.26 | | | | $ | 55.91 | |
| | | |
| | | |
| | | |
| |
| Net Assets Consist of: | | | | | | | | | | | | | | | |
Paid-in capital | | | $ | 20,545,703 | | | | $ | 33,274,845 | | | | $ | 1,147,606,714 | |
Accumulated net investment income (loss) | | | | 42,325 | | | | | (92,507 | ) | | | | (742,146 | ) |
Accumulated net realized gain on investments | | | | 2,174,528 | | | | | 2,210,901 | | | | | 32,808 | |
Net unrealized appreciation on investments | | | | 2,870,444 | | | | | 1,668,248 | | | | | 524,322,919 | |
| | | |
| | | |
| | | |
| |
| NET ASSETS | | | $ | 25,633,000 | | | | $ | 37,061,487 | | | | $ | 1,671,220,295 | |
| | | |
| | | |
| | | |
| |
69
The FBR Funds
Statements of Assets and Liabilities (continued)
April 30, 2007
(unaudited)
| | | FBR
Small Cap
Financial Fund | | FBR
Small Cap
Technology Fund | | FBR
Gas Utility
Index Fund |
| | |
| |
| |
|
| ASSETS | | | | | | | | | | | | | | | |
Investment Securities | | | | | | | | | | | | | | | |
Securities at Cost: | | | | | | | | | | | | | | | |
Unaffiliated issuers | | | $ | 183,197,227 | | | | $ | 4,180,905 | | | | $ | 140,123,896 | |
Repurchase Agreements | | | | 13,855,000 | | | | | 213,000 | | | | | 3,646,000 | |
| | | |
| | | |
| | | |
| |
Total securities | | | $ | 197,052,227 | | | | $ | 4,393,905 | | | | $ | 143,769,896 | |
| | | |
| | | |
| | | |
| |
Securities at Value (Note 2): | | | | | | | | | | | | | | | |
Unaffiliated issuers | | | $ | 219,791,168 | | | | $ | 4,582,984 | | | | $ | 294,971,238 | |
Repurchase Agreements | | | | 13,855,000 | | | | | 213,000 | | | | | 3,646,000 | |
| | | |
| | | |
| | | |
| |
Total securities | | | | 233,646,168 | | | | | 4,795,984 | | | | | 298,617,238 | |
Cash | | | | 170 | | | | | 879 | | | | | 140 | |
Receivable for Capital Shares Sold | | | | 25,654 | | | | | 17,588 | | | | | 134,783 | |
Receivable for Investment Securities Sold | | | | 156,598 | | | | | — | | | | | 357,555 | |
Dividends and Interest Receivable | | | | 414,308 | | | | | 487 | | | | | 437,143 | |
Receivable from Adviser | | | | — | | | | | 3,611 | | | | | — | |
Prepaid Expenses | | | | 14,784 | | | | | 10,231 | | | | | 14,438 | |
| | | |
| | | |
| | | |
| |
Total Assets | | | | 234,257,682 | | | | | 4,828,780 | | | | | 299,561,297 | |
| | | |
| | | |
| | | |
| |
| LIABILITIES | | | | | | | | | | | | | | | |
Payable for Capital Shares Redeemed | | | | 872,343 | | | | | 11,573 | | | | | 189,746 | |
Payable for Investment Securities Purchased | | | | 303,891 | | | | | 68,166 | | | | | 323,253 | |
Investment Advisory Fee Payable (Note 3) | | | | 182,300 | | | | | — | | | | | 96,740 | |
Administration Fee Payable (Note 3) | | | | 11,759 | | | | | 220 | | | | | 14,040 | |
Distribution Fees Payable (Note 3) | | | | 50,639 | | | | | 945 | | | | | — | |
Trustees’ Fees Payable | | | | 2,400 | | | | | 2,400 | | | | | 2,400 | |
Other Accrued Expenses | | | | 180,593 | | | | | 30,392 | | | | | 131,430 | |
| | | |
| | | |
| | | |
| |
Total Liabilities | | | | 1,603,925 | | | | | 113,696 | | | | | 757,609 | |
| | | |
| | | |
| | | |
| |
| NET ASSETS | | | $ | 232,653,757 | | | | $ | 4,715,084 | | | | $ | 298,803,688 | |
| | | |
| | | |
| | | |
| |
| Shares of Beneficial Interest Outstanding | | | | | | | | | | | | | | | |
(unlimited number of shares authorized, no par value) | | | | 8,689,994 | | | | | 386,561 | | | | | 13,597,323 | |
| | | |
| | | |
| | | |
| |
| Net Asset Value Per Share | | | $ | 26.77 | | | | $ | 12.20 | | | | $ | 21.98 | |
| | | |
| | | |
| | | |
| |
| Net Assets Consist of: | | | | | | | | | | | | | | | |
Paid-in capital | | | $ | 160,413,555 | | | | $ | 4,038,656 | | | | $ | 146,344,203 | |
Accumulated net investment income (loss) | | | | 205,179 | | | | | (33,824 | ) | | | | 225,953 | |
Accumulated net realized gain (loss) on investments | | | | 35,441,082 | | | | | 308,173 | | | | | (2,613,810 | ) |
Net unrealized appreciation on investments | | | | 36,593,941 | | | | | 402,079 | | | | | 154,847,342 | |
| | | |
| | | |
| | | |
| |
| NET ASSETS | | | $ | 232,653,757 | | | | $ | 4,715,084 | | | | $ | 298,803,688 | |
| | | |
| | | |
| | | |
| |
70
The FBR Funds
Statements of Assets and Liabilities (continued)
April 30, 2007
(unaudited)
| | | | FBR
Fund for
Government Investors | |
| | | |
| |
| ASSETS | | | | | |
Investment Securities | | | | | |
Securities at Amortized Cost: | | | | | |
Unaffiliated Issuers | | | $ | 195,465,978 | |
Repurchase Agreements | | | | 11,569,833 | |
| | | |
| |
Total securities | | | $ | 207,035,811 | |
| | | |
| |
Securities at Value (Note 2): | | | | | |
Unaffiliated Issuers | | | $ | 195,465,978 | |
Repurchase Agreements | | | | 11,569,833 | |
| | | |
| |
Total securities | | | | 207,035,811 | |
Cash | | | | 13 | |
Receivable for Capital Shares Sold | | | | 2,998,685 | |
Dividends and Interest Receivable | | | | 190,860 | |
Prepaid Expenses | | | | 14,761 | |
| | | |
| |
Total Assets | | | | 210,240,130 | |
| | | |
| |
| LIABILITIES | | | | | |
Payable for Capital Shares Redeemed | | | | 4,079,072 | |
Dividends and Income Payable | | | | 20,615 | |
Investment Advisory Fee Payable (Note 3) | | | | 87,877 | |
Administration Fee Payable (Note 3) | | | | 10,205 | |
Trustees’ Fees Payable | | | | 2,400 | |
Other Accrued Expenses | | | | 179,301 | |
| | | |
| |
Total Liabilities | | | | 4,379,470 | |
| | | |
| |
| NET ASSETS | | | $ | 205,860,660 | |
| | | |
| |
| Shares of Beneficial Interest Outstanding | | | | | |
(unlimited number of shares authorized, no par value) | | | | 206,050,613 | |
| | | |
| |
| Net Asset Value Per Share | | | $ | 1.00 | |
| | | |
| |
| Net Assets Consist of: | | | | | |
Paid-in capital | | | $ | 206,050,613 | |
Accumulated net realized loss on investments | | | | (189,953 | ) |
| | | |
| |
| NET ASSETS | | | $ | 205,860,660 | |
| | | |
| |
The accompanying notes are an integral part of the financial statements.
71
The FBR Funds
Statements of Operations
For the Six Months Ended April 30, 2007
(unaudited)
| | | FBR
Pegasus
FundTM | | FBR
Pegasus Mid Cap
FundTM1 | | FBR
Pegasus Small Cap
FundTM1 |
| | |
| |
| |
|
| Investment Income | | | | | | | | | | | | | | | |
Dividends2 | | | $ | 92,306 | | | | $ | 6,464 | | | | $ | 11,335 | |
Interest | | | | 14,726 | | | | | 6,107 | | | | | 4,694 | |
| | | |
| | | |
| | | |
| |
Total Investment Income | | | | 107,032 | | | | | 12,571 | | | | | 16,029 | |
| | | |
| | | |
| | | |
| |
| Expenses | | | | | | | | | | | | | | | |
Investment Advisory fees (Note 3) | | | | 60,669 | | | | | 4,732 | | | | | 4,900 | |
Administration fees (Note 3) | | | | 3,995 | | | | | 306 | | | | | 317 | |
Distribution fees (Note 3) | | | | 16,850 | | | | | 1,314 | | | | | 1,361 | |
Professional fees | | | | 24,285 | | | | | 5,913 | | | | | 5,913 | |
Registration fees | | | | 10,818 | | | | | 963 | | | | | 963 | |
Shareholder servicing fees | | | | 8,593 | | | | | 1,080 | | | | | 1,475 | |
Custodian fees | | | | 7,736 | | | | | 2,795 | | | | | 2,400 | |
Trustees’ fees | | | | 5,900 | | | | | 2,400 | | | | | 2,400 | |
Compliance fees | | | | 5,007 | | | | | 1,467 | | | | | 1,468 | |
Accounting services fees | | | | 4,011 | | | | | 1,039 | | | | | 1,039 | |
Transfer agent fees | | | | 2,261 | | | | | 600 | | | | | 600 | |
Reports to shareholders | | | | 1,714 | | | | | 644 | | | | | 644 | |
Insurance fees | | | | 379 | | | | | — | | | | | — | |
Other expenses | | | | 258 | | | | | 96 | | | | | 96 | |
| | | |
| | | |
| | | |
| |
Total expenses before waivers and related reimbursements | | | | 152,476 | | | | | 23,349 | | | | | 23,576 | |
Less waivers and related reimbursements | | | | (20,983 | ) | | | | (13,099 | ) | | | | (12,959 | ) |
| | | |
| | | |
| | | |
| |
Total expenses after waivers and related reimbursements | | | | 131,493 | | | | | 10,250 | | | | | 10,617 | |
| | | |
| | | |
| | | |
| |
Net Investment Income (Loss) | | | | (24,461 | ) | | | | 2,321 | | | | | 5,412 | |
| | | |
| | | |
| | | |
| |
| Net Realized and Unrealized Gain on Investments | | | | | | | | | | | | | | | |
Net Realized Gain on Investment Transactions | | | | 944,132 | | | | | 25,586 | | | | | 49,279 | |
Change in Net Unrealized Appreciation/Depreciation of Investments | | | | 125,023 | | | | | 137,482 | | | | | 163,156 | |
| | | |
| | | |
| | | |
| |
Net Gain on Investments | | | | 1,069,155 | | | | | 163,068 | | | | | 212,435 | |
| | | |
| | | |
| | | |
| |
| Net Increase in Net Assets Resulting from Operations | | | $ | 1,044,694 | | | | $ | 165,389 | | | | $ | 217,847 | |
| | | |
| | | |
| | | |
| |
|
| 1 | | Represents the period from commencement of operations (February 28, 2007) through April 30, 2007. |
| 2 | | Net of foreign taxes withheld of $3,682, $370 and $34 for the FBR Pegasus FundTM, FBR Pegasus Mid Cap FundTM and FBR Pegasus Small Cap FundTM, respectively. |
72
The FBR Funds
Statements of Operations (continued)
For the Six Months Ended April 30, 2007
(unaudited)
| | | FBR
Large Cap
Financial
Fund | | FBR
Large Cap
Technology
Fund | | FBR
Small Cap
Fund |
| | |
| |
| |
|
| Investment Income | | | | | | | | | | | | | | | |
Dividends1 | | | $ | 267,541 | | | | $ | 186,056 | | | | $ | 1,151,726 | |
Interest | | | | 41,067 | | | | | 67,795 | | | | | 6,809,264 | |
| | | |
| | | |
| | | |
| |
Total Investment Income | | | | 308,608 | | | | | 253,851 | | | | | 7,960,990 | |
| | | |
| | | |
| | | |
| |
| Expenses | | | | | | | | | | | | | | | |
Investment Advisory fees (Note 3) | | | | 117,610 | | | | | 180,614 | | | | | 5,726,140 | |
Administration fees (Note 3) | | | | 7,736 | | | | | 11,886 | | | | | 375,604 | |
Distribution fees (Note 3) | | | | 32,669 | | | | | 50,170 | | | | | 1,568,271 | 2 |
Professional fees | | | | 25,513 | | | | | 25,513 | | | | | 25,512 | |
Registration fees | | | | 10,706 | | | | | 12,283 | | | | | 39,000 | |
Transfer agent fees | | | | 10,166 | | | | | 4,373 | | | | | 105,175 | |
Shareholder servicing fees | | | | 9,629 | | | | | 23,114 | | | | | 485,502 | |
Custodian fees | | | | 6,908 | | | | | 12,988 | | | | | 32,947 | |
Trustees’ fees | | | | 5,900 | | | | | 5,900 | | | | | 5,900 | |
Accounting services fees | | | | 5,525 | | | | | 8,792 | | | | | 171,692 | |
Compliance fees | | | | 5,300 | | | | | 5,580 | | | | | 29,488 | |
Reports to shareholders | | | | 3,074 | | | | | 2,638 | | | | | 48,316 | |
Insurance fees | | | | 3,039 | | | | | 2,268 | | | | | 87,618 | |
Other expenses | | | | 358 | | | | | 239 | | | | | 1,971 | |
| | | |
| | | |
| | | |
| |
Total expenses before waivers and related reimbursements | | | | 244,133 | | | | | 346,358 | | | | | 8,703,136 | |
Less waivers and related reimbursements | | | | (28 | ) | | | | — | | | | | — | |
| | | |
| | | |
| | | |
| |
Total expenses after waivers and related reimbursements | | | | 244,105 | | | | | 346,358 | | | | | 8,703,136 | |
| | | |
| | | |
| | | |
| |
Net Investment Income (Loss) | | | | 64,503 | | | | | (92,507 | ) | | | | (742,146 | ) |
| | | |
| | | |
| | | |
| |
| Net Realized and Unrealized Gain on Investments | | | | | | | | | | | | | | | |
Net Realized Gain on Investment Transactions | | | | 2,299,739 | | | | | 2,743,070 | | | | | 34,392 | |
Change in Net Unrealized Appreciation/Depreciation of Investments | | | | (833,976 | ) | | | | (567,261 | ) | | | | 131,067,022 | |
| | | |
| | | |
| | | |
| |
Net Gain on Investments | | | | 1,465,763 | | | | | 2,175,809 | | | | | 131,101,414 | |
| | | |
| | | |
| | | |
| |
| Net Increase in Net Assets Resulting from Operations | | | $ | 1,530,266 | | | | $ | 2,083,302 | | | | $ | 130,359,268 | |
| | | |
| | | |
| | | |
| |
|
| 1 | | Net of foreign taxes withheld of $301, $9,309 and $0 for the FBR Large Cap Financial Fund, FBR Large Cap Technology Fund, and FBR Small Cap Fund, respectively. |
| 2 | | Distribution fees are net waivers of $22,326. The Distributor had agreed to voluntarily waive a portion of the FBR Small Cap Fund’s distribution fees until such time as the Fund was reopened to new investors on January 3, 2007. Had the Distributor not waived any fees, the distribution expense would have been $1,590,597. |
73
The FBR Funds
Statements of Operations (continued)
For the Six Months Ended April 30, 2007
(unaudited)
| | | FBR
Small Cap
Financial
Fund | | FBR
Small Cap
Technology
Fund | | FBR
Gas Utility
Index Fund |
| | |
| |
| |
|
| Investment Income | | | | | | | | | | | | | | | |
Dividends1 | | | $ | 3,115,949 | | | $ | 2,204 | | | | $ | 3,924,983 | |
Interest | | | | 191,873 | | | | 3,182 | | | | | 50,112 | |
| | | |
| | |
| | | |
| |
Total Investment Income | | | | 3,307,822 | | | | 5,386 | | | | | 3,975,095 | |
| | | |
| | |
| | | |
| |
| Expenses | | | | | | | | | | | | | | |
Investment Advisory fees (Note 3) | | | | 1,331,187 | | | | 18,093 | | | | | 560,097 | |
Administration fees (Note 3) | | | | 87,683 | | | | 1,189 | | | | | 175,749 | |
Distribution fees (Note 3) | | | | 369,774 | | | | 5,026 | | | | | — | |
Shareholder servicing fees | | | | 161,650 | | | | 5,829 | | | | | 80,728 | |
Transfer agent fees | | | | 79,547 | | | | 1,486 | | | | | 105,298 | |
Accounting services fees | | | | 57,837 | | | | 2,414 | | | | | 49,155 | |
Insurance fees | | | | 44,494 | | | | 270 | | | | | 30,170 | |
Reports to shareholders | | | | 29,229 | | | | 1,534 | | | | | 16,853 | |
Professional fees | | | | 25,513 | | | | 25,832 | | | | | 25,513 | |
Custodian fees | | | | 17,741 | | | | 6,784 | | | | | 13,887 | |
Registration fees | | | | 15,890 | | | | 9,990 | | | | | 13,465 | |
Compliance fees | | | | 12,719 | | | | 4,750 | | | | | 11,724 | |
Trustees’ fees | | | | 5,900 | | | | 5,900 | | | | | 5,900 | |
Other expenses | | | | 8,572 | | | | 208 | | | | | 1,948 | |
| | | |
| | |
| | | |
| |
Total expenses before waivers and related reimbursements | | | | 2,247,736 | | | | 89,305 | | | | | 1,090,487 | |
Less waivers and related reimbursements | | | | — | | | | (50,095 | ) | | | | — | |
| | | |
| | |
| | | |
| |
Total expenses after waivers and related reimbursements | | | | 2,247,736 | | | | 39,210 | | | | | 1,090,487 | |
| | | |
| | |
| | | |
| |
Net Investment Income (Loss) | | | | 1,060,086 | | | | (33,824 | ) | | | | 2,884,608 | |
| | | |
| | |
| | | |
| |
| Net Realized and Unrealized Gain on Investments | | | | | | | | | | | | | | |
Net Realized Gain on Investment Transactions | | | | 35,858,226 | | | | 329,445 | | | | | 9,040,456 | |
Change in Net Unrealized Appreciation/Depreciation of Investments | | | | (51,115,504 | ) | | | 173,723 | | | | | 24,796,999 | |
| | | |
| | |
| | | |
| |
Net Gain (Loss) on Investments | | | | (15,257,278 | ) | | | 503,168 | | | | | 33,837,455 | |
| | | |
| | |
| | | |
| |
| Net Increase (Decrease) in Net Assets Resulting from Operations | | | $ | (14,197,192 | ) | | $ | 469,344 | | | | $ | 36,722,063 | |
| | | |
| | |
| | | |
| |
|
| 1 | | Net of foreign taxes withheld of $0, $0 and $66,257 for the FBR Small Cap Financial Fund, FBR Small Cap Technology Fund, and FBR Gas Utility Index Fund, respectively. |
74
The FBR Funds
Statements of Operations (continued)
For the Six Months Ended April 30, 2007
(unaudited)
| | | FBR
Fund for
Government
Investors |
| | |
|
| Investment Income | | | | | |
Interest (Note 2) | | | $ | 5,402,641 |
| Expenses | | | | |
Investment Advisory fees (Note 3) | | | | 514,644 |
Administration fees (Note 3) | | | | 60,927 |
Transfer agent fees | | | | 149,363 |
Shareholder servicing fees | | | | 50,838 |
Accounting services fees | | | | 35,456 |
Professional fees | | | | 25,513 |
Insurance fees | | | | 24,916 |
Registration fees | | | | 14,839 |
Reports to shareholders | | | | 11,181 |
Compliance fees | | | | 10,335 |
Custodian fees | | | | 8,611 |
Trustees’ fees | | | | 5,900 |
Other expenses | | | | 1,855 |
| | | |
|
Total expenses | | | | 914,378 |
| | | |
|
Net Investment Income and Net Increase in Net Assets Resulting from Operations | | | $ | 4,488,263 |
| | | |
|
The accompanying notes are an integral part of the financial statements.
75
The FBR Funds
Statements of Changes in Net Assets
| | | | | | | | | | | | | FBR Pegasus | | FBR Pegasus |
| | | FBR Pegasus FundTM | | Mid Cap FundTM | | Small Cap FundTM |
| | |
| |
| |
|
| | | For the
Six Months
Ended
April 30,
2007
(unaudited) | | For the
Period
Ended
October 31,
2006(A) | | For the
Period
Ended
April 30,
2007(B)
(unaudited) | | For the
Period
Ended
April 30,
2007(B)
(unaudited) |
| | |
| |
| |
| |
|
| From Investment Activities | | | | | | | | | | | | | | | | | | | | |
Net Investment Income (Loss) | | | $ | (24,461 | ) | | | $ | (19,167 | ) | | | $ | 2,321 | | | | $ | 5,412 | |
Net Realized Gain on Investment Transactions | | | | 944,132 | | | | | 545,511 | | | | | 25,586 | | | | | 49,279 | |
Change in Net Unrealized Appreciation/Depreciation of Investments | | | | 125,023 | | | | | 637,397 | | | | | 137,482 | | | | | 163,156 | |
| | | |
| | | |
| | | |
| | | |
| |
Net Increase in Net Assets Resulting from Operations | | | | 1,044,694 | | | | | 1,163,741 | | | | | 165,389 | | | | | 217,847 | |
| | | |
| | | |
| | | |
| | | |
| |
| Distributions to Shareholders | | | | | | | | | | | | | | | | | | | | |
From Net Investment Income | | | | — | | | | | (1,131 | ) | | | | — | | | | | — | |
From Net Realized Gain on Investments | | | | (585,158 | ) | | | | — | | | | | — | | | | | — | |
| | | |
| | | |
| | | |
| | | |
| |
Total Distributions to Shareholders | | | | (585,158 | ) | | | | (1,131 | ) | | | | — | | | | | — | |
| | | |
| | | |
| | | |
| | | |
| |
| From Share Transactions | | | | | | | | | | | | | | | | | | | | |
Net Proceeds from Sales of Shares | | | | 6,054,728 | | | | | 19,873,808 | | | | | 3,119,266 | | | | | 3,342,515 | |
Reinvestment of Distributions | | | | 583,994 | | | | | 1,129 | | | | | — | | | | | — | |
Cost of Shares Redeemed(C) | | | | (8,498,543 | ) | | | | (7,688,355 | ) | | | | (22,944 | ) | | | | (23,870 | ) |
| | | |
| | | |
| | | |
| | | |
| |
Net Increase (Decrease) in Net Assets Resulting from Share Transactions | | | | (1,859,821 | ) | | | | 12,186,582 | | | | | 3,096,322 | | | | | 3,318,645 | |
| | | |
| | | |
| | | |
| | | |
| |
Total Increase (Decrease) in Net Assets | | | | (1,400,285 | ) | | | | 13,349,192 | | | | | 3,261,711 | | | | | 3,536,492 | |
| Net Assets – Beginning of Period | | | | 13,349,192 | | | | | — | | | | | — | | | | | — | |
| | | |
| | | |
| | | |
| | | |
| |
| Net Assets – End of Period | | | $ | 11,948,907 | | | | $ | 13,349,192 | | | | $ | 3,261,711 | | | | $ | 3,536,492 | |
| | | |
| | | |
| | | |
| | | |
| |
| Accumulated Net Investment Income (Loss) | | | $ | (24,461 | ) | | | $ | — | | | | $ | 2,321 | | | | $ | 5,412 | |
| Shares Issued and Redeemed | | | | | | | | | | | | | | | | | | | | |
Sold | | | | 505,541 | | | | | 1,807,008 | | | | | 311,567 | | | | | 332,538 | |
Issued in Reinvestment of Distributions | | | | 49,491 | | | | | 111 | | | | | — | | | | | — | |
Redeemed | | | | (723,126 | ) | | | | (679,462 | ) | | | | (2,218 | ) | | | | (2,259 | ) |
| | | |
| | | |
| | | |
| | | |
| |
Net Increase (Decrease) in Shares | | | | (168,094 | ) | | | | 1,127,657 | | | | | 309,349 | | | | | 330,279 | |
| | | |
| | | |
| | | |
| | | |
| |
|
| (A) | | Represents the period from commencement of operations (November 15, 2005) through October 31, 2006. |
| (B) | | Represents the period from commencement of operations (February 28, 2007) through April 30, 2007. |
| (C) | | The cost of shares redeemed is net of the 1% redemption fee on fund shares which have been held 90 days or less. For the period ended April 30, 2007, these fees were $961, $120 and $200 for the FBR Pegasus FundTM, FBR Pegasus Mid Cap FundTM, and FBR Pegasus Small Cap FundTM, respectively. For the period ended October 31, 2006, these fees were $8,813 for the FBR Pegasus FundTM. |
76
The FBR Funds
Statements of Changes in Net Assets (continued)| | | FBR Large Cap | | FBR Large Cap |
| | | Financial Fund | | Technology Fund |
| | |
| |
|
| | | For the | | | | For the | | |
| | | Six Months | | For the | | Six Months | | For the |
| | | Ended | | Year | | Ended | | Year |
| | | April 30, | | Ended | | April 30, | | Ended |
| | | 2007 | | October 31, | | 2007 | | October 31, |
| | | (unaudited) | | 2006 | | (unaudited) | | 2006 |
| | |
| |
| |
| |
|
| From Investment Activities | | | | | | | | | | | | | | | | |
Net Investment Income (Loss) | | $ | 64,503 | | | $ | 186,468 | | | $ | (92,507 | ) | | $ | (138,653 | ) |
Net Realized Gain on Investment Transactions | | | 2,299,739 | | | | 2,610,208 | | | | 2,743,070 | | | | 1,103,903 | |
Change in Net Unrealized Appreciation/Depreciation of Investments | | | (833,976 | ) | | | 840,507 | | | | (567,261 | ) | | | 1,815,071 | |
| | |
| | |
| | |
| | |
| |
Net Increase in Net Assets Resulting from Operations | | | 1,530,266 | | | | 3,637,183 | | | | 2,083,302 | | | | 2,780,321 | |
| | |
| | |
| | |
| | |
| |
| Distributions to Shareholders | | | | | | | | | | | | | | | | |
From Net Investment Income | | | (145,001 | ) | | | (231,630 | ) | | | — | | | | — | |
From Net Realized Gain on Investments | | | (2,416,486 | ) | | | (3,691,188 | ) | | | (1,396,046 | ) | | | (932,291 | ) |
| | |
| | |
| | |
| | |
| |
Total Distributions to Shareholders | | | (2,561,487 | ) | | | (3,922,818 | ) | | | (1,396,046 | ) | | | (932,291 | ) |
| | |
| | |
| | |
| | |
| |
| From Share Transactions | | | | | | | | | | | | | | | | |
Net Proceeds from Sales of Shares | | | 1,330,694 | | | | 1,711,344 | | | | 5,987,271 | | | | 27,826,230 | |
Reinvestment of Distributions | | | 2,508,728 | | | | 3,834,060 | | | | 1,385,564 | | | | 912,545 | |
Cost of Shares Redeemed(A) | | | (3,488,381 | ) | | | (7,983,348 | ) | | | (10,405,897 | ) | | | (5,989,960 | ) |
| | |
| | |
| | |
| | |
| |
Net Increase (Decrease) in Net Assets Resulting from Share Transactions | | | 351,041 | | | | (2,437,944 | ) | | | (3,033,062 | ) | | | 22,748,815 | |
| | |
| | |
| | |
| | |
| |
Total Increase (Decrease) in Net Assets | | | (680,180 | ) | | | (2,723,579 | ) | | | (2,345,806 | ) | | | 24,596,845 | |
| Net Assets – Beginning of Period | | | 26,313,180 | | | | 29,036,759 | | | | 39,407,293 | | | | 14,810,448 | |
| | |
| | |
| | |
| | |
| |
| Net Assets – End of Period | | $ | 25,633,000 | | | $ | 26,313,180 | | | $ | 37,061,487 | | | $ | 39,407,293 | |
| | |
| | |
| | |
| | |
| |
| Accumulated Net Investment Income (Loss) | | $ | 42,325 | | | $ | 122,823 | | | $ | (92,507 | ) | | $ | — | |
| Shares Issued and Redeemed | | | | | | | | | | | | | | | | |
Sold | | | 64,115 | | | | 83,184 | | | | 500,616 | | | | 2,370,140 | |
Issued in Reinvestment of Distributions | | | 123,104 | | | | 190,616 | | | | 117,720 | | | | 82,211 | |
Redeemed | | | (169,362 | ) | | | (389,141 | ) | | | (887,448 | ) | | | (527,882 | ) |
| | |
| | |
| | |
| | |
| |
Net Increase (Decrease) in Shares | | | 17,857 | | | | (115,341 | ) | | | (269,112 | ) | | | 1,924,469 | |
| | |
| | |
| | |
| | |
| |
|
| (A) | | The cost of shares redeemed is net of the 1% redemption fee on fund shares which have been held 90 days or less. For the six months ended April 30, 2007, these fees were $1,136 and $9,347 for the FBR Large Cap Financial Fund and FBR Large Cap Technology Fund, respectively. For the year ended October 31, 2006, these fees were $1,291 and $6,940 for the FBR Large Cap Financial and FBR Large Cap Technology Fund, respectively. |
77
The FBR Funds
Statements of Changes in Net Assets (continued)| | | | | FBR Small Cap | | FBR Small Cap |
| | | FBR Small Cap Fund | | Financial Fund | | Technology Fund |
| | |
| |
| |
|
| | | For the | | | | For the | | | | For the | | |
| | | Six Months | | For the | | Six Months | | For the | | Six Months | | For the |
| | | Ended | | Year | | Ended | | Year | | Ended | | Year |
| | | April 30, | | Ended | | April 30, | | Ended | | April 30, | | Ended |
| | | 2007 | | October 31, | | 2007 | | October 31, | | 2007 | | October 31, |
| | | (unaudited) | | 2006 | | (unaudited) | | 2006 | | (unaudited) | | 2006 |
| | |
| |
| |
| |
| |
| |
|
From Investment Activities | | | | | | | | | | | | | | | | | | | | | | | | |
Net Investment Income (Loss) | | $ | (742,146 | ) | | $ | (8,007,752 | ) | | $ | 1,060,086 | | | $ | 1,726,184 | | | $ | (33,824 | ) | | $ | (48,023 | ) |
Net Realized Gain on Investment Transactions from: Unaffiliated Issuers | | | 34,392 | | | | 3,833,930 | | | | 35,858,226 | | | | 43,905,032 | | | | 329,445 | | | | 206,694 | |
Change in Net Unrealized Appreciation/Depreciation of Investments | | | 131,067,022 | | | | 185,777,592 | | | | (51,115,504 | ) | | | (1,497,455 | ) | | | 173,723 | | | | 243,617 | |
| | |
| | |
| | |
| | |
| | |
| | |
| |
Net Increase (Decrease) in Net Assets Resulting from Operations | | | 130,359,268 | | | | 181,603,770 | | | | (14,197,192 | ) | | | 44,133,761 | | | | 469,344 | | | | 402,288 | |
| | |
| | |
| | |
| | |
| | |
| | |
| |
Distributions to Shareholders | | | | | | | | | | | | | | | | | | | | | | | | |
From Net Investment Income | | | — | | | | — | | | | (1,631,560 | ) | | | (2,080,797 | ) | | | — | | | | — | |
From Net Realized Gain on Investments | | | (2,384,603 | ) | | | (14,760,977 | ) | | | (44,028,565 | ) | | | (49,145,199 | ) | | | (167,748 | ) | | | — | |
| | |
| | |
| | |
| | |
| | |
| | |
| |
Total Distributions to Shareholders | | | (2,384,603 | ) | | | (14,760,977 | ) | | | (45,660,125 | ) | | | (51,225,996 | ) | | | (167,748 | ) | | | — | |
| | |
| | |
| | |
| | |
| | |
| | |
| |
From Share Transactions | | | | | | | | | | | | | | | | | | | | | | | | |
Net Proceeds from Sales of Shares | | | 730,004,118 | | | | 209,187,431 | | | | 17,277,257 | | | | 59,440,939 | | | | 1,143,553 | | | | 2,155,372 | |
Reinvestment of Distributions | | | 2,336,579 | | | | 14,446,856 | | | | 44,110,288 | | | | 50,058,935 | | | | 166,452 | | | | — | |
Cost of Shares Redeemed(A) | | | (118,685,197 | ) | | | (266,745,027 | ) | | | (115,031,217 | ) | | | (219,586,101 | ) | | | (488,036 | ) | | | (724,777 | ) |
| | |
| | |
| | |
| | |
| | |
| | |
| |
Net Increase (Decrease) in Net Assets Resulting from Share Transactions | | | 613,655,500 | | | | (43,110,740 | ) | | | (53,643,672 | ) | | | (110,086,227 | ) | | | 821,969 | | | | 1,430,595 | |
| | |
| | |
| | |
| | |
| | |
| | |
| |
Total Increase (Decrease) in Net Assets | | | 741,630,165 | | | | 123,732,053 | | | | (113,500,989 | ) | | | (117,178,462 | ) | | | 1,123,565 | | | | 1,832,883 | |
Net Assets – Beginning of Period | | | 929,590,130 | | | | 805,858,077 | | | | 346,154,746 | | | | 463,333,208 | | | | 3,591,519 | | | | 1,758,636 | |
| | |
| | |
| | |
| | |
| | |
| | |
| |
Net Assets – End of Period | | $ | 1,671,220,295 | | | $ | 929,590,130 | | | $ | 232,653,757 | | | $ | 346,154,746 | | | $ | 4,715,084 | | | $ | 3,591,519 | |
| | |
| | |
| | |
| | |
| | |
| | |
| |
Accumulated Net Investment Income (Loss) | | $ | (742,146 | ) | | $ | — | | | $ | 205,179 | | | $ | 776,653 | | | $ | (33,824 | ) | | $ | — | |
Shares Issued and Redeemed | | | | | | | | | | | | | | | | | | | | | | | | |
Sold | | | 13,174,439 | | | | 4,514,344 | | | | 577,377 | | | | 1,892,561 | | | | 97,566 | | | | 199,392 | |
Issued in Reinvestment of Distributions | | | 44,405 | | | | 342,577 | | | | 1,526,231 | | | | 1,643,878 | | | | 14,704 | | | | — | |
Redeemed | | | (2,161,923 | ) | | | (5,991,888 | ) | | | (4,000,595 | ) | | | (7,007,379 | ) | | | (42,457 | ) | | | (68,535 | ) |
| | |
| | |
| | |
| | |
| | |
| | |
| |
Net Increase (Decrease) in Shares | | | 11,056,921 | | | | (1,134,967 | ) | | | (1,896,987 | ) | | | (3,470,940 | ) | | | 69,813 | | | | 130,857 | |
| | |
| | |
| | |
| | |
| | |
| | |
| |
|
| (A) | | The cost of shares redeemed is net of the 1% redemption fee on fund shares which have been held 90 days or less. For the six months ended April 30, 2007, these fees were $279,456, $17,174, and $1,108 for the FBR Small Cap Fund, FBR Small Cap Financial Fund, and FBR Small Cap Technology Fund, respectively. For the year ended October 31, 2006, these fees were $58,201, $39,251 and $2,203 for the FBR Small Cap Fund, FBR Small Cap Financial Fund, and FBR Small Cap Technology Fund, respectively. |
78
The FBR Funds
Statements of Changes in Net Assets (continued)| | | | | FBR Fund for |
| | | FBR Gas Utility Index Fund | | Government Investors |
| | |
| |
|
| | | For the | | | | For the | | |
| | | Six Months | | For the | | Six Months | | For the |
| | | Ended | | Year | | Ended | | Year |
| | | April 30, | | Ended | | April 30, | | Ended |
| | | 2007 | | October 31, | | 2007 | | October 31, |
| | | (unaudited) | | 2006 | | (unaudited) | | 2006 |
| | |
| |
| |
| |
|
From Investment Activities | | | | | | | | | | | | | | | | |
Net Investment Income | | $ | 2,884,608 | | | $ | 7,272,570 | | | $ | 4,488,263 | | | $ | 9,042,605 | |
Net Realized Gain (Loss) on Investment Transactions | | | 9,040,456 | | | | 19,047,484 | | | | — | | | | (23 | ) |
Change in Net Unrealized Appreciation/Depreciation of Investments | | | 24,796,999 | | | | 15,168,791 | | | | — | | | | — | |
| | |
| | |
| | |
| | |
| |
Net Increase in Net Assets Resulting from Operations | | | 36,722,063 | | | | 41,488,845 | | | | 4,488,263 | | | | 9,042,582 | |
| | |
| | |
| | |
| | |
| |
Distributions to Shareholders | | | | | | | | | | | | | | | | |
From Net Investment Income | | | (2,928,439 | ) | | | (9,174,877 | ) | | | (4,488,263 | ) | | | (9,042,605 | ) |
| | |
| | |
| | |
| | |
| |
From Share Transactions | | | | | | | | | | | | | | | | |
Net Proceeds from Sales of Shares | | | 24,954,741 | | | | 37,112,389 | | | | 345,224,971 | | | | 1,190,953,823 | |
Reinvestment of Distributions | | | 2,692,694 | | | | 8,437,169 | | | | 4,364,087 | | | | 8,812,307 | |
Cost of Shares Redeemed(A) | | | (32,668,089 | ) | | | (103,636,356 | ) | | | (354,899,084 | ) | | | (1,240,270,272 | ) |
| | |
| | |
| | |
| | |
| |
Net Decrease in Net Assets Resulting from Share Transactions | | | (5,020,654 | ) | | | (58,086,798 | ) | | | (5,310,026 | ) | | | (40,504,142 | ) |
| | |
| | |
| | |
| | |
| |
Total Increase (Decrease) in Net Assets | | | 28,772,970 | | | | (25,772,830 | ) | | | (5,310,026 | ) | | | (40,504,165 | ) |
Net Assets – Beginning of Period | | | 270,030,718 | | | | 295,803,548 | | | | 211,170,686 | | | | 251,674,851 | |
| | |
| | |
| | |
| | |
| |
Net Assets – End of Period | | $ | 298,803,688 | | | $ | 270,030,718 | | | $ | 205,860,660 | | | $ | 211,170,686 | |
| | |
| | |
| | |
| | |
| |
Accumulated Net Investment Income | | $ | 225,953 | | | $ | 269,784 | | | $ | — | | | $ | — | |
Shares Issued and Redeemed | | | | | | | | | | | | | | | | |
Sold | | | 1,193,564 | | | | 2,065,235 | | | | 345,224,971 | | | | 1,190,953,823 | |
Issued in Reinvestment of Distributions | | | 129,488 | | | | 474,683 | | | | 4,364,087 | | | | 8,812,307 | |
Redeemed | | | (1,584,752 | ) | | | (5,828,607 | ) | | | (354,899,084 | ) | | | (1,240,270,272 | ) |
| | |
| | |
| | |
| | |
| |
Net Decrease in Shares | | | (261,700 | ) | | | (3,288,689 | ) | | | (5,310,026 | ) | | | (40,504,142 | ) |
| | |
| | |
| | |
| | |
| |
|
| (A) | | The cost of shares redeemed is net of the 1% redemption fee on fund shares which have been held 90 days or less. For the FBR Gas Utility Index Fund, these fees for the six months ended April 30, 2007 and the year ended October 31, 2006 were $11,042 and $31,687, respectively. The FBR Fund for Government Investors does not charge a redemption fee. |
The accompanying notes are an integral part of the financial statements.
79
The FBR Funds
Financial HighlightsThe following tables provide per share data for a share outstanding throughout each period for each Fund. Other data includes investment performance, ratios to average net assets and other supplemental information.
| | | FBR Pegasus FundTM |
| | |
|
| | | For the | | | | | |
| | | Six Months Ended | | For the Period |
| | | April 30, 2007 | | Ended |
| | | (unaudited) | | October 31, 2006* |
| | |
| |
|
| Per Share Operating Performance: | | | | | | | | | | |
Net Asset Value – Beginning of Period | | | $ | 11.84 | | | | $ | 10.00 | |
| | | |
| | | |
| |
Income (Loss) from Investment Operations: | | | | | | | | | | |
Net Investment Loss1,3 | | | | (0.03 | ) | | | | (0.01 | ) |
Net Realized and Unrealized Gain on Investments1,4 | | | | 1.09 | | | | | 1.84 | |
| | | |
| | | |
| |
Total from Investment Operations | | | | 1.06 | | | | | 1.83 | |
| | | |
| | | |
| |
Distributions to Shareholders: | | | | | | | | | | |
From Net Investment Income | | | | — | | | | | (0.00 | )2 |
From Net Realized Gain | | | | (0.45 | ) | | | | — | |
| | | |
| | | |
| |
Total Distributions | | | | (0.45 | ) | | | | (0.00 | )2 |
| | | |
| | | |
| |
Paid-in Capital from Redemption Fees | | | | 0.00 | 2 | | | | 0.01 | |
| | | |
| | | |
| |
Net Increase in Net Asset Value | | | | 0.61 | | | | | 1.84 | |
| | | |
| | | |
| |
Net Asset Value – End of Period | | | $ | 12.45 | | | | $ | 11.84 | |
| | | |
| | | |
| |
| Total Investment Return5 | | | | 9.19% | (A) | | | | 18.45% | (A) |
| Ratios to Average Net Assets: | | | | | | | | | | |
Expenses After Waivers and Related Reimbursements3 | | | | 1.95% | (B) | | | | 1.94% | (B) |
Expenses Before Waivers and Related Reimbursements | | | | 2.26% | (B) | | | | 2.74% | (B) |
Net Investment Loss After Waivers and Related Reimbursements3 | | | | (0.36)% | (B) | | | | (0.23)% | (B) |
Net Investment Loss Before Waivers and Related Reimbursements | | | | (0.67)% | (B) | | | | (1.03)% | (B) |
| Supplementary Data: | | | | | | | | | | |
Portfolio Turnover Rate | | | | 61% | (A) | | | | 166% | (A) |
Net Assets at End of Period (in thousands) | | | $ | 11,949 | | | | $ | 13,349 | |
|
| * | | For the period November 15, 2005 (commencement of operations) to October 31, 2006. |
| 1 | | Calculated based on shares outstanding on the first and last day of the respective periods, except for dividends and distributions, if any, which are based on the actual shares outstanding on the dates of distributions. |
| 2 | | Less than $0.01 |
| 3 | | Reflects fees waived and reimbursed by FBR Fund Advisers, Inc. pursuant to a contractual expense limitation of 1.95%. |
| 4 | | The amounts shown for a share outstanding throughout the period may not be in accordance with the changes in the aggregate gains and losses on investments during the period because of the timing of sales and repurchases of Fund shares in relation to fluctuating net asset values during the period. |
| 5 | | Total investment return is calculated assuming a purchase of shares on the first day and a sale on the last day of each period reported and will include reinvestment of dividends and distributions, if any. |
| (A) | | Not Annualized |
| (B) | | Annualized |
80
The FBR Funds
Financial Highlights (continued)| | | FBR Pegasus Mid Cap FundTM |
| | |
|
| | | For the Period |
| | | Ended |
| | | April 30, 2007* |
| | | (unaudited) |
| | |
|
| Per Share Operating Performance: | | | | | |
Net Asset Value – Beginning of Period | | | $ | 10.00 | |
| | | |
| |
Income from Investment Operations: | | | | | |
Net Investment Income1,3 | | | | 0.01 | |
Net Realized and Unrealized Gain on Investments1,4 | | | | 0.53 | |
| | | |
| |
Total from Investment Operations | | | | 0.54 | |
| | | |
| |
Paid-in Capital from Redemption Fees | | | | 0.00 | 2 |
| | | |
| |
Net Increase in Net Asset Value | | | | 0.54 | |
| | | |
| |
Net Asset Value – End of Period | | | $ | 10.54 | |
| | | |
| |
| Total Investment Return5 | | | | 5.40% | (A) |
| Ratios to Average Net Assets: | | | | | |
Expenses After Waivers and Related Reimbursements3 | | | | 1.95% | (B) |
Expenses Before Waivers and Related Reimbursements | | | | 4.44% | (B) |
Net Investment Income After Waivers and Related Reimbursements3 | | | | 0.44% | (B) |
Net Investment Loss Before Waivers and Related Reimbursements | | | | (2.05)% | (B) |
| Supplementary Data: | | | | | |
Portfolio Turnover Rate | | | | 26% | (A) |
Net Assets at End of Period (in thousands) | | | $ | 3,262 | |
|
| * | | For the period February 28, 2007 (commencement of operations) to April 30, 2007. |
| 1 | | Calculated based on shares outstanding on the first and last day of the respective periods, except for dividends and distributions, if any, which are based on the actual shares outstanding on the dates of distributions. |
| 2 | | Less than $0.01 |
| 3 | | Reflects fees waived and reimbursed by FBR Fund Advisers, Inc. pursuant to a contractual expense limitation of 1.95%. |
| 4 | | The amounts shown for a share outstanding throughout the period may not be in accordance with the changes in the aggregate gains and losses on investments during the period because of the timing of sales and repurchases of Fund shares in relation to fluctuating net asset values during the period. |
| 5 | | Total investment return is calculated assuming a purchase of shares on the first day and a sale on the last day of each period reported and will include reinvestment of dividends and distributions, if any. |
| (A) | | Not Annualized |
| (B) | | Annualized |
81
The FBR Funds
Financial Highlights (continued)| | | FBR Pegasus Small Cap FundTM |
| | |
|
| | | For the Period |
| | | Ended |
| | | April 30, 2007* |
| | | (unaudited) |
| | |
|
| | | | | | |
| Per Share Operating Performance: | | | | | |
Net Asset Value – Beginning of Period | | | $ | 10.00 | |
| | | |
| |
Income from Investment Operations: | | | | | |
Net Investment Income1,3 | | | | 0.02 | |
Net Realized and Unrealized Gain on Investments1,4 | | | | 0.69 | |
| | | |
| |
Total from Investment Operations | | | | 0.71 | |
| | | |
| |
Paid-in Capital from Redemption Fees | | | | 0.00 | 2 |
| | | |
| |
Net Increase in Net Asset Value | | | | 0.71 | |
| | | |
| |
Net Asset Value – End of Period | | | $ | 10.71 | |
| | | |
| |
| Total Investment Return5 | | | | 7.10% | (A) |
| Ratios to Average Net Assets: | | | | | |
Expenses After Waivers and Related Reimbursements3 | | | | 1.95% | (B) |
Expenses Before Waivers and Related Reimbursements | | | | 4.32% | (B) |
Net Investment Income After Waivers and Related Reimbursements3 | | | | 0.99% | (B) |
Net Investment Loss Before Waivers and Related Reimbursements | | | | (1.38)% | (B) |
| Supplementary Data: | | | | | |
Portfolio Turnover Rate | | | | 26% | (A) |
Net Assets at End of Period (in thousands) | | | $ | 3,536 | |
|
| * | | For the period February 28, 2007 (commencement of operations) to April 30, 2007. |
| 1 | | Calculated based on shares outstanding on the first and last day of the respective periods, except for dividends and distributions, if any, which are based on the actual shares outstanding on the dates of distributions. |
| 2 | | Less than $0.01 |
| 3 | | Reflects fees waived and reimbursed by FBR Fund Advisers, Inc. pursuant to a contractual expense limitation of 1.95%. |
| 4 | | The amounts shown for a share outstanding throughout the period may not be in accordance with the changes in the aggregate gains and losses on investments during the period because of the timing of sales and repurchases of Fund shares in relation to fluctuating net asset values during the period. |
| 5 | | Total investment return is calculated assuming a purchase of shares on the first day and a sale on the last day of each period reported and will include reinvestment of dividends and distributions, if any. |
| (A) | | Not Annualized |
| (B) | | Annualized |
82
The FBR Funds
Financial Highlights (continued)| | | FBR Large Cap Financial Fund |
| | |
|
| | | For the
Six Months | | | | | | | | | | | | | | | | | | | | |
| | | Ended | | | | | | | | | | | | | | | | | | | | |
| | | April 30, | | For the Years Ended October 31, |
| | | 2007 | |
|
| | | (unaudited) | | 2006 | | | 2005 | | | 2004 | | | 2003 | | | 2002 | |
| | |
| |
| | |
| | |
| | |
| | |
| |
| Per Share Operating Performance: | | | | | | | | | | | | | | | | | | | | | | | | | |
Net Asset Value – Beginning of Period | | | $ | 21.67 | | | $ | 21.84 | | | $ | 24.46 | | | $ | 22.43 | | | $ | 17.73 | | | $ | 18.18 | |
| | | |
| | |
| | |
| | |
| | |
| | |
| |
Income from Investment Operations: | | | | | | | | | | | | | | | | | | | | | | | | | |
Net Investment Income1,3 | | | | 0.04 | | | | 0.13 | | | | 0.13 | | | | 0.08 | | | | 0.10 | | | | 0.07 | |
Net Realized and Unrealized Gain on Investments1,4 | | | | 1.23 | | | | 2.72 | | | | 0.15 | | | | 2.08 | | | | 4.69 | | | | 0.70 | |
| | | |
| | |
| | |
| | |
| | |
| | |
| |
Total from Investment Operations | | | | 1.27 | | | | 2.85 | | | | 0.28 | | | | 2.16 | | | | 4.79 | | | | 0.77 | |
| | | |
| | |
| | |
| | |
| | |
| | |
| |
Distributions to Shareholders: | | | | | | | | | | | | | | | | | | | | | | | | | |
From Net Investment Income | | | | (0.11 | ) | | | (0.16 | ) | | | (0.08 | ) | | | (0.07 | ) | | | (0.09 | ) | | | (0.08 | ) |
From Net Realized Gain | | | | (2.02 | ) | | | (2.86 | ) | | | (2.82 | ) | | | (0.08 | ) | | | — | | | | (1.15 | ) |
| | | |
| | |
| | |
| | |
| | |
| | |
| |
Total Distributions | | | | (2.13 | ) | | | (3.02 | ) | | | (2.90 | ) | | | (0.15 | ) | | | (0.09 | ) | | | (1.23 | ) |
| | | |
| | |
| | |
| | |
| | |
| | |
| |
Paid-in Capital from Redemption Fees | | | | 0.00 | 2 | | | 0.00 | 2 | | | 0.00 | 2 | | | 0.02 | | | | 0.00 | 2 | | | 0.01 | |
| | | |
| | |
| | |
| | |
| | |
| | |
| |
Net Increase (Decrease) in Net Asset Value | | | | (0.86 | ) | | | (0.17 | ) | | | (2.62 | ) | | | 2.03 | | | | 4.70 | | | | (0.45 | ) |
| | | |
| | |
| | |
| | |
| | |
| | |
| |
Net Asset Value – End of Period | | | $ | 20.81 | | | $ | 21.67 | | | $ | 21.84 | | | $ | 24.46 | | | $ | 22.43 | | | $ | 17.73 | |
| | | |
| | |
| | |
| | |
| | |
| | |
| |
| Total Investment Return5 | | | | 6.12% | (A) | | | 14.21% | | | | 0.86% | | | | 9.76% | | | | 27.13% | | | | 4.11% | |
| Ratios to Average Net Assets: | | | | | | | | | | | | | | | | | | | | | | | | | |
Expenses After Waivers3 | | | | 1.87% | (B) | | | 1.83% | | | | 1.95% | | | | 1.91% | | | | 1.92% | | | | 1.95% | |
Expenses Before Waivers | | | | 1.87% | (B) | | | 1.84% | | | | 1.96% | | | | 1.94% | | | | 1.98% | | | | 2.03% | |
Net Investment Income After Waivers3 | | | | 0.49% | (B) | | | 0.68% | | | | 0.62% | | | | 0.28% | | | | 0.53% | | | | 0.36% | |
Net Investment Income Before Waivers | | | | 0.49% | (B) | | | 0.67% | | | | 0.61% | | | | 0.25% | | | | 0.47% | | | | 0.28% | |
| Supplementary Data: | | | | | | | | | | | | | | | | | | | | | | | | | |
Portfolio Turnover Rate | | | | 34% | (A) | | | 54% | | | | 41% | | | | 42% | | | | 67% | | | | 97% | |
Net Assets at End of Period (in thousands) | | | $ | 25,633 | | | $ | 26,313 | | | $ | 29,037 | | | $ | 30,384 | | | $ | 35,459 | | | $ | 26,541 | |
|
| 1 | | Calculated based on shares outstanding on the first and last day of the respective periods, except for dividends and distributions, if any, which are based on the actual shares outstanding on the dates of distributions. |
| 2 | | Less than $0.01 |
| 3 | | Reflects fees waived by FBR Fund Advisers, Inc. pursuant to a contractual expense limitation of 1.95%. |
| 4 | | The amounts shown for a share outstanding throughout the respective periods may not be in accordance with the changes in the aggregate gains and losses on investments during the respective periods because of the timing of sales and repurchases of Fund shares in relation to fluctuating net asset values during the respective periods. |
| 5 | | Total investment return is calculated assuming a purchase of shares on the first day and a sale on the last day of each period reported and will include reinvestment of dividends and distributions, if any. |
| (A) | | Not Annualized |
| (B) | | Annualized |
83
The FBR Funds
Financial Highlights (continued)| | | FBR Large Cap Technology Fund |
| | |
|
| | | For the | | | | | | | | | | | | | | | | | | | | | |
| | | Six Months | | | | | | | | | | | | | | | | | | For the |
| | | Ended | | | | | | | | | | | | | | | | | | Period |
| | | April 30, | | For the Years Ended October 31, | | | Ended |
| | | 2007 | |
| | | October 31, |
| | | (unaudited) | | 2006 | | | 2005 | | | 2004 | | | 2003 | | | 2002* |
| | |
| |
| | |
| | |
| | |
| | |
|
| Per Share Operating Performance: | | | | | | | | | | | | | | | | | | | | | | | | | | |
Net Asset Value – Beginning of Period | | | $ | 11.97 | | | $ | 10.82 | | | $ | 10.96 | | | $ | 11.03 | | | $ | 7.19 | | | | $ | 10.00 | |
| | | |
| | |
| | |
| | |
| | |
| | | |
| |
Income (Loss) from Investment Operations: | | | | | | | | | | | | | | | | | | | | | | | | | | |
Net Investment Loss1,3 | | | | (0.03 | ) | | | (0.04 | ) | | | (0.05 | ) | | | (0.14 | ) | | | (0.08 | ) | | | | (0.05 | ) |
Net Realized and Unrealized Gain (Loss) on Investments1,4 | | | | 0.71 | | | | 1.77 | | | | 1.53 | | | | 0.24 | | | | 3.92 | | | | | (2.76 | ) |
| | | |
| | |
| | |
| | |
| | |
| | | |
| |
Total from Investment Operations | | | | 0.68 | | | | 1.73 | | | | 1.48 | | | | 0.10 | | | | 3.84 | | | | | (2.81 | ) |
| | | |
| | |
| | |
| | |
| | |
| | | |
| |
Distributions to Shareholders: | | | | | | | | | | | | | | | | | | | | | | | | | | |
From Net Realized Gain | | | | (0.39 | ) | | | (0.58 | ) | | | (1.62 | ) | | | (0.20 | ) | | | — | | | | | — | |
| | | |
| | |
| | |
| | |
| | |
| | | |
| |
Paid-in Capital from Redemption Fees | | | | 0.00 | 2 | | | 0.00 | 2 | | | 0.00 | 2 | | | 0.03 | | | | 0.00 | 2 | | | | 0.00 | 2 |
| | | |
| | |
| | |
| | |
| | |
| | | |
| |
Net Increase (Decrease) in Net Asset Value | | | | 0.29 | | | | 1.15 | | | | (0.14 | ) | | | (0.07 | ) | | | 3.84 | | | | | (2.81 | ) |
| | | |
| | |
| | |
| | |
| | |
| | | |
| |
Net Asset Value – End of Period | | | $ | 12.26 | | | $ | 11.97 | | | $ | 10.82 | | | $ | 10.96 | | | $ | 11.03 | | | | $ | 7.19 | |
| | | |
| | |
| | |
| | |
| | |
| | | |
| |
| Total Investment Return5 | | | | 5.85% | (A) | | | 16.40% | | | | 14.51% | | | | 1.17% | | | | 53.41% | | | | | (28.10)% | (A) |
| Ratios to Average Net Assets: | | | | | | | | | | | | | | | | | | | | | | | | | | |
Expenses After Waivers and Related Reimbursements3 | | | | 1.73% | (B) | | | 1.87% | | | | 1.94% | | | | 1.95% | | | | 1.94% | | | | | 1.94% | (B) |
Expenses Before Waivers and Related Reimbursements | | | | 1.73% | (B) | | | 1.92% | | | | 2.74% | | | | 3.21% | | | | 4.61% | | | | | 4.43% | (B) |
Net Investment Loss After Waivers and Related Reimbursements3 | | | | (0.46)% | (B) | | | (0.60)% | | | | (0.77)% | | | | (1.23)% | | | | (1.11)% | | | | | (1.37)% | (B) |
Net Investment Loss Before Waivers and Related Reimbursements | | | | (0.46)% | (B) | | | (0.65)% | | | | (1.57)% | | | | (2.49)% | | | | (3.78)% | | | | | (3.86)% | (B) |
| Supplementary Data: | | | | | | | | | | | | | | | | | | | | | | | | | | |
Portfolio Turnover Rate | | | | 113% | (A) | | | 108% | | | | 100% | | | | 99% | | | | 146% | | | | | 165% | (A) |
Net Assets at End of Period (in thousands) | | | $ | 37,061 | | | $ | 39,407 | | | $ | 14,810 | | | $ | 6,608 | | | $ | 6,170 | | | | $ | 2,485 | |
|
| * | | From the period February 1, 2002 (commencement of operations) to October 31, 2002. |
| 1 | | Calculated based on shares outstanding on the first and last day of the respective periods, except for dividends and distributions, if any, which are based on the actual shares outstanding on the dates of distributions. |
| 2 | | Less than $0.01 |
| 3 | | Reflects fees waived by FBR Fund Advisers, Inc. pursuant to a contractual expense limitation of 1.95%. |
| 4 | | The amounts shown for a share outstanding throughout the respective periods may not be in accordance with the changes in the aggregate gains and losses on investments during the respective periods because of the timing of sales and repurchases of Fund shares in relation to fluctuating net asset values during the respective periods. |
| 5 | | Total investment return is calculated assuming a purchase of shares on the first day and a sale on the last day of each period reported and will include reinvestment of dividends and distributions, if any. |
| (A) | | Not Annualized |
| (B) | | Annualized |
84
The FBR Funds
Financial Highlights (continued)| | | FBR Small Cap Fund |
| | |
|
| | | For the | | | | | | | | | | | | | | | | | | | | |
| | | Six Months | | | | | | | | | | | | | | | | | | | | |
| | | Ended | | | | | | | | | | | | | | | | | | | | |
| | | April 30, | | For the Years Ended October 31, |
| | | 2007 | |
|
| | | (unaudited) | | 2006 | | | 2005 | | | 2004 | | | 2003 | | | 2002 | |
| | |
| |
| | |
| | |
| | |
| | |
| |
| Per Share Operating Performance: | | | | | | | | | | | | | | | | | | | | | | | | | |
Net Asset Value – Beginning of Period | | | $ | 49.36 | | | $ | 40.36 | | | $ | 37.68 | | | $ | 31.57 | | | $ | 21.15 | | | $ | 19.97 | |
| | | |
| | |
| | |
| | |
| | |
| | |
| |
Income (Loss) from Investment Operations: | | | | | | | | | | | | | | | | | | | | | | | | | |
Net Investment Loss1,3 | | | | (0.02 | ) | | | (0.43 | ) | | | (0.27 | ) | | | (0.17 | ) | | | (0.11 | ) | | | (0.25 | ) |
Net Realized and Unrealized Gain on Investments1,4 | | | | 6.68 | | | | 10.20 | | | | 3.51 | | | | 6.30 | | | | 10.50 | | | | 1.50 | |
| | | |
| | |
| | |
| | |
| | |
| | |
| |
Total from Investment Operations | | | | 6.66 | | | | 9.77 | | | | 3.24 | | | | 6.13 | | | | 10.39 | | | | 1.25 | |
| | | |
| | |
| | |
| | |
| | |
| | |
| |
Distributions to Shareholders: | | | | | | | | | | | | | | | | | | | | | | | | | |
From Net Realized Gain | | | | (0.12 | ) | | | (0.77 | ) | | | (0.57 | ) | | | (0.03 | ) | | | — | | | | (0.17 | ) |
| | | |
| | |
| | |
| | |
| | |
| | |
| |
Paid-in Capital from Redemption Fees | | | | 0.01 | | | | 0.00 | 2 | | | 0.01 | | | | 0.01 | | | | 0.03 | | | | 0.10 | |
| | | |
| | |
| | |
| | |
| | |
| | |
| |
Net Increase in Net Asset Value | | | | 6.55 | | | | 9.00 | | | | 2.68 | | | | 6.11 | | | | 10.42 | | | | 1.18 | |
| | | |
| | |
| | |
| | |
| | |
| | |
| |
Net Asset Value – End of Period | | | $ | 55.91 | | | $ | 49.36 | | | $ | 40.36 | | | $ | 37.68 | | | $ | 31.57 | | | $ | 21.15 | |
| | | |
| | |
| | |
| | |
| | |
| | |
| |
| Total Investment Return5 | | | | 13.54% | (A) | | | 24.53% | | | | 8.63% | | | | 19.46% | | | | 49.27% | | | | 6.76% | |
| Ratios to Average Net Assets: | | | | | | | | | | | | | | | | | | | | | | | | | |
Expenses After Waivers3 | | | | 1.36% | (B) | | | 1.38% | | | | 1.50% | | | | 1.59% | | | | 1.60% | | | | 1.94% | |
Expenses Before Waivers | | | | 1.37% | (B) | | | 1.40% | | | | 1.53% | | | | 1.59% | | | | 1.60% | | | | 2.07% | |
Net Investment Loss After Waivers3 | | | | (0.12)% | (B) | | | (0.94)% | | | | (0.56)% | | | | (0.75)% | | | | (0.75)% | | | | (1.39)% | |
Net Investment Loss Before Waivers | | | | (0.11)% | (B) | | | (0.96)% | | | | (0.59)% | | | | (0.75)% | | | | (0.75)% | | | | (1.52)% | |
| Supplementary Data: | | | | | | | | | | | | | | | | | | | | | | | | | |
Portfolio Turnover Rate | | | | 0% | (A) | | | 3% | | | | 20% | | | | 19% | | | | 16% | | | | 13% | |
Net Assets at End of Period (in thousands) | | | $ | 1,671,220 | | | $ | 929,590 | | | $ | 805,858 | | | $ | 825,497 | | | $ | 343,824 | | | $ | 28,803 | |
|
| 1 | | Calculated based on shares outstanding on the first and last day of the respective periods, except for dividends and distributions, if any, which are based on the actual shares outstanding on the dates of distributions. |
| 2 | | Less than $0.01 |
| 3 | | Reflects fees waived by FBR Fund Advisers, Inc. pursuant to a contractual expense limitation of 1.95% and fees voluntarily waived by the Distributor in an amount attributable to marketing expenses for the Fund while closed to new investors. |
| 4 | | The amounts shown for a share outstanding throughout the respective periods may not be in accordance with the changes in the aggregate gains and losses on investments during the respective periods because of the timing of sales and repurchases of Fund shares in relation to fluctuating net asset values during the respective periods. |
| 5 | | Total investment return is calculated assuming a purchase of shares on the first day and a sale on the last day of each period reported and will include reinvestment of dividends and distributions, if any. |
| (A) | | Not Annualized |
| (B) | | Annualized |
85
The FBR Funds
Financial Highlights (continued)| | | FBR Small Cap Financial Fund |
| | |
|
| | | For the | | | | | | | | | | | | | | | | | | | | |
| | | Six Months | | | | | | | | | | | | | | | | | | | | |
| | | Ended | | | | | | | | | | | | | | | | | | | | |
| | | April 30, | | For the Years Ended October 31, |
| | | 2007 | |
|
| | | (unaudited) | | 2006 | | | 2005 | | | 2004 | | | 2003 | | | 2002 | |
| | |
| |
| | |
| | |
| | |
| | |
| |
| | | | | | | | | | | | | | | | | | | | | | | | | | |
| Per Share Operating Performance: | | | | | | | | | | | | | | | | | | | | | | | | | |
Net Asset Value – Beginning of Period | | | $ | 32.70 | | | $ | 32.96 | | | $ | 36.41 | | | $ | 32.56 | | | $ | 24.38 | | | $ | 20.53 | |
| | | |
| | |
| | |
| | |
| | |
| | |
| |
Income from Investment Operations: | | | | | | | | | | | | | | | | | | | | | | | | | |
Net Investment Income1,3 | | | | 0.10 | | | | 0.14 | | | | 0.23 | | | | 0.13 | | | | 0.05 | | | | 0.15 | |
Net Realized and Unrealized Gain (Loss) on Investments1,4 | | | | (1.53 | ) | | | 3.44 | | | | 0.85 | | | | 4.40 | | | | 8.88 | | | | 4.35 | |
| | | |
| | |
| | |
| | |
| | |
| | |
| |
Total from Investment Operations | | | | (1.43 | ) | | | 3.58 | | | | 1.08 | | | | 4.53 | | | | 8.93 | | | | 4.50 | |
| | | |
| | |
| | |
| | |
| | |
| | |
| |
Distributions to Shareholders: | | | | | | | | | | | | | | | | | | | | | | | | | |
From Net Investment Income | | | | (0.15 | ) | | | (0.14 | ) | | | (0.18 | ) | | | (0.07 | ) | | | (0.13 | ) | | | (0.47 | ) |
From Net Realized Gain | | | | (4.35 | ) | | | (3.70 | ) | | | (4.36 | ) | | | (0.65 | ) | | | (0.64 | ) | | | (0.34 | ) |
| | | |
| | |
| | |
| | |
| | |
| | |
| |
Total Distributions | | | | (4.50 | ) | | | (3.84 | ) | | | (4.54 | ) | | | (0.72 | ) | | | (0.77 | ) | | | (0.81 | ) |
| | | |
| | |
| | |
| | |
| | |
| | |
| |
Paid-in Capital from Redemption Fees | | | | 0.00 | 2 | | | 0.00 | 2 | | | 0.01 | | | | 0.04 | | | | 0.02 | | | | 0.16 | |
| | | |
| | |
| | |
| | |
| | |
| | |
| |
Net Increase (Decrease) in Net Asset Value | | | | (5.93 | ) | | | (0.26 | ) | | | (3.45 | ) | | | 3.85 | | | | 8.18 | | | | 3.85 | |
| | | |
| | |
| | |
| | |
| | |
| | |
| |
Net Asset Value – End of Period | | | $ | 26.77 | | | $ | 32.70 | | | $ | 32.96 | | | $ | 36.41 | | | $ | 32.56 | | | $ | 24.38 | |
| | | |
| | |
| | |
| | |
| | |
| | |
| |
| Total Investment Return5 | | | | (5.32)% | (A) | | | 11.81% | | | | 2.63% | | | | 14.29% | | | | 37.80% | | | | 23.37% | |
| Ratios to Average Net Assets: | | | | | | | | | | | | | | | | | | | | | | | | | |
Expenses After Waivers3 | | | | 1.52% | (B) | | | 1.46% | | | | 1.55% | | | | 1.59% | | | | 1.57% | | | | 1.56% | |
Expenses Before Waivers | | | | 1.52% | (B) | | | 1.46% | | | | 1.55% | | | | 1.59% | | | | 1.57% | | | | 1.56% | |
Net Investment Income After Waivers3 | | | | 0.72% | (B) | | | 0.45% | | | | 0.69% | | | | 0.40% | | | | 0.26% | | | | 0.54% | |
Net Investment Income Before Waivers | | | | 0.72% | (B) | | | 0.45% | | | | 0.69% | | | | 0.40% | | | | 0.26% | | | | 0.54% | |
| Supplementary Data: | | | | | | | | | | | �� | | | | | | | | | | | | | | |
Portfolio Turnover Rate | | | | 6% | (A) | | | 8% | | | | 15% | | | | 36% | | | | 16% | | | | 44% | |
Net Assets at End of Period (in thousands) | | | $ | 232,654 | | | $ | 346,155 | | | $ | 463,333 | | | $ | 594,625 | | | $ | 513,808 | | | $ | 319,762 | |
|
| 1 | | Calculated based on shares outstanding on the first and last day of the respective periods, except for dividends and distributions, if any, which are based on the actual shares outstanding on the dates of distributions. |
| 2 | | Less than $0.01 |
| 3 | | Reflects fees waived by FBR Fund Advisers, Inc. pursuant to a contractual expense limitation of 1.95%. |
| 4 | | The amounts shown for a share outstanding throughout the respective periods may not be in accordance with the changes in the aggregate gains and losses on investments during the respective periods because of the timing of sales and repurchases of Fund shares in relation to fluctuating net asset values during the respective periods. |
| 5 | | Total investment return is calculated assuming a purchase of shares on the first day and a sale on the last day of each period reported and will include reinvestment of dividends and distributions, if any. |
| (A) | | Not Annualized |
| (B) | | Annualized |
86
| The FBR Funds |
|
| Financial Highlights (continued) |
| | | FBR Small Cap Technology Fund |
| | |
|
| | | For the | | | | | | | | | | | | | | | |
| | | Six Months | | | | | | | | | | | | | For the |
| | | Ended | | | For the Years | | | | Period |
| | | April 30, | | | Ended October 31, | | | | Ended |
| | | 2007 | | |
| | | | October 31, |
| | | (unaudited) | | | 2006 | | | | 2005 | | | | 2004* |
| Per Share Operating Performance: | |
| | |
| | | |
| | | |
|
Net Asset Value – Beginning of Period | | $ | 11.34 | | | | $ | 9.46 | | | | $ | 8.88 | | | | $ | 10.00 | |
| | |
| | | |
| | | |
| | | |
| |
Income (Loss) from Investment Operations: | | | | | | | | | | | | | | | | | | | |
Net Investment Loss1,2 | | | (0.09 | ) | | | | (0.15 | ) | | | | (0.16 | ) | | | | (0.11 | ) |
Net Realized and Unrealized Gain (Loss) on Investments1,3 | | | 1.47 | | | | | 2.02 | | | | | 0.70 | | | | | (1.06 | ) |
| | |
| | | |
| | | |
| | | |
| |
Total from Investment Operations | | | 1.38 | | | | | 1.87 | | | | | 0.54 | | | | | (1.17 | ) |
| | |
| | | |
| | | |
| | | |
| |
Distributions to Shareholders: | | | | | | | | | | | | | | | | | | | |
From Net Realized Gain | | | (0.52 | ) | | | | — | | | | | — | | | | | — | |
| | |
| | | |
| | | |
| | | |
| |
Paid-in Capital from Redemption Fees | | | — | | | | | 0.01 | | | | | 0.04 | | | | | 0.05 | |
| | |
| | | |
| | | |
| | | |
| |
Net Increase (Decrease) in Net Asset Value | | | 0.86 | | | | | 1.88 | | | | | 0.58 | | | | | (1.12 | ) |
| | |
| | | |
| | | |
| | | |
| |
Net Asset Value – End of Period | | $ | 12.20 | | | | $ | 11.34 | | | | $ | 9.46 | | | | $ | 8.88 | |
| | |
| | | |
| | | |
| | | |
| |
| Total Investment Return4 | | | 12.52% | (A) | | | | 19.87% | | | | | 6.53% | | | | | (11.20)% | (A) |
| Ratios to Average Net Assets: | | | | | | | | | | | | | | | | | | | |
Expenses After Waivers and Related Reimbursements2 | | | 1.95% | (B) | | | | 1.95% | | | | | 1.95% | | | | | 1.95% | (B) |
Expenses Before Waivers and Related Reimbursements | | | 4.44% | (B) | | | | 5.45% | | | | | 9.14% | | | | | 6.43% | (B) |
Net Investment Loss After Waivers and Related Reimbursements2 | | | (1.68)% | (B) | | | | (1.65)% | | | | | (1.68)% | | | | | (1.79)% | (B) |
Net Investment Loss Before Waivers and Related Reimbursements | | | (4.17)% | (B) | | | | (5.15)% | | | | | (8.87)% | | | | | (6.27)% | (B) |
| Supplementary Data: | | | | | | | | | | | | | | | | | | | |
Portfolio Turnover Rate | | | 56% | (A) | | | | 152% | | | | | 246% | | | | | 150% | (A) |
Net Assets at End of Period (in thousands) | | $ | 4,715 | | | | $ | 3,592 | | | | $ | 1,759 | | | | $ | 1,440 | |
|
| * | | For the period January 20, 2004 (commencement of operations) to October 31, 2004. |
| 1 | | Calculated based on shares outstanding on the first and last day of the respective periods, except for dividends and distributions, if any, which are based on the actual shares outstanding on the dates of distributions. |
| 2 | | Reflects fees waived by FBR Fund Advisers, Inc. pursuant to a contractual expense limitation of 1.95%. |
| 3 | | The amounts shown for a share outstanding throughout the respective periods may not be in accordance with the changes in the aggregate gains and losses on investments during the respective periods because of the timing of sales and repurchases of Fund shares in relation to fluctuating net asset values during the respective periods. |
| 4 | | Total investment return is calculated assuming a purchase of shares on the first day and a sale on the last day of each period reported and will include reinvestment of dividends and distributions, if any. |
| (A) | | Not Annualized |
| (B) | | Annualized |
87
| The FBR Funds |
|
| Financial Highlights (continued) |
| | | FBR Gas Utility Index Fund |
| | |
|
| | | For the | | | | | | | | | | | | | | | | | | | | | | | | | | | | | | |
| | | Six Months | | | | | | | | | | | | | | | | | | For the | | | | | | | | | | |
| | | Ended | | | For the Years | | | | Period | | | For the Years Ended |
| | | April 30, | | | Ended October 31, | | | | Ended | | | March 31, |
| | | 2007 | | |
| | | | October 31, | | |
|
| | | (unaudited) | | | 2006 | | | | 2005 | | | | 2004 | | | | 2003* | | | 2003 | | | 2002 |
| Per Share Operating Performance: | |
| | |
| | | |
| | | |
| | | |
| | |
|
Net Asset Value – Beginning of Period | | $ | 19.48 | | | | $ | 17.25 | | | | $ | 14.67 | | | | $ | 12.51 | | | | $ | 10.41 | | | | $ | 15.53 | | | | $ | 19.42 | |
| | |
| | | |
| | | |
| | | |
| | | |
| | | |
| | | |
| |
Income (Loss) from Investment Operations: | | | | | | | | | | | | | | | | | | | | | | | | | | | | | | | | | | |
Net Investment Income1,3 | | | 0.21 | | | | | 0.50 | | | | | 0.52 | | | | | 0.38 | | | | | 0.20 | | | | | 0.43 | | | | | 0.49 | |
Net Realized and Unrealized Gain (Loss) on | | | | | | | | | | | | | | | | | | | | | | | | | | | | | | | | | | |
Investments1,4 | | | 2.50 | | | | | 2.34 | | | | | 2.47 | | | | | 2.17 | | | | | 2.08 | | | | | (5.12 | ) | | | | (1.86 | ) |
| | |
| | | |
| | | |
| | | |
| | | |
| | | |
| | | |
| |
Total from Investment Operations | | | 2.71 | | | | | 2.84 | | | | | 2.99 | | | | | 2.55 | | | | | 2.28 | | | | | (4.69 | ) | | | | (1.37 | ) |
| | |
| | | |
| | | |
| | | |
| | | |
| | | |
| | | |
| |
Distributions to Shareholders: | | | | | | | | | | | | | | | | | | | | | | | | | | | | | | | | | | |
From Net Investment Income | | | (0.21 | ) | | | | (0.61 | ) | | | | (0.41 | ) | | | | (0.39 | ) | | | | (0.18 | ) | | | | (0.43 | ) | | | | (0.49 | ) |
From Net Realized Gain | | | — | | | | | — | | | | | — | | | | | — | | | | | — | | | | | — | | | | | (2.03 | ) |
| | |
| | | |
| | | |
| | | |
| | | |
| | | |
| | | |
| |
Total Distributions | | | (0.21 | ) | | | | (0.61 | ) | | | | (0.41 | ) | | | | (0.39 | ) | | | | (0.18 | ) | | | | (0.43 | ) | | | | (2.52 | ) |
| | |
| | | |
| | | |
| | | |
| | | |
| | | |
| | | |
| |
| Paid-in Capital from Redemption Fees | | | — | | | | | 0.00 | 2 | | | | 0.00 | 2 | | | | 0.00 | 2 | | | | 0.00 | 2 | | | | — | | | | | — | |
| | |
| | | |
| | | |
| | | |
| | | |
| | | |
| | | |
| |
| Net Increase (Decrease) in Net Asset Value | | | 2.50 | | | | | 2.23 | | | | | 2.58 | | | | | 2.16 | | | | | 2.10 | | | | | (5.12 | ) | | | | (3.89 | ) |
| | |
| | | |
| | | |
| | | |
| | | |
| | | |
| | | |
| |
| Net Asset Value – End of Period | | $ | 21.98 | | | | $ | 19.48 | | | | $ | 17.25 | | | | $ | 14.67 | | | | $ | 12.51 | | | | $ | 10.41 | | | | $ | 15.53 | |
| | |
| | | |
| | | |
| | | |
| | | |
| | | |
| | | |
| |
| Total Investment Return5 | | | 14.00% | (A) | | | | 16.84% | | | | | 20.48% | | | | | 20.63% | | | | | 21.98% | (A) | | | | (30.40)% | | | | | (5.90)% | |
| Ratios to Average Net Assets: | | | | | | | | | | | | | | | | | | | | | | | | | | | | | | | | | | |
Expenses After Waivers3 | | | 0.78% | (B) | | | | 0.80% | | | | | 0.80% | | | | | 0.85% | | | | | 0.85% | (B) | | | | 0.85% | | | | | 0.85% | |
Expenses Before Waivers | | | 0.78% | (B) | | | | 0.80% | | | | | 0.80% | | | | | 0.88% | | | | | 0.87% | (B) | | | | 0.86% | | | | | 0.85% | |
Net Investment Income After Waivers3 | | | 2.06% | (B) | | | | 2.69% | | | | | 3.18% | | | | | 2.90% | | | | | 3.02% | (B) | | | | 3.58% | | | | | 2.88% | |
Net Investment Income Before Waivers | | | 2.06% | (B) | | | | 2.69% | | | | | 3.18% | | | | | 2.87% | | | | | 3.00% | (B) | | | | 3.57% | | | | | 2.88% | |
| Supplementary Data: | | | | | | | | | | | | | | | | | | | | | | | | | | | | | | | | | | |
Portfolio Turnover Rate | | | 12% | (A) | | | | 16% | | | | | 20% | | | | | 34% | | | | | 5% | (A) | | | | 39% | | | | | 29% | |
Net Assets at End of Period (in thousands) | | $ | 298,804 | | | | $ | 270,031 | | | | $ | 295,804 | | | | $ | 220,545 | | | | $ | 184,818 | | | | $ | 145,663 | | | | $ | 224,681 | |
|
| * | | Effective April 1, 2003, the Fund’s fiscal year end was changed to October 31. |
| 1 | | Calculated based on shares outstanding on the first and last day of the respective periods, except for dividends and distributions, if any, which are based on the actual shares outstanding on the dates of distributions. |
| 2 | | Less than $0.01 |
| 3 | | Reflects fees waived by FBR Fund Advisers, Inc. pursuant to a contractual expense limitation of 0.85%. |
| 4 | | The amounts shown for a share outstanding throughout the respective periods may not be in accordance with the changes in the aggregate gains and losses on investments during the respective periods because of the timing of sales and repurchases of Fund shares in relation to fluctuating net asset values during the respective periods. |
| 5 | | Total investment return is calculated assuming a purchase of shares on the first day and a sale on the last day of each period reported and will include reinvestment of dividends and distributions, if any. |
| (A) | | Not Annualized |
| (B) | | Annualized |
88
| The FBR Funds |
|
| Financial Highlights (continued) |
| | | FBR Fund for Government Investors |
| | |
|
| | | For the | | | | | | | | | | | | | | | | | | | | | | | | | | |
| | | Six Months | | | | | | | | | | | | | | For the | | | For the |
| | | Ended | | | | For the Years Ended | | | | Period | | | Years Ended |
| | | April 30, | | | | October 31, | | | | Ended | | | December 31, |
| | | 2007 | | | |
| | | | October 31, | | |
|
| | | (unaudited) | | | | 2006 | | | | 2005 | | | | 2004* | | | 2003 | | | 2002 |
| | |
| | | |
| | | |
| | | |
| | |
| | |
|
| Per Share Operating Performance: | | | | | | | | | | | | | | | | | | | | | | | | | | | | | |
Net Asset Value – Beginning of Period | | $ | 1.00 | | | | $ | 1.00 | | | | $ | 1.00 | | | | $ | 1.00 | | | | $ | 1.00 | | | | $ | 1.00 | |
| | |
| | | |
| | | |
| | | |
| | | |
| | | |
| |
Income (Loss) from Investment Operations: | | | | | | | | | | | | | | | | | | | | | | | | | | | | | |
Net Investment Income1,3 | | | 0.02 | | | | | 0.04 | | | | | 0.02 | | | | | 0.00 | 2 | | | | 0.00 | 2 | | | | 0.01 | |
Net Realized Loss on Investments1,4 | | | — | | | | | (0.00 | )2 | | | | (0.00 | )2 | | | | (0.00 | )2 | | | | (0.00 | )2 | | | | — | |
| | |
| | | |
| | | |
| | | |
| | | |
| | | |
| |
Total From Investment Operations | | | 0.02 | | | | | 0.04 | | | | | 0.02 | | | | | 0.00 | 2 | | | | 0.00 | 2 | | | | 0.01 | |
| | |
| | | |
| | | |
| | | |
| | | |
| | | |
| |
Distributions to Shareholders: | | | | | | | | | | | | | | | | | | | | | | | | | | | | | |
From Net Investment Income | | | (0.02 | ) | | | | (0.04 | ) | | | | (0.02 | ) | | | | (0.00 | )2 | | | | (0.00 | )2 | | | | (0.01 | ) |
| | |
| | | |
| | | |
| | | |
| | | |
| | | |
| |
Net Asset Value – End of Period | | $ | 1.00 | | | | $ | 1.00 | | | | $ | 1.00 | | | | $ | 1.00 | | | | $ | 1.00 | | | | $ | 1.00 | |
| | |
| | | |
| | | |
| | | |
| | | |
| | | |
| |
| Total Investment Return5 | | | 2.18% | (A) | | | | 3.89% | | | | | 1.96% | | | | | 0.42% | (A) | | | | 0.42% | | | | | 1.03% | |
| Ratios to Average Net Assets: | | | | | | | | | | | | | | | | | | | | | | | | | | | | | |
Expenses After Waivers3 | | | 0.89% | (B) | | | | 0.85% | | | | | 0.76% | | | | | 0.75% | (B) | | | | 0.75% | | | | | 0.75% | |
Expenses Before Waivers | | | 0.89% | (B) | | | | 0.85% | | | | | 0.86% | | | | | 0.85% | (B) | | | | 0.82% | | | | | 0.75% | |
Net Investment Income After Waivers3 | | | 4.36% | (B) | | | | 3.81% | | | | | 1.92% | | | | | 0.50% | (B) | | | | 0.43% | | | | | 1.03% | |
Net Investment Income Before Waivers | | | 4.36% | (B) | | | | 3.81% | | | | | 1.82% | | | | | 0.40% | (B) | | | | 0.36% | | | | | 1.03% | |
| Supplementary Data: | | | | | | | | | | | | | | | | | | | | | | | | | | | | | |
Net Assets at End of Period (in thousands) | | $ | 205,861 | | | | $ | 211,171 | | | | $ | 251,675 | | | | $ | 288,761 | | | | $ | 341,413 | | | | $ | 454,247 | |
|
| * | | Effective March 1, 2004, the Fund’s fiscal year end changed to October 31. |
| 1 | | Calculated based on shares outstanding on the first and last day of the respective periods, except for dividends and distributions, if any, which are based on the actual shares outstanding on the dates of distributions. |
| 2 | | Less than $0.01 |
| 3 | | Prior to November 1, 2005, reflects fees waived by FBR Fund Advisers, Inc. pursuant to a contractual advisory fee waiver of 0.10%. |
| 4 | | The amounts shown for a share outstanding throughout the respective periods may not be in accordance with the changes in the aggregate gains and losses in investments during the respective periods because of the timing of sales and repurchases of Fund shares in relation to fluctuating net asset values during the respective periods. |
| 5 | | Total investment return is calculated assuming a purchase of shares on the first day and a sale on the last day of each period reported and will include reinvestment of dividends and distributions, if any. |
| (A) | | Not Annualized |
| (B) | | Annualized |
| The accompanying notes are an integral part of the financial statements. |
| 89 |
| The FBR Funds |
|
Schedule of Shareholder Expenses
(unaudited) |
As a shareholder of the Funds, you incur two types of costs: (1) transaction costs, including reinvested dividends or other distributions; redemption fees; and exchange fees; and (2) ongoing costs, including investment advisory fees; distribution (12b-1) fees; and other Fund expenses. This example is intended to help you understand your ongoing costs (in dollars) of investing in the Funds and to compare these costs with the ongoing costs of investing in other mutual funds.
The example is based on an investment of $1,000 invested at the beginning of the period and held for the entire period (November 1, 2006 through April 30, 2007).
Actual Expenses
The first line of the table on the following page provides information about actual account values and actual expenses. You may use the information in this line, together with the amount you invested, to estimate the expenses that you paid over the period. Simply divide your account value by $1,000 (for example, an $8,600 account value divided by $1,000 = 8.6), then multiply the result by the number in the first line under the heading entitled “Expenses Paid During the Six Months Ended April 30, 2007” to estimate the expenses you paid on your account during this period.
Hypothetical Example for Comparison Purposes
The second line of the table on the following page provides information about hypothetical account values and hypothetical expenses based on the Funds’ actual expense ratio and an assumed rate of return of 5% per year before expenses, which is not the Funds’ actual return. The hypothetical account values and expenses may not be used to estimate the actual ending account balance or expenses you paid for the period. You may use this information to compare the ongoing costs of investing in the Funds and other funds. To do so, compare this 5% hypothetical example with the 5% hypothetical examples that appear in the shareholder reports of the other funds.
90
| The FBR Funds |
|
Schedule of Shareholder Expenses (continued)
(unaudited) |
| | | | | | | | | | | | | | | | Expenses Paid |
| | | Net Expense | | | Beginning | | Ending | | During the |
| | | Ratio | | | Account | | Account | | Six Months |
| | | Annualized | | | Value | | Value | | Ended |
| | | April 30, 2007 | | | November 1, 2006 | | April 30, 2007 | | April 30, 2007* |
| | |
| | |
| |
| |
|
| Pegasus Fund | | | | | | | | | | | | | | | | | |
Actual | | | 1.95 | % | | | $ | 1,000.00 | | | $ | 1,091.90 | | | $ | 10.11 | |
Hypothetical | | | 1.95 | | | | | 1,000.00 | | | | 1,015.12 | | | | 9.74 | |
| Pegasus Mid Cap Fund** | | | | | | | | | | | | | | | | | |
Actual | | | 1.95 | | | | | 1,000.00 | | | | 1,054.00 | | | | 3.40 | |
Hypothetical | | | 1.95 | | | | | 1,000.00 | | | | 1,005.23 | | | | 3.32 | |
| Pegasus Small Cap Fund** | | | | | | | | | | | | | | | | | |
Actual | | | 1.95 | | | | | 1,000.00 | | | | 1,071.00 | | | | 3.43 | |
Hypothetical | | | 1.95 | | | | | 1,000.00 | | | | 1,005.23 | | | | 3.32 | |
| Large Cap Financial Fund | | | | | | | | | | | | | | | | | |
Actual | | | 1.87 | | | | | 1,000.00 | | | | 1,061.20 | | | | 9.56 | |
Hypothetical | | | 1.87 | | | | | 1,000.00 | | | | 1,015.53 | | | | 9.33 | |
| Large Cap Technology Fund | | | | | | | | | | | | | | | | | |
Actual | | | 1.73 | | | | | 1,000.00 | | | | 1,058.50 | | | | 8.83 | |
Hypothetical | | | 1.73 | | | | | 1,000.00 | | | | 1,016.23 | | | | 8.63 | |
| Small Cap Fund | | | | | | | | | | | | | | | | | |
Actual | | | 1.36 | | | | | 1,000.00 | | | | 1,135.40 | | | | 7.20 | |
Hypothetical | | | 1.36 | | | | | 1,000.00 | | | | 1,018.03 | | | | 6.82 | |
| Small Cap Financial Fund | | | | | | | | | | | | | | | | | |
Actual | | | 1.52 | | | | | 1,000.00 | | | | 946.80 | | | | 7.34 | |
Hypothetical | | | 1.52 | | | | | 1,000.00 | | | | 1,017.24 | | | | 7.62 | |
| Small Cap Technology Fund | | | | | | | | | | | | | | | | | |
Actual | | | 1.95 | | | | | 1,000.00 | | | | 1,125.20 | | | | 10.28 | |
Hypothetical | | | 1.95 | | | | | 1,000.00 | | | | 1,015.12 | | | | 9.74 | |
| Gas Utility Index Fund | | | | | | | | | | | | | | | | | |
Actual | | | 0.78 | | | | | 1,000.00 | | | | 1,140.00 | | | | 4.14 | |
Hypothetical | | | 0.78 | | | | | 1,000.00 | | | | 1,020.93 | | | | 3.90 | |
| Fund for Government Investors | | | | | | | | | | | | | | | | | |
Actual | | | 0.89 | | | | | 1,000.00 | | | | 1,021.80 | | | | 4.46 | |
Hypothetical | | | 0.89 | | | | | 1,000.00 | | | | 1,020.38 | | | | 4.46 | |
|
| * | | Expenses are equal to the Fund’s annualized expense ratio, multiplied by the average account value over the period, multiplied by the number of days in most recent fiscal half-year then divided by 365. |
| ** | | Represents the period from commencement of operations (February 28, 2007) through April 30, 2007. |
91
The FBR Funds
Notes to Financial Statements
(unaudited)
1. Organization
The FBR Funds (the “Trust”) is registered under the Investment Company Act of 1940, as amended, (“1940 Act”) as an open-end management investment company. The Trust was organized as a business trust under the laws of the State of Delaware on September 29, 2003. The Trust currently consists of ten series which represent interests in one of the following investment portfolios: FBR Pegasus FundTM (“Pegasus Fund”), FBR Pegasus Mid Cap FundTM (“Pegasus Mid Cap Fund”), FBR Pegasus Small Cap FundTM (“Pegasus Small Cap Fund”), FBR Large Cap Financial Fund (“Large Cap Financial Fund”), FBR Large Cap Technology Fund (“Large Cap Technology Fund”), FBR Small Cap Fund (“Small Cap Fund”), FBR Small Cap Financial Fund (“Small Cap Financial Fund”), FBR Small Cap Technology Fund (“Small Cap Technology Fund”), FBR Gas Utility Index Fund (“Gas Utility Index Fund”) and FBR Fund for Government Investors (“Money Market Fund”), (each a “Fund” and collectively, the “Funds”). The Trust is authorized to issue an unlimited number of shares of beneficial interest with no par value which may be issued in more than one class or series. Each Fund offers one class of shares, which is offered as no-load shares. The Pegasus Mid Cap Fund and Pegasus Small Cap Fund commenced operations on February 28, 2007.
The Pegasus Fund, a non-diversified fund, intends to invest in the stocks of companies of any size without regard to market capitalization. The investment objective of the Fund is capital appreciation.
The Pegasus Mid Cap Fund, a non-diversified fund, intends to invest, under normal circumstances, at least 80% of its net assets in securities of mid capitalization (“mid-cap”) companies. The investment objective of the Fund is capital appreciation.
The Pegasus Small Cap Fund, a non-diversified fund, intends to invest, under normal circumstances, at least 80% of its net assets in securities of small capitalization (“small-cap”) companies. The investment objective of the Fund is capital appreciation.
The Large Cap Financial Fund, a non-diversified fund, intends to invest, under normal circumstances, at least 80% of its net assets in securities of large capitalization (“large-cap”) companies principally engaged in the business of financial services including, but not limited to, commercial banks, savings and loan associations, consumer and industrial finance companies, securities brokerage companies, insurance companies, real estate and leasing companies, holding companies for each of the foregoing types of business, or companies that combine some or all of these businesses. The investment objective of the Fund is capital appreciation.
The Large Cap Technology Fund, a non-diversified fund, intends to invest, under normal circumstances, at least 80% of its net assets in securities of large-cap companies that are principally engaged in the research, design, development, manufacturing or distributing products or services in the technology industry. The investment objective of the Fund is long-term capital appreciation.
92
The FBR Funds
Notes to Financial Statements (continued)
(unaudited)
The Small Cap Fund, a non-diversified fund, intends to invest, under normal circumstances, at least 80% of its net assets in securities of small-cap companies. The investment objective of the Fund is capital appreciation.
The Small Cap Financial Fund, a non-diversified fund, intends to invest, under normal circumstances, at least 80% of its net assets in securities of small-cap companies principally engaged in the business of providing financial services to consumers and industry. The investment objective of the Fund is capital appreciation.
The Small Cap Technology Fund, a non-diversified fund, intends to invest, under normal circumstances, at least 80% of its net assets in securities of small-cap companies that are principally engaged in the research, design, development, manufacturing or distributing products or services in the technology industry. The investment objective of the Fund is long-term capital appreciation.
The Gas Utility Index Fund, a diversified fund, intends to invest, under normal circumstances, at least 85% of its net assets in the common stock of companies that have natural gas distribution and transmission operations. The investment objective of the Fund is income and capital appreciation.
The Money Market Fund, a diversified fund, intends to invest, under normal circumstances, at least 95% of its total assets in fixed-rate and floating-rate short-term instruments issued or guaranteed by the U.S. Government, its agencies or instrumentalities and in repurchase agreements secured by such instruments. The investment objective of the Fund is current income consistent with liquidity and preservation of capital.
2. Significant Accounting Policies
The following is a summary of the Funds’ significant accounting policies:
Portfolio Valuation — The net asset value per share (“NAV”) of each Fund is determined as of the close of regular trading on the New York Stock Exchange (“NYSE”) (normally 4:00 p.m., Eastern Time) on each business day that the exchange is open for trading. Each Fund’s securities are valued at the last sale price on the securities exchange or national securities market on which such securities are primarily traded. Securities that are quoted by NASDAQ are valued at the NASDAQ Official Closing Price. Securities not listed on an exchange or national securities market, or securities in which there were no transactions, are valued at the average of the most recent bid and ask prices, except in the case of open short positions where the ask price is used for valuation purposes. The bid price is used when no ask price is available. Short-term investments are carried at amortized cost, which approximates market value. Restricted securities, as well as securities or other assets for which market quotations are not readily available, or are not valued by a pricing service approved by the Funds’ Board of Trustees (the “Board”), are valued at fair value in good faith by, or at the direction of, the Board.
In September 2006, the Financial Accounting Standards Board (FASB) issued Statement on Financial Accounting Standards (SFAS) No. 157, “Fair Value Measurements.” This
93
The FBR Funds
Notes to Financial Statements (continued)
(unaudited)
standard establishes a single authoritative definition of fair value, sets out a framework for measuring fair value and requires additional disclosures about fair value measurements. SFAS No. 157 applies to fair value measurements already required or permitted by existing standards. SFAS No. 157 is effective for financial statements issued for fiscal years beginning after November 15, 2007 and interim periods within those fiscal years. The changes to current generally accepted accounting principles from the application of this Statement relate to the definition of fair value, the methods used to measure fair value, and the expanded disclosures about fair value measurements. As of April 30, 2007, the Funds do not believe the adoption of SFAS No. 157 will impact the amounts reported in the financial statements, however, additional disclosures may be required about the inputs used to develop the measurements and the effect of certain of the measurements reported on the statement of changes in net assets for a fiscal period.
Share Valuation — The NAV of each Fund is calculated by dividing the sum of the value of the securities held by each Fund, plus cash or other assets, minus all liabilities (including estimated accrued expenses) by the total number of shares outstanding of each Fund, rounded to the nearest cent. Each Fund’s shares will not be priced on the days on which the NYSE is closed for trading. The offering and redemption price per share of each Fund is equal to each Fund’s NAV. The Funds, except for the Money Market Fund, charge a 1% redemption fee on shares redeemed or exchanged within 90 days of purchase. These fees are deducted from the redemption proceeds otherwise payable to the shareholder. The Funds will retain the fee charged as paid-in capital and such fees become part of that Fund’s daily NAV calculation.
Investment Income — Dividend income is recorded on the ex-dividend date. Interest income, which includes the amortization of premium and accretion of discount, if any, is recorded on an accrual basis.
Expenses — The Funds pay all operational expenses, which are either charged directly to a Fund for which the expense is attributable or are allocated proportionately among the Funds based on allocation methods approved by the Board.
Distributions to Shareholders — Each Fund, except the Gas Utility Index Fund and Money Market Fund, declares and pays any dividends from its net investment income, if any, annually. The Gas Utility Index Fund declares and pays any such dividends quarterly. The Money Market Fund declares dividends each day the Fund is open for business and pays monthly. Distributions from net realized capital gains, if any, will be distributed at least annually for each Fund. Income and capital gain distributions are determined in accordance with U.S. federal income tax regulations.
Security Transactions — Security transactions are accounted for on the trade date. Securities sold are determined on a specific identification basis.
Estimates — The preparation of financial statements in accordance with U.S. generally accepted accounting principles requires management to make estimates and assumptions that may affect the reported amounts of assets and liabilities and disclosure of contingent
94
The FBR Funds
Notes to Financial Statements (continued)
(unaudited)
assets and liabilities at the date of the financial statements and the reported amounts of income and expenses during the reporting period. Actual results could differ from those estimates.
Options — Each Fund, except the Gas Utility Index Fund and Money Market Fund, may buy and sell call and put options to hedge against changes in net asset value or to attempt to realize a greater current return. The risk associated with purchasing an option is that a Fund pays a premium whether or not the option is exercised. Additionally, a Fund bears the risk of loss of premium and change in market value should the counterparty not perform under the contract. Put and call options purchased are accounted for in the same manner as portfolio securities. The cost of securities acquired through the exercise of call options is increased by the premiums paid. The proceeds from securities sold through the exercise of put options are decreased by the premiums paid. When a Fund writes an option, an amount equal to the premium received by the Fund is recorded as a liability and is subsequently adjusted to the current market value of the option written. Premiums received from writing options which expire unexercised are recorded by a Fund on the expiration date as realized gains from option transactions.
The difference between the premium and the amount paid on effecting a closing purchase transaction, including brokerage commissions, is also treated as a realized gain, or if the premium is less than the amount paid for the closing purchase transaction, as a realized loss. If a call option is exercised, the premium is added to the proceeds from the sale of the underlying securities in determining whether a Fund has a realized gain or loss. If a put option is exercised, the premium reduces the cost basis of the securities purchased by a Fund. Each Fund’s use of written options involves, to varying degrees, elements of market risk in excess of the amount recognized in the Statement of Assets and Liabilities. The contract or notional amounts reflect the extent of a Fund’s involvement in these financial instruments. In writing an option, a Fund bears the market risk of an unfavorable change in the price of the security underlying the written option. Exercise of an option written by a Fund could result in a Fund selling or buying a security at a price different from the current market value. A Fund’s activities in written options are conducted through regulated exchanges, which do not result in counterparty credit risks. The Funds had no outstanding options at April 30, 2007.
Repurchase Agreements — The Pegasus Fund, Pegasus Mid Cap Fund, Pegasus Small Cap Fund, Large Cap Financial Fund, Large Cap Technology Fund, Small Cap Fund, Small Cap Financial Fund, Small Cap Technology Fund, Gas Utility Index Fund and Money Market Fund have agreed to purchase securities from financial institutions subject to the seller’s agreement to repurchase them at an agreed-upon time and price (“repurchase agreement”). The financial institutions with whom each Fund enters into repurchase agreements are banks and broker/dealers which the adviser considers creditworthy pursuant to criteria approved by the Board. The seller under a repurchase agreement will be required to maintain the value of the securities as collateral, subject to the agreement at not less than the repurchase price plus accrued interest. The adviser marks to market daily
95
The FBR Funds
Notes to Financial Statements (continued)
(unaudited)
the value of the collateral, and, if necessary, requires the seller to maintain additional securities, to ensure that the value is not less than the repurchase price. Default by or bankruptcy of the seller would, however, expose each Fund to possible loss because of adverse market action or delays in connection with the disposition of the underlying securities.
Securities Lending — Each Fund may lend its portfolio securities to broker-dealers, banks or institutional borrowers of securities. Loans of securities are required at all times to be secured by collateral equal to at least 100% of the market value of the securities on loan. However, in the event of default or bankruptcy by the other party to the agreement, realization and/or retention of the collateral may be subject to legal proceedings. In the event that the borrower fails to return securities, and cash collateral being maintained by the borrower is insufficient to cover the value of loaned securities and provided such collateral insufficiency is not the result of investment losses, the lending agent has agreed to pay the amount of the shortfall to the Funds. The Funds had no securities on loan to brokers at April 30, 2007.
Line of Credit — The Trust has a line of credit (“Credit Agreement”) with Custodial Trust Company (“CTC”) for temporary or emergency purposes. Under the Credit Agreement, CTC provides a line of credit in an amount up to the maximum amount permitted under the 1940 Act and each Fund’s prospectus. Pursuant to the Credit Agreement, each participating Fund is liable only for principal and interest payments related to borrowings made by that Fund. Borrowings under the Credit Agreement bear interest at 100 basis points (100 basis points = 1%) over the LIBOR (London Inter-Bank Offer Rate). The Funds had no borrowings outstanding at April 30, 2007.
3. Transactions with Affiliates
Investment Adviser — FBR Fund Advisers, Inc. (“Fund Advisers”) serves as investment adviser to the Funds. For its advisory services, Fund Advisers receives a monthly fee at an annual rate of 0.90% of the average daily net assets of the Pegasus Fund, Pegasus Mid Cap Fund, Pegasus Small Cap Fund, Large Cap Financial Fund, Large Cap Technology Fund, Small Cap Fund, Small Cap Financial Fund and Small Cap Technology Fund, and at an annual rate of 0.40% of the average daily net assets of the Gas Utility Index Fund. The Money Market Fund pays a management fee at an annual rate based on the Fund’s average daily net assets of 0.50% on the first $500 million, 0.45% on the next $250 million, 0.40% on the next $250 million, and 0.35% on net assets over $1 billion.
Fund Advisers has contractually agreed to limit each Fund’s total operating expenses to 1.95% of each Fund’s average daily net assets, except for the Gas Utility Index Fund and Money Market Fund, which Fund Advisers has contractually agreed to limit total operating expenses to 0.85% and 1.00% of average daily net assets, respectively. Fund Advisers has agreed to maintain these limitations with regard to each Fund through November 1, 2007.
96
The FBR Funds
Notes to Financial Statements (continued)
(unaudited)
Fund Advisers has retained Akre Capital Management, LLC (“ACM”) as investment subadviser to the Small Cap Fund. In this capacity, subject to the supervision of Fund Advisers and the Board, ACM directs the investments of the Small Cap Fund’s assets, continually conducts investment research and supervision for the Small Cap Fund, and is responsible for the purchase and sale of the Small Cap Fund’s investments. For these services, Fund Advisers (and not the Fund) pays ACM a fee out of the Adviser’s advisory fee.
Administrator — Fund Advisers provides day-to-day administrative services including monitoring portfolio compliance, determining compliance with provisions of the Internal Revenue Code, oversight of the service providers and preparing the Funds’ registration statements. Pursuant to the Administration Agreement, Fund Advisers receives a fee of 0.06% on the first $2 billion of total average daily net assets of the Funds, 0.05% on the next $1 billion of total average daily net assets of the Funds and 0.035% on the Funds’ average daily net assets in excess of $3 billion. Fund Advisers also provides the Funds with office space, facilities and business equipment and generally administers the Funds’ business affairs and provides the services of executive and clerical personnel for administering the affairs of the Funds. Fund Advisers compensates all personnel, Officers, and Trustees of the Funds if such persons are employees of the Investment Adviser or Administrator. As of November 1, 2005, the Funds have contracted directly with a third party, Integrated Investment Services, Inc., for transfer agency and fund accounting services, and the Funds pay for all operating costs.
Plan of Distribution — The Trust, on behalf of each Fund, except the Gas Utility Index Fund and Money Market Fund, has adopted a Distribution Plan (the “Plan”) pursuant to Rule 12b-1 under the 1940 Act. Under the Plan, each Fund may pay FBR Investment Services, Inc. (the “Distributor”) a fee at an annual rate of up to 0.25% of each Fund’s average daily net assets. Fees paid to the Distributor under the Plan are payable without regard to actual expenses incurred. The Distributor had voluntarily agreed to waive a portion of the distribution fees payable by the Small Cap Fund in an amount attributable to marketing expenses for the Fund until such time as the Fund was reopened to new investors on January 3, 2007.
Brokerage Commissions — For the six months ended April 30, 2007, the Small Cap Financial Fund paid $13,438 in brokerage commissions from portfolio transactions to Friedman, Billings, Ramsey and Co., Inc. (FBR & Co.), an affiliate of Fund Advisers and the Distributor. No other Fund paid commissions to FBR & Co. during the period.
Trustees’ Fees — Each Trustee of the Trust who is not an employee of the Adviser or affiliate of the Adviser receives an annual retainer fee of $14,000 and an additional meeting fee of $2,250 for each quarterly meeting attended. In addition, each Trustee that serves on the Audit Committee or Nominating Committee receives a meeting fee of $1,000 for attendance at the meeting. If a Trustee participates by teleconference, the meeting fee is 50% of the respective in-person meeting fee. The Chairman of the Board, an independent Trustee, receives an additional $1,000 for each meeting attended.
97
The FBR Funds
Notes to Financial Statements (continued)
(unaudited)
4. Investment Transactions
For the six months ended April 30, 2007, purchases and sales of investment securities (excluding short-term securities and U.S. government obligations) for each Fund were as follows:
| | | Purchases | | Sales |
| | |
| |
|
| Pegasus Fund | | $ | 7,825,939 | | $ | 10,055,281 |
| Pegasus Mid Cap Fund | | | 3,526,818 | | | 521,175 |
| Pegasus Small Cap Fund | | | 3,894,400 | | | 582,589 |
| Large Cap Financial Fund | | | 8,559,880 | | | 11,872,526 |
| Large Cap Technology Fund | | | 41,987,383 | | | 44,508,517 |
| Small Cap Fund | | | 137,718,648 | | | 570,126 |
| Small Cap Financial Fund | | | 18,521,530 | | | 123,131,669 |
| Small Cap Technology Fund | | | 2,637,015 | | | 2,199,297 |
| Gas Utility Index Fund | | | 32,812,885 | | | 37,396,563 |
5. Federal Income Taxes
It is each Fund’s policy to continue to comply with the special provisions of the Internal Revenue Code that are applicable to regulated investment companies. As provided therein, in any fiscal year in which a Fund so qualifies and distributes at least 90% of its taxable net income, the Fund (but not the shareholders) will be relieved of federal income tax on the income distributed. Accordingly, no provision for income taxes has been made.
In order to avoid imposition of the excise tax applicable to regulated investment companies, it is also each Fund’s intention to declare and pay as dividends in each calendar year at least 98% of its net investment income (earned during the calendar year) and 98% of its net realized capital gains (earned during the twelve months ending October 31) plus undistributed amounts from prior years.
Income and capital gain distributions are determined in accordance with income tax regulations that may differ from accounting principles that are generally accepted in the United States of America. As a result, the character of tax-basis distributions and the composition of net assets for tax purposes may differ from those reflected in the Funds’ financial statements. These book/tax differences may be temporary or permanent in nature. Temporary differences are primarily the result of wash sales. Reclassifications for permanent differences are made to components of capital. These reclassifications have no effect on net assets or net asset value per share.
98
The FBR Funds
Notes to Financial Statements (continued)
(unaudited)
The tax character of distributions paid for each Fund’s tax year was as follows:
| | | Ordinary Income | | Long-Term Capital Gains |
| | |
| |
|
| | | Dollar | | Per share | | Dollar | | | Per share |
| | | Amount | | Amount | | Amount | | | Amount |
| | |
| |
| |
| | |
|
| Pegasus Fund | | | | | | | | | | | | | |
For the Year Ended October 31, 2006 | | $ | 1,131 | | $ | 0.004657 | | $ | — | | | $ | — |
For the Year Ended October 31, 2005 | | | — | | | — | | | — | | | | — |
| Large Cap Financial Fund | | | | | | | | | | | | | |
For the Year Ended October 31, 2006 | | | 231,630 | | | 0.158660 | | | 3,691,188 | | | | 2.856242 |
For the Year Ended October 31, 2005 | | | 1,139,465 | | | 0.900999 | | | 2,502,844 | | | | 2.000403 |
| Large Cap Technology Fund | | | | | | | | | | | | | |
For the Year Ended October 31, 2006 | | | 278,046 | | | 0.172572 | | | 654,245 | | | | 0.406063 |
For the Year Ended October 31, 2005 | | | 456,981 | | | 0.769208 | | | 507,449 | | | | 0.854158 |
| Small Cap Fund | | | | | | | | | | | | | |
For the Year Ended October 31, 2006 | | | — | | | — | | | 14,760,977 | | | | 0.769867 |
For the Year Ended October 31, 2005 | | | 7,424,560 | | | 0.342813 | | | 6,107,872 | | | | 0.232018 |
| Small Cap Financial Fund | | | | | | | | | | | | | |
For the Year Ended October 31, 2006 | | | 2,080,797 | | | 0.144159 | | | 49,145,199 | | | | 3.703541 |
For the Year Ended October 31, 2005 | | | 5,438,732 | | | 0.294938 | | | 72,966,205 | | | | 4.253542 |
| Small Cap Technology Fund | | | | | | | | | | | | | |
For the Year Ended October 31, 2006 | | | — | | | — | | | — | | | | — |
For the Year Ended October 31, 2005 | | | — | | | — | | | — | | | | — |
| Gas Utility Index Fund | | | | | | | | | | | | | |
For the Year Ended October 31, 2006 | | | 9,174,876 | | | 0.609932 | | | — | | | | — |
For the Year Ended October 31, 2005 | | | 6,644,316 | | | 0.410258 | | | — | | | | — |
| Fund for Government Investors | | | | | | | | | | | | | |
For the Year Ended October 31, 2006 | | | 9,042,605 | | | 0.038269 | | | — | | | | — |
For the Year Ended October 31, 2005 | | | 5,300,978 | | | 0.019400 | | | — | | | | — |
99
The FBR Funds
Notes to Financial Statements (continued)
(unaudited)
The following information is computed on a tax basis for each item:
| | | As of October 31, 2006 |
| | |
|
| | | Pegasus | | Large Cap | | Large Cap | | Small Cap |
| | | Fund | | Financial Fund | | Technology Fund | | Fund |
| | |
| |
| |
| |
|
| Tax cost of investment securities | | | $12,805,230 | | | | $23,156,495 | | | | $39,180,312 | | | | $537,586,650 | |
| | | |
| | | |
| | | |
| | | |
| |
| Gross unrealized appreciation | | | 740,264 | | | | 3,767,072 | | | | 2,492,927 | | | | 402,228,397 | |
| Gross unrealized depreciation | | | (162,882 | ) | | | (187,863 | ) | | | (789,587 | ) | | | (8,972,500 | ) |
| | | |
| | | |
| | | |
| | | |
| |
| Net unrealized appreciation | | | 577,382 | | | | 3,579,209 | | | | 1,703,340 | | | | 393,255,897 | |
| Undistributed ordinary income | | | 585,228 | | | | 122,823 | | | | 718,645 | | | | — | |
| Undistributed long-term capital gains | | | — | | | | 2,416,486 | | | | 677,401 | | | | 2,383,019 | |
| | | |
| | | |
| | | |
| | | |
| |
| Accumulated earnings | | | $ 1,162,610 | | | | $ 6,118,518 | | | | $ 3,099,386 | | | | $395,638,916 | |
| | | |
| | | |
| | | |
| | | |
| |
| | | | | | | | | | | | | | | | |
| | | As of October 31, 2006 |
| | |
|
| | | | | | | | | | | | | | | Fund for |
| | | Small Cap | | Small Cap | | Gas Utility | | Government |
| | | Financial Fund | | Technology Fund | | Index Fund | | Investors |
| | |
| | |
| |
| |
|
| Tax cost of investment securities | | | $258,850,194 | | | | $3,548,006 | | | | $149,944,396 | | | | $210,893,586 | |
| | | |
| | | |
| | | |
| | | |
| |
| Gross unrealized appreciation | | | 93,220,240 | | | | 304,469 | | | | 126,060,527 | | | | — | |
| Gross unrealized depreciation | | | (5,927,932 | ) | | | (96,378 | ) | | | (6,609,424 | ) | | | — | |
| | | |
| | | |
| | | |
| | | |
| |
| Net unrealized appreciation | | | 87,292,308 | | | | 208,091 | | | | 119,451,103 | | | | — | |
| Undistributed ordinary income | | | 1,573,107 | | | | 124,829 | | | | 269,784 | | | | — | |
| Undistributed long-term capital gains | | | 43,232,104 | | | | 41,912 | | | | — | | | | — | |
| Capital loss carryforward | | | — | | | | — | | | | (1,055,026 | ) | | | (189,953 | ) |
| | | |
| | | |
| | | |
| | | |
| |
| Accumulated earnings (loss) | | | $132,097,519 | | | | $374,832 | | | | $118,665,861 | | | | $ (189,953 | ) |
| | | |
| | | |
| | | |
| | | |
| |
Unused capital loss carryforwards as of October 31, 2006, were as follows:
| | | Gas Utility | | Fund for |
| | | Index Fund | | Government Investors |
| | |
| |
|
| October 31, 2011 | | $ | — | | $ | 23,854 | |
| October 31, 2012 | | | 1,055,026 | | | 165,106 | |
| October 31, 2013 | | | — | | | 970 | |
| October 31, 2014 | | | — | | | 23 | |
The capital loss carryforwards may be utilized in the current and future years to offset net realized capital gains, if any, prior to distributing such gains to shareholders.
100
The FBR Funds
Notes to Financial Statements (continued)
(unaudited)
The following reclassifications, the result of permanent differences between financial statement and income tax reporting requirements, have been made to the components of capital.
| | | | | | | Accumulated | | | | |
| | | Undistributed | | Net Realized | | Paid-In |
| | | Income (Loss) | | Gain (Loss) | | Capital |
| | |
| |
| |
|
| Pegasus Fund | | $ | 20,298 | | | $ | (20,298 | ) | | $ | — | |
| Large Cap Technology Fund | | | 138,653 | | | | (138,653 | ) | | | — | |
| Small Cap Fund | | | 8,007,752 | | | | (274,415 | ) | | | (7,733,337 | ) |
| Small Cap Financial Fund | | | (127,202 | ) | | | 94,904 | | | | 32,298 | |
| Small Cap Technology Fund | | | 48,023 | | | | (48,023 | ) | | | — | |
On July 13, 2006, the FASB released FASB Interpretation No. 48 “Accounting for Uncertainty in Income Taxes” (FIN 48). FIN 48 provides guidance for how uncertain tax positions should be recognized, measured, presented and disclosed in the financial statements. FIN 48 requires the evaluation of tax positions taken or expected to be taken in the course of preparing the Funds’ tax returns to determine whether the tax positions are “more-likely-than-not” of being sustained by the applicable tax authority. Tax positions not deemed to meet the more-likely-than-not threshold will be required to be recorded as a tax benefit or expense in the current year. Adoption of FIN 48 is required for fiscal years beginning after December 15, 2006 and is to be applied to all open tax years as of the effective date. Management is in the process of determining the impact of adoption.
As of April 30, 2007, the Federal Tax Cost of securities and the resulting net unrealized appreciation are as follows:
| | | | | | Gross | | Gross | | | | |
| | | Federal | | Unrealized | | Unrealized | | | Net Unrealized |
| | | Tax Cost | | Appreciation | | Depreciation | | | Appreciation |
| | |
| |
| |
| | |
|
| Pegasus Fund | | $ | 11,560,058 | | $ | 935,086 | | $ | (232,681 | ) | | | $ 702,405 |
| Pegasus Mid Cap Fund | | | 3,141,230 | | | 178,231 | | | (40,749 | ) | | | 137,482 |
| Pegasus Small Cap Fund | | | 3,407,092 | | | 199,874 | | | (36,717 | ) | | | 163,157 |
| Large Cap Financial Fund | | | 23,814,587 | | | 2,902,731 | | | (157,498 | ) | | | 2,745,233 |
| Large Cap Technology Fund | | | 35,467,295 | | | 2,136,500 | | | (1,000,421 | ) | | | 1,136,079 |
| Small Cap Fund | | | 1,143,906,064 | | | 530,634,212 | | | (6,311,293 | ) | | | 524,322,919 |
| Small Cap Financial Fund | | | 197,469,363 | | | 44,269,064 | | | (8,092,259 | ) | | | 36,176,805 |
| Small Cap Technology Fund | | | 4,414,170 | | | 466,173 | | | (84,359 | ) | | | 381,814 |
| Gas Utility Index Fund | | | 154,369,137 | | | 150,254,491 | | | (6,006,390 | ) | | | 144,248,101 |
| Fund for Government Investors | | | 207,035,811 | | | — | | | — | | | | — |
101
The FBR Funds
Notes to Financial Statements (continued)
(unaudited)
6. Investments in Affiliates
Affiliated issuers, as defined by the 1940 Act, are those in which a Fund’s holdings represent 5% or more of the outstanding voting securities of the issuer. A summary of each Fund’s investments in affiliates, if any, for the six months ended April 30, 2007, is noted below:
| | | SHARE ACTIVITY | | | | | | | | | | | |
| | |
| | | | | | | | | | | |
| | | Balance | | | | | | Balance | | | Realized | | | | | Value | | | Acquisition |
| Affiliate | | 10/31/06 | | Purchases | | Sales | | 04/30/07 | | | Gain | | Dividends | | | 04/30/07 | | | Cost |
|
| FBR Small Cap Fund Monarch Casino & Resort, Inc. | | 992,000 | | — | | — | | 992,000 | | | — | | — | | $ | 26,456,640 | | | $4,511,967 |
7. Commitments and Contingencies
In the normal course of business, the Funds enter into contracts that contain a variety of representations and warranties and which provide general indemnifications. The Funds’ maximum exposure under these arrangements is unknown, as this would involve future claims that may be made against the Funds that have not yet occurred. However, based on experience, the Funds expect the risk of loss to be remote.
102
The FBR Funds
Important Supplemental Information
(unaudited)
Approval of the Investment Advisory Agreements for the FBR Pegasus Small Cap FundTM and FBR Pegasus Mid Cap FundTM (the “Funds”)
In accordance with the 1940 Act, the Board is required, at an in-person meeting of the Board called for such purpose, to approve investment advisory agreements with regard to the Trust (“Advisory Agreements”).
The relevant provisions of the 1940 Act specifically provide that it is the duty of the Board to request and evaluate such information as the Board determines is necessary to allow them to properly consider the approval of Advisory Agreements, and it is the duty of the Adviser to furnish the Trustees with such information that is reasonably necessary for the Trustees to evaluate the terms of the Advisory Agreements.
Accordingly, in determining whether to approve the Advisory Agreements, the Board requested, and the Adviser provided, information and data relevant to the Board’s consideration. This included information regarding the anticipated fees and expenses of the Funds, as compared to other similar mutual funds.
As part of its deliberations, the Board also considered and relied upon the information about the other FBR Funds and the Adviser that had been provided to them throughout the year in connection with their regular Board meetings at which they engage in the ongoing oversight of the FBR Funds and their operations. The Independent Trustees were counseled during this process by independent legal counsel, as such term is defined in the rules under the 1940 Act, who reviewed with them their duties and responsibilities with respect to their approval of the Advisory Agreements.
The Board held an in-person meeting on October 24, 2006, at which they considered the approval of the Advisory Agreements with regard to the Funds and the Board engaged in a thorough review process to determine whether or not to approve the Advisory Agreements. During this meeting, the Board reviewed relevant information and data provided by the Adviser and held extended discussions with independent legal counsel to the Independent Trustees concerning the same. The Board met with representatives of Fund Advisers and discussed with them their investment process, compensation arrangements for the portfolio managers, brokerage practices expected to be used for the Funds, and matters relating to the distribution and marketing of the Funds.
The Board reviewed information and materials regarding the proposed investment advisory fees for the Funds. Representatives of Fund Advisers stated that the investment advisory fees for the Funds would not be subject to any asset based breakpoints, but that Fund Advisers has in place with respect to each of the Funds an expense limitation agreement limiting total annual operating expenses.
The Board then considered proposed expense information for each of the Funds, the costs of providing services, the expected profitability of each of the Funds to Fund Advisers, and distribution arrangements for each of the Funds.
103
The FBR Funds
Important Supplemental Information (continued)
(unaudited)
The Board then undertook a review of the proposed Advisory Agreements. Among the factors the Board considered was the overall performance of the other FBR Funds relative to the performance of other mutual funds in each Funds’ peer group over long-term and short-term time periods. The Board also took note of the long-term relationship between Fund Advisers and the FBR Funds and the efforts that had been undertaken by Fund Advisers to foster the growth and development of the FBR Funds since the inception of the FBR Funds. The Trustees noted the range of investment advisory and administrative services to be provided by Fund Advisers and its affiliates to the Funds and the level and quality of these services, and in particular, the quality of the personnel providing these services. The Board also reviewed financial information concerning Fund Advisers and its affiliates relating to the proposed operation of the Funds, noting the financial soundness of Fund Advisers as demonstrated by the financial information provided.
The Board took note of the fact that an affiliate of Fund Advisers, the Distributor continues to serve as the distributor of the shares of the Funds and receive distribution fees from the Funds for serving in that role. The Board considered and discussed the activities routinely engaged in by the Distributor in order to distribute and market the FBR Funds. The Board reviewed the distribution arrangements maintained by the Distributor for the FBR Funds, noting the extensive sales arrangements for the FBR Funds on various mutual fund supermarket platforms and the manner in which the distribution fees paid by those of the Funds that pay distribution fees are utilized in connection with these arrangements.
The Board also considered and reviewed information regarding the administrative services fees to be paid to Fund Advisers by the Funds for providing certain types of administrative services. The Board determined that these administrative fees were fair and reasonable in connection with the types of services provided by Fund Advisers to the FBR Funds and that they were reasonable fees to be paid in addition to the investment advisory fees paid by the Funds to Fund Advisers given that the administrative services are separate and distinct services apart from the investment advisory services to be provided to the Funds by Fund Advisers.
The Independent Trustees then met separately with the independent legal counsel to the Independent Trustees in order to consider the proposed approval of the Advisory Agreements. At the conclusion of their session, the Independent Trustees indicated that they had determined that they had received sufficient information in order to allow them to take action with respect to their approval of the Advisory Agreements.
In reaching their conclusion with respect to the approval of the Agreements, the Trustees did not identify any single factor as being controlling, rather, the Board took note of a combination of factors that influenced their decision-making process. The Board did, however, identify the commitment of Fund Advisers to the successful operation of the Funds, and the level of proposed expenses of the Funds, as well as the use of expense limitation agreements in order to reduce the overall operating expenses of the Funds, as being important elements of their consideration. The Board also took note of the effective
104
The FBR Funds
Important Supplemental Information (continued)
(unaudited)
implementation of the compliance programs of the FBR Funds and Fund Advisers in accordance with applicable requirements relating to mutual funds and their investment advisers. Based upon their review and consideration of these factors and other matters deemed relevant by the Board in reaching an informed business judgment, a majority of the Board of Trustees, including a majority of the Independent Trustees, concluded that the terms of the Investment Advisory Agreements are fair and reasonable, and the Board voted to approve the Agreements, subject to the applicable limitations on the total operating expenses of each of the Funds as considered and approved at the meeting.
Proxy Voting Guidelines
Fund Advisers is responsible for exercising the voting rights associated with the securities purchased and held by the Funds. A description of the policies and procedures Fund Advisers uses in fulfilling this responsibility is included in the Funds’ Statement of Additional Information and is available without charge, upon request, by calling 888.888.0025. The policies and procedures are also available on the Securities and Exchange Commission’s (“SEC”) website at http://www.sec.gov. Information on how the Funds voted proxies relating to portfolio securities during the most recent 12 month period ended June 30 is available without charge, upon request, by calling 888.888.0025 and is also available on the SEC’s website at http://www.sec.gov.
Portfolio Holdings
The Funds file their complete schedule of holdings with the SEC for the first and third quarters of each fiscal year on Form N-Q. The Funds’ Form N-Q is available on the SEC’s website, beginning with the July 31, 2004 report, at http://www.sec.gov. You may review and make copies at the SEC’s Public Reference Room in Washington, D.C. You may also obtain copies after paying a duplicating fee by writing the SEC’s Public Reference Section, Washington, D.C. 20549-0102 or by electronic request to publicinfo@sec.gov. Information on the operation of the Public Reference Room may be obtained by calling 800.SEC.0330. A copy of the quarterly holdings report is available, without charge, upon request, by calling 888.888.0025.
105
[THIS PAGE INTENTIONALLY LEFT BLANK]
THE FBR FUNDS
888.888.0025
funds@fbr.com
www.fbrfunds.com
Investment Adviser and Administrator
FBR FUND ADVISERS, INC.
1001 NINETEENTH STREET NORTH
ARLINGTON, VIRGINIA 22209
Distributor
FBR INVESTMENT SERVICES, INC.
1001 NINETEENTH STREET NORTH
ARLINGTON, VIRGINIA 22209
Custodian
CARDINAL BANK
8270 GREENSBORO DRIVE
McLEAN, VIRGINIA 22102
Transfer Agent
INTEGRATED INVESTMENT SERVICES, INC.
P.O. BOX 5354
CINCINNATI, OHIO 45201
Independent Registered Public Accounting Firm
TAIT, WELLER, AND BAKER LLP
1818 MARKET STREET
PHILADELPHIA, PENNSYLVANIA 19103
This report is not authorized
for distribution to prospective
investors unless it is preceded or
accompanied by a current prospectus.
ITEM 2. CODE OF ETHICS.
Not applicable for semi-annual reports.
ITEM 3. AUDIT COMMITTEE FINANCIAL EXPERT.
Not applicable for semi-annual reports.
ITEM 4. PRINCIPAL ACCOUNTANT FEES AND SERVICES.
Not applicable for semi-annual reports.
ITEM 5. AUDIT COMMITTEE OF LISTED REGISTRANTS
Not applicable.
ITEM 6. SCHEDULE OF INVESTMENTS
Schedule is included as part of the report to shareholders filed under Item 1 of this Form.
ITEM 7. DISCLOSURE OF PROXY VOTING POLICIES AND PROCEDURES FOR CLOSED-END MANAGEMENT INVESTMENT COMPANIES.
Not applicable.
ITEM 8. PORTFOLIO MANAGERS OF CLOSED-END MANAGEMENT COMPANIES.
Not applicable.
ITEM 9. PURCHASES OF EQUITY SECURITIES BY CLOSED-END MANAGEMENT INVESTMENT COMPANY AND AFFILIATED PURCHASERS.
Not applicable.
ITEM 10. SUBMISSION OF MATTERS TO A VOTE OF SECURITY HOLDERS.
There have been no material changes to the procedures by which shareholders may recommend nominees to the Board.
ITEM 11. CONTROLS AND PROCEDURES.
| (a) | | Based upon an evaluation of the disclosure controls and procedures (as defined in Rule 30a-3(c) under the Act) as of a date within 90 days of the filing of this report, the Registrant’s principal executive officer and principal financial officer have concluded that such disclosure controls and procedures are effectively designed to ensure that information required to be disclosed by the Registrant is accumulated and communicated to the Registrant’s management to allow timely decisions regarding required disclosure. |
| (b) | | There was no change in the Registrant’s internal controls over financial reporting (as defined in Rule 30a-3(d) under the Act) that occurred during the second fiscal quarter of the period covered by this report that has materially affected, or is reasonably likely to materially affect, the Registrant’s internal control over financial reporting. |
ITEM 12. EXHIBITS.
File the exhibits listed below as part of this Form. Letter or number the exhibits in the sequence indicated.
| (a) | | (1) Not applicable. |
| | | (2) The certifications required by Rule 30a-2(a) under the Act are attached hereto. |
| | | (3) Not applicable. |
| (b) | | (1) The certifications required by Rule 30a-2(b) under the Act and Section 906 of the Sarbanes-Oxley Act of 2002 are attached hereto. |
SIGNATURES
Pursuant to the requirements of the Securities Exchange Act of 1934 and the Investment Company Act of 1940, the registrant has duly caused this report to be signed on its behalf by the undersigned, thereunto duly authorized.
(Registrant) The FBR Funds
| By (Signature and Title)* | | /s/ Kimberly J. Bradshaw | | 7/2/2007 | |
| | |
| |
| | | Kimberly J. Bradshaw | | Date | |
| | | Treasurer and Secretary | | | |
| | | The FBR Funds | | | |
Pursuant to the requirements of the Securities Exchange Act of 1934 and the Investment Company Act of 1940, this report has been signed below by the following persons on behalf of the registrant and in the capacities and on the dates indicated.
| By (Signature and Title) | | /s/ David H. Ellison | | 7/2/2007 | |
| | |
| |
| | | David H. Ellison | | Date | |
| | | President | | | |
| | | The FBR Funds | | | |
| | | (Principal Executive Officer) | | | |
| By (Signature and Title) | | /s/ Kimberly J. Bradshaw | | 7/2/2007 | |
| | |
| |
| | | Kimberly J. Bradshaw | | Date | |
| | | Treasurer and Secretary | | | |
| | | The FBR Funds | | | |
| | | (Principal Financial Officer and Accounting Officer) | | | |