UNITED STATES
SECURITIES AND EXCHANGE COMMISSION
Washington, D.C. 20549
FORM N-CSR
CERTIFIED SHAREHOLDER REPORT OF REGISTERED
MANAGEMENT INVESTMENT COMPANIES
Investment Company Act file number 811-21503
The FBR Funds
(Exact name of registrant as specified in charter)
1001 Nineteenth Street North
Arlington, VA 22209
(Address of principal executive offices) (Zip code)
Registrant’s telephone number, including area code: 703.469.1040
William Ginivan
General Counsel
Friedman, Billings, Ramsey Group, Inc.
Potomac Tower
1001 Nineteenth Street North
Arlington, VA 22209
(Name and address of agent for service)Date of fiscal year end: October 31, 2008
Date of reporting period: April 30, 2008
ITEM 1. REPORT TO SHAREHOLDERS.
The following is a copy of the report transmitted to shareholders pursuant to Rule 30e-1 under the Investment Company Act of 1940 (17CRF 270.30e-1).
THE FBR FUNDS
Investor Class
FBR Pegasus FundTM
FBR Pegasus Mid Cap FundTM
FBR Pegasus Small Cap FundTM
FBR Pegasus Small Cap Growth FundTM
FBR Focus Fund
FBR Large Cap Financial Fund
FBR Small Cap Financial Fund
FBR Technology Fund
FBR Gas Utility Index Fund
FBR Fund for Government Investors
Semi-Annual Report
April 30, 2008
[THIS PAGE INTENTIONALLY LEFT BLANK]
The FBR Funds
Semi-Annual Letter to Shareholders
Dear Valued Investor,
We are pleased to provide you with the 2008 Semi-Annual Report for The FBR Funds. This report contains the management discussion, portfolio information, and financial statements for the six-month period ended April 30, 2008.
In our last communication at the end of October we stressed the importance of a healthy lending system to facilitate a stable and growing economy. Since then, we have witnessed an unprecedented draining of liquidity in the bond and credit markets demonstrated in the forced rescue of Bear Stearns and the write-down of more than $300 billion in financial assets at banks, broker/dealers, and insurance companies. Simultaneously, consumers, which account for almost two-thirds of our domestic economy, continued to lose confidence in their ability to spend in the face of a slumping U.S. housing market and steadily rising inflation.
As energy and commodity prices rose to new highs, equity investors experienced increased volatility and lackluster returns over the course of the reporting period. The S&P 500 Index finished the first half of our fiscal year in negative territory, down 9.64%. During the reporting period eight of the top ten best performing Morningstar fund categories were government and municipal bond portfolios. The remaining two categories were bear market and natural resources funds. No one particular asset class (e.g. large, mid and small) or style of investing (e.g. value and growth) stood apart from their peers as the average equity fund in the Morningstar domestic universe declined 10.60% during the period.
The strong performance of our Funds, especially our newer core equity funds, during this volatile reporting period is a true testament to the validity of our conservative, fundamentally driven investment philosophy and process. By focusing investments in companies with defensive balance sheets, an established record of profitability and below market valuations, we are able to construct portfolios that provide less downside volatility and strong relative risk-adjusted returns. In our experience, the long-term value of a company is far less volatile than its daily stock price may indicate. Our investment process affords us the confidence to take advantage of short-term dislocations between a company’s current price and our understanding of its value.
In January the Funds’ Board of Trustees approved important changes allowing us to reposition two of our existing Funds. Effective May 1st, the FBR Large Cap Technology Fund was renamed the FBR Technology Fund and the FBR Small Cap Technology Fund was renamed the FBR Pegasus Small Cap Growth FundTM. In addition to the name change, the Pegasus Small Cap Growth Fund no longer focuses investments entirely in the technology sector. In April, the Fund’s primary benchmark was changed to the Russell 2000 Growth Index and its style will be sector neutral to emphasize the stock picking ability of the portfolio manager.
We believe that diversification is an essential element to a successful investment strategy through every market cycle. With this in mind, we are committed to providing investors with the appropriate strategies, investment expertise and solutions to meet complex allocation objectives. As in prior years, what follows is a discussion from each of our portfolio managers with respect to their Fund’s performance over the first half of our 2008 fiscal year and their outlook going forward.
2
All of us at The FBR Funds want to thank you for your continued support, and we look forward to serving your investment needs in the years ahead. If you would like more frequent and timely updates, fbrfunds.com provides daily prices, monthly performance data, fund news and other updates. As always, we welcome your questions and comments. You can reach us via e-mail at fbrfundsinfo@fbr.com or toll free at 888.200.4710.
Sincerely,

David Ellison
President, Chief Investment Officer and Trustee
The FBR Funds
3
The FBR Funds
FBR Pegasus FundTM
Management Overview
Portfolio Managers: Robert C. Barringer, CFA and Ryan Kelley, CFA
How did the Fund perform?
For the six-month period ended April 30, 2008, the FBR Pegasus FundTM returned -5.62%. This compares to the S&P 500 Index and the Morningstar Large Cap Value Category Average, which returned -9.64% and -10.58% for the same period respectively.
What factors contributed to the Fund’s performance?
During the past six months, the Fund benefited from its exposure to the energy, materials, and consumer staples sectors. Additionally, the Fund benefited from its underexposure to two of the three worst performing sectors of the broader market, namely the financial and telecommunications sectors.
The difficult operating environment for financial services companies, created by the challenging credit and housing markets, persisted throughout our reporting period. Once again, financials were the largest detractor from the market’s performance. We entered the reporting period with 14% of the Fund’s assets invested in financials which was significantly underweight the S&P 500 Index’s 18%. In the second half of the period, we selectively increased our exposure to the financials as our process identified attractive investment opportunities in this downtrodden sector. On balance, we continue to maintain a slight underweight position as we monitor the industry’s fundamentals searching for signs of improvement.
We strive to provide solid long-term returns for our shareholders while protecting against the downside and exhibiting a lower level of volatility. During the past six months, the Fund outperformed its benchmark, the S&P 500 Index. Furthermore, our downside capture percent was approximately 74%, meaning that for every 1% drop in the index, the Fund only moved down approximately 0.74%. Lastly, the Fund’s fluctuations in total return were approximately in-line with those of the index. We continue to aim for these types of portfolio metrics, which become integral parts of our overall stock selection process.
What is the outlook for the Fund?
We remain enthusiastic about the outlook for the Fund. Our disciplined and consistent investment process and ability to under- or overweight specific sectors of the market allows us to maintain a long-term orientation while constructing a well-rounded and balanced portfolio. Our focus on stocks with sound business models, improving fundamentals and attractive valuations affords us the confidence to make investments within underperforming sectors and avoid market bubbles, while preserving capital in declining markets.
During the course of the past six months, we have decreased our cash holdings from approximately 11% of the portfolio to 5% in order to take advantage of the market
4
The FBR Funds
FBR Pegasus FundTM
Management Overview (continued)
downturn. We invested the cash in certain segments of the market that have been largely out of favor (i.e. financial companies) and in other traditionally defensive sectors (i.e. consumer staples and healthcare). We believe that our investments in the financial and consumer discretionary sectors are poised to benefit from an eventual recovery in the economy. Overall, we are confident in our investment process and in our Fund’s position as we head into the second half of 2008, despite uncertainties that exist in the market.
The opinions expressed in this commentary reflect those of the Portfolio Managers as of the date written. Any such opinions are subject to change based on market or other conditions. These opinions may not be relied upon as investment advice. Investment decisions for The FBR Funds are based on several factors, and may not be relied upon as an indication of trading intent on behalf of any FBR Fund. Security positions can and do change.
5
The FBR Funds
FBR Pegasus FundTM
Comparison of Changes in Value of $10,000 Investment in
Fund Shares(1)(2) vs. S&P 500 Index(1)(3)
(unaudited)
| Total Returns—For the Periods Ended April 30, 2008(4) |
| | | | | | Annualized | |
| | | | | | Since | |
| | | | One Year | | Inception(5) | |
| | | |
| |
| |
| | FBR Pegasus FundTM(1)(2) | | 1.59% | | 11.76% | |
| | S&P 500 Index(1)(3) | | (4.68% | ) | 3.96% | |
| | | | | | | |
PAST PERFORMANCE IS NO GUARANTEE OF FUTURE RESULTS.
The performance data quoted represents past performance and the current performance may be lower or higher than the performance data quoted. The investment return and principal will fluctuate so that investors’ shares, when redeemed, may be worth more or less than their original cost. The performance data does not reflect the deduction of redemption fees and if reflected, the redemption fee would reduce the performance data quoted. To obtain performance data current to the most recent month-end, please call 888.200.4710 or visit www.fbrfunds.com.
| (1) | | The graph assumes a hypothetical $10,000 initial investment in the Fund and reflects the reinvestment of dividends and all Fund expenses. Investors should note that the Fund is a professionally managed mutual fund while the index is unmanaged, does not incur expenses and is not available for investment. The performance of the index includes reinvested dividends, and does not reflect sales charges or expenses. |
| (2) | | FBR Fund Advisers, Inc. waived a portion of its advisory fees and agreed to contractually reimburse a portion of the Fund’s operating expenses, as necessary, to maintain existing expense limitations, as set forth in the notes to the financial statements. Total returns shown include fee waivers and expense reimbursements; total returns would have been lower had there been no waiver of fees and/or reimbursement of expenses in excess of expense limitations. |
| (3) | | S&P 500 Index is a capitalization-weighted index of 500 stocks. The index is designed to represent the broad domestic economy through changes in aggregate market value of 500 stocks representing all major industries. |
| (4) | | The total returns shown do not reflect the deduction of taxes that a shareholder would pay on fund distributions or the redemption of fund shares. |
| (5) | | For the period November 15, 2005 (commencement of investment operations) through April 30, 2008. |
6
| The FBR Funds |
|
| FBR Pegasus FundTM |
| Portfolio Summary |
April 30, 2008
(unaudited) |
The following provides a breakdown of the Fund by industry sectors. The underlying securities represent a percentage of the portfolio investments.
| Industry Sector | | % of Total Investments |
| |
|
| Information Technology | | | 18.8 | % |
| Financials | | | 16.8 | % |
| Consumer Staples | | | 11.6 | % |
| Health Care | | | 11.2 | % |
| Energy | | | 9.8 | % |
| Industrials | | | 8.9 | % |
| Consumer Discretionary | | | 8.6 | % |
| Money Market Funds | | | 5.1 | % |
| Utilities | | | 4.8 | % |
| Materials | | | 3.2 | % |
| Telecommunication Services | | | 1.2 | % |
7
| The FBR Funds |
|
| FBR Pegasus FundTM |
| Portfolio of Investments |
April 30, 2008
(unaudited) |
|
| | | | | | VALUE |
| | SHARES | | | | (NOTE 2) |
|
| | | | COMMON STOCKS — 95.1% | | | | |
| | | | Consumer Discretionary — 8.6% | | | | |
| | 1,150 | | Abercrombie & Fitch Co., Class A | | $ | 85,457 | |
| | 6,000 | | American Eagle Outfitters, Inc. | | | 110,220 | |
| | 1,750 | | Apollo Group, Inc., Class A* | | | 89,075 | |
| | 4,000 | | Lowe’s Companies, Inc. | | | 100,760 | |
| | 3,600 | | Target Corp. | | | 191,268 | |
| | 8,900 | | The Gap, Inc. | | | 165,718 | |
| | | | | |
| |
| | | | | | | 742,498 | |
| | | | | |
| |
| | | | Consumer Staples — 11.6% | | | | |
| | 2,900 | | Campbell Soup Co. | | | 100,920 | |
| | 1,600 | | Colgate-Palmolive Co. | | | 113,120 | |
| | 4,000 | | The Coca-Cola Co. | | | 235,480 | |
| | 1,800 | | The Procter & Gamble Co. | | | 120,690 | |
| | 2,600 | | Wal-Mart Stores, Inc. | | | 150,748 | |
| | 3,700 | | Wm. Wrigley Jr. Co. | | | 281,792 | |
| | | | | |
| |
| | | | | | | 1,002,750 | |
| | | | | |
| |
| | | | Energy — 9.9% | | | | |
| | 1,177 | | Apache Corp. | | | 158,518 | |
| | 2,900 | | Chesapeake Energy Corp. | | | 149,930 | |
| | 1,750 | | ConocoPhillips | | | 150,763 | |
| | 1,275 | | Newfield Exploration Co.* | | | 77,469 | |
| | 1,885 | | Occidental Petroleum Corp. | | | 156,851 | |
| | 1,998 | | Royal Dutch Shell PLC, Class A ADR | | | 160,459 | |
| | | | | |
| |
| | | | | | | 853,990 | |
| | | | | |
| |
| | | | Financials — 16.8% | | | | |
| | 2,600 | | ACE Ltd. | | | 156,754 | |
| | 2,300 | | American Express Co. | | | 110,446 | |
| | 900 | | American International Group, Inc. | | | 41,580 | |
| | 2,725 | | Ameriprise Financial, Inc. | | | 129,410 | |
| | 3,800 | | Astoria Financial Corp. | | | 90,060 | |
| | 2,400 | | Bank of America Corp. | | | 90,096 | |
| | 1,700 | | Citigroup, Inc. | | | 42,959 | |
| | 1,555 | | Fannie Mae (Federal National Mortgage) | | | 44,007 | |
| | 1,635 | | Freddie Mac (Federal Home Loan) | | | 40,728 | |
8
| The FBR Funds |
|
| FBR Pegasus FundTM |
| Portfolio of Investments (continued) |
April 30, 2008
(unaudited) |
| | | | | | | | |
|
| | | | | | VALUE |
| | SHARES | | | | (NOTE 2) |
|
| | | | Financials — 16.8% (continued) | | | | |
| | 6,300 | | Hudson City Bancorp, Inc. | | $ | 120,519 | |
| | 2,251 | | Morgan Stanley | | | 109,399 | |
| | 3,100 | | T. Rowe Price Group, Inc. | | | 181,535 | |
| | 2,119 | | The Hartford Financial Services Group, Inc. | | | 151,021 | |
| | 4,900 | | Wells Fargo & Co. | | | 145,775 | |
| | | | | |
| |
| | | | | | | 1,454,289 | |
| | | | | |
| |
| | | | Health Care — 11.2% | | | | |
| | 4,100 | | Applera Corp. - Applied Biosystems Group | | | 130,831 | |
| | 1,025 | | Becton, Dickinson and Co. | | | 91,635 | |
| | 3,725 | | Eli Lilly and Co. | | | 179,322 | |
| | 2,725 | | Johnson & Johnson | | | 182,820 | |
| | 2,350 | | Novartis AG ADR | | | 118,276 | |
| | 3,920 | | Novo Nordisk A/S ADR | | | 269,264 | |
| | | | | |
| |
| | | | | | | 972,148 | |
| | | | | |
| |
| | | | Industrials — 8.9% | | | | |
| | 2,750 | | 3M Co. | | | 211,475 | |
| | 2,375 | | Burlington Northern Santa Fe Corp. | | | 243,556 | |
| | 3,000 | | Cummins, Inc. | | | 187,950 | |
| | 2,600 | | Fastenal Co. | | | 126,906 | |
| | | | | |
| |
| | | | | | | 769,887 | |
| | | | | |
| |
| | | | Information Technology — 18.8% | | | | |
| | 3,250 | | Accenture Ltd., Class A | | | 122,038 | |
| | 1,225 | | Apple, Inc.* | | | 213,088 | |
| | 3,200 | | Automatic Data Processing, Inc. | | | 141,440 | |
| | 4,000 | | Canon, Inc. ADR | | | 199,880 | |
| | 5,300 | | Cisco Systems, Inc.* | | | 135,892 | |
| | 80 | | Google, Inc., Class A* | | | 45,943 | |
| | 7,900 | | Intel Corp. | | | 175,854 | |
| | 1,060 | | Kyocera Corp. ADR | | | 96,704 | |
| | 6,300 | | Microsoft Corp. | | | 179,676 | |
| | 9,000 | | Oracle Corp.* | | | 187,650 | |
| | 5,700 | | Total System Services, Inc. | | | 135,660 | |
| | | | | |
| |
| | | | | | | 1,633,825 | |
| | | | | |
| |
9
| The FBR Funds |
|
| FBR Pegasus FundTM |
| Portfolio of Investments (continued) |
April 30, 2008
(unaudited) |
| | | | | | | | |
|
| | | | | | VALUE |
| | SHARES | | | | (NOTE 2) |
|
| | | | Materials — 3.2% | | | | |
| | 1,038 | | Arcelor Mittal, Class A NYS | | $ | 92,475 | |
| | 900 | | Freeport-McMoRan Copper & Gold, Inc. | | | 102,375 | |
| | 1,900 | | Teck Cominco Ltd., Class B | | | 82,973 | |
| | | | �� | |
| |
| | | | | | | 277,823 | |
| | | | | |
| |
| | | | Telecommunication Services — 1.2% | | | | |
| | 1,850 | | America Movil S.A.B. de C.V., Series L ADR | | | 107,226 | |
| | | | | |
| |
| | | | Utilities — 4.9% | | | | |
| | 1,826 | | Edison International | | | 95,262 | |
| | 3,200 | | Mirant Corp.* | | | 131,553 | |
| | 2,675 | | PG&E Corp. | | | 107,000 | |
| | 1,517 | | Sempra Energy | | | 85,968 | |
| | | | | |
| |
| | | | | | | 419,783 | |
| | | | | |
| |
| | | | Total Common Stocks (Cost $7,959,307) | | | 8,234,219 | |
| | | | | |
| |
| | | | MONEY MARKET FUNDS — 5.1% | | | | |
| | 437,289 | | JPMorgan 100% U.S. Treasury Securities Money Market Fund (Cost $437,289) | | | 437,289 | |
| | | | | |
| |
| | | | Total Investments — 100.2% (Cost $8,396,596) | | | 8,671,508 | |
| | | | Liabilities Less Other Assets — (0.2%) | | | (17,337 | ) |
| | | | | |
| |
| | | | Net Assets — 100.0% | | $ | 8,654,171 | |
| | | | | |
| |
|
| * | | Non-income producing security |
| ADR | | American Depositary Receipts |
| NYS | | New York Shares |
| Note: | | For presentation purposes, the Fund has grouped some of the industry categories. For purposes of categorizing securities for compliance with Section 8(b)(1) of the Investment Company Act of 1940, the Fund uses more specific industry classifications. |
The accompanying notes are an integral part of the financial statements.
10
The FBR Funds
FBR Pegasus Mid Cap FundTM
Management Overview
Portfolio Manager: Ryan Kelley, CFA
How did the Fund perform?
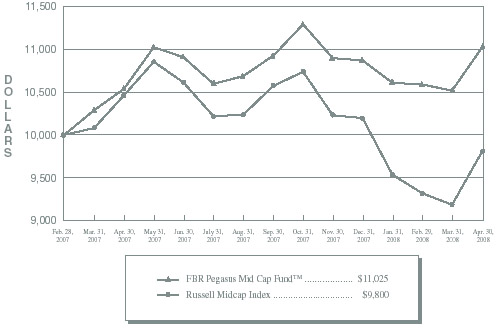
For the six months ended April 30, 2008, the FBR Pegasus Mid Cap FundTM returned -2.43%. This compares to the Russell Mid Cap Index and the Morningstar Mid Cap Blend Category Average which returned -8.74% and -10.05% for the same period respectively.
What factors contributed to the Fund’s performance?
We strive to provide solid long-term returns for our shareholders while protecting against the downside and exhibiting a lower level of volatility. As discussed above, the Fund outperformed its primary benchmark, the Russell Mid Cap Index, during the past six months. Our downside capture percent was approximately 48%, meaning that for every 1% drop in the index, the Fund only moved down approximately 0.48%. Additionally, the Fund’s standard deviation of returns, a common measure of volatility, was just a little over half that of the index, meaning the Fund exhibited much lower fluctuations of value. We continue to aim for these types of metrics, which become integral parts of our stock selection process.
We attribute our Fund’s outperformance against its benchmark and peers as much to the sectors that we did not own as to those we did. The Fund benefited from underexposure to two of the three worst performing sectors of the market, namely the financial and telecommunications sectors. Financials lagged the broader market given the difficult operating environment caused by the challenged credit and housing markets. On the positive side, our investments in the energy and materials sector contribute to our outperformance.
What is the outlook for the Fund?
We believe that the outlook for our Fund remains attractive. As shown above, our balanced approach to portfolio management and ability to under- or overweight specific sectors of the market allow us to manage the portfolio for the long-term while performing well compared to our peers. Our stock selection process leads us to find companies that exhibit a certain combination of characteristics that we believe are necessary to outperform their peers through all economic and market cycles.
During the course of the past six months, we have moved the portfolio to a somewhat more diversified position relative to the index. We did this by decreasing our exposure to technology and increasing our holdings in energy, financial, and utility companies. In addition, we currently have slightly higher than normal levels of cash which we will
11
The FBR Funds
FBR Pegasus Mid Cap FundTM
Management Overview (continued)
opportunistically deploy to take advantage of price dips of our favorite stocks. Overall, we are confident in our investment process and in our Fund’s position as we head into the second half of 2008.
The opinions expressed in this commentary reflect those of the Portfolio Manager as of the date written. Any such opinions are subject to change based on market or other conditions. These opinions may not be relied upon as investment advice. Investment decisions for The FBR Funds are based on several factors, and may not be relied upon as an indication of trading intent on behalf of any FBR Fund. Security positions can and do change.
12
The FBR Funds
FBR Pegasus Mid Cap FundTM
Comparison of Changes in Value of $10,000 Investment in
Fund Shares(1)(2) vs. Russell Midcap Index(1)(3)
(unaudited)
| Total Returns—For the Periods Ended April 30, 2008(4) |
| | | | | | Annualized | |
| | | | | | Since | |
| | | | One Year | | Inception(5) | |
| | | |
| |
| |
| | FBR Pegasus Mid Cap FundTM(1)(2) | | 4.61% | | 8.72% | |
| | Russell Midcap Index(1)(3) | | (6.34% | ) | (1.71% | ) |
| | | | | | | |
PAST PERFORMANCE IS NO GUARANTEE OF FUTURE RESULTS.
The performance data quoted represents past performance and the current performance may be lower or higher than the performance data quoted. The investment return and principal will fluctuate so that investors’ shares, when redeemed, may be worth more or less than their original cost. The performance data does not reflect the deduction of redemption fees and if reflected, the redemption fee would reduce the performance data quoted. To obtain performance data current to the most recent month-end, please call 888.200.4710 or visit www.fbrfunds.com.
| (1) | | The graph assumes a hypothetical $10,000 initial investment in the Fund and reflects the reinvestment of dividends and all Fund expenses. Investors should note that the Fund is a professionally managed mutual fund while the index is unmanaged, does not incur expenses and is not available for investment. The performance of the index includes reinvested dividends, and does not reflect sales charges or expenses. |
| (2) | | FBR Fund Advisers, Inc. waived a portion of its advisory fees and agreed to contractually reimburse a portion of the Fund’s operating expenses, as necessary, to maintain existing expense limitations, as set forth in the notes to the financial statements. Total returns shown include fee waivers and expense reimbursements; total returns would have been lower had there been no waiver of fees and/or reimbursement of expenses in excess of expense limitations. |
| (3) | | Russell Midcap Index measures the performance of the 800 smallest companies in the Russell 1000 Index, which represents approximately 31% of the total market-capitalization of the Russell 1000 Index. |
| (4) | | The total returns shown do not reflect the deduction of taxes that a shareholder would pay on fund distributions or the redemption of fund shares. |
| (5) | | For the period February 28, 2007 (commencement of investment operations) through April 30, 2008. |
13
| The FBR Funds |
|
| FBR Pegasus Mid Cap FundTM |
| Portfolio Summary |
April 30, 2008
(unaudited) |
The following provides a breakdown of the Fund by industry sectors. The underlying securities represent a percentage of the portfolio investments.
| Industry Sector | | % of Total Investments |
| |
|
| Information Technology | | | 15.6 | % |
| Financials | | | 15.1 | % |
| Industrials | | | 11.3 | % |
| Consumer Discretionary | | | 10.8 | % |
| Energy | | | 9.9 | % |
| Health Care | | | 9.4 | % |
| Utilities | | | 8.1 | % |
| Money Market Funds | | | 7.3 | % |
| Consumer Staples | | | 6.3 | % |
| Materials | | | 5.5 | % |
| Telecommunication Services | | | 0.7 | % |
14
| The FBR Funds |
|
| FBR Pegasus Mid Cap FundTM |
| Portfolio of Investments |
April 30, 2008
(unaudited) |
| | | | | | | | |
|
| | | | | | VALUE |
| | SHARES | | | | (NOTE 2) |
|
| | | | COMMON STOCKS — 92.5% | | | | |
| | | | Consumer Discretionary — 10.8% | | | | |
| | 685 | | Abercrombie & Fitch Co., Class A | | $ | 50,902 | |
| | 3,625 | | American Eagle Outfitters, Inc. | | | 66,591 | |
| | 1,120 | | Magna International, Inc., Class A | | | 83,586 | |
| | 5,175 | | Mattel, Inc. | | | 97,031 | |
| | 2,450 | | Saks, Inc.* | | | 31,875 | |
| | 1,050 | | Tiffany & Co. | | | 45,717 | |
| | 700 | | VF Corp. | | | 52,066 | |
| | | | | |
| |
| | | | | | | 427,768 | |
| | | | | |
| |
| | | | Consumer Staples — 6.3% | | | | |
| | 1,025 | | Alberto-Culver Co. | | | 25,799 | |
| | 1,575 | | BJ’s Wholesale Club, Inc.* | | | 60,039 | |
| | 1,035 | | Bunge Ltd. | | | 118,083 | |
| | 2,500 | | Tyson Foods, Inc., Class A | | | 44,500 | |
| | | | | |
| |
| | | | | | | 248,421 | |
| | | | | |
| |
| | | | Energy — 9.9% | | | | |
| | 1,125 | | ENSCO International, Inc. | | | 71,696 | |
| | 525 | | Helmerich & Payne, Inc. | | | 28,219 | |
| | 2,375 | | Hercules Offshore, Inc.* | | | 62,605 | |
| | 525 | | Overseas Shipholding Group, Inc. | | | 39,512 | |
| | 1,325 | | Pioneer Natural Resources Co. | | | 76,492 | |
| | 220 | | SEACOR Holdings, Inc.* | | | 18,724 | |
| | 2,350 | | W&T Offshore, Inc. | | | 96,115 | |
| | | | | |
| |
| | | | | | | 393,363 | |
| | | | | |
| |
| | | | Financials — 15.1% | | | | |
| | 2,800 | | Annaly Capital Management, Inc. | | | 46,928 | |
| | 3,225 | | Astoria Financial Corp. | | | 76,433 | |
| | 1,000 | | Capitol Federal Financial | | | 38,700 | |
| | 4,150 | | Hudson City Bancorp, Inc. | | | 79,390 | |
| | 800 | | Marshall & Ilsley Corp. | | | 19,984 | |
| | 1,500 | | People’s United Financial, Inc. | | | 25,455 | |
| | 3,000 | | Sovereign Bancorp, Inc. | | | 22,410 | |
| | 2,240 | | T. Rowe Price Group, Inc. | | | 131,174 | |
| | 400 | | The Hanover Insurance Group, Inc. | | | 17,952 | |
15
| The FBR Funds |
|
| FBR Pegasus Mid Cap FundTM |
| Portfolio of Investments (continued) |
April 30, 2008
(unaudited) |
| | | | | | | | |
|
| | | | | | VALUE |
| | SHARES | | | | (NOTE 2) |
|
| | | | Financials — 15.1% (continued) | | | | |
| | 2,825 | | Unum Group | | $ | 65,568 | |
| | 3,200 | | Washington Federal, Inc. | | | 76,192 | |
| | | | | |
| |
| | | | | | | 600,186 | |
| | | | | |
| |
| | | | Health Care — 9.4% | | | | |
| | 210 | | Bio-Rad Laboratories, Inc., Class A* | | | 17,504 | |
| | 625 | | C.R. Bard, Inc. | | | 58,856 | |
| | 1,925 | | Forest Laboratories, Inc.* | | | 66,817 | |
| | 1,750 | | Kinetic Concepts, Inc.* | | | 69,405 | |
| | 1,100 | | Techne Corp.* | | | 79,772 | |
| | 1,750 | | Varian Medical Systems, Inc.* | | | 82,040 | |
| | | | | |
| |
| | | | | | | 374,394 | |
| | | | | |
| |
| | | | Industrials — 11.3% | | | | |
| | 2,375 | | Copart, Inc.* | | | 97,066 | |
| | 1,455 | | Cummins, Inc. | | | 91,156 | |
| | 375 | | Fastenal Co. | | | 18,304 | |
| | 2,500 | | Graco, Inc. | | | 103,524 | |
| | 1,050 | | Kubota Corp. ADR | | | 36,551 | |
| | 950 | | Pall Corp. | | | 33,032 | |
| | 2,775 | | Ritchie Bros. Auctioneers, Inc. | | | 69,236 | |
| | | | | |
| |
| | | | | | | 448,869 | |
| | | | | |
| |
| | | | Information Technology — 15.5% | | | | |
| | 4,925 | | Check Point Software Technologies Ltd.* | | | 116,328 | |
| | 1,750 | | FactSet Research Systems, Inc. | | | 105,052 | |
| | 2,250 | | Global Payments, Inc. | | | 99,585 | |
| | 1,300 | | Ingram Micro, Inc., Class A* | | | 22,113 | |
| | 3,700 | | Jack Henry & Associates, Inc. | | | 97,236 | |
| | 2,100 | | NeuStar, Inc., Class A* | | | 57,771 | |
| | 1,400 | | Novellus Systems, Inc.* | | | 30,604 | |
| | 1,750 | | QLogic Corp.* | | | 27,930 | |
| | 900 | | TDK Corp. ADR | | | 61,830 | |
| | | | | |
| |
| | | | | | | 618,449 | |
| | | | | |
| |
| | | | Materials — 5.5% | | | | |
| | 675 | | Compania de Minas Buenaventura S.A.A. ADR | | | 42,235 | |
| | 2,400 | | Domtar Corp.* | | | 14,328 | |
16
| The FBR Funds |
|
| FBR Pegasus Mid Cap FundTM |
| Portfolio of Investments (continued) |
April 30, 2008
(unaudited) |
| | | | | | | | |
|
| | | | | | VALUE |
| | SHARES | | | | (NOTE 2) |
|
| | | | Materials — 5.5% (continued) | | | | |
| | 580 | | Freeport-McMoRan Copper & Gold, Inc., Class B | | $ | 65,974 | |
| | 1,025 | | Sigma-Aldrich Corp. | | | 58,446 | |
| | 1,075 | | Ternium S.A. ADR | | | 37,496 | |
| | | | | |
| |
| | | | | | | 218,479 | |
| | | | | |
| |
| | | | Telecommunication Services — 0.7% | | | | |
| | 725 | | Telephone and Data Systems, Inc. | | | 27,768 | |
| | | | | |
| |
| | | | Utilities — 8.0% | | | | |
| | 1,500 | | Energen Corp. | | | 102,359 | |
| | 875 | | Pinnacle West Capital Corp. | | | 29,698 | |
| | 1,175 | | Questar Corp. | | | 72,885 | |
| | 850 | | SCANA Corp. | | | 33,516 | |
| | 600 | | Sempra Energy | | | 34,002 | |
| | 1,325 | | Westar Energy, Inc. | | | 30,727 | |
| | 800 | | Xcel Energy, Inc. | | | 16,640 | |
| | | | | |
| |
| | | | | | | 319,827 | |
| | | | | |
| |
| | | | Total Common Stocks (Cost $3,510,681) | | | 3,677,524 | |
| | | | | |
| |
| | | | MONEY MARKET FUNDS — 7.2% | | | | |
| | 285,882 | | JPMorgan 100% U.S. Treasury Securities Money Market Fund (Cost $285,882) | | | 285,882 | |
| | | | | |
| |
| | | | Total Investments — 99.7% (Cost $3,796,563) | | | 3,963,406 | |
| | | | | | | | |
| | | | Other Assets Less Liabilities — 0.3% | | | 10,800 | |
| | | | | |
| |
| | | | Net Assets — 100.0% | | $ | 3,974,206 | |
| | | | | |
| |
|
| * | | Non-income producing security |
| ADR | | American Depositary Receipts |
| Note: | | For presentation purposes, the Fund has grouped some of the industry categories. For purposes of categorizing securities for compliance with Section 8(b)(1) of the Investment Company Act of 1940, the Fund uses more specific industry classifications. |
The accompanying notes are an integral part of the financial statements.
17
The FBR Funds
FBR Pegasus Small Cap FundTM
Management Overview
Portfolio Manager: Robert C. Barringer, CFA
How did the Fund perform?
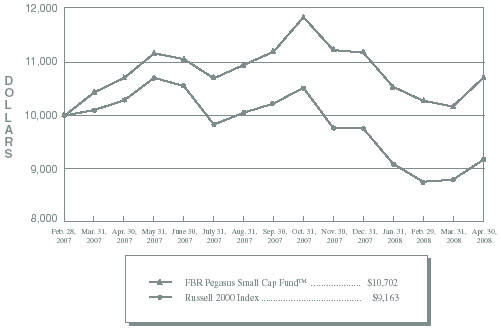
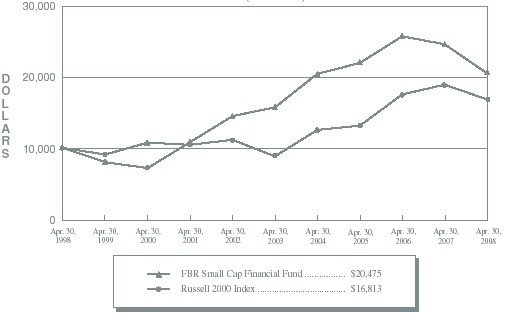
For the six-month period ending April 30, 2008, the FBR Pegasus Small Cap FundTM returned -9.69%. This compares to the Russell 2000 Index and the Morningstar Small Blend Category Average which returned -12.92% and -13.03% for the same period respectively.
What factors contributed to the Fund’s performance?
Performance of the Fund was aided by a combination of sector weightings as well as individual stock investments. In particular, the Fund’s overweight position and selection of holdings in the materials industry helped relative performance in comparison to the Russell 2000. Positions in Cleveland Cliffs (up 32%), Texas Industries (up 29%) and Schnitzer Steel (up 24%), companies that supply steel and cement to various end market users, benefited from increased pricing power driven by strong global demand. Additionally, the Fund benefited from being underweight in the consumer discretionary sector as the continued pressure of rising inflation and higher energy costs fuel economic uncertainty. The Fund’s underweight position in the robust energy sector relative to its benchmark detracted from its overall performance.
What is the outlook for the Fund and the small cap sector?
We continue to believe that the long-term outlook for small-cap companies remains strong despite relative lower returns over the most recent periods. Other asset classes have outperformed small-caps as there has generally been a flight to the perceived safety, quality and stability found in mid- to large-cap companies. However, even in the current uncertain environment, we believe that there are always opportunities to uncover attractive investment opportunities in the small-cap segment of the market. The investment approach utilized by the Fund attempts to consistently identify small-cap companies with strong balance sheets, high levels of free cash flow and better than average returns on owner’s capital that are able to be purchased at reasonable valuations. We believe the combination of these characteristics serves as the front line of defense in difficult environments which leads to attractive risk-adjusted returns over the long-run.
As always, careful stock selection is critical, and we believe that our disciplined investment process will provide us with many opportunities to buy a wide range of outstanding small-cap businesses trading at attractive valuations.
The opinions expressed in this commentary reflect those of the Portfolio Manager as of the date written. Any such opinions are subject to change based on market or other conditions. These opinions may not be relied upon as investment advice. Investment decisions for The FBR Funds are based on several factors, and may not be relied upon as an indication of trading intent on behalf of any FBR Fund. Security positions can and do change.
18
The FBR Funds
FBR Pegasus Small Cap FundTM
Comparison of Changes in Value of $10,000 Investment in
Fund Shares(1)(2) vs. Russell 2000 Index(1)(3)
(unaudited)
| Total Returns—For the Periods Ended April 30, 2008(4) |
| | | | | | Annualized | |
| | | | | | Since | |
| | | | One Year | | Inception(5) | |
| | | |
| |
| |
| | FBR Pegasus Small Cap FundTM(1)(2) | | (0.07% | ) | 5.99% | |
| | Russell 2000 Index(1)(3) | | (10.96% | ) | (7.18% | ) |
| | | | | | | |
PAST PERFORMANCE IS NO GUARANTEE OF FUTURE RESULTS.
The performance data quoted represents past performance and the current performance may be lower or higher than the performance data quoted. The investment return and principal will fluctuate so that investors’ shares, when redeemed, may be worth more or less than their original cost. The performance data does not reflect the deduction of redemption fees and if reflected, the redemption fee would reduce the performance data quoted. To obtain performance data current to the most recent month-end, please call 888.200.4710 or visit www.fbrfunds.com.
| (1) | | The graph assumes a hypothetical $10,000 initial investment in the Fund and reflects the reinvestment of dividends and all Fund expenses. Investors should note that the Fund is a professionally managed mutual fund while the index is unmanaged, does not incur expenses and is not available for investment. The performance of the index includes reinvested dividends, and does not reflect sales charges or expenses. |
| (2) | | FBR Fund Advisers, Inc. waived a portion of its advisory fees and agreed to contractually reimburse a portion of the Fund’s operating expenses, as necessary, to maintain existing expense limitations, as set forth in the notes to the financial statements. Total returns shown include fee waivers and expense reimbursements; total returns would have been lower had there been no waiver of fees and/or reimbursement of expenses in excess of expense limitations. |
| (3) | | Russell 2000 Index is comprised of the smallest of the 2000 companies of the Russell 3000 Index, representing approximately 8% of the Russell 3000’s total market-capitalization. |
| (4) | | The total returns shown do not reflect the deduction of taxes that a shareholder would pay on fund distributions or the redemption of fund shares. |
| (5) | | For the period February 28, 2007 (commencement of investment operations) through April 30, 2008. |
19
| The FBR Funds |
|
| FBR Pegasus Small Cap FundTM |
| Portfolio Summary |
April 30, 2008
(unaudited) |
The following provides a breakdown of the Fund by industry sectors. The underlying securities represent a percentage of the portfolio investments.
| Industry Sector | | % of Total Investments |
| |
|
| Industrials | | | 21.3 | % |
| Information Technology | | | 16.8 | % |
| Financials | | | 16.0 | % |
| Energy | | | 12.4 | % |
| Consumer Discretionary | | | 10.9 | % |
| Health Care | | | 6.6 | % |
| Money Market Funds | | | 6.3 | % |
| Materials | | | 4.0 | % |
| Utilities | | | 3.0 | % |
| Consumer Staples | | | 1.4 | % |
| Telecommunication Services | | | 1.3 | % |
20
| The FBR Funds |
|
| FBR Pegasus Small Cap FundTM |
| Portfolio of Investments |
April 30, 2008
(unaudited) |
| | | | | | | | |
|
| | | | | | VALUE |
| | SHARES | | | | (NOTE 2) |
|
| | | | COMMON STOCKS — 94.3% | | | | |
| | | | Consumer Discretionary — 10.9% | | | | |
| | 1,650 | | Aeropostale, Inc.* | | $ | 52,454 | |
| | 1,775 | | Dick’s Sporting Goods, Inc.* | | | 50,765 | |
| | 2,700 | | Gentex Corp. | | | 50,436 | |
| | 2,250 | | Interactive Data Corp. | | | 60,705 | |
| | 600 | | Morningstar, Inc.* | | | 34,788 | |
| | 35 | | NVR, Inc.* | | | 21,473 | |
| | 2,700 | | SKECHERS U.S.A., Inc., Class A* | | | 63,854 | |
| | 950 | | The Buckle, Inc. | | | 46,151 | |
| | 1,075 | | The Gymboree Corp.* | | | 46,462 | |
| | 900 | | The Men’s Wearhouse, Inc. | | | 23,967 | |
| | 1,750 | | Wolverine World Wide, Inc. | | | 50,295 | |
| | | | | |
| |
| | | | | | | 501,350 | |
| | | | | |
| |
| | | | Consumer Staples — 1.4% | | | | |
| | 1,700 | | Alberto-Culver Co. | | | 42,789 | |
| | 500 | | Longs Drug Stores Corp. | | | 20,030 | |
| | | | | |
| |
| | | | | | | 62,819 | |
| | | | | |
| |
| | | | Energy — 12.4% | | | | |
| | 400 | | Alpha Natural Resources, Inc.* | | | 19,460 | |
| | 700 | | ATP Oil & Gas Corp.* | | | 20,118 | |
| | 375 | | Core Laboratories N.V.* | | | 46,980 | |
| | 1,350 | | Dril-Quip, Inc.* | | | 77,166 | |
| | 875 | | Foundation Coal Holdings, Inc. | | | 52,483 | |
| | 6,000 | | Grey Wolf, Inc.* | | | 37,620 | |
| | 725 | | Holly Corp. | | | 30,073 | |
| | 1,000 | | Parallel Petroleum Corp.* | | | 21,190 | |
| | 1,050 | | Penn Virginia Corp. | | | 55,125 | |
| | 2,100 | | Rosetta Resources, Inc.* | | | 45,759 | |
| | 1,800 | | St. Mary Land & Exploration Co. | | | 78,696 | |
| | 1,200 | | Superior Energy Services, Inc.* | | | 53,256 | |
| | 500 | | Tidewater, Inc. | | | 32,610 | |
| | | | | |
| |
| | | | | | | 570,536 | |
| | | | | |
| |
21
| The FBR Funds |
|
| FBR Pegasus Small Cap FundTM |
| Portfolio of Investments (continued) |
April 30, 2008
(unaudited) |
| | | | | | | | |
|
| | | | | | VALUE |
| | SHARES | | | | (NOTE 2) |
|
| | | | Financials — 16.1% | | | | |
| | 1,940 | | Astoria Financial Corp. | | $ | 45,978 | |
| | 1,800 | | Cohen & Steers, Inc. | | | 50,256 | |
| | 1,800 | | Colonial Properties Trust | | | 43,614 | |
| | 800 | | eHealth, Inc.* | | | 21,640 | |
| | 200 | | Essex Property Trust, Inc. | | | 23,800 | |
| | 200 | | First Citizens BancShares, Inc., Class A | | | 28,154 | |
| | 950 | | GAMCO Investors, Inc., Class A | | | 43,710 | |
| | 1,850 | | Hatteras Financial Corp.* | | | 46,768 | |
| | 500 | | Investment Technology Group, Inc.* | | | 24,130 | |
| | 2,025 | | National Health Investors, Inc. | | | 61,945 | |
| | 1,450 | | optionsXpress Holdings, Inc. | | | 31,132 | |
| | 600 | | Piper Jaffray Companies* | | | 22,356 | |
| | 3,750 | | Raymond James Financial, Inc. | | | 107,887 | |
| | 3,350 | | Waddell & Reed Financial, Inc., Class A | | | 113,430 | |
| | 3,050 | | Washington Federal, Inc. | | | 72,621 | |
| | | | | |
| |
| | | | | | | 737,421 | |
| | | | | |
| |
| | | | Health Care — 6.7% | | | | |
| | 300 | | Dionex Corp.* | | | 23,466 | |
| | 1,720 | | IDEXX Laboratories, Inc.* | | | 91,504 | |
| | 1,375 | | Techne Corp.* | | | 99,715 | |
| | 610 | | Varian, Inc.* | | | 31,067 | |
| | 1,200 | | VCA Antech, Inc.* | | | 38,844 | |
| | 500 | | WellCare Health Plans, Inc.* | | | 21,890 | |
| | | | | |
| |
| | | | | | | 306,486 | |
| | | | | |
| |
| | | | Industrials — 21.5% | | | | |
| | 1,000 | | Acuity Brands, Inc. | | | 47,840 | |
| | 1,000 | | American Woodmark Corp. | | | 18,870 | |
| | 1,350 | | Carlisle Companies, Inc. | | | 38,988 | |
| | 1,700 | | Ceradyne, Inc.* | | | 66,232 | |
| | 2,000 | | Copart, Inc.* | | | 81,740 | |
| | 1,300 | | Genesee & Wyoming, Inc., Class A* | | | 46,384 | |
| | 2,380 | | Graco, Inc. | | | 98,556 | |
| | 2,750 | | Knight Transportation, Inc. | | | 46,723 | |
22
| The FBR Funds |
|
| FBR Pegasus Small Cap FundTM |
| Portfolio of Investments (continued) |
April 30, 2008
(unaudited) |
| | | | | | | | |
|
| | | | | | VALUE |
| | SHARES | | | | (NOTE 2) |
|
| | | | Industrials — 21.5% (continued) | | | | |
| | 600 | | Lincoln Electric Holdings, Inc. | | $ | 45,780 | |
| | 1,400 | | Mueller Industries, Inc. | | | 45,318 | |
| | 775 | | Nordson Corp. | | | 45,748 | |
| | 1,800 | | Ritchie Bros Auctioneers, Inc. | | | 44,910 | |
| | 4,950 | | Rollins, Inc. | | | 78,854 | |
| | 1,600 | | Simpson Manufacturing Company, Inc. | | | 42,224 | |
| | 700 | | The Middleby Corp.* | | | 43,925 | |
| | 1,950 | | Watson Wyatt Worldwide, Inc., Class A | | | 114,308 | |
| | 2,200 | | Woodward Governor Co. | | | 77,286 | |
| | | | | |
| |
| | | | | | | 983,686 | |
| | | | | |
| |
| | | | Information Technology — 16.9% | | | | |
| | 600 | | ANSYS, Inc.* | | | 24,138 | |
| | 1,600 | | FactSet Research Systems, Inc. | | | 96,048 | |
| | 1,250 | | Fair Isaac Corp. | | | 30,963 | |
| | 1,600 | | FLIR Systems, Inc.* | | | 54,928 | |
| | 4,150 | | Informatica Corp.* | | | 66,234 | |
| | 1,600 | | j2 Global Communications, Inc.* | | | 34,240 | |
| | 2,800 | | Jack Henry & Associates, Inc. | | | 73,584 | |
| | 2,550 | | MICROS Systems, Inc.* | | | 90,908 | |
| | 500 | | MicroStrategy, Inc., Class A* | | | 44,365 | |
| | 2,600 | | Parametric Technology Corp.* | | | 45,318 | |
| | 1,025 | | SPSS, Inc.* | | | 43,296 | |
| | 3,350 | | Sybase, Inc.* | | | 98,556 | |
| | 3,040 | | TIBCO Software, Inc.* | | | 23,317 | |
| | 1,550 | | Wright Express Corp.* | | | 51,150 | |
| | | | | |
| |
| | | | | | | 777,045 | |
| | | | | |
| |
| | | | Materials — 4.0% | | | | |
| | 625 | | Century Aluminum Co.* | | | 43,306 | |
| | 300 | | Compass Minerals International, Inc. | | | 18,900 | |
| | 2,000 | | H.B. Fuller Co. | | | 46,160 | |
| | 500 | | Schnitzer Steel Industries, Inc., Class A | | | 44,000 | |
| | 1,500 | | The Valspar Corp. | | | 32,970 | |
| | | | | |
| |
| | | | | | | 185,336 | |
| | | | | |
| |
23
| The FBR Funds |
|
| FBR Pegasus Small Cap FundTM |
| Portfolio of Investments (continued) |
April 30, 2008
(unaudited) |
| | | | | | | | |
|
| | | | | | VALUE |
| | SHARES | | | | (NOTE 2) |
|
| | | | Telecommunication Services — 1.4% | | | | |
| | 900 | | Telemig Celular Participacoes S.A. ADR | | $ | 62,109 | |
| | | | | |
| |
| | | | Utilities — 3.0% | | | | |
| | 1,000 | | AGL Resources, Inc. | | | 34,000 | |
| | 500 | | ITC Holdings Corp. | | | 27,890 | |
| | 2,000 | | Vectren Corp. | | | 56,560 | |
| | 900 | | Westar Energy, Inc. | | | 20,871 | |
| | | | | |
| |
| | | | | | | 139,321 | |
| | | | | |
| |
| | | | Total Common Stocks (Cost $4,057,474) | | | 4,326,109 | |
| | | | | |
| |
| | | | MONEY MARKET FUNDS — 6.4% | | | | |
| | 293,039 | | JPMorgan 100% U.S. Treasury Securities Money Market Fund (Cost $293,039) | | | 293,039 | |
| | | | | |
| |
| | | | | | | | |
| | | | Total Investments — 100.7% (Cost $4,350,513) | | | 4,619,148 | |
| | | | | | | | |
| | | | Liabilities Less Other Assets — (0.7%) | | | (30,371 | ) |
| | | | | |
| |
| | | | | | | | |
| | | | Net Assets — 100.0% | | $ | 4,588,777 | |
| | | | | |
| |
|
| * | | Non-income producing security |
| ADR | | American Depositary Receipts |
| Note: | | For presentation purposes, the Fund has grouped some of the industry categories. For purposes of categorizing securities for compliance with Section 8(b)(1) of the Investment Company Act of 1940, the Fund uses more specific industry classifications. |
The accompanying notes are an integral part of the financial statements.
24
The FBR Funds
FBR Pegasus Small Cap Growth FundTM
(Formerly known as the FBR Small Cap Technology Fund)
Management Overview
Portfolio Manager: Robert C. Barringer, CFA
How did the Fund perform?
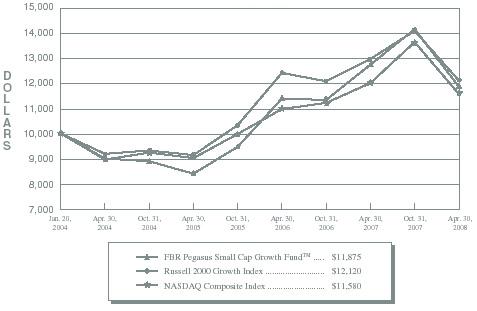
For the six-month period ending April 30, 2008, the FBR Pegasus Small Cap Growth FundTM returned -16.27%. This compares to the NASDAQ Composite Index, Russell 2500 Technology Index and the Morningstar Specialty-Technology Category Average which returned -15.27%, -18.24% and -16.47% for the same period respectively.
What factors contributed to the Fund’s performance?
The technology sector, in general, underperformed the broader market during the reporting period and the Fund performed in-line with its most comparable indices. Historically, investor returns in the technology sector have exhibited higher levels of volatility than those generated by investments in the broader market. This period was no different especially as investors sought the perceived safety of high quality, more established companies. Companies that missed earnings expectations and poorly executed their business plan were severely punished. The Fund managed to avoid many of these situations by focusing investments in companies with little to no debt, better than average operating margins and high levels of free cash flow. Conservatively capitalized companies can better weather disruptions in revenues because they have the necessary reserves available to manage through these difficult periods.
What is the outlook for the Fund and the small cap technology sector?
Effective May 1, 2008, the Fund changed its name to FBR Pegasus Small Cap Growth FundTM. Going forward, the Fund’s benchmark will be the Russell 2000 Growth Index and will no longer focus investments solely in the technology sector. Rather, investments will be more broadly diversified across a wide variety of sectors and industries in companies that stand-up to our strict criteria for inclusion.
I believe that the long-term outlook for small-caps remains strong despite the lower returns we have experienced recently. Other asset classes have outperformed as there has generally been a flight to perceived safety and quality found in mid- to large-cap companies. However, even in this uncertain economic environment, we believe there are always opportunities to uncover attractive investments in the small-cap segment of the market. The investment approach utilized by the Fund attempts to consistently identify those companies with strong balance sheets, high levels of free cash flow, and reasonable valuations that have a chance to grow at an above average secular growth rate over a longer period of time.
The opinions expressed in this commentary reflect those of the Portfolio Manager as of the date written. Any such opinions are subject to change based on market or other conditions. These opinions may not be relied upon as investment advice. Investment decisions for The FBR Funds are based on several factors, and may not be relied upon as an indication of trading intent on behalf of any FBR Fund. Security positions can and do change.
25
The FBR Funds
FBR Pegasus Small Cap Growth FundTM
Comparison of Changes in Value of $10,000 Investment in
Fund Shares(1)(2) vs. Various Indices(1)(3)
(unaudited)
| Total Returns—For the Periods Ended April 30, 2008(4) |
| | | | | | | Since |
| | | | One Year | | Inception(5) | |
| | | |
| |
| |
| | FBR Pegasus Small Cap Growth FundTM(1)(2) | | (6.93 | % | ) | 4.10 | % | |
| | Russell 2000 Growth Index(1)(3) | | (6.71 | % | ) | 4.59 | % | |
| | NASDAQ Composite Index(1)(3) | | (3.67 | % | ) | 3.48 | % | |
| |
PAST PERFORMANCE IS NO GUARANTEE OF FUTURE RESULTS.
The performance data quoted represents past performance and the current performance may be lower or higher than the performance data quoted. The investment return and principal will fluctuate so that investors’shares, when redeemed, may be worth more or less than their original cost. The performance data does not reflect the deduction of redemption fees and if reflected, the redemption fee would reduce the performance data quoted. To obtain performance data current to the most recent month-end, please call 888.200.4710 or visit www.fbrfunds.com.
| (1) | | The graph assumes a hypothetical $10,000 initial investment in the Fund and reflects the reinvestment of dividends and all Fund expenses. Investors should note that the Fund is a professionally managed mutual fund while the indices are unmanaged, do not incur expenses and are not available for investment. The performance of the indices includes reinvested dividends, and does not reflect sales charges or expenses. |
| (2) | | FBR Fund Advisers, Inc. waived a portion of its advisory fees and agreed to contractually reimburse a portion of the Fund’s operating expenses, as necessary, to maintain existing expense limitations, as set forth in the notes to the financial statements. Total returns shown includes fee waivers and expense reimbursements, if any; total returns would have been lower had there been no waiver of fees and/or reimbursement of expenses in excess of expense limitations. |
| (3) | | In April 2008, the Fund’s Board of Trustees approved the change of the primary benchmark to the Russell 2000 Growth Index. The Russell 2000 Growth Index measures the performance of the small-cap growth segment of the U.S. equity universe. It includes those Russell 2000 companies with higher price-to-value ratios and higher forecasted growth values. The NASDAQ Composite Index is a broad-based capitalization-weighted index of all NASDAQ National Market and Small Cap stocks. |
| (4) | | The total returns shown do not reflect the deduction of taxes that a shareholder would pay on fund distributions or the redemption of fund shares. |
| (5) | | For the period January 20, 2004 (commencement of investment operations) through April 30, 2008. |
26
The FBR Funds
FBR Pegasus Small Cap Growth FundTM
Portfolio Summary
April 30, 2008
(unaudited)
The following provides a breakdown of the Fund by industry sectors. The underlying securities represent a percentage of the portfolio investments.
| | Industry Sector | | % of Total Investments |
| |
| |
|
| | Software and Services | | 43.7 | % |
| | Technology Hardware and Equipment | | 13.1 | % |
| | Semiconductors and Semiconductor Equipment | | 10.5 | % |
| | Health Care Equipment and Services | | 5.8 | % |
| | Money Market Funds | | 5.4 | % |
| | Pharmaceuticals, Biotechnology and Life Sciences | | 4.4 | % |
| | Capital Goods | | 4.2 | % |
| | Consumer Services | | 3.8 | % |
| | Diversified Financials | | 3.1 | % |
| | Commercial Services and Supplies | | 1.8 | % |
| | Utilities | | 1.3 | % |
| | Media | | 1.1 | % |
| | Telecommunication Services | | 1.1 | % |
| | Insurance | | 0.7 | % |
27
The FBR Funds
FBR Pegasus Small Cap Growth FundTM
Portfolio of Investments
April 30, 2008
(unaudited)
|
| | | | | VALUE |
| SHARES | | | | (NOTE 2) |
|
| | | COMMON STOCKS — 98.5% | | | |
| | | Capital Goods — 4.4% | | | |
| 3,025 | | JA Solar Holdings Company Ltd. ADR* | | $ | 72,630 |
| 2,400 | | Woodward Governor Co. | | | 84,312 |
| | | | |
|
| | | | | | 156,942 |
| | | | |
|
| | | Commercial Services and Supplies — 1.8% | | | |
| 1,000 | | IHS, Inc., Class A* | | | 66,050 |
| | | | |
|
| | | Consumer Services — 4.0% | | | |
| 400 | | Ctrip.com International Ltd. ADR | | | 24,824 |
| 500 | | ITT Educational Services, Inc.* | | | 38,330 |
| 300 | | New Oriental Education & Technology Group, Inc. ADR* | | | 22,518 |
| 300 | | Strayer Education, Inc. | | | 55,707 |
| | | | |
|
| | | | | | 141,379 |
| | | | |
|
| | | Diversified Financials — 3.3% | | | |
| 1,145 | | Investment Technology Group, Inc.* | | | 55,258 |
| 2,900 | | optionsXpress Holdings, Inc. | | | 62,263 |
| | | | |
|
| | | | | | 117,521 |
| | | | |
|
| | | Health Care Equipment and Services — 6.0% | | | |
| 600 | | Gen-Probe, Inc.* | | | 33,816 |
| 2,000 | | IDEXX Laboratories, Inc.* | | | 106,400 |
| 1,300 | | Meridian Bioscience, Inc. | | | 35,009 |
| 1,300 | | VCA Antech, Inc.* | | | 42,081 |
| | | | |
|
| | | | | | 217,306 |
| | | | |
|
| | | Insurance — 0.7% | | | |
| 900 | | eHealth, Inc.* | | | 24,345 |
| | | | |
|
| | | | | | |
| | | Media — 1.2% | | | |
| 3,000 | | Global Sources Ltd.* | | | 41,670 |
| | | | |
|
| | | | | | |
| | | Pharmaceuticals, Biotechnology and Life Sciences — 4.6% | | | |
| 2,080 | | Techne Corp.* | | | 150,842 |
| 300 | | Varian, Inc.* | | | 15,279 |
| | | | |
|
| | | | | | 166,121 |
| | | | |
|
28
The FBR Funds
FBR Pegasus Small Cap Growth FundTM
Portfolio of Investments (continued)
April 30, 2008
(unaudited)
|
| | | | | VALUE | |
| SHARES | | | | (NOTE 2) | |
|
| | | Semiconductors and Semiconductor Equipment — 10.9% | | | | |
| 7,275 | | Atmel Corp.* | | $ | 27,063 | |
| 1,200 | | Cabot Microelectronics Corp.* | | | 40,860 | |
| 1,350 | | Diodes, Inc.* | | | 36,504 | |
| 1,800 | | Fairchild Semiconductor International, Inc.* | | | 23,472 | |
| 1,700 | | Hittite Microwave Corp.* | | | 67,489 | |
| 2,425 | | International Rectifier Corp.* | | | 55,193 | |
| 1,000 | | Microsemi Corp.* | | | 24,500 | |
| 2,500 | | ON Semiconductor Corp.* | | | 18,675 | |
| 2,250 | | Standard Microsystems Corp.* | | | 66,713 | |
| 450 | | Varian Semiconductor Equipment Associates, Inc.* | | | 16,484 | |
| 1,200 | | Zoran Corp.* | | | 15,792 | |
| | | | |
| |
| | | | | | 392,745 | |
| | | | |
| |
| | | Software and Services — 45.4% | | | | |
| 6,000 | | Actuate Corp.* | | | 24,420 | |
| 3,000 | | Aladdin Knowledge Systems Ltd.* | | | 43,650 | |
| 750 | | ANSYS, Inc.* | | | 30,173 | |
| 4,800 | | Aspen Technology, Inc.* | | | 65,952 | |
| 6,100 | | Compuware Corp.* | | | 45,994 | |
| 1,600 | | Concur Technologies, Inc.* | | | 53,024 | |
| 2,000 | | DealerTrack Holdings, Inc.* | | | 38,480 | |
| 1,350 | | FactSet Research Systems, Inc. | | | 81,041 | |
| 1,250 | | Fair Isaac Corp. | | | 30,963 | |
| 1,000 | | Global Payments, Inc. | | | 44,260 | |
| 6,000 | | Informatica Corp.* | | | 95,760 | |
| 1,400 | | Interwoven, Inc.* | | | 15,764 | |
| 3,000 | | j2 Global Communications, Inc.* | | | 64,200 | |
| 2,800 | | Jack Henry & Associates, Inc. | | | 73,584 | |
| 1,500 | | JDA Software Group, Inc.* | | | 28,350 | |
| 3,100 | | Lawson Software, Inc.* | | | 24,769 | |
| 300 | | MercadoLibre, Inc.* | | | 15,174 | |
| 1,600 | | Metavante Technologies, Inc.* | �� | | 37,712 | |
| 3,800 | | MICROS Systems, Inc.* | | | 135,469 | |
| 550 | | MicroStrategy, Inc., Class A* | | | 48,802 | |
| 500 | | NetSuite, Inc.* | | | 9,870 | |
29
The FBR Funds
FBR Pegasus Small Cap Growth FundTM
Portfolio of Investments (continued)
April 30, 2008
(unaudited)
|
| | | | | | VALUE | |
| SHARES | | | | | (NOTE 2) | |
|
| | | Software and Services — 45.4% (continued) | | | | |
| 2,700 | | Nuance Communications, Inc.* | | $ | 54,756 | |
| 2,800 | | Parametric Technology Corp.* | | | 48,804 | |
| 3,500 | | Perot Systems Corp., Class A* | | | 54,740 | |
| 1,200 | | Progress Software Corp.* | | | 36,276 | |
| 3,000 | | Quest Software, Inc.* | | | 39,960 | |
| 2,500 | | SPSS, Inc.* | | | 105,599 | |
| 3,800 | | Sybase, Inc.* | | | 111,795 | |
| 600 | | Synchronoss Technologies, Inc.* | | | 12,522 | |
| 1,400 | | Syntel, Inc. | | | 46,354 | |
| 700 | | THQ, Inc.* | | | 14,896 | |
| 3,360 | | TIBCO Software, Inc.* | | | 25,771 | |
| 2,200 | | VASCO Data Security International, Inc.* | | | 22,198 | |
| 1,800 | | Wright Express Corp.* | | | 59,400 | |
| | | | |
| |
| | | | | | 1,640,482 | |
| | | | |
| |
| | | Technology Hardware and Equipment — 13.6% | | | | |
| 1,200 | | Agilysys, Inc. | | | 13,152 | |
| 2,300 | | Arris Group, Inc.* | | | 18,630 | |
| 1,400 | | Arrow Electronics, Inc.* | | | 38,094 | |
| 4,550 | | Brocade Communications Systems, Inc.* | | | 32,578 | |
| 1,565 | | CommScope, Inc.* | | | 74,416 | |
| 2,225 | | Emulex Corp.* | | | 29,125 | |
| 1,200 | | F5 Networks, Inc.* | | | 27,156 | |
| 6,475 | | Foundry Networks, Inc.* | | | 82,427 | |
| 2,800 | | Ingram Micro, Inc., Class A* | | | 47,628 | |
| 800 | | NETGEAR, Inc.* | | | 12,968 | |
| 1,000 | | OSI Systems, Inc.* | | | 24,450 | |
| 2,300 | | QLogic Corp.* | | | 36,708 | |
| 1,400 | | ScanSource, Inc.* | | | 34,958 | |
| 5,000 | | Sonus Networks, Inc.* | | | 20,050 | |
| | | | |
| |
| | | | | | 492,340 | |
| | | | |
| |
| | | Telecommunication Services — 1.2% | | | | |
| 2,100 | | Cbeyond, Inc.* | | | 41,454 | |
| | | | |
| |
30
The FBR Funds
FBR Pegasus Small Cap Growth FundTM
Portfolio of Investments (continued)
April 30, 2008
(unaudited)
|
| | | | | VALUE | |
| SHARES | | | | (NOTE 2) | |
|
| | | Utilities — 1.4% | | | | |
| 1,000 | | Ormat Technologies, Inc. | | $ | 49,300 | |
| | | | |
| |
| | | | | | | |
| | | Total Common Stocks (Cost $3,566,362) | | | 3,547,655 | |
| | | | |
| |
| | | | | | | |
| | | MONEY MARKET FUNDS — 5.7% | | | | |
| 203,560 | | JPMorgan 100% U.S. Treasury Securities Money Market Fund (Cost $203,560) | | | 203,560 | |
| | | | |
| |
| | | | | | | |
| | | Total Investments — 104.2% (Cost $3,769,922) | | | 3,751,215 | |
| | | | | | | |
| | | Liabilities Less Other Assets — (4.2%) | | | (152,530 | ) |
| | | | |
| |
| | | | | | | |
| | | Net Assets — 100.0% | | $ | 3,598,685 | |
| | | | |
| |
|
| * | | Non-income producing security |
| ADR | | American Depositary Receipts |
The accompanying notes are an integral part of the financial statements.
31
The FBR Funds
FBR Focus Fund
Management Overview
Investment Sub Adviser: Akre Capital Management, LLC
Portfolio Manager: Charles T. Akre, Jr.
We agree with Warren Buffet’s observation that the stock market is designed to transfer money from the active to the patient. By only swinging at fat pitches and avoiding curveballs thrown far outside the strike zone, we attempt to compound your capital at an above average rate while incurring a below average level risk. In investing, patience often means the accumulation of large cash balances as we wait to purchase “compounding machines” at valuations that provide a margin of safety.
In our last letter to you, our fellow shareholders, we suggested that in an up market the Fund’s large cash balance could hinder short-term performance. At the same time, we wrote that in our experience, it is during periods of economic and market distress that investors can create the most value. Great businesses can go from overvalued, to undervalued, to throwaway prices that could never be imagined in better times.
During much of the last several months we have seen pitches in the sweet spot we were hoping for, where individual business values have declined to very attractive levels. This is not to suggest that we know where the market is headed. But, we do recognize a fat pitch when we see it, and we have been building important positions in businesses which will likely compound our capital at well above average rates for years to come.
It is important that we comment on one of our most prolific contributors to our above average returns over the entire life of the Fund, and that is Penn National Gaming. Last year it again contributed to our positive returns with an outsized gain, as it announced in June 2007 that it had agreed to be acquired by a group of private equity investors at $67/share in cash. The transaction has been slated to close around mid June 2008. The turmoil in the credit markets during the last few months has thrown every transaction of this type into question, including the Penn transaction. In fact, Penn has been trading in the low $40 a share range for weeks on end, suggesting that the market has grave doubts about the ability of this particular transaction to close as presently structured. Without going into all of the circumstances surrounding this and other similar deals, it will suffice to say that we remain optimistic about the likelihood of the transaction closing. We have not sold, or even reduced our position in Penn.
You may recall that when the deal was originally announced, we stated quite clearly that we were of a very mixed view. After all, Penn has been one of our very best (if not the best) compounder of our capital for a decade, and accordingly we would be very disappointed to lose it. Recall that we have owned shares of Penn since our very first week in existence, January 1997. On the other hand, we also faced the prospect of receiving substantial cash from the transaction during a significant market decline. A tough call! But, either way we will do just fine, either retaining a great compounder, or being faced with a large cash inflow at just the right time in the market.
32
The FBR Funds
FBR Focus Fund
Management Overview (continued)
On that note, it is important to recognize that a successful deal completion will mean substantial capital gains; a good result from a successful investment! For us tax payers, the gain at the Fund level will be long term in nature, subjecting us to the lowest capital gains tax rate in the last sixty or more years!
Our performance since the last report has been below average, due primarily to the action around Penn as it declined from the low $60s to the low $40s. It is our view that one should consider carefully the short-term impact of Penn’s recent price action on our current performance, and weigh that in the context of our long-term record now firmly in its twelfth year.
When you examine the holdings in the accompanying report, you will see important increases in a few companies, and more than one new holding. These more recent capital allocations are the result of a market environment more suited to our taste. You may recall that at the time the Fund was reopened to shareholders in January 2007, my statement at the time (and often repeated) was “...over the next several years, we expected we will have an opportunity to put substantial amounts of capital to work at attractive valuations.” The market during the last several months has yielded such an opportunity, and may continue to yield exciting opportunities in the months ahead. We do not, and can not know where the market is headed, but emphasize again, that we can and do recognize great value when we see it.
The point of this discussion is to reemphasize our view that the time is at hand for us to be able to put substantial sums to work at very attractive valuations. We certainly have not seen these attractive price levels since the second half of 2002,and in some cases, not since the early 1990s.
The opinions expressed in this commentary reflect those of the Portfolio Manager as of the date written. Any such opinions are subject to change based on market or other conditions. These opinions may not be relied upon as investment advice. Investment decisions for The FBR Funds are based on several factors, and may not be relied upon as an indication of trading intent on behalf of any FBR Fund. Security positions can and do change.
33
The FBR Funds
FBR Focus Fund
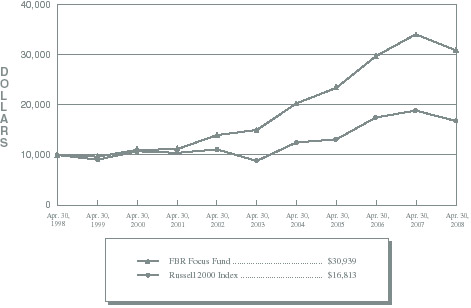
Comparison of Changes in Value of $10,000 Investment in
Fund Shares(1)(2) vs. Russell 2000 Index(1)(3)
(unaudited)
| Total Returns—For the Periods Ended April 30, 2008(4) |
| | | | | | Annualized | | Annualized | |
| | One Year | | Five Year | | Ten Year | |
| |
| |
| |
| |
FBR Focus Fund(1)(2) | | (9.34 | % | ) | | 15.57 | % | | | 11.96 | % | |
Russell 2000 Index(1)(3) | | (10.96 | % | ) | | 13.77 | % | | | 5.33 | % | |
| |
PAST PERFORMANCE IS NO GUARANTEE OF FUTURE RESULTS.
The performance data quoted represents past performance and the current performance may be lower or higher than the performance data quoted. The investment return and principal will fluctuate so that investors’ shares, when redeemed, may be worth more or less than their original cost. The performance data does not reflect the deduction of redemption fees and if reflected, the redemption fee would reduce the performance data quoted. To obtain performance data current to the most recent month-end, please call 888.200.4710 or visit www.fbrfunds.com.
|
| (1) | | The graph assumes a hypothetical $10,000 initial investment in the Fund and reflects the reinvestment of dividends and all Fund expenses. Investors should note that the Fund is a professionally managed mutual fund while the index is unmanaged, does not incur expenses and is not available for investment. The performance of the index includes reinvested dividends, and does not reflect sales charges or expenses. |
| (2) | | FBR Fund Advisers, Inc. waived a portion of its advisory fees and agreed to contractually reimburse a portion of the Fund’s operating expenses, as necessary, to maintain existing expense limitations, as set forth in the notes to the financial statements. Total returns shown include fee waivers and expense reimbursements, if any; total returns would have been lower had there been no waiver of fees and/or reimbursement of expenses in excess of expense limitations. |
| (3) | | Russell 2000 Index is comprised of the smallest of the 2000 companies of the Russell 3000 Index, representing approximately 8% of the Russell 3000’s total market-capitalization. |
| (4) | | The total returns shown do not reflect the deduction of taxes that a shareholder would pay on fund distributions or the redemption of fund shares. |
34
The FBR Funds
FBR Focus Fund
Portfolio Summary
April 30, 2008
(unaudited)
The following provides a breakdown of the Fund by industry sectors. The underlying securities represent a percentage of the portfolio investments.
| Industry Sector | | % of Total Investments |
| |
|
| Consumer Discretionary | | | 50.0 | % |
| Financials | | | 16.4 | % |
| Telecommunication Services | | | 15.6 | % |
| Energy | | | 6.5 | % |
| Industrials | | | 6.5 | % |
| Money Market Funds | | | 2.5 | % |
| Consumer Staples | | | 2.1 | % |
| Information Technology | | | 0.4 | % |
35
The FBR Funds
FBR Focus Fund
Portfolio of Investments
April 30, 2008
(unaudited)
|
| | | | | | VALUE | |
| SHARES | | | | | (NOTE 2) | |
|
| | | COMMON STOCKS — 97.1% | | | | |
| | | Consumer Discretionary — 50.0% | | | | |
| 5,791,474 | | 99 Cents Only Stores* † | | $ | 55,076,918 | |
| 1,600,000 | | Bally Technologies, Inc.* | | | 53,904,000 | |
| 3,060,000 | | CarMax, Inc.* | | | 63,495,000 | |
| 2,568,614 | | CSK Auto Corp.* † | | | 30,643,565 | |
| 365,900 | | Dover Motorsports, Inc. | | | 2,239,308 | |
| 555,943 | | Isle of Capri Casinos, Inc.* | | | 3,747,056 | |
| 1,200,000 | | Lamar Advertising Co., Class A* | | | 47,448,000 | |
| 992,000 | | Monarch Casino & Resort, Inc.* † | | | 13,134,080 | |
| 1,721,425 | | O’Reilly Automotive, Inc.* | | | 49,697,540 | |
| 4,100,000 | | Penn National Gaming, Inc.* | | | 175,151,999 | |
| 1,621,407 | | Pinnacle Entertainment, Inc.* | | | 25,164,237 | |
| 1,725,000 | | Pool Corp. | | | 37,656,750 | |
| 600,000 | | Toll Brothers, Inc.* | | | 13,584,000 | |
| | | | |
| |
| | | | | | 570,942,453 | |
| | | | |
| |
| | | Consumer Staples — 2.1% | | | | |
| 1,700,000 | | Alimentation Couche-Tard, Inc., Class B | | | 23,533,100 | |
| | | | |
| |
| | | Energy — 6.5% | | | | |
| 758,033 | | MarkWest Energy Partners L.P. | | | 27,061,778 | |
| 423,600 | | Penn Virginia Corp. | | | 22,239,000 | |
| 1,300,000 | | Peyto Energy Trust | | | 25,339,092 | |
| | | | |
| |
| | | | | | 74,639,870 | |
| | | | |
| |
| | | Financials — 16.0% | | | | |
| 1,450,000 | | AmeriCredit Corp.* | | | 20,242,000 | |
| 80 | | Berkshire Hathaway, Inc., Class B* | | | 356,560 | |
| 700,000 | | Encore Capital Group, Inc.* | | | 4,690,000 | |
| 1,676,475 | | Flagstone Reinsurance Holdings Ltd. | | | 20,503,289 | |
| 881,700 | | HFF, Inc., Class A* † | | | 5,545,893 | |
| 381,900 | | Hilb Rogal and Hobbs Co. | | | 11,048,367 | |
| 604,425 | | Hilltop Holdings, Inc.* | | | 6,382,728 | |
| 255,400 | | Markel Corp.* | | | 110,945,761 | |
| 190,837 | | White River Capital, Inc.* | | | 2,833,929 | |
| | | | |
| |
| | | | | | 182,548,527 | |
| | | | |
| |
36
The FBR Funds
FBR Focus Fund
Portfolio of Investments (continued)
April 30, 2008
(unaudited)
|
| | | | | | VALUE | |
| SHARES | | | | | (NOTE 2) | |
|
| | | Industrials — 6.5% | | | | |
| 900,000 | | American Woodmark Corp.† | | $ | 16,983,000 | |
| 598,610 | | Dynamex, Inc.* † | | | 15,043,069 | |
| 1,060,000 | | Knight Transportation, Inc. | | | 18,009,400 | |
| 902,300 | | Simpson Manufacturing Company, Inc. | | | 23,811,697 | |
| | | | |
| |
| | | | | | 73,847,166 | |
| | | | |
| |
| | | Information Technology — 0.4% | | | | |
| 183,200 | | Iron Mountain, Inc.* | | | 5,032,504 | |
| | | | |
| |
| | | Telecommunication Services — 15.6% | | | | |
| 4,107,256 | | American Tower Corp., Class A* | | | 178,337,056 | |
| | | | |
| |
| | | Total Common Stocks (Cost $754,008,987) | | | 1,108,880,676 | |
| | | | |
| |
| | | PREFERRED STOCK — 0.4% | | | | |
| | | Financials — 0.4% | | | | |
| 200,000 | | ING Groep N.V., 6.125% (Cost $5,000,000) | | | 4,190,000 | |
| | | | |
| |
| | | MONEY MARKET FUNDS — 2.5% | | | | |
| 28,127,267 | | JPMorgan 100% U.S. Treasury Securities Money Market Fund (Cost $28,127,267) | | | 28,127,267 | |
| | | | |
| |
| |
| | | Total Investments — 100.0% (Cost $787,136,254) | | | 1,141,197,943 | |
| | | | | | | |
| | | Liabilities Less Other Assets — N.M. | | | (180,560 | ) |
| | | | |
| |
| | | | | | | |
| | | Net Assets — 100.0% | | $ | 1,141,017,383 | |
| | | | |
| |
|
| * | | Non-income producing security |
| † | | Affiliated issuer as defined in the Investment Company Act of 1940 (ownership of at least 5% of the outstanding voting securities of an issuer) |
| N.M. | | Not meaningful |
| Note: | | For presentation purposes, the Fund has grouped some of the industry categories. For purposes of categorizing securities for compliance with Section 8(b)(1) of the Investment Company Act of 1940, the Fund uses more specific industry classifications. |
The accompanying notes are an integral part of the financial statements.
37
| The FBR Funds |
|
| FBR Large Cap Financial Fund |
| Management Overview |
Portfolio Manager: David Ellison
How did the Fund perform?
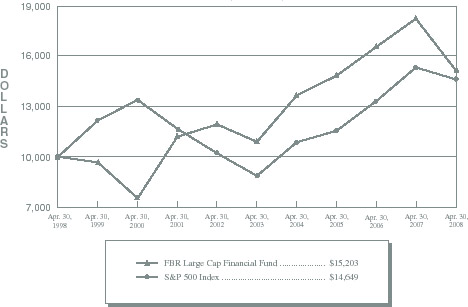
For the six months ended April 30, 2008, the FBR Large Cap Financial Fund returned -7.61%. This compares to the S&P 500 Index and the Morningstar Specialty-Financial Category Average, which returned -9.64% and -16.78% for the same period respectively.
What factors contributed to the Fund’s performance?
The Fund performed better than the related index and peers during the reporting period. Holding higher than average cash balances, avoiding companies with weak balance sheets and those engaged in aggressive underwriting practices, were tactics that positively contributed to the Fund’s outperformance.
The Fund continued to focus investments in traditional commercial banks, especially those that maintained adequate levels of capital and conservative and diversified lending patterns. Companies like Comerica (CMA), Keycorp (KEY), Wells Fargo (WFC) and Unionbancal (UB) are just a few examples of portfolio holdings that exhibit these defensive characteristics mentioned above which helped performance during the period.
What is the outlook for the Fund and the financial services sector?
Operating conditions in the industry deteriorated during the period. The primary driver was the slowing housing market, which negatively impacted credit trends. Most companies are experiencing an increase in mortgage delinquencies as more of their portfolio loans stop making payments and possibly enter foreclosure, which is a drag on earnings. These negative credit trends have also impacted many of the complex securities you may have been hearing about in the media and financial press. These so called complex securities are nothing more than a bundle of loans that are going delinquent and/or entering foreclosure.
Adding to the reversal in credit was the increasing use of leverage and short-term funding to purchase these loan assets over the last few years. As leverage rises and the funding becomes more short-term, the room for error decreases and the risk of loss upon reversal of favorable conditions grows.
The participants in the market have recently grown fearful that excessive leverage and declining credit will produce a flood of financial bankruptcies. This fear has added volatility to the stock prices and lowered valuations relative to the company’s earnings and book value. The most glaring example of this was the collapse of Bear Stearns in March.
I believe that credit and interest rate trends are the two primary factors that drive earnings in the financial space. Over the last year, interest rate changes have been favorable (moving down), but the positive effects have been overwhelmed by deteriorating credit conditions and, in many cases, the excessive leverage that has been well-reported by the popular press.
38
| The FBR Funds |
|
| FBR Large Cap Financial Fund |
| Management Overview (continued) |
Bad credit conditions do a number of unfortunate things to earnings. First, the loan defaults and interest payments are no longer earned. Second, the company must spend time and money trying to get the customer to make payments again. If these attempts fail, more time and even more money is spent executing the foreclosure process. Third, once the bank takes possession of the house, it has to arrange to pay taxes, insurance, heating and electric bills and other sundry costs, as well as mow the lawn and rake the leaves. Finally, the bank has to employ a broker to sell the house who will need to be paid. All these expenses quickly add-up and eat away at profitability.
While bad credit conditions are increasing the costs, they are also adversely impacting management’s outlook. The industry’s response to these rising costs has been to tighten lending standards and make fewer loans. We are seeing signs of credit tightening all around us, which has the effect of making things worse in the short-run. When credit is made less available after being overly abundant (as in the last three years), the industry and possibly the overall economy will suffer in the near-term.
While the short-run will be difficult, a long-term opportunity in the financial sector is developing. With all the bad news concerning credit, liquidity, leverage and reported losses come the seeds of a recovery. Managements are, as you read this, proactively working to correct the mistakes of the last few years and watering the seeds of better credit, liquidity and earnings for the future. The only open question is what the timing will be.
My goal is to position the Fund to take advantage of this turn in credit, liquidity and profitability over the long-run, while maintaining our conservative approach to protect against the possibility of further downside volatility.
The opinions expressed in this commentary reflect those of the Portfolio Manager as of the date written. Any such opinions are subject to change based on market or other conditions. These opinions may not be relied upon as investment advice. Investment decisions for The FBR Funds are based on several factors, and may not be relied upon as an indication of trading intent on behalf of any FBR Fund. Security positions can and do change.
39
The FBR Funds
FBR Large Cap Financial Fund
Comparison of Changes in Value of $10,000 Investment in
Fund Shares(1)(2) vs. S&P 500 Index(1)(3)
(unaudited)
| Total Returns—For the Periods Ended April 30, 2008(4) |
| | | | | | Annualized | | Annualized | |
| | One Year | | Five Year | | Ten Year | |
| |
| |
| |
| |
FBR Large Cap Financial Fund(1)(2) | | (16.93 | % | ) | | 6.90 | % | | | 4.28 | % | |
S&P 500 Index(1)(3) | | (4.68 | % | ) | | 10.60 | % | | | 3.89 | % | |
| |
PAST PERFORMANCE IS NO GUARANTEE OF FUTURE RESULTS.
The performance data quoted represents past performance and the current performance may be lower or higher than the performance data quoted. The investment return and principal will fluctuate so that investors’ shares, when redeemed, may be worth more or less than their original cost. The performance data does not reflect the deduction of redemption fees and if reflected, the redemption fee would reduce the performance data quoted. To obtain performance data current to the most recent month-end, please call 888.200.4710 or visit www.fbrfunds.com.
|
| (1) | | The graph assumes a hypothetical $10,000 initial investment in the Fund and reflects the reinvestment of dividends and all Fund expenses. Investors should note that the Fund is a professionally managed mutual fund while the index is unmanaged, does not incur expenses and is not available for investment. The performance of the index includes reinvested dividends, and does not reflect sales charges or expenses. |
| (2) | | FBR Fund Advisers, Inc. waived a portion of its advisory fees and agreed to contractually reimburse a portion of the Fund’s operating expenses, as necessary, to maintain existing expense limitations, as set forth in the notes to the financial statements. Total returns shown include fee waivers and expense reimbursements, if any; total returns would have been lower had there been no waiver of fees and/or reimbursement of expenses in excess of expense limitations. |
| (3) | | S&P 500 Index is a capitalization-weighted index of 500 stocks. The index is designed to represent the broad domestic economy through changes in aggregate market value of 500 stocks representing all major industries. |
| (4) | | The total returns shown do not reflect the deduction of taxes that a shareholder would pay on fund distributions or the redemption of fund shares. |
40
The FBR Funds
FBR Large Cap Financial Fund
Portfolio Summary
April 30, 2008
(unaudited)
The following provides a breakdown of the Fund by industry sectors. The underlying securities represent a percentage of the portfolio investments.
| Industry Sector | | % of Total Investments |
| |
|
| Money Market Funds | | | 27.3 | % |
| Commercial Banks | | | 21.3 | % |
| Thrifts and Mortgage Finance | | | 11.1 | % |
| Diversified Financial Services | | | 10.6 | % |
| Insurance | | | 10.5 | % |
| Capital Markets | | | 8.5 | % |
| IT Services | | | 5.6 | % |
| Real Estate Investment Trusts | | | 2.7 | % |
| Household Durables | | | 1.9 | % |
| Consumer Finance | | | 0.5 | % |
41
The FBR Funds
FBR Large Cap Financial Fund
Portfolio of Investments
April 30, 2008
(unaudited)
|
| | | | | | VALUE | |
| SHARES | | | | | (NOTE 2) | |
|
| | | COMMON STOCKS — 75.7% | | | | |
| | | Capital Markets — 8.8% | | | | |
| 1,500 | | Ameriprise Financial, Inc. | | $ | 71,235 | |
| 5,000 | | Lehman Brothers Holdings, Inc. | | | 221,200 | |
| 2,000 | | Merrill Lynch & Company, Inc. | | | 99,660 | |
| 3,000 | | Morgan Stanley | | | 145,800 | |
| 4,000 | | State Street Corp. | | | 288,560 | |
| 7,000 | | The Bank of New York Mellon Corp. | | | 304,710 | |
| 700 | | The Goldman Sachs Group, Inc. | | | 133,959 | |
| | | | |
| |
| | | | | | 1,265,124 | |
| | | | |
| |
| | | Commercial Banks — 22.3% | | | | |
| 500 | | BB&T Corp. | | | 17,145 | |
| 8,000 | | Comerica, Inc. | | | 277,840 | |
| 5,000 | | Fifth Third Bancorp | | | 107,150 | |
| 13,500 | | KeyCorp | | | 325,755 | |
| 1,500 | | M&T Bank Corp. | | | 139,845 | |
| 8,000 | | Marshall & Ilsley Corp. | | | 199,840 | |
| 45,000 | | National City Corp. | | | 283,500 | |
| 5,500 | | SunTrust Banks, Inc. | | | 306,625 | |
| 20,000 | | Synovus Financial Corp. | | | 236,800 | |
| 4,000 | | U.S. Bancorp | | | 135,560 | |
| 7,500 | | UnionBanCal Corp. | | | 393,825 | |
| 14,000 | | Wachovia Corp. | | | 408,100 | |
| 3,000 | | Wells Fargo & Co. | | | 89,250 | |
| 5,500 | | Zions Bancorp | | | 254,925 | |
| | | | |
| |
| | | | | | 3,176,160 | |
| | | | |
| |
| | | Consumer Finance — 0.5% | | | | |
| 4,000 | | Discover Financial Services | | | 72,840 | |
| | | | |
| |
| | | Diversified Financial Services — 11.0% | | | | |
| 8,500 | | Bank of America Corp. | | | 319,090 | |
| 26,000 | | CIT Group, Inc. | | | 283,140 | |
| 5,000 | | Citigroup, Inc. | | | 126,350 | |
42
The FBR Funds
FBR Large Cap Financial Fund
Portfolio of Investments (continued)
April 30, 2008
(unaudited)
|
| | | | | | VALUE | |
| SHARES | | | | | (NOTE 2) | |
|
| | | Diversified Financial Services — 11.0% (continued) | | | | |
| 10,000 | | Interactive Brokers Group, Inc., Class A* | | $ | 315,700 | |
| 8,500 | | JPMorgan Chase & Co. | | | 405,025 | |
| 2,000 | | NYSE Euronext, Inc. | | | 132,200 | |
| | | | |
| |
| | | | | | 1,581,505 | |
| | | | |
| |
| | | Household Durables — 2.0% | | | | |
| 5,000 | | D.R. Horton, Inc. | | | 77,450 | |
| 16,000 | | Pulte Homes, Inc. | | | 208,640 | |
| | | | |
| |
| | | | | | 286,090 | |
| | | | |
| |
| | | Insurance — 10.9% | | | | |
| 2,500 | | ACE Ltd. | | | 150,725 | |
| 8,500 | | American International Group, Inc. | | | 392,700 | |
| 6,000 | | Fidelity National Financial, Inc., Class A | | | 95,940 | |
| 2,500 | | Loews Corp. | | | 105,275 | |
| 1,000 | | MetLife, Inc. | | | 60,850 | |
| 3,000 | | Safeco Corp. | | | 200,220 | |
| 4,000 | | The Chubb Corp. | | | 211,880 | |
| 2,000 | | The Hartford Financial Services Group, Inc. | | | 142,540 | |
| 4,000 | | The Travelers Companies, Inc. | | | 201,600 | |
| | | | |
| |
| | | | | | 1,561,730 | |
| | | | |
| |
| | | IT Services — 5.8% | | | | |
| 1,200 | | MasterCard, Inc., Class A | | | 333,792 | |
| 6,000 | | Visa, Inc., Class A* | | | 500,700 | |
| | | | |
| |
| | | | | | 834,492 | |
| | | | |
| |
| | | Real Estate Investment Trusts — 2.8% | | | | |
| 24,000 | | Annaly Capital Management, Inc. | | | 402,240 | |
| | | | |
| |
| | | Thrifts and Mortgage Finance — 11.6% | | | | |
| 13,000 | | Astoria Financial Corp. | | | 308,100 | |
| 9,500 | | Fannie Mae (Federal National Mortgage) | | | 268,850 | |
| 10,500 | | Freddie Mac (Federal Home Loan) | | | 261,555 | |
| 13,000 | | Hudson City Bancorp, Inc. | | | 248,690 | |
| 10,000 | | People’s United Financial, Inc. | | | 169,700 | |
43
The FBR Funds
FBR Large Cap Financial Fund
Portfolio of Investments (continued)
April 30, 2008
(unaudited)
|
| | | | | | VALUE | |
| SHARES | | | | | (NOTE 2) | |
|
| | | Thrifts and Mortgage Finance — 11.6% (continued) | | | | |
| 28,000 | | Sovereign Bancorp, Inc. | | $ | 209,160 | |
| 15,000 | | Washington Mutual, Inc. | | | 184,350 | |
| | | | |
| |
| | | | | | 1,650,405 | |
| | | | |
| |
| | | Total Common Stocks (Cost $10,476,117) | | | 10,830,586 | |
| | | | |
| |
| | | | | | | |
| | | MONEY MARKET FUNDS — 28.6% | | | | |
| 4,092,950 | | JPMorgan 100% U.S. Treasury Securities Money Market Fund (Cost $4,092,950) | | | 4,092,950 | |
| | | | |
| |
| | | | | | | |
| | | Total Investments — 104.3% (Cost $14,569,067) | | | 14,923,536 | |
| | | | | | | |
| | | Liabilities Less Other Assets — (4.3%) | | | (610,316 | ) |
| | | | |
| |
| | | | | | | |
| | | Net Assets — 100.0% | | $ | 14,313,220 | |
| | | | |
| |
|
| * Non-income producing security |
The accompanying notes are an integral part of the financial statements.
44
The FBR Funds
FBR Small Cap Financial Fund
Management Overview
Portfolio Manager: David Ellison
How did the Fund perform?
For the six-month period ended April 30, 2008, the FBR Small Cap Financial Fund returned -3.70%. This compares to the Russell 2000 Index and the Morningstar Specialty-Financial Category Average which returned -12.92% and -16.78% for the same period respectively.
What factors contributed to the Fund’s performance?
The Fund performed well during the period relative to the related indices. My historical bias against companies with poor loan underwriting histories was the primary reason for the outperformance during the period. Currently, industry earnings continue to be impacted by troubles in the housing market and the stocks are, on balance, following this trend (down). However, companies that maintained their historically strict underwriting criteria, and focused on the appropriate mix of loan-type, pricing and volume levels, experienced stronger earnings which translated into better stock performance. Consequently, portfolio companies such as Hudson City (HCBK), Bank Mutual (BKMU), Danvers Bancorp (DNBK) and Bancorp Rhode Island (BARI), who have historically paid attention to loan quality, contributed positively to the Fund’s favorable relative performance during the period.
What is the outlook for the Fund and the financial services sector?
Operating conditions in the industry deteriorated during the period. Most companies are seeing rising mortgage delinquencies, which are negatively impacting earnings as these loans stop paying and possibly enter foreclosure. Loan originations have also slowed in response to these negative credit trends, and are impacting the near-term growth outlook for the sector.
Adding to the reversal in credit was the increased use of leverage and short-term funding to purchase these loan assets over the last few years. As leverage rises and the funding becomes more short-term, the room for error decreases and the risk of loss upon reversal of favorable conditions becomes significant.
I believe that credit and interest rate trends are the two primary factors that drive earnings in the financial space. Over the last year, interest rate changes have been favorable (moving lower), but have been overwhelmed by deteriorating credit conditions and, in some cases, excessive leverage.
Bad credit conditions do a number of unfortunate things to earnings. First, the loan defaults and the interest payments are no longer earned. Second, the company must spend time and money trying to get the customer to begin making payments again, and if that fails, spend even more money on lawyers taking the customer to foreclosure. Third, once
45
The FBR Funds
FBR Small Cap Financial Fund
Management Overview (continued)
the bank takes the house from the delinquent owner, it has to arrange to pay the taxes, insurance, mow the lawn, rake the leaves, pay for heat, electricity and other sundry costs. Finally, the bank has to employ a broker to sell the house who will need to be paid. These expenses quickly add-up and eat into profitability.
While bad credit conditions are increasing the costs, they are also adversely impacting management’s outlook. The industry’s response to these rising costs has been to tighten lending standards and make fewer loans to keep from adding additional bad credits. We are seeing signs of credit tightening all around us, which has the effect of making things worse in the short-run. When credit is made less available after being overly abundant (as in the last three years) the industry and possibly the overall economy will suffer in the near-term.
While the short-run will be difficult, a long-term opportunity in the small-cap financial sector is developing. With all the bad news concerning credit comes the seeds of a recovery in credit and earnings. Managements are, as you read this, correcting the mistakes of the last few years and watering the seeds of better profit trends in the future. The only open question is what the timing will be.
My goal is to position the Fund to take advantage of this profit improvement over the long-run, while protecting against possible further downside volatility through the near-term.
The opinions expressed in this commentary reflect those of the Portfolio Manager as of the date written. Any such opinions are subject to change based on market or other conditions. These opinions may not be relied upon as investment advice. Investment decisions for The FBR Funds are based on several factors, and may not be relied upon as an indication of trading intent on behalf of any FBR Fund. Security positions can and do change.
46
The FBR Funds
FBR Small Cap Financial Fund
Comparison of Changes in Value of $10,000 Investment in
Fund Shares(1)(2) vs. Rssell 2000 Index(1)(3)
(unaudited)
| Total Returns—For the Periods Ended April 30, 2008(4) |
| | | | | | | | Annualized | | Annualized | |
| | | | One Year | | | Five Year | | Ten Year | |
| | | |
| | |
| |
| |
FBR Small Cap Financial Fund(1)(2) | | | (16.62 | % | ) | | 5.46 | % | | 7.43 | % | |
Russell 2000 Index(1)(3) | | | (10.96 | % | ) | | 13.77 | % | | 5.33 | % | |
| |
PAST PERFORMANCE IS NO GUARANTEE OF FUTURE RESULTS.
The performance data quoted represents past performance and the current performance may be lower or higher than the performance data quoted. The investment return and principal will fluctuate so that investors’ shares, when redeemed, may be worth more or less than their original cost. The performance data does not reflect the deduction of redemption fees and if reflected, the redemption fee would reduce the performance data quoted. To obtain performance data current to the most recent month-end, please call 888.200.4710 or visit www.fbrfunds.com.
|
| (1) | | | The graph assumes a hypothetical $10,000 initial investment in the Fund and reflects the reinvestment of dividends and all Fund expenses. Investors should note that the Fund is a professionally managed mutual fund while the index is unmanaged, does not incur expenses and is not available for investment. The performance of the index includes reinvested dividends, and does not reflect sales charges or expenses. |
| (2) | | | FBR Fund Advisers, Inc. waived a portion of its advisory fees and agreed to contractually reimburse a portion of the Fund’s operating expenses, as necessary, to maintain existing expense limitations, as set forth in the notes to the financial statements. Total returns shown include fee waivers and expense reimbursements, if any; total returns would have been lower had there been no waiver of fees and/or reimbursement of expenses in excess of expense limitations. |
| (3) | | | Russell 2000 Index is comprised of the smallest of the 2000 companies of the Russell 3000 Index, representing approximately 8% of the Russell 3000’s total market-capitalization. |
| (4) | | | The total returns shown do not reflect the deduction of taxes that a shareholder would pay on fund distributions or the redemption of fund shares. |
47
The FBR Funds
FBR Small Cap Financial Fund
Portfolio Summary
April 30, 2008
(unaudited)
The following provides a breakdown of the Fund by industry sectors. The underlying securities represent a percentage of the portfolio investments.
| Industry Sector | | % of Total Investments |
| |
|
| Thrifts and Mortgage Finance | | 45.6 | % |
| Money Market Funds | | 34.1 | % |
| Real Estate Investment Trusts | | 13.1 | % |
| Commerical Banks | | 6.7 | % |
| Household Durables | | 0.5 | % |
48
The FBR Funds
FBR Small Cap Financial Fund
Portfolio of Investments
April 30, 2008
(unaudited)
|
| | | | | | VALUE | |
| | SHARES | | | | (NOTE 2) | |
|
| | | | COMMON STOCKS — 67.8% | | | | |
| | | | Commercial Banks — 6.9% | | | | |
| | 52,374 | | Bancorp Rhode Island, Inc. | | $ | 1,755,052 | |
| | 90,737 | | Cape Bancorp, Inc.* | | | 908,277 | |
| | 20,000 | | Cathay General Bancorp | | | 341,000 | |
| | 95,000 | | East West Bancorp, Inc. | | | 1,352,800 | |
| | 10,000 | | First Community Bancorp | | | 214,900 | |
| | 40,000 | | First Horizon National Corp. | | | 432,000 | |
| | 1,400 | | Hampden Bancorp, Inc. | | | 15,330 | |
| | 75,000 | | Investors Bancorp, Inc.* | | | 1,100,250 | |
| | 74,372 | | Pacific Premier Bancorp, Inc.* | | | 561,509 | |
| | 9,889 | | Patriot National Bancorp, Inc. | | | 143,391 | |
| | 14,392 | | Southern First Bancshares, Inc.* | | | 208,540 | |
| | 40,000 | | Sterling Financial Corp. | | | 488,400 | |
| | 47,904 | | Taylor Capital Group, Inc. | | | 714,728 | |
| | 100,000 | | The South Financial Group, Inc. | | | 604,000 | |
| | 20,000 | | UCBH Holdings, Inc. | | | 145,600 | |
| | 35,000 | | Webster Financial Corp. | | | 911,750 | |
| | | | | |
|
| | | | | | | 9,897,527 | |
| | | | | |
|
| | | | Household Durables — 0.5% | | | | |
| | 40,000 | | Lennar Corp., Class A | | | 736,800 | |
| | | | | |
|
| | | | | | | | |
| | | | Real Estate Investment Trusts — 13.5% | | | | |
| | 310,750 | | Annaly Mortgage Management, Inc. | | | 5,208,170 | |
| | 485,850 | | Anworth Mortgage Asset Corp. | | | 3,245,478 | |
| | 223,850 | | Capstead Mortgage Corp. | | | 2,887,665 | |
| | 310,000 | | Chimera Investment Corp. | | | 4,299,700 | |
| | 10,000 | | Hatteras Financial Corp.* | | | 252,800 | |
| | 494,250 | | MFA Mortgage Investments, Inc. | | | 3,454,808 | |
| | 50,000 | | New York Mortgage Trust, Inc. | | | 120,000 | |
| | | | | |
|
| | | | | | | 19,468,621 | |
| | | | | |
|
| | | | Thrifts and Mortgage Finance — 46.9% | | | | |
| | 75,710 | | Abington Bancorp, Inc. | | | 791,926 | |
| | 235,000 | | Astoria Financial Corp. | | | 5,569,500 | |
| | 359,895 | | Bank Mutual Corp. | | | 4,027,225 | |
| | 10,000 | | BankAtlantic Bancorp, Inc., Class A | | | 30,800 | |
49
The FBR Funds
FBR Small Cap Financial Fund
Portfolio of Investments (continued)
April 30, 2008
(unaudited)
|
| | | | | | VALUE | |
| | SHARES | | | | (NOTE 2) | |
|
| | | | Thrifts and Mortgage Finance — 46.9% (continued) | | | | |
| | 70,863 | | BankUnited Financial Corp., Class A | | $ | 278,492 | |
| | 77,000 | | Capitol Federal Financial | | | 2,979,900 | |
| | 141,402 | | Danvers Bancorp, Inc.* | | | 1,578,046 | |
| | 90,000 | | Downey Financial Corp. | | | 1,272,600 | |
| | 90,700 | | FirstFed Financial Corp.* | | | 1,385,896 | |
| | 30,000 | | Franklin Bank Corp.* | | | 46,500 | |
| | 20,000 | | Guaranty Financial Group, Inc.* | | | 153,000 | |
| | 33,000 | | Harrington West Financial Group, Inc. | | | 255,750 | |
| | 101,700 | | Hingham Institution for Savings | | | 3,059,136 | |
| | 29,041 | | HMN Financial, Inc. | | | 646,162 | |
| | 969,156 | | Hudson City Bancorp, Inc. | | | 18,539,954 | |
| | 30,000 | | NewAlliance Bancshares, Inc. | | | 403,800 | |
| | 29,650 | | OceanFirst Financial Corp. | | | 558,310 | |
| | 4,752 | | Oritani Financial Corp.* | | | 72,088 | |
| | 193,944 | | Parkvale Financial Corp. | | | 5,042,544 | |
| | 202,525 | | People’s United Financial, Inc. | | | 3,436,849 | |
| | 55,500 | | PFF Bancorp, Inc. | | | 209,790 | |
| | 47,151 | | TF Financial Corp. | | | 1,176,182 | |
| | 75,000 | | United Community Financial Corp. | | | 615,750 | |
| | 511,734 | | Washington Federal, Inc. | | | 12,184,387 | |
| | 62,629 | | WSFS Financial Corp. | | | 3,182,179 | |
| | | | | |
|
| | | | | | | 67,496,766 | |
| | | | | |
|
| | | | Total Common Stocks (Cost $86,995,124) | | | 97,599,714 | |
| | | | | |
|
| | | | | | | | |
| | | | MONEY MARKET FUNDS — 35.1% | | | | |
| | 50,494,324 | | JPMorgan 100% U.S. Treasury Securities Money Market Fund (Cost $50,494,324) | | | 50,494,324 | |
| | | | | |
|
| | | | | | | | |
| | | | Total Investments — 102.9% (Cost $137,489,448) | | | 148,094,038 | |
| | | | | | | | |
| | | | Liabilities Less Other Assets — (2.9%) | | | (4,125,165 | ) |
| | | | | |
|
| | | | | | | | |
| | | | Net Assets — 100.0% | | $ | 143,968,873 | |
| | | | | |
|
|
| * | | Non-income producing security |
The accompanying notes are an integral part of the financial statements.
50
| The FBR Funds |
|
FBR Technology Fund
(Formerly known as the FBR Large Cap Technology Fund) |
| Management Overview |
Portfolio Managers: David Ellison and Winsor Aylesworth
How did the Fund perform?
For the six-month period ended April 30, 2008, the FBR Large Cap Technology Fund returned -12.95%. This compares to the NASDAQ Composite Index and the Morningstar Specialty-Technology Category Average which returned -15.27% and -16.47% for the same period respectively.
What factors contributed to the Fund’s performance?
For the most recent six-month period, the Fund outperformed many of its peers and several appropriate benchmarks. The period was characterized by a general market sell-off led by the financial services sector. Technology companies were not immune with most stocks getting re-priced lower over the period. We have always maintained that your Fund was conservatively positioned to weather such a period. Its emphasis on low-leveraged, profitable companies purchased at reasonable prices served us well during the period. Although negative returns are never appreciated, “losing less” should provide the necessary confidence and comfort in the Fund’s investment process.
What is the outlook for the Fund and the technology sector?
The “credit crisis” and higher energy prices and their impact on the overall economy are the big question marks hanging over the immediate future. As the financial sector deals with its problems there could be overflow into other sectors including technology. With less credit available for not only individuals but corporations, expansions could be constrained and demand for products could be reduced. This economic contraction, if severe, could put us in a period of lower corporate earnings and increase the prospect for lower stock prices.
Amongst all this uncertainty, technology companies continue to develop new products and create demand. Apple continues to be in the sweet spot of retail product demand and Research in Motion, with its popular Blackberry, is similarly positioned in the corporate world. Solar and wind power companies continue to grow to meet record demand as the world struggles with “Global Warming”. These themes all play a major part of the Fund’s portfolio.
51
| The FBR Funds |
|
| FBR Technology Fund |
| Management Overview (continued) |
We continue to believe that the companies best suited to benefit from these trends will be the larger ones with a capital structure that will allow them to spend on research or acquisitions and that have a history of profitability and growth. It is these types of companies that form the mantra for your Fund’s investment philosophy.
As fellow shareholders, we are looking forward to the future.
The opinions expressed in this commentary reflect those of the Portfolio Managers as of the date written. Any such opinions are subject to change based on market or other conditions. These opinions may not be relied upon as investment advice. Investment decisions for The FBR Funds are based on several factors, and may not be relied upon as an indication of trading intent on behalf of any FBR Fund. Security positions can and do change.
52
The FBR Funds
FBR Technology Fund
Comparison of Changes in Value of $10,000 Investment in
Fund Shares(1)(2) vs. Various Indices(1)(3)
(unaudited)
| Total Returns—For the Periods Ended April 30, 2008(4) |
| | | | | | | | | | | Annualized | |
| | | | | | | | Annualized | | Since | |
| | | | One Year | | | Five Year | | Inception(5) | |
| | | |
| | |
| |
| |
FBR Technology Fund(1)(2) | | | (5.29 | % | ) | | 12.54 | % | | 6.61 | % | |
S&P 500 Index(1)(3) | | | (4.68 | % | ) | | 10.60 | % | | 5.32 | % | |
NASDAQ Composite Index(1)(3) | | | (3.67 | % | ) | | 11.24 | % | | 4.46 | % | |
| |
PAST PERFORMANCE IS NO GUARANTEE OF FUTURE RESULTS.
The performance data quoted represents past performance and the current performance may be lower or higher than the performance data quoted. The investment return and principal will fluctuate so that investors’shares, when redeemed, may be worth more or less than their original cost. The performance data does not reflect the deduction of redemption fees and if reflected, the redemption fee would reduce the performance data quoted. To obtain performance data current to the most recent month-end, please call 888.200.4710 or visit www.fbrfunds.com.
| (1) | | The graph assumes a hypothetical $10,000 initial investment in the Fund and reflects the reinvestment of dividends and all Fund expenses. Investors should note that the Fund is a professionally managed mutual fund while the indices are unmanaged, do not incur expenses and are not available for investment. The performance of the indices includes reinvested dividends, and does not reflect sales charges or expenses. |
| (2) | | FBR Fund Advisers, Inc. waived a portion of its advisory fees and agreed to contractually reimburse a portion of the Fund’s operating expenses, as necessary, to maintain existing expense limitations, as set forth in the notes to the financial statements. Total returns shown include fee waivers and expense reimbursements, if any; total returns would have been lower had there been no waiver of fees and/or reimbursement of expenses in excess of expense limitations. |
| (3) | | S&P 500 Index is a capitalization-weighted index of 500 stocks. The index is designed to represent the broad domestic economy through changes in aggregate market value of 500 stocks representing all major industries. The NASDAQ Composite Index is a broad-based capitalization-weighted index of all NASDAQ National Market and Small Cap stocks. |
| (4) | | The total returns shown do not reflect the deduction of taxes that a shareholder would pay on fund distributions or the redemption of fund shares. |
| (5) | | For the period February 1, 2002 (commencement of investment operations) through April 30, 2008. |
53
| The FBR Funds |
|
| FBR Technology Fund |
| Portfolio Summary |
April 30, 2008
(unaudited) |
The following provides a breakdown of the Fund by industry sectors. The underlying securities represent a percentage of the portfolio investments.
| Industry Sector | | % of Total Investments |
| |
|
| Money Market Funds | | | 33.8 | % |
| Technology, Hardware and Equipment | | | 16.2 | % |
| Pharmaceuticals, Biotechnology and Life Sciences | | | 11.9 | % |
| Capital Goods | | | 11.3 | % |
| Software and Services | | | 9.8 | % |
| Health Care Equipment and Services | | | 5.5 | % |
| Semiconductors and Semiconductor Equipment | | | 4.2 | % |
| Telecommunication Services | | | 2.6 | % |
| Consumer Durables and Apparel | | | 2.1 | % |
| Retailing | | | 1.1 | % |
| Automobiles and Components | | | 1.0 | % |
| Media | | | 0.5 | % |
54
| The FBR Funds |
|
| FBR Technology Fund |
| Portfolio of Investments |
April 30, 2008
(unaudited) |
|
| | | | | | VALUE | |
| | SHARES | | | | (NOTE 2) | |
|
| | | | COMMON STOCKS — 66.8% | | | | |
| | | | Automobiles and Components — 1.0% | | | | |
| | 800 | | BorgWarner, Inc. | | $ | 39,320 | |
| | 4,600 | | Johnson Controls, Inc. | | | 162,196 |
| | | | | |
|
| | | | | | | 201,516 |
| | | | | |
|
| | | | Capital Goods — 11.4% | | | |
| | 5,000 | | 3M Co. | | | 384,499 |
| | 14,700 | | ABB Ltd. ADR | | | 450,848 |
| | 3,350 | | Cummins, Inc. | | | 209,878 |
| | 450 | | First Solar, Inc.* | | | 131,396 |
| | 2,700 | | General Dynamics Corp. | | | 244,134 |
| | 850 | | Goodrich Corp. | | | 57,928 |
| | 7,000 | | Koninklijke Philips Electronics N.V. NYS | | | 262,920 |
| | 1,950 | | Pall Corp. | | | 67,802 |
| | 900 | | Precision Castparts Corp. | | | 105,804 |
| | 1,050 | | Rockwell Collins, Inc. | | | 66,266 |
| | 825 | | SunPower Corp., Class A* | | | 71,998 |
| | 1,455 | | Suntech Power Holdings Company Ltd. ADR* | | | 65,082 |
| | 3,900 | | Vestas Wind Systems A/S ADR* | | | 141,971 |
| | | | | |
|
| | | | | | | 2,260,526 |
| | | | | |
|
| | | | Consumer Durables and Apparel — 2.1% | | | |
| | 3,000 | | Garmin Ltd. | | | 122,700 |
| | 6,500 | | Sony Corp. ADR | | | 297,635 |
| | | | | |
|
| | | | | | | 420,335 |
| | | | | |
|
| | | | Health Care Equipment and Services — 5.6% | | | |
| | 4,400 | | Baxter International, Inc. | | | 274,208 |
| | 1,750 | | Becton, Dickinson and Co. | | | 156,450 |
| | 4,000 | | Cerner Corp.* | | | 185,080 |
| | 1,035 | | DENTSPLY International, Inc. | | | 40,230 |
| | 600 | | Intuitive Surgical, Inc.* | | | 173,556 |
| | 2,450 | | Kinetic Concepts, Inc.* | | | 97,167 |
| | 2,750 | | Stryker Corp. | | | 178,283 |
| | | | | |
|
| | | | | | | 1,104,974 |
| | | | | |
|
55
| The FBR Funds |
|
| FBR Technology Fund |
| Portfolio of Investments (continued) |
April 30, 2008
(unaudited) |
|
| | | | | | VALUE | |
| | SHARES | | | | (NOTE 2) | |
|
| | | | Media — 0.5% | | | | |
| | 3,100 | | DISH Network Corp., Class A* | | $ | 92,504 | |
| | | | | |
|
| | | | | | | | |
| | | | Pharmaceuticals, Biotechnology and Life Sciences — 12.0% | | | | |
| | 1,900 | | Biogen Idec, Inc.* | | | 115,311 | |
| | 2,700 | | Celgene Corp.* | | | 167,778 | |
| | 750 | | Covance, Inc.* | | | 62,843 | |
| | 5,600 | | Forest Laboratories, Inc.* | | | 194,376 | |
| | 6,300 | | Genentech, Inc.* | | | 429,660 | |
| | 1,860 | | Genzyme Corp.* | | | 130,851 | |
| | 13,800 | | Merck & Company, Inc. | | | 524,951 | |
| | 8,705 | | Novartis AG ADR | | | 438,123 | |
| | 900 | | Pharmaceutical Product Development, Inc. | | | 37,278 | |
| | 14,600 | | Schering-Plough Corp. | | | 268,786 | |
| | | | | |
|
| | | | | | | 2,369,957 | |
| | | | | |
|
| | | | Retailing — 1.1% | | | | |
| | 2,750 | | Amazon.com, Inc.* | | | 216,233 | |
| | | | | |
|
| | | | Semiconductors and Semiconductor Equipment — 4.2% | | | | |
| | 1,800 | | Cypress Semiconductor Corp.* | | | 50,616 | |
| | 18,000 | | Intel Corp. | | | 400,680 | |
| | 4,000 | | Marvell Technology Group Ltd.* | | | 51,800 | |
| | 3,000 | | MEMC Electronic Materials* | | | 188,910 | |
| | 6,825 | | NVIDIA Corp.* | | | 140,254 | |
| | | | | |
|
| | | | | | | 832,260 | |
| | | | | |
|
| | | | Software and Services — 9.9% | | | | |
| | 1,950 | | Akamai Technologies, Inc.* | | | 69,752 | |
| | 1,400 | | Amdocs Ltd.* | | | 43,932 | |
| | 190 | | Baidu.com, Inc. ADR* | | | 69,464 | |
| | 1,300 | | Citrix Systems, Inc.* | | | 42,575 | |
| | 1,950 | | Cognizant Technology Solutions Corp., Class A* | | | 62,888 | |
| | 757 | | Dassault Systemes S.A. ADR | | | 47,456 | |
| | 9,700 | | eBay, Inc.* | | | 303,513 | |
| | 2,100 | | Electronic Arts, Inc.* | | | 108,087 | |
| | 8,200 | | Electronic Data Systems Corp. | | | 152,192 | |
56
| The FBR Funds |
|
| FBR Technology Fund |
| Portfolio of Investments (continued) |
April 30, 2008
(unaudited) |
|
| | | | | | VALUE | |
| | SHARES | | | | (NOTE 2) | |
|
| | | | Software and Services — 9.9% (continued) | | | | |
| | 760 | | Google, Inc., Class A* | | $ | 436,459 | |
| | 3,750 | | Infosys Technologies Ltd. ADR | | | 163,838 |
| | 1,200 | | McAfee, Inc.* | | | 39,900 |
| | 800 | | Salesforce.com, Inc.* | | | 53,384 |
| | 5,300 | | Satyam Computer Services Ltd. ADR | | | 136,104 |
| | 1,400 | | Total System Services, Inc. | | | 33,320 |
| | 2,800 | | VMware, Inc., Class A* | | | 186,592 |
| | | | | |
|
| | | | | | | 1,949,456 |
| | | | | |
|
| | | | Technology, Hardware and Equipment — 16.3% | | | |
| | 1,175 | | Amphenol Corp., Class A | | | 54,262 |
| | 2,650 | | Apple, Inc.* | | | 460,967 |
| | 6,600 | | AU Optronics Corp. ADR | | | 128,832 |
| | 7,100 | | Avnet, Inc.* | | | 185,949 |
| | 10,600 | | Corning, Inc. | | | 283,126 |
| | 2,250 | | Dolby Laboratories, Inc., Class A* | | | 90,338 |
| | 13,900 | | EMC Corp.* | | | 214,060 |
| | 27,700 | | Flextronics International Ltd.* | | | 287,803 |
| | 4,525 | | Juniper Networks, Inc.* | | | 124,981 |
| | 8,000 | | LG Display Company Ltd. ADR | | | 174,160 |
| | 33,800 | | Motorola, Inc. | | | 336,647 |
| | 3,325 | | Research In Motion Ltd.* | | | 404,419 |
| | 10,100 | | Seagate Technology | | | 190,587 |
| | 3,325 | | Tyco Electronics Ltd. | | | 124,388 |
| | 6,100 | | Western Digital Corp.* | | | 176,839 |
| | | | | |
|
| | | | | | | 3,237,358 |
| | | | | |
|
| | | | Telecommunication Services — 2.7% | | | |
| | 7,200 | | Telephone and Data Systems, Inc. | | | 275,760 |
| | 4,550 | | United States Cellular Corp.* | | | 250,933 |
| | | | | |
|
| | | | | | | 526,693 |
| | | | | |
|
| | | | Total Common Stocks (Cost $12,950,314) | | | 13,211,812 |
| | | | | |
|
57
| The FBR Funds |
|
| FBR Technology Fund |
| Portfolio of Investments (continued) |
April 30, 2008
(unaudited) |
|
| | | | | | VALUE | |
| | SHARES | | | | (NOTE 2) | |
|
| | | | MONEY MARKET FUNDS — 34.1% | | | | |
| | 6,751,732 | | JPMorgan 100% U.S. Treasury Securities Money Market Fund (Cost $6,751,732) | | $ | 6,751,732 | |
| | | | | |
| |
| | | | Total Investments — 100.9% (Cost $19,702,046) | | | 19,963,544 | |
| | | | | | | | |
| | | | Liabilities Less Other Assets — (0.9%) | | | (172,386 | ) |
| | | | | |
| |
| | | | Net Assets — 100.0% | | $ | 19,791,158 | |
| | | | | |
| |
|
| * | | Non-income producing |
| ADR | | American Depositary Receipts |
| NYS | | New York Shares |
The accompanying notes are an integral part of the financial statements.
58
The FBR Funds
FBR Gas Utility Index Fund
Management Overview
Portfolio Manager: Winsor Aylesworth
How did the Fund perform?
For the six months ended April 30, 2008, the FBR Gas Utility Index Fund returned -4.41%. This compares to the American Gas Association (AGA) Stock Index, S&P 500 Index and the Morningstar Specialty-Utilities Category Average which returned -3.47%, -9.64% and -5.78% for the same period respectively.
What factors contributed to the Fund’s performance?
Your Fund slightly underperformed as compared against its underlying index, the AGA Stock Index as adjusted for Fund expenses, and beat the S&P 500 for the six-month period ended April 30, 2008. In a change from recent periods, the Fund outperformed in relation to other utility funds. Due to the index nature of the Fund, short-term under and over performance is often associated with the timing of purchases and withdrawals of the Fund and Fund’s subsequent cash positions. Investors are reminded that the performance of the Fund against other utility investments is a result of the emphasis on natural gas oriented utilities. The Fund’s lack of non-gas related utility investments such as water, communication and telephone utilities and non-gas oriented power generators served it well as these securities more fully participated in the period’s market downturn. The objective of the Fund is to track its underlying index, how the index performs against other measures is not a concern.
The major macro issues of weather and economy, which heavily influence the utility sector, sent mixed signals to investors. The winter heating season was near normal in most parts of the country while the economy was impacted by higher fuel prices and the credit crisis. Natural gas supplies appear to be in equilibrium as we head into the summer cooling season. The Federal Reserve lowered interest rates in a response to the weaker economy which helped make utility stocks dividend yields more attractive.
What is the outlook for the Fund and the utility sector?
The immediate outlook is contingent on the economy and the weather as one would expect. How the economy reacts to the current increase in energy prices, including natural gas, as well as how severe the Hurricane season will be are major unknown factors that will heavily influence the Fund’s near-term performance.
The wholesale price of natural gas has tracked the rapid rise in oil prices with roughly a 30% increase in price over the last year. If this increase continues or remains at current levels, the economy will need to adjust to this increase. Offsetting the impact of decreasing demand caused by price increases is the environmental desirability of gas as a clean fuel of choice for energy production. Right now, supplies appear to be in balance with U.S. demand and since we control our own supplies, we are not subject to foreign supply issues. Disruption in U.S. supplies due to hurricanes or an exceedingly hot summer could result in increased usage and cause negative short-term performance.
59
The FBR Funds
FBR Gas Utility Index Fund
Management Overview (continued)
Besides the typical natural gas fueled electric utility or distributor, the Fund owns companies that deal in other facets of the natural gas industry. Moving the gas around the country to meet the demand is the job of the various pipeline companies the Fund owns. We also own several companies that derive revenue from the storage of natural gas. Storage becomes increasingly important in balancing the supply demand issues that come with the different seasons. Finally we also own one of the few companies that develop and own liquefied natural gas (LNG) facilities. Today, imported LNG comprises about 5% of the natural gas supply chain. It is expected to grow over time as demand increases and will become more important in the overall U.S. energy picture.
We believe that this well diversified portfolio participates in an industry segment that should, over the long-term, do well under most scenarios looking forward. The future for natural gas and the Fund’s holdings remain strong and as a fellow shareholder, I feel confident about the future.
The opinions expressed in this commentary reflect those of the Portfolio Manager as of the date written. Any such opinions are subject to change based on market or other conditions. These opinions may not be relied upon as investment advice. Investment decisions for The FBR Funds are based on several factors, and may not be relied upon as an indication of trading intent on behalf of any FBR Fund. Security positions can and do change.
60
The FBR Funds
FBR Gas Utility Index Fund
Comparison of Changes in Value of $10,000 Investment in
Fund Shares(1)(2) vs. Various Indices(1)(3)
(unaudited)
| Total Returns—For the Periods Ended April 30, 2008 (4)(5) |
| | | | | | | Annualized | | Annualized | |
| | | | One Year | | | Five Year | | Ten Year | |
| | | |
| | |
| |
| |
| FBR Gas Utility Index Fund (1)(2) | | | 1.89 | % | | | 17.42 | % | | 8.70 | % | |
| S&P 500 Index (1)(3) | | | (4.68 | % | ) | | 10.60 | % | | 3.89 | % | |
| AGA Stock Index(1)(3) | | | 1.93 | % | | | 17.83 | % | | 9.41 | % | |
| | | | | | | | | | | | | |
PAST PERFORMANCE IS NO GUARANTEE OF FUTURE RESULTS.
The performance data quoted represents past performance and the current performance may be lower or higher than the performance data quoted. The investment return and principal will fluctuate so that investors’ shares, when redeemed, may be worth more or less than their original cost. The performance data does not reflect the deduction of redemption fees and if reflected, the redemption fee would reduce the performance data quoted. To obtain performance data current to the most recent month-end, please call 888.200.4710 or visit www.fbrfunds.com.
|
| (1) | | The graph assumes a hypothetical $10,000 initial investment in the Fund and reflects the reinvestment of dividends and all Fund expenses. Investors should note that the Fund is a professionally managed mutual fund while the indices are unmanaged, do not incur expenses and are not available for investment. The performance of the indices includes reinvested dividends, and does not reflect sales charges or expenses. |
| (2) | | FBR Fund Advisers, Inc. waived a portion of its advisory fees and agreed to contractually reimburse a portion of the Fund’s operating expenses, as necessary, to maintain existing expense limitations, as set forth in the notes to the financial statements. Total returns shown include fee waivers and expense reimbursements, if any; total returns would have been lower had there been no waiver of fees and/or reimbursement of expenses in excess of expense limitations. |
| (3) | | S&P 500 Index is a capitalization-weighted index of 500 stocks. The index is designed to represent the broad domestic economy through changes in aggregate market value of 500 stocks representing all major industries. The AGA Stock Index is a market capitalization weighted index, adjusted monthly, consisting of member companies of the American Gas Association. |
| (4) | | The total returns shown do not reflect the deduction of taxes that a shareholder would pay on fund distributions or the redemption of fund shares. |
| (5) | | Effective April 1, 2003, the Fund changed its fiscal year-end from March 31 to October 31. |
61
The FBR Funds
FBR Gas Utility Index Fund
Portfolio Summary
April 30, 2008
(unaudited)
The following provides a breakdown of the Fund by industry sectors. The underlying securities represent a percentage of the portfolio investments.
| Industry Sector | | % of Total Investments |
| |
|
| Multi-Utilities | | | 35.7 | % | |
| Gas Utilities | | | 27.2 | % | |
| Oil, Gas and Consumable Fuels | | | 25.3 | % | |
| Electric Utilities | | | 9.3 | % | |
| Money Market Funds | | | 1.7 | % | |
| Independent Power Producers and Energy Traders | | | 0.8 | % | |
62
The FBR Funds
FBR Gas Utility Index Fund
Portfolio of Investments
April 30, 2008
(unaudited)
|
| | | | | VALUE |
| SHARES | | | | (NOTE 2) |
|
| | | COMMON STOCKS — 98.3% | | | | |
| | | Electric Utilities — 9.3% | | | | |
| 900 | | ALLETE, Inc. | | $ | 37,593 | |
| 92,537 | | Duke Energy Corp. | | | 1,694,352 | |
| 199,840 | | E.ON AG ADR | | | 13,572,513 | |
| 1,200 | | Entergy Corp. | | | 137,832 | |
| 76,225 | | Exelon Corp. | | | 6,515,713 | |
| 8,678 | | MGE Energy, Inc. | | | 301,908 | |
| 26,700 | | Northeast Utilities | | | 702,744 | |
| 13,666 | | Pepco Holdings, Inc. | | | 340,420 | |
| 16,350 | | PPL Corp. | | | 785,127 | |
| 16,825 | | Sierra Pacific Resources | | | 229,325 | |
| 6,900 | | The Empire District Electric Co. | | | 143,727 | |
| 5,005 | | UniSource Energy Corp. | | | 156,356 | |
| | | | |
| |
| | | | | | 24,617,610 | |
| | | | |
| |
| | | Gas Utilities — 27.2% | | | | |
| 127,150 | | AGL Resources, Inc. | | | 4,323,100 | |
| 188,150 | | Atmos Energy Corp. | | | 5,207,992 | |
| 12,065 | | Chesapeake Utilities Corp. | | | 358,813 | |
| 1,825 | | Corning Natural Gas Corp.* | | | 29,656 | |
| 7,157 | | Delta Natural Gas Company, Inc. | | | 178,710 | |
| 56,625 | | Energen Corp. | | | 3,864,090 | |
| 6,690 | | Energy West, Inc.* | | | 57,534 | |
| 18,039 | | EnergySouth, Inc. | | | 975,008 | |
| 118,550 | | Equitable Resources, Inc. | | | 7,868,164 | |
| 112,200 | | National Fuel Gas Co. | | | 5,742,396 | |
| 62,150 | | New Jersey Resources Corp. | | | 1,979,478 | |
| 94,250 | | Nicor, Inc. | | | 3,310,060 | |
| 59,500 | | Northwest Natural Gas Co. | | | 2,669,765 | |
| 109,600 | | ONEOK, Inc. | | | 5,273,952 | |
| 160,900 | | Piedmont Natural Gas Company, Inc. | | | 4,230,061 | |
| 156,200 | | Questar Corp. | | | 9,689,086 | |
| 4,943 | | RGC Resources, Inc. | | | 137,465 | |
| 47,610 | | South Jersey Industries, Inc. | | | 1,738,241 | |
| 202,057 | | Southern Union Co. | | | 5,176,700 | |
63
The FBR Funds
FBR Gas Utility Index Fund
Portfolio of Investments (continued)
April 30, 2008
(unaudited)
|
| | | | | VALUE |
| SHARES | | | | (NOTE 2) |
|
| | | Gas Utilities — 27.2% (continued) | | | | |
| 93,100 | | Southwest Gas Corp. | | $ | 2,687,797 | |
| 41,650 | | The Laclede Group, Inc. | | | 1,575,203 | |
| 71,025 | | UGI Corp. | | | 1,846,650 | |
| 98,900 | | WGL Holdings, Inc. | | | 3,243,920 | |
| | | | |
| |
| | | | | | 72,163,841 | |
| | | | |
| |
| | | Independent Power Producers and Energy Traders — 0.7% | | | | |
| 22,450 | | Constellation Energy Group, Inc. | | | 1,900,393 | |
| | | | |
| |
| | | Multi-Utilities — 35.8% | | | | |
| 26,975 | | Alliant Energy Corp. | | | 1,016,148 | |
| 29,125 | | Ameren Corp. | | | 1,321,110 | |
| 167,050 | | Aquila, Inc.* | | | 601,380 | |
| 22,375 | | Avista Corp. | | | 459,359 | |
| 1,475 | | Black Hills Corp. | | | 57,540 | |
| 268,700 | | CenterPoint Energy, Inc. | | | 4,089,614 | |
| 7,200 | | CH Energy Group, Inc. | | | 254,592 | |
| 129,750 | | CMS Energy Corp. | | | 1,891,755 | |
| 97,675 | | Consolidated Edison, Inc. | | | 4,063,280 | |
| 221,400 | | Dominion Resources, Inc. | | | 9,606,546 | |
| 48,325 | | DTE Energy Co. | | | 1,947,981 | |
| 126,509 | | Energy East Corp. | | | 2,884,405 | |
| 34,671 | | Integrys Energy Group, Inc. | | | 1,660,394 | |
| 92,900 | | MDU Resources Group, Inc. | | | 2,682,023 | |
| 186,776 | | National Grid PLC ADR | | | 13,214,402 | |
| 354,250 | | NiSource, Inc. | | | 6,341,075 | |
| 28,916 | | NorthWestern Corp. | | | 717,695 | |
| 24,775 | | NSTAR | | | 798,003 | |
| 213,125 | | PG&E Corp. | | | 8,525,000 | |
| 19,725 | | PNM Resources, Inc. | | | 285,815 | |
| 239,400 | | Public Service Enterprise Group, Inc. | | | 10,512,054 | |
| 78,100 | | Puget Energy, Inc. | | | 2,125,101 | |
| 230,700 | | Sempra Energy | | | 13,073,769 | |
| 53,975 | | TECO Energy, Inc. | | | 864,140 | |
| 73,405 | | Vectren Corp. | | | 2,075,893 | |
64
The FBR Funds
FBR Gas Utility Index Fund
Portfolio of Investments (continued)
April 30, 2008
(unaudited)
|
| | | | | VALUE |
| SHARES | | | | (NOTE 2) |
|
| | | Multi-Utilities — 35.8% (continued) | | | | |
| 30,825 | | Wisconsin Energy Corp. | | $ | 1,462,955 | |
| 103,350 | | Xcel Energy, Inc. | | | 2,149,680 | |
| | | | |
| |
| | | | | | 94,681,709 | |
| | | | |
| |
| | | Oil, Gas and Consumable Fuels — 25.3% | | | | |
| 76,500 | | Cheniere Energy, Inc.* | | | 745,110 | |
| 734,800 | | El Paso Corp. | | | 12,594,472 | |
| 312,460 | | Enbridge, Inc. | | | 12,867,103 | |
| 67,200 | | Southwestern Energy Co.* | | | 2,843,232 | |
| 522,368 | | Spectra Energy Corp. | | | 12,902,490 | |
| 333,800 | | The Williams Companies, Inc. | | | 11,849,900 | |
| 361,750 | | TransCanada Corp. | | | 13,290,694 | |
| | | | |
| |
| | | | | | 67,093,001 | |
| | | | |
| |
| | | Total Common Stocks (Cost $125,195,772) | | | 260,456,554 | |
| | | | |
| |
| | | MONEY MARKET FUNDS — 1.7% | | | | |
| 4,569,847 | | JPMorgan 100% U.S. Treasury Securities Money Market Fund (Cost $4,569,847) | | | 4,569,847 | |
| | | | |
| |
| | | | | | | |
| | | Total Investments — 100.0% (Cost $129,765,619) | | | 265,026,401 | |
| | | | | | | |
| | | Liabilities Less Other Assets — N.M. | | | (92,758 | ) |
| | | | |
| |
| | | | | | | |
| | | Net Assets — 100.0% | | $ | 264,933,643 | |
| | | | |
| |
|
| * | Non-income producing security |
| ADR | American Depositary Receipts |
| N.M. | Not meaningful |
The accompanying notes are an integral part of the financial statements.
65
The FBR Funds
FBR Fund for Government Investors
Management Overview
Portfolio Manager: William Barlow Sanders, III
How did the Fund perform?
For the six-month period ended April 30, 2008, the FBR Fund for Government Investors (FGI) returned 1.59%.
What factors contributed to the Fund’s performance?
The continued weakness of the housing market, sub-prime mortgage issues and massive deleveraging of banks’ balance sheets are inflicting damage on our economy with ripple effects being felt far and wide. The Federal Open Market Committee (the “Fed”) continues to prime the liquidity pump, but faced with surging commodity inflation, has its hands tied as far as taking its target rate much lower. In fact, many now assume that this easing campaign is over and the Fed’s next moves will be tighter monetary policies to counter inflation. In an effort to bolster the sagging economy, in the six-month period ended April 30, 2008, the Fed dropped its target rate from 4.50% to 2.00%. In the same time period the Fed’s risk assessment moved from “balanced” to “downside risk” to the economy. Seventy-five basis points of the rate cuts came “inter-meeting” on January 22, 2008, which tells us how quickly the economic situation had deteriorated and that the Fed felt it was behind the curve and needed to act more quickly than its usual measured pace. Also, lest we forget, the collapse and sale of investment banking house Bear Stearns in March. To avert serious economic repercussions the Fed stepped in and facilitated JP Morgan’s purchase only by guaranteeing (with taxpayer dollars) approximately $30 billion of Bear’s troubled mortgage and other asset backed securities.
As the Fed has boosted liquidity to banks and other intermediaries there has been actually less credit extended to consumers. Banks have pulled in the reins on their lending and substantially raised their lending standards. This is evidenced by banks cancelling home equity lines of credit, mortgage rates not dropping (and actually going up a bit) and credit card companies not showering every man, woman, child and pet in each house with preapproved credit card offers. Also, banks are aggressively raising capital and shoring up their balance sheets through dilutive equity offerings and the selling of distressed assets at fire sale prices.
What is the outlook for the Fund?
Technically we are not in a recession yet but may soon be. Clearly, growth has slowed substantially and the traditionally hardy U.S. consumer is starting to show signs of stress with their heavy debt loads and rising prices at the grocery store and gas pump. Consumer sentiment levels have dropped very low, not helped by the constant bombardment of negative news in the media and other reminders such as rising unemployment rates. Could the Fed cut rates even further? That is a possibility, but I think they will let the effects of the past cuts start to work their way through the economy as changes to the target rate
66
The FBR Funds
FBR Fund for Government Investors
Management Overview (continued)
work with a lag. Most likely the Fed is in a holding mode as they closely monitor the elevated inflation levels so they do not have to raise rates in the face of a weakening economy. Without a doubt, less credit available to a weakened consumer, the continued housing correction and significant commodity inflation all pose substantial challenges to our economy and the Fed.
The performance of the Fund remains linked to the movements of the Fed Funds target rate and regardless of what the Fed does or does not do next. The Fund will stay with our conservative investment style of owning only the highest quality and most liquid government issued and sponsored securities.
The opinions expressed in this commentary reflect those of the Portfolio Manager as of the date written. Any such opinions are subject to change based on market or other conditions. These opinions may not be relied upon as investment advice. Investment decisions for The FBR Funds are based on several factors, and may not be relied upon as an indication of trading intent on behalf of any FBR Fund. Security positions can and do change.
67
The FBR Funds
FBR Fund for Government Investors
Portfolio Summary
April 30, 2008
(unaudited)
The following provides a breakdown of the Fund by maturity schedule1. The underlying securities represent a percentage of the portfolio investments.
| Time to Maturity | | % of Total Investments |
| |
|
| 30 days or Less | | | 53.0 | % | |
| 31 to 60 days | | | 26.9 | % | |
| 61 to 90 days | | | 20.1 | % | |
|
| 1 | The maturity date used for each security in the portfolio to determine the schedule is the shorter of the next interest rate reset date or the final maturity date. |
68
The FBR Funds
FBR Fund for Government Investors
Portfolio of Investments
April 30, 2008
(unaudited)
|
| | | | | | | | MATURITY | | VALUE |
| PAR | | | | RATE | | | DATE | | (NOTE 2) |
|
| | | U.S. GOVERNMENT AND AGENCY OBLIGATIONS — 76.2% | | | | | | | | | | | |
| | | Federal Home Loan Bank — 38.1% | | | | | | | | | | | |
| $12,000,000 | | FHLB Discount Note* | | 2.76 | % | | | 6/18/08 | | | $ | 11,955,840 | |
| 10,000,000 | | FHLB Discount Note* | | 2.06 | | | | 6/25/08 | | | | 9,968,528 | |
| 12,000,000 | | FHLB Discount Note* | | 2.06 | | | | 7/9/08 | | | | 11,952,620 | |
| 12,000,000 | | FHLB Discount Note* | | 2.065 | | | | 7/25/08 | | | | 11,941,492 | |
| | | | | | | | | | | |
| |
| | | | | | | | | | | | | 45,818,480 | |
| | | | | | | | | | | |
| |
| | | Federal National Mortgage Association — 38.1% | | | | | | | | | | | |
| 12,000,000 | | Fannie Mae Discount Note* | | 4.08 | | | | 5/12/08 | | | | 11,985,040 | |
| 12,000,000 | | Fannie Mae Discount Note* | | 4.13 | | | | 5/22/08 | | | | 11,971,090 | |
| 12,000,000 | | Fannie Mae Discount Note* | | 2.81 | | | | 5/30/08 | | | | 11,972,837 | |
| 10,000,000 | | Fannie Mae Discount Note* | | 2.0 | | | | 6/9/08 | | | | 9,978,332 | |
| | | | | | | | | | | |
| |
| | | | | | | | | | | | | 45,907,299 | |
| | | | | | | | | | | |
| |
| | | MONEY MARKET FUNDS — 22.3% | | | | |
| 26,866,324 | | JPMorgan 100% U.S. Treasury Securities Money Market Fund | | | | |
| | | (Cost $26,866,324) | | | 26,866,324 | |
| | | | |
| |
| | | | | | | |
| | | Total Investments — 98.5% (Amortized Cost $118,592,103)† | | | 118,592,103 | |
| | | | | | | |
| | | Other Assets Less Liabilities — 1.5% | | | 1,814,875 | |
| | | | |
| |
| | | | | | | |
| | | Net Assets — 100.0% | | $ | 120,406,978 | |
| | | | |
| |
|
| * | Interest rates for the discount notes represent the yield to maturity at the date of purchase. |
| † | Same cost is used for federal income tax purposes. |
Weighted Average Maturity of Portfolio: 35 Days
The accompanying notes are an integral part of the financial statements.
69
The FBR Funds
Statements of Assets and Liabilities
April 30, 2008
(unaudited)
| | | | | | | FBR |
| | FBR | | Pegasus Mid Cap |
| | Pegasus FundTM | | FundTM |
| |
| |
|
| ASSETS | | | | | | | | | |
Investment Securities at Cost | | $ | 8,396,596 | | | | $ | 3,796,563 | |
| | |
| | | |
| |
Investment Securities at Value (Note 2) | | $ | 8,671,508 | | | | $ | 3,963,406 | |
Receivable for Capital Shares Sold | | | — | | | | | 1,000 | |
Receivable for Investment Securities Sold | | | — | | | | | 19,504 | |
Dividends and Interest Receivable | | | 5,340 | | | | | 3,252 | |
Receivable from Adviser | | | 293 | | | | | 5,139 | |
Prepaid Expenses | | | 9,450 | | | | | 10,444 | |
| | |
| | | |
| |
Total Assets | | | 8,686,591 | | | | | 4,002,745 | |
| | |
| | | |
| |
| LIABILITIES | | | | | | | | | |
Administration Fee Payable (Note 3) | | | 139 | | | | | 63 | |
Distribution Fees Payable (Note 3) | | | 1,737 | | | | | 784 | |
Other Accrued Expenses | | | 30,544 | | | | | 27,692 | |
| | |
| | | |
| |
Total Liabilities | | | 32,420 | | | | | 28,539 | |
| | |
| | | |
| |
| NET ASSETS | | $ | 8,654,171 | | | | $ | 3,974,206 | |
| | |
| | | |
| |
| Shares of Beneficial Interest Outstanding | | | | | | | | | |
(unlimited number of shares authorized, no par value) | | | 761,984 | | | | | 365,053 | |
| | |
| | | |
| |
| Net Asset Value Per Share | | $ | 11.36 | | | | $ | 10.89 | |
| | |
| | | |
| |
| Net Assets Consist of: | | | | | | | | | |
Paid-in capital | | $ | 8,276,805 | | | | $ | 3,714,612 | |
Accumulated net investment income (loss) | | | 24,093 | | | | | (8,537 | ) |
Accumulated net realized gain on investments | | | 78,361 | | | | | 101,288 | |
Net unrealized appreciation on investments | | | 274,912 | | | | | 166,843 | |
| | |
| | | |
| |
| NET ASSETS | | $ | 8,654,171 | | | | $ | 3,974,206 | |
| | |
| | | |
| |
70
The FBR Funds
Statements of Assets and Liabilities (continued)
April 30, 2008
(unaudited)
| | FBR | | FBR |
| | Pegasus Small Cap | | Pegasus Small Cap |
| | FundTM | | Growth FundTM |
| |
| |
|
| ASSETS | | | | | | | | | |
Investment Securities at Cost | | $ | 4,350,513 | | | | $ | 3,769,922 | |
| | |
| | | |
| |
Investment Securities at Value (Note 2) | | $ | 4,619,148 | | | | $ | 3,751,215 | |
Receivable for Investment Securities Sold | | | 192,107 | | | | | — | |
Dividends and Interest Receivable | | | 3,484 | | | | | 401 | |
Receivable from Adviser | | | 4,679 | | | | | 6,534 | |
Prepaid Expenses | | | 10,445 | | | | | 10,136 | |
| | |
| | | |
| |
Total Assets | | | 4,829,863 | | | | | 3,768,286 | |
| | |
| | | |
| |
| LIABILITIES | | | | | | | | | |
Payable for Capital Shares Redeemed | | | — | | | | | 231 | |
Payable for Investment Securities Purchased | | | 212,818 | | | | | 139,700 | |
Administration Fee Payable (Note 3) | | | 74 | | | | | 58 | |
Distribution Fees Payable (Note 3) | | | 928 | | | | | 721 | |
Other Accrued Expenses | | | 27,266 | | | | | 28,891 | |
| | |
| | | |
| |
Total Liabilities | | | 241,086 | | | | | 169,601 | |
| | |
| | | |
| |
| NET ASSETS | | $ | 4,588,777 | | | | $ | 3,598,685 | |
| | |
| | | |
| |
| Shares of Beneficial Interest Outstanding | | | | | | | | | |
(unlimited number of shares authorized, no par value) | | | 430,522 | | | | | 328,945 | |
| | |
| | | |
| |
| Net Asset Value Per Share | | $ | 10.66 | | | | $ | 10.94 | |
| | |
| | | |
| |
| Net Assets Consist of: | | | | | | | | | |
Paid-in capital | | $ | 4,455,721 | | | | $ | 3,466,220 | |
Accumulated net investment loss | | | (14,046 | ) | | | | (31,114 | ) |
Accumulated net realized gain (loss) on investments | | | (121,533 | ) | | | | 182,286 | |
Net unrealized appreciation (depreciation) on investments | | | 268,635 | | | | | (18,707 | ) |
| | |
| | | |
| |
| NET ASSETS | | $ | 4,588,777 | | | | $ | 3,598,685 | |
| | |
| | | |
| |
71
The FBR Funds
Statements of Assets and Liabilities (continued)
April 30, 2008
(unaudited)
| | | | | | | FBR | | FBR |
| | | FBR | | Large Cap | | Small Cap |
| | | Focus Fund | | Financial Fund | | Financial Fund |
| | |
| |
| |
|
| ASSETS | | | | | | | | | | | | |
Investment Securities
Securities at Cost: | | | | | | | | | | | | |
Unaffiliated Issuers | | $ | 656,338,889 | | | $ | 14,569,067 | | | $ | 137,489,448 | |
Affiliated Issuers | | | 130,797,365 | | | | — | | | | — | |
| | |
| | |
| | |
| |
Total securities | | $ | 787,136,254 | | | $ | 14,569,067 | | | $ | 137,489,448 | |
| | |
| | |
| | |
| |
Securities at Value (Note 2): | | | | | | | | | | | | |
Unaffiliated issuers | | $ | 1,004,771,418 | | | $ | 14,923,536 | | | $ | 148,094,038 | |
Affiliated Issuers | | | 136,426,525 | | | | — | | | | — | |
| | |
| | |
| | |
| |
Total securities | | | 1,141,197,943 | | | | 14,923,536 | | | | 148,094,038 | |
Foreign currency (Cost $516) | | | — | | | | 516 | | | | — | |
Receivable for Capital Shares Sold | | | 603,564 | | | | 158,300 | | | | 283,349 | |
Receivable for Investment Securities Sold | | | 1,923,915 | | | | — | | | | 647,361 | |
Dividends and Interest Receivable | | | 182,425 | | | | 13,316 | | | | 233,947 | |
Prepaid Expenses | | | 29,289 | | | | 8,835 | | | | 7,200 | |
| | |
| | |
| | |
| |
Total Assets | | | 1,143,937,136 | | | | 15,104,503 | | | | 149,265,895 | |
| | |
| | |
| | |
| |
| LIABILITIES | | | | | | | | | | | | |
Payable for Capital Shares Redeemed | | | 1,235,992 | | | | 6,960 | | | | 209,081 | |
Payable for Investment Securities Purchased | | | — | | | | 743,306 | | | | 4,848,992 | |
Investment Advisory Fee Payable (Note 3) | | | 832,275 | | | | 5,526 | | | | 103,859 | |
Administration Fee Payable (Note 3) | | | 18,493 | | | | 226 | | | | 2,308 | |
Distribution Fees Payable (Note 3) | | | 231,187 | | | | 2,829 | | | | 28,850 | |
Other Accrued Expenses | | | 601,806 | | | | 32,436 | | | | 103,932 | |
| | |
| | |
| | |
| |
Total Liabilities | | | 2,919,753 | | | | 791,283 | | | | 5,297,022 | |
| | |
| | |
| | |
| |
| NET ASSETS | | $ | 1,141,017,383 | | | $ | 14,313,220 | | | $ | 143,968,873 | |
| | |
| | |
| | |
| |
| Shares of Beneficial Interest Outstanding | | | | | | | | | | | | |
(unlimited number of shares authorized, no par value) | | | 22,773,290 | | | | 1,060,261 | | | | 9,158,408 | |
| | |
| | |
| | |
| |
| Net Asset Value Per Share | | $ | 50.10 | | | $ | 13.50 | | | $ | 15.72 | |
| | |
| | |
| | |
| |
| Net Assets Consist of: | | | | | | | | | | | | |
Paid-in capital | | $ | 762,907,347 | | | $ | 15,465,683 | | | $ | 143,630,761 | |
Accumulated net investment income (loss) | | | (4,478,716 | ) | | | 40,841 | | | | 604,663 | |
Accumulated net realized gain (loss) on investments and foreign currency transactions | | | 28,527,063 | | | | (1,547,773 | ) | | | (10,871,141 | ) |
Net unrealized appreciation on investments | | | 354,061,689 | | | | 354,469 | | | | 10,604,590 | |
| | |
| | |
| | |
| |
| NET ASSETS | | $ | 1,141,017,383 | | | $ | 14,313,220 | | | $ | 143,968,873 | |
| | |
| | |
| | |
| |
72
The FBR Funds
Statements of Assets and Liabilities (continued)
April 30, 2008
(unaudited)
| | | | | | | | | | | FBR |
| | | | | | | FBR | | Fund for |
| | | FBR | | Gas Utility | | Government |
| | | Technology Fund | | Index Fund | | Investors |
| | |
| |
| |
|
| ASSETS | | | | | | | | | | | | |
Investment Securities at Cost* | | $ | 19,702,046 | | | $ | 129,765,619 | | | $ | 118,592,103 | |
| | |
| | |
| | |
| |
Investment Securities at Value* (Note 2) | | $ | 19,963,544 | | | $ | 265,026,401 | | | $ | 118,592,103 | |
Receivable for Capital Shares Sold | | | 21,815 | | | | 44,676 | | | | 2,209,826 | |
Dividends and Interest Receivable | | | 10,822 | | | | 592,586 | | | | 22,042 | |
Prepaid Expenses | | | 11,439 | | | | 15,773 | | | | 9,097 | |
| | |
| | |
| | |
| |
Total Assets | | | 20,007,620 | | | | 265,679,436 | | | | 120,833,068 | |
| | |
| | |
| | |
| |
| LIABILITIES | | | | | | | | | | | | |
Payable for Capital Shares Redeemed | | | 3,508 | | | | 71,206 | | | | 268,424 | |
Payable for Investment Securities Purchased | | | 152,620 | | | | 459,511 | | | | — | |
Dividends and Income Payable | | | — | | | | — | | | | 7,662 | |
Investment Advisory Fee Payable (Note 3) | | | 10,400 | | | | 86,172 | | | | 49,300 | |
Administration Fee Payable (Note 3) | | | 327 | | | | 4,308 | | | | 1,972 | |
Distribution Fees Payable (Note 3) | | | 4,089 | | | | — | | | | — | |
Other Accrued Expenses | | | 45,518 | | | | 124,596 | | | | 98,732 | |
| | |
| | |
| | |
| |
Total Liabilities | | | 216,462 | | | | 745,793 | | | | 426,090 | |
| | |
| | |
| | |
| |
| NET ASSETS | | $ | 19,791,158 | | | $ | 264,933,643 | | | $ | 120,406,978 | |
| | |
| | |
| | |
| |
| Shares of Beneficial Interest Outstanding | | | | | | | | | | | | |
(unlimited number of shares authorized, no par value) | | | 1,884,055 | | | | 13,113,143 | | | | 120,593,645 | |
| | |
| | |
| | |
| |
| Net Asset Value Per Share | | $ | 10.50 | | | $ | 20.20 | | | $ | 1.00 | |
| | |
| | |
| | |
| |
| Net Assets Consist of: | | | | | | | | | | | | |
Paid-in capital | | $ | 21,598,756 | | | $ | 136,421,604 | | | $ | 120,593,645 | |
Accumulated net investment income (loss) | | | (72,709 | ) | | | 433,391 | | | | — | |
Accumulated net realized loss on investments | | | (1,996,387 | ) | | | (7,182,134 | ) | | | (186,667 | ) |
Net unrealized appreciation on investments | | | 261,498 | | | | 135,260,782 | | | | — | |
| | |
| | |
| | |
| |
| NET ASSETS | | $ | 19,791,158 | | | $ | 264,933,643 | | | $ | 120,406,978 | |
| | |
| | |
| | |
| |
|
| * | For the FBR Fund for Government Investors, securities are reported at amortized cost. |
The accompanying notes are an integral part of the financial statements.
73
The FBR Funds
Statements of Operations
For the Six Months Ended April 30, 2008
(unaudited)
| | | | | | | FBR |
| | FBR | | Pegasus Mid Cap |
| | Pegasus FundTM | | FundTM |
| |
| |
|
| Investment Income | | | | | | | | | |
Dividends1 | | $ | 116,008 | | | | $ | 21,950 | |
Interest | | | 9,835 | | | | | 5,241 | |
| | |
| | | |
| |
Total Investment Income | | | 125,843 | | | | | 27,191 | |
| | |
| | | |
| |
| Expenses | | | | | | | | | |
Investment Advisory fees (Note 3) | | | 46,962 | | | | | 16,489 | |
Administration fees (Note 3) | | | 2,135 | | | | | 750 | |
Distribution fees (Note 3) | | | 13,045 | | | | | 4,580 | |
Professional fees | | | 25,544 | | | | | 25,630 | |
Registration fees | | | 9,826 | | | | | 5,326 | |
Trustees’fees | | | 8,760 | | | | | 8,760 | |
Shareholder servicing fees | | | 8,406 | | | | | 4,685 | |
Compliance fees | | | 4,316 | | | | | 4,108 | |
Accounting services fees | | | 3,003 | | | | | 1,885 | |
Transfer agent fees | | | 2,196 | | | | | 985 | |
Custodian fees | | | 2,145 | | | | | 1,807 | |
Reports to shareholders | | | 2,064 | | | | | 1,743 | |
Insurance fees | | | 772 | | | | | 187 | |
Other expenses | | | 244 | | | | | 242 | |
| | |
| | | |
| |
Total expenses before waivers and related reimbursements | | | 129,418 | | | | | 77,177 | |
Less waivers and related reimbursements | | | (27,668 | ) | | | | (41,449 | ) |
| | |
| | | |
| |
Total expenses after waivers and related reimbursements | | | 101,750 | | | | | 35,728 | |
| | |
| | | |
| |
Net Investment Income (Loss) | | | 24,093 | | | | | (8,537 | ) |
| | |
| | | |
| |
| Net Realized and Unrealized Loss on Investments | | | | | | | | | |
Net Realized Gain on Investment Transactions | | | 114,213 | | | | | 109,903 | |
Change in Net Unrealized Appreciation/Depreciation of Investments | | | (1,060,554 | ) | | | | (199,442 | ) |
| | |
| | | |
| |
Net Loss on Investments | | | (946,341 | ) | | | | (89,539 | ) |
| | |
| | | |
| |
| Net Decrease in Net Assets Resulting from Operations | | $ | (922,248 | ) | | | $ | (98,076 | ) |
| | |
| | | |
| |
|
| 1 | Net of foreign taxes withheld of $1,336 and $201 for the FBR Pegasus FundTM and FBR Pegasus Mid Cap FundTM, respectively. |
74
The FBR Funds
Statements of Operations (continued)
For the Six Months Ended April 30, 2008
(unaudited)
| | FBR | | FBR |
| | Pegasus Small Cap | | Pegasus Small Cap |
| | FundTM | | Growth FundTM |
| |
| |
|
| Investment Income | | | | | | | | | |
Dividends1 | | $ | 24,744 | | | | $ | 3,984 | |
Interest | | | 4,920 | | | | | 5,976 | |
| | |
| | | |
| |
Total Investment Income | | | 29,664 | | | | | 9,960 | |
| | |
| | | |
| |
| Expenses | | | | | | | | | |
Investment Advisory fees (Note 3) | | | 20,174 | | | | | 18,958 | |
Administration fees (Note 3) | | | 924 | | | | | 931 | |
Distribution fees (Note 3) | | | 5,604 | | | | | 5,266 | |
Professional fees | | | 24,985 | | | | | 25,328 | |
Trustees’ fees | | | 8,760 | | | | | 8,759 | |
Registration fees | | | 5,466 | | | | | 9,922 | |
Shareholder servicing fees | | | 4,937 | | | | | 5,715 | |
Compliance fees | | | 4,126 | | | | | 4,240 | |
Custodian fees | | | 2,462 | | | | | 1,751 | |
Accounting services fees | | | 2,033 | | | | | 2,128 | |
Reports to shareholders | | | 1,746 | | | | | 1,840 | |
Transfer agent fees | | | 1,456 | | | | | 1,883 | |
Insurance fees | | | 187 | | | | | 198 | |
Other expenses | | | 254 | | | | | 989 | |
| | |
| | | |
| |
Total expenses before waivers and related reimbursements | | | 83,114 | | | | | 87,908 | |
Less waivers and related reimbursements | | | (39,404 | ) | | | | (46,834 | ) |
| | |
| | | |
| |
Total expenses after waivers and related reimbursements | | | 43,710 | | | | | 41,074 | |
| | |
| | | |
| |
Net Investment Loss | | | (14,046 | ) | | | | (31,114 | ) |
| | |
| | | |
| |
| Net Realized and Unrealized Loss on Investments | | | | | | | | | |
Net Realized Gain (Loss) on Investment Transactions | | | (112,740 | ) | | | | 194,293 | |
Change in Net Unrealized Appreciation/Depreciation of Investments | | | (350,051 | ) | | | | (1,042,826 | ) |
| | |
| | | |
| |
Net Loss on Investments | | | (462,791 | ) | | | | (848,533 | ) |
| | |
| | | |
| |
| Net Decrease in Net Assets Resulting from Operations | | $ | (476,837 | ) | | | $ | (879,647 | ) |
| | |
| | | |
| |
|
| 1 | Net of foreign taxes withheld of $22 and $0 for the FBR Pegasus Small Cap FundTM and FBR Pegasus Small Cap Growth FundTM, respectively. |
75
The FBR Funds
Statements of Operations (continued)
For the Six Months Ended April 30, 2008
(unaudited)
| | | | | | | | FBR | | | | FBR | |
| | | | | | | Large Cap | | Small Cap |
| | | FBR | | Financial | | Financial |
| | | Focus Fund | | Fund | | Fund |
| | |
| |
| |
|
| Investment Income | | | | | | | | | | | | |
Dividends from Unaffiliated Issuers1 | | $ | 2,277,064 | | | $ | 147,255 | | | $ | 2,086,554 | |
Dividends from Affiliated Issuers | | | 162,000 | | | | — | | | | — | |
Interest | | | 3,113,622 | | | | 89,547 | | | | 450,328 | |
| | |
| | |
| | |
| |
Total Investment Income | | | 5,552,686 | | | | 236,802 | | | | 2,536,882 | |
| | |
| | |
| | |
| |
| Expenses | | | | | | | | | | | | |
Investment Advisory fees (Note 3) | | | 5,663,903 | | | | 61,946 | | | | 608,809 | |
Administration fees (Note 3) | | | 270,033 | | | | 2,809 | | | | 27,041 | |
Distribution fees (Note 3) | | | 1,573,305 | | | | 17,207 | | | | 169,113 | |
Shareholder servicing fees | | | 765,708 | | | | 4,235 | | | | 67,114 | |
Accounting services fees | | | 220,225 | | | | 2,698 | | | | 18,291 | |
Transfer agent fees | | | 218,976 | | | | 6,541 | | | | 43,034 | |
Registration fees | | | 84,099 | | | | 9,399 | | | | 12,935 | |
Reports to shareholders | | | 81,136 | | | | 3,040 | | | | 20,585 | |
Insurance fees | | | 64,205 | | | | 1,108 | | | | 9,527 | |
Professional fees | | | 40,911 | | | | 25,743 | | | | 26,008 | |
Compliance fees | | | 39,245 | | | | 4,462 | | | | 7,358 | |
Custodian fees | | | 35,704 | | | | 3,350 | | | | 7,145 | |
Trustees’ fees | | | 8,759 | | | | 8,759 | | | | 8,759 | |
Other expenses | | | 5,036 | | | | 345 | | | | 719 | |
| | |
| | |
| | |
| |
Total expenses before waivers and related reimbursements | | | 9,071,245 | | | | 151,642 | | | | 1,026,438 | |
Less waivers and related reimbursements | | | — | | | | (19,364 | ) | | | — | |
| | |
| | |
| | |
| |
Total expenses after waivers and related reimbursements | | | 9,071,245 | | | | 132,278 | | | | 1,026,438 | |
| | |
| | |
| | |
| |
Net Investment Income (Loss) | | | (3,518,559 | ) | | | 104,524 | | | | 1,510,444 | |
| | |
| | |
| | |
| |
| Net Realized and Unrealized Loss on Investments | | | | | | | | | | | | |
Net Realized Gain (Loss) on Investment and Foreign Currency Transactions | | | 28,527,063 | | | | (1,452,581 | ) | | | (10,075,019 | ) |
Change in Net Unrealized Appreciation/Depreciation of Investments | | | (212,556,527 | ) | | | 158,458 | | | | 1,836,324 | |
| | |
| | |
| | |
| |
Net Loss on Investments | | | (184,029,464 | ) | | | (1,294,123 | ) | | | (8,238,695 | ) |
| | |
| | |
| | |
| |
| Net Decrease in Net Assets Resulting from Operations | | $ | (187,548,023 | ) | | $ | (1,189,599 | ) | | $ | (6,728,251 | ) |
| | |
| | |
| | |
| |
|
| 1 | Net of foreign taxes withheld of $197,584, $90 and $70 for the FBR Focus Fund, FBR Large Cap Financial Fund, and FBR Small Cap Financial Fund, respectively. |
76
| The FBR Funds |
|
| Statements of Operations (continued) |
| For the Six Months Ended April 30, 2008 |
| (unaudited) |
| | | | | | | | | | | FBR |
| | | FBR | | FBR | | Fund for |
| | | Technology | | Gas Utility | | Government |
| | | Fund | | Index Fund | | Investors |
| | |
| |
| |
|
| Investment Income | | | | | | | | | | | | |
Dividends1 | | $ | 121,548 | | | $ | 3,972,436 | | | $ | — | |
Interest (Note 2) | | | 64,522 | | | | 64,765 | | | | 3,266,982 | |
| | |
| | |
| | |
| |
Total Investment Income | | | 186,070 | | | | 4,037,201 | | | | 3,266,982 | |
| | |
| | |
| | |
| |
| Expenses | | | | | | | | | | | | |
Investment Advisory fees (Note 3) | | | 129,137 | | | | 534,539 | | | | 397,847 | |
Administration fees (Note 3) | | | 6,554 | | | | 107,118 | | | | 34,444 | |
Distribution fees (Note 3) | | | 35,871 | | | | — | | | | — | |
Professional fees | | | 26,390 | | | | 23,318 | | | | 26,148 | |
Shareholder servicing fees | | | 20,538 | | | | 75,318 | | | | 33,028 | |
Registration fees | | | 10,690 | | | | 17,839 | | | | 16,508 | |
Trustees’ fees | | | 8,759 | | | | 8,759 | | | | 8,759 | |
Custodian fees | | | 6,689 | | | | 9,673 | | | | 8,069 | |
Accounting services fees | | | 6,684 | | | | 41,018 | | | | 27,300 | |
Compliance fees | | | 4,933 | | | | 10,936 | | | | 8,261 | |
Reports to shareholders | | | 4,461 | | | | 16,239 | | | | 4,609 | |
Transfer agent fees | | | 4,014 | | | | 76,253 | | | | 76,467 | |
Insurance fees | | | 2,204 | | | | 11,728 | | | | 7,908 | |
Other expenses | | | 1,077 | | | | 1,034 | | | | 317 | |
| | |
| | |
| | |
| |
Total expenses before waivers and related | | | | | | | | | | | | |
reimbursements | | | 268,001 | | | | 933,772 | | | | 649,665 | |
Less waivers and related reimbursements | | | (9,222 | ) | | | — | | | | — | |
| | |
| | |
| | |
| |
Total expenses after waivers and related | | | | | | | | | | | | |
reimbursements | | | 258,779 | | | | 933,772 | | | | 649,665 | |
| | |
| | |
| | |
| |
Net Investment Income (Loss) | | | (72,709 | ) | | | 3,103,429 | | | | 2,617,317 | |
| | |
| | |
| | |
| |
| Net Realized and Unrealized Gain (Loss) on Investments | | | | | | | | | | | | |
Net Realized Gain (Loss) on Investment Transactions | | | (1,938,846 | ) | | | 3,816,470 | | | | 3,286 | |
Change in Net Unrealized Appreciation/Depreciation of | | | | | | | | | | | | |
Investments | | | (3,372,705 | ) | | | (19,643,577 | ) | | | — | |
| | |
| | |
| | |
| |
Net Gain (Loss) on Investments | | | (5,311,551 | ) | | | (15,827,107 | ) | | | 3,286 | |
| | |
| | |
| | |
| |
| Net Increase (Decrease) in Net Assets Resulting | | | | | | | | | | | | |
from Operations | | $ | (5,384,260 | ) | | $ | (12,723,678 | ) | | $ | 2,620,603 | |
| | |
| | |
| | |
| |
|
| 1 | Net of foreign taxes withheld of $6,813, $115,117 and $0 for the FBR Technology Fund, FBR Gas Utility Index Fund, and FBR Fund for Government Investors, respectively. |
| | |
| The accompanying notes are an integral part of the financial statements. |
| | |
| 77 |
| The FBR Funds |
|
| Statements of Changes in Net Assets |
| | | | FBR Pegasus FundTM | | FBR Pegasus Mid Cap FundTM |
| | | |
| |
|
| | | | For the | | | | | | For the | | | | |
| | | | Six Months | | For the | | Six Months | | For the |
| | | | Ended | | Year | | Ended | | Period |
| | | | April 30, | | Ended | | April 30, | | Ended |
| | | | 2008 | | October 31, | | 2008 | | October 31, |
| | | | (unaudited) | | 2007 | | (unaudited) | | 2007(A) |
| | | |
| |
| |
| |
|
| From Investment Activities | | | | | | | | | | | | | | | | | |
Net Investment Income (Loss) | | | $ | 24,093 | | | $ | (38,956 | ) | | $ | (8,537 | ) | | $ | (8,228 | ) |
Net Realized Gain on Investment | | | | | | | | | | | | | | | | | |
Transactions | | | | 114,213 | | | | 1,290,741 | | | | 109,903 | | | | 44,986 | |
Change in Net Unrealized | | | | | | | | | | | | | | | | | |
Appreciation/Depreciation of | | | | | | | | | | | | | | | | | |
Investments | | | | (1,060,554 | ) | | | 698,069 | | | | (199,442 | ) | | | 366,285 | |
| | | |
| | |
| | |
| | |
| |
Net Increase (Decrease) in Net Assets | | | | | | | | | | | | | | | | | |
Resulting from Operations | | | | (922,248 | ) | | | 1,949,854 | | | | (98,076 | ) | | | 403,043 | |
| | | |
| | |
| | |
| | |
| |
| Distributions to Shareholders | | | | | | | | | | | | | | | | | |
From Net Realized Gain on | | | | | | | | | | | | | | | | | |
Investments | | | | (1,227,692 | ) | | | (585,158 | ) | | | (45,373 | ) | | | — | |
| | | |
| | |
| | |
| | |
| |
| From Share Transactions | | | | | | | | | | | | | | | | | |
Net Proceeds from Sales of Shares | | | | 539,297 | | | | 7,243,398 | | | | 418,470 | | | | 3,706,491 | |
Reinvestment of Distributions | | | | 1,222,454 | | | | 583,994 | | | | 45,373 | | | | — | |
Cost of Shares Redeemed(B) | | | | (3,994,502 | ) | | | (9,504,418 | ) | | | (219,015 | ) | | | (236,707 | ) |
| | | |
| | |
| | |
| | |
| |
Net Increase (Decrease) in Net Assets | | | | | | | | | | | | | | | | | |
Resulting from Share Transactions | | | | (2,232,751 | ) | | | (1,677,026 | ) | | | 244,828 | | | | 3,469,784 | |
| | | |
| | |
| | |
| | |
| |
Total Increase (Decrease) in | | | | | | | | | | | | | | | | | |
Net Assets | | | | (4,382,691 | ) | | | (312,330 | ) | | | 101,379 | | | | 3,872,827 | |
| Net Assets – Beginning of Period | | | | 13,036,862 | | | | 13,349,192 | | | | 3,872,827 | | | | — | |
| | | |
| | |
| | |
| | |
| |
| Net Assets – End of Period | | | $ | 8,654,171 | | | $ | 13,036,862 | | | $ | 3,974,206 | | | $ | 3,872,827 | |
| | | |
| | |
| | |
| | |
| |
| Accumulated Net Investment | | | | | | | | | | | | | | | | | |
Income (Loss) | | | $ | 24,093 | | | $ | — | | | $ | (8,537 | ) | | $ | — | |
| Shares Issued and Redeemed | | | | | | | | | | | | | | | | | |
Sold | | | | 47,254 | | | | 597,613 | | | | 39,194 | | | | 364,879 | |
Issued in Reinvestment of Distributions | | | | 106,208 | | | | 49,491 | | | | 4,248 | | | | — | |
Redeemed | | | | (364,542 | ) | | | (801,697 | ) | | | (21,082 | ) | | | (22,186 | ) |
| | | |
| | |
| | |
| | |
| |
Net Increase (Decrease) in Shares | | | | (211,080 | ) | | | (154,593 | ) | | | 22,360 | | | | 342,693 | |
| | | |
| | |
| | |
| | |
| |
|
| (A) | Represents the period from commencement of operations (February 28, 2007) through October 31, 2007. |
| (B) | The cost of shares redeemed is net of the 1% redemption fee on fund shares which have been held 90 days or less. For the six months ended April 30, 2008, these fees were $2,277 and $1,812 for the FBR Pegasus FundTM and FBR Pegasus Mid Cap FundTM, respectively. For the period ended October 31, 2007, these fees were $1,520 and $1,074 for the FBR Pegasus FundTM and FBR Pegasus Mid Cap FundTM, respectively. |
| | |
| | 78 |
| The FBR Funds |
|
| Statements of Changes in Net Assets (continued) |
| | | FBR Pegasus | | FBR Pegasus Small |
| | | Small Cap FundTM | | Cap Growth FundTM |
| | |
| |
|
| | | For the | | | | | | For the | | | | |
| | | Six Months | | For the | | Six Months | | For the |
| | | Ended | | Period | | Ended | | Year |
| | | April 30, | | Ended | | April 30, | | Ended |
| | | 2008 | | October 31, | | 2008 | | October 31, |
| | | (unaudited) | | 2007(A) | | (unaudited) | | 2007 |
| | |
| |
| |
| |
|
| From Investment Activities | | | | | | | | | | | | | | | | |
Net Investment Loss | | $ | (14,046 | ) | | $ | (15,868 | ) | | $ | (31,114 | ) | | $ | (75,527 | ) |
Net Realized Gain (Loss) on Investment | | | | | | | | | | | | | | | | |
Transactions | | | (112,740 | ) | | | 25,357 | | | | 194,293 | | | | 269,099 | |
Change in Net Unrealized | | | | | | | | | | | | | | | | |
Appreciation/Depreciation of | | | | | | | | | | | | | | | | |
Investments | | | (350,051 | ) | | | 618,686 | | | | (1,042,826 | ) | | | 795,763 | |
| | |
| | |
| | |
| | |
| |
Net Increase (Decrease) in Net Assets | | | | | | | | | | | | | | | | |
Resulting from Operations | | | (476,837 | ) | | | 628,175 | | | | (879,647 | ) | | | 989,335 | |
| | |
| | |
| | |
| | |
| |
| Distributions to Shareholders | | | | | | | | | | | | | | | | |
From Net Realized Gain on | | | | | | | | | | | | | | | | |
Investments | | | (18,282 | ) | | | — | | | | (184,307 | ) | | | (167,748 | ) |
| | |
| | |
| | |
| | |
| |
| From Share Transactions | | | | | | | | | | | | | | | | |
Net Proceeds from Sales of Shares | | | 729,884 | | | | 4,844,179 | | | | 540,331 | | | | 2,106,874 | |
Reinvestment of Distributions | | | 18,282 | | | | — | | | | 182,968 | | | | 166,452 | |
Cost of Shares Redeemed(B) | | | (563,984 | ) | | | (572,640 | ) | | | (1,511,289 | ) | | | (1,235,803 | ) |
| | |
| | |
| | |
| | |
| |
Net Increase (Decrease) in Net Assets | | | | | | | | | | | | | | | | |
Resulting from Share Transactions | | | 184,182 | | | | 4,271,539 | | | | (787,990 | ) | | | 1,037,523 | |
| | |
| | |
| | |
| | |
| |
Total Increase (Decrease) in | | | | | | | | | | | | | | | | |
Net Assets | | | (310,937 | ) | | | 4,899,714 | | | | (1,851,944 | ) | | | 1,859,110 | |
| Net Assets – Beginning of Period | | | 4,899,714 | | | | — | | | | 5,450,629 | | | | 3,591,519 | |
| | |
| | |
| | |
| | |
| |
| Net Assets – End of Period | | $ | 4,588,777 | | | $ | 4,899,714 | | | $ | 3,598,685 | | | $ | 5,450,629 | |
| | |
| | |
| | |
| | |
| |
| Accumulated Net Investment Loss | | $ | (14,046 | ) | | $ | — | | | $ | (31,114 | ) | | $ | — | |
| Shares Issued and Redeemed | | | | | | | | | | | | | | | | |
Sold | | | 69,700 | | | | 465,369 | | | | 46,013 | | | | 173,213 | |
Issued in Reinvestment of Distributions | | | 1,647 | | | | — | | | | 14,863 | | | | 14,704 | |
Redeemed | | | (54,380 | ) | | | (51,814 | ) | | | (133,806 | ) | | | (102,790 | ) |
| | |
| | |
| | |
| | |
| |
Net Increase (Decrease) in Shares | | | 16,967 | | | | 413,555 | | | | (72,930 | ) | | | 85,127 | |
| | |
| | |
| | |
| | |
| |
|
| (A) | Represents the period from commencement of operations (February 28, 2007) through October 31, 2007. |
| (B) | The cost of shares redeemed is net of the 1% redemption fee on fund shares which have been held 90 days or less. For the six months ended April 30, 2008, these fees were $1,922 and $2,320 for the FBR Pegasus Small Cap FundTM and FBR Pegasus Small Cap Growth FundTM, respectively. For the year ended October 31, 2007, these fees were $1,577 and $3,320 for the FBR Pegasus Small Cap FundTM and FBR Pegasus Small Cap Growth FundTM, respectively. |
| | |
| 79 |
| The FBR Funds |
|
| Statements of Changes in Net Assets (continued) |
| | | | | | | | | | | FBR Large Cap | | FBR Small Cap |
| | | FBR Focus Fund | | Financial Fund | | Financial Fund |
| | |
| |
| |
|
| | | | | | | | | | | | | | | | | | | | | | | | | |
| | | For the | | | | | | For the | | | | | | For the | | | | |
| | | Six Months | | For the | | Six Months | | For the | | Six Months | | For the |
| | | Ended | | Year | | Ended | | Year | | Ended | | Year |
| | | April 30, | | Ended | | April 30, | | Ended | | April 30, | | Ended |
| | | 2008 | | October 31, | | 2008 | | October 31, | | 2008 | | October 31, |
| | | (unaudited) | | 2007 | | (unaudited) | | 2007 | | (unaudited) | | 2007 |
| | |
| |
| |
| |
| |
| |
|
| From Investment Activities | | | | | | | | | | | | | | | | | | | | | | | | |
Net Investment Income (Loss) | | $ | (3,518,559 | ) | | $ | 2,087,975 | | | $ | 104,524 | | | $ | 136,302 | | | $ | 1,510,444 | | | $ | 2,209,998 | |
Net Realized Gain (Loss) on Investment and Foreign Currency Transactions | | | 28,527,063 | | | | 13,069,421 | | | | (1,452,581 | ) | | | 2,941,002 | | | | (10,075,019 | ) | | | 36,298,984 | |
Change in Net Unrealized Appreciation/Depreciation of Investments | | | (212,556,527 | ) | | | 173,362,319 | | | | 158,458 | | | | (3,508,409 | ) | | | 1,836,324 | | | | (78,941,179 | ) |
| | |
| | |
| | |
| | |
| | |
| | |
| |
Net Increase (Decrease) in Net Assets Resulting from Operations | | | (187,548,023 | ) | | | 188,519,715 | | | | (1,189,599 | ) | | | (431,105 | ) | | | (6,728,251 | ) | | | (40,432,197 | ) |
| | |
| | |
| | |
| | |
| | |
| | |
| |
| Distributions to Shareholders | | | | | | | | | | | | | | | | | | | | | | | | |
From Net Investment Income | | | (3,048,132 | ) | | | — | | | | (177,807 | ) | | | (145,001 | ) | | | (2,225,546 | ) | | | (1,631,560 | ) |
From Net Realized Gain on Investments | | | (13,064,697 | ) | | | (2,384,603 | ) | | | (2,910,983 | ) | | | (2,416,486 | ) | | | (36,692,650 | ) | | | (44,028,565 | ) |
| | |
| | |
| | |
| | |
| | |
| | |
| |
Total Distributions to Shareholders | | | (16,112,829 | ) | | | (2,384,603 | ) | | | (3,088,790 | ) | | | (2,561,487 | ) | | | (38,918,196 | ) | | | (45,660,125 | ) |
| | |
| | |
| | |
| | |
| | |
| | |
| |
| From Share Transactions | | | | | | | | | | | | | | | | | | | | | | | | |
Net Proceeds from Sales of Shares | | | 150,270,348 | | | | 1,026,699,295 | | | | 2,595,113 | | | | 2,112,482 | | | | 47,856,352 | | | | 38,350,436 | |
Reinvestment of Distributions | | | 15,739,961 | | | | 2,336,579 | | | | 3,006,657 | | | | 2,508,729 | | | | 38,016,471 | | | | 44,110,288 | |
Cost of Shares Redeemed(A) | | | (377,671,517 | ) | | | (588,421,673 | ) | | | (2,961,302 | ) | | | (11,990,658 | ) | | | (40,471,736 | ) | | | (198,308,915 | ) |
| | |
| | |
| | |
| | |
| | |
| | |
| |
Net Increase (Decrease) in Net Assets Resulting from Share Transactions | | | (211,661,208 | ) | | | 440,614,201 | | | | 2,640,468 | | | | (7,369,447 | ) | | | 45,401,087 | | | | (115,848,191 | ) |
| | |
| | |
| | |
| | |
| | |
| | |
| |
Total Increase (Decrease) in Net Assets | | | (415,322,060 | ) | | | 626,749,313 | | | | (1,637,921 | ) | | | (10,362,039 | ) | | | (245,360 | ) | | | (201,940,513 | ) |
Net Assets – Beginning of Period | | | 1,556,339,443 | | | | 929,590,130 | | | | 15,951,141 | | | | 26,313,180 | | | | 144,214,233 | | | | 346,154,746 | |
| | |
| | |
| | |
| | |
| | |
| | |
| |
Net Assets – End of Period | | $ | 1,141,017,383 | | | $ | 1,556,339,443 | | | $ | 14,313,220 | | | $ | 15,951,141 | | | $ | 143,968,873 | | | $ | 144,214,233 | |
| | |
| | |
| | |
| | |
| | |
| | |
| |
Accumulated Net Investment Income (Loss) | | $ | (4,478,716 | ) | | $ | 2,087,975 | | | $ | 40,841 | | | $ | 114,124 | | | $ | 604,663 | | | $ | 1,319,765 | |
| Shares Issued and Redeemed | | | | | | | | | | | | | | | | | | | | | | | | |
Sold | | | 2,939,029 | | | | 18,377,190 | | | | 185,178 | | | | 103,543 | | | | 2,899,441 | | | | 1,440,016 | |
Issued in Reinvestment of Distributions | | | 292,791 | | | | 44,405 | | | | 215,341 | | | | 123,104 | | | | 2,408,457 | | | | 1,526,231 | |
Redeemed | | | (7,306,753 | ) | | | (10,407,459 | ) | | | (192,593 | ) | | | (588,332 | ) | | | (2,371,275 | ) | | | (7,331,443 | ) |
| | |
| | |
| | |
| | |
| | |
| | |
| |
Net Increase (Decrease) in Shares | | | (4,074,933 | ) | | | 8,014,136 | | | | 207,926 | | | | (361,685 | ) | | | 2,936,623 | | | | (4,365,196 | ) |
| | |
| | |
| | |
| | |
| | |
| | |
| |
|
| (A) | The cost of shares redeemed is net of the 1% redemption fee on fund shares which have been held 90 days or less. For the six months ended April 30, 2008, these fees were $111,407, $1,823 and $48,208 for the FBR Focus Fund, FBR Large Cap Financial Fund, and FBR Small Cap Financial Fund, respectively. For the year ended October 31, 2007, these fees were $529,480, $2,457 and $37,223 for the FBR Focus Fund, FBR Large Cap Financial Fund, and FBR Small Cap Financial Fund, respectively. |
80
| The FBR Funds |
|
| Statements of Changes in Net Assets (continued) |
| | | | | | | | | | FBR Gas Utility | | FBR Fund for |
| | FBR Technology Fund | | Index Fund | | Government Investors |
| |
| |
| |
|
| | For the | | | | | | For the | | | | | | For the | | | | |
| | Six Months | | For the | | Six Months | | For the | | Six Months | | For the |
| | Ended | | Year | | Ended | | Year | | Ended | | Year |
| | April 30, | | Ended | | April 30, | | Ended | | April 30, | | Ended |
| | 2008 | | October 31, | | 2008 | | October 31, | | 2008 | | October 31, |
| | (unaudited) | | 2007 | | (unaudited) | | 2007 | | (unaudited) | | 2007 |
| |
| |
| |
| |
| |
| |
|
| From Investment Activities | | | | | | | | | | | | | | | | | | | | | | | |
Net Investment Income (Loss) | $ | (72,709 | ) | | $ | (162,292 | ) | | $ | 3,103,429 | | | $ | 6,321,984 | | | $ | 2,617,317 | | | $ | 8,612,054 | |
Net Realized Gain (Loss) on Investment Transactions | | (1,938,846 | ) | | | 4,164,831 | | | | 3,816,470 | | | | 22,237,982 | | | | 3,286 | | | | — | |
Change in Net Unrealized Appreciation/Depreciation of Investments | | (3,372,705 | ) | | | 1,398,694 | | | | (19,643,577 | ) | | | 24,854,016 | | | | — | | | | — | |
| |
| | |
| | |
| | |
| | |
| | |
| |
Net Increase (Decrease) in Net Assets Resulting from Operations | | (5,384,260 | ) | | | 5,401,233 | | | | (12,723,678 | ) | | | 53,413,982 | | | | 2,620,603 | | | | 8,612,054 | |
| |
| | |
| | |
| | |
| | |
| | |
| |
| Distributions to Shareholders | | | | | | | | | | | | | | | | | | | | | | | |
From Net Investment Income | | — | | | | — | | | | (2,757,572 | ) | | | (6,504,234 | ) | | | (2,617,315 | ) | | | (8,612,056 | ) |
From Net Realized Gain on Investments | | (3,527,911 | ) | | | (1,396,046 | ) | | | (21,582,320 | ) | | | — | | | | — | | | | — | |
| |
| | |
| | |
| | |
| | |
| | |
| |
Total Distributions to Shareholders | | (3,527,911 | ) | | | (1,396,046 | ) | | | (24,339,892 | ) | | | (6,504,234 | ) | | | (2,617,315 | ) | | | (8,612,056 | ) |
| |
| | |
| | |
| | |
| | |
| | |
| |
| From Share Transactions | | | | | | | | | | | | | | | | | | | | | | | |
Net Proceeds from Sales of Shares | | 2,199,280 | | | | 10,873,118 | | | | 13,145,902 | | | | 49,210,577 | | | | 296,024,939 | | | | 630,550,580 | |
Reinvestment of Distributions | | 3,499,542 | | | | 1,385,564 | | | | 22,834,376 | | | | 6,008,567 | | | | 2,517,610 | | | | 8,359,928 | |
Cost of Shares Redeemed(A) | | (17,930,331 | ) | | | (14,736,324 | ) | | | (19,934,235 | ) | | | (86,208,440 | ) | | | (359,178,832 | ) | | | (669,041,219 | ) |
| |
| | |
| | |
| | |
| | |
| | |
| |
Net Increase (Decrease) in Net Assets Resulting from Share Transactions | | (12,231,509 | ) | | | (2,477,642 | ) | | | 16,046,043 | | | | (30,989,296 | ) | | | (60,636,283 | ) | | | (30,130,711 | ) |
| |
| | |
| | |
| | |
| | |
| | |
| |
Total Increase (Decrease) in Net Assets | | (21,143,680 | ) | | | 1,527,545 | | | | (21,017,527 | ) | | | 15,920,452 | | | | (60,632,995 | ) | | | (30,130,713 | ) |
| Net Assets – Beginning of Period | | 40,934,838 | | | | 39,407,293 | | | | 285,951,170 | | | | 270,030,718 | | | | 181,039,973 | | | | 211,170,686 | |
| |
| | |
| | |
| | |
| | |
| | |
| |
| Net Assets – End of Period | $ | 19,791,158 | | | $ | 40,934,838 | | | $ | 264,933,643 | | | $ | 285,951,170 | | | $ | 120,406,978 | | | $ | 181,039,973 | |
| |
| | |
| | |
| | |
| | |
| | |
| |
Accumulated/(Distributions in excess of) Net Investment Income | $ | (72,709 | ) | | $ | — | | | $ | 433,391 | | | $ | 87,534 | | | $ | — | | | $ | (2 | ) |
| Shares Issued and Redeemed | | | | | | | | | | | | | | | | | | | | | | | |
Sold | | 192,014 | | | | 890,911 | | | | 633,327 | | | | 2,289,265 | | | | 296,024,939 | | | | 630,550,580 | |
Issued in Reinvestment of Distributions | | 301,685 | | | | 117,720 | | | | 1,097,046 | | | | 282,736 | | | | 2,517,610 | | | | 8,359,928 | |
Redeemed | | (1,678,158 | ) | | | (1,233,052 | ) | | | (973,347 | ) | | | (4,074,907 | ) | | | (359,178,832 | ) | | | (669,041,219 | ) |
| |
| | |
| | |
| | |
| | |
| | |
| |
Net Increase (Decrease) in Shares | | (1,184,459 | ) | | | (224,421 | ) | | | 757,026 | | | | (1,502,906 | ) | | | (60,636,283 | ) | | | (30,130,711 | ) |
| |
| | |
| | |
| | |
| | |
| | |
| |
|
| (A) | The cost of shares redeemed is net of the 1% redemption fee on fund shares which have been held 90 days or less. For the six months ended April 30, 2008, these fees were $4,350 and $8,002 for the FBR Technology Fund and FBR Gas Utility Index Fund, respectively. For the year ended October 31, 2007, these fees were $11,319 and $36,591 for the FBR Technology Fund and FBR Gas Utility Index Fund, respectively. The FBR Fund for Government Investors does not charge a redemption fee. |
The accompanying notes are an integral part of the financial statements.
81
| The FBR Funds |
|
| Financial Highlights |
The following tables provide per share data for a share outstanding throughout each period for each Fund. Other data includes investment performance, ratios to average net assets and other supplemental information.
| | | FBR Pegasus FundTM |
| | |
|
| | | For the | | | | | | | | | | |
| | | Six Months Ended | | | For the | | | For the |
| | | April 30, 2008 | | | Year Ended | | | Period Ended |
| | | (unaudited) | | | October 31, 2007 | | | October 31, 2006* |
| | |
| | |
| | |
|
| Per Share Operating Performance: | | | | | | | | | | | | | | |
Net Asset Value – Beginning of Period | | $ | 13.40 | | | | $ | 11.84 | | | | $ | 10.00 | |
| | |
| | | |
| | | |
| |
| Income (Loss) from Investment Operations: | | | | | | | | | | | | | | |
Net Investment Income (Loss)1,2 | | | 0.03 | | | | | (0.04 | ) | | | | (0.01 | ) |
Net Realized and Unrealized Gain (Loss) on Investments1,3 | | | (0.77 | ) | | | | 2.05 | | | | | 1.84 | |
| | |
| | | |
| | | |
| |
Total from Investment Operations | | | (0.74 | ) | | | | 2.01 | | | | | 1.83 | |
| | |
| | | |
| | | |
| |
Distributions to Shareholders: | | | | | | | | | | | | | | |
From Net Investment Income | | | — | | | | | — | | | | | (0.00 | )4 |
From Net Realized Gain | | | (1.30 | ) | | | | (0.45 | ) | | | | — | |
| | |
| | | |
| | | |
| |
Total Distributions | | | (1.30 | ) | | | | (0.45 | ) | | | | (0.00 | )4 |
| | |
| | | |
| | | |
| |
Paid-in Capital from Redemption Fees5 | | | 0.00 | 4 | | | | 0.00 | 4 | | | | 0.01 | |
| | |
| | | |
| | | |
| |
Net Increase (Decrease) in Net Asset Value | | | (2.04 | ) | | | | 1.56 | | | | | 1.84 | |
| | |
| | | |
| | | |
| |
Net Asset Value – End of Period | | $ | 11.36 | | | | $ | 13.40 | | | | $ | 11.84 | |
| | |
| | | |
| | | |
| |
| Total Investment Return6 | | | (5.62)% | (A) | | | | 17.52% | | | | | 18.45% | (A) |
| Ratios to Average Net Assets: | | | | | | | | | | | | | | |
Expenses After Waivers and Related Reimbursements2 | | | 1.95% | (B) | | | | 1.97% | | | | | 1.94% | (B) |
Expenses Before Waivers and Related Reimbursements | | | 2.48% | (B) | | | | 2.21% | | | | | 2.74% | (B) |
Net Investment Income (Loss) After Waivers and Related | | | | | | | | | | | | | | |
Reimbursements2 | | | 0.46% | (B) | | | | (0.30)% | | | | | (0.23)% | (B) |
Net Investment Loss Before Waivers and Related Reimbursements | | | (0.07)% | (B) | | | | (0.54)% | | | | | (1.03)% | (B) |
| Supplementary Data: | | | | | | | | | | | | | | |
Portfolio Turnover Rate | | | 15% | (A) | | | | 108% | | | | | 166% | (A) |
Net Assets at End of Period (in thousands) | | $ | 8,654 | | | | $ | 13,037 | | | | $ | 13,349 | |
|
* | | Represents the period from commencement of operations (November 15, 2005) through October 31, 2006. |
1 | | Calculated based on shares outstanding on the first and last day of the respective periods, except for dividends and distributions, if any, which are based on the actual shares outstanding on the dates of distributions. |
2 | | Reflects fees waived and reimbursed by FBR Fund Advisers, Inc. pursuant to a contractual expense limitation of 1.95% (excluding interest, taxes, brokerage commissions, extraordinary legal expenses, or any other extraordinary expenses). |
3 | | The amounts shown for a share outstanding throughout the period may not be in accordance with the changes in the aggregate gains and losses on investments during the period because of the timing of sales and repurchases of Fund shares in relation to fluctuating net asset values during the period. |
4 | | Less than $0.01 |
5 | | Calculated based on average shares outstanding. |
6 | | Total investment return is calculated assuming a purchase of shares on the first day and a sale on the last day of each period reported and will include reinvestment of dividends and distributions, if any. |
| (A) | | Not Annualized |
| (B) | | Annualized |
82
| The FBR Funds |
|
| Financial Highlights (continued) |
| | | FBR Pegasus Mid Cap FundTM |
| | |
|
| | | For the | | | | |
| | | Six Months Ended | | For the |
| | | April 30, 2008 | | Period Ended |
| | | (unaudited) | | October 31, 2007* |
| | |
| |
|
| Per Share Operating Performance: | | | | | | | | |
Net Asset Value – Beginning of Period | | $ | 11.30 | | | $ | 10.00 | |
| | |
| | |
| |
Income (Loss) from Investment Operations: | | | | | | | | |
Net Investment Loss1,2 | | | (0.02 | ) | | | (0.02 | ) |
Net Realized and Unrealized Gain (Loss) on Investments1,3 | | | (0.27 | ) | | | 1.32 | |
| | |
| | |
| |
Total from Investment Operations | | | (0.29 | ) | | | 1.30 | |
| | |
| | |
| |
Distributions to Shareholders: | | | | | | | | |
From Net Realized Gain | | | (0.13 | ) | | | — | |
| | |
| | |
| |
Paid-in Capital from Redemption Fees4 | | | 0.01 | | | | 0.00 | 5 |
| | |
| | |
| |
Net Increase (Decrease) in Net Asset Value | | | (0.41 | ) | | | 1.30 | |
| | |
| | |
| |
Net Asset Value – End of Period | | $ | 10.89 | | | $ | 11.30 | |
| | |
| | |
| |
| Total Investment Return6 | | | (2.43)% | (A) | | | 13.00% | (A) |
| Ratios to Average Net Assets: | | | | | | | | |
Expenses After Waivers and Related Reimbursements2 | | | 1.95% | (B) | | | 1.95% | (B) |
Expenses Before Waivers and Related Reimbursements | | | 4.21% | (B) | | | 4.17% | (B) |
Net Investment Loss After Waivers and Related Reimbursements2 | | | (0.47)% | (B) | | | (0.36)% | (B) |
Net Investment Loss Before Waivers and Related Reimbursements | | | (2.73)% | (B) | | | (2.58)% | (B) |
| Supplementary Data: | | | | | | | | |
Portfolio Turnover Rate | | | 34% | (A) | | | 135% | (A) |
Net Assets at End of Period (in thousands) | | $ | 3,974 | | | $ | 3,873 | |
|
* | | Represents the period from commencement of operations (February 28, 2007) through October 31, 2007. |
1 | | Calculated based on shares outstanding on the first and last day of the respective periods, except for dividends and distributions, if any, which are based on the actual shares outstanding on the dates of distributions. |
2 | | Reflects fees waived and reimbursed by FBR Fund Advisers, Inc. pursuant to a contractual expense limitation of 1.95% (excluding interest, taxes, brokerage commissions, extraordinary legal expenses, or any other extraordinary expenses). |
3 | | The amounts shown for a share outstanding throughout the period may not be in accordance with the changes in the aggregate gains and losses on investments during the period because of the timing of sales and repurchases of Fund shares in relation to fluctuating net asset values during the period. |
4 | | Calculated based on average shares outstanding. |
5 | | Less than $0.01 |
6 | | Total investment return is calculated assuming a purchase of shares on the first day and a sale on the last day of each period reported and will include reinvestment of dividends and distributions, if any. |
| (A) | | Not Annualized |
| (B) | | Annualized |
83
| The FBR Funds |
|
| Financial Highlights (continued) |
| | | FBR Pegasus Small Cap FundTM |
| | |
|
| | | For the | | | | | |
| | | Six Months Ended | | For the |
| | | April 30, 2008 | | Period Ended |
| | | (unaudited) | | October 31, 2007* |
| | |
| |
|
| Per Share Operating Performance: | | | | | | | | | | |
Net Asset Value – Beginning of Period | | | $ | 11.85 | | | | $ | 10.00 | |
| | | |
| | | |
| |
Income (Loss) from Investment Operations: | | | | | | | | | | |
Net Investment Loss1,2 | | | | (0.03 | ) | | | | (0.04 | ) |
Net Realized and Unrealized Gain (Loss) on Investments1,3 | | | | (1.12 | ) | | | | 1.89 | |
| | | |
| | | |
| |
Total from Investment Operations | | | | (1.15 | ) | | | | 1.85 | |
| | | |
| | | |
| |
Distributions to Shareholders: | | | | | | | | | | |
From Net Realized Gain | | | | (0.04 | ) | | | | — | |
| | | |
| | | |
| |
Paid-in Capital from Redemption Fees4 | | | | 0.00 5 | | | | | 0.00 5 | |
| | | |
| | | |
| |
Net Increase (Decrease) in Net Asset Value | | | | (1.19 | ) | | | | 1.85 | |
| | | |
| | | |
| |
Net Asset Value – End of Period | | | $ | 10.66 | | | | $ | 11.85 | |
| | | |
| | | |
| |
| Total Investment Return6 | | | | (9.69)% | (A) | | | | 18.50% | (A) |
| Ratios to Average Net Assets: | | | | | | | | | | |
Expenses After Waivers and Related Reimbursements2 | | | | 1.95% | (B) | | | | 1.95% | (B) |
Expenses Before Waivers and Related Reimbursements | | | | 3.71% | (B) | | | | 3.77% | (B) |
Net Investment Loss After Waivers and Related Reimbursements2 | | | | (0.63)% | (B) | | | | (0.61)% | (B) |
Net Investment Loss Before Waivers and Related Reimbursements | | | | (2.39)% | (B) | | | | (2.43)% | (B) |
| Supplementary Data: | | | | | | | | | | |
Portfolio Turnover Rate | | | | 82% | (A) | | | | 107% | (A) |
Net Assets at End of Period (in thousands) | | | $ | 4,589 | | | | $ | 4,900 | |
|
* | | Represents the period from commencement of operations (February 28, 2007) through October 31, 2007. |
1 | | Calculated based on shares outstanding on the first and last day of the respective periods, except for dividends and distributions, if any, which are based on the actual shares outstanding on the dates of distributions. |
2 | | Reflects fees waived and reimbursed by FBR Fund Advisers, Inc. pursuant to a contractual expense limitation of 1.95% (excluding interest, taxes, brokerage commissions, extraordinary legal expenses, or any other extraordinary expenses). |
3 | | The amounts shown for a share outstanding throughout the period may not be in accordance with the changes in the aggregate gains and losses on investments during the period because of the timing of sales and repurchases of Fund shares in relation to fluctuating net asset values during the period. |
4 | | Calculated based on average shares outstanding. |
5 | | Less than $0.01 |
6 | | Total investment return is calculated assuming a purchase of shares on the first day and a sale on the last day of each period reported and will include reinvestment of dividends and distributions, if any. |
(A) | | Not Annualized |
(B) | | Annualized |
84
| The FBR Funds |
|
| Financial Highlights (continued) |
| | | FBR Pegasus Small Cap Growth FundTM |
| | |
|
| | | For the | | | | | | | | | | | | | | | | | For the |
| | | Six Months
Ended | | For the Years Ended
October 31, | Period
Ended |
| | | April 30, 2008 | |
| October 31, |
| | | (unaudited) | | 2007 | | 2006 | | 2005 | | 2004* |
| | |
| |
| |
| |
| |
|
| Per Share Operating Performance: | | | | | | | | | | | | | | | | | | | | | | | | | |
Net Asset Value – Beginning of Period | | | $ | 13.56 | | | | $ | 11.34 | | | | $ | 9.46 | | | | $ | 8.88 | | | | $ | 10.00 | |
| | | |
| | | |
| | | |
| | | |
| | | |
| |
Income (Loss) from Investment Operations: | | | | | | | | | | | | | | | | | | | | | | | | | |
Net Investment Loss1,2 | | | | (0.09 | ) | | | | (0.19 | ) | | | | (0.15 | ) | | | | (0.16 | ) | | | | (0.11 | ) |
Net Realized and Unrealized Gain (Loss) on Investments1,3 | | | | (2.07 | ) | | | | 2.92 | | | | | 2.02 | | | | | 0.70 | | | | | (1.06 | ) |
| | | |
| | | |
| | | |
| | | |
| | | |
| |
Total from Investment Operations | | | | (2.16 | ) | | | | 2.73 | | | | | 1.87 | | | | | 0.54 | | | | | (1.17 | ) |
| | | |
| | | |
| | | |
| | | |
| | | |
| |
Distributions to Shareholders: | | | | | | | | | | | | | | | | | | | | | | | | | |
From Net Realized Gain | | | | (0.47 | ) | | | | (0.52 | ) | | | | — | | | | | — | | | | | — | |
| | | |
| | | |
| | | |
| | | |
| | | |
| |
Paid-in Capital from Redemption Fees4 | | | | 0.01 | | | | | 0.01 | | | | | 0.01 | | | | | 0.04 | | | | | 0.05 | |
| | | |
| | | |
| | | |
| | | |
| | | |
| |
Net Increase (Decrease) in Net Asset Value | | | | (2.62 | ) | | | | 2.22 | | | | | 1.88 | | | | | 0.58 | | | | | (1.12 | ) |
| | | |
| | | |
| | | |
| | | |
| | | |
| |
Net Asset Value – End of Period | | | $ | 10.94 | | | | $ | 13.56 | | | | $ | 11.34 | | | | $ | 9.46 | | | | $ | 8.88 | |
| | | |
| | | |
| | | |
| | | |
| | | |
| |
Total Investment Return5 | | | | (16.27)% | (A) | | | | 25.06% | | | | | 19.87% | | | | | 6.53% | | | | | (11.20)% | (A) |
| Ratios to Average Net Assets: | | | | | | | | | | | | | | | | | | | | | | | | | |
Expenses After Waivers and Related Reimbursements2 | | | | 1.95% | (B) | | | | 1.95% | | | | | 1.95% | | | | | 1.95% | | | | | 1.95% | (B) |
Expenses Before Waivers and Related Reimbursements | | | | 4.18% | (B) | | | | 3.81% | | | | | 5.45% | | | | | 9.14% | | | | | 6.43% | (B) |
Net Investment Loss After Waivers and Related Reimbursements2 | | | | (1.48)% | (B) | | | | (1.65)% | | | | | (1.65)% | | | | | (1.68)% | | | | | (1.79)% | (B) |
Net Investment Loss Before Waivers and Related Reimbursements | | | | (3.70)% | (B) | | | | (3.51)% | | | | | (5.15)% | | | | | (8.87)% | | | | | (6.27)% | (B) |
| Supplementary Data: | | | | | | | | | | | | | | | | | | | | | | | | | |
Portfolio Turnover Rate | | | | 21% | (A) | | | | 108% | | | | | 152% | | | | | 246% | | | | | 150% | (A) |
Net Assets at End of Period (in thousands) | | | $ | 3,599 | | | | $ | 5,451 | | | | $ | 3,592 | | | | $ | 1,759 | | | | $ | 1,440 | |
|
* | | Represents the period from commencement of operations (January 20, 2004) through October 31, 2004. |
1 | | Calculated based on shares outstanding on the first and last day of the respective periods, except for dividends and distributions, if any, which are based on the actual shares outstanding on the dates of distributions. |
2 | | Reflects fees waived and reimbursed by FBR Fund Advisers, Inc. pursuant to a contractual expense limitation of 1.95% (excluding interest, taxes, brokerage commissions, extraordinary legal expenses, or any other extraordinary expenses). |
3 | | The amounts shown for a share outstanding throughout the respective periods may not be in accordance with the changes in the aggregate gains and losses on investments during the respective periods because of the timing of sales and repurchases of Fund shares in relation to fluctuating net asset values during the respective periods. |
4 | | Calculated based on average shares outstanding. |
5 | | Total investment return is calculated assuming a purchase of shares on the first day and a sale on the last day of each period reported and will include reinvestment of dividends and distributions, if any. |
(A) | | Not Annualized |
| (B) | | Annualized |
85
| The FBR Funds |
|
| Financial Highlights (continued) |
| | | | FBR Focus Fund |
| | | |
|
| | | | For the | | | | | | | | | | | | | | | | | | | | | | | | | |
| | | | Six Months | | | | | | | | | | | | | | | | | | | | | | | | | |
| | | | Ended | | | | | | | | | | | | | | | | | | | | | | | | | |
| | | | April 30, | | For the Years Ended October 31, |
| | | | 2008 | |
|
| | | | (unaudited) | | | 2007 | | | 2006 | | | 2005 | | | 2004 | | | 2003 |
| | | |
| | |
| | |
| | |
| | |
| | |
|
| Per Share Operating Performance: | | | | | | | | | | | | | | | | | | | | | | | | | | | | | | |
Net Asset Value – Beginning of Period | | | $ | 57.97 | | | | $ | 49.36 | | | | $ | 40.36 | | | | $ | 37.68 | | | | $ | 31.57 | | | | $ | 21.15 | |
| | | |
| | | |
| | | |
| | | |
| | | |
| | | |
| |
Income (Loss) from Investment Operations: | | | | | | | | | | | | | | | | | | | | | | | | | | | | | | |
Net Investment Income (Loss)1,2 | | | | (0.15 | ) | | | | 0.08 | | | | | (0.43 | ) | | | | (0.27 | ) | | | | (0.17 | ) | | | | (0.11 | ) |
Net Realized and Unrealized Gain (Loss) on Investments1,3 | | | | (7.09 | ) | | | | 8.63 | | | | | 10.20 | | | | | 3.51 | | | | | 6.30 | | | | | 10.50 | |
| | | |
| | | |
| | | |
| | | |
| | | |
| | | |
| |
Total from Investment Operations | | | | (7.24 | ) | | | | 8.71 | | | | | 9.77 | | | | | 3.24 | | | | | 6.13 | | | | | 10.39 | |
| | | |
| | | |
| | | |
| | | |
| | | |
| | | |
| |
Distributions to Shareholders: | | | | | | | | | | | | | | | | | | | | | | | | | | | | | | |
From Net Investment Income | | | | (0.12 | ) | | | | — | | | | | — | | | | | — | | | | | — | | | | | — | |
From Net Realized Gain | | | | (0.51 | ) | | | | (0.12 | ) | | | | (0.77 | ) | | | | (0.57 | ) | | | | (0.03 | ) | | | | — | |
| | | |
| | | |
| | | |
| | | |
| | | |
| | | |
| |
Total Distributions | | | | (0.63 | ) | | | | (0.12 | ) | | | | (0.77 | ) | | | | (0.57 | ) | | | | (0.03 | ) | | | | — | |
| | | |
| | | |
| | | |
| | | |
| | | |
| | | |
| |
Paid-in Capital from Redemption Fees4 | | | | 0.00 | 5 | | | | 0.02 | | | | | 0.00 | 5 | | | | 0.01 | | | | | 0.01 | | | | | 0.03 | |
| | | |
| | | |
| | | |
| | | |
| | | |
| | | |
| |
Net Increase (Decrease) in Net Asset Value | | | | (7.87 | ) | | | | 8.61 | | | | | 9.00 | | | | | 2.68 | | | | | 6.11 | | | | | 10.42 | |
| | | |
| | | |
| | | |
| | | |
| | | |
| | | |
| |
Net Asset Value – End of Period | | | $ | 50.10 | | | | $ | 57.97 | | | | $ | 49.36 | | | | $ | 40.36 | | | | $ | 37.68 | | | | $ | 31.57 | |
| | | |
| | | |
| | | |
| | | |
| | | |
| | | |
| |
| Total Investment Return6 | | | | (12.56)% | (A) | | | | 17.72% | | | | | 24.53% | | | | | 8.63% | | | | | 19.46% | | | | | 49.27% | |
| Ratios to Average Net Assets: | | | | | | | | | | | | | | | | | | | | | | | | | | | | | | |
Expenses After Waivers2 | | | | 1.44% | (B) | | | | 1.40% | | | | | 1.38% | | | | | 1.50% | | | | | 1.59% | | | | | 1.60% | |
Expenses Before Waivers | | | | 1.44% | (B) | | | | 1.40% | | | | | 1.40% | | | | | 1.53% | | | | | 1.59% | | | | | 1.60% | |
Net Investment Income (Loss) After Waivers2 | | | | (0.56)% | (B) | | | | 0.14% | | | | | (0.94)% | | | | | (0.56)% | | | | | (0.75)% | | | | | (0.75)% | |
Net Investment Income (Loss) Before Waivers | | | | (0.56)% | (B) | | | | 0.14% | | | | | (0.96)% | | | | | (0.59)% | | | | | (0.75)% | | | | | (0.75)% | |
| Supplementary Data: | | | | | | | | | | | | | | | | | | | | | | | | | | | | | | |
Portfolio Turnover Rate | | | | 5% | (A) | | | | 5% | | | | | 3% | | | | | 20% | | | | | 19% | | | | | 16% | |
Net Assets at End of Period (in thousands) | | | $ | 1,141,017 | | | | $ | 1,556,339 | | | | $ | 929,590 | | | | $ | 805,858 | | | | $ | 825,497 | | | | $ | 343,824 | |
|
1 | | Calculated based on shares outstanding on the first and last day of the respective periods, except for dividends and distributions, if any, which are based on the actual shares outstanding on the dates of distributions. |
2 | | Reflects fees waived by FBR Fund Advisers, Inc. pursuant to a contractual expense limitation of 1.95% (excluding interest, taxes, brokerage commissions, extraordinary legal expenses, or any other extraordinary expenses) and fees voluntarily waived by the Distributor in an amount attributable to marketing expenses for the Fund while closed to new investors. |
3 | | The amounts shown for a share outstanding throughout the respective periods may not be in accordance with the changes in the aggregate gains and losses on investments during the respective periods because of the timing of sales and repurchases of Fund shares in relation to fluctuating net asset values during the respective periods. |
4 | | Calculated based on average shares outstanding. |
5 | | Less than $0.01 |
6 | | Total investment return is calculated assuming a purchase of shares on the first day and a sale on the last day of each period reported and will include reinvestment of dividends and distributions, if any. |
| (A) | | Not Annualized |
| (B) | | Annualized |
86
| The FBR Funds |
|
| Financial Highlights (continued) |
| | | FBR Large Cap Financial Fund |
| | |
|
| | | For the | | | | | | | | | | | | | | | | | | | | |
| | | Six Months | | | | | | | | | | | | | | | | | | | | |
| | | Ended | | | | | | | | | | | | | | | | | | | | |
| | | April 30, | | For the Years Ended October 31, |
| | | 2008 | |
|
| | | (unaudited) | | 2007 | | | 2006 | | | 2005 | | | 2004 | | | 2003 | |
| | |
| |
| | |
| | |
| | |
| | |
| |
| Per Share Operating Performance: | | | | | | | | | | | | | | | | | | | | | | | | |
Net Asset Value – Beginning of Period | | $ | 18.71 | | | $ | 21.67 | | | $ | 21.84 | | | $ | 24.46 | | | $ | 22.43 | | | $ | 17.73 | |
| | |
| | |
| | |
| | |
| | |
| | |
| |
Income (Loss) from Investment Operations: | | | | | | | | | | | | | | | | | | | | | | | | |
Net Investment Income1,2 | | | 0.09 | | | | 0.14 | | | | 0.13 | | | | 0.13 | | | | 0.08 | | | | 0.10 | |
Net Realized and Unrealized Gain (Loss) on Investments1,3 | | | (1.44 | ) | | | (0.97 | ) | | | 2.72 | | | | 0.15 | | | | 2.08 | | | | 4.69 | |
| | |
| | |
| | |
| | |
| | |
| | |
| |
Total from Investment Operations | | | (1.35 | ) | | | (0.83 | ) | | | 2.85 | | | | 0.28 | | | | 2.16 | | | | 4.79 | |
| | |
| | |
| | |
| | |
| | |
| | |
| |
Distributions to Shareholders: | | | | | | | | | | | | | | | | | | | | | | | | |
From Net Investment Income | | | (0.18 | ) | | | (0.11 | ) | | | (0.16 | ) | | | (0.08 | ) | | | (0.07 | ) | | | (0.09 | ) |
From Net Realized Gain | | | (3.68 | ) | | | (2.02 | ) | | | (2.86 | ) | | | (2.82 | ) | | | (0.08 | ) | | | — | |
| | |
| | |
| | |
| | |
| | |
| | |
| |
Total Distributions | | | (3.86 | ) | | | (2.13 | ) | | | (3.02 | ) | | | (2.90 | ) | | | (0.15 | ) | | | (0.09 | ) |
| | |
| | |
| | |
| | |
| | |
| | |
| |
Paid-in Capital from Redemption Fees4 | | | 0.00 | 5 | | | 0.00 | 5 | | | 0.00 | 5 | | | 0.00 | 5 | | | 0.02 | | | | 0.00 | 5 |
| | |
| | |
| | |
| | |
| | |
| | |
| |
Net Increase (Decrease) in Net Asset Value | | | (5.21 | ) | | | (2.96 | ) | | | (0.17 | ) | | | (2.62 | ) | | | 2.03 | | | | 4.70 | |
| | |
| | |
| | |
| | |
| | |
| | |
| |
Net Asset Value – End of Period | | $ | 13.50 | | | $ | 18.71 | | | $ | 21.67 | | | $ | 21.84 | | | $ | 24.46 | | | $ | 22.43 | |
| | |
| | |
| | |
| | |
| | |
| | |
| |
| Total Investment Return6 | | | (7.61)% | (A) | | | (4.59)% | | | | 14.21% | | | | 0.86% | | | | 9.76% | | | | 27.13% | |
| Ratios to Average Net Assets: | | | | | | | | | | | | | | | | | | | | | | | | |
Expenses After Waivers2 | | | 1.92% | (B) | | | 1.89% | | | | 1.83% | | | | 1.95% | | | | 1.91% | | | | 1.92% | |
Expenses Before Waivers | | | 2.20% | (B) | | | 1.92% | | | | 1.84% | | | | 1.96% | | | | 1.94% | | | | 1.98% | |
Net Investment Income After Waivers2 | | | 1.52% | (B) | | | 0.59% | | | | 0.68% | | | | 0.62% | | | | 0.28% | | | | 0.53% | |
Net Investment Income Before Waivers | | | 1.24% | (B) | | | 0.56% | | | | 0.67% | | | | 0.61% | | | | 0.25% | | | | 0.47% | |
| Supplementary Data: | | | | | | | | | | | | | | | | | | | | | | | | |
Portfolio Turnover Rate | | | 208% | (A) | | | 95% | | | | 54% | | | | 41% | | | | 42% | | | | 67% | |
Net Assets at End of Period (in thousands) | | $ | 14,313 | | | $ | 15,951 | | | $ | 26,313 | | | $ | 29,037 | | | $ | 30,384 | | | $ | 35,459 | |
|
1 | | Calculated based on shares outstanding on the first and last day of the respective periods, except for dividends and distributions, if any, which are based on the actual shares outstanding on the dates of distributions. |
2 | | Reflects fees waived by FBR Fund Advisers, Inc. pursuant to a contractual expense limitation of 1.95% (excluding interest, taxes, brokerage commissions, extraordinary legal expenses, or any other extraordinary expenses). |
3 | | The amounts shown for a share outstanding throughout the respective periods may not be in accordance with the changes in the aggregate gains and losses on investments during the respective periods because of the timing of sales and repurchases of Fund shares in relation to fluctuating net asset values during the respective periods. |
4 | | Calculated based on average shares outstanding. |
5 | | Less than $0.01 |
| 6 | | Total investment return is calculated assuming a purchase of shares on the first day and a sale on the last day of each period reported and will include reinvestment of dividends and distributions, if any. |
| (A) | | Not Annualized |
| (B) | | Annualized |
87
| The FBR Funds |
|
| Financial Highlights (continued) |
| | | FBR Small Cap Financial Fund |
| | |
|
| | | For the | | | | | | | | | | | | | | | | | | | | |
| | | Six Months | | | | | | | | | | | | | | | | | | | | |
| | | Ended | | | | | | | | | | | | | | | | | | | | |
| | | April 30, | | For the Years Ended October 31, |
| | | 2008 | |
|
| | | (unaudited) | | 2007 | | | 2006 | | | 2005 | �� | | 2004 | | | 2003 | |
| | |
| |
| | |
| | |
| | |
| | |
| |
| Per Share Operating Performance: | | | | | | | | | | | | | | | | | | | | | | | | |
Net Asset Value – Beginning of Period | | $ | 23.18 | | | $ | 32.70 | | | $ | 32.96 | | | $ | 36.41 | | | $ | 32.56 | | | $ | 24.38 | |
| | |
| | |
| | |
| | |
| | |
| | |
| |
Income (Loss) from Investment Operations: | | | | | | | | | | | | | | | | | | | | | | | | |
Net Investment Income1 | | | 0.14 | | | | 0.29 | | | | 0.14 | | | | 0.23 | | | | 0.13 | | | | 0.05 | |
Net Realized and Unrealized Gain (Loss) on Investments1,2 | | | (1.09 | ) | | | (5.31 | ) | | | 3.44 | | | | 0.85 | | | | 4.40 | | | | 8.88 | |
| | |
| | |
| | |
| | |
| | |
| | |
| |
Total from Investment Operations | | | (0.95 | ) | | | (5.02 | ) | | | 3.58 | | | | 1.08 | | | | 4.53 | | | | 8.93 | |
| | |
| | |
| | |
| | |
| | |
| | |
| |
Distributions to Shareholders: | | | | | | | | | | | | | | | | | | | | | | | | |
From Net Investment Income | | | (0.28 | ) | | | (0.15 | ) | | | (0.14 | ) | | | (0.18 | ) | | | (0.07 | ) | | | (0.13 | ) |
From Net Realized Gain | | | (6.24 | ) | | | (4.35 | ) | | | (3.70 | ) | | | (4.36 | ) | | | (0.65 | ) | | | (0.64 | ) |
| | |
| | |
| | |
| | |
| | |
| | |
| |
Total Distributions | | | (6.52 | ) | | | (4.50 | ) | | | (3.84 | ) | | | (4.54 | ) | | | (0.72 | ) | | | (0.77 | ) |
| | |
| | |
| | |
| | |
| | |
| | |
| |
Paid-in Capital from Redemption Fees3 | | | 0.01 | | | | 0.00 | 4 | | | 0.00 | 4 | | | 0.01 | | | | 0.04 | | | | 0.02 | |
| | |
| | |
| | |
| | |
| | |
| | |
| |
Net Increase (Decrease) in Net Asset Value | | | (7.46 | ) | | | (9.52 | ) | | | (0.26 | ) | | | (3.45 | ) | | | 3.85 | | | | 8.18 | |
| | |
| | |
| | |
| | |
| | |
| | |
| |
Net Asset Value – End of Period | | $ | 15.72 | | | $ | 23.18 | | | $ | 32.70 | | | $ | 32.96 | | | $ | 36.41 | | | $ | 32.56 | |
| | |
| | |
| | |
| | |
| | |
| | |
| |
| Total Investment Return5 | | | (3.70)% | (A) | �� | | (18.02)% | | | | 11.81% | | | | 2.63% | | | | 14.29% | | | | 37.80% | |
| Ratios to Average Net Assets: | | | | | | | | | | | | | | | | | | | | | | | | |
Expenses After Waivers | | | 1.52% | (B) | | | 1.51% | | | | 1.46% | | | | 1.55% | | | | 1.59% | | | | 1.57% | |
Expenses Before Waivers | | | 1.52% | (B) | | | 1.51% | | | | 1.46% | | | | 1.55% | | | | 1.59% | | | | 1.57% | |
Net Investment Income After Waivers | | | 2.23% | (B) | | | 0.93% | | | | 0.45% | | | | 0.69% | | | | 0.40% | | | | 0.26% | |
Net Investment Income Before Waivers | | | 2.23% | (B) | | | 0.93% | | | | 0.45% | | | | 0.69% | | | | 0.40% | | | | 0.26% | |
| Supplementary Data: | | | | | | | | | | | | | | | | | | | | | | | | |
Portfolio Turnover Rate | | | 41% | (A) | | | 13% | | | | 8% | | | | 15% | | | | 36% | | | | 16% | |
Net Assets at End of Period (in thousands) | | $ | 143,969 | | | $ | 144,214 | | | $ | 346,155 | | | $ | 463,333 | | | $ | 594,625 | | | $ | 513,808 | |
|
1 | | Calculated based on shares outstanding on the first and last day of the respective periods, except for dividends and distributions, if any, which are based on the actual shares outstanding on the dates of distributions. |
2 | | The amounts shown for a share outstanding throughout the respective periods may not be in accordance with the changes in the aggregate gains and losses on investments during the respective periods because of the timing of sales and repurchases of Fund shares in relation to fluctuating net asset values during the respective periods. |
3 | | Calculated based on average shares outstanding. |
4 | | Less than $0.01 |
5 | | Total investment return is calculated assuming a purchase of shares on the first day and a sale on the last day of each period reported and will include reinvestment of dividends and distributions, if any. |
(A) | | Not Annualized |
| (B) | | Annualized |
88
| The FBR Funds |
|
| Financial Highlights (continued) |
| | | FBR Technology Fund |
| | |
|
| | | For the | | | | | | | | | | | | | | | | | | | | |
| | | Six Months | | | | | | | | | | | | | | | | | | | | |
| | | Ended | | | | | | | | | | | | | | | | | | | | |
| | | April 30, | | For the Years Ended October 31, |
| | | 2008 | |
|
| | | (unaudited) | | 2007 | | | 2006 | | | 2005 | | | 2004 | | | 2003 | |
| | |
| |
| | |
| | |
| | |
| | |
| |
| Per Share Operating Performance: | | | | | | | | | | | | | | | | | | | | | | | | |
Net Asset Value – Beginning of Period | | $ | 13.34 | | | $ | 11.97 | | | $ | 10.82 | | | $ | 10.96 | | | $ | 11.03 | | | $ | 7.19 | |
| | |
| | |
| | |
| | |
| | |
| | |
| |
Income (Loss) from Investment Operations: | | | | | | | | | | | | | | | | | | | | | | | | |
Net Investment Loss1,2 | | | (0.04 | ) | | | (0.05 | ) | | | (0.04 | ) | | | (0.05 | ) | | | (0.14 | ) | | | (0.08 | ) |
Net Realized and Unrealized Gain (Loss) on Investments1,3 | | | (1.57 | ) | | | 1.81 | | | | 1.77 | | | | 1.53 | | | | 0.24 | | | | 3.92 | |
| | |
| | |
| | |
| | |
| | |
| | |
| |
Total from Investment Operations | | | (1.61 | ) | | | 1.76 | | | | 1.73 | | | | 1.48 | | | | 0.10 | | | | 3.84 | |
| | |
| | |
| | |
| | |
| | |
| | |
| |
Distributions to Shareholders: | | | | | | | | | | | | | | | | | | | | | | | | |
From Net Realized Gain | | | (1.23 | ) | | | (0.39 | ) | | | (0.58 | ) | | | (1.62 | ) | | | (0.20 | ) | | | — | |
| | |
| | |
| | |
| | |
| | |
| | |
| |
Paid-in Capital from Redemption Fees4 | | | 0.00 | 5 | | | 0.00 | 5 | | | 0.00 | 5 | | | 0.00 | 5 | | | 0.03 | | | | 0.00 | 5 |
| | |
| | |
| | |
| | |
| | |
| | |
| |
Net Increase (Decrease) in Net Asset Value | | | (2.84 | ) | | | 1.37 | | | | 1.15 | | | | (0.14 | ) | | | (0.07 | ) | | | 3.84 | |
| | |
| | |
| | |
| | |
| | |
| | |
| |
Net Asset Value – End of Period | | $ | 10.50 | | | $ | 13.34 | | | $ | 11.97 | | | $ | 10.82 | | | $ | 10.96 | | | $ | 11.03 | |
| | |
| | |
| | |
| | |
| | |
| | |
| |
| Total Investment Return6 | | | (12.95)% | (A) | | | 15.18% | | | | 16.40% | | | | 14.51% | | | | 1.17% | | | | 53.41% | |
| Ratios to Average Net Assets: | | | | | | | | | | | | | | | | | | | | | | | | |
Expenses After Waivers and Related Reimbursements2 | | | 1.81% | (B) | | | 1.70% | | | | 1.87% | | | | 1.94% | | | | 1.95% | | | | 1.94% | |
Expenses Before Waivers and Related Reimbursements | | | 1.87% | (B) | | | 1.70% | | | | 1.92% | | | | 2.74% | | | | 3.21% | | | | 4.61% | |
Net Investment Loss After Waivers and Related Reimbursements2 | | | (0.51)% | (B) | | | (0.41)% | | | | (0.60)% | | | | (0.77)% | | | | (1.23)% | | | | (1.11)% | |
Net Investment Loss Before Waivers and Related Reimbursements | | | (0.57)% | (B) | | | (0.41)% | | | | (0.65)% | | | | (1.57)% | | | | (2.49)% | | | | (3.78)% | |
| Supplementary Data: | | | | | | | | | | | | | | | | | | | | | | | | |
Portfolio Turnover Rate | | | 76% | (A) | | | 229% | | | | 108% | | | | 100% | | | | 99% | | | | 146% | |
Net Assets at End of Period (in thousands) | | $ | 19,791 | | | $ | 40,935 | | | $ | 39,407 | | | $ | 14,810 | | | $ | 6,608 | | | $ | 6,170 | |
|
1 | | Calculated based on shares outstanding on the first and last day of the respective periods, except for dividends and distributions, if any, which are based on the actual shares outstanding on the dates of distributions. |
2 | | Reflects fees waived and reimbursed by FBR Fund Advisers, Inc. pursuant to a contractual expense limitation of 1.95% (excluding interest, taxes, brokerage commissions, extraordinary legal expenses, or any other extraordinary expenses). |
3 | | The amounts shown for a share outstanding throughout the respective periods may not be in accordance with the changes in the aggregate gains and losses on investments during the respective periods because of the timing of sales and repurchases of Fund shares in relation to fluctuating net asset values during the respective periods. |
4 | | Calculated based on average shares outstanding. |
5 | | Less than $0.01 |
6 | | Total investment return is calculated assuming a purchase of shares on the first day and a sale on the last day of each period reported and will include reinvestment of dividends and distributions, if any. |
| (A) | | Not Annualized |
| (B) | | Annualized |
89
| The FBR Funds |
|
| Financial Highlights (continued) |
| | | FBR Gas Utility Index Fund |
| | |
|
| | | For the | | | | | | | | | | | | | | | | | | | | | | | | |
| | | Six Months | | | | | | | | | | | | | | | | | | For the | | For the |
| | | Ended | | | | | | | | | | | | | | | | | | Period | | Year |
| | | April 30, | | For the Years Ended October 31, | | Ended | | Ended |
| | | 2008 | |
| | October 31, | | March 31, |
| | | (unaudited) | | 2007 | | | 2006 | | | 2005 | | | 2004 | | | 2003* | | 2003 |
| | |
| |
| | |
| | |
| | |
| | |
| |
|
| Per Share Operating Performance: | | | | | | | | | | | | | | | | | | | | | | | | | | | | |
Net Asset Value – Beginning of Period | | $ | 23.14 | | | $ | 19.48 | | | $ | 17.25 | | | $ | 14.67 | | | $ | 12.51 | | | $ | 10.41 | | | $ | 15.53 | |
| | |
| | |
| | |
| | |
| | |
| | |
| | |
| |
Income (Loss) from Investment Operations: | | | | | | | | | | | | | | | | | | | | | | | | | | | | |
Net Investment Income1,2 | | | 0.24 | | | | 0.47 | | | | 0.50 | | | | 0.52 | | | | 0.38 | | | | 0.20 | | | | 0.43 | |
Net Realized and Unrealized Gain (Loss) on Investments1,3 | | | (1.22 | ) | | | 3.67 | | | | 2.34 | | | | 2.47 | | | | 2.17 | | | | 2.08 | | | | (5.12 | ) |
| | |
| | |
| | |
| | |
| | |
| | |
| | |
| |
Total from Investment Operations | | | (0.98 | ) | | | 4.14 | | | | 2.84 | | | | 2.99 | | | | 2.55 | | | | 2.28 | | | | (4.69 | ) |
| | |
| | |
| | |
| | |
| | |
| | |
| | |
| |
Distributions to Shareholders: | | | | | | | | | | | | | | | | | | | | | | | | | | | | |
From Net Investment Income | | | (0.21 | ) | | | (0.48 | ) | | | (0.61 | ) | | | (0.41 | ) | | | (0.39 | ) | | | (0.18 | ) | | | (0.43 | ) |
From Net Realized Gain | | | (1.75 | ) | | | — | | | | — | | | | — | | | | — | | | | — | | | | — | |
| | |
| | |
| | |
| | |
| | |
| | |
| | |
| |
Total Distributions | | | (1.96 | ) | | | (0.48 | ) | | | (0.61 | ) | | | (0.41 | ) | | | (0.39 | ) | | | (0.18 | ) | | | (0.43 | ) |
| | |
| | |
| | |
| | |
| | |
| | |
| | |
| |
Paid-in Capital from Redemption Fees4 | | | 0.00 | 5 | | | 0.00 | 5 | | | 0.00 | 5 | | | 0.00 | 5 | | | 0.00 | 5 | | | 0.00 | 5 | | | — | |
| | |
| | |
| | |
| | |
| | |
| | |
| | |
| |
Net Increase (Decrease) in Net Asset Value | | | (2.94 | ) | | | 3.66 | | | | 2.23 | | | | 2.58 | | | | 2.16 | | | | 2.10 | | | | (5.12 | ) |
| | |
| | |
| | |
| | |
| | |
| | |
| | |
| |
Net Asset Value – End of Period | | $ | 20.20 | | | $ | 23.14 | | | $ | 19.48 | | | $ | 17.25 | | | $ | 14.67 | | | $ | 12.51 | | | $ | 10.41 | |
| | |
| | |
| | |
| | |
| | |
| | |
| | |
| |
| Total Investment Return6 | | | (4.41)% | (A) | | | 21.51% | | | | 16.84% | | | | 20.48% | | | | 20.63% | | | | 21.98% | (A) | | | (30.40)% | |
| Ratios to Average Net Assets: | | | | | | | | | | | | | | | | | | | | �� | | | | | | | | |
Expenses After Waivers2 | | | 0.70% | (B) | | | 0.75% | | | | 0.80% | | | | 0.80% | | | | 0.85% | | | | 0.85% | (B) | | | 0.85% | |
Expenses Before Waivers | | | 0.70% | (B) | | | 0.75% | | | | 0.80% | | | | 0.80% | | | | 0.88% | | | | 0.87% | (B) | | | 0.86% | |
Net Investment Income After Waivers2 | | | 2.31% | (B) | | | 2.21% | | | | 2.69% | | | | 3.18% | | | | 2.90% | | | | 3.02% | (B) | | | 3.58% | |
Net Investment Income Before Waivers | | | 2.31% | (B) | | | 2.21% | | | | 2.69% | | | | 3.18% | | | | 2.87% | | | | 3.00% | (B) | | | 3.57% | |
| Supplementary Data: | | | | | | | | | | | | | | | | | | | | | | | | | | | | |
Portfolio Turnover Rate | | | 8% | (A) | | | 22% | | | | 16% | | | | 20% | | | | 34% | | | | 5% | (A) | | | 39% | |
Net Assets at End of Period (in thousands) | | $ | 264,934 | | | $ | 285,951 | | | $ | 270,031 | | | $ | 295,804 | | | $ | 220,545 | | | $ | 184,818 | | | $ | 145,663 | |
|
* | | Effective April 1, 2003, the Fund’s fiscal year end was changed to October 31. |
1 | | Calculated based on shares outstanding on the first and last day of the respective periods, except for dividends and distributions, if any, which are based on the actual shares outstanding on the dates of distributions. |
2 | | Reflects fees waived by FBR Fund Advisers, Inc. pursuant to a contractual expense limitation of 0.85% (excluding interest, taxes, brokerage commissions, extraordinary legal expenses, or any other extraordinary expenses). |
3 | | The amounts shown for a share outstanding throughout the respective periods may not be in accordance with the changes in the aggregate gains and losses on investments during the respective periods because of the timing of sales and repurchases of Fund shares in relation to fluctuating net asset values during the respective periods. |
4 | | Calculated based on average shares outstanding. |
5 | | Less than $0.01 |
6 | | Total investment return is calculated assuming a purchase of shares on the first day and a sale on the last day of each period reported and will include reinvestment of dividends and distributions, if any. |
| (A) | | Not Annualized |
| (B) | | Annualized |
90
| The FBR Funds |
|
| Financial Highlights (continued) |
| | | | FBR Fund for Government Investors |
| | | |
|
| | | | For the | | | | | | | | | | | | | | | | | | | | | | | | |
| | | | Six Months | | | | | | | | | | | | | | For the | | | | | | | | |
| | | | Ended | | For the Years | | Period | | For the Years Ended |
| | | | April 30, | | Ended October 31, | | Ended | | December 31, |
| | | | 2008 | |
| | October 31, | |
|
| | | | (unaudited) | | 2007 | | 2006 | | 2005 | | 2004* | | 2003 | | 2002 |
| | | |
| |
| |
| |
| |
| |
| |
|
| Per Share Operating Performance: | | | | | | | | | | | | | | | | | | | | | | | | | | | | | |
Net Asset Value – Beginning of Period | | | $ | 1.00 | | | $ | 1.00 | | | $ | 1.00 | | | $ | 1.00 | | | $ | 1.00 | | | $ | 1.00 | | | $ | 1.00 | |
| | | |
| | |
| | |
| | |
| | |
| | |
| | |
| |
Income from Investment Operations: | | | | | | | | | | | | | | | | | | | | | | | | | | | | | |
Net Investment Income1,2 | | | | 0.02 | | | | 0.04 | | | | 0.04 | | | | 0.02 | | | | (0.00 | )3 | | | 0.00 | 3 | | | 0.01 | |
Net Realized Loss on Investments1,4 | | | | — | | | | — | | | | (0.00 | )3 | | | (0.00 | )3 | | | (0.00 | )3 | | | (0.00 | )3 | | | — | |
| | | |
| | |
| | |
| | |
| | |
| | |
| | |
| |
Total From Investment Operations | | | | 0.02 | | | | 0.04 | | | | 0.04 | | | | 0.02 | | | | 0.00 | 3 | | | 0.00 | 3 | | | 0.01 | |
| | | |
| | |
| | |
| | |
| | |
| | |
| | |
| |
Distributions to Shareholders: | | | | | | | | | | | | | | | | | | | | | | | | | | | | | |
From Net Investment Income | | | | (0.02 | ) | | | (0.04 | ) | | | (0.04 | ) | | | (0.02 | ) | | | (0.00 | )3 | | | (0.00 | )3 | | | (0.01 | ) |
| | | |
| | |
| | |
| | |
| | |
| | |
| | |
| |
Net Asset Value – End of Period | | | $ | 1.00 | | | $ | 1.00 | | | $ | 1.00 | | | $ | 1.00 | | | $ | 1.00 | | | $ | 1.00 | | | $ | 1.00 | |
| | | |
| | |
| | |
| | |
| | |
| | |
| | |
| |
| Total Investment Return5 | | | | 1.59 | %(A) | | | 4.46 | % | | | 3.89 | % | | | 1.96 | % | | | 0.42 | %(A) | | | 0.42 | % | | | 1.03 | % |
| Ratios to Average Net Assets: | | | | | | | | | | | | | | | | | | | | | | | | | | | | | |
Expenses After Waivers2 | | | | 0.82 | %(B) | | | 0.83 | % | | | 0.85 | % | | | 0.76 | % | | | 0.75 | %(B) | | | 0.75 | % | | | 0.75 | % |
Expenses Before Waivers | | | | 0.82 | %(B) | | | 0.83 | % | | | 0.85 | % | | | 0.86 | % | | | 0.85 | %(B) | | | 0.82 | % | | | 0.75 | % |
Net Investment Income After Waivers2 | | | | 3.29 | %(B) | | | 4.37 | % | | | 3.81 | % | | | 1.92 | % | | | 0.50 | %(B) | | | 0.43 | % | | | 1.03 | % |
Net Investment Income Before Waivers | | | | 3.29 | %(B) | | | 4.37 | % | | | 3.81 | % | | | 1.82 | % | | | 0.40 | %(B) | | | 0.36 | % | | | 1.03 | % |
| Supplementary Data: | | | | | | | | | | | | | | | | | | | | | | | | | | | | | |
Net Assets at End of Period (in thousands) | | | $ | 120,407 | | | $ | 181,040 | | | $ | 211,171 | | | $ | 251,675 | | | $ | 288,761 | | | $ | 341,413 | | | $ | 454,247 | |
|
| * | | Effective March 1, 2004, the Fund’s fiscal year end changed to October 31. |
| 1 | | Calculated based on shares outstanding on the first and last day of the respective periods, except for dividends and distributions, if any, which are based on the actual shares outstanding on the dates of distributions. |
| 2 | | Prior to November 1, 2005, reflects fees waived by FBR Fund Adviser, Inc. pursuant to a contractual advisory fee waiver of 0.10% (excluding interest, taxes, brokerage commissions, extraordinary legal expenses, or any other extraordinary expenses). |
| 3 | | Less than $0.01 |
| 4 | | The amounts shown for a share outstanding throughout the respective periods may not be in accordance with the changes in the aggregate gains and losses in investments during the respective periods because of the timing of sales and repurchases of Fund shares in relation to fluctuating net asset values during the respective periods. |
| 5 | | Total investment return is calculated assuming a purchase of shares on the first day and a sale on the last day of each period reported and will include reinvestment of dividends and distributions, if any. |
| (A) | | Not Annualized |
| (B) | | Annualized |
| | | |
| The accompanying notes are an integral part of the financial statements. |
| | | |
| 91 |
| The FBR Funds |
|
| Schedule of Shareholder Expenses |
| (unaudited) |
As a shareholder of the Funds, you incur two types of costs: (1) transaction costs, including reinvested dividends or other distributions; redemption fees; and exchange fees; and (2) ongoing costs, including investment advisory fees; distribution (12b-1) fees; and other Fund expenses. This example is intended to help you understand your ongoing costs (in dollars) of investing in the Funds and to compare these costs with the ongoing costs of investing in other mutual funds.
The example is based on an investment of $1,000 invested at the beginning of the period and held for the entire period (November 1, 2007 through April 30, 2008).
Actual Expenses
The first line of the table on the following page provides information about actual account values and actual expenses. You may use the information in this line, together with the amount you invested, to estimate the expenses that you paid over the period. Simply divide your account value by $1,000 (for example, an $8,600 account value divided by $1,000 = 8.6), then multiply the result by the number in the first line under the heading entitled “Expenses Paid During the Six Months Ended April 30, 2008” to estimate the expenses you paid on your account during this period.
Hypothetical Example for Comparison Purposes
The second line of the table on the following page provides information about hypothetical account values and hypothetical expenses based on the Funds’ actual expense ratio and an assumed rate of return of 5% per year before expenses, which is not the Funds’ actual return. The hypothetical account values and expenses may not be used to estimate the actual ending account balance or expenses you paid for the period. You may use this information to compare the ongoing costs of investing in the Funds and other funds. To do so, compare this 5% hypothetical example with the 5% hypothetical examples that appear in the shareholder reports of the other funds.
92
| The FBR Funds |
|
| Schedule of Shareholder Expenses (continued) |
| (unaudited) |
| | | | | | | | | | | | | | | Expenses Paid |
| | | Net Expense | | Beginning | | Ending | | During the |
| | | Ratio | | Account | | Account | | Six Months |
| | | Annualized | �� | Value | | Value | | Ended |
| | | April 30, 2008 | | November 1, 2007 | | April 30, 2008 | | April 30, 2008* |
| | |
| |
| |
| |
|
| Pegasus Fund | | | | | | | | | | | | | | | | |
Actual | | | 1.95 | % | | $ | 1,000.00 | | | $ | 943.80 | | | $ | 9.43 | |
Hypothetical | | | 1.95 | | | | 1,000.00 | | | | 1,015.16 | | | | 9.77 | |
| Pegasus Mid Cap Fund | | | | | | | | | | | | | | | | |
Actual | | | 1.95 | | | | 1,000.00 | | | | 975.70 | | | | 9.58 | |
Hypothetical | | | 1.95 | | | | 1,000.00 | | | | 1,015.16 | | | | 9.77 | |
| Pegasus Small Cap Fund | | | | | | | | | | | | | | | | |
Actual | | | 1.95 | | | | 1,000.00 | | | | 903.10 | | | | 9.23 | |
Hypothetical | | | 1.95 | | | | 1,000.00 | | | | 1,015.16 | | | | 9.77 | |
| Pegasus Small Cap Growth Fund | | | | | | | | | | | | | | | | |
Actual | | | 1.95 | | | | 1,000.00 | | | | 837.30 | | | | 8.91 | |
Hypothetical | | | 1.95 | | | | 1,000.00 | | | | 1,015.16 | | | | 9.77 | |
| Focus Fund | | | | | | | | | | | | | | | | |
Actual | | | 1.44 | | | | 1,000.00 | | | | 874.40 | | | | 6.71 | |
Hypothetical | | | 1.44 | | | | 1,000.00 | | | | 1,017.70 | | | | 7.22 | |
| Large Cap Financial Fund | | | | | | | | | | | | | | | | |
Actual | | | 1.92 | | | | 1,000.00 | | | | 923.90 | | | | 9.18 | |
Hypothetical | | | 1.92 | | | | 1,000.00 | | | | 1,015.32 | | | | 9.62 | |
| Small Cap Financial Fund | | | | | | | | | | | | | | | | |
Actual | | | 1.52 | | | | 1,000.00 | | | | 963.00 | | | | 7.41 | |
Hypothetical | | | 1.52 | | | | 1,000.00 | | | | 1,017.31 | | | | 7.62 | |
| Technology Fund | | | | | | | | | | | | | | | | |
Actual | | | 1.81 | | | | 1,000.00 | | | | 870.50 | | | | 8.42 | |
Hypothetical | | | 1.81 | | | | 1,000.00 | | | | 1,015.86 | | | | 9.07 | |
| Gas Utility Index Fund | | | | | | | | | | | | | | | | |
Actual | | | 0.70 | | | | 1,000.00 | | | | 955.90 | | | | 3.40 | |
Hypothetical | | | 0.70 | | | | 1,000.00 | | | | 1,021.38 | | | | 3.52 | |
| Fund for Government Investors | | | | | | | | | | | | | | | | |
Actual | | | 0.82 | | | | 1,000.00 | | | | 1,015.90 | | | | 4.11 | |
Hypothetical | | | 0.82 | | | | 1,000.00 | | | | 1,020.78 | | | | 4.12 | |
|
| * | Expenses are equal to the Fund’s annualized expense ratio, multiplied by the average account value over the period, multiplied by the number of days in most recent fiscal half-year then divided by 366. |
| | |
| 93 |
| The FBR Funds |
|
| Notes to Financial Statements |
| (unaudited) |
1. Organization
The FBR Funds (the “Trust”) is registered under the Investment Company Act of 1940, as amended, (“1940 Act”) as an open-end management investment company. The Trust was organized as a business trust under the laws of the State of Delaware on September 29, 2003. The Trust currently consists of ten series which represent interests in one of the following investment portfolios: FBR Pegasus FundTM (“Pegasus Fund”), FBR Pegasus Mid Cap FundTM (“Pegasus Mid Cap Fund”), FBR Pegasus Small Cap FundTM (“Pegasus Small Cap Fund”), FBR Pegasus Small Cap Growth FundTM (“Pegasus Small Cap Growth Fund”) (formerly FBR Small Cap Technology Fund), FBR Focus Fund (“Focus Fund”), FBR Large Cap Financial Fund (“Large Cap Financial Fund”), FBR Small Cap Financial Fund (“Small Cap Financial Fund”), FBR Technology Fund (“Technology Fund”) (formerly FBR Large Cap Technology Fund), FBR Gas Utility Index Fund (“Gas Utility Index Fund”) and FBR Fund for Government Investors (“Money Market Fund”), (each a “Fund” and collectively, the “Funds”). The Trust is authorized to issue an unlimited number of shares of beneficial interest with no par value which may be issued in more than one class or series. As of April 30, 2008, each Fund offers one class of shares, which is offered as no-load shares. Effective May 30, 2008, certain of the Funds began offering new share classes: R Class shares intended for retirement investors and I Class shares intended for institutional investors. The initial class of shares are now referred to as Investor Class.
The Pegasus Fund, a non-diversified fund, intends to invest in the stocks of companies of any size without regard to market capitalization. The investment objective of the Fund is capital appreciation.
The Pegasus Mid Cap Fund, a non-diversified fund, intends to invest, under normal circumstances, at least 80% of its net assets plus the amount of any borrowings for investment purposes in securities of mid capitalization (“mid-cap”) companies. The investment objective of the Fund is capital appreciation.
The Pegasus Small Cap Fund, a non-diversified fund, intends to invest, under normal circumstances, at least 80% of its net assets plus the amount of any borrowings for investment purposes in securities of small capitalization (“small-cap”) companies. The investment objective of the Fund is capital appreciation.
The Pegasus Small Cap Growth Fund, a non-diversified fund, intends to invest, under normal circumstances, at least 80% of its net assets plus the amount of any borrowings for investment purposes in securities of small-cap companies. Prior to May 1, 2008, the Fund invested, under normal circumstances, at least 80% of its net assets in securities of small-cap companies that were principally engaged in the research, design, development, manufacturing or distributing products or services in the technology industry. The investment objective of the Fund is long-term capital appreciation.
The Focus Fund, a non-diversified fund, intends to invest, under normal circumstances primarily in securities of companies traded in domestic markets. The investment objective of the Fund is capital appreciation.
94
| The FBR Funds |
|
| Notes to Financial Statements (continued) |
| (unaudited) |
The Large Cap Financial Fund, a non-diversified fund, intends to invest, under normal circumstances, at least 80% of its net assets plus the amount of any borrowings for investment purposes in securities of large capitalization (“large-cap”) companies principally engaged in the business of financial services including, but not limited to, commercial banks, savings and loan associations, consumer and industrial finance companies, securities brokerage companies, insurance companies, real estate and leasing companies, holding companies for each of the foregoing types of business, or companies that combine some or all of these businesses. The investment objective of the Fund is capital appreciation.
The Small Cap Financial Fund, a non-diversified fund, intends to invest, under normal circumstances, at least 80% of its net assets plus the amount of any borrowings for investment purposes in securities of small-cap companies principally engaged in the business of providing financial services to consumers and industry. The investment objective of the Fund is capital appreciation.
The Technology Fund, a non-diversified fund, intends to invest, under normal circumstances, at least 80% of its net assets plus the amount of any borrowings for investment purposes in securities of companies that are principally engaged in the research, design, development, manufacturing or distributing products or services in the technology industry. The investment objective of the Fund is long-term capital appreciation.
The Gas Utility Index Fund, a diversified fund, intends to invest, under normal circumstances, at least 85% of its net assets in the common stock of companies that have natural gas distribution and transmission operations. The investment objective of the Fund is income and capital appreciation.
The Money Market Fund, a diversified fund, intends to invest, under normal circumstances, at least 95% of its total assets in fixed-rate and floating-rate short-term instruments issued or guaranteed by the U.S. Government, its agencies or instrumentalities and in repurchase agreements secured by such instruments. The investment objective of the Fund is current income consistent with liquidity and preservation of capital.
2. Significant Accounting Policies
The following is a summary of the Funds’ significant accounting policies:
Portfolio Valuation — The net asset value per share (“NAV”) of each Fund is determined as of the close of regular trading on the New York Stock Exchange (“NYSE”) (normally 4:00 p.m., Eastern Time) on each business day that the exchange is open for trading. Each Fund’s securities are valued at the last sale price on the securities exchange or national securities market on which such securities are primarily traded. Securities that are quoted by NASDAQ are valued at the NASDAQ Official Closing Price. Securities not listed on an exchange or national securities market, or securities in which there were no transactions, are valued at the average of the most recent bid and ask prices, except in the case of open short positions where the ask price is used for valuation purposes. The bid price is used when no ask price is available. Short-term investments are carried at amortized cost, which approximates market value. Restricted securities, as well as securities or other assets for
95
| The FBR Funds |
|
| Notes to Financial Statements (continued) |
| (unaudited) |
which market quotations are not readily available, or are not valued by a pricing service approved by the Funds’ Board of Trustees (the “Board”), are valued at fair value in good faith by, or at the direction of, the Board.
In September 2006, the Financial Accounting Standards Board (FASB) issued Statement on Financial Accounting Standards (SFAS) No. 157, “Fair Value Measurements.” This standard establishes a single authoritative definition of fair value, sets out a framework for measuring fair value and requires additional disclosures about fair value measurements. SFAS No. 157 applies to fair value measurements already required or permitted by existing standards. SFAS No. 157 is effective for financial statements issued for fiscal years beginning after November 15, 2007 and interim periods within those fiscal years. The changes to current generally accepted accounting principles from the application of this Statement relate to the definition of fair value, the methods used to measure fair value, and the expanded disclosures about fair value measurements. As of April 30, 2008, the Funds do not believe the adoption of SFAS No. 157 will impact the amounts reported in the financial statements, however, additional disclosures may be required about the inputs used to develop the measurements and the effect of certain of the measurements reported on the statement of changes in net assets for a fiscal period.
Share Valuation — The NAV of each Fund is calculated by dividing the sum of the value of the securities held by each Fund, plus cash or other assets, minus all liabilities (including estimated accrued expenses) by the total number of shares outstanding of each Fund, rounded to the nearest cent. Each Fund’s shares will not be priced on the days on which the NYSE is closed for trading. The offering and redemption price per share of each Fund is equal to each Fund’s NAV. The Funds, except for the Money Market Fund, charge a 1% redemption fee on shares redeemed or exchanged within 90 days of purchase. These fees are deducted from the redemption proceeds otherwise payable to the shareholder. The Funds will retain the fee charged as paid-in capital and such fees become part of that Fund’s daily NAV calculation.
Investment Income — Dividend income is recorded on the ex-dividend date. Interest income, which includes the amortization of premium and accretion of discount, if any, is recorded on an accrual basis.
Expenses — The Funds pay all operational expenses, which are either charged directly to a Fund for which the expense is attributable or are allocated proportionately among the Funds based on allocation methods approved by the Board.
Distributions to Shareholders — Each Fund, except the Gas Utility Index Fund and Money Market Fund, declares and pays any dividends from its net investment income, if any, annually. The Gas Utility Index Fund declares and pays any such dividends quarterly. The Money Market Fund declares dividends each day the Fund is open for business and pays monthly. Distributions from net realized capital gains, if any, will be distributed at least annually for each Fund. Income and capital gain distributions are determined in accordance with U.S. federal income tax regulations.
96
| The FBR Funds |
|
| Notes to Financial Statements (continued) |
| (unaudited) |
Security Transactions — Security transactions are accounted for on the trade date. Securities sold are determined on a specific identification basis.
Estimates — The preparation of financial statements in accordance with U.S. generally accepted accounting principles requires management to make estimates and assumptions that may affect the reported amounts of assets and liabilities and disclosure of contingent assets and liabilities at the date of the financial statements and the reported amounts of income and expenses during the reporting period. Actual results could differ from those estimates.
Options — Each Fund, except the Gas Utility Index Fund and Money Market Fund, may buy and sell call and put options to hedge against changes in net asset value or to attempt to realize a greater current return. The risk associated with purchasing an option is that a Fund pays a premium whether or not the option is exercised. Additionally, a Fund bears the risk of loss of premium and change in market value should the counterparty not perform under the contract. Put and call options purchased are accounted for in the same manner as portfolio securities. The cost of securities acquired through the exercise of call options is increased by the premiums paid. The proceeds from securities sold through the exercise of put options are decreased by the premiums paid. When a Fund writes an option, an amount equal to the premium received by the Fund is recorded as a liability and is subsequently adjusted to the current market value of the option written. Premiums received from writing options which expire unexercised are recorded by a Fund on the expiration date as realized gains from option transactions.
The difference between the premium and the amount paid on effecting a closing purchase transaction, including brokerage commissions, is also treated as a realized gain, or if the premium is less than the amount paid for the closing purchase transaction, as a realized loss. If a call option is exercised, the premium is added to the proceeds from the sale of the underlying securities in determining whether a Fund has a realized gain or loss. If a put option is exercised, the premium reduces the cost basis of the securities purchased by a Fund. Each Fund’s use of written options involves, to varying degrees, elements of market risk in excess of the amount recognized in the Statement of Assets and Liabilities. The contract or notional amounts reflect the extent of a Fund’s involvement in these financial instruments. In writing an option, a Fund bears the market risk of an unfavorable change in the price of the security underlying the written option. Exercise of an option written by a Fund could result in a Fund selling or buying a security at a price different from the current market value. A Fund’s activities in written options are conducted through regulated exchanges, which do not result in counterparty credit risks. The Funds had no outstanding options at April 30, 2008.
Repurchase Agreements — The Funds have agreed to purchase securities from financial institutions subject to the seller’s agreement to repurchase them at an agreed-upon time and price (“repurchase agreement”). The financial institutions with whom each Fund enters into repurchase agreements are banks and broker/dealers which the adviser considers creditworthy pursuant to criteria approved by the Board. The seller under a repurchase agreement will be required to maintain the value of the securities as collateral, subject to the agreement at not less than the repurchase price plus accrued interest. The
97
| The FBR Funds |
|
| Notes to Financial Statements (continued) |
| (unaudited) |
adviser marks to market daily the value of the collateral, and, if necessary, requires the seller to maintain additional securities, to ensure that the value is not less than the repurchase price. Default by or bankruptcy of the seller would, however, expose each Fund to possible loss because of adverse market action or delays in connection with the disposition of the underlying securities.
Securities Lending — Each Fund may lend its portfolio securities to broker-dealers, banks or institutional borrowers of securities. Loans of securities are required at all times to be secured by collateral equal to at least 100% of the market value of the securities on loan. However, in the event of default or bankruptcy by the other party to the agreement, realization and/or retention of the collateral may be subject to legal proceedings. In the event that the borrower fails to return securities, and cash collateral being maintained by the borrower is insufficient to cover the value of loaned securities and provided such collateral insufficiency is not the result of investment losses, the lending agent has agreed to pay the amount of the shortfall to the Funds. The Funds had no securities on loan at April 30, 2008.
Line of Credit — The Trust had a line of credit (“Credit Agreement”) with Custodial Trust Company (“CTC”) for temporary or emergency purposes. Under the Credit Agreement, CTC provided a line of credit in an amount up to the maximum amount permitted under the 1940 Act and each Fund’s prospectus. Pursuant to the Credit Agreement, each participating Fund was liable only for principal and interest payments related to borrowings made by that Fund. Borrowings under the Credit Agreement bear interest at 100 basis points (100 basis points = 1%) over the LIBOR (London Inter-Bank Offer Rate). For the six months ended April 30, 2008, the Funds had no borrowings outstanding.
3. Transactions with Affiliates
Investment Adviser — FBR Fund Advisers, Inc. (“Fund Advisers”) serves as investment adviser to the Funds. For its advisory services, Fund Advisers receives a monthly fee at an annual rate of 0.90% of the average daily net assets of the Pegasus Fund, Pegasus Mid Cap Fund, Pegasus Small Cap Fund, Pegasus Small Cap Growth Fund, Focus Fund, Large Cap Financial Fund, Small Cap Financial Fund, and Technology Fund, at an annual rate of 0.40% of the average daily net assets of the Gas Utility Index Fund. The Money Market Fund pays a management fee at an annual rate based on the Fund’s average daily net assets of 0.50% on the first $500 million, 0.45% on the next $250 million, 0.40% on the next $250 million, and 0.35% on net assets over $1 billion.
Fund Advisers has contractually agreed to limit each Fund’s total operating expenses to 1.95% of each Fund’s average daily net assets, except for the Gas Utility Index Fund and Money Market Fund, which Fund Advisers has contractually agreed to limit total operating expenses to 0.85% and 1.00% of average daily net assets, respectively (excluding interest, taxes, brokerage commissions, dividend expenses, acquired fund fees and expenses, extraordinary legal expenses, or any other extraordinary expenses). Fund Advisers has contractually agreed to maintain these limitations with regard to each Fund through October 31, 2011.
98
| The FBR Funds |
|
| Notes to Financial Statements (continued) |
| (unaudited) |
Effective May 30, 2008, in regards to the Investor Class, Fund Advisers has contractually agreed to limit the total operating expenses to 1.25% for the Pegasus Fund; 1.35% for the Pegasus Mid Cap Fund; 1.45% for the Pegasus Small Cap Fund and the Pegasus Small Cap Growth Fund. Fund Advisers has agreed to maintain these limitations with regard to each Fund through October 31, 2011.
Administrator — JPMorgan Chase Bank N.A. (“JPMorgan”) serves as the administrator to the Funds and provides pursuant to an Administration Agreement (“Agreement”) day-to-day administrative services including monitoring portfolio compliance, determining compliance with provisions of the Internal Revenue Code and preparing the Funds’ registration statements. Pursuant to the Agreement, JPMorgan receives a fee of 0.02% of the first $2.5 billion of average daily net assets of the Trust, 0.0175% of the next $2.5 billion of average daily net assets of the Trust and 0.015% of the Trust’s average daily net assets in excess of $5 billion.
Pursuant to the Administrative Services Agreement, the Adviser also provides administrative services to the Funds including oversight of service providers. The Adviser receives 0.02% of average daily net assets of the Trust. The Adviser also provides the Funds with office space, facilities and business equipment and generally administers the Funds’ business affairs and provides the services of executive and clerical personnel for administering the affairs of the Funds. The Adviser compensates all personnel, Officers, and Trustees of the Funds if such persons are employees of the Adviser. For the six months ended April 30, 2008, JPMorgan earned $210,741 and Fund Advisers earned $188,544 in Administrator fees.
Plan of Distribution — The Trust, on behalf of each Fund, except the Gas Utility Index Fund and Money Market Fund, has adopted a Distribution Plan (the “Plan”) pursuant to Rule 12b-1 under the 1940 Act. Under the Plan, each Fund may pay FBR Investment Services, Inc. (the “Distributor”) a fee at an annual rate of up to 0.25% of each Fund’s average daily net assets. Fees paid to the Distributor under the Plan are payable without regard to actual expenses incurred.
Brokerage Commissions — For the six months ended April 30, 2008, the Small Cap Financial Fund and the Large Cap Financial Fund paid $12,766 and $200, respectively, in brokerage commissions from portfolio transactions to Friedman, Billings, Ramsey and Co., Inc. (FBR & Co.), an affiliate of Fund Advisers and the Distributor. No other Fund paid commissions to FBR & Co. during the period.
Trustees’ Fees — Each Trustee of the Trust who is not an employee of Fund Advisers or an affiliate of Fund Advisers receives an annual retainer fee of $25,000 and an additional meeting fee of $2,500 for each regular meeting attended. In addition, each Trustee that serves on the Audit Committee or Nominating Committee receives a meeting fee of $1,000 for attendance at the meeting. If a Trustee participates by teleconference, the meeting fee is $1,000. The Chairman of the Board, an independent Trustee, receives an additional $2,000 for each meeting attended, and the Audit Committee Chairman receives an additional $1,000 for each committee meeting attended.
99
| The FBR Funds |
|
| Notes to Financial Statements (continued) |
| (unaudited) |
4. Investment Transactions
For the six months ended April 30, 2008, purchases and sales of investment securities (excluding short-term securities and U.S. government obligations) for each Fund were as follows:
| | | Purchases | | Sales |
| | |
| |
|
| Pegasus Fund | | $ | 1,532,678 | | $ | 3,921,651 |
| Pegasus Mid Cap Fund | | | 1,630,438 | | | 1,153,120 |
| Pegasus Small Cap Fund | | | 4,000,526 | | | 3,537,713 |
| Pegasus Small Cap Growth Fund | | | 838,265 | | | 1,078,096 |
| Focus Fund | | | 152,807,170 | | | 58,681,942 |
| Large Cap Financial Fund | | | 19,543,672 | | | 18,235,413 |
| Small Cap Financial Fund | | | 43,556,860 | | | 53,042,550 |
| Technology Fund | | | 18,328,434 | | | 39,802,888 |
| Gas Utility Index Fund | | | 22,243,102 | | | 25,421,788 |
5. Federal Income Taxes
It is each Fund’s policy to continue to comply with the special provisions of the Internal Revenue Code that are applicable to regulated investment companies. As provided therein, in any fiscal year in which a Fund so qualifies and distributes at least 90% of its taxable net income, the Fund (but not the shareholders) will be relieved of federal income tax on the income distributed. Accordingly, no provision for income taxes has been made.
In order to avoid imposition of the excise tax applicable to regulated investment companies, it is also each Fund’s intention to declare and pay as dividends in each calendar year at least 98% of its net investment income (earned during the calendar year) and 98% of its net realized capital gains (earned during the twelve months ending October 31) plus undistributed amounts from prior years.
Income and capital gain distributions are determined in accordance with income tax regulations that may differ from accounting principles that are generally accepted in the United States of America. As a result, the character of tax-basis distributions and the composition of net assets for tax purposes may differ from those reflected in the Funds’ financial statements. These book/tax differences may be temporary or permanent in nature. Temporary differences are primarily the result of wash sales. Reclassifications for permanent differences are made to components of capital. These reclassifications have no effect on net assets or net asset value per share.
100
| The FBR Funds |
|
| Notes to Financial Statements (continued) |
| (unaudited) |
The tax character of distributions paid for each Fund’s tax year was as follows: |
| | | | | | | | | | | | | | | | | |
| | | Ordinary Income | | Long-Term Capital Gains |
| | |
| |
|
| | | Dollar | | | Per share | | | Dollar | | | Per share | |
| | | Amount | | | Amount | | | Amount | | | Amount | |
| | |
| | |
| | |
| | |
| |
| Pegasus Fund | | | | | | | | | | | | | | | | |
For the Year Ended October 31, 2007 | | $ | 585,158 | | | $ | 0.453075 | | | $ | — | | | $ | — | |
For the Year Ended October 31, 2006 | | | 1,131 | | | | 0.004657 | | | | — | | | | | |
| Pegasus Mid Cap Fund | | | | | | | | | | | | | | | | |
For the Period Ended October 31, 2007 | | | — | | | | — | | | | — | | | | — | |
| Pegasus Small Cap Fund | | | | | | | | | | | | | | | | |
For the Period Ended October 31, 2007 | | | — | | | | — | | | | — | | | | — | |
| Pegasus Small Cap Growth Fund | | | | | | | | | | | | | | | | |
For the Year Ended October 31, 2007 | | | 125,836 | | | | 0.389428 | | | | 41,912 | | | | 0.129706 | |
For the Year Ended October 31, 2006 | | | — | | | | — | | | | — | | | | — | |
| Focus Fund | | | | | | | | | | | | | | | | |
For the Year Ended October 31, 2007 | | | — | | | | — | | | | 2,384,603 | | | | 0.123866 | |
For the Year Ended October 31, 2006 | | | — | | | | — | | | | 14,760,977 | | | | 0.769867 | |
| Large Cap Financial Fund | | | | | | | | | | | | | | | | |
For the Year Ended October 31, 2007 | | | 145,001 | | | | 0.111451 | | | | 2,416,486 | | | | 2.017514 | |
For the Year Ended October 31, 2006 | | | 231,630 | | | | 0.158660 | | | | 3,691,188 | | | | 2.856242 | |
| Small Cap Financial Fund | | | | | | | | | | | | | | | | |
For the Year Ended October 31, 2007 | | | 2,428,021 | | | | 0.225500 | | | | 43,232,104 | | | | 4.275126 | |
For the Year Ended October 31, 2006 | | | 2,080,797 | | | | 0.144159 | | | | 49,145,199 | | | | 3.703541 | |
| Technology Fund | | | | | | | | | | | | | | | | |
For the Year Ended October 31, 2007 | | | 718,645 | | | | 0.202896 | | | | 677,401 | | | | 0.191251 | |
For the Year Ended October 31, 2006 | | | 278,046 | | | | 0.172572 | | | | 654,245 | | | | 0.406063 | |
| Gas Utility Index Fund | | | | | | | | | | | | | | | | |
For the Year Ended October 31, 2007 | | | 6,504,234 | | | | 0.483831 | | | | — | | | | — | |
For the Year Ended October 31, 2006 | | | 9,174,877 | | | | 0.609932 | | | | — | | | | — | |
| Fund for Government Investors | | | | | | | | | | | | | | | | |
For the Year Ended October 31, 2007 | | | 8,612,056 | | | | 0.043674 | | | | — | | | | — | |
For the Year Ended October 31, 2006 | | | 9,042,605 | | | | 0.038269 | | | | — | | | | — | |
| | | | | | | | | | | | | | | | | |
| 101 |
| The FBR Funds |
|
| Notes to Financial Statements (continued) |
| (unaudited) |
| The following information is computed on a tax basis for each item: |
| | | As of October 31, 2007 |
| | |
|
| | | | | | | | | | | | | | | Pegasus | | | | |
| | | Pegasus | | Pegasus | | Pegasus | | Small Cap | | Focus |
| | | Fund | | Mid Cap Fund | | Small Cap Fund | | Growth Fund | | Fund |
| | |
| |
| |
| |
| |
|
| Tax cost of investment | | | | | | | | | | | | | | | | | | | | |
securities | | $ | 10,905,518 | | | $ | 3,221,075 | | | $ | 4,482,194 | | | $ | 4,259,908 | | | $ | 997,494,412 | |
| | |
| | |
| | |
| | |
| | |
| |
| Gross unrealized appreciation | | | 1,531,197 | | | | 386,500 | | | | 649,188 | | | | 1,037,530 | | | | 615,944,604 | |
| Gross unrealized depreciation | | | (214,180 | ) | | | (28,830 | ) | | | (39,295 | ) | | | (25,418 | ) | | | (49,326,388 | ) |
| | |
| | |
| | |
| | |
| | |
| |
| Net unrealized appreciation | | | 1,317,017 | | | | 357,670 | | | | 609,893 | | | | 1,012,112 | | | | 566,618,216 | |
| Undistributed ordinary income | | | 1,210,051 | | | | 45,373 | | | | 18,282 | | | | 166,019 | | | | 2,637,313 | |
| Undistributed long-term capital gains | | | 238 | | | | — | | | | — | | | | 18,288 | | | | 12,515,359 | |
| | |
| | |
| | |
| | |
| | |
| |
| Accumulated earnings | | $ | 2,527,306 | | | $ | 403,043 | | | $ | 628,175 | | | $ | 1,196,419 | | | $ | 581,770,888 | |
| | |
| | |
| | |
| | |
| | |
| |
| | | | | | | | | | | | | | | | | | | | | |
| | | As of October 31, 2007 |
| | |
|
| | | | | | | | | | | | | | | | | | | Fund for |
| | | Large Cap | | Small Cap | | Technology | | Gas Utility | | Government |
| | | Financial Fund | | Financial Fund | | Fund | | Index Fund | | Investors |
| | |
| |
| |
| |
| |
|
| Tax cost of investment | | | | | | | | | | | | | | | | | | | | |
securities | | $ | 15,665,251 | | | $ | 136,163,040 | | | $ | 37,434,170 | | | $ | 141,866,924 | | | $ | 191,027,695 | |
| | |
| | |
| | |
| | |
| | |
| |
| Gross unrealized appreciation | | | 628,857 | | | | 21,345,779 | | | | 4,558,047 | | | | 149,891,226 | | | | — | |
| Gross unrealized depreciation | | | (528,038 | ) | | | (13,373,635 | ) | | | (981,385 | ) | | | (5,985,471 | ) | | | — | |
| | |
| | |
| | |
| | |
| | |
| |
| Net unrealized appreciation | | | 100,819 | | | | 7,972,144 | | | | 3,576,662 | | | | 143,905,755 | | | | — | |
| Undistributed ordinary income | | | 114,124 | | | | 1,319,765 | | | | 2,491,355 | | | | 794,439 | | | | 20,787 | |
| Undistributed long-term | | | | | | | | | | | | | | | | | | | | |
capital gains | | | 2,910,983 | | | | 36,692,650 | | | | 1,036,556 | | | | 20,875,415 | | | | — | |
| Capital loss carryforward | | | — | | | | — | | | | — | | | | — | | | | (189,953 | ) |
| Other temporary differences | | | — | | | | — | | | | — | | | | — | | | | (20,789 | ) |
| | |
| | |
| | |
| | |
| | |
| |
| Accumulated earnings (deficit) | | $ | 3,125,926 | | | $ | 45,984,559 | | | $ | 7,104,573 | | | $ | 165,575,609 | | | $ | (189,955 | ) |
| | |
| | |
| | |
| | |
| | |
| |
| Unused capital loss carryforwards as of October 31, 2007, were as follows: |
| | | Fund for |
| | | Government Investors |
| | |
|
| October 31, 2011 | | | 23,854 | |
| October 31, 2012 | | | 165,106 | |
| October 31, 2013 | | | 970 | |
| October 31, 2014 | | | 23 | |
The capital loss carryforwards may be utilized in the current and future years to offset net realized capital gains, if any, prior to distributing such gains to shareholders.
102
| The FBR Funds |
|
| Notes to Financial Statements (continued) |
| (unaudited) |
The following reclassifications, the result of permanent differences between financial statement and income tax reporting requirements, have been made to the components of capital. These reclassifications have no impact on the net assets or net asset value per share of the Funds.
| | | | | | | Accumulated | | | | |
| | | Undistributed | | Net Realized | | Paid-In |
| | | Income (Loss) | | Gain (Loss) | | Capital |
| | |
| |
| |
|
| Pegasus Fund | | $ | 38,956 | | | $ | (38,956 | ) | | $ | — | |
| Pegasus Mid Cap Fund | | | 8,228 | | | | (8,228 | ) | | | — | |
| Pegasus Small Cap Fund | | | 15,868 | | | | (15,868 | ) | | | — | |
| Pegasus Small Cap Growth Fund | | | 75,527 | | | | (75,527 | ) | | | — | |
| Focus Fund | | | — | | | | (3,140 | ) | | | 3,140 | |
| Small Cap Financial Fund | | | (35,326 | ) | | | 14,688 | | | | 20,638 | |
| Technology Fund | | | 162,292 | | | | (162,292 | ) | | | — | |
On July 13, 2006, the FASB released FASB Interpretation No. 48 “Accounting for Uncertainty in Income Taxes” (FIN 48). FIN 48 provides guidance for how uncertain tax positions should be recognized, measured, presented and disclosed in the financial statements. FIN 48 requires the evaluation of tax positions taken or expected to be taken in the course of preparing the Funds’ tax returns to determine whether the tax positions are “more-likely-than-not” of being sustained by the applicable tax authority. Tax positions not deemed to meet the more-likely-than-not threshold will be required to be recorded as a tax benefit or expense in the current year. Adoption of FIN 48 is required for fiscal years beginning after December 15, 2006 and is to be applied to all open tax years as of the effective date. The Funds have analyzed their tax positions taken on Federal income tax returns for all open tax years (tax years ended December 31, 2004 through 2007) for purposes of implementing FIN 48 and have concluded that no provision for income tax is required in their financial statements.
As of April 30, 2008, the Federal Tax Cost of securities and the resulting net unrealized appreciation (depreciation) are as follows:
| | | | | | | | Gross | | Gross | | Net Unrealized |
| | | | Federal | | Unrealized | | Unrealized | | Appreciation |
| | | | Tax Cost | | Appreciation | | Depreciation | | (Depreciation) |
| | | |
| |
| |
| |
|
| Pegasus Fund | | | $ | 8,415,045 | | | $ | 787,180 | | | $ | (530,718 | ) | | $ | 256,463 | |
| Pegasus Mid Cap Fund | | | | 3,805,178 | | | | 311,147 | | | | (152,919 | ) | | | 158,228 | |
| Pegasus Small Cap Fund | | | | 4,359,306 | | | | 384,799 | | | | (124,957 | ) | | | 259,842 | |
| Pegasus Small Cap Growth Fund | | | | 3,781,929 | | | | 361,143 | | | | (391,857 | ) | | | (30,714 | ) |
| Focus Fund | | | | 787,136,254 | | | | 443,954,091 | | | | (89,892,402 | ) | | | 354,061,689 | |
| Large Cap Financial Fund | | | | 14,664,259 | | | | 513,784 | | | | (254,507 | ) | | | 259,277 | |
| Small Cap Financial Fund | | | | 138,285,610 | | | | 14,322,769 | | | | (4,514,303 | ) | | | 9,808,466 | |
| Technology Fund | | | | 19,759,587 | | | | 1,006,170 | | | | (802,212 | ) | | | 203,957 | |
| Gas Utility Index Fund | | | | 140,764,223 | | | | 132,674,028 | | | | (8,411,850 | ) | | | 124,262,178 | |
| Fund for Government Investors | | | | 118,592,103 | | | | — | | | | — | | | | — | |
| | | | | | | | | | | | | | | | | | |
| 103 |
| The FBR Funds |
|
| Notes to Financial Statements (continued) |
| (unaudited) |
6. Investments in Affiliates
Affiliated issuers, as defined by the 1940 Act, are those in which a Fund’s holdings represent 5% or more of the outstanding voting securities of the issuer. A summary of each Fund’s investments in affiliates, if any, for the six months ended April 30, 2008, is noted below:
| | | SHARE ACTIVITY | | | | | | | | | | | | | | | | |
| | |
| | | | | | | | | | | | | | | | |
| | | Balance | | | | | | | | | | Balance | | Realized | | | | | | Value | | Acquisition |
| Affiliate | | 10/31/07 | | Purchases | | Sales | | 04/30/08 | | Gain | | Dividends | | 04/30/08 | | Cost |
|
| FBR Focus Fund | | | | | | | | | | | | | | | | | | | | | | | | | | | | | | | | |
99 Cents Only Stores | | | 4,045,374 | | | | 1,746,100 | | | | — | | | | 5,791,474 | | | | — | | | | — | | | $ | 55,076,918 | | | $ | 66,728,709 | |
American Woodmark Corp. | | | 845,850 | | | | 54,150 | | | | — | | | | 900,000 | | | | — | | | $ | 162,000 | | | | 16,983,000 | | | | 28,730,843 | |
CSK Auto | | | — | | | | 2,568,614 | | | | — | | | | 2,568,614 | | | | — | | | | — | | | | 30,643,565 | | | | 12,619,497 | |
Dyanmex, Inc. | | | 594,810 | | | | 3,800 | | | | — | | | | 598,610 | | | | — | | | | — | | | | 15,043,069 | | | | 11,258,278 | |
HFF, Inc. | | | 200,000 | | | | 681,700 | | | | — | | | | 881,700 | | | | — | | | | — | | | | 5,545,893 | | | | 6,948,071 | |
Monarch Casino & Resort, Inc. | | | 992,000 | | | | — | | | | — | | | | 992,000 | | | | — | | | | — | | | | 13,134,080 | | | | 4,511,967 | |
7. Commitments and Contingencies
In the normal course of business, the Funds enter into contracts that contain a variety of representations and warranties and which provide general indemnifications. The Funds’ maximum exposure under these arrangements is unknown, as this would involve future claims that may be made against the Funds that have not yet occurred. However, based on experience, the Funds expect the risk of loss to be remote.
104
| The FBR Funds |
|
| Important Supplemental Information |
| (unaudited) |
Proxy Voting Guidelines
Fund Advisers is responsible for exercising the voting rights associated with the securities purchased and held by the Funds. A description of the policies and procedures Fund Advisers uses in fulfilling this responsibility is included in the Funds’ Statement of Additional Information and is available without charge, upon request, by calling 888.888.0025. The policies and procedures are also available on the Securities and Exchange Commission’s (“SEC”) website at http://www.sec.gov. Information on how the Funds voted proxies relating to portfolio securities during the most recent 12 month period ended June 30 is available without charge, upon request, by calling 888.888.0025 and is also available on the SEC’s website at http://www.sec.gov.
Portfolio Holdings
The Funds file their complete schedule of holdings with the SEC for the first and third quarters of each fiscal year on Form N-Q. The Funds’ Form N-Q is available on the SEC’s website at http://www.sec.gov. You may review and make copies at the SEC’s Public Reference Room in Washington, D.C. You may also obtain copies after paying a duplicating fee by writing the SEC’s Public Reference Section, Washington, D.C. 20549-0102 or by electronic request to publicinfo@sec.gov. Information on the operation of the Public Reference Room may be obtained by calling 800.SEC.0330. A copy of the quarterly holdings report is available, without charge, upon request, by calling 888.888.0025.
105
[THIS PAGE INTENTIONALLY LEFT BLANK]
THE FBR FUNDS
888.888.0025
fbrfundsinfo@fbr.com
www.fbrfunds.com
Investment Adviser
FBR FUND ADVISERS, INC.
1001 NINETEENTH STREET NORTH
ARLINGTON, VIRGINIA 22209
Distributor
FBR INVESTMENT SERVICES, INC.
1001 NINETEENTH STREET NORTH
ARLINGTON, VIRGINIA 22209
Transfer Agent
JPMORGAN CHASE BANK, N.A.
P.O. BOX 5354
CINCINNATI, OHIO 45201
Independent Registered Public Accounting Firm
TAIT, WELLER, AND BAKER LLP
1818 MARKET STREET
PHILADELPHIA, PENNSYLVANIA 19103
This report is not authorized
for distribution to prospective
investors unless it is preceded or
accompanied by a current prospectus.
ITEM 2. CODE OF ETHICS.
Not applicable for semiannual reports.
ITEM 3. AUDIT COMMITTEE FINANCIAL EXPERT.
Not applicable for semiannual reports.
ITEM 4. PRINCIPAL ACCOUNTANT FEES AND SERVICES.
Not applicable for semiannual reports.
ITEMS 5. AUDIT COMMITTEE OF LISTED REGISTRANTS.
Not applicable.
ITEM 6. SCHEDULE OF INVESTMENTS.
Contained in Item 1.
ITEM 7. DISCLOSURE OF PROXY VOTING POLICIES AND PROCEDURES FOR CLOSED-END MANAGEMENT INVESTMENT COMPANIES.
Not applicable.
ITEM 8. PORTFOLIO MANAGERS OF CLOSED-END MANAGEMENT INVESTMENT COMPANIES.
Not applicable.
ITEM 9. PURCHASES OF EQUITY SECURITIES BY CLOSED-END MANAGEMENT INVESTMENT COMPANY AND AFFILIATED PURCHASERS.
Not applicable.
ITEM 10. SUBMISSION OF MATTERS TO A VOTE OF SECURITY HOLDERS.
There have been no material changes to the procedures by which shareholders may recommend nominees to the Board.
| ITEM 11. CONTROLS AND PROCEDURES. |
| (a) | | Based upon their evaluation of the Registrant’s disclosure controls and procedures as conducted within 90 days of the filing date of this Form N-CSR, the Registrant’s PFO and PEO have concluded that those disclosure controls and procedures provide reasonable assurance that the material information required to be disclosed by the Registrant in this Form N-CSR has been recorded, processed, summarized and reported within the time periods specified in the Securities and Exchange Commission’s rules and forms. |
| (b) | | There were no changes in the Registrant’s internal controls over financial reporting as defined in Rule 30a-3(d) under the Act (17 CFR 270.30a-3(d)) that occurred during the second fiscal |
| | | half-year of the period covered by this report that has materially affected, or is reasonably likely to materially affect, the Registrant’s internal control over financial reporting. |
| | | |
| ITEM 12. EXHIBITS. |
| File the exhibits listed below as part of this Form. Letter or number the exhibits in the sequence indicated. |
| (a) | | (1) Not applicable. |
| | | (2) A separate certification for each principal executive officer and principal financial officer of the Registrant as required by Rule 30a-2(a) under the Act (17 CFR 270.30a-2): Attached herewith. |
| | | (3) Not applicable. |
| (b) | | (1) The certifications required by Rule 30a-2(b) of the Investment Company Act of 1940 and Section 906 of the Sarbanes-Oxley Act of 2002: Attached herewith. |
SIGNATURES
Pursuant to the requirements of the Securities Exchange Act of 1934 and the Investment Company Act of 1940, the registrant has duly caused this report to be signed on its behalf by the undersigned, thereunto duly authorized.
(Registrant) The FBR Funds
| By (Signature and Title)* | | /s/ Kimberly J. Bradshaw | | 06/27/08 |
| | |
|
| | | Kimberly J. Bradshaw | | Date |
| | | Treasurer, Secretary and Principal Financial Officer |
| | | The FBR Funds | | |
Pursuant to the requirements of the Securities Exchange Act of 1934 and the Investment Company Act of 1940, this report has been signed below by the following persons on behalf of the registrant and in the capacities and on the dates indicated.
| By (Signature and Title) | | /s/ David H. Ellison | | 06/27/08 |
| | |
|
| | | David H. Ellison | | Date |
| | | President and Principal Executive Officer |
| | | The FBR Funds | | |
| | | | | |
| | | | | |
| By (Signature and Title) | | /s/ Kimberly J. Bradshaw | | 06/27/08 |
| | |
|
| | | Kimberly J. Bradshaw | | Date |
| | | Treasurer, Secretary and Principal Financial Officer |
| | | The FBR Funds | | |