Exhibit 99.1
| 20_13 ANNUAL REPORT Making Our Mark in 2013 LAKE SHORE GOLD CORP. |
| TABLE OF CONTENTS 2 Letter to Shareholders 4 Performance Against 2013 Objectives 4 Objectives for 2014 5 Reserves and Resources 6 Management’s Discussion & Analysis 34 Management’s Responsibility for Financial Reporting 35 Management’s Report on Internal Controls Over Financial Reporting 36 Report of Independent Registered Public Accounting Firm 37 Consolidated Statements of Financial Position 38 Consolidated Statements of Comprehensive Loss 39 Consolidated Statements of Cash Flows 40 Consolidated Statements of Changes in Equity 41 Notes to the Consolidated Financial Statements 82 Corporate Information CORPORATE PROFILE Lake Shore Gold Corp. is a Canadian gold producer that is generating net free cash flow from its wholly owned operations in the Timmins Gold Camp of Northern Ontario. The Company is in production at both the Timmins West and Bell Creek mines, which combined for 134,600 ounces of gold production in 2013, a 57% increase from 2012. The completion of a mill expansion during the third quarter of 2013 marked the end of a multi-year growth capital program aimed at establishing mining and milling operations capable of producing over 3,000 tonnes per day. The target production rate was met, and exceeded, beginning in September 2013, with the Company entering 2014 positioned to process between 3,200 and 3,300 tonnes per day and produce between 160,000 and 180,000 ounces of gold during the year. In addition to current operations, the Company has a number of highly prospective projects and exploration targets located in and around the Timmins Camp and, in many cases, situated in close proximity to existing operations. The Company’s common shares trade on the TSX and NYSE MKT under the symbol LSG. MINING OPERATIONS Lake Shore Gold is in production at both the Timmins West Mine (photo above) and Bell Creek Mine. Timmins West Mine, located 18 kilometres west of Timmins, Ontario, is the Company’s flagship asset. In 2013, production at the mine totaled 107,100 ounces and is expected to grow to over 130,000 ounces in 2014. The mine is well constructed with excellent infrastructure and significant potential to grow resources and extend mine life. Bell Creek Mine, located 20 kilometres east of Timmins, produced 27,500 ounces in 2013 using a surface ramp with production targeted to grow to over 30,000 ounces in 2014. With the majority of resources below current mining, considerable opportunity exists to grow the size and scale of mining operations at Bell Creek with additional investment. |
| LAKE SHORE GOLD CORP. ANNUAL REPORT 2013 1 MILL EXPANSION In 2013, Lake Shore Gold made its mark by completing a major expansion, increasing production, improving unit costs, reducing capital requirements, managing its balance sheet and generating net free cash flow during the fourth quarter. Making Our Mark in 2013 1 LAKE SHORE GOLD CORP. ANNUAL REPORT 2013 A major milestone was achieved during the third quarter of 2013 when the Company completed an expansion of its milling facility to a production rate of over 3,000 tonnes per day. The Bell Creek Mill is a conventional gold milling circuit that has consistently achieved average recoveries of over 95%. Following completion of the expansion, the Company averaged 3,500 tonnes per day in the fourth quarter of 2013 as the mill processed both mine production and ore stockpiled during mill commissioning. While the Company anticipates averaging between 3,200 and 3,300 tonnes per day in 2014, the fact that the mill has performed well at higher throughput levels is a reflection of the excellent quality of the new milling infrastructure and the opportunity it provides for future growth. |

| LETTER TO SHAREHOLDERS In 2013, YOUR COMPANY COMPLETED A MULTI-YEAR GROWTH CAPITAL PROGRAM AND MET OR EXCEEDED ITS KEY PERFORMANCE TARGETS. WE INCREASED PRODUCTION, IMPROVED UNIT COSTS, REDUCED CAPITAL REQUIREMENTS, MANAGED OUR BALANCE SHEET AND GENERATED NET FREE CASH FLOW DURING THE FOURTH QUARTER. VERY IMPORTANTLY, WE IMPROVED OUR SAFETY PERFORMANCE, MAKING LAKE SHORE GOLD ONE OF THE SAFEST MINING COMPANIES IN ONTARIO. Lake Shore Gold had a very successful 2013. We completed our mill expansion and brought our production rate to well over 3,000 tonnes per day. For the year, we increased production 57% to 134,600 ounces, improved our cash operating costs(1) per ounce sold by 23% and reduced our capital expenditures. We made debt repayments of approximately $20 million and commenced generating net free cash flow in the fourth quarter. Our cash earnings from mine operations(1) rose 60% from 2012. Our net loss for the year reflected non-cash items, most significantly a $225 million impairment charge. The charge largely resulted from lower gold prices, which affected the estimated net carrying value of our assets as well as our levels of resources and reserves. A very important area of progress in 2013 was safety. We achieved the best safety performance in our history, improving our Total Medical Injury Frequency Rate to 2.6, among the best in the province. If cash flow is the fuel that drives our future, operating safely and responsibly provides the driver’s license that keeps us on the road. Looking back over 2013, our stock price reached a low in June. Among the contributing factors was a gold price that had corrected by over US$300 per ounce from a few months earlier. In addition, we were still investing considerable capital on our mill expansion and ramping up production. As a result, we were drawing down our cash at a time of declining gold prices and our share price was affected by market concern over our debt and debt covenants. How did your company respond? We effectively managed our debt and remained in compliance with our debt covenants throughout the year. We also extended the maturity of the standby line of credit in December and negotiated improvements to our debt covenants, providing us with greater flexibility. 2 LAKE SHORE GOLD CORP. ANNUAL REPORT 2013 |
| At the same time, we remained focused on our capital program and business objectives. We completed our mill expansion during the third quarter and, by the fourth quarter, were operating at well over 3,000 tonnes per day. Our production increased significantly, totaling 51,700 ounces in the fourth quarter, ahead of target levels. Our unit costs improved each quarter of 2013, with cash operating costs for the full year averaging US$766 per ounce, better than our guidance of US$800 to US$875 per ounce. Our capital requirements declined sharply, falling to $10.3 million in the fourth quarter and totaling $90.4 million for the year, in line with our guidance. And, we increased our cash and bullion during the fourth quarter by $18.8 million to $34.0 million at year end. Looking forward, we entered 2014 positioned for a record year including production of 160,000 – 180,000 ounces of gold, cash operating costs of between US$675 and US$775 per ounce sold and all-in sustaining costs(1) of US$950 – US$1,050 per ounce sold. We expect to generate significant free cash flow assuming our budget price of $1,300 (Canadian) per ounce and are highly leveraged to gold prices above that level. We are off to a good start in the year. In the first two months of 2014 our production totaled 29,500 ounces and, with an average selling price of $1,406 per ounce, our cash position increased by approximately $7.0 million. We also entered 2014 with a renewed commitment to exploration. In March, we announced a reduction in our resources and reserves. The reduction largely reflected lower gold prices and the fact that we have focused our drilling over the last two years within existing resources in support of mining activities rather than on identifying and adding new ounces. We have now entered a replenishing phase with a new drilling program in progress. The program is focused on high-potential targets at both our Timmins West and Bell Creek mines. We have already announced some encouraging drill results at Bell Creek, which included identifying new, high-grade structures within 100 metres of current mining activities. It is an exciting time for Lake Shore Gold. It is a time when the return on a lot of hard work and investment has started to be realized. It is also a time when we have resumed the build out of our existing deposits and can consider future growth through evaluation of our large, wholly owned projects. Through our Gold River, Bell Creek Deep, Vogel and Fenn-Gib projects, we have a number of attractive opportunities for future growth located in close proximity to our existing mining operations. I want to thank the people of Lake Shore Gold, our employees, suppliers and contractors, for their hard work and commitment over the last year. I also want to thank our shareholders for their ongoing support and belief in our future. We have come through the challenging development phase of building a low-cost gold producer. We have invested our capital well, achieved target production levels and are well positioned to create value going forward. Tony Makuch President & CEO 3 LAKE SHORE GOLD CORP. ANNUAL REPORT 2013 |
| LAKE SHORE GOLD CORP. ANNUAL REPORT 2013 4 Q1 2013 Production (Ounces) 23,200 Q2 Q3 Q4 2013 30,800 28,900 51,700 134,600 Q1 2013 Cash Operating Costs & All-In Sustaining Costs (US$ Per Ounce Sold) 982 1,550 Q2 Q3 Q4 2013 908 1,257 701 1,027 609 849 766 1,139 Q1 Mill Throughput (Tonnes Per Day) 2,200 Q2 Q3 Q4 2013 2,540 2,200 3,500 2,610 ALL-IN SUSTAINING COSTS CASH OPERATING COSTS Q1 Capital Investment ($ Millions) 38.2 Q2 Q3 Q4 2013 27.7 14.2 10.3 90.4 Achieve at least 40% growth in production to 120,000 to 135,000 ounces of gold. Production increased 57% to 134,600 ounces. The Company set a quarterly record for production in the second quarter of 2013, with mill throughput averaging over 2,500 tonnes per day for the first time. Following completion of Phase 2 of the Company’s mill expansion during the third quarter, production reached a new record of 51,700 ounces in the fourth quarter, with average mill throughput of 3,500 tonnes per day resulting from processing both mine production and ore from stockpiles built up during mill commissioning. Improve cash operating costs(1) to between US$800 and US$875 per ounce. Cash operating costs in 2013 averaged US$766 per ounce sold, a 23% improvement from 2012 and better than the target range. Cash operating costs improved each quarter during the year and reached a low of US$609 per ounce sold during the fourth quarter. In the second quarter of 2013, the Company adopted a new unit cost measure, all-in sustaining costs(1) or “AISC”. The Company defines AISC as the sum of production costs, sustaining capital, corporate general and administrative expenses, in-mine exploration expenses and reclamation cost accretion related to current operations. AISC in 2013 averaged US$1,139 per ounce sold, a 37% improvement from 2012. Reduce capital investment by close to 50%, to $90 million. Total capital investment in 2013 totaled $90.4 million, a reduction of 47% from 2012 and in line with the Company’s guidance. Investment levels decreased each quarter of 2013 and declined dramatically starting in the third quarter with the completion and commissioning of Phase 2 of the Company’s mill expansion. Complete Phase 2 mill expansion to a production rate of over 3,000 tonnes per day during the second quarter. Commissioning of Phase 2 of the mill expansion commenced in July with the target processing rate achieved, and exceeded, for the first time in September, when mill throughput averaged 3,370 tonnes per day. During the fourth quarter, throughput averaged 3,500 tonnes per day, in excess of target levels. The expansion was completed in the third quarter rather than on the original schedule reflecting the need to manage the timing of cash outflows during a period of declining gold prices. (1) cash operating costs, all-in sustaining costs and cash earnings from mine operations are examples of non-Gaap measures. a discussion of non-Gaap measures is provided in the Non-Gaap Measures section of the Management’s Discussion & Analysis beginning on page 23 of this annual report. Objectives for 2014 Performance Against 2013 Objectives • Increase production to 160,000 – 180,000 ounces of gold • Achieve cash operating costs of between US$675 and US$775 per ounce sold • Reduce AISC to within a range of US$950 and US$1,050 per ounce sold • Achieve average mill throughput of 3,200 – 3,300 tonnes per day • Make debt repayments of between $20 and $25 million 4 LAKE SHORE GOLD CORP. ANNUAL REPORT 2013 |
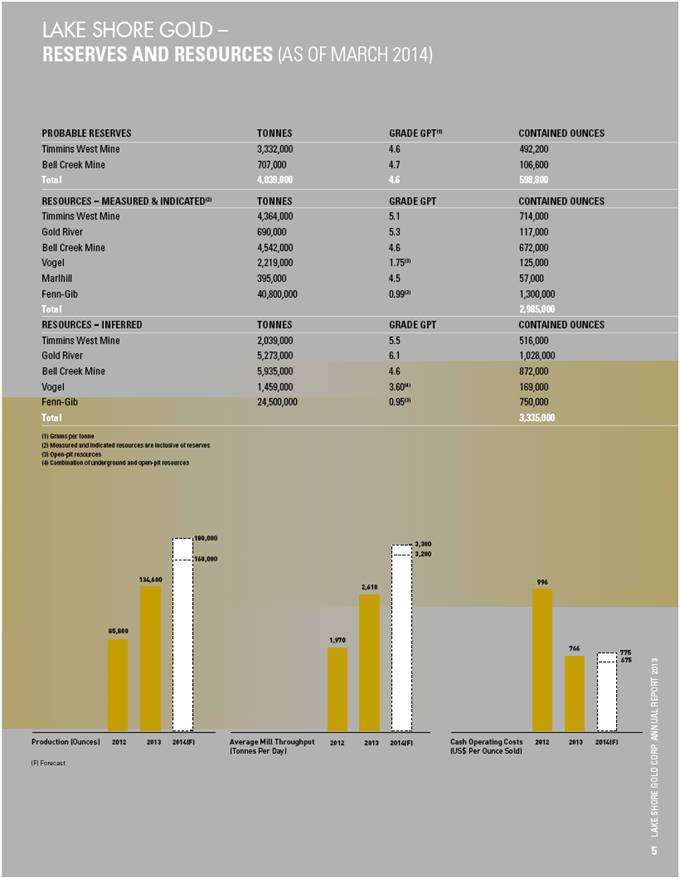
| LAKE SHORE GOLD CORP. ANNUAL REPORT 2013 5 LAKE SHORE GOLD – RESERVES AND RESOURCES (AS OF MARCH 2014) PROBABLE RESERVES TONNES GRADE GPT(1) CONTAINED OUNCES Timmins West Mine 3,332,000 4.6 492,200 Bell Creek Mine 707,000 4.7 106,600 Total 4,039,000 4.6 598,800 RESOURCES – MEASURED & INDICATED(2) TONNES GRADE GPT CONTAINED OUNCES Timmins West Mine 4,364,000 5.1 714,000 Gold River 690,000 5.3 117,000 Bell Creek Mine 4,542,000 4.6 672,000 Vogel 2,219,000 1.75(3) 125,000 Marlhill 395,000 4.5 57,000 Fenn-Gib 40,800,000 0.99(3) 1,300,000 Total 2,985,000 RESOURCES – INFERRED TONNES GRADE GPT CONTAINED OUNCES Timmins West Mine 2,039,000 5.5 516,000 Gold River 5,273,000 6.1 1,028,000 Bell Creek Mine 5,935,000 4.6 872,000 Vogel 1,459,000 3.60(4) 169,000 Fenn-Gib 24,500,000 0.95(3) 750,000 Total 3,335,000 (1) Grams per tonne (2) Measured and indicated resources are inclusive of reserves (3) Open-pit resources (4) Combination of underground and open-pit resources Production (Ounces) 2014(F) 2013 2012 85,800 134,600 180,000 160,000 Cash Operating Costs (US$ Per Ounce Sold) 2014(F) 2013 2012 996 766 775 675 Average Mill Throughput (Tonnes Per Day) 2014(F) 2013 2012 1,970 2,610 3,200 3,300 (F) Forecast 5 LAKE SHORE GOLD CORP. ANNUAL REPORT 2013 |
Management’s Responsibility for Financial Reporting
The accompanying consolidated financial statements have been prepared by management and are in accordance with International Financial Reporting Standards as issued by the International Accounting Standards Board (“IASB”). Other information contained in this document has also been prepared by management and is consistent with the data contained in the consolidated financial statements. A system of internal controls has been developed and is maintained by management to provide reasonable assurance that assets are safeguarded and financial information is accurate and reliable.
The Board of Directors approves the financial statements and ensures that management discharges its financial reporting responsibilities. The Board’s review is accomplished principally through the audit committee, which is composed of non-executive directors. The audit committee meets periodically with management and the auditors to review financial reporting and control matters.
/signed Anthony Makuch | | /signed Philip C. Yee |
| | |
Anthony Makuch | | Philip C. Yee |
Chief Executive Officer | | Vice President and Chief Financial Officer |
| | |
March 18, 2014 | | |
Toronto, Canada | | |
2
Management’s Report on Internal Controls Over Financial Reporting
The management of Lake Shore Gold Corp. (the “Company”) is responsible for establishing and maintaining adequate internal controls over financial reporting. The Company’s internal controls over financial reporting are reviewed and approved by the Chief Executive Officer and the Vice President and Chief Financial Officer with the expectation of providing reasonable assurance regarding the reliability of financial reporting and the preparation of financial statements for external purposes in accordance with International Financial Reporting Standards as issued by the IASB.
Due to its inherent limitations, internal controls over financial reporting may not prevent or detect misstatements on a timely basis. Also, projections regarding the effectiveness of these controls applicable to future periods are subject to risk and may not be sufficient to meet the degree of compliance required to comply with the policies or procedures in the future.
Management conducted an assessment of the Company’s internal controls over financial reporting based on the “Internal Control-Integrated Framework (1992)” established by the Committee of Sponsoring Organizations of the Treadway Commission (“COSO”). Based on that assessment, the Chief Executive Officer and Vice President and Chief Financial Officer concluded the Company’s internal controls over financial reporting were effective as of December 31, 2013. There were no material weaknesses identified by management as of December 31, 2013.
/signed Anthony Makuch | | /signed Philip C. Yee |
| | |
Anthony Makuch | | Philip C. Yee |
Chief Executive Officer | | Vice President and Chief Financial Officer |
| | |
March 18, 2014 | | |
Toronto, Canada | | |
3
Report of Independent Registered Public Accounting Firm
To the Shareholders and Board of Directors of Lake Shore Gold Corp.
We have audited the accompanying consolidated financial statements of Lake Shore Gold Corp. and subsidiaries (the “Company”), which comprise the consolidated statements of financial position as at December 31, 2013 and 2012 and the consolidated statements of comprehensive loss, consolidated statements of changes in equity and consolidated statements of cash flows for the years ended December 31, 2013 and December 31, 2012, and a summary of significant accounting policies and other explanatory information.
Management’s Responsibility for the Consolidated Financial Statements
Management is responsible for the preparation and fair presentation of these consolidated financial statements in accordance with International Financial Reporting Standards as issued by the International Accounting Standards Board, and for such internal control as management determines is necessary to enable the preparation of consolidated financial statements that are free from material misstatement, whether due to fraud or error.
Auditor’s Responsibility
Our responsibility is to express an opinion on these consolidated financial statements based on our audits. We conducted our audits in accordance with Canadian generally accepted auditing standards. Those standards require that we comply with ethical requirements and plan and perform the audit to obtain reasonable assurance about whether the consolidated financial statements are free from material misstatement. We were not engaged to perform an audit of the Company’s internal control over financial reporting. Our audit included consideration of internal control over financial reporting as a basis for designing audit procedures that are appropriate in the circumstances, but not for the purpose of expressing an opinion on the effectiveness of the Company’s internal control over financial reporting, accordingly we express no such opinion.
An audit involves performing procedures to obtain audit evidence about the amounts and disclosures in the consolidated financial statements. The procedures selected depend on the auditor’s judgment, including the assessment of the risks of material misstatement of the consolidated financial statements, whether due to fraud or error. An audit also includes evaluating the appropriateness of accounting policies used and the reasonableness of accounting estimates made by management, as well as evaluating the overall presentation of the consolidated financial statements.
We believe that the audit evidence we have obtained in our audits is sufficient and appropriate to provide a basis for our audit opinion.
Opinion
In our opinion, the consolidated financial statements present fairly, in all material respects, the financial position of the Company as at December 31, 2013 and 2012 and its financial performance and its cash flows for the years ended December 31, 2013 and December 31, 2012 in accordance with International Financial Reporting Standards as issued by the International Accounting Standards Board.
“Deloitte LLP” |
|
Chartered Professional Accountants, Chartered Accountants |
Licensed Public Accountants |
|
March 18, 2014 |
Toronto, Canada |
4
CONSOLIDATED STATEMENTS OF FINANCIAL POSITION
(in thousands of Canadian dollars)
As at | | Note | | December 31, 2013 | | December 31, 2012 | |
| | | | | | | |
Assets | | | | | | | |
Current assets | | | | | | | |
Cash and cash equivalents | | | | $ | 33,120 | | $ | 48,715 | |
Receivables and prepaids | | 10 | | 3,589 | | 7,736 | |
Inventories and stockpiled ore | | 11 | | 20,378 | | 27,626 | |
Assets held for sale | | 9(i)(a) | | — | | 2,432 | |
| | | | 57,087 | | 86,509 | |
Non-current assets | | | | | | | |
Available for sale financial assets and warrant investments | | 12 | | 416 | | 810 | |
Investments in associates | | 13 | | 1,749 | | 5,361 | |
Restricted cash | | 14 | | 7,095 | | 7,095 | |
Mining interests | | 15 | | 531,585 | | 719,888 | |
Deferred financing costs | | 19(a) | | — | | 3,352 | |
| | | | $ | 597,932 | | $ | 823,015 | |
| | | | | | | |
Liabilities | | | | | | | |
Current liabilities | | | | | | | |
Accounts payable and accrued liabilities | | 17 | | $ | 21,619 | | $ | 33,867 | |
Current portion of finance lease obligations | | 18 | | 3,446 | | 6,324 | |
Current portion of long term debt | | 19 | | 13,339 | | 18,219 | |
| | | | 38,404 | | 58,410 | |
Non-current liabilities | | | | | | | |
Finance lease obligations | | 18 | | 6,150 | | 2,812 | |
Long term debt | | 19 | | 116,686 | | 100,334 | |
Share-based liabilities | | 20 | | 754 | | 479 | |
Environmental rehabilitation provision | | 21 | | 4,770 | | 5,257 | |
| | | | 128,360 | | 108,882 | |
| | | | | | | |
Shareholders’ Equity | | | | | | | |
Share capital | | | | 1,017,262 | | 1,016,524 | |
Equity portion of convertible debentures | | | | 14,753 | | 14,753 | |
Reserves | | | | 31,388 | | 23,212 | |
Deficit | | | | (632,235 | ) | (398,766 | ) |
| | | | 431,168 | | 655,723 | |
| | | | $ | 597,932 | | $ | 823,015 | |
Commitments and contractual obligations (note 29)
See accompanying notes to the consolidated financial statements
Approved by the Board
/signed Alan Moon | | /signed Arnold Klassen |
Alan C. Moon | | Arnold Klassen |
Director | | Director |
5
CONSOLIDATED STATEMENTS OF COMPREHENSIVE LOSS
(in thousands of Canadian dollars, except per share amounts)
For the years ended December 31, | | Note | | 2013 | | 2012 | |
| | | | | | | |
Revenue | | | | $ | 192,647 | | $ | 133,012 | |
Production costs | | 6 | | (107,491 | ) | (80,037 | ) |
Depletion and depreciation | | | | (60,205 | ) | (42,641 | ) |
Impairment charge | | 16 | | (225,000 | ) | (231,000 | ) |
Loss from mine operations | | | | (200,049 | ) | (220,666 | ) |
| | | | | | | |
General and administrative | | | | (12,555 | ) | (11,467 | ) |
Exploration and evaluation | | 15 | | (1,313 | ) | (3,769 | ) |
Write down of investments in associates and available for sale investment | | 12,13,28 | | (3,874 | ) | (7,529 | ) |
Share of loss of investments in associates | | 13 | | (1,833 | ) | (2,738 | ) |
Loss from operations and associates | | | | (219,624 | ) | (246,169 | ) |
Other income (loss), net | | 7 | | 5,133 | | (518 | ) |
Finance items | | 8 | | | | | |
Finance income | | | | 706 | | 552 | |
Finance expense | | | | (15,382 | ) | (3,283 | ) |
Loss before taxes | | | | (229,167 | ) | (249,418 | ) |
Deferred mining tax recovery | | 16,22 | | — | | 3,029 | |
Loss from continuing operations | | | | (229,167 | ) | (246,389 | ) |
Loss from discontinued operations | | 9(i) | | (4,302 | ) | (71,543 | ) |
Net loss | | | | $ | (233,469 | ) | $ | (317,932 | ) |
Other comprehensive income (loss) | | | | | | | |
Items that may be reclassified subsequently to profit or loss | | | | | | | |
Other comprehensive income (loss) from continuing operations, net of tax | | | | | | | |
Unrealized loss on available for sale investments, net of tax | | 9(ii),12 | | 1,786 | | (2,560 | ) |
Other comprehensive income from discontinued operations | | | | | | | |
Exchange differences on translation of foreign operations | | 9(i(b)) | | 3,967 | | 3,712 | |
Comprehensive loss from continuing operations | | | | $ | (227,381 | ) | $ | (248,949 | ) |
Comprehensive loss from discontinued operations | | | | $ | (335 | ) | $ | (67,831 | ) |
Total comprehensive loss | | | | $ | (227,716 | ) | $ | (316,780 | ) |
Basic and diluted loss per share | | 23(c) | | | | | |
Loss per share from continuing operations | | | | $ | (0.55 | ) | $ | (0.60 | ) |
Loss per share | | | | $ | (0.56 | ) | $ | (0.77 | ) |
| | | | | | | |
Weighted average number of common shares outstanding (in 000’s) | | 23(c) | | | | | |
Basic and Diluted | | | | 416,536 | | 411,334 | |
See accompanying notes to the consolidated financial statements
6
CONSOLIDATED STATEMENTS OF CASH FLOWS
(in thousands of Canadian dollars)
For the years ended December 31, | | Note | | 2013 | | 2012 | |
| | | | | | | |
Operating Activities | | | | | | | |
| | | | | | | |
Loss from continuing operations | | | | $ | (229,167 | ) | $ | (246,389 | ) |
Impairment charge | | | | 225,000 | | 231,000 | |
Depletion and depreciation | | | | 60,316 | | 42,812 | |
Share-based payments expense | | | | 2,621 | | 4,136 | |
Share of loss of investments in associates | | | | 1,833 | | 2,738 | |
Write down of investment in associates and available for sale investment | | | | 3,874 | | 7,529 | |
Other (income) loss, net | | | | (5,133 | ) | 518 | |
Finance income | | | | (706 | ) | (552 | ) |
Interest received | | | | 629 | | 531 | |
Finance expense | | | | 15,382 | | 3,283 | |
Interest paid | | | | (10,120 | ) | (2,260 | ) |
Deferred mining tax recovery | | | | — | | (3,029 | ) |
Change in non-cash operating working capital | | 25 | | 6,118 | | (10,434 | ) |
Net cash flow provided by continuing operating activities | | | | 70,647 | | 29,883 | |
Net cash flow used by discontinued operating activities | | | | — | | (43 | ) |
| | | | | | | |
Investing Activities | | | | | | | |
| | | | | | | |
Additions to mining interests, net of pre-production sales and movements in working capital | | | | (99,901 | ) | (161,888 | ) |
Restricted cash | | | | — | | (1,441 | ) |
Proceed from sale of available for sale investment | | 12 | | — | | 1,017 | |
Proceeds from sale of mining interest | | | | 200 | | — | |
Net cash flow used in investing activities of continuing operations | | | | (99,701 | ) | (162,312 | ) |
Net cash flow used in investing activities of discontinued operations | | | | — | | — | |
| | | | | | | |
Financing Activities | | | | | | | |
| | | | | | | |
Proceeds from long term debt, net of transaction costs | | 19(a,b) | | 33,450 | | 132,435 | |
Proceeds from sale lease back | | 18 | | 7,300 | | — | |
Long term debt payments | | 19(a,c) | | (21,454 | ) | (49,055 | ) |
Payment of finance lease obligations | | | | (5,739 | ) | (8,598 | ) |
Proceeds from sale of royalty interest, net of transaction costs | | 15 | | — | | 34,704 | |
Common shares issued for cash (net of share issue costs) | | | | — | | 14,881 | |
Exercise of stock options and warrants | | | | 23 | | 68 | |
Net cash flow provided by financing activities of continuing operations | | | | 13,580 | | 124,435 | |
Net cash flow provided by financing activities of discontinued operations | | 15 | | — | | 1,151 | |
| | | | | | | |
Impact of foreign exchange on cash balances | | | | $ | (121 | ) | (358 | ) |
| | | | | | | |
Decrease in cash and cash equivalents during the year | | | | (15,595 | ) | (7,244 | ) |
Cash and cash equivalents at beginning of year | | | | 48,715 | | 55,959 | |
Cash and cash equivalents at end of year | | | | $ | 33,120 | | $ | 48,715 | |
Supplemental cash flow information note 25
See accompanying notes to the consolidated financial statements
7
LAKE SHORE GOLD CORP.
CONSOLIDATED STATEMENTS OF CHANGES IN EQUITY
(in thousands of Canadian dollar except for share information)
| | | | | | | | | | Reserves | | | | | |
| | | | Share capital | | Equity portion | | | | | | Currency | | Investment | | | | | |
| | Note | | Shares
(‘000s) | | Amount | | of convertible
debentures | | Warrants | | Share-based
payments | | translation
adjustment | | revaluation
reserve | | Deficit | | Shareholders’
equity | |
At January 1, 2013 | | | | 415,654 | | 1,016,524 | | $ | 14,753 | | $ | 2,469 | | $ | 26,259 | | $ | (3,967 | ) | $ | (1,549 | ) | $ | (398,766 | ) | $ | 655,723 | |
Shares issued as part of agreements (net of share issue costs of $30) | | 23(a) | | 936 | | 702 | | — | | — | | — | | — | | — | | — | | 702 | |
Share based payments | | 23(b(iv)) | | — | | — | | — | | — | | 2,436 | | — | | — | | — | | 2,436 | |
Stock-options exercised (including transfer from share based payments reserve of $13) | | 23(b(ii)) | | 30 | | 36 | | — | | — | | (13 | ) | — | | — | | — | | 23 | |
Net loss | | | | | | | | | | | | | | | | | | $ | (233,469 | ) | (233,469 | ) |
Other comprehensive income, net of tax | | | | | | | | | | | | | | 3,967 | | 1,786 | | — | | 5,753 | |
Total comprehensive income | | | | | | | | | | | | | | 3,967 | | 1,786 | | (233,469 | ) | (227,716 | ) |
At December 31, 2013 | | | | 416,620 | | 1,017,262 | | $ | 14,753 | | $ | 2,469 | | $ | 28,682 | | $ | — | | $ | 237 | | $ | (632,235 | ) | $ | 431,168 | |
| | | | | | | | | | Reserves | | | | | |
| | | | Share capital | | Equity portion of | | | | | | Currency | | Investment | | | | | |
| | Note | | Shares
(‘000s) | | Amount | | convertible
debentures | | Warrants | | Share-based
payments | | translation
adjustment | | revaluation
reserve | | Deficit | | Shareholders’
equity | |
At January 1, 2012 | | | | 400,169 | | $ | 992,318 | | $ | — | | $ | 2,469 | | $ | 21,543 | | $ | (7,679 | ) | $ | 1,011 | | $ | (80,834 | ) | $ | 928,828 | |
Shares issued as part of agreements (net of share issue costs of $119) | | 23(a) | | 15,401 | | 19,742 | | — | | — | | — | | — | | — | | — | | 19,742 | |
Equity portion of convertible debentures (net of transaction costs of $988) | | 19(b) | | — | | — | | 20,000 | | — | | — | | — | | — | | — | | 20,000 | |
Share based payments | | 23(b(iv)) | | — | | — | | — | | — | | 4,744 | | — | | — | | — | | 4,744 | |
Stock-options exercised (including transfer from share based payments reserve of $28) | | 23(b(ii)) | | 84 | | 96 | | — | | — | | (28 | ) | — | | — | | — | | 68 | |
Change in deferred tax assets (liabilities) | | 22 | | — | | 4,368 | | (5,247 | ) | — | | — | | — | | — | | — | | (879 | ) |
Net loss | | | | — | | — | | — | | — | | — | | — | | — | | (317,932 | ) | (317,932 | ) |
Other comprehensive income (loss), net of tax | | | | — | | — | | — | | — | | — | | 3,712 | | (2,560 | ) | — | | 1,152 | |
Total comprehensive income | | | | | | | | | | | | | | 3,712 | | (2,560 | ) | (317,932 | ) | (316,780 | ) |
At December 31, 2012 | | | | 415,654 | | 1,016,524 | | $ | 14,753 | | $ | 2,469 | | $ | 26,259 | | $ | (3,967 | ) | $ | (1,549 | ) | $ | (398,766 | ) | $ | 655,723 | |
| | | | | | | | | | | | | | | | | | | | | | | | | | | | | |
See accompanying notes to the consolidated financial statements
8
LAKE SHORE GOLD CORP.
NOTES TO THE CONSOLIDATED FINANCIAL STATEMENTS
FOR THE YEARS ENDED DECEMBER 31, 2013 AND 2012
(in thousands of Canadian dollars, except per share amounts)
1. DESCRIPTION OF BUSINESS AND NATURE OF OPERATIONS
Lake Shore Gold Corp. (“Lake Shore Gold” or the “Company”) is a publicly listed company, incorporated in Canada; the Company’s shares are traded on the Toronto Stock Exchange and on the NYSE MKT stock exchange. The head office, principal address and record office are located at 181 University Avenue, Suite 2000, Toronto, Ontario, Canada, M5H 3M7. The Company is primarily engaged in the operation, exploration and development of three gold complexes located in the Timmins Gold Camp in Timmins, Ontario; the Company also has certain exploration properties in Quebec. The Company is in commercial production at its Timmins West Mine and Bell Creek Mine.
2. BASIS OF PREPARATION
Statement of Compliance
These consolidated financial statements have been prepared in accordance with International Financial Reporting Standards (“IFRS”) as issued by the International Accounting Standards Board (“IASB”). The consolidated financial statements were approved by the Board of Directors of the Company on March 18, 2014.
These consolidated financial statements have been prepared under the historical cost convention, except for certain financial instruments measured at fair value, as set out in the accounting policies in note 3.
The preparation of financial statements in accordance with IFRS requires the use of certain critical accounting estimates. It also requires management to exercise its judgment in the process of applying the Company’s accounting policies. The areas involving a higher degree of judgment or complexity, or areas where assumptions and estimates are significant to the consolidated financial statements are disclosed in note 4.
3. SIGNIFICANT ACCOUNTING POLICIES
The principal accounting policies are set out below:
a) Basis of presentation and consolidation
The consolidated financial statements incorporate the financial statements of the Company and its subsidiaries. Subsidiaries are those entities controlled by the Company. Control exists when the Company is exposed or has rights to the variable returns from the subsidiary and has the ability to affect those returns through its power over the subsidiary. Power is defined as existing rights that give the Company the ability to direct the relevant activities of the subsidiary. The financial statements of the subsidiaries are included in the consolidated financial statements from the date that control is transferred to the Company to the date control ceases. All intercompany transactions, balances, income and expenses are eliminated in full upon consolidation.
An associate is an entity in which the Company or any of its subsidiaries have significant influence, and that is neither a subsidiary nor an interest in a joint venture. Significant influence is the power to participate in the financial and operating policy decisions of the investee but is not control or joint control over those
9
LAKE SHORE GOLD CORP.
NOTES TO THE CONSOLIDATED FINANCIAL STATEMENTS
FOR THE YEARS ENDED DECEMBER 31, 2013 AND 2012
(in thousands of Canadian dollars, except per share amounts)
policies and is presumed to exist when the Company holds between 20 and 50 percent of the voting power of another entity.
The subsidiaries and associates of the Company as at December 31, 2013 and their principal activities are described below:
Name | | Place of
Incorporation | | Proportion of
Ownership Interest | | Principal Activity | |
Subsidiaries | | | | | | | |
LSG Holdings Corp. | | British Columbia | | 100 | % | Not active* | |
1583908 Alberta Limited | | Alberta | | 100 | % | Not active* | �� |
Associates | | | | | | | |
Northern Superior Resources | | British Columbia | | 23.8 | % | Exploration | |
Revolution Resources Corp. | | British Columbia | | 22.5 | % | Exploration | |
*In process of winding-up
The financial statements of subsidiaries are prepared for the same reporting periods as the Company, using consistent accounting policies. Where necessary, adjustments are made to bring the accounting policies of the Company’s associates in line with those of the Company. All intercompany balances and transactions have been eliminated upon consolidation.
b) Investment in associates
The Company’s investments in associates are accounted for using the equity method of accounting. Under the equity method, the Company’s investment in an associate is initially recognized at cost and subsequently increased or decreased to recognize the Company’s share of earnings and losses of the associate and for impairment losses after the initial recognition date. The Company’s share of an associate’s losses that are in excess of its investment in the associate are recognized only to the extent that the Company has incurred legal or constructive obligations or made payments on behalf of the associate. The Company’s share of earnings and losses of associates are recognized in net loss during the period.
After application of the equity method, the Company determines whether it is necessary to recognize an impairment loss on the Company’s investment in its associates. The Company determines at each statement of financial position date whether there is any objective evidence that the investment in the associate is impaired. If this is the case the Company calculates the amount of impairment as the difference between the recoverable amount of the associate and its carrying value and recognizes the amount in net loss. When a group entity transacts with an associate of the Company, profit and losses are eliminated to the extent of the Company’s interest in the relevant associate.
10
LAKE SHORE GOLD CORP.
NOTES TO THE CONSOLIDATED FINANCIAL STATEMENTS
FOR THE YEARS ENDED DECEMBER 31, 2013 AND 2012
(in thousands of Canadian dollars, except per share amounts)
c) Non-current assets held for sale and discontinued operations
Non-current assets and disposal group are classified as held for sale if their carrying amount will be recovered principally through a sale transaction rather than through continuing use. This condition is regarded as met only when the sale is highly probable and the non-current asset (or disposal group) is available for sale in its present condition. Management must be committed to the sale, which should be expected to qualify for recognition as a completed sale within one year from the date of classification.
When the Company is committed to a sale plan involving loss of control of a subsidiary, all of the assets and liabilities of that subsidiary are classified as held for sale when the criteria described in the above paragraph are met, regardless of whether the Company will retain a non-controlling interest in its former subsidiary after the sale.
A discontinued operation is a component of an entity that either has been disposed of, or that is classified as held for sale, and represents a separate major line of business or geographical area of operations, is a part of a single coordinated plan to dispose of a separate major line of business or geographical area of operations, or is a subsidiary acquired exclusively with a view to resale.
Non-current assets (and disposal group) classified as held for sale and discontinued operations are measured at the lower of carrying amount or fair value less costs to sell. Any gain or loss from disposal of a business, together with the results of these operations until the date of disposal, is reported separately as discontinued operations. The financial information of discontinued operations is excluded from the respective captions in the Consolidated financial statements and related notes for all years presented.
d) Foreign currency translation
The functional currency for each entity consolidated with the Company is determined by the currency of the primary economic environment in which it operates (the “functional currency”). The consolidated financial statements are presented in Canadian dollars, which is the Company’s functional and reporting currency.
In preparing the financial statements of the individual entities, transactions in currencies other than the entity’s functional currency (foreign currencies) are recognized at the rates of exchange prevailing at the dates of the transactions. At the end of each reporting period, monetary items denominated in foreign currencies are retranslated at the rates prevailing at that date. Non-monetary items carried at fair value that are denominated in foreign currencies are translated at the rates prevailing at the date when the fair value was determined. Non-monetary items that are measured in terms of historical cost in a foreign currency are translated at the rate on the date of transaction.
Foreign operations are translated from their functional currencies into Canadian dollars on consolidation by applying the exchange rate at period-end for assets and liabilities and the average exchange rate for profit and loss items. Exchange differences, including differences that arise relating to long-term intercompany balances that form part of the net investment in a foreign operation, are recognized in other comprehensive income (as exchange differences on translation of foreign operations). Fair value adjustments arising on the acquisition of a foreign entity are treated as assets and liabilities of the foreign entity and translated at
11
LAKE SHORE GOLD CORP.
NOTES TO THE CONSOLIDATED FINANCIAL STATEMENTS
FOR THE YEARS ENDED DECEMBER 31, 2013 AND 2012
(in thousands of Canadian dollars, except per share amounts)
the closing rate. On the disposal of a foreign operation the accumulated exchange differences in respect of that operation are reclassified to net loss.
e) Financial instruments
Financial assets and liabilities are recognized when the Company or its subsidiaries become party to the contracts that give rise to them and are classified as loans and receivables, financial instruments fair valued through profit or loss, held-to-maturity, available-for-sale financial assets and other liabilities, as appropriate. The Company considers whether a contract contains an embedded derivative when the entity first becomes a party to it. The embedded derivatives are separated from the host contract if the host contract is not measured at fair value through profit or loss and when the economic characteristics and risks are not closely related to those of the host contract. Reassessment only occurs if there is a change in the terms of the contract that significantly modifies the cash flows that would otherwise be required.
Financial assets at fair value through profit or loss (“FVTPL”)
Financial assets at FVTPL include financial assets held for trading and financial assets designated upon initial recognition as at FVTPL. A financial asset is classified in this category principally for the purpose of selling in the short term or if so designated by management. The Company holds warrants in certain public companies; the warrants are considered derivatives and measured at fair value, with changes in fair value at each period end recorded in net loss. Transaction costs are expensed as incurred.
Available-for-sale financial assets
Available-for-sale (“AFS”) financial assets are those non-derivative financial assets that are designated as such or are not classified as loans and receivables, held-to-maturity investments or financial assets at FVTPL. AFS financial assets are measured at fair value upon initial recognition and at each period end, with unrealized gains or losses being recognized as a separate component of equity in other comprehensive income until the investment is derecognized or until the investment is determined to be impaired at which time the cumulative gain or loss previously reported in equity is included in net loss. The Company has classified its investments in certain public companies as available-for-sale.
Loans and receivables
Trade receivables, loans and other receivables that have fixed or determinable payments that are not quoted in an active market are classified as loans and receivable. Loans and receivable are initially recognized at the transaction value and subsequently carried at amortized cost using the effective interest method if the time value of money is significant. Gains and losses are recognized in the statement of comprehensive loss when the loans and receivables are derecognized or impaired, as well as through the amortization process. Interest income is recognized by applying the effective interest rate, except for short term receivables when the recognition of interest would be immaterial.
12
LAKE SHORE GOLD CORP.
NOTES TO THE CONSOLIDATED FINANCIAL STATEMENTS
FOR THE YEARS ENDED DECEMBER 31, 2013 AND 2012
(in thousands of Canadian dollars, except per share amounts)
Other financial liabilities
Other financial liabilities, including borrowings, are recognized initially at fair value, net of transaction costs. After initial recognition, interest bearing loans and borrowings are subsequently measured at amortized cost using the effective interest method. Gains and losses are recognized in net loss when the liabilities are derecognized as well as through the amortization process. Borrowings are classified as current liabilities unless the Company has an unconditional right to defer settlement of the liability for at least 12 months after the statement of financial position date, and are derecognized when, and only when, the Company’s obligations are discharged or they expire.
Derivative instruments
Derivative instruments, including embedded derivatives, are recorded at fair value on initial recognition and at each subsequent reporting period. Any gains or losses arising from changes in fair value on derivatives are recorded in the statement of comprehensive loss.
Fair values
The fair value of quoted investments is determined by reference to market prices at the close of business on the statement of financial position date. Where there is no active market, fair value is determined using valuation techniques. These include using recent arm’s length market transactions; reference to the current market value of another instrument which is substantially the same; discounted cash flow analysis and pricing models.
Financial instruments that are measured subsequent to initial recognition are grouped into a hierarchy based on the degree to which the fair value is observable as follows:
Level 1 fair value measurements are quoted prices (unadjusted) in active markets for identical assets or liabilities;
Level 2 fair value measurements are those derived from inputs other than quoted prices included within Level 1 that are observable for the asset or liability either directly (i.e. as prices) or indirectly (i.e. derived from prices); and
Level 3 fair value measurements are those derived from valuation techniques that include inputs for the asset or liability that are not based on observable market data (unobservable inputs).
Impairment of financial assets
Financial assets, other than those recorded at FVTPL, are assessed for indicators of impairment at each period end. A financial asset is considered impaired when there is objective evidence that, as a result of one or more events that occurred after the initial recognition of the financial asset, the estimated future cash flows of the investments have been adversely impacted.
If an available-for-sale asset is impaired, an amount comprising the difference between its cost (net of any principal payment and amortization) and its fair value is transferred from equity to net loss, and cumulative
13
LAKE SHORE GOLD CORP.
NOTES TO THE CONSOLIDATED FINANCIAL STATEMENTS
FOR THE YEARS ENDED DECEMBER 31, 2013 AND 2012
(in thousands of Canadian dollars, except per share amounts)
gains or losses previously recognized in other comprehensive income or loss are reclassified to net loss in the period. Reversals of impairment in respect of equity instruments classified as available-for-sale are not recognized in net loss but included in other comprehensive income.
f) Cash and cash equivalents
Cash and cash equivalents includes cash and short-term money market instruments that are readily convertible to cash with original terms of three months or less.
g) Inventories and stockpiled ore
Inventories are valued at the lower of cost or net realizable value. Inventories include stockpiled ore, gold in circuit and bullion inventories as well as materials and supplies inventory. Cost is determined using the weighted average method. The cost of ore inventories is based on the average cost of production. For this purpose, the costs of production include: (i) materials, equipment, labour and contractor expenses which are directly attributable to the extraction and processing of ore; (ii) depletion and depreciation of property, plant and equipment used in the extraction and processing of ore; and (iii) related production overheads (based on normal operating capacity).
Net realizable value is the estimated selling price in the ordinary course of business, less all estimated costs of completion and costs necessary to make the sale.
h) Mining interests
Mining interests represent capitalized expenditures related to the development of mining properties, related plant and equipment and expenditures arising from property acquisitions. Upon disposal or abandonment, the carrying amounts of mining interests are derecognized and any associated gains or losses are recognized in net loss.
Mining properties
Purchased mining properties are recognized as assets at their cost of acquisition or at fair value if purchased as part of a business combination. Mineral exploration costs are charged to net income (loss) in the year in which they are incurred (“green field exploration”), unless any of the conditions listed as (i) and (ii) are present in any of the mineral properties, in which case the costs of further exploration and development on the property are capitalized:
(i) The Company establishes a National Instrument (“NI”) 43-101 technical report with resources and/or reserves in a property; and/or
(ii) The Board of Directors of the Company approves the start of an advanced exploration program on a property, which requires surface or/and underground work (such as an open pit or underground drifts, shafts and other works, other than exploration drilling and analysis).
14
LAKE SHORE GOLD CORP.
NOTES TO THE CONSOLIDATED FINANCIAL STATEMENTS
FOR THE YEARS ENDED DECEMBER 31, 2013 AND 2012
(in thousands of Canadian dollars, except per share amounts)
Mining properties and process facility assets are amortized upon commencement of commercial production either on a unit-of-production basis over measured and indicated resources included in the mine plan or the life of mine.
Revenues realized before commencement of commercial production (“pre-production revenues”), which are not incidental but are necessary to bring the mine to the condition required to be operating in the manner intended by management, are recorded as a reduction of the respective mining asset.
Commercial production
Capitalization of costs incurred ceases when the related mining property has reached operating levels intended by management. Costs incurred prior to this point, including depreciation of related plant and equipment, are capitalized and proceeds from sales during this period are offset against costs capitalized.
Operating levels intended by management are considered to be reached when operational commissioning of major mine and plant components is complete, operating results are achieved consistently for a period of time and there are indications that these operating results will be continued. Other factors include one or more of the following:
(iii) a significant portion of plant/mill capacity is achieved;
(iv) a significant portion of available funding is directed towards operating activities;
(v) a pre-determined, reasonable period of time has passed;
(vi) a development project significant to the primary business objective of the Company has been completed in terms of significant milestones being achieved; or
(vii) the Company has filed a NI 43-101 technical report for the property.
Costs incurred to maintain current production are included in mine operating costs. These costs include the development and access (tunneling) costs of production drifts to develop the ore body in the current production cycle. During the production phase of a mine, costs incurred that provide access to reserves and resources that will be produced in future periods that would not have otherwise been accessible are capitalized and included in the carrying amount of the related mining property. Capitalized stripping costs are depleted over the estimated recoverable ounces contained in reserves and resources that directly benefit from the stripping activities. Costs for regular waste removal that do not give rise to future economic benefits are included in mine operating costs in the period they are incurred.
Plant and equipment
Plant and equipment is stated at cost less accumulated depreciation and impairment losses. The cost capitalized for plant and equipment includes borrowing costs incurred that are attributable to qualifying plant and equipment as noted in note 3(i). The carrying amounts of plant and equipment are depreciated
15
LAKE SHORE GOLD CORP.
NOTES TO THE CONSOLIDATED FINANCIAL STATEMENTS
FOR THE YEARS ENDED DECEMBER 31, 2013 AND 2012
(in thousands of Canadian dollars, except per share amounts)
using either the straight-line or unit-of-production method over the estimated useful lives of the related assets.
The significant classes of depreciable plant and equipment and their estimated useful lives are as follows:
Category | | Rates |
| | |
Mill and related infrastructure | | 20 years or unit-of-production |
Underground infrastructure | | Life of mine |
Vehicles and mobile equipment | | 3-10 years |
Office equipment | | 20% |
Computer equipment | | 30% |
Assets under construction are carried at cost less any recognized impairment loss. Cost includes cost of equipment, cost of labour and installation, project management cost and other indirect costs specifically for assets under construction. When the asset is completed and ready for intended use, the Company reclassifies it from assets under construction to plant and equipment or depletable assets.
Leased assets
Leases in which the Company assumes substantially all risks and rewards of ownership are classified as finance leases. Assets held under finance leases are recognized at the lower of the fair value and the present value of minimum lease payments at inception of the lease, less accumulated depreciation and impairment losses. Lease payments are accounted for as discussed in note 3(k).
Assets held under finance leases are depreciated over their expected useful lives on the same basis as owned assets.
i) Borrowing costs
Borrowing costs directly attributable to the acquisition, construction or production of a qualifying asset (i.e. an asset that necessarily takes a substantial period of time to get ready for its intended use or sale) are capitalized as part of the cost of the asset. All other borrowing costs are expensed in the period they occur.
j) Impairment of assets
Assets that have an indefinite useful life are not subject to amortization and are tested annually for impairment or whenever other indicators exist. Assets that are subject to amortization or depreciation are reviewed for impairment whenever events or changes in circumstances indicate that the carrying amount may not be recoverable. An impairment loss is recognized for the amount by which the asset’s carrying amount exceeds its recoverable amount. The recoverable amount of assets is the greater of their fair value less costs to sell and value in use. Fair value is based on an estimate of the amount that the Company may obtain in a sale transaction on an arm’s-length basis. In assessing value in use, the estimated future cash flows are discounted to their present value using a pre-tax discount rate that reflects current market assessments of the time value of money and the risks specific to the asset. For an asset that does not
16
LAKE SHORE GOLD CORP.
NOTES TO THE CONSOLIDATED FINANCIAL STATEMENTS
FOR THE YEARS ENDED DECEMBER 31, 2013 AND 2012
(in thousands of Canadian dollars, except per share amounts)
generate cash inflows largely independent of those from other assets, the recoverable amount is determined for the cash-generating unit to which the asset belongs. The Company’s cash generating units are the lowest level of identifiable groups of assets that generate cash inflows that are largely independent of the cash inflows from other assets or groups of assets. Where a reasonable and consistent basis of allocation can be identified, corporate assets are also allocated to individual cash-generating units, otherwise they are allocated to the smallest group of cash-generating units for which a reasonable and consistent allocation basis can be identified.
An impairment loss is reversed if there has been a change in the estimates used to determine the recoverable amount. An impairment loss is reversed only to the extent that the asset’s carrying amount does not exceed the carrying amount that would have been determined, net of depreciation or amortization, if no impairment loss had been recognized.
k) Leases
Assets held under finance leases are recognized as discussed in note 3(h). The corresponding liability is recognized as a finance lease obligation. Lease payments are apportioned between finance charges and reduction of the lease obligation to achieve a constant rate of interest on the remaining liability. Finance charges are recorded as a finance expense to profit and loss, unless they are attributable to qualifying assets, in which case they are capitalized.
Operating lease payments are recognized as an expense on a straight-line basis over the lease term, except where another systematic basis is more representative of the time pattern in which economic benefits from the leased asset are consumed.
The Company engages in sales and leaseback transactions as part of the Company’s financing strategy. Where a sale and leaseback transaction results in a finance lease, any excess of sales proceeds over the carrying amount is deferred and amortized over the lease term. Where a sale and leaseback transaction results in an operating lease, and it is clear that the transaction is established at fair value, any profit or loss is recognized immediately. If the sales price is below fair value, the shortfall is recognized in income immediately, except that, if the loss is compensated for by future lease payments at below market price, it is deferred and amortized in proportion to the lease payments over the period for which the asset is expected to be used. If the sale price is above fair value, the excess over fair value is deferred and amortized over the period the asset is expected to be used.
l) Provisions
Provisions are recognized when the Company or its subsidiaries have a present obligation (legal or constructive) as a result of a past event, it is probable that an outflow of resources will be required to settle the obligation and a reliable estimate can be made of the amount of the obligation. The amount recognized as a provision is the best estimate of the consideration required to settle the present obligation at the end of the reporting period. If the effect of the time value of money is material, provisions are determined by discounting the expected future cash flows at a pre-tax rate that reflects current market assessments of the time value of money and, where appropriate, the risks specific to the liability. Where discounting is used, the increase in the provision due to the passage of time is recognized as a finance cost.
17
LAKE SHORE GOLD CORP.
NOTES TO THE CONSOLIDATED FINANCIAL STATEMENTS
FOR THE YEARS ENDED DECEMBER 31, 2013 AND 2012
(in thousands of Canadian dollars, except per share amounts)
Contingent liabilities are not recognized in the consolidated financial statements, if not estimable and probable, and are disclosed in notes to the financial information unless their occurrence is remote. Contingent assets are not recognized in the consolidated financial statements, but are disclosed in the notes if their recovery is deemed probable.
Environmental rehabilitation
Provisions for environmental rehabilitation are made in respect of the estimated future costs of closure and restoration and for environmental rehabilitation costs (which include the dismantling and demolition of infrastructure, removal of residual materials and remediation of disturbed areas) in the accounting period when the related environmental disturbance occurs. The provision is discounted using a pre-tax rate, and the unwinding of the discount is included in finance costs. At the time of establishing the provision, a corresponding asset is capitalized and is depreciated over future production from the mining property to which it relates. The provision is reviewed on an annual basis for changes in cost estimates, discount rates and operating lives.
Changes to estimated future costs are recognized in the statement of financial position by adjusting the rehabilitation asset and liability. Increases in estimated costs related to mine production become part of ore inventory. For closed sites, changes to estimated costs are recognized immediately in the profit and loss.
m) Share-based payments
The fair value of the estimated number of stock options awarded to employees, officers and directors that will eventually vest, is recognized as share-based compensation expense over the vesting period of the stock options with a corresponding increase to equity. The fair value of each stock option granted is estimated on the date of the grant using the Black-Scholes option-pricing model and is expensed over the vesting period, based on the Company’s estimate of equity instruments that will eventually vest. At the end of each reporting period, the Company revises its estimate of the number of equity instruments expected to vest. The impact of the revision of the original estimates, if any, is recognized in net loss or capitalized in mining properties such that the accumulated expense reflects the revised estimate, with a corresponding adjustment to the share-based payment reserve. The share based payment cost is recognized in net loss or capitalized in mining properties (options granted to individuals involved on specific projects).
Performance share units (“PSUs”) awarded to eligible executives are settled in cash. The fair value of the estimated number of PSUs awarded expected to vest is recognized as share-based compensation expense over the vesting period of the PSUs with a corresponding amount set up as a liability. Until the liability is settled, the fair value of the PSUs is re-measured at the end of each reporting period and at the date of settlement, with changes in fair value recognized as share-based compensation expense or recovery over the vesting period. The fair value of PSUs is estimated using the Monte-Carlo simulation pricing model to determine the expected market value of the underlying Lake Shore Gold shares on settlement date, multiplied by the expected target settlement percentage (multiplier).
Deferred share units (“DSUs”) awarded to non-executive directors can be settled in cash, shares or a combination of both as elected by the directors. In the case of a payment in shares, the Company will purchase the shares on the open market, through a broker, on behalf of the directors. The fair value of the
18
LAKE SHORE GOLD CORP.
NOTES TO THE CONSOLIDATED FINANCIAL STATEMENTS
FOR THE YEARS ENDED DECEMBER 31, 2013 AND 2012
(in thousands of Canadian dollars, except per share amounts)
DSUs awarded is recognized as share-based compensation expense at grant date with a corresponding amount set up as a liability. Until the liability is settled, the fair value of the DSUs is re-measured at the end of each reporting period and at the date of settlement, with changes in fair value recognized as share-based compensation expense or recovery in the period. The fair value of DSUs is estimated using the Black-Scholes option-pricing model to determine the expected market value of the underlying Lake Shore Gold shares on settlement date.
n) Defined contribution pension plan
The Company has a defined contribution pension plan which covers all of the Company’s employees. Under the plan provisions, the Company contributes a fixed percentage of the employees’ salaries to the pension plan. The employees are able to direct the contributions into a variety of investment funds offered by the plan. Pension costs associated with the Company’s required contributions under the plan are recognized as an expense when the employees have rendered service entitling them to the contribution and are charged to profit or loss, or capitalized to mining interests for employees directly involved in the specific projects.
o) Deferred income and mining taxes
Taxes, comprising both income taxes and mining taxes accounted for as income taxes, are recognized in net loss, except where they relate to items recognized in other comprehensive income or directly in equity, in which case the related taxes are recognized in other comprehensive income or equity. Deferred income taxes are provided using the balance sheet liability method, providing for unused tax losses, unused tax credits and temporary differences between the carrying amounts of assets and liabilities for financial reporting purposes and the amounts used for taxation purposes. As an exception, deferred tax assets and liabilities are not recognized if the temporary differences arise from the initial recognition of goodwill or an asset or liability in a transaction (other than in a business combination) that affects neither accounting profit or taxable profit.
Deferred tax assets and liabilities are measured at the tax rates that are expected to apply to the period when the asset is realized or the liability is settled based on the tax rates (and tax laws) that have been enacted or substantively enacted at the statement of financial position date.
A deferred tax asset is recognized only to the extent that it is probable that future taxable profits will be available against which the asset can be utilized. Deferred tax assets are reduced to the extent that it is no longer probable that the related tax benefit will be realized.
Deferred tax assets and liabilities are offset when there is a legally enforceable right to set off current tax assets against current tax liabilities and when they relate to income taxes levied by the same taxation authority and the Company intends to settle its current assets and liabilities on a net basis.
p) Share capital
Common shares issued by the Company are classified as equity. Incremental costs directly attributable to the issue of new common shares are recognized in equity, net of tax, as a deduction from the share proceeds (share issue costs).
19
LAKE SHORE GOLD CORP.
NOTES TO THE CONSOLIDATED FINANCIAL STATEMENTS
FOR THE YEARS ENDED DECEMBER 31, 2013 AND 2012
(in thousands of Canadian dollars, except per share amounts)
q) Revenue recognition
Revenue is measured at the fair value of the consideration received or receivable and represents amounts received for goods sold in the normal course of business, net of discounts and sales related taxes. Revenue from gold sales is recognized to the extent that it is probable that economic benefits will flow to the Company, the revenue can be reliably measured and when all significant risks and rewards of ownership are transferred to the customer, which is when title has passed to the customer. Revenue from by-product sales is recorded as a reduction of production costs.
r) Finance income and costs
Finance income and costs comprise interest income on funds invested, interest expense on borrowings and the accumulation of interest on provisions. Interest income is recognized as it accrues, taking into account the effective yield on the asset.
s) Earnings (loss) per share
Basic earnings (loss) per share is computed by dividing net earnings (loss) available to common shareholders by the weighted average number of outstanding common shares for the period. In computing diluted earnings per share, an adjustment is made for the dilutive effect of the exercise of stock options and warrants. The number of additional shares is calculated by assuming that outstanding stock options, debentures and warrants are exercised and that the proceeds from such exercises were used to acquire common shares at the average market price during the reporting periods. In periods where a net loss is reported, all outstanding options and warrants are excluded from the calculation of diluted loss per share, as they are anti-dilutive.
t) Deferred financing charges
Costs of arranging a loan facility are recorded in the statement of financial position net of the respective facility obligation and amortized using the effective interest method over the term of the respective facility agreement.
u) Other comprehensive income (loss)
Other comprehensive income (loss) is the change in the Company’s net assets that results from transactions, events and circumstances from sources other than the Company’s shareholders and includes items that are not included in net profits such as unrealized gains and losses on financial assets classified as available-for-sale, net of income taxes, gain or losses on certain derivative instruments and foreign currency exchange gains or losses related to foreign subsidiaries which functional currency is different than the functional currency of the Company.
20
LAKE SHORE GOLD CORP.
NOTES TO THE CONSOLIDATED FINANCIAL STATEMENTS
FOR THE YEARS ENDED DECEMBER 31, 2013 AND 2012
(in thousands of Canadian dollars, except per share amounts)
v) Segment reporting
An operating segment is a component of an entity:
(i) that engages in business activities from which it may earn revenues and incur expenses (including revenues and expenses relating to transactions with other components of the same entity);
(ii) whose operating results are regularly reviewed by the entity’s chief operating decision maker to make decisions about resources to be allocated to the segment and assess its performance; and
(iii) for which discrete financial information is available.
The Company’s operating segments are its mining operations segment and exploration and advanced exploration segments.
4. CRITICAL ACCOUNTING JUDGMENTS AND KEY SOURCES OF ESTIMATION UNCERTAINTY
In the application of the Company’s accounting policies, which are described in note 3, management is required to make judgments, estimates and assumptions about the carrying amount and classification of assets and liabilities that are not readily apparent from other sources. The estimates and associated assumptions are based on historical experience and other factors that are considered to be relevant. Actual results may differ from these estimates.
The estimates and underlying assumptions are reviewed on an ongoing basis. Revisions to accounting estimates are recognized in the period in which the estimate is revised if the revisions affect only that period, or in the period of the revision and future periods, if the revision affects both current and future periods.
The following are the critical judgments and areas involving estimates, that management have made in the process of applying the Company’s accounting policies and that have the most significant effect on the amounts recognized in the consolidated financial statements.
CRITICAL JUDGMENTS IN APPLYING ACCOUNTING POLICIES
Commercial production - Operating levels intended by management
Prior to reaching operating levels intended by management, costs incurred are capitalized as part of costs of the related mining property and proceeds from sales are offset against costs capitalized. Depletion of capitalized costs for mining properties begins when operating levels intended by management have been reached. Management considers several factors in determining when a mining property has reached the operating levels intended by management.
21
LAKE SHORE GOLD CORP.
NOTES TO THE CONSOLIDATED FINANCIAL STATEMENTS
FOR THE YEARS ENDED DECEMBER 31, 2013 AND 2012
(in thousands of Canadian dollars, except per share amounts)
Determination of functional currency
In accordance with International Accounting Standards (“IAS”) 21, The Effects of Changes in Foreign Exchange Rates, management determined that the functional currency of its Canadian entities (the Company and its Canadian subsidiaries — note 3(a)) is the Canadian dollar and Mexico pesos for the Company’s subsidiary in Mexico (Minera Golondrina S. de R.L. de C.V. or the “Mexico entity”). The Company disposed of its Mexico entity on May 8, 2013 (note 9).
KEY SOURCES OF ESTIMATION UNCERTAINTIES
Useful life of plant and equipment
As discussed in note 3(h), the Company reviews the estimated lives of its plant and equipment at the end of each reporting period. There were no material changes in the lives of plant and equipment for the years ended December 31, 2013 and 2012.
Determination of ore reserves and resources
Reserves and resources are used in the units of production calculation for depreciation and depletion calculations and in the determination of the timing of environmental rehabilitation costs as well as in the impairment analysis.
There are numerous uncertainties inherent in estimating ore reserves and resources. Assumptions that are valid at the time of estimation may change significantly when new information becomes available. Changes in the forecast prices of commodities, exchange rates, production costs, or recovery rates as well as new drilling results may change the economic status of reserves and resources and may result in the reserves and resources being revised.
Deferred income taxes
Judgment is required in determining whether deferred tax assets are recognized on the statement of financial position. Deferred tax assets, including those arising from unutilized tax losses require management to assess the likelihood that the Company and/or its subsidiaries will generate taxable earnings in future periods, in order to utilize recognized deferred tax assets. Estimates of future taxable income are based on forecast cash flows from operations and the application of existing tax laws in each jurisdiction. To the extent that future cash flows and taxable income differ significantly from estimates, the ability of the Company and/or its subsidiaries to realize the net deferred tax assets recorded at the statement of financial position date could be impacted. Additionally, future changes in tax laws in the jurisdictions in which the Company and its subsidiaries operates could limit the ability of the Company to obtain tax deductions in future periods.
22
LAKE SHORE GOLD CORP.
NOTES TO THE CONSOLIDATED FINANCIAL STATEMENTS
FOR THE YEARS ENDED DECEMBER 31, 2013 AND 2012
(in thousands of Canadian dollars, except per share amounts)
Impairment of assets
The carrying amounts of mining properties and plant and equipment are reviewed for impairment if events or changes in circumstances indicate that the carrying value may not be recoverable. If there are indicators of impairment, an exercise is undertaken to determine whether the carrying values are in excess of their recoverable amount. Such review is undertaken on an asset by asset basis, except where such assets do not generate cash flows independent of other assets, and then the review is undertaken at the cash generating unit level (“CGU”).
The assessment requires the use of estimates and assumptions such as, but not limited to, long-term commodity prices, foreign exchange rates, discount rates, future capital requirements, resource estimates, exploration potential and operating performance as well as the CGU definition. It is possible that the actual fair value could be significantly different from those assumptions, and changes in these assumptions will affect the recoverable amount of the mining interests. In the absence of any mitigating valuation factors, adverse changes in valuation assumptions or declines in the fair values of the Company’s CGUs or other assets may, over time, result in impairment charges causing the Company to record material losses.
Environmental rehabilitation
Significant estimates and assumptions are made in determining the environmental rehabilitation costs as there are numerous factors that will affect the ultimate liability payable. These factors include estimates of the extent and costs of rehabilitation activities, technological changes, regulatory changes, cost increases, and changes in discount rates.
Those uncertainties may result in actual expenditures in the future being different from the amounts currently provided. The provision represents management’s best estimate of the present value of the future rehabilitation costs required.
Share-based payments
Management assesses the fair value of stock options granted, PSUs and DSUs in accordance with the accounting policy stated in note 3(m). The fair value of stock options granted and DSUs is measured using the Black-Scholes option valuation model; the fair value of PSUs is measured using the Monte Carlo simulation valuation model. The fair value of stock options granted, PSUs and DSUs using valuation models is only an estimate of their potential value and requires the use of estimates and assumptions.
23
LAKE SHORE GOLD CORP.
NOTES TO THE CONSOLIDATED FINANCIAL STATEMENTS
FOR THE YEARS ENDED DECEMBER 31, 2013 AND 2012
(in thousands of Canadian dollars, except per share amounts)
5. CHANGES IN ACCOUNTING POLICIES AND ACCOUNTING STANDARDS ISSUED BUT NOT YET EFFECTIVE
CHANGES IN ACCOUNTING POLICIES
The Company has adopted the following new standards, along with any consequential amendments, effective January 1, 2013. These changes were made in accordance with the applicable transitional provisions.
Amendments to IFRS 7, Financial Instruments: Disclosures
In December 2011, the IASB approved amendments to IFRS 7, Financial Instruments: Disclosures, with respect to offsetting financial assets and financial liabilities. The common disclosure requirements of amended IFRS 7 are intended to help investors and other users to better assess the effect or potential effect of offsetting arrangements on a company’s financial position. Companies and other entities are required to apply the amendments for annual reporting periods beginning on or after January 1, 2013, and interim periods within those annual periods. The required disclosures should be provided retrospectively.
The Company reviewed the amendments to IFRS 7 and determined that no additional disclosures are currently required.
IFRS 10, Consolidated Financial Statements
IFRS 10 establishes principles for the presentation and preparation of consolidated financial statements when an entity controls one or more other entities. IFRS 10 supersedes IAS 27, Consolidated and Separate Financial Statements and Standing Interpretation Committee (“SIC”)-12, Consolidation — Special Purpose Entities, and is effective for annual periods beginning on or after January 1, 2013.
The Company assessed its consolidation conclusions on January 1, 2013 and determined that the adoption of IFRS 10 did not result in any change in the consolidation status of the Company’s subsidiaries.
IFRS 11, Joint Arrangements
IFRS 11 establishes principles for financial reporting by parties to a joint arrangement. IFRS 11 supersedes current IAS 31, Interests in Joint Ventures and SIC-13, Jointly Controlled Entities — Non-Monetary Contributions by Venturers and is effective for annual periods beginning on or after January 1, 2013. The Company determined that the standard did not have any impact on its consolidated financial statements.
IFRS 12, Disclosure of Interests in Other Entities
IFRS 12 applies to entities that have an interest in a subsidiary, a joint arrangement, an associate or an unconsolidated structured entity. IFRS 12 is effective for annual periods beginning on or after January 1, 2013. Earlier application is permitted. The Company assessed its disclosures and concluded that the adoption of IFRS 12 did not result in any material change in disclosures in the consolidated financial statements.
24
LAKE SHORE GOLD CORP.
NOTES TO THE CONSOLIDATED FINANCIAL STATEMENTS
FOR THE YEARS ENDED DECEMBER 31, 2013 AND 2012
(in thousands of Canadian dollars, except per share amounts)
IFRS 13, Fair Value Measurements
IFRS 13 defines fair value and sets out a single framework for measuring fair value which is applicable to all IFRSs that require or permit fair value measurements or disclosures about fair value measurements. IFRS 13 requires that when using a valuation technique to measure fair value, the use of relevant observable inputs should be maximized while unobservable inputs should be minimized. IFRS 13 is to be applied for annual periods beginning on or after January 1, 2013. The consolidated financial statements of the Company include additional disclosures in accordance with the requirements of IFRS 13 (refer to note 27).
Amendments to IAS 1, Presentation of Financial Statements
The amendments introduce changes to the presentation of items of other comprehensive income. The amendments require that an entity present separately the items of other comprehensive income that would be reclassified to profit and loss in the future if certain conditions are met from those that would never be reclassified to profit and loss. The amendments are to be applied effective July 1, 2012 and may be early adopted. The amendments are to be applied retroactively in accordance with IAS 8, Accounting Policies, Changes in Accounting Estimates and Errors. In accordance with the requirements of Amendments to IAS 1, the Company separated the items of other comprehensive income that would be reclassified to profit and loss from those that would never be reclassified to profit and loss on the Statement of Other Comprehensive Income (Loss).
Amendments to IAS 16 — Property, Plant and Equipment
Paragraph 8 of IAS 16, Property, plant and equipment, was amended requiring entities to recognize items such as spare parts, stand-by equipment, and servicing equipment as property, plant and equipment when they meet the definition of property, plant and equipment; otherwise, such items are classified as inventory. The impact in 2013 on the Company was a reclassification of $444 (2012 - $272) out of inventories and stockpiled ore into property, plant and equipment.
IAS 19, Employee Benefits (amended standard)
The amended standard introduces various changes in accounting and disclosure requirements for defined benefit plans. The amended standard also finalizes proposals on accounting for termination benefits; under the amended standard the termination benefits are recognized at the earlier of when the entity recognizes costs for a restructuring within the scope of IAS 37, Provisions, Contingent Liabilities and Contingent Assets, that includes the payment of a termination benefit, and when the entity can no longer withdraw the offer of the termination benefit. The amended standard is to be applied for periods beginning on or after January 1, 2013. The amended standard does not impact the Company’s consolidated financial statements.
IAS 27 - Separate financial statements
IAS 27, Separate financial statements (IAS 27) was re-issued by the IASB in May 2011 to only prescribe the accounting and disclosure requirements for investments in subsidiaries, joint ventures and associates when an entity prepares separate financial statements. The consolidation guidance will now be included in IFRS 10. The amendments to IAS 27 are effective for annual periods beginning on or after January 1,
25
LAKE SHORE GOLD CORP.
NOTES TO THE CONSOLIDATED FINANCIAL STATEMENTS
FOR THE YEARS ENDED DECEMBER 31, 2013 AND 2012
(in thousands of Canadian dollars, except per share amounts)
2013. The Company determined that the amendments to IAS 27 did not have any impact on its consolidated financial statements.
Amendments to IAS 28 — Investments in Associates and Joint Ventures
These amendments carry forward the requirements of IAS 28 (2008), with limited amendments related to associates and joint ventures held for sale, as well as to changes in interests held in associates and joint ventures when an entity retains an interest in the investment. The Company determined that the amendments to IAS 28 did not have any impact on its consolidated financial statements.
IFRIC 20, Stripping Costs in the Production Phase of a Surface Mine
IFRIC 20 is a new interpretation on the accounting for waste removal activities. The interpretation considers when and how to account separately for the benefits arising from a stripping activity, as well as how to measure such benefit.
The interpretation requires that costs from a stripping activity which improve access to ore to be recognized as a non-current asset when certain criteria are met and should be accounted as an addition to the related asset. IFRIC 20 does not impact the Company’s consolidated financial statements.
ACCOUNTING STANDARDS ISSUED BUT NOT YET EFFECTIVE
IFRS 9, Financial Instruments
IFRS 9 was issued by the IASB in November 2009 and will replace IAS 39, “Financial instruments: recognition and measurement”. IFRS 9 replaces the multiple rules in IAS 39 with a single approach to determine whether a financial asset is measured at amortized cost or fair value and a new mixed measurement model for debt instruments having only two categories: amortized cost and fair value. The approach in IFRS 9 is based on how an entity manages its financial instruments in the context of its business model and the contractual cash flow characteristics of the financial assets. This standard also requires a single impairment method to be used, replacing the multiple impairment methods in IAS 39.
In December 2011, the IASB issued amendments to IFRS 9 that also provide relief from the requirement to restate comparative financial statements for the effect of applying IFRS 9 which was originally limited to companies that chose to apply IFRS 9 prior to 2012. Alternatively, additional transition disclosures will be required to help investors understand the effect that the initial application of IFRS 9 has on the classification and measurement of financial instruments. In November 2013, the IASB issued amendments to IFRS 9 deferring the mandatory effective date, of which has not yet been finalized; however early adoption is permitted. The Company is currently evaluating the impact of this standard and amendments on its consolidated financial statements.
IAS 32, Financial instruments: presentation
IAS 32, Financial instruments: presentation was amended by the IASB in December 2011. The amendment clarifies that an entity has a legally enforceable right to offset financial assets and financial liabilities if that right is not contingent on a future event and it is enforceable both in the normal course of business and in the event of default, insolvency or bankruptcy of the entity and all counterparties. The amendments to IAS
26
LAKE SHORE GOLD CORP.
NOTES TO THE CONSOLIDATED FINANCIAL STATEMENTS
FOR THE YEARS ENDED DECEMBER 31, 2013 AND 2012
(in thousands of Canadian dollars, except per share amounts)
32 are effective for annual periods beginning on or after January 1, 2014. The adoption of this standard is not expected to have a significant impact on the Company’s financial statements.
IAS 36, Impairment of assets
IAS 36, Impairment of assets, was amended by the IASB in May 2013. The amendments require the disclosure of the recoverable amount of impaired assets when an impairment loss has been recognised or reversed during the period and additional disclosures about the measurement of the recoverable amount of impaired assets when the recoverable amount is based on fair value less costs of disposal, including the discount rate when a present value technique is used to measure the recoverable amount. The amendments to IAS 36 are effective for annual periods beginning on or after January 1, 2014. The Company is currently evaluating the impact of this amendment on its consolidated financial statements.
IAS 39, Financial instruments: recognition and measurement
IAS 39, Financial instruments: recognition and measurement, was amended by the IASB in June 2013. The amendments clarify that novation of a hedging derivative to a clearing counterparty as a consequence of laws or regulations or the introduction of laws or regulations does not terminate hedge accounting. The amendments to IAS 39 are effective for annual periods beginning on or after January 1, 2014. The adoption of this standard is not expected to have an impact on the Company’s financial statements.
IFRIC 21, Levies
IFRIC 21, Levies was issued in May 2013 and is an interpretation of IAS 37, Provisions, Contingent Liabilities and Contingent Assets. The interpretation clarifies the obligating event that gives rise to a liability to pay a levy. IFRIC 21 is effective for periods beginning on or after January 1, 2014. The Company is currently evaluating the impact of this interpretation on its financial statements.
6. PRODUCTION COSTS
For the years ended December 31, | | 2013 | | 2012 | |
Raw materials and consumables | | $ | 38,883 | | $ | 28,490 | |
Salaries, employee benefits and other employee related expenses | | 32,051 | | 28,465 | |
Contractors | | 18,651 | | 18,627 | |
Definition and delineation drilling | | 4,656 | | 9,678 | |
Change in stockpiles and other gold inventories | | 6,956 | | (10,286 | ) |
Royalties | | 4,379 | | 2,336 | |
Rentals and operating leases | | 974 | | 1,046 | |
Share based payments note 23(b(iv)) | | 471 | | 775 | |
Other | | 470 | | 906 | |
| | $ | 107,491 | | $ | 80,037 | |
27
LAKE SHORE GOLD CORP.
NOTES TO THE CONSOLIDATED FINANCIAL STATEMENTS
FOR THE YEARS ENDED DECEMBER 31, 2013 AND 2012
(in thousands of Canadian dollars, except per share amounts)
7. OTHER INCOME (LOSS), NET
For the years ended December 31, | | 2013 | | 2012 | |
Unrealized and realized gain (loss) on embedded derivatives note 19(a) | | $ | 8,171 | | $ | (2,247 | ) |
Loss on deemed disposition of available for sale investment note 9(ii) | | (1,681 | ) | — | |
Loss on sale lease back transaction note 18 | | (682 | ) | — | |
Unrealized and realized foreign exchange (loss) gain, net | | (489 | ) | 771 | |
Gain on settlement of debt | | — | | 546 | |
Gain on sale of available for sale investments note 12 | | — | | 718 | |
Other loss, net | | (186 | ) | (306 | ) |
Other income (loss), net | | $ | 5,133 | | $ | (518 | ) |
Unrealized foreign exchange (loss) gain, net for the year ended December 31, 2013 includes $30 loss from the mark to market of certain embedded derivatives (2012 - $1,102 gain) - note 19(a).
Gain on settlement of debt in 2012 relates to the repayment by the Company of the UniCredit Bank AG (“UniCredit”) revolving credit facility on September 7, 2012 (note 19(c)) and includes $1,796 of realized foreign exchange gain partially offset by the write off of $1,250 of unamortized transaction costs.
Other loss, net, includes $108 (note 12) unrealized loss on certain warrants held by the Company (2012 - $306), $278 write-off of certain amounts receivable (2012 - $Nil) and $200 gain from the sale of one of its non-core green field exploration properties for same amount (2012 - $Nil).
8. FINANCE ITEMS
For the years ended December 31, | | 2013 | | 2012 | |
| | | | | |
Interest income on bank deposits | | $ | 706 | | $ | 552 | |
Finance income | | $ | 706 | | $ | 552 | |
| | | | | |
Borrowing costs and other interest expense note 19 | | $ | (15,328 | ) | $ | (3,225 | ) |
Unwinding of the discount on environmental rehabilitation provision | | (54 | ) | (58 | ) |
Total finance expense | | $ | (15,382 | ) | $ | (3,283 | ) |
Net finance items | | $ | (14,676 | ) | $ | (2,731 | ) |
Borrowing costs and other interest expense include interest expense under the effective interest method related to long term debt of $14,943 (2012 - $2,952) (note 19), bank charges and interest expense related to finance leases of $385 (2012 - $273).
28
LAKE SHORE GOLD CORP.
NOTES TO THE CONSOLIDATED FINANCIAL STATEMENTS
FOR THE YEARS ENDED DECEMBER 31, 2013 AND 2012
(in thousands of Canadian dollars, except per share amounts)
9. SALE OF THE MEXICO SUBSIDIARY
On January 30, 2013 the Company and Revolution Resources Corp. (“Revolution”) entered into an agreement for the sale of the Company’s Mexico subsidiary (which held 100% of the Company’s Mexico property portfolio) to Revolution for:
· 20,000,000 common shares of Revolution, receivable on closing;
· 2% to 3.5% Net Smelter Return (“NSR”) on the various properties of the Mexico portfolio (subject to rights of Revolution to repurchase a portion of the NSR); and
· $5,000 in cash or common shares on or before December 31, 2017 contingent on certain conditions being met, for a maximum of 25,000,000 common shares of Revolution (valued at the greater of $0.20 and share price of Revolution at time of issuance).
The agreement closed on May 8, 2013 (the “closing date”) at which time the Company received 20,000,000 common shares of Revolution; the amended option agreement entered between the Company and Revolution in 2012 was terminated.
(i) Disposal of the Mexico subsidiary
The disposal of the Mexico property portfolio is consistent with the Company’s long term policy to focus its activities in its three gold complexes in Canada. The Company recorded a loss of $4,302 on the disposal of its Mexico subsidiary as detailed below:
Consideration received: | | | |
20,000,000 shares of Revolution valued at $0.085 per share | | $ | 1,700 | |
Total consideration received | | $ | 1,700 | |
| | | |
Asset over which control was lost: | | | |
Mining interest (Mexico properties) | | $ | 2,192 | |
Net asset disposed of | | $ | 2,192 | |
| | | |
Loss on disposal of the Mexico subsidiary | | | |
Consideration received | | $ | 1,700 | |
Net assets disposed of | | (2,192 | ) |
Cumulative exchange loss in respect of the net assets of the subsidiary | | (3,810 | ) |
Loss on disposal | | $ | (4,302 | ) |
At December 31, 2012, the assets and liabilities of the Mexico subsidiary were reclassified as held for sale in the statement of financial position; the Company recorded an impairment charge of $71,500 on the reclassification.
a) Assets and liabilities held for sale
The major classes of assets and liabilities of the Mexico subsidiary at December 31, 2012 are as follows (none at December 31, 2013):
29
LAKE SHORE GOLD CORP.
NOTES TO THE CONSOLIDATED FINANCIAL STATEMENTS
FOR THE YEARS ENDED DECEMBER 31, 2013 AND 2012
(in thousands of Canadian dollars, except per share amounts)
As at December 31, | | 2012 | |
Cash and cash equivalents | | $ | 379 | |
Mining interests | | 2,053 | |
Net assets held for sale | | $ | 2,432 | |
b) Discontinued operations
The results of discontinued operations included in the loss for the year are presented below; the comparative periods have been represented accordingly.
For the years ended December 31, | | 2013 | | 2012 | |
| | | | | |
Expenses | | | | | |
Exploration and evaluation | | $ | — | | $ | (43 | ) |
| | — | | (43 | ) |
Loss on disposal of assets held for sale | | (4,302 | ) | — | |
Impairment charge | | — | | (71,500 | ) |
Net loss from discontinued operations after tax | | (4,302 | ) | (71,543 | ) |
Other comprehensive income (loss) | | | | | |
Items that may be reclassified subsequently to profit or loss: | | | | | |
Exchange differences on translation of foreign operations | | 3,967 | | 3,712 | |
Comprehensive loss from discontinued operations | | $ | (335 | ) | $ | (67,831 | ) |
| | | | | |
Loss per share from discontinued operations | | | | | |
Basic and diluted | | $ | (0.01 | ) | $ | (0.17 | ) |
| | | | | |
Weighted average number of common shares outstanding (in 000’s) | | | | | |
Basic and diluted | | 416,536 | | 411,334 | |
(ii) Deemed disposition of available for sale investment in Revolution
Prior to May 8, 2013 (the closing date of the agreement), the Company held 6,713,740 of Revolution’s shares representing approximately 7% of the then issued and outstanding shares of Revolution; the newly issued shares brought the Company’s equity ownership on Revolution to 22.5%, making Revolution an associate (ownership over 20% and the right of board representation gives the Company significant influence over Revolution). As such, from May 8, 2013, Revolution is accounted for under the equity method of accounting which requires the investment in the associate to be initially recorded at cost and the carrying amount adjusted thereafter for the Company’s share of the post-acquisition profits and losses of the investee.
Prior to the deemed disposition, the Company’s investment in Revolution was considered available for sale and marked to market at each period end ($470 and $705 respectively at March 31, 2013 and December 31, 2012) with changes in value accumulated in other comprehensive income (loss) as part of investment revaluation reserve. The Company recorded a loss of $1,681 on the transaction (deemed disposition of the
30
LAKE SHORE GOLD CORP.
NOTES TO THE CONSOLIDATED FINANCIAL STATEMENTS
FOR THE YEARS ENDED DECEMBER 31, 2013 AND 2012
(in thousands of Canadian dollars, except per share amounts)
available for sale investment in Revolution), $1,790 of which was transferred from investment revaluation reserve.
10. RECEIVABLES AND PREPAIDS
As at December 31, | | 2013 | | 2012 | |
Sales tax and government receivables | | $ | 2,355 | | $ | 5,665 | |
Prepaid expenses | | 1,184 | | 1,158 | |
Other | | 50 | | 913 | |
| | $ | 3,589 | | $ | 7,736 | |
The fair value of receivables approximates their carrying value. None of the amounts included in receivables at December 31, 2013 are past due.
11. INVENTORIES AND STOCKPILED ORE
As at December 31, | | 2013 | | 2012 | |
Gold in circuit | | $ | 10,068 | | $ | 10,494 | |
Stockpiled ore | | 3,902 | | 7,784 | |
Bullion | | 782 | | 6,420 | |
Materials and supplies inventory | | 5,626 | | 2,928 | |
| | $ | 20,378 | | $ | 27,626 | |
The cost of inventories and stockpiled ore recognized as an expense in 2013 and 2012 is $103,112 (excluding royalty expense of $4,379) and $77,701 (excluding royalty expense of $2,336), respectively. There were no write downs or reversals of write-downs of inventory to net realizable value during the years ended December 31, 2013 and 2012.
12. AVAILABLE FOR SALE FINANCIAL ASSETS AND WARRANT INVESTMENTS
As at December 31, | | 2013 | | 2012 | |
Available for sale investments | | $ | 416 | | $ | 702 | |
Warrant investments | | — | | 108 | |
| | $ | 416 | | $ | 810 | |
The Company holds available for sale investments in certain public companies. During the year ended December 31, 2013, the Company recorded $4 of after tax unrealized loss in other comprehensive loss (2012 - $1,734), representing the change in the market value of its available for sale investments during the year.
As at December 31, 2013 and 2012 the Company holds 2,169,000 warrants of Golden Share Mining Corporation (“Golden Share”) which entitles the Company to acquire one common share of Golden Share each at a price of $1.0 to June 30, 2014. In 2013 the Company recorded $108 of unrealized loss (2012 - $306), representing the change in the market value of its warrant investments during the year.
31
LAKE SHORE GOLD CORP.
NOTES TO THE CONSOLIDATED FINANCIAL STATEMENTS
FOR THE YEARS ENDED DECEMBER 31, 2013 AND 2012
(in thousands of Canadian dollars, except per share amounts)
In 2012, the Company sold certain of its available for sale investments for $1,017, recorded a realized gain of $718 and transferred $826 from accumulated other comprehensive loss to net loss; also in 2012, the Company wrote-off one of its available for sale investments and recorded $90 in net loss.
13. INVESTMENTS IN ASSOCIATES
The Company’s investments in associates are as follows:
| | 2013 | | 2012 | |
As at December 31, | | Net book value | | Fair value | | Net book value | | Fair value | |
Northern Superior Resources Inc. | | $ | 1,349 | | $ | 1,349 | | $ | 4,493 | | $ | 4,493 | |
Revolution Resources Corp. | | $ | 400 | | $ | 400 | | $ | — | | $ | — | |
Golden Share Mining Corporation | | $ | — | | $ | — | | $ | 868 | | $ | 868 | |
| | $ | 1,749 | | | | $ | 5,361 | | | |
Movements on equity investments for the years ended December 31, 2013 and 2012 are as follows:
| | December 31, 2013 | | December 31, 2012 | |
| | Northern
Superior | | Revolution
Resources | | Golden
Share | | Total | | Northern
Superior | | Golden
Share | | RT
Minerals | | Total | |
Balance, beginning of year | | $ | 4,493 | | $ | — | | $ | 868 | | $ | 5,361 | | $ | 13,103 | | $ | 1,627 | | $ | 561 | | $ | 15,291 | |
Additions / transfer from (to) available for sale investments | | — | | 2,271 | | (176 | ) | 2,095 | | — | | — | | — | | — | |
Company’s share of net loss | | (1,288 | ) | (426 | ) | (119 | ) | (1,833 | ) | (1,897 | ) | (306 | ) | (535 | ) | (2,738 | ) |
Write-down | | (1,856 | ) | (1,445 | ) | (573 | ) | (3,874 | ) | (6,713 | ) | (453 | ) | (26 | ) | (7,192 | ) |
Balance, end of year | | $ | 1,349 | | $ | 400 | | $ | — | | $ | 1,749 | | $ | 4,493 | | $ | 868 | | $ | — | | $ | 5,361 | |
Effective July 29, 2013 (the “transaction date”), the Company’s ownership in Golden Share was diluted to 7.31% and the Company no longer has the right of board representation; the investment in Golden Share was written down to $176, being its fair value at the transaction date, and transferred to available for sale investments.
Summary financial information for the equity accounted investments, not adjusted for percentage of ownership held by the Company is as follows:
32
LAKE SHORE GOLD CORP.
NOTES TO THE CONSOLIDATED FINANCIAL STATEMENTS
FOR THE YEARS ENDED DECEMBER 31, 2013 AND 2012
(in thousands of Canadian dollars, except per share amounts)
| | Ownership* | | Current
assets* | | Non-current
assets* | | Total
assets* | | Current
liabilities* | | Non-
current
liabilities* | | Total
liabilities* | | Loss** | |
2013 | | | | | | | | | | | | | | | | | |
Northern Superior Resources Inc. | | 23.82 | % | $ | 6,176 | | $ | 1,542 | | $ | 7,718 | | $ | 129 | | $ | — | | $ | 129 | | $ | 6,487 | |
Revolution Resources Corp. | | 22.45 | % | 260 | | 9,645 | | 9,905 | | 1,769 | | — | | 1,769 | | 1,897 | |
| | | | $ | 6,436 | | $ | 11,187 | | $ | 17,623 | | $ | 1,898 | | — | | $ | 1,898 | | $ | 8,384 | |
2012 | | | | | | | | | | | | | | | | | |
Northern Superior Resources Inc. | | 23.84 | % | $ | 9,410 | | $ | 4,880 | | $ | 14,290 | | $ | 371 | | $ | — | | $ | 371 | | $ | 7,681 | |
RT Minerals Corp*** | | 27.12 | % | 157 | | 3,029 | | 3,186 | | 590 | | — | | 590 | | 958 | |
Golden Share | | 19.76 | % | 579 | | 7,795 | | 8,374 | | 186 | | — | | 186 | | 1,281 | |
| | | | $ | 10,146 | | $ | 15,704 | | $ | 25,850 | | $ | 1,147 | | $ | — | | $ | 1,147 | | $ | 9,920 | |
*At December 31 values are adjusted to align the policies of the equity-accounted investments to the Company’s accounting policies
** All the equity-accounted investments of the Company are exploration stage entities and as such do not have any sources of revenue and losses are equal to expenses
***RT Minerals values are as of and for the year ended November 30, 2012
During 2013 and 2012, the Company wrote down its investment in associates to their fair values and recorded an impairment charge of $3,874 (2012 - $7,192) as the decline in value was considered significant or prolonged.
The investment in RT Minerals Corp. was written down to $Nil at December 31, 2012; during 2013 RT Minerals ceased to be an associate as the Company’s interest was diluted to 7% and the investment was transferred to available for sale investments.
14. RESTRICTED CASH
Restricted cash includes secured funds for letters of credit issued by the Company in favor of the Ontario Ministry of Northern Development, Mines and Forestry as security for the Company’s obligations under the Closure Plans submitted for various properties of $5,198 (2012 - $5,198) and other letters of credit issued under various agreements of $1,897 (2012 - $1,897). These funds are restricted and not available for current operations.
33
LAKE SHORE GOLD CORP.
NOTES TO THE CONSOLIDATED FINANCIAL STATEMENTS
FOR THE YEARS ENDED DECEMBER 31, 2013 AND 2012
(in thousands of Canadian dollars, except per share amounts)
15. MINING INTERESTS
Year ended December 31, 2013 | | Depletable | | Non depletable | | Total | | Plant and
equipment | | Total | |
Cost | | | | | | | | | | | |
At January 1, 2013 | | $ | 501,107 | | $ | 134,605 | | $ | 635,712 | | $ | 175,851 | | $ | 811,563 | |
Additions | | 57,461 | | 302 | | 57,763 | | 3,193 | | 60,956 | |
Construction in progress additions net of transfers | | — | | — | | — | | 38,232 | | 38,232 | |
Change in estimate and discount rate (environmental rehabilitation assets) | | (540 | ) | — | | (540 | ) | — | | (540 | ) |
Sale leaseback transaction note 18 | | — | | — | | — | | (2,977 | ) | (2,977 | ) |
Impairment charge note 16 | | (145,495 | ) | (30,398 | ) | (175,893 | ) | (49,107 | ) | (225,000 | ) |
Cost at December 31, 2013 | | $ | 412,533 | | $ | 104,509 | | $ | 517,042 | | $ | 165,192 | | $ | 682,234 | |
Accumulated depreciation and depletion | | | | | | | | | | | |
At January 1, 2013 | | $ | 47,779 | | $ | — | | $ | 47,779 | | $ | 43,896 | | $ | 91,675 | |
Sale leaseback transaction note 18 | | — | | — | | — | | (821 | ) | (821 | ) |
Depreciation | | — | | — | | — | | 14,346 | | 14,346 | |
Depletion | | 45,449 | | — | | 45,449 | | — | | 45,449 | |
Accumulated depreciation and depletion at December 31, 2013 | | $ | 93,228 | | $ | — | | $ | 93,228 | | $ | 57,421 | | $ | 150,649 | |
Carrying amount at December 31, 2013 | | $ | 319,305 | | $ | 104,509 | | $ | 423,814 | | $ | 107,771 | | $ | 531,585 | |
Year ended December 31, 2012 | | Depletable | | Non depletable | | Total | | Plant and
equipment | | Total | |
Cost | | | | | | | | | | | |
At January 1, 2012 | | $ | 228,921 | | $ | 611,899 | | $ | 840,820 | | $ | 137,306 | | $ | 978,126 | |
Transfers from non depletable to depletable | | 379,188 | | (379,188 | ) | — | | — | | — | |
Additions | | 92,443 | | 4,626 | | 97,069 | | 45,481 | | 142,550 | |
Construction in progress additions net of transfer to plant and equipment | | — | | — | | — | | 37,566 | | 37,566 | |
Pre-production revenue | | (6,706 | ) | — | | (6,706 | ) | — | | (6,706 | ) |
Transfer to inventories | | (5,270 | ) | — | | (5,270 | ) | — | | (5,270 | ) |
Change in estimate and discount rate (environmental rehabilitation assets) | | 842 | | — | | 842 | | — | | 842 | |
Foreign exchange | | — | | 3,712 | | 3,712 | | — | | 3,712 | |
Franco-Nevada transaction | | (34,704 | ) | — | | (34,704 | ) | — | | (34,704 | ) |
Reclass to assets held for sale note 9 | | — | | (2,053 | ) | (2,053 | ) | — | | (2,053 | ) |
Impairment charge note 16 | | (153,607 | ) | (104,391 | ) | (257,998 | ) | (44,502 | ) | (302,500 | ) |
Cost at December 31, 2012 | | $ | 501,107 | | $ | 134,605 | | $ | 635,712 | | $ | 175,851 | | $ | 811,563 | |
Accumulated depreciation and depletion | | | | | | | | | | | |
At January 1, 2012 | | $ | 10,173 | | $ | — | | $ | 10,173 | | $ | 28,405 | | $ | 38,578 | |
Depreciation | | — | | — | | — | | 15,491 | | 15,491 | |
Depletion | | 37,606 | | — | | 37,606 | | — | | 37,606 | |
Accumulated depreciation and depletion at December 31, 2012 | | $ | 47,779 | | $ | — | | $ | 47,779 | | $ | 43,896 | | $ | 91,675 | |
Carrying amount at December 31, 2012 | | $ | 453,328 | | $ | 134,605 | | $ | 587,933 | | $ | 131,955 | | $ | 719,888 | |
34
LAKE SHORE GOLD CORP.
NOTES TO THE CONSOLIDATED FINANCIAL STATEMENTS
FOR THE YEARS ENDED DECEMBER 31, 2013 AND 2012
(in thousands of Canadian dollars, except per share amounts)
A summary by property of the net carrying value at December 31, 2013 and 2012 is as follows:
At December 31, 2013 | | Depletable | | Non-
depletable | | Total Mining
properties | | Plant and
equipment | | Mining interests | |
Timmins West Mine | | $ | 247,699 | | $ | — | | $ | 247,699 | | $ | 18,340 | | $ | 266,039 | |
Bell Creek Mill | | 15,796 | | — | | 15,796 | | 84,018 | | 99,814 | |
Bell Creek Mine | | 55,810 | | — | | 55,810 | | 5,260 | | 61,070 | |
| | 319,305 | | — | | 319,305 | | 107,618 | | 426,923 | |
Exploration and evaluation | | | | | | | | | | | |
Gold River property | | — | | 41,595 | | 41,595 | | — | | 41,595 | |
Fenn-Gib Project | | — | | 37,796 | | 37,796 | | — | | 37,796 | |
Other exploration properties* | | — | | 25,118 | | 25,118 | | — | | 25,118 | |
| | — | | 104,509 | | 104,509 | | — | | 104,509 | |
Corporate | | — | | — | | — | | 153 | | 153 | |
| | $ | 319,305 | | $ | 104,509 | | $ | 423,814 | | $ | 107,771 | | $ | 531,585 | |
*Other exploration properties carrying value at December 31, 2013 includes $13,060 for Other Bell Creek properties, $7,875 for Highway 144 and remaining $4,183 for various other properties
At December 31, 2012 | | Depletable | | Non-
depletable | | Total Mining
properties | | Plant and
equipment | | Mining interests | |
Timmins West Mine | | $ | 357,971 | | $ | — | | $ | 357,971 | | $ | 32,519 | | $ | 390,490 | |
Bell Creek Mill | | 25,468 | | — | | 25,468 | | 89,573 | | 115,041 | |
Bell Creek Mine | | 69,889 | | — | | 69,889 | | 9,539 | | 79,428 | |
| | 453,328 | | — | | 453,328 | | 131,631 | | 584,959 | |
Exploration and evaluation | | | | | | | | | | | |
Gold River property | | — | | 60,544 | | 60,544 | | — | | 60,544 | |
Fenn-Gib Project | | — | | 37,545 | | 37,545 | | — | | 37,545 | |
Other exploration properties* | | — | | 36,516 | | 36,516 | | — | | 36,516 | |
| | — | | 134,605 | | 134,605 | | — | | 134,605 | |
Corporate | | — | | — | | — | | 324 | | 324 | |
| | $ | 453,328 | | $ | 134,605 | | $ | 587,933 | | $ | 131,955 | | $ | 719,888 | |
*Other exploration properties carrying value at December 31, 2012 includes $18,963 for Other Bell Creek properties, $11,463 for Highway 144 and remaining $6,090 for various other properties
Effective January 1, 2012, upon declaring commercial production on the Thunder Creek Deposit and Bell Creek Mine, the Company transferred $379,188 from non-depletable assets to depletable assets; $5,270 were transferred from mining interest to inventories and stockpiled ore (gold in circuit and stockpiled ore). In 2012, the Company recorded $6,706 of pre-production revenue, representing sales of gold bullion produced from Thunder Creek Deposit and Bell Creek Mine prior to commercial production.
Plant and Equipment
Plant and equipment at December 31, 2013, includes $1,538 of construction in progress (December 31, 2012 - $45,516); December 31, 2012 construction in progress mainly related to the Bell Creek Mill expansion and related infrastructure. The first phase and second phase of the mill expansion to increase the mill capacity to 2,500 and 3,000 tonnes per day, respectively, was commissioned on November 30,
35
LAKE SHORE GOLD CORP.
NOTES TO THE CONSOLIDATED FINANCIAL STATEMENTS
FOR THE YEARS ENDED DECEMBER 31, 2013 AND 2012
(in thousands of Canadian dollars, except per share amounts)
2012 and August 31, 2013 at which time $37,798 and $73,933 respectively, was transferred from construction in progress to depreciable assets.
Plant and equipment also includes costs of $10,676 (2012 - $17,182) and accumulated depreciation of $5,160 (2012 - $9,530) related to capital equipment and vehicles under finance leases (note 18); during 2013 the Company capitalized in plant and equipment interest related to finance leases of $Nil (2012 - $319).
The depreciation of plant and equipment used in the exploration and capital development activities of mining properties is capitalized in the specific property ($2,418 for the year ended December 31, 2013; $4,623 in 2012).
Borrowing costs incurred from long term debt facilities (note 19) totaling $6,202 for the year ended December 31, 2013 are capitalized to qualifying assets (2012 - $5,264).
Timmins West Mine
Lake Shore Gold owns 100% of the Timmins West Mine which includes the Timmins Deposit and Thunder Creek Deposit.
On March 7, 2012, the Company received US$35,000 ($34,976) and $15,000 from Franco-Nevada Corporation (“Franco-Nevada”) as consideration, respectively, for the Company granting to Franco-Nevada a 2.25% net smelter royalty (“NSR”) on the sale of minerals from the Company’s Timmins West Mine and surrounding properties and issuing 10,050,591 common shares of the Company. The Company incurred $272 of transaction costs and $119 of share issue costs in relation to the transaction; the Company reduced the carrying value of the Timmins West Mine by $34,704 at the date of transaction.
There are several other royalties applicable to various land areas comprising the Timmins West Mine. Only one of these royalties, a 1% NSR royalty related to Thunder Creek, involves areas of known mineralization.
On February 17, 2011, the Company signed an Impact and Benefits Agreement with the Flying Post First Nation and Mattagami First Nation (the “First Nation communities”) in order to promote a cooperative and mutually respectful relationship between the communities and Lake Shore Gold. The agreement established a framework for ongoing dialogue and consultation, including providing business, employment and training opportunities for members of the two First Nation communities.
Bell Creek Mine
The Company acquired the Bell Creek Mine and Mill in December 2007 from the Porcupine Joint Venture (“PJV”), a joint venture between Goldcorp Canada Ltd. (“Goldcorp”) and Kinross Gold Corporation. The agreement provides for a 2% NSR on the Bell Creek Mine, payable to PJV, subsequently transferred to Goldcorp, subject to any existing underlying royalties encumbering the Bell Creek Mine; the royalty payable to Goldcorp is subject to the recovery by the Company of $6,015 related to Goldcorp’s share of the purchase price of a prior royalty on the mine that will be offset against royalty payable to Goldcorp. As at
36
LAKE SHORE GOLD CORP.
NOTES TO THE CONSOLIDATED FINANCIAL STATEMENTS
FOR THE YEARS ENDED DECEMBER 31, 2013 AND 2012
(in thousands of Canadian dollars, except per share amounts)
December 31, 2013 the Company has royalty expense of $1,446 (2012 - $700) to offset against the payment owed by Goldcorp.
Exploration and evaluation
The Company’s acquisition costs for all properties are capitalized in mining interests; all other expenditures related to green field exploration are charged to the statement of comprehensive loss. In 2013 the Company incurred $1,313 of exploration and evaluation expenses charged to comprehensive loss (2012 — $3,769).
Fenn-Gib Project
The Fenn-Gib Project located approximately 60 kilometres east of Timmins includes the Fenn-Gib and Guibord Main properties on which the Company has a 100% interest. The Company acquired the Project from Barrick Gold Corporation in 2011; Barrick retains the right to re-acquire a 51% interest in the Project (excluding the Guibord Main property), and become the Project’s operator, in the event that a NI 43-101 compliant resource of at least 5 million ounces is established, for cash consideration representing two times the total investment by the Company (excluding acquisition costs) in the Fenn-Gib Project at the time the right is exercised.
In October 2013 the Company purchased 100% interest on certain properties forming part of the Fenn-Gib deposit for $200.
Other Bell Creek properties
Other Bell Creek properties include a number of properties acquired in 2007 from Goldcorp as manager of PJV, in the vicinity of the Bell Creek Mine (the “Bell Creek West properties”) as well as Vogel and Schumacher properties.
The PJV has retained a 2% NSR relating to any future production from the Bell Creek West properties; the Company has the right to buy back 1% of the NSR on four of the five blocks of properties for $2,500 for each block.
The Company has a mining lease on the Vogel property; the property, located contiguous to the Bell Creek Mine, is subject to a maximum 3% NSR. A cash payment of $500 will be payable once an indicated resource (as defined by NI 43-101) of 600,000 ounces of gold or more is confirmed on the property. The Company commenced capitalization of expenditures on the Vogel property effective May 1, 2011, when a NI 43-101 report was filed for the property.
The Company has a mining lease on the Schumacher property located contiguous to the Vogel property. The property is subject to a 2% NSR with advance annual royalty payments of $25 in years 4-6 and $50 thereafter.
37
LAKE SHORE GOLD CORP.
NOTES TO THE CONSOLIDATED FINANCIAL STATEMENTS
FOR THE YEARS ENDED DECEMBER 31, 2013 AND 2012
(in thousands of Canadian dollars, except per share amounts)
Casa Berardi
In 2012, the Company earned a 50% interest in the Casa Berardi property by spending $5,000 as provided in a joint venture agreement between the Company and Aurizon Mines Ltd. (“Aurizon”) in 2007.
The 2007 joint venture agreement provides that if an indicated mineral resource of at least 500,000 ounces of gold at a minimum grade of 6.0 grams of gold per tonne (or economic equivalent thereof) is established, the area containing the resource plus a one kilometer radius surrounding the outer perimeter of the resource may be transferred to a specific property joint venture, in which Aurizon and Lake Shore Gold will each have a 50% interest. Aurizon will then have the right to earn an additional 10% interest in the specific property by funding the costs of a feasibility study. During the year ended December 31, 2013, Aurizon was purchased by Hecla Mining Company.
Other properties
The Company owns 51% to 55% on various other properties. Certain of those properties are subject to NSR agreements between 2% and 3%. On certain of those properties, the Company is required to make cash payments of $1,000 or issue 146,000 Lake Shore Gold common shares upon commencement of commercial production.
16. IMPAIRMENT
The Company completed an assessment of the carrying value of its cash generating units (“CGUs”) as at December 31, 2013 and 2012 and as a result, recorded after-tax non-cash impairment charges aggregating $225,000 and $302,500, respectively for 2013 and 2012; the 2013 write down relates to the Timmins CGU while the 2012 write down includes $231,000 at the Timmins CGU and $71,500 at the Mexico CGU (note 9).
The Timmins CGU is comprised of the Timmins West Mine and the adjoining exploration properties, including Gold River Trend and Highway 144, Bell Creek Mine and Mill and adjoining properties, including Vogel and Marhill. Among the indicators triggering the impairment assessment at December 31, 2013 was the fact that the carrying amount of the Company’s net assets was materially higher than its market capitalization. Contributing to the reduction in the estimated carrying value of the Timmins CGU were lower short and long term gold price assumptions used in the determination of fair value as well as a decrease in resources and reserves.
As a result of the impairment charge related to the Timmins CGU, a deferred mining tax recovery of $2,150 was recorded in 2012 (none in 2013) on the consolidated statement of comprehensive loss.
Key assumptions
The key assumptions used in determining the recoverable amount (fair value less cost to sell) for each CGU are long-term commodity prices, discount rates, cash costs of production, capital expenditures, foreign exchange rates, and net asset value multiples. To determine the recoverable amount of the Timmins CGU at December 31, 2013 and 2012, management used:
38
LAKE SHORE GOLD CORP.
NOTES TO THE CONSOLIDATED FINANCIAL STATEMENTS
FOR THE YEARS ENDED DECEMBER 31, 2013 AND 2012
(in thousands of Canadian dollars, except per share amounts)
· discount rates between 7.5% to 8.5% (December 31, 2012 — between 8% and 9%) for various assets of the CGU.
· gold price of US$1,300 in 2014 and subsequent years for the 2013 valuation; for the 2012 valuation, management used US$1,665 for 2013 and declining gradually to US$1,400 in 2018 and beyond.
· foreign exchange rates (USD/CAD) of 1:1.07 in 2014 increasing gradually to 1.011 in 2019 and beyond for the December 31, 2013 valuation; for the December 31, 2012 valuation, foreign exchange rates of 1:1.01 in 2013 increasing gradually to 1:1.07 in 2018 and beyond.
As at December 31, 2013, the estimated recoverable amount of the Timmins CGU equals its carrying amount, after giving effect to the impairment charge noted above.
17. ACCOUNTS PAYABLE AND ACCRUED LIABILITIES
As at December 31, | | 2013 | | 2012 | |
Trade payables | | $ | 4,511 | | $ | 11,351 | |
Accrued liabilities | | 14,646 | | 19,128 | |
Salaries and wages payable | | 2,462 | | 3,388 | |
| | $ | 21,619 | | $ | 33,867 | |
The fair value of accounts payable and accruals approximate their carrying amount. Trade payables relate mainly to the acquisition of materials, supplies and contractors services. These payables do not accrue interest and no guarantees have been granted. Trade payables and accrued liabilities at December 31, 2013 and 2012 are denominated in Canadian dollars.
18. FINANCE LEASE OBLIGATIONS
The Company has entered into equipment and vehicle leases expiring between 2014 and 2016 with interest rates between 1.50% to 6.50%. The Company has the option to purchase the equipment and vehicle leased at the end of the term of the lease, for a nominal amount. The Company’s obligations under finance leases are secured by the lessor’s title to the leased assets. The fair value of the finance lease liabilities approximates their carrying amount.
| | Minimum lease payments | |
| | December 31, 2013 | | December 31, 2012 | |
| | | | | |
Not later than one year | | $ | 3,773 | | $ | 6,580 | |
Later than one year and not later than five years | | 6,313 | | 2,867 | |
| | | | | |
Less: Future finance charges | | (490 | ) | (311 | ) |
| | | | | |
Present value of minimum lease payments | | $ | 9,596 | | $ | 9,136 | |
Less: Current portion | | (3,446 | ) | (6,324 | ) |
| | | | | |
Non-current portion | | $ | 6,150 | | $ | 2,812 | |
39
LAKE SHORE GOLD CORP.
NOTES TO THE CONSOLIDATED FINANCIAL STATEMENTS
FOR THE YEARS ENDED DECEMBER 31, 2013 AND 2012
(in thousands of Canadian dollars, except per share amounts)
On December 31, 2013, the Company entered into an agreement with Macquarie Technology Services (Canada) Ltd. (“Macquarie”) whereby the Company sold certain mobile equipment to Macquarie for $7,300 and leased them back for a period of 36 months. The lease liability is paid through 12 quarterly installments (with the first and last payment, respectively, on January 1, 2014 and October 1, 2016) and bears interest at 3.7%. At the end of the lease term, the Company has the option of purchasing all the equipment at a price equal to their fair value but no less than $730 and no more than $1,460.
A portion of the equipment leased back under the transaction was accounted for as a finance lease with the remaining treated as operating leases. The Company incurred a loss of $682 on the transaction representing the difference between the portion of the cash payment related to equipment qualifying as operating lease and their net book value.
19. LONG TERM DEBT
As at December 31, | | 2013 | | 2012 | |
Gold Loan (a(i)) | | $ | 18,458 | | $ | 36,775 | |
Standby Line (a(ii)) | | 26,275 | | — | |
Convertible Debentures (b) | | 85,292 | | 81,778 | |
| | $ | 130,025 | | $ | 118,553 | |
Current portion of long term debt (a) | | 13,339 | | 18,219 | |
Long term debt | | $ | 116,686 | | $ | 100,334 | |
(a) Sprott Resource Lending Partnership Credit Facility
Credit Facility Agreement
On June 14, 2012, the Company signed a financing agreement with Sprott Resource Lending Partnership (“Sprott”) for a credit facility (the “Facility”) totaling up to $70,000, secured by the material assets of the Company. The Facility involves two components, a $35,000 gold loan (the “Gold Loan”), payable monthly starting on January 31, 2013 to May 31, 2015 and a standby line of credit (the “Standby Line”) for an additional $35,000. The transaction closed on July 16, 2012, at which time the Company received $35,000 for the Gold Loan.
As provided in the Facility agreement, in June 2012, the Company issued to Sprott 5,000,000 common shares of Lake Shore Gold (1,923,077 common shares as consideration for the Gold Loan and the remaining consideration for the Standby Line), valued at $4,479 ($1,722 value of shares issued for the Gold Loan and remaining for the Standby Line); the Company incurred other transaction costs of $1,190 related to the agreement which were allocated equally between the Gold Loan and the Standby Line.
The Standby Line of $35,000 was drawn down on February 1, 2013. Upon the draw down the Company issued 885,964 common shares of Lake Shore Gold to Sprott (valued at $700), representing a drawdown fee of 2%. Effective the date of the draw down, $4,095 of transaction costs related to the Standby Line were netted against the long term debt ($3,352 of deferred financing costs outstanding at December 31,
40
LAKE SHORE GOLD CORP.
NOTES TO THE CONSOLIDATED FINANCIAL STATEMENTS
FOR THE YEARS ENDED DECEMBER 31, 2013 AND 2012
(in thousands of Canadian dollars, except per share amounts)
2012 and remaining incurred upon the draw down, including value of shares issued) and will be amortized over the term of the Standby Line.
Modification Agreement
As of December 12, 2013, the Company entered into a modification agreement (the “Modification Agreement”) with Sprott whereby the Company will repay the Standby Line through 18 equal monthly payments of $1,667 starting on June 30, 2015 with the final payment due on November 30, 2016; previously, the Standby Line was due in full on January 1, 2015. The Modification Agreement provides for:
· $5,000 principal payment on or before January 2, 2014 (paid in December 2013) and the payment of an accommodation fee of $350 (paid on closing);
· The Company’s right to prepay up to $10,000 of the principal on the Standby Line without penalty between January 2, 2014 and December 31, 2014; the Company will incur prepayment penalties of 8% in 2014 for any prepayments over and above $10,000, and respectively 6% and 4% for any prepayments in 2015 and 2016;
· The addition of a 2% rollover fee on the outstanding principal of the Standby Line at December 31, 2014 with a provision for the fee to reduce to 1% should the Company prepay more than $5,000 during the period from January 2, 2014 to December 31, 2014;
· Increase of the minimum return on the Gold Loan to 7.5% (from 5% under the original agreement); the minimum return does not include any fees paid or payable to Sprott;
· Changes and modifications to the financial covenants (refer to note 27 for more details on covenants remaining and their definition as per the Modification Agreement) as follows:
· The removal of the total indebtedness to tangible net worth ratio covenant;
· The removal of the reserve tail ratio covenant;
· The addition of a minimum balance requirement for cash and cash equivalents of not less than $10,000 at any time as part of the current ratio covenant.
The annual interest rate for the Standby Line remained unchanged at 9.75%.
As provided in the original agreement, the Company paid $1,200 for the 4% rollover fee due on December 31, 2013.
The Standby Line transaction costs (unamortized portion at date of Modification Agreement of $2,262 and transaction costs related to the roll over and the Modification Agreement of $1,550) are amortized over the new term of the loan using the effective interest rate method.
41
LAKE SHORE GOLD CORP.
NOTES TO THE CONSOLIDATED FINANCIAL STATEMENTS
FOR THE YEARS ENDED DECEMBER 31, 2013 AND 2012
(in thousands of Canadian dollars, except per share amounts)
(i) Gold Loan
As at December 31, | | 2013 | | 2012 | |
Accreted principal, net of unamortized transaction costs | | $ | 22,754 | | $ | 35,630 | |
Embedded derivative (asset) liability | | (6,702 | ) | 1,145 | |
Minimum return derivative liability | | 2,406 | | — | |
| | $ | 18,458 | | $ | 36,775 | |
Current portion of gold loan | | 18,024 | | 17,761 | |
Current portion of embedded derivative (asset) liability | | (4,685 | ) | 458 | |
Long term portion of gold loan | | $ | 5,119 | | $ | 18,556 | |
The Gold Loan is being repaid through 29 monthly cash payments which commenced on January 31, 2013, calculated based on 947 ounces of gold multiplied by the Bloomberg gold closing price prior to the date of payment each month.
The Gold Loan was recorded at $32,682 at initial recognition (fair value, net of transaction costs of $2,318) and is subsequently measured at amortized cost using the effective interest method.
As a result of the indexation of the principal repayments to the movement in the price of gold, the Company has determined that the Gold Loan contains a derivative which is embedded in the Canadian dollar denominated debt instrument (the “Embedded Derivative”). The embedded derivative is the equivalent of a series of 29 gold forward contracts which mature on each of the payment dates; the embedded derivative is marked to market at each period end with changes in fair value recorded as unrealized derivative gain (loss) and unrealized foreign exchange gain (loss), the latter representing the impact of changes in US$/Canadian$ exchange rate to the fair value of the derivative.
As provided in the Modification Agreement, the minimum return (the “floor”) on the Gold Loan is now 7.5% (from 5% under the original agreement) and is considered a derivative embedded in the Gold Loan (the “Minimum Return Derivative”) due to the floor being in the money at the time of the modification. The minimum return derivative is equivalent to the additional amount (if any) the Company will have to pay at the maturity of the Gold Loan to ensure the return to Sprott is at least 7.5%; the derivative is marked to market at each period end with changes in fair value recorded as unrealized derivative gain (loss). As at December 31, 2013 the Company recorded a minimum return derivative liability of $2,406.
42
LAKE SHORE GOLD CORP.
NOTES TO THE CONSOLIDATED FINANCIAL STATEMENTS
FOR THE YEARS ENDED DECEMBER 31, 2013 AND 2012
(in thousands of Canadian dollars, except per share amounts)
Gold Loan changes for the year ended December 31, 2013 and 2012 were as follows:
Accreted principal net of transaction
costs | | Principal | | Transaction Costs | | Total | |
At inception (July 2012) | | $ | 35,000 | | $ | (2,318 | ) | $ | 32,682 | |
Interest expense | | 2,577 | | 371 | | 2,948 | |
At December 31, 2012 | | $ | 37,577 | | $ | (1,947 | ) | $ | 35,630 | |
Cash payments | | (16,454 | ) | — | | (16,454 | ) |
Interest expense | | 4,885 | | 807 | | 5,692 | |
Realized derivative gain | | (2,699 | ) | — | | (2,699 | ) |
Realized foreign exchange loss | | 585 | | — | | 585 | |
At December 31, 2013 | | $ | 23,894 | | $ | (1,140 | ) | $ | 22,754 | |
During 2013 and 2012 the Company capitalized in mining interest $1,746 and $1,952 of interest expense and amortization of transaction costs.
Embedded derivative and minimum return derivative movements for 2013 and 2012 are as follows:
Embedded derivatives | | Embedded derivative
(asset) liability | | Minimum return
derivative liability | | Total | |
At inception (July 2012) | | $ | — | | $ | — | | $ | — | |
Unrealized derivative loss | | 2,247 | | — | | 2,247 | |
Unrealized foreign exchange gain | | (1,102 | ) | — | | (1,102 | ) |
At December 31, 2012 | | $ | 1,145 | | $ | — | | $ | 1,145 | |
Unrealized derivative (gain) loss | | (7,878 | ) | 2,406 | | (5,472 | ) |
Unrealized foreign exchange loss | | 30 | | — | | 30 | |
At December 31, 2013 | | $ | (6,703 | ) | $ | 2,406 | | $ | (4,297 | ) |
(ii) Standby Line
The Standby Line bears annual interest of 9.75%, compounded monthly. For the year ended December 31, 2013 the Company incurred borrowing costs of $4,991, of which $1,446 are capitalized in mining interests; borrowing costs include interest expense of $3,157 and amortization of deferred transaction costs of $1,834. The Company drew down the Standby Line on February 1, 2013, therefore, there were no related borrowing costs incurred in 2012.
As at December 31, | | 2013 | | 2012 | |
Accreted principal | | $ | 30,087 | | $ | — | |
Unamortized transaction costs | | (3,812 | ) | — | |
| | $ | 26,275 | | $ | — | |
43
LAKE SHORE GOLD CORP.
NOTES TO THE CONSOLIDATED FINANCIAL STATEMENTS
FOR THE YEARS ENDED DECEMBER 31, 2013 AND 2012
(in thousands of Canadian dollars, except per share amounts)
(b) Convertible Debentures
In September 2012, the Company issued 103,500 at $1,000 of Convertible Unsecured Debentures (the “Debentures”) for an aggregate principal amount of $103,500 which bear annual interest at 6.25%, payable semi-annually in arrears on March 31 and September 30 of each year, starting from March 31, 2013, and mature on September 30, 2017.
The Debenture holders may convert the Debentures at their option at any time prior to the maturity date. The Debentures are convertible into common shares of the Company at a conversion rate of 714.2857 common shares of the Company for every $1,000 amount principal of the Debentures, subject to adjustment in certain events.
The Debentures are redeemable in cash or in the Company’s shares starting from September 30, 2015 provided the volume weighted average price of the Company’s shares on the TSX for 20 consecutive trading days ending five days prior to the date on which notice of redemption is given (the “current market price”) is at least $1.82 per common share. The number of shares to be issued will be determined by dividing the principal amount of Debentures to be redeemed by 95% of the current market price.
The option of the holders to convert the Debentures into common shares of the Company result in accounting for the Debentures as a compound financial instrument with $82,512 ($78,626 net of transaction costs of $3,886 — refer below) recorded as long term debt, being the fair value of the principal and interest cash payments, and the remaining $20,988 (or $20,000 net of transaction costs of $988 — refer below) recorded as equity and representing the value of the holder conversion option. The debt component is subsequently measured at amortized cost using the effective interest method.
The Company incurred transaction costs of $4,875 related to the issuance of the Debentures (including underwriter fees of $4,140) which are proportionately allocated between the debt and equity component and netted against each; the portion allocated to the debt component ($3,886) is amortized over the term of the Debentures using the effective interest rate method.
As at December 31, | | 2013 | | 2012 | |
Beginning balance | | $ | 81,778 | | $ | 78,626 | |
Interest expense and unwinding of discount | | 10,390 | | 3,152 | |
Interest payment | | (6,876 | ) | — | |
| | $ | 85,292 | | $ | 81,778 | |
In 2013 and 2012, respectively, the Company incurred $10,390 and $3,152 of interest expense and unwinding of the discount related to the debentures ($7,370 and $1,956, respectively in 2013 and 2012, recorded in the statement of comprehensive loss as borrowing costs and $3,020 and $1,194, respectively in 2013 and 2012, capitalized to mining interests).
44
LAKE SHORE GOLD CORP.
NOTES TO THE CONSOLIDATED FINANCIAL STATEMENTS
FOR THE YEARS ENDED DECEMBER 31, 2013 AND 2012
(in thousands of Canadian dollars, except per share amounts)
(c) Unicredit Bank AG Revolving Credit Facility
On September 7, 2012, concurrent with the closing of the Debenture agreement (note19(b)), the Company repaid the US$50,000 ($49,055) UniCredit revolving credit facility and wrote off $1,250 of unamortized transaction costs outstanding at September 7, 2012. The Company realized $1,910 of foreign exchange gain on payment of the facility.
The interest rate on the revolving credit facility from January 1 to September 7, 2012 was 4.50%.
Borrowing costs related to the revolving credit facility (which include interest expense on the amount drawn during the periods and amortization of deferred transaction costs) totaling $2,118 for the year ended December 31, 2012 are capitalized to mining interests.
20. SHARE-BASED LIABILITIES
As at December 31, | | 2013 | | 2012 | |
| | | | | |
Performance share units | | $ | 435 | | $ | 255 | |
Deferred share units | | 319 | | 224 | |
Total share based liabilities | | $ | 754 | | $ | 479 | |
The Company has a Performance Share Unit Plan (the “PSU plan”) whereby PSUs are issued to eligible executives as determined by the Company’s Board of Directors. PSUs issued under the PSU plan entitle the holder to a cash payment at the end of a three year performance period equal to a target settlement ranging from 100% to 150% of the current market value of the underlying Lake Shore Gold shares, to be determined at the end of the performance period based on the performance of the underlying Lake Shore Gold shares.
In 2013 and 2012, the Company issued 2,576,978 and 1,208,150 PSUs, respectively. The fair value of the PSUs at December 31, 2013 and 2012 was determined using the Monte-Carlo option pricing model with the following assumptions: expected volatility based on past history of 74% to 84% (2012 - 62% to 68%), risk-free interest rate of 1.10% (2012 - 1.10% to 1.25%) and dividend rate of $Nil.
Changes to the PSUs liability are as follows:
For the year ended December 31, | | 2013 | | 2012 | |
Balance, beginning of year | | $ | 255 | | $ | 49 | |
Share based payment expense | | 180 | | 206 | |
Total performance share units liability | | $ | 435 | | $ | 255 | |
The Company has a Deferred Share Unit Plan (the “DSU plan”) whereby, the non-executive Directors of the Company can elect to receive the annual compensation in cash, DSUs or a combination of both. Under the plan, DSUs may be issued to non-executive Directors of the Company as determined by the Company’s Board of Directors. DSUs issued under the DSU plan entitle the holder upon retirement to a cash payment, shares of the Company or a combination of both, as elected by the holder. In the case of a payment in shares, the Company will purchase the shares on the open market, through a broker, on behalf of the holder.
45
LAKE SHORE GOLD CORP.
NOTES TO THE CONSOLIDATED FINANCIAL STATEMENTS
FOR THE YEARS ENDED DECEMBER 31, 2013 AND 2012
(in thousands of Canadian dollars, except per share amounts)
In 2013 and 2012, the Company issued 1,076,862 and 287,355 DSUs, respectively. The fair value of the DSUs at December 31, 2013 and 2012 was determined using the Black-Scholes option pricing model with the following assumptions: expected volatility based on past history of 74% to 84% (2012 - 64% to 67%), risk-free interest rate of 1.07% to 3.0% (2012 - 1.10% to 1.53%), dividend rate of $Nil and expected life ranging between 1.0 — 10.0 years (2012 - 1.0 — 7.0 years).
Changes to the DSUs liability are as follows:
For the year ended December 31, | | 2013 | | 2012 | |
Balance, beginning of year | | $ | 224 | | $ | 105 | |
Share based payment expense | | 95 | | 119 | |
Total deferred share units liability | | $ | 319 | | $ | 224 | |
21. ENVIRONMENTAL REHABILITATION PROVISION
Environmental rehabilitation provision represents the discounted values of the estimated cost for site reclamation and remediation of the Bell Creek Mill ($2,591), Bell Creek Mine ($694) and Timmins West Mine ($1,185) as well as liability for some small projects ($300). This includes site restoration, rehabilitation and remediation of tailings pond, roads, mine infrastructure and plant and equipment.
The present value of the provision has been calculated using a real pre-tax annual discount rate, based on Bank of Canada treasury bonds of an appropriate tenure as at December 31, 2013 and 2012 (1.14% to 1.89% at December 31, 2013 and 0.66% to 1.22% at December 31, 2012); estimated remaining life of mine of 7 years for the Timmins West Mine, 15 years for Bell Creek Mine and 17 years for the Bell Creek Mill as at December 31, 2013 (10, 15 and 20 years, respectively for Timmins West Mine, Bell Creek Mine and Bell Creek Mill at December 31, 2012); the cash flows have been adjusted to reflect the risk attached to these cash flows. Uncertainties in the timing for use of this provision include changes in the future that could impact the timing of closing the mines, as new resources and reserves are discovered. Letters of credit of $5,198 have been issued to the Ministry of Natural Resources (note 14); the funds supporting the letters of credit will be used to cover expenses incurred for site reclamation and remediation upon the closure of the mines. The total undiscounted estimated rehabilitation provision is $6,290.
The liability is accreted over time through charges to finance costs and, the associated costs capitalized on the related assets are amortized for the Timmins West Mine, Bell Creek Mine and Bell Creek Mill over the respective life of the mines and the mill.
Changes to the environmental rehabilitation provision are as follows:
For the year ended December 31, | | 2013 | | 2012 | |
Balance, beginning of year | | $ | 5,257 | | $ | 4,357 | |
Revisions in estimates | | (541 | ) | 842 | |
Unwinding of the discount | | 54 | | 58 | |
Total environmental rehabilitation provision | | $ | 4,770 | | $ | 5,257 | |
46
LAKE SHORE GOLD CORP.
NOTES TO THE CONSOLIDATED FINANCIAL STATEMENTS
FOR THE YEARS ENDED DECEMBER 31, 2013 AND 2012
(in thousands of Canadian dollars, except per share amounts)
22. DEFERRED TAXES
The provision for income and mining taxes included in net loss represents an effective rate different than the statutory rate of 25% (2012 — 25%) computed by applying the cumulative Canadian federal and provincial income tax rates to the loss before taxes due to the following:
For the year ended December 31, | | 2013 | | 2012 | |
Loss from continuing operation before taxes | | $ | (229,167 | ) | $ | (249,418 | ) |
Computed income tax recovery at Canadian statutory rates | | (57,292 | ) | (62,354 | ) |
Non-deductible expenses | | 2,252 | | 3,752 | |
Tax losses not recognized | | 55,040 | | 57,721 | |
Ontario mining tax recovery | | — | | (2,148 | ) |
Deferred mining tax recovery | | $ | — | | $ | (3,029 | ) |
Deferred income tax
Deferred tax assets and liabilities have been offset where they relate to income taxes levied by the same taxation authority and the Company has the legal right and intent to offset.
As at December 31, | | 2013 | | 2012 | |
| | | | | |
Deferred income tax assets | | | | | |
| | | | | |
Operating losses carried forward | | $ | 1,803 | | $ | 2,337 | |
Share issue costs | | 4,368 | | 4,368 | |
Total deferred income tax assets | | $ | 6,171 | | $ | 6,705 | |
| | | | | |
Deferred income tax liabilities | | | | | |
| | | | | |
Mining interests | | $ | — | | $ | — | |
Long term debt | | $ | (6,171 | ) | (6,705 | ) |
Total deferred income tax liability | | $ | (6,171 | ) | $ | (6,705 | ) |
Net deferred income tax asset | | $ | — | | $ | — | |
During 2012, the Company recognized $5,247 of deferred income tax liability (included in the income tax liabilities above) on the Debentures transaction (note 19(b)) reducing the equity portion of the Debentures, $4,368 of deferred income tax asset (recorded as a reduction of share capital) and $879 deferred income tax recovery.
Unrecognized deferred tax assets and liabilities
Deferred tax assets have not been recognized in respect of the following items:
47
LAKE SHORE GOLD CORP.
NOTES TO THE CONSOLIDATED FINANCIAL STATEMENTS
FOR THE YEARS ENDED DECEMBER 31, 2013 AND 2012
(in thousands of Canadian dollars, except per share amounts)
As at December 31, | | 2013 | | 2012 | |
Income tax: | | | | | |
Tax losses | | $ | 163,700 | | $ | 139,000 | |
Deductible temporary difference | | $ | 93,200 | | $ | 5,700 | |
Federal investment tax credits | | $ | 17,200 | | $ | 17,200 | |
| | | | | |
Mining tax: | | | | | |
Deductible temporary difference | | $ | 229,600 | | $ | 83,200 | |
The tax losses and deductible temporary differences not recognized expire as noted below and can be applied against future taxable profit. Deferred tax assets have not been recognized in respect of these items because the Company does not have a history of taxable earnings.
Income tax:
Type | | Amount | | Expiry date | |
Net operating losses | | $ | 163,700 | | 2027-2033 | |
Deductible temporary differences | | $ | 93,200 | | N/A | |
Federal investment tax credits | | $ | 17,200 | | 2025-2032 | |
Mining tax
Type | | Amount | | Expiry date | |
Deductible temporary differences | | $ | 229,600 | | N/A | |
| | | | | | |
The Company has deductible temporary differences of a capital nature of $29,400 (2012 - $23,600), the benefit of which have not been recognized in the consolidated financial statements.
23. SHAREHOLDERS’ EQUITY
a) Share capital
In 2013, 885,964 common shares of the Company valued at $700 were issued to Sprott (note 19(a)) representing the 2% drawdown fee for the Standby Line.
As part of an agreement with Flying Post First Nation and Mattagami First Nation (note 15), Lake Shore Gold issued 50,000 common shares of the Company to the two First Nation communities in each of the 2013 and 2012 (valued at $32 and $45).
In 2012, in addition to shares issued to Franco Nevada (10,050,591 shares valued at $15,000 or $14,881 net of share issue costs, note 15) and Sprott (5,000,000 shares valued at $4,479, note 19(a)), the Company issued 350,000 shares under various mining property agreements valued at $382.
48
LAKE SHORE GOLD CORP.
NOTES TO THE CONSOLIDATED FINANCIAL STATEMENTS
FOR THE YEARS ENDED DECEMBER 31, 2013 AND 2012
(in thousands of Canadian dollars, except per share amounts)
b) Reserves
i) Share Options
As at December 31, 2013, the Company had 24,245,365 options outstanding of which 12,689,750 are exercisable. Under the Company’s stock option plan, options may not be granted for a term exceeding ten years and the minimum exercise price cannot be less than the volume weighted average closing price of the Company’s common shares on the Toronto Stock Exchange, for the five trading days preceding the grant of the option. All options granted to date have been for a term of five years. The maximum number of options issuable by the Company is 7% of the issued and outstanding common shares. The Board of Directors determines the vesting terms of the options which vary between grants, from vesting half on grant date and half in the first anniversary of the grant date to vesting in three equal amounts in a three year period from the grant date.
Movements in share options during the years ended December 31, 2013 and 2012 were as follows:
| | December 31, 2013 | | December 31, 2012 | |
| | Number of
options | | Weighted-
average exercise
price | | Number of
options | | Weighted-
average exercise
price | |
Outstanding, beginning of year | | 23,087,535 | | $ | 2.32 | | 20,187,752 | | $ | 2.75 | |
Granted | | 7,527,615 | | $ | 0.41 | | 5,160,000 | | $ | 0.87 | |
Exercised | | (30,000 | ) | $ | 0.79 | | (84,000 | ) | $ | 0.82 | |
Forfeited | | (6,339,785 | ) | $ | 1.72 | | (2,176,217 | ) | $ | 2.94 | |
Outstanding, end of year | | 24,245,365 | | $ | 1.89 | | 23,087,535 | | $ | 2.32 | |
Exercisable, end of year | | 12,689,750 | | | | 13,021,635 | | | |
During the year ended December 31, 2013, the Company granted 7,527,615 (2012 - 5,160,000) stock options to its employees which vest over a period of 3 years, are exercisable at a weighted average price of $0.41 per option (2012 - $0.87), expire in 2018 (2012 - 2017), and have a total fair value of $1,533 (2012 - $1,836); weighted average fair value at grant date is $0.20 for the year ended December 31, 2013 ($0.36 for the year ended December 31, 2012).
The fair value of stock options granted during 2013 and 2012 is estimated at the time of the grant using the Black-Scholes option pricing model with assumptions as follows: expected volatility based on past history of 63% to 92% (2012 - 63% to 64%), a risk-free interest rate of 0.99% to 1.5% (2012 - 1.00% to 1.27%), forfeiture rate of 7.6% to 8.7% (2012 - 7.43% to 11.37%), dividend rate of $Nil and expected life ranging between 1.6 - 3.5 years for different vesting tranches of options granted for both years.
ii) Share Options Exercised
The following table outlines share options exercised during the year ended December 31, 2013:
49
LAKE SHORE GOLD CORP.
NOTES TO THE CONSOLIDATED FINANCIAL STATEMENTS
FOR THE YEARS ENDED DECEMBER 31, 2013 AND 2012
(in thousands of Canadian dollars, except per share amounts)
Grant price | | Number of options
exercised | | Exercise dates | | Weighted average
closing share price at
exercise date | |
$0.55-$0.99 | | 30,000 | | January 15, 2013 | | $ | 0.91 | |
| | 30,000 | | | | $ | 0.91 | |
For the year ended December 31, 2012:
Grant price | | Number of options
exercised | | Exercise dates | | Weighted average
closing share price at
exercise date | |
$0.55-$0.99 | | 84,000 | | January 20 to September 27, 2012 | | $ | 1.16 | |
| | 84,000 | | | | $ | 1.16 | |
iii) Share Options outstanding at the end of the year
The following table summarizes information concerning outstanding and exercisable options at December 31, 2013:
Exercise price | | Options
outstanding | | Options
exercisable | | Remaining
contractual life
(years) | | Expiry dates | |
$0.41-$0.99 | | 12,296,615 | | 1,739,000 | | 3.38 | | January 7, 2014 to November 12, 2018 | |
$1.00-$1.99 | | 2,472,000 | | 1,668,000 | | 2.73 | | January 26, 2014 to March 23, 2017 | |
$2.00-$2.99 | | 569,750 | | 519,750 | | 0.90 | | June 24, 2014 to September 11, 2016 | |
$3.00-$3.99 | | 6,966,000 | | 6,822,000 | | 1.78 | | November 9, 2014 to June 5, 2016 | |
$4.00-$5.00 | | 1,941,000 | | 1,941,000 | | 0.88 | | November 17, 2014 | |
| | 24,245,365 | | 12,689,750 | | | | | |
iv) Share-based payment expense
The cost of share based payments is allocated to production costs (options granted to employees involved in the commercial operations at the mines and mill), general and administrative costs (options granted to directors and corporate employees), exploration expenses (options granted to individuals involved in exploration work on the green field exploration stage properties), and capitalized as part of mining properties (options granted to individuals involved on the specific projects capitalized). The Company capitalized $149 of share-based payments for the year ended December 31, 2013 ($933 in 2012).
The allocation of share-based payments on the consolidated statement of comprehensive loss for the year ended December 31, 2013 and 2012 is as follows:
50
LAKE SHORE GOLD CORP.
NOTES TO THE CONSOLIDATED FINANCIAL STATEMENTS
FOR THE YEARS ENDED DECEMBER 31, 2013 AND 2012
(in thousands of Canadian dollars, except per share amounts)
For the year ended December 31, | | 2013 | | 2012 | |
| | | | | |
General and administrative | | $ | 1,706 | | $ | 2,854 | |
Production costs note 6 | | 471 | | 775 | |
Exploration | | 110 | | 182 | |
Total share-based payments | | $ | 2,287 | | $ | 3,811 | |
v) Warrants
150,000 warrants, outstanding at December 31, 2012, valued at $25 expired unexercised in October 2013.
c) Basic and diluted loss per share
The impact of the outstanding options, debentures and warrants for the year ended December 31, 2013 and 2012 has not been included in the calculation of loss per share as the impact would be anti-dilutive. The basic and diluted loss per share for the year ended December 31, 2013 and 2012 is calculated as follows:
For the year ended December 31, | | 2013 | | 2012 | |
| | | | | |
Loss from continuing operations | | $ | (229,167 | ) | $ | (246,389 | ) |
Weighted average basic and diluted number of common shares outstanding (in ‘000s) | | 416,536 | | 411,334 | |
Basic and diluted loss per share from continuing operations | | $ | (0.55 | ) | $ | (0.60 | ) |
For the year ended December 31, | | 2013 | | 2012 | |
| | | | | |
Loss from continuing and discontinued operations | | $ | (233,469 | ) | $ | (317,932 | ) |
Weighted average basic and diluted number of common shares outstanding (in ‘000s) | | 416,536 | | 411,334 | |
Basic and diluted loss per share from continuing and discontinued operations | | $ | (0.56 | ) | $ | (0.77 | ) |
24. DEFINED CONTRIBUTION PENSION PLAN
The Company has a defined contribution pension plan which covers all the Company’s employees. The only obligation of the Company with respect to the plan is to make the specified contributions. During the year ended December 31, 2013, the Company recorded $1,576 of pension expense (2012 - $1,411) in the consolidated statement of comprehensive loss and capitalized $426 to mining properties (2012 - $507) in the consolidated statement of financial position.
51
LAKE SHORE GOLD CORP.
NOTES TO THE CONSOLIDATED FINANCIAL STATEMENTS
FOR THE YEARS ENDED DECEMBER 31, 2013 AND 2012
(in thousands of Canadian dollars, except per share amounts)
25. SUPPLEMENTAL CASH FLOW INFORMATION
For the year ended December 31, | | 2013 | | 2012 | |
| | | | | |
Change in operating working capital | | | | | |
Decrease (increase) in receivables and prepaids | | $ | 2,201 | | $ | (2,050 | ) |
Decrease (increase) in inventory and stockpiled ore | | 4,529 | | (10,041 | ) |
(Decrease) increase in accounts payable and accrued liabilities | | (612 | ) | 1,657 | |
| | $ | 6,118 | | $ | (10,434 | ) |
| | | | | |
Cash and cash equivalents at December 31 consist of: | | | | | |
Cash | | $ | 33,120 | | $ | 18,588 | |
Short term investments | | — | | 30,127 | |
| | $ | 33,120 | | $ | 48,715 | |
Non-cash investing and financing activities
For the year ended December 31, | | 2013 | | 2012 | |
| | | | | |
Mining interests | | | | | |
Reduction in working capital related to mining interests | | $ | (9,242 | ) | $ | (3,414 | ) |
Non cash borrowing costs capitalized | | 6,205 | | 3,874 | |
Shares received as part of the Mexico subsidiary disposal (2012 - mining interest sale) | | (1,700 | ) | (195 | ) |
Additions on finance lease assets | | 5,899 | | 2,649 | |
Shares issued as part of mining property agreements | | $ | 32 | | $ | 382 | |
Share based payments expense capitalized | | 149 | | 933 | |
Transfers to inventories and stockpiled ore upon commercial production | | — | | (5,270 | ) |
Changes in mine closure assets | | (541 | ) | 842 | |
| | $ | 802 | | $ | (199 | ) |
| | | | | |
Assets held for sale | | | | | |
Translation of foreign operations | | 3,967 | | $ | 3,712 | |
| | $ | 3,967 | | $ | 3,712 | |
| | | | | |
Share Capital | | | | | |
Transfer of amounts from reserves | | 13 | | 29 | |
Shares issued for mining properties | | 32 | | 382 | |
Shares issued for financing agreement (note 18(a)) | | 700 | | 4,479 | |
| | $ | 745 | | $ | 4,890 | |
52
LAKE SHORE GOLD CORP.
NOTES TO THE CONSOLIDATED FINANCIAL STATEMENTS
FOR THE YEARS ENDED DECEMBER 31, 2013 AND 2012
(in thousands of Canadian dollars, except per share amounts)
26. SEGMENTED INFORMATION
The Company has two operating segments: mining operations and exploration and advanced exploration. Corporate, which is not an operating segment includes all the corporate growth and development activities and the corporate team that provides administrative, technical, financial and other support to all of the Company’s business units. Other corporate expenses include general and administrative costs and the Company’s share of earnings (loss) of its equity investments; finance loss, net, includes bank and debt interest and other charges, and interest earned on cash and cash equivalents. The information reported below is based on the information provided to the Chief Executive Officer, the chief operating decision maker.
As at and for the year ended December 31, 2013
| | Mining
operations* | | Exploration and
advanced
exploration** | | Corporate | | Total | |
Revenues | | $ | 192,647 | | $ | — | | $ | — | | $ | 192,647 | |
Loss from mine operations | | $ | (200,049 | ) | — | | — | | $ | (200,049 | ) |
General and administrative | | — | | — | | (12,555 | ) | (12,555 | ) |
Exploration | | — | | (1,313 | ) | — | | (1,313 | ) |
Write down of investments in associates | | — | | — | | (3,874 | ) | (3,874 | ) |
Share of loss of investments in associates | | — | | — | | (1,833 | ) | (1,833 | ) |
Loss from operations and associates | | (200,049 | ) | (1,313 | ) | (18,262 | ) | $ | (219,624 | ) |
Other income, net | | — | | — | | 5,133 | | 5,133 | |
Finance loss, net | | — | | — | | (14,676 | ) | (14,676 | ) |
Loss from continuing operations | | (200,049 | ) | (1,313 | ) | (27,805 | ) | (229,167 | ) |
Loss from discontinued operations | | — | | (4,302 | ) | — | | (4,302 | ) |
Net loss | | $ | (200,049 | ) | $ | (5,615 | ) | $ | (27,805 | ) | $ | (233,469 | ) |
Expenditures on mining interests including movements on working capital | | 99,849 | | $ | 52 | | $ | — | | $ | 99,901 | |
| | | | | | | | | |
Total assets | | $ | 454,350 | | $ | 104,568 | | $ | 39,014 | | $ | 597,932 | |
Total liabilities | | $ | 33,086 | | $ | — | | $ | 133,678 | | $ | 166,764 | |
53
LAKE SHORE GOLD CORP.
NOTES TO THE CONSOLIDATED FINANCIAL STATEMENTS
FOR THE YEARS ENDED DECEMBER 31, 2013 AND 2012
(in thousands of Canadian dollars, except per share amounts)
As at and for the year ended December 31, 2012
| | Mining operations* | | Exploration and
advanced exploration** | | Corporate | | Total | |
Revenues | | $ | 133,012 | | $ | — | | $ | — | | $ | 133,012 | |
Loss from mine operations | | (220,666 | ) | — | | — | | (220,666 | ) |
General and administrative | | — | | — | | (11,467 | ) | (11,467 | ) |
Exploration | | — | | (3,769 | ) | — | | (3,769 | ) |
Write down of investments in associates | | — | | — | | (7,529 | ) | (7,529 | ) |
Share of loss of investments in associates | | | | | | (2,738 | ) | (2,738 | ) |
Loss from operations and associates | | (220,666 | ) | (3,769 | ) | (21,734 | ) | (246,169 | ) |
Other loss, net | | — | | — | | (518 | ) | (518 | ) |
Finance loss (net) | | — | | — | | (2,731 | ) | (2,731 | ) |
Loss before taxes | | (220,666 | ) | (3,769 | ) | (24,983 | ) | (249,418 | ) |
Deferred mining tax recovery | | 3,029 | | — | | — | | 3,029 | |
Loss from continuing operations | | (217,637 | ) | (3,769 | ) | (24,983 | ) | (246,389 | ) |
Loss from discontinued operations | | — | | (71,543 | ) | — | | (71,543 | ) |
Net loss | | $ | (217,637 | ) | $ | (75,312 | ) | $ | (24,983 | ) | $ | (317,932 | ) |
Expenditures on mining interests including movements on working capital | | $ | 163,888 | | $ | 4,706 | | $ | — | | $ | 168,594 | |
Pre-production revenue | | $ | (6,706 | ) | $ | — | | $ | — | | $ | (6,706 | ) |
*Mining operations include activities of the Company’s Timmins West Mine, Bell Creek Mine and Bell Creek Mill.
** Exploration and advanced exploration include green field exploration (which is expensed on the consolidated statement of comprehensive loss) as well as properties capitalized as per the Company’s policy (other than Timmins West Mine, Bell Creek Mine and Bell Creek Mill, which are in operations).
All of the Company’s mining interests at December 31, 2013 are in Canada; at December 31, 2012, the Company had mining interests of $2,053 in Mexico which were classified as assets held for sale at December 31, 2012 and were sold in 2013 (note 9).
The Company sells its gold bullion through several brokers and there is no economic dependence; the Company does not have any long term sales contracts.
27. FINANCIAL INSTRUMENTS
MANAGEMENT OF CAPITAL RISK
The Company manages its capital structure and makes adjustments to it to effectively support the acquisition, exploration and development of mineral properties. In the definition of capital, the Company includes, as disclosed on its consolidated statement of financial position: share capital, equity portion of convertible debentures, deficit, reserves and long-term debt (as disclosed in note 19).
54
LAKE SHORE GOLD CORP.
NOTES TO THE CONSOLIDATED FINANCIAL STATEMENTS
FOR THE YEARS ENDED DECEMBER 31, 2013 AND 2012
(in thousands of Canadian dollars, except per share amounts)
The Company’s capital at December 31, 2013 and 2012 is as follows:
As at December 31, | | 2013 | | 2012 | |
Share capital | | $ | 1,017,262 | | $ | 1,016,524 | |
Equity portion of convertible debentures | | 14,753 | | 14,753 | |
Reserves | | 31,388 | | 23,212 | |
Deficit | | (632,235 | ) | (398,766 | ) |
Long term debt note 19 | | 130,025 | | 118,553 | |
| | $ | 561,193 | | $ | 774,276 | |
The Company believes it has sufficient funds to finance its current core operating, development and exploration expenditures. Longer term, the Company may pursue opportunities to raise additional capital through equity and/or debt markets as it progresses with its projects and properties. The Company will continue to assess new properties and seek to acquire an interest in additional properties if it feels there is sufficient geologic or economic potential and if it has adequate financial resources to do so.
Management reviews its capital management approach on an ongoing basis and believes that its approach, given the relative size of the Company, is reasonable.
The Sprott debt facility (note 19(a)) has certain financial covenants, which must be maintained on an ongoing basis, as follows:
· Leverage ratio of less than or equal to 3;
· Current ratio of no less than 1.10; and
· Cash and cash equivalents balance of not less than $10,000 (added effective December 12, 2013, effective date of the Modification Agreement (note 19(a)).
Below are the definitions as provided in the agreement:
· Leverage ratio at a certain date is the ratio of net indebtedness to rolling EBITDA;
· EBITDA is defined as the Company’s earnings before interest, income taxes, depreciation and amortization under IFRS;
· Rolling EBITDA is the sum of EBITDA for the current quarter and for the three immediate preceding quarters;
· Current ratio is equal to current assets of the Company divided by current liabilities under IFRS. The December 12, 2013 Modification Agreement provide for certain exclusions from current liabilities; and
· Total indebtedness at a certain date includes the total borrowings of the Company (including the Facility, finance lease obligations but excluding accounts payable and accruals and environmental obligations);
Non-compliance with the financial covenants could result in the Company having to immediately repay the outstanding balance of the Sprott debt facility. Throughout 2013 and 2012 and as at December 31, 2013 and 2012 the Company was in compliance with all applicable debt covenants.
55
LAKE SHORE GOLD CORP.
NOTES TO THE CONSOLIDATED FINANCIAL STATEMENTS
FOR THE YEARS ENDED DECEMBER 31, 2013 AND 2012
(in thousands of Canadian dollars, except per share amounts)
Neither the Company nor its subsidiaries are subject to any other externally imposed capital requirements and do not have exposure to asset-backed commercial paper or similar products.
CARRYING VALUES OF FINANCIAL INSTRUMENTS
The carrying values of the financial assets and liabilities at December 31, 2013 and 2012 are as follows:
As at December 31, | | 2013 | | 2012 | |
Financial Assets | | | | | |
At fair value through profit or loss | | | | | |
Cash and cash equivalents | | $ | 33,120 | | $ | 48,715 | |
Restricted cash | | 7,095 | | 7,095 | |
Warrant investments note 12 | | — | | 108 | |
Embedded derivative asset note 19(a) | | 6,702 | | — | |
| | $ | 46,917 | | $ | 55,918 | |
Loans and receivable, measured at amortized cost | | | | | |
Receivables | | $ | 2,405 | | $ | 6,578 | |
| | | | | |
Available-for-sale, measured at fair value | | | | | |
Investments in public companies note 12 | | $ | 416 | | $ | 702 | |
| | | | | |
Financial Liabilities | | | | | |
At fair value through profit or loss | | | | | |
Embedded derivative liability note 19(a) | | $ | — | | $ | 1,145 | |
| | | | | |
Other financial liabilities, measured at fair value | | | | | |
Share-based liabilities note 20 | | $ | 754 | | $ | 479 | |
| | | | | |
Other financial liabilities, measured at amortized cost | | | | | |
Accounts payable and accrued liabilities | | $ | 21,619 | | $ | 33,867 | |
Long term debt note 19 | | $ | 130,025 | | $ | 118,553 | |
| | $ | 151,644 | | $ | 152,420 | |
FAIR VALUES OF FINANCIAL INSTRUMENTS
The fair values of cash and cash equivalents, restricted cash, receivables and accounts payable and accrued liabilities approximate their carrying values due to the short-term to maturity of these financial instruments. The fair value of debentures at December 31, 2013 is $79,809 (December 31, 2012 - $95,499).
56
LAKE SHORE GOLD CORP.
NOTES TO THE CONSOLIDATED FINANCIAL STATEMENTS
FOR THE YEARS ENDED DECEMBER 31, 2013 AND 2012
(in thousands of Canadian dollars, except per share amounts)
The fair value hierarchy of financial instruments measured at fair value on the balance sheet is as follows:
| | 2013 | | 2012 | |
As at December 31, | | Level 1 | | Level 1 | |
| | | | | |
Cash and cash equivalents | | $ | 33,120 | | $ | 48,715 | |
Restricted cash | | $ | 7,095 | | $ | 7,095 | |
Investments in public companies note 12 | | $ | 416 | | $ | 702 | |
Standby Line liability note 19(a(ii)) | | $ | 30,120 | | $ | — | |
| | Level 2 | | Level 2 | |
| | | | | |
Gold loan liability note 19(a(i)) | | $ | 21,192 | | $ | 40,347 | |
Embedded derivative (asset) liability note 19(a(i)) | | $ | 6,702 | | $ | 1,145 | |
Share-based liabilities note 20 | | $ | 754 | | $ | 479 | |
Warrant investments note 12 | | $ | — | | $ | 108 | |
The Company does not have any financial instruments measured using Level 3 inputs. The Company does not offset financial assets with financial liabilities and there were no transfers between Level 1 and Level 2 input financial instruments.
The fair value of the gold loan liability and embedded derivative (asset) liability are determined by discounting future payments based on forward gold prices and forward US$/Canadian$ foreign exchange rates.
The fair value of share based liabilities and warrant investments are determined based on option pricing models that utilize a variety of inputs that are a combination of quoted prices and market corroborated inputs.
RISK MANAGEMENT POLICIES
The Company is exposed to financial risks sensitive to changes in commodity prices, foreign exchange and interest rates. The Company’s Board of Directors has overall responsibility for the establishment and oversight of the risk management framework. Currently the Company has not entered into any material options, forward or future contracts to manage its price-related exposures. Similarly, derivative financial instruments are not used to reduce these financial risks.
The Company’s risk exposures and the impact on the Company’s financial instruments are summarized below:
Credit Risk
The Company’s credit risk is primarily attributable to receivables, which mainly consist of sales tax due from the Federal Government of Canada. The Company’s surplus cash at December 31, 2013, is invested in very liquid low risk accounts in A rated Canadian Banks. The Company has no significant concentration of
57
LAKE SHORE GOLD CORP.
NOTES TO THE CONSOLIDATED FINANCIAL STATEMENTS
FOR THE YEARS ENDED DECEMBER 31, 2013 AND 2012
(in thousands of Canadian dollars, except per share amounts)
credit risk arising from operations. Management believes that the credit risk concentration with respect to financial instruments included in other assets is remote.
Liquidity Risk
The Company’s approach to managing liquidity risk is to ensure that it will have sufficient liquidity to meet liabilities when due. The Company has a planning and budgeting process in place to help determine the funds required to support the Company’s normal operating requirements on an ongoing basis and its expansionary plans. In the normal course of business, the Company enters into contracts that give rise to commitments for future payments as disclosed in notes 15, 18 and 29. All of the Company’s financial liabilities are subject to normal trade terms.
Market Risk
a. Interest rate risk
The Company is exposed to interest rate fluctuations related to interest earned on its cash on hand. The Company’s current policy is to invest surplus cash in very low risk investments with banking institutions. The Company periodically monitors the investments it makes and is satisfied with the credit ratings of its banks and investments.
The Company’s surplus cash at December 31, 2013, is invested in very liquid and low risk accounts in A rated Canadian Banks. The Company is exposed to short term interest rates through the interest earned on cash balances. A 1% change in short term rates would change the interest income and net loss of the Company, assuming that all other variables remain constant, by approximately $260 in 2013 (2012 - $300).
b. Price risk
The Company is exposed to price risk with respect to fluctuation in gold prices which impacts the future economic feasibility of its mining interests and cash earnings from its operating mines. The Company is also exposed to price risk with respect to its gold loan facility (note 19(a)), which will be repaid using a fixed amount of gold ounces multiplied by the Bloomberg gold closing price on the date of payment.
The Company has not entered into any derivative financial instruments to manage exposure to price risk. Gold prices are affected by numerous factors such as the sale or purchase of gold by various central banks and financial institutions, interest rates, exchange rates, inflation or deflation, fluctuations in the value of the US dollar and foreign currencies, global and regional supply and demand, and the political and economic conditions of major gold producing countries throughout the world. A 10% change in gold prices would result in approximately $19,500 (2012 - $13,000) change in the Company’s net loss; the change in the net loss includes $300 (2012 - $4,500) change in the mark to market value of gold loan derivatives.
c. Foreign currency exchange risk
The Company is exposed to foreign currency exchange risk with respect to future gold sales, since gold sales are denominated in United States Dollars (US$) and the Company’s functional currency is Canadian
58
LAKE SHORE GOLD CORP.
NOTES TO THE CONSOLIDATED FINANCIAL STATEMENTS
FOR THE YEARS ENDED DECEMBER 31, 2013 AND 2012
(in thousands of Canadian dollars, except per share amounts)
dollar. The movements on US$ rates may impact the future economic feasibility of the Company’s mining interests.
The Company is also exposed to foreign currency exchange risk with respect to its gold loan facility (note 19(a)), which will be repaid using a fixed amount of gold ounces multiplied by the Bloomberg gold closing price on the date of payment (gold price is denominated in US$). A 10% change in the US$/CAD$ exchange rate would change the unrealized foreign exchange gain (loss) and net loss of the Company, assuming that all other variables remains constant, by approximately $300 in 2013 (2012 - $4,000).
28. RELATED PARTY TRANSACTIONS
Balances and transactions between the Company and its subsidiaries have been eliminated on consolidation and are not disclosed in this note.
At December 31, 2012, the Company wrote-off of $247 receivable from RT Minerals, a then related party by virtue of being an equity investee; there was no other receivable from RT Minerals at December 31, 2012. RT Minerals ceased being a related party in 2013 when the Company’s interest was diluted to 7%.
In 2012 the Company and RT Minerals spent $424 toward the earn in interest in a property adjacent to Timmins Deposit (the Company’ share was $201).
Compensation of key management personnel
The remuneration of directors and other members of key executive management personnel (Chief Executive Officer, Vice President and Chief Financial Officer, Senior Vice President of Operations and Vice President of Exploration) during the year ended December 31, 2013 and 2012 are as follows:
For the year ended December 31, | | 2013 | | 2012 | |
Salaries and directors’ fees | | $ | 2,256 | | $ | 2,763 | |
Benefits | | 174 | | 183 | |
Share-based payments | | 1,584 | | 2,548 | |
| | $ | 4,014 | | $ | 5,494 | |
Share-based payments include the fair value of options granted of $1,337 (2012 - $2,223), PSUs $151 (2012 - $206) and DSUs $96 (2012 - $119) awarded to directors and key management personnel; there were no post-employment benefits, termination benefits, or other long term benefits during the years ended December 31, 2013 and 2012.
Related party transactions are measured at the exchange amount which is the consideration agreed to between the parties.
59
LAKE SHORE GOLD CORP.
NOTES TO THE CONSOLIDATED FINANCIAL STATEMENTS
FOR THE YEARS ENDED DECEMBER 31, 2013 AND 2012
(in thousands of Canadian dollars, except per share amounts)
29. COMMITMENTS AND CONTRACTUAL OBLIGATIONS
In addition to commitments and contractual obligations under various property agreements (note 15), the Company’s existing contractual obligations are as follows:
| | Payments Due by Period | |
Contractual obligations | | Total | | Less than a
year | | 1-3 years | | 4-5 years | | after 5 years | |
Accounts payable and accrued liabilities | | $ | 21,619 | | $ | 21,619 | | $ | — | | $ | — | | $ | — | |
Finance leases and other | | $ | 12,031 | | $ | 3,871 | | $ | 6,979 | | $ | 943 | | $ | 238 | |
Environmental rehabilitation provision | | $ | 4,770 | | $ | — | | $ | — | | $ | — | | $ | 4,770 | |
Long term debt - principal and interest payments | | $ | 192,712 | | $ | 28,266 | | $ | 54,477 | | $ | 109,969 | | $ | — | |
| | $ | 231,132 | | $ | 53,756 | | $ | 61,456 | | $ | 110,912 | | $ | 5,008 | |
60
LAKE SHORE GOLD CORP.
MANAGEMENT’S DISCUSSION & ANALYSIS
Years ended December 31, 2013 and 2012
General
This Management’s Discussion and Analysis, or MD&A, is intended to assist the reader in the understanding and assessment of the trends and significant changes in the results of operations and financial condition of Lake Shore Gold Corp. (the “Company” or “Lake Shore Gold”). This MD&A should be read in conjunction with the audited consolidated financial statements of the Company, including the notes thereto, for the years ended December 31, 2013 and 2012 (the “financial statements”), which are prepared in accordance with International Financial Reporting Standards (“IFRS”), as issued by the International Accounting Standards Board. This MD&A has taken into account information available up to and including March 18, 2014. All dollar amounts are in Canadian dollars unless otherwise stated.
This MD&A contains forward-looking statements. For example, statements in the “Outlook” section of this MD&A are forward looking, and any statements elsewhere with respect to the cost or timeline of planned or expected development, production, or exploration are all forward-looking statements. As well, statements about future mining or milling capacity, future growth, future financial position, the adequacy of the Company’s cash resources or the need for future financing are also forward-looking statements. All forward-looking statements, including forward-looking statements not specifically identified in this paragraph, are made subject to the cautionary language at the end of this document, and readers are directed to refer to that cautionary language when reading any forward-looking statements.
FULL-YEAR AND FOURTH QUARTER 2013 (“Q4/13”) HIGHLIGHTS (1)
· Strong production growth
2013: 134,600 ounces, 57% higher than in 2012
Q4/13: 51,700 ounces, more than double the level in fourth quarter 2012 (“Q4/12”)
· Higher gold sales
2013: 135,550 ounces, 62% increase from 2012
Q4/13: 49,600 ounces, up 149% from Q4/12
· Improved cash operating costs(1)
2013: US$766 per ounce sold, 23% lower than 2012
Q4/13: US$609 per ounce sold, a 38% improvement from Q4/12
· Lower all-in sustaining costs(1)
2013: US$1,139 per ounce sold, 37% improvement from 2012
Q4/13: US$849 per ounce sold, 52% improvement from Q4/12
· Total production costs reflect higher volumes
2013: $107.5 million versus $80.0 million in 2012
Q4/13: $32.0 million compared to $19.8 million in Q4/12
· Net loss mainly reflects $225 million impairment charge in 2013
2013: $233.5 million or $0.56 per common share including impairment charge; $8.5 million excluding impairment charge versus $15.4 million on same basis in 2012
Q4/13: $225.7 million or $0.54 per common share including impairment charge; $0.7 million excluding impairment charge compared to $0.3 million on same basis in Q4/12
1
· Growth in earnings from mine operations (excluding impairment charge)
2013: $25.0 million, 143% higher than the $10.3 million reported in 2012
Q4/13: $11.7 million, more than triple the $3.3 million reported in Q4/12
· Investment levels in line with guidance
2013: $90.4 million, in line with the Company’s guidance of $90 million
Q4/13: $10.3 million, all sustaining capital investment
· Cash and bullion increases in Q4/13
2013: Cash and bullion totaled $34.0 million at December 31, 2013
Q4/13: Cash and bullion increased $18.8 million during Q4/13
· Mill expansion completed
2013: Mill expansion completed in third quarter of 2013
Q4/13: Averaged 3,500 tonnes per day by milling mine production and stockpiles
· $20 million of debt repayments, extended maturity of standby line of credit
2013: Made approximately $20.0 million of debt repayments to Sprott Resource Lending Partnership (“Sprott”)
Q4/13: Approximately $9.0 million of debt repayments made to Sprott and maturity of the standby line of credit (“Standby Line”) extended
(1) The Company’s Highlights include measures such as cash operating cost per ounce sold and all-in sustaining cost (“AISC”) per ounce sold that are not prepared in accordance with Generally Accepted Accounting Principles (“GAAP”), but which the Company believes provide useful information that can be used to evaluate the Company’s performance and ability to generate cash flows. These measures do not have standardized definitions and should not be relied upon in isolation or as a substitute for measures prepared in accordance with GAAP. A reconciliation of these measures to amounts included in the Consolidated Statements of Comprehensive Loss is set out at page 21 of this MD&A.
OUTLOOK
In 2014, the Company is targeting gold production of 160,000 — 180,000 ounces, with expected cash operating costs per ounce sold in the range of US$675 to US$775, all-in sustaining costs per ounce sold in the range of US$950 to US$1,050 and total production costs of $128 million. Mill throughput for the year is targeted to average 3,200 — 3,300 tonnes per day with average grades between 4.5 and 5.0 grams per tonne.
Based on the Company’s business plan for the year using a Canadian dollar gold price of $1,300 per ounce, the Company is well positioned to fund all cash and capital requirements and to increase its cash position during 2014. The Company is planning total debt repayments in 2014 of $20 — $25 million, approximately $15 million related to the Company’s gold-linked note (“Gold Note”) and $5 — $10 million to be paid on the Standby Line.
With the Company’s cash and bullion increasing as of the fourth quarter of 2013, the Company entered 2014 with a renewed commitment to exploration and to replenishing resources and reserves. A new drilling program was launched in January 2014 focused on high-potential targets at the Timmins West and Bell Creek mines in close proximity to existing resources and reserves.
IMPAIRMENT CHARGE
The Company recorded an impairment charge of $225.0 million as part of its full-year and fourth quarter 2013 results. The impairment charge represents a reduction in the estimated net carrying
2
value of the Timmins cash generating unit (“CGU”), which comprises the Company’s Timmins West Mine and surrounding properties, Bell Creek Mine and surrounding properties and the Bell Creek Mill. Among the indicators triggering the impairment assessment was the fact that the carrying amount of the Company’s net assets materially exceeded its market capitalization.
Contributing to the reduction in the estimated carrying value of the Timmins CGU were lower short and long term gold price assumptions used in the determination of fair value. For purposes of the impairment assessment, the Canadian dollar gold price used was $1,391 (US$1,300) per ounce for 2014, which was increased to $1,430 (US$1,300) per ounce by 2017 followed by a longer-term price of $1,443 (US$1,300). On average, the Canadian dollar gold price used for the 2013 impairment assessment was $240 per ounce lower than the gold price assumptions used in 2012 for the years 2014 — 2016.
The reduction in the estimated carrying value of the Timmins CGU also reflected a decrease in resources and reserves. The Company has been in a depletion phase for the last two years with all drilling focused within existing resources, largely in support of production. As a result, no new ounces have been added to reserves and resources to replace production or to offset losses. Over the last year, a total of 140,000 contained ounces were mined from the Company’s Timmins West and Bell Creek mines. In addition, 190,000 ounces have been removed from the Timmins West Mine reserves reflecting a significant reduction in the assumed average gold price and the results of extensive definition drilling, which have indicated lower grades and changes in the interpretation of geology in some areas. The key effect of the lower grades is removal of certain low-grade sections from new resource and reserve models and more conservative projection of grades, especially near zone boundaries. When the Company files an updated 43-101 technical report for the Timmins West Mine (expected by March 31, 2014), its total reserves and resources are expected to support a five-year mine plan at current production rates. The updated Timmins West Mine 43-101 technical report assumes an weighted average gold price of $1,150 (approximately US$1,100) per ounce compared to $1,500 (approximately US$1,430) per ounce used for the previous reserve update.
KEY DEVELOPMENTS AND SENSITIVITIES
During the third quarter of 2013, the Company completed a capital investment program that had been conducted over a period of approximately four years, aimed at developing the Timmins West and Bell Creek underground mines and expanding the Bell Creek Mill to support a production rate of over 3,000 tonnes per day. The Company’s target production rate was achieved for the first time in September 2013, when production through the mill averaged 3,370 tonnes per day. During the fourth quarter 2013, the Company averaged 3,500 tonnes per day, exceeding target levels as a result of processing both mine production and ore from stockpiles established during the mill commissioning period. Production during the fourth quarter totaled 51,700 ounces. At the same time that production increased, unit operating costs improved and capital requirements declined. As a result, the Company generated significant cash flow from operations during the fourth quarter, which contributed to an $18.8 million increase in cash and bullion from $15.2 million at September 30, 2013 to approximately $34.0 million at December 31, 2013.
The Company’s average selling price of gold in 2013 was US$1,377 per ounce, a reduction of US$289 per ounce from 2012. Given that approximately 98% of the Company’s costs are in Canadian dollars, and all of the Company’s debt is Canadian-dollar denominated, the gold price
3
of greatest significance to the Company is the Canadian dollar gold price. The average Canadian dollar gold price in 2013 was $1,422 per ounce based on an average C$/US$ exchange rate of $0.97 compared to $1,668 per ounce sold based on an average exchange rate of $1.00 in 2012. The negative impact of the lower average gold price on the Company’s cash flows was more than offset by higher production volumes and lower unit operating costs.
As of March 18, 2014, the average Canadian dollar gold price for the year to date was $1,419 per ounce compared to the Company’s budgeted price for the year of $1,300 per ounce. In 2014, every $100 per ounce change in the average Canadian dollar selling price of gold has an estimated impact on the Company’s earnings of approximately $16 — $18 million.
On December 16, 2013, the Company announced the signing of a Modification Agreement with Sprott for the primary purpose of extending the maturity of the Standby Line. Under terms of the Modification Agreement, the Standby Line will be repaid through 18 equal monthly payments of outstanding principal plus accrued interest starting on June 30, 2015 with the final monthly payment due on November 30, 2016. Previously, the Standby Line was due in full on January 1, 2015. A number of other revisions were made involving the Standby Line and the Gold Note, also with Sprott. A review of the key revisions is provided in the Financial Condition, Liquidity and Capital Resources section of this MD&A on page 18.
COMPANY OVERVIEW
Lake Shore Gold is a gold producing company with three multi-million ounce gold complexes located in the Timmins Gold Camp of Northern Ontario.
The Timmins West Complex is located 18 kilometres west of Timmins and hosts the Timmins West Mine, an underground mining operation that produces ore using a 710 metre, 5.5 metre diameter shaft, with a 6,000 tonne per day total hoisting capacity. The ore is accessed using mobile equipment via internal ramps both from surface and the main shaft. Primary mining methods include longitudinal longhole mining at Timmins Deposit and Thunder Creek Deposit Rusk Zone, and transverse longhole mining at the Thunder Creek Porphyry Zone with a primary/secondary stoping sequence. Broken ore is removed from the stopes using remote controlled Load-Haul-Dump Loaders (“LHDs”), loaded onto trucks and hauled to the main shaft rockbreaker station prior to skipping to surface. During 2013, the mine produced at an average rate of just over 2,000 tonnes per day of ore and is expected to increase to an average of approximately 2,500 tonnes per day of ore in 2014.
On the east side of Timmins, the Bell Creek Complex hosts the Company’s newly-expanded milling facility as well as the Bell Creek Mine. The Bell Creek Mine is an underground mine that produces ore using a five metre wide by five metre high surface ramp. Longitudinal longhole stoping is the primary mining method. Broken ore is removed from the stope using remote controlled LHDs, and trucked to surface. During 2013, Bell Creek Mine averaged 560 tonnes per day of ore production, with increased output targeted for over 700 tonnes per day in 2014.
The Company’s central mill, located at the Bell Creek Complex, is a conventional gold mill circuit, involving crushing and grinding, gravity and leaching, followed by carbon-in-leach and carbon-in-pulp processes for gold recovery. The mill, which processes ore from both the Timmins West and Bell Creek mines, has consistently achieved metallurgical recoveries of at least 95%. In late 2011, the Company commenced a 50% expansion of its milling facility, from a processing rate of
4
2,000 tonnes per day to 3,000 tonnes per day. Phase 1 of the expansion, which increased the mill’s capacity to 2,500 tonnes per day, was completed at the end of 2012. Phase 2 of the expansion, to a production rate exceeding 3,000 tonnes per day, was completed during the third quarter of 2013.
In addition to its existing operations, the Company has significant exploration potential. At the Timmins West Complex, both the Timmins and Thunder Creek deposits at Timmins West Mine are open for expansion. At the Gold River Trend project, located 3 kilometres south of Timmins West Mine, resources exceeding a million ounces have been identified with significant opportunity for growth. The 144 property covers a four kilometre trend to the southwest of Thunder Creek. Encouraging drill results have already been reported at 144 with there being considerable potential for new discoveries. At Bell Creek Complex, resources have been established in a deep zone (the “Labine Zone”) at Bell Creek Mine, the development of which has the potential to significantly grow the size of the mining operation. The complex also hosts exploration projects with existing resources, including Vogel and Marlhill, as well as other exploration properties.
The Company’s third gold complex is the Fenn-Gib project, located approximately 60 kilometres east of Bell Creek. Fenn-Gib is an advanced stage exploration project, which hosts a large, near-surface, potential open-pitable resource and has excellent potential for further growth.
Lake Shore Gold is a reporting issuer in all Provinces in Canada (excluding Territories), and a foreign private issuer in the United States. The Company’s common shares trade on the Toronto Stock Exchange and NYSE MKT under the symbol LSG.
KEY PERFORMANCE INDICATORS
| | Quarter ended December 31, | | Year ended December 31, | |
| | 2013 | | 2012 | | 2013 | | 2012 | |
Tonnes milled | | 321,800 | | 181,600 | | 952,700 | | 719,300 | |
Grade | | 5.2 | | 4.2 | | 4.6 | | 3.9 | |
Average mill recoveries | | 96.3 | % | 96.0 | % | 95.8 | % | 96.3 | % |
Ounces recovered | | 51,700 | | 23,700 | | 134,600 | | 85,800 | |
Ounces poured | | 51,400 | | 24,000 | | 129,600 | | 85,200 | |
Ounces sold | | 49,600 | | 19,900 | | 135,550 | | 83,800 | |
Average price (US$/oz) | | $ | 1,261 | | $ | 1,705 | | $ | 1,377 | | $ | 1,666 | |
Average price ($/oz) | | $ | 1,328 | | $ | 1,705 | | $ | 1,422 | | $ | 1,668 | |
Revenue | | $ | 65,814 | | $ | 33,976 | | $ | 192,647 | | $ | 133,012 | |
Cash operating costs (2,3) | | $ | (31,725 | ) | $ | (19,659 | ) | $ | (106,961 | ) | $ | (79,295 | ) |
Cash earnings from mine operations (2) | | $ | 34,089 | | $ | 14,317 | | $ | 85,686 | | $ | 53,717 | |
Adjusted earnings from mine operations (4) | | $ | 11,740 | | $ | 3,306 | | $ | 24,951 | | $ | 10,334 | |
Impairment charge | | (225,000 | ) | (231,000 | ) | (225,000 | ) | (231,000 | ) |
Loss from mine operations | | $ | (213,260 | ) | $ | (227,694 | ) | $ | (200,049 | ) | $ | (220,666 | ) |
Net loss | | $ | (225,693 | ) | $ | (302,226 | ) | $ | (233,469 | ) | $ | (317,932 | ) |
Cash and Cash equivalent | | $ | 33,120 | | $ | 48,715 | | $ | 33,120 | | $ | 48,715 | |
(2) The Company’s Key Performance Indicators include measures such as cash operating cost and cash earnings from mine operations that are not prepared in accordance with GAAP, but which the Company believes provide useful information that can be used to evaluate the Company’s operational performance and ability to generate cash flows. These measures do not have standardized definitions and should not be relied upon in isolation or as a substitute for measures prepared in accordance with GAAP. A reconciliation of these measures to amounts included in the Consolidated Statements of Comprehensive Loss is set out at page 21 of this MD&A.
5
(3) Cash operating costs for the fourth quarter and year ended December 31, 2013, include royalty expenditures of $1.5 million and $4.4 million, respectively (same periods in 2012 $0.7 million and $2.3 million respectively)
(4) Adjusted earnings from operations equal loss from mine operations as disclosed on the statement of comprehensive loss net of impairment charge.
57% production growth in 2013
Production increased to 134,600 ounces of gold in 2013, reflecting higher mill throughput and improved grades. Production for the year achieved the top end of the Company’s guidance of 120,000 — 135,000 ounces. A 32% increase in mill throughput was due to the completion of the Company’s mill expansion, with throughput increasing in two stages from 2,000 tonnes per day to a capacity of 2,500 tonnes per day at the end of 2012 and then increasing again to an average throughput rate of over 3,000 tonnes per day starting in September 2013. The average grade of 4.6 grams per tonne was 18% higher than in 2012 and reflected quarter over quarter grade improvements throughout 2013. Improved grades largely resulted from completing significant definition drilling and mine development over a two-year period to provide better information and greater production flexibility, as well as from completion of key infrastructure.
Production in the fourth quarter of 2013 was a record 51,700 ounces, more than double the level of production during the fourth quarter 2012 and 68% higher than the previous record for quarterly production established in the second quarter of 2013. Average mill throughput during the fourth quarter of 2013 was 3,500 tonnes per day as the Company processed both mine production and ore from stockpiles established during commissioning of the mill expansion in the third quarter of 2013. Grades for the quarter averaged 5.2 grams per tonne, largely reflecting mine sequencing.
6

Increased gold sales drive revenues higher
Gold sales in 2013 totaled 135,550 ounces, an increase of 62% from 2012 reflecting higher production levels. Strong growth in volumes more than offset the impact of a 15% reduction in the average Canadian dollar gold price for the year to $1,422 (US$1,377) per ounce compared to $1,668 (US$1,666) per ounce in 2012 leading to a 45% increase in revenues to $192.6 million in 2013 versus $133.0 million in 2012.
Gold sales during the fourth quarter of 2013 totaled 49,600 ounces, a 150% improvement from the 19,900 ounces sold during the fourth quarter of 2012. The selling price of gold during the fourth quarter of 2013 averaged $1,328 (US$1,261) per ounce, a reduction of 22% from $1,705 (US$1,705) per ounce for the same period in 2012. Higher volumes more than offset the impact of lower gold prices, resulting in a 94% increase in revenues to $65.8 million for the fourth quarter of 2013 from $34.0 million in the fourth quarter of 2012.
Sharply lower unit operating costs partially offset impact of reduced gold prices on margins
Total production costs of $107.5 million in 2013 were $27.5 million higher than in 2012 as a result of increased production volumes. On a unit cost basis, cash operating costs improved by US$229 per ounce sold or 23% from the prior year to US$766 per ounce sold, better than the Company’s target range of US$800 to US$875. The Company’s improved unit cost performance in 2013 reflected a number of factors, including higher throughput levels, increased grades, benefits related to the completion of infrastructure and greater efficiency in key areas such as the use of contractors, shift scheduling and improvements to management, procurement and accounting systems. All-in sustaining costs averaged US$1,139 per ounce sold in 2013, a 37% improvement from 2012.
The Company’s unit cost performance improved each quarter during 2013, with cash operating costs improving to US$609 per ounce sold during the fourth quarter, a US$381 per ounce sold or 38% improvement from the fourth quarter of 2012. AISC during the fourth quarter 2013 averaged US$846 per ounce sold, 51% lower than the level recorded for the same period a year earlier.
7
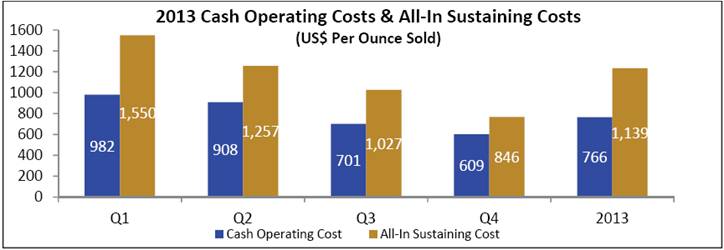
Strong growth in cash earnings from mine operations
The Company generated cash earnings from mine operations in 2013 of $85.7 million, an increase of 60% from the $53.7 million reported in 2012. The significant increase in cash earnings from mine operations largely reflected the 62% increase in gold sales and the impact of improved unit cash operating costs. These factors more than offset the unfavourable impact of a 15% reduction in the average realized Canadian dollar gold price ($1,422 per ounce in 2013 versus $1,668 per ounce in 2012).
For the fourth quarter of 2013, cash earnings from mine operations totaled $34.1 million, an increase of 138% from $14.3 million in the same period in 2012. Growth of 150% in sales volumes and improved unit operating costs more than offset a 22% reduction in the average realized Canadian dollar gold price ($1,328 per ounce in the fourth quarter of 2013 compared to $1,705 per ounce a year earlier) in accounting for the increase from a year ago.
Net loss of $0.7 million reported in fourth quarter 2013, excluding impairment charge
Net loss in 2013 totaled $233.5 million compared to $317.9 million in 2012. Net loss in 2013 included a fourth-quarter impairment charge of $225.0 million compared to a fourth-quarter impairment charge of $302.5 million in 2012. For more information about the impairment charge in 2013 see “Impairment Charge” on page 2 of this MD&A. Excluding the impairment charges, net loss in 2013 totaled $8.5 million compared to a net loss of $15.4 million in 2012. The improvement from a year earlier mainly reflected a 2.5 times increase in earnings from mine operations in 2013 (excluding impairment charges) due mainly to higher production levels and improved unit operating costs. Higher earnings in 2013 were also impacted by the unrealized and realized gain from the mark to market of certain embedded derivatives on the Company’s long term debt (2012 — net unrealized loss). Offsetting higher earnings from mine operations were the impact of increased finance expense, as well as a number of non-cash items, including translation and other losses related to the sale of the Company’s Mexican subsidiary.
Excluding impairment charges, the Company reported net loss of $0.7 million in the fourth quarter of 2013 compared to net earnings of $0.3 million for the same period in 2012. Earnings from operations in the fourth quarter of 2013, net of impairment charges, totaled $25.0 million, a 143% increase from $10.3 million for the same period in 2012. The net loss for the quarter, net of impairment charge, resulted from increased finance expenses (due to higher debt levels in the fourth quarter of 2013 and the fact that no finance costs were capitalized following the commissioning of the mill expansion during the third quarter of 2013), a deferred tax recovery recorded in the fourth quarter of 2012 (none in 2013) and an unrealized gain from the mark to
8
market of the embedded derivatives in the fourth quarter of 2012 (unrealized loss in the fourth quarter of 2013).
2013 investment in mining interests in line with Company guidance
During 2013, the Company invested a total of $90.4 million, in line with its guidance for the year and a reduction of 47% from the $169.8 million invested in 2012. Lower levels of investment in 2013 reflected progress achieved with the Company’s growth program, designed to develop and construct the Company’s mining and milling operations to a production rate of over 3,000 tonnes per day. This program was largely completed as of the third quarter of the year. Of the $90.4 million invested in 2013, $38.9 million was sustaining capital and $51.5 million was growth capital.
Included in the $90.4 million invested in 2013 was $44.0 million invested at Timmins West Mine, $14.0 million at the Bell Creek Mine and $32.2 million related to the Company’s mill expansion and other mill infrastructure related costs. Approximately $42.3 million of the capital investment at the Company’s two mines related to capital development, $2.6 million was for new equipment, $7.8 million was for various projects, including the new paste-fill plant at Timmins West Mine, with the remainder largely related to mine geology.
The Company’s investment in mining interests during the fourth quarter of 2013 totaled $10.3 million, mainly in sustaining capital.
Cash and Bullion of $34.0 million at December 31, 2013
Cash and bullion at December 31, 2013 totaled $34.0 million ($33.1 million of cash and cash equivalents and $0.9 million of bullion inventory, valued at market prices) compared to $61.0 million at December 31, 2012 ($48.7 million of cash and cash equivalents and the remainder in bullion inventory). Cash flow from operating activities totaled $70.6 million in 2013, a 136% increase from 2012. Financing activities contributed $13.6 million of cash as the full drawdown of the Company’s $35 million Standby Line and proceeds of $7.3 million for the sale and lease back of mobile equipment were only partially offset by cash used for debt repayments and payments on lease obligations. Investing activities accounted for a use of $99.7 million of cash during 2013 (including $9.3 million of movements in working capital) all related to investment in mining interests during the year.
During the fourth quarter of 2013, the Company’s cash and bullion increased by $18.8 million from $15.2 million ($14.7 million of cash and cash equivalents and $0.5 million of bullion inventory) at September 30, 2013. Cash flow from operating activities totaled $34.3 million compared to $4.2 million in the fourth quarter of 2012. The $34.3 million of net cash flow from operating activities was only partially offset by cash used for investing and financing activities. The increase in cash flow from operating activities compared to the prior year’s fourth quarter mainly reflected a 150% growth in gold sales and a 39% improvement in AISC, which more than offset the impact of a lower average gold price. A $25.8 million reduction in cash used for investing activities mainly reflected a 72% decrease in investment in mining interests in the fourth quarter of 2013 versus a year earlier, while cash used for financing activities increased by $1.2 million.
9
REVIEW OF OPERATIONS
Bell Creek Mill
The Company’s central mill, located at the Bell Creek Complex, is a conventional gold mill circuit, involving crushing and grinding, gravity and leaching, followed by carbon-in-leach and carbon-in-pulp processes for gold recovery. The milling facility is located approximately 20 kilometres east of the city of Timmins and, along with the Bell Creek Mine, was acquired in December 2007. The mill, which processes ore from both the Timmins West and Bell Creek mines, has consistently achieved metallurgical recoveries of at least 95%. In late 2011, the Company commenced a 50% expansion of its milling facility, from a processing capacity of 2,000 tonnes per day to 3,000 tonnes per day. Phase 1 of the expansion, which increased the mill’s capacity to 2,500 tonnes per day, was completed at the end of 2012. Phase 2 of the expansion, to a capacity of 3,000 tonnes per day, was completed during the third quarter of 2013. In 2013 the Company invested $32.2 million at the Bell Creek Mill, mainly related to Phase 2 of the mill expansion and other mill infrastructure.
During 2013, a total of 952,700 tonnes of ore was processed at the Bell Creek Mill, an increase of 32% from 2012 reflecting higher capacity levels throughout 2013 given the completion of Phase 1 of the Company’s mill expansion (adding 500 tonnes per day of capacity) as of the end of 2012 and the completion of Phase 2 of the expansion to 3,000 tonnes per day during the third quarter of 2013. A total of 134,600 ounces were recovered in 2013 at an average grade of 4.6 grams per tonne compared to 85,800 ounces at an average grade of 3.9 grams per tonne in 2012. The Company poured 129,600 ounces of gold in 2013, a 52% increase from the 85,200 ounces poured in 2012.
For the fourth quarter of 2013, the first full quarter following completion of the Company’s mill expansion, a total of 321,800 tonnes was processed at an average grade of 5.2 grams per tonne for a total of 51,700 ounces recovered. Mill throughput during the quarter averaged 3,500 tonnes per day, higher than target levels as the Company processed both mine production and ore from stockpiles established during commissioning of the mill expansion. Production during the fourth quarter of 2012 included 181,600 tonnes at an average grade of 4.2 grams per tonne for a total of 23,700 ounces recovered. A total of 51,400 ounces were poured during the fourth quarter of 2013, more than double the ounces poured in the same quarter a year earlier.
Timmins West Mine
The Timmins West Mine is an underground mine located approximately 18 kilometres west of Timmins, Ontario at the junction of highways 101 and 144. The mine was established effective January 1, 2012, through the combination of the Timmins Deposit and adjacent Thunder Creek Deposit into a single, fully integrated mining operation given their close proximity and use of the same infrastructure. As of January 1, 2012, both deposits, which are approximately 800 metres apart and are connected by two ramps, are in commercial production.
In March 2012, Franco-Nevada Corporation paid the Company $35.0 million for a 2.25% NSR royalty on the sale of minerals from the Company’s Timmins West Complex, including Timmins West Mine. In addition, there are several other royalties applicable to various land areas comprising the Timmins West Mine. Only one of these royalties, a 1% NSR royalty related to Thunder Creek, involves areas of known mineralization.
10
A total of 107,100 ounces of gold was produced at Timmins West Mine in 2013 from processing 747,500 tonnes at an average grade of 4.6 grams per tonne. Production for the year was 67% higher than the 64,200 ounces (536,900 tonnes at an average grade of 3.8 grams per tonne) produced in 2012. Production during 2013 was primarily from stopes in the Rusk and Porphyry zones between the 660 and 765 levels at Thunder Creek and in the UM and Footwall zones between the 670 and 790 levels at Timmins Deposit.
During the fourth quarter of 2013, a total of 41,600 ounces was produced from processing 259,800 tonnes at an average grade of 5.2 grams per tonne. Production during the year’s fourth quarter compared to production of 19,000 ounces (140,500 tonnes at an average grade of 4.4 grams per tonne) during the fourth quarter of 2012. The increase from the prior year’s fourth quarter reflected higher volumes, as both the Company’s mining and milling infrastructure supported increased levels of production, and increased grades. Production during the fourth quarter of 2013 was mainly from stopes in the Rusk and Porphyry zones between the 695 and 765 levels at Thunder Creek and in the UM and Footwall zones between the 770 and 790 levels at Timmins Deposit.
During 2013, the Company invested $44.0 million at the Timmins West Mine, including ramp, infrastructure and level development expenditures.
Among the work completed at the Timmins West Mine in 2013 were 10,700 metres of mine capital and operating development. At Timmins Deposit, the ramp was advanced below the 850 Level with level development advancing on the 750, 770, 790, 810, 830 and 850 levels. The ramp in the lower mine at Thunder Creek was advanced upwards to the 590 Level and down to the 765 Level with level development focused mainly on the 590, 765, 730, 695, 660 and 625 levels. Other components of the Company’s 2013 capital program at Timmins West Mine included establishment of an underground paste fill distribution system, completion of a diamond drill drift on the 790 Level of Timmins Deposit, commissioning of a ventilation system from the 730 to 870 levels at Timmins Deposit and completion of a waste pass at Thunder Creek from 730 Level to surface.
A total of 64,000 metres of in-mine drilling was completed in 2013. Drilling during the year was focused between the 790 and 830 levels at the Timmins Deposit and between the 660 and 765 levels at Thunder Creek. Drilling at the Timmins Deposit was completed mainly with two drill rigs and targeted the downward extension of the UM5 and FW zones between the 790 and 830 levels which contain key mining blocks for the second half of 2013 and beyond. Drilling at Thunder Creek was completed with two drill rigs and targeted new stoping blocks in the Porphyry and Rusk zones near the 765 and 660 levels.
Bell Creek Mine
The Bell Creek Mine is an underground mine located approximately 20 kilometres northeast of Timmins Ontario close to Goldcorp Inc.’s (“Goldcorp”) Hoyle Pond Mine. The Bell Creek Mine was operated by a number of owners from 1987 to 1994, producing a total of 113,000 ounces of gold (576,000 tons at an average grade of 5.6 grams per tonne). Lake Shore Gold acquired the Bell Creek Mine, and the Bell Creek Mill, in December 2007.
In May 2009, the Company commenced an advanced exploration program at Bell Creek Mine mainly focused on de-watering and rehabilitating the existing Bell Creek shaft and workings and collaring a surface ramp at Bell Creek to connect to the underground mine workings. Effective
11
January 1, 2012, the Bell Creek Mine was put into commercial production. Ounces produced at Bell Creek Mine are subject to a 2% NSR royalty payable to Goldcorp, subject to the recovery by the Company of $6 million related to Goldcorp’s share of the purchase price of a prior royalty on the mine that will be offset against royalty payments payable to Goldcorp. During 2013, the Company incurred $0.7 million in royalty expenses that were offset against the $6.0 million owed by Goldcorp, bringing the total royalty expense applied against the Goldcorp payment to $1.4 million as of December 31, 2013.
During the year ended December 31, 2013, a total of 27,500 ounces of gold was produced from Bell Creek Mine (205,200 tonnes at an average grade of 4.4 grams per tonne), which compared to production of 21,600 ounces (182,350 tonnes at an average grade of 3.9 grams per tonne) in 2012. Production in 2013 was primarily in the North A Deep and Hanging Wall zones between the 505 and 625 levels with sill development to the 685 Level.
Production in the fourth quarter of 2013 totaled 10,100 ounces (62,000 tonnes at an average grade of 5.3 grams per tonne) compared to 4,713 ounces (41,084 tonnes at an average grade of 3.9 grams per tonne) in 2012. The significant growth in production resulted from a 51% increase in tonnes and a 36% improvement in grade.
In 2013 the Company invested $14.0 million at Bell Creek Mine. During the year, 6,320 metres of capital and operating development were completed, including advancing the ramp from surface to the 715 Level and advancing level development mainly on the 625, 640, 655, 670 and 685 levels. A total of 7,860 metres of in-mine drilling was completed at the Bell Creek Mine during 2013.
12
FINANCIAL REVIEW
The table below highlights the results of operations for the three months and years ended December 31, 2013 and 2012:
| | Quarter ended December 31, | | Year ended December 31, | |
(in $’000, except the per share amounts) | | 2013 | | 2012 | | 2013 | | 2012 | |
| | | | | | | | | |
Revenue | | $ | 65,814 | | $ | 33,976 | | $ | 192,647 | | $ | 133,012 | |
Cash operating costs* | | (31,725 | ) | (19,659 | ) | (106,961 | ) | (79,295 | ) |
Cash earnings from operations* | | $ | 34,089 | | $ | 14,317 | | $ | 85,686 | | $ | 53,717 | |
Depreciation and depletion | | (22,122 | ) | (10,854 | ) | (60,205 | ) | (42,641 | ) |
Share based payments in production costs | | (227 | ) | (157 | ) | (530 | ) | (742 | ) |
Impairment Charge | | (225,000 | ) | (231,000 | ) | (225,000 | ) | (231,000 | ) |
Loss from mine operations | | $ | (213,260 | ) | $ | (227,694 | ) | $ | (200,049 | ) | $ | (220,666 | ) |
General and administrative** | | (3,256 | ) | (1,653 | ) | (10,573 | ) | (8,613 | ) |
Exploration** | | (262 | ) | (1,201 | ) | (1,203 | ) | (3,587 | ) |
Share of loss of investments in associates | | (871 | ) | (395 | ) | (1,833 | ) | (2,738 | ) |
Write down of investment in associates | | (302 | ) | (1,572 | ) | (3,874 | ) | (7,529 | ) |
Share based payments in expenses** | | (626 | ) | (748 | ) | (2,092 | ) | (3,036 | ) |
Loss from operations and associates | | $ | (218,577 | ) | $ | (233,263 | ) | $ | (219,624 | ) | $ | (246,169 | ) |
Other (loss) income, net | | (1,830 | ) | 2,605 | | 5,133 | | (518 | ) |
Finance expense, net | | (5,286 | ) | (2,778 | ) | (14,676 | ) | (2,738 | ) |
Loss before taxes | | $ | (225,693 | ) | $ | (233,436 | ) | $ | (229,167 | ) | $ | (249,425 | ) |
Deferred mining tax recovery | | — | | 2,710 | | — | | 3,029 | |
Loss from continuing operations | | $ | (225,693 | ) | $ | (230,726 | ) | (229,167 | ) | $ | (246,396 | ) |
Loss from discontinued operations | | — | | (71,500 | ) | (4,302 | ) | (71,543 | ) |
Net loss | | $ | (225,693 | ) | $ | (302,226 | ) | $ | (233,469 | ) | $ | (317,932 | ) |
Net loss per share | | | | | | | | | |
Loss per share from continuing operations | | $ | (0.54 | ) | $ | (0.56 | ) | $ | (0.55 | ) | $ | (0.60 | ) |
Loss per share | | $ | (0.54 | ) | $ | (0.73 | ) | $ | (0.56 | ) | $ | (0.77 | ) |
* Non-GAAP measure. See “Non-GAAP measures” on page 21 of this MD&A
**General and administrative and exploration expenses differ from the balances on the consolidated statement of comprehensive loss by the share based payments in expenses.
Summary
Cash earnings from operations were $85.7 million and $34.1 million, respectively, for the year and three months ended December 31, 2013 compared to $53.7 million and $14.3 million, respectively, for the same periods in 2012. The significant improvement in cash earnings from mine operations in the fourth quarter of 2013, as compared to the same period a year earlier reflected a 58% increase in sales volumes and lower unit cash operating costs. These factors more than offset the unfavourable impact of a 15% reduction in the average Canadian dollar gold price ($1,328 per ounce in the fourth quarter of 2013 versus $1,705 per ounce for the same period in 2012).
Net loss for the year and three months ended December 31, 2013 totaled $233.5 million and $225.7 million, respectively (or $0.56 and $0.54, respectively, per share). Net loss for the same periods in 2012 totaled $317.9 million and $302.2 million, respectively (or $0.77 and $0.73 and, respectively, per share). Net loss for both years and quarters were primarily impacted by non-cash impairment charges.
13
Discontinued Operations
For the year ended December 31, 2013, the Company recorded a loss from discontinued operations of $4.3 million, which related to the sale of the shares of the Company’s Mexico subsidiary (please refer below for more details), mainly representing the translation losses accumulated in reserves which were transferred to profit and loss upon the sale.
On May 8, 2013, the Company sold to Revolution Resources Corp. (“Revolution”) all of the shares of its Mexico subsidiary (which held 100% of the Company’s Mexico property portfolio) in exchange for 20 million common shares of Revolution (received on May 8, 2013 when the sale closed), 2% to 3.5% Net Smelter Return royalties (“NSR”) on the various properties of the Mexico portfolio (subject to rights of Revolution to repurchase a portion of the NSR), and $5.0 million in cash or common shares of Revolution on or before December 31, 2017 contingent on certain conditions being met (to a maximum of an additional 25 million common shares of Revolution). Upon closing of the sale, the amended option agreement entered into by the Company and Revolution on July 26, 2012 was terminated.
The newly received shares increased the Company’s ownership in Revolution from approximately 7% to approximately 23%, making Revolution an associate (ownership over 20% and the right of board representation gives the Company significant influence on Revolution) while previously considered an available for sale investment. During the second quarter of 2013, the Company recorded in other income (loss) a $1.7 million loss related to the deemed disposition of the available for sale investment in Revolution (transfer of accumulated mark to market losses of Revolution from reserves to profit and loss).
Revenue
| | Quarter ended December 31, | | Year ended December 31, | |
| | 2013 | | 2012 | | 2013 | | 2012 | |
Revenues | | | | | | | | | |
Commercial gold sales (ounces) | | 49,600 | | 19,900 | | 135,550 | | 79,750 | |
Realized gold price - all sales ($’s) | | $ | 1,328 | | $ | 1,705 | | $ | 1,422 | | $ | 1,668 | |
Revenue ($’000) | | $ | 65,814 | | $ | 33,976 | | $ | 192,647 | | $ | 133,012 | |
Add gold sales capitalised in mining interests | | $ | — | | $ | — | | $ | — | | $ | 6,706 | |
Total gold sale proceeds ($’000) | | $ | 65,814 | | $ | 33,976 | | $ | 192,647 | | $ | 139,718 | |
Total gold sales (ounces) | | 49,600 | | 19,900 | | 135,550 | | 83,800 | |
Revenues for the year and three months ended December 31, 2013 of $192.6 million and $65.8 million, respectively, are 45% and 94% higher than in same periods in 2012. The increased revenues reflect higher commercial ounces sold which more than offset lower price realized.
Cash operating costs
Cash operating costs totaled $107.0 million in 2013, which represented US$766 per ounce sold. By comparison, cash operating costs in 2012 totaled $79.3 million which equated to US$966 per ounce sold.
Cash operating costs in the fourth quarter of 2013 totaled $31.7 million, which represented US$609 per ounce sold; cash operating costs in the fourth quarter of 2012 totaled $19.7 million, which equated to US$996 per ounce.
14
Depreciation and depletion
Depreciation and depletion increased by $17.6 million and $11.3 million respectively, for the year and fourth quarter 2013 compared to same periods in 2012. Both increases were due to higher sales volumes. On a per ounce sold basis, depletion and depreciation were $444 and $446 per ounce, respectively, in the year and fourth quarter of 2013, a reduction of 13% and 18%, respectively, from the comparable periods in 2012. The reduction in per unit depletion and depreciation costs from 2012 in both periods was mainly due to the lower carrying value of mining interests in 2013 after the impairment charge recorded at the end of 2012.
Share-based payments in production costs
Share-based payments in production costs for 2013 were comparable to the same periods in 2012.
Other income (loss) and expense items
General and administrative expenses for the year and fourth quarter 2013 increased by $2.0 million and $1.6 million, respectively, compared to the same periods in 2012, reflecting higher bonuses for 2013 as the Company met and exceeded certain targets for the year, as well as certain restructuring expenses incurred in 2013 as the Company reduced its work force as part of its cost reduction initiatives.
Exploration expenses, which include green field exploration expenditures, in the year and fourth quarter 2013 decreased by $2.4 million and $0.9 million, respectively, compared to the same periods in 2012 reflecting the Company’s focus on operations and development activities in 2013.
Share based payments in expenses for the year 2013 were $0.9 million lower than in 2012 due to lower fair value of options granted in previous years vesting in 2013; share based payments in expenses for the fourth quarter of 2013 are comparable to same period in 2012.
Share of loss of investments in associates represents the Company’s proportionate share of the losses relating to its equity investments for the periods.
In 2013, the Company wrote down its investment in associates to their market value, for a total write down of $3.9 million (2012 - $7.2 million) of which $0.3 million (2012 - $1.6 million) was recorded in the fourth quarter as the decline in market value was considered significant or prolonged.
Other income (loss) for the year and fourth quarter ended December 31, 2013 and 2012 is as follows in ($’000s):
| | Quarter ended December 31, | | Year ended December 31, | |
| | 2013 | | 2012 | | 2013 | | 2012 | |
Unrealized and realized (loss) gain on embedded derivatives | | $ | (245 | ) | $ | 2,805 | | $ | 8,171 | | $ | (2,247 | ) |
Loss on deemed disposition of available for sale investment | | — | | — | | (1,681 | ) | — | |
Loss on sale leaseback transaction | | (682 | ) | — | | (682 | ) | — | |
Unrealized and realized foreign exchange (loss) gain, net | | (555 | ) | (287 | ) | (489 | ) | 771 | |
Gain on settlement of debt | | — | | — | | — | | 546 | |
Gain on sale of available for sale investments | | — | | 134 | | — | | 718 | |
Other loss, net | | (348 | ) | (47 | ) | (186 | ) | (306 | ) |
Other (loss) income, net | | $ | (1,830 | ) | $ | 2,605 | | $ | 5,133 | | $ | (518 | ) |
15
The unrealized and realized (loss) gain on the embedded derivatives represents the (loss) gain from the mark to market of the embedded derivatives on the Gold Note as a result of movements in gold prices.
Loss on deemed disposition of available for sale investment of $1.7 million in 2013 relates to the deemed disposition of the investment in Revolution Resources Corp.
Loss on sale leaseback transaction represents the loss on the transaction with Macquarie Technology Services (Canada) Ltd. (“Macquarie”) the Company entered into in the fourth quarter of 2013 (for more details refer to the section of this MDA under the heading “Financial Condition, Liquidity and Capital Resources”).
Unrealized and realized foreign exchange gain (loss) for the year and fourth quarter 2013 includes unrealized gain from the mark to market of the embedded derivative on the Gold Note and reflects movements in the C$/US$ exchange rate during the periods.
Gain on settlement of debt of $0.5 million in 2012 relates to the repayment by the Company of the UniCredit Bank AG revolving credit facility on September 7, 2012.
Gain on disposal of mining interest for 2013 represents the gain from the sale of a non-core exploration property for $0.2 million in the second quarter of 2013.
In 2012, the Company realized a gain of $0.7 million from the sale of one of its available for sale investments.
Finance items, for the year and fourth quarter of 2013 include borrowing costs of $14.9 million and $5.2 million, respectively ($3.0 million and $3.0 million in the same periods in 2012). The increase in finance expense reflects higher borrowing costs in 2013 due to an increase in long-term debt as the $35.0 million Standby Line was fully drawn in February 2013. In addition, there were no amounts capitalized on mining interests in the fourth quarter of 2013 once the Bell Creek Mill expansion was finalized.
16
SELECTED ANNUAL FINANCIAL INFORMATION
The following selected financial data has been prepared in accordance with IFRS and should be read in conjunction with the Company’s audited financial statements (in $’000s except for loss per share and number of shares issued and outstanding).
Year ended December 31, | | 2013 | | 2012 | |
Financial Results: | | | | | |
Revenue | | $ | 192,647 | | $ | 133,012 | |
Loss from mine operations | | $ | (200,049 | ) | $ | (220,666 | ) |
Loss from continuing operations | | $ | (229,167 | ) | $ | (246,389 | ) |
Loss from discontinued operations | | $ | (4,302 | ) | $ | (71,543 | ) |
Loss per share* - basic and diluted | | $ | (0.56 | ) | $ | (0.77 | ) |
Loss per share* from discontinued operations - basic and diluted | | $ | (0.01 | ) | $ | (0.17 | ) |
| | | | | |
Financial Position: At December 31, | | | | | |
Cash and cash equivalents | | $ | 33,120 | | $ | 48,715 | |
Assets held for sale | | $ | — | | $ | 2,432 | |
Working capital | | $ | 18,683 | | $ | 28,099 | |
Mining interests | | $ | 531,585 | | $ | 719,888 | |
Total assets | | $ | 597,932 | | $ | 823,015 | |
Long term debt | | $ | 116,686 | | $ | 100,334 | |
Long term finance lease obligations | | $ | 6,150 | | $ | 2,812 | |
Environmental rehabilitation provision | | $ | 4,770 | | $ | 5,257 | |
Share capital | | $ | 1,017,262 | | $ | 1,016,524 | |
Equity portion of convertible debentures | | $ | 14,753 | | $ | 14,753 | |
Reserves | | $ | 31,388 | | $ | 23,212 | |
Deficit | | $ | (632,235 | ) | $ | (398,766 | ) |
| | | | | |
Number of shares issued and outstanding (000s) | | 416,620 | | 415,654 | |
* Loss per share is calculated based on weighted average number of shares outstanding for the year
17
SUMMARY OF QUARTERLY RESULTS
The following selected financial data has been prepared in accordance with IFRS and should be read in conjunction with the Company’s interim consolidated financial statements ($000’s, other than “per share” amounts):
Fiscal quarter ended | | December 31, 2013 | | September 30, 2013 | | June 30, 2013 | | March 31, 2013 | |
Revenue | | $ | 65,814 | | $ | 44,301 | | $ | 39,675 | | $ | 42,857 | |
(Loss) earnings from mine operations | | $ | (213,260 | ) | $ | 7,554 | | $ | 1,797 | | $ | 3,860 | |
Finance expense, net | | $ | (5,286 | ) | $ | (3,495 | ) | $ | (2,794 | ) | $ | (3,101 | ) |
Loss from continuing and discontinued operations | | $ | (225,693 | ) | $ | (1,718 | ) | $ | (5,446 | ) | $ | (612 | ) |
Loss from discontinued operations | | $ | — | | $ | — | | $ | (4,302 | ) | $ | — | |
Net loss per share* basic and diluted | | | | | | | | | |
From continuing and discontinued operations | | $ | (0.54 | ) | $ | (0.00 | ) | $ | (0.01 | ) | $ | (0.00 | ) |
From discontinued operations | | $ | 0.00 | | $ | (0.00 | ) | $ | (0.00 | ) | $ | (0.00 | ) |
Fiscal quarter ended | | December 31, 2012 | | September 30, 2012 | | June 30, 2012 | | March 31, 2012 | |
Revenue | | $ | 33,976 | | $ | 33,734 | | $ | 40,739 | | $ | 24,563 | |
Earnings (loss) from mine operations | | $ | (227,694 | ) | $ | 2,573 | | $ | 3,194 | | $ | 1,261 | |
Finance (expense) income, net | | $ | (2,778 | ) | $ | 7 | | $ | 16 | | $ | 24 | |
Loss from continuing and discontinued operations | | $ | (302,226 | ) | $ | (10,771 | ) | $ | (1,982 | ) | $ | (2,953 | ) |
Loss from discontinued operations | | $ | (71,500 | ) | $ | (3 | ) | $ | (5 | ) | $ | (35 | ) |
Net loss per share* - basic and diluted | | | | | | | | | |
From continuing and discontinued operations | | $ | (0.73 | ) | $ | (0.03 | ) | $ | (0.00 | ) | $ | (0.01 | ) |
From discontinued operations | | $ | (0.17 | ) | $ | (0.00 | ) | $ | (0.00 | ) | $ | (0.00 | ) |
* Net loss per share is calculated based on the weighted average number of shares outstanding for the quarter
The loss from mine operations in the fourth quarter of 2013 and 2012 includes an impairment charge related to the Timmins West Mine cash generating unit (“CGU”) of $225.0 million and $231.0 million, respectively. Excluding the impairment charge, earnings from mine operations in the fourth quarter of 2013 and 2012 totaled $11.7 million and $3.3 million, respectively. The increase in earnings from mine operations in the fourth quarter of 2013 compared to the previous quarters is due to higher gold sales and lower production costs, partially offset by lower gold price realized.
FINANCIAL CONDITION, LIQUIDITY AND CAPITAL RESOURCES
In 2013, the Company generated cash from continuing operating activities of $70.6 million or 136% higher than the $29.9 million generated in 2012. The increase in cash generated from continuing operations in 2013, compared to the same period in 2012, reflects higher cash earnings from mine operations, resulting from higher sales volumes and lower costs, which more than offset the impact of higher interest paid.
Impairment charge, changes in non-cash working capital items, depletion and depreciation, write down of investment in associates, share of loss of investments in associates, other income and expense, finance income and expense, and share-based payments expense make up the principal amounts that reconcile the consolidated statements of loss to the consolidated statements of cash flows from operating activities.
Receivables and prepaids at December 31, 2013 of $3.6 million are $4.1 million lower than the amount at December 31, 2012, with the decrease mainly due to lower sales tax receivable. Accounts payable and accrued liabilities of $21.6 million at December 31, 2013 are lower than the balance at December 31, 2012 ($33.9 million) partially reflecting the decrease in the Company’s investing activities and partially the timing of these activities.
18
Net cash used in investing activities of continuing operations (including changes in working capital related to capital investments) in 2013 of $99.7 million ($90.4 million after movements in working capital), decreased by $62.6 million from the same period in 2012 reflecting lower capital investments in 2013.
On June 14, 2012, the Company signed a credit agreement (the “Credit Agreement”) with Sprott, as agent for a group of lenders (“Sprott Lenders”), for a credit facility (the “Facility”) totaling up to $70.0 million, secured over the material assets of the Company. The Facility involved two components, a $35.0 million Gold Note payable in monthly installments from January 31, 2013 to May 31, 2015, and a Standby Line for an additional $35.0 million, maturing on January 1, 2015. The transaction closed on July 16, 2012, on which date the Company received the $35.0 million Gold Note.
The Gold Note is being repaid through 29 monthly cash payments based on 947 ounces of gold each month multiplied by the Bloomberg closing price on the date of payment.
On February 1, 2013, the Company drew down the Standby Line of $35.0 million and issued 0.9 million common shares of the Company to the Sprott Lenders (valued at $0.7 million), representing the 2% drawdown fee. The Standby Line which, when drawn, matured on January 1, 2015, bears annual interest of 9.75%, compounded monthly. Under the Credit Agreement, the Company can pay the Standby Line or portions of it at any time before the maturity date. The Company paid a 4% rollover fee on the outstanding principal at December 31, 2013 in cash.
On December 12, 2013, the Company entered into a modification agreement (the “Modification Agreement”) with Sprott whereby the Company agreed to repay the Standby Line through 18 equal monthly payments of $1.7 million starting on June 30, 2015 with the final monthly payment due on November 30, 2016; previously, the Standby Line was due in full on January 1, 2015. The Modification Agreement provides for:
· $5.0 million principal payment on or before January 2, 2014 (paid in December 2013) and the payment of an accommodation fee of $0.4 million (paid upon closing);
· The Company’s right to prepay up to $10 million of the principal on the Standby Line without penalty between January 2, 2014 and December 31, 2014; the Company will incur prepayment penalties of 8% in 2014 for any prepayments over and above $10.0 million, and respectively 6% and 4% for any prepayments in 2015 and 2016;
· The addition of a 2% rollover fee on the outstanding principal of the Standby Line at December 31, 2014 with a provision for the fee to be reduced to 1% should the Company prepay more than $5.0 million during the period from January 2, 2014 to December 31, 2014;
· Increase of the minimum return on the Gold Loan to 7.5% (from 5% under the original agreement); the minimum return does not include any fees paid or payable to Sprott;
· Changes and modifications to the financial covenants as follows:
· The removal of the total indebtedness to tangible net worth ratio covenant;
· The removal of the reserve tail ratio covenant;
· The addition of a minimum balance requirement for cash and cash equivalents of not less than $10.0 million at any time as part of the current ratio covenant.
On December 31, 2013, the Company entered into an agreement with Macquarie whereby the Company sold certain mobile equipment to Macquarie for $7.3 million and leased the equipment
19
back for a period of 36 months. The lease liability is paid through 12 quarterly installments (with the last payment on October 1, 2016) and bears interest at 3.7%.
CONTRACTUAL OBLIGATIONS
The Company has various obligations, such as contractual obligations in respect of the various debts, office rent obligations, finance lease obligations and environmental rehabilitation obligations for the Bell Creek Mine and Mill and Timmins West Mine, as at December 31, 2013 as follows (in $’000s):
| | Payments Due by Period | |
Contractual obligations | | Total | | Less than a
year | | 1-3 years | | 4-5 years | | after 5 years | |
Accounts payable and accrued liabilities | | $ | 21,619 | | $ | 21,619 | | $ | — | | $ | — | | $ | — | |
Finance leases and other | | $ | 12,031 | | $ | 3,871 | | $ | 6,979 | | $ | 943 | | $ | 238 | |
Environmental rehabilitation provision | | $ | 4,770 | | $ | — | | $ | — | | $ | — | | $ | 4,770 | |
Long term debt - principal and interest payments | | $ | 192,712 | | $ | 28,266 | | $ | 54,477 | | $ | 109,969 | | $ | — | |
| | $ | 231,132 | | $ | 53,756 | | $ | 61,456 | | $ | 110,912 | | $ | 5,008 | |
The Company has certain contractual obligations with First Nation communities as provided in the Impact and Benefits Agreement with the Flying Post First Nation and Mattagami First Nation signed on February 17, 2011 and the Exploration Agreement with the Flying Post First Nation, Mattagami First Nation, Matachewan First Nation and Wahgoshig First Nation signed on March 10, 2009 (for the exploration and advanced exploration work on the Bell Creek Complex). The agreements establish a framework for ongoing dialogue and consultation, including providing business, employment and training opportunities for members of the First Nation communities.
The Company is required to make yearly nominal cash payments (advanced royalty payments) to maintain its 100% interest on the Vogel property, and yearly nominal payments in 2010 to 2015 as required under the Schumacher agreement.
CAPITAL RESOURCES
The Company’s capital at December 31, 2013 and 2012 is as follows (in $’000):
As at December 31, | | 2013 | | 2012 | |
Share capital | | $ | 1,017,262 | | $ | 1,016,524 | |
Equity portion of convertible debentures | | 14,753 | | 14,753 | |
Reserves | | 31,388 | | 23,212 | |
Deficit | | (632,235 | ) | (398,766 | ) |
Long term debt | | 130,025 | | 118,553 | |
| | $ | 561,193 | | $ | 774,276 | |
The Company believes it has the financial resources available to finance its operations and capital activities on its operating mines and mill based on management’s expectations and assumptions, including in respect of gold prices, production levels and costs. The Company may pursue opportunities to strengthen its balance sheet and financial flexibility if and when required, and may raise additional capital through debt and/or equity markets or any combination as it progresses with its projects and properties.
20
The Facility with Sprott has certain financial covenants, which must be maintained on an ongoing basis. Non-compliance with the covenants could result in the Company having to pay the outstanding balance of the loan. Throughout 2013 and 2012, and as at December 31, 2013 and 2012, the Company was in compliance with all debt covenants.
The Company and its subsidiaries are not subject to any other externally imposed capital requirements and do not have exposure to asset-backed commercial paper or similar products.
As at March 18, 2014, there were 416,695,224 common shares of the Company issued and outstanding, 22,916,465 stock options outstanding exercisable into common shares of the Company at prices ranging between $0.41 per share and $4.13 per share.
OPTIONS OUTSTANDING AT MARCH 18, 2014:
Number of Options Outstanding | | Exercise Price Range | |
11,855,715 | | $0.41-$0.99 | |
2,145,000 | | $1.00-$1.99 | |
569,750 | | $2.00-$2.99 | |
6,555,000 | | $3.00-$3.99 | |
1,791,000 | | $4.00-$4.13 | |
22,916,465 | | | |
NON-GAAP MEASURES
The Company has included in this MD&A certain non-GAAP (Generally Accepted Accounting Principles) performance measures as detailed below. In the gold mining industry, these are common performance measures but do not have any standardized meaning, and are non-GAAP measures. The Company believes that, in addition to conventional measures prepared in accordance with GAAP, certain investors use this information to evaluate the Company’s performance and ability to generate cash flow. Accordingly, it is intended to provide additional information and should not be considered in isolation or as a substitute for measures of performance prepared in accordance with GAAP.
The Company has included in this MD&A the non-GAAP performance measures listed below. Lake Shore Gold reports cash operating costs per ounce and AISC per ounce on a sales basis.
Cash operating costs per gold ounce
Cash operating cost per ounce is a Non-GAAP measure. In the gold mining industry, cash operating cost per ounce is a common performance measure but does not have any standardized meaning. Cash operating costs per ounce are based on ounces sold and are calculated by dividing cash operating costs (refer below for details) by commercial gold ounces sold and the average Bank of Canada C$/US$ exchange rate.
The Company discloses cash operating cost per ounce as it believes this measure provides valuable assistance to investors and analysts in evaluating the Company’s operational performance and ability to generate cash flow. The most directly comparable measure prepared in accordance with GAAP is total production costs. Cash operating cost per ounce should not be considered in isolation or as a substitute for measures prepared in accordance with GAAP.
21
Cash operating costs
Cash operating costs are derived from amounts included in the Consolidated Statements of Comprehensive Income (Loss) and include mine site operating costs such as mining, processing and administration as well as royalty expenses, but exclude depreciation, depletion and share-based payment expenses and reclamation costs.
All-in sustaining costs per ounce of gold
Effective in the second quarter 2013, the Company adopted an all-in sustaining cost (“AISC”) performance measure. The measure is intended to assist readers in evaluating the total costs of producing gold from current operations. While there is no standardized meaning across the industry for this measure, the Company’s definition conforms to the AISC definition as set out by the World Gold Council in its guidance note dated June 27, 2013. The Company defines all-in sustaining costs as the sum of production costs, sustaining capital (capital required to maintain current operations at existing levels), corporate general and administrative expenses, in-mine exploration expenses and reclamation cost accretion related to current operations. All-in sustaining costs excludes growth capital, reclamation cost accretion not related to current operations, interest expense, debt repayment and taxes. The costs included in the calculation of all-in sustaining costs are divided by commercial gold ounces sold and the average Bank of Canada CAD$/US$ exchange rate.
Cash earnings from mine operations
Cash earnings from operations are determined by deducting cash operating costs from revenues recognized in the period. The Company discloses cash earnings from mine operations as it believes this measure provides valuable assistance to investors and analysts in evaluating the Company’s ability to finance its ongoing business and capital activities.
The cash operating costs, cash operating costs per ounce and all-in sustaining cost per ounce are reconciled to the amounts included in the Consolidated Statements of Comprehensive Loss (Income) as follows (all dollar amounts, other than the per ounce, in 000’s):
| | Quarter ended December 31, | | Year ended December 31, | |
| | 2013 | | 2012 | | 2013 | | 2012 | |
Production costs | | $ | 31,952 | | $ | 19,816 | | $ | 107,491 | | $ | 80,037 | |
Less share based payments | | (227 | ) | (157 | ) | (530 | ) | (742 | ) |
Cash operating costs | | $ | 31,725 | | $ | 19,659 | | $ | 106,961 | | $ | 79,295 | |
Share based payments in production costs | | $ | 227 | | $ | 157 | | $ | 530 | | $ | 742 | |
General and administrative | | 3,844 | | 2,348 | | 12,555 | | 11,467 | |
Rehabilitation - accretion and amortization (operating sites) | | 40 | | 47 | | 186 | | 174 | |
Mine on-site exploration and evaluation costs | | 1,270 | | 1,033 | | 4,834 | | 5,229 | |
Mine development expenditures | | 6,421 | | 10,352 | | 31,338 | | 41,436 | |
Sustaining capital expenditures | | 652 | | 905 | | 2,682 | | 6,050 | |
All-in sustaining costs | | $ | 44,179 | | $ | 34,501 | | $ | 159,086 | | $ | 144,393 | |
Commercial gold sales (ounces) | | 49,600 | | 19,900 | | 135,550 | | 79,750 | |
Cash operating cost per ounces of gold ($/ounce) | | $ | 640 | | $ | 986 | | $ | 789 | | $ | 994 | |
Cash operating cost per ounces of gold (US$/ounce) | | $ | 609 | | $ | 990 | | $ | 766 | | $ | 996 | |
All-in sustaining cost per ounce ($/ounce) | | $ | 891 | | $ | 1,734 | | $ | 1,174 | | $ | 1,811 | |
All-in sustaining cost per ounce (US$/ounce) | | $ | 849 | | $ | 1,741 | | $ | 1,139 | | $ | 1,813 | |
22
CHANGES IN ACCOUNTING POLICIES
The Company has adopted the following new standards, along with any consequential amendments, effective January 1, 2013. These changes were made in accordance with the applicable transitional provisions.
Amendments to IFRS 7, Financial Instruments: Disclosures
In December 2011, the IASB approved amendments to IFRS 7, Financial Instruments: Disclosures, with respect to offsetting financial assets and financial liabilities. The common disclosure requirements of amended IFRS 7 are intended to help investors and other users to better assess the effect or potential effect of offsetting arrangements on a company’s financial position. Companies and other entities are required to apply the amendments for annual reporting periods beginning on or after January 1, 2013, and interim periods within those annual periods. The required disclosures should be provided retrospectively.
The Company reviewed the amendments to IFRS 7 and determined that no additional disclosures currently required.
IFRS 10, Consolidated Financial Statements
IFRS 10 establishes principles for the presentation and preparation of consolidated financial statements when an entity controls one or more other entities. IFRS 10 supersedes IAS 27, Consolidated and Separate Financial Statements and Standing Interpretation Committee (“SIC”)-12, Consolidation — Special Purpose Entities, and is effective for annual periods beginning on or after January 1, 2013.
The Company assessed its consolidation conclusions on January 1, 2013 and determined that the adoption of IFRS 10 did not result in any change in the consolidation status of the Company’s subsidiaries.
IFRS 11, Joint Arrangements
IFRS 11 establishes principles for financial reporting by parties to a joint arrangement. IFRS 11 supersedes current IAS 31, Interests in Joint Ventures and SIC-13, Jointly Controlled Entities — Non-Monetary Contributions by Venturers and is effective for annual periods beginning on or after January 1, 2013. The Company determined that the standard did not have any impact on its consolidated financial statements.
IFRS 12, Disclosure of Interests in Other Entities
IFRS 12 applies to entities that have an interest in a subsidiary, a joint arrangement, an associate or an unconsolidated structured entity. IFRS 12 is effective for annual periods beginning on or after January 1, 2013. Earlier application is permitted. The Company assessed its disclosures and concluded that the adoption of IFRS 12 did not result in any change in disclosures in the consolidated financial statements.
IFRS 13, Fair Value Measurements
IFRS 13 defines fair value and sets out a single framework for measuring fair value which is applicable to all IFRSs that require or permit fair value measurements or disclosures about fair value measurements. IFRS 13 requires that when using a valuation technique to measure fair
23
value, the use of relevant observable inputs should be maximized while unobservable inputs should be minimized. IFRS 13 is to be applied for annual periods beginning on or after January 1, 2013. The consolidated financial statements of the Company include additional disclosures in accordance with the requirements of IFRS 13.
Amendments to IAS 1, Presentation of Financial Statements
The amendments introduce changes to the presentation of items of other comprehensive income. The amendments require that an entity present separately the items of other comprehensive income that would be reclassified to profit and loss in the future if certain conditions are met from those that would never be reclassified to profit and loss. The amendments are to be applied effective July 1, 2012 and may be early adopted. The amendments are to be applied retroactively in accordance with IAS 8, Accounting Policies, Changes in Accounting Estimates and Errors. In accordance with the requirements of Amendments to IAS 1, the Company separated the items of other comprehensive income that would be reclassified to profit and loss from those that would never be reclassified to profit and loss on the Statement of Other Comprehensive Income (Loss).
Amendments to IAS 16 — Property, Plant and Equipment
Paragraph 8 of IAS 16, Property, plant and equipment, was amended requiring entities to recognize items such as spare parts, stand-by equipment, and servicing equipment as property, plant and equipment when they meet the definition of property, plant and equipment; otherwise, such items are classified as inventory. The impact in 2013 on the Company was a reclassification of $0.4 million (2012 - $0.3 million) out of inventories and stockpiled ore into property, plant and equipment.
IAS 19, Employee Benefits (amended standard)
The amended standard introduces various changes in accounting and disclosure requirements for defined benefit plans. The amended standard also finalizes proposals on accounting for termination benefits; under the amended standard the termination benefits are recognized at the earlier of when the entity recognizes costs for a restructuring within the scope of IAS 37, Provisions, Contingent Liabilities and Contingent Assets, that includes the payment of a termination benefit, and when the entity can no longer withdraw the offer of the termination benefit. The amended standard is to be applied for periods beginning on or after January 1, 2013. The amended standard does not impact the Company’s consolidated financial statements.
IAS 27 - Separate financial statements
IAS 27, Separate financial statements (IAS 27) was re-issued by the IASB in May 2011 to only prescribe the accounting and disclosure requirements for investments in subsidiaries, joint ventures and associates when an entity prepares separate financial statements. The consolidation guidance will now be included in IFRS 10. The amendments to IAS 27 are effective for annual periods beginning on or after January 1, 2013. The Company determined that the amendments to IAS 27 did not have any impact on its consolidated financial statements.
Amendments to IAS 28 — Investments in Associates and Joint Ventures
These amendments carry forward the requirements of IAS 28 (2008), with limited amendments related to associates and joint ventures held for sale, as well as to changes in interests held in associates and joint ventures when an entity retains an interest in the investment. The Company
24
determined that the amendments to IAS 28 did not have any impact on its consolidated financial statements.
IFRIC 20, Stripping Costs in the Production Phase of a Surface Mine
IFRIC 20 is a new interpretation on the accounting for waste removal activities. The interpretation considers when and how to account separately for the benefits arising from a stripping activity, as well as how to measure such benefit.
The interpretation requires that costs from a stripping activity which improve access to ore to be recognized as a non-current asset when certain criteria are met and should be accounted as an addition to the related asset. IFRIC 20 does not impact the Company’s consolidated financial statements.
ACCOUNTING STANDARDS ISSUED BUT NOT YET EFFECTIVE
IFRS 9, Financial Instruments
IFRS 9 was issued by the IASB in November 2009 and will replace IAS 39, “Financial instruments: recognition and measurement”. IFRS 9 replaces the multiple rules in IAS 39 with a single approach to determine whether a financial asset is measured at amortized cost or fair value and a new mixed measurement model for debt instruments having only two categories: amortized cost and fair value. The approach in IFRS 9 is based on how an entity manages its financial instruments in the context of its business model and the contractual cash flow characteristics of the financial assets. This standard also requires a single impairment method to be used, replacing the multiple impairment methods in IAS 39.
In December 2011, the IASB issued amendments to IFRS 9 that also provide relief from the requirement to restate comparative financial statements for the effect of applying IFRS 9 which was originally limited to companies that chose to apply IFRS 9 prior to 2012. Alternatively, additional transition disclosures will be required to help investors understand the effect that the initial application of IFRS 9 has on the classification and measurement of financial instruments. In November 2013, the IASB issued amendments to IFRS 9 deferring the mandatory effective date, of which has not yet been finalized; however early adoption is permitted. The Company is currently evaluating the impact of this standard and amendments on its consolidated financial statements.
IAS 32, Financial instruments: presentation
IAS 32, Financial instruments: presentation was amended by the IASB in December 2011. The amendment clarifies that an entity has a legally enforceable right to offset financial assets and financial liabilities if that right is not contingent on a future event and it is enforceable both in the normal course of business and in the event of default, insolvency or bankruptcy of the entity and all counterparties. The amendments to IAS 32 are effective for annual periods beginning on or after January 1, 2014. The adoption of this standard is not expected to have a significant impact on the Company’s financial statements.
IAS 36, Impairment of assets
IAS 36, Impairment of assets, was amended by the IASB in May 2013. The amendments require the disclosure of the recoverable amount of impaired assets when an impairment loss has been recognised or reversed during the period and additional disclosures about the measurement
25
of the recoverable amount of impaired assets when the recoverable amount is based on fair value less costs of disposal, including the discount rate when a present value technique is used to measure the recoverable amount. The amendments to IAS 36 are effective for annual periods beginning on or after January 1, 2014. The Company is currently evaluating the impact of this amendment on its consolidated financial statements.
IAS 39, Financial instruments: recognition and measurement
IAS 39, Financial instruments: recognition and measurement, was amended by the IASB in June 2013. The amendments clarify that novation of a hedging derivative to a clearing counterparty as a consequence of laws or regulations or the introduction of laws or regulations does not terminate hedge accounting. The amendments to IAS 39 are effective for annual periods beginning on or after January 1, 2014. The adoption of this standard is not expected to have an impact on the Company’s financial statements.
IFRIC 21, Levies
IFRIC 21, Levies was issued in May 2013 and is an interpretation of IAS 37, Provisions, Contingent Liabilities and Contingent Assets. The interpretation clarifies the obligating event that gives rise to a liability to pay a levy. IFRIC 21 is effective for periods beginning on or after January 1, 2014. The Company is currently evaluating the impact of this interpretation on its financial statements.
CRITICAL ACCOUNTING JUDGMENTS AND KEY SOURCES OF ESTIMATION UNCERTAINTY
In the application of the Company’s accounting policies, which are described in note 3 to the consolidated financial statements for the years ended December 31, 2013 and 2012, management is required to make judgments, estimates and assumptions about the carrying amount and classification of assets and liabilities that are not readily apparent from other sources. The estimates and associated assumptions are based on historical experience and other factors that are considered to be relevant. Actual results may differ from these estimates.
The estimates and underlying assumptions are reviewed on an ongoing basis. Revisions to accounting estimates are recognized in the period in which the estimate is revised if the revisions affect only that period, or in the period of the revision and future periods, if the revision affects both current and future periods.
The following are the critical judgments and areas involving estimates, that management has made in the process of applying the Company’s accounting policies, and that have the most significant effect on the amount recognized in the consolidated financial statements.
CRITICAL JUDGMENTS IN APPLYING ACCOUNTING POLICIES
Commercial production - Operating levels intended by management
Prior to reaching operating levels intended by management, costs incurred are capitalized as part of costs of related mining properties and proceeds from sales are offset against costs capitalized. Depletion of capitalized costs for mining properties begins when operating levels intended by management have been reached. Management considers several factors in determining when a mining property has reached the operating levels intended by management.
26
Determination of functional currency
In accordance with International Accounting Standards (“IAS”) 21, The Effects of Changes in Foreign Exchange Rates, management determined that the functional currency of its Canadian entities is the Canadian dollar and Mexico pesos for the Company’s subsidiary in Mexico. The Company disposed of its Mexico entity on May 8, 2013.
KEY SOURCES OF ESTIMATION UNCERTAINTIES
Useful life of plant and equipment
The Company reviews the estimated lives of its plant and equipment at the end of each reporting period. There were no material changes in the lives of plant and equipment for the years ended December 31, 2013 and 2012.
Determination of ore reserves and resources
Reserves and resources are used in the units of production calculation for depreciation, depletion calculations and in the determination of the timing of environmental rehabilitation costs as well as impairment analysis.
There are numerous uncertainties inherent in estimating ore reserves and resources. Assumptions that are valid at the time of estimation may change significantly when new information becomes available. Changes in the forecast prices of commodities, exchange rates, production costs, drilling or recovery rates may change the economic status of reserves and resources and may, ultimately, result in the reserves and resources being revised.
Deferred income taxes
Judgment is required in determining whether deferred tax assets are recognized on the statement of financial position. Deferred tax assets, including those arising from unutilized tax losses require management to assess the likelihood that the Company or/and its subsidiaries will generate taxable earnings in future periods, in order to utilize recognized deferred tax assets. Estimates of future taxable income are based on forecast cash flows from operations and the application of existing tax laws in each jurisdiction. To the extent that future cash flows and taxable income differ significantly from estimates, the ability of the Company or/and its subsidiaries to realize the net deferred tax assets recorded at the statement of financial position date could be impacted. Additionally, future changes in tax laws in the jurisdictions in which the Company and its subsidiaries operates could limit the ability of the Company to obtain tax deductions in future periods.
Impairment of assets
The carrying amounts of mining properties and plant and equipment are reviewed for impairment if events or changes in circumstances indicate that the carrying value may not be recoverable. If there are indicators of impairment, an exercise is undertaken to determine whether the carrying values are in excess of their recoverable amount. Such a review is undertaken on an asset by asset basis, except where such assets do not generate cash flows independent of other assets, and then the review is undertaken at the cash generating unit level (“CGU”).
27
The assessment requires the use of estimates and assumptions such as, but not limited to, long-term commodity prices, foreign exchange rates, discount rates, future capital requirements, resource estimates, exploration potential and operating performance as well as the CGU definition. It is possible that the actual fair value could be significantly different from those assumptions, and changes in these assumptions will affect the recoverable amount of the mining interests. In the absence of any mitigating valuation factors, the Company’s failure to achieve its valuation assumptions or declines in the fair values of its CGU or other assets may, over time, result in impairment charges causing the Company to record material losses.
Environmental rehabilitation
Significant estimates and assumptions are made in determining the environmental rehabilitation costs as there are numerous factors that will affect the ultimate liability payable. These factors include estimates of the extent and costs of rehabilitation activities, technological changes, regulatory changes, cost increases, and changes in discount rates.
Those uncertainties may result in actual expenditures in the future being different from the amounts currently provided. The provision represents management’s best estimate of the present value of the future rehabilitation costs required.
Share-based payments
Management assesses the fair value of stock options granted, PSUs and DSUs in accordance with the accounting policy stated in note 3(m) of the consolidated financial statements. The fair value of stock options granted and DSUs is measured using the Black-Scholes option valuation model; the fair value of PSUs is measured using the Monte Carlo simulation valuation model. The fair value of stock options granted, PSUs and DSUs using valuation models is only an estimate of their potential value and requires the use of estimates and assumptions.
RELATED PARTY TRANSACTIONS
In 2012 the Company wrote-off a $0.2 million receivable from RT Minerals, a then related party by virtue of being an equity investee; there was no other receivable from RT Minerals at December 31, 2012. RT Minerals ceased being a related party in 2013 when the Company’s interest was diluted to 7%.
In 2012 the Company and RT Minerals spent $0.4 million toward the interest in a property adjacent to Timmins Deposit (the Company’s share $0.2 million).
FINANCIAL INSTRUMENTS RISKS EXPOSURE
The Company is exposed to financial risks sensitive to changes in commodity prices, foreign exchange and interest rates. The Company’s Board of Directors has overall responsibility for the establishment and oversight of the risk management framework. Currently the Company has not entered into any options, forward and future contracts to manage its price-related exposures. Similarly, derivative financial instruments are not used to reduce these financial risks.
28
The Company’s risk exposures and the impact on the Company’s financial instruments are summarized below:
Credit Risk
The Company’s credit risk is primarily attributable to receivables, which mainly consist of sales tax due from the Federal Government of Canada. The Company’s surplus cash at December 31, 2013, is invested in very liquid low risk accounts in A rated Canadian Banks. The Company has no significant concentration of credit risk arising from operations. Management believes that the credit risk concentration with respect to financial instruments included in other assets is remote.
Liquidity Risk
The Company’s approach to managing liquidity risk is to ensure that it will have sufficient liquidity to meet liabilities when due. The Company has a planning and budgeting process in place to help determine the funds required to support the Company’s normal operating requirements on an ongoing basis and its expansionary plans. In the normal course of business, the Company enters into contracts that give rise to commitments for future minimum payments as disclosed in the “Contractual Obligations” section on this MD&A. All of the Company’s financial liabilities are subject to normal trade terms.
Market Risk
Interest rate risk
The Company is exposed to interest rate fluctuations related to interest earned on its cash on hand. The Company’s current policy is to invest excess cash in very low risk investments with banking institutions. The Company periodically monitors the investments it makes and is satisfied with the credit ratings of its banks and investments.
The Company’s excess cash at December 31, 2013, is invested in very liquid and low risk accounts in A rated Canadian Banks. The Company is exposed to short-term interest rates through the interest earned on cash balances. A 1% change in short term rates would change the interest income and net loss of the Company, assuming that all other variables remain constant, by approximately $0.3 million in 2013 (2012 - $0.3 million).
Price risk
The Company is exposed to price risk with respect to fluctuation in gold prices, which impacts the future economic feasibility of its mining interests and cash earnings from its operating mines. The Company is also exposed to price risk with respect to its Gold Loan (note 19(a)), which will be repaid using a fixed amount of gold ounces multiplied by the Bloomberg gold closing price on the date of payment.
The Company has not entered into any derivative financial instruments to manage exposure to price risk. Gold prices are affected by numerous factors such as the sale or purchase of gold by various central banks and financial institutions, interest rates, exchange rates, inflation or deflation, fluctuations in the value of the US dollar and foreign currencies, global and regional supply and demand, and the political and economic conditions of major gold producing countries throughout the world. A 10% change in gold prices would result in an approximately $19.5 million (2012 - $13 million) change in the Company’s net loss; the change in the net loss in 2013 includes a $0.3 million (2012 - $4.5 million) change in the mark to market value of gold loan derivatives.
29
Foreign currency exchange risk
The Company is exposed to foreign currency exchange risk with respect to future gold sales, since gold sales are denominated in United States Dollars (US$) and the Company’s functional currency is Canadian dollar. The movements on US$ rates may impact the future economic feasibility of the Company’s mining interests as well as earnings from its mine operations.
The Company is also exposed to foreign currency exchange risk with respect to the Gold Note, which will be repaid using a fixed amount of gold ounces multiplied by the Bloomberg gold closing price on the date of payment (gold price is denominated in US$). A 10% change in the US$/CAD$ exchange rate would change the unrealized foreign exchange gain (loss) and net loss of the Company, assuming that all other variables remains constant, by approximately $0.3 million in 2013 (2012, $4.0 million).
OTHER RISKS AND UNCERTAINTIES
The most significant risks and uncertainties faced by the Company are: changes in the price of gold; the uncertainty of production estimates, including the ability to extract anticipated tonnes and successfully realize estimated grades; the inherent risk associated with project development and mineral exploration activities; the uncertainty of mineral resources and their development into mineable reserves; uncertainty as to potential project delays from circumstances beyond the Company’s control; and timing of production; as well as title risks and the possible failure to obtain mining licenses.
The success of the Company’s Timmins West Mine, Bell Creek Mine, and its other properties will be primarily dependent on the future price of gold. Metal prices have historically been subject to significant price fluctuation. No assurance may be given that metal prices will remain stable. Significant price fluctuations over short periods of time may be generated by numerous factors beyond the control of the Company, including domestic and international economic and political trends, expectations of inflation, currency exchange fluctuations, interest rates, global or regional consumption patterns, speculative activities and increases or decreases in production due to improved mining and production methods.
Since March 31, 2013, gold prices have moved sharply lower. Significant reductions or volatility in metal prices may have an adverse effect on the Company’s business, including the economic attractiveness of the Company’s projects, the Company’s ability to obtain financing and the amount of the Company’s revenue or profit or loss. In addition, a prolonged period of lower gold prices could result in the Company breaching one or more covenants in the future with regard to its outstanding credit facility with Sprott. The Company has held discussions with Sprott in regards to this risk.
For a detailed description of Risks and Uncertainties refer to the Company’s Annual Information Form for the year ended December 31, 2013.
CORPORATE GOVERNANCE
The Company’s Board of Directors follows accepted corporate governance guidelines for public companies to ensure transparency and accountability to shareholders.
30
The Audit Committee of the Company fulfills its role of ensuring the integrity of the reported information through its review of the interim and audited annual financial statements prior to their submission to the Board of Directors for approval. The Audit Committee, comprised of three independent directors, meets with management and the external auditors of the Company on a quarterly basis to review the financial statements, including the MD&A, and to discuss other financial, operating and internal control matters. The Company also has adopted the practice of engaging its external auditors to perform quarterly reviews of its interim financial statements.
CONTROLS AND PROCEDURES
The Company’s management, including the Chief Executive Officer (“CEO”) and the Vice-President and Chief Financial Officer (“CFO”) has evaluated the operating effectiveness of the Company’s internal control over financial reporting. Management of the Company is responsible for establishing and maintaining adequate internal control over financial reporting. Internal control over financial reporting is a process designed by, or under the supervision of, the CEO and CFO and effected by management and other personnel to provide reasonable assurance regarding the reliability of financial reporting and the preparation of financial statements for external purposes in accordance with IFRS. Management assessed the effectiveness of the Company’s internal control over financial reporting as of December 31, 2013. Based on this assessment, management concluded that, as of December 31, 2013, the Company’s internal control over financial reporting is operating effectively. The evaluation was performed using the criteria set forth in the Internal Control-Integrated Framework (1992) issued by the Committee of Sponsoring Organizations of the Treadway Commission (COSO).
Disclosure controls and procedures are designed to provide reasonable assurance that all relevant information is gathered and reported to senior management, including the CEO and CFO on a timely basis so that appropriate decisions can be made regarding annual and interim financial statement disclosure. An evaluation of the effectiveness of the design and operation of disclosure controls and procedures was conducted as of December 31, 2013, by the Company’s management, including the CEO and CFO. Based on this evaluation, the CEO and CFO have concluded that the Company’s disclosure controls and procedures are effective.
FORWARD-LOOKING STATEMENTS
All statements, other than statements of historical fact, contained or incorporated by reference in this MD&A including, but not limited to, any information as to the future financial or operating performance of Lake Shore Gold Corp., constitute “forward-looking information” or “forward-looking statements” within the meaning of certain securities laws, including the provisions of the Securities Act (Ontario) and the provisions for “safe harbour” under the United States Private Securities Litigation Reform Act of 1995, and are based on expectations, estimates and projections as of the date of this MD&A or, in the case of documents incorporated by reference herein, as of the date of such documents. Forward-looking statements are provided for the purpose of providing information about management’s expectations and plans relating to the future. All of the forward-looking statements made in this MD&A are qualified by these cautionary statements and those made in our other filings with the securities regulators of Canada and the Securities Exchange Commission.
31
Other than as specifically required by law, the Company does not intend, and does not assume any obligation, to explain any material difference between subsequent actual events and such forward-looking statements, or to update any forward-looking statement to reflect events or circumstances after the date on which such statement is made or to reflect the occurrence of unanticipated events, whether as a result of new information, future events or results or otherwise. These forward-looking statements represent management’s best judgment based on facts and assumptions that management considers reasonable, including that: there are no significant disruptions affecting operations, whether due to labour disruptions, supply disruptions, power disruptions, damage to equipment or otherwise; permitting, development, operations, expansion and acquisitions at the Timmins West Complex continue on a basis consistent with the Company’s current expectations; permitting, development and operations at the Bell Creek Complex continue on a basis consistent with the Company’s current expectations; the exchange rate between the Canadian dollar and the U.S. dollar stays approximately consistent with current levels; price assumptions for gold hold true; prices for fuel, electricity and other key supplies remains consistent with current levels; production and cost of sales forecasts meet expectations; the accuracy of the Company’s current mineral reserve and mineral resource estimates hold true; and labour and materials costs increase on a basis consistent with the Company’s current expectations. The Company makes no representation that reasonable business people in possession of the same information would reach the same conclusions.
Forward-looking statements include, but are not limited to, possible events, statements with respect to possible events, statements with respect to the future price of gold and other metals, the estimation of mineral resources and reserves, the realization of mineral reserve and resource estimates, the timing and amount of estimated future production, costs of production, expected capital expenditures, costs and timing of the development of new deposits, success of exploration and development activities, permitting time lines, currency fluctuations, requirements for additional capital, government regulation of exploration and mining operations, environmental risks, unanticipated reclamation expenses, title disputes or claims, completion of acquisitions and their potential impact on the Company and its operations, limitations on insurance coverage and the timing and possible outcome of pending litigation. In certain cases, forward-looking statements can be identified by the use of words such as “plans”, “expects” or “does not expect”, “is expected”, “budget”, “scheduled”, “estimates”, “forecasts”, “intends”, “anticipates” or “does not anticipate”, or “believes”, or variations of such words and phrases or statements that certain actions, events or results “may”, “could”, “would”, “might” or “will be taken”, “occur” or “be achieved”.
Forward-looking statements involve known and unknown risks, uncertainties and other factors which may cause the actual results, performance or achievements of the Company to be materially different from any future results, performance or achievements expressed or implied by the forward-looking statements. As well as those factors discussed in the section entitled “Risks and Uncertainties” in this MD&A and in the section entitled “Risk Factors” in the Company’s most recently filed AIF, known and unknown risks which could cause actual results to differ materially from projections in forward-looking statements include, among others: fluctuations in the currency markets; fluctuations in the spot and forward price of gold or certain other commodities (such as diesel fuel and electricity); changes in interest rates; changes in national and local government legislation, taxation, controls, regulations and political or economic developments in Canada or other countries in which the Company may carry on business in the future; business opportunities that may be presented to, or pursued by, the Company; the Company’s ability to integrate acquisitions successfully; operating or technical difficulties in connection with mining or
32
development activities; employee relations; the speculative nature of gold exploration and development, including the risks of obtaining necessary licenses and permits; diminishing quantities or grades of reserves; and contests over title to properties, particularly title to undeveloped properties. In addition, there are risks and hazards associated with the business of gold exploration, development and mining, including environmental hazards, industrial accidents, unusual or unexpected formations, pressures, cave-ins, flooding and gold bullion losses (and the risk of inadequate insurance, or the inability to obtain insurance, to cover these risks).
Although the Company has attempted to identify important factors (which it believes are reasonable) that could cause actual actions, events or results to differ materially from those described in forward-looking statements, there may be other factors that cause actions, events or results not to be as anticipated, estimated or intended. There can be no assurance that forward-looking statements will prove to be accurate, as actual results and future events could differ materially from those anticipated in such statements. Accordingly, readers should not place undue reliance on forward-looking statements.
QUALITY CONTROL
Lake Shore Gold has a quality control program to ensure best practices in the sampling and analysis of drill core. Normal practice for all programs has been to insert three Quality Control samples including one blank, one certified standard and one reject duplicate at a frequency of every twenty drill core samples submitted. Subsequent to September 2012, all surface exploration drilling programs have modified the frequency of insertion of the three Quality Control samples to one blank, one certified standard and one reject duplicate every forty drill core samples submitted and, as of March 18, 2013, all underground drilling used this same frequency. The blanks and the certified standards are checked to be within acceptable limits prior to being accepted into the GEMS SQL database. Routine assays have been completed using a standard fire assay with a 30-gram aliquot. For samples that return a value greater than ten grams per tonne gold, the remaining pulp is taken and fire assayed with a gravimetric finish.
Underground drilling at the Timmins West and Bell Creek mines utilizes four different core sizes including; NQ with a core diameter of 47.6mm; AQTK with a core diameter of 30.5mm; BQTK which has a core diameter of 40.7mm; and BQ which has a core diameter of 36.4mm. Most underground definition and delineation drilling is done with AQTK, BQTK or BQ with any underground exploration core with NQ. All surface exploration drilling is done with NQ. Sampling of drill core is conducted in standard intervals with most BQTK, BQ and AQTK sized core being whole core sampled and selected core from underground as well as all surface exploration core being saw cut. For core that is saw cut, the remaining half is stored in a secure location.
Gold analysis for underground drill core has utilized four analytical laboratories. All underground drill core is analyzed at either ALS Canada Ltd. (2090 Riverside Drive, Timmins and 2103 Dollarton Hwy, North Vancouver), Activation Lab (1752 Riverside Drive, Timmins) or Accurassay Laboratories (150A Jaguar Drive Timmins and 1046 Gorham Street, Thunder Bay, not used since May, 2013) and select drill core, test holes and production samples at Lake Shore Gold Corp.’s Bell Creek Complex mill laboratory. ALS Canada Ltd. is ISO 9001:2008 and ISO 17025 certified and Accurassay conforms with requirements of CAN P—4E ISO/IEC 17025, and CAN—P—1579, not used since May, 2013). Activation Laboratories Ltd. in Timmins is ISO 9001 certified and follows their fully certified main Ancaster, Ontario Lab analytical procedures (working towards ISO
33
17025 CANP4E in early 2014). Lake Shore Gold Corp’s Bell Creek mill laboratory is not ISO registered.
QUALIFIED PERSON
Scientific and technical information contained in this MD&A has been reviewed and approved by Dan Gagnon, P.Geo., Senior Vice-President, Operations, and Natasha Vaz, P.Eng., Vice-President, Technical Services, both of whom are employees of Lake Shore Gold Corp., and “qualified persons” as defined by National Instrument 43-101 — Standards of Disclosure for Mineral Projects (“NI 43-101”).
Scientific and technical information related to resources, drilling and all matters involving mine production geology contained in this MD&A or source material, was reviewed and approved by Eric Kallio, P.Geo., Vice-President, Exploration. Mr. Kallio is an employee of Lake Shore Gold Corp., and is a “qualified person” as defined by NI 43-101.
ADDITIONAL INFORMATION
Additional information relating to the Company is provided in the Company’s audited consolidated financial statements for the year ended December 31, 2013, its Annual Information Form for the year ended December 31, 2013, and its most recently filed Information Circular. These and other documents relating to the Company will be available on SEDAR at www.sedar.com.
34
| Head Office 181 University Ave., Suite 2000, Toronto, Ontario, Canada M5H 3M7 Tel: 416 703 6298 | Fax: 416 703 7764 | Internet: www.lsgold.com INVESTOR RELATIONS Mark Utting Vice-President, Investor Relations Tel: 416-703-6298 x 2226 TIMMINS OPERATIONS AND EXPLORATION P.O. Box 1067 Timmins, Ontario, Canada P4N 7H9 Tel: 705-269-4344 Fax: 705-268-1794 TRANSFER AGENT Computershare Investor Services Inc. Toll-free within North America 1 (800) 564 6253 International: (514) 982 7555 Email: service@computershare.com Manage your shares online at Computershare’s Investor Centre at www-us.computershare.com/investor auditors Deloitte LLP 181 Bay Street, Suite 1400 Toronto, Ontario, Canada M5J 2V1 Stock exchange listings: TSX – LSG, NYSE MKT – LSG BOARD OF DIRECTORS Alan Moon, Chair (1) (3) (4) Anthony Makuch (2) Peter Crossgrove (1) (4) (5) Diane Francis (1) Jonathan Gill (2) (4) (5) Frank Hallam (2) (3) Arnold Klassen (1) (3) (5) (1) Corporate Governance and Nominating Committee (2) Health, Safety, Environment and Community Committee (3) Audit Committee (4) Compensation Committee (5) Technical Advisory Committee OFFICERS Anthony (Tony) Makuch, President & CEO Philip Yee, Vice-President & CFO Dan Gagnon, Senior Vice-President, Operations Alasdair Federico, Vice-President, General Counsel & Corporate Secretary Eric Kallio, Vice-President, Exploration Tina Ouellette, Vice-President, Human Resources Mark Utting, Vice-President, Investor Relations Natasha Vaz, Vice-President, Technical Services Merushe (Meri) Verli, Vice-President, Finance CORPORATE INFORMATION ANNUAL GENERAL MEETING TMX Broadcast Centre The Exchange Tower 130 King Street West Toronto, Ontario, Canada M5X 1J2 May 7, 2014 at 10:00 a.m. LAKE SHORE GOLD CORP. ANNUAL REPORT 2013 82 |
| A newly assembled Atlas Copco ST 1530 Scooptram being deployed at Timmins West Mine in March 2014. With a capacity of approximately 13 tonnes per load, the ST 1530 carries 40% more material than the Company’s existing Scooptrams and is part of Lake Shore Gold’s ongoing effort to maximize efficiency and continually improve unit costs. |
| 181 University Ave., Suite 2000 Toronto, Ontario, Canada M5H 3M7 tel 416 703 6298 fax 416 703 7764 www.lsgold.com LAKE SHORE GOLD CORP. |