UNITED STATES
SECURITIES AND EXCHANGE COMMISSION
Washington, D.C. 20549
FORM N-CSR
CERTIFIED SHAREHOLDER REPORT OF REGISTERED MANAGEMENT INVESTMENT COMPANIES
Investment Company Act file number 811-21515
TS&W / Claymore Tax-Advantaged Balanced Fund
(Exact name of registrant as specified in charter)
2455 Corporate West Drive, Lisle, IL 60532
(Address of principal executive offices) (Zip code)
J. Thomas Futrell
2455 Corporate West Drive, Lisle, IL 60532
(Name and address of agent for service)
Registrant's telephone number, including area code: (630) 505-3700
Date of fiscal year end: December 31
Date of reporting period: January 1, 2010 - June 30, 2010
Form N-CSR is to be used by management investment companies to file reports with the Commission not later than 10 days after the transmission to stockholders of any report that is required to be transmitted to stockholders under Rule 30e-1 under the Investment Company Act of 1940 (17 CFR 270.30e-1). The Commission may use the information provided on Form N-CSR in its regulatory, disclosure review, inspection, and policymaking roles.
A registrant is required to disclose the information specified by Form N-CSR, and the Commission will make this information public. A registrant is not required to respond to the collection of information contained in Form N-CSR unless the Form displays a currently valid Office of Management and Budget ("OMB") control number. Please direct comments concerning the accuracy of the information collection burden estimate and any suggestions for reducing the burden to Secretary, Securities and Exchange Commission, 450 Fifth Street, NW, Washington, DC 20549-0609. The OMB has reviewed this collection of information under the clearance requirements of 44 U.S.C. Section 3507.
Item 1. Reports to Stockholders.
The registrant's semi-annual report transmitted to shareholders pursuant to Rule 30e-1 under the Investment Company Act of 1940, as amended (the “Investment Company Act”), is as follows:

www.claymore.com/tyw
... home port for the LATEST,
most up-to-date INFORMATION about the
TS&W/Claymore Tax-Advantaged Balanced Fund
The shareholder report you are reading right now is just the beginning of the story. Online at www.claymore.com/tyw, you will find:
| · | Daily, weekly and monthly data on share prices, distributions and more |
| · | Portfolio overviews and performance analyses |
| · | Announcements, press releases and special notices |
| · | Fund and adviser contact information |
Thompson, Siegel & Walmsley LLC, SMC Fixed Income Management, LP and Claymore are continually updating and expanding shareholder information services on the Fund’s website, in an ongoing effort to provide you with the most current information about how your Fund’s assets are managed, and the results of our efforts. It is just one more way we are working to keep you better informed about your investment in the Fund.
2 | Semiannual Report | June 30, 2010
TYW | TS&W/Claymore Tax-Advantaged Balanced Fund
Dear Shareholder|
We thank you for your investment in the TS&W/Claymore Tax-Advantaged Balanced Fund (the “Fund”).This report covers the Fund’s performance for the semiannual period ended June 30, 2010.
The Fund’s investment objective is to provide a high level of total after-tax return, including attractive tax-advantaged income.The Fund focuses its investments mainly on (i) municipal securities, the interest on which is exempt from regular Federal income tax, and which is not a preference item for purposes of the alternative minimum tax (such securities referred to generally as “municipal securities”) and (ii) common stocks and preferred securities that are eligible to pay dividends which, for individual shareholders, qualify for the long-term capital gains rate.The portfolio is comprised primarily of municipal securities, equity securities, preferred securities and high-yield debt securities and real estate investment trusts.
Claymore Advisors, LLC is the investment adviser (“Adviser”) to the Fund and is responsible for managing the Fund’s overall asset allocation. Claymore entities provided supervision, management or servicing on approximately $15.3 billion in assets as of June 30, 2010.Two Investment Sub-Advisers are responsible for day-to-day management of the Fund’s investments.Thompson, Siegel & Walmsley LLC (“TS&W”) manages the Fund’s equity portfolio and other non-municipal income-producing securities.As of June 30, 2010,TS&W managed or supervised approximately $7.2 billion in assets. SMC Fixed Income Management, LP (“SMC”) is responsible for the Fund’s portfolio of municipal securities.As of June 30, 2010, SMC managed or supervised approximately $1.2 billion in assets. Collectively ,TS&W and SMC are also referred to as the “Sub-Advisers.”
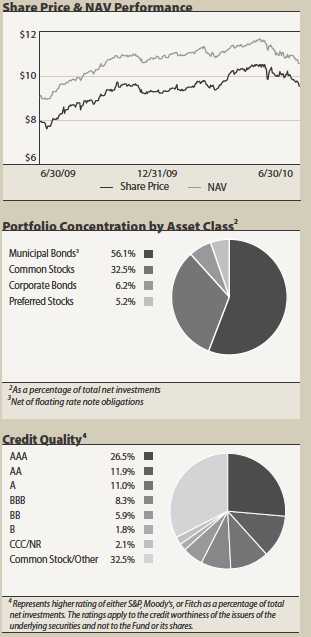
All Fund returns cited—whether based on net asset value (“NAV”) or market price—assume the reinvestment of all distributions. For the six months ended June 30, 2010, the Fund provided a total return based on market price of 3.52% and a total return based on NAV of -0.91%.As of June 30, 2010, the Fund’s market price of $9.53 per share represented a discount of 9.75% to its NAV of $10.56 per share. Past performance is not a guarantee of future results.The market price of the Fund’s shares fluctuates from time to time, and it may be higher or lower than the Fund’s NAV.
The Fund paid quarterly dividends of $0.1800 on March 31 and June 30, 2010.The most recent dividend represents an annualized distribution rate of 7.56% based on the Fund’s closing market price of $9.53 on June 30, 2010.This translates to a tax-advantaged distribution rate of 10.94% for investors in the 35% federal income tax bracket, based on the 2009 tax characteristics of distributions paid. However, there is no guarantee that this level of income will be maintained.
On October 15, 2009, Guggenheim Partners, LLC, a global diversified financial services firm, and Claymore Group Inc. (“Claymore”), the parent company of the Fund’s adviser, announced the completion of a previously announced merger.As a result of the transaction, Claymore and its associated entities, including Claymore Securities, Inc., Claymore Advisors, LLC and Claymore Investments, Inc. (in Canada), are now indirect wholly-owned subsidiaries of Guggenheim Partners, LLC, a global diversified financial services firm with more than $100 billion in assets under supervision.
On February 19, 2010, the Fund announced that it had entered into a new investment advisory agreement with Claymore Advisors, LLC and new investment sub-advisory agreements with TS&W and SMC upon receiving the necessary shareholder approval.These new agreements were necessary because the former agreements were automatically terminated upon the merger of Claymore with Guggenheim Partners.
In an effort to enhance shareholder value, the Fund announced on January 2, 2009, the adoption of an open-market share repurchase plan (the “Plan”) authorizing the purchase of up to 5% of its outstanding common shares in the open market on a quarterly basis, subject to applicable
Semiannual Report | June 30, 2010 | 3
TYW | TS&W/Claymore Tax-Advantaged Balanced Fund |Dear Shareholder continued
regulatory and legal restrictions and in consideration of certain operational and market factors, including the size of the market price discount to net asset value of the Fund.There is no assurance that the Fund will purchase shares at any particular discount levels or in any particular amounts.There is also no assurance that the market price of the Fund’s shares, either absolutely or relative to the net asset value, will increase as a result of any share repurchases.
We encourage shareholders to consider the opportunity to reinvest their distributions from the Fund through the Dividend Reinvestment Plan (“DRIP”), which is described in detail on page 29 of the Fund’s semiannual report.When shares trade at a discount to NAV, the DRIP takes advantage of the discount by reinvesting the quarterly dividend distribution in common shares of the Fund purchased in the market at a price less than NAV. Conversely, when the market price of the Fund’s common shares is at a premium above NAV, the DRIP reinvests participants’ dividends in newly-issued common shares at NAV, subject to an IRS limitation that the purchase price cannot be more than 5% below the market price per share.The DRIP provides a cost-effective means to accumulate additional shares and enjoy the benefits of compoundin g returns over time. Since the Fund endeavors to maintain a steady quarterly distribution rate, the DRIP plan effectively provides an income averaging technique, which causes shareholders to accumulate a larger number of Fund shares when the market price is depressed than when the price is higher.
To learn more about the Fund’s performance and investment strategy, we encourage you to read the Questions & Answers section of the report, which begins on page 5. You will find information about what impacted the performance of the Fund during the first half of 2010 and the Adviser’s and Sub-Advisers’ views on the market environment.
We appreciate your investment and look forward to serving your investment needs in the future. For the most up-to-date information on your investment, please visit the Fund’s website at www.claymore.com/tyw.
Sincerely,
J. Thomas Futrell
Chief Executive Officer
TS&W/ClaymoreTax-Advantaged Balanced Fund
4 | Semiannual Report | June 30, 2010
TYW | TS&W/Claymore Tax-Advantaged Balanced Fund
Questions & Answers|
The TS&W/Claymore Tax-Advantaged Balanced Fund (the “Fund”) is managed jointly by Thompson, Siegel &Walmsley LLC (“TS&W”) and SMC Fixed Income Management, LP (“SMC”).The portfolio management teams apply their specialized experience to different sleeves within the Fund, but work closely with one another to collectively guide the overall operations of the Fund.The individuals named below are responsible for managing the Fund.
Vincent R. Giordano, Portfolio Manager, Managing Member SMC Fixed Income Management, LP
Mr. Giordano is a Managing Member of SMC. He leads SMC’s municipal fixed-income investment management team and co-manages the Fund’s municipal securities portfolio. Prior to joining SMC, Mr. Giordano was employed by Claymore Advisors, LLC (“Claymore”) and Merrill Lynch. He has more than 30 years of investment experience.
RobertoW. Roffo, Portfolio Manager, Managing Director SMC Fixed Income Management, LP
Mr. Roffo co-manages the Fund’s municipal securities portfolio. He has more than 15 years of investment management experience focused on the municipal securities market. Prior to joining SMC, Mr. Roffo was employed by Claymore and Merrill Lynch. He has worked closely with Mr. Giordano throughout his career. He holds a Bachelor’s Degree from the University of Massachusetts.
Paul A. Ferwerda, CFA, Portfolio Manager, Senior Vice President –Domestic Equity and Research Thompson, Siegel &Walmsley LLC
Mr. Ferwerda is responsible for the day-to-day management of the Fund’s common stock portfolio. He has been with TS&W for over 20 years and has more than 25 years of investment experience. Mr. Ferwerda has extensive equity research experience within the financial sector and holds an MBA from Duke University.
William M. Bellamy, CFA, Portfolio Manager, Vice President Thompson, Siegel &Walmsley LLC
Mr. Bellamy joined TS&W in 2002. He has over 20 years of investment industry experience focused on the fixed-income markets. Mr. Bellamy is responsible for managing the Fund’s taxable fixed-income securities. He holds an MBA from Duke University.
In the following interview, Claymore,TS&W and SMC share their thoughts on the market and discuss the factors that influenced the Fund’s performance for the six months ended June 30, 2010.
Please remind us of this Fund’s objective and strategy.
The Fund’s investment objective is to provide a high level of total after-tax return, including attractive tax-advantaged income.The Fund seeks to achieve its objective by investing in a portfolio of assets consisting primarily of (i) municipal securities, the interest on which is exempt from regular Federal income tax, and which is not a preference item for purposes of the alternative minimum tax (such securities referred to generally as “municipal securities”) and (ii) common stocks and preferred securities that are eligible to pay dividends which, for individual shareholders, qualify for the long-term capital gains rate.The portfolio is comprised primarily of municipal securities, equity securities, preferred securities, high-yield debt securities and real estate investment trusts.
How did the Fund perform during the first six months of 2010?
All Fund returns cited—whether based on net asset value (“NAV”) or market price—assume the reinvestment of all distributions. For the six months ended June 30, 2010, the Fund provided a total return based on market price of 3.52% and a total return based on NAV of -0.91%.As of June 30, 2010, the Fund’s market price of $9.53 per share represented a discount of 9.75% to its NAV of $10.56 per share.The market value of the Fund’s shares fluctuates from time to time and it may be higher or lower than the Fund’s NAV. Past performance is not a guarantee of future results.
For NAV performance comparison purposes, the municipal bond market, as measured by the Barclays Capital U.S. Municipal Long Bond Index (“Barclays Muni Index”), a widely used measure of the municipal bond market as a whole, returned 4.50% for the six months ended June 30, 2010.The broad equity market, as measured by the Standard & Poor’s 500 Index (“S&P 500”), returned -6.65%.The high-yield bond market, as measured by the Merrill Lynch HighYield Master II Index, returned 4.74% for the period, and the Merrill Lynch Fixed Rate Preferred Securities Index returned 4.68%.
The Fund paid quarterly dividends of $0.1800 on March 31 and June 30, 2010.The most recent dividend represents an annualized distribution rate of 7.56% based on the Fund’s closing market price of $9.53 on June 30, 2010.This translates to a tax-advantaged distribution rate of 10.94% for investors in the 35% federal income tax bracket, based on the 2009 tax characteristics of distributions paid. However, there is no guarantee that this level of income will be maintained.
Semiannual Report | June 30, 2010 | 5
TYW | TS&W/Claymore Tax-Advantaged Balanced Fund |Questions & Answers continued
How are assets allocated among the various asset classes?
The Fund invests at least 50%, and may invest up to 60%, of its total assets in municipal securities.As of June 30, 2010, approximately 56.1% of the Fund’s portfolio was invested in municipal securities. Of the remaining assets in the Fund’s portfolio as of June 30, 2010, approximately 32.5% were invested in equity securities consisting primarily of large-cap dividend-paying stocks, and approximately 11.4% were invested in other taxable income-producing securities, which include but are not limited to high-yield bonds, preferred stocks and real estate investment trusts. From time to time, assets are rebalanced to maintain at least 50% of the Fund’s total assets in municipal securities.
How has the Fund’s leverage strategy affected performance?
The Fund utilizes leverage (borrowing) as part of its investment strategy, to finance the purchase of additional securities that provide increased income and potentially greater appreciation potential to common shareholders than could be achieved from a portfolio that is not leveraged. Of course, leverage results in greater NAV volatility and entails more downside risk than an unleveraged portfolio. Leverage adds to performance only when the cost of leverage is less than the total return generated by investments. During the six months ended June 30, 2010, the cost of leverage was less than the return of the Fund’s investments before the impact of the Fund’s operating expenses; accordingly, leverage contributed positively to the Fund’s total return.
As of June 30, 2010, the Fund had $105 million of leverage outstanding in the form of Auction Market Preferred Shares (“AMPSSM”).The Fund has two series of AMPS, one 7-day series and one 28-day series.AMPS holders receive a dividend that is reset every 7 or 28 days, depending on the tranche.1 The broad auction-rate preferred securities market remains essentially frozen, as it has been since February 2008.The auctions for nearly all auction-rate preferred shares, including those issued by the Fund, continue to fail. Investors need to be aware that a failed auction is not a default, nor does it require the redemption of a fund’s auction-rate preferred shares. Provi sions in the offering documents of the Fund’s AMPS provide a mechanism to set a maximum rate in the event of a failed auction, and, thus, investors will continue to be entitled to receive payment for holding these AMPS.This maximum rate is determined based upon a multiple of or a spread to LIBOR2, whichever is greater. During the six months ended June 30, 2010, established maximum rates were based on a spread of 125 basis points over the applicable LIBOR rates, with the maximum rates ranging from 1.46% to 1.60%.
There is no guarantee that the Fund’s leverage strategy will be successful, and the Fund’s use of leverage may cause the Fund’s NAV and market price of common shares to be more volatile. Leverage adds value only when the return on securities purchased exceeds the cost of leverage.
The following questions are related to the municipal securities portfolio and are answered by Portfolio Managers Vincent R. Giordano and Roberto W. Roffo, who have managed the municipal securities portfolio since the Fund’s inception.
Please provide an overview of the municipal securities market during the first six months of 2010.
In the Fund’s last annual report, dated December 31, 2009, SMC pointed out that it did not seem reasonable to expect the unusually strong overall performance of municipal securities in 2009 to be repeated in 2010. During the first half of 2010, municipal securities have continued to provide attractive returns, but the returns were a bit lower than returns on taxable bonds. For the six months ended June 30, 2010, return of the Barclays Muni Index, which measures performance of the U.S. municipal market, was 4.50%. Some of that return was price appreciation, but the majority of it was income.
For comparison, return of the Barclays Capital U.S.Aggregate Bond Index, which measures performance of the U.S. taxable bond market, was 5.33%, and return of the Barclays U.S.Treasury Index was 5.86%.Treasury securities have performed well because of a flight to quality, as credit crises in several states, as well as problems with sovereign debt of several European nations, have made investors wary of credit risk.
Interest rates remained quite low during the first half of 2010, as the Federal Reserve’s stimulative monetary policy kept short-term rates at historically low levels. Individual investors, who are usually the main buyers of municipal securities, were reluctant to commit to bonds with very low coupons, and that has put some pressure on municipal securities.
How did the municipal securities portion of the Fund perform in this environment and what decisions drove that performance?
The Fund’s municipal securities portfolio performed well, and the positive impact of leverage made the total return even higher.
| 1 | The term tranche is used to describe a specific series of AMPS. The Fund has issued two tranches of AMPS. |
| 2 | LIBOR is the interest rate that banks charge one another in the short-term international interbank market. |
6 | Semiannual Report | June 30, 2010
TYW | TS&W/Claymore Tax-Advantaged Balanced Fund |Questions & Answers continued
Since the majority of the return on bonds during the period came from income, the Fund’s performance benefited from a focus on increasing the average coupon.The portfolio is structured with a significantly higher average coupon than the Barclays Muni Index.
SMC’s practice of carefully analyzing each bond under consideration has made it possible to achieve a high level of income while also maintaining high credit quality. In a market environment that is challenging for issuers, some bonds have been offered at what might seem to be a higher than normal coupon for reasons that really have little to do with credit quality.A good example is a City of Detroit Sewer Disposal bond with a 7.0% coupon, maturing in 2027. SMC feels is a very solid AAA rated security, plus it is insured by Assured Guaranty Municipal, the only remaining AAA-rated insurer. Just because the issuer is a Detroit entity, and investors mentally connect Detroit with the rust belt and the troubled automotive industry, the 7% coupon was necessary to get the deal done.The portfolio includes a number of bonds with attractive i ncome streams and similar situations.
Most of the bonds in the portfolio performed well. Notable contributors to performance were relatively large positions in AAA-rated Texas Permanent School Fund (“PSF”) bonds and a Rhode Island State Health & Educational Corp. hospital bond with an A rating on the underlying credit that is insured by Assured Guaranty.
With regard to duration, most of the bonds that have been added to the portfolio during the period are priced to the first call date. (Duration is a measure of a bond’s price sensitivity to changes in interest rates.) In the expectation that interest rates are unlikely to move lower, and will eventually rise, the duration has been kept fairly short.The duration of the municipal securities portfolio is approximately eight years, much shorter than the duration of the Barclays Muni Index, which is approximately 14 years.As bonds have rallied a bit in 2010, this shorter duration has hurt the portfolio’s performance relative to the index, but this was more than offset by the advantage of the portfolio’s higher coupon on average compared to the index.Another negative trend was that spreads widened on some of the Fund’s l ower rated credits, such as BBB tobacco bonds and a BB hospital bond, and that was detrimental for performance.
How are municipal securities selected for the Fund?
SMC begins by analyzing broad macroeconomic trends and developments affecting the fixed-income markets, including the economic outlook, market conditions and perceived effects on interest rates and yield curves. From there, a bottom-up and top-down analysis is incorporated to help construct a portfolio that SMC believes optimizes federally tax-exempt income while seeking to avoid undue credit risk and market timing risk.While SMC monitors interest rates very closely and acts quickly to adjust the portfolio to changing market rates, positions in the portfolio are not traded in search of incremental gains that could be achieved by active trading based on daily changes in rates. SMC’s proprietary unbiased research makes it possible to identify undervalued sectors that are considered to have the potential for ratings upgrades and capita l appreciation; however, there is no guarantee that such events will occur.
What is the outlook for the municipal securities market and what does this mean for the Fund?
SMC believes it is unlikely that interest rates will move significantly lower.With the massive amounts of stimulus provided by the government plus some other positive trends, economic activity is expected to pick up eventually.Although certain states and European nations definitely have credit issues, current concerns of some investors seem overblown. Since bond prices generally move in the opposite directions of interest rates, SMC does not expect that bond prices will move significantly higher. Accordingly, the current focus is on income and increasing the average coupon of the portfolio. Ongoing efforts will be made to purchase bonds that can provide an attractive level of income such as the Detroit Sewer bonds mentioned earlier.
The Fund’s equity portfolio and taxable fixed-income securities are managed by TS&W.The following questions are related to those portions of the portfolio and are answered by Portfolio Managers Paul A. Ferwerda and William M. Bellamy.
Please provide an overview of the U.S. equity and high-yield bond markets during the six months ended June 30, 2010.
Market conditions in first half of 2010 are difficult to characterize concisely because there was so much variation within the period. As the year began, there was a fair amount of enthusiasm, and the rally that began in 2009 continued into the first quarter. Investors exhibited high hopes that the economic recovery was well
Semiannual Report | June 30, 2010 | 7
TYW | TS&W/Claymore Tax-Advantaged Balanced Fund |Questions & Answers continued
underway and was becoming more entrenched as the government stimulus had a positive impact.Then in April that sentiment shifted to a more sober view, as investors seemed to lose confidence that there would be a smooth transition from a stimulus-fueled recovery to sustained economic growth driven by the private sector.The considerable uncertainty about the strength of the economy created substantial volatility in capital markets in the second quarter of 2010.
For the six-month period ended June 30, 2010, the broad equity market, as measured by the S&P 500, was down, with a return of -6.65%. Performance of sectors and industry groups was rather odd, with some of the sectors normally considered defensive performing poorly; for example, food and staples retailing was one of the worst performing groups. Other economically sensitive sectors, such as materials and processing, were down, as would be expected when economic concerns are affecting the market. Energy stocks were dragged down by concerns about the oil spill in the Gulf of Mexico.Technology and communications were weak, and many health care stocks were down, even though recent legislation removed some of the uncertainty that had been plaguing that sector. In contrast, some sectors that are generally considered to be sensitive to econom ic conditions performed relatively well. Banks, real estate and transportation were among the better performing sectors in the first half of 2010. Other relatively strong sectors were defensive groups such as food, beverage and tobacco and household and personal products.
Another unusual characteristic of the equity market during this period was that small to mid-cap stocks were generally stronger than large-cap. Ordinarily, when the market is weak, the more defensive large-cap stocks perform better.As would be expected, growth stock indices were down more than value indices.
In the bond market, the most notable feature was a significant decline in interest rates: the rate on the 10-year U.S.Treasury note went from approximately 4% at the beginning of the period to approximately 3% as of June 30.This meant that in the investment-grade market, most of the performance was driven by lower interest rates.Treasury securities performed very well, as investors who worried about European credits sought the safety of U.S. Treasury securities.The return of the Barclays U.S.Treasury Index was 5.86% for the six months ended June 30, 2010.
In the high-yield bond market, credit quality was a much more important determinant of performance than interest rates. High-yield bonds performed relatively well; return of the Merrill Lynch HighYield Master II Index was 4.74%.Within the high-yield category, bonds with lower credit ratings generally performed better than higher rated bonds. Bond issuers’ balance sheets seem to be fairly healthy, and there have been few defaults.
Please describe how equity and high-yield securities are selected for the Fund.
TS&W’s investment process is value-driven and team-oriented. On the equity side, a proprietary quantitative valuation model is applied to more than 400 stocks.This directs TS&W’s review process toward companies believed to have the highest expected return potential over a multi-year period.TS&W’s in-house research analysts are responsible for validating the model inputs for companies under their coverage and monitoring them over the holding period. Buys and sells are discussed at weekly research meetings or more frequently as needed.TS&W’s fixed-income team is responsible for overall bond market strategy as well as security selection. In-house analysts are used to support the credit review process.
How did the equity portfolio perform over this period, and what were the main determinants of this performance?
The common equity portion of the portfolio, including some perpetual preferreds, had a return of approximately -7.6% (excluding the effect of leverage) for the six months ended June 30, 2010.This was below the Russell 1000Value Index, which returned -5.12%, and the S&P 500 Index, which returned -6.65%.
The portfolio’s pattern of performance was generally as would be expected, since it is designed to be a defensive portfolio: it outperformed during the periods when the market was down, and underperformed when the market was up. However, in part because of the disappointing performance of several of the industry groups that are generally regarded as defensive, the Fund’s return for the period as a whole was below that of its benchmarks.
The main source of the underperformance was a large position in BP PLC (0.3% of total net investment at the end of the reporting period), an international oil company that is now best known for the massive oil spill in the Gulf of Mexico and its handling the aftermath of the spill.TS&W continued to hold the stock, which was an attractive source of dividend income, until the dividend was suspended.While TS&W believes that BP has the financial resources to pay the dividend, the matter has become so
8 | Semiannual Report | June 30, 2010
TYW | TS&W/Claymore Tax-Advantaged Balanced Fund |Questions & Answers continued
politicized that it now appears that the dividend will not be reinstated until the company believes it can do so without incurring public criticism and political pressure.The decision was therefore made to begin selling the stock with approximately 60% of the position disposed of prior to the end of the reporting period.
Also negative was a position in Noble Corp., (0.7% of total net investments) an offshore drilling company that had nothing to do with the oil spill disaster, although the drilling moratorium will have some impact. Noble just announced the acquisition of a privately owned offshore drilling company and also a major joint venture with Royal Dutch Shell PLC (1.2% of total net investments), an international oil company that was another detractor from performance, as the entire energy group sold off. TS&W continues to believe that both of these stocks represent good value.
Looking to decisions that contributed to performance in the equity portfolio, an underweight in the technology sector, which performed poorly, contributed to performance relative to the S&P 500.Also, an overweight in the financials sector relative to the S&P 500 contributed to performance, as this sector performed well despite concerns about financial reform legislation.
One of the best performing holdings was Rayonier, Inc. (0.6% of total net investments), a real estate investment trust that is an international forest products company. Several stocks in the consumer discretionary sector were major contributors, including Nintendo Co., Ltd., a Japanese manufacturer of computer games and game consoles, andYum! Brands Inc., a quick service restaurant company; both of these stocks were sold on strength and are not in the portfolio at period end. Other holdings that contributed to performance include H.J. Heinz Co. (not held in the portfolio at period end), a global branded food company;The Chubb Corp. (0.9% of total net investments), a property and casualty insurance company; Republic Services, Inc. (not held in the portfolio at period end), a waste management company; and Bristol-Myers Squibb Co., (1.0% of total net investments), a global pharmaceutical company.
How did the portfolio’s high-yield bonds and preferred stocks perform?
As the high-yield bond market continued to recover, this portion of the Fund’s portfolio had a return of 4.57% in the first half of 2010, slightly below the 4.74% return of the Merrill Lynch High Yield Master II Index (the “HighYield Index”), which measures return of the high-yield market as a whole. Since this portion of the portfolio includes both high-yield bonds and preferred stock, a blended benchmark which is 67% the HighYield Index and 33% the Merrill Lynch Fixed Rate Preferred Securities Index (the “Preferred Index”) is helpful in evaluating performance.The Preferred Index returned 4.68% for the six-month period, and the return of the blended benchmark was 4.72%.
While the portfolio’s return was very close to that of the blended benchmark, the slight underperformance resulted mainly from a bias toward higher quality during a period when lower rated credits generally performed better than higher rated issues.This was the case with both high-yield bonds and preferred stocks. While it is always desirable to outperform the benchmark,TS&W is more concerned about being confident that the holdings in the portfolio have the financial strength and staying power to pay the interest and principal than about short-term performance.
Among the better performing holdings were several health care names, which benefited from the elimination of some uncertainty when the recent health care legislation was passed.These include Omega Healthcare Investors, Inc., a real estate investment trust that invests in long-term health care facilities; Community Health Systems, Inc. a hospital operator; and Omnicare, Inc., a pharmaceutical services company (0.2%, 0.2% and 0.1% of total net investments, respectively).The worst performing issues in the portfolio, though still with good income and positive total returns, were several oil companies that were hurt by the fallout from the Gulf oil spill, even though they had no direct involve-ment.These include Tesoro Corp., an oil refiner; and McMoRan Exploration Co., an offshore driller (0.1% and 0.2% of total net investments, respectively) .
What is the outlook for the equity and high-yield markets in the months ahead, and what is the portfolio’s strategy for that outlook?
TS&W believes that the recent weakness in the equity market may indicate that investors who began the year with a very optimistic view may not have fully appreciated the extent to which the early stages of the recovery were driven by government stim-
Semiannual Report | June 30, 2010 | 9
TYW | TS&W/Claymore Tax-Advantaged Balanced Fund |Questions & Answers continued
ulus and the huge amounts of liquidity injected by the Federal Reserve.A big question now is whether there will be a smooth transition into a period of economic growth driven by the consumer spending and business investment.At this point, with the stimulus in place for about a year, year-over-year comparisons have become more difficult.TS&W does not expect that the economy will slip back into recession, but it seems likely that growth will be tepid.
Nonetheless,TS&W believes that valuations are compelling for many equities and especially for higher quality companies with ample free cash flow and little debt on their balance sheets. In a slow growth economy, many of these companies have the opportunity to perform very well. Some recent additions to the portfolio include economically sensitive companies with improving fundamentals that are selling at low multiples of price to earnings, book value and cash flow.These include Corning, Inc., which produces specialty glass and ceramics products; electronics retailer Best Buy Co.; and Freeport-McMoRan Copper & Gold, Inc., a mining company (0.6%, 0.7% and 0.5% of total net investments, respectively). In addition to the appeal of each of these stocks on their own merits, these stocks are expected to increase the portfolio’s beta (sensitivity to broad market movements), which should help performance as the market recovers from the recent weakness.
10 | Semiannual Report | June 30, 2010
TYW | TS&W/Claymore Tax-Advantaged Balanced Fund |Questions & Answers continued
Index Definitions
Indices are unmanaged and it is not possible to invest directly in an index.
Barclays Capital U.S. Municipal Long Bond Index is a rules-based, market-value-weighted index engineered for the long-term (22+ years) tax-exempt bond market.
The S&P 500 is an unmanaged, capitalization-weighted index of 500 stocks.The index is designed to measure performance of the broad domestic economy through changes in the aggregate market value of 500 stocks representing all major industries.
The Merrill Lynch HighYield Master II Index is a commonly used benchmark index for high yield corporate bonds and is a measure of the broad high yield market.
The Merrill Lynch Fixed Rate Preferred Securities Index is designed to replicate the total return of a diversified group of investment-grade preferred securities.The Index is rebalanced on a monthly basis.
Barclays Capital U.S.Aggregate Bond Index represents securities that are U.S. domestic, taxable, and dollar denominated.The index covers the U.S. investment grade fixed rate bond market, with index components for government and corporate securities, mortgage pass-through securities, and asset-backed securities.
Barclays Capital U.S.Treasury Index is an unmanaged index of prices of U.S.Treasury bonds with maturities of one to 30 years.
The Russell 1000®Value Index measures the performance of those Russell 1000 companies with lower price-to-book ratios and lower forecasted growth values, while the Russell 1000 Growth Index measures the performance of those Russell 1000 companies with higher price-to-book ratios and higher forecasted growth values.
TYW Risks and Other Considerations
The views expressed in this report reflect those of the portfolio managers only through the report period as stated on the cover. These views are subject to change at any time, based on market and other conditions and should not be construed as a recommendation of any kind.The material may also include forward looking statements that involve risk and uncertainty, and there is no guarantee that any predictions will come to pass.There can be no assurance that the Fund will achieve its investment objectives. The value of the Fund will fluctuate with the value of the underlying securities. Historically, closed-end funds often trade at a discount to their net asset value. There can be no assurance that the Fund will achieve its investment objective. The value of the Fund will fluctuate with the value of the underlying securities. The Fund is s ubject to investment risk, including the possible loss of the entire amount that you invest.
Municipal Securities Market Risk. The yields on and market prices of municipal securities are dependent on a variety of factors, including general conditions of the municipal securities market, the size of a particular offering, the maturity of the obligation and the rating of the issue. The value of outstanding municipal securities will vary as a result of changing evaluations of the ability of their issuers to meet interest and principal payments. Such values will also change in response to changes in the interest rates payable on new issues of municipal securities and changes in general interest rate levels. Changes in the value of the municipal securities held in the Fund’s portfolio arising from these or other factors will cause changes in the Fund’s net asset val ue per share.
Income and Interest Rate Risk. The income shareholders receive from the Fund is based primarily on the dividends and interest earned by the Fund from its investments, which can vary widely over the short and long term. The dividend income from the Fund’s investment in equity securities will be influenced by both general economic activity and issuer-specific factors. In the event of a recession or adverse events effecting a specific industry or issuer, the issuers of the common stocks held by the Fund may reduce the dividends paid on such common stocks. Interest rate risk is the risk that municipal securities and other debt (and, in certain cases, equity) securities in which the Fund invests (and the Fund’s net assets) will decline in value because of changes in interest r ates.
Lower Grade Securities. Investment in fixed income securities of below-investment grade quality (commonly known as “Junk bonds”) involves substantial risk of loss.They are considered predominantly speculative with respect to the issuer’s ability to pay interest and repay principal and are susceptible to default or decline in market value due to adverse economic and business developments. Debt securities in the lowest investment grade category may also be considered to have speculative characteristics by certain ratings agencies.The market values for fixed income securities of below investment grade quality tend to be more volatile, and these securities are less liquid, than investment grade debt securities.
Common Stock Risk. The common stocks and other equity securities in which the Fund invests may experience substantial volatility in their market value. Although common stocks typically provide higher returns than debt securities, they are also more susceptible to adverse changes in market value due to issuer-specific events. The market values of common stocks
Semiannual Report | June 30, 2010 | 11
TYW | TS&W/Claymore Tax-Advantaged Balanced Fund |Questions & Answers continued
are also sensitive to changes in investor perceptions as well as general movements in the equities markets.
State Concentration Risk. To the extent the Fund concentrates its investments in municipal bonds, the Fund may be significantly impacted by political, economic, or regulatory developments that affect issuers and their ability to pay principal and interest on their obligations.
Leverage Risk. Certain risks are associated with the leveraging of common stock. Both the net asset value and the market value of shares of common stock may be subject to higher volatility and a decline in value.
AMPS Risk. There also risks associated with investing in Auction Market Preferred Shares or AMPS.The AMPS are redeemable, in whole or in part, at the option of the Fund on any dividend payment date for the AMPS, and will be subject to mandatory redemption in certain circumstances. The AMPS will not be listed on an exchange. You may only buy or sell AMPS through an order placed at an auction with or through a broker-dealer that has entered into an agreement with the auction agent and the Fund or in a secondary market maintained by certain broker dealers. These broker-dealers are not required to maintain this market, and it may not provide you with liquidity. The federal tax advice contained herein was not intended or written to be used, and it cannot be used by any taxpayer, for th e purpose of avoiding penalties that may be imposed on the taxpayer; the advice was written to support the promotion or marketing of the matters addressed; and the taxpayers should seek advice based on the taxpayer’s particular circumstances from an independent tax advisor.
Equity Risk. A principal risk of investing in the Fund is equity risk, which is the risk that the value of the securities held by the Fund will fall due to general market and economic conditions, perceptions regarding the industries in which the issuers of securities held by the Fund participate, or factors relating to specific companies in which the Fund invests. For example, an adverse event, such as an unfavorable earnings report, may depress the value of equity securities of an issuer held by the Fund; the price of common stock of an issuer may be particularly sensitive to general movements in the stock market; or a drop in the stock market may depress the price of most or all of the common stocks and other equity securities held by the Fund. In addition, common stock of an is suer in the Fund’s portfolio may decline in price if the issuer fails to make anticipated dividend payments because, among other reasons, the issuer of the security experiences a decline in its financial condition. Common stock is subordinated to preferred stocks, bonds and other debt instruments in a company’s capital structure, in terms of priority to corporate income, and therefore will be subject to greater dividend risk than preferred stocks or debt instruments of such issuers. In addition, while broad market measures of common stocks have historically generated higher average returns than fixed income securities, common stocks have also experienced significantly more volatility in those returns.
Preferred Securities Risk These securities are inherently more risky than the bonds and other debt instruments of the issuer, but typically less risky than its common stock. They may be significantly less liquid than many other securities, such as U.S. Government securities, corporate debt and common stock.
Taxable Debt Securities. The value of debt securities, including corporate debt securities, can be expected to vary inversely with interest rates. Income payments received by the Fund on debt securities will not be eligible for treatment as tax-qualified dividends.
High Yield Risk: CEFs that invest in high yield securities and unrated securities of similar credit quality (commonly known as “junk bonds”) may be subject to greater levels of credit and liquidity risk than funds that do not invest in such securities. These securities are considered predominately speculative with respect to the issuer’s continuing ability to make principal and interest payments. An economic downturn or period of rising interest rates could adversely affect the market for these securities and reduce the fund’s ability to sell these securities. If the issuer of a security is in default with respect to interest or principal payments, the fund may lose its entire investment.
In addition to the risks described above, the Fund is also subject to: Investment Risk, Common Share Market Risk, Tax Risk, Credit Risk, Geographical and Sector Risk, Interest Rate and Hedging Transactions Risk, Value Investing Risk, Illiquid Investments Risk, Foreign Securities Risk, Small- and Medium-Sized Company Risk, Fund Distribution Risk, Market Discount Risk, Portfolio Turnover, and Current Developments. Please see www.claymore.com/tyw for a more detailed discussion about Fund risks and considerations.
12 | Semiannual Report | June 30, 2010
| |
TYW | TS&W/Claymore Tax-Advantaged Balanced Fund |
Fund Summary | As of June 30, 2010 (unaudited) |
| | | |
| Fund Statistics | | |
| Share Price | | $9.53 |
| Common Share Net Asset Value | | $10.56 |
| Premium/(Discount) to NAV | | -9.75% |
| Net Asset Applicable to Common Shareholders ($000) | $162,740 |
Total Returns | | |
| (Inception 4/28/04) | Market | NAV |
| Six Month | 3.52% | -0.91% |
| One Year | 29.35% | 24.13% |
| Three Year - average annual | -5.29% | -6.57% |
| Five Year - average annual | 1.12% | 0.08% |
| Since Inception - average annual | 0.59% | 2.19% |
| Returns for periods of less than one year are not annualized. | |
| | | |
| Top Ten Holdings | % of Total |
Municipal Portfolio1 | Net Investments |
| Birmingham Special Care Facilities Financing Authority | | |
Health Care Facilities Revenue, ASSURED Insured, AAA, | | |
| Aa3, 6.00%, 6/1/2039 | | 3.2% |
| Frisco Texas Independent School District, School Improvements, | | |
Series A, PSF Guaranteed, NR, Aaa, 6.00%, 8/15/2038 | | 2.9% |
| Louisiana State Citizens Property Insurance Corp. Assessment Revenue, | |
Series C-2-RMKT, ASSURED Insured, AAA, Aa3, 6.75%, 6/1/2026 | 2.9% |
| Fomey Independent School District, Unlimited Tax School | | |
Building Bonds, Series A, PSF Guaranteed, AAA, NR, 6.00%, 8/15/2037 | 2.8% |
| Detroit Michigan Sewer Disposal Revenue | | |
Rols RR II R 11841-1, AGM Insured, AAA, NR, 14.21%, 7/1/2017 | 2.6% |
| Rhode Island State Health & Educational Building Corp. Revenue | |
Hospital Financing Lifespan Obligation, ASSURED Insured, | | |
Series A, AAA, NR, 13.29%, 5/15/2017 | | 2.6% |
| Detroit Michigan Sewer Disposal Revenue | | |
Refunding-Senior Lien-Series C-1-RMKT, AGM Insured, | | |
AAA, Aa3, 7.00%, 7/1/2027 | | 2.1% |
| Metropolitan Transportation Authority Revenue | | |
| Transportation - Series 2008C, A, A2, 6.50%, 11/15/2028 | | 2.1% |
| North Texas Tollway Authority Revenue | | |
Rols RR II R-11392-1, BHAC Insured, NR, Aa1, 10.82%, 1/1/2016 | 2.1% |
| New York State Dormitory Authority Income Tax Revenue, | | |
PIT Education - Series B, AAA, NR, 5.75%, 3/15/2036 | | 2.1% |
1 Excludes short-term | | |
| | |
| Top Ten Holdings | % of Total |
| Equity and Income Portfolio | Net Investments |
| AT&T, Inc. | 1.4% |
| Verizon Communications, Inc. | 1.3% |
| Waste Management, Inc. | 1.3% |
| Royal Dutch Shell PLC, ADR - Class B (United Kingdom) | 1.2% |
| ITT Corp. | 1.2% |
| Kimberly-Clark Corp. | 1.1% |
| Chevron Corp. | 1.0% |
| Pfizer, Inc. | 1.0% |
| Merck & Co., Inc. | 1.0% |
| Bristol-Myers Squibb Co. | 1.0% |
Securities and holdings are subject to change daily. For more current information, please visit www.claymore.com/tyw. The above summaries are provided for informational purposes only and should not be viewed as recommendations. Past performance does not guarantee future results.
| | |
| | % of Total |
| Top Ten Sectors | Net Investments |
| Health Care | 15.2% |
| Special Tax | 11.1% |
| General Obligation | 9.0% |
| Water & Sewer | 8.1% |
| Insurance | 5.0% |
| Telecommunications | 4.4% |
| Pharmaceuticals | 3.7% |
| General Funds | 3.6% |
| Oil&Gas | 3.6% |
| Diversified Financial Services | 3.5% |
Semiannual Report | June 30, 2010 | 13
TYW | TS&W/Claymore Tax-Advantaged Balanced Fund
Portfolio of Investments | June 30, 2010 (unaudited)
| | | | | |
| Principal | | | Optional Call | |
| Amount | | Description | Provisions | Value |
| | | Long-Term Municipal Bonds — 95.0% | |
| | | Alabama — 5.4% | | |
| $ 8,150,000 | | Birmingham Special Care Facilities Financing Authority, | | |
| | | Health Care Facilities Revenue, ASSURED Insured, AAA, Aa3 | |
| | | 6.00%, 6/1/2039 | 6/1/19 @ 100.00 | $ 8,850,003 |
| | | Arizona — 2.0% | | |
| 3,000,000 | | Glendale Western Loop 101, Public Facilities Corp., | | |
| | | Third Lien Excise Tax Revenue, Series A, AA, A1 | | |
| | | 7.00%, 7/1/2033 | 1/1/14 @ 100.00 | 3,226,470 |
| | | California — 8.3% | | |
| 4,610,000 | | Alhambra Certificates of Participation, | | |
| | | Police Facilities 91-1-RMK, AMBAC Insured, NR, NR | | |
| | | 6.75%, 9/1/2023 | N/A | 5,279,925 |
| 2,000,000 | | California Statewide Communities Development Authority, | |
| | | American Baptist Homes West, BBB-, NR | | |
| | | 6.25%, 10/1/2039 | 10/1/19 @ 100.00 | 1,986,480 |
| 2,500,000 | | Golden State Tobacco Securitization Corp., | | |
| | | Tobacco Settlement Asset-Backed Bonds, Series 2007A-1, BBB, Baa3 | |
| | | 5.75%, 6/1/2047 | 6/1/17 @ 100.00 | 1,789,550 |
| 4,600,000 | | Manhattan Beach California Unified School District, | | |
| | | Capital Appreciation-Election 2008, Series B, AA, Aa2 | | |
| | | 6.50%, 9/1/2045 (a) | 9/1/35 @ 100.00 | 1,672,238 |
| 2,500,000 | | M-S-R Energy Authority, | | |
| | | Natural Gas Revenue, Series B, A, NR | | |
| | | 7.00%, 11/1/2034 | N/A | 2,845,525 |
| | | | | 13,573,718 |
| | | District of Columbia — 0.7% | | |
| 1,000,000 | | District of Columbia Water & Sewer Authority, | | |
| | | Public Utility Revenue, Series A, AA, Aa2 | | |
| | | 6.00%, 10/1/2035 | 10/1/18 @ 100.00 | 1,122,890 |
| | | Indiana— 2.2% | | |
| 3,500,000 | | Evansville Industrial Redevelopment Authority, | | |
| | | Build America Bonds, Series B, A, Aa3 | | |
| | | 7.21%, 2/1/2039 (b) | 8/1/20 @ 100.00 | 3,626,455 |
| | | Kentucky — 3.6% | | |
| 2,700,000 | | Kentucky Economic Development Finance Authority, | | |
| | | Owensboro Medical Health System, Series A, NR, Baa2 | | |
| | | 6.375%, 6/1/2040 | 6/1/20 @ 100.00 | 2,768,607 |
| 3,050,000 | | Kentucky Economic Development Finance Authority, | | |
| | | Owensboro Medical Health System, Series B, NR, Baa2 | | |
| | | 6.375%, 3/1/2040 | 6/1/20 @ 100.00 | 3,134,393 |
| | | | | 5,903,000 |
| | | Louisiana — 4.8% | | |
| 6,980,000 | | Louisiana State Citizens Property Insurance Corp. Assessment Revenue, | |
| | | Series C-2-RMKT, ASSURED Insured, AAA, Aa3 | | |
| | | 6.75%, 6/1/2026 | 6/1/18 @ 100.00 | 7,861,714 |
| | | Massachusetts — 1.0% | | |
| 1,820,000 | | Massachusetts Development Finance Agency Revenue, | | |
| | | Evergreen Center, BBB-, NR | | |
| | | 5.50%, 1/1/2035 | 1/1/15 @ 100.00 | 1,578,450 |
| | | |
| | | | | |
| Principal | | | Optional Call | |
| Amount | | Description | Provisions | Value |
| | | Michigan — 14.5% | | |
| $ 5,150,000 | | Detroit Michigan Sewer Disposal Revenue, | | |
| | | Rols RR II R 11841-1, AGM Insured, AAA, NR | | |
| | | (Underlying Obligor: Detroit Michigan Sewer Disposal) | | |
| | | 14.21%, 7/1/2017 (c) | N/A | $ 7,205,365 |
| 5,000,000 | | Detroit Michigan Sewer Disposal Revenue, | | |
| | | Refunding-Senior Lien-Series C-1-RMKT, AGM Insured, AAA, Aa3 | |
| | | 7.00%, 7/1/2027 | 7/1/19 @ 100.00 | 5,816,350 |
| 5,000,000 | | Detroit Michigan Water Supply System Revenue, | | |
| | | Refunding-Senior Lien-Series C-RMKT, BHAC/FGIC Insured, AA+, Aa1 | |
| | | 5.75%, 7/1/2026 | 7/1/18 @ 100.00 | 5,419,650 |
| 2,265,000 | | Detroit Michigan Water Supply System Revenue, | | |
| | | Second Lien-Series B-RMKT, AGM Insured, AAA, NR | | |
| | | 7.00%, 7/1/2036 | 7/1/19 @ 100.00 | 2,607,921 |
| 2,500,000 | | Michigan Public Educational Facilities Authority Revenue, | |
| | | Refunding-Limited, Obligation-Landmark Academy, BBB-, NR | |
| | | 7.00%, 12/1/2039 | 6/1/20 @ 100.00 | 2,569,925 |
| | | | | 23,619,211 |
| | | New Jersey — 2.9% | | |
| 4,150,000 | | Newark Housing Authority Revenue, | | |
| | | South Ward Police Facility, ASSURED Insured, NR, Aa3 | | |
| | | 6.75%, 12/1/2038 | 12/1/19 @ 100.00 | 4,726,892 |
| | | New York — 16.1% | | |
| 3,000,000 | | Long Island Power Authority Revenue, | | |
| | | Electrical Light and Power Improvements, Series A, A-, A3 | |
| | | 6.25%, 4/1/2033 | 4/1/19 @ 100.00 | 3,460,590 |
| 5,000,000 | | Metropolitan Transportation Authority Revenue, | | |
| | | Transportation - Series 2008C, A, A2 | | |
| | | 6.50%, 11/15/2028 | 11/15/18 @ 100.00 | 5,804,600 |
| 5,000,000 | | New York State Dormitory Authority Income Tax Revenue, | |
| | | PIT Education - Series B, AAA, NR | | |
| | | 5.75%, 3/15/2036 | 3/15/19 @ 100.00 | 5,657,400 |
| 1,000,000 | | New York State Dormitory Authority Revenue, | | |
| | | The Bronx-Lebanon Hospital Center, NR, Aa2 | | |
| | | 6.50%, 8/15/2030 | 2/15/19 @ 100.00 | 1,099,570 |
| | | New York State Dormitory Authority Revenue, | | |
| | | Health, Hospital & Nursing Home Improvements, FHA, AAA, Aa2 | |
| 4,500,000 | | 6.25%, 8/15/2034 | 8/15/19 @ 100.00 | 4,998,330 |
| 2,500,000 | | 6.00%, 8/15/2038 | 8/15/19 @ 100.00 | 2,717,475 |
| 2,220,000 | | New York State Dormitory Authority Revenue, | | |
| | | School Districts Financing Program, ASSURED Insured, Series A, AAA, Aa3 | |
| | | 5.625%, 10/1/2029 | 10/1/19 @ 100.00 | 2,415,915 |
| | | | | 26,153,880 |
| | | Ohio — 1.4% | | |
| 2,900,000 | | Buckeye Tobacco Settlement Financing Authority, | | |
| | | Tobacco Settlement Asset-Backed Bonds, Series 2007A-2, BBB, Baa3 | |
| | | 6.50%, 6/1/2047 | 6/1/17 @ 100.00 | 2,275,224 |
| | | Pennsylvania — 1.2% | | |
| 2,500,000 | | Allegheny County Hospital Development Authority Health System Revenue, | |
| | | West Penn, Series 2007A, BB-, B1 | | |
| | | 5.375%, 11/15/2040 | 11/15/17 @ 100.00 | 1,883,725 |
See notes to financial statements.
14 | Semiannual Report | June 30, 2010
TYW | TS&W/Claymore Tax-Advantaged Balanced Fund |Portfolio of Investments (unaudited) continued
| | | | | |
| Principal | | | Optional Call | |
| Amount | | Description | Provisions | Value |
| | | Puerto Rico — 7.7% | | |
| $ 2,500,000 | | Puerto Rico Highway and Transportation Authority Revenue, | |
| | | Refunding Bonds, Series AA-1-RMKT, AGM Insured, AAA, Aa3 | |
| | | 4.95%, 7/1/2026 | 7/1/20 @ 100.00 | $ 2,525,550 |
| | | Puerto Rico Sales Tax Financing Revenue, | | |
| | | Public Improvements, First Sub-Series A, A+, A1 | | |
| 2,000,000 | | 6.00%, 8/1/2042 | 8/1/19 @ 100.00 | 2,120,540 |
| 5,000,000 | | 6.50%, 8/1/2044 | 8/1/19 @ 100.00 | 5,549,750 |
| 2,000,000 | | Puerto Rico Sales Tax Financing Revenue, | | |
| | | Public Improvements, First Sub-Series C, A+, A1 | | |
| | | 6.50%, 8/1/2035 | 8/1/20 @ 100.00 | 2,253,860 |
| | | | | 12,449,700 |
| | | Rhode Island — 4.7% | | |
| 5,500,000 | | Rhode Island State Health & Educational Building Corp. Revenue, | |
| | | Hospital Financing Lifespan Obligation, ASSURED Insured, Series A, AAA, NR | |
| | | (Underlying Obligor: Rhode Island State Health and Educational Building Corp.) | |
| | | 13.29%, 5/15/2017 (c) | N/A | 7,167,820 |
| 500,000 | | Rhode Island State Health & Educational Building Corp. Revenue, | |
| | | Hospital Financing Lifespan Obligation, A-, A3 | | |
| | | 6.375%, 8/15/2021 | 8/15/12 @ 100.00 | 517,635 |
| | | | | 7,685,455 |
| | | Texas — 16.8% | | |
| 6,700,000 | | Forney Independent School District, | | |
| | | Unlimited Tax School Building Bonds, Series A, PSF Guaranteed, AAA, NR | |
| | | 6.00%, 8/15/2037 (d) | N/A | 7,651,333 |
| | | Forney Independent School District, | | |
| | | Property Tax School Building Bonds, PSF Guaranteed, AAA, NR | |
| 3,030,000 | | 5.50%, 8/15/2038 | 8/15/20 @ 100.00 | 3,351,998 |
| 2,310,000 | | 5.50%, 8/15/2040 | 8/15/20 @ 100.00 | 2,545,458 |
| 7,000,000 | | Frisco Texas Independent School District, | | |
| | | School Improvements, Series A, PSF Guaranteed, NR, Aaa | | |
| | | 6.00%, 8/15/2038 (d) | N/A | 8,025,360 |
| 5,000,000 | | North Texas Tollway Authority Revenue, | | |
| | | Rols RR II R-11392-1, BHAC Insured, NR, Aa1 | | |
| | | (Underlying Obligor: North Texas Tollway Authority) | | |
| | | 10.82%, 1/1/2016 (c) | N/A | 5,775,300 |
| | | | | 27,349,449 |
| | | Wisconsin — 1.7% | | |
| 2,000,000 | | Wisconsin State Health & Educational Facilities Authority Revenue, | |
| | | Aurora Health Care, Series A, NR, A3 | | |
| | | 5.60%, 2/15/2029 | 2/15/11 @ 100.00 | 1,974,820 |
| 750,000 | | Wisconsin State Health & Educational Facilities Authority Revenue, | |
| | | Blood Center Southeastern Project, A-, NR | | |
| | | 5.75%, 6/1/2034 | 6/1/14 @ 100.00 | 762,300 |
| | | | | 2,737,120 |
| | | Total Long-Term Municipal Bonds — 95.0% | | |
| | | (Cost $147,657,327) | | 154,623,356 |
| | | | |
| Number | | | |
| of Shares | | Description | Value |
| | | Common Stocks — 54.9% | |
| | | Aerospace & Defense — 3.1% | |
| 27,500 | | General Dynamics Corp. | $ 1,610,400 |
| 75,000 | | ITT Corp. | 3,369,000 |
| | | | 4,979,400 |
| | | Beverages — 0.7% | |
| 17,500 | | Diageo PLC, ADR (United Kingdom) | 1,097,950 |
| | | Capital Markets — 0.8% | |
| 55,000 | | Morgan Stanley | 1,276,550 |
| | | Chemicals — 0.6% | |
| 16,000 | | CF Industries Holdings, Inc. | 1,015,200 |
| | | Commercial Banks — 0.3% | |
| 20,000 | | Wells Fargo & Co. | 512,000 |
| | | Commercial Services & Supplies — 3.5% | |
| 100,000 | | Pitney Bowes, Inc. | 2,196,000 |
| 110,000 | | Waste Management, Inc. | 3,441,900 |
| | | | 5,637,900 |
| | | Communications Equipment — 0.5% | |
| 38,500 | | Cisco Systems, Inc. (e) | 820,435 |
| | | Computers & Peripherals — 0.4% | |
| 35,000 | | EMC Corp. (e) | 640,500 |
| | | Containers & Packaging — 0.4% | |
| 25,000 | | Bemis Co., Inc. | 675,000 |
| | | Diversified Financial Services — 1.2% | |
| 52,500 | | JPMorgan Chase & Co. | 1,922,025 |
| | | Diversified Telecommunication — 5.0% | |
| 155,000 | | AT&T, Inc. | 3,749,450 |
| 125,000 | | Verizon Communications, Inc. | 3,502,500 |
| 85,000 | | Windstream Corp. | 897,600 |
| | | | 8,149,550 |
| | | Electric Utilities — 0.6% | |
| 30,000 | | Southern Co. | 998,400 |
| | | Electronic Equipment & Instruments — 1.0% | |
| 100,000 | | Corning, Inc. | 1,615,000 |
| | | Energy Equipment & Services — 1.2% | |
| 62,500 | | Noble Corp. (Switzerland) (e) | 1,931,875 |
| | | Food Products — 2.2% | |
| 77,700 | | Kraft Foods, Inc. - Class A | 2,175,600 |
| 50,000 | | Unilever NV (Netherlands) | 1,366,000 |
| | | | 3,541,600 |
| | | Health Care Equipment & Supplies — 0.8% | |
| 20,000 | | Becton, Dickinson and Co. | 1,352,400 |
See notes to financial statements.
Semiannual Report | June 30, 2010 | 15
TYW | TS&W/Claymore Tax-Advantaged Balanced Fund |Portfolio of Investments (unaudited) continued
| | | | |
| Number | | | |
| of Shares | | Description | Value |
| | | Hotels, Restaurants & Leisure — 0.4% | |
| 15,000 | | Darden Restaurants, Inc. | $ 582,750 |
| | | Household Durables — 0.5% | |
| 29,475 | | Garmin Ltd. (Switzerland) | 860,081 |
| | | Household Products — 1.9% | |
| 50,000 | | Kimberly-Clark Corp. | 3,031,500 |
| | | Industrial Conglomerates — 1.2% | |
| 22,500 | | Siemens AG, ADR (Germany) | 2,014,425 |
| | | Insurance — 4.4% | |
| 50,000 | | Chubb Corp. | 2,500,500 |
| 60,000 | | MetLife, Inc. | 2,265,600 |
| 50,000 | | Travelers Cos., Inc. (The) | 2,462,500 |
| | | | 7,228,600 |
| | | IT Services — 1.3% | |
| 16,500 | | IBM Corp. | 2,037,420 |
| | | Metals & Mining— 0.9% | |
| 25,000 | | Freeport-McMoRan Copper & Gold, Inc. - Class B | 1,478,250 |
| | | Multiline Retail — 2.3% | |
| 75,000 | | Macy’s, Inc. | 1,342,500 |
| 50,000 | | Target Corp. | 2,458,500 |
| | | | 3,801,000 |
| | | Multi-Utilities — 2.5% | |
| 150,000 | | Centerpoint Energy, Inc. | 1,974,000 |
| 75,000 | | NiSource, Inc. | 1,087,500 |
| 24,225 | | PG&E Corp. | 995,648 |
| | | | 4,057,148 |
| | | Oil, Gas & Consumable Fuels — 4.3% | |
| 30,000 | | BP PLC, ADR (United Kingdom) | 866,400 |
| 40,000 | | Chevron Corp. | 2,714,400 |
| 70,719 | | Royal Dutch Shell PLC, ADR - Class B (United Kingdom) | 3,414,313 |
| | | | 6,995,113 |
| | | Pharmaceuticals — 7.3% | |
| 105,000 | | Bristol-Myers Squibb Co. | 2,618,700 |
| 55,000 | | Eli Lilly & Co. | 1,842,500 |
| 37,500 | | Johnson & Johnson | 2,214,750 |
| 75,000 | | Merck & Co., Inc. | 2,622,750 |
| 185,000 | | Pfizer, Inc. | 2,638,100 |
| | | | 11,936,800 |
| | | Real Estate Investment Trusts — 0.9% | |
| 35,000 | | Rayonier, Inc. | 1,540,700 |
| | | Semiconductors — 1.3% | |
| 105,000 | | Intel Corp. | 2,042,250 |
| | | | | |
| Number | | | | |
| of Shares | | Description | | Value |
| | | Software — 1.1% | | |
| 125,000 | | Symantec Corp. (e) | | $ 1,735,000 |
| | | Specialty Retail — 1.2% | | |
| 57,500 | | Best Buy Co., Inc. | | 1,946,950 |
| | | Tobacco — 1.1% | | |
| 35,000 | | Reynolds American, Inc. | | 1,824,200 |
| | | Total Common Stocks — 54.9% | | |
| | | (Cost $96,742,060) | | 89,277,972 |
| | | | |
| Principal | | | Optional Call | |
| Amount | | Description | Provisions | Value |
| | | Corporate Bonds — 10.4% | | |
| | | Aerospace & Defense — 0.7% | | |
| $ 875,000 | | Alliant Techsystems, Inc., BB-, B1 | | |
| | | 6.75%, 4/1/2016 | 4/1/11 @ 103.38 | 857,500 |
| 350,000 | | Triumph Group, Inc., B+, B1 | | |
| | | 8.00%, 11/15/2017 | 11/15/13 @ 104.00 | 334,250 |
| | | | | 1,191,750 |
| | | Banks — 0.1% | | |
| 100,000 | | FCB/NC Capital Trust I, BB, Baa2 | | |
| | | 8.05%, 3/1/2028 | 3/1/11 @ 102.82 | 96,144 |
| | | Building Materials — 0.1% | | |
| 239,000 | | Boise Cascade LLC, B+, Caa1 | | |
| | | 7.125%, 10/15/2014 | 10/15/10 @ 102.38 | 224,959 |
| | | Commercial Services — 0.8% | | |
| 600,000 | | Hertz Corp. (The), CCC+, B2 | | |
| | | 8.875%, 1/1/2014 | 1/1/11 @ 102.22 | 607,500 |
| 668,000 | | Valassis Communications, Inc., BB-, Ba3 | | |
| | | 8.25%, 3/1/2015 | 3/1/11 @ 104.13 | 689,710 |
| | | | | 1,297,210 |
| | | Containers & Packaging — 0.4% | | |
| 600,000 | | Greif, Inc., BB+, Ba2 | | |
| | | 7.75%, 8/1/2019 | N/A | 618,000 |
| | | Diversified Financial Services — 0.7% | | |
| 750,000 | | Ford Motor Credit Co. LLC, B-, Ba3 | | |
| | | 8.70%, 10/1/2014 | N/A | 781,642 |
| 500,000 | | Goldman Sachs Capital II, BBB, Baa2 | | |
| | | 5.793%, 6/1/2043 (f) (g) | 6/1/12 @ 100.00 | 377,500 |
| | | | | 1,159,142 |
| | | Diversified Telecommunications — 0.9% | | |
| 541,000 | | Frontier Communications Corp., BB, Ba2 | | |
| | | 7.125%, 3/15/2019 | N/A | 500,425 |
| 425,000 | | NII Capital Corp., BB-,B1 | | |
| | | 10.00%, 8/15/2016 | 8/15/13 @ 105.00 | 447,312 |
| 500,000 | | Windstream Corp., B+, Ba3 | | |
| | | 8.625%, 8/1/2016 | 8/1/11 @ 104.31 | 503,750 |
| | | | | 1,451,487 |
See notes to financial statements.
16 | Semiannual Report | June 30, 2010
TYW | TS&W/Claymore Tax-Advantaged Balanced Fund |Portfolio of Investments (unaudited) continued
| | | | | |
| Principal | | | Optional Call | |
| Amount | | Description | Provisions | Value |
| | | Food — 0.6% | | |
| $ 1,015,000 | | Dean Foods Co., B, B2 | | |
| | | 7.00%, 6/1/2016 | N/A | $ 949,025 |
| | | Health Care — 0.8% | | |
| 550,000 | | Community Health Systems, Inc., B, B3 | | |
| | | 8.875%, 7/15/2015 | 7/15/11 @ 104.44 | 567,187 |
| 740,000 | | DaVita, Inc., B, B2 | | |
| | | 7.25%, 3/15/2015 | 3/15/11 @ 102.42 | 740,000 |
| | | | | 1,307,187 |
| | | Independent Power Producers — 0.3% | | |
| 520,000 | | NRG Energy, Inc., BB-, B1 | | |
| | | 8.50%, 6/15/2019 | 6/15/14 @ 104.25 | 528,450 |
| | | Insurance — 0.5% | | |
| 500,000 | | Genworth Financial, Inc., BB+, Ba1 | | |
| | | 6.15%, 11/15/66 (f) | 11/15/16 @ 100.00 | 341,250 |
| 445,000 | | White Mountain Re Group Ltd. (Bermuda), BBB-, Baa3 | | |
| | | 6.375%, 3/20/17 (h) | N/A | 445,474 |
| | | | | 786,724 |
| | | Internet & Catalog Retail — 0.3% | | |
| 500,000 | | NetFlix, Inc., BB-, Ba2 | | |
| | | 8.50%, 11/15/2017 | 11/15/13 @ 104.25 | 520,000 |
| | | Iron/Steel — 0.2% | | |
| 350,000 | | Allegheny Technologies, Inc., BBB-, Baa3 | | |
| | | 9.375%, 6/1/2019 | N/A | 413,271 |
| | | IT Services — 0.3% | | |
| 425,000 | | Unisys Corp., B, Caa1 | | |
| | | 12.50%, 1/15/2016 | 1/15/12 @ 106.25 | 459,000 |
| | | Office/Business Equipment — 0.6% | | |
| 1,000,000 | | Xerox Capital Trust I, BB, Baa3 | | |
| | | 8.00%, 2/1/2027 | 2/1/11 @ 101.47 | 1,005,383 |
| | | Oil, Gas & Consumable Fuels — 0.5% | | |
| 500,000 | | McMoRan Exploration Co., B, Caa1 | | |
| | | 11.875%, 11/15/2014 | 11/15/11 @ 105.94 | 510,000 |
| 425,000 | | Tesoro Corp., BB+, Ba1 | | |
| | | 6.625%, 11/1/2015 | 11/1/11 @ 102.21 | 398,438 |
| | | | | 908,438 |
| | | Pharmaceuticals — 0.2% | | |
| 325,000 | | Omnicare, Inc., BB, Ba2 | | |
| | | 7.75%, 6/1/2020 | 6/1/15 @ 103.88 | 331,500 |
| | | Real Estate Investment Trusts — 0.3% | | |
| 500,000 | | Omega Healthcare Investors, Inc., BB+, Ba3 | | |
| | | 7.00%, 1/15/2016 | 1/15/11 @ 103.50 | 493,750 |
| | | Real Estate Management Services — 0.4% | | |
| 525,000 | | CB Richard Ellis Services, Inc., B+, Ba3 | | |
| | | 11.625%, 6/15/2017 | 6/15/13 @ 105.81 | 588,000 |
| | | | | |
| Principal | | | Optional Call | |
| Amount | | Description | Provisions | Value |
| | | Retail — 0.6% | | |
| $ 700,000 | | Dillards, Inc., B+, B3 | | |
| | | 7.13%, 8/1/2018 | N/A | $ 658,000 |
| 315,000 | | Foot Locker, Inc., B+, B1 | | |
| | | 8.50%, 1/15/2022 | N/A | 296,100 |
| | | | | 954,100 |
| | | Transportation — 1.1% | | |
| 500,000 | | Kansas City Southern Railway, BB-, B2 | | |
| | | 8.00%, 6/1/2015 | 6/1/12 @ 104.00 | 515,000 |
| | | Overseas Shipholding Group, Inc., BB-, Ba3 | | |
| 850,000 | | 8.75%, 12/1/2013 | N/A | 873,375 |
| 350,000 | | 8.125%, 3/30/2018 | N/A | 343,875 |
| | | | | 1,732,250 |
| | | Total Corporate Bonds — 10.4% | | |
| | | (Cost $17,030,759) | | 17,015,770 |
| Number | | | | |
| of Shares | | Description | | Value |
| | | Preferred Stocks — 8.8% | | |
| | | Diversified Financial Services — 2.8% | | |
| 7,500 | | Ameriprise Financial, Inc., 7.75%, A, A3 | | 199,200 |
| 50,000 | | Bank of America Corp., Series 3, 6.375%, BB, Ba3 | | 962,500 |
| 56,000 | | Bank of America Corp., Series MER, 8.625%, BB, Ba3 | | 1,394,960 |
| 23,060 | | BB&T Capital Trust VI, 9.60%, BBB, A3 | | 627,693 |
| 31,650 | | Deutsche Bank Contingent Capital Trust II, 6.55%, BBB+, Baa2 | 653,256 |
| 60,000 | | RBS Capital Funding Trust VII, Series G, 6.08%, CC, B3 | | 732,000 |
| | | | | 4,569,609 |
| | | Electric — 0.3% | | |
| 20,000 | | Dominion Resources, Inc., Series A, 8.375%, BBB, Baa3 | | 556,000 |
| | | Insurance — 3.5% | | |
| 50,000 | | Aegon NV (Netherlands), 6.50%, BBB, Baa2 | | 881,000 |
| 51,240 | | Allianz SE (Germany), 8.375%, A+, A3 | | 1,295,414 |
| 25,000 | | Aspen Insurance Holdings Ltd. (Bermuda), 7.401%, BBB-, Ba1 (f) | 564,250 |
| 33,200 | | ING Groep NV (Netherlands), 7.375%, BB, Ba1 | | 623,164 |
| 50,000 | | Metlife, Inc., Series B, 6.50%, BBB-, Baa2 | | 1,163,000 |
| 48,600 | | Prudential PLC (United Kingdom), 6.50%, A-, Baa1 | | 1,132,380 |
| | | | | 5,659,208 |
See notes to financial statements.
Semiannual Report | June 30, 2010 | 17
TYW l TS&W/Claymore Tax-Advantaged Balanced Fund |Portfolio of Investments (unaudited) continued
| | | | | |
| Number | | | | |
| of Shares | | Description | | Value |
| | | Real Estate Investment Trusts — 2.2% | | |
| 15,480 | | Apartment Investment & Management Co., Series T, 8.00%, B+, Ba3 | $ 363,780 |
| 19,000 | | Brandywine Realty Trust, Series C, 7.50%, NR, NR | | 447,070 |
| 11,000 | | Capital Automotive REIT, Series A, 7.50%, NR, NR | | 221,719 |
| 10,000 | | CBL & Associates Properties, Inc., Series C, 7.75%, NR, NR | | 223,000 |
| 10,000 | | First Industrial Realty Trust, Inc., Series J, 7.25%, B-, B2 | | 169,800 |
| 6,700 | | Health Care REIT, Inc., Series D, 7.875%, BB, Baa3 | | 168,639 |
| 13,000 | | Kimco Realty Corp., Series G, 7.75%, BBB-, Baa2 | | 330,590 |
| 12,000 | | PS Business Parks, Inc., Series H, 7.00%, BB+, Baa3 | | 273,840 |
| 24,500 | | Public Storage, Series M, 6.625%, BBB, Baa1 | | 596,820 |
| 15,200 | | Regency Centers Corp., Series D, 7.25%, BB+, Baa3 | | 350,816 |
| 15,000 | | Vornado Realty Trust, Series E, 7.00%, BBB-, Baa3 | | 349,650 |
| | | | | 3,495,724 |
| | | Total Preferred Stocks — 8.8% | | |
| | | (Cost $16,466,812) | | 14,280,541 |
| | | Total Long-Term Investments - 169.1% | | |
| | | (Cost $277,896,958) | | 275,197,639 |
| Principal | | | Optional Call | |
| Amount | | Description | Provisions | Value |
| | | Short-Term Investments — 3.7% | | |
| | | Municipal Bonds — 3.7% | | |
| | | Tennessee — 3.7% | | |
| $ 6,000,000 | | Blount County Public Building Authority, | | |
| | | Local Government Public Improvements-A-4-A, NR, Aa1 | | |
| | | 1.41%, 6/1/2032 (i) | 9/1/10 @ 100.00 | |
| | | (Cost $6,000,000) | | 6,000,000 |
| | | Total Investments — 172.8% | | |
| | | (Cost $283,896,958) | | 281,197,639 |
| | | Floating Rate Note Obligations — (4.2%) | | |
| (6,850,000) | | Notes with interest rates ranging from 0.31% to 0.32% on June 30, 2010, | |
| | | and contractual maturities of collateral from 2016 to 2037. | | |
| | | (Cost ($6,850,000)) | | (6,850,000) |
| | | Total Net Investments — 168.6% | | |
| | | (Cost $277,046,958) | | 274,347,639 |
| | | Liabilities in excess of Other Assets — (4.1%) | | (6,607,349) |
| | | Preferred Shares, at Liquidation Value — (-64.5% of Net Assets | |
| | | Applicable to Common Shareholders or -37.3% of Total Investments) | (105,000,000) |
| | | Net Assets Applicable to Common Shareholders — 100.0% | $ 162,740,290 |
| | | |
| ADR | | American Depositary Receipt |
| AG | | Stock Corporation |
| AGM | Assured Guaranty Municipal Corp. |
| AMBAC | Ambac Assurance Corporation |
| ASSURED | Assured Guaranty Corporation |
| BHAC | Berkshire Hathaway Assurance Corporation |
| FGIC | | Financial Guaranty Insurance Company |
| FHA | | Guaranteed by Federal Housing Administration |
| LLC | | Limited Liability Corporation |
| N/A | | Not Applicable |
| NV | | Publicly Traded Company |
| PLC | | Public Limited Company |
| PSF | | Permanent School Fund (Texas) |
| REIT | | Real Estate Investment Trust |
| (a) | Security has a step coupon and a convertible feature effective after September 1, 2026 . |
| (b) | Taxable municipal bond issued as part of the Build America Bond program. |
| (c) | Inverse floating rate investment. Interest rate shown is that in effect at June 30, 2010. |
| (d) | Underlying security related to inverse floating rate investment entered into by the Fund. |
| (e) | Non-income producing security. |
| (f) | Floating or variable rate coupon. The rate shown is as of June 30, 2010. |
| (g) | Security is a hybrid bond that will convert to a preferred stock on the first call date. |
| (h) | Securities are exempt from registration under Rule 144A of the Securities Act of 1933. These securities may be |
| | resold in transactions exempt from registration, normally to qualified institutional buyers. At June 30, 2010, these |
| | securities amounted to $445,474, which represents 0.27% of net assets applicable to common shares. |
| (i) | Security has a maturity of more than one year, but has variable rate and demand features which qualify it as a |
| | short-term security. The rate shown is that earned by the Fund as of June 30, 2010. |
Ratings shown are per Standard & Poor’s and Moody’s. Securities classified as NR are not rated.
All percentages shown in the Portfolio of Investments are based on Net Assets Applicable to Common Shareholders unless otherwise noted.
See notes to financial statements.
18 | Semiannual Report | June 30, 2010
TYW | TS&W/Claymore Tax-Advantaged Balanced Fund
Statement of Assets and Liabilities| June 30, 2010 (unaudited)
| Assets | | |
| Investments in securities, at value (cost $283,896,958) | $ | 281,197,639 | |
| Interest receivable | | 2,946,607 | |
| Dividends receivable | | 290,501 | |
| Other assets | | 13,743 | |
Total assets | | 284,448,490 | |
| Liabilities | | | |
| Floating rate note obligations | | 6,850,000 | |
| Payable for securities purchased | | 6,702,221 | |
| Custodian bank | | 2,830,810 | |
| Advisory fee payable | | 156,944 | |
| Administration fee payable | | 5,717 | |
| Dividend payable - preferred shares | | 5,298 | |
| Accrued expenses and other liabilities | | 157,210 | |
| Total liabilities | | 16,708,200 | |
| Preferred Shares, at Redemption Value | | | |
| $.01 par value per share; 4,200 Auction Market Preferred Shares authorized, | | | |
| issued and outstanding at $25,000 per share liquidation preference | | 105,000,000 | |
| Net Assets Applicable to Common Shareholders | $ | 162,740,290 | |
| Composition of Net Assets Applicable to Common Shareholders | | | |
| Common stock, $.01 par value per share; unlimited number of shares authorized, 15,407,000 shares issued and outstanding | $ | 154,070 | |
| Additional paid-in capital | | 218,557,393 | |
| Accumulated net realized loss on investments and swaps | | (53,127,199 | ) |
| Net unrealized depreciation on investments | | (2,699,319 | ) |
| Accumulated distributions in excess of net investment income | | (144,655 | ) |
| Net Assets Applicable to Common Shareholders | $ | 162,740,290 | |
Net Asset Value Applicable to Common Shareholders (based on 15,407,000 common shares outstanding) | $ | 10.56 | |
See notes to financial statements.
Semiannual Report | June 30, 2010 | 19
TYW | TS&W/Claymore Tax-Advantaged Balanced Fund
Statement of Operations | For the Six Months Ended June 30, 2010 (unaudited)
| | | |
| Investment Income | | |
| Interest | $ 4,692,914 | |
| Dividends (net of foreign withholding taxes of $2,073) | 2,214,613 | |
Total income | | $ 6,907,527 |
| Expenses | | |
| Advisory fee | 963,116 | |
| Professional fees | 96,228 | |
| Preferred share maintenance | 84,989 | |
| Trustees’fees and expenses | 75,720 | |
| Fund accounting | 41,780 | |
| Administration fee | 34,956 | |
| Printing expenses | 28,142 | |
| Custodian fee | 25,392 | |
| Miscellaneous | 17,586 | |
| NYSE listing fee | 10,498 | |
| Insurance | 10,134 | |
| Transfer agent fee | 9,237 | |
| Interest expense on floating rate note obligations | 8,503 | |
Total expenses | | 1,406,281 |
Net investment income | | 5,501,246 |
| Realized and Unrealized Gain (Loss) on Investments | | |
| Net realized gain on: | | |
Investments | | 51,643 |
| Net change in unrealized appreciation (depreciation) on: | | |
Investments | | (6,147,787) |
| Net realized and unrealized gain (loss) on investments | | (6,096,144) |
| Distributions to Preferred Shareholders from | | |
| Net investment income | | (792,501) |
| Net Decrease in Net Assets Applicable to Common Shareholders Resulting from Operations | | $ (1,387,399) |
See notes to financial statements.
20 | Semiannual Report | June 30, 2010
| | | | | |
TYW | TS&W/Claymore Tax-Advantaged Balanced Fund | | | | |
Statement of Changes in Net Assets | | | | |
| Applicable to Common Shareholders| | | | | |
| | For the | | | |
| | Six Months Ended | | For the | |
| | June 30, 2010 | | Year Ended | |
| | (unaudited) | | December 31, 2009 | |
| Increase (Decrease) in Net Assets Applicable to Common Shareholders | | | | |
| Resulting from Operations | | | | |
| Net investment income | $ | 5,501,246 | | | $ | 11,549,549 | |
| Net realized gain (loss) on investments and swaps | | 51,643 | | | | (21,464,737 | ) |
| Net change in unrealized appreciation (depreciation) on investments and swaps | | (6,147,787 | ) | | | 63,093,469 | |
| Distributions to Preferred Shareholders | | | | | | | |
| From net investment income | | (792,501 | ) | | | (1,739,505 | ) |
| Net increase (decrease) in net assets applicable to common shareholders resulting from operations | | (1,387,399 | ) | | | 51,438,776 | |
| Distributions to Common Shareholders: | | | | | | | |
| From and in excess of net investment income | | (5,546,520 | ) | | | (12,210,048 | ) |
| Total increase (decrease) in net assets applicable to common shareholders | | (6,933,919 | ) | | | 39,228,728 | |
| Net Assets | | | | | | | |
| Beginning of period | | 169,674,209 | | | | 130,445,481 | |
| End of period (including distributions in excess of net investment income and accumulated | | | | | | | |
| undistributed net investment income of ($144,655) and $693,120, respectively) | $ | 162,740,290 | | | $ | 169,674,209 | |
See notes to financial statements.
Semiannual Report | June 30, 2010 | 21
| | | | | | | | | | | | | |
TYW | TS&W/Claymore Tax-Advantaged Balanced Fund | | | | | | | | | | | | | |
Financial Highlights | | | | | | | | | | | | | |
| | For the | | | | | | | | | | | |
| Six Months Ended | | For the | | For the | | For the | | For the | | For the | |
| Per share operating performance | June 30, 2010 | | Year Ended | | Year Ended | | Year Ended | | Year Ended | | Year Ended | |
| for a common share outstanding throughout the period | (unaudited) | | December 31, 2009 | | December 31, 2008 | | December 31, 2007 | | December 31, 2006 | | December 31, 2005 | |
| Net asset value, beginning of period | $ | 11.01 | | $ | 8.47 | | $ | 14.94 | | $ | 16.83 | | $ | 15.44 | | $ | 15.47 | |
| Income from investment operations | | | | | | | | | | | | | | | | | | |
Net investment income (a) | | 0.36 | | | 0.75 | | | 0.92 | | | 0.92 | | | 0.91 | | | 0.88 | |
Net realized and unrealized gain (loss) on investments,
options and swaps | | (0.40 | ) | | 2.69 | | | (6.07 | ) | | (1.08 | ) | | 1.79 | | | 0.29 | |
| Distributions to preferred shareholders | | | | | | | | | | | | | | | | | | |
From and in excess of net investment income (common
share equivalent basis) | | (0.05 | ) | | (0.11 | ) | | (0.31 | ) | | (0.30 | ) | | (0.37 | ) | | (0.26 | ) |
| From realized gains (common share equivalent basis) | | – | | | – | | | – | | | (0.11 | ) | | – | | | – | |
Total distributions to Preferred Shareholders | | (0.05 | ) | | (0.11 | ) | | (0.31 | ) | | (0.41 | ) | | (0.37 | ) | | (0.26 | ) |
| Total from investment operations | | (0.09 | ) | | 3.33 | | | (5.46 | ) | | (0.57 | ) | | 2.33 | | | 0.91 | |
| Distributions to common shareholders | | | | | | | | | | | | | | | | | | |
| From and in excess of net investment income | | (0.36 | ) | | (0.79 | ) | | (1.01 | ) | | (0.95 | ) | | (0.94 | ) | | (0.94 | ) |
| From realized gains | | – | | | – | | | – | | | (0.37 | ) | | – | | | – | |
Total distributions to common shareholders | | (0.36 | ) | | (0.79 | ) | | (1.01 | ) | | (1.32 | ) | | (0.94 | ) | | (0.94 | ) |
Common and preferred shares’offering expenses charged to
paid-in capital | | – | | | – | | | – | | | – | | | – | | | – | (d) |
| Net asset value, end of period | $ | 10.56 | | $ | 11.01 | | $ | 8.47 | | $ | 14.94 | | $ | 16.83 | | $ | 15.44 | |
| Market value, end of period | $ | 9.53 | | $ | 9.54 | | $ | 6.65 | | $ | 13.10 | | $ | 15.77 | | $ | 13.35 | |
Total investment return (b) | | | | | | | | | | | | | | | | | | |
| Net asset value | | -0.91 | % | | 41.34 | % | | -37.97 | % | | -3.60 | % | | 15.50 | % | | 6.02 | % |
| Market value | | 3.52 | % | | 57.57 | % | | -43.70 | % | | -8.97 | % | | 25.98 | % | | 4.80 | % |
| Ratios and supplemental data | | | | | | | | | | | | | | | | | | |
Net assets applicable to common shareholders, end
of period (thousands) | $ | 162,740 | | $ | 169,674 | | $ | 130,445 | | $ | 230,202 | | $ | 259,334 | | $ | 237,818 | |
| Preferred shares, at liquidation value ($25,000 per share | | | | | | | | | | | | | | | | | | |
liquidation preference) (thousands) | $ | 105,000 | | $ | 105,000 | | $ | 120,000 | | $ | 120,000 | | $ | 120,000 | | $ | 120,000 | |
| Preferred shares asset coverage per share | $ | 63,748 | | $ | 65,399 | | $ | 52,176 | | $ | 72,959 | | $ | 79,028 | | $ | 74,545 | |
Ratios to average net assets applicable to common
shareholders: | | | | | | | | | | | | | | | | | | |
Total expenses (excluding interest expense on
floating rate note obligations) | | 1.63 | %(e) | | 1.93 | % | | 1.67 | % | | 1.44 | % | | 1.46 | % | | 1.52 | % |
Total expenses (including interest expense on
floating rate note obligations (c)) | | 1.64 | %(e) | | 1.94 | % | | 1.72 | % | | 1.53 | % | | 1.50 | % | | – | |
Net investment income, prior to effect of dividends to
preferred shares | | 6.43 | %(e) | | 7.92 | % | | 7.48 | % | | 5.60 | % | | 5.70 | % | | 5.73 | % |
Net investment income, after effect of dividends to
preferred shares | | 5.51 | %(e) | | 6.73 | % | | 4.97 | % | | 3.81 | % | | 3.41 | % | | 4.05 | % |
| Portfolio turnover rate | | 80 | % | | 151 | % | | 181 | % | | 114 | % | | 159 | % | | 103 | % |
Asset coverage per $1,000 unit of indebtedness(f) | $ | 40,086 | | $ | 41,098 | | $ | – | | $ | 74,727 | | $ | 29,902 | | $ | – | |
| (a) | Based on average shares outstanding during the period. |
| (b) | Total investment return is calculated assuming a purchase of a common share at the beginning of the period and a sale on the last day of the period reported either at net asset value (“NAV”) or market price per share. Dividends and distri- butions are assumed to be reinvested at NAV for NAV returns or the prices obtained under the Fund’s Dividend Reinvestment Plan for market value returns.Total investment return does not reflect brokerage commissions. A return calculated for a period of less than one year is not annualized. |
| (c) | See note 2(d) of the Notes to Financial Statements for more information on floating rate note obligations. |
| (d) | Amount is less than $0.01. |
| (e) | Annualized. |
| (f) | Calculated by subtracting the Fund’s total liabilities (not including the floating rate note obligations) from the Fund’s total assets and dividing by the total number of indebtedness units, where one unit equals $1,000 of indebtedness. |
See notes to financial statements.
22 | Semiannual Report | June 30, 2010
TYW | TS&W/Claymore Tax-Advantaged Balanced Fund
Notes to Financial Statements| June 30, 2010 (unaudited)
Note 1 – Organization:
TS&W/Claymore Tax-Advantaged Balanced Fund (the “Fund”) was organized as a Delaware statutory trust on February 12, 2004. The Fund is registered as a diversified, closed-end management investment company under the Investment Company Act of 1940.
Under normal market conditions, the Fund will invest at least 50%, but less than 60%, of its total assets in debt securities and other obligations issued by or on behalf of states, territories and possessions of the United States and the District of Columbia and their political subdivisions, agencies and instrumentalities, the interest on which is exempt from regular federal income tax and which is not a preference item for purposes of the alternative minimum tax (the “Municipal Securities Portfolio”) and at least 40%, but less than 50%, of its total assets in common stocks, preferred securities and other income securities (the “Equity and Income Securities Portfolio”).
Note 2 – Accounting Policies:
The preparation of the financial statement in accordance with U.S. generally accepted accounting principles (“GAAP”) requires management to make estimates and assumptions that affect the reported amounts and disclosures in the financial statements. Actual results could differ from these estimates.
The following is a summary of significant accounting policies consistently followed by the Fund.
(a) Valuation of Investments
The Fund values equity securities at the last reported sale price on the principal exchange or in the principal Over-the-Counter (“OTC”) market in which such securities are traded, as of the close of regular trading on the New York Stock Exchange (“NYSE”) on the day the securities are being valued or, if there are no sales, at the mean between the last available bid and asked prices on that day. Securities traded on the NASDAQ are valued at the NASDAQ Official Closing Price. Preferred stocks are valued at their sales price as of the close of the exchange on which they are traded. Preferred stocks for which the last sales price is not available are valued at the last available bid price. Debt securities are valued at the last available bid price for such securities or, if such prices are not available, at prices for securities of comparable maturity, quality and type. Foreign securities are translated from the local currency into U.S. dollars using the current exchange rate. The Fund’s securities that are primarily traded in foreign markets may be traded in such markets on days that the NYSE is closed. As a result, the net asset value of the Fund may be significantly affected on days when holders of common shares have no ability to trade common shares on the NYSE. Investment Companies are valued at the last available closing price. For those securities where quotations or prices are not available, valuations are determined in accordance with procedures established in good faith by the Board of Trustees. Short-term securities with remaining maturities of 60 days or less are valued at amortized cost, which approximates market value.
For those securities whose quotations or prices are not available, the valuations are determined in accordance with procedures established in good faith by the Board of Trustees. Valuations in accordance with these procedures are intended to reflect each security’s (or asset’s) “fair value”. Such “fair value” is the amount that the Fund might reasonably expect to receive for the security (or asset) upon its current sale. Each such determination should be based on a consideration of all relevant factors, which are likely to vary from one pricing context to another. Examples of such factors may include, but are not limited to: (i) the type of security, (ii) the initial cost of the security, (iii) the existence of any contractual restrictions on the security’s disposition, (iv) the price and exten t of public trading in similar securities of the issuer or of comparable companies, (v) quotations or evaluated prices from broker-dealers and/or pricing services, (vi) information obtained from the issuer, analysts, and/or the appropriate stock exchange (for exchange traded securities), (vii) an analysis of the company’s financial statements, and (viii) an evaluation of the forces that influence the issuer and the market(s) in which the security is purchased and sold (e.g. the existence of pending merger activity, public offerings or tender offers that might affect the value of the security).
In accordance with ASC 820, Fair Value Measurements and Disclosures, fair value is defined as the price that the Fund would receive to sell an investment or pay to transfer a liability in an orderly transaction with an independent buyer in the principal market, or in the absence of a principal market the most advantageous market for the investment or liability. ASC 820 establishes three different categories for valuations. Level 1 valuations are those based upon quoted prices in active markets. Level 2 valuations are those based upon quoted prices in inactive markets or based upon significant observable inputs (e.g. yield curves; benchmark interest rates; indices). Level 3 valuations are those based upon unobservable inputs (e.g. discounted cash flow analysis; non-market based methods used to determine fair valuation). The following ta ble represents the Fund’s investments carried on the Statement of Assets and Liabilities by caption and by level within the fair value hierarchy as of June 30, 2010:
| | | | | | | | | |
| Description | Level 1 | | Level 2 | | Level 3 | | Total | |
| (value in $000s) | | | | | | | | |
| Assets: | | | | | | | | |
| Municipal Bonds | | $ | – | | | $ | 160,623 | | | $ | – | | | $ | 160,623 | |
| Common Stocks | | | 89,278 | | | | – | | | | – | | | | 89,278 | |
| Corporate Bonds | | | – | | | | 17,016 | | | | – | | | | 17,016 | |
| Preferred Stocks | | | 14,281 | | | | – | | | | – | | | | 14,281 | |
| Total | | $ | 103,559 | | | $ | 177,639 | | | $ | – | | | $ | 281,198 | |
The Fund has adopted the Accounting Standard Update, Fair Value Measurements and Disclosures (Topic 820): Improving Disclosures about Fair Value Measurements which provides guidance on how investment assets and liabilities are to be valued and disclosed. Specifically, the amendment requires reporting entities to disclose i) the input and valuation techniques used to measure fair value for both recurring and nonrecurring fair value measurements, for Level 2 or Level 3 positions ii) transfers between all levels (including Level 1 and Level 2) on a gross basis (i.e. transfers out must be disclosed separately from transfers in) as well as the reasons(s) for the transfer and iii) purchases, sales, issuances and settlements on a gross basis in the Level 3 rollforward rather than as one net number. The effective date of the amendment is for interim and annual periods beginning after December 15, 2009 however, the requirement to provide the Level 3 activity for purchases, sales, issuances and settlements on a gross basis will be effective for interim and annual periods beginning after December 15, 2010. The fund values its current Level 2 securities through independent pricing providers who employ matrix pricing models utilizing market prices, broker quotes and prices of securities with comparable maturities and qualities. There were no transfers between Level 1 and Level 2 during the six months ended June 30, 2010.
(b) Investment Transactions and Investment Income
Investment transactions are accounted for on the trade date. Realized gains and losses on investments are determined on the identified cost basis. Dividend income is recorded net of applicable withholding taxes on the ex-dividend date and interest income is recorded on an accrual basis. Discounts or premiums on debt securities purchased are accreted or amortized to interest income over the lives of the respective securities using the effective interest method.
(c) Distributions to Shareholders
The Fund declares and pays quarterly dividends to common shareholders. These dividends consist of tax-exempt income and investment company taxable income, which generally includes qualified dividend income, ordinary income and short-term capital gains. Any net realized long-term capital gains are distributed annually to common shareholders.
Semiannual Report | June 30, 2010 | 23
TYW | TS&W/Claymore Tax-Advantaged Balanced Fund | Notes to Financial Statements (unaudited) continued
Distributions to shareholders are recorded on the ex-dividend date. The amount and timing of distributions are determined in accordance with federal income tax regulations, which may differ from U.S. generally accepted accounting principles.
(d) Inverse Floating Rate Investments and Floating Rate Note Obligations
Inverse floating rate instruments are notes whose coupon rate fluctuates inversely to a predetermined interest rate index. These instruments typically involve greater risks than a fixed rate municipal bond. In particular, the holder of these inverse floating rate instruments retain all credit and interest rate risk associated with the full underlying bond and not just the par value of the inverse floating rate instrument. As such, these instruments should be viewed as having inherent leverage and therefore involve many of the risks associated with leverage. Leverage is a speculative technique that may expose the Fund to greater risk and increased costs. Leverage may cause the Fund’s net asset value to be more volatile than if it had not been leveraged because leverage tends to magnify the effect of any increases or decreases in t he value of the Fund’s portfolio securities. The use of leverage may also cause the Fund to liquidate portfolio positions when it may not be advantageous to do so in order to satisfy its obligations with respect to inverse floating rate instruments. The Fund may invest in inverse floating rate securities through either a direct purchase or through the transfer of bonds to a dealer trust in exchange for cash and/or residual interests in the dealer trust.
For those inverse floating rate securities purchased directly, the instrument is included in the Portfolio of Investments with income recognized on an accrual basis.
For those inverse floating rate securities purchased through a transfer of a fixed rate bond to a dealer trust in exchange for cash and/or residual interests in the dealer trusts’assets and cash flows, ASC 860, Transfers and Servicing (“ASC 860”) (formerly known as SFAS No. 140) calls for this transaction to be accounted for as a financing by the dealer trust of the transferred fixed rate bond. In these transactions, the dealer trusts fund the purchases of the fixed rate bonds by issuing floating rate notes to third parties and allowing the Fund to retain residual interests in the bonds. The residual interests held by the Fund (the inverse floating rate investments) include the right of the Fund to cause the holders of the floating rate notes to tender their notes at par at the next interest rate reset date and to tra nsfer the municipal bond from the dealer trusts to the Fund, thereby collapsing the dealer trusts. The Fund accounts for the transfer of bonds to the dealer trusts as secured borrowings, with the securities transferred remaining in the Fund’s Portfolio of Investments, and the related floating rate notes reflected as a liability under the caption ‘‘Floating rate note obligations’’ on the Statement of Assets and Liabilities. The Fund records the interest income from the fixed rate bonds under the caption ‘‘Interest’’ and records the expenses related to floating rate note obligations and any administrative expenses of the dealer trusts under the caption‘‘Interest expense on floating rate note obligations’’on the Fund’s Statement of Operations. The notes issued by the dealer trusts have interest rates that reset weekly and the floating rate note holders have the option to tender their notes to the dealer trusts for redemption at par at each reset date. At June 30, 2010, Fund investments with a par value of $13,700,000 (market value of approximately $15,700,000) are held by the dealer trusts and serve as collateral for the $6,850,000 in floating rate notes outstanding at that date. Contractual maturities of the floating rate notes and interest rates in effect at June 30, 2010 are presented on the Portfolio of Investments. The average floating rate notes balance and average annual interest rate during the period ended June 30, 2010 were $ 6,850,000 and 0.25%, respectively.
Note 3 – Investment Advisory Agreement, Investment Sub-Advisory Agreement and Other Agreements:
Pursuant to an Investment Advisory Agreement (the “Advisory Agreement”) between the Fund and Claymore Advisors, LLC (the “Adviser”), the Adviser is responsible for managing, either directly or through others selected by it, the investment activities of the Fund and the Fund’s business affairs and other administrative matters. The Adviser receives a fee, payable monthly, at an annual rate equal to 0.70% of the Fund’s average daily managed assets (total assets including the assets attributable to the proceeds from any financial leverage but excluding the assets attributable to floating rate note obligations, minus liabilities, other than debt representing financial leverage).
The Adviser has entered into an Investment Sub-Advisory Agreement (the “Sub-Advisory Agreement”) with Thompson, Siegel & Walmsley LLC (“TS&W”). TS&W is responsible for day-to-day portfolio management of the Fund’s assets allocated to the Equity and Income Securities Portfolio. Under the terms of the Sub-Advisory Agreement between the Adviser and TS&W, the Adviser pays monthly to TS&W a fee at the annual rate of 0.42% of the Fund’s average daily managed assets attributable to the Equity and Income Securities Portfolio.
On July 11, 2006, the Adviser entered into an Investment Sub-Advisory Agreement (the “Sub-Advisory Agreement 2”) with SMC Fixed Income Management, LP (“SMC”). SMC is responsible for day-to-day portfolio management of the Fund’s assets allocated to the Municipal Securities Portfolio. Under the terms if the Sub-Advisory Agreement 2 between the Adviser and SMC, the Adviser pays monthly to SMC a fee at the annual rate of 0.30% of the Fund’s average daily managed assets attributable to the Municipal Securities Portfolio. Prior to July 11, 2006 the Adviser was responsible for the day-to-day portfolio management for the Municipal Securities Portfolio.
On October 15, 2009, Guggenheim Partners LLC, (“Guggenheim”), a global diversified financial services firm, and Claymore Group Inc., parent of the Adviser, announced the completion of a previously announced merger. The closing of this transaction took place on October 14, 2009 (“The Effective Date”). This transaction resulted in a change-of-control whereby Claymore Group Inc. and its subsidiaries, including the Adviser, became indirect, wholly-owned subsidiaries of Guggenheim. The transaction has not affected the daily operations of the Fund or the investment activities or the investment management activities of the Adviser.
Under the Investment Company Act of 1940, as amended, (the “1940 Act”), the consummation of this transaction resulted in the automatic termination of the Fund’s Advisory Agreement, Sub-Advisory Agreement, and Sub-Advisory Agreement 2.
On September 28, 2009, the Board of Trustees approved a new investment advisory agreement between the Fund and the Adviser (the “New Advisory Agreement”), a new sub-advisory agreement among the Fund, the Adviser and TS&W (the “New TS&W Sub-Advisory Agreement”), and a new sub-advisory agreement among the Fund, the Adviser and SMC (the “New SMC Sub-Advisory Agreement” and together with the New Advisory Agreement and New TS&W Sub-Advisory Agreement, the “New Agreements”) and recommended that the New Agreements be submitted to the shareholders of the Fund for their approval. The New Agreements, which were approved by shareholders on February 18, 2010, have an initial term of one year. Thereafter, the New Agreements will continue in effect only if their continuance is annually appr oved by the Board of Trustees. Other than effective dates, there are no material differences between the terms of the New Agreements and those of the original Advisory Agreement and Sub-Advisory Agreements.
24 | Semiannual Report | June 30, 2010
TYW | TS&W/Claymore Tax-Advantaged Balanced Fund | Notes to Financial Statements (unaudited) continued
The Bank of New York Mellon (“BNY”) acts as the Fund’s custodian, accounting agent, auction agent and transfer agent. As custodian, BNY is responsible for the custody of the Fund’s assets. As accounting agent, BNY is responsible for maintaining the books and records of the Fund’s securities and cash. As auction agent, BNY is responsible for conducting the auction of the preferred shares. As transfer agent, BNY is responsible for performing transfer agency services for the Fund.
Under a separate Fund Administration agreement (the “Administration Agreement”), the Adviser provides fund administration services to the Fund. As compensation for services performed under the Administration Agreement, the Adviser receives an administration fee payable monthly at the annual rate set forth below as a percentage of the average daily managed assets of the Fund:
| | |
| Managed Assets | Rate |
| First $200,000,000 | 0.0275% |
| Next $300,000,000 | 0.0200% |
| Next $500,000,000 | 0.0150% |
| Over $1,000,000,000 | 0.0100% |
Certain officers and trustees of the Fund are also officers and directors of the Adviser, TS&W and SMC. The Fund does not compensate its officers or trustees who are officers of the aforementioned firms.
Note 4 – Federal Income Taxes:
The Fund intends to comply with the requirements of Subchapter M of the Internal Revenue Code of 1986, as amended, applicable to regulated investment companies. Accordingly, no provision for U.S. federal income taxes is required. In addition, by distributing substantially all of its ordinary income and long-term capital gains, if any, during each calendar year, the Fund intends not to be subject to U.S. federal excise tax.
Information on the tax components of investments and net assets as of June 30, 2010 is as follows:
| | | | |
| Cost of | | | Net Tax |
| Investments | Gross Tax | Gross Tax | Unrealized |
| for Tax | Unrealized | Unrealized | Depreciation |
| Purposes | Appreciation | Depreciation | on Investments |
| $284,737,798 | $11,942,252 | ($15,482,411) | ($3,540,159) |
Tax components of the following balances as of December 31, 2009, (the most recent fiscal year end for federal income tax purposes) are as follows:
| | |
| | Undistributed |
| | Long-Term |
| Undistributed | Gains/ |
| Ordinary | (Accumulated |
| Income* | Capital Loss) |
| $734,370 | $(52,379,252) |
*Includes tax-exempt income.
The differences between book basis and tax basis unrealized appreciation/(depreciation) is attributable to additional income accrued for tax purposes on certain preferred stocks and investments in real estate investment trusts.
At December 31, 2009, (the most recent fiscal year end for federal income tax purposes), the Fund has a capital loss carryforward of $52,243,833 available to offset future capital gains. Of the capital loss carryforward, $23,316,538 is set to expire on December 31, 2016, and $28,927,295 is set to expire on December 31, 2017.
Capital losses incurred after October 31 (“post-October”losses) within the taxable year are deemed to arise on the first business day of the Fund’s next taxable year. The Fund incurred and will elect to defer capital losses of $135,419.
For the year ended December 31, 2009, (the most recent fiscal year end for federal income tax purposes), the tax character of distributions paid to common and preferred shareholders as reflected in the Statement of Changes in Net Assets was as follows:
| | |
| Distributions paid from: | 2009 |
| Ordinary income* | $ 4,736,647 |
| Tax-exempt income | $ 9,212,906 |
| Total Distributions | $13,949,553 |
* For the year ended December 31, 2009 the Fund received approximately $4.2 million of qualified dividend income.
For all open tax years and all major jurisdictions, management of the Fund has concluded that there are no significant uncertain tax positions that would require recognition in the financial statements. Open tax years are those that are open for examination by taxing authorities (i.e. generally the last four tax year ends and the interim tax period since then). Furthermore, management of the Fund is also not aware of any tax positions for which it is reasonably possible that the total amounts of unrecognized tax benefits will significantly change in the next twelve months.
Note 5 – Investment in Securities:
For the period ended June 30, 2010, purchases and sales of investments, excluding short-term securities, were $217,995,117 and $213,596,811, respectively.
Note 6 – Derivatives:
(a) Swaps
A swap is an agreement to exchange the return generated by one instrument for the return generated by another instrument. The Fund may enter into swap agreements to manage its exposure to interest rates and/or credit risk or to generate income. The swaps are valued daily at current market value and any unrealized gain or loss is included in the Statement of Assets and Liabilities. Gain or loss is realized on the termination date of the swap and is equal to the difference between the Fund’s basis in the swap and the proceeds of the closing transaction, including any fees. During the period that the swap agreement is open, the Fund may be subject to risk from the potential inability of the counterparty to meet the terms of the agreement. The swaps involve elements of both market and credit risk in excess of the amounts reflected on the Statement of Assets and Liabilities. Upon termination of a swap agreement, a payable to or receivable from swap counterparty is established on the Statement of Assets and Liabilities to reflect the net gain/loss, including interest income/expense, on terminated swap positions. The line item is removed upon settlement according to the terms of the swap agreement.
Realized gain (loss) upon termination of swap contracts is recorded on the Statement of Operations. Fluctuations in the value of swap contracts are recorded as a component of net change in unrealized appreciation (depreciation) of swap contracts. Net periodic payments received by the Fund are included as part of realized gain (loss) and, in the case of accruals for periodic payments, are included as part of unrealized appreciation (depreciation) on the Statement of Operations.
As of June 30, 2010, there were no swap contracts outstanding during the period.
Semiannual Report | June 30, 2010 | 25
TYW | TS&W/Claymore Tax-Advantaged Balanced Fund | Notes to Financial Statements (unaudited) continued
(b) Accounting Pronouncement for Derivatives:
The Fund adopted FASB ASC 815, Derivatives and Hedging (“ASC 815”) (formerly known as SFAS No. 161), effective January 1, 2009. ASC 815 is intended to improve financial reporting about derivative instruments by requiring enhanced disclosures to enable investors to better understand: a) how and why a fund uses derivative instruments, b) how derivatives instruments and related hedge fund items are accounted for, and c) how derivative instruments and related hedge items affect a fund’s financial position, results of operations and cash flows.
There were no derivative positions outstanding as of June 30, 2010.
Note 7 – Capital:
Common Shares
The Fund has an unlimited amount of common shares, $0.01 par value, authorized and 15,407,000 issued and outstanding. In connection with the Fund’s dividend reinvestment plan, the Fund did not issue any shares during the period ended June 30, 2010 or the year ended December 31, 2009.
Preferred Shares
On April 29, 2004, the Fund’s Board of Trustees authorized the issuance of preferred shares, in addition to the existing common shares, as part of the Fund’s leverage strategy. The Fund may also borrow or issue debt securities collectively with preferred shares for leveraging purposes. Preferred shares issued by the Fund have seniority over the common shares.
On July 1, 2004, the Fund issued 2,400 shares of Preferred Shares Series M7 and 2,400 shares of Preferred Shares Series T28 each with a net asset and liquidation value of $25,000 per share plus accrued dividends. Dividends are accumulated daily at an annual rate set through auction procedures. Distribution of net realized capital gains, if any, are paid annually. On February 27, 2009, the Fund announced the redemption of 100 shares of each series of Auction Market Preferred Shares (“AMPS”). On March 10, 2009, the Fund announced the redemption of 200 shares of each series of AMPS. Bank of New York Mellon is the auction agent and provides administrative, transfer agency, and dividend distribution services for the preferred shares.
The broad auction-rate preferred securities market, including the Fund’s AMPS, has experienced considerable disruption since February 2008. The result has been failed auctions on nearly all auction-rate preferred shares, including the Fund’s AMPS. A failed auction is not a default, nor does it require the redemption of the Fund’s AMPS. Provisions on the offering documents of the Fund’s AMPS provide a mechanism to set a maximum rate in the event of a failed auction. The maximum rate is LIBOR + 1.25% or LIBOR x 125%, whichever is greater.
For the period ended June 30, 2010, the annualized dividend rates ranged from:
| | | | |
| | High | Low | At 6/30/10 |
| Series M7 | 1.58% | 1.46% | 1.58% |
| Series T28 | 1.60% | 1.48% | 1.60% |
The Fund is subject to certain limitations and restrictions while preferred shares are outstanding. Failure to comply with these limitations and restrictions could preclude the Fund from declaring any dividends or distributions to common shareholders or repurchasing common shares and/or could trigger the mandatory redemption of Preferred Shares at their liquidation value.
Preferred shares, which are entitled to one vote per share, generally vote with the common stock but vote separately as a class to elect two Trustees and on any matters affecting the rights of the preferred shares.
Note 8 – Indemnifications:
In the normal course of business, the Fund enters into contracts that contain a variety of representations, which provide general indemnifications. The Fund’s maximum exposure under these arrangements is unknown, as this would require future claims that may be made against the Fund that have not yet occurred. However, the Fund expects the risk of loss to be remote.
Note 9– Subsequent Events
On August 2, 2010, the Fund announced that it is increasing its quarterly dividend to $0.20 per share, effective with its September 2010 dividend.
26 | Semiannual Report | June 30, 2010
TYW | TS&W/Claymore Tax-Advantaged Balanced Fund
Supplemental Information| (unaudited)
Federal Income Tax Information
In January 2011, you will be advised on IRS Form 1099 DIV or substitute 1099 DIV as to the federal tax status of the distributions received by you in the calendar year 2010.
Result of Shareholder Votes
The Annual Meeting of Shareholders of the Fund was held on January 12, 2010, and adjourned until February 18, 2010. At the February 18, 2010, meeting common shareholders voted on the election of Trustees and the proposal for a new Investment Advisory Agreement and Investment Sub-Advisory Agreement.
With regard to the election of the following Trustees by common shareholders of the Fund and the proposal for the new Advisory Agreement and Sub-Advisory Agreements:
| | | | |
| | # of Shares | # of Shares | # of Shares |
| | In Favor | Against | Withheld |
| New Advisory Agreement | 7,004,421 | 660,675 | 358,929 |
| New TS&W Sub-Advisory Agreement | 6,965,495 | 685,425 | 367,105 |
| New SMC Sub-Advisory Agreement | 6,954,620 | 685,607 | 377,799 |
Trustees
The Trustees of the TS&W/Claymore Tax-Advantaged Balanced Fund and their principal occupations during the past five years:
| | | | Number of | |
| Name, Address*, | Term of | | Portfolios in the | |
| Year of Birth | Office** | | Fund Complex*** | |
| and Position(s) | and Length of | Principal Occupations During the Past Five Years | Overseen by | Other Directorships |
| Held with Registrant | Time Served | and Other Affiliations | Trustee | Held by Trustee |
| Independent Trustees: | | | | |
| Randall C. Barnes | Since 2005 | Private Investor (2001-present). Formerly, Senior Vice President & Treasurer, PepsiCo., Inc. | 52 | None. |
| Year of Birth: 1951 | | (1993-1997), President, Pizza Hut International (1991-1993) and Senior Vice President, | | |
| Trustee | | Strategic Planning and New Business Development (1987-1990) of PepsiCo, Inc. (1987-1997). | | |
| Steven D. Cosler | Since 2005 | Retired. Formerly, President, Chief Executive Officer and Director of Priority Healthcare | 2 | Director, SXC Health Solutions. |
| Year of Birth: 1955 | | Corp.(2002-2005). Formerly, President and Chief Operating Officer of Priority Healthcare | | |
| Trustee | | Corp.(2001-2002). Formerly, Executive Vice President and Chief Operating Officer of Priority | | |
| | | Healthcare Corp.(2000-2001). | | |
| Robert M. Hamje | Since 2004 | Retired. Formerly, President and Chief Investment Officer of TRW Investment Management | 2 | Trustee, Old Mutual Advisor Mutual Funds. |
| Year of Birth: 1942 | | Co. (1990-2003). | | |
| Trustee | | | | |
| L. Kent Moore | Since 2004 | Owner, Eagle River Ventures, LLC (1999-present) and Chairman Foothills Energy Ventures, | 2 | Trustee, Old Mutual Advisor Mutual Funds. |
| Year of Birth: 1955 | | LLC (2006-present). Formerly, Partner at WilSource Enterprise (2005-2006). Managing Director | | |
| Trustee | | High Sierra Energy L.P., (2004-2005). Portfolio Manager and Vice President of Janus Capital | | |
| | | Corp. (2000-2002) and Senior Analyst/Portfolio Manager of Marsico Capital Management | | |
| | | (1997-1999). | | |
| Ronald A. Nyberg | Since 2004 | Partner of Nyberg & Cassioppi, LLC, a law firm specializing in corporate law, estate planning and | 54 | None. |
| Year of Birth: 1953 | | business transactions (2000-present). Formerly, Executive Vice President, General Counsel and | | |
| Trustee | | Corporate Secretary of Van Kampen Investments (1982-1999). | | |
| Ronald E. Toupin, Jr. | Since 2004 | Retired. Formerly, Vice President, Manager and Portfolio Manager of Nuveen Asset Management | 51 | None. |
| Year of Birth: 1958 | | (1998-1999), Vice President of Nuveen Investment Advisory Corp. (1992-1999), Vice President | | |
| Trustee | | and Manager of Nuveen Unit Investment Trusts (1991-1999), and Assistant Vice President and | | |
| | | Portfolio Manager of Nuveen Unit Investment Trusts (1988-1999), each of John Nuveen & | | |
| | | Company, Inc. (1982-1999). | | |
| Interested Trustees: | | | | |
| Matthew J. Appelstein† | Since 2005 | Senior Vice President of Product Strategy and Retirement Solutions Planning, Director of | 1 | None. |
| Year of Birth: 1961 | | Investment Services, Old Mutual Asset Management (2003-present). Formerly, Senior Vice | | |
| Trustee | | President of Consulting Relationships, Fidelity Management Trust Co.(1998-2003). | | |
| * | Address for all Trustees: 2455 Corporate West Drive, Lisle, IL 60532 |
| ** | After a Trustees’initial term, each Trustee is expected to serve a three-year term concurrent with the class of Trustees for which he serves: -Messrs. Barnes and Hamje, as Class I Trustees, are expected to stand for re-election at the Fund’s 2011 annual meeting of shareholders. |
| | -Messrs. Appelstein, Moore and Nyberg, as Class II Trustees, are expected to stand for re-election at the Fund’s 2012 annual meeting of shareholders. -Messrs. Cosler and Toupin, as Class III Trustees, are expected to stand for re-election at the Fund’s 2013 annual meeting of shareholders. |
| *** | The Claymore Fund Complex consists of U.S. registered investment companies advised or serviced by Claymore Advisors, LLC or Claymore Securities, Inc. The Claymore Fund Complex is overseen by multiple Boards of Trustees. |
| † | Mr. Appelstein is an “interested person”(as defined in Section 2(a)(19) of the 1940 Act) of the Fund because of his position as an officer of Old Mutual Asset Management, the parent company of the Fund’s Sub-Adviser. |
Semiannual Report | June 30, 2010 | 27
TYW | TS&W/Claymore Tax-Advantaged Balanced Fund |Supplemental Information (unaudited) continued
Officers
The Officers of the TS&W/Claymore Tax-Advantaged Balanced Fund and their principal occupations during the past five years:
| Name, Address*, | Term of Office** | |
Year of Birth and | and Length of | |
| Position(s) Held | Time | Principal Occupations During the Past Five Years |
| with Registrant | Served | and Other Affiliations |
| Officers: | | |
| J. Thomas Futrell | Since 2008 | Senior Managing Director, Chief Investment Officer of Claymore Advisors, LLC and Claymore Securities, Inc.; Chief Executive Officer of certain |
| Year of Birth: 1955 | | other Funds advised by Claymore Advisors, LLC (2008-present). Formerly, Managing Director in charge of Research for Nuveen Asset |
| Chief Executive Officer | | Management. (2000-2007). |
| Kevin Robinson | Since 2008 | Senior Managing Director and General Counsel of Claymore Advisors, LLC, Claymore Securities, Inc. and Claymore Group, Inc.(2007-present). |
| Year of Birth: 1959 | | Chief Legal Officer of certain other funds in the Fund Complex. Formerly, Associate General Counsel and Assistant Corporate Secretary of NYSE |
| Chief Legal Officer | | Euronext, Inc. (2000-2007). |
| Steven M. Hill | Since 2004 | Senior Managing Director of Claymore Advisors, LLC and Claymore Securities, Inc.(2005-present); Formerly, Chief Financial Officer of Claymore |
| Year of Birth: 1964 | | Group, Inc.(2005-2006); Managing Director of Claymore Advisors, LLC and Claymore Securities, Inc.(2003-2005). Formerly, Treasurer of Henderson |
| Chief Financial | | Global Funds and Operations Manager for Henderson Global Investors (NA) Inc.,(2002-2003). Formerly, Managing Director, Front Point Partners |
| Officer, Chief | | LLC (2001-2002). Formerly, Vice President, Nuveen Investments (1999-2001). |
| Accounting Officer | | |
| and Treasurer | | |
| Vincent R. Giordano | Since 2004 | Senior Managing Director of SMC Fixed Income Management, LP.(2006-present). Formerly, Senior Managing Director of Claymore Advisors, LLC |
| Year of Birth: 1948 | | (2004-2006). Formerly, Senior Vice President and Portfolio Manager of Merrill Lynch Asset Management, Inc.(1985-2001). |
| Vice President | | |
| George Gregorio | Since 2004 | Managing Director of SMC Fixed Income Management, LP (2006-present). Formerly, Managing Director of Claymore Advisors, LLC (2004-2006). |
| Year of Birth: 1949 | | Formerly, Sell Side Analyst for JB Hanauer & Co. |
| Vice President | | |
| Roberto W. Roffo | Since 2004 | Managing Director of SMC Fixed Income Management, LP (2006-present). Formerly, Managing Director of Claymore Advisors, LLC (2004-2006). |
| Year of Birth: 1966 | | Formerly, Director and Vice President of Merrill Lynch Investment Managers. |
| Vice President | | |
| Bruce Saxon | Since 2006 | Vice President, Fund Compliance Officer of Claymore Group, Inc.(2006-present). Formerly, Chief Compliance Officer/Assistant Secretary of Harris |
| Year of Birth: 1957 | | Investment Management, Inc. (2003-2006).Formerly, Director-Compliance of Harrisdirect LLC (1999-2003). |
| Chief Compliance Officer | | |
| Mark E. Mathiasen | Since 2008 | Vice President; Assistant General Counsel of Claymore Securities, Inc. (2007-present). Secretary of certain funds in the Fund Complex. Formerly, |
| Year of Birth: 1978 | | Law Clerk, Idaho State Courts (2003-2006). |
| Secretary | | |
| Elizabeth H. Hudson | Since 2009 | Assistant General Counsel of Claymore Group Inc. (2009-present). Assistant Secretary of certain funds in the Fund Complex. Formerly, Associate at |
| Year of Birth: 1980 | | Bell, Boyd & Lloyd LLP (inka K&L Gates LLP) (2007-2008); J.D., Northwestern University (2004-2007). |
| Assistant Secretary | | |
| * | Address for all Officers: 2455 Corporate West Drive, Lisle, IL 60532 |
| ** | Officers serve at the pleasure of the Board of Trustees and until his or her successor is appointed and qualified or until his or her earlier resignation or removal. |
28 | Semiannual Report | June 30, 2010
TYW | TS&W/Claymore Tax-Advantaged Balanced Fund
Dividend Reinvestment Plan | (unaudited)
Unless the registered owner of common shares elects to receive cash by contacting the Plan Administrator, all dividends declared on common shares of the Fund will be automatically reinvested by The Bank of New York Mellon (the “Plan Administrator”), Administrator for shareholders in the Fund’s Dividend Reinvestment Plan (the “Plan”), in additional common shares of the Fund. Participation in the Plan is completely voluntary and may be terminated or resumed at any time without penalty by notice if received and processed by the Plan Administrator prior to the dividend record date; otherwise such termination or resumption will be effective with respect to any subsequently declared dividend or other distribution. Some brokers may automatically elect to receive cash on your behalf and may re-invest that cash in add itional common shares of the Fund for you. If you wish for all dividends declared on your common shares of the Fund to be automatically reinvested pursuant to the Plan, please contact your broker.
The Plan Administrator will open an account for each common shareholder under the Plan in the same name in which such common shareholder’s common shares are registered. Whenever the Fund declares a dividend or other distribution (together, a “Dividend”) payable in cash, non-participants in the Plan will receive cash and participants in the Plan will receive the equivalent in common shares. The common shares will be acquired by the Plan Administrator for the participants’accounts, depending upon the circumstances described below, either (i) through receipt of additional unissued but authorized common shares from the Fund (“Newly Issued Common Shares”) or (ii) by purchase of outstanding common shares on the open market (“Open-Market Purchases”) on the New York Stock Exchange or elsewhere. I f, on the payment date for any Dividend, the closing market price plus estimated brokerage commission per common share is equal to or greater than the net asset value per common share, the Plan Administrator will invest the Dividend amount in Newly Issued Common Shares on behalf of the participants. The number of Newly Issued Common Shares to be credited to each participant’s account will be determined by dividing the dollar amount of the Dividend by the net asset value per common share on the payment date; provided that, if the net asset value is less than or equal to 95% of the closing market value on the payment date, the dollar amount of the Dividend will be divided by 95% of the closing market price per common share on the payment date. If, on the payment date for any Dividend, the net asset value per common share is greater than the closing market value plus estimated brokerage commission, the Plan Administrator will invest the Dividend amount in common shares acquired on behalf of the participan ts in Open-Market Purchases.
If, before the Plan Administrator has completed its Open-Market Purchases, the market price per common share exceeds the net asset value per common share, the average per common share purchase price paid by the Plan Administrator may exceed the net asset value of the common shares, resulting in the acquisition of fewer common shares than if the Dividend had been paid in Newly Issued Common Shares on the Dividend payment date. Because of the foregoing difficulty with respect to Open-Market Purchases, the Plan provides that if the Plan Administrator is unable to invest the full Dividend amount in Open-Market Purchases during the purchase period or if the market discount shifts to a market premium during the purchase period, the Plan Administrator may cease making Open-Market Purchases and may invest the uninvested portion of the Dividend amount in Newly Issued Common Shares at net asset value per common share at the close of business on the Last Purchase Date provided that, if the net asset value is less than or equal to 95% of the then current market price per common share; the dollar amount of the Dividend will be divided by 95% of the market price on the payment date.
The Plan Administrator maintains all shareholders’accounts in the Plan and furnishes written confirmation of all transactions in the accounts, including information needed by shareholders for tax records. Common shares in the account of each Plan participant will be held by the Plan Administrator on behalf of the Plan participant, and each shareholder proxy will include those shares purchased or received pursuant to the Plan. The Plan Administrator will forward all proxy solicitation materials to participants and vote proxies for shares held under the Plan in accordance with the instruction of the participants.
There will be no brokerage charges with respect to common shares issued directly by the Fund. However, each participant will pay a pro rata share of brokerage commission incurred in connection with Open-Market Purchases. The automatic reinvestment of Dividends will not relieve participants of any Federal, state or local income tax that may be payable (or required to be withheld) on such Dividends.
The Fund reserves the right to amend or terminate the Plan. There is no direct service charge to participants with regard to purchases in the Plan; however, the Fund reserves the right to amend the Plan to include a service charge payable by the participants.
All correspondence or questions concerning the Plan should be directed to the Plan Administrator, BNY Mellon Shareowner Services, P.O. Box 358015, Pittsburgh, Pennsylvania 15252-8015, Attention: Shareholder Services Department, Phone Number: (866) 488-3559.
Semiannual Report | June 30, 2010 | 29
TYW | TS&W/Claymore Tax-Advantaged Balanced Fund
Board Considerations Regarding Investment Advisory Agreement and Investment Subadvisory Agreements Contract Re-Approval
On April 20, 2010, the Board of Trustees (the “Board”) of TS&W/Claymore Tax-Advantaged Balanced Fund (the “Fund”), including those trustees who are not “interested persons”as defined by the Investment Company Act of 1940, as amended (the “Independent Trustees”), on the recommendation of the Nominating & Governance Committee (referred to as the “Committee”and consisting solely of the Independent Trustees) of the Board of the Fund, renewed: (1) the investment advisory agreement (“Investment Advisory Agreement”) between the Fund and Claymore Advisors, LLC (“Adviser”), (2) the subadvisory agreement (“TS&W Subadvisory Agreement”) relating to management of the equity and income securities portion of the Fund’s portfolio (the R 20;Equity and Income Portfolio”) among the Adviser, the Fund and Thompson, Siegel & Walmsley LLC (“TS&W”) and (3) the subadvisory agreement (“SMC Subadvisory Agreement”) relating to management of the municipal securities portion of the Fund’s portfolio (the “Municipal Portfolio”) among the Adviser, the Fund and SMC Fixed Income Management, L.P. (“SMC”). The Investment Advisory Agreement, the TS&W Subadvisory Agreement and the SMC Subadvisory Agreement are collectively referred to as the “Advisory Agreements”. As part of its review process, the Committee was represented by independent legal counsel. The Board and Committee reviewed materials received from the Adviser, TS&W, SMC and independent legal counsel. The Board and Committee had previously received, throughout the year, Board meeting information regarding performance and operating results of the Fund.
In preparation for its review, the Committee communicated with independent legal counsel regarding the nature of information to be requested, and independent legal counsel, on behalf of the Committee, sent a formal request for information to the Adviser, TS&W and SMC. The Adviser, TS&W and SMC provided extensive information in response to that request as well as to a follow-up request for information. Among other information, the Adviser, TS&W and SMC provided general information to assist the Committee in assessing the nature and quality of services provided by the Adviser, TS&W and SMC and information comparing the investment performance, advisory fee and total expenses of the Fund to other funds, information about the profitability of the Advisory Agreements to each of the Adviser, TS&W and SMC and the compliance program of each of the Adviser, TS&W and SMC.
Based upon its review, the Board and the Committee concluded that it was in the best interests of the Fund to renew each of the Advisory Agreements. In reaching this conclusion for the Fund, no single factor was determinative in the Board’s analysis, but rather the Board considered a variety of factors.
Investment Advisory Agreement
With respect to the nature, extent and quality of services currently provided by the Adviser, the Board noted that the Adviser had delegated responsibility for the investment and reinvestment of the Equity and Income Portfolio to TS&W and the Municipal Portfolio to SMC. The Board considered the Adviser’s responsibility to oversee TS&W and SMC and that the Adviser has similar oversight responsibilities for other registered funds for which it serves as investment adviser. The Board reviewed financial information regarding the Adviser and its parent company and considered the parent company’s guaranty of the Adviser’s obligations under the Investment Advisory Agreement. The Board considered the experience and qualifications of the Adviser’s personnel, including those personnel providing compliance oversight and oversight of each of TS&W and SMC’s investment activities. Specifically, the Board noted the ongoing oversight activities performed by the Adviser, including on-site compliance reviews and monitoring of compliance with policies and procedures and with the Fund’s investment policies and restrictions. The Board also considered the secondary market support services provided by the Adviser to the Fund and the Adviser’s collaboration with the subad-visers on the Fund’s use of leverage and the Fund’s distribution rate.
The Board reviewed the Fund’s investment performance by reviewing the Fund’s net asset value (“NAV”) and market price returns for the three month, six month, one year, three year, five year and since inception periods ended February 28, 2010 and compared it to the NAV and market price returns of a custom blended peer group of funds selected by the Adviser emphasizing large capitalization value and/or dividend paying common or preferred stocks (“equity peer group”) and a peer group of funds selected by the Adviser investing primarily in municipal securities with long maturities that are investment grade (“municipal peer group”) (the equity peer group together with the municipal peer group, the “custom blended peer group”) and to the Russell 1000 Value Index and the Barclays Capital Municipal Bond Index for the same time periods. The Board noted that the Fund’s investment results were consistent with the Fund’s investment objective. The Board also considered the impact of leverage on the Fund’s performance for the twelve months ended February 28, 2010 and since inception. The Board also considered that the Adviser does not directly control investment performance but had delegated such duties to TS&W and SMC.
The Board considered the Fund’s advisory fee (which includes the subadvisory fees paid to TS&W and SMC) and expense ratio compared to the equity peer group and municipal peer group and to the custom blended peer group as a whole and to the advisory fee that the Adviser charges to other closed-end funds for which it serves as adviser. The Board also reviewed the mean advisory fees and expense ratios of the funds within the custom blended peer group and the custom blended peer group as a whole.
With respect to the costs of services to be provided and profits realized by the Adviser from its relationship with the Fund, the Board reviewed information regarding the revenues the Adviser received under the Investment Advisory Agreement as well as the estimated direct and indirect costs the Adviser incurred in providing the services to the Fund, including paying the subadvisory fees to TS&W and SMC.
The Board considered the extent to which economies of scale could be realized with respect to the management of the Fund as the Fund grows and whether fee levels reflect a reasonable sharing of such economies of scale for the benefit of Fund investors and also considered the current assets of the Fund. Given the size of the Fund and the relatively fixed nature of closed-end fund assets, the Board does not anticipate significant economies of scale.
The Board considered other benefits available to the Adviser because of its relationship with the Fund and noted that the administrative services fees received by the Adviser from serving as administrator to the Fund provides it with additional revenue.
TS&W Subadvisory Agreement
With respect to the nature, extent and quality of services provided by TS&W, the Board considered the qualifications, experience and skills of TS&W’s portfolio management and other key personnel. The Board considered TS&W’s ability to achieve the Fund’s investment objective as it relates to the Equity and Income Portfolio of providing a high level of after-tax return and in managing the portfolio’s equity and high yield securities, preferred stocks and real estate investment trusts for purposes of generating income. The Board compared the equity portion of the Equity and Income Portfolio’s performance to the Russell 1000 Value Index and the S&P 500 Index for the twelve months ended March 31, 2010, noting that absolute NAV performance was good but that the equity portion of the portfolio had under-performed the benchmark indices as the equity portfolio was not invested in certain non-dividend paying stocks that had outperformed. The Board also compared the fixed income portion of the Equity and Income Portfolio to a blended index of the Merrill Lynch High Yield Master II Index and Merrill Lynch Preferred Index for the same period. The Board noted the relative underperformance of the fixed income portion of the portfolio was primarily due to a bias toward higher quality bonds in the portfolio. The Board noted that the Equity and Income Portfolio’s performance has outperformed the S&P 500 Index since the Fund’s inception in 2004.
30 | Semiannual Report | June 30, 2010
TYW | TS&W/Claymore Tax-Advantaged Balanced Fund |Board Considerations continued
The Board reviewed the subadvisory fee paid by the Adviser to TS&W and compared it to the fees charged by TS&W to other investment company clients for which TS&W serves as adviser. The Board noted that the sub-advisory fee charged to the Fund was lower than the advisory fees charged by TS&W to its other investment company clients.
With respect to the costs of services to be provided and profits realized by TS&W from its relationship to the Fund, the Board reviewed information regarding the revenues TS&W received under the TS&W Subadvisory Agreement and estimated direct and indirect allocated expenses of TS&W in providing services under the TS&W Subadvisory Agreement.
The Board reviewed the extent to which economies of scale with respect to the subadvisory services provided to the Fund would be realized as the Fund grows and whether fee levels reflect a reasonable sharing of such economies of scale for the benefit of Fund investors. Given the size of the Fund and the relatively fixed nature of closed-end funds assets, the Board does not anticipate significant economies of scale.
The Board considered other benefits derived by TS&W from its relationship with the Fund, including its use of soft dollars, and other business relationships of affiliates of TS&W with the Adviser. The Board noted TS&W’s statement that it receives indirect benefits in the form of soft dollar arrangements which may or may not be used for the benefit of the Fund and may be used for the benefit of other clients of TS&W.
SMC Subadvisory Agreement
With respect to the nature, extent and quality of the services provided by SMC, the Board considered the qualifications, experience and skills of the SMC portfolio management team and other key personnel. In evaluating the performance of the Municipal Portfolio, the Board considered SMC’s success in achieving the Fund’s investment objective as it relates to the Municipal Portfolio of providing a high level of tax-advantaged income and the portfolio management team’s performance track record for the Municipal Portfolio. The Board noted that the Municipal Portfolio had outperformed its primary benchmark index, the Barclays Long Municipal Bond Index, during the twelve months ended March 31, 2010, and noted SMC’s view that this performance was primarily due to lengthening the duration of the portfolio at the beginni ng of the year and that the portfolio had a significantly higher coupon than the Barclays Long Municipal Bond Index.
The Board reviewed the subadvisory fee paid by the Adviser to SMC and compared it to the fees charged by SMC to other products for which it provides services.
With respect to the costs of services provided and profits realized by SMC from its relationship to the Fund, the Board reviewed the revenues received by SMC under the SMC Subadvisory Agreement and SMC’s estimated profitability thereof.
The Board reviewed the extent to which economies of scale with respect to the subadvisory services provided to the Fund would be realized as the Fund grows and whether fee levels reflect a reasonable sharing of such economies of scale for the benefit of Fund investors. Given the size of the Fund and the relatively fixed nature of closed-end fund assets, the Board does not anticipate significant economies of scale.
The Board considered other benefits to SMC and its affiliates to be derived from its relationship with the Fund, including the market awareness SMC gains by managing the Fund’s Municipal Portfolio.
Overall Conclusions
Based upon all of the information considered and the conclusions reached, the Board determined that the terms of each Advisory Agreement continue to be fair and reasonable and that the continuation of each Advisory Agreement is in the best interests of the Fund, taking into consideration the costs of services to be provided and profit realized, economies of scale and other benefits to the Adviser, TS&W and SMC.
Semiannual Report | June 30, 2010 | 31
TYW | TS&W/Claymore Tax-Advantaged Balanced Fund
Fund Information|
| | | | |
| Board of Trustees | Officers | Investment Manager – | Preferred Stock – |
| Matthew J.Appelstein* | J. Thomas Futrell | Equity and Income | Dividend Paying Agent |
| | Chief Executive Officer | Thompson, Siegel & | The Bank of |
| Randall C. Barnes | | Walmsley LLC | New York Mellon |
| | Kevin Robinson | | |
| Steven D. Cosler | Chief Legal Officer | | |
| | Chief Financial Officer, | Municipals | Skadden, Arps, Slate, |
| L. Kent Moore | Chief Accounting Officer | SMC Fixed Income | Meagher & Flom LLP |
| | | | |
| Ronald A. Nyberg | | | |
| | Vincent R. Giordano | | Independent Registered |
| Ronald E.Toupin, Jr. | Vice President | Investment Adviser and | |
| | | Administrator | Ernst &Young LLP |
| * Trustee is an “interested person” of the | George Gregorio | Claymore Advisors, LLC | Chicago, Illinois |
| Fund as defined in the Investment | Vice President | | |
| Company Act of 1940, as amended. | | | |
| | | | |
| | | | |
| | | | |
| | Bruce Saxon | New York Mellon | |
| | | | |
| | | | |
| | Mark E. Mathiasen | | |
| | Secretary | | |
| | | | |
| | Elizabeth H. Hudson | | |
| | Assistant Secretary | | |
Privacy Principles of TS&W/Claymore Tax-Advantaged Balanced Fund for Shareholders
The Fund is committed to maintaining the privacy of its shareholders and to safeguarding its non-public personal information. The following information is provided to help you understand what personal information the Fund collects, how we protect that information and why, in certain cases, we may share information with select other parties.
Generally, the Fund does not receive any non-public personal information relating to its shareholders, although certain non-public personal information of its shareholders may become available to the Fund. The Fund does not disclose any non-public personal information about its shareholders or former shareholders to anyone, except as permitted by law or as is necessary in order to service shareholder accounts (for example, to a transfer agent or third party administrator).
The Fund restricts access to non-public personal information about the shareholders to Claymore Advisors, LLC employees with a legitimate business need for the information. The Fund maintains physical, electronic and procedural safeguards designed to protect the non-public personal information of its shareholders.
Questions concerning your shares of TS&W/Claymore Tax-Advantaged Balanced Fund?
| · | If your shares are held in a Brokerage Account, contact your Broker. |
| · | If you have physical possession of your shares in certificate form, contact the Fund’s Custodian and Transfer Agent: |
The Bank of New York Mellon, 101 Barclay 11E,, New York, NY 10286; (866) 488-3559
This report is sent to shareholders of TS&W/Claymore Tax-Advantaged Balanced Fund for their information. It is not a Prospectus, circular or representation intended for use in the purchase or sale of shares of the Fund or of any securities mentioned in this report.
A description of the Fund’s proxy voting policies and procedures related to portfolio securities is available without charge, upon request, by calling the Fund at (866)882-0688.
Information regarding how the Fund voted proxies for portfolio securities, if applicable, during the most recent 12-month period ended December 31, is also available, without charge and upon request by calling (866)882-0688, by visiting Claymore’s website at www.claymore.com/tyw or by accessing the Fund’s Form N-PX on the U.S. Securities and Exchange Commission’s (“SEC”) website at www.sec.gov.
The Fund files its complete schedule of portfolio holdings with the SEC for the first and third quarters of each fiscal year on Form N-Q. The Fund’s Form N-Q is available on the SEC website at www.sec.gov or by visiting Claymore’s website at www.claymore.com/tyw. The Fund’s Form N-Q may also be viewed and copied at the SEC’s Public Reference Room in Washington, DC; information on the operation of the Public Reference Room may be obtained by calling (800) SEC-0330.
Notice to Shareholders
Notice is hereby given in accordance with Section 23(c) of the Investment Company Act of 1940, as amended, that the Fund may from time to time purchase its shares of common stock and preferred stock in the open market.
Effective 7/19/2010, the By-Laws of the Fund were changed as follows: If the Shareholders of any class or series of Shares are entitled to elect one or more Trustees, only such persons who are holders of record of such class or series of Shares at the time notice is provided with regards to the Annual Meetings of Shareholders shall be entitled to nominate persons for election as a Trustee by such class or series of Shares voting separately.
TYW | TS&W/Claymore Tax-Advantaged Balanced Fund
About the Fund Managers|
TS&W/ClaymoreTax-Advantaged Balanced Fund (TYW) is managed jointly by seasoned investment professionals from SMC Fixed Income Management, LP andThompson, Siegel &Walmsley LLC.The teams employ their specialized experience to different sleeves within the Fund, but work closely with one another to collectively guide the overall operations ofTYW.
Claymore Advisors, LLC
Claymore Advisors, LLC is a registered investment adviser that provides investment management and research-related services to registered investment companies. Claymore Advisors, LLC is responsible for the Fund’s overall asset allocation.
SMC Fixed Income Management, LP
SMC Fixed Income Management, LP (“SMC”) is a subsidiary of Spring Mountain Capital LP (“Spring Mountain”). Spring Mountain is an investment management firm founded in July 2001 that specializes in alternative investments and advisory services for both broad asset allocation and/or focused portfolios.
SMC’s Investment Philosophy and Process
SMC attempts to identify investment grade and below-investment grade municipal securities that are trading at attractive valuations relative to the Firm’s evaluation of the issuer’s creditworthiness, and with respect to private activity bonds, the profit potential of the corporation from which the revenue supporting the bonds is derived.
The municipal management team begins their credit selection process by analyzing broad macroeconomic trends and developments affecting the fixed-income markets.The managers analyze the economic outlook, market conditions and perceived effects on interest rates and yield curves. From there they incorporate a bottom-up and top-down analysis that helps construct a portfolio that the managers believe optimizes federally tax-exempt income while seeking to avoid undue credit risk and market timing risk. SMC’s proprietary, unbiased research helps the managers identify undervalued sectors that they believe have the potential for ratings upgrades and capital appreciation.
Thompson, Siegel & Walmsley LLC (TS&W)
Thompson, Siegel & Walmsley LLC (TS&W) is a registered investment adviser founded in 1969 in Richmond, Virginia and provides investment management services to corporations, pension and profit-sharing plans, 401(k) and thrift plans, open and closed-end mutual funds, trusts, estates and other institutions and individuals.The firm is a majority owned subsidiary of Old Mutual (US) Holdings Inc.TS&W is responsible for the day-today management of the equity and taxable income securities portion of the Fund.
TS&W Investment Philosophy and Process
Thompson, Siegel & Walmsley LLC’s investment process is value-driven and team-oriented.TS&W pursues a relative value-oriented philosophy and focuses its equity selection on the higher dividend paying stocks that meet its investment criteria.TS&W’s investment process uses a combination of quantitative and qualitative methods based on a four-factor screen. Parts one and two of the screen attempt to assess a company’s attractiveness based on cash flows relative to other stocks and as compared to their industry or sector peers.The third factor considers the relative earnings prospects of the company.The fourth factor involves looking at the company’s recent price action.TS&W generally limits its investment universe to those companies with a minimum of three years of sound operating history.
TS&W’s analysts also perform rigorous fundamental analysis, exploring numerous factors that may affect the outlook for a company.They evaluate publicly available information including sell-side research, company filings, and trade periodicals.The analysts may speak with company management to hear their perspectives and outlook on the pertinent business issues.They apply a consistent and disciplined review in a team environment that encourages critical thinking and analysis for each company considered for investment.
Established positions in the portfolio are ranked daily and are reviewed regularly in the same manner to re-examine their fundamental and valuation characteristics.The product team meets periodically to discuss each stock’s place in the portfolio.TS&W employs a consistent sell discipline.
TS&W’s Fixed-Income team is responsible for overall bond market strategy as well as security selection. In-house analysts are used to support the credit review process.
| Claymore Securities, Inc. |
| 2455 Corporate West Drive |
| Lisle, IL 60532 |
| Member FINRA/SIPC (08/10) |
NOT FDIC-INSURED l NOT BANK- GUARANTEED l MAY LOSE VALUE
TYW-SAR-0610
Item 2. Code of Ethics.
Not applicable for a semi-annual reporting period.
Item 3. Audit Committee Financial Expert.
Not applicable for a semi-annual reporting period.
Item 4. Principal Accountant Fees and Services.
Not applicable for a semi-annual reporting period.
Item 5. Audit Committee of Listed Registrants.
Not applicable for a semi-annual reporting period.
Item 6. Schedule of Investments.
The Schedule of Investments is included as part of Item 1.
Item 7. Disclosure of Proxy Voting Policies and Procedures for Closed-End Management Investment Companies.
Not applicable for a semi-annual reporting period.
Item 8. Portfolio Managers of Closed-End Management Investment Companies.
| (a) | Not applicable for a semi-annual reporting period. |
| (b) | There has been no change, as of the date of this filing, in the Portfolio Manager identified in response to paragraph (a) (1) of this item in the registrant’s most recent annual report on Form N-CSR. |
Item 9. Purchases of Equity Securities by Closed-End Management Investment Company and Affiliated Purchasers.
None.
Item 10. Submission of Matters to a Vote of Security Holders.
The registrant has not made any material changes to the procedures by which shareholders may recommend nominees to the registrant’s Board of Trustees.
Item 11. Controls and Procedures.
| (a) | The registrant's principal executive officer and principal financial officer have evaluated the registrant's disclosure controls and procedures (as defined in Rule 30a-3(c) under the Investment Company Act) as of a date within 90 days of this filing and have concluded based on such |
| | evaluation, that the registrant's disclosure controls and procedures were effective, as of that date, in ensuring that information required to be disclosed by the registrant in this Form N-CSR was recorded, processed, summarized, and reported within the time periods specified in the Securities and Exchange Commission’s rules and forms. |
| (b) | There were no changes in the registrant’s internal control over financial reporting (as defined in Rule 30a-3(d) under the Investment Company Act of 1940) that occurred during the registrant’s last fiscal quarter that have materially affected, or are reasonably likely to materially affect, the registrant’s internal control over financial reporting. |
Item 12. Exhibits.
(a)(1) Not Applicable
(a)(2) Certifications of principal executive officer and principal financial officer pursuant to Rule30a-2 of the Investment Company Act of 1940.
(a)(3) Not applicable.
(b) Certification of principal executive officer and principal financial officer pursuant to Rule 30a-2(b) of the Investment Company Act and Section 906 of the Sarbanes-Oxley Act of 2002.
SIGNATURES
Pursuant to the requirements of the Securities Exchange Act of 1934 and the Investment Company Act of 1940, the registrant has duly caused this report to be signed on its behalf by the undersigned, thereunto duly authorized.
(Registrant) TS&W/Claymore Tax-Advantaged Balanced Fund
By: /s/ J. Thomas Futrell
____________________________________________________________________
| Name: | J. Thomas Futrell |
| Title: | Chief Executive Officer |
| Date: | September 1, 2010 |
Pursuant to the requirements of the Securities Exchange Act of 1934 and the Investment Company Act of 1940, this report has been signed by the following persons on behalf of the registrant and in the capacities and on the dates indicated.
By: /s/ J. Thomas Futrell
____________________________________________________________________
| Name: | J. Thomas Futrell |
| Title: | Chief Executive Officer |
| Date: | September 1, 2010 |
By: /s/ Steven M. Hill
____________________________________________________________________
| Name: | Steven M. Hill |
| Title: | Treasurer and Chief Financial Officer |
| Date: | September 1, 2010 |